| OMB APPROVAL |
| OMB Number: |
| 3235-0570 |
| Expires: January |
| 31, 2017 |
| Estimated average |
| burden hours per |
| response: 20.6 |
UNITED STATES
SECURITIES AND EXCHANGE COMMISSION
Washington, D.C. 20549
FORM N-CSR
CERTIFIED SHAREHOLDER REPORT OF REGISTERED MANAGEMENT
INVESTMENT COMPANIES
Investment Company Act file number: 811-03153
Russell Investment Company
(Exact name of registrant as specified in charter)
1301 2nd Avenue 18th Floor, Seattle Washington 98101
(Address of principal executive offices) (Zip code)
Mary Beth R. Albaneze, Secretary and Chief Legal Officer
1301 2nd Avenue
18th Floor
Seattle, Washington 98101
206-505-4846
______________________________________________
(Name and address of agent for service)
Registrant's telephone number, including area code: 800-787-7354
Date of fiscal year end: October 31
Date of reporting period: November 1, 2013 to October 31, 2014
Item 1. Reports to Stockholders
![]()
2014 ANNUAL REPORT
Russell Funds
OCTOBER 31, 2014
| FUND | SHARE CLASS |
| U.S. Equity Funds | |
| Russell U.S. Core Equity Fund | A, C, E, I, S, Y |
| Russell U.S. Defensive Equity Fund | A, C, E, I, S, Y |
| Russell U.S. Dynamic Equity Fund | A, C, E, I, S, Y |
| Russell U.S. Strategic Equity Fund | A, C, E, S |
| Select U.S. Equity Fund | Y |
| Russell U.S. Large Cap Equity Fund | A, C, S |
| Russell U.S. Mid Cap Equity Fund | A, C, S |
| Russell U.S. Small Cap Equity Fund | A, C, E, I, S, Y |
| International and Global Equity Funds | |
| Russell International Developed Markets Fund | A, C, E, I, S, Y |
| Russell Global Equity Fund | A, C, E, S, Y |
| Select International Equity Fund | Y |
| Russell Emerging Markets Fund | A, C, E, S, Y |
| Tax-Managed Equity Funds | |
| Russell Tax-Managed U.S. Large Cap Fund | A, C, E, S |
| Russell Tax-Managed U.S. Mid & Small Cap Fund | A, C, E, S |
| Taxable Fixed Income Funds | |
| Russell Global Opportunistic Credit Fund | A, C, E, S, Y |
| Russell Strategic Bond Fund | A, C, E, I, S, Y |
| Russell Investment Grade Bond Fund | A, C, E, I, S, Y |
| Russell Short Duration Bond Fund | A, C, E, S, Y |
| Tax Exempt Fixed Income Funds | |
| Russell Tax Exempt Bond Fund | A, C, E, S |
| Alternative and Specialty Funds | |
| Russell Commodity Strategies Fund | A, C, E, S, Y |
| Russell Global Infrastructure Fund | A, C, E, S, Y |
| Russell Global Real Estate Securities Fund | A, C, E, S, Y |
| Russell Multi-Strategy Alternative Fund | A, C, E, S, Y |
| Russell Strategic Call Overwriting Fund | S |
Russell Investment Company
Russell Investment Company is a series investment company with 39 different investment portfolios referred to as Funds. These financial statements report on 24 of these Funds.
Russell Investment Company Russell Funds
Annual Report
October 31, 2014
Table of Contents
| Page |
| To Our Shareholders ........................................................................................... 3 |
| Market Summary ................................................................................................. 4 |
| Russell U.S. Core Equity Fund ......................................................................... 12 |
| Russell U.S. Defensive Equity Fund ................................................................. 32 |
| Russell U.S. Dynamic Equity Fund .................................................................. 54 |
| Russell U.S. Strategic Equity Fund ................................................................... 76 |
| Select U.S. Equity Fund .................................................................................... 98 |
| Russell U.S. Large Cap Equity Fund .............................................................. 120 |
| Russell U.S. Mid Cap Equity Fund ................................................................. 138 |
| Russell U.S. Small Cap Equity Fund .............................................................. 156 |
| Russell International Developed Markets Fund .............................................. 182 |
| Russell Global Equity Fund ............................................................................ 216 |
| Select International Equity Fund .................................................................... 242 |
| Russell Emerging Markets Fund ..................................................................... 268 |
| Russell Tax-Managed U.S. Large Cap Fund .................................................... 298 |
| Russell Tax-Managed U.S. Mid and Small Cap Fund ...................................... 318 |
| Russell Global Opportunistic Credit Fund ...................................................... 342 |
| Russell Strategic Bond Fund ........................................................................... 380 |
| Russell Investment Grade Bond Fund ............................................................ 428 |
| Russell Short Duration Bond Fund ................................................................. 468 |
| Russell Tax Exempt Bond Fund ...................................................................... 498 |
| Russell Commodity Strategies Fund ............................................................... 524 |
| Russell Global Infrastructure Fund ................................................................. 542 |
| Russell Global Real Estate Securities Fund ................................................... 566 |
| Russell Multi-Strategy Alternative Fund ......................................................... 590 |
| Russell Strategic Call Overwriting Fund ......................................................... 664 |
| Notes to Schedules of Investments .................................................................. 684 |
| Notes to Financial Highlights ......................................................................... 686 |
| Notes to Financial Statements ......................................................................... 687 |
| Report of Independent Registered Public Accounting Firm ............................ 720 |
| Tax Information ............................................................................................... 721 |
| Affiliated Brokerage Transactions ................................................................... 723 |
| Basis for Approval of Investment Advisory Contracts ..................................... 724 |
| Shareholder Requests for Additional Information ........................................... 739 |
| Disclosure of Information about Fund Trustees and Officers ........................... 740 |
| Adviser, Money Managers and Service Providers ............................................ 745 |
Russell Investment Company – Russell Funds.
Copyright © Russell Investments 2014. All rights reserved.
Russell Investments is a trade name and registered trademark of Frank Russell Company, a Washington USA corporation, which operates through subsidiaries worldwide and is part of London Stock Exchange Group.
Fund objectives, risks, charges and expenses should be carefully considered before investing. A prospectus containing this and other important information must precede or accompany this material. Please read the prospectus carefully before investing.
Securities distributed through Russell Financial Services, Inc., member FINRA and part of Russell Investments.
Indices and benchmarks are unmanaged and cannot be invested in directly. Returns represent past performance, are not a guarantee of future performance, and are not indicative of any specific investment. Index return information is provided by vendors and although deemed reliable, is not guaranteed by Russell Investments or its affiliates.
Russell Investments is the owner of the trademarks, service marks, and copyrights related to its respective indexes.
Performance quoted represents past performance and does not guarantee future results. The investment return and principal value of an investment will fluctuate so that shares, when redeemed, may be worth more or less than their original cost. Current performance may be lower or higher than the performance data quoted. Current to the most recent month-end performance data may be obtained by visiting www.russell.com/us/fundperformance.
To Our Shareholders
Dear Shareholder,
After strong performance in 2013, equity markets in the U.S. continued to move higher through the end of October 2014. The broad-based Russell 3000® Index was up 9.90% year-to-date as of October 31, 2014, and its one-year total return as of October 31, 2014 was 16.07%.
A number of factors contributed to this strong performance. After a somewhat slow start, the U.S economy has shown its resilience as corporate profits remain robust. Unemployment dropped below 6% in October for the first time since July 2008. And inflation remained tame, standing at just 1.7% on October 3, 2014.
At the same time, global markets contended with their fair share of concerns: instability in the Middle East, an Ebola outbreak in western Africa that spread fears across the globe, and unrest in the Ukraine. Add to that doubts about Europe’s economic recovery and a burst of volatility in the U.S. equity and Treasury markets in October and you might wonder how U.S. markets had such a strong year.
What all of this shows us is that the markets can – and often do – react to short-term events. But what matters most is to have a thoughtful financial plan, a long-term investment horizon, and a diversified, multi-asset portfolio that can weather periods of market volatility. We believe your financial advisor can also play a critical role in helping you stay on track and focus on your financial goals.
On the following pages you can gain additional insights on the markets and your investments by reviewing our Russell Investment Company’s 2014 Annual Report for the fiscal year ended October 31, 2014, including portfolio management discussions and fund performance information.
Thank you for the trust you have placed in our firm. All of us at Russell Investments appreciate the opportunity to help you achieve financial security.
Best regards,

Sandra Cavanaugh
CEO, U.S. Private Client Services
To Our Shareholders 3
Russell Investment Company
Market Summary as of October 31, 2014 (Unaudited)
U.S. Equity Markets
The U.S. equity market performed well over the fiscal year ended October 31, 2014 despite reactions to monetary policy and various geopolitical concerns. Broadly measured by the Russell 3000® Index, U.S. stocks returned 16.07% over the period, which is the sixth straight fiscal year ending October 31st that the Russell 3000® Index has finished with a positive absolute return.
The Russell 3000® Index finished higher in nine of the fiscal year’s twelve months, with exceptions in January, July and September 2014. Within U.S. large cap stocks, the Russell 1000® Growth Index outperformed the Russell 1000® Value Index as stocks with lower valuations (lower price-to-book and price-to-cash flow ratios) lagged the market. In particular, stocks with high historical 5-year earnings growth, including certain industries within technology and health care sectors, led the market upward. Similarly, within U.S. Small Cap, the Russell 2000® Growth Index outperformed the Russell 2000® Value Index returning 8.26% compared to 7.89%. The fiscal year was led by larger capitalization stocks as the Russell Top 200® Index returned 17.43% compared with the Russell Midcap® Index, Russell 2000® Index, and the Russell Microcap® Index, which returned 15.32%, 8.06% and 7.34%, respectively. The fiscal year was also led by defensive stocks as the Russell 1000® Defensive Index® returned 16.91% while the Russell 1000® Dynamic Index® returned 16.59%. Stocks of companies with less financial leverage (lower debt-to-capital ratios) generally outperformed those with more debt in their capital structures.
Toward the end of calendar year 2013, the U.S. equity market performed well as the Russell 3000® Index returned 2.90% in November and 2.64% in December despite investor concerns over macroeconomic events. One concern was focused on the pending reduction of quantitative easing (tapering) by the U.S. Federal Reserve (the “Fed”), although some uncertainty around the timing and amount was resolved in December when it was announced the Fed would reduce asset purchases from $85 billion to $75 billion in January. Also in December, the U.S. Congress passed legislation to prevent another government “shutdown” that may have occurred in early 2014 had there been no action.
U.S. equities rebounded from a challenging start to 2014 with the Russell 3000® Index recording positive returns in five of the first six months of the year. Investors shrugged off disappointing U.S. non-farm payroll numbers for December and January, which were generally blamed on unusually cold weather. Markets jumped considerably in February on “dovish” comments from new Fed Chair Janet Yellen in her first Congressional testimony. In March, high dividend yield stocks briefly underperformed after comments from Yellen suggesting that U.S. short term interest rates may rise sooner than some were expecting. Toward the end of March, the market’s focus shifted to profit taking among high momentum stocks which were viewed as overbought by some investors. The final U.S. gross domestic product (“GDP”) growth rate for the fourth quarter of 2013 came in at 2.6%, slightly behind forecasts. Elsewhere, a series of concerns about Ukraine, Crimea and Russia kept a lid on global market appreciation over the first few months of 2014.
The Russell 3000® Index gained 4.87% from April through June, ending the period at a new record high. The equity market was led by high dividend yield stocks early in the period, as investors bid up interest rate sensitive stocks in pursuit of more yield from equity oriented investments as long term interest rates fell. Economic data released during the quarter generally provided indications of a continued economic expansion. The standout anomaly was the third revision to U.S. first-quarter real GDP (an inflation adjusted GDP measure), which was sharply revised downward to -2.9% largely driven by a decrease in personal consumption expenditures. The Fed downwardly revised its 2014 GDP forecasts from 2.9% to 2.2%. Elsewhere, non-farm payrolls remained healthy, with June being the fifth straight month of growth above 200,000 jobs, which is the first time this has happened in 14 years. Meanwhile, the Fed cut its monthly asset purchases by $10 billion at each monthly meeting, reducing the amount to $35 billion at June’s meeting.
During the summer (July 2014 through September 2014), the Russell 3000® Index finished virtually unchanged from where it started, returning 0.01%. However, U.S. equities suffered negative returns in July and September. Geopolitical
4 Market Summary
Russell Investment Company
Market Summary as of October 31, 2014, continued — (Unaudited)
risks and negative investor reaction to the Fed’s monthly statement, which was perceived as being more hawkish, dragged down equities in July, while the sell-off in the final days of September was driven in part by fears of a potentially larger than anticipated rise in interest rates. This led interest rate sensitive industries, such as REITs and Utilities, to underperform. Non-farm payrolls missed estimates in August at 180,000, the second weakest number this year, although this followed six months of 200,000+ additions. Unemployment fell to 6.1% in August, partially due to a marginal tick down in the participation rate. Meanwhile, the Fed continued its monthly reductions in quantitative easing as it prepared to fully halt the program in October. The U.S. dollar experienced its strongest three month period against other G10 currencies since 2008 after enjoying an eleven week run of successive gains.
In October, volatility in the market picked up significantly, partially driven by concerns over a European slowdown, the strength of the ISIS terror group in the Middle East, and the Russian/Ukrainian conflict. Excess supply of oil was a concern for the energy sector, with the price of WTI crude falling below $80 a barrel. The market was down over 5.50% in the first half of October with consumer staples, health care, utilities and real estate investment trusts outperforming during the downturn and for the month as a whole. However, the second half of October was much more positive with the market recouping all of its earlier losses, as favorable third quarter earnings boosted investor confidence. It was another good month for the Biotech industry despite many market participants expressing concern over the level of valuations within the industry. On October 29, 2014 the Fed officially announced the end to its 6 year long bond buying program that was intended to jumpstart the U.S. economy after the massive recession in 2008. The Fed is generally expected by analysts to increase interest rates modestly sometime in mid 2015.
Non-U.S. Developed Equity Markets
For the fiscal year ended October 31, 2014, the non-U.S. equity market, as measured by the Russell Developed ex-U.S. Large Cap® Index (the “Index”), was up 0.17%. Equity prices increased to new highs during the period, despite the continued tepid global growth environment and elevated valuations, before pulling back in the last few months of the fiscal year. U.S. Dollar strength was a significant headwind during the period as other major currencies fell against the U.S. dollar - the Euro (-7.87%), Yen (-12.64%), Canadian dollar (-6.51%), Swiss Franc (-6.06%), and British Pound (-0.01%). Concerns heightened in the latter part of the fiscal period over European growth further slowing from an already modest pace, particularly in the larger economies such as Germany. At the end of the fiscal year political uncertainties in Eastern Europe and the Middle East continued to hang over the market.
During the fourth quarter of 2013, the global ex-U.S. market posted solid gains as the Index was up 5.8%. Several important U.S. macro indicators came in on the upside during November and December, fueling the positive momentum in the U.S. economy and spurring market anticipation of a near-term deceleration in the pace of U.S. Federal Reserve (“Fed”) quantitative easing (“QE”). U.S. gross domestic product (“GDP”) grew 2.8% year-over-year in the third quarter of 2013, while Institute for Supply Management® manufacturing and non-farm payrolls both beat consensus forecasts. The beginning of QE’s wind down was officially announced towards mid-December in the amount of $10 billion tapering to start in January 2014. The relatively low amount of tapering, coupled with new Fed Chair Janet Yellen’s dovish commentary on future monetary policy stance, were positively acknowledged by the markets.
Geo-politics and policymaker rhetoric dominated headlines in what was a relatively volatile first quarter of 2014. The Index registered positive returns of 1.2%, after recovering strongly from a sharp decline at the end of January. The quarter began with concerns over the outlook for growth in emerging markets (“EM”), amid ongoing speculation regarding the Fed’s plans for the reversal of QE. Political upheaval in a number of EM countries also caused concern, most notably in Ukraine and Venezuela, as the currencies of a series of EM countries sold-off. However, comments from Fed Chair Janet Yellen soothed investor concerns as she stated that “a highly accommodative policy will remain appropriate for a considerable time after asset purchases end.” European Central Bank (“ECB”) Chairman Draghi added to the positive mood as he re-iterated the ECB was “ready and willing” to act. However, an uptick in political risk weighed on markets at the beginning of March as fallout from Crimea’s independence referendum and its resulting decision to join with Russia stoked wider international
Market Summary 5
Russell Investment Company
Market Summary as of October 31, 2014, continued — (Unaudited)
tensions. Despite sanctions between Russia and its Western critics, a feared escalation of tensions did not materialize and markets rebounded. Although macro data out of China worsened towards the second half of March, comments from the country’s Premier Li served to boost equity markets and spark a reversal in sentiment as he reassured investors that the government would support the economy.
A challenging start to the second quarter of 2014 saw equity markets track lower as policymaker inaction and an intensification of geopolitical events in Ukraine and the Middle East led to heightened investor risk aversion. However, non-U.S. equities maintained a largely positive trajectory through the quarter, as the Index advanced 4.4%.
The ECB’s announcement of renewed stimulus efforts in early June, as well as moderation of tensions between Russia and the West, contributed to an improvement in market sentiment toward the end of the second quarter. Consistently dovish comments from Fed Chair Janet Yellen, in particular her assertion that “a high degree of monetary accommodation remains warranted,” were also well received. Emerging markets also enjoyed a strong quarter, boosted by a series of welcome election results, most notably in India, and less dire concern toward the Chinese government’s restraint in policy support in the face of a decelerating economy.
Equity markets tracked lower over the third quarter of 2014, as the strengthening recovery in the U.S. wasn’t enough to offset a resurgence of geopolitical tension in the Middle East and sluggishness in Europe. Once again, monetary policy was key to equity performance across the world. Markets seemed unperturbed by the imminent end of QE in the U.S., preferring to focus on the country’s strong economic fundamentals, but concerns over interest rate hikes prompted Fed Chair Janet Yellen to insist that interest rates would remain low for a “considerable time.” Low inflation and high unemployment in the Eurozone pushed the ECB to cut deposit and interest rates to record lows and pledge to start buying covered bonds. By quarter-end, however, poor economic data highlighted that further stimulatory action would likely be necessary. Emerging markets had a patchy quarter, with underwhelming data from China doing little to quell concerns that the country may yet face a hard economic landing.
Overall, the non-U.S. markets fell 5.9% in the third quarter of 2014, as measured by the Index. Japan shed 2.57% as the after-effects of the consumer-tax hike continued to weigh on inflation and consumer sentiment. European markets were the biggest laggard, dropping 7.5% on the back of persistently bad economic news from the region’s key economies: Italy fell into recession in the second quarter, France stagnated and Germany saw business confidence slump to its lowest level in 17 months. Emerging market equities declined 3.3% in U.S. dollar terms during the quarter, largely driven by a September sell-off. Over the period, strength in the U.S. economy and a likelihood of further monetary easing in Europe and Japan weren’t enough to overcome broader fears over the health of the global economy. Though emerging markets fell overall, they contained several bright spots, especially in East Asia.
The largest capitalization stocks and those with higher dividend yields were strong performers over the year which generally favored more defensively oriented companies such as those found in the health care sector which led the other sectors by a large margin. Positive returns were also generated from telecommunication and utilities sectors. Information technology was the only other sector that outperformed for the fiscal year. Materials and energy sectors posted strong gains in the first half of the fiscal year but ended the fiscal year as the worst performers over growing concerns of economic growth and U.S. dollar strength.
Regionally, Asia ex-Japan was the clear leader, led largely by strong performance in Hong Kong as concerns over China eased in the latter part of the fiscal year. Europe was weak as the larger economies such as Germany and France pulled back on poor economic data, concerns over growth, and questions whether the European Central Bank will act in a timely manner to stimulate the fledgling economy.
The fiscal year did not show a clear trend between value and growth styles, though stocks that exhibited higher price-to-book ratios and strong historical growth were generally favored over the fiscal year.
6 Market Summary
Russell Investment Company
Market Summary as of October 31, 2014, continued — (Unaudited)
Emerging Markets
The Russell Emerging Markets® Index (the “Index”) gained 1.86% over the fiscal year ended October 31, 2014. In what was another volatile fiscal year period, macroeconomic events continued to impact emerging market equities against a backdrop of interest rate uncertainty and geopolitical headwinds. With central banks in the developed world extending quantitative easing measures, emerging markets rallied into early September of 2014. Positive geopolitical events highlighted by Prime Minister Modi’s assumption of power in India underpinned gains. However, this was offset by the turmoil caused by the ongoing Ukraine crisis. The rally in emerging markets reversed course in September 2014 largely driven by speculation of rising interest rates. A combination of geopolitics and weak data further added to the downturn.
In November and December of 2013, the Index lost 2.3%. Ongoing speculation as to when the U.S. Federal Reserve (“Fed”) would begin to reduce its stimulus measures continued to impact emerging markets over the period and the asset class suffered outflows. When the news finally arrived in mid-December that the Fed was to cut its quantitative easing (“QE”) program by $10 billion, emerging markets did not react too sharply and actually rallied into year-end. The November announcement of an agreement which would see Iran reduce its nuclear program in exchange for a lifting of international sanctions was negative for some net oil exporters such as Russia and Colombia. China was boosted by a raft of reforms announced at the Third Plenary Session of the 18th Congress. The Indian market was boosted by a drop in the price of oil, which may help to reduce inflation, and a gross domestic product (“GDP”) reading which showed the economy had grown. Brazil’s macro fundamentals remained challenging and GDP growth slowed. The Brazilian central bank moved to hike rates as it continued to fight high inflation. In emerging Europe, Purchasing Managers Indices (“PMI”) ticked up and GDP growth accelerated. However, the Turkish market was hampered by Fed taper fears and by a corruption scandal, which engulfed Prime Minister Erdogan’s cabinet, highlighting the increasing tensions between the PM and the country’s judiciary.
The first quarter of 2014 turned out to be volatile, with the Index slipping -0.2%. The asset class was off to a tough start amid uncertainty surrounding the Fed’s plans for QE reduction and increasing concerns over the Chinese economy. Uncertainty linked to Fed tapering began to evaporate in February and emerging markets rebounded, bolstered by comments from new Fed chair Janet Yellen. However, a rise in political risk spurred bouts of renewed volatility, primarily due to Crimea’s independence referendum and its resulting decision to join with Russia. Meanwhile, Chinese macro data continued to deteriorate. In conjunction with comments from Premier Li, this sparked a reversal in sentiment amid expectations that the government may take action to support the economy. Despite tit-for-tat sanctions between Russia and its Western critics, a feared escalation of tensions did not materialize and combined with a drop in risk aversion in China, emerging markets rebounded. In this environment, there was a high dispersion in country returns while EM currencies also registered some sizeable movements. China (-5.6%) underperformed as PMI manufacturing data continued to worsen and the central bank moved to tighten liquidity conditions. Indonesia (+21.7%) bounced back as markets reacted positively to news that popular Jakarta governor, Joko Widodo, would run for president. Data showing that its current account deficit had narrowed also helped to restore investor confidence and spurred a gain in the rupiah. The Philippines (+8.9%) and Thailand (+8.7%) also outperformed while Korea (-2.1%) lagged. India (+8.9%) recorded solid gains, boosted by central bank action, which contributed to a 3.2% gain in the rupee, and by polls which indicated the opposition BJP may win upcoming elections. In Latin America, Colombia (+4.2%) and Brazil (+1.8%) were the only countries to outperform. In Brazil, expectations that the central bank’s interest rate hiking cycle was coming to an end, and polls which indicated lower approval ratings for president Rousseff, sparked resurgence in the local market. Russia (-14.4%) was the worst performing country in the Index, as events in Crimea were the catalyst for a significant sell-off which also saw the ruble fall 6.5%. Emerging Europe was mixed with Greece (+15.8%) benefiting from increased stability in the Eurozone. In contrast, Hungary (-8.8%) lagged, as the central bank cut interest rates more than anticipated. Turkey (+3.2%) epitomized the high levels of volatility, with its perceived fragility to Fed tapering resulting in sizeable capital outflows and a sell-off in the lira early in the quarter. However, the central bank’s decision to hike rates 300bps served to stabilize the currency, and as wider concerns over emerging markets eased, the local market more than recouped losses. South Africa (+4.4%) finished in positive territory
Market Summary 7
Russell Investment Company
Market Summary as of October 31, 2014, continued — (Unaudited)
while Egypt (+14.7%) registered strong gains ahead of Presidential elections. From an investment style perspective, growth was strongly outperforming value coming into the first quarter of 2014, particularly stocks with the highest price-to-book valuations and high return-on-equity. However, mid-March saw a sharp reversal with value stocks, in particular deep value stocks, outperforming significantly. On a market capitalization basis, small capitalization equities outperformed large capitalization equities, as measured by the Russell Emerging Markets Small Cap Index (+2.6% over the quarter).
The second quarter of 2014 saw the Index rally +7%. Diminished concerns over a nearer term rise in global interest rates provided a tailwind to market returns. However, the main catalyst for gains was a series of favorable election results, most notably in India (+17%) where Narendra Modi’s BJP party became the first to attain a majority in the lower house for more than 30 years. Elections in South Africa, Egypt and frontier market Ukraine also completed relatively smoothly, with no major surprises. The Chinese market (+5.0%) witnessed some large swings through the period. Concerns over PMI data early in the quarter dissipated as renewed fears over a hard landing were allayed by upside data surprises and as investors appeared more at ease with the government’s restraint in implementing large scale policy intervention through the current period of transition. Elsewhere in Asia, the Philippines (+9.6%) outperformed, despite the publication of a weak first quarter GDP report which was hit by the effects of typhoon Yolanda. However, the market gained on expectations that higher private consumption and reconstruction spending may boost full year GDP growth as the World Bank increased its Philippine outlook. After initial fears, a military coup in Thailand (+8.4%) was interpreted as a stabilizing factor, generating more optimistic sentiment in financial markets. Indonesia (-1.3%) was the regional laggard, hampered by uncertainty over July’s Presidential election. India was the standout country in the Index, buoyed by high expectations that the new administration would succeed in delivering economic reforms to restore growth and battle high inflation. In Latin America, Brazil (+7.0%) rallied as polls showed support for President Rousseff was declining ahead of October’s Presidential election. However, fundamentals for the country’s economy remained weak with the Brazilian central bank raising its already above target inflation outlook for 2014 and the World Bank cutting its GDP growth forecast to 1.5%. Peru (+8.5%) outperformed, while Chile (+2.0%) lagged as the economy continued to slow. An easing in tensions between Russia (+11.7%) and the West, and a cooling of events in Ukraine, was beneficial for various emerging European markets. Turkey (+15.0%) enjoyed a strong quarter, as its current account deficit continued to recede. Greece (-9.8%) was the worst performing country in the Index as data for the Eurozone remained weak and some Greek bank equities declined sharply on concerns over the banks’ exposure to Ukraine and Bulgaria. South Africa (+5.1%) capped a solid quarter, as the ruling ANC party held control of the national assembly, albeit with a reduced majority. The United Arab Emirates (-6.1%) underperformed, particularly in June.
Following a very strong second quarter, the Index declined 3.1% in the third quarter of 2014, largely driven by a September sell-off. Emerging markets sold off on speculation around rising interest rates and U.S. dollar strength: the 5-year U.S. Treasury rate rose by 16 basis points over the quarter and the dollar strengthened relative to most currencies. China ended the quarter in mildly positive territory (+1.6%) despite enduring some poor economic data towards the end of the period. While the government had been making positive statements about reform, investors remained concerned – given falling industrial production and a surprise drop in lending – that it won’t be sufficient for the country to hit its growth targets for the year. Meanwhile, geopolitics played a large role in the performance of emerging markets over the period. Brazil fell 9.2% amid a resurgence in support for the incumbent presidential candidate, Dilma Rousseff. The Russian markets slumped 15.8% as geopolitical tensions in Ukraine rumbled on, and sanctions imposed by Europe and the U.S. began to bite. A significant portion of returns for both Russia and Brazil were driven by currency weakness relative to the U.S. dollar. Over the quarter, the Brazilian and Russian currencies declined by more than 10% against the U.S. dollar. Emerging markets in Europe had a poor quarter overall, with Hungary falling 12.1% and Turkey by 11.5%. Turkey is considered particularly vulnerable to interest rate hikes due to its high current account deficit. Thailand rose sharply (+8.0%) after the appointment of a new prime minister appeared to assure a period of greater stability. Indonesia climbed (+2.9%) following the election of Joko Widodo. Elsewhere, India continued to do well (+1.7%) as recently elected Prime Minister Narendra Modi pressed forward with a reformist agenda. Notably, GDP growth of 5.7% year-over-year recorded in the second quarter was the fastest rate since the first quarter of 2012. In the Middle East, the United Arab Emirates enjoyed a strong quarter,
8 Market Summary
Russell Investment Company
Market Summary as of October 31, 2014, continued — (Unaudited)
with its market rising by 18.4% to add to its leading year-to-date returns. Mexico (+0.6%) also gained despite the sell-off in September and the Philippines (+2.8%) posted strong GDP growth which helped drive gains. Additional laggards included Greece, which ended down 19.9%, and South Korea, which was also among the biggest detractors as markets fell by 5.8%. With China being one of its biggest export markets, South Korea is especially vulnerable to the economic travails of its giant northern neighbor. Taiwan also declined (-4.3%), as the recent strong run of its technology companies led to profit taking. Elsewhere, Malaysia (-2.4%), Peru (-3.8%) and Chile (-5.1%) all slipped lower.
The Index was up 1% in October with positive upside largely coming from China (+4%). Expectations around state-owned enterprise reform fueled the rally in spite of slowed manufacturing numbers. Turkey (+10%) also rallied as its central bank kept interest rates steady. In contrast, Greece (-15.6%) sold off due to elevated election risks and concerns as to whether it would be able to cover its financing needs.
U.S./Global Fixed Income Markets
The fiscal year ended October 31, 2014 was a positive period for global fixed income markets overall, although not without a few surprises along the way. Sovereign yields ended the period moderately lower than they began across all regions, buoying returns across fixed income sectors. Globally, credit sectors largely outperformed similar-duration government bonds as spreads generally held or narrowed modestly over the period.
The fiscal year began with positive momentum, emanating from the U.S. in particular. This was following a volatile end to the 2013 fiscal year period, as investors grappled with the prospect of a gradual end to the Fed’s monetary expansion and later uncertainty surrounding the U.S. debt ceiling and possible government shutdown. Year-on-year 2013 third quarter U.S. gross domestic product (“GDP”) growth surprised materially to the upside, at 4.1% compared to expectations of 2.0%. Then in January 2014, the U.S. unemployment rate dipped to below 7%, where it would stay for the remainder of the fiscal year. Later in January, market optimism stumbled briefly as disappointing U.S. non-farm payroll data was released and concern grew over the global economic outlook for China as the potential for accelerating credit defaults became more apparent. However, this was more than offset by a fourth quarter 2013 U.S. GDP growth reading coming in ahead of expectations, as well as the smooth leadership transition at the U.S. Federal Reserve (the “Fed”). Chairwoman Janet Yellen’s first testimony to the U.S. Congress was positively received by global financial markets, during which she stressed continuity, if not a slightly more dovish stance than her predecessor. The result was a positive end to 2013 and a positive first quarter of 2014 for global fixed income markets, particularly for credit sectors.
The moderate rally in global fixed income markets extended through the second quarter of 2014 amid economic data that supported a progressive economic recovery in the U.S. and bottoming-out in Europe. Given gradual tapering in the Fed’s asset purchasing program and positive U.S. growth outlook, the mid-year rally in U.S. Treasuries caught many market participants by surprise. The rally was driven by a lull in new issuance squeezing supply (and yields) of longer-term bonds as well as demand from price-insensitive buyers (de-risking pension funds, the Fed and China). While the impact of a particularly harsh winter became more evident in the second quarter, accentuated by a meaningful downwards revision in first quarter GDP growth, fixed income markets proved resilient. Improving unemployment, job gains and consumer confidence re-affirmed the market’s optimism, as did Chairwoman Yellen’s commitment to maintain an accommodative stance even as unemployment and inflation approached target levels.
Market calm turned to concern during the last four months of the fiscal year amid heightened uncertainty surrounding geopolitical events and the robustness of global growth. Despite generally positive economic data out of the U.S., Israeli-Palestinian tension in the Gaza Strip escalated dramatically in July, putting investors a little more on edge, although the immediate market impact was relatively muted. More impactful was news of a Malaysia Airlines passenger jet being shot down over Ukraine later in the month, raising the stakes in the conflict between Kiev and pro-Moscow rebels in which Russia and the West backed opposing sides. The Ukraine conflict continued to escalate throughout July and August, but was halted by a tense cease-fire in September. As a result, the third quarter of 2014 was challenging for global
Market Summary 9
Russell Investment Company
Market Summary as of October 31, 2014, continued — (Unaudited)
fixed income markets, particularly credit sectors. Safe-haven U.S. and core European government bonds posted modestly positive returns.
On the other hand, the U.S. economy continued to show strength, with employment gains, consumer confidence and second quarter GDP growth coming in largely ahead of expectations. However, weak economic data out of core Europe and China scared credit markets, tempering the outlook for growth globally. Moves by the European Central Bank to loosen monetary policy, including its own form of asset purchasing program, put further downward pressure on government bond yields, most notably in Europe, but with sympathy downward moves in North America and Asia-Pacific. Volatility spiked in October amid weak data releases out of Europe (namely Germany) and China, sending yields and risk assets plummeting globally, only to nearly revert to prior levels days later. Growing fears over the spread of Ebola from Africa also contributed to investors being more on edge as the first cases were reported in the U.S. and Europe. By fiscal year-end, global government bond yields remained lower for the year, while credit spreads, which had contracted during the first two-thirds of the period, ended flat overall.
A key indicator of global fixed income performance, the Barclays Global Aggregate Index, returned 5.32% for the fiscal year, in USD hedged terms, buoyed by moderately lower government bond yields and broadly flat credit spreads.
Over the fiscal year, European bonds outperformed those of other regions (returning 8.8% as measured by the Barclays European Aggregate Index) on the back of strong Treasury returns, most notably among lower-rated “peripheral” countries such as Ireland, Spain, Italy and Slovenia, as spreads between peripheral and “core” countries (e.g., Germany) narrowed materially. U.S. bonds posted solid gains (returning 4.1% as measured by the Barclays U.S. Aggregate Index) as U.S. Treasury yields ended the year modestly lower and credit spreads held. Asia-Pacific bonds lagged (returning -5% as measured by the Barclays Asian Pacific Aggregate Index) as a slowing Chinese growth outlook weighed on the region, offsetting the Bank of Japan’s commitment to, and later ramp-up in, aggressive monetary policy support.
Strong new issuance volumes characterized most credit sectors, particularly in the U.S., over the fiscal year, in both corporate and securitized markets. Sectors generally performed in-line with spreads, with corporate credit outperforming securitized credit across regions (returning 3.4% vs. 2.7% on a global basis, respectively, as measured by Barclays Global Aggregate Index - Corporates and Barclays Global Aggregate Index - Securitized). Overall, lower-quality investment grade corporates outperformed higher-quality investment grade corporates, and utilities and industrials outperformed financials. U.S. agency mortgage-backed securities (“MBS”) performed well (returning 4.1% as measured by Barclays U.S. Aggregate Index – Agency MBS) despite concerns of reduced demand from tapering Fed purchases.
Similar to fiscal year 2013, non-Agency MBS again outperformed most other sectors, aided by favorable supply and demand forces and solid housing fundamentals. High yield corporate credit performed in-line with investment grade corporate credit on an equivalent-duration basis, as slightly wider spreads offset higher running yields. The lowest-quality segments of the sector underperformed significantly, failing to fully recover from global growth concerns that rattled markets in the latter part of the fiscal year. Emerging market (“EM”) debt outperformed developed fixed income markets, largely as a result of a bounce-back from weakness at the end of the previous fiscal year, and reflecting the valuation gap between emerging and developed market assets. Local currency bonds (those denominated in the currency of the issuing EM country) significantly underperformed hard currency bonds (those issued by EM issuers but denominated in “hard currencies” such as the U.S. dollar or Euro), largely as a result of EM currency weakness amid global and market-specific growth and geopolitical concerns.
10 Market Summary
(This page intentionally left blank)
Russell Investment Company Russell U.S. Core Equity Fund
Portfolio Management Discussion and Analysis — October 31, 2014 (Unaudited)
| Russell U.S. Core Equity Fund - Class A‡ | Russell U.S. Core Equity Fund - Class S‡‡‡ | ||||||
| Total | Total | ||||||
| Return | Return | ||||||
| 1 Year | 7.90 | % | 1 Year | 14.80 | % | ||
| 5 Years | 13.25 | %§ | 5 Years | 14.89 | %§ | ||
| 10 Years | 6.68 | %§ | 10 Years | 7.56 | %§ | ||
| Russell U.S. Core Equity Fund - Class C‡‡ | Russell U.S. Core Equity Fund - Class Y | ||||||
| Total | Total | ||||||
| Return | Return | ||||||
| 1 Year | 13.66 | % | 1 Year | 15.02 | % | ||
| 5 Years | 13.74 | %§ | 5 Years | 15.10 | %§ | ||
| 10 Years | 6.80 | %§ | 10 Years | 7.70 | %§ | ||
| Russell U.S. Core Equity Fund - Class E | Russell 1000® Index** | ||||||
| Total | Total | ||||||
| Return | Return | ||||||
| 1 Year | 14.52 | % | 1 Year | 16.78 | % | ||
| 5 Years | 14.65 | %§ | 5 Years | 16.98 | %§ | ||
| 10 Years | 7.33 | %§ | 10 Years | 8.54 | %§ | ||
| Russell U.S. Core Equity Fund - Class I | |||||||
| Total | |||||||
| Return | |||||||
| 1 Year | 14.90 | % | |||||
| 5 Years | 14.99 | %§ | |||||
| 10 Years | 7.62 | %§ | |||||
12 Russell U.S. Core Equity Fund
Russell Investment Company
Russell U.S. Core Equity Fund
Portfolio Management Discussion and Analysis, continued — October 31, 2014 (Unaudited)
The Russell U.S. Core Equity Fund (the “Fund”) employs a multi- However, the Fund’s tilts away from midcap stocks and toward manager approach whereby portions of the Fund are allocated to health care stocks were beneficial. different money managers. Fund assets not allocated to money With the continuation of the economic recovery, the Fund was managers are managed by Russell Investment Management underweight in most of the sectors that are traditionally considered Company (“RIMCo”), the Fund’s advisor. RIMCo may change to be “non-cyclical” and/or interest rate sensitive. However, the allocation of the Fund’s assets among money managers at certain industries that tend to be viewed as “bond substitutes,” any time. An exemptive order from the Securities and Exchange due to their income producing qualities, such as electric utilities Commission (“SEC”) permits RIMCo to engage or terminate a and real estate investment trusts (REITs), outperformed given money manager at any time, subject to approval by the Fund’s the decline in interest rates and this detracted from the Fund’s Board, without a shareholder vote. Pursuant to the terms of the benchmark-relative performance. exemptive order, the Fund is required to notify its shareholders within 90 days of when a money manager begins providing How did the investment strategies and techniques employed services. As of October 31, 2014, the Fund had seven money by the Fund and its money managers affect its benchmark-managers. relative performance?
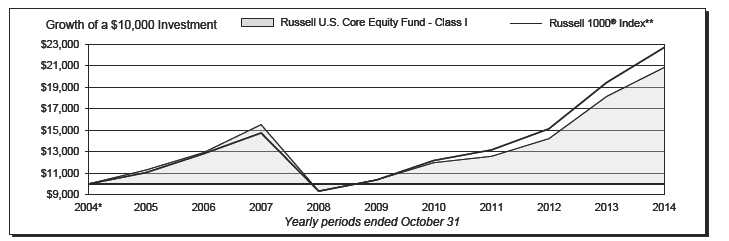
What is the Fund’s investment objective? Stock selection effects within the technology sector (an underweight to Apple Inc.) and within the health care sector (an The Fund seeks to provide long term capital growth. overweight to Pfizer Inc.) detracted from the Fund’s benchmark-How did the Fund perform relative to its benchmark for the relative returns for the fiscal year. The Fund’s overweight to the fiscal year ended October 31, 2014? health care sector and underweight to the consumer staples sector For the fiscal year ended October 31, 2014, the Fund’s Class A, were beneficial. Factor exposures were mixed, as an overweight to Class C, Class E, Class I, Class S and Class Y Shares gained stocks with the lowest valuations (lowest price-to-book and price-14.49%, 13.66%, 14.52%, 14.90%, 14.80% and 15.02%, to-cash flow ratios) detracted, while an underweight to midcap respectively. This is compared to the Fund’s benchmark, the stocks was rewarded.
Russell 1000® Index, which gained 16.78% during the same Barrow, Hanley, Mewhinney & Strauss, LLC (“Barrow”) period. The Fund’s performance includes operating expenses, outperformed the Russell 1000® Value Index for the fiscal year. whereas index returns are unmanaged and do not include Factor exposures were rewarded, specifically a tilt toward stocks expenses of any kind. with low earnings variability and away from mid cap stocks.
For the fiscal year ended October 31, 2014, the Morningstar® Barrow’s underweight to the technology sector and overweight to Large Blend, a group of funds that Morningstar considers to the producer durables sector detracted, although an overweight to have investment strategies similar to those of the Fund, gained the health care sector was beneficial. Stock selection within the 14.34%. This result serves as a peer comparison and is expressed producer durables sector (overweights to Southwest Airlines Co. net of operating expenses. and General Dynamics Corporation) was additive to benchmark-relative returns.
RIMCo may assign a money manager a specific style or capitalization benchmark other than the Fund’s index. However, Columbus Circle Investors (“Columbus Circle”) underperformed the Fund’s primary index remains the benchmark for the Fund the Russell 1000® Growth Index for the fiscal year. Factor and is representative of the aggregate of each money manager’s exposures were mixed, and specifically a tilt toward high beta benchmark index. stocks (stocks with high sensitivity to market movements) detracted, although a tilt toward stocks with rising earnings How did the market conditions described in the Market estimates was beneficial. Sector exposures were also mixed, with Summary report affect the Fund’s performance? an underweight to technology detracting, while an overweight During the fiscal year, the U.S. large capitalization equity market to health care was rewarded. Stock selection within the energy produced positive returns. Relevant Fund exposures included sector (overweights to Pioneer Natural Resources Company and tilts toward stocks with the lowest valuation ratios (lowest price- Noble Energy, Inc.) held back benchmark-relative performance. to-book and price-to-cash flow ratios) and health care stocks, and Institutional Capital LLC (“ICAP”) underperformed the Russell away from midcap stocks, growth stocks, and technology stocks. 1000® Value Index for the fiscal year. From a sector perspective, Growth stocks outperformed value stocks for the fiscal year an underweight to energy and an overweight to health care and technology stocks outperformed the Russell 1000® Index, contributed positively to benchmark-relative returns. Stock detracting from the Fund’s benchmark-relative performance. selection within the consumer discretionary sector (overweights to Viacom, Inc. and Ford Motor Company) and within the technology
Russell U.S. Core Equity Fund 13
Russell Investment Company
Russell U.S. Core Equity Fund
Portfolio Management Discussion and Analysis, continued — October 31, 2014 (Unaudited)
| sector (an underweight to Intel Corporation) significantly detracted | allocated to managers include the Fund’s liquidity reserves and | |
| from benchmark-relative performance. | assets which may be managed directly by RIMCo to modify the | |
| Jacobs Levy Equity Management, Inc (“Jacobs”) outperformed | Fund’s overall portfolio characteristics to seek to achieve the | |
| the Russell 1000® Defensive™/Russell 1000® Value 70/30 | desired risk/return profile for the Fund. | |
| blended Index for the fiscal year. Factor exposures were rewarded, | RIMCo pursues an investment strategy for the Fund that is a | |
| specifically tilts toward stocks with rising earnings estimates and | replication of the Russell Top 200® Defensive™ Index and | |
| positive earnings surprise and a tilt away from stocks with high | intended to help control the Fund’s beta (beta is a measure of | |
| financial leverage (high debt-to-capital ratios). Jacob’s overweight | a portfolio’s volatility and its sensitivity to the direction of the | |
| to the technology and health care sectors contributed positively | market).This strategy performed in-line with expectations, as it | |
| to benchmark-relative returns. Stock selection within the health | reduced the Fund’s beta and smoothed the Fund’s return pattern. | |
| care sector (an overweight to Forest Laboratories, Inc.) was | During the market environment of this fiscal year, low beta stocks | |
| additive to benchmark-relative performance. | (stocks with low sensitivity to market movements) produced | |
| Schneider Capital Management Corporation (“Schneider”) | higher returns than high beta stocks, which was reflected in the | |
| underperformed the Russell 1000® Value Index for the fiscal | investment returns of this strategy. | |
| year. Many of Schneider’s factor exposures were not rewarded, | During the period, RIMCo used index futures contracts to equitize | |
| specifically overweights to mid cap stocks, stocks with low | the Fund and money managers’ cash. The decision to equitize | |
| valuations (low price-to-book and price-to-cash flow ratios), | Fund and manager cash was beneficial to Fund performance for | |
| and high beta stocks. An underweight to the technology sector | the fiscal year. | |
| and an overweight to the energy sector detracted, although an | ||
| overweight to the financial services sector was beneficial. Stock | Describe any changes to the Fund’s structure or the money | |
| selection within the energy sector (overweights to Peabody Energy | manager line-up. | |
| Corporation and Arch Coal, Inc.) detracted. | There were no changes to the Fund’s structure or money manager | |
| line up during the fiscal year. | ||
| Suffolk Capital Management, LLC (“Suffolk”) outperformed the | ||
| Russell 1000® Index for the fiscal year. Many of Suffolk’s portfolio | Money Managers as of October 31, | |
| exposures were rewarded, specifically tilts toward stocks with | 2014 | Styles |
| lower dividend yields, higher growth rates, and rising earnings | Barrow, Hanley, Mewhinney & Strauss, LLC | Value |
| estimates. Overweights to the health care and technology sectors | Columbus Circle Investors | Growth |
| were beneficial. Stock selection within the technology sector (an | Institutional Capital LLC | Value |
| overweight to Avago Technologies Limited) and within the health | Jacobs Levy Equity Management, Inc. | Defensive Value |
| Schneider Capital Management Corporation | Value | |
| care sector (overweights to Pharmacyclics, Inc. and Valeant | Suffolk Capital Management, LLC | Market-Oriented |
| Pharmaceuticals International, Inc.) contributed positively to | Sustainable Growth Advisers, LP | Growth |
| benchmark-relative returns. | The views expressed in this report reflect those of the portfolio | |
| Sustainable Growth Advisers, LP (“Sustainable”) underperformed | managers only through the end of the period covered by | |
| the Russell 1000® Growth Index for the fiscal year. Stock | the report. These views do not necessarily represent the | |
| selection was the primary source of negative benchmark-relative | views of RIMCo, or any other person in RIMCo or any other | |
| return. Stock selection was particularly detrimental within the | affiliated organization. These views are subject to change | |
| technology sector (underweights to Apple, Inc. and Microsoft | at any time based upon market conditions or other events, | |
| Corporation) and the consumer staples sector (an overweight | and RIMCo disclaims any responsibility to update the views | |
| to Whole Foods Market, Inc.). From a sector perspective, an | contained herein. These views should not be relied on as | |
| overweight to materials and processing and an underweight to | investment advice and, because investment decisions for | |
| technology detracted. | a Russell Investment Company (“RIC”) Fund are based on | |
| numerous factors, should not be relied on as an indication | ||
| RIMCo manages the portion of the Fund’s assets that RIMCo | of investment decisions of any RIC Fund. | |
| determines not to allocate to the money managers. Assets not | ||
14 Russell U.S. Core Equity Fund
Russell Investment Company
Russell U.S. Core Equity Fund
Portfolio Management Discussion and Analysis, continued — October 31, 2014 (Unaudited)
| * | Assumes initial investment on November 1, 2004. |
| ** | Russell 1000® Index includes the 1,000 largest companies in the Russell 3000® Index. The Russell 1000® Index represents the universe of stocks from which most active money managers typically select. The Russell 1000® Index return reflects adjustments from income dividends and capital gain distributions reinvested as of the ex-dividend dates. |
| ‡ | The Fund first issued Class A Shares on September 2, 2008. The returns shown for Class A Shares prior to that date are the returns of Class E Shares. The performance shown has been adjusted to reflect the deduction of the maximum Class A sales charge of 5.75%. Annual returns for each Class will differ only to the extent that the Class A Shares do not have the same expenses as Class E Shares. |
| ‡‡ | The Fund first issued Class C Shares on September 2, 2008. The returns shown for Class C Shares prior to that date are the returns of the Fund’s Class E Shares and do not reflect deduction of Rule 12b-1 distribution fees that apply to Class C Shares. Had they done so, the returns shown for those periods would have been lower. Annual returns for each Class will differ only to the extent that the Class C Shares do not have the same expenses as the Class E Shares. |
| ‡‡‡ | The Fund first issued Class S Shares on September 2, 2008. The returns shown for Class S Shares prior to that date are the returns of the Fund’s Class I |
| Shares. Class S Shares will have substantially similar annual returns as the Class I Shares because the Shares of each Class are invested in the same portfolio of securities. Annual returns for each Class will differ only to the extent that the Class S Shares do not have the same expenses as the Class I Shares. | |
| § | Annualized. |
Performance is historical and assumes reinvestment of all dividends and capital gains. Investment return and principal value will fluctuate so that an investor’s shares, when redeemed, may be worth more or less than when purchased. Past performance is not indicative of future results. The returns shown do not reflect the deduction of taxes that a shareholder would pay on Fund distributions or the redemption of Fund shares.
Russell U.S. Core Equity Fund 15
Russell Investment Company Russell U.S. Core Equity Fund
Shareholder Expense Example — October 31, 2014 (Unaudited)
| Fund Expenses | Please note that the expenses shown in the table are meant | |||||
| The following disclosure provides important information | to highlight your ongoing costs only and do not reflect any | |||||
| regarding the Fund’s Shareholder Expense Example | transactional costs. Therefore, the information under the heading | |||||
| (“Example”). | “Hypothetical Performance (5% return before expenses)” is | |||||
| useful in comparing ongoing costs only, and will not help you | ||||||
| Example | determine the relative total costs of owning different funds. In | |||||
| As a shareholder of the Fund, you incur two types of costs: (1) | addition, if these transactional costs were included, your costs | |||||
| transaction costs, and (2) ongoing costs, including advisory and | would have been higher. | |||||
| administrative fees; distribution (12b-1) and/or service fees; | Hypothetical | |||||
| and other Fund expenses. The Example is intended to help | Performance (5% | |||||
| you understand your ongoing costs (in dollars) of investing in | Actual | return before | ||||
| the Fund and to compare these costs with the ongoing costs of | Class A | Performance | expenses) | |||
| Beginning Account Value | ||||||
| investing in other mutual funds. The Example is based on an | May 1, 2014 | $ | 1,000.00 | $ | 1,000.00 | |
| investment of $1,000 invested at the beginning of the period and | Ending Account Value | |||||
| held for the entire period indicated, which for this Fund is from | October 31, 2014 | $ | 1,070.90 | $ | 1,019.76 | |
| May 1, 2014 to October 31, 2014. | Expenses Paid During Period* | $ | 5.64 | $ | 5.50 | |
| Actual Expenses | * Expenses are equal to the Fund's annualized expense ratio of 1.08% | |||||
| (representing the six month period annualized), multiplied by the average | ||||||
| The information in the table under the heading “Actual | account value over the period, multiplied by 184/365 (to reflect the one-half | |||||
| Performance” provides information about actual account values | year period). | |||||
| and actual expenses. You may use the information in this column, | ||||||
| together with the amount you invested, to estimate the expenses | Hypothetical | |||||
| Performance (5% | ||||||
| that you paid over the period. Simply divide your account value by | Actual | return before | ||||
| $1,000 (for example, an $8,600 account value divided by $1,000 | Class C | Performance | expenses) | |||
| = 8.6), then multiply the result by the number in the first column | Beginning Account Value | |||||
| in the row entitled “Expenses Paid During Period” to estimate | May 1, 2014 | $ | 1,000.00 | $ | 1,000.00 | |
| Ending Account Value | ||||||
| the expenses you paid on your account during this period. | October 31, 2014 | $ | 1,067.00 | $ | 1,015.98 | |
| Expenses Paid During Period* | $ | 9.53 | $ | 9.30 | ||
| Hypothetical Example for Comparison Purposes | ||||||
| The information in the table under the heading “Hypothetical | * Expenses are equal to the Fund's annualized expense ratio of 1.83% | |||||
| Performance (5% return before expenses)” provides information | (representing the six month period annualized), multiplied by the average | |||||
| account value over the period, multiplied by 184/365 (to reflect the one-half | ||||||
| about hypothetical account values and hypothetical expenses | year period). | |||||
| based on the Fund’s actual expense ratio and an assumed rate of | ||||||
| return of 5% per year before expenses, which is not the Fund’s | Hypothetical | |||||
| actual return. The hypothetical account values and expenses | Performance (5% | |||||
| Actual | return before | |||||
| may not be used to estimate the actual ending account balance or | Class E | Performance | expenses) | |||
| expenses you paid for the period. You may use this information | Beginning Account Value | |||||
| to compare the ongoing costs of investing in the Fund and other | May 1, 2014 | $ | 1,000.00 | $ | 1,000.00 | |
| funds. To do so, compare this 5% hypothetical example with the | Ending Account Value | |||||
| October 31, 2014 | $ | 1,071.20 | $ | 1,019.76 | ||
| 5% hypothetical examples that appear in the shareholder reports | Expenses Paid During Period* | $ | 5.64 | $ | 5.50 | |
| of other funds. | ||||||
| * Expenses are equal to the Fund's annualized expense ratio of 1.08% | ||||||
| (representing the six month period annualized), multiplied by the average | ||||||
| account value over the period, multiplied by 184/365 (to reflect the one-half | ||||||
| year period). | ||||||
16 Russell U.S. Core Equity Fund
Russell Investment Company Russell U.S. Core Equity Fund
Shareholder Expense Example, continued — October 31, 2014 (Unaudited)
| Hypothetical | |||||
| Performance (5% | |||||
| Actual | return before | ||||
| Class I | Performance | expenses) | |||
| Beginning Account Value | |||||
| May 1, 2014 | $ | 1,000.00 | $ | 1,000.00 | |
| Ending Account Value | |||||
| October 31, 2014 | $ | 1,073.00 | $ | 1,021.42 | |
| Expenses Paid During Period* | $ | 3.92 | $ | 3.82 | |
| * Expenses are equal to the Fund's annualized expense ratio of 0.75% | |||||
| (representing the six month period annualized), multiplied by the average | |||||
| account value over the period, multiplied by 184/365 (to reflect the one-half | |||||
| year period). | |||||
| Hypothetical | |||||
| Performance (5% | |||||
| Actual | return before | ||||
| Class S | Performance | expenses) | |||
| Beginning Account Value | |||||
| May 1, 2014 | $ | 1,000.00 | $ | 1,000.00 | |
| Ending Account Value | |||||
| October 31, 2014 | $ | 1,072.50 | $ | 1,021.02 | |
| Expenses Paid During Period* | $ | 4.34 | $ | 4.23 | |
| * Expenses are equal to the Fund's annualized expense ratio of 0.83% | |||||
| (representing the six month period annualized), multiplied by the average | |||||
| account value over the period, multiplied by 184/365 (to reflect the one-half | |||||
| year period). | |||||
| Hypothetical | |||||
| Performance (5% | |||||
| Actual | return before | ||||
| Class Y | Performance | expenses) | |||
| Beginning Account Value | |||||
| May 1, 2014 | $ | 1,000.00 | $ | 1,000.00 | |
| Ending Account Value | |||||
| October 31, 2014 | $ | 1,073.40 | $ | 1,022.03 | |
| Expenses Paid During Period* | $ | 3.29 | $ | 3.21 | |
| * Expenses are equal to the Fund's annualized expense ratio of 0.63% | |||||
| (representing the six month period annualized), multiplied by the average | |||||
| account value over the period, multiplied by 184/365 (to reflect the one-half | |||||
| year period). | |||||
Russell U.S. Core Equity Fund 17
| Russell Investment Company | |||||||
| Russell U.S. Core Equity Fund | |||||||
| Schedule of Investments — October 31, 2014 | |||||||
| Amounts in thousands (except share amounts) | Amounts in thousands (except share amounts) | ||||||
| Principal | Fair | Principal | Fair | ||||
| Amount ($) or | Value | Amount ($) or | Value | ||||
| Shares | $ | Shares | $ | ||||
| Common Stocks - 96.1% | Yum! Brands, Inc. | 4,143 | 298 | ||||
| Consumer Discretionary - 14.1% | 255,272 | ||||||
| Advance Auto Parts, Inc. | 6,370 | 936 | |||||
| Amazon.com, Inc.(Æ) | 27,900 | 8,522 | Consumer Staples - 5.2% | ||||
| AutoZone, Inc.(Æ) | 5,350 | 2,961 | Altria Group, Inc. | 130,931 | 6,329 | ||
| Belmond, Ltd. Class A(Æ) | 8,997 | 103 | Andersons, Inc. (The) | 6,500 | 414 | ||
| Brinker International, Inc. | 54,107 | 2,902 | Archer-Daniels-Midland Co. | 3,294 | 155 | ||
| Carnival Corp. | 100,430 | 4,032 | Casey's General Stores, Inc. | 5,200 | 426 | ||
| CBS Corp. Class B | 59,995 | 3,253 | Coca-Cola Co. (The) | 197,186 | 8,258 | ||
| Chipotle Mexican Grill, Inc. Class A(Æ) | 4,480 | 2,858 | Colgate-Palmolive Co. | 146,724 | 9,813 | ||
| Choice Hotels International, Inc. | 12,800 | 685 | Constellation Brands, Inc. Class A(Æ) | 21,282 | 1,948 | ||
| Columbia Sportswear Co. | 11,800 | 455 | CVS Health Corp. | 12,201 | 1,047 | ||
| Comcast Corp. Class A(Æ) | 347,191 | 19,217 | General Mills, Inc. | 6,338 | 329 | ||
| Costco Wholesale Corp. | 43,157 | 5,756 | Hershey Co. (The) | 59,240 | 5,682 | ||
| DIRECTV(Æ) | 2,277 | 198 | JM Smucker Co. (The) | 30,948 | 3,219 | ||
| Domino's Pizza, Inc. | 5,200 | 462 | Kellogg Co. | 2,649 | 169 | ||
| Estee Lauder Cos., Inc. (The) Class A | 46,482 | 3,495 | Kimberly-Clark Corp. | 3,887 | 444 | ||
| Foot Locker, Inc. | 6,100 | 342 | Kraft Foods Group, Inc.(Æ) | 3,070 | 173 | ||
| Ford Motor Co. | 512,600 | 7,223 | Kroger Co. (The) | 52,500 | 2,925 | ||
| Gap, Inc. (The) | 122,900 | 4,657 | Molson Coors Brewing Co. Class B | 41,465 | 3,084 | ||
| Garmin, Ltd. | 32,800 | 1,820 | Mondelez International, Inc. Class A | 12,161 | 429 | ||
| General Motors Co. | 44,200 | 1,388 | PepsiCo, Inc. | 77,989 | 7,500 | ||
| Home Depot, Inc. | 63,141 | 6,157 | Philip Morris International, Inc. | 185,583 | 16,519 | ||
| Hyatt Hotels Corp. Class A(Æ) | 18,000 | 1,066 | Procter & Gamble Co. (The) | 203,814 | 17,787 | ||
| Jarden Corp.(Æ) | 53,366 | 3,474 | Reynolds American, Inc. | 3,185 | 200 | ||
| Johnson Controls, Inc. | 212,950 | 10,062 | Sysco Corp. | 6,030 | 232 | ||
| Kohl's Corp. | 33,000 | 1,789 | Walgreen Co. | 2,786 | 179 | ||
| L Brands, Inc. | 25,200 | 1,817 | Whole Foods Market, Inc. | 184,120 | 7,242 | ||
| Las Vegas Sands Corp. | 34,222 | 2,131 | 94,503 | ||||
| Lennar Corp. Class A | 126,930 | 5,468 | |||||
| Liberty Media Corp.(Æ) | 115,400 | 5,531 | Energy - 7.7% | ||||
| Lowe's Cos., Inc. | 204,630 | 11,705 | Arch Coal, Inc. | 591,797 | 1,278 | ||
| Macy's, Inc. | 7,700 | 445 | Baker Hughes, Inc. | 9,500 | 503 | ||
| Marriott International, Inc. Class A | 67,900 | 5,143 | BP PLC - ADR | 101,300 | 4,403 | ||
| Mattel, Inc. | 49,800 | 1,547 | Cameron International Corp.(Æ) | 79,950 | 4,761 | ||
| McDonald's Corp. | 10,314 | 967 | Chesapeake Energy Corp. | 159,990 | 3,549 | ||
| Meritage Homes Corp.(Æ) | 6,430 | 237 | Chevron Corp. | 123,672 | 14,834 | ||
| Nike, Inc. Class B | 78,237 | 7,274 | ConocoPhillips | 141,703 | 10,224 | ||
| NVR, Inc.(Æ) | 122 | 150 | CONSOL Energy, Inc. | 17,688 | 651 | ||
| Office Depot, Inc.(Æ) | 187,180 | 977 | Continental Resources, Inc.(Æ) | 24,036 | 1,355 | ||
| Omnicom Group, Inc. | 10,050 | 722 | Devon Energy Corp. | 109,822 | 6,589 | ||
| O'Reilly Automotive, Inc.(Æ) | 13,090 | 2,302 | Exxon Mobil Corp. | 242,492 | 23,451 | ||
| Priceline Group, Inc. (The)(Æ) | 8,031 | 9,687 | FMC Technologies, Inc.(Æ) | 2,300 | 129 | ||
| Ralph Lauren Corp. Class A | 17,397 | 2,868 | Halliburton Co. | 198,417 | 10,941 | ||
| Royal Caribbean Cruises, Ltd. | 60,177 | 4,090 | Hess Corp. | 12,738 | 1,080 | ||
| Starbucks Corp. | 145,479 | 10,992 | Marathon Oil Corp. | 6,074 | 215 | ||
| Target Corp. | 130,451 | 8,064 | Nabors Industries, Ltd. | 48,300 | 862 | ||
| Taylor Morrison Home Corp. Class A(Æ) | 16,780 | 289 | National Oilwell Varco, Inc. | 4,178 | 303 | ||
| Tiffany & Co. | 16,000 | 1,538 | Occidental Petroleum Corp. | 173,819 | 15,458 | ||
| Time Warner, Inc. | 175,768 | 13,968 | Patterson-UTI Energy, Inc. | 54,700 | 1,260 | ||
| TJX Cos., Inc. | 67,283 | 4,260 | PBF Energy, Inc. Class A | 4,400 | 115 | ||
| Toll Brothers, Inc.(Æ) | 90,570 | 2,894 | Peabody Energy Corp. | 244,027 | 2,545 | ||
| Ulta Salon Cosmetics & Fragrance, Inc.(Æ) | 23,739 | 2,868 | Phillips 66(Æ) | 134,048 | 10,523 | ||
| Under Armour, Inc. Class A(Æ) | 32,538 | 2,134 | Pioneer Natural Resources Co. | 23,713 | 4,483 | ||
| Viacom, Inc. Class B | 183,534 | 13,339 | Schlumberger, Ltd. | 127,266 | 12,556 | ||
| Wal-Mart Stores, Inc. | 213,700 | 16,299 | Seventy Seven Energy, Inc.(Æ) | 2,435 | 32 | ||
| Walt Disney Co. (The) | 205,701 | 18,797 | Spectra Energy Corp. | 5,106 | 200 | ||
| Whirlpool Corp. | 15,447 | 2,658 | Valero Energy Corp. | 26,700 | 1,337 | ||
| Weatherford International PLC(Æ) | 208,820 | 3,429 | |||||
| See accompanying notes which are an integral part of the financial statements. | |||||||
| 18 Russell U.S. Core Equity Fund | |||||||
| Russell Investment Company | |||||||
| Russell U.S. Core Equity Fund | |||||||
| Schedule of Investments, continued — October 31, 2014 | |||||||
| Amounts in thousands (except share amounts) | Amounts in thousands (except share amounts) | ||||||
| Principal | Fair | Principal | Fair | ||||
| Amount ($) or | Value | Amount ($) or | Value | ||||
| Shares | $ | Shares | $ | ||||
| Whiting Petroleum Corp.(Æ) | 42,505 | 2,603 | Progressive Corp. (The) | 142,632 | 3,767 | ||
| WPX Energy, Inc.(Æ) | 10,200 | 195 | Prologis, Inc.(ö) | 21,400 | 891 | ||
| 139,864 | Prudential Financial, Inc. | 55,343 | 4,900 | ||||
| Public Storage(ö) | 1,481 | 273 | |||||
| Financial Services - 20.1% | Raymond James Financial, Inc. | 11,800 | 662 | ||||
| ACE, Ltd. | 3,483 | 381 | Regions Financial Corp. | 246,543 | 2,448 | ||
| Aflac, Inc. | 58,830 | 3,514 | Reinsurance Group of America, Inc. Class A | 27,000 | 2,275 | ||
| Allstate Corp. (The) | 37,045 | 2,402 | SEI Investments Co. | 14,500 | 561 | ||
| American Express Co. | 231,190 | 20,796 | Signature Bank(Æ) | 1,420 | 172 | ||
| American International Group, Inc. | 47,959 | 2,569 | Simon Property Group, Inc.(ö) | 2,205 | 395 | ||
| Ameriprise Financial, Inc. | 97,550 | 12,308 | State Street Corp. | 270,790 | 20,434 | ||
| Aon PLC | 125,270 | 10,773 | SunTrust Banks, Inc. | 149,273 | 5,843 | ||
| Arch Capital Group, Ltd.(Æ) | 45,500 | 2,563 | T Rowe Price Group, Inc. | 18,600 | 1,527 | ||
| Aspen Insurance Holdings, Ltd. | 50,000 | 2,181 | TCF Financial Corp. | 21,100 | 326 | ||
| Assurant, Inc. | 6,700 | 457 | Thomson Reuters Corp. | 3,137 | 117 | ||
| Assured Guaranty, Ltd. | 73,029 | 1,686 | Travelers Cos., Inc. (The) | 3,584 | 361 | ||
| Axis Capital Holdings, Ltd. | 31,300 | 1,507 | US Bancorp | 61,971 | 2,640 | ||
| Bank of America Corp. | 1,957,049 | 33,583 | Visa, Inc. Class A | 73,493 | 17,743 | ||
| Barclays PLC - ADR | 65,704 | 1,012 | Voya Financial, Inc. | 42,000 | 1,648 | ||
| BB&T Corp. | 1,556 | 59 | Wells Fargo & Co. | 558,876 | 29,671 | ||
| Berkshire Hathaway, Inc. Class B(Æ) | 35,013 | 4,907 | Zions Bancorporation | 5,700 | 165 | ||
| BlackRock, Inc. Class A | 3,285 | 1,121 | 363,354 | ||||
| Brixmor Property Group, Inc.(ö) | 1,500 | 37 | |||||
| Capital One Financial Corp. | 85,514 | 7,078 | Health Care - 16.8% | ||||
| CDK Global, Inc. | 1,658 | 56 | Abbott Laboratories | 49,390 | 2,153 | ||
| Chubb Corp. (The) | 25,322 | 2,516 | Actavis PLC(Æ) | 29,808 | 7,236 | ||
| Citigroup, Inc. | 488,857 | 26,169 | Aetna, Inc. | 14,465 | 1,193 | ||
| City National Corp. | 18,600 | 1,464 | Allergan, Inc. | 21,392 | 4,066 | ||
| CME Group, Inc. Class A | 171 | 14 | Amgen, Inc. | 114,492 | 18,568 | ||
| Columbia Property Trust, Inc.(ö) | 21,846 | 551 | Baxter International, Inc. | 5,597 | 393 | ||
| Comerica, Inc. | 30,800 | 1,470 | Becton Dickinson and Co. | 1,993 | 256 | ||
| Cullen/Frost Bankers, Inc. | 39,300 | 3,176 | Biogen Idec, Inc.(Æ) | 21,000 | 6,743 | ||
| Discover Financial Services | 91,430 | 5,831 | Boston Scientific Corp.(Æ) | 48,000 | 637 | ||
| Equifax, Inc. | 12,700 | 962 | Bristol-Myers Squibb Co. | 182,876 | 10,642 | ||
| Equity Residential(ö) | 223 | 16 | Brookdale Senior Living, Inc. Class A(Æ) | 32,076 | 1,081 | ||
| Everest Re Group, Ltd. | 20,330 | 3,469 | Cardinal Health, Inc. | 130,642 | 10,253 | ||
| Fifth Third Bancorp | 20,700 | 414 | Celgene Corp.(Æ) | 34,410 | 3,685 | ||
| First American Financial Corp. | 33,324 | 1,010 | Cerner Corp.(Æ) | 125,930 | 7,976 | ||
| First Niagara Financial Group, Inc. | 174,500 | 1,307 | Clovis Oncology, Inc.(Æ) | 75,421 | 4,500 | ||
| Fiserv, Inc.(Æ) | 43,140 | 2,997 | Covidien PLC | 133,001 | 12,295 | ||
| FleetCor Technologies, Inc.(Æ) | 19,635 | 2,956 | Edwards Lifesciences Corp.(Æ) | 7,500 | 907 | ||
| Franklin Resources, Inc. | 8,722 | 485 | Eli Lilly & Co. | 103,248 | 6,848 | ||
| Fulton Financial Corp. | 30,500 | 362 | Express Scripts Holding Co.(Æ) | 101,644 | 7,808 | ||
| Goldman Sachs Group, Inc. (The) | 53,400 | 10,145 | Gilead Sciences, Inc.(Æ) | 90,126 | 10,094 | ||
| Hanover Insurance Group, Inc. (The) | 3,300 | 221 | HCA Holdings, Inc.(Æ) | 80,300 | 5,625 | ||
| Hartford Financial Services Group, Inc. | 161,253 | 6,382 | Health Net, Inc.(Æ) | 17,000 | 808 | ||
| JPMorgan Chase & Co. | 287,810 | 17,407 | Henry Schein, Inc.(Æ) | 8,010 | 961 | ||
| KeyCorp | 51,367 | 678 | Humana, Inc. | 17,250 | 2,395 | ||
| Lincoln National Corp. | 60,380 | 3,306 | Illumina, Inc.(Æ) | 10,529 | 2,028 | ||
| Loews Corp. | 183,800 | 8,014 | Intercept Pharmaceuticals, Inc.(Æ) | 14,205 | 3,670 | ||
| Marsh & McLennan Cos., Inc. | 5,669 | 308 | Johnson & Johnson | 261,945 | 28,232 | ||
| MasterCard, Inc. Class A | 107,643 | 9,015 | McKesson Corp. | 34,578 | 7,034 | ||
| MetLife, Inc. | 61,360 | 3,328 | MEDNAX, Inc.(Æ) | 10,300 | 643 | ||
| Morgan Stanley | 128,400 | 4,488 | Medtronic, Inc. | 196,205 | 13,373 | ||
| Morningstar, Inc. | 740 | 51 | Merck & Co., Inc. | 355,201 | 20,580 | ||
| Northern Trust Corp. | 106,897 | 7,087 | Mylan, Inc.(Æ) | 84,258 | 4,512 | ||
| NorthStar Realty Finance Corp.(ö) | 77,850 | 1,446 | Perrigo Co. PLC | 29,140 | 4,705 | ||
| PartnerRe, Ltd. | 6,630 | 767 | Pfizer, Inc. | 1,330,636 | 39,853 | ||
| PNC Financial Services Group, Inc. (The) | 344,166 | 29,733 | Pharmacyclics, Inc.(Æ) | 26,443 | 3,455 | ||
| See accompanying notes which are an integral part of the financial statements. | |||||||
| Russell U.S. Core Equity Fund 19 | |||||||
| Russell Investment Company | |||||||
| Russell U.S. Core Equity Fund | |||||||
| Schedule of Investments, continued — October 31, 2014 | |||||||
| Amounts in thousands (except share amounts) | Amounts in thousands (except share amounts) | ||||||
| Principal | Fair | Principal | Fair | ||||
| Amount ($) or | Value | Amount ($) or | Value | ||||
| Shares | $ | Shares | $ | ||||
| Regeneron Pharmaceuticals, Inc.(Æ) | 12,494 | 4,919 | Illinois Tool Works, Inc. | 122,023 | 11,110 | ||
| Sanofi - ADR | 148,457 | 6,865 | Knight Transportation, Inc. | 14,600 | 427 | ||
| St. Jude Medical, Inc. | 56,330 | 3,615 | L-3 Communications Holdings, Inc. | 31,260 | 3,797 | ||
| Stryker Corp. | 3,468 | 304 | Landstar System, Inc. | 33,569 | 2,484 | ||
| Thermo Fisher Scientific, Inc. | 37,559 | 4,416 | Lexmark International, Inc. Class A | 1,900 | 82 | ||
| UnitedHealth Group, Inc. | 145,388 | 13,813 | Lockheed Martin Corp. | 25,435 | 4,847 | ||
| Valeant Pharmaceuticals International, Inc. | Manpowergroup, Inc. | 10,100 | 674 | ||||
| (Æ) | 105,368 | 14,018 | MAXIMUS, Inc. | 4,400 | 213 | ||
| Varian Medical Systems, Inc.(Æ) | 3,300 | 278 | Navistar International Corp.(Æ) | 12,618 | 446 | ||
| WellPoint, Inc. | 5,900 | 747 | Norfolk Southern Corp. | 48,679 | 5,386 | ||
| 304,183 | Northrop Grumman Corp. | 8,179 | 1,128 | ||||
| Parker-Hannifin Corp. | 8,000 | 1,016 | |||||
| Materials and Processing - 4.5% | Paychex, Inc. | 38,400 | 1,802 | ||||
| Air Products & Chemicals, Inc. | 847 | 114 | Raytheon Co. | 155,053 | 16,107 | ||
| Alcoa, Inc. | 205,739 | 3,448 | Southwest Airlines Co. | 212,700 | 7,334 | ||
| AptarGroup, Inc. | 4,200 | 261 | Stanley Black & Decker, Inc. | 63,300 | 5,927 | ||
| Bombardier, Inc. Class B | 232,443 | 766 | Textron, Inc. | 19,300 | 802 | ||
| Cabot Corp. | 3,100 | 144 | Toro Co. (The) | 3,900 | 241 | ||
| Commercial Metals Co. | 14,200 | 246 | Union Pacific Corp. | 85,383 | 9,943 | ||
| CRH PLC - ADR | 223,400 | 5,006 | United Continental Holdings, Inc.(Æ) | 72,024 | 3,804 | ||
| Dow Chemical Co. (The) | 37,400 | 1,848 | United Parcel Service, Inc. Class B | 7,404 | 777 | ||
| Ecolab, Inc. | 70,390 | 7,830 | United Technologies Corp. | 39,070 | 4,180 | ||
| EI du Pont de Nemours & Co. | 21,792 | 1,507 | Wabtec Corp. | 13,100 | 1,131 | ||
| Fastenal Co. | 156,270 | 6,882 | Waste Management, Inc. | 2,784 | 136 | ||
| International Flavors & Fragrances, Inc. | 28,200 | 2,796 | 185,408 | ||||
| Lennox International, Inc. | 12,400 | 1,103 | |||||
| LyondellBasell Industries NV Class A | 40,674 | 3,727 | Technology - 14.4% | ||||
| Minerals Technologies, Inc. | 7,600 | 583 | Adobe Systems, Inc.(Æ) | 48,297 | 3,387 | ||
| Monsanto Co. | 173,801 | 19,994 | Altera Corp. | 97,931 | 3,366 | ||
| Mosaic Co. (The) | 99,100 | 4,391 | Apple, Inc. | 255,356 | 27,578 | ||
| Nucor Corp. | 36,470 | 1,972 | ASML Holding NV Class G | 53,700 | 5,353 | ||
| PPG Industries, Inc. | 39,070 | 7,958 | Autodesk, Inc.(Æ) | 13,100 | 754 | ||
| Praxair, Inc. | 3,022 | 381 | Avnet, Inc. | 6,561 | 284 | ||
| Precision Castparts Corp. | 14,741 | 3,253 | Broadcom Corp. Class A | 34,100 | 1,428 | ||
| Reliance Steel & Aluminum Co. | 5,900 | 398 | Cisco Systems, Inc. | 329,917 | 8,073 | ||
| Rio Tinto PLC - ADR | 54,500 | 2,614 | Cognizant Technology Solutions Corp. Class | ||||
| Sherwin-Williams Co. (The) | 8,690 | 1,995 | A(Æ) | 11,803 | 576 | ||
| Steel Dynamics, Inc. | 33,100 | 762 | Dolby Laboratories, Inc. Class A | 8,900 | 373 | ||
| United States Steel Corp. | 50,800 | 2,034 | Electronic Arts, Inc.(Æ) | 85,900 | 3,519 | ||
| 82,013 | EMC Corp. | 192,545 | 5,532 | ||||
| Equinix, Inc. | 37,200 | 7,771 | |||||
| Producer Durables - 10.2% | Facebook, Inc. Class A(Æ) | 86,478 | 6,485 | ||||
| 3M Co. | 6,827 | 1,050 | Gartner, Inc.(Æ) | 5,500 | 444 | ||
| Accenture PLC Class A | 50,925 | 4,131 | Google, Inc. Class C(Æ) | 36,984 | 20,797 | ||
| Aegean Marine Petroleum Network, Inc. | 57,005 | 482 | Hewlett-Packard Co. | 135,178 | 4,850 | ||
| Automatic Data Processing, Inc. | 113,973 | 9,321 | Intel Corp. | 452,997 | 15,406 | ||
| Boeing Co. (The) | 107,500 | 13,428 | International Business Machines Corp. | 47,315 | 7,779 | ||
| Canadian Pacific Railway, Ltd. | 19,988 | 4,151 | Juniper Networks, Inc. | 27,200 | 573 | ||
| CSX Corp. | 136,627 | 4,868 | Lam Research Corp. | 40,980 | 3,191 | ||
| Cummins, Inc. | 7,694 | 1,125 | LinkedIn Corp. Class A(Æ) | 18,625 | 4,264 | ||
| Danaher Corp. | 6,267 | 504 | Marvell Technology Group, Ltd. | 80,700 | 1,085 | ||
| Deere & Co. | 642 | 55 | Mentor Graphics Corp. | 45,666 | 968 | ||
| Delta Air Lines, Inc. | 100,497 | 4,043 | Microsoft Corp. | 603,985 | 28,357 | ||
| Emerson Electric Co. | 6,862 | 440 | Motorola Solutions, Inc. | 50,400 | 3,251 | ||
| FedEx Corp. | 20,137 | 3,371 | NetApp, Inc. | 175,100 | 7,494 | ||
| General Dynamics Corp. | 60,255 | 8,421 | NXP Semiconductor NV(Æ) | 40,800 | 2,801 | ||
| General Electric Co. | 983,405 | 25,382 | Oracle Corp. | 344,607 | 13,457 | ||
| Honeywell International, Inc. | 214,743 | 20,641 | Palo Alto Networks, Inc.(Æ) | 23,000 | 2,431 | ||
| Huntington Ingalls Industries, Inc. | 1,900 | 201 | Plexus Corp.(Æ) | 3,000 | 124 | ||
| See accompanying notes which are an integral part of the financial statements. | |||||||
| 20 Russell U.S. Core Equity Fund | |||||||
Russell Investment Company Russell U.S. Core Equity Fund
Schedule of Investments, continued — October 31, 2014
Amounts in thousands (except share amounts)
| Principal | Fair | |||
| Amount ($) or | Value | |||
| Shares | $ | |||
| Polycom, Inc.(Æ) | 8,425 | 110 | ||
| QUALCOMM, Inc. | 135,303 | 10,623 | ||
| Red Hat, Inc.(Æ) | 96,780 | 5,702 | ||
| Salesforce.com, Inc.(Æ) | 108,848 | 6,965 | ||
| SAP SE - ADR | 100,080 | 6,818 | ||
| ServiceNow, Inc.(Æ) | 33,504 | 2,276 | ||
| Splunk, Inc.(Æ) | 32,334 | 2,137 | ||
| Symantec Corp. | 69,188 | 1,717 | ||
| Synopsys, Inc.(Æ) | 98,600 | 4,041 | ||
| Syntel, Inc.(Æ) | 3,900 | 338 | ||
| Tableau Software, Inc. Class A(Æ) | 18,200 | 1,503 | ||
| Texas Instruments, Inc. | 183,783 | 9,127 | ||
| VMware, Inc. Class A(Æ) | 52 | 4 | ||
| Vodafone Group PLC - ADR | 196,372 | 6,523 | ||
| Western Digital Corp. | 44,207 | 4,349 | ||
| Workday, Inc. Class A(Æ) | 25,940 | 2,477 | ||
| Yahoo!, Inc.(Æ) | 78,754 | 3,627 | ||
| 260,088 | ||||
| Utilities - 3.1% | ||||
| AES Corp. | 22,200 | 312 | ||
| American Electric Power Co., Inc. | 4,174 | 244 | ||
| AT&T, Inc. | 578,500 | 20,155 | ||
| Dominion Resources, Inc. | 1,854 | 132 | ||
| Duke Energy Corp. | 14,205 | 1,167 | ||
| Edison International | 19,100 | 1,195 | ||
| Encana Corp. | 214,150 | 3,990 | ||
| Entergy Corp. | 86,000 | 7,226 | ||
| Exelon Corp. | 215,164 | 7,873 | ||
| FirstEnergy Corp. | 10,663 | 398 | ||
| NextEra Energy, Inc. | 3,846 | 385 | ||
| PG&E Corp. | 4,176 | 210 | ||
| Southern Co. | 7,807 | 362 | ||
| Verizon Communications, Inc. | 243,521 | 12,237 | ||
| 55,886 | ||||
| Total Common Stocks | ||||
| (cost $1,387,331) | 1,740,571 | |||
| Investments in Other Funds - 0.1% | ||||
| Financial Services - 0.1% | ||||
| iShares Russell 1000 Value ETF | 12,879 | 1,316 | ||
| Total Investments in Other Funds | ||||
| (cost $1,255) | 1,316 | |||
| Short-Term Investments - 3.6% | ||||
| Russell U.S. Cash Management Fund | 64,727,413 | (8) | 64,727 | |
| Total Short-Term Investments | ||||
| (cost $64,727) | 64,727 | |||
| Total Investments 99.8% | ||||
| (identified cost $1,453,313) | 1,806,614 | |||
| Other Assets and Liabilities, Net | ||||
| - 0.2% | 4,345 | |||
| Net Assets - 100.0% | 1,810,959 | |||
See accompanying notes which are an integral part of the financial statements.
Russell U.S. Core Equity Fund 21
| Russell Investment Company | ||||||||||||
| Russell U.S. Core Equity Fund | ||||||||||||
| Schedule of Investments, continued — October 31, 2014 | ||||||||||||
| Futures Contracts | ||||||||||||
| Amounts in thousands (except contract amounts) | ||||||||||||
| Unrealized | ||||||||||||
| Appreciation | ||||||||||||
| Number of | Notional | Expiration | (Depreciation) | |||||||||
| Contracts | Amount | Date | $ | |||||||||
| Long Positions | ||||||||||||
| Russell 1000 Mini Index Futures | 181 | USD | 20,247 | 12/14 | 773 | |||||||
| S&P E-Mini Energy Select Sector Index Futures | 78 | USD | 6,815 | 12/14 | (298 | ) | ||||||
| S&P Mid 500 E-Mini Index Futures | 396 | USD | 39,826 | 12/14 | 854 | |||||||
| Total Unrealized Appreciation (Depreciation) on Open Futures Contracts (å) | 1,329 | |||||||||||
| Presentation of Portfolio Holdings | ||||||||||||
| Amounts in thousands | ||||||||||||
| Fair Value | ||||||||||||
| Portfolio Summary | Level 1 | Level 2 | Level 3 | Total | % of Net Assets | |||||||
| Common Stocks | ||||||||||||
| Consumer Discretionary | $ | 255,272 | $ | — | $ | — | $ | 255,272 | 14.1 | |||
| Consumer Staples | 94,503 | — | — | 94,503 | 5.2 | |||||||
| Energy | 139,864 | — | — | 139,864 | 7.7 | |||||||
| Financial Services | 363,354 | — | — | 363,354 | 20.1 | |||||||
| Health Care | 304,183 | — | — | 304,183 | 16.8 | |||||||
| Materials and Processing | 82,013 | — | — | 82,013 | 4.5 | |||||||
| Producer Durables | 185,408 | — | — | 185,408 | 10.2 | |||||||
| Technology | 260,088 | — | — | 260,088 | 14.4 | |||||||
| Utilities | 55,886 | — | — | 55,886 | 3.1 | |||||||
| Investments in Other Funds | 1,316 | — | — | 1,316 | 0.1 | |||||||
| Short-Term Investments | — | 64,727 | — | 64,727 | 3.6 | |||||||
| Total Investments | 1,741,887 | 64,727 | — | 1,806,614 | 99.8 | |||||||
| Other Assets and Liabilities, Net | 0.2 | |||||||||||
| 100.0 | ||||||||||||
| Other Financial Instruments | ||||||||||||
| Futures Contracts | 1,329 | — | — | 1,329 | 0.1 | |||||||
| Total Other Financial Instruments* | $ | 1,329 | $ | — | $ | — | $ | 1,329 | ||||
* Futures and foreign currency exchange contract values reflect the unrealized appreciation (depreciation) on the instruments.
For a description of the Levels see note 2 in the Notes to Financial Statements.
For disclosure on transfers between Levels 1, 2 and 3 during the period ended October 31, 2014, see note 2 in the Notes to Financial Statements.
See accompanying notes which are an integral part of the financial statements.
22 Russell U.S. Core Equity Fund
| Russell Investment Company | |||
| Russell U.S. Core Equity Fund | |||
| Fair Value of Derivative Instruments — October 31, 2014 | |||
| Amounts in thousands | |||
| Equity | |||
| Derivatives not accounted for as hedging instruments | Contracts | ||
| Location: Statement of Assets and Liabilities - Assets | |||
| Variation margin on futures contracts* | $ | 1,627 | |
| Location: Statement of Assets and Liabilities - Liabilities | |||
| Variation margin on futures contracts* | $ | 298 | |
| Equity | |||
| Derivatives not accounted for as hedging instruments | Contracts | ||
| Location: Statement of Operations - Net realized gain (loss) | |||
| Futures contracts | $ | 11,864 | |
| Location: Statement of Operations - Net change in unrealized appreciation (depreciation) | |||
| Futures contracts | $ | (1,616 | ) |
| * | Includes cumulative appreciation/depreciation of futures contracts as reported in the Schedule of Investments. Only variation margin is reported within the Statement of Assets and Liabilities. |
For further disclosure on derivatives see note 2 in the Notes to Financial Statements.
See accompanying notes which are an integral part of the financial statements.
Russell U.S. Core Equity Fund 23
Russell Investment Company Russell U.S. Core Equity Fund
Balance Sheet Offsetting of Financial and Derivative Instruments — October 31, 2014
| Amounts in thousands | ||||||||
| Offsetting of Financial Assets and Derivative Assets | ||||||||
| Gross | Net Amounts | |||||||
| Amounts | of Assets | |||||||
| Gross | Offset in the | Presented in | ||||||
| Amounts of | Statement of | the Statement | ||||||
| Recognized | Assets and | of Assets and | ||||||
| Description | Location: Statement of Assets and Liabilities - Assets | Assets | Liabilities | Liabilities | ||||
| Futures Contracts | Variation margin on futures contracts | $ | 895 | $ — | $ 895 | |||
| Total | $ | 895 | $ — | $ 895 | ||||
| Financial Assets, Derivative Assets, and Collateral Held by Counterparty | |
| Gross Amounts Not Offset in | |
| the Statement of Assets and | |
| Liabilities |
| Net Amounts | ||||||||
| of Assets | ||||||||
| Presented in | ||||||||
| the Statement | Financial and | |||||||
| of Assets and | Derivative | Collateral | ||||||
| Counterparty | Liabilities | Instruments | Received^ Net Amount | |||||
| Merrill Lynch | $ | 895 | $ | — $ | — $ | 895 | ||
| Total | $ | 895 | $ | — $ | — $ | 895 | ||
^ Collateral received or pledged amounts may not reconcile to those disclosed in the Statement of Assets and Liabilities due to the inclusion of off-Balance Sheet collateral and adjustments made to exclude overcollateralization.
For further disclosure on derivatives and counterparty risk see note 2 in the Notes to Financial Statements.
See accompanying notes which are an integral part of the financial statements.
24 Russell U.S. Core Equity Fund
| Russell Investment Company | ||
| Russell U.S. Core Equity Fund | ||
| Statement of Assets and Liabilities — October 31, 2014 | ||
| Amounts in thousands | ||
| Assets | ||
| Investments, at identified cost | $ | 1,453,313 |
| Investments, at fair value(>) | 1,806,614 | |
| Cash | 54 | |
| Cash (restricted)(a) | 4,012 | |
| Receivables: | ||
| Dividends and interest | 1,843 | |
| Dividends from affiliated Russell funds | 6 | |
| Investments sold | 13,876 | |
| Fund shares sold | 189 | |
| Variation margin on futures contracts | 895 | |
| Prepaid expenses | 5 | |
| Total assets | 1,827,494 | |
| Liabilities | ||
| Payables: | ||
| Investments purchased | 12,900 | |
| Fund shares redeemed | 2,413 | |
| Accrued fees to affiliates | 1,091 | |
| Other accrued expenses | 131 | |
| Total liabilities | 16,535 | |
| Net Assets | $ | 1,810,959 |
See accompanying notes which are an integral part of the financial statements.
Russell U.S. Core Equity Fund 25
| Russell Investment Company | ||
| Russell U.S. Core Equity Fund | ||
| Statement of Assets and Liabilities, continued — October 31, 2014 | ||
| Amounts in thousands | ||
| Net Assets Consist of: | ||
| Undistributed (overdistributed) net investment income | $ | 2,285 |
| Accumulated net realized gain (loss) | 232,508 | |
| Unrealized appreciation (depreciation) on: | ||
| Investments | 353,301 | |
| Futures contracts | 1,329 | |
| Shares of beneficial interest | 419 | |
| Additional paid-in capital | 1,221,117 | |
| Net Assets | $ | 1,810,959 |
| Net Asset Value, offering and redemption price per share: | ||
| Net asset value per share: Class A(#) | $ | 43.30 |
| Maximum offering price per share (Net asset value plus sales charge of 5.75%): Class A | $ | 45.94 |
| Class A — Net assets | $ | 36,334,362 |
| Class A — Shares outstanding ($.01 par value) | 839,076 | |
| Net asset value per share: Class C(#) | $ | 42.78 |
| Class C — Net assets | $ | 54,529,610 |
| Class C — Shares outstanding ($.01 par value) | 1,274,580 | |
| Net asset value per share: Class E(#) | $ | 43.33 |
| Class E — Net assets | $ | 11,449,342 |
| Class E — Shares outstanding ($.01 par value) | 264,247 | |
| Net asset value per share: Class I(#) | $ | 43.24 |
| Class I — Net assets | $ | 572,063,788 |
| Class I — Shares outstanding ($.01 par value) | 13,231,345 | |
| Net asset value per share: Class S(#) | $ | 43.26 |
| Class S — Net assets | $ | 428,951,475 |
| Class S — Shares outstanding ($.01 par value) | 9,916,580 | |
| Net asset value per share: Class Y(#) | $ | 43.19 |
| Class Y — Net assets | $ | 707,630,127 |
| Class Y — Shares outstanding ($.01 par value) | 16,383,013 | |
| Amounts in thousands | ||
| (>) Investments in affiliates, Russell U.S. Cash Management Fund | $ | 64,727 |
| (a) Cash Collateral for Futures | $ | 4,012 |
| (#) Net asset value per share equals class level net assets divided by class level shares of beneficial interest outstanding. | ||
See accompanying notes which are an integral part of the financial statements.
26 Russell U.S. Core Equity Fund
| Russell Investment Company | |||
| Russell U.S. Core Equity Fund | |||
| Statement of Operations — For the Period Ended October 31, 2014 | |||
| Amounts in thousands | |||
| Investment Income | |||
| Dividends | $ | 39,850 | |
| Dividends from affiliated Russell funds | 68 | ||
| Securities lending income | 57 | ||
| Total investment income | 39,975 | ||
| Expenses | |||
| Advisory fees | 10,746 | ||
| Administrative fees | 931 | ||
| Custodian fees | 324 | ||
| Distribution fees - Class A | 86 | ||
| Distribution fees - Class C | 413 | ||
| Transfer agent fees - Class A | 69 | ||
| Transfer agent fees - Class C | 110 | ||
| Transfer agent fees - Class E | 35 | ||
| Transfer agent fees - Class I | 699 | ||
| Transfer agent fees - Class S | 881 | ||
| Transfer agent fees - Class Y | 36 | ||
| Professional fees | 93 | ||
| Registration fees | 105 | ||
| Shareholder servicing fees - Class C | 138 | ||
| Shareholder servicing fees - Class E | 44 | ||
| Trustees’ fees | 50 | ||
| Printing fees | —** | ||
| Miscellaneous | 109 | ||
| Total expenses | 14,869 | ||
| Net investment income (loss) | 25,106 | ||
| Net Realized and Unrealized Gain (Loss) | |||
| Net realized gain (loss) on: | |||
| Investments | 271,851 | ||
| Futures contracts | 11,864 | ||
| Net realized gain (loss) | 283,715 | ||
| Net change in unrealized appreciation (depreciation) on: | |||
| Investments | (32,671 | ) | |
| Futures contracts | (1,616 | ) | |
| Net change in unrealized appreciation (depreciation) | (34,287 | ) | |
| Net realized and unrealized gain (loss) | 249,428 | ||
| Net Increase (Decrease) in Net Assets from Operations | $ | 274,534 | |
| ** | Less than $500. |
See accompanying notes which are an integral part of the financial statements.
Russell U.S. Core Equity Fund 27
| Russell Investment Company | ||||||
| Russell U.S. Core Equity Fund | ||||||
| Statements of Changes in Net Assets | ||||||
| For the Periods Ended October 31, | ||||||
| Amounts in thousands | 2014 | 2013 | ||||
| Increase (Decrease) in Net Assets | ||||||
| Operations | ||||||
| Net investment income (loss) | $ | 25,106 | $ | 27,060 | ||
| Net realized gain (loss) | 283,715 | 337,035 | ||||
| Net change in unrealized appreciation (depreciation) | (34,287 | ) | 165,466 | |||
| Net increase (decrease) in net assets from operations | 274,534 | 529,561 | ||||
| Distributions | ||||||
| From net investment income | ||||||
| Class A | (320 | ) | (275 | ) | ||
| Class C | (211 | ) | (137 | ) | ||
| Class E | (153 | ) | (198 | ) | ||
| Class I | (7,259 | ) | (7,154 | ) | ||
| Class S | (5,100 | ) | (5,099 | ) | ||
| Class Y | (10,752 | ) | (14,541 | ) | ||
| Net decrease in net assets from distributions | (23,795 | ) | (27,404 | ) | ||
| Share Transactions* | ||||||
| Net increase (decrease) in net assets from share transactions | (567,295 | ) | (551,833 | ) | ||
| Total Net Increase (Decrease) in Net Assets | (316,556 | ) | (49,676 | ) | ||
| Net Assets | ||||||
| Beginning of period | 2,127,515 | 2,177,191 | ||||
| End of period | $ | 1,810,959 | $ | 2,127,515 | ||
| Undistributed (overdistributed) net investment income included in net assets | $ | 2,285 | $ | 974 | ||
See accompanying notes which are an integral part of the financial statements.
28 Russell U.S. Core Equity Fund
Russell Investment Company Russell U.S. Core Equity Fund
Statements of Changes in Net Assets, continued
* Share transaction amounts (in thousands) for the periods ended October 31, 2014 and October 31, 2013 were as follows:
| 2014 | 2013 | |||||||||||
| Shares | Dollars | Shares | Dollars | |||||||||
| Class A | ||||||||||||
| Proceeds from shares sold | 87 | $ | 3,527 | 135 | $ | 4,666 | ||||||
| Proceeds from reinvestment of distributions | 8 | 317 | 8 | 273 | ||||||||
| Payments for shares redeemed | (133 | ) | (5,377 | ) | (234 | ) | (7,770 | ) | ||||
| Net increase (decrease) | (38 | ) | (1,533 | ) | (91 | ) | (2,831 | ) | ||||
| Class C | ||||||||||||
| Proceeds from shares sold | 80 | 3,165 | 182 | 6,512 | ||||||||
| Proceeds from reinvestment of distributions | 5 | 209 | 4 | 136 | ||||||||
| Payments for shares redeemed | (269 | ) | (10,831 | ) | (501 | ) | (16,847 | ) | ||||
| Net increase (decrease) | (184 | ) | (7,457 | ) | (315 | ) | (10,199 | ) | ||||
| Class E | ||||||||||||
| Proceeds from shares sold | 23 | 920 | 40 | 1,401 | ||||||||
| Proceeds from reinvestment of distributions | 3 | 152 | 6 | 194 | ||||||||
| Payments for shares redeemed | (277 | ) | (11,483 | ) | (359 | ) | (12,094 | ) | ||||
| Net increase (decrease) | (251 | ) | (10,411 | ) | (313 | ) | (10,499 | ) | ||||
| Class I | ||||||||||||
| Proceeds from shares sold | 1,230 | 50,569 | 1,418 | 47,467 | ||||||||
| Proceeds from reinvestment of distributions | 173 | 7,189 | 211 | 7,035 | ||||||||
| Payments for shares redeemed | (3,380 | ) | (139,008 | ) | (6,183 | ) | (205,557 | ) | ||||
| Net increase (decrease) | (1,977 | ) | (81,250 | ) | (4,554 | ) | (151,055 | ) | ||||
| Class S | ||||||||||||
| Proceeds from shares sold | 1,103 | 44,906 | 2,028 | 68,207 | ||||||||
| Proceeds from reinvestment of distributions | 121 | 5,010 | 150 | 5,000 | ||||||||
| Payments for shares redeemed | (3,119 | ) | (127,204 | ) | (4,920 | ) | (164,502 | ) | ||||
| Net increase (decrease) | (1,895 | ) | (77,288 | ) | (2,742 | ) | (91,295 | ) | ||||
| Class Y | ||||||||||||
| Proceeds from shares sold | 722 | 29,244 | 1,015 | 34,181 | ||||||||
| Proceeds from reinvestment of distributions | 260 | 10,752 | 437 | 14,541 | ||||||||
| Payments for shares redeemed | (10,596 | ) | (429,352 | ) | (9,602 | ) | (334,676 | ) | ||||
| Net increase (decrease) | (9,614 | ) | (389,356 | ) | (8,150 | ) | (285,954 | ) | ||||
| Total increase (decrease) | (13,959 | ) | $ | (567,295 | ) | (16,165 | ) | $ | (551,833 | ) | ||
See accompanying notes which are an integral part of the financial statements.
Russell U.S. Core Equity Fund 29
| Russell Investment Company | ||||||||||||||||
| Russell U.S. Core Equity Fund | ||||||||||||||||
| Financial Highlights — For the Periods Ended | ||||||||||||||||
| For a Share Outstanding Throughout Each Period. | ||||||||||||||||
| $ | $ | $ | $ | $ | ||||||||||||
| Net Asset Value, | Net | Net Realized | Total from | Distributions | ||||||||||||
| Beginning of | Investment | and Unrealized | Investment | from Net | $ | |||||||||||
| Period | Income (Loss)(a)(d) | Gain (Loss) | Operations | Investment Income | Total Distributions | |||||||||||
| Class A | ||||||||||||||||
| October 31, 2014 | 38.17 | .39 | 5.12 | 5.51 | (.38 | ) | (.38 | ) | ||||||||
| October 31, 2013 | 30.29 | .31 | 7.88 | 8.19 | (.31 | ) | (.31 | ) | ||||||||
| October 31, 2012 | 27.08 | .21 | 3.23 | 3.44 | (.23 | ) | (.23 | ) | ||||||||
| October 31, 2011 | 26.05 | .17 | 1.03 | 1.20 | (.17 | ) | (.17 | ) | ||||||||
| October 31, 2010 | 22.76 | .13 | 3.29 | 3.42 | (.13 | ) | (.13 | ) | ||||||||
| Class C | ||||||||||||||||
| October 31, 2014 | 37.78 | .08 | 5.07 | 5.15 | (.15 | ) | (.15 | ) | ||||||||
| October 31, 2013 | 30.01 | .05 | 7.80 | 7.85 | (.08 | ) | (.08 | ) | ||||||||
| October 31, 2012 | 26.89 | (.01 | ) | 3.20 | 3.19 | (.07 | ) | (.07 | ) | |||||||
| October 31, 2011 | 25.91 | (.03 | ) | 1.03 | 1.00 | (.02 | ) | (.02 | ) | |||||||
| October 31, 2010 | 22.69 | (.05 | ) | 3.27 | 3.22 | —(f) | —(f) | |||||||||
| Class E | ||||||||||||||||
| October 31, 2014 | 38.17 | .40 | 5.13 | 5.53 | (.37 | ) | (.37 | ) | ||||||||
| October 31, 2013 | 30.29 | .32 | 7.87 | 8.19 | (.31 | ) | (.31 | ) | ||||||||
| October 31, 2012 | 27.06 | .23 | 3.21 | 3.44 | (.21 | ) | (.21 | ) | ||||||||
| October 31, 2011 | 26.02 | .20 | 1.03 | 1.23 | (.19 | ) | (.19 | ) | ||||||||
| October 31, 2010 | 22.73 | .16 | 3.29 | 3.45 | (.16 | ) | (.16 | ) | ||||||||
| Class I | ||||||||||||||||
| October 31, 2014 | 38.10 | .52 | 5.13 | 5.65 | (.51 | ) | (.51 | ) | ||||||||
| October 31, 2013 | 30.24 | .42 | 7.86 | 8.28 | (.42 | ) | (.42 | ) | ||||||||
| October 31, 2012 | 27.04 | .31 | 3.22 | 3.53 | (.33 | ) | (.33 | ) | ||||||||
| October 31, 2011 | 26.01 | .27 | 1.02 | 1.29 | (.26 | ) | (.26 | ) | ||||||||
| October 31, 2010 | 22.72 | .21 | 3.30 | 3.51 | (.22 | ) | (.22 | ) | ||||||||
| Class S | ||||||||||||||||
| October 31, 2014 | 38.12 | .49 | 5.13 | 5.62 | (.48 | ) | (.48 | ) | ||||||||
| October 31, 2013 | 30.26 | .39 | 7.86 | 8.25 | (.39 | ) | (.39 | ) | ||||||||
| October 31, 2012 | 27.04 | .28 | 3.23 | 3.51 | (.29 | ) | (.29 | ) | ||||||||
| October 31, 2011 | 26.01 | .24 | 1.03 | 1.27 | (.24 | ) | (.24 | ) | ||||||||
| October 31, 2010 | 22.72 | .19 | 3.29 | 3.48 | (.19 | ) | (.19 | ) | ||||||||
| Class Y | ||||||||||||||||
| October 31, 2014 | 38.06 | .58 | 5.11 | 5.69 | (.56 | ) | (.56 | ) | ||||||||
| October 31, 2013 | 30.21 | .46 | 7.85 | 8.31 | (.46 | ) | (.46 | ) | ||||||||
| October 31, 2012 | 27.02 | .33 | 3.23 | 3.56 | (.37 | ) | (.37 | ) | ||||||||
| October 31, 2011 | 25.99 | .29 | 1.03 | 1.32 | (.29 | ) | (.29 | ) | ||||||||
| October 31, 2010 | 22.71 | .23 | 3.29 | 3.52 | (.24 | ) | (.24 | ) | ||||||||
See accompanying notes which are an integral part of the financial statements.
30 Russell U.S. Core Equity Fund
| % | % | % | |||||||||||||
| $ | $ | Ratio of Expenses | Ratio of Expenses | Ratio of Net | |||||||||||
| Net Asset Value, | % | Net Assets, | to Average | to Average | Investment Income | % | |||||||||
| End of | Total | End of Period | Net Assets, | Net Assets, | to Average | Portfolio | |||||||||
| Period | Return(c) | (000) | Gross | Net(d) | Net Assets(d) | Turnover Rate | |||||||||
| 43.30 | 14.49 | 36,334 | 1.08 | 1.08 | .95 | 73 | |||||||||
| 38.17 | 27.19 | 33,491 | 1.07 | 1.07 | .90 | 97 | |||||||||
| 30.29 | 12.73 | 29,349 | 1.07 | 1.07 | .72 | 117 | |||||||||
| 27.08 | 4.60 | 29,238 | 1.07 | 1.07 | .62 | 90 | |||||||||
| 26.05 | 15.10 | 25,461 | 1.06 | 1.06 | .52 | 97 | |||||||||
| 42.78 | 13.66 | 54,530 | 1.83 | 1.83 | .21 | 73 | |||||||||
| 37.78 | 26.23 | 55,105 | 1.82 | 1.82 | .16 | 97 | |||||||||
| 30.01 | 11.89 | 53,222 | 1.82 | 1.82 | (.02 | ) | 117 | ||||||||
| 26.89 | 3.81 | 61,417 | 1.82 | 1.82 | (.13 | ) | 90 | ||||||||
| 25.91 | 14.24 | 76,345 | 1.81 | 1.81 | (.22 | ) | 97 | ||||||||
| 43.33 | 14.52 | 11,449 | 1.08 | 1.08 | .97 | 73 | |||||||||
| 38.17 | 27.18 | 19,657 | 1.07 | 1.06 | .95 | 97 | |||||||||
| 30.29 | 12.78 | 25,075 | 1.07 | 1.02 | .81 | 117 | |||||||||
| 27.06 | 4.67 | 67,675 | 1.07 | .99 | .71 | 90 | |||||||||
| 26.02 | 15.23 | 88,999 | 1.06 | .95 | .63 | 97 | |||||||||
| 43.24 | 14.90 | 572,064 | .75 | .75 | 1.28 | 73 | |||||||||
| 38.10 | 27.59 | 579,477 | .74 | .74 | 1.23 | 97 | |||||||||
| 30.24 | 13.13 | 597,630 | .74 | .74 | 1.07 | 117 | |||||||||
| 27.04 | 4.95 | 887,294 | .74 | .74 | .96 | 90 | |||||||||
| 26.01 | 15.52 | 969,214 | .73 | .72 | .86 | 97 | |||||||||
| 43.26 | 14.80 | 428,952 | .83 | .83 | 1.20 | 73 | |||||||||
| 38.12 | 27.51 | 450,265 | .82 | .82 | 1.15 | 97 | |||||||||
| 30.26 | 13.01 | 440,333 | .82 | .82 | .99 | 117 | |||||||||
| 27.04 | 4.87 | 1,509,859 | .82 | .82 | .87 | 90 | |||||||||
| 26.01 | 15.40 | 1,367,750 | .81 | .81 | .77 | 97 | |||||||||
| 43.19 | 15.02 | 707,630 | .63 | .63 | 1.42 | 73 | |||||||||
| 38.06 | 27.74 | 989,520 | .62 | .62 | 1.35 | 97 | |||||||||
| 30.21 | 13.24 | 1,031,582 | .64 | .64 | 1.16 | 117 | |||||||||
| 27.02 | 5.06 | 1,239,602 | .64 | .64 | 1.05 | 90 | |||||||||
| 25.99 | 15.57 | 1,372,658 | .64 | .64 | .96 | 97 | |||||||||
See accompanying notes which are an integral part of the financial statements.
Russell U.S. Core Equity Fund 31
Russell Investment Company Russell U.S. Defensive Equity Fund
Portfolio Management Discussion and Analysis — October 31, 2014 (Unaudited)
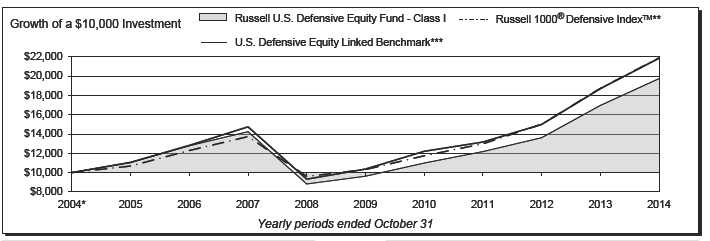
| Russell U.S. Defensive Equity Fund - Class A‡ | Russell U.S. Defensive Equity Fund - Class S‡‡‡ | ||||||
| Total | Total | ||||||
| Return | Return | ||||||
| 1 Year | 9.39 | % | 1 Year | 16.32 | % | ||
| 5 Years | 13.75 | %§ | 5 Years | 15.38 | %§ | ||
| 10 Years | 6.10 | %§ | 10 Years | 6.99 | %§ | ||
| Russell U.S. Defensive Equity Fund - Class C‡‡ | Russell U.S. Defensive Equity Fund - Class Y | ||||||
| Total | Total | ||||||
| Return | Return | ||||||
| 1 Year | 15.15 | % | 1 Year | 16.54 | % | ||
| 5 Years | 14.24 | %§ | 5 Years | 15.60 | %§ | ||
| 10 Years | 6.22 | %§ | 10 Years | 7.12 | %§ | ||
| Russell U.S. Defensive Equity Fund - Class E | Russell 1000® Defensive IndexTM** | ||||||
| Total | Total | ||||||
| Return | Return | ||||||
| 1 Year | 16.03 | % | 1 Year | 16.91 | % | ||
| 5 Years | 15.15 | %§ | 5 Years | 16.25 | %§ | ||
| 10 Years | 6.75 | %§ | 10 Years | 8.15 | %§ | ||
| Russell U.S. Defensive Equity Fund - Class I | U.S. Defensive Equity Linked Benchmark*** | ||||||
| Total | Total | ||||||
| Return | Return | ||||||
| 1 Year | 16.41 | % | 1 Year | 16.91 | % | ||
| 5 Years | 15.48 | %§ | 5 Years | 16.11 | %§ | ||
| 10 Years | 7.04 | %§ | 10 Years | 8.14 | %§ | ||
32 Russell U.S. Defensive Equity Fund
Russell Investment Company Russell U.S. Defensive Equity Fund
Portfolio Management Discussion and Analysis, continued — October 31, 2014 (Unaudited)
The Russell U.S. Defensive Equity Fund (the “Fund”) employs to consumer discretionary sectors detracted from benchmark-a multi-manager approach whereby portions of the Fund relative return. are allocated to different money managers. Fund assets not allocated to money managers are managed by Russell Investment How did the investment strategies and techniques employed Management Company (“RIMCo”), the Fund’s advisor. RIMCo by the Fund and its money managers affect its benchmark-may change the allocation of the Fund’s assets among money relative performance? managers at any time. An exemptive order from the Securities INTECH Investment Management, LLC (“INTECH”) and Exchange Commission (“SEC”) permits RIMCo to engage outperformed the Fund’s benchmark for the fiscal year. INTECH’s or terminate a money manager at any time, subject to approval underweight to size and liquidity detracted from benchmark-by the Fund’s Board, without a shareholder vote. Pursuant to the relative performance while an overweight to momentum and an terms of the exemptive order, the Fund is required to notify its underweight to the highest yielding stocks contributed positively. shareholders within 90 days of when a money manager begins An underweight to the technology sector also detracted while an providing services. As of October 31, 2014, the Fund had four underweight to the energy sector contributed positively. Stock money managers. selection contributed positively overall, with stock selection within the producer durables sector contributing most positively, What is the Fund’s investment objective? while stock selection in financial services sector detracted from The Fund seeks to provide long term capital growth. further gains.
How did the Fund perform relative to its benchmark for the J.P. Morgan Investment Management, Inc. (“JP Morgan”) fiscal year ended October 31, 2014? outperformed the Fund’s benchmark for the fiscal year. JP For the fiscal year ended October 31, 2014, the Fund’s Class A, Morgan’s overweight to high beta stocks (stocks with high Class C, Class E, Class I, Class S and Class Y Shares gained sensitivity to market movements) and value stocks contributed 16.05%, 15.15%, 16.03%, 16.41%, 16.32% and 16.54%, most positively to benchmark-relative performance while a respectively. This is compared to the Fund’s benchmark, the tilt toward exchange rate sensitivity detracted as export driven Russell 1000® Defensive™ Index, which gained 16.91% during companies were hurt by a strengthening U.S. dollar. JPMorgan’s the same period. The Fund’s performance includes operating sector allocation also contributed to positive benchmark-relative expenses, whereas index returns are unmanaged and do not performance. An overweight to the technology sector contributed include expenses of any kind. positively. Stock selection contributed positively overall with stock selection within the consumer discretionary and financial For the fiscal year ended October 31, 2014, the Morningstar® services sectors contributing most positively while stock selection Large Blend, a group of funds that Morningstar considers to within the producer durables sector detracted from benchmark-have investment strategies similar to those of the Fund, gained relative returns.
14.34%. This result serves as a peer comparison and is expressed net of operating expenses. Jacobs Levy Equity Management, Inc. (“Jacobs Levy”) outperformed the Fund’s benchmark for the fiscal year. Jacobs How did the market conditions described in the Market Levy’s overweight to higher volatility, higher momentum, and Summary report affect the Fund’s performance? higher growth stocks contributed positively to benchmark-relative The fiscal year saw relatively strong performance for U.S. large returns as did an underweight to higher leverage and the highest capitalization equity securities, although defensive stocks yielding stocks. An overweight to value and underweight to the slightly outperformed dynamic stocks. Relative to its benchmark, largest stocks by market capitalization detracted modestly from the Russell 1000® Defensive™ Index, the Fund was consistently benchmark-relative returns. Jacobs Levy’s sector allocation and underweight to the highest dividend yielding stocks and stock selection both contributed positively to benchmark-relative overweight to both stocks with high price momentum and fastest returns. An overweight to the healthcare and technology sectors growth. The market environment was favorable to these factors contributed positively as did stock selection within those sectors. and this positioning benefited the Fund’s benchmark-relative An underweight to and stock selection within the energy sector returns. also contributed positively. Stock selection within the financial From a sector perspective, the Fund benefited from being services and utilities sectors detracted from further gains. overweight to both healthcare and consumer staples sectors. PanAgora Asset Management (“PanAgora”) underperformed An underweight to the energy sector also benefited the Fund. the Fund’s benchmark for the fiscal year. PanAgora’s The Fund’s underweight to producer durables and overweight underperformance relative to the benchmark was primarily due to stock selection within the technology and producer durables
Russell U.S. Defensive Equity Fund 33
Russell Investment Company Russell U.S. Defensive Equity Fund
Portfolio Management Discussion and Analysis, continued — October 31, 2014 (Unaudited)
| sector. In addition, PanAgora’s mix of exposure to leverage | Describe any changes to the Fund’s structure or the money | |
| detracted from benchmark-relative returns though it was mostly | manager line-up. | |
| offset by an overweight tohigh beta stocks. | In August 2014, the benchmark used for RIMCo’s positioning | |
| RIMCo manages the portion of the Fund’s assets that RIMCo | strategy was expanded to include the Russell 1000® Defensive™ | |
| determines not to allocate to the money managers. Assets not | Energy Index, and is now a blended combination of the Russell | |
| allocated to managers include the Fund’s liquidity reserves and | Top 200® Defensive™ Index and the Russell 1000® Defensive™ | |
| assets which may be managed directly by RIMCo to modify the | Energy Index. This strategy is designed to reduce the Fund’s | |
| Fund’s overall portfolio characteristics to seek to achieve the | underweight to market capitalization and underweight to the | |
| desired risk/return profile for the Fund. | energy sector. | |
| RIMCo pursues a positioning strategy for the Fund that is a | There were no other changes to the Fund’s structure or money | |
| replication of a blended index that includes the Russell Top | manager line up during the fiscal year. | |
| 200® Defensive™ Index, which consists of the largest stocks | ||
| within the Russell 1000® Defensive™ Index, and the Russell | Money Managers as of October 31, | |
| 1000® Defensive™ Energy Index, which consists of the energy | 2014 | Styles |
| stocks within the Russell 1000® Defensive™ Index. This | INTECH Investment Management LLC | Defensive |
| J.P. Morgan Investment Management, Inc. | Defensive | |
| strategy is designed to reduce the Fund’s underweight to market | Jacobs Levy Equity Management, Inc. | Defensive |
| capitalization and underweight to the energy sector. This strategy | PanAgora Asset Management Inc. | Defensive |
| underperformed the Fund’s benchmark during the fiscal year due | The views expressed in this report reflect those of the portfolio | |
| to its allocation to Russell 1000® Defensive™ Energy Index, | managers only through the end of the period covered by | |
| which underperformed the Fund’s benchmark during the period. | the report. These views do not necessarily represent the | |
| During the period, RIMCo used a combination of index futures | views of RIMCo, or any other person in RIMCo or any other | |
| contracts to equitize a portion of the Fund’s cash, which includes | affiliated organization. These views are subject to change | |
| manager cash, and sold equity index put options with respect | at any time based upon market conditions or other events, | |
| to the portion of the Fund’s cash that RIMCo determined not to | and RIMCo disclaims any responsibility to update the views | |
| equitize in order to seek gains from premiums received on their | contained herein. These views should not be relied on as | |
| sale. These strategies were beneficial to Fund performance for | investment advice and, because investment decisions for | |
| the fiscal year. | a Russell Investment Company (“RIC”) Fund are based on | |
| numerous factors, should not be relied on as an indication | ||
| of investment decisions of any RIC Fund. | ||
34 Russell U.S. Defensive Equity Fund
Russell Investment Company Russell U.S. Defensive Equity Fund
Portfolio Management Discussion and Analysis, continued — October 31, 2014 (Unaudited)
| * | Assumes initial investment on November 1, 2004. |
| ** | Russell 1000® Defensive IndexTM measures the performance of the large-cap defensive segment of the U.S. equity universe. It includes those Russell 1000 Index companies with relatively stable business conditions which are less sensitive to economic cycles, credit cycles, and market volatility based on their stability variables. Stability is measured in terms of volatility (price and earnings), leverage, and return on assets. |
| *** | The U.S. Defensive Equity Linked Benchmark provides a means to compare the Fund’s average annual returns to a secondary benchmark that takes into account historical changes in the Fund’s primary benchmark. The U.S. Defensive Equity Linked Benchmark represents the returns of the Russell 1000® Index through August 14, 2012 and the returns of the Russell 1000® Defensive Index thereafter. |
| ‡ | The Fund first issued Class A Shares on September 2, 2008. The returns shown for Class A Shares prior to that date are the returns of the Fund’s Class E Shares. The performance shown has been adjusted to reflect the deduction of the maximum Class A sales charge of 5.75%. Annual returns for each Class will differ only to the extent that the Class A Shares do not have the same expenses as the Class E Shares. |
| ‡‡ | The Fund first issued Class C Shares on September 2, 2008. The returns shown for Class C Shares prior to that date are the returns of the Fund’s Class E Shares and do not reflect deduction of Rule 12b-1 distribution fees that apply to Class C Shares. Had they done so, the returns shown for those periods would have been lower. Annual returns for each Class will differ only to the extent that the Class C Shares do not have the same expenses as the Class E Shares. |
| ‡‡‡ | The Fund first issued Class S Shares on September 2, 2008. The returns shown for Class S Shares prior to that date are the returns of the Fund’s Class I |
| Shares. Class S Shares will have substantially similar annual returns as the Class I Shares because the Shares of each Class are invested in the same portfolio of securities. Annual returns for each Class will differ only to the extent that the Class S Shares do not have the same expenses as the Class I Shares. | |
| § | Annualized. |
Performance is historical and assumes reinvestment of all dividends and capital gains. Investment return and principal value will fluctuate so that an investor’s shares, when redeemed, may be worth more or less than when purchased. Past performance is not indicative of future results. The returns shown do not reflect the deduction of taxes that a shareholder would pay on Fund distributions or the redemption of Fund shares.
Russell U.S. Defensive Equity Fund 35
Russell Investment Company Russell U.S. Defensive Equity Fund
Shareholder Expense Example — October 31, 2014 (Unaudited)
| Fund Expenses | Please note that the expenses shown in the table are meant | |||||
| The following disclosure provides important information | to highlight your ongoing costs only and do not reflect any | |||||
| regarding the Fund’s Shareholder Expense Example | transactional costs. Therefore, the information under the heading | |||||
| (“Example”). | “Hypothetical Performance (5% return before expenses)” is | |||||
| useful in comparing ongoing costs only, and will not help you | ||||||
| Example | determine the relative total costs of owning different funds. In | |||||
| As a shareholder of the Fund, you incur two types of costs: (1) | addition, if these transactional costs were included, your costs | |||||
| transaction costs, and (2) ongoing costs, including advisory and | would have been higher. | |||||
| administrative fees; distribution (12b-1) and/or service fees; | Hypothetical | |||||
| and other Fund expenses. The Example is intended to help | Performance (5% | |||||
| you understand your ongoing costs (in dollars) of investing in | Actual | return before | ||||
| the Fund and to compare these costs with the ongoing costs of | Class A | Performance | expenses) | |||
| Beginning Account Value | ||||||
| investing in other mutual funds. The Example is based on an | May 1, 2014 | $ | 1,000.00 | $ | 1,000.00 | |
| investment of $1,000 invested at the beginning of the period and | Ending Account Value | |||||
| held for the entire period indicated, which for this Fund is from | October 31, 2014 | $ | 1,072.70 | $ | 1,019.76 | |
| May 1, 2014 to October 31, 2014. | Expenses Paid During Period* | $ | 5.64 | $ | 5.50 | |
| Actual Expenses | * Expenses are equal to the Fund's annualized expense ratio of 1.08% | |||||
| (representing the six month period annualized), multiplied by the average | ||||||
| The information in the table under the heading “Actual | account value over the period, multiplied by 184/365 (to reflect the one-half | |||||
| Performance” provides information about actual account values | year period). | |||||
| and actual expenses. You may use the information in this column, | ||||||
| together with the amount you invested, to estimate the expenses | Hypothetical | |||||
| Performance (5% | ||||||
| that you paid over the period. Simply divide your account value by | Actual | return before | ||||
| $1,000 (for example, an $8,600 account value divided by $1,000 | Class C | Performance | expenses) | |||
| = 8.6), then multiply the result by the number in the first column | Beginning Account Value | |||||
| in the row entitled “Expenses Paid During Period” to estimate | May 1, 2014 | $ | 1,000.00 | $ | 1,000.00 | |
| Ending Account Value | ||||||
| the expenses you paid on your account during this period. | October 31, 2014 | $ | 1,068.30 | $ | 1,015.98 | |
| Expenses Paid During Period* | $ | 9.54 | $ | 9.30 | ||
| Hypothetical Example for Comparison Purposes | ||||||
| The information in the table under the heading “Hypothetical | * Expenses are equal to the Fund's annualized expense ratio of 1.83% | |||||
| Performance (5% return before expenses)” provides information | (representing the six month period annualized), multiplied by the average | |||||
| account value over the period, multiplied by 184/365 (to reflect the one-half | ||||||
| about hypothetical account values and hypothetical expenses | year period). | |||||
| based on the Fund’s actual expense ratio and an assumed rate of | ||||||
| return of 5% per year before expenses, which is not the Fund’s | Hypothetical | |||||
| actual return. The hypothetical account values and expenses | Performance (5% | |||||
| Actual | return before | |||||
| may not be used to estimate the actual ending account balance or | Class E | Performance | expenses) | |||
| expenses you paid for the period. You may use this information | Beginning Account Value | |||||
| to compare the ongoing costs of investing in the Fund and other | May 1, 2014 | $ | 1,000.00 | $ | 1,000.00 | |
| funds. To do so, compare this 5% hypothetical example with the | Ending Account Value | |||||
| October 31, 2014 | $ | 1,072.60 | $ | 1,019.76 | ||
| 5% hypothetical examples that appear in the shareholder reports | Expenses Paid During Period* | $ | 5.64 | $ | 5.50 | |
| of other funds. | ||||||
| * Expenses are equal to the Fund's annualized expense ratio of 1.08% | ||||||
| (representing the six month period annualized), multiplied by the average | ||||||
| account value over the period, multiplied by 184/365 (to reflect the one-half | ||||||
| year period). | ||||||
36 Russell U.S. Defensive Equity Fund
Russell Investment Company Russell U.S. Defensive Equity Fund
Shareholder Expense Example, continued — October 31, 2014 (Unaudited)
| Hypothetical | |||||
| Performance (5% | |||||
| Actual | return before | ||||
| Class I | Performance | expenses) | |||
| Beginning Account Value | |||||
| May 1, 2014 | $ | 1,000.00 | $ | 1,000.00 | |
| Ending Account Value | |||||
| October 31, 2014 | $ | 1,074.20 | $ | 1,021.42 | |
| Expenses Paid During Period* | $ | 3.92 | $ | 3.82 | |
| * Expenses are equal to the Fund's annualized expense ratio of 0.75% | |||||
| (representing the six month period annualized), multiplied by the average | |||||
| account value over the period, multiplied by 184/365 (to reflect the one-half | |||||
| year period). | |||||
| Hypothetical | |||||
| Performance (5% | |||||
| Actual | return before | ||||
| Class S | Performance | expenses) | |||
| Beginning Account Value | |||||
| May 1, 2014 | $ | 1,000.00 | $ | 1,000.00 | |
| Ending Account Value | |||||
| October 31, 2014 | $ | 1,073.70 | $ | 1,021.02 | |
| Expenses Paid During Period* | $ | 4.34 | $ | 4.23 | |
| * Expenses are equal to the Fund's annualized expense ratio of 0.83% | |||||
| (representing the six month period annualized), multiplied by the average | |||||
| account value over the period, multiplied by 184/365 (to reflect the one-half | |||||
| year period). | |||||
| Hypothetical | |||||
| Performance (5% | |||||
| Actual | return before | ||||
| Class Y | Performance | expenses) | |||
| Beginning Account Value | |||||
| May 1, 2014 | $ | 1,000.00 | $ | 1,000.00 | |
| Ending Account Value | |||||
| October 31, 2014 | $ | 1,074.90 | $ | 1,021.98 | |
| Expenses Paid During Period* | $ | 3.35 | $ | 3.26 | |
| * Expenses are equal to the Fund's annualized expense ratio of 0.64% | |||||
| (representing the six month period annualized), multiplied by the average | |||||
| account value over the period, multiplied by 184/365 (to reflect the one-half | |||||
| year period). | |||||
Russell U.S. Defensive Equity Fund 37
| Russell Investment Company | |||||||
| Russell U.S. Defensive Equity Fund | |||||||
| Schedule of Investments — October 31, 2014 | |||||||
| Amounts in thousands (except share amounts) | Amounts in thousands (except share amounts) | ||||||
| Principal | Fair | Principal | Fair | ||||
| Amount ($) or | Value | Amount ($) or | Value | ||||
| Shares | $ | Shares | $ | ||||
| Common Stocks - 94.9% | Hormel Foods Corp. | 4,800 | 259 | ||||
| Consumer Discretionary - 9.3% | Kellogg Co. | 77,853 | 4,979 | ||||
| Advance Auto Parts, Inc. | 7,400 | 1,087 | Kimberly-Clark Corp. | 154,832 | 17,693 | ||
| AutoZone, Inc.(Æ) | 14,177 | 7,847 | Kraft Foods Group, Inc.(Æ) | 1,219 | 69 | ||
| BorgWarner, Inc. | 2,800 | 160 | Kroger Co. (The) | 90,865 | 5,062 | ||
| Chipotle Mexican Grill, Inc. Class A(Æ) | 500 | 319 | Lorillard, Inc. | 11,100 | 683 | ||
| Choice Hotels International, Inc. | 18,139 | 970 | McCormick & Co., Inc. | 35,600 | 2,518 | ||
| Columbia Sportswear Co. | 4,764 | 184 | Molson Coors Brewing Co. Class B | 47,219 | 3,512 | ||
| Comcast Corp. Class A(Æ) | 116,803 | 6,465 | Mondelez International, Inc. Class A | 261,703 | 9,228 | ||
| Costco Wholesale Corp. | 54,008 | 7,203 | Monster Beverage Corp.(Æ) | 1,500 | 151 | ||
| DIRECTV(Æ) | 21,991 | 1,909 | PepsiCo, Inc. | 135,137 | 12,996 | ||
| Dollar General Corp.(Æ) | 10,874 | 681 | Philip Morris International, Inc. | 228,835 | 20,368 | ||
| Dollar Tree, Inc.(Æ) | 22,504 | 1,363 | Procter & Gamble Co. (The) | 275,018 | 24,001 | ||
| Domino's Pizza, Inc. | 17,665 | 1,568 | Reynolds American, Inc. | 71,364 | 4,489 | ||
| Dunkin' Brands Group, Inc. | 2,605 | 118 | Sysco Corp. | 2,393 | 92 | ||
| Estee Lauder Cos., Inc. (The) Class A | 12,448 | 936 | Walgreen Co. | 3,406 | 219 | ||
| Foot Locker, Inc. | 8,500 | 476 | 160,814 | ||||
| Gap, Inc. (The) | 27,796 | 1,053 | |||||
| Garmin, Ltd. | 1,200 | 67 | Energy - 9.2% | ||||
| Home Depot, Inc. | 194,157 | 18,934 | Chevron Corp. | 227,028 | 27,232 | ||
| Hyatt Hotels Corp. Class A(Æ) | 9,000 | 533 | ConocoPhillips | 77,120 | 5,564 | ||
| John Wiley & Sons, Inc. Class A(Æ) | 17,300 | 1,010 | Dril-Quip, Inc.(Æ) | 297 | 27 | ||
| Lowe's Cos., Inc. | 90,463 | 5,174 | EQT Corp. | 3,118 | 293 | ||
| Macy's, Inc. | 13,467 | 779 | Exxon Mobil Corp. | 438,449 | 42,403 | ||
| Marriott International, Inc. Class A | 31,191 | 2,363 | FMC Technologies, Inc.(Æ) | 4,286 | 240 | ||
| McDonald's Corp. | 9,977 | 935 | Halliburton Co. | 51,237 | 2,825 | ||
| Michael Kors Holdings, Ltd.(Æ) | 10,900 | 857 | Helmerich & Payne, Inc. | 10,167 | 883 | ||
| Nike, Inc. Class B | 2,860 | 266 | Hess Corp. | 3,855 | 327 | ||
| NVR, Inc.(Æ) | 2,480 | 3,044 | Marathon Oil Corp. | 64,103 | 2,269 | ||
| Omnicom Group, Inc. | 2,471 | 178 | National Oilwell Varco, Inc. | 51,515 | 3,742 | ||
| O'Reilly Automotive, Inc.(Æ) | 31,130 | 5,475 | NOW, Inc.(Æ) | 1,313 | 40 | ||
| Ralph Lauren Corp. Class A | 8,114 | 1,337 | Occidental Petroleum Corp. | 131,488 | 11,693 | ||
| Ross Stores, Inc. | 2,177 | 176 | Oceaneering International, Inc. | 1,118 | 79 | ||
| Starbucks Corp. | 17,848 | 1,349 | Patterson-UTI Energy, Inc. | 22,900 | 527 | ||
| Target Corp. | 1,370 | 85 | Phillips 66(Æ) | 16,687 | 1,310 | ||
| Time Warner Cable, Inc. | 18,995 | 2,796 | Schlumberger, Ltd. | 110,118 | 10,864 | ||
| Time Warner, Inc. | 106,952 | 8,499 | Southwestern Energy Co.(Æ) | 7,901 | 257 | ||
| TJX Cos., Inc. | 107,385 | 6,800 | Spectra Energy Corp. | 24,364 | 953 | ||
| VF Corp. | 47,389 | 3,207 | Valero Energy Corp. | 3,500 | 175 | ||
| Viacom, Inc. Class B | 45,760 | 3,326 | World Fuel Services Corp. | 1,431 | 59 | ||
| Visteon Corp.(Æ) | 2,700 | 254 | 111,762 | ||||
| WABCO Holdings, Inc.(Æ) | 1,700 | 166 | |||||
| Wal-Mart Stores, Inc. | 48,698 | 3,714 | Financial Services - 14.0% | ||||
| Walt Disney Co. (The) | 98,269 | 8,980 | ACE, Ltd. | 52,155 | 5,701 | ||
| Yum! Brands, Inc. | 5,149 | 370 | Aflac, Inc. | 41,141 | 2,457 | ||
| 113,013 | Allied World Assurance Co. Holdings AG | 48,300 | 1,835 | ||||
| Allstate Corp. (The) | 1,777 | 115 | |||||
| Consumer Staples - 13.3% | American Express Co. | 18,089 | 1,627 | ||||
| Altria Group, Inc. | 135,533 | 6,552 | American Financial Group, Inc. | 29,800 | 1,783 | ||
| Andersons, Inc. (The) | 6,900 | 440 | Aon PLC | 34,500 | 2,967 | ||
| Archer-Daniels-Midland Co. | 33,651 | 1,581 | Arch Capital Group, Ltd.(Æ) | 88,400 | 4,979 | ||
| Casey's General Stores, Inc. | 6,000 | 491 | Aspen Insurance Holdings, Ltd. | 51,370 | 2,241 | ||
| Coca-Cola Co. (The) | 420,075 | 17,593 | Assurant, Inc. | 23,261 | 1,587 | ||
| Coca-Cola Enterprises, Inc. | 27,820 | 1,206 | AvalonBay Communities, Inc.(ö) | 9,042 | 1,409 | ||
| Colgate-Palmolive Co. | 54,557 | 3,649 | Axis Capital Holdings, Ltd. | 78,443 | 3,776 | ||
| Constellation Brands, Inc. Class A(Æ) | 11,893 | 1,089 | BB&T Corp. | 8,157 | 309 | ||
| CVS Health Corp. | 100,308 | 8,607 | Berkshire Hathaway, Inc. Class B(Æ) | 114,571 | 16,058 | ||
| Dr Pepper Snapple Group, Inc. | 49,680 | 3,440 | BlackRock, Inc. Class A | 1,676 | 572 | ||
| General Mills, Inc. | 110,878 | 5,761 | Boston Properties, Inc.(ö) | 6,835 | 866 | ||
| Hershey Co. (The) | 42,600 | 4,086 | |||||
| See accompanying notes which are an integral part of the financial statements. | |||||||
| 38 Russell U.S. Defensive Equity Fund | |||||||
| Russell Investment Company | |||||||
| Russell U.S. Defensive Equity Fund | |||||||
| Schedule of Investments, continued — October 31, 2014 | |||||||
| Amounts in thousands (except share amounts) | Amounts in thousands (except share amounts) | ||||||
| Principal | Fair | Principal | Fair | ||||
| Amount ($) or | Value | Amount ($) or | Value | ||||
| Shares | $ | Shares | $ | ||||
| Broadridge Financial Solutions, Inc. | 40,300 | 1,770 | Health Care - 13.0% | ||||
| CBOE Holdings, Inc. | 35,200 | 2,075 | Abbott Laboratories | 131,435 | 5,729 | ||
| CDK Global, Inc.(Æ) | 718 | 24 | Aetna, Inc. | 35,707 | 2,946 | ||
| Charles Schwab Corp. (The) | 14,790 | 424 | Alexion Pharmaceuticals, Inc.(Æ) | 4,240 | 811 | ||
| Chubb Corp. (The) | 1,001 | 99 | Allergan, Inc. | 253 | 48 | ||
| Cincinnati Financial Corp. | 1,000 | 50 | AmerisourceBergen Corp. Class A | 44,700 | 3,818 | ||
| City National Corp. | 3,100 | 244 | Amgen, Inc. | 61,063 | 9,903 | ||
| CME Group, Inc. Class A | 1,139 | 95 | Baxter International, Inc. | 2,222 | 156 | ||
| Comerica, Inc. | 12,400 | 592 | Becton Dickinson and Co. | 13,941 | 1,794 | ||
| Commerce Bancshares, Inc. | 160 | 7 | Biogen Idec, Inc.(Æ) | 13,276 | 4,263 | ||
| Cullen/Frost Bankers, Inc. | 71,387 | 5,769 | Boston Scientific Corp.(Æ) | 63,990 | 850 | ||
| DCT Industrial Trust, Inc.(ö) | 8,597 | 74 | Bristol-Myers Squibb Co. | 57,851 | 3,366 | ||
| Equifax, Inc. | 13,900 | 1,053 | Cardinal Health, Inc. | 107,239 | 8,416 | ||
| Equity Residential(ö) | 9,231 | 642 | CareFusion Corp.(Æ) | 7,822 | 449 | ||
| Erie Indemnity Co. Class A | 3,899 | 331 | Celgene Corp.(Æ) | 16,270 | 1,742 | ||
| Everest Re Group, Ltd. | 40,510 | 6,913 | Cigna Corp. | 16,172 | 1,610 | ||
| Federal Realty Investment Trust(ö) | 5,500 | 725 | Covidien PLC | 13,130 | 1,214 | ||
| Fidelity National Information Services, Inc. | 66,451 | 3,880 | CR Bard, Inc. | 100 | 16 | ||
| Fiserv, Inc.(Æ) | 84,766 | 5,890 | Eli Lilly & Co. | 65,328 | 4,333 | ||
| FNF Group | 24,385 | 728 | Express Scripts Holding Co.(Æ) | 2,920 | 224 | ||
| FNFV Group(Æ) | 47,615 | 640 | Henry Schein, Inc.(Æ) | 8,700 | 1,044 | ||
| Franklin Resources, Inc. | 6,638 | 369 | Humana, Inc. | 19,288 | 2,678 | ||
| Global Payments, Inc. | 1,200 | 97 | IDEXX Laboratories, Inc.(Æ) | 9,600 | 1,360 | ||
| Hanover Insurance Group, Inc. (The) | 24,268 | 1,625 | Johnson & Johnson | 314,961 | 33,947 | ||
| HCC Insurance Holdings, Inc. | 6,100 | 318 | Laboratory Corp. of America Holdings(Æ) | 2,500 | 273 | ||
| Intercontinental Exchange, Inc. | 5,050 | 1,052 | McKesson Corp. | 19,225 | 3,911 | ||
| Invesco, Ltd. | 18,340 | 742 | MEDNAX, Inc.(Æ) | 15,200 | 949 | ||
| Jack Henry & Associates, Inc. | 25,353 | 1,517 | Medtronic, Inc. | 4,090 | 279 | ||
| Kilroy Realty Corp.(ö) | 1,099 | 74 | Merck & Co., Inc. | 290,954 | 16,858 | ||
| M&T Bank Corp. | 1,600 | 195 | Myriad Genetics, Inc.(Æ) | 4,500 | 178 | ||
| Markel Corp.(Æ) | 700 | 484 | Perrigo Co. PLC | 389 | 63 | ||
| Marsh & McLennan Cos., Inc. | 64,115 | 3,486 | Pfizer, Inc. | 737,391 | 22,085 | ||
| MasterCard, Inc. Class A | 40,071 | 3,356 | St. Jude Medical, Inc. | 23,393 | 1,501 | ||
| MFA Financial, Inc.(ö) | 104,900 | 879 | Stryker Corp. | 44,244 | 3,873 | ||
| Northern Trust Corp. | 2,300 | 153 | Teleflex, Inc. | 13,600 | 1,552 | ||
| PartnerRe, Ltd. | 43,716 | 5,058 | Thermo Fisher Scientific, Inc. | 36,400 | 4,280 | ||
| PNC Financial Services Group, Inc. (The) | 56,286 | 4,863 | UnitedHealth Group, Inc. | 58,441 | 5,552 | ||
| Public Storage(ö) | 2,088 | 385 | Varian Medical Systems, Inc.(Æ) | 4,800 | 404 | ||
| Realty Income Corp.(ö) | 10,900 | 502 | Zimmer Holdings, Inc. | 40,458 | 4,501 | ||
| Reinsurance Group of America, Inc. Class A | 77,619 | 6,539 | 156,976 | ||||
| RenaissanceRe Holdings, Ltd. | 700 | 72 | |||||
| SEI Investments Co. | 14,800 | 572 | Materials and Processing - 2.5% | ||||
| Simon Property Group, Inc.(ö) | 30,447 | 5,456 | Air Products & Chemicals, Inc. | 367 | 49 | ||
| T Rowe Price Group, Inc. | 2,484 | 204 | AptarGroup, Inc. | 4,300 | 268 | ||
| Tanger Factory Outlet Centers, Inc.(ö) | 3,600 | 129 | Ball Corp. | 49,727 | 3,204 | ||
| Taubman Centers, Inc.(ö) | 2,100 | 160 | Bemis Co., Inc. | 2,200 | 85 | ||
| TD Ameritrade Holding Corp. | 1,500 | 51 | Brown-Forman Corp. Class B - ADR | 17,100 | 1,585 | ||
| Thomson Reuters Corp. | 1,361 | 51 | Commercial Metals Co. | 14,500 | 251 | ||
| Torchmark Corp. | 37,328 | 1,977 | Crown Holdings, Inc.(Æ) | 65,169 | 3,123 | ||
| Travelers Cos., Inc. (The) | 4,164 | 420 | Cytec Industries, Inc. | 1,600 | 75 | ||
| Two Harbors Investment Corp.(ö) | 36,000 | 365 | Dow Chemical Co. (The) | 6,400 | 316 | ||
| US Bancorp | 22,264 | 948 | Ecolab, Inc. | 1,691 | 188 | ||
| Visa, Inc. Class A | 62,475 | 15,083 | EI du Pont de Nemours & Co. | 17,800 | 1,231 | ||
| Voya Financial, Inc. | 18,100 | 710 | International Flavors & Fragrances, Inc. | 25,860 | 2,564 | ||
| Waddell & Reed Financial, Inc. Class A | 200 | 10 | Lennox International, Inc. | 32,313 | 2,873 | ||
| Wells Fargo & Co. | 587,161 | 31,172 | LyondellBasell Industries NV Class A | 15,526 | 1,423 | ||
| 169,381 | Minerals Technologies, Inc. | 6,200 | 476 | ||||
| Monsanto Co. | 10,598 | 1,219 | |||||
| NewMarket Corp. | 1,800 | 698 | |||||
| See accompanying notes which are an integral part of the financial statements. | |||||||
| Russell U.S. Defensive Equity Fund 39 | |||||||
| Russell Investment Company | |||||||
| Russell U.S. Defensive Equity Fund | |||||||
| Schedule of Investments, continued — October 31, 2014 | |||||||
| Amounts in thousands (except share amounts) | Amounts in thousands (except share amounts) | ||||||
| Principal | Fair | Principal | Fair | ||||
| Amount ($) or | Value | Amount ($) or | Value | ||||
| Shares | $ | Shares | $ | ||||
| Nucor Corp. | 16,500 | 892 | Zebra Technologies Corp. Class A(Æ) | 6,900 | 509 | ||
| Packaging Corp. of America | 21,432 | 1,545 | 131,319 | ||||
| PPG Industries, Inc. | 18,070 | 3,681 | |||||
| Praxair, Inc. | 1,199 | 151 | Technology - 15.6% | ||||
| Precision Castparts Corp. | 4,993 | 1,102 | Adobe Systems, Inc.(Æ) | 31,190 | 2,187 | ||
| Reliance Steel & Aluminum Co. | 6,000 | 405 | Amdocs, Ltd. | 26,700 | 1,269 | ||
| Sherwin-Williams Co. (The) | 10,470 | 2,403 | Amphenol Corp. Class A | 7,000 | 354 | ||
| Sigma-Aldrich Corp. | 4,400 | 598 | Apple, Inc. | 270,064 | 29,167 | ||
| Valmont Industries, Inc. | 200 | 27 | Autodesk, Inc.(Æ) | 1,100 | 63 | ||
| Westlake Chemical Corp. | 2,500 | 176 | Avago Technologies, Ltd. Class A | 57,870 | 4,991 | ||
| 30,608 | Cisco Systems, Inc. | 227,804 | 5,574 | ||||
| Cognizant Technology Solutions Corp. Class | |||||||
| Producer Durables - 10.9% | A(Æ) | 72,965 | 3,564 | ||||
| 3M Co. | 13,726 | 2,111 | Dolby Laboratories, Inc. Class A | 5,300 | 222 | ||
| Accenture PLC Class A | 105,675 | 8,572 | DST Systems, Inc. | 15,373 | 1,481 | ||
| Automatic Data Processing, Inc. | 1,974 | 161 | Electronic Arts, Inc.(Æ) | 58,600 | 2,401 | ||
| Canadian Pacific Railway, Ltd. | 6,429 | 1,335 | EMC Corp. | 278,378 | 7,998 | ||
| Cintas Corp. | 9,600 | 703 | F5 Networks, Inc.(Æ) | 7,400 | 910 | ||
| CSX Corp. | 209,214 | 7,454 | Facebook, Inc. Class A(Æ) | 4,357 | 327 | ||
| Cummins, Inc. | 10,364 | 1,515 | Gartner, Inc.(Æ) | 27,400 | 2,211 | ||
| Danaher Corp. | 2,488 | 200 | Google, Inc. Class C(Æ) | 32,125 | 18,108 | ||
| Deere & Co. | 278 | 24 | Harris Corp. | 600 | 42 | ||
| Dover Corp. | 58,484 | 4,646 | Intel Corp. | 331,309 | 11,268 | ||
| Emerson Electric Co. | 58,678 | 3,759 | International Business Machines Corp. | 60,061 | 9,874 | ||
| Flir Systems, Inc. | 3,700 | 124 | Intuit, Inc. | 55,243 | 4,862 | ||
| Fluor Corp. | 13,930 | 924 | KLA-Tencor Corp. | 34,210 | 2,708 | ||
| General Dynamics Corp. | 34,273 | 4,790 | Linear Technology Corp. | 13,000 | 557 | ||
| General Electric Co. | 7,226 | 186 | Maxim Integrated Products, Inc. | 3,000 | 88 | ||
| Honeywell International, Inc. | 69,094 | 6,641 | Microsoft Corp. | 727,353 | 34,149 | ||
| IDEX Corp. | 17,514 | 1,312 | Motorola Solutions, Inc. | 41,000 | 2,645 | ||
| Illinois Tool Works, Inc. | 1,598 | 145 | Oracle Corp. | 249,896 | 9,758 | ||
| Kirby Corp.(Æ) | 17,657 | 1,953 | Palo Alto Networks, Inc.(Æ) | 26,400 | 2,791 | ||
| Knight Transportation, Inc. | 14,800 | 433 | QUALCOMM, Inc. | 242,954 | 19,074 | ||
| L-3 Communications Holdings, Inc. | 53,530 | 6,502 | Skyworks Solutions, Inc. | 21,800 | 1,270 | ||
| Landstar System, Inc. | 36,600 | 2,709 | SolarWinds, Inc.(Æ) | 900 | 43 | ||
| Lockheed Martin Corp. | 51,485 | 9,811 | Synopsys, Inc.(Æ) | 74,200 | 3,041 | ||
| Norfolk Southern Corp. | 15,406 | 1,705 | Syntel, Inc.(Æ) | 4,400 | 381 | ||
| Northrop Grumman Corp. | 28,237 | 3,896 | Texas Instruments, Inc. | 71,868 | 3,569 | ||
| Old Dominion Freight Line, Inc.(Æ) | 19,500 | 1,421 | VMware, Inc. Class A(Æ) | 930 | 78 | ||
| PACCAR, Inc. | 16,060 | 1,049 | Western Digital Corp. | 12,300 | 1,210 | ||
| Parker-Hannifin Corp. | 3,580 | 455 | Xilinx, Inc. | 1,300 | 58 | ||
| Paychex, Inc. | 30,290 | 1,422 | 188,293 | ||||
| Quanta Services, Inc.(Æ) | 16,000 | 545 | |||||
| Raytheon Co. | 64,781 | 6,729 | Utilities - 7.1% | ||||
| Robert Half International, Inc. | 2,100 | 115 | AGL Resources, Inc. | 13,500 | 728 | ||
| Rockwell Automation, Inc. | 43,325 | 4,868 | Alliant Energy Corp. | 5,400 | 334 | ||
| Snap-on, Inc. | 12,256 | 1,620 | Ameren Corp. | 19,200 | 813 | ||
| Spirit Airlines, Inc.(Æ) | 2,700 | 197 | American Electric Power Co., Inc. | 18,757 | 1,094 | ||
| Toro Co. (The) | 37,270 | 2,301 | American Water Works Co., Inc. | 13,312 | 710 | ||
| Towers Watson & Co. Class A | 3,300 | 364 | AT&T, Inc. | 275,450 | 9,597 | ||
| Tyco International, Ltd. | 14,420 | 619 | Atmos Energy Corp. | 14,900 | 790 | ||
| Union Pacific Corp. | 167,177 | 19,468 | CenterPoint Energy, Inc. | 53,371 | 1,310 | ||
| United Parcel Service, Inc. Class B | 5,233 | 549 | CenturyLink, Inc. | 39,329 | 1,631 | ||
| United Technologies Corp. | 110,885 | 11,865 | CMS Energy Corp. | 60,206 | 1,967 | ||
| Wabtec Corp. | 40,200 | 3,469 | Dominion Resources, Inc. | 48,052 | 3,426 | ||
| Waste Management, Inc. | 1,105 | 54 | DTE Energy Co. | 67,992 | 5,586 | ||
| WW Grainger, Inc. | 8,464 | 2,089 | Duke Energy Corp. | 4,538 | 373 | ||
| Edison International | 73,293 | 4,587 | |||||
| Entergy Corp. | 12,990 | 1,091 | |||||
| See accompanying notes which are an integral part of the financial statements. | |||||||
| 40 Russell U.S. Defensive Equity Fund | |||||||
Russell Investment Company Russell U.S. Defensive Equity Fund
Schedule of Investments, continued — October 31, 2014
Amounts in thousands (except share amounts)
| Principal | Fair | |||||
| Amount ($) or | Value | |||||
| Shares | $ | |||||
| Exelon Corp. | 79,784 | 2,919 | ||||
| Great Plains Energy, Inc. | 22,600 | 609 | ||||
| Integrys Energy Group, Inc. | 1,400 | 102 | ||||
| ITC Holdings Corp. | 61,000 | 2,416 | ||||
| MDU Resources Group, Inc. | 16,800 | 473 | ||||
| NextEra Energy, Inc. | 104,965 | 10,520 | ||||
| NiSource, Inc. | 60,904 | 2,562 | ||||
| Northeast Utilities | 9,100 | 449 | ||||
| PG&E Corp. | 10,957 | 551 | ||||
| PPL Corp. | 17,200 | 602 | ||||
| Public Service Enterprise Group, Inc. | 19,900 | 822 | ||||
| Questar Corp. | 20,982 | 506 | ||||
| SCANA Corp. | 7,300 | 401 | ||||
| Sempra Energy | 31,071 | 3,418 | ||||
| Southern Co. | 5,499 | 255 | ||||
| TransCanada Corp. | 3,382 | 167 | ||||
| UGI Corp. | 67,600 | 2,548 | ||||
| Vectren Corp. | 7,800 | 351 | ||||
| Verizon Communications, Inc. | 390,197 | 19,607 | ||||
| Westar Energy, Inc. Class A | 19,600 | 741 | ||||
| Wisconsin Energy Corp. | 11,900 | 591 | ||||
| Xcel Energy, Inc. | 21,200 | 709 | ||||
| 85,356 | ||||||
| Total Common Stocks | ||||||
| (cost $980,269) | 1,147,522 | |||||
| Short | -Term Investments - 4.5% | |||||
| Russell U.S. Cash Management Fund | 53,974,907 | (8) | 53,975 | |||
| Total Short-Term Investments | ||||||
| (cost $53,975) | 53,975 | |||||
| Total Investments 99.4% | ||||||
| (identified cost $1,034,244) | 1,201,497 | |||||
| Other Assets and Liabilities, Net | ||||||
| - 0.6% | 7,441 | |||||
| Net Assets - 100.0% | 1,208,938 | |||||
See accompanying notes which are an integral part of the financial statements.
Russell U.S. Defensive Equity Fund 41
| Russell Investment Company | |||||||||||||||||
| Russell U.S. Defensive Equity Fund | |||||||||||||||||
| Schedule of Investments, continued — October 31, 2014 | |||||||||||||||||
| Futures Contracts | |||||||||||||||||
| Amounts in thousands (except contract amounts) | |||||||||||||||||
| Unrealized | |||||||||||||||||
| Appreciation | |||||||||||||||||
| Number of | Notional | Expiration | (Depreciation) | ||||||||||||||
| Contracts | Amount | Date | $ | ||||||||||||||
| Long Positions | |||||||||||||||||
| S&P E-Mini Energy Select Sector Index Futures | 55 | USD | 4,806 | 12/14 | 56 | ||||||||||||
| S&P Mid 500 E-Mini Index Futures | 138 | USD | 13,879 | 12/14 | 675 | ||||||||||||
| Total Unrealized Appreciation (Depreciation) on Open Futures Contracts (å) | 731 | ||||||||||||||||
| Options Written | |||||||||||||||||
| Amounts in thousands (except contract amounts) | |||||||||||||||||
| Number of | Strike | Notional | Expiration | Fair Value | |||||||||||||
| Call/Put | Contracts | Price | Amount | Date | $ | ||||||||||||
| S&P 500 Index | Put | 35 | 1,775.00 | USD | 4 | 11/07/14 | — | ||||||||||
| S&P 500 Index | Put | 8 | 1,780.00 | USD | 1 | 11/07/14 | — | ||||||||||
| S&P 500 Index | Put | 36 | 1,720.00 | USD | 4 | 11/14/14 | (1 | ) | |||||||||
| S&P 500 Index | Put | 8 | 1,765.00 | USD | 1 | 11/14/14 | — | ||||||||||
| S&P 500 Index | Put | 9 | 1,760.00 | USD | 1 | 11/22/14 | (1 | ) | |||||||||
| S&P 500 Index | Put | 32 | 1,860.00 | USD | 3 | 11/22/14 | (6 | ) | |||||||||
| S&P 500 Index | Put | 9 | 1,750.00 | USD | 1 | 11/28/14 | (1 | ) | |||||||||
| S&P 500 Index | Put | 30 | 1,925.00 | USD | 3 | 11/28/14 | (20 | ) | |||||||||
| Total Liability for Options Written (premiums received $147) | (29 | ) | |||||||||||||||
| Transactions in options written contracts for the period ended October 31, 2014 were as follows: | |||||||||||||||||
| Number of | Premiums | ||||||||||||||||
| Contracts | Received | ||||||||||||||||
| Outstanding October 31, 2013 | — | $ | — | ||||||||||||||
| Opened | 1,163 | 761 | |||||||||||||||
| Closed | (776 | ) | (471 | ) | |||||||||||||
| Expired | (220 | ) | (143 | ) | |||||||||||||
| Outstanding October 31, 2014 | 167 | $ | 147 | ||||||||||||||
| Presentation of Portfolio Holdings | |||||||||||||||||
| Amounts in thousands | |||||||||||||||||
| Fair Value | |||||||||||||||||
| Portfolio Summary | Level 1 | Level 2 | Level 3 | Total | % of Net Assets | ||||||||||||
| Common Stocks | |||||||||||||||||
| Consumer Discretionary | $ | 113,013 | $ | — | $ | — | $ | 113,013 | 9.3 | ||||||||
| Consumer Staples | 160,814 | — | — | 160,814 | 13.3 | ||||||||||||
| Energy | 111,762 | — | — | 111,762 | 9.2 | ||||||||||||
| Financial Services | 169,381 | — | — | 169,381 | 14.0 | ||||||||||||
| Health Care | 156,976 | — | — | 156,976 | 13.0 | ||||||||||||
| Materials and Processing | 30,608 | — | — | 30,608 | 2.5 | ||||||||||||
| Producer Durables | 131,319 | — | — | 131,319 | 10.9 | ||||||||||||
| Technology | 188,293 | — | — | 188,293 | 15.6 | ||||||||||||
| Utilities | 85,356 | — | — | 85,356 | 7.1 | ||||||||||||
| Short-Term Investments | — | 53,975 | — | 53,975 | 4.5 | ||||||||||||
| Total Investments | 1,147,522 | 53,975 | — | 1,201,497 | 99.4 | ||||||||||||
| Other Assets and Liabilities, Net | 0.6 | ||||||||||||||||
| 100.0 | |||||||||||||||||
| Other Financial Instruments | |||||||||||||||||
| Futures Contracts | 731 | — | — | 731 | 0.1 | ||||||||||||
| Options Written | (29 | ) | — | — | (29 | ) | (—)* | ||||||||||
| Total Other Financial Instruments** | $ | 702 | $ | — | $ | — | $ | 702 | |||||||||
| * | Less than .05% of net assets. |
| ** | Futures and foreign currency exchange contract values reflect the unrealized appreciation (depreciation) on the instruments. |
See accompanying notes which are an integral part of the financial statements.
42 Russell U.S. Defensive Equity Fund
Russell Investment Company Russell U.S. Defensive Equity Fund
Schedule of Investments, continued — October 31, 2014
| Presentation of Portfolio Holdings | |||||
| Amounts in thousands | |||||
| Fair Value | |||||
| Portfolio Summary | Level 1 | Level 2 | Level 3 | Total | % of Net Assets |
| For a description of the Levels see note 2 in the Notes to Financial Statements. | |||||
| For disclosure on transfers between Levels 1, 2 and 3 during the period ended October 31, 2014, see note 2 in the Notes to Financial | |||||
| Statements. | |||||
See accompanying notes which are an integral part of the financial statements.
Russell U.S. Defensive Equity Fund 43
| Russell Investment Company | ||
| Russell U.S. Defensive Equity Fund | ||
| Fair Value of Derivative Instruments — October 31, 2014 | ||
| Amounts in thousands | ||
| Equity | ||
| Derivatives not accounted for as hedging instruments | Contracts | |
| Location: Statement of Assets and Liabilities - Assets | ||
| Variation margin on futures contracts* | $ | 731 |
| Location: Statement of Assets and Liabilities - Liabilities | ||
| Options written, at fair value | $ | 29 |
| Equity | ||
| Derivatives not accounted for as hedging instruments | Contracts | |
| Location: Statement of Operations - Net realized gain (loss) | ||
| Futures contracts | $ | 2,167 |
| Options written | 405 | |
| Total | $ | 2,572 |
| Location: Statement of Operations - Net change in unrealized appreciation (depreciation) | ||
| Futures contracts | $ | 242 |
| Options written | 118 | |
| Total | $ | 360 |
| * | Includes cumulative appreciation/depreciation of futures contracts as reported in the Schedule of Investments. Only variation margin is reported within the Statement of Assets and Liabilities. |
For further disclosure on derivatives see note 2 in the Notes to Financial Statements.
See accompanying notes which are an integral part of the financial statements.
44 Russell U.S. Defensive Equity Fund
Russell Investment Company Russell U.S. Defensive Equity Fund
Balance Sheet Offsetting of Financial and Derivative Instruments — October 31, 2014
| Amounts in thousands | ||||||||
| Offsetting of Financial Assets and Derivative Assets | ||||||||
| Gross | Net Amounts | |||||||
| Amounts | of Assets | |||||||
| Gross | Offset in the | Presented in | ||||||
| Amounts of | Statement of | the Statement | ||||||
| Recognized | Assets and | of Assets and | ||||||
| Description | Location: Statement of Assets and Liabilities - Assets | Assets | Liabilities | Liabilities | ||||
| Futures Contracts | Variation margin on futures contracts | $ | 273 | $ — | $ | 273 | ||
| Total | $ | 273 | $ — | $ | 273 | |||
| Financial Assets, Derivative Assets, and Collateral Held by Counterparty | ||||||||
| Gross Amounts Not Offset in | ||||||||
| the Statement of Assets and | ||||||||
| Liabilities | ||||||||
| Net Amounts | ||||||||
| of Assets | ||||||||
| Presented in | ||||||||
| the Statement | Financial and | |||||||
| of Assets and | Derivative | Collateral | ||||||
| Counterparty | Liabilities | Instruments | Received^ Net Amount | |||||
| Merrill Lynch | $ | 273 | $ — | $ — | $ | 273 | ||
| Total | $ | 273 | $ — | $ — | $ | 273 | ||
| Offsetting of Financial Liabilities and Derivative Liabilities | |||||||
| Gross | Net Amounts | ||||||
| Amounts | of Assets | ||||||
| Gross | Offset in the | Presented in | |||||
| Amounts of | Statement of | the Statement | |||||
| Recognized | Assets and | of Assets and | |||||
| Description | Location: Statement of Assets and Liabilities - Liabilities | Liabilities | Liabilities | Liabilities | |||
| Options Written Contracts | Options written, at fair value | $ 29 | $ — | $ 29 | |||
| Total | $ 29 | $ — | $ 29 | ||||
| Financial Liabilities, Derivative Liabilities, and Collateral Pledged by Counterparty | |||||||
| Gross Amounts Not Offset in | |||||||
| the Statement of Assets and | |||||||
| Liabilities | |||||||
| Net Amounts | |||||||
| of Liabilities | |||||||
| Presented in | |||||||
| the Statement | Financial and | ||||||
| of Assets and | Derivative | Collateral | |||||
| Counterparty | Liabilities | Instruments | Pledged^ Net Amount | ||||
| Goldman Sachs | $ 29 | $ — | $ 29 | $ — | |||
| Total | $ 29 | $ — | $ 29 | $ — | |||
^ Collateral received or pledged amounts may not reconcile to those disclosed in the Statement of Assets and Liabilities due to the inclusion of off-Balance Sheet collateral and adjustments made to exclude overcollateralization.
For further disclosure on derivatives and counterparty risk see note 2 in the Notes to Financial Statements.
See accompanying notes which are an integral part of the financial statements.
Russell U.S. Defensive Equity Fund 45
| Russell Investment Company | ||
| Russell U.S. Defensive Equity Fund | ||
| Statement of Assets and Liabilities — October 31, 2014 | ||
| Amounts in thousands | ||
| Assets | ||
| Investments, at identified cost | $ | 1,034,244 |
| Investments, at fair value(>) | 1,201,497 | |
| Cash (restricted)(a)(b) | 8,715 | |
| Receivables: | ||
| Dividends and interest | 1,039 | |
| Dividends from affiliated Russell funds | 5 | |
| Investments sold | 2,444 | |
| Fund shares sold | 65 | |
| Variation margin on futures contracts | 273 | |
| Prepaid expenses | 4 | |
| Total assets | 1,214,042 | |
| Liabilities | ||
| Payables: | ||
| Investments purchased | 2,490 | |
| Fund shares redeemed | 1,717 | |
| Accrued fees to affiliates | 729 | |
| Other accrued expenses | 139 | |
| Options written, at fair value(x) | 29 | |
| Total liabilities | 5,104 | |
| Net Assets | $ | 1,208,938 |
See accompanying notes which are an integral part of the financial statements.
46 Russell U.S. Defensive Equity Fund
| Russell Investment Company | |||
| Russell U.S. Defensive Equity Fund | |||
| Statement of Assets and Liabilities, continued — October 31, 2014 | |||
| Amounts in thousands | |||
| Net Assets Consist of: | |||
| Undistributed (overdistributed) net investment income | $ | 365 | |
| Accumulated net realized gain (loss) | (148,563 | ) | |
| Unrealized appreciation (depreciation) on: | |||
| Investments | 167,253 | ||
| Futures contracts | 731 | ||
| Options written | 118 | ||
| Shares of beneficial interest | 263 | ||
| Additional paid-in capital | 1,188,771 | ||
| Net Assets | $ | 1,208,938 | |
| Net Asset Value, offering and redemption price per share: | |||
| Net asset value per share: Class A(#) | $ | 46.04 | |
| Maximum offering price per share (Net asset value plus sales charge of 5.75%): Class A | $ | 48.85 | |
| Class A — Net assets | $ | 25,232,981 | |
| Class A — Shares outstanding ($.01 par value) | 548,118 | ||
| Net asset value per share: Class C(#) | $ | 45.80 | |
| Class C — Net assets | $ | 50,832,865 | |
| Class C — Shares outstanding ($.01 par value) | 1,109,816 | ||
| Net asset value per share: Class E(#) | $ | 46.08 | |
| Class E — Net assets | $ | 9,598,523 | |
| Class E — Shares outstanding ($.01 par value) | 208,292 | ||
| Net asset value per share: Class I(#) | $ | 46.03 | |
| Class I — Net assets | $ | 260,234,877 | |
| Class I — Shares outstanding ($.01 par value) | 5,653,496 | ||
| Net asset value per share: Class S(#) | $ | 46.09 | |
| Class S — Net assets | $ | 266,201,966 | |
| Class S — Shares outstanding ($.01 par value) | 5,775,214 | ||
| Net asset value per share: Class Y(#) | $ | 46.03 | |
| Class Y — Net assets | $ | 596,837,235 | |
| Class Y — Shares outstanding ($.01 par value) | 12,965,632 | ||
| Amounts in thousands | |||
| (x) Premiums received on options written | $ | 147 | |
| (>) Investments in affiliates, Russell U.S. Cash Management Fund | $ | 53,975 | |
| (a) Cash Collateral for Futures | $ | 1,683 | |
| (b) Cash Collateral for Options | $ | 7,032 | |
| (#) Net asset value per share equals class level net assets divided by class level shares of beneficial interest outstanding. | |||
See accompanying notes which are an integral part of the financial statements.
Russell U.S. Defensive Equity Fund 47
| Russell Investment Company | |||
| Russell U.S. Defensive Equity Fund | |||
| Statement of Operations — For the Period Ended October 31, 2014 | |||
| Amounts in thousands | |||
| Investment Income | |||
| Dividends | $ | 26,782 | |
| Dividends from affiliated Russell funds | 46 | ||
| Total investment income | 26,828 | ||
| Expenses | |||
| Advisory fees | 7,256 | ||
| Administrative fees | 628 | ||
| Custodian fees | 249 | ||
| Distribution fees - Class A | 66 | ||
| Distribution fees - Class C | 373 | ||
| Transfer agent fees - Class A | 53 | ||
| Transfer agent fees - Class C | 99 | ||
| Transfer agent fees - Class E | 30 | ||
| Transfer agent fees - Class I | 333 | ||
| Transfer agent fees - Class S | 545 | ||
| Transfer agent fees - Class Y | 30 | ||
| Professional fees | 86 | ||
| Registration fees | 80 | ||
| Shareholder servicing fees - Class C | 125 | ||
| Shareholder servicing fees - Class E | 37 | ||
| Trustees’ fees | 33 | ||
| Printing fees | 14 | ||
| Miscellaneous | 64 | ||
| Total expenses | 10,101 | ||
| Net investment income (loss) | 16,727 | ||
| Net Realized and Unrealized Gain (Loss) | |||
| Net realized gain (loss) on: | |||
| Investments | 198,255 | ||
| Futures contracts | 2,167 | ||
| Options written | 405 | ||
| Net realized gain (loss) | 200,827 | ||
| Net change in unrealized appreciation (depreciation) on: | |||
| Investments | (16,018 | ) | |
| Futures contracts | 242 | ||
| Options written | 118 | ||
| Net change in unrealized appreciation (depreciation) | (15,658 | ) | |
| Net realized and unrealized gain (loss) | 185,169 | ||
| Net Increase (Decrease) in Net Assets from Operations | $ | 201,896 | |
See accompanying notes which are an integral part of the financial statements.
48 Russell U.S. Defensive Equity Fund
| Russell Investment Company | ||||||
| Russell U.S. Defensive Equity Fund | ||||||
| Statements of Changes in Net Assets | ||||||
| For the Periods Ended October 31, | ||||||
| Amounts in thousands | 2014 | 2013 | ||||
| Increase (Decrease) in Net Assets | ||||||
| Operations | ||||||
| Net investment income (loss) | $ | 16,727 | $ | 18,323 | ||
| Net realized gain (loss) | 200,827 | 183,897 | ||||
| Net change in unrealized appreciation (depreciation) | (15,658 | ) | 67,153 | |||
| Net increase (decrease) in net assets from operations | 201,896 | 269,373 | ||||
| Distributions | ||||||
| From net investment income | ||||||
| Class A | (256 | ) | (273 | ) | ||
| Class C | (120 | ) | (222 | ) | ||
| Class E | (133 | ) | (217 | ) | ||
| Class I | (3,611 | ) | (4,179 | ) | ||
| Class S | (3,314 | ) | (4,046 | ) | ||
| Class Y | (9,491 | ) | (9,677 | ) | ||
| Net decrease in net assets from distributions | (16,925 | ) | (18,614 | ) | ||
| Share Transactions* | ||||||
| Net increase (decrease) in net assets from share transactions | (205,576 | ) | (246,318 | ) | ||
| Total Net Increase (Decrease) in Net Assets | (20,605 | ) | 4,441 | |||
| Net Assets | ||||||
| Beginning of period | 1,229,543 | 1,225,102 | ||||
| End of period | $ | 1,208,938 | $ | 1,229,543 | ||
| Undistributed (overdistributed) net investment income included in net assets | $ | 365 | $ | 566 | ||
See accompanying notes which are an integral part of the financial statements.
Russell U.S. Defensive Equity Fund 49
Russell Investment Company Russell U.S. Defensive Equity Fund
Statements of Changes in Net Assets, continued
* Share transaction amounts (in thousands) for the periods ended October 31, 2014 and October 31, 2013 were as follows:
| 2014 | 2013 | |||||||||||
| Shares | Dollars | Shares | Dollars | |||||||||
| Class A | ||||||||||||
| Proceeds from shares sold | 59 | $ | 2,498 | 136 | $ | 5,139 | ||||||
| Proceeds from reinvestment of distributions | 6 | 229 | 7 | 263 | ||||||||
| Payments for shares redeemed | (166 | ) | (7,108 | ) | (167 | ) | (5,917 | ) | ||||
| Net increase (decrease) | (101 | ) | (4,381 | ) | (24 | ) | (515 | ) | ||||
| Class C | ||||||||||||
| Proceeds from shares sold | 97 | 4,047 | 163 | 6,120 | ||||||||
| Proceeds from reinvestment of distributions | 3 | 118 | 7 | 218 | ||||||||
| Payments for shares redeemed | (200 | ) | (8,493 | ) | (356 | ) | (12,809 | ) | ||||
| Net increase (decrease) | (100 | ) | (4,328 | ) | (186 | ) | (6,471 | ) | ||||
| Class E | ||||||||||||
| Proceeds from shares sold | 15 | 621 | 43 | 1,579 | ||||||||
| Proceeds from reinvestment of distributions | 3 | 132 | 6 | 199 | ||||||||
| Payments for shares redeemed | (237 | ) | (10,348 | ) | (194 | ) | (7,055 | ) | ||||
| Net increase (decrease) | (219 | ) | (9,595 | ) | (145 | ) | (5,277 | ) | ||||
| Class I | ||||||||||||
| Proceeds from shares sold | 552 | 23,342 | 1,146 | 41,188 | ||||||||
| Proceeds from reinvestment of distributions | 82 | 3,546 | 114 | 4,047 | ||||||||
| Payments for shares redeemed | (1,880 | ) | (81,670 | ) | (2,965 | ) | (106,021 | ) | ||||
| Net increase (decrease) | (1,246 | ) | (54,782 | ) | (1,705 | ) | (60,786 | ) | ||||
| Class S | ||||||||||||
| Proceeds from shares sold | 1,081 | 46,369 | 1,157 | 41,821 | ||||||||
| Proceeds from reinvestment of distributions | 74 | 3,216 | 111 | 3,913 | ||||||||
| Payments for shares redeemed | (2,240 | ) | (96,464 | ) | (3,254 | ) | (116,202 | ) | ||||
| Net increase (decrease) | (1,085 | ) | (46,879 | ) | (1,986 | ) | (70,468 | ) | ||||
| Class Y | ||||||||||||
| Proceeds from shares sold | 6,317 | 261,430 | 391 | 13,671 | ||||||||
| Proceeds from reinvestment of distributions | 219 | 9,491 | 273 | 9,677 | ||||||||
| Payments for shares redeemed | (8,214 | ) | (356,532 | ) | (3,446 | ) | (126,149 | ) | ||||
| Net increase (decrease) | (1,678 | ) | (85,611 | ) | (2,782 | ) | (102,801 | ) | ||||
| Total increase (decrease) | (4,429 | ) | $ | (205,576 | ) | (6,828 | ) | $ | (246,318 | ) | ||
See accompanying notes which are an integral part of the financial statements.
50 Russell U.S. Defensive Equity Fund
(This page intentionally left blank)
| Russell Investment Company | ||||||||||||||
| Russell U.S. Defensive Equity Fund | ||||||||||||||
| Financial Highlights — For the Periods Ended | ||||||||||||||
| For a Share Outstanding Throughout Each Period. | ||||||||||||||
| $ | $ | $ | $ | $ | ||||||||||
| Net Asset Value, | Net | Net Realized | Total from | Distributions | ||||||||||
| Beginning of | Investment | and Unrealized | Investment | from Net | $ | |||||||||
| Period | Income (Loss)(a)(d) | Gain (Loss) | Operations | Investment Income | Total Distributions | |||||||||
| Class A | ||||||||||||||
| October 31, 2014 | 40.06 | .40 | 6.00 | 6.40 | (.42 | ) | (.42 | ) | ||||||
| October 31, 2013 | 32.65 | .43 | 7.42 | 7.85 | (.44 | ) | (.44 | ) | ||||||
| October 31, 2012 | 29.57 | .27 | 3.11 | 3.38 | (.30 | ) | (.30 | ) | ||||||
| October 31, 2011 | 26.98 | .23 | 2.59 | 2.82 | (.23 | ) | (.23 | ) | ||||||
| October 31, 2010 | 23.94 | .23 | 3.07 | 3.30 | (.26 | ) | (.26 | ) | ||||||
| Class C | ||||||||||||||
| October 31, 2014 | 39.87 | .08 | 5.95 | 6.03 | (.10 | ) | (.10 | ) | ||||||
| October 31, 2013 | 32.50 | .16 | 7.38 | 7.54 | (.17 | ) | (.17 | ) | ||||||
| October 31, 2012 | 29.45 | .03 | 3.10 | 3.13 | (.08 | ) | (.08 | ) | ||||||
| October 31, 2011 | 26.91 | .01 | 2.58 | 2.59 | (.05 | ) | (.05 | ) | ||||||
| October 31, 2010 | 23.89 | .04 | 3.06 | 3.10 | (.08 | ) | (.08 | ) | ||||||
| Class E | ||||||||||||||
| October 31, 2014 | 40.08 | .42 | 5.98 | 6.40 | (.40 | ) | (.40 | ) | ||||||
| October 31, 2013 | 32.66 | .44 | 7.41 | 7.85 | (.43 | ) | (.43 | ) | ||||||
| October 31, 2012 | 29.54 | .30 | 3.09 | 3.39 | (.27 | ) | (.27 | ) | ||||||
| October 31, 2011 | 26.96 | .26 | 2.57 | 2.83 | (.25 | ) | (.25 | ) | ||||||
| October 31, 2010 | 23.92 | .26 | 3.07 | 3.33 | (.29 | ) | (.29 | ) | ||||||
| Class I | ||||||||||||||
| October 31, 2014 | 40.06 | .55 | 5.99 | 6.54 | (.57 | ) | (.57 | ) | ||||||
| October 31, 2013 | 32.65 | .55 | 7.42 | 7.97 | (.56 | ) | (.56 | ) | ||||||
| October 31, 2012 | 29.57 | .38 | 3.11 | 3.49 | (.41 | ) | (.41 | ) | ||||||
| October 31, 2011 | 26.98 | .33 | 2.58 | 2.91 | (.32 | ) | (.32 | ) | ||||||
| October 31, 2010 | 23.95 | .32 | 3.06 | 3.38 | (.35 | ) | (.35 | ) | ||||||
| Class S | ||||||||||||||
| October 31, 2014 | 40.11 | .51 | 6.00 | 6.51 | (.53 | ) | (.53 | ) | ||||||
| October 31, 2013 | 32.69 | .53 | 7.42 | 7.95 | (.53 | ) | (.53 | ) | ||||||
| October 31, 2012 | 29.59 | .35 | 3.10 | 3.45 | (.35 | ) | (.35 | ) | ||||||
| October 31, 2011 | 27.00 | .30 | 2.59 | 2.89 | (.30 | ) | (.30 | ) | ||||||
| October 31, 2010 | 23.96 | .30 | 3.07 | 3.37 | (.33 | ) | (.33 | ) | ||||||
| Class Y | ||||||||||||||
| October 31, 2014 | 40.06 | .60 | 5.99 | 6.59 | (.62 | ) | (.62 | ) | ||||||
| October 31, 2013 | 32.65 | .59 | 7.42 | 8.01 | (.60 | ) | (.60 | ) | ||||||
| October 31, 2012 | 29.58 | .42 | 3.10 | 3.52 | (.45 | ) | (.45 | ) | ||||||
| October 31, 2011 | 26.99 | .36 | 2.58 | 2.94 | (.35 | ) | (.35 | ) | ||||||
| October 31, 2010 | 23.96 | .35 | 3.05 | 3.40 | (.37 | ) | (.37 | ) | ||||||
See accompanying notes which are an integral part of the financial statements.
52 Russell U.S. Defensive Equity Fund
| % | % | % | ||||||||||||
| $ | $ | Ratio of Expenses | Ratio of Expenses | Ratio of Net | ||||||||||
| Net Asset Value, | % | Net Assets, | to Average | to Average | Investment Income | % | ||||||||
| End of | Total | End of Period | Net Assets, | Net Assets, | to Average | Portfolio | ||||||||
| Period | Return(c) | (000 | ) | Gross | Net(d)(g) | Net Assets(d) | Turnover Rate | |||||||
| 46.04 | 16.05 | 25,233 | 1.09 | 1.09 | .94 | 105 | ||||||||
| 40.06 | 24.18 | 26,019 | 1.10 | 1.10 | 1.17 | 105 | ||||||||
| 32.65 | 11.47 | 21,977 | 1.28 | 1.28 | .85 | 150 | ||||||||
| 29.57 | 10.47 | 18,284 | 1.26 | 1.26 | .77 | 142 | ||||||||
| 26.98 | 13.87 | 17,610 | 1.26 | 1.26 | .88 | 102 | ||||||||
| 45.80 | 15.15 | 50,833 | 1.84 | 1.84 | .19 | 105 | ||||||||
| 39.87 | 23.30 | 48,222 | 1.85 | 1.85 | .44 | 105 | ||||||||
| 32.50 | 10.64 | 45,352 | 2.03 | 2.03 | .10 | 150 | ||||||||
| 29.45 | 9.63 | 48,096 | 2.01 | 2.01 | .04 | 142 | ||||||||
| 26.91 | 12.98 | 61,826 | 2.01 | 2.01 | .14 | 102 | ||||||||
| 46.08 | 16.03 | 9,598 | 1.09 | 1.09 | .97 | 105 | ||||||||
| 40.08 | 24.23 | 17,140 | 1.10 | 1.09 | 1.21 | 105 | ||||||||
| 32.66 | 11.47 | 18,709 | 1.28 | 1.23 | .93 | 150 | ||||||||
| 29.54 | 10.55 | 51,877 | 1.27 | 1.19 | .89 | 142 | ||||||||
| 26.96 | 13.99 | 67,618 | 1.26 | 1.15 | 1.01 | 102 | ||||||||
| 46.03 | 16.41 | 260,235 | .76 | .76 | 1.28 | 105 | ||||||||
| 40.06 | 24.63 | 276,370 | .77 | .77 | 1.52 | 105 | ||||||||
| 32.65 | 11.83 | 280,933 | .95 | .95 | 1.19 | 150 | ||||||||
| 29.57 | 10.83 | 374,489 | .93 | .93 | 1.13 | 142 | ||||||||
| 26.98 | 14.22 | 476,481 | .93 | .91 | 1.26 | 102 | ||||||||
| 46.09 | 16.32 | 266,202 | .84 | .84 | 1.20 | 105 | ||||||||
| 40.11 | 24.53 | 275,158 | .85 | .85 | 1.45 | 105 | ||||||||
| 32.69 | 11.70 | 289,196 | 1.03 | 1.03 | 1.10 | 150 | ||||||||
| 29.59 | 10.74 | 1,209,861 | 1.01 | 1.01 | 1.02 | 142 | ||||||||
| 27.00 | 14.14 | 1,029,950 | 1.01 | 1.01 | 1.15 | 102 | ||||||||
| 46.03 | 16.54 | 596,837 | .64 | .64 | 1.39 | 105 | ||||||||
| 40.06 | 24.78 | 586,634 | .65 | .65 | 1.64 | 105 | ||||||||
| 32.65 | 11.93 | 568,935 | .85 | .85 | 1.31 | 150 | ||||||||
| 29.58 | 10.94 | 1,149,049 | .83 | .83 | 1.21 | 142 | ||||||||
| 26.99 | 14.30 | 1,242,933 | .83 | .83 | 1.35 | 102 | ||||||||
See accompanying notes which are an integral part of the financial statements.
Russell U.S. Defensive Equity Fund 53
Russell Investment Company Russell U.S. Dynamic Equity Fund
Portfolio Management Discussion and Analysis — October 31, 2014 (Unaudited)
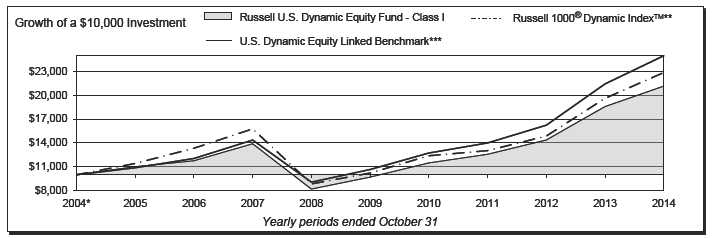
| Russell U.S. Dynamic Equity Fund - Class A‡ | Russell U.S. Dynamic Equity Fund - Class S | ||||||
| Total | Total | ||||||
| Return | Return | ||||||
| 1 Year | 6.86 | % | 1 Year | 13.68 | % | ||
| 5 Years | 15.05 | %§ | 5 Years | 16.71 | %§ | ||
| 10 Years | 6.73 | %§ | 10 Years | 7.62 | %§ | ||
| Russell U.S. Dynamic Equity Fund - Class C | Russell U.S. Dynamic Equity Fund - Class Y‡‡ | ||||||
| Total | Total | ||||||
| Return | Return | ||||||
| 1 Year | 12.54 | % | 1 Year | 13.99 | % | ||
| 5 Years | 15.55 | %§ | 5 Years | 16.94 | %§ | ||
| 10 Years | 6.52 | %§ | 10 Years | 7.81 | %§ | ||
| Russell U.S. Dynamic Equity Fund - Class E | Russell 1000® Dynamic IndexTM** | ||||||
| Total | Total | ||||||
| Return | Return | ||||||
| 1 Year | 13.46 | % | 1 Year | 16.59 | % | ||
| 5 Years | 16.41 | %§ | 5 Years | 17.52 | %§ | ||
| 10 Years | 7.36 | %§ | 10 Years | 8.63 | %§ | ||
| Russell U.S. Dynamic Equity Fund - Class I | U.S. Dynamic Equity Linked Benchmark*** | ||||||
| Total | Total | ||||||
| Return | Return | ||||||
| 1 Year | 13.86 | % | 1 Year | 16.59 | % | ||
| 5 Years | 16.89 | %§ | 5 Years | 18.60 | %§ | ||
| 10 Years | 7.79 | %§ | 10 Years | 9.59 | %§ | ||
54 Russell U.S. Dynamic Equity Fund
Russell Investment Company Russell U.S. Dynamic Equity Fund
Portfolio Management Discussion and Analysis, continued — October 31, 2014 (Unaudited)
The Russell U.S. Dynamic Equity Fund (the “Fund”) employs With the continuation of the economic recovery, the Fund was a multi-manager approach whereby portions of the Fund underweight in most of the sectors that are traditionally considered are allocated to different money managers. Fund assets not to be “non-cyclical” and/or interest rate sensitive. However, allocated to money managers are managed by Russell Investment certain industries that tend to be viewed as “bond substitutes,” Management Company (“RIMCo”), the Fund’s advisor. RIMCo due to their income producing qualities, such as electric utilities may change the allocation of the Fund’s assets among money and real estate investment trusts (REITs), outperformed given managers at any time. An exemptive order from the Securities the decline in interest rates and this detracted from the Fund’s and Exchange Commission (“SEC”) permits RIMCo to engage benchmark-relative performance. or terminate a money manager at any time, subject to approval by the Fund’s Board, without a shareholder vote. Pursuant to the How did the investment strategies and techniques employed terms of the exemptive order, the Fund is required to notify its by the Fund and its money managers affect its benchmark-shareholders within 90 days of when a money manager begins relative performance? providing services. As of October 31, 2014, the Fund had five Stock selection effects within the energy sector (overweights money managers. to Peabody Energy Corporation and Arch Coal) and within the financial services sector (an underweight to Wells Fargo & What is the Fund’s investment objective? Company) detracted from the Fund’s benchmark-relative returns The Fund seeks to provide long term capital growth. for the fiscal year. The Fund’s overweights to the health care and technology sectors were beneficial. Factor exposures were mixed,
How did the Fund perform relative to its benchmark for the as an overweight to stocks with the lowest valuations (lowest fiscal year ended October 31, 2014? price-to-book and price-to-cash flow ratios) detracted while an For the fiscal year ended October 31, 2014, the Fund’s Class A, overweight to stocks with low financial leverage (low debt-to-Class C, Class E, Class I, Class S and Class Y Shares gained capital ratios) was rewarded.
13.40%, 12.54%, 13.46%, 13.86%, 13.68% and 13.99%, respectively. This is compared to the Fund’s benchmark, the AJO, LP (“AJO”) outperformed the Russell 1000® Dynamic™ Russell 1000® Dynamic Index, which gained 16.59% during Index for the fiscal year. Factor exposures were rewarded, the same period. The Fund’s performance includes operating specifically an overweight to stocks with rising earnings estimates expenses, whereas index returns are unmanaged and do not and an underweight to stocks with high financial leverage (high include expenses of any kind. debt-to-capital ratios). An underweight to the energy sector and an overweight to the health care sector were additive to relative For the fiscal year ended October 31, 2014, the Morningstar® returns. Stock selection within the producer durables sector Large Blend, a group of funds that Morningstar considers to have (overweights to Southwest Airlines Co. and Huntington Ingalls investment strategies similar to those of the Fund, gained 14.34%.
Industries, Inc.) was beneficial. This result serves as a peer comparison and is expressed net of operating expenses. Cornerstone Capital Management, LLC (“Cornerstone”) underperformed the Russell 1000® Growth Index linked to the RIMCo may assign a money manager a specific style or Russell 1000® Dynamic Index for the fiscal year. Factor exposures capitalization benchmark other that the Fund’s index. However, were not rewarded, specifically an overweight to high beta stocks the Fund’s primary index remains the benchmark for the Fund (stocks with high sensitivity to market movements). An overweight and is representative of the aggregate of each money manager’s to the consumer discretionary sector and an underweight to benchmark index. the health care sector detracted, although an overweight to the How did the market conditions described in the Market technology sector was beneficial. Stock selection within the Summary report affect the Fund’s performance? energy sector (an overweight to Cobalt International Energy, Inc.) During the fiscal year, the U.S. large capitalization equity market and the technology sector (overweights to Rackspace Hosting, produced positive returns. Relevant Fund exposures included Inc. and underweight Apple, Inc.) significantly detracted from tilts toward stocks with the lowest valuation ratios (lowest price- benchmark-relative performance. The linked benchmark to-book and price-to-cash flow ratios), and technology and represents the returns of the Russell 1000® Dynamic Index from health care stocks and away from growth stocks. Growth stocks November 1, 2013 through June 8, 2014 and the returns of the outperformed value stocks for the fiscal year and this detracted Russell 1000® Growth Index thereafter. from the Fund’s benchmark-relative performance. However, Jacobs Levy Equity Management, Inc. (“Jacobs Levy”) was added the Fund’s tilt toward health care and technology stocks was to the Fund in June 2014 and underperformed the Russell 1000® beneficial to the Fund’s benchmark-relative performance. Dynamic™ Index for the portion of the fiscal year in which it
Russell U.S. Dynamic Equity Fund 55
Russell Investment Company Russell U.S. Dynamic Equity Fund
Portfolio Management Discussion and Analysis, continued — October 31, 2014 (Unaudited)
| was a manager for the Fund. A tilt toward stocks with lower | market) and since its implementation, has performed in-line with | |
| than benchmark capitalization detracted, while a tilt away from | expectations. | |
| stocks with high financial leverage (high debt-to-capital ratios) | During the period, RIMCo used index futures contracts to equitize | |
| was beneficial. From a sector perspective, an overweight to health | the Fund and money managers’ cash. The decision to equitize | |
| care was rewarded, although overweights to energy and producer | Fund and manager cash was beneficial to Fund performance for | |
| durables held back benchmark-relative performance. | the fiscal year. | |
| Schneider Capital Management Corporation (“Schneider”) | ||
| underperformed the Russell 1000® Value Index for the fiscal | Describe any changes to the Fund’s structure or the money | |
| year. Many of Schneider’s factor exposures were not rewarded, | manager line-up. | |
| specifically overweights to mid cap stocks, stocks with low | In June 2014, RIMCo hired Jacobs Levy. RIMCo has high | |
| valuations (low price-to-book and price-to-cash flow ratios), | conviction in Jacobs Levy’s ability to run a dynamic strategy. | |
| and high beta stocks. An underweight to the technology sector | Also in June 2014, RIMCo changed Cornerstone’s mandate from | |
| and an overweight to the energy sector detracted, although an | being benchmarked to the Russell 1000® Dynamic™ Index to | |
| overweight to the financial services sector was beneficial. Stock | being benchmarked to the Russell 1000® Growth Index. RIMCo | |
| selection within the energy sector (overweights to Peabody Energy | made this change due to RIMCo’s heightened confidence in | |
| Corporation and Arch Coal, Inc.) detracted from benchmark- | Cornerstone’s growth strategy. | |
| relative performance. | In June 2014, RIMCo also introduced the positioning strategy | |
| Suffolk Capital Management, LLC (“Suffolk”) outperformed the | described above. | |
| Russell 1000® Dynamic™ Index for the fiscal year. Factor tilts | ||
| There were no other changes to the Fund’s structure or money | ||
| away from mid cap stocks and stocks with above-benchmark | manager line up during the fiscal year. | |
| financial leverage (higher debt-to-capital ratios) were additive to | ||
| relative returns. Overweights to the technology and health care | Money Managers as of October 31, | |
| sectors were beneficial. Stock selection within the technology | 2014 | Styles |
| sector (overweights to Avago Technologies Limited and Intel | AJO, LP | Dynamic |
| Corporation) was a significant driver of positive benchmark- | Cornerstone Capital Management Inc. | Growth |
| relative performance. | Jacobs Levy Equity Management, Inc. | Dynamic |
| Schneider Capital Management Corporation | Value | |
| RIMCo manages the portion of the Fund’s assets that RIMCo | Suffolk Capital Management, LLC | Dynamic |
| determines not to allocate to the money managers. Assets not | The views expressed in this report reflect those of the portfolio | |
| allocated to managers include the Fund’s liquidity reserves and | managers only through the end of the period covered by | |
| assets which may be managed directly by RIMCo to modify the | the report. These views do not necessarily represent the | |
| Fund’s overall portfolio characteristics to seek to achieve the | views of RIMCo, or any other person in RIMCo or any other | |
| desired risk/return profile for the Fund. | affiliated organization. These views are subject to change | |
| In June 2014, RIMCo implemented a RIMCo managed positioning | at any time based upon market conditions or other events, | |
| strategy that pursues a full replication of the Russell Top 200® | and RIMCo disclaims any responsibility to update the views | |
| Index, which consists of the largest Russell 1000® Index stocks. | contained herein. These views should not be relied on as | |
| This strategy is designed to provide the Fund with ultra large cap | investment advice and, because investment decisions for | |
| exposure with moderate beta characteristics (beta is a measure | a Russell Investment Company (“RIC”) Fund are based on | |
| of a portfolio’s volatility and its sensitivity to the direction of the | numerous factors, should not be relied on as an indication | |
| of investment decisions of any RIC Fund. | ||
56 Russell U.S. Dynamic Equity Fund
Russell Investment Company
Russell U.S. Dynamic Equity Fund
Portfolio Management Discussion and Analysis, continued — October 31, 2014 (Unaudited)
| * | Assumes initial investment on November 1, 2004. |
| ** | The Russell 1000® Dynamic IndexTM measures the performance of the large-cap dynamic segment of the U.S. equity universe. It includes the Russell 1000 Index companies with relatively less stable business conditions which are more sensitive to economic cycle, credit cycle and market volatility based on their stability variables. Stability is measured in terms of volatility (price and earnings), leverage, and return on assets. |
| *** | The U.S. Dynamic Equity Linked Benchmark provides a means to compare the Fund’s average annual returns to a secondary benchmark that takes into account historical changes in the Fund’s primary benchmark. The U.S. Dynamic Equity Linked Benchmark represents the returns of the Russell 1000® Growth Index through August 14, 2012 and the returns of the Russell 1000® Dynamic IndexTM thereafter. |
| ‡ | The Fund first issued Class A Shares on August 15, 2012. The returns shown for Class A Shares prior to that date are the returns of Class E Shares. The performance shown has been adjusted to reflect the deduction of the maximum Class A sales charge of 5.75%. Annual returns for each Class will differ only to the extent that the Class A Shares do not have the same expenses as Class E Shares. |
| ‡‡ | The Fund first issued Class Y Shares on August 15, 2012. The returns shown for Class Y Shares prior to that date are the returns of the Fund’s Class I Shares. Class Y Shares will have substantially similar annual returns as the Class I Shares because the Shares of each Class are invested in the same portfolio of securities. Annual returns for each Class will differ only to the extent that the Class Y Shares do not have the same expenses as the Class I Shares. |
| § | Annualized. |
Performance is historical and assumes reinvestment of all dividends and capital gains. Investment return and principal value will fluctuate so that an investor’s shares, when redeemed, may be worth more or less than when purchased. Past performance is not indicative of future results. The returns shown do not reflect the deduction of taxes that a shareholder would pay on Fund distributions or the redemption of Fund shares.
Russell U.S. Dynamic Equity Fund 57
Russell Investment Company Russell U.S. Dynamic Equity Fund
Shareholder Expense Example — October 31, 2014 (Unaudited)
| Fund Expenses | Please note that the expenses shown in the table are meant | |||||
| The following disclosure provides important information | to highlight your ongoing costs only and do not reflect any | |||||
| regarding the Fund’s Shareholder Expense Example | transactional costs. Therefore, the information under the heading | |||||
| (“Example”). | “Hypothetical Performance (5% return before expenses)” is | |||||
| useful in comparing ongoing costs only, and will not help you | ||||||
| Example | determine the relative total costs of owning different funds. In | |||||
| As a shareholder of the Fund, you incur two types of costs: (1) | addition, if these transactional costs were included, your costs | |||||
| transaction costs, and (2) ongoing costs, including advisory and | would have been higher. | |||||
| administrative fees; distribution (12b-1) and/or service fees; | Hypothetical | |||||
| and other Fund expenses. The Example is intended to help | Performance (5% | |||||
| you understand your ongoing costs (in dollars) of investing in | Actual | return before | ||||
| the Fund and to compare these costs with the ongoing costs of | Class A | Performance | expenses) | |||
| Beginning Account Value | ||||||
| investing in other mutual funds. The Example is based on an | May 1, 2014 | $ | 1,000.00 | $ | 1,000.00 | |
| investment of $1,000 invested at the beginning of the period and | Ending Account Value | |||||
| held for the entire period indicated, which for this Fund is from | October 31, 2014 | $ | 1,069.80 | $ | 1,017.39 | |
| May 1, 2014 to October 31, 2014. | Expenses Paid During Period* | $ | 8.09 | $ | 7.88 | |
| Actual Expenses | * Expenses are equal to the Fund's annualized expense ratio of 1.55% | |||||
| (representing the six month period annualized), multiplied by the average | ||||||
| The information in the table under the heading “Actual | account value over the period, multiplied by 184/365 (to reflect the one-half | |||||
| Performance” provides information about actual account values | year period). May reflect amounts waived and/or reimbursed. Without any | |||||
| and actual expenses. You may use the information in this column, | waivers and/or reimbursements, expenses would have been higher. | |||||
| together with the amount you invested, to estimate the expenses | ||||||
| Hypothetical | ||||||
| that you paid over the period. Simply divide your account value by | Performance (5% | |||||
| $1,000 (for example, an $8,600 account value divided by $1,000 | Actual | return before | ||||
| = 8.6), then multiply the result by the number in the first column | Class C | Performance | expenses) | |||
| Beginning Account Value | ||||||
| in the row entitled “Expenses Paid During Period” to estimate | May 1, 2014 | $ | 1,000.00 | $ | 1,000.00 | |
| the expenses you paid on your account during this period. | Ending Account Value | |||||
| October 31, 2014 | $ | 1,065.70 | $ | 1,013.51 | ||
| Hypothetical Example for Comparison Purposes | Expenses Paid During Period* | $ | 12.08 | $ | 11.77 | |
| The information in the table under the heading “Hypothetical | ||||||
| Performance (5% return before expenses)” provides information | * Expenses are equal to the Fund's annualized expense ratio of 2.32% | |||||
| (representing the six month period annualized), multiplied by the average | ||||||
| about hypothetical account values and hypothetical expenses | account value over the period, multiplied by 184/365 (to reflect the one-half | |||||
| based on the Fund’s actual expense ratio and an assumed rate of | year period). May reflect amounts waived and/or reimbursed. Without any | |||||
| return of 5% per year before expenses, which is not the Fund’s | waivers and/or reimbursements, expenses would have been higher. | |||||
| actual return. The hypothetical account values and expenses | ||||||
| Hypothetical | ||||||
| may not be used to estimate the actual ending account balance or | Performance (5% | |||||
| expenses you paid for the period. You may use this information | Actual | return before | ||||
| to compare the ongoing costs of investing in the Fund and other | Class E | Performance | expenses) | |||
| funds. To do so, compare this 5% hypothetical example with the | Beginning Account Value | |||||
| May 1, 2014 | $ | 1,000.00 | $ | 1,000.00 | ||
| 5% hypothetical examples that appear in the shareholder reports | Ending Account Value | |||||
| of other funds. | October 31, 2014 | $ | 1,069.60 | $ | 1,017.29 | |
| Expenses Paid During Period* | $ | 8.19 | $ | 7.98 | ||
| * Expenses are equal to the Fund's annualized expense ratio of 1.57% | ||||||
| (representing the six month period annualized), multiplied by the average | ||||||
| account value over the period, multiplied by 184/365 (to reflect the one-half | ||||||
| year period). May reflect amounts waived and/or reimbursed. Without any | ||||||
| waivers and/or reimbursements, expenses would have been higher. | ||||||
58 Russell U.S. Dynamic Equity Fund
Russell Investment Company Russell U.S. Dynamic Equity Fund
Shareholder Expense Example, continued — October 31, 2014 (Unaudited)
| Hypothetical | ||||||
| Performance (5% | ||||||
| Actual | return before | |||||
| Class I | Performance | expenses) | ||||
| Beginning Account Value | ||||||
| May 1, 2014 | $ | 1,000.00 | $ | 1,000.00 | ||
| Ending Account Value | ||||||
| October 31, 2014 | $ | 1,071.90 | $ | 1,018.95 | ||
| Expenses Paid During Period* | $ | 6.48 | $ | 6.31 | ||
| * Expenses are equal to the Fund's annualized expense ratio of 1.24% | ||||||
| (representing the six month period annualized), multiplied by the average | ||||||
| account value over the period, multiplied by 184/365 (to reflect the one-half | ||||||
| year period). May reflect amounts waived and/or reimbursed. Without any | ||||||
| waivers and/or reimbursements, expenses would have been higher. | ||||||
| Hypothetical | ||||||
| Performance (5% | ||||||
| Actual | return before | |||||
| Class S | Performance | expenses) | ||||
| Beginning Account Value | ||||||
| May 1, 2014 | $ | 1,000.00 | $ | 1,000.00 | ||
| Ending Account Value | ||||||
| October 31, 2014 | $ | 1,070.90 | $ | 1,018.50 | ||
| Expenses Paid During Period* | $ | 6.94 | $ | 6.77 | ||
| * Expenses are equal to the Fund's annualized expense ratio of 1.33% | ||||||
| (representing the six month period annualized), multiplied by the average | ||||||
| account value over the period, multiplied by 184/365 (to reflect the one-half | ||||||
| year period). May reflect amounts waived and/or reimbursed. Without any | ||||||
| waivers and/or reimbursements, expenses would have been higher. | ||||||
| Hypothetical | ||||||
| Performance (5% | ||||||
| Actual | return before | |||||
| Class Y | Performance | expenses) | ||||
| Beginning Account Value | ||||||
| May 1, 2014 | $ | 1,000.00 | $ | 1,000.00 | ||
| Ending Account Value | ||||||
| October 31, 2014 | $ | 1,072.50 | $ | 1,019.61 | ||
| Expenses Paid During Period* | $ | 5.80 | $ | 5.65 | ||
| * Expenses are equal to the Fund's annualized expense ratio of 1.11% | ||||||
| (representing the six month period annualized), multiplied by the average | ||||||
| account value over the period, multiplied by 184/365 (to reflect the one-half | ||||||
| year period). May reflect amounts waived and/or reimbursed. Without any | ||||||
| waivers and/or reimbursements, expenses would have been higher. | ||||||
Russell U.S. Dynamic Equity Fund 59
| Russell Investment Company | |||||||
| Russell U.S. Dynamic Equity Fund | |||||||
| Schedule of Investments — October 31, 2014 | |||||||
| Amounts in thousands (except share amounts) | Amounts in thousands (except share amounts) | ||||||
| Principal | Fair | Principal | Fair | ||||
| Amount ($) or | Value | Amount ($) or | Value | ||||
| Shares | $ | Shares | $ | ||||
| Common Stocks - 100.4% | Royal Caribbean Cruises, Ltd. | 44,360 | 3,015 | ||||
| Consumer Discretionary - 18.0% | Shutterfly, Inc.(Æ) | 9,576 | 401 | ||||
| Abercrombie & Fitch Co. Class A | 66,500 | 2,226 | Starbucks Corp. | 40,108 | 3,031 | ||
| Advance Auto Parts, Inc. | 5,140 | 755 | Target Corp. | 1,001 | 62 | ||
| Alibaba Group Holding, Ltd. - ADR(Æ) | 12,118 | 1,195 | Taylor Morrison Home Corp. Class A(Æ) | 25,060 | 432 | ||
| Amazon.com, Inc.(Æ) | 16,842 | 5,145 | Tesla Motors, Inc.(Æ)(Ñ) | 2,750 | 665 | ||
| Apollo Education Group, Inc. Class A(Æ) | 35,500 | 1,017 | Time Warner Cable, Inc. | 5,526 | 813 | ||
| Avis Budget Group, Inc.(Æ) | 45,900 | 2,559 | Time Warner, Inc. | 63,571 | 5,052 | ||
| Belmond, Ltd. Class A(Æ) | 11,360 | 130 | TJX Cos., Inc. | 1,102 | 70 | ||
| Big Lots, Inc. | 19,400 | 886 | Toll Brothers, Inc.(Æ) | 115,230 | 3,682 | ||
| Brinker International, Inc. | 76,419 | 4,099 | Viacom, Inc. Class B | 679 | 49 | ||
| Cablevision Systems Corp. Class A | 128,500 | 2,393 | Wal-Mart Stores, Inc. | 2,541 | 194 | ||
| Carnival Corp. | 119,166 | 4,785 | Walt Disney Co. (The) | 22,766 | 2,080 | ||
| Carter's, Inc. | 5,400 | 422 | Whirlpool Corp.(Û) | 44,915 | 7,728 | ||
| CBS Corp. Class B | 110,601 | 5,997 | Wyndham Worldwide Corp. | 13,240 | 1,028 | ||
| Chipotle Mexican Grill, Inc. Class A(Æ) | 1,900 | 1,212 | Yum! Brands, Inc. | 697 | 50 | ||
| Comcast Corp. Class A(Æ) | 125,539 | 6,949 | 130,528 | ||||
| Costco Wholesale Corp. | 693 | 92 | |||||
| Deckers Outdoor Corp.(Æ) | 5,100 | 446 | Consumer Staples - 1.6% | ||||
| Diageo PLC - ADR | 7,229 | 853 | Altria Group, Inc. | 3,132 | 151 | ||
| Dillard's, Inc. Class A | 4,600 | 486 | Archer-Daniels-Midland Co. | 1,034 | 49 | ||
| DIRECTV(Æ)(Û) | 9,536 | 828 | Coca-Cola Co. (The) | 6,317 | 265 | ||
| DISH Network Corp. Class A(Æ) | 17,110 | 1,089 | Colgate-Palmolive Co. | 1,443 | 96 | ||
| Domino's Pizza, Inc. | 4,700 | 417 | CVS Health Corp. | 1,844 | 158 | ||
| eBay, Inc.(Æ) | 20,559 | 1,079 | General Mills, Inc. | 971 | 50 | ||
| Estee Lauder Cos., Inc. (The) Class A | 10,181 | 765 | Kellogg Co. | 405 | 26 | ||
| Expedia, Inc. | 30,000 | 2,549 | Kimberly-Clark Corp. | 593 | 68 | ||
| Foot Locker, Inc.(Û) | 47,700 | 2,672 | Kraft Foods Group, Inc.(Æ) | 940 | 53 | ||
| Ford Motor Co. | 113,499 | 1,599 | Kroger Co. (The)(Û) | 79,850 | 4,448 | ||
| GameStop Corp. Class A | 17,400 | 744 | Lorillard, Inc.(Û) | 28,900 | 1,777 | ||
| General Motors Co. | 34,186 | 1,073 | Mondelez International, Inc. Class A | 2,665 | 94 | ||
| Goodyear Tire & Rubber Co. (The) | 12,800 | 310 | Monster Beverage Corp.(Æ) | 800 | 81 | ||
| Harman International Industries, Inc. | 10,110 | 1,085 | PepsiCo, Inc. | 2,394 | 230 | ||
| Hilton Worldwide Holdings, Inc.(Æ) | 41,100 | 1,037 | Philip Morris International, Inc. | 2,507 | 223 | ||
| Home Depot, Inc. | 9,390 | 916 | Pilgrim's Pride Corp.(Æ) | 19,400 | 551 | ||
| Jarden Corp.(Æ) | 77,859 | 5,068 | Procter & Gamble Co. (The) | 4,301 | 375 | ||
| Johnson Controls, Inc. | 1,049 | 50 | Reynolds American, Inc. | 487 | 31 | ||
| Kate Spade & Co.(Æ) | 29,984 | 813 | SABMiller PLC - ADR | 28,917 | 1,638 | ||
| L Brands, Inc. | 14,400 | 1,039 | Sysco Corp. | 924 | 36 | ||
| Las Vegas Sands Corp. | 20,597 | 1,282 | Tyson Foods, Inc. Class A | 27,500 | 1,110 | ||
| Lear Corp.(Û) | 27,260 | 2,522 | Walgreen Co. | 1,503 | 97 | ||
| Leggett & Platt, Inc. | 19,000 | 748 | 11,607 | ||||
| Lennar Corp. Class A | 66,290 | 2,856 | |||||
| Lowe's Cos., Inc. | 1,605 | 92 | Energy - 8.5% | ||||
| Macy's, Inc.(Û) | 61,240 | 3,541 | Anadarko Petroleum Corp. | 20,822 | 1,911 | ||
| Marriott International, Inc. Class A | 77,415 | 5,864 | Apache Corp. | 610 | 47 | ||
| McDonald's Corp. | 1,559 | 146 | Arch Coal, Inc.(Ñ) | 754,530 | 1,630 | ||
| MercadoLibre, Inc. | 10,310 | 1,404 | Baker Hughes, Inc.(Û) | 63,638 | 3,370 | ||
| Meritage Homes Corp.(Æ) | 8,885 | 327 | Cameron International Corp.(Æ) | 40,800 | 2,430 | ||
| Nike, Inc. Class B | 19,704 | 1,832 | Carrizo Oil & Gas, Inc.(Æ) | 2,600 | 135 | ||
| Nordstrom, Inc. | 13,700 | 995 | Chesapeake Energy Corp. | 208,140 | 4,616 | ||
| NVR, Inc.(Æ) | 1,986 | 2,438 | Chevron Corp. | 3,027 | 363 | ||
| Office Depot, Inc.(Æ) | 243,199 | 1,269 | Cobalt International Energy, Inc.(Æ) | 59,920 | 702 | ||
| Omnicom Group, Inc. | 6,180 | 444 | ConocoPhillips | 1,936 | 140 | ||
| Polaris Industries, Inc.(Û) | 16,950 | 2,557 | CONSOL Energy, Inc. | 21,741 | 800 | ||
| Priceline Group, Inc. (The)(Æ) | 1,542 | 1,860 | CVR Energy, Inc. | 41,900 | 2,035 | ||
| PulteGroup, Inc. | 125,808 | 2,414 | Devon Energy Corp. | 131,507 | 7,890 | ||
| Ralph Lauren Corp. Class A | 26,148 | 4,310 | EOG Resources, Inc. | 36,656 | 3,484 | ||
| Ross Stores, Inc. | 6,131 | 495 | Exxon Mobil Corp. | 6,807 | 658 | ||
| See accompanying notes which are an integral part of the financial statements. | |||||||
| 60 Russell U.S. Dynamic Equity Fund | |||||||
| Russell Investment Company | |||||||
| Russell U.S. Dynamic Equity Fund | |||||||
| Schedule of Investments, continued — October 31, 2014 | |||||||
| Amounts in thousands (except share amounts) | Amounts in thousands (except share amounts) | ||||||
| Principal | Fair | Principal | Fair | ||||
| Amount ($) or | Value | Amount ($) or | Value | ||||
| Shares | $ | Shares | $ | ||||
| Halliburton Co.(Û) | 69,170 | 3,814 | Equity Residential(ö) | 570 | 40 | ||
| Hess Corp. | 3,539 | 300 | First American Financial Corp. | 43,306 | 1,313 | ||
| Kinder Morgan, Inc. | 1,038 | 40 | First Niagara Financial Group, Inc. | 226,780 | 1,699 | ||
| Marathon Oil Corp. | 1,068 | 38 | First Republic Bank | 31,615 | 1,610 | ||
| Marathon Petroleum Corp. | 7,697 | 700 | Franklin Resources, Inc. | 627 | 35 | ||
| Nabors Industries, Ltd. | 130,370 | 2,327 | Genworth Financial, Inc. Class A(Æ)(Û) | 139,300 | 1,949 | ||
| National Oilwell Varco, Inc. | 678 | 49 | Global Payments, Inc. | 12,850 | 1,034 | ||
| Occidental Petroleum Corp. | 1,241 | 110 | Goldman Sachs Group, Inc. (The) | 706 | 134 | ||
| Patterson-UTI Energy, Inc. | 105,020 | 2,419 | Hartford Financial Services Group, Inc. | 219,050 | 8,670 | ||
| PBF Energy, Inc. Class A | 28,600 | 746 | Hospitality Properties Trust(ö) | 88,100 | 2,609 | ||
| Peabody Energy Corp.(Ñ) | 317,955 | 3,316 | Jones Lang LaSalle, Inc. | 18,300 | 2,474 | ||
| Phillips 66(Æ) | 891 | 70 | JPMorgan Chase & Co. | 292,517 | 17,691 | ||
| Pioneer Natural Resources Co. | 6,366 | 1,204 | KeyCorp | 84,586 | 1,117 | ||
| Schlumberger, Ltd. | 2,074 | 205 | Lincoln National Corp. | 100,400 | 5,498 | ||
| Seventy Seven Energy, Inc.(Æ) | 2,135 | 28 | Marsh & McLennan Cos., Inc. | 868 | 47 | ||
| SM Energy Co.(Û) | 29,290 | 1,649 | MasterCard, Inc. Class A | 1,585 | 133 | ||
| Spectra Energy Corp. | 1,060 | 41 | McGraw Hill Financial, Inc.(Û) | 32,300 | 2,923 | ||
| Superior Energy Services, Inc. | 40,500 | 1,019 | MetLife, Inc. | 1,474 | 80 | ||
| Tesoro Corp. | 38,700 | 2,764 | Moody's Corp. | 17,000 | 1,687 | ||
| Valero Energy Corp. | 59,313 | 2,971 | Morgan Stanley | 2,416 | 84 | ||
| Weatherford International PLC(Æ) | 272,576 | 4,476 | NorthStar Realty Finance Corp.(ö) | 101,150 | 1,879 | ||
| Whiting Petroleum Corp.(Æ) | 45,034 | 2,758 | PNC Financial Services Group, Inc. (The) | 60,790 | 5,252 | ||
| Williams Cos., Inc. (The) | 1,176 | 65 | Principal Financial Group, Inc. | 20,960 | 1,098 | ||
| WPX Energy, Inc.(Æ) | 12,248 | 234 | Prologis, Inc.(ö) | 31,190 | 1,299 | ||
| 61,554 | Prudential Financial, Inc. | 71,619 | 6,341 | ||||
| Public Storage(ö) | 227 | 42 | |||||
| Financial Services - 23.6% | Raymond James Financial, Inc. | 14,240 | 799 | ||||
| ACE, Ltd. | 533 | 58 | Regions Financial Corp. | 287,094 | 2,851 | ||
| Affiliated Managers Group, Inc.(Æ) | 5,470 | 1,093 | Reinsurance Group of America, Inc. Class A | 28,200 | 2,376 | ||
| Aflac, Inc. | 19,017 | 1,136 | Simon Property Group, Inc.(ö) | 489 | 88 | ||
| Allstate Corp. (The)(Û) | 81,070 | 5,257 | State Street Corp. | 31,440 | 2,372 | ||
| American Express Co. | 23,731 | 2,135 | SunTrust Banks, Inc. | 176,910 | 6,924 | ||
| American International Group, Inc.(Û) | 171,985 | 9,213 | SVB Financial Group(Æ) | 5,510 | 617 | ||
| American Tower Corp. Class A(ö) | 14,925 | 1,455 | Thomson Reuters Corp. | 562 | 21 | ||
| Ameriprise Financial, Inc. | 10,829 | 1,366 | Travelers Cos., Inc. (The) | 548 | 55 | ||
| Aspen Insurance Holdings, Ltd. | 52,300 | 2,282 | Twenty-First Century Fox, Inc.(Æ) | 3,008 | 104 | ||
| Assurant, Inc.(Û) | 32,920 | 2,246 | Unum Group | 60,800 | 2,034 | ||
| Assured Guaranty, Ltd. | 95,950 | 2,215 | US Bancorp | 2,708 | 115 | ||
| Axis Capital Holdings, Ltd. | 18,480 | 890 | Validus Holdings, Ltd. | 60,600 | 2,411 | ||
| Bank of America Corp. | 520,448 | 8,931 | Visa, Inc. Class A | 17,989 | 4,343 | ||
| Bank of New York Mellon Corp. (The) | 35,525 | 1,376 | Voya Financial, Inc. | 26,430 | 1,037 | ||
| Barclays PLC - ADR(Ñ) | 90,322 | 1,391 | Wells Fargo & Co. | 7,576 | 402 | ||
| BB&T Corp. | 1,134 | 43 | XL Group PLC Class A | 24,110 | 817 | ||
| Berkshire Hathaway, Inc. Class B(Æ) | 2,904 | 407 | Zions Bancorporation | 15,700 | 455 | ||
| BlackRock, Inc. Class A | 4,280 | 1,460 | 170,524 | ||||
| Brixmor Property Group, Inc.(ö) | 1,470 | 36 | |||||
| Capital One Financial Corp.(Û) | 99,700 | 8,252 | Health Care - 14.5% | ||||
| CBOE Holdings, Inc. | 26,900 | 1,585 | Abbott Laboratories | 31,272 | 1,363 | ||
| CBRE Group, Inc. Class A(Æ)(Û) | 73,700 | 2,358 | AbbVie, Inc. | 2,508 | 159 | ||
| CDK Global, Inc.(Æ) | 312 | 10 | Actavis PLC(Æ) | 400 | 97 | ||
| Charles Schwab Corp. (The) | 20,216 | 580 | Aetna, Inc. | 16,865 | 1,392 | ||
| Chubb Corp. (The) | 386 | 38 | Alexion Pharmaceuticals, Inc.(Æ) | 13,810 | 2,643 | ||
| Citigroup, Inc. | 216,244 | 11,576 | Allergan, Inc. | 20,328 | 3,864 | ||
| City National Corp. | 10,060 | 792 | AmerisourceBergen Corp. Class A | 31,400 | 2,682 | ||
| CME Group, Inc. Class A | 18,020 | 1,510 | Amgen, Inc. | 1,207 | 196 | ||
| Columbia Property Trust, Inc.(ö) | 28,537 | 720 | Baxter International, Inc. | 857 | 60 | ||
| Comerica, Inc. | 23,000 | 1,098 | Becton Dickinson and Co. | 305 | 39 | ||
| Discover Financial Services(Û) | 58,046 | 3,702 | Biogen Idec, Inc.(Æ)(Û) | 9,674 | 3,106 | ||
| E*Trade Financial Corp.(Æ) | 33,800 | 754 | Boston Scientific Corp.(Æ) | 93,280 | 1,239 | ||
| See accompanying notes which are an integral part of the financial statements. | |||||||
| Russell U.S. Dynamic Equity Fund 61 | |||||||
| Russell Investment Company | |||||||
| Russell U.S. Dynamic Equity Fund | |||||||
| Schedule of Investments, continued — October 31, 2014 | |||||||
| Amounts in thousands (except share amounts) | Amounts in thousands (except share amounts) | ||||||
| Principal | Fair | Principal | Fair | ||||
| Amount ($) or | Value | Amount ($) or | Value | ||||
| Shares | $ | Shares | $ | ||||
| Bristol-Myers Squibb Co. | 13,143 | 765 | Sherwin-Williams Co. (The) | 1,190 | 273 | ||
| Brookdale Senior Living, Inc. Class A(Æ) | 12,043 | 406 | Southern Copper Corp. | 283 | 8 | ||
| Bruker Corp.(Æ) | 15,050 | 312 | United States Steel Corp. | 69,300 | 2,775 | ||
| Cardinal Health, Inc.(Û) | 50,110 | 3,933 | Westlake Chemical Corp. | 9,800 | 691 | ||
| Catamaran Corp.(Æ) | 73,675 | 3,512 | 32,171 | ||||
| Celgene Corp.(Æ)(Û) | 92,355 | 9,890 | |||||
| Cigna Corp.(Û) | 24,400 | 2,429 | Producer Durables - 9.3% | ||||
| Clovis Oncology, Inc.(Æ)(Ñ) | 84,009 | 5,012 | 3M Co. | 1,034 | 159 | ||
| Covidien PLC | 710 | 66 | Accenture PLC Class A | 997 | 81 | ||
| Eli Lilly & Co. | 1,550 | 103 | Aegean Marine Petroleum Network, Inc. | 68,237 | 577 | ||
| Envision Healthcare Holdings, Inc.(Æ) | 3,980 | 139 | Alaska Air Group, Inc. | 49,400 | 2,630 | ||
| Express Scripts Holding Co.(Æ)(Û) | 23,318 | 1,791 | Alliant Techsystems, Inc.(Û) | 13,500 | 1,579 | ||
| Gilead Sciences, Inc.(Æ) | 75,345 | 8,439 | American Airlines Group, Inc. | 20,438 | 845 | ||
| HCA Holdings, Inc.(Æ) | 18,030 | 1,263 | Automatic Data Processing, Inc. | 762 | 62 | ||
| Health Net, Inc.(Æ) | 24,650 | 1,171 | B/E Aerospace, Inc.(Æ) | 10,360 | 771 | ||
| Humana, Inc.(Û) | 13,730 | 1,906 | Boeing Co. (The) | 22,920 | 2,863 | ||
| Intercept Pharmaceuticals, Inc.(Æ) | 15,324 | 3,960 | Caterpillar, Inc. | 985 | 100 | ||
| Johnson & Johnson | 4,487 | 484 | CoStar Group, Inc.(Æ) | 8,679 | 1,398 | ||
| McKesson Corp.(Û) | 24,994 | 5,084 | CSX Corp. | 34,676 | 1,235 | ||
| Medtronic, Inc. | 1,574 | 107 | Cummins, Inc. | 291 | 42 | ||
| Merck & Co., Inc. | 24,950 | 1,446 | Danaher Corp. | 959 | 77 | ||
| Mylan, Inc.(Æ) | 98,407 | 5,270 | Deere & Co. | 14,435 | 1,235 | ||
| Myriad Genetics, Inc.(Æ)(Û) | 33,260 | 1,313 | Delphi Automotive PLC(Û) | 60,510 | 4,174 | ||
| Omnicare, Inc. | 12,100 | 806 | Delta Air Lines, Inc. | 78,739 | 3,168 | ||
| Pfizer, Inc. | 10,147 | 304 | Eaton Corp. PLC | 753 | 51 | ||
| Pharmacyclics, Inc.(Æ) | 15,003 | 1,960 | Emerson Electric Co. | 1,105 | 71 | ||
| Regeneron Pharmaceuticals, Inc.(Æ) | 125 | 49 | FedEx Corp. | 32,478 | 5,437 | ||
| St. Jude Medical, Inc. | 84,266 | 5,407 | Fluor Corp. | 3,950 | 262 | ||
| Stryker Corp. | 531 | 46 | General Dynamics Corp. | 483 | 67 | ||
| Thermo Fisher Scientific, Inc. | 48,796 | 5,737 | General Electric Co. | 30,127 | 778 | ||
| United Therapeutics Corp.(Æ)(Û) | 18,600 | 2,436 | HD Supply Holdings, Inc.(Æ) | 32,090 | 925 | ||
| UnitedHealth Group, Inc. | 54,239 | 5,153 | Honeywell International, Inc. | 1,235 | 119 | ||
| Valeant Pharmaceuticals International, Inc. | Huntington Ingalls Industries, Inc.(Û) | 35,390 | 3,745 | ||||
| (Æ) | 41,751 | 5,555 | Illinois Tool Works, Inc. | 540 | 49 | ||
| WellPoint, Inc. | 11,922 | 1,510 | Lexmark International, Inc. Class A(Û) | 68,480 | 2,956 | ||
| 104,604 | Lockheed Martin Corp. | 427 | 81 | ||||
| Manpowergroup, Inc. | 7,980 | 533 | |||||
| Materials and Processing - 4.4% | Navistar International Corp.(Æ)(Ñ) | 25,758 | 911 | ||||
| Air Products & Chemicals, Inc. | 335 | 45 | Norfolk Southern Corp. | 489 | 54 | ||
| Alcoa, Inc. | 206,700 | 3,464 | Northrop Grumman Corp. | 320 | 44 | ||
| Bombardier, Inc. Class B | 302,247 | 997 | Parker-Hannifin Corp. | 8,100 | 1,029 | ||
| Cabot Corp. | 11,470 | 533 | Raytheon Co. | 40,399 | 4,197 | ||
| Celanese Corp. Class A | 27,600 | 1,621 | Southwest Airlines Co.(Û) | 80,500 | 2,776 | ||
| CF Industries Holdings, Inc.(Û) | 9,400 | 2,444 | Spirit AeroSystems Holdings, Inc. Class A(Æ) | 46,800 | 1,841 | ||
| Domtar Corp.(Û) | 16,500 | 678 | Textron, Inc. | 86,398 | 3,588 | ||
| Dow Chemical Co. (The) | 37,197 | 1,837 | Trimble Navigation, Ltd.(Æ) | 48,307 | 1,297 | ||
| Ecolab, Inc. | 421 | 47 | Trinity Industries, Inc. | 35,700 | 1,275 | ||
| EI du Pont de Nemours & Co. | 1,447 | 100 | Union Pacific Corp. | 38,727 | 4,510 | ||
| Fastenal Co. | 50,585 | 2,228 | United Continental Holdings, Inc.(Æ) | 35,400 | 1,869 | ||
| Freeport-McMoRan, Inc. | 1,641 | 47 | United Parcel Service, Inc. Class B | 1,118 | 117 | ||
| Huntsman Corp.(Û) | 90,500 | 2,208 | United Rentals, Inc.(Æ) | 30,143 | 3,318 | ||
| Lennox International, Inc. | 1,000 | 89 | United Technologies Corp. | 44,355 | 4,746 | ||
| LyondellBasell Industries NV Class A(Û) | 39,764 | 3,644 | Waste Management, Inc. | 735 | 36 | ||
| Masco Corp. | 30,500 | 673 | 67,678 | ||||
| Monsanto Co. | 828 | 95 | |||||
| Mosaic Co. (The) | 24,100 | 1,068 | Technology - 19.0% | ||||
| PPG Industries, Inc. | 218 | 44 | Adobe Systems, Inc.(Æ) | 68,986 | 4,837 | ||
| Praxair, Inc. | 463 | 58 | Altera Corp. | 113,889 | 3,914 | ||
| Precision Castparts Corp. | 29,470 | 6,504 | Apple, Inc.(Û) | 232,756 | 25,138 | ||
| See accompanying notes which are an integral part of the financial statements. | |||||||
| 62 Russell U.S. Dynamic Equity Fund | |||||||
| Russell Investment Company | |||||||||
| Russell U.S. Dynamic Equity Fund | |||||||||
| Schedule of Investments, continued — October 31, 2014 | |||||||||
| Amounts in thousands (except share amounts) | Amounts in thousands (except share amounts) | ||||||||
| Principal | Fair | Principal | Fair | ||||||
| Amount ($) or | Value | Amount ($) or | Value | ||||||
| Shares | $ | Shares | $ | ||||||
| Arrow Electronics, Inc.(Æ) | 36,320 | 2,065 | Edison International | 14,370 | 899 | ||||
| Aruba Networks, Inc.(Æ) | 17,300 | 373 | Exelon Corp. | 1,357 | 50 | ||||
| Autodesk, Inc.(Æ) | 20,050 | 1,154 | FirstEnergy Corp. | 13,560 | 506 | ||||
| Avnet, Inc.(Û) | 67,320 | 2,912 | NextEra Energy, Inc. | 688 | 69 | ||||
| Broadcom Corp. Class A | 32,680 | 1,369 | PG&E Corp. | 734 | 37 | ||||
| Brocade Communications Systems, Inc. | 244,090 | 2,619 | Southern Co. | 1,408 | 65 | ||||
| Cisco Systems, Inc. | 159,786 | 3,910 | Sprint Corp.(Æ) | 1,414 | 9 | ||||
| Cognizant Technology Solutions Corp. Class | T-Mobile US, Inc.(Æ) | 419 | 12 | ||||||
| A(Æ) | 20,361 | 995 | Verizon Communications, Inc. | 6,585 | 331 | ||||
| Computer Sciences Corp. | 37,900 | 2,289 | 11,053 | ||||||
| Corning, Inc. | 20,866 | 426 | |||||||
| Dolby Laboratories, Inc. Class A | 9,600 | 402 | Total Common Stocks | ||||||
| Electronic Arts, Inc.(Æ) | 30,080 | 1,232 | (cost $631,112) | 726,915 | |||||
| EMC Corp. | 38,025 | 1,092 | |||||||
| Facebook, Inc. Class A(Æ) | 84,084 | 6,305 | Investments in Other Funds - 0.2% | ||||||
| Freescale Semiconductor, Ltd.(Æ)(Ñ) | 20,310 | 404 | Financial Services - 0.2% | ||||||
| Google, Inc. Class C(Æ) | 19,471 | 10,969 | iShares Russell 1000 Value ETF | 16,483 | 1,684 | ||||
| Hewlett-Packard Co. | 154,981 | 5,561 | Total Investments in Other Funds | ||||||
| Ingram Micro, Inc. Class A(Æ) | 83,900 | 2,252 | (cost $1,595) | 1,684 | |||||
| Intel Corp. | 79,137 | 2,691 | |||||||
| International Business Machines Corp. | 1,505 | 247 | Short-Term Investments - 3.4% | ||||||
| Jabil Circuit, Inc. | 122,300 | 2,562 | Russell U.S. Cash Management Fund | 24,902,697 | (8) | 24,903 | |||
| Juniper Networks, Inc. | 45,600 | 961 | Total Short-Term Investments | ||||||
| Lam Research Corp.(Û) | 29,200 | 2,274 | (cost $24,903) | 24,903 | |||||
| Lambda TD Software, Inc.(Æ)(Û) | 81,400 | 1,453 | |||||||
| Marvell Technology Group, Ltd. | 75,490 | 1,015 | Other Securities - 1.5% | ||||||
| Micron Technology, Inc.(Æ) | 167,104 | 5,529 | Russell U.S. Cash Collateral Fund(×) | 10,661,710 | (8) | 10,662 | |||
| Microsoft Corp. | 47,895 | 2,249 | Total Other Securities | ||||||
| Motorola Solutions, Inc. | 17,000 | 1,097 | (cost $10,662) | 10,662 | |||||
| NetApp, Inc. | 15,600 | 668 | |||||||
| ON Semiconductor Corp.(Æ) | 186,700 | 1,548 | Total Investments 105.5% | ||||||
| Oracle Corp. | 122,518 | 4,784 | (identified cost $668,272) | 764,164 | |||||
| Palo Alto Networks, Inc.(Æ) | 12,700 | 1,342 | Securities Sold Short - (4.1)% | ||||||
| Polycom, Inc.(Æ) | 37,020 | 484 | Consumer Discretionary - (0.4)% | ||||||
| DreamWorks Animation SKG, Inc. Class | |||||||||
| PTC, Inc.(Æ) | 46,700 | 1,782 | A(Æ) | (46,200 | ) | (1,029 | ) | ||
| QUALCOMM, Inc. | 2,691 | 211 | HomeAway, Inc.(Æ) | (24,800 | ) | (866 | ) | ||
| Rackspace Hosting, Inc.(Æ) | 77,283 | 2,965 | Nu Skin Enterprises, Inc. Class A | (16,400 | ) | (866 | ) | ||
| Salesforce.com, Inc.(Æ) | 65,936 | 4,219 | (2,761 | ) | |||||
| Sanmina Corp.(Æ) | 4,800 | 120 | Energy - (1.2)% | ||||||
| Skyworks Solutions, Inc. | 24,400 | 1,421 | Golar LNG, Ltd.(Æ) | (38,700 | ) | (2,172 | ) | ||
| Stratasys, Ltd.(Æ)(Ñ) | 13,923 | 1,676 | Gulfport Energy Corp.(Æ) | (38,600 | ) | (1,937 | ) | ||
| Symantec Corp. | 99,708 | 2,475 | Seadrill, Ltd. | (56,400 | ) | (1,297 | ) | ||
| Texas Instruments, Inc. | 1,705 | 85 | SolarCity Corp.(Æ) | (39,800 | ) | (2,355 | ) | ||
| VeriSign, Inc.(Æ) | 43,400 | 2,594 | SunPower Corp. Class A(Æ) | (33,000 | ) | (1,051 | ) | ||
| Vishay Intertechnology, Inc. | 114,200 | 1,543 | (8,812 | ) | |||||
| VMware, Inc. Class A(Æ) | 138 | 12 | Financial Services - (0.8)% | ||||||
| Western Digital Corp. | 32,840 | 3,230 | Ocwen Financial Corp.(Æ) | (88,000 | ) | (2,073 | ) | ||
| Yahoo!, Inc.(Æ) | 116,134 | 5,348 | Plum Creek Timber Co., Inc.(ö) | (52,800 | ) | (2,165 | ) | ||
| Zynga, Inc. Class A(Æ) | 154,160 | 393 | St. Joe Co. (The)(Æ) | (95,700 | ) | (1,833 | ) | ||
| 137,196 | (6,071 | ) | |||||||
| Health Care - (0.3)% | |||||||||
| Utilities - 1.5% | athenahealth, Inc.(Æ) | (2,700 | ) | (331 | ) | ||||
| AES Corp.(Û) | 165,100 | 2,323 | Brookdale Senior Living, Inc. Class A(Æ) | (46,400 | ) | (1,564 | ) | ||
| American Electric Power Co., Inc. | 771 | 45 | (1,895 | ) | |||||
| AT&T, Inc. | 44,257 | 1,542 | Materials and Processing - (0.3)% | ||||||
| Calpine Corp.(Æ) | 83,300 | 1,901 | Tahoe Resources, Inc.(Æ) | (77,200 | ) | (1,340 | ) | ||
| CenturyLink, Inc.(Û) | 74,905 | 3,107 | Vulcan Materials Co. | (14,700 | ) | (907 | ) | ||
| Dominion Resources, Inc. | 916 | 65 | (2,247 | ) | |||||
| Duke Energy Corp. | 1,114 | 92 | Producer Durables - (0.2)% | ||||||
| See accompanying notes which are an integral part of the financial statements. | |||||||||
| Russell U.S. Dynamic Equity Fund 63 | |||||||||
Russell Investment Company Russell U.S. Dynamic Equity Fund
Schedule of Investments, continued — October 31, 2014
| Amounts in thousands (except share amounts) | ||||||
| Principal | Fair | |||||
| Amount ($) or | Value | |||||
| Shares | $ | |||||
| Colfax Corp.(Æ) | (32,300 | ) | (1,757 | ) | ||
| Technology - (0.8)% | ||||||
| Advanced Micro Devices, Inc.(Æ) | (748,200 | ) | (2,095 | ) | ||
| NetSuite, Inc.(Æ) | (3,700 | ) | (402 | ) | ||
| Stratasys, Ltd.(Æ) | (8,900 | ) | (1,071 | ) | ||
| SunEdison, Inc.(Æ) | (20,300 | ) | (396 | ) | ||
| Zynga, Inc. Class A(Æ) | (667,190 | ) | (1,702 | ) | ||
| (5,666 | ) | |||||
| Utilities - (0.1)% | ||||||
| US Cellular Corp.(Æ) | (21,000 | ) | (765 | ) | ||
| Total Securities Sold Short | ||||||
| (proceeds $30,785) | (29,974 | ) | ||||
| Other Assets and Liabilities, Net | ||||||
| -(1.4%) | (10,313 | ) | ||||
| Net Assets - 100.0% | 723,877 | |||||
See accompanying notes which are an integral part of the financial statements.
64 Russell U.S. Dynamic Equity Fund
| Russell Investment Company | |||||||||||||||
| Russell U.S. Dynamic Equity Fund | |||||||||||||||
| Schedule of Investments, continued — October 31, 2014 | |||||||||||||||
| Futures Contracts | |||||||||||||||
| Amounts in thousands (except contract amounts) | |||||||||||||||
| Unrealized | |||||||||||||||
| Appreciation | |||||||||||||||
| Number of | Notional | Expiration | (Depreciation) | ||||||||||||
| Contracts | Amount | Date | $ | ||||||||||||
| Long Positions | |||||||||||||||
| Russell 1000 Mini Index Futures | 91 | USD | 10,180 | 12/14 | 189 | ||||||||||
| Russell 2000 Mini Index Futures | 22 | USD | 2,576 | 12/14 | 122 | ||||||||||
| S&P Mid 500 E-Mini Index Futures | 123 | USD | 12,370 | 12/14 | 273 | ||||||||||
| Total Unrealized Appreciation (Depreciation) on Open Futures Contracts (å) | 584 | ||||||||||||||
| Presentation of Portfolio Holdings | |||||||||||||||
| Amounts in thousands | |||||||||||||||
| Fair Value | |||||||||||||||
| Portfolio Summary | Level 1 | Level 2 | Level 3 | Total | % of Net Assets | ||||||||||
| Common Stocks | |||||||||||||||
| Consumer Discretionary | $ | 130,528 | $ | — | $ | — | $ | 130,528 | 18.0 | ||||||
| Consumer Staples | 11,607 | — | — | 11,607 | 1.6 | ||||||||||
| Energy | 61,554 | — | — | 61,554 | 8.5 | ||||||||||
| Financial Services | 170,524 | — | — | 170,524 | 23.6 | ||||||||||
| Health Care | 104,604 | — | — | 104,604 | 14.5 | ||||||||||
| Materials and Processing | 32,171 | — | — | 32,171 | 4.4 | ||||||||||
| Producer Durables | 67,678 | — | — | 67,678 | 9.3 | ||||||||||
| Technology | 137,196 | — | — | 137,196 | 19.0 | ||||||||||
| Utilities | 11,053 | — | — | 11,053 | 1.5 | ||||||||||
| Investments in Other Funds | 1,684 | — | — | 1,684 | 0.2 | ||||||||||
| Short-Term Investments | — | 24,903 | — | 24,903 | 3.4 | ||||||||||
| Other Securities | — | 10,662 | — | 10,662 | 1.5 | ||||||||||
| Total Investments | 728,599 | 35,565 | — | 764,164 | 105.5 | ||||||||||
| Securities Sold Short* | (29,974 | ) | — | — | (29,974 | ) | (4.1 | ) | |||||||
| Other Assets and Liabilities, Net | (1.4 | ) | |||||||||||||
| 100.0 | |||||||||||||||
| Other Financial Instruments | |||||||||||||||
| Futures Contracts | 584 | — | — | 584 | 0.1 | ||||||||||
| Total Other Financial Instruments** | $ | 584 | $ | — | $ | — | $ | 584 | |||||||
| * | Refer to Schedule of Investments for detailed sector breakout. |
| ** | Futures and foreign currency exchange contract values reflect the unrealized appreciation (depreciation) on the instruments. |
For a description of the Levels see note 2 in the Notes to Financial Statements.
For disclosure on transfers between Levels 1, 2 and 3 during the period ended October 31, 2014, see note 2 in the Notes to Financial Statements.
See accompanying notes which are an integral part of the financial statements.
Russell U.S. Dynamic Equity Fund 65
| Russell Investment Company | |||
| Russell U.S. Dynamic Equity Fund | |||
| Fair Value of Derivative Instruments — October 31, 2014 | |||
| Amounts in thousands | |||
| Equity | |||
| Derivatives not accounted for as hedging instruments | Contracts | ||
| Location: Statement of Assets and Liabilities - Assets | |||
| Variation margin on futures contracts* | $ | 584 | |
| Equity | |||
| Derivatives not accounted for as hedging instruments | Contracts | ||
| Location: Statement of Operations - Net realized gain (loss) | |||
| Futures contracts | $ | 6,459 | |
| Location: Statement of Operations - Net change in unrealized appreciation (depreciation) | |||
| Futures contracts | $ | (431 | ) |
| * Includes cumulative appreciation/depreciation of futures contracts as reported in the Schedule of Investments. Only variation margin is reported within the | |||
| Statement of Assets and Liabilities. | |||
| For further disclosure on derivatives see note 2 in the Notes to Financial Statements. | |||
See accompanying notes which are an integral part of the financial statements.
66 Russell U.S. Dynamic Equity Fund
Russell Investment Company Russell U.S. Dynamic Equity Fund
Balance Sheet Offsetting of Financial and Derivative Instruments — October 31, 2014
| Amounts in thousands | ||||||||
| Offsetting of Financial Assets and Derivative Assets | ||||||||
| Gross | Net Amounts | |||||||
| Amounts | of Assets | |||||||
| Gross | Offset in the | Presented in | ||||||
| Amounts of | Statement of | the Statement | ||||||
| Recognized | Assets and | of Assets and | ||||||
| Description | Location: Statement of Assets and Liabilities - Assets | Assets | Liabilities | Liabilities | ||||
| Securities on Loan* | Investments, at fair value | $ | 10,671 | $ — | $ | 10,671 | ||
| Futures Contracts | Variation margin on futures contracts | 303 | — | 303 | ||||
| Total | $ | 10,974 | $ — | $ | 10,974 | |||
| Financial Assets, Derivative Assets, and Collateral Held by Counterparty | ||||||||||
| Gross Amounts Not Offset in | ||||||||||
| the Statement of Assets and | ||||||||||
| Liabilities | ||||||||||
| Net Amounts | ||||||||||
| of Assets | ||||||||||
| Presented in | ||||||||||
| the Statement | Financial and | |||||||||
| of Assets and | Derivative | Collateral | ||||||||
| Counterparty | Liabilities | Instruments | Received^ | Net Amount | ||||||
| Barclays | $ | 5,450 | $ | — | $ 5,450 | $ | — | |||
| Citigroup | 745 | — | 745 | — | ||||||
| Deutsche Bank | 1,277 | — | 1,277 | — | ||||||
| Fidelity | 562 | — | 562 | — | ||||||
| JPMorgan Chase | 1,309 | — | 1,309 | — | ||||||
| Merrill Lynch | 303 | — | — | 303 | ||||||
| Morgan Stanley | 896 | — | 896 | — | ||||||
| UBS | 432 | — | 432 | — | ||||||
| Total | $ | 10,974 | $ | — | $ 10,671 | $ | 303 | |||
* Fair value of securities on loan as reported in the footnotes to the Statement of Assets and Liabilities.
^ Collateral received or pledged amounts may not reconcile to those disclosed in the Statement of Assets and Liabilities due to the inclusion of off-Balance Sheet collateral and adjustments made to exclude overcollateralization.
For further disclosure on derivatives and counterparty risk see note 2 in the Notes to Financial Statements.
See accompanying notes which are an integral part of the financial statements.
Russell U.S. Dynamic Equity Fund 67
| Russell Investment Company | ||
| Russell U.S. Dynamic Equity Fund | ||
| Statement of Assets and Liabilities — October 31, 2014 | ||
| Amounts in thousands | ||
| Assets | ||
| Investments, at identified cost | $ | 668,272 |
| Investments, at fair value(*)(>) | 764,164 | |
| Cash | 12 | |
| Cash (restricted)(a) | 1,705 | |
| Receivables: | ||
| Dividends and interest | 243 | |
| Dividends from affiliated Russell funds | 2 | |
| Investments sold | 5,989 | |
| Fund shares sold | 6 | |
| Variation margin on futures contracts | 303 | |
| Prepaid expenses | 2 | |
| Total assets | 772,426 | |
| Liabilities | ||
| Payables: | ||
| Investments purchased | 6,207 | |
| Fund shares redeemed | 1,059 | |
| Accrued fees to affiliates | 526 | |
| Other accrued expenses | 121 | |
| Securities sold short, at fair value(‡) | 29,974 | |
| Payable upon return of securities loaned | 10,662 | |
| Total liabilities | 48,549 | |
| Net Assets | $ | 723,877 |
See accompanying notes which are an integral part of the financial statements.
68 Russell U.S. Dynamic Equity Fund
| Russell Investment Company | |||
| Russell U.S. Dynamic Equity Fund | |||
| Statement of Assets and Liabilities, continued — October 31, 2014 | |||
| Amounts in thousands | |||
| Net Assets Consist of: | |||
| Undistributed (overdistributed) net investment income | $ | (10 | ) |
| Accumulated net realized gain (loss) | 97,676 | ||
| Unrealized appreciation (depreciation) on: | |||
| Investments | 95,892 | ||
| Futures contracts | 584 | ||
| Securities sold short | 811 | ||
| Shares of beneficial interest | 573 | ||
| Additional paid-in capital | 528,351 | ||
| Net Assets | $ | 723,877 | |
| Net Asset Value, offering and redemption price per share: | |||
| Net asset value per share: Class A(#) | $ | 12.12 | |
| Maximum offering price per share (Net asset value plus sales charge of 5.75%): Class A | $ | 12.86 | |
| Class A — Net assets | $ | 1,994,045 | |
| Class A — Shares outstanding ($.01 par value) | 164,588 | ||
| Net asset value per share: Class C(#) | $ | 10.70 | |
| Class C — Net assets | $ | 11,643,666 | |
| Class C — Shares outstanding ($.01 par value) | 1,088,068 | ||
| Net asset value per share: Class E(#) | $ | 12.14 | |
| Class E — Net assets | $ | 1,893,421 | |
| Class E — Shares outstanding ($.01 par value) | 155,970 | ||
| Net asset value per share: Class I(#) | $ | 12.73 | |
| Class I — Net assets | $ | 28,157,500 | |
| Class I — Shares outstanding ($.01 par value) | 2,212,452 | ||
| Net asset value per share: Class S(#) | $ | 12.55 | |
| Class S — Net assets | $ | 50,903,441 | |
| Class S — Shares outstanding ($.01 par value) | 4,054,535 | ||
| Net asset value per share: Class Y(#) | $ | 12.69 | |
| Class Y — Net assets | $ | 629,285,234 | |
| Class Y — Shares outstanding ($.01 par value) | 49,594,662 | ||
| Amounts in thousands | |||
| (*) Securities on loan included in investments | $ | 10,671 | |
| (‡) Proceeds on securities sold short | $ | 30,785 | |
| (>) Investments in affiliates, Russell U.S. Cash Management Fund and Russell U.S. Cash Collateral Fund | $ | 35,565 | |
| (a) Cash Collateral for Futures | $ | 1,705 | |
| (#) Net asset value per share equals class level net assets divided by class level shares of beneficial interest outstanding. | |||
See accompanying notes which are an integral part of the financial statements.
Russell U.S. Dynamic Equity Fund 69
| Russell Investment Company | |||
| Russell U.S. Dynamic Equity Fund | |||
| Statement of Operations — For the Period Ended October 31, 2014 | |||
| Amounts in thousands | |||
| Investment Income | |||
| Dividends | $ | 9,363 | |
| Dividends from affiliated Russell funds | 34 | ||
| Securities lending income | 80 | ||
| Total investment income | 9,477 | ||
| Expenses | |||
| Advisory fees | 5,798 | ||
| Administrative fees | 345 | ||
| Custodian fees | 158 | ||
| Distribution fees - Class A | 4 | ||
| Distribution fees - Class C | 83 | ||
| Transfer agent fees - Class A | 3 | ||
| Transfer agent fees - Class C | 22 | ||
| Transfer agent fees - Class E | 5 | ||
| Transfer agent fees - Class I | 35 | ||
| Transfer agent fees - Class S | 138 | ||
| Transfer agent fees - Class Y | 27 | ||
| Professional fees | 53 | ||
| Registration fees | 83 | ||
| Shareholder servicing fees - Class C | 27 | ||
| Shareholder servicing fees - Class E | 7 | ||
| Trustees’ fees | 16 | ||
| Printing fees | 5 | ||
| Dividends from securities sold short | 675 | ||
| Interest expense paid on securities sold short | 573 | ||
| Miscellaneous | 42 | ||
| Expenses before reductions | 8,099 | ||
| Expense reductions | (5 | ) | |
| Net expenses | 8,094 | ||
| Net investment income (loss) | 1,383 | ||
| Net Realized and Unrealized Gain (Loss) | |||
| Net realized gain (loss) on: | |||
| Investments | 101,898 | ||
| Futures contracts | 6,459 | ||
| Securities sold short | (4,687 | ) | |
| Net realized gain (loss) | 103,670 | ||
| Net change in unrealized appreciation (depreciation) on: | |||
| Investments | (11,710 | ) | |
| Futures contracts | (431 | ) | |
| Securities sold short | 996 | ||
| Net change in unrealized appreciation (depreciation) | (11,145 | ) | |
| Net realized and unrealized gain (loss) | 92,525 | ||
| Net Increase (Decrease) in Net Assets from Operations | $ | 93,908 | |
See accompanying notes which are an integral part of the financial statements.
70 Russell U.S. Dynamic Equity Fund
| Russell Investment Company | ||||||
| Russell U.S. Dynamic Equity Fund | ||||||
| Statements of Changes in Net Assets | ||||||
| For the Periods Ended October 31, | ||||||
| Amounts in thousands | 2014 | 2013 | ||||
| Increase (Decrease) in Net Assets | ||||||
| Operations | ||||||
| Net investment income (loss) | $ | 1,383 | $ | 3,586 | ||
| Net realized gain (loss) | 103,670 | 75,319 | ||||
| Net change in unrealized appreciation (depreciation) | (11,145 | ) | 98,153 | |||
| Net increase (decrease) in net assets from operations | 93,908 | 177,058 | ||||
| Distributions | ||||||
| From net investment income | ||||||
| Class A | (—)** | (1 | ) | |||
| Class C | — | — | ||||
| Class E | — | (3 | ) | |||
| Class I | (49 | ) | (97 | ) | ||
| Class S | (68 | ) | (245 | ) | ||
| Class Y | (1,381 | ) | (3,494 | ) | ||
| From net realized gain | ||||||
| Class A | (134 | ) | — | |||
| Class C | (1,271 | ) | — | |||
| Class E | (332 | ) | — | |||
| Class I | (3,204 | ) | — | |||
| Class S | (8,405 | ) | — | |||
| Class Y | (65,604 | ) | — | |||
| Net decrease in net assets from distributions | (80,448 | ) | (3,840 | ) | ||
| Share Transactions* | ||||||
| Net increase (decrease) in net assets from share transactions | 8,793 | (114,970 | ) | |||
| Total Net Increase (Decrease) in Net Assets | 22,253 | 58,248 | ||||
| Net Assets | ||||||
| Beginning of period | 701,624 | 643,376 | ||||
| End of period | $ | 723,877 | $ | 701,624 | ||
| Undistributed (overdistributed) net investment income included in net assets | $ | (10 | ) | $ | 23 | |
| ** | Less than $500. |
See accompanying notes which are an integral part of the financial statements.
Russell U.S. Dynamic Equity Fund 71
Russell Investment Company Russell U.S. Dynamic Equity Fund
Statements of Changes in Net Assets, continued
* Share transaction amounts (in thousands) for the periods ended October 31, 2014 and October 31, 2013 were as follows:
| 2014 | 2013 | |||||||||||
| Shares | Dollars | Shares | Dollars | |||||||||
| Class A | ||||||||||||
| Proceeds from shares sold | 69 | $ | 787 | 91 | $ | 1,021 | ||||||
| Proceeds from reinvestment of distributions | 12 | 134 | —** | 1 | ||||||||
| Payments for shares redeemed | (7 | ) | (82 | ) | (23 | ) | (244 | ) | ||||
| Net increase (decrease) | 74 | 839 | 68 | 778 | ||||||||
| Class C | ||||||||||||
| Proceeds from shares sold | 248 | 2,498 | 403 | 4,126 | ||||||||
| Proceeds from reinvestment of distributions | 124 | 1,232 | — | — | ||||||||
| Payments for shares redeemed | (144 | ) | (1,499 | ) | (174 | ) | (1,643 | ) | ||||
| Net increase (decrease) | 228 | 2,231 | 229 | 2,483 | ||||||||
| Class E | ||||||||||||
| Proceeds from shares sold | 12 | 142 | 17 | 186 | ||||||||
| Proceeds from reinvestment of distributions | 30 | 331 | 1 | 3 | ||||||||
| Payments for shares redeemed | (130 | ) | (1,551 | ) | (33 | ) | (350 | ) | ||||
| Net increase (decrease) | (88 | ) | (1,078 | ) | (15 | ) | (161 | ) | ||||
| Class I | ||||||||||||
| Proceeds from shares sold | 513 | 6,188 | 1,142 | 12,545 | ||||||||
| Proceeds from reinvestment of distributions | 268 | 3,135 | 8 | 93 | ||||||||
| Payments for shares redeemed | (812 | ) | (10,027 | ) | (805 | ) | (8,513 | ) | ||||
| Net increase (decrease) | (31 | ) | (704 | ) | 345 | 4,125 | ||||||
| Class S | ||||||||||||
| Proceeds from shares sold | 2,721 | 32,116 | 4,379 | 46,182 | ||||||||
| Proceeds from reinvestment of distributions | 525 | 6,066 | 15 | 162 | ||||||||
| Payments for shares redeemed | (5,002 | ) | (60,177 | ) | (4,054 | ) | (45,590 | ) | ||||
| Net increase (decrease) | (1,756 | ) | (21,995 | ) | 340 | 754 | ||||||
| Class Y | ||||||||||||
| Proceeds from shares sold | 10,707 | 129,603 | 1,394 | 14,718 | ||||||||
| Proceeds from reinvestment of distributions | 5,742 | 66,985 | 329 | 3,494 | ||||||||
| Payments for shares redeemed | (13,632 | ) | (167,088 | ) | (12,651 | ) | (141,161 | ) | ||||
| Net increase (decrease) | 2,817 | 29,500 | (10,928 | ) | (122,949 | ) | ||||||
| Total increase (decrease) | 1,244 | $ | 8,793 | (9,961 | ) | $ | (114,970 | ) | ||||
| ** Less than 500 | ||||||||||||
See accompanying notes which are an integral part of the financial statements.
72 Russell U.S. Dynamic Equity Fund
(This page intentionally left blank)
| Russell Investment Company | ||||||||||||||||
| Russell U.S. Dynamic Equity Fund | ||||||||||||||||
| Financial Highlights — For the Periods Ended | ||||||||||||||||
| For a Share Outstanding Throughout Each Period. | ||||||||||||||||
| $ | $ | $ | $ | $ | $ | |||||||||||
| Net Asset Value, | Net | Net Realized | Total from | Distributions | Distributions | |||||||||||
| Beginning of | Investment | and Unrealized | Investment | from Net | from Net | |||||||||||
| Period | Income (Loss)(a)(d) | Gain (Loss) | Operations | Investment Income | Realized Gain | |||||||||||
| Class A | ||||||||||||||||
| October 31, 2014 | 12.08 | (.03 | ) | 1.53 | 1.50 | —(f) | (1.46 | ) | ||||||||
| October 31, 2013 | 9.40 | —(f) | 2.71 | 2.71 | (.03 | ) | — | |||||||||
| October 31, 2012(6) | 9.20 | .01 | .20 | .21 | (.01 | ) | — | |||||||||
| Class C | ||||||||||||||||
| October 31, 2014 | 10.90 | (.10 | ) | 1.36 | 1.26 | — | (1.46 | ) | ||||||||
| October 31, 2013 | 8.53 | (.07 | ) | 2.44 | 2.37 | — | — | |||||||||
| October 31, 2012 | 7.56 | (.06 | ) | 1.03 | .97 | — | — | |||||||||
| October 31, 2011 | 6.97 | (.07 | ) | .66 | .59 | — | — | |||||||||
| October 31, 2010 | 5.96 | (.07 | ) | 1.08 | 1.01 | — | — | |||||||||
| Class E | ||||||||||||||||
| October 31, 2014 | 12.10 | (.02 | ) | 1.52 | 1.50 | — | (1.46 | ) | ||||||||
| October 31, 2013 | 9.41 | .01 | 2.69 | 2.70 | (.01 | ) | — | |||||||||
| October 31, 2012 | 8.27 | —(f) | 1.14 | 1.14 | — | — | ||||||||||
| October 31, 2011 | 7.58 | (.02 | ) | .71 | .69 | — | — | |||||||||
| October 31, 2010 | 6.43 | (.02 | ) | 1.17 | 1.15 | — | — | |||||||||
| Class I | ||||||||||||||||
| October 31, 2014 | 12.60 | .02 | 1.60 | 1.62 | (.03 | ) | (1.46 | ) | ||||||||
| October 31, 2013 | 9.79 | .05 | 2.81 | 2.86 | (.05 | ) | — | |||||||||
| October 31, 2012 | 8.56 | .03 | 1.21 | 1.24 | (.01 | ) | — | |||||||||
| October 31, 2011 | 7.83 | .01 | .72 | .73 | — | — | ||||||||||
| October 31, 2010 | 6.62 | —(f) | 1.22 | 1.22 | (.01 | ) | — | |||||||||
| Class S | ||||||||||||||||
| October 31, 2014 | 12.45 | .01 | 1.57 | 1.58 | (.02 | ) | (1.46 | ) | ||||||||
| October 31, 2013 | 9.68 | .04 | 2.76 | 2.80 | (.03 | ) | — | |||||||||
| October 31, 2012 | 8.48 | .03 | 1.17 | 1.20 | —(f) | — | ||||||||||
| October 31, 2011 | 7.76 | —(f) | .72 | .72 | — | — | ||||||||||
| October 31, 2010 | 6.56 | (.01 | ) | 1.21 | 1.20 | —(f) | — | |||||||||
| Class Y | ||||||||||||||||
| October 31, 2014 | 12.56 | .03 | 1.59 | 1.62 | (.03 | ) | (1.46 | ) | ||||||||
| October 31, 2013 | 9.77 | .06 | 2.80 | 2.86 | (.07 | ) | — | |||||||||
| October 31, 2012(6) | 9.56 | .02 | .21 | .23 | (.02 | ) | — | |||||||||
See accompanying notes which are an integral part of the financial statements.
74 Russell U.S. Dynamic Equity Fund
| % | % | % | |||||||||||||||||
| $ | $ | Ratio of Expenses | Ratio of Expenses | Ratio of Net | |||||||||||||||
| Net Asset Value, | % | Net Assets, | to Average | to Average | Investment Income | % | |||||||||||||
| $ | End of | Total | End of Period | Net Assets, | Net Assets, | to Average | Portfolio | ||||||||||||
| Total Distributions | Period | Return(b)(c) | (000 | ) | Gross(e) | Net(d)(e)(g) | Net Assets(d)(e) | Turnover Rate(b) | |||||||||||
| (1.46 | ) | 12.12 | 13.40 | 1,994 | 1.52 | 1.52 | (.22 | ) | 146 | ||||||||||
| (.03 | ) | 12.08 | 28.84 | 1,089 | 1.51 | 1.51 | — | (i) | 142 | ||||||||||
| (.01 | ) | 9.40 | 2.30 | 206 | 1.36 | 1.35 | .31 | 120 | |||||||||||
| (1.46 | ) | 10.70 | 12.66 | 11,644 | 2.27 | 2.27 | (.96 | ) | 146 | ||||||||||
| — | 10.90 | 27.90 | 9,380 | 2.26 | 2.26 | (.68 | ) | 142 | |||||||||||
| — | 8.53 | 12.83 | 5,386 | 2.28 | 2.07 | (.72 | ) | 120 | |||||||||||
| — | 7.56 | 8.18 | 5,335 | 2.29 | 2.05 | (.97 | ) | 142 | |||||||||||
| — | 6.97 | 16.95 | 5,456 | 2.24 | 2.05 | (1.08 | ) | 111 | |||||||||||
| (1.46 | ) | 12.14 | 13.46 | 1,893 | 1.52 | 1.52 | (.19 | ) | 146 | ||||||||||
| (.01 | ) | 12.10 | 28.75 | 2,959 | 1.51 | 1.51 | .10 | 142 | |||||||||||
| — | 9.41 | 13.78 | 2,443 | 1.55 | 1.32 | (.01 | ) | 120 | |||||||||||
| — | 8.27 | 8.97 | 3,906 | 1.54 | 1.30 | (.22 | ) | 142 | |||||||||||
| — | 7.58 | 17.88 | 5,795 | 1.49 | 1.30 | (.34 | ) | 111 | |||||||||||
| (1.49 | ) | 12.73 | 13.86 | 28,158 | 1.19 | 1.18 | .14 | 146 | |||||||||||
| (.05 | ) | 12.60 | 29.28 | 28,265 | 1.18 | 1.13 | .41 | 142 | |||||||||||
| (.01 | ) | 9.79 | 14.34 | 18,586 | 1.21 | .94 | .38 | 120 | |||||||||||
| — | 8.56 | 9.45 | 26,748 | 1.19 | .92 | .10 | 142 | ||||||||||||
| (.01 | ) | 7.83 | 18.44 | 46,926 | 1.16 | .92 | .05 | 111 | |||||||||||
| (1.48 | ) | 12.55 | 13.68 | 50,903 | 1.27 | 1.27 | .05 | 146 | |||||||||||
| (.03 | ) | 12.45 | 29.04 | 72,332 | 1.26 | 1.26 | .35 | 142 | |||||||||||
| —(f) | 9.68 | 14.20 | 52,928 | 1.26 | 1.07 | .29 | 120 | ||||||||||||
| — | 8.48 | 9.28 | 27,847 | 1.29 | 1.05 | .02 | 142 | ||||||||||||
| —(f) | 7.76 | 18.30 | 31,701 | 1.24 | 1.05 | (.09 | ) | 111 | |||||||||||
| (1.49 | ) | 12.69 | 13.99 | 629,285 | 1.07 | 1.07 | .23 | 146 | |||||||||||
| (.07 | ) | 12.56 | 29.34 | 587,599 | 1.06 | 1.06 | .56 | 142 | |||||||||||
| (.02 | ) | 9.77 | 2.36 | 563,827 | .91 | .91 | .80 | 120 | |||||||||||
See accompanying notes which are an integral part of the financial statements.
Russell U.S. Dynamic Equity Fund 75
Russell Investment Company Russell U.S. Strategic Equity Fund
Portfolio Management Discussion and Analysis — October 31, 2014 (Unaudited)

| Russell U.S. Strategic Equity Fund - Class A‡ | Russell U.S. Strategic Equity Fund - Class S | ||||||
| Total | Total | ||||||
| Return | Return | ||||||
| 1 Year | 8.10 | % | 1 Year | 15.05 | % | ||
| Inception* | 16.04 | %§ | Inception* | 19.47 | %§ | ||
| Russell U.S. Strategic Equity Fund - Class C | Russell 1000® Index** | ||||||
| Total | Total | ||||||
| Return | Return | ||||||
| 1 Year | 13.86 | % | 1 Year | 16.78 | % | ||
| Inception* | 18.30 | %§ | Inception* | 21.01 | %§ | ||
| Russell U.S. Strategic Equity Fund - Class E | |||||||
| Total | |||||||
| Return | |||||||
| 1 Year | 14.76 | % | |||||
| Inception* | 19.21 | %§ | |||||
76 Russell U.S. Strategic Equity Fund
Russell Investment Company Russell U.S. Strategic Equity Fund
Portfolio Management Discussion and Analysis, continued — October 31, 2014 (Unaudited)
The Russell U.S. Strategic Equity Fund (the “Fund”) employs With the continuation of the economic recovery, the Fund was a multi-manager approach whereby portions of the Fund underweight in most of the sectors that are traditionally considered are allocated to different money managers. Fund assets not to be “non-cyclical” and/or interest rate sensitive. However, allocated to money managers are managed by Russell Investment certain industries that tend to be viewed as “bond substitutes,” Management Company (“RIMCo”), the Fund’s advisor. RIMCo due to their income producing qualities, such as electric utilities may change the allocation of the Fund’s assets among money and real estate investment trusts (REITs), outperformed given managers at any time. An exemptive order from the Securities the decline in interest rates and this detracted from the Fund’s and Exchange Commission (“SEC”) permits RIMCo to engage benchmark-relative performance. or terminate a money manager at any time, subject to approval by the Fund’s Board, without a shareholder vote. Pursuant to the How did the investment strategies and techniques employed terms of the exemptive order, the Fund is required to notify its by the Fund and its money managers affect its benchmark-shareholders within 90 days of when a money manager begins relative performance? providing services. As of October 31, 2014, the Fund had nine Stock selection effects within the energy sector (an overweight to money managers. Peabody Energy Corporation) and within the health care sector (an overweight to Pfizer Inc.) detracted from the Fund’s benchmark-What is the Fund’s investment objective? relative returns for the fiscal year. The Fund’s overweight to the The Fund seeks to provide long term capital growth. health care sector and underweight to the consumer staples sector were beneficial. Factor exposures were mixed, as an overweight to
How did the Fund perform relative to its benchmark for the stocks with the lowest valuations (lowest price-to-book and price-fiscal year ended October 31, 2014? to-cash flow ratios) detracted, while an underweight to mid cap For the fiscal year ended October 31, 2014, the Fund’s Class A, stocks was rewarded.
Class C, Class E and Class S Shares gained 14.72%, 13.86%,
14.76% and 15.05%, respectively. This is compared to the Fund’s AJO, LP (“AJO”) outperformed the Russell 1000® Dynamic™ benchmark, the Russell 1000® Index, which gained 16.78% Index for the fiscal year. Factor exposures were rewarded, during the same period. The Fund’s performance includes specifically an overweight to stocks with rising earnings estimates operating expenses, whereas index returns are unmanaged and and an underweight to stocks with high financial leverage (high do not include expenses of any kind. debt-to-capital ratios). An underweight to the energy sector and an overweight to the health care sector were additive to benchmark-For the fiscal year ended October 31, 2014, the Morningstar® relative returns. Stock selection within the producer durables Large Blend, a group of funds that Morningstar considers to sector (overweights to Southwest Airlines Co. and Huntington have investment strategies similar to those of the Fund, gained Ingalls Industries, Inc.) was also beneficial to benchmark-relative 14.34%. This result serves as a peer comparison and is expressed returns. net of operating expenses.
Barrow, Hanley, Mewhinney & Strauss, LLC (“Barrow”) RIMCo may assign a money manager a specific style or outperformed the Russell 1000® Value Index for the fiscal year. capitalization benchmark other than the Fund’s index. However, Factor exposures were rewarded, specifically a tilt toward stocks the Fund’s primary index remains the benchmark for the Fund with low earnings variability and away from mid cap stocks. and is representative of the aggregate of each money manager’s Barrow’s underweight to the technology sector and overweight to benchmark index. the producer durables sector detracted, although an overweight to How did the market conditions described in the Market the health care sector was beneficial. Stock selection within the Summary report affect the Fund’s performance? producer durables sector (overweights to Southwest Airlines Co. During the fiscal year, the U.S. large capitalization equity market and General Dynamics Corporation) was additive to benchmark-produced positive returns. Relevant Fund exposures included relative returns. tilts toward stocks with the lowest valuation ratios (lowest price- Columbus Circle Investors (“Columbus Circle”) underperformed to-book and price-to-cash flow ratios) and health care stocks, and the Russell 1000® Growth Index for the fiscal year. Factor away from mid cap stocks, growth stocks, and technology stocks. exposures were mixed, specifically a tilt toward high beta stocks Growth stocks outperformed value stocks for the fiscal year (stocks with high sensitivity to market movements) detracted, and technology stocks outperformed the Russell 1000® Index, although a tilt toward stocks with rising earnings estimates was detracting from the Fund’s benchmark-relative performance. beneficial. Sector exposures were also mixed, with an underweight However, the Fund’s tilts away from mid cap stocks and toward to technology detracting, while an overweight to health care was health care stocks were beneficial. rewarded. Stock selection within the energy sector (overweights
Russell U.S. Strategic Equity Fund 77
Russell Investment Company Russell U.S. Strategic Equity Fund
Portfolio Management Discussion and Analysis, continued — October 31, 2014 (Unaudited)
| to Pioneer Natural Resources Company and Noble Energy, Inc.) | selection within the energy sector (overweights to Peabody Energy | |
| held back benchmark-relative performance. | Corporation and Arch Coal, Inc.) detracted. | |
| Cornerstone Capital Management, LLC (“Cornerstone”) | Suffolk Capital Management, LLC (“Suffolk”) outperformed the | |
| underperformed the Russell 1000® Growth Index for the fiscal | Russell 1000® Dynamic™ Index for the fiscal year. Factor tilts | |
| year. Factor exposures were not rewarded, specifically overweights | away from mid cap stocks and stocks with above-benchmark | |
| to mid cap stocks and high beta stocks. An overweight to the | financial leverage (higher debt-to-capital ratios) were additive to | |
| consumer discretionary sector and an underweight to the health | benchmark-relative returns. Overweights to the technology and | |
| care sector detracted, although an underweight to the utilities | health care sectors were beneficial. Stock selection within the | |
| sector was beneficial. Stock selection within the technology sector | technology sector (overweights to Avago Technologies Limited and | |
| (overweights to Rackspace Hosting, Inc. and underweight Apple, | Intel Corporation) was a significant driver of positive benchmark- | |
| Inc.) and the energy sector (overweight to Cobalt International | relative performance. | |
| Energy) significantly detracted from benchmark-relative | RIMCo manages the portion of the Fund’s assets that RIMCo | |
| performance. | determines not to allocate to the money managers. Assets not | |
| Institutional Capital LLC (“ICAP”) underperformed the Russell | allocated to managers include the Fund’s liquidity reserves and | |
| 1000® Value Index for the fiscal year. From a sector perspective, | assets which may be managed directly by RIMCo to modify the | |
| an underweight to energy and an overweight to health care | Fund’s overall portfolio characteristics to seek to achieve the | |
| contributed positively to benchmark-relative returns. Stock | desired risk/return profile for the Fund. | |
| selection within the consumer discretionary sector (overweights to | In the beginning of April 2014, RIMCo implemented a RIMCo | |
| Viacom, Inc. and Ford Motor Company) and within the technology | managed positioning strategy that pursues a full replication of | |
| sector (underweight Intel Corporation) significantly detracted | the Russell Top 200® Value Index, which consists of the largest | |
| from benchmark-relative performance. | Russell 1000® Value Index stocks. This strategy is designed | |
| Jacobs Levy Equity Management, Inc (“Jacobs”) outperformed | to provide the Fund with ultra large cap value exposure with | |
| the Russell 1000® Defensive™ Index for the fiscal year. A factor | moderate beta characteristics (beta is a measure of a portfolio’s | |
| tilt toward stocks with high historical earnings growth rates was | volatility and its sensitivity to the direction of the market) and | |
| rewarded. Jacob’s overweight to the technology and health care | since its implementation, has performed in-line with expectations. | |
| sectors contributed positively to benchmark-relative returns. | During the period, RIMCo used index futures contracts to equitize | |
| Stock selection within the health care sector (an overweight | the Fund’s and managers’ cash. RIMCo’s decision to equitize | |
| to Forest Laboratories, Inc.) and within the technology sector | Fund and manager cash was beneficial to Fund performance for | |
| (overweights to Apple, Inc. and Electronic Arts, Inc.) was additive | the year. | |
| to benchmark-relative performance. | ||
| PanAgora Asset Management, Inc (“PanAgora”) underperformed | Describe any changes to the Fund’s structure or the money | |
| the Russell 1000® Defensive™ Index for the fiscal year. Factor | manager line-up. | |
| tilts toward stocks with above-benchmark financial leverage | There were no changes to the Fund’s money manager line up | |
| (highest debt-to-capital ratios) and away from stocks with high | during the fiscal year. | |
| historical earnings growth rates detracted. An overweight to the | In the beginning of April 2014, RIMCo introduced the positioning | |
| health care sector was beneficial, while an underweight to the | strategy described above. | |
| producer durables sector detracted. Stock selection within the | There were no other changes to the Fund’s structure during the | |
| technology sector (overweights to Qualcomm Incorporated and | fiscal year. | |
| Oracle Corporation) held back benchmark-relative returns. | ||
| Schneider Capital Management Corporation (“Schneider”) | Money Managers as of October 31, | |
| underperformed the Russell 1000® Value Index for the fiscal | 2014 | Styles |
| year. Many of Schneider’s factor exposures were not rewarded, | AJO, LP | Dynamic |
| specifically overweights to mid cap stocks, stocks with low | Barrow, Hanley, Mewhinney & Strauss, LLC | Value |
| Columbus Circle Investors | Growth | |
| valuations (low price-to-book and price-to-cash flow ratios), | Cornerstone Capital Management Inc. | Growth |
| and high beta stocks. An underweight to the technology sector | Institutional Capital LLC | Value |
| and an overweight to the energy sector detracted, although an | Jacobs Levy Equity Management, Inc. | Defensive |
| overweight to the financial services sector was beneficial. Stock | PanAgora Asset Management Inc. | Defensive |
| Schneider Capital Management Corporation | Value | |
| Suffolk Capital Management, LLC | Dynamic | |
78 Russell U.S. Strategic Equity Fund
Russell Investment Company Russell U.S. Strategic Equity Fund
Portfolio Management Discussion and Analysis, continued — October 31, 2014 (Unaudited)
The views expressed in this report reflect those of the portfolio
managers only through the end of the period covered by
the report. These views do not necessarily represent the
views of RIMCo, or any other person in RIMCo or any other
affiliated organization. These views are subject to change
at any time based upon market conditions or other events,
and RIMCo disclaims any responsibility to update the views
contained herein. These views should not be relied on as
investment advice and, because investment decisions for
a Russell Investment Company (“RIC”) Fund are based on
numerous factors, should not be relied on as an indication
of investment decisions of any RIC Fund.
| * | Assumes initial investment on August 6, 2012. |
| ** | Russell 1000® Index includes the 1,000 largest companies in the Russell 3000® Index. The Russell 1000® Index represents the universe of stocks from which most active money managers typically select. The Russell 1000® Index return reflects adjustments from income dividends and capital gain distributions reinvested as of the ex-dividend dates. |
| ‡ | The performance shown has been adjusted to reflect the deduction of the maximum Class A sales charge of 5.75%. |
| § | Annualized. |
Performance is historical and assumes reinvestment of all dividends and capital gains. Investment return and principal value will fluctuate so that an investor’s shares, when redeemed, may be worth more or less than when purchased. Past performance is not indicative of future results. The returns shown do not reflect the deduction of taxes that a shareholder would pay on Fund distributions or the redemption of Fund shares.
Russell U.S. Strategic Equity Fund 79
| Russell Investment Company | ||||||
| Russell U.S. Strategic Equity Fund | ||||||
| Shareholder Expense Example — October 31, 2014 (Unaudited) | ||||||
| Fund Expenses | Please note that the expenses shown in the table are meant | |||||
| The following disclosure provides important information | to highlight your ongoing costs only and do not reflect any | |||||
| regarding the Fund’s Shareholder Expense Example | transactional costs. Therefore, the information under the heading | |||||
| (“Example”). | “Hypothetical Performance (5% return before expenses)” is | |||||
| useful in comparing ongoing costs only, and will not help you | ||||||
| Example | determine the relative total costs of owning different funds. In | |||||
| As a shareholder of the Fund, you incur two types of costs: (1) | addition, if these transactional costs were included, your costs | |||||
| transaction costs, and (2) ongoing costs, including advisory and | would have been higher. | |||||
| administrative fees; distribution (12b-1) and/or service fees; | Hypothetical | |||||
| and other Fund expenses. The Example is intended to help | Performance (5% | |||||
| you understand your ongoing costs (in dollars) of investing in | Actual | return before | ||||
| the Fund and to compare these costs with the ongoing costs of | Class A | Performance | expenses) | |||
| Beginning Account Value | ||||||
| investing in other mutual funds. The Example is based on an | May 1, 2014 | $ | 1,000.00 | $ | 1,000.00 | |
| investment of $1,000 invested at the beginning of the period and | Ending Account Value | |||||
| held for the entire period indicated, which for this Fund is from | October 31, 2014 | $ | 1,070.60 | $ | 1,019.81 | |
| May 1, 2014 to October 31, 2014. | Expenses Paid During Period* | $ | 5.58 | $ | 5.45 | |
| Actual Expenses | * Expenses are equal to the Fund's annualized expense ratio of 1.07% | |||||
| (representing the six month period annualized), multiplied by the average | ||||||
| The information in the table under the heading “Actual | account value over the period, multiplied by 184/365 (to reflect the one-half | |||||
| Performance” provides information about actual account values | year period). May reflect amounts waived and/or reimbursed. Without any | |||||
| and actual expenses. You may use the information in this column, | waivers and/or reimbursements, expenses would have been higher. | |||||
| together with the amount you invested, to estimate the expenses | ||||||
| Hypothetical | ||||||
| that you paid over the period. Simply divide your account value by | Performance (5% | |||||
| $1,000 (for example, an $8,600 account value divided by $1,000 | Actual | return before | ||||
| = 8.6), then multiply the result by the number in the first column | Class C | Performance | expenses) | |||
| Beginning Account Value | ||||||
| in the row entitled “Expenses Paid During Period” to estimate | May 1, 2014 | $ | 1,000.00 | $ | 1,000.00 | |
| the expenses you paid on your account during this period. | Ending Account Value | |||||
| October 31, 2014 | $ | 1,067.00 | $ | 1,016.03 | ||
| Hypothetical Example for Comparison Purposes | Expenses Paid During Period* | $ | 9.48 | $ | 9.25 | |
| The information in the table under the heading “Hypothetical | ||||||
| Performance (5% return before expenses)” provides information | * Expenses are equal to the Fund's annualized expense ratio of 1.82% | |||||
| (representing the six month period annualized), multiplied by the average | ||||||
| about hypothetical account values and hypothetical expenses | account value over the period, multiplied by 184/365 (to reflect the one-half | |||||
| based on the Fund’s actual expense ratio and an assumed rate of | year period). May reflect amounts waived and/or reimbursed. Without any | |||||
| return of 5% per year before expenses, which is not the Fund’s | waivers and/or reimbursements, expenses would have been higher. | |||||
| actual return. The hypothetical account values and expenses | ||||||
| Hypothetical | ||||||
| may not be used to estimate the actual ending account balance or | Performance (5% | |||||
| expenses you paid for the period. You may use this information | Actual | return before | ||||
| to compare the ongoing costs of investing in the Fund and other | Class E | Performance | expenses) | |||
| funds. To do so, compare this 5% hypothetical example with the | Beginning Account Value | |||||
| May 1, 2014 | $ | 1,000.00 | $ | 1,000.00 | ||
| 5% hypothetical examples that appear in the shareholder reports | Ending Account Value | |||||
| of other funds. | October 31, 2014 | $ | 1,071.20 | $ | 1,019.81 | |
| Expenses Paid During Period* | $ | 5.59 | $ | 5.45 | ||
| * Expenses are equal to the Fund's annualized expense ratio of 1.07% | ||||||
| (representing the six month period annualized), multiplied by the average | ||||||
| account value over the period, multiplied by 184/365 (to reflect the one-half | ||||||
| year period). May reflect amounts waived and/or reimbursed. Without any | ||||||
| waivers and/or reimbursements, expenses would have been higher. | ||||||
80 Russell U.S. Strategic Equity Fund
Russell Investment Company Russell U.S. Strategic Equity Fund
Shareholder Expense Example, continued — October 31, 2014 (Unaudited)
| Hypothetical | ||||
| Performance (5% | ||||
| Actual | return before | |||
| Class S | Performance | expenses) | ||
| Beginning Account Value | ||||
| May 1, 2014 | $ | 1,000.00 | $ | 1,000.00 |
| Ending Account Value | ||||
| October 31, 2014 | $ | 1,072.60 | $ | 1,021.07 |
| Expenses Paid During Period* | $ | 4.28 | $ | 4.18 |
* Expenses are equal to the Fund's annualized expense ratio of 0.82% (representing the six month period annualized), multiplied by the average account value over the period, multiplied by 184/365 (to reflect the one-half year period). May reflect amounts waived and/or reimbursed. Without any waivers and/or reimbursements, expenses would have been higher.
Russell U.S. Strategic Equity Fund 81
| Russell Investment Company | |||||||
| Russell U.S. Strategic Equity Fund | |||||||
| Schedule of Investments — October 31, 2014 | |||||||
| Amounts in thousands (except share amounts) | Amounts in thousands (except share amounts) | ||||||
| Principal | Fair | Principal | Fair | ||||
| Amount ($) or | Value | Amount ($) or | Value | ||||
| Shares | $ | Shares | $ | ||||
| Common Stocks - 96.1% | PulteGroup, Inc. | 422,591 | 8,110 | ||||
| Consumer Discretionary - 14.1% | Ralph Lauren Corp. Class A | 33,417 | 5,508 | ||||
| Abercrombie & Fitch Co. Class A | 78,100 | 2,615 | Ross Stores, Inc. | 23,068 | 1,862 | ||
| Advance Auto Parts, Inc. | 14,440 | 2,122 | Royal Caribbean Cruises, Ltd. | 115,783 | 7,870 | ||
| Alibaba Group Holding, Ltd. - ADR(Æ) | 45,086 | 4,446 | Shutterfly, Inc.(Æ) | 35,460 | 1,483 | ||
| Amazon.com, Inc.(Æ) | 29,984 | 9,159 | Starbucks Corp. | 246,045 | 18,591 | ||
| Apollo Group, Inc. Class A(Æ) | 39,200 | 1,123 | Target Corp. | 213,774 | 13,216 | ||
| AutoZone, Inc.(Æ) | 10,565 | 5,848 | Taylor Morrison Home Corp. Class A(Æ) | 42,000 | 724 | ||
| Avis Budget Group, Inc.(Æ) | 49,300 | 2,749 | Tesla Motors, Inc.(Æ) | 10,221 | 2,470 | ||
| Belmond, Ltd. Class A(Æ) | 16,218 | 186 | Tiffany & Co. | 30,700 | 2,951 | ||
| Brinker International, Inc. | 109,681 | 5,883 | Time Warner Cable, Inc. | 57,514 | 8,467 | ||
| Cablevision Systems Corp. Class A | 137,900 | 2,568 | Time Warner, Inc. | 245,295 | 19,494 | ||
| Carnival Corp. | 149,693 | 6,010 | TJX Cos., Inc. | 123,100 | 7,795 | ||
| Carter's, Inc. | 10,000 | 781 | Toll Brothers, Inc.(Æ) | 186,365 | 5,954 | ||
| CBS Corp. Class B | 195,227 | 10,585 | Ulta Salon Cosmetics & Fragrance, Inc.(Æ) | 45,423 | 5,488 | ||
| Chipotle Mexican Grill, Inc. Class A(Æ) | 8,676 | 5,535 | Under Armour, Inc. Class A(Æ) | 62,212 | 4,080 | ||
| Choice Hotels International, Inc. | 40,101 | 2,145 | Viacom, Inc. Class B | 310,400 | 22,560 | ||
| Columbia Sportswear Co. | 21,731 | 838 | Wal-Mart Stores, Inc. | 379,044 | 28,910 | ||
| Comcast Corp. Class A(Æ) | 735,329 | 40,700 | Walt Disney Co. (The) | 236,248 | 21,588 | ||
| Costco Wholesale Corp. | 67,486 | 9,001 | Whirlpool Corp.(Û) | 44,793 | 7,707 | ||
| Deckers Outdoor Corp.(Æ) | 5,300 | 464 | 517,998 | ||||
| Diageo PLC - ADR | 26,843 | 3,167 | |||||
| Dillard's, Inc. Class A | 7,200 | 761 | Consumer Staples - 5.3% | ||||
| DIRECTV(Æ)(Û) | 48,682 | 4,225 | Altria Group, Inc. | 193,893 | 9,373 | ||
| Domino's Pizza, Inc. | 34,741 | 3,085 | Andersons, Inc. (The) | 9,863 | 629 | ||
| eBay, Inc.(Æ) | 68,979 | 3,621 | Archer-Daniels-Midland Co. | 5,465 | 257 | ||
| Estee Lauder Cos., Inc. (The) Class A | 121,381 | 9,125 | Casey's General Stores, Inc. | 13,100 | 1,072 | ||
| Expedia, Inc. | 33,500 | 2,847 | Coca-Cola Co. (The) | 427,044 | 17,885 | ||
| Foot Locker, Inc. | 50,100 | 2,806 | Colgate-Palmolive Co. | 100,627 | 6,730 | ||
| Ford Motor Co. | 707,946 | 9,975 | Constellation Brands, Inc. Class A(Æ) | 41,037 | 3,757 | ||
| GameStop Corp. Class A | 16,200 | 693 | CVS Health Corp. | 35,273 | 3,027 | ||
| Gap, Inc. (The) | 238,978 | 9,055 | Dr Pepper Snapple Group, Inc. | 30,809 | 2,134 | ||
| Garmin, Ltd. | 62,700 | 3,479 | Kellogg Co. | 209 | 13 | ||
| General Motors Co. | 15,071 | 473 | Kimberly-Clark Corp. | 140,397 | 16,043 | ||
| Home Depot, Inc. | 252,132 | 24,588 | Kroger Co. (The)(Û) | 232,516 | 12,953 | ||
| Hyatt Hotels Corp. Class A(Æ) | 15,439 | 914 | Lorillard, Inc.(Û) | 32,300 | 1,986 | ||
| Jarden Corp.(Æ) | 99,636 | 6,485 | Molson Coors Brewing Co. Class B | 77,063 | 5,732 | ||
| Johnson Controls, Inc. | 349,257 | 16,502 | Mondelez International, Inc. Class A | 218,912 | 7,719 | ||
| Kate Spade & Co.(Æ) | 104,538 | 2,836 | PepsiCo, Inc. | 233,768 | 22,481 | ||
| Kohl's Corp. | 63,100 | 3,421 | Philip Morris International, Inc. | 511,998 | 45,573 | ||
| L Brands, Inc. | 48,300 | 3,483 | Pilgrim's Pride Corp.(Æ) | 23,900 | 679 | ||
| Las Vegas Sands Corp. | 139,845 | 8,707 | Procter & Gamble Co. (The) | 339,994 | 29,671 | ||
| Lear Corp.(Û) | 27,670 | 2,559 | Reynolds American, Inc. | 700 | 44 | ||
| Leggett & Platt, Inc. | 17,700 | 697 | SABMiller PLC - ADR(Æ) | 105,464 | 5,973 | ||
| Lennar Corp. Class A | 227,450 | 9,799 | Sysco Corp. | 3,382 | 130 | ||
| Liberty Media Corp.(Æ) | 185,700 | 8,901 | Tyson Foods, Inc. Class A | 30,900 | 1,247 | ||
| Lowe's Cos., Inc. | 105,863 | 6,055 | Walgreen Co. | 2,191 | 141 | ||
| Macy's, Inc.(Û) | 74,847 | 4,328 | 195,249 | ||||
| Marriott International, Inc. Class A | 157,757 | 11,950 | |||||
| Mattel, Inc. | 86,300 | 2,681 | Energy - 8.3% | ||||
| MercadoLibre, Inc. | 38,310 | 5,216 | Anadarko Petroleum Corp. | 78,823 | 7,234 | ||
| Meritage Homes Corp.(Æ) | 8,120 | 299 | Apache Corp. | 3,570 | 276 | ||
| Nike, Inc. Class B | 205,067 | 19,065 | Arch Coal, Inc. | 1,182,364 | 2,554 | ||
| NVR, Inc.(Æ) | 2,382 | 2,924 | Baker Hughes, Inc.(Û) | 46,501 | 2,463 | ||
| Office Depot, Inc.(Æ) | 381,097 | 1,989 | BP PLC - ADR | 313,700 | 13,633 | ||
| Omnicom Group, Inc. | 16,050 | 1,153 | Cameron International Corp.(Æ) | 174,300 | 10,380 | ||
| O'Reilly Automotive, Inc.(Æ) | 30,270 | 5,324 | Chesapeake Energy Corp. | 325,055 | 7,210 | ||
| Polaris Industries, Inc.(Û) | 17,720 | 2,673 | Chevron Corp. | 251,599 | 30,179 | ||
| Priceline Group, Inc. (The)(Æ) | 3,773 | 4,551 | Cobalt International Energy, Inc.(Æ) | 221,075 | 2,589 | ||
| See accompanying notes which are an integral part of the financial statements. | |||||||
| 82 Russell U.S. Strategic Equity Fund | |||||||
| Russell Investment Company | |||||||
| Russell U.S. Strategic Equity Fund | |||||||
| Schedule of Investments, continued — October 31, 2014 | |||||||
| Amounts in thousands (except share amounts) | Amounts in thousands (except share amounts) | ||||||
| Principal | Fair | Principal | Fair | ||||
| Amount ($) or | Value | Amount ($) or | Value | ||||
| Shares | $ | Shares | $ | ||||
| ConocoPhillips | 357,639 | 25,804 | Columbia Property Trust, Inc.(ö) | 44,336 | 1,119 | ||
| CONSOL Energy, Inc. | 35,551 | 1,308 | Comerica, Inc. | 22,655 | 1,082 | ||
| Continental Resources, Inc.(Æ) | 46,024 | 2,594 | Cullen/Frost Bankers, Inc. | 88,443 | 7,147 | ||
| CVR Energy, Inc. | 45,610 | 2,216 | Discover Financial Services(Û) | 184,514 | 11,768 | ||
| Devon Energy Corp. | 159,214 | 9,553 | East West Bancorp, Inc. | 20,840 | 766 | ||
| EOG Resources, Inc. | 72,065 | 6,850 | Equifax, Inc. | 31,100 | 2,355 | ||
| Exxon Mobil Corp. | 463,719 | 44,846 | Equity Residential(ö) | 3,344 | 233 | ||
| FMC Technologies, Inc.(Æ) | 5,100 | 286 | Erie Indemnity Co. Class A | 7,734 | 656 | ||
| Halliburton Co.(Û) | 434,021 | 23,932 | Everest Re Group, Ltd. | 31,025 | 5,294 | ||
| Hess Corp. | 2,572 | 218 | First American Financial Corp. | 67,614 | 2,050 | ||
| Kinder Morgan, Inc. | 4,402 | 170 | First Niagara Financial Group, Inc. | 354,506 | 2,655 | ||
| Marathon Oil Corp. | 219,558 | 7,772 | First Republic Bank | 117,352 | 5,977 | ||
| Marathon Petroleum Corp. | 11,894 | 1,081 | Fiserv, Inc.(Æ) | 156,912 | 10,902 | ||
| Nabors Industries, Ltd. | 104,500 | 1,865 | FleetCor Technologies, Inc.(Æ) | 37,584 | 5,659 | ||
| National Oilwell Varco, Inc. | 93,024 | 6,757 | FNF Group | 50,984 | 1,521 | ||
| Occidental Petroleum Corp. | 408,201 | 36,301 | FNFV Group(Æ) | 92,814 | 1,247 | ||
| Patterson-UTI Energy, Inc. | 109,600 | 2,524 | Franklin Resources, Inc. | 12,401 | 690 | ||
| PBF Energy, Inc. Class A | 27,100 | 706 | Genworth Financial, Inc. Class A(Æ)(Û) | 145,700 | 2,038 | ||
| Peabody Energy Corp. | 501,515 | 5,231 | Goldman Sachs Group, Inc. (The) | 90,330 | 17,162 | ||
| Phillips 66(Æ) | 211,590 | 16,610 | Hanover Insurance Group, Inc. (The) | 45,591 | 3,052 | ||
| Pioneer Natural Resources Co. | 45,311 | 8,567 | Hartford Financial Services Group, Inc. | 307,660 | 12,177 | ||
| Schlumberger, Ltd. | 74,467 | 7,347 | Hospitality Properties Trust(ö) | 85,900 | 2,543 | ||
| SM Energy Co. | 22,960 | 1,293 | Jones Lang LaSalle, Inc. | 19,700 | 2,664 | ||
| Spectra Energy Corp. | 6,209 | 243 | JPMorgan Chase & Co. | 691,066 | 41,796 | ||
| Superior Energy Services, Inc. | 69,100 | 1,738 | KeyCorp | 52,224 | 689 | ||
| Tesoro Corp. | 39,200 | 2,799 | Lincoln National Corp. | 125,800 | 6,889 | ||
| Valero Energy Corp. | 41,259 | 2,067 | Loews Corp. | 300,200 | 13,089 | ||
| Weatherford International PLC(Æ) | 425,933 | 6,994 | Marsh & McLennan Cos., Inc. | 78,377 | 4,261 | ||
| Whiting Petroleum Corp.(Æ) | 40,993 | 2,510 | MasterCard, Inc. Class A | 198,423 | 16,618 | ||
| WPX Energy, Inc.(Æ) | 19,332 | 370 | McGraw Hill Financial, Inc.(Û) | 35,800 | 3,239 | ||
| 307,070 | MetLife, Inc. | 8,793 | 477 | ||||
| Moody's Corp. | 17,500 | 1,736 | |||||
| Financial Services - 18.9% | Morgan Stanley | 260,078 | 9,090 | ||||
| ACE, Ltd. | 3,126 | 342 | Morningstar, Inc. | 684 | 47 | ||
| Aflac, Inc. | 84,075 | 5,022 | Northern Trust Corp. | 186,945 | 12,394 | ||
| Allstate Corp. (The)(Û) | 111,765 | 7,248 | NorthStar Realty Finance Corp.(ö) | 158,040 | 2,936 | ||
| American Express Co. | 206,900 | 18,611 | PartnerRe, Ltd. | 47,941 | 5,546 | ||
| American International Group, Inc.(Û) | 185,681 | 9,947 | PNC Financial Services Group, Inc. (The) | 548,735 | 47,405 | ||
| Ameriprise Financial, Inc. | 201,107 | 25,374 | Progressive Corp. (The) | 230,912 | 6,098 | ||
| Aon PLC | 72,500 | 6,235 | Prudential Financial, Inc. | 73,681 | 6,524 | ||
| Arch Capital Group, Ltd.(Æ) | 80,900 | 4,556 | Public Storage(ö) | 102 | 19 | ||
| Aspen Insurance Holdings, Ltd. | 197,423 | 8,614 | Regions Financial Corp. | 264,238 | 2,624 | ||
| Assurant, Inc.(Û) | 77,468 | 5,285 | Reinsurance Group of America, Inc. Class A | 120,230 | 10,129 | ||
| Assured Guaranty, Ltd. | 148,390 | 3,425 | SEI Investments Co. | 32,995 | 1,276 | ||
| Axis Capital Holdings, Ltd. | 27,490 | 1,323 | Simon Property Group, Inc.(ö) | 41,572 | 7,450 | ||
| Bank of America Corp. | 3,530,884 | 60,590 | State Street Corp. | 280,951 | 21,201 | ||
| Bank of New York Mellon Corp. (The) | 10,556 | 409 | SunTrust Banks, Inc. | 241,775 | 9,463 | ||
| Barclays PLC - ADR | 133,359 | 2,054 | T Rowe Price Group, Inc. | 35,000 | 2,873 | ||
| BB&T Corp. | 6,651 | 252 | Thomson Reuters Corp. | 3,289 | 122 | ||
| Berkshire Hathaway, Inc. Class B(Æ) | 126,047 | 17,667 | Torchmark Corp. | 47,276 | 2,504 | ||
| BlackRock, Inc. Class A | 729 | 249 | Travelers Cos., Inc. (The) | 3,217 | 324 | ||
| Capital One Financial Corp.(Û) | 176,991 | 14,650 | Twenty-First Century Fox, Inc.(Æ) | 4,636 | 160 | ||
| CBOE Holdings, Inc. | 23,700 | 1,397 | Unum Group(Û) | 67,600 | 2,262 | ||
| CBRE Group, Inc. Class A(Æ)(Û) | 79,300 | 2,538 | US Bancorp | 16,067 | 684 | ||
| Charles Schwab Corp. (The) | 8,689 | 249 | Validus Holdings, Ltd. | 63,400 | 2,522 | ||
| Chubb Corp. (The) | 45,463 | 4,517 | Visa, Inc. Class A | 144,794 | 34,958 | ||
| Citigroup, Inc. | 893,915 | 47,851 | Voya Financial, Inc. | 40,307 | 1,582 | ||
| City National Corp. | 14,350 | 1,129 | |||||
| CME Group, Inc. Class A | 68,007 | 5,700 | |||||
| See accompanying notes which are an integral part of the financial statements. | |||||||
| Russell U.S. Strategic Equity Fund 83 | |||||||
| Russell Investment Company | |||||||
| Russell U.S. Strategic Equity Fund | |||||||
| Schedule of Investments, continued — October 31, 2014 | |||||||
| Amounts in thousands (except share amounts) | Amounts in thousands (except share amounts) | ||||||
| Principal | Fair | Principal | Fair | ||||
| Amount ($) or | Value | Amount ($) or | Value | ||||
| Shares | $ | Shares | $ | ||||
| Wells Fargo & Co. | 1,161,446 | 61,661 | Celanese Corp. Class A | 27,700 | 1,627 | ||
| 696,639 | CF Industries Holdings, Inc.(Û) | 9,900 | 2,574 | ||||
| Commercial Metals Co. | 32,400 | 560 | |||||
| Health Care - 15.0% | CRH PLC - ADR | 367,000 | 8,224 | ||||
| Abbott Laboratories | 14,069 | 613 | Crown Holdings, Inc.(Æ) | 56,937 | 2,729 | ||
| Actavis PLC(Æ) | 30,830 | 7,484 | Dow Chemical Co. (The) | 25,706 | 1,270 | ||
| Aetna, Inc. | 73,438 | 6,059 | EI du Pont de Nemours & Co. | 31,576 | 2,183 | ||
| Alexion Pharmaceuticals, Inc.(Æ) | 28,658 | 5,484 | Fastenal Co. | 188,068 | 8,283 | ||
| Allergan, Inc. | 25,340 | 4,816 | Freeport-McMoRan, Inc. | 9,615 | 274 | ||
| AmerisourceBergen Corp. Class A | 33,700 | 2,878 | Huntsman Corp.(Û) | 94,600 | 2,308 | ||
| Amgen, Inc. | 113,183 | 18,356 | International Flavors & Fragrances, Inc. | 44,700 | 4,432 | ||
| Biogen Idec, Inc.(Æ)(Û) | 51,436 | 16,515 | Lennox International, Inc. | 52,596 | 4,677 | ||
| Bristol-Myers Squibb Co. | 323,678 | 18,835 | LyondellBasell Industries NV Class A(Û) | 111,567 | 10,223 | ||
| Brookdale Senior Living, Inc. Class A(Æ) | 61,957 | 2,089 | Minerals Technologies, Inc. | 14,427 | 1,107 | ||
| Cardinal Health, Inc. | 359,801 | 28,237 | Monsanto Co. | 160,700 | 18,487 | ||
| Catamaran Corp.(Æ) | 277,981 | 13,251 | Mosaic Co. (The) | 155,500 | 6,890 | ||
| Celgene Corp.(Æ)(Û) | 87,389 | 9,359 | Nucor Corp. | 36,800 | 1,989 | ||
| Cigna Corp.(Û) | 41,281 | 4,110 | Packaging Corp. of America | 39,935 | 2,879 | ||
| Clovis Oncology, Inc.(Æ) | 107,499 | 6,413 | PPG Industries, Inc. | 103,252 | 21,031 | ||
| Covidien PLC | 211,924 | 19,590 | Precision Castparts Corp. | 61,876 | 13,656 | ||
| Edwards Lifesciences Corp.(Æ) | 14,300 | 1,729 | Reliance Steel & Aluminum Co. | 13,400 | 904 | ||
| Eli Lilly & Co. | 145,252 | 9,635 | Rio Tinto PLC - ADR | 86,100 | 4,130 | ||
| Envision Healthcare Holdings, Inc.(Æ) | 14,798 | 517 | Sherwin-Williams Co. (The) | 18,990 | 4,359 | ||
| Express Scripts Holding Co.(Æ)(Û) | 186,910 | 14,359 | United States Steel Corp. | 168,300 | 6,739 | ||
| Gilead Sciences, Inc.(Æ) | 196,701 | 22,031 | Westlake Chemical Corp. | 14,500 | 1,023 | ||
| HCA Holdings, Inc.(Æ) | 122,800 | 8,602 | 149,212 | ||||
| Henry Schein, Inc.(Æ) | 18,250 | 2,191 | |||||
| Humana, Inc.(Û) | 17,010 | 2,362 | Producer Durables - 11.3% | ||||
| Illumina, Inc.(Æ) | 20,173 | 3,885 | 3M Co. | 7,109 | 1,093 | ||
| Intercept Pharmaceuticals, Inc.(Æ) | 19,630 | 5,072 | Accenture PLC Class A | 96,900 | 7,861 | ||
| Johnson & Johnson | 555,195 | 59,839 | Aegean Marine Petroleum Network, Inc. | 82,700 | 699 | ||
| McKesson Corp.(Û) | 99,153 | 20,169 | Alaska Air Group, Inc. | 48,200 | 2,566 | ||
| MEDNAX, Inc.(Æ) | 23,377 | 1,459 | Alliant Techsystems, Inc.(Û) | 14,100 | 1,649 | ||
| Medtronic, Inc. | 281,459 | 19,184 | American Airlines Group, Inc. | 27,700 | 1,145 | ||
| Merck & Co., Inc. | 765,860 | 44,374 | Boeing Co. (The) | 200,955 | 25,101 | ||
| Mylan, Inc.(Æ) | 125,956 | 6,745 | Canadian Pacific Railway, Ltd. | 38,321 | 7,959 | ||
| Myriad Genetics, Inc.(Æ)(Û) | 34,920 | 1,379 | Caterpillar, Inc. | 4,623 | 469 | ||
| Omnicare, Inc. | 11,800 | 786 | CoStar Group, Inc.(Æ) | 31,910 | 5,140 | ||
| Pfizer, Inc. | 2,771,409 | 83,004 | CSX Corp. | 210,203 | 7,490 | ||
| Pharmacyclics, Inc.(Æ) | 55,807 | 7,292 | Cummins, Inc. | 19,930 | 2,913 | ||
| St. Jude Medical, Inc. | 134,412 | 8,625 | Danaher Corp. | 4,303 | 346 | ||
| Stryker Corp. | 1,257 | 110 | Deere & Co. | 2,627 | 225 | ||
| Thermo Fisher Scientific, Inc. | 63,802 | 7,501 | Delphi Automotive PLC(Û) | 138,916 | 9,582 | ||
| United Therapeutics Corp.(Æ)(Û) | 19,700 | 2,580 | Delta Air Lines, Inc. | 282,802 | 11,377 | ||
| UnitedHealth Group, Inc. | 236,447 | 22,465 | Dover Corp. | 120,185 | 9,548 | ||
| Valeant Pharmaceuticals International, Inc. | Eaton Corp. PLC | 4,413 | 302 | ||||
| (Æ) | 171,443 | 22,809 | Emerson Electric Co. | 1,643 | 105 | ||
| WellPoint, Inc. | 2,589 | 328 | FedEx Corp. | 43,445 | 7,273 | ||
| Zimmer Holdings, Inc. | 78,757 | 8,761 | General Dynamics Corp. | 176,530 | 24,672 | ||
| Zoetis, Inc. Class A | 1 | — | General Electric Co. | 1,469,960 | 37,940 | ||
| 551,882 | Honeywell International, Inc. | 349,850 | 33,628 | ||||
| Huntington Ingalls Industries, Inc.(Û) | 27,400 | 2,899 | |||||
| Materials and Processing - 4.1% | IDEX Corp. | 33,017 | 2,473 | ||||
| Air Products & Chemicals, Inc. | 1,965 | 265 | Illinois Tool Works, Inc. | 173,100 | 15,761 | ||
| Alcoa, Inc. | 451,820 | 7,573 | Kirby Corp.(Æ) | 34,418 | 3,806 | ||
| AptarGroup, Inc. | 9,700 | 604 | Knight Transportation, Inc. | 32,022 | 937 | ||
| Ball Corp. | 92,101 | 5,934 | L-3 Communications Holdings, Inc. | 44,000 | 5,344 | ||
| Bombardier, Inc. Class B | 471,678 | 1,555 | Landstar System, Inc. | 69,095 | 5,114 | ||
| Brown-Forman Corp. Class B - ADR | 7,800 | 723 | Lexmark International, Inc. Class A | 57,200 | 2,469 | ||
| See accompanying notes which are an integral part of the financial statements. | |||||||
| 84 Russell U.S. Strategic Equity Fund | |||||||
| Russell Investment Company | |||||||
| Russell U.S. Strategic Equity Fund | |||||||
| Schedule of Investments, continued — October 31, 2014 | |||||||
| Amounts in thousands (except share amounts) | Amounts in thousands (except share amounts) | ||||||
| Principal | Fair | Principal | Fair | ||||
| Amount ($) or | Value | Amount ($) or | Value | ||||
| Shares | $ | Shares | $ | ||||
| Lockheed Martin Corp. | 60,196 | 11,472 | Palo Alto Networks, Inc.(Æ) | 45,900 | 4,852 | ||
| Navistar International Corp.(Æ) | 27,213 | 963 | PTC, Inc.(Æ) | 43,600 | 1,663 | ||
| Norfolk Southern Corp. | 135,559 | 14,998 | QUALCOMM, Inc. | 241,708 | 18,977 | ||
| Northrop Grumman Corp. | 11,807 | 1,629 | Rackspace Hosting, Inc.(Æ) | 287,173 | 11,016 | ||
| Parker-Hannifin Corp. | 19,330 | 2,455 | Salesforce.com, Inc.(Æ) | 302,035 | 19,327 | ||
| Paychex, Inc. | 84,200 | 3,952 | ServiceNow, Inc.(Æ) | 64,114 | 4,355 | ||
| Raytheon Co. | 285,063 | 29,612 | Skyworks Solutions, Inc. | 29,900 | 1,741 | ||
| Rockwell Automation, Inc. | 85,332 | 9,587 | Splunk, Inc.(Æ) | 61,858 | 4,088 | ||
| Rockwell Collins, Inc. | 16,100 | 1,355 | Stratasys, Ltd.(Æ) | 46,779 | 5,630 | ||
| Snap-on, Inc. | 23,024 | 3,042 | Symantec Corp. | 79,279 | 1,968 | ||
| Southwest Airlines Co.(Û) | 406,500 | 14,016 | Synopsys, Inc.(Æ) | 122,700 | 5,028 | ||
| Stanley Black & Decker, Inc. | 99,200 | 9,289 | Syntel, Inc.(Æ) | 9,700 | 840 | ||
| Textron, Inc. | 147,660 | 6,132 | Tableau Software, Inc. Class A(Æ) | 32,700 | 2,701 | ||
| Toro Co. (The) | 46,159 | 2,849 | Texas Instruments, Inc. | 338,681 | 16,819 | ||
| Trimble Navigation, Ltd.(Æ) | 179,593 | 4,824 | VeriSign, Inc.(Æ) | 46,700 | 2,791 | ||
| Trinity Industries, Inc. | 39,800 | 1,421 | Vishay Intertechnology, Inc. | 107,100 | 1,447 | ||
| Union Pacific Corp. | 228,819 | 26,646 | Vodafone Group PLC - ADR | 317,822 | 10,558 | ||
| United Continental Holdings, Inc.(Æ) | 175,388 | 9,262 | Western Digital Corp.(Û) | 79,584 | 7,829 | ||
| United Rentals, Inc.(Æ) | 64,097 | 7,055 | Workday, Inc. Class A(Æ) | 49,698 | 4,745 | ||
| United Technologies Corp. | 128,387 | 13,737 | Yahoo!, Inc.(Æ) | 155,805 | 7,175 | ||
| Wabtec Corp. | 52,932 | 4,568 | 575,012 | ||||
| Waste Management, Inc. | 3,864 | 189 | |||||
| 416,939 | Utilities - 3.5% | ||||||
| AES Corp.(Û) | 183,900 | 2,587 | |||||
| Technology - 15.6% | American Electric Power Co., Inc. | 4,518 | 264 | ||||
| Adobe Systems, Inc.(Æ) | 87,400 | 6,128 | AT&T, Inc. | 786,981 | 27,418 | ||
| Altera Corp. | 145,649 | 5,006 | Calpine Corp.(Æ) | 85,700 | 1,956 | ||
| Apple, Inc.(Û) | 755,759 | 81,622 | CenturyLink, Inc.(Û) | 157,549 | 6,535 | ||
| Arrow Electronics, Inc.(Æ) | 43,800 | 2,490 | CMS Energy Corp. | 97,012 | 3,169 | ||
| ASML Holding NV Class G | 87,150 | 8,687 | Dominion Resources, Inc. | 5,056 | 361 | ||
| Autodesk, Inc.(Æ) | 11,198 | 644 | DTE Energy Co. | 129,085 | 10,606 | ||
| Avnet, Inc. | 74,721 | 3,232 | Duke Energy Corp. | 6,634 | 545 | ||
| Brocade Communications Systems, Inc. | 179,500 | 1,926 | Encana Corp. | 346,250 | 6,451 | ||
| Cisco Systems, Inc. | 722,453 | 17,678 | Entergy Corp. | 126,100 | 10,595 | ||
| Computer Sciences Corp. | 40,800 | 2,464 | Exelon Corp. | 353,549 | 12,936 | ||
| Corning, Inc. | 9,302 | 190 | FirstEnergy Corp. | 21,295 | 795 | ||
| Dolby Laboratories, Inc. Class A | 11,882 | 498 | NextEra Energy, Inc. | 113,115 | 11,336 | ||
| DST Systems, Inc. | 1,737 | 167 | PG&E Corp. | 4,302 | 216 | ||
| Electronic Arts, Inc.(Æ) | 185,400 | 7,596 | Southern Co. | 8,252 | 383 | ||
| EMC Corp. | 581,330 | 16,702 | Sprint Corp.(Æ) | 6,743 | 40 | ||
| Facebook, Inc. Class A(Æ) | 289,937 | 21,742 | T-Mobile US, Inc.(Æ) | 2,458 | 72 | ||
| Gartner, Inc.(Æ) | 11,910 | 961 | UGI Corp. | 98,347 | 3,707 | ||
| Google, Inc. Class C(Æ) | 82,299 | 46,457 | Verizon Communications, Inc. | 590,986 | 29,697 | ||
| Hewlett-Packard Co. | 145,801 | 5,231 | 129,669 | ||||
| Ingram Micro, Inc. Class A(Æ) | 90,200 | 2,421 | |||||
| Intel Corp. | 1,246,857 | 42,406 | Total Common Stocks | ||||
| International Business Machines Corp. | 113,734 | 18,698 | (cost $3,024,149) | 3,539,670 | |||
| Intuit, Inc. | 103,699 | 9,127 | |||||
| Jabil Circuit, Inc. | 131,500 | 2,755 | Investments in Other Funds - 0.1% | ||||
| Lam Research Corp.(Û) | 114,730 | 8,933 | Financial Services - 0.1% | ||||
| Lambda TD Software, Inc.(Æ)(Û) | 100,600 | 1,796 | iShares Russell 1000 Value ETF | 25,836 | 2,640 | ||
| Mentor Graphics Corp. | 33,267 | 705 | Total Investments in Other Funds | ||||
| Micron Technology, Inc.(Æ) | 387,322 | 12,816 | (cost $2,493) | 2,640 | |||
| Microsoft Corp. | 1,191,853 | 55,958 | |||||
| Motorola Solutions, Inc. | 65,631 | 4,233 | Short-Term Investments - 4.4% | ||||
| NetApp, Inc. | 247,250 | 10,582 | Russell U.S. Cash Management Fund | 163,585,853(8) | 163,586 | ||
| NXP Semiconductor NV(Æ) | 78,200 | 5,369 | Total Short-Term Investments | ||||
| ON Semiconductor Corp.(Æ) | 114,900 | 953 | (cost $163,586) | 163,586 | |||
| Oracle Corp. | 903,679 | 35,289 | |||||
| See accompanying notes which are an integral part of the financial statements. | |||||||
| Russell U.S. Strategic Equity Fund 85 | |||||||
Russell Investment Company Russell U.S. Strategic Equity Fund
Schedule of Investments, continued — October 31, 2014
Amounts in thousands (except share amounts)
| Principal | Fair | |||||
| Amount ($) or | Value | |||||
| Shares | $ | |||||
| Total Investments 100.6% | ||||||
| (identified cost $3,190,228) | 3,705,896 | |||||
| Securities Sold Short - (0.9)% | ||||||
| Consumer Discretionary - (0.1)% | ||||||
| DreamWorks Animation SKG, Inc. Class | ||||||
| A(Æ) | (58,130 | ) | (1,295 | ) | ||
| HomeAway, Inc.(Æ) | (29,200 | ) | (1,019 | ) | ||
| Nu Skin Enterprises, Inc. Class A | (23,600 | ) | (1,247 | ) | ||
| (3,561 | ) | |||||
| Energy - (0.3)% | ||||||
| Golar LNG, Ltd.(Æ) | (41,600 | ) | (2,334 | ) | ||
| Gulfport Energy Corp.(Æ) | (41,500 | ) | (2,083 | ) | ||
| Seadrill, Ltd. | (61,400 | ) | (1,412 | ) | ||
| SolarCity Corp.(Æ) | (42,700 | ) | (2,527 | ) | ||
| SunPower Corp. Class A(Æ) | (40,700 | ) | (1,296 | ) | ||
| (9,652 | ) | |||||
| Financial Services - (0.2)% | ||||||
| Ocwen Financial Corp.(Æ) | (100,000 | ) | (2,356 | ) | ||
| Plum Creek Timber Co., Inc.(ö) | (63,300 | ) | (2,596 | ) | ||
| St. Joe Co. (The)(Æ) | (102,200 | ) | (1,957 | ) | ||
| (6,909 | ) | |||||
| Health Care - (0.1)% | ||||||
| Brookdale Senior Living, Inc. Class A(Æ) | (73,800 | ) | (2,488 | ) | ||
| Materials and Processing – (0.0)% | ||||||
| Tahoe Resources, Inc.(Æ) | (52,000 | ) | (903 | ) | ||
| Vulcan Materials Co. | (13,600 | ) | (839 | ) | ||
| (1,742 | ) | |||||
| Producer Durables - (0.0)% | ||||||
| Colfax Corp.(Æ) | (33,500 | ) | (1,822 | ) | ||
| Technology - (0.2)% | ||||||
| Advanced Micro Devices, Inc.(Æ) | (793,400 | ) | (2,221 | ) | ||
| NetSuite, Inc.(Æ) | (3,100 | ) | (337 | ) | ||
| Stratasys, Ltd.(Æ) | (5,200 | ) | (626 | ) | ||
| SunEdison, Inc.(Æ) | (29,900 | ) | (583 | ) | ||
| Zynga, Inc. Class A(Æ) | (791,690 | ) | (2,019 | ) | ||
| (5,786 | ) | |||||
| Utilities - (0.0)% | ||||||
| US Cellular Corp.(Æ) | (10,100 | ) | (368 | ) | ||
| Total Securities Sold Short | ||||||
| (proceeds $32,957) | (32,328 | ) | ||||
| Other Assets and Liabilities, Net | ||||||
| - 0.3% | 11,711 | |||||
| Net Assets - 100.0% | 3,685,279 | |||||
See accompanying notes which are an integral part of the financial statements.
86 Russell U.S. Strategic Equity Fund
| Russell Investment Company | |||||||||||||||
| Russell U.S. Strategic Equity Fund | |||||||||||||||
| Schedule of Investments, continued — October 31, 2014 | |||||||||||||||
| Futures Contracts | |||||||||||||||
| Amounts in thousands (except contract amounts) | |||||||||||||||
| Unrealized | |||||||||||||||
| Appreciation | |||||||||||||||
| Number of | Notional | Expiration | (Depreciation) | ||||||||||||
| Contracts | Amount | Date | $ | ||||||||||||
| Long Positions | |||||||||||||||
| Russell 1000 Mini Index Futures | 155 | USD | 17,338 | 12/14 | 300 | ||||||||||
| S&P 500 E-Mini Index Futures | 1,520 | USD | 152,867 | 12/14 | 2,702 | ||||||||||
| Total Unrealized Appreciation (Depreciation) on Open Futures Contracts (å) | 3,002 | ||||||||||||||
| Presentation of Portfolio Holdings | |||||||||||||||
| Amounts in thousands | |||||||||||||||
| Fair Value | |||||||||||||||
| Portfolio Summary | Level 1 | Level 2 | Level 3 | Total | % of Net Assets | ||||||||||
| Common Stocks | |||||||||||||||
| Consumer Discretionary | $ | 517,998 | $ | — | $ | — | $ | 517,998 | 14.1 | ||||||
| Consumer Staples | 195,249 | — | — | 195,249 | 5.3 | ||||||||||
| Energy | 307,070 | — | — | 307,070 | 8.3 | ||||||||||
| Financial Services | 696,639 | — | — | 696,639 | 18.9 | ||||||||||
| Health Care | 551,882 | — | — | 551,882 | 15.0 | ||||||||||
| Materials and Processing | 149,212 | — | — | 149,212 | 4.1 | ||||||||||
| Producer Durables | 416,939 | — | — | 416,939 | 11.3 | ||||||||||
| Technology | 575,012 | — | — | 575,012 | 15.6 | ||||||||||
| Utilities | 129,669 | — | — | 129,669 | 3.5 | ||||||||||
| Investments in Other Funds | 2,640 | — | — | 2,640 | 0.1 | ||||||||||
| Short-Term Investments | — | 163,586 | — | 163,586 | 4.4 | ||||||||||
| Total Investments | 3,542,310 | 163,586 | — | 3,705,896 | 100.6 | ||||||||||
| Securities Sold Short* | (32,328 | ) | — | — | (32,328 | ) | (0.9 | ) | |||||||
| Other Assets and Liabilities, Net | 0.3 | ||||||||||||||
| 100.0 | |||||||||||||||
| Other Financial Instruments | |||||||||||||||
| Futures Contracts | 3,002 | — | — | 3,002 | 0.1 | ||||||||||
| Total Other Financial Instruments** | $ | 3,002 | $ | — | $ | — | $ | 3,002 | |||||||
| * | Refer to Schedule of Investments for detailed sector breakout. |
| ** | Futures and foreign currency exchange contract values reflect the unrealized appreciation (depreciation) on the instruments. |
For a description of the Levels see note 2 in the Notes to Financial Statements.
For disclosure on transfers between Levels 1, 2 and 3 during the period ended October 31, 2014, see note 2 in the Notes to Financial Statements.
See accompanying notes which are an integral part of the financial statements.
Russell U.S. Strategic Equity Fund 87
| Russell Investment Company | |||
| Russell U.S. Strategic Equity Fund | |||
| Fair Value of Derivative Instruments — October 31, 2014 | |||
| Amounts in thousands | |||
| Equity | |||
| Derivatives not accounted for as hedging instruments | Contracts | ||
| Location: Statement of Assets and Liabilities - Assets | |||
| Variation margin on futures contracts* | $ | 3,002 | |
| Equity | |||
| Derivatives not accounted for as hedging instruments | Contracts | ||
| Location: Statement of Operations - Net realized gain (loss) | |||
| Futures contracts | $ | 25,170 | |
| Location: Statement of Operations - Net change in unrealized appreciation (depreciation) | |||
| Futures contracts | $ | (1,473 | ) |
| * | Includes cumulative appreciation/depreciation of futures contracts as reported in the Schedule of Investments. Only variation margin is reported within the Statement of Assets and Liabilities. |
For further disclosure on derivatives see note 2 in the Notes to Financial Statements.
See accompanying notes which are an integral part of the financial statements.
88 Russell U.S. Strategic Equity Fund
Russell Investment Company Russell U.S. Strategic Equity Fund
Balance Sheet Offsetting of Financial and Derivative Instruments — October 31, 2014
| Amounts in thousands | ||||||||||
| Offsetting of Financial Assets and Derivative Assets | ||||||||||
| Gross | Net Amounts | |||||||||
| Amounts | of Assets | |||||||||
| Gross | Offset in the | Presented in | ||||||||
| Amounts of | Statement of | the Statement | ||||||||
| Recognized | Assets and | of Assets and | ||||||||
| Description | Location: Statement of Assets and Liabilities - Assets | Assets | Liabilities | Liabilities | ||||||
| Futures Contracts | Variation margin on futures contracts | $ | 1,936 | $ | — $ | 1,936 | ||||
| Total | $ | 1,936 | $ | — $ | 1,936 | |||||
| Financial Assets, Derivative Assets, and Collateral Held by Counterparty | ||||||||||
| Gross Amounts Not Offset in | ||||||||||
| the Statement of Assets and | ||||||||||
| Liabilities | ||||||||||
| Net Amounts | ||||||||||
| of Assets | ||||||||||
| Presented in | ||||||||||
| the Statement | Financial and | |||||||||
| of Assets and | Derivative | Collateral | ||||||||
| Counterparty | Liabilities | Instruments | Received^ | Net Amount | ||||||
| Merrill Lynch | $ | 1,936 | $ | — | $ — | $ 1,936 | ||||
| Total | $ | 1,936 | $ | — | $ — | $ 1,936 | ||||
^ Collateral received or pledged amounts may not reconcile to those disclosed in the Statement of Assets and Liabilities due to the inclusion of off-Balance Sheet collateral and adjustments made to exclude overcollateralization.
For further disclosure on derivatives and counterparty risk see note 2 in the Notes to Financial Statements.
See accompanying notes which are an integral part of the financial statements.
Russell U.S. Strategic Equity Fund 89
| Russell Investment Company | ||
| Russell U.S. Strategic Equity Fund | ||
| Statement of Assets and Liabilities — October 31, 2014 | ||
| Amounts in thousands | ||
| Assets | ||
| Investments, at identified cost | $ | 3,190,228 |
| Investments, at fair value(>) | 3,705,896 | |
| Cash | 85 | |
| Cash (restricted)(a) | 8,091 | |
| Receivables: | ||
| Dividends and interest | 2,602 | |
| Dividends from affiliated Russell funds | 13 | |
| Investments sold | 20,723 | |
| Fund shares sold | 6,324 | |
| Variation margin on futures contracts | 1,936 | |
| Prepaid expenses | 5 | |
| Total assets | 3,745,675 | |
| Liabilities | ||
| Payables: | ||
| Investments purchased | 22,894 | |
| Fund shares redeemed | 2,656 | |
| Accrued fees to affiliates | 2,289 | |
| Other accrued expenses | 229 | |
| Securities sold short, at fair value(‡) | 32,328 | |
| Total liabilities | 60,396 | |
| Net Assets | $ | 3,685,279 |
See accompanying notes which are an integral part of the financial statements.
90 Russell U.S. Strategic Equity Fund
| Russell Investment Company | ||
| Russell U.S. Strategic Equity Fund | ||
| Statement of Assets and Liabilities, continued — October 31, 2014 | ||
| Amounts in thousands | ||
| Net Assets Consist of: | ||
| Undistributed (overdistributed) net investment income | $ | 1,199 |
| Accumulated net realized gain (loss) | 300,200 | |
| Unrealized appreciation (depreciation) on: | ||
| Investments | 515,668 | |
| Futures contracts | 3,002 | |
| Securities sold short | 629 | |
| Shares of beneficial interest | 2,742 | |
| Additional paid-in capital | 2,861,839 | |
| Net Assets | $ | 3,685,279 |
| Net Asset Value, offering and redemption price per share: | ||
| Net asset value per share: Class A(#) | $ | 13.42 |
| Maximum offering price per share (Net asset value plus sales charge of 5.75%): Class A | $ | 14.24 |
| Class A — Net assets | $ | 4,826,058 |
| Class A — Shares outstanding ($.01 par value) | 359,508 | |
| Net asset value per share: Class C(#) | $ | 13.39 |
| Class C — Net assets | $ | 16,787,247 |
| Class C — Shares outstanding ($.01 par value) | 1,253,382 | |
| Net asset value per share: Class E(#) | $ | 13.44 |
| Class E — Net assets | $ | 97,618,309 |
| Class E — Shares outstanding ($.01 par value) | 7,262,823 | |
| Net asset value per share: Class S(#) | $ | 13.44 |
| Class S — Net assets | $ 3,566,047,210 | |
| Class S — Shares outstanding ($.01 par value) | 265,278,968 | |
| Amounts in thousands | ||
| (‡) Proceeds on securities sold short | $ | 32,957 |
| (>) Investments in affiliates, Russell U.S. Cash Management Fund | $ | 163,586 |
| (a) Cash Collateral for Futures | $ | 8,091 |
| (#) Net asset value per share equals class level net assets divided by class level shares of beneficial interest outstanding. | ||
See accompanying notes which are an integral part of the financial statements.
Russell U.S. Strategic Equity Fund 91
| Russell Investment Company | |||
| Russell U.S. Strategic Equity Fund | |||
| Statement of Operations — For the Period Ended October 31, 2014 | |||
| Amounts in thousands | |||
| Investment Income | |||
| Dividends | $ | 65,712 | |
| Dividends from affiliated Russell funds | 148 | ||
| Total investment income | 65,860 | ||
| Expenses | |||
| Advisory fees | 25,305 | ||
| Administrative fees | 1,607 | ||
| Custodian fees | 459 | ||
| Distribution fees - Class A | 10 | ||
| Distribution fees - Class C | 105 | ||
| Transfer agent fees - Class A | 8 | ||
| Transfer agent fees - Class C | 28 | ||
| Transfer agent fees - Class E | 197 | ||
| Transfer agent fees - Class S | 6,515 | ||
| Professional fees | 104 | ||
| Registration fees | 122 | ||
| Shareholder servicing fees - Class C | 35 | ||
| Shareholder servicing fees - Class E | 246 | ||
| Trustees’ fees | 82 | ||
| Printing fees | 153 | ||
| Dividends from securities sold short | 615 | ||
| Interest expense paid on securities sold short | 647 | ||
| Miscellaneous | 159 | ||
| Expenses before reductions | 36,397 | ||
| Expense reductions | (8,340 | ) | |
| Net expenses | 28,057 | ||
| Net investment income (loss) | 37,803 | ||
| Net Realized and Unrealized Gain (Loss) | |||
| Net realized gain (loss) on: | |||
| Investments | 299,199 | ||
| Futures contracts | 25,170 | ||
| Securities sold short | (3,165 | ) | |
| Foreign currency-related transactions | (1 | ) | |
| Net realized gain (loss) | 321,203 | ||
| Net change in unrealized appreciation (depreciation) on: | |||
| Investments | 113,529 | ||
| Futures contracts | (1,473 | ) | |
| Securities sold short | 546 | ||
| Net change in unrealized appreciation (depreciation) | 112,602 | ||
| Net realized and unrealized gain (loss) | 433,805 | ||
| Net Increase (Decrease) in Net Assets from Operations | $ | 471,608 | |
See accompanying notes which are an integral part of the financial statements.
92 Russell U.S. Strategic Equity Fund
| Russell Investment Company | ||||||
| Russell U.S. Strategic Equity Fund | ||||||
| Statements of Changes in Net Assets | ||||||
| For the Periods Ended October 31, | ||||||
| Amounts in thousands | 2014 | 2013 | ||||
| Increase (Decrease) in Net Assets | ||||||
| Operations | ||||||
| Net investment income (loss) | $ | 37,803 | $ | 28,484 | ||
| Net realized gain (loss) | 321,203 | 211,594 | ||||
| Net change in unrealized appreciation (depreciation) | 112,602 | 394,834 | ||||
| Net increase (decrease) in net assets from operations | 471,608 | 634,912 | ||||
| Distributions | ||||||
| From net investment income | ||||||
| Class A | (38 | ) | (12 | ) | ||
| Class C | (30 | ) | (14 | ) | ||
| Class E | (855 | ) | (681 | ) | ||
| Class S | (36,992 | ) | (27,735 | ) | ||
| From net realized gain | ||||||
| Class A | (255 | ) | (1 | ) | ||
| Class C | (786 | ) | (11 | ) | ||
| Class E | (6,859 | ) | (190 | ) | ||
| Class S | (224,840 | ) | (5,721 | ) | ||
| Net decrease in net assets from distributions | (270,655 | ) | (34,365 | ) | ||
| Share Transactions* | ||||||
| Net increase (decrease) in net assets from share transactions | 404,716 | 333,482 | ||||
| Total Net Increase (Decrease) in Net Assets | 605,669 | 934,029 | ||||
| Net Assets | ||||||
| Beginning of period | 3,079,610 | 2,145,581 | ||||
| End of period | $ | 3,685,279 | $ | 3,079,610 | ||
| Undistributed (overdistributed) net investment income included in net assets | $ | 1,199 | $ | 1,304 | ||
See accompanying notes which are an integral part of the financial statements.
Russell U.S. Strategic Equity Fund 93
Russell Investment Company Russell U.S. Strategic Equity Fund
Statements of Changes in Net Assets, continued
* Share transaction amounts (in thousands) for the periods ended October 31, 2014 and October 31, 2013 were as follows:
| 2014 | 2013 | |||||||||||
| Shares | Dollars | Shares | Dollars | |||||||||
| Class A | ||||||||||||
| Proceeds from shares sold | 181 | $ | 2,297 | 246 | $ | 2,884 | ||||||
| Proceeds from reinvestment of distributions | 24 | 291 | 1 | 14 | ||||||||
| Payments for shares redeemed | (107 | ) | (1,365 | ) | (48 | ) | (549 | ) | ||||
| Net increase (decrease) | 98 | 1,223 | 199 | 2,349 | ||||||||
| Class C | ||||||||||||
| Proceeds from shares sold | 563 | 7,081 | 581 | 6,583 | ||||||||
| Proceeds from reinvestment of distributions | 67 | 815 | 2 | 25 | ||||||||
| Payments for shares redeemed | (159 | ) | (2,023 | ) | (144 | ) | (1,662 | ) | ||||
| Net increase (decrease) | 471 | 5,873 | 439 | 4,946 | ||||||||
| Class E | ||||||||||||
| Proceeds from shares sold | 1,343 | 16,957 | 1,933 | 22,115 | ||||||||
| Proceeds from reinvestment of distributions | 602 | 7,419 | 78 | 849 | ||||||||
| Payments for shares redeemed | (1,811 | ) | (23,446 | ) | (1,699 | ) | (19,754 | ) | ||||
| Net increase (decrease) | 134 | 930 | 312 | 3,210 | ||||||||
| Class S | ||||||||||||
| Proceeds from shares sold | 68,530 | 872,109 | 73,197 | 832,119 | ||||||||
| Proceeds from reinvestment of distributions | 21,116 | 260,569 | 3,018 | 33,361 | ||||||||
| Payments for shares redeemed | (57,926 | ) | (735,988 | ) | (47,186 | ) | (542,503 | ) | ||||
| Net increase (decrease) | 31,720 | 396,690 | 29,029 | 322,977 | ||||||||
| Total increase (decrease) | 32,423 | $ | 404,716 | 29,979 | $ | 333,482 | ||||||
See accompanying notes which are an integral part of the financial statements.
94 Russell U.S. Strategic Equity Fund
(This page intentionally left blank)
| Russell Investment Company | |||||||||||||||
| Russell U.S. Strategic Equity Fund | |||||||||||||||
| Financial Highlights — For the Periods Ended | |||||||||||||||
| For a Share Outstanding Throughout Each Period. | |||||||||||||||
| $ | $ | $ | $ | $ | $ | ||||||||||
| Net Asset Value, | Net | Net Realized | Total from | Distributions | Distributions | ||||||||||
| Beginning of | Investment | and Unrealized | Investment | from Net | from Net | ||||||||||
| Period | Income (Loss)(a)(d) | Gain (Loss) | Operations | Investment Income | Realized Gain | ||||||||||
| Class A | |||||||||||||||
| October 31, 2014 | 12.73 | .11 | 1.66 | 1.77 | (.12 | ) | (.96 | ) | |||||||
| October 31, 2013 | 10.13 | .08 | 2.65 | 2.73 | (.10 | ) | (.03 | ) | |||||||
| October 31, 2012(5) | 10.00 | .01 | .13 | .14 | (.01 | ) | — | ||||||||
| Class C | |||||||||||||||
| October 31, 2014 | 12.71 | .02 | 1.65 | 1.67 | (.03 | ) | (.96 | ) | |||||||
| October 31, 2013 | 10.12 | — | (f) | 2.65 | 2.65 | (.03 | ) | (.03 | ) | ||||||
| October 31, 2012(5) | 10.00 | — | (f) | .13 | .13 | (.01 | ) | — | |||||||
| Class E | |||||||||||||||
| October 31, 2014 | 12.74 | .11 | 1.66 | 1.77 | (.11 | ) | (.96 | ) | |||||||
| October 31, 2013 | 10.13 | .10 | 2.63 | 2.73 | (.09 | ) | (.03 | ) | |||||||
| October 31, 2012(5) | 10.00 | .01 | .14 | .15 | (.02 | ) | — | ||||||||
| Class S | |||||||||||||||
| October 31, 2014 | 12.74 | .14 | 1.67 | 1.81 | (.15 | ) | (.96 | ) | |||||||
| October 31, 2013 | 10.13 | .13 | 2.63 | 2.76 | (.12 | ) | (.03 | ) | |||||||
| October 31, 2012(5) | 10.00 | .02 | .13 | .15 | (.02 | ) | — | ||||||||
See accompanying notes which are an integral part of the financial statements.
96 Russell U.S. Strategic Equity Fund
| % | % | % | |||||||||||||||
| $ | $ | Ratio of Expenses | Ratio of Expenses | Ratio of Net | |||||||||||||
| Net Asset Value, | % | Net Assets, | to Average | to Average | Investment Income | % | |||||||||||
| $ | End of | Total | End of Period | Net Assets, | Net Assets, | to Average | Portfolio | ||||||||||
| Total Distributions | Period | Return(b)(c) | (000 | ) | Gross(e) | Net(d)(e)(g) | Net Assets(d)(e) | Turnover Rate(b) | |||||||||
| (1.08 | ) | 13.42 | 14.72 | 4,826 | 1.32 | 1.07 | .86 | 85 | |||||||||
| (.13 | ) | 12.73 | 27.15 | 3,327 | 1.31 | 1.13 | .73 | 125 | |||||||||
| (.01 | ) | 10.13 | 1.44 | 633 | 1.36 | 1.12 | .57 | 15 | |||||||||
| (.99 | ) | 13.39 | 13.86 | 16,787 | 2.07 | 1.82 | .12 | 85 | |||||||||
| (.06 | ) | 12.71 | 26.27 | 9,948 | 2.07 | 1.88 | .03 | 125 | |||||||||
| (.01 | ) | 10.12 | 1.28 | 3,479 | 2.12 | 1.87 | (.19 | ) | 15 | ||||||||
| (1.07 | ) | 13.44 | 14.76 | 97,618 | 1.32 | 1.07 | .90 | 85 | |||||||||
| (.12 | ) | 12.74 | 27.19 | 90,808 | 1.31 | 1.13 | .86 | 125 | |||||||||
| (.02 | ) | 10.13 | 1.46 | 69,066 | 1.37 | 1.12 | .41 | 15 | |||||||||
| (1.11 | ) | 13.44 | 15.05 | 3,566,048 | 1.07 | .82 | 1.13 | 85 | |||||||||
| (.15 | ) | 12.74 | 27.51 | 2,975,527 | 1.06 | .88 | 1.10 | 125 | |||||||||
| (.02 | ) | 10.13 | 1.46 | 2,072,403 | 1.11 | .87 | .96 | 15 | |||||||||
See accompanying notes which are an integral part of the financial statements.
Russell U.S. Strategic Equity Fund 97
Russell Investment Company Select U.S. Equity Fund
Portfolio Management Discussion and Analysis — October 31, 2014 (Unaudited)

| Select U.S. Equity Fund - Class Y | Russell 1000® Index** | ||||||
| Total | Total | ||||||
| Return | Return | ||||||
| Inception* | 4.34 | % | Inception* | 4.81 | % |
98 Select U.S. Equity Fund
Russell Investment Company
Select U.S. Equity Fund
Portfolio Management Discussion and Analysis, continued — October 31, 2014 (Unaudited)
With the continuation of the economic recovery, the Fund was underweight in most of the sectors that are traditionally considered
What is the Fund’s investment objective? to be “non-cyclical” and/or interest rate sensitive. However, The Select U.S. Equity Fund (the “Fund”) seeks to provide long certain industries that tend to be viewed as “bond substitutes,” term capital growth. due to their income producing qualities, such as electric utilities, How did the Fund perform relative to its benchmark for the outperformed and this detracted from the Fund’s benchmark-fiscal year ended October 31, 2014? relative performance.
For the period of July 31, 2014 (inception of the Fund) through How did the investment strategies and techniques employed October 31, 2014, the Fund’s Class Y Shares gained 4.34%. by the Fund and its money managers affect its benchmark-This is compared to the Fund’s benchmark, the Russell 1000® relative performance?
Index, which gained 4.81% during the same period. The Fund’s
The Fund’s factor exposures were not rewarded, and specifically performance includes operating expenses, whereas index returns an overweight to stocks with lower than benchmark valuation are unmanaged and do not include expenses of any kind. ratios (lower price-to-earnings, price-to-book, and price-to-cash For the period from July 31, 2014 (inception of the Fund) to flow ratios) detracted. The Fund’s overweight to the energy sector October 31, 2014, the Morningstar® Large Blend, a group of funds and underweights to the electric utilities and biotechnology that Morningstar considers to have investment strategies similar industries were not beneficial, although an overweight to the to those of the Fund, gained 3.64%. These results serve as peer insurance: property and casualty industry was rewarded. comparisons and are expressed net of operating expenses.
During the period, RIMCo used index futures contracts to equitize How did the market conditions described in the Market the Fund’s cash. The decision to equitize cash was beneficial to
Summary report affect the Fund’s performance? Fund performance.
The Fund was launched on July 31, 2014. Over the three month Describe any changes to the Fund’s structure or the money period since the Fund’s inception, the U.S. large capitalization manager line-up. equity market produced positive returns. Relevant Fund exposures There were no changes to the Fund’s structure since its launch. included tilts toward stocks with lower than benchmark valuation ratios (lower price-to-earnings, price-to-book, and price-to-cash The views expressed in this report reflect those of the portfolio flow ratios) and energy stocks, and away from biotechnology managers only through the end of the period covered by stocks. Growth stocks outperformed value stocks for the relevant the report. These views do not necessarily represent the portion of the fiscal year and health care stocks outperformed the views of RIMCo, or any other person in RIMCo or any other Russell 1000® Index, detracting from the Fund’s benchmark- affiliated organization. These views are subject to change relative performance. The overweight to the energy sector and at any time based upon market conditions or other events, the underweight to the biotechnology industry detracted. An and RIMCo disclaims any responsibility to update the views overweight to the insurance: property and casualty industry was contained herein. These views should not be relied on as beneficial as it outperformed the Russell 1000® Index for the investment advice and, because investment decisions for relevant period. a Russell Investment Company (“RIC”) Fund are based on numerous factors, should not be relied on as an indication of investment decisions of any RIC Fund.
| * | Assumes initial investment on July 31, 2014. |
| ** | Russell 1000® Index includes the 1,000 largest companies in the Russell 3000® Index. The Russell 1000® Index represents the universe of stocks from which most active money managers typically select. The Russell 1000® Index return reflects adjustments from income dividends and capital gain distributions reinvested as of the ex-dividend dates. |
Performance is historical and assumes reinvestment of all dividends and capital gains. Investment return and principal value will fluctuate so that an investor’s shares, when redeemed, may be worth more or less than when purchased. Past performance is not indicative of future results. The returns shown do not reflect the deduction of taxes that a shareholder would pay on Fund distributions or the redemption of Fund shares.
Select U.S. Equity Fund 99
Russell Investment Company Select U.S. Equity Fund
Shareholder Expense Example — October 31, 2014 (Unaudited)
| Fund Expenses | Please note that the expenses shown in the table are meant | ||||||
| The following disclosure provides important information | to highlight your ongoing costs only and do not reflect any | ||||||
| regarding the Fund’s Shareholder Expense Example | transactional costs. Therefore, the information under the heading | ||||||
| (“Example”). | “Hypothetical Performance (5% return before expenses)” is | ||||||
| useful in comparing ongoing costs only, and will not help you | |||||||
| Example | determine the relative total costs of owning different funds. In | ||||||
| As a shareholder of the Fund, you incur two types of costs: (1) | addition, if these transactional costs were included, your costs | ||||||
| transaction costs, and (2) ongoing costs, including advisory and | would have been higher. | ||||||
| administrative fees; and other Fund expenses. The Example is | Hypothetical | ||||||
| intended to help you understand your ongoing costs (in dollars) | Performance (5% | ||||||
| of investing in the Fund and to compare these costs with the | Actual | return before | |||||
| ongoing costs of investing in other mutual funds. The Example | Class Y | Performance | expenses) | ||||
| Beginning Account Value | |||||||
| is based on an investment of $1,000 invested at the beginning of | August 1, 2014 | $ | 1,000.00 | $ | 1,000.00 | ||
| the period and held for the entire period indicated, which for this | Ending Account Value | ||||||
| Fund is from August 1, 2014 to October 31, 2014. | October 31, 2014 | $ | 1,043.40 | $ | 1,023.44 | ||
| Expenses Paid During Period* | $ | 0.90 | $ | 1.79 | |||
| Actual Expenses | |||||||
| The information in the table under the heading “Actual | * Expenses are equal to the Fund's annualized expense ratio of 0.35% | ||||||
| (representing the 92-day period annualized), multiplied by the average | |||||||
| Performance” provides information about actual account values | account value over the period, multiplied by 92/365 (to reflect the period since | ||||||
| and actual expenses. You may use the information in this column, | commencement of operations). May reflect amounts waived and/or reimbursed. | ||||||
| together with the amount you invested, to estimate the expenses | Without any waivers and/or reimbursements, expenses would have been higher. | ||||||
| that you paid over the period. Simply divide your account value by | Hypothetical expenses are equal to the Fund’s annualized expense ratio of | ||||||
| 0.35% (representing the six-month period annualized), multiplied by the | |||||||
| $1,000 (for example, an $8,600 account value divided by $1,000 | average account value over the period, multiplied by 184/365 (to reflect the | ||||||
| = 8.6), then multiply the result by the number in the first column | one-half year period). | ||||||
| in the row entitled “Expenses Paid During Period” to estimate | |||||||
| the expenses you paid on your account during this period. | |||||||
| Hypothetical Example for Comparison Purposes | |||||||
| The information in the table under the heading “Hypothetical | |||||||
| Performance (5% return before expenses)” provides information | |||||||
| about hypothetical account values and hypothetical expenses | |||||||
| based on the Fund’s actual expense ratio and an assumed rate of | |||||||
| return of 5% per year before expenses, which is not the Fund’s | |||||||
| actual return. The hypothetical account values and expenses | |||||||
| may not be used to estimate the actual ending account balance or | |||||||
| expenses you paid for the period. You may use this information | |||||||
| to compare the ongoing costs of investing in the Fund and other | |||||||
| funds. To do so, compare this 5% hypothetical example with the | |||||||
| 5% hypothetical examples that appear in the shareholder reports | |||||||
| of other funds. | |||||||
100 Select U.S. Equity Fund
| Russell Investment Company | ||||||||
| Select U.S. Equity Fund | ||||||||
| Schedule of Investments — October 31, 2014 | ||||||||
| Amounts in thousands (except share amounts) | Amounts in thousands (except share amounts) | |||||||
| Principal | Fair | Principal | Fair | |||||
| Amount ($) or | Value | Amount ($) or | Value | |||||
| Shares | $ | Shares | $ | |||||
| Common Stocks - 96.5% | Fortune Brands Home & Security, Inc. | 837 | 36 | |||||
| Consumer Discretionary - 13.3% | Fossil Group, Inc.(Æ) | 94 | 10 | |||||
| Aaron's, Inc. Class A | 378 | 9 | GameStop Corp. Class A | 938 | 40 | |||
| Abercrombie & Fitch Co. Class A | 750 | 25 | Gannett Co., Inc. | 1,757 | 55 | |||
| Advance Auto Parts, Inc. | 608 | 89 | Gap, Inc. (The) | 901 | 34 | |||
| Amazon.com, Inc.(Æ) | 1,791 | 547 | Garmin, Ltd. | 1,217 | 68 | |||
| AMC Networks, Inc. Class A(Æ) | 121 | 7 | General Motors Co. | 13,740 | 431 | |||
| Amerco, Inc. | 54 | 15 | Gentex Corp. | 513 | 17 | |||
| Apollo Group, Inc. Class A(Æ) | 1,317 | 38 | Genuine Parts Co. | 1,321 | 128 | |||
| Ascena Retail Group, Inc.(Æ) | 754 | 9 | Goodyear Tire & Rubber Co. (The) | 1,931 | 47 | |||
| AutoNation, Inc.(Æ) | 681 | 39 | Graham Holdings Co. Class B | 67 | 53 | |||
| AutoZone, Inc.(Æ) | 301 | 167 | H&R Block, Inc. | 1,006 | 33 | |||
| Avis Budget Group, Inc.(Æ) | 748 | 42 | Hanesbrands, Inc. | 645 | 68 | |||
| Avon Products, Inc. | 1,327 | 14 | Harley-Davidson, Inc. | 1,147 | 75 | |||
| Bally Technologies, Inc.(Æ) | 80 | 6 | Harman International Industries, Inc. | 481 | 52 | |||
| Bed Bath & Beyond, Inc.(Æ) | 2,090 | 141 | Hasbro, Inc. | 696 | 40 | |||
| Best Buy Co., Inc. | 1,952 | 67 | Hertz Global Holdings, Inc.(Æ) | 1,414 | 31 | |||
| Big Lots, Inc. | 738 | 34 | Hilton Worldwide Holdings, Inc.(Æ) | 798 | 20 | |||
| BorgWarner, Inc. | 2,423 | 138 | Home Depot, Inc. | 8,054 | 785 | |||
| Brinker International, Inc. | 475 | 26 | HomeAway, Inc.(Æ) | 202 | 7 | |||
| Burger King Worldwide, Inc. | 1,074 | 35 | Hyatt Hotels Corp. Class A(Æ) | 546 | 32 | |||
| Cabela's, Inc.(Æ) | 614 | 30 | International Game Technology | 2,212 | 36 | |||
| Cablevision Systems Corp. Class A | 396 | 7 | Interpublic Group of Cos., Inc. (The) | 2,955 | 57 | |||
| CarMax, Inc.(Æ) | 1,104 | 62 | Jarden Corp.(Æ) | 619 | 40 | |||
| Carnival Corp. | 4,112 | 165 | JC Penney Co., Inc.(Æ) | 2,990 | 23 | |||
| Carter's, Inc. | 108 | 8 | John Wiley & Sons, Inc. Class A(Æ) | 723 | 42 | |||
| CBS Corp. Class B | 2,700 | 146 | Johnson Controls, Inc. | 6,126 | 289 | |||
| CBS Outdoor Americas, Inc.(ö) | 447 | 14 | KAR Auction Services, Inc. | 1,157 | 35 | |||
| Charter Communications, Inc. Class A(Æ) | 254 | 40 | Kate Spade & Co.(Æ) | 1,076 | 29 | |||
| Chico's FAS, Inc. | 761 | 12 | Kohl's Corp. | 2,051 | 111 | |||
| Chipotle Mexican Grill, Inc. Class A(Æ) | 193 | 123 | L Brands, Inc. | 1,187 | 86 | |||
| Choice Hotels International, Inc. | 256 | 14 | Lamar Advertising Co. Class A | 162 | 8 | |||
| Cinemark Holdings, Inc. | 277 | 10 | Las Vegas Sands Corp. | 2,653 | 165 | |||
| Coach, Inc. | 1,090 | 38 | Lear Corp. | 1,063 | 98 | |||
| Comcast Corp. Class A(Æ) | 16,065 | 889 | Leggett & Platt, Inc. | 1,174 | 46 | |||
| Costco Wholesale Corp. | 2,928 | 391 | Lennar Corp. Class A | 1,032 | 44 | |||
| CST Brands, Inc. | 169 | 6 | Liberty Media Corp.(Æ) | 3,508 | 122 | |||
| Darden Restaurants, Inc. | 972 | 50 | Liberty Media Corp. Class A(Æ) | 790 | 38 | |||
| Deckers Outdoor Corp.(Æ) | 398 | 35 | Liberty TripAdvisor Holdings, Inc. Class | |||||
| DeVry Education Group, Inc. | 875 | 42 | A(Æ) | 396 | 13 | |||
| Dick's Sporting Goods, Inc. | 817 | 37 | Liberty Ventures Class A(Æ) | 1,094 | 38 | |||
| Dillard's, Inc. Class A | 319 | 34 | Lions Gate Entertainment Corp. | 164 | 5 | |||
| DIRECTV(Æ) | 3,978 | 345 | Live Nation Entertainment, Inc.(Æ) | 1,534 | 40 | |||
| Discovery Communications, Inc. Class A(Æ) | 1,022 | 36 | LKQ Corp.(Æ) | 1,216 | 35 | |||
| Discovery Communications, Inc. Class C(Æ) | 1,024 | 36 | Lowe's Cos., Inc. | 5,337 | 305 | |||
| DISH Network Corp. Class A(Æ) | 1,369 | 87 | Macy's, Inc. | 2,143 | 124 | |||
| Dollar General Corp.(Æ) | 2,094 | 131 | Madison Square Garden Co. (The) Class A(Æ) | 236 | 18 | |||
| Dollar Tree, Inc.(Æ) | 1,418 | 86 | Marriott International, Inc. Class A | 1,863 | 141 | |||
| Domino's Pizza, Inc. | 178 | 16 | Mattel, Inc. | 2,699 | 84 | |||
| DR Horton, Inc. | 2,257 | 51 | McDonald's Corp. | 5,638 | 528 | |||
| DreamWorks Animation, Inc. Class A(Æ) | 556 | 12 | MGM Resorts International(Æ) | 4,106 | 95 | |||
| DSW, Inc. Class A | 429 | 13 | Michael Kors Holdings, Ltd.(Æ) | 1,328 | 104 | |||
| Dunkin' Brands Group, Inc. | 218 | 10 | Mohawk Industries, Inc.(Æ) | 317 | 45 | |||
| eBay, Inc.(Æ) | 6,141 | 322 | Murphy USA, Inc.(Æ) | 136 | 8 | |||
| Estee Lauder Cos., Inc. (The) Class A | 1,539 | 116 | Netflix, Inc.(Æ) | 318 | 125 | |||
| Expedia, Inc. | 202 | 17 | Newell Rubbermaid, Inc. | 1,100 | 37 | |||
| Family Dollar Stores, Inc. | 738 | 58 | News Corp. Class A(Æ) | 4,574 | 71 | |||
| Foot Locker, Inc. | 2,105 | 118 | Nielsen | 2,085 | 89 | |||
| Ford Motor Co. | 32,938 | 464 | Nike, Inc. Class B | 4,554 | 423 | |||
| See accompanying notes which are an integral part of the financial statements. | ||||||||
| Select U.S. Equity Fund 101 | ||||||||
Russell Investment Company Select U.S. Equity Fund
Schedule of Investments, continued — October 31, 2014
| Amounts in thousands (except share amounts) | Amounts in thousands (except share amounts) | ||||||
| Principal | Fair | Principal | Fair | ||||
| Amount ($) or | Value | Amount ($) or | Value | ||||
| Shares | $ | Shares | $ | ||||
| Nordstrom, Inc. | 491 | 36 | Yum! Brands, Inc. | 2,752 | 198 | ||
| Norwegian Cruise Line Holdings, Ltd.(Æ) | 331 | 13 | 18,780 | ||||
| Nu Skin Enterprises, Inc. Class A | 126 | 7 | |||||
| NVR, Inc.(Æ) | 35 | 43 | Consumer Staples - 7.2% | ||||
| Omnicom Group, Inc. | 1,631 | 117 | Altria Group, Inc. | 9,265 | 448 | ||
| O'Reilly Automotive, Inc.(Æ) | 1,186 | 209 | Archer-Daniels-Midland Co. | 7,717 | 363 | ||
| Pandora Media, Inc.(Æ) | 411 | 8 | Bunge, Ltd. | 1,190 | 105 | ||
| Panera Bread Co. Class A(Æ) | 57 | 9 | Campbell Soup Co. | 782 | 34 | ||
| Penske Automotive Group, Inc. | 721 | 33 | Church & Dwight Co., Inc. | 850 | 61 | ||
| PetSmart, Inc. | 740 | 54 | Clorox Co. (The) | 797 | 79 | ||
| Polaris Industries, Inc. | 204 | 31 | Coca-Cola Co. (The) | 17,937 | 751 | ||
| Priceline Group, Inc. (The)(Æ) | 363 | 438 | Coca-Cola Enterprises, Inc. | 1,779 | 77 | ||
| PulteGroup, Inc. | 2,775 | 53 | Colgate-Palmolive Co. | 4,683 | 313 | ||
| PVH Corp. | 297 | 34 | ConAgra Foods, Inc. | 4,139 | 142 | ||
| Ralph Lauren Corp. Class A | 396 | 65 | Constellation Brands, Inc. Class A(Æ) | 1,022 | 93 | ||
| Regal Entertainment Group Class A | 358 | 8 | CVS Health Corp. | 10,053 | 863 | ||
| Ross Stores, Inc. | 1,615 | 130 | Dr Pepper Snapple Group, Inc. | 2,095 | 145 | ||
| Royal Caribbean Cruises, Ltd. | 2,192 | 149 | Energizer Holdings, Inc. | 300 | 37 | ||
| Sally Beauty Holdings, Inc.(Æ) | 399 | 12 | General Mills, Inc. | 3,174 | 165 | ||
| Scripps Networks Interactive, Inc. Class A | 496 | 38 | Hain Celestial Group, Inc. (The)(Æ) | 249 | 27 | ||
| SeaWorld Entertainment, Inc. | 137 | 3 | Herbalife, Ltd. | 475 | 25 | ||
| Service Corp. International | 663 | 15 | Hershey Co. (The) | 1,034 | 99 | ||
| Signet Jewelers, Ltd. | 624 | 75 | Hormel Foods Corp. | 1,999 | 108 | ||
| Sirius XM Holdings, Inc.(Æ) | 5,482 | 19 | Ingredion, Inc. | 550 | 42 | ||
| Six Flags Entertainment Corp. | 148 | 6 | JM Smucker Co. (The) | 1,082 | 112 | ||
| Staples, Inc. | 6,247 | 79 | Kellogg Co. | 1,597 | 102 | ||
| Starbucks Corp. | 4,322 | 327 | Keurig Green Mountain, Inc. | 738 | 112 | ||
| Starwood Hotels & Resorts Worldwide, Inc. | 814 | 62 | Kimberly-Clark Corp. | 2,080 | 238 | ||
| Starz(Æ) | 1,456 | 45 | Kraft Foods Group, Inc.(Æ) | 2,655 | 150 | ||
| Target Corp. | 6,296 | 389 | Kroger Co. (The) | 2,962 | 165 | ||
| Taylor Morrison Home Corp. Class A(Æ) | 335 | 6 | Lorillard, Inc. | 2,680 | 165 | ||
| Tempur Sealy International, Inc.(Æ) | 122 | 6 | McCormick & Co., Inc. | 889 | 63 | ||
| Tesla Motors, Inc.(Æ) | 586 | 142 | Mead Johnson Nutrition Co. Class A | 762 | 76 | ||
| Thor Industries, Inc. | 290 | 15 | Molson Coors Brewing Co. Class B | 2,056 | 153 | ||
| Tiffany & Co. | 962 | 93 | Mondelez International, Inc. Class A | 16,304 | 575 | ||
| Time Warner Cable, Inc. | 1,712 | 252 | Monster Beverage Corp.(Æ) | 433 | 44 | ||
| Time Warner, Inc. | 8,410 | 668 | PepsiCo, Inc. | 6,755 | 650 | ||
| TJX Cos., Inc. | 4,605 | 292 | Philip Morris International, Inc. | 8,925 | 794 | ||
| Toll Brothers, Inc.(Æ) | 1,110 | 35 | Pilgrim's Pride Corp.(Æ) | 458 | 13 | ||
| Tractor Supply Co. | 651 | 48 | Pinnacle Foods, Inc. | 521 | 18 | ||
| TripAdvisor, Inc.(Æ) | 644 | 57 | Procter & Gamble Co. (The) | 19,501 | 1,702 | ||
| TRW Automotive Holdings Corp.(Æ) | 1,375 | 139 | Reynolds American, Inc. | 2,791 | 176 | ||
| Tupperware Brands Corp. | 117 | 7 | Rite Aid Corp.(Æ) | 7,660 | 40 | ||
| Ulta Salon Cosmetics & Fragrance, Inc.(Æ) | 150 | 18 | Safeway, Inc. | 2,940 | 102 | ||
| Under Armour, Inc. Class A(Æ) | 1,195 | 78 | Spectrum Brands Holdings, Inc. | 108 | 10 | ||
| Urban Outfitters, Inc.(Æ) | 887 | 27 | Sysco Corp. | 4,076 | 157 | ||
| VF Corp. | 2,804 | 190 | Tyson Foods, Inc. Class A | 3,310 | 134 | ||
| Viacom, Inc. Class B | 2,594 | 189 | Walgreen Co. | 6,162 | 396 | ||
| Visteon Corp.(Æ) | 687 | 65 | WhiteWave Foods Co. (The) Class A(Æ) | 875 | 33 | ||
| WABCO Holdings, Inc.(Æ) | 462 | 45 | Whole Foods Market, Inc. | 1,257 | 49 | ||
| Wal-Mart Stores, Inc. | 14,042 | 1,071 | 10,206 | ||||
| Walt Disney Co. (The) | 12,547 | 1,147 | |||||
| Wendy's Co. (The) | 3,468 | 28 | Energy - 9.8% | ||||
| Whirlpool Corp. | 621 | 107 | Anadarko Petroleum Corp. | 3,310 | 304 | ||
| Williams-Sonoma, Inc. | 189 | 12 | Apache Corp. | 3,324 | 257 | ||
| Wyndham Worldwide Corp. | 437 | 34 | Athlon Energy, Inc.(Æ) | 564 | 33 | ||
| Wynn Resorts, Ltd. | 664 | 126 | Atwood Oceanics, Inc. | 288 | 12 | ||
| Baker Hughes, Inc. | 4,908 | 260 | |||||
| Cabot Oil & Gas Corp. | 969 | 30 | |||||
See accompanying notes which are an integral part of the financial statements.
102 Select U.S. Equity Fund
Russell Investment Company Select U.S. Equity Fund
Schedule of Investments, continued — October 31, 2014
| Amounts in thousands (except share amounts) | Amounts in thousands (except share amounts) | ||||||
| Principal | Fair | Principal | Fair | ||||
| Amount ($) or | Value | Amount ($) or | Value | ||||
| Shares | $ | Shares | $ | ||||
| Cameron International Corp.(Æ) | 598 | 36 | Southwestern Energy Co.(Æ) | 1,838 | 60 | ||
| Cheniere Energy, Inc.(Æ) | 1,398 | 105 | Spectra Energy Corp. | 5,181 | 203 | ||
| Chesapeake Energy Corp. | 5,711 | 127 | SunPower Corp. Class A(Æ) | 316 | 10 | ||
| Chevron Corp. | 15,809 | 1,896 | Superior Energy Services, Inc. | 1,493 | 37 | ||
| Cimarex Energy Co. | 788 | 90 | Targa Resources Corp. | 254 | 33 | ||
| Cobalt International Energy, Inc.(Æ) | 511 | 6 | Tesoro Corp. | 776 | 55 | ||
| Concho Resources, Inc.(Æ) | 718 | 78 | Ultra Petroleum Corp.(Æ) | 1,397 | 32 | ||
| ConocoPhillips | 11,346 | 819 | Unit Corp.(Æ) | 599 | 29 | ||
| CONSOL Energy, Inc. | 2,915 | 107 | Valero Energy Corp. | 6,593 | 330 | ||
| Continental Resources, Inc.(Æ) | 544 | 31 | Whiting Petroleum Corp.(Æ) | 937 | 57 | ||
| CVR Energy, Inc. | 126 | 6 | Williams Cos., Inc. (The) | 4,383 | 243 | ||
| Denbury Resources, Inc. | 2,568 | 32 | World Fuel Services Corp. | 395 | 16 | ||
| Devon Energy Corp. | 4,454 | 267 | WPX Energy, Inc.(Æ) | 1,478 | 28 | ||
| Diamond Offshore Drilling, Inc. | 309 | 12 | 13,849 | ||||
| Dresser-Rand Group, Inc.(Æ) | 153 | 12 | |||||
| Dril-Quip, Inc.(Æ) | 92 | 8 | Financial Services - 18.8% | ||||
| EOG Resources, Inc. | 3,301 | 314 | ACE, Ltd. | 3,341 | 365 | ||
| EP Energy Corp. Class A(Æ) | 289 | 4 | Affiliated Managers Group, Inc.(Æ) | 62 | 12 | ||
| EQT Corp. | 1,125 | 106 | Aflac, Inc. | 4,097 | 245 | ||
| Exxon Mobil Corp. | 36,018 | 3,483 | Alexandria Real Estate Equities, Inc.(ö) | 143 | 12 | ||
| First Solar, Inc.(Æ) | 689 | 41 | Alleghany Corp.(Æ) | 142 | 63 | ||
| FMC Technologies, Inc.(Æ) | 563 | 31 | Alliance Data Systems Corp.(Æ) | 215 | 61 | ||
| Golar LNG, Ltd.(Æ) | 480 | 27 | Allied World Assurance Co. Holdings AG | 2,083 | 79 | ||
| Gulfport Energy Corp.(Æ) | 406 | 20 | Allstate Corp. (The) | 4,368 | 283 | ||
| Halliburton Co. | 5,825 | 321 | Ally Financial, Inc.(Æ) | 363 | 8 | ||
| Helmerich & Payne, Inc. | 933 | 81 | American Campus Communities, Inc.(ö) | 229 | 9 | ||
| Hess Corp. | 3,625 | 307 | American Capital Agency Corp.(ö) | 2,031 | 46 | ||
| HollyFrontier Corp. | 1,624 | 74 | American Express Co. | 3,248 | 292 | ||
| Hubbell, Inc. Class B(Æ) | 532 | 60 | American Financial Group, Inc. | 1,160 | 69 | ||
| Kinder Morgan, Inc. | 3,949 | 153 | American Homes 4 Rent Class A(ö) | 297 | 5 | ||
| Laredo Petroleum, Inc.(Æ) | 369 | 7 | American International Group, Inc. | 10,939 | 586 | ||
| Marathon Oil Corp. | 6,718 | 238 | American National Insurance Co. | 66 | 8 | ||
| Marathon Petroleum Corp. | 1,708 | 155 | American Realty Capital Properties, Inc.(ö) | 2,538 | 23 | ||
| Murphy Oil Corp. | 1,470 | 78 | American Tower Corp. Class A(ö) | 1,164 | 114 | ||
| Nabors Industries, Ltd. | 3,106 | 55 | Ameriprise Financial, Inc. | 1,217 | 154 | ||
| National Oilwell Varco, Inc. | 3,897 | 283 | Annaly Capital Management, Inc.(ö) | 4,271 | 49 | ||
| Newfield Exploration Co.(Æ) | 1,422 | 46 | Aon PLC | 2,145 | 184 | ||
| Noble Energy, Inc. | 846 | 49 | Apartment Investment & Management Co. | ||||
| NOW, Inc.(Æ) | 497 | 15 | Class A(ö) | 132 | 5 | ||
| Oasis Petroleum, Inc.(Æ) | 132 | 4 | Arch Capital Group, Ltd.(Æ) | 1,949 | 110 | ||
| Occidental Petroleum Corp. | 6,092 | 542 | Arthur J Gallagher & Co. | 947 | 45 | ||
| Oceaneering International, Inc. | 508 | 36 | Aspen Insurance Holdings, Ltd. | 1,126 | 49 | ||
| Oil States International, Inc.(Æ) | 548 | 33 | Associated Banc-Corp. | 1,709 | 32 | ||
| ONEOK, Inc. | 1,475 | 87 | Assurant, Inc. | 1,462 | 100 | ||
| Patterson-UTI Energy, Inc. | 1,506 | 35 | Assured Guaranty, Ltd. | 1,520 | 35 | ||
| PBF Energy, Inc. Class A | 1,098 | 29 | AvalonBay Communities, Inc.(ö) | 323 | 50 | ||
| Peabody Energy Corp. | 2,143 | 22 | Axis Capital Holdings, Ltd. | 1,744 | 84 | ||
| Phillips 66(Æ) | 5,513 | 433 | Bank of America Corp. | 73,606 | 1,263 | ||
| Pioneer Natural Resources Co. | 853 | 161 | Bank of Hawaii Corp. | 300 | 18 | ||
| QEP Resources, Inc. | 1,236 | 31 | Bank of New York Mellon Corp. (The) | 9,963 | 386 | ||
| Range Resources Corp. | 427 | 29 | BankUnited, Inc. | 876 | 26 | ||
| Rowan Companies PLC(Æ) | 602 | 15 | BB&T Corp. | 6,363 | 241 | ||
| RPC, Inc. | 448 | 7 | Berkshire Hathaway, Inc. Class B(Æ) | 14,639 | 2,052 | ||
| SandRidge Energy, Inc.(Æ) | 3,250 | 13 | BioMed Realty Trust, Inc.(ö) | 411 | 9 | ||
| Schlumberger, Ltd. | 7,075 | 698 | BlackRock, Inc. Class A | 765 | 261 | ||
| Seadrill, Ltd. | 1,999 | 46 | BOK Financial Corp. | 474 | 33 | ||
| Seventy Seven Energy, Inc.(Æ) | 288 | 4 | Boston Properties, Inc.(ö) | 367 | 47 | ||
| SM Energy Co. | 83 | 5 | Brandywine Realty Trust(ö) | 340 | 5 | ||
| SolarCity Corp.(Æ) | 162 | 10 | Broadridge Financial Solutions, Inc. | 1,340 | 59 | ||
See accompanying notes which are an integral part of the financial statements.
Select U.S. Equity Fund 103
| Russell Investment Company | |||||||
| Select U.S. Equity Fund | |||||||
| Schedule of Investments, continued — October 31, 2014 | |||||||
| Amounts in thousands (except share amounts) | Amounts in thousands (except share amounts) | ||||||
| Principal | Fair | Principal | Fair | ||||
| Amount ($) or | Value | Amount ($) or | Value | ||||
| Shares | $ | Shares | $ | ||||
| Brown & Brown, Inc. | 1,138 | 36 | Goldman Sachs Group, Inc. (The) | 3,436 | 653 | ||
| Camden Property Trust(ö) | 183 | 14 | Hanover Insurance Group, Inc. (The) | 582 | 39 | ||
| Capital One Financial Corp. | 4,900 | 406 | Hartford Financial Services Group, Inc. | 2,980 | 118 | ||
| CBL & Associates Properties, Inc.(ö) | 244 | 5 | HCC Insurance Holdings, Inc. | 1,548 | 81 | ||
| CBOE Holdings, Inc. | 591 | 35 | HCP, Inc.(ö) | 1,119 | 49 | ||
| CBRE Group, Inc. Class A(Æ) | 1,610 | 52 | Health Care, Inc.(ö) | 272 | 19 | ||
| CDK Global Inc.(Æ) | 792 | 27 | Healthcare Trust of America, Inc. Class A(ö) | 459 | 6 | ||
| Charles Schwab Corp. (The) | 6,432 | 184 | Home Properties, Inc.(ö) | 119 | 8 | ||
| Chimera Investment Corp.(ö) | 4,362 | 14 | Hospitality Properties Trust(ö) | 263 | 8 | ||
| Chubb Corp. (The) | 2,638 | 262 | Host Hotels & Resorts, Inc.(ö) | 4,599 | 107 | ||
| Cincinnati Financial Corp. | 1,869 | 94 | Howard Hughes Corp. (The)(Æ) | 259 | 38 | ||
| CIT Group, Inc. | 1,026 | 50 | Hudson City Bancorp, Inc. | 4,083 | 39 | ||
| Citigroup, Inc. | 21,186 | 1,134 | Huntington Bancshares, Inc. | 5,294 | 52 | ||
| City National Corp. | 461 | 36 | Interactive Brokers Group, Inc. Class A | 1,294 | 33 | ||
| CME Group, Inc. Class A | 2,417 | 203 | Intercontinental Exchange, Inc. | 319 | 66 | ||
| CNA Financial Corp. | 215 | 8 | Invesco, Ltd. | 1,733 | 70 | ||
| Columbia Property Trust, Inc.(ö) | 236 | 6 | iShares Russell 2000 Value Index Fund | 4,108 | 411 | ||
| Comerica, Inc. | 1,171 | 56 | Jack Henry & Associates, Inc. | 670 | 40 | ||
| Commerce Bancshares, Inc. | 946 | 43 | Jones Lang LaSalle, Inc. | 581 | 79 | ||
| CoreLogic, Inc.(Æ) | 263 | 8 | JPMorgan Chase & Co. | 28,519 | 1,725 | ||
| Corporate Office Properties Trust(ö) | 187 | 5 | KeyCorp | 5,950 | 79 | ||
| Corrections Corp. of America(ö) | 882 | 32 | Kilroy Realty Corp.(ö) | 144 | 10 | ||
| Cullen/Frost Bankers, Inc. | 627 | 51 | Kimco Realty Corp.(ö) | 818 | 20 | ||
| DDR Corp.(ö) | 438 | 8 | Lazard, Ltd. Class A | 804 | 40 | ||
| Digital Realty Trust, Inc.(ö) | 193 | 13 | Legg Mason, Inc. | 1,464 | 76 | ||
| Discover Financial Services | 3,407 | 217 | Leucadia National Corp. | 1,879 | 45 | ||
| Douglas Emmett, Inc.(ö) | 299 | 8 | Liberty Property Trust(ö) | 323 | 11 | ||
| Duke Realty Corp.(ö) | 705 | 13 | Lincoln National Corp. | 1,879 | 103 | ||
| Dun & Bradstreet Corp. (The) | 229 | 28 | Loews Corp. | 3,469 | 151 | ||
| E*Trade Financial Corp.(Æ) | 2,319 | 52 | LPL Financial Holdings, Inc. | 286 | 12 | ||
| East West Bancorp, Inc. | 530 | 19 | M&T Bank Corp. | 1,354 | 165 | ||
| Eaton Vance Corp. | 703 | 26 | Macerich Co. (The)(ö) | 228 | 16 | ||
| Endurance Specialty Holdings, Ltd. | 684 | 40 | Markel Corp.(Æ) | 155 | 107 | ||
| Equifax, Inc. | 1,001 | 76 | Marsh & McLennan Cos., Inc. | 3,637 | 198 | ||
| Equity Commonwealth(Æ)(ö) | 171 | 5 | MasterCard, Inc. Class A | 4,535 | 380 | ||
| Equity Residential(ö) | 1,648 | 115 | MBIA, Inc.(Æ) | 751 | 7 | ||
| Erie Indemnity Co. Class A | 185 | 16 | McGraw Hill Financial, Inc. | 1,240 | 112 | ||
| Essex Property Trust, Inc.(ö) | 195 | 39 | Mercury General Corp. | 611 | 32 | ||
| Everest Re Group, Ltd. | 697 | 119 | MetLife, Inc. | 7,364 | 399 | ||
| Extra Space Storage, Inc.(ö) | 687 | 40 | MFA Financial, Inc.(ö) | 4,278 | 36 | ||
| FactSet Research Systems, Inc. | 278 | 37 | Mid-America Apartment Communities, Inc. | ||||
| Federal Realty Investment Trust(ö) | 344 | 45 | (ö) | 140 | 10 | ||
| Federated Investors, Inc. Class B | 217 | 7 | Moody's Corp. | 1,194 | 118 | ||
| Fidelity National Information Services, Inc. | 2,085 | 122 | Morgan Stanley | 12,025 | 420 | ||
| Fifth Third Bancorp | 5,354 | 107 | Morningstar, Inc. | 121 | 8 | ||
| First Horizon National Corp. | 1,084 | 14 | MSCI, Inc. Class A | 803 | 37 | ||
| First Niagara Financial Group, Inc. | 3,434 | 26 | NASDAQ OMX Group, Inc. (The) | 1,209 | 52 | ||
| First Republic Bank | 922 | 47 | National Retail Properties, Inc.(ö) | 264 | 10 | ||
| Fiserv, Inc.(Æ) | 2,243 | 156 | Navient Corp. | 2,098 | 42 | ||
| FleetCor Technologies, Inc.(Æ) | 360 | 54 | New York Community Bancorp, Inc. | 5,352 | 85 | ||
| FNF Group | 3,196 | 95 | Northern Trust Corp. | 2,138 | 142 | ||
| FNFV Group(Æ) | 715 | 10 | NorthStar Asset Management Group, Inc.(Æ) | 1,891 | 34 | ||
| Forest City Enterprises, Inc. Class A(Æ) | 476 | 10 | NorthStar Realty Finance Corp.(ö) | 877 | 16 | ||
| Franklin Resources, Inc. | 2,324 | 129 | Ocwen Financial Corp.(Æ) | 122 | 3 | ||
| Fulton Financial Corp. | 1,112 | 13 | Old Republic International Corp. | 3,243 | 48 | ||
| Gaming and Leisure Properties, Inc.(ö) | 159 | 5 | Omega Healthcare Investors, Inc.(ö) | 840 | 32 | ||
| General Growth Properties, Inc.(ö) | 1,509 | 39 | PacWest Bancorp | 289 | 12 | ||
| Genworth Financial, Inc. Class A(Æ) | 5,989 | 84 | PartnerRe, Ltd. | 778 | 90 | ||
| Global Payments, Inc. | 582 | 47 | People's United Financial, Inc. | 3,210 | 47 | ||
| See accompanying notes which are an integral part of the financial statements. | |||||||
| 104 Select U.S. Equity Fund | |||||||
Russell Investment Company Select U.S. Equity Fund
Schedule of Investments, continued — October 31, 2014
| Amounts in thousands (except share amounts) | Amounts in thousands (except share amounts) | ||||||
| Principal | Fair | Principal | Fair | ||||
| Amount ($) or | Value | Amount ($) or | Value | ||||
| Shares | $ | Shares | $ | ||||
| Piedmont Office Realty Trust, Inc. Class A(ö) | 357 | 7 | Western Union Co. (The) | 604 | 10 | ||
| Plum Creek Timber Co., Inc.(ö) | 224 | 9 | Weyerhaeuser Co.(ö) | 1,251 | 42 | ||
| PNC Financial Services Group, Inc. (The) | 4,720 | 408 | White Mountains Insurance Group, Ltd. | 80 | 50 | ||
| Popular, Inc.(Æ) | 520 | 17 | WP Carey, Inc.(ö) | 182 | 12 | ||
| Post Properties, Inc.(ö) | 116 | 7 | WR Berkley Corp. | 1,291 | 67 | ||
| Principal Financial Group, Inc. | 2,004 | 105 | XL Group PLC Class A | 2,421 | 82 | ||
| ProAssurance Corp. | 829 | 39 | Zillow, Inc. Class A(Æ) | 118 | 13 | ||
| Progressive Corp. (The) | 6,365 | 168 | Zions Bancorporation | 1,136 | 33 | ||
| Prologis, Inc.(ö) | 1,200 | 50 | 26,507 | ||||
| Protective Life Corp. | 741 | 52 | |||||
| Prudential Financial, Inc. | 3,509 | 311 | Health Care - 13.2% | ||||
| Public Storage(ö) | 488 | 90 | Abbott Laboratories | 12,399 | 540 | ||
| Raymond James Financial, Inc. | 961 | 54 | AbbVie, Inc. | 6,612 | 420 | ||
| Rayonier, Inc.(ö) | 185 | 6 | Actavis PLC(Æ) | 1,767 | 429 | ||
| Realogy Holdings Corp.(Æ) | 317 | 13 | Aetna, Inc. | 3,249 | 268 | ||
| Realty Income Corp.(ö) | 949 | 44 | Alere, Inc.(Æ) | 1,009 | 40 | ||
| Regency Centers Corp.(ö) | 196 | 12 | Alexion Pharmaceuticals, Inc.(Æ) | 1,233 | 236 | ||
| Regions Financial Corp. | 5,152 | 51 | Align Technology, Inc.(Æ) | 311 | 16 | ||
| Reinsurance Group of America, Inc. Class A | 627 | 53 | Alkermes PLC(Æ) | 849 | 43 | ||
| RenaissanceRe Holdings, Ltd. | 630 | 65 | Allergan, Inc. | 1,766 | 336 | ||
| Retail Properties of America, Inc. Class A(ö) | 439 | 7 | Allscripts Healthcare Solutions, Inc.(Æ) | 391 | 5 | ||
| Santander Consumer USA Holdings, Inc. | 242 | 4 | Alnylam Pharmaceuticals, Inc.(Æ) | 377 | 35 | ||
| SEI Investments Co. | 1,023 | 40 | AmerisourceBergen Corp. Class A | 2,088 | 178 | ||
| Senior Housing Properties Trust(ö) | 637 | 14 | Amgen, Inc. | 3,034 | 492 | ||
| Signature Bank(Æ) | 326 | 39 | athenahealth, Inc.(Æ) | 187 | 23 | ||
| Simon Property Group, Inc.(ö) | 961 | 172 | Baxter International, Inc. | 2,717 | 191 | ||
| SL Green Realty Corp.(ö) | 482 | 56 | Becton Dickinson and Co. | 1,154 | 149 | ||
| SLM Corp. | 954 | 9 | Biogen Idec, Inc.(Æ) | 1,379 | 443 | ||
| Spirit Realty Capital, Inc.(ö) | 3,092 | 37 | BioMarin Pharmaceutical, Inc.(Æ) | 158 | 13 | ||
| StanCorp Financial Group, Inc. | 484 | 34 | Bio-Rad Laboratories, Inc. Class A(Æ) | 290 | 33 | ||
| Starwood Property Trust, Inc.(ö) | 1,807 | 41 | Boston Scientific Corp.(Æ) | 11,109 | 148 | ||
| State Street Corp. | 3,370 | 254 | Bristol-Myers Squibb Co. | 8,233 | 479 | ||
| SunTrust Banks, Inc. | 3,195 | 125 | Brookdale Senior Living, Inc. Class A(Æ) | 804 | 27 | ||
| SVB Financial Group(Æ) | 254 | 28 | Bruker Corp.(Æ) | 478 | 10 | ||
| Synovus Financial Corp. | 653 | 17 | Cardinal Health, Inc. | 2,562 | 201 | ||
| T Rowe Price Group, Inc. | 1,461 | 120 | CareFusion Corp.(Æ) | 1,878 | 108 | ||
| Tanger Factory Outlet Centers, Inc.(ö) | 301 | 11 | Catamaran Corp.(Æ) | 220 | 10 | ||
| TCF Financial Corp. | 836 | 13 | Celgene Corp.(Æ) | 3,096 | 332 | ||
| TD Ameritrade Holding Corp. | 634 | 21 | Centene Corp.(Æ) | 458 | 42 | ||
| TFS Financial Corp. | 575 | 9 | Cerner Corp.(Æ) | 1,660 | 105 | ||
| Thomson Reuters Corp. | 3,030 | 113 | Charles River Laboratories International, | ||||
| Torchmark Corp. | 1,868 | 99 | Inc.(Æ) | 96 | 6 | ||
| Total System Services, Inc. | 1,087 | 37 | Cigna Corp. | 1,710 | 170 | ||
| Travelers Cos., Inc. (The) | 3,692 | 372 | Community Health Systems, Inc.(Æ) | 731 | 40 | ||
| Twenty-First Century Fox, Inc.(Æ) | 10,362 | 357 | Cooper Cos., Inc. (The) | 264 | 43 | ||
| Two Harbors Investment Corp.(ö) | 1,833 | 19 | Covance, Inc.(Æ) | 75 | 6 | ||
| UDR, Inc.(ö) | 446 | 13 | Covidien PLC | 4,306 | 398 | ||
| Unum Group | 1,701 | 57 | CR Bard, Inc. | 817 | 134 | ||
| US Bancorp | 13,692 | 583 | DaVita HealthCare Partners, Inc.(Æ) | 748 | 58 | ||
| Validus Holdings, Ltd. | 979 | 39 | Dentsply International, Inc. | 1,151 | 58 | ||
| Vantiv, Inc. Class A(Æ) | 139 | 4 | Edwards Lifesciences Corp.(Æ) | 104 | 13 | ||
| Ventas, Inc.(ö) | 292 | 20 | Eli Lilly & Co. | 8,703 | 577 | ||
| Visa, Inc. Class A | 2,172 | 524 | Endo International PLC(Æ) | 751 | 50 | ||
| Vornado Realty Trust(ö) | 982 | 108 | Express Scripts Holding Co.(Æ) | 4,537 | 349 | ||
| Voya Financial, Inc. | 877 | 34 | Gilead Sciences, Inc.(Æ) | 7,134 | 799 | ||
| Waddell & Reed Financial, Inc. Class A | 423 | 20 | HCA Holdings, Inc.(Æ) | 2,588 | 181 | ||
| Washington Prime Group, Inc.(ö) | 338 | 6 | Health Net, Inc.(Æ) | 916 | 44 | ||
| Weingarten Realty Investors(ö) | 261 | 9 | Henry Schein, Inc.(Æ) | 703 | 84 | ||
| Wells Fargo & Co. | 39,681 | 2,107 | Hill-Rom Holdings, Inc. | 285 | 13 | ||
See accompanying notes which are an integral part of the financial statements.
Select U.S. Equity Fund 105
Russell Investment Company Select U.S. Equity Fund
Schedule of Investments, continued — October 31, 2014
| Amounts in thousands (except share amounts) | Amounts in thousands (except share amounts) | |||||||
| Principal | Fair | Principal | Fair | |||||
| Amount ($) or | Value | Amount ($) or | Value | |||||
| Shares | $ | Shares | $ | |||||
| Hologic, Inc.(Æ) | 1,290 | 34 | Ashland, Inc. | 507 | 55 | |||
| Hospira, Inc.(Æ) | 1,666 | 89 | Ball Corp. | 1,668 | 107 | |||
| Humana, Inc. | 1,593 | 221 | Bemis Co., Inc. | 1,130 | 44 | |||
| IDEXX Laboratories, Inc.(Æ) | 513 | 73 | Brown-Forman Corp. Class B - ADR | 1,694 | 157 | |||
| Illumina, Inc.(Æ) | 751 | 145 | Cabot Corp. | 734 | 34 | |||
| Incyte Corp.(Æ) | 709 | 48 | Carpenter Technology Corp. | 699 | 35 | |||
| Intercept Pharmaceuticals, Inc.(Æ) | 94 | 24 | Celanese Corp. Class A | 1,121 | 66 | |||
| Intuitive Surgical, Inc.(Æ) | 85 | 42 | CF Industries Holdings, Inc. | 520 | 135 | |||
| Jazz Pharmaceuticals PLC(Æ) | 306 | 52 | Cliffs Natural Resources, Inc. | 667 | 8 | |||
| Johnson & Johnson | 20,405 | 2,199 | Crown Holdings, Inc.(Æ) | 288 | 14 | |||
| Laboratory Corp. of America Holdings(Æ) | 695 | 76 | Cytec Industries, Inc. | 686 | 32 | |||
| LifePoint Hospitals, Inc.(Æ) | 530 | 37 | Domtar Corp. | 595 | 24 | |||
| Mallinckrodt PLC(Æ) | 666 | 61 | Dow Chemical Co. (The) | 9,013 | 445 | |||
| McKesson Corp. | 1,502 | 306 | Eagle Materials, Inc. | 330 | 29 | |||
| Medivation, Inc.(Æ) | 444 | 47 | Eastman Chemical Co. | 646 | 52 | |||
| MEDNAX, Inc.(Æ) | 693 | 43 | Ecolab, Inc. | 1,457 | 162 | |||
| Medtronic, Inc. | 7,533 | 513 | EI du Pont de Nemours & Co. | 4,652 | 322 | |||
| Merck & Co., Inc. | 21,915 | 1,270 | Fastenal Co. | 1,510 | 67 | |||
| Mylan, Inc.(Æ) | 2,084 | 112 | FMC Corp. | 560 | 32 | |||
| Myriad Genetics, Inc.(Æ) | 321 | 13 | Freeport-McMoRan, Inc. | 6,788 | 193 | |||
| Omnicare, Inc. | 825 | 55 | Greif, Inc. Class A | 177 | 8 | |||
| Patterson Cos., Inc. | 1,032 | 45 | Hexcel Corp.(Æ) | 353 | 15 | |||
| PerkinElmer, Inc. | 1,069 | 46 | Huntsman Corp. | 1,314 | 32 | |||
| Perrigo Co. PLC | 514 | 83 | Ingersoll-Rand PLC | 850 | 53 | |||
| Pfizer, Inc. | 47,994 | 1,437 | International Flavors & Fragrances, Inc. | 971 | 96 | |||
| Pharmacyclics, Inc.(Æ) | 67 | 9 | International Paper Co. | 2,075 | 105 | |||
| Qiagen NV(Æ) | 1,294 | 30 | Lennox International, Inc. | 157 | 14 | |||
| Quest Diagnostics, Inc. | 1,633 | 104 | LyondellBasell Industries Class A | 2,243 | 206 | |||
| Quintiles Transnational Holdings, Inc.(Æ) | 112 | 7 | Martin Marietta Materials, Inc. | 277 | 32 | |||
| Regeneron Pharmaceuticals, Inc.(Æ) | 612 | 241 | MeadWestvaco Corp. | 1,611 | 71 | |||
| ResMed, Inc. | 859 | 45 | Monsanto Co. | 2,090 | 240 | |||
| Salix Pharmaceuticals, Ltd.(Æ) | 345 | 50 | Mosaic Co. (The) | 1,543 | 68 | |||
| Seattle Genetics, Inc.(Æ) | 107 | 4 | MRC Global, Inc.(Æ) | 363 | 8 | |||
| Sirona Dental Systems, Inc.(Æ) | 476 | 37 | NewMarket Corp. | 97 | 38 | |||
| St. Jude Medical, Inc. | 1,677 | 108 | Newmont Mining Corp. | 3,426 | 64 | |||
| Stryker Corp. | 2,914 | 255 | Nucor Corp. | 2,071 | 112 | |||
| Teleflex, Inc. | 451 | 51 | Owens Corning | 952 | 31 | |||
| Tenet Healthcare Corp.(Æ) | 106 | 6 | Owens-Illinois, Inc.(Æ) | 182 | 5 | |||
| Thermo Fisher Scientific, Inc. | 3,338 | 392 | Packaging Corp. of America | 539 | 39 | |||
| United Therapeutics Corp.(Æ) | 407 | 53 | Pentair PLC | 812 | 54 | |||
| UnitedHealth Group, Inc. | 8,594 | 817 | Platform Specialty Products Corp.(Æ) | 509 | 13 | |||
| Universal Health Services, Inc. Class B | 933 | 97 | PPG Industries, Inc. | 771 | 157 | |||
| Varian Medical Systems, Inc.(Æ) | 633 | 53 | Praxair, Inc. | 1,260 | 159 | |||
| VCA, Inc.(Æ) | 930 | 42 | Precision Castparts Corp. | 572 | 126 | |||
| Veeva Systems, Inc. Class A(Æ) | 193 | 6 | Reliance Steel & Aluminum Co. | 582 | 39 | |||
| Vertex Pharmaceuticals, Inc.(Æ) | 420 | 47 | Rock-Tenn Co. Class A | 816 | 42 | |||
| WellPoint, Inc. | 3,249 | 412 | Rockwood Holdings, Inc. | 147 | 11 | |||
| Zimmer Holdings, Inc. | 1,898 | 211 | Royal Gold, Inc. | 508 | 29 | |||
| Zoetis, Inc. Class A | 1,131 | 42 | RPM International, Inc. | 885 | 40 | |||
| 18,565 | Scotts Miracle-Gro Co. (The) Class A | 149 | 9 | |||||
| Sherwin-Williams Co. (The) | 398 | 91 | ||||||
| Materials and Processing - 3.6% | Sigma-Aldrich Corp. | 951 | 129 | |||||
| Acuity Brands, Inc. | 296 | 41 | Silgan Holdings, Inc. | 196 | 10 | |||
| Air Products & Chemicals, Inc. | 1,885 | 254 | Sonoco Products Co. | 1,152 | 47 | |||
| Airgas, Inc. | 353 | 39 | Southern Copper Corp. | 278 | 8 | |||
| Albemarle Corp. | 524 | 31 | Steel Dynamics, Inc. | 1,332 | 31 | |||
| Alcoa, Inc. | 10,437 | 175 | Tahoe Resources, Inc.(Æ) | 456 | 8 | |||
| Allegheny Technologies, Inc. | 1,164 | 38 | Timken Co. (The) | 344 | 15 | |||
| AptarGroup, Inc. | 584 | 36 | TimkenSteel Corp. | 177 | 7 | |||
See accompanying notes which are an integral part of the financial statements.
106 Select U.S. Equity Fund
Russell Investment Company Select U.S. Equity Fund
Schedule of Investments, continued — October 31, 2014
| Amounts in thousands (except share amounts) | Amounts in thousands (except share amounts) | ||||||
| Principal | Fair | Principal | Fair | ||||
| Amount ($) or | Value | Amount ($) or | Value | ||||
| Shares | $ | Shares | $ | ||||
| United States Steel Corp. | 777 | 31 | General Electric Co. | 71,683 | 1,850 | ||
| USG Corp.(Æ) | 385 | 10 | Genesee & Wyoming, Inc. Class A(Æ) | 109 | 11 | ||
| Valmont Industries, Inc. | 269 | 37 | Genpact, Ltd.(Æ) | 732 | 13 | ||
| Valspar Corp. | 94 | 8 | Graco, Inc. | 196 | 15 | ||
| Vulcan Materials Co. | 339 | 21 | Honeywell International, Inc. | 3,487 | 335 | ||
| Westlake Chemical Corp. | 350 | 25 | Huntington Ingalls Industries, Inc. | 349 | 37 | ||
| WR Grace & Co.(Æ) | 48 | 5 | IDEX Corp. | 780 | 58 | ||
| 5,026 | IHS, Inc. Class A(Æ) | 115 | 15 | ||||
| Illinois Tool Works, Inc. | 1,791 | 163 | |||||
| Producer Durables - 10.7% | Iron Mountain, Inc.(ö) | 168 | 6 | ||||
| 3M Co. | 3,277 | 504 | ITT Corp. | 779 | 35 | ||
| Accenture PLC Class A | 2,800 | 227 | Jacobs Engineering Group, Inc.(Æ) | 871 | 41 | ||
| ADT Corp. (The) | 1,079 | 39 | JB Hunt Transport Services, Inc. | 573 | 46 | ||
| AECOM Technology Corp.(Æ) | 677 | 22 | Joy Global, Inc. | 664 | 35 | ||
| AGCO Corp. | 731 | 32 | Kansas City Southern | 130 | 16 | ||
| Agilent Technologies, Inc. | 972 | 54 | KBR, Inc. | 681 | 13 | ||
| Air Lease Corp. Class A | 896 | 33 | Kennametal, Inc. | 711 | 27 | ||
| Alaska Air Group, Inc. | 902 | 48 | Kirby Corp.(Æ) | 535 | 59 | ||
| Allegion PLC | 307 | 16 | L-3 Communications Holdings, Inc. | 1,442 | 175 | ||
| Alliant Techsystems, Inc. | 351 | 41 | Landstar System, Inc. | 558 | 41 | ||
| Allison Transmission Holdings, Inc. Class A | 611 | 20 | Lexmark International, Inc. Class A | 773 | 33 | ||
| American Airlines Group, Inc. | 4,119 | 170 | Lincoln Electric Holdings, Inc. | 530 | 38 | ||
| Ametek, Inc. | 1,389 | 72 | Lockheed Martin Corp. | 1,811 | 345 | ||
| AO Smith Corp. | 275 | 15 | Manitowoc Co., Inc. (The) | 562 | 12 | ||
| Automatic Data Processing, Inc. | 2,377 | 194 | Manpowergroup, Inc. | 771 | 51 | ||
| Avery Dennison Corp. | 281 | 13 | Mettler-Toledo International, Inc.(Æ) | 184 | 48 | ||
| B/E Aerospace, Inc.(Æ) | 580 | 43 | Middleby Corp.(Æ) | 280 | 25 | ||
| Babcock & Wilcox Co. (The) | 1,285 | 37 | MSC Industrial Direct Co., Inc. Class A | 382 | 31 | ||
| Boeing Co. (The) | 3,143 | 393 | National Instruments Corp. | 252 | 8 | ||
| Booz Allen Hamilton Holding Corp. Class A | 387 | 10 | Navistar International Corp.(Æ) | 123 | 4 | ||
| Carlisle Cos., Inc. | 877 | 78 | Nordson Corp. | 50 | 4 | ||
| Caterpillar, Inc. | 4,810 | 488 | Norfolk Southern Corp. | 2,537 | 281 | ||
| CH Robinson Worldwide, Inc. | 938 | 65 | Northrop Grumman Corp. | 2,577 | 356 | ||
| Chicago Bridge & Iron Co. | 137 | 8 | Old Dominion Freight Line, Inc.(Æ) | 697 | 51 | ||
| Cintas Corp. | 1,370 | 100 | Oshkosh Corp. | 948 | 42 | ||
| Clean Harbors, Inc.(Æ) | 76 | 4 | PACCAR, Inc. | 665 | 43 | ||
| Colfax Corp.(Æ) | 620 | 34 | Pall Corp. | 520 | 48 | ||
| Con-way, Inc. | 258 | 11 | Parker-Hannifin Corp. | 937 | 119 | ||
| Copa Holdings SA Class A | 39 | 5 | Paychex, Inc. | 1,590 | 75 | ||
| Copart, Inc.(Æ) | 1,038 | 35 | Pitney Bowes, Inc. | 1,481 | 37 | ||
| Covanta Holding Corp. | 268 | 6 | Quanta Services, Inc.(Æ) | 2,705 | 92 | ||
| Crane Co. | 569 | 35 | Raytheon Co. | 3,489 | 362 | ||
| CSX Corp. | 8,062 | 287 | Regal-Beloit Corp. | 238 | 17 | ||
| Cummins, Inc. | 1,191 | 174 | Republic Services, Inc. Class A | 2,788 | 107 | ||
| Danaher Corp. | 3,945 | 317 | Robert Half International, Inc. | 1,577 | 86 | ||
| Deere & Co. | 2,608 | 223 | Rockwell Automation, Inc. | 991 | 111 | ||
| Delta Air Lines, Inc. | 7,336 | 295 | Rockwell Collins, Inc. | 926 | 78 | ||
| Donaldson Co., Inc. | 1,033 | 43 | Rollins, Inc. | 334 | 11 | ||
| Dover Corp. | 1,579 | 125 | Roper Industries, Inc. | 785 | 124 | ||
| Eaton Corp. PLC | 3,644 | 249 | RR Donnelley & Sons Co. | 451 | 8 | ||
| Emerson Electric Co. | 3,587 | 230 | Ryder System, Inc. | 650 | 58 | ||
| Expeditors International of Washington, Inc. | 1,041 | 44 | Snap-on, Inc. | 755 | 100 | ||
| FedEx Corp. | 2,309 | 387 | Southwest Airlines Co. | 4,298 | 148 | ||
| Flir Systems, Inc. | 1,087 | 36 | Spirit AeroSystems Holdings, Inc. Class A(Æ) | 1,047 | 41 | ||
| Flowserve Corp. | 287 | 20 | Spirit Airlines, Inc.(Æ) | 490 | 36 | ||
| Fluor Corp. | 552 | 37 | SPX Corp. | 505 | 48 | ||
| Foster Wheeler AG | 915 | 28 | Stanley Black & Decker, Inc. | 1,053 | 99 | ||
| GATX Corp. | 571 | 36 | Stericycle, Inc.(Æ) | 536 | 68 | ||
| General Dynamics Corp. | 3,410 | 477 | Teekay Corp. | 242 | 14 | ||
See accompanying notes which are an integral part of the financial statements.
Select U.S. Equity Fund 107
Russell Investment Company Select U.S. Equity Fund
Schedule of Investments, continued — October 31, 2014
| Amounts in thousands (except share amounts) | Amounts in thousands (except share amounts) | ||||||
| Principal | Fair | Principal | Fair | ||||
| Amount ($) or | Value | Amount ($) or | Value | ||||
| Shares | $ | Shares | $ | ||||
| Terex Corp. | 870 | 25 | Computer Sciences Corp. | 2,037 | 123 | ||
| Textron, Inc. | 2,948 | 122 | Concur Technologies, Inc.(Æ) | 68 | 9 | ||
| Tidewater, Inc. | 232 | 9 | Corning, Inc. | 13,620 | 278 | ||
| Toro Co. (The) | 647 | 40 | Cree, Inc.(Æ) | 634 | 20 | ||
| Towers Watson & Co. Class A | 320 | 35 | Dolby Laboratories, Inc. Class A | 297 | 12 | ||
| TransDigm Group, Inc. | 459 | 86 | DST Systems, Inc. | 484 | 47 | ||
| Trimble Navigation, Ltd.(Æ) | 1,488 | 40 | EchoStar Corp. Class A(Æ) | 240 | 11 | ||
| Trinity Industries, Inc. | 1,002 | 36 | Electronic Arts, Inc.(Æ) | 2,350 | 96 | ||
| Triumph Group, Inc. | 212 | 15 | EMC Corp. | 17,496 | 503 | ||
| Tyco International, Ltd. | 3,762 | 162 | Equinix, Inc. | 141 | 29 | ||
| Union Pacific Corp. | 4,791 | 558 | F5 Networks, Inc.(Æ) | 698 | 86 | ||
| United Continental Holdings, Inc.(Æ) | 2,157 | 114 | Facebook, Inc. Class A(Æ) | 9,958 | 747 | ||
| United Parcel Service, Inc. Class B | 2,412 | 253 | FireEye, Inc.(Æ) | 156 | 5 | ||
| United Rentals, Inc.(Æ) | 521 | 57 | Fortinet, Inc.(Æ) | 1,174 | 31 | ||
| United Technologies Corp. | 6,325 | 677 | Freescale Semiconductor, Ltd.(Æ) | 1,208 | 24 | ||
| Vectrus, Inc.(Æ) | 110 | 3 | Gartner, Inc.(Æ) | 206 | 17 | ||
| Verisk Analytics, Inc. Class A(Æ) | 640 | 40 | Google, Inc. Class C(Æ) | 3,025 | 1,705 | ||
| Wabtec Corp. | 998 | 86 | Groupon, Inc. Class A(Æ) | 714 | 5 | ||
| Waste Connections, Inc. | 923 | 46 | Harris Corp. | 1,222 | 85 | ||
| Waste Management, Inc. | 2,876 | 141 | Hewlett-Packard Co. | 18,462 | 662 | ||
| Waters Corp.(Æ) | 383 | 42 | IAC/InterActiveCorp | 434 | 29 | ||
| WESCO International, Inc.(Æ) | 216 | 18 | Informatica Corp.(Æ) | 181 | 6 | ||
| WW Grainger, Inc. | 383 | 95 | Ingram Micro, Inc. Class A(Æ) | 1,662 | 45 | ||
| Xerox Corp. | 11,899 | 158 | Intel Corp. | 39,231 | 1,334 | ||
| Xylem, Inc. | 1,222 | 44 | International Business Machines Corp. | 5,287 | 869 | ||
| Zebra Technologies Corp. Class A(Æ) | 504 | 37 | Intuit, Inc. | 2,101 | 185 | ||
| 15,049 | IPG Photonics Corp.(Æ) | 75 | 6 | ||||
| Jabil Circuit, Inc. | 1,574 | 33 | |||||
| Technology - 15.5% | JDS Uniphase Corp.(Æ) | 748 | 10 | ||||
| 3D Systems Corp.(Æ) | 161 | 6 | Juniper Networks, Inc. | 2,712 | 57 | ||
| Activision Blizzard, Inc. | 2,755 | 55 | KLA-Tencor Corp. | 755 | 60 | ||
| Adobe Systems, Inc.(Æ) | 3,201 | 224 | Knowles Corp.(Æ) | 903 | 18 | ||
| Akamai Technologies, Inc.(Æ) | 1,384 | 83 | Lam Research Corp. | 1,515 | 118 | ||
| Altera Corp. | 1,250 | 43 | Lambda TD Software, Inc.(Æ) | 1,986 | 35 | ||
| Amdocs, Ltd. | 2,954 | 140 | Leidos Holdings, Inc. | 859 | 31 | ||
| Amphenol Corp. Class A | 2,042 | 103 | Linear Technology Corp. | 1,288 | 55 | ||
| Analog Devices, Inc. | 2,403 | 119 | LinkedIn Corp. Class A(Æ) | 204 | 47 | ||
| Ansys, Inc.(Æ) | 1,125 | 88 | Marvell Technology Group, Ltd. | 5,089 | 68 | ||
| AOL, Inc.(Æ) | 751 | 33 | Maxim Integrated Products, Inc. | 3,340 | 98 | ||
| Apple, Inc. | 36,147 | 3,904 | Microchip Technology, Inc. | 2,189 | 94 | ||
| Applied Materials, Inc. | 7,180 | 159 | Micron Technology, Inc.(Æ) | 8,122 | 269 | ||
| ARRIS Group, Inc.(Æ) | 1,029 | 31 | Microsoft Corp. | 55,620 | 2,611 | ||
| Arrow Electronics, Inc.(Æ) | 1,544 | 88 | Motorola Solutions, Inc. | 1,253 | 81 | ||
| Atmel Corp.(Æ) | 622 | 5 | NCR Corp.(Æ) | 933 | 26 | ||
| Autodesk, Inc.(Æ) | 1,919 | 110 | NetApp, Inc. | 1,148 | 49 | ||
| Avago Technologies, Ltd. Class A | 1,617 | 139 | NetSuite, Inc.(Æ) | 60 | 7 | ||
| Avnet, Inc. | 1,166 | 50 | Nuance Communications, Inc.(Æ) | 847 | 13 | ||
| AVX Corp. | 756 | 11 | NVIDIA Corp. | 5,677 | 111 | ||
| Bio Techne Corp. | 347 | 32 | ON Semiconductor Corp.(Æ) | 3,374 | 28 | ||
| Broadcom Corp. Class A | 3,801 | 159 | Oracle Corp. | 19,768 | 772 | ||
| Brocade Communications Systems, Inc. | 5,209 | 56 | Palo Alto Networks, Inc.(Æ) | 390 | 41 | ||
| CA, Inc. | 3,697 | 107 | PTC, Inc.(Æ) | 918 | 35 | ||
| Cadence Design Systems, Inc.(Æ) | 428 | 8 | QUALCOMM, Inc. | 10,051 | 789 | ||
| CDW Corp. | 130 | 4 | Rackspace Hosting, Inc.(Æ) | 175 | 7 | ||
| Cisco Systems, Inc. | 40,866 | 1,000 | Red Hat, Inc.(Æ) | 511 | 30 | ||
| Citrix Systems, Inc.(Æ) | 477 | 31 | Riverbed Technology, Inc.(Æ) | 1,589 | 30 | ||
| Cognizant Technology Solutions Corp. Class | Rovi Corp.(Æ) | 304 | 6 | ||||
| A(Æ) | 4,288 | 209 | Salesforce.com, Inc.(Æ) | 2,906 | 186 | ||
| CommScope Holding Co., Inc.(Æ) | 404 | 9 | SanDisk Corp. | 1,674 | 158 | ||
See accompanying notes which are an integral part of the financial statements.
108 Select U.S. Equity Fund
Russell Investment Company Select U.S. Equity Fund
Schedule of Investments, continued — October 31, 2014
| Amounts in thousands (except share amounts) | Amounts in thousands (except share amounts) | ||||||||||
| Principal | Fair | Principal | Fair | ||||||||
| Amount ($) or | Value | Amount ($) or | Value | ||||||||
| Shares | $ | Shares | $ | ||||||||
| SBA Communications Corp. Class A(Æ) | 941 | 106 | NiSource, Inc. | 3,710 | 156 | ||||||
| ServiceNow, Inc.(Æ) | 449 | 30 | Northeast Utilities | 1,651 | 81 | ||||||
| Skyworks Solutions, Inc. | 1,643 | 96 | NRG Energy, Inc. | 2,191 | 66 | ||||||
| SolarWinds, Inc.(Æ) | 141 | 7 | OGE Energy Corp. | 903 | 34 | ||||||
| Solera Holdings, Inc. | 102 | 5 | Pepco Holdings, Inc. | 1,351 | 37 | ||||||
| Splunk, Inc.(Æ) | 168 | 11 | PG&E Corp. | 1,860 | 94 | ||||||
| Stratasys, Ltd.(Æ) | 110 | 13 | Pinnacle West Capital Corp. | 417 | 26 | ||||||
| SunEdison, Inc.(Æ) | 2,190 | 43 | PPL Corp. | 2,453 | 86 | ||||||
| Symantec Corp. | 4,265 | 106 | Public Service Enterprise Group, Inc. | 2,953 | 122 | ||||||
| Synopsys, Inc.(Æ) | 1,427 | 58 | Questar Corp. | 1,579 | 38 | ||||||
| Tech Data Corp.(Æ) | 604 | 36 | SCANA Corp. | 772 | 42 | ||||||
| Teradata Corp.(Æ) | 724 | 31 | Sempra Energy | 2,218 | 244 | ||||||
| Teradyne, Inc. | 1,569 | 29 | Southern Co. | 2,753 | 128 | ||||||
| Texas Instruments, Inc. | 7,743 | 385 | Sprint Corp.(Æ) | 7,023 | 42 | ||||||
| TIBCO Software, Inc.(Æ) | 246 | 6 | TECO Energy, Inc. | 1,524 | 30 | ||||||
| Twitter, Inc.(Æ) | 940 | 39 | Telephone & Data Systems, Inc. | 482 | 12 | ||||||
| VeriFone Systems, Inc.(Æ) | 906 | 34 | Time Warner Telecom, Inc. Class A(Æ) | 297 | 13 | ||||||
| VeriSign, Inc.(Æ) | 179 | 11 | T-Mobile US, Inc.(Æ) | 3,530 | 103 | ||||||
| Vishay Intertechnology, Inc. | 1,978 | 27 | UGI Corp. | 2,752 | 104 | ||||||
| VMware, Inc. Class A(Æ) | 767 | 64 | US Cellular Corp.(Æ) | 143 | 5 | ||||||
| Western Digital Corp. | 2,496 | 246 | Vectren Corp. | 937 | 42 | ||||||
| Workday, Inc. Class A(Æ) | 132 | 13 | Verizon Communications, Inc. | 18,793 | 944 | ||||||
| Xilinx, Inc. | 1,113 | 50 | Westar Energy, Inc. Class A | 716 | 27 | ||||||
| Yahoo!, Inc.(Æ) | 7,739 | 356 | Windstream Holdings, Inc. | 3,622 | 38 | ||||||
| Yelp, Inc. Class A(Æ) | 334 | 20 | Wisconsin Energy Corp. | 1,505 | 75 | ||||||
| Zynga, Inc. Class A(Æ) | 2,360 | 6 | Xcel Energy, Inc. | 2,504 | 84 | ||||||
| 21,776 | 6,189 | ||||||||||
| Utilities - 4.4% | Total Common Stocks | ||||||||||
| AES Corp. | 1,227 | 17 | (cost $132,223) | 135,947 | |||||||
| AGL Resources, Inc. | 1,654 | 89 | |||||||||
| Alliant Energy Corp. | 584 | 36 | Short-Term Investments - 3.5% | ||||||||
| Ameren Corp. | 556 | 23 | Russell U.S. Cash Management Fund | 4,918,144 | (8) | 4,918 | |||||
| American Electric Power Co., Inc. | 2,651 | 155 | Total Short-Term Investments | ||||||||
| American Water Works Co., Inc. | 1,054 | 56 | (cost $4,918) | 4,918 | |||||||
| Aqua America, Inc. | 1,557 | 41 | |||||||||
| AT&T, Inc. | 40,654 | 1,416 | Total Investments 100.0% | ||||||||
| Atmos Energy Corp. | 1,289 | 68 | (identified cost $137,141) | 140,865 | |||||||
| Calpine Corp.(Æ) | 1,542 | 35 | |||||||||
| CenterPoint Energy, Inc. | 3,144 | 77 | Other Assets and Liabilities, Net | ||||||||
| CenturyLink, Inc. | 4,838 | 201 | - | (0.0%) | (26 | ) | |||||
| CMS Energy Corp. | 1,068 | 35 | Net Assets - 100.0% | 140,839 | |||||||
| Consolidated Edison, Inc. | 1,426 | 90 | |||||||||
| Dominion Resources, Inc. | 1,218 | 87 | |||||||||
| DTE Energy Co. | 1,103 | 91 | |||||||||
| Duke Energy Corp. | 2,043 | 168 | |||||||||
| Edison International | 1,056 | 66 | |||||||||
| Energen Corp. | 556 | 38 | |||||||||
| Entergy Corp. | 690 | 58 | |||||||||
| Exelon Corp. | 3,969 | 145 | |||||||||
| FirstEnergy Corp. | 356 | 13 | |||||||||
| Frontier Communications Corp. | 13,170 | 86 | |||||||||
| Great Plains Energy, Inc. | 474 | 13 | |||||||||
| Hawaiian Electric Industries, Inc. | 415 | 12 | |||||||||
| Integrys Energy Group, Inc. | 558 | 41 | |||||||||
| Level 3 Communications, Inc.(Æ) | 1,091 | 51 | |||||||||
| MDU Resources Group, Inc. | 2,943 | 83 | |||||||||
| National Fuel Gas Co. | 698 | 48 | |||||||||
| NextEra Energy, Inc. | 1,771 | 177 | |||||||||
See accompanying notes which are an integral part of the financial statements.
Select U.S. Equity Fund 109
| Russell Investment Company | ||||||||||
| Select U.S. Equity Fund | ||||||||||
| Schedule of Investments, continued — October 31, 2014 | ||||||||||
| Futures Contracts | ||||||||||
| Amounts in thousands (except contract amounts) | ||||||||||
| Unrealized | ||||||||||
| Appreciation | ||||||||||
| Number of | Notional | Expiration | (Depreciation) | |||||||
| Contracts | Amount | Date | $ | |||||||
| Long Positions | ||||||||||
| Russell 1000 Mini Index Futures | 23 | USD | 2,573 | 12/14 | 59 | |||||
| S&P E-Mini Technology Select Sector Index Futures | 12 | USD | 486 | 12/14 | 10 | |||||
| S&P Mid 500 E-Mini Index Futures | 21 | USD | 2,112 | 12/14 | 49 | |||||
| Total Unrealized Appreciation (Depreciation) on Open Futures Contracts (å) | 118 | |||||||||
| Presentation of Portfolio Holdings | ||||||||||
| Amounts in thousands | ||||||||||
| Fair Value | ||||||||||
| Portfolio Summary | Level 1 | Level 2 | Level 3 | Total | % of Net Assets | |||||
| Common Stocks | ||||||||||
| Consumer Discretionary | $ | 18,780 | $ | — | $ | — | $ | 18,780 | 13.3 | |
| Consumer Staples | 10,206 | — | — | 10,206 | 7.2 | |||||
| Energy | 13,849 | — | — | 13,849 | 9.8 | |||||
| Financial Services | 26,507 | — | — | 26,507 | 18.8 | |||||
| Health Care | 18,565 | — | — | 18,565 | 13.2 | |||||
| Materials and Processing | 5,026 | — | — | 5,026 | 3.6 | |||||
| Producer Durables | 15,049 | — | — | 15,049 | 10.7 | |||||
| Technology | 21,776 | — | — | 21,776 | 15.5 | |||||
| Utilities | 6,189 | — | — | 6,189 | 4.4 | |||||
| Short-Term Investments | — | 4,918 | — | 4,918 | 3.5 | |||||
| Total Investments | 135,947 | 4,918 | — | 140,865 | 100.0 | |||||
| Other Assets and Liabilities, Net | (-)* | |||||||||
| 100.0 | ||||||||||
| Other Financial Instruments | ||||||||||
| Futures Contracts | 118 | — | — | 118 | 0.1 | |||||
| Total Other Financial Instruments** | $ | 118 | $ | — | $ | — | $ | 118 | ||
| * | Less than .05% of net assets. |
| ** | Futures and foreign currency exchange contract values reflect the unrealized appreciation (depreciation) on the instruments. |
For a description of the Levels see note 2 in the Notes to Financial Statements.
For disclosure on transfers between Levels 1, 2 and 3 during the period ended October 31, 2014, see note 2 in the Notes to Financial Statements.
See accompanying notes which are an integral part of the financial statements.
110 Select U.S. Equity Fund
| Russell Investment Company | |||
| Select U.S. Equity Fund | |||
| Fair Value of Derivative Instruments — October 31, 2014 | |||
| Amounts in thousands | |||
| Equity | |||
| Derivatives not accounted for as hedging instruments | Contracts | ||
| Location: Statement of Assets and Liabilities - Assets | |||
| Variation margin on futures contracts* | $ | 118 | |
| Equity | |||
| Derivatives not accounted for as hedging instruments | Contracts | ||
| Location: Statement of Operations - Net realized gain (loss) | |||
| Futures contracts | $ | (59 | ) |
| Location: Statement of Operations - Net change in unrealized appreciation (depreciation) | |||
| Futures contracts | $ | 118 | |
| * | Includes cumulative appreciation/depreciation of futures contracts as reported in the Schedule of Investments. Only variation margin is reported within the Statement of Assets and Liabilities. |
For further disclosure on derivatives see note 2 in the Notes to Financial Statements.
See accompanying notes which are an integral part of the financial statements.
Select U.S. Equity Fund 111
Russell Investment Company Select U.S. Equity Fund
Balance Sheet Offsetting of Financial and Derivative Instruments — October 31, 2014
| Amounts in thousands | ||||||||
| Offsetting of Financial Assets and Derivative Assets | ||||||||
| Gross | Net Amounts | |||||||
| Amounts | of Assets | |||||||
| Gross | Offset in the | Presented in | ||||||
| Amounts of | Statement of | the Statement | ||||||
| Recognized | Assets and | of Assets and | ||||||
| Description | Location: Statement of Assets and Liabilities - Assets | Assets | Liabilities | Liabilities | ||||
| Futures Contracts | Variation margin on futures contracts | $ | 57 $ | — $ | 57 | |||
| Total | $ | 57 $ | — $ | 57 | ||||
| Financial Assets, Derivative Assets, and Collateral Held by Counterparty | ||||||||
| Gross Amounts Not Offset in | ||||||||
| the Statement of Assets and | ||||||||
| Liabilities | ||||||||
| Net Amounts | ||||||||
| of Assets | ||||||||
| Presented in | ||||||||
| the Statement | Financial and | |||||||
| of Assets and | Derivative | Collateral | ||||||
| Counterparty | Liabilities | Instruments | Received^ | Net Amount | ||||
| Merrill Lynch | $ 57 | $ | — $ | — | $ 57 | |||
| Total | $ 57 | $ | — $ | — | $ 57 | |||
^ Collateral received or pledged amounts may not reconcile to those disclosed in the Statement of Assets and Liabilities due to the inclusion of off-Balance Sheet collateral and adjustments made to exclude overcollateralization.
For further disclosure on derivatives and counterparty risk see note 2 in the Notes to Financial Statements.
See accompanying notes which are an integral part of the financial statements.
112 Select U.S. Equity Fund
| Russell Investment Company | ||
| Select U.S. Equity Fund | ||
| Statement of Assets and Liabilities — October 31, 2014 | ||
| Amounts in thousands | ||
| Assets | ||
| Investments, at identified cost | $ | 137,141 |
| Investments, at fair value(>) | 140,865 | |
| Cash (restricted)(a) | 300 | |
| Receivables: | ||
| Dividends and interest | 118 | |
| Dividends from affiliated Russell funds | 13 | |
| Fund shares sold | 47 | |
| Variation margin on futures contracts | 57 | |
| Prepaid expenses | 26 | |
| Total assets | 141,426 | |
| Liabilities | ||
| Payables: | ||
| Fund shares redeemed | 521 | |
| Accrued fees to affiliates | 11 | |
| Other accrued expenses | 55 | |
| Total liabilities | 587 | |
| Net Assets | $ | 140,839 |
See accompanying notes which are an integral part of the financial statements.
Select U.S. Equity Fund 113
| Russell Investment Company | |||
| Select U.S. Equity Fund | |||
| Statement of Assets and Liabilities, continued — October 31, 2014 | |||
| Amounts in thousands | |||
| Net Assets Consist of: | |||
| Undistributed (overdistributed) net investment income | $ | 127 | |
| Accumulated net realized gain (loss) | (19 | ) | |
| Unrealized appreciation (depreciation) on: | |||
| Investments | 3,724 | ||
| Futures contracts | 118 | ||
| Shares of beneficial interest | 135 | ||
| Additional paid-in capital | 136,754 | ||
| Net Assets | $ | 140,839 | |
| Net Asset Value, offering and redemption price per share: | |||
| Net asset value per share: Class Y(#) | $ | 10.41 | |
| Class Y — Net assets | $ | 140,838,626 | |
| Class Y — Shares outstanding ($.01 par value) | 13,523,803 | ||
| Amounts in thousands | |||
| (>) Investments in affiliates, Russell U.S. Cash Management Fund | $ | 4,918 | |
| (a) Cash Collateral for Futures | $ | 300 | |
| (#) Net asset value per share equals class level net assets divided by class level shares of beneficial interest outstanding. | |||
See accompanying notes which are an integral part of the financial statements.
114 Select U.S. Equity Fund
| Russell Investment Company | |||
| Select U.S. Equity Fund | |||
| Statement of Operations — For the Period Ended October 31, 2014(1) | |||
| Amounts in thousands | |||
| Investment Income | |||
| Dividends | $ | 525 | |
| Dividends from affiliated Russell funds | 2 | ||
| Interest | 12 | ||
| Total investment income | 539 | ||
| Expenses | |||
| Advisory fees | 91 | ||
| Administrative fees | 14 | ||
| Custodian fees | 9 | ||
| Transfer agent fees – Class Y | 1 | ||
| Professional fees | 45 | ||
| Registration fees | 6 | ||
| Trustees’ fees | 1 | ||
| Printing fees | 3 | ||
| Organizational fees | 11 | ||
| Miscellaneous | 2 | ||
| Expenses before reductions | 183 | ||
| Expense reductions | (75 | ) | |
| Net expenses | 108 | ||
| Net investment income (loss) | 431 | ||
| Net Realized and Unrealized Gain (Loss) | |||
| Net realized gain (loss) on: | |||
| Investments | 40 | ||
| Futures contracts | (59 | ) | |
| Net realized gain (loss) | (19 | ) | |
| Net change in unrealized appreciation (depreciation) on: | |||
| Investments | 3,724 | ||
| Futures contracts | 118 | ||
| Net change in unrealized appreciation (depreciation) | 3,842 | ||
| Net realized and unrealized gain (loss) | 3,823 | ||
| Net Increase (Decrease) in Net Assets from Operations | $ | 4,254 | |
| (1) For the period August 1, 2014 (commencement of operations) to October 31, 2014. | |||
See accompanying notes which are an integral part of the financial statements.
Select U.S. Equity Fund 115
| Russell Investment Company | |||
| Select U.S. Equity Fund | |||
| Statement of Changes in Net Assets | |||
| For the Period Ended | |||
| Amounts in thousands | 2014 | (1) | |
| Increase (Decrease) in Net Assets | |||
| Operations | |||
| Net investment income (loss) | $ | 431 | |
| Net realized gain (loss) | (19 | ) | |
| Net change in unrealized appreciation (depreciation) | 3,842 | ||
| Net increase (decrease) in net assets from operations | 4,254 | ||
| Distributions | |||
| From net investment income | (315 | ) | |
| Net decrease in net assets from distributions | (315 | ) | |
| Share Transactions* | |||
| Net increase (decrease) in net assets from share transactions | 136,900 | ||
| Total Net Increase (Decrease) in Net Assets | 140,839 | ||
| Net Assets | |||
| Beginning of period | — | ||
| End of period | $ | 140,839 | |
| Undistributed (overdistributed) net investment income included in net assets | $ | 127 | |
| (1) For the period August 1, 2014 (commencement of operations) to October 31, 2014. | |||
See accompanying notes which are an integral part of the financial statements.
116 Select U.S. Equity Fund
| Russell Investment Company | |||||||
| Select U.S. Equity Fund | |||||||
| Statements of Changes in Net Assets, continued | |||||||
| * Share transaction amounts (in thousands) for the periods ended October 31, 2014 were as follows: | |||||||
| 2014 | (1) | ||||||
| Shares | Dollars | ||||||
| Class Y | |||||||
| Proceeds from shares sold | 14,731 | $ | 149,195 | ||||
| Proceeds from reinvestment of distributions | 31 | 315 | |||||
| Payments for shares redeemed | (1,238 | ) | (12,610 | ) | |||
| Total increase (decrease) | 13,524 | $ | 136,900 | ||||
| (1) For the period August 1, 2014 (commencement of operations) to October 31, 2014. | |||||||
See accompanying notes which are an integral part of the financial statements.
Select U.S. Equity Fund 117
| Russell Investment Company | ||||||||||||||
| Select U.S. Equity Fund | ||||||||||||||
| Financial Highlights — For the Periods Ended | ||||||||||||||
| For a Share Outstanding Throughout Each Period. | ||||||||||||||
| $ | $ | $ | $ | $ | ||||||||||
| Net Asset Value, | Net | Net Realized | Total from | Distributions | ||||||||||
| Beginning of | Investment | and Unrealized | Investment | from Net | $ | |||||||||
| Period | Income (Loss)(a)(d) | Gain (Loss) | Operations | Investment Income | Total Distributions | |||||||||
| Class Y | ||||||||||||||
| October 31, 2014(7) | 10.00 | .04 | .39 | .43 | (.02 | ) | (.02 | ) | ||||||
See accompanying notes which are an integral part of the financial statements.
118 Select U.S. Equity Fund
| % | % | % | |||||||||||
| $ | $ | Ratio of Expenses | Ratio of Expenses | Ratio of Net | |||||||||
| Net Asset Value, | % | Net Assets, | to Average | to Average | Investment Income | % | |||||||
| End of | Total | End of Period | Net Assets, | Net Assets, | to Average | Portfolio | |||||||
| Period | Return(b) | (000 | ) | Gross(e) | Net(d)(e) | Net Assets(d)(e) | Turnover Rate(b) | ||||||
| 10.41 | 4.34 | 140,839 | .60 | .35 | 1.42 | 2 | |||||||
See accompanying notes which are an integral part of the financial statements.
Select U.S. Equity Fund 119
Russell Investment Company Russell U.S. Large Cap Equity Fund
Portfolio Management Discussion and Analysis — October 31, 2014 (Unaudited)
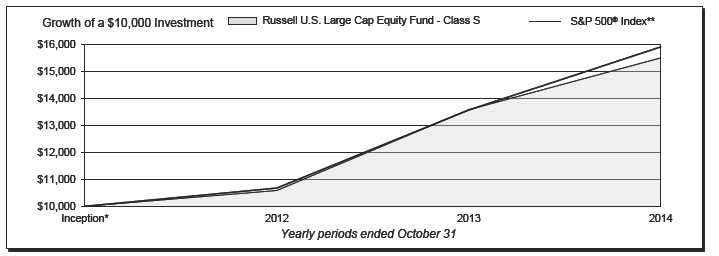
| Russell U.S. Large Cap Equity Fund - Class A‡ | Russell U.S. Large Cap Equity Fund - Class S | ||||||
| Total | Total | ||||||
| Return | Return | ||||||
| 1 Year | 7.30 | % | 1 Year | 14.17 | % | ||
| Inception* | 14.61 | %§ | Inception* | 17.42 | %§ | ||
| Russell U.S. Large Cap Equity Fund - Class C | S&P 500® Index** | ||||||
| Total | Total | ||||||
| Return | Return | ||||||
| 1 Year | 13.06 | % | 1 Year | 17.27 | % | ||
| Inception* | 16.27 | %§ | Inception* | 18.54 | %§ | ||
120 Russell U.S. Large Cap Equity Fund
Russell Investment Company Russell U.S. Large Cap Equity Fund
Portfolio Management Discussion and Analysis, continued — October 31, 2014 (Unaudited)
| The Russell U.S. Large Cap Equity Fund (the “Fund”) employs | Fund’s tilt away from the largest cap tier of stocks within the S&P | |
| a multi-manager approach whereby portions of the Fund | 500® Index also held back benchmark-relative returns. | |
| are allocated to different money managers. Fund assets not | In addition, the Fund’s underweight to an area that tends to be | |
| allocated to money managers are managed by Russell Investment | viewed as a “bond substitute,” due to their income producing | |
| Management Company (“RIMCo”), the Fund’s advisor. RIMCo | qualities, the electric utilities industry, detracted from benchmark- | |
| may change the allocation of the Fund’s assets among money | relative performance given the industry’s outperformance as | |
| managers at any time. An exemptive order from the Securities | interest rates declined, although the Fund’s tilt toward stocks with | |
| and Exchange Commission (“SEC”) permits RIMCo to engage | above average growth rates provided a positive contribution to | |
| or terminate a money manager at any time, subject to approval | benchmark-relative performance. | |
| by the Fund’s Board, without a shareholder vote. Pursuant to the | ||
| terms of the exemptive order, the Fund is required to notify its | How did the investment strategies and techniques employed | |
| shareholders within 90 days of when a money manager begins | by the Fund and its money managers affect its benchmark- | |
| providing services. As of October 31, 2014, the Fund had five | relative performance? | |
| money managers. | Stock selection effects within the health care sector (overweights | |
| What is the Fund’s investment objective? | to Pfizer Inc. and Sanofi) and the technology sector (underweight | |
| The Fund seeks to provide long term capital growth. | to Apple Inc.) detracted from the Fund’s benchmark-relative | |
| returns for the fiscal year. An underweight to the technology sector | ||
| How did the Fund perform relative to its benchmark for the | detracted, although an overweight to the health care sector and | |
| fiscal year ended October 31, 2014? | underweight to the consumer staples sector were beneficial. The | |
| For the fiscal year ended October 31, 2014, the Fund’s Class A, | Fund’s tilt away from the ultra large cap tier of the benchmark was | |
| Class C and Class S Shares gained 13.85%, 13.06% and 14.17%, | detrimental as that narrow set of stocks outperformed, although | |
| respectively. This is compared to the Fund’s benchmark, the S&P | the Fund’s tilt towards less financial leverage (lower debt-to- | |
| 500® Index, which gained 17.27% during the same period. The | capital ratios) was beneficial. | |
| Fund’s performance includes operating expenses, whereas index | Ceredex Value Advisors LLC (“Ceredex”) underperformed the | |
| returns are unmanaged and do not include expenses of any kind. | Russell 1000® Value Index for the fiscal year. From a sector | |
| For the fiscal year ended October 31, 2014, the Morningstar® | perspective, an overweight to technology and underweight to | |
| Large Blend, a group of funds that Morningstar considers to | energy were beneficial, although an | overweight to producer |
| have investment strategies similar to those of the Fund, gained | durables detracted. Stock selection | within the consumer |
| 14.34%. This result serves as a peer comparison and is expressed | discretionary sector (overweights to Mattel, Inc. and Pearson) and | |
| net of operating expenses. | within the technology sector (an underweight to Hewlett-Packard | |
| Company) held back benchmark-relative performance. | ||
| RIMCo may assign a money manager a specific style or | ||
| capitalization benchmark other than the Fund’s | Columbus Circle Investors (“Columbus Circle”) underperformed | |
| the Russell 1000® Growth Index for the fiscal year. Factor | ||
| index. However, the Fund’s primary index remains the benchmark | exposures were mixed, specifically a tilt toward high beta stocks | |
| for the Fund and is representative of | (stocks with high sensitivity to market movements) detracted, | |
| the aggregate of each money manager’s benchmark index. | although a tilt toward stocks with rising earnings estimates was | |
| beneficial. Sector exposures were also mixed, with an underweight | ||
| How did the market conditions described in the Market | to technology detracting, while an overweight to health care was | |
| Summary report affect the Fund’s performance? | rewarded. Stock selection within the energy sector (overweights | |
| During the fiscal year, the U.S. large capitalization equity market | to Pioneer Natural Resources Company and Noble Energy, Inc.) | |
| produced positive returns. Given the ongoing economic recovery, | held back benchmark-relative performance. | |
| relevant Fund exposures included tilts away from sectors that are | ||
| Institutional Capital LLC (“ICAP”) underperformed the S&P 500® | ||
| traditionally considered to be “non-cyclical,” such as consumer | ||
| staples, and toward economically sensitive sectors such as | Index for the fiscal year. A factor tilt toward stocks with the lowest | |
| materials and processing and consumer discretionary. The | valuations (lowest price-to-book and price-to-cash flow ratios) | |
| Fund’s overweight to the materials and processing and consumer | was not rewarded. An overweight to the health care sector and an | |
| discretionary sectors detracted from the Fund’s benchmark- | underweight to the consumer staples sector were beneficial. Stock | |
| relative performance, as these sectors underperformed, although | selection within the health care sector (an overweight to Pfizer | |
| the Fund’s underweight to consumer staples was beneficial. The | Inc) detracted from benchmark-relative performance. | |
Russell U.S. Large Cap Equity Fund 121
Russell Investment Company Russell U.S. Large Cap Equity Fund
Portfolio Management Discussion and Analysis, continued — October 31, 2014 (Unaudited)
| Jacobs Levy Equity Management, Inc (“Jacobs”) outperformed the | decision to equitize Fund and manager cash was beneficial to | |
| S&P 500® Index for the fiscal year. A tilt toward stocks with above | Fund performance for the fiscal year. | |
| average earnings growth rates was beneficial. An overweight to | ||
| both the technology and health care sectors was rewarded. Stock | Describe any changes to the Fund’s structure or the money | |
| selection within the health care sector (overweights to Forest | manager line-up. | |
| Laboratories, Inc. and Allergan, Inc.) was a contributor to positive | There were no changes to the Fund’s structure or money manager | |
| benchmark relative performance. | line up during the fiscal year. | |
| Sustainable Growth Advisers, LP (“Sustainable”) underperformed | Money Managers as of October 31, | |
| the Russell 1000® Growth Index for the fiscal year. Stock | 2014 | Styles |
| selection was the primary source of negative benchmark-relative | Ceredex Value Advisors LLC | Value |
| returns. Stock selection was particularly detrimental within the | Columbus Circle Investors | Growth |
| technology sector (underweights to Apple, Inc. and Microsoft | Institutional Capital Management LLC | Market-Oriented |
| Corporation) and the consumer staples sector (an overweight | Jacobs Levy Equity Management | Market-Oriented |
| Sustainable Growth Advisers, LP | Growth | |
| to Whole Foods Market, Inc.). From a sector perspective, an | The views expressed in this report reflect those of the portfolio | |
| overweight to materials and processing and an underweight to | managers only through the end of the period covered by | |
| technology detracted. | the report. These views do not necessarily represent the | |
| RIMCo manages the portion of the Fund’s assets that RIMCo | views of RIMCo, or any other person in RIMCo or any other | |
| determines not to allocate to the money managers. Assets not | affiliated organization. These views are subject to change | |
| allocated to managers include the Fund’s liquidity reserves and | at any time based upon market conditions or other events, | |
| assets which may be managed directly by RIMCo to modify the | and RIMCo disclaims any responsibility to update the views | |
| Fund’s overall portfolio characteristics to seek to achieve the | contained herein. These views should not be relied on as | |
| desired risk/return profile for the Fund. | investment advice and, because investment decisions for | |
| During the period, RIMCo used index futures contracts to | a Russell Investment Company (“RIC”) Fund are based on | |
| equitize the majority of the Fund and money managers’ cash. The | numerous factors, should not be relied on as an indication | |
| of investment decisions of any RIC Fund. | ||
| * | Assumes initial investment on February 6, 2012. |
| ** | The Standard & Poor’s 500® Index is composed of 500 common stocks which are chosen by Standard & Poor’s Corporation to best capture the price performance of a large cross-section of the U.S. publicly traded stock market. The index is structured to approximate the general distribution of industries in the U.S. economy. |
| ‡ | The performance shown has been adjusted to reflect the deduction of the maximum Class A sales charge of 5.75%. |
| § | Annualized. |
Performance is historical and assumes reinvestment of all dividends and capital gains. Investment return and principal value will fluctuate so that an investor’s shares, when redeemed, may be worth more or less than when purchased. Past performance is not indicative of future results. The returns shown do not reflect the deduction of taxes that a shareholder would pay on Fund distributions or the redemption of Fund shares.
122 Russell U.S. Large Cap Equity Fund
Russell Investment Company Russell U.S. Large Cap Equity Fund
Shareholder Expense Example — October 31, 2014 (Unaudited)
| Fund Expenses | Please note that the expenses shown in the table are meant | |||||
| The following disclosure provides important information | to highlight your ongoing costs only and do not reflect any | |||||
| regarding the Fund’s Shareholder Expense Example | transactional costs. Therefore, the information under the heading | |||||
| (“Example”). | “Hypothetical Performance (5% return before expenses)” is | |||||
| useful in comparing ongoing costs only, and will not help you | ||||||
| Example | determine the relative total costs of owning different funds. In | |||||
| As a shareholder of the Fund, you incur two types of costs: (1) | addition, if these transactional costs were included, your costs | |||||
| transaction costs, and (2) ongoing costs, including advisory and | would have been higher. | |||||
| administrative fees; distribution (12b-1) and/or service fees; | Hypothetical | |||||
| and other Fund expenses. The Example is intended to help | Performance (5% | |||||
| you understand your ongoing costs (in dollars) of investing in | Actual | return before | ||||
| the Fund and to compare these costs with the ongoing costs of | Class A | Performance | expenses) | |||
| Beginning Account Value | ||||||
| investing in other mutual funds. The Example is based on an | May 1, 2014 | $ | 1,000.00 | $ | 1,000.00 | |
| investment of $1,000 invested at the beginning of the period and | Ending Account Value | |||||
| held for the entire period indicated, which for this Fund is from | October 31, 2014 | $ | 1,069.60 | $ | 1,019.56 | |
| May 1, 2014 to October 31, 2014. | Expenses Paid During Period* | $ | 5.84 | $ | 5.70 | |
| Actual Expenses | * Expenses are equal to the Fund's annualized expense ratio of 1.12% | |||||
| (representing the six month period annualized), multiplied by the average | ||||||
| The information in the table under the heading “Actual | account value over the period, multiplied by 184/365 (to reflect the one-half | |||||
| Performance” provides information about actual account values | year period). May reflect amounts waived and/or reimbursed. Without any | |||||
| and actual expenses. You may use the information in this column, | waivers and/or reimbursements, expenses would have been higher. | |||||
| together with the amount you invested, to estimate the expenses | ||||||
| Hypothetical | ||||||
| that you paid over the period. Simply divide your account value by | Performance (5% | |||||
| $1,000 (for example, an $8,600 account value divided by $1,000 | Actual | return before | ||||
| = 8.6), then multiply the result by the number in the first column | Class C | Performance | expenses) | |||
| Beginning Account Value | ||||||
| in the row entitled “Expenses Paid During Period” to estimate | May 1, 2014 | $ | 1,000.00 | $ | 1,000.00 | |
| the expenses you paid on your account during this period. | Ending Account Value | |||||
| October 31, 2014 | $ | 1,065.60 | $ | 1,015.78 | ||
| Hypothetical Example for Comparison Purposes | Expenses Paid During Period* | $ | 9.74 | $ | 9.50 | |
| The information in the table under the heading “Hypothetical | ||||||
| Performance (5% return before expenses)” provides information | * Expenses are equal to the Fund's annualized expense ratio of 1.87% | |||||
| (representing the six month period annualized), multiplied by the average | ||||||
| about hypothetical account values and hypothetical expenses | account value over the period, multiplied by 184/365 (to reflect the one-half | |||||
| based on the Fund’s actual expense ratio and an assumed rate of | year period). May reflect amounts waived and/or reimbursed. Without any | |||||
| return of 5% per year before expenses, which is not the Fund’s | waivers and/or reimbursements, expenses would have been higher. | |||||
| actual return. The hypothetical account values and expenses | ||||||
| Hypothetical | ||||||
| may not be used to estimate the actual ending account balance or | Performance (5% | |||||
| expenses you paid for the period. You may use this information | Actual | retaurn before | ||||
| to compare the ongoing costs of investing in the Fund and other | Class S | Performance | expenses) | |||
| funds. To do so, compare this 5% hypothetical example with the | Beginning Account Value | |||||
| May 1, 2014 | $ | 1,000.00 | $ | 1,000.00 | ||
| 5% hypothetical examples that appear in the shareholder reports | Ending Account Value | |||||
| of other funds. | October 31, 2014 | $ | 1,070.70 | $ | 1,020.82 | |
| Expenses Paid During Period* | $ | 4.54 | $ | 4.43 | ||
| * Expenses are equal to the Fund's annualized expense ratio of 0.87% | ||||||
| (representing the six month period annualized), multiplied by the average | ||||||
| account value over the period, multiplied by 184/365 (to reflect the one-half | ||||||
| year period). May reflect amounts waived and/or reimbursed. Without any | ||||||
| waivers and/or reimbursements, expenses would have been higher. | ||||||
Russell U.S. Large Cap Equity Fund 123
| Russell Investment Company | |||||||
| Russell U.S. Large Cap Equity Fund | |||||||
| Schedule of Investments — October 31, 2014 | |||||||
| Amounts in thousands (except share amounts) | Amounts in thousands (except share amounts) | ||||||
| Principal | Fair | Principal | Fair | ||||
| Amount ($) or | Value | Amount ($) or | Value | ||||
| Shares | $ | Shares | $ | ||||
| Common Stocks - 92.4% | Philip Morris International, Inc. | 12,400 | 1,104 | ||||
| Consumer Discretionary - 14.1% | Procter & Gamble Co. (The) | 41,700 | 3,640 | ||||
| Advance Auto Parts, Inc. | 1,280 | 188 | Whole Foods Market, Inc. | 39,090 | 1,537 | ||
| Amazon.com, Inc.(Æ) | 5,790 | 1,769 | 13,765 | ||||
| AutoZone, Inc.(Æ) | 1,500 | 830 | |||||
| Brinker International, Inc. | 3,600 | 193 | Energy - 7.4% | ||||
| Carnival Corp. | 9,000 | 361 | Apache Corp. | 500 | 39 | ||
| CBS Corp. Class B | 4,235 | 230 | Baker Hughes, Inc. | 10,450 | 553 | ||
| Chipotle Mexican Grill, Inc. Class A(Æ) | 1,659 | 1,059 | Cameron International Corp.(Æ) | 25,450 | 1,516 | ||
| Choice Hotels International, Inc. | 1,900 | 102 | Chevron Corp. | 49,380 | 5,923 | ||
| Columbia Sportswear Co. | 1,600 | 62 | ConocoPhillips | 27,280 | 1,969 | ||
| Comcast Corp. Class A(Æ) | 113,310 | 6,273 | Continental Resources, Inc.(Æ) | 6,630 | 374 | ||
| Costco Wholesale Corp. | 10,610 | 1,415 | Devon Energy Corp. | 8,450 | 507 | ||
| Domino's Pizza, Inc. | 1,300 | 115 | EOG Resources, Inc. | 7,780 | 739 | ||
| DR Horton, Inc. | 30,905 | 704 | Exxon Mobil Corp. | 70,511 | 6,820 | ||
| Estee Lauder Cos., Inc. (The) Class A | 12,251 | 921 | FMC Technologies, Inc.(Æ) | 700 | 39 | ||
| Ford Motor Co. | 155,000 | 2,184 | Halliburton Co. | 59,600 | 3,286 | ||
| Gap, Inc. (The) | 5,600 | 212 | Marathon Petroleum Corp. | 2,400 | 218 | ||
| Garmin, Ltd. | 9,000 | 499 | Nabors Industries, Ltd. | 7,200 | 129 | ||
| General Motors Co. | 19,700 | 619 | Occidental Petroleum Corp. | 38,385 | 3,413 | ||
| Hilton Worldwide Holdings, Inc.(Æ) | 9,900 | 250 | Patterson-UTI Energy, Inc. | 6,700 | 154 | ||
| Home Depot, Inc. | 9,600 | 936 | PBF Energy, Inc. Class A | 2,000 | 52 | ||
| Hyatt Hotels Corp. Class A(Æ) | 6,200 | 367 | Phillips 66 | 3,300 | 259 | ||
| Johnson Controls, Inc. | 110,248 | 5,210 | Pioneer Natural Resources Co. | 6,533 | 1,235 | ||
| Kohl's Corp. | 9,100 | 493 | Schlumberger, Ltd. | 44,320 | 4,373 | ||
| L Brands, Inc. | 10,400 | 750 | Seventy Seven Energy, Inc.(Æ) | 535 | 7 | ||
| Las Vegas Sands Corp. | 9,500 | 591 | Valero Energy Corp. | 9,900 | 496 | ||
| Liberty Media Corp.(Æ) | 36,450 | 1,747 | Whiting Petroleum Corp.(Æ) | 1,100 | 67 | ||
| Lowe's Cos., Inc. | 50,950 | 2,914 | 32,168 | ||||
| Marriott International, Inc. Class A | 1,000 | 76 | |||||
| Mattel, Inc. | 59,000 | 1,833 | Financial Services - 19.2% | ||||
| Nike, Inc. Class B | 19,597 | 1,822 | Affiliated Managers Group, Inc.(Æ) | 200 | 40 | ||
| Omnicom Group, Inc. | 6,400 | 460 | Aflac, Inc. | 14,300 | 854 | ||
| O'Reilly Automotive, Inc.(Æ) | 3,110 | 547 | American Express Co. | 31,260 | 2,812 | ||
| Priceline Group, Inc. (The)(Æ) | 1,876 | 2,263 | American International Group, Inc. | 16,140 | 865 | ||
| PulteGroup, Inc. | 36,829 | 707 | American Tower Corp. Class A(ö) | 13,060 | 1,274 | ||
| PVH Corp. | 4,577 | 523 | Ameriprise Financial, Inc. | 36,500 | 4,605 | ||
| Royal Caribbean Cruises, Ltd. | 12,332 | 838 | Aon PLC | 43,044 | 3,701 | ||
| Starbucks Corp. | 33,748 | 2,550 | Arch Capital Group, Ltd.(Æ) | 4,100 | 231 | ||
| Tiffany & Co. | 4,400 | 423 | Aspen Insurance Holdings, Ltd. | 3,800 | 166 | ||
| Time Warner, Inc. | 30,114 | 2,393 | Axis Capital Holdings, Ltd. | 800 | 39 | ||
| TJX Cos., Inc. | 16,110 | 1,020 | Bank of America Corp. | 227,050 | 3,896 | ||
| Ulta Salon Cosmetics & Fragrance, Inc.(Æ) | 6,551 | 791 | Bank of New York Mellon Corp. (The) | 6,800 | 263 | ||
| Under Armour, Inc. Class A(Æ) | 8,948 | 587 | Berkshire Hathaway, Inc. Class B(Æ) | 2,350 | 329 | ||
| Viacom, Inc. Class B | 56,960 | 4,141 | BlackRock, Inc. Class A | 5,272 | 1,799 | ||
| Wal-Mart Stores, Inc. | 42,961 | 3,276 | Capital One Financial Corp. | 7,910 | 655 | ||
| Walt Disney Co. (The) | 57,850 | 5,286 | Charles Schwab Corp. (The) | 6,700 | 192 | ||
| WPP PLC - ADR | 5,103 | 498 | Chubb Corp. (The) | 2,200 | 219 | ||
| Wyndham Worldwide Corp. | 2,000 | 155 | Citigroup, Inc. | 124,350 | 6,657 | ||
| 61,183 | City National Corp. | 800 | 63 | ||||
| Comerica, Inc. | 12,340 | 589 | |||||
| Consumer Staples - 3.2% | Crown Castle International Corp.(ö) | 21,690 | 1,694 | ||||
| Andersons, Inc. (The) | 700 | 45 | Cullen/Frost Bankers, Inc. | 7,530 | 608 | ||
| Casey's General Stores, Inc. | 700 | 57 | Discover Financial Services | 32,256 | 2,057 | ||
| Coca-Cola Co. (The) | 32,100 | 1,344 | Equifax, Inc. | 1,500 | 114 | ||
| Colgate-Palmolive Co. | 31,300 | 2,094 | Everest Re Group, Ltd. | 1,610 | 275 | ||
| Constellation Brands, Inc. Class A(Æ) | 5,936 | 543 | First Horizon National Corp. | 4,200 | 54 | ||
| Hershey Co. (The) | 10,940 | 1,049 | Fiserv, Inc.(Æ) | 4,800 | 334 | ||
| Kroger Co. (The) | 18,400 | 1,025 | FleetCor Technologies, Inc.(Æ) | 5,400 | 813 | ||
| PepsiCo, Inc. | 13,800 | 1,327 | |||||
| See accompanying notes which are an integral part of the financial statements. | |||||||
| 124 Russell U.S. Large Cap Equity Fund | |||||||
| Russell Investment Company | |||||||
| Russell U.S. Large Cap Equity Fund | |||||||
| Schedule of Investments, continued — October 31, 2014 | |||||||
| Amounts in thousands (except share amounts) | Amounts in thousands (except share amounts) | ||||||
| Principal | Fair | Principal | Fair | ||||
| Amount ($) or | Value | Amount ($) or | Value | ||||
| Shares | $ | Shares | $ | ||||
| Franklin Resources, Inc. | 29,210 | 1,625 | UnitedHealth Group, Inc. | 31,410 | 2,984 | ||
| Goldman Sachs Group, Inc. (The) | 16,950 | 3,220 | Valeant Pharmaceuticals International, Inc. | ||||
| JPMorgan Chase & Co. | 41,710 | 2,523 | (Æ) | 23,150 | 3,080 | ||
| Marsh & McLennan Cos., Inc. | 3,900 | 212 | WellPoint, Inc. | 4,670 | 592 | ||
| MasterCard, Inc. Class A | 28,834 | 2,415 | 68,912 | ||||
| MetLife, Inc. | 40,760 | 2,211 | |||||
| Morgan Stanley | 78,327 | 2,737 | Materials and Processing - 4.6% | ||||
| Northern Trust Corp. | 38,159 | 2,530 | Airgas, Inc. | 7,050 | 786 | ||
| PNC Financial Services Group, Inc. (The) | 56,310 | 4,865 | Alcoa, Inc. | 75,868 | 1,272 | ||
| Progressive Corp. (The) | 32,900 | 869 | AptarGroup, Inc. | 500 | 31 | ||
| Prudential Financial, Inc. | 10,690 | 946 | Ashland, Inc. | 10,096 | 1,091 | ||
| Regions Financial Corp. | 129,360 | 1,284 | Brown-Forman Corp. Class B - ADR | 1,200 | 111 | ||
| Reinsurance Group of America, Inc. Class A | 2,800 | 236 | Cabot Corp. | 2,000 | 93 | ||
| SEI Investments Co. | 1,600 | 62 | Commercial Metals Co. | 1,600 | 28 | ||
| Simon Property Group, Inc.(ö) | 7,963 | 1,427 | Dow Chemical Co. (The) | 7,500 | 371 | ||
| State Street Corp. | 29,840 | 2,251 | Ecolab, Inc. | 16,010 | 1,781 | ||
| SunTrust Banks, Inc. | 8,300 | 325 | Fastenal Co. | 32,840 | 1,446 | ||
| T Rowe Price Group, Inc. | 24,440 | 2,006 | Graphic Packaging Holding Co.(Æ) | 6,100 | 74 | ||
| Travelers Cos., Inc. (The) | 18,630 | 1,878 | International Flavors & Fragrances, Inc. | 5,900 | 585 | ||
| US Bancorp | 60,480 | 2,577 | Lennox International, Inc. | 3,000 | 267 | ||
| Visa, Inc. Class A | 22,352 | 5,396 | LyondellBasell Industries NV Class A | 12,389 | 1,135 | ||
| Voya Financial, Inc. | 14,500 | 569 | Minerals Technologies, Inc. | 800 | 61 | ||
| Wells Fargo & Co. | 98,350 | 5,221 | Monsanto Co. | 46,140 | 5,307 | ||
| Zions Bancorporation | 32,762 | 949 | Mosaic Co. (The) | 30,500 | 1,351 | ||
| 83,532 | Nucor Corp. | 8,500 | 460 | ||||
| Pentair PLC(Æ) | 10,719 | 719 | |||||
| Health Care - 15.8% | PPG Industries, Inc. | 11,276 | 2,297 | ||||
| Abbott Laboratories | 10,400 | 453 | Reliance Steel & Aluminum Co. | 700 | 47 | ||
| Actavis PLC(Æ) | 4,421 | 1,073 | Steel Dynamics, Inc. | 3,600 | 83 | ||
| Aetna, Inc. | 20,623 | 1,702 | United States Steel Corp. | 14,000 | 561 | ||
| Amgen, Inc. | 26,630 | 4,319 | Westlake Chemical Corp. | 500 | 35 | ||
| Baxter International, Inc. | 20,255 | 1,421 | 19,992 | ||||
| Becton Dickinson and Co. | 1,800 | 232 | |||||
| Biogen Idec, Inc.(Æ) | 6,102 | 1,959 | Producer Durables - 9.3% | ||||
| Boston Scientific Corp.(Æ) | 20,700 | 275 | Accenture PLC Class A | 4,800 | 389 | ||
| Bristol-Myers Squibb Co. | 54,972 | 3,198 | Agilent Technologies, Inc. | 28,369 | 1,568 | ||
| Brookdale Senior Living, Inc. Class A(Æ) | 6,100 | 206 | AO Smith Corp. | 9,780 | 522 | ||
| Cardinal Health, Inc. | 6,600 | 518 | Automatic Data Processing, Inc. | 25,640 | 2,097 | ||
| Celgene Corp.(Æ) | 2,900 | 311 | Boeing Co. (The) | 39,470 | 4,929 | ||
| Cerner Corp.(Æ) | 29,180 | 1,848 | Canadian Pacific Railway, Ltd. | 5,553 | 1,153 | ||
| Cigna Corp. | 34,480 | 3,433 | CSX Corp. | 36,900 | 1,315 | ||
| Covidien PLC | 40,760 | 3,768 | Cummins, Inc. | 3,630 | 531 | ||
| Edwards Lifesciences Corp.(Æ) | 2,100 | 254 | Delta Air Lines, Inc. | 54,568 | 2,196 | ||
| Eli Lilly & Co. | 22,640 | 1,502 | FedEx Corp. | 3,050 | 511 | ||
| Express Scripts Holding Co.(Æ) | 30,550 | 2,347 | Flowserve Corp. | 10,700 | 727 | ||
| Gilead Sciences, Inc.(Æ) | 31,146 | 3,488 | General Dynamics Corp. | 8,570 | 1,198 | ||
| HCA Holdings, Inc.(Æ) | 19,200 | 1,345 | General Electric Co. | 338,550 | 8,738 | ||
| Health Net, Inc.(Æ) | 2,900 | 138 | HD Supply Holdings, Inc.(Æ) | 5,500 | 159 | ||
| Henry Schein, Inc.(Æ) | 830 | 100 | Honeywell International, Inc. | 45,460 | 4,370 | ||
| Humana, Inc. | 4,700 | 653 | Huntington Ingalls Industries, Inc. | 4,800 | 508 | ||
| Illumina, Inc.(Æ) | 2,920 | 562 | Knight Transportation, Inc. | 1,800 | 53 | ||
| Johnson & Johnson | 44,060 | 4,749 | L-3 Communications Holdings, Inc. | 1,230 | 149 | ||
| McKesson Corp. | 12,828 | 2,609 | Landstar System, Inc. | 3,500 | 259 | ||
| MEDNAX, Inc.(Æ) | 1,200 | 75 | Lexmark International, Inc. Class A | 4,500 | 194 | ||
| Merck & Co., Inc. | 85,540 | 4,956 | Lockheed Martin Corp. | 2,010 | 383 | ||
| Perrigo Co. PLC | 6,690 | 1,080 | Manpowergroup, Inc. | 2,700 | 180 | ||
| Pfizer, Inc. | 363,327 | 10,881 | Norfolk Southern Corp. | 7,800 | 863 | ||
| Regeneron Pharmaceuticals, Inc.(Æ) | 3,104 | 1,222 | Northrop Grumman Corp. | 4,320 | 596 | ||
| Sanofi - ADR | 34,157 | 1,579 | Parker-Hannifin Corp. | 4,630 | 588 | ||
| See accompanying notes which are an integral part of the financial statements. | |||||||
| Russell U.S. Large Cap Equity Fund 125 | |||||||
Russell Investment Company Russell U.S. Large Cap Equity Fund
Schedule of Investments, continued — October 31, 2014
| Amounts in thousands (except share amounts) | Amounts in thousands (except share amounts) | ||||||||
| Principal | Fair | Principal | Fair | ||||||
| Amount ($) or | Value | Amount ($) or | Value | ||||||
| Shares | $ | Shares | $ | ||||||
| Paychex, Inc. | 10,300 | 483 | Utilities - 2.9% | ||||||
| Raytheon Co. | 12,020 | 1,249 | AT&T, Inc. | 69,810 | 2,432 | ||||
| Rockwell Collins, Inc. | 1,500 | 126 | Duke Energy Corp. | 18,845 | 1,548 | ||||
| Textron, Inc. | 5,900 | 245 | Encana Corp. | 68,000 | 1,267 | ||||
| Toro Co. (The) | 200 | 12 | Exelon Corp. | 67,900 | 2,485 | ||||
| Union Pacific Corp. | 23,620 | 2,751 | NextEra Energy, Inc. | 16,535 | 1,657 | ||||
| United Continental Holdings, Inc.(Æ) | 19,867 | 1,049 | Verizon Communications, Inc. | 67,330 | 3,383 | ||||
| Wabtec Corp. | 2,700 | 233 | 12,772 | ||||||
| 40,324 | |||||||||
| Total Common Stocks | |||||||||
| Technology - 15.9% | (cost $334,310) | 401,689 | |||||||
| Apple, Inc. | 66,002 | 7,128 | |||||||
| ASML Holding NV Class G | 17,050 | 1,700 | Short-Term Investments - 7.2% | ||||||
| Aspen Technology, Inc.(Æ) | 6,400 | 236 | Russell U.S. Cash Management Fund | 31,162,948 | (8) | 31,163 | |||
| Autodesk, Inc.(Æ) | 6,800 | 391 | Total Short-Term Investments | ||||||
| Broadcom Corp. Class A | 13,870 | 581 | (cost $31,163) | 31,163 | |||||
| Cisco Systems, Inc. | 84,690 | 2,072 | |||||||
| Cognizant Technology Solutions Corp. Class | Total Investments 99.6% | ||||||||
| A(Æ) | 6,000 | 293 | (identified cost $365,473) | 432,852 | |||||
| Dolby Laboratories, Inc. Class A | 2,800 | 117 | Other Assets and Liabilities, Net | ||||||
| DST Systems, Inc. | 1,300 | 125 | |||||||
| Electronic Arts, Inc.(Æ) | 27,650 | 1,133 | - 0.4% | 1,720 | |||||
| EMC Corp. | 104,140 | 2,992 | Net Assets - 100.0% | 434,572 | |||||
| Equinix, Inc. | 8,390 | 1,753 | |||||||
| Facebook, Inc. Class A(Æ) | 17,780 | 1,333 | |||||||
| Gartner, Inc.(Æ) | 1,000 | 81 | |||||||
| Google, Inc. Class C(Æ) | 6,569 | 3,692 | |||||||
| Hewlett-Packard Co. | 27,930 | 1,002 | |||||||
| Intel Corp. | 118,320 | 4,024 | |||||||
| International Business Machines Corp. | 4,080 | 671 | |||||||
| Juniper Networks, Inc. | 70,570 | 1,487 | |||||||
| Lam Research Corp. | 11,339 | 883 | |||||||
| LinkedIn Corp. Class A(Æ) | 4,286 | 981 | |||||||
| Maxim Integrated Products, Inc. | 53,240 | 1,562 | |||||||
| Mentor Graphics Corp. | 3,100 | 66 | |||||||
| Microsoft Corp. | 117,992 | 5,540 | |||||||
| Motorola Solutions, Inc. | 11,080 | 715 | |||||||
| NetApp, Inc. | 74,090 | 3,171 | |||||||
| NXP Semiconductor NV(Æ) | 11,300 | 776 | |||||||
| Oracle Corp. | 125,710 | 4,909 | |||||||
| Palo Alto Networks, Inc.(Æ) | 3,700 | 391 | |||||||
| QUALCOMM, Inc. | 21,970 | 1,725 | |||||||
| Red Hat, Inc.(Æ) | 22,230 | 1,310 | |||||||
| Salesforce.com, Inc.(Æ) | 25,881 | 1,657 | |||||||
| SanDisk Corp. | 16,710 | 1,573 | |||||||
| SAP SE - ADR | 23,000 | 1,567 | |||||||
| Seagate Technology PLC | 6,200 | 390 | |||||||
| ServiceNow, Inc.(Æ) | 9,257 | 629 | |||||||
| Splunk, Inc.(Æ) | 8,915 | 589 | |||||||
| Symantec Corp. | 18,900 | 469 | |||||||
| Synopsys, Inc.(Æ) | 16,290 | 668 | |||||||
| Syntel, Inc.(Æ) | 1,010 | 87 | |||||||
| Tableau Software, Inc. Class A(Æ) | 4,700 | 388 | |||||||
| Texas Instruments, Inc. | 86,280 | 4,284 | |||||||
| Vodafone Group PLC - ADR | 62,343 | 2,071 | |||||||
| Western Digital Corp. | 11,680 | 1,149 | |||||||
| Workday, Inc. Class A(Æ) | 7,124 | 680 | |||||||
| 69,041 | |||||||||
| See accompanying notes which are an integral part of the financial statements. | |||||||||
| 126 Russell U.S. Large Cap Equity Fund | |||||||||
| Russell Investment Company | |||||||||||
| Russell U.S. Large Cap Equity Fund | |||||||||||
| Schedule of Investments, continued — October 31, 2014 | |||||||||||
| Futures Contracts | |||||||||||
| Amounts in thousands (except contract amounts) | |||||||||||
| Unrealized | |||||||||||
| Appreciation | |||||||||||
| Number of | Notional | Expiration | (Depreciation) | ||||||||
| Contracts | Amount | Date | $ | ||||||||
| Long Positions | |||||||||||
| S&P E-Mini Consumer Staples Select Sector Index Futures | 59 | USD | 2,756 | 12/14 | 94 | ||||||
| S&P Mid 500 E-Mini Index Futures | 252 | USD | 25,344 | 12/14 | 589 | ||||||
| Total Unrealized Appreciation (Depreciation) on Open Futures Contracts (å) | 683 | ||||||||||
| Presentation of Portfolio Holdings | |||||||||||
| Amounts in thousands | |||||||||||
| Fair Value | |||||||||||
| Portfolio Summary | Level 1 | Level 2 | Level 3 | Total | % of Net Assets | ||||||
| Common Stocks | |||||||||||
| Consumer Discretionary | $ | 61,183 | $ | — | $ | — | $ | 61,183 | 14.1 | ||
| Consumer Staples | 13,765 | — | — | 13,765 | 3.2 | ||||||
| Energy | 32,168 | — | — | 32,168 | 7.4 | ||||||
| Financial Services | 83,532 | — | — | 83,532 | 19.2 | ||||||
| Health Care | 68,912 | — | — | 68,912 | 15.8 | ||||||
| Materials and Processing | 19,992 | — | — | 19,992 | 4.6 | ||||||
| Producer Durables | 40,324 | — | — | 40,324 | 9.3 | ||||||
| Technology | 69,041 | — | — | 69,041 | 15.9 | ||||||
| Utilities | 12,772 | — | — | 12,772 | 2.9 | ||||||
| Short-Term Investments | — | 31,163 | — | 31,163 | 7.2 | ||||||
| Total Investments | 401,689 | 31,163 | — | 432,852 | 99.6 | ||||||
| Other Assets and Liabilities, Net | 0.4 | ||||||||||
| 100.0 | |||||||||||
| Other Financial Instruments | |||||||||||
| Futures Contracts | 683 | — | — | 683 | 0.2 | ||||||
| Total Other Financial Instruments* | $ | 683 | $ | — | $ | — | $ | 683 | |||
* Futures and foreign currency exchange contract values reflect the unrealized appreciation (depreciation) on the instruments.
For a description of the Levels see note 2 in the Notes to Financial Statements.
For disclosure on transfers between Levels 1, 2 and 3 during the period ended October 31, 2014, see note 2 in the Notes to Financial Statements.
See accompanying notes which are an integral part of the financial statements.
Russell U.S. Large Cap Equity Fund 127
| Russell Investment Company | ||
| Russell U.S. Large Cap Equity Fund | ||
| Fair Value of Derivative Instruments — October 31, 2014 | ||
| Amounts in thousands | ||
| Equity | ||
| Derivatives not accounted for as hedging instruments | Contracts | |
| Location: Statement of Assets and Liabilities - Assets | ||
| Variation margin on futures contracts* | $ | 683 |
| Equity | ||
| Derivatives not accounted for as hedging instruments | Contracts | |
| Location: Statement of Operations - Net realized gain (loss) | ||
| Futures contracts | $ | 3,698 |
| Location: Statement of Operations - Net change in unrealized appreciation (depreciation) | ||
| Futures contracts | $ | 190 |
| * Includes cumulative appreciation/depreciation of futures contracts as reported in the Schedule of Investments. Only variation margin is reported within the | ||
| Statement of Assets and Liabilities. | ||
| For further disclosure on derivatives see note 2 in the Notes to Financial Statements. | ||
See accompanying notes which are an integral part of the financial statements.
128 Russell U.S. Large Cap Equity Fund
Russell Investment Company Russell U.S. Large Cap Equity Fund
Balance Sheet Offsetting of Financial and Derivative Instruments — October 31, 2014
| Amounts in thousands | ||||||||||
| Offsetting of Financial Assets and Derivative Assets | ||||||||||
| Gross | Net Amounts | |||||||||
| Amounts | of Assets | |||||||||
| Gross | Offset in the | Presented in | ||||||||
| Amounts of | Statement of | the Statement | ||||||||
| Recognized | Assets and | of Assets and | ||||||||
| Description | Location: Statement of Assets and Liabilities - Assets | Assets | Liabilities | Liabilities | ||||||
| Futures Contracts | Variation margin on futures contracts | $ | 308 | $ | — $ | 308 | ||||
| Total | $ | 308 | $ | — $ | 308 | |||||
| Financial Assets, Derivative Assets, and Collateral Held by Counterparty | ||||||||||
| Gross Amounts Not Offset in | ||||||||||
| the Statement of Assets and | ||||||||||
| Liabilities | ||||||||||
| Net Amounts | ||||||||||
| of Assets | ||||||||||
| Presented in | ||||||||||
| the Statement | Financial and | |||||||||
| of Assets and | Derivative | Collateral | ||||||||
| Counterparty | Liabilities | Instruments | Received^ | Net Amount | ||||||
| Merrill Lynch | $ 308 | $ | — $ — | $ | 308 | |||||
| Total | $ 308 | $ | — $ — | $ | 308 | |||||
^ Collateral received or pledged amounts may not reconcile to those disclosed in the Statement of Assets and Liabilities due to the inclusion of off-Balance Sheet collateral and adjustments made to exclude overcollateralization.
For further disclosure on derivatives and counterparty risk see note 2 in the Notes to Financial Statements.
See accompanying notes which are an integral part of the financial statements.
Russell U.S. Large Cap Equity Fund 129
| Russell Investment Company | ||
| Russell U.S. Large Cap Equity Fund | ||
| Statement of Assets and Liabilities — October 31, 2014 | ||
| Amounts in thousands | ||
| Assets | ||
| Investments, at identified cost | $ | 365,473 |
| Investments, at fair value(>) | 432,852 | |
| Cash (restricted)(a) | 1,519 | |
| Receivables: | ||
| Dividends and interest | 419 | |
| Dividends from affiliated Russell funds | 2 | |
| Investments sold | 3,147 | |
| Fund shares sold | 430 | |
| Variation margin on futures contracts | 308 | |
| Total assets | 438,677 | |
| Liabilities | ||
| Payables: | ||
| Investments purchased | 3,040 | |
| Fund shares redeemed | 693 | |
| Accrued fees to affiliates | 309 | |
| Other accrued expenses | 63 | |
| Total liabilities | 4,105 | |
| Net Assets | $ | 434,572 |
See accompanying notes which are an integral part of the financial statements.
130 Russell U.S. Large Cap Equity Fund
| Russell Investment Company | ||
| Russell U.S. Large Cap Equity Fund | ||
| Statement of Assets and Liabilities, continued — October 31, 2014 | ||
| Amounts in thousands | ||
| Net Assets Consist of: | ||
| Undistributed (overdistributed) net investment income | $ | 176 |
| Accumulated net realized gain (loss) | 36,346 | |
| Unrealized appreciation (depreciation) on: | ||
| Investments | 67,379 | |
| Futures contracts | 683 | |
| Shares of beneficial interest | 310 | |
| Additional paid-in capital | 329,678 | |
| Net Assets | $ | 434,572 |
| Net Asset Value, offering and redemption price per share: | ||
| Net asset value per share: Class A(#) | $ | 13.99 |
| Maximum offering price per share (Net asset value plus sales charge of 5.75%): Class A | $ | 14.84 |
| Class A — Net assets | $ | 7,166,028 |
| Class A — Shares outstanding ($.01 par value) | 512,177 | |
| Net asset value per share: Class C(#) | $ | 13.96 |
| Class C — Net assets | $ | 1,393,836 |
| Class C — Shares outstanding ($.01 par value) | 99,860 | |
| Net asset value per share: Class S(#) | $ | 14.02 |
| Class S — Net assets | $ | 426,011,799 |
| Class S — Shares outstanding ($.01 par value) | 30,382,700 | |
| Amounts in thousands | ||
| (>) Investments in affiliates, Russell U.S. Cash Management Fund | $ | 31,163 |
| (a) Cash Collateral for Futures | $ | 1,519 |
| (#) Net asset value per share equals class level net assets divided by class level shares of beneficial interest outstanding. | ||
See accompanying notes which are an integral part of the financial statements.
Russell U.S. Large Cap Equity Fund 131
| Russell Investment Company | |||
| Russell U.S. Large Cap Equity Fund | |||
| Statement of Operations — For the Period Ended October 31, 2014 | |||
| Amounts in thousands | |||
| Investment Income | |||
| Dividends | $ | 8,107 | |
| Dividends from affiliated Russell funds | 25 | ||
| Total investment income | 8,132 | ||
| Expenses | |||
| Advisory fees | 2,752 | ||
| Administrative fees | 187 | ||
| Custodian fees | 106 | ||
| Distribution fees - Class A | 14 | ||
| Distribution fees - Class C | 9 | ||
| Transfer agent fees - Class A | 12 | ||
| Transfer agent fees - Class C | 2 | ||
| Transfer agent fees - Class S | 772 | ||
| Professional fees | 49 | ||
| Registration fees | 48 | ||
| Shareholder servicing fees - Class C | 3 | ||
| Trustees’ fees | 10 | ||
| Printing fees | 17 | ||
| Miscellaneous | 26 | ||
| Expenses before reductions | 4,007 | ||
| Expense reductions | (560 | ) | |
| Net expenses | 3,447 | ||
| Net investment income (loss) | 4,685 | ||
| Net Realized and Unrealized Gain (Loss) | |||
| Net realized gain (loss) on: | |||
| Investments | 34,771 | ||
| Futures contracts | 3,698 | ||
| Net realized gain (loss) | 38,469 | ||
| Net change in unrealized appreciation (depreciation) on: | |||
| Investments | 8,418 | ||
| Futures contracts | 190 | ||
| Net change in unrealized appreciation (depreciation) | 8,608 | ||
| Net realized and unrealized gain (loss) | 47,077 | ||
| Net Increase (Decrease) in Net Assets from Operations | $ | 51,762 | |
See accompanying notes which are an integral part of the financial statements.
132 Russell U.S. Large Cap Equity Fund
| Russell Investment Company | ||||||
| Russell U.S. Large Cap Equity Fund | ||||||
| Statements of Changes in Net Assets | ||||||
| For the Periods Ended October 31, | ||||||
| Amounts in thousands | 2014 | 2013 | ||||
| Increase (Decrease) in Net Assets | ||||||
| Operations | ||||||
| Net investment income (loss) | $ | 4,685 | $ | 3,233 | ||
| Net realized gain (loss) | 38,469 | 22,519 | ||||
| Net change in unrealized appreciation (depreciation) | 8,608 | 50,433 | ||||
| Net increase (decrease) in net assets from operations | 51,762 | 76,185 | ||||
| Distributions | ||||||
| From net investment income | ||||||
| Class A | (57 | ) | (20 | ) | ||
| Class C | (4 | ) | (1 | ) | ||
| Class S | (4,623 | ) | (3,200 | ) | ||
| From net realized gain | ||||||
| Class A | (313 | ) | (5 | ) | ||
| Class C | (69 | ) | (2 | ) | ||
| Class S | (23,479 | ) | (1,291 | ) | ||
| Net decrease in net assets from distributions | (28,545 | ) | (4,519 | ) | ||
| Share Transactions* | ||||||
| Net increase (decrease) in net assets from share transactions | 62,467 | 35,364 | ||||
| Total Net Increase (Decrease) in Net Assets | 85,684 | 107,030 | ||||
| Net Assets | ||||||
| Beginning of period | 348,888 | 241,858 | ||||
| End of period | $ | 434,572 | $ | 348,888 | ||
| Undistributed (overdistributed) net investment income included in net assets | $ | 176 | $ | 176 | ||
See accompanying notes which are an integral part of the financial statements.
Russell U.S. Large Cap Equity Fund 133
Russell Investment Company Russell U.S. Large Cap Equity Fund
Statements of Changes in Net Assets, continued
* Share transaction amounts (in thousands) for the periods ended October 31, 2014 and October 31, 2013 were as follows:
| 2014 | 2013 | |||||||||||
| Shares | Dollars | Shares | Dollars | |||||||||
| Class A | ||||||||||||
| Proceeds from shares sold | 223 | $ | 2,968 | 305 | $ | 3,667 | ||||||
| Proceeds from reinvestment of distributions | 28 | 370 | 2 | 25 | ||||||||
| Payments for shares redeemed | (79 | ) | (1,062 | ) | (66 | ) | (765 | ) | ||||
| Net increase (decrease) | 172 | 2,276 | 241 | 2,927 | ||||||||
| Class C | ||||||||||||
| Proceeds from shares sold | 53 | 701 | 61 | 729 | ||||||||
| Proceeds from reinvestment of distributions | 6 | 73 | —** | 3 | ||||||||
| Payments for shares redeemed | (22 | ) | (295 | ) | (33 | ) | (396 | ) | ||||
| Net increase (decrease) | 37 | 479 | 28 | 336 | ||||||||
| Class S | ||||||||||||
| Proceeds from shares sold | 6,466 | 86,261 | 8,071 | 93,657 | ||||||||
| Proceeds from reinvestment of distributions | 2,165 | 28,099 | 396 | 4,492 | ||||||||
| Payments for shares redeemed | (4,092 | ) | (54,648 | ) | (5,471 | ) | (66,048 | ) | ||||
| Net increase (decrease) | 4,539 | 59,712 | 2,996 | 32,101 | ||||||||
| Total increase (decrease) | 4,748 | $ | 62,467 | 3,265 | $ | 35,364 | ||||||
| ** Less than 500 | ||||||||||||
See accompanying notes which are an integral part of the financial statements.
134 Russell U.S. Large Cap Equity Fund
(This page intentionally left blank)
| Russell Investment Company | |||||||||||||||
| Russell U.S. Large Cap Equity Fund | |||||||||||||||
| Financial Highlights — For the Periods Ended | |||||||||||||||
| For a Share Outstanding Throughout Each Period. | |||||||||||||||
| $ | $ | $ | $ | $ | $ | ||||||||||
| Net Asset Value, | Net | Net Realized | Total from | Distributions | Distributions | ||||||||||
| Beginning of | Investment | and Unrealized | Investment | from Net | from Net | ||||||||||
| Period | Income(Loss)(a)(d) | Gain (Loss) | Operations | Investment Income | Realized Gain | ||||||||||
| Class A | |||||||||||||||
| October 31, 2014 | 13.27 | .12 | 1.63 | 1.75 | (.13 | ) | (.90 | ) | |||||||
| October 31, 2013 | 10.52 | .06 | 2.85 | 2.91 | (.11 | ) | (.05 | ) | |||||||
| October 31, 2012(4) | 10.00 | .05 | .53 | .58 | (.06 | ) | — | ||||||||
| Class C | |||||||||||||||
| October 31, 2014 | 13.25 | .02 | 1.63 | 1.65 | (.04 | ) | (.90 | ) | |||||||
| October 31, 2013 | 10.51 | —(f) | 2.82 | 2.82 | (.03 | ) | (.05 | ) | |||||||
| October 31, 2012(4) | 10.00 | —(f) | .52 | .52 | (.01 | ) | — | ||||||||
| Class S | |||||||||||||||
| October 31, 2014 | 13.29 | .16 | 1.63 | 1.79 | (.16 | ) | (.90 | ) | |||||||
| October 31, 2013 | 10.52 | .13 | 2.82 | 2.95 | (.13 | ) | (.05 | ) | |||||||
| October 31, 2012(4) | 10.00 | .07 | .52 | .59 | (.07 | ) | — | ||||||||
See accompanying notes which are an integral part of the financial statements.
136 Russell U.S. Large Cap Equity Fund
| % | % | % | |||||||||||||||
| $ | $ | Ratio of Expenses | Ratio of Expenses | Ratio of Net | |||||||||||||
| Net Asset Value, | % | Net Assets, | to Average | to Average | Investment Income | % | |||||||||||
| $ | End of | Total | End of Period | Net Assets, | Net Assets, | to Average | Portfolio | ||||||||||
| Total Distributions | Period | Return(b)(c) | (000 | ) | Gross(e) | Net(d)(e) | Net Assets(d)(e) | Turnover Rate(b) | |||||||||
| (1.03 | ) | 13.99 | 13.85 | 7,166 | 1.26 | 1.12 | .93 | 81 | |||||||||
| (.16 | ) | 13.27 | 27.93 | 4,509 | 1.28 | 1.12 | .48 | 84 | |||||||||
| (.06 | ) | 10.52 | 5.76 | 1,037 | 1.28 | 1.11 | .64 | 55 | |||||||||
| (.94 | ) | 13.96 | 13.06 | 1,394 | 2.01 | 1.87 | .18 | 81 | |||||||||
| (.08 | ) | 13.25 | 26.99 | 838 | 2.03 | 1.87 | .02 | 84 | |||||||||
| (.01 | ) | 10.51 | 5.17 | 367 | 2.11 | 1.86 | (.01 | ) | 55 | ||||||||
| (1.06 | ) | 14.02 | 14.17 | 426,012 | 1.01 | .87 | 1.20 | 81 | |||||||||
| (.18 | ) | 13.29 | 28.35 | 343,541 | 1.03 | .87 | 1.06 | 84 | |||||||||
| (.07 | ) | 10.52 | 5.85 | 240,454 | 1.11 | .86 | .96 | 55 | |||||||||
See accompanying notes which are an integral part of the financial statements.
Russell U.S. Large Cap Equity Fund 137
Russell Investment Company Russell U.S. Mid Cap Equity Fund
Portfolio Management Discussion and Analysis — October 31, 2014 (Unaudited)
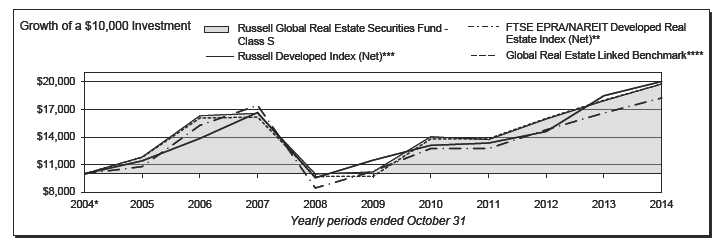
| Russell U.S. Mid Cap Equity Fund - Class A‡ | Russell U.S. Mid Cap Equity Fund - Class S | ||||||
| Total | Total | ||||||
| Return | Return | ||||||
| 1 Year | 5.60 | % | 1 Year | 12.28 | % | ||
| Inception* | 13.37 | %§ | Inception* | 16.15 | %§ | ||
| Russell U.S. Mid Cap Equity Fund - Class C | Russell Midcap® Index** | ||||||
| Total | Total | ||||||
| Return | Return | ||||||
| 1 Year | 11.18 | % | 1 Year | 15.32 | % | ||
| Inception* | 15.02 | %§ | Inception* | 18.55 | %§ | ||
138 Russell U.S. Mid Cap Equity Fund
Russell Investment Company Russell U.S. Mid Cap Equity Fund
Portfolio Management Discussion and Analysis, continued — October 31, 2014 (Unaudited)
| The Russell U.S. Mid Cap Equity Fund (the “Fund”) employs | From a sector perspective, the Fund was penalized for being |
| a multi-manager approach whereby portions of the Fund | underweight to the utilities and health care sectors (especially |
| are allocated to different money managers. Fund assets not | within pharmaceuticals and biotechnology stocks), while |
| allocated to money managers are managed by Russell Investment | an underweight to the poor performing energy sector and an |
| Management Company (“RIMCo”), the Fund’s advisor. RIMCo | overweight the technology sector were beneficial. |
| may change the allocation of the Fund’s assets among money | |
| managers at any time. An exemptive order from the Securities | How did the investment strategies and techniques employed |
| and Exchange Commission (“SEC”) permits RIMCo to engage | by the Fund and its money managers affect its benchmark- |
| or terminate a money manager at any time, subject to approval | relative performance? |
| by the Fund’s Board, without a shareholder vote. Pursuant to the | Negative stock selection effects were attributable to a majority of |
| terms of the exemptive order, the Fund is required to notify its | the Fund’s benchmark relative returns. As of October 31, 2014, |
| shareholders within 90 days of when a money manager begins | the Fund had three money managers: one growth orientated, one |
| providing services. As of October 31, 2014, the Fund had three | value orientated and one market orientated. Two of the three |
| money managers. | managers underperformed their respective benchmarks. The |
| Fund also employs a positioning strategy managed by RIMCo | |
| What is the Fund’s investment objective? | which aims to control Fund-level exposures and/or risks with an |
| The Fund seeks to provide long term capital growth. | optimized portfolio. |
| How did the Fund perform relative to its benchmark for the | Arbor Asset Management (“Arbor”) underperformed the Russell |
| fiscal year ended October 31, 2014? | Midcap® Growth Index for the fiscal year. While Arbor had solid |
| For the fiscal year ended October 31, 2014, the Fund’s Class A, | performance towards the end of the fiscal year, it wasn’t enough |
| Class C and Class S Shares gained 12.05%, 11.18% and 12.28%, | to overcome negative stock selection effects within the computer |
| respectively. This is compared to the Fund’s benchmark, the | software and health care industries. Arbor’s underweight to the |
| Russell Midcap® Index, which gained 15.32% during the same | pharmaceuticals and biotechnology industries was also penalized. |
| period. The Fund’s performance includes operating expenses, | Ceredex Value Advisors LLC (“Ceredex”) underperformed the |
| whereas index returns are unmanaged and do not include | Russell Midcap® Value Index for the fiscal year. Ceredex’s stock |
| expenses of any kind. | selection within the consumer discretionary and technology sectors |
| For the fiscal year ended October 31, 2014, the Morningstar® | was the largest negative impact to performance over the period. |
| Mid-Cap Blend, a group of funds that Morningstar considers to | An overweight to the producer durables and an underweight to |
| have investment strategies similar to those of the Fund, gained | utilities sectors also detracted, while an overweight to health care |
| 11.11%. This result serves as a peer comparison and is expressed | services added value. |
| net of operating expenses. | Jacobs Levy Equity Management, Inc. (“Jacobs Levy”) |
| RIMCo may assign a money manager a specific style or | outperformed the Russell Midcap® Index for the fiscal year. |
| capitalization benchmark other than the Fund’s index. However, | Jacobs Levy’s quantitative modeling approach benefited from an |
| the Fund’s primary index remains the benchmark for the Fund | overweight to the highest price momentum stocks during the year. |
| and is representative of the aggregate of each money manager’s | Holdings within technology and consumer staples sectors also |
| benchmark index. | added value. |
| RIMCo manages the portion of the Fund’s assets that RIMCo | |
| How did the market conditions described in the Market | determines not to allocate to the money managers. Assets not |
| Summary report affect the Fund’s performance? | allocated to managers include the Fund’s liquidity reserves and |
| The fiscal year saw strong performance for U.S. mid capitalization | assets which may be managed directly by RIMCo to modify the |
| equity securities. The Fund was consistently underweight to the | Fund’s overall portfolio characteristics to seek to achieve the |
| highest dividend yielding stocks and overweight to the lowest | desired risk/return profile for the Fund. |
| market capitalization tier stocks within the Russell Midcap® | |
| Index. The market environment was mixed to these factors, as the | RIMCo manages a strategy that invests in a portfolio of stocks |
| that it considers representative of the Russell Midcap® Index, | |
| smallest and highest yielding stocks in the Index detracted. The | |
| Fund’s underweight to companies with highly leveraged balance | with a focus on decreasing the Fund’s volatility and increasing |
| sheets detracted from benchmark relative returns for the fiscal | the Fund’s momentum while preserving the effects of the money |
| year. | managers’ active stock selection. The strategy aims to control |
| Fund-level exposures and/or risks with an optimized portfolio. | |
| Optimized index sampling strategies do not attempt to purchase | |
| Russell U.S. Mid Cap Equity Fund 139 | |
Russell Investment Company
Russell U.S. Mid Cap Equity Fund
Portfolio Management Discussion and Analysis, continued — October 31, 2014 (Unaudited)
| every security in the reference index, but instead purchase a | There were no changes to the Fund’s structure or money manager | |
| sampling of securities using optimization and risk models. This | line up during the fiscal year. | |
| process involves the analysis of tradeoffs between various factors | ||
| as well as turnover and transaction costs in order to estimate | Money Managers as of October 31, | |
| optimal portfolio holdings based upon the reference index in order | 2014 | Styles |
| to achieve desired Fund exposures. The strategy outperformed | Arbor Capital Management, LLC | Growth |
| the Russell Midcap® Index for the fiscal year. Overweights to the | Ceredex Value Advisors LLC | Value |
| Jacobs Levy Equity Management, Inc. | Market-Oriented | |
| producer durables and health care sectors, and an underweight to | The views expressed in this report reflect those of the portfolio | |
| the energy sector, were beneficial. RIMCo’s tilt toward holdings | managers only through the end of the period covered by | |
| with larger market capitalization and lower betas (stocks with low | the report. These views do not necessarily represent the | |
| sensitivity to market movements) than the Russell Midcap® Index | ||
| views of RIMCo, or any other person in RIMCo or any other | ||
| added value. | affiliated organization. These views are subject to change | |
| During the period, RIMCo used index futures contracts to | at any time based upon market conditions or other events, | |
| equitize Fund and manager cash. The use of these derivatives | and RIMCo disclaims any responsibility to update the views | |
| had a positive impact on Fund performance for the fiscal year. | contained herein. These views should not be relied on as | |
| Describe any changes to the Fund’s structure or the money | investment advice and, because investment decisions for | |
| manager line-up. | a Russell Investment Company (“RIC”) Fund are based on | |
| numerous factors, should not be relied on as an indication | ||
| of investment decisions of any RIC Fund. | ||
| * | Assumes initial investment on February 6, 2012. |
| ** | Russell Midcap® Index measures the performance of the mid-cap segment of the U.S. equity universe. The Russell Midcap is a subset of the Russell 1000® Index. It includes approximately 800 of the smallest securities based on a combination of their market cap and current index membership. The Russell Midcap represents approximately 31% of the total market capitalization of the Russell 1000 companies. |
| ‡ | The performance shown has been adjusted to reflect the deduction of the maximum Class A sales charge of 5.75%. |
| § | Annualized. |
Performance is historical and assumes reinvestment of all dividends and capital gains. Investment return and principal value will fluctuate so that an investor’s shares, when redeemed, may be worth more or less than when purchased. Past performance is not indicative of future results. The returns shown do not reflect the deduction of taxes that a shareholder would pay on Fund distributions or the redemption of Fund shares.
140 Russell U.S. Mid Cap Equity Fund
Russell Investment Company Russell U.S. Mid Cap Equity Fund
Shareholder Expense Example — October 31, 2014 (Unaudited)
| Fund Expenses | Please note that the expenses shown in the table are meant | |||||
| The following disclosure provides important information | to highlight your ongoing costs only and do not reflect any | |||||
| regarding the Fund’s Shareholder Expense Example | transactional costs. Therefore, the information under the heading | |||||
| (“Example”). | “Hypothetical Performance (5% return before expenses)” is | |||||
| useful in comparing ongoing costs only, and will not help you | ||||||
| Example | determine the relative total costs of owning different funds. In | |||||
| As a shareholder of the Fund, you incur two types of costs: (1) | addition, if these transactional costs were included, your costs | |||||
| transaction costs, and (2) ongoing costs, including advisory and | would have been higher. | |||||
| administrative fees; distribution (12b-1) and/or service fees; | Hypothetical | |||||
| and other Fund expenses. The Example is intended to help | Performance (5% | |||||
| you understand your ongoing costs (in dollars) of investing in | Actual | return before | ||||
| the Fund and to compare these costs with the ongoing costs of | Class A | Performance | expenses) | |||
| Beginning Account Value | ||||||
| investing in other mutual funds. The Example is based on an | May 1, 2014 | $ | 1,000.00 | $ | 1,000.00 | |
| investment of $1,000 invested at the beginning of the period and | Ending Account Value | |||||
| held for the entire period indicated, which for this Fund is from | October 31, 2014 | $ | 1,070.80 | $ | 1,019.06 | |
| May 1, 2014 to October 31, 2014. | Expenses Paid During Period* | $ | 6.37 | $ | 6.21 | |
| Actual Expenses | * Expenses are equal to the Fund's annualized expense ratio of 1.22% | |||||
| (representing the six month period annualized), multiplied by the average | ||||||
| The information in the table under the heading “Actual | account value over the period, multiplied by 184/365 (to reflect the one-half | |||||
| Performance” provides information about actual account values | year period). May reflect amounts waived and/or reimbursed. Without any | |||||
| and actual expenses. You may use the information in this column, | waivers and/or reimbursements, expenses would have been higher. | |||||
| together with the amount you invested, to estimate the expenses | ||||||
| Hypothetical | ||||||
| that you paid over the period. Simply divide your account value by | Performance (5% | |||||
| $1,000 (for example, an $8,600 account value divided by $1,000 | Actual | return before | ||||
| = 8.6), then multiply the result by the number in the first column | Class C | Performance | expenses) | |||
| Beginning Account Value | ||||||
| in the row entitled “Expenses Paid During Period” to estimate | May 1, 2014 | $ | 1,000.00 | $ | 1,000.00 | |
| the expenses you paid on your account during this period. | Ending Account Value | |||||
| October 31, 2014 | $ | 1,066.90 | $ | 1,015.27 | ||
| Hypothetical Example for Comparison Purposes | Expenses Paid During Period* | $ | 10.26 | $ | 10.01 | |
| The information in the table under the heading “Hypothetical | ||||||
| Performance (5% return before expenses)” provides information | * Expenses are equal to the Fund's annualized expense ratio of 1.97% | |||||
| (representing the six month period annualized), multiplied by the average | ||||||
| about hypothetical account values and hypothetical expenses | account value over the period, multiplied by 184/365 (to reflect the one-half | |||||
| based on the Fund’s actual expense ratio and an assumed rate of | year period). May reflect amounts waived and/or reimbursed. Without any | |||||
| return of 5% per year before expenses, which is not the Fund’s | waivers and/or reimbursements, expenses would have been higher. | |||||
| actual return. The hypothetical account values and expenses | ||||||
| Hypothetical | ||||||
| may not be used to estimate the actual ending account balance or | Performance (5% | |||||
| expenses you paid for the period. You may use this information | Actual | return before | ||||
| to compare the ongoing costs of investing in the Fund and other | Class S | Performance | expenses) | |||
| funds. To do so, compare this 5% hypothetical example with the | Beginning Account Value | |||||
| May 1, 2014 | $ | 1,000.00 | $ | 1,000.00 | ||
| 5% hypothetical examples that appear in the shareholder reports | Ending Account Value | |||||
| of other funds. | October 31, 2014 | $ | 1,071.90 | $ | 1,020.32 | |
| Expenses Paid During Period* | $ | 5.07 | $ | 4.94 | ||
| * Expenses are equal to the Fund's annualized expense ratio of 0.97% | ||||||
| (representing the six month period annualized), multiplied by the average | ||||||
| account value over the period, multiplied by 184/365 (to reflect the one-half | ||||||
| year period). May reflect amounts waived and/or reimbursed. Without any | ||||||
| waivers and/or reimbursements, expenses would have been higher. | ||||||
Russell U.S. Mid Cap Equity Fund 141
| Russell Investment Company | |||||||
| Russell U.S. Mid Cap Equity Fund | |||||||
| Schedule of Investments — October 31, 2014 | |||||||
| Amounts in thousands (except share amounts) | Amounts in thousands (except share amounts) | ||||||
| Principal | Fair | Principal | Fair | ||||
| Amount ($) or | Value | Amount ($) or | Value | ||||
| Shares | $ | Shares | $ | ||||
| Common Stocks - 95.1% | Tupperware Brands Corp. | 221 | 14 | ||||
| Consumer Discretionary - 17.6% | VF Corp. | 915 | 62 | ||||
| Advance Auto Parts, Inc. | 6,137 | 902 | Viacom, Inc. Class B | 7,909 | 575 | ||
| Amerco, Inc. | 83 | 23 | Wendy's Co. (The) | 2,167 | 17 | ||
| Aramark | 8,600 | 240 | Williams-Sonoma, Inc. | 293 | 19 | ||
| AutoZone, Inc.(Æ) | 1,572 | 870 | WPP PLC - ADR | 250 | 24 | ||
| Big Lots, Inc. | 10,900 | 498 | 35,814 | ||||
| Buffalo Wild Wings, Inc.(Æ) | 840 | 125 | |||||
| Burger King Worldwide, Inc. | 674 | 22 | Consumer Staples - 3.3% | ||||
| CarMax, Inc.(Æ) | 26,977 | 1,508 | Andersons, Inc. (The) | 6,300 | 401 | ||
| Carter's, Inc. | 14,006 | 1,094 | Campbell Soup Co. | 408 | 18 | ||
| Chipotle Mexican Grill, Inc. Class A(Æ) | 1,190 | 759 | Casey's General Stores, Inc. | 1,300 | 106 | ||
| Choice Hotels International, Inc. | 5,000 | 267 | Church & Dwight Co., Inc. | 3,051 | 221 | ||
| CST Brands, Inc. | 15,900 | 608 | Clorox Co. (The) | 2,710 | 270 | ||
| Discovery Communications, Inc. Class A(Æ) | 492 | 17 | ConAgra Foods, Inc. | 607 | 21 | ||
| Discovery Communications, Inc. Class C(Æ) | 492 | 17 | Constellation Brands, Inc. Class A(Æ) | 223 | 20 | ||
| DISH Network Corp. Class A(Æ) | 9,700 | 617 | Dr Pepper Snapple Group, Inc. | 3,995 | 277 | ||
| Dollar Tree, Inc.(Æ) | 16,505 | 1,000 | Hershey Co. (The) | 2,633 | 253 | ||
| Domino's Pizza, Inc. | 7,612 | 676 | Hormel Foods Corp. | 386 | 21 | ||
| DR Horton, Inc. | 31,400 | 716 | Ingredion, Inc. | 258 | 20 | ||
| Dunkin' Brands Group, Inc. | 367 | 17 | Kroger Co. (The) | 21,981 | 1,225 | ||
| Foot Locker, Inc. | 11,900 | 667 | McCormick & Co., Inc. | 3,328 | 235 | ||
| Gap, Inc. (The) | 17,771 | 673 | Monster Beverage Corp.(Æ) | 7,600 | 767 | ||
| Goodyear Tire & Rubber Co. (The) | 23,102 | 560 | Pinnacle Foods, Inc. | 1,031 | 35 | ||
| Graham Holdings Co. Class B | 37 | 29 | Sprouts Farmers Market, Inc.(Æ)(Ñ) | 35,911 | 1,045 | ||
| H&R Block, Inc. | 2,203 | 71 | Sysco Corp. | 19,800 | 763 | ||
| Hanesbrands, Inc. | 8,573 | 905 | Tyson Foods, Inc. Class A | 18,100 | 730 | ||
| Harman International Industries, Inc. | 5,410 | 581 | WhiteWave Foods Co. (The) Class A(Æ) | 7,500 | 279 | ||
| Hilton Worldwide Holdings, Inc.(Æ) | 25,100 | 634 | 6,707 | ||||
| Hyatt Hotels Corp. Class A(Æ) | 7,600 | 450 | |||||
| Johnson Controls, Inc. | 18,300 | 865 | Energy - 4.6% | ||||
| KAR Auction Services, Inc. | 29,800 | 905 | Baker Hughes, Inc. | 26,476 | 1,402 | ||
| KB Home(Ñ) | 31,900 | 502 | Cabot Oil & Gas Corp. | 17,400 | 541 | ||
| L Brands, Inc. | 12,000 | 865 | Cheniere Energy, Inc.(Æ) | 467 | 35 | ||
| Lear Corp. | 373 | 35 | Delek US Holdings, Inc. | 1,800 | 61 | ||
| Live Nation Entertainment, Inc.(Æ) | 49,967 | 1,299 | FMC Technologies, Inc.(Æ) | 28,417 | 1,592 | ||
| LKQ Corp.(Æ) | 57,981 | 1,657 | Nabors Industries, Ltd. | 32,300 | 577 | ||
| Macy's, Inc. | 10,900 | 630 | NextEra Energy Partners, LP(Æ)(Ñ) | 13,710 | 501 | ||
| Mattel, Inc. | 56,100 | 1,743 | Noble Energy, Inc. | 19,363 | 1,116 | ||
| MercadoLibre, Inc.(Ñ) | 11,669 | 1,589 | ONEOK, Inc. | 3,715 | 219 | ||
| Mohawk Industries, Inc.(Æ) | 135 | 19 | Patterson-UTI Energy, Inc. | 21,100 | 486 | ||
| NVR, Inc.(Æ) | 136 | 167 | PBF Energy, Inc. Class A | 4,900 | 128 | ||
| Omnicom Group, Inc. | 11,100 | 798 | Pioneer Natural Resources Co. | 3,650 | 690 | ||
| O'Reilly Automotive, Inc.(Æ) | 14,541 | 2,557 | Rowan Companies PLC(Æ) | 576 | 14 | ||
| Penske Automotive Group, Inc. | 4,900 | 222 | Seventy Seven Energy, Inc.(Æ) | 1,285 | 17 | ||
| Priceline Group, Inc. (The)(Æ) | 1,056 | 1,274 | SM Energy Co. | 7,700 | 433 | ||
| PVH Corp. | 7,400 | 846 | Targa Resources Corp. | 4,880 | 628 | ||
| Ralph Lauren Corp. Class A | 3,700 | 610 | Unit Corp.(Æ) | 1,185 | 57 | ||
| Regal Entertainment Group Class A(Ñ) | 18,991 | 421 | Valero Energy Corp. | 4,085 | 205 | ||
| Ross Stores, Inc. | 11,371 | 918 | Whiting Petroleum Corp.(Æ) | 9,700 | 594 | ||
| Royal Caribbean Cruises, Ltd. | 9,400 | 639 | 9,296 | ||||
| Sally Beauty Holdings, Inc.(Æ) | 3,158 | 93 | |||||
| Scripps Networks Interactive, Inc. Class A | 1,400 | 108 | Financial Services - 20.4% | ||||
| Service Corp. International | 970 | 21 | Affiliated Managers Group, Inc.(Æ) | 3,730 | 745 | ||
| Signet Jewelers, Ltd. | 179 | 21 | Aflac, Inc. | 4,400 | 263 | ||
| Starz(Æ) | 846 | 26 | Alexandria Real Estate Equities, Inc.(ö) | 248 | 21 | ||
| Thor Industries, Inc. | 314 | 17 | Alleghany Corp.(Æ) | 430 | 191 | ||
| TJX Cos., Inc. | 6,700 | 424 | Allied World Assurance Co. Holdings AG | 453 | 17 | ||
| TripAdvisor, Inc.(Æ) | 14,506 | 1,286 | Allstate Corp. (The) | 11,012 | 714 | ||
| American Campus Communities, Inc.(ö) | 22,571 | 886 | |||||
| See accompanying notes which are an integral part of the financial statements. | |||||||
| 142 Russell U.S. Mid Cap Equity Fund | |||||||
Russell Investment Company Russell U.S. Mid Cap Equity Fund
Schedule of Investments, continued — October 31, 2014
| Amounts in thousands (except share amounts) | Amounts in thousands (except share amounts) | ||||||
| Principal | Fair | Principal | Fair | ||||
| Amount ($) or | Value | Amount ($) or | Value | ||||
| Shares | $ | Shares | $ | ||||
| American Financial Group, Inc. | 745 | 45 | Prologis, Inc.(ö) | 16,236 | 676 | ||
| American Homes 4 Rent Class A(ö) | 1,565 | 27 | Protective Life Corp. | 359 | 25 | ||
| American Tower Corp. Class A(ö) | 1,800 | 176 | Prudential Financial, Inc. | 3,800 | 336 | ||
| Ameriprise Financial, Inc. | 16,000 | 2,019 | Regions Financial Corp. | 98,009 | 973 | ||
| Annaly Capital Management, Inc.(ö) | 7,053 | 80 | Reinsurance Group of America, Inc. Class A | 239 | 20 | ||
| Aon PLC | 18,637 | 1,603 | RenaissanceRe Holdings, Ltd. | 313 | 32 | ||
| Arch Capital Group, Ltd.(Æ) | 12,300 | 693 | StanCorp Financial Group, Inc. | 302 | 21 | ||
| Arthur J Gallagher & Co. | 14,300 | 682 | SVB Financial Group(Æ) | 5,476 | 613 | ||
| Aspen Insurance Holdings, Ltd. | 9,700 | 423 | T Rowe Price Group, Inc. | 18,112 | 1,487 | ||
| Assurant, Inc. | 10,947 | 747 | Taubman Centers, Inc.(ö) | 260 | 20 | ||
| Axis Capital Holdings, Ltd. | 13,055 | 628 | TCF Financial Corp. | 27,021 | 417 | ||
| BankUnited, Inc. | 15,000 | 449 | TD Ameritrade Holding Corp. | 39,844 | 1,344 | ||
| Boston Properties, Inc.(ö) | 5,070 | 643 | TFS Financial Corp. | 2,280 | 34 | ||
| Brixmor Property Group, Inc.(ö) | 9,590 | 234 | Torchmark Corp. | 1,002 | 53 | ||
| CBOE Holdings, Inc. | 12,233 | 721 | Total System Services, Inc. | 600 | 20 | ||
| City National Corp. | 7,600 | 598 | Umpqua Holdings Corp. | 56,000 | 986 | ||
| CNA Financial Corp. | 442 | 17 | Vornado Realty Trust(ö) | 1,527 | 167 | ||
| Comerica, Inc. | 35,465 | 1,693 | Voya Financial, Inc. | 17,240 | 677 | ||
| Crown Castle International Corp.(ö) | 13,100 | 1,023 | White Mountains Insurance Group, Ltd. | 191 | 119 | ||
| Cullen/Frost Bankers, Inc. | 7,900 | 638 | WP Carey, Inc.(ö) | 1,471 | 100 | ||
| DDR Corp.(ö) | 1,072 | 19 | Zions Bancorporation | 46,100 | 1,336 | ||
| Discover Financial Services | 6,200 | 395 | 41,638 | ||||
| Douglas Emmett, Inc.(ö) | 21,300 | 599 | |||||
| Duke Realty Corp.(ö) | 35,100 | 666 | Health Care - 10.4% | ||||
| Endurance Specialty Holdings, Ltd. | 362 | 21 | Aetna, Inc. | 14,600 | 1,205 | ||
| Equity Commonwealth(Æ)(ö) | 3,649 | 97 | AmerisourceBergen Corp. Class A | 3,190 | 273 | ||
| Everest Re Group, Ltd. | 4,240 | 724 | athenahealth, Inc.(Æ) | 5,269 | 645 | ||
| Extra Space Storage, Inc.(ö) | 612 | 36 | Boston Scientific Corp.(Æ) | 63,915 | 849 | ||
| FactSet Research Systems, Inc.(Ñ) | 12,064 | 1,586 | Cardinal Health, Inc.(Ñ) | 12,882 | 1,011 | ||
| Fidelity National Information Services, Inc. | 303 | 18 | CareFusion Corp.(Æ) | 468 | 27 | ||
| Fifth Third Bancorp | 1,518 | 30 | Centene Corp.(Æ) | 6,000 | 556 | ||
| FNF Group | 527 | 16 | Cerner Corp.(Æ) | 31,358 | 1,986 | ||
| Forest City Enterprises, Inc. Class A(Æ) | 4,044 | 85 | Cigna Corp. | 22,900 | 2,280 | ||
| Global Payments, Inc. | 9,100 | 733 | Community Health Systems, Inc.(Æ) | 9,800 | 539 | ||
| Hanover Insurance Group, Inc. (The) | 6,386 | 428 | Cooper Cos., Inc. (The) | 137 | 22 | ||
| Hartford Financial Services Group, Inc. | 47,890 | 1,896 | Covance, Inc.(Æ) | 223 | 18 | ||
| Health Care REIT, Inc.(ö) | 745 | 53 | CR Bard, Inc. | 132 | 22 | ||
| Howard Hughes Corp. (The)(Æ) | 125 | 18 | Dentsply International, Inc. | 3,669 | 186 | ||
| Hudson City Bancorp, Inc. | 16,299 | 157 | Edwards Lifesciences Corp.(Æ) | 6,410 | 775 | ||
| Invesco, Ltd. | 31,690 | 1,283 | HCA Holdings, Inc.(Æ) | 12,200 | 855 | ||
| Jack Henry & Associates, Inc. | 12,275 | 734 | Health Net, Inc.(Æ) | 16,600 | 789 | ||
| Kimco Realty Corp.(ö) | 8,483 | 212 | Henry Schein, Inc.(Æ) | 1,702 | 204 | ||
| Lazard, Ltd. Class A | 19,489 | 959 | Hill-Rom Holdings, Inc. | 19,000 | 845 | ||
| M&T Bank Corp. | 2,083 | 255 | Humana, Inc. | 7,500 | 1,041 | ||
| Markel Corp.(Æ) | 369 | 255 | IDEXX Laboratories, Inc.(Æ) | 1,583 | 224 | ||
| MB Financial, Inc. | 26,900 | 849 | Laboratory Corp. of America Holdings(Æ) | 2,335 | 255 | ||
| McGraw Hill Financial, Inc. | 10,260 | 928 | Magellan Health, Inc.(Æ) | 6,600 | 399 | ||
| MFA Financial, Inc.(ö) | 11,144 | 93 | Mylan, Inc.(Æ) | 369 | 20 | ||
| Mid-America Apartment Communities, Inc. | Nektar Therapeutics(Æ) | 6,100 | 84 | ||||
| (ö) | 260 | 18 | Omnicare, Inc. | 25,455 | 1,695 | ||
| Moody's Corp. | 949 | 94 | Patterson Cos., Inc. | 415 | 18 | ||
| Morningstar, Inc. | 2,500 | 171 | Quest Diagnostics, Inc. | 3,923 | 249 | ||
| Navient Corp. | 11,812 | 234 | Sirona Dental Systems, Inc.(Æ) | 1,741 | 137 | ||
| New York Community Bancorp, Inc. | 11,292 | 180 | St. Jude Medical, Inc. | 815 | 52 | ||
| Northern Trust Corp. | 11,000 | 729 | STERIS Corp. | 27,046 | 1,671 | ||
| PartnerRe, Ltd. | 216 | 25 | Teleflex, Inc. | 1,268 | 145 | ||
| Plum Creek Timber Co., Inc.(ö) | 712 | 29 | Universal Health Services, Inc. Class B | 423 | 44 | ||
| Principal Financial Group, Inc. | 14,957 | 783 | WellPoint, Inc. | 16,685 | 2,114 | ||
| Progressive Corp. (The) | 30,200 | 798 | |||||
| See accompanying notes which are an integral part of the financial statements. | |||||||
| Russell U.S. Mid Cap Equity Fund 143 | |||||||
Russell Investment Company Russell U.S. Mid Cap Equity Fund
Schedule of Investments, continued — October 31, 2014
| Amounts in thousands (except share amounts) | Amounts in thousands (except share amounts) | ||||||
| Principal | Fair | Principal | Fair | ||||
| Amount ($) or | Value | Amount ($) or | Value | ||||
| Shares | $ | Shares | $ | ||||
| Zoetis, Inc. Class A | 703 | 26 | Kirby Corp.(Æ) | 172 | 19 | ||
| 21,261 | Knight Transportation, Inc. | 5,990 | 175 | ||||
| L-3 Communications Holdings, Inc. | 5,912 | 718 | |||||
| Materials and Processing - 7.5% | Landstar System, Inc. | 9,300 | 688 | ||||
| Airgas, Inc. | 12,025 | 1,341 | Lexmark International, Inc. Class A | 16,000 | 691 | ||
| Albemarle Corp. | 259 | 15 | Manpowergroup, Inc. | 8,200 | 547 | ||
| Alcoa, Inc. | 49,500 | 830 | Navistar International Corp.(Æ) | 6,300 | 223 | ||
| AptarGroup, Inc. | 1,709 | 106 | Oshkosh Corp. | 12,700 | 568 | ||
| Ashland, Inc. | 9,200 | 994 | PACCAR, Inc. | 289 | 19 | ||
| Ball Corp. | 553 | 36 | Parker-Hannifin Corp. | 2,400 | 305 | ||
| Bemis Co., Inc. | 2,635 | 101 | Paychex, Inc. | 16,100 | 756 | ||
| Brown-Forman Corp. Class B - ADR(Æ) | 202 | 19 | Republic Services, Inc. Class A | 5,569 | 214 | ||
| Cabot Corp. | 30,647 | 1,423 | Rockwell Automation, Inc. | 8,528 | 958 | ||
| Ecolab, Inc. | 13,812 | 1,536 | Rockwell Collins, Inc. | 232 | 20 | ||
| Fastenal Co. | 21,993 | 969 | Rollins, Inc. | 53,933 | 1,719 | ||
| Ingersoll-Rand PLC | 16,176 | 1,013 | RR Donnelley & Sons Co. | 1,120 | 20 | ||
| International Flavors & Fragrances, Inc. | 6,188 | 613 | Ryder System, Inc. | 301 | 27 | ||
| Lennox International, Inc. | 7,275 | 647 | Southwest Airlines Co. | 845 | 29 | ||
| Martin Marietta Materials, Inc. | 7,157 | 837 | SPX Corp. | 800 | 76 | ||
| Masco Corp. | 29,400 | 649 | Stanley Black & Decker, Inc. | 262 | 25 | ||
| MeadWestvaco Corp. | 18,700 | 826 | Stericycle, Inc.(Æ) | 20,220 | 2,548 | ||
| Nucor Corp. | 1,700 | 92 | Textron, Inc. | 19,100 | 793 | ||
| Owens-Illinois, Inc.(Æ) | 590 | 15 | Tidewater, Inc. | 35,930 | 1,325 | ||
| Packaging Corp. of America | 1,037 | 75 | Towers Watson & Co. Class A | 9,400 | 1,037 | ||
| Pentair PLC(Æ) | 9,667 | 648 | TransDigm Group, Inc. | 125 | 23 | ||
| PPG Industries, Inc. | 2,350 | 479 | Trimble Navigation, Ltd.(Æ) | 38,287 | 1,028 | ||
| Rock-Tenn Co. Class A | 386 | 20 | Tyco International, Ltd. | 11,746 | 504 | ||
| Sherwin-Williams Co. (The) | 3,680 | 845 | Vectrus, Inc.(Æ) | 1,611 | 39 | ||
| Sigma-Aldrich Corp. | 2,354 | 320 | Wabtec Corp. | 8,440 | 728 | ||
| Silgan Holdings, Inc. | 1,129 | 55 | Waste Connections, Inc. | 411 | 20 | ||
| Sonoco Products Co. | 2,593 | 106 | WW Grainger, Inc. | 131 | 32 | ||
| Steel Dynamics, Inc. | 1,095 | 25 | 24,431 | ||||
| Timken Co. (The) | 12,900 | 555 | |||||
| Valspar Corp. | 2,167 | 178 | Technology - 15.8% | ||||
| 15,368 | Amdocs, Ltd. | 4,845 | 230 | ||||
| Aruba Networks, Inc.(Æ) | 12,600 | 272 | |||||
| Producer Durables - 12.0% | Autodesk, Inc.(Æ) | 12,900 | 742 | ||||
| AGCO Corp. | 309 | 14 | Broadcom Corp. Class A | 21,600 | 905 | ||
| Agilent Technologies, Inc. | 17,639 | 975 | Brocade Communications Systems, Inc. | 82,638 | 887 | ||
| AO Smith Corp. | 21,718 | 1,159 | CA, Inc. | 5,988 | 174 | ||
| Avery Dennison Corp. | 884 | 41 | Cadence Design Systems, Inc.(Æ) | 41,960 | 753 | ||
| B/E Aerospace, Inc.(Æ) | 3,894 | 290 | Concur Technologies, Inc.(Æ) | 16,105 | 2,067 | ||
| CH Robinson Worldwide, Inc. | 3,486 | 241 | Dolby Laboratories, Inc. Class A | 9,190 | 385 | ||
| Cintas Corp. | 332 | 24 | Electronic Arts, Inc.(Æ) | 24,350 | 998 | ||
| Colfax Corp.(Æ) | 251 | 14 | Freescale Semiconductor, Ltd.(Æ)(Ñ) | 17,800 | 354 | ||
| Covanta Holding Corp. | 3,260 | 72 | Gartner, Inc.(Æ) | 8,770 | 708 | ||
| Crane Co. | 294 | 18 | Harris Corp. | 8,400 | 585 | ||
| CSX Corp. | 1,656 | 59 | Ingram Micro, Inc. Class A(Æ) | 21,700 | 582 | ||
| Cummins, Inc. | 990 | 145 | Intersil Corp. Class A | 99,100 | 1,317 | ||
| Delta Air Lines, Inc. | 23,400 | 941 | Intuit, Inc. | 3,253 | 286 | ||
| Dover Corp. | 215 | 17 | Juniper Networks, Inc. | 96,300 | 2,029 | ||
| Fluor Corp. | 9,400 | 624 | Lambda TD Software, Inc.(Æ) | 8,400 | 150 | ||
| Graco, Inc. | 5,900 | 463 | LinkedIn Corp. Class A(Æ) | 4,908 | 1,124 | ||
| HD Supply Holdings, Inc.(Æ) | 17,300 | 499 | Marvell Technology Group, Ltd. | 51,500 | 692 | ||
| Huntington Ingalls Industries, Inc. | 7,378 | 781 | Maxim Integrated Products, Inc. | 48,500 | 1,423 | ||
| IHS, Inc. Class A(Æ) | 14,770 | 1,935 | Mentor Graphics Corp. | 21,160 | 448 | ||
| Itron, Inc.(Æ) | 4,766 | 186 | Microchip Technology, Inc. | 394 | 17 | ||
| ITT Corp. | 971 | 44 | Motorola Solutions, Inc. | 16,365 | 1,056 | ||
| Kennametal, Inc. | 383 | 15 | NetApp, Inc. | 57,827 | 2,475 | ||
See accompanying notes which are an integral part of the financial statements.
144 Russell U.S. Mid Cap Equity Fund
| Russell Investment Company | |||||||||
| Russell U.S. Mid Cap Equity Fund | |||||||||
| Schedule of Investments, continued — October 31, 2014 | |||||||||
| Amounts in thousands (except share amounts) | Amounts in thousands (except share amounts) | ||||||||
| Principal | Fair | Principal | Fair | ||||||
| Amount ($) or | Value | Amount ($) or | Value | ||||||
| Shares | $ | Shares | $ | ||||||
| Palo Alto Networks, Inc.(Æ) | 8,500 | 898 | |||||||
| Plexus Corp.(Æ) | 900 | 37 | Total Investments 101.9% | ||||||
| Polycom, Inc.(Æ) | 32,900 | 430 | (identified cost $178,167) | 207,696 | |||||
| Red Hat, Inc.(Æ) | 12,400 | 731 | |||||||
| Rovi Corp.(Æ) | 10,000 | 209 | Other Assets and Liabilities, Net | ||||||
| SanDisk Corp. | 20,800 | 1,958 | (1.9%) | (3,814 | ) | ||||
| SBA Communications Corp. Class A(Æ) | 5,617 | 631 | Net Assets - 100.0% | 203,882 | |||||
| Seagate Technology PLC | 14,200 | 892 | |||||||
| Symantec Corp. | 35,200 | 874 | |||||||
| Synopsys, Inc.(Æ) | 20,403 | 836 | |||||||
| Ultimate Software Group, Inc.(Æ) | 9,551 | 1,437 | |||||||
| VMware, Inc. Class A(Æ) | 800 | 67 | |||||||
| Western Digital Corp. | 9,882 | 972 | |||||||
| Workday, Inc. Class A(Æ) | 15,153 | 1,447 | |||||||
| Zynga, Inc. Class A(Æ) | 84,000 | 214 | |||||||
| 32,292 | |||||||||
| Utilities - 3.5% | |||||||||
| AGL Resources, Inc. | 3,645 | 196 | |||||||
| Alliant Energy Corp. | 1,670 | 103 | |||||||
| American Water Works Co., Inc. | 4,987 | 266 | |||||||
| Aqua America, Inc. | 4,506 | 118 | |||||||
| Atmos Energy Corp. | 1,157 | 61 | |||||||
| Calpine Corp.(Æ) | 10,577 | 241 | |||||||
| CenterPoint Energy, Inc. | 1,704 | 42 | |||||||
| Consolidated Edison, Inc. | 327 | 21 | |||||||
| DTE Energy Co. | 347 | 29 | |||||||
| Edison International | 13,400 | 839 | |||||||
| Energen Corp. | 225 | 15 | |||||||
| Entergy Corp. | 1,120 | 94 | |||||||
| Exelon Corp. | 25,600 | 937 | |||||||
| Great Plains Energy, Inc. | 749 | 20 | |||||||
| Integrys Energy Group, Inc. | 369 | 27 | |||||||
| ITC Holdings Corp. | 17,000 | 673 | |||||||
| Northeast Utilities | 4,437 | 219 | |||||||
| NRG Energy, Inc. | 42,100 | 1,262 | |||||||
| OGE Energy Corp. | 504 | 19 | |||||||
| Pepco Holdings, Inc. | 2,114 | 58 | |||||||
| Pinnacle West Capital Corp. | 415 | 26 | |||||||
| PPL Corp. | 574 | 20 | |||||||
| Questar Corp. | 3,102 | 75 | |||||||
| Sempra Energy | 11,019 | 1,212 | |||||||
| UGI Corp. | 4,374 | 165 | |||||||
| Vectren Corp. | 455 | 20 | |||||||
| Westar Energy, Inc. Class A | 3,257 | 123 | |||||||
| Xcel Energy, Inc. | 6,686 | 224 | |||||||
| 7,105 | |||||||||
| Total Common Stocks | |||||||||
| (cost $164,383) | 193,912 | ||||||||
| Short-Term Investments - 4.5% | |||||||||
| Russell U.S. Cash Management Fund | 9,184,521 | (8) | 9,185 | ||||||
| Total Short-Term Investments | |||||||||
| (cost $9,185) | 9,185 | ||||||||
| Other Securities - 2.3% | |||||||||
| Russell U.S. Cash Collateral Fund(×) | 4,599,095 | (8) | 4,599 | ||||||
| Total Other Securities | |||||||||
| (cost $4,599) | 4,599 | ||||||||
| See accompanying notes which are an integral part of the financial statements. | |||||||||
| Russell U.S. Mid Cap Equity Fund 145 | |||||||||
| Russell Investment Company | ||||||
| Russell U.S. Mid Cap Equity Fund | ||||||
| Schedule of Investments, continued — October 31, 2014 | ||||||
| Futures Contracts | ||||||
| Amounts in thousands (except contract amounts) | ||||||
| Unrealized | ||||||
| Appreciation | ||||||
| Number of | Notional | Expiration | (Depreciation) | |||
| Contracts | Amount | Date | $ | |||
| Long Positions | ||||||
| S&P Mid 400 E-Mini Index Futures | 67 | USD | 9,483 | 12/14 | 201 | |
| Total Unrealized Appreciation (Depreciation) on Open Futures Contracts (å) | 201 | |||||
Presentation of Portfolio Holdings
Amounts in thousands
| Fair Value | ||||||||||||
| Portfolio Summary | Level 1 | Level 2 | Level 3 | Total | % of Net Assets | |||||||
| Common Stocks | ||||||||||||
| Consumer Discretionary | $ | 35,814 | $ | — | $ | — | $ | 35,814 | 17.6 | |||
| Consumer Staples | 6,707 | — | — | 6,707 | 3.3 | |||||||
| Energy | 9,296 | — | — | 9,296 | 4.6 | |||||||
| Financial Services | 41,638 | — | — | 41,638 | 20.4 | |||||||
| Health Care | 21,261 | — | — | 21,261 | 10.4 | |||||||
| Materials and Processing | 15,368 | — | — | 15,368 | 7.5 | |||||||
| Producer Durables | 24,431 | — | — | 24,431 | 12.0 | |||||||
| Technology | 32,292 | — | — | 32,292 | 15.8 | |||||||
| Utilities | 7,105 | — | — | 7,105 | 3.5 | |||||||
| Short-Term Investments | — | 9,185 | — | 9,185 | 4.5 | |||||||
| Other Securities | — | 4,599 | — | 4,599 | 2.3 | |||||||
| Total Investments | 193,912 | 13,784 | — | 207,696 | 101.9 | |||||||
| Other Assets and Liabilities, Net | (1.9 | ) | ||||||||||
| 100.0 | ||||||||||||
| Other Financial Instruments | ||||||||||||
| Futures Contracts | 201 | — | — | 201 | 0.1 | |||||||
| Total Other Financial Instruments* | $ | 201 | $ | — | $ | — | $ | 201 | ||||
* Futures and foreign currency exchange contract values reflect the unrealized appreciation (depreciation) on the instruments.
For a description of the Levels see note 2 in the Notes to Financial Statements.
For disclosure on transfers between Levels 1, 2 and 3 during the period ended October 31, 2014, see note 2 in the Notes to Financial Statements.
See accompanying notes which are an integral part of the financial statements.
146 Russell U.S. Mid Cap Equity Fund
| Russell Investment Company | |||
| Russell U.S. Mid Cap Equity Fund | |||
| Fair Value of Derivative Instruments — October 31, 2014 | |||
| Amounts in thousands | |||
| Equity | |||
| Derivatives not accounted for as hedging instruments | Contracts | ||
| Location: Statement of Assets and Liabilities - Assets | |||
| Variation margin on futures contracts* | $ | 201 | |
| Equity | |||
| Derivatives not accounted for as hedging instruments | Contracts | ||
| Location: Statement of Operations - Net realized gain (loss) | |||
| Futures contracts | $ | 1,020 | |
| Location: Statement of Operations - Net change in unrealized appreciation (depreciation) | |||
| Futures contracts | $ | (88 | ) |
| * | Includes cumulative appreciation/depreciation of futures contracts as reported in the Schedule of Investments. Only variation margin is reported within the Statement of Assets and Liabilities. |
For further disclosure on derivatives see note 2 in the Notes to Financial Statements.
See accompanying notes which are an integral part of the financial statements.
Russell U.S. Mid Cap Equity Fund 147
Russell Investment Company Russell U.S. Mid Cap Equity Fund
Balance Sheet Offsetting of Financial and Derivative Instruments — October 31, 2014
| Amounts in thousands | ||||||||
| Offsetting of Financial Assets and Derivative Assets | ||||||||
| Gross | Net Amounts | |||||||
| Amounts | of Assets | |||||||
| Gross | Offset in the | Presented in | ||||||
| Amounts of | Statement of | the Statement | ||||||
| Recognized | Assets and | of Assets and | ||||||
| Description | Location: Statement of Assets and Liabilities - Assets | Assets | Liabilities | Liabilities | ||||
| Securities on Loan* | Investments, at fair value | $ | 4,624 | $ — | $ | 4,624 | ||
| Futures Contracts | Variation margin on futures contracts | 115 | — | 115 | ||||
| Total | $ | 4,739 | $ — | $ | 4,739 | |||
| Financial Assets, Derivative Assets, and Collateral Held by Counterparty | ||||||||||
| Gross Amounts Not Offset in | ||||||||||
| the Statement of Assets and | ||||||||||
| Liabilities | ||||||||||
| Net Amounts | ||||||||||
| of Assets | ||||||||||
| Presented in | ||||||||||
| the Statement | Financial and | |||||||||
| of Assets and | Derivative | Collateral | ||||||||
| Counterparty | Liabilities | Instruments | Received^ | Net Amount | ||||||
| Barclays | $ | 1,785 | $ | — $ | 1,785 | $ | — | |||
| Credit Suisse | 359 | — | 359 | — | ||||||
| Goldman Sachs | 461 | — | 461 | — | ||||||
| JPMorgan Chase | 1,528 | — | 1,528 | — | ||||||
| Merrill Lynch | 115 | — | — | 115 | ||||||
| Morgan Stanley | 491 | — | 491 | — | ||||||
| Total | $ | 4,739 | $ | — $ | 4,624 | $ | 115 | |||
* Fair value of securities on loan as reported in the footnotes to the Statement of Assets and Liabilities.
^ Collateral received or pledged amounts may not reconcile to those disclosed in the Statement of Assets and Liabilities due to the inclusion of off-Balance Sheet collateral and adjustments made to exclude overcollateralization.
For further disclosure on derivatives and counterparty risk see note 2 in the Notes to Financial Statements.
See accompanying notes which are an integral part of the financial statements.
148 Russell U.S. Mid Cap Equity Fund
| Russell Investment Company | ||
| Russell U.S. Mid Cap Equity Fund | ||
| Statement of Assets and Liabilities — October 31, 2014 | ||
| Amounts in thousands | ||
| Assets | ||
| Investments, at identified cost | $ | 178,167 |
| Investments, at fair value(>) | 207,696 | |
| Cash (restricted)(a) | 742 | |
| Receivables: | ||
| Dividends and interest | 71 | |
| Investments sold | 1,792 | |
| Fund shares sold | 217 | |
| Variation margin on futures contracts | 115 | |
| Total assets | 210,633 | |
| Liabilities | ||
| Payables: | ||
| Investments purchased | 1,756 | |
| Fund shares redeemed | 163 | |
| Accrued fees to affiliates | 161 | |
| Other accrued expenses | 72 | |
| Payable upon return of securities loaned | 4,599 | |
| Total liabilities | 6,751 | |
| Net Assets | $ | 203,882 |
See accompanying notes which are an integral part of the financial statements.
Russell U.S. Mid Cap Equity Fund 149
| Russell Investment Company | ||
| Russell U.S. Mid Cap Equity Fund | ||
| Statement of Assets and Liabilities, continued — October 31, 2014 | ||
| Amounts in thousands | ||
| Net Assets Consist of: | ||
| Undistributed (overdistributed) net investment income | $ | 27 |
| Accumulated net realized gain (loss) | 15,917 | |
| Unrealized appreciation (depreciation) on: | ||
| Investments | 29,529 | |
| Futures contracts | 201 | |
| Shares of beneficial interest | 153 | |
| Additional paid-in capital | 158,055 | |
| Net Assets | $ | 203,882 |
| Net Asset Value, offering and redemption price per share: | ||
| Net asset value per share: Class A(#) | $ | 13.27 |
| Maximum offering price per share (Net asset value plus sales charge of 5.75%): Class A | $ | 14.08 |
| Class A — Net assets | $ | 4,560,079 |
| Class A — Shares outstanding ($.01 par value) | 343,609 | |
| Net asset value per share: Class C(#) | $ | 13.08 |
| Class C — Net assets | $ | 1,967,641 |
| Class C — Shares outstanding ($.01 par value) | 150,426 | |
| Net asset value per share: Class S(#) | $ | 13.30 |
| Class S — Net assets | $ | 197,354,309 |
| Class S — Shares outstanding ($.01 par value) | 14,835,340 | |
| Amounts in thousands | ||
| (*) Securities on loan included in investments | $ | 4,624 |
| (>) Investments in affiliates, Russell U.S. Cash Management Fund and Russell U.S. Cash Collateral Fund | $ | 13,784 |
| (a) Cash Collateral for Futures | $ | 742 |
| (#) Net asset value per share equals class level net assets divided by class level shares of beneficial interest outstanding. | ||
See accompanying notes which are an integral part of the financial statements.
150 Russell U.S. Mid Cap Equity Fund
| Russell Investment Company | |||
| Russell U.S. Mid Cap Equity Fund | |||
| Statement of Operations — For the Period Ended October 31, 2014 | |||
| Amounts in thousands | |||
| Investment Income | |||
| Dividends | $ | 2,377 | |
| Dividends from affiliated Russell funds | 10 | ||
| Securities lending income | 15 | ||
| Total investment income | 2,402 | ||
| Expenses | |||
| Advisory fees | 1,476 | ||
| Administrative fees | 88 | ||
| Custodian fees | 111 | ||
| Distribution fees - Class A | 9 | ||
| Distribution fees - Class C | 11 | ||
| Transfer agent fees - Class A | 7 | ||
| Transfer agent fees - Class C | 3 | ||
| Transfer agent fees - Class S | 359 | ||
| Professional fees | 50 | ||
| Registration fees | 42 | ||
| Shareholder servicing fees - Class C | 4 | ||
| Trustees’ fees | 5 | ||
| Printing fees | 8 | ||
| Miscellaneous | 15 | ||
| Expenses before reductions | 2,188 | ||
| Expense reductions | (375 | ) | |
| Net expenses | 1,813 | ||
| Net investment income (loss) | 589 | ||
| Net Realized and Unrealized Gain (Loss) | |||
| Net realized gain (loss) on: | |||
| Investments | 15,815 | ||
| Futures contracts | 1,020 | ||
| Net realized gain (loss) | 16,835 | ||
| Net change in unrealized appreciation (depreciation) on: | |||
| Investments | 4,174 | ||
| Futures contracts | (88 | ) | |
| Net change in unrealized appreciation (depreciation) | 4,086 | ||
| Net realized and unrealized gain (loss) | 20,921 | ||
| Net Increase (Decrease) in Net Assets from Operations | $ | 21,510 | |
See accompanying notes which are an integral part of the financial statements.
Russell U.S. Mid Cap Equity Fund 151
| Russell Investment Company | ||||||
| Russell U.S. Mid Cap Equity Fund | ||||||
| Statements of Changes in Net Assets | ||||||
| For the Periods Ended October 31, | ||||||
| Amounts in thousands | 2014 | 2013 | ||||
| Increase (Decrease) in Net Assets | ||||||
| Operations | ||||||
| Net investment income (loss) | $ | 589 | $ | 711 | ||
| Net realized gain (loss) | 16,835 | 19,833 | ||||
| Net change in unrealized appreciation (depreciation) | 4,086 | 24,428 | ||||
| Net increase (decrease) in net assets from operations | 21,510 | 44,972 | ||||
| Distributions | ||||||
| From net investment income | ||||||
| Class A | (7 | ) | (5 | ) | ||
| Class C | — | (1 | ) | |||
| Class S | (758 | ) | (822 | ) | ||
| From net realized gain | ||||||
| Class A | (315 | ) | — | |||
| Class C | (108 | ) | — | |||
| Class S | (17,800 | ) | — | |||
| Net decrease in net assets from distributions | (18,988 | ) | (828 | ) | ||
| Share Transactions* | ||||||
| Net increase (decrease) in net assets from share transactions | 34,425 | (17 | ) | |||
| Total Net Increase (Decrease) in Net Assets | 36,947 | 44,127 | ||||
| Net Assets | ||||||
| Beginning of period | 166,935 | 122,808 | ||||
| End of period | $ | 203,882 | $ | 166,935 | ||
| Undistributed (overdistributed) net investment income included in net assets | $ | 27 | $ | 28 | ||
See accompanying notes which are an integral part of the financial statements.
152 Russell U.S. Mid Cap Equity Fund
Russell Investment Company Russell U.S. Mid Cap Equity Fund
Statements of Changes in Net Assets, continued
* Share transaction amounts (in thousands) for the periods ended October 31, 2014 and October 31, 2013 were as follows:
| 2014 | 2013 | |||||||||||
| Shares | Dollars | Shares | Dollars | |||||||||
| Class A | ||||||||||||
| Proceeds from shares sold | 149 | $ | 1,881 | 153 | $ | 1,801 | ||||||
| Proceeds from reinvestment of distributions | 26 | 317 | 1 | 5 | ||||||||
| Payments for shares redeemed | (49 | ) | (639 | ) | (26 | ) | (291 | ) | ||||
| Net increase (decrease) | 126 | 1,559 | 128 | 1,515 | ||||||||
| Class C | ||||||||||||
| Proceeds from shares sold | 117 | 1,480 | 47 | 540 | ||||||||
| Proceeds from reinvestment of distributions | 9 | 108 | — | — | ||||||||
| Payments for shares redeemed | (27 | ) | (338 | ) | (16 | ) | (206 | ) | ||||
| Net increase (decrease) | 99 | 1,250 | 31 | 334 | ||||||||
| Class S | ||||||||||||
| Proceeds from shares sold | 3,116 | 39,588 | 4,084 | 45,927 | ||||||||
| Proceeds from reinvestment of distributions | 1,260 | 15,435 | 56 | 627 | ||||||||
| Payments for shares redeemed | (1,834 | ) | (23,407 | ) | (4,136 | ) | (48,420 | ) | ||||
| Net increase (decrease) | 2,542 | 31,616 | 4 | (1,866 | ) | |||||||
| Total increase (decrease) | 2,767 | $ | 34,425 | 163 | $ | (17 | ) | |||||
See accompanying notes which are an integral part of the financial statements.
Russell U.S. Mid Cap Equity Fund 153
| Russell Investment Company | ||||||||||||||||||
| Russell U.S. Mid Cap Equity Fund | ||||||||||||||||||
| Financial Highlights — For the Periods Ended | ||||||||||||||||||
| For a Share Outstanding Throughout Each Period. | ||||||||||||||||||
| $ | $ | $ | $ | $ | $ | |||||||||||||
| Net Asset Value, | Net | Net Realized | Total from | Distributions | Distributions | |||||||||||||
| Beginning of | Investment | and Unrealized | Investment | from Net | from Net | |||||||||||||
| Period | Income (Loss)(a)(d) | Gain (Loss) | Operations | Investment Income | Realized Gain | |||||||||||||
| Class A | ||||||||||||||||||
| October 31, 2014 | 13.26 | .01 | 1.46 | 1.47 | (.03 | ) | (1.43 | ) | ||||||||||
| October 31, 2013 | 9.89 | .01 | 3.40 | 3.41 | (.04 | ) | — | |||||||||||
| October 31, 2012(4) | 10.00 | -(f) | (.08 | ) | (.08 | ) | (.03 | ) | — | |||||||||
| Class C | ||||||||||||||||||
| October 31, 2014 | 13.16 | (.09 | ) | 1.44 | 1.35 | — | (1.43 | ) | ||||||||||
| October 31, 2013 | 9.86 | (.07 | ) | 3.39 | 3.32 | (.02 | ) | — | ||||||||||
| October 31, 2012(4) | 10.00 | (.05 | ) | (.09 | ) | (.14 | ) | —(f) | — | |||||||||
| Class S | ||||||||||||||||||
| October 31, 2014 | 13.29 | .04 | 1.45 | 1.49 | (.05 | ) | (1.43 | ) | ||||||||||
| October 31, 2013 | 9.90 | .06 | 3.39 | 3.45 | (.06 | ) | — | |||||||||||
| October 31, 2012(4) | 10.00 | .03 | (.10 | ) | (.07 | ) | (.03 | ) | — | |||||||||
See accompanying notes which are an integral part of the financial statements.
154 Russell U.S. Mid Cap Equity Fund
| % | % | % | |||||||||||||||||
| $ | $ | Ratio of Expenses | Ratio of Expenses | Ratio of Net | |||||||||||||||
| Net Asset Value, | % | Net Assets, | to Average | to Average | Investment Income | % | |||||||||||||
| $ | End of | Total | End of Period | Net Assets, | Net Assets, | to Average | Portfolio | ||||||||||||
| Total Distributions | Period | Return(b)(c) | (000 | ) | Gross(e) | Net(d)(e) | Net Assets(d)(e) | Turnover Rate(b) | |||||||||||
| (1.46 | ) | 13.27 | 12.05 | 4,560 | 1.42 | 1.22 | .07 | 96 | |||||||||||
| (.04 | ) | 13.26 | 34.59 | 2,896 | 1.44 | 1.22 | .11 | 122 | |||||||||||
| (.03 | ) | 9.89 | (.85 | ) | 897 | 1.44 | 1.21 | .06 | 96 | ||||||||||
| (1.43 | ) | 13.08 | 11.18 | 1,968 | 2.17 | 1.97 | (.70 | ) | 96 | ||||||||||
| (.02 | ) | 13.16 | 33.67 | 672 | 2.19 | 1.97 | (.63 | ) | 122 | ||||||||||
| —(f) | 9.86 | (1.36 | ) | 197 | 2.24 | 1.96 | (.64 | ) | 96 | ||||||||||
| (1.48 | ) | 13.30 | 12.28 | 197,354 | 1.17 | .97 | .33 | 96 | |||||||||||
| (.06 | ) | 13.29 | 34.87 | 163,367 | 1.19 | .97 | .47 | 122 | |||||||||||
| (.03 | ) | 9.90 | (.66 | ) | 121,714 | 1.25 | .96 | .40 | 96 | ||||||||||
See accompanying notes which are an integral part of the financial statements.
Russell U.S. Mid Cap Equity Fund 155
Russell Investment Company Russell U.S. Small Cap Equity Fund
Portfolio Management Discussion and Analysis — October 31, 2014 (Unaudited)
| Russell U.S. Small Cap Equity Fund - Class A‡ | Russell U.S. Small Cap Equity Fund - Class S‡‡‡ | ||||||
| Total | Total | ||||||
| Return | Return | ||||||
| 1 Year | 0.57 | % | 1 Year | 7.01 | % | ||
| 5 Years | 15.81 | %§ | 5 Years | 17.47 | %§ | ||
| 10 Years | 7.02 | %§ | 10 Years | 7.90 | %§ | ||
| Russell U.S. Small Cap Equity Fund - Class C‡‡ | Russell U.S. Small Cap Equity Fund - Class Y | ||||||
| Total | Total | ||||||
| Return | Return | ||||||
| 1 Year | 5.91 | % | 1 Year | 7.17 | % | ||
| 5 Years | 16.30 | %§ | 5 Years | 17.69 | %§ | ||
| 10 Years | 7.15 | %§ | 10 Years | 8.06 | %§ | ||
| Russell U.S. Small Cap Equity Fund - Class E | Russell 2000® Index** | ||||||
| Total | Total | ||||||
| Return | Return | ||||||
| 1 Year | 6.71 | % | 1 Year | 8.06 | % | ||
| 5 Years | 17.24 | %§ | 5 Years | 17.39 | %§ | ||
| 10 Years | 7.69 | %§ | 10 Years | 8.67 | %§ | ||
| U.S. Small Cap Equity Linked Benchmark*** | |||||||
| Russell U.S. Small Cap Equity Fund - Class I | Total | ||||||
| Total | Return | ||||||
| Return | 1 Year | 8.06 | % | ||||
| 1 Year | 7.06 | % | 5 Years | 17.79 | %§ | ||
| 5 Years | 17.57 | %§ | 10 Years | 9.40 | %§ | ||
| 10 Years | 7.96 | %§ | |||||
156 Russell U.S. Small Cap Equity Fund
Russell Investment Company Russell U.S. Small Cap Equity Fund
Portfolio Management Discussion and Analysis, continued — October 31, 2014 (Unaudited)
| The Russell U.S. Small Cap Equity Fund (the “Fund”) employs | sectors. Growth stocks narrowly outperformed value stocks and |
| a multi-manager approach whereby portions of the Fund | defensive stocks beat dynamic stocks for the fiscal year, which |
| are allocated to different money managers. Fund assets not | contributed negatively to the Fund’s value tilt and aided the |
| allocated to money managers are managed by Russell Investment | Fund’s exposure toward stocks with lower betas. The Fund’s |
| Management Company (“RIMCo”), the Fund’s advisor. RIMCo | emphasis on stocks with higher quality measures was mixed, as |
| may change the allocation of the Fund’s assets among money | stocks with modest amounts of leverage and lower returns-on- |
| managers at any time. An exemptive order from the Securities | equity outperformed. |
| and Exchange Commission (“SEC”) permits RIMCo to engage | With the continuation of the economic recovery in mind, the |
| or terminate a money manager at any time, subject to approval | Fund was underweight in most of the sectors that are traditionally |
| by the Fund’s Board, without a shareholder vote. Pursuant to the | considered to be “non-cyclical” and/or interest rate sensitive. |
| terms of the exemptive order, the Fund is required to notify its | However, certain segments that tend to be viewed as “bond |
| shareholders within 90 days of when a money manager begins | substitutes,” due to their income producing qualities, such as |
| providing services. As of October 31, 2014, the Fund had eleven | utilities and real estate investment trusts (REITs), outperformed |
| money managers. | given the decline in interest rates and this detracted from the |
| What is the Fund’s investment objective? | Fund’s benchmark-relative performance. |
| The Fund seeks to provide long term capital growth. | How did the investment strategies and techniques employed |
| How did the Fund perform relative to its benchmark for the | by the Fund and its money managers affect its benchmark- |
| fiscal year ended October 31, 2014? | relative performance? |
| For the fiscal year ended October 31, 2014, the Fund’s Class A, | The Fund’s underweight to health care, especially within the highly |
| Class C, Class E, Class I, Class S and Class Y Shares gained | volatile biotechnology industry, and overweight to the producer |
| 6.70%, 5.91%, 6.71%, 7.06%, 7.01%, and 7.17%, respectively. | durables sector, detracted. Elsewhere, a slight overweight to |
| This is compared to the Fund’s benchmark, the Russell 2000® | the poor performing energy sector and stock selection within |
| Index, which gained 8.06% during the same period. The Fund’s | the information technology sector detracted. Stock selection |
| performance includes operating expenses, whereas index returns | effects within the consumer discretionary (notably among retail, |
| are unmanaged and do not include expenses of any kind. | leisure and media stocks) and energy (specifically, non-renewable |
| For the fiscal year ended October 31, 2014, the Morningstar® | energy companies) sectors positively contributed to the Fund’s |
| benchmark-relative return for the fiscal year. | |
| Small Blend, a group of funds that Morningstar considers to have | |
| investment strategies similar to those of the Fund, gained 7.66%. | Cardinal Capital Management LLC (“Cardinal”) outperformed |
| This result serves as a peer comparison and is expressed net of | the Russell 2000® Index for the fiscal year. Cardinal’s discounted |
| operating expenses. | cash-flow, catalyst driven process uncovered opportunities within |
| consumer discretionary and energy sectors. An overweight | |
| RIMCo may assign a money manager a specific style or | exposure to stocks with high returns-on-equity was beneficial. |
| capitalization benchmark other than the Fund’s index. However, | |
| the Fund’s primary index remains the benchmark for the Fund | Chartwell Investment Partners (“Chartwell”) outperformed |
| and is representative of the aggregate of each money manager’s | the Russell 2000® Value Index for the fiscal year. Chartwell’s |
| benchmark index. | valuation conscious, catalyst driven strategy was particularly |
| beneficial within producer durables and consumer discretionary | |
| How did the market conditions described in the Market | sectors. An underweight to energy was rewarded. |
| Summary report affect the Fund’s performance? | ClariVest Asset Management LLC (“ClariVest”) outperformed the |
| The fiscal year ended October 31, 2014 saw the Fund underperform | Russell 2000® Index for the portion of the fiscal year in which it |
| the Russell 2000® Index. Through the end of 2013, the U.S. small | |
| was a money manager for the Fund. Holdings within consumer | |
| cap market continued to produce strong positive returns, while | discretionary, computer software and banks added value. An |
| the beginning of 2014 introduced higher price volatility with | underweight to the energy sector, highly leveraged stocks and |
| more modest returns that eventually turned negative towards the | companies with high price to earnings was rewarded. |
| end of the 2014 fiscal year. At the beginning of 2014, the Fund | |
| decreased its beta and growth exposures (beta is a measure of | Copeland Capital Management LLC (“Copeland”) outperformed |
| the Russell 2000® Index for the portion of the fiscal year in which | |
| a portfolio’s volatility and its sensitivity to the direction of the | |
| market) while continuing to emphasize higher quality measures | it was a money manager for the Fund. Copeland’s benchmark- |
| (lower leverage and higher returns-on-equity) within cyclical | relative overweight to larger market capitalization stocks with |
Russell U.S. Small Cap Equity Fund 157
Russell Investment Company Russell U.S. Small Cap Equity Fund
Portfolio Management Discussion and Analysis, continued — October 31, 2014 (Unaudited)
| lower beta was rewarded. Stock selection within the energy sector, | underweight to the highly volatile biotechnology industry was |
| notably within non-renewable energy stocks, added value. | penalized. |
| DePrince, Race & Zollo, Inc. (“DePrince”) outperformed the | Signia Capital Management, LLC (“Signia”) underperformed the |
| Russell 2000® Value Index for the fiscal year. DePrince’s dividend | Russell 2000® Value Index for the fiscal year. Signia’s significant |
| focused strategy added value within energy, computer software | overweight to the lagging energy sector and underperforming |
| and producer durables sectors. An underweight to the highest | holdings within producer durables sector detracted. Elsewhere, |
| beta, highest leveraged names was beneficial. | the manager’s underweight to holdings with high dividend yields |
| EAM Investors, LLC (“EAM”) underperformed the Russell | held back benchmark-relative returns. |
| Microcap® Growth Index for the fiscal year. Factor exposures | RIMCo manages the portion of the Fund’s assets that RIMCo |
| were mixed, specifically an overweight to stocks with higher | determines not to allocate to the money managers. Assets not |
| price momentum added value, while their holdings with higher | allocated to managers include the Fund’s liquidity reserves and |
| returns-on-equity stocks held back benchmark-relative returns. | assets which may be managed directly by RIMCo to modify the |
| Stock selection within health care services and computer software | Fund’s overall portfolio characteristics to seek to achieve the |
| detracted. | desired risk/return profile for the Fund. |
| Falcon Point Capital, LLC (“Falcon Point”) outperformed the | In June 2014, RIMCo implemented a 5% allocation to a |
| Russell 2000® Growth Index for the fiscal year. Falcon Point’s | positioning strategy which aims to control Fund-level exposures |
| valuation conscious, consistent growth strategy found success | and/or risks with an optimized portfolio. The optimization |
| within the consumer discretionary sector and pharmaceutical | attempts to preserve active management in the Fund by seeking |
| industries. An overweight to the strong performing tobacco | to align the overall Fund composite with the money managers’ |
| industry also added value over the period. | positioning while meeting RIMCo’s exposure and risk constraints. |
| Jacobs Levy Equity Management, Inc. (“Jacobs”) outperformed | Optimized index sampling strategies do not attempt to purchase |
| the Russell 2000® Value Index for the fiscal year. Jacobs Levy’s | every security in the reference index, but instead purchase a |
| quantitative modeling added value within the producer durables | sampling of securities using optimization and risk models. This |
| and technology sectors. An underweight to the poor performing | process involves the analysis of tradeoffs between various factors |
| energy sector was rewarded. | as well as turnover and transaction costs in order to estimate |
| optimal portfolio holdings based upon the reference index in order | |
| Next Century Growth Investors, LLC (“Next Century”) | to achieve desired Fund exposures. This strategy is designed to |
| underperformed the Russell 2000® Growth Index for the fiscal | |
| tilt the Fund toward lower volatility and lower valuations and, | |
| year. Next Century’s high growth investment approach faced | based on RIMCo’s expectations for rising interest rates, increase |
| strong headwinds over the course of the year as their stock | the Fund’s REIT underweight while preserving the direction |
| selections in computer software and financial services significantly | and impact of the money managers’ active stock selection. The |
| underperformed. | strategy underperformed the Russell 2000® Index for the portion |
| Netols Asset Management, Inc. (“Netols”) outperformed the | of the fiscal year it was a part of the fund. During the period, the |
| Russell 2000® Index for the portion of the fiscal year in which it | strategy’s underweight to interest rate sensatives, such as REITs |
| was a money manager for the Fund. Netols’ valuation sensitive, | and Utilities, detracted. An underweight to the highly leveraged |
| strong balance sheet approach led to selection of outperforming | biotechnology and pharmaceuticals industry was penalized. An |
| stocks within the health care services industry and financial | overweight to holdings with higher quality metrics, those with |
| services sector. | lower long-term debt-to-capital and higher returns-on-equity, |
| PENN Capital Management Company, Inc. (“PENN”) | added value. RIMCo equitized the Fund’s cash using index futures |
| underperformed the Russell 2000® Index for the fiscal year. | contracts to ensure that the Fund had full market exposure. This |
| Penn’s overweight to companies with higher betas and higher | had a positive impact on the Fund’s performance. |
| historical earnings growth than the benchmark detracted from | Describe any changes to the Fund’s structure or the money |
| benchmark-relative returns. Stock selection within energy and | manager line-up. |
| producer durables was penalized. | In December 2013, RIMCo terminated Clarivest Asset |
| Ranger Investment Management L.P. (“Ranger”) underperformed | Management LLC and Ranger Investment Management, L.P. |
| the Russell 2000® Growth Index for the portion of the fiscal year | as money managers for the Fund and hired Copeland Capital |
| in which it was a money manager for the Fund. Holdings within | Management, LLC and Netols Asset Management, Inc. as money |
| producer durables, computer software and energy detracted. An | managers for the Fund. |
158 Russell U.S. Small Cap Equity Fund
Russell Investment Company Russell U.S. Small Cap Equity Fund
Portfolio Management Discussion and Analysis, continued — October 31, 2014 (Unaudited)
| The addition of Netols filled a value tilted core role that RIMCo | Money Managers as of October 31, | |
| expects to blend well with the Fund’s existing managers. In | 2014 | Styles |
| particular, replacing ClariVest’s growth tilted core strategy with | ||
| Cardinal Capital Management, L.L.C. | Microcap/Small Cap Value | |
| Netols was intended to reduce the growth emphasis in the Fund | Chartwell Investment Partners | Small Cap Value |
| and bring it more in line with RIMCo’s preferred positioning. The | Copeland Capital Management, LLC | Small Cap Core |
| addition of Copeland was intended to add a high conviction, early | DePrince, Race & Zollo, Inc. | Small Cap Value |
| lifecycle defensive manager. RIMCo believes their consistent | EAM Investors, LLC | Microcap Growth |
| dividend growth discipline is an attractive strategy in the U.S. | Falcon Point Capital, LLC | Small Cap Growth |
| Jacobs Levy Equity Management, Inc. | Small Cap Value | |
| small cap market. Importantly, this strategy is meaningfully | Netols Asset Management Inc. | Small Cap Core |
| different from the other growth strategies in the Fund and RIMCo | Next Century Growth Investors, LLC | Small Cap Growth |
| believes that the addition of Copeland materially improves the | PENN Capital Management Company, Inc. | Microcap/Small Cap Core |
| diversity of growth levers in the Fund. | Signia Capital Management, LLC | Small Cap Value |
| The views expressed in this report reflect those of the portfolio | ||
| managers only through the end of the period covered by | ||
| the report. These views do not necessarily represent the | ||
| views of RIMCo, or any other person in RIMCo or any other | ||
| affiliated organization. These views are subject to change | ||
| at any time based upon market conditions or other events, | ||
| and RIMCo disclaims any responsibility to update the views | ||
| contained herein. These views should not be relied on as | ||
| investment advice and, because investment decisions for | ||
| a Russell Investment Company (“RIC”) Fund are based on | ||
| numerous factors, should not be relied on as an indication | ||
| of investment decisions of any RIC Fund. | ||
| * | Assumes initial investment on November 1, 2004. |
| ** | Russell 2000® Index measures the performance of the small-cap segment of the U.S. equity universe. The Russell 2000 is a subset of the Russell 3000® Index representing approximately 10% of the total market capitalization of that index. It includes approximately 2000 of the smallest securities based on a combination of their market cap and current index membership. The Russell 2000 Index is constructed to provide a comprehensive and unbiased small-cap opportunity barometer and is completely reconstituted annually to ensure larger stocks do not distort the performance and characteristics of the true small-cap opportunity set. |
| *** | The U.S. Small Cap Equity Linked Benchmark provides a means to compare the Fund’s average annual returns to a secondary benchmark that takes into account historical changes in the Fund’s primary benchmark. The U.S. Small Cap Equity Linked Benchmark represents the returns of the Russell 2500TM Index through December 31, 2011 and the returns of the Russell 2000® Index thereafter. |
| ‡ | The Fund first issued Class A Shares on September 2, 2008. The returns shown for Class A Shares prior to that date are the returns of the Fund’s Class E Shares. The performance shown has been adjusted to reflect the deduction of the maximum Class A sales charge of 5.75%. Annual returns for each Class will differ only to the extent that the Class A Shares do not have the same expenses as the Class E Shares. |
| ‡‡ | The Fund first issued Class C Shares on September 2, 2008. The returns shown for Class C Shares prior to that date are the returns of the Fund’s Class E Shares and do not reflect deduction of Rule 12b-1 distribution fees that apply to Class C Shares. Had they done so, the returns shown for those periods would have been lower. Annual returns for each Class will differ only to the extent that the Class C Shares do not have the same expenses as the Class E Shares. |
| ‡‡‡ | The Fund first issued Class S Shares on September 2, 2008. The returns shown for Class S Shares prior to that date are the returns of the Fund’s Class I |
| Shares. Class S Shares will have substantially similar annual returns as the Class I Shares because the Shares of each Class are invested in the same portfolio of securities. Annual returns for each Class will differ only to the extent that the Class S Shares do not have the same expenses as the Class I Shares. | |
| § | Annualized. |
Performance is historical and assumes reinvestment of all dividends and capital gains. Investment return and principal value will fluctuate so that an investor’s shares, when redeemed, may be worth more or less than when purchased. Past performance is not indicative of future results. The returns shown do not reflect the deduction of taxes that a shareholder would pay on Fund distributions or the redemption of Fund shares.
Russell U.S. Small Cap Equity Fund 159
Russell Investment Company Russell U.S. Small Cap Equity Fund
Shareholder Expense Example — October 31, 2014 (Unaudited)
| Fund Expenses | Please note that the expenses shown in the table are meant | |||||
| The following disclosure provides important information | to highlight your ongoing costs only and do not reflect any | |||||
| regarding the Fund’s Shareholder Expense Example | transactional costs. Therefore, the information under the heading | |||||
| (“Example”). | “Hypothetical Performance (5% return before expenses)” is | |||||
| useful in comparing ongoing costs only, and will not help you | ||||||
| Example | determine the relative total costs of owning different funds. In | |||||
| As a shareholder of the Fund, you incur two types of costs: (1) | addition, if these transactional costs were included, your costs | |||||
| transaction costs, and (2) ongoing costs, including advisory and | would have been higher. | |||||
| administrative fees; distribution (12b-1) and/or service fees; | Hypothetical | |||||
| and other Fund expenses. The Example is intended to help | Performance (5% | |||||
| you understand your ongoing costs (in dollars) of investing in | Actual | return before | ||||
| the Fund and to compare these costs with the ongoing costs of | Class A | Performance | expenses) | |||
| Beginning Account Value | ||||||
| investing in other mutual funds. The Example is based on an | May 1, 2014 | $ | 1,000.00 | $ | 1,000.00 | |
| investment of $1,000 invested at the beginning of the period and | Ending Account Value | |||||
| held for the entire period indicated, which for this Fund is from | October 31, 2014 | $ | 1,031.00 | $ | 1,018.90 | |
| May 1, 2014 to October 31, 2014. | Expenses Paid During Period* | $ | 6.40 | $ | 6.36 | |
| Actual Expenses | * Expenses are equal to the Fund's annualized expense ratio of 1.25% | |||||
| (representing the six month period annualized), multiplied by the average | ||||||
| The information in the table under the heading “Actual | account value over the period, multiplied by 184/365 (to reflect the one-half | |||||
| Performance” provides information about actual account values | year period). | |||||
| and actual expenses. You may use the information in this column, | ||||||
| together with the amount you invested, to estimate the expenses | Hypothetical | |||||
| Performance (5% | ||||||
| that you paid over the period. Simply divide your account value by | Actual | return before | ||||
| $1,000 (for example, an $8,600 account value divided by $1,000 | Class C | Performance | expenses) | |||
| = 8.6), then multiply the result by the number in the first column | Beginning Account Value | |||||
| in the row entitled “Expenses Paid During Period” to estimate | May 1, 2014 | $ | 1,000.00 | $ | 1,000.00 | |
| Ending Account Value | ||||||
| the expenses you paid on your account during this period. | October 31, 2014 | $ | 1,027.10 | $ | 1,015.12 | |
| Expenses Paid During Period* | $ | 10.22 | $ | 10.16 | ||
| Hypothetical Example for Comparison Purposes | ||||||
| The information in the table under the heading “Hypothetical | * Expenses are equal to the Fund's annualized expense ratio of 2.00% | |||||
| Performance (5% return before expenses)” provides information | (representing the six month period annualized), multiplied by the average | |||||
| account value over the period, multiplied by 184/365 (to reflect the one-half | ||||||
| about hypothetical account values and hypothetical expenses | year period). | |||||
| based on the Fund’s actual expense ratio and an assumed rate of | ||||||
| return of 5% per year before expenses, which is not the Fund’s | Hypothetical | |||||
| actual return. The hypothetical account values and expenses | Performance (5% | |||||
| Actual | return before | |||||
| may not be used to estimate the actual ending account balance or | Class E | Performance | expenses) | |||
| expenses you paid for the period. You may use this information | Beginning Account Value | |||||
| to compare the ongoing costs of investing in the Fund and other | May 1, 2014 | $ | 1,000.00 | $ | 1,000.00 | |
| funds. To do so, compare this 5% hypothetical example with the | Ending Account Value | |||||
| October 31, 2014 | $ | 1,030.90 | $ | 1,018.90 | ||
| 5% hypothetical examples that appear in the shareholder reports | Expenses Paid During Period* | $ | 6.40 | $ | 6.36 | |
| of other funds. | ||||||
| * Expenses are equal to the Fund's annualized expense ratio of 1.25% | ||||||
| (representing the six month period annualized), multiplied by the average | ||||||
| account value over the period, multiplied by 184/365 (to reflect the one-half | ||||||
| year period). | ||||||
160 Russell U.S. Small Cap Equity Fund
Russell Investment Company Russell U.S. Small Cap Equity Fund
Shareholder Expense Example, continued — October 31, 2014 (Unaudited)
| Hypothetical | |||||
| Performance (5% | |||||
| Actual | return before | ||||
| Class I | Performance | expenses) | |||
| Beginning Account Value | |||||
| May 1, 2014 | $ | 1,000.00 | $ | 1,000.00 | |
| Ending Account Value | |||||
| October 31, 2014 | $ | 1,032.60 | $ | 1,020.57 | |
| Expenses Paid During Period* | $ | 4.71 | $ | 4.69 | |
| * Expenses are equal to the Fund's annualized expense ratio of 0.92% | |||||
| (representing the six month period annualized), multiplied by the average | |||||
| account value over the period, multiplied by 184/365 (to reflect the one-half | |||||
| year period). | |||||
| Hypothetical | |||||
| Performance (5% | |||||
| Actual | return before | ||||
| Class S | Performance | expenses) | |||
| Beginning Account Value | |||||
| May 1, 2014 | $ | 1,000.00 | $ | 1,000.00 | |
| Ending Account Value | |||||
| October 31, 2014 | $ | 1,032.40 | $ | 1,020.16 | |
| Expenses Paid During Period* | $ | 5.12 | $ | 5.09 | |
| * Expenses are equal to the Fund's annualized expense ratio of 1.00% | |||||
| (representing the six month period annualized), multiplied by the average | |||||
| account value over the period, multiplied by 184/365 (to reflect the one-half | |||||
| year period). | |||||
| Hypothetical | |||||
| Performance (5% | |||||
| Actual | return before | ||||
| Class Y | Performance | expenses) | |||
| Beginning Account Value | |||||
| May 1, 2014 | $ | 1,000.00 | $ | 1,000.00 | |
| Ending Account Value | |||||
| October 31, 2014 | $ | 1,033.10 | $ | 1,021.17 | |
| Expenses Paid During Period* | $ | 4.10 | $ | 4.08 | |
| * Expenses are equal to the Fund's annualized expense ratio of 0.80% | |||||
| (representing the six month period annualized), multiplied by the average | |||||
| account value over the period, multiplied by 184/365 (to reflect the one-half | |||||
| year period). | |||||
Russell U.S. Small Cap Equity Fund 161
| Russell Investment Company | |||||||
| Russell U.S. Small Cap Equity Fund | |||||||
| Schedule of Investments — October 31, 2014 | |||||||
| Amounts in thousands (except share amounts) | Amounts in thousands (except share amounts) | ||||||
| Principal | Fair | Principal | Fair | ||||
| Amount ($) or | Value | Amount ($) or | Value | ||||
| Shares | $ | Shares | $ | ||||
| Common Stocks - 94.2% | Finish Line, Inc. (The) Class A | 5,207 | 138 | ||||
| Consumer Discretionary - 14.1% | Foot Locker, Inc. | 4,800 | 269 | ||||
| 1-800-Flowers.com, Inc. Class A(Æ) | 127,345 | 1,023 | FTD Cos., Inc.(Æ) | 87,177 | 3,067 | ||
| 2U, Inc.(Æ)(Ñ) | 50,183 | 913 | Fuel Systems Solutions, Inc.(Æ) | 500,606 | 4,621 | ||
| Abercrombie & Fitch Co. Class A | 142,939 | 4,786 | Full House Resorts, Inc.(Æ) | 515,451 | 665 | ||
| AMC Entertainment Holdings, Inc. Class A | 39,195 | 996 | Gentherm, Inc.(Æ) | 80,332 | 3,350 | ||
| American Axle & Manufacturing Holdings, | G-III Apparel Group, Ltd.(Æ) | 60,237 | 4,780 | ||||
| Inc.(Æ) | 8,000 | 155 | Grand Canyon Education, Inc.(Æ) | 32,090 | 1,537 | ||
| American Eagle Outfitters, Inc.(Ñ) | 279,546 | 3,598 | Gray Television, Inc.(Æ) | 434,225 | 4,012 | ||
| ANN, Inc.(Æ) | 188,240 | 7,227 | Guess?, Inc. | 112,700 | 2,499 | ||
| Aramark | 8,313 | 232 | Harman International Industries, Inc. | 1,100 | 118 | ||
| Bally Technologies, Inc.(Æ) | 4,291 | 345 | Haverty Furniture Cos., Inc. | 16,076 | 354 | ||
| Beazer Homes USA, Inc.(Æ) | 65,568 | 1,176 | Helen of Troy, Ltd.(Æ) | 64,212 | 3,972 | ||
| Belmond, Ltd. Class A(Æ) | 173,397 | 1,987 | Ignite Restaurant Group, Inc.(Æ)(Ñ) | 7,335 | 51 | ||
| Big Lots, Inc. | 11,790 | 538 | IMAX Corp.(Æ)(Ñ) | 33,328 | 982 | ||
| Black Diamond, Inc.(Æ)(Ñ) | 170,296 | 1,321 | Isle of Capri Casinos, Inc.(Æ) | 207,108 | 1,539 | ||
| Boyd Gaming Corp.(Æ) | 98,982 | 1,143 | Jack in the Box, Inc. | 165,542 | 11,760 | ||
| Bravo Brio Restaurant Group, Inc.(Æ) | 8,587 | 119 | JAKKS Pacific, Inc.(Æ)(Ñ) | 27,600 | 176 | ||
| Brinker International, Inc. | 101,306 | 5,434 | Jamba, Inc.(Æ) | 81,738 | 1,091 | ||
| Brown Shoe Co., Inc. | 35,238 | 937 | Johnson Outdoors, Inc. Class A | 800 | 24 | ||
| Buffalo Wild Wings, Inc.(Æ) | 10,809 | 1,614 | Journal Communications, Inc. Class A(Æ) | 214,610 | 2,105 | ||
| Build-A-Bear Workshop, Inc. Class A(Æ) | 70,917 | 1,202 | KAR Auction Services, Inc. | 100,955 | 3,065 | ||
| Burlington Stores, Inc.(Æ) | 22,356 | 938 | Kona Grill, Inc.(Æ) | 57,611 | 1,298 | ||
| Cabela's, Inc.(Æ)(Ñ) | 67,046 | 3,220 | Krispy Kreme Doughnuts, Inc.(Æ) | 195,003 | 3,689 | ||
| Capella Education Co. | 77,514 | 5,483 | LeapFrog Enterprises, Inc. Class A(Æ) | 95,123 | 506 | ||
| Carmike Cinemas, Inc.(Æ) | 103,887 | 3,330 | Libbey, Inc.(Æ) | 42,179 | 1,213 | ||
| Carrols Restaurant Group, Inc.(Æ) | 155,895 | 1,202 | LIN Media LLC Class A(Æ) | 104,725 | 2,506 | ||
| Carter's, Inc. | 43,392 | 3,390 | Lincoln Educational Services Corp. | 1,062,872 | 2,817 | ||
| Cato Corp. (The) Class A | 6,089 | 217 | Lithia Motors, Inc. Class A | 25,324 | 1,966 | ||
| Cavco Industries, Inc.(Æ) | 1,284 | 94 | Live Nation Entertainment, Inc.(Æ) | 5,477 | 142 | ||
| Central Garden and Pet Co. Class A(Æ) | 18,325 | 157 | Malibu Boats, Inc. Class A(Æ) | 69,972 | 1,306 | ||
| Cheesecake Factory, Inc. (The) | 148,826 | 6,837 | Marcus Corp. | 58,870 | 1,008 | ||
| Chico's FAS, Inc. | 379,479 | 5,723 | MarineMax, Inc.(Æ) | 126,010 | 2,416 | ||
| Children's Place, Inc. (The) | 18,053 | 889 | Matthews International Corp. Class A | 65,774 | 3,031 | ||
| Choice Hotels International, Inc. | 5,500 | 294 | MDC Holdings, Inc.(Ñ) | 95,057 | 2,321 | ||
| Christopher & Banks Corp.(Æ) | 119,018 | 777 | MDC Partners, Inc. Class A | 532,328 | 11,019 | ||
| Churchill Downs, Inc. | 43,375 | 4,423 | Media General, Inc. Class A(Æ)(Ñ) | 168,302 | 2,514 | ||
| Chuy's Holdings, Inc.(Æ) | 96,850 | 2,897 | Meredith Corp. | 118,500 | 6,179 | ||
| Cinemark Holdings, Inc. | 30,281 | 1,070 | Meritage Homes Corp.(Æ) | 41,821 | 1,539 | ||
| Citi Trends, Inc.(Æ) | 312,381 | 7,075 | Meritor, Inc.(Æ) | 73,500 | 845 | ||
| Clear Channel Outdoor Holdings, Inc. Class | Monarch Casino & Resort, Inc.(Æ) | 1,859 | 30 | ||||
| A | 10,133 | 74 | Monro Muffler Brake, Inc. | 85,327 | 4,560 | ||
| Columbia Sportswear Co. | 56,634 | 2,183 | Motorcar Parts of America, Inc.(Æ) | 119,216 | 3,462 | ||
| Coty, Inc. Class A(Æ) | 54,309 | 902 | Movado Group, Inc. | 89,089 | 3,145 | ||
| Cracker Barrel Old Country Store, Inc. | 5,265 | 607 | Multimedia Games Holding Co., Inc.(Æ) | 75,225 | 2,625 | ||
| Cumulus Media, Inc. Class A(Æ) | 728,059 | 2,810 | National CineMedia, Inc. | 70,952 | 1,128 | ||
| Deckers Outdoor Corp.(Æ) | 49,467 | 4,326 | Nautilus, Inc.(Æ) | 100,559 | 1,345 | ||
| Del Frisco's Restaurant Group, Inc.(Æ) | 159,686 | 3,708 | New York & Co., Inc.(Æ) | 16,877 | 55 | ||
| Denny's Corp.(Æ) | 255,279 | 2,200 | Nexstar Broadcasting Group, Inc. Class A(Ñ) | 48,011 | 2,166 | ||
| Destination Maternity Corp. | 26,555 | 398 | Nutrisystem, Inc. | 3,344 | 56 | ||
| DeVry Education Group, Inc. | 79,362 | 3,842 | Office Depot, Inc.(Æ) | 239,549 | 1,250 | ||
| Domino's Pizza, Inc. | 38,771 | 3,442 | Oxford Industries, Inc. | 20,831 | 1,276 | ||
| Drew Industries, Inc. | 7,920 | 381 | Papa John's International, Inc. | 21,932 | 1,026 | ||
| Einstein Noah Restaurant Group, Inc. | 110,041 | 2,228 | Paylocity Corp(Æ) | 1,650 | 40 | ||
| Entercom Communications Corp. Class A(Æ) | 121,341 | 1,247 | Penn National Gaming, Inc.(Æ) | 132,934 | 1,740 | ||
| Entravision Communications Corp. Class A | 320,599 | 1,654 | Penske Automotive Group, Inc. | 4,821 | 218 | ||
| Ethan Allen Interiors, Inc. | 237,597 | 6,724 | Pep Boys-Manny Moe & Jack (The)(Æ) | 724,088 | 6,901 | ||
| EW Scripps Co. (The) Class A(Æ) | 88,238 | 1,694 | Performance Sports Group, Ltd.(Æ) | 131,782 | 2,271 | ||
| Fiesta Restaurant Group, Inc.(Æ) | 98,398 | 5,427 | Perry Ellis International, Inc.(Æ) | 291,063 | 5,952 | ||
| See accompanying notes which are an integral part of the financial statements. | |||||||
| 162 Russell U.S. Small Cap Equity Fund | |||||||
Russell Investment Company Russell U.S. Small Cap Equity Fund
Schedule of Investments, continued — October 31, 2014
| Amounts in thousands (except share amounts) | Amounts in thousands (except share amounts) | ||||||
| Principal | Fair | Principal | Fair | ||||
| Amount ($) or | Value | Amount ($) or | Value | ||||
| Shares | $ | Shares | $ | ||||
| Pier 1 Imports, Inc. | 7,092 | 91 | Snyders-Lance, Inc. | 409,092 | 12,187 | ||
| Pinnacle Entertainment, Inc.(Æ) | 78,129 | 2,002 | SpartanNash Co. | 59,072 | 1,324 | ||
| Pool Corp. | 88,345 | 5,274 | SUPERVALU, Inc.(Æ) | 531,987 | 4,591 | ||
| Popeyes Louisiana Kitchen, Inc.(Æ) | 9,500 | 440 | TravelCenters of America LLC(Æ) | 783,991 | 7,589 | ||
| QuinStreet, Inc.(Æ) | 25,100 | 102 | TreeHouse Foods, Inc.(Æ) | 101,375 | 8,634 | ||
| Radio One, Inc. Class D(Æ)(Ñ) | 168,442 | 419 | Universal Corp. | 88,541 | 3,940 | ||
| Rentrak Corp.(Æ) | 63,540 | 4,884 | WD-40 Co. | 4,674 | 358 | ||
| Restoration Hardware Holdings, Inc.(Æ)(Ñ) | 20,885 | 1,677 | 102,940 | ||||
| Ritchie Bros Auctioneers, Inc.(Ñ) | 189,640 | 4,625 | |||||
| Rocky Brands, Inc. | 284,975 | 3,745 | Energy - 4.0% | ||||
| Ruby Tuesday, Inc.(Æ) | 849,739 | 6,526 | Alliance Resource Partners, LP(Ñ) | 96,306 | 4,631 | ||
| Scholastic Corp. | 5,851 | 204 | Atwood Oceanics, Inc. | 6,200 | 252 | ||
| Scientific Games Corp. Class A(Æ)(Ñ) | 202,647 | 2,385 | Basic Energy Services, Inc.(Æ) | 41,480 | 535 | ||
| Select Comfort Corp.(Æ) | 60,328 | 1,550 | Bill Barrett Corp.(Æ)(Ñ) | 154,850 | 2,354 | ||
| Shutterstock, Inc.(Æ)(Ñ) | 59,122 | 4,597 | Bonanza Creek Energy, Inc.(Æ) | 33,562 | 1,518 | ||
| Six Flags Entertainment Corp. | 53,583 | 2,159 | C&J Energy Services, Inc.(Æ) | 39,690 | 766 | ||
| Sizmek, Inc.(Æ) | 41,000 | 235 | Callon Petroleum Co.(Æ) | 22,200 | 146 | ||
| Skullcandy, Inc.(Æ) | 110,606 | 922 | CARBO Ceramics, Inc.(Ñ) | 42,622 | 2,202 | ||
| Sotheby's Class A | 122,934 | 4,876 | Carrizo Oil & Gas, Inc.(Æ) | 62,200 | 3,231 | ||
| Stage Stores, Inc. | 336,902 | 5,684 | Comstock Resources, Inc. | 185,482 | 2,196 | ||
| Standard Motor Products, Inc. | 111,304 | 4,399 | Contango Oil & Gas Co.(Æ) | 888 | 33 | ||
| Steiner Leisure, Ltd.(Æ) | 12,527 | 528 | Delek US Holdings, Inc. | 181,033 | 6,135 | ||
| Strayer Education, Inc.(Æ) | 990 | 72 | Diamondback Energy, Inc.(Æ) | 20,856 | 1,427 | ||
| Systemax, Inc.(Æ) | 1,675 | 26 | Enphase Energy, Inc.(Æ)(Ñ) | 64,605 | 970 | ||
| Tenneco, Inc.(Æ) | 90,048 | 4,715 | Forum Energy Technologies, Inc.(Æ) | 58,759 | 1,604 | ||
| Texas Roadhouse, Inc. Class A | 44,741 | 1,292 | Goodrich Petroleum Corp.(Æ)(Ñ) | 134,004 | 1,104 | ||
| Thor Industries, Inc. | 69,967 | 3,701 | Gulf Island Fabrication, Inc. | 5,622 | 119 | ||
| TiVo, Inc.(Æ) | 79,005 | 1,031 | Halcon Resources Corp.(Æ)(Ñ) | 231,379 | 720 | ||
| Townsquare Media, Inc. Class A(Æ) | 5,653 | 71 | Helix Energy Solutions Group, Inc.(Æ) | 44,530 | 1,186 | ||
| TubeMogul, Inc.(Æ)(Ñ) | 76,584 | 1,190 | Key Energy Services, Inc.(Æ) | 512,652 | 1,559 | ||
| Tuesday Morning Corp.(Æ) | 65,376 | 1,333 | Magnum Hunter Resources Corp.(Æ)(Ñ) | 265,090 | 1,230 | ||
| Universal Electronics, Inc.(Æ) | 25,783 | 1,467 | Matrix Service Co.(Æ) | 23,851 | 598 | ||
| Viad Corp. | 18,197 | 464 | McDermott International, Inc.(Æ)(Ñ) | 571,025 | 2,193 | ||
| Vince Holding Corp.(Æ) | 36,552 | 1,281 | Natural Gas Services Group, Inc.(Æ) | 39,036 | 1,004 | ||
| West Marine, Inc.(Æ) | 439,852 | 4,328 | Pacific Ethanol, Inc.(Æ) | 3,617 | 51 | ||
| Wolverine World Wide, Inc. | 143,850 | 3,904 | Parker Drilling Co.(Æ) | 49,705 | 221 | ||
| Zoe's Kitchen, Inc.(Æ)(Ñ) | 29,435 | 1,073 | Parsley Energy, Inc. Class A(Æ) | 2,862 | 49 | ||
| 345,617 | Patterson-UTI Energy, Inc. | 186,666 | 4,299 | ||||
| PBF Energy, Inc. Class A | 210,087 | 5,477 | |||||
| Consumer Staples - 4.2% | PDC Energy, Inc.(Æ) | 28,745 | 1,257 | ||||
| Andersons, Inc. (The) | 40,682 | 2,593 | Penn Virginia Corp.(Æ) | 79,943 | 685 | ||
| B&G Foods, Inc. Class A | 7,244 | 213 | PetroQuest Energy, Inc.(Æ) | 666,618 | 3,133 | ||
| Boulder Brands, Inc.(Æ) | 279,329 | 2,480 | Pioneer Energy Services Corp.(Æ) | 16,989 | 156 | ||
| Calavo Growers, Inc. | 85,861 | 4,168 | PowerSecure International, Inc.(Æ)(Ñ) | 177,897 | 1,987 | ||
| Cal-Maine Foods, Inc. | 8,100 | 711 | Rex Energy Corp.(Æ) | 87,813 | 688 | ||
| Casey's General Stores, Inc. | 221,366 | 18,123 | Rice Energy, Inc.(Æ) | 50,089 | 1,324 | ||
| Coca-Cola Bottling Co. Consolidated | 667 | 60 | Rowan Companies PLC(Æ) | 223,561 | 5,426 | ||
| Core-Mark Holding Co., Inc. | 200,140 | 11,614 | RSP Permian, Inc.(Æ)(Ñ) | 61,400 | 1,502 | ||
| Dean Foods Co.(Ñ) | 421,083 | 6,194 | Sanchez Energy Corp.(Æ)(Ñ) | 63,921 | 1,091 | ||
| Farmer Bros Co.(Æ) | 68,273 | 1,991 | SemGroup Corp. Class A | 62,879 | 4,826 | ||
| Fresh Del Monte Produce, Inc. | 18,646 | 599 | Seventy Seven Energy, Inc.(Æ) | 1,932 | 25 | ||
| Ingles Markets, Inc. Class A | 31,398 | 845 | Stone Energy Corp.(Æ) | 29,768 | 729 | ||
| Inventure Foods, Inc.(Æ) | 79,914 | 1,058 | Superior Energy Services, Inc. | 271,522 | 6,829 | ||
| J&J Snack Foods Corp. | 51,562 | 5,312 | Synergy Resources Corp.(Æ) | 103,776 | 1,265 | ||
| John B Sanfilippo & Son, Inc. | 55,823 | 2,074 | Targa Resources Corp.(Ñ) | 37,306 | 4,799 | ||
| Lancaster Colony Corp. | 6,936 | 635 | Tesco Corp. | 5,146 | 98 | ||
| Limoneira Co. | 100,467 | 2,578 | Trecora Resources(Æ) | 101,155 | 1,330 | ||
| Pantry, Inc. (The)(Æ) | 92,797 | 2,391 | Triangle Petroleum Corp.(Æ)(Ñ) | 445,230 | 3,451 | ||
| Sanderson Farms, Inc. | 8,068 | 678 | Unit Corp.(Æ) | 85,130 | 4,122 | ||
See accompanying notes which are an integral part of the financial statements.
Russell U.S. Small Cap Equity Fund 163
| Russell Investment Company | |||||||
| Russell U.S. Small Cap Equity Fund | |||||||
| Schedule of Investments, continued — October 31, 2014 | |||||||
| Amounts in thousands (except share amounts) | Amounts in thousands (except share amounts) | ||||||
| Principal | Fair | Principal | Fair | ||||
| Amount ($) or | Value | Amount ($) or | Value | ||||
| Shares | $ | Shares | $ | ||||
| US Antimony Corp.(Æ) | 1,270,186 | 1,397 | Charter Financial Corp. | 71,000 | 805 | ||
| Willbros Group, Inc.(Æ) | 369,616 | 2,170 | Chemical Financial Corp. | 164,698 | 4,905 | ||
| World Fuel Services Corp. | 55,086 | 2,272 | Chesapeake Lodging Trust(ö) | 107,700 | 3,558 | ||
| 98,372 | City National Corp. | 13,013 | 1,024 | ||||
| CNO Financial Group, Inc. | 5,542 | 100 | |||||
| Financial Services - 22.9% | Columbia Banking System, Inc. | 214,383 | 5,956 | ||||
| Acadia Realty Trust(ö) | 25,700 | 802 | Community Bank System, Inc. | 77,327 | 2,950 | ||
| Advent Software, Inc. | 121,894 | 4,213 | Community Trust Bancorp, Inc. | 16,548 | 595 | ||
| AG Mortgage Investment Trust, Inc.(ö) | 49,900 | 952 | Consolidated-Tomoka Land Co. | 58,073 | 3,031 | ||
| Agree Realty Corp.(ö) | 2,300 | 70 | Consumer Portfolio Services, Inc.(Æ) | 18,508 | 131 | ||
| Alexander & Baldwin, Inc. | 91,612 | 3,667 | Cowen Group, Inc. Class A(Æ) | 16,952 | 69 | ||
| Alleghany Corp.(Æ) | 105 | 47 | Crawford & Co. Class B | 9,532 | 97 | ||
| American Equity Investment Life Holding | Credit Acceptance Corp.(Æ)(Ñ) | 743 | 110 | ||||
| Co. | 180,659 | 4,663 | CU Bancorp(Æ) | 1,264 | 25 | ||
| American Financial Group, Inc. | 2,095 | 125 | CubeSmart Class A(ö) | 57,808 | 1,217 | ||
| American National Bankshares, Inc. | 2,126 | 51 | Cullen/Frost Bankers, Inc. | 15,419 | 1,246 | ||
| Ameris Bancorp | 52,754 | 1,308 | CVB Financial Corp. | 143,917 | 2,271 | ||
| AMERISAFE, Inc. | 31,844 | 1,328 | CYS Investments, Inc.(ö) | 121,800 | 1,088 | ||
| AmTrust Financial Services, Inc.(Ñ) | 33,504 | 1,503 | Diamond Hill Investment Group, Inc. | 1,472 | 197 | ||
| Apartment Investment & Management Co. | Diamond Hill Investment Group, Inc.(Å)(Þ) | 21,827 | 2,925 | ||||
| Class A(ö) | 8,800 | 315 | DiamondRock Hospitality Co.(ö) | 395,510 | 5,676 | ||
| Apollo Residential Mortgage, Inc.(ö) | 24,960 | 416 | Duke Realty Corp.(ö) | 20,000 | 379 | ||
| Arbor Realty Trust, Inc.(ö) | 40,600 | 273 | DuPont Fabros Technology, Inc.(ö) | 89,300 | 2,766 | ||
| Ares Commercial Real Estate Corp.(ö) | 162,500 | 1,976 | Eagle Bancorp, Inc.(Æ) | 56,218 | 2,020 | ||
| Argo Group International Holdings, Ltd. | 122,581 | 6,840 | EastGroup Properties, Inc.(ö) | 27,800 | 1,914 | ||
| Arlington Asset Investment Corp. Class A(Ñ) | 37,521 | 1,027 | Education Realty Trust, Inc. Class A(ö) | 617,030 | 6,948 | ||
| Armada Hoffler Properties, Inc.(ö) | 25,600 | 240 | Endurance Specialty Holdings, Ltd. | 67,546 | 3,914 | ||
| Arrow Financial Corp. | 6,508 | 178 | Enstar Group, Ltd.(Æ) | 5,203 | 770 | ||
| Ashford Hospitality Prime, Inc.(ö) | 8,247 | 143 | Enterprise Financial Services Corp. | 3,668 | 69 | ||
| Ashford Hospitality Trust, Inc.(ö) | 41,731 | 472 | EPR Properties(ö) | 59,230 | 3,323 | ||
| Assurant, Inc. | 19,910 | 1,358 | Equity One, Inc.(ö) | 97,366 | 2,337 | ||
| Astoria Financial Corp. | 261,134 | 3,434 | Evercore Partners, Inc. Class A | 25,708 | 1,331 | ||
| Aviv REIT, Inc.(ö) | 4,998 | 169 | EVERTEC, Inc. | 31,938 | 725 | ||
| Baldwin & Lyons, Inc. Class B | 1,367 | 37 | Excel Trust, Inc.(ö) | 7,000 | 91 | ||
| BancFirst Corp. | 12,518 | 814 | Fair Isaac Corp. | 67,679 | 4,216 | ||
| Bancorp, Inc.(Æ) | 530,877 | 5,022 | Federated National Holding Co. | 3,800 | 127 | ||
| BancorpSouth, Inc. | 147,136 | 3,389 | FelCor Lodging Trust, Inc.(ö) | 588,530 | 6,315 | ||
| Bank of Marin Bancorp | 6,854 | 342 | Fidelity & Guaranty Life | 6,449 | 153 | ||
| Bank of the Ozarks, Inc. | 216,529 | 7,631 | Fifth Street Asset Management, Inc. Class | ||||
| BBCN Bancorp, Inc. | 313,558 | 4,434 | A(Æ) | 50,000 | 730 | ||
| BGC Partners, Inc. Class A | 114,431 | 970 | Financial Engines, Inc.(Ñ) | 54,228 | 2,162 | ||
| BioMed Realty Trust, Inc.(ö) | 260,264 | 5,653 | First Bancorp | 1,902 | 34 | ||
| Blackhawk Network Holdings, Inc. Class | First BanCorp(Æ) | 4,739 | 25 | ||||
| A(Æ)(Ñ) | 1,332 | 46 | First Busey Corp. | 35,428 | 221 | ||
| Bluerock Residential Growth REIT, Inc. | First Business Financial Services, Inc. | 5,777 | 271 | ||||
| Class A(ö) | 80,200 | 982 | First Defiance Financial Corp. | 7,449 | 228 | ||
| BNC Bancorp | 8,593 | 146 | First Financial Bancorp | 269,296 | 4,723 | ||
| Boston Private Financial Holdings, Inc. | 220,605 | 2,901 | First Financial Corp. | 10,051 | 349 | ||
| Brookline Bancorp, Inc. | 461,839 | 4,429 | First Industrial Realty Trust, Inc.(ö) | 334,131 | 6,526 | ||
| Bryn Mawr Bank Corp. | 7,721 | 238 | First Interstate BancSystem, Inc. Class A | 12,701 | 373 | ||
| Capital Bank Financial Corp. Class A(Æ) | 88,730 | 2,297 | First Merchants Corp. | 125,852 | 2,851 | ||
| Capitol Federal Financial, Inc. | 304,535 | 3,901 | First Midwest Bancorp, Inc. | 328,221 | 5,511 | ||
| Cardinal Financial Corp. | 167,580 | 3,218 | First NBC Bank Holding Co.(Æ) | 60,082 | 2,207 | ||
| Cardtronics, Inc.(Æ) | 247,365 | 9,496 | FirstMerit Corp. | 29,898 | 549 | ||
| Cash America International, Inc. | 14,800 | 727 | FNB Corp. | 954,285 | 12,205 | ||
| CBL & Associates Properties, Inc.(ö) | 7,300 | 140 | Forestar Group, Inc.(Æ) | 220,262 | 3,844 | ||
| CBOE Holdings, Inc. | 3,800 | 224 | Franklin Street Properties Corp.(ö) | 487,926 | 5,850 | ||
| Cedar Realty Trust, Inc.(ö) | 66,941 | 461 | Fulton Financial Corp. | 82,207 | 977 | ||
| Central Pacific Financial Corp. | 1,999 | 38 | FXCM, Inc. Class A(Ñ) | 99,569 | 1,639 | ||
| See accompanying notes which are an integral part of the financial statements. | |||||||
| 164 Russell U.S. Small Cap Equity Fund | |||||||
| Russell Investment Company | |||||||
| Russell U.S. Small Cap Equity Fund | |||||||
| Schedule of Investments, continued — October 31, 2014 | |||||||
| Amounts in thousands (except share amounts) | Amounts in thousands (except share amounts) | ||||||
| Principal | Fair | Principal | Fair | ||||
| Amount ($) or | Value | Amount ($) or | Value | ||||
| Shares | $ | Shares | $ | ||||
| Gain Capital Holdings, Inc. | 928,739 | 7,950 | MidWestOne Financial Group, Inc. | 6,847 | 183 | ||
| German American Bancorp, Inc. | 8,801 | 263 | MoneyGram International, Inc.(Æ) | 23,900 | 206 | ||
| GFI Group, Inc. | 762,913 | 4,196 | Montpelier Re Holdings, Ltd. | 2,502 | 83 | ||
| Glacier Bancorp, Inc. | 131,260 | 3,766 | Morningstar, Inc. | 10,218 | 697 | ||
| Gladstone Commercial Corp.(ö) | 6,971 | 126 | National Bank Holdings Corp. Class A | 242,013 | 4,741 | ||
| Global Cash Access Holdings, Inc.(Æ) | 98,620 | 719 | National Health Investors, Inc.(ö) | 45,287 | 2,985 | ||
| Golub Capital BDC, Inc.(Ñ) | 57,278 | 993 | National Penn Bancshares, Inc. | 449,626 | 4,627 | ||
| Great Southern Bancorp, Inc. | 33,632 | 1,278 | Navigators Group, Inc. (The)(Æ) | 20,258 | 1,379 | ||
| Green Dot Corp. Class A(Æ) | 25,443 | 608 | Nelnet, Inc. Class A | 24,414 | 1,162 | ||
| Greenlight Capital Re, Ltd. Class A(Æ) | 23,660 | 768 | New Residential Investment Corp.(ö) | 307,701 | 3,809 | ||
| Hallmark Financial Services, Inc.(Æ) | 8,878 | 104 | Northfield Bancorp, Inc. | 104,902 | 1,494 | ||
| Hancock Holding Co. | 204,019 | 7,179 | Northwest Bancshares, Inc. | 316,015 | 4,054 | ||
| Hanmi Financial Corp. | 126,094 | 2,705 | OceanFirst Financial Corp. | 28,245 | 468 | ||
| Hanover Insurance Group, Inc. (The) | 75,073 | 5,025 | OFG Bancorp | 127,982 | 1,993 | ||
| Healthcare Realty Trust, Inc.(ö) | 216,730 | 5,737 | Old National Bancorp | 575,213 | 8,369 | ||
| Heartland Financial USA, Inc. | 4,800 | 128 | Old Republic International Corp. | 3,007 | 44 | ||
| Heartland Payment Systems, Inc. | 109,622 | 5,662 | Omega Healthcare Investors, Inc.(Ñ)(ö) | 107,695 | 4,110 | ||
| Hercules Technology Growth Capital, Inc. | Oritani Financial Corp. | 4,573 | 68 | ||||
| (Æ)(Ñ) | 161,097 | 2,539 | Pacific Continental Corp. | 180,590 | 2,604 | ||
| Hersha Hospitality Trust Class A(ö) | 237,300 | 1,730 | PacWest Bancorp | 165,017 | 7,040 | ||
| HFF, Inc. Class A | 162,046 | 5,101 | Park National Corp.(Ñ) | 4,307 | 363 | ||
| Higher One Holdings, Inc.(Æ) | 30,300 | 78 | Park Sterling Corp. | 32,987 | 253 | ||
| Home BancShares, Inc. | 161,491 | 5,155 | Pebblebrook Hotel Trust(ö) | 12,790 | 545 | ||
| Home Loan Servicing Solutions, Ltd. | 4,316 | 83 | PennyMac Financial Services, Inc. Class | ||||
| HomeTrust Bancshares, Inc.(Æ) | 17,279 | 267 | A(Æ) | 7,454 | 124 | ||
| Horace Mann Educators Corp. | 17,639 | 536 | Peoples Bancorp, Inc. | 1,353 | 33 | ||
| Horizon Bancorp | 5,168 | 133 | Physicians Realty Trust(ö) | 168,900 | 2,591 | ||
| Hospitality Properties Trust(ö) | 9,700 | 287 | Pinnacle Financial Partners, Inc. | 116,415 | 4,563 | ||
| Howard Hughes Corp. (The)(Æ) | 19,494 | 2,873 | Piper Jaffray Cos.(Æ) | 135,602 | 7,656 | ||
| Huntington Bancshares, Inc. | 27,402 | 272 | Planet Payment, Inc.(Æ) | 627,200 | 1,060 | ||
| Iberiabank Corp. | 57,073 | 3,930 | Platinum Underwriters Holdings, Ltd. | 11,852 | 742 | ||
| Independent Bank Corp. | 13,885 | 567 | Potlatch Corp.(ö) | 9,300 | 409 | ||
| Independent Bank Group, Inc. | 1,632 | 73 | PRA Group(Æ) | 58,663 | 3,710 | ||
| Infinity Property & Casualty Corp. | 76,215 | 5,564 | Preferred Bank | 6,339 | 169 | ||
| Inland Real Estate Corp.(ö) | 15,305 | 162 | PrivateBancorp, Inc. Class A | 118,978 | 3,845 | ||
| International. FCStone, Inc.(Æ) | 1,233 | 22 | ProAssurance Corp. | 103,061 | 4,821 | ||
| Investment Technology Group, Inc.(Æ) | 113,844 | 2,041 | Prosperity Bancshares, Inc. | 54,112 | 3,268 | ||
| Jack Henry & Associates, Inc. | 82,843 | 4,956 | Provident Financial Services, Inc. | 107,737 | 1,964 | ||
| JG Wentworth Co. Class A(Æ) | 69,327 | 771 | PS Business Parks, Inc.(ö) | 47,225 | 3,977 | ||
| JMP Group, Inc. | 131,937 | 963 | Raymond James Financial, Inc. | 19,700 | 1,106 | ||
| KCG Holdings, Inc. Class A(Æ) | 95,726 | 1,020 | RCS Capital Corp. Class A | 52,170 | 856 | ||
| Kite Realty Group Trust(ö) | 160,637 | 4,159 | Regional Management Corp.(Æ) | 132,694 | 1,547 | ||
| Ladenburg Thalmann Financial Services, | Reinsurance Group of America, Inc. Class A | 9,971 | 840 | ||||
| Inc.(Æ) | 286,215 | 1,222 | Renasant Corp. | 40,186 | 1,212 | ||
| Lakeland Bancorp, Inc. | 10,754 | 118 | Retail Opportunity Investments Corp.(ö) | 368,635 | 6,024 | ||
| Lakeland Financial Corp. | 5,319 | 220 | RLI Corp. | 25,359 | 1,258 | ||
| LaSalle Hotel Properties(ö) | 145,100 | 5,689 | Ryman Hospitality Properties, Inc.(Ñ)(ö) | 26,342 | 1,300 | ||
| LCNB Corp.(Ñ) | 113,386 | 1,701 | S&T Bancorp, Inc. | 12,191 | 336 | ||
| LTC Properties, Inc.(ö) | 43,421 | 1,821 | Sabra Health Care REIT, Inc.(ö) | 1,800 | 51 | ||
| Maiden Holdings, Ltd. | 175,653 | 2,099 | Safeguard Scientifics, Inc.(Æ) | 3,935 | 79 | ||
| MainSource Financial Group, Inc. | 5,182 | 94 | Safety Insurance Group, Inc. | 13,779 | 860 | ||
| Manning & Napier, Inc. Class A | 20,652 | 327 | Sandy Spring Bancorp, Inc. | 7,817 | 202 | ||
| Marcus & Millichap, Inc.(Æ) | 71,184 | 2,211 | Saul Centers, Inc.(ö) | 5,979 | 329 | ||
| MarketAxess Holdings, Inc. | 1,400 | 91 | Selective Insurance Group, Inc. | 388,539 | 10,032 | ||
| MB Financial, Inc. | 163,707 | 5,165 | Silver Bay Realty Trust Corp.(ö) | 49,048 | 830 | ||
| Medical Properties Trust, Inc.(ö) | 163,900 | 2,211 | Simmons First National Corp. Class A | 40,315 | 1,693 | ||
| MGIC Investment Corp.(Æ) | 504,723 | 4,502 | South State Corp. | 58,921 | 3,554 | ||
| Mid-America Apartment Communities, Inc. | Southside Bancshares, Inc.(Ñ) | 33,377 | 1,121 | ||||
| (ö) | 42,475 | 3,001 | Southwest Bancorp, Inc. | 63,737 | 1,149 | ||
| See accompanying notes which are an integral part of the financial statements. | |||||||
| Russell U.S. Small Cap Equity Fund 165 | |||||||
| Russell Investment Company | |||||||
| Russell U.S. Small Cap Equity Fund | |||||||
| Schedule of Investments, continued — October 31, 2014 | |||||||
| Amounts in thousands (except share amounts) | Amounts in thousands (except share amounts) | ||||||
| Principal | Fair | Principal | Fair | ||||
| Amount ($) or | Value | Amount ($) or | Value | ||||
| Shares | $ | Shares | $ | ||||
| Sovran Self Storage, Inc.(ö) | 13,000 | 1,106 | AMN Healthcare Services, Inc.(Æ) | 60,722 | 1,041 | ||
| STAG Industrial, Inc.(ö) | 16,910 | 413 | Anacor Pharmaceuticals, Inc.(Æ)(Ñ) | 35,676 | 1,049 | ||
| Starwood Property Trust, Inc.(ö) | 43,400 | 979 | Analogic Corp. | 54,033 | 3,941 | ||
| Starwood Waypoint Residential Trust(Æ)(ö) | 15,280 | 400 | ANI Pharmaceuticals, Inc.(Æ) | 75,992 | 2,581 | ||
| State Bank Financial Corp. | 320,441 | 5,742 | Anika Therapeutics, Inc.(Æ) | 1,543 | 62 | ||
| Sterling Bancorp | 307,694 | 4,326 | Avanir Pharmaceuticals, Inc. Class A(Æ) | 184,329 | 2,385 | ||
| Stewart Information Services Corp. | 734 | 26 | BioCryst Pharmaceuticals, Inc.(Æ)(Ñ) | 82,650 | 969 | ||
| Stock Yards Bancorp, Inc. | 9,609 | 320 | BioDelivery Sciences International, Inc.(Æ) | ||||
| Stonegate Bank | 10,607 | 288 | (Ñ) | 229,749 | 3,998 | ||
| Sun Communities, Inc.(ö) | 85,079 | 4,932 | Bio-Rad Laboratories, Inc. Class A(Æ) | 1,698 | 192 | ||
| Susquehanna Bancshares, Inc. | 582,388 | 5,713 | BioSpecifics Technologies Corp.(Æ) | 25,458 | 1,021 | ||
| SVB Financial Group(Æ) | 8,608 | 964 | Bio-Techne Corp. | 59,364 | 5,405 | ||
| Symetra Financial Corp. | 86,522 | 2,051 | Bluebird Bio, Inc.(Æ) | 28,374 | 1,191 | ||
| Talmer Bancorp, Inc. Class A | 48,241 | 674 | Cambrex Corp.(Æ) | 114,321 | 2,410 | ||
| TCF Financial Corp. | 40,971 | 633 | Capital Senior Living Corp.(Æ) | 166,994 | 3,757 | ||
| Territorial Bancorp, Inc. | 7,690 | 165 | Cardiovascular Systems, Inc.(Æ) | 173,663 | 5,384 | ||
| Texas Capital Bancshares, Inc.(Æ) | 21,800 | 1,333 | Centene Corp.(Æ) | 74,970 | 6,948 | ||
| Third Point Reinsurance, Ltd.(Æ) | 26,338 | 403 | Chemed Corp.(Ñ) | 41,574 | 4,297 | ||
| Tree.com, Inc.(Æ) | 30,454 | 1,127 | Chimerix, Inc.(Æ)(Ñ) | 45,883 | 1,424 | ||
| Trustmark Corp. | 115,820 | 2,818 | Community Health Systems, Inc.(Æ) | 2,300 | 126 | ||
| Two Harbors Investment Corp.(ö) | 169,600 | 1,718 | Computer Programs & Systems, Inc. | 70,090 | 4,414 | ||
| UMB Financial Corp. | 66,828 | 3,982 | Concert Pharmaceuticals, Inc.(Æ) | 70,648 | 1,034 | ||
| Umpqua Holdings Corp. | 232,869 | 4,099 | Cutera, Inc.(Æ) | 2,439 | 26 | ||
| United Bankshares, Inc. | 100,150 | 3,433 | Cytokinetics, Inc.(Æ) | 8,300 | 31 | ||
| United Community Banks, Inc. | 152,700 | 2,753 | Depomed, Inc.(Æ) | 162,388 | 2,501 | ||
| United Financial Bancorp, Inc. | 390,622 | 5,480 | DexCom, Inc.(Æ) | 55,024 | 2,473 | ||
| United Fire Group, Inc. | 2,752 | 89 | Diplomat Pharmacy, Inc.(Æ) | 114,518 | 2,462 | ||
| Universal Insurance Holdings, Inc. | 22,203 | 389 | Emergent Biosolutions, Inc.(Æ) | 50,141 | 1,134 | ||
| ViewPoint Financial Group, Inc. | 141,795 | 3,867 | Enanta Pharmaceuticals, Inc.(Æ)(Ñ) | 21,827 | 939 | ||
| Waddell & Reed Financial, Inc. Class A | 1,285 | 61 | Ensign Group, Inc. (The) | 108,351 | 4,195 | ||
| Walker & Dunlop, Inc.(Æ) | 208,380 | 3,357 | Enzo Biochem, Inc.(Æ) | 169,676 | 886 | ||
| Walter Investment Management Corp.(Æ)(Ñ) | 96,045 | 2,182 | Esperion Therapeutics, Inc.(Æ)(Ñ) | 40,309 | 1,179 | ||
| Washington Federal, Inc. | 248,058 | 5,415 | Exact Sciences Corp.(Æ)(Ñ) | 103,171 | 2,483 | ||
| Webster Financial Corp. | 145,531 | 4,561 | Exactech, Inc.(Æ) | 21,351 | 455 | ||
| WesBanco, Inc. | 28,024 | 966 | Five Star Quality Care, Inc.(Æ) | 5,097 | 21 | ||
| Westamerica Bancorporation(Ñ) | 112,120 | 5,532 | Fluidigm Corp.(Æ) | 131,843 | 3,823 | ||
| Western Alliance Bancorp(Æ) | 45,047 | 1,199 | Globus Medical, Inc. Class A(Æ) | 74,246 | 1,646 | ||
| Western Asset Mortgage Capital Corp.(Ñ)(ö) | 70,700 | 1,062 | Greatbatch, Inc.(Æ) | 121,161 | 6,081 | ||
| Wilshire Bancorp, Inc. | 66,387 | 657 | Haemonetics Corp.(Æ) | 170,270 | 6,423 | ||
| Winthrop Realty Trust(ö) | 345,575 | 5,401 | Health Net, Inc.(Æ) | 4,861 | 231 | ||
| WisdomTree Investments, Inc.(Æ)(Ñ) | 126,604 | 1,867 | ICON PLC(Æ) | 93,337 | 4,910 | ||
| WSFS Financial Corp. | 14,144 | 1,112 | IGI Laboratories, Inc.(Æ) | 129,710 | 1,272 | ||
| Zions Bancorporation | 4,711 | 136 | Impax Laboratories, Inc.(Æ) | 46,767 | 1,355 | ||
| 559,035 | Infinity Pharmaceuticals, Inc.(Æ) | 77,971 | 1,062 | ||||
| Inogen, Inc.(Æ) | 42,663 | 1,007 | |||||
| Health Care - 10.2% | Insulet Corp.(Æ) | 172,509 | 7,447 | ||||
| Abiomed, Inc.(Æ)(Ñ) | 174,841 | 5,733 | Integra LifeSciences Holdings Corp.(Æ) | 87,976 | 4,496 | ||
| Acadia Healthcare Co., Inc.(Æ) | 158,233 | 9,818 | Invacare Corp. | 229,975 | 3,613 | ||
| Achillion Pharmaceuticals, Inc.(Æ)(Ñ) | 88,887 | 1,044 | Kindred Healthcare, Inc. | 55,540 | 1,208 | ||
| Acorda Therapeutics, Inc.(Æ) | 59,911 | 2,086 | LDR Holding Corp.(Æ) | 42,540 | 1,465 | ||
| Adeptus Health, Inc. Class A(Æ) | 33,076 | 1,098 | LifePoint Hospitals, Inc.(Æ) | 44,923 | 3,145 | ||
| Aerie Pharmaceuticals, Inc.(Æ) | 42,548 | 1,073 | Ligand Pharmaceuticals, Inc. Class B(Æ) | 96,752 | 5,348 | ||
| Affymetrix, Inc.(Æ)(Ñ) | 72,656 | 655 | Luminex Corp.(Æ) | 11,800 | 224 | ||
| Akorn, Inc.(Æ) | 64,750 | 2,885 | Magellan Health, Inc.(Æ) | 42,588 | 2,577 | ||
| Albany Molecular Research, Inc.(Æ) | 225,065 | 5,235 | Masimo Corp.(Æ) | 26,980 | 681 | ||
| Alphatec Holdings, Inc.(Æ) | 4,164 | 6 | MEDNAX, Inc.(Æ) | 2,900 | 181 | ||
| AMAG Pharmaceuticals, Inc.(Æ) | 40,285 | 1,330 | Merrimack Pharmaceuticals, Inc.(Æ)(Ñ) | 114,073 | 1,046 | ||
| Amedisys, Inc.(Æ) | 48,038 | 1,254 | MiMedx Group, Inc.(Æ)(Ñ) | 113,122 | 1,152 | ||
| Amicus Therapeutics, Inc.(Æ) | 136,965 | 794 | Molina Healthcare, Inc.(Æ) | 81,506 | 3,964 | ||
| See accompanying notes which are an integral part of the financial statements. | |||||||
| 166 Russell U.S. Small Cap Equity Fund | |||||||
| Russell Investment Company | |||||||
| Russell U.S. Small Cap Equity Fund | |||||||
| Schedule of Investments, continued — October 31, 2014 | |||||||
| Amounts in thousands (except share amounts) | Amounts in thousands (except share amounts) | ||||||
| Principal | Fair | Principal | Fair | ||||
| Amount ($) or | Value | Amount ($) or | Value | ||||
| Shares | $ | Shares | $ | ||||
| Natus Medical, Inc.(Æ) | 206,268 | 7,013 | Cytec Industries, Inc. | 8,660 | 404 | ||
| Nektar Therapeutics(Æ) | 41,800 | 576 | Domtar Corp. | 129,714 | 5,327 | ||
| NeoGenomics, Inc.(Æ) | 178,083 | 1,006 | Eagle Materials, Inc. | 26,584 | 2,324 | ||
| Novadaq Technologies, Inc.(Æ) | 88,620 | 1,384 | Global Brass & Copper Holdings, Inc. | 18,697 | 262 | ||
| Novavax, Inc.(Æ)(Ñ) | 174,604 | 978 | Graphic Packaging Holding Co.(Æ) | 130,870 | 1,587 | ||
| NPS Pharmaceuticals, Inc.(Æ) | 169,007 | 4,631 | Greif, Inc. Class A | 85,324 | 3,759 | ||
| Omeros Corp.(Æ)(Ñ) | 60,921 | 1,010 | Haynes International, Inc. | 54,863 | 2,551 | ||
| Omnicell, Inc.(Æ) | 59,334 | 1,917 | Horsehead Holding Corp.(Æ) | 3,073 | 48 | ||
| OncoGenex Pharmaceutical, Inc.(Æ) | 43,484 | 97 | Innophos Holdings, Inc. | 136,698 | 7,792 | ||
| OraSure Technologies, Inc.(Æ) | 169,689 | 1,519 | Innospec, Inc. | 90,360 | 3,648 | ||
| OvaScience, Inc.(Æ) | 46,403 | 906 | Insteel Industries, Inc. | 50,756 | 1,210 | ||
| Pacira Pharmaceuticals, Inc.(Æ) | 47,925 | 4,448 | Intrepid Potash, Inc.(Æ)(Ñ) | 173,986 | 2,340 | ||
| Pernix Therapeutics Holdings, Inc.(Æ) | 101,927 | 994 | Koppers Holdings, Inc. | 101,879 | 4,022 | ||
| PharMerica Corp.(Æ) | 51,602 | 1,481 | Kraton Performance Polymers, Inc.(Æ) | 13,149 | 235 | ||
| Phibro Animal Health Corp. Class A | 39,707 | 1,029 | Kronos Worldwide, Inc.(Ñ) | 262,314 | 3,526 | ||
| POZEN, Inc.(Æ) | 10,200 | 93 | Minerals Technologies, Inc. | 86,447 | 6,631 | ||
| Prestige Brands Holdings, Inc.(Æ) | 140,239 | 4,967 | MRC Global, Inc.(Æ) | 33,575 | 706 | ||
| Providence Service Corp. (The)(Æ) | 26,219 | 1,158 | NCI Building Systems, Inc.(Æ) | 83,532 | 1,660 | ||
| PTC Therapeutics, Inc.(Æ) | 24,919 | 1,018 | Neenah Paper, Inc. | 4,533 | 277 | ||
| Quintiles Transnational Holdings, Inc.(Æ) | 10,500 | 615 | NewMarket Corp. | 10,928 | 4,240 | ||
| Radius Health, Inc.(Æ)(Ñ) | 45,123 | 831 | NN, Inc. | 38,549 | 964 | ||
| RadNet, Inc.(Æ) | 123,062 | 1,145 | Noranda Aluminum Holding Corp. | 493,378 | 2,176 | ||
| Receptos, Inc.(Æ) | 25,165 | 2,608 | Olympic Steel, Inc. | 4,439 | 89 | ||
| Regulus Therapeutics, Inc.(Æ)(Ñ) | 57,795 | 1,154 | OM Group, Inc. | 182,297 | 4,745 | ||
| Repligen Corp.(Æ) | 46,661 | 1,177 | Patrick Industries, Inc.(Æ) | 21,163 | 904 | ||
| Rigel Pharmaceuticals, Inc.(Æ) | 115,633 | 229 | PGT, Inc.(Æ) | 305,190 | 2,870 | ||
| RTI Surgical, Inc.(Æ) | 1,020,109 | 5,192 | PH Glatfelter Co. | 45,418 | 1,146 | ||
| Sagent Pharmaceuticals, Inc.(Æ) | 75,621 | 2,393 | PolyOne Corp. | 33,653 | 1,246 | ||
| SciClone Pharmaceuticals, Inc.(Æ) | 112,896 | 863 | Quaker Chemical Corp. | 65,874 | 5,407 | ||
| Sientra, Inc.(Æ) | 22,500 | 401 | Reliance Steel & Aluminum Co. | 890 | 60 | ||
| Spectranetics Corp. (The)(Æ) | 62,439 | 1,984 | Resolute Forest Products, Inc.(Æ) | 321,893 | 5,974 | ||
| STAAR Surgical Co.(Æ) | 141,690 | 1,356 | RTI International Metals, Inc.(Æ) | 149,065 | 3,510 | ||
| STERIS Corp. | 94,844 | 5,861 | Schnitzer Steel Industries, Inc. Class A | 133,170 | 3,136 | ||
| Tetraphase Pharmaceuticals, Inc.(Æ) | 45,369 | 1,084 | Sensient Technologies Corp. | 62,726 | 3,712 | ||
| Trinity Biotech PLC - ADR | 169,012 | 2,941 | Silgan Holdings, Inc. | 57,367 | 2,820 | ||
| Triple-S Management Corp. Class B(Æ) | 9,527 | 211 | Simpson Manufacturing Co., Inc. | 111,338 | 3,683 | ||
| US Physical Therapy, Inc. | 81,834 | 3,531 | Sonoco Products Co. | 8,375 | 342 | ||
| VCA, Inc.(Æ) | 84,751 | 3,862 | Stepan Co. | 8,346 | 370 | ||
| West Pharmaceutical Services, Inc. | 88,998 | 4,561 | Trex Co., Inc.(Æ) | 96,091 | 4,132 | ||
| Zeltiq Aesthetics, Inc.(Æ) | 54,907 | 1,408 | Unifi, Inc.(Æ) | 169,232 | 4,733 | ||
| 249,414 | Universal Forest Products, Inc. | 57,465 | 2,872 | ||||
| US Silica Holdings, Inc.(Ñ) | 33,907 | 1,522 | |||||
| Materials and Processing - 6.2% | Watsco, Inc. | 27,092 | 2,753 | ||||
| A Schulman, Inc. | 50,598 | 1,792 | Worthington Industries, Inc. | 26,955 | 1,042 | ||
| Acuity Brands, Inc. | 35,217 | 4,910 | 151,977 | ||||
| Apogee Enterprises, Inc. | 162,427 | 7,131 | |||||
| AptarGroup, Inc. | 6,600 | 411 | Producer Durables - 16.7% | ||||
| Ashland, Inc. | 342 | 37 | ABM Industries, Inc. | 214,026 | 5,916 | ||
| Axiall Corp. | 8,479 | 342 | Accuride Corp.(Æ) | 473,387 | 2,282 | ||
| Belden, Inc. | 9,333 | 664 | Actuant Corp. Class A | 90,444 | 2,866 | ||
| Berry Plastics Group, Inc.(Æ) | 122,090 | 3,177 | Advisory Board Co. (The)(Æ) | 4,437 | 238 | ||
| Boise Cascade Co.(Æ) | 11,305 | 408 | Aerovironment, Inc.(Æ) | 4,905 | 150 | ||
| Cabot Corp. | 79,361 | 3,685 | AGCO Corp. | 4,659 | 206 | ||
| Caesarstone Sdot-Yam, Ltd. | 49,386 | 2,759 | Air Lease Corp. Class A | 24,604 | 900 | ||
| Calgon Carbon Corp.(Æ) | 214,699 | 4,515 | Air Transport Services Group, Inc.(Æ) | 9,606 | 79 | ||
| Carpenter Technology Corp. | 51,511 | 2,578 | Aircastle, Ltd. | 4,388 | 84 | ||
| Comfort Systems USA, Inc. | 85,880 | 1,319 | Albany International Corp. Class A | 1,914 | 72 | ||
| Commercial Metals Co. | 125,562 | 2,171 | Allegiant Travel Co. Class A | 6,214 | 829 | ||
| Compass Minerals International, Inc. | 38,757 | 3,321 | Altra Industrial Motion Corp. | 224,140 | 7,065 | ||
| See accompanying notes which are an integral part of the financial statements. | |||||||
| Russell U.S. Small Cap Equity Fund 167 | |||||||
Russell Investment Company Russell U.S. Small Cap Equity Fund
Schedule of Investments, continued — October 31, 2014
| Amounts in thousands (except share amounts) | Amounts in thousands (except share amounts) | ||||||
| Principal | Fair | Principal | Fair | ||||
| Amount ($) or | Value | Amount ($) or | Value | ||||
| Shares | $ | Shares | $ | ||||
| American Superconductor Corp.(Æ)(Ñ) | 13,600 | 18 | Herman Miller, Inc. | 260,977 | 8,351 | ||
| AO Smith Corp. | 6,782 | 362 | Hub Group, Inc. Class A(Æ) | 7,245 | 263 | ||
| Applied Industrial Technologies, Inc. | 24,991 | 1,220 | Huntington Ingalls Industries, Inc. | 800 | 85 | ||
| ArcBest Corp. | 99,018 | 3,832 | Huron Consulting Group, Inc.(Æ) | 83,644 | 5,822 | ||
| Ardmore Shipping Corp.(Ñ) | 415,346 | 4,207 | InnerWorkings, Inc.(Æ) | 38,214 | 347 | ||
| Argan, Inc. | 25,824 | 899 | Itron, Inc.(Æ) | 46,916 | 1,826 | ||
| Astec Industries, Inc. | 191,729 | 7,268 | Kadant, Inc. | 17,759 | 734 | ||
| Astronics Corp.(Æ) | 23,912 | 1,239 | Kaman Corp. Class A | 59,898 | 2,579 | ||
| Babcock & Wilcox Co. (The) | 7,600 | 217 | Kelly Services, Inc. Class A(Æ) | 2,308 | 41 | ||
| Baltic Trading, Ltd.(Ñ) | 210,178 | 788 | Knight Transportation, Inc. | 388,363 | 11,364 | ||
| Barnes Group, Inc. | 122,744 | 4,488 | Knoll, Inc. | 378,594 | 7,530 | ||
| Barrett Business Services, Inc. | 6,047 | 142 | Layne Christensen Co.(Æ) | 12,362 | 89 | ||
| Blount International, Inc.(Æ) | 328,536 | 5,030 | Lexmark International, Inc. Class A | 50,704 | 2,188 | ||
| Brady Corp. Class A | 71,582 | 1,707 | Lindsay Corp.(Ñ) | 36,679 | 3,217 | ||
| Briggs & Stratton Corp. | 408,193 | 8,250 | Littelfuse, Inc. | 44,816 | 4,371 | ||
| Bristow Group, Inc. | 95,615 | 7,066 | Lydall, Inc.(Æ) | 44,644 | 1,381 | ||
| CAI International, Inc.(Æ) | 20,959 | 441 | Manitowoc Co., Inc. (The) | 32,207 | 671 | ||
| CBIZ, Inc.(Æ) | 616,763 | 5,693 | Manpowergroup, Inc. | 11,173 | 746 | ||
| Chart Industries, Inc.(Æ) | 29,716 | 1,383 | Marten Transport, Ltd. | 14,181 | 278 | ||
| CIRCOR International, Inc. | 732 | 55 | Matson, Inc. | 28,684 | 817 | ||
| Clarcor, Inc. | 155,175 | 10,391 | MAXIMUS, Inc. | 183,555 | 8,895 | ||
| Columbus McKinnon Corp. | 2,688 | 76 | McGrath RentCorp | 63,452 | 2,318 | ||
| Commercial Vehicle Group, Inc.(Æ) | 284,916 | 1,866 | Modine Manufacturing Co.(Æ) | 57,495 | 738 | ||
| Convergys Corp. | 111,083 | 2,241 | Multi-Color Corp. | 27,789 | 1,370 | ||
| Corporate Executive Board Co. (The) | 69,526 | 5,124 | MYR Group, Inc.(Æ) | 37,286 | 967 | ||
| CoStar Group, Inc.(Æ) | 11,906 | 1,918 | Navistar International Corp.(Æ)(Ñ) | 2,600 | 92 | ||
| Covenant Transportation Group, Inc. Class | Old Dominion Freight Line, Inc.(Æ) | 88,906 | 6,479 | ||||
| A(Æ) | 3,182 | 66 | On Assignment, Inc.(Æ) | 134,706 | 3,920 | ||
| CPI Aerostructures, Inc.(Æ) | 88,638 | 847 | Park-Ohio Holdings Corp. | 1,698 | 90 | ||
| CTPartners Executive Search, Inc.(Æ) | 57,047 | 1,041 | Patriot Transportation Holding, Inc.(Æ) | 14,000 | 593 | ||
| Deluxe Corp. | 21,515 | 1,308 | PHH Corp.(Æ)(Ñ) | 5,519 | 131 | ||
| Dice Holdings, Inc.(Æ) | 527,524 | 5,259 | Powell Industries, Inc. | 65,252 | 2,971 | ||
| Ducommun, Inc.(Æ) | 4,361 | 115 | Proto Labs, Inc.(Æ)(Ñ) | 86,364 | 5,646 | ||
| Echo Global Logistics, Inc.(Æ) | 152,870 | 3,995 | Quad/Graphics, Inc. | 48,207 | 1,063 | ||
| EMCOR Group, Inc. | 66,929 | 2,954 | Quality Distribution, Inc.(Æ) | 93,213 | 1,208 | ||
| Engility Holdings, Inc.(Æ) | 26,239 | 1,134 | Regal-Beloit Corp. | 81,444 | 5,780 | ||
| Ennis, Inc. | 26,157 | 388 | Resources Connection, Inc. | 254,835 | 3,942 | ||
| EnPro Industries, Inc.(Æ) | 70,593 | 4,555 | Roadrunner Transportation Systems, Inc.(Æ) | 237,074 | 4,886 | ||
| ESCO Technologies, Inc. | 132,102 | 5,023 | RPX Corp. Class A(Æ) | 14,100 | 198 | ||
| Exponent, Inc. | 58,279 | 4,652 | Rush Enterprises, Inc. Class A(Æ) | 118,965 | 4,533 | ||
| Forward Air Corp. | 109,553 | 5,244 | SkyWest, Inc. | 511,535 | 5,893 | ||
| Franklin Electric Co., Inc. | 51,761 | 1,933 | Spartan Motors, Inc. | 20,229 | 115 | ||
| FreightCar America, Inc. | 39,558 | 1,304 | SPX Corp. | 727 | 69 | ||
| G&K Services, Inc. Class A | 133,570 | 8,424 | Standex International Corp. | 17,002 | 1,466 | ||
| GATX Corp. | 82,473 | 5,229 | Steelcase, Inc. Class A | 259,390 | 4,596 | ||
| General Cable Corp. | 9,715 | 138 | SunOpta, Inc.(Æ) | 265,157 | 3,755 | ||
| Genesee & Wyoming, Inc. Class A(Æ) | 26,112 | 2,512 | Swift Transportation Co. Class A(Æ) | 168,877 | 4,171 | ||
| Global Power Equipment Group, Inc. | 1,404 | 19 | Sykes Enterprises, Inc.(Æ) | 263,308 | 5,672 | ||
| GrafTech International, Ltd.(Æ)(Ñ) | 606,155 | 2,600 | Taser International, Inc.(Æ)(Ñ) | 249,995 | 4,710 | ||
| Granite Construction, Inc. | 477,391 | 17,621 | Teledyne Technologies, Inc.(Æ) | 55,129 | 5,713 | ||
| Greenbrier Cos., Inc.(Ñ) | 60,617 | 3,791 | TeleTech Holdings, Inc.(Æ) | 29,883 | 771 | ||
| Gulfmark Offshore, Inc. Class A | 240,878 | 7,265 | Tennant Co. | 5,169 | 381 | ||
| H&E Equipment Services, Inc. | 160,902 | 6,016 | Terex Corp. | 1,800 | 52 | ||
| Hardinge, Inc. | 12,741 | 143 | Textainer Group Holdings, Ltd. | 7,870 | 271 | ||
| Harsco Corp. | 427,497 | 9,268 | Thermon Group Holdings, Inc.(Æ) | 191,618 | 4,670 | ||
| Hawaiian Holdings, Inc.(Æ)(Ñ) | 163,684 | 2,838 | Tidewater, Inc.(Ñ) | 69,951 | 2,579 | ||
| Healthcare Services Group, Inc. | 170,071 | 5,065 | Titan International, Inc.(Ñ) | 131,583 | 1,390 | ||
| Heico Corp. Class A | 58,835 | 2,692 | Toro Co. (The) | 16,094 | 993 | ||
| HEICO Corp. | 50,680 | 2,749 | TriMas Corp.(Æ) | 135,339 | 4,285 | ||
See accompanying notes which are an integral part of the financial statements.
168 Russell U.S. Small Cap Equity Fund
Russell Investment Company Russell U.S. Small Cap Equity Fund
Schedule of Investments, continued — October 31, 2014
| Amounts in thousands (except share amounts) | Amounts in thousands (except share amounts) | ||||||
| Principal | Fair | Principal | Fair | ||||
| Amount ($) or | Value | Amount ($) or | Value | ||||
| Shares | $ | Shares | $ | ||||
| TrueBlue, Inc.(Æ) | 1,421 | 35 | Emulex Corp.(Æ) | 70,500 | 399 | ||
| Tsakos Energy Navigation, Ltd. | 175,381 | 1,187 | Entegris, Inc.(Æ) | 231,261 | 3,141 | ||
| Tutor Perini Corp.(Æ) | 80,381 | 2,251 | Envestnet, Inc.(Æ) | 69,562 | 3,090 | ||
| Twin Disc, Inc. | 2,703 | 70 | EPAM Systems, Inc.(Æ) | 110,311 | 5,266 | ||
| UniFirst Corp. | 610 | 68 | ePlus, Inc.(Æ) | 798 | 49 | ||
| United Rentals, Inc.(Æ) | 31,931 | 3,514 | Fabrinet(Æ) | 225,672 | 4,109 | ||
| United Stationers, Inc. | 62,270 | 2,601 | Fairchild Semiconductor International, Inc. | ||||
| US Ecology, Inc. | 28,355 | 1,426 | Class A(Æ) | 11,412 | 175 | ||
| Wabtec Corp. | 75,581 | 6,523 | FEI Co. | 1,092 | 92 | ||
| WageWorks, Inc.(Æ) | 170,696 | 9,731 | FormFactor, Inc.(Æ) | 981,921 | 7,826 | ||
| Watts Water Technologies, Inc. Class A | 8,576 | 520 | GSI Group, Inc.(Æ) | 1,847 | 24 | ||
| Woodward, Inc. | 23,941 | 1,226 | Guidewire Software, Inc.(Æ) | 69,286 | 3,460 | ||
| Zebra Technologies Corp. Class A(Æ) | 71,530 | 5,275 | Harmonic, Inc.(Æ) | 150,615 | 1,005 | ||
| 407,295 | IAC/InterActiveCorp | 29,707 | 2,011 | ||||
| Imperva, Inc.(Æ) | 46,043 | 1,886 | |||||
| Technology - 12.6% | Infinera Corp.(Æ)(Ñ) | 236,722 | 3,440 | ||||
| Acacia Research Corp.(Ñ) | 258,775 | 4,658 | Ingram Micro, Inc. Class A(Æ) | 18,344 | 492 | ||
| ACI Worldwide, Inc.(Æ) | 119,710 | 2,303 | Inphi Corp.(Æ) | 54,693 | 847 | ||
| Acxiom Corp.(Æ) | 189,338 | 3,567 | Insight Enterprises, Inc.(Æ) | 63,068 | 1,435 | ||
| ADTRAN, Inc. | 238,193 | 5,052 | Integrated Silicon Solution, Inc. | 6,000 | 81 | ||
| Allot Communications, Ltd.(Æ)(Ñ) | 127,999 | 1,462 | InterDigital, Inc. | 54,310 | 2,685 | ||
| Ambarella, Inc.(Æ)(Ñ) | 42,490 | 1,882 | Intralinks Holdings, Inc.(Æ) | 10,639 | 92 | ||
| American Software, Inc. Class A(Æ) | 4,081 | 39 | Kulicke & Soffa Industries, Inc.(Æ) | 547,084 | 7,889 | ||
| Anixter International, Inc. | 53,048 | 4,518 | Lattice Semiconductor Corp.(Æ) | 21,932 | 147 | ||
| Applied Optoelectronics, Inc.(Æ) | 87,910 | 1,419 | Limelight Networks, Inc.(Æ) | 152,416 | 372 | ||
| ARC Document Solutions, Inc.(Æ) | 141,549 | 1,437 | LivePerson, Inc.(Æ) | 91,600 | 1,319 | ||
| Aruba Networks, Inc.(Æ) | 127,977 | 2,762 | LogMeIn, Inc.(Æ) | 22,533 | 1,083 | ||
| Aspen Technology, Inc.(Æ) | 67,635 | 2,498 | Mandalay Digital Group, Inc.(Æ)(Ñ) | 184,842 | 708 | ||
| Atmel Corp.(Æ) | 150,853 | 1,119 | Manhattan Associates, Inc.(Æ) | 3,362 | 135 | ||
| Attunity, Ltd.(Æ) | 105,448 | 943 | ManTech International Corp. Class A | 17,626 | 496 | ||
| Bel Fuse, Inc. Class B | 39,756 | 1,125 | Marketo, Inc.(Æ)(Ñ) | 103,509 | 3,340 | ||
| Benchmark Electronics, Inc.(Æ) | 101,715 | 2,413 | Mentor Graphics Corp. | 89,484 | 1,896 | ||
| Blackbaud, Inc. | 86,272 | 3,839 | Mercury Systems, Inc.(Æ) | 263,899 | 3,689 | ||
| Brocade Communications Systems, Inc. | 84,432 | 906 | Methode Electronics, Inc. | 28,496 | 1,122 | ||
| CACI International, Inc. Class A(Æ) | 46,165 | 3,799 | Micrel, Inc. | 428,999 | 5,208 | ||
| Calix, Inc.(Æ) | 185,405 | 2,004 | MKS Instruments, Inc. | 8,687 | 316 | ||
| Callidus Software, Inc.(Æ) | 134,839 | 1,900 | Monotype Imaging Holdings, Inc. | 385,422 | 11,027 | ||
| Cavium, Inc.(Æ) | 52,697 | 2,704 | NetScout Systems, Inc.(Æ) | 30,330 | 1,118 | ||
| CEVA, Inc.(Æ) | 3,908 | 64 | Newport Corp.(Æ) | 5,003 | 90 | ||
| Checkpoint Systems, Inc.(Æ) | 289,667 | 3,841 | NIC, Inc. | 12,159 | 224 | ||
| Ciber, Inc.(Æ) | 34,943 | 114 | Nimble Storage, Inc.(Æ)(Ñ) | 63,149 | 1,728 | ||
| Cohu, Inc. | 15,556 | 159 | NVE Corp.(Æ) | 14,273 | 1,023 | ||
| Cohu, Inc.(Å) | 187,270 | 1,910 | Oclaro, Inc.(Æ) | 39,520 | 62 | ||
| Computer Task Group, Inc. | 27,000 | 238 | Oplink Communications, Inc. | 165,612 | 3,453 | ||
| Comtech Telecommunications Corp. | 34,243 | 1,304 | Palo Alto Networks, Inc.(Æ) | 4,600 | 486 | ||
| CSG Systems International, Inc. | 32,434 | 860 | Park Electrochemical Corp. | 122,663 | 3,165 | ||
| Daktronics, Inc. | 30,075 | 400 | Paycom Software, Inc.(Æ) | 60,999 | 1,083 | ||
| Datalink Corp.(Æ) | 1,917 | 24 | PC Connection, Inc. | 36,113 | 861 | ||
| Dealertrack Technologies, Inc.(Æ) | 37,077 | 1,744 | PDF Solutions, Inc.(Æ) | 361,669 | 4,691 | ||
| Demand Media, Inc.(Æ) | 56,115 | 395 | Perficient, Inc.(Æ) | 227,907 | 3,779 | ||
| Demandware, Inc.(Æ) | 57,264 | 3,433 | Photronics, Inc.(Æ) | 731,641 | 6,577 | ||
| Diebold, Inc. | 151,860 | 5,380 | Plexus Corp.(Æ) | 259,292 | 10,722 | ||
| Digimarc Corp. | 24,900 | 722 | PMC Sierra, Inc.(Æ) | 239,000 | 1,862 | ||
| Digital River, Inc.(Æ) | 6,318 | 162 | Polycom, Inc.(Æ) | 244,654 | 3,200 | ||
| Diodes, Inc.(Æ) | 124,400 | 3,213 | Progress Software Corp.(Æ) | 429,875 | 11,134 | ||
| Dolby Laboratories, Inc. Class A | 10,500 | 440 | Proofpoint, Inc.(Æ) | 262,880 | 11,577 | ||
| DTS, Inc.(Æ) | 65,745 | 1,958 | PROS Holdings, Inc.(Æ) | 25,866 | 724 | ||
| Electro Scientific Industries, Inc. | 607,362 | 4,312 | QLogic Corp.(Æ) | 112,723 | 1,331 | ||
| Ellie Mae, Inc.(Æ) | 50,687 | 1,945 | Qualys, Inc.(Æ) | 194,446 | 6,238 | ||
See accompanying notes which are an integral part of the financial statements.
Russell U.S. Small Cap Equity Fund 169
Russell Investment Company Russell U.S. Small Cap Equity Fund
Schedule of Investments, continued — October 31, 2014
| Amounts in thousands (except share amounts) | Amounts in thousands (except share amounts) | |||||||||
| Principal | Fair | Principal | Fair | |||||||
| Amount ($) or | Value | Amount ($) or | Value | |||||||
| Shares | $ | Shares | $ | |||||||
| Quantum Corp.(Æ) | 326,886 | 418 | j2 Global, Inc. | 146,497 | 7,924 | |||||
| Radware, Ltd.(Æ) | 72,718 | 1,381 | Laclede Group, Inc. (The) | 50,600 | 2,569 | |||||
| Rally Software Development Corp.(Æ)(Ñ) | 88,968 | 909 | Magellan Petroleum Corp.(Æ)(Ñ) | 684,716 | 1,233 | |||||
| Rambus, Inc.(Æ) | 134,355 | 1,538 | MGE Energy, Inc. | 9,196 | 409 | |||||
| Rightside Group, Ltd.(Æ) | 3,686 | 35 | New Jersey Resources Corp. | 15,935 | 932 | |||||
| Rubicon Project, Inc. (The)(Æ) | 40,983 | 470 | NorthWestern Corp. | 113,453 | 5,995 | |||||
| Rudolph Technologies, Inc.(Æ) | 7,232 | 63 | NRG Yield, Inc. Class A | 104,861 | 5,240 | |||||
| Saba Software, Inc.(Æ) | 240,421 | 3,222 | Orbcomm, Inc.(Æ) | 132,284 | 836 | |||||
| Sanmina Corp.(Æ) | 47,690 | 1,196 | Phillips 66 Partners, LP(Ñ) | 67,762 | 4,722 | |||||
| ServiceNow, Inc.(Æ) | 47,636 | 3,236 | Piedmont Natural Gas Co., Inc.(Ñ) | 35,174 | 1,337 | |||||
| ShoreTel, Inc.(Æ) | 122,071 | 988 | PNM Resources, Inc. | 39,815 | 1,149 | |||||
| Sigma Designs, Inc.(Æ) | 53,783 | 215 | Portland General Electric Co. | 21,460 | 781 | |||||
| Silicon Graphics International Corp.(Æ) | 306,850 | 2,663 | Premiere Global Services, Inc.(Æ) | 524,959 | 5,496 | |||||
| Silicon Image, Inc.(Æ) | 141,007 | 756 | Pure Cycle Corp.(Æ)(Ñ) | 289,414 | 1,736 | |||||
| Sonus Networks, Inc.(Æ) | 48,800 | 169 | Shenandoah Telecommunications Co. | 3,295 | 98 | |||||
| Spansion, Inc. Class A(Æ) | 79,896 | 1,644 | Southwest Gas Corp. | 51,212 | 2,975 | |||||
| SPS Commerce, Inc.(Æ) | 96,807 | 5,644 | UIL Holdings Corp. | 17,348 | 714 | |||||
| Super Micro Computer, Inc.(Æ) | 55,318 | 1,768 | Unitil Corp. | 4,918 | 171 | |||||
| Synaptics, Inc.(Æ) | 5,100 | 349 | Vonage Holdings Corp.(Æ) | 31,752 | 111 | |||||
| Synopsys, Inc.(Æ) | 42,913 | 1,759 | WGL Holdings, Inc. | 1,005 | 47 | |||||
| Syntel, Inc.(Æ) | 14,019 | 1,214 | York Water Co. | 1,704 | 37 | |||||
| Tableau Software, Inc. Class A(Æ) | 26,870 | 2,219 | 80,585 | |||||||
| Take-Two Interactive Software, Inc.(Æ) | 3,491 | 92 | ||||||||
| Tangoe, Inc.(Æ) | 176,440 | 2,588 | Total Common Stocks | |||||||
| TechTarget, Inc.(Æ) | 104,700 | 999 | (cost $2,049,971) | 2,302,539 | ||||||
| TeleNav, Inc.(Æ) | 225,361 | 1,627 | ||||||||
| Teradyne, Inc. | 48,376 | 890 | Warrants & Rights - 0.0% | |||||||
| Tessera Technologies, Inc. | 59,856 | 1,819 | Magnum Hunter Resources Corp.(Æ) | |||||||
| Tyler Technologies, Inc.(Æ) | 12,003 | 1,343 | 2015 Warrant | 26,846 | — | |||||
| Ultimate Software Group, Inc.(Æ) | 33,977 | 5,114 | Total Warrants & Rights | |||||||
| Unisys Corp.(Æ) | 2,900 | 74 | (cost $0) | — | ||||||
| United Online, Inc. | 26,744 | 300 | ||||||||
| VASCO Data Security International, Inc.(Æ) | 66,640 | 1,687 | Short-Term Investments - 5.1% | |||||||
| Russell U.S. Cash Management Fund | 123,076,671(8) | 123,077 | ||||||||
| VeriFone Systems, Inc.(Æ) | 141,541 | 5,274 | Total Short-Term Investments | |||||||
| Verint Systems, Inc.(Æ) | 25,616 | 1,473 | (cost $123,077) | |||||||
| Vishay Intertechnology, Inc. | 253,714 | 3,428 | 123,077 | |||||||
| Xcerra Corp.(Æ) | 694,874 | 5,899 | Other Securities - 6.1% | |||||||
| Yelp, Inc. Class A(Æ) | 34,334 | 2,060 | Russell U.S. Cash Collateral Fund(×) | 150,104,409(8) | 150,104 | |||||
| Zynga, Inc. Class A(Æ) | 130,900 | 334 | Total Other Securities | |||||||
| 307,304 | (cost $150,104) | 150,104 | ||||||||
| Utilities - 3.3% | Total Investments 105.4% | |||||||||
| Advantage Oil & Gas, Ltd.(Æ) | 988,434 | 4,221 | ||||||||
| Alaska Communications Systems Group, Inc. | (identified cost $2,323,152) | 2,575,720 | ||||||||
| (Æ) | 38,400 | 52 | Other Assets and Liabilities, Net | |||||||
| ALLETE, Inc. | 1,020 | 53 | -(5.4%) | (131,768 | ) | |||||
| American States Water Co. | 154,276 | 5,520 | Net Assets - 100.0% | 2,443,952 | ||||||
| Artesian Resources Corp. Class A | 2,746 | 61 | ||||||||
| Avista Corp. | 87,896 | 3,116 | ||||||||
| Black Hills Corp. | 63,478 | 3,474 | ||||||||
| Boingo Wireless, Inc.(Æ) | 179,063 | 1,255 | ||||||||
| California Water Service Group | 59,344 | 1,545 | ||||||||
| Chesapeake Utilities Corp. | 700 | 34 | ||||||||
| Cleco Corp. | 106,722 | 5,737 | ||||||||
| El Paso Electric Co. | 99,930 | 3,781 | ||||||||
| FairPoint Communications, Inc.(Æ)(Ñ) | 159,900 | 2,654 | ||||||||
| Genesis Energy, LP(Ñ) | 76,299 | 3,661 | ||||||||
| IDT Corp. Class B | 21,466 | 354 | ||||||||
| Intelsat SA(Æ) | 28,517 | 555 | ||||||||
See accompanying notes which are an integral part of the financial statements.
170 Russell U.S. Small Cap Equity Fund
| Russell Investment Company | |||||||||||||||||
| Russell U.S. Small Cap Equity Fund | |||||||||||||||||
| Schedule of Investments, continued — October 31, 2014 | |||||||||||||||||
| Restricted Securities | |||||||||||||||||
| Amounts in thousands (except share and cost per unit amounts) | |||||||||||||||||
| Principal | Cost per | Cost | Fair Value | ||||||||||||||
| % of Net Assets | Acquisition | Amount ($) | Unit | (000 | ) | (000 | ) | ||||||||||
| Securities | Date | or shares | $ | $ | $ | ||||||||||||
| 0.2% | |||||||||||||||||
| Cohu, Inc. | 03/11/08 | 187,270 | 11.04 | 2,068 | 1,910 | ||||||||||||
| Diamond Hill Investment Group, Inc. | 12/12/11 | 21,827 | 78.72 | 1,718 | 2,925 | ||||||||||||
| 4,835 | |||||||||||||||||
| For a description of restricted securities see note 9 in the Notes to Financial Statements. | |||||||||||||||||
| Futures Contracts | |||||||||||||||||
| Amounts in thousands (except contract amounts) | |||||||||||||||||
| Unrealized | |||||||||||||||||
| Appreciation | |||||||||||||||||
| Number of | Notional | Expiration | (Depreciation) | ||||||||||||||
| Contracts | Amount | Date | $ | ||||||||||||||
| Long Positions | |||||||||||||||||
| Russell 2000 Mini Index Futures | 1,143 | USD | 133,845 | 12/14 | 1,113 | ||||||||||||
| Total Unrealized Appreciation (Depreciation) on Open Futures Contracts (å) | 1,113 | ||||||||||||||||
| Presentation of Portfolio Holdings | |||||||||||||||||
| Amounts in thousands | |||||||||||||||||
| Fair Value | |||||||||||||||||
| Portfolio Summary | Level 1 | Level 2 | Level 3 | Total | % of Net Assets | ||||||||||||
| Common Stocks | |||||||||||||||||
| Consumer Discretionary | $ | 345,617 | $ | — | $ | — | $ | 345,617 | 14.1 | ||||||||
| Consumer Staples | 102,940 | — | — | 102,940 | 4.2 | ||||||||||||
| Energy | 98,372 | — | — | 98,372 | 4.0 | ||||||||||||
| Financial Services | 559,035 | — | — | 559,035 | 22.9 | ||||||||||||
| Health Care | 249,414 | — | — | 249,414 | 10.2 | ||||||||||||
| Materials and Processing | 151,977 | — | — | 151,977 | 6.2 | ||||||||||||
| Producer Durables | 407,295 | — | — | 407,295 | 16.7 | ||||||||||||
| Technology | 307,304 | — | — | 307,304 | 12.6 | ||||||||||||
| Utilities | 80,585 | — | — | 80,585 | 3.3 | ||||||||||||
| Warrants & Rights | — | — | — | — | — | ||||||||||||
| Short-Term Investments | — | 123,077 | — | 123,077 | 5.1 | ||||||||||||
| Other Securities | — | 150,104 | — | 150,104 | 6.1 | ||||||||||||
| Total Investments | 2,302,539 | 273,181 | — | 2,575,720 | 105.4 | ||||||||||||
| Other Assets and Liabilities, Net | (5.4 | ) | |||||||||||||||
| 100.0 | |||||||||||||||||
| Other Financial Instruments | |||||||||||||||||
| Futures Contracts | 1,113 | — | — | 1,113 | —* | ||||||||||||
| Total Other Financial Instruments** | $ | 1,113 | $ | — | $ | — | $ | 1,113 | |||||||||
| * | Less than .05% of net assets. |
| ** | Futures and foreign currency exchange contract values reflect the unrealized appreciation (depreciation) on the instruments. |
For a description of the Levels see note 2 in the Notes to Financial Statements.
For disclosure on transfers between Levels 1, 2 and 3 during the period ended October 31, 2014, see note 2 in the Notes to Financial Statements.
See accompanying notes which are an integral part of the financial statements.
Russell U.S. Small Cap Equity Fund 171
| Russell Investment Company | ||||
| Russell U.S. Small Cap Equity Fund | ||||
| Fair Value of Derivative Instruments — October 31, 2014 | ||||
| Amounts in thousands | ||||
| Equity | ||||
| Derivatives not accounted for as hedging instruments | Contracts | |||
| Location: Statement of Assets and Liabilities - Assets | ||||
| Variation margin on futures contracts* | $ | 1,113 | ||
| Location: Statement of Assets and Liabilities - Liabilities | ||||
| Equity | ||||
| Derivatives not accounted for as hedging instruments | Contracts | |||
| Location: Statement of Operations - Net realized gain (loss) | ||||
| Futures contracts | $ | 9,364 | ||
| Location: Statement of Operations - Net change in unrealized appreciation (depreciation) | ||||
| Futures contracts | $ | (681 | ) | |
| * | Includes cumulative appreciation/depreciation of futures contracts as reported in the Schedule of Investments. Only variation margin is reported within the | |||
| Statement of Assets and Liabilities. | ||||
| For further disclosure on derivatives see note 2 in the Notes to Financial Statements. | ||||
See accompanying notes which are an integral part of the financial statements.
172 Russell U.S. Small Cap Equity Fund
Russell Investment Company Russell U.S. Small Cap Equity Fund
Balance Sheet Offsetting of Financial and Derivative Instruments — October 31, 2014
| Amounts in thousands | ||||||||
| Offsetting of Financial Assets and Derivative Assets | ||||||||
| Gross | Net Amounts | |||||||
| Amounts | of Assets | |||||||
| Gross | Offset in the | Presented in | ||||||
| Amounts of | Statement of | the Statement | ||||||
| Recognized | Assets and | of Assets and | ||||||
| Description | Location: Statement of Assets and Liabilities - Assets | Assets | Liabilities | Liabilities | ||||
| Securities on Loan* | Investments, at fair value | $ | 142,610 | $ — | $ | 142,610 | ||
| Futures Contracts | Variation margin on futures contracts | 1,966 | — | 1,966 | ||||
| Total | $ | 144,576 | $ — | $ | 144,576 | |||
| Financial Assets, Derivative Assets, and Collateral Held by Counterparty | ||||||||||
| Gross Amounts Not Offset in | ||||||||||
| the Statement of Assets and | ||||||||||
| Liabilities | ||||||||||
| Net Amounts | ||||||||||
| of Assets | ||||||||||
| Presented in | ||||||||||
| the Statement | Financial and | |||||||||
| of Assets and | Derivative | Collateral | ||||||||
| Counterparty | Liabilities | Instruments | Received^ | Net Amount | ||||||
| Barclays | $ | 35,356 | $ | — $ | 35,356 | $ | — | |||
| Citigroup | 15,231 | — | 15,231 | — | ||||||
| Credit Suisse | 12,647 | — | 12,647 | — | ||||||
| Deutsche Bank | 16,352 | — | 16,352 | — | ||||||
| Fidelity | 8,656 | — | 8,656 | — | ||||||
| Goldman Sachs | 10,025 | — | 10,025 | — | ||||||
| ING | 4,597 | — | 4,597 | — | ||||||
| JPMorgan Chase | 18,973 | — | 18,973 | — | ||||||
| Merrill Lynch | 3,191 | — | 1,225 | 1,966 | ||||||
| Morgan Stanley | 16,259 | — | 16,259 | — | ||||||
| UBS | 3,289 | — | 3,289 | — | ||||||
| Total | $ | 144,576 | $ | — $ | 142,610 | $ | 1,966 | |||
* Fair value of securities on loan as reported in the footnotes to the Statement of Assets and Liabilities.
^ Collateral received or pledged amounts may not reconcile to those disclosed in the Statement of Assets and Liabilities due to the inclusion of off-Balance Sheet collateral and adjustments made to exclude overcollateralization.
For further disclosure on derivatives and counterparty risk see note 2 in the Notes to Financial Statements.
See accompanying notes which are an integral part of the financial statements.
Russell U.S. Small Cap Equity Fund 173
| Russell Investment Company | ||
| Russell U.S. Small Cap Equity Fund | ||
| Statement of Assets and Liabilities — October 31, 2014 | ||
| Amounts in thousands | ||
| Assets | ||
| Investments, at identified cost | $ | 2,323,152 |
| Investments, at fair value(*)(>) | 2,575,720 | |
| Cash | 24 | |
| Cash (restricted)(a) | 10,420 | |
| Foreign currency holdings(^) | 989 | |
| Receivables: | ||
| Dividends and interest | 1,253 | |
| Dividends from affiliated Russell funds | 15 | |
| Investments sold | 24,834 | |
| Fund shares sold | 2,567 | |
| Variation margin on futures contracts | 1,966 | |
| Prepaid expenses | 5 | |
| Total assets | 2,617,793 | |
| Liabilities | ||
| Payables: | ||
| Investments purchased | 18,279 | |
| Fund shares redeemed | 3,446 | |
| Accrued fees to affiliates | 1,769 | |
| Other accrued expenses | 243 | |
| Payable upon return of securities loaned | 150,104 | |
| Total liabilities | 173,841 | |
| Net Assets | $ | 2,443,952 |
See accompanying notes which are an integral part of the financial statements.
174 Russell U.S. Small Cap Equity Fund
| Russell Investment Company | |||
| Russell U.S. Small Cap Equity Fund | |||
| Statement of Assets and Liabilities, continued — October 31, 2014 | |||
| Amounts in thousands | |||
| Net Assets Consist of: | |||
| Undistributed (overdistributed) net investment income | $ | 5,529 | |
| Accumulated net realized gain (loss) | 134,921 | ||
| Unrealized appreciation (depreciation) on: | |||
| Investments | 252,568 | ||
| Futures contracts | 1,113 | ||
| Foreign currency-related transactions | (144 | ) | |
| Shares of beneficial interest | 784 | ||
| Additional paid-in capital | 2,049,181 | ||
| Net Assets | $ | 2,443,952 | |
| Net Asset Value, offering and redemption price per share: | |||
| Net asset value per share: Class A(#) | $ | 30.93 | |
| Maximum offering price per share (Net asset value plus sales charge of 5.75%): Class A | $ | 32.82 | |
| Class A — Net assets | $ | 25,406,217 | |
| Class A — Shares outstanding ($.01 par value) | 821,542 | ||
| Net asset value per share: Class C(#) | $ | 29.89 | |
| Class C — Net assets | $ | 33,003,277 | |
| Class C — Shares outstanding ($.01 par value) | 1,104,082 | ||
| Net asset value per share: Class E(#) | $ | 31.03 | |
| Class E — Net assets | $ | 42,588,230 | |
| Class E — Shares outstanding ($.01 par value) | 1,372,377 | ||
| Net asset value per share: Class I(#) | $ | 31.33 | |
| Class I — Net assets | $ | 192,130,967 | |
| Class I — Shares outstanding ($.01 par value) | 6,132,057 | ||
| Net asset value per share: Class S(#) | $ | 31.19 | |
| Class S — Net assets | $ 1,512,046,319 | ||
| Class S — Shares outstanding ($.01 par value) | 48,483,742 | ||
| Net asset value per share: Class Y(#) | $ | 31.24 | |
| Class Y — Net assets | $ | 638,777,394 | |
| Class Y — Shares outstanding ($.01 par value) | 20,450,684 | ||
| Amounts in thousands | |||
| (^) Foreign currency holdings - cost | $ | 1,133 | |
| (*) Securities on loan included in investments | $ | 142,610 | |
| (>) Investments in affiliates, Russell U.S. Cash Management Fund and Russell U.S. Cash Collateral Fund | $ | 273,181 | |
| (a) Cash Collateral for Futures | $ | 10,420 | |
| (#) Net asset value per share equals class level net assets divided by class level shares of beneficial interest outstanding. | |||
See accompanying notes which are an integral part of the financial statements.
Russell U.S. Small Cap Equity Fund 175
| Russell Investment Company | |||
| Russell U.S. Small Cap Equity Fund | |||
| Statement of Operations — For the Period Ended October 31, 2014 | |||
| Amounts in thousands | |||
| Investment Income | |||
| Dividends | $ | 26,495 | |
| Dividends from affiliated Russell funds | 143 | ||
| Interest | 1 | ||
| Securities lending income | 1,730 | ||
| Total investment income | 28,369 | ||
| Expenses | |||
| Advisory fees | 14,959 | ||
| Administrative fees | 1,017 | ||
| Custodian fees | 536 | ||
| Distribution fees - Class A | 61 | ||
| Distribution fees - Class C | 250 | ||
| Transfer agent fees - Class A | 49 | ||
| Transfer agent fees - Class C | 67 | ||
| Transfer agent fees - Class E | 84 | ||
| Transfer agent fees - Class I | 226 | ||
| Transfer agent fees - Class S | 2,723 | ||
| Transfer agent fees - Class Y | 21 | ||
| Professional fees | 104 | ||
| Registration fees | 128 | ||
| Shareholder servicing fees - Class C | 83 | ||
| Shareholder servicing fees - Class E | 105 | ||
| Trustees’ fees | 47 | ||
| Printing fees | 228 | ||
| Miscellaneous | 108 | ||
| Total expenses | 20,796 | ||
| Net investment income (loss) | 7,573 | ||
| Net Realized and Unrealized Gain (Loss) | |||
| Net realized gain (loss) on: | |||
| Investments | 174,429 | ||
| Futures contracts | 9,364 | ||
| Foreign currency-related transactions | (1 | ) | |
| Net realized gain (loss) | 183,792 | ||
| Net change in unrealized appreciation (depreciation) on: | |||
| Investments | (60,965 | ) | |
| Futures contracts | (681 | ) | |
| Foreign currency-related transactions | (79 | ) | |
| Net change in unrealized appreciation (depreciation) | (61,725 | ) | |
| Net realized and unrealized gain (loss) | 122,067 | ||
| Net Increase (Decrease) in Net Assets from Operations | $ | 129,640 | |
See accompanying notes which are an integral part of the financial statements.
176 Russell U.S. Small Cap Equity Fund
| Russell Investment Company | ||||||
| Russell U.S. Small Cap Equity Fund | ||||||
| Statements of Changes in Net Assets | ||||||
| For the Periods Ended October 31, | ||||||
| Amounts in thousands | 2014 | 2013 | ||||
| Increase (Decrease) in Net Assets | ||||||
| Operations | ||||||
| Net investment income (loss) | $ | 7,573 | $ | 12,930 | ||
| Net realized gain (loss) | 183,792 | 265,932 | ||||
| Net change in unrealized appreciation (depreciation) | (61,725 | ) | 253,882 | |||
| Net increase (decrease) in net assets from operations | 129,640 | 532,744 | ||||
| Distributions | ||||||
| From net investment income | ||||||
| Class A | (36 | ) | (101 | ) | ||
| Class C | (—**) | — | ||||
| Class E | (26 | ) | (191 | ) | ||
| Class I | (679 | ) | (1,535 | ) | ||
| Class S | (3,294 | ) | (7,076 | ) | ||
| Class Y | (1,500 | ) | (4,677 | ) | ||
| From net realized gain | ||||||
| Class A | (3,239 | ) | — | |||
| Class C | (4,461 | ) | — | |||
| Class E | (4,312 | ) | — | |||
| Class I | (23,779 | ) | — | |||
| Class S | (138,845 | ) | — | |||
| Class Y | (41,975 | ) | — | |||
| Net decrease in net assets from distributions | (222,146 | ) | (13,580 | ) | ||
| Share Transactions* | ||||||
| Net increase (decrease) in net assets from share transactions | 905,797 | (248,630 | ) | |||
| Total Net Increase (Decrease) in Net Assets | 813,291 | 270,534 | ||||
| Net Assets | ||||||
| Beginning of period | 1,630,661 | 1,360,127 | ||||
| End of period | $ | 2,443,952 | $ | 1,630,661 | ||
| Undistributed (overdistributed) net investment income included in net assets | $ | 5,529 | $ | 3,578 | ||
| ** | Less than $500. |
See accompanying notes which are an integral part of the financial statements.
Russell U.S. Small Cap Equity Fund 177
Russell Investment Company Russell U.S. Small Cap Equity Fund
Statements of Changes in Net Assets, continued
* Share transaction amounts (in thousands) for the periods ended October 31, 2014 and October 31, 2013 were as follows:
| 2014 | 2013 | |||||||||||
| Shares | Dollars | Shares | Dollars | |||||||||
| Class A | ||||||||||||
| Proceeds from shares sold | 142 | $ | 4,349 | 221 | $ | 6,756 | ||||||
| Proceeds from reinvestment of distributions | 106 | 3,244 | 4 | 100 | ||||||||
| Payments for shares redeemed | (137 | ) | (4,240 | ) | (155 | ) | (4,271 | ) | ||||
| Net increase (decrease) | 111 | 3,353 | 70 | 2,585 | ||||||||
| Class C | ||||||||||||
| Proceeds from shares sold | 173 | 5,204 | 143 | 4,155 | ||||||||
| Proceeds from reinvestment of distributions | 150 | 4,435 | — | — | ||||||||
| Payments for shares redeemed | (212 | ) | (6,369 | ) | (252 | ) | (6,930 | ) | ||||
| Net increase (decrease) | 111 | 3,270 | (109 | ) | (2,775 | ) | ||||||
| Class E | ||||||||||||
| Proceeds from shares sold | 652 | 19,874 | 208 | 5,930 | ||||||||
| Proceeds from reinvestment of distributions | 135 | 4,141 | 7 | 183 | ||||||||
| Payments for shares redeemed | (377 | ) | (11,569 | ) | (301 | ) | (8,811 | ) | ||||
| Net increase (decrease) | 410 | 12,446 | (86 | ) | (2,698 | ) | ||||||
| Class I | ||||||||||||
| Proceeds from shares sold | 1,507 | 46,321 | 901 | 25,646 | ||||||||
| Proceeds from reinvestment of distributions | 786 | 24,194 | 61 | 1,500 | ||||||||
| Payments for shares redeemed | (1,525 | ) | (47,272 | ) | (1,974 | ) | (55,782 | ) | ||||
| Net increase (decrease) | 768 | 23,243 | (1,012 | ) | (28,636 | ) | ||||||
| Class S | ||||||||||||
| Proceeds from shares sold | 21,885 | 671,640 | 7,831 | 222,516 | ||||||||
| Proceeds from reinvestment of distributions | 4,573 | 140,224 | 286 | 7,016 | ||||||||
| Payments for shares redeemed | (8,811 | ) | (271,709 | ) | (7,919 | ) | (228,155 | ) | ||||
| Net increase (decrease) | 17,647 | 540,155 | 198 | 1,377 | ||||||||
| Class Y | ||||||||||||
| Proceeds from shares sold | 12,502 | 381,826 | 414 | 11,017 | ||||||||
| Proceeds from reinvestment of distributions | 1,418 | 43,474 | 190 | 4,677 | ||||||||
| Payments for shares redeemed | (3,237 | ) | (101,970 | ) | (7,846 | ) | (234,177 | ) | ||||
| Net increase (decrease) | 10,683 | 323,330 | (7,242 | ) | (218,483 | ) | ||||||
| Total increase (decrease) | 29,730 | $ | 905,797 | (8,181 | ) | $ | (248,630 | ) | ||||
See accompanying notes which are an integral part of the financial statements.
178 Russell U.S. Small Cap Equity Fund
(This page intentionally left blank)
| Russell Investment Company | |||||||||||||||
| Russell U.S. Small Cap Equity Fund | |||||||||||||||
| Financial Highlights — For the Periods Ended | |||||||||||||||
| For a Share Outstanding Throughout Each Period. | |||||||||||||||
| $ | $ | $ | $ | $ | $ | ||||||||||
| Net Asset Value, | Net | Net Realized | Total from | Distributions | Distributions | ||||||||||
| Beginning of | Investment | and Unrealized | Investment | from Net | from Net | ||||||||||
| Period | Income (Loss)(a)(d) | Gain (Loss) | Operations | Investment Income | Realized Gain | ||||||||||
| Class A | |||||||||||||||
| October 31, 2014 | 33.31 | .04 | 2.13 | 2.17 | (.05 | ) | (4.50 | ) | |||||||
| October 31, 2013 | 23.77 | .16 | 9.55 | 9.71 | (.17 | ) | — | ||||||||
| October 31, 2012 | 21.67 | .05 | 2.06 | 2.11 | (.01 | ) | — | ||||||||
| October 31, 2011 | 20.39 | .02 | 1.32 | 1.34 | (.06 | ) | — | ||||||||
| October 31, 2010 | 16.28 | .02 | 4.14 | 4.16 | (.05 | ) | — | ||||||||
| Class C | |||||||||||||||
| October 31, 2014 | 32.51 | (.20 | ) | 2.08 | 1.88 | — | (4.50 | ) | |||||||
| October 31, 2013 | 23.22 | (.04 | ) | 9.33 | 9.29 | — | — | ||||||||
| October 31, 2012 | 21.32 | (.12 | ) | 2.02 | 1.90 | — | — | ||||||||
| October 31, 2011 | 20.16 | (.15 | ) | 1.31 | 1.16 | — | — | ||||||||
| October 31, 2010 | 16.18 | (.12 | ) | 4.10 | 3.98 | — | — | ||||||||
| Class E | |||||||||||||||
| October 31, 2014 | 33.39 | .04 | 2.13 | 2.17 | (.03 | ) | (4.50 | ) | |||||||
| October 31, 2013 | 23.84 | .17 | 9.56 | 9.73 | (.18 | ) | — | ||||||||
| October 31, 2012 | 21.74 | .06 | 2.06 | 2.12 | (.02 | ) | — | ||||||||
| October 31, 2011 | 20.45 | .04 | 1.30 | 1.35 | (.06 | ) | — | ||||||||
| October 31, 2010 | 16.32 | .04 | 4.15 | 4.19 | (.06 | ) | — | �� | |||||||
| Class I | |||||||||||||||
| October 31, 2014 | 33.66 | .14 | 2.16 | 2.30 | (.13 | ) | (4.50 | ) | |||||||
| October 31, 2013 | 24.03 | .27 | 9.61 | 9.88 | (.25 | ) | — | ||||||||
| October 31, 2012 | 21.91 | .12 | 2.08 | 2.20 | (.08 | ) | — | ||||||||
| October 31, 2011 | 20.60 | .10 | 1.32 | 1.42 | (.11 | ) | — | ||||||||
| October 31, 2010 | 16.43 | .09 | 4.17 | 4.26 | (.09 | ) | — | ||||||||
| Class S | |||||||||||||||
| October 31, 2014 | 33.53 | .10 | 2.17 | 2.27 | (.11 | ) | (4.50 | ) | |||||||
| October 31, 2013 | 23.94 | .23 | 9.59 | 9.82 | (.23 | ) | — | ||||||||
| October 31, 2012 | 21.83 | .11 | 2.07 | 2.18 | (.07 | ) | — | ||||||||
| October 31, 2011 | 20.53 | .08 | 1.32 | 1.40 | (.10 | ) | — | ||||||||
| October 31, 2010 | 16.39 | .07 | 4.15 | 4.22 | (.08 | ) | — | ||||||||
| Class Y | |||||||||||||||
| October 31, 2014 | 33.58 | .17 | 2.16 | 2.33 | (.17 | ) | (4.50 | ) | |||||||
| October 31, 2013 | 23.97 | .32 | 9.57 | 9.89 | (.28 | ) | — | ||||||||
| October 31, 2012 | 21.85 | .15 | 2.07 | 2.22 | (.10 | ) | — | ||||||||
| October 31, 2011 | 20.55 | .12 | 1.32 | 1.44 | (.14 | ) | — | ||||||||
| October 31, 2010 | 16.39 | .10 | 4.17 | 4.27 | (.11 | ) | — | ||||||||
See accompanying notes which are an integral part of the financial statements.
180 Russell U.S. Small Cap Equity Fund
| % | % | % | |||||||||||||||
| $ | $ | Ratio of Expenses | Ratio of Expenses | Ratio of Net | |||||||||||||
| Net Asset Value, | % | Net Assets, | to Average | to Average | Investment Income | % | |||||||||||
| $ | End of | Total | End of Period | Net Assets, | Net Assets, | to Average | Portfolio | ||||||||||
| Total Distributions | Period | Return(c) | (000) | Gross | Net(d) | Net Assets(d) | Turnover Rate | ||||||||||
| (4.55 | ) | 30.93 | 6.70 | 25,406 | 1.25 | 1.25 | .09 | 86 | |||||||||
| (.17 | ) | 33.31 | 41.08 | 23,677 | 1.25 | 1.25 | .58 | 111 | |||||||||
| (.01 | ) | 23.77 | 9.73 | 15,232 | 1.25 | 1.25 | .21 | 129 | |||||||||
| (.06 | ) | 21.67 | 6.55 | 15,392 | 1.25 | 1.25 | .09 | 111 | |||||||||
| (.05 | ) | 20.39 | 25.58 | 13,078 | 1.23 | 1.23 | .12 | 99 | |||||||||
| (4.50 | ) | 29.89 | 5.91 | 33,003 | 2.00 | 2.00 | (.66 | ) | 86 | ||||||||
| — | 32.51 | 40.01 | 32,285 | 2.00 | 2.00 | (.15 | ) | 111 | |||||||||
| — | 23.22 | 8.91 | 25,597 | 2.00 | 2.00 | (.54 | ) | 129 | |||||||||
| — | 21.32 | 5.75 | 28,910 | 2.00 | 2.00 | (.66 | ) | 111 | |||||||||
| — | 20.16 | 24.60 | 32,499 | 1.98 | 1.98 | (.63 | ) | 99 | |||||||||
| (4.53 | ) | 31.03 | 6.71 | 42,588 | 1.25 | 1.25 | .09 | 86 | |||||||||
| (.18 | ) | 33.39 | 41.10 | 32,126 | 1.24 | 1.23 | .60 | 111 | |||||||||
| (.02 | ) | 23.84 | 9.78 | 24,995 | 1.25 | 1.20 | .26 | 129 | |||||||||
| (.06 | ) | 21.74 | 6.58 | 26,404 | 1.24 | 1.16 | .18 | 111 | |||||||||
| (.06 | ) | 20.45 | 25.71 | 30,702 | 1.23 | 1.12 | .24 | 99 | |||||||||
| (4.63 | ) | 31.33 | 7.06 | 192,131 | .92 | .92 | .42 | 86 | |||||||||
| (.25 | ) | 33.66 | 41.53 | 180,599 | .92 | .92 | .95 | 111 | |||||||||
| (.08 | ) | 24.03 | 10.08 | 153,233 | .92 | .92 | .54 | 129 | |||||||||
| (.11 | ) | 21.91 | 6.89 | 177,437 | .92 | .92 | .42 | 111 | |||||||||
| (.09 | ) | 20.60 | 26.03 | 216,197 | .90 | .90 | .45 | 99 | |||||||||
| (4.61 | ) | 31.19 | 7.01 | 1,512,046 | 1.00 | 1.00 | .33 | 86 | |||||||||
| (.23 | ) | 33.53 | 41.38 | 1,034,016 | 1.00 | 1.00 | .81 | 111 | |||||||||
| (.07 | ) | 23.94 | 10.02 | 733,436 | 1.00 | 1.00 | .46 | 129 | |||||||||
| (.10 | ) | 21.83 | 6.80 | 704,781 | 1.00 | 1.00 | .34 | 111 | |||||||||
| (.08 | ) | 20.53 | 25.84 | 647,424 | .98 | .98 | .37 | 99 | |||||||||
| (4.67 | ) | 31.24 | 7.17 | 638,778 | .80 | .80 | .51 | 86 | |||||||||
| (.28 | ) | 33.58 | 41.67 | 327,958 | .80 | .80 | 1.13 | 111 | |||||||||
| (.10 | ) | 23.97 | 10.22 | 407,634 | .82 | .82 | .65 | 129 | |||||||||
| (.14 | ) | 21.85 | 7.01 | 490,804 | .82 | .82 | .52 | 111 | |||||||||
| (.11 | ) | 20.55 | 26.08 | 547,009 | .80 | .80 | .55 | 99 | |||||||||
See accompanying notes which are an integral part of the financial statements.
Russell U.S. Small Cap Equity Fund 181
Russell Investment Company
Russell International Developed Markets Fund
Portfolio Management Discussion and Analysis — October 31, 2014 (Unaudited)

| Russell International Developed Markets Fund - Class A‡ | Russell International Developed Markets Fund - Class S‡‡‡ | ||||||
| Total | Total | ||||||
| Return | Return | ||||||
| 1 Year | (5.33 | )% | 1 Year | 0.69 | % | ||
| 5 Years | 5.01 | %§ | 5 Years | 6.55 | %§ | ||
| 10 Years | 4.44 | %§ | 10 Years | 5.33 | %§ | ||
| Russell International Developed Markets Fund - Class C‡‡ | Russell International Developed Markets Fund - Class Y | ||||||
| Total | Total | ||||||
| Return | Return | ||||||
| 1 Year | (0.33 | )% | 1 Year | 0.90 | % | ||
| 5 Years | 5.49 | %§ | 5 Years | 6.70 | %§ | ||
| 10 Years | 4.58 | %§ | 10 Years | 5.45 | %§ | ||
| Russell International Developed Markets Fund - Class E | Russell Developed ex-U.S. Large Cap® Index Net** | ||||||
| Total | Total | ||||||
| Return | Return | ||||||
| 1 Year | 0.46 | % | 1 Year | 0.17 | % | ||
| 5 Years | 6.32 | %§ | 5 Years | 6.85 | %§ | ||
| 10 Years | 5.10 | %§ | 10 Years | 6.25 | %§ | ||
| International Developed Markets Linked Benchmark*** | |||||||
| Russell International Developed Markets Fund - Class I | Total | ||||||
| Total | Return | ||||||
| Return | 1 Year | 0.17 | % | ||||
| 1 Year | 0.79 | % | 5 Years | 6.34 | %§ | ||
| 5 Years | 6.63 | %§ | 10 Years | 5.72 | %§ | ||
| 10 Years | 5.38 | %§ | |||||
182 Russell International Developed Markets Fund
Russell Investment Company
Russell International Developed Markets Fund
Portfolio Management Discussion and Analysis, continued — October 31, 2014 (Unaudited)
| The Russell International Developed Markets Fund (the “Fund”) | period but ineffective stock selection within the country detracted | |
| employs a multi-manager approach whereby portions of the Fund | from overall benchmark-relative performance. European stocks | |
| are allocated to different money managers. Fund assets not | were the poorest performing stocks over the fiscal period as poor | |
| allocated to money managers are managed by Russell Investment | economic data in the latter part of the fiscal period overshadowed | |
| Management Company (“RIMCo”), the Fund’s advisor. RIMCo | the European Central Bank cutting deposit and interest rates | |
| may change the allocation of the Fund’s assets among money | to record lows and pledging to start buying covered bonds. | |
| managers at any time. An exemptive order from the Securities | Within Europe, effective stock selection within financials and an | |
| and Exchange Commission (“SEC”) permits RIMCo to engage | overweight position in health care added strongly to benchmark- | |
| or terminate a money manager at any time, subject to approval | relative performance. The Japanese market performed strongly | |
| by the Fund’s Board, without a shareholder vote. Pursuant to the | over the fiscal period in local returns however the weakening | |
| terms of the exemptive order, the Fund is required to notify its | Japanese yen caused the market to slightly lag the Fund’s index | |
| shareholders within 90 days of when a money manager begins | in U.S. dollar terms. Effective stock selection in the industrials, | |
| providing services. As of October 31, 2014, the Fund had seven | health care, and materials sectors contributed to the Fund’s | |
| money managers. | benchmark-relative positive performance within Japan. Similar | |
| What is the Fund’s investment objective? | to Japan, Canada performed strongly in local terms but weakness | |
| in the Canadian dollar dampened these returns. Within Canada, | ||
| The Fund seeks to provide long-term capital growth. | effective stock selection within materials and an underweight | |
| How did the Fund perform relative to its benchmark for the | position to the sector combined with an overweight position | |
| fiscal year ended October 31, 2014? | in industrials contributed positively to benchmark-relative | |
| For the fiscal year ended October 31, 2014, the Fund’s Class | performance. The Fund’s out-of-benchmark exposure to emerging | |
| A, Class E, Class I, Class S and Class Y Shares gained 0.43%, | markets was beneficial, as welcomed election results in countries | |
| 0.46%, 0.79%, 0.69% and 0.90%, respectively, and the Fund’s | such as India, along with the market’s lessening concerns over the | |
| Class C Shares lost 0.33%. This is compared to the Fund’s | Chinese government’s restraint in policy support, helped these | |
| benchmark, the Russell Developed ex-U.S. Large Cap Index | economies advance in the latter part of the fiscal period. Chinese, | |
| (Net), which gained 0.17% during the same period. The Fund’s | Indian and Taiwanese stocks held in the Fund were all strong | |
| performance includes operating expenses, whereas index returns | contributors during the period. | |
| are unmanaged and do not include expenses of any kind. | Sector performance tended to benefit more defensive areas of the | |
| For the fiscal year ended October 31, 2014, the Morningstar® | market as concerns over economic growth and a stronger U.S. dollar | |
| Foreign Large Blend, a group of funds that Morningstar considers | weighed on the more cyclical (economically sensitive) sectors such | |
| to have investment strategies similar to those of the Fund, lost | as energy, materials and consumer discretionary, while rewarding | |
| 0.05%. This result serves as a peer comparison and is expressed | the health care and utilities sectors. The Fund’s underweight to | |
| net of operating expenses. | the utilities sector and overweight to consumer discretionary had | |
| a negative impact on benchmark-relative performance. Security | ||
| How did the market conditions described in the Market | selection within the financials sector contributed strongly to the | |
| Summary report affect the Fund’s performance? | Fund’s performance particularly within Continental Europe, | |
| Equity prices increased to new highs during the period prior to | where the Fund avoided the more economically sensitive banks. | |
| pulling back during the last few months of the fiscal year. | Easy | An underweight to materials benefited the Fund and was further |
| monetary policies continued to support equity prices. | The | helped by effective selection within the sector as the Fund was |
| markets rotated among leadership during the period as concerns | underweight the poorer performing metals and mining companies | |
| over global growth and fiscal policy caused the markets to pull | in favor of the better performing chemical companies. The Fund’s | |
| back at various times during the period. The Fund’s balanced | beneficial overweight to health care was offset by poor stock | |
| position between manager styles such as growth, value, defensive | selection within the sector, as the Fund had less exposure to the | |
| and dynamic allowed it to navigate the markets well and this | stronger performing large cap pharmaceutical stocks. | |
| aided the Fund’s benchmark-relative returns. | How did the investment strategies and techniques employed | |
| Over the fiscal year, Asia ex-Japan was the strongest performing | by the Fund and its money managers affect its benchmark- | |
| region driven primarily by Hong Kong, which returned 8.73% as | relative performance? | |
| measured by the Russell Global Large Cap Hong Kong Index. | AQR Capital Management, LLC (“AQR”) outperformed the | |
| The Fund’s Hong Kong positioning with respect to percentage | Fund’s benchmark for the fiscal year. AQR’s quantitative approach | |
| country exposure was largely benchmark neutral during the | emphasizes stocks trading at low valuations with good momentum | |
| Russell International Developed Markets Fund 183 | ||
Russell Investment Company
Russell International Developed Markets Fund
Portfolio Management Discussion and Analysis, continued — October 31, 2014 (Unaudited)
| in a variety of earnings and price measures. Additionally, AQR | diminished by the weakening yen, as Numeric held a large |
| employs a country and currency model. AQR’s primary shortfall | overweight to this region relative to the Fund’s benchmark. |
| was in their country model though the stock selection model | Pzena Investment Management LLC (“Pzena”) performed in line |
| made up for the shortfall due to effective stock selection across | with the Fund’s benchmark for the fiscal year. Pzena’s deeper |
| almost all sectors and regions. AQR was particularly effective | value style was largely out of favor over the period. Effective |
| in materials and European stocks. AQR’s defensive orientation | stock selection in telecommunication and financials stocks |
| proved beneficial over the period. | helped offset poor selection within industrials and consumer |
| Barrow, Hanley, Mewhinney & Strauss, LLC (“Barrow Hanley”) | discretionary stocks. Pzena struggled with emerging market |
| outperformed the Fund’s benchmark for the fiscal year. Effective | stocks as selections like Gazprom struggled in the period given |
| stock selection with financials and consumer stocks were key | geopolitical events. |
| drivers. On a regional basis, Barrow Hanley added significant | Wellington Capital Management (“Wellington”) was hired in |
| value in Continental European stocks. Effective stock selection | September 2014 and outperformed the Fund’s benchmark for the |
| within emerging market stocks also added meaningfully to | portion of the fiscal year in which it was a money manager in |
| performance. | the Fund. Effective stock selection within health care, industrials |
| del Rey Global Investors, LLC (“del Rey”) was terminated in | and information technology sectors was a key contributor over the |
| March 2014 and performed in line with the Fund’s benchmark for | period, further benefited by an underweight to energy stocks and |
| the portion of the fiscal year in which it was a money manager in | an overweight to health care stocks. Wellington’s performance |
| the Fund. del Rey was most effective within the financial sector | also benefited from effective selection within emerging markets |
| as positive stock selection within a few Continental European | and Japan. |
| banks further added to a beneficial underweight to the sector. | William Blair & Company, LLC (“William Blair”) outperformed |
| Japan was del Rey’s strongest region with effective stock selection | the Fund’s benchmark for the fiscal year. William Blair’s stock |
| particularly in industrials overcoming a shortfall given the | selection within emerging markets companies like Tata Motors, |
| negative effects of an overweight to the region. del Rey struggled | Tencent, Baidu, and HDFC Bank added strongly to performance. |
| in the telecommunications and materials sector mainly driven by | Consumer discretionary and telecommunication stocks were |
| their holdings in emerging market stocks within these sectors. | another area of strength for William Blair. Stock selection within |
| Driehaus Capital Management, LLC (“Driehaus”) was terminated | the U.K. proved challenging, as Tullow Oil and Meggitt weighed |
| in September 2014 and underperformed the Fund’s benchmark | on performance. |
| for the portion of the fiscal year in which it was a money manager | RIMCo manages the portion of the Fund’s assets that RIMCo |
| in the Fund. Driehaus’ momentum focus was a significant | determines not to allocate to the money managers. Assets not |
| challenge to their performance over this period and accounted for | allocated to managers include the Fund’s liquidity reserves and |
| the majority of the shortfall. | assets which may be managed directly by RIMCo to modify the |
| MFS Institutional Advisors Inc. (“MFS”) outperformed the Fund’s | Fund’s overall portfolio characteristics to seek to achieve the |
| benchmark for the fiscal year. MFS had strong stock selection | desired risk/return profile for the Fund. |
| within their emerging market holdings, particularly in their | At the beginning of the period, RIMCo managed a positioning |
| Taiwanese technology holdings. Additionally, effective stock | strategy that invested in securities exhibiting higher quality |
| selection within materials and consumer discretionary stocks | characteristics than the benchmark in order to dampen Fund |
| added to performance. European stock selection was a particular | volatility and provide exposure to areas of the market that the |
| challenge for MFS during the period, particularly in French | money managers were not accessing. In March 2014, this strategy |
| consumer staples stocks. Stock selection within European | was modified to implement a value bias while maintaining the |
| financials was also challenging during the period. | strategy’s defensive characteristics. The strategy’s effect on |
| Numeric Investors LLC (“Numeric”) outperformed the Fund’s | Fund performance was positive, as the strategy meaningfully |
| benchmark for the fiscal year. Numeric’s smaller cap focus was | outperformed the Fund’s benchmark. During the fiscal year, |
| a drag on performance given these stocks underperformed their | markets rewarded higher quality, larger cap securities, which |
| larger cap peers, however, strong stock selection in consumer | the strategy explicitly overweighted. Additionally, the strategy’s |
| discretionary, financials, industrials and information technology | selection within financials was a meaningful contributor to |
| helped overcome this drag. Regionally, Numeric was most | benchmark-relative performance. |
| effective in stock selection within Continental Europe. Numeric | During the period, the Fund used derivatives, including stock |
| was effective in selecting Japanese stocks but returns were | options, country index futures, swaps and currency forwards, |
184 Russell International Developed Markets Fund
Russell Investment Company
Russell International Developed Markets Fund
Portfolio Management Discussion and Analysis, continued — October 31, 2014 (Unaudited)
| to manage country and currency exposure as a substitute for | Money Managers as of October 31, | |
| holding securities directly and to facilitate the implementation | 2014 | Styles |
| of its investment strategy. In addition, the Fund used forward | ||
| AQR Capital Management, LLC | Market-Oriented | |
| currency contracts to hedge against adverse currency exchange | Barrow, Hanley, Mewhinney & Strauss, LLC Value | |
| rate changes. The use of these derivatives did not have a material | MFS Institutional Advisors, Inc. | Market-Oriented |
| impact on performance. | Numeric Investors LLC | Market-Oriented |
| Pzena Investment Management, LLC | Value | |
| Describe any changes to the Fund’s structure or the money | Wellington Capital Management LLP | Growth |
| manager line-up. | William Blair & Company, LLC | Growth |
| In March 2014, RIMCo terminated del Rey Global Investors, LLC | The views expressed in this report reflect those of the portfolio | |
| as a money manager for the Fund. | managers only through the end of the period covered by | |
| the report. These views do not necessarily represent the | ||
| In September 2014, RIMCo terminated Driehaus Capital | views of RIMCo, or any other person in RIMCo or any other | |
| Management LLC and hired Wellington Capital Management as a | affiliated organization. These views are subject to change | |
| money manager for the Fund. | at any time based upon market conditions or other events, | |
| In March 2014, RIMCo altered its positioning strategy as | and RIMCo disclaims any responsibility to update the views | |
| described above. | contained herein. These views should not be relied on as | |
| investment advice and, because investment decisions for | ||
| a Russell Investment Company (“RIC”) Fund are based on | ||
| numerous factors, should not be relied on as an indication | ||
| of investment decisions of any RIC Fund. | ||
| * | Assumes initial investment on November 1, 2004. |
| ** | Russell Developed ex-U.S. Large Cap® Index Net is an index which offers investors access to the large-cap segment of the global equity market, excluding companies assigned to the United States. It is constructed to provide a comprehensive and unbiased barometer for the large-cap segment and is completely reconstituted annually to accurately reflect the changes in the market over time. |
| *** | The International Developed Markets Linked Benchmark provides a means to compare the Fund’s average annual returns to a secondary benchmark that takes into account historical changes in the Fund’s primary benchmark. The International Developed Markets Linked Benchmark represents the returns of the MSCI EAFE Index (net of tax on dividends from foreign holdings) through December 31, 2010 and the returns of the Russell Developed ex-U.S. Large Cap Index (net of tax on dividends from foreign holdings) thereafter. |
| ‡ | The Fund first issued Class A Shares on September 2, 2008. The returns shown for Class A Shares prior to that date are the returns of Class E Shares. The performance shown has been adjusted to reflect the deduction of the maximum Class A sales charge of 5.75%. Annual returns for each Class will differ only to the extent that the Class A Shares do not have the same expenses as Class E Shares. |
| ‡‡ | The Fund first issued Class C Shares on September 2, 2008. The returns shown for Class C Shares prior to that date are the returns of the Fund’s Class E Shares and do not reflect deduction of Rule 12b-1 distribution fees that apply to Class C Shares. Had they done so, the returns shown for those periods would have been lower. Annual returns for each Class will differ only to the extent that the Class C Shares do not have the same expenses as the Class E Shares. |
| ‡‡‡ | The Fund first issued Class S Shares on September 2, 2008. The returns shown for Class S Shares prior to that date are the returns of the Fund’s Class I |
| Shares. Class S Shares will have substantially similar annual returns as the Class I Shares because the Shares of each Class are invested in the same portfolio of securities. Annual returns for each Class will differ only to the extent that the Class S Shares do not have the same expenses as the Class I Shares. | |
| § | Annualized. |
Performance is historical and assumes reinvestment of all dividends and capital gains. Investment return and principal value will fluctuate so that an investor’s shares, when redeemed, may be worth more or less than when purchased. Past performance is not indicative of future results. The returns shown do not reflect the deduction of taxes that a shareholder would pay on Fund distributions or the redemption of Fund shares.
Russell International Developed Markets Fund 185
Russell Investment Company
Russell International Developed Markets Fund
Shareholder Expense Example — October 31, 2014 (Unaudited)
| Fund Expenses | Please note that the expenses shown in the table are meant | |||||
| The following disclosure provides important information | to highlight your ongoing costs only and do not reflect any | |||||
| regarding the Fund’s Shareholder Expense Example | transactional costs. Therefore, the information under the heading | |||||
| (“Example”). | “Hypothetical Performance (5% return before expenses)” is | |||||
| useful in comparing ongoing costs only, and will not help you | ||||||
| Example | determine the relative total costs of owning different funds. In | |||||
| As a shareholder of the Fund, you incur two types of costs: (1) | addition, if these transactional costs were included, your costs | |||||
| transaction costs, and (2) ongoing costs, including advisory and | would have been higher. | |||||
| administrative fees; distribution (12b-1) and/or service fees; | Hypothetical | |||||
| and other Fund expenses. The Example is intended to help | Performance (5% | |||||
| you understand your ongoing costs (in dollars) of investing in | Actual | return before | ||||
| the Fund and to compare these costs with the ongoing costs of | Class A | Performance | expenses) | |||
| Beginning Account Value | ||||||
| investing in other mutual funds. The Example is based on an | May 1, 2014 | $ | 1,000.00 | $ | 1,000.00 | |
| investment of $1,000 invested at the beginning of the period and | Ending Account Value | |||||
| held for the entire period indicated, which for this Fund is from | October 31, 2014 | $ | 958.20 | $ | 1,018.90 | |
| May 1, 2014 to October 31, 2014. | Expenses Paid During Period* | $ | 6.17 | $ | 6.36 | |
| Actual Expenses | * Expenses are equal to the Fund's annualized expense ratio of 1.25% | |||||
| (representing the six month period annualized), multiplied by the average | ||||||
| The information in the table under the heading “Actual | account value over the period, multiplied by 184/365 (to reflect the one-half | |||||
| Performance” provides information about actual account values | year period). | |||||
| and actual expenses. You may use the information in this column, | ||||||
| together with the amount you invested, to estimate the expenses | Hypothetical | |||||
| Performance (5% | ||||||
| that you paid over the period. Simply divide your account value by | Actual | return before | ||||
| $1,000 (for example, an $8,600 account value divided by $1,000 | Class C | Performance | expenses) | |||
| = 8.6), then multiply the result by the number in the first column | Beginning Account Value | |||||
| in the row entitled “Expenses Paid During Period” to estimate | May 1, 2014 | $ | 1,000.00 | $ | 1,000.00 | |
| Ending Account Value | ||||||
| the expenses you paid on your account during this period. | October 31, 2014 | $ | 954.40 | $ | 1,015.12 | |
| Expenses Paid During Period* | $ | 9.85 | $ | 10.16 | ||
| Hypothetical Example for Comparison Purposes | ||||||
| The information in the table under the heading “Hypothetical | * Expenses are equal to the Fund's annualized expense ratio of 2.00% | |||||
| Performance (5% return before expenses)” provides information | (representing the six month period annualized), multiplied by the average | |||||
| account value over the period, multiplied by 184/365 (to reflect the one-half | ||||||
| about hypothetical account values and hypothetical expenses | year period). | |||||
| based on the Fund’s actual expense ratio and an assumed rate of | ||||||
| return of 5% per year before expenses, which is not the Fund’s | Hypothetical | |||||
| actual return. The hypothetical account values and expenses | Performance (5% | |||||
| Actual | return before | |||||
| may not be used to estimate the actual ending account balance or | Class E | Performance | expenses) | |||
| expenses you paid for the period. You may use this information | Beginning Account Value | |||||
| to compare the ongoing costs of investing in the Fund and other | May 1, 2014 | $ | 1,000.00 | $ | 1,000.00 | |
| funds. To do so, compare this 5% hypothetical example with the | Ending Account Value | |||||
| October 31, 2014 | $ | 958.30 | $ | 1,018.90 | ||
| 5% hypothetical examples that appear in the shareholder reports | Expenses Paid During Period* | $ | 6.17 | $ | 6.36 | |
| of other funds. | ||||||
| * Expenses are equal to the Fund's annualized expense ratio of 1.25% | ||||||
| (representing the six month period annualized), multiplied by the average | ||||||
| account value over the period, multiplied by 184/365 (to reflect the one-half | ||||||
| year period). | ||||||
186 Russell International Developed Markets Fund
Russell Investment Company
Russell International Developed Markets Fund
Shareholder Expense Example, continued — October 31, 2014 (Unaudited)
| Hypothetical | |||||
| Performance (5% | |||||
| Actual | return before | ||||
| Class I | Performance | expenses) | |||
| Beginning Account Value | |||||
| May 1, 2014 | $ | 1,000.00 | $ | 1,000.00 | |
| Ending Account Value | |||||
| October 31, 2014 | $ | 959.90 | $ | 1,020.57 | |
| Expenses Paid During Period* | $ | 4.54 | $ | 4.69 | |
| * Expenses are equal to the Fund's annualized expense ratio of 0.92% | |||||
| (representing the six month period annualized), multiplied by the average | |||||
| account value over the period, multiplied by 184/365 (to reflect the one-half | |||||
| year period). | |||||
| Hypothetical | |||||
| Performance (5% | |||||
| Actual | return before | ||||
| Class S | Performance | expenses) | |||
| Beginning Account Value | |||||
| May 1, 2014 | $ | 1,000.00 | $ | 1,000.00 | |
| Ending Account Value | |||||
| October 31, 2014 | $ | 959.30 | $ | 1,020.16 | |
| Expenses Paid During Period* | $ | 4.94 | $ | 5.09 | |
| * Expenses are equal to the Fund's annualized expense ratio of 1.00% | |||||
| (representing the six month period annualized), multiplied by the average | |||||
| account value over the period, multiplied by 184/365 (to reflect the one-half | |||||
| year period). | |||||
| Hypothetical | |||||
| Performance (5% | |||||
| Actual | return before | ||||
| Class Y | Performance | expenses) | |||
| Beginning Account Value | |||||
| May 1, 2014 | $ | 1,000.00 | $ | 1,000.00 | |
| Ending Account Value | |||||
| October 31, 2014 | $ | 960.10 | $ | 1,021.17 | |
| Expenses Paid During Period* | $ | 3.95 | $ | 4.08 | |
| * Expenses are equal to the Fund's annualized expense ratio of 0.80% | |||||
| (representing the six month period annualized), multiplied by the average | |||||
| account value over the period, multiplied by 184/365 (to reflect the one-half | |||||
| year period). | |||||
Russell International Developed Markets Fund 187
| Russell Investment Company | ||||||||||
| Russell International Developed Markets Fund | ||||||||||
| Schedule of Investments — October 31, 2014 | ||||||||||
| Amounts in thousands (except share amounts) | Amounts in thousands (except share amounts) | |||||||||
| Principal | Fair | Principal | Fair | |||||||
| Amount ($) | Value | Amount ($) | Value | |||||||
| or Shares | $ | or Shares | $ | |||||||
| Common Stocks - 92.2% | Austria - 0.3% | |||||||||
| Australia - 2.5% | Erste Group Bank AG | 437,001 | 11,122 | |||||||
| Abacus Property Group(ö) | 305,900 | 727 | S IMMO AG(Æ) | 107,407 | 827 | |||||
| AGL Energy, Ltd. | 147,612 | 1,765 | 11,949 | |||||||
| Amcor, Ltd. Class A | 230,465 | 2,377 | ||||||||
| APA Group | 89,596 | 620 | Belgium - 1.3% | |||||||
| Asciano, Ltd. | 430,245 | 2,374 | Ageas(Æ) | 12,778 | — | |||||
| ASX, Ltd. - ADR | 17,166 | 544 | AGFA-Gevaert NV(Æ) | 602,135 | 1,518 | |||||
| Aurizon Holdings, Ltd. | 220,433 | 908 | Anheuser-Busch InBev NV | 204,735 | 22,606 | |||||
| Ausdrill, Ltd. - GDR | 123,000 | 64 | Belgacom SA | 181,628 | 6,853 | |||||
| AusNet Services(Æ) | 369,948 | 448 | bpost SA | 129,642 | 3,209 | |||||
| Austal, Ltd.(Æ) | 40,100 | 45 | Delhaize Group SA | 35,276 | 2,410 | |||||
| Australia & New Zealand Banking | Elia System Operator SA | 6,639 | 329 | |||||||
| Group, Ltd. - ADR | 459,947 | 13,559 | Groupe Bruxelles Lambert SA | 19,016 | 1,698 | |||||
| BC Iron, Ltd. | 85,800 | 81 | KBC Groep NV(Æ) | 94,265 | 5,050 | |||||
| Beach Energy, Ltd. | 463,100 | 475 | Nyrstar NV(Æ) | 374,865 | 1,264 | |||||
| Bendigo & Adelaide Bank, Ltd. | 101,117 | 1,105 | Tessenderlo Chemie NV(Æ) | 8,640 | 224 | |||||
| BGP Holdings PLC(Æ)(Þ) | 559,805 | — | UCB SA | 82,237 | 6,636 | |||||
| BHP Billiton, Ltd. - ADR | 168,363 | 5,031 | Umicore SA | 43,707 | 1,711 | |||||
| Caltex Australia, Ltd. | 20,784 | 568 | 53,508 | |||||||
| CFS Retail Property Trust Group(ö) | 212,679 | 393 | ||||||||
| Coca-Cola Amatil, Ltd. | 192,390 | 1,549 | Bermuda - 0.5% | |||||||
| Commonwealth Bank of Australia - ADR | 96,957 | 6,867 | Catlin Group, Ltd. | 65,345 | 561 | |||||
| Computershare, Ltd. | 45,224 | 488 | Cheung Kong Infrastructure Holdings, | |||||||
| CSL, Ltd. | 5,436 | 384 | Ltd. | 54,000 | 394 | |||||
| Dexus Property Group(ö) | 505,198 | 538 | Dairy Farm International Holdings, Ltd. | 11,700 | 112 | |||||
| Downer EDI, Ltd. | 477,800 | 1,993 | Emperor Entertainment Hotel, Ltd. | 2,330,000 | 700 | |||||
| Echo Entertainment Group, Ltd. | 534,700 | 1,788 | Emperor International Holdings, Ltd. | 620,000 | 135 | |||||
| Fairfax Media, Ltd. | 329,700 | 236 | Great Eagle Holdings, Ltd. | 499,000 | 1,679 | |||||
| Genworth Mortgage Insurance Australia, | Jardine Strategic Holdings, Ltd. | 19,500 | 695 | |||||||
| Ltd.(Æ) | 527,200 | 1,726 | Li & Fung, Ltd. | 6,193,164 | 7,547 | |||||
| GPT Group (The)(ö) | 141,406 | 513 | Orient Overseas International, Ltd. | 251,500 | 1,432 | |||||
| Harvey Norman Holdings, Ltd. | 70,267 | 235 | PartnerRe, Ltd. | 49,941 | 5,778 | |||||
| Incitec Pivot, Ltd. | 318,944 | 817 | Soundwill Holdings, Ltd. | 44,000 | 70 | |||||
| Insurance Australia Group, Ltd. | 426,936 | 2,450 | 19,103 | |||||||
| Investa Office Fund(ö) | 625,700 | 1,960 | Brazil - 0.7% | |||||||
| Mirvac Group(ö) | 274,240 | 433 | BM&FBovespa SA | 26,342 | 116 | |||||
| National Australia Bank, Ltd. - ADR | 360,692 | 11,106 | Brookfield Incorporacoes SA(Æ) | 2,878,300 | 1,835 | |||||
| NRW Holdings, Ltd. | 343,200 | 228 | Cielo SA | 192,500 | 3,161 | |||||
| Orica, Ltd. | 159,898 | 2,899 | Embraer SA - ADR | 369,200 | 14,266 | |||||
| Origin Energy, Ltd. | 74,389 | 934 | Itau Unibanco Holding SA - ADR | 376,231 | 5,553 | |||||
| Ramsay Health Care, Ltd. | 37,561 | 1,727 | Kroton Educacional SA | 662,800 | 4,724 | |||||
| Rio Tinto, Ltd. - ADR | 21,223 | 1,128 | 29,655 | |||||||
| Sandfire Resources NL | 323,200 | 1,596 | ||||||||
| Scentre Group(Æ)(ö) | 179,996 | 561 | Canada - 5.3% | |||||||
| Sigma Pharmaceuticals, Ltd. | 1,091,900 | 745 | Advantage Oil & Gas, Ltd.(Æ) | 15,042 | 64 | |||||
| Sonic Healthcare, Ltd. | 15,996 | 263 | Aecon Group, Inc.(Ñ) | 17,300 | 225 | |||||
| Stockland(ö) | 181,368 | 677 | Agrium, Inc. | 24,500 | 2,397 | |||||
| Suncorp Group, Ltd. | 317,820 | 4,097 | Aimia, Inc. | 45,000 | 649 | |||||
| Tabcorp Holdings, Ltd. | 409,564 | 1,467 | Air Canada Class A(Æ) | 39,300 | 327 | |||||
| Tatts Group, Ltd. | 179,845 | 549 | Alimentation Couche-Tard, Inc. Class B | 391,855 | 13,299 | |||||
| Telstra Corp., Ltd. | 523,391 | 2,593 | Atco, Ltd. Class I | 12,900 | 524 | |||||
| Transfield Services, Ltd.(Æ) | 308,600 | 516 | Bank of Montreal(Ñ) | 81,731 | 5,927 | |||||
| Wesfarmers, Ltd. | 95,490 | 3,709 | Bank of Nova Scotia (The) | 128,524 | 7,871 | |||||
| Westfield Corp.(Æ)(ö) | 144,460 | 1,007 | Bankers Petroleum, Ltd.(Æ) | 296,600 | 1,140 | |||||
| Westpac Banking Corp. | 342,355 | 10,478 | BCE, Inc.(Ñ) | 21,454 | 953 | |||||
| Woodside Petroleum, Ltd. | 72,059 | 2,545 | Boardwalk Real Estate Investment | |||||||
| Woolworths, Ltd. | 16,451 | 521 | Trust(ö) | 26,800 | 1,698 | |||||
| 102,407 | Bonavista Energy Corp.(Ñ) | 64,900 | 610 | |||||||
| See accompanying notes which are an integral part of the financial statements. | ||||||||||
| 188 Russell International Developed Markets Fund | ||||||||||
| Russell Investment Company | ||||||||||
| Russell International Developed Markets Fund | ||||||||||
| Schedule of Investments, continued — October 31, 2014 | ||||||||||
| Amounts in thousands (except share amounts) | Amounts in thousands (except share amounts) | |||||||||
| Principal | Fair | Principal | Fair | |||||||
| Amount ($) | Value | Amount ($) | Value | |||||||
| or Shares | $ | or Shares | $ | |||||||
| Brookfield Asset Management, Inc. Class | RioCan Real Estate Investment Trust(Ñ) | |||||||||
| A(Æ) | 236,996 | 11,606 | (ö) | 59,400 | 1,399 | |||||
| Brookfield Asset Management, Inc. | Ritchie Bros Auctioneers, Inc.(Ñ) | 13,400 | 328 | |||||||
| Class A | 76,344 | 3,737 | RONA, Inc. | 52,300 | 638 | |||||
| CAE, Inc. | 48,600 | 623 | Royal Bank of Canada - GDR | 108,475 | 7,701 | |||||
| Calloway Real Estate Investment Trust(ö) | 66,800 | 1,635 | ShawCor, Ltd. | 14,900 | 656 | |||||
| Canadian Imperial Bank of Commerce(Þ) | 82,311 | 7,514 | Suncor Energy, Inc. | 317,183 | 11,263 | |||||
| Canadian National Railway Co. | 223,737 | 15,791 | Superior Plus Corp.(Ñ) | 136,300 | 1,477 | |||||
| Canadian National Railway Co.(Ñ) | 53,400 | 3,765 | Tim Hortons, Inc. | 11,200 | 907 | |||||
| Canadian Natural Resources, Ltd. | 72,400 | 2,527 | Toronto Dominion Bank | 237,088 | 11,669 | |||||
| Canadian Oil Sands, Ltd. | 44,349 | 695 | TransAlta Corp. | 35,400 | 344 | |||||
| Canadian Pacific Railway, Ltd. | 47,233 | 9,816 | TransCanada Corp. | 25,431 | 1,253 | |||||
| Canadian Tire Corp., Ltd. Class A | 10,330 | 1,133 | Transcontinental, Inc. Class A - ADR | 122,700 | 1,675 | |||||
| Canfor Pulp Products, Inc. | 13,700 | 153 | Uni-Select, Inc. | 7,400 | 186 | |||||
| Capital Power Corp. | 30,800 | 699 | Valeant Pharmaceuticals International, | |||||||
| Cascades, Inc.(Ñ) | 200,830 | 1,117 | Inc.(Æ) | 56,811 | 7,558 | |||||
| CCL Industries, Inc. Class B | 9,500 | 960 | Vermilion Energy, Inc.(Ñ) | 16,400 | 931 | |||||
| Celestica, Inc.(Æ) | 84,400 | 927 | West Fraser Timber Co., Ltd. | 12,500 | 656 | |||||
| Cenovus Energy, Inc. | 38,500 | 953 | Yellow Media, Ltd.(Æ)(Ñ) | 110,000 | 1,607 | |||||
| Centerra Gold, Inc. | 35,600 | 139 | 217,851 | |||||||
| CI Financial Corp. | 226,001 | 6,571 | ||||||||
| Cominar Real Estate Investment Trust(ö) | 95,500 | 1,617 | Cayman Islands - 1.3% | |||||||
| Concordia Healthcare Corp.(Æ) | 26,900 | 1,008 | Alibaba Group Holding, Ltd. - ADR(Æ) | 121,302 | 11,960 | |||||
| Constellation Software, Inc.(Þ) | 5,400 | 1,521 | Baidu, Inc. - ADR(Æ) | 75,387 | 18,000 | |||||
| Crescent Point Energy Corp.(Ñ) | 52,763 | 1,744 | Chaoda Modern Agriculture Holdings, | |||||||
| Dollarama, Inc. | 22,900 | 2,012 | Ltd.(Æ)(Å) | 12,120,000 | 703 | |||||
| Dominioin Diamond Corp.(Æ) | 130,100 | 1,820 | ENN Energy Holdings, Ltd. | 768,000 | 4,981 | |||||
| Dream Industrial Real Estate Investment | Hopewell Highway Infrastructure, Ltd. | 1,275 | 1 | |||||||
| Trust(ö) | 32,400 | 265 | MGM China Holdings, Ltd. | 2,096,400 | 6,731 | |||||
| Dundee Corp. Class A(Æ) | 15,700 | 223 | Sands China, Ltd. | 1,660,800 | 10,344 | |||||
| Encana Corp. | 349,400 | 6,510 | United Laboratories International | |||||||
| Enerplus Corp. | 153,300 | 2,195 | Holdings, Ltd. (The)(Æ) | 564,000 | 433 | |||||
| Ensign Energy Services, Inc. | 39,700 | 448 | 53,153 | |||||||
| Finning International, Inc. | 79,600 | 2,055 | Czech Republic - 0.2% | |||||||
| Genworth MI Canada, Inc.(Ñ) | 99,000 | 3,461 | CEZ AS | 238,175 | 6,588 | |||||
| Gibson Energy, Inc. | 133,500 | 3,883 | ||||||||
| Great-West Lifeco, Inc.(Þ) | 12,900 | 361 | Denmark - 2.0% | |||||||
| Husky Energy, Inc. | 35,520 | 858 | AP Moeller - Maersk A/S Class A | 422 | 958 | |||||
| IGM Financial, Inc. | 9,700 | 388 | AP Moeller - Maersk A/S Class B | 1,820 | 4,241 | |||||
| Imperial Oil, Ltd.(Ñ) | 21,853 | 1,052 | Carlsberg A/S Class B | 41,551 | 3,659 | |||||
| Industrial Alliance Insurance & | Coloplast A/S Class B | 101,815 | 8,862 | |||||||
| Financial Services, Inc. | 13,300 | 536 | Danske Bank A/S | 897,774 | 24,623 | |||||
| Keyera Corp. | 15,900 | 1,265 | Dfds A/S | 20,971 | 1,776 | |||||
| Lightstream Resources, Ltd.(Æ)(Ñ) | 21,700 | 57 | DSV A/S | 26,623 | 796 | |||||
| Loblaw Cos., Ltd. | 127,287 | 6,632 | GN Store Nord A/S | 108,016 | 2,513 | |||||
| Lucara Diamond Corp. | 868,300 | 1,757 | H Lundbeck A/S | 17,909 | 380 | |||||
| Magellan Aerospace Corp.(Æ) | 4,400 | 48 | Novo Nordisk A/S Class B | 264,395 | 11,961 | |||||
| Magna International, Inc. Class A | 54,500 | 5,379 | Pandora A/S | 27,798 | 2,340 | |||||
| MEG Energy Corp. Class A(Æ) | 214,200 | 5,169 | Schouw & Co. | 17,518 | 776 | |||||
| Morguard Corp. | 9,100 | 1,169 | Sydbank A/S(Æ) | 15,750 | 500 | |||||
| Morguard North American Residential | TDC A/S | 2,247,154 | 17,143 | |||||||
| Real Estate Investment Trust(ö) | 49,000 | 451 | Topdanmark A/S(Æ) | 29,242 | 930 | |||||
| Morguard Real Estate Investment | 81,458 | |||||||||
| Trust(ö) | 30,200 | 496 | ||||||||
| National Bank of Canada | 68,781 | 3,215 | Finland - 0.7% | |||||||
| Nevsun Resources, Ltd. | 361,400 | 1,222 | Fortum OYJ | 265,360 | 6,148 | |||||
| Power Corp. of Canada | 70,227 | 1,853 | HKScan OYJ A Shares(Æ) | 44,058 | 187 | |||||
| Power Financial Corp. | 30,317 | 888 | Kesko OYJ Class B | 24,729 | 936 | |||||
| Kone OYJ Class B | 106,452 | 4,576 | ||||||||
| See accompanying notes which are an integral part of the financial statements. | ||||||||||
| Russell International Developed Markets Fund 189 | ||||||||||
| Russell Investment Company | ||||||||||
| Russell International Developed Markets Fund | ||||||||||
| Schedule of Investments, continued — October 31, 2014 | ||||||||||
| Amounts in thousands (except share amounts) | Amounts in thousands (except share amounts) | |||||||||
| Principal | Fair | Principal | Fair | |||||||
| Amount ($) | Value | Amount ($) | Value | |||||||
| or Shares | $ | or Shares | $ | |||||||
| Orion OYJ Class B | 146,219 | 4,964 | Bayerische Motoren Werke AG | 73,429 | 7,851 | |||||
| Sampo Oyj Class A | 220,637 | 10,554 | Beiersdorf AG(Æ) | 111,539 | 9,024 | |||||
| Sponda OYJ | 210,086 | 961 | Continental AG | 62,571 | 12,283 | |||||
| 28,326 | Daimler AG | 246,800 | 19,184 | |||||||
| Deutsche Beteiligungs AG | 35,006 | 958 | ||||||||
| France - 8.4% | Deutsche Boerse AG | 346,963 | 23,701 | |||||||
| Air Liquide SA Class A | 98,935 | 11,933 | Deutsche Post AG | 230,843 | 7,248 | |||||
| Altamir(Æ) | 3,500 | 44 | Deutsche Telekom AG | 419,611 | 6,321 | |||||
| ANF Immobilier Class A(ö) | 20,364 | 561 | ELMOS Semiconductor AG(Æ) | 12,215 | 218 | |||||
| AXA SA | 140,180 | 3,234 | Fielmann AG | 6,408 | 418 | |||||
| BNP Paribas SA | 68,517 | 4,305 | Freenet AG | 42,422 | 1,110 | |||||
| Boiron SA | 8,804 | 783 | Fresenius Medical Care AG & Co. KGaA | 17,661 | 1,295 | |||||
| Bouygues SA - ADR | 248,366 | 8,575 | Fresenius SE & Co. KGaA | 35,112 | 1,806 | |||||
| Bureau Veritas SA | 115,422 | 2,854 | Hannover Rueck SE | 24,050 | 2,004 | |||||
| Capital Gemini SA | 310,247 | 20,396 | HeidelbergCement AG | 52,539 | 3,576 | |||||
| Casino Guichard Perrachon SA(Æ) | 118,028 | 12,096 | Hornbach Baumarkt AG(Æ) | 19,355 | 688 | |||||
| Cegid Group | 14,580 | 537 | Infineon Technologies AG - ADR | 456,131 | 4,425 | |||||
| Credit Agricole SA | 562,975 | 8,321 | Krones AG | 6,497 | 622 | |||||
| Danone SA | 181,335 | 12,321 | Linde AG | 80,995 | 14,936 | |||||
| Dassault Systemes SA | 47,544 | 3,013 | Merck KGaA | 193,055 | 17,436 | |||||
| Etablissements Maurel et Prom(Æ) | 81,505 | 975 | MTU Aero Engines AG | 26,364 | 2,308 | |||||
| Euler Hermes Group | 2,497 | 244 | Muenchener Rueckversicherungs- | |||||||
| Faurecia | 239,790 | 7,750 | Gesellschaft AG | 57,173 | 11,238 | |||||
| GDF Suez | 596,454 | 14,467 | Nordex SE(Æ) | 111,530 | 1,884 | |||||
| GDF Suez(Æ) | 55,671 | — | OSRAM Licht AG(Æ) | 4,366 | 153 | |||||
| Guerbet(Æ) | 12,078 | 562 | ProSiebenSat.1 Media AG | 128,957 | 5,196 | |||||
| Ipsen SA | 57,386 | 2,822 | Rational AG | 10,734 | 3,359 | |||||
| Legrand SA - ADR | 122,569 | 6,595 | Rhoen Klinikum AG | 87,845 | 2,618 | |||||
| L'Oreal SA | 43,313 | 6,790 | SAP SE - ADR | 262,967 | 17,874 | |||||
| LVMH Moet Hennessy Louis Vuitton | Siemens AG | 161,060 | 18,147 | |||||||
| SA - ADR | 72,363 | 12,274 | Sky Deutschland AG(Æ) | 381,100 | 3,214 | |||||
| Metropole Television SA | 76,464 | 1,323 | Software AG | 36,315 | 912 | |||||
| Natixis SA | 558,319 | 3,842 | Symrise AG | 22,280 | 1,253 | |||||
| Pernod Ricard SA | 108,120 | 12,307 | Talanx AG | 23,540 | 759 | |||||
| Publicis Groupe SA - ADR(Æ) | 109,702 | 7,598 | TUI AG | 111,401 | 1,700 | |||||
| Rallye SA | 87,006 | 3,366 | United Internet AG | 52,728 | 2,062 | |||||
| Rexel SA Class H | 54,746 | 920 | Volkswagen AG | 75,300 | 16,013 | |||||
| Safran SA | 124,285 | 7,865 | Wacker Neuson SE(Æ) | 83,886 | 1,629 | |||||
| Sanofi - ADR | 571,690 | 52,771 | 258,043 | |||||||
| Schneider Electric SE(Æ) | 394,355 | 31,074 | ||||||||
| SCOR SE - ADR | 206,219 | 6,316 | Hong Kong - 2.5% | |||||||
| Societe BIC SA | 15,744 | 1,962 | AIA Group, Ltd. | 3,728,769 | 20,795 | |||||
| Societe Financière Foncière et de | Champion REIT(ö) | 3,878,000 | 1,710 | |||||||
| Participations(Æ) | 14,205 | 861 | Cheung Kong Holdings, Ltd. | 508,000 | 9,014 | |||||
| Tarkett(Æ) | 8,708 | 251 | China Mobile, Ltd. | 1,075,000 | 13,377 | |||||
| Teleperformance - GDR | 21,928 | 1,381 | CLP Holdings, Ltd. | 93,500 | 805 | |||||
| Thales SA | 35,502 | 1,761 | CSI Properties, Ltd. | 22,190,000 | 959 | |||||
| Total SA | 663,494 | 39,428 | Global Brands Group Holdings, Ltd.(Æ) | 15,505,164 | 3,439 | |||||
| Unibail-Rodamco SE(ö) | 4,681 | 1,199 | Guangdong Investment, Ltd. | 4,037,200 | 5,310 | |||||
| Valeo SA | 42,229 | 4,727 | Hang Seng Bank, Ltd. | 61,700 | 1,045 | |||||
| Vallourec SA | 388,353 | 14,259 | Hong Kong Exchanges and Clearing, | |||||||
| Vicat | 2,994 | 205 | Ltd. | 34,854 | 773 | |||||
| Vinci SA | 142,526 | 8,122 | Hopewell Holdings, Ltd. | 25,500 | 90 | |||||
| Vivendi SA - ADR(Æ) | 126,034 | 3,076 | Hysan Development Co., Ltd. | 418,000 | 1,905 | |||||
| 346,066 | Kowloon Development Co., Ltd. | 1,408,000 | 1,681 | |||||||
| Lai Sun Development Co., Ltd. | 4,413,000 | 113 | ||||||||
| Germany - 6.3% | Lenovo Group, Ltd. | 9,404,000 | 13,848 | |||||||
| Aareal Bank AG | 4,800 | 205 | Link Real Estate Investment Trust (The) | |||||||
| Axel Springer SE Class A | 11,217 | 615 | (ö) | 421,000 | 2,473 | |||||
| Bayer AG | 223,676 | 31,800 | MTR Corp., Ltd. | 100,000 | 408 | |||||
| See accompanying notes which are an integral part of the financial statements. | ||||||||||
| 190 Russell International Developed Markets Fund | ||||||||||
| Russell Investment Company | ||||||||||
| Russell International Developed Markets Fund | ||||||||||
| Schedule of Investments, continued — October 31, 2014 | ||||||||||
| Amounts in thousands (except share amounts) | Amounts in thousands (except share amounts) | |||||||||
| Principal | Fair | Principal | Fair | |||||||
| Amount ($) | Value | Amount ($) | Value | |||||||
| or Shares | $ | or Shares | $ | |||||||
| Power Assets Holdings, Ltd. | 378,000 | 3,648 | Italmobiliare SpA | 22,229 | 357 | |||||
| Sino Land Co., Ltd. | 874,000 | 1,445 | Parmalat SpA | 320,962 | 964 | |||||
| Sun Hung Kai & Co., Ltd. | 1,146,000 | 854 | Recordati SpA | 68,979 | 1,193 | |||||
| Sunlight Real Estate Investment Trust(ö) | 1,308,000 | 568 | Saipem SpA - ADR(Æ) | 195,189 | 3,057 | |||||
| Swire Pacific, Ltd. Class A | 129,321 | 1,696 | Snam Rete Gas SpA | 343,532 | 1,855 | |||||
| Swire Properties, Ltd. | 162,800 | 522 | Telecom Italia SpA(Æ)(Ñ) | 7,074,575 | 8,001 | |||||
| Tai Cheung Holdings, Ltd.(Æ) | 299,000 | 246 | 74,407 | |||||||
| Television Broadcasts, Ltd. | 141,934 | 777 | ||||||||
| Tencent Holdings, Ltd.(Æ) | 1,026,200 | 16,355 | Japan - 13.1% | |||||||
| 103,856 | Aderans Co., Ltd. | 47,900 | 564 | |||||||
| Aichi Bank, Ltd. (The) | 1,800 | 87 | ||||||||
| India - 1.0% | Ajinomoto Co., Inc. | 67,000 | 1,254 | |||||||
| HDFC Bank, Ltd. - ADR | 261,917 | 13,732 | Alps Electric Co., Ltd. | 30,800 | 507 | |||||
| Housing Development Finance Corp. | 402,002 | 7,241 | Amada Co., Ltd. | 1,231,900 | 10,452 | |||||
| ICICI Bank, Ltd. - ADR | 108,200 | 6,098 | Arcs Co., Ltd. | 51,400 | 1,117 | |||||
| Reliance Industries, Ltd. | 226,871 | 3,697 | Asahi Group Holdings, Ltd. | 84,600 | 2,581 | |||||
| Tata Motors, Ltd. - ADR(Ñ) | 244,105 | 11,497 | Asahi Holdings, Inc.(Æ) | 50,900 | 836 | |||||
| 42,265 | Asahi Kasei Corp. | 333,000 | 2,674 | |||||||
| Astellas Pharma, Inc. | 1,518,900 | 22,975 | ||||||||
| Indonesia - 0.3% | Bandai Namco Holdings, Inc. | 29,300 | 705 | |||||||
| Bank Rakyat Indonesia | 9,884,700 | 9,059 | Bic Camera, Inc.(Æ)(Ñ) | 70,300 | 606 | |||||
| Telekomunikasi Indonesia Persero Tbk | Bridgestone Corp. | 5,400 | 176 | |||||||
| PT | 10,714,100 | 2,438 | Calbee, Inc. | 8,900 | 309 | |||||
| 11,497 | Canon Marketing Japan, Inc. | 94,400 | 1,900 | |||||||
| Ireland - 0.9% | Canon, Inc. | 540,700 | 16,314 | |||||||
| CRH PLC | 604,900 | 13,412 | Cawachi, Ltd. | 95,500 | 1,466 | |||||
| DCC PLC | 56,115 | 3,137 | Central Glass Co., Ltd. | 271,000 | 878 | |||||
| James Hardie Industries PLC | 418,930 | 4,431 | Chudenko Corp. | 9,700 | 152 | |||||
| Origin Enterprises PLC | 69,006 | 683 | Daicel Chemical Industries, Ltd. | 92,000 | 1,045 | |||||
| Ryanair Holdings PLC - ADR(Æ) | 123,455 | 6,857 | Daihatsu Motor Co., Ltd. | 6,000 | 84 | |||||
| Total Produce PLC | 274,640 | 337 | Dai-ichi Life Insurance Co., Ltd. (The) | 341,525 | 5,017 | |||||
| XL Group PLC Class A | 182,000 | 6,166 | Daikin Industries, Ltd. | 177,200 | 10,750 | |||||
| 35,023 | Daito Trust Construction Co., Ltd. | 46,600 | 5,736 | |||||||
| Daiwa Industries, Ltd. | 29,000 | 218 | ||||||||
| Isle of Man - 0.1% | Denso Corp. | 280,600 | 12,513 | |||||||
| GVC Holdings PLC(Æ) | 11,500 | 89 | Doutor Nichires Holdings Co., Ltd. | 79,000 | 1,163 | |||||
| Playtech PLC | 280,578 | 3,169 | Dydo Drinco, Inc. | 2,200 | 93 | |||||
| 3,258 | East Japan Railway Co. | 18,000 | 1,385 | |||||||
| Eighteenth Bank, Ltd. (The) | 172,000 | 482 | ||||||||
| Israel - 1.0% | FANUC Corp. | 88,700 | 15,099 | |||||||
| Check Point Software Technologies, Ltd. | Fidea Holdings Co., Ltd.(Æ)(Ñ) | 71,200 | 140 | |||||||
| (Æ) | 119,147 | 8,847 | Fuji Electric Co., Ltd. | 205,000 | 874 | |||||
| Discount Investment Corp., Ltd.(Æ) | 38,739 | 262 | Fuji Heavy Industries, Ltd. | 270,400 | 8,664 | |||||
| Israel Discount Bank, Ltd. Class A(Æ) | 219,799 | 350 | Fuji Soft, Inc. | 72,200 | 1,743 | |||||
| Orbotech, Ltd.(Æ) | 40,600 | 651 | Fujitsu General, Ltd. | 2,000 | 25 | |||||
| Taro Pharmaceutical Industries, Ltd.(Æ) | 11,100 | 1,798 | Fukuda Denshi Co., Ltd.(Ñ) | 27,700 | 1,403 | |||||
| Teva Pharmaceutical Industries, Ltd. | Fuyo General Lease Co., Ltd. | 45,800 | 1,774 | |||||||
| - ADR | 477,223 | 26,949 | Geo Holdings Corp. | 109,500 | 958 | |||||
| 38,857 | Gunma Bank, Ltd. | 64,000 | 391 | |||||||
| Gunze, Ltd. | 415,000 | 1,142 | ||||||||
| Italy - 1.8% | Heiwa Corp. | 85,400 | 1,715 | |||||||
| ASTM SpA | 21,254 | 255 | Heiwado Co., Ltd. | 97,500 | 1,791 | |||||
| Atlantia SpA | 203,360 | 4,791 | Hitachi, Ltd. | 2,928,000 | 22,394 | |||||
| Beni Stabili SpA SIIQ(ö) | 2,593,000 | 1,786 | Honda Motor Co., Ltd. | 866,070 | 26,824 | |||||
| Danieli & C Officine Meccaniche SpA | 53,806 | 971 | Hoya Corp. | 640,300 | 22,274 | |||||
| De Longhi SPA(Æ) | 14,680 | 287 | Hyakugo Bank, Ltd. (The) | 41,000 | 169 | |||||
| Enel SpA | 1,529,125 | 7,799 | Inpex Corp. | 652,600 | 8,151 | |||||
| ENI SpA - ADR | 1,469,509 | 31,306 | Isuzu Motors, Ltd. | 290,000 | 3,697 | |||||
| Immobiliare Grande Distribuzione(ö) | 1,919,659 | 1,601 | IT Holdings Corp. | 22,800 | 365 | |||||
| Intesa Sanpaolo SpA | 3,475,847 | 10,184 | ||||||||
| See accompanying notes which are an integral part of the financial statements. | ||||||||||
| Russell International Developed Markets Fund 191 | ||||||||||
| Russell Investment Company | ||||||||||
| Russell International Developed Markets Fund | ||||||||||
| Schedule of Investments, continued — October 31, 2014 | ||||||||||
| Amounts in thousands (except share amounts) | Amounts in thousands (except share amounts) | |||||||||
| Principal | Fair | Principal | Fair | |||||||
| Amount ($) | Value | Amount ($) | Value | |||||||
| or Shares | $ | or Shares | $ | |||||||
| ITOCHU Corp. | 735,200 | 8,748 | Osaka Gas Co., Ltd. | 145,000 | 569 | |||||
| Itoki Corp. | 15,800 | 87 | Otsuka Corp. | 16,900 | 615 | |||||
| Japan Petroleum Exploration Co. | 22,900 | 737 | Otsuka Holdings Co., Ltd. | 167,500 | 5,782 | |||||
| Japan Tobacco, Inc. | 202,600 | 6,793 | Paltac Corp.(Æ) | 109,900 | 1,322 | |||||
| JGC Corp. | 16,000 | 401 | Panahome Corp.(Æ) | 86,000 | 567 | |||||
| Kamei Corp. | 39,000 | 277 | Prima Meat Packers, Ltd. | 388,000 | 908 | |||||
| Kamigumi Co., Ltd. | 10,000 | 95 | Ricoh Leasing Co., Ltd. | 17,100 | 468 | |||||
| Kanamoto Co., Ltd. | 19,400 | 689 | Rinnai Corp. | 2,100 | 183 | |||||
| Kanematsu Corp. | 1,092,000 | 1,692 | Round One Corp. | 276,200 | 1,638 | |||||
| Kao Corp. | 228,900 | 8,772 | Saizeriya Co., Ltd.(Æ) | 30,500 | 448 | |||||
| Kato Sangyo Co., Ltd. | 54,000 | 1,133 | San-A Co., Ltd. Class A | 7,900 | 264 | |||||
| Kawasaki Kisen Kaisha, Ltd. | 367,000 | 817 | San-In Godo Bank, Ltd. (The) | 28,000 | 212 | |||||
| KDDI Corp. | 171,400 | 11,025 | Sanki Engineering Co., Ltd. | 24,400 | 167 | |||||
| Keihan Electric Railway Co., Ltd. | 21,000 | 102 | Sankyp Tateyama, Inc.(Æ) | 5,800 | 102 | |||||
| Keyence Corp. | 16,300 | 7,616 | Sanshin Electronics Co., Ltd. | 215,700 | 1,509 | |||||
| Kinden Corp. | 10,000 | 101 | Santen Pharmaceutical Co., Ltd. | 24,700 | 1,443 | |||||
| Kissei Pharmaceutical Co., Ltd. | 33,600 | 860 | Sanyo Shokai, Ltd. | 118,000 | 285 | |||||
| Kohnan Shoji Co. Ltd.(Æ) | 42,600 | 484 | Secom Co., Ltd. | 175,000 | 10,518 | |||||
| Kokuyo Co., Ltd.(Æ) | 36,200 | 284 | Seiren Co., Ltd. | 35,800 | 304 | |||||
| Konoike Transport Co., Ltd. | 5,900 | 114 | Seven & I Holdings Co., Ltd. | 280,100 | 10,675 | |||||
| Kura Corp.(Æ) | 9,900 | 265 | Shimamura Co., Ltd. | 13,800 | 1,188 | |||||
| Kurimoto, Ltd. | 239,000 | 483 | Shin-Etsu Chemical Co., Ltd. | 349,225 | 21,900 | |||||
| Kyocera Corp. | 124,600 | 5,596 | SKY Perfect JSAT Holdings, Inc. | 283,300 | 1,707 | |||||
| KYORIN Holdings, Inc. | 82,200 | 1,695 | SMC Corp. | 48,600 | 13,443 | |||||
| Kyudenko Corp. | 136,000 | 1,492 | SoftBank Corp. | 141,700 | 10,015 | |||||
| Mabuchi Motor Co., Ltd. | 168,600 | 14,229 | Sompo Japan Nipponkoa Holdings, Inc. | 184,600 | 4,518 | |||||
| Maeda Road Construction Co., Ltd. | 75,000 | 1,137 | Sony Corp. | 281,200 | 5,187 | |||||
| Marudai Food Co. Ltd.(Æ) | 27,000 | 100 | Start Today Co., Ltd. | 68,500 | 1,451 | |||||
| MID Reit, Inc. Class A(ö) | 648 | 1,612 | Sumitomo Corp. | 969,600 | 10,151 | |||||
| Mimasu Semiconductor Industry Co., | Sumitomo Densetsu Co., Ltd. | 10,600 | 128 | |||||||
| Ltd. | 62,000 | 547 | Sumitomo Mitsui Financial Group, Inc. | 437,800 | 17,148 | |||||
| Mitsubishi Heavy Industries, Ltd. | 967,000 | 5,885 | Taisho Pharmaceutical Holdings Co., | |||||||
| Mitsubishi Tanabe Pharma Corp. | 51,300 | 767 | Ltd. | 5,300 | 367 | |||||
| Mitsubishi UFJ Financial Group, Inc. | 1,794,800 | 10,102 | Takara Leben Co., Ltd. | 34,300 | 141 | |||||
| Mitsuboshi Belting Co., Ltd. | 10,000 | 71 | Takeda Pharmaceutical Co., Ltd. | 69,700 | 2,981 | |||||
| Mitsui Fudosan Co., Ltd. | 139,000 | 4,340 | Takiron Co., Ltd. | 67,000 | 327 | |||||
| Mitsui High-Tec, Inc. | 10,800 | 63 | Takuma Co., Ltd. | 206,000 | 1,287 | |||||
| Mochida Pharmaceutical Co., Ltd. | 6,000 | 365 | Terumo Corp. | 225,600 | 5,487 | |||||
| MS&AD Insurance Group Holdings, Inc. | 124,500 | 2,613 | Tobu Railway Co., Ltd. | 56,000 | 279 | |||||
| Namura Shipbuilding Co., Ltd. | 65,600 | 616 | Tochigi Bank, Ltd. (The) | 18,000 | 72 | |||||
| Nankai Electric Railway Co., Ltd. | 30,000 | 141 | Tokai Holdings Corp.(Æ) | 52,200 | 252 | |||||
| Nichireki Co., Ltd.(Æ)(Ñ) | 45,000 | 349 | Tokai Rika Co., Ltd.(Æ) | 4,600 | 86 | |||||
| NIFTY Corp. | 13,200 | 157 | Tokyo Gas Co., Ltd. | 222,000 | 1,257 | |||||
| Nippo Corp. | 101,000 | 1,812 | TonenGeneral Sekiyu KK | 5,000 | 43 | |||||
| Nippon Building Fund, Inc.(ö) | 16 | 89 | Toppan Forms Co., Ltd. | 65,400 | 604 | |||||
| Nippon Road Co., Ltd. (The) | 321,000 | 1,755 | Toshiba TEC Corp. | 70,000 | 485 | |||||
| Nippon Telegraph & Telephone Corp. | 64,800 | 3,976 | Tosoh Corp. | 471,000 | 1,988 | |||||
| Nishimatsuya Chain Co., Ltd. | 171,200 | 1,529 | Toyo Suisan Kaisha, Ltd. | 15,000 | 512 | |||||
| Nissan Chemical Industries, Ltd. | 15,800 | 286 | Toyota Motor Corp. | 105,000 | 6,074 | |||||
| Nisshin Seifun Group, Inc. | 32,890 | 328 | Tsukada Global Holdings, Inc.(Ñ) | 14,800 | 119 | |||||
| Nisshinbo Holdings, Inc. | 59,000 | 471 | UKC Holdings Corp.(Æ) | 42,200 | 674 | |||||
| Nitori Holdings Co., Ltd. | 93,100 | 5,843 | Valor Co., Ltd. | 81,000 | 1,296 | |||||
| Noevir Holdings Co., Ltd. | 25,500 | 458 | West Japan Railway Co. | 55,000 | 2,593 | |||||
| NTT DOCOMO, Inc. | 584,825 | 9,695 | Yahagi Construction Co., Ltd. | 24,100 | 178 | |||||
| Oita Bank, Ltd. (The) | 83,000 | 306 | Yamato Holdings Co., Ltd. | 73,400 | 1,542 | |||||
| Oki Electric Industry Co., Ltd. | 664,000 | 1,490 | Yamazen Corp. | 18,100 | 139 | |||||
| Okinawa Cellular Telephone Co.(Æ) | 27,200 | 733 | Yellow Hat, Ltd. | 16,300 | 344 | |||||
| Ono Pharmaceutical Co., Ltd. | 162,600 | 16,126 | Yuasa Trading Co., Ltd. | 77,500 | 1,439 | |||||
| ORIX Corp. | 608,900 | 8,177 | Yurtec Corp.(Æ) | 80,000 | 440 | |||||
| See accompanying notes which are an integral part of the financial statements. | ||||||||||
| 192 Russell International Developed Markets Fund | ||||||||||
| Russell Investment Company | |||||||||
| Russell International Developed Markets Fund | |||||||||
| Schedule of Investments, continued — October 31, 2014 | |||||||||
| Amounts in thousands (except share amounts) | Amounts in thousands (except share amounts) | ||||||||
| Principal | Fair | Principal | Fair | ||||||
| Amount ($) | Value | Amount ($) | Value | ||||||
| or Shares | $ | or Shares | $ | ||||||
| ZERIA Pharmaceutical Co., Ltd. | 15,900 | 316 | Norway - 1.0% | ||||||
| 536,295 | Austevoll Seafood ASA | 237,271 | 1,541 | ||||||
| Bakkafrost P/F | 39,241 | 960 | |||||||
| Jersey - 0.8% | Bonheur ASA | 5,404 | 68 | ||||||
| Delphi Automotive PLC | 63,916 | 4,409 | DNB ASA | 1,052,011 | 19,325 | ||||
| Henderson Group PLC | 1,163,529 | 3,924 | Marine Harvest ASA | 322,037 | 4,559 | ||||
| WPP PLC | 1,319,224 | 25,704 | Orkla ASA | 1,205,310 | 9,212 | ||||
| 34,037 | Statoil ASA Class N | 78,963 | 1,791 | ||||||
| TE Connectivity, Ltd. | 166,610 | 3,745 | |||||||
| Kazakhstan - 0.0% | 41,201 | ||||||||
| Per Aarsleff A/S(Æ) | 4,114 | 684 | |||||||
| Portugal - 0.1% | |||||||||
| Kenya - 0.1% | �� | Galp Energia SGPS SA Class B | 342,892 | 4,969 | |||||
| Safaricom, Ltd. | 23,176,200 | 3,148 | Sonaecom SGPS SA(Æ) | 172,764 | 331 | ||||
| Liechtenstein - 0.0% | 5,300 | ||||||||
| VP Bank AG | 4,314 | 358 | Russia - 0.3% | ||||||
| Luxembourg - 0.0% | Gazprom OAO - ADR(Æ) | 1,698,337 | 11,257 | ||||||
| Tenaris SA | 47,621 | 937 | Sberbank of Russia - ADR | 305,298 | 2,317 | ||||
| 13,574 | |||||||||
| Mexico - 0.2% | |||||||||
| Cemex SAB de CV - ADR(Æ) | 339,716 | 4,179 | Singapore - 1.5% | ||||||
| Fomento Economico Mexicano SAB de | Ascendas Real Estate Investment | ||||||||
| CV - ADR | 46,793 | 4,503 | Trust(ö) | 194,000 | 337 | ||||
| 8,682 | CapitaMall Trust Class A(ö) | 207,000 | 317 | ||||||
| Chip Eng Seng Corp., Ltd. | 327,000 | 224 | |||||||
| Netherlands - 4.7% | ComfortDelGro Corp., Ltd. | 944,000 | 1,940 | ||||||
| Aegon NV | 1,994,100 | 16,228 | CSE Global, Ltd. | 927,000 | 487 | ||||
| Akzo Nobel NV | 361,816 | 24,035 | DBS Group Holdings, Ltd. | 822,796 | 11,836 | ||||
| AMG Advanced Metallurgical Group | First Resources, Ltd.(Æ) | 243,000 | 393 | ||||||
| NV(Æ) | 2,011 | 17 | Fortune Real Estate Investment Trust(ö) | 1,125,000 | 1,026 | ||||
| ASM International NV | 36,626 | 1,465 | Indofood Agri Resources, Ltd. | 750,000 | 488 | ||||
| BE Semiconductor Industries NV | 100,204 | 1,905 | Jardine Cycle & Carriage, Ltd. | 501,000 | 15,560 | ||||
| Boskalis Westminster NV | 47,453 | 2,528 | Keppel Corp., Ltd. - ADR | 138,000 | 1,014 | ||||
| Delta Lloyd NV | 764,731 | 17,417 | Keppel REIT Management, Ltd.(ö) | 18,320 | 17 | ||||
| Heineken NV | 147,386 | 11,006 | Lian Beng Group, Ltd.(Æ) | 1,569,000 | 843 | ||||
| ING Groep NV(Æ) | 3,208,179 | 45,872 | Oversea-Chinese Banking Corp., Ltd. | 148,875 | 1,146 | ||||
| Koninklijke Ahold NV(Æ) | 188,930 | 3,158 | Pacific Radiance, Ltd.(Æ) | 823,000 | 682 | ||||
| Koninklijke KPN NV | 2,574,000 | 8,441 | SATS, Ltd. | 107,000 | 258 | ||||
| Koninklijke Philips NV | 405,674 | 11,332 | Sembcorp Industries, Ltd. | 47,000 | 178 | ||||
| NN Group NV(Æ) | 242,876 | 6,930 | Singapore Airlines, Ltd. | 91,000 | 701 | ||||
| Nutreco NV | 23,081 | 1,156 | Singapore Exchange, Ltd. | 80,000 | 436 | ||||
| NXP Semiconductor NV(Æ) | 72,861 | 5,003 | Singapore Technologies Engineering, | ||||||
| Randstad Holding NV(Æ) | 217,770 | 9,598 | Ltd. | 81,000 | 236 | ||||
| Reed Elsevier NV(Æ) | 356,546 | 8,206 | Singapore Telecommunications, Ltd. | 919,554 | 2,706 | ||||
| STMicroelectronics NV | 1,149,802 | 7,664 | StarHub, Ltd. | 112,000 | 360 | ||||
| TNT NV - ADR(Æ) | 437,900 | 1,856 | United Overseas Bank, Ltd. | 1,038,857 | 18,599 | ||||
| Unilever NV | 168,774 | 6,545 | UOL Group, Ltd. | 22,000 | 110 | ||||
| Wereldhave NV(ö) | 22,514 | 1,845 | Venture Corp., Ltd. | 127,000 | 764 | ||||
| Wolters Kluwer NV | 60,262 | 1,608 | Wheelock Properties Singapore, Ltd. | 97,000 | 136 | ||||
| 193,815 | Wing Tai Holdings, Ltd. | 1,207,000 | 1,682 | ||||||
| 62,476 | |||||||||
| New Zealand - 0.1% | |||||||||
| Air New Zealand, Ltd. | 1,081,842 | 1,695 | South Africa - 0.3% | ||||||
| Chorus, Ltd.(Æ) | 94,711 | 156 | Bidvest Group, Ltd.(Æ) | 238,079 | 6,548 | ||||
| Heartland New Zealand, Ltd.(Æ) | 547,300 | 426 | Discovery Holdings, Ltd. | 819,858 | 7,458 | ||||
| Infratil, Ltd. | 356,383 | 796 | 14,006 | ||||||
| Vector, Ltd. | 21,600 | 46 | |||||||
| 3,119 | South Korea - 1.0% | ||||||||
| Hana Financial Group, Inc. | 174,545 | 6,051 | |||||||
| Hankook Tire Co., Ltd. | 161,700 | 8,321 | |||||||
| See accompanying notes which are an integral part of the financial statements. | |||||||||
| Russell International Developed Markets Fund 193 | |||||||||
| Russell Investment Company | ||||||||||
| Russell International Developed Markets Fund | ||||||||||
| Schedule of Investments, continued — October 31, 2014 | ||||||||||
| Amounts in thousands (except share amounts) | Amounts in thousands (except share amounts) | |||||||||
| Principal | Fair | Principal | Fair | |||||||
| Amount ($) | Value | Amount ($) | Value | |||||||
| or Shares | $ | or Shares | $ | |||||||
| Samsung Electronics Co., Ltd. | 5,060 | 5,890 | Bucher Industries AG | 795 | 202 | |||||
| Shinhan Financial Group Co., Ltd. | 284,830 | 13,406 | Credit Suisse Group AG(Æ) | 903,923 | 24,032 | |||||
| SK Hynix, Inc.(Æ) | 136,996 | 6,082 | Flughafen Zuerich AG | 1,263 | 804 | |||||
| 39,750 | Galenica AG | 703 | 601 | |||||||
| GAM Holding AG(Æ) | 192,721 | 3,285 | ||||||||
| Spain - 1.4% | Geberit AG | 26,875 | 9,156 | |||||||
| Acciona SA(Æ) | 1,726 | 120 | Givaudan SA(Æ) | 693 | 1,155 | |||||
| Amadeus IT Holding SA Class A | 360,592 | 13,240 | Helvetia Holding AG | 14,697 | 6,977 | |||||
| Banco Bilbao Vizcaya Argentaria SA | Julius Baer Group, Ltd.(Æ) | 160,292 | 7,010 | |||||||
| - ADR | 641,370 | 7,160 | Kardex AG(Æ) | 11,140 | 504 | |||||
| Banco Santander SA - ADR | 2,112,858 | 18,608 | Kuehne & Nagel International AG | 25,267 | 3,288 | |||||
| Corp. Financiera Alba SA | 15,584 | 859 | Lonza Group AG(Æ) | 123,256 | 13,566 | |||||
| Ebro Foods SA | 75,454 | 1,349 | Metall Zug AG | 377 | 929 | |||||
| Endesa SA - ADR(Ñ) | 92,047 | 1,792 | Nestle SA | 628,460 | 45,984 | |||||
| Gamesa Corp. Tecnologica SA(Æ) | 46,500 | 459 | Novartis AG | 642,140 | 59,599 | |||||
| Gas Natural SDG SA | 47,651 | 1,374 | OC Oerlikon Corp. AG(Æ) | 679,900 | 8,586 | |||||
| Iberdrola SA | 1,117,430 | 7,899 | Partners Group Holding AG | 29,519 | 7,846 | |||||
| Indra Sistemas SA | 175,225 | 1,932 | PSP Swiss Property AG | 4,143 | 355 | |||||
| Prosegur Cia de Seguridad SA | 59,934 | 352 | Rieter Holding AG(Æ) | 3,628 | 669 | |||||
| Red Electrica Corp. SA | 18,005 | 1,571 | Roche Holding AG | 219,677 | 64,774 | |||||
| Zeltia SA(Æ) | 109,207 | 357 | Siegfried Holding AG(Æ) | 2,460 | 378 | |||||
| 57,072 | Sika AG | 2,081 | 7,419 | |||||||
| Sweden - 2.1% | Sonova Holding AG | 46,967 | 7,312 | |||||||
| Assa Abloy AB Class B | 140,706 | 7,452 | Straumann Holding AG | 2,923 | 719 | |||||
| Atlas Copco AB Class A | 467,708 | 13,498 | Swiss Life Holding AG(Æ) | 48,200 | 11,041 | |||||
| B&B Tools AB Class B | 46,854 | 879 | Swiss Prime Site AG Class A(Æ) | 5,544 | 421 | |||||
| Electrolux AB | 314,472 | 8,922 | Swiss Re AG(Æ) | 74,514 | 6,018 | |||||
| Fastighets AB Balder Class B(Æ) | 10,720 | 139 | Swisscom AG | 2,154 | 1,268 | |||||
| Hennes & Mauritz AB Class B | 165,860 | 6,597 | UBS AG(Æ) | 1,564,974 | 27,163 | |||||
| KappAhl AB(Æ) | 40,863 | 227 | Vaudoise Assurances Holding SA Class | |||||||
| Klovern AB | 109,457 | 556 | B | 553 | 242 | |||||
| L E Lundbergforetagen AB | 37,246 | 1,563 | Zurich Insurance Group AG(Æ) | 59,375 | 17,946 | |||||
| Meda AB Class A | 81,818 | 1,075 | 398,534 | |||||||
| NCC AB Class B | 27,160 | 798 | Taiwan - 1.0% | |||||||
| Nibe Industrier AB Class B | 13,508 | 358 | Hon Hai Precision Industry Co., Ltd. | 4,001,537 | 12,630 | |||||
| Nordea Bank AB | 294,899 | 3,782 | MediaTek, Inc. | 596,000 | 8,484 | |||||
| Recipharm AB Class B(Æ) | 32,016 | 564 | Taiwan Semiconductor Manufacturing | |||||||
| Sandvik AB | 1,082,800 | 11,863 | Co., Ltd. - ADR | 577,640 | 12,720 | |||||
| Securitas AB Class B | 282,946 | 3,123 | Teco Electric and Machinery Co., Ltd. | 6,741,400 | 7,491 | |||||
| Svenska Cellulosa AB SCA Class B | 131,656 | 2,944 | 41,325 | |||||||
| Svenska Handelsbanken AB Class A | 23,587 | 1,125 | ||||||||
| Swedish Match AB | 33,709 | 1,094 | Thailand - 0.4% | |||||||
| Telefonaktiebolaget LM Ericsson Class B | 692,265 | 8,156 | Charoen Pokphand Foods PCL | 14,407,100 | 13,823 | |||||
| TeliaSonera AB | 726,772 | 5,024 | Kasikornbank PCL Class R | 263,600 | 1,910 | |||||
| Tethys Oil AB(Æ) | 144,964 | 1,595 | 15,733 | |||||||
| Unibet Group PLC | 32,953 | 1,899 | ||||||||
| Vitrolife AB(Æ) | 29,753 | 603 | United Kingdom - 16.1% | |||||||
| 83,836 | Abcam PLC Class A | 15,300 | 98 | |||||||
| African Barrick Gold PLC | 453,574 | 1,495 | ||||||||
| Switzerland - 9.7% | AMEC PLC - GDR | 196,149 | 3,263 | |||||||
| ABB, Ltd.(Æ) | 1,092,376 | 23,910 | ARM Holdings PLC | 497,186 | 6,959 | |||||
| ABB, Ltd. - ADR(Æ)(Ñ) | 186,000 | 4,081 | Associated British Foods PLC | 152,078 | 6,700 | |||||
| ACE, Ltd. | 65,750 | 7,186 | AstraZeneca PLC - ADR(Æ) | 335,683 | 24,398 | |||||
| Actelion, Ltd.(Æ) | 82,432 | 9,801 | Aviva PLC | 964,507 | 8,039 | |||||
| Adecco SA(Æ) | 79,510 | 5,376 | BAE Systems PLC | 535,116 | 3,927 | |||||
| Aryzta AG(Æ) | 63,401 | 5,394 | Barclays PLC | 6,191,352 | 23,850 | |||||
| Baloise Holding AG | 18,606 | 2,338 | Barratt Developments PLC | 26,200 | 175 | |||||
| Banque Cantonale Vaudoise | 1,947 | 1,042 | Bellway PLC | 51,720 | 1,447 | |||||
| Bobst Group SA(Æ) | 3,610 | 157 | Berendsen PLC | 128,064 | 2,069 | |||||
| See accompanying notes which are an integral part of the financial statements. | ||||||||||
| 194 Russell International Developed Markets Fund | ||||||||||
| Russell Investment Company | |||||||||
| Russell International Developed Markets Fund | |||||||||
| Schedule of Investments, continued — October 31, 2014 | |||||||||
| Amounts in thousands (except share amounts) | Amounts in thousands (except share amounts) | ||||||||
| Principal | Fair | Principal | Fair | ||||||
| Amount ($) | Value | Amount ($) | Value | ||||||
| or Shares | $ | or Shares | $ | ||||||
| Berkeley Group Holdings PLC | 307,171 | 11,203 | Shire PLC - ADR(Æ) | 90,940 | 6,056 | ||||
| BG Group PLC | 1,024,895 | 17,051 | Smith & Nephew PLC | 175,182 | 2,962 | ||||
| BHP Billiton PLC | 133,284 | 3,434 | Smiths Group PLC | 342,260 | 6,378 | ||||
| BP PLC | 3,800,596 | 27,298 | Soco International PLC(Æ) | 288,791 | 1,518 | ||||
| Brit PLC(Æ) | 143,635 | 577 | Spire Healthcare Group PLC(Æ) | 20,700 | 93 | ||||
| British American Tobacco PLC | 216,323 | 12,274 | St. James's Place PLC | 583,388 | 6,953 | ||||
| British Land Co. PLC (The)(ö) | 157,475 | 1,835 | Stagecoach Group PLC | 105,534 | 653 | ||||
| British Sky Broadcasting Group PLC | 767,308 | 10,875 | Standard Chartered PLC | 595,423 | 8,950 | ||||
| BT Group PLC | 2,239,698 | 13,167 | Stock Spirits Group PLC | 137,500 | 671 | ||||
| Camella PLC(Æ) | 398 | 55 | SVG Capital PLC(Æ) | 280,505 | 1,916 | ||||
| Capita PLC | 396,546 | 6,959 | Tate & Lyle PLC | 336,842 | 3,265 | ||||
| Carillion PLC | 608,538 | 3,238 | Tesco PLC | 482,384 | 1,340 | ||||
| Carnival PLC | 24,335 | 969 | Travis Perkins PLC | 725,579 | 19,175 | ||||
| Centrica PLC | 514,992 | 2,492 | Trinity Mirror PLC(Æ) | 513,098 | 1,346 | ||||
| Close Brothers Group PLC | 45,247 | 1,060 | Unilever PLC | 344,881 | 13,870 | ||||
| Cobham PLC | 197,284 | 918 | Vedanta Resources PLC | 15,640 | 206 | ||||
| Compass Group PLC(Æ) | 1,833,049 | 29,499 | Vertu Motors PLC(Æ) | 49,200 | 45 | ||||
| Dairy Crest Group PLC | 1,253,520 | 8,352 | Vodafone Group PLC | 7,815,720 | 25,918 | ||||
| Dart Group PLC | 290,344 | 1,212 | Whitbread PLC | 16,894 | 1,179 | ||||
| Derwent London PLC(ö) | 16,604 | 789 | WM Morrison Supermarkets PLC | 289,239 | 716 | ||||
| Diageo PLC | 460,148 | 13,529 | WS Atkins PLC | 51,060 | 1,108 | ||||
| Evraz PLC(Æ) | 108,100 | 223 | Xchanging PLC | 564,582 | 1,716 | ||||
| Galiform PLC | 149,350 | 818 | 659,824 | ||||||
| Gem Diamonds, Ltd.(Æ) | 35,000 | 87 | |||||||
| GlaxoSmithKline PLC - ADR | 1,384,704 | 31,399 | United States - 1.2% | ||||||
| Go-Ahead Group PLC | 2,190 | 86 | American Shared Hospital Services(Æ) | 6,520 | 233 | ||||
| Greggs PLC(Æ) | 194,315 | 1,881 | Dream Office Real Estate Investment | ||||||
| Guinness Peat Group PLC(Æ) | 2,401,279 | 973 | Trust(Ñ)(ö) | 51,600 | 1,306 | ||||
| Hammerson PLC(ö) | 67,465 | 662 | ETRACS CMCI Long Platinum Total | ||||||
| Hays PLC | 969,749 | 1,913 | Return ETN | 47,733 | 276 | ||||
| Hikma Pharmaceuticals PLC | 35,937 | 1,089 | Joy Global, Inc. | 205,100 | 10,794 | ||||
| HSBC Holdings PLC | 5,783,490 | 59,166 | Memorial Resource Development Corp. | ||||||
| HSBC Holdings PLC - ADR(Æ) | 10,700 | 546 | (Æ) | 10,400 | 227 | ||||
| Hunting PLC | 90,190 | 1,061 | Meridian Energy, Ltd.(Æ) | 883,305 | 1,133 | ||||
| Imperial Tobacco Group PLC | 830,749 | 36,028 | MFS Intermediate Income Trust | 97,400 | 729 | ||||
| Inchcape PLC | 319,013 | 3,547 | NCR Corp.(Æ) | 93,961 | 2,600 | ||||
| Intercontinental Hotels Group PLC(Æ) | 135,958 | 5,152 | Newmont Mining Corp. | 3,322 | 330 | ||||
| ITV PLC | 689,177 | 2,238 | News Corp. Class A(Æ) | 654,900 | 10,138 | ||||
| J Sainsbury PLC(Ñ) | 185,794 | 730 | News Corp. Class B(Æ) | 117,402 | 1,767 | ||||
| Johnson Matthey PLC | 41,655 | 1,982 | Philip Morris International, Inc. | 106,300 | 9,462 | ||||
| Kingfisher PLC | 1,238,154 | 5,991 | Technicolor Regr Common Stock | 256,400 | 1,512 | ||||
| Land Securities Group PLC(ö) | 40,123 | 710 | Yum! Brands, Inc. | 134,565 | 9,666 | ||||
| Lookers PLC | 768,860 | 1,707 | 50,173 | ||||||
| Mitchells & Butlers PLC(Æ) | 288,400 | 1,753 | Total Common Stocks | ||||||
| National Grid PLC | 1,342,365 | 19,885 | |||||||
| Next PLC | 12,047 | 1,242 | (cost $3,475,951) | 3,781,149 | |||||
| Pace PLC | 154,689 | 857 | |||||||
| Pearson PLC | 69,168 | 1,295 | Preferred Stocks - 0.2% | ||||||
| Pendragon PLC | 327,500 | 165 | Brazil - 0.1% | ||||||
| Usinas Siderurgicas de Minas Gerais | |||||||||
| Prudential PLC | 372,024 | 8,585 | SA(Æ) | 1,827,600 | 4,204 | ||||
| Reckitt Benckiser Group PLC | 160,649 | 13,492 | |||||||
| Reed Elsevier PLC | 106,282 | 1,746 | Germany - 0.1% | ||||||
| Rio Tinto PLC(Æ) | 155,644 | 7,399 | Bayerische Motoren Werke AG | 14,836 | 1,187 | ||||
| Rolls-Royce Holdings PLC | 527,364 | 7,112 | Henkel AG & Co. KGaA | 25,393 | 2,507 | ||||
| Royal Bank of Scotland Group PLC(Æ) | 1,668,792 | 10,358 | Hornbach Holding AG(Æ) | 4,561 | 380 | ||||
| Royal Dutch Shell PLC Class A | 1,561,042 | 55,733 | 4,074 | ||||||
| Royal Dutch Shell PLC Class B | 214,111 | 7,921 | |||||||
| RSA Insurance Group PLC(Æ) | 677,087 | 5,235 | |||||||
| SABMiller PLC - ADR | 67,683 | 3,817 | |||||||
| See accompanying notes which are an integral part of the financial statements. | |||||||||
| Russell International Developed Markets Fund 195 | |||||||||
Russell Investment Company
Russell International Developed Markets Fund
Schedule of Investments, continued — October 31, 2014
| Amounts in thousands (except share amounts) | |||||
| Principal | Fair | ||||
| Amount ($) | Value | ||||
| or Shares | $ | ||||
| Italy- 0.0% | |||||
| Unipol Gruppo Finanziario SpA | 132,300 | 589 | |||
| United Kingdom - 0.0% | |||||
| Rolls-Royce Holdings PLC | 47,462,760 | 76 | |||
| Total Preferred Stocks | |||||
| (cost $15,946) | 8,943 | ||||
| Warrants & Rights - 0.4% | |||||
| Hong Kong - 0.0% | |||||
| Sun Hung Kai Properties, Ltd.(Æ) | |||||
| 2016 Warrants | 5 | — | |||
| Portugal - 0.0% | |||||
| Mota-Engil Africa SGPA SA(Æ) | |||||
| 2049 Rights | 167,880 | — | |||
| Spain- 0.0% | |||||
| Banco Santander SA - ADR(Æ) | |||||
| 2014 Rights | 2,112,858 | 402 | |||
| United Kingdom - 0.4% | |||||
| DS Smith PLC Class F(Æ) | |||||
| 2014 Rights | 3,727,047 | 15,782 | |||
| Total Warrants & Rights | |||||
| (cost $13,060) | 16,184 | ||||
| Short-Term Investments - 5.3% | |||||
| United States - 5.3% | |||||
| Russell U.S. Cash Management Fund | 219,120,310 | (8) | 219,120 | ||
| Total Short-Term Investments | |||||
| (cost $219,120) | 219,120 | ||||
| Other Securities - 0.9% | |||||
| Russell U.S. Cash Collateral Fund(×) | 37,265,285 | (8) | 37,265 | ||
| Total Other Securities | |||||
| (cost $37,265) | 37,265 | ||||
| Total Investments 99.0% | |||||
| (identified cost $3,761,342) | 4,062,661 | ||||
| Other Assets and Liabilities, Net | |||||
| - 1.0% | 39,850 | ||||
| Net Assets - 100.0% | 4,102,511 | ||||
See accompanying notes which are an integral part of the financial statements.
196 Russell International Developed Markets Fund
| Russell Investment Company | ||||||||||||||
| Russell International Developed Markets Fund | ||||||||||||||
| Schedule of Investments, continued — October 31, 2014 | ||||||||||||||
| Restricted Securities | ||||||||||||||
| Amounts in thousands (except share and cost per unit amounts) | ||||||||||||||
| Principal | Cost per | Cost | Fair Value | |||||||||||
| % of Net Assets | Acquisition | Amount ($) | Unit | (000 | ) | (000 | ) | |||||||
| Securities | Date | or shares | $ | $ | $ | |||||||||
| 0.0% | ||||||||||||||
| Chaoda Modern Agriculture Holdings, Ltd. | 10/18/10 | HKD | 12,120,000 | 0.55 | 6,664 | 703 | ||||||||
| 703 | ||||||||||||||
| For a description of restricted securities see note 9 in the Notes to Financial Statements. | ||||||||||||||
| Futures Contracts | ||||||||||||||
| Amounts in thousands (except contract amounts) | ||||||||||||||
| Unrealized | ||||||||||||||
| Appreciation | ||||||||||||||
| Number of | Notional | Expiration | (Depreciation) | |||||||||||
| Contracts | Amount | Date | $ | |||||||||||
| Long Positions | ||||||||||||||
| Amsterdam Index Futures | 121 | EUR | 9,923 | 11/14 | 625 | |||||||||
| CAC 40 Index Futures | 1,047 | EUR | 44,293 | 11/14 | 2,576 | |||||||||
| DAX Index Futures | 87 | EUR | 20,247 | 12/14 | (459 | ) | ||||||||
| EURO STOXX 50 Index Futures | 1,153 | EUR | 35,755 | 12/14 | (1,287 | ) | ||||||||
| FTSE 100 Index Futures | 688 | GBP | 44,758 | 12/14 | (2,437 | ) | ||||||||
| Hang Seng Index Futures | 301 | HKD | 360,342 | 11/14 | 1,054 | |||||||||
| IBEX 35 Index Futures | 1 | EUR | 104 | 11/14 | 3 | |||||||||
| MSCI SING IX ETS Futures | 142 | SGD | 10,494 | 11/14 | 170 | |||||||||
| NIKKEI 225 (Yen) Index Futures | 1,112 | JPY | 9,465,900 | 12/14 | 6,425 | |||||||||
| S&P/TSX 60 Index Futures | 128 | CAD | 21,704 | 12/14 | (914 | ) | ||||||||
| SPI 200 Index Futures | 121 | AUD | 16,692 | 12/14 | 218 | |||||||||
| TOPIX Index Futures | 541 | JPY | 7,233,170 | 12/14 | 2,577 | |||||||||
| Short Positions | ||||||||||||||
| FTSE/MIB Index Futures | 103 | EUR | 10,152 | 12/14 | 650 | |||||||||
| MSCI Emerging Markets Mini Index Futures | 1,600 | USD | 81,088 | 12/14 | 4,077 | |||||||||
| OMXS 30 Index Futures | 334 | SEK | 47,144 | 11/14 | (353 | ) | ||||||||
| S&P/TSX 60 Index Futures | 37 | CAD | 6,274 | 12/14 | 221 | |||||||||
| SPI 200 Index Futures | 350 | AUD | 48,282 | 12/14 | (818 | ) | ||||||||
| Swiss Market Index Futures | 323 | CHF | 28,508 | 12/14 | (2,179 | ) | ||||||||
| Total Unrealized Appreciation (Depreciation) on Open Futures Contracts (å) | 10,149 | |||||||||||||
| Foreign Currency Exchange Contracts | ||||||||||||||
| Amounts in thousands | ||||||||||||||
| Unrealized | ||||||||||||||
| Appreciation | ||||||||||||||
| Amount | Amount | (Depreciation) | ||||||||||||
| Counterparty | Sold | Bought | Settlement Date | $ | ||||||||||
| Bank of America | AUD | 500 | USD | 452 | 12/17/14 | 13 | ||||||||
| Bank of America | AUD | 500 | USD | 433 | 12/17/14 | (5 | ) | |||||||
| Bank of America | CAD | 600 | USD | 546 | 12/17/14 | 14 | ||||||||
| Bank of America | CAD | 2,000 | USD | 1,766 | 12/17/14 | (6 | ) | |||||||
| Bank of America | EUR | 1,000 | USD | 1,297 | 12/17/14 | 44 | ||||||||
| Bank of America | EUR | 6,000 | USD | 7,592 | 12/17/14 | 71 | ||||||||
| Bank of America | GBP | 500 | USD | 813 | 12/17/14 | 14 | ||||||||
| Bank of America | GBP | 1,500 | USD | 2,385 | 12/17/14 | (14 | ) | |||||||
| Bank of America | HKD | 1,000 | USD | 129 | 12/17/14 | — | ||||||||
| Bank of America | HKD | 3,000 | USD | 387 | 12/17/14 | — | ||||||||
| Bank of America | JPY | 100,000 | USD | 934 | 12/17/14 | 43 | ||||||||
| Bank of America | JPY | 200,000 | USD | 1,871 | 12/17/14 | 89 | ||||||||
| Bank of New York | USD | 915 | AUD | 1,000 | 12/17/14 | (38 | ) | |||||||
| Bank of New York | USD | 2,919 | AUD | 3,214 | 12/17/14 | (100 | ) | |||||||
| Bank of New York | USD | 895 | CAD | 1,000 | 12/17/14 | (9 | ) | |||||||
| Bank of New York | USD | 909 | CAD | 1,000 | 12/17/14 | (23 | ) | |||||||
| Bank of New York | USD | 3,729 | CAD | 4,104 | 12/17/14 | (92 | ) | |||||||
| Bank of New York | USD | 3,889 | EUR | 3,000 | 12/17/14 | (128 | ) | |||||||
| Bank of New York | USD | 5,079 | EUR | 4,000 | 12/17/14 | (65 | ) | |||||||
| Bank of New York | USD | 19,861 | EUR | 15,384 | 12/17/14 | (578 | ) | |||||||
| Bank of New York | USD | 1,611 | GBP | 1,000 | 12/17/14 | (11 | ) | |||||||
| Bank of New York | USD | 1,623 | GBP | 1,000 | 12/17/14 | (24 | ) | |||||||
| Bank of New York | USD | 7,560 | GBP | 4,689 | 12/17/14 | (62 | ) | |||||||
| Bank of New York | USD | 257 | HKD | 2,000 | 12/17/14 | 1 | ||||||||
| See accompanying notes which are an integral part of the financial statements. | ||||||||||||||
| Russell International Developed Markets Fund 197 | ||||||||||||||
| Russell Investment Company | |||||||
| Russell International Developed Markets Fund | |||||||
| Schedule of Investments, continued — October 31, 2014 | |||||||
| Foreign Currency Exchange Contracts | |||||||
| Amounts in thousands | |||||||
| Unrealized | |||||||
| Appreciation | |||||||
| Amount | Amount | (Depreciation) | |||||
| Counterparty | Sold | Bought | Settlement Date | $ | |||
| Bank of New York | USD | 387 | HKD | 3,000 | 12/17/14 | — | |
| Bank of New York | USD | 3,773 | JPY | 400,000 | 12/17/14 | (210 | ) |
| Bank of New York | USD | 8,059 | JPY | 859,585 | 12/17/14 | (402 | ) |
| Commonwealth Bank of Australia | USD | 2,919 | AUD | 3,214 | 12/17/14 | (100 | ) |
| Commonwealth Bank of Australia | USD | 3,729 | CAD | 4,104 | 12/17/14 | (91 | ) |
| Commonwealth Bank of Australia | USD | 19,860 | EUR | 15,384 | 12/17/14 | (576 | ) |
| Commonwealth Bank of Australia | USD | 7,557 | GBP | 4,689 | 12/17/14 | (59 | ) |
| Commonwealth Bank of Australia | USD | 8,058 | JPY | 859,585 | 12/17/14 | (402 | ) |
| Commonwealth Bank of Australia | GBP | 470 | USD | 758 | 12/17/14 | 6 | |
| Credit Suisse | USD | 507 | AUD | 545 | 12/17/14 | (29 | ) |
| Credit Suisse | USD | 639 | AUD | 694 | 12/17/14 | (30 | ) |
| Credit Suisse | USD | 640 | AUD | 691 | 12/17/14 | (34 | ) |
| Credit Suisse | USD | 640 | AUD | 689 | 12/17/14 | (36 | ) |
| Credit Suisse | USD | 655 | AUD | 706 | 12/17/14 | (35 | ) |
| Credit Suisse | USD | 1,033 | AUD | 1,122 | 12/17/14 | (48 | ) |
| Credit Suisse | USD | 1,247 | AUD | 1,422 | 12/17/14 | 1 | |
| Credit Suisse | USD | 2,213 | AUD | 2,395 | 12/17/14 | (112 | ) |
| Credit Suisse | USD | 4,463 | AUD | 5,068 | 12/17/14 | (17 | ) |
| Credit Suisse | USD | 4,818 | AUD | 5,233 | 12/17/14 | (228 | ) |
| Credit Suisse | USD | 10,866 | AUD | 12,506 | 12/17/14 | 106 | |
| Credit Suisse | USD | 875 | CAD | 987 | 12/17/14 | (1 | ) |
| Credit Suisse | USD | 973 | CAD | 1,073 | 12/17/14 | (23 | ) |
| Credit Suisse | USD | 4,794 | CAD | 5,241 | 12/17/14 | (149 | ) |
| Credit Suisse | USD | 7,399 | CAD | 8,334 | 12/17/14 | (13 | ) |
| Credit Suisse | USD | 13,103 | CAD | 14,500 | 12/17/14 | (252 | ) |
| Credit Suisse | USD | 2,623 | CHF | 2,515 | 12/17/14 | (8 | ) |
| Credit Suisse | USD | 10,822 | CHF | 9,937 | 12/17/14 | (490 | ) |
| Credit Suisse | USD | 18 | DKK | 104 | 12/17/14 | — | |
| Credit Suisse | USD | 22 | DKK | 127 | 12/17/14 | (1 | ) |
| Credit Suisse | USD | 27 | DKK | 153 | 12/17/14 | (1 | ) |
| Credit Suisse | USD | 46 | DKK | 272 | 12/17/14 | (1 | ) |
| Credit Suisse | USD | 60 | DKK | 342 | 12/17/14 | (3 | ) |
| Credit Suisse | USD | 275 | DKK | 1,582 | 12/17/14 | (8 | ) |
| Credit Suisse | USD | 203 | EUR | 160 | 12/17/14 | (3 | ) |
| Credit Suisse | USD | 317 | EUR | 245 | 12/17/14 | (10 | ) |
| Credit Suisse | USD | 451 | EUR | 350 | 12/17/14 | (12 | ) |
| Credit Suisse | USD | 2,339 | EUR | 1,813 | 12/17/14 | (66 | ) |
| Credit Suisse | USD | 2,792 | EUR | 2,162 | 12/17/14 | (82 | ) |
| Credit Suisse | USD | 2,917 | EUR | 2,223 | 12/17/14 | (131 | ) |
| Credit Suisse | USD | 2,922 | EUR | 2,252 | 12/17/14 | (99 | ) |
| Credit Suisse | USD | 2,938 | EUR | 2,252 | 12/17/14 | (116 | ) |
| Credit Suisse | USD | 3,358 | EUR | 2,618 | 12/17/14 | (77 | ) |
| Credit Suisse | USD | 3,485 | EUR | 2,755 | 12/17/14 | (31 | ) |
| Credit Suisse | USD | 3,504 | EUR | 2,661 | 12/17/14 | (168 | ) |
| Credit Suisse | USD | 5,448 | EUR | 4,289 | 12/17/14 | (73 | ) |
| Credit Suisse | USD | 5,839 | EUR | 4,504 | 12/17/14 | (194 | ) |
| Credit Suisse | USD | 5,974 | EUR | 4,641 | 12/17/14 | (158 | ) |
| Credit Suisse | USD | 7,270 | EUR | 5,614 | 12/17/14 | (234 | ) |
| Credit Suisse | USD | 387 | GBP | 237 | 12/17/14 | (8 | ) |
| Credit Suisse | USD | 642 | GBP | 397 | 12/17/14 | (7 | ) |
| Credit Suisse | USD | 719 | GBP | 447 | 12/17/14 | (4 | ) |
| Credit Suisse | USD | 1,530 | GBP | 944 | 12/17/14 | (22 | ) |
| Credit Suisse | USD | 1,668 | GBP | 1,040 | 12/17/14 | (6 | ) |
| Credit Suisse | USD | 4,201 | GBP | 2,589 | 12/17/14 | (61 | ) |
| Credit Suisse | USD | 22 | HKD | 169 | 12/17/14 | — | |
| Credit Suisse | USD | 110 | HKD | 852 | 12/17/14 | — | |
| Credit Suisse | USD | 114 | HKD | 887 | 12/17/14 | — | |
| Credit Suisse | USD | 197 | HKD | 1,528 | 12/17/14 | — | |
| Credit Suisse | USD | 8 | ILS | 29 | 12/17/14 | — | |
| Credit Suisse | USD | 10 | ILS | 38 | 12/17/14 | — | |
| Credit Suisse | USD | 20 | ILS | 73 | 12/17/14 | (1 | ) |
| Credit Suisse | USD | 33 | ILS | 122 | 12/17/14 | (1 | ) |
| Credit Suisse | USD | 34 | ILS | 121 | 12/17/14 | (2 | ) |
| Credit Suisse | USD | 49 | ILS | 180 | 12/17/14 | (1 | ) |
| Credit Suisse | USD | 80 | ILS | 302 | 12/17/14 | (1 | ) |
| Credit Suisse | USD | 2,103 | ILS | 7,532 | 12/17/14 | (121 | ) |
| Credit Suisse | USD | 1,301 | JPY | 137,968 | 12/17/14 | (72 | ) |
| See accompanying notes which are an integral part of the financial statements. | |||||||
| 198 Russell International Developed Markets Fund | |||||||
| Russell Investment Company | |||||||
| Russell International Developed Markets Fund | |||||||
| Schedule of Investments, continued — October 31, 2014 | |||||||
| Foreign Currency Exchange Contracts | |||||||
| Amounts in thousands | |||||||
| Unrealized | |||||||
| Appreciation | |||||||
| Amount | Amount | (Depreciation) | |||||
| Counterparty | Sold | Bought | Settlement Date | $ | |||
| Credit Suisse | USD | 1,660 | JPY | 174,217 | 12/17/14 | (108 | ) |
| Credit Suisse | USD | 1,927 | JPY | 204,498 | 12/17/14 | (105 | ) |
| Credit Suisse | USD | 1,935 | JPY | 203,511 | 12/17/14 | (122 | ) |
| Credit Suisse | USD | 1,935 | JPY | 202,689 | 12/17/14 | (130 | ) |
| Credit Suisse | USD | 1,935 | JPY | 203,694 | 12/17/14 | (121 | ) |
| Credit Suisse | USD | 1,953 | JPY | 204,522 | 12/17/14 | (131 | ) |
| Credit Suisse | USD | 3,007 | JPY | 320,222 | 12/17/14 | (155 | ) |
| Credit Suisse | USD | 4,190 | JPY | 439,594 | 12/17/14 | (274 | ) |
| Credit Suisse | USD | 9,742 | JPY | 1,067,017 | 12/17/14 | (238 | ) |
| Credit Suisse | USD | 1,539 | NOK | 9,568 | 12/17/14 | (122 | ) |
| Credit Suisse | USD | 2,779 | NOK | 17,852 | 12/17/14 | (136 | ) |
| Credit Suisse | USD | 27,704 | NOK | 175,079 | 12/17/14 | (1,786 | ) |
| Credit Suisse | USD | 7,447 | NZD | 9,103 | 12/17/14 | (380 | ) |
| Credit Suisse | USD | 7,788 | NZD | 9,451 | 12/17/14 | (451 | ) |
| Credit Suisse | USD | 7,820 | NZD | 9,452 | 12/17/14 | (483 | ) |
| Credit Suisse | USD | 7,918 | NZD | 9,602 | 12/17/14 | (464 | ) |
| Credit Suisse | USD | 7,918 | NZD | 9,651 | 12/17/14 | (427 | ) |
| Credit Suisse | USD | 7,926 | NZD | 9,646 | 12/17/14 | (439 | ) |
| Credit Suisse | USD | 58 | SEK | 410 | 12/17/14 | (3 | ) |
| Credit Suisse | USD | 73 | SEK | 524 | 12/17/14 | (2 | ) |
| Credit Suisse | USD | 148 | SEK | 1,075 | 12/17/14 | (3 | ) |
| Credit Suisse | USD | 182 | SEK | 1,302 | 12/17/14 | (5 | ) |
| Credit Suisse | USD | 330 | SEK | 2,356 | 12/17/14 | (11 | ) |
| Credit Suisse | USD | 4 | SGD | 5 | 12/17/14 | — | |
| Credit Suisse | USD | 12 | SGD | 15 | 12/17/14 | — | |
| Credit Suisse | USD | 29 | SGD | 37 | 12/17/14 | — | |
| Credit Suisse | USD | 56 | SGD | 71 | 12/17/14 | (1 | ) |
| Credit Suisse | USD | 63 | SGD | 80 | 12/17/14 | (1 | ) |
| Credit Suisse | USD | 206 | SGD | 257 | 12/17/14 | (5 | ) |
| Credit Suisse | USD | 785 | SGD | 985 | 12/17/14 | (19 | ) |
| Credit Suisse | AUD | 2,568 | USD | 2,298 | 12/17/14 | 46 | |
| Credit Suisse | AUD | 3,340 | USD | 2,915 | 12/17/14 | (15 | ) |
| Credit Suisse | AUD | 5,684 | USD | 4,971 | 12/17/14 | (15 | ) |
| Credit Suisse | CAD | 46 | USD | 41 | 12/17/14 | 1 | |
| Credit Suisse | CAD | 63 | USD | 57 | 12/17/14 | 2 | |
| Credit Suisse | CAD | 109 | USD | 99 | 12/17/14 | 3 | |
| Credit Suisse | CAD | 124 | USD | 114 | 12/17/14 | 4 | |
| Credit Suisse | CAD | 156 | USD | 143 | 12/17/14 | 5 | |
| Credit Suisse | CAD | 157 | USD | 144 | 12/17/14 | 5 | |
| Credit Suisse | CAD | 2,276 | USD | 2,062 | 12/17/14 | 45 | |
| Credit Suisse | CAD | 2,929 | USD | 2,605 | 12/17/14 | 9 | |
| Credit Suisse | CAD | 7,361 | USD | 6,579 | 12/17/14 | 55 | |
| Credit Suisse | CHF | 757 | USD | 796 | 12/17/14 | 9 | |
| Credit Suisse | CHF | 1,554 | USD | 1,661 | 12/17/14 | 46 | |
| Credit Suisse | CHF | 3,449 | USD | 3,751 | 12/17/14 | 164 | |
| Credit Suisse | CHF | 3,487 | USD | 3,770 | 12/17/14 | 145 | |
| Credit Suisse | CHF | 5,482 | USD | 5,870 | 12/17/14 | 171 | |
| Credit Suisse | CHF | 5,951 | USD | 6,395 | 12/17/14 | 207 | |
| Credit Suisse | CHF | 6,140 | USD | 6,527 | 12/17/14 | 143 | |
| Credit Suisse | DKK | 175 | USD | 30 | 12/17/14 | — | |
| Credit Suisse | DKK | 560 | USD | 96 | 12/17/14 | 2 | |
| Credit Suisse | DKK | 585 | USD | 101 | 12/17/14 | 3 | |
| Credit Suisse | DKK | 926 | USD | 158 | 12/17/14 | 2 | |
| Credit Suisse | DKK | 16,800 | USD | 2,910 | 12/17/14 | 81 | |
| Credit Suisse | EUR | 10,657 | USD | 13,479 | 12/17/14 | 121 | |
| Credit Suisse | EUR | 15,204 | USD | 19,996 | 12/17/14 | 938 | |
| Credit Suisse | GBP | 907 | USD | 1,460 | 12/17/14 | 10 | |
| Credit Suisse | GBP | 2,271 | USD | 3,671 | 12/17/14 | 40 | |
| Credit Suisse | GBP | 2,333 | USD | 3,842 | 12/17/14 | 111 | |
| Credit Suisse | GBP | 2,610 | USD | 4,200 | 12/17/14 | 26 | |
| Credit Suisse | GBP | 6,612 | USD | 10,640 | 12/17/14 | 67 | |
| Credit Suisse | GBP | 8,319 | USD | 13,421 | 12/17/14 | 118 | |
| Credit Suisse | GBP | 9,929 | USD | 16,203 | 12/17/14 | 326 | |
| Credit Suisse | GBP | 12,880 | USD | 21,276 | 12/17/14 | 678 | |
| Credit Suisse | HKD | 273 | USD | 35 | 12/17/14 | — | |
| Credit Suisse | HKD | 291 | USD | 37 | 12/17/14 | — | |
| Credit Suisse | HKD | 385 | USD | 50 | 12/17/14 | — | |
| Credit Suisse | HKD | 649 | USD | 84 | 12/17/14 | — | |
| See accompanying notes which are an integral part of the financial statements. | |||||||
| Russell International Developed Markets Fund 199 | |||||||
| Russell Investment Company | |||||||
| Russell International Developed Markets Fund | |||||||
| Schedule of Investments, continued — October 31, 2014 | |||||||
| Foreign Currency Exchange Contracts | |||||||
| Amounts in thousands | |||||||
| Unrealized | |||||||
| Appreciation | |||||||
| Amount | Amount | (Depreciation) | |||||
| Counterparty | Sold | Bought | Settlement Date | $ | |||
| Credit Suisse | HKD | 991 | USD | 128 | 12/17/14 | — | |
| Credit Suisse | ILS | 281 | USD | 75 | 12/17/14 | 1 | |
| Credit Suisse | JPY | 133,268 | USD | 1,247 | 12/17/14 | 60 | |
| Credit Suisse | JPY | 134,212 | USD | 1,238 | 12/17/14 | 42 | |
| Credit Suisse | JPY | 368,693 | USD | 3,445 | 12/17/14 | 161 | |
| Credit Suisse | JPY | 562,175 | USD | 5,207 | 12/17/14 | 200 | |
| Credit Suisse | NOK | 5,341 | USD | 808 | 12/17/14 | 17 | |
| Credit Suisse | NOK | 8,146 | USD | 1,279 | 12/17/14 | 73 | |
| Credit Suisse | NOK | 16,714 | USD | 2,562 | 12/17/14 | 88 | |
| Credit Suisse | NOK | 17,363 | USD | 2,647 | 12/17/14 | 76 | |
| Credit Suisse | NZD | 1,026 | USD | 831 | 12/17/14 | 35 | |
| Credit Suisse | NZD | 1,988 | USD | 1,533 | 12/17/14 | (10 | ) |
| Credit Suisse | NZD | 4,273 | USD | 3,436 | 12/17/14 | 119 | |
| Credit Suisse | NZD | 9,041 | USD | 7,062 | 12/17/14 | 45 | |
| Credit Suisse | NZD | 10,355 | USD | 8,374 | 12/17/14 | 336 | |
| Credit Suisse | SEK | 221 | USD | 31 | 12/17/14 | 1 | |
| Credit Suisse | SEK | 402 | USD | 56 | 12/17/14 | 2 | |
| Credit Suisse | SEK | 565 | USD | 79 | 12/17/14 | 3 | |
| Credit Suisse | SEK | 653 | USD | 92 | 12/17/14 | 3 | |
| Credit Suisse | SEK | 886 | USD | 124 | 12/17/14 | 4 | |
| Credit Suisse | SEK | 1,243 | USD | 169 | 12/17/14 | 1 | |
| Credit Suisse | SEK | 3,915 | USD | 558 | 12/17/14 | 28 | |
| Credit Suisse | SEK | 3,915 | USD | 557 | 12/17/14 | 27 | |
| Credit Suisse | SEK | 4,698 | USD | 672 | 12/17/14 | 35 | |
| Credit Suisse | SEK | 4,728 | USD | 662 | 12/17/14 | 22 | |
| Credit Suisse | SEK | 5,360 | USD | 754 | 12/17/14 | 28 | |
| Credit Suisse | SEK | 5,537 | USD | 783 | 12/17/14 | 33 | |
| Credit Suisse | SEK | 5,587 | USD | 784 | 12/17/14 | 27 | |
| Credit Suisse | SEK | 5,950 | USD | 840 | 12/17/14 | 34 | |
| Credit Suisse | SEK | 5,950 | USD | 838 | 12/17/14 | 32 | |
| Credit Suisse | SGD | 42 | USD | 32 | 12/17/14 | — | |
| Credit Suisse | SGD | 44 | USD | 35 | 12/17/14 | — | |
| Credit Suisse | SGD | 53 | USD | 41 | 12/17/14 | — | |
| Credit Suisse | SGD | 72 | USD | 57 | 12/17/14 | 1 | |
| Deutsche Bank | USD | 2,624 | AUD | 3,000 | 12/17/14 | 8 | |
| Deutsche Bank | USD | 2,546 | EUR | 2,000 | 12/17/14 | (39 | ) |
| HSBC | USD | 2,920 | AUD | 3,214 | 12/17/14 | (100 | ) |
| HSBC | USD | 3,729 | CAD | 4,104 | 12/17/14 | (91 | ) |
| HSBC | USD | 19,867 | EUR | 15,384 | 12/17/14 | (583 | ) |
| HSBC | USD | 7,557 | GBP | 4,689 | 12/17/14 | (59 | ) |
| HSBC | USD | 3,708 | HKD | 28,737 | 12/17/14 | (3 | ) |
| HSBC | USD | 8,058 | JPY | 859,585 | 12/17/14 | (402 | ) |
| JPMorgan Chase | USD | 2,920 | AUD | 3,214 | 12/17/14 | (101 | ) |
| JPMorgan Chase | USD | 3,730 | CAD | 4,104 | 12/17/14 | (92 | ) |
| JPMorgan Chase | USD | 19,867 | EUR | 15,384 | 12/17/14 | (583 | ) |
| JPMorgan Chase | USD | 7,559 | GBP | 4,689 | 12/17/14 | (61 | ) |
| JPMorgan Chase | USD | 3,708 | HKD | 28,737 | 12/17/14 | (3 | ) |
| JPMorgan Chase | USD | 8,059 | JPY | 859,585 | 12/17/14 | (402 | ) |
| JPMorgan Chase | EUR | 1,520 | USD | 1,963 | 12/17/14 | 58 | |
| JPMorgan Chase | GBP | 260 | USD | 415 | 11/04/14 | — | |
| Northern Trust | USD | 1,844 | AUD | 2,000 | 12/17/14 | (89 | ) |
| Northern Trust | USD | 2,728 | CAD | 3,000 | 12/17/14 | (69 | ) |
| Northern Trust | USD | 10,329 | EUR | 8,000 | 12/17/14 | (302 | ) |
| Northern Trust | USD | 4,829 | GBP | 3,000 | 12/17/14 | (31 | ) |
| Northern Trust | USD | 774 | HKD | 6,000 | 12/17/14 | (1 | ) |
| Northern Trust | USD | 2,834 | JPY | 300,000 | 12/17/14 | (162 | ) |
| Royal Bank of Scotland | USD | 507 | AUD | 545 | 12/17/14 | (29 | ) |
| Royal Bank of Scotland | USD | 639 | AUD | 694 | 12/17/14 | (30 | ) |
| Royal Bank of Scotland | USD | 640 | AUD | 691 | 12/17/14 | (34 | ) |
| Royal Bank of Scotland | USD | 640 | AUD | 689 | 12/17/14 | (36 | ) |
| Royal Bank of Scotland | USD | 655 | AUD | 706 | 12/17/14 | (35 | ) |
| Royal Bank of Scotland | USD | 1,033 | AUD | 1,122 | 12/17/14 | (48 | ) |
| Royal Bank of Scotland | USD | 1,247 | AUD | 1,422 | 12/17/14 | 1 | |
| Royal Bank of Scotland | USD | 1,367 | AUD | 1,555 | 12/17/14 | (2 | ) |
| Royal Bank of Scotland | USD | 2,213 | AUD | 2,395 | 12/17/14 | (112 | ) |
| Royal Bank of Scotland | USD | 4,463 | AUD | 5,068 | 12/17/14 | (16 | ) |
| Royal Bank of Scotland | USD | 4,648 | AUD | 5,297 | 12/17/14 | — | |
| See accompanying notes which are an integral part of the financial statements. | |||||||
| 200 Russell International Developed Markets Fund | |||||||
| Russell Investment Company | |||||||
| Russell International Developed Markets Fund | |||||||
| Schedule of Investments, continued — October 31, 2014 | |||||||
| Foreign Currency Exchange Contracts | |||||||
| Amounts in thousands | |||||||
| Unrealized | |||||||
| Appreciation | |||||||
| Amount | Amount | (Depreciation) | |||||
| Counterparty | Sold | Bought | Settlement Date | $ | |||
| Royal Bank of Scotland | USD | 4,819 | AUD | 5,233 | 12/17/14 | (228 | ) |
| Royal Bank of Scotland | USD | 10,866 | AUD | 12,506 | 12/17/14 | 106 | |
| Royal Bank of Scotland | USD | 4 | CAD | 4 | 12/17/14 | — | |
| Royal Bank of Scotland | USD | 875 | CAD | 987 | 12/17/14 | (1 | ) |
| Royal Bank of Scotland | USD | 973 | CAD | 1,073 | 12/17/14 | (23 | ) |
| Royal Bank of Scotland | USD | 4,794 | CAD | 5,241 | 12/17/14 | (148 | ) |
| Royal Bank of Scotland | USD | 7,399 | CAD | 8,334 | 12/17/14 | (13 | ) |
| Royal Bank of Scotland | USD | 13,103 | CAD | 14,500 | 12/17/14 | (252 | ) |
| Royal Bank of Scotland | USD | 2,623 | CHF | 2,515 | 12/17/14 | (8 | ) |
| Royal Bank of Scotland | USD | 10,822 | CHF | 9,937 | 12/17/14 | (490 | ) |
| Royal Bank of Scotland | USD | 18 | DKK | 104 | 12/17/14 | — | |
| Royal Bank of Scotland | USD | 22 | DKK | 127 | 12/17/14 | (1 | ) |
| Royal Bank of Scotland | USD | 27 | DKK | 153 | 12/17/14 | (1 | ) |
| Royal Bank of Scotland | USD | 46 | DKK | 272 | 12/17/14 | (1 | ) |
| Royal Bank of Scotland | USD | 60 | DKK | 342 | 12/17/14 | (3 | ) |
| Royal Bank of Scotland | USD | 275 | DKK | 1,582 | 12/17/14 | (8 | ) |
| Royal Bank of Scotland | USD | 2,328 | DKK | 13,636 | 12/17/14 | (32 | ) |
| Royal Bank of Scotland | USD | 2,381 | DKK | 13,772 | 12/17/14 | (61 | ) |
| Royal Bank of Scotland | USD | 124 | EUR | 96 | 12/17/14 | (4 | ) |
| Royal Bank of Scotland | USD | 203 | EUR | 160 | 12/17/14 | (3 | ) |
| Royal Bank of Scotland | USD | 317 | EUR | 245 | 12/17/14 | (10 | ) |
| Royal Bank of Scotland | USD | 451 | EUR | 350 | 12/17/14 | (12 | ) |
| Royal Bank of Scotland | USD | 2,339 | EUR | 1,813 | 12/17/14 | (66 | ) |
| Royal Bank of Scotland | USD | 2,792 | EUR | 2,162 | 12/17/14 | (82 | ) |
| Royal Bank of Scotland | USD | 2,917 | EUR | 2,223 | 12/17/14 | (131 | ) |
| Royal Bank of Scotland | USD | 2,922 | EUR | 2,252 | 12/17/14 | (99 | ) |
| Royal Bank of Scotland | USD | 2,938 | EUR | 2,252 | 12/17/14 | (116 | ) |
| Royal Bank of Scotland | USD | 3,358 | EUR | 2,618 | 12/17/14 | (77 | ) |
| Royal Bank of Scotland | USD | 3,485 | EUR | 2,755 | 12/17/14 | (32 | ) |
| Royal Bank of Scotland | USD | 3,504 | EUR | 2,661 | 12/17/14 | (168 | ) |
| Royal Bank of Scotland | USD | 5,449 | EUR | 4,289 | 12/17/14 | (73 | ) |
| Royal Bank of Scotland | USD | 5,839 | EUR | 4,504 | 12/17/14 | (194 | ) |
| Royal Bank of Scotland | USD | 5,975 | EUR | 4,641 | 12/17/14 | (158 | ) |
| Royal Bank of Scotland | USD | 7,271 | EUR | 5,614 | 12/17/14 | (234 | ) |
| Royal Bank of Scotland | USD | 387 | GBP | 237 | 12/17/14 | (8 | ) |
| Royal Bank of Scotland | USD | 642 | GBP | 397 | 12/17/14 | (7 | ) |
| Royal Bank of Scotland | USD | 719 | GBP | 447 | 12/17/14 | (4 | ) |
| Royal Bank of Scotland | USD | 1,530 | GBP | 944 | 12/17/14 | (22 | ) |
| Royal Bank of Scotland | USD | 1,668 | GBP | 1,040 | 12/17/14 | (6 | ) |
| Royal Bank of Scotland | USD | 4,201 | GBP | 2,589 | 12/17/14 | (61 | ) |
| Royal Bank of Scotland | USD | 7,096 | GBP | 4,330 | 12/17/14 | (171 | ) |
| Royal Bank of Scotland | USD | 22 | HKD | 169 | 12/17/14 | — | |
| Royal Bank of Scotland | USD | 110 | HKD | 852 | 12/17/14 | — | |
| Royal Bank of Scotland | USD | 114 | HKD | 887 | 12/17/14 | — | |
| Royal Bank of Scotland | USD | 197 | HKD | 1,528 | 12/17/14 | — | |
| Royal Bank of Scotland | USD | 282 | HKD | 2,182 | 12/17/14 | — | |
| Royal Bank of Scotland | USD | 8 | ILS | 29 | 12/17/14 | — | |
| Royal Bank of Scotland | USD | 10 | ILS | 38 | 12/17/14 | — | |
| Royal Bank of Scotland | USD | 20 | ILS | 73 | 12/17/14 | (1 | ) |
| Royal Bank of Scotland | USD | 33 | ILS | 122 | 12/17/14 | (1 | ) |
| Royal Bank of Scotland | USD | 34 | ILS | 121 | 12/17/14 | (2 | ) |
| Royal Bank of Scotland | USD | 49 | ILS | 180 | 12/17/14 | (1 | ) |
| Royal Bank of Scotland | USD | 80 | ILS | 302 | 12/17/14 | (1 | ) |
| Royal Bank of Scotland | USD | 2,103 | ILS | 7,532 | 12/17/14 | (121 | ) |
| Royal Bank of Scotland | USD | 364 | JPY | 39,586 | 12/17/14 | (11 | ) |
| Royal Bank of Scotland | USD | 1,301 | JPY | 137,968 | 12/17/14 | (72 | ) |
| Royal Bank of Scotland | USD | 1,660 | JPY | 174,217 | 12/17/14 | (108 | ) |
| Royal Bank of Scotland | USD | 1,927 | JPY | 204,498 | 12/17/14 | (105 | ) |
| Royal Bank of Scotland | USD | 1,935 | JPY | 203,511 | 12/17/14 | (122 | ) |
| Royal Bank of Scotland | USD | 1,935 | JPY | 202,689 | 12/17/14 | (130 | ) |
| Royal Bank of Scotland | USD | 1,935 | JPY | 203,694 | 12/17/14 | (121 | ) |
| Royal Bank of Scotland | USD | 1,953 | JPY | 204,522 | 12/17/14 | (131 | ) |
| Royal Bank of Scotland | USD | 3,007 | JPY | 320,222 | 12/17/14 | (155 | ) |
| Royal Bank of Scotland | USD | 4,190 | JPY | 439,594 | 12/17/14 | (275 | ) |
| Royal Bank of Scotland | USD | 7,458 | JPY | 802,904 | 12/17/14 | (307 | ) |
| Royal Bank of Scotland | USD | 9,742 | JPY | 1,067,017 | 12/17/14 | (238 | ) |
| Royal Bank of Scotland | USD | 1,539 | NOK | 9,568 | 12/17/14 | (122 | ) |
| Royal Bank of Scotland | USD | 2,779 | NOK | 17,852 | 12/17/14 | (137 | ) |
| See accompanying notes which are an integral part of the financial statements. | |||||||
| Russell International Developed Markets Fund 201 | |||||||
| Russell Investment Company | |||||||
| Russell International Developed Markets Fund | |||||||
| Schedule of Investments, continued — October 31, 2014 | |||||||
| Foreign Currency Exchange Contracts | |||||||
| Amounts in thousands | |||||||
| Unrealized | |||||||
| Appreciation | |||||||
| Amount | Amount | (Depreciation) | |||||
| Counterparty | Sold | Bought | Settlement Date | $ | |||
| Royal Bank of Scotland | USD | 27,704 | NOK | 175,079 | 12/17/14 | (1,786 | ) |
| Royal Bank of Scotland | USD | 7,447 | NZD | 9,103 | 12/17/14 | (380 | ) |
| Royal Bank of Scotland | USD | 7,788 | NZD | 9,451 | 12/17/14 | (451 | ) |
| Royal Bank of Scotland | USD | 7,820 | NZD | 9,452 | 12/17/14 | (483 | ) |
| Royal Bank of Scotland | USD | 7,918 | NZD | 9,602 | 12/17/14 | (464 | ) |
| Royal Bank of Scotland | USD | 7,918 | NZD | 9,651 | 12/17/14 | (427 | ) |
| Royal Bank of Scotland | USD | 7,926 | NZD | 9,646 | 12/17/14 | (439 | ) |
| Royal Bank of Scotland | USD | 58 | SEK | 410 | 12/17/14 | (3 | ) |
| Royal Bank of Scotland | USD | 73 | SEK | 524 | 12/17/14 | (2 | ) |
| Royal Bank of Scotland | USD | 149 | SEK | 1,075 | 12/17/14 | (3 | ) |
| Royal Bank of Scotland | USD | 182 | SEK | 1,302 | 12/17/14 | (5 | ) |
| Royal Bank of Scotland | USD | 330 | SEK | 2,356 | 12/17/14 | (11 | ) |
| Royal Bank of Scotland | USD | 4 | SGD | 5 | 12/17/14 | — | |
| Royal Bank of Scotland | USD | 12 | SGD | 15 | 12/17/14 | — | |
| Royal Bank of Scotland | USD | 29 | SGD | 37 | 12/17/14 | — | |
| Royal Bank of Scotland | USD | 56 | SGD | 71 | 12/17/14 | (1 | ) |
| Royal Bank of Scotland | USD | 63 | SGD | 80 | 12/17/14 | (1 | ) |
| Royal Bank of Scotland | USD | 206 | SGD | 257 | 12/17/14 | (5 | ) |
| Royal Bank of Scotland | USD | 785 | SGD | 985 | 12/17/14 | (19 | ) |
| Royal Bank of Scotland | USD | 7,685 | SGD | 9,795 | 12/17/14 | (62 | ) |
| Royal Bank of Scotland | AUD | 2,568 | USD | 2,298 | 12/17/14 | 46 | |
| Royal Bank of Scotland | AUD | 3,340 | USD | 2,915 | 12/17/14 | (15 | ) |
| Royal Bank of Scotland | AUD | 5,684 | USD | 4,971 | 12/17/14 | (15 | ) |
| Royal Bank of Scotland | CAD | 1 | USD | 1 | 12/17/14 | — | |
| Royal Bank of Scotland | CAD | 46 | USD | 41 | 12/17/14 | 1 | |
| Royal Bank of Scotland | CAD | 63 | USD | 57 | 12/17/14 | 2 | |
| Royal Bank of Scotland | CAD | 84 | USD | 75 | 12/17/14 | 1 | |
| Royal Bank of Scotland | CAD | 109 | USD | 99 | 12/17/14 | 3 | |
| Royal Bank of Scotland | CAD | 124 | USD | 114 | 12/17/14 | 4 | |
| Royal Bank of Scotland | CAD | 131 | USD | 118 | 12/17/14 | 2 | |
| Royal Bank of Scotland | CAD | 156 | USD | 143 | 12/17/14 | 5 | |
| Royal Bank of Scotland | CAD | 157 | USD | 144 | 12/17/14 | 5 | |
| Royal Bank of Scotland | CAD | 589 | USD | 523 | 12/17/14 | 1 | |
| Royal Bank of Scotland | CAD | 1,461 | USD | 1,317 | 12/17/14 | 22 | |
| Royal Bank of Scotland | CAD | 2,276 | USD | 2,062 | 12/17/14 | 45 | |
| Royal Bank of Scotland | CAD | 2,929 | USD | 2,605 | 12/17/14 | 9 | |
| Royal Bank of Scotland | CAD | 7,361 | USD | 6,579 | 12/17/14 | 55 | |
| Royal Bank of Scotland | CHF | 757 | USD | 796 | 12/17/14 | 9 | |
| Royal Bank of Scotland | CHF | 1,554 | USD | 1,661 | 12/17/14 | 46 | |
| Royal Bank of Scotland | CHF | 1,873 | USD | 1,975 | 12/17/14 | 28 | |
| Royal Bank of Scotland | CHF | 3,449 | USD | 3,751 | 12/17/14 | 164 | |
| Royal Bank of Scotland | CHF | 3,487 | USD | 3,770 | 12/17/14 | 145 | |
| Royal Bank of Scotland | CHF | 4,612 | USD | 4,916 | 12/17/14 | 120 | |
| Royal Bank of Scotland | CHF | 5,482 | USD | 5,870 | 12/17/14 | 171 | |
| Royal Bank of Scotland | CHF | 5,951 | USD | 6,395 | 12/17/14 | 207 | |
| Royal Bank of Scotland | CHF | 6,140 | USD | 6,527 | 12/17/14 | 143 | |
| Royal Bank of Scotland | DKK | 175 | USD | 30 | 12/17/14 | — | |
| Royal Bank of Scotland | DKK | 560 | USD | 96 | 12/17/14 | 2 | |
| Royal Bank of Scotland | DKK | 585 | USD | 101 | 12/17/14 | 3 | |
| Royal Bank of Scotland | DKK | 926 | USD | 158 | 12/17/14 | 2 | |
| Royal Bank of Scotland | DKK | 16,800 | USD | 2,910 | 12/17/14 | 81 | |
| Royal Bank of Scotland | EUR | 2,192 | USD | 2,820 | 12/17/14 | 72 | |
| Royal Bank of Scotland | EUR | 6,458 | USD | 8,210 | 12/17/14 | 115 | |
| Royal Bank of Scotland | EUR | 10,657 | USD | 13,479 | 12/17/14 | 121 | |
| Royal Bank of Scotland | EUR | 15,204 | USD | 19,995 | 12/17/14 | 937 | |
| Royal Bank of Scotland | GBP | 907 | USD | 1,460 | 12/17/14 | 10 | |
| Royal Bank of Scotland | GBP | 1,880 | USD | 3,031 | 12/17/14 | 24 | |
| Royal Bank of Scotland | GBP | 2,271 | USD | 3,671 | 12/17/14 | 40 | |
| Royal Bank of Scotland | GBP | 2,333 | USD | 3,842 | 12/17/14 | 111 | |
| Royal Bank of Scotland | GBP | 2,610 | USD | 4,200 | 12/17/14 | 26 | |
| Royal Bank of Scotland | GBP | 6,612 | USD | 10,640 | 12/17/14 | 67 | |
| Royal Bank of Scotland | GBP | 8,319 | USD | 13,421 | 12/17/14 | 118 | |
| Royal Bank of Scotland | GBP | 9,929 | USD | 16,203 | 12/17/14 | 325 | |
| Royal Bank of Scotland | GBP | 12,880 | USD | 21,276 | 12/17/14 | 677 | |
| Royal Bank of Scotland | HKD | 273 | USD | 35 | 12/17/14 | — | |
| Royal Bank of Scotland | HKD | 291 | USD | 37 | 12/17/14 | — | |
| Royal Bank of Scotland | HKD | 385 | USD | 50 | 12/17/14 | — | |
| Royal Bank of Scotland | HKD | 991 | USD | 128 | 12/17/14 | — | |
| See accompanying notes which are an integral part of the financial statements. | |||||||
| 202 Russell International Developed Markets Fund | |||||||
| Russell Investment Company | |||||||
| Russell International Developed Markets Fund | |||||||
| Schedule of Investments, continued — October 31, 2014 | |||||||
| Foreign Currency Exchange Contracts | |||||||
| Amounts in thousands | |||||||
| Unrealized | |||||||
| Appreciation | |||||||
| Amount | Amount | (Depreciation) | |||||
| Counterparty | Sold | Bought | Settlement Date | $ | |||
| Royal Bank of Scotland | HKD | 7,041 | USD | 908 | 12/17/14 | — | |
| Royal Bank of Scotland | HKD | 9,115 | USD | 1,175 | 12/17/14 | — | |
| Royal Bank of Scotland | ILS | 281 | USD | 75 | 12/17/14 | 1 | |
| Royal Bank of Scotland | JPY | 133,268 | USD | 1,247 | 12/17/14 | 60 | |
| Royal Bank of Scotland | JPY | 134,212 | USD | 1,238 | 12/17/14 | 42 | |
| Royal Bank of Scotland | JPY | 368,693 | USD | 3,445 | 12/17/14 | 161 | |
| Royal Bank of Scotland | JPY | 562,175 | USD | 5,207 | 12/17/14 | 200 | |
| Royal Bank of Scotland | NOK | 5,341 | USD | 808 | 12/17/14 | 17 | |
| Royal Bank of Scotland | NOK | 8,146 | USD | 1,279 | 12/17/14 | 73 | |
| Royal Bank of Scotland | NOK | 16,714 | USD | 2,562 | 12/17/14 | 88 | |
| Royal Bank of Scotland | NOK | 17,363 | USD | 2,647 | 12/17/14 | 76 | |
| Royal Bank of Scotland | NZD | 1,026 | USD | 831 | 12/17/14 | 35 | |
| Royal Bank of Scotland | NZD | 1,988 | USD | 1,533 | 12/17/14 | (10 | ) |
| Royal Bank of Scotland | NZD | 4,273 | USD | 3,436 | 12/17/14 | 119 | |
| Royal Bank of Scotland | NZD | 9,041 | USD | 7,063 | 12/17/14 | 45 | |
| Royal Bank of Scotland | NZD | 10,355 | USD | 8,374 | 12/17/14 | 337 | |
| Royal Bank of Scotland | SEK | 221 | USD | 31 | 12/17/14 | 1 | |
| Royal Bank of Scotland | SEK | 402 | USD | 56 | 12/17/14 | 2 | |
| Royal Bank of Scotland | SEK | 565 | USD | 79 | 12/17/14 | 3 | |
| Royal Bank of Scotland | SEK | 653 | USD | 92 | 12/17/14 | 3 | |
| Royal Bank of Scotland | SEK | 886 | USD | 124 | 12/17/14 | 4 | |
| Royal Bank of Scotland | SEK | 1,243 | USD | 169 | 12/17/14 | 1 | |
| Royal Bank of Scotland | SEK | 3,915 | USD | 558 | 12/17/14 | 28 | |
| Royal Bank of Scotland | SEK | 3,915 | USD | 557 | 12/17/14 | 27 | |
| Royal Bank of Scotland | SEK | 4,698 | USD | 672 | 12/17/14 | 35 | |
| Royal Bank of Scotland | SEK | 4,728 | USD | 662 | 12/17/14 | 22 | |
| Royal Bank of Scotland | SEK | 5,360 | USD | 754 | 12/17/14 | 28 | |
| Royal Bank of Scotland | SEK | 5,537 | USD | 783 | 12/17/14 | 33 | |
| Royal Bank of Scotland | SEK | 5,587 | USD | 784 | 12/17/14 | 28 | |
| Royal Bank of Scotland | SEK | 5,950 | USD | 840 | 12/17/14 | 34 | |
| Royal Bank of Scotland | SEK | 5,950 | USD | 838 | 12/17/14 | 32 | |
| Royal Bank of Scotland | SEK | 16,383 | USD | 2,292 | 12/17/14 | 73 | |
| Royal Bank of Scotland | SEK | 26,584 | USD | 3,641 | 12/17/14 | 40 | |
| Royal Bank of Scotland | SGD | 37 | USD | 29 | 12/17/14 | 1 | |
| Royal Bank of Scotland | SGD | 42 | USD | 32 | 12/17/14 | — | |
| Royal Bank of Scotland | SGD | 44 | USD | 35 | 12/17/14 | — | |
| Royal Bank of Scotland | SGD | 53 | USD | 41 | 12/17/14 | — | |
| Royal Bank of Scotland | SGD | 72 | USD | 57 | 12/17/14 | 1 | |
| Royal Bank of Scotland | SGD | 1,941 | USD | 1,530 | 12/17/14 | 19 | |
| State Street | USD | 225 | CAD | 253 | 11/04/14 | — | |
| State Street | USD | 478 | DKK | 2,838 | 11/03/14 | — | |
| State Street | USD | 137 | EUR | 109 | 11/04/14 | — | |
| State Street | USD | 194 | SGD | 248 | 11/03/14 | (1 | ) |
| State Street | USD | 69 | THB | 2,231 | 11/03/14 | — | |
| State Street | USD | 108 | THB | 3,513 | 11/04/14 | — | |
| State Street | AUD | 200 | USD | 178 | 12/17/14 | 2 | |
| State Street | AUD | 500 | USD | 440 | 12/17/14 | 2 | |
| State Street | AUD | 1,000 | USD | 893 | 12/17/14 | 16 | |
| State Street | AUD | 3,429 | USD | 3,000 | 12/17/14 | (9 | ) |
| State Street | BRL | 231 | USD | 97 | 11/03/14 | 3 | |
| State Street | BRL | 176 | USD | 72 | 11/04/14 | 1 | |
| State Street | CAD | 100 | USD | 89 | 12/17/14 | 1 | |
| State Street | CAD | 500 | USD | 456 | 12/17/14 | 12 | |
| State Street | CAD | 1,000 | USD | 894 | 12/17/14 | 8 | |
| State Street | CAD | 1,200 | USD | 1,094 | 12/17/14 | 30 | |
| State Street | EUR | 517 | USD | 649 | 11/03/14 | 1 | |
| State Street | EUR | 1,737 | USD | 2,191 | 11/03/14 | 14 | |
| State Street | EUR | 1,200 | USD | 1,513 | 12/17/14 | 9 | |
| State Street | EUR | 2,000 | USD | 2,569 | 12/17/14 | 62 | |
| State Street | EUR | 3,000 | USD | 3,822 | 12/17/14 | 61 | |
| State Street | EUR | 3,000 | USD | 3,878 | 12/17/14 | 117 | |
| State Street | GBP | 300 | USD | 484 | 12/17/14 | 4 | |
| State Street | GBP | 500 | USD | 815 | 12/17/14 | 15 | |
| State Street | GBP | 700 | USD | 1,119 | 12/17/14 | — | |
| State Street | GBP | 1,200 | USD | 1,964 | 12/17/14 | 45 | |
| State Street | HKD | 13,122 | USD | 1,692 | 11/03/14 | — | |
| State Street | HKD | 2,000 | USD | 258 | 12/17/14 | — | |
| See accompanying notes which are an integral part of the financial statements. | |||||||
| Russell International Developed Markets Fund 203 | |||||||
| Russell Investment Company | ||||||||||||
| Russell International Developed Markets Fund | ||||||||||||
| Schedule of Investments, continued — October 31, 2014 | ||||||||||||
| Foreign Currency Exchange Contracts | ||||||||||||
| Amounts in thousands | ||||||||||||
| Unrealized | ||||||||||||
| Appreciation | ||||||||||||
| Amount | Amount | (Depreciation) | ||||||||||
| Counterparty | Sold | Bought | Settlement Date | $ | ||||||||
| State Street | HKD | 2,000 | USD | 258 | 12/17/14 | — | ||||||
| State Street | HKD | 2,000 | USD | 258 | 12/17/14 | — | ||||||
| State Street | HKD | 2,000 | USD | 258 | 12/17/14 | — | ||||||
| State Street | JPY | 50,000 | USD | 459 | 12/17/14 | 14 | ||||||
| State Street | JPY | 100,000 | USD | 925 | 12/17/14 | 34 | ||||||
| State Street | JPY | 150,000 | USD | 1,373 | 12/17/14 | 37 | ||||||
| State Street | JPY | 200,000 | USD | 1,840 | 12/17/14 | 59 | ||||||
| State Street | NZD | 877 | USD | 685 | 11/04/14 | 1 | ||||||
| UBS | USD | 2,919 | AUD | 3,214 | 12/17/14 | (100 | ) | |||||
| UBS | USD | 3,729 | CAD | 4,104 | 12/17/14 | (92 | ) | |||||
| UBS | USD | 19,867 | EUR | 15,384 | 12/17/14 | (582 | ) | |||||
| UBS | USD | 7,563 | GBP | 4,689 | 12/17/14 | (65 | ) | |||||
| UBS | USD | 8,060 | JPY | 859,585 | 12/17/14 | (404 | ) | |||||
| Total Unrealized Appreciation (Depreciation) on Open Foreign Currency Exchange Contracts | (15,082 | ) | ||||||||||
| Presentation of Portfolio Holdings | ||||||||||||
| Amounts in thousands | ||||||||||||
| Fair Value | ||||||||||||
| Portfolio Summary | Level 1 | Level 2 | Level 3 | Total | % of Net Assets | |||||||
| Common Stocks | ||||||||||||
| Australia | $ | 102,407 | $ | — | $ | — | $ | 102,407 | 2.5 | |||
| Austria | 11,949 | — | — | 11,949 | 0.3 | |||||||
| Belgium | 53,508 | — | — | 53,508 | 1.3 | |||||||
| Bermuda | 19,103 | — | — | 19,103 | 0.5 | |||||||
| Brazil | 29,655 | — | — | 29,655 | 0.7 | |||||||
| Canada | 217,851 | — | — | 217,851 | 5.3 | |||||||
| Cayman Islands | 52,450 | — | 703 | 53,153 | 1.3 | |||||||
| Czech Republic | 6,588 | — | — | 6,588 | 0.2 | |||||||
| Denmark | 81,458 | — | — | 81,458 | 2.0 | |||||||
| Finland | 28,326 | — | — | 28,326 | 0.7 | |||||||
| France | 346,066 | — | — | 346,066 | 8.4 | |||||||
| Germany | 258,043 | — | — | 258,043 | 6.3 | |||||||
| Hong Kong | 103,856 | — | — | 103,856 | 2.5 | |||||||
| India | 42,265 | — | — | 42,265 | 1.0 | |||||||
| Indonesia | 11,497 | — | — | 11,497 | 0.3 | |||||||
| Ireland | 35,023 | — | — | 35,023 | 0.9 | |||||||
| Isle of Man | 3,258 | — | — | 3,258 | 0.1 | |||||||
| Israel | 38,857 | — | — | 38,857 | 1.0 | |||||||
| Italy | 74,407 | — | — | 74,407 | 1.8 | |||||||
| Japan | 536,295 | — | — | 536,295 | 13.1 | |||||||
| Jersey | 34,037 | — | — | 34,037 | 0.8 | |||||||
| Kazakhstan | 684 | — | — | 684 | —* | |||||||
| Kenya | 3,148 | — | — | 3,148 | 0.1 | |||||||
| Liechtenstein | 358 | — | — | 358 | —* | |||||||
| Luxembourg | 937 | — | — | 937 | —* | |||||||
| Mexico | 8,682 | — | — | 8,682 | 0.2 | |||||||
| Netherlands | 193,815 | — | — | 193,815 | 4.7 | |||||||
| New Zealand | 3,119 | — | — | 3,119 | 0.1 | |||||||
| Norway | 41,201 | — | — | 41,201 | 1.0 | |||||||
| Portugal | 5,300 | — | — | 5,300 | 0.1 | |||||||
| Russia | 13,574 | — | — | 13,574 | 0.3 | |||||||
| Singapore | 62,476 | — | — | 62,476 | 1.5 | |||||||
| South Africa | 14,006 | — | — | 14,006 | 0.3 | |||||||
| South Korea | 39,750 | — | — | 39,750 | 1.0 | |||||||
| Spain | 57,072 | — | — | 57,072 | 1.4 | |||||||
| Sweden | 83,836 | — | — | 83,836 | 2.1 | |||||||
| Switzerland | 398,534 | — | — | 398,534 | 9.7 | |||||||
| Taiwan | 41,325 | — | — | 41,325 | 1.0 | |||||||
| Thailand | 15,733 | — | — | 15,733 | 0.4 | |||||||
| United Kingdom | 659,824 | — | — | 659,824 | 16.1 | |||||||
| United States | 50,173 | — | — | 50,173 | 1.2 | |||||||
| Preferred Stocks | 8,867 | — | 76 | 8,943 | 0.2 | |||||||
| See accompanying notes which are an integral part of the financial statements. | ||||||||||||
| 204 Russell International Developed Markets Fund | ||||||||||||
| Russell Investment Company | ||||||||||||||
| Russell International Developed Markets Fund | ||||||||||||||
| Schedule of Investments, continued — October 31, 2014 | ||||||||||||||
| Presentation of Portfolio Holdings | ||||||||||||||
| Amounts in thousands | ||||||||||||||
| Fair Value | ||||||||||||||
| Portfolio Summary | Level 1 | Level 2 | Level 3 | Total | % of Net Assets | |||||||||
| Warrants & Rights | 16,184 | — | — | 16,184 | 0.4 | |||||||||
| Short-Term Investments | — | 219,120 | — | 219,120 | 5.3 | |||||||||
| Other Securities | — | 37,265 | — | 37,265 | 0.9 | |||||||||
| Total Investments | 3,805,497 | 256,385 | 779 | 4,062,661 | 99.0 | |||||||||
| Other Assets and Liabilities, Net | 1.0 | |||||||||||||
| 100.0 | ||||||||||||||
| Other Financial Instruments | ||||||||||||||
| Futures Contracts | 10,149 | — | — | 10,149 | 0.2 | |||||||||
| Foreign Currency Exchange Contracts | 18 | (15,100 | ) | — | (15,082 | ) | (0.4 | ) | ||||||
| Total Other Financial Instruments** | $ | 10,167 | $ | (15,100 | ) | $ | — | $ | (4,933 | ) | ||||
| * | Less than .05% of net assets. |
| ** | Futures and foreign currency exchange contract values reflect the unrealized appreciation/depreciation on the instruments. |
For a description of the Levels see note 2 in the Notes to Financial Statements.
For disclosure on transfers between Levels 1, 2 and 3 during the period ended October 31, 2014, see note 2 in the Notes to Financial Statements.
Investments in which significant unobservable inputs (Level 3) were used in determining a fair value for the period ended October 31, 2014 were less than 1% of net assets.
See accompanying notes which are an integral part of the financial statements.
Russell International Developed Markets Fund 205
| Russell Investment Company | ||||||
| Russell International Developed Markets Fund | ||||||
| Fair Value of Derivative Instruments — October 31, 2014 | ||||||
| Amounts in thousands | ||||||
| Foreign | ||||||
| Equity | Currency | |||||
| Derivatives not accounted for as hedging instruments | Contracts | Contracts | ||||
| Location: Statement of Assets and Liabilities - Assets | ||||||
| Unrealized appreciation on foreign currency exchange contracts | $ | — | $ | 11,874 | ||
| Variation margin on futures contracts* | 18,596 | — | ||||
| Total | $ | 18,596 | $ | 11,874 | ||
| Location: Statement of Assets and Liabilities - Liabilities | ||||||
| Variation margin on futures contracts* | $ | 8,447 | $ | — | ||
| Unrealized depreciation on foreign currency exchange contracts | — | 26,956 | ||||
| Total | $ | 8,447 | $ | 26,956 | ||
| Foreign | ||||||
| Equity | Currency | |||||
| Derivatives not accounted for as hedging instruments | Contracts | Contracts | ||||
| Location: Statement of Operations - Net realized gain (loss) | ||||||
| Futures contracts | $ | 31,867 | $ | — | ||
| Foreign currency-related transactions** | — | (3,453 | ) | |||
| Total | $ | 31,867 | $ | (3,453 | ) | |
| Location: Statement of Operations - Net change in unrealized appreciation (depreciation) | ||||||
| Futures contracts | $ | (3,176 | ) | $ | — | |
| Foreign currency-related transactions*** | — | (22,237 | ) | |||
| Total | $ | (3,176 | ) | $ | (22,237 | ) |
| * | Includes cumulative appreciation/depreciation of futures contracts as reported in the Schedule of Investments. Only variation margin is reported within the Statement of Assets and Liabilities. |
| ** | Only includes net realized gain (loss) on forward and spot contracts. May differ from the net realized gain (loss) on foreign currency-related transactions reported within the Statement of Operations. |
| *** | Only includes change in unrealized gain (loss) on forward and spot contracts. May differ from the net change in unrealized gain (loss) on foreign currency- related transactions reported within the Statement of Operations. |
For further disclosure on derivatives see note 2 in the Notes to Financial Statements.
See accompanying notes which are an integral part of the financial statements.
206 Russell International Developed Markets Fund
Russell Investment Company
Russell International Developed Markets Fund
Balance Sheet Offsetting of Financial and Derivative Instruments — October 31, 2014
| Amounts in thousands | ||||||||
| Offsetting of Financial Assets and Derivative Assets | ||||||||
| Gross | Net Amounts | |||||||
| Amounts | of Assets | |||||||
| Gross | Offset in the | Presented in | ||||||
| Amounts of | Statement of | the Statement | ||||||
| Recognized Assets and | of Assets and | |||||||
| Description | Location: Statement of Assets and Liabilities - Assets | Assets | Liabilities | Liabilities | ||||
| Securities on Loan* | Investments, at fair value | $ | 36,328 | $ — | $ | 36,328 | ||
| Foreign Currency Exchange Contracts | Unrealized appreciation on foreign currency exchange contracts | 11,874 | — | 11,874 | ||||
| Futures Contracts | Variation margin on futures contracts | 13,648 | — | 13,648 | ||||
| Total | $ | 61,850 | $ — | $ | 61,850 | |||
| Financial Assets, Derivative Assets, and Collateral Held by Counterparty | |||||||||||
| Gross Amounts Not Offset in | |||||||||||
| the Statement of Assets and | |||||||||||
| Liabilities | |||||||||||
| Net Amounts | |||||||||||
| of Assets | |||||||||||
| Presented in | |||||||||||
| the Statement | Financial and | ||||||||||
| of Assets and | Derivative | Collateral | |||||||||
| Counterparty | Liabilities | Instruments | Received^ | Net Amount | |||||||
| Bank of America | $ | 289 | $ | 26 | $ | — $ | 263 | ||||
| Bank of New York | 1 | 1 | — | — | |||||||
| Barclays | 3,394 | — | 477 | 2,917 | |||||||
| Citigroup | 5,439 | — | 5,439 | — | |||||||
| Commonwealth Bank of Australia | 6 | 6 | — | — | |||||||
| Credit Suisse | 5,413 | 5,219 | 194 | — | |||||||
| Deutsche Bank | 4,538 | 8 | 4,530 | — | |||||||
| Fidelity | 10,640 | — | 10,640 | — | |||||||
| Goldman Sachs | 68 | — | 68 | — | |||||||
| JPMorgan Chase | 8,734 | 58 | 8,676 | — | |||||||
| Merrill Lynch | 1,096 | — | 1,096 | — | |||||||
| Morgan Stanley | 12,714 | — | 1,983 | 10,731 | |||||||
| Royal Bank of Scotland | 5,746 | 5,746 | — | — | |||||||
| State Street | 548 | 9 | — | 539 | |||||||
| UBS | 3,224 | — | 3,224 | — | |||||||
| Total | $ | 61,850 | $ | 11,073 | $ | 36,327 | $ | 14,450 | |||
See accompanying notes which are an integral part of the financial statements.
Russell International Developed Markets Fund 207
Russell Investment Company
Russell International Developed Markets Fund
Balance Sheet Offsetting of Financial and Derivative Instruments, continued —October 31, 2014
| Amounts in thousands | ||||||||
| Offsetting of Financial Liabilities and Derivative Liabilities | ||||||||
| Gross | Net Amounts | |||||||
| Amounts | of Assets | |||||||
| Gross | Offset in the | Presented in | ||||||
| Amounts of | Statement of | the Statement | ||||||
| Recognized | Assets and | of Assets and | ||||||
| Description | Location: Statement of Assets and Liabilities - Liabilities | Liabilities | Liabilities | Liabilities | ||||
| Futures Contracts | Variation margin on futures contracts | $ | 1,258 | $ — | $ | 1,258 | ||
| Foreign Currency Exchange Contracts | Unrealized depreciation on foreign currency exchange contracts | 26,956 | — | 26,956 | ||||
| Total | $ | 28,214 | $ — | $ | 28,214 | |||
| Financial Liabilities, Derivative Liabilities, and Collateral Pledged by Counterparty | |||||||||||
| Gross Amounts Not Offset in | |||||||||||
| the Statement of Assets and | |||||||||||
| Liabilities | |||||||||||
| Net Amounts | |||||||||||
| of Liabilities | |||||||||||
| Presented in | |||||||||||
| the Statement | Financial and | ||||||||||
| of Assets and | Derivative | Collateral | |||||||||
| Counterparty | Liabilities | Instruments | Pledged^ | Net Amount | |||||||
| Bank of America | $ | 26 | $ | 26 | $ | — $ | — | ||||
| Bank of New York | 1,742 | 1 | — | 1,741 | |||||||
| Barclays | 936 | — | 936 | — | |||||||
| Commonwealth Bank of Australia | 1,228 | 6 | — | 1,222 | |||||||
| Credit Suisse | 9,444 | 5,219 | 3,330 | 895 | |||||||
| Deutsche Bank | 39 | 8 | — | 31 | |||||||
| HSBC | 1,238 | — | — | 1,238 | |||||||
| JPMorgan Chase | 1,242 | 58 | — | 1,184 | |||||||
| Morgan Stanley | 321 | — | 321 | — | |||||||
| Northern Trust | 654 | — | — | 654 | |||||||
| Royal Bank of Scotland | 10,090 | 5,746 | 3,210 | 1,134 | |||||||
| State Street | 11 | 9 | — | 2 | |||||||
| UBS | 1,243 | — | — | 1,243 | |||||||
| Total | $ | 28,214 | $ | 11,073 | $ | 7,797 | $ | 9,344 | |||
* Fair value of securities on loan as reported in the footnotes to the Statement of Assets and Liabilities.
^ Collateral received or pledged amounts may not reconcile to those disclosed in the Statement of Assets and Liabilities due to the inclusion of off-Balance Sheet collateral and adjustments made to exclude overcollateralization.
For further disclosure on derivatives and counterparty risk see note 2 in the Notes to Financial Statements.
See accompanying notes which are an integral part of the financial statements.
208 Russell International Developed Markets Fund
| Russell Investment Company | ||
| Russell International Developed Markets Fund | ||
| Statement of Assets and Liabilities — October 31, 2014 | ||
| Amounts in thousands | ||
| Assets | ||
| Investments, at identified cost | $ | 3,761,342 |
| Investments, at fair value(*)(>) | 4,062,661 | |
| Cash | 262 | |
| Cash (restricted)(a) | 51,781 | |
| Foreign currency holdings(^) | 15,805 | |
| Unrealized appreciation on foreign currency exchange contracts | 11,874 | |
| Receivables: | ||
| Dividends and interest | 6,681 | |
| Dividends from affiliated Russell funds | 20 | |
| Investments sold | 13,173 | |
| Fund shares sold | 5,390 | |
| Foreign capital gains taxes recoverable | 3,368 | |
| Variation margin on futures contracts | 13,648 | |
| Prepaid expenses | 12 | |
| Total assets | 4,184,675 | |
| Liabilities | ||
| Payables: | ||
| Due to broker(b) | 2,179 | |
| Investments purchased | 8,670 | |
| Fund shares redeemed | 2,099 | |
| Accrued fees to affiliates | 3,080 | |
| Other accrued expenses | 428 | |
| Variation margin on futures contracts | 1,258 | |
| Deferred capital gains tax liability | 229 | |
| Unrealized depreciation on foreign currency exchange contracts | 26,956 | |
| Payable upon return of securities loaned | 37,265 | |
| Total liabilities | 82,164 | |
| Net Assets | $ | 4,102,511 |
See accompanying notes which are an integral part of the financial statements.
Russell International Developed Markets Fund 209
| Russell Investment Company | |||
| Russell International Developed Markets Fund | |||
| Statement of Assets and Liabilities, continued — October 31, 2014 | |||
| Amounts in thousands | |||
| Net Assets Consist of: | |||
| Undistributed (overdistributed) net investment income | $ | 74,005 | |
| Accumulated net realized gain (loss) | (485,033 | ) | |
| Unrealized appreciation (depreciation) on: | |||
| Investments (net of deferred tax liability for foreign capital gains taxes) | 301,090 | ||
| Futures contracts | 10,149 | ||
| Foreign currency-related transactions | (15,667 | ) | |
| Shares of beneficial interest | 1,144 | ||
| Additional paid-in capital | 4,216,823 | ||
| Net Assets | $ | 4,102,511 | |
| Net Asset Value, offering and redemption price per share: | |||
| Net asset value per share: Class A(#) | $ | 35.77 | |
| Maximum offering price per share (Net asset value plus sales charge of 5.75%): Class A | $ | 37.95 | |
| Class A — Net assets | $ | 29,619,304 | |
| Class A — Shares outstanding ($.01 par value) | 828,073 | ||
| Net asset value per share: Class C(#) | $ | 35.62 | |
| Class C — Net assets | $ | 37,425,385 | |
| Class C — Shares outstanding ($.01 par value) | 1,050,591 | ||
| Net asset value per share: Class E(#) | $ | 35.81 | |
| Class E — Net assets | $ | 79,957,099 | |
| Class E — Shares outstanding ($.01 par value) | 2,233,034 | ||
| Net asset value per share: Class I(#) | $ | 35.91 | |
| Class I — Net assets | $ | 674,127,288 | |
| Class I — Shares outstanding ($.01 par value) | 18,770,370 | ||
| Net asset value per share: Class S(#) | $ | 35.86 | |
| Class S — Net assets | $ 2,347,214,266 | ||
| Class S — Shares outstanding ($.01 par value) | 65,457,906 | ||
| Net asset value per share: Class Y(#) | $ | 35.90 | |
| Class Y — Net assets | $ | 934,167,662 | |
| Class Y — Shares outstanding ($.01 par value) | 26,019,642 | ||
| Amounts in thousands | |||
| (^) Foreign currency holdings - cost | $ | 16,042 | |
| (*) Securities on loan included in investments | $ | 36,328 | |
| (>) Investments in affiliates, Russell U.S. Cash Management Fund and Russell U.S. Cash Collateral Fund | $ | 256,385 | |
| (a) Cash Collateral for Futures | $ | 51,781 | |
| (b) Due to Broker for Futures | $ | 2,179 | |
| (#) Net asset value per share equals class level net assets divided by class level shares of beneficial interest outstanding. | |||
See accompanying notes which are an integral part of the financial statements.
210 Russell International Developed Markets Fund
| Russell Investment Company | |||
| Russell International Developed Markets Fund | |||
| Statement of Operations — For the Period Ended October 31, 2014 | |||
| Amounts in thousands | |||
| Investment Income | |||
| Dividends | $ | 139,372 | |
| Dividends from affiliated Russell funds | 281 | ||
| Securities lending income | 3,194 | ||
| Less foreign taxes withheld | (11,513 | ) | |
| Total investment income | 131,334 | ||
| Expenses | |||
| Advisory fees | 31,274 | ||
| Administrative fees | 2,128 | ||
| Custodian fees | 1,581 | ||
| Distribution fees - Class A | 74 | ||
| Distribution fees - Class C | 311 | ||
| Transfer agent fees - Class A | 59 | ||
| Transfer agent fees - Class C | 83 | ||
| Transfer agent fees - Class E | 193 | ||
| Transfer agent fees - Class I | 853 | ||
| Transfer agent fees - Class S | 4,817 | ||
| Transfer agent fees - Class Y | 52 | ||
| Professional fees | 179 | ||
| Registration fees | 198 | ||
| Shareholder servicing fees - Class C | 103 | ||
| Shareholder servicing fees - Class E | 241 | ||
| Trustees’ fees | 114 | ||
| Printing fees | 180 | ||
| Miscellaneous | 209 | ||
| Total expenses | 42,649 | ||
| Net investment income (loss) | 88,685 | ||
| Net Realized and Unrealized Gain (Loss) | |||
| Net realized gain (loss) on: | |||
| Investments (net of deferred tax liability for foreign capital gains taxes) | 363,821 | ||
| Futures contracts | 31,867 | ||
| Foreign currency-related transactions | (1,770 | ) | |
| Net realized gain (loss) | 393,918 | ||
| Net change in unrealized appreciation (depreciation) on: | |||
| Investments (net of deferred tax liability for foreign capital gains taxes) | (391,910 | ) | |
| Futures contracts | (3,176 | ) | |
| Foreign currency-related transactions | (22,903 | ) | |
| Net change in unrealized appreciation (depreciation) | (417,989 | ) | |
| Net realized and unrealized gain (loss) | (24,071 | ) | |
| Net Increase (Decrease) in Net Assets from Operations | $ | 64,614 | |
See accompanying notes which are an integral part of the financial statements.
Russell International Developed Markets Fund 211
| Russell Investment Company | ||||||
| Russell International Developed Markets Fund | ||||||
| Statements of Changes in Net Assets | ||||||
| For the Periods Ended October 31, | ||||||
| Amounts in thousands | 2014 | 2013 | ||||
| Increase (Decrease) in Net Assets | ||||||
| Operations | ||||||
| Net investment income (loss) | $ | 88,685 | $ | 83,270 | ||
| Net realized gain (loss) | 393,918 | 399,999 | ||||
| Net change in unrealized appreciation (depreciation) | (417,989 | ) | 548,605 | |||
| Net increase (decrease) in net assets from operations | 64,614 | 1,031,874 | ||||
| Distributions | ||||||
| From net investment income | ||||||
| Class A | (546 | ) | (404 | ) | ||
| Class C | (495 | ) | (372 | ) | ||
| Class E | (2,131 | ) | (1,707 | ) | ||
| Class I | (16,544 | ) | (13,997 | ) | ||
| Class S | (59,262 | ) | (43,392 | ) | ||
| Class Y | (33,976 | ) | (27,956 | ) | ||
| Net decrease in net assets from distributions | (112,954 | ) | (87,828 | ) | ||
| Share Transactions* | ||||||
| Net increase (decrease) in net assets from share transactions | (1,018,548 | ) | 47,354 | |||
| Total Net Increase (Decrease) in Net Assets | (1,066,888 | ) | 991,400 | |||
| Net Assets | ||||||
| Beginning of period | 5,169,399 | 4,177,999 | ||||
| End of period | $ | 4,102,511 | $ | 5,169,399 | ||
| Undistributed (overdistributed) net investment income included in net assets | $ | 74,005 | $ | 85,094 | ||
See accompanying notes which are an integral part of the financial statements.
212 Russell International Developed Markets Fund
Russell Investment Company
Russell International Developed Markets Fund
Statements of Changes in Net Assets, continued
* Share transaction amounts (in thousands) for the periods ended October 31, 2014 and October 31, 2013 were as follows:
| 2014 | 2013 | |||||||||||
| Shares | Dollars | Shares | Dollars | |||||||||
| Class A | ||||||||||||
| Proceeds from shares sold | 172 | $ | 6,367 | 212 | $ | 6,921 | ||||||
| Proceeds from reinvestment of distributions | 15 | 543 | 13 | 401 | ||||||||
| Payments for shares redeemed | (160 | ) | (5,912 | ) | (196 | ) | (6,273 | ) | ||||
| Net increase (decrease) | 27 | 998 | 29 | 1,049 | ||||||||
| Class C | ||||||||||||
| Proceeds from shares sold | 129 | 4,758 | 137 | 4,471 | ||||||||
| Proceeds from reinvestment of distributions | 13 | 490 | 12 | 370 | ||||||||
| Payments for shares redeemed | (285 | ) | (10,522 | ) | (343 | ) | (11,068 | ) | ||||
| Net increase (decrease) | (143 | ) | (5,274 | ) | (194 | ) | (6,227 | ) | ||||
| Class E | ||||||||||||
| Proceeds from shares sold | 444 | 16,402 | 679 | 22,208 | ||||||||
| Proceeds from reinvestment of distributions | 57 | 2,061 | 54 | 1,649 | ||||||||
| Payments for shares redeemed | (1,336 | ) | (49,218 | ) | (686 | ) | (22,626 | ) | ||||
| Net increase (decrease) | (835 | ) | (30,755 | ) | 47 | 1,231 | ||||||
| Class I | ||||||||||||
| Proceeds from shares sold | 3,295 | 121,484 | 4,202 | 136,669 | ||||||||
| Proceeds from reinvestment of distributions | 449 | 16,280 | 445 | 13,709 | ||||||||
| Payments for shares redeemed | (5,652 | ) | (207,600 | ) | (6,560 | ) | (213,341 | ) | ||||
| Net increase (decrease) | (1,908 | ) | (69,836 | ) | (1,913 | ) | (62,963 | ) | ||||
| Class S | ||||||||||||
| Proceeds from shares sold | 18,954 | 697,497 | 22,417 | 732,311 | ||||||||
| Proceeds from reinvestment of distributions | 1,626 | 58,870 | 1,398 | 43,015 | ||||||||
| Payments for shares redeemed | (30,461 | ) | (1,116,369 | ) | (18,223 | ) | (598,228 | ) | ||||
| Net increase (decrease) | (9,881 | ) | (360,002 | ) | 5,592 | 177,098 | ||||||
| Class Y | ||||||||||||
| Proceeds from shares sold | 492 | 18,057 | 5,823 | 193,538 | ||||||||
| Proceeds from reinvestment of distributions | 939 | 33,976 | 909 | 27,956 | ||||||||
| Payments for shares redeemed | (16,375 | ) | (605,712 | ) | (8,686 | ) | (284,328 | ) | ||||
| Net increase (decrease) | (14,944 | ) | (553,679 | ) | (1,954 | ) | (62,834 | ) | ||||
| Total increase (decrease) | (27,684 | ) | $ | (1,018,548 | ) | 1,607 | $ | 47,354 | ||||
See accompanying notes which are an integral part of the financial statements.
Russell International Developed Markets Fund 213
| Russell Investment Company | ||||||||||||||||
| Russell International Developed Markets Fund | ||||||||||||||||
| Financial Highlights — For the Periods Ended | ||||||||||||||||
| For a Share Outstanding Throughout Each Period. | ||||||||||||||||
| $ | $ | $ | $ | $ | ||||||||||||
| Net Asset Value, | Net | Net Realized | Total from | Distributions | ||||||||||||
| Beginning of | Investment | and Unrealized | Investment | from Net | $ | |||||||||||
| Period | Income (Loss)(a)(d) | Gain (Loss) | Operations | Investment Income | Total Distributions | |||||||||||
| Class A | ||||||||||||||||
| October 31, 2014 | 36.30 | .64 | (.48 | ) | .16 | (.69 | ) | (.69 | ) | |||||||
| October 31, 2013 | 29.68 | .49 | 6.67 | 7.16 | (.54 | ) | (.54 | ) | ||||||||
| October 31, 2012 | 28.67 | .52 | .89 | 1.41 | (.40 | ) | (.40 | ) | ||||||||
| October 31, 2011 | 31.14 | .47 | (2.55 | ) | (2.08 | ) | (.39 | ) | (.39 | ) | ||||||
| October 31, 2010 | 29.09 | .34 | 2.67 | 3.01 | (.96 | ) | (.96 | ) | ||||||||
| Class C | ||||||||||||||||
| October 31, 2014 | 36.15 | .37 | (.48 | ) | (.11 | ) | (.42 | ) | (.42 | ) | ||||||
| October 31, 2013 | 29.52 | .24 | 6.67 | 6.91 | (.28 | ) | (.28 | ) | ||||||||
| October 31, 2012 | 28.46 | .30 | .90 | 1.20 | (.14 | ) | (.14 | ) | ||||||||
| October 31, 2011 | 30.85 | .22 | (2.49 | ) | (2.27 | ) | (.13 | ) | (.13 | ) | ||||||
| October 31, 2010 | 28.83 | .12 | 2.65 | 2.77 | (.75 | ) | (.75 | ) | ||||||||
| Class E | ||||||||||||||||
| October 31, 2014 | 36.33 | .62 | (.45 | ) | .17 | (.69 | ) | (.69 | ) | |||||||
| October 31, 2013 | 29.72 | .49 | 6.68 | 7.17 | (.56 | ) | (.56 | ) | ||||||||
| October 31, 2012 | 28.72 | .53 | .90 | 1.43 | (.43 | ) | (.43 | ) | ||||||||
| October 31, 2011 | 31.19 | .49 | (2.55 | ) | (2.06 | ) | (.41 | ) | (.41 | ) | ||||||
| October 31, 2010 | 29.12 | .37 | 2.68 | 3.05 | (.98 | ) | (.98 | ) | ||||||||
| Class I | ||||||||||||||||
| October 31, 2014 | 36.43 | .76 | (.48 | ) | .28 | (.80 | ) | (.80 | ) | |||||||
| October 31, 2013 | 29.77 | .60 | 6.70 | 7.30 | (.64 | ) | (.64 | ) | ||||||||
| October 31, 2012 | 28.78 | .61 | .89 | 1.50 | (.51 | ) | (.51 | ) | ||||||||
| October 31, 2011 | 31.23 | .57 | (2.54 | ) | (1.97 | ) | (.48 | ) | (.48 | ) | ||||||
| October 31, 2010 | 29.16 | .44 | 2.69 | 3.13 | (1.06 | ) | (1.06 | ) | ||||||||
| Class S | ||||||||||||||||
| October 31, 2014 | 36.38 | .71 | (.45 | ) | .26 | (.78 | ) | (.78 | ) | |||||||
| October 31, 2013 | 29.74 | .57 | 6.69 | 7.26 | (.62 | ) | (.62 | ) | ||||||||
| October 31, 2012 | 28.75 | .59 | .89 | 1.48 | (.49 | ) | (.49 | ) | ||||||||
| October 31, 2011 | 31.19 | .55 | (2.53 | ) | (1.98 | ) | (.46 | ) | (.46 | ) | ||||||
| October 31, 2010 | 29.13 | .42 | 2.66 | 3.08 | (1.02 | ) | (1.02 | ) | ||||||||
| Class Y | ||||||||||||||||
| October 31, 2014 | 36.41 | .79 | (.46 | ) | .33 | (.84 | ) | (.84 | ) | |||||||
| October 31, 2013 | 29.76 | .63 | 6.69 | 7.32 | (.67 | ) | (.67 | ) | ||||||||
| October 31, 2012 | 28.77 | .65 | .88 | 1.53 | (.54 | ) | (.54 | ) | ||||||||
| October 31, 2011 | 31.26 | .60 | (2.58 | ) | (1.98 | ) | (.51 | ) | (.51 | ) | ||||||
| October 31, 2010 | 29.18 | .47 | 2.68 | 3.15 | (1.07 | ) | (1.07 | ) | ||||||||
See accompanying notes which are an integral part of the financial statements.
214 Russell International Developed Markets Fund
| % | % | % | |||||||||||||
| $ | $ | Ratio of Expenses | Ratio of Expenses | Ratio of Net | |||||||||||
| Net Asset Value, | % | Net Assets, | to Average | to Average | Investment Income | % | |||||||||
| End of | Total | End of Period | Net Assets, | Net Assets, | to Average | Portfolio | |||||||||
| Period | Return(c) | (000 | ) | Gross | Net(d) | Net Assets(d) | Turnover Rate | ||||||||
| 35.77 | .43 | 29,619 | 1.25 | 1.25 | 1.74 | 74 | |||||||||
| 36.30 | 24.47 | 29,088 | 1.24 | 1.24 | 1.51 | 89 | |||||||||
| 29.68 | 5.04 | 22,905 | 1.24 | 1.24 | 1.83 | 65 | |||||||||
| 28.67 | (6.76 | ) | 22,963 | 1.24 | 1.24 | 1.51 | 74 | ||||||||
| 31.14 | 10.61 | 23,702 | 1.24 | 1.24 | 1.18 | 91 | |||||||||
| 35.62 | (.33 | ) | 37,426 | 2.00 | 2.00 | 1.00 | 74 | ||||||||
| 36.15 | 23.53 | 43,136 | 1.99 | 1.99 | .75 | 89 | |||||||||
| 29.52 | 4.26 | 40,958 | 1.99 | 1.99 | 1.07 | 65 | |||||||||
| 28.46 | (7.34 | ) | 52,552 | 1.99 | 1.99 | .72 | 74 | ||||||||
| 30.85 | 9.80 | 69,576 | 1.99 | 1.99 | .43 | 91 | |||||||||
| 35.81 | .46 | 79,957 | 1.25 | 1.25 | 1.69 | 74 | |||||||||
| 36.33 | 24.48 | 111,467 | 1.24 | 1.23 | 1.51 | 89 | |||||||||
| 29.72 | 5.11 | 89,772 | 1.24 | 1.19 | 1.87 | 65 | |||||||||
| 28.72 | (6.66 | ) | 89,952 | 1.24 | 1.16 | 1.58 | 74 | ||||||||
| 31.19 | 10.75 | 96,680 | 1.24 | 1.13 | 1.29 | 91 | |||||||||
| 35.91 | .76 | 674,127 | .92 | .92 | 2.05 | 74 | |||||||||
| 36.43 | 24.87 | 753,290 | .91 | .91 | 1.84 | 89 | |||||||||
| 29.77 | 5.40 | 672,661 | .91 | .91 | 2.16 | 65 | |||||||||
| 28.78 | (6.39 | ) | 820,995 | .91 | .91 | 1.81 | 74 | ||||||||
| 31.23 | 11.01 | 923,019 | .91 | .89 | 1.53 | 91 | |||||||||
| 35.86 | .69 | 2,347,214 | 1.00 | 1.00 | 1.92 | 74 | |||||||||
| 36.38 | 24.76 | 2,740,707 | .99 | .99 | 1.76 | 89 | |||||||||
| 29.74 | 5.33 | 2,074,313 | .99 | .99 | 2.10 | 65 | |||||||||
| 28.75 | (6.43 | ) | 1,905,604 | .99 | .99 | 1.77 | 74 | ||||||||
| 31.19 | 10.90 | 1,694,995 | .99 | .99 | 1.45 | 91 | |||||||||
| 35.90 | .90 | 934,168 | .80 | .80 | 2.15 | 74 | |||||||||
| 36.41 | 24.99 | 1,491,711 | .79 | .79 | 1.93 | 89 | |||||||||
| 29.76 | 5.52 | 1,277,390 | .80 | .80 | 2.30 | 65 | |||||||||
| 28.77 | (6.46 | ) | 1,722,957 | .81 | .81 | 1.92 | 74 | ||||||||
| 31.26 | 11.12 | 1,971,140 | .81 | .81 | 1.64 | 91 | |||||||||
See accompanying notes which are an integral part of the financial statements.
Russell International Developed Markets Fund 215
Russell Investment Company Russell Global Equity Fund
Portfolio Management Discussion and Analysis — October 31, 2014 (Unaudited)

| Russell Global Equity Fund - Class A‡ | Russell Global Equity Fund - Class Y‡‡ | ||||||
| Total | Total | ||||||
| Return | Return | ||||||
| 1 Year | 1.92 | % | 1 Year | 8.56 | % | ||
| 5 Years | 9.77 | %§ | 5 Years | 11.50 | %§ | ||
| Inception* | 2.55 | %§ | Inception* | 3.73 | %§ | ||
| Russell Global Equity Fund - Class C | Russell Developed Large Cap® Index Net** | ||||||
| Total | Total | ||||||
| Return | Return | ||||||
| 1 Year | 7.26 | % | 1 Year | 8.87 | % | ||
| 5 Years | 10.21 | %§ | 5 Years | 11.76 | %§ | ||
| Inception* | 2.54 | %§ | Inception* | 4.27 | %§ | ||
| Global Equity Linked Benchmark*** | |||||||
| Russell Global Equity Fund - Class E | Total | ||||||
| Total | Return | ||||||
| Return | 1 Year | 8.87 | % | ||||
| 1 Year | 8.15 | % | 5 Years | 11.58 | %§ | ||
| 5 Years | 11.03 | %§ | Inception* | 4.12 | %§ | ||
| Inception* | 3.31 | %§ | |||||
| Russell Global Equity Fund - Class S | |||||||
| Total | |||||||
| Return | |||||||
| 1 Year | 8.48 | % | |||||
| 5 Years | 11.32 | %§ | |||||
| Inception* | 3.59 | %§ | |||||
216 Russell Global Equity Fund
Russell Investment Company
Russell Global Equity Fund
Portfolio Management Discussion and Analysis, continued — October 31, 2014 (Unaudited)
| The Russell Global Equity Fund (the “Fund”) employs a multi- | from Fund performance. However, the Fund had strong stock |
| manager approach whereby portions of the Fund are allocated to | selection within the U.S. and more particularly within U.S. |
| different money managers. Fund assets not allocated to money | information technology and health care sectors. |
| managers are managed by Russell Investment Management | Over the period, the Fund retained an overweight to consumer |
| Company (“RIMCo”), the Fund’s advisor. RIMCo may change | discretionary, technology and industrials sectors (which are |
| the allocation of the Fund’s assets among money managers at | modestly pro cyclical). Cyclical stocks tended to underperform |
| any time. An exemptive order from the Securities and Exchange | during the period and accordingly, the Fund’s overweight position |
| Commission (“SEC”) permits RIMCo to engage or terminate a | in consumer discretionary and industrials sectors detracted |
| money manager at any time, subject to approval by the Fund’s | from performance. The overweight to technology was a positive |
| Board, without a shareholder vote. Pursuant to the terms of the | contributor to benchmark-relative performance as this sector |
| exemptive order, the Fund is required to notify its shareholders | performed strongly in the period and the Fund further benefited |
| within 90 days of when a money manager begins providing | from effective stock selection within this sector with holdings in |
| services. As of October 31, 2014, the Fund had five money | stocks such as Intel and Visa. The Fund was further aided by |
| managers. | an underweight to the energy sector, which was one of the worst |
| What is the Fund’s investment objective? | performing sectors over the year. |
| The Fund seeks to provide long-term capital growth. | Lack of exposure to the largest capitalization stocks also hurt the |
| How did the Fund perform relative to its benchmark for the | Fund’s benchmark-relative performance. |
| fiscal year ended October 31, 2014? | How did the investment strategies and techniques employed |
| For the fiscal year ended October 31, 2014, the Fund’s Class | by the Fund and its money managers affect its benchmark- |
| A, Class C, Class E, Class S and Class Y Shares gained 8.18%, | relative performance? |
| 7.26%, 8.15%, 8.48% and 8.56%, respectively. This is compared | During the period, the market environment was generally more |
| to the Fund’s benchmark, the Russell Developed Large Cap Index | favorable to growth managers than value managers and this was |
| (Net), which gained 8.87% during the same period. The Fund’s | reflected in the money managers’ performance. Most of the Fund’s |
| performance includes operating expenses, whereas index returns | money managers either generated positive benchmark-relative |
| are unmanaged and do not include expenses of any kind. | returns or performed in-line with benchmark returns, with the |
| For the fiscal year ended October 31, 2014, the Morningstar® | exception of Harris Associates LP (“Harris”), which significantly |
| World Stock, a group of funds that Morningstar considers to have | underperformed the Fund’s benchmark. |
| investment strategies similar to those of the Fund, gained 6.85%. | Harris underperformed the Fund’s benchmark for the fiscal year. |
| This result serves as a peer comparison and is expressed net of | The main driver of Harris’ underperformance was poor stock |
| operating expenses. | selection in Continental Europe and a significant overweight to |
| the region. Ineffective stock selection within the U.K., financials, | |
| How did the market conditions described in the Market | industrials, consumer staples, and consumer discretionary also |
| Summary report affect the Fund’s performance? | detracted from performance. CNH Industrials and Tesco were |
| The fiscal year ended October 31, 2014 was a favorable market | the most notable detractors from a stock selection perspective. |
| environment for equities as many markets hit new highs during | However, some of Harris’ losses were mitigated by an overweight |
| the fiscal year before pulling back at the end of the period. Easy | to and effective stock selection within the information technology |
| monetary policies continued to support equity prices, though | sector, such as its holding in Intel Corporation. |
| market environments became more volatile and mixed across | |
| regions and countries which worked against the Fund during the | MFS Institutional Advisors, Inc. (“MFS”) outperformed the |
| period. | Fund’s benchmark for the fiscal year. MFS’s focus on high quality |
| growth companies continued to pay off over a period in which | |
| The U.S. continued to show strength while Europe stumbled | investors rewarded this investment characteristic. Strong stock |
| with some of the larger countries announcing disappointing | selection in North America and an underweight to Japan were |
| economic activity. The Fund finished the fiscal year behind its | the most positive contributors, as well as effective stock selection |
| benchmark, mainly driven by the Fund’s underweight to the U.S., | within industrials and consumer discretionary. Walt Disney and |
| which was one of the strongest performing countries. This was | Canadian National Railway were the top two positive contributors. |
| further compounded by the Fund’s overweight position in France | On the other hand, an overweight to Continental Europe and poor |
| and Germany. Stock selection within France and Switzerland in | stock selection in the region detracted from performance, followed |
| luxury goods companies such as Richemont and LVMH detracted | by ineffective stock selection within consumer staples and health |
Russell Global Equity Fund 217
Russell Investment Company
Russell Global Equity Fund
Portfolio Management Discussion and Analysis, continued — October 31, 2014 (Unaudited)
| care. Luxury good holding companies like Richemont and LVMH | Russell Developed Large Cap Defensive Index®. In October | |
| were the biggest detractors at a stock level. | 2014, RIMCo discontinued this strategy in favor of a positioning | |
| Polaris Capital Management, LLC (“Polaris”) outperformed the | strategy that targets global income-oriented securities of a larger | |
| Fund’s benchmark for the fiscal year. Performance was mainly | breadth of companies across the market capitalization spectrum, | |
| driven by strong stock selection in North America, Japan, health | while maintaining RIMCo’s preferred | defensive positioning. |
| care, consumer staples, telecoms, and consumer discretionary. | During the fiscal year, these strategies contributed positively to | |
| Forest Laboratories was the biggest contributor, followed by | the Fund’s benchmark-relative performance. | |
| General Dynamics and Frontier Communications. However, | In connection with the cash equitization process, RIMCo | |
| some of these gains were weakened by sizeable overweights | employed a combination of futures contracts to moderate regional | |
| to Continental Europe and emerging markets as well as an | risks resulting from the money manager portfolios. This involved | |
| overweight to materials and poor stock selection within energy. | taking short exposures to Europe and emerging markets and | |
| Tullow Oil, Thai Oil Public, and Maurel & Prom were the biggest | long exposures to the U.S. and Japan. | This strategy benefited |
| detractors in the energy sector. | the Fund during the fiscal year as European stocks significantly | |
| Sanders Capital, LLC (“Sanders”) performed in-line with the | lagged their U.S. peers over the period. In addition, for a portion | |
| Fund’s benchmark for the fiscal year. Strong stock selection in | of the fiscal year, RIMCo kept a small portion of the Fund’s cash | |
| the U.S. was the most notable positive contributor to Sanders’ | unequitized in order to lower the Fund’s market exposure. This | |
| performance,withSanders’toptenstocksbeingallU.S.companies. | modestly detracted from Fund performance. As of the end of the | |
| However, a sizeable off-benchmark exposure to emerging markets | fiscal year, RIMCo fully equitized the Fund’s cash. | |
| and poor stock selection within consumer discretionary, health | Describe any changes to the Fund’s structure or the money | |
| care, and energy sectors detracted from performance. Samsung | manager line-up. | |
| Electronics, a representative emerging market stock, was the | In October 2014, RIMCo altered its positioning strategy as | |
| biggest detractor for the period. | described above. | |
| Wellington Management Company (“Wellington”) performed in- | There were no other changes to the Fund’s structure or its money | |
| line with the Fund’s benchmark for the fiscal year. Strong stock | manager line-up during the period. | |
| selection within information technology and an overweight to the | ||
| sector was a strong contributor as seven out of Wellington’s top ten | Money Managers as of October 31, | |
| stocks were information technology holdings. In addition, effective | 2014 | Styles |
| stock selection in and an underweight to the U.K. added value. | Harris Associates, L.P. | Value |
| Poor stock selection within consumer discretionary, industrials, | MFS Institutional Advisors, Inc. | Market-Oriented |
| financials, North America, and Continental Europe detracted | Polaris Capital Management, LLC | Value |
| from performance. Consumer discretionary stocks like Lululemon | Sanders Capital, LLC | Value |
| Wellington Management Company, LLP | Growth | |
| athletic, Amazon.com, Bloomin’ Brands, and Cyberagent were the | The views expressed in this report reflect those of the portfolio | |
| bottom four detractors. | managers only through the end of the period covered by | |
| RIMCo manages the portion of the Fund’s assets that RIMCo | the report. These views do not necessarily represent the | |
| determines not to allocate to the money managers. Assets not | views of RIMCo, or any other person in RIMCo or any other | |
| allocated to managers include the Fund’s liquidity reserves and | affiliated organization. These views are subject to change | |
| assets which may be managed directly by RIMCo to modify the | at any time based upon market conditions or other events, | |
| Fund’s overall portfolio characteristics to seek to achieve the | and RIMCo disclaims any responsibility to update the views | |
| desired risk/return profile for the Fund. | contained herein. These views should not be relied on as | |
| At the beginning of the period, RIMCo managed a positioning | investment advice and, because investment decisions for | |
| strategy designed to position the Fund more defensively by | a Russell Investment Company (“RIC”) Fund are based on | |
| investing 5% of the Fund in the top 200 largest stocks of the | numerous factors, should not be relied on as an indication | |
| of investment decisions of any RIC Fund. | ||
218 Russell Global Equity Fund
Russell Investment Company
Russell Global Equity Fund
Portfolio Management Discussion and Analysis, continued — October 31, 2014 (Unaudited)
| * | Assumes initial investment on February 28, 2007. |
| ** | Russell Developed Large Cap® Index Net is an index which offers investors access to the large-cap segment of the developed equity universe. It is constructed to provide a comprehensive and unbiased barometer for the large-cap segment of this market and is completely reconstituted annually to accurately reflect the changes in the market over time. |
| *** | The Global Equity Linked Benchmark provides a means to compare the Fund’s average annual returns to a secondary benchmark that takes into account historical changes in the Fund’s primary benchmark. The Global Equity Linked Benchmark represents the returns of the MSCI World Index (net of tax on dividends from foreign holdings) through December 31, 2010 and the returns of the Russell Developed Large Cap Index (net of tax on dividends from foreign holdings) thereafter. |
| ‡ | The performance shown has been adjusted to reflect the deduction of the maximum Class A sales charge of 5.75%. |
| ‡‡ | The Fund first issued Class Y Shares on September 29, 2008. The returns shown for Class Y Shares prior to that date are the returns of the Fund’s Class S Shares. Class Y Shares will have substantially similar returns as the Class S Shares because the Shares of each Class are invested in the same portfolio of securities. Annual returns for each Class will differ only to the extent that the Class Y Shares do not have the same expenses as the Class S Shares. |
| § | Annualized. |
Performance is historical and assumes reinvestment of all dividends and capital gains. Investment return and principal value will fluctuate so that an investor’s shares, when redeemed, may be worth more or less than when purchased. Past performance is not indicative of future results. The returns shown do not reflect the deduction of taxes that a shareholder would pay on Fund distributions or the redemption of Fund shares.
Russell Global Equity Fund 219
Russell Investment Company Russell Global Equity Fund
Shareholder Expense Example — October 31, 2014 (Unaudited)
| Fund Expenses | Please note that the expenses shown in the table are meant | |||||
| The following disclosure provides important information | to highlight your ongoing costs only and do not reflect any | |||||
| regarding the Fund’s Shareholder Expense Example | transactional costs. Therefore, the information under the heading | |||||
| (“Example”). | “Hypothetical Performance (5% return before expenses)” is | |||||
| useful in comparing ongoing costs only, and will not help you | ||||||
| Example | determine the relative total costs of owning different funds. In | |||||
| As a shareholder of the Fund, you incur two types of costs: (1) | addition, if these transactional costs were included, your costs | |||||
| transaction costs, and (2) ongoing costs, including advisory and | would have been higher. | |||||
| administrative fees; distribution (12b-1) and/or service fees; | Hypothetical | |||||
| and other Fund expenses. The Example is intended to help | Performance (5% | |||||
| you understand your ongoing costs (in dollars) of investing in | Actual | return before | ||||
| the Fund and to compare these costs with the ongoing costs of | Class A | Performance | expenses) | |||
| Beginning Account Value | ||||||
| investing in other mutual funds. The Example is based on an | May 1, 2014 | $ | 1,000.00 | $ | 1,000.00 | |
| investment of $1,000 invested at the beginning of the period and | Ending Account Value | |||||
| held for the entire period indicated, which for this Fund is from | October 31, 2014 | $ | 1,024.50 | $ | 1,017.69 | |
| May 1, 2014 to October 31, 2014. | Expenses Paid During Period* | $ | 7.60 | $ | 7.58 | |
| Actual Expenses | * Expenses are equal to the Fund's annualized expense ratio of 1.49% | |||||
| (representing the six month period annualized), multiplied by the average | ||||||
| The information in the table under the heading “Actual | account value over the period, multiplied by 184/365 (to reflect the one-half | |||||
| Performance” provides information about actual account values | year period). | |||||
| and actual expenses. You may use the information in this column, | ||||||
| together with the amount you invested, to estimate the expenses | Hypothetical | |||||
| Performance (5% | ||||||
| that you paid over the period. Simply divide your account value by | Actual | return before | ||||
| $1,000 (for example, an $8,600 account value divided by $1,000 | Class C | Performance | expenses) | |||
| = 8.6), then multiply the result by the number in the first column | Beginning Account Value | |||||
| in the row entitled “Expenses Paid During Period” to estimate | May 1, 2014 | $ | 1,000.00 | $ | 1,000.00 | |
| Ending Account Value | ||||||
| the expenses you paid on your account during this period. | October 31, 2014 | $ | 1,019.40 | $ | 1,013.91 | |
| Expenses Paid During Period* | $ | 11.40 | $ | 11.37 | ||
| Hypothetical Example for Comparison Purposes | ||||||
| The information in the table under the heading “Hypothetical | * Expenses are equal to the Fund's annualized expense ratio of 2.24% | |||||
| Performance (5% return before expenses)” provides information | (representing the six month period annualized), multiplied by the average | |||||
| account value over the period, multiplied by 184/365 (to reflect the one-half | ||||||
| about hypothetical account values and hypothetical expenses | year period). | |||||
| based on the Fund’s actual expense ratio and an assumed rate of | ||||||
| return of 5% per year before expenses, which is not the Fund’s | Hypothetical | |||||
| actual return. The hypothetical account values and expenses | Performance (5% | |||||
| Actual | return before | |||||
| may not be used to estimate the actual ending account balance or | Class E | Performance | expenses) | |||
| expenses you paid for the period. You may use this information | Beginning Account Value | |||||
| to compare the ongoing costs of investing in the Fund and other | May 1, 2014 | $ | 1,000.00 | $ | 1,000.00 | |
| funds. To do so, compare this 5% hypothetical example with the | Ending Account Value | |||||
| October 31, 2014 | $ | 1,023.60 | $ | 1,017.69 | ||
| 5% hypothetical examples that appear in the shareholder reports | Expenses Paid During Period* | $ | 7.60 | $ | 7.58 | |
| of other funds. | ||||||
| * Expenses are equal to the Fund's annualized expense ratio of 1.49% | ||||||
| (representing the six month period annualized), multiplied by the average | ||||||
| account value over the period, multiplied by 184/365 (to reflect the one-half | ||||||
| year period). | ||||||
220 Russell Global Equity Fund
Russell Investment Company Russell Global Equity Fund
Shareholder Expense Example, continued — October 31, 2014 (Unaudited)
| Hypothetical | |||||
| Performance (5% | |||||
| Actual | return before | ||||
| Class S | Performance | expenses) | |||
| Beginning Account Value | |||||
| May 1, 2014 | $ | 1,000.00 | $ | 1,000.00 | |
| Ending Account Value | |||||
| October 31, 2014 | $ | 1,025.30 | $ | 1,018.95 | |
| Expenses Paid During Period* | $ | 6.33 | $ | 6.31 | |
| * Expenses are equal to the Fund's annualized expense ratio of 1.24% | |||||
| (representing the six month period annualized), multiplied by the average | |||||
| account value over the period, multiplied by 184/365 (to reflect the one-half | |||||
| year period). | |||||
| Hypothetical | |||||
| Performance (5% | |||||
| Actual | return before | ||||
| Class Y | Performance | expenses) | |||
| Beginning Account Value | |||||
| May 1, 2014 | $ | 1,000.00 | $ | 1,000.00 | |
| Ending Account Value | |||||
| October 31, 2014 | $ | 1,026.10 | $ | 1,019.96 | |
| Expenses Paid During Period* | $ | 5.31 | $ | 5.30 | |
| * Expenses are equal to the Fund's annualized expense ratio of 1.04% | |||||
| (representing the six month period annualized), multiplied by the average | |||||
| account value over the period, multiplied by 184/365 (to reflect the one-half | |||||
| year period). | |||||
Russell Global Equity Fund 221
| Russell Investment Company | ||||||||||
| Russell Global Equity Fund | ||||||||||
| Schedule of Investments — October 31, 2014 | ||||||||||
| Amounts in thousands (except share amounts) | Amounts in thousands (except share amounts) | |||||||||
| Principal | Fair | Principal | Fair | |||||||
| Amount ($) | Value | Amount ($) | Value | |||||||
| or Shares | $ | or Shares | $ | |||||||
| Common Stocks - 94.5% | Baidu, Inc. - ADR(Æ) | 43,229 | 10,322 | |||||||
| Australia - 0.4% | ENN Energy Holdings, Ltd. | 1,462,840 | 9,488 | |||||||
| Amcor, Ltd. Class A | 87,871 | 906 | 33,845 | |||||||
| ASX, Ltd. - ADR | 14,098 | 447 | ||||||||
| Brambles, Ltd. | 113,810 | 954 | China - 0.4% | |||||||
| Commonwealth Bank of Australia - ADR | 37,455 | 2,653 | China Longyuan Power Group Corp., | |||||||
| Flight Centre, Ltd. | 3,883 | 143 | Ltd. Class H | 8,411,000 | 8,980 | |||||
| Insurance Australia Group, Ltd. | 170,517 | 978 | China Petroleum & Chemical Corp. | |||||||
| New Hope Corp., Ltd. | 17,327 | 34 | Class H | 4,319,600 | 3,743 | |||||
| Tatts Group, Ltd. | 104,456 | 319 | 12,723 | |||||||
| Telstra Corp., Ltd. | 317,137 | 1,571 | ||||||||
| Washington H Soul Pattinson & Co., Ltd. | 3,636 | 46 | Denmark - 0.3% | |||||||
| Wesfarmers, Ltd. | 58,637 | 2,278 | DSV A/S | 309,907 | 9,267 | |||||
| Woodside Petroleum, Ltd. | 46,153 | 1,630 | Tryg A/S | 1,505 | 162 | |||||
| Woolworths, Ltd. | 71,853 | 2,276 | 9,429 | |||||||
| 14,235 | Finland - 0.3% | |||||||||
| Austria - 0.0% | Caverion Corp. | 291,645 | 2,343 | |||||||
| Oesterreichische Post AG | 2,321 | 113 | Kone OYJ Class B(Ñ) | 144,046 | 6,191 | |||||
| Sampo Oyj Class A | 31,082 | 1,487 | ||||||||
| Belgium - 0.3% | YIT OYJ(Ñ) | 212,900 | 1,419 | |||||||
| Belgacom SA | 10,078 | 380 | 11,440 | |||||||
| Delhaize Group SA | 62,521 | 4,271 | ||||||||
| Groupe Bruxelles Lambert SA | 5,421 | 484 | France - 7.0% | |||||||
| Solvay SA | 40,096 | 5,462 | BNP Paribas SA | 637,159 | 40,035 | |||||
| 10,597 | Christian Dior SA | 36,568 | 6,468 | |||||||
| Danone SA | 677,971 | 46,065 | ||||||||
| Bermuda - 0.1% | Edenred | 338,747 | 9,381 | |||||||
| Axis Capital Holdings, Ltd. | 7,859 | 378 | Etablissements Maurel et Prom(Æ) | 400,524 | 4,792 | |||||
| Catlin Group, Ltd. | 26,367 | 226 | Euler Hermes Group | 975 | 95 | |||||
| China Hongxing Sports, Ltd.(Æ) | 6,320,000 | — | Imerys SA | 88,389 | 6,337 | |||||
| Endurance Specialty Holdings, Ltd. | 3,257 | 189 | IPSOS | 120,876 | 3,135 | |||||
| Hiscox, Ltd. | 23,150 | 252 | Legrand SA - ADR | 481,313 | 25,900 | |||||
| PartnerRe, Ltd. | 3,684 | 426 | LVMH Moet Hennessy Louis Vuitton | |||||||
| REXLot Holdings, Ltd.(Ñ) | 18,125,000 | 1,870 | SA - ADR | 193,508 | 32,822 | |||||
| VTech Holdings, Ltd. | 11,800 | 148 | Metropole Television SA | 4,679 | 81 | |||||
| 3,489 | PPR SA | 95,374 | 18,400 | |||||||
| Publicis Groupe SA - ADR(Æ) | 107,614 | 7,454 | ||||||||
| Brazil - 0.2% | Renault SA | 160,587 | 11,919 | |||||||
| Cielo SA | 314,900 | 5,171 | Sanofi - ADR | 180,098 | 16,624 | |||||
| Societe Television Francaise 1 | 8,693 | 129 | ||||||||
| Canada - 2.0% | Total SA | 80,868 | 4,806 | |||||||
| Canadian Imperial Bank of Commerce(Þ) | 11,058 | 1,010 | Transgene SA(Æ)(Ñ) | 44,857 | 416 | |||||
| Canadian National Railway Co.(Þ) | 599,960 | 42,345 | 234,859 | |||||||
| CI Financial Corp. | 11,032 | 321 | ||||||||
| Crescent Point Energy Corp.(Ñ) | 30,632 | 1,012 | Germany - 4.1% | |||||||
| Genworth MI Canada, Inc. | 2,782 | 97 | Allianz SE | 191,532 | 30,410 | |||||
| Great-West Lifeco, Inc.(Þ) | 21,113 | 592 | BASF SE | 53,552 | 4,714 | |||||
| Husky Energy, Inc. | 21,809 | 527 | Daimler AG | 268,300 | 20,856 | |||||
| Intact Financial Corp. | 9,579 | 642 | Deutsche Telekom AG | 369,189 | 5,561 | |||||
| Keyera Corp. | 6,107 | 486 | Freenet AG | 179,900 | 4,708 | |||||
| Methanex Corp.(Ñ) | 109,400 | 6,502 | Hannover Rueck SE | 80,361 | 6,696 | |||||
| Pacific Rubiales Energy Corp. | 466,100 | 7,030 | Lanxess AG | 83,392 | 4,335 | |||||
| Pembina Pipeline Corp. | 23,287 | 966 | Linde AG | 183,436 | 33,826 | |||||
| Thomson Reuters Corp. | 25,911 | 964 | Muenchener Rueckversicherungs- | |||||||
| Toronto Dominion Bank | 47,766 | 2,351 | Gesellschaft AG | 38,455 | 7,559 | |||||
| Vermilion Energy, Inc. | 7,453 | 423 | ProSiebenSat.1 Media AG | 183,300 | 7,386 | |||||
| 65,268 | Symrise AG | 123,720 | 6,957 | |||||||
| Wincor Nixdorf AG | 101,563 | 4,662 | ||||||||
| Cayman Islands - 1.0% | 137,670 | |||||||||
| Alibaba Group Holding, Ltd. - ADR(Æ) | 142,346 | 14,035 | ||||||||
| See accompanying notes which are an integral part of the financial statements. | ||||||||||
| 222 Russell Global Equity Fund | ||||||||||
Russell Investment Company Russell Global Equity Fund
Schedule of Investments, continued — October 31, 2014
| Amounts in thousands (except share amounts) | Amounts in thousands (except share amounts) | |||||||||
| Principal | Fair | Principal | Fair | |||||||
| Amount ($) | Value | Amount ($) | Value | |||||||
| or Shares | $ | or Shares | $ | |||||||
| Greece - 0.1% | Toyota Motor Corp. | 323,300 | 18,703 | |||||||
| OPAP SA | 331,066 | 4,012 | 153,297 | |||||||
| Hong Kong - 0.5% | Jersey - 0.3% | |||||||||
| Cathay Pacific Airways, Ltd. | 2,171,200 | 4,071 | Delphi Automotive PLC | 160,800 | 11,092 | |||||
| Cheung Kong Holdings, Ltd. | 95,599 | 1,696 | ||||||||
| China Resources Power Holdings Co., | Luxembourg - 0.4% | |||||||||
| Ltd. | 766,000 | 2,227 | Samsonite International SA | 3,618,300 | 12,014 | |||||
| CLP Holdings, Ltd. | 133,402 | 1,148 | ||||||||
| Guangdong Investment, Ltd. | 3,561,400 | 4,684 | Mexico - 0.5% | |||||||
| Hang Seng Bank, Ltd. | 52,793 | 895 | Alfa SAB de CV Class A | 2,586,500 | 8,242 | |||||
| MTR Corp., Ltd. | 99,500 | 406 | Grupo Financiero Banorte SAB de CV | |||||||
| Power Assets Holdings, Ltd. | 49,243 | 475 | Class O | 1,078,700 | 6,920 | |||||
| Television Broadcasts, Ltd. | 15,654 | 86 | 15,162 | |||||||
| 15,688 | Netherlands - 3.1% | |||||||||
| India - 0.4% | Akzo Nobel NV | 307,651 | 20,437 | |||||||
| HDFC Bank, Ltd. - ADR | 113,069 | 5,928 | CNH Industrial NV | 2,647,900 | 21,568 | |||||
| Infosys, Ltd. - ADR(Ñ) | 134,100 | 8,966 | Heineken NV | 341,808 | 25,525 | |||||
| 14,894 | ING Groep NV(Æ) | 493,444 | 7,056 | |||||||
| Koninklijke Ahold NV(Æ) | 60,904 | 1,018 | ||||||||
| Ireland - 2.0% | Koninklijke Philips NV | 584,589 | 16,329 | |||||||
| Accenture PLC Class A | 490,085 | 39,756 | Nutreco NV | 5,018 | 251 | |||||
| Actavis PLC(Æ) | 65,546 | 15,910 | NXP Semiconductor NV(Æ) | 146,167 | 10,036 | |||||
| CRH PLC | 227,114 | 5,029 | 102,220 | |||||||
| Greencore Group PLC Class A | 1,449,825 | 6,086 | ||||||||
| James Hardie Industries PLC | 32,709 | 346 | New Zealand - 0.0% | |||||||
| 67,127 | Auckland International Airport, Ltd.(Æ) | 67,313 | 203 | |||||||
| Contact Energy, Ltd. | 25,056 | 121 | ||||||||
| Israel - 0.2% | 324 | |||||||||
| Teva Pharmaceutical Industries, Ltd. | ||||||||||
| - ADR | 123,600 | 6,980 | Norway - 0.6% | |||||||
| DNB ASA | 343,898 | 6,317 | ||||||||
| Italy - 0.5% | SpareBank 1 SR-Bank ASA | 641,352 | 5,515 | |||||||
| Enel SpA | 1,368,693 | 6,981 | TGS Nopec Geophysical Co. ASA - ADR | 7,433 | 173 | |||||
| GTECH SpA(Ñ) | 247,216 | 5,753 | Yara International ASA | 145,300 | 6,672 | |||||
| Trevi Finanziaria Industriale SpA(Ñ) | 766,346 | 2,752 | 18,677 | |||||||
| 15,486 | ||||||||||
| Portugal - 0.2% | ||||||||||
| Japan - 4.6% | Energias de Portugal SA | 1,597,300 | 6,868 | |||||||
| Asahi Group Holdings, Ltd. | 197,500 | 6,026 | Portugal Telecom SGPS SA | 42,839 | 70 | |||||
| Canon, Inc. | 253,700 | 7,655 | 6,938 | |||||||
| Daito Trust Construction Co., Ltd. | 5,500 | 677 | ||||||||
| Daiwa Securities Group, Inc. | 2,912,000 | 22,321 | Russia - 0.2% | |||||||
| Eisai Co., Ltd. | 17,200 | 659 | Gazprom OAO - ADR(Æ) | 173,026 | 1,147 | |||||
| Honda Motor Co., Ltd. | 133,600 | 4,138 | Gazprom OAO - ADR | 80,031 | 528 | |||||
| Japan Tobacco, Inc. | 63,900 | 2,142 | Rosneft OAO - GDR(Æ) | 548,391 | 3,054 | |||||
| Kakaku.com, Inc. | 376,200 | 4,980 | Rosneft Oil Co. - GDR | 95,700 | 533 | |||||
| KDDI Corp. | 100,900 | 6,490 | Sberbank of Russia - ADR(Æ) | 241,400 | 1,813 | |||||
| MEIJI Holdings Co., Ltd. | 96,200 | 7,922 | 7,075 | |||||||
| Mitsui Fudosan Co., Ltd. | 240,000 | 7,494 | Singapore - 0.2% | |||||||
| NEC Corp. | 2,045,000 | 7,028 | ComfortDelGro Corp., Ltd. | 155,000 | 319 | |||||
| Nidec Corp. | 123,000 | 7,908 | SATS, Ltd. | 46,000 | 111 | |||||
| NTT DOCOMO, Inc. | 99,300 | 1,646 | Sembcorp Industries, Ltd. | 163,189 | 4,562 | |||||
| Ono Pharmaceutical Co., Ltd. | 128,940 | 12,788 | SIA Engineering Co., Ltd. | 18,000 | 67 | |||||
| Sankyo Co., Ltd. | 3,500 | 126 | Singapore Exchange, Ltd. | 56,000 | 305 | |||||
| Shinsei Bank, Ltd. | 3,618,000 | 7,859 | Singapore Press Holdings, Ltd. | 117,000 | 390 | |||||
| Showa Denko KK | 4,026,000 | 5,233 | Singapore Telecommunications, Ltd. | 559,000 | 1,627 | |||||
| Sumco Corp.(Ñ) | 958,000 | 12,537 | StarHub, Ltd. | 41,000 | 132 | |||||
| Takeda Pharmaceutical Co., Ltd. | 209,600 | 8,965 | 7,513 | |||||||
See accompanying notes which are an integral part of the financial statements.
Russell Global Equity Fund 223
| Russell Investment Company | |||||||||
| Russell Global Equity Fund | |||||||||
| Schedule of Investments, continued — October 31, 2014 | |||||||||
| Amounts in thousands (except share amounts) | Amounts in thousands (except share amounts) | ||||||||
| Principal | Fair | Principal | Fair | ||||||
| Amount ($) | Value | Amount ($) | Value | ||||||
| or Shares | $ | or Shares | $ | ||||||
| South Africa - 0.5% | United Kingdom - 7.5% | ||||||||
| Naspers, Ltd. Class N | 81,610 | 10,156 | Admiral Group PLC | 5,061 | 108 | ||||
| Sasol, Ltd. - ADR | 108,993 | 5,427 | AMEC PLC - GDR | 21,715 | 361 | ||||
| 15,583 | Amlin PLC | 36,462 | 266 | ||||||
| Aon PLC | 149,200 | 12,831 | |||||||
| South Korea - 1.2% | AstraZeneca PLC - ADR(Æ) | 187,916 | 13,658 | ||||||
| BS Financial Group, Inc. | 250,584 | 3,904 | BAE Systems PLC | 230,263 | 1,690 | ||||
| DGB Financial Group, Inc. | 6,900 | 99 | Barclays PLC | 4,694,953 | 18,085 | ||||
| Hyundai Heavy Industries Co., Ltd. | 17,307 | 1,606 | Barratt Developments PLC | 1,137,197 | 7,619 | ||||
| Hyundai Motor Co. | 20,371 | 3,240 | BBA Aviation PLC | 764,357 | 4,325 | ||||
| Samsung Electronics Co., Ltd. | 24,079 | 28,028 | Bellway PLC | 242,687 | 6,790 | ||||
| Shinhan Financial Group Co., Ltd. | 79,010 | 3,719 | BHP Billiton PLC - ADR(Ñ) | 98,900 | 5,147 | ||||
| 40,596 | Booker Group PLC | 115,512 | 259 | ||||||
| Spain - 0.1% | BP PLC | 2,320,526 | 16,668 | ||||||
| Bolsas y Mercados Espanoles SA | 5,856 | 223 | British American Tobacco PLC | 43,028 | 2,442 | ||||
| Repsol SA - ADR | 129,777 | 2,897 | British Sky Broadcasting Group PLC | 68,672 | 973 | ||||
| Tecnicas Reunidas SA(Æ) | 2,279 | 112 | Centrica PLC | 367,053 | 1,776 | ||||
| Zardoya Otis SA | 12,257 | 143 | Diageo PLC | 1,711,984 | 50,337 | ||||
| 3,375 | Experian PLC | 1,279,500 | 19,209 | ||||||
| GlaxoSmithKline PLC - ADR | 259,050 | 5,874 | |||||||
| Sweden - 1.2% | Imperial Tobacco Group PLC | 116,334 | 5,045 | ||||||
| Duni AB | 260,200 | 3,700 | Man Group PLC | 128,936 | 255 | ||||
| Investor AB Class B | 198,842 | 7,114 | Marks & Spencer Group PLC | 660,973 | 4,300 | ||||
| Loomis AB Class B | 188,660 | 5,187 | Next PLC | 11,289 | 1,164 | ||||
| Nordea Bank AB | 1,147,000 | 14,710 | Nomad Holdings Ltd.(Æ) | 228,200 | 2,630 | ||||
| Skanska AB Class B | 27,727 | 564 | Persimmon PLC Class A(Æ) | 361,720 | 8,466 | ||||
| Svenska Handelsbanken AB Class A | 154,564 | 7,370 | Reckitt Benckiser Group PLC | 449,598 | 37,759 | ||||
| 38,645 | Rexam PLC(Æ) | 752,554 | 5,730 | ||||||
| Scottish & Southern Energy PLC | 4,303 | 110 | |||||||
| Switzerland - 6.6% | Standard Chartered PLC | 258,914 | 3,892 | ||||||
| ACE, Ltd. | 20,478 | 2,238 | Tate & Lyle PLC | 33,917 | 329 | ||||
| Adecco SA(Æ) | 224,500 | 15,178 | Taylor Wimpey PLC | 3,683,759 | 6,977 | ||||
| Allied World Assurance Co. Holdings | Tullow Oil PLC | 437,523 | 3,400 | ||||||
| AG | 7,187 | 273 | 248,475 | ||||||
| Banque Cantonale Vaudoise | 207 | 111 | |||||||
| Cie Financiere Richemont SA | 493,857 | 41,550 | United States - 47.0% | ||||||
| Credit Suisse Group AG(Æ) | 839,687 | 22,324 | 3M Co. | 191,908 | 29,510 | ||||
| GAM Holding AG(Æ) | 11,817 | 201 | Activision Blizzard, Inc. | 66,299 | 1,323 | ||||
| Helvetia Holding AG | 412 | 196 | Acuity Brands, Inc. | 101,573 | 14,162 | ||||
| Holcim, Ltd.(Æ) | 223,000 | 15,795 | Advance Auto Parts, Inc. | 64,531 | 9,483 | ||||
| Julius Baer Group, Ltd.(Æ) | 755,164 | 33,027 | AECOM Technology Corp.(Æ) | 340,164 | 11,072 | ||||
| Kuehne & Nagel International AG | 121,438 | 15,802 | Aetna, Inc. | 116,100 | 9,579 | ||||
| Nestle SA | 567,473 | 41,522 | Akamai Technologies, Inc.(Æ) | 178,711 | 10,776 | ||||
| Novartis AG | 192,665 | 17,882 | ALLETE, Inc. | 117,700 | 6,149 | ||||
| SGS SA | 387 | 850 | Altria Group, Inc. | 51,833 | 2,506 | ||||
| Swisscom AG | 1,632 | 961 | Amazon.com, Inc.(Æ) | 24,309 | 7,425 | ||||
| Syngenta AG | 6,561 | 2,031 | American Financial Group, Inc. | 5,285 | 316 | ||||
| TE Connectivity, Ltd. | 140,200 | 8,571 | American International Group, Inc. | 585,260 | 31,352 | ||||
| 218,512 | Ameris Bancorp | 191,400 | 4,747 | ||||||
| Analog Devices, Inc. | 11,056 | 549 | |||||||
| Taiwan - 0.4% | Apache Corp. | 75,800 | 5,852 | ||||||
| Taiwan Semiconductor Manufacturing | Apple, Inc. | 661,079 | 71,397 | ||||||
| Co., Ltd. | 1,920,000 | 8,238 | Applied Materials, Inc. | 171,200 | 3,782 | ||||
| Taiwan Semiconductor Manufacturing | Astoria Financial Corp. | 470,600 | 6,188 | ||||||
| Co., Ltd. - ADR | 282,300 | 6,216 | Atmos Energy Corp. | 7,306 | 387 | ||||
| 14,454 | Automatic Data Processing, Inc. | 29,621 | 2,422 | ||||||
| AVX Corp. | 3,396 | 49 | |||||||
| Thailand - 0.1% | Bank of America Corp. | 939,100 | 16,115 | ||||||
| Thai Oil PCL | 3,108,400 | 4,271 | Bank of Hawaii Corp. | 3,240 | 190 | ||||
| Bank of New York Mellon Corp. (The) | 838,157 | 32,453 | |||||||
| See accompanying notes which are an integral part of the financial statements. | |||||||||
| 224 Russell Global Equity Fund | |||||||||
| Russell Investment Company | |||||||||
| Russell Global Equity Fund | |||||||||
| Schedule of Investments, continued — October 31, 2014 | |||||||||
| Amounts in thousands (except share amounts) | Amounts in thousands (except share amounts) | ||||||||
| Principal | Fair | Principal | Fair | ||||||
| Amount ($) | Value | Amount ($) | Value | ||||||
| or Shares | $ | or Shares | $ | ||||||
| Bed Bath & Beyond, Inc.(Æ) | 56,900 | 3,832 | Lowe's Cos., Inc. | 226,485 | 12,955 | ||||
| BlackRock, Inc. Class A | 58,570 | 19,979 | Marathon Oil Corp. | 172,100 | 6,092 | ||||
| Boeing Co. (The) | 10,615 | 1,326 | Marathon Petroleum Corp. | 80,800 | 7,345 | ||||
| Bristol-Myers Squibb Co. | 356,565 | 20,749 | Martin Marietta Materials, Inc. | 47,200 | 5,519 | ||||
| Brookline Bancorp, Inc. | 622,276 | 5,968 | MasterCard, Inc. Class A | 129,500 | 10,846 | ||||
| Brooks Automation, Inc. | 628,477 | 7,749 | McDonald's Corp. | 19,680 | 1,845 | ||||
| CA, Inc. | 23,327 | 678 | MDU Resources Group, Inc. | 13,975 | 394 | ||||
| Cadence Design Systems, Inc.(Æ) | 537,548 | 9,649 | Medtronic, Inc. | 659,869 | 44,977 | ||||
| Carter's, Inc. | 89,800 | 7,016 | Merck & Co., Inc. | 46,424 | 2,690 | ||||
| Chevron Corp. | 24,590 | 2,950 | Mercury General Corp. | 1,960 | 104 | ||||
| Chubb Corp. (The) | 86,528 | 8,597 | Meritage Homes Corp.(Æ) | 119,900 | 4,411 | ||||
| Cigna Corp. | 69,800 | 6,950 | MetLife, Inc. | 150,300 | 8,152 | ||||
| Cincinnati Financial Corp. | 11,924 | 602 | Microchip Technology, Inc. | 14,605 | 630 | ||||
| Citigroup, Inc. | 405,500 | 21,706 | Microsoft Corp. | 722,494 | 33,921 | ||||
| Clorox Co. (The) | 9,377 | 933 | Motorola Solutions, Inc. | 16,372 | 1,056 | ||||
| Coca-Cola Co. (The) | 59,263 | 2,482 | National Oilwell Varco, Inc. | 160,200 | 11,637 | ||||
| ConocoPhillips | 3,873 | 279 | Netflix, Inc.(Æ) | 20,497 | 8,051 | ||||
| Corning, Inc. | 776,800 | 15,870 | NextEra Energy, Inc. | 72,000 | 7,216 | ||||
| Cummins, Inc. | 13,409 | 1,960 | Occidental Petroleum Corp. | 23,685 | 2,106 | ||||
| Danaher Corp. | 155,269 | 12,484 | Oracle Corp. | 830,280 | 32,422 | ||||
| DigitalGlobe, Inc.(Æ) | 361,518 | 10,336 | Patterson Cos., Inc. | 6,264 | 270 | ||||
| Dime Community Bancshares, Inc. | 309,300 | 4,871 | PepsiCo, Inc. | 3,410 | 328 | ||||
| Dominion Resources, Inc. | 612 | 44 | Pfizer, Inc. | 95,112 | 2,849 | ||||
| DR Horton, Inc. | 499,600 | 11,386 | Philip Morris International, Inc. | 26,839 | 2,389 | ||||
| Dr Pepper Snapple Group, Inc. | 14,320 | 992 | Pioneer Natural Resources Co. | 56,614 | 10,703 | ||||
| DSW, Inc. Class A | 5,478 | 162 | Platform Specialty Products Corp.(Æ) | 543,447 | 14,130 | ||||
| Eli Lilly & Co. | 2,270 | 151 | Praxair, Inc. | 253,920 | 31,991 | ||||
| Emerson Electric Co. | 34,241 | 2,193 | ProAssurance Corp. | 4,329 | 202 | ||||
| Envision Healthcare Holdings, Inc.(Æ) | 213,149 | 7,450 | Procter & Gamble Co. (The) | 35,662 | 3,112 | ||||
| Erie Indemnity Co. Class A | 1,782 | 151 | Progressive Corp. (The) | 43,169 | 1,140 | ||||
| Exxon Mobil Corp. | 29,528 | 2,856 | Public Storage(ö) | 10,472 | 1,930 | ||||
| Facebook, Inc. Class A(Æ) | 119,624 | 8,971 | QUALCOMM, Inc. | 33,891 | 2,661 | ||||
| FairPoint Communications, Inc.(Æ)(Ñ) | 200,904 | 3,335 | Quest Diagnostics, Inc.(Ñ) | 95,900 | 6,086 | ||||
| Family Dollar Stores, Inc. | 45,000 | 3,523 | Questar Corp. | 12,772 | 308 | ||||
| Franklin Resources, Inc. | 319,900 | 17,790 | Ralph Lauren Corp. Class A | 41,600 | 6,857 | ||||
| Frontier Communications Corp.(Ñ) | 1,322,400 | 8,648 | Rayonier, Inc.(ö) | 8,254 | 276 | ||||
| GameStop Corp. Class A(Ñ) | 8,356 | 357 | Raytheon Co. | 20,940 | 2,175 | ||||
| General Dynamics Corp. | 152,200 | 21,271 | Regal Entertainment Group Class A(Ñ) | 138,585 | 3,070 | ||||
| General Electric Co. | 296,500 | 7,653 | Reynolds American, Inc. | 22,513 | 1,416 | ||||
| General Motors Co. | 652,800 | 20,498 | RPC, Inc. | 4,484 | 74 | ||||
| Gentex Corp. | 10,640 | 348 | Ryland Group, Inc. (The) | 112,200 | 4,018 | ||||
| Genuine Parts Co. | 11,201 | 1,087 | SanDisk Corp. | 54,700 | 5,149 | ||||
| Goldman Sachs Group, Inc. (The) | 43,800 | 8,322 | Southwest Bancorp, Inc.(Ñ) | 364,200 | 6,567 | ||||
| Google, Inc. Class C(Æ) | 22,970 | 13,044 | St. Jude Medical, Inc. | 208,000 | 13,347 | ||||
| HD Supply Holdings, Inc.(Æ) | 360,814 | 10,406 | Starwood Hotels & Resorts Worldwide, | ||||||
| Helmerich & Payne, Inc. | 7,045 | 612 | Inc. | 120,600 | 9,245 | ||||
| Hewlett-Packard Co. | 228,100 | 8,184 | SunTrust Banks, Inc. | 110,600 | 4,329 | ||||
| Home Depot, Inc. | 27,420 | 2,674 | T Rowe Price Group, Inc. | 6,092 | 500 | ||||
| Honeywell International, Inc. | 442,390 | 42,523 | Texas Instruments, Inc. | 45,557 | 2,262 | ||||
| IHS, Inc. Class A(Æ) | 97,554 | 12,782 | Thermo Fisher Scientific, Inc. | 367,510 | 43,208 | ||||
| Independent Bank Corp. | 172,892 | 7,054 | Tiffany & Co. | 64,339 | 6,184 | ||||
| Intel Corp. | 1,510,838 | 51,384 | Time Warner, Inc. | 554,531 | 44,069 | ||||
| International Bancshares Corp. | 192,518 | 5,462 | Travelers Cos., Inc. (The) | 22,473 | 2,265 | ||||
| International Business Machines Corp. | 64,826 | 10,657 | United Parcel Service, Inc. Class B | 362,198 | 37,998 | ||||
| JM Smucker Co. (The) | 64,761 | 6,735 | United Technologies Corp. | 380,360 | 40,699 | ||||
| Johnson & Johnson | 100,625 | 10,845 | UnitedHealth Group, Inc. | 187,400 | 17,805 | ||||
| JPMorgan Chase & Co. | 608,800 | 36,820 | Valero Energy Corp. | 139,200 | 6,973 | ||||
| Kimberly-Clark Corp. | 19,973 | 2,282 | Verizon Communications, Inc. | 124,700 | 6,266 | ||||
| Lockheed Martin Corp. | 12,069 | 2,300 | Visa, Inc. Class A | 247,610 | 59,780 | ||||
| See accompanying notes which are an integral part of the financial statements. | |||||||||
| Russell Global Equity Fund 225 | |||||||||
Russell Investment Company Russell Global Equity Fund
Schedule of Investments, continued — October 31, 2014
| Amounts in thousands (except share amounts) | |||||||
| Principal | Fair | ||||||
| Amount ($) | Value | ||||||
| or Shares | $ | ||||||
| Wal-Mart Stores, Inc. | 132,951 | 10,140 | |||||
| Walt Disney Co. (The) | 558,820 | 51,065 | |||||
| Waters Corp.(Æ) | 229,280 | 25,404 | |||||
| Webster Financial Corp. | 241,800 | 7,578 | |||||
| WellPoint, Inc. | 132,100 | 16,736 | |||||
| Wells Fargo & Co. | 443,600 | 23,551 | |||||
| Western Union Co. (The)(Ñ) | 395,700 | 6,711 | |||||
| Whirlpool Corp. | 74,915 | 12,889 | |||||
| Wisconsin Energy Corp.(Ñ) | 16,445 | 817 | |||||
| Xerox Corp. | 558,900 | 7,422 | |||||
| Zayo Group Holdings, Inc.(Æ) | 50,300 | 1,178 | |||||
| 1,564,193 | |||||||
| Total Common Stocks | |||||||
| (cost $2,435,086) | 3,145,442 | ||||||
| Preferred Stocks - 0.7% | |||||||
| Brazil - 0.2% | |||||||
| Investimentos Itau SA | 1,831,275 | 7,309 | |||||
| Germany - 0.5% | |||||||
| Porsche Automobil Holding SE | 76,008 | 6,223 | |||||
| Volkswagen AG | 47,100 | 10,037 | |||||
| 16,260 | |||||||
| Total Preferred Stocks | |||||||
| (cost $23,245) | 23,569 | ||||||
| Warrants & Rights - 0.0% | |||||||
| Italy- 0.0% | |||||||
| Trevi Finanziaria Industriale SpA(Æ) | |||||||
| 2014 Rights | 766,346 | 855 | |||||
| United Kingdom - 0.0% | |||||||
| Nomad Holdings Ltd.(Æ) | |||||||
| 2017 Warrants | 228,200 | 122 | |||||
| Total Warrants & Rights | |||||||
| (cost $1,177) | 977 | ||||||
| Short-Term Investments - 3.1% | |||||||
| United States - 3.1% | |||||||
| Russell U.S. Cash Management Fund | 104,348,013 | (8) | 104,348 | ||||
| Total Short-Term Investments | |||||||
| (cost $104,348) | 104,348 | ||||||
| Other Securities - 2.2% | |||||||
| Russell U.S. Cash Collateral Fund(×) | 72,926,132 | (8) | 72,926 | ||||
| Total Other Securities | |||||||
| (cost $72,926) | 72,926 | ||||||
| Total Investments 100.5% | |||||||
| (identified cost $2,636,782) | 3,347,262 | ||||||
| Other Assets and Liabilities, Net | |||||||
| -(0.5%) | (18,102 | ) | |||||
| Net Assets - 100.0% | 3,329,160 | ||||||
See accompanying notes which are an integral part of the financial statements.
226 Russell Global Equity Fund
| Russell Investment Company | |||||||
| Russell Global Equity Fund | |||||||
| Schedule of Investments, continued — October 31, 2014 | |||||||
| Futures Contracts | |||||||
| Amounts in thousands (except contract amounts) | |||||||
| Unrealized | |||||||
| Appreciation | |||||||
| Number of | Notional | Expiration | (Depreciation) | ||||
| Contracts | Amount | Date | $ | ||||
| Long Positions | |||||||
| CAC 40 Index Futures | 192 | EUR | 8,123 | 11/14 | 420 | ||
| DAX Index Futures | 32 | EUR | 7,447 | 12/14 | 134 | ||
| EURO STOXX 50 Index Futures | 172 | EUR | 5,334 | 12/14 | (8 | ) | |
| FTSE 100 Index Futures | 107 | GBP | 6,961 | 12/14 | (23 | ) | |
| Hang Seng Index Futures | 15 | HKD | 17,957 | 11/14 | 57 | ||
| NIKKEI/Yen Index Futures | 905 | JPY | 7,703,812 | 12/14 | 5,175 | ||
| OMXS 30 Index Futures | 98 | SEK | 13,833 | 11/14 | 147 | ||
| S&P Mid 400 E-Mini Index Futures | 51 | USD | 7,219 | 12/14 | 254 | ||
| S&P Mid 500 E-Mini Index Futures | 2,467 | USD | 248,106 | 12/14 | 5,041 | ||
| S&P/TSX 60 Index Futures | 40 | CAD | 6,782 | 12/14 | (47 | ) | |
| SPI 200 Index Futures | 37 | AUD | 5,104 | 12/14 | 174 | ||
| TOPIX Index Futures | 97 | JPY | 1,296,890 | 12/14 | 575 | ||
| Short Positions | |||||||
| EURO STOXX 50 Index Futures | 5,162 | EUR | 160,074 | 12/14 | 6,505 | ||
| MSCI Emerging Markets Mini Index Futures | 650 | USD | 32,942 | 12/14 | 1,596 | ||
| Total Unrealized Appreciation (Depreciation) on Open Futures Contracts (å) | 20,000 | ||||||
Foreign Currency Exchange Contracts
Amounts in thousands
| Unrealized | |||||||||
| Appreciation | |||||||||
| Amount | Amount | (Depreciation) | |||||||
| Counterparty | Sold | Bought | Settlement Date | $ | |||||
| Bank of America | USD | 5,293 | EUR | 4,153 | 12/17/14 | (88 | ) | ||
| Bank of America | AUD | 100 | USD | 87 | 12/17/14 | (1 | ) | ||
| Bank of America | CAD | 200 | USD | 179 | 12/17/14 | 1 | |||
| Bank of America | EUR | 600 | USD | 757 | 12/17/14 | 5 | |||
| Bank of America | GBP | 200 | USD | 323 | 12/17/14 | 4 | |||
| Bank of America | JPY | 40,000 | USD | 367 | 12/17/14 | 11 | |||
| Bank of America | SEK | 1,000 | USD | 138 | 12/17/14 | 3 | |||
| Bank of Montreal | USD | 219 | AUD | 250 | 12/17/14 | 1 | |||
| Bank of Montreal | USD | 221 | CAD | 250 | 12/17/14 | — | |||
| Bank of Montreal | USD | 1,664 | EUR | 1,300 | 12/17/14 | (35 | ) | ||
| Bank of Montreal | USD | 478 | GBP | 300 | 12/17/14 | 2 | |||
| Bank of Montreal | USD | 129 | HKD | 1,000 | 12/17/14 | — | |||
| Bank of Montreal | USD | 472 | JPY | 50,000 | 12/17/14 | (26 | ) | ||
| Bank of Montreal | USD | 139 | SEK | 1,000 | 12/17/14 | (4 | ) | ||
| Bank of Montreal | EUR | 3,500 | USD | 4,382 | 12/17/14 | (5 | ) | ||
| Bank of New York | USD | 183 | AUD | 200 | 12/17/14 | (8 | ) | ||
| Bank of New York | USD | 263 | AUD | 300 | 12/17/14 | — | |||
| Bank of New York | USD | 1,036 | AUD | 1,200 | 12/17/14 | 17 | |||
| Bank of New York | USD | 179 | CAD | 200 | 12/17/14 | (2 | ) | ||
| Bank of New York | USD | 182 | CAD | 200 | 12/17/14 | (5 | ) | ||
| Bank of New York | USD | 267 | CAD | 300 | 12/17/14 | (1 | ) | ||
| Bank of New York | USD | 1,419 | CAD | 1,600 | 12/17/14 | (1 | ) | ||
| Bank of New York | USD | 2,705 | CAD | 2,976 | 12/17/14 | (66 | ) | ||
| Bank of New York | USD | 635 | EUR | 500 | 12/17/14 | (8 | ) | ||
| Bank of New York | USD | 778 | EUR | 600 | 12/17/14 | (26 | ) | ||
| Bank of New York | USD | 1,271 | EUR | 1,000 | 12/17/14 | (17 | ) | ||
| Bank of New York | USD | 2,885 | EUR | 2,235 | 12/17/14 | (83 | ) | ||
| Bank of New York | USD | 6,259 | EUR | 5,000 | 12/17/14 | 9 | |||
| Bank of New York | USD | 162 | GBP | 100 | 12/17/14 | (2 | ) | ||
| Bank of New York | USD | 322 | GBP | 200 | 12/17/14 | (2 | ) | ||
| Bank of New York | USD | 645 | GBP | 400 | 12/17/14 | (5 | ) | ||
| Bank of New York | USD | 2,714 | GBP | 1,700 | 12/17/14 | 4 | |||
| Bank of New York | USD | 129 | HKD | 1,000 | 12/17/14 | — | |||
| Bank of New York | USD | 258 | HKD | 2,000 | 12/17/14 | — | |||
| Bank of New York | USD | 606 | HKD | 4,700 | 12/17/14 | — | |||
| Bank of New York | USD | 274 | JPY | 30,000 | 12/17/14 | (7 | ) | ||
| Bank of New York | USD | 283 | JPY | 30,000 | 12/17/14 | (16 | ) | ||
| Bank of New York | USD | 464 | JPY | 50,000 | 12/17/14 | (19 | ) | ||
| Bank of New York | USD | 1,259 | JPY | 134,267 | 12/17/14 | (63 | ) | ||
| Bank of New York | USD | 2,825 | JPY | 310,000 | 12/17/14 | (64 | ) | ||
| See accompanying notes which are an integral part of the financial statements. | |||||||||
| Russell Global Equity Fund 227 | |||||||||
| Russell Investment Company | |||||||
| Russell Global Equity Fund | |||||||
| Schedule of Investments, continued — October 31, 2014 | |||||||
| Foreign Currency Exchange Contracts | |||||||
| Amounts in thousands | |||||||
| Unrealized | |||||||
| Appreciation | |||||||
| Amount | Amount | (Depreciation) | |||||
| Counterparty | Sold | Bought | Settlement Date | $ | |||
| Bank of New York | USD | 137 | SEK | 1,000 | 12/17/14 | (1 | ) |
| Bank of New York | USD | 138 | SEK | 1,000 | 12/17/14 | (3 | ) |
| Bank of New York | USD | 467 | SEK | 3,400 | 12/17/14 | (7 | ) |
| Bank of New York | AUD | 300 | USD | 271 | 12/17/14 | 8 | |
| Bank of New York | CAD | 500 | USD | 452 | 12/17/14 | 8 | |
| Bank of New York | EUR | 1,500 | USD | 1,939 | 12/17/14 | 59 | |
| Bank of New York | EUR | 30,401 | USD | 39,248 | 12/17/14 | 1,141 | |
| Bank of New York | GBP | 400 | USD | 648 | 12/17/14 | 9 | |
| Bank of New York | HKD | 1,000 | USD | 129 | 12/17/14 | — | |
| Bank of New York | JPY | 70,000 | USD | 654 | 12/17/14 | 30 | |
| BNP Paribas | USD | 694 | AUD | 800 | 12/17/14 | 8 | |
| BNP Paribas | USD | 1,062 | CAD | 1,200 | 12/17/14 | 2 | |
| BNP Paribas | USD | 3,795 | EUR | 3,000 | 12/17/14 | (34 | ) |
| BNP Paribas | USD | 1,908 | GBP | 1,200 | 12/17/14 | 11 | |
| BNP Paribas | USD | 387 | HKD | 3,000 | 12/17/14 | — | |
| BNP Paribas | USD | 1,869 | JPY | 200,000 | 12/17/14 | (88 | ) |
| BNP Paribas | USD | 276 | SEK | 2,000 | 12/17/14 | (5 | ) |
| Brown Brothers Harriman | USD | 88 | AUD | 100 | 12/17/14 | — | |
| Brown Brothers Harriman | USD | 180 | CAD | 200 | 12/17/14 | (3 | ) |
| Brown Brothers Harriman | USD | 515 | EUR | 400 | 12/17/14 | (13 | ) |
| Brown Brothers Harriman | USD | 164 | GBP | 100 | 12/17/14 | (4 | ) |
| Brown Brothers Harriman | USD | 129 | HKD | 1,000 | 12/17/14 | — | |
| Brown Brothers Harriman | USD | 184 | JPY | 20,000 | 12/17/14 | (6 | ) |
| Commonwealth Bank of Australia | USD | 2,885 | EUR | 2,235 | 12/17/14 | (84 | ) |
| Commonwealth Bank of Australia | USD | 1,259 | JPY | 134,267 | 12/17/14 | (63 | ) |
| Commonwealth Bank of Australia | EUR | 30,401 | USD | 39,246 | 12/17/14 | 1,140 | |
| Deutsche Bank | USD | 460 | CHF | 442 | 11/04/14 | — | |
| Deutsche Bank | USD | 460 | CHF | 443 | 11/04/14 | — | |
| Deutsche Bank | USD | 7,110 | EUR | 5,600 | 12/17/14 | (91 | ) |
| Deutsche Bank | USD | 461 | GBP | 288 | 11/04/14 | — | |
| Deutsche Bank | CAD | 100 | USD | 88 | 12/17/14 | — | |
| Deutsche Bank | EUR | 400 | USD | 512 | 12/17/14 | 11 | |
| Deutsche Bank | HKD | 1,000 | USD | 129 | 12/17/14 | — | |
| Deutsche Bank | SEK | 300 | USD | 42 | 12/17/14 | 1 | |
| HSBC | USD | 2,198 | AUD | 2,419 | 12/17/14 | (76 | ) |
| HSBC | USD | 2,886 | EUR | 2,235 | 12/17/14 | (85 | ) |
| HSBC | USD | 533 | HKD | 4,131 | 12/17/14 | — | |
| HSBC | USD | 1,259 | JPY | 134,267 | 12/17/14 | (63 | ) |
| HSBC | EUR | 30,401 | USD | 39,259 | 12/17/14 | 1,152 | |
| JPMorgan Chase | USD | 2,886 | EUR | 2,235 | 12/17/14 | (85 | ) |
| JPMorgan Chase | USD | 533 | HKD | 4,131 | 12/17/14 | — | |
| JPMorgan Chase | USD | 1,259 | JPY | 134,267 | 12/17/14 | (63 | ) |
| JPMorgan Chase | USD | 899 | SEK | 6,394 | 12/17/14 | (33 | ) |
| JPMorgan Chase | EUR | 30,401 | USD | 39,259 | 12/17/14 | 1,151 | |
| Northern Trust | USD | 175 | AUD | 200 | 12/17/14 | — | |
| Northern Trust | USD | 268 | CAD | 300 | 12/17/14 | (3 | ) |
| Northern Trust | USD | 761 | EUR | 600 | 12/17/14 | (7 | ) |
| Northern Trust | USD | 323 | GBP | 200 | 12/17/14 | (3 | ) |
| Northern Trust | USD | 277 | JPY | 30,000 | 12/17/14 | (9 | ) |
| Northern Trust | USD | 70 | SEK | 500 | 12/17/14 | (2 | ) |
| Northern Trust | AUD | 100 | USD | 92 | 12/17/14 | 4 | |
| Northern Trust | EUR | 300 | USD | 387 | 12/17/14 | 12 | |
| Northern Trust | GBP | 356 | USD | 568 | 11/03/14 | (2 | ) |
| Northern Trust | GBP | 100 | USD | 161 | 12/17/14 | 1 | |
| Northern Trust | HKD | 1,000 | USD | 129 | 12/17/14 | — | |
| Northern Trust | JPY | 10,000 | USD | 94 | 12/17/14 | 5 | |
| State Street | USD | 87 | AUD | 100 | 12/17/14 | 1 | |
| State Street | USD | 177 | AUD | 200 | 12/17/14 | (1 | ) |
| State Street | USD | 177 | AUD | 200 | 12/17/14 | (1 | ) |
| State Street | USD | 179 | CAD | 200 | 12/17/14 | (2 | ) |
| State Street | USD | 179 | CAD | 200 | 12/17/14 | (2 | ) |
| State Street | USD | 181 | CAD | 200 | 12/17/14 | (3 | ) |
| State Street | USD | 2,772 | EUR | 2,173 | 11/06/14 | (49 | ) |
| State Street | USD | 640 | EUR | 500 | 12/17/14 | (13 | ) |
| State Street | USD | 1,266 | EUR | 1,000 | 12/17/14 | (12 | ) |
| State Street | USD | 1,274 | EUR | 1,000 | 12/17/14 | (20 | ) |
| See accompanying notes which are an integral part of the financial statements. | |||||||
| 228 Russell Global Equity Fund | |||||||
| Russell Investment Company | |||||||||
| Russell Global Equity Fund | |||||||||
| Schedule of Investments, continued — October 31, 2014 | |||||||||
| Foreign Currency Exchange Contracts | |||||||||
| Amounts in thousands | |||||||||
| Unrealized | |||||||||
| Appreciation | |||||||||
| Amount | Amount | (Depreciation) | |||||||
| Counterparty | Sold | Bought | Settlement Date | $ | |||||
| State Street | USD | 321 | GBP | 200 | 12/17/14 | (2 | ) | ||
| State Street | USD | 323 | GBP | 200 | 12/17/14 | (3 | ) | ||
| State Street | USD | 327 | GBP | 200 | 12/17/14 | (7 | ) | ||
| State Street | USD | 103 | HKD | 797 | 11/04/14 | — | |||
| State Street | USD | 125 | HKD | 973 | 11/04/14 | — | |||
| State Street | USD | 257 | JPY | 27,822 | 11/04/14 | (10 | ) | ||
| State Street | USD | 275 | JPY | 30,000 | 12/17/14 | (8 | ) | ||
| State Street | USD | 276 | JPY | 30,000 | 12/17/14 | (9 | ) | ||
| State Street | USD | 277 | JPY | 30,000 | 12/17/14 | (10 | ) | ||
| State Street | AUD | 100 | USD | 88 | 12/17/14 | — | |||
| State Street | AUD | 100 | USD | 87 | 12/17/14 | (1 | ) | ||
| State Street | AUD | 100 | USD | 89 | 12/17/14 | 1 | |||
| State Street | AUD | 100 | USD | 88 | 12/17/14 | — | |||
| State Street | AUD | 100 | USD | 88 | 12/17/14 | 1 | |||
| State Street | AUD | 200 | USD | 175 | 12/17/14 | — | |||
| State Street | AUD | 200 | USD | 175 | 12/17/14 | (1 | ) | ||
| State Street | CAD | 100 | USD | 89 | 12/17/14 | — | |||
| State Street | CAD | 100 | USD | 91 | 12/17/14 | 2 | |||
| State Street | CAD | 200 | USD | 178 | 12/17/14 | 1 | |||
| State Street | CAD | 200 | USD | 180 | 12/17/14 | 2 | |||
| State Street | CAD | 200 | USD | 181 | 12/17/14 | 4 | |||
| State Street | CAD | 300 | USD | 267 | 12/17/14 | 1 | |||
| State Street | CHF | 33,728 | USD | 36,176 | 12/17/14 | 1,109 | |||
| State Street | EUR | 100 | USD | 126 | 12/17/14 | 1 | |||
| State Street | EUR | 100 | USD | 128 | 12/17/14 | 3 | |||
| State Street | EUR | 300 | USD | 376 | 12/17/14 | — | |||
| State Street | EUR | 400 | USD | 505 | 12/17/14 | 4 | |||
| State Street | EUR | 500 | USD | 643 | 12/17/14 | 16 | |||
| State Street | EUR | 600 | USD | 764 | 12/17/14 | 11 | |||
| State Street | EUR | 1,000 | USD | 1,267 | 12/17/14 | 14 | |||
| State Street | EUR | 4,000 | USD | 5,107 | 12/17/14 | 94 | |||
| State Street | GBP | 100 | USD | 163 | 12/17/14 | 3 | |||
| State Street | GBP | 100 | USD | 162 | 12/17/14 | 2 | |||
| State Street | GBP | 100 | USD | 164 | 12/17/14 | 4 | |||
| State Street | GBP | 200 | USD | 323 | 12/17/14 | 3 | |||
| State Street | GBP | 200 | USD | 321 | 12/17/14 | 1 | |||
| State Street | GBP | 300 | USD | 482 | 12/17/14 | 3 | |||
| State Street | HKD | 1,000 | USD | 129 | 12/17/14 | — | |||
| State Street | HKD | 1,000 | USD | 129 | 12/17/14 | — | |||
| State Street | HKD | 1,000 | USD | 129 | 12/17/14 | — | |||
| State Street | JPY | 76,953 | USD | 707 | 11/05/14 | 22 | |||
| State Street | JPY | 50,046 | USD | 448 | 11/06/14 | 2 | |||
| State Street | JPY | 10,000 | USD | 92 | 12/17/14 | 3 | |||
| State Street | JPY | 20,000 | USD | 185 | 12/17/14 | 7 | |||
| State Street | JPY | 20,000 | USD | 187 | 12/17/14 | 9 | |||
| State Street | JPY | 30,000 | USD | 274 | 12/17/14 | 6 | |||
| State Street | JPY | 30,000 | USD | 276 | 12/17/14 | 9 | |||
| State Street | JPY | 70,000 | USD | 648 | 12/17/14 | 24 | |||
| State Street | MXN | 263 | USD | 19 | 11/03/14 | — | |||
| State Street | SEK | 1,000 | USD | 138 | 12/17/14 | 2 | |||
| State Street | SEK | 1,000 | USD | 140 | 12/17/14 | 4 | |||
| UBS | USD | 2,886 | EUR | 2,235 | 12/17/14 | (85 | ) | ||
| UBS | USD | 6,070 | GBP | 3,763 | 12/17/14 | (52 | ) | ||
| UBS | USD | 1,259 | JPY | 134,267 | 12/17/14 | (63 | ) | ||
| UBS | EUR | 30,401 | USD | 39,259 | 12/17/14 | 1,152 | |||
| Total Unrealized Appreciation (Depreciation) on Open Foreign Currency Exchange Contracts | 5,590 | ||||||||
| Presentation of Portfolio Holdings | |||||||||
| Amounts in thousands | |||||||||
| Fair Value | |||||||||
| Portfolio Summary | Level 1 | Level 2 | Level 3 | Total | % of Net Assets | ||||
| Common Stocks | |||||||||
| See accompanying notes which are an integral part of the financial statements. | |||||||||
| Russell Global Equity Fund 229 | |||||||||
| Russell Investment Company | |||||||||||
| Russell Global Equity Fund | |||||||||||
| Schedule of Investments, continued — October 31, 2014 | |||||||||||
| Presentation of Portfolio Holdings | |||||||||||
| Amounts in thousands | |||||||||||
| Fair Value | |||||||||||
| Portfolio Summary | Level 1 | Level 2 | Level 3 | Total | % of Net Assets | ||||||
| Australia | $ | 14,235 | $ | — | $ | — | $ | 14,235 | 0.4 | ||
| Austria | 113 | — | — | 113 | —* | ||||||
| Belgium | 10,597 | — | — | 10,597 | 0.3 | ||||||
| Bermuda | 3,489 | — | — | 3,489 | 0.1 | ||||||
| Brazil | 5,171 | — | — | 5,171 | 0.2 | ||||||
| Canada | 65,268 | — | — | 65,268 | 2.0 | ||||||
| Cayman Islands | 33,845 | — | — | 33,845 | 1.0 | ||||||
| China | 12,723 | — | — | 12,723 | 0.4 | ||||||
| Denmark | 9,429 | — | — | 9,429 | 0.3 | ||||||
| Finland | 11,440 | — | — | 11,440 | 0.3 | ||||||
| France | 234,859 | — | — | 234,859 | 7.0 | ||||||
| Germany | 137,670 | — | — | 137,670 | 4.1 | ||||||
| Greece | 4,012 | — | — | 4,012 | 0.1 | ||||||
| Hong Kong | 15,688 | — | — | 15,688 | 0.5 | ||||||
| India | 14,894 | — | — | 14,894 | 0.4 | ||||||
| Ireland | 67,127 | — | — | 67,127 | 2.0 | ||||||
| Israel | 6,980 | — | — | 6,980 | 0.2 | ||||||
| Italy | 15,486 | — | — | 15,486 | 0.5 | ||||||
| Japan | 153,297 | — | — | 153,297 | 4.6 | ||||||
| Jersey | 11,092 | — | — | 11,092 | 0.3 | ||||||
| Luxembourg | 12,014 | — | — | 12,014 | 0.4 | ||||||
| Mexico | 15,162 | — | — | 15,162 | 0.5 | ||||||
| Netherlands | 102,220 | — | — | 102,220 | 3.1 | ||||||
| New Zealand | 324 | — | — | 324 | —* | ||||||
| Norway | 18,677 | — | — | 18,677 | 0.6 | ||||||
| Portugal | 6,938 | — | — | 6,938 | 0.2 | ||||||
| Russia | 7,075 | — | — | 7,075 | 0.2 | ||||||
| Singapore | 7,513 | — | — | 7,513 | 0.2 | ||||||
| South Africa | 15,583 | — | — | 15,583 | 0.5 | ||||||
| South Korea | 40,596 | — | — | 40,596 | 1.2 | ||||||
| Spain | 3,375 | — | — | 3,375 | 0.1 | ||||||
| Sweden | 38,645 | — | — | 38,645 | 1.2 | ||||||
| Switzerland | 218,512 | — | — | 218,512 | 6.6 | ||||||
| Taiwan | 14,454 | — | — | 14,454 | 0.4 | ||||||
| Thailand | 4,271 | — | — | 4,271 | 0.1 | ||||||
| United Kingdom | 248,475 | — | — | 248,475 | 7.5 | ||||||
| United States | 1,564,193 | — | — | 1,564,193 | 47.0 | ||||||
| Preferred Stocks | 23,569 | — | — | 23,569 | 0.7 | ||||||
| Warrants & Rights | 977 | — | — | 977 | —* | ||||||
| Short-Term Investments | — | 104,348 | — | 104,348 | 3.1 | ||||||
| Other Securities | — | 72,926 | — | 72,926 | 2.2 | ||||||
| Total Investments | 3,169,988 | 177,274 | — | 3,347,262 | 100.5 | ||||||
| Other Assets and Liabilities, Net | (0.5 | ) | |||||||||
| 100.0 | |||||||||||
| Other Financial Instruments | |||||||||||
| Futures Contracts | 20,000 | — | — | 20,000 | 0.6 | ||||||
| Foreign Currency Exchange Contracts | 13 | 5,577 | — | 5,590 | 0.2 | ||||||
| Total Other Financial Instruments** | $ | 20,013 | $ | 5,577 | $ | — | $ | 25,590 | |||
| * | Less than .05% of net assets. |
| ** | Futures and foreign currency exchange contract values reflect the unrealized appreciation/depreciation on the instruments. |
For a description of the Levels see note 2 in the Notes to Financial Statements.
For disclosure on transfers between Levels 1, 2 and 3 during the period ended October 31, 2014, see note 2 in the Notes to Financial Statements.
See accompanying notes which are an integral part of the financial statements.
230 Russell Global Equity Fund
| Russell Investment Company | |||||
| Russell Global Equity Fund | |||||
| Fair Value of Derivative Instruments — October 31, 2014 | |||||
| Amounts in thousands | |||||
| Foreign | |||||
| Equity | Currency | ||||
| Derivatives not accounted for as hedging instruments | Contracts | Contracts | |||
| Location: Statement of Assets and Liabilities - Assets | |||||
| Unrealized appreciation on foreign currency exchange contracts | $ | — | $ | 7,331 | |
| Variation margin on futures contracts* | 20,078 | — | |||
| Total | $ | 20,078 | $ | 7,331 | |
| Location: Statement of Assets and Liabilities - Liabilities | |||||
| Variation margin on futures contracts* | $ | 78 | $ | — | |
| Unrealized depreciation on foreign currency exchange contracts | — | 1,741 | |||
| Total | $ | 78 | $ | 1,741 | |
| Foreign | |||||
| Equity | Currency | ||||
| Derivatives not accounted for as hedging instruments | Contracts | Contracts | |||
| Location: Statement of Operations - Net realized gain (loss) | |||||
| Futures contracts | $ | 23,568 | $ | — | |
| Foreign currency-related transactions** | — | 6,922 | |||
| Total | $ | 23,568 | $ | 6,922 | |
| Location: Statement of Operations - Net change in unrealized appreciation (depreciation) | |||||
| Futures contracts | $ | 21,084 | $ | — | |
| Foreign currency-related transactions*** | — | 8,587 | |||
| Total | $ | 21,084 | $ | 8,587 | |
| * | Includes cumulative appreciation/depreciation of futures contracts as reported in the Schedule of Investments. Only variation margin is reported within the Statement of Assets and Liabilities. |
| ** | Only includes net realized gain (loss) on forward and spot contracts. May differ from the net realized gain (loss) on foreign currency-related transactions reported within the Statement of Operations. |
| *** | Only includes change in unrealized gain (loss) on forward and spot contracts. May differ from the net change in unrealized gain (loss) on foreign currency-related transactions reported within the Statement of Operations. |
For further disclosure on derivatives see note 2 in the Notes to Financial Statements.
See accompanying notes which are an integral part of the financial statements.
Russell Global Equity Fund 231
Russell Investment Company Russell Global Equity Fund
Balance Sheet Offsetting of Financial and Derivative Instruments — October 31, 2014
| Amounts in thousands | |||||||||||
| Offsetting of Financial Assets and Derivative Assets | |||||||||||
| Gross | Net Amounts | ||||||||||
| Amounts | of Assets | ||||||||||
| Gross | Offset in the | Presented in | |||||||||
| Amounts of | Statement of | the Statement | |||||||||
| Recognized Assets and | of Assets and | ||||||||||
| Description | Location: Statement of Assets and Liabilities - Assets | Assets | Liabilities | Liabilities | |||||||
| Securities on Loan* | Investments, at fair value | $ | 70,816 | $ | — $ | 70,816 | |||||
| Foreign Currency Exchange Contracts | Unrealized appreciation on foreign currency exchange contracts | 7,331 | — | 7,331 | |||||||
| Futures Contracts | Variation margin on futures contracts | 9,207 | — | 9,207 | |||||||
| Total | $ | 87,354 | $ | — $ | 87,354 | ||||||
| Financial Assets, Derivative Assets, and Collateral Held by Counterparty | |||||||||||
| Gross Amounts Not Offset in | |||||||||||
| the Statement of Assets and | |||||||||||
| Liabilities | |||||||||||
| Net Amounts | |||||||||||
| of Assets | |||||||||||
| Presented in | |||||||||||
| the Statement | Financial and | ||||||||||
| of Assets and | Derivative | Collateral | |||||||||
| Counterparty | Liabilities | Instruments Received^ | Net Amount | ||||||||
| Bank of America | $ | 24 | $ | 24 | $ | — | $ | — | |||
| Bank of Montreal | 3 | 3 | — | — | |||||||
| Bank of New York | 1,285 | 406 | — | 879 | |||||||
| Barclays | 14,667 | — | 14,667 | — | |||||||
| BNP Paribas | 21 | 21 | — | — | |||||||
| Citigroup | 4,624 | — | 4,624 | — | |||||||
| Commonwealth Bank of Australia | 1,139 | 146 | — | 993 | |||||||
| Credit Suisse | 4,339 | — | 4,339 | — | |||||||
| Deutsche Bank | 1,832 | 12 | 1,820 | — | |||||||
| Fidelity | 19,666 | — | 19,666 | — | |||||||
| Goldman Sachs | 14,939 | — | 14,939 | — | |||||||
| HSBC | 1,152 | 223 | — | 929 | |||||||
| JPMorgan Chase | 4,315 | 181 | 3,164 | 970 | |||||||
| Merrill Lynch | 1,501 | — | 1,501 | — | |||||||
| Morgan Stanley | 11,342 | — | 2,133 | 9,209 | |||||||
| Northern Trust | 23 | 23 | — | — | |||||||
| State Street | 1,367 | 94 | — | 1,273 | |||||||
| UBS | 5,115 | 200 | 3,963 | 952 | |||||||
| Total | $ | 87,354 | $ | 1,333 | $ | 70,816 | $ | 15,205 | |||
See accompanying notes which are an integral part of the financial statements.
232 Russell Global Equity Fund
Russell Investment Company
Russell Global Equity Fund
Balance Sheet Offsetting of Financial and Derivative Instruments, continued —October 31, 2014
| Amounts in thousands | ||||||||
| Offsetting of Financial Liabilities and Derivative Liabilities | ||||||||
| Gross | Net Amounts | |||||||
| Amounts | of Assets | |||||||
| Gross | Offset in the | Presented in | ||||||
| Amounts of | Statement of | the Statement | ||||||
| Recognized | Assets and | of Assets and | ||||||
| Description | Location: Statement of Assets and Liabilities - Liabilities | Liabilities | Liabilities | Liabilities | ||||
| Futures Contracts | Variation margin on futures contracts | $ | 5,068 | $ | — $ | 5,068 | ||
| Foreign Currency Exchange Contracts | Unrealized depreciation on foreign currency exchange contracts | 1,741 | — | 1,741 | ||||
| Total | $ | 6,809 | $ | — $ | 6,809 | |||
| Financial Liabilities, Derivative Liabilities, and Collateral Pledged by Counterparty | ||||||||
| Gross Amounts Not Offset in | ||||||||
| the Statement of Assets and | ||||||||
| Liabilities | ||||||||
| Net Amounts | ||||||||
| of Liabilities | ||||||||
| Presented in | ||||||||
| the Statement | Financial and | |||||||
| of Assets and | Derivative | Collateral | ||||||
| Counterparty | Liabilities | Instruments | Pledged^ | Net Amount | ||||
| Bank of America | $ | 89 | $ | 24 | $ | — $ | 65 | |
| Bank of Montreal | 70 | 3 | — | 67 | ||||
| Bank of New York | 406 | 406 | — | — | ||||
| BNP Paribas | 128 | 21 | — | 107 | ||||
| Brown Brothers Harriman | 26 | — | — | 26 | ||||
| Commonwealth Bank of Australia | 146 | 146 | — | — | ||||
| Deutsche Bank | 91 | 12 | — | 79 | ||||
| HSBC | 223 | 223 | — | — | ||||
| JPMorgan Chase | 181 | 181 | — | — | ||||
| Morgan Stanley | 5,068 | — | 5,068 | — | ||||
| Northern Trust | 27 | 23 | — | 4 | ||||
| State Street | 154 | 94 | — | 60 | ||||
| UBS | 200 | 200 | — | — | ||||
| Total | $ | 6,809 | $ | 1,333 | $ | 5,068 | $ | 408 |
* Fair value of securities on loan as reported in the footnotes to the Statement of Assets and Liabilities.
^ Collateral received or pledged amounts may not reconcile to those disclosed in the Statement of Assets and Liabilities due to the inclusion of off-Balance Sheet collateral and adjustments made to exclude overcollateralization.
For further disclosure on derivatives and counterparty risk see note 2 in the Notes to Financial Statements.
See accompanying notes which are an integral part of the financial statements.
Russell Global Equity Fund 233
| Russell Investment Company | ||
| Russell Global Equity Fund | ||
| Y a | ||
| Statement of Assets and Liabilities — October 31, 2014 | ||
| Amounts in thousands | ||
| Assets | ||
| Investments, at identified cost | $ | 2,636,782 |
| Investments, at fair value(*)(>) | 3,347,262 | |
| Cash | 48 | |
| Cash (restricted)(a) | 41,400 | |
| Foreign currency holdings(^) | 993 | |
| Unrealized appreciation on foreign currency exchange contracts | 7,331 | |
| Receivables: | ||
| Dividends and interest | 2,399 | |
| Dividends from affiliated Russell funds | 8 | |
| Investments sold | 9,473 | |
| Fund shares sold | 3,385 | |
| Foreign capital gains taxes recoverable | 1,665 | |
| Variation margin on futures contracts | 9,207 | |
| Prepaid expenses | 9 | |
| Total assets | 3,423,180 | |
| Liabilities | ||
| Payables: | ||
| Investments purchased | 7,727 | |
| Fund shares redeemed | 3,166 | |
| Accrued fees to affiliates | 3,112 | |
| Other accrued expenses | 280 | |
| Variation margin on futures contracts | 5,068 | |
| Unrealized depreciation on foreign currency exchange contracts | 1,741 | |
| Payable upon return of securities loaned | 72,926 | |
| Total liabilities | 94,020 | |
| Net Assets | $ | 3,329,160 |
See accompanying notes which are an integral part of the financial statements.
234 Russell Global Equity Fund
| Russell Investment Company | ||
| Russell Global Equity Fund | ||
| Statement of Assets and Liabilities, continued — October 31, 2014 | ||
| Amounts in thousands | ||
| Net Assets Consist of: | ||
| Undistributed (overdistributed) net investment income | $ | 32,884 |
| Accumulated net realized gain (loss) | 135,616 | |
| Unrealized appreciation (depreciation) on: | ||
| Investments | 710,480 | |
| Futures contracts | 20,000 | |
| Foreign currency-related transactions | 5,445 | |
| Shares of beneficial interest | 2,828 | |
| Additional paid-in capital | 2,421,907 | |
| Net Assets | $ | 3,329,160 |
| Net Asset Value, offering and redemption price per share: | ||
| Net asset value per share: Class A(#) | $ | 11.72 |
| Maximum offering price per share (Net asset value plus sales charge of 5.75%): Class A | $ | 12.44 |
| Class A — Net assets | $ | 12,819,429 |
| Class A — Shares outstanding ($.01 par value) | 1,094,152 | |
| Net asset value per share: Class C(#) | $ | 11.55 |
| Class C — Net assets | $ | 14,285,871 |
| Class C — Shares outstanding ($.01 par value) | 1,236,399 | |
| Net asset value per share: Class E(#) | $ | 11.72 |
| Class E — Net assets | $ | 53,265,256 |
| Class E — Shares outstanding ($.01 par value) | 4,543,566 | |
| Net asset value per share: Class S(#) | $ | 11.77 |
| Class S — Net assets | $ 2,240,990,679 | |
| Class S — Shares outstanding ($.01 par value) | 190,468,373 | |
| Net asset value per share: Class Y(#) | $ | 11.79 |
| Class Y — Net assets | $ 1,007,798,454 | |
| Class Y — Shares outstanding ($.01 par value) | 85,458,190 | |
| Amounts in thousands | ||
| (^) Foreign currency holdings - cost | $ | 1,001 |
| (*) Securities on loan included in investments | $ | 70,816 |
| (>) Investments in affiliates, Russell U.S. Cash Management Fund and Russell U.S. Cash Collateral Fund | $ | 177,274 |
| (a) Cash Collateral for Futures | $ | 41,400 |
| (#) Net asset value per share equals class level net assets divided by class level shares of beneficial interest outstanding. | ||
See accompanying notes which are an integral part of the financial statements.
Russell Global Equity Fund 235
| Russell Investment Company | |||
| Russell Global Equity Fund | |||
| Statement of Operations — For the Period Ended October 31, 2014 | |||
| Amounts in thousands | |||
| Investment Income | |||
| Dividends | $ | 72,810 | |
| Dividends from affiliated Russell funds | 154 | ||
| Securities lending income | 1,411 | ||
| Less foreign taxes withheld | (4,471 | ) | |
| Total investment income | 69,904 | ||
| Expenses | |||
| Advisory fees | 31,900 | ||
| Administrative fees | 1,599 | ||
| Custodian fees | 735 | ||
| Distribution fees - Class A | 31 | ||
| Distribution fees - Class C | 109 | ||
| Transfer agent fees - Class A | 25 | ||
| Transfer agent fees - Class C | 29 | ||
| Transfer agent fees - Class E | 117 | ||
| Transfer agent fees - Class S | 4,358 | ||
| Transfer agent fees - Class Y | 48 | ||
| Professional fees | 139 | ||
| Registration fees | 143 | ||
| Shareholder servicing fees - Class C | 36 | ||
| Shareholder servicing fees - Class E | 146 | ||
| Trustees’ fees | 81 | ||
| Printing fees | 154 | ||
| Miscellaneous | 163 | ||
| Total expenses | 39,813 | ||
| Net investment income (loss) | 30,091 | ||
| Net Realized and Unrealized Gain (Loss) | |||
| Net realized gain (loss) on: | |||
| Investments | 118,298 | ||
| Futures contracts | 23,568 | ||
| Foreign currency-related transactions | 6,574 | ||
| Net realized gain (loss) | 148,440 | ||
| Net change in unrealized appreciation (depreciation) on: | |||
| Investments | 66,931 | ||
| Futures contracts | 21,084 | ||
| Foreign currency-related transactions | 8,339 | ||
| Net change in unrealized appreciation (depreciation) | 96,354 | ||
| Net realized and unrealized gain (loss) | 244,794 | ||
| Net Increase (Decrease) in Net Assets from Operations | $ | 274,885 | |
See accompanying notes which are an integral part of the financial statements.
236 Russell Global Equity Fund
| Russell Investment Company | ||||||
| Russell Global Equity Fund | ||||||
| Statements of Changes in Net Assets | ||||||
| For the Periods Ended October 31, | ||||||
| Amounts in thousands | 2014 | 2013 | ||||
| Increase (Decrease) in Net Assets | ||||||
| Operations | ||||||
| Net investment income (loss) | $ | 30,091 | $ | 29,243 | ||
| Net realized gain (loss) | 148,440 | 203,518 | ||||
| Net change in unrealized appreciation (depreciation) | 96,354 | 487,338 | ||||
| Net increase (decrease) in net assets from operations | 274,885 | 720,099 | ||||
| Distributions | ||||||
| From net investment income | ||||||
| Class A | (47 | ) | (73 | ) | ||
| Class C | (—)** | — | ||||
| Class E | (220 | ) | (403 | ) | ||
| Class S | (13,352 | ) | (17,023 | ) | ||
| Class Y | (8,451 | ) | (12,946 | ) | ||
| From net realized gain | ||||||
| Class A | (206 | ) | — | |||
| Class C | (258 | ) | — | |||
| Class E | (1,009 | ) | — | |||
| Class S | (37,208 | ) | — | |||
| Class Y | (18,439 | ) | — | |||
| Net decrease in net assets from distributions | (79,190 | ) | (30,445 | ) | ||
| Share Transactions* | ||||||
| Net increase (decrease) in net assets from share transactions | (93,950 | ) | (112,917 | ) | ||
| Total Net Increase (Decrease) in Net Assets | 101,745 | 576,737 | ||||
| Net Assets | ||||||
| Beginning of period | 3,227,415 | 2,650,678 | ||||
| End of period | $ | 3,329,160 | $ | 3,227,415 | ||
| Undistributed (overdistributed) net investment income included in net assets | $ | 32,884 | $ | 17,914 | ||
| ** | Less than $500. |
See accompanying notes which are an integral part of the financial statements.
Russell Global Equity Fund 237
Russell Investment Company Russell Global Equity Fund
Statements of Changes in Net Assets, continued
* Share transaction amounts (in thousands) for the periods ended October 31, 2014 and October 31, 2013 were as follows:
| 2014 | 2013 | |||||||||||
| Shares | Dollars | Shares | Dollars | |||||||||
| Class A | ||||||||||||
| Proceeds from shares sold | 247 | $ | 2,818 | 241 | $ | 2,447 | ||||||
| Proceeds from reinvestment of distributions | 22 | 246 | 8 | 72 | ||||||||
| Payments for shares redeemed | (207 | ) | (2,390 | ) | (323 | ) | (3,147 | ) | ||||
| Net increase (decrease) | 62 | 674 | (74 | ) | (628 | ) | ||||||
| Class C | ||||||||||||
| Proceeds from shares sold | 205 | 2,309 | 282 | 2,788 | ||||||||
| Proceeds from reinvestment of distributions | 23 | 257 | — | — | ||||||||
| Payments for shares redeemed | (280 | ) | (3,181 | ) | (355 | ) | (3,526 | ) | ||||
| Net increase (decrease) | (52 | ) | (615 | ) | (73 | ) | (738 | ) | ||||
| Class E | ||||||||||||
| Proceeds from shares sold | 861 | 9,820 | 988 | 9,849 | ||||||||
| Proceeds from reinvestment of distributions | 103 | 1,157 | 42 | 380 | ||||||||
| Payments for shares redeemed | (1,496 | ) | (17,363 | ) | (1,338 | ) | (13,533 | ) | ||||
| Net increase (decrease) | (532 | ) | (6,386 | ) | (308 | ) | (3,304 | ) | ||||
| Class S | ||||||||||||
| Proceeds from shares sold | 45,595 | 522,725 | 51,046 | 511,971 | ||||||||
| Proceeds from reinvestment of distributions | 4,413 | 49,647 | 1,826 | 16,653 | ||||||||
| Payments for shares redeemed | (46,524 | ) | (533,520 | ) | (40,908 | ) | (410,880 | ) | ||||
| Net increase (decrease) | 3,484 | 38,852 | 11,964 | 117,744 | ||||||||
| Class Y | ||||||||||||
| Proceeds from shares sold | 13,589 | 153,808 | 2,312 | 22,320 | ||||||||
| Proceeds from reinvestment of distributions | 2,388 | 26,890 | 1,405 | 12,814 | ||||||||
| Payments for shares redeemed | (26,377 | ) | (307,173 | ) | (26,270 | ) | (261,125 | ) | ||||
| Net increase (decrease) | (10,400 | ) | (126,475 | ) | (22,553 | ) | (225,991 | ) | ||||
| Total increase (decrease) | (7,438 | ) | $ | (93,950 | ) | (11,044 | ) | $ | (112,917 | ) | ||
See accompanying notes which are an integral part of the financial statements.
238 Russell Global Equity Fund
(This page intentionally left blank)
| Russell Investment Company | |||||||||||||||||||
| Russell Global Equity Fund | |||||||||||||||||||
| Financial Highlights — For the Periods Ended | |||||||||||||||||||
| For a Share Outstanding Throughout Each Period. | |||||||||||||||||||
| $ | $ | $ | $ | $ | $ | ||||||||||||||
| Net Asset Value, | Net | Net Realized | Total from | Distributions | Distributions | ||||||||||||||
| Beginning of | Investment | and Unrealized | Investment | from Net | from Net | ||||||||||||||
| Period | Income (Loss)(a)(d) | Gain (Loss) | Operations | Investment Income | Realized Gain | ||||||||||||||
| Class A | |||||||||||||||||||
| October 31, 2014 | 11.07 | .07 | .83 | .90 | (.05 | ) | (.20 | ) | |||||||||||
| October 31, 2013 | 8.76 | .07 | 2.31 | 2.38 | (.07 | ) | — | ||||||||||||
| October 31, 2012 | 8.37 | .06 | .38 | .44 | (.05 | ) | — | ||||||||||||
| October 31, 2011 | 8.41 | .04 | (.05 | ) | (.01 | ) | (.03 | ) | — | ||||||||||
| October 31, 2010 | 7.29 | .02 | 1.19 | 1.21 | (.09 | ) | — | ||||||||||||
| Class C | |||||||||||||||||||
| October 31, 2014 | 10.96 | (.02 | ) | .81 | .79 | —(f) | (.20 | ) | |||||||||||
| October 31, 2013 | 8.66 | (.01 | ) | 2.31 | 2.30 | — | — | ||||||||||||
| October 31, 2012 | 8.29 | —(f) | .37 | .37 | — | — | |||||||||||||
| October 31, 2011 | 8.37 | (.03 | ) | (.05 | ) | (.08 | ) | — | — | ||||||||||
| October 31, 2010 | 7.26 | (.04 | ) | 1.18 | 1.14 | (.03 | ) | — | |||||||||||
| Class E | |||||||||||||||||||
| October 31, 2014 | 11.07 | .07 | .82 | .89 | (.04 | ) | (.20 | ) | |||||||||||
| October 31, 2013 | 8.76 | .07 | 2.31 | 2.38 | (.07 | ) | — | ||||||||||||
| October 31, 2012 | 8.38 | .06 | .37 | .43 | (.05 | ) | — | ||||||||||||
| October 31, 2011 | 8.42 | .04 | (.06 | ) | (.02 | ) | (.02 | ) | — | ||||||||||
| October 31, 2010 | 7.30 | .02 | 1.18 | 1.20 | (.08 | ) | — | ||||||||||||
| Class S | |||||||||||||||||||
| October 31, 2014 | 11.11 | .09 | .84 | .93 | (.07 | ) | (.20 | ) | |||||||||||
| October 31, 2013 | 8.79 | .09 | 2.33 | 2.42 | (.10 | ) | — | ||||||||||||
| October 31, 2012 | 8.41 | .08 | .37 | .45 | (.07 | ) | — | ||||||||||||
| October 31, 2011 | 8.45 | .06 | (.06 | ) | — | (.04 | ) | — | |||||||||||
| October 31, 2010 | 7.32 | .04 | 1.19 | 1.23 | (.10 | ) | — | ||||||||||||
| Class Y | |||||||||||||||||||
| October 31, 2014 | 11.14 | .12 | .82 | .94 | (.09 | ) | (.20 | ) | |||||||||||
| October 31, 2013 | 8.81 | .11 | 2.33 | 2.44 | (.11 | ) | — | ||||||||||||
| October 31, 2012 | 8.42 | .10 | .38 | .48 | (.09 | ) | — | ||||||||||||
| October 31, 2011 | 8.46 | .08 | (.07 | ) | .01 | (.05 | ) | — | |||||||||||
| October 31, 2010 | 7.32 | .05 | 1.20 | 1.25 | (.11 | ) | — | ||||||||||||
See accompanying notes which are an integral part of the financial statements.
240 Russell Global Equity Fund
| % | % | % | ||||||||||||||||
| $ | $ | Ratio of Expenses | Ratio of Expenses | Ratio of Net | ||||||||||||||
| Net Asset Value, | % | Net Assets, | to Average | to Average | Investment Income | % | ||||||||||||
| $ | End of | Total | End of Period | Net Assets, | Net Assets, | to Average | Portfolio | |||||||||||
| Total Distributions | Period | Return(c) | (000 | ) | Gross | Net(d) | Net Assets(d) | Turnover Rate | ||||||||||
| (.25 | ) | 11.72 | 8.18 | 12,819 | 1.49 | 1.49 | .59 | 39 | ||||||||||
| (.07 | ) | 11.07 | 27.37 | 11,427 | 1.49 | 1.49 | .67 | 82 | ||||||||||
| (.05 | ) | 8.76 | 5.32 | 9,684 | 1.48 | 1.48 | .72 | 107 | ||||||||||
| (.03 | ) | 8.37 | (.18 | ) | 9,598 | 1.50 | 1.50 | .45 | 83 | |||||||||
| (.09 | ) | 8.41 | 16.66 | 7,732 | 1.49 | 1.49 | .22 | 74 | ||||||||||
| (.20 | ) | 11.55 | 7.26 | 14,286 | 2.24 | 2.24 | (.16 | ) | 39 | |||||||||
| — | 10.96 | 26.56 | 14,118 | 2.24 | 2.24 | (.08 | ) | 82 | ||||||||||
| — | 8.66 | 4.46 | 11,794 | 2.23 | 2.23 | (.02 | ) | 107 | ||||||||||
| — | 8.29 | (.96 | ) | 14,319 | 2.25 | 2.25 | (.31 | ) | 83 | |||||||||
| (.03 | ) | 8.37 | 15.76 | 12,471 | 2.24 | 2.24 | (.53 | ) | 74 | |||||||||
| (.24 | ) | 11.72 | 8.15 | 53,265 | 1.49 | 1.49 | .60 | 39 | ||||||||||
| (.07 | ) | 11.07 | 27.41 | 56,210 | 1.49 | 1.49 | .67 | 82 | ||||||||||
| (.05 | ) | 8.76 | 5.25 | 47,176 | 1.48 | 1.48 | .71 | 107 | ||||||||||
| (.02 | ) | 8.38 | (.19 | ) | 47,601 | 1.50 | 1.50 | .47 | 83 | |||||||||
| (.08 | ) | 8.42 | 16.59 | 36,042 | 1.49 | 1.49 | .29 | 74 | ||||||||||
| (.27 | ) | 11.77 | 8.48 | 2,240,991 | 1.24 | 1.24 | .83 | 39 | ||||||||||
| (.10 | ) | 11.11 | 27.74 | 2,078,046 | 1.24 | 1.24 | .92 | 82 | ||||||||||
| (.07 | ) | 8.79 | 5.49 | 1,538,904 | 1.23 | 1.23 | .97 | 107 | ||||||||||
| (.04 | ) | 8.41 | .01 | 1,391,111 | 1.25 | 1.25 | .70 | 83 | ||||||||||
| (.10 | ) | 8.45 | 16.92 | 1,080,410 | 1.24 | 1.24 | .50 | 74 | ||||||||||
| (.29 | ) | 11.79 | 8.56 | 1,007,799 | 1.04 | 1.04 | 1.06 | 39 | ||||||||||
| (.11 | ) | 11.14 | 28.01 | 1,067,614 | 1.04 | 1.04 | 1.13 | 82 | ||||||||||
| (.09 | ) | 8.81 | 5.79 | 1,043,120 | 1.05 | 1.05 | 1.18 | 107 | ||||||||||
| (.05 | ) | 8.42 | .13 | 1,215,633 | 1.07 | 1.07 | .85 | 83 | ||||||||||
| (.11 | ) | 8.46 | 17.06 | 1,296,377 | 1.06 | 1.06 | .71 | 74 | ||||||||||
See accompanying notes which are an integral part of the financial statements.
Russell Global Equity Fund 241
Russell Investment Company Select International Equity Fund
Portfolio Management Discussion and Analysis — October 31, 2014 (Unaudited)

| Select International Equity Fund - Class Y | Russell Developed ex-U.S. Large Cap® Index Net** | ||||||
| Total | Total | ||||||
| Return | Return | ||||||
| Inception* | (5.80 | )% | Inception* | (5.43 | )% | ||
242 Select International Equity Fund
Russell Investment Company Select International Equity Fund
Portfolio Management Discussion and Analysis, continued — October 31, 2014 (Unaudited)
| Over the period, the Fund was regionally positioned to favor | ||
| What is the Fund’s investment objective? | Continental Europe and Japan while being underweight to | |
| Canada and Asia ex-Japan. This positioning did not have a | ||
| The Select International Equity Fund (the “Fund”) seeks to | significant impact on performance; however, the Fund’s valuation | |
| provide long term capital growth. | bias within these regions was impactful as lower price-to-book | |
| How did the Fund perform relative to its benchmark for the | stocks strongly underperformed the market in these regions and | |
| fiscal year ended October 31, 2014? | thus detracted from the Fund’s benchmark-relative performance. | |
| For the period of July 31, 2014 (inception of the Fund) through | Benchmark-relative sector deviations in the Fund were modest | |
| October 31, 2014, the Fund’s Class Y Shares lost 5.80%. This is | and over the period favored financials, telecommunication, and | |
| compared to the Fund’s benchmark, the Russell Developed ex- | energy sectors while being underweight industrials, materials, | |
| U.S. Large Cap Index, which lost 5.43% during the same period. | and health care sectors. The Fund’s underweight to materials | |
| The Fund’s performance includes operating expenses, whereas | was a strong contributor to benchmark-relative performance as | |
| index returns are unmanaged and do not include expenses of any | this was one of the worst performing sectors over the period. The | |
| kind. | Fund’s overweight position in financials and telecoms also had a | |
| For the period from July 31, 2014 (inception of the Fund) to | positive impact on benchmark-relative performance. However, | |
| October 31, 2014, the Morningstar® Foreign Large Blend, a group | this was offset by the overweight to energy, which was the worst | |
| of funds that Morningstar considers to have investment strategies | performing sector, and underweight to health care, which was | |
| similar to those of the Fund, lost 3.82%. These results serve as | the best performing sector. Within the health care, industrials | |
| peer comparisons and are expressed net of operating expenses. | and consumer staples sectors, the lower exposure to high price- | |
| to-book stocks in favor of lower price-to-book stocks was an | ||
| How did the market conditions described in the Market | additional detractor to benchmark-relative performance. | |
| Summary report affect the Fund’s performance? | ||
| The Fund was launched on July 31, 2014. Over the three month | Describe any changes to the Fund’s structure or the money | |
| period since the Fund’s inception, the market strongly favored | manager line-up. | |
| growth stocks over value stocks, as measured by the performance | There were no changes to the Fund’s structure since its launch. | |
| of the Russell Large Cap Developed ex-US Growth and Value | The views expressed in this report reflect those of the portfolio | |
| indexes. A stock’s price-to-book ratio can be crudely used as a | managers only through the end of the period covered by | |
| proxy for valuation, with high price-to-book stocks representing | the report. These views do not necessarily represent the | |
| growth stocks and low price-to-book stocks representing value | views of RIMCo, or any other person in RIMCo or any other | |
| stocks. Over the period, the Fund emphasized stocks with low | affiliated organization. These views are subject to change | |
| price-to-book multiples and was underweight stocks with high | at any time based upon market conditions or other events, | |
| price-to-book multiples. This allocation accounted for the | and RIMCo disclaims any responsibility to update the views | |
| majority of the Fund’s performance shortfall since its inception. | contained herein. These views should not be relied on as | |
| How did the investment strategies and techniques employed | investment advice and, because investment decisions for | |
| by the Fund and its money managers affect its benchmark- | a Russell Investment Company (“RIC”) Fund are based on | |
| relative performance? | numerous factors, should not be relied on as an indication | |
| of investment decisions of any RIC Fund. | ||
| * | Assumes initial investment on July 31, 2014. | |
| ** | The Russell Developed ex-U.S. Large Cap® Index Net is an index which offers investors access to the large-cap segment of the global equity market, excluding | |
| companies assigned to the United States. It is constructed to provide a comprehensive and unbiased barometer of the large-cap segment and is completely | ||
| reconstituted annually to accurately reflect the changes in the market over time. | ||
| Performance is historical and assumes reinvestment of all dividends and capital gains. Investment return and principal value will fluctuate so that an investor’s | ||
| shares, when redeemed, may be worth more or less than when purchased. Past performance is not indicative of future results. The returns shown do not reflect the | ||
| deduction of taxes that a shareholder would pay on Fund distributions or the redemption of Fund shares. | ||
Select International Equity Fund 243
Russell Investment Company Select International Equity Fund
Shareholder Expense Example — October 31, 2014 (Unaudited)
| Fund Expenses | Please note that the expenses shown in the table are meant | ||||||
| The following disclosure provides important information | to highlight your ongoing costs only and do not reflect any | ||||||
| regarding the Fund’s Shareholder Expense Example | transactional costs. Therefore, the information under the heading | ||||||
| (“Example”). | “Hypothetical Performance (5% return before expenses)” is | ||||||
| useful in comparing ongoing costs only, and will not help you | |||||||
| Example | determine the relative total costs of owning different funds. In | ||||||
| As a shareholder of the Fund, you incur two types of costs: (1) | addition, if these transactional costs were included, your costs | ||||||
| transaction costs, and (2) ongoing costs, including advisory and | would have been higher. | ||||||
| administrative fees; and other Fund expenses. The Example is | Hypothetical | ||||||
| intended to help you understand your ongoing costs (in dollars) | Performance (5% | ||||||
| of investing in the Fund and to compare these costs with the | Actual | return before | |||||
| ongoing costs of investing in other mutual funds. The Example | Class Y | Performance | expenses) | ||||
| Beginning Account Value | |||||||
| is based on an investment of $1,000 invested at the beginning of | August 1, 2014 | $ | 1,000.00 | $ | 1,000.00 | ||
| the period and held for the entire period indicated, which for this | Ending Account Value | ||||||
| Fund is from August 1, 2014 to October 31, 2014. | October 31, 2014 | $ | 942.00 | $ | 1,022.99 | ||
| Expenses Paid During Period* | $ | 1.08 | $ | 2.24 | |||
| Actual Expenses | |||||||
| The information in the table under the heading “Actual | * Expenses are equal to the Fund's annualized expense ratio of 0.44% | ||||||
| (representing the 92-day period annualized), multiplied by the average | |||||||
| Performance” provides information about actual account values | account value over the period, multiplied by 92/365 (to reflect the period since | ||||||
| and actual expenses. You may use the information in this column, | commencement of operations). May reflect amounts waived and/or reimbursed. | ||||||
| together with the amount you invested, to estimate the expenses | Without any waivers and/or reimbursements, expenses would have been higher. | ||||||
| that you paid over the period. Simply divide your account value by | Hypothetical expenses are equal to the Fund’s annualized expense ratio of | ||||||
| 0.44% (representing the six-month period annualized), multiplied by the | |||||||
| $1,000 (for example, an $8,600 account value divided by $1,000 | average account value over the period, multiplied by 184/365 (to reflect the | ||||||
| = 8.6), then multiply the result by the number in the first column | one-half year period). | ||||||
| in the row entitled “Expenses Paid During Period” to estimate | |||||||
| the expenses you paid on your account during this period. | |||||||
| Hypothetical Example for Comparison Purposes | |||||||
| The information in the table under the heading “Hypothetical | |||||||
| Performance (5% return before expenses)” provides information | |||||||
| about hypothetical account values and hypothetical expenses | |||||||
| based on the Fund’s actual expense ratio and an assumed rate of | |||||||
| return of 5% per year before expenses, which is not the Fund’s | |||||||
| actual return. The hypothetical account values and expenses | |||||||
| may not be used to estimate the actual ending account balance or | |||||||
| expenses you paid for the period. You may use this information | |||||||
| to compare the ongoing costs of investing in the Fund and other | |||||||
| funds. To do so, compare this 5% hypothetical example with the | |||||||
| 5% hypothetical examples that appear in the shareholder reports | |||||||
| of other funds. | |||||||
244 Select International Equity Fund
| Russell Investment Company | ||||||||||||
| Select International Equity Fund | ||||||||||||
| Schedule of Investments — October 31, 2014 | ||||||||||||
| Amounts in thousands (except share amounts) | Amounts in thousands (except share amounts) | |||||||||||
| Principal | Fair | Principal | Fair | |||||||||
| Amount ($) | Value | Amount ($) | Value | |||||||||
| or Shares | $ | or Shares | $ | |||||||||
| Common Stocks - 93.8% | Stockland(ö) | 17,615 | 66 | |||||||||
| Australia - 6.1% | Suncorp Group, Ltd. | 12,426 | 160 | |||||||||
| AGL Energy, Ltd. | 7,771 | 93 | Sydney Airport | 5,492 | 21 | |||||||
| ALS, Ltd. | 964 | 5 | Tabcorp Holdings, Ltd. | 5,203 | 19 | |||||||
| Alumina, Ltd.(Æ) | 17,121 | 25 | Tatts Group, Ltd. | 24,581 | 75 | |||||||
| Amcor, Ltd. Class A | 3,134 | 32 | Telstra Corp., Ltd. | 26,257 | 130 | |||||||
| AMP, Ltd. | 11,369 | 59 | Toll Holdings, Ltd. | 6,856 | 34 | |||||||
| APA Group | 3,736 | 26 | TPG Telecom, Ltd. | 1,396 | 9 | |||||||
| Asciano, Ltd. | 6,299 | 35 | Transurban Group - ADR(Æ) | 6,116 | 44 | |||||||
| ASX, Ltd. - ADR | 1,420 | 45 | Treasury Wine Estates, Ltd. | 6,875 | 28 | |||||||
| Aurizon Holdings, Ltd. | 13,944 | 57 | Washington H Soul Pattinson & Co., Ltd. | 1,175 | 15 | |||||||
| AusNet Services(Æ) | 19,450 | 24 | Wesfarmers, Ltd. | 11,520 | 447 | |||||||
| Australia & New Zealand Banking | Westfield Corp.(Æ)(ö) | 17,802 | 124 | |||||||||
| Group, Ltd. - ADR | 23,286 | 686 | Westpac Banking Corp. | 26,621 | 815 | |||||||
| Bank of Queensland, Ltd. | 2,153 | 24 | Woodside Petroleum, Ltd. | 2,364 | 83 | |||||||
| Bendigo & Adelaide Bank, Ltd. | 6,245 | 68 | Woolworths, Ltd. | 7,493 | 237 | |||||||
| BHP Billiton, Ltd. - ADR | 11,549 | 345 | WorleyParsons, Ltd. | 1,723 | 21 | |||||||
| BlueScope Steel, Ltd.(Æ) | 5,345 | 25 | 6,800 | |||||||||
| Boral, Ltd. | 4,456 | 19 | ||||||||||
| Brambles, Ltd. | 6,089 | 51 | Austria - 0.3% | |||||||||
| Caltex Australia, Ltd. | 800 | 22 | Andritz AG | 536 | 26 | |||||||
| CFS Retail Property Trust Group(ö) | 20,475 | 38 | Erste Group Bank AG | 3,473 | 87 | |||||||
| Challenger, Ltd. | 3,425 | 21 | EVN AG | 1,332 | 17 | |||||||
| Coca-Cola Amatil, Ltd. | 2,757 | 22 | Immofinanz AG(Æ) | 10,149 | 31 | |||||||
| Cochlear, Ltd. | 121 | 8 | Mayr Melnhof Karton AG | 166 | 18 | |||||||
| Commonwealth Bank of Australia - ADR | 6,817 | 483 | Oesterreichische Post AG | 155 | 8 | |||||||
| Computershare, Ltd. | 2,625 | 28 | OMV AG | 2,201 | 69 | |||||||
| Crown Resorts, Ltd. | 2,088 | 27 | Raiffeisen Bank International AG | 764 | 16 | |||||||
| CSL, Ltd. | 2,194 | 155 | Strabag SE | 266 | 6 | |||||||
| Dexus Property Group(Æ)(ö) | 86,165 | 92 | Telekom Austria AG - ADR | 926 | 7 | |||||||
| Echo Entertainment Group, Ltd. | 7,812 | 26 | UNIQA Insurance Group AG | 670 | 7 | |||||||
| Federation Centres(ö) | 4,732 | 11 | Verbund AG Class A | 544 | 11 | |||||||
| Flight Centre, Ltd. | 203 | 7 | Vienna Insurance Group AG Wiener | |||||||||
| Fortescue Metals Group, Ltd. | 6,487 | 20 | Versicherung Gruppe | 407 | 20 | |||||||
| Goodman Group(ö) | 6,486 | 32 | Voestalpine AG | 1,072 | 43 | |||||||
| GPT Group (The)(ö) | 25,272 | 92 | 366 | |||||||||
| Harvey Norman Holdings, Ltd. | 6,370 | 21 | ||||||||||
| Iluka Resources, Ltd. | 852 | 5 | Belgium - 1.2% | |||||||||
| Incitec Pivot, Ltd. | 15,291 | 39 | Ackermans & van Haaren NV | 346 | 43 | |||||||
| Insurance Australia Group, Ltd. | 17,448 | 100 | Ageas | 1,871 | 62 | |||||||
| Leighton Holdings, Ltd. - ADR | 976 | 19 | Anheuser-Busch InBev NV | 5,619 | 621 | |||||||
| Lend Lease Group | 6,433 | 89 | Belgacom SA | 1,382 | 52 | |||||||
| Macquarie Group, Ltd. | 1,478 | 80 | bpost SA | 745 | 18 | |||||||
| Metcash, Ltd. | 12,336 | 31 | Colruyt SA | 688 | 31 | |||||||
| Mirvac Group(ö) | 29,385 | 46 | Delhaize Group SA | 1,371 | 94 | |||||||
| National Australia Bank, Ltd. - ADR | 18,948 | 583 | D'ieteren SA | 424 | 15 | |||||||
| Newcrest Mining, Ltd.(Æ) | 5,729 | 47 | Elia System Operator SA | 528 | 26 | |||||||
| Orica, Ltd. | 2,387 | 43 | Financiere de Tubize SA | 184 | 13 | |||||||
| Origin Energy, Ltd. | 10,831 | 136 | Groupe Bruxelles Lambert SA | 1,145 | 102 | |||||||
| Qantas Airways, Ltd.(Æ) | 12,739 | 19 | KBC Groep NV(Æ) | 2,541 | 137 | |||||||
| QBE Insurance Group, Ltd. | 9,818 | 100 | Sofina SA | 262 | 28 | |||||||
| Ramsay Health Care, Ltd. | 620 | 29 | Solvay SA | 261 | 36 | |||||||
| REA Group, Ltd. | 196 | 8 | Telenet Group Holding NV(Æ) | 327 | 18 | |||||||
| Rio Tinto, Ltd. - ADR | 1,972 | 105 | UCB SA | 827 | 67 | |||||||
| Santos, Ltd. | 7,390 | 84 | Umicore SA | 738 | 29 | |||||||
| Scentre Group(Æ)(ö) | 39,611 | 123 | 1,392 | |||||||||
| Seek, Ltd. | 1,738 | 25 | Bermuda - 0.5% | |||||||||
| Seven Group Holdings, Ltd. | 1,241 | 7 | Catlin Group, Ltd. | 5,853 | 50 | |||||||
| Sonic Healthcare, Ltd. | 1,821 | 30 | ||||||||||
| See accompanying notes which are an integral part of the financial statements. | ||||||||||||
| Select International Equity Fund 245 | ||||||||||||
| Russell Investment Company | ||||||||||||
| Select International Equity Fund | ||||||||||||
| Schedule of Investments, continued — October 31, 2014 | ||||||||||||
| Amounts in thousands (except share amounts) | Amounts in thousands (except share amounts) | |||||||||||
| Principal | Fair | Principal | Fair | |||||||||
| Amount ($) | Value | Amount ($) | Value | |||||||||
| or Shares | $ | or Shares | $ | |||||||||
| Cheung Kong Infrastructure Holdings, | Choice Properties Real Estate | |||||||||||
| Ltd. | 3,000 | 22 | Investment Trust(ö) | 938 | 9 | |||||||
| Chinese Estates Holdings, Ltd. | 5,500 | 15 | CI Financial Corp. | 791 | 23 | |||||||
| Dairy Farm International Holdings, Ltd. | 900 | 9 | Cominar Real Estate Investment Trust(ö) | 1,404 | 24 | |||||||
| Esprit Holdings, Ltd. | 4,600 | 6 | Constellation Software, Inc.(Þ) | 115 | 32 | |||||||
| First Pacific Co., Ltd. | 18,000 | 19 | Crescent Point Energy Corp. | 3,473 | 115 | |||||||
| Goldin Financial Holdings, Ltd.(Æ) | 20,000 | 16 | Dollarama, Inc. | 275 | 24 | |||||||
| Guoco Group, Ltd. | 569 | 7 | Eldorado Gold Corp. | 4,750 | 26 | |||||||
| HAL Trust | 228 | 35 | Emera, Inc. | 618 | 21 | |||||||
| Hiscox, Ltd. | 5,310 | 58 | Empire Co., Ltd. Class A | 1,075 | 74 | |||||||
| Hongkong Land Holdings, Ltd. | 10,000 | 70 | Enbridge, Inc. | 2,569 | 122 | |||||||
| Jardine Matheson Holdings, Ltd. | 2,000 | 119 | Encana Corp. | 2,317 | 43 | |||||||
| Jardine Strategic Holdings, Ltd. | 500 | 18 | Enerplus Corp. | 759 | 11 | |||||||
| Kerry Logistics Network, Ltd. | 4,000 | 7 | Ensign Energy Services, Inc. | 1,287 | 15 | |||||||
| Li & Fung, Ltd. | 16,000 | 19 | Fairfax Financial Holdings, Ltd. | 261 | 119 | |||||||
| Markit, Ltd.(Æ) | 497 | 13 | Finning International, Inc. | 931 | 24 | |||||||
| Noble Group, Ltd. | 20,000 | 19 | First Capital Realty, Inc. Class A | 1,537 | 25 | |||||||
| Orient Overseas International, Ltd. | 3,000 | 17 | First Quantum Minerals, Ltd.(Æ) | 2,295 | 35 | |||||||
| 519 | Fortis, Inc. | 2,246 | 73 | |||||||||
| Franco-Nevada Corp. Class T | 618 | 29 | ||||||||||
| Canada - 7.9% | Genworth MI Canada, Inc. | 793 | 28 | |||||||||
| Agnico Eagle Mines, Ltd.(Þ) | 689 | 16 | George Weston, Ltd. | 703 | 57 | |||||||
| Agrium, Inc. | 873 | 85 | Gibson Energy, Inc. | 790 | 23 | |||||||
| Aimia, Inc. | 405 | 6 | Gildan Activewear, Inc. Class A | 801 | 48 | |||||||
| Alimentation Couche-Tard, Inc. Class B | 2,464 | 84 | Goldcorp, Inc. | 5,479 | 103 | |||||||
| AltaGas, Ltd. - ADR | 598 | 25 | Great-West Lifeco, Inc.(Þ) | 4,244 | 119 | |||||||
| ARC Resources, Ltd. | 1,234 | 29 | H&R Real Estate Investment Trust(ö) | 838 | 17 | |||||||
| Atco, Ltd. Class I | 579 | 24 | Home Capital Group, Inc. Class B | 445 | 21 | |||||||
| Athabasca Oil Corp. | 1,761 | 6 | Husky Energy, Inc. | 3,172 | 77 | |||||||
| Bank of Montreal | 6,720 | 487 | IGM Financial, Inc. | 604 | 24 | |||||||
| Bank of Nova Scotia (The) | 9,640 | 591 | Imperial Oil, Ltd. | 1,025 | 49 | |||||||
| Barrick Gold Corp. | 6,684 | 79 | Industrial Alliance Insurance & | |||||||||
| Baytex Energy Corp. | 436 | 13 | Financial Services, Inc. | 1,104 | 44 | |||||||
| BCE, Inc. | 1,865 | 83 | Intact Financial Corp. | 779 | 52 | |||||||
| Bell Aliant, Inc.(Æ) | 1,172 | 33 | Inter Pipeline, Ltd. | 1,123 | 35 | |||||||
| BlackBerry, Ltd. - ADR(Æ) | 3,466 | 36 | Jean Coutu Group PJC, Inc. (The) Class | |||||||||
| Boardwalk Real Estate Investment | A | 362 | 8 | |||||||||
| Trust(ö) | 426 | 27 | Keyera Corp. | 429 | 34 | |||||||
| Bombardier, Inc. Class B | 2,567 | 8 | Kinross Gold Corp.(Æ) | 6,815 | 15 | |||||||
| Bonavista Energy Corp. | 1,009 | 9 | Linamar Corp. | 378 | 19 | |||||||
| Brookfield Asset Management, Inc. | Loblaw Cos., Ltd. | 2,186 | 114 | |||||||||
| Class A | 6,130 | 300 | Lundin Mining Corp.(Æ) | 4,167 | 19 | |||||||
| Brookfield Canada Office Pro REIT(Æ) | Magna International, Inc. Class A | 1,206 | 119 | |||||||||
| (ö) | 282 | 7 | Manitoba Telecom Services, Inc. - ADR | 237 | 6 | |||||||
| CAE, Inc. | 1,768 | 23 | Manulife Financial Corp. | 9,657 | 183 | |||||||
| Calloway Real Estate Investment Trust(ö) | 1,056 | 26 | MEG Energy Corp. Class A(Æ) | 546 | 13 | |||||||
| Cameco Corp. | 1,318 | 23 | Methanex Corp. | 141 | 8 | |||||||
| Canadian Imperial Bank of Commerce(Þ) | 2,755 | 252 | Metro, Inc. Class A | 1,037 | 73 | |||||||
| Canadian National Railway Co. | 3,008 | 212 | National Bank of Canada | 3,494 | 163 | |||||||
| Canadian Natural Resources, Ltd. | 5,096 | 178 | New Gold, Inc.(Æ) | 3,893 | 14 | |||||||
| Canadian Oil Sands, Ltd. | 3,289 | 52 | Onex Corp. | 480 | 27 | |||||||
| Canadian Pacific Railway, Ltd. | 651 | 135 | Open Text Corp. | 668 | 37 | |||||||
| Canadian Real Estate Investment | Osisko Gold Royalties, Ltd. | 490 | 6 | |||||||||
| Trust(ö) | 353 | 16 | Pacific Rubiales Energy Corp. | 2,146 | 32 | |||||||
| Canadian Tire Corp., Ltd. Class A | 1,273 | 140 | Paramount Resources, Ltd. Class A | 366 | 15 | |||||||
| Canadian Utilities, Ltd. Class A | 683 | 24 | Pembina Pipeline Corp. | 841 | 35 | |||||||
| CCL Industries, Inc. Class B | 80 | 8 | Pengrowth Energy Corp. | 4,913 | 20 | |||||||
| Cenovus Energy, Inc. | 1,930 | 48 | Penn West Petroleum, Ltd. | 3,719 | 17 | |||||||
| CGI Group, Inc. Class A(Æ) | 984 | 34 | Peyto Exploration & Development Corp. | 770 | 22 | |||||||
| See accompanying notes which are an integral part of the financial statements. | ||||||||||||
| 246 Select International Equity Fund | ||||||||||||
| Russell Investment Company | |||||||||
| Select International Equity Fund | |||||||||
| Schedule of Investments, continued — October 31, 2014 | |||||||||
| Amounts in thousands (except share amounts) | Amounts in thousands (except share amounts) | ||||||||
| Principal | Fair | Principal | Fair | ||||||
| Amount ($) | Value | Amount ($) | Value | ||||||
| or Shares | $ | or Shares | $ | ||||||
| Potash Corp. of Saskatchewan, Inc. | 1,907 | 65 | Novo Nordisk A/S Class B | 11,519 | 521 | ||||
| Power Corp. of Canada | 4,858 | 128 | Novozymes A/S Class B | 1,477 | 69 | ||||
| Power Financial Corp. | 3,485 | 102 | Pandora A/S | 542 | 46 | ||||
| Precision Drilling Corp. | 1,183 | 10 | Rockwool International A/S Class B | 77 | 11 | ||||
| Progressive Waste Solutions, Ltd.(Æ) | 286 | 8 | TDC A/S | 9,767 | 75 | ||||
| Quebecor, Inc. Class B | 295 | 8 | Topdanmark A/S(Æ) | 412 | 13 | ||||
| RioCan Real Estate Investment Trust(ö) | 2,268 | 53 | Tryg A/S | 98 | 11 | ||||
| Ritchie Bros Auctioneers, Inc. | 291 | 7 | Vestas Wind Systems A/S(Æ) | 1,259 | 42 | ||||
| Rogers Communications, Inc. Class B | 1,966 | 74 | William Demant Holding A/S(Æ) | 110 | 8 | ||||
| Royal Bank of Canada - GDR | 6,437 | 457 | 1,635 | ||||||
| Saputo, Inc. - ADR | 1,999 | 57 | |||||||
| Shaw Communications, Inc. Class B | 2,490 | 64 | Finland - 0.8% | ||||||
| ShawCor, Ltd. | 277 | 12 | Cargotec Oyj Class B | 610 | 18 | ||||
| Silver Wheaton Corp. | 1,030 | 18 | Elisa OYJ Class A | 1,015 | 28 | ||||
| SNC-Lavalin Group, Inc. | 483 | 21 | Fortum OYJ | 4,770 | 111 | ||||
| Sun Life Financial, Inc. | 4,650 | 165 | Kesko OYJ Class A | 340 | 12 | ||||
| Suncor Energy, Inc. | 14,283 | 507 | Kesko OYJ Class B | 1,010 | 38 | ||||
| Talisman Energy, Inc. | 6,714 | 43 | Kone OYJ Class B | 1,454 | 62 | ||||
| Teck Resources, Ltd. Class B | 3,242 | 51 | Metso OYJ | 975 | 32 | ||||
| TELUS Corp. | 1,435 | 51 | Neste Oil OYJ | 1,305 | 28 | ||||
| Tim Hortons, Inc. | 946 | 77 | Nokia OYJ | 20,059 | 167 | ||||
| TMX Group, Ltd. | 361 | 17 | Nokian Renkaat OYJ | 648 | 18 | ||||
| Toronto Dominion Bank | 10,769 | 531 | Orion OYJ Class A(Æ) | 194 | 7 | ||||
| Tourmaline Oil Corp.(Æ)(Þ) | 677 | 24 | Orion OYJ Class B | 650 | 22 | ||||
| TransAlta Corp. | 2,743 | 27 | Outokumpu OYJ(Æ) | 2,454 | 14 | ||||
| TransCanada Corp. | 6,062 | 299 | Sampo Oyj Class A | 4,340 | 209 | ||||
| Trican Well Service, Ltd. | 582 | 5 | Stora Enso OYJ Class R | 7,170 | 59 | ||||
| Turquoise Hill Resources, Ltd. Class B | 3,327 | 11 | UPM-Kymmene OYJ | 6,079 | 96 | ||||
| Valeant Pharmaceuticals International, | Wartsila OYJ Abp Class B | 653 | 30 | ||||||
| Inc.(Æ) | 1,534 | 204 | 951 | ||||||
| Veresen, Inc. | 1,515 | 24 | |||||||
| Vermilion Energy, Inc. | 396 | 22 | France - 9.1% | ||||||
| Accor SA | 1,249 | 52 | |||||||
| West Fraser Timber Co., Ltd. | 155 | 8 | Aeroports de Paris | 202 | 24 | ||||
| Whitecap Resources, Inc. | 947 | 12 | Air France-KLM(Æ) | 2,141 | 18 | ||||
| Yamana Gold, Inc. | 4,822 | 19 | Air Liquide SA Class A | 1,263 | 152 | ||||
| 8,840 | Alcatel-Lucent - ADR(Æ) | 17,939 | 55 | ||||||
| Cayman Islands - 0.1% | Alstom SA(Æ) | 2,493 | 87 | ||||||
| HK Electric Investments & HK Electric | Areva SA(Æ) | 452 | 6 | ||||||
| Investments, Ltd.(Þ) | 10,500 | 7 | Arkema SA | 152 | 9 | ||||
| Hopewell Highway Infrastructure, Ltd. | 275 | — | AtoS | 404 | 28 | ||||
| Melco Crown Entertainment, Ltd. | 2,100 | 19 | AXA SA | 17,647 | 408 | ||||
| MGM China Holdings, Ltd. | 2,000 | 6 | BioMerieux | 76 | 8 | ||||
| Sands China, Ltd. | 9,200 | 58 | BNP Paribas SA | 7,518 | 473 | ||||
| Wynn Macau, Ltd. | 6,400 | 23 | Bollore SA | 44 | 21 | ||||
| 113 | Bourbon | 295 | 8 | ||||||
| Bouygues SA - ADR | 2,775 | 96 | |||||||
| Denmark - 1.5% | Bureau Veritas SA | 1,449 | 36 | ||||||
| AP Moeller - Maersk A/S Class A | 45 | 102 | Capital Gemini SA | 1,703 | 112 | ||||
| AP Moeller - Maersk A/S Class B | 103 | 240 | Carrefour SA | 3,585 | 105 | ||||
| Carlsberg A/S Class B | 1,744 | 154 | Casino Guichard Perrachon SA(Æ) | 929 | 95 | ||||
| Christian Hansen Holding A/S | 194 | 8 | CGG SA(Æ) | 1,977 | 11 | ||||
| Coloplast A/S Class B | 717 | 62 | Christian Dior SA | 371 | 66 | ||||
| Danske Bank A/S | 5,928 | 163 | Cie de St.-Gobain | 4,542 | 195 | ||||
| DSV A/S | 877 | 26 | CNP Assurances | 1,791 | 33 | ||||
| FLSmidth & Co. A/S | 423 | 19 | Credit Agricole SA | 12,319 | 182 | ||||
| GN Store Nord A/S | 964 | 22 | Danone SA | 3,523 | 239 | ||||
| H Lundbeck A/S | 393 | 8 | Dassault Systemes SA | 807 | 51 | ||||
| ISS A/S | 220 | 6 | Edenred | 892 | 25 | ||||
| Jyske Bank A/S(Æ) | 538 | 29 | Eiffage SA | 630 | 33 | ||||
| See accompanying notes which are an integral part of the financial statements. | |||||||||
| Select International Equity Fund 247 | |||||||||
| Russell Investment Company | ||||||||||
| Select International Equity Fund | ||||||||||
| Schedule of Investments, continued — October 31, 2014 | ||||||||||
| Amounts in thousands (except share amounts) | Amounts in thousands (except share amounts) | |||||||||
| Principal | Fair | Principal | Fair | |||||||
| Amount ($) | Value | Amount ($) | Value | |||||||
| or Shares | $ | or Shares | $ | |||||||
| Electricite de France SA | 1,830 | 54 | Vallourec SA | 1,518 | 56 | |||||
| Eramet(Æ) | 173 | 16 | Veolia Environnement SA(Æ) | 4,466 | 75 | |||||
| Essilor International SA | 1,187 | 131 | Vicat | 371 | 25 | |||||
| Etablissements Maurel et Prom(Æ) | 484 | 6 | Vinci SA | 6,834 | 389 | |||||
| Euler Hermes Group | 115 | 11 | Vivendi SA - ADR(Æ) | 14,761 | 360 | |||||
| Eurazeo SA | 205 | 14 | Wendel SA | 273 | 30 | |||||
| Eutelsat Communications SA | 1,141 | 37 | Zodiac Aerospace | 771 | 24 | |||||
| Faurecia | 264 | 9 | 10,205 | |||||||
| Financiere de L'Odet | 21 | 22 | ||||||||
| Fonciere Des Regions(ö) | 620 | 57 | Germany - 6.4% | |||||||
| GDF Suez | 11,635 | 282 | adidas AG | 1,265 | 92 | |||||
| Gecina SA(ö) | 198 | 27 | Allianz SE | 4,231 | 672 | |||||
| Groupe Eurotunnel SA | 4,652 | 59 | Aurubis AG | 356 | 19 | |||||
| Havas SA | 1,581 | 13 | Axel Springer SE Class A | 164 | 9 | |||||
| Icad, Inc.(ö) | 231 | 18 | BASF SE | 3,523 | 310 | |||||
| Iliad SA | 169 | 37 | Bayer AG | 4,399 | 625 | |||||
| Imerys SA | 106 | 8 | Bayerische Motoren Werke AG | 3,252 | 348 | |||||
| Ingenico | 253 | 25 | Beiersdorf AG(Æ) | 652 | 53 | |||||
| Ipsen SA | 212 | 10 | Bilfinger SE | 588 | 38 | |||||
| JCDecaux SA | 392 | 13 | Brenntag AG | 758 | 37 | |||||
| Kering | 542 | 105 | Celesio AG | 504 | 17 | |||||
| Klepierre - GDR(ö) | 536 | 23 | Commerzbank AG(Æ) | 8,290 | 125 | |||||
| Korian-Medica Class B | 306 | 11 | Continental AG | 649 | 127 | |||||
| Lafarge SA | 1,463 | 101 | Daimler AG | 9,768 | 760 | |||||
| Legrand SA - ADR | 1,641 | 88 | Deutsche Annington Immobilien SE | 367 | 11 | |||||
| L'Oreal SA | 1,319 | 207 | Deutsche Bank AG | 9,056 | 282 | |||||
| LVMH Moet Hennessy Louis Vuitton | Deutsche Boerse AG | 821 | 56 | |||||||
| SA - ADR | 1,583 | 268 | Deutsche Lufthansa AG | 2,376 | 35 | |||||
| Mercialys SA(ö) | 375 | 8 | Deutsche Post AG | 3,893 | 122 | |||||
| Metropole Television SA | 388 | 7 | Deutsche Postbank AG | 191 | 9 | |||||
| Natixis SA | 10,254 | 71 | Deutsche Telekom AG | 23,350 | 352 | |||||
| Neopost SA | 342 | 24 | Deutsche Wohnen AG | 1,766 | 40 | |||||
| Numericable Group SA(Æ) | 128 | 5 | E.ON SE | 11,556 | 199 | |||||
| Orange SA - ADR | 24,458 | 391 | Evonik Industries AG | 188 | 6 | |||||
| Orpea | 248 | 15 | Fielmann AG | 174 | 11 | |||||
| Pernod Ricard SA | 2,517 | 286 | Fraport AG Frankfurt Airport Services | |||||||
| Peugeot SA(Æ) | 7,099 | 84 | Worldwide | 306 | 19 | |||||
| Plastic Omnium SA | 266 | 6 | Freenet AG | 1,406 | 37 | |||||
| Publicis Groupe SA - ADR | 1,053 | 73 | Fresenius Medical Care AG & Co. KGaA | 1,631 | 120 | |||||
| Remy Cointreau SA | 86 | 6 | Fresenius SE & Co. KGaA | 2,106 | 108 | |||||
| Renault SA | 2,561 | 190 | GEA Group AG | 1,024 | 47 | |||||
| Rexel SA Class H | 2,429 | 41 | Hannover Rueck SE | 887 | 74 | |||||
| Safran SA | 1,129 | 71 | HeidelbergCement AG | 1,230 | 84 | |||||
| Sanofi - ADR | 12,885 | 1,190 | Henkel AG & Co. KGaA | 687 | 62 | |||||
| Schneider Electric SE(Æ) | 2,099 | 165 | Hochtief AG | 120 | 9 | |||||
| SCOR SE - ADR | 3,144 | 96 | HUGO BOSS AG | 165 | 22 | |||||
| SEB SA | 299 | 24 | Infineon Technologies AG - ADR | 7,515 | 73 | |||||
| Societe BIC SA | 201 | 25 | K+S AG | 1,297 | 36 | |||||
| Societe Fonciere Lyonnaise SA(ö) | 464 | 22 | Kabel Deutschland Holding AG(Æ) | 64 | 9 | |||||
| Societe Generale SA | 6,334 | 305 | KION Group AG(Æ) | 248 | 9 | |||||
| Societe Television Francaise 1 | 1,471 | 22 | Lanxess AG | 695 | 36 | |||||
| Sodexo | 613 | 59 | LEG Immobilien AG | 295 | 20 | |||||
| Suez Environnement Co. | 3,532 | 59 | Linde AG | 826 | 152 | |||||
| Technip SA | 351 | 25 | MAN SE | 247 | 28 | |||||
| Teleperformance - GDR | 213 | 13 | Merck KGaA | 724 | 65 | |||||
| Thales SA | 523 | 26 | Metro AG(Æ) | 1,419 | 45 | |||||
| Total SA | 23,189 | 1,379 | MTU Aero Engines AG | 306 | 27 | |||||
| Unibail-Rodamco SE(ö) | 871 | 223 | Muenchener Rueckversicherungs- | |||||||
| Valeo SA | 494 | 55 | Gesellschaft AG | 2,154 | 423 | |||||
| See accompanying notes which are an integral part of the financial statements. | ||||||||||
| 248 Select International Equity Fund | ||||||||||
Russell Investment Company Select International Equity Fund
Schedule of Investments, continued — October 31, 2014
| Amounts in thousands (except share amounts) | Amounts in thousands (except share amounts) | |||||||||
| Principal | Fair | Principal | Fair | |||||||
| Amount ($) | Value | Amount ($) | Value | |||||||
| or Shares | $ | or Shares | $ | |||||||
| OSRAM Licht AG(Æ) | 514 | 18 | Wharf Holdings, Ltd. (The) | 9,000 | 66 | |||||
| ProSiebenSat.1 Media AG | 903 | 36 | Wheelock & Co., Ltd. | 5,000 | 24 | |||||
| Puma SE | 27 | 6 | 1,674 | |||||||
| Rheinmetall AG | 415 | 18 | ||||||||
| Rhoen Klinikum AG | 1,627 | 48 | Ireland - 0.5% | |||||||
| RWE AG | 2,786 | 99 | Bank of Ireland(Æ) | 208,153 | 82 | |||||
| Salzgitter AG | 475 | 14 | CRH PLC | 5,997 | 134 | |||||
| SAP SE - ADR | 4,654 | 316 | DCC PLC | 485 | 27 | |||||
| Siemens AG | 3,927 | 442 | Glanbia PLC | 1,309 | 18 | |||||
| Sky Deutschland AG(Æ) | 2,399 | 20 | ICON PLC(Æ) | 334 | 18 | |||||
| Software AG | 279 | 7 | James Hardie Industries PLC | 2,470 | 26 | |||||
| Stada Arzneimittel AG | 168 | 6 | Kerry Group PLC Class A | 979 | 66 | |||||
| Suedzucker AG | 1,025 | 14 | Paddy Power PLC | 173 | 13 | |||||
| Symrise AG | 711 | 40 | Seagate Technology PLC | 1,385 | 87 | |||||
| Talanx AG | 517 | 17 | Smurfit Kappa Group PLC | 1,993 | 41 | |||||
| Telefonica Deutschland Holdings | 3,978 | 20 | Weatherford International PLC(Æ) | 3,365 | 55 | |||||
| ThyssenKrupp AG - ADR | 2,376 | 57 | Willis Group Holdings PLC | 921 | 37 | |||||
| TUI AG | 782 | 12 | 604 | |||||||
| United Internet AG | 745 | 29 | Isle of Man - 0.0% | |||||||
| Volkswagen AG | 187 | 40 | Genting Singapore PLC | 7,000 | 6 | |||||
| Wacker Chemie AG | 105 | 13 | Playtech PLC | 941 | 11 | |||||
| Wirecard AG | 963 | 34 | 17 | |||||||
| 7,166 | ||||||||||
| Israel - 0.5% | ||||||||||
| Guernsey - 0.1% | Azrieli Group | 749 | 24 | |||||||
| Friends Life Group, Ltd. | 13,517 | 70 | Bank Hapoalim BM | 12,376 | 63 | |||||
| Hong Kong - 1.5% | Bank Leumi Le-Israel BM(Æ) | 9,912 | 35 | |||||||
| AIA Group, Ltd. | 7,800 | 44 | Bezeq The Israeli Telecommunication | |||||||
| Bank of East Asia, Ltd. | 9,800 | 41 | Corp., Ltd. | 13,380 | 23 | |||||
| Cathay Pacific Airways, Ltd. | 10,000 | 19 | Check Point Software Technologies, Ltd. | |||||||
| Champion REIT(Æ)(ö) | 27,000 | 12 | (Æ) | 494 | 37 | |||||
| Cheung Kong Holdings, Ltd. | 14,000 | 248 | Delek Group, Ltd. | 18 | 6 | |||||
| CLP Holdings, Ltd. | 3,000 | 26 | Israel Chemicals, Ltd. | 1,041 | 7 | |||||
| Galaxy Entertainment Group, Ltd. | 9,000 | 61 | Mizrahi Tefahot Bank, Ltd.(Æ) | 2,125 | 23 | |||||
| Hang Lung Group, Ltd. | 6,000 | 30 | NICE-Systems, Ltd. | 356 | 14 | |||||
| Hang Lung Properties, Ltd. - ADR | 15,000 | 47 | Taro Pharmaceutical Industries, Ltd.(Æ) | 49 | 8 | |||||
| Hang Seng Bank, Ltd. | 4,100 | 69 | Teva Pharmaceutical Industries, Ltd. | 5,796 | 320 | |||||
| Henderson Land Development Co., Ltd. | 9,000 | 61 | 560 | |||||||
| Hong Kong Exchanges and Clearing, | Italy - 2.5% | |||||||||
| Ltd. | 2,000 | 44 | A2A SpA | 21,381 | 21 | |||||
| Hongkong & Shanghai Hotels (The) | 6,000 | 10 | Assicurazioni Generali SpA | 11,861 | 244 | |||||
| Hopewell Holdings, Ltd. | 5,500 | 20 | Atlantia SpA | 2,940 | 69 | |||||
| Hutchison Whampoa, Ltd. | 15,000 | 190 | Autogrill SpA(Æ) | 815 | 6 | |||||
| Hysan Development Co., Ltd. | 7,000 | 32 | Azimut Holding SpA | 369 | 9 | |||||
| Johnson Electric Holdings, Ltd.(Æ) | 2,625 | 9 | Banca Monte dei Paschi di Siena SpA | 25,563 | 19 | |||||
| Link Real Estate Investment Trust (The) | Banca Popolare dell'Emilia Romagna | |||||||||
| (ö) | 26,500 | 156 | SC(Æ) | 4,843 | 37 | |||||
| Melco International Development, Ltd. | 4,000 | 11 | Banca Popolare di Milano Scarl(Æ) | 49,957 | 37 | |||||
| MTR Corp., Ltd. | 10,500 | 43 | Banco Popolare SC(Æ) | 3,385 | 49 | |||||
| New World Development Co., Ltd. | 20,000 | 25 | Buzzi Unicem SpA | 572 | 8 | |||||
| PCCW, Ltd. | 16,000 | 10 | Credito Emiliano SpA | 1,030 | 8 | |||||
| Power Assets Holdings, Ltd. | 5,500 | 53 | Davide Campari-Milano SpA | 1,476 | 11 | |||||
| Sino Land Co., Ltd. | 18,000 | 30 | De Longhi SPA(Æ) | 332 | 6 | |||||
| SJM Holdings, Ltd. | 3,000 | 6 | Enel Green Power SpA | 6,142 | 15 | |||||
| Sun Hung Kai Properties, Ltd. | 8,000 | 119 | Enel SpA | 44,662 | 229 | |||||
| Swire Pacific, Ltd. Class B | 10,000 | 24 | ENI SpA - ADR | 27,503 | 587 | |||||
| Swire Pacific, Ltd. Class A | 7,000 | 92 | Exor SpA | 674 | 29 | |||||
| Swire Properties, Ltd. | 9,000 | 29 | Finmeccanica SpA(Æ) | 3,898 | 35 | |||||
| Techtronic Industries Co., Ltd. | 7,500 | 23 | ||||||||
| See accompanying notes which are an integral part of the financial statements. | ||||||||||
| Select International Equity Fund 249 | ||||||||||
Russell Investment Company Select International Equity Fund
Schedule of Investments, continued — October 31, 2014
| Amounts in thousands (except share amounts) | Amounts in thousands (except share amounts) | ||||||||||
| Principal | Fair | Principal | Fair | ||||||||
| Amount ($) | Value | Amount ($) | Value | ||||||||
| or Shares | $ | or Shares | $ | ||||||||
| Fondiaria-Sai SpA(Æ) | 3,526 | 9 | Chiba Bank, Ltd. (The) | 7,000 | 49 | ||||||
| GTECH SpA | 580 | 13 | Chiyoda Corp. | 1,000 | 10 | ||||||
| Hera SpA | 10,661 | 28 | Chubu Electric Power Co., Inc. | 2,900 | 34 | ||||||
| Intesa Sanpaolo SpA | 123,373 | 359 | Chugai Pharmaceutical Co., Ltd. | 1,200 | 36 | ||||||
| Luxottica Group SpA | 772 | 39 | Chugoku Bank, Ltd. (The) | 1,600 | 23 | ||||||
| Mediaset SpA(Æ) | 4,253 | 14 | Chugoku Electric Power Co., Inc. (The) | 1,300 | 17 | ||||||
| Mediobanca SpA | 3,452 | 30 | Citizen Holdings Co., Ltd. | 2,300 | 15 | ||||||
| Mediolanum SpA | 913 | 6 | Credit Saison Co., Ltd. | 1,300 | 27 | ||||||
| Moncler SpA | 462 | 6 | Dai Nippon Printing Co., Ltd. | 6,000 | 58 | ||||||
| Parmalat SpA | 10,348 | 31 | Daicel Chemical Industries, Ltd. | 2,000 | 23 | ||||||
| Pirelli & C. SpA - ADR | 1,497 | 20 | Daido Steel Co., Ltd. | 3,000 | 11 | ||||||
| Prada SpA | 2,900 | 18 | Daihatsu Motor Co., Ltd. | 1,800 | 25 | ||||||
| Prysmian SpA | 518 | 9 | Dai-ichi Life Insurance Co., Ltd. (The) | 3,700 | 54 | ||||||
| Recordati SpA | 440 | 8 | Daiichi Sankyo Co., Ltd. | 4,800 | 71 | ||||||
| Saipem SpA - ADR(Æ) | 2,517 | 39 | Daikin Industries, Ltd. | 1,100 | 67 | ||||||
| Salvatore Ferragamo SpA | 347 | 8 | Daito Trust Construction Co., Ltd. | 500 | 62 | ||||||
| Snam Rete Gas SpA | 10,349 | 56 | Daiwa House Industry Co., Ltd. | 3,000 | 56 | ||||||
| Telecom Italia SpA(Æ) | 137,809 | 156 | Daiwa Securities Group, Inc. | 7,000 | 54 | ||||||
| Telecom Italia SpA | 47,343 | 42 | Dena Co., Ltd. | 500 | 6 | ||||||
| Terna Rete Elettrica Nazionale SpA | 4,818 | 24 | Denso Corp. | 2,800 | 125 | ||||||
| Tod's SpA | 64 | 6 | Dentsu, Inc. | 1,500 | 54 | ||||||
| UniCredit SpA | 39,135 | 283 | Disco Corp. | 100 | 7 | ||||||
| Unione di Banche Italiane SCpA | 9,993 | 78 | Don Quijote Holdings Co., Ltd. | 400 | 23 | ||||||
| Unipol Gruppo Finanziario SpA | 3,178 | 15 | East Japan Railway Co. | 2,000 | 154 | ||||||
| UnipolSai SpA | 9,505 | 25 | Eisai Co., Ltd. | 1,600 | 61 | ||||||
| World Duty Free SpA(Æ) | 599 | 5 | Electric Power Development Co., Ltd. | 900 | 31 | ||||||
| 2,746 | FamilyMart Co., Ltd. | 800 | 32 | ||||||||
| FANUC Corp. | 700 | 119 | |||||||||
| Japan - 16.3% | Fast Retailing Co., Ltd. | 200 | 72 | ||||||||
| ABC-Mart, Inc. | 200 | 11 | Fuji Electric Co., Ltd. | 4,000 | 17 | ||||||
| Acom Co., Ltd.(Æ) | 2,900 | 9 | Fuji Heavy Industries, Ltd. | 2,500 | 80 | ||||||
| Advance Residence Investment Corp.(ö) | 13 | 30 | FUJIFILM Holdings Corp. | 3,400 | 112 | ||||||
| Advantest Corp. | 600 | 7 | Fujitsu, Ltd. | 12,000 | 71 | ||||||
| Aeon Co., Ltd. | 7,200 | 70 | Fukuoka Financial Group, Inc. | 8,000 | 40 | ||||||
| AEON Financial Service Co., Ltd. | 300 | 6 | GS Yuasa Corp. | 3,000 | 15 | ||||||
| Aeon Mall Co., Ltd. | 300 | 5 | GungHo Online Entertainment, Inc. | 1,500 | 6 | ||||||
| Air Water, Inc. | 2,000 | 31 | Gunma Bank, Ltd. | 5,000 | 31 | ||||||
| Aisin Seiki Co., Ltd. | 1,900 | 62 | Hachijuni Bank, Ltd. (The) | 3,000 | 18 | ||||||
| Ajinomoto Co., Inc. | 6,000 | 112 | Hakuhodo DY Holdings, Inc. | 2,600 | 25 | ||||||
| Alfresa Holdings Corp. | 2,400 | 30 | Hamamatsu Photonics KK | 600 | 27 | ||||||
| Amada Co., Ltd. | 2,900 | 25 | Hankyu Hanshin Holdings, Inc. | 7,000 | 41 | ||||||
| ANA Holdings, Inc. | 14,000 | 32 | Hikari Tsushin, Inc. | 100 | 7 | ||||||
| Aozora Bank, Ltd. | 12,000 | 42 | Hino Motors, Ltd. | 700 | 10 | ||||||
| Asahi Glass Co., Ltd. | 8,000 | 41 | Hirose Electric Co., Ltd. | 400 | 48 | ||||||
| Asahi Group Holdings, Ltd. | 4,200 | 128 | Hiroshima Bank, Ltd. (The) | 4,000 | 20 | ||||||
| Asahi Kasei Corp. | 15,000 | 120 | Hisamitsu Pharmaceutical Co., Inc. | 600 | 20 | ||||||
| Asics Corp. | 1,200 | 28 | Hitachi Capital Corp. | 300 | 7 | ||||||
| Astellas Pharma, Inc. | 9,700 | 147 | Hitachi Chemical Co., Ltd. | 1,200 | 21 | ||||||
| Bandai Namco Holdings, Inc. | 1,200 | 29 | Hitachi Construction Machinery Co., | ||||||||
| Bank of Kyoto, Ltd. (The) | 3,000 | 25 | Ltd. | 1,000 | 20 | ||||||
| Bank of Yokohama, Ltd. (The) | 10,000 | 57 | Hitachi High-Technologies Corp. | 700 | 21 | ||||||
| Benesse Holdings, Inc. | 1,000 | 31 | Hitachi Metals, Ltd. | 1,000 | 16 | ||||||
| Bridgestone Corp. | 4,200 | 137 | Hitachi, Ltd. | 33,000 | 252 | ||||||
| Brother Industries, Ltd. | 1,800 | 31 | Hokuhoku Financial Group, Inc. | 12,000 | 24 | ||||||
| Calbee, Inc. | 900 | 31 | Hokuriku Electric Power Co. | 800 | 11 | ||||||
| Canon, Inc. | 10,300 | 311 | Honda Motor Co., Ltd. | 11,800 | 364 | ||||||
| Casio Computer Co., Ltd. | 1,700 | 26 | Hoshizaki Electric Co., Ltd. | 500 | 24 | ||||||
| Central Japan Railway Co. | 900 | 132 | Hoya Corp. | 2,300 | 80 | ||||||
| Century Tokyo Leasing Corp. | 600 | 15 | Hulic Co., Ltd. | 700 | 8 | ||||||
See accompanying notes which are an integral part of the financial statements.
250 Select International Equity Fund
| Russell Investment Company | ||||||||||
| Select International Equity Fund | ||||||||||
| Schedule of Investments, continued — October 31, 2014 | ||||||||||
| Amounts in thousands (except share amounts) | Amounts in thousands (except share amounts) | |||||||||
| Principal | Fair | Principal | Fair | |||||||
| Amount ($) | Value | Amount ($) | Value | |||||||
| or Shares | $ | or Shares | $ | |||||||
| Ibiden Co., Ltd. | 1,400 | 20 | Mazda Motor Corp. | 2,500 | 57 | |||||
| Idemitsu Kosan Co., Ltd. | 1,200 | 23 | McDonald's Holdings Co. Japan, Ltd. | 500 | 12 | |||||
| IHI Corp. | 5,000 | 23 | Medipal Holdings Corp. | 2,000 | 22 | |||||
| Iida Group Holdings(Æ) | 500 | 5 | MEIJI Holdings Co., Ltd. | 400 | 33 | |||||
| Inpex Corp. | 10,300 | 129 | Minebea Co., Ltd. | 2,000 | 26 | |||||
| Isetan Mitsukoshi Holdings, Ltd. | 3,000 | 40 | Mitsubishi Chemical Holdings Corp. | 10,200 | 50 | |||||
| Isuzu Motors, Ltd. | 3,000 | 38 | Mitsubishi Corp. | 14,900 | 287 | |||||
| ITOCHU Corp. | 11,000 | 131 | Mitsubishi Electric Corp. | 9,000 | 112 | |||||
| Itochu Techno-Solutions Corp. | 200 | 8 | Mitsubishi Estate Co., Ltd. | 3,000 | 75 | |||||
| Iyo Bank, Ltd. (The) | 2,200 | 23 | Mitsubishi Gas Chemical Co., Inc. | 2,000 | 12 | |||||
| J Front Retailing Co., Ltd. | 1,500 | 19 | Mitsubishi Heavy Industries, Ltd. | 13,000 | 79 | |||||
| Japan Display, Inc.(Æ) | 1,300 | 4 | Mitsubishi Logistics Corp. | 1,000 | 15 | |||||
| Japan Exchange Group, Inc. | 1,000 | 24 | Mitsubishi Materials Corp. | 9,000 | 27 | |||||
| Japan Petroleum Exploration Co. | 200 | 6 | Mitsubishi Motors Corp. | 3,600 | 36 | |||||
| Japan Real Estate Investment Corp.(ö) | 9 | 49 | Mitsubishi Tanabe Pharma Corp. | 3,100 | 46 | |||||
| Japan Retail Fund Investment Corp.(ö) | 16 | 32 | Mitsubishi UFJ Financial Group, Inc. | 72,400 | 406 | |||||
| Japan Tobacco, Inc. | 7,300 | 245 | Mitsubishi UFJ Lease & Finance Co., | |||||||
| JFE Holdings, Inc. | 2,800 | 54 | Ltd. | 4,000 | 20 | |||||
| JGC Corp. | 1,000 | 25 | Mitsui & Co., Ltd. | 13,600 | 202 | |||||
| Joyo Bank, Ltd. (The) | 7,000 | 37 | Mitsui Chemicals, Inc. | 8,000 | 23 | |||||
| JSR Corp. | 600 | 11 | Mitsui Fudosan Co., Ltd. | 2,000 | 62 | |||||
| JTEKT Corp. | 1,100 | 17 | Mitsui OSK Lines, Ltd. | 8,000 | 25 | |||||
| JX Holdings, Inc. | 21,100 | 89 | Mizuho Financial Group, Inc. | 137,400 | 245 | |||||
| Kajima Corp. | 11,000 | 48 | MS&AD Insurance Group Holdings, Inc. | 3,300 | 69 | |||||
| Kakaku.com, Inc. | 1,200 | 16 | Murata Manufacturing Co., Ltd. | 800 | 87 | |||||
| Kamigumi Co., Ltd. | 4,000 | 38 | Nabtesco Corp. | 300 | 7 | |||||
| Kaneka Corp. | 4,000 | 22 | Nagoya Railroad Co., Ltd. | 10,000 | 42 | |||||
| Kansai Electric Power Co., Inc. (The) | 3,300 | 32 | Nankai Electric Railway Co., Ltd. | 5,000 | 23 | |||||
| Kansai Paint Co., Ltd. | 2,000 | 30 | NEC Corp. | 19,000 | 65 | |||||
| Kao Corp. | 3,700 | 142 | Nexon Co., Ltd. | 1,400 | 12 | |||||
| Kawasaki Heavy Industries, Ltd. | 9,000 | 34 | NGK Insulators, Ltd. | 1,000 | 21 | |||||
| KDDI Corp. | 4,000 | 257 | NGK Spark Plug Co., Ltd. | 1,000 | 26 | |||||
| Keihan Electric Railway Co., Ltd. | 4,000 | 19 | NH Foods, Ltd. | 1,000 | 23 | |||||
| Keikyu Corp. | 3,000 | 25 | NHK Spring Co., Ltd. | 2,300 | 21 | |||||
| Keio Corp. | 4,000 | 30 | Nidec Corp. | 900 | 58 | |||||
| Keisei Electric Railway Co., Ltd. | 2,000 | 23 | Nikon Corp. | 3,100 | 41 | |||||
| Keyence Corp. | 200 | 93 | Nintendo Co., Ltd. | 600 | 64 | |||||
| Kikkoman Corp. | 2,000 | 45 | Nippon Building Fund, Inc.(ö) | 8 | 44 | |||||
| Kintetsu Corp. | 10,000 | 34 | Nippon Electric Glass Co., Ltd. | 3,000 | 14 | |||||
| Kirin Holdings Co., Ltd. | 5,100 | 65 | Nippon Express Co., Ltd. | 9,000 | 39 | |||||
| Kobayashi Pharmaceutical Co., Ltd. | 400 | 24 | Nippon Paint Holdings Co., Ltd. | 1,000 | 22 | |||||
| Kobe Steel, Ltd. | 23,000 | 36 | Nippon Prologis REIT, Inc.(ö) | 10 | 23 | |||||
| Koito Manufacturing Co., Ltd. | 900 | 26 | Nippon Shokubai Co., Ltd. | 2,000 | 24 | |||||
| Komatsu, Ltd. | 3,800 | 88 | Nippon Steel & Sumitomo Metal Corp. | 37,000 | 96 | |||||
| Konami Corp. | 500 | 10 | Nippon Telegraph & Telephone Corp. | 5,600 | 344 | |||||
| Konica Minolta, Inc. | 4,800 | 52 | Nippon Yusen KK | 12,000 | 31 | |||||
| Kubota Corp. | 4,000 | 62 | Nissan Motor Co., Ltd. | 18,000 | 160 | |||||
| Kuraray Co., Ltd. | 4,100 | 47 | Nisshin Seifun Group, Inc. | 3,800 | 38 | |||||
| Kurita Water Industries, Ltd. | 1,000 | 21 | Nissin Foods Holdings Co., Ltd. | 1,100 | 57 | |||||
| Kyocera Corp. | 3,000 | 135 | Nitori Holdings Co., Ltd. | 800 | 50 | |||||
| Kyowa Hakko Kirin Co., Ltd. | 3,000 | 34 | Nitto Denko Corp. | 600 | 32 | |||||
| Kyushu Electric Power Co., Inc. | 1,100 | 12 | NOK Corp. | 1,100 | 27 | |||||
| Lawson, Inc. | 600 | 40 | Nomura Holdings, Inc. | 15,300 | 92 | |||||
| LIXIL Group Corp. | 1,400 | 30 | Nomura Real Estate Holdings, Inc. | 1,200 | 21 | |||||
| M3, Inc. | 1,300 | 21 | Nomura Research Institute, Ltd. | 400 | 13 | |||||
| Mabuchi Motor Co., Ltd. | 200 | 17 | NSK, Ltd. | 2,000 | 25 | |||||
| Makita Corp. | 600 | 33 | NTT Data Corp. | 800 | 30 | |||||
| Marubeni Corp. | 16,500 | 104 | NTT DOCOMO, Inc. | 15,200 | 252 | |||||
| Marui Group Co., Ltd. | 3,300 | 27 | NTT Urban Development Corp. | 800 | 9 | |||||
| See accompanying notes which are an integral part of the financial statements. | ||||||||||
| Select International Equity Fund 251 | ||||||||||
Russell Investment Company Select International Equity Fund
Schedule of Investments, continued — October 31, 2014
| Amounts in thousands (except share amounts) | Amounts in thousands (except share amounts) | |||||||||
| Principal | Fair | Principal | Fair | |||||||
| Amount ($) | Value | Amount ($) | Value | |||||||
| or Shares | $ | or Shares | $ | |||||||
| Obayashi Corp. | 4,000 | 27 | Sumitomo Mitsui Financial Group, Inc. | 7,100 | 278 | |||||
| Obic Co., Ltd. | 700 | 24 | Sumitomo Mitsui Trust Holdings, Inc. | 22,000 | 87 | |||||
| Odakyu Electric Railway Co., Ltd. | 3,000 | 28 | Sumitomo Realty & Development Co., | |||||||
| Oji Holdings Corp. | 7,000 | 25 | Ltd. | 1,000 | 36 | |||||
| Olympus Corp.(Æ) | 900 | 31 | Sumitomo Rubber Industries, Ltd. | 1,800 | 24 | |||||
| Omron Corp. | 900 | 42 | Suntory Beverage & Food, Ltd. | 1,100 | 39 | |||||
| Ono Pharmaceutical Co., Ltd. | 600 | 60 | Suruga Bank Ltd. | 1,000 | 20 | |||||
| Oracle Corp. Japan | 500 | 19 | Suzuken Co., Ltd. | 800 | 21 | |||||
| Oriental Land Co., Ltd. | 500 | 106 | Suzuki Motor Corp. | 2,500 | 81 | |||||
| ORIX Corp. | 5,500 | 74 | Sysmex Corp. | 1,200 | 50 | |||||
| Osaka Gas Co., Ltd. | 21,000 | 82 | T&D Holdings, Inc. | 2,500 | 31 | |||||
| Otsuka Corp. | 500 | 18 | Taiheiyo Cement Corp. | 7,000 | 25 | |||||
| Otsuka Holdings Co., Ltd. | 2,800 | 97 | Taisei Corp. | 7,000 | 38 | |||||
| Panasonic Corp. | 12,700 | 148 | Taisho Pharmaceutical Holdings Co., | |||||||
| Park24 Co., Ltd. | 500 | 7 | Ltd. | 200 | 14 | |||||
| Rakuten, Inc. | 3,100 | 34 | Taiyo Nippon Sanso Corp. | 2,000 | 18 | |||||
| Renesas Electronics Corp.(Æ) | 900 | 7 | Takashimaya Co., Ltd. | 3,000 | 25 | |||||
| Resona Holdings, Inc. | 17,500 | 98 | Takeda Pharmaceutical Co., Ltd. | 7,100 | 304 | |||||
| Ricoh Co., Ltd. | 6,000 | 61 | TDK Corp. | 800 | 44 | |||||
| Rinnai Corp. | 300 | 26 | Teijin, Ltd. | 7,000 | 17 | |||||
| Rohm Co., Ltd. | 700 | 42 | Terumo Corp. | 1,200 | 29 | |||||
| Sankyo Co., Ltd. | 800 | 29 | THK Co., Ltd. | 500 | 12 | |||||
| Sanrio Co., Ltd. | 200 | 6 | Tobu Railway Co., Ltd. | 7,000 | 35 | |||||
| Santen Pharmaceutical Co., Ltd. | 500 | 29 | Toho Co., Ltd. | 1,300 | 29 | |||||
| SBI Holdings, Inc. | 1,100 | 12 | Toho Gas Co., Ltd. | 3,000 | 16 | |||||
| Secom Co., Ltd. | 2,300 | 138 | Tohoku Electric Power Co., Inc. | 900 | 11 | |||||
| Sega Sammy Holdings, Inc. | 1,300 | 20 | Tokio Marine Holdings, Inc. | 3,200 | 100 | |||||
| Seibu Holdings, Inc. | 1,100 | 21 | Tokyo Broadcasting System Holdings, | |||||||
| Seiko Epson Corp. | 1,100 | 50 | Inc. | 700 | 8 | |||||
| Sekisui Chemical Co., Ltd. | 4,000 | 48 | Tokyo Electric Power Co., Inc.(Æ) | 7,700 | 27 | |||||
| Sekisui House, Ltd. | 5,200 | 63 | Tokyo Electron, Ltd. | 1,100 | 68 | |||||
| Seven & I Holdings Co., Ltd. | 7,400 | 282 | Tokyo Gas Co., Ltd. | 17,000 | 96 | |||||
| Seven Bank, Ltd. | 2,400 | 10 | Tokyo Tatemono Co., Ltd. | 2,000 | 17 | |||||
| Sharp Corp. | 4,000 | 10 | Tokyu Corp. | 6,000 | 39 | |||||
| Shikoku Electric Power Co., Inc. | 700 | 9 | Tokyu Fudosan Holdings Corp. | 1,600 | 11 | |||||
| Shimadzu Corp. | 1,000 | 9 | TonenGeneral Sekiyu KK | 3,000 | 26 | |||||
| Shimamura Co., Ltd. | 300 | 26 | Toppan Printing Co., Ltd. | 7,000 | 47 | |||||
| Shimano, Inc. | 600 | 78 | Toray Industries, Inc. | 10,000 | 66 | |||||
| Shimizu Corp. | 5,000 | 36 | Toshiba Corp. | 18,000 | 77 | |||||
| Shin-Etsu Chemical Co., Ltd. | 2,700 | 169 | TOTO, Ltd. | 1,000 | 11 | |||||
| Shinsei Bank, Ltd. | 6,000 | 13 | Toyo Seikan Group Holdings, Ltd. | 1,000 | 12 | |||||
| Shionogi & Co., Ltd. | 1,800 | 46 | Toyo Suisan Kaisha, Ltd. | 1,300 | 44 | |||||
| Shiseido Co., Ltd. | 3,500 | 57 | Toyoda Gosei Co., Ltd. | 900 | 17 | |||||
| Shizuoka Bank, Ltd. (The) | 4,000 | 40 | Toyota Boshoku Corp. | 1,500 | 17 | |||||
| Showa Shell Sekiyu KK | 2,000 | 17 | Toyota Industries Corp. | 1,100 | 51 | |||||
| SMC Corp. | 400 | 111 | Toyota Motor Corp. | 17,700 | 1,023 | |||||
| SoftBank Corp. | 4,500 | 318 | Toyota Tsusho Corp. | 1,900 | 47 | |||||
| Sojitz Corp. | 14,800 | 22 | Trend Micro, Inc. | 400 | 13 | |||||
| Sompo Japan Nipponkoa Holdings, Inc. | 1,900 | 46 | Unicharm Corp. | 2,500 | 57 | |||||
| Sony Corp. | 8,300 | 153 | United Urban Investment Corp.(ö) | 22 | 34 | |||||
| Sony Financial Holdings, Inc. | 400 | 6 | USS Co., Ltd. | 2,300 | 36 | |||||
| Stanley Electric Co., Ltd. | 1,300 | 26 | West Japan Railway Co. | 2,000 | 94 | |||||
| Sumco Corp. | 1,100 | 14 | Yahoo! Japan Corp. | 6,600 | 23 | |||||
| Sumitomo Chemical Co., Ltd. | 10,000 | 34 | Yakult Honsha Co., Ltd. | 700 | 38 | |||||
| Sumitomo Corp. | 13,000 | 136 | Yamada Denki Co., Ltd. | 7,000 | 22 | |||||
| Sumitomo Dainippon Pharma Co., Ltd. | 900 | 10 | Yamaguchi Financial Group, Inc. | 2,000 | 19 | |||||
| Sumitomo Electric Industries, Ltd. | 6,500 | 86 | Yamaha Corp. | 1,500 | 20 | |||||
| Sumitomo Heavy Industries, Ltd. | 5,000 | 27 | Yamaha Motor Co., Ltd. | 1,900 | 35 | |||||
| Sumitomo Metal Mining Co., Ltd. | 5,000 | 67 | Yamato Holdings Co., Ltd. | 2,800 | 59 | |||||
See accompanying notes which are an integral part of the financial statements.
252 Select International Equity Fund
Russell Investment Company Select International Equity Fund
Schedule of Investments, continued — October 31, 2014
| Amounts in thousands (except share amounts) | Amounts in thousands (except share amounts) | |||||||||
| Principal | Fair | Principal | Fair | |||||||
| Amount ($) | Value | Amount ($) | Value | |||||||
| or Shares | $ | or Shares | $ | |||||||
| Yamazaki Baking Co., Ltd. | 2,000 | 24 | Mobileye NV(Æ) | 255 | 13 | |||||
| Yaskawa Electric Corp. | 700 | 9 | NN Group NV(Æ) | 573 | 16 | |||||
| Yokogawa Electric Corp. | 700 | 9 | Nutreco NV | 889 | 45 | |||||
| Yokohama Rubber Co., Ltd. (The) | 2,000 | 18 | NXP Semiconductor NV(Æ) | 1,516 | 104 | |||||
| 18,199 | OCI NV(Æ) | 185 | 6 | |||||||
| Randstad Holding NV(Æ) | 499 | 22 | ||||||||
| Jersey - 0.7% | Reed Elsevier NV(Æ) | 5,023 | 116 | |||||||
| Delphi Automotive PLC | 2,116 | 146 | SBM Offshore NV(Æ) | 1,688 | 21 | |||||
| Experian PLC | 4,364 | 66 | Sensata Technologies Holding NV(Æ) | 711 | 35 | |||||
| Genel Energy PLC(Æ) | 609 | 7 | STMicroelectronics NV | 3,594 | 24 | |||||
| Glencore PLC | 53,156 | 271 | TNT Express NV | 3,087 | 18 | |||||
| Henderson Group PLC | 6,878 | 23 | Unilever NV | 9,174 | 355 | |||||
| Petrofac, Ltd. | 984 | 17 | Wolters Kluwer NV | 3,427 | 91 | |||||
| Polyus Gold International, Ltd.(Æ) | 3,409 | 10 | X5 Retail Group NV - GDR(Æ) | 1,179 | 22 | |||||
| Randgold Resources, Ltd. | 276 | 16 | Yandex NV Class A(Æ) | 911 | 26 | |||||
| United Business Media, Ltd. | 2,199 | 20 | Ziggo NV(Æ) | 896 | 44 | |||||
| Wolseley PLC - ADR | 935 | 50 | 2,747 | |||||||
| WPP PLC | 9,853 | 192 | ||||||||
| 818 | New Zealand - 0.2% | |||||||||
| Auckland International Airport, Ltd.(Æ) | 7,636 | 23 | ||||||||
| Luxembourg - 0.4% | Contact Energy, Ltd. | 5,915 | 29 | |||||||
| Altice SA | 337 | 21 | Fletcher Building, Ltd. | 4,950 | 33 | |||||
| ArcelorMittal | 8,791 | 115 | Fonterra Shareholders Fund(Æ) | 1,339 | 7 | |||||
| Eurofins Scientific SE | 56 | 14 | Mighty River Power, Ltd. | 11,500 | 25 | |||||
| GAGFAH SA(Æ) | 624 | 12 | Ryman Healthcare, Ltd. | 3,116 | 18 | |||||
| Millicom International Cellular SA | 316 | 26 | Spark New Zealand, Ltd. | 14,741 | 36 | |||||
| RTL Group SA | 240 | 22 | Xero, Ltd. | 329 | 4 | |||||
| Samsonite International SA | 7,200 | 24 | 175 | |||||||
| SES SA | 2,179 | 75 | ||||||||
| Subsea 7 SA | 2,434 | 26 | Norway - 0.9% | |||||||
| Tenaris SA | 3,388 | 67 | Aker Solutions ASA(Æ) | 1,195 | 8 | |||||
| Ternium SA - ADR | 711 | 16 | Aker Solutions ASA | 1,195 | 4 | |||||
| 418 | DNB ASA | 9,554 | 176 | |||||||
| DNO ASA(Æ) | 2,086 | 5 | ||||||||
| Mauritius - 0.0% | Gjensidige Forsikring ASA | 1,292 | 23 | |||||||
| Golden Agri-Resources, Ltd. | 56,000 | 23 | Kongsberg Gruppen AS | 509 | 10 | |||||
| Marine Harvest ASA | 1,861 | 26 | ||||||||
| Netherlands - 2.5% | Norsk Hydro ASA | 13,920 | 78 | |||||||
| Aalberts Industries NV | 373 | 10 | ||||||||
| Aegon NV | 16,046 | 131 | Orkla ASA | 9,387 | 72 | |||||
| AerCap Holdings NV(Æ) | 945 | 41 | Petroleum Geo-Services ASA | 2,663 | 13 | |||||
| Airbus Group NV | 1,887 | 113 | Schibsted ASA | 411 | 22 | |||||
| Akzo Nobel NV | 733 | 49 | Statoil ASA Class N | 14,389 | 326 | |||||
| ASML Holding NV | 1,475 | 147 | TE Connectivity, Ltd. | 3,955 | 89 | |||||
| Boskalis Westminster NV | 503 | 27 | TGS Nopec Geophysical Co. ASA - ADR | 250 | 6 | |||||
| CNH Industrial NV | 3,305 | 27 | Yara International ASA | 2,283 | 105 | |||||
| Constellium NV Class A(Æ) | 317 | 6 | 963 | |||||||
| Core Laboratories NV | 161 | 22 | Portugal - 0.2% | |||||||
| Corio NV(ö) | 783 | 38 | Banco BPI SA Class G | 8,969 | 18 | |||||
| Delta Lloyd NV | 1,739 | 40 | Banco Comercial Portugues SA Class | |||||||
| Fugro NV | 842 | 12 | R(Æ) | 220,487 | 25 | |||||
| Gemalto NV | 376 | 29 | Banco Espirito Santo SA Class C(Æ) | 22,842 | 3 | |||||
| Heineken Holding NV | 730 | 47 | Energias de Portugal SA | 26,812 | 116 | |||||
| Heineken NV | 1,277 | 95 | Galp Energia SGPS SA Class B | 2,134 | 31 | |||||
| ING Groep NV(Æ) | 31,200 | 431 | Jeronimo Martins SGPS SA | 943 | 8 | |||||
| Koninklijke Ahold NV(Æ) | 11,033 | 184 | NOS SGPS | 1,430 | 8 | |||||
| Koninklijke DSM NV(Æ) | 1,193 | 75 | Portucel SA - ADR | 3,135 | 12 | |||||
| Koninklijke KPN NV | 39,611 | 130 | Portugal Telecom SGPS SA | 7,972 | 13 | |||||
| Koninklijke Philips NV | 4,541 | 127 | ||||||||
| Koninklijke Vopak NV | 156 | 8 | ||||||||
See accompanying notes which are an integral part of the financial statements.
Select International Equity Fund 253
Russell Investment Company Select International Equity Fund
Schedule of Investments, continued — October 31, 2014
| Amounts in thousands (except share amounts) | Amounts in thousands (except share amounts) | ||||||||
| Principal | Fair | Principal | Fair | ||||||
| Amount ($) | Value | Amount ($) | Value | ||||||
| or Shares | $ | or Shares | $ | ||||||
| Sonae SGPS SA | 14,481 | 19 | CaixaBank SA | 11,913 | 65 | ||||
| 253 | Corp. Financiera Alba SA | 419 | 23 | ||||||
| Distribuidora Internacional de | |||||||||
| Singapore - 1.1% | Alimentacion SA | 3,595 | 23 | ||||||
| Ascendas Real Estate Investment | Ebro Foods SA | 1,667 | 30 | ||||||
| Trust(Æ)(ö) | 18,000 | 31 | Enagas SA | 718 | 24 | ||||
| CapitaCommercial Trust(Æ)(ö) | 28,000 | 36 | Endesa SA - ADR | 1,191 | 23 | ||||
| CapitaLand, Ltd. | 20,000 | 49 | Ferrovial SA | 2,109 | 43 | ||||
| CapitaMall Trust Class A(Æ)(ö) | 18,000 | 28 | Gas Natural SDG SA | 3,830 | 110 | ||||
| City Developments, Ltd. | 6,000 | 44 | Grifols SA | 1,739 | 67 | ||||
| ComfortDelGro Corp., Ltd. | 7,000 | 14 | Grupo Catalana Occidente SA | 606 | 18 | ||||
| DBS Group Holdings, Ltd. | 14,000 | 202 | Iberdrola SA | 50,097 | 354 | ||||
| First Resources, Ltd.(Æ) | 4,000 | 6 | Inditex SA(Æ) | 7,010 | 197 | ||||
| Flextronics International, Ltd.(Æ) | 2,498 | 27 | Indra Sistemas SA | 1,181 | 13 | ||||
| Fraser and Neave, Ltd. | 3,000 | 7 | International Consolidated Airlines | ||||||
| Frasers Centerpoint Ltd.(Æ) | 4,969 | 6 | Group SA(Æ) | 4,555 | 30 | ||||
| Global Logistic Properties, Ltd. | 12,000 | 26 | Mapfre SA | 7,258 | 25 | ||||
| Hutchison Port Holdings Trust Class U | 18,000 | 12 | Mediaset Espana Comunicacion SA(Æ) | 1,297 | 16 | ||||
| Keppel Corp., Ltd. - ADR | 10,000 | 73 | Obrascon Huarte Lain SA | 431 | 13 | ||||
| Keppel Land, Ltd. | 5,000 | 13 | Prosegur Cia de Seguridad SA | 1,029 | 6 | ||||
| Keppel REIT Management, Ltd.(ö) | 25,000 | 24 | Red Electrica Corp. SA | 368 | 32 | ||||
| Neptune Orient Lines, Ltd.(Æ) | 9,000 | 6 | Repsol SA - ADR | 8,811 | 197 | ||||
| Olam International, Ltd. | 10,000 | 17 | Sacyr SA(Æ) | 1,196 | 5 | ||||
| Oversea-Chinese Banking Corp., Ltd. | 17,000 | 132 | Tecnicas Reunidas SA(Æ) | 219 | 11 | ||||
| SATS, Ltd. | 3,000 | 7 | Telefonica SA - ADR | 31,428 | 472 | ||||
| Sembcorp Industries, Ltd. | 8,000 | 30 | Zardoya Otis SA | 808 | 9 | ||||
| SIA Engineering Co., Ltd. | 2,000 | 7 | 3,633 | ||||||
| Singapore Airlines, Ltd. | 7,000 | 54 | |||||||
| Singapore Exchange, Ltd. | 1,000 | 5 | Sweden - 2.6% | ||||||
| Singapore Press Holdings, Ltd. | 17,000 | 57 | Alfa Laval AB | 1,945 | 40 | ||||
| Singapore Technologies Engineering, | Assa Abloy AB Class B | 1,402 | 74 | ||||||
| Ltd. | 4,000 | 12 | Atlas Copco AB Class A | 3,580 | 103 | ||||
| Singapore Telecommunications, Ltd. | 27,000 | 79 | Atlas Copco AB Class B | 2,174 | 57 | ||||
| StarHub, Ltd. | 3,000 | 10 | BillerudKorsnas AB | 660 | 10 | ||||
| Suntec Real Estate Investment Trust(ö) | 24,000 | 33 | Boliden AB | 1,673 | 28 | ||||
| United Industrial Corp., Ltd. | 4,000 | 10 | Electrolux AB | 1,177 | 33 | ||||
| United Overseas Bank, Ltd. | 8,000 | 144 | Elekta AB Class B | 913 | 9 | ||||
| UOL Group, Ltd. | 6,000 | 30 | Getinge AB Class B | 916 | 21 | ||||
| Wilmar International, Ltd. | 22,000 | 55 | Hennes & Mauritz AB Class B | 5,287 | 210 | ||||
| 1,286 | Hexagon AB Class B | 1,049 | 35 | ||||||
| Hexpol AB(Æ) | 122 | 11 | |||||||
| Spain - 3.2% | Holmen AB Class B | 942 | 31 | ||||||
| Abertis Infraestructuras SA | 1,799 | 37 | Hufvudstaden AB Class A | 2,117 | 27 | ||||
| Acciona SA(Æ) | 311 | 22 | Husqvarna AB(Æ) | 895 | 7 | ||||
| Acerinox SA | 817 | 12 | Husqvarna AB Class B | 3,443 | 26 | ||||
| ACS Actividades de Construccion y | ICA Gruppen AB | 368 | 15 | ||||||
| Servicios SA | 1,119 | 41 | Investment AB Latour | 251 | 7 | ||||
| Amadeus IT Holding SA Class A | 1,888 | 69 | L E Lundbergforetagen AB | 724 | 30 | ||||
| Applus Services SA(ö) | 443 | 5 | Lundin Petroleum AB(Æ) | 419 | 6 | ||||
| Applus Services SA(Æ) | 297 | 6 | Meda AB Class A | 1,474 | 19 | ||||
| Atresmedia Corp de Medios de | Melker Schorling AB | 304 | 14 | ||||||
| Comunicacion SA | 480 | 7 | Modern Times Group MTG AB Class B | 179 | 6 | ||||
| Banco Bilbao Vizcaya Argentaria SA | NCC AB Class B | 745 | 22 | ||||||
| - ADR | 42,370 | 474 | Nibe Industrier AB Class B | 319 | 8 | ||||
| Banco de Sabadell SA - ADR | 43,204 | 125 | Nordea Bank AB | 28,513 | 366 | ||||
| Banco Popular Espanol SA | 18,511 | 106 | Ratos AB Class B | 2,548 | 17 | ||||
| Banco Santander SA - ADR | 86,857 | 766 | Saab AB Class B | 401 | 11 | ||||
| Bankia SA Class A | 57,093 | 102 | Sandvik AB | 4,995 | 55 | ||||
| Bankinter SA | 4,176 | 34 | Securitas AB Class B | 3,056 | 34 | ||||
| Bolsas y Mercados Espanoles SA | 557 | 21 | |||||||
| See accompanying notes which are an integral part of the financial statements. | |||||||||
| 254 Select International Equity Fund | |||||||||
Russell Investment Company Select International Equity Fund
Schedule of Investments, continued — October 31, 2014
| Amounts in thousands (except share amounts) | Amounts in thousands (except share amounts) | |||||||||
| Principal | Fair | Principal | Fair | |||||||
| Amount ($) | Value | Amount ($) | Value | |||||||
| or Shares | $ | or Shares | $ | |||||||
| Skandinaviska Enskilda Banken AB | Novartis AG | 15,093 | 1,401 | |||||||
| Class A | 13,192 | 169 | OC Oerlikon Corp. AG(Æ) | 922 | 12 | |||||
| Skanska AB Class B | 3,793 | 77 | Panalpina Welttransport Holding AG | 52 | 7 | |||||
| SKF AB Class B | 1,967 | 39 | Partners Group Holding AG | 109 | 29 | |||||
| SSAB AB Class A(Æ) | 2,771 | 20 | PSP Swiss Property AG | 686 | 59 | |||||
| SSAB AB Class B(Æ) | 803 | 5 | Roche Holding AG | 4,623 | 1,361 | |||||
| Svenska Cellulosa AB SCA Class B | 6,602 | 148 | Schindler Holding AG(ö) | 316 | 44 | |||||
| Svenska Cellulosa AB SCA Class A | 284 | 6 | SGS SA | 29 | 64 | |||||
| Svenska Handelsbanken AB Class A | 5,904 | 282 | Sika AG | 11 | 39 | |||||
| Svenska Handelsbanken AB Class B | 161 | 7 | Sonova Holding AG | 282 | 44 | |||||
| Swedbank AB Class A | 5,420 | 143 | St. Galler Kantonalbank AG | 65 | 24 | |||||
| Swedish Match AB | 1,267 | 41 | Straumann Holding AG | 31 | 8 | |||||
| Swedish Orphan Biovitrum AB Class B | 584 | 7 | Sulzer AG | 159 | 18 | |||||
| Tele2 AB Class B | 6,666 | 85 | Swatch Group AG (The) | 398 | 34 | |||||
| Telefonaktiebolaget LM Ericsson Class B | 17,349 | 204 | Swatch Group AG (The) Class B | 188 | 89 | |||||
| Telefonaktiebolaget LM Ericsson Class A | 596 | 7 | Swiss Life Holding AG(Æ) | 363 | 83 | |||||
| TeliaSonera AB | 26,969 | 186 | Swiss Prime Site AG Class A(Æ) | 894 | 68 | |||||
| Trelleborg AB Class B | 1,567 | 27 | Swiss Re AG(Æ) | 2,945 | 238 | |||||
| Volvo AB Class B | 5,368 | 62 | Swisscom AG | 228 | 134 | |||||
| Volvo AB Class A - GDR | 563 | 7 | Syngenta AG | 335 | 104 | |||||
| 2,854 | TE Connectivity, Ltd. | 1,754 | 107 | |||||||
| Transocean, Ltd. | 1,814 | 53 | ||||||||
| Switzerland - 7.6% | UBS AG(Æ) | 23,271 | 404 | |||||||
| ABB, Ltd.(Æ) | 9,413 | 206 | Zurich Insurance Group AG(Æ) | 1,763 | 533 | |||||
| Actelion, Ltd.(Æ) | 655 | 78 | 8,498 | |||||||
| Adecco SA(Æ) | 735 | 50 | ||||||||
| Allreal Holding AG(Æ) | 226 | 30 | United Kingdom - 18.8% | |||||||
| Alpiq Holding AG(Æ) | 91 | 9 | 3i Group PLC | 6,430 | 41 | |||||
| Aryzta AG(Æ) | 624 | 53 | AA PLC(Æ) | 2,538 | 14 | |||||
| Baloise Holding AG | 858 | 108 | Aberdeen Asset Management PLC | 3,323 | 23 | |||||
| Banque Cantonale Vaudoise | 52 | 28 | Admiral Group PLC | 1,296 | 28 | |||||
| Barry Callebaut AG(Æ) | 10 | 10 | Aggreko PLC | 882 | 21 | |||||
| Basellandschaftliche Kantonalbank | 12 | 11 | AMEC PLC - GDR | 1,900 | 32 | |||||
| Basler Kantonalbank | 96 | 6 | Amlin PLC | 10,615 | 77 | |||||
| Berner Kantonalbank AG | 120 | 22 | Anglo American PLC | 10,970 | 231 | |||||
| Bucher Industries AG | 44 | 11 | Antofagasta PLC | 2,688 | 30 | |||||
| Chocoladefabriken Lindt & Sprungli AG | 1 | 60 | ARM Holdings PLC | 6,672 | 93 | |||||
| Cie Financiere Richemont SA | 2,770 | 233 | Ashmore Group PLC | 1,702 | 9 | |||||
| Clariant AG(Æ) | 2,054 | 36 | Ashtead Group PLC | 2,862 | 48 | |||||
| Coca-Cola HBC AG - ADR(Æ) | 1,137 | 25 | Associated British Foods PLC | 2,680 | 118 | |||||
| Credit Suisse Group AG(Æ) | 11,616 | 309 | AstraZeneca PLC - ADR(Æ) | 8,935 | 649 | |||||
| DKSH Holding AG | 98 | 7 | Aviva PLC | 27,527 | 229 | |||||
| Dufry AG(Æ) | 129 | 19 | Babcock International Group PLC | 2,700 | 47 | |||||
| EMS-Chemie Holding AG | 62 | 22 | BAE Systems PLC | 17,850 | 131 | |||||
| Flughafen Zuerich AG | 43 | 27 | Balfour Beatty PLC | 7,001 | 17 | |||||
| Galenica AG | 24 | 21 | Barclays PLC | 102,394 | 394 | |||||
| GAM Holding AG(Æ) | 683 | 12 | Barratt Developments PLC | 9,272 | 62 | |||||
| Geberit AG | 177 | 60 | Berkeley Group Holdings PLC | 558 | 20 | |||||
| Georg Fischer AG(Æ) | 33 | 19 | BG Group PLC | 16,452 | 274 | |||||
| Givaudan SA(Æ) | 41 | 68 | BHP Billiton PLC | 10,141 | 261 | |||||
| Graubuendner Kantonalbank | 8 | 11 | Booker Group PLC | 9,794 | 22 | |||||
| Helvetia Holding AG | 77 | 37 | BP PLC | 181,755 | 1,305 | |||||
| Holcim, Ltd.(Æ) | 1,683 | 119 | British American Tobacco PLC | 12,430 | 705 | |||||
| Julius Baer Group, Ltd.(Æ) | 1,560 | 68 | British Land Co. PLC (The)(ö) | 11,529 | 134 | |||||
| Kuehne & Nagel International AG | 271 | 35 | British Sky Broadcasting Group PLC | 6,480 | 92 | |||||
| Lindt & Spruengli AG | 7 | 35 | Britvic PLC | 2,025 | 22 | |||||
| Lonza Group AG(Æ) | 304 | 33 | BT Group PLC | 77,810 | 457 | |||||
| Luzerner Kantonalbank AG | 39 | 14 | BTG PLC | 2,136 | 26 | |||||
| Nestle SA | 22,537 | 1,649 | Bunzl PLC | 2,891 | 78 | |||||
See accompanying notes which are an integral part of the financial statements.
Select International Equity Fund 255
Russell Investment Company Select International Equity Fund
Schedule of Investments, continued — October 31, 2014
| Amounts in thousands (except share amounts) | Amounts in thousands (except share amounts) | |||||||||
| Principal | Fair | Principal | Fair | |||||||
| Amount ($) | Value | Amount ($) | Value | |||||||
| or Shares | $ | or Shares | $ | |||||||
| Burberry Group PLC | 2,272 | 56 | Meggitt PLC | 9,318 | 67 | |||||
| Capita PLC | 3,677 | 65 | Melrose Industries PLC | 10,320 | 42 | |||||
| Capital & Counties Properties PLC | 9,461 | 52 | Merlin Entertainment PLC | 1,205 | 7 | |||||
| Carnival PLC | 1,708 | 68 | Millennium & Copthorne Hotels PLC | 2,081 | 19 | |||||
| Centrica PLC | 10,980 | 53 | Mondi PLC | 1,962 | 33 | |||||
| Close Brothers Group PLC | 580 | 14 | National Grid PLC | 23,944 | 355 | |||||
| Cobham PLC | 7,310 | 34 | Next PLC | 1,082 | 112 | |||||
| Compass Group PLC(Æ) | 10,334 | 166 | Noble Corp. PLC | 1,911 | 40 | |||||
| Croda International PLC | 837 | 31 | Ocado Group PLC(Æ) | 1,234 | 5 | |||||
| Daily Mail & General Trust PLC Class A | 1,419 | 18 | Old Mutual PLC | 49,000 | 152 | |||||
| Derwent London PLC(ö) | 1,792 | 85 | Ophir Energy PLC Class W(Æ) | 2,979 | 9 | |||||
| Diageo PLC | 15,876 | 467 | Paragon Offshore PLC(Æ) | 430 | 2 | |||||
| Direct Line Insurance Group PLC | 11,742 | 52 | Pearson PLC | 10,044 | 188 | |||||
| Dixons Carphone PLC | 4,691 | 30 | Pennon Group PLC | 3,134 | 42 | |||||
| Drax Group PLC | 3,350 | 32 | Persimmon PLC Class A(Æ) | 1,205 | 28 | |||||
| Dunelm Group PLC(Æ) | 676 | 9 | Premier Oil PLC | 2,593 | 11 | |||||
| easyJet PLC | 1,431 | 34 | Provident Financial PLC | 734 | 25 | |||||
| Ensco PLC Class A | 2,562 | 104 | Prudential PLC | 10,941 | 252 | |||||
| Evraz PLC(Æ) | 4,357 | 9 | Reckitt Benckiser Group PLC | 3,964 | 333 | |||||
| G4S PLC | 7,025 | 29 | Reed Elsevier PLC | 8,894 | 146 | |||||
| Galiform PLC | 3,959 | 22 | Rentokil Initial PLC | 12,322 | 24 | |||||
| GKN PLC | 13,160 | 67 | Rexam PLC(Æ) | 7,266 | 55 | |||||
| GlaxoSmithKline PLC - ADR | 29,291 | 664 | Rightmove PLC | 504 | 17 | |||||
| Great Portland Estates PLC(ö) | 6,991 | 77 | Rio Tinto PLC(Æ) | 6,494 | 309 | |||||
| Greene King PLC | 3,989 | 51 | Rolls-Royce Holdings PLC | 7,243 | 98 | |||||
| Halma PLC | 2,925 | 29 | Rotork PLC | 566 | 23 | |||||
| Hammerson PLC(ö) | 12,070 | 118 | Royal Bank of Scotland Group PLC(Æ) | 18,783 | 117 | |||||
| Hays PLC | 9,973 | 20 | Royal Dutch Shell PLC Class A | 43,090 | 1,538 | |||||
| Hikma Pharmaceuticals PLC | 846 | 26 | Royal Dutch Shell PLC Class B | 23,823 | 881 | |||||
| Hill Station PLC | 690 | 11 | Royal Mail PLC | 4,284 | 30 | |||||
| HSBC Holdings PLC | 189,570 | 1,940 | RSA Insurance Group PLC(Æ) | 8,748 | 68 | |||||
| ICAP PLC | 1,172 | 8 | SABMiller PLC - ADR | 6,865 | 387 | |||||
| IG Group Holdings PLC | 2,513 | 24 | Sage Group PLC (The) | 6,499 | 39 | |||||
| IMI PLC | 1,569 | 31 | Schroders PLC | 501 | 19 | |||||
| Imperial Tobacco Group PLC | 7,048 | 306 | Scottish & Southern Energy PLC | 2,501 | 64 | |||||
| Inchcape PLC | 8,011 | 89 | Segro PLC(ö) | 5,269 | 32 | |||||
| Informa PLC | 2,678 | 21 | Serco Group PLC | 3,852 | 18 | |||||
| Inmarsat PLC | 2,946 | 32 | Severn Trent PLC Class H | 1,148 | 37 | |||||
| Intercontinental Hotels Group PLC(Æ) | 2,464 | 93 | Shaftesbury PLC(ö) | 4,171 | 48 | |||||
| Intermediate Capital Group PLC | 3,808 | 25 | Shire PLC - ADR(Æ) | 2,915 | 194 | |||||
| Intertek Group PLC | 743 | 32 | Smith & Nephew PLC | 6,160 | 104 | |||||
| Intu Properties PLC Class H(ö) | 10,444 | 57 | Smiths Group PLC | 2,073 | 39 | |||||
| Investec PLC | 6,131 | 56 | Songbird Estates PLC | 4,792 | 20 | |||||
| ITV PLC | 24,338 | 79 | Spectris PLC | 627 | 18 | |||||
| J Sainsbury PLC | 22,892 | 90 | Spirax-Sarco Engineering PLC | 526 | 24 | |||||
| Jardine Lloyd Thompson Group PLC | 532 | 8 | Sports Direct International PLC(Æ) | 1,890 | 19 | |||||
| Jazztel PLC(Æ) | 1,669 | 27 | St. James's Place PLC | 2,290 | 27 | |||||
| John Wood Group PLC | 2,926 | 31 | Stagecoach Group PLC | 4,265 | 26 | |||||
| Johnson Matthey PLC | 579 | 28 | Standard Chartered PLC | 16,185 | 243 | |||||
| Kazakhmys PLC(Æ) | 3,766 | 14 | Standard Life PLC | 20,006 | 126 | |||||
| Kingfisher PLC | 37,538 | 182 | Tate & Lyle PLC | 3,140 | 30 | |||||
| Ladbrokes PLC Class A | 3,196 | 6 | Taylor Wimpey PLC | 37,476 | 71 | |||||
| Land Securities Group PLC(ö) | 11,773 | 208 | Telecity Group PLC | 871 | 11 | |||||
| Legal & General Group PLC | 51,151 | 189 | Tesco PLC | 105,133 | 293 | |||||
| Liberty Global PLC(Æ) | 3,337 | 148 | Thomas Cook Group PLC(Æ) | 8,308 | 17 | |||||
| Lloyds Banking Group PLC(Æ) | 301,888 | 372 | Travis Perkins PLC | 2,391 | 63 | |||||
| London Stock Exchange Group PLC | 1,228 | 40 | TUI Travel PLC | 2,981 | 19 | |||||
| Man Group PLC | 20,240 | 40 | Tullow Oil PLC | 2,778 | 22 | |||||
| Marks & Spencer Group PLC | 13,791 | 90 | Unilever PLC | 7,916 | 318 | |||||
See accompanying notes which are an integral part of the financial statements.
256 Select International Equity Fund
Russell Investment Company Select International Equity Fund
Schedule of Investments, continued — October 31, 2014
| Amounts in thousands (except share amounts) | Amounts in thousands (except share amounts) | ||||||||
| Principal | Fair | Principal | Fair | ||||||
| Amount ($) | Value | Amount ($) | Value | ||||||
| or Shares | $ | or Shares | $ | ||||||
| United Utilities Group PLC | 6,802 | 93 | United States - 5.2% | ||||||
| Vedanta Resources PLC | 1,083 | 14 | Russell U.S. Cash Management Fund | 5,774,586 | (8) | 5,775 | |||
| Vodafone Group PLC | 273,368 | 907 | Total Short-Term Investments | ||||||
| Weir Group PLC (The) | 1,215 | 44 | (cost $5,775) | 5,775 | |||||
| Whitbread PLC | 1,265 | 88 | |||||||
| William Hill PLC | 3,854 | 22 | Total Investments 99.5% | ||||||
| WM Morrison Supermarkets PLC | 24,638 | 61 | (identified cost $117,995) | 111,352 | |||||
| 21,034 | |||||||||
| Other Assets and Liabilities, Net | |||||||||
| United States - 0.3% | - 0.5% | 549 | |||||||
| AdStar, Inc.(Æ) | 160 | 7 | |||||||
| American Exploration Co.(Æ) | 5,129 | 11 | Net Assets - 100.0% | 111,901 | |||||
| Autoliv, Inc. | 601 | 55 | |||||||
| BlackRock Health Sciences Trust | 2,770 | 11 | |||||||
| Dream Office Real Estate Investment | |||||||||
| Trust(Æ)(ö) | 977 | 25 | |||||||
| Essentra PLC | 547 | 6 | |||||||
| Fiat Chrysler Automobiles NV | 12,430 | 139 | |||||||
| GateHouse Media, Inc. Class A(Æ) | 1,864 | 85 | |||||||
| lululemon athletica, Inc.(Æ) | 531 | 22 | |||||||
| Talk America Holdings, Inc.(Æ) | 4,267 | 20 | |||||||
| 381 | |||||||||
| Total Common Stocks | |||||||||
| (cost $111,527) | 104,940 | ||||||||
| Preferred Stocks - 0.5% | |||||||||
| Germany - 0.5% | |||||||||
| Bayerische Motoren Werke AG | 661 | 53 | |||||||
| Fuchs Petrolub SE | 172 | 7 | |||||||
| Henkel AG & Co. KGaA | 1,047 | 103 | |||||||
| MAN SE | 60 | 7 | |||||||
| Porsche Automobil Holding SE | 1,654 | 135 | |||||||
| Volkswagen AG | 1,373 | 293 | |||||||
| 598 | |||||||||
| Italy - 0.0% | |||||||||
| Unipol Gruppo Finanziario SpA | 1,370 | 6 | |||||||
| Japan - 0.0% | |||||||||
| Shinkin Central Bank Class K | 8 | 15 | |||||||
| United Kingdom - 0.0% | |||||||||
| Rolls-Royce Holdings PLC(Æ) | 651,870 | 1 | |||||||
| Total Preferred Stocks | |||||||||
| (cost $677) | 620 | ||||||||
| Warrants & Rights - 0.0% | |||||||||
| France - 0.0% | |||||||||
| Numericable Group SA(Æ) | |||||||||
| 2015 Rights | 128 | 4 | |||||||
| United Kingdom - 0.0% | |||||||||
| DS Smith PLC Class F(Æ) | |||||||||
| 2014 Rights | 2,977 | 13 | |||||||
| Total Warrants & Rights | |||||||||
| (cost $16) | 17 | ||||||||
| Short-Term Investments - 5.2% | |||||||||
See accompanying notes which are an integral part of the financial statements.
Select International Equity Fund 257
Russell Investment Company Select International Equity Fund
Schedule of Investments, continued — October 31, 2014
| Futures Contracts | |||||||||||||
| Amounts in thousands (except contract amounts) | |||||||||||||
| Unrealized | |||||||||||||
| Appreciation | |||||||||||||
| Number of | Notional | Expiration | (Depreciation) | ||||||||||
| Contracts | Amount | Date | $ | ||||||||||
| Long Positions | |||||||||||||
| MSCI EAFE Mini Index Futures | 71 | USD | 6,518 | 12/14 | (9 | ) | |||||||
| Total Unrealized Appreciation (Depreciation) on Open Futures Contracts (å) | (9 | ) | |||||||||||
| Presentation of Portfolio Holdings | |||||||||||||
| Amounts in thousands | |||||||||||||
| Fair Value | |||||||||||||
| Portfolio Summary | Level 1 | Level 2 | Level 3 | Total | % of Net Assets | ||||||||
| Common Stocks | |||||||||||||
| Australia | $ | 6,800 | $ | — | $ | — | $ | 6,800 | 6.1 | ||||
| Austria | 366 | — | — | 366 | 0.3 | ||||||||
| Belgium | 1,392 | — | — | 1,392 | 1.2 | ||||||||
| Bermuda | 519 | — | — | 519 | 0.5 | ||||||||
| Canada | 8,840 | — | — | 8,840 | 7.9 | ||||||||
| Cayman Islands | 113 | — | — | 113 | 0.1 | ||||||||
| Denmark | 1,635 | — | — | 1,635 | 1.5 | ||||||||
| Finland | 951 | — | — | 951 | 0.8 | ||||||||
| France | 10,205 | — | — | 10,205 | 9.1 | ||||||||
| Germany | 7,166 | — | — | 7,166 | 6.4 | ||||||||
| Guernsey | 70 | — | — | 70 | 0.1 | ||||||||
| Hong Kong | 1,674 | — | — | 1,674 | 1.5 | ||||||||
| Ireland | 604 | — | — | 604 | 0.5 | ||||||||
| Isle of Man | 17 | — | — | 17 | —* | ||||||||
| Israel | 560 | — | — | 560 | 0.5 | ||||||||
| Italy | 2,746 | — | — | 2,746 | 2.5 | ||||||||
| Japan | 18,199 | — | — | 18,199 | 16.3 | ||||||||
| Jersey | 818 | — | — | 818 | 0.7 | ||||||||
| Luxembourg | 418 | — | — | 418 | 0.4 | ||||||||
| Mauritius | 23 | — | — | 23 | —* | ||||||||
| Netherlands | 2,747 | — | — | 2,747 | 2.5 | ||||||||
| New Zealand | 175 | — | — | 175 | 0.2 | ||||||||
| Norway | 963 | — | — | 963 | 0.9 | ||||||||
| Portugal | 250 | — | 3 | 253 | 0.2 | ||||||||
| Singapore | 1,279 | — | 7 | 1,286 | 1.1 | ||||||||
| Spain | 3,633 | — | — | 3,633 | 3.2 | ||||||||
| Sweden | 2,854 | — | — | 2,854 | 2.6 | ||||||||
| Switzerland | 8,498 | — | — | 8,498 | 7.6 | ||||||||
| United Kingdom | 21,034 | — | — | 21,034 | 18.8 | ||||||||
| United States | 381 | — | — | 381 | 0.3 | ||||||||
| Preferred Stocks | 619 | — | 1 | 620 | 0.5 | ||||||||
| Warrants & Rights | 17 | — | — | 17 | —* | ||||||||
| Short-Term Investments | — | 5,775 | — | 5,775 | 5.2 | ||||||||
| Total Investments | 105,566 | 5,775 | 11 | 111,352 | 99.5 | ||||||||
| Other Assets and Liabilities, Net | 0.5 | ||||||||||||
| 100.0 | |||||||||||||
| Other Financial Instruments | |||||||||||||
| Futures Contracts | (9 | ) | — | — | (9 | ) | (—)* | ||||||
| Total Other Financial Instruments** | $ | (9 | ) | $ | — | $ | — | $ | (9 | ) | |||
| * Less than .05% of net assets. | |||||||||||||
| ** | Futures and foreign currency exchange contract values reflect the unrealized appreciation/depreciation on the instruments. |
For a description of the Levels see note 2 in the Notes to Financial Statements.
For disclosure on transfers between Levels 1, 2 and 3 during the period ended October 31, 2014, see note 2 in the Notes to Financial Statements. Investments in which significant unobservable inputs (Level 3) were used in determining a fair value for the period ended October 31, 2014 were less than 1% of net assets.
See accompanying notes which are an integral part of the financial statements.
258 Select International Equity Fund
| Russell Investment Company | |||||||
| Select International Equity Fund | |||||||
| Fair Value of Derivative Instruments — October 31, 2014 | |||||||
| Amounts in thousands | |||||||
| Equity | |||||||
| Derivatives not accounted for as hedging instruments | Contracts | ||||||
| Location: Statement of Assets and Liabilities - Liabilities | |||||||
| Variation margin on futures contracts* | $ | 9 | |||||
| Foreign | |||||||
| Equity | Currency | ||||||
| Derivatives not accounted for as hedging instruments | Contracts | Contracts | |||||
| Location: Statement of Operations - Net realized gain (loss) | |||||||
| Futures contracts | $ | (139 | ) | $ | — | ||
| Foreign currency-related transactions** | — | (139 | ) | ||||
| Total | $ | (139 | ) | $ | (139 | ) | |
| Location: Statement of Operations - Net change in unrealized appreciation (depreciation) | |||||||
| Futures contracts | $ | (9 | ) | ||||
| * | Includes cumulative appreciation/depreciation of futures contracts as reported in the Schedule of Investments. Only variation margin is reported within the | ||||||
| Statement of Assets and Liabilities. | |||||||
| ** | Only includes net realized gain (loss) on forward and spot contracts. May differ from the net realized gain (loss) on foreign currency-related transactions reported | ||||||
| within the Statement of Operations. | |||||||
| For further disclosure on derivatives see note 2 in the Notes to Financial Statements. | |||||||
See accompanying notes which are an integral part of the financial statements.
Select International Equity Fund 259
Russell Investment Company Select International Equity Fund
Balance Sheet Offsetting of Financial and Derivative Instruments — October 31, 2014
| Amounts in thousands | ||||||||||
| Offsetting of Financial Assets and Derivative Assets | ||||||||||
| Gross | Net Amounts | |||||||||
| Amounts | of Assets | |||||||||
| Gross | Offset in the | Presented in | ||||||||
| Amounts of | Statement of | the Statement | ||||||||
| Recognized | Assets and | of Assets and | ||||||||
| Description | Location: Statement of Assets and Liabilities - Assets | Assets | Liabilities | Liabilities | ||||||
| Futures Contracts | Variation margin on futures contracts | $ | 125 | $ | — $ | 125 | ||||
| Total | $ | 125 | $ | — $ | 125 | |||||
| Financial Assets, Derivative Assets, and Collateral Held by Counterparty | ||||||||||
| Gross Amounts Not Offset in | ||||||||||
| the Statement of Assets and | ||||||||||
| Liabilities | ||||||||||
| Net Amounts | ||||||||||
| of Assets | ||||||||||
| Presented in | ||||||||||
| the Statement | Financial and | |||||||||
| of Assets and | Derivative | Collateral | ||||||||
| Counterparty | Liabilities | Instruments | Received^ | Net Amount | ||||||
| Merrill Lynch | $ | 125 | $ | — $ | — $ | 125 | ||||
| Total | $ | 125 | $ | — $ | — $ | 125 | ||||
^ Collateral received or pledged amounts may not reconcile to those disclosed in the Statement of Assets and Liabilities due to the inclusion of off-Balance Sheet collateral and adjustments made to exclude overcollateralization.
For further disclosure on derivatives and counterparty risk see note 2 in the Notes to Financial Statements.
See accompanying notes which are an integral part of the financial statements.
260 Select International Equity Fund
| Russell Investment Company | ||
| Select International Equity Fund | ||
| Statement of Assets and Liabilities — October 31, 2014 | ||
| Amounts in thousands | ||
| Assets | ||
| Investments, at identified cost | $ | 117,995 |
| Investments, at fair value(>) | 111,352 | |
| Cash (restricted)(a) | 500 | |
| Foreign currency holdings(^) | 67 | |
| Receivables: | ||
| Dividends and interest | 201 | |
| Dividends from affiliated Russell funds | 15 | |
| Fund shares sold | 25 | |
| Foreign capital gains taxes recoverable | 16 | |
| Variation margin on futures contracts | 125 | |
| Prepaid expenses | 26 | |
| Total assets | 112,327 | |
| Liabilities | ||
| Payables: | ||
| Investments purchased | 1 | |
| Fund shares redeemed | 342 | |
| Accrued fees to affiliates | 10 | |
| Other accrued expenses | 73 | |
| Total liabilities | 426 | |
| Net Assets | $ | 111,901 |
See accompanying notes which are an integral part of the financial statements.
Select International Equity Fund 261
| Russell Investment Company | |||
| Select International Equity Fund | |||
| Statement of Assets and Liabilities, continued — October 31, 2014 | |||
| Amounts in thousands | |||
| Net Assets Consist of: | |||
| Undistributed (overdistributed) net investment income | $ | 455 | |
| Accumulated net realized gain (loss) | (341 | ) | |
| Unrealized appreciation (depreciation) on: | |||
| Investments (net of deferred tax liability for foreign capital gains taxes) | (6,643 | ) | |
| Futures contracts | (9 | ) | |
| Foreign currency-related transactions | (5 | ) | |
| Shares of beneficial interest | 119 | ||
| Additional paid-in capital | 118,325 | ||
| Net Assets | $ | 111,901 | |
| Net Asset Value, offering and redemption price per share: | |||
| Net asset value per share: Class Y(#) | $ | 9.42 | |
| Class Y — Net assets | $ | 111,901,481 | |
| Class Y — Shares outstanding ($.01 par value) | 11,877,582 | ||
| Amounts in thousands | |||
| (^) Foreign currency holdings - cost | $ | 67 | |
| (>) Investments in affiliates, Russell U.S. Cash Management Fund | $ | 5,775 | |
| (a) Cash Collateral for Futures | $ | 500 | |
| (#) Net asset value per share equals class level net assets divided by class level shares of beneficial interest outstanding. | |||
See accompanying notes which are an integral part of the financial statements.
262 Select International Equity Fund
| Russell Investment Company | |||
| Select International Equity Fund | |||
| Statement of Operations — For the Period Ended October 31, 2014(1) | |||
| Amounts in thousands | |||
| Investment Income | |||
| Dividends | $ | 595 | |
| Dividends from affiliated Russell funds | 2 | ||
| Interest | 15 | ||
| Less foreign taxes withheld | (44 | ) | |
| Total investment income | 568 | ||
| Expenses | |||
| Advisory fees | 109 | ||
| Administrative fees | 12 | ||
| Custodian fees | 24 | ||
| Transfer agent fees – Class Y | 1 | ||
| Professional fees | 48 | ||
| Registration fees | 1 | ||
| Trustees’ fees | 1 | ||
| Printing fees | 2 | ||
| Organizational fees | 11 | ||
| Miscellaneous | 1 | ||
| Expenses before reductions | 210 | ||
| Expense reductions | (102 | ) | |
| Net expenses | 108 | ||
| Net investment income (loss) | 460 | ||
| Net Realized and Unrealized Gain (Loss) | |||
| Net realized gain (loss) on: | |||
| Investments (net of deferred tax liability for foreign capital gains taxes) | (199 | ) | |
| Futures contracts | (139 | ) | |
| Foreign currency-related transactions | (20 | ) | |
| Net realized gain (loss) | (358 | ) | |
| Net change in unrealized appreciation (depreciation) on: | |||
| Investments (net of deferred tax liability for foreign capital gains taxes) | (6,643 | ) | |
| Futures contracts | (9 | ) | |
| Foreign currency-related transactions | (5 | ) | |
| Net change in unrealized appreciation (depreciation) | (6,657 | ) | |
| Net realized and unrealized gain (loss) | (7,015 | ) | |
| Net Increase (Decrease) in Net Assets from Operations | $ | (6,555 | ) |
| (1) For the period August 1, 2014 (commencement of operations) to October 31, 2014. | |||
See accompanying notes which are an integral part of the financial statements.
Select International Equity Fund 263
| Russell Investment Company | |||
| Select International Equity Fund | |||
| Statement of Changes in Net Assets | |||
| For the Period Ended | |||
| Amounts in thousands | 2014 | (1) | |
| Increase (Decrease) in Net Assets | |||
| Operations | |||
| Net investment income (loss) | $ | 460 | |
| Net realized gain (loss) | (358 | ) | |
| Net change in unrealized appreciation (depreciation) | (6,657 | ) | |
| Net increase (decrease) in net assets from operations | (6,555 | ) | |
| Share Transactions* | |||
| Net increase (decrease) in net assets from share transactions | 118,456 | ||
| Total Net Increase (Decrease) in Net Assets | 111,901 | ||
| Net Assets | |||
| Beginning of period | — | ||
| End of period | $ | 111,901 | |
| Undistributed (overdistributed) net investment income included in net assets | $ | 455 | |
| (1) For the period August 1, 2014 (commencement of operations) to October 31, 2014. | |||
See accompanying notes which are an integral part of the financial statements.
264 Select International Equity Fund
| Russell Investment Company | |||||||
| Select International Equity Fund | |||||||
| Statement of Changes in Net Assets, continued | |||||||
| * Share transaction amounts (in thousands) for the periods ended October 31, 2014 were as follows: | |||||||
| 2014 | (1) | ||||||
| Shares | Dollars | ||||||
| Class Y | |||||||
| Proceeds from shares sold | 12,448 | $ | 123,949 | ||||
| Payments for shares redeemed | (570 | ) | (5,493 | ) | |||
| Total increase (decrease) | 11,878 | $ | 118,456 | ||||
| (1) For the period August 1, 2014 (commencement of operations) to October 31, 2014. | |||||||
See accompanying notes which are an integral part of the financial statements.
Select International Equity Fund 265
Russell Investment Company Select International Equity Fund
Financial Highlights — For the Periods Ended
| For a Share Outstanding Throughout Each Period. | ||||||||||||
| $ | $ | $ | $ | $ | ||||||||
| Net Asset Value, | Net | Net Realized | Total from | Net Asset Value, | ||||||||
| Beginning of | Investment | and Unrealized | Investment | End of | ||||||||
| Period | Income (Loss)(a)(d) | Gain (Loss) | Operations | Period | ||||||||
| Class Y | ||||||||||||
| October 31, 2014(7) | 10.00 | .05 | (.63 | ) | (.58 | ) | 9.42 | |||||
See accompanying notes which are an integral part of the financial statements.
266 Select International Equity Fund
| % | % | % | ||||||||||
| $ | Ratio of Expenses | Ratio of Expenses | Ratio of Net | |||||||||
| % | Net Assets, | to Average | to Average | Investment Income | % | |||||||
| Total | End of Period | Net Assets, | Net Assets, | to Average | Portfolio | |||||||
| Return(b) | (000 | ) | Gross(e) | Net(d)(e) | Net Assets(d)(e) | Turnover Rate(b) | ||||||
| (5.80 | ) | 111,901 | .87 | .44 | 1.90 | 7 | ||||||
See accompanying notes which are an integral part of the financial statements.
Select International Equity Fund 267
Russell Investment Company Russell Emerging Markets Fund
Portfolio Management Discussion and Analysis — October 31, 2014 (Unaudited)

| Russell Emerging Markets Fund - Class A‡ | Russell Emerging Markets Fund - Class Y‡‡ | ||||
| Total | Total | ||||
| Return | Return | ||||
| 1 Year | (4.78 | )% | 1 Year | 1.50 | % |
| 5 Years | 4.09 | %§ | 5 Years | 5.78 | %§ |
| 10 Years | 9.87 | %§ | 10 Years | 10.93 | %§ |
| Russell Emerging Markets Fund - Class C | Russell Emerging Markets® Index Net** | ||||
| Total | Total | ||||
| Return | Return | ||||
| 1 Year | 0.26 | % | 1 Year | 1.86 | % |
| 5 Years | 4.54 | %§ | 5 Years | 5.72 | %§ |
| 10 Years | 9.70 | %§ | 10 Years | 10.99 | %§ |
| Emerging Markets Linked Benchmark*** | |||||
| Russell Emerging Markets Fund - Class E | Total | ||||
| Total | 1 Year | 1.86 | % | ||
| Return | 5 Years | 5.17 | %§ | ||
| 1 Year | 1.09 | % | 10 Years | 10.83 | %§ |
| 5 Years | 5.34 | %§ | |||
| 10 Years | 10.53 | %§ | |||
| Russell Emerging Markets Fund - Class S | |||||
| Total | |||||
| Return | |||||
| 1 Year | 1.31 | % | |||
| 5 Years | 5.59 | %§ | |||
| 10 Years | 10.81 | %§ | |||
268 Russell Emerging Markets Fund
Russell Investment Company Russell Emerging Markets Fund
Portfolio Management Discussion and Analysis, continued — October 31, 2014 (Unaudited)
| The Russell Emerging Markets Fund (the “Fund”) employs | Brazilian markets sold off over the fiscal year driven by the |
| a multi-manager approach whereby portions of the Fund | anticipation of and the eventual achievement of Dilma Rousseff’s |
| are allocated to different money managers. Fund assets not | reelection. Investor confidence in her administration was at an |
| allocated to money managers are managed by Russell Investment | all-time low over the fiscal year due to her leadership over the |
| Management Company (“RIMCo”), the Fund’s advisor. RIMCo | country’s slowest economic growth in two decades. The Brazilian |
| may change the allocation of the Fund’s assets among money | sell-off drove emerging markets as a whole lower and also |
| managers at any time. An exemptive order from the Securities | negatively impacted the Fund’s absolute performance. |
| and Exchange Commission (“SEC”) permits RIMCo to engage | Russian markets sold off this year driven by geopolitical tensions |
| or terminate a money manager at any time, subject to approval | in Ukraine. This had a negative impact on the Fund’s absolute |
| by the Fund’s Board, without a shareholder vote. Pursuant to the | performance. Russian positions were approximately 6% of Fund |
| terms of the exemptive order, the Fund is required to notify its | holdings throughout the year, a benchmark-relative overweight. |
| shareholders within 90 days of when a money manager begins | |
| providing services. As of October 31, 2014, the Fund had eight | How did the investment strategies and techniques employed |
| money managers. | by the Fund and its money managers affect its benchmark- |
| What is the Fund’s investment objective? | relative performance? |
| The Fund seeks to provide long term capital growth. | AllianceBernstein L.P. (“Alliance”) outperformed the Fund’s |
| benchmark for the fiscal year. Alliance’s positive stock selection | |
| How did the Fund perform relative to its benchmark for the | in India was a key driver of outperformance this year, driven by |
| fiscal year ended October 31, 2014? | its overweight to Tata Motors and Bank of Baroda. In addition, |
| For the fiscal year ended October 31, 2014, the Fund’s Class | Alliance’s overweight to positions in the United Arab Emirates, |
| A, Class C, Class E, Class S and Class Y Shares gained 1.04%, | including Emaar Properties and First Gulf Bank, helped. In |
| 0.26%, 1.09%, 1.31% and 1.50%, respectively. This is compared | contrast, Alliance’s overweight to and negative stock selection |
| to the Fund’s benchmark, the Russell Emerging Markets Index | within Brazilian securities dampened performance. Alliance’s |
| Net, which gained 1.86% during the same period. The Fund’s | value focus did not have a strong impact on fiscal year performance. |
| performance includes operating expenses, whereas index returns | Delaware Management Company (“Delaware”) underperformed |
| are unmanaged and do not include expenses of any kind. | the Fund’s benchmark for the fiscal year. This was driven by |
| For the fiscal year ended October 31, 2014, the Morningstar® | negative stock selection in India and China, as Delaware held zero |
| Diversified Emerging Markets, a group of funds that Morningstar | weights in a number of the countries’ best performing securities. |
| considers to have investment strategies similar to those of the | In contrast, Delaware outperformed in South Korea, driven by |
| Fund, gained 1.37%. This result serves as a peer comparison and | overweights to KCC Corporation and SK Telecom. |
| is expressed net of operating expenses. | Genesis Asset Managers, LLP (“Genesis”) underperformed the |
| RIMCo may assign a money manager a specific style or | Fund’s benchmark for the fiscal year. Negative stock selection in |
| capitalization benchmark other than the Fund’s index. However, | China detracted from benchmark-relative performance. This was |
| the Fund’s primary index remains the benchmark for the Fund | driven by an overweight to China Resources, which sold off over |
| and is representative of the aggregate of each money manager’s | the period, and underweights to Tencent Holdings and Baidu Inc, |
| benchmark index. | which rallied. This was offset by an overweight to and positive |
| stock selection in India. Top positive contributors to benchmark- | |
| How did the market conditions described in the Market | relative performance in India included overweights to Sun |
| Summary report affect the Fund’s performance? | Pharmaceutical, Axis Bank and Lupin Limited. |
| During the fiscal year, market conditions in emerging markets | Harding Loevner LP (“Harding”) outperformed the Fund’s |
| were generally driven by geopolitical events. These were the | benchmark for the fiscal year. This was partially driven by an |
| largest drivers of returns in the emerging markets asset class. In | overweight to and positive stock selection in India. In particular, |
| particular, presidential elections in India and Brazil and tensions | Harding’s off-benchmark position in Maruti Suzuki contributed |
| in the Ukraine drove market movements. This, in turn, impacted | to benchmark-relative gains. In addition, positive stock selection |
| Fund performance in these regions. | in Taiwan driven by technology stocks added to outperformance. |
| Indian markets rallied significantly over the fiscal year driven | Offsetting benchmark-relative gains, Harding’s off-benchmark |
| by Prime Minister Modi’s election and anticipation of his reform | positions in Saudi Arabia detracted. Its underweight to and |
| agenda. This led to significant gains in Indian stocks, which | unsuccessful stock selection in China also contributed negatively |
| benefited the Fund’s absolute returns. | to benchmark-relative performance. |
Russell Emerging Markets Fund 269
Russell Investment Company Russell Emerging Markets Fund
Portfolio Management Discussion and Analysis, continued — October 31, 2014 (Unaudited)
| Numeric Investors LLC (“Numeric”) outperformed the Fund’s | off-benchmark positions in Qatar, Pakistan and Georgia which | |
| benchmark for the fiscal year. This was partially driven by positive | outperformed the benchmark. | |
| stock selection in and an overweight to India. In particular, | RIMCo manages the portion of the Fund’s assets that RIMCo | |
| Numeric held overweights to Tata Motors and Apollo Tyres, | determines not to allocate to the money managers. Assets not | |
| which outperformed during the period. Successful stock selection | allocated to managers include the Fund’s liquidity reserves and | |
| in Taiwan, driven by overweights to Inotera Memories and | assets which may be managed directly by RIMCo to modify the | |
| Micro-Star International, also contributed to benchmark-relative | Fund’s overall portfolio characteristics to seek to achieve the | |
| outperformance. Offsetting these gains, Numeric’s overweight to | desired risk/return profile for the Fund. | |
| and unsuccessful stock selection in Russia contributed negatively | ||
| to benchmark-relative performance. In particular, Numeric was | During the period, RIMCo used index futures, swaps and | |
| overweight Gazprom, Sberbank and LukOil, which sold off amid | currency forwards to equitize the Fund’s cash in order to gain | |
| escalating sanctions against Russia. | market exposure. At the beginning of the fiscal year, a portion | |
| of the Fund’s cash was unequitized in order to maintain the | ||
| Oaktree Capital Management, L.P. (“Oaktree”) was added to the | Fund’s overall beta exposure (beta is a measure of a portfolio’s | |
| Fund in March 2014 and underperformed the Fund’s benchmark | volatility and its sensitivity to the direction of the market) at | |
| for the portion of the fiscal year in which it was a manager in the | close to benchmark-neutral. In April, 2014, RIMCo terminated | |
| Fund. This was driven by unsuccessful stock selection in China | all unequitized cash positions in order to continue to maintain | |
| and South Korea. Off-benchmark weights in Galaxy Entertainment | the Fund’s overall beta exposure at close to benchmark-neutral. | |
| Group and Sands China were detractors, as these stocks sold- | Over the period, RIMCo’s cash equitization strategy had a neutral | |
| off after China clamped down with its anti-graft campaign. | effect on the Fund’s performance. | |
| Oaktree’s overweights to Samsung and Hyundai also contributed | ||
| negatively to benchmark-relative performance. Offsetting losses, | Describe any changes to the Fund’s structure or the money | |
| Oaktree’s successful stock selection in Taiwan, driven by Taiwan | manager line-up. | |
| Semiconductor, contributed to benchmark-relative gains. | In March 2014, RIMCo terminated Victoria 1522 Investments, | |
| UBS Global Asset Management (Americas) Inc. (“UBS”) | L.P. as a money manager for the Fund and hired Oaktree Capital | |
| outperformed the Fund’s benchmark for the fiscal year. This | Management, L.P. as a money manager for the Fund. RIMCo | |
| was driven by positive stock selection in South Korea and | believed that Oaktree was a good structural fit for the Fund as | |
| Taiwan. In particular, UBS’ overweight positions in SK Hynix | exhibited by its opportunistic approach. | |
| and Amorepacific Corp drove benchmark-relative gains. In | Money Managers as of October 31, | |
| addition, UBS was overweight Largan Precision Co. in Taiwan, | 2014 | Styles |
| which underpinned outperformance. Offsetting gains, UBS’ | ||
| AllianceBernstein L.P. | Value | |
| unsuccessful stock selection in China, driven by overweights to | Delaware Management Company | Value |
| Youku Tudou, China Cinda Asset Management and Qihoo 360, | Genesis Asset Managers, LLP | Market-Oriented |
| led to benchmark-relative losses. | Harding Loevner LP | Market-Oriented |
| Numeric Investors LLC | Value | |
| Westwood Management Corp (“Westwood”) outperformed the | Oaktree Capital Management, L.P. | Market-Oriented |
| Russell Emerging Markets SMID Extended Net Index for the | Westwood Management Corp. | Market-Oriented |
| fiscal year. This was driven by positive stock selection in and | UBS Global Asset Management (Americas) | |
| an overweight to India. In particular, Westwood’s overweights in | Inc. | Growth |
| Bharat Forge and Titan Company and its off-benchmark weight | The views expressed in this report reflect those of the portfolio | |
| in Bharat Heavy Electricals fueled outperformance. In addition, | managers only through the end of the period covered by | |
| successful stock selection in Taiwan, driven by an overweight | the report. These views do not necessarily represent the | |
| to Largan Precision, contributed to benchmark-relative gains. | views of RIMCo, or any other person in RIMCo or any other | |
| Offsetting gains were Westwood’s overweight to and unsuccessful | affiliated organization. These views are subject to change | |
| stock selection in Turkey. Poor stock selection in South Africa | at any time based upon market conditions or other events, | |
| also contributed to benchmark-relative losses. | and RIMCo disclaims any responsibility to update the views | |
| contained herein. These views should not be relied on as | ||
| Victoria 1522 Investments, L.P. (“Victoria”) was terminated from | investment advice and, because investment decisions for | |
| the Fund in March 2014 and outperformed the Fund’s benchmark | a Russell Investment Company (“RIC”) Fund are based on | |
| for the portion of the period in which it was a money manager in | numerous factors, should not be relied on as an indication | |
| the Fund. This was driven by an overweight position in Emaar | of investment decisions of any RIC Fund. | |
| Properties, which had significant gains. In addition, Victoria held | ||
| 270 Russell Emerging Markets Fund | ||
Russell Investment Company
Russell Emerging Markets Fund
Portfolio Management Discussion and Analysis, continued — October 31, 2014 (Unaudited)
| * | Assumes initial investment on November 1, 2004. |
| ** | The Russell Emerging Markets® Index is an index which measures the performance of the investable securities in emerging countries globally. It is constructed to provide a comprehensive and unbiased barometer for this market segment and is completely reconstituted annually to accurately reflect the changes in the market over time. |
| *** | The Emerging Markets Linked Benchmark provides a means to compare the Fund’s average annual returns to a secondary benchmark that takes into account historical changes in the Fund’s primary benchmark. The Emerging Markets Linked Benchmark represents the returns of the MSCI Emerging Markets Index (net of tax on dividends from foreign holdings) through December 31, 2010 and the returns of the Russell Emerging Markets Index (net of tax on dividends from foreign holdings) thereafter. |
| ‡ | The Fund first issued Class A Shares on March 1, 2007. The returns shown for Class A Shares prior to that date are the returns of Class E Shares. The performance shown has been adjusted to reflect the deduction of the maximum Class A sales charge of 5.75%. Annual returns for each Class will differ only to the extent that the Class A Shares do not have the same expenses as Class E Shares. |
| ‡‡ | The Fund first issued Class Y Shares on September 26, 2008. The returns shown for Class Y Shares prior to that date are the returns of the Fund’s Class S Shares. Y Shares will have substantially similar annual returns as the Class S Shares because the Shares of each Class are invested in the same portfolio of securities. Annual returns for each Class will differ only to the extent that the Class Y Shares do not have the same expenses as the Class S Shares. |
| § | Annualized. |
Performance is historical and assumes reinvestment of all dividends and capital gains. Investment return and principal value will fluctuate so that an investor’s shares, when redeemed, may be worth more or less than when purchased. Past performance is not indicative of future results. The returns shown do not reflect the deduction of taxes that a shareholder would pay on Fund distributions or the redemption of Fund shares.
Russell Emerging Markets Fund 271
Russell Investment Company Russell Emerging Markets Fund
Shareholder Expense Example — October 31, 2014 (Unaudited)
| Fund Expenses | Please note that the expenses shown in the table are meant | |||||
| The following disclosure provides important information | to highlight your ongoing costs only and do not reflect any | |||||
| regarding the Fund’s Shareholder Expense Example | transactional costs. Therefore, the information under the heading | |||||
| (“Example”). | “Hypothetical Performance (5% return before expenses)” is | |||||
| useful in comparing ongoing costs only, and will not help you | ||||||
| Example | determine the relative total costs of owning different funds. In | |||||
| As a shareholder of the Fund, you incur two types of costs: (1) | addition, if these transactional costs were included, your costs | |||||
| transaction costs, and (2) ongoing costs, including advisory and | would have been higher. | |||||
| administrative fees; distribution (12b-1) and/or service fees; | Hypothetical | |||||
| and other Fund expenses. The Example is intended to help | Performance (5% | |||||
| you understand your ongoing costs (in dollars) of investing in | Actual | return before | ||||
| the Fund and to compare these costs with the ongoing costs of | Class A | Performance | expenses) | |||
| Beginning Account Value | ||||||
| investing in other mutual funds. The Example is based on an | May 1, 2014 | $ | 1,000.00 | $ | 1,000.00 | |
| investment of $1,000 invested at the beginning of the period and | Ending Account Value | |||||
| held for the entire period indicated, which for this Fund is from | October 31, 2014 | $ | 1,033.50 | $ | 1,016.33 | |
| May 1, 2014 to October 31, 2014. | Expenses Paid During Period* | $ | 9.02 | $ | 8.94 | |
| Actual Expenses | * Expenses are equal to the Fund's annualized expense ratio of 1.76% | |||||
| (representing the six month period annualized), multiplied by the average | ||||||
| The information in the table under the heading “Actual | account value over the period, multiplied by 184/365 (to reflect the one-half | |||||
| Performance” provides information about actual account values | year period). | |||||
| and actual expenses. You may use the information in this column, | ||||||
| together with the amount you invested, to estimate the expenses | Hypothetical | |||||
| Performance (5% | ||||||
| that you paid over the period. Simply divide your account value by | Actual | return before | ||||
| $1,000 (for example, an $8,600 account value divided by $1,000 | Class C | Performance | expenses) | |||
| = 8.6), then multiply the result by the number in the first column | Beginning Account Value | |||||
| in the row entitled “Expenses Paid During Period” to estimate | May 1, 2014 | $ | 1,000.00 | $ | 1,000.00 | |
| Ending Account Value | ||||||
| the expenses you paid on your account during this period. | October 31, 2014 | $ | 1,029.20 | $ | 1,012.55 | |
| Expenses Paid During Period* | $ | 12.84 | $ | 12.73 | ||
| Hypothetical Example for Comparison Purposes | ||||||
| The information in the table under the heading “Hypothetical | * Expenses are equal to the Fund's annualized expense ratio of 2.51% | |||||
| Performance (5% return before expenses)” provides information | (representing the six month period annualized), multiplied by the average | |||||
| account value over the period, multiplied by 184/365 (to reflect the one-half | ||||||
| about hypothetical account values and hypothetical expenses | year period). | |||||
| based on the Fund’s actual expense ratio and an assumed rate of | ||||||
| return of 5% per year before expenses, which is not the Fund’s | Hypothetical | |||||
| actual return. The hypothetical account values and expenses | Performance (5% | |||||
| Actual | return before | |||||
| may not be used to estimate the actual ending account balance or | Class E | Performance | expenses) | |||
| expenses you paid for the period. You may use this information | Beginning Account Value | |||||
| to compare the ongoing costs of investing in the Fund and other | May 1, 2014 | $ | 1,000.00 | $ | 1,000.00 | |
| funds. To do so, compare this 5% hypothetical example with the | Ending Account Value | |||||
| October 31, 2014 | $ | 1,033.40 | $ | 1,016.33 | ||
| 5% hypothetical examples that appear in the shareholder reports | Expenses Paid During Period* | $ | 9.02 | $ | 8.94 | |
| of other funds. | ||||||
| * Expenses are equal to the Fund's annualized expense ratio of 1.76% | ||||||
| (representing the six month period annualized), multiplied by the average | ||||||
| account value over the period, multiplied by 184/365 (to reflect the one-half | ||||||
| year period). | ||||||
272 Russell Emerging Markets Fund
Russell Investment Company Russell Emerging Markets Fund
Shareholder Expense Example, continued — October 31, 2014 (Unaudited)
| Hypothetical | |||||
| Performance (5% | |||||
| Actual | return before | ||||
| Class S | Performance | expenses) | |||
| Beginning Account Value | |||||
| May 1, 2014 | $ | 1,000.00 | $ | 1,000.00 | |
| Ending Account Value | |||||
| October 31, 2014 | $ | 1,034.40 | $ | 1,017.59 | |
| Expenses Paid During Period* | $ | 7.74 | $ | 7.68 | |
| * Expenses are equal to the Fund's annualized expense ratio of 1.51% | |||||
| (representing the six month period annualized), multiplied by the average | |||||
| account value over the period, multiplied by 184/365 (to reflect the one-half | |||||
| year period). | |||||
| Hypothetical | |||||
| Performance (5% | |||||
| Actual | return before | ||||
| Class Y | Performance | expenses) | |||
| Beginning Account Value | |||||
| May 1, 2014 | $ | 1,000.00 | $ | 1,000.00 | |
| Ending Account Value | |||||
| October 31, 2014 | $ | 1,035.50 | $ | 1,018.60 | |
| Expenses Paid During Period* | $ | 6.72 | $ | 6.67 | |
| * Expenses are equal to the Fund's annualized expense ratio of 1.31% | |||||
| (representing the six month period annualized), multiplied by the average | |||||
| account value over the period, multiplied by 184/365 (to reflect the one-half | |||||
| year period). | |||||
Russell Emerging Markets Fund 273
| Russell Investment Company | |||||||||||
| Russell Emerging Markets Fund | |||||||||||
| Schedule of Investments — October 31, 2014 | |||||||||||
| Amounts in thousands (except share amounts) | Amounts in thousands (except share amounts) | ||||||||||
| Principal | Fair | Principal | Fair | ||||||||
| Amount ($) | Value | Amount ($) | Value | ||||||||
| or Shares | $ | or Shares | $ | ||||||||
| Common Stocks - 91.2% | Gol Linhas Aereas Inteligentes SA | ||||||||||
| Argentina - 0.1% | - ADR(Æ) | 552,000 | 2,854 | ||||||||
| Banco Macro SA - ADR(Ñ) | 20,270 | 856 | Grendene SA | 375,410 | 2,650 | ||||||
| YPF SA - ADR | 51,600 | 1,815 | Grupo BTG Pactual Class Miscellaneous | 180,987 | 2,290 | ||||||
| 2,671 | HRT Participacoes em Petroleo SA(Æ) | 27,300 | 107 | ||||||||
| Hypermarcas SA(Æ) | 859,100 | 6,001 | |||||||||
| Austria - 0.1% | Itau Unibanco Holding SA - ADR | 1,766,284 | 26,070 | ||||||||
| Vienna Insurance Group AG | 33,998 | 1,634 | JBS SA | 2,161,500 | 9,639 | ||||||
| Bermuda - 1.7% | Light SA | 354,400 | 2,911 | ||||||||
| Asian Citrus Holdings, Ltd. | 1,010,000 | 181 | Linx S.A.(Æ) | 39,600 | 823 | ||||||
| Brilliance China Automotive Holdings, | Lojas Renner SA | 91,215 | 2,731 | ||||||||
| Ltd. | 776,000 | 1,341 | MRV Engenharia e Participacoes SA | 118,000 | 391 | ||||||
| China Foods, Ltd.(Æ) | 901,732 | 337 | Odontoprev SA | 65,228 | 236 | ||||||
| China Resources Gas Group, Ltd. | 806,594 | 2,304 | Petroleo Brasileiro SA - ADR(Æ)(Ñ) | 3,119,509 | 37,075 | ||||||
| Credicorp, Ltd. | 96,500 | 15,536 | Porto Seguro SA | 237,289 | 2,844 | ||||||
| Haier Electronics Group Co., Ltd. | 1,866,000 | 5,041 | Rossi Residencial SA(Æ) | 1,779,677 | 704 | ||||||
| Hopson Development Holdings, Ltd.(Æ) | 490,000 | 435 | Sao Martinho SA | 54,100 | 851 | ||||||
| Huabao International Holdings, Ltd. | 6,105,000 | 4,361 | Smiles SA(Æ) | 93,700 | 1,618 | ||||||
| Kosmos Energy, Ltd.(Æ) | 111,462 | 1,040 | Telefonica Brasil SA - ADR(Ñ) | 105,870 | 2,164 | ||||||
| Nine Dragons Paper Holdings, Ltd. | 6,489,000 | 5,029 | Tim Participacoes SA - ADR | 372,800 | 10,259 | ||||||
| Skyworth Digital Holdings, Ltd. | 8,428,000 | 4,619 | Tractebel Energia SA | 126,501 | 1,723 | ||||||
| SmarTone Telecommunications Holdings, | Ultrapar Participacoes SA | 55,192 | 1,204 | ||||||||
| Ltd. | 2,224,726 | 2,860 | Ultrapar Participacoes SA - ADR | 7,100 | 154 | ||||||
| VTech Holdings, Ltd. | 245,798 | 3,078 | Vale SA Class B - ADR(Ñ) | 1,697,997 | 15,658 | ||||||
| Yue Yuen Industrial Holdings, Ltd. | 1,248,000 | 4,184 | 279,867 | ||||||||
| 50,346 | Canada - 0.3% | ||||||||||
| Brazil - 9.4% | First Quantum Minerals, Ltd.(Æ) | 503,380 | 7,593 | ||||||||
| ALL - America Latina Logistica SA | 1,375,023 | 3,768 | Torex Gold Resources, Inc.(Æ) | 471,855 | 502 | ||||||
| AMBEV SA - ADR | 718,600 | 4,800 | 8,095 | ||||||||
| B2W Cia Digital(Æ) | 970,376 | 12,641 | |||||||||
| Banco Bradesco SA - ADR | 900,990 | 13,497 | Cayman Islands - 6.5% | ||||||||
| Banco Bradesco SA(Æ) | 238,200 | 3,507 | 51job, Inc. - ADR(Æ)(Ñ) | 152,588 | 4,684 | ||||||
| Banco do Brasil SA | 1,489,200 | 16,666 | AAC Technologies Holdings, Inc. | 326,404 | 1,955 | ||||||
| Banco Santander Brasil SA - ADR(Æ)(Ñ) | 854,681 | 4,684 | Alibaba Group Holding, Ltd. - ADR(Æ) | 59,200 | 5,837 | ||||||
| Banco Santander SA(Æ) | 838,584 | 2,572 | ANTA Sports Products, Ltd. | 1,363,000 | 2,671 | ||||||
| BB Seguridade Participacoes SA | 910,600 | 12,149 | Asia Cement China Holdings Corp.(Ñ) | 349,000 | 198 | ||||||
| BM&FBovespa SA | 769,100 | 3,383 | ASM Pacific Technology, Ltd. | 1,222,266 | 13,444 | ||||||
| BR Malls Participacoes SA | 337,512 | 2,711 | Baidu, Inc. - ADR(Æ) | 98,600 | 23,543 | ||||||
| Belle International Holdings, Ltd. Class | |||||||||||
| Braskem SA - ADR(Ñ) | 227,338 | 3,335 | H | 4,345,000 | 5,530 | ||||||
| BRF SA - ADR(Æ)(Ñ) | 609,832 | 15,886 | Casetek Holdings, Ltd. | 939,000 | 5,773 | ||||||
| BRF SA(Æ) | 216,600 | 5,637 | Chaowei Power Holdings, Ltd.(Ñ) | 460,000 | 258 | ||||||
| CCR SA | 155,592 | 1,159 | China Forestry Holdings Co., Ltd.(Æ) | 871,100 | — | ||||||
| Centrais Eletricas Brasileiras SA(Æ) | 406,200 | 1,020 | China Great Star International, Ltd.(Æ) | 724,706 | 1,580 | ||||||
| Cia Brasileira de Distribuicao - ADR(Ñ) | 253,008 | 10,576 | China Hongqiao Group, Ltd. | 1,852,000 | 1,426 | ||||||
| Cia de Saneamento Basico do Estado de | China Lumena New Materials Corp.(Æ) | ||||||||||
| Sao Paulo(Æ) | 334,440 | 2,617 | (Ñ) | 3,024,000 | 487 | ||||||
| Cia de Saneamento de Minas | China Mengniu Dairy Co., Ltd. | 1,402,000 | 6,192 | ||||||||
| Gerais-COPASA(Æ) | 278,200 | 3,168 | |||||||||
| Cia Energetica de Minas Gerais | China Metal Recycling Holdings, Ltd. | ||||||||||
| - ADR(Ñ) | 577,681 | 3,339 | (Æ) | 335,400 | 408 | ||||||
| Cia Paranaense de Energia - ADR(Ñ) | 202,102 | 2,850 | China Resources Cement Holdings, Ltd. | 2,478,000 | 1,684 | ||||||
| Cielo SA | 616,000 | 10,115 | CIFI Holdings Group Co., Ltd. | 9,574,000 | 1,778 | ||||||
| Even Construtora e Incorporadora SA | 990,000 | 2,142 | CKH Food & Health, Ltd.(Æ) | 247,965 | 845 | ||||||
| Fibria Celulose SA - ADR(Æ)(Ñ) | 409,600 | 5,009 | Country Garden Holdings Co., Ltd. | 5,846,400 | 2,299 | ||||||
| Gafisa SA | 1,117,500 | 1,218 | Ctrip.com International, Ltd. - ADR(Æ) | 67,800 | 3,953 | ||||||
| Gerdau SA - ADR | 85,304 | 386 | ENN Energy Holdings, Ltd. | 408,500 | 2,649 | ||||||
| Gerdau SA | 20,287 | 75 | Eurasia Drilling Co., Ltd. - GDR | 59,265 | 1,482 | ||||||
| Evergrande Real Estate Group, Ltd.(Ñ) | 6,736,000 | 2,588 | |||||||||
| GCL-Poly Energy Holdings, Ltd.(Æ) | 14,457,000 | 4,884 | |||||||||
| See accompanying notes which are an integral part of the financial statements. | |||||||||||
| 274 Russell Emerging Markets Fund | |||||||||||
| Russell Investment Company | |||||||||||
| Russell Emerging Markets Fund | |||||||||||
| Schedule of Investments, continued — October 31, 2014 | |||||||||||
| Amounts in thousands (except share amounts) | Amounts in thousands (except share amounts) | ||||||||||
| Principal | Fair | Principal | Fair | ||||||||
| Amount ($) | Value | Amount ($) | Value | ||||||||
| or Shares | $ | or Shares | $ | ||||||||
| Geely Automobile Holdings, Ltd. | 3,785,000 | 1,694 | Beijing Yanjing Brewery Co., Ltd. Class | ||||||||
| Golden Eagle Retail Group, Ltd.(Ñ) | 1,399,070 | 1,714 | A | 641,196 | 723 | ||||||
| JA Solar Holdings Co., Ltd. - ADR(Æ) | China Cinda Asset Management Co., | ||||||||||
| (Ñ) | 345,261 | 2,890 | Ltd. Class H(Æ) | 13,894,400 | 6,575 | ||||||
| JD.com, Inc. - ADR(Æ)(Ñ) | 196,503 | 4,694 | China CITIC Bank Corp., Ltd. Class H | 12,541,000 | 8,166 | ||||||
| JinkoSolar Holding Co., Ltd. - ADR(Æ) | China Construction Bank Corp. Class H | 38,864,120 | 28,966 | ||||||||
| (Ñ) | 12,900 | 318 | China Merchants Bank Co., Ltd. Class H | 3,690,467 | 6,833 | ||||||
| Ju Teng International Holdings, Ltd. | 3,593,000 | 2,001 | China Modern Dairy Holdings(Æ)(Ñ) | 6,159,000 | 2,716 | ||||||
| Jumei International Holding, Ltd. - | China National Building Material Co., | ||||||||||
| ADR(Æ)(Ñ) | 84,700 | 2,280 | Ltd. Class H | 2,296,693 | 2,129 | ||||||
| Kaisa Group Holdings, Ltd.(Ñ) | 7,663,000 | 2,846 | China Pacific Insurance Group Co., Ltd. | ||||||||
| KWG Property Holding, Ltd. | 12,526,900 | 8,690 | Class H | 2,092,000 | 7,823 | ||||||
| Li Ning Co., Ltd.(Æ)(Ñ) | 1,458,405 | 773 | China Petroleum & Chemical Corp. | ||||||||
| Longfor Properties Co., Ltd. | 1,144,552 | 1,327 | Class H | 13,992,750 | 12,125 | ||||||
| Mindray Medical International, Ltd. | China Railway Construction Corp., Ltd. | ||||||||||
| - ADR(Ñ) | 44,632 | 1,301 | Class H | 2,880,000 | 3,023 | ||||||
| Mongolian Mining Corp.(Æ)(Ñ) | 2,338,052 | 208 | China Shenhua Energy Co., Ltd. Class H | 1,565,000 | 4,409 | ||||||
| NetEase, Inc. - ADR | 39,813 | 3,771 | China Shipping Container Lines Co., | ||||||||
| Parkson Retail Group, Ltd. | 328,308 | 96 | Ltd. Class H(Æ) | 18,238,000 | 5,197 | ||||||
| Perfect World Co., Ltd. - ADR | 24,900 | 517 | China South Locomotive and Rolling | ||||||||
| Qihoo 360 Technology Co., Ltd. - | Stock Corp. | 3,662,175 | 3,726 | ||||||||
| ADR(Æ)(Ñ) | 88,300 | 6,444 | China Telecom Corp., Ltd. Class H | 3,404,000 | 2,168 | ||||||
| Real Gold Mining, Ltd.(Æ) | 463,232 | — | China Vanke Co., Ltd.(Æ) | 1,733,400 | 3,232 | ||||||
| Sands China, Ltd. | 873,387 | 5,440 | Chongqing Rural Commercial Bank Co., | ||||||||
| Shimao Property Holdings, Ltd. | 3,886,000 | 8,358 | Ltd. Class H | 4,237,000 | 2,038 | ||||||
| Silicon Motion Technology Corp. - ADR | 102,514 | 2,431 | Cosmo Lady Holdings Co. Ltd.(Æ) | 2,918,673 | 1,758 | ||||||
| SINA Corp.(Æ) | 55,900 | 2,290 | Datang International Power Generation | ||||||||
| SouFun Holdings, Ltd. - ADR(Ñ) | 100,200 | 977 | Co., Ltd. Class H | 348,000 | 183 | ||||||
| Sunac China Holdings, Ltd. | 4,255,000 | 3,682 | Dongfeng Motor Group Co., Ltd. Class H | 850,000 | 1,313 | ||||||
| TCL Communication Technology | Great Wall Motor Co., Ltd. Class H | 810,000 | 3,551 | ||||||||
| Holdings, Ltd.(Ñ) | 1,264,000 | 1,242 | Gree Electric Appliances, Inc.(Æ) | 276,100 | 1,283 | ||||||
| Tingyi Cayman Islands Holding Corp. | 2,176,000 | 5,410 | Huadian Fuxin Energy Corp.(Æ) | 4,550,000 | 2,617 | ||||||
| Trina Solar, Ltd. - ADR(Æ)(Ñ) | 584,000 | 6,167 | Huadian Power International Corp., Ltd. | ||||||||
| Uni-President China Holdings, Ltd. | 5,285,200 | 4,886 | Class H | 7,870,000 | 6,008 | ||||||
| Want Want China Holdings, Ltd. | 2,718,000 | 3,708 | Huaneng Power International, Inc. Class | ||||||||
| WH Group, Ltd.(Æ)(Þ) | 4,356,000 | 2,848 | H | 1,214,000 | 1,490 | ||||||
| WuXi PharmaTech Cayman, Inc. | Industrial & Commercial Bank of China, | ||||||||||
| - ADR(Æ) | 91,266 | 3,441 | Ltd. Class H | 31,360,000 | 20,744 | ||||||
| Xingda International Holdings, Ltd. | 1,050,000 | 363 | Jiangnan Group Ltd.(Æ)(Ñ) | 7,342,000 | 1,467 | ||||||
| Xinyi Glass Holdings, Ltd. | 7,128,605 | 4,210 | Jiangsu Yanghe Brewery Joint-Stock Co., | ||||||||
| Yuzhou Properties Co., Ltd. | 2,041,000 | 474 | Ltd. Class A | 105,046 | 1,038 | ||||||
| 193,639 | Kweichow Moutai Co., Ltd.(Æ) | 44,684 | 1,145 | ||||||||
| Metallurgical Corp. of China(Æ) | 8,857,000 | 2,433 | |||||||||
| Chile - 0.2% | PetroChina Co., Ltd. - ADR(Ñ) | 34,300 | 4,305 | ||||||||
| Cia Cervecerias Unidas SA - ADR | 180,181 | 1,897 | Ping An Insurance Group Co. of China, | ||||||||
| Embotelladora Andina SA - ADR(Ñ) | 42,553 | 779 | Ltd. Class H | 546,000 | 4,460 | ||||||
| Entel Chile SA | 223,059 | 2,412 | Qinhuangdao Port Co. Ltd.(Æ) | 771,500 | 386 | ||||||
| Sociedad Quimica y Minera de Chile | Shanghai Mechanical and Electrical | ||||||||||
| SA - ADR | 87,600 | 2,079 | Industry Co., Ltd. Class B | 219,034 | 451 | ||||||
| 7,167 | Shanghai Pharmaceuticals Holding Co., | ||||||||||
| Ltd. Class H | 2,321,000 | 5,812 | |||||||||
| China - 7.0% | Shenzhen Expressway Co., Ltd. Class H | 530,000 | 339 | ||||||||
| Agricultural Bank of China, Ltd. Class H | 6,089,000 | 2,827 | Tsingtao Brewery Co., Ltd. Class H | 1,214,000 | 8,970 | ||||||
| Anhui Conch Cement Co., Ltd. Class | Weiqiao Textile Co. Class H | 500,500 | 250 | ||||||||
| H(Ñ) | 1,643,057 | 5,381 | Wumart Stores, Inc. Class H | 2,031,327 | 1,758 | ||||||
| Anhui Conch Cement Co., Ltd. Class A | 641,346 | 1,808 | Zhejiang Expressway Co., Ltd. Class H | 1,084,000 | 1,093 | ||||||
| Bank of China, Ltd. Class H | 43,006,000 | 20,574 | ZTE Corp. Class H | 1,800,600 | 4,365 | ||||||
| Bank of Communications Co., Ltd. Class | 208,131 | ||||||||||
| H | 220,000 | 165 | |||||||||
| Beijing Capital Land, Ltd. Class H | 892,000 | 308 | |||||||||
| See accompanying notes which are an integral part of the financial statements. | |||||||||||
| Russell Emerging Markets Fund 275 | |||||||||||
| Russell Investment Company | ||||||||||
| Russell Emerging Markets Fund | ||||||||||
| Schedule of Investments, continued — October 31, 2014 | ||||||||||
| Amounts in thousands (except share amounts) | Amounts in thousands (except share amounts) | |||||||||
| Principal | Fair | Principal | Fair | |||||||
| Amount ($) | Value | Amount ($) | Value | |||||||
| or Shares | $ | or Shares | $ | |||||||
| Colombia - 0.3% | Bank of Baroda | 334,876 | 5,070 | |||||||
| Almacenes Exito SA | 165,705 | 2,337 | Bharti Airtel, Ltd. | 2,126,593 | 13,816 | |||||
| Bancolombia SA | 114,038 | 1,563 | Dabur India, Ltd. Class A | 1,655,221 | 6,106 | |||||
| Bancolombia SA - ADR(Ñ) | 107,533 | 6,083 | GHCL, Ltd.(Æ) | 211,436 | 294 | |||||
| 9,983 | Gujarat State Fertilisers & Chemicals, | |||||||||
| Ltd. | 418,054 | 826 | ||||||||
| Cyprus - 0.0% | HCL Technologies, Ltd. | 97,500 | 2,554 | |||||||
| Global Ports Investments PLC - GDR | 37,002 | 230 | HDFC Bank, Ltd. - ADR | 21,500 | 1,127 | |||||
| Global Ports Investments PLC - GDR(Þ) | 32,776 | 203 | Hero MotoCorp, Ltd. | 53,676 | 2,679 | |||||
| Qiwi PLC - ADR | 9,758 | 309 | Housing Development & Infrastructure, | |||||||
| 742 | Ltd.(Æ) | 1,801,269 | 2,442 | |||||||
| Czech Republic - 0.4% | Housing Development Finance Corp. | 187,500 | 3,377 | |||||||
| Komercni Banka AS | 56,109 | 12,019 | ICICI Bank, Ltd. - ADR | 324,233 | 18,274 | |||||
| ICICI Bank, Ltd. | 128,310 | 3,399 | ||||||||
| Egypt - 0.1% | Indiabulls Housing Finance Ltd(Æ) | 382,451 | 2,606 | |||||||
| Commercial International Bank Egypt | Infosys, Ltd. - ADR(Ñ) | 79,639 | 5,325 | |||||||
| SAE | 384,151 | 2,594 | Infosys, Ltd. | 30,398 | 2,006 | |||||
| ITC, Ltd. | 1,407,384 | 8,142 | ||||||||
| Greece - 0.1% | JK Tyre & Industries, Ltd. | 340,843 | 2,726 | |||||||
| Hellenic Telecommunications | Kotak Mahindra Bank, Ltd. | 314,295 | 5,724 | |||||||
| Organization SA(Æ) | 59,950 | 677 | LIC Housing Finance, Ltd. | 123,698 | 729 | |||||
| Public Power Corp. SA(Æ) | 111,354 | 846 | Lupin, Ltd. | 218,784 | 4,878 | |||||
| 1,523 | Mahindra & Mahindra, Ltd. | 126,242 | 2,686 | |||||||
| Maruti Suzuki India, Ltd. | 158,340 | 8,606 | ||||||||
| Hong Kong - 4.5% | NTPC, Ltd. | 1,795,620 | 4,390 | |||||||
| AIA Group, Ltd. | 2,336,830 | 13,032 | Oriental Bank of Commerce | 219,854 | 1,022 | |||||
| BYD Electronic International Co., Ltd. | 7,897,500 | 9,400 | Petronet LNG, Ltd. | 1,462,681 | 4,751 | |||||
| China Fiber Optic Network System | Power Finance Corp., Ltd. | 540,370 | 2,485 | |||||||
| Group, Ltd.(Æ)(Ñ) | 6,738,000 | 2,042 | Punjab National Bank | 193,513 | 2,934 | |||||
| China Merchants Holdings International | Reliance Industries, Ltd. | 999,894 | 16,294 | |||||||
| Co., Ltd. | 1,154,486 | 3,647 | Reliance Industries, Ltd. - GDR(Þ) | 459,343 | 14,883 | |||||
| China Mobile, Ltd. | 1,180,232 | 14,686 | Rural Electrification Corp., Ltd. | 247,103 | 1,215 | |||||
| China Mobile, Ltd. - ADR | 258,365 | 16,042 | Shriram Transport Finance Co., Ltd. | 4,343 | 67 | |||||
| China Overseas Land & Investment, Ltd. | 4,496,667 | 13,046 | State Bank of India | 48,100 | 2,117 | |||||
| China Power International Development, | Sun Pharmaceutical Industries, Ltd. | 1,140,628 | 15,705 | |||||||
| Ltd.(Ñ) | 1,873,000 | 845 | Tata Chemicals, Ltd. | 316,601 | 2,098 | |||||
| China Resources Enterprise, Ltd. | 1,654,480 | 3,934 | Tata Consultancy Services, Ltd. | 221,180 | 9,394 | |||||
| China Resources Power Holdings Co., | Tata Global Beverages, Ltd. | 610,733 | 1,592 | |||||||
| Ltd. | 754,000 | 2,193 | Tata Motors, Ltd. Class A | 1,719,916 | 9,392 | |||||
| China Unicom Hong Kong, Ltd. | 4,644,000 | 6,982 | Tata Motors, Ltd. | 569,020 | 4,966 | |||||
| China Unicom Hong Kong, Ltd. | Tata Motors, Ltd. - ADR(Ñ) | 446,100 | 21,011 | |||||||
| - ADR(Ñ) | 31,195 | 467 | Tata Sponge Iron, Ltd.(Æ) | 55,615 | 648 | |||||
| CNOOC, Ltd. - ADR(Ñ) | 51,066 | 7,985 | Tata Steel, Ltd. | 523,760 | 4,180 | |||||
| Galaxy Entertainment Group, Ltd. | 1,270,000 | 8,671 | Ultratech Cement, Ltd. | 57,470 | 2,385 | |||||
| Lenovo Group, Ltd. | 7,476,000 | 11,009 | Union Bank of India | 726,680 | 2,670 | |||||
| PAX Global Technology, Ltd.(Æ) | 3,001,000 | 3,220 | United Phosphorus, Ltd. | 1,025,621 | 5,822 | |||||
| TCC International Holdings, Ltd.(Æ) | 1,262,000 | 508 | Zee Entertainment Enterprises, Ltd. | 641,343 | 3,596 | |||||
| Tencent Holdings, Ltd.(Æ) | 1,017,900 | 16,223 | 258,320 | |||||||
| 133,932 | ||||||||||
| Hungary - 0.5% | Indonesia - 2.1% | |||||||||
| Alam Sutera Realty Tbk PT | 12,210,600 | 469 | ||||||||
| OTP Bank PLC | 353,712 | 5,848 | Astra International Tbk PT | 7,295,600 | 4,090 | |||||
| Richter Gedeon Nyrt | 638,776 | 9,751 | Bank Mandiri Persero Tbk PT | 3,972,500 | 3,402 | |||||
| 15,599 | Bank Negara Indonesia Persero Tbk PT | 3,066,700 | 1,510 | |||||||
| India - 8.7% | Bank Rakyat Indonesia Persero Tbk PT | 15,455,200 | 14,164 | |||||||
| Allahabad Bank | 913,942 | 1,709 | Bank Tabungan Pensiunan Nasional Tbk | |||||||
| Ambuja Cements, Ltd. | 1,878,347 | 6,964 | PT(Æ) | 492,300 | 172 | |||||
| Apollo Tyres, Ltd. | 275,055 | 982 | Ciputra Development Tbk PT | 7,255,800 | 687 | |||||
| Axis Bank, Ltd.(Æ) | 1,628,770 | 11,656 | Energi Mega Persada Tbk PT(Æ) | 50,144,000 | 469 | |||||
| Indocement Tunggal Prakarsa Tbk PT | 1,465,871 | 2,911 | ||||||||
| See accompanying notes which are an integral part of the financial statements. | ||||||||||
| 276 Russell Emerging Markets Fund | ||||||||||
| Russell Investment Company | |||||||||||
| Russell Emerging Markets Fund | |||||||||||
| Schedule of Investments, continued — October 31, 2014 | |||||||||||
| Amounts in thousands (except share amounts) | Amounts in thousands (except share amounts) | ||||||||||
| Principal | Fair | Principal | Fair | ||||||||
| Amount ($) | Value | Amount ($) | Value | ||||||||
| or Shares | $ | or Shares | $ | ||||||||
| Indofood CBP Sukses Makmur Tbk PT | 6,367,400 | 5,822 | Westports Holdings BHD | 975,846 | 890 | ||||||
| Lippo Cikarang Tbk PT(Æ) | 543,800 | 382 | 31,243 | ||||||||
| Lippo Karawaci Tbk PT | 18,264,500 | 1,617 | |||||||||
| Malindo Feedmill Tbk PT | 9,564,588 | 2,473 | Mexico - 4.2% | ||||||||
| Media Nusantara Citra Tbk PT | 12,726,225 | 2,949 | Alfa SAB de CV Class A | 874,000 | 2,785 | ||||||
| Perusahaan Perkebunan London Sumatra | America Movil SAB de CV Class L | ||||||||||
| Indonesia Tbk PT | 2,510,100 | 404 | - ADR | 674,885 | 16,474 | ||||||
| Ramayana Lestari Sentosa Tbk PT | 5,036,892 | 338 | Cemex SAB de CV - ADR(Æ)(Ñ) | 1,761,961 | 21,672 | ||||||
| Semen Indonesia Persero Tbk PT | 4,725,425 | 6,207 | Corp. Moctezuma SAB de CV(Å) | 284,063 | 930 | ||||||
| Surya Semesta Internusa Tbk PT | 6,497,000 | 409 | Credito Real SAB de CV | 79,568 | 204 | ||||||
| Tambang Batubara Bukit Asam Persero | Empresas ICA SAB de CV(Æ) | 393,400 | 700 | ||||||||
| Tbk PT | 1,702,000 | 1,824 | Empresas ICA SAB de CV - ADR(Æ)(Ñ) | 205,700 | 1,467 | ||||||
| Telekomunikasi Indonesia Persero Tbk | Fomento Economico Mexicano SAB de | ||||||||||
| PT | 30,298,800 | 6,895 | CV - ADR | 111,300 | 10,711 | ||||||
| United Tractors Tbk PT | 2,575,610 | 3,916 | Genomma Lab Internacional SAB de CV | ||||||||
| Wijaya Karya Persero Tbk PT | 5,944,800 | 1,407 | Class B(Æ) | 986,519 | 2,490 | ||||||
| 62,517 | Gruma SAB de CV Class B(Æ) | 424,450 | 4,674 | ||||||||
| Grupo Aeroportuario del Sureste SAB de | |||||||||||
| Ireland - 0.1% | CV - ADR | 32,800 | 4,417 | ||||||||
| Dragon Oil PLC | 311,002 | 2,674 | Grupo Financiero Banorte SAB de CV | ||||||||
| Class O | 2,854,097 | 18,310 | |||||||||
| Israel - 0.4% | Grupo Financiero Inbursa SAB de CV | ||||||||||
| Israel Chemicals, Ltd. | 293,420 | 1,971 | Class O | 627,254 | 1,884 | ||||||
| Teva Pharmaceutical Industries, Ltd. | Grupo Mexico SAB de CV | 2,022,300 | 6,949 | ||||||||
| - ADR | 175,000 | 9,882 | Grupo Televisa SAB - ADR | 658,100 | 23,784 | ||||||
| 11,853 | Kimberly-Clark de Mexico SAB de CV | ||||||||||
| Class A | 935,999 | 2,167 | |||||||||
| Jersey - 0.1% | Megacable Holdings SAB de CV | 408,803 | 1,873 | ||||||||
| Randgold Resources, Ltd. | 42,524 | 2,502 | Wal-Mart de Mexico SAB de CV | 1,125,173 | 2,601 | ||||||
| West China Cement, Ltd. | 11,229,485 | 1,115 | 124,092 | ||||||||
| 3,617 | |||||||||||
| Kazakhstan - 0.1% | Morocco - 0.0% | ||||||||||
| KazMunaiGas Exploration Production | Attijariwafa Bank(Æ) | 8,155 | 319 | ||||||||
| JSC - GDR | 162,310 | 2,589 | Netherlands - 0.6% | ||||||||
| Nostrum Oil & Gas PLC(Æ) | 167,698 | 1,811 | |||||||||
| Luxembourg - 0.4% | OCI NV(Æ)(Ñ) | 93,217 | 3,246 | ||||||||
| Kernel Holding SA(Æ) | 350,785 | 2,759 | X5 Retail Group NV - GDR(Æ) | 293,140 | 5,350 | ||||||
| MHP SA - GDR | 120,144 | 1,273 | Yandex NV Class A(Æ) | 297,400 | 8,511 | ||||||
| O'Key Group SA - GDR | 15,666 | 94 | 18,918 | ||||||||
| Tenaris SA - ADR | 112,400 | 4,456 | |||||||||
| Ternium SA - ADR | 153,338 | 3,375 | Nigeria - 0.6% | ||||||||
| 11,957 | Dangote Cement PLC | 1,485,778 | 1,928 | ||||||||
| FBN Holdings PLC | 3,269,421 | 229 | |||||||||
| Malaysia - 1.0% | FCMB Group PLC | 15,631,592 | 367 | ||||||||
| 7-Eleven Malaysia Holdings, Bhd(Æ) | 911,500 | 463 | Guaranty Trust Bank PLC | 27,279,172 | 4,117 | ||||||
| Axiata Group BHD | 3,699,500 | 7,929 | Guaranty Trust Bank PLC - GDR(Å) | 129,606 | 998 | ||||||
| Berjaya Auto BHD | 83,300 | 89 | Guaranty Trust Bank PLC - GDR(Þ) | 116,338 | 896 | ||||||
| British American Tobacco Malaysia BHD | 142,912 | 3,020 | Nigerian Breweries PLC | 2,443,066 | 2,389 | ||||||
| CIMB Group Holdings BHD | 1,721,068 | 3,396 | United Bank for Africa PLC Class A | 23,482,152 | 673 | ||||||
| IJM Corp. BHD | 1,594,300 | 3,354 | Zenith Bank PLC | 40,615,824 | 5,198 | ||||||
| Inari Amertron BHD | 655,000 | 597 | 16,795 | ||||||||
| KNM Group BHD(Æ) | 4,396,600 | 1,076 | |||||||||
| KSL Holdings BHD(Æ) | 160,700 | 221 | Pakistan - 0.1% | ||||||||
| Lafarge Malayan Cement BHD(Æ) | 211,941 | 675 | United Bank, Ltd. | 2,019,200 | 3,862 | ||||||
| Malayan Banking BHD | 419,700 | 1,238 | |||||||||
| Petronas Dagangan BHD | 324,167 | 2,010 | Panama - 0.2% | ||||||||
| Press Metal Berhad(Æ) | 496,200 | 996 | Copa Holdings SA Class A | 40,363 | 4,719 | ||||||
| Puncak Niaga Holdings BHD(Æ) | 484,400 | 487 | |||||||||
| SapuraKencana Petroleum BHD | 2,244,500 | 2,327 | Philippines - 0.7% | ||||||||
| UEM Sunrise BHD | 4,329,500 | 2,475 | Alliance Global Group, Inc. | 2,586,900 | 1,458 | ||||||
| See accompanying notes which are an integral part of the financial statements. | |||||||||||
| Russell Emerging Markets Fund 277 | |||||||||||
| Russell Investment Company | ||||||||||
| Russell Emerging Markets Fund | ||||||||||
| Schedule of Investments, continued — October 31, 2014 | ||||||||||
| Amounts in thousands (except share amounts) | Amounts in thousands (except share amounts) | |||||||||
| Principal | Fair | Principal | Fair | |||||||
| Amount ($) | Value | Amount ($) | Value | |||||||
| or Shares | $ | or Shares | $ | |||||||
| Ayala Land, Inc. | 3,904,446 | 2,915 | Massmart Holdings, Ltd. | 144,432 | 1,560 | |||||
| Metropolitan Bank & Trust Co. - ADR | 1,393,128 | 2,561 | MMI Holdings, Ltd. | 172,557 | 441 | |||||
| Nickel Asia Corp.(Æ) | 2,056,900 | 1,907 | Mr Price Group, Ltd. | 79,420 | 1,643 | |||||
| Philippine Long Distance Telephone Co. | 39,540 | 2,753 | MTN Group, Ltd. | 92,624 | 2,049 | |||||
| SM Investments Corp. | 158,598 | 2,769 | Naspers, Ltd. Class N | 173,708 | 21,618 | |||||
| Universal Robina Corp. | 1,592,060 | 6,599 | Nedbank Group, Ltd. | 123,082 | 2,681 | |||||
| 20,962 | Pick n Pay Holdings, Ltd. | 38,790 | 81 | |||||||
| Pick n Pay Stores, Ltd. | 216,411 | 1,046 | ||||||||
| Poland - 0.4% | Remgro, Ltd. | 154,084 | 3,534 | |||||||
| Alior Bank SA(Æ) | 46,674 | 1,036 | Reunert, Ltd. | 234,809 | 1,239 | |||||
| Bank Pekao SA | 89,344 | 4,670 | RMB Holdings, Ltd. | 57,936 | 322 | |||||
| Energa SA | 243,321 | 1,808 | Sanlam, Ltd. | 154,499 | 976 | |||||
| KGHM Polska Miedz SA | 25,210 | 972 | Sappi, Ltd. - ADR(Æ) | 1,583,146 | 6,254 | |||||
| PGE SA | 465,483 | 3,053 | Sasol, Ltd. - ADR | 244,550 | 12,234 | |||||
| Polski Koncern Naftowy Orlen S.A. | 113,769 | 1,416 | Sibanye Gold, Ltd. | 666,640 | 1,269 | |||||
| Tauron Polska Energia SA | 182,658 | 285 | Standard Bank Group, Ltd. | 846,295 | 10,646 | |||||
| 13,240 | Steinhoff International Holdings, Ltd. | 272,787 | 1,395 | |||||||
| Qatar - 0.1% | Super Group, Ltd.(Æ) | 15,474 | 44 | |||||||
| Industries Qatar QSC | 86,376 | 4,469 | Telkom SA SOC, Ltd.(Æ) | 714,141 | 3,792 | |||||
| Vodacom Group, Ltd. - ADR | 306,257 | 3,716 | ||||||||
| Russia - 4.5% | Woolworths Holdings, Ltd. | 962,516 | 6,841 | |||||||
| Alrosa AO | 2,254,653 | 2,012 | 145,586 | |||||||
| Federal Grid Co. Unified Energy System | ||||||||||
| JSC(Æ) | 583,180,000 | 726 | South Korea - 11.8% | |||||||
| Gazprom OAO - ADR | 2,536,947 | 16,739 | Amorepacific Corp. | 3,425 | 7,371 | |||||
| Gazprom OAO - ADR(Æ) | 2,149,044 | 14,244 | Amorepacific Group | 3,487 | 3,860 | |||||
| LSR Group - GDR | 198,762 | 580 | Asia Paper Manufacturing Co., Ltd. | 5,070 | 140 | |||||
| LSR Group | 6,272 | 88 | BGF retail Co., Ltd.(Æ) | 3,951 | 251 | |||||
| Lukoil OAO - ADR(Æ) | 548,711 | 26,914 | BS Financial Group, Inc. | 169,939 | 2,647 | |||||
| Lukoil OAO - ADR | 238,937 | 11,732 | Byucksan Corp.(Æ) | 29,266 | 174 | |||||
| Magnit PJSC - GDR | 144,071 | 9,653 | CJ Korea Express Co., Ltd.(Æ)(Ñ) | 19,618 | 3,543 | |||||
| MMC Norilsk Nickel OJSC - ADR | 444,900 | 8,280 | Cosmax, Inc.(Æ) | 23,254 | 2,350 | |||||
| Mobile Telesystems OJSC - ADR | 486,000 | 6,950 | Coway Co., Ltd. | 41,204 | 3,146 | |||||
| Moscow Exchange MICEX-RTS OAO | 1,784,005 | 2,409 | Daeduck GDS Co., Ltd. | 11,164 | 111 | |||||
| NovaTek OAO - GDR | 64,261 | 6,902 | Daishin Media, Inc.(Æ) | 40,388 | 387 | |||||
| Novolipetsk Steel OJSC - GDR | 188,326 | 2,411 | DGB Financial Group, Inc. | 400,040 | 5,708 | |||||
| PhosAgro OAO(Æ) | 542,915 | 5,809 | DK UIL Co., Ltd. | 14,028 | 153 | |||||
| Raspadskaya OAO(Æ) | 297,534 | 120 | E-Mart Co., Ltd. | 5,981 | 1,108 | |||||
| Rosneft OAO - GDR(Æ) | 509,444 | 2,838 | Halla Holdings Corp.(Æ) | 35,927 | 2,383 | |||||
| Sberbank of Russia | 4,167,368 | 7,359 | Halla Visteon Climate Control Corp. | 84,803 | 3,789 | |||||
| Sberbank of Russia - ADR | 643,448 | 4,884 | Hanil Cement Co., Ltd.(Æ) | 1,397 | 180 | |||||
| Surgutneftegas OAO - ADR | 327,366 | 2,154 | Hankook Tire Co., Ltd. | 239,976 | 12,350 | |||||
| Tatneft OAO - ADR | 7,300 | 260 | Harim Holdings Co., Ltd.(Æ) | 69,743 | 309 | |||||
| 133,064 | Hyosung Corp. | 60,400 | 3,589 | |||||||
| Hyundai Development Co.-Engineering | ||||||||||
| Singapore - 0.2% | & Construction | 82,866 | 3,129 | |||||||
| Luye Pharma Group, Ltd.(Æ) | 3,502,230 | 5,058 | Hyundai Mobis Co., Ltd. | 1,016 | 238 | |||||
| Hyundai Motor Co. | 75,643 | 12,032 | ||||||||
| South Africa - 4.9% | Hyundai Wia Corp. | 16,731 | 2,888 | |||||||
| African Bank Investments, Ltd. | 887,049 | — | Industrial Bank of Korea | 185,473 | 2,716 | |||||
| Anglo American Platinum, Ltd.(Æ) | 22,395 | 706 | Jahwa Electronics Co., Ltd. | 28,958 | 303 | |||||
| AngloGold Ashanti, Ltd. - ADR(Æ) | 404,500 | 3,345 | JB Financial Group Co., Ltd. | 186,960 | 1,148 | |||||
| Aspen Pharmacare Holdings, Ltd.(Æ) | 465,296 | 16,597 | KB Financial Group, Inc. | 307,819 | 12,097 | |||||
| AVI, Ltd. | 705,134 | 4,597 | KB Financial Group, Inc. - ADR | 156,600 | 6,060 | |||||
| Bidvest Group, Ltd.(Æ) | 474,986 | 13,064 | KCC Corp. | 13,919 | 7,710 | |||||
| Capitec Bank Holdings, Ltd. | 27,326 | 721 | Kia Motors Corp. | 88,870 | 4,332 | |||||
| Discovery Holdings, Ltd. | 1,474,773 | 13,415 | Korea Electric Power Corp. - ADR(Ñ) | 168,700 | 3,688 | |||||
| FirstRand, Ltd. | 1,559,632 | 6,674 | Korea Kolmar Co., Ltd. | 73,106 | 3,557 | |||||
| Investec, Ltd. | 192,577 | 1,758 | KT Corp. - ADR | 238,300 | 3,653 | |||||
| Life Healthcare Group Holdings, Ltd. | 351,265 | 1,328 | ||||||||
| See accompanying notes which are an integral part of the financial statements. | ||||||||||
| 278 Russell Emerging Markets Fund | ||||||||||
| Russell Investment Company | |||||||||
| Russell Emerging Markets Fund | |||||||||
| Schedule of Investments, continued — October 31, 2014 | |||||||||
| Amounts in thousands (except share amounts) | Amounts in thousands (except share amounts) | ||||||||
| Principal | Fair | Principal | Fair | ||||||
| Amount ($) | Value | Amount ($) | Value | ||||||
| or Shares | $ | or Shares | $ | ||||||
| KT&G Corp. | 16,876 | 1,500 | Elitegroup Computer Systems Co., Ltd. | ||||||
| Ktis Corp. | 30,820 | 104 | (Æ) | 441,535 | 372 | ||||
| LG Chem, Ltd. | 17,436 | 3,263 | Epistar Corp. | 2,388,000 | 4,310 | ||||
| LG Display Co., Ltd. - ADR(Ñ) | 338,400 | 5,083 | Fubon Financial Holding Co., Ltd. | 2,007,000 | 3,392 | ||||
| LG Display Co., Ltd.(Æ) | 90,080 | 2,642 | Giant Manufacturing Co., Ltd. | 407,911 | 3,299 | ||||
| LG Electronics, Inc. Class H | 89,298 | 5,456 | Global Mixed Mode Technology, Inc. | 975,563 | 2,614 | ||||
| LG International Corp. | 70,462 | 1,427 | HannStar Display Corp. | 534,000 | 134 | ||||
| Lotte Chilsung Beverage Co., Ltd. | 3,510 | 5,573 | Hiwin Technologies Corp. | 370,575 | 2,924 | ||||
| Lotte Confectionery Co., Ltd. | 2,343 | 4,214 | Hon Hai Precision Industry Co., Ltd. | 5,804,545 | 18,320 | ||||
| Meritz Securities Co., Ltd.(Æ) | 358,458 | 1,457 | Huaku Development Co., Ltd.(Æ) | 437,000 | 718 | ||||
| NAVER Corp. | 6,756 | 4,766 | Innolux Corp. | 10,076,970 | 4,588 | ||||
| POSCO - ADR | 23,500 | 1,682 | Inotera Memories, Inc.(Æ) | 3,256,000 | 5,004 | ||||
| Samsung Electronics Co., Ltd. | 59,730 | 69,526 | Inventec Corp. | 6,049,000 | 4,196 | ||||
| Samsung Electronics Co., Ltd. - GDR | 20,794 | 11,957 | King Yuan Electronics Co., Ltd. | 3,623,000 | 2,859 | ||||
| Samsung Electronics Co., Ltd. - GDR | 12,602 | 6,357 | King's Town Bank Co., Ltd. | 945,000 | 1,031 | ||||
| Samsung Engineering Co., Ltd.(Æ) | 41,643 | 2,400 | Kinsus Interconnect Technology Corp. | 1,742,000 | 6,529 | ||||
| Samsung Fire & Marine Insurance Co., | Largan Precision Co., Ltd. | 185,505 | 13,021 | ||||||
| Ltd. | 55,406 | 14,905 | Lite-On Technology Corp. | 4,758,002 | 6,664 | ||||
| Samsung Life Insurance Co., Ltd. | 47,981 | 5,230 | Longwell Co. | 372,000 | 330 | ||||
| Samsung Techwin Co., Ltd. | 69,316 | 2,127 | MediaTek, Inc. | 1,709,022 | 24,329 | ||||
| SeAH Besteel Corp.(Æ) | 4,229 | 126 | Mega Financial Holding Co., Ltd. | 7,041,618 | 8,224 | ||||
| Shinhan Financial Group Co., Ltd. | 434,243 | 20,438 | Micro-Star International Co., Ltd. | 1,505,000 | 1,838 | ||||
| Shinsegae Co., Ltd. | 12,484 | 2,319 | Novatek Microelectronics Corp. | 727,000 | 3,753 | ||||
| SK Holdings Co., Ltd. | 19,381 | 3,028 | Pegatron Corp. | 1,534,000 | 2,784 | ||||
| SK Hynix, Inc.(Æ) | 696,530 | 30,925 | Powertech Technology, Inc.(Æ) | 121,000 | 203 | ||||
| SK Telecom Co., Ltd. - ADR(Ñ) | 506,400 | 14,073 | President Chain Store Corp. | 320,000 | 2,399 | ||||
| SK Telecom Co., Ltd. | 19,820 | 4,952 | Richtek Technology Corp. | 100,706 | 485 | ||||
| Sungshin Cement Co., Ltd.(Æ) | 55,930 | 430 | Shin Kong Financial Holding Co., Ltd. | 351,735 | 107 | ||||
| Sungwoo Hitech Co., Ltd. | 177,385 | 2,556 | Sitronix Technology Corp. | 54,000 | 130 | ||||
| Tovis Co., Ltd.(Æ) | 142,274 | 2,376 | Taishin Financial Holding Co., Ltd. | 3,628,000 | 1,729 | ||||
| Woori Finance Holdings Co., Ltd.(Æ) | 347,351 | 3,868 | Taiwan Semiconductor Manufacturing | ||||||
| Zeus Co., Ltd.(Æ) | 25,265 | 491 | Co., Ltd. | 7,875,133 | 33,788 | ||||
| 352,351 | Taiwan Semiconductor Manufacturing | ||||||||
| Co., Ltd. - ADR | 1,933,500 | 42,576 | |||||||
| Spain - 0.1% | Tripod Technology Corp. | 1,600,498 | 2,989 | ||||||
| Banco Santander SA - ADR | 152,400 | 3,229 | TSRC Corp. | 1,909,052 | 2,146 | ||||
| Unimicron Technology Corp. | 2,536,000 | 1,947 | |||||||
| Switzerland - 0.3% | United Microelectronics Corp.(Æ) | 5,220,000 | 2,300 | ||||||
| Coca-Cola HBC AG - ADR(Æ) | 264,804 | 5,757 | Winbond Electronics Corp.(Æ) | 1,993,000 | 638 | ||||
| Dufry AG(Æ) | 32,822 | 4,724 | |||||||
| 10,481 | Wistron Corp. | 2,594,000 | 2,720 | ||||||
| Yageo Corp. | 1,546,416 | 2,395 | |||||||
| Taiwan - 9.2% | Yuanta Financial Holding Co., Ltd. | 8,657,150 | 4,355 | ||||||
| Acer, Inc.(Æ) | 714,000 | 489 | 274,190 | ||||||
| Advanced Semiconductor Engineering, | |||||||||
| Inc. | 6,797,459 | 8,123 | Thailand - 3.0% | ||||||
| Advanced Semiconductor Engineering, | Airports of Thailand PCL | 1,136,046 | 8,441 | ||||||
| Inc. - ADR(Ñ) | 983,653 | 6,069 | Bangkok Bank PCL | 1,734,400 | 10,669 | ||||
| Advantech Co., Ltd. | 637,115 | 4,420 | BEC World PCL | 1,802,356 | 2,670 | ||||
| Ardentec Corp. | 797,595 | 627 | Big C Supercenter PCL | 376,700 | 2,695 | ||||
| Asustek Computer, Inc. | 730,000 | 7,440 | Central Pattana PCL | 3,419,523 | 5,066 | ||||
| AU Optronics Corp.(Æ) | 4,403,000 | 2,084 | Charoen Pokphand Foods PCL | 2,755,400 | 2,644 | ||||
| Catcher Technology Co., Ltd. | 1,140,000 | 9,595 | Delta Electronics Thailand PCL | 585,200 | 1,159 | ||||
| Cathay Financial Holding Co., Ltd. | 751,000 | 1,234 | GFPT PCL | 2,018,400 | 1,196 | ||||
| China Development Financial Holding | Hana Microelectronics PCL | 559,800 | 748 | ||||||
| Corp. | 4,625,000 | 1,484 | Jasmine International PCL | 14,258,388 | 3,261 | ||||
| Compal Electronics, Inc. | 683,000 | 504 | Kasikornbank PCL | 854,739 | 6,193 | ||||
| Coretronic Corp.(Æ) | 274,750 | 412 | Kasikornbank PCL Class R | 133,500 | 967 | ||||
| CviLux Corp.(Æ) | 464,000 | 731 | KCE Electronics PCL | 1,349,800 | 1,658 | ||||
| Delta Electronics, Inc. | 1,476,970 | 8,838 | Krung Thai Bank PCL | 3,612,200 | 2,584 | ||||
| Pruksa Real Estate PCL | 6,454,978 | 6,639 | |||||||
| See accompanying notes which are an integral part of the financial statements. | |||||||||
| Russell Emerging Markets Fund 279 | |||||||||
| Russell Investment Company | ||||||||||
| Russell Emerging Markets Fund | ||||||||||
| Schedule of Investments, continued — October 31, 2014 | ||||||||||
| Amounts in thousands (except share amounts) | Amounts in thousands (except share amounts) | |||||||||
| Principal | Fair | Principal | Fair | |||||||
| Amount ($) | Value | Amount ($) | Value | |||||||
| or Shares | $ | or Shares | $ | |||||||
| PTT PCL | 646,000 | 7,299 | Bank of Georgia Holdings PLC | 178,619 | 7,315 | |||||
| Raimon Land PLC(Æ) | 3,833,000 | 259 | Gentera SAB de CV(Æ) | 644,260 | 1,435 | |||||
| Robinson Department Store PCL | 598,900 | 942 | Hikma Pharmaceuticals PLC | 193,303 | 5,860 | |||||
| Siam Cement PCL (The) | 68,700 | 949 | SABMiller PLC - ADR | 400,091 | 22,534 | |||||
| Siam Commercial Bank PCL (The) | 1,374,301 | 7,490 | Tullow Oil PLC | 859,182 | 6,677 | |||||
| Siamgas & Petrochemical NVDR(Æ) | 239,300 | 93 | 59,926 | |||||||
| Supalai PCL | 1,597,200 | 1,263 | ||||||||
| Thai Beverage PCL | 8,436,890 | 5,024 | United States - 1.0% | |||||||
| Thai Oil PCL | 1,599,538 | 2,198 | Avon Products, Inc. | 165,500 | 1,721 | |||||
| Thai Union Frozen Products PCL | 1,486,466 | 3,400 | Cognizant Technology Solutions Corp. | |||||||
| Thanachart Capital PCL | 244,700 | 263 | Class A(Æ) | 120,755 | 5,899 | |||||
| Tisco Financial Group PCL | 2,250,017 | 3,074 | ePlus, Inc.(Æ) | 17,740,000 | 10,935 | |||||
| TMB Bank PCL | 17,303,705 | 1,636 | First Cash Financial Services, Inc.(Æ) | 20,043 | 1,184 | |||||
| 90,480 | Maginet Corp.(Æ) | 47,136 | 3,158 | |||||||
| Sohu.com, Inc.(Æ) | 95,100 | 4,621 | ||||||||
| Turkey - 2.6% | X5 Retail Group NV - GDR(Æ) | 104,065 | 1,899 | |||||||
| Akfen Holding AS | 138,748 | 296 | 29,417 | |||||||
| Anadolu Efes Biracilik Ve Malt Sanayii | ||||||||||
| AS(Æ) | 243,660 | 2,850 | Virgin Islands, British - 0.2% | |||||||
| Arcelik AS | 1,074,979 | 6,602 | Arcos Dorados Holdings, Inc. Class A(Ñ) | 288,800 | 1,779 | |||||
| Coca-Cola Icecek AS | 202,308 | 4,615 | Tianhe Chemicals Group Limited(Æ)(Ñ) | 25,272,000 | 4,399 | |||||
| Enka Insaat ve Sanayi AS | 1,101,448 | 2,666 | 6,178 | |||||||
| Eregli Demir ve Celik Fabrikalari TAS | 1,020,723 | 2,126 | Zimbabwe - 0.0% | |||||||
| Ford Otomotiv Sanayi AS | 175,761 | 2,246 | Delta Corp., Ltd. | 496,450 | 571 | |||||
| GSD Holding AS(Æ) | 1,793,162 | 1,154 | ||||||||
| Haci Omer Sabanci Holding AS | 29,993 | 137 | Total Common Stocks | |||||||
| Kardemir Karabuk Demir Celik Sanayi | (cost $2,476,605) | 2,721,175 | ||||||||
| ve Ticaret AS Class D(Æ) | 2,228,243 | 2,486 | ||||||||
| Koza Altin Isletmeleri AS | 327,038 | 2,111 | Investments in Other Funds - 1.1% | |||||||
| Koza Anadolu Metal Madencilik | Luxembourg - 0.4% | |||||||||
| Isletmeleri AS(Æ) | 1,518,604 | 1,182 | SHS Genesis Smaller Co. | 122,618 | 14,668 | |||||
| TAV Havalimanlari Holding AS | 409,040 | 3,432 | ||||||||
| Torunlar Gayrimenkul Yatirim Ortakligi | United Kingdom - 0.7% | |||||||||
| AS(ö) | 260,764 | 367 | Genesis Indian Investment Co., Ltd. | 154,453 | 19,649 | |||||
| Trakya Cam Sanayi AS | 185,675 | 244 | Total Investments in Other Funds | |||||||
| Tupras Turkiye Petrol Rafinerileri AS | 141,126 | 3,064 | ||||||||
| Turk Hava Yollari(Æ) | 1,084,148 | 3,556 | (cost $4,061) | 34,317 | ||||||
| Turkcell Iletisim Hizmetleri AS(Æ) | 716,520 | 4,159 | ||||||||
| Turkcell Iletisim Hizmetleri AS | Preferred Stocks - 1.5% | |||||||||
| - ADR(Æ) | 274,091 | 4,010 | Brazil - 0.9% | |||||||
| Banco Bradesco SA Class Preference(Æ) | 283,300 | 4,267 | ||||||||
| Turkiye Garanti Bankasi AS | 2,853,201 | 11,142 | Centrais Eletricas Brasileiras SA(Æ) | 33,300 | 126 | |||||
| Turkiye Halk Bankasi AS | 1,830,980 | 12,233 | Cia Brasileira de Distribuicao Class | |||||||
| Turkiye Sise ve Cam Fabrikalari AS | 303,670 | 462 | Preference | 75,700 | 3,174 | |||||
| Ulker Biskuvi Sanayi AS | 146,795 | 1,083 | Cia Energetica de Minas Gerais | 356,800 | 2,049 | |||||
| Vestel Elektronik Sanayi ve Ticaret | Cia Energetica de Sao Paulo Class | |||||||||
| AS(Æ) | 974,416 | 3,227 | Preference | 269,100 | 2,653 | |||||
| Yapi ve Kredi Bankasi AS | 913,514 | 2,002 | Gerdau SA | 43,640 | 195 | |||||
| 77,452 | Investimentos Itau SA | 2,100,135 | 8,382 | |||||||
| United Arab Emirates - 0.4% | Itau Unibanco Holding SA | 85,600 | 1,270 | |||||||
| Abu Dhabi Commercial Bank PJSC | 996,420 | 2,143 | Lojas Americanas SA | 496,021 | 2,927 | |||||
| Air Arabia PJSC | 2,879,050 | 1,035 | Metalurgica Gerdau SA Class A | 399,200 | 2,159 | |||||
| Dubai Islamic Bank(Æ) | 1,881,533 | 3,873 | Telefonica Brasil SA | 110 | 2 | |||||
| Emaar Properties PJSC | 1,245,663 | 3,391 | 27,204 | |||||||
| First Gulf Bank PJSC | 538,720 | 2,662 | ||||||||
| 13,104 | Chile - 0.0% | |||||||||
| Embotelladora Andina SA | 73,915 | 235 | ||||||||
| United Kingdom - 2.0% | Embotelladora Andina SA Class A | 24,883 | 64 | |||||||
| Anglo American PLC | 703,598 | 14,797 | 299 | |||||||
| Anglo American PLC - ADR(Ñ) | 123,400 | 1,308 | ||||||||
| See accompanying notes which are an integral part of the financial statements. | ||||||||||
| 280 Russell Emerging Markets Fund | ||||||||||
Russell Investment Company Russell Emerging Markets Fund
Schedule of Investments, continued — October 31, 2014
| Amounts in thousands (except share amounts) | Amounts in thousands (except share amounts) | ||||||||||||||
| Principal | Fair | Principal | Fair | ||||||||||||
| Amount ($) | Value | Amount ($) | Value | ||||||||||||
| or Shares | $ | or Shares | $ | ||||||||||||
| Colombia - 0.0% | Commercial Bank of Qatar QSC (The)(Æ) | ||||||||||||||
| Bancolombia SA Class Preference | 11,144 | 157 | 2017 Warrants | 259,279 | 5,227 | ||||||||||
| 6,767 | |||||||||||||||
| Russia - 0.2% | |||||||||||||||
| Sberbank of Russia | 1,412,200 | 1,868 | Netherlands - 0.1% | ||||||||||||
| Surgutneftegas OAO | 4,413,900 | 3,022 | Grasim Industries, Ltd.(Æ) | ||||||||||||
| 4,890 | 2017 Warrants | 51,487 | 2,927 | ||||||||||||
| South Korea - 0.4% | Total Warrants & Rights | ||||||||||||||
| Hyundai Motor Co. | 33,080 | 3,895 | (cost $10,286) | 15,209 | |||||||||||
| Samsung Electronics Co., Ltd. Class | |||||||||||||||
| Preference | 8,382 | 7,725 | Short-Term Investments - 3.8% | ||||||||||||
| 11,620 | United States - 3.8% | ||||||||||||||
| Russell U.S. Cash Management Fund | 107,932,130 | (8) | 107,932 | ||||||||||||
| Total Preferred Stocks | United States Treasury Bills (§) | ||||||||||||||
| (cost $40,240) | 44,170 | Zero coupon due 01/08/15 | 5,000 | 5,000 | |||||||||||
| Total Short-Term Investments | |||||||||||||||
| Certificates of Participation - 1.1% | (cost $112,932) | 112,932 | |||||||||||||
| Netherlands - 0.5% | |||||||||||||||
| JP Morgan Structured Products BV | |||||||||||||||
| Zero coupon due 02/16/17 | 930 | 3,869 | Other Securities - 5.4% | ||||||||||||
| Russell U.S. Cash Collateral Fund(×) | 160,224,212 | (8) | 160,224 | ||||||||||||
| Zero Series coupon 0001 due 05/16/17 | 353 | 4,648 | Total Other Securities | ||||||||||||
| Zero coupon due 07/02/18 | 20 | 1,246 | (cost $160,224) | 160,224 | |||||||||||
| Series 0002 | |||||||||||||||
| Zero coupon due 07/02/18 | 388 | 2,512 | Total Investments 104.6% | ||||||||||||
| JPMorgan Structured Products BV | |||||||||||||||
| Zero coupon due 08/14/17 | 653 | 4,167 | (identified cost $2,827,925) | 3,122,425 | |||||||||||
| 16,442 | |||||||||||||||
| United Kingdom - 0.6% | Other Assets and Liabilities, Net | ||||||||||||||
| HSBC Bank PLC | -(4.6%) | (138,267 | ) | ||||||||||||
| Zero coupon due | 91 | 1,946 | Net Assets - 100.0% | 2,984,158 | |||||||||||
| Zero coupon due 03/27/15 | 63 | 965 | |||||||||||||
| Zero coupon due 05/04/15 | 114 | 5,728 | |||||||||||||
| Zero coupon due 09/12/16 | 74 | 4,367 | |||||||||||||
| Series 0001 | |||||||||||||||
| Zero coupon due 12/05/14 | 192 | 4,050 | |||||||||||||
| 17,056 | |||||||||||||||
| United States - 0.0% | |||||||||||||||
| Citigroup, Inc. | |||||||||||||||
| Zero coupon due 02/04/16 | 498 | 897 | |||||||||||||
| JP Morgan Structured Products BV | |||||||||||||||
| Zero coupon due 08/14/17 | 20 | 3 | |||||||||||||
| 900 | |||||||||||||||
| Total Certificates of Participation | |||||||||||||||
| (cost $23,577) | 34,398 | ||||||||||||||
| Warrants & Rights - 0.5% | |||||||||||||||
| Brazil - 0.0% | |||||||||||||||
| HRT Participacoes em Petroleo SA(Æ) | |||||||||||||||
| 2014 Rights | 4,130 | — | |||||||||||||
| Curacao - 0.2% | |||||||||||||||
| Emaar Properties PJSC(Æ) | |||||||||||||||
| 2015 Warrants | 1,322,595 | 3,600 | |||||||||||||
| First Gulf Bank PJSC(Æ) | |||||||||||||||
| 2015 Warrants | 390,031 | 1,915 | |||||||||||||
| 5,515 | |||||||||||||||
| Germany - 0.2% | |||||||||||||||
| Abu Dhabi Commercial Bank PJSC(Æ) | |||||||||||||||
| 2019 Warrants | 328,430 | 707 | |||||||||||||
| Almarai Co.(Æ)(Þ) | |||||||||||||||
| 2016 Warrants | 39,053 | 833 | |||||||||||||
| See accompanying notes which are an integral part of the financial statements. | |||||||||||||||
| Russell Emerging Markets Fund 281 | |||||||||||||||
| Russell Investment Company | ||||||||||||||
| Russell Emerging Markets Fund | ||||||||||||||
| Schedule of Investments, continued — October 31, 2014 | ||||||||||||||
| Restricted Securities | ||||||||||||||
| Amounts in thousands (except share and cost per unit amounts) | ||||||||||||||
| Principal | Cost per | Cost | Fair Value | |||||||||||
| % of Net Assets | Acquisition | Amount ($) | Unit | (000 | ) | (000 | ) | |||||||
| Securities | Date | or shares | $ | $ | $ | |||||||||
| 0.1% | ||||||||||||||
| Corp. Moctezuma SAB de CV | 03/01/06 | MXN | 284,063 | 1.91 | 541 | 930 | ||||||||
| Guaranty Trust Bank PLC | 07/20/07 | NGN | 129,606 | 5.02 | 650 | 998 | ||||||||
| 1,928 | ||||||||||||||
| For a description of restricted securities see note 9 in the Notes to Financial Statements. | ||||||||||||||
| Futures Contracts | ||||||||||||||
| Amounts in thousands (except contract amounts) | ||||||||||||||
| Unrealized | ||||||||||||||
| Appreciation | ||||||||||||||
| Number of | Notional | Expiration | (Depreciation) | |||||||||||
| Contracts | Amount | Date | $ | |||||||||||
| Long Positions | ||||||||||||||
| BIST 30 Index Futures | 740 | TRY | 7,396 | 12/14 | 59 | |||||||||
| FTSE JSE TOP 40 Index Futures | 224 | ZAR | 100,092 | 12/14 | (336 | ) | ||||||||
| Hang Seng Index Futures | 103 | HKD | 123,307 | 11/14 | 387 | |||||||||
| H-Shares Index Futures | 242 | HKD | 129,990 | 11/14 | 553 | |||||||||
| KOSPI 200 Index Futures | 168 | KRW 21,016,800 | 12/14 | (743 | ) | |||||||||
| Mexico Bolsa Index Futures | 241 | MXN | 108,599 | 12/14 | (161 | ) | ||||||||
| MSCI Taiwan Index Futures | 558 | USD | 18,632 | 11/14 | 486 | |||||||||
| SGX CNX NIFTY Index Futures | 794 | USD | 13,277 | 11/14 | 459 | |||||||||
| Total Unrealized Appreciation (Depreciation) on Open Futures Contracts (å) | 704 | |||||||||||||
| Foreign Currency Exchange Contracts | ||||||||||||||
| Amounts in thousands | ||||||||||||||
| Unrealized | ||||||||||||||
| Appreciation | ||||||||||||||
| Amount | Amount | (Depreciation) | ||||||||||||
| Counterparty | Sold | Bought | Settlement Date | $ | ||||||||||
| Bank of America | USD | 2,046 | BRL | 5,000 | 11/04/14 | (27 | ) | |||||||
| Bank of America | USD | 446 | TRY | 1,000 | 12/17/14 | (1 | ) | |||||||
| Bank of America | USD | 3,480 | TRY | 7,800 | 12/17/14 | (5 | ) | |||||||
| Bank of America | USD | 4,684 | ZAR | 52,067 | 12/17/14 | 2 | ||||||||
| Bank of America | BRL | 5,000 | USD | 1,995 | 11/04/14 | (23 | ) | |||||||
| Bank of America | HKD | 20,000 | USD | 2,575 | 12/17/14 | (4 | ) | |||||||
| Bank of America | INR | 20,000 | USD | 320 | 12/17/14 | (3 | ) | |||||||
| Bank of America | INR | 30,000 | USD | 483 | 12/17/14 | (1 | ) | |||||||
| Bank of America | MXN | 20,000 | USD | 1,480 | 12/17/14 | (1 | ) | |||||||
| Bank of America | TRY | 2,000 | USD | 892 | 12/17/14 | 1 | ||||||||
| Bank of America | ZAR | 9,538 | USD | 878 | 11/04/14 | 13 | ||||||||
| Bank of America | ZAR | 10,000 | USD | 878 | 12/17/14 | (23 | ) | |||||||
| Barclays | USD | 4,398 | IDR | 52,429,541 | 12/15/14 | (89 | ) | |||||||
| Barclays | USD | 5,642 | MXN | 75,114 | 12/15/14 | (78 | ) | |||||||
| Barclays | INR | 105,258 | USD | 1,705 | 12/15/14 | 5 | ||||||||
| Barclays | KRW | 10,441,102 | USD | 10,120 | 12/15/14 | 366 | ||||||||
| BNP Paribas | USD | 6,207 | BRL | 15,170 | 11/04/14 | (84 | ) | |||||||
| BNP Paribas | USD | 6,262 | BRL | 15,170 | 12/02/14 | (192 | ) | |||||||
| BNP Paribas | BRL | 15,170 | USD | 6,316 | 11/04/14 | 194 | ||||||||
| Citibank | RUB | 61,181 | USD | 1,581 | 12/15/14 | 175 | ||||||||
| Deutsche Bank | USD | 7,155 | BRL | 17,670 | 11/04/14 | (24 | ) | |||||||
| Deutsche Bank | USD | 11,681 | MYR | 37,332 | 12/15/14 | (366 | ) | |||||||
| Deutsche Bank | BRL | 17,670 | USD | 7,229 | 11/04/14 | 98 | ||||||||
| Goldman Sachs | USD | 6,207 | BRL | 15,170 | 11/04/14 | (84 | ) | |||||||
| Goldman Sachs | USD | 3,440 | BRL | 8,615 | 12/02/14 | 7 | ||||||||
| Goldman Sachs | USD | 6,261 | BRL | 15,170 | 12/02/14 | (191 | ) | |||||||
| Goldman Sachs | USD | 6,185 | CNY | 38,015 | 12/15/14 | 11 | ||||||||
| Goldman Sachs | BRL | 15,170 | USD | 6,316 | 11/04/14 | 193 | ||||||||
| Goldman Sachs | INR | 293,088 | USD | 4,715 | 12/15/14 | (17 | ) | |||||||
| Goldman Sachs | KRW | 3,428,044 | USD | 3,312 | 12/15/14 | 110 | ||||||||
| Goldman Sachs | PLN | 16,762 | USD | 5,049 | 12/15/14 | 83 | ||||||||
| Goldman Sachs | TWD | 35,644 | USD | 1,190 | 12/15/14 | 17 | ||||||||
| HSBC | USD | 16,747 | HKD | 129,777 | 12/17/14 | (12 | ) | |||||||
| See accompanying notes which are an integral part of the financial statements. | ||||||||||||||
| 282 Russell Emerging Markets Fund | ||||||||||||||
| Russell Investment Company | |||||||
| Russell Emerging Markets Fund | |||||||
| Schedule of Investments, continued — October 31, 2014 | |||||||
| Foreign Currency Exchange Contracts | |||||||
| Amounts in thousands | |||||||
| Unrealized | |||||||
| Appreciation | |||||||
| Amount | Amount | (Depreciation) | |||||
| Counterparty | Sold | Bought | Settlement Date | $ | |||
| HSBC | USD | 5,868 | INR | 362,000 | 12/17/14 | (25 | ) |
| HSBC | USD | 6,001 | KRW | 6,235,000 | 12/17/14 | (177 | ) |
| JPMorgan Chase | USD | 16,747 | HKD | 129,777 | 12/17/14 | (12 | ) |
| JPMorgan Chase | USD | 3,992 | MXN | 53,097 | 12/17/14 | (59 | ) |
| Northern Trust | USD | 4,263 | MXN | 57,764 | 12/15/14 | 16 | |
| Royal Bank of Scotland | USD | 1,578 | CLP | 933,321 | 12/15/14 | 38 | |
| Royal Bank of Scotland | USD | 3,553 | CLP | 2,122,019 | 12/15/14 | 121 | |
| Royal Bank of Scotland | USD | 2,878 | KRW | 3,018,985 | 12/15/14 | (58 | ) |
| Royal Bank of Scotland | USD | 1,419 | PEN | 4,033 | 12/15/14 | (46 | ) |
| Royal Bank of Scotland | CNY | 22,124 | USD | 3,598 | 12/15/14 | (9 | ) |
| Royal Bank of Scotland | INR | 358,353 | USD | 5,708 | 12/15/14 | (78 | ) |
| Royal Bank of Scotland | PEN | 4,033 | USD | 1,393 | 12/15/14 | 20 | |
| Royal Bank of Scotland | RUB | 103,716 | USD | 2,756 | 12/15/14 | 373 | |
| Royal Bank of Scotland | RUB | 190,804 | USD | 5,031 | 12/15/14 | 646 | |
| Royal Bank of Scotland | TWD | 35,852 | USD | 1,196 | 12/15/14 | 16 | |
| Royal Bank of Scotland | TWD | 108,560 | USD | 3,638 | 12/15/14 | 67 | |
| Royal Bank of Scotland | ZAR | 12,695 | USD | 1,135 | 12/15/14 | (8 | ) |
| Standard Chartered | USD | 3,288 | BRL | 8,111 | 11/04/14 | (15 | ) |
| Standard Chartered | USD | 6,843 | BRL | 16,726 | 11/04/14 | (93 | ) |
| Standard Chartered | USD | 3,992 | MXN | 53,097 | 12/17/14 | (59 | ) |
| Standard Chartered | USD | 1,374 | MYR | 4,418 | 12/15/14 | (35 | ) |
| Standard Chartered | USD | 1,181 | TWD | 35,740 | 12/15/14 | (6 | ) |
| Standard Chartered | USD | 4,753 | TWD | 144,316 | 12/15/14 | (7 | ) |
| Standard Chartered | USD | 12,797 | ZAR | 139,922 | 12/15/14 | (197 | ) |
| Standard Chartered | BRL | 8,111 | USD | 3,318 | 11/04/14 | 45 | |
| Standard Chartered | BRL | 16,726 | USD | 6,940 | 11/04/14 | 190 | |
| Standard Chartered | CNY | 38,015 | USD | 6,166 | 12/15/14 | (30 | ) |
| Standard Chartered | INR | 69,181 | USD | 1,120 | 12/15/14 | 3 | |
| State Street | USD | 133 | BRL | 319 | 11/03/14 | (4 | ) |
| State Street | USD | 274 | BRL | 664 | 11/03/14 | (6 | ) |
| State Street | USD | 251 | BRL | 609 | 11/04/14 | (5 | ) |
| State Street | USD | 822 | BRL | 1,999 | 11/04/14 | (15 | ) |
| State Street | USD | 7,156 | BRL | 17,670 | 11/04/14 | (25 | ) |
| State Street | USD | 2 | HKD | 13 | 11/03/14 | — | |
| State Street | USD | 45 | HKD | 350 | 11/03/14 | — | |
| State Street | USD | 87 | HKD | 673 | 11/03/14 | — | |
| State Street | USD | 118 | HKD | 918 | 11/03/14 | — | |
| State Street | USD | 467 | HKD | 3,619 | 11/03/14 | — | |
| State Street | USD | 888 | HKD | 6,887 | 11/03/14 | — | |
| State Street | USD | 2,355 | HKD | 18,267 | 11/03/14 | — | |
| State Street | USD | 45 | HKD | 346 | 11/04/14 | — | |
| State Street | USD | 148 | HKD | 1,146 | 11/04/14 | — | |
| State Street | USD | 167 | HKD | 1,298 | 11/04/14 | — | |
| State Street | USD | 626 | HKD | 4,857 | 11/04/14 | — | |
| State Street | USD | 884 | HKD | 6,857 | 11/04/14 | — | |
| State Street | USD | 5,158 | HKD | 40,000 | 12/17/14 | — | |
| State Street | USD | 5,869 | INR | 362,000 | 12/17/14 | (26 | ) |
| State Street | USD | 289 | KRW | 306,446 | 11/03/14 | (2 | ) |
| State Street | USD | 347 | KRW | 368,546 | 11/03/14 | (2 | ) |
| State Street | USD | 5,993 | KRW | 6,235,000 | 12/17/14 | (169 | ) |
| State Street | USD | 225 | MXN | 3,036 | 11/03/14 | — | |
| State Street | USD | 61 | MXN | 819 | 11/04/14 | — | |
| State Street | USD | 14 | MYR | 47 | 11/03/14 | — | |
| State Street | USD | 134 | MYR | 441 | 11/03/14 | — | |
| State Street | USD | 5,163 | PLN | 16,762 | 12/15/14 | (197 | ) |
| State Street | USD | 33 | THB | 1,089 | 11/03/14 | — | |
| State Street | USD | — | THB | 10 | 11/04/14 | — | |
| State Street | USD | 377 | TRY | 838 | 11/03/14 | — | |
| State Street | USD | 128 | ZAR | 1,403 | 11/05/14 | (1 | ) |
| State Street | USD | 2,180 | ZAR | 24,382 | 12/15/14 | 16 | |
| State Street | USD | 4,688 | ZAR | 52,067 | 12/17/14 | (1 | ) |
| State Street | BRL | 115 | USD | 46 | 11/03/14 | — | |
| State Street | BRL | 3,090 | USD | 1,253 | 11/03/14 | 6 | |
| State Street | BRL | 1,450 | USD | 602 | 11/04/14 | 17 | |
| State Street | BRL | 17,670 | USD | 7,229 | 11/04/14 | 98 | |
| State Street | BRL | 842 | USD | 340 | 11/05/14 | — | |
| State Street | CZK | 157,010 | USD | 7,353 | 12/15/14 | 276 | |
| See accompanying notes which are an integral part of the financial statements. | |||||||
| Russell Emerging Markets Fund 283 | |||||||
| Russell Investment Company | |||||||||||
| Russell Emerging Markets Fund | |||||||||||
| Schedule of Investments, continued — October 31, 2014 | |||||||||||
| Foreign Currency Exchange Contracts | |||||||||||
| Amounts in thousands | |||||||||||
| Unrealized | |||||||||||
| Appreciation | |||||||||||
| Amount | Amount | (Depreciation) | |||||||||
| Counterparty | Sold | Bought | Settlement Date | $ | |||||||
| State Street | HKD | 95 | USD | 12 | 11/03/14 | — | |||||
| State Street | HKD | 437 | USD | 56 | 11/03/14 | — | |||||
| State Street | HKD | 529 | USD | 68 | 11/03/14 | — | |||||
| State Street | HKD | 963 | USD | 124 | 11/03/14 | — | |||||
| State Street | HKD | 1,033 | USD | 133 | 11/03/14 | — | |||||
| State Street | HKD | 1,874 | USD | 242 | 11/03/14 | — | |||||
| State Street | HKD | 2,794 | USD | 360 | 11/03/14 | — | |||||
| State Street | HKD | 21,667 | USD | 2,794 | 11/03/14 | — | |||||
| State Street | HKD | 430 | USD | 55 | 11/04/14 | — | |||||
| State Street | HKD | 526 | USD | 68 | 11/04/14 | — | |||||
| State Street | HKD | 811 | USD | 105 | 11/04/14 | — | |||||
| State Street | HKD | 1,298 | USD | 167 | 11/04/14 | — | |||||
| State Street | IDR | 299,652 | USD | 25 | 11/03/14 | — | |||||
| State Street | KRW | 200,000 | USD | 192 | 12/17/14 | 5 | |||||
| State Street | MXN | 118 | USD | 9 | 11/03/14 | — | |||||
| State Street | MXN | 136 | USD | 10 | 11/03/14 | — | |||||
| State Street | MXN | 250 | USD | 19 | 11/03/14 | — | |||||
| State Street | MXN | 259 | USD | 19 | 11/03/14 | — | |||||
| State Street | MYR | 139 | USD | 42 | 11/03/14 | — | |||||
| State Street | MYR | 912 | USD | 277 | 11/04/14 | — | |||||
| State Street | PHP | 10,420 | USD | 232 | 11/03/14 | — | |||||
| State Street | PHP | 3,625 | USD | 81 | 11/04/14 | — | |||||
| State Street | PHP | 9,089 | USD | 203 | 11/04/14 | — | |||||
| State Street | THB | 2,860 | USD | 88 | 11/03/14 | — | |||||
| State Street | THB | 6,314 | USD | 194 | 11/03/14 | — | |||||
| State Street | THB | 2,663 | USD | 82 | 11/04/14 | — | |||||
| State Street | THB | 2,781 | USD | 85 | 11/04/14 | — | |||||
| State Street | TRY | 275 | USD | 121 | 12/17/14 | (1 | ) | ||||
| State Street | ZAR | 57 | USD | 5 | 11/03/14 | — | |||||
| State Street | ZAR | 413 | USD | 38 | 11/03/14 | — | |||||
| State Street | ZAR | 1,129 | USD | 104 | 11/03/14 | 1 | |||||
| State Street | ZAR | 1,241 | USD | 114 | 11/03/14 | 1 | |||||
| State Street | ZAR | 1,271 | USD | 117 | 11/04/14 | 2 | |||||
| State Street | ZAR | 522 | USD | 48 | 11/05/14 | — | |||||
| State Street | ZAR | 589 | USD | 54 | 11/06/14 | 1 | |||||
| UBS | USD | 3,396 | BRL | 8,615 | 11/04/14 | 81 | |||||
| UBS | BRL | 8,615 | USD | 3,525 | 11/04/14 | 48 | |||||
| UBS | BRL | 8,615 | USD | 3,369 | 12/02/14 | (78 | ) | ||||
| Total Unrealized Appreciation (Depreciation) on Open Foreign Currency Exchange Contracts | 691 | ||||||||||
| Index Swap Contracts (*) | |||||||||||
| Amounts in thousands | |||||||||||
| Fund Receives | Notional | Termination | Fair Value | ||||||||
| Underlying Security | Counterparty | Amount | Date | $ | |||||||
| Bovespa Index Futures | Goldman Sachs | BRL | 20,666 | 12/18/14 | (523 | ) | |||||
| Bovespa Index Futures | Goldman Sachs | BRL | 20,662 | 12/18/14 | (522 | ) | |||||
| Total Fair Value of Open Index Swap Contracts Premiums Paid (Received) - $— (å) | (1,045 | ) | |||||||||
| (*) Total return swaps (which includes index swaps) are agreements between counterparties to exchange cash flows, one based on a market-linked | |||||||||||
| returns of an individual asset or a basket of assets (i.e. an index), and the other on a fixed or floating rate. The floating rate fees were all based | |||||||||||
| on the total return of underlying security at termination. | |||||||||||
| Presentation of Portfolio Holdings | |||||||||||
| Amounts in thousands | |||||||||||
| Fair Value | |||||||||||
| Portfolio Summary | Level 1 | Level 2 | Level 3 | Total | % of Net Assets | ||||||
| Common Stocks | |||||||||||
| Argentina | $ | 2,671 | $ | — | $ | — | $ | 2,671 | 0.1 | ||
| Austria | 1,634 | — | — | 1,634 | 0.1 | ||||||
| See accompanying notes which are an integral part of the financial statements. | |||||||||||
| 284 Russell Emerging Markets Fund | |||||||||||
| Russell Investment Company | |||||||||||
| Russell Emerging Markets Fund | |||||||||||
| Schedule of Investments, continued — October 31, 2014 | |||||||||||
| Presentation of Portfolio Holdings | |||||||||||
| Amounts in thousands | |||||||||||
| Fair Value | |||||||||||
| Portfolio Summary | Level 1 | Level 2 | Level 3 | Total | % of Net Assets | ||||||
| Bermuda | 50,346 | — | — | 50,346 | 1.7 | ||||||
| Brazil | 279,867 | — | — | 279,867 | 9.4 | ||||||
| Canada | 8,095 | — | — | 8,095 | 0.3 | ||||||
| Cayman Islands | 192,744 | — | 895 | 193,639 | 6.5 | ||||||
| Chile | 7,167 | — | — | 7,167 | 0.2 | ||||||
| China | 208,131 | — | — | 208,131 | 7.0 | ||||||
| Colombia | 9,983 | — | — | 9,983 | 0.3 | ||||||
| Cyprus | 539 | 203 | — | 742 | —* | ||||||
| Czech Republic | 12,019 | — | — | 12,019 | 0.4 | ||||||
| Egypt | 2,594 | — | — | 2,594 | 0.1 | ||||||
| Greece | 1,523 | — | — | 1,523 | 0.1 | ||||||
| Hong Kong | 133,932 | — | — | 133,932 | 4.5 | ||||||
| Hungary | 15,599 | — | — | 15,599 | 0.5 | ||||||
| India | 258,320 | — | — | 258,320 | 8.7 | ||||||
| Indonesia | 62,517 | — | — | 62,517 | 2.1 | ||||||
| Ireland | 2,674 | — | — | 2,674 | 0.1 | ||||||
| Israel | 11,853 | — | — | 11,853 | 0.4 | ||||||
| Jersey | 3,617 | — | — | 3,617 | 0.1 | ||||||
| Kazakhstan | 2,589 | — | — | 2,589 | 0.1 | ||||||
| Luxembourg | 11,957 | — | — | 11,957 | 0.4 | ||||||
| Malaysia | 31,243 | — | — | 31,243 | 1.0 | ||||||
| Mexico | 124,092 | — | — | 124,092 | 4.2 | ||||||
| Morocco | 319 | — | — | 319 | —* | ||||||
| Netherlands | 18,918 | — | — | 18,918 | 0.6 | ||||||
| Nigeria | 16,795 | — | — | 16,795 | 0.6 | ||||||
| Pakistan | 3,862 | — | — | 3,862 | 0.1 | ||||||
| Panama | 4,719 | — | — | 4,719 | 0.2 | ||||||
| Philippines | 20,962 | — | — | 20,962 | 0.7 | ||||||
| Poland | 13,240 | — | — | 13,240 | 0.4 | ||||||
| Qatar | 4,469 | — | — | 4,469 | 0.1 | ||||||
| Russia | 133,064 | — | — | 133,064 | 4.5 | ||||||
| Singapore | 5,058 | — | — | 5,058 | 0.2 | ||||||
| South Africa | 145,586 | — | — | 145,586 | 4.9 | ||||||
| South Korea | 352,351 | — | — | 352,351 | 11.8 | ||||||
| Spain | 3,229 | — | — | 3,229 | 0.1 | ||||||
| Switzerland | 10,481 | — | — | 10,481 | 0.3 | ||||||
| Taiwan | 274,190 | — | — | 274,190 | 9.2 | ||||||
| Thailand | 90,480 | — | — | 90,480 | 3.0 | ||||||
| Turkey | 77,452 | — | — | 77,452 | 2.6 | ||||||
| United Arab Emirates | 13,104 | — | — | 13,104 | 0.4 | ||||||
| United Kingdom | 59,926 | — | — | 59,926 | 2.0 | ||||||
| United States | 29,417 | — | — | 29,417 | 1.0 | ||||||
| Virgin Islands, British | 6,178 | — | — | 6,178 | 0.2 | ||||||
| Zimbabwe | 571 | — | — | 571 | —* | ||||||
| Investments in Other Funds | 14,668 | 19,649 | — | 34,317 | 1.1 | ||||||
| Preferred Stocks | 44,170 | — | — | 44,170 | 1.5 | ||||||
| Certificates of Participation | 3 | 34,395 | — | 34,398 | 1.1 | ||||||
| Warrants & Rights | — | 15,209 | — | 15,209 | 0.5 | ||||||
| Short-Term Investments | — | 112,932 | — | 112,932 | 3.8 | ||||||
| Other Securities | — | 160,224 | — | 160,224 | 5.4 | ||||||
| Total Investments | 2,778,918 | 342,612 | 895 | 3,122,425 | 104.6 | ||||||
| Other Assets and Liabilities, Net | (4.6 | ) | |||||||||
| 100.0 | |||||||||||
See accompanying notes which are an integral part of the financial statements.
Russell Emerging Markets Fund 285
| Russell Investment Company | |||||||||||||
| Russell Emerging Markets Fund | |||||||||||||
| Schedule of Investments, continued — October 31, 2014 | |||||||||||||
| Presentation of Portfolio Holdings | |||||||||||||
| Amounts in thousands | |||||||||||||
| Fair Value | |||||||||||||
| Portfolio Summary | Level 1 | Level 2 | Level 3 | Total | % of Net Assets | ||||||||
| Other Financial Instruments | |||||||||||||
| Futures Contracts | 704 | — | — | 704 | —* | ||||||||
| Foreign Currency Exchange Contracts | 104 | 587 | — | 691 | —* | ||||||||
| Index Swap Contracts | — | (1,045 | ) | — | (1,045 | ) | (—)* | ||||||
| Total Other Financial Instruments** | $ | 808 | $ | (458 | ) | $ | — | $ | 350 | ||||
| * | Less than .05% of net assets. |
| ** | Futures and foreign currency exchange contract values reflect the unrealized appreciation/depreciation on the instruments. |
For a description of the Levels see note 2 in the Notes to Financial Statements.
For disclosure on transfers between Levels 1, 2 and 3 during the period ended October 31, 2014, see note 2 in the Notes to Financial Statements.
Investments in which significant unobservable inputs (Level 3) were used in determining a fair value for the period ended October 31, 2014 were less than 1% of net assets.
See accompanying notes which are an integral part of the financial statements.
286 Russell Emerging Markets Fund
| Russell Investment Company | ||||||
| Russell Emerging Markets Fund | ||||||
| Fair Value of Derivative Instruments — October 31, 2014 | ||||||
| Amounts in thousands | ||||||
| Foreign | ||||||
| Equity | Currency | |||||
| Derivatives not accounted for as hedging instruments | Contracts | Contracts | ||||
| Location: Statement of Assets and Liabilities - Assets | ||||||
| Unrealized appreciation on foreign currency exchange contracts | $ | — | $ | 3,362 | ||
| Variation margin on futures contracts* | 1,944 | — | ||||
| Total | $ | 1,944 | $ | 3,362 | ||
| Location: Statement of Assets and Liabilities - Liabilities | ||||||
| Variation margin on futures contracts* | $ | 1,240 | $ | — | ||
| Unrealized depreciation on foreign currency exchange contracts | — | 2,671 | ||||
| Index swap contracts, at fair value | 1,045 | — | ||||
| Total | $ | 2,285 | $ | 2,671 | ||
| Foreign | ||||||
| Equity | Currency | |||||
| Derivatives not accounted for as hedging instruments | Contracts | Contracts | ||||
| Location: Statement of Operations - Net realized gain (loss) | ||||||
| Futures contracts | $ | 5,506 | $ | — | ||
| Index swap contracts | (60 | ) | — | |||
| Foreign currency-related transactions** | — | 1,454 | ||||
| Total | $ | 5,446 | $ | 1,454 | ||
| Location: Statement of Operations - Net change in unrealized appreciation (depreciation) | ||||||
| Futures contracts | $ | (582 | ) | $ | — | |
| Index swap contracts | (1,182 | ) | — | |||
| Foreign currency-related transactions*** | — | (1,006 | ) | |||
| Total | $ | (1,764 | ) | $ | (1,006 | ) |
| * | Includes cumulative appreciation/depreciation of futures contracts as reported in the Schedule of Investments. Only variation margin is reported within the Statement of Assets and Liabilities. |
| ** | Only includes net realized gain (loss) on forward and spot contracts. May differ from the net realized gain (loss) on foreign currency-related transactions reported within the Statement of Operations. |
| *** | Only includes change in unrealized gain (loss) on forward and spot contracts. May differ from the net change in unrealized gain (loss) on foreign currency-related transactions reported within the Statement of Operations. |
For further disclosure on derivatives see note 2 in the Notes to Financial Statements.
See accompanying notes which are an integral part of the financial statements.
Russell Emerging Markets Fund 287
Russell Investment Company Russell Emerging Markets Fund
Balance Sheet Offsetting of Financial and Derivative Instruments — October 31, 2014
| Amounts in thousands | ||||||||
| Offsetting of Financial Assets and Derivative Assets | ||||||||
| Gross | Net Amounts | |||||||
| Amounts | of Assets | |||||||
| Gross | Offset in the | Presented in | ||||||
| Amounts of | Statement of | the Statement | ||||||
| Recognized | Assets and | of Assets and | ||||||
| Description | Location: Statement of Assets and Liabilities - Assets | Assets | Liabilities | Liabilities | ||||
| Securities on Loan* | Investments, at fair value | $ | 154,625 | $ | — $ | 154,625 | ||
| Foreign Currency Exchange Contracts | Unrealized appreciation on foreign currency exchange contracts | 3,362 | — | 3,362 | ||||
| Futures Contracts | Variation margin on futures contracts | 11,786 | — | 11,786 | ||||
| Total | $ | 169,773 | $ | — $ | 169,773 | |||
| Financial Assets, Derivative Assets, and Collateral Held by Counterparty | ||||||||
| Gross Amounts Not Offset in | ||||||||
| the Statement of Assets and | ||||||||
| Liabilities | ||||||||
| Net Amounts | ||||||||
| of Assets | ||||||||
| Presented in | ||||||||
| the Statement | Financial and | |||||||
| of Assets and | Derivative | Collateral | ||||||
| Counterparty | Liabilities | Instruments | Received^ | Net Amount | ||||
| Bank of America | $ | 17 | $ | 3 | $ | — $ | 14 | |
| Barclays | 58,220 | 167 | 57,849 | 204 | ||||
| BNP Paribas | 194 | 194 | — | — | ||||
| Citigroup | 4,202 | — | 4,027 | 175 | ||||
| Credit Suisse | 16,136 | — | 16,136 | — | ||||
| Deutsche Bank | 6,148 | 24 | 6,050 | 74 | ||||
| Fidelity | 870 | — | 870 | — | ||||
| Goldman Sachs | 16,555 | 211 | 4,933 | 11,411 | ||||
| ING | 1,578 | — | 1,578 | — | ||||
| JPMorgan Chase | 26,498 | — | 26,498 | — | ||||
| Merrill Lynch | 7,421 | — | 7,421 | — | ||||
| Morgan Stanley | 26,794 | — | 26,794 | — | ||||
| Northern Trust | 16 | — | — | 16 | ||||
| Royal Bank of Scotland | 1,276 | 199 | — | 1,077 | ||||
| Standard Chartered | 238 | 238 | — | — | ||||
| State Street | 425 | 202 | — | 223 | ||||
| UBS | 3,185 | 78 | 3,056 | 51 | ||||
| Total | $ | 169,773 | $ | 1,316 | $ | 155,212 | $ | 13,245 |
See accompanying notes which are an integral part of the financial statements.
288 Russell Emerging Markets Fund
Russell Investment Company
Russell Emerging Markets Fund
Balance Sheet Offsetting of Financial and Derivative Instruments, continued —October 31, 2014
| Amounts in thousands | ||||||||
| Offsetting of Financial Liabilities and Derivative Liabilities | ||||||||
| Gross | Net Amounts | |||||||
| Amounts | of Assets | |||||||
| Gross | Offset in the | Presented in | ||||||
| Amounts of | Statement of | the Statement | ||||||
| Recognized | Assets and | of Assets and | ||||||
| Description | Location: Statement of Assets and Liabilities - Liabilities | Liabilities | Liabilities | Liabilities | ||||
| Foreign Currency Exchange Contracts | Unrealized depreciation on foreign currency exchange contracts | $ | 2,671 | $ | — $ | 2,671 | ||
| Index Swap Contracts | Index swap contracts, at fair value | 1,045 | — | 1,045 | ||||
| Total | $ | 3,716 | $ | — $ | 3,716 | |||
| Financial Liabilities, Derivative Liabilities, and Collateral Pledged by Counterparty | ||||||||
| Gross Amounts Not Offset in | ||||||||
| the Statement of Assets and | ||||||||
| Liabilities | ||||||||
| Net Amounts | ||||||||
| of Liabilities | ||||||||
| Presented in | ||||||||
| the Statement | Financial and | |||||||
| of Assets and | Derivative | Collateral | ||||||
| Counterparty | Liabilities | Instruments | Pledged^ | Net Amount | ||||
| Bank of America | $ | 89 | $ | 3 | $ | — $ | 86 | |
| Barclays | 167 | 167 | — | — | ||||
| BNP Paribas | 277 | 194 | — | 83 | ||||
| Deutsche Bank | 384 | 24 | — | 360 | ||||
| Goldman Sachs | 1,338 | 211 | 1,127 | — | ||||
| HSBC | 214 | — | — | 214 | ||||
| JPMorgan Chase | 71 | — | — | 71 | ||||
| Royal Bank of Scotland | 199 | 199 | — | — | ||||
| Standard Chartered | 442 | 238 | — | 204 | ||||
| State Street | 457 | 202 | — | 255 | ||||
| UBS | 78 | 78 | — | — | ||||
| Total | $ | 3,716 | $ | 1,316 | $ | 1,127 | $ | 1,273 |
* Fair value of securities on loan as reported in the footnotes to the Statement of Assets and Liabilities.
^ Collateral received or pledged amounts may not reconcile to those disclosed in the Statement of Assets and Liabilities due to the inclusion of off-Balance Sheet collateral and adjustments made to exclude overcollateralization.
For further disclosure on derivatives and counterparty risk see note 2 in the Notes to Financial Statements.
See accompanying notes which are an integral part of the financial statements.
Russell Emerging Markets Fund 289
| Russell Investment Company | ||
| Russell Emerging Markets Fund | ||
| Statement of Assets and Liabilities — October 31, 2014 | ||
| Amounts in thousands | ||
| Assets | ||
| Investments, at identified cost | $ | 2,827,925 |
| Investments, at fair value(*)(>) | 3,122,425 | |
| Cash | 19 | |
| Cash (restricted)(a)(b) | 2,845 | |
| Foreign currency holdings(^) | 7,722 | |
| Unrealized appreciation on foreign currency exchange contracts | 3,362 | |
| Receivables: | ||
| Dividends and interest | 2,601 | |
| Dividends from affiliated Russell funds | 9 | |
| Investments sold | 26,545 | |
| Fund shares sold | 3,876 | |
| Foreign capital gains taxes recoverable | 7 | |
| Variation margin on futures contracts | 11,786 | |
| Prepaid expenses | 7 | |
| Total assets | 3,181,204 | |
| Liabilities | ||
| Payables: | ||
| Due to broker(c) | 585 | |
| Investments purchased | 23,145 | |
| Fund shares redeemed | 1,416 | |
| Accrued fees to affiliates | 3,391 | |
| Other accrued expenses | 589 | |
| Deferred capital gains tax liability | 3,980 | |
| Unrealized depreciation on foreign currency exchange contracts | 2,671 | |
| Payable upon return of securities loaned | 160,224 | |
| Index swap contracts, at fair value(8) | 1,045 | |
| Total liabilities | 197,046 | |
| Net Assets | $ | 2,984,158 |
See accompanying notes which are an integral part of the financial statements.
290 Russell Emerging Markets Fund
| Russell Investment Company | |||
| Russell Emerging Markets Fund | |||
| Statement of Assets and Liabilities, continued — October 31, 2014 | |||
| Amounts in thousands | |||
| Net Assets Consist of: | |||
| Undistributed (overdistributed) net investment income | $ | 5,397 | |
| Accumulated net realized gain (loss) | 71 | ||
| Unrealized appreciation (depreciation) on: | |||
| Investments (net of deferred tax liability for foreign capital gains taxes) | 290,520 | ||
| Futures contracts | 704 | ||
| Index swap contracts | (1,045 | ) | |
| Foreign currency-related transactions | 90 | ||
| Shares of beneficial interest | 1,602 | ||
| Additional paid-in capital | 2,686,819 | ||
| Net Assets | $ | 2,984,158 | |
| Net Asset Value, offering and redemption price per share: | |||
| Net asset value per share: Class A(#) | $ | 18.50 | |
| Maximum offering price per share (Net asset value plus sales charge of 5.75%): Class A | $ | 19.63 | |
| Class A — Net assets | $ | 22,378,358 | |
| Class A — Shares outstanding ($.01 par value) | 1,209,625 | ||
| Net asset value per share: Class C(#) | $ | 17.29 | |
| Class C — Net assets | $ | 28,601,331 | |
| Class C — Shares outstanding ($.01 par value) | 1,653,802 | ||
| Net asset value per share: Class E(#) | $ | 18.56 | |
| Class E — Net assets | $ | 49,652,065 | |
| Class E — Shares outstanding ($.01 par value) | 2,675,404 | ||
| Net asset value per share: Class S(#) | $ | 18.63 | |
| Class S — Net assets | $ 2,231,798,635 | ||
| Class S — Shares outstanding ($.01 par value) | 119,787,877 | ||
| Net asset value per share: Class Y(#) | $ | 18.68 | |
| Class Y — Net assets | $ | 651,727,539 | |
| Class Y — Shares outstanding ($.01 par value) | 34,883,719 | ||
| Amounts in thousands | |||
| (^) Foreign currency holdings - cost | $ | 8,185 | |
| (*) Securities on loan included in investments | $ | 154,625 | |
| (>) Investments in affiliates, Russell U.S. Cash Management Fund and Russell U.S. Cash Collateral Fund | $ | 268,156 | |
| (8) Index swap contracts - premiums paid (received) | $ | — | |
| (a) Cash Collateral for Futures | $ | 2,245 | |
| (b) Cash Collateral for Swaps | $ | 600 | |
| (c) Due to Broker for Futures | $ | 585 | |
| (#) Net asset value per share equals class level net assets divided by class level shares of beneficial interest outstanding. | |||
See accompanying notes which are an integral part of the financial statements.
Russell Emerging Markets Fund 291
| Russell Investment Company | |||
| Russell Emerging Markets Fund | |||
| Statement of Operations — For the Period Ended October 31, 2014 | |||
| Amounts in thousands | |||
| Investment Income | |||
| Dividends | $ | 73,253 | |
| Dividends from affiliated Russell funds | 150 | ||
| Interest | 1,612 | ||
| Securities lending income | 1,259 | ||
| Less foreign taxes withheld | (6,960 | ) | |
| Total investment income | 69,314 | ||
| Expenses | |||
| Advisory fees | 31,662 | ||
| Administrative fees | 1,311 | ||
| Custodian fees | 2,285 | ||
| Distribution fees - Class A | 55 | ||
| Distribution fees - Class C | 217 | ||
| Transfer agent fees - Class A | 44 | ||
| Transfer agent fees - Class C | 58 | ||
| Transfer agent fees - Class E | 102 | ||
| Transfer agent fees - Class S | 4,124 | ||
| Transfer agent fees - Class Y | 26 | ||
| Professional fees | 184 | ||
| Registration fees | 137 | ||
| Shareholder servicing fees - Class C | 72 | ||
| Shareholder servicing fees - Class E | 127 | ||
| Trustees’ fees | 60 | ||
| Printing fees | 253 | ||
| Miscellaneous | 129 | ||
| Total expenses | 40,846 | ||
| Net investment income (loss) | 28,468 | ||
| Net Realized and Unrealized Gain (Loss) | |||
| Net realized gain (loss) on: | |||
| Investments (net of deferred tax liability for foreign capital gains taxes) | 30,979 | ||
| Futures contracts | 5,506 | ||
| Index swap contracts | (60 | ) | |
| Foreign currency-related transactions | 1,831 | ||
| Net realized gain (loss) | 38,256 | ||
| Net change in unrealized appreciation (depreciation) on: | |||
| Investments (net of deferred tax liability for foreign capital gains taxes) | 6,612 | ||
| Futures contracts | (582 | ) | |
| Index swap contracts | (1,182 | ) | |
| Foreign currency-related transactions | (1,635 | ) | |
| Other investments | 21 | ||
| Net change in unrealized appreciation (depreciation) | 3,234 | ||
| Net realized and unrealized gain (loss) | 41,490 | ||
| Net Increase (Decrease) in Net Assets from Operations | $ | 69,958 | |
See accompanying notes which are an integral part of the financial statements.
292 Russell Emerging Markets Fund
| Russell Investment Company | ||||||
| Russell Emerging Markets Fund | ||||||
| Statements of Changes in Net Assets | ||||||
| For the Periods Ended October 31, | ||||||
| Amounts in thousands | 2014 | 2013 | ||||
| Increase (Decrease) in Net Assets | ||||||
| Operations | ||||||
| Net investment income (loss) | $ | 28,468 | $ | 20,475 | ||
| Net realized gain (loss) | 38,256 | 64,246 | ||||
| Net change in unrealized appreciation (depreciation) | 3,234 | 58,311 | ||||
| Net increase (decrease) in net assets from operations | 69,958 | 143,032 | ||||
| Distributions | ||||||
| From net investment income | ||||||
| Class A | (96 | ) | (154 | ) | ||
| Class C | (—)** | (8 | ) | |||
| Class E | (170 | ) | (276 | ) | ||
| Class S | (11,119 | ) | (13,672 | ) | ||
| Class Y | (4,235 | ) | (4,486 | ) | ||
| From net realized gain | ||||||
| Class A | (624 | ) | — | |||
| Class C | (904 | ) | — | |||
| Class E | (1,133 | ) | — | |||
| Class S | (45,961 | ) | — | |||
| Class Y | (13,854 | ) | — | |||
| Net decrease in net assets from distributions | (78,096 | ) | (18,596 | ) | ||
| Share Transactions* | ||||||
| Net increase (decrease) in net assets from share transactions | 823,559 | 224,283 | ||||
| Total Net Increase (Decrease) in Net Assets | 815,421 | 348,719 | ||||
| Net Assets | ||||||
| Beginning of period | 2,168,737 | 1,820,018 | ||||
| End of period | $ | 2,984,158 | $ | 2,168,737 | ||
| Undistributed (overdistributed) net investment income included in net assets | $ | 5,397 | $ | (15,953 | ) | |
| ** | Less than $500. |
See accompanying notes which are an integral part of the financial statements.
Russell Emerging Markets Fund 293
Russell Investment Company Russell Emerging Markets Fund
Statements of Changes in Net Assets, continued
* Share transaction amounts (in thousands) for the periods ended October 31, 2014 and October 31, 2013 were as follows:
| 2014 | 2013 | |||||||||||
| Shares | Dollars | Shares | Dollars | |||||||||
| Class A | ||||||||||||
| Proceeds from shares sold | 327 | $ | 5,917 | 311 | $ | 5,694 | ||||||
| Proceeds from reinvestment of distributions | 39 | 692 | 8 | 150 | ||||||||
| Payments for shares redeemed | (303 | ) | (5,543 | ) | (330 | ) | (5,978 | ) | ||||
| Net increase (decrease) | 63 | 1,066 | (11 | ) | (134 | ) | ||||||
| Class C | ||||||||||||
| Proceeds from shares sold | 394 | 6,740 | 273 | 4,771 | ||||||||
| Proceeds from reinvestment of distributions | 53 | 886 | 1 | 8 | ||||||||
| Payments for shares redeemed | (411 | ) | (7,016 | ) | (551 | ) | (9,404 | ) | ||||
| Net increase (decrease) | 36 | 610 | (277 | ) | (4,625 | ) | ||||||
| Class E | ||||||||||||
| Proceeds from shares sold | 1,424 | 25,324 | 744 | 13,873 | ||||||||
| Proceeds from reinvestment of distributions | 71 | 1,256 | 14 | 267 | ||||||||
| Payments for shares redeemed | (886 | ) | (16,716 | ) | (868 | ) | (15,612 | ) | ||||
| Net increase (decrease) | 609 | 9,864 | (110 | ) | (1,472 | ) | ||||||
| Class S | ||||||||||||
| Proceeds from shares sold | 56,245 | 1,007,872 | 25,160 | 463,014 | ||||||||
| Proceeds from reinvestment of distributions | 3,191 | 56,703 | 730 | 13,550 | ||||||||
| Payments for shares redeemed | (23,271 | ) | (428,433 | ) | (17,132 | ) | (314,617 | ) | ||||
| Net increase (decrease) | 36,165 | 636,142 | 8,758 | 161,947 | ||||||||
| Class Y | ||||||||||||
| Proceeds from shares sold | 14,643 | 270,290 | 7,387 | 139,793 | ||||||||
| Proceeds from reinvestment of distributions | 1,017 | 18,089 | 241 | 4,486 | ||||||||
| Payments for shares redeemed | (5,968 | ) | (112,502 | ) | (4,036 | ) | (75,712 | ) | ||||
| Net increase (decrease) | 9,692 | 175,877 | 3,592 | 68,567 | ||||||||
| Total increase (decrease) | 46,565 | $ | 823,559 | 11,952 | $ | 224,283 | ||||||
See accompanying notes which are an integral part of the financial statements.
294 Russell Emerging Markets Fund
(This page intentionally left blank)
| Russell Investment Company | |||||||||||||||||
| Russell Emerging Markets Fund | |||||||||||||||||
| Financial Highlights — For the Periods Ended | |||||||||||||||||
| For a Share Outstanding Throughout Each Period. | |||||||||||||||||
| $ | $ | $ | $ | $ | $ | ||||||||||||
| Net Asset Value, | Net | Net Realized | Total from | Distributions | Distributions | ||||||||||||
| Beginning of | Investment | and Unrealized | Investment | from Net | from Net | ||||||||||||
| Period | Income (Loss)(a)(d) | Gain (Loss) | Operations | Investment Income | Realized Gain | ||||||||||||
| Class A | |||||||||||||||||
| October 31, 2014 | 18.96 | .13 | .04 | .17 | (.08 | ) | (.55 | ) | |||||||||
| October 31, 2013 | 17.79 | .13 | 1.18 | 1.31 | (.14 | ) | — | ||||||||||
| October 31, 2012 | 18.06 | .19 | .46 | .65 | (.22 | ) | (.70 | ) | |||||||||
| October 31, 2011 | 20.37 | .21 | (2.14 | ) | (1.93 | ) | (.38 | ) | — | ||||||||
| October 31, 2010 | 16.44 | .08 | 4.29 | 4.37 | (.44 | ) | — | ||||||||||
| Class C | |||||||||||||||||
| October 31, 2014 | 17.81 | (.01 | ) | .04 | .03 | — | (.55 | ) | |||||||||
| October 31, 2013 | 16.72 | (.01 | ) | 1.10 | 1.09 | — | — | ||||||||||
| October 31, 2012 | 16.99 | .05 | .45 | .50 | (.07 | ) | (.70 | ) | |||||||||
| October 31, 2011 | 19.20 | .05 | (2.02 | ) | (1.97 | ) | (.24 | ) | — | ||||||||
| October 31, 2010 | 15.53 | (.05 | ) | 4.06 | 4.01 | (.34 | ) | — | |||||||||
| Class E | |||||||||||||||||
| October 31, 2014 | 19.01 | .15 | .03 | .18 | (.08 | ) | (.55 | ) | |||||||||
| October 31, 2013 | 17.83 | .14 | 1.17 | 1.31 | (.13 | ) | — | ||||||||||
| October 31, 2012 | 18.10 | .18 | .47 | .65 | (.22 | ) | (.70 | ) | |||||||||
| October 31, 2011 | 20.41 | .22 | (2.16 | ) | (1.94 | ) | (.37 | ) | — | ||||||||
| October 31, 2010 | 16.47 | .08 | 4.30 | 4.38 | (.44 | ) | — | ||||||||||
| Class S | |||||||||||||||||
| October 31, 2014 | 19.09 | .19 | .03 | .22 | (.13 | ) | (.55 | ) | |||||||||
| October 31, 2013 | 17.91 | .18 | 1.18 | 1.36 | (.18 | ) | — | ||||||||||
| October 31, 2012 | 18.19 | .23 | .46 | .69 | (.27 | ) | (.70 | ) | |||||||||
| October 31, 2011 | 20.50 | .27 | (2.17 | ) | (1.90 | ) | (.41 | ) | — | ||||||||
| October 31, 2010 | 16.52 | .12 | 4.33 | 4.45 | (.47 | ) | — | ||||||||||
| Class Y | |||||||||||||||||
| October 31, 2014 | 19.14 | .22 | .03 | .25 | (.16 | ) | (.55 | ) | |||||||||
| October 31, 2013 | 17.96 | .23 | 1.17 | 1.40 | (.22 | ) | — | ||||||||||
| October 31, 2012 | 18.23 | .26 | .47 | .73 | (.30 | ) | (.70 | ) | |||||||||
| October 31, 2011 | 20.54 | .29 | (2.16 | ) | (1.87 | ) | (.44 | ) | — | ||||||||
| October 31, 2010 | 16.55 | .15 | 4.33 | 4.48 | (.49 | ) | — | ||||||||||
See accompanying notes which are an integral part of the financial statements.
296 Russell Emerging Markets Fund
| % | % | % | ||||||||||||||||
| $ | $ | Ratio of Expenses | Ratio of Expenses | Ratio of Net | ||||||||||||||
| Net Asset Value, | % | Net Assets, | to Average | to Average | Investment Income | % | ||||||||||||
| $ | End of | Total | End of Period | Net Assets, | Net Assets, | to Average | Portfolio | |||||||||||
| Total Distributions | Period | Return(c) | (000 | ) | Gross | Net(d) | Net Assets(d) | Turnover Rate | ||||||||||
| (.63 | ) | 18.50 | 1.04 | 22,378 | 1.76 | 1.76 | .72 | 67 | ||||||||||
| (.14 | ) | 18.96 | 7.36 | 21,736 | 1.75 | 1.75 | .74 | 93 | ||||||||||
| (.92 | ) | 17.79 | 4.11 | 20,585 | 1.75 | 1.75 | 1.07 | 94 | ||||||||||
| (.38 | ) | 18.06 | (9.67 | ) | 21,834 | 1.78 | 1.78 | 1.06 | 73 | |||||||||
| (.44 | ) | 20.37 | 27.09 | 21,428 | 1.78 | 1.78 | .47 | 67 | ||||||||||
| (.55 | ) | 17.29 | .26 | 28,601 | 2.51 | 2.51 | (.05 | ) | 67 | |||||||||
| — | 17.81 | 6.55 | 28,808 | 2.50 | 2.50 | (.04 | ) | 93 | ||||||||||
| (.77 | ) | 16.72 | 3.37 | 31,671 | 2.50 | 2.50 | .29 | 94 | ||||||||||
| (.24 | ) | 16.99 | (10.37 | ) | 36,942 | 2.53 | 2.53 | .25 | 73 | |||||||||
| (.34 | ) | 19.20 | 26.15 | 44,932 | 2.53 | 2.53 | (.29 | ) | 67 | |||||||||
| (.63 | ) | 18.56 | 1.09 | 49,652 | 1.76 | 1.76 | .80 | 67 | ||||||||||
| (.13 | ) | 19.01 | 7.37 | 39,296 | 1.75 | 1.75 | .74 | 93 | ||||||||||
| (.92 | ) | 17.83 | 4.11 | 38,808 | 1.75 | 1.75 | 1.05 | 94 | ||||||||||
| (.37 | ) | 18.10 | (9.70 | ) | 45,591 | 1.78 | 1.78 | 1.11 | 73 | |||||||||
| (.44 | ) | 20.41 | 27.13 | 39,733 | 1.78 | 1.78 | .44 | 67 | ||||||||||
| (.68 | ) | 18.63 | 1.31 | 2,231,799 | 1.51 | 1.51 | 1.02 | 67 | ||||||||||
| (.18 | ) | 19.09 | 7.64 | 1,596,632 | 1.50 | 1.50 | .99 | 93 | ||||||||||
| (.97 | ) | 17.91 | 4.33 | 1,341,106 | 1.50 | 1.50 | 1.33 | 94 | ||||||||||
| (.41 | ) | 18.19 | (9.45 | ) | 1,215,031 | 1.53 | 1.53 | 1.34 | 73 | |||||||||
| (.47 | ) | 20.50 | 27.41 | 1,065,718 | 1.53 | 1.53 | .70 | 67 | ||||||||||
| (.71 | ) | 18.68 | 1.50 | 651,728 | 1.31 | 1.31 | 1.16 | 67 | ||||||||||
| (.22 | ) | 19.14 | 7.80 | 482,265 | 1.30 | 1.30 | 1.26 | 93 | ||||||||||
| (1.00 | ) | 17.96 | 4.58 | 387,848 | 1.32 | 1.32 | 1.50 | 94 | ||||||||||
| (.44 | ) | 18.23 | (9.30 | ) | 471,717 | 1.35 | 1.35 | 1.45 | 73 | |||||||||
| (.49 | ) | 20.54 | 27.60 | 508,992 | 1.35 | 1.35 | .85 | 67 | ||||||||||
See accompanying notes which are an integral part of the financial statements.
Russell Emerging Markets Fund 297
Russell Investment Company
Russell Tax-Managed U.S. Large Cap Fund
Portfolio Management Discussion and Analysis — October 31, 2014 (Unaudited)

| Russell Tax-Managed U.S. Large Cap Fund - Class A‡ | Russell Tax-Managed U.S. Large Cap Fund - Class S | ||||||
| Total | Total | ||||||
| Return | Return | ||||||
| 1 Year | 7.89 | % | 1 Year | 14.75 | % | ||
| 5 Years | 14.41 | %§ | 5 Years | 16.08 | %§ | ||
| 10 Years | 6.45 | %§ | 10 Years | 7.36 | %§ | ||
| Russell Tax-Managed U.S. Large Cap Fund - Class C | S&P 500® Index** | ||||||
| Total | Total | ||||||
| Return | Return | ||||||
| 1 Year | 13.60 | % | 1 Year | 17.27 | % | ||
| 5 Years | 14.93 | %§ | 5 Years | 16.69 | %§ | ||
| 10 Years | 6.29 | %§ | 10 Years | 8.20 | %§ | ||
| Russell Tax-Managed U.S. Large Cap Fund - Class E | |||||||
| Total | |||||||
| Return | |||||||
| 1 Year | 14.48 | % | |||||
| 5 Years | 15.81 | %§ | |||||
| 10 Years | 7.09 | %§ | |||||
298 Russell Tax-Managed U.S. Large Cap Fund
Russell Investment Company
Russell Tax-Managed U.S. Large Cap Fund
Portfolio Management Discussion and Analysis, continued — October 31, 2014 (Unaudited)
| The Russell Tax-Managed U.S. Large Cap Fund (the “Fund”) | traditionally considered to be “non-cyclical,” such as consumer |
| employs a multi-manager approach whereby portions of the | staples, and toward economically sensitive sectors such as |
| Fund are allocated to different money manager strategies. A | materials and processing and consumer discretionary. The |
| money manager may have (1) a discretionary asset management | Fund’s overweight to the materials and processing and consumer |
| assignment pursuant to which it is allocated a portion of Fund | discretionary sectors detracted, as these sectors underperformed, |
| assets to manage directly or (2) a non-discretionary assignment | although its underweight to consumer staples was beneficial. |
| pursuant to which it provides a model portfolio to RIMCo | The Fund’s slight tilt toward midcap stocks also detracted from |
| representing its investment recommendations, based upon which | benchmark-relative returns. This combination of exposures was |
| RIMCo purchases and sells securities for a Fund. Fund assets | the primary contributor to the Fund’s underperformance relative |
| not allocated to discretionary money managers are managed | to its benchmark for the fiscal year. |
| by Russell Investment Management Company (“RIMCo”), the | The Fund’s underweight to an area that tends to be viewed as a |
| Fund’s advisor. RIMCo may change the allocation of the Fund’s | “bond substitute,” due to their income producing qualities, the |
| assets among money managers at any time. An exemptive order | electric utilities industry, detracted from benchmark-relative |
| from the Securities and Exchange Commission (“SEC”) permits | performance given the industry’s outperformance as interest rates |
| RIMCo to engage or terminate a money manager at any time, | declined. The Fund’s tilt toward stocks with above average growth |
| subject to approval by the Fund’s Board, without a shareholder | rates provided a positive contribution to benchmark-relative |
| vote. Pursuant to the terms of the exemptive order, the Fund is | performance. |
| required to notify its shareholders within 90 days of when a money | |
| manager begins providing services. As of October 31, 2014, the | How did the investment strategies and techniques employed |
| Fund had five money managers. | by the Fund and its money managers affect its benchmark- |
| What is the Fund’s investment objective? | relative performance? |
| The Fund seeks to provide long term capital growth on an after- | Stock selection effects within the technology sector (underweights |
| tax basis. | to Apple Inc. and Intel Corporation) detracted from the Fund’s |
| benchmark-relative return for the fiscal year. Underweights to the | |
| How did the Fund perform relative to its benchmark for the | health care and technology sectors were not rewarded, although |
| fiscal year ended October 31, 2014? | an underweight to the consumer staples sector was beneficial. The |
| For the fiscal year ended October 31, 2014, the Fund’s Class A, | Fund’s exposure to stocks with various valuation metrics provided |
| Class C, Class E and Class S Shares gained 14.48%, 13.60%, | mixed results, as the positioning could not be categorically |
| 14.48% and 14.75%, respectively. This is compared to the Fund’s | labeled as either cheaper or more expensive than the benchmark. |
| benchmark, the S&P 500® Index, which gained 17.27% during | During the fiscal year, stocks with low valuations underperformed, |
| the same period. The Fund’s performance includes operating | but the net effect of the Fund’s value exposures did not have a |
| expenses, whereas index returns are unmanaged and do not | material impact on the Fund’s benchmark-relative performance. |
| include expenses of any kind. | An underweight to the ultra large cap tier of the benchmark was |
| For the fiscal year ended October 31, 2014, the Morningstar® | detrimental, as that narrow set of stocks outperformed. |
| Large Growth, a group of funds that Morningstar considers to have | Armstrong Shaw Associates Inc. (“Armstrong”) slightly |
| investment strategies similar to those of the Fund, gained 14.58%. | outperformed the Russell 1000® Value Index for the fiscal year. |
| This result serves as a peer comparison and is expressed net of | Factor tilts away from midcap stocks and stocks with high yield |
| operating expenses. | were rewarded. An underweight to the energy sector and an |
| overweight to the technology sector were beneficial, although an | |
| RIMCo may assign a money manager a specific style or | overweight to the consumer discretionary sector detracted. Stock |
| capitalization benchmark other than the Fund’s index. However, | selection within the health care sector (overweights to WellPoint, |
| the Fund’s primary index remains the benchmark for the Fund | Inc., Covidien, and Amgen, Inc.) contributed to positive |
| and is representative of the aggregate of each money manager’s | benchmark-relative returns. |
| benchmark index. | |
| JP Morgan Investment Management, Inc. (“JPM”) outperformed | |
| How did the market conditions described in the Market | the S&P 500 Index for the fiscal year. An overweight to stocks |
| Summary report affect the Fund’s performance? | with rising earnings estimates was rewarded. From a sector |
| During the fiscal year, the U.S. large capitalization equity market | perspective, an overweight to consumer discretionary detracted, |
| produced positive returns. Given the ongoing economic recovery, | while an underweight to energy was additive to benchmark- |
| relevant Fund exposures included tilts away from sectors that are | |
Russell Tax-Managed U.S. Large Cap Fund 299
Russell Investment Company
Russell Tax-Managed U.S. Large Cap Fund
Portfolio Management Discussion and Analysis, continued — October 31, 2014 (Unaudited)
| relative returns. Stock selection within the utilities sector (an | RIMCo manages a positioning strategy for the Fund that includes | |||
| underweight to AT&T Inc.) was beneficial. | Russell Top 200® Index holdings and through these holdings | |||
| Mar Vista Investment Partners, LLC (“Mar Vista”) was added | provides additional exposure to some sectors that tend to be | |||
| to the Fund at the end of December 2013 and outperformed the | underweighted relative to the Fund’s S&P 500 benchmark. The | |||
| Russell Top 200® Index consists of the largest Russell 1000® Index | ||||
| Russell 1000® Growth Index for the portion of the fiscal year in | ||||
| which it was a money manager for the Fund. Factor tilts toward | stocks. Additionally, this portfolio is used for tax lot swapping | |||
| larger capitalization stocks and away from high beta stocks (stocks | with manager holdings and associated tax loss harvesting. The | |||
| with high sensitivity to market movements) were rewarded. An | strategy is designed to help control the Fund’s sector tilts as well | |||
| underweight to the consumer discretionary sector was beneficial, | as the beta (beta is a measure of a portfolio’s volatility and its | |||
| although an underweight to the health care sector detracted. | sensitivity to the direction of the market), volatility, and market | |||
| Stock selection within the financial services sector (overweights | capitalization exposures that normally come from the money | |||
| to Markel Corporation and American Tower Corporation) | managers’ portfolios. The positioning strategy performed in-line | |||
| contributed to positive benchmark-relative performance. | with expectations for the fiscal year, as it helped control these | |||
| exposures. | ||||
| NWQ | Investment | Management Company (“NWQ”) | ||
| underperformed the Russell 1000® Value Index for the fiscal year. | During the period, RIMCo used index futures contracts to | |||
| Overweights to high beta and high earnings variability stocks | equitize the majority of the Fund and money managers’ cash. The | |||
| were not rewarded. An overweight to the consumer discretionary | decision to equitize Fund and manager cash was beneficial to | |||
| sector and an underweight to the health care sector held back | Fund performance for the fiscal year. | |||
| performance. Stock selection within the technology sector (an | Describe any changes to the Fund’s structure or the money | |||
| overweight to CA, Inc.) and within the energy sector (overweights | manager line-up. | |||
| to Talisman Energy Inc. and Apache Corporation) detracted. | In late December 2013, RIMCo terminated Sands as a money | |||
| Sands Capital Management, Inc. (“Sands”) was terminated in | manager for the Fund and hired Mar Vista as a money manager for | |||
| December 2013 and performed in line with the Russell 1000® | the Fund. Although RIMCo viewed Sands as a capable U.S. equity | |||
| Growth Index for the portion of the fiscal year in which it was a | manager, Sand’s portfolio contributed to the Fund’s historical bias | |||
| money manager for the Fund. Sector exposures were rewarded, | towards stocks with high price-to-earnings ratios and high betas. | |||
| specifically a large overweight to technology and a large | RIMCo believed that it was prudent to address this structural tilt | |||
| underweight to consumer staples. An overweight to the energy | in the Fund by moving Fund assets to Mar Vista, which does not | |||
| sector held back benchmark-relative performance. | purchase the highest beta growth stocks relative to other growth | |||
| Sustainable Growth Advisers, LP (“Sustainable”) underperformed | managers, due to its more conservative nature. | |||
| the Russell 1000® Growth Index for the fiscal year. Stock selection | During the second quarter of 2014, Mar Vista and Sustainable’s | |||
| was the primary source of negative excess return. Stock selection | assignments were converted to non-discretionary assignments | |||
| was particularly detrimental within the technology sector | pursuant to which each manager provides a model portfolio to | |||
| (underweights to Apple, Inc. and Microsoft Corporation) and the | RIMCo representing its investment recommendations, based upon | |||
| consumer staples sector (an overweight to Whole Foods Market, | which RIMCo purchases and sells securities for a Fund. These | |||
| Inc.). From a sector perspective, an overweight to materials and | changes were made in order to improve RIMCo’s tax management | |||
| processing and an underweight to technology detracted. | capabilities within the Fund. | |||
| RIMCo manages the portion of the Fund’s assets that RIMCo | There were no other changes to the Fund’s money manager line- | |||
| determines not to allocate to the money managers. Assets not | up or structure during the fiscal year. | |||
| allocated to managers include assets managed by RIMCo based | ||||
| upon model portfolios provided by non-discretionary money | Money Managers as of October 31, | |||
| managers, the Fund’s liquidity reserves and assets which may be | 2014 | Styles | ||
| managed directly by RIMCo to modify the Fund’s overall portfolio | Armstrong Shaw Associates Inc. | Value | ||
| characteristics to seek to achieve the desired risk/return profile | J.P. Morgan Investment Management Inc. | Market-Oriented | ||
| MarVista Investment Partners, LLC | Growth | |||
| for the Fund. | NWQ Investment Management Company, | |||
| LLC | Value | |||
| Sustainable Growth Advisers, LP | Growth | |||
300 Russell Tax-Managed U.S. Large Cap Fund
Russell Investment Company
Russell Tax-Managed U.S. Large Cap Fund
Portfolio Management Discussion and Analysis, continued — October 31, 2014 (Unaudited)
The views expressed in this report reflect those of the portfolio
managers only through the end of the period covered by
the report. These views do not necessarily represent the
views of RIMCo, or any other person in RIMCo or any other
affiliated organization. These views are subject to change
at any time based upon market conditions or other events,
and RIMCo disclaims any responsibility to update the views
contained herein. These views should not be relied on as
investment advice and, because investment decisions for
a Russell Investment Company (“RIC”) Fund are based on
numerous factors, should not be relied on as an indication
of investment decisions of any RIC Fund.
| * | Assumes initial investment on November 1, 2004. |
| ** | The Standard & Poor’s 500® Index is composed of 500 common stocks which are chosen by Standard & Poor’s Corporation to best capture the price performance of a large cross-section of the U.S. publicly traded stock market. The index is structured to approximate the general distribution of industries in the U.S. economy. |
| ‡ | The Fund first issued Class A Shares on June 1, 2010. The returns shown for Class A Shares prior to that date are the returns of Class E Shares. The performance shown has been adjusted to reflect the deduction of the maximum Class A sales charge of 5.75%. Annual returns for each Class will differ only to the extent that the Class A Shares do not have the same expenses as Class E Shares. |
| § | Annualized. |
Performance is historical and assumes reinvestment of all dividends and capital gains. Investment return and principal value will fluctuate so that an investor’s shares, when redeemed, may be worth more or less than when purchased. Past performance is not indicative of future results. The returns shown do not reflect the deduction of taxes that a shareholder would pay on Fund distributions or the redemption of Fund shares.
Russell Tax-Managed U.S. Large Cap Fund 301
Russell Investment Company
Russell Tax-Managed U.S. Large Cap Fund
Shareholder Expense Example — October 31, 2014 (Unaudited)
| Fund Expenses | Please note that the expenses shown in the table are meant | |||||
| The following disclosure provides important information | to highlight your ongoing costs only and do not reflect any | |||||
| regarding the Fund’s Shareholder Expense Example | transactional costs. Therefore, the information under the heading | |||||
| (“Example”). | “Hypothetical Performance (5% return before expenses)” is | |||||
| useful in comparing ongoing costs only, and will not help you | ||||||
| Example | determine the relative total costs of owning different funds. In | |||||
| As a shareholder of the Fund, you incur two types of costs: (1) | addition, if these transactional costs were included, your costs | |||||
| transaction costs, and (2) ongoing costs, including advisory and | would have been higher. | |||||
| administrative fees; distribution (12b-1) and/or service fees; | Hypothetical | |||||
| and other Fund expenses. The Example is intended to help | Performance (5% | |||||
| you understand your ongoing costs (in dollars) of investing in | Actual | return before | ||||
| the Fund and to compare these costs with the ongoing costs of | Class A | Performance | expenses) | |||
| Beginning Account Value | ||||||
| investing in other mutual funds. The Example is based on an | May 1, 2014 | $ | 1,000.00 | $ | 1,000.00 | |
| investment of $1,000 invested at the beginning of the period and | Ending Account Value | |||||
| held for the entire period indicated, which for this Fund is from | October 31, 2014 | $ | 1,069.20 | $ | 1,018.90 | |
| May 1, 2014 to October 31, 2014. | Expenses Paid During Period* | $ | 6.52 | $ | 6.36 | |
| Actual Expenses | * Expenses are equal to the Fund's annualized expense ratio of 1.25% | |||||
| (representing the six month period annualized), multiplied by the average | ||||||
| The information in the table under the heading “Actual | account value over the period, multiplied by 184/365 (to reflect the one-half | |||||
| Performance” provides information about actual account values | year period). | |||||
| and actual expenses. You may use the information in this column, | ||||||
| together with the amount you invested, to estimate the expenses | Hypothetical | |||||
| Performance (5% | ||||||
| that you paid over the period. Simply divide your account value by | Actual | return before | ||||
| $1,000 (for example, an $8,600 account value divided by $1,000 | Class C | Performance | expenses) | |||
| = 8.6), then multiply the result by the number in the first column | Beginning Account Value | |||||
| in the row entitled “Expenses Paid During Period” to estimate | May 1, 2014 | $ | 1,000.00 | $ | 1,000.00 | |
| Ending Account Value | ||||||
| the expenses you paid on your account during this period. | October 31, 2014 | $ | 1,065.20 | $ | 1,015.17 | |
| Expenses Paid During Period* | $ | 10.36 | $ | 10.11 | ||
| Hypothetical Example for Comparison Purposes | ||||||
| The information in the table under the heading “Hypothetical | * Expenses are equal to the Fund's annualized expense ratio of 1.99% | |||||
| Performance (5% return before expenses)” provides information | (representing the six month period annualized), multiplied by the average | |||||
| account value over the period, multiplied by 184/365 (to reflect the one-half | ||||||
| about hypothetical account values and hypothetical expenses | year period). | |||||
| based on the Fund’s actual expense ratio and an assumed rate of | ||||||
| return of 5% per year before expenses, which is not the Fund’s | Hypothetical | |||||
| actual return. The hypothetical account values and expenses | Performance (5% | |||||
| Actual | return before | |||||
| may not be used to estimate the actual ending account balance or | Class E | Performance | expenses) | |||
| expenses you paid for the period. You may use this information | Beginning Account Value | |||||
| to compare the ongoing costs of investing in the Fund and other | May 1, 2014 | $ | 1,000.00 | $ | 1,000.00 | |
| funds. To do so, compare this 5% hypothetical example with the | Ending Account Value | |||||
| October 31, 2014 | $ | 1,069.30 | $ | 1,018.95 | ||
| 5% hypothetical examples that appear in the shareholder reports | Expenses Paid During Period* | $ | 6.47 | $ | 6.31 | |
| of other funds. | ||||||
| * Expenses are equal to the Fund's annualized expense ratio of 1.24% | ||||||
| (representing the six month period annualized), multiplied by the average | ||||||
| account value over the period, multiplied by 184/365 (to reflect the one-half | ||||||
| year period). | ||||||
302 Russell Tax-Managed U.S. Large Cap Fund
Russell Investment Company
Russell Tax-Managed U.S. Large Cap Fund
Shareholder Expense Example, continued — October 31, 2014 (Unaudited)
| Hypothetical | |||||
| Performance (5% | |||||
| Actual | return before | ||||
| Class S | Performance | expenses) | |||
| Beginning Account Value | |||||
| May 1, 2014 | $ | 1,000.00 | $ | 1,000.00 | |
| Ending Account Value | |||||
| October 31, 2014 | $ | 1,070.60 | $ | 1,020.16 | |
| Expenses Paid During Period* | $ | 5.22 | $ | 5.09 | |
| * Expenses are equal to the Fund's annualized expense ratio of 1.00% | |||||
| (representing the six month period annualized), multiplied by the average | |||||
| account value over the period, multiplied by 184/365 (to reflect the one-half | |||||
| year period). | |||||
Russell Tax-Managed U.S. Large Cap Fund 303
| Russell Investment Company | |||||||
| Russell Tax-Managed U.S. Large Cap Fund | |||||||
| Schedule of Investments — October 31, 2014 | |||||||
| Amounts in thousands (except share amounts) | Amounts in thousands (except share amounts) | ||||||
| Principal | Fair | Principal | Fair | ||||
| Amount ($) or | Value | Amount ($) or | Value | ||||
| Shares | $ | Shares | $ | ||||
| Common Stocks - 92.5% | CVS Health Corp. | 219,955 | 18,874 | ||||
| Consumer Discretionary - 13.0% | Dr Pepper Snapple Group, Inc. | 17,480 | 1,211 | ||||
| Amazon.com, Inc.(Æ) | 29,303 | 8,951 | General Mills, Inc. | 19,076 | 991 | ||
| AutoZone, Inc.(Æ) | 2,200 | 1,218 | Hershey Co. (The) | 37,496 | 3,596 | ||
| Avon Products, Inc. | 119,290 | 1,241 | Kellogg Co. | 6,702 | 429 | ||
| CBS Corp. Class B | 24,143 | 1,309 | Kimberly-Clark Corp. | 16,240 | 1,856 | ||
| CBS Outdoor Americas, Inc.(ö) | 1,570 | 48 | Kraft Foods Group, Inc.(Æ) | 13,302 | 750 | ||
| Charter Communications, Inc. Class A(Æ) | 3,190 | 505 | Kroger Co. (The) | 14,200 | 791 | ||
| Comcast Corp. Class A(Æ) | 339,340 | 18,731 | Lorillard, Inc. | 701 | 43 | ||
| Costco Wholesale Corp. | 16,740 | 2,233 | Metro AG - ADR(Æ) | 311,700 | 1,957 | ||
| CST Brands, Inc. | 3,500 | 134 | Molson Coors Brewing Co. Class B | 12,040 | 896 | ||
| DIRECTV(Æ) | 371 | 32 | Mondelez International, Inc. Class A | 252,068 | 8,888 | ||
| DISH Network Corp. Class A(Æ) | 16,010 | 1,019 | PepsiCo, Inc. | 76,610 | 7,368 | ||
| Dollar General Corp.(Æ) | 5,400 | 338 | Philip Morris International, Inc. | 42,983 | 3,826 | ||
| Dollar Tree, Inc.(Æ) | 5,970 | 362 | Procter & Gamble Co. (The) | 155,002 | 13,527 | ||
| eBay, Inc.(Æ) | 53,199 | 2,793 | Reynolds American, Inc. | 15,454 | 972 | ||
| Estee Lauder Cos., Inc. (The) Class A | 8,561 | 644 | Sysco Corp. | 6,717 | 259 | ||
| Expedia, Inc. | 5,900 | 501 | Walgreen Co. | 11,531 | 741 | ||
| Ford Motor Co. | 656,760 | 9,254 | Whole Foods Market, Inc. | 142,385 | 5,600 | ||
| General Motors Co. | 172,373 | 5,412 | 96,767 | ||||
| Harman International Industries, Inc. | 11,710 | 1,257 | |||||
| Home Depot, Inc. | 48,186 | 4,699 | Energy - 7.6% | ||||
| Interpublic Group of Cos., Inc. (The) | 174,350 | 3,381 | Anadarko Petroleum Corp. | 15,007 | 1,377 | ||
| Johnson Controls, Inc. | 22,738 | 1,074 | Apache Corp. | 43,750 | 3,378 | ||
| Lennar Corp. Class A | 2,800 | 121 | Baker Hughes, Inc. | 41,707 | 2,209 | ||
| Liberty Global PLC(Æ) | 184,539 | 8,206 | Cheniere Energy, Inc.(Æ) | 5,800 | 435 | ||
| Lowe's Cos., Inc. | 202,253 | 11,569 | Chevron Corp. | 100,024 | 11,998 | ||
| Macy's, Inc. | 12,300 | 711 | ConocoPhillips | 19,978 | 1,441 | ||
| McDonald's Corp. | 5,663 | 531 | Core Laboratories NV | 26,617 | 3,714 | ||
| Nike, Inc. Class B | 1,253 | 116 | Devon Energy Corp. | 1,374 | 82 | ||
| Norwegian Cruise Line Holdings, Ltd.(Æ) | 71,650 | 2,794 | Ensco PLC Class A | 4,320 | 175 | ||
| O'Reilly Automotive, Inc.(Æ) | 32,041 | 5,635 | EOG Resources, Inc. | 17,347 | 1,649 | ||
| Priceline Group, Inc. (The)(Æ) | 6,518 | 7,862 | EQT Corp. | 7,800 | 734 | ||
| PulteGroup, Inc. | 44,100 | 846 | Exxon Mobil Corp. | 130,405 | 12,612 | ||
| Ralph Lauren Corp. Class A | 2,100 | 346 | Halliburton Co. | 163,661 | 9,024 | ||
| Ross Stores, Inc. | 9,400 | 759 | Hess Corp. | 3,262 | 277 | ||
| Royal Caribbean Cruises, Ltd. | 13,290 | 903 | Kinder Morgan, Inc. | 14,345 | 555 | ||
| Starbucks Corp. | 167,771 | 12,677 | Marathon Oil Corp. | 46,711 | 1,654 | ||
| Target Corp. | 43,177 | 2,669 | Marathon Petroleum Corp. | 5,325 | 484 | ||
| Time Warner Cable, Inc. | 11,113 | 1,636 | National Oilwell Varco, Inc. | 48,374 | 3,514 | ||
| Time Warner, Inc. | 89,982 | 7,151 | NOW, Inc.(Æ) | 542 | 16 | ||
| Time, Inc.(Æ) | 6,695 | 151 | Occidental Petroleum Corp. | 114,776 | 10,207 | ||
| TJX Cos., Inc. | 125,707 | 7,960 | Phillips 66 | 41,589 | 3,265 | ||
| TRW Automotive Holdings Corp.(Æ) | 5,140 | 521 | Pioneer Natural Resources Co. | 2,784 | 526 | ||
| VF Corp. | 35,920 | 2,431 | QEP Resources, Inc. | 7,940 | 199 | ||
| Viacom, Inc. Class B | 29,965 | 2,178 | Schlumberger, Ltd. | 193,507 | 19,091 | ||
| Wal-Mart Stores, Inc. | 14,868 | 1,134 | Spectra Energy Corp. | 23,708 | 928 | ||
| Walt Disney Co. (The) | 145,149 | 13,264 | Valero Energy Corp. | 21,078 | 1,056 | ||
| Wyndham Worldwide Corp. | 77,201 | 5,996 | Weatherford International PLC(Æ) | 302,083 | 4,960 | ||
| Yum! Brands, Inc. | 11,620 | 835 | Williams Cos., Inc. (The) | 15,422 | 856 | ||
| 164,138 | 96,416 | ||||||
| Consumer Staples - 7.6% | Financial Services - 19.3% | ||||||
| Altria Group, Inc. | 39,837 | 1,926 | ACE, Ltd. | 95,131 | 10,398 | ||
| Anheuser-Busch InBev NV - ADR | 42,848 | 4,755 | Alliance Data Systems Corp.(Æ) | 1,700 | 482 | ||
| Archer-Daniels-Midland Co. | 37,797 | 1,776 | American Express Co. | 99,152 | 8,919 | ||
| Coca-Cola Co. (The) | 137,880 | 5,774 | American International Group, Inc. | 225,416 | 12,075 | ||
| Coca-Cola Enterprises, Inc. | 8,200 | 355 | American Tower Corp. Class A(ö) | 113,696 | 11,085 | ||
| Colgate-Palmolive Co. | 120,989 | 8,092 | Aon PLC | 106,925 | 9,196 | ||
| Constellation Brands, Inc. Class A(Æ) | 16,540 | 1,514 | |||||
| See accompanying notes which are an integral part of the financial statements. | |||||||
| 304 Russell Tax-Managed U.S. Large Cap Fund | |||||||
| Russell Investment Company | |||||||
| Russell Tax-Managed U.S. Large Cap Fund | |||||||
| Schedule of Investments, continued — October 31, 2014 | |||||||
| Amounts in thousands (except share amounts) | Amounts in thousands (except share amounts) | ||||||
| Principal | Fair | Principal | Fair | ||||
| Amount ($) or | Value | Amount ($) or | Value | ||||
| Shares | $ | Shares | $ | ||||
| AvalonBay Communities, Inc.(ö) | 7,200 | 1,122 | Baxter International, Inc. | 1,296 | 91 | ||
| Axis Capital Holdings, Ltd. | 7,100 | 342 | Becton Dickinson and Co. | 1,091 | 140 | ||
| Bank of America Corp. | 278,383 | 4,777 | Biogen Idec, Inc.(Æ) | 12,389 | 3,978 | ||
| Bank of New York Mellon Corp. (The) | 310 | 12 | Boston Scientific Corp.(Æ) | 110,750 | 1,471 | ||
| BB&T Corp. | 26,290 | 996 | Bristol-Myers Squibb Co. | 84,335 | 4,907 | ||
| Berkshire Hathaway, Inc. Class B(Æ) | 91,819 | 12,869 | CareFusion Corp.(Æ) | 16,630 | 954 | ||
| BlackRock, Inc. Class A | 3,265 | 1,114 | Celgene Corp.(Æ) | 41,668 | 4,462 | ||
| Boston Properties, Inc.(ö) | 7,840 | 994 | Cerner Corp.(Æ) | 107,742 | 6,824 | ||
| Capital One Financial Corp. | 166,389 | 13,772 | Covidien PLC | 50,759 | 4,692 | ||
| CDK Global Inc.(Æ) | 996 | 33 | Eli Lilly & Co. | 4,993 | 331 | ||
| Charles Schwab Corp. (The) | 48,330 | 1,386 | Express Scripts Holding Co.(Æ) | 4,688 | 360 | ||
| Chubb Corp. (The) | 821 | 82 | Gilead Sciences, Inc.(Æ) | 16,543 | 1,853 | ||
| CIT Group, Inc. | 49,700 | 2,432 | Humana, Inc. | 15,980 | 2,219 | ||
| Citigroup, Inc. | 275,683 | 14,757 | Intuitive Surgical, Inc.(Æ) | 104 | 52 | ||
| Discover Financial Services | 6,200 | 395 | Johnson & Johnson | 124,495 | 13,418 | ||
| Everest Re Group, Ltd. | 900 | 154 | Mallinckrodt PLC(Æ) | 143 | 13 | ||
| Extra Space Storage, Inc.(ö) | 6,120 | 356 | McKesson Corp. | 9,600 | 1,953 | ||
| Fidelity National Information Services, Inc. | 11,500 | 671 | Medtronic, Inc. | 4,819 | 328 | ||
| Goldman Sachs Group, Inc. (The) | 46,023 | 8,744 | Merck & Co., Inc. | 65,247 | 3,780 | ||
| Hartford Financial Services Group, Inc. | 135,760 | 5,373 | Mylan, Inc.(Æ) | 2,000 | 107 | ||
| Highwoods Properties, Inc.(ö) | 11,240 | 482 | PerkinElmer, Inc. | 2,100 | 91 | ||
| Intercontinental Exchange, Inc. | 27,889 | 5,809 | Perrigo Co. PLC | 34,572 | 5,582 | ||
| Invesco, Ltd. | 33,700 | 1,364 | Pfizer, Inc. | 229,135 | 6,863 | ||
| JPMorgan Chase & Co. | 218,434 | 13,211 | Regeneron Pharmaceuticals, Inc.(Æ) | 10,794 | 4,250 | ||
| Kilroy Realty Corp.(ö) | 9,100 | 616 | Sanofi - ADR | 175,579 | 8,119 | ||
| Lincoln National Corp. | 4,840 | 265 | St. Jude Medical, Inc. | 62,971 | 4,041 | ||
| Loews Corp. | 55,100 | 2,402 | Stryker Corp. | 18,925 | 1,657 | ||
| Markel Corp.(Æ) | 9,116 | 6,298 | Teva Pharmaceutical Industries, Ltd. - ADR | 86,850 | 4,904 | ||
| Marsh & McLennan Cos., Inc. | 27,660 | 1,504 | Thermo Fisher Scientific, Inc. | 58,686 | 6,900 | ||
| MasterCard, Inc. Class A | 18,270 | 1,530 | UnitedHealth Group, Inc. | 115,831 | 11,005 | ||
| MetLife, Inc. | 249,093 | 13,511 | Vertex Pharmaceuticals, Inc.(Æ) | 8,600 | 969 | ||
| Morgan Stanley | 81,232 | 2,839 | WellPoint, Inc. | 63,556 | 8,052 | ||
| PNC Financial Services Group, Inc. (The) | 40,510 | 3,500 | Zoetis, Inc. Class A | 13,700 | 509 | ||
| Prologis, Inc.(ö) | 25,040 | 1,043 | 151,412 | ||||
| Prudential Financial, Inc. | 13,244 | 1,173 | |||||
| Realogy Holdings Corp.(Æ) | 191,192 | 7,841 | Materials and Processing - 4.6% | ||||
| Simon Property Group, Inc.(ö) | 10,970 | 1,966 | Agrium, Inc. | 21,600 | 2,113 | ||
| State Street Corp. | 112,668 | 8,502 | Air Products & Chemicals, Inc. | 33,360 | 4,492 | ||
| SunTrust Banks, Inc. | 6,350 | 248 | Alcoa, Inc. | 100,290 | 1,681 | ||
| SVB Financial Group(Æ) | 2,100 | 235 | AngloGold Ashanti, Ltd. - ADR(Æ) | 66,050 | 546 | ||
| TD Ameritrade Holding Corp. | 6,600 | 223 | Axiall Corp. | 5,720 | 231 | ||
| Thomson Reuters Corp. | 3,730 | 139 | Ball Corp. | 3,000 | 193 | ||
| Travelers Cos., Inc. (The) | 657 | 66 | CF Industries Holdings, Inc. | 1,700 | 442 | ||
| Twenty-First Century Fox, Inc.(Æ) | 37,300 | 1,286 | Crown Holdings, Inc.(Æ) | 16,700 | 801 | ||
| Unum Group | 114,160 | 3,820 | Dow Chemical Co. (The) | 180,211 | 8,903 | ||
| US Bancorp | 11,418 | 486 | Ecolab, Inc. | 96,153 | 10,695 | ||
| Visa, Inc. Class A | 80,556 | 19,449 | EI du Pont de Nemours & Co. | 16,516 | 1,142 | ||
| Wells Fargo & Co. | 370,158 | 19,652 | Fastenal Co. | 125,630 | 5,533 | ||
| Zions Bancorporation | 70,850 | 2,052 | Freeport-McMoRan, Inc. | 23,133 | 659 | ||
| 244,048 | Ingersoll-Rand PLC | 38,600 | 2,417 | ||||
| LyondellBasell Industries NV Class A | 107 | 10 | |||||
| Health Care - 12.0% | Martin Marietta Materials, Inc. | 2,440 | 285 | ||||
| Abbott Laboratories | 72,784 | 3,173 | Masco Corp. | 34,250 | 756 | ||
| AbbVie, Inc. | 96,897 | 6,149 | Monsanto Co. | 68,796 | 7,914 | ||
| Actavis PLC(Æ) | 4,017 | 975 | Pentair PLC(Æ) | 6,410 | 430 | ||
| Aetna, Inc. | 11,638 | 960 | PPG Industries, Inc. | 2,130 | 434 | ||
| Alexion Pharmaceuticals, Inc.(Æ) | 7,739 | 1,481 | Praxair, Inc. | 32,234 | 4,061 | ||
| Allergan, Inc. | 41,483 | 7,884 | Precision Castparts Corp. | 15,896 | 3,508 | ||
| Amgen, Inc. | 98,131 | 15,915 | Southern Copper Corp. | 672 | 19 | ||
| See accompanying notes which are an integral part of the financial statements. | |||||||
| Russell Tax-Managed U.S. Large Cap Fund 305 | |||||||
| Russell Investment Company | |||||||
| Russell Tax-Managed U.S. Large Cap Fund | |||||||
| Schedule of Investments, continued — October 31, 2014 | |||||||
| Amounts in thousands (except share amounts) | Amounts in thousands (except share amounts) | ||||||
| Principal | Fair | Principal | Fair | ||||
| Amount ($) or | Value | Amount ($) or | Value | ||||
| Shares | $ | Shares | $ | ||||
| United States Steel Corp. | 25,530 | 1,022 | EMC Corp. | 329,597 | 9,469 | ||
| 58,287 | Equinix, Inc. | 30,502 | 6,372 | ||||
| Facebook, Inc. Class A(Æ) | 36,672 | 2,750 | |||||
| Producer Durables - 10.7% | Freescale Semiconductor, Ltd.(Æ) | 7,400 | 147 | ||||
| 3M Co. | 6,010 | 924 | Google, Inc. Class C(Æ) | 39,606 | 22,232 | ||
| Accenture PLC Class A | 25,922 | 2,103 | Hewlett-Packard Co. | 37,670 | 1,352 | ||
| American Airlines Group, Inc. | 4,608 | 191 | Intel Corp. | 7,221 | 246 | ||
| Automatic Data Processing, Inc. | 100,120 | 8,188 | International Business Machines Corp. | 8,660 | 1,424 | ||
| B/E Aerospace, Inc.(Æ) | 87,195 | 6,492 | Intuit, Inc. | 51,689 | 4,549 | ||
| Boeing Co. (The) | 3,690 | 461 | KLA-Tencor Corp. | 11,520 | 912 | ||
| Canadian Pacific Railway, Ltd. | 6,600 | 1,371 | Lam Research Corp. | 27,130 | 2,112 | ||
| Caterpillar, Inc. | 2,432 | 247 | LinkedIn Corp. Class A(Æ) | 9,753 | 2,233 | ||
| CSX Corp. | 95,131 | 3,389 | Micron Technology, Inc.(Æ) | 369 | 12 | ||
| Cummins, Inc. | 702 | 103 | Microsoft Corp. | 422,867 | 19,854 | ||
| Danaher Corp. | 4,171 | 335 | Oracle Corp. | 468,431 | 18,292 | ||
| Deere & Co. | 6,351 | 543 | QUALCOMM, Inc. | 193,147 | 15,164 | ||
| Delta Air Lines, Inc. | 144,346 | 5,807 | Red Hat, Inc.(Æ) | 77,723 | 4,579 | ||
| Eaton Corp. PLC | 32,700 | 2,236 | Salesforce.com, Inc.(Æ) | 66,304 | 4,243 | ||
| Emerson Electric Co. | 44,990 | 2,882 | SanDisk Corp. | 8,730 | 822 | ||
| FedEx Corp. | 2,119 | 355 | SAP SE - ADR | 64,249 | 4,377 | ||
| Flowserve Corp. | 4,020 | 273 | Teradyne, Inc. | 149,400 | 2,749 | ||
| Fluor Corp. | 37,670 | 2,499 | Texas Instruments, Inc. | 1,909 | 95 | ||
| General Dynamics Corp. | 1,967 | 275 | Twitter, Inc.(Æ) | 2,959 | 123 | ||
| General Electric Co. | 435,547 | 11,241 | VMware, Inc. Class A(Æ) | 3,820 | 319 | ||
| Honeywell International, Inc. | 208,951 | 20,084 | Xilinx, Inc. | 5,800 | 258 | ||
| Illinois Tool Works, Inc. | 4,454 | 405 | Yahoo!, Inc.(Æ) | 2,748 | 127 | ||
| L-3 Communications Holdings, Inc. | 6,000 | 729 | 172,551 | ||||
| Lockheed Martin Corp. | 1,729 | 329 | |||||
| Mettler-Toledo International, Inc.(Æ) | 23,853 | 6,165 | Utilities - 4.1% | ||||
| Norfolk Southern Corp. | 13,867 | 1,534 | American Electric Power Co., Inc. | 11,179 | 652 | ||
| Northrop Grumman Corp. | 1,327 | 183 | AT&T, Inc. | 71,379 | 2,487 | ||
| PACCAR, Inc. | 77,000 | 5,030 | Calpine Corp.(Æ) | 318,567 | 7,270 | ||
| Parker-Hannifin Corp. | 800 | 102 | Canadian Natural Resources, Ltd. | 64,300 | 2,243 | ||
| Raytheon Co. | 23,389 | 2,430 | CenterPoint Energy, Inc. | 24,400 | 599 | ||
| Sensata Technologies Holding NV(Æ) | 201,729 | 9,846 | CenturyLink, Inc. | 56,265 | 2,334 | ||
| SPX Corp. | 4,600 | 436 | CMS Energy Corp. | 27,650 | 903 | ||
| TransDigm Group, Inc. | 32,271 | 6,036 | Dominion Resources, Inc. | 34,814 | 2,482 | ||
| Tyco International, Ltd. | 121,357 | 5,210 | Duke Energy Corp. | 18,671 | 1,534 | ||
| Union Pacific Corp. | 114,598 | 13,345 | Edison International | 26,200 | 1,640 | ||
| United Continental Holdings, Inc.(Æ) | 14,980 | 791 | Entergy Corp. | 10,340 | 869 | ||
| United Parcel Service, Inc. Class B | 5,737 | 602 | Exelon Corp. | 57,052 | 2,087 | ||
| United Technologies Corp. | 99,629 | 10,660 | NextEra Energy, Inc. | 35,151 | 3,523 | ||
| Waste Management, Inc. | 4,229 | 207 | NiSource, Inc. | 32,200 | 1,354 | ||
| WW Grainger, Inc. | 3,070 | 758 | NRG Energy, Inc. | 94,300 | 2,827 | ||
| 134,797 | PG&E Corp. | 11,449 | 576 | ||||
| Sempra Energy | 14,900 | 1,639 | |||||
| Technology - 13.6% | Southern Co. | 24,974 | 1,158 | ||||
| Adobe Systems, Inc.(Æ) | 105,376 | 7,389 | Talisman Energy, Inc. | 439,550 | 2,804 | ||
| Analog Devices, Inc. | 91,540 | 4,542 | Verizon Communications, Inc. | 263,215 | 13,226 | ||
| Apple, Inc. | 180,453 | 19,489 | Windstream Holdings, Inc. | 4,079 | 43 | ||
| Applied Materials, Inc. | 28,900 | 638 | 52,250 | ||||
| Avago Technologies, Ltd. Class A | 30,330 | 2,616 | |||||
| Broadcom Corp. Class A | 36,440 | 1,526 | Total Common Stocks | ||||
| CA, Inc. | 124,300 | 3,612 | (cost $892,184) | 1,170,666 | |||
| Cisco Systems, Inc. | 228,988 | 5,603 | |||||
| Citrix Systems, Inc.(Æ) | 12,730 | 818 | Short-Term Investments - 7.9% | ||||
| Cognizant Technology Solutions Corp. Class | Russell U.S. Cash Management Fund | 100,561,557(8) | 100,562 | ||||
| A(Æ) | 29,400 | 1,436 | Total Short-Term Investments | ||||
| Corning, Inc. | 3,445 | 70 | (cost $100,562) | 100,562 | |||
| See accompanying notes which are an integral part of the financial statements. | |||||||
| 306 Russell Tax-Managed U.S. Large Cap Fund | |||||||
Russell Investment Company
Russell Tax-Managed U.S. Large Cap Fund
Schedule of Investments, continued — October 31, 2014
| Amounts in thousands (except share amounts) | ||||
| Principal | Fair | |||
| Amount ($) or | Value | |||
| Shares | $ | |||
| Total Investments 100.4% | ||||
| (identified cost $992,746) | 1,271,228 | |||
| Other Assets and Liabilities, Net | ||||
| -(0.4%) | (5,650 | ) | ||
| Net Assets - 100.0% | 1,265,578 | |||
See accompanying notes which are an integral part of the financial statements.
Russell Tax-Managed U.S. Large Cap Fund 307
| Russell Investment Company | ||||||||||||
| Russell Tax-Managed U.S. Large Cap Fund | ||||||||||||
| Schedule of Investments, continued — October 31, 2014 | ||||||||||||
| Futures Contracts | ||||||||||||
| Amounts in thousands (except contract amounts) | ||||||||||||
| Unrealized | ||||||||||||
| Appreciation | ||||||||||||
| Number of | Notional | Expiration | (Depreciation) | |||||||||
| Contracts | Amount | Date | $ | |||||||||
| Long Positions | ||||||||||||
| S&P Mid 500 E-Mini Index Futures | 925 | USD | 93,027 | 12/14 | 2,013 | |||||||
| Total Unrealized Appreciation (Depreciation) on Open Futures Contracts (å) | 2,013 | |||||||||||
| Presentation of Portfolio Holdings | ||||||||||||
| Amounts in thousands | ||||||||||||
| Fair Value | ||||||||||||
| Portfolio Summary | Level 1 | Level 2 | Level 3 | Total | % of Net Assets | |||||||
| Common Stocks | �� | |||||||||||
| Consumer Discretionary | $ | 164,138 | $ | — | $ | — | $ | 164,138 | 13.0 | |||
| Consumer Staples | 96,767 | — | — | 96,767 | 7.6 | |||||||
| Energy | 96,416 | — | — | 96,416 | 7.6 | |||||||
| Financial Services | 244,048 | — | — | 244,048 | 19.3 | |||||||
| Health Care | 151,412 | — | — | 151,412 | 12.0 | |||||||
| Materials and Processing | 58,287 | — | — | 58,287 | 4.6 | |||||||
| Producer Durables | 134,797 | — | — | 134,797 | 10.7 | |||||||
| Technology | 172,551 | — | — | 172,551 | 13.6 | |||||||
| Utilities | 52,250 | — | — | 52,250 | 4.1 | |||||||
| Short-Term Investments | — | 100,562 | — | 100,562 | 7.9 | |||||||
| Total Investments | 1,170,666 | 100,562 | — | 1,271,228 | 100.4 | |||||||
| Other Assets and Liabilities, Net | (0.4 | ) | ||||||||||
| 100.0 | ||||||||||||
| Other Financial Instruments | ||||||||||||
| Futures Contracts | 2,013 | — | — | 2,013 | 0.2 | |||||||
| Total Other Financial Instruments* | $ | 2,013 | $ | — | $ | — | $ | 2,013 | ||||
* Futures and foreign currency exchange contract values reflect the unrealized appreciation (depreciation) on the instruments.
For a description of the Levels see note 2 in the Notes to Financial Statements.
For disclosure on transfers between Levels 1, 2 and 3 during the period ended October 31, 2014, see note 2 in the Notes to Financial Statements.
See accompanying notes which are an integral part of the financial statements.
308 Russell Tax-Managed U.S. Large Cap Fund
| Russell Investment Company | ||
| Russell Tax-Managed U.S. Large Cap Fund | ||
| Fair Value of Derivative Instruments — October 31, 2014 | ||
| Amounts in thousands | ||
| Equity | ||
| Derivatives not accounted for as hedging instruments | Contracts | |
| Location: Statement of Assets and Liabilities - Assets | ||
| Variation margin on futures contracts* | $ | 2,013 |
| Equity | ||
| Derivatives not accounted for as hedging instruments | Contracts | |
| Location: Statement of Operations - Net realized gain (loss) | ||
| Futures contracts | $ | 11,398 |
| Location: Statement of Operations - Net change in unrealized appreciation (depreciation) | ||
| Futures contracts | $ | 99 |
| * | Includes cumulative appreciation/depreciation of futures contracts as reported in the Schedule of Investments. Only variation margin is reported within the Statement of Assets and Liabilities. |
For further disclosure on derivatives see note 2 in the Notes to Financial Statements.
See accompanying notes which are an integral part of the financial statements.
Russell Tax-Managed U.S. Large Cap Fund 309
Russell Investment Company
Russell Tax-Managed U.S. Large Cap Fund
Balance Sheet Offsetting of Financial and Derivative Instruments — October 31, 2014
| Amounts in thousands | ||||||||||
| Offsetting of Financial Assets and Derivative Assets | ||||||||||
| Gross | Net Amounts | |||||||||
| Amounts | of Assets | |||||||||
| Gross | Offset in the | Presented in | ||||||||
| Amounts of | Statement of | the Statement | ||||||||
| Recognized | Assets and | of Assets and | ||||||||
| Description | Location: Statement of Assets and Liabilities - Assets | Assets | Liabilities | Liabilities | ||||||
| Futures Contracts | Variation margin on futures contracts | $ | 1,054 | $ | — $ | 1,054 | ||||
| Total | $ | 1,054 | $ | — $ | 1,054 | |||||
| Financial Assets, Derivative Assets, and Collateral Held by Counterparty | ||||||||||
| Gross Amounts Not Offset in | ||||||||||
| the Statement of Assets and | ||||||||||
| Liabilities | ||||||||||
| Net Amounts | ||||||||||
| of Assets | ||||||||||
| Presented in | ||||||||||
| the Statement | Financial and | |||||||||
| of Assets and | Derivative | Collateral | ||||||||
| Counterparty | Liabilities | Instruments | Received^ | Net Amount | ||||||
| Merrill Lynch | $ | 1,054 | $ | — $ | — $ | 1,054 | ||||
| Total | $ | 1,054 | $ | — $ | — $ | 1,054 | ||||
^ Collateral received or pledged amounts may not reconcile to those disclosed in the Statement of Assets and Liabilities due to the inclusion of off-Balance Sheet collateral and adjustments made to exclude overcollateralization.
For further disclosure on derivatives and counterparty risk see note 2 in the Notes to Financial Statements.
See accompanying notes which are an integral part of the financial statements.
310 Russell Tax-Managed U.S. Large Cap Fund
| Russell Investment Company | ||
| Russell Tax-Managed U.S. Large Cap Fund | ||
| Statement of Assets and Liabilities — October 31, 2014 | ||
| Amounts in thousands | ||
| Assets | ||
| Investments, at identified cost | $ | 992,746 |
| Investments, at fair value(>) | 1,271,228 | |
| Cash (restricted)(a) | 4,802 | |
| Receivables: | ||
| Dividends and interest | 1,211 | |
| Dividends from affiliated Russell funds | 8 | |
| Investments sold | 6,795 | |
| Fund shares sold | 2,939 | |
| Variation margin on futures contracts | 1,054 | |
| Prepaid expenses | 2 | |
| Total assets | 1,288,039 | |
| Liabilities | ||
| Payables: | ||
| Investments purchased | 20,967 | |
| Fund shares redeemed | 427 | |
| Accrued fees to affiliates | 991 | |
| Other accrued expenses | 76 | |
| Total liabilities | 22,461 | |
| Net Assets | $ | 1,265,578 |
See accompanying notes which are an integral part of the financial statements.
Russell Tax-Managed U.S. Large Cap Fund 311
| Russell Investment Company | ||
| Russell Tax-Managed U.S. Large Cap Fund | ||
| Statement of Assets and Liabilities, continued — October 31, 2014 | ||
| Amounts in thousands | ||
| Net Assets Consist of: | ||
| Undistributed (overdistributed) net investment income | $ | 6,002 |
| Accumulated net realized gain (loss) | 52,121 | |
| Unrealized appreciation (depreciation) on: | ||
| Investments | 278,482 | |
| Futures contracts | 2,013 | |
| Shares of beneficial interest | 394 | |
| Additional paid-in capital | 926,566 | |
| Net Assets | $ | 1,265,578 |
| Net Asset Value, offering and redemption price per share: | ||
| Net asset value per share: Class A(#) | $ | 31.83 |
| Maximum offering price per share (Net asset value plus sales charge of 5.75%): Class A | $ | 33.77 |
| Class A — Net assets | $ | 18,675,791 |
| Class A — Shares outstanding ($.01 par value) | 586,716 | |
| Net asset value per share: Class C(#) | $ | 30.40 |
| Class C — Net assets | $ | 19,360,281 |
| Class C — Shares outstanding ($.01 par value) | 636,903 | |
| Net asset value per share: Class E(#) | $ | 31.95 |
| Class E — Net assets | $ | 45,650,469 |
| Class E — Shares outstanding ($.01 par value) | 1,428,933 | |
| Net asset value per share: Class S(#) | $ | 32.13 |
| Class S — Net assets | $ 1,181,891,342 | |
| Class S — Shares outstanding ($.01 par value) | 36,784,523 | |
| Amounts in thousands | ||
| (>) Investments in affiliates, Russell U.S. Cash Management Fund | $ | 100,562 |
| (a) Cash Collateral for Futures | $ | 4,802 |
| (#) Net asset value per share equals class level net assets divided by class level shares of beneficial interest outstanding. | ||
See accompanying notes which are an integral part of the financial statements.
312 Russell Tax-Managed U.S. Large Cap Fund
| Russell Investment Company | ||
| Russell Tax-Managed U.S. Large Cap Fund | ||
| Statement of Operations — For the Period Ended October 31, 2014 | ||
| Amounts in thousands | ||
| Investment Income | ||
| Dividends | $ | 17,451 |
| Dividends from affiliated Russell funds | 74 | |
| Securities lending income | 5 | |
| Total investment income | 17,530 | |
| Expenses | ||
| Advisory fees | 7,268 | |
| Administrative fees | 494 | |
| Custodian fees | 169 | |
| Distribution fees - Class A | 37 | |
| Distribution fees - Class C | 131 | |
| Transfer agent fees - Class A | 30 | |
| Transfer agent fees - Class C | 35 | |
| Transfer agent fees - Class E | 83 | |
| Transfer agent fees - Class S | 1,929 | |
| Professional fees | 57 | |
| Registration fees | 119 | |
| Shareholder servicing fees - Class C | 44 | |
| Shareholder servicing fees - Class E | 104 | |
| Trustees’ fees | 23 | |
| Printing fees | 35 | |
| Miscellaneous | 56 | |
| Total expenses | 10,614 | |
| Net investment income (loss) | 6,916 | |
| Net Realized and Unrealized Gain (Loss) | ||
| Net realized gain (loss) on: | ||
| Investments | 75,260 | |
| Futures contracts | 11,398 | |
| Net realized gain (loss) | 86,658 | |
| Net change in unrealized appreciation (depreciation) on: | ||
| Investments | 47,098 | |
| Futures contracts | 99 | |
| Net change in unrealized appreciation (depreciation) | 47,197 | |
| Net realized and unrealized gain (loss) | 133,855 | |
| Net Increase (Decrease) in Net Assets from Operations | $ | 140,771 |
See accompanying notes which are an integral part of the financial statements.
Russell Tax-Managed U.S. Large Cap Fund 313
| Russell Investment Company | ||||||
| Russell Tax-Managed U.S. Large Cap Fund | ||||||
| Statements of Changes in Net Assets | ||||||
| For the Periods Ended October 31, | ||||||
| Amounts in thousands | 2014 | 2013 | ||||
| Increase (Decrease) in Net Assets | ||||||
| Operations | ||||||
| Net investment income (loss) | $ | 6,916 | $ | 3,280 | ||
| Net realized gain (loss) | 86,658 | 37,041 | ||||
| Net change in unrealized appreciation (depreciation) | 47,197 | 117,385 | ||||
| Net increase (decrease) in net assets from operations | 140,771 | 157,706 | ||||
| Distributions | ||||||
| From net investment income | ||||||
| Class A | (15 | ) | (43 | ) | ||
| Class E | (58 | ) | (105 | ) | ||
| Class S | (2,947 | ) | (3,206 | ) | ||
| Net decrease in net assets from distributions | (3,020 | ) | (3,354 | ) | ||
| Share Transactions* | ||||||
| Net increase (decrease) in net assets from share transactions | 306,318 | 153,854 | ||||
| Total Net Increase (Decrease) in Net Assets | 444,069 | 308,206 | ||||
| Net Assets | ||||||
| Beginning of period | 821,509 | 513,303 | ||||
| End of period | $ | 1,265,578 | $ | 821,509 | ||
| Undistributed (overdistributed) net investment income included in net assets | $ | 6,002 | $ | 2,106 | ||
See accompanying notes which are an integral part of the financial statements.
314 Russell Tax-Managed U.S. Large Cap Fund
Russell Investment Company
Russell Tax-Managed U.S. Large Cap Fund
Statements of Changes in Net Assets, continued
* Share transaction amounts (in thousands) for the periods ended October 31, 2014 and October 31, 2013 were as follows:
| 2014 | 2013 | |||||||||||
| Shares | Dollars | Shares | Dollars | |||||||||
| Class A | ||||||||||||
| Proceeds from shares sold | 260 | $ | 7,781 | 231 | $ | 5,483 | ||||||
| Proceeds from reinvestment of distributions | —** | 15 | 2 | 43 | ||||||||
| Payments for shares redeemed | (91 | ) | (2,722 | ) | (76 | ) | (1,873 | ) | ||||
| Net increase (decrease) | 169 | 5,074 | 157 | 3,653 | ||||||||
| Class C | ||||||||||||
| Proceeds from shares sold | 204 | 5,834 | 134 | 3,208 | ||||||||
| Payments for shares redeemed | (125 | ) | (3,609 | ) | (80 | ) | (1,920 | ) | ||||
| Net increase (decrease) | 79 | 2,225 | 54 | 1,288 | ||||||||
| Class E | ||||||||||||
| Proceeds from shares sold | 387 | 11,609 | 465 | 11,750 | ||||||||
| Proceeds from reinvestment of distributions | 2 | 57 | 5 | 103 | ||||||||
| Payments for shares redeemed | (262 | ) | (7,965 | ) | (232 | ) | (5,866 | ) | ||||
| Net increase (decrease) | 127 | 3,701 | 238 | 5,987 | ||||||||
| Class S | ||||||||||||
| Proceeds from shares sold | 14,141 | 427,200 | 10,405 | 258,822 | ||||||||
| Proceeds from reinvestment of distributions | 99 | 2,886 | 137 | 3,097 | ||||||||
| Payments for shares redeemed | (4,449 | ) | (134,768 | ) | (4,788 | ) | (118,993 | ) | ||||
| Net increase (decrease) | 9,791 | 295,318 | 5,754 | 142,926 | ||||||||
| Total increase (decrease) | 10,166 | $ | 306,318 | 6,203 | $ | 153,854 | ||||||
| ** | Less than 500 |
See accompanying notes which are an integral part of the financial statements.
Russell Tax-Managed U.S. Large Cap Fund 315
| Russell Investment Company | |||||||||||||||
| Russell Tax-Managed U.S. Large Cap Fund | |||||||||||||||
| Financial Highlights — For the Periods Ended | |||||||||||||||
| For a Share Outstanding Throughout Each Period. | |||||||||||||||
| $ | $ | $ | $ | $ | |||||||||||
| Net Asset Value, | Net | Net Realized | Total from | Distributions | |||||||||||
| Beginning of | Investment | and Unrealized | Investment | from Net | $ | ||||||||||
| Period | Income (Loss)(a)(d) | Gain (Loss) | Operations | Investment Income | Total Distributions | ||||||||||
| Class A | |||||||||||||||
| October 31, 2014 | 27.84 | .13 | 3.90 | 4.03 | (.04 | ) | (.04 | ) | |||||||
| October 31, 2013 | 22.11 | .06 | 5.79 | 5.85 | (.12 | ) | (.12 | ) | |||||||
| October 31, 2012 | 19.49 | .06 | 2.58 | 2.64 | (.02 | ) | (.02 | ) | |||||||
| October 31, 2011 | 18.15 | .02 | 1.38 | 1.40 | (.06 | ) | (.06 | ) | |||||||
| October 31, 2010(1) | 16.60 | — | 1.55 | 1.55 | — | — | |||||||||
| Class C | |||||||||||||||
| October 31, 2014 | 26.76 | (.09 | ) | 3.73 | 3.64 | — | — | ||||||||
| October 31, 2013 | 21.29 | (.11 | ) | 5.58 | 5.47 | — | — | ||||||||
| October 31, 2012 | 18.88 | (.08 | ) | 2.49 | 2.41 | — | — | ||||||||
| October 31, 2011 | 17.65 | (.12 | ) | 1.35 | 1.23 | — | — | ||||||||
| October 31, 2010 | 15.16 | (.09 | ) | 2.58 | 2.49 | — | — | ||||||||
| Class E | |||||||||||||||
| October 31, 2014 | 27.95 | .14 | 3.90 | 4.04 | (.04 | ) | (.04 | ) | |||||||
| October 31, 2013 | 22.17 | .07 | 5.81 | 5.88 | (.10 | ) | (.10 | ) | |||||||
| October 31, 2012 | 19.53 | .08 | 2.57 | 2.65 | (.01 | ) | (.01 | ) | |||||||
| October 31, 2011 | 18.15 | .02 | 1.40 | 1.42 | (.04 | ) | (.04 | ) | |||||||
| October 31, 2010 | 15.54 | .03 | 2.66 | 2.69 | (.08 | ) | (.08 | ) | |||||||
| Class S | |||||||||||||||
| October 31, 2014 | 28.10 | .21 | 3.92 | 4.13 | (.10 | ) | (.10 | ) | |||||||
| October 31, 2013 | 22.28 | .13 | 5.84 | 5.97 | (.15 | ) | (.15 | ) | |||||||
| October 31, 2012 | 19.63 | .13 | 2.58 | 2.71 | (.06 | ) | (.06 | ) | |||||||
| October 31, 2011 | 18.24 | .07 | 1.40 | 1.47 | (.08 | ) | (.08 | ) | |||||||
| October 31, 2010 | 15.61 | .08 | 2.66 | 2.74 | (.11 | ) | (.11 | ) | |||||||
See accompanying notes which are an integral part of the financial statements.
316 Russell Tax-Managed U.S. Large Cap Fund
| % | % | % | ||||||||||||
| $ | $ | Ratio of Expenses | Ratio of Expenses | Ratio of Net | ||||||||||
| Net Asset Value, | % | Net Assets, | to Average | to Average | Investment Income | % | ||||||||
| End of | Total | End of Period | Net Assets, | Net Assets, | to Average | Portfolio | ||||||||
| Period | Return(b)(c) | (000 | ) | Gross(e) | Net(d)(e) | Net Assets(d)(e) | Turnover Rate(b) | |||||||
| 31.83 | 14.48 | 18,676 | 1.24 | 1.24 | .45 | 63 | ||||||||
| 27.84 | 26.60 | 11,631 | 1.24 | 1.24 | .25 | 35 | ||||||||
| 22.11 | 13.54 | 5,765 | 1.23 | 1.23 | .29 | 48 | ||||||||
| 19.49 | 7.73 | 2,682 | 1.24 | 1.24 | .10 | 58 | ||||||||
| 18.15 | 9.34 | 729 | 1.24 | 1.24 | (.01 | ) | 82 | |||||||
| 30.40 | 13.60 | 19,360 | 1.99 | 1.99 | (.30 | ) | 63 | |||||||
| 26.76 | 25.69 | 14,927 | 1.99 | 1.98 | (.46 | ) | 35 | |||||||
| 21.29 | 12.71 | 10,733 | 1.98 | 1.94 | (.39 | ) | 48 | |||||||
| 18.88 | 7.03 | 9,217 | 2.01 | 1.95 | (.64 | ) | 58 | |||||||
| 17.65 | 16.42 | 10,996 | 1.99 | 1.91 | (.55 | ) | 82 | |||||||
| 31.95 | 14.48 | 45,651 | 1.24 | 1.24 | .45 | 63 | ||||||||
| 27.95 | 26.61 | 36,395 | 1.24 | 1.23 | .29 | 35 | ||||||||
| 22.17 | 13.57 | 23,578 | 1.23 | 1.19 | .36 | 48 | ||||||||
| 19.53 | 7.82 | 20,474 | 1.26 | 1.20 | .12 | 58 | ||||||||
| 18.15 | 17.36 | 19,744 | 1.24 | 1.16 | .19 | 82 | ||||||||
| 32.13 | 14.75 | 1,181,891 | .99 | .99 | .70 | 63 | ||||||||
| 28.10 | 26.94 | 758,556 | .99 | .98 | .53 | 35 | ||||||||
| 22.28 | 13.84 | 473,227 | .98 | .94 | .61 | 48 | ||||||||
| 19.63 | 8.04 | 400,643 | 1.01 | .95 | .36 | 58 | ||||||||
| 18.24 | 17.65 | 362,585 | .99 | .91 | .44 | 82 | ||||||||
See accompanying notes which are an integral part of the financial statements.
Russell Tax-Managed U.S. Large Cap Fund 317
Russell Investment Company
Russell Tax-Managed U.S. Mid and Small Cap Fund
Portfolio Management Discussion and Analysis — October 31, 2014 (Unaudited)
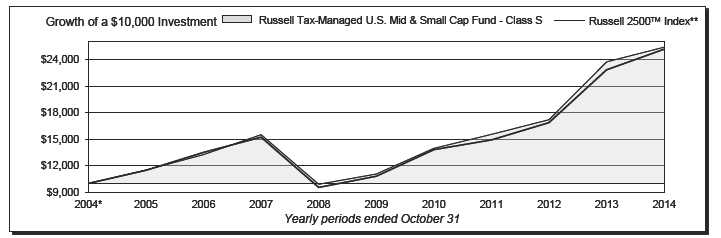
| Russell Tax-Managed U.S. Mid & Small Cap Fund - Class | Russell Tax-Managed U.S. Mid & Small Cap Fund - Class S | ||||||
| A‡ | |||||||
| Total | Total | ||||||
| Return | Return | ||||||
| 1 Year | 0.60 | % | 1 Year | 7.01 | % | ||
| 5 Years | 16.37 | %§ | 5 Years | 18.08 | %§ | ||
| 10 Years | 8.85 | %§ | 10 Years | 9.78 | %§ | ||
| Russell Tax-Managed U.S. Mid & Small Cap Fund - Class C | Russell 2500TM Index** | ||||||
| Total | Total | ||||||
| Return | Return | ||||||
| 1 Year | 5.95 | % | 1 Year | 10.23 | % | ||
| 5 Years | 16.92 | %§ | 5 Years | 18.40 | %§ | ||
| 10 Years | 8.68 | %§ | 10 Years | 9.68 | %§ | ||
| Russell Tax-Managed U.S. Mid & Small Cap Fund - Class E | |||||||
| Total | |||||||
| Return | |||||||
| 1 Year | 6.77 | % | |||||
| 5 Years | 17.78 | %§ | |||||
| 10 Years | 9.50 | %§ | |||||
318 Russell Tax-Managed U.S. Mid and Small Cap Fund
Russell Investment Company
Russell Tax-Managed U.S. Mid and Small Cap Fund
Portfolio Management Discussion and Analysis, continued — October 31, 2014 (Unaudited)
| The Russell Tax-Managed U.S. Mid & Small Cap Fund (the | produce strong positive returns, while the beginning of 2014 |
| “Fund”) employs a multi-manager approach whereby portions of | introduced higher price volatility with more modest returns that |
| the Fund are allocated to different money manager strategies. A | eventually turned negative towards the end of the 2014 fiscal |
| money manager may have (1) a discretionary asset management | year. At the beginning of 2014, the Fund decreased its beta (beta |
| assignment pursuant to which it is allocated a portion of Fund | is a measure of a portfolio’s volatility and its sensitivity to the |
| assets to manage directly or (2) a non-discretionary assignment | direction of the market) and growth exposures while continuing |
| pursuant to which it provides a model portfolio to RIMCo | to emphasize higher quality measures (lower leverage and |
| representing its investment recommendations, based upon which | higher returns-on-equity) within cyclical sectors. Growth stocks |
| RIMCo purchases and sells securities for a Fund. Fund assets | narrowly outperformed value stocks and defensive stocks beat |
| not allocated to discretionary money managers are managed | dynamic stocks for the fiscal year, which contributed negatively to |
| by Russell Investment Management Company (“RIMCo”), the | the Fund’s value tilt and aided the Fund’s exposure toward stocks |
| Fund’s advisor. RIMCo may change the allocation of the Fund’s | with lower betas. The Fund’s emphasis on stocks with higher |
| assets among money managers at any time. An exemptive order | quality measures was mixed, as stocks with modest amounts of |
| from the Securities and Exchange Commission (“SEC”) permits | leverage and lower returns-on-equity outperformed. |
| RIMCo to engage or terminate a money manager at any time, | With the continuation of the economic recovery in mind, the |
| subject to approval by the Fund’s Board, without a shareholder | Fund was underweight in most of the sectors that are traditionally |
| vote. Pursuant to the terms of the exemptive order, the Fund is | considered to be “non-cyclical” and/or interest rate sensitive. |
| required to notify its shareholders within 90 days of when a money | However, certain segments that tend to be viewed as “bond |
| manager begins providing services. As of October 31, 2014, the | substitutes,” due to their income producing qualities, such as |
| Fund had four money managers. | utilities and real estate investment trusts (REITs), outperformed |
| What is the Fund’s investment objective? | given the decline in interest rates and this detracted from the |
| The Fund seeks to provide long term capital growth on an after- | Fund’s benchmark-relative performance. |
| tax basis. | How did the investment strategies and techniques employed |
| How did the Fund perform relative to its benchmark for the | by the Fund and its money managers affect its benchmark- |
| fiscal year ended October 31, 2014? | relative performance? |
| For the fiscal year ended October 31, 2014, the Fund’s Class | Stock selection effects within the producer durables, consumer |
| A, Class C, Class E and Class S Shares gained 6.73%, 5.95%, | staples and financial services sectors detracted from the Fund’s |
| 6.77% and 7.01%, respectively. This is compared to the Fund’s | benchmark-relative return for the fiscal year. The Fund’s |
| benchmark, the Russell 2500™ Index, which gained 10.23% | underweight to interest rate sensitive sectors, namely utilities |
| during the same period. The Fund’s performance includes | and REITs, and overweight to the consumer discretionary sector, |
| operating expenses, whereas index returns are unmanaged and | was penalized. An overweight to health care and stock selection |
| do not include expenses of any kind. | within the materials and processing sectors added value. |
| For the fiscal year ended October 31, 2014, the Morningstar® | Chartwell Investment Partners (“Chartwell”) outperformed |
| Small Growth, a group of funds that Morningstar considers to have | the Russell 2500™ Value Index for the fiscal year. Chartwell |
| investment strategies similar to those of the Fund, gained 5.84%. | continued to find opportunities within energy services, regional |
| These results serve as peer comparisons and are expressed net of | banking and consumer discretionary sectors. Chartwells’s |
| operating expenses. | exposure to stocks with lower beta and higher price momentum |
| than the benchmark was rewarded. An underweight to utilities | |
| RIMCo may assign a money manager a specific style or | and information technology detracted. |
| capitalization benchmark other than the Fund’s index. However, | |
| the Fund’s primary index remains the benchmark for the Fund | Netols Asset Management, Inc. (“Netols”) outperformed the |
| and is representative of the aggregate of each money manager’s | Russell 2000® Value Index for the fiscal year. Stock selection |
| benchmark index. | within transportation and freight, computer software and health |
| care services industries added value. An overweight exposure to | |
| How did the market conditions described in the Market | railroad equipment and health care stocks added value. From a |
| Summary report affect the Fund’s performance? | factor perspective, exposure to the larger capitalization stocks in |
| The fiscal year ended October 31, 2014 saw the Fund | the Russell 2000® Value Index was beneficial. An underweight to |
| underperform the Russell 2500™ Index. Through the end of | utilities detracted. |
| 2013, the U.S. small and mid cap equity market continued to |
Russell Tax-Managed U.S. Mid and Small Cap Fund 319
Russell Investment Company
Russell Tax-Managed U.S. Mid and Small Cap Fund
Portfolio Management Discussion and Analysis, continued — October 31, 2014 (Unaudited)
| Summit Creek Advisors, LLC (“Summit Creek”) underperformed | balance the Fund’s capitalization structure relative to the Russell | |
| the Russell 2500™ Growth Index for the fiscal year. An overweight | 2500™ Index while targeting stocks with lower volatility, lower | |
| exposure to the technology sector and holdings within producer | valuations and higher quality measures (e.g., stocks with lower | |
| durables and energy detracted. Summit Creek’s underweight to | leverage than the index). The positioning strategy outperformed | |
| stocks with the highest leverage and overweight to near-term | the Russell 2500™ Index for the portion of the fiscal year that it | |
| price momentum detracted. | was implemented in the Fund. | |
| Luther King Capital Management Corporation (“Luther King”) | During the period, RIMCo equitized Fund and manager cash using | |
| was hired in March 2014 and underperformed the Russell 2500™ | index futures contracts to ensure that the Fund had full market | |
| Growth Index for the portion of the fiscal year that it was a money | exposure. This had a positive impact on the Fund’s performance. | |
| manager in the Fund. An underweight to information technology | ||
| and biotechnology industries and an overweight to energy and | Describe any changes to the Fund’s structure or the money | |
| consumer staples sectors detracted. Exposure to stocks with | manager line-up. | |
| higher beta than the benchmark detracted. | In March 2014, Chartwell’s benchmark was changed from the | |
| Russell 2000® Value Index to the Russell 2500™ Value Index in | ||
| Parametric Portfolio Associates (“Parametric”) was terminated | order to align the manager’s benchmark to the Fund’s benchmark. | |
| in June 2014 and underperformed the Russell 2500™ Index for | ||
| the portion of the fiscal year that it was a money manager in the | In March 2014, RIMCo hired Luther King and terminated | |
| Fund. Holdings within computer software, pharmaceuticals and | Turner. RIMCo made this manager change in order to seek to | |
| biotechnology and producer durables detracted. | improve the Fund’s tax-efficiency. Luther King was hired as a | |
| non-discretionary sub-advisor to the Fund, pursuant to which | ||
| RIMCo manages the portion of the Fund’s assets that RIMCo | Luther King provides a model portfolio to RIMCo representing | |
| determines not to allocate to the money managers. Assets not | its investment recommendations and based upon which RIMCo | |
| allocated to managers include assets managed by RIMCo based | purchases and sells securities for the Fund. | |
| upon model portfolios provided by non-discretionary money | ||
| managers, the Fund’s liquidity reserves and assets which may be | In June 2014, RIMCo terminated Parametric as a money manager | |
| managed directly by RIMCo to modify the Fund’s overall portfolio | for the Fund and implemented the | tax-managed positioning |
| characteristics to seek to achieve the desired risk/return profile | strategy described above. | |
| for the Fund. | In August 2014, RIMCo implemented the additional positioning | |
| In June 2014, RIMCo implemented a tax-managed positioning | strategy described above. | |
| strategy in connection with its termination of Parametric. This | Money Managers as of October 31, | |
| strategy employs quantitative analysis to select a diversified | 2014 | Styles |
| portfolio of market-oriented, mid and small cap stocks that | ||
| Chartwell Investment Partners | Value | |
| are intended to broadly track the performance of the Fund’s | Luther King Capital Management | |
| index, while using active tax management strategies to seek to | Corporation | Growth |
| improve total Fund after-tax returns. The strategy uses active tax | Netols Asset Management Inc. | Value |
| management strategies such as deferral of gains, management of | Summit Creek Advisors LLC | Growth |
| wash sales, tax loss harvesting and tax lot swapping in order to | The views expressed in this report reflect those of the portfolio | |
| seek to improve tax efficiency at the total Fund level. | managers only through the end of the period covered by | |
| The strategy underperformed the Russell 2500™ Index for | the report. These views do not necessarily represent the | |
| the portion of the fiscal year that it implemented in the Fund. | views of RIMCo, or any other person in RIMCo or any other | |
| Stock selection within producer durables, health care and | affiliated organization. These views are subject to change | |
| information technology sectors detracted. An overweight to the | at any time based upon market conditions or other events, | |
| poor performing energy sector also detracted. However, through | and RIMCo disclaims any responsibility to update the views | |
| its tax loss harvesting activities, RIMCo was able to harvest a | contained herein. These views should not be relied on as | |
| substantial amount of losses that the Fund would not have been | investment advice and, because investment decisions for | |
| able to realize under the prior structure, which improved the | a Russell Investment Company (“RIC”) Fund are based on | |
| Fund’s after tax returns. | numerous factors, should not be relied on as an indication | |
| of investment decisions of any RIC Fund. | ||
| In August 2014, RIMCo implemented a separate positioning | ||
| strategy to express RIMCo’s preferred exposures by seeking to | ||
320 Russell Tax-Managed U.S. Mid and Small Cap Fund
Russell Investment Company
Russell Tax-Managed U.S. Mid and Small Cap Fund
Portfolio Management Discussion and Analysis, continued — October 31, 2014 (Unaudited)
| * | Assumes initial investment on November 1, 2004. |
| ** | Russell 2500TM Index is composed of the bottom 500 stocks in the Russell 1000® Index and all the stocks in the Russell 2000® Index. The Russell 2500TM Index return reflect adjustments for income dividends and capital gains distributions reinvested as of the ex-dividend dates. |
| ‡ | The Fund first issued Class A Shares on June 1, 2010. The returns shown for Class A Shares prior to that date are the returns of Class E Shares. The performance shown has been adjusted to reflect the deduction of the maximum Class A sales charge of 5.75%. Annual returns for each Class will differ only to the extent that the Class A Shares do not have the same expenses as Class E Shares. |
| § | Annualized. |
Performance is historical and assumes reinvestment of all dividends and capital gains. Investment return and principal value will fluctuate so that an investor’s shares, when redeemed, may be worth more or less than when purchased. Past performance is not indicative of future results. The returns shown do not reflect the deduction of taxes that a shareholder would pay on Fund distributions or the redemption of Fund shares.
Russell Tax-Managed U.S. Mid and Small Cap Fund 321
Russell Investment Company
Russell Tax-Managed U.S. Mid & Small Cap Fund
Shareholder Expense Example — October 31, 2014 (Unaudited)
| Fund Expenses | Please note that the expenses shown in the table are meant | |||||
| The following disclosure provides important information | to highlight your ongoing costs only and do not reflect any | |||||
| regarding the Fund’s Shareholder Expense Example | transactional costs. Therefore, the information under the heading | |||||
| (“Example”). | “Hypothetical Performance (5% return before expenses)” is | |||||
| useful in comparing ongoing costs only, and will not help you | ||||||
| Example | determine the relative total costs of owning different funds. In | |||||
| As a shareholder of the Fund, you incur two types of costs: (1) | addition, if these transactional costs were included, your costs | |||||
| transaction costs, and (2) ongoing costs, including advisory and | would have been higher. | |||||
| administrative fees; distribution (12b-1) and/or service fees; | Hypothetical | |||||
| and other Fund expenses. The Example is intended to help | Performance (5% | |||||
| you understand your ongoing costs (in dollars) of investing in | Actual | return before | ||||
| the Fund and to compare these costs with the ongoing costs of | Class A | Performance | expenses) | |||
| Beginning Account Value | ||||||
| investing in other mutual funds. The Example is based on an | May 1, 2014 | $ | 1,000.00 | $ | 1,000.00 | |
| investment of $1,000 invested at the beginning of the period and | Ending Account Value | |||||
| held for the entire period indicated, which for this Fund is from | October 31, 2014 | $ | 1,040.30 | $ | 1,017.49 | |
| May 1, 2014 to October 31, 2014. | Expenses Paid During Period* | $ | 7.87 | $ | 7.78 | |
| Actual Expenses | * Expenses are equal to the Fund's annualized expense ratio of 1.53% | |||||
| (representing the six month period annualized), multiplied by the average | ||||||
| The information in the table under the heading “Actual | account value over the period, multiplied by 184/365 (to reflect the one-half | |||||
| Performance” provides information about actual account values | year period). May reflect amounts waived and/or reimbursed. Without any | |||||
| and actual expenses. You may use the information in this column, | waivers and/or reimbursements, expenses would have been higher. | |||||
| together with the amount you invested, to estimate the expenses | ||||||
| Hypothetical | ||||||
| that you paid over the period. Simply divide your account value by | Performance (5% | |||||
| $1,000 (for example, an $8,600 account value divided by $1,000 | Actual | return before | ||||
| = 8.6), then multiply the result by the number in the first column | Class C | Performance | expenses) | |||
| Beginning Account Value | ||||||
| in the row entitled “Expenses Paid During Period” to estimate | May 1, 2014 | $ | 1,000.00 | $ | 1,000.00 | |
| the expenses you paid on your account during this period. | Ending Account Value | |||||
| October 31, 2014 | $ | 1,036.70 | $ | 1,013.86 | ||
| Hypothetical Example for Comparison Purposes | Expenses Paid During Period* | $ | 11.55 | $ | 11.42 | |
| The information in the table under the heading “Hypothetical | ||||||
| Performance (5% return before expenses)” provides information | * Expenses are equal to the Fund's annualized expense ratio of 2.25% | |||||
| (representing the six month period annualized), multiplied by the average | ||||||
| about hypothetical account values and hypothetical expenses | account value over the period, multiplied by 184/365 (to reflect the one-half | |||||
| based on the Fund’s actual expense ratio and an assumed rate of | year period). May reflect amounts waived and/or reimbursed. Without any | |||||
| return of 5% per year before expenses, which is not the Fund’s | waivers and/or reimbursements, expenses would have been higher. | |||||
| actual return. The hypothetical account values and expenses | ||||||
| Hypothetical | ||||||
| may not be used to estimate the actual ending account balance or | Performance (5% | |||||
| expenses you paid for the period. You may use this information | Actual | return before | ||||
| to compare the ongoing costs of investing in the Fund and other | Class E | Performance | expenses) | |||
| funds. To do so, compare this 5% hypothetical example with the | Beginning Account Value | |||||
| May 1, 2014 | $ | 1,000.00 | $ | 1,000.00 | ||
| 5% hypothetical examples that appear in the shareholder reports | Ending Account Value | |||||
| of other funds. | October 31, 2014 | $ | 1,040.80 | $ | 1,017.64 | |
| Expenses Paid During Period* | $ | 7.72 | $ | 7.63 | ||
| * Expenses are equal to the Fund's annualized expense ratio of 1.50% | ||||||
| (representing the six month period annualized), multiplied by the average | ||||||
| account value over the period, multiplied by 184/365 (to reflect the one-half | ||||||
| year period). May reflect amounts waived and/or reimbursed. Without any | ||||||
| waivers and/or reimbursements, expenses would have been higher. | ||||||
322 Russell Tax-Managed U.S. Mid & Small Cap Fund
Russell Investment Company
Russell Tax-Managed U.S. Mid & Small Cap Fund
Shareholder Expense Example, continued — October 31, 2014 (Unaudited)
| Hypothetical | ||||||
| Performance (5% | ||||||
| Actual | return before | |||||
| Class S | Performance | expenses) | ||||
| Beginning Account Value | ||||||
| May 1, 2014 | $ | 1,000.00 | $ | 1,000.00 | ||
| Ending Account Value | ||||||
| October 31, 2014 | $ | 1,041.90 | $ | 1,018.90 | ||
| Expenses Paid During Period* | $ | 6.43 | $ | 6.36 | ||
| * Expenses are equal to the Fund's annualized expense ratio of 1.25% | ||||||
| (representing the six month period annualized), multiplied by the average | ||||||
| account value over the period, multiplied by 184/365 (to reflect the one-half | ||||||
| year period). May reflect amounts waived and/or reimbursed. Without any | ||||||
| waivers and/or reimbursements, expenses would have been higher. | ||||||
Russell Tax-Managed U.S. Mid & Small Cap Fund 323
| Russell Investment Company | |||||||
| Russell Tax-Managed U.S. Mid & Small Cap Fund | |||||||
| Schedule of Investments — October 31, 2014 | |||||||
| Amounts in thousands (except share amounts) | Amounts in thousands (except share amounts) | ||||||
| Principal | Fair | Principal | Fair | ||||
| Amount ($) or | Value | Amount ($) or | Value | ||||
| Shares | $ | Shares | $ | ||||
| Common Stocks - 91.7% | Hanesbrands, Inc. | 5,428 | 573 | ||||
| Consumer Discretionary - 13.8% | Haverty Furniture Cos., Inc. | 708 | 16 | ||||
| 1-800-Flowers.com, Inc. Class A(Æ) | 16,643 | 134 | Helen of Troy, Ltd.(Æ) | 13,050 | 807 | ||
| Aaron's, Inc. Class A | 5,967 | 148 | Hertz Global Holdings, Inc.(Æ) | 6,972 | 153 | ||
| AMC Entertainment Holdings, Inc. Class A | 6,575 | 167 | Hillenbrand, Inc. | 31,864 | 1,061 | ||
| AMC Networks, Inc. Class A(Æ) | 109 | 7 | HomeAway, Inc.(Æ) | 1,075 | 38 | ||
| American Eagle Outfitters, Inc. | 2,217 | 29 | HSN, Inc. | 816 | 54 | ||
| American Public Education, Inc.(Æ) | 572 | 18 | Hyatt Hotels Corp. Class A(Æ) | 2,601 | 154 | ||
| ANN, Inc.(Æ) | 25,330 | 972 | Iconix Brand Group, Inc.(Æ) | 6,240 | 250 | ||
| Asbury Automotive Group, Inc.(Æ) | 291 | 20 | International Game Technology | 2,371 | 39 | ||
| Bally Technologies, Inc.(Æ) | 640 | 51 | Interpublic Group of Cos., Inc. (The) | 14,186 | 275 | ||
| Barnes & Noble, Inc.(Æ) | 7,464 | 163 | Jack in the Box, Inc. | 18,836 | 1,338 | ||
| Beazer Homes USA, Inc.(Æ) | 5,350 | 96 | Jarden Corp.(Æ) | 1,488 | 97 | ||
| Bed Bath & Beyond, Inc.(Æ) | 254 | 17 | John Wiley & Sons, Inc. Class A(Æ) | 3,050 | 178 | ||
| Big Lots, Inc. | 927 | 42 | Kate Spade & Co.(Æ) | 26,352 | 715 | ||
| Biglari Holdings, Inc.(Æ) | 267 | 93 | La Quinta Holdings, Inc.(Æ) | 51,527 | 1,052 | ||
| Brinker International, Inc. | 5,264 | 282 | Lamar Advertising Co. Class A | 2,956 | 153 | ||
| Buffalo Wild Wings, Inc.(Æ) | 6,100 | 911 | LeapFrog Enterprises, Inc. Class A(Æ) | 2,599 | 14 | ||
| Burger King Worldwide, Inc.(Ñ) | 3,019 | 99 | Leggett & Platt, Inc. | 1,002 | 39 | ||
| Burlington Stores, Inc.(Æ) | 1,109 | 47 | Liberty Media Corp. Class A(Æ) | 4,459 | 214 | ||
| Cabela's, Inc.(Æ)(Ñ) | 17,208 | 826 | Liberty Media Corp.(Æ) | 5,508 | 264 | ||
| Cablevision Systems Corp. Class A | 3,394 | 63 | Liberty Ventures Class A(Æ) | 1,972 | 69 | ||
| Callaway Golf Co. | 14,551 | 114 | Life Time Fitness, Inc.(Æ)(Ñ) | 2,971 | 166 | ||
| Capella Education Co. | 20,402 | 1,443 | Live Nation Entertainment, Inc.(Æ) | 602 | 16 | ||
| CarMax, Inc.(Æ) | 3,653 | 204 | LKQ Corp.(Æ) | 46,473 | 1,328 | ||
| Carter's, Inc. | 11,919 | 931 | Lumber Liquidators Holdings, Inc.(Æ)(Ñ) | 13,742 | 739 | ||
| Cheesecake Factory, Inc. (The) | 16,639 | 764 | Madison Square Garden Co. (The) Class A(Æ) | 515 | 39 | ||
| Chico's FAS, Inc. | 10,882 | 164 | Matthews International Corp. Class A | 13,450 | 620 | ||
| Columbia Sportswear Co. | 436 | 17 | Monro Muffler Brake, Inc. | 19,383 | 1,036 | ||
| Conversant, Inc.(Æ) | 6,302 | 222 | Motorcar Parts of America, Inc.(Æ) | 26,471 | 769 | ||
| Cooper Tire & Rubber Co. | 4,271 | 138 | Murphy USA, Inc.(Æ) | 16 | 1 | ||
| Coty, Inc. Class A(Æ) | 1,704 | 28 | National Presto Industries, Inc. | 255 | 16 | ||
| Dana Holding Corp. | 9,122 | 187 | New Media Investment Group, Inc. | 978 | 19 | ||
| Deckers Outdoor Corp.(Æ) | 8,225 | 719 | Nu Skin Enterprises, Inc. Class A | 744 | 39 | ||
| DeVry Education Group, Inc. | 20,617 | 998 | NVR, Inc.(Æ) | 61 | 75 | ||
| Dick's Sporting Goods, Inc. | 681 | 31 | Office Depot, Inc.(Æ) | 3,315 | 17 | ||
| Dillard's, Inc. Class A | 573 | 61 | Outerwall, Inc.(Æ) | 220 | 14 | ||
| Domino's Pizza, Inc. | 11,166 | 991 | Panera Bread Co. Class A(Æ) | 414 | 67 | ||
| Dorman Products, Inc.(Æ)(Ñ) | 29,068 | 1,348 | PetSmart, Inc. | 1,692 | 122 | ||
| DR Horton, Inc. | 1,552 | 35 | Polaris Industries, Inc. | 6,166 | 930 | ||
| DreamWorks Animation SKG, Inc. Class | Pool Corp. | 13,250 | 791 | ||||
| A(Æ) | 5,210 | 116 | PulteGroup, Inc. | 17,628 | 338 | ||
| Drew Industries, Inc. | 357 | 17 | PVH Corp. | 580 | 66 | ||
| Dunkin' Brands Group, Inc. | 1,169 | 53 | Ralph Lauren Corp. Class A | 95 | 16 | ||
| Ethan Allen Interiors, Inc. | 45,969 | 1,301 | Red Robin Gourmet Burgers, Inc.(Æ) | 2,684 | 148 | ||
| Five Below, Inc.(Æ)(Ñ) | 17,296 | 690 | Revlon, Inc. Class A(Æ) | 1,384 | 47 | ||
| Foot Locker, Inc. | 3,108 | 174 | Ross Stores, Inc. | 2,423 | 196 | ||
| Fossil Group, Inc.(Æ) | 311 | 32 | Sally Beauty Holdings, Inc.(Æ) | 62,068 | 1,819 | ||
| GameStop Corp. Class A(Ñ) | 916 | 39 | Service Corp. International | 12,050 | 264 | ||
| Gannett Co., Inc. | 32,893 | 1,036 | Shoe Carnival, Inc. | 6,564 | 121 | ||
| Garmin, Ltd. | 314 | 17 | Shutterfly, Inc.(Æ) | 25,345 | 1,060 | ||
| Gentex Corp. | 6,490 | 212 | Signet Jewelers, Ltd. | 3,381 | 406 | ||
| Gentherm, Inc.(Æ) | 38,134 | 1,590 | Skechers U.S.A., Inc. Class A(Æ) | 489 | 27 | ||
| Genuine Parts Co. | 183 | 18 | Stamps.com, Inc.(Æ) | 504 | 19 | ||
| G-III Apparel Group, Ltd.(Æ) | 15,400 | 1,222 | Standard Motor Products, Inc. | 465 | 18 | ||
| Goodyear Tire & Rubber Co. (The) | 9,881 | 239 | Starz(Æ) | 5,402 | 167 | ||
| GoPro, Inc. Class A(Æ) | 451 | 35 | Stein Mart, Inc. | 1,370 | 18 | ||
| Grand Canyon Education, Inc.(Æ) | 5,539 | 265 | Sturm Ruger & Co., Inc. | 346 | 14 | ||
| Guess?, Inc. | 2,150 | 48 | Superior Industries International, Inc. | 882 | 17 | ||
| See accompanying notes which are an integral part of the financial statements. | |||||||
| 324 Russell Tax-Managed U.S. Mid & Small Cap Fund | |||||||
Russell Investment Company
Russell Tax-Managed U.S. Mid & Small Cap Fund
Schedule of Investments, continued — October 31, 2014
| Amounts in thousands (except share amounts) | Amounts in thousands (except share amounts) | ||||||
| Principal | Fair | Principal | Fair | ||||
| Amount ($) or | Value | Amount ($) or | Value | ||||
| Shares | $ | Shares | $ | ||||
| Tempur Sealy International, Inc.(Æ) | 363 | 19 | Matador Resources Co.(Æ) | 28,774 | 698 | ||
| Tenneco, Inc.(Æ) | 20,282 | 1,062 | McDermott International, Inc.(Æ) | 217,555 | 835 | ||
| Tiffany & Co. | 1,713 | 165 | Memorial Resource Development Corp.(Æ) | 32,039 | 868 | ||
| TiVo, Inc.(Æ) | 12,831 | 167 | Newfield Exploration Co.(Æ) | 1,855 | 61 | ||
| Toll Brothers, Inc.(Æ) | 42,800 | 1,367 | Oceaneering International, Inc. | 3,328 | 234 | ||
| Tractor Supply Co. | 6,838 | 501 | Oil States International, Inc.(Æ) | 2,561 | 153 | ||
| TRW Automotive Holdings Corp.(Æ) | 837 | 85 | Peabody Energy Corp. | 2,327 | 24 | ||
| Tumi Holdings, Inc.(Æ) | 35,927 | 746 | Renewable Energy Group, Inc.(Æ) | 15,494 | 163 | ||
| Tupperware Brands Corp. | 2,897 | 185 | Rice Energy, Inc.(Æ) | 1,207 | 32 | ||
| Ulta Salon Cosmetics & Fragrance, Inc.(Æ) | 4,987 | 602 | Rosetta Resources, Inc.(Æ) | 3,716 | 141 | ||
| Under Armour, Inc. Class A(Æ) | 1,557 | 102 | SandRidge Energy, Inc.(Æ) | 7,319 | 29 | ||
| Vail Resorts, Inc. | 589 | 51 | SemGroup Corp. Class A | 625 | 48 | ||
| Vistaprint NV(Æ) | 544 | 36 | SunCoke Energy, Inc.(Æ) | 7,348 | 176 | ||
| WABCO Holdings, Inc.(Æ) | 175 | 17 | SunPower Corp. Class A(Æ)(Ñ) | 7,412 | 236 | ||
| WCI Communities, Inc.(Æ) | 873 | 16 | Superior Energy Services, Inc. | 36,430 | 916 | ||
| Williams-Sonoma, Inc. | 1,726 | 112 | Synergy Resources Corp.(Æ) | 12,491 | 152 | ||
| Wolverine World Wide, Inc. | 8,200 | 223 | TerraForm Power, Inc. Class A(Æ) | 1,107 | 32 | ||
| Wyndham Worldwide Corp. | 2,673 | 208 | Tesoro Corp. | 3,098 | 221 | ||
| 44,466 | Weatherford International PLC(Æ) | 103,800 | 1,704 | ||||
| Western Refining, Inc. | 699 | 32 | |||||
| Consumer Staples - 3.5% | Whiting Petroleum Corp.(Æ) | 3,134 | 192 | ||||
| Boulder Brands, Inc.(Æ) | 102,404 | 909 | Willbros Group, Inc.(Æ) | 102,226 | 600 | ||
| Casey's General Stores, Inc. | 31,935 | 2,614 | World Fuel Services Corp. | 3,772 | 156 | ||
| Constellation Brands, Inc. Class A(Æ) | 2,422 | 222 | 13,104 | ||||
| Energizer Holdings, Inc. | 1,144 | 140 | |||||
| Fresh Market, Inc. (The)(Æ)(Ñ) | 28,840 | 1,059 | Financial Services - 21.0% | ||||
| GNC Holdings, Inc. Class A | 379 | 16 | Advent Software, Inc. | 5,097 | 176 | ||
| Hain Celestial Group, Inc. (The)(Æ) | 2,875 | 311 | Affiliated Managers Group, Inc.(Æ) | 3,810 | 761 | ||
| Herbalife, Ltd.(Ñ) | 1,212 | 64 | Alexandria Real Estate Equities, Inc.(ö) | 390 | 32 | ||
| JM Smucker Co. (The) | 1,628 | 169 | Alleghany Corp.(Æ) | 38 | 17 | ||
| Monster Beverage Corp.(Æ) | 2,242 | 226 | Allied World Assurance Co. Holdings AG | 442 | 17 | ||
| Pilgrim's Pride Corp.(Æ) | 892 | 25 | Altisource Asset Management Corp.(Æ) | 12 | 6 | ||
| Pinnacle Foods, Inc. | 285 | 10 | American Equity Investment Life Holding | ||||
| Safeway, Inc. | 4,725 | 165 | Co. | 44,650 | 1,152 | ||
| Snyders-Lance, Inc. | 39,475 | 1,176 | American Financial Group, Inc. | 275 | 16 | ||
| Spectrum Brands Holdings, Inc. | 921 | 83 | American National Insurance Co. | 1,419 | 162 | ||
| Sprouts Farmers Market, Inc.(Æ) | 159 | 5 | AmREIT, Inc. Class B(ö) | 5,658 | 139 | ||
| SUPERVALU, Inc.(Æ) | 117,293 | 1,012 | Apollo Investment Corp.(Ñ) | 9,487 | 78 | ||
| Tootsie Roll Industries, Inc. | 5,797 | 172 | Arch Capital Group, Ltd.(Æ) | 768 | 43 | ||
| TreeHouse Foods, Inc.(Æ) | 24,088 | 2,052 | Ares Capital Corp. | 10,550 | 169 | ||
| Vector Group, Ltd. | 2,959 | 66 | Argo Group International Holdings, Ltd. | 21,594 | 1,205 | ||
| WhiteWave Foods Co. (The) Class A(Æ) | 24,959 | 929 | Arthur J Gallagher & Co. | 2,251 | 107 | ||
| 11,425 | Aspen Insurance Holdings, Ltd. | 378 | 16 | ||||
| Assurant, Inc. | 246 | 17 | |||||
| Energy - 4.1% | Assured Guaranty, Ltd. | 14,197 | 328 | ||||
| Athlon Energy, Inc.(Æ) | 24,473 | 1,427 | Astoria Financial Corp. | 9,675 | 127 | ||
| Basic Energy Services, Inc.(Æ) | 8,450 | 109 | Axis Capital Holdings, Ltd. | 5,579 | 269 | ||
| Bill Barrett Corp.(Æ) | 48,685 | 740 | BancFirst Corp. | 246 | 16 | ||
| Cabot Oil & Gas Corp. | 4,672 | 145 | Banco Latinoamericano de Comercio Exterior | ||||
| Carrizo Oil & Gas, Inc.(Æ) | 3,467 | 180 | SA Class E | 6,718 | 226 | ||
| Cheniere Energy, Inc.(Æ) | 3,515 | 264 | BancorpSouth, Inc. | 56,220 | 1,295 | ||
| Civeo Corp. | 5,074 | 62 | Bank of Hawaii Corp. | 276 | 16 | ||
| CVR Energy, Inc. | 351 | 17 | Bank of the Ozarks, Inc. | 38,820 | 1,368 | ||
| Delek US Holdings, Inc. | 1,427 | 48 | Berkshire Hills Bancorp, Inc. | 665 | 17 | ||
| Dresser-Rand Group, Inc.(Æ) | 869 | 71 | Blackhawk Network Holdings, Inc. Class | ||||
| Dril-Quip, Inc.(Æ) | 14,590 | 1,312 | A(Æ) | 1,024 | 35 | ||
| Exterran Holdings, Inc. | 6,019 | 237 | Boston Private Financial Holdings, Inc. | 1,280 | 17 | ||
| First Solar, Inc.(Æ) | 4,411 | 260 | Brixmor Property Group, Inc.(ö) | 833 | 20 | ||
| Laredo Petroleum, Inc.(Æ)(Ñ) | 27,906 | 529 | Broadridge Financial Solutions, Inc. | 5,818 | 256 | ||
See accompanying notes which are an integral part of the financial statements.
Russell Tax-Managed U.S. Mid & Small Cap Fund 325
| Russell Investment Company | |||||||
| Russell Tax-Managed U.S. Mid & Small Cap Fund | |||||||
| Schedule of Investments, continued — October 31, 2014 | |||||||
| Amounts in thousands (except share amounts) | Amounts in thousands (except share amounts) | ||||||
| Principal | Fair | Principal | Fair | ||||
| Amount ($) or | Value | Amount ($) or | Value | ||||
| Shares | $ | Shares | $ | ||||
| Camden Property Trust(ö) | 3,242 | 249 | Fulton Financial Corp. | 1,390 | 17 | ||
| Capital Bank Financial Corp. Class A(Æ) | 652 | 17 | GAMCO Investors, Inc. Class A | 2,247 | 186 | ||
| Cardtronics, Inc.(Æ) | 34,125 | 1,310 | Genworth Financial, Inc. Class A(Æ) | 84,713 | 1,185 | ||
| Cash America International, Inc. | 2,833 | 139 | Getty Realty Corp.(ö) | 916 | 17 | ||
| Cass Information Systems, Inc. | 360 | 17 | Glacier Bancorp, Inc. | 38,664 | 1,109 | ||
| CBL & Associates Properties, Inc.(ö) | 9,772 | 187 | Global Payments, Inc. | 781 | 63 | ||
| CBOE Holdings, Inc. | 3,885 | 229 | Green Dot Corp. Class A(Æ) | 7,567 | 181 | ||
| Cedar Realty Trust, Inc.(ö) | 20,389 | 140 | Greenlight Capital Re, Ltd. Class A(Æ) | 4,868 | 158 | ||
| Central Pacific Financial Corp. | 8,782 | 166 | Hancock Holding Co. | 483 | 17 | ||
| Chesapeake Lodging Trust(ö) | 28,669 | 947 | Hanover Insurance Group, Inc. (The) | 40,279 | 2,696 | ||
| Chimera Investment Corp.(ö) | 44,201 | 138 | Harbinger Group, Inc.(Æ) | 665 | 9 | ||
| City National Corp. | 24,404 | 1,921 | Health Care, Inc.(ö) | 1,344 | 96 | ||
| CNA Financial Corp. | 424 | 17 | Healthcare Realty Trust, Inc.(ö) | 19,335 | 512 | ||
| CNO Financial Group, Inc. | 947 | 17 | Heartland Payment Systems, Inc. | 416 | 21 | ||
| CoBiz Financial, Inc. | 1,406 | 17 | Heritage Financial Corp. | 8,234 | 144 | ||
| Columbia Banking System, Inc. | 5,350 | 149 | Home Properties, Inc.(ö) | 2,156 | 139 | ||
| Columbia Property Trust, Inc.(ö) | 426 | 11 | Hudson City Bancorp, Inc. | 17,006 | 164 | ||
| Comerica, Inc. | 15,410 | 736 | Huntington Bancshares, Inc. | 21,443 | 212 | ||
| Commerce Bancshares, Inc. | 352 | 16 | Iberiabank Corp. | 2,759 | 190 | ||
| Community Bank System, Inc. | 27,109 | 1,034 | Imperial Holdings, Inc.(Æ) | 12,830 | 80 | ||
| Corrections Corp. of America(ö) | 5,353 | 197 | Inland Real Estate Corp.(ö) | 14,388 | 153 | ||
| Cullen/Frost Bankers, Inc. | 204 | 16 | iStar Financial, Inc.(Æ)(ö) | 15,472 | 220 | ||
| CVB Financial Corp. | 10,947 | 173 | Jack Henry & Associates, Inc. | 502 | 30 | ||
| DCT Industrial Trust, Inc.(ö) | 213,400 | 1,829 | Jones Lang LaSalle, Inc. | 7,935 | 1,073 | ||
| Duke Realty Corp.(ö) | 1,172 | 22 | Kansas City Life Insurance Co. | 351 | 17 | ||
| DuPont Fabros Technology, Inc.(ö) | 9,425 | 292 | Kayne Anderson Energy Development Co.(Ñ) | 5,082 | 184 | ||
| E*Trade Financial Corp.(Æ) | 37,484 | 836 | Kennedy-Wilson Holdings, Inc. | 1,849 | 50 | ||
| East West Bancorp, Inc. | 469 | 17 | KeyCorp | 15,208 | 201 | ||
| Education Realty Trust, Inc. Class A(ö) | 76,743 | 864 | Kilroy Realty Corp.(ö) | 242 | 16 | ||
| Endurance Specialty Holdings, Ltd. | 17,623 | 1,021 | Lakeland Financial Corp. | 411 | 17 | ||
| Equifax, Inc. | 4,071 | 308 | Liberty Property Trust(ö) | 742 | 26 | ||
| Equity Lifestyle Properties, Inc. Class A(ö) | 1,461 | 72 | Macerich Co. (The)(ö) | 2,415 | 170 | ||
| Essex Property Trust, Inc.(ö) | 750 | 151 | Markel Corp.(Æ) | 428 | 296 | ||
| Euronet Worldwide, Inc.(Æ) | 15,381 | 825 | MarketAxess Holdings, Inc. | 488 | 32 | ||
| EverBank Financial Corp. | 874 | 17 | MBIA, Inc.(Æ) | 2,639 | 26 | ||
| Evercore Partners, Inc. Class A | 435 | 23 | MFA Financial, Inc.(ö) | 1,427 | 12 | ||
| Everest Re Group, Ltd. | 551 | 94 | MGIC Investment Corp.(Æ) | 168,929 | 1,507 | ||
| Extra Space Storage, Inc.(ö) | 5,406 | 314 | Mid-America Apartment Communities, Inc. | ||||
| Ezcorp, Inc. Class A(Æ) | 16,053 | 181 | (ö) | 2,173 | 154 | ||
| FactSet Research Systems, Inc. | 364 | 48 | Montpelier Re Holdings, Ltd. | 508 | 17 | ||
| Fair Isaac Corp. | 17,317 | 1,079 | Morningstar, Inc. | 237 | 16 | ||
| FBL Financial Group, Inc. Class A | 358 | 18 | MSCI, Inc. Class A | 2,167 | 101 | ||
| Federal Agricultural Mortgage Corp. Class C | 4,640 | 155 | NASDAQ OMX Group, Inc. (The) | 2,676 | 116 | ||
| Federal Realty Investment Trust(ö) | 2,297 | 303 | National Health Investors, Inc.(ö) | 12,368 | 815 | ||
| FelCor Lodging Trust, Inc.(ö) | 101,881 | 1,093 | National Retail Properties, Inc.(ö) | 465 | 18 | ||
| Fidelity & Guaranty Life | 7,464 | 177 | National Western Life Insurance Co. Class | ||||
| Financial Engines, Inc. | 25,559 | 1,019 | A(Æ) | 650 | 176 | ||
| First Financial Bankshares, Inc.(Ñ) | 8,720 | 277 | Navigators Group, Inc. (The)(Æ) | 2,541 | 173 | ||
| First Financial Corp. | 505 | 18 | New York Mortgage Trust, Inc.(Ñ)(ö) | 19,093 | 149 | ||
| First Industrial Realty Trust, Inc.(ö) | 82,703 | 1,615 | NorthStar Asset Management Group, Inc.(Æ) | 1,710 | 31 | ||
| First Interstate BancSystem, Inc. Class A | 5,890 | 173 | NorthStar Realty Finance Corp.(ö) | 4,038 | 75 | ||
| First Midwest Bancorp, Inc. | 25,974 | 436 | Northwest Bancshares, Inc. | 8,090 | 104 | ||
| First Niagara Financial Group, Inc. | 37,103 | 278 | Old National Bancorp | 48,211 | 701 | ||
| Fiserv, Inc.(Æ) | 22,500 | 1,563 | Old Republic International Corp. | 7,030 | 104 | ||
| Flagstar Bancorp, Inc.(Æ) | 12,562 | 197 | OneBeacon Insurance Group, Ltd. Class | ||||
| FNB Corp. | 27,025 | 346 | A(Æ) | 571 | 9 | ||
| FNF Group | 7,383 | 220 | Opus Bank(Æ) | 161 | 4 | ||
| FNFV Group(Æ) | 2,460 | 33 | Oritani Financial Corp. | 8,387 | 124 | ||
| Forest City Enterprises, Inc. Class A(Æ) | 3,006 | 63 | PacWest Bancorp | 25,292 | 1,079 | ||
| See accompanying notes which are an integral part of the financial statements. | |||||||
| 326 Russell Tax-Managed U.S. Mid & Small Cap Fund | |||||||
Russell Investment Company
Russell Tax-Managed U.S. Mid & Small Cap Fund
Schedule of Investments, continued — October 31, 2014
| Amounts in thousands (except share amounts) | Amounts in thousands (except share amounts) | ||||||
| Principal | Fair | Principal | Fair | ||||
| Amount ($) or | Value | Amount ($) or | Value | ||||
| Shares | $ | Shares | $ | ||||
| PartnerRe, Ltd. | 621 | 72 | WesBanco, Inc. | 527 | 18 | ||
| Pebblebrook Hotel Trust(ö) | 4,149 | 177 | Westamerica Bancorporation(Ñ) | 2,545 | 126 | ||
| PennyMac Mortgage Investment Trust(ö) | 6,200 | 134 | White Mountains Insurance Group, Ltd. | 84 | 52 | ||
| People's United Financial, Inc. | 1,098 | 16 | Wintrust Financial Corp. | 347 | 16 | ||
| Platinum Underwriters Holdings, Ltd. | 261 | 16 | WP Carey, Inc.(ö) | 556 | 38 | ||
| Popular, Inc.(Æ) | 8,414 | 268 | WR Berkley Corp. | 606 | 31 | ||
| Post Properties, Inc.(ö) | 3,782 | 212 | WSFS Financial Corp. | 2,677 | 211 | ||
| PRA Group(Æ) | 3,932 | 251 | XL Group PLC Class A | 4,714 | 160 | ||
| PrivateBancorp, Inc. Class A | 535 | 17 | Zillow, Inc. Class A(Æ) | 433 | 47 | ||
| ProAssurance Corp. | 355 | 17 | Zions Bancorporation | 26,882 | 779 | ||
| Prosperity Bancshares, Inc. | 6,470 | 391 | 67,517 | ||||
| Protective Life Corp. | 1,541 | 107 | |||||
| Provident Financial Services, Inc. | 971 | 18 | Health Care - 10.8% | ||||
| PS Business Parks, Inc.(ö) | 10,510 | 885 | AAC Holdings, Inc.(Æ) | 6,760 | 147 | ||
| Radian Group, Inc.(Ñ) | 16,993 | 286 | Acadia Healthcare Co., Inc.(Æ) | 31,317 | 1,943 | ||
| Raymond James Financial, Inc. | 15,272 | 857 | Actavis PLC(Æ) | 829 | 201 | ||
| Realogy Holdings Corp.(Æ) | 1,393 | 57 | Agios Pharmaceuticals, Inc.(Æ) | 305 | 26 | ||
| Reinsurance Group of America, Inc. Class A | 2,725 | 230 | Akorn, Inc.(Æ) | 72,296 | 3,221 | ||
| RenaissanceRe Holdings, Ltd. | 514 | 53 | Albany Molecular Research, Inc.(Æ) | 43,869 | 1,020 | ||
| Resource Capital Corp.(ö) | 13,779 | 73 | Alere, Inc.(Æ) | 5,509 | 220 | ||
| Retail Opportunity Investments Corp.(ö) | 9,870 | 161 | Alexion Pharmaceuticals, Inc.(Æ) | 1,299 | 249 | ||
| Retail Properties of America, Inc. Class A(ö) | 122,111 | 1,916 | Align Technology, Inc.(Æ) | 13,895 | 731 | ||
| Ryman Hospitality Properties, Inc.(Ñ)(ö) | 4,049 | 200 | Alkermes PLC(Æ) | 1,874 | 95 | ||
| SEI Investments Co. | 441 | 17 | Alnylam Pharmaceuticals, Inc.(Æ) | 3,127 | 290 | ||
| Selective Insurance Group, Inc. | 75,080 | 1,939 | AMAG Pharmaceuticals, Inc.(Æ) | 594 | 20 | ||
| ServisFirst Bancshares, Inc. | 569 | 17 | Analogic Corp. | 13,701 | 999 | ||
| Signature Bank(Æ) | 8,347 | 1,011 | ARIAD Pharmaceuticals, Inc.(Æ) | 1,802 | 11 | ||
| SL Green Realty Corp.(ö) | 1,767 | 204 | Auxilium Pharmaceuticals, Inc.(Æ) | 5,769 | 186 | ||
| SLM Corp. | 17,945 | 171 | Avanir Pharmaceuticals, Inc. Class A(Æ) | 2,636 | 34 | ||
| St. Joe Co. (The)(Æ) | 1,553 | 30 | BioDelivery Sciences International, Inc.(Æ) | 697 | 12 | ||
| StanCorp Financial Group, Inc. | 2,478 | 172 | BioMarin Pharmaceutical, Inc.(Æ) | 2,801 | 231 | ||
| Starwood Property Trust, Inc.(ö) | 709 | 16 | Bio-Rad Laboratories, Inc. Class A(Æ) | 137 | 16 | ||
| State Bank Financial Corp. | 48,911 | 876 | Bio-Techne Corp. | 171 | 16 | ||
| Sterling Bancorp | 64,155 | 902 | Bluebird Bio, Inc.(Æ) | 46 | 2 | ||
| Stock Yards Bancorp, Inc. | 533 | 18 | CareFusion Corp.(Æ) | 349 | 20 | ||
| Sun Communities, Inc.(ö) | 26,633 | 1,544 | Catalent, Inc.(Æ) | 1,241 | 32 | ||
| SunTrust Banks, Inc. | 411 | 16 | Celldex Therapeutics, Inc.(Æ)(Ñ) | 7,464 | 125 | ||
| Symetra Financial Corp. | 687 | 16 | Centene Corp.(Æ) | 907 | 84 | ||
| T Rowe Price Group, Inc. | 2,053 | 169 | Cepheid(Æ) | 955 | 51 | ||
| Tanger Factory Outlet Centers, Inc.(ö) | 5,573 | 199 | Chemed Corp.(Ñ) | 2,336 | 241 | ||
| Taubman Centers, Inc.(ö) | 1,033 | 79 | Chimerix, Inc.(Æ)(Ñ) | 976 | 30 | ||
| Texas Capital Bancshares, Inc.(Æ) | 11,073 | 677 | Community Health Systems, Inc.(Æ) | 1,988 | 109 | ||
| TrustCo Bank Corp. NY | 2,446 | 18 | Cooper Cos., Inc. (The) | 2,058 | 337 | ||
| Trustmark Corp. | 675 | 16 | Covance, Inc.(Æ) | 1,725 | 138 | ||
| Two Harbors Investment Corp.(ö) | 14,321 | 145 | Cubist Pharmaceuticals, Inc.(Æ) | 911 | 66 | ||
| UMB Financial Corp. | 15,462 | 921 | Cyberonics, Inc.(Æ) | 5,100 | 268 | ||
| Umpqua Holdings Corp. | 54,842 | 965 | Depomed, Inc.(Æ) | 1,316 | 20 | ||
| United Community Banks, Inc. | 9,570 | 173 | DexCom, Inc.(Æ) | 15,059 | 677 | ||
| Universal Insurance Holdings, Inc. | 8,695 | 152 | Dyax Corp.(Æ) | 1,524 | 19 | ||
| Unum Group | 455 | 15 | Enanta Pharmaceuticals, Inc.(Æ) | 180 | 8 | ||
| Validus Holdings, Ltd. | 419 | 17 | Envision Healthcare Holdings, Inc.(Æ) | 446 | 16 | ||
| Vantiv, Inc. Class A(Æ) | 407 | 13 | Exact Sciences Corp.(Æ)(Ñ) | 1,631 | 39 | ||
| Ventas, Inc.(ö) | 2,256 | 155 | ExamWorks Group, Inc.(Æ) | 643 | 25 | ||
| Voya Financial, Inc. | 4,128 | 162 | Gentiva Health Services, Inc.(Æ) | 1,028 | 20 | ||
| Waddell & Reed Financial, Inc. Class A | 4,533 | 216 | Greatbatch, Inc.(Æ) | 27,475 | 1,379 | ||
| Walter Investment Management Corp.(Æ) | 26,232 | 596 | Haemonetics Corp.(Æ) | 41,934 | 1,582 | ||
| Washington Federal, Inc. | 773 | 17 | Health Net, Inc.(Æ) | 1,064 | 51 | ||
| Washington Trust Bancorp, Inc. | 471 | 18 | Henry Schein, Inc.(Æ) | 1,751 | 210 | ||
| Webster Financial Corp. | 26,742 | 838 | Hologic, Inc.(Æ) | 9,896 | 259 | ||
See accompanying notes which are an integral part of the financial statements.
Russell Tax-Managed U.S. Mid & Small Cap Fund 327
Russell Investment Company
Russell Tax-Managed U.S. Mid & Small Cap Fund
Schedule of Investments, continued — October 31, 2014
| Amounts in thousands (except share amounts) | Amounts in thousands (except share amounts) | ||||||
| Principal | Fair | Principal | Fair | ||||
| Amount ($) or | Value | Amount ($) or | Value | ||||
| Shares | $ | Shares | $ | ||||
| ICON PLC(Æ) | 26,560 | 1,397 | US Physical Therapy, Inc. | 27,991 | 1,208 | ||
| ICU Medical, Inc.(Æ) | 264 | 19 | VCA, Inc.(Æ) | 75,970 | 3,462 | ||
| IDEXX Laboratories, Inc.(Æ) | 614 | 87 | WellCare Health Plans, Inc.(Æ) | 196 | 13 | ||
| IGI Laboratories, Inc.(Æ) | 29,900 | 293 | Wright Medical Group, Inc.(Æ) | 4,682 | 148 | ||
| Impax Laboratories, Inc.(Æ) | 242 | 7 | 34,783 | ||||
| Incyte Corp.(Æ) | 2,174 | 146 | |||||
| Integra LifeSciences Holdings Corp.(Æ) | 17,898 | 915 | Materials and Processing - 6.7% | ||||
| Intercept Pharmaceuticals, Inc.(Æ) | 195 | 50 | AAON, Inc. | 11,226 | 221 | ||
| Invacare Corp. | 70,162 | 1,102 | Acuity Brands, Inc. | 15,434 | 2,152 | ||
| IPC The Hospitalist Co., Inc.(Æ) | 11,962 | 498 | Airgas, Inc. | 1,657 | 185 | ||
| Ironwood Pharmaceuticals, Inc. Class A(Æ) | 1,582 | 22 | Allegheny Technologies, Inc. | 27,225 | 894 | ||
| Isis Pharmaceuticals, Inc.(Æ)(Ñ) | 6,951 | 320 | AptarGroup, Inc. | 264 | 16 | ||
| Karyopharm Therapeutics, Inc.(Æ) | 72 | 3 | Ashland, Inc. | 2,610 | 282 | ||
| Keryx Biopharmaceuticals, Inc.(Æ) | 2,186 | 37 | Balchem Corp. | 7,864 | 509 | ||
| LifePoint Hospitals, Inc.(Æ) | 11,851 | 830 | Ball Corp. | 4,470 | 288 | ||
| Magellan Health, Inc.(Æ) | 291 | 18 | Belden, Inc. | 15,360 | 1,093 | ||
| Mallinckrodt PLC(Æ) | 2,291 | 211 | Berry Plastics Group, Inc.(Æ) | 35 | 1 | ||
| MannKind Corp.(Æ)(Ñ) | 5,540 | 33 | Calgon Carbon Corp.(Æ) | 44,000 | 925 | ||
| MedAssets, Inc.(Æ) | 8,685 | 188 | Carpenter Technology Corp. | 19,969 | 999 | ||
| Medivation, Inc.(Æ) | 1,345 | 142 | Compass Minerals International, Inc. | 9,938 | 852 | ||
| MEDNAX, Inc.(Æ) | 5,112 | 319 | Crown Holdings, Inc.(Æ) | 5,723 | 274 | ||
| Merrimack Pharmaceuticals, Inc.(Æ) | 2,347 | 22 | Eagle Materials, Inc. | 3,008 | 263 | ||
| MiMedx Group, Inc.(Æ)(Ñ) | 80,364 | 818 | Eastman Chemical Co. | 2,170 | 175 | ||
| MWI Veterinary Supply, Inc.(Æ) | 12,489 | 2,119 | Hawkins, Inc. | 456 | 18 | ||
| Myriad Genetics, Inc.(Æ)(Ñ) | 1,112 | 44 | Hexcel Corp.(Æ) | 14,765 | 619 | ||
| Nektar Therapeutics(Æ) | 1,691 | 23 | Horsehead Holding Corp.(Æ) | 11,069 | 174 | ||
| Novavax, Inc.(Æ) | 1,064 | 6 | Innophos Holdings, Inc. | 15,420 | 879 | ||
| NPS Pharmaceuticals, Inc.(Æ) | 1,450 | 40 | International Flavors & Fragrances, Inc. | 1,908 | 189 | ||
| Omnicare, Inc. | 1,310 | 87 | Intrepid Potash, Inc.(Æ)(Ñ) | 50,719 | 682 | ||
| Omnicell, Inc.(Æ) | 8,346 | 270 | Koppers Holdings, Inc. | 20,600 | 813 | ||
| Ophthotech Corp.(Æ) | 34 | 1 | LB Foster Co. Class A | 334 | 18 | ||
| Orexigen Therapeutics, Inc.(Æ)(Ñ) | 26,292 | 107 | Lennox International, Inc. | 3,222 | 287 | ||
| Orthofix International NV(Æ) | 4,798 | 141 | Martin Marietta Materials, Inc. | 6,545 | 765 | ||
| Otonomy, Inc.(Æ) | 788 | 21 | Materion Corp. | 519 | 20 | ||
| Owens & Minor, Inc. | 483 | 16 | MeadWestvaco Corp. | 386 | 17 | ||
| Pacira Pharmaceuticals, Inc.(Æ) | 832 | 77 | Minerals Technologies, Inc. | 19,497 | 1,496 | ||
| PAREXEL International Corp.(Æ) | 380 | 21 | OM Group, Inc. | 9,525 | 248 | ||
| Patterson Cos., Inc. | 477 | 21 | Owens Corning | 3,111 | 100 | ||
| PerkinElmer, Inc. | 24,483 | 1,063 | Packaging Corp. of America | 4,726 | 341 | ||
| Pernix Therapeutics Holdings, Inc.(Æ) | 241 | 2 | Pentair PLC(Æ) | 2,864 | 192 | ||
| Pharmacyclics, Inc.(Æ) | 998 | 130 | PGT, Inc.(Æ) | 117,076 | 1,101 | ||
| Phibro Animal Health Corp. Class A | 192 | 5 | Platform Specialty Products Corp.(Æ) | 404 | 11 | ||
| Prestige Brands Holdings, Inc.(Æ) | 175 | 6 | PolyOne Corp. | 18,217 | 674 | ||
| Puma Biotechnology, Inc.(Æ) | 297 | 74 | Post Holdings, Inc.(Æ) | 7,873 | 295 | ||
| Quality Systems, Inc. | 2,976 | 45 | Quaker Chemical Corp. | 213 | 17 | ||
| Quintiles Transnational Holdings, Inc.(Æ) | 678 | 40 | Quanex Building Products Corp. | 881 | 18 | ||
| Receptos, Inc.(Æ) | 286 | 30 | RBC Bearings, Inc. | 2,208 | 134 | ||
| Regeneron Pharmaceuticals, Inc.(Æ) | 337 | 133 | Rock-Tenn Co. Class A | 774 | 40 | ||
| Repligen Corp.(Æ) | 792 | 20 | RPM International, Inc. | 6,601 | 299 | ||
| ResMed, Inc.(Ñ) | 4,741 | 248 | Sealed Air Corp. | 1,032 | 37 | ||
| Salix Pharmaceuticals, Ltd.(Æ) | 399 | 57 | Sensient Technologies Corp. | 16,063 | 951 | ||
| Seattle Genetics, Inc.(Æ)(Ñ) | 4,553 | 167 | Simpson Manufacturing Co., Inc. | 531 | 18 | ||
| Spectrum Pharmaceuticals, Inc.(Æ)(Ñ) | 17,827 | 135 | Sonoco Products Co. | 4,585 | 187 | ||
| Team Health Holdings, Inc.(Æ) | 18,374 | 1,149 | Steel Dynamics, Inc. | 10,715 | 247 | ||
| Tenet Healthcare Corp.(Æ) | 4,944 | 277 | Timken Co. (The) | 366 | 16 | ||
| Trevena, Inc.(Æ) | 15,004 | 87 | Unifi, Inc.(Æ) | 36,376 | 1,017 | ||
| Triple-S Management Corp. Class B(Æ) | 8,491 | 188 | United States Steel Corp.(Ñ) | 1,749 | 70 | ||
| United Therapeutics Corp.(Æ) | 736 | 96 | Universal Forest Products, Inc. | 2,625 | 131 | ||
| Universal Health Services, Inc. Class B | 515 | 53 | Valmont Industries, Inc. | 201 | 27 | ||
See accompanying notes which are an integral part of the financial statements.
328 Russell Tax-Managed U.S. Mid & Small Cap Fund
Russell Investment Company
Russell Tax-Managed U.S. Mid & Small Cap Fund
Schedule of Investments, continued — October 31, 2014
| Amounts in thousands (except share amounts) | Amounts in thousands (except share amounts) | ||||||
| Principal | Fair | Principal | Fair | ||||
| Amount ($) or | Value | Amount ($) or | Value | ||||
| Shares | $ | Shares | $ | ||||
| Valspar Corp. | 421 | 35 | HNI Corp. | 4,654 | 217 | ||
| WR Grace & Co.(Æ) | 2,986 | 282 | Hub Group, Inc. Class A(Æ) | 3,437 | 125 | ||
| 21,594 | Hyster-Yale Materials Handling, Inc. | 219 | 17 | ||||
| Insperity, Inc. | 588 | 19 | |||||
| Producer Durables - 15.8% | Iron Mountain, Inc.(ö) | 1,135 | 41 | ||||
| ABM Industries, Inc. | 595 | 16 | ITT Corp. | 10,779 | 486 | ||
| Accuride Corp.(Æ) | 129,255 | 623 | JetBlue Airways Corp.(Æ) | 613 | 7 | ||
| Actuant Corp. Class A | 31,235 | 990 | Kadant, Inc. | 4,016 | 166 | ||
| ADT Corp. (The) | 630 | 23 | Kansas City Southern | 1,553 | 191 | ||
| Advanced Emissions Solutions, Inc.(Æ) | 26,206 | 530 | KBR, Inc. | 14,680 | 280 | ||
| Advisory Board Co. (The)(Æ) | 26,509 | 1,423 | Kelly Services, Inc. Class A(Æ) | 9,937 | 175 | ||
| AGCO Corp. | 356 | 16 | Kennametal, Inc. | 1,137 | 44 | ||
| Aircastle, Ltd. | 8,190 | 156 | Kimball International, Inc. Class B | 1,063 | 19 | ||
| Alaska Air Group, Inc. | 551 | 29 | Kirby Corp.(Æ) | 24,380 | 2,696 | ||
| Allegiant Travel Co. Class A | 1,795 | 240 | Knight Transportation, Inc. | 36,775 | 1,076 | ||
| Allison Transmission Holdings, Inc. Class A | 417 | 14 | Korn/Ferry International(Æ) | 589 | 16 | ||
| Altra Industrial Motion Corp. | 37,507 | 1,182 | Landstar System, Inc. | 313 | 23 | ||
| Ametek, Inc. | 3,761 | 196 | Lexmark International, Inc. Class A | 4,190 | 181 | ||
| AO Smith Corp. | 333 | 18 | Lincoln Electric Holdings, Inc. | 726 | 53 | ||
| Applied Industrial Technologies, Inc. | 4,342 | 212 | Lindsay Corp. | 219 | 19 | ||
| Astec Industries, Inc. | 421 | 16 | Littelfuse, Inc. | 2,549 | 249 | ||
| B/E Aerospace, Inc.(Æ) | 8,761 | 652 | Manitowoc Co., Inc. (The) | 7,453 | 155 | ||
| Babcock & Wilcox Co. (The) | 576 | 16 | Marten Transport, Ltd. | 880 | 17 | ||
| Barnes Group, Inc. | 28,674 | 1,048 | Matson, Inc. | 1,614 | 46 | ||
| Booz Allen Hamilton Holding Corp. Class A | 2,018 | 53 | MAXIMUS, Inc. | 31,808 | 1,541 | ||
| Briggs & Stratton Corp. | 49,757 | 1,006 | Mettler-Toledo International, Inc.(Æ) | 812 | 210 | ||
| Bristow Group, Inc. | 20,348 | 1,504 | Middleby Corp.(Æ) | 9,504 | 841 | ||
| Carlisle Cos., Inc. | 3,457 | 307 | MSC Industrial Direct Co., Inc. Class A | 183 | 15 | ||
| CDI Corp. | 6,882 | 118 | MYR Group, Inc.(Æ) | 647 | 17 | ||
| Celadon Group, Inc. | 5,958 | 116 | Navigant Consulting, Inc.(Æ) | 8,155 | 125 | ||
| Chicago Bridge & Iron Co. | 3,261 | 178 | Old Dominion Freight Line, Inc.(Æ) | 817 | 60 | ||
| Clarcor, Inc. | 13,025 | 872 | Orbital Sciences Corp.(Æ) | 9,617 | 253 | ||
| Commercial Vehicle Group, Inc.(Æ) | 77,794 | 510 | Oshkosh Corp. | 351 | 16 | ||
| Convergys Corp. | 879 | 18 | Pall Corp. | 2,164 | 198 | ||
| Con-way, Inc. | 3,100 | 134 | Parker-Hannifin Corp. | 141 | 18 | ||
| Copa Holdings SA Class A | 307 | 36 | Paychex, Inc. | 380 | 18 | ||
| CoStar Group, Inc.(Æ) | 9,402 | 1,515 | Powell Industries, Inc. | 3,145 | 143 | ||
| Covanta Holding Corp. | 923 | 20 | Power Solutions International, Inc.(Æ)(Ñ) | 10,199 | 668 | ||
| Electronics For Imaging, Inc.(Æ) | 5,581 | 255 | Proto Labs, Inc.(Æ) | 21,654 | 1,416 | ||
| EMCOR Group, Inc. | 381 | 17 | Quad/Graphics, Inc. | 778 | 17 | ||
| Encore Wire Corp. | 415 | 16 | Quanta Services, Inc.(Æ) | 31,971 | 1,090 | ||
| EnerSys | 260 | 16 | Regal-Beloit Corp. | 246 | 17 | ||
| EnPro Industries, Inc.(Æ) | 16,406 | 1,059 | Resources Connection, Inc. | 1,143 | 18 | ||
| ESCO Technologies, Inc. | 452 | 17 | Roadrunner Transportation Systems, Inc.(Æ) | 48,480 | 999 | ||
| Esterline Technologies Corp.(Æ) | 145 | 17 | Robert Half International, Inc. | 4,436 | 243 | ||
| ExlService Holdings, Inc.(Æ) | 4,790 | 134 | Rollins, Inc. | 545 | 17 | ||
| Expeditors International of Washington, Inc. | 390 | 17 | RPX Corp. Class A(Æ) | 1,109 | 16 | ||
| Exponent, Inc. | 223 | 18 | Rush Enterprises, Inc. Class A(Æ) | 31,947 | 1,217 | ||
| Fluor Corp. | 236 | 16 | SkyWest, Inc. | 1,826 | 21 | ||
| Forward Air Corp. | 4,181 | 200 | Snap-on, Inc. | 203 | 27 | ||
| G&K Services, Inc. Class A | 15,691 | 990 | Spirit Airlines, Inc.(Æ) | 716 | 52 | ||
| GATX Corp. | 15,975 | 1,013 | Sykes Enterprises, Inc.(Æ) | 36,145 | 779 | ||
| Genesee & Wyoming, Inc. Class A(Æ) | 6,677 | 642 | Taser International, Inc.(Æ) | 81,385 | 1,533 | ||
| Granite Construction, Inc. | 4,810 | 178 | Teekay Corp. | 1,194 | 70 | ||
| Gulfmark Offshore, Inc. Class A | 39,969 | 1,205 | Teledyne Technologies, Inc.(Æ) | 13,002 | 1,347 | ||
| HD Supply Holdings, Inc.(Æ) | 30 | 1 | Terex Corp. | 4,352 | 125 | ||
| Healthcare Services Group, Inc. | 33,794 | 1,006 | Tetra Tech, Inc. | 5,010 | 134 | ||
| HEICO Corp. | 4,771 | 259 | Thermon Group Holdings, Inc.(Æ) | 48,442 | 1,181 | ||
| Herman Miller, Inc. | 28,260 | 904 | Titan International, Inc.(Ñ) | 33,042 | 349 | ||
See accompanying notes which are an integral part of the financial statements.
Russell Tax-Managed U.S. Mid & Small Cap Fund 329
Russell Investment Company
Russell Tax-Managed U.S. Mid & Small Cap Fund
Schedule of Investments, continued — October 31, 2014
| Amounts in thousands (except share amounts) | Amounts in thousands (except share amounts) | ||
| Principal | Fair | Principal | Fair |
| Amount ($) or | Value | Amount ($) or | Value |
| Shares | $ | Shares | $ |
| Toro Co. (The) | 12,417 | 766 | IPG Photonics Corp.(Æ)(Ñ) | 1,991 | 146 | ||
| Towers Watson & Co. Class A | 361 | 40 | Jabil Circuit, Inc. | 80,993 | 1,697 | ||
| TransDigm Group, Inc. | 86 | 16 | JDS Uniphase Corp.(Æ) | 15,012 | 202 | ||
| TriMas Corp.(Æ) | 41,214 | 1,305 | Lambda TD Software, Inc.(Æ) | 7,641 | 136 | ||
| Trimble Navigation, Ltd.(Æ) | 30,907 | 830 | MA-COM Technology Solutions Holdings, | ||||
| UniFirst Corp. | 163 | 18 | Inc.(Æ) | 51,770 | 1,138 | ||
| United Rentals, Inc.(Æ) | 7,878 | 867 | ManTech International Corp. Class A | 5,703 | 161 | ||
| United Stationers, Inc. | 12,685 | 530 | Mentor Graphics Corp. | 10,513 | 223 | ||
| Vectrus, Inc.(Æ) | 424 | 10 | MKS Instruments, Inc. | 482 | 18 | ||
| Wabtec Corp. | 16,615 | 1,434 | Monolithic Power Systems, Inc. | 6,476 | 286 | ||
| WageWorks, Inc.(Æ) | 12,650 | 721 | Monotype Imaging Holdings, Inc. | 28,311 | 810 | ||
| Werner Enterprises, Inc. | 644 | 18 | NETGEAR, Inc.(Æ) | 500 | 17 | ||
| XPO Logistics, Inc.(Æ) | 510 | 20 | Newport Corp.(Æ) | 8,837 | 158 | ||
| Xylem, Inc. | 746 | 27 | Nuance Communications, Inc.(Æ) | 2,045 | 32 | ||
| Zebra Technologies Corp. Class A(Æ) | 17,575 | 1,296 | ON Semiconductor Corp.(Æ) | 9,500 | 79 | ||
| 50,774 | Palo Alto Networks, Inc.(Æ) | 753 | 80 | ||||
| Park Electrochemical Corp. | 28,452 | 734 | |||||
| Technology - 12.3% | PC Connection, Inc. | 720 | 17 | ||||
| 3D Systems Corp.(Æ) | 810 | 31 | Plantronics, Inc. | 978 | 51 | ||
| ACI Worldwide, Inc.(Æ) | 42,354 | 815 | Plexus Corp.(Æ) | 52,740 | 2,181 | ||
| Amdocs, Ltd. | 3,406 | 162 | Progress Software Corp.(Æ) | 87,192 | 2,258 | ||
| Anixter International, Inc. | 3,970 | 338 | Qlik Technologies, Inc.(Æ) | 5,493 | 156 | ||
| Ansys, Inc.(Æ) | 3,243 | 255 | QLogic Corp.(Æ) | 1,691 | 20 | ||
| AOL, Inc.(Æ) | 5,211 | 227 | Rambus, Inc.(Æ) | 66,204 | 758 | ||
| Applied Micro Circuits Corp.(Æ) | 13,404 | 87 | RF Micro Devices, Inc.(Æ)(Ñ) | 22,417 | 292 | ||
| Aruba Networks, Inc.(Æ) | 44,865 | 968 | Rogers Corp.(Æ) | 2,812 | 192 | ||
| Aspen Technology, Inc.(Æ) | 34,920 | 1,290 | Rovi Corp.(Æ) | 7,181 | 150 | ||
| Atmel Corp.(Æ) | 16,416 | 122 | Sapient Corp.(Æ) | 40,857 | 708 | ||
| Avnet, Inc. | 5,555 | 240 | SBA Communications Corp. Class A(Æ) | 2,283 | 256 | ||
| AVX Corp. | 12,110 | 175 | ScanSource, Inc.(Æ) | 449 | 17 | ||
| Benchmark Electronics, Inc.(Æ) | 7,056 | 167 | Science Applications International Corp. | 272 | 13 | ||
| Bottomline Technologies de, Inc.(Æ) | 36,219 | 909 | ServiceNow, Inc.(Æ) | 1,874 | 127 | ||
| Brooks Automation, Inc. | 1,493 | 18 | Skyworks Solutions, Inc. | 2,478 | 144 | ||
| CA, Inc. | 573 | 17 | Spansion, Inc. Class A(Æ) | 8,610 | 177 | ||
| CACI International, Inc. Class A(Æ) | 12,609 | 1,038 | Splunk, Inc.(Æ) | 1,607 | 106 | ||
| Cadence Design Systems, Inc.(Æ) | 3,334 | 60 | Stratasys, Ltd.(Æ)(Ñ) | 6,902 | 831 | ||
| CalAmp Corp.(Æ) | 26,087 | 503 | SunEdison, Inc.(Æ) | 1,635 | 32 | ||
| Cavium, Inc.(Æ) | 15,210 | 780 | Synchronoss Technologies, Inc.(Æ) | 6,060 | 313 | ||
| Checkpoint Systems, Inc.(Æ) | 90,748 | 1,203 | Synopsys, Inc.(Æ) | 3,998 | 164 | ||
| Ciena Corp.(Æ) | 29,072 | 487 | Syntel, Inc.(Æ) | 17,360 | 1,504 | ||
| Computer Sciences Corp. | 280 | 17 | Take-Two Interactive Software, Inc.(Æ) | 25,586 | 677 | ||
| Compuware Corp. | 1,516 | 15 | Tangoe, Inc.(Æ) | 30,750 | 451 | ||
| comScore, Inc.(Æ) | 36,936 | 1,556 | Teradyne, Inc. | 25,188 | 463 | ||
| Concur Technologies, Inc.(Æ) | 742 | 95 | TIBCO Software, Inc.(Æ) | 8,815 | 206 | ||
| Covisint Corp.(Æ) | 212 | 1 | Trulia, Inc.(Æ) | 456 | 21 | ||
| Dealertrack Technologies, Inc.(Æ) | 37,540 | 1,766 | Tyler Technologies, Inc.(��) | 6,068 | 679 | ||
| DigitalGlobe, Inc.(Æ) | 5,661 | 162 | Ultimate Software Group, Inc.(Æ) | 4,328 | 651 | ||
| Diodes, Inc.(Æ) | 25,387 | 656 | VASCO Data Security International, Inc.(Æ) | 814 | 21 | ||
| Dolby Laboratories, Inc. Class A | 381 | 16 | VeriFone Systems, Inc.(Æ) | 40,056 | 1,492 | ||
| DST Systems, Inc. | 186 | 18 | Verint Systems, Inc.(Æ) | 511 | 29 | ||
| Ellie Mae, Inc.(Æ) | 11,640 | 447 | 39,668 | ||||
| Entegris, Inc.(Æ) | 59,131 | 803 | |||||
| Envestnet, Inc.(Æ) | 11,462 | 509 | Utilities - 3.7% | ||||
| EPAM Systems, Inc.(Æ) | 14,416 | 688 | 8x8, Inc.(Æ) | 140,283 | 1,103 | ||
| Equinix, Inc. | 697 | 146 | AGL Resources, Inc. | 2,183 | 118 | ||
| F5 Networks, Inc.(Æ) | 6,571 | 808 | ALLETE, Inc. | 3,252 | 170 | ||
| Fabrinet(Æ) | 48,542 | 884 | Alliant Energy Corp. | 1,238 | 77 | ||
| FEI Co. | 203 | 17 | American Water Works Co., Inc. | 4,572 | 244 | ||
| Gartner, Inc.(Æ) | 1,217 | 98 | Atlantic Tele-Network, Inc. | 281 | 19 |
See accompanying notes which are an integral part of the financial statements.
330 Russell Tax-Managed U.S. Mid & Small Cap Fund
Russell Investment Company
Russell Tax-Managed U.S. Mid & Small Cap Fund
Schedule of Investments, continued — October 31, 2014
Amounts in thousands (except share amounts)
| Principal | Fair | ||||
| Amount ($) or | Value | ||||
| Shares | $ | ||||
| Atmos Energy Corp. | 1,039 | 55 | |||
| Avista Corp. | 8,880 | 315 | |||
| Black Hills Corp. | 13,821 | 756 | |||
| CenterPoint Energy, Inc. | 7,174 | 176 | |||
| Cleco Corp. | 24,843 | 1,336 | |||
| CMS Energy Corp. | 9,476 | 310 | |||
| Connecticut Water Service, Inc. | 4,800 | 178 | |||
| Dynegy, Inc. Class A(Æ) | 2,559 | 78 | |||
| El Paso Electric Co. | 25,411 | 962 | |||
| Empire District Electric Co. (The) | 5,785 | 164 | |||
| Energen Corp. | 501 | 34 | |||
| Frontier Communications Corp.(Ñ) | 17,191 | 112 | |||
| Gran Tierra Energy, Inc.(Æ) | 17,173 | 78 | |||
| Idacorp, Inc. | 3,075 | 194 | |||
| Integrys Energy Group, Inc. | 1,290 | 94 | |||
| ITC Holdings Corp. | 2,513 | 99 | |||
| Level 3 Communications, Inc.(Æ) | 1,783 | 84 | |||
| National Fuel Gas Co. | 22,100 | 1,530 | |||
| New Jersey Resources Corp. | 3,300 | 193 | |||
| Northeast Utilities | 3,872 | 191 | |||
| Northwest Natural Gas Co. | 2,955 | 139 | |||
| NorthWestern Corp. | 26,353 | 1,392 | |||
| NRG Energy, Inc. | 1,034 | 31 | |||
| Pepco Holdings, Inc. | 5,235 | 143 | |||
| PNM Resources, Inc. | 6,214 | 179 | |||
| Questar Corp. | 621 | 15 | |||
| SCANA Corp. | 4,985 | 274 | |||
| Southwest Gas Corp. | 4,108 | 239 | |||
| TECO Energy, Inc. | 6,490 | 127 | |||
| Telephone & Data Systems, Inc. | 650 | 17 | |||
| Time Warner Telecom, Inc. Class A(Æ) | 7,653 | 327 | |||
| UGI Corp. | 3,945 | 149 | |||
| US Cellular Corp.(Æ) | 3,946 | 144 | |||
| Windstream Holdings, Inc. | 12,546 | 131 | |||
| 11,977 | |||||
| Total Common Stocks | |||||
| (cost $208,011) | 295,308 | ||||
| Short-Term Investments - 8.9% | |||||
| Russell U.S. Cash Management Fund | 28,536,866 | (8) | 28,537 | ||
| Total Short-Term Investments | |||||
| (cost $28,537) | 28,537 | ||||
| Other Securities - 3.3% | |||||
| Russell U.S. Cash Collateral Fund(×) | 10,669,351 | (8) | 10,669 | ||
| Total Other Securities | |||||
| (cost $10,669) | 10,669 | ||||
| Total Investments 103.9% | |||||
| (identified cost $247,217) | 334,514 | ||||
| Other Assets and Liabilities, Net | |||||
| - (3.9%) | (12,588 | ) | |||
| Net Assets - 100.0% | 321,926 | ||||
See accompanying notes which are an integral part of the financial statements.
Russell Tax-Managed U.S. Mid & Small Cap Fund 331
| Russell Investment Company | ||||||
| Russell Tax-Managed U.S. Mid & Small Cap Fund | ||||||
| Schedule of Investments, continued — October 31, 2014 | ||||||
| Futures Contracts | ||||||
| Amounts in thousands (except contract amounts) | ||||||
| Unrealized | ||||||
| Appreciation | ||||||
| Number of | Notional | Expiration | (Depreciation) | |||
| Contracts | Amount | Date | $ | |||
| Long Positions | ||||||
| S&P Mid 400 E-Mini Index Futures | 180 | USD | 25,477 | 12/14 | 161 | |
| Total Unrealized Appreciation (Depreciation) on Open Futures Contracts (å) | 161 | |||||
Presentation of Portfolio Holdings
Amounts in thousands
| Fair Value | ||||||||||||
| Portfolio Summary | Level 1 | Level 2 | Level 3 | Total | % of Net Assets | |||||||
| Common Stocks | ||||||||||||
| Consumer Discretionary | $ | 44,466 | $ | — | $ | — | $ | 44,466 | 13.8 | |||
| Consumer Staples | 11,425 | — | — | 11,425 | 3.5 | |||||||
| Energy | 13,104 | — | — | 13,104 | 4.1 | |||||||
| Financial Services | 67,517 | — | — | 67,517 | 21.0 | |||||||
| Health Care | 34,783 | — | — | 34,783 | 10.8 | |||||||
| Materials and Processing | 21,594 | — | — | 21,594 | 6.7 | |||||||
| Producer Durables | 50,774 | — | — | 50,774 | 15.8 | |||||||
| Technology | 39,668 | — | — | 39,668 | 12.3 | |||||||
| Utilities | 11,977 | — | — | 11,977 | 3.7 | |||||||
| Short-Term Investments | — | 28,537 | — | 28,537 | 8.9 | |||||||
| Other Securities | — | 10,669 | — | 10,669 | 3.3 | |||||||
| Total Investments | 295,308 | 39,206 | — | 334,514 | 103.9 | |||||||
| Other Assets and Liabilities, Net | (3.9 | ) | ||||||||||
| 100.0 | ||||||||||||
| Other Financial Instruments | ||||||||||||
| Futures Contracts | 161 | — | — | 161 | 0.1 | |||||||
| Total Other Financial Instruments* | $ | 161 | $ | — | $ | — | $ | 161 | ||||
* Futures and foreign currency exchange contract values reflect the unrealized appreciation (depreciation) on the instruments.
For a description of the Levels see note 2 in the Notes to Financial Statements.
For disclosure on transfers between Levels 1, 2 and 3 during the period ended October 31, 2014, see note 2 in the Notes to Financial Statements.
See accompanying notes which are an integral part of the financial statements.
332 Russell Tax-Managed U.S. Mid & Small Cap Fund
| Russell Investment Company | |||
| Russell Tax-Managed U.S. Mid & Small Cap Fund | |||
| Fair Value of Derivative Instruments — October 31, 2014 | |||
| Amounts in thousands | |||
| Equity | |||
| Derivatives not accounted for as hedging instruments | Contracts | ||
| Location: Statement of Assets and Liabilities - Assets | |||
| Variation margin on futures contracts* | $ | 161 | |
| Equity | |||
| Derivatives not accounted for as hedging instruments | Contracts | ||
| Location: Statement of Operations - Net realized gain (loss) | |||
| Futures contracts | $ | 3,332 | |
| Location: Statement of Operations - Net change in unrealized appreciation (depreciation) | |||
| Futures contracts | $ | (505 | ) |
| * | Includes cumulative appreciation/depreciation of futures contracts as reported in the Schedule of Investments. Only variation margin is reported within the Statement of Assets and Liabilities. |
For further disclosure on derivatives see note 2 in the Notes to Financial Statements.
See accompanying notes which are an integral part of the financial statements.
Russell Tax-Managed U.S. Mid & Small Cap Fund 333
Russell Investment Company
Russell Tax-Managed U.S. Mid & Small Cap Fund
Balance Sheet Offsetting of Financial and Derivative Instruments — October 31, 2014
| Amounts in thousands | ||||||||
| Offsetting of Financial Assets and Derivative Assets | ||||||||
| Gross | Net Amounts | |||||||
| Amounts | of Assets | |||||||
| Gross | Offset in the | Presented in | ||||||
| Amounts of | Statement of | the Statement | ||||||
| Recognized | Assets and | of Assets and | ||||||
| Description | Location: Statement of Assets and Liabilities - Assets | Assets | Liabilities | Liabilities | ||||
| Securities on Loan* | Investments, at fair value | $ | 9,505 | $ | — $ | 9,505 | ||
| Futures Contracts | Variation margin on futures contracts | 334 | — | 334 | ||||
| Total | $ | 9,839 | $ | — $ | 9,839 | |||
| Financial Assets, Derivative Assets, and Collateral Held by Counterparty | ||||||||||
| Gross Amounts Not Offset in | ||||||||||
| the Statement of Assets and | ||||||||||
| Liabilities | ||||||||||
| Net Amounts | ||||||||||
| of Assets | ||||||||||
| Presented in | ||||||||||
| the Statement | Financial and | |||||||||
| of Assets and | Derivative | Collateral | ||||||||
| Counterparty | Liabilities | Instruments | Received^ | Net Amount | ||||||
| Barclays | $ | 2,794 | $ | — $ | 2,794 | $ | — | |||
| Citigroup | 983 | — | 983 | — | ||||||
| Credit Suisse | 285 | — | 285 | — | ||||||
| Deutsche Bank | 227 | — | 227 | — | ||||||
| Fidelity | 290 | — | 290 | — | ||||||
| Goldman Sachs | 1,142 | — | 1,142 | — | ||||||
| JPMorgan Chase | 2,532 | — | 2,532 | — | ||||||
| Merrill Lynch | 334 | — | — | 334 | ||||||
| Morgan Stanley | 1,197 | — | 1,197 | — | ||||||
| UBS | 55 | — | 55 | — | ||||||
| Total | $ | 9,839 | $ | — $ | 9,505 | $ | 334 | |||
* Fair value of securities on loan as reported in the footnotes to the Statement of Assets and Liabilities.
^ Collateral received or pledged amounts may not reconcile to those disclosed in the Statement of Assets and Liabilities due to the inclusion of off-Balance Sheet collateral and adjustments made to exclude overcollateralization.
For further disclosure on derivatives and counterparty risk see note 2 in the Notes to Financial Statements.
See accompanying notes which are an integral part of the financial statements.
334 Russell Tax-Managed U.S. Mid & Small Cap Fund
| Russell Investment Company | ||
| Russell Tax-Managed U.S. Mid & Small Cap Fund | ||
| Statement of Assets and Liabilities — October 31, 2014 | ||
| Amounts in thousands | ||
| Assets | ||
| Investments, at identified cost | $ | 247,217 |
| Investments, at fair value(*)(>) | 334,514 | |
| Cash (restricted)(a) | 1,645 | |
| Receivables: | ||
| Dividends and interest | 67 | |
| Dividends from affiliated Russell funds | 2 | |
| Investments sold | 3,422 | |
| Fund shares sold | 681 | |
| Variation margin on futures contracts | 334 | |
| Total assets | 340,665 | |
| Liabilities | ||
| Payables: | ||
| Investments purchased | 7,617 | |
| Fund shares redeemed | 91 | |
| Accrued fees to affiliates | 310 | |
| Other accrued expenses | 52 | |
| Payable upon return of securities loaned | 10,669 | |
| Total liabilities | 18,739 | |
| Net Assets | $ | 321,926 |
See accompanying notes which are an integral part of the financial statements.
Russell Tax-Managed U.S. Mid & Small Cap Fund 335
| Russell Investment Company | |||
| Russell Tax-Managed U.S. Mid & Small Cap Fund | |||
| Statement of Assets and Liabilities, continued — October 31, 2014 | |||
| Amounts in thousands | |||
| Net Assets Consist of: | |||
| Undistributed (overdistributed) net investment income | $ | (1,278 | ) |
| Accumulated net realized gain (loss) | 17,281 | ||
| Unrealized appreciation (depreciation) on: | |||
| Investments | 87,297 | ||
| Futures contracts | 161 | ||
| Shares of beneficial interest | 145 | ||
| Additional paid-in capital | 218,320 | ||
| Net Assets | $ | 321,926 | |
| Net Asset Value, offering and redemption price per share: | |||
| Net asset value per share: Class A(#) | $ | 21.65 | |
| Maximum offering price per share (Net asset value plus sales charge of 5.75%): Class A | $ | 22.97 | |
| Class A — Net assets | $ | 6,489,169 | |
| Class A — Shares outstanding ($.01 par value) | 299,696 | ||
| Net asset value per share: Class C(#) | $ | 19.18 | |
| Class C — Net assets | $ | 11,555,290 | |
| Class C — Shares outstanding ($.01 par value) | 602,363 | ||
| Net asset value per share: Class E(#) | $ | 21.68 | |
| Class E — Net assets | $ | 6,382,710 | |
| Class E — Shares outstanding ($.01 par value) | 294,342 | ||
| Net asset value per share: Class S(#) | $ | 22.38 | |
| Class S — Net assets | $ | 297,498,460 | |
| Class S — Shares outstanding ($.01 par value) | 13,294,420 | ||
| Amounts in thousands | |||
| (*) Securities on loan included in investments | $ | 9,505 | |
| (>) Investments in affiliates, Russell U.S. Cash Management Fund and Russell U.S. Cash Collateral Fund | $ | 39,206 | |
| (a) Cash Collateral for Futures | $ | 1,645 | |
| (#) Net asset value per share equals class level net assets divided by class level shares of beneficial interest outstanding. | |||
See accompanying notes which are an integral part of the financial statements.
336 Russell Tax-Managed U.S. Mid & Small Cap Fund
| Russell Investment Company | |||
| Russell Tax-Managed U.S. Mid & Small Cap Fund | |||
| Statement of Operations — For the Period Ended October 31, 2014 | |||
| Amounts in thousands | |||
| Investment Income | |||
| Dividends | $ | 2,309 | |
| Dividends from affiliated Russell funds | 24 | ||
| Securities lending income | 98 | ||
| Total investment income | 2,431 | ||
| Expenses | |||
| Advisory fees | 2,793 | ||
| Administrative fees | 136 | ||
| Custodian fees | 81 | ||
| Distribution fees - Class A | 12 | ||
| Distribution fees - Class C | 89 | ||
| Transfer agent fees - Class A | 10 | ||
| Transfer agent fees - Class C | 24 | ||
| Transfer agent fees - Class E | 12 | ||
| Transfer agent fees - Class S | 524 | ||
| Professional fees | 76 | ||
| Registration fees | 67 | ||
| Shareholder servicing fees - Class C | 30 | ||
| Shareholder servicing fees - Class E | 15 | ||
| Trustees’ fees | 7 | ||
| Printing fees | 19 | ||
| Miscellaneous | 21 | ||
| Expenses before reductions | 3,916 | ||
| Expense reductions | (201 | ) | |
| Net expenses | 3,715 | ||
| Net investment income (loss) | (1,284 | ) | |
| Net Realized and Unrealized Gain (Loss) | |||
| Net realized gain (loss) on: | |||
| Investments | 15,188 | ||
| Futures contracts | 3,332 | ||
| Net realized gain (loss) | 18,520 | ||
| Net change in unrealized appreciation (depreciation) on: | |||
| Investments | 2,563 | ||
| Futures contracts | (505 | ) | |
| Net change in unrealized appreciation (depreciation) | 2,058 | ||
| Net realized and unrealized gain (loss) | 20,578 | ||
| Net Increase (Decrease) in Net Assets from Operations | $ | 19,294 | |
See accompanying notes which are an integral part of the financial statements.
Russell Tax-Managed U.S. Mid & Small Cap Fund 337
| Russell Investment Company | ||||||
| Russell Tax-Managed U.S. Mid & Small Cap Fund | ||||||
| Statements of Changes in Net Assets | ||||||
| For the Periods Ended October 31, | ||||||
| Amounts in thousands | 2014 | 2013 | ||||
| Increase (Decrease) in Net Assets | ||||||
| Operations | ||||||
| Net investment income (loss) | $ | (1,284 | ) | $ | (344 | ) |
| Net realized gain (loss) | 18,520 | 19,560 | ||||
| Net change in unrealized appreciation (depreciation) | 2,058 | 48,427 | ||||
| Net increase (decrease) in net assets from operations | 19,294 | 67,643 | ||||
| Distributions | ||||||
| From net investment income | ||||||
| Class A | (—**) | (—**) | ||||
| Class C | (—**) | — | ||||
| Class E | (—**) | — | ||||
| Class S | (—**) | (288 | ) | |||
| From net realized gain | ||||||
| Class A | (263 | ) | (2 | ) | ||
| Class C | (1,021 | ) | (10 | ) | ||
| Class E | (432 | ) | (5 | ) | ||
| Class S | (18,502 | ) | (188 | ) | ||
| Net decrease in net assets from distributions | (20,218 | ) | (493 | ) | ||
| Share Transactions* | ||||||
| Net increase (decrease) in net assets from share transactions | 68,824 | 22,066 | ||||
| Total Net Increase (Decrease) in Net Assets | 67,900 | 89,216 | ||||
| Net Assets | ||||||
| Beginning of period | 254,026 | 164,810 | ||||
| End of period | $ | 321,926 | $ | 254,026 | ||
| Undistributed (overdistributed) net investment income included in net assets | $ | (1,278 | ) | $ | (551 | ) |
| ** Less than $500. | ||||||
See accompanying notes which are an integral part of the financial statements.
338 Russell Tax-Managed U.S. Mid & Small Cap Fund
Russell Investment Company
Russell Tax-Managed U.S. Mid & Small Cap Fund
Statements of Changes in Net Assets, continued
* Share transaction amounts (in thousands) for the periods ended October 31, 2014 and October 31, 2013 were as follows:
| 2014 | 2013 | |||||||||||
| Shares | Dollars | Shares | Dollars | |||||||||
| Class A | ||||||||||||
| Proceeds from shares sold | 183 | $ | 3,852 | 85 | $ | 1,558 | ||||||
| Proceeds from reinvestment of distributions | 13 | 263 | —** | 2 | ||||||||
| Payments for shares redeemed | (44 | ) | (931 | ) | (26 | ) | (515 | ) | ||||
| Net increase (decrease) | 152 | 3,184 | 59 | 1,045 | ||||||||
| Class C | ||||||||||||
| Proceeds from shares sold | 143 | 2,713 | 173 | 2,843 | ||||||||
| Proceeds from reinvestment of distributions | 54 | 1,009 | —** | 10 | ||||||||
| Payments for shares redeemed | (161 | ) | (3,049 | ) | (95 | ) | (1,603 | ) | ||||
| Net increase (decrease) | 36 | 673 | 78 | 1,250 | ||||||||
| Class E | ||||||||||||
| Proceeds from shares sold | 87 | 1,848 | 94 | 1,768 | ||||||||
| Proceeds from reinvestment of distributions | 20 | 423 | —** | 5 | ||||||||
| Payments for shares redeemed | (70 | ) | (1,507 | ) | (80 | ) | (1,549 | ) | ||||
| Net increase (decrease) | 37 | 764 | 14 | 224 | ||||||||
| Class S | ||||||||||||
| Proceeds from shares sold | 3,767 | 82,154 | 2,872 | 53,990 | ||||||||
| Proceeds from reinvestment of distributions | 839 | 18,177 | 28 | 466 | ||||||||
| Payments for shares redeemed | (1,657 | ) | (36,128 | ) | (1,830 | ) | (34,909 | ) | ||||
| Net increase (decrease) | 2,949 | 64,203 | 1,070 | 19,547 | ||||||||
| Total increase (decrease) | 3,174 | $ | 68,824 | 1,221 | $ | 22,066 | ||||||
| ** | Less than 500 |
See accompanying notes which are an integral part of the financial statements.
Russell Tax-Managed U.S. Mid & Small Cap Fund 339
Russell Investment Company
Russell Tax-Managed U.S. Mid & Small Cap Fund
Financial Highlights — For the Periods Ended
For a Share Outstanding Throughout Each Period.
| $ | $ | $ | $ | $ | $ | ||||||||||
| Net Asset Value, | Net | Net Realized | Total from | Distributions | Distributions | ||||||||||
| Beginning of | Investment | and Unrealized | Investment | from Net | from Net | ||||||||||
| Period | Income (Loss)(a)(d) | Gain (Loss) | Operations | Investment Income | Realized Gain | ||||||||||
| Class A | |||||||||||||||
| October 31, 2014 | 21.99 | (.14 | ) | 1.56 | 1.42 | —(f) | (1.76 | ) | |||||||
| October 31, 2013 | 16.00 | (.08 | ) | 6.09 | 6.01 | —(f) | (.02 | ) | |||||||
| October 31, 2012 | 14.47 | (.05 | ) | 1.58 | 1.53 | — | — | ||||||||
| October 31, 2011 | 13.06 | (.07 | ) | 1.48 | 1.41 | — | — | ||||||||
| October 31, 2010(1) | 12.18 | (.02 | ) | .90 | .88 | — | — | ||||||||
| Class C | |||||||||||||||
| October 31, 2014 | 19.81 | (.26 | ) | 1.39 | 1.13 | —(f) | (1.76 | ) | |||||||
| October 31, 2013 | 14.51 | (.18 | ) | 5.50 | 5.32 | — | (.02 | ) | |||||||
| October 31, 2012 | 13.23 | (.15 | ) | 1.43 | 1.28 | — | — | ||||||||
| October 31, 2011 | 12.02 | (.18 | ) | 1.39 | 1.21 | — | — | ||||||||
| October 31, 2010 | 9.62 | (.11 | ) | 2.51 | 2.40 | — | — | ||||||||
| Class E | |||||||||||||||
| October 31, 2014 | 22.01 | (.14 | ) | 1.57 | 1.43 | —(f) | (1.76 | ) | |||||||
| October 31, 2013 | 16.01 | (.06 | ) | 6.08 | 6.02 | — | (.02 | ) | |||||||
| October 31, 2012 | 14.48 | (.05 | ) | 1.58 | 1.53 | — | — | ||||||||
| October 31, 2011 | 13.06 | (.08 | ) | 1.50 | 1.42 | — | — | ||||||||
| October 31, 2010 | 10.38 | (.03 | ) | 2.71 | 2.68 | — | — | ||||||||
| Class S | |||||||||||||||
| October 31, 2014 | 22.61 | (.09 | ) | 1.62 | 1.53 | —(f) | (1.76 | ) | |||||||
| October 31, 2013 | 16.43 | (.02 | ) | 6.25 | 6.23 | (.03 | ) | (.02 | ) | ||||||
| October 31, 2012 | 14.83 | (.01 | ) | 1.61 | 1.60 | — | — | ||||||||
| October 31, 2011 | 13.34 | (.05 | ) | 1.54 | 1.49 | — | — | ||||||||
| October 31, 2010 | 10.58 | — | 2.77 | 2.77 | (.01 | ) | — | ||||||||
See accompanying notes which are an integral part of the financial statements.
340 Russell Tax-Managed U.S. Mid & Small Cap Fund
| % | % | % | |||||||||||||||
| $ | $ | Ratio of Expenses | Ratio of Expenses | Ratio of Net | |||||||||||||
| Net Asset Value, | % | Net Assets, | to Average | to Average | Investment Income | % | |||||||||||
| $ | End of | Total | End of Period | Net Assets, | Net Assets, | to Average | Portfolio | ||||||||||
| Total Distributions | Period | Return(b)(c) | (000 | ) | Gross(e) | Net(d)(e) | Net Assets(d)(e) | Turnover Rate(b) | |||||||||
| (1.76 | ) | 21.65 | 6.73 | 6,489 | 1.58 | 1.53 | (.69 | ) | 80 | ||||||||
| (.02 | ) | 21.99 | 37.62 | 3,256 | 1.56 | 1.53 | (.44 | ) | 46 | ||||||||
| — | 16.00 | 10.57 | 1,426 | 1.58 | 1.53 | (.34 | ) | 48 | |||||||||
| — | 14.47 | 11.03 | 932 | 1.63 | 1.53 | (.48 | ) | 46 | |||||||||
| — | 13.06 | 7.23 | 213 | 1.61 | 1.50 | (.44 | ) | 57 | |||||||||
| (1.76 | ) | 19.18 | 5.95 | 11,555 | 2.32 | 2.25 | (1.39 | ) | 80 | ||||||||
| (.02 | ) | 19.81 | 36.71 | 11,218 | 2.31 | 2.25 | (1.11 | ) | 46 | ||||||||
| — | 14.51 | 9.68 | 7,083 | 2.34 | 2.25 | (1.06 | ) | 48 | |||||||||
| — | 13.23 | 10.23 | 6,571 | 2.36 | 2.25 | (1.33 | ) | 46 | |||||||||
| — | 12.02 | 24.95 | 7,170 | 2.34 | 2.24 | (1.02 | ) | 57 | |||||||||
| (1.76 | ) | 21.68 | 6.77 | 6,383 | 1.57 | 1.50 | (.65 | ) | 80 | ||||||||
| (.02 | ) | 22.01 | 37.64 | 5,665 | 1.56 | 1.50 | (.36 | ) | 46 | ||||||||
| — | 16.01 | 10.57 | 3,898 | 1.59 | 1.50 | (.31 | ) | 48 | |||||||||
| — | 14.48 | 11.10 | 3,443 | 1.61 | 1.50 | (.56 | ) | 46 | |||||||||
| — | 13.06 | 25.82 | 3,966 | 1.60 | 1.49 | (.29 | ) | 57 | |||||||||
| (1.76 | ) | 22.38 | 7.01 | 297,498 | 1.32 | 1.25 | (.40 | ) | 80 | ||||||||
| (.05 | ) | 22.61 | 38.02 | 233,887 | 1.31 | 1.25 | (.11 | ) | 46 | ||||||||
| — | 16.43 | 10.79 | 152,403 | 1.34 | 1.25 | (.06 | ) | 48 | |||||||||
| — | 14.83 | 11.32 | 137,579 | 1.36 | 1.25 | (.32 | ) | 46 | |||||||||
| (.01 | ) | 13.34 | 26.20 | 137,567 | 1.35 | 1.24 | (.03 | ) | 57 | ||||||||
See accompanying notes which are an integral part of the financial statements.
Russell Tax-Managed U.S. Mid & Small Cap Fund 341
Russell Investment Company
Russell Global Opportunistic Credit Fund
Portfolio Management Discussion and Analysis — October 31, 2014 (Unaudited)

| Russell Global Opportunistic Credit Fund - Class A‡ | BofA Merrill Lynch Global High Yield Index (USD | ||||||
| Total | Hedged)** | ||||||
| Return | Total | ||||||
| 1 Year | (0.75 | )% | Return | ||||
| Inception* | 4.77 | %§ | 1 Year | 5.94 | % | ||
| Inception* | 8.81 | %§ | |||||
| Russell Global Opportunistic Credit Fund - Class C | |||||||
| Total | Global Opportunistic Credit Blended Benchmark*** | ||||||
| Return | Total | ||||||
| 1 Year | 2.41 | % | Return | ||||
| Inception* | 4.98 | %§ | 1 Year | 6.99 | % | ||
| Inception* | 7.88 | %§ | |||||
| Russell Global Opportunistic Credit Fund - Class E | |||||||
| Total | |||||||
| Return | |||||||
| 1 Year | 3.16 | % | |||||
| Inception* | 5.77 | %§ | |||||
| Russell Global Opportunistic Credit Fund - Class S | |||||||
| Total | |||||||
| Return | |||||||
| 1 Year | 3.41 | % | |||||
| Inception* | 6.04 | %§ | |||||
| Russell Global Opportunistic Credit Fund - Class Y | |||||||
| Total | |||||||
| Return | |||||||
| 1 Year | 3.39 | % | |||||
| Inception* | 6.12 | %§ | |||||
342 Russell Global Opportunistic Credit Fund
Russell Investment Company
Russell Global Opportunistic Credit Fund
Portfolio Management Discussion and Analysis, continued — October 31, 2014 (Unaudited)
| The Russell Global Opportunistic Credit Fund (the “Fund”) | fiscal year as the market expectation coming in to 2014 was for |
| employs a multi-manager approach whereby portions of the Fund | interest rates to rise. However, unexpected falling yields and |
| are allocated to different money managers. Fund assets not | heightened geopolitical tension prompted outflows beginning in |
| allocated to money managers are managed by Russell Investment | July, slowing performance. Cash flows to floating rate bank loans, |
| Management Company (“RIMCo”), the Fund’s advisor. RIMCo | which have an even lower interest rate-sensitivity than high yield |
| may change the allocation of the Fund’s assets among money | corporate bonds, also benefited from the rate-rise expectation |
| managers at any time. An exemptive order from the Securities | and, at one point during the fiscal year, bank loans peaked at |
| and Exchange Commission (“SEC”) permits RIMCo to engage | 95-weeks of continuous inflows. In spite of this, bank loans |
| or terminate a money manager at any time, subject to approval | underperformed the bond market as credit spreads compressed, |
| by the Fund’s Board, without a shareholder vote. Pursuant to the | which was more positive for bonds. As a result, the Fund’s ex- |
| terms of the exemptive order, the Fund is required to notify its | benchmark exposure to bank loans had a negative impact on the |
| shareholders within 90 days of when a money manager begins | Fund’s benchmark-relative performance. |
| providing services. As of October 31, 2014, the Fund had five | There was significant divergence between hard currency emerging |
| money managers. | market debt and local currency debt results over the one year |
| What is the Fund’s investment objective? | period, as hard currency led all major fixed income sectors and |
| The Fund seeks to provide total return. | local currency dipped in to negative territory. Risk aversion |
| in 2014 to select emerging economies associated with specific | |
| How did the Fund perform relative to its benchmark for the | geopolitical risks (such as Russia/Ukraine and the Middle East) |
| fiscal year ended October 31, 2014? | coupled with supportive growth data in the U.S. drove a strong |
| For the fiscal year ended October 31, 2014, the Fund’s Class A, | selloff in U.S. Treasuries and U.S. dollar appreciation. As a result, |
| Class C, Class E, Class S, and Class Y Shares gained 3.15%, | a key detractor to Fund performance during the period was the |
| 2.41%, 3.16%, 3.41% and 3.39%, respectively. This is compared | Fund’s ex-benchmark allocation to local currency denominated |
| to the Fund’s benchmark, the BofA Merrill Lynch Global High | emerging market bonds, as emerging market currencies weakened |
| Yield Index (USD Hedged), which gained 5.94% during the same | significantly against the U.S. dollar during the period. |
| period, and the Fund’s secondary benchmark, a composite index | The Fund’s returns were also hampered by a short duration |
| consisting of 60% Bank of America Merrill Lynch Global High | position, particularly amid the long-end of the U.S. yield curve as |
| Yield Index (USD Hedged) and 40% JP Morgan EMBI Global | the curve flattened significantly. |
| Diversified Index, which gained 6.99% during the same period. | |
| RIMCo believes that the Fund’s secondary benchmark is more | How did the investment strategies and techniques employed |
| representative than the primary benchmark of the investment | by the Fund and its money managers affect its benchmark- |
| strategies pursued by the Fund. The Fund’s performance includes | relative performance? |
| operating expenses, whereas index returns are unmanaged and do | Given the Fund’s investment strategies, the Fund will tend to |
| not include expenses of any kind. | outperform in markets where high yield financials underperform |
| For the fiscal year ended October 31, 2014, Morningstar® Multi- | and non-U.S. dollar emerging market sovereign bonds outperform |
| Sector Bond, a group of funds that Morningstar considers to have | the dollar market. Outperformance from lower quality high yield |
| investment strategies similar to those of the Fund, gained 4.66%. | also tends to benefit the Fund as does strong performance of |
| This return serves as a peer comparison and is expressed net of | bank loans. These broad factors had a negative impact on Fund |
| operating expenses. | performance over the year. Local emerging market debt, bank |
| loan exposure, and a short duration position, were primary drivers | |
| RIMCo may assign a money manager a benchmark other that the | to negative results, overwhelming positive impacts from lower- |
| Fund’s index. However, the Fund’s primary index remains the | quality high yield and non-U.S. sovereign allocations. |
| benchmark for the Fund. | |
| DDJ Capital Management, LLC (“DDJ”) outperformed the BofA | |
| How did the market conditions described in the Market | Merrill Lynch U.S. High Yield Master II Index for the fiscal year. |
| Summary report affect the Fund’s performance? | Sector selection was a lead factor to positive results, outweighing |
| High yield corporate debt continued its strong run of performance | detracting impacts from a short duration position early in 2014 |
| over the one-year period, albeit at a slower pace later in the period. | and overall defensive spread positioning. Exposure to bank loans |
| A ‘risk-on’ market sentiment was the primary driver for positive | detracted overall, but DDJ’s tactical timing of the exposure was |
| results, and low default rates and lower interest rate-sensitivity | modestly additive. |
| features attracted inflows to the sector during the first part of the |
Russell Global Opportunistic Credit Fund 343
Russell Investment Company
Russell Global Opportunistic Credit Fund
Portfolio Management Discussion and Analysis, continued — October 31, 2014 (Unaudited)
| Lazard Asset Management, LLC (“Lazard”) outperformed the | portion of the Fund allocated to cash reserves. Derivatives were | |
| JP Morgan GBI-EM Global Diversified Index for the fiscal year. | also used in connection with the cash management process to | |
| Strong currency management was a primary contributor to positive | manage Fund characteristics by augmenting or reducing specific | |
| results. To a lesser extent, overall selections from various country | exposures associated with one or more managers or strategies | |
| interest rates also had a positive impact on performance. | and gaining desired exposures beyond those generated by the | |
| Oaktree Capital Management, L.P. (“Oaktree”) underperformed | manager strategies. Generally these strategies added value. | |
| its 60% BofA Merrill Lynch US High Yield Master II 2% | RIMCo also manages a basket of developed market currency | |
| Constrained Index / 40% BofA Merrill Lynch Global High Yield | forwards to seek to hedge part of the Fund’s ex-benchmark | |
| European Issuers 3% Constrained Index (USD Hedged) blended | emerging market currency exposure. This “proxy” hedge, along | |
| benchmark for the fiscal year. Underperformance was largely due | with the credit/duration strategies with respect to the Fund’s cash | |
| to selection, timing, and positioning within particular industries | reserves, had positive results and outweighed detracting impacts | |
| such as banking and oil equipment and services. A short duration | from the use of currency forwards and swaps by the Fund’s money | |
| position also hurt performance in the first half of 2014. | managers to gain emerging currency exposure. | |
| Stone Harbor Investment Partners LP (“Stone Harbor”) | Describe any changes to the Fund’s structure or the money | |
| underperformed the JP Morgan EMBI Global Diversified Index | manager line-up. | |
| for the fiscal year. Hard currency sovereign allocations were the | In December 2013 RIMCo hired THL Credit Advisors, LLC as a | |
| lead cause of disappointing results. Although overall interest rate | money manager for the Fund. | |
| selections also contributed to disappointing results, an overweight | ||
| position to Venezuela sovereign bonds was a recurring detractor. | There were no other changes to the Fund’s structure or money | |
| Unfavorable conditionals within local currency emerging markets | manager line up during the fiscal year. | |
| toward the beginning of the period also challenged Stone Harbor’s | Money Managers as of October 31, | |
| exposures. | 2014 | Styles |
| THL Credit Advisors, LLC (“THL”) was hired in December 2013 | DDJ Capital Management, LLC | Sector Specialist |
| and underperformed the Credit Suisse Leveraged Loan Index | Lazard Asset Management, LLC | Sector Specialist |
| for the portion of the fiscal year it was a manager in the Fund. | Oaktree Capital Management, L.P. | Sector Specialist |
| Despite the general challenges within bank loan securities, issuer | Stone Harbor Investment Partners L.P. | Sector Specialist |
| THL Credit Advisors LLC | Sector Specialist | |
| selection and industry allocations further detracted from THL’s | The views expressed in this report reflect those of the portfolio | |
| performance. However, an overweight position to second-lien | managers only through the end of the period covered by | |
| loans was positive and helped to mitigate results. | the report. These views do not necessarily represent the | |
| RIMCo manages the portion of the Fund’s assets that RIMCo | views of RIMCo, or any other person in RIMCo or any other | |
| determines not to allocate to the money managers. Assets not | affiliated organization. These views are subject to change | |
| allocated to managers include the Fund’s liquidity reserves and | at any time based upon market conditions or other events, | |
| assets which may be managed directly by RIMCo to modify the | and RIMCo disclaims any responsibility to update the views | |
| Fund’s overall portfolio characteristics to seek to achieve the | contained herein. These views should not be relied on as | |
| desired risk/return profile for the Fund. | investment advice and, because investment decisions for | |
| During the period, RIMCo utilized derivative instruments such | a Russell Investment Company (“RIC”) Fund are based on | |
| as futures, forwards and swaps to seek to achieve the Fund | numerous factors, should not be relied on as an indication | |
| benchmark’s duration and credit exposures with respect to the | of investment decisions of any RIC Fund. | |
344 Russell Global Opportunistic Credit Fund
Russell Investment Company
Russell Global Opportunistic Credit Fund
Portfolio Management Discussion and Analysis, continued — October 31, 2014 (Unaudited)
| * | Assumes initial investment on September 30, 2010. |
| ** | The BofA Merrill Lynch Global High Yield Index (USD Hedged) is composed of below investment grade bonds of corporate issuers domiciled in countries having an investment foreign currency long-term debt rating. |
| *** | The Global Opportunistic Credit Blended Benchmark is a composite index consisting of 60% BofA Merrill Lynch Global High Yield Index (USD Hedged) and 40% JP Morgan EMBI Global Diversified Index. The Global Opportunistic Credit Blended Benchmark provides a means to compare the Fund’s average annual returns to a secondary benchmark that is more representative of the investment strategies pursued by the Fund. |
| ‡ | The performance shown has been adjusted to reflect the deduction of the maximum Class A sales charge of 3.75%. |
| § | Annualized. |
Performance is historical and assumes reinvestment of all dividends and capital gains. Investment return and principal value will fluctuate so that an investor’s shares, when redeemed, may be worth more or less than when purchased. Past performance is not indicative of future results. The returns shown do not reflect the deduction of taxes that a shareholder would pay on Fund distributions or the redemption of Fund shares.
Russell Global Opportunistic Credit Fund 345
Russell Investment Company
Russell Global Opportunistic Credit Fund
Shareholder Expense Example — October 31, 2014 (Unaudited)
| Fund Expenses | Please note that the expenses shown in the table are meant | |||||
| The following disclosure provides important information | to highlight your ongoing costs only and do not reflect any | |||||
| regarding the Fund’s Shareholder Expense Example | transactional costs. Therefore, the information under the heading | |||||
| (“Example”). | “Hypothetical Performance (5% return before expenses)” is | |||||
| useful in comparing ongoing costs only, and will not help you | ||||||
| Example | determine the relative total costs of owning different funds. In | |||||
| As a shareholder of the Fund, you incur two types of costs: (1) | addition, if these transactional costs were included, your costs | |||||
| transaction costs, and (2) ongoing costs, including advisory and | would have been higher. | |||||
| administrative fees; distribution (12b-1) and/or service fees; | Hypothetical | |||||
| and other Fund expenses. The Example is intended to help | Performance (5% | |||||
| you understand your ongoing costs (in dollars) of investing in | Actual | return before | ||||
| the Fund and to compare these costs with the ongoing costs of | Class A | Performance | expenses) | |||
| Beginning Account Value | ||||||
| investing in other mutual funds. The Example is based on an | May 1, 2014 | $ | 1,000.00 | $ | 1,000.00 | |
| investment of $1,000 invested at the beginning of the period and | Ending Account Value | |||||
| held for the entire period indicated, which for this Fund is from | October 31, 2014 | $ | 1,007.90 | $ | 1,019.31 | |
| May 1, 2014 to October 31, 2014. | Expenses Paid During Period* | $ | 5.92 | $ | 5.96 | |
| Actual Expenses | * Expenses are equal to the Fund's annualized expense ratio of 1.17% | |||||
| (representing the six month period annualized), multiplied by the average | ||||||
| The information in the table under the heading “Actual | account value over the period, multiplied by 184/365 (to reflect the one-half | |||||
| Performance” provides information about actual account values | year period). May reflect amounts waived and/or reimbursed. Without any | |||||
| and actual expenses. You may use the information in this column, | waivers and/or reimbursements, expenses would have been higher. | |||||
| together with the amount you invested, to estimate the expenses | ||||||
| Hypothetical | ||||||
| that you paid over the period. Simply divide your account value by | Performance (5% | |||||
| $1,000 (for example, an $8,600 account value divided by $1,000 | Actual | return before | ||||
| = 8.6), then multiply the result by the number in the first column | Class C | Performance | expenses) | |||
| Beginning Account Value | ||||||
| in the row entitled “Expenses Paid During Period” to estimate | May 1, 2014 | $ | 1,000.00 | $ | 1,000.00 | |
| the expenses you paid on your account during this period. | Ending Account Value | |||||
| October 31, 2014 | $ | 1,004.30 | $ | 1,015.48 | ||
| Hypothetical Example for Comparison Purposes | Expenses Paid During Period* | $ | 9.75 | $ | 9.80 | |
| The information in the table under the heading “Hypothetical | ||||||
| Performance (5% return before expenses)” provides information | * Expenses are equal to the Fund's annualized expense ratio of 1.93% | |||||
| (representing the six month period annualized), multiplied by the average | ||||||
| about hypothetical account values and hypothetical expenses | account value over the period, multiplied by 184/365 (to reflect the one-half | |||||
| based on the Fund’s actual expense ratio and an assumed rate of | year period). May reflect amounts waived and/or reimbursed. Without any | |||||
| return of 5% per year before expenses, which is not the Fund’s | waivers and/or reimbursements, expenses would have been higher. | |||||
| actual return. The hypothetical account values and expenses | ||||||
| Hypothetical | ||||||
| may not be used to estimate the actual ending account balance or | Performance (5% | |||||
| expenses you paid for the period. You may use this information | Actual | return before | ||||
| to compare the ongoing costs of investing in the Fund and other | Class E | Performance | expenses) | |||
| funds. To do so, compare this 5% hypothetical example with the | Beginning Account Value | |||||
| May 1, 2014 | $ | 1,000.00 | $ | 1,000.00 | ||
| 5% hypothetical examples that appear in the shareholder reports | Ending Account Value | |||||
| of other funds. | October 31, 2014 | $ | 1,008.00 | $ | 1,019.26 | |
| Expenses Paid During Period* | $ | 5.97 | $ | 6.01 | ||
| * Expenses are equal to the Fund's annualized expense ratio of 1.18% | ||||||
| (representing the six month period annualized), multiplied by the average | ||||||
| account value over the period, multiplied by 184/365 (to reflect the one-half | ||||||
| year period). May reflect amounts waived and/or reimbursed. Without any | ||||||
| waivers and/or reimbursements, expenses would have been higher. | ||||||
346 Russell Global Opportunistic Credit Fund
Russell Investment Company
Russell Global Opportunistic Credit Fund
Shareholder Expense Example, continued — October 31, 2014 (Unaudited)
| Hypothetical | ||||||
| Performance (5% | ||||||
| Actual | return before | |||||
| Class S | Performance | expenses) | ||||
| Beginning Account Value | ||||||
| May 1, 2014 | $ | 1,000.00 | $ | 1,000.00 | ||
| Ending Account Value | ||||||
| October 31, 2014 | $ | 1,009.20 | $ | 1,020.52 | ||
| Expenses Paid During Period* | $ | 4.71 | $ | 4.74 | ||
| * Expenses are equal to the Fund's annualized expense ratio of 0.93% | ||||||
| (representing the six month period annualized), multiplied by the average | ||||||
| account value over the period, multiplied by 184/365 (to reflect the one-half | ||||||
| year period). May reflect amounts waived and/or reimbursed. Without any | ||||||
| waivers and/or reimbursements, expenses would have been higher. | ||||||
| Hypothetical | ||||||
| Performance (5% | ||||||
| Actual | return before | |||||
| Class Y | Performance | expenses) | ||||
| Beginning Account Value | ||||||
| May 1, 2014 | $ | 1,000.00 | $ | 1,000.00 | ||
| Ending Account Value | ||||||
| October 31, 2014 | $ | 1,008.60 | $ | 1,020.92 | ||
| Expenses Paid During Period* | $ | 4.30 | $ | 4.33 | ||
| * Expenses are equal to the Fund's annualized expense ratio of 0.85% | ||||||
| (representing the six month period annualized), multiplied by the average | ||||||
| account value over the period, multiplied by 184/365 (to reflect the one-half | ||||||
| year period). May reflect amounts waived and/or reimbursed. Without any | ||||||
| waivers and/or reimbursements, expenses would have been higher. | ||||||
Russell Global Opportunistic Credit Fund 347
| Russell Investment Company | |||||||||||
| Russell Global Opportunistic Credit Fund | |||||||||||
| Schedule of Investments — October 31, 2014 | |||||||||||
| Amounts in thousands (except share amounts) | Amounts in thousands (except share amounts) | ||||||||||
| Principal | Fair | Principal | Fair | ||||||||
| Amount ($) | Value | Amount ($) | Value | ||||||||
| or Shares | $ | or Shares | $ | ||||||||
| Long-Term Fixed Income Investments - 89.5% | 9.500% due 10/01/20 | 1,240 | 1,302 | ||||||||
| Argentina - 0.7% | Kodiak Oil & Gas Corp. | ||||||||||
| Argentina Bonar Bonds | 5.500% due 01/15/21 | 1,215 | 1,233 | ||||||||
| Series X | Masonite International Corp. | ||||||||||
| 7.000% due 04/17/17 | 9,708 | 8,616 | 8.250% due 04/15/21 (Þ) | 2,750 | 2,942 | ||||||
| Republic of Argentina Government Bond | New Red Finance, Inc. | ||||||||||
| 6.000% due 03/31/23 | 1,238 | 1,399 | 6.000% due 04/01/22 (Å) | 3,780 | 3,832 | ||||||
| YPF Sociedad Anonima | Precision Drilling Corp. | ||||||||||
| 8.750% due 04/04/24 (Þ) | 856 | 885 | 6.500% due 12/15/21 | 3,500 | 3,587 | ||||||
| 10,900 | Valeant Pharmaceuticals International, | ||||||||||
| Australia - 0.2% | Inc. | ||||||||||
| FMG Resources Pty, Ltd. | 7.500% due 07/15/21 (Þ) | 1,605 | 1,717 | ||||||||
| 8.250% due 11/01/19 (Å) | 825 | 856 | 5.625% due 12/01/21 (Þ) | 505 | 500 | ||||||
| 6.875% due 04/01/22 (Þ) | 1,325 | 1,368 | Valeant Pharmaceuticals International, | ||||||||
| FMG Resources Pty, Ltd. 1st Lien Term | Inc. 1st Lien Term Loan B | ||||||||||
| Loan B | 3.750% due 08/05/20 (Ê) | 864 | 857 | ||||||||
| 3.750% due 06/30/19 | 997 | 972 | 21,514 | ||||||||
| 3,196 | Cayman Islands - 0.5% | ||||||||||
| Austria - 0.0% | Brazil Minas SPE via State of Minas | ||||||||||
| ESAL GmbH | Gerais | ||||||||||
| 6.250% due 02/05/23 (Þ) | 711 | 725 | Series REGS | ||||||||
| 5.333% due 02/15/28 | 1,731 | 1,740 | |||||||||
| Azerbaijan - 0.4% | Country Garden Holdings Co., Ltd. | ||||||||||
| Republic of Azerbaijan International | Series REGS | ||||||||||
| Bond | 11.125% due 02/23/18 | 229 | 245 | ||||||||
| 4.750% due 03/18/24 (Þ) | 2,644 | 2,753 | Kaisa Group Holdings, Ltd. | ||||||||
| State Oil Co. of the Azerbaijan Republic | 8.875% due 03/19/18 (Þ) | 200 | 202 | ||||||||
| 5.450% due 02/09/17 | 743 | 776 | MAF Global Securities, Ltd. | ||||||||
| 4.750% due 03/13/23 | 2,860 | 2,840 | 7.125% due 12/31/49 (ƒ) | 200 | 220 | ||||||
| 6,369 | MCE Finance, Ltd. | ||||||||||
| Barbados - 0.0% | Series REGS | ||||||||||
| 5.000% due 02/15/21 | 501 | 493 | |||||||||
| Columbus International, Inc. | Odebrecht Offshore Drilling Finance, | ||||||||||
| 7.375% due 03/30/21 (Þ) | 464 | 492 | Ltd. | ||||||||
| Bermuda - 0.1% | 6.750% due 10/01/22 (Þ) | 163 | 171 | ||||||||
| Inkia Energy, Ltd. | Sinopec Group Overseas Co. | ||||||||||
| 8.375% due 04/04/21 (Þ) | 200 | 216 | 4.375% due 04/10/24 (Þ) | 653 | 682 | ||||||
| Seadrill, Ltd. | UPCB Finance II, Ltd. | ||||||||||
| 6.125% due 09/15/17 (Þ) | 1,815 | 1,766 | 6.375% due 07/01/20 | EUR | 2,650 | 3,487 | |||||
| 1,982 | 7,240 | ||||||||||
| Brazil - 2.4% | Chile - 0.9% | ||||||||||
| Brazil Letras do Tesouro Nacional | Banco del Estado de Chile | ||||||||||
| Series LTN | 3.875% due 02/08/22 (Þ) | 1,171 | 1,186 | ||||||||
| Zero coupon due 01/01/16 | BRL | 27,570 | 9,729 | Cencosud SA | |||||||
| Zero coupon due 01/01/17 | BRL | 25,760 | 8,091 | 4.875% due 01/20/23 (Þ) | 19 | 19 | |||||
| Brazil Notas do Tesouro Nacional | Chile Government International Bond | ||||||||||
| Series NTNB | 5.500% due 08/05/20 | CLP | 200,000 | 367 | |||||||
| 6.000% due 08/15/50 | 3,070 | 3,137 | Series REGS | ||||||||
| Series NTNF | 6.000% due 01/01/18 | CLP | 95,000 | 176 | |||||||
| 10.000% due 01/01/23 | BRL | 5,270 | 1,972 | Corp. Nacional del Cobre de Chile | |||||||
| 10.000% due 01/01/25 | BRL | 4,062 | 1,505 | 3.000% due 07/17/22 (Þ) | 2,900 | 2,800 | |||||
| Brazilian Government International Bond | 4.500% due 08/13/23 (Þ) | 1,819 | 1,924 | ||||||||
| 2.625% due 01/05/23 | 10,506 | 9,681 | 4.250% due 07/17/42 (Þ) | 1,260 | 1,151 | ||||||
| 4.250% due 01/07/25 | 470 | 478 | Series REGS | ||||||||
| 8.250% due 01/20/34 | 2,818 | 3,903 | 7.500% due 01/15/19 | 1,049 | 1,265 | ||||||
| 38,496 | 3.750% due 11/04/20 | 1,315 | 1,354 | ||||||||
| Canada - 1.4% | 3.875% due 11/03/21 | 1,694 | 1,750 | ||||||||
| First Quantum Minerals, Ltd. | 6.150% due 10/24/36 | 1,709 | 2,005 | ||||||||
| 7.250% due 05/15/22(Þ) | 2,405 | 2,345 | 13,997 | ||||||||
| Great Canadian Gaming Corp. | Colombia - 2.0% | ||||||||||
| 6.625% due 07/25/22 (Þ) | CAD | 275 | 256 | Bogota Distrito Capital | |||||||
| Harvest Operations Corp. | 9.750% due 07/26/28 | COP | 800,000 | 470 | |||||||
| 6.875% due 10/01/17 | 2,885 | 2,943 | Series REGS | ||||||||
| HudBay Minerals, Inc. | 9.750% due 07/26/28 | COP | 3,000,000 | 1,761 | |||||||
| See accompanying notes which are an integral part of the financial statements. | |||||||||||
| 348 Russell Global Opportunistic Credit Fund | |||||||||||
| Russell Investment Company | |||||||||||
| Russell Global Opportunistic Credit Fund | |||||||||||
| Schedule of Investments, continued — October 31, 2014 | |||||||||||
| Amounts in thousands (except share amounts) | Amounts in thousands (except share amounts) | ||||||||||
| Principal | Fair | Principal | Fair | ||||||||
| Amount ($) | Value | Amount ($) | Value | ||||||||
| or Shares | $ | or Shares | $ | ||||||||
| Colombia Government International | 6.875% due 08/15/21 | EUR | 1,765 | 2,256 | |||||||
| Bond | Kerneos Corporate SAS | ||||||||||
| 11.750% due 02/25/20 | 895 | 1,273 | 5.750% due 03/01/21 (Þ) | EUR | 1,060 | 1,322 | |||||
| 7.750% due 04/14/21 | COP | 11,485,000 | 6,075 | Loxam SAS | |||||||
| 4.375% due 07/12/21 | 4,282 | 4,567 | 7.375% due 01/24/20 (Þ) | EUR | 1,455 | 1,844 | |||||
| 4.375% due 03/21/23 | COP | 550,000 | 236 | 7.000% due 07/23/22 (Þ) | EUR | 350 | 406 | ||||
| 4.000% due 02/26/24 | 5,616 | 5,762 | Series REGS | ||||||||
| 8.125% due 05/21/24 | 360 | 480 | 7.375% due 01/24/20 | EUR | 440 | 558 | |||||
| 9.850% due 06/28/27 | COP | 13,370,000 | 8,316 | Numericable Group SA | |||||||
| 7.375% due 09/18/37 | 846 | 1,140 | 5.375% due 05/15/22 (Þ) | EUR | 160 | 208 | |||||
| 6.125% due 01/18/41 | 739 | 887 | 6.000% due 05/15/22 (Þ) | 1,580 | 1,616 | ||||||
| Emgesa SA ESP | 5.625% due 05/15/24 | EUR | 2,100 | 2,724 | |||||||
| Series REGS | Rexel SA | ||||||||||
| 8.750% due 01/25/21 | COP | 1,000,000 | 521 | 5.250% due 06/15/20 (Þ) | 590 | 594 | |||||
| Empresas Publicas de Medellin ESP | SPCM SA | ||||||||||
| Series REGS | 5.500% due 06/15/20 | EUR | 900 | 1,201 | |||||||
| 8.375% due 02/01/21 | COP | 570,000 | 295 | 6.000% due 01/15/22 (Å) | 250 | 262 | |||||
| 31,783 | 23,365 | ||||||||||
| Costa Rica - 0.6% | Gabon - 0.1% | ||||||||||
| Costa Rica Government International | Gabonese Republic | ||||||||||
| Bond | 6.375% due 12/12/24 (Þ) | 407 | 432 | ||||||||
| 4.375% due 04/30/25 (Þ) | 2,044 | 1,901 | Series REGS | ||||||||
| Series REGS | 8.200% due 12/12/17 | 685 | 772 | ||||||||
| 4.250% due 01/26/23 | 5,783 | 5,494 | 1,204 | ||||||||
| Republic of Costa Rica | Germany - 1.3% | ||||||||||
| 7.000% due 04/04/44 (Þ) | 1,906 | 1,968 | Deutsche Bank AG | ||||||||
| 9,363 | Series EmTN | ||||||||||
| Croatia - 0.4% | 7.000% due 05/17/22 (Þ) | IDR | 37,800,000 | 2,940 | |||||||
| Croatia Government International Bond | Deutsche Raststaetten Gruppe IV GmbH | ||||||||||
| 6.375% due 03/24/21 (Þ) | 960 | 1,055 | 6.750% due 12/30/20 (Þ) | EUR | 1,040 | 1,378 | |||||
| 6.000% due 01/26/24 (Þ) | 4,918 | 5,318 | Series REGS | ||||||||
| 6,373 | 6.750% due 12/30/20 | EUR | 1,550 | 2,054 | |||||||
| Dominican Republic - 1.1% | Techem Energy Metering Service GmbH | ||||||||||
| Dominican Republic International Bond | & Co. KG | ||||||||||
| 6.600% due 01/28/24 | 2,428 | 2,689 | 7.875% due 10/01/20 (Þ) | EUR | 560 | 774 | |||||
| 5.875% due 04/18/24 (Þ) | 7,230 | 7,628 | Series REGS | ||||||||
| 7.875% due 10/01/20 | EUR | 1,820 | 2,515 | ||||||||
| 7.450% due 04/30/44 | 792 | 885 | Trionista TopCo GmbH | ||||||||
| Series REGS | 6.875% due 04/30/21 (Þ) | EUR | 1,045 | 1,372 | |||||||
| 9.040% due 01/23/18 | 425 | 463 | Series REGS | ||||||||
| 7.500% due 05/06/21 | 4,709 | 5,356 | 6.875% due 04/30/21 | EUR | 2,650 | 3,479 | |||||
| 17,021 | Unitymedia Hessen GmbH & Co. KG / | ||||||||||
| El Salvador - 0.5% | Unitymedia NRW GmbH | ||||||||||
| El Salvador Government International | 5.750% due 01/15/23 (Þ) | EUR | 800 | 1,090 | |||||||
| Bond | Series REGS | ||||||||||
| 7.750% due 01/24/23 | 1,414 | 1,605 | 5.500% due 09/15/22 | EUR | 150 | 202 | |||||
| 5.875% due 01/30/25 (Þ) | 1,607 | 1,603 | 5.750% due 01/15/23 | EUR | 1,469 | 2,002 | |||||
| 6.375% due 01/18/27 (Þ) | 886 | 908 | Unitymedia KabelBW GmbH | ||||||||
| Series REGS | Series REGS | ||||||||||
| 7.375% due 12/01/19 | 830 | 923 | 9.500% due 03/15/21 | EUR | 790 | 1,111 | |||||
| 5.875% due 01/30/25 | 2,504 | 2,498 | WEPA Hygieneprodukte GmbH | ||||||||
| 7,537 | 6.500% due 05/15/20 (Þ) | EUR | 870 | 1,162 | |||||||
| France - 1.5% | Series REGS | ||||||||||
| Cerba European Lab SAS | 6.500% due 05/15/20 | EUR | 290 | 387 | |||||||
| 7.000% due 02/01/20 | EUR | 1,800 | 2,350 | 20,466 | |||||||
| CGG SA | Ghana - 0.1% | ||||||||||
| 6.500% due 06/01/21 | 1,600 | 1,280 | Republic of Ghana | ||||||||
| Crown European Holdings SA | 8.125% due 01/18/26 | 479 | 481 | ||||||||
| 4.000% due 07/15/22 | EUR | 2,650 | 3,392 | Series REGS | |||||||
| Holding Medi-Partenaires SAS | 8.500% due 10/04/17 | 524 | 554 | ||||||||
| 7.000% due 05/15/20 (Þ) | EUR | 970 | 1,270 | 1,035 | |||||||
| Series REGS | Honduras - 0.2% | ||||||||||
| 7.000% due 05/15/20 | EUR | 1,590 | 2,082 | Honduras Government International | |||||||
| HomeVi SAS | Bond | ||||||||||
| See accompanying notes which are an integral part of the financial statements. | |||||||||||
| Russell Global Opportunistic Credit Fund 349 | |||||||||||
| Russell Investment Company | |||||||||||
| Russell Global Opportunistic Credit Fund | |||||||||||
| Schedule of Investments, continued — October 31, 2014 | |||||||||||
| Amounts in thousands (except share amounts) | Amounts in thousands (except share amounts) | ||||||||||
| Principal | Fair | Principal | Fair | ||||||||
| Amount ($) | Value | Amount ($) | Value | ||||||||
| or Shares | $ | or Shares | $ | ||||||||
| Series REGS | Series FR70 | ||||||||||
| 7.500% due 03/15/24 | 835 | 900 | 8.375% due 03/15/24 | IDR | 24,945,000 | 2,109 | |||||
| Republic of Honduras | Series FR71 | ||||||||||
| 8.750% due 12/16/20 | 2,342 | 2,667 | 9.000% due 03/15/29 | IDR | 39,800,000 | 3,459 | |||||
| 3,567 | Pertamina Persero PT | ||||||||||
| Hong Kong - 0.0% | Series REGS | ||||||||||
| Citic Pacific Ltd. | 6.000% due 05/03/42 | 602 | 602 | ||||||||
| 7.875% due 04/15/49 | 375 | 392 | 60,220 | ||||||||
| Citic, Ltd. | Iraq - 0.2% | ||||||||||
| 8.625% due 05/29/49 | 200 | 228 | Republic of Iraq | ||||||||
| 620 | Series REGS | ||||||||||
| Hungary - 1.1% | 5.800% due 01/15/28 | 3,085 | 2,723 | ||||||||
| Hungary Government Bond | |||||||||||
| 6.500% due 06/24/19 | HUF | 732,580 | 3,415 | Ireland - 0.9% | |||||||
| AerCap Ireland Capital, Ltd. / AerCap | |||||||||||
| 5.500% due 06/24/25 | HUF | 214,040 | 987 | Global Aviation Trust | |||||||
| Series 17/A | 5.000% due 10/01/21 (Þ) | 3,006 | 3,126 | ||||||||
| 6.750% due 11/24/17 | HUF | 969,600 | 4,424 | Ardagh Glass Finance PLC | |||||||
| Series 20/A | Series REGS | ||||||||||
| 7.500% due 11/12/20 | HUF | 76,100 | 377 | 8.750% due 02/01/20 | EUR | 100 | 130 | ||||
| Series 23/A | Ardagh Packaging Finance PLC | ||||||||||
| 6.000% due 11/24/23 | HUF | 460,940 | 2,174 | 4.250% due 01/15/22 | EUR | 1,560 | 1,907 | ||||
| Hungary Government International Bond | Series REGS | ||||||||||
| 5.000% due 03/30/16 | GBP | 209 | 345 | 9.250% due 10/15/20 | EUR | 1,490 | 1,998 | ||||
| 3.500% due 07/18/16 | EUR | 229 | 298 | Ardagh Packing Financial Holdings | |||||||
| 6.375% due 03/29/21 | 2,070 | 2,349 | 4.250% due 01/15/22 | EUR | 300 | 367 | |||||
| 5.750% due 11/22/23 | 2,426 | 2,669 | Grifols Worldwide Operations, Ltd. | ||||||||
| 5.375% due 03/25/24 | 252 | 270 | 5.250% due 04/01/22 (Þ) | 4,595 | 4,710 | ||||||
| 17,308 | Smurfit Kappa Acquisitions | ||||||||||
| Indonesia - 3.8% | 3.250% due 06/01/21 | EUR | 105 | 132 | |||||||
| Indonesia Government Bond | 3.250% due 06/01/21 (Þ) | EUR | 1,700 | 2,130 | |||||||
| 6.625% due 02/17/37 | 899 | 1,050 | Vimpel Communications Via VIP | ||||||||
| Indonesia Government International | Finance Ireland, Ltd. OJSC | ||||||||||
| Bond | 7.748% due 02/02/21 (Þ) | 96 | 98 | ||||||||
| 6.875% due 01/17/18 | 1,862 | 2,102 | Series REGS | ||||||||
| 11.625% due 03/04/19 | 6,274 | 8,407 | 7.748% due 02/02/21 | 400 | 407 | ||||||
| 5.875% due 03/13/20 | 2,252 | 2,519 | 15,005 | ||||||||
| 3.375% due 04/15/23 (Þ) | 1,551 | 1,485 | Italy - 0.6% | ||||||||
| 8.375% due 03/15/34 | IDR | 11,817,000 | 971 | ENEL SPA | |||||||
| 8.500% due 10/12/35 | 1,900 | 2,650 | 6.500% due 01/10/74 | EUR | 2,420 | 3,348 | |||||
| 7.750% due 01/17/38 | 2,202 | 2,898 | Telecom Italia SPA | ||||||||
| Series REGS | 5.375% due 01/29/19 | EUR | 2,300 | 3,192 | |||||||
| 4.875% due 05/05/21 | 2,436 | 2,603 | 6.375% due 06/24/19 | GBP | 650 | 1,124 | |||||
| 5.375% due 10/17/23 | 3,097 | 3,403 | 5.250% due 02/10/22 | EUR | 1,650 | 2,308 | |||||
| Indonesia Treasury Bond | 9,972 | ||||||||||
| Series FR53 | Ivory Coast - 0.4% | ||||||||||
| 8.250% due 07/15/21 | IDR | 5,100,000 | 427 | Ivory Coast Government Bond | |||||||
| Series FR58 | 5.375% due 07/23/24 | 637 | 615 | ||||||||
| 8.250% due 06/15/32 | IDR | 20,400,000 | 1,633 | Ivory Coast Government International | |||||||
| Series FR59 | Bond | ||||||||||
| 7.000% due 05/15/27 | IDR | 32,440,000 | 2,419 | Series REGS | |||||||
| Series FR61 | 5.750% due 12/31/32 | 5,653 | 5,456 | ||||||||
| 7.000% due 05/15/22 | IDR | 39,650,000 | 3,092 | 6,071 | |||||||
| Series FR62 | Jamaica - 0.3% | ||||||||||
| 6.375% due 04/15/42 | IDR | 2,000,000 | 124 | Government of Jamaica | |||||||
| Series FR63 | 7.625% due 07/09/25 | 4,153 | 4,439 | ||||||||
| 5.625% due 05/15/23 | IDR | 17,050,000 | 1,206 | ||||||||
| Series FR65 | Jersey - 0.3% | ||||||||||
| 6.625% due 05/15/33 | IDR | 6,000,000 | 405 | AA Bond Co., Ltd. | |||||||
| Series FR66 | Series REGS | ||||||||||
| 5.250% due 05/15/18 | IDR | 16,000,000 | 1,220 | 9.500% due 07/31/19 | GBP | 2,430 | 4,280 | ||||
| Series FR69 | |||||||||||
| 7.875% due 04/15/19 | IDR 186,356,000 | 15,436 | Kazakhstan - 1.2% | ||||||||
| See accompanying notes which are an integral part of the financial statements. | |||||||||||
| 350 Russell Global Opportunistic Credit Fund | |||||||||||
| Russell Investment Company | |||||||||||
| Russell Global Opportunistic Credit Fund | |||||||||||
| Schedule of Investments, continued — October 31, 2014 | |||||||||||
| Amounts in thousands (except share amounts) | Amounts in thousands (except share amounts) | ||||||||||
| Principal | Fair | Principal | Fair | ||||||||
| Amount ($) | Value | Amount ($) | Value | ||||||||
| or Shares | $ | or Shares | $ | ||||||||
| Kazakhstan Government International | Series REGS | ||||||||||
| Bond | 6.500% due 11/15/18 | EUR | 1,200 | 1,555 | |||||||
| 3.875% due 10/14/24 (Þ) | 1,751 | 1,720 | Gestamp Funding Luxembourg SA | ||||||||
| KazMunajGaz National Co. | 5.875% due 05/31/20 (Þ) | EUR | 400 | 527 | |||||||
| 6.375% due 04/09/21 | 980 | 1,076 | Series REGS | ||||||||
| 4.875% due 05/07/25 | 616 | 612 | 5.875% due 05/31/20 | EUR | 1,250 | 1,648 | |||||
| 5.750% due 04/30/43 | 1,838 | 1,787 | Intelsat Jackson Holdings SA | ||||||||
| 9.125% due 07/02/18 (Þ) | 2,396 | 2,833 | 7.250% due 10/15/20 | 2,300 | 2,455 | ||||||
| 6.375% due 04/09/21 (Þ) | 5,398 | 5,924 | Mallinckrodt International Finance S.A. | ||||||||
| 4.400% due 04/30/23 (Þ) | 678 | 666 | 3.500% due 03/19/21 | 1,246 | 1,233 | ||||||
| 5.750% due 04/30/43 (Þ) | 366 | 356 | Matterhorn Midco & Cy SCA | ||||||||
| Series REGS | |||||||||||
| Series REGS | 7.750% due 02/15/20 | EUR | 2,385 | 3,116 | |||||||
| 7.000% due 05/05/20 | 3,076 | 3,465 | Monitchem Holdco | ||||||||
| Zhaikmunai LLP | 5.250% due 06/15/21 | EUR | 1,975 | 2,457 | |||||||
| 7.125% due 11/13/19 (Þ) | 483 | 502 | Ontex IV SA | ||||||||
| 18,941 | 9.000% due 04/15/19 (Þ) | EUR | 1,050 | 1,395 | |||||||
| Kenya - 0.1% | Series REGS | ||||||||||
| Republic of Kenya Government Bond | 9.000% due 04/15/19 | EUR | 1,495 | 1,986 | |||||||
| 6.875% due 06/24/24 | 1,830 | 1,949 | Pinnacle Holdco Sarl Term Loan | ||||||||
| 10.500% due 07/30/20 (Ê) | 943 | 922 | |||||||||
| Lithuania - 0.1% | Sunrise Communications Holdings SA | ||||||||||
| Lithuania Government International | 8.500% due 12/31/18 (Þ) | EUR | 1,370 | 1,794 | |||||||
| Bond | Series REGS | ||||||||||
| Series REGS | 8.500% due 12/31/18 | EUR | 460 | 602 | |||||||
| 6.625% due 02/01/22 | 847 | 1,021 | Telenet Finance III Luxembourg SCA | ||||||||
| Luxembourg - 4.2% | Series REGS | ||||||||||
| Accudyne Industries Borrower SCA Term | 6.625% due 02/15/21 | EUR | 350 | 468 | |||||||
| Loan | Telenet Finance Luxembourg SCA | ||||||||||
| 4.000% due 12/13/19 (Ê) | 727 | 714 | Series REGS | ||||||||
| 6.375% due 11/15/20 | EUR | 200 | 265 | ||||||||
| Altice SA | Telenet Finance V Luxembourg SCA | ||||||||||
| 7.250% due 05/15/22 (Þ) | EUR | 1,550 | 2,006 | 6.750% due 08/15/24 (Þ) | EUR | 600 | 839 | ||||
| APERAM | |||||||||||
| 7.750% due 04/01/18 (Þ) | 2,265 | 2,344 | Series REGS | ||||||||
| 6.750% due 08/15/24 | EUR | 965 | 1,349 | ||||||||
| ArcelorMittal | Telenet Finance V SCA | ||||||||||
| 2.875% due 07/06/20 | EUR | 100 | 126 | 6.250% due 08/15/22 | EUR | 320 | 434 | ||||
| 6.000% due 03/01/21 | 6,810 | 7,304 | Travelport Finance SARL Term Loan | ||||||||
| BMBG Bond Finance SCA | 6.000% due 09/02/21 | 500 | 499 | ||||||||
| 5.327% due 10/15/20 (Å)(Ê) | EUR | 1,325 | 1,664 | Trinseo Materials Operating SCA / | |||||||
| 5.327% due 10/15/20 | EUR | 455 | 571 | Trinseo Materials Finance, Inc. | |||||||
| Capsugel SA | 8.750% due 02/01/19 | 2,471 | 2,613 | ||||||||
| 7.000% due 05/15/19 (Þ) | 3,230 | 3,285 | Wind Acquisition Finance SA | ||||||||
| ConvaTec Finance International SA | 4.000% due 07/15/20 (Þ) | EUR | 1,914 | 2,362 | |||||||
| 8.250% due 01/15/19 (Þ) | 2,180 | 2,227 | 4.750% due 07/15/20 (Þ) | 86 | 84 | ||||||
| Cosan Luxembourg SA | 7.000% due 04/23/21 (Þ) | EUR | 2,500 | 3,095 | |||||||
| 5.000% due 03/14/23 (Þ) | 874 | 841 | Xefin Lux SCA | ||||||||
| Delta 2 (Lux) Sarl 2nd Lien Term Loan | 3.913% due 06/01/19 | EUR | 195 | 242 | |||||||
| 7.750% due 07/15/22 | 3,255 | 3,241 | Xella Holdco Finance SA | ||||||||
| Dufry Finance SCA | 9.125% due 09/15/18 (Þ) | EUR | 1,100 | 1,409 | |||||||
| 4.500% due 07/15/22 (Þ) | EUR | 1,350 | 1,762 | Series REGS | |||||||
| Elior Finance & Co. SCA | 9.125% due 09/15/18 | EUR | 430 | 551 | |||||||
| 6.500% due 05/01/20 (Þ) | EUR | 546 | 741 | ||||||||
| Series REGS | 66,811 | ||||||||||
| 6.500% due 05/01/20 | EUR | 650 | 882 | Malaysia - 1.1% | |||||||
| Evergreen Skills Luxembourg S.A.R.L. | Malaysia Government Bond | ||||||||||
| Initial Term Loan | 4.048% due 09/30/21 | MYR | 17,000 | 5,253 | |||||||
| 5.750% due 04/28/21 | 998 | 984 | Series 0111 | ||||||||
| Finmeccanica Finance SA | 4.160% due 07/15/21 | MYR | 21,610 | 6,719 | |||||||
| 8.000% due 12/16/19 | GBP | 665 | 1,223 | Series 0311 | |||||||
| Gategroup Finance Luxembourg SA | 4.392% due 04/15/26 | MYR | 6,880 | 2,156 | |||||||
| 6.750% due 03/01/19 (Þ) | EUR | 1,130 | 1,459 | Series 0313 | |||||||
| Series REGS | 3.480% due 03/15/23 | MYR | 3,450 | 1,026 | |||||||
| 6.750% due 03/01/19 | EUR | 1,190 | 1,537 | Series 0511 | |||||||
| GCS Holdco Finance I SA | 3.580% due 09/28/18 | MYR | 6,600 | 2,004 | |||||||
| See accompanying notes which are an integral part of the financial statements. | |||||||||||
| Russell Global Opportunistic Credit Fund 351 | |||||||||||
| Russell Investment Company | |||||||||||
| Russell Global Opportunistic Credit Fund | |||||||||||
| Schedule of Investments, continued — October 31, 2014 | |||||||||||
| Amounts in thousands (except share amounts) | Amounts in thousands (except share amounts) | ||||||||||
| Principal | Fair | Principal | Fair | ||||||||
| Amount ($) | Value | Amount ($) | Value | ||||||||
| or Shares | $ | or Shares | $ | ||||||||
| Series 0902 | 7.375% due 07/29/20 (Þ) | 200 | 212 | ||||||||
| 4.378% due 11/29/19 | MYR | 3,490 | 1,094 | Interxion Holdings | |||||||
| 18,252 | 6.000% due 07/15/20 | EUR | 2,580 | 3,364 | |||||||
| Mexico - 3.2% | Listrindo Capital BV | ||||||||||
| America Movil SAB de CV | 6.950% due 02/21/19 (Þ) | 300 | 319 | ||||||||
| 6.000% due 06/09/19 | MXN | 5,210 | 390 | OI European Group B.V. | |||||||
| Series 12 | 4.875% due 03/31/21 | EUR | 2,530 | 3,408 | |||||||
| 6.450% due 12/05/22 | MXN | 6,500 | 474 | PortAventura Entertainment Barcelona | |||||||
| Cemex SAB de CV | BV | ||||||||||
| 9.500% due 06/15/18 (Þ) | 216 | 241 | 5.788% due 12/01/19 (Ê)(Þ) | EUR | 370 | 461 | |||||
| 7.250% due 01/15/21 (Þ) | 239 | 258 | 7.250% due 12/01/20 (Þ) | EUR | 330 | 416 | |||||
| Comision Federal de Electricidad | Series REGS | ||||||||||
| 4.875% due 01/15/24 (Þ) | 224 | 236 | 7.250% due 12/01/20 | EUR | 900 | 1,133 | |||||
| Mexican Bonos | Refresco Gerber BV | ||||||||||
| Series M 10 | Series REGS | ||||||||||
| 8.500% due 12/13/18 | MXN | 101,111 | 8,531 | 7.375% due 05/15/18 | EUR | 1,365 | 1,792 | ||||
| Series M 20 | Schaeffler Holding Finance BV | ||||||||||
| 12.500% due 11/30/17 | MXN | 15,896 | 1,543 | 6.875% due 08/15/18 (Þ) | EUR | 1,370 | 1,803 | ||||
| Series M 30 | 5.750% due 11/15/21 (Å) | EUR | 1,300 | 1,682 | |||||||
| 10.000% due 11/20/36 | MXN | 36,482 | 3,715 | Series REGS | |||||||
| 8.500% due 11/18/38 | MXN | 17,100 | 1,529 | 6.875% due 08/15/18 | EUR | 150 | 197 | ||||
| Series M | Sensata Technologies BV | ||||||||||
| 6.250% due 06/16/16 | MXN | 784 | 61 | 5.625% due 11/01/24 (Å) | 1,270 | 1,341 | |||||
| 8.000% due 12/07/23 | MXN | 52,533 | 4,477 | Suam Finance BV | |||||||
| 7.750% due 05/29/31 | MXN | 50,220 | 4,157 | 4.875% due 04/17/24 (Þ) | 105 | 108 | |||||
| 7.750% due 11/13/42 | MXN | 32,410 | 2,691 | Telefonica Europe BV | |||||||
| Mexican Udibonos | 6.500% due 12/31/49 (ƒ) | EUR | 2,300 | 3,174 | |||||||
| Series S | VimpelCom Holdings BV | ||||||||||
| 5.000% due 06/16/16 | MXN | 27,094 | 2,174 | 5.950% due 02/13/23 (Þ) | 200 | 184 | |||||
| 4.000% due 11/15/40 | MXN | 5,200 | 423 | VTR Finance BV | |||||||
| Mexico Government International Bond | 6.875% due 01/15/24 (Þ) | 896 | 941 | ||||||||
| 4.000% due 10/02/23 | 9,978 | 10,417 | 26,734 | ||||||||
| 6.050% due 01/11/40 | 1,598 | 1,930 | Nigeria - 0.3% | ||||||||
| 4.750% due 03/08/44 | 4,088 | 4,151 | Nigeria Government Bond | ||||||||
| Series 07YR | |||||||||||
| 5.550% due 01/21/45 | 1,760 | 1,998 | 16.000% due 06/29/19 | NGN | 215,000 | 1,450 | |||||
| Series GMTN | Series 10YR | ||||||||||
| 5.950% due 03/19/19 | 354 | 406 | 16.390% due 01/27/22 | NGN | 99,600 | 708 | |||||
| Petroleos Mexicanos | Nigeria Government International Bond | ||||||||||
| Series REGS | 6.750% due 01/28/21 | 1,531 | 1,655 | ||||||||
| 5.500% due 02/24/25 | EUR | 600 | 939 | 6.375% due 07/12/23 (Þ) | 431 | 457 | |||||
| 50,741 | Series REGS | ||||||||||
| Morocco - 0.1% | 6.375% due 07/12/23 | 824 | 873 | ||||||||
| Morocco Government International Bond | |||||||||||
| 4.250% due 12/11/22 (Þ) | 1,452 | 1,472 | 5,143 | ||||||||
| Office Cherifien des Phosphates | Norway - 0.1% | ||||||||||
| 5.625% due 04/25/24 (Þ) | 688 | 722 | Albain Bidco Norway AS | ||||||||
| 6.750% due 11/01/20 (Þ) | EUR | 1,080 | 1,265 | ||||||||
| 2,194 | Series REGS | ||||||||||
| Netherlands - 1.7% | 6.750% due 11/01/20 | EUR | 780 | 914 | |||||||
| AP NMT Acquisition B.V. Term Loan B | |||||||||||
| 6.750% due 08/13/21 | 1,000 | 971 | 2,179 | ||||||||
| Carlson Wagonlit BV | Panama - 0.6% | ||||||||||
| Series REGS | Panama Government International Bond | ||||||||||
| 7.500% due 06/15/19 | EUR | 765 | 1,011 | 7.125% due 01/29/26 | 116 | 149 | |||||
| CIMPOR Financial Operations B.V. | 9.375% due 04/01/29 | 4,899 | 7,324 | ||||||||
| 5.750% due 07/17/24 (Þ) | 1,030 | 990 | 6.700% due 01/26/36 | 1,708 | 2,148 | ||||||
| EMATUM Via Mozambique EMATUM | 9,621 | ||||||||||
| Finance 2020 BV | Paraguay - 0.1% | ||||||||||
| Series REGS | Republic of Paraguay | ||||||||||
| 6.305% due 09/11/20 | 1,113 | 1,112 | 4.625% due 01/25/23 | 821 | 838 | ||||||
| Grupo Antolin Dutch BV | 6.100% due 08/11/44 | 633 | 678 | ||||||||
| 4.750% due 04/01/21 | EUR | 1,175 | 1,506 | 1,516 | |||||||
| 4.750% due 04/01/21 (Þ) | EUR | 475 | 609 | Peru - 0.6% | |||||||
| Indosat Palapa Co. BV | Cementos Pacasmayo SAA | ||||||||||
| See accompanying notes which are an integral part of the financial statements. | |||||||||||
| 352 Russell Global Opportunistic Credit Fund | |||||||||||
Russell Investment Company
Russell Global Opportunistic Credit Fund
Schedule of Investments, continued — October 31, 2014
| Amounts in thousands (except share amounts) | Amounts in thousands (except share amounts) | ||||||||||
| Principal | Fair | Principal | Fair | ||||||||
| Amount ($) | Value | Amount ($) | Value | ||||||||
| or Shares | $ | or Shares | $ | ||||||||
| 4.500% due 02/08/23 (Þ) | 196 | 187 | Series REGS | ||||||||
| Peruvian Government International Bond | 7.850% due 03/10/18 | RUB | 65,000 | 1,419 | |||||||
| 7.350% due 07/21/25 | 1,434 | 1,896 | Series REGS | ||||||||
| 8.750% due 11/21/33 | 3,577 | 5,500 | 7.500% due 03/31/30 | 24,216 | 27,473 | ||||||
| Series REGS | Russian Government Bond | ||||||||||
| 7.840% due 08/12/20 | PEN | 4,050 | 1,605 | 7.000% due 08/16/23 | RUB | 176,400 | 3,451 | ||||
| Republic of Peru | 51,726 | ||||||||||
| 6.900% due 08/12/37 | PEN | 2,690 | 969 | Serbia - 0.3% | |||||||
| 10,157 | Republic of Serbia International Bond | ||||||||||
| Philippines - 0.5% | 7.250% due 09/28/21 | 4,269 | 4,907 | ||||||||
| Philippine Government International | |||||||||||
| Bond | Singapore - 0.1% | ||||||||||
| 4.000% due 01/15/21 | 2,050 | 2,196 | ABJA Investment Co. Pte Ltd. | ||||||||
| 4.950% due 01/15/21 | PHP | 22,000 | 508 | 5.950% due 07/31/24 | 860 | 874 | |||||
| 9.500% due 02/02/30 | 2,631 | 4,200 | |||||||||
| 6.250% due 01/14/36 | PHP | 30,000 | 731 | Slovenia - 0.3% | |||||||
| Slovenia Government International Bond | |||||||||||
| 7,635 | 5.250% due 02/18/24 (Þ) | 2,623 | 2,825 | ||||||||
| Poland - 1.3% | Series REGS | ||||||||||
| Poland Government Bond | 5.850% due 05/10/23 | 1,366 | 1,532 | ||||||||
| Series 0418 | 4,357 | ||||||||||
| 3.750% due 04/25/18 | PLN | 4,200 | 1,324 | ||||||||
| Series 0922 | South Africa - 2.4% | ||||||||||
| 5.750% due 09/23/22 | PLN | 31,835 | 11,735 | Eskom Holdings SOC, Ltd. | |||||||
| 6.750% due 08/06/23 (Þ) | 617 | 664 | |||||||||
| Series 1019 | Series ES26 | ||||||||||
| 5.500% due 10/25/19 | PLN | 8,725 | 3,014 | 7.850% due 04/02/26 | ZAR | 6,000 | 512 | ||||
| Poland Government Bonds | |||||||||||
| Zero coupon due 07/25/16 | PLN | 18,560 | 5,350 | South Africa Government Bond | |||||||
| 8.250% due 03/31/32 | ZAR | 98,070 | 8,729 | ||||||||
| 21,423 | Series 2023 | ||||||||||
| Romania - 1.4% | 7.750% due 02/28/23 | ZAR | 20,875 | 1,899 | |||||||
| Romania Government Bond | Series R186 | ||||||||||
| 4.750% due 08/29/16 | RON | 3,400 | 1,011 | 10.500% due 12/21/26 | ZAR | 27,930 | 3,040 | ||||
| 5.950% due 06/11/21 | RON | 33,550 | 10,880 | Series R207 | |||||||
| Series 04YR | 7.250% due 01/15/20 | ZAR | 60,981 | 5,522 | |||||||
| 5.750% due 01/27/16 | RON | 5,860 | 1,742 | Series R208 | |||||||
| Romanian Government International | 6.750% due 03/31/21 | ZAR | 8,510 | 745 | |||||||
| Bond | Series R213 | ||||||||||
| 4.875% due 01/22/24 (Þ) | 1,880 | 2,026 | 7.000% due 02/28/31 | ZAR | 39,055 | 3,116 | |||||
| Series REGS | South Africa Government International | ||||||||||
| 6.750% due 02/07/22 | 4,486 | 5,374 | Bond | ||||||||
| 4.375% due 08/22/23 | 1,402 | 1,460 | 5.500% due 03/09/20 | 1,473 | 1,615 | ||||||
| 22,493 | 5.875% due 05/30/22 | 804 | 909 | ||||||||
| Russia - 3.3% | 4.665% due 01/17/24 | 787 | 818 | ||||||||
| Russian Government Bond | 5.875% due 09/16/25 | 8,220 | 9,289 | ||||||||
| 6.700% due 05/15/19 | RUB | 60,140 | 1,242 | Transnet SOC, Ltd. | |||||||
| 6.400% due 05/27/20 | RUB | 29,100 | 577 | 9.500% due 05/13/21 (Þ) | ZAR | 7,700 | 704 | ||||
| Russian Government International Bond | 37,562 | ||||||||||
| 7.600% due 07/20/22 | RUB | 45,000 | 923 | Spain - 0.1% | |||||||
| Russian Federal Bond - OFZ | Obrascon Huarte Lain SA | ||||||||||
| Series 6205 | Series REGS | ||||||||||
| 7.600% due 04/14/21 | RUB | 37,460 | 780 | 7.625% due 03/15/20 | EUR | 1,090 | 1,482 | ||||
| Series 6207 | 4.750% due 03/15/22 | EUR | 280 | 354 | |||||||
| 8.150% due 02/03/27 | RUB | 35,000 | 719 | ||||||||
| Series 6208 | 1,836 | ||||||||||
| 7.500% due 02/27/19 | RUB | 345,200 | 7,360 | Thailand - 0.9% | |||||||
| PTT Exploration and Production Public | |||||||||||
| Series 6210 | Co., Ltd. | ||||||||||
| 6.800% due 12/11/19 | RUB | 59,778 | 1,223 | ||||||||
| Series 6211 | 4.875% due 12/29/49 | 657 | 668 | ||||||||
| 7.000% due 01/25/23 | RUB | 180,400 | 3,540 | Thailand Government Bond | |||||||
| Series 6212 | 3.250% due 06/16/17 | THB | 34,300 | 1,077 | |||||||
| 7.050% due 01/19/28 | RUB | 54,700 | 1,016 | 3.450% due 03/08/19 | THB | 10,000 | 315 | ||||
| Russian Federation International Bond | 3.875% due 06/13/19 | THB | 212,410 | 6,857 | |||||||
| 4.875% due 09/16/23 | 2,000 | 2,003 | 3.650% due 12/17/21 | THB | 119,250 | 3,815 | |||||
| Russian Foreign Bond - Eurobond | 3.580% due 12/17/27 | THB | 26,600 | 829 | |||||||
| See accompanying notes which are an integral part of the financial statements. | |||||||||||
| Russell Global Opportunistic Credit Fund 353 | |||||||||||
| Russell Investment Company | |||||||||||
| Russell Global Opportunistic Credit Fund | |||||||||||
| Schedule of Investments, continued — October 31, 2014 | |||||||||||
| Amounts in thousands (except share amounts) | Amounts in thousands (except share amounts) | ||||||||||
| Principal | Fair | Principal | Fair | ||||||||
| Amount ($) | Value | Amount ($) | Value | ||||||||
| or Shares | $ | or Shares | $ | ||||||||
| Series ILB | 9.250% due 05/15/18 (Þ) | EUR | 1,775 | 2,243 | |||||||
| 1.200% due 07/14/21 | THB | 24,782 | 737 | Stretford 79 PLC | |||||||
| 14,298 | 6.250% due 07/15/21 | GBP | 910 | 1,223 | |||||||
| Trinidad and Tobago - 0.1% | Thames Water Kemble Finance PLC | ||||||||||
| Republic of Trinidad & Tobago | 7.750% due 04/01/19 | GBP | 1,355 | 2,341 | |||||||
| 4.375% due 01/16/24 (Þ) | 1,455 | 1,575 | Tullow Oil PLC | ||||||||
| 6.000% due 11/01/20 (Þ) | 1,600 | 1,496 | |||||||||
| Turkey - 3.1% | Vedanta Resources PLC | ||||||||||
| Republic of Turkey | 6.000% due 01/31/19 | 200 | 204 | ||||||||
| 6.625% due 02/17/45 | 335 | 401 | 6.000% due 01/31/19 (Þ) | 463 | 472 | ||||||
| Turk Telekomunikasyon AS | 8.250% due 06/07/21 (Þ) | 600 | 654 | ||||||||
| 4.875% due 06/19/24 (Þ) | 1,031 | 1,023 | Series REGS | ||||||||
| Turkey Government Bond | 6.750% due 06/07/16 | 175 | 183 | ||||||||
| 9.000% due 01/27/16 | TRY | 7,410 | 3,358 | Virgin Media Finance PLC | |||||||
| 10.400% due 03/27/19 | TRY | 7,000 | 3,398 | 4.875% due 02/15/22 | 1,000 | 940 | |||||
| 7.100% due 03/08/23 | TRY | 5,600 | 2,305 | 7.000% due 04/15/23 (Þ) | GBP | 1,200 | 2,044 | ||||
| 8.800% due 09/27/23 | TRY | 1,743 | 796 | Series REGS | |||||||
| Series 5YR | 7.000% due 04/15/23 | GBP | 120 | 204 | |||||||
| 9.000% due 03/08/17 | TRY | 14,865 | 6,805 | Virgin Media Investment Holdings, Ltd. | |||||||
| Series 5Y | Term Loan | ||||||||||
| 6.300% due 02/14/18 | TRY | 10,020 | 4,265 | 3.500% due 06/07/20 (Ê) | 1,250 | 1,232 | |||||
| Series CPI | Vougeot Bidco PLC | ||||||||||
| 4.000% due 04/01/20 | TRY | 792 | 399 | 7.875% due 07/15/20 (Þ) | GBP | 160 | 256 | ||||
| 3.000% due 07/21/21 | TRY | 5,107 | 2,467 | Series RegS | |||||||
| Turkey Government International Bond | 7.875% due 07/15/20 | GBP | 1,390 | 2,224 | |||||||
| 7.000% due 09/26/16 | 374 | 409 | 32,312 | ||||||||
| 7.500% due 07/14/17 | 356 | 400 | United States - 34.4% | ||||||||
| 7.000% due 03/11/19 | 4,543 | 5,204 | 24 Hour Holdings III LLC | ||||||||
| 7.500% due 11/07/19 | 1,122 | 1,322 | 8.000% due 06/01/22 (Þ) | 3,070 | 2,901 | ||||||
| 7.000% due 06/05/20 | 3,654 | 4,251 | 4L Technologies, Inc. Term Loan | ||||||||
| 5.125% due 03/25/22 | 1,723 | 1,832 | 5.500% due 05/08/20 (Ê) | 1,000 | 993 | ||||||
| ABG Intermediate Holdings 2, LLC 1st | |||||||||||
| 6.250% due 09/26/22 | 3,967 | 4,503 | Lien Term Loan | ||||||||
| 5.750% due 03/22/24 | 1,495 | 1,651 | 5.500% due 05/27/21 | 1,327 | 1,317 | ||||||
| 7.375% due 02/05/25 | 3,451 | 4,265 | ABG Intermediate Holdings 2, LLC 2nd | ||||||||
| 6.000% due 01/14/41 | 619 | 686 | Lien Term Loan | ||||||||
| 49,740 | 9.000% due 05/27/22 | 500 | 492 | ||||||||
| Ukraine - 0.6% | ABILITY Network, Inc. 1st Lien Term | ||||||||||
| Ukraine Government Infrastructure | Loan | ||||||||||
| Government Bond | 6.000% due 05/14/21 (Ê) | 748 | 739 | ||||||||
| 9.000% due 12/07/17 | 3,218 | 2,751 | ACCO Brands Corp. | ||||||||
| Ukraine Government International Bond | 6.750% due 04/30/20 | 3,290 | 3,496 | ||||||||
| 6.250% due 06/17/16 (Þ) | 642 | 571 | ADS Waste Holdings, Inc. Term Loan | ||||||||
| Series REGS | 3.750% due 10/09/19 (Ê) | 993 | 971 | ||||||||
| 6.250% due 06/17/16 | 1,191 | 1,060 | ADT Corp. | ||||||||
| 6.580% due 11/21/16 | 1,259 | 1,108 | 6.250% due 10/15/21 | 2,000 | 2,100 | ||||||
| 9.250% due 07/24/17 | 4,486 | 4,082 | Affinion Group, Inc. Term Loan B | ||||||||
| 6.750% due 11/14/17 | 200 | 174 | 6.750% due 04/30/18 (Ê) | 971 | 938 | ||||||
| Alaska Communications Systems | |||||||||||
| 9,746 | Holdings, Inc. Term Loan B | ||||||||||
| United Kingdom - 2.0% | 6.250% due 10/21/16 | 242 | 240 | ||||||||
| Arqiva Broadcast Finance PLC | Albertsons LLC Term Loan B4 | ||||||||||
| 9.500% due 03/31/20 (Þ) | GBP | 1,270 | 2,222 | 4.500% due 08/25/21 (Ê) | 1,000 | 1,000 | |||||
| Series REGS | Albertson's LLC Term Loan B4-1 | ||||||||||
| 9.500% due 03/31/20 | GBP | 1,610 | 2,817 | 4.500% due 08/25/21 | 500 | 500 | |||||
| Iron Mountain, Inc. | Allison Transmission, Inc. Term Loan B3 | ||||||||||
| 6.125% due 09/15/22(Þ) | GBP | 2,215 | 3,588 | 3.500% due 08/23/19 | 744 | 738 | |||||
| Paragon Offshore PLC | Alpha Natural Resources, Inc. | ||||||||||
| 6.750% due 07/15/22 | 3,260 | 2,486 | 6.000% due 06/01/19 | 1,275 | 637 | ||||||
| Pendragon PLC | Alphabet Holding Co., Inc. | ||||||||||
| 6.875% due 05/01/20 | GBP | 2,500 | 4,147 | 7.750% due 11/01/17 | 2,805 | 2,721 | |||||
| Priory Group No. 3 PLC | American Airlines, Inc. Exit Term Loan | ||||||||||
| Series REGS | 3.750% due 06/27/19 (Ê) | 992 | 979 | ||||||||
| 7.000% due 02/15/18 | GBP | 800 | 1,336 | ||||||||
| R&R Pik PLC | |||||||||||
| See accompanying notes which are an integral part of the financial statements. | |||||||||||
| 354 Russell Global Opportunistic Credit Fund | |||||||||||
| Russell Investment Company | |||||||||||
| Russell Global Opportunistic Credit Fund | |||||||||||
| Schedule of Investments, continued — October 31, 2014 | |||||||||||
| Amounts in thousands (except share amounts) | Amounts in thousands (except share amounts) | ||||||||||
| Principal | Fair | Principal | Fair | ||||||||
| Amount ($) | Value | Amount ($) | Value | ||||||||
| or Shares | $ | or Shares | $ | ||||||||
| American Builders & Contractors Supply | 4.000% due 12/18/20 (Ê) | 175 | 172 | ||||||||
| Co., Inc. | Building Materials Corp. of America | ||||||||||
| 5.625% due 04/15/21 (Þ) | 3,500 | 3,544 | 5.375% due 11/15/24 (Å) | 2,555 | 2,561 | ||||||
| American Pacific Corp. 1st Lien Term | Burger King Corp. Term Loan B | ||||||||||
| Loan B | 4.500% due 09/24/21 | 500 | 499 | ||||||||
| 7.000% due 02/27/19 (Ê) | 995 | 995 | BWAY Holding Co. Term Loan B | ||||||||
| AmeriGas Finance LLC / AmeriGas | 5.500% due 08/14/20 (Ê) | 998 | 1,001 | ||||||||
| Finance Corp. | Cablevision Systems Corp. | ||||||||||
| 7.000% due 05/20/22 | 3,115 | 3,364 | 5.875% due 09/15/22 | 300 | 305 | ||||||
| Amsurg Corp. | Caesars Entertainment Corp. 1st Lien | ||||||||||
| 5.625% due 11/30/20 | 1,000 | 1,030 | Term Loan B | ||||||||
| 5.625% due 07/15/22 (Þ) | 6,035 | 6,253 | 7.000% due 10/11/20 (Ê) | 1,987 | 1,893 | ||||||
| Ancestry.com, Inc. | Caesars Entertainment Operating Co., | ||||||||||
| 9.625% due 10/15/18 (Þ) | 2,830 | 2,823 | Inc. | ||||||||
| 11.000% due 12/15/20 | 3,620 | 4,100 | 11.250% due 06/01/17 | 7,485 | 5,614 | ||||||
| Ancestry.com, Inc. Term Loan | Caesars Entertainment Operating Co., | ||||||||||
| 4.500% due 12/28/18 (Ê) | 1,489 | 1,479 | Inc. Term Loan B4 | ||||||||
| Apex Tool Group LLC | 9.500% due 10/31/16 (Ê) | 289 | 263 | ||||||||
| 7.000% due 02/01/21 (Þ) | 4,065 | 3,658 | California Resources Corp. | ||||||||
| Arch Coal, Inc. | 5.500% due 09/15/21 (Þ) | 2,285 | 2,331 | ||||||||
| Zero coupon due 05/16/18 (Ê) | 1,070 | 943 | Calpine Construction Finance Co., LP | ||||||||
| Arctic Glacier U.S.A., Inc. Term Loan | 1st Lien Term Loan B2 | ||||||||||
| 5.000% due 05/13/19 (Ê) | 992 | 975 | 3.250% due 01/31/22 (Ê) | 1,990 | 1,938 | ||||||
| Ashtead Capital, Inc. | Calpine Corp. | ||||||||||
| 6.500% due 07/15/22 (Þ) | 2,310 | 2,495 | 5.375% due 01/15/23 | 850 | 858 | ||||||
| 5.625% due 10/01/24 | 990 | 1,032 | 7.875% due 01/15/23 (Þ) | 1,335 | 1,479 | ||||||
| AssuredPartners Capital, Inc. 1st Lien | Calpine Corp. Term Loan B1 | ||||||||||
| Term Loan | 4.000% due 04/01/18 | 994 | 989 | ||||||||
| 4.500% due 04/02/21 | 1,000 | 993 | Carlson Travel Holdings, Inc. | ||||||||
| AssuredPartners Capital, Inc. 2nd Lien | 7.500% due 08/15/19 (Þ) | 2,800 | 2,807 | ||||||||
| Term Loan | CCO Holdings LLC / CCO Holdings | ||||||||||
| 7.750% due 04/02/22 | 1,000 | 979 | Capital Corp. | ||||||||
| Asurion LLC Term Loan B2 | 6.500% due 04/30/21 | 1,370 | 1,445 | ||||||||
| 4.250% due 07/08/20 (Ê) | 992 | 979 | CCOH Safari LLC | ||||||||
| Audatex NA, Inc. | 5.500% due 12/01/22 | 2,460 | 2,485 | ||||||||
| 6.000% due 06/15/21 (Þ) | 1,845 | 1,951 | CDW LLC / CDW Finance Corp. | ||||||||
| Axalta Coating Systems US Holdings, | 6.000% due 08/15/22 | 2,050 | 2,163 | ||||||||
| Inc. / Axalta Coating Systems Dutch | CEC Entertainment, Inc. Term Loan | ||||||||||
| Holding B | 4.250% due 02/14/21 (Ê) | 995 | 962 | ||||||||
| 5.750% due 02/01/21 (Þ) | 730 | 955 | Celanese US Holdings LLC | ||||||||
| Series REGS | 3.250% due 10/15/19 | 1,840 | 2,351 | ||||||||
| 5.750% due 02/01/21 | 1,875 | 2,453 | Cengage Learning Acquisitions, Inc. 1st | ||||||||
| Belden, Inc. | Lien Term Loan | ||||||||||
| 5.500% due 04/15/23 | 300 | 389 | 7.000% due 03/31/20 (Ê) | 5,368 | 5,370 | ||||||
| Berlin Packaging LLC 2nd Lien Term | Century Aluminum Co. | ||||||||||
| Loan | 7.500% due 06/01/21 (Þ) | 4,040 | 4,303 | ||||||||
| 7.750% due 09/24/22 | 1,250 | 1,245 | Cequel Communications Holdings I, LLC | ||||||||
| Bill Barrett Corp. | 5.125% due 12/15/21 | 2,545 | 2,485 | ||||||||
| 7.625% due 10/01/19 | 1,580 | 1,596 | Charming Charlie, Inc. Term Loan B | ||||||||
| BioScrip, Inc. Term Loan | 9.000% due 12/24/19 (Ê) | 186 | 184 | ||||||||
| 6.500% due 07/31/20 (Ê) | 40 | 40 | Charter Commercial Operating LLC | ||||||||
| BioScrip, Inc. Term Loan B | Term Loan G | ||||||||||
| 6.500% due 07/31/20 (Ê) | 66 | 66 | 4.250% due 09/12/21 | 1,000 | 1,006 | ||||||
| BMC Software Finance, Inc. Term Loan | Checkout Holding Corp. 1st Lien Term | ||||||||||
| 5.500% due 09/10/20 (Ê) | 958 | 947 | Loan B | ||||||||
| Brazil Loan Trust 1 | 4.500% due 04/09/21 (Ê) | 1,995 | 1,941 | ||||||||
| 5.477% due 07/24/23 (Þ) | 2,221 | 2,310 | Checkout Holding Corp. 2nd Lien Term | ||||||||
| BreitBurn Energy Partners, LP / | Loan | ||||||||||
| BreitBurn Finance Corp. | 7.750% due 04/09/22 (Ê) | 750 | 711 | ||||||||
| 8.625% due 10/15/20 | 450 | 459 | Chrysler Group LLC 1st Lien Term | ||||||||
| 7.875% due 04/15/22 | 3,860 | 3,703 | Loan B | ||||||||
| Brickman Group, Ltd. LLC 2nd Lien | 3.250% due 12/31/18 | 498 | 492 | ||||||||
| Term Loan | Chrysler Group LLC Term Loan B | ||||||||||
| 7.500% due 12/18/21 | 500 | 491 | 3.500% due 05/24/17 (Ê) | 744 | 740 | ||||||
| Brickman Group, Ltd. LLC Term Loan | CHS/Community Health Systems, Inc. | ||||||||||
| See accompanying notes which are an integral part of the financial statements. | |||||||||||
| Russell Global Opportunistic Credit Fund 355 | |||||||||||
| Russell Investment Company | |||||||||||
| Russell Global Opportunistic Credit Fund | |||||||||||
| Schedule of Investments, continued — October 31, 2014 | |||||||||||
| Amounts in thousands (except share amounts) | Amounts in thousands (except share amounts) | ||||||||||
| Principal | Fair | Principal | Fair | ||||||||
| Amount ($) | Value | Amount ($) | Value | ||||||||
| or Shares | $ | or Shares | $ | ||||||||
| 6.875% due 02/01/22 | 4,230 | 4,558 | 7.750% due 08/01/22 (Ê) | 250 | 246 | ||||||
| CITGO Petroleum Corp. | Emerald US, Inc. Term Loan | ||||||||||
| 6.250% due 08/15/22 (Þ) | 2,015 | 2,050 | Zero coupon due 05/09/21 | 700 | 687 | ||||||
| Clear Channel Worldwide Holdings, Inc. | Endo Finance LLC | ||||||||||
| 7.625% due 03/15/20 | 1,750 | 1,846 | 5.750% due 01/15/22 (Þ) | 1,520 | 1,528 | ||||||
| 6.500% due 11/15/22 | 5,070 | 5,222 | Energy XXI Gulf Coast, Inc. | ||||||||
| Cleaver-Brooks, Inc. | 6.875% due 03/15/24 | 985 | 778 | ||||||||
| 8.750% due 12/15/19 (Þ) | 940 | 1,022 | EnergySolutions LLC Term Loan | ||||||||
| Community Health Systems, Inc. Term | 6.750% due 05/29/20 (Ê) | 1,496 | 1,502 | ||||||||
| Loan D | Extreme Reach, Inc. 1st Lien Term Loan | ||||||||||
| 4.250% due 01/27/21 (Ê) | 1,242 | 1,242 | 6.750% due 02/10/20 | 1,621 | 1,621 | ||||||
| Connolly Corp. 2nd Lien Term Loan | FairPoint Communications, Inc. Term | ||||||||||
| 8.000% due 05/14/22 (Ê) | 2,970 | 2,959 | Loan | ||||||||
| Consolidated Communications, Inc. Term | 7.500% due 02/14/19 (Ê) | 2,481 | 2,498 | ||||||||
| Loan B | FIDJI Luxembourg BC4 S.A R.L Initial | ||||||||||
| 4.250% due 12/23/20 (Ê) | 993 | 987 | Term Loan | ||||||||
| ConvergeOne Holdings Corp. 1st Lien | 6.250% due 12/18/20 | 488 | 487 | ||||||||
| Term Loan | Fieldwood Energy LLC 2nd Lien Term | ||||||||||
| 6.000% due 06/17/20 (Ê) | 249 | 247 | Loan | ||||||||
| Cott Beverages, Inc. | 8.375% due 09/30/20 | 2,335 | 2,243 | ||||||||
| 5.375% due 07/01/22 | 2,175 | 2,153 | First Data Corp. | ||||||||
| CPG International, Inc. 1st Lien Term | 6.750% due 11/01/20 (Þ) | 3,802 | 4,068 | ||||||||
| Loan B | 8.250% due 01/15/21 (Þ) | 5,080 | 5,512 | ||||||||
| 4.750% due 09/30/20 (Ê) | 1,386 | 1,373 | First Data Corp. Term Loan | ||||||||
| CPI Buyer LLC Second Lien Term Loan | 3.666% due 03/24/18 (Ê) | 500 | 495 | ||||||||
| 8.500% due 07/18/22 | 2,540 | 2,502 | First Quality Finance Co., Inc. | ||||||||
| CROWN Americas LLC Term Loan B | 4.625% due 05/15/21 (Þ) | 1,410 | 1,304 | ||||||||
| Zero coupon due 10/22/21 | 250 | 249 | Fitness International LLC Term Loan B | ||||||||
| Crown Castle International Corp. | 5.500% due 07/01/20 (Ê) | 748 | 741 | ||||||||
| 5.250% due 01/15/23 | 1,970 | 2,017 | Flexera Software LLC 1st Lien Term | ||||||||
| Crowne Group LLC Term Loan | Loan | ||||||||||
| 6.000% due 09/29/20 | 500 | 493 | 4.500% due 04/02/20 | 969 | 957 | ||||||
| CSC Holdings LLC | Foresight Energy LLC / Foresight Energy | ||||||||||
| 6.750% due 11/15/21 | 700 | 779 | Corp. | ||||||||
| 5.250% due 06/01/24 (Þ) | 350 | 351 | 7.875% due 08/15/21 (Þ) | 10,330 | 10,743 | ||||||
| DaVita HealthCare Partners, Inc. | FPC Holdings Inc First Lien | ||||||||||
| 5.750% due 08/15/22 | 4,900 | 5,194 | 5.250% due 11/27/19 (Ê) | 744 | 728 | ||||||
| DBP Holding Corp. | FPC Holdings, Inc. 2nd Lien Term Loan | ||||||||||
| 7.750% due 10/15/20 (Þ) | 1,565 | 1,389 | 9.250% due 05/19/20 (Å) | 2,000 | 1,940 | ||||||
| Denali Borrower LLC / Denali Finance | Freescale Semiconductor, Ltd. Term | ||||||||||
| Corp. | Loan | ||||||||||
| 5.625% due 10/15/20 (Þ) | 4,255 | 4,513 | 4.250% due 03/01/20 (Ê) | 744 | 733 | ||||||
| Denbury Resources, Inc. | Frontier Communications Corp. | ||||||||||
| 6.375% due 08/15/21 | 1,130 | 1,181 | 7.625% due 04/15/24 | 1,340 | 1,440 | ||||||
| 5.500% due 05/01/22 | 1,405 | 1,384 | Gates Global LLC Term Loan | ||||||||
| Dialysis Newco, Inc. 2nd Lien Term | 4.250% due 07/03/21 (Ê) | 1,000 | 988 | ||||||||
| Loan | GENEX Holdings, Inc. 1st Lien Term | ||||||||||
| 7.750% due 10/25/21 (Ê) | 1,630 | 1,622 | Loan | ||||||||
| DISH DBS Corp. | 5.250% due 05/30/21 | 998 | 990 | ||||||||
| 5.875% due 07/15/22 | 1,410 | 1,495 | Getty Images, Inc. Term Loan B | ||||||||
| Dynegy Finance I, Inc. / Dynegy Finance | 4.750% due 10/18/19 (Ê) | 1,522 | 1,436 | ||||||||
| II Inc | Global Brass & Copper, Inc. | ||||||||||
| 6.750% due 11/01/19 (Å) | 2,500 | 2,587 | 9.500% due 06/01/19 | 1,570 | 1,723 | ||||||
| Dynegy, Inc. | Global TIP Finance B.V. Term Loan | ||||||||||
| 5.875% due 06/01/23 | 80 | 78 | 6.500% due 10/23/20 (Ê) | 1,429 | 1,422 | ||||||
| Education Management LLC / Education | Goodyear Tire & Rubber Co. (The) | ||||||||||
| Management Finance Corp. | 6.500% due 03/01/21 | 1,855 | 1,985 | ||||||||
| 16.000% due 07/01/18 | 875 | 438 | 7.000% due 05/15/22 | 1,230 | 1,338 | ||||||
| Education Management LLC Term Loan | Gray Television, Inc. Term Loan B | ||||||||||
| C3 | 3.750% due 06/13/21 (Ê) | 1,000 | 986 | ||||||||
| 8.250% due 03/30/18 | 1,242 | 551 | Grifols Worldwide Operations, Ltd. | ||||||||
| Emerald 3, Ltd. 2nd Lien Term Loan | 3.155% due 02/27/21 | 746 | 736 | ||||||||
| 8.000% due 05/09/22 | 800 | 784 | GTCR Valor Cos., Inc. 1st Lien Term | ||||||||
| Emerald Performance Materials, LLC | Loan | ||||||||||
| Second Lien Term Loan | 6.000% due 05/30/21 | 568 | 552 | ||||||||
| See accompanying notes which are an integral part of the financial statements. | |||||||||||
| 356 Russell Global Opportunistic Credit Fund | |||||||||||
| Russell Investment Company | |||||||||||
| Russell Global Opportunistic Credit Fund | |||||||||||
| Schedule of Investments, continued — October 31, 2014 | |||||||||||
| Amounts in thousands (except share amounts) | Amounts in thousands (except share amounts) | ||||||||||
| Principal | Fair | Principal | Fair | ||||||||
| Amount ($) | Value | Amount ($) | Value | ||||||||
| or Shares | $ | or Shares | $ | ||||||||
| GTCR Valor Cos., Inc. Delayed Draw | 5.375% due 08/15/22 (Þ) | 2,120 | 2,157 | ||||||||
| Term Loan | Level 3 Financing Inc. Incremental Term | ||||||||||
| 6.000% due 05/30/21 | 431 | 419 | Loan B | ||||||||
| Harbinger Group, Inc. | Zero coupon due 01/31/22 | 750 | 744 | ||||||||
| 7.875% due 07/15/19 | 1,387 | 1,501 | Level 3 Financing, Inc. | ||||||||
| 7.750% due 01/15/22 | 5,813 | 5,900 | 7.000% due 06/01/20 | 1,405 | 1,500 | ||||||
| 7.750% due 01/15/22 (Þ) | 3,580 | 3,625 | 6.125% due 01/15/21 (Þ) | 965 | 1,012 | ||||||
| Harland Clarke Holdings Corp. Term | LIN Television Corp. | ||||||||||
| Loan B4 | 6.375% due 01/15/21 | 1,920 | 1,949 | ||||||||
| 6.000% due 08/04/19 (Ê) | 1,970 | 1,974 | Linn Energy LLC / Linn Energy Finance | ||||||||
| HCA Holdings, Inc. | Corp. | ||||||||||
| 6.250% due 02/15/21 | 1,740 | 1,873 | 6.500% due 05/15/19 | 2,645 | 2,473 | ||||||
| Heartland Dental Care LLC Term Loan | 6.250% due 11/01/19 | 725 | 667 | ||||||||
| 9.750% due 06/21/19 | 2,200 | 2,216 | Lonestar Resources America, Inc. | ||||||||
| Heartland Dental Care LLC Term Loan | 8.750% due 04/15/19 (Þ) | 1,010 | 929 | ||||||||
| B1 | LTS Buyer LLC 2nd Lien Term Loan | ||||||||||
| 5.500% due 12/21/18 (Ê) | 2,408 | 2,402 | 8.000% due 04/01/21 (Ê) | 120 | 119 | ||||||
| HGIM Corp. Term Loan B | M/A-COM Technology Solutions | ||||||||||
| 5.500% due 06/18/20 (Ê) | 746 | 708 | Holdings, Inc. Term Loan | ||||||||
| Hockey Merger Sub 2, Inc. | 4.500% due 05/08/21 | 636 | 633 | ||||||||
| 7.875% due 10/01/21 (Þ) | 2,220 | 2,314 | McJunkin Red Man Corp. 1st Lien Term | ||||||||
| HUB International, Ltd. 1st Lien Term | Loan B | ||||||||||
| Loan B | 5.000% due 11/09/19 (Ê) | 2,941 | 2,944 | ||||||||
| 4.750% due 10/02/20 (Ê) | 893 | 881 | Meccanica Holdings USA, Inc. | ||||||||
| Hyperion Insurance Group Term Loan B | 6.250% due 07/15/19 (Þ) | 430 | 461 | ||||||||
| 5.750% due 10/04/19 | 1,000 | 999 | Medpace Holdings, Inc. 1st Lien Term | ||||||||
| Ikaria, Inc. 1st Lien Term Loan | Loan B | ||||||||||
| 5.000% due 02/12/21 | 471 | 471 | 4.750% due 04/01/21 | 953 | 947 | ||||||
| Ikaria, Inc. 2nd Lien Term Loan | Memorial Production Partners, LP / | ||||||||||
| 8.750% due 02/12/22 (Ê) | 500 | 500 | Memorial Production Finance Corp. | ||||||||
| IMG Worldwide Holdings LLC 1st Lien | 7.625% due 05/01/21 | 3,600 | 3,487 | ||||||||
| Term | 6.875% due 08/01/22 (Þ) | 3,470 | 3,140 | ||||||||
| 5.250% due 05/06/21 (Ê) | 1,496 | 1,470 | Mergermarket USA, Inc. 1st Lien Term | ||||||||
| Inmar, Inc. 1st Lien Term Loan | Loan | ||||||||||
| 4.250% due 01/27/21 (Ê) | 998 | 973 | 4.500% due 02/04/21 (Ê) | 995 | 949 | ||||||
| Inmar, Inc. 2nd Lien Term Loan | Milacron LLC / Mcron Finance Corp. | ||||||||||
| 8.000% due 01/27/22 | 1,000 | 990 | 7.750% due 02/15/21 (Þ) | 1,610 | 1,674 | ||||||
| Interactive Data Corp. Term Loan | Millennium Laboratories, Inc. Term | ||||||||||
| 4.750% due 05/02/21 (Ê) | 1,496 | 1,496 | Loan B | ||||||||
| Intrawest Operations Group, LLC Term | 5.250% due 04/16/21 (Ê) | 748 | 748 | ||||||||
| Loan | Mitchell International, Inc. 1st Lien | ||||||||||
| 5.500% due 12/09/20 | 1,980 | 1,978 | Term Loan | ||||||||
| Intrepid Aviation Group Holdings | 4.250% due 10/12/20 | 744 | 737 | ||||||||
| 6.875% due 02/15/19 | 1,985 | 1,970 | Mitchell International, Inc. 2nd Lien | ||||||||
| ION Media Networks, Inc. Term Loan | Term Loan | ||||||||||
| 5.000% due 12/18/20 | 993 | 990 | 8.500% due 10/11/21 (Ê) | 500 | 498 | ||||||
| Isle of Capri Casinos, Inc. | Mood Media Corp. Term Loan | ||||||||||
| 8.875% due 06/15/20 | 1,223 | 1,309 | 7.000% due 05/01/19 | 746 | 729 | ||||||
| Jaguar Holding Co. I | MPG Holdco I, Inc. Term Loan B | ||||||||||
| 9.375% due 10/15/17 (Þ) | 4,040 | 4,136 | 4.500% due 10/20/21 | 500 | 500 | ||||||
| Jarden Corp. | MPH Acquisition Holdings LLC | ||||||||||
| 3.750% due 10/01/21 (Þ) | 1,845 | 2,341 | 6.625% due 04/01/22 (Å) | 720 | 753 | ||||||
| JBS USA LLC / JBS USA Finance, Inc. | MSC Software Corp. 1st Lien Term Loan | ||||||||||
| 8.250% due 02/01/20 (Þ) | 635 | 679 | 5.000% due 05/29/20 (Ê) | 1,496 | 1,481 | ||||||
| 7.250% due 06/01/21 (Þ) | 2,900 | 3,088 | National Mentor Holdings, Inc. Term | ||||||||
| 5.875% due 07/15/24 | 120 | 121 | Loan | ||||||||
| Laredo Petroleum, Inc. | 4.750% due 01/31/21 (Ê) | 774 | 767 | ||||||||
| 5.625% due 01/15/22 | 2,200 | 2,167 | Natural Resource Partners LP | ||||||||
| Legacy Reserves, LP / Legacy Reserves | 9.125% due 10/01/18 | 1,175 | 1,175 | ||||||||
| Finance Corp. | Neiman Marcus Group, Ltd. LLC | ||||||||||
| 8.000% due 12/01/20 | 510 | 514 | 8.750% due 10/15/21 (Þ) | 1,990 | 2,129 | ||||||
| 6.625% due 12/01/21 | 2,200 | 2,134 | Neiman Marcus Group, Ltd. LLC Term | ||||||||
| 6.625% due 12/01/21 (Þ) | 830 | 805 | Loan | ||||||||
| Level 3 Escrow II, Inc. | 4.250% due 10/25/20 (Ê) | 744 | 734 | ||||||||
| See accompanying notes which are an integral part of the financial statements. | |||||||||||
| Russell Global Opportunistic Credit Fund 357 | |||||||||||
Russell Investment Company
Russell Global Opportunistic Credit Fund
Schedule of Investments, continued — October 31, 2014
| Amounts in thousands (except share amounts) | Amounts in thousands (except share amounts) | ||||||||||
| Principal | Fair | Principal | Fair | ||||||||
| Amount ($) | Value | Amount ($) | Value | ||||||||
| or Shares | $ | or Shares | $ | ||||||||
| Neuberger Berman Group LLC / | Pipeline Supply and Service LLC Term | ||||||||||
| Neuberger Berman Finance Corp. | Loan B | ||||||||||
| 5.875% due 03/15/22 (Þ) | 635 | 673 | 5.500% due 01/28/20 | 497 | 494 | ||||||
| North Atlantic Trading Co., Inc. Term | Pittsburgh Glass Works LLC | ||||||||||
| Loan | 8.000% due 11/15/18 (Þ) | 1,395 | 1,465 | ||||||||
| Zero coupon due 01/13/20 (Ê) | 2,690 | 2,704 | Planet Fitness Holdings LLC Term Loan | ||||||||
| NRG Energy, Inc. | 4.750% due 03/10/21 | 1,851 | 1,851 | ||||||||
| 6.250% due 07/15/22 | 1,500 | 1,567 | Plastipak Holdings, Inc. | ||||||||
| 6.625% due 03/15/23 | 2,440 | 2,574 | 6.500% due 10/01/21 (Þ) | 1,180 | 1,215 | ||||||
| NTELOS Inc Term Loan B | Polymer Group, Inc. | ||||||||||
| 5.750% due 11/09/19 (Ê) | 744 | 743 | 7.750% due 02/01/19 | 2,048 | 2,130 | ||||||
| Nuance Communications, Inc. | Portillo's Holdings, LLC First Lien Term | ||||||||||
| 5.375% due 08/15/20 (Þ) | 5,480 | 5,507 | Loan | ||||||||
| NVA Holdings, Inc. 2nd Lien Term Loan | 4.750% due 08/01/21 (Ê) | 750 | 739 | ||||||||
| 8.000% due 08/14/22 | 250 | 248 | Portillo's Holdings, LLC Second Lien | ||||||||
| Oasis Petroleum, Inc. | Term Loan | ||||||||||
| 6.875% due 01/15/23 | 1,920 | 1,997 | 8.000% due 08/01/22 (Ê) | 250 | 248 | ||||||
| Opal Acquisition, Inc. | Post Holdings, Inc. | ||||||||||
| 8.875% due 12/15/21 (Þ) | 470 | 491 | 6.000% due 12/15/22 | 1,815 | 1,751 | ||||||
| Opal Acquisition, Inc. 1st Lien Term | Post Holdings, Inc. Incremental Term | ||||||||||
| Loan B | Loan | ||||||||||
| 5.000% due 11/27/20 (Ê) | 2,630 | 2,617 | 3.750% due 06/02/21 | 1,995 | 1,985 | ||||||
| Open Text Corp. Term Loan B | PowerTeam Services, LLC 2nd Lien | ||||||||||
| 3.250% due 01/04/21 | 993 | 979 | Term Loan | ||||||||
| Optima Specialty Steel, Inc. | 8.250% due 11/06/20 (Ê) | 500 | 485 | ||||||||
| 12.500% due 12/15/16 (Þ) | 2,030 | 2,162 | Preferred Proppants LLC Term Loan | ||||||||
| 16.000% due 12/30/16 (Å) | 1,950 | 2,106 | 6.750% due 08/12/20 | 500 | 475 | ||||||
| Orbitz Worldwide, Inc. Term Loan B | Premier Foods Finance PLC | ||||||||||
| 4.500% due 04/15/21 | 995 | 985 | 6.500% due 03/15/21 | 950 | 1,366 | ||||||
| OSP Group, Inc. Term Loan B | Presidio, Inc. Term 1st Lien Loan B | ||||||||||
| 4.500% due 03/17/21 (Ê) | 746 | 743 | 5.000% due 03/31/17 (Ê) | 633 | 631 | ||||||
| P2 Newco Acquisition Inc. 2nd Lien | PVH Corp. Term Loan B | ||||||||||
| Term Loan | 3.250% due 02/13/20 (Ê) | 627 | 627 | ||||||||
| 9.500% due 10/22/21 (Ê) | 750 | 735 | Qualitytech, LP/QTS Finance Corp. | ||||||||
| Peabody Energy Corp. | 5.875% due 08/01/22 (Þ) | 2,150 | 2,161 | ||||||||
| 6.000% due 11/15/18 | 920 | 890 | RCN Telecom Services LLC / RCN | ||||||||
| 6.500% due 09/15/20 | 330 | 314 | Capital Corp. | ||||||||
| 8.500% due 08/15/20 (Þ) | 330 | 346 | |||||||||
| 6.250% due 11/15/21 | 3,480 | 3,295 | Regency Energy Partners, LP / Regency | ||||||||
| Peak 10 Corp. 1st Lien Term Loan | Energy Finance Corp. | ||||||||||
| 5.000% due 06/17/21 | 998 | 992 | |||||||||
| Penn Virginia Resource Partners, LP | 5.875% due 03/01/22 | 2,030 | 2,162 | ||||||||
| / Penn Virginia Resource Finance | Renaissance Learning, Inc. Term Loan | ||||||||||
| 4.500% due 04/10/21 (Ê) | 995 | 976 | |||||||||
| Corp. | Rent-A-Center, Inc. | ||||||||||
| 6.500% due 05/15/21 | 725 | 772 | 6.625% due 11/15/20 | 3,100 | 2,991 | ||||||
| PFS Acquisition LLC 2nd Lien Term | |||||||||||
| Loan | RentPath, Inc. Term Loan B | ||||||||||
| 8.250% due 01/31/22 (Ê) | 2,090 | 1,573 | 6.250% due 05/29/20 | 1,990 | 1,985 | ||||||
| ResCare, Inc. | |||||||||||
| PFS Holding Corp. | 10.750% due 01/15/19 | 30 | 32 | ||||||||
| 4.500% due 01/31/21 (Ê) | 998 | 843 | |||||||||
| PGX Holdings, Inc. 1st Lien Term Loan | Rex Energy Corp. | ||||||||||
| 6.250% due 08/01/22 (Þ) | 2,220 | 2,087 | |||||||||
| 6.250% due 09/29/20 | 500 | 496 | Reynolds Group Issuer, Inc. / Reynolds | ||||||||
| Pharmedium Healthcare Corp. 2nd Lien | |||||||||||
| Term Loan | Group Issuer LLC / Reynolds Group | ||||||||||
| 7.750% due 01/28/22 (Ê) | 1,840 | 1,835 | Issuer Lu | ||||||||
| PHI, Inc. | 5.750% due 10/15/20 | 2,065 | 2,148 | ||||||||
| 5.250% due 03/15/19 | 1,920 | 1,897 | 6.875% due 02/15/21 | 5 | 5 | ||||||
| Physio-Control International, Inc. | 8.250% due 02/15/21 | 1,000 | 1,075 | ||||||||
| 9.875% due 01/15/19 (Þ) | 1,062 | 1,144 | Rite Aid Corp. | ||||||||
| Pilot Travel Centers LLC Term Loan B | 6.750% due 06/15/21 | 5,670 | 6,053 | ||||||||
| 4.250% due 10/03/21 | 500 | 500 | Roundy's Supermarkets, Inc. 1st Lien | ||||||||
| Pinnacle Entertainment, Inc. | Term Loan B | ||||||||||
| 7.500% due 04/15/21 | 1,500 | 1,601 | 5.750% due 03/03/21 (Ê) | 995 | 883 | ||||||
| 6.375% due 08/01/21 | 1,230 | 1,316 | Rovi Solutions Corp. Syndicated Loans | ||||||||
| Term Loan B | |||||||||||
| 7.750% due 04/01/22 | 1,125 | 1,229 | 3.750% due 07/02/21 | 998 | 969 | ||||||
| See accompanying notes which are an integral part of the financial statements. | |||||||||||
| 358 Russell Global Opportunistic Credit Fund | |||||||||||
Russell Investment Company
Russell Global Opportunistic Credit Fund
Schedule of Investments, continued — October 31, 2014
| Amounts in thousands (except share amounts) | Amounts in thousands (except share amounts) | ||||||||||
| Principal | Fair | Principal | Fair | ||||||||
| Amount ($) | Value | Amount ($) | Value | ||||||||
| or Shares | $ | or Shares | $ | ||||||||
| RP Crown Parent LLC Term Loan | Suncoke Energy Partnership LP/FI | ||||||||||
| 6.000% due 12/21/18 | 993 | 960 | 7.375% due 02/01/20 | 810 | 846 | ||||||
| Ryerson, Inc. / Joseph T Ryerson & Son | Sungard Availability Services Capital, | ||||||||||
| Inc | Inc. | ||||||||||
| 9.000% due 10/15/17 | 2,430 | 2,558 | 8.750% due 04/01/22 | 2,325 | 1,709 | ||||||
| Sabine Pass Liquefaction LLC | Sungard Availability Services Capital, | ||||||||||
| 5.625% due 02/01/21 | 3,047 | 3,192 | Inc. Term Loan | ||||||||
| 6.250% due 03/15/22 (Þ) | 220 | 237 | 6.000% due 03/31/19 (Ê) | 1,493 | 1,328 | ||||||
| Salix Pharmaceuticals, Ltd. | Symbion, Inc. | ||||||||||
| 4.250% due 01/02/20 (Ê) | 1,444 | 1,442 | 8.000% due 06/15/16 | 1,020 | 1,056 | ||||||
| SBA Telecommunications, Inc. | TCH-2 Holdings LLC 1st Lien Term | ||||||||||
| 5.750% due 07/15/20 | 140 | 146 | Loan | ||||||||
| Scientific Games International, Inc. | 5.500% due 05/12/21 (Ê) | 399 | 394 | ||||||||
| 6.250% due 09/01/20 | 3,780 | 3,024 | TCH-2 Holdings LLC 2nd Lien Term | ||||||||
| Scientific Games International, Inc. Term | Loan | ||||||||||
| Loan | 8.750% due 11/12/21 (Ê) | 500 | 479 | ||||||||
| 4.250% due 10/18/20 (Ê) | 2,233 | 2,184 | Tempur Sealy International, Inc. | ||||||||
| Sequa Corp. | 6.875% due 12/15/20 | 2,660 | 2,840 | ||||||||
| 7.000% due 12/15/17 (Þ) | 3,465 | 2,945 | Tenet Healthcare Corp. | ||||||||
| Shale-Inland Holdings LLC / Shale- | 6.000% due 10/01/20 | 4,520 | 4,859 | ||||||||
| Inland Finance Corp. | Tesoro Logistics, LP / Tesoro Logistics | ||||||||||
| 8.750% due 11/15/19 (Þ) | 2,030 | 2,101 | Finance Corp. | ||||||||
| Signode Industrial Group US, Inc. Term | 5.500% due 10/15/19 (Å) | 1,890 | 1,942 | ||||||||
| Loan B | The Active Network, Inc. 1st Lien Term | ||||||||||
| 4.000% due 03/21/21 | 1,289 | 1,264 | Loan | ||||||||
| Sinclair Television Group, Inc. | 5.500% due 11/15/20 (Ê) | 746 | 738 | ||||||||
| 5.375% due 04/01/21 | 465 | 466 | Time, Inc. | ||||||||
| 6.375% due 11/01/21 | 665 | 693 | 5.750% due 04/15/22 (Þ) | 2,505 | 2,449 | ||||||
| Sirius XM Holdings, Inc. | T-Mobile USA, Inc. | ||||||||||
| 5.750% due 08/01/21 (Þ) | 2,030 | 2,106 | 5.250% due 09/01/18 | 270 | 280 | ||||||
| Sirius XM Radio, Inc. | 6.542% due 04/28/20 | 880 | 928 | ||||||||
| 5.875% due 10/01/20 (Þ) | 3,830 | 4,041 | 6.633% due 04/28/21 | 1,015 | 1,070 | ||||||
| SIRVA Worldwide, Inc. | 6.000% due 03/01/23 | 1,805 | 1,859 | ||||||||
| 7.500% due 03/27/19 (Ê) | 1,478 | 1,492 | TMS International Corp. | ||||||||
| Six Flags Entertainment Corp. | 7.625% due 10/15/21 (Þ) | 2,420 | 2,529 | ||||||||
| 5.250% due 01/15/21 (Þ) | 1,960 | 1,970 | TNT Crane & Rigging Inc. 1st Lien Term | ||||||||
| Skillsoft 2nd Lien Term Loan | Loan | ||||||||||
| 7.750% due 04/22/22 | 3,080 | 2,906 | 5.500% due 11/27/20 | 993 | 980 | ||||||
| Smithfield Foods, Inc. | TNT Crane & Rigging Inc. 2nd Lien | ||||||||||
| 6.625% due 08/15/22 | 2,200 | 2,398 | Term Loan | ||||||||
| Spansion LLC Term Loan B | 10.000% due 11/27/21 (Ê) | 250 | 247 | ||||||||
| 7.500% due 12/19/19 (Ê) | 1,489 | 1,461 | Tower Development Corp. Term Loan | ||||||||
| Spectrum Brands, Inc. Term Loan C | 9.000% due 01/02/17 | 2,580 | 2,580 | ||||||||
| 3.500% due 09/04/19 (Ê) | 497 | 492 | Toys "R" Us Property Co. I LLC Term | ||||||||
| Sprint Communications, Inc. | Loan B | ||||||||||
| 7.000% due 08/15/20 | 115 | 122 | 6.000% due 08/21/19 | 1,747 | 1,656 | ||||||
| 6.000% due 11/15/22 | 1,335 | 1,332 | Toys R Us Property Co. II LLC | ||||||||
| Sprint Corp. | 8.500% due 12/01/17 | 600 | 600 | ||||||||
| 7.250% due 09/15/21 (Þ) | 3,595 | 3,802 | TransDigm, Inc. | ||||||||
| Steak N' Shake Operations, Inc. Term | 5.500% due 10/15/20 | 4,280 | 4,280 | ||||||||
| Loan | 6.000% due 07/15/22 | 710 | 718 | ||||||||
| 4.750% due 03/19/21 (Ê) | 746 | 743 | 6.500% due 07/15/24 | 530 | 546 | ||||||
| Stena International SA Term Loan B | Tribune Media Co. Term Loan | ||||||||||
| 4.000% due 03/03/21 | 1,493 | 1,463 | 4.000% due 12/27/20 (Ê) | 1,000 | 991 | ||||||
| Stone Energy Corp. | Tronox Finance LLC | ||||||||||
| 7.500% due 11/15/22 | 1,805 | 1,683 | 6.375% due 08/15/20 | 1,770 | 1,819 | ||||||
| Stuart Weitzman Acquisition Co LLC | TV Borrower U.S. LLC, Term Loan B | ||||||||||
| Term Loan | 6.000% due 07/08/21 | 1,000 | 977 | ||||||||
| 4.500% due 03/04/20 (Ê) | 748 | 732 | TWCC Holding Corp. 2nd Lien Term | ||||||||
| Suburban Propane Partners, LP/ | Loan | ||||||||||
| Suburban Energy Finance Corp. | 7.000% due 06/26/20 (Ê) | 1,000 | 980 | ||||||||
| 7.375% due 08/01/21 | 2,200 | 2,365 | Twin River Management Group, Inc. | ||||||||
| Summit Materials LLC / Summit | 5.250% due 07/10/20 | 998 | 993 | ||||||||
| Materials Finance Corp. | U.S. Renal Care, Inc. 1st Lien Term Loan | ||||||||||
| 10.500% due 01/31/20 | 3,360 | 3,755 | 4.250% due 07/03/19 (Ê) | 1,606 | 1,594 | ||||||
| See accompanying notes which are an integral part of the financial statements. | |||||||||||
| Russell Global Opportunistic Credit Fund 359 | |||||||||||
| Russell Investment Company | ||||||||||||
| Russell Global Opportunistic Credit Fund | ||||||||||||
| Schedule of Investments, continued — October 31, 2014 | ||||||||||||
| Amounts in thousands (except share amounts) | Amounts in thousands (except share amounts) | |||||||||||
| Principal | Fair | Principal | Fair | |||||||||
| Amount ($) | Value | Amount ($) | Value | |||||||||
| or Shares | $ | or Shares | $ | |||||||||
| U.S. Renal Care, Inc. 2nd Lien Term | 5.100% due 06/18/50 | 4,150 | 4,114 | |||||||||
| Loan | 6,577 | |||||||||||
| 8.500% due 07/03/20 | 910 | 910 | Venezuela, Bolivarian Republic of - 2.3% | |||||||||
| United Rentals NA, Inc. | Petroleos de Venezuela SA | |||||||||||
| 7.625% due 04/15/22 | 2,045 | 2,280 | 5.125% due 10/28/16 | 325 | 242 | |||||||
| United Surgical Partners International, | 9.000% due 11/17/21 | 3,168 | 2,008 | |||||||||
| Inc. | ||||||||||||
| 9.000% due 04/01/20 | 2,070 | 2,236 | 6.000% due 05/16/24 | 10,122 | 5,207 | |||||||
| Univision Communications, Inc. | 6.000% due 11/15/26 | 904 | 442 | |||||||||
| 6.875% due 05/15/19 (Þ) | 1,870 | 1,966 | 9.750% due 05/17/35 | 2,232 | 1,363 | |||||||
| 6.750% due 09/15/22 (Þ) | 104 | 115 | Series REGS | |||||||||
| US Ecology, Inc. Term Loan | 5.250% due 04/12/17 | 2,648 | 1,755 | |||||||||
| 3.750% due 06/07/21 | 998 | 992 | 8.500% due 11/02/17 | 11,528 | 8,731 | |||||||
| US Foods, Inc. | Venezuela Government International | |||||||||||
| 8.500% due 06/30/19 | 9,410 | 9,916 | Bond | |||||||||
| US Shipping Corp. Term Loan | 5.750% due 02/26/16 | 6,892 | 5,858 | |||||||||
| 5.500% due 04/30/18 | 500 | 488 | 7.750% due 10/13/19 | 6,388 | 4,136 | |||||||
| UTEX Industries, Inc. 1st Lien Term | 6.000% due 12/09/20 | 1,778 | 1,058 | |||||||||
| Loan B | 9.000% due 05/07/23 | 997 | 641 | |||||||||
| 5.000% due 05/22/21 (Ê) | 1,197 | 1,180 | 8.250% due 10/13/24 | 1,022 | 617 | |||||||
| UTEX Industries, Inc. 2nd Lien Term | Series REGS | |||||||||||
| Loan B | 13.625% due 08/15/18 | 1,024 | 833 | |||||||||
| 8.250% due 05/22/22 (Ê) | 1,910 | 1,885 | 12.750% due 08/23/22 | 795 | 632 | |||||||
| Valeant Pharmaceuticals International | 11.950% due 08/05/31 | 2,999 | 2,181 | |||||||||
| 6.750% due 08/15/21 (Þ) | 1,175 | 1,213 | ||||||||||
| Veyance Technologies, Inc. Term Loan | Virgin Islands, British - 0.6% | 35,704 | ||||||||||
| 5.250% due 09/08/17 (Ê) | 925 | 922 | ||||||||||
| Vince Intermediate Holding LLC Term | Sinochem Offshore Capital Company | |||||||||||
| Loan | 3.250% due 04/29/19 (Þ) | 1,958 | 1,987 | |||||||||
| 6.000% due 11/04/19 | 583 | 582 | Sinochem Overseas Capital Co., Ltd. | |||||||||
| Virgin Media Secured Finance PLC | 4.500% due 11/12/20 (Þ) | 6,446 | 6,872 | |||||||||
| 6.000% due 04/15/21 | 280 | 468 | Series REGS | |||||||||
| Visant Corp. Term Loan | 4.500% due 11/12/20 | 353 | 376 | |||||||||
| 7.000% due 09/23/21 | 1,000 | 985 | Sinopec Capital 2013, Ltd. | |||||||||
| VWR Funding, Inc. | 3.125% due 04/24/23 (Þ) | 573 | 547 | |||||||||
| 7.250% due 09/15/17 | 2,640 | 2,772 | 9,782 | |||||||||
| Walker & Dunlop, Inc. Term Loan B | Total Long-Term Fixed Income | |||||||||||
| 5.500% due 12/20/20 (Ê) | 993 | 980 | Investments | |||||||||
| Walter Investment Management Corp. | (cost $1,448,176) | 1,421,656 | ||||||||||
| 7.875% due 12/15/21 (Þ) | 1,805 | 1,697 | ||||||||||
| Washington Inventory Service 2nd Lien | Short-Term Investments - 8.7% | |||||||||||
| Term Loan | Argentina - 0.6% | |||||||||||
| 10.250% due 06/18/19 | 2,600 | 2,556 | Argentina Boden Bonds | |||||||||
| WESCO Distribution, Inc. | ||||||||||||
| 5.375% due 12/15/21 | 1,590 | 1,598 | 7.000% due 10/03/15 | 10,112 | 9,505 | |||||||
| West Corp. | Colombia - 0.4% | |||||||||||
| Colombia Government International | ||||||||||||
| 5.375% due 07/15/22 | 2,615 | 2,537 | Bond | |||||||||
| Windstream Corp. | ||||||||||||
| 7.750% due 10/01/21 | 575 | 615 | 12.000% due 10/22/15 | COP | 12,678,000 | 6,535 | ||||||
| 7.500% due 04/01/23 | 620 | 651 | Kazakhstan - 0.0% | |||||||||
| KazMunayGas National Co. JSC | ||||||||||||
| WMG Acquisition Corp. | Series REGS | |||||||||||
| 6.750% due 04/15/22 (Þ) | 3,650 | 3,595 | ||||||||||
| Series REGS | 11.750% due 01/23/15 | 842 | 859 | |||||||||
| 6.250% due 01/15/21 | 1,602 | 2,068 | Mexico - 0.0% | |||||||||
| Yankee Cable Acquisition LLC Term | Mexican Bonos | |||||||||||
| Loan B | Series MI10 | |||||||||||
| 4.500% due 03/01/20 | 738 | 734 | 9.500% due 12/18/14 | MXN | 2,378 | 178 | ||||||
| Zebra Technologies Corp. | Malaysia - 0.0% | |||||||||||
| 7.250% due 10/15/22 (Å) | 2,310 | 2,431 | Series 0312 | |||||||||
| 3.197% due 10/15/15 | MYR | 1,275 | 387 | |||||||||
| 546,587 | Nigeria - 0.1% | |||||||||||
| Uruguay - 0.4% | NGO Mobile | |||||||||||
| Uruguay Government International Bond | ||||||||||||
| 4.500% due 08/14/24 | 2,335 | 2,463 | 0.010% due 11/27/14 (~) | NGN | 62,900 | 377 | ||||||
| Nigeria Treasury Bills | ||||||||||||
| Zero coupon due 11/27/14 (~) | NGN | — | — | |||||||||
| See accompanying notes which are an integral part of the financial statements. | ||||||||||||
| 360 Russell Global Opportunistic Credit Fund | ||||||||||||
Russell Investment Company
Russell Global Opportunistic Credit Fund
Schedule of Investments, continued — October 31, 2014
| Amounts in thousands (except share amounts) | ||||
| Principal | Fair | |||
| Amount ($) | Value | |||
| or Shares | $ | |||
| Zero coupon due 12/18/14 (~) | NGN | 100,071 | 595 | |
| Zero coupon due 01/08/15 (~) | NGN | 56,000 | 331 | |
| Zero coupon due 02/05/15 (~) | NGN | 81,070 | 477 | |
| 1,780 | ||||
| Turkey - 0.1% | ||||
| Turkey Government Bond | ||||
| 6.500% due 01/07/15 | TRY | 2,300 | 1,031 | |
| Ukraine - 0.1% | ||||
| Ukraine Government International Bond | ||||
| Series REGS | ||||
| 4.950% due 10/13/15 | EUR | 780 | 883 | |
| United States - 7.4% | ||||
| Russell U.S. Cash Management Fund | 117,148,488 (8) | 117,148 | ||
| Venezuela, Bolivarian Republic of - 0.0% | ||||
| Petroleos de Venezuela SA | ||||
| Series 2015 | ||||
| 5.000% due 10/28/15 | 806 | 713 | ||
| Total Short-Term Investments | ||||
| (cost $139,701) | 139,019 | |||
| Total Investments 98.2% | ||||
| (identified cost $1,587,877) | 1,560,675 | |||
| Other Assets and Liabilities, Net | ||||
| - 1.8% | 28,191 | |||
| Net Assets - 100.0% | 1,588,866 | |||
See accompanying notes which are an integral part of the financial statements.
Russell Global Opportunistic Credit Fund 361
| Russell Investment Company | |||||||||||||||
| Russell Global Opportunistic Credit Fund | |||||||||||||||
| Schedule of Investments, continued — October 31, 2014 | |||||||||||||||
| Restricted Securities | |||||||||||||||
| Amounts in thousands (except share and cost per unit amounts) | |||||||||||||||
| Principal | Cost per | Cost | Fair Value | ||||||||||||
| % of Net Assets | Acquisition | Amount ($) | Unit | (000 | ) | (000 | ) | ||||||||
| Securities | Date | or shares | $ | $ | $ | ||||||||||
| 1.5% | |||||||||||||||
| BMBG Bond Finance SCA | 04/09/14 | EUR | 1,325,000 | 138.57 | 1,836 | 1,664 | |||||||||
| Building Materials Corp. of America | 10/27/14 | 2,555,000 | 100.00 | 2,555 | 2,561 | ||||||||||
| Dynegy Finance I, Inc. / Dynegy Finance II Inc | 10/14/14 | 2,500,000 | 100.00 | 2,500 | 2,587 | ||||||||||
| FMG Resources Pty, Ltd. | 10/22/14 | 825,000 | 105.61 | 871 | 856 | ||||||||||
| FPC Holdings, Inc. 2nd Lien Term Loan | 05/23/13 | 2,000,000 | 98.00 | 1,960 | 1,940 | ||||||||||
| MPH Acquisition Holdings LLC | 10/03/14 | 720,000 | 102.92 | 741 | 753 | ||||||||||
| New Red Finance, Inc. | 09/24/14 | 3,780,000 | 99.90 | 3,776 | 3,832 | ||||||||||
| Optima Specialty Steel, Inc. | 01/31/13 | 1,950,000 | 98.74 | 1,925 | 2,106 | ||||||||||
| Schaeffler Holding Finance BV | 10/21/14 | EUR | 1,300,000 | 125.35 | 1,630 | 1,682 | |||||||||
| Sensata Technologies BV | 10/07/14 | 1,270,000 | 100.00 | 1,270 | 1,341 | ||||||||||
| SPCM SA | 10/16/14 | 250,000 | 104.73 | 262 | 262 | ||||||||||
| Tesoro Logistics, LP / Tesoro Logistics Finance Corp. | 10/22/14 | 1,890,000 | 101.01 | 1,909 | 1,942 | ||||||||||
| Zebra Technologies Corp. | 09/30/14 | 2,310,000 | 100.37 | 2,319 | 2,431 | ||||||||||
| 23,957 | |||||||||||||||
| For a description of restricted securities see note 9 in the Notes to Financial Statements. | |||||||||||||||
| Futures Contracts | |||||||||||||||
| Amounts in thousands (except contract amounts) | |||||||||||||||
| Unrealized | |||||||||||||||
| Appreciation | |||||||||||||||
| Number of | Notional | Expiration | (Depreciation) | ||||||||||||
| Contracts | Amount | Date | $ | ||||||||||||
| Long Positions | |||||||||||||||
| United States Treasury 5 Year Note Futures | 479 | USD | 57,207 | 12/14 | 417 | ||||||||||
| United States Treasury Long Bond Futures | 184 | USD | 25,961 | 12/14 | 400 | ||||||||||
| Short Positions | |||||||||||||||
| United States Treasury 2 Year Note Futures | 360 | USD | 79,042 | 12/14 | (237 | ) | |||||||||
| Total Unrealized Appreciation (Depreciation) on Open Futures Contracts (å) | 580 | ||||||||||||||
| Foreign Currency Exchange Contracts | |||||||||||||||
| Amounts in thousands | |||||||||||||||
| Unrealized | |||||||||||||||
| Appreciation | |||||||||||||||
| Amount | Amount | (Depreciation) | |||||||||||||
| Counterparty | Sold | Bought | Settlement Date | $ | |||||||||||
| Bank of America | USD | 770 | BRL | 1,883 | 11/04/14 | (10 | ) | ||||||||
| Bank of America | USD | 750 | BRL | 1,883 | 12/02/14 | 3 | |||||||||
| Bank of America | USD | 1,727 | MXN | 23,340 | 12/10/14 | 2 | |||||||||
| Bank of America | USD | 570 | PEN | 1,668 | 12/10/14 | (2 | ) | ||||||||
| Bank of America | USD | 236 | ZAR | 2,623 | 12/10/14 | — | |||||||||
| Bank of America | BRL | 1,883 | USD | 756 | 11/04/14 | (4 | ) | ||||||||
| Bank of America | MXN | 23,340 | USD | 1,731 | 11/06/14 | (2 | ) | ||||||||
| Bank of America | MXN | 10,142 | USD | 750 | 12/10/14 | (1 | ) | ||||||||
| Bank of New York | USD | 854 | AUD | 979 | 11/07/14 | 7 | |||||||||
| Bank of New York | USD | 555 | EUR | 439 | 11/07/14 | (5 | ) | ||||||||
| Bank of New York | AUD | 2,229 | USD | 1,945 | 11/07/14 | (16 | ) | ||||||||
| Bank of New York | CAD | 782 | USD | 699 | 11/07/14 | 5 | |||||||||
| Bank of New York | CAD | 1,864 | USD | 1,667 | 11/07/14 | 13 | |||||||||
| Bank of New York | EUR | 792 | USD | 1,000 | 11/07/14 | 8 | |||||||||
| Bank of New York | JPY | 31,825 | USD | 290 | 11/07/14 | 7 | |||||||||
| Bank of New York | JPY | 276,332 | USD | 2,520 | 11/07/14 | 60 | |||||||||
| Barclays | USD | 930 | BRL | 2,282 | 11/04/14 | (9 | ) | ||||||||
| Barclays | USD | 1,657 | BRL | 3,987 | 11/04/14 | (48 | ) | ||||||||
| Barclays | USD | 615 | COP | 1,265,125 | 11/06/14 | (1 | ) | ||||||||
| Barclays | USD | 1,218 | COP | 2,469,677 | 11/06/14 | (18 | ) | ||||||||
| Barclays | USD | 1,270 | EUR | 1,004 | 11/06/14 | (12 | ) | ||||||||
| Barclays | USD | 13,137 | EUR | 10,295 | 11/06/14 | (236 | ) | ||||||||
| Barclays | USD | 1,586 | HUF | 384,700 | 11/06/14 | (22 | ) | ||||||||
| Barclays | USD | 1,682 | HUF | 407,296 | 11/06/14 | (25 | ) | ||||||||
| See accompanying notes which are an integral part of the financial statements. | |||||||||||||||
| 362 Russell Global Opportunistic Credit Fund | |||||||||||||||
| Russell Investment Company | |||||||
| Russell Global Opportunistic Credit Fund | |||||||
| Schedule of Investments, continued — October 31, 2014 | |||||||
| Foreign Currency Exchange Contracts | |||||||
| Amounts in thousands | |||||||
| Unrealized | |||||||
| Appreciation | |||||||
| Amount | Amount | (Depreciation) | |||||
| Counterparty | Sold | Bought | Settlement Date | $ | |||
| Barclays | USD | 10,523 | IDR | 127,698,814 | 11/06/14 | 40 | |
| Barclays | USD | 650 | INR | 39,783 | 11/07/14 | (2 | ) |
| Barclays | USD | 1,064 | INR | 65,587 | 11/07/14 | 3 | |
| Barclays | USD | 1,542 | INR | 95,134 | 12/10/14 | (4 | ) |
| Barclays | USD | 410 | MXN | 5,541 | 11/06/14 | 1 | |
| Barclays | USD | 560 | MXN | 7,522 | 11/06/14 | (1 | ) |
| Barclays | USD | 750 | MXN | 10,152 | 11/06/14 | 4 | |
| Barclays | USD | 870 | MXN | 11,689 | 11/06/14 | (2 | ) |
| Barclays | USD | 1,229 | MXN | 16,627 | 11/06/14 | 5 | |
| Barclays | USD | 1,727 | MXN | 23,340 | 12/10/14 | 2 | |
| Barclays | USD | 1,810 | MYR | 5,909 | 11/06/14 | (14 | ) |
| Barclays | USD | 757 | PEN | 2,210 | 11/06/14 | (1 | ) |
| Barclays | USD | 160 | PHP | 7,176 | 11/06/14 | — | |
| Barclays | USD | 410 | PLN | 1,353 | 11/06/14 | (8 | ) |
| Barclays | USD | 1,671 | PLN | 5,557 | 11/06/14 | (22 | ) |
| Barclays | USD | 1,660 | PLN | 5,549 | 12/10/14 | (16 | ) |
| Barclays | USD | 1,956 | PLN | 6,487 | 12/10/14 | (33 | ) |
| Barclays | USD | 4,024 | RON | 13,981 | 11/06/14 | (52 | ) |
| Barclays | USD | 900 | RUB | 36,963 | 11/06/14 | (41 | ) |
| Barclays | USD | 1,263 | RUB | 50,250 | 11/06/14 | (95 | ) |
| Barclays | USD | 2,368 | RUB | 102,614 | 12/10/14 | (6 | ) |
| Barclays | USD | 256 | SGD | 325 | 11/06/14 | (2 | ) |
| Barclays | USD | 2,252 | TRY | 5,194 | 11/06/14 | 83 | |
| Barclays | USD | 10 | TRY | 23 | 12/10/14 | — | |
| Barclays | USD | 138 | ZAR | 1,560 | 11/06/14 | 4 | |
| Barclays | USD | 1,678 | ZAR | 18,619 | 11/06/14 | 10 | |
| Barclays | USD | 33 | ZAR | 359 | 12/10/14 | — | |
| Barclays | BRL | 2,282 | USD | 934 | 11/04/14 | 13 | |
| Barclays | BRL | 1,872 | USD | 771 | 12/02/14 | 22 | |
| Barclays | COP | 1,265,125 | USD | 613 | 12/10/14 | 1 | |
| Barclays | EUR | 3,888 | USD | 4,935 | 11/06/14 | 63 | |
| Barclays | EUR | 10,295 | USD | 13,139 | 12/10/14 | 235 | |
| Barclays | HUF | 384,700 | USD | 1,585 | 12/10/14 | 21 | |
| Barclays | IDR | 3,447,484 | USD | 280 | 11/06/14 | (5 | ) |
| Barclays | IDR | 33,207,080 | USD | 2,734 | 11/06/14 | (13 | ) |
| Barclays | IDR | 127,698,814 | USD | 10,459 | 12/10/14 | (46 | ) |
| Barclays | INR | 10,236 | USD | 165 | 11/07/14 | (2 | ) |
| Barclays | INR | 95,134 | USD | 1,549 | 11/07/14 | 1 | |
| Barclays | MXN | 23,340 | USD | 1,731 | 11/06/14 | (2 | ) |
| Barclays | MXN | 734 | USD | 54 | 12/10/14 | — | |
| Barclays | MXN | 5,803 | USD | 430 | 12/10/14 | — | |
| Barclays | MYR | 1,489 | USD | 451 | 11/06/14 | (2 | ) |
| Barclays | NGN | 36,838 | USD | 222 | 12/03/14 | 1 | |
| Barclays | PEN | 2,210 | USD | 755 | 12/10/14 | 2 | |
| Barclays | PHP | 7,176 | USD | 160 | 12/10/14 | 1 | |
| Barclays | PLN | 5,540 | USD | 1,660 | 11/04/14 | 16 | |
| Barclays | PLN | 465 | USD | 140 | 11/06/14 | 2 | |
| Barclays | PLN | 1,156 | USD | 350 | 11/06/14 | 7 | |
| Barclays | PLN | 6,487 | USD | 1,958 | 11/06/14 | 33 | |
| Barclays | RON | 491 | USD | 140 | 11/06/14 | 1 | |
| Barclays | RON | 13,981 | USD | 4,018 | 12/10/14 | 50 | |
| Barclays | RUB | 15,946 | USD | 400 | 11/06/14 | 29 | |
| Barclays | RUB | 102,614 | USD | 2,392 | 11/06/14 | 7 | |
| Barclays | RUB | 6,011 | USD | 141 | 12/10/14 | 2 | |
| Barclays | SGD | 325 | USD | 256 | 11/06/14 | 3 | |
| Barclays | SGD | 325 | USD | 256 | 12/10/14 | 2 | |
| Barclays | TRY | 23 | USD | 11 | 11/06/14 | — | |
| Barclays | TRY | 1,743 | USD | 760 | 11/06/14 | (24 | ) |
| Barclays | TRY | 2,949 | USD | 1,291 | 11/06/14 | (34 | ) |
| Barclays | ZAR | 359 | USD | 33 | 11/06/14 | — | |
| Barclays | ZAR | 7,993 | USD | 720 | 11/06/14 | (4 | ) |
| Barclays | ZAR | 8,315 | USD | 750 | 11/06/14 | (4 | ) |
| BNP Paribas | USD | 7,947 | CAD | 8,961 | 11/07/14 | 3 | |
| BNP Paribas | CAD | 8,961 | USD | 7,942 | 12/05/14 | (3 | ) |
| Brown Brothers Harriman | AUD | 2,229 | USD | 1,946 | 11/07/14 | (14 | ) |
| Brown Brothers Harriman | CAD | 721 | USD | 644 | 11/07/14 | 4 | |
| Brown Brothers Harriman | CAD | 1,864 | USD | 1,667 | 11/07/14 | 13 | |
| See accompanying notes which are an integral part of the financial statements. | |||||||
| Russell Global Opportunistic Credit Fund 363 | |||||||
| Russell Investment Company | |||||||
| Russell Global Opportunistic Credit Fund | |||||||
| Schedule of Investments, continued — October 31, 2014 | |||||||
| Foreign Currency Exchange Contracts | |||||||
| Amounts in thousands | |||||||
| Unrealized | |||||||
| Appreciation | |||||||
| Amount | Amount | (Depreciation) | |||||
| Counterparty | Sold | Bought | Settlement Date | $ | |||
| Brown Brothers Harriman | EUR | 240 | USD | 302 | 11/07/14 | 1 | |
| Brown Brothers Harriman | EUR | 792 | USD | 1,000 | 11/07/14 | 8 | |
| Brown Brothers Harriman | JPY | 31,825 | USD | 290 | 11/07/14 | 7 | |
| Citibank | USD | 528 | PEN | 1,540 | 11/06/14 | (2 | ) |
| Citibank | PEN | 1,540 | USD | 530 | 11/06/14 | 3 | |
| Citibank | PEN | 1,540 | USD | 526 | 12/10/14 | 2 | |
| Deutsche Bank | USD | 516 | GBP | 320 | 11/28/14 | (3 | ) |
| Deutsche Bank | AUD | 2,229 | USD | 1,946 | 11/07/14 | (15 | ) |
| Deutsche Bank | CAD | 1,864 | USD | 1,667 | 11/07/14 | 13 | |
| Deutsche Bank | EUR | 792 | USD | 1,000 | 11/07/14 | 8 | |
| Deutsche Bank | EUR | 559 | USD | 704 | 11/28/14 | 3 | |
| Deutsche Bank | EUR | 1,733 | USD | 2,182 | 11/28/14 | 11 | |
| Deutsche Bank | GBP | 222 | USD | 359 | 11/28/14 | 4 | |
| Deutsche Bank | GBP | 320 | USD | 518 | 11/28/14 | 6 | |
| Deutsche Bank | JPY | 31,825 | USD | 290 | 11/07/14 | 7 | |
| Goldman Sachs | USD | 7,584 | AUD | 8,628 | 11/07/14 | 7 | |
| Goldman Sachs | AUD | 8,628 | USD | 7,570 | 12/05/14 | (7 | ) |
| HSBC | USD | 1,142 | INR | 70,411 | 11/07/14 | 4 | |
| HSBC | USD | 1,142 | INR | 70,411 | 12/10/14 | (3 | ) |
| HSBC | USD | 1,247 | MXN | 16,868 | 11/06/14 | 5 | |
| HSBC | USD | 1,651 | MXN | 22,228 | 11/06/14 | (1 | ) |
| HSBC | USD | 1,727 | MXN | 23,340 | 12/10/14 | 2 | |
| HSBC | USD | 109 | NGN | 17,974 | 11/06/14 | — | |
| HSBC | USD | 108 | NGN | 17,974 | 12/03/14 | (1 | ) |
| HSBC | USD | 765 | RUB | 31,347 | 11/06/14 | (36 | ) |
| HSBC | USD | 762 | RUB | 32,469 | 12/10/14 | (15 | ) |
| HSBC | INR | 70,411 | USD | 1,147 | 11/07/14 | 1 | |
| HSBC | MXN | 23,340 | USD | 1,731 | 11/06/14 | (2 | ) |
| HSBC | NGN | 17,974 | USD | 109 | 11/06/14 | — | |
| HSBC | NGN | 61,298 | USD | 368 | 12/03/14 | 2 | |
| JPMorgan Chase | USD | 1,410 | IDR | 17,001,780 | 11/06/14 | (4 | ) |
| JPMorgan Chase | USD | 430 | INR | 26,617 | 11/07/14 | 3 | |
| JPMorgan Chase | USD | 464 | INR | 28,616 | 11/07/14 | 2 | |
| JPMorgan Chase | USD | 616 | INR | 38,022 | 12/10/14 | (2 | ) |
| JPMorgan Chase | USD | 1,247 | MXN | 16,868 | 11/06/14 | 5 | |
| JPMorgan Chase | USD | 1,727 | MXN | 23,340 | 12/10/14 | 2 | |
| JPMorgan Chase | USD | 100 | PHP | 4,487 | 11/06/14 | — | |
| JPMorgan Chase | USD | 1,644 | PLN | 5,472 | 11/06/14 | (20 | ) |
| JPMorgan Chase | USD | 762 | RUB | 32,485 | 12/10/14 | (14 | ) |
| JPMorgan Chase | USD | 2,052 | SGD | 2,613 | 11/06/14 | (19 | ) |
| JPMorgan Chase | USD | 1,086 | THB | 35,319 | 12/11/14 | (4 | ) |
| JPMorgan Chase | USD | 408 | ZAR | 4,521 | 12/10/14 | — | |
| JPMorgan Chase | EUR | 1,982 | USD | 2,516 | 11/06/14 | 32 | |
| JPMorgan Chase | IDR | 46,601,840 | USD | 3,790 | 11/06/14 | (64 | ) |
| JPMorgan Chase | INR | 17,211 | USD | 277 | 11/07/14 | (3 | ) |
| JPMorgan Chase | INR | 38,022 | USD | 619 | 11/07/14 | — | |
| JPMorgan Chase | MXN | 673 | USD | 50 | 11/06/14 | — | |
| JPMorgan Chase | MXN | 23,340 | USD | 1,731 | 11/06/14 | (2 | ) |
| JPMorgan Chase | MXN | 6,048 | USD | 448 | 12/10/14 | — | |
| JPMorgan Chase | PHP | 11,663 | USD | 260 | 11/06/14 | — | |
| JPMorgan Chase | PLN | 1,830 | USD | 550 | 11/06/14 | 7 | |
| JPMorgan Chase | RON | 6,868 | USD | 1,971 | 11/06/14 | 19 | |
| JPMorgan Chase | SGD | 632 | USD | 497 | 11/06/14 | 5 | |
| JPMorgan Chase | SGD | 1,981 | USD | 1,558 | 11/06/14 | 16 | |
| JPMorgan Chase | SGD | 2,613 | USD | 2,052 | 12/10/14 | 19 | |
| JPMorgan Chase | THB | 35,319 | USD | 1,088 | 11/06/14 | 4 | |
| Merrill Lynch | USD | 1,098 | MXN | 14,848 | 11/06/14 | 4 | |
| Merrill Lynch | MYR | 1,603 | USD | 490 | 11/06/14 | 3 | |
| Standard Chartered | USD | 770 | BRL | 1,883 | 11/04/14 | (10 | ) |
| Standard Chartered | USD | 2,100 | BRL | 5,110 | 11/04/14 | (38 | ) |
| Standard Chartered | USD | 750 | BRL | 1,883 | 12/02/14 | 3 | |
| Standard Chartered | USD | 540 | COP | 1,099,170 | 11/06/14 | (6 | ) |
| Standard Chartered | USD | 1,586 | HUF | 384,700 | 11/06/14 | (22 | ) |
| Standard Chartered | USD | 1,928 | INR | 118,825 | 11/07/14 | 6 | |
| Standard Chartered | USD | 1,678 | INR | 103,439 | 12/10/14 | (6 | ) |
| Standard Chartered | USD | 111 | MXN | 1,500 | 11/06/14 | — | |
| Standard Chartered | USD | 1,727 | MXN | 23,340 | 12/10/14 | 2 | |
| See accompanying notes which are an integral part of the financial statements. | |||||||
| 364 Russell Global Opportunistic Credit Fund | |||||||
| Russell Investment Company | |||||||
| Russell Global Opportunistic Credit Fund | |||||||
| Schedule of Investments, continued — October 31, 2014 | |||||||
| Foreign Currency Exchange Contracts | |||||||
| Amounts in thousands | |||||||
| Unrealized | |||||||
| Appreciation | |||||||
| Amount | Amount | (Depreciation) | |||||
| Counterparty | Sold | Bought | Settlement Date | $ | |||
| Standard Chartered | USD | 3,388 | MYR | 11,072 | 11/06/14 | (22 | ) |
| Standard Chartered | USD | 457 | PLN | 1,518 | 11/06/14 | (6 | ) |
| Standard Chartered | USD | 2,858 | PLN | 9,493 | 11/06/14 | (41 | ) |
| Standard Chartered | USD | 656 | RUB | 27,989 | 12/10/14 | (12 | ) |
| Standard Chartered | USD | 2,359 | SGD | 3,003 | 11/06/14 | (22 | ) |
| Standard Chartered | USD | 1,091 | THB | 35,319 | 11/06/14 | (7 | ) |
| Standard Chartered | USD | 642 | TRY | 1,465 | 11/06/14 | 17 | |
| Standard Chartered | USD | 382 | ZAR | 4,234 | 11/06/14 | 2 | |
| Standard Chartered | USD | 366 | ZAR | 4,059 | 12/10/14 | — | |
| Standard Chartered | BRL | 1,883 | USD | 756 | 11/04/14 | (4 | ) |
| Standard Chartered | BRL | 5,110 | USD | 2,091 | 11/04/14 | 28 | |
| Standard Chartered | COP | 4,833,972 | USD | 2,376 | 11/06/14 | 27 | |
| Standard Chartered | EUR | 143 | USD | 180 | 11/06/14 | 1 | |
| Standard Chartered | HUF | 144,300 | USD | 589 | 11/06/14 | 2 | |
| Standard Chartered | HUF | 532,097 | USD | 2,166 | 11/06/14 | 2 | |
| Standard Chartered | HUF | 384,700 | USD | 1,585 | 12/10/14 | 22 | |
| Standard Chartered | IDR | 57,602,416 | USD | 4,691 | 11/06/14 | (73 | ) |
| Standard Chartered | INR | 15,386 | USD | 248 | 11/07/14 | (3 | ) |
| Standard Chartered | INR | 103,439 | USD | 1,685 | 11/07/14 | 2 | |
| Standard Chartered | MXN | 23,340 | USD | 1,731 | 11/06/14 | (2 | ) |
| Standard Chartered | MXN | 5,561 | USD | 412 | 12/10/14 | — | |
| Standard Chartered | MXN | 27,515 | USD | 2,035 | 12/10/14 | (3 | ) |
| Standard Chartered | MYR | 1,253 | USD | 379 | 11/06/14 | (2 | ) |
| Standard Chartered | NGN | 126,388 | USD | 760 | 12/03/14 | 4 | |
| Standard Chartered | PEN | 671 | USD | 230 | 11/06/14 | 1 | |
| Standard Chartered | PEN | 1,540 | USD | 529 | 11/06/14 | 2 | |
| Standard Chartered | PLN | 17,921 | USD | 5,357 | 11/06/14 | 38 | |
| Standard Chartered | RON | 1,723 | USD | 490 | 11/06/14 | — | |
| Standard Chartered | RON | 10,164 | USD | 2,917 | 11/06/14 | 29 | |
| Standard Chartered | RUB | 7,656 | USD | 179 | 12/10/14 | 3 | |
| Standard Chartered | RUB | 13,904 | USD | 320 | 12/10/14 | — | |
| Standard Chartered | RUB | 27,322 | USD | 640 | 12/10/14 | 11 | |
| Standard Chartered | SGD | 422 | USD | 330 | 11/06/14 | 2 | |
| Standard Chartered | SGD | 568 | USD | 447 | 11/06/14 | 5 | |
| Standard Chartered | SGD | 2,013 | USD | 1,583 | 11/06/14 | 16 | |
| Standard Chartered | SGD | 3,003 | USD | 2,359 | 12/10/14 | 22 | |
| State Street | USD | 3,914 | JPY | 438,753 | 11/07/14 | (8 | ) |
| State Street | AUD | 693 | USD | 604 | 11/07/14 | (6 | ) |
| State Street | AUD | 2,229 | USD | 1,945 | 11/07/14 | (16 | ) |
| State Street | AUD | 11,141 | USD | 9,772 | 12/05/14 | (11 | ) |
| State Street | CAD | 1,864 | USD | 1,667 | 11/07/14 | 13 | |
| State Street | CAD | 3,673 | USD | 3,255 | 12/05/14 | (1 | ) |
| State Street | EUR | 121 | USD | 155 | 11/07/14 | 3 | |
| State Street | EUR | 792 | USD | 1,000 | 11/07/14 | 8 | |
| State Street | EUR | 5,981 | USD | 7,598 | 11/07/14 | 102 | |
| State Street | EUR | 102,583 | USD | 128,816 | 11/07/14 | 263 | |
| State Street | EUR | 2,967 | USD | 3,718 | 12/05/14 | (1 | ) |
| State Street | EUR | 3,537 | USD | 4,432 | 12/05/14 | (1 | ) |
| State Street | GBP | 320 | USD | 516 | 11/07/14 | 4 | |
| State Street | GBP | 882 | USD | 1,419 | 11/07/14 | 9 | |
| State Street | GBP | 18,535 | USD | 29,624 | 11/07/14 | (25 | ) |
| State Street | JPY | 31,825 | USD | 290 | 11/07/14 | 7 | |
| State Street | JPY | 35,122 | USD | 322 | 11/07/14 | 9 | |
| State Street | JPY | 438,753 | USD | 3,915 | 12/05/14 | 8 | |
| State Street | JPY | 847,044 | USD | 7,558 | 12/05/14 | 15 | |
| UBS | USD | 620 | BRL | 1,546 | 11/04/14 | 4 | |
| UBS | USD | 770 | BRL | 1,883 | 11/04/14 | (10 | ) |
| UBS | USD | 1,346 | BRL | 3,290 | 11/04/14 | (18 | ) |
| UBS | USD | 750 | BRL | 1,883 | 12/02/14 | 3 | |
| UBS | USD | 294 | CLP | 170,976 | 11/06/14 | 3 | |
| UBS | USD | 130 | HUF | 31,800 | 11/06/14 | (1 | ) |
| UBS | USD | 1,466 | INR | 90,384 | 11/07/14 | 5 | |
| UBS | USD | 1,465 | INR | 90,384 | 12/10/14 | (4 | ) |
| UBS | USD | 1,247 | MXN | 16,868 | 11/06/14 | 6 | |
| UBS | USD | 1,727 | MXN | 23,340 | 12/10/14 | 3 | |
| UBS | USD | 3,383 | MYR | 11,072 | 11/06/14 | (17 | ) |
| UBS | USD | 6,762 | MYR | 22,187 | 12/10/14 | (35 | ) |
| See accompanying notes which are an integral part of the financial statements. | |||||||
| Russell Global Opportunistic Credit Fund 365 | |||||||
| Russell Investment Company | ||||||||||||||
| Russell Global Opportunistic Credit Fund | ||||||||||||||
| Schedule of Investments, continued — October 31, 2014 | ||||||||||||||
| Foreign Currency Exchange Contracts | ||||||||||||||
| Amounts in thousands | ||||||||||||||
| Unrealized | ||||||||||||||
| Appreciation | ||||||||||||||
| Amount | Amount | (Depreciation) | ||||||||||||
| Counterparty | Sold | Bought | Settlement Date | $ | ||||||||||
| UBS | USD | 1,660 | PLN | 5,522 | 11/06/14 | (21 | ) | |||||||
| UBS | USD | 4,030 | RON | 13,981 | 11/06/14 | (57 | ) | |||||||
| UBS | USD | 440 | SGD | 560 | 11/06/14 | (4 | ) | |||||||
| UBS | BRL | 1,546 | USD | 632 | 11/04/14 | 9 | ||||||||
| UBS | BRL | 1,883 | USD | 756 | 11/04/14 | (4 | ) | |||||||
| UBS | BRL | 3,290 | USD | 1,370 | 11/04/14 | 42 | ||||||||
| UBS | CLP | 170,976 | USD | 285 | 11/06/14 | (12 | ) | |||||||
| UBS | CLP | 170,976 | USD | 294 | 12/10/14 | (3 | ) | |||||||
| UBS | EUR | 5,286 | USD | 6,709 | 11/06/14 | 85 | ||||||||
| UBS | HUF | 532,097 | USD | 2,167 | 11/06/14 | 2 | ||||||||
| UBS | IDR | 3,841,774 | USD | 312 | 11/06/14 | (6 | ) | |||||||
| UBS | INR | 90,384 | USD | 1,472 | 11/07/14 | — | ||||||||
| UBS | MXN | 23,340 | USD | 1,730 | 11/06/14 | (3 | ) | |||||||
| UBS | MYR | 1,520 | USD | 460 | 11/06/14 | (2 | ) | |||||||
| UBS | MYR | 22,187 | USD | 6,779 | 11/06/14 | 35 | ||||||||
| UBS | PLN | 1,057 | USD | 320 | 11/06/14 | 6 | ||||||||
| UBS | RON | 8,716 | USD | 2,498 | 11/06/14 | 21 | ||||||||
| UBS | RON | 13,981 | USD | 4,024 | 12/10/14 | 56 | ||||||||
| UBS | SGD | 560 | USD | 440 | 11/06/14 | 5 | ||||||||
| UBS | SGD | 560 | USD | 440 | 12/10/14 | 4 | ||||||||
| UBS | TRY | 1,944 | USD | 869 | 11/06/14 | (5 | ) | |||||||
| UBS | ZAR | 7,386 | USD | 670 | 11/06/14 | 1 | ||||||||
| Total Unrealized Appreciation (Depreciation) on Open Foreign Currency Exchange Contracts | 352 | |||||||||||||
| Credit Default Swap Contracts | ||||||||||||||
| Amounts in thousands | ||||||||||||||
| Credit Indices | ||||||||||||||
| Fund (Pays)/ | ||||||||||||||
| Receives | Termination | Fair Value | ||||||||||||
| Reference Entity | Counterparty | Notional Amount | Fixed Rate | Date | $ | |||||||||
| CDX NA High Yield Index | Morgan Stanley | USD | 75,000 | 5.000 | % | 12/20/19 | 5,590 | |||||||
| Total Fair Value on Open Credit Indices Premiums Paid (Received) - $4,755 | 5,590 | |||||||||||||
| Presentation of Portfolio Holdings | ||||||||||||||
| Amounts in thousands | ||||||||||||||
| Fair Value | ||||||||||||||
| Portfolio Summary | Level 1 | Level 2 | Level 3 | Total | % of Net Assets | |||||||||
| Long-Term Fixed Income Investments | ||||||||||||||
| Argentina | — | 10,900 | — | 10,900 | 0.7 | |||||||||
| Australia | — | 3,196 | — | 3,196 | 0.2 | |||||||||
| Austria | — | 725 | — | 725 | —* | |||||||||
| Azerbaijan | — | 6,369 | — | 6,369 | 0.4 | |||||||||
| Barbados | — | 492 | — | 492 | —* | |||||||||
| Bermuda | — | 1,982 | — | 1,982 | 0.1 | |||||||||
| Brazil | — | 38,496 | — | 38,496 | 2.4 | |||||||||
| Canada | — | 21,514 | — | 21,514 | 1.4 | |||||||||
| Cayman Islands | — | 7,240 | — | 7,240 | 0.5 | |||||||||
| Chile | — | 13,997 | — | 13,997 | 0.9 | |||||||||
| Colombia | — | 31,783 | — | 31,783 | 2.0 | |||||||||
| Costa Rica | — | 9,363 | — | 9,363 | 0.6 | |||||||||
| Croatia | — | 6,373 | — | 6,373 | 0.4 | |||||||||
| Dominican Republic | — | 17,021 | — | 17,021 | 1.1 | |||||||||
| El Salvador | — | 7,537 | — | 7,537 | 0.5 | |||||||||
| France | — | 23,365 | — | 23,365 | 1.5 | |||||||||
| See accompanying notes which are an integral part of the financial statements. | ||||||||||||||
| 366 Russell Global Opportunistic Credit Fund | ||||||||||||||
| Russell Investment Company | ||||||||||
| Russell Global Opportunistic Credit Fund | ||||||||||
| Schedule of Investments, continued — October 31, 2014 | ||||||||||
| Presentation of Portfolio Holdings | ||||||||||
| Amounts in thousands | ||||||||||
| Fair Value | ||||||||||
| Portfolio Summary | Level 1 | Level 2 | Level 3 | Total | % of Net Assets | |||||
| Gabon | — | 1,204 | — | 1,204 | 0.1 | |||||
| Germany | — | 20,466 | — | 20,466 | 1.3 | |||||
| Ghana | — | 1,035 | — | 1,035 | 0.1 | |||||
| Honduras | — | 3,567 | — | 3,567 | 0.2 | |||||
| Hong Kong | — | 620 | — | 620 | —* | |||||
| Hungary | — | 17,308 | — | 17,308 | 1.1 | |||||
| Indonesia | — | 60,220 | — | 60,220 | 3.8 | |||||
| Iraq | — | 2,723 | — | 2,723 | 0.2 | |||||
| Ireland | — | 15,005 | — | 15,005 | 0.9 | |||||
| Italy | — | 9,972 | — | 9,972 | 0.6 | |||||
| Ivory Coast | — | 6,071 | — | 6,071 | 0.4 | |||||
| Jamaica | — | 4,439 | — | 4,439 | 0.3 | |||||
| Jersey | — | 4,280 | — | 4,280 | 0.3 | |||||
| Kazakhstan | — | 18,941 | — | 18,941 | 1.2 | |||||
| Kenya | — | 1,949 | — | 1,949 | 0.1 | |||||
| Lithuania | — | 1,021 | — | 1,021 | 0.1 | |||||
| Luxembourg | — | 66,811 | — | 66,811 | 4.2 | |||||
| Malaysia | — | 18,252 | — | 18,252 | 1.1 | |||||
| Mexico | — | 50,741 | — | 50,741 | 3.2 | |||||
| Morocco | — | 2,194 | — | 2,194 | 0.1 | |||||
| Netherlands | — | 26,734 | — | 26,734 | 1.7 | |||||
| Nigeria | — | 5,143 | — | 5,143 | 0.3 | |||||
| Norway | — | 2,179 | — | 2,179 | 0.1 | |||||
| Panama | — | 9,621 | — | 9,621 | 0.6 | |||||
| Paraguay | — | 1,516 | — | 1,516 | 0.1 | |||||
| Peru | — | 10,157 | — | 10,157 | 0.6 | |||||
| Philippines | — | 7,635 | — | 7,635 | 0.5 | |||||
| Poland | — | 21,423 | — | 21,423 | 1.3 | |||||
| Romania | — | 22,493 | — | 22,493 | 1.4 | |||||
| Russia | — | 51,726 | — | 51,726 | 3.3 | |||||
| Serbia | — | 4,907 | — | 4,907 | 0.3 | |||||
| Singapore | — | 874 | — | 874 | 0.1 | |||||
| Slovenia | — | 4,357 | — | 4,357 | 0.3 | |||||
| South Africa | — | 37,562 | — | 37,562 | 2.4 | |||||
| Spain | — | 1,836 | — | 1,836 | 0.1 | |||||
| Thailand | — | 14,298 | — | 14,298 | 0.9 | |||||
| Trinidad and Tobago | — | 1,575 | — | 1,575 | 0.1 | |||||
| Turkey | — | 49,740 | — | 49,740 | 3.1 | |||||
| Ukraine | — | 9,746 | — | 9,746 | 0.6 | |||||
| United Kingdom | — | 32,312 | — | 32,312 | 2.0 | |||||
| United States | — | 542,171 | 4,416 | 546,587 | 34.4 | |||||
| Uruguay | — | 6,577 | — | 6,577 | 0.4 | |||||
| Venezuela, Bolivarian Republic of | — | 35,704 | — | 35,704 | 2.3 | |||||
| Virgin Islands, British | — | 9,782 | — | 9,782 | 0.6 | |||||
| Short-Term Investments | — | 139,019 | — | 139,019 | 8.7 | |||||
| Total Investments | — | 1,556,259 | 4,416 | 1,560,675 | 98.2 | |||||
| Other Assets and Liabilities, Net | 1.8 | |||||||||
| 100.0 | ||||||||||
| See accompanying notes which are an integral part of the financial statements. | ||||||||||
| Russell Global Opportunistic Credit Fund 367 | ||||||||||
| Russell Investment Company | ||||||||||||
| Russell Global Opportunistic Credit Fund | ||||||||||||
| Schedule of Investments, continued — October 31, 2014 | ||||||||||||
| Presentation of Portfolio Holdings | ||||||||||||
| Amounts in thousands | ||||||||||||
| Fair Value | ||||||||||||
| Portfolio Summary | Level 1 | Level 2 | Level 3 | Total | % of Net Assets | |||||||
| Other Financial Instruments | ||||||||||||
| Futures Contracts | 580 | — | — | 580 | —* | |||||||
| Foreign Currency Exchange Contracts | (55 | ) | 407 | — | 352 | —* | ||||||
| Credit Default Swap Contracts | — | 5,590 | — | 5,590 | 0.4 | |||||||
| Total Other Financial Instruments** | $ | 525 | $ | 5,997 | $ | — | $ | 6,522 | ||||
| * | Less than .05% of net assets. |
| ** | Futures and foreign currency exchange contract values reflect the unrealized appreciation/depreciation on the instruments. |
For a description of the Levels see note 2 in the Notes to Financial Statements.
For disclosure on transfers between Levels 1, 2 and 3 during the period ended October 31, 2014, see note 2 in the Notes to Financial Statements.
Investments in which significant unobservable inputs (Level 3) were used in determining a fair value for the period ended October 31, 2014 were less than 1% of net assets.
See accompanying notes which are an integral part of the financial statements.
368 Russell Global Opportunistic Credit Fund
| Russell Investment Company | ||||||||
| Russell Global Opportunistic Credit Fund | ||||||||
| Fair Value of Derivative Instruments — October 31, 2014 | ||||||||
| Amounts in thousands | ||||||||
| Foreign | ||||||||
| Credit | Currency | Interest Rate | ||||||
| Derivatives not accounted for as hedging instruments | Contracts | Contracts | Contracts | |||||
| Location: Statement of Assets and Liabilities - Assets | ||||||||
| Unrealized appreciation on foreign currency exchange contracts | $ | — | $ | 1,982 | $ | — | ||
| Variation margin on futures contracts* | — | — | 817 | |||||
| Credit default swap contracts, at fair value | 5,590 | — | — | |||||
| Total | $ | 5,590 | $ | 1,982 | $ | 817 | ||
| Location: Statement of Assets and Liabilities - Liabilities | ||||||||
| Variation margin on futures contracts* | $ | — | $ | — | $ | 237 | ||
| Unrealized depreciation on foreign currency exchange contracts | — | 1,630 | — | |||||
| Total | $ | — | $ | 1,630 | $ | 237 | ||
| Foreign | ||||||||
| Credit | Currency | Interest Rate | ||||||
| Derivatives not accounted for as hedging instruments | Contracts | Contracts | Contracts | |||||
| Location: Statement of Operations - Net realized gain (loss) | ||||||||
| Futures contracts | $ | — | $ | — | $ | 3,721 | ||
| Options written | — | — | (198 | ) | ||||
| Credit default swap contracts | 3,568 | — | — | |||||
| Foreign currency-related transactions** | — | 11,994 | — | |||||
| Total | $ | 3,568 | $ | 11,994 | $ | 3,523 | ||
| Location: Statement of Operations - Net change in unrealized appreciation (depreciation) | ||||||||
| Futures contracts | $ | — | $ | — | $ | 221 | ||
| Credit default swap contracts | 17 | — | — | |||||
| Foreign currency-related transactions*** | — | (121 | ) | — | ||||
| Total | $ | 17 | $ | (121 | ) | $ | 221 | |
| * | Includes cumulative appreciation/depreciation of futures contracts as reported in the Schedule of Investments. Only variation margin is reported within the Statement of Assets and Liabilities. |
| ** | Only includes change in unrealized gain (loss) on forward and spot contracts. May differ from the net change in unrealized gain (loss) on foreign currency-related transactions reported within the Statement of Operations. |
| *** | Only includes net realized gain (loss) on forward and spot contracts. May differ from the net realized gain (loss) on foreign currency-related transactions reported within the Statement of Operations. |
For further disclosure on derivatives see note 2 in the Notes to Financial Statements.
See accompanying notes which are an integral part of the financial statements.
Russell Global Opportunistic Credit Fund 369
Russell Investment Company
Russell Global Opportunistic Credit Fund
Balance Sheet Offsetting of Financial and Derivative Instruments — October 31, 2014
| Amounts in thousands | ||||||||
| Offsetting of Financial Assets and Derivative Assets | ||||||||
| Gross | Net Amounts | |||||||
| Amounts | of Assets | |||||||
| Gross | Offset in the | Presented in | ||||||
| Amounts of | Statement of | the Statement | ||||||
| Recognized Assets | of Assets and | |||||||
| Description | Location: Statement of Assets and Liabilities - Assets | Assets | Liabilities | Liabilities | ||||
| Foreign Currency Exchange Contracts | Unrealized appreciation on foreign currency exchange contracts | $ | 1,982 | — $ | 1,982 | |||
| Futures Contracts | Variation margin on futures contracts | 22 | — | 22 | ||||
| Credit Default Swap Contracts | Credit default swap contracts, at fair value | 5,590 | — | 5,590 | ||||
| Total | $ | 7,594 | — $ | 7,594 | ||||
| Financial Assets, Derivative Assets, and Collateral Held by Counterparty | |
| Gross Amounts Not Offset in | |
| the Statement of Assets and | |
| Liabilities |
| Net Amounts | ||||||||||
| of Assets | ||||||||||
| Presented in | ||||||||||
| the Statement | Financial and | |||||||||
| of Assets and | Derivative | Collateral | ||||||||
| Counterparty | Liabilities | Instruments | Received^ | Net Amount | ||||||
| Bank of America | $ | 6 | $ | 6 | $ | — | $ | — | ||
| Bank of New York | 99 | 20 | — | 79 | ||||||
| Barclays | 665 | 665 | — | — | ||||||
| BNP Paribas | 3 | 3 | — | — | ||||||
| Brown Brothers Harriman | 33 | 15 | — | 18 | ||||||
| Citigroup | 5 | 2 | — | 3 | ||||||
| Deutsche Bank | 52 | 18 | — | 34 | ||||||
| Goldman Sachs | 29 | 7 | — | 22 | ||||||
| HSBC | 14 | 14 | — | — | ||||||
| JPMorgan Chase | 115 | 115 | — | — | ||||||
| Merrill Lynch | 7 | — | — | 7 | ||||||
| Morgan Stanley | 5,590 | — | 5,366 | 224 | ||||||
| Standard Chartered | 247 | 247 | — | — | ||||||
| State Street | 440 | 61 | — | 379 | ||||||
| UBS | 289 | 201 | — | 88 | ||||||
| Total | $ | 7,594 | $ | 1,374 | $ | 5,366 | $ | 854 | ||
See accompanying notes which are an integral part of the financial statements.
370 Russell Global Opportunistic Credit Fund
Russell Investment Company
Russell Global Opportunistic Credit Fund
Balance Sheet Offsetting of Financial and Derivative Instruments, continued —October 31, 2014
| Amounts in thousands | ||||||||
| Offsetting of Financial Liabilities and Derivative Liabilities | ||||||||
| Gross | Net Amounts | |||||||
| Amounts | of Assets | |||||||
| Gross | Offset in the | Presented in | ||||||
| Amounts of | Statement of | the Statement | ||||||
| Recognized | Assets and | of Assets and | ||||||
| Description | Location: Statement of Assets and Liabilities - Liabilities | Liabilities | Liabilities | Liabilities | ||||
| Futures Contracts | Variation margin on futures contracts | $ | 164 | $ | — $ | 164 | ||
| Foreign Currency Exchange Contracts | Unrealized depreciation on foreign currency exchange contracts | 1,630 | — | 1,630 | ||||
| Total | $ | 1,794 | $ | — $ | 1,794 | |||
| Financial Liabilities, Derivative Liabilities, and Collateral Pledged by Counterparty | |||||||||
| Gross Amounts Not Offset in | |||||||||
| the Statement of Assets and | |||||||||
| Liabilities | |||||||||
| Net Amounts | |||||||||
| of Liabilities | |||||||||
| Presented in | |||||||||
| the Statement | Financial and | ||||||||
| of Assets and | Derivative | Collateral | |||||||
| Counterparty | Liabilities | Instruments | Pledged^ Net Amount | ||||||
| Bank of America | $ | 19 | $ | 6 | $ | — $ | 13 | ||
| Bank of New York | 20 | 20 | — | — | |||||
| Barclays | 806 | 665 | — | 141 | |||||
| BNP Paribas | 3 | 3 | — | — | |||||
| Brown Brothers Harriman | 15 | 15 | — | — | |||||
| Citigroup | 2 | 2 | — | — | |||||
| Deutsche Bank | 18 | 18 | — | — | |||||
| Goldman Sachs | 172 | 7 | 165 | — | |||||
| HSBC | 58 | 14 | — | 44 | |||||
| JPMorgan Chase | 132 | 115 | — | 17 | |||||
| Standard Chartered | 280 | 247 | — | 33 | |||||
| State Street | 68 | 61 | — | 7 | |||||
| UBS | 201 | 201 | — | — | |||||
| Total | $ | 1,794 | $ | 1,374 | $ | 165 | $ | 255 | |
^ Collateral received or pledged amounts may not reconcile to those disclosed in the Statement of Assets and Liabilities due to the inclusion of off-Balance Sheet collateral and adjustments made to exclude overcollateralization.
For further disclosure on derivatives and counterparty risk see note 2 in the Notes to Financial Statements.
See accompanying notes which are an integral part of the financial statements.
Russell Global Opportunistic Credit Fund 371
| Russell Investment Company | ||
| Russell Global Opportunistic Credit Fund | ||
| Statement of Assets and Liabilities — October 31, 2014 | ||
| Amounts in thousands | ||
| Assets | ||
| Investments, at identified cost | $ | 1,587,877 |
| Investments, at fair value(>) | 1,560,675 | |
| Cash (restricted)(a)(b) | 5,496 | |
| Foreign currency holdings(^) | 6,797 | |
| Unrealized appreciation on foreign currency exchange contracts | 1,982 | |
| Receivables: | ||
| Dividends and interest | 21,214 | |
| Dividends from affiliated Russell funds | 11 | |
| Investments sold | 22,999 | |
| Fund shares sold | 2,005 | |
| Foreign capital gains taxes recoverable | 78 | |
| Variation margin on futures contracts | 22 | |
| Prepaid expenses | 3 | |
| Credit default swap contracts, at fair value | 5,590 | |
| Total assets | 1,626,872 | |
| Liabilities | ||
| Payables: | ||
| Due to custodian | 23 | |
| Due to broker (c) | 5,366 | |
| Investments purchased | 28,803 | |
| Fund shares redeemed | 695 | |
| Accrued fees to affiliates | 1,126 | |
| Other accrued expenses | 199 | |
| Variation margin on futures contracts | 164 | |
| Unrealized depreciation on foreign currency exchange contracts | 1,630 | |
| Total liabilities | 38,006 | |
| Net Assets | $ | 1,588,866 |
See accompanying notes which are an integral part of the financial statements.
372 Russell Global Opportunistic Credit Fund
| Russell Investment Company | |||
| Russell Global Opportunistic Credit Fund | |||
| Statement of Assets and Liabilities, continued — October 31, 2014 | |||
| Amounts in thousands | |||
| Net Assets Consist of: | |||
| Undistributed (overdistributed) net investment income | $ | 16,898 | |
| Accumulated net realized gain (loss) | 6,965 | ||
| Unrealized appreciation (depreciation) on: | |||
| Investments | (27,202 | ) | |
| Futures contracts | 580 | ||
| Credit default swap contracts | 835 | ||
| Foreign currency-related transactions | 78 | ||
| Shares of beneficial interest | 1,589 | ||
| Additional paid-in capital | 1,589,123 | ||
| Net Assets | $ | 1,588,866 | |
| Net Asset Value, offering and redemption price per share: | |||
| Net asset value per share: Class A(#) | $ | 9.97 | |
| Maximum offering price per share (Net asset value plus sales charge of 3.75%): Class A | $ | 10.36 | |
| Class A — Net assets | $ | 5,744,869 | |
| Class A — Shares outstanding ($.01 par value) | 576,190 | ||
| Net asset value per share: Class C(#) | $ | 9.93 | |
| Class C — Net assets | $ | 13,224,375 | |
| Class C — Shares outstanding ($.01 par value) | 1,331,981 | ||
| Net asset value per share: Class E(#) | $ | 9.99 | |
| Class E — Net assets | $ | 29,115,103 | |
| Class E — Shares outstanding ($.01 par value) | 2,915,699 | ||
| Net asset value per share: Class S(#) | $ | 10.00 | |
| Class S — Net assets | $ 1,082,504,875 | ||
| Class S — Shares outstanding ($.01 par value) | 108,255,858 | ||
| Net asset value per share: Class Y(#) | $ | 10.00 | |
| Class Y — Net assets | $ | 458,276,738 | |
| Class Y — Shares outstanding ($.01 par value) | 45,813,146 | ||
| Amounts in thousands | |||
| (^) Foreign currency holdings - cost | $ | 6,878 | |
| (+) Credit default swap contracts - premiums paid (received) | $ | 4,755 | |
| (>) Investments in affiliates, Russell U.S. Cash Management Fund | $ | 117,148 | |
| (a) Cash Collateral for Futures | $ | 1,160 | |
| (b) Cash Collateral for Swaps | $ | 4,336 | |
| (c) Due to Broker for Swaps | $ | 5,366 | |
| (#) Net asset value per share equals class level net assets divided by class level shares of beneficial interest outstanding. | |||
See accompanying notes which are an integral part of the financial statements.
Russell Global Opportunistic Credit Fund 373
| Russell Investment Company | |||
| Russell Global Opportunistic Credit Fund | |||
| Statement of Operations — For the Period Ended October 31, 2014 | |||
| Amounts in thousands | |||
| Investment Income | |||
| Dividends | $ | 129 | |
| Dividends from affiliated Russell funds | 137 | ||
| Interest | 82,156 | ||
| Less foreign taxes withheld | (251 | ) | |
| Total investment income | 82,171 | ||
| Expenses | |||
| Advisory fees | 14,230 | ||
| Administrative fees | 677 | ||
| Custodian fees | 560 | ||
| Distribution fees - Class A | 18 | ||
| Distribution fees - Class C | 97 | ||
| Transfer agent fees - Class A | 14 | ||
| Transfer agent fees - Class C | 26 | ||
| Transfer agent fees - Class E | 52 | ||
| Transfer agent fees - Class S | 1,880 | ||
| Transfer agent fees - Class Y | 19 | ||
| Professional fees | 119 | ||
| Registration fees | 112 | ||
| Shareholder servicing fees - Class C | 32 | ||
| Shareholder servicing fees - Class E | 65 | ||
| Trustees’ fees | 30 | ||
| Printing fees | 135 | ||
| Miscellaneous | 72 | ||
| Expenses before reductions | 18,138 | ||
| Expense reductions | (5,168 | ) | |
| Net expenses | 12,970 | ||
| Net investment income (loss) | 69,201 | ||
| Net Realized and Unrealized Gain (Loss) | |||
| Net realized gain (loss) on: | |||
| Investments | 406 | ||
| Futures contracts | 3,721 | ||
| Options written | (198 | ) | |
| Credit default swap contracts | 3,568 | ||
| Foreign currency-related transactions | 10,973 | ||
| Net realized gain (loss) | 18,470 | ||
| Net change in unrealized appreciation (depreciation) on: | |||
| Investments | (34,692 | ) | |
| Futures contracts | 221 | ||
| Credit default swap contracts | 17 | ||
| Foreign currency-related transactions | (364 | ) | |
| Net change in unrealized appreciation (depreciation) | (34,818 | ) | |
| Net realized and unrealized gain (loss) | (16,348 | ) | |
| Net Increase (Decrease) in Net Assets from Operations | $ | 52,853 | |
See accompanying notes which are an integral part of the financial statements.
374 Russell Global Opportunistic Credit Fund
| Russell Investment Company | ||||||
| Russell Global Opportunistic Credit Fund | ||||||
| Statements of Changes in Net Assets | ||||||
| For the Periods Ended October 31, | ||||||
| Amounts in thousands | 2014 | 2013 | ||||
| Increase (Decrease) in Net Assets | ||||||
| Operations | ||||||
| Net investment income (loss) | $ | 69,201 | $ | 45,586 | ||
| Net realized gain (loss) | 18,470 | 3,496 | ||||
| Net change in unrealized appreciation (depreciation) | (34,818 | ) | (18,676 | ) | ||
| Net increase (decrease) in net assets from operations | 52,853 | 30,406 | ||||
| Distributions | ||||||
| From net investment income | ||||||
| Class A | (334 | ) | (553 | ) | ||
| Class C | (485 | ) | (539 | ) | ||
| Class E | (1,112 | ) | (779 | ) | ||
| Class S | (42,423 | ) | (29,453 | ) | ||
| Class Y | (20,283 | ) | (17,432 | ) | ||
| From net realized gain | ||||||
| Class A | (55 | ) | (64 | ) | ||
| Class C | (83 | ) | (53 | ) | ||
| Class E | (107 | ) | (85 | ) | ||
| Class S | (4,071 | ) | (2,966 | ) | ||
| Class Y | (2,113 | ) | (1,922 | ) | ||
| Net decrease in net assets from distributions | (71,066 | ) | (53,846 | ) | ||
| Share Transactions* | ||||||
| Net increase (decrease) in net assets from share transactions | 665,009 | 170,933 | ||||
| Total Net Increase (Decrease) in Net Assets | 646,796 | 147,493 | ||||
| Net Assets | ||||||
| Beginning of period | 942,070 | 794,577 | ||||
| End of period | $ | 1,588,866 | $ | 942,070 | ||
| Undistributed (overdistributed) net investment income included in net assets | $ | 16,898 | $ | 1,764 | ||
See accompanying notes which are an integral part of the financial statements.
Russell Global Opportunistic Credit Fund 375
Russell Investment Company
Russell Global Opportunistic Credit Fund
Statements of Changes in Net Assets, continued
* Share transaction amounts (in thousands) for the periods ended October 31, 2014 and October 31, 2013 were as follows:
| 2014 | 2013 | |||||||||||
| Shares | Dollars | Shares | Dollars | |||||||||
| Class A | ||||||||||||
| Proceeds from shares sold | 211 | $ | 2,115 | 463 | $ | 4,837 | ||||||
| Proceeds from reinvestment of distributions | 37 | 372 | 58 | 600 | ||||||||
| Payments for shares redeemed | (484 | ) | (4,876 | ) | (554 | ) | (5,663 | ) | ||||
| Net increase (decrease) | (236 | ) | (2,389 | ) | (33 | ) | (226 | ) | ||||
| Class C | ||||||||||||
| Proceeds from shares sold | 413 | 4,136 | 877 | 9,175 | ||||||||
| Proceeds from reinvestment of distributions | 56 | 557 | 57 | 582 | ||||||||
| Payments for shares redeemed | (338 | ) | (3,381 | ) | (396 | ) | (3,985 | ) | ||||
| Net increase (decrease) | 131 | 1,312 | 538 | 5,772 | ||||||||
| Class E | ||||||||||||
| Proceeds from shares sold | 1,542 | 15,385 | 407 | 4,180 | ||||||||
| Proceeds from reinvestment of distributions | 110 | 1,100 | 72 | 739 | ||||||||
| Payments for shares redeemed | (291 | ) | (2,930 | ) | (180 | ) | (1,849 | ) | ||||
| Net increase (decrease) | 1,361 | 13,555 | 299 | 3,070 | ||||||||
| Class S | ||||||||||||
| Proceeds from shares sold | 61,647 | 616,388 | 21,112 | 218,142 | ||||||||
| Proceeds from reinvestment of distributions | 4,591 | 46,143 | 3,114 | 32,132 | ||||||||
| Payments for shares redeemed | (15,788 | ) | (158,977 | ) | (9,994 | ) | (103,219 | ) | ||||
| Net increase (decrease) | 50,450 | 503,554 | 14,232 | 147,055 | ||||||||
| Class Y | ||||||||||||
| Proceeds from shares sold | 18,461 | 184,356 | 4,718 | 48,310 | ||||||||
| Proceeds from reinvestment of distributions | 2,228 | 22,396 | 1,872 | 19,355 | ||||||||
| Payments for shares redeemed | (5,754 | ) | (57,775 | ) | (5,042 | ) | (52,403 | ) | ||||
| Net increase (decrease) | 14,935 | 148,977 | 1,548 | 15,262 | ||||||||
| Total increase (decrease) | 66,641 | $ | 665,009 | 16,584 | $ | 170,933 | ||||||
See accompanying notes which are an integral part of the financial statements.
376 Russell Global Opportunistic Credit Fund
(This page intentionally left blank)
| Russell Investment Company | |||||||||||||||
| Russell Global Opportunistic Credit Fund | |||||||||||||||
| Financial Highlights — For the Periods Ended | |||||||||||||||
| For a Share Outstanding Throughout Each Period. | |||||||||||||||
| $ | $ | $ | $ | $ | $ | ||||||||||
| Net Asset Value, | Net | Net Realized | Total from | Distributions | Distributions | ||||||||||
| Beginning of | Investment | and Unrealized | Investment | from Net | from Net | ||||||||||
| Period | Income (Loss)(a)(d) | Gain (Loss) | Operations | Investment Income | Realized Gain | ||||||||||
| Class A | |||||||||||||||
| October 31, 2014 | 10.18 | .46 | (.15) | .31 | (.45) | (.07) | |||||||||
| October 31, 2013 | 10.47 | .52 | (.17) | .35 | (.57) | (.07) | |||||||||
| October 31, 2012 | 10.32 | .58 | .67 | 1.25 | (1.10) | — | |||||||||
| October 31, 2011 | 10.09 | .57 | (.25) | .32 | (.09) | —(f) | |||||||||
| October 31, 2010(3) | 10.00 | .03 | .06 | .09 | — | — | |||||||||
| Class C | |||||||||||||||
| October 31, 2014 | 10.14 | .39 | (.15) | .24 | (.38) | (.07) | |||||||||
| October 31, 2013 | 10.44 | .42 | (.15) | .27 | (.50) | (.07) | |||||||||
| October 31, 2012 | 10.25 | .51 | .67 | 1.18 | (.99) | — | |||||||||
| October 31, 2011 | 10.08 | .48 | (.23) | .25 | (.08) | —(f) | |||||||||
| October 31, 2010(3) | 10.00 | .02 | .06 | .08 | — | — | |||||||||
| Class E | |||||||||||||||
| October 31, 2014 | 10.20 | .46 | (.15) | .31 | (.45) | (.07) | |||||||||
| October 31, 2013 | 10.49 | .52 | (.17) | .35 | (.57) | (.07) | |||||||||
| October 31, 2012 | 10.32 | .59 | .67 | 1.26 | (1.09) | — | |||||||||
| October 31, 2011 | 10.09 | .56 | (.24) | .32 | (.09) | —(f) | |||||||||
| October 31, 2010(3) | 10.00 | .03 | .06 | .09 | — | — | |||||||||
| Class S | |||||||||||||||
| October 31, 2014 | 10.21 | .49 | (.15) | .34 | (.48) | (.07) | |||||||||
| October 31, 2013 | 10.50 | .54 | (.16) | .38 | (.60) | (.07) | |||||||||
| October 31, 2012 | 10.35 | .62 | .66 | 1.28 | (1.13) | — | |||||||||
| October 31, 2011 | 10.09 | .58 | (.22) | .36 | (.10) | —(f) | |||||||||
| October 31, 2010(3) | 10.00 | .03 | .06 | .09 | — | — | |||||||||
| Class Y | |||||||||||||||
| October 31, 2014 | 10.22 | .50 | (.17) | .33 | (.48) | (.07) | |||||||||
| October 31, 2013 | 10.51 | .56 | (.17) | .39 | (.61) | (.07) | |||||||||
| October 31, 2012 | 10.36 | .63 | .66 | 1.29 | (1.14) | — | |||||||||
| October 31, 2011 | 10.09 | .58 | (.21) | .37 | (.10) | —(f) | |||||||||
| October 31, 2010(3) | 10.00 | .03 | .06 | .09 | — | — | |||||||||
See accompanying notes which are an integral part of the financial statements.
378 Russell Global Opportunistic Credit Fund
| % | % | % | ||||||||||||||
| $ | $ | Ratio of Expenses | Ratio of Expenses | Ratio of Net | ||||||||||||
| Net Asset Value, | % | Net Assets, | to Average | to Average | Investment Income | % | ||||||||||
| $ | End of | Total | End of Period | Net Assets, | Net Assets, | to Average | Portfolio | |||||||||
| Total Distributions | Period | Return(b)(c) | (000) | Gross(e) | Net(d)(e) | Net Assets(d)(e) | Turnover Rate(b) | |||||||||
| (.52 | ) | 9.97 | 3.15 | 5,745 | 1.57 | 1.17 | 4.61 | 80 | ||||||||
| (.64 | ) | 10.18 | 3.48 | 8,273 | 1.59 | 1.20 | 5.12 | 85 | ||||||||
| (1.10 | ) | 10.47 | 13.09 | 8,857 | 1.57 | 1.20 | 5.67 | 109 | ||||||||
| (.09 | ) | 10.32 | 3.24 | 2,468 | 1.57 | 1.20 | 5.58 | 126 | ||||||||
| — | 10.09 | .90 | 234 | 1.88 | 1.51 | 3.13 | 4 | |||||||||
| (.45 | ) | 9.93 | 2.41 | 13,224 | 2.32 | 1.92 | 3.86 | 80 | ||||||||
| (.57 | ) | 10.14 | 2.65 | 12,184 | 2.34 | 1.95 | 4.34 | 85 | ||||||||
| (.99 | ) | 10.44 | 12.33 | 6,918 | 2.32 | 1.95 | 4.94 | 109 | ||||||||
| (.08 | ) | 10.25 | 2.51 | 3,432 | 2.32 | 1.95 | 4.78 | 126 | ||||||||
| — | 10.08 | .80 | 664 | 2.63 | 2.26 | 2.53 | 4 | |||||||||
| (.52 | ) | 9.99 | 3.16 | 29,115 | 1.57 | 1.17 | 4.59 | 80 | ||||||||
| (.64 | ) | 10.20 | 3.42 | 15,856 | 1.59 | 1.20 | 5.09 | 85 | ||||||||
| (1.09 | ) | 10.49 | 13.18 | 13,165 | 1.57 | 1.20 | 5.75 | 109 | ||||||||
| (.09 | ) | 10.32 | 3.22 | 14,029 | 1.57 | 1.20 | 5.53 | 126 | ||||||||
| — | 10.09 | .90 | 885 | 1.88 | 1.51 | 3.80 | 4 | |||||||||
| (.55 | ) | 10.00 | 3.41 | 1,082,505 | 1.32 | .92 | 4.86 | 80 | ||||||||
| (.67 | ) | 10.21 | 3.72 | 590,280 | 1.34 | .95 | 5.33 | 85 | ||||||||
| (1.13 | ) | 10.50 | 13.37 | 457,523 | 1.32 | .95 | 6.00 | 109 | ||||||||
| (.10 | ) | 10.35 | 3.57 | 412,737 | 1.32 | .95 | 5.71 | 126 | ||||||||
| — | 10.09 | .90 | 247,804 | 1.63 | 1.26 | 3.58 | 4 | |||||||||
| (.55 | ) | 10.00 | 3.39 | 458,277 | 1.12 | .84 | 4.92 | 80 | ||||||||
| (.68 | ) | 10.22 | 3.76 | 315,477 | 1.14 | .86 | 5.43 | 85 | ||||||||
| (1.14 | ) | 10.51 | 13.43 | 308,114 | 1.13 | .85 | 6.11 | 109 | ||||||||
| (.10 | ) | 10.36 | 3.69 | 344,443 | 1.14 | .86 | 5.73 | 126 | ||||||||
| — | 10.09 | .90 | 370,496 | 1.46 | 1.18 | 3.37 | 4 | |||||||||
See accompanying notes which are an integral part of the financial statements.
Russell Global Opportunistic Credit Fund 379
Russell Investment Company Russell Strategic Bond Fund
Portfolio Management Discussion and Analysis — October 31, 2014 (Unaudited)
| Russell Strategic Bond Fund - Class A‡ | Russell Strategic Bond Fund - Class S‡‡‡ | ||||||
| Total | Total | ||||||
| Return | Return | ||||||
| 1 Year | 0.12 | % | 1 Year | 4.19 | % | ||
| 5 Years | 4.61 | %§ | 5 Years | 5.65 | %§ | ||
| 10 Years | 4.25 | %§ | 10 Years | 4.94 | %§ | ||
| Russell Strategic Bond Fund - Class C‡‡ | Russell Strategic Bond Fund - Class Y‡‡‡‡ | ||||||
| Total | Total | ||||||
| Return | Return | ||||||
| 1 Year | 3.15 | % | 1 Year | 4.31 | % | ||
| 5 Years | 4.57 | %§ | 5 Years | 5.83 | %§ | ||
| 10 Years | 4.17 | %§ | 10 Years | 5.03 | %§ | ||
| Russell Strategic Bond Fund - Class E | Barclays U.S. Aggregate Bond Index** | ||||||
| Total | Total | ||||||
| Return | Return | ||||||
| 1 Year | 3.96 | % | 1 Year | 4.14 | % | ||
| 5 Years | 5.44 | %§ | 5 Years | 4.22 | %§ | ||
| 10 Years | 4.69 | %§ | 10 Years | 4.64 | %§ | ||
| Russell Strategic Bond Fund - Class I | |||||||
| Total | |||||||
| Return | |||||||
| 1 Year | 4.29 | % | |||||
| 5 Years | 5.71 | %§ | |||||
| 10 Years | 4.95 | %§ | |||||
380 Russell Strategic Bond Fund
Russell Investment Company
Russell Strategic Bond Fund
Portfolio Management Discussion and Analysis, continued — October 31, 2014 (Unaudited)
| The Russell Strategic Bond Fund (the “Fund”) employs a multi- | on” market where investors are generally bullish about the |
| manager approach whereby portions of the Fund are allocated to | economy. Environments that feature mass sell-offs in fixed income |
| different money managers. Fund assets not allocated to money | risk assets (e.g., the recent global financial crisis) will tend to be |
| managers are managed by Russell Investment Management | unfavorable for the Fund. Overall, Fund positioning had a mixed |
| Company (“RIMCo”), the Fund’s advisor. RIMCo may change | impact on performance during the period, with an overweight to |
| the allocation of the Fund’s assets among money managers at | credit being a modestly positive contributor, while yield curve |
| any time. An exemptive order from the Securities and Exchange | positioning and short duration exposure detracted from results, as |
| Commission (“SEC”) permits RIMCo to engage or terminate a | yields unexpectedly decreased over the period. |
| money manager at any time, subject to approval by the Fund’s | |
| Board, without a shareholder vote. Pursuant to the terms of the | How did the investment strategies and techniques employed |
| exemptive order, the Fund is required to notify its shareholders | by the Fund and its money managers affect its benchmark- |
| within 90 days of when a money manager begins providing | relative performance? |
| services. As of October 31, 2014, the Fund had seven money | The Fund generally performed in-line with its benchmark, with |
| managers. | some share classes outperforming and some underperforming |
| the benchmark. Primary detractors during the period included | |
| What is the Fund’s investment objective? | the Fund’s positioning along the yield curve and a short duration |
| The Fund seeks to provide current income, and as a secondary | relative to its benchmark as the U.S. yield curve flattened against |
| objective, capital appreciation. | expectations in 2014. To a lesser extent, selection across agency |
| How did the Fund perform relative to its benchmark for the | mortgage-backed securities also detracted from performance. |
| fiscal year ended October 31, 2014? | However, exposure to non-agency mortgage-backed securities |
| such as sub-prime mortgages added value over the period given | |
| For the fiscal year ended October 31, 2014, the Fund’s Class A, | general housing improvements, and allocations among non-U.S. |
| Class C, Class E, Class I, Class S and Class Y Shares gained 4.03%, | interest rates and currencies had positive results in the setting of |
| 3.15%, 3.96%, 4.29%, 4.19% and 4.31%, respectively. This is | U.S. economic strengthening and select emerging market turmoil. |
| compared to the Fund’s benchmark, the Barclays U.S. Aggregate | |
| Bond Index, which gained 4.14% during the same period. The | Brookfield Investment Management Inc. (“Brookfield”) |
| Fund’s performance includes operating expenses, whereas index | outperformed the Fund’s benchmark for the fiscal year. Ex- |
| returns are unmanaged and do not include expenses of any kind. | benchmark exposure to non-agency mortgage-backed securities |
| For the fiscal year ended October 31, 2014, Morningstar® | was a primary driver to results, though Brookfield’s selections |
| to commercial mortgage-backed securities also contributed | |
| Intermediate-Term Bond, a group of funds that Morningstar | positively to performance to a lesser extent. Issuer selection |
| considers to have investment strategies similar to those of the | within agency mortgage-backed securities detracted toward the |
| Fund, gained 4.08%. These returns serve as peer comparisons | beginning of the period. |
| and are expressed net of operating expenses. | |
| Colchester Global Investors Limited (“Colchester”) outperformed | |
| How did the market conditions described in the Market | the Fund’s benchmark for the fiscal year. Results were primarily |
| Summary report affect the Fund’s performance? | due to currency selections. Toward the end of the period, a long |
| Despite a rough start at the beginning of the one-year period, the | U.S. dollar (USD) position versus short allocations to a handful of |
| U.S. bond market turned around in 2014 resulting in generally | currencies was a significant contributor as the USD appreciated |
| positive performance among bonds over the fiscal year. Various | significantly. Beneficial interest rate selections across developed |
| positive factors included: strengthening data for U.S. growth amid | markets also contributed positively to benchmark-relative |
| heightened geopolitical tension in select emerging economies, | performance. |
| which drove a U.S. Treasury rally and robust U.S. dollar | Logan Circle Partners, L.P. (“Logan”) outperformed the Fund’s |
| appreciation; continued improvements in housing fundamentals; | benchmark for the fiscal year. Market conditions were favorable |
| ongoing low interest rates that fueled issuance activity; and | to Logan’s portfolio and results were more specifically achieved |
| sustained investor demand. | via positive security selection within investment grade corporate |
| The Fund will generally perform well in markets where non- | credit. Allocations to country interest rates and an overweight |
| treasury sectors lead. These are environments where the economy | position to hard currency emerging market debt also materially |
| is stable and a higher coupon can be collected, or an environment | contributed to positive benchmark-relative performance. Issuer |
| where corporate profits are increasing, enabling issuers to pay | selection within agency and commercials mortgage-backed |
| down their debt burden. This may also be generalized as a “risk- | securities was also beneficial over the one-year period. |
Russell Strategic Bond Fund 381
Russell Investment Company
Russell Strategic Bond Fund
Portfolio Management Discussion and Analysis, continued — October 31, 2014 (Unaudited)
| Macro Currency Group (“Macro”) underperformed the Fund’s | fiscal period, a long U.S. Dollar (USD) position versus a handful | |
| benchmark for the fiscal year. Despite positive attribution from | of currencies was a material contributor to positive results. | |
| top-down, macro selections within a thematic strategy based on | RIMCo manages the portion of the Fund’s assets that RIMCo | |
| developed market central bank policies, allocations amid market | determines not to allocate to the money managers. Assets not | |
| volatility detracted from performance. In response to heightened | allocated to managers include the Fund’s liquidity reserves and | |
| volatility, Macro deployed an additional thematic strategy toward | assets which may be managed directly by RIMCo to modify the | |
| the end of the summer of 2014. This latter strategy included a | Fund’s overall portfolio characteristics to seek to achieve the | |
| long position to the Japanese Yen (JPY) versus a short position to | desired risk/return profile for the Fund. | |
| the Australian Dollar (AUD) that led to negative results when the | ||
| AUD failed to sell-off at the same rate as JPY. | During the period, RIMCo utilized futures and swaps to seek to | |
| achieve the Fund benchmark’s duration exposures with respect to | ||
| Metropolitan West Asset Management, LLC (“Met West”) | the portion of the Fund allocated to cash reserves. While this was | |
| outperformed the Fund’s benchmark for the fiscal year. Exposure | a positive in terms of absolute return contribution, it detracted | |
| to, and security selection within, non-agency residential | relative to the benchmark. | |
| mortgage-backed securities consistently contributed positively | ||
| throughout the one-year period. General allocations to asset- | In March 2014, RIMCo implemented a three-pronged strategy | |
| and commercial-mortgage backed securities, or sectors tied to | to seek to generate active returns through currency positioning | |
| securitized assets such as credit cards, student loans, shopping | by supplementing the Fund’s existing active currency mandate | |
| malls, or apartment complexes, also contributed positively, but | with a more mechanistic strategy and to further reduce the | |
| to a lesser extent. Selections to corporate bonds detracted from | Fund’s reliance on traditional fixed income market risks. This | |
| performance throughout the period, whereas detractions from | approach incorporates a currency overlay, an index replication | |
| positioning along the U.S. yield curve only impacted performance | and an enhanced cash strategy. The currency overlay utilizes | |
| at the start of the period. | currency forward contracts to take long and short positions in | |
| global foreign exchange markets. Because the currency overlay | ||
| Scout Investments, Inc. (“Scout”) was hired in October 2014 | is an out-of-benchmark position, RIMCo implemented an index | |
| but did not manage Fund assets until the end of the month, | replication strategy in connection with the currency overlay to | |
| and therefore did not have a meaningful impact on the Fund’s | provide benchmark-like exposure to its overall strategy. The | |
| performance for the period. | enhanced cash strategy is designed to provide for modest returns | |
| Pacific Investment Management | Company (“PIMCO”) was | on the cash held in connection with the currency overlay and |
| terminated in October 2014 and | underperformed the Fund’s | index replication strategies. For the portion of the fiscal year in |
| benchmark for the portion of the fiscal year in which it was a | which it was employed in the Fund, the currency overlay strategy | |
| manager for the Fund. A yield curve-steepening bias over the | was positive for Fund performance, as was the underlying index | |
| period was a primary detractor as the U.S. yield curve fell during | replication strategy, due to its slightly greater interest rate | |
| 2014. Duration positioning and sector selection (investment | sensitivity as yields fell. | |
| grade corporate bonds and agency mortgage-backed securities) | Throughout the period, RIMCo also implemented tactical ‘tilts’ | |
| also held back performance. However, exposure to non-agency | based on its judgments regarding shorter-term opportunities to | |
| mortgage-backed securities was especially positive and helped | seek to generate returns and/or mitigate risk by purchasing and | |
| to mitigate further losses. Selections to non-U.S. interest rates as | shorting U.S. Treasury futures and currency forward contracts. | |
| well as currency allocations also contributed positively over the | These tilts detracted modestly during the period due to RIMCo’s | |
| period. | U.S. Treasury futures selections. | |
| Wellington Management Company, LLP (“Wellington”) | ||
| outperformed the Fund’s benchmark for the fiscal year. Macro- | Describe any changes to the Fund’s structure or the money | |
| driven strategies added the greatest value over the period, | manager line-up. | |
| beginning with positive selections to U.K. and U.S. interest rates | In October 2014, RIMCo terminated Pacific Investment | |
| at the end of 2013. Although the same positions turned sluggish | Management Company (“PIMCO”) as a money manager for the | |
| going into 2014, the manager was able to re-position those | Fund and hired Scout Investments, Inc. as a money manager for | |
| allocations, resulting in minimal losses. Toward the end of the | the Fund. There were some minor re-weightings among managers | |
| and strategies within the Fund as a result of these changes. | ||
382 Russell Strategic Bond Fund
Russell Investment Company
Russell Strategic Bond Fund
Portfolio Management Discussion and Analysis, continued — October 31, 2014 (Unaudited)
| Money Managers as of October 31, | The views expressed in this report reflect those of the portfolio | |
| 2014 | Styles | managers only through the end of the period covered by |
| the report. These views do not necessarily represent the | ||
| Colchester Brookfield Investment Global Investors Management Limited Inc. | Fully Sector Discretionary Specialist | views of RIMCo, or any other person in RIMCo or any other |
| Logan Circle Partners, L.P. | Fully Discretionary | affiliated organization. These views are subject to change |
| Macro Currency Group - an investment | at any time based upon market conditions or other events, | |
| group within Principal Global Investors | and RIMCo disclaims any responsibility to update the views | |
| LLC* | Fully Discretionary | contained herein. These views should not be relied on as |
| Metropolitan West Asset Management, LLC | Fully Discretionary | |
| Scout Investments, Inc. | Fully Discretionary | investment advice and, because investment decisions for |
| Wellington Management Company, LLP | Fully Discretionary | a Russell Investment Company (“RIC”) Fund are based on |
| numerous factors, should not be relied on as an indication | ||
| of investment decisions of any RIC Fund. |
| * | Assumes initial investment on November 1, 2004. |
| ** | The Barclays U.S. Aggregate Bond Index is an index, with income reinvested, generally representative of intermediate-term government bonds, investment-grade corporate debt securities and mortgage-backed securities. |
| ‡ | The Fund first issued Class A Shares on September 2, 2008. The returns shown for Class A Shares prior to that date are the returns of Class E Shares. The performance shown has been adjusted to reflect the deduction of the maximum Class A sales charge of 3.75%. Annual returns for each Class will differ only to the extent that the Class A Shares do not have the same expenses as Class E Shares. |
| ‡‡ | The Fund first issued Class C Shares on September 2, 2008. The returns shown for Class C Shares prior to that date are the returns of the Fund’s Class E Shares and do not reflect deduction of Rule 12b-1 distribution fees that apply to Class C Shares. Had they done so, the returns shown for those periods would have been lower. Annual returns for each Class will differ only to the extent that the Class C Shares do not have the same expenses as the Class E Shares. |
| ‡‡‡ | The Fund first issued Class S Shares on September 2, 2008. The returns shown for Class S Shares prior to that date are the returns of the Fund’s Class I |
| Shares. Class S Shares will have substantially similar annual returns as the Class I Shares because the Shares of each Class are invested in the same portfolio of securities. Annual returns for each Class will differ only to the extent that the Class S Shares do not have the same expenses as the Class I Shares. | |
| ‡‡‡‡ | The Fund first issued Class Y Shares on June 7, 2000, closed its Class Y Shares on November 19, 2001 and reopened its Class Y Shares on June 23, 2005. The returns shown for Class Y Shares prior to June 23, 2005 are the returns of the Fund’s Class I Shares. Class Y Shares will have substantially similar annual returns as the Class I Shares because the Shares of each Class are invested in the same portfolio of securities. Annual returns for each Class will differ only to the extent that the Class Y Shares do not have the same expenses as the Class I Shares. |
| § | Annualized. |
Performance is historical and assumes reinvestment of all dividends and capital gains. Investment return and principal value will fluctuate so that an investor’s shares, when redeemed, may be worth more or less than when purchased. Past performance is not indicative of future results. The returns shown do not reflect the deduction of taxes that a shareholder would pay on Fund distributions or the redemption of Fund shares.
Russell Strategic Bond Fund 383
Russell Investment Company Russell Strategic Bond Fund
Shareholder Expense Example — October 31, 2014 (Unaudited)
| Fund Expenses | Please note that the expenses shown in the table are meant | |||||
| The following disclosure provides important information | to highlight your ongoing costs only and do not reflect any | |||||
| regarding the Fund’s Shareholder Expense Example | transactional costs. Therefore, the information under the heading | |||||
| (“Example”). | “Hypothetical Performance (5% return before expenses)” is | |||||
| useful in comparing ongoing costs only, and will not help you | ||||||
| Example | determine the relative total costs of owning different funds. In | |||||
| As a shareholder of the Fund, you incur two types of costs: (1) | addition, if these transactional costs were included, your costs | |||||
| transaction costs, and (2) ongoing costs, including advisory and | would have been higher. | |||||
| administrative fees; distribution (12b-1) and/or service fees; | Hypothetical | |||||
| and other Fund expenses. The Example is intended to help | Performance (5% | |||||
| you understand your ongoing costs (in dollars) of investing in | Actual | return before | ||||
| the Fund and to compare these costs with the ongoing costs of | Class A | Performance | expenses) | |||
| Beginning Account Value | ||||||
| investing in other mutual funds. The Example is based on an | May 1, 2014 | $ | 1,000.00 | $ | 1,000.00 | |
| investment of $1,000 invested at the beginning of the period and | Ending Account Value | |||||
| held for the entire period indicated, which for this Fund is from | October 31, 2014 | $ | 1,023.80 | $ | 1,020.21 | |
| May 1, 2014 to October 31, 2014. | Expenses Paid During Period* | $ | 5.05 | $ | 5.04 | |
| Actual Expenses | * Expenses are equal to the Fund's annualized expense ratio of 0.99% | |||||
| (representing the six month period annualized), multiplied by the average | ||||||
| The information in the table under the heading “Actual | account value over the period, multiplied by 184/365 (to reflect the one-half | |||||
| Performance” provides information about actual account values | year period). May reflect amounts waived and/or reimbursed. Without any | |||||
| and actual expenses. You may use the information in this column, | waivers and/or reimbursements, expenses would have been higher. | |||||
| together with the amount you invested, to estimate the expenses | ||||||
| Hypothetical | ||||||
| that you paid over the period. Simply divide your account value by | Performance (5% | |||||
| $1,000 (for example, an $8,600 account value divided by $1,000 | Actual | return before | ||||
| = 8.6), then multiply the result by the number in the first column | Class C | Performance | expenses) | |||
| Beginning Account Value | ||||||
| in the row entitled “Expenses Paid During Period” to estimate | May 1, 2014 | $ | 1,000.00 | $ | 1,000.00 | |
| the expenses you paid on your account during this period. | Ending Account Value | |||||
| October 31, 2014 | $ | 1,019.00 | $ | 1,016.43 | ||
| Hypothetical Example for Comparison Purposes | Expenses Paid During Period* | $ | 8.85 | $ | 8.84 | |
| The information in the table under the heading “Hypothetical | ||||||
| Performance (5% return before expenses)” provides information | * Expenses are equal to the Fund's annualized expense ratio of 1.74% | |||||
| (representing the six month period annualized), multiplied by the average | ||||||
| about hypothetical account values and hypothetical expenses | account value over the period, multiplied by 184/365 (to reflect the one-half | |||||
| based on the Fund’s actual expense ratio and an assumed rate of | year period). May reflect amounts waived and/or reimbursed. Without any | |||||
| return of 5% per year before expenses, which is not the Fund’s | waivers and/or reimbursements, expenses would have been higher. | |||||
| actual return. The hypothetical account values and expenses | ||||||
| Hypothetical | ||||||
| may not be used to estimate the actual ending account balance or | Performance (5% | |||||
| expenses you paid for the period. You may use this information | Actual | return before | ||||
| to compare the ongoing costs of investing in the Fund and other | Class E | Performance | expenses) | |||
| funds. To do so, compare this 5% hypothetical example with the | Beginning Account Value | |||||
| May 1, 2014 | $ | 1,000.00 | $ | 1,000.00 | ||
| 5% hypothetical examples that appear in the shareholder reports | Ending Account Value | |||||
| of other funds. | October 31, 2014 | $ | 1,024.00 | $ | 1,020.21 | |
| Expenses Paid During Period* | $ | 5.05 | $ | 5.04 | ||
| * Expenses are equal to the Fund's annualized expense ratio of 0.99% | ||||||
| (representing the six month period annualized), multiplied by the average | ||||||
| account value over the period, multiplied by 184/365 (to reflect the one-half | ||||||
| year period). May reflect amounts waived and/or reimbursed. Without any | ||||||
| waivers and/or reimbursements, expenses would have been higher. | ||||||
384 Russell Strategic Bond Fund
Russell Investment Company Russell Strategic Bond Fund
Shareholder Expense Example, continued — October 31, 2014 (Unaudited)
| Hypothetical | ||||||
| Performance (5% | ||||||
| Actual | return before | |||||
| Class I | Performance | expenses) | ||||
| Beginning Account Value | ||||||
| May 1, 2014 | $ | 1,000.00 | $ | 1,000.00 | ||
| Ending Account Value | ||||||
| October 31, 2014 | $ | 1,024.70 | $ | 1,021.68 | ||
| Expenses Paid During Period* | $ | 3.57 | $ | 3.57 | ||
| * Expenses are equal to the Fund's annualized expense ratio of 0.70% | ||||||
| (representing the six month period annualized), multiplied by the average | ||||||
| account value over the period, multiplied by 184/365 (to reflect the one-half | ||||||
| year period). May reflect amounts waived and/or reimbursed. Without any | ||||||
| waivers and/or reimbursements, expenses would have been higher. | ||||||
| Hypothetical | ||||||
| Performance (5% | ||||||
| Actual | return before | |||||
| Class S | Performance | expenses) | ||||
| Beginning Account Value | ||||||
| May 1, 2014 | $ | 1,000.00 | $ | 1,000.00 | ||
| Ending Account Value | ||||||
| October 31, 2014 | $ | 1,025.10 | $ | 1,021.48 | ||
| Expenses Paid During Period* | $ | 3.78 | $ | 3.77 | ||
| * Expenses are equal to the Fund's annualized expense ratio of 0.74% | ||||||
| (representing the six month period annualized), multiplied by the average | ||||||
| account value over the period, multiplied by 184/365 (to reflect the one-half | ||||||
| year period). May reflect amounts waived and/or reimbursed. Without any | ||||||
| waivers and/or reimbursements, expenses would have been higher. | ||||||
| Hypothetical | ||||||
| Performance (5% | ||||||
| Actual | return before | |||||
| Class Y | Performance | expenses) | ||||
| Beginning Account Value | ||||||
| May 1, 2014 | $ | 1,000.00 | $ | 1,000.00 | ||
| Ending Account Value | ||||||
| October 31, 2014 | $ | 1,025.20 | $ | 1,022.23 | ||
| Expenses Paid During Period* | $ | 3.01 | $ | 3.01 | ||
| * Expenses are equal to the Fund's annualized expense ratio of 0.59% | ||||||
| (representing the six month period annualized), multiplied by the average | ||||||
| account value over the period, multiplied by 184/365 (to reflect the one-half | ||||||
| year period). May reflect amounts waived and/or reimbursed. Without any | ||||||
| waivers and/or reimbursements, expenses would have been higher. | ||||||
Russell Strategic Bond Fund 385
| Russell Investment Company | |||||||||
| Russell Strategic Bond Fund | |||||||||
| Schedule of Investments — October 31, 2014 | |||||||||
| Amounts in thousands (except share amounts) | Amounts in thousands (except share amounts) | ||||||||
| Principal | Fair | Principal | Fair | ||||||
| Amount ($) | Value | Amount ($) | Value | ||||||
| or Shares | $ | or Shares | $ | ||||||
| Long-Term Investments - 82.6% | Bank of America Auto Trust | ||||||||
| Series 2012-1 Class A3 | |||||||||
| Asset-Backed Securities - 9.5% | 0.780% due 06/15/16 | 4,650 | 4,652 | ||||||
| Access Group, Inc. | BMW Vehicle Owner Trust | ||||||||
| Series 2003-A Class A2 | Series 2011-A Class A4 | ||||||||
| 1.230% due 07/01/38 (Ê) | 1,830 | 1,805 | 1.030% due 02/26/18 | 6,632 | 6,644 | ||||
| Series 2004-2 Class A3 | BNC Mortgage Loan Trust | ||||||||
| 0.424% due 10/25/24 (Ê) | 3,700 | 3,463 | Series 2007-2 Class A5 | ||||||
| Accredited Mortagage Loan Trust | 0.465% due 05/25/37 | 4,248 | 3,073 | ||||||
| Series 2006-2 Class A4 | Brazos Higher Education Authority | ||||||||
| 0.415% due 09/25/36 | 4,540 | 3,781 | Series 2010-1 Class A2 | ||||||
| Ally Auto Receivables Trust | 1.438% due 02/25/35 (Ê) | 5,000 | 5,175 | ||||||
| Series 2011-1 Class A4 | Cabela's Credit Card Master Note Trust | ||||||||
| 2.230% due 03/15/16 | 1,104 | 1,105 | Series 2012-1A Class A2 | ||||||
| Series 2012-1 Class A4 | 0.683% due 02/18/20 (Ê)(Þ) | 6,500 | 6,547 | ||||||
| 1.210% due 07/15/16 | 3,050 | 3,061 | Series 2014-1 Class A | ||||||
| Series 2012-3 Class A3 | 0.503% due 03/16/20 (Ê) | 1,820 | 1,819 | ||||||
| 0.850% due 08/15/16 | 5,349 | 5,355 | Capital Auto Receivables Asset Trust | ||||||
| Series 2012-4 Class A3 | Series 2013-4 Class A2 | ||||||||
| 0.590% due 01/17/17 | 9,516 | 9,522 | 0.850% due 02/21/17 | 3,200 | 3,207 | ||||
| Series 2013-1 Class A3 | Series 2014-1 Class A2 | ||||||||
| 0.630% due 05/15/17 | 4,874 | 4,878 | 0.960% due 04/20/17 | 3,420 | 3,431 | ||||
| Series 2013-2 Class A2B | CarFinance Capital Auto Trust | ||||||||
| 0.383% due 07/15/16 (Ê) | 2,972 | 2,973 | Series 2013-1A Class A | ||||||
| Ally Master Owner Trust | 1.650% due 07/17/17 (Þ) | 1,003 | 1,006 | ||||||
| Series 2010-2 Class A | Series 2014-1A Class A | ||||||||
| 4.250% due 04/15/17 (Þ) | 3,719 | 3,769 | 1.460% due 12/17/18 (Þ) | 5,949 | 5,962 | ||||
| Series 2012-1 Class A2 | CarMax Auto Owner Trust | ||||||||
| 1.440% due 02/15/17 | 2,495 | 2,501 | Series 2011-1 Class C | ||||||
| Series 2014-2 Class A | 2.830% due 02/15/17 | 7,725 | 7,789 | ||||||
| 0.523% due 01/16/18 (Ê) | 6,220 | 6,220 | CCG Receivables Trust | ||||||
| American Express Credit Account | Series 2013-1 Class A2 | ||||||||
| Master Trust | 1.050% due 08/14/20 (Þ) | 1,934 | 1,938 | ||||||
| Series 2012-2 Class A | Series 2014-1 Class A2 | ||||||||
| 0.680% due 03/15/18 | 2,595 | 2,600 | 1.060% due 11/15/21 (Þ) | 3,120 | 3,119 | ||||
| American Homes 4 Rent | Cent CLO 19, Ltd. | ||||||||
| Series 2014-SFR2 Class A | Series 2013-19A Class A1A | ||||||||
| 3.786% due 10/17/36 (Å) | 3,750 | 3,781 | 1.564% due 10/29/25 (Ê)(Þ) | 4,436 | 4,394 | ||||
| American Money Management Corp. | Centex Home Equity Loan Trust | ||||||||
| 1.680% due 07/27/26 | 3,250 | 3,228 | Series 2002-D Class AF4 | ||||||
| AmeriCredit Automobile Receivables | 5.210% due 11/25/28 | 101 | 101 | ||||||
| Trust | Series 2006-A Class AV4 | ||||||||
| Series 2012-3 Class B | 0.402% due 06/25/36 (Ê) | 4,713 | 4,221 | ||||||
| 1.590% due 07/10/17 | 1,985 | 1,996 | Chase Issuance Trust | ||||||
| Series 2012-4 Class B | Series 2012-A3 Class A3 | ||||||||
| 1.310% due 11/08/17 | 2,395 | 2,404 | 0.790% due 06/15/17 | 11,985 | 12,009 | ||||
| Series 2012-5 Class A3 | Series 2014-A1 Class A1 | ||||||||
| 0.620% due 06/08/17 | 2,444 | 2,444 | 1.150% due 01/15/19 | 6,560 | 6,579 | ||||
| Series 2013-2 Class A2 | Chesapeake Funding LLC | ||||||||
| 0.530% due 11/08/16 | 2,170 | 2,171 | Series 2012-1A Class A | ||||||
| Series 2013-3 Class A2 | 0.903% due 11/07/23 (Ê)(Þ) | 2,801 | 2,810 | ||||||
| 0.680% due 10/11/16 | 2,315 | 2,315 | Series 2014-1A Class A | ||||||
| Series 2014-1 Class A2 | 0.573% due 03/07/26 (Ê)(Þ) | 4,620 | 4,616 | ||||||
| 0.570% due 07/10/17 | 4,026 | 4,028 | Series 2014-1A Class C | ||||||
| Series 2014-2 Class A2B | 1.353% due 03/07/26 (Ê)(Þ) | 1,370 | 1,371 | ||||||
| 0.433% due 10/10/17 (Ê) | 8,960 | 8,960 | CIT Education Loan Trust | ||||||
| Asset Backed Securities Corp. Home | Series 2007-1 Class A | ||||||||
| Equity Loan Trust | 0.324% due 03/25/42 (Ê)(Þ) | 3,990 | 3,792 | ||||||
| Series 2004-HE6 Class A1 | Citibank Credit Card Issuance Trust | ||||||||
| 0.702% due 09/25/34 (Ê) | 3 | 2 | Series 2006-A7 Class A7 | ||||||
| Series 2006-HE5 Class A5 | 0.294% due 12/17/18 (Ê) | 11,480 | 11,449 | ||||||
| 0.395% due 07/25/36 (Ê) | 8,729 | 7,265 | Citigroup Mortgage Loan Trust, Inc. | ||||||
| Ballyrock CLO LLC | Series 2007-WFH1 Class A3 | ||||||||
| Series 2014-1A Class A1 | 0.302% due 01/25/37 (Ê) | 3,340 | 3,276 | ||||||
| 1.711% due 10/20/26 (Å)(Ê) | 670 | 670 | |||||||
| See accompanying notes which are an integral part of the financial statements. | |||||||||
| 386 Russell Strategic Bond Fund | |||||||||
| Russell Investment Company | |||||||||
| Russell Strategic Bond Fund | |||||||||
| Schedule of Investments, continued — October 31, 2014 | |||||||||
| Amounts in thousands (except share amounts) | Amounts in thousands (except share amounts) | ||||||||
| Principal | Fair | Principal | Fair | ||||||
| Amount ($) | Value | Amount ($) | Value | ||||||
| or Shares | $ | or Shares | $ | ||||||
| Series 2007-WFH1 Class A4 | Series 2013-1A Class A1 | ||||||||
| 0.352% due 01/25/37 (Ê) | 7,880 | 7,289 | 1.628% due 01/17/26 (Ê)(Þ) | 3,350 | 3,332 | ||||
| Conseco Finance Home Improvement | Ford Credit Auto Lease Trust | ||||||||
| Loan Trust | Series 2014-A Class A2B | ||||||||
| Series 2000-E Class M1 | 0.333% due 10/15/16 (Ê) | 5,690 | 5,688 | ||||||
| 8.130% due 08/15/31 | 48 | 48 | Ford Credit Auto Owner Trust | ||||||
| Conseco Finance Securitizations Corp. | Series 2011-B Class A4 | ||||||||
| Series 2001-4 Class A4 | 1.350% due 12/15/16 | 1,230 | 1,234 | ||||||
| 7.360% due 08/01/32 | 2,156 | 2,377 | Series 2012-A Class A3 | ||||||
| Conseco Financial Corp. | 0.840% due 08/15/16 | 1,060 | 1,061 | ||||||
| Series 1997-7 Class A6 | Series 2012-D Class A3 | ||||||||
| 6.760% due 07/15/28 | 224 | 233 | 0.510% due 04/15/17 | 3,631 | 3,631 | ||||
| Countrywide Asset-Backed Certificates | Series 2014-A Class A2 | ||||||||
| Series 2006-3 Class 2A2 | 0.480% due 11/15/16 | 3,722 | 3,723 | ||||||
| 0.332% due 06/25/36 (Ê) | 1,297 | 1,263 | GE Dealer Floorplan Master Note Trust | ||||||
| Series 2007-4 Class A2 | Series 2012-1 Class A | ||||||||
| 5.530% due 04/25/47 | 1,952 | 1,904 | 0.727% due 02/20/17 (Ê) | 4,945 | 4,950 | ||||
| Countrywide Asset-Backed Certificates | Global SC Finance SRL | ||||||||
| Trust | 3.090% due 07/17/29 (Þ) | 3,690 | 3,640 | ||||||
| Series 2005-4 Class AF3 | Green Tree Financial Corp. | ||||||||
| 4.456% due 10/25/35 | 83 | 83 | Series 1994-1 Class A5 | ||||||
| Credit-Based Asset Servicing and | 7.650% due 04/15/19 | 200 | 208 | ||||||
| Securitization LLC | GSAA Trust | ||||||||
| Series 2003-CB6 Class M1 | Series 2006-2 Class 2A3 | ||||||||
| 1.205% due 12/25/33 (Ê) | 3,510 | 3,293 | 0.422% due 12/25/35 (Ê) | 2,412 | 2,392 | ||||
| Discover Card Execution Note Trust | GSAMP Trust | ||||||||
| Series 2012-A1 Class A1 | Series 2005-WMC2 Class A2C | ||||||||
| 0.810% due 08/15/17 | 8,220 | 8,231 | 0.502% due 11/25/35 (Ê) | 5,136 | 4,977 | ||||
| Dryden XXV Senior Loan Fund | Series 2006-HE5 Class A2C | ||||||||
| Series 2012-25A Class A | 0.302% due 08/25/36 (Ê) | 6,825 | 5,741 | ||||||
| 1.611% due 01/15/25 (Ê)(Þ) | 4,000 | 3,970 | Higher Education Funding I | ||||||
| DT Auto Owner Trust | Series 2014-1 Class A | ||||||||
| Series 2013-2A Class A | 1.288% due 05/25/34 (Ê)(Þ) | 3,148 | 3,183 | ||||||
| 0.810% due 09/15/16 (Þ) | 3,365 | 3,367 | Home Equity Asset Trust | ||||||
| Eaton Vance CLO 2014-1, Ltd. | Series 2006-4 Class 2A4 | ||||||||
| Series 2014-1A Class A | 0.432% due 08/25/36 (Ê) | 3,361 | 2,825 | ||||||
| 1.685% due 07/15/26 (Ê)(Þ) | 1,300 | 1,293 | Honda Auto Receivables Owner Trust | ||||||
| Education Loan Asset-Backed Trust I | Series 2012-1 Class A4 | ||||||||
| Series 2013-1 Class B1 | 0.970% due 04/16/18 | 3,835 | 3,846 | ||||||
| 1.152% due 11/25/33 (Ê)(Þ) | 6,889 | 6,414 | Series 2012-2 Class A3 | ||||||
| Enterprise Fleet Financing LLC | 0.700% due 02/16/16 | 4,319 | 4,322 | ||||||
| Series 2013-2 Class A2 | |||||||||
| 1.060% due 03/20/19 (Þ) | 6,191 | 6,211 | HSBC Home Equity Loan Trust | ||||||
| Series 2006-2 Class A1 | |||||||||
| Series 2014-1 Class A2 | 0.307% due 03/20/36 (Ê) | 1,885 | 1,871 | ||||||
| 0.870% due 09/20/19 (Þ) | 2,090 | 2,092 | Series 2007-1 Class AS | ||||||
| EquiFirst Mortgage Loan Trust | 0.357% due 03/20/36 (Ê) | 4,207 | 4,167 | ||||||
| Series 2003-2 Class M2 | |||||||||
| 2.702% due 09/25/33 (Ê) | 1,744 | 1,651 | Series 2007-2 Class A3V | ||||||
| Exeter Automobile Receivables Trust | 0.377% due 07/20/36 (Ê) | 949 | 948 | ||||||
| Series 2013-1A Class A | HSI Asset Securitization Corp. Trust | ||||||||
| 1.290% due 10/16/17 (Þ) | 1,039 | 1,041 | Series 2007-WF1 Class 2A4 | ||||||
| Fannie Mae Grantor Trust | 0.402% due 05/25/37 (Ê) | 9,069 | 6,962 | ||||||
| Series 2003-T4 Class 2A5 | Hyundai Auto Receivables Trust | ||||||||
| 5.407% due 09/26/33 | 557 | 609 | Series 2011-B Class A4 | ||||||
| Federal Home Loan Mortgage Corp. | 1.650% due 02/15/17 | 795 | 796 | ||||||
| Structured Pass-Through Securities | Series 2011-C Class A4 | ||||||||
| Series 2000-30 Class A5 | 1.300% due 02/15/18 | 9,772 | 9,828 | ||||||
| 7.658% due 12/25/30 | 374 | 396 | Series 2012-A Class A3 | ||||||
| FFMLT Trust | 0.720% due 03/15/16 | 17 | 17 | ||||||
| Series 2005-FF8 Class M1 | Series 2013-A Class A3 | ||||||||
| 0.642% due 09/25/35 (Ê) | 4,700 | 4,453 | 0.560% due 07/17/17 | 13,767 | 13,775 | ||||
| First Franklin Mortgage Loan Asset | IXIS Real Estate Capital Trust | ||||||||
| Backed Certificates | Series 2006-HE1 Class A3 | ||||||||
| Series 2006-FF18 Class A2B | 0.352% due 03/25/36 (Ê) | 2,079 | 1,293 | ||||||
| 0.262% due 12/25/37 (Ê) | 9,628 | 6,284 | Series 2006-HE1 Class A4 | ||||||
| Flatiron CLO, Ltd. | 0.452% due 03/25/36 (Ê) | 5,646 | 3,601 | ||||||
| See accompanying notes which are an integral part of the financial statements. | |||||||||
| Russell Strategic Bond Fund 387 | |||||||||
Russell Investment Company Russell Strategic Bond Fund
Schedule of Investments, continued — October 31, 2014
| Amounts in thousands (except share amounts) | Amounts in thousands (except share amounts) | ||||||||
| Principal | Fair | Principal | Fair | ||||||
| Amount ($) | Value | Amount ($) | Value | ||||||
| or Shares | $ | or Shares | $ | ||||||
| Series 2006-HE2 Class A3 | Series 2013-B Class A2B | ||||||||
| 0.312% due 08/25/36 (Ê) | 712 | 331 | 0.423% due 01/15/16 (Ê) | 1,923 | 1,923 | ||||
| Series 2006-HE2 Class A4 | Nissan Auto Receivables Owner Trust | ||||||||
| 0.412% due 08/25/36 (Ê) | 5,887 | 2,784 | Series 2011-B Class A3 | ||||||
| JGWPT XXX LLC | 0.950% due 02/16/16 | 660 | 660 | ||||||
| Series 2013-3A Class A | Series 2011-B Class A4 | ||||||||
| 4.080% due 01/17/73 (Þ) | 2,238 | 2,355 | 1.240% due 01/16/18 | 10,450 | 10,499 | ||||
| JGWPT XXXII LLC | OHA Credit Partners VII, Ltd. | ||||||||
| Series 2014-2A Class A | Series 2012-7A Class A | ||||||||
| 3.610% due 01/17/73 (Þ) | 2,597 | 2,638 | 1.652% due 11/20/23 (Ê)(Þ) | 3,800 | 3,779 | ||||
| JPMorgan Mortgage Acquisition Trust | Panhandle-Plains Higher Education | ||||||||
| Series 2007-CH2 Class AV4 | Authority, Inc. | ||||||||
| 0.302% due 01/25/37 (Ê) | 10,370 | 8,789 | Series 2011-1 Class A3 | ||||||
| Latitude CLO II Corp. | 1.185% due 10/01/37 (Ê) | 2,500 | 2,519 | ||||||
| Series 2006-2A Class A2 | Popular ABS Mortgage Pass-Through | ||||||||
| 0.564% due 12/15/18 (Ê)(Þ) | 1,570 | 1,561 | Trust | ||||||
| Lehman XS Trust | Series 2006-C Class A4 | ||||||||
| Series 2006-9 Class A1B | 0.402% due 07/25/36 (Ê) | 7,224 | 6,766 | ||||||
| 0.312% due 05/25/46 (Ê) | 1,051 | 866 | Series 2006-D Class A3 | ||||||
| Series 2006-13 Class 1A2 | 0.412% due 11/25/46 (Ê) | 5,455 | 4,741 | ||||||
| 0.322% due 09/25/36 (Ê) | 1,017 | 852 | Prestige Auto Receivables Trust | ||||||
| Series 2006-19 Class A2 | Series 2013-1A Class A2 | ||||||||
| 0.322% due 12/25/36 (Ê) | 1,465 | 1,199 | 1.090% due 02/15/18 (Þ) | 1,387 | 1,390 | ||||
| Long Beach Mortgage Loan Trust | Series 2014-1A Class A3 | ||||||||
| Series 2004-4 Class M1 | 1.520% due 04/15/20 (Þ) | 3,360 | 3,360 | ||||||
| 1.052% due 10/25/34 (Ê) | 10,600 | 10,012 | Renaissance Home Equity Loan Trust | ||||||
| M&T Bank Auto Receivables Trust | Series 2005-4 Class A3 | ||||||||
| 2013-1 | 5.565% due 02/25/36 | 133 | 130 | ||||||
| Series 2013-1A Class A3 | Series 2006-1 Class AF3 | ||||||||
| 1.060% due 11/15/17 (Þ) | 6,975 | 7,011 | 5.608% due 05/25/36 | 72 | 50 | ||||
| Mastr Asset Backed Securities Trust | Series 2006-1 Class AF6 | ||||||||
| Series 2006-HE5 Class A3 | 5.746% due 05/25/36 | 1,749 | 1,290 | ||||||
| 0.312% due 11/25/36 (Ê) | 4,221 | 2,835 | Series 2006-2 Class AF2 | ||||||
| Series 2006-HE5 Class A4 | 5.762% due 08/25/36 | 234 | 149 | ||||||
| 0.372% due 11/25/36 (Ê) | 1,197 | 811 | Series 2007-1 Class AF2 | ||||||
| Series 2006-NC2 Class A4 | 5.512% due 04/25/37 | 4,680 | 2,577 | ||||||
| 0.302% due 08/25/36 (Ê) | 12,266 | 6,470 | Series 2007-2 Class AF2 | ||||||
| Series 2006-NC3 Class A3 | 5.675% due 06/25/37 | 1,433 | 754 | ||||||
| 0.255% due 10/25/36 | 2,171 | 1,347 | Santander Drive Auto Receivables Trust | ||||||
| Series 2006-NC3 Class A4 | Series 2012-1 Class B | ||||||||
| 0.312% due 10/25/36 (Ê) | 166 | 104 | 2.720% due 05/16/16 | 581 | 581 | ||||
| Series 2006-NC3 Class A5 | Series 2012-2 Class B | ||||||||
| 0.362% due 10/25/36 (Ê) | 7,377 | 4,661 | 2.090% due 08/15/16 | 2,036 | 2,039 | ||||
| Mercedes Benz Auto Lease Trust | Series 2012-5 Class A3 | ||||||||
| Series 2013-B Class A4 | 0.830% due 12/15/16 | 448 | 448 | ||||||
| 0.760% due 07/15/19 | 2,470 | 2,472 | Series 2013-1 Class A3 | ||||||
| Mercedes-Benz Master Owner Trust | 0.620% due 06/15/17 | 4,364 | 4,367 | ||||||
| Series 2012-BA Class A | Series 2013-2 Class A3 | ||||||||
| 0.423% due 11/15/16 (Ê)(Þ) | 5,980 | 5,980 | 0.700% due 09/15/17 | 16,960 | 16,974 | ||||
| Navient Student Loan Trust | Series 2013-3 Class A3 | ||||||||
| Series 2014-1 Class A3 | 0.700% due 10/16/17 | 14,155 | 14,162 | ||||||
| 0.658% due 06/25/31 | 6,465 | 6,480 | Series 2013-A Class A2 | ||||||
| Series 2014-2 Class A | 0.800% due 10/17/16 (Þ) | 679 | 679 | ||||||
| 0.797% due 03/25/43 (Ê) | 6,448 | 6,412 | Series 2014-1 Class A2A | ||||||
| Series 2014-3 Class A | 0.660% due 06/15/17 | 3,917 | 3,917 | ||||||
| 0.777% due 03/25/43 (Ê) | 6,579 | 6,584 | Series 2014-4 Class B | ||||||
| Series 2014-AA Class A2A | 1.820% due 05/15/19 | 2,690 | 2,698 | ||||||
| 2.740% due 02/15/29 (Å) | 5,085 | 5,083 | Scholar Funding Trust | ||||||
| Nelnet Student Loan Trust | Series 2012-B Class A2 | ||||||||
| Series 2014-4A Class A2 | 1.252% due 03/28/46 (Ê)(Þ) | 3,500 | 3,578 | ||||||
| 1.102% due 11/25/43 (Ê)(Þ) | 3,225 | 3,225 | Securitized Asset Backed Receivables | ||||||
| Nissan Auto Lease Trust | LLC Trust | ||||||||
| Series 2012-B Class A4 | Series 2007-BR2 Class A2 | ||||||||
| 0.740% due 09/17/18 | 4,277 | 4,281 | 0.382% due 02/25/37 (Ê) | 3,134 | 1,849 | ||||
| See accompanying notes which are an integral part of the financial statements. | |||||||||
| 388 Russell Strategic Bond Fund | |||||||||
Russell Investment Company Russell Strategic Bond Fund
Schedule of Investments, continued — October 31, 2014
| Amounts in thousands (except share amounts) | Amounts in thousands (except share amounts) | ||||||||
| Principal | Fair | Principal | Fair | ||||||
| Amount ($) | Value | Amount ($) | Value | ||||||
| or Shares | $ | or Shares | $ | ||||||
| Series 2007-BR4 Class A2B | Series 2005-4XS Class 2A1A | ||||||||
| 0.352% due 05/25/37 (Ê) | 7,093 | 4,618 | 1.903% due 03/25/35 (Ê) | 1,516 | 1,510 | ||||
| Series 2007-BR5 Class A2A | Series 2006-BC6 Class A4 | ||||||||
| 0.282% due 05/25/37 (Ê) | 3,992 | 2,874 | 0.322% due 01/25/37 (Ê) | 4,740 | 3,930 | ||||
| Series 2007-NC1 Class A2B | Series 2006-WF2 Class A3 | ||||||||
| 0.302% due 12/25/36 (Ê) | 7,746 | 4,375 | 0.302% due 07/25/36 (Ê) | 1,591 | 1,580 | ||||
| Series 2007-NC1 Class A2C | Series 2006-WF3 Class A4 | ||||||||
| 0.362% due 12/25/36 (Ê) | 1,923 | 1,094 | 0.462% due 09/25/36 (Ê) | 5,740 | 5,314 | ||||
| SLM Private Education Loan Trust | Series 2007-BC1 Class A4 | ||||||||
| Series 2010-A Class 2A | 0.282% due 02/25/37 (Ê) | 9,815 | 8,470 | ||||||
| 3.403% due 05/16/44 (Ê)(Þ) | 8,158 | 8,638 | Series 2007-BC3 Class 2A1 | ||||||
| Series 2012-B Class A2 | 0.212% due 05/25/47 (Ê) | 788 | 785 | ||||||
| 3.480% due 10/15/30 (Þ) | 5,720 | 5,969 | SunTrust Student Loan Trust | ||||||
| SLM Student Loan Trust | Series 2006-1A Class A4 | ||||||||
| Series 2004-8 Class B | 0.423% due 10/28/37 (Å)(Ê) | 5,000 | 4,792 | ||||||
| 0.694% due 01/25/40 (Ê) | 895 | 816 | Synchrony Credit Card Master Note Trust | ||||||
| Series 2006-2 Class A6 | Series 2012-1 Class A | ||||||||
| 0.404% due 01/25/41 (Ê) | 4,400 | 4,056 | 1.030% due 01/15/18 | 6,200 | 6,207 | ||||
| Series 2006-8 Class A6 | Toyota Auto Receivables Owner Trust | ||||||||
| 0.394% due 01/25/41 (Ê) | 4,400 | 4,007 | Series 2013-A Class A3 | ||||||
| Series 2007-6 Class B | 0.550% due 01/17/17 | 4,207 | 4,211 | ||||||
| 1.084% due 04/27/43 (Ê) | 1,427 | 1,319 | Series 2013-B Class A2 | ||||||
| Series 2008-2 Class B | 0.480% due 02/15/16 | 1,370 | 1,371 | ||||||
| 1.434% due 01/25/29 (Ê) | 1,530 | 1,401 | Series 2014-C Class A2 | ||||||
| Series 2008-3 Class A3 | 0.510% due 02/15/17 | 3,400 | 3,401 | ||||||
| 1.234% due 10/25/21 (Ê) | 5,445 | 5,544 | Volkswagen Auto Loan Enhanced Trust | ||||||
| Series 2008-3 Class B | Series 2012-1 Class A3 | ||||||||
| 1.434% due 04/25/29 (Ê) | 1,530 | 1,409 | 0.850% due 08/22/16 | 2,969 | 2,973 | ||||
| Series 2008-4 Class B | World Financial Network Credit Card | ||||||||
| 2.084% due 04/25/29 (Ê) | 1,530 | 1,543 | Master Trust | ||||||
| Series 2008-5 Class B | Series 2014-A Class A | ||||||||
| 2.084% due 07/25/29 (Ê) | 1,530 | 1,569 | 0.533% due 12/15/19 (Ê) | 3,525 | 3,527 | ||||
| Series 2008-6 Class B | World Omni Auto Receivables Trust | ||||||||
| 2.084% due 07/25/29 (Ê) | 1,530 | 1,530 | Series 2011-A Class A4 | ||||||
| Series 2008-7 Class A2 | 1.910% due 04/15/16 | 374 | 374 | ||||||
| World Omni Master Owner Trust | |||||||||
| 0.734% due 10/25/17 (Ê) | 8,468 | 8,479 | Series 2013-1 Class A | ||||||
| 0.605% due 09/25/26 | 5,670 | 5,660 | 0.503% due 02/15/18 (Ê)(Þ) | 7,075 | 7,081 | ||||
| Series 2008-7 Class B | 692,480 | ||||||||
| 2.084% due 07/25/29 (Ê) | 1,530 | 1,537 | Corporate Bonds and Notes - 16.4% | ||||||
| Series 2008-8 Class B | 21st Century Fox America, Inc. | ||||||||
| 2.484% due 10/25/29 (Ê) | 1,530 | 1,614 | 4.500% due 02/15/21 | 3,080 | 3,364 | ||||
| Series 2008-9 Class B | |||||||||
| 2.484% due 10/25/29 (Ê) | 1,530 | 1,621 | 3.000% due 09/15/22 | 2,250 | 2,213 | ||||
| Series 2013-4 Class A | 3.700% due 09/15/24 (Þ) | 2,515 | 2,556 | ||||||
| 0.705% due 06/25/27 (Ê) | 3,129 | 3,129 | 3M Co. | ||||||
| Small Business Administration | 1.625% due 06/15/19 | 6,050 | 6,001 | ||||||
| Participation Certificates | AbbVie, Inc. | ||||||||
| Series 1997-20D Class 1 | 1.200% due 11/06/15 | 7,300 | 7,341 | ||||||
| 7.500% due 04/01/17 | 129 | 135 | Advanced Micro Devices, Inc. | ||||||
| SMART Trust | 7.750% due 08/01/20 | 1,450 | 1,363 | ||||||
| Series 2012-1USA Class A4A | 7.500% due 08/15/22 | 5,200 | 4,758 | ||||||
| 2.010% due 12/14/17 (Þ) | 3,925 | 3,947 | Aetna, Inc. | ||||||
| Soundview Home Equity Loan Trust | 2.750% due 11/15/22 | 1,715 | 1,651 | ||||||
| Series 2005-4 Class M2 | Air Lease Corp. | ||||||||
| 0.624% due 03/25/36 | 3,870 | 3,335 | 4.500% due 01/15/16 | 2,700 | 2,788 | ||||
| Series 2006-EQ2 Class A3 | Ally Financial, Inc. | ||||||||
| 0.312% due 01/25/37 (Ê) | 10,096 | 6,845 | 2.750% due 01/30/17 | 6,900 | 6,908 | ||||
| Series 2007-OPT1 Class 2A1 | Alterra USA Holdings, Ltd. | ||||||||
| 0.232% due 06/25/37 (Ê) | 292 | 174 | 7.200% due 04/14/17 (Þ) | 2,005 | 2,212 | ||||
| Structured Asset Investment Loan Trust | Altria Group, Inc. | ||||||||
| Series 2006-2 Class A3 | 9.700% due 11/10/18 | 365 | 470 | ||||||
| 0.332% due 04/25/36 (Ê) | 3,261 | 2,904 | 4.750% due 05/05/21 | 7,050 | 7,765 | ||||
| Structured Asset Securities Corp. | |||||||||
| Mortgage Loan Trust | 4.000% due 01/31/24 | 2,725 | 2,821 | ||||||
See accompanying notes which are an integral part of the financial statements.
Russell Strategic Bond Fund 389
| Russell Investment Company | |||||||||
| Russell Strategic Bond Fund | |||||||||
| Schedule of Investments, continued — October 31, 2014 | |||||||||
| Amounts in thousands (except share amounts) | Amounts in thousands (except share amounts) | ||||||||
| Principal | Fair | Principal | Fair | ||||||
| Amount ($) | Value | Amount ($) | Value | ||||||
| or Shares | $ | or Shares | $ | ||||||
| 9.950% due 11/10/38 | 370 | 621 | Series BKNT | ||||||
| 10.200% due 02/06/39 | 1,630 | 2,792 | 0.514% due 06/15/16 (Ê) | 3,100 | 3,088 | ||||
| 4.250% due 08/09/42 | 2,285 | 2,140 | 5.300% due 03/15/17 | 4,165 | 4,516 | ||||
| American Airlines Pass-Through Trust | 0.534% due 06/15/17 (Ê) | 4,175 | 4,144 | ||||||
| 4.375% due 10/01/22 | 1,940 | 1,962 | 6.100% due 06/15/17 | 2,000 | 2,219 | ||||
| 4.950% due 01/15/23 | 5,434 | 5,801 | Bayer US Finance LLC | ||||||
| Series A | 2.375% due 10/08/19 (Þ) | 1,635 | 1,638 | ||||||
| 5.250% due 01/31/21 | 1,970 | 2,115 | 2.375% due 10/08/19 (Å) | 2,860 | 2,865 | ||||
| American Express Credit Corp. | 3.000% due 10/08/21 (Å) | 3,185 | 3,199 | ||||||
| 2.375% due 03/24/17 | 2,740 | 2,809 | BB&T Corp. | ||||||
| American Honda Finance Corp. | 1.093% due 06/15/18 | 4,000 | 4,059 | ||||||
| 0.732% due 10/07/16 (Ê) | 5,875 | 5,916 | Bear Stearns Cos. LLC (The) | ||||||
| American International Group, Inc. | 5.550% due 01/22/17 | 2,401 | 2,611 | ||||||
| 5.450% due 05/18/17 | 1,075 | 1,182 | Bellsouth Capital Funding Corp. | ||||||
| 6.400% due 12/15/20 | 8,685 | 10,371 | 7.875% due 02/15/30 | 2,680 | 3,579 | ||||
| 8.175% due 05/15/58 | 1,350 | 1,833 | Boston Scientific Corp. | ||||||
| American Tower Trust I | 6.000% due 01/15/20 | 2,382 | 2,732 | ||||||
| 3.070% due 03/15/23 (Þ) | 3,505 | 3,474 | Bristol-Myers Squibb Co. | ||||||
| Ameriprise Financial, Inc. | 2.000% due 08/01/22 | 7,605 | 7,078 | ||||||
| 3.700% due 10/15/24 | 1,945 | 1,972 | Burlington Northern Santa Fe, LLC | ||||||
| 7.518% due 06/01/66 | 2,705 | 2,915 | 3.050% due 03/15/22 | 2,100 | 2,104 | ||||
| Amgen, Inc. | 3.400% due 09/01/24 | 10,090 | 10,131 | ||||||
| 2.125% due 05/15/17 | 1,030 | 1,050 | CareFusion Corp. | ||||||
| Anadarko Petroleum Corp. | 6.375% due 08/01/19 | 1,680 | 1,950 | ||||||
| 6.375% due 09/15/17 | 2,890 | 3,263 | Caterpillar Financial Services Corp. | ||||||
| 6.950% due 06/15/19 | 1,675 | 1,998 | 7.150% due 02/15/19 | 1,575 | 1,894 | ||||
| Anheuser-Busch InBev Finance, Inc. | CBS Corp. | ||||||||
| 3.700% due 02/01/24 | 2,725 | 2,804 | 4.300% due 02/15/21 | 1,444 | 1,551 | ||||
| Anheuser-Busch InBev Worldwide, Inc. | 3.375% due 03/01/22 | 2,650 | 2,674 | ||||||
| 2.875% due 02/15/16 | 2,150 | 2,210 | CCOH Safari LLC | ||||||
| 5.375% due 01/15/20 | 4,055 | 4,605 | 5.500% due 12/01/22 | 2,085 | 2,106 | ||||
| Apollo Management Holdings, LP | Celgene Corp. | ||||||||
| 4.000% due 05/30/24 (Þ) | 3,615 | 3,644 | 2.250% due 05/15/19 | 2,385 | 2,373 | ||||
| Apple, Inc. | CF Industries, Inc. | ||||||||
| 0.489% due 05/03/18 (Ê) | 10,416 | 10,431 | 5.150% due 03/15/34 | 1,305 | 1,389 | ||||
| 2.850% due 05/06/21 | 1,805 | 1,832 | Chase Capital III | ||||||
| AT&T, Inc. | Series C | ||||||||
| 2.950% due 05/15/16 | 5,375 | 5,544 | 0.784% due 03/01/27 (Ê) | 1,740 | 1,522 | ||||
| Chesapeake Energy Corp. | |||||||||
| 1.700% due 06/01/17 | 4,440 | 4,477 | 3.481% due 04/15/19 (Ê) | 2,850 | 2,852 | ||||
| 4.350% due 06/15/45 | 1,747 | 1,631 | 6.625% due 08/15/20 | 3,550 | 4,003 | ||||
| Series FRN | |||||||||
| 0.620% due 02/12/16 (Ê) | 3,603 | 3,611 | Chevron Corp. | ||||||
| 1.104% due 12/05/17 | 1,745 | 1,733 | |||||||
| Avaya, Inc. | 2.355% due 12/05/22 | 8,350 | 8,077 | ||||||
| 9.000% due 04/01/19 (Þ) | 3,180 | 3,259 | |||||||
| Axiall Corp. | 3.191% due 06/24/23 | 2,750 | 2,805 | ||||||
| 4.875% due 05/15/23 | 5,155 | 5,000 | CHS/Community Health Systems, Inc. | ||||||
| Bank of America Corp. | 8.000% due 11/15/19 | 1,375 | 1,485 | ||||||
| 3.625% due 03/17/16 | 1,575 | 1,631 | CIT Group, Inc. | ||||||
| 5.625% due 10/14/16 | 1,680 | 1,827 | 5.000% due 05/15/17 | 3,450 | 3,614 | ||||
| 5.750% due 12/01/17 | 3,495 | 3,890 | 6.625% due 04/01/18 (Þ) | 3,155 | 3,455 | ||||
| Citigroup, Inc. | |||||||||
| 6.875% due 04/25/18 | 5,100 | 5,900 | 5.300% due 01/07/16 | 1,325 | 1,393 | ||||
| 5.875% due 01/05/21 | 1,075 | 1,242 | 3.953% due 06/15/16 | 600 | 627 | ||||
| 3.300% due 01/11/23 | 1,150 | 1,140 | 4.450% due 01/10/17 | 3,435 | 3,657 | ||||
| 4.200% due 08/26/24 | 3,130 | 3,153 | 6.000% due 08/15/17 | 1,500 | 1,674 | ||||
| 4.250% due 10/22/26 | 3,240 | 3,216 | 6.125% due 11/21/17 | 7,695 | 8,651 | ||||
| Series GMTN | |||||||||
| 6.400% due 08/28/17 | 600 | 676 | 8.500% due 05/22/19 | 1,195 | 1,499 | ||||
| Series MTNL | 4.500% due 01/14/22 | 2,400 | 2,604 | ||||||
| 5.650% due 05/01/18 | 3,500 | 3,907 | 0.785% due 08/25/36 (Ê) | 2,250 | 1,808 | ||||
| Bank of America NA | Series N | ||||||||
| 0.703% due 11/14/16 (Ê) | 10,200 | 10,204 | 5.800% due 12/31/49 (ƒ) | 5,220 | 5,231 | ||||
| See accompanying notes which are an integral part of the financial statements. | |||||||||
| 390 Russell Strategic Bond Fund | |||||||||
Russell Investment Company Russell Strategic Bond Fund
Schedule of Investments, continued — October 31, 2014
| Amounts in thousands (except share amounts) | Amounts in thousands (except share amounts) | ||||||||
| Principal | Fair | Principal | Fair | ||||||
| Amount ($) | Value | Amount ($) | Value | ||||||
| or Shares | $ | or Shares | $ | ||||||
| CNA Financial Corp. | 5.250% due 01/31/20 | 4,800 | 5,407 | ||||||
| 7.250% due 11/15/23 | 1,850 | 2,297 | 3.750% due 02/15/25 | 1,375 | 1,383 | ||||
| Comcast Corp. | 5.950% due 02/01/41 | 3,625 | 4,328 | ||||||
| 3.600% due 03/01/24 | 3,925 | 4,057 | Series B | ||||||
| 6.950% due 08/15/37 | 3,550 | 4,818 | 7.034% due 01/15/68 | 2,730 | 3,037 | ||||
| Commonwealth Edison Co. | Express Scripts Holding Co. | ||||||||
| 5.800% due 03/15/18 | 1,745 | 1,981 | 7.250% due 06/15/19 | 1,000 | 1,211 | ||||
| Compass Bank | Farmers Exchange Capital | ||||||||
| 2.750% due 09/29/19 | 1,780 | 1,793 | 7.200% due 07/15/48 (Þ) | 1,100 | 1,354 | ||||
| ConAgra Foods, Inc. | Farmers Exchange Capital II | ||||||||
| 4.950% due 08/15/20 | 4,425 | 4,876 | 6.151% due 11/01/53 (Þ) | 4,000 | 4,374 | ||||
| Series NOTE | Farmers Exchange Capital III | ||||||||
| 0.601% due 07/21/16 (Ê) | 10,000 | 9,995 | 5.454% due 10/15/54 (Å) | 2,460 | 2,500 | ||||
| Continental Airlines Pass-Through Trust | Fifth Third Bank | ||||||||
| 9.000% due 07/08/16 | 2,612 | 2,900 | Series BKNT | ||||||
| Continental Resources, Inc. | 2.875% due 10/01/21 | 2,900 | 2,879 | ||||||
| 5.000% due 09/15/22 | 3,465 | 3,673 | First Chicago NBD Institutional Capital I | ||||||
| Credit Suisse | 0.790% due 02/01/27 (Ê) | 1,250 | 1,094 | ||||||
| 0.717% due 05/26/17 | 2,200 | 2,205 | First Union Capital II | ||||||
| Crown Castle Towers LLC | Series A | ||||||||
| 5.495% due 01/15/17 (Þ) | 1,900 | 2,021 | 7.950% due 11/15/29 | 1,575 | 2,094 | ||||
| 4.174% due 08/15/17 (Þ) | 3,880 | 4,072 | FirstEnergy Transmission, LLC | ||||||
| CSX Corp. | 5.450% due 07/15/44 | 3,050 | 3,140 | ||||||
| 4.250% due 06/01/21 | 3,075 | 3,351 | Ford Motor Credit Co. LLC | ||||||
| CVS Health Corp. | 3.984% due 06/15/16 | 9,630 | 10,059 | ||||||
| 1.200% due 12/05/16 | 5,700 | 5,710 | 1.008% due 01/17/17 (Ê) | 15,200 | 15,289 | ||||
| Daimler Finance NA LLC | 4.250% due 02/03/17 | 9,500 | 10,057 | ||||||
| 0.584% due 03/10/17 (Ê)(Þ) | 5,500 | 5,505 | 3.000% due 06/12/17 | 2,800 | 2,887 | ||||
| Delphi Corp. | Forest Laboratories, Inc. | ||||||||
| 5.000% due 02/15/23 | 2,500 | 2,678 | 4.875% due 02/15/21 (Þ) | 8,705 | 9,283 | ||||
| Delta Air Lines Pass-Through Trust | FPL Energy Wind Funding LLC | ||||||||
| Series 071A | 6.876% due 06/27/17 (Þ) | 336 | 332 | ||||||
| 6.821% due 08/10/22 | 3,390 | 3,915 | Freeport-McMoRan, Inc. | ||||||
| Series 2002-1 Class G-1 | 3.100% due 03/15/20 | 2,760 | 2,751 | ||||||
| 6.718% due 01/02/23 | 2,934 | 3,389 | 3.550% due 03/01/22 | 2,000 | 1,954 | ||||
| DIRECTV Holdings LLC / DIRECTV | |||||||||
| Financing Co., Inc. | General Electric Capital Corp. | ||||||||
| 4.600% due 02/15/21 | 1,950 | 2,112 | 1.000% due 01/08/16 | 11,140 | 11,197 | ||||
| 5.000% due 03/01/21 | 2,825 | 3,111 | 0.404% due 02/15/17 (Ê) | 4,995 | 4,989 | ||||
| 4.450% due 04/01/24 | 2,130 | 2,222 | 4.375% due 09/16/20 | 3,100 | 3,403 | ||||
| Discover Bank | 0.714% due 08/15/36 (Ê) | 1,000 | 872 | ||||||
| Series BKNT | Series GMTN | ||||||||
| 3.200% due 08/09/21 | 2,845 | 2,844 | 0.880% due 07/12/16 (Ê) | 5,570 | 5,615 | ||||
| Dominion Resources, Inc. | 1.250% due 05/15/17 | 11,190 | 11,219 | ||||||
| 4.450% due 03/15/21 | 3,075 | 3,347 | 4.625% due 01/07/21 | 16,100 | 17,948 | ||||
| Series B | 3.100% due 01/09/23 | 3,000 | 3,005 | ||||||
| 2.750% due 09/15/22 | 3,525 | 3,440 | 6.150% due 08/07/37 | 2,035 | 2,564 | ||||
| Duke Energy Corp. | Series MTNA | ||||||||
| 3.050% due 08/15/22 | 6,450 | 6,445 | 6.750% due 03/15/32 | 2,975 | 3,956 | ||||
| Duke Energy Progress, Inc. | General Electric Co. | ||||||||
| 4.100% due 03/15/43 | 1,545 | 1,563 | 5.250% due 12/06/17 | 3,805 | 4,235 | ||||
| Dynegy Finance I, Inc. / Dynegy Finance | 2.700% due 10/09/22 | 4,725 | 4,660 | ||||||
| II Inc | 4.500% due 03/11/44 | 2,015 | 2,148 | ||||||
| 7.375% due 11/01/22 (Å) | 3,595 | 3,802 | General Mills, Inc. | ||||||
| eBay, Inc. | 0.433% due 01/28/16 (Ê) | 3,915 | 3,915 | ||||||
| 0.433% due 07/28/17 (Ê) | 5,290 | 5,249 | 1.400% due 10/20/17 | 3,435 | 3,433 | ||||
| 0.715% due 08/01/19 (Ê) | 3,950 | 3,866 | Series FRN | ||||||
| El Paso Natural Gas Co. LLC | 0.533% due 01/29/16 (Ê) | 5,675 | 5,680 | ||||||
| 7.500% due 11/15/26 | 1,425 | 1,799 | General Motors Co. | ||||||
| Energy Transfer Partners, LP | 4.875% due 10/02/23 | 6,115 | 6,551 | ||||||
| 6.050% due 06/01/41 | 2,158 | 2,395 | 6.250% due 10/02/43 | 1,655 | 1,969 | ||||
| 3.257% due 11/01/66 (Ê) | 11,467 | 10,679 | Georgia-Pacific LLC | ||||||
| Enterprise Products Operating LLC | |||||||||
See accompanying notes which are an integral part of the financial statements.
Russell Strategic Bond Fund 391
Russell Investment Company Russell Strategic Bond Fund
Schedule of Investments, continued — October 31, 2014
| Amounts in thousands (except share amounts) | Amounts in thousands (except share amounts) | ||||||||
| Principal | Fair | Principal | Fair | ||||||
| Amount ($) | Value | Amount ($) | Value | ||||||
| or Shares | $ | or Shares | $ | ||||||
| 8.875% due 05/15/31 | 2,280 | 3,480 | 4.350% due 08/15/21 | 2,900 | 3,114 | ||||
| Gilead Sciences, Inc. | 3.375% due 05/01/23 | 1,325 | 1,294 | ||||||
| 4.800% due 04/01/44 | 1,235 | 1,339 | 3.875% due 09/10/24 | 2,815 | 2,797 | ||||
| GlaxoSmithKline Capital, Inc. | Series X | ||||||||
| 2.800% due 03/18/23 | 2,455 | 2,413 | 6.100% due 12/31/49 (ƒ) | 3,215 | 3,223 | ||||
| Goldman Sachs Group, Inc. | JPMorgan Chase Bank NA | ||||||||
| 1.830% due 11/29/23 | 1,510 | 1,559 | Series BKNT | ||||||
| Goldman Sachs Group, Inc. (The) | 5.875% due 06/13/16 | 240 | 259 | ||||||
| 0.683% due 03/22/16 (Ê) | 4,500 | 4,495 | 6.000% due 10/01/17 | 7,900 | 8,847 | ||||
| 5.750% due 10/01/16 | 1,338 | 1,452 | JPMorgan Chase Capital XIII | ||||||
| 6.250% due 09/01/17 | 5,310 | 5,952 | Series M | ||||||
| 2.550% due 10/23/19 | 2,770 | 2,752 | 1.183% due 09/30/34 (Ê) | 3,530 | 3,080 | ||||
| 5.750% due 01/24/22 | 3,985 | 4,591 | JPMorgan Chase Capital XXI | ||||||
| Series U | |||||||||
| 3.625% due 01/22/23 | 650 | 652 | 1.189% due 02/02/37 (Ê) | 455 | 384 | ||||
| 6.750% due 10/01/37 | 6,162 | 7,555 | JPMorgan Chase Capital XXIII | ||||||
| 4.800% due 07/08/44 | 2,350 | 2,427 | 1.234% due 05/15/47 (Ê) | 8,880 | 7,193 | ||||
| Series D | Kinder Morgan Energy Partners, LP | ||||||||
| 6.000% due 06/15/20 | 1,875 | 2,156 | 3.500% due 03/01/21 | 2,840 | 2,826 | ||||
| Great Plains Energy, Inc. | 5.500% due 03/01/44 | 3,125 | 3,129 | ||||||
| 5.292% due 06/15/22 | 3,785 | 4,349 | KKR Group Finance Co. III LLC | ||||||
| HCA, Inc. | 5.125% due 06/01/44 (Þ) | 2,905 | 3,056 | ||||||
| 7.250% due 09/15/20 | 1,962 | 2,080 | Life Technologies Corp. | ||||||
| HCP, Inc. | 6.000% due 03/01/20 | 3,668 | 4,235 | ||||||
| 6.300% due 09/15/16 | 2,700 | 2,956 | Lorillard Tobacco Co. | ||||||
| 2.625% due 02/01/20 | 3,066 | 3,043 | 6.875% due 05/01/20 | 5,256 | 6,204 | ||||
| 4.250% due 11/15/23 | 670 | 695 | 3.750% due 05/20/23 | 4,500 | 4,477 | ||||
| Health Care REIT, Inc. | Manufacturers & Traders Trust Co. | ||||||||
| 6.125% due 04/15/20 | 2,740 | 3,173 | Series BKNT | ||||||
| 4.950% due 01/15/21 | 650 | 714 | 1.400% due 07/25/17 | 5,600 | 5,608 | ||||
| 5.250% due 01/15/22 | 2,500 | 2,771 | Marathon Oil Corp. | ||||||
| 6.500% due 03/15/41 | 1,415 | 1,787 | 0.900% due 11/01/15 | 6,300 | 6,306 | ||||
| Hewlett-Packard Co. | McKesson Corp. | ||||||||
| 3.750% due 12/01/20 | 1,285 | 1,318 | 2.284% due 03/15/19 | 1,825 | 1,817 | ||||
| 6.000% due 09/15/41 | 2,145 | 2,392 | Medco Health Solutions, Inc. | ||||||
| Historic TW, Inc. | 4.125% due 09/15/20 | 2,027 | 2,170 | ||||||
| 8.050% due 01/15/16 | 2,900 | 3,139 | Merck & Co., Inc. | ||||||
| Honeywell International, Inc. | 0.591% due 05/18/18 (Ê) | 10,425 | 10,465 | ||||||
| 5.700% due 03/15/36 | 1,100 | 1,350 | MetLife, Inc. | ||||||
| Hospira, Inc. | 10.750% due 08/01/39 | 4,215 | 6,839 | ||||||
| 5.200% due 08/12/20 | 5,020 | 5,432 | 4.125% due 08/13/42 | 370 | 360 | ||||
| Howard Hughes Medical Institute | Metropolitan Life Global Funding I | ||||||||
| 3.500% due 09/01/23 | 1,640 | 1,704 | 1.500% due 01/10/18 (Þ) | 7,000 | 6,961 | ||||
| HSBC USA, Inc. | Mirant Mid-Atlantic Series B Pass- | ||||||||
| 2.625% due 09/24/18 | 5,875 | 6,056 | Through Trust | ||||||
| Humana, Inc. | Series B | ||||||||
| 4.950% due 10/01/44 | 2,410 | 2,478 | 9.125% due 06/30/17 | 1,281 | 1,378 | ||||
| Indiantown Cogeneration, LP | Monongahela Power Co. | ||||||||
| Series A-10 | 4.100% due 04/15/24 (Þ) | 1,815 | 1,929 | ||||||
| 9.770% due 12/15/20 | 1,645 | 1,867 | 5.400% due 12/15/43 (Þ) | 1,850 | 2,162 | ||||
| Innovation Ventures LLC / Innovation | Morgan Stanley | ||||||||
| Ventures Finance Corp. | 5.750% due 10/18/16 | 1,500 | 1,628 | ||||||
| 9.500% due 08/15/19 (Å) | 1,900 | 1,874 | 5.550% due 04/27/17 | 2,450 | 2,683 | ||||
| IPALCO Enterprises, Inc. | 3.700% due 10/23/24 | 3,625 | 3,617 | ||||||
| 5.000% due 05/01/18 | 3,500 | 3,710 | Series GMTN | ||||||
| JetBlue Airways Pass-Through Trust | 5.450% due 01/09/17 | 2,425 | 2,631 | ||||||
| Series 04-2 Class G-2 | 6.625% due 04/01/18 | 4,905 | 5,617 | ||||||
| 0.684% due 11/15/16 (Ê) | 4,039 | 3,978 | 5.500% due 07/24/20 | 1,500 | 1,695 | ||||
| John Deere Capital Corp. | |||||||||
| 0.363% due 04/12/16 | 10,200 | 10,204 | 4.350% due 09/08/26 | 3,680 | 3,690 | ||||
| JPMorgan Chase & Co. | Mutual of Omaha Insurance Co. | ||||||||
| 6.300% due 04/23/19 | 3,050 | 3,540 | 4.297% due 07/15/54 (Þ) | 3,060 | 3,112 | ||||
| 2.200% due 10/22/19 | 3,795 | 3,749 | National City Bank | ||||||
See accompanying notes which are an integral part of the financial statements.
392 Russell Strategic Bond Fund
| Russell Investment Company | |||||||||
| Russell Strategic Bond Fund | |||||||||
| Schedule of Investments, continued — October 31, 2014 | |||||||||
| Amounts in thousands (except share amounts) | Amounts in thousands (except share amounts) | ||||||||
| Principal | Fair | Principal | Fair | ||||||
| Amount ($) | Value | Amount ($) | Value | ||||||
| or Shares | $ | or Shares | $ | ||||||
| Series BKNT | 6.750% due 06/15/17 | 3,400 | 3,833 | ||||||
| 0.603% due 06/07/17 (Ê) | 3,075 | 3,051 | Rockwood Specialties Group, Inc. | ||||||
| Navient Corp. | 4.625% due 10/15/20 | 4,865 | 5,079 | ||||||
| 5.500% due 01/15/19 | 1,690 | 1,752 | Rohm & Haas Co. | ||||||
| NiSource Finance Corp. | 6.000% due 09/15/17 | 29 | 32 | ||||||
| 6.400% due 03/15/18 | 2,180 | 2,492 | Sabine Pass LNG, LP | ||||||
| Nissan Motor Acceptance Corp. | 7.500% due 11/30/16 | 385 | 413 | ||||||
| 0.784% due 03/03/17 (Ê)(Þ) | 4,430 | 4,439 | 7.500% due 11/30/16 (Þ) | 2,900 | 3,096 | ||||
| Norfolk Southern Corp. | Samsung Electronics America, Inc. | ||||||||
| 3.000% due 04/01/22 | 1,675 | 1,680 | 1.750% due 04/10/17 (Þ) | 6,460 | 6,498 | ||||
| NVR, Inc. | SL Green Realty Corp | ||||||||
| 3.950% due 09/15/22 | 3,700 | 3,783 | 7.750% due 03/15/20 | 3,000 | 3,607 | ||||
| Oncor Electric Delivery Co. LLC | Sprint Capital Corp. | ||||||||
| 6.800% due 09/01/18 | 7,750 | 9,134 | 8.750% due 03/15/32 | 8,565 | 9,571 | ||||
| 7.000% due 09/01/22 | 1,275 | 1,617 | Symantec Corp. | ||||||
| Oracle Corp. | 2.750% due 06/15/17 | 1,480 | 1,504 | ||||||
| 2.250% due 10/08/19 | 4,585 | 4,595 | Sysco Corp. | ||||||
| O'Reilly Automotive, Inc. | 1.450% due 10/02/17 | 1,750 | 1,759 | ||||||
| 3.800% due 09/01/22 | 1,430 | 1,476 | Tennessee Gas Pipeline Co. LLC | ||||||
| PACCAR Financial Corp. | 8.000% due 02/01/16 | 2,050 | 2,220 | ||||||
| 0.504% due 02/08/16 (Ê) | 1,455 | 1,458 | 8.375% due 06/15/32 | 3,080 | 4,100 | ||||
| 0.423% due 06/06/17 (Ê) | 1,000 | 1,000 | Time Warner Cable, Inc. | ||||||
| Panhandle Eastern Pipe Line Co., LP | 8.250% due 04/01/19 | 2,000 | 2,484 | ||||||
| 8.125% due 06/01/19 | 3,542 | 4,328 | 5.000% due 02/01/20 | 2,935 | 3,285 | ||||
| Pfizer, Inc. | 6.550% due 05/01/37 | 2,285 | 2,875 | ||||||
| 0.384% due 05/15/17 (Ê) | 4,150 | 4,146 | 7.300% due 07/01/38 | 2,417 | 3,325 | ||||
| 6.200% due 03/15/19 | 2,345 | 2,739 | Time Warner Entertainment Co., LP | ||||||
| 7.200% due 03/15/39 | 1,900 | 2,672 | 8.375% due 03/15/23 | 1,000 | 1,345 | ||||
| Philip Morris International, Inc. | Time Warner, Inc. | ||||||||
| 2.900% due 11/15/21 | 5,575 | 5,619 | 5.875% due 11/15/16 | 6,075 | 6,648 | ||||
| Plains All American Pipeline, LP / PAA | 4.000% due 01/15/22 | 5,025 | 5,276 | ||||||
| Finance Corp. | Toyota Motor Credit Corp. | ||||||||
| 2.850% due 01/31/23 | 850 | 817 | 0.521% due 05/17/16 (Ê) | 10,110 | 10,133 | ||||
| PNC Bank NA | UAL Pass-Through Trust | ||||||||
| 3.300% due 10/30/24 | 4,565 | 4,548 | Series 09-1 | ||||||
| Series BKNT | 10.400% due 11/01/16 | 236 | 261 | ||||||
| 2.700% due 11/01/22 | 3,755 | 3,607 | Unilever Capital Corp. | ||||||
| PNC Funding Corp. | 2.750% due 02/10/16 | 1,300 | 1,334 | ||||||
| 3.300% due 03/08/22 | 8,530 | 8,670 | United Technologies Corp. | ||||||
| Procter & Gamble Co. (The) | 3.100% due 06/01/22 | 3,550 | 3,610 | ||||||
| 1.450% due 08/15/16 | 250 | 254 | UnitedHealth Group, Inc. | ||||||
| 0.319% due 11/04/16 (Ê) | 3,615 | 3,616 | 3.875% due 10/15/20 | 2,640 | 2,840 | ||||
| Progress Energy, Inc. | Unum Group | ||||||||
| 7.050% due 03/15/19 | 1,000 | 1,195 | 4.000% due 03/15/24 | 2,940 | 3,013 | ||||
| 3.150% due 04/01/22 | 3,750 | 3,779 | US Airways Pass-Through Trust | ||||||
| Prudential Financial, Inc. | 5.900% due 10/01/24 | 2,990 | 3,311 | ||||||
| 5.625% due 06/15/43 | 2,550 | 2,646 | Series A | ||||||
| Prudential Holdings LLC | 7.125% due 10/22/23 | 2,784 | 3,215 | ||||||
| 8.695% due 12/18/23 (Þ) | 3,302 | 4,229 | US Bank NA | ||||||
| Series FSA | Series BKNT | ||||||||
| 1.109% due 12/18/17 (Ê)(Þ) | 2,357 | 2,374 | 0.435% due 09/11/17 (Ê) | 4,800 | 4,795 | ||||
| Public Service Co. of New Mexico | 1.375% due 09/11/17 | 2,400 | 2,404 | ||||||
| 7.950% due 05/15/18 | 3,320 | 3,957 | USF&G Capital III | ||||||
| Quebecor World Capital Corp. | 8.312% due 07/01/46 (Þ) | 2,244 | 3,248 | ||||||
| 4.875% due 01/02/49 (Ø) | 625 | — | Ventas Realty LP/CAP CRP | ||||||
| 6.125% due 11/15/49 (Ø) | 1,955 | — | 2.000% due 02/15/18 | 1,400 | 1,406 | ||||
| QVC, Inc. | Verizon Communications, Inc. | ||||||||
| 4.375% due 03/15/23 | 5,765 | 5,719 | 2.500% due 09/15/16 | 800 | 824 | ||||
| 5.450% due 08/15/34 (Þ) | 2,040 | 1,973 | 1.350% due 06/09/17 | 5,620 | 5,610 | ||||
| Republic Services, Inc. | 1.984% due 09/14/18 (Ê) | 600 | 628 | ||||||
| 3.550% due 06/01/22 | 5,550 | 5,691 | 3.650% due 09/14/18 | 4,270 | 4,516 | ||||
| Reynolds American, Inc. | 3.000% due 11/01/21 | 4,000 | 3,969 | ||||||
| See accompanying notes which are an integral part of the financial statements. | |||||||||
| Russell Strategic Bond Fund 393 | |||||||||
Russell Investment Company Russell Strategic Bond Fund
Schedule of Investments, continued — October 31, 2014
| Amounts in thousands (except share amounts) | Amounts in thousands (except share amounts) | ||||||||
| Principal | Fair | Principal | Fair | ||||||
| Amount ($) | Value | Amount ($) | Value | ||||||
| or Shares | $ | or Shares | $ | ||||||
| 3.500% due 11/01/21 | 6,625 | 6,753 | BP Capital Markets PLC | ||||||
| 5.150% due 09/15/23 | 19,930 | 22,319 | 0.567% due 11/06/15 (Ê) | 7,600 | 7,617 | ||||
| 4.400% due 11/01/34 | 2,155 | 2,104 | 0.657% due 11/07/16 (Ê) | 3,800 | 3,812 | ||||
| Viacom, Inc. | 3.245% due 05/06/22 | 8,225 | 8,250 | ||||||
| 3.125% due 06/15/22 | 2,375 | 2,320 | BPCE SA | ||||||
| Wachovia Capital Trust III | 0.801% due 11/18/16 (Ê) | 4,000 | 4,008 | ||||||
| 5.570% due 03/29/49 (Ê)(ƒ) | 3,440 | 3,328 | 4.000% due 04/15/24 | 2,485 | 2,569 | ||||
| Wal-Mart Stores, Inc. | Braskem Finance, Ltd. | ||||||||
| 2.800% due 04/15/16 | 1,330 | 1,373 | 6.450% due 02/03/24 | 3,350 | 3,553 | ||||
| 6.500% due 08/15/37 | 2,030 | 2,736 | Brazilian Government International Bond | ||||||
| Walt Disney Co. (The) | 4.250% due 01/07/25 | 2,700 | 2,743 | ||||||
| 2.750% due 08/16/21 | 1,325 | 1,349 | British Sky Broadcasting Group PLC | ||||||
| WellPoint, Inc. | 6.100% due 02/15/18 (Þ) | 2,290 | 2,577 | ||||||
| 2.300% due 07/15/18 | 1,550 | 1,563 | 3.750% due 09/16/24 | 1,601 | 1,606 | ||||
| 3.125% due 05/15/22 | 3,025 | 2,994 | British Telecommunications PLC | ||||||
| 4.650% due 01/15/43 | 1,155 | 1,169 | 2.350% due 02/14/19 | 2,910 | 2,921 | ||||
| Wells Fargo & Co. | Canadian Pacific Railway Co. | ||||||||
| 0.531% due 06/02/17 | 16,500 | 16,470 | 7.250% due 05/15/19 | 2,500 | 3,027 | ||||
| 3.500% due 03/08/22 | 7,390 | 7,642 | Canadian Pacific Railway, Ltd. | ||||||
| 4.125% due 08/15/23 | 3,350 | 3,494 | 4.500% due 01/15/22 | 3,642 | 4,013 | ||||
| CDP Financial, Inc. | |||||||||
| 4.100% due 06/03/26 | 3,415 | 3,464 | 5.600% due 11/25/39 (Þ) | 2,000 | 2,537 | ||||
| 4.650% due 11/04/44 | 2,960 | 2,950 | Coca Cola Enterprises | ||||||
| Williams Cos., Inc. (The) | 2.375% due 05/07/25 | EUR | 2,475 | 3,236 | |||||
| 7.875% due 09/01/21 | 458 | 553 | Colombia Government International | ||||||
| Williams Partners, LP | Bond | ||||||||
| 4.300% due 03/04/24 | 1,205 | 1,247 | 4.375% due 07/12/21 | 1,535 | 1,637 | ||||
| Williams Partners, LP / Williams | Cooperatieve Centrale Raiffeisen- | ||||||||
| Partners Finance Corp. | Boerenleenbank BA | ||||||||
| 7.250% due 02/01/17 | 2,765 | 3,094 | 4.625% due 12/01/23 | 4,500 | 4,730 | ||||
| Wm Wrigley Jr Co. | Corp. Andina de Fomento | ||||||||
| 2.000% due 10/20/17 (Þ) | 5,355 | 5,410 | 4.375% due 06/15/22 | 2,486 | 2,671 | ||||
| ZFS Finance USA Trust II | Credit Suisse | ||||||||
| 6.450% due 12/15/65 (Þ) | 4,650 | 4,952 | 6.000% due 02/15/18 | 690 | 772 | ||||
| ZFS Finance USA Trust V | Credit Suisse Group AG | ||||||||
| 6.500% due 05/09/37 (Þ) | 11,829 | 12,716 | 6.250% due 12/31/49 (ƒ)(Þ) | 2,670 | 2,597 | ||||
| 1,200,822 | Credit Suisse NY | ||||||||
| International Debt - 5.5% | 5.400% due 01/14/20 | 1,200 | 1,344 | ||||||
| Abbey National Treasury Services PLC | Deutsche Telekom International Finance | ||||||||
| 2.350% due 09/10/19 | 3,250 | 3,231 | BV | ||||||
| ABN Amro Bank NV | 3.125% due 04/11/16 (Þ) | 4,050 | 4,177 | ||||||
| 1.033% due 10/28/16 (Å)(Ê) | 2,320 | 2,338 | 2.250% due 03/06/17 (Þ) | 6,590 | 6,733 | ||||
| ArcelorMittal | Digicel Group, Ltd. | ||||||||
| 5.000% due 02/25/17 | 2,410 | 2,519 | 8.250% due 09/30/20 (Þ) | 2,455 | 2,565 | ||||
| 7.250% due 03/01/41 | 3,948 | 4,076 | Electricite de France SA | ||||||
| AWAS Aviation Capital, Ltd. | 4.875% due 01/22/44 (Þ) | 3,415 | 3,637 | ||||||
| 7.000% due 10/17/16 (Þ) | 2,341 | 2,382 | Encana Corp. | ||||||
| Baidu, Inc. | 5.900% due 12/01/17 | 4,000 | 4,489 | ||||||
| 3.250% due 08/06/18 | 2,685 | 2,761 | General Electric Capital Corp. | ||||||
| Banco do Brasil SA | 5.500% due 09/15/67 | EUR | 900 | 1,220 | |||||
| 9.000% due 12/29/49 (Å)(ƒ) | 3,140 | 3,087 | GlaxoSmithKline Capital PLC | ||||||
| Banco Santander Brasil SA | 1.500% due 05/08/17 | 1,490 | 1,503 | ||||||
| 4.250% due 01/14/16 (Þ) | 600 | 616 | Government of the Cayman Islands | ||||||
| Bank of Nova Scotia | 5.950% due 11/24/19 (Þ) | 1,185 | 1,365 | ||||||
| 0.423% due 05/09/16 (Ê)(~) | 6,495 | 6,493 | Granite Master Issuer PLC | ||||||
| Barrick Gold Corp. | Series 2007-1 Class 2A1 | ||||||||
| 4.100% due 05/01/23 | 3,190 | 3,083 | 0.297% due 12/20/54 (Ê) | 2,513 | 2,495 | ||||
| BAT International Finance PLC | HBOS PLC | ||||||||
| 2.125% due 06/07/17 (Þ) | 6,527 | 6,638 | Series GMTN | ||||||
| BBVA Bancomer SA | 6.750% due 05/21/18 (Þ) | 9,920 | 11,141 | ||||||
| 4.500% due 03/10/16 (Þ) | 600 | 625 | HSBC Holdings PLC | ||||||
| BHP Billiton Finance USA, Ltd. | 6.375% due 12/31/49 (ƒ) | 2,585 | 2,637 | ||||||
| 3.850% due 09/30/23 | 2,450 | 2,563 | Hutchison Whampoa, Ltd. | ||||||
See accompanying notes which are an integral part of the financial statements.
394 Russell Strategic Bond Fund
| Russell Investment Company | |||||||||
| Russell Strategic Bond Fund | |||||||||
| Schedule of Investments, continued — October 31, 2014 | |||||||||
| Amounts in thousands (except share amounts) | Amounts in thousands (except share amounts) | ||||||||
| Principal | Fair | Principal | Fair | ||||||
| Amount ($) | Value | Amount ($) | Value | ||||||
| or Shares | $ | or Shares | $ | ||||||
| 3.625% due 10/31/24 (Þ) | 2,475 | 2,459 | Rio Tinto Finance USA PLC | ||||||
| ING Bank NV | 1.375% due 06/17/16 | 2,110 | 2,126 | ||||||
| 3.750% due 03/07/17 (Þ) | 2,125 | 2,238 | Royal Bank of Scotland Group PLC | ||||||
| 4.125% due 11/21/23 | 2,000 | 2,049 | 5.125% due 05/28/24 | 2,855 | 2,893 | ||||
| Intesa Sanpaolo SpA | Saudi Electricity Global Sukuk Co. 2 | ||||||||
| 2.375% due 01/13/17 | 3,405 | 3,443 | 5.060% due 04/08/43 (Þ) | 4,390 | 4,453 | ||||
| 5.017% due 06/26/24 (Þ) | 4,665 | 4,559 | Seagate HDD Cayman | ||||||
| JPMorgan Chase & Co. | 4.750% due 06/01/23 | 2,505 | 2,585 | ||||||
| Series MPLE | Shell International Finance BV | ||||||||
| 2.920% due 09/19/17 (Þ) | CAD | 7,095 | 6,435 | 0.444% due 11/15/16 (Ê) | 11,580 | 11,606 | |||
| KFW | 2.000% due 11/15/18 | 2,360 | 2,379 | ||||||
| 4.000% due 01/27/20 | 8,525 | 9,439 | 2.250% due 01/06/23 | 9,975 | 9,499 | ||||
| Lloyds Bank PLC | Sirius International Group, Ltd. | ||||||||
| 2.300% due 11/27/18 | 2,695 | 2,713 | 7.506% due 05/29/49 (ƒ)(Þ) | 4,170 | 4,378 | ||||
| Lloyds Banking Group PLC | Skandinaviska Enskilda Banken AB | ||||||||
| 7.500% due 12/31/49 (ƒ) | 5,455 | 5,673 | 2.375% due 03/25/19 (Þ) | 4,250 | 4,291 | ||||
| Macquarie Bank, Ltd. | SMART Trust | ||||||||
| 0.864% due 10/27/17 (Å)(Ê) | 3,000 | 2,998 | Series 2011-2USA Class A4A | ||||||
| Marfrig Overseas, Ltd. | 2.310% due 04/14/17 (Þ) | 6,279 | 6,311 | ||||||
| 9.500% due 05/04/20 (Þ) | 4,200 | 4,436 | South Africa Government International | ||||||
| Mexico Government International Bond | Bond | ||||||||
| 6.050% due 01/11/40 | 1,276 | 1,541 | 4.665% due 01/17/24 | 800 | 832 | ||||
| 4.750% due 03/08/44 | 1,526 | 1,549 | Statoil ASA | ||||||
| Motor PLC | 0.694% due 11/08/18 (Ê) | 8,300 | 8,346 | ||||||
| Series 2012-12A Class A1C | 3.150% due 01/23/22 | 1,600 | 1,640 | ||||||
| 1.286% due 02/25/20 (Þ) | 768 | 768 | Suncor Energy, Inc. | ||||||
| Nexen Energy ULC | 5.950% due 12/01/34 | 2,690 | 3,270 | ||||||
| 6.200% due 07/30/19 | 1,775 | 2,066 | Sydney Airport Finance Co. Pty, Ltd. | ||||||
| 7.500% due 07/30/39 | 3,170 | 4,453 | 3.900% due 03/22/23 (Þ) | 3,000 | 3,082 | ||||
| Nokia OYJ | Telefonica Emisiones SAU | ||||||||
| 6.625% due 05/15/39 | 4,906 | 5,311 | 3.992% due 02/16/16 | 2,507 | 2,601 | ||||
| Nomura Holdings Inc. | Tencent Holdings, Ltd. | ||||||||
| 2.000% due 09/13/16 | 4,385 | 4,440 | 3.375% due 05/02/19 (Þ) | 2,355 | 2,395 | ||||
| NOVA Chemicals Corp. | Teva Pharmaceutical Finance Co. BV | ||||||||
| 5.250% due 08/01/23 (Þ) | 5,265 | 5,502 | 2.950% due 12/18/22 | 3,200 | 3,103 | ||||
| OHA Credit Partners IX, Ltd. | Toronto-Dominion Bank (The) | ||||||||
| Series 2013-9A Class A1 | 0.400% due 07/13/16 (Ê) | 10,000 | 10,000 | ||||||
| 1.631% due 10/20/25 (Å)(Ê) | 4,145 | 4,109 | Total Capital Canada, Ltd. | ||||||
| Paragon Offshore PLC | 2.750% due 07/15/23 | 2,680 | 2,599 | ||||||
| 7.250% due 08/15/24 (Å) | 3,900 | 2,983 | Total Capital International SA | ||||||
| Peruvian Government International Bond | 1.000% due 08/12/16 | 10,485 | 10,534 | ||||||
| 6.550% due 03/14/37 | 675 | 862 | Total Capital SA | ||||||
| Petrobras Global Finance BV | 2.125% due 08/10/18 | 3,300 | 3,352 | ||||||
| 1.852% due 05/20/16 (Ê) | 2,207 | 2,207 | Trade MAPS 1, Ltd. | ||||||
| 3.250% due 03/17/17 | 1,400 | 1,415 | Series 2013-1A Class A | ||||||
| Petroleos Mexicanos | 0.852% due 12/10/18 (Ê)(Þ) | 6,410 | 6,411 | ||||||
| 4.875% due 01/24/22 | 2,125 | 2,265 | TransCanada PipeLines, Ltd. | ||||||
| 6.375% due 01/23/45 | 2,890 | 3,316 | 3.800% due 10/01/20 | 7,000 | 7,340 | ||||
| Philip Morris International, Inc. | 2.500% due 08/01/22 | 1,975 | 1,881 | ||||||
| Series EMTn | Transocean, Inc. | ||||||||
| 2.875% due 03/03/26 | EUR | 3,900 | 5,371 | 6.375% due 12/15/21 | 2,370 | 2,491 | |||
| Philippine Government International | Turkey Government International Bond | ||||||||
| Bond | 5.750% due 03/22/24 | 3,575 | 3,948 | ||||||
| 4.200% due 01/21/24 | 2,200 | 2,373 | Tyco Electronics Group SA | ||||||
| Poland Government International Bond | 6.550% due 10/01/17 | 2,425 | 2,760 | ||||||
| 5.125% due 04/21/21 | 1,250 | 1,411 | UBS AG | ||||||
| Province of Ontario Canada | Series BKNT | ||||||||
| 3.200% due 05/16/24 | 2,750 | 2,829 | 5.750% due 04/25/18 | 940 | 1,061 | ||||
| Province of Quebec Canada | Vale Overseas, Ltd. | ||||||||
| 3.500% due 07/29/20 | 465 | 499 | 8.250% due 01/17/34 | 1,960 | 2,476 | ||||
| 2.625% due 02/13/23 | 550 | 544 | Validus Holdings, Ltd. | ||||||
| Rabobank Nederland | 8.875% due 01/26/40 | 1,993 | 2,813 | ||||||
| 11.000% due 06/29/49 (ƒ)(Þ) | 4,813 | 6,281 | Vodafone Group PLC | ||||||
| See accompanying notes which are an integral part of the financial statements. | |||||||||
| Russell Strategic Bond Fund 395 | |||||||||
Russell Investment Company Russell Strategic Bond Fund
Schedule of Investments, continued — October 31, 2014
| Amounts in thousands (except share amounts) | Amounts in thousands (except share amounts) | ||||||||
| Principal | Fair | Principal | Fair | ||||||
| Amount ($) | Value | Amount ($) | Value | ||||||
| or Shares | $ | or Shares | $ | ||||||
| 1.625% due 03/20/17 | 3,525 | 3,542 | Banc of America Alternative Loan Trust | ||||||
| Series FRN | Series 2005-5 Class 2CB1 | ||||||||
| 0.617% due 02/19/16 (Ê) | 2,800 | 2,806 | 6.000% due 06/25/35 | 419 | 396 | ||||
| Weatherford International, Ltd. | Banc of America Commercial Mortgage | ||||||||
| 5.125% due 09/15/20 | 3,933 | 4,289 | Trust | ||||||
| Willis Group Holdings PLC | Series 2007-2 Class AM | ||||||||
| 4.125% due 03/15/16 | 1,935 | 2,005 | 5.622% due 04/10/49 | 1,490 | 1,619 | ||||
| Banc of America Funding Corp. | |||||||||
| 403,229 | Series 2006-3 Class 5A8 | ||||||||
| Loan Agreements - 0.5% | 5.500% due 03/25/36 | 1,860 | 1,769 | ||||||
| Avago Technologies Cayman, Ltd. Term | Series 2006-G Class 2A3 | ||||||||
| Loan B | 0.327% due 07/20/36 (Ê) | 903 | 901 | ||||||
| 3.750% due 05/06/21 | 3,466 | 3,454 | Banc of America Funding Trust | ||||||
| Chrysler Group LLC Term Loan B | Series 2005-8 Class 1A1 | ||||||||
| 3.500% due 05/24/17 (Ê) | 4,004 | 3,981 | 5.500% due 01/25/36 | 2,925 | 2,955 | ||||
| First Data Corp. Term Loan | Series 2006-F Class 1A2 | ||||||||
| 3.653% due 03/24/18 (Ê) | 4,050 | 4,009 | 2.616% due 07/20/36 (Ê) | 129 | 93 | ||||
| HCA, Inc. Term Loan B4 | Series 2006-J Class 4A1 | ||||||||
| 2.983% due 05/01/18 (Ê) | 5,394 | 5,366 | 2.829% due 01/20/47 (Ê) | 1 | 1 | ||||
| Hologic, Inc.Term Loan | Series 2007-2 Class TA1B | ||||||||
| 3.250% due 08/01/19 (Ê) | 3,416 | 3,396 | 5.806% due 03/25/37 | 3 | 3 | ||||
| MacDermid, Inc. 1st Lien Term Loan | Banc of America Merrill Lynch | ||||||||
| 4.000% due 06/07/20 (Ê) | 5,925 | 5,797 | Commercial Mortgage, Inc. | ||||||
| Numericable U.S. LLC 1st Lien Term | Series 2005-1 Class A5 | ||||||||
| Loan B1 | 5.258% due 11/10/42 | 1,112 | 1,114 | ||||||
| 4.500% due 04/23/20 (Ê) | 2,091 | 2,094 | Series 2007-2 Class A4 | ||||||
| Numericable U.S. LLC 1st Lien Term | 5.612% due 04/10/49 | 4,700 | 5,094 | ||||||
| Loan B2 | Series 2008-1 Class A4 | ||||||||
| 4.500% due 04/23/20 (Ê) | 1,809 | 1,811 | 6.245% due 02/10/51 | 1,617 | 1,810 | ||||
| Sungard Availability Services Capital, | Banc of America Mortgage Securities, | ||||||||
| Inc. Term Loan | Inc. | ||||||||
| 6.000% due 03/31/19 (Ê) | 3,234 | 2,878 | Series 2004-1 Class 5A1 | ||||||
| TWCC Holding Corp. 2nd Lien Term | 6.500% due 09/25/33 | 14 | 14 | ||||||
| Loan | Series 2004-11 Class 2A1 | ||||||||
| 7.000% due 06/26/20 (Ê) | 3,000 | 2,939 | 5.750% due 01/25/35 | 611 | 621 | ||||
| Valeant Pharmaceuticals International, | Series 2004-F Class 1A1 | ||||||||
| Inc. 1st Lien Term Loan B | 2.498% due 07/25/34 (Ê) | 375 | 378 | ||||||
| 3.500% due 08/05/20 (Ê) | 1,194 | 1,184 | Series 2004-I Class 2A2 | ||||||
| Visant Corp. Term Loan | 2.709% due 10/25/34 (Ê) | 87 | 87 | ||||||
| 7.000% due 09/23/21 | 1,415 | 1,394 | Series 2005-H Class 2A5 | ||||||
| 38,303 | 2.689% due 09/25/35 (Ê) | 2,193 | 2,072 | ||||||
| Mortgage-Backed Securities - 25.1% | Banc of America Mortgage Trust | ||||||||
| Adjustable Rate Mortgage Trust | Series 2005-D Class 2A7 | ||||||||
| Series 2006-1 Class 2A1 | 2.645% due 05/25/35 (Ê) | 1,745 | 1,612 | ||||||
| 3.219% due 03/25/36 (Ê) | 789 | 590 | Bank of America Commercial Mortgage | ||||||
| Alternative Loan Trust | Trust | ||||||||
| Series 2005-85CB Class 2A2 | 5.765% due 06/10/49 | 2,530 | 2,624 | ||||||
| 5.500% due 02/25/36 | 16 | 15 | Bayview Commercial Asset Trust | ||||||
| Series 2006-OA10 Class 3A1 | Series 2008-4 Class A2 | ||||||||
| 0.342% due 08/25/46 (Ê) | 5,965 | 4,598 | 2.652% due 07/25/38 (Ê)(Þ) | 223 | 243 | ||||
| Series 2007-15CB Class A5 | BCAP LLC Trust | ||||||||
| 5.750% due 07/25/37 | 541 | 481 | Series 2011-R11 Class 15A1 | ||||||
| Series 2007-15CB Class A7 | 2.594% due 10/26/33 (Ê)(Þ) | 4,315 | 4,394 | ||||||
| 6.000% due 07/25/37 | 1,534 | 1,384 | Series 2011-R11 Class 20A5 | ||||||
| Series 2007-HY6 Class A1 | 2.602% due 03/26/35 (Ê)(Þ) | 1,789 | 1,814 | ||||||
| 0.362% due 08/25/47 (Ê) | 7,025 | 5,728 | Bear Stearns Adjustable Rate Mortgage | ||||||
| American Home Mortgage Investment | Trust | ||||||||
| Trust | Series 2002-11 Class 1A2 | ||||||||
| Series 2007-1 Class GA1C | 2.668% due 02/25/33 (Ê) | — | — | ||||||
| 0.342% due 05/25/47 (Ê) | 6,513 | 4,660 | Series 2004-5 Class 2A | ||||||
| Series 2007-4 Class A2 | 2.953% due 07/25/34 (Ê) | 866 | 861 | ||||||
| 0.342% due 08/25/37 (Ê) | 1,444 | 1,408 | Series 2004-10 Class 22A1 | ||||||
| Aventura Mall Trust | 2.557% due 01/25/35 (Ê) | 245 | 245 | ||||||
| Series 2013-AVM Class A | Series 2005-12 Class 13A1 | ||||||||
| 3.743% due 12/05/32 (Þ) | 260 | 275 | 5.457% due 02/25/36 (Ê) | 253 | 227 | ||||
| See accompanying notes which are an integral part of the financial statements. | |||||||||
396 Russell Strategic Bond Fund
| Russell Investment Company | |||||||||
| Russell Strategic Bond Fund | |||||||||
| Schedule of Investments, continued — October 31, 2014 | |||||||||
| Amounts in thousands (except share amounts) | Amounts in thousands (except share amounts) | ||||||||
| Principal | Fair | Principal | Fair | ||||||
| Amount ($) | Value | Amount ($) | Value | ||||||
| or Shares | $ | or Shares | $ | ||||||
| Series 2007-3 Class 1A1 | Series 2014-GC23 Class A4 | ||||||||
| 2.933% due 05/25/47 (Ê) | 2,015 | 1,718 | 3.622% due 07/10/47 | 7,000 | 7,225 | ||||
| Bear Stearns ARM Trust | Citigroup Mortgage Loan Trust, Inc. | ||||||||
| Series 2003-8 Class 4A1 | Series 2005-11 Class A2A | ||||||||
| 2.772% due 01/25/34 (Ê) | 172 | 174 | 2.510% due 10/25/35 (Ê) | 130 | 129 | ||||
| Bear Stearns Commercial Mortgage | Series 2006-AR7 Class 1A4A | ||||||||
| Securities Trust | 2.482% due 11/25/36 (Ê) | 3,027 | 2,618 | ||||||
| Series 2005-PW10 Class A4 | Series 2007-6 Class 1A4A | ||||||||
| 5.405% due 12/11/40 | 1,254 | 1,292 | 2.914% due 03/25/37 (Ê) | 1,451 | 1,029 | ||||
| Series 2007-PW15 Class A4 | Series 2007-10 Class 2A3A | ||||||||
| 5.331% due 02/11/44 | 505 | 543 | 2.917% due 09/25/37 (Ê) | — | — | ||||
| Series 2007-PW16 Class A4 | Series 2007-10 Class 2A4A | ||||||||
| 5.707% due 06/11/40 | 50 | 55 | 5.823% due 09/25/37 (Ê) | — | — | ||||
| Series 2007-PW17 Class A4 | Series 2007-AR8 Class 2A1A | ||||||||
| 5.694% due 06/11/50 | 1,335 | 1,460 | 2.681% due 07/25/37 (Ê) | 1,545 | 1,434 | ||||
| Bear Stearns Commercial Mortgage | Citigroup/Deutsche Bank Commercial | ||||||||
| Securities, Inc. | Mortgage Trust | ||||||||
| Series 2005-T20 Class E | Series 2007-CD4 Class A4 | ||||||||
| 5.288% due 10/12/42 | 170 | 170 | 5.322% due 12/11/49 | 340 | 363 | ||||
| Bear Stearns Mortgage Backed Securities | Commercial Mortgage Asset Trust | ||||||||
| Series 2005-PWR9 Class A4A | Series 1999-C1 Class D | ||||||||
| 4.871% due 09/11/42 | 534 | 545 | 6.900% due 01/17/32 | 61 | 60 | ||||
| Bear Stearns Structured Products, Inc. | Commercial Mortgage Loan Trust | ||||||||
| Series 2007-R6 Class 1A1 | Series 2008-LS1 Class A4B | ||||||||
| 2.509% due 01/26/36 (Ê) | 1,656 | 1,317 | 6.040% due 12/10/49 | 1,579 | 1,711 | ||||
| Series 2007-R6 Class 2A1 | Commercial Mortgage Pass-Through | ||||||||
| 2.555% due 12/26/46 (Ê) | 1,468 | 1,120 | Certificates | ||||||
| BHMS Mortgage Trust | Series 2014-CR20 Class AM | ||||||||
| Series 2014-ATLS Class AFL | 3.938% due 11/10/47 | 2,180 | 2,225 | ||||||
| 1.652% due 07/05/33 (Ê)(Þ) | 1,215 | 1,216 | Commercial Mortgage Trust | ||||||
| Series 2014-ATLS Class BFX | Series 2001-J2A Class E | ||||||||
| 4.241% due 07/05/33 (Þ) | 3,195 | 3,210 | 6.922% due 07/16/34 (Þ) | 2,100 | 2,322 | ||||
| CD Commercial Mortgage Trust | Series 2005-C6 Class AJ | ||||||||
| Series 2005-CD1 Class C | 5.209% due 06/10/44 | 560 | 575 | ||||||
| 5.226% due 07/15/44 | 900 | 921 | Series 2005-GG3 Class A4 | ||||||
| Series 2007-CD5 Class A4 | 4.799% due 08/10/42 | 10 | 10 | ||||||
| 5.886% due 11/15/44 | 625 | 687 | Series 2006-C7 Class A4 | ||||||
| Chase Mortgage Finance Trust | 5.756% due 06/10/46 | 350 | 370 | ||||||
| Series 2007-A1 Class 2A1 | Series 2006-GG7 Class A4 | ||||||||
| 2.465% due 02/25/37 (Ê) | 379 | 378 | 5.819% due 07/10/38 | 562 | 595 | ||||
| CHL Mortgage Pass-Through Trust | Series 2007-GG11 Class A4 | ||||||||
| Series 2004-11 Class 2A1 | 5.736% due 12/10/49 | 1,345 | 1,472 | ||||||
| 2.061% due 07/25/34 (Ê) | 2,502 | 2,479 | Series 2007-GG11 Class AJ | ||||||
| Series 2004-22 Class A3 | 6.051% due 12/10/49 | 2,642 | 2,762 | ||||||
| 2.431% due 11/25/34 (Ê) | 1,042 | 987 | Series 2010-RR1 Class GEA | ||||||
| Series 2005-17 Class 1A6 | 5.543% due 12/11/49 (Þ) | 7,300 | 7,691 | ||||||
| 5.500% due 09/25/35 | 1,115 | 1,089 | Series 2012-CR4 Class A3 | ||||||
| Series 2006-1 Class A2 | 2.853% due 10/15/45 | 763 | 755 | ||||||
| 6.000% due 03/25/36 | 556 | 510 | Series 2013-CR7 Class A4 | ||||||
| Series 2006-21 Class A8 | 3.213% due 03/10/46 | 270 | 273 | ||||||
| 5.750% due 02/25/37 | 2,652 | 2,504 | Series 2013-CR9 Class A3 | ||||||
| Series 2007-9 Class A11 | 4.022% due 07/10/45 | 320 | 341 | ||||||
| 5.750% due 07/25/37 | 3,479 | 3,249 | Series 2013-CR9 Class A4 | ||||||
| Citicorp Mortgage Securities Trust | 4.236% due 07/10/45 | 760 | 827 | ||||||
| Series 2006-3 Class 1A4 | Series 2014-CR14 Class A3 | ||||||||
| 6.000% due 06/25/36 | 3,756 | 3,897 | 3.955% due 02/10/47 | 455 | 481 | ||||
| Citigroup Commercial Mortgage Trust | Series 2014-CR14 Class A4 | ||||||||
| Series 2006-C4 Class A3 | |||||||||
| 5.779% due 03/15/49 | 124 | 131 | 4.236% due 02/10/47 | 3,761 | 4,074 | ||||
| Series 2008-C7 Class A4 | Series 2014-KY0 Class F | ||||||||
| 6.133% due 12/10/49 | 1,100 | 1,219 | 3.654% due 06/11/27 | 2,180 | 2,175 | ||||
| Series 2009-RR1 Class MA4A | Series 2014-UBS2 Class A5 | ||||||||
| 5.485% due 03/17/51 (Þ) | 400 | 433 | 3.961% due 03/10/47 | 315 | 333 | ||||
| Series 2014-UBS4 Class A5 | |||||||||
| 3.694% due 08/10/47 | 375 | 386 | |||||||
| See accompanying notes which are an integral part of the financial statements. | |||||||||
| Russell Strategic Bond Fund 397 | |||||||||
Russell Investment Company Russell Strategic Bond Fund
Schedule of Investments, continued — October 31, 2014
| Amounts in thousands (except share amounts) | Amounts in thousands (except share amounts) | ||||||||
| Principal | Fair | Principal | Fair | ||||||
| Amount ($) | Value | Amount ($) | Value | ||||||
| or Shares | $ | or Shares | $ | ||||||
| Series 2014-UBS5 Class A4 | 4.000% due 2020 | 6 | 7 | ||||||
| 3.838% due 09/10/47 | 3,165 | 3,298 | 4.250% due 2020 | 7,249 | 7,995 | ||||
| Countrywide Alternative Loan Trust | 4.338% due 2020 | 6,093 | 6,779 | ||||||
| 6.000% due 05/25/36 | 3,816 | 3,333 | 4.772% due 2020 | 2,449 | 2,732 | ||||
| Countrywide Home Loan Mortgage Pass- | |||||||||
| Through Trust | 3.000% due 2021 | 216 | 226 | ||||||
| Series 2005-HYB9 Class 3A2A | 3.400% due 2021 | 17,700 | 18,601 | ||||||
| 2.313% due 02/20/36 (Ê) | — | — | 3.500% due 2021 | 371 | 393 | ||||
| Series 2007-4 Class 1A10 | 3.840% due 2021 | 5,956 | 6,489 | ||||||
| 6.000% due 05/25/37 | 6,138 | 5,542 | 3.890% due 2021 | 1,892 | 2,053 | ||||
| Countrywide Home Loans, Inc. | 5.500% due 2021 | 139 | 151 | ||||||
| Series 2003-46 Class 1A1 | 2.820% due 2022 | 2,555 | 2,600 | ||||||
| 2.612% due 01/19/34 | 4,746 | 4,742 | |||||||
| Series 2006-14 Class A4 | 3.000% due 2022 | 245 | 256 | ||||||
| 6.250% due 09/25/36 | 3,404 | 3,167 | 5.000% due 2022 | 1,590 | 1,699 | ||||
| Credit Suisse Commercial Mortgage | 5.500% due 2022 | 551 | 603 | ||||||
| Trust | 4.500% due 2023 | 79 | 86 | ||||||
| Series 2007-C1 Class A3 | 5.500% due 2023 | 1,114 | 1,221 | ||||||
| 5.383% due 02/15/40 | 4,706 | 5,028 | 4.000% due 2024 | 91 | 97 | ||||
| Credit Suisse First Boston Mortgage | 5.500% due 2024 | 784 | 863 | ||||||
| Securities Corp. | |||||||||
| Series 2004-C5 Class B | 7.500% due 2024 | 2 | 2 | ||||||
| 4.929% due 11/15/37 | 3,730 | 3,728 | 10.000% due 2024 | 3 | 4 | ||||
| Series 2005-9 Class 2A1 | 4.000% due 2025 | 3,485 | 3,725 | ||||||
| 5.500% due 10/25/35 | 2,870 | 2,785 | 4.500% due 2025 | 2,235 | 2,401 | ||||
| Series 2005-C2 Class A3 | 4.500% due 2025 | 65 | 71 | ||||||
| 4.691% due 04/15/37 | 620 | 621 | 5.500% due 2025 | 134 | 148 | ||||
| Series 2005-C2 Class AMFX | 3.500% due 2026 | 2,621 | 2,774 | ||||||
| 4.877% due 04/15/37 | 1,145 | 1,154 | 4.000% due 2026 | 8,134 | 8,714 | ||||
| Series 2005-C3 Class AJ | 4.500% due 2026 | 214 | 242 | ||||||
| 4.771% due 07/15/37 | 695 | 705 | |||||||
| Series 2005-C6 Class B | 5.500% due 2026 | 227 | 254 | ||||||
| 5.230% due 12/15/40 | 2,415 | 2,487 | 9.000% due 2026 | 6 | 7 | ||||
| Credit Suisse Mortgage Capital | 3.000% due 2027 | 2,829 | 2,943 | ||||||
| Certificates | 3.500% due 2027 | 3,817 | 4,043 | ||||||
| Series 2007-2 Class 3A4 | 4.500% due 2027 | 4,420 | 4,787 | ||||||
| 5.500% due 03/25/37 | 3,252 | 3,107 | 4.500% due 2027 | 713 | 807 | ||||
| Credit Suisse Mortgage Trust | 5.500% due 2027 | 81 | 90 | ||||||
| 3.250% due 08/27/36 | 3,290 | 3,133 | 7.000% due 2028 | 45 | 51 | ||||
| CSMC Trust | |||||||||
| Series 2014-USA Class A2 | 6.500% due 2029 | 53 | 60 | ||||||
| 3.953% due 09/15/37 (Å) | 3,905 | 4,081 | 7.000% due 2029 | 470 | 557 | ||||
| DBCCRE Mortgage Trust | 7.500% due 2029 | 7 | 8 | ||||||
| Series 2014-ARCP Class C | 8.500% due 2029 | 2 | 2 | ||||||
| 4.935% due 01/10/34 (Å) | 2,495 | 2,633 | 6.500% due 2030 | 78 | 88 | ||||
| DBUBS Mortgage Trust | 7.000% due 2030 | 150 | 168 | ||||||
| Series 2011-LC3A Class A2 | |||||||||
| 3.642% due 08/10/44 | 5,255 | 5,458 | 8.000% due 2030 | 70 | 87 | ||||
| Deutsche Alt-A Securities Mortgage | 8.500% due 2030 | 73 | 83 | ||||||
| Loan Trust | 9.500% due 2030 | 29 | 34 | ||||||
| Series 2007-OA4 Class 1A1A | 4.000% due 2031 | 2,361 | 2,533 | ||||||
| 0.342% due 08/25/47 (Ê) | 4,619 | 3,805 | 6.500% due 2031 | 131 | 151 | ||||
| Series 2007-OA5 Class A1A | 7.000% due 2031 | 316 | 373 | ||||||
| 0.352% due 08/25/47 (Ê) | 3,058 | 2,612 | 7.500% due 2031 | 25 | 29 | ||||
| DSLA Mortgage Loan Trust | 8.500% due 2031 | 147 | 165 | ||||||
| Series 2007-AR1 Class 2A1A | |||||||||
| 0.297% due 04/19/47 (Ê) | 7,339 | 6,036 | 3.500% due 2032 | 10,490 | 11,023 | ||||
| Extended Stay America Trust | 6.500% due 2032 | 171 | 202 | ||||||
| Series 2013-ESH7 Class A27 | 7.000% due 2032 | 796 | 922 | ||||||
| 2.958% due 12/05/31 (Þ) | 3,845 | 3,903 | 7.500% due 2032 | 19 | 22 | ||||
| Fannie Mae | 8.500% due 2032 | 14 | 17 | ||||||
| 10.000% due 2018 | 4 | 5 | 2.340% due 2033(Ê) | 163 | 165 | ||||
| 5.000% due 2019 | 246 | 263 | 3.000% due 2033 | 6,132 | 6,279 | ||||
| 3.763% due 2020 | 6,189 | 6,683 | 3.500% due 2033 | 5,707 | 5,979 | ||||
See accompanying notes which are an integral part of the financial statements.
398 Russell Strategic Bond Fund
| Russell Investment Company | ||||||||||
| Russell Strategic Bond Fund | ||||||||||
| Schedule of Investments, continued — October 31, 2014 | ||||||||||
| Amounts in thousands (except share amounts) | Amounts in thousands (except share amounts) | |||||||||
| Principal | Fair | Principal | Fair | |||||||
| Amount ($) | Value | Amount ($) | Value | |||||||
| or Shares | $ | or Shares | $ | |||||||
| 6.500% due 2033 | 154 | 175 | Series 2002-320 Class 2 | |||||||
| 7.000% due 2033 | 356 | 401 | Interest Only STRIP | |||||||
| 2.249% due 2034(Ê) | 601 | 642 | 7.000% due 04/25/32 | 10 | 2 | |||||
| Series 2003-339 Class 23 | ||||||||||
| 2.263% due 2034(Ê) | 108 | 114 | Interest Only STRIP | |||||||
| 2.307% due 2034(Ê) | 311 | 331 | 5.000% due 06/25/18 | 391 | 24 | |||||
| 4.500% due 2034 | 1,243 | 1,398 | Series 2003-343 Class 6 | |||||||
| 5.500% due 2034 | 79 | 88 | Interest Only STRIP | |||||||
| 6.500% due 2034 | 342 | 400 | 5.000% due 10/25/33 | 620 | 111 | |||||
| 7.000% due 2034 | 43 | 51 | Series 2003-345 Class 18 | |||||||
| 2.099% due 2035(Ê) | 677 | 729 | Interest Only STRIP | |||||||
| 4.500% due 12/25/18 | 1,025 | 62 | ||||||||
| 2.135% due 2035(Ê) | 1,005 | 1,080 | Series 2003-345 Class 19 | |||||||
| 2.250% due 2035(Ê) | 698 | 739 | Interest Only STRIP | |||||||
| 4.500% due 2035 | 936 | 1,067 | 4.500% due 01/25/19 | 1,119 | 68 | |||||
| 5.500% due 2035 | 910 | 1,022 | Series 2005-365 Class 12 | |||||||
| 7.000% due 2035 | 36 | 39 | Interest Only STRIP | |||||||
| 7.500% due 2035 | 345 | 420 | 4.500% due 12/25/35 | 2,212 | 352 | |||||
| 2.192% due 2036(Ê) | 7 | 7 | Series 2006-369 Class 8 | |||||||
| Interest Only STRIP | ||||||||||
| 4.000% due 2036 | 80 | 85 | 5.500% due 04/25/36 | 328 | 53 | |||||
| 5.500% due 2036 | 670 | 727 | Fannie Mae Grantor Trust | |||||||
| 7.000% due 2036 | 89 | 97 | Series 1999-T2 Class A1 | |||||||
| 4.000% due 2037 | 83 | 88 | 7.500% due 01/19/39 | 37 | 41 | |||||
| 4.500% due 2037 | 1,742 | 1,956 | Series 2001-T4 Class A1 | |||||||
| 5.500% due 2037 | 1,647 | 1,812 | 7.500% due 07/25/41 | 1,590 | 1,897 | |||||
| 6.500% due 2037 | 326 | 370 | Series 2001-T8 Class A2 | |||||||
| 4.500% due 2038 | 1,127 | 1,225 | 9.500% due 07/25/41 | 101 | 123 | |||||
| Series 2001-T10 Class A2 | ||||||||||
| 4.500% due 2038 | 2,066 | 2,321 | 7.500% due 12/25/41 | 2,313 | 2,677 | |||||
| 5.500% due 2038 | 556 | 621 | Series 2002-T19 Class A1 | |||||||
| 6.500% due 2038 | 310 | 352 | 6.500% due 07/25/42 | 323 | 369 | |||||
| 4.500% due 2039 | 933 | 1,077 | Series 2004-T1 Class 1A2 | |||||||
| 4.500% due 2039 | 993 | 1,079 | 6.500% due 01/25/44 | 16 | 19 | |||||
| 6.500% due 2039 | 168 | 191 | Fannie Mae REMICS | |||||||
| 4.500% due 2040 | 361 | 392 | Series 1996-46 Class ZA | |||||||
| 4.000% due 2041 | 18,728 | 19,984 | 7.500% due 11/25/26 | 91 | 103 | |||||
| 4.500% due 2041 | 16,717 | 18,150 | Series 1997-68 Class SC | |||||||
| 8.343% due 05/18/27 (Å)(Ê) | 30 | 8 | ||||||||
| 4.500% due 2041 | 2,215 | 2,510 | Series 1999-56 Class Z | |||||||
| 5.000% due 2041 | 22,973 | 25,473 | 7.000% due 12/18/29 | 333 | 377 | |||||
| 4.500% due 2042 | 1,191 | 1,292 | Series 2001-4 Class SA | |||||||
| 3.500% due 2043 | 11,974 | 12,397 | 7.397% due 02/17/31 (Ê) | 20 | 2 | |||||
| 15 Year TBA(Ï) | Series 2002-57 Class PG | |||||||||
| 2.000% | 2,550 | 2,526 | 5.500% due 09/25/17 | 741 | 777 | |||||
| 2.500% | 39,955 | 40,542 | Series 2003-25 Class IK | |||||||
| 3.000% | 6,700 | 6,948 | 7.000% due 04/25/33 (Å) | 89 | 15 | |||||
| 3.500% | 9,490 | 10,010 | Series 2003-32 Class UI | |||||||
| 30 Year TBA(Ï) | 6.000% due 05/25/33 (Å) | 71 | 15 | |||||||
| 2.500% | 1,625 | 1,568 | Series 2003-33 Class IA | |||||||
| 3.000% | 129,420 | 129,444 | 6.500% due 05/25/33 (Å) | 451 | 81 | |||||
| 3.500% | 25,200 | 26,387 | Series 2003-35 Class FY | |||||||
| 0.552% due 05/25/18 (Ê) | 628 | 630 | ||||||||
| 4.500% | 270,975 | 286,284 | Series 2003-35 Class IU | |||||||
| 2.830% due 06/01/22 | 2,365 | 2,407 | 6.000% due 05/25/33 (Å) | 86 | 18 | |||||
| Series 1997-281 Class 2 | Series 2003-35 Class UI | |||||||||
| Interest Only STRIP | 6.500% due 05/25/33 (Å) | 97 | 17 | |||||||
| 9.000% due 11/25/26 | 22 | 5 | Series 2003-64 Class JI | |||||||
| Series 2000-306 | 6.000% due 07/25/33 (Å) | 60 | 11 | |||||||
| Interest Only STRIP | ||||||||||
| 8.000% due 05/25/30 (Å) | 22 | 4 | Series 2004-70 Class EB | |||||||
| Series 2001-317 Class 2 | 5.000% due 10/25/24 | 1,036 | 1,125 | |||||||
| Interest Only STRIP | Series 2005-110 Class MB | |||||||||
| 8.000% due 12/25/31 | 32 | 7 | 5.500% due 09/25/35 | 385 | 417 | |||||
| See accompanying notes which are an integral part of the financial statements. | ||||||||||
| Russell Strategic Bond Fund 399 | ||||||||||
| Russell Investment Company | ||||||||||
| Russell Strategic Bond Fund | ||||||||||
| Schedule of Investments, continued — October 31, 2014 | ||||||||||
| Amounts in thousands (except share amounts) | Amounts in thousands (except share amounts) | |||||||||
| Principal | Fair | Principal | Fair | |||||||
| Amount ($) | Value | Amount ($) | Value | |||||||
| or Shares | $ | or Shares | $ | |||||||
| Series 2005-117 Class LC | Series 2002-42 Class A6 | |||||||||
| 5.500% due 11/25/35 | 2,913 | 3,172 | 9.500% due 02/25/42 | 54 | 67 | |||||
| Series 2006-22 Class CE | Series 2003-56 Class A5 | |||||||||
| 4.500% due 08/25/23 | 996 | 1,072 | 5.231% due 05/25/43 | 2,042 | 2,265 | |||||
| Series 2006-118 Class A1 | Series 2003-58 Class 2A | |||||||||
| 0.212% due 12/25/36 (Ê) | 81 | 79 | 6.500% due 09/25/43 | 173 | 198 | |||||
| Series 2007-73 Class A1 | First Horizon Asset Securities, Inc. | |||||||||
| 0.212% due 07/25/37 (Ê) | 825 | 800 | Series 2005-AR4 Class 2A1 | |||||||
| Series 2009-39 Class LB | 2.564% due 10/25/35 (Ê) | 1,846 | 1,613 | |||||||
| 4.500% due 06/25/29 | 1,468 | 1,567 | First Union National Bank-Bank of | |||||||
| Series 2009-70 Class PS | America NA Commercial Mortgage | |||||||||
| Interest Only STRIP | Trust | |||||||||
| 6.598% due 01/25/37 (Ê) | 15,675 | 2,420 | Series 2001-C1 Class IO1 | |||||||
| Series 2009-71 Class MB | 1.692% due 03/15/33 (Å) | 2,390 | 4 | |||||||
| 4.500% due 09/25/24 | 1,573 | 1,691 | Four Times Square Trust Commercial | |||||||
| Series 2009-96 Class DB | Mortgage Pass-Through Certificates | |||||||||
| 4.000% due 11/25/29 | 5,089 | 5,467 | Series 2006-4TS Class A | |||||||
| Series 2010-95 Class S | 5.401% due 12/13/28 (Þ) | 370 | 420 | |||||||
| 6.448% due 09/25/40 (Ê) | 13,866 | 2,732 | Freddie Mac | |||||||
| Series 2013-111 Class PL | 8.500% due 2017 | 5 | 5 | |||||||
| 2.000% due 12/25/42 | 3,641 | 3,277 | 8.000% due 2020 | 21 | 23 | |||||
| Fannie Mae Whole Loan | 10.000% due 2020 | 6 | 7 | |||||||
| Series 2003-W1 Class 2A | 11.000% due 2020 | 4 | 4 | |||||||
| 6.584% due 12/25/42 | 68 | 80 | 10.500% due 2021 | 6 | 6 | |||||
| Series 2003-W4 Class 4A | 8.500% due 2025 | 10 | 11 | |||||||
| 7.040% due 10/25/42 | 26 | 30 | 4.000% due 2026 | 2,290 | 2,452 | |||||
| Series 2004-W2 Class 2A2 | ||||||||||
| 7.000% due 02/25/44 | 2,122 | 2,451 | 3.500% due 2027 | 4,407 | 4,664 | |||||
| Series 2004-W9 Class 2A1 | 7.000% due 2027 | 51 | 57 | |||||||
| 6.500% due 02/25/44 | 145 | 165 | 8.500% due 2027 | 56 | 67 | |||||
| Series 2004-W11 Class 1A2 | 7.500% due 2030 | 50 | 58 | |||||||
| 6.500% due 05/25/44 | 313 | 365 | 8.500% due 2030 | 20 | 23 | |||||
| Fannie Mae-Aces | 6.500% due 2031 | 172 | 201 | |||||||
| 0.505% due 08/25/18 | 4,917 | 4,914 | 8.000% due 2031 | 4 | 5 | |||||
| Series 2012-M12 Class 1A | 7.000% due 2032 | 56 | 64 | |||||||
| 2.840% due 08/25/22 | 6,827 | 6,943 | 2.361% due 2033(Ê) | 173 | 185 | |||||
| Series 2012-M15 Class A | 2.380% due 2034(Ê) | 391 | 418 | |||||||
| 2.656% due 10/25/22 | 7,126 | 7,152 | ||||||||
| Series 2014-M12 Class FA | 2.460% due 2034(Ê) | 3 | 3 | |||||||
| 0.453% due 10/25/21 (Ê) | 6,635 | 6,667 | 5.000% due 2035 | 81 | 90 | |||||
| FDIC Guaranteed Notes Trust | 4.000% due 2036 | 172 | 183 | |||||||
| Series 2010-S1 Class 1A | 5.500% due 2038 | 19,597 | 22,325 | |||||||
| 0.703% due 02/25/48 (Ê)(Þ) | 916 | 916 | 6.000% due 2038 | 3,350 | 3,796 | |||||
| FDIC Trust | 6.500% due 2038 | 42 | 47 | |||||||
| Series 2010-R1 Class A | 4.500% due 2039 | 9,009 | 9,943 | |||||||
| 2.184% due 05/25/50 (Þ) | 1,183 | 1,191 | 5.500% due 2039 | 2,045 | 2,282 | |||||
| Series 2011-R1 Class A | ||||||||||
| 2.672% due 07/25/26 (Þ) | 4,744 | 4,866 | 4.000% due 2040 | 10,958 | 11,762 | |||||
| Federal Home Loan Mortgage Corp. | 4.500% due 2040 | 5,490 | 6,060 | |||||||
| Multifamily Structured Pass-Through | 5.500% due 2040 | 3,456 | 3,858 | |||||||
| Certificates | 4.000% due 2041 | 11,004 | 11,782 | |||||||
| Series 2011-K702 Class X1 | 3.000% due 2042 | 3,628 | 3,637 | |||||||
| Interest Only STRIP | 4.000% due 2044 | 23,186 | 24,739 | |||||||
| 1.528% due 02/25/18 | 60,308 | 2,655 | 15 Year TBA(Ï) | |||||||
| Series 2012-K501 Class X1A | 2.500% | 7,650 | 7,755 | |||||||
| Interest Only STRIP | ||||||||||
| 1.717% due 08/25/16 | 36,943 | 827 | 3.000% | 11,350 | 11,753 | |||||
| Series 2013-K032 Class A2 | 30 Year TBA(Ï) | |||||||||
| 3.310% due 05/25/23 | 6,890 | 7,193 | 3.000% | 14,500 | 14,511 | |||||
| Series 2014-K715 Class A2 | 3.500% | 15,125 | 15,612 | |||||||
| 2.856% due 01/25/21 | 2,460 | 2,530 | 4.000% | 25,250 | 26,787 | |||||
| Federal Home Loan Mortgage Corp. | 5.000% | 7,450 | 8,232 | |||||||
| Structured Pass-Through Securities | 6.000% | 6,800 | 7,682 | |||||||
Freddie Mac Mortgage Trust
See accompanying notes which are an integral part of the financial statements.
400 Russell Strategic Bond Fund
Russell Investment Company Russell Strategic Bond Fund
Schedule of Investments, continued — October 31, 2014
| Amounts in thousands (except share amounts) | Amounts in thousands (except share amounts) | ||||||||
| Principal | Fair | Principal | Fair | ||||||
| Amount ($) | Value | Amount ($) | Value | ||||||
| or Shares | $ | or Shares | $ | ||||||
| Series 2010-K7 Class B | 10.500% due 2016 | 1 | 2 | ||||||
| 5.435% due 04/25/20 (Þ) | 5,700 | 6,367 | 11.000% due 2020 | 4 | 4 | ||||
| Freddie Mac REMICS | 10.500% due 2021 | 10 | 11 | ||||||
| Series 1994-1730 Class Z | |||||||||
| 7.000% due 05/15/24 | 108 | 123 | 10.000% due 2022 | 17 | 19 | ||||
| Series 1999-2129 Class SG | 10.000% due 2025 | 21 | 24 | ||||||
| 6.847% due 06/17/27 (Ê) | 567 | 134 | 8.000% due 2030 | 102 | 118 | ||||
| Series 2000-2247 Class SC | 7.500% due 2031 | 15 | 15 | ||||||
| 7.347% due 08/15/30 (Ê) | 18 | 4 | 7.500% due 2032 | 7 | 8 | ||||
| Series 2002-2463 Class SJ | 5.500% due 2034 | 31 | 35 | ||||||
| 7.847% due 03/15/32 (Ê) | 54 | 14 | 5.500% due 2035 | 4,772 | 5,373 | ||||
| Series 2003-2610 Class UI | 5.500% due 2036 | 53 | 59 | ||||||
| 6.500% due 05/15/33 (Å) | 14 | 2 | 5.500% due 2037 | 66 | 73 | ||||
| Series 2003-2621 Class QH | 5.500% due 2038 | 55 | 61 | ||||||
| 5.000% due 05/15/33 | 947 | 1,039 | |||||||
| Series 2003-2624 Class QH | 4.500% due 2039 | 14,528 | 15,861 | ||||||
| 5.000% due 06/15/33 | 902 | 990 | 5.000% due 2039 | 8,625 | 9,560 | ||||
| Series 2003-2649 Class IM | 4.500% due 2040 | 13,025 | 14,253 | ||||||
| 7.000% due 07/15/33 (Å) | 112 | 21 | 5.000% due 2040 | 1,478 | 1,638 | ||||
| Series 2003-2697 Class LG | 4.500% due 2041 | 5,115 | 5,596 | ||||||
| 4.500% due 10/15/23 | 486 | 521 | 4.500% due 2042 | 434 | 474 | ||||
| Series 2003-2725 Class TA | 3.000% due 2043 | 8,538 | 8,713 | ||||||
| 4.500% due 12/15/33 | 1,300 | 1,449 | 30 Year TBA(Ï) | ||||||
| Series 2006-3123 Class HT | 4.000% | 13,650 | 14,564 | ||||||
| 5.000% due 03/15/26 | 2,113 | 2,269 | 6.000% | 22,450 | 25,319 | ||||
| Series 2006-3150 Class EQ | Ginnie Mae II | ||||||||
| 5.000% due 05/15/26 | 1,486 | 1,627 | 3.500% due 2040(Ê) | 9,412 | 9,926 | ||||
| Series 2006-R006 Class ZA | 4.000% due 2040(Ê) | 3,382 | 3,620 | ||||||
| 6.000% due 04/15/36 | 2,701 | 3,045 | 5.390% due 2059 | 3,358 | 3,570 | ||||
| Series 2007-3335 Class FT | |||||||||
| 0.303% due 08/15/19 (Ê) | 907 | 909 | 4.700% due 2061 | 7,890 | 8,512 | ||||
| Series 2007-3345 Class FP | 4.810% due 2061 | 7,734 | 8,376 | ||||||
| 0.353% due 11/15/36 (Ê) | 616 | 617 | 4.564% due 2062 | 6,121 | 6,729 | ||||
| Series 2007-3345 Class PF | 4.845% due 2062 | 1,609 | 1,750 | ||||||
| 0.333% due 05/15/36 (Ê) | 704 | 705 | 5.065% due 2062 | 2,717 | 2,958 | ||||
| Series 2009-3558 Class G | 4.652% due 2063 | 957 | 1,058 | ||||||
| 4.000% due 08/15/24 | 150 | 163 | 4.661% due 2063 | 428 | 473 | ||||
| Series 2010-3704 Class DC | 30 Year TBA(Ï) | ||||||||
| 4.000% due 11/15/36 | 1,479 | 1,576 | 3.000% | 12,355 | 12,587 | ||||
| Series 2011-3927 Class PC | 3.500% | 23,500 | 24,585 | ||||||
| 4.500% due 09/15/41 | 6,800 | 7,713 | 4.000% | 15,490 | 16,494 | ||||
| Series 2011-3963 Class JB | GMAC Commercial Mortgage Securities, | ||||||||
| 4.500% due 11/15/41 | 3,500 | 3,902 | Inc.Trust | ||||||
| Freddie Mac Strips | Series 2006-C1 Class A4 | ||||||||
| Series 1998-191 | 5.238% due 11/10/45 | 322 | 332 | ||||||
| 8.000% due 01/01/28 (Å) | 20 | 5 | GMACM Mortgage Loan Trust | ||||||
| Series 1998-194 | Series 2005-AR2 Class 4A | ||||||||
| 6.500% due 04/01/28 (Å) | 59 | 8 | 4.590% due 05/25/35 (Ê) | 2,186 | 2,100 | ||||
| Series 2001-212 | Government National Mortgage | ||||||||
| 6.000% due 05/01/31 (Å) | 56 | 14 | Association | ||||||
| Series 2001-215 | Series 1999-27 Class SE | ||||||||
| 8.000% due 06/15/31 (Å) | 54 | 11 | 8.448% due 08/16/29 (Ê) | 78 | 23 | ||||
| Gabs Dynegy Danskammer | Series 2001-46 Class SA | ||||||||
| Class B | 7.428% due 09/16/31 (Ê) | 10 | 2 | ||||||
| 7.670% due 11/08/16 (Ø) | 7,845 | — | Series 2002-27 Class SA | ||||||
| GE Capital Commercial Mortgage Corp. | 7.848% due 05/16/32 (Ê) | 17 | 4 | ||||||
| Series 2005-C3 Class F | Series 2010-14 Class A | ||||||||
| 5.158% due 07/10/45 (Þ) | 2,591 | 2,619 | 4.500% due 06/16/39 | 1,018 | 1,092 | ||||
| Series 2005-C4 Class A4 | Series 2010-74 | ||||||||
| 5.312% due 11/10/45 | 360 | 368 | Interest Only STRIP | ||||||
| Ginnie Mae I | 0.430% due 03/16/50 | 24,787 | 588 | ||||||
| 10.500% due 2015 | 2 | 2 | Series 2010-124 Class C | ||||||
| 7.000% due 2016 | — | 1 | 3.392% due 03/16/45 | 1,875 | 1,939 | ||||
See accompanying notes which are an integral part of the financial statements.
Russell Strategic Bond Fund 401
| Russell Investment Company | |||||||||
| Russell Strategic Bond Fund | |||||||||
| Schedule of Investments, continued — October 31, 2014 | |||||||||
| Amounts in thousands (except share amounts) | Amounts in thousands (except share amounts) | ||||||||
| Principal | Fair | Principal | Fair | ||||||
| Amount ($) | Value | Amount ($) | Value | ||||||
| or Shares | $ | or Shares | $ | ||||||
| Series 2010-H04 Class BI | Series 2013-GC13 Class XA | ||||||||
| Interest Only STRIP | Interest Only STRIP | ||||||||
| 1.386% due 04/20/60 | 13,848 | 695 | 0.317% due 07/10/46 | 8,831 | 105 | ||||
| Series 2010-H12 Class PT | Series 2014-GC20 Class A3 | ||||||||
| 5.470% due 11/20/59 | 5,080 | 5,396 | 3.680% due 04/10/47 | 705 | 737 | ||||
| Series 2010-H22 Class JI | Series 2014-GC20 Class D | ||||||||
| Interest Only STRIP | 4.867% due 04/10/47 (Þ) | 460 | 434 | ||||||
| 2.499% due 11/20/60 | 22,711 | 2,264 | GSMPS Mortgage Loan Trust | ||||||
| Series 2011-67 Class B | Series 1998-1 Class A | ||||||||
| 3.863% due 10/16/47 | 2,665 | 2,791 | 8.000% due 09/19/27 (Þ) | 66 | 67 | ||||
| Series 2011-H02 Class BI | Series 1998-3 Class A | ||||||||
| Interest Only STRIP | 7.750% due 09/19/27 (Þ) | 53 | 56 | ||||||
| 0.411% due 02/20/61 | 20,181 | 353 | Series 1999-3 Class A | ||||||
| Series 2012-70 | 8.000% due 08/19/29 (Þ) | 174 | 171 | ||||||
| Interest Only STRIP | Series 2005-RP1 Class 1A4 | ||||||||
| 0.967% due 08/16/52 | 50,298 | 3,124 | 8.500% due 01/25/35 (Þ) | 546 | 590 | ||||
| Series 2012-78 | Series 2006-RP1 Class 1A2 | ||||||||
| Interest Only STRIP | 7.500% due 01/25/36 (Þ) | 1,139 | 1,151 | ||||||
| 1.046% due 06/16/52 | 41,984 | 2,847 | Series 2006-RP1 Class 1A3 | ||||||
| Series 2012-95 | 8.000% due 01/25/36 (Þ) | 1,221 | 1,272 | ||||||
| Interest Only STRIP | GSR Mortgage Loan Trust | ||||||||
| 0.980% due 02/16/53 | 11,076 | 841 | Series 2005-AR7 Class 6A1 | ||||||
| Series 2012-99 Class CI | 4.989% due 11/25/35 (Ê) | 698 | 686 | ||||||
| Interest Only STRIP | Series 2006-2F Class 2A17 | ||||||||
| 1.054% due 10/16/49 | 21,352 | 1,556 | 5.750% due 02/25/36 | 13 | 12 | ||||
| Series 2012-100 | Series 2006-3F Class 2A3 | ||||||||
| Interest Only STRIP | |||||||||
| 0.827% due 08/16/52 | 36,536 | 2,279 | 5.750% due 03/25/36 | — | — | ||||
| Series 2012-H11 Class CI | Series 2007-AR1 Class 2A1 | ||||||||
| Interest Only STRIP | 2.721% due 03/25/47 | 3,926 | 3,419 | ||||||
| 2.904% due 04/20/62 | 21,359 | 2,123 | HarborView Mortgage Loan Trust | ||||||
| Series 2012-H23 Class FI | Series 2005-4 Class 3A1 | ||||||||
| Interest Only STRIP | 2.613% due 07/19/35 (Ê) | 2,493 | 2,265 | ||||||
| 0.792% due 10/20/62 | 22,126 | 624 | Hilton USA Trust | ||||||
| Series 2013-H03 Class HI | Series 2013-HLF Class DFL | ||||||||
| Interest Only STRIP | 2.902% due 11/05/30 (Ê)(Þ) | 210 | 210 | ||||||
| 2.588% due 12/20/62 | 14,315 | 1,530 | Series 2013-HLT Class EFX | ||||||
| Series 2013-H06 Class HI | 5.609% due 11/05/30 (Þ) | 5,000 | 5,094 | ||||||
| Interest Only STRIP | IndyMac INDA Mortgage Loan Trust | ||||||||
| 2.932% due 01/20/63 | 31,874 | 3,133 | Series 2007-AR1 Class 1A1 | ||||||
| Series 2013-H07 Class JL | 2.822% due 03/25/37 (Ê) | 2,422 | 2,248 | ||||||
| Interest Only STRIP | IndyMac INDX Mortgage Loan Trust | ||||||||
| 2.635% due 03/20/63 | 33,907 | 3,943 | Series 2004-AR11 Class 2A | ||||||
| Granite Master Issuer PLC | 2.544% due 12/25/34 (Ê) | 68 | 62 | ||||||
| Series 2005-2 Class A6 | Series 2005-AR25 Class 1A21 | ||||||||
| 0.417% due 12/20/54 (Ê) | 2,130 | 2,130 | 4.838% due 12/25/35 (Ê) | 580 | 465 | ||||
| GreenPoint Mortgage Funding Trust | Series 2006-AR4 Class A1A | ||||||||
| Series 2005-AR5 Class 1A1 | 0.365% due 05/25/46 (Ê) | 4,315 | 3,668 | ||||||
| 0.422% due 11/25/45 (Ê) | 160 | 125 | Series 2006-AR6 Class 2A1A | ||||||
| Greenpoint Mortgage Pass-Through | 0.352% due 06/25/47 (Ê) | 8,014 | 6,132 | ||||||
| Certificates | Series 2006-AR8 Class A3A | ||||||||
| Series 2003-1 Class A1 | 0.382% due 07/25/46 (Ê) | 7,682 | 5,960 | ||||||
| 2.795% due 10/25/33 (Ê) | 509 | 498 | Series 2006-FLX1 Class A1 | ||||||
| GS Mortgage Securities Corp. II | 0.362% due 11/25/36 (Ê) | 1,196 | 1,046 | ||||||
| Series 2011-GC5 Class A4 | JPMorgan Alternative Loan Trust | ||||||||
| 3.707% due 08/10/44 | 7,580 | 8,021 | Series 2006-A2 Class 3A1 | ||||||
| GS Mortgage Securities Trust | 2.562% due 05/25/36 (Ê) | 3,996 | 3,247 | ||||||
| Series 2007-GG10 Class A4 | JPMorgan Chase Commercial Mortgage | ||||||||
| 5.797% due 08/10/45 | 470 | 514 | Securities Trust | ||||||
| Series 2011-GC5 Class A2 | 3.461% due 07/15/47 | 1,430 | 1,481 | ||||||
| 2.999% due 08/10/44 | 6,500 | 6,706 | 5.464% due 01/15/49 | 1,045 | 1,097 | ||||
| Series 2011-GC5 Class XA | Series 2003-C1 Class D | ||||||||
| Interest Only STRIP | 5.192% due 01/12/37 | 640 | 641 | ||||||
| 1.695% due 08/10/44 (Þ) | 1,718 | 105 | Series 2004-LN2 Class B | ||||||
| 5.199% due 07/15/41 | 1,550 | 1,590 | |||||||
| See accompanying notes which are an integral part of the financial statements. | |||||||||
| 402 Russell Strategic Bond Fund | |||||||||
Russell Investment Company Russell Strategic Bond Fund
Schedule of Investments, continued — October 31, 2014
| Amounts in thousands (except share amounts) | Amounts in thousands (except share amounts) | ||||||||
| Principal | Fair | Principal | Fair | ||||||
| Amount ($) | Value | Amount ($) | Value | ||||||
| or Shares | $ | or Shares | $ | ||||||
| Series 2005-CB12 Class AJ | Series 2005-C3 Class B | ||||||||
| 4.987% due 09/12/37 | 1,440 | 1,468 | 4.895% due 07/15/40 | 1,390 | 1,409 | ||||
| Series 2005-CB13 Class A4 | Series 2007-C1 Class AJ | ||||||||
| 5.244% due 01/12/43 | 686 | 708 | 5.484% due 02/15/40 | 3,840 | 3,996 | ||||
| Series 2006-LDP8 Class A4 | Series 2007-C1 Class AM | ||||||||
| 5.399% due 05/15/45 | 180 | 191 | 5.455% due 02/15/40 | 2,570 | 2,763 | ||||
| Series 2007-C1 Class A4 | Series 2007-C2 Class A3 | ||||||||
| 5.716% due 02/15/51 | 538 | 586 | 5.430% due 02/15/40 | 340 | 368 | ||||
| Series 2007-CB19 Class A4 | Series 2007-C6 Class A4 | ||||||||
| 5.703% due 02/12/49 | 1,350 | 1,468 | 5.858% due 07/15/40 | 1,015 | 1,076 | ||||
| Series 2007-LDPX Class A3 | Series 2007-C7 Class A3 | ||||||||
| 5.420% due 01/15/49 | 189 | 204 | 5.866% due 09/15/45 | 331 | 368 | ||||
| Series 2008-C2 Class A4FL | Series 2007-C7 Class AJ | ||||||||
| 1.653% due 02/12/51 (Ê) | 1,407 | 1,411 | 6.249% due 09/15/45 | 4,830 | 5,108 | ||||
| Series 2009-IWST Class C | Lehman XS Trust | ||||||||
| 7.445% due 12/05/27 (Þ) | 2,020 | 2,467 | Series 2005-9N Class 1A1 | ||||||
| Series 2011-C3 Class A3 | 0.422% due 02/25/36 (Ê) | 2,617 | 2,247 | ||||||
| 4.388% due 02/15/46 (Þ) | 5,915 | 6,399 | Mastr Adjustable Rate Mortgages Trust | ||||||
| Series 2012-C8 Class A3 | Series 2004-10 Class 2A2 | ||||||||
| 2.829% due 10/15/45 | 480 | 476 | 3.020% due 10/25/34 (Ê) | 6 | 3 | ||||
| Series 2012-C8 Class E | Series 2005-1 Class B1 | ||||||||
| 4.667% due 10/15/45 (Þ) | 100 | 99 | 3.333% due 03/25/35 (Ê) | 772 | 73 | ||||
| Series 2013-C10 Class A5 | Series 2006-2 Class 4A1 | ||||||||
| 3.143% due 12/15/47 | 5,000 | 5,032 | 2.628% due 02/25/36 (Ê) | 876 | 861 | ||||
| Series 2014-C23 Class XA | Series 2007-HF2 Class A1 | ||||||||
| Interest Only STRIP | 0.462% due 09/25/37 (Ê) | 4,222 | 3,854 | ||||||
| 0.890% due 09/15/47 | 4,978 | 263 | Mastr Reperforming Loan Trust | ||||||
| Series 2014-FBLU Class C | Series 2005-1 Class 1A3 | ||||||||
| 2.154% due 12/15/28 (Ê)(Þ) | 2,435 | 2,431 | 7.000% due 08/25/34 (Þ) | 424 | 434 | ||||
| JPMorgan Mortgage Trust | Series 2005-2 Class 1A4 | ||||||||
| Series 2004-A2 Class 3A1 | 8.000% due 05/25/35 (Þ) | 872 | 931 | ||||||
| 2.468% due 05/25/34 (Ê) | 430 | 425 | Merrill Lynch Mortgage Investors Trust | ||||||
| Series 2005-A1 Class 6T1 | Series 2005-A10 Class A | ||||||||
| 2.640% due 02/25/35 (Ê) | 111 | 109 | 0.362% due 02/25/36 (Ê) | 423 | 387 | ||||
| Series 2005-A4 Class 1A1 | Merrill Lynch Mortgage Trust | ||||||||
| 5.296% due 07/25/35 (Ê) | 574 | 576 | Series 2005-CIP1 Class AJ | ||||||
| Series 2005-A8 Class 1A1 | 5.137% due 07/12/38 | 270 | 277 | ||||||
| 5.040% due 11/25/35 (Ê) | 1,475 | 1,398 | Series 2005-CIP1 Class AM | ||||||
| Series 2005-S3 Class 1A2 | 5.107% due 07/12/38 | 6,370 | 6,522 | ||||||
| 5.750% due 01/25/36 | 101 | 94 | Series 2006-C2 Class AM | ||||||
| Series 2006-A2 Class 2A1 | 5.782% due 08/12/43 | 1,400 | 1,494 | ||||||
| 2.646% due 04/25/36 (Ê) | 119 | 107 | Series 2008-C1 Class A4 | ||||||
| Series 2006-A6 Class 1A2 | 5.690% due 02/12/51 | 4,611 | 5,069 | ||||||
| 2.535% due 10/25/36 (Ê) | 767 | 682 | MLCC Mortgage Investors, Inc. | ||||||
| Series 2007-A1 Class 5A2 | Series 2005-3 Class 5A | ||||||||
| 2.594% due 07/25/35 (Ê) | 162 | 164 | 0.402% due 11/25/35 (Ê) | 729 | 686 | ||||
| Series 2007-A1 Class B1 | ML-CFC Commercial Mortgage Trust | ||||||||
| Series 2007-5 Class A4 | |||||||||
| 2.552% due 07/25/35 (Ê) | 77 | 22 | 5.378% due 08/12/48 | 821 | 879 | ||||
| Series 2007-A4 Class 3A3 | Series 2007-5 Class AM | ||||||||
| 5.583% due 06/25/37 (Ê) | 1,604 | 1,460 | 5.419% due 08/12/48 | 350 | 368 | ||||
| Series 2007-S3 Class 1A8 | Morgan Stanley Bank of America Merrill | ||||||||
| 6.000% due 08/25/37 | 10 | 9 | Lynch Trust | ||||||
| Series 2007-S3 Class 1A96 | Series 2013-C7 Class A4 | ||||||||
| 6.000% due 08/25/37 | 1 | 1 | 2.918% due 02/15/46 | 7,060 | 6,999 | ||||
| Series 2007-S3 Class 1A97 | Series 2013-C8 Class A4 | ||||||||
| 6.000% due 08/25/37 | 2 | 2 | 3.134% due 12/15/48 | 3,530 | 3,540 | ||||
| JPMorgan Trust Re-REMIC | Series 2014-C17 Class A5 | ||||||||
| 1.850% due 01/26/37 | 5,816 | 4,593 | 3.741% due 08/15/47 | 325 | 337 | ||||
| LB-Commercial Mortgage Trust | Morgan Stanley Capital I Trust | ||||||||
| Series 2007-C3 Class AJ | 5.676% due 03/12/44 | 1,405 | 1,421 | ||||||
| 5.903% due 07/15/44 | 2,440 | 2,464 | Series 2001-C2 Class A2 | ||||||
| LB-UBS Commercial Mortgage Trust | 3.476% due 06/15/44 | 5,000 | 5,176 | ||||||
| Series 2005-C2 Class AJ | |||||||||
| 5.205% due 04/15/30 | 2,585 | 2,626 | |||||||
| See accompanying notes which are an integral part of the financial statements. | |||||||||
| Russell Strategic Bond Fund 403 | |||||||||
| Russell Investment Company | |||||||||
| Russell Strategic Bond Fund | |||||||||
| Schedule of Investments, continued — October 31, 2014 | |||||||||
| Amounts in thousands (except share amounts) | Amounts in thousands (except share amounts) | ||||||||
| Principal | Fair | Principal | Fair | ||||||
| Amount ($) | Value | Amount ($) | Value | ||||||
| or Shares | $ | or Shares | $ | ||||||
| Series 2005-HQ6 Class A4A | Series 2013-1R Class 3A12 | ||||||||
| 4.989% due 08/13/42 | 1,171 | 1,181 | 0.314% due 10/26/36 (Ê)(Þ) | 2,482 | 1,880 | ||||
| Series 2005-HQ6 Class D | NorthStar Mortgage Trust | ||||||||
| 5.202% due 08/13/42 | 685 | 694 | Series 2012-1 Class A | ||||||
| Series 2006-IQ11 Class A4 | 1.355% due 08/25/29 (Ê)(Þ) | 542 | 542 | ||||||
| 5.656% due 10/15/42 | 346 | 359 | Prime Mortgage Trust | ||||||
| Series 2006-T21 Class D | Series 2004-CL1 Class 1A2 | ||||||||
| 5.406% due 10/12/52 (Þ) | 85 | 87 | 0.552% due 02/25/34 (Ê) | 34 | 32 | ||||
| Series 2006-T21 Class E | Prudential Commercial Mortgage Trust | ||||||||
| 5.403% due 10/12/52 | 55 | 55 | Series 2003-PWR1 Class E | ||||||
| Series 2007-HQ12 Class A2 | 5.259% due 02/11/36 (Þ) | 686 | 685 | ||||||
| 5.592% due 04/12/49 | 651 | 659 | RAMP Trust | ||||||
| Series 2007-IQ14 Class A2FL | Series 2004-SL1 Class A3 | ||||||||
| 0.313% due 04/15/49 (Ê) | 4,026 | 4,007 | 7.000% due 11/25/31 | 2 | 2 | ||||
| Series 2007-IQ16 Class AM | RBSCF Trust | ||||||||
| Series 2010-RR4 Class WBCA | |||||||||
| 6.088% due 12/12/49 | 6,907 | 7,658 | 5.509% due 04/16/47 (Þ) | 200 | 210 | ||||
| Series 2007-T25 Class AJ | |||||||||
| 5.574% due 11/12/49 | 2,962 | 3,038 | RBSSP Series Resecuritization 2010-3 Class 9A1 Trust | ||||||
| Series 2007-T27 Class A4 | 5.500% due 02/26/35 (Þ) | 997 | 1,033 | ||||||
| 5.651% due 06/11/42 | 45 | 49 | Reperforming Loan REMIC Trust | ||||||
| Series 2008-T29 Class AM | Series 2005-R2 Class 2A4 | ||||||||
| 6.278% due 01/11/43 | 4,950 | 5,569 | 8.500% due 06/25/35 (Þ) | 123 | 131 | ||||
| Morgan Stanley Capital I, Inc. | Residential Asset Securitization Trust | ||||||||
| Series 2005-HQ7 Class A4 | Series 2007-A5 Class 2A5 | ||||||||
| 5.207% due 11/14/42 | 232 | 238 | 6.000% due 05/25/37 | 1,595 | 1,414 | ||||
| Series 2007-IQ14 Class A2 | RFMSI Trust | ||||||||
| 5.610% due 04/15/49 | 3,341 | 3,358 | Series 2005-SA4 Class 1A21 | ||||||
| Series 2007-IQ14 Class A4 | 2.956% due 09/25/35 (Ê) | 3,361 | 2,639 | ||||||
| 5.692% due 04/15/49 | 1,015 | 1,102 | Series 2006-SA4 Class 2A1 | ||||||
| Series 2007-IQ16 Class A4 | 3.501% due 11/25/36 (Ê) | 476 | 410 | ||||||
| 5.809% due 12/12/49 | 536 | 587 | Rialto Capital Management LLC | �� | |||||
| Morgan Stanley Dean Witter Capital I | Series 2014-LT5 Class A | ||||||||
| Trust | 2.850% due 05/15/24 (Þ) | 888 | 888 | ||||||
| Series 2001-TOP3 Class C | RREF LLC | ||||||||
| 6.790% due 07/15/33 | 147 | 153 | Series 2014-LT6 Class A | ||||||
| Morgan Stanley Re-REMIC Trust | 2.750% due 09/15/24 (Å) | 1,562 | 1,562 | ||||||
| Series 2009-GG10 Class A4A | Structured Adjustable Rate Mortgage | ||||||||
| 5.797% due 08/12/45 (Þ) | 1,055 | 1,144 | Loan Trust | ||||||
| Series 2010-GG10 Class A4A | Series 2004-12 Class 2A | ||||||||
| 5.797% due 08/15/45 (Þ) | 208 | 225 | 2.414% due 09/25/34 (Ê) | 6,700 | 6,699 | ||||
| Mortgage Pass-Through Certificates | Series 2004-18 Class 5A | ||||||||
| Series 2001-CIB2 Class D | 4.027% due 12/25/34 | 82 | 79 | ||||||
| 6.847% due 04/15/35 | 1,340 | 1,357 | Series 2006-4 Class 6A | ||||||
| Mortgage-Linked Amortizing Notes | 5.321% due 05/25/36 | 1,305 | 1,018 | ||||||
| Series 2012-1 Class A10 | Structured Asset Mortgage Investments | ||||||||
| 2.060% due 01/15/22 | 3,265 | 3,322 | II Trust | ||||||
| Motel 6 Trust | Series 2004-AR7 Class A1B | ||||||||
| Series 2012-MTL6 Class A1 | 0.557% due 04/19/35 (Ê) | 795 | 757 | ||||||
| 1.500% due 10/05/25 (Þ) | 2,684 | 2,680 | Series 2005-AR5 Class A3 | ||||||
| Series 2012-MTL6 Class A2 | 0.407% due 07/19/35 (Ê) | 2 | 1 | ||||||
| 1.948% due 10/05/25 (Þ) | 2,287 | 2,285 | Series 2007-AR6 Class A1 | ||||||
| Series 2012-MTL6 Class XA1 | 1.615% due 08/25/47 (Ê) | 8,617 | 7,623 | ||||||
| Interest Only STRIP | Thornburg Mortgage Securities Trust | ||||||||
| 3.005% due 10/05/25 (Þ) | 23,310 | 58 | Series 2005-1 Class A3 | ||||||
| NCUA Guaranteed Notes | 2.234% due 04/25/45 (Ê) | 2,761 | 2,784 | ||||||
| Series 2010-R1 Class 2A | Series 2007-1 Class A2B | ||||||||
| 1.840% due 10/07/20 | 2,583 | 2,602 | 1.452% due 03/25/37 (Ê) | 2,153 | 1,956 | ||||
| Series 2010-R3 Class 3A | UBS-Barclays Commercial Mortgage | ||||||||
| 2.400% due 12/08/20 | 1,909 | 1,930 | Trust | ||||||
| Nomura Asset Acceptance Corp. | Series 2013-C5 Class A4 | ||||||||
| Alternative Loan Trust | 3.185% due 03/10/46 | 470 | 472 | ||||||
| Series 2005-WF1 Class 2A2 | Wachovia Bank Commercial Mortgage | ||||||||
| 4.786% due 03/25/35 | 174 | 179 | Trust | ||||||
| Nomura Resecuritization Trust | |||||||||
| See accompanying notes which are an integral part of the financial statements. | |||||||||
| 404 Russell Strategic Bond Fund | |||||||||
Russell Investment Company Russell Strategic Bond Fund
Schedule of Investments, continued — October 31, 2014
| Amounts in thousands (except share amounts) | Amounts in thousands (except share amounts) | ||||||||
| Principal | Fair | Principal | Fair | ||||||
| Amount ($) | Value | Amount ($) | Value | ||||||
| or Shares | $ | or Shares | $ | ||||||
| Series 2005-C17 Class G | Series 2006-6 Class 1A8 | ||||||||
| 5.590% due 03/15/42 | 335 | 335 | 5.750% due 05/25/36 | 1,400 | 1,401 | ||||
| Series 2007-WHL8 Class A1 | Series 2006-8 Class A15 | ||||||||
| 0.233% due 06/15/20 (Ê)(Þ) | 295 | 294 | 6.000% due 07/25/36 | 2,842 | 2,878 | ||||
| Wachovia Bank Commercial Mortgage | Series 2006-11 Class A9 | ||||||||
| Trust Series | 6.500% due 09/25/36 | 1,279 | 1,263 | ||||||
| Series 2005-C18 Class A4 | Series 2006-AR1 Class 2A5 | ||||||||
| 4.935% due 04/15/42 | 151 | 152 | 5.364% due 03/25/36 (Ê) | 1,144 | 1,137 | ||||
| Series 2006-C23 Class A4 | Series 2006-AR2 Class 2A1 | ||||||||
| 5.418% due 01/15/45 | 496 | 513 | 2.615% due 03/25/36 | 1,138 | 1,133 | ||||
| Series 2007-C33 Class AJ | Series 2006-AR10 Class 4A1 | ||||||||
| 5.941% due 02/15/51 | 5,100 | 5,360 | 2.610% due 07/25/36 (Ê) | 2,147 | 1,974 | ||||
| Washington Mutual Mortgage Pass- | Series 2006-AR12 Class 1A1 | ||||||||
| Through Certificates | 2.486% due 09/25/36 (Ê) | 3,311 | 3,075 | ||||||
| Series 2004-AR1 Class A | Series 2006-AR17 Class A1 | ||||||||
| 2.405% due 03/25/34 (Ê) | 77 | 77 | 2.612% due 10/25/36 (Ê) | 6,059 | 5,869 | ||||
| Series 2004-AR13 Class A1A | Series 2007-11 Class A81 | ||||||||
| 0.512% due 11/25/34 (Ê) | 2,807 | 2,698 | 6.000% due 08/25/37 | 2,740 | 2,702 | ||||
| Series 2005-AR2 Class 2A23 | Series 2007-13 Class A7 | ||||||||
| 0.532% due 01/25/45 (Ê) | 5,068 | 4,684 | 6.000% due 09/25/37 | 540 | 542 | ||||
| Series 2005-AR6 Class 2A1A | WF-RBS Commercial Mortgage Trust | ||||||||
| 0.382% due 04/25/45 (Ê) | 5,986 | 5,724 | Series 2011-C4 Class A4 | ||||||
| Series 2005-AR13 Class A1A1 | 4.902% due 06/15/44 (Þ) | 905 | 1,016 | ||||||
| 0.442% due 10/25/45 (Ê) | 163 | 156 | Series 2012-C6 Class D | ||||||
| Series 2006-1 Class 4CB | 5.562% due 04/15/45 (Þ) | 415 | 439 | ||||||
| 6.500% due 02/25/36 | 8,994 | 5,773 | Series 2012-C8 Class A1 | ||||||
| Series 2006-AR5 Class A1A | 0.864% due 08/15/45 | 6,266 | 6,271 | ||||||
| 1.105% due 06/25/46 (Ê) | 3,248 | 2,818 | Series 2012-C8 Class A3 | ||||||
| Series 2006-AR7 Class 2A | 3.001% due 08/15/45 | 3,910 | 3,929 | ||||||
| 1.095% due 07/25/46 (Ê) | 1,807 | 1,537 | Series 2013-C15 Class A3 | ||||||
| Series 2006-AR7 Class A1A | 3.881% due 08/15/46 | 460 | 487 | ||||||
| 1.035% due 09/25/46 (Ê) | 9,752 | 6,455 | Series 2014-C19 Class A3 | ||||||
| Series 2006-AR10 Class 1A1 | 3.660% due 03/15/47 | 1,780 | 1,860 | ||||||
| 2.237% due 09/25/36 | 5,021 | 4,496 | Series 2014-C21 Class A2 | ||||||
| Series 2006-AR12 Class 1A2 | 2.917% due 08/15/47 | 380 | 392 | ||||||
| 2.293% due 10/25/36 (Ê) | 2,575 | 2,208 | Series 2014-LC14 Class XA | ||||||
| Series 2006-AR16 Class 3A3 | 1.466% due 03/15/47 | 2,607 | 226 | ||||||
| 4.064% due 12/25/36 (Ê) | 5,202 | 4,725 | 1,835,985 | ||||||
| Series 2006-AR18 Class 3A1 | Municipal Bonds - 0.8% | ||||||||
| 3.879% due 01/25/37 (Ê) | 1,767 | 1,617 | Brazos Higher Education Authority | ||||||
| Series 2006-AR18 Class 3A2 | Revenue Bonds | ||||||||
| 3.879% due 01/25/37 (Ê) | 2,099 | 1,922 | 0.584% due 12/26/24 (Ê) | 1,506 | 1,481 | ||||
| Series 2007-HY2 Class 2A3 | City of Houston Texas General | ||||||||
| 1.756% due 04/25/37 (Ê) | 3,779 | 2,740 | Obligation Limited | ||||||
| Series 2007-HY5 Class 3A1 | 6.290% due 03/01/32 | 3,410 | 4,262 | ||||||
| 4.603% due 05/25/37 (Ê) | 5,064 | 4,837 | City of New York New York General | ||||||
| Series 2007-OA2 Class 1A | Obligation Unlimited | ||||||||
| 0.815% due 03/25/47 (Ê) | 5,709 | 4,475 | 5.047% due 10/01/24 | 2,200 | 2,505 | ||||
| Series 2007-OA3 Class 2A | 6.646% due 12/01/31 | 1,500 | 1,782 | ||||||
| 0.885% due 04/25/47 (Ê) | 6,053 | 4,978 | La Paz County Industrial Development | ||||||
| Wells Fargo Mortgage Backed Securities | Authority Revenue Bonds | ||||||||
| Trust | 7.000% due 03/01/34 | 3,280 | 3,295 | ||||||
| Series 2004-CC Class A1 | Metropolitan Transportation Authority | ||||||||
| 2.615% due 01/25/35 (Ê) | 796 | 799 | Revenue Bonds | ||||||
| Series 2005-18 Class 2A10 | 6.089% due 11/15/40 | 2,800 | 3,613 | ||||||
| 22.176% due 01/25/36 (Ê) | 558 | 700 | Municipal Electric Authority of Georgia | ||||||
| Series 2005-AR7 Class 2A1 | Revenue Bonds | ||||||||
| 5.027% due 05/25/35 (Ê) | 2,254 | 2,257 | 6.637% due 04/01/57 | 4,755 | 6,053 | ||||
| Series 2005-AR8 Class 1A1 | 7.055% due 04/01/57 | 4,445 | 5,211 | ||||||
| 2.613% due 06/25/35 (Ê) | 5,324 | 5,404 | New York City Water & Sewer System | ||||||
| Series 2005-AR11 Class 1A1 | Revenue Bonds | ||||||||
| 2.615% due 06/25/35 (Ê) | 582 | 577 | 5.375% due 06/15/43 | 5,075 | 5,966 | ||||
| Series 2006-2 Class 2A3 | North Texas Tollway Authority Revenue | ||||||||
| 5.500% due 03/25/36 | 818 | 784 | Bonds | ||||||
| See accompanying notes which are an integral part of the financial statements. | |||||||||
Russell Strategic Bond Fund 405
Russell Investment Company Russell Strategic Bond Fund
Schedule of Investments, continued — October 31, 2014
| Amounts in thousands (except share amounts) | Amounts in thousands (except share amounts) | ||||||||
| Principal | Fair | Principal | Fair | ||||||
| Amount ($) | Value | Amount ($) | Value | ||||||
| or Shares | $ | or Shares | $ | ||||||
| 6.718% due 01/01/49 | 1,100 | 1,530 | Intesa Sanpaolo SpA | ||||||
| Port Authority of New York & New | 2.000% due 06/18/21 | EUR | 2,025 | 2,625 | |||||
| Jersey Revenue Bonds | Ireland Government Bond | ||||||||
| 4.458% due 10/01/62 | 4,175 | 4,206 | 3.400% due 03/18/24 | EUR | 560 | 803 | |||
| South Carolina Student Loan Corp. | 5.400% due 03/13/25 | EUR | 7,850 | 12,992 | |||||
| Revenue Bonds | Malaysia Government Bond | ||||||||
| 0.354% due 12/01/20 (Ê) | 2,233 | 2,219 | 4.181% due 07/15/24 | MYR | 17,700 | 5,518 | |||
| State of California General Obligation | Series 0113 | ||||||||
| Unlimited | 3.172% due 07/15/16 | MYR | 5,430 | 1,642 | |||||
| 5.700% due 11/01/21 | 920 | 1,073 | Series 1/06 | ||||||
| 6.650% due 03/01/22 | 945 | 1,169 | 4.262% due 09/15/16 | MYR | 13,889 | 4,281 | |||
| State of Illinois General Obligation | Mexican Bonos | ||||||||
| Unlimited | Series M 20 | ||||||||
| 4.350% due 06/01/18 | 805 | 843 | 7.500% due 06/03/27 | MXN | 137,403 | 11,274 | |||
| 4.950% due 06/01/23 | 2,340 | 2,444 | Series M 30 | ||||||
| 5.100% due 06/01/33 | 2,720 | 2,667 | 10.000% due 11/20/36 | MXN | 104,940 | 10,687 | |||
| 7.350% due 07/01/35 | 4,100 | 4,768 | Series M | ||||||
| University of California Revenue Bonds | 8.000% due 06/11/20 | MXN | 136,550 | 11,487 | |||||
| 4.601% due 05/15/31 | 3,085 | 3,343 | 7.750% due 05/29/31 | MXN | 79,000 | 6,540 | |||
| 58,430 | New Zealand Government Bond | ||||||||
| Non-US Bonds - 4.3% | 3.000% due 04/15/20 | NZD | 8,521 | 6,360 | |||||
| Achmea BV | 2.000% due 09/20/25 | NZD | 4,460 | 3,465 | |||||
| 2.500% due 11/19/20 | EUR | 2,800 | 3,765 | Series 423 | |||||
| Australia Government Bond | 5.500% due 04/15/23 | NZD | 7,040 | 6,067 | |||||
| 4.500% due 04/21/33 | AUD | 13,790 | 13,355 | Series 521 | |||||
| Series 120 | 6.000% due 05/15/21 | NZD | 28,485 | 24,846 | |||||
| 6.000% due 02/15/17 | AUD | 12,169 | 11,532 | Norway Government Bond | |||||
| Series 126 | 3.000% due 03/14/24 | NOK | 24,180 | 3,872 | |||||
| 4.500% due 04/15/20 | AUD | 19,930 | 18,957 | Series 472 | |||||
| Series 133 | 4.250% due 05/19/17 | NOK | 93,396 | 14,880 | |||||
| 5.500% due 04/21/23 | AUD | 7,910 | 8,139 | Peru Government Bond | |||||
| Barclays Bank PLC | 7.840% due 08/12/20 | PEN | 22,030 | 8,729 | |||||
| 6.000% due 01/14/21 | EUR | 1,225 | 1,850 | Pohjola Bank PLC | |||||
| Brazil Notas do Tesouro Nacional | 5.750% due 02/28/22 | EUR | 1,650 | 2,615 | |||||
| Series NTNB | Poland Government Bond | ||||||||
| 6.000% due 05/15/45 | BRL | 5,401 | 5,577 | Series 0417 | |||||
| 6.000% due 08/15/50 | BRL | 4,990 | 5,099 | 4.750% due 04/25/17 | PLN | 21,410 | 6,806 | ||
| Series NTNF | Series 1019 | ||||||||
| 10.000% due 01/01/17 | BRL | 11,926 | 4,757 | 5.500% due 10/25/19 | PLN | 29,620 | 10,231 | ||
| 10.000% due 01/01/23 | BRL | 17,651 | 6,604 | Republic of Portugal | |||||
| Casino Guichard Perrachon SA | 3.875% due 02/15/30 | EUR | 1,655 | 2,049 | |||||
| 2.798% due 08/05/26 | EUR | 2,700 | 3,433 | Silenus European Loan Conduit NO 25, | |||||
| Ltd. | |||||||||
| CRH Finland Services OYJ | Series 2007-25X Class A | ||||||||
| 2.750% due 10/15/20 | EUR | 725 | 981 | 0.348% due 05/15/19 (Ê) | EUR | 47 | 58 | ||
| Danska Bank A/S | |||||||||
| 2.750% due 05/19/26 | EUR | 2,100 | 2,696 | South Series Africa R203 Government Bond | |||||
| Emirates Telecommunication Corp. | 8.250% due 09/15/17 | ZAR | 42,480 | 4,002 | |||||
| 2.750% due 06/18/26 | EUR | 2,225 | 2,928 | Series R214 | |||||
| European Financial Stability Facility | 6.500% due 02/28/41 | ZAR | 149,240 | 10,529 | |||||
| 1.625% due 07/17/20 | EUR | 7,550 | 10,098 | Standard Life PLC | |||||
| European Investment Bank | 5.314% due 12/31/49 (ƒ) | EUR | 2,400 | 3,008 | |||||
| Series EMTn | |||||||||
| 1.375% due 09/15/21 | EUR | 5,725 | 7,576 | Titulos De Tesoreria B Bonds | |||||
| FADE - Fondo de Amortizacion del | 10.000% due 07/24/24 | COP | 24,678,800 | 14,869 | |||||
| Deficit Electrico | 316,636 | ||||||||
| 2.250% due 12/17/16 | EUR | 5,600 | 7,238 | United States Government Agencies - 0.4% | |||||
| FGA Capital Ireland Co. | Fannie Mae | ||||||||
| 2.875% due 01/26/18 | EUR | 1,420 | 1,838 | 5.000% due 05/11/17 | 100 | 110 | |||
| Housing Financing Fund | 5.375% due 06/12/17 | 2,900 | 3,232 | ||||||
| Series 2 | Federal Farm Credit Bank | ||||||||
| 3.750% due 04/15/34 | ISK | 368,582 | 3,151 | 0.176% due 09/14/16 | 6,330 | 6,334 | |||
| Series 3 | Federal Home Loan Banks | ||||||||
| 3.750% due 06/15/44 | ISK | 780,088 | 6,827 | 0.375% due 06/24/16 | 6,850 | 6,839 | |||
See accompanying notes which are an integral part of the financial statements.
406 Russell Strategic Bond Fund
Russell Investment Company Russell Strategic Bond Fund
Schedule of Investments, continued — October 31, 2014
| Amounts in thousands (except share amounts) | Amounts in thousands (except share amounts) | |||||||||
| Principal | Fair | Principal | Fair | |||||||
| Amount ($) | Value | Amount ($) | Value | |||||||
| or Shares | $ | or Shares | $ | |||||||
| Federal Home Loan Mortgage Corp. | ||||||||||
| 1.000% due 03/08/17 | 5,100 | 5,131 | Preferred Stocks - 0.2% | |||||||
| Series 1 | ||||||||||
| 1.000% due 07/28/17 | 7,000 | 7,012 | Financial Services - 0.1% | |||||||
| Federal National Mortgage Association | XLIT, Ltd. | 3,585 | 2,989 | |||||||
| 1.250% due 01/30/17 | 1,000 | 1,012 | ||||||||
| 0.875% due 08/28/17 | 1,200 | 1,197 | Technology - 0.1% | |||||||
| 30,867 | Verizon Communications, Inc. | 260,200 | 6,739 | |||||||
| United States Government Treasuries - 20.1% | ||||||||||
| United States Treasury Inflation Indexed | Total Preferred Stocks | |||||||||
| Bonds | (cost $9,536) | 9,728 | ||||||||
| 0.125% due 04/15/16 | 13,788 | 13,942 | ||||||||
| 0.125% due 04/15/17 | 6,106 | 6,201 | ||||||||
| 1.250% due 07/15/20 | 202 | 216 | Options Purchased - 0.0% | |||||||
| 0.125% due 01/15/22 | 262 | 258 | (Number of Contracts) | |||||||
| Swaptions | ||||||||||
| 0.125% due 07/15/24 | 5,279 | 5,134 | (Fund Receives/Fund Pays) | |||||||
| 1.375% due 02/15/44 | 17,871 | 19,706 | USD 4.500%/USD Three Month LIBOR | |||||||
| United States Treasury Notes | Mar 2018 0.00 Put (2) | 21,630 | (ÿ) | 853 | ||||||
| 0.500% due 06/15/16 | 108,100 | 108,379 | USD 4.500%/USD Three Month LIBOR | |||||||
| 0.500% due 07/31/16 | 43,665 | 43,754 | Apr 2018 0.00 Put (1) | 13,190 | (ÿ) | 530 | ||||
| 0.500% due 08/31/16 | 60,590 | 60,675 | USD 5.000%/USD Three Month LIBOR | |||||||
| 0.875% due 09/15/16 | 7,345 | 7,398 | Jan 2019 0.00 Put (1) | 7,875 | (ÿ) | 268 | ||||
| 0.500% due 09/30/16 | 8,790 | 8,794 | Total Options Purchased | |||||||
| 0.375% due 10/31/16 | 1,750 | 1,745 | (cost $2,913) | 1,651 | ||||||
| 0.875% due 05/15/17 | 11,995 | 12,031 | ||||||||
| 0.875% due 07/15/17 | 12,870 | 12,889 | Short-Term Investments - 24.9% | |||||||
| 0.625% due 08/31/17 | 68,615 | 68,084 | Adam Aircraft Industries, Inc. Term | |||||||
| 0.875% due 10/15/17 | 8,050 | 8,039 | Loan | |||||||
| 1.500% due 08/31/18 | 117,900 | 118,738 | 15.130% due 05/23/15 (Å) | 760 | 8 | |||||
| 1.625% due 06/30/19 | 390,500 | 391,751 | Ally Financial, Inc. | |||||||
| 1.000% due 09/30/19 | 62,840 | 60,960 | 4.625% due 06/26/15 | 100 | 102 | |||||
| American Honda Finance Corp. | ||||||||||
| 1.750% due 09/30/19 | 13,480 | 13,570 | 0.230% due 06/04/15 | 7,300 | 7,300 | |||||
| 1.375% due 10/31/19 | 16,285 | 16,198 | American International Group, Inc. | |||||||
| 2.125% due 01/31/21 | 15,775 | 15,936 | 5.050% due 10/01/15 | 400 | 416 | |||||
| 2.125% due 09/30/21 | 3,790 | 3,811 | Anheuser-Busch InBev Worldwide, Inc. | |||||||
| 2.000% due 02/15/23 | 2,745 | 2,704 | 3.625% due 04/15/15 | 2,785 | 2,824 | |||||
| 2.750% due 11/15/23 | 4,700 | 4,888 | 0.800% due 07/15/15 | 3,395 | 3,405 | |||||
| 2.500% due 05/15/24 | 158,065 | 160,609 | ARI Fleet Lease Trust | |||||||
| 2.375% due 08/15/24 | 125,415 | 125,905 | 0.250% due 04/15/15 (Þ) | 2,028 | 2,028 | |||||
| Zero coupon due 11/15/27 | 12,295 | 8,583 | BAE Systems Holdings, Inc. | |||||||
| 2.750% due 08/15/42 | 32,050 | 30,170 | 5.200% due 08/15/15 (Þ) | 4,175 | 4,321 | |||||
| 2.750% due 11/15/42 | 1,985 | 1,866 | Banco Santander Brasil SA | |||||||
| 2.875% due 05/15/43 | 6,985 | 6,724 | 4.500% due 04/06/15 (Þ) | 300 | 304 | |||||
| 3.750% due 11/15/43 | 5,550 | 6,297 | Bank of America Corp. | |||||||
| 3.625% due 02/15/44 | 24,195 | 26,851 | 4.500% due 04/01/15 | 5,300 | 5,386 | |||||
| 3.375% due 05/15/44 | 25,720 | 27,285 | 4.750% due 08/01/15 | 3,475 | 3,574 | |||||
| 3.125% due 08/15/44 | 74,085 | 74,999 | 1.500% due 10/09/15 | 7,320 | 7,373 | |||||
| 1,475,090 | Barclays Bank PLC | |||||||||
| Total Long-Term Investments | 2.750% due 02/23/15 | 1,835 | 1,848 | |||||||
| (cost $5,956,318) | 6,051,842 | BBVA US Senior SAU | ||||||||
| 4.664% due 10/09/15 | 4,145 | 4,295 | ||||||||
| British Telecommunications PLC | ||||||||||
| Common Stocks - 0.0% | 2.000% due 06/22/15 | 3,320 | 3,350 | |||||||
| Financial Services - 0.0% | Caisse Centrale Desjardins | |||||||||
| Escrow GM Corp.(Þ) | 420,000 | — | 0.513% due 10/29/15 (Ê)(Þ) | 9,785 | 9,801 | |||||
| Utilities - 0.0% | CCG Receivables Trust | |||||||||
| Dynegy, Inc. Class A(Æ) | 18,469 | 563 | ||||||||
| Total Common Stocks | Series 2014-1 Class A1 | |||||||||
| 0.270% due 05/14/15 (Þ) | 2,117 | 2,117 | ||||||||
| (cost $370) | 563 | Citigroup, Inc. | ||||||||
See accompanying notes which are an integral part of the financial statements.
Russell Strategic Bond Fund 407
| Russell Investment Company | |||||||||
| Russell Strategic Bond Fund | |||||||||
| Schedule of Investments, continued — October 31, 2014 | |||||||||
| Amounts in thousands (except share amounts) | Amounts in thousands (except share amounts) | ||||||||
| Principal | Fair | Principal | Fair | ||||||
| Amount ($) | Value | Amount ($) | Value | ||||||
| or Shares | $ | or Shares | $ | ||||||
| 0.518% due 11/05/14 (Ê) | 9,600 | 9,600 | 0.727% due 01/12/15 | 2,119 | 2,119 | ||||
| 6.010% due 01/15/15 | 10,100 | 10,211 | Goldman Sachs Group, Inc. (The) | ||||||
| 2.650% due 03/02/15 | 3,500 | 3,524 | Series GMTN | ||||||
| 3.700% due 08/01/15 | 4,360 | 4,457 | |||||||
| 4.700% due 05/29/15 | 350 | 358 | Series MTNB | ||||||
| 2.250% due 08/07/15 | 6,500 | 6,573 | 0.632% due 07/22/15 (Ê) | 6,400 | 6,401 | ||||
| Coca-Cola Co. (The) | Harley-Davidson Financial Services, Inc. | ||||||||
| 0.750% due 03/13/15 | 10,140 | 10,155 | 1.150% due 09/15/15 (Þ) | 7,500 | 7,533 | ||||
| ConocoPhillips | Honda Auto Receivables Owner Trust | ||||||||
| 4.600% due 01/15/15 | 8,635 | 8,702 | 0.180% due 05/18/15 | 4,018 | 4,018 | ||||
| Constellation Energy Group, Inc. | Series 2011-3 Class A3 | ||||||||
| 4.550% due 06/15/15 | 6,776 | 6,929 | 0.880% due 09/21/15 | 25 | 25 | ||||
| Credit Suisse | Series 2013-2 Class A2 | ||||||||
| 3.500% due 03/23/15 | 4,100 | 4,148 | 0.370% due 10/16/15 | 389 | 389 | ||||
| 0.467% due 04/10/15 (~) | 2,000 | 2,000 | Series 2014-3 Class A1 | ||||||
| Credit Suisse NY | 0.190% due 08/17/15 | 9,797 | 9,797 | ||||||
| 0.555% due 08/24/15 (Ê)(~) | 17,485 | 17,488 | HSBC Finance Corp. | ||||||
| Daimler Finance NA LLC | 5.250% due 04/15/15 | 600 | 612 | ||||||
| 1.300% due 07/31/15 (Þ) | 6,450 | 6,486 | Hyundai Auto Lease Securitization | ||||||
| Dell Equipment Finance Trust | Series 2012-A Class A3 | ||||||||
| 0.260% due 08/14/15 (Þ) | 4,203 | 4,203 | 0.920% due 08/17/15 (Þ) | 2,526 | 2,526 | ||||
| Discovery Communications LLC | International Lease Finance Corp. | ||||||||
| 3.700% due 06/01/15 | 3,792 | 3,859 | 4.875% due 04/01/15 | 2,805 | 2,838 | ||||
| Ecolab, Inc. | JPMorgan Chase & Co. | ||||||||
| 1.000% due 08/09/15 | 7,025 | 7,048 | 3.700% due 01/20/15 | 15,785 | 15,893 | ||||
| ENI Finance USA, Inc. | 4.750% due 03/01/15 | 4,548 | 4,612 | ||||||
| Zero coupon due 11/07/14 (ç)(~) | 3,250 | 3,250 | 1.875% due 03/20/15 | 2,600 | 2,613 | ||||
| Zero coupon due 12/15/14 (ç)(~) | 625 | 625 | Series GMTN | ||||||
| Express Scripts Holding Co. | 1.100% due 10/15/15 | 11,500 | 11,551 | ||||||
| 2.100% due 02/12/15 | 6,925 | 6,953 | JPMorgan Chase Bank NA | ||||||
| Fairway Finance Co., LLC | Series BKNT | ||||||||
| Zero coupon due 01/12/15 (~) | 2,900 | 2,899 | 0.483% due 07/30/15 (Ê) | 1,700 | 1,702 | ||||
| FCE Bank PLC | Kellogg Co. | ||||||||
| 4.750% due 01/19/15 | EUR | 5,875 | 7,428 | 0.464% due 02/13/15 (Ê) | 6,535 | 6,538 | |||
| Federal Home Loan Bank Discount | 1.125% due 05/15/15 | 4,445 | 4,458 | ||||||
| Notes | Kubota Credit Owner Trust | ||||||||
| Zero coupon due 11/26/14 (ç)(~) | 29,090 | 29,089 | Series 2014-1A Class A1 | ||||||
| Zero coupon due 11/28/14 (ç)(~) | 26,910 | 26,909 | 0.220% due 05/15/15 (Þ) | 838 | 838 | ||||
| Zero coupon due 03/25/15 (~) | 15,450 | 15,447 | MMAF Equipment Finance LLC | ||||||
| Federal Home Loan Banks | Series 2014-AA Class A1 | ||||||||
| 2.500% due 05/26/15 | 7,830 | 7,791 | 0.200% due 07/02/15 (Þ) | 6,694 | 6,694 | ||||
| Ford Credit Auto Lease Trust | Morgan Stanley | ||||||||
| Series 2012-B Class A3 | 6.000% due 04/28/15 | 8,800 | 9,027 | ||||||
| 0.570% due 09/15/15 | 314 | 314 | 0.711% due 10/15/15 (Ê) | 9,735 | 9,765 | ||||
| Ford Motor Credit Co. LLC | 5.375% due 10/15/15 | 7,000 | 7,307 | ||||||
| 3.875% due 01/15/15 | 5,875 | 5,912 | Novartis Capital Corp. | ||||||
| 7.000% due 04/15/15 | 4,800 | 4,932 | 2.900% due 04/24/15 | 1,485 | 1,503 | ||||
| 2.750% due 05/15/15 | 1,300 | 1,313 | PACCAR Financial Corp. | ||||||
| 12.000% due 05/15/15 | 1,700 | 1,799 | 0.362% due 05/05/15 (Ê) | 6,217 | 6,221 | ||||
| 5.625% due 09/15/15 | 1,200 | 1,249 | Pacific Gas & Electric Co. | ||||||
| 0.433% due 05/11/15 (Ê) | 6,700 | 6,700 | |||||||
| Freddie Mac REMICS | Penske Truck Leasing Co. Lp / PTL | ||||||||
| Series 2010-3640 Class JA | |||||||||
| 1.500% due 03/15/15 | 330 | 330 | Finance Corp. | ||||||
| Georgia-Pacific LLC | 3.125% due 05/11/15 (Þ) | 5,480 | 5,543 | ||||||
| 7.700% due 06/15/15 | 2,700 | 2,811 | Petrobras International Finance Co. SA | ||||||
| Gilead Sciences, Inc. | 2.875% due 02/06/15 | 6,300 | 6,323 | ||||||
| 2.400% due 12/01/14 | 4,200 | 4,206 | Private Export Funding Corp. | ||||||
| Ginnie Mae I | Zero coupon due 05/12/15 (~) | 5,500 | 5,492 | ||||||
| 10.500% due 10/15/15 | 4 | 4 | Province of Ontario Canada | ||||||
| Goldman Sachs Group, Inc. | 0.950% due 05/26/15 | 10,980 | 11,026 | ||||||
| See accompanying notes which are an integral part of the financial statements. | |||||||||
| 408 Russell Strategic Bond Fund | |||||||||
Russell Investment Company Russell Strategic Bond Fund
Schedule of Investments, continued — October 31, 2014
| Amounts in thousands (except share amounts) | Amounts in thousands (except share amounts) | |||||||
| Principal | Fair | Principal | Fair | |||||
| Amount ($) | Value | Amount ($) | Value | |||||
| or Shares | $ | or Shares | $ | |||||
| Reckitt Benckiser Treasury Services PLC | Other Assets and Liabilities, | |||||||
| Zero coupon due 04/02/15 (~) | 12,140 | 12,124 | Net - (7.7%) | (560,608 | ) | |||
| Royal Bank of Canada | ||||||||
| 1.920% due 07/30/15 | 4,573 | 4,626 | Net Assets - 100.0% | 7,325,389 | ||||
| 0.800% due 10/30/15 | 2,042 | 2,050 | ||||||
| Russell U.S. Cash Management Fund | 1,064,168,089 | (8) | 1,064,168 | |||||
| Sheffield Receivables Corp. | ||||||||
| Zero coupon due 01/23/15 (~) | 5,200 | 5,197 | ||||||
| Southern Copper Corp. | ||||||||
| 6.375% due 07/27/15 | 1,410 | 1,461 | ||||||
| Standard Chartered PLC | ||||||||
| 3.850% due 04/27/15 (Þ) | 11,150 | 11,318 | ||||||
| Susquehanna Auto Receivables Trust | ||||||||
| Series 2014-1A Class A1 | ||||||||
| 0.240% due 08/17/15 (Þ) | 7,798 | 7,799 | ||||||
| Tate & Lyle International Finance PLC | ||||||||
| 5.000% due 11/15/14 (Å) | 7,600 | 7,610 | ||||||
| Telefonos de Mexico SAB de CV | ||||||||
| 5.500% due 01/27/15 | 2,655 | 2,682 | ||||||
| Tidewater Auto Receivables Trust | ||||||||
| Series 2014-AA Class A1 | ||||||||
| 0.400% due 06/15/15 (Þ) | 651 | 651 | ||||||
| United States Treasury Bills | ||||||||
| Zero coupon due 11/06/14 (ç)(~) | 145 | 145 | ||||||
| Zero coupon due 01/15/15 | 92,920 | 92,917 | ||||||
| Zero coupon due 04/02/15 (~) | 2,500 | 2,499 | ||||||
| 0.038% due 04/09/15 | 6,200 | 6,199 | ||||||
| 0.038% due 04/09/15 (~) | 260 | 260 | ||||||
| United States Treasury Inflation Indexed | ||||||||
| Bonds | ||||||||
| 1.625% due 01/15/15 | 2,597 | 2,593 | ||||||
| 0.500% due 04/15/15 | 5,098 | 5,089 | ||||||
| United States Treasury Notes | ||||||||
| 0.250% due 05/15/15 | 89,260 | 89,323 | ||||||
| Verizon Communications, Inc. | ||||||||
| 4.900% due 09/15/15 | 8,545 | 8,868 | ||||||
| Vodafone Group PLC | ||||||||
| Zero coupon due 04/10/15 (~) | 11,485 | 11,458 | ||||||
| Volkswagen International Finance NV | ||||||||
| 1.625% due 03/22/15 (Þ) | 14,600 | 14,666 | ||||||
| Volvo Treasury AB | ||||||||
| 5.950% due 04/01/15 (Þ) | 2,734 | 2,792 | ||||||
| Wells Fargo & Co. | ||||||||
| 0.433% due 10/28/15 (Ê) | 5,495 | 5,499 | ||||||
| Westlake Automobile Receivables Trust | ||||||||
| Series 2014-1A Class A1 | ||||||||
| 0.350% due 06/15/15 (Þ) | 1,728 | 1,728 | ||||||
| Wheels SPV 2 LLC | ||||||||
| Series 2014-1A Class A1 | ||||||||
| 0.240% due 05/20/15 (Þ) | 5,083 | 5,083 | ||||||
| Working Capital Management Co. L.P. | ||||||||
| 1.000% due 11/12/14 (ç)(~) | 5,890 | 5,890 | ||||||
| Total Short-Term Investments | ||||||||
| (cost $1,823,003) | 1,822,213 | |||||||
| Total Investments 107.7% | ||||||||
| (identified cost $7,792,140) | 7,885,997 | |||||||
See accompanying notes which are an integral part of the financial statements.
Russell Strategic Bond Fund 409
| Russell Investment Company | ||||||||||||
| Russell Strategic Bond Fund | ||||||||||||
| Schedule of Investments, continued — October 31, 2014 | ||||||||||||
| Restricted Securities | ||||||||||||
| Amounts in thousands (except share and cost per unit amounts) | ||||||||||||
| Principal | Cost per | Cost | Fair Value | |||||||||
| % of Net Assets | Acquisition | Amount ($) | Unit | (000 | ) | (000 | ) | |||||
| Securities | Date | or shares | $ | $ | $ | |||||||
| 0.8% | ||||||||||||
| ABN Amro Bank NV | 10/23/13 | 2,320,000 | 100.00 | 2,320 | 2,338 | |||||||
| Adam Aircraft Industries, Inc. Term Loan | 03/28/08 | 760,489 | 99.87 | 760 | 8 | |||||||
| American Homes 4 Rent | 09/10/14 | 3,750,000 | 99.99 | 3,750 | 3,781 | |||||||
| Ballyrock CLO LLC | 10/22/14 | 670,000 | 100.00 | 670 | 670 | |||||||
| Banco do Brasil SA | 06/11/14 | 3,140,000 | 99.66 | 3,129 | 3,087 | |||||||
| Bayer US Finance LLC | 10/01/14 | 3,185,000 | 100.15 | 3,190 | 3,199 | |||||||
| Bayer US Finance LLC | 10/01/14 | 2,860,000 | 99.55 | 2,847 | 2,865 | |||||||
| CSMC Trust | 09/22/14 | 3,905,000 | 102.99 | 4,022 | 4,081 | |||||||
| DBCCRE Mortgage Trust | 01/24/14 | 2,495,000 | 101.50 | 2,533 | 2,633 | |||||||
| Dynegy Finance I, Inc. / Dynegy Finance II Inc | 10/10/14 | 3,595,000 | 103.57 | 3,723 | 3,802 | |||||||
| Fannie Mae | 02/12/01 | 22,243 | 19.89 | 4 | 4 | |||||||
| Fannie Mae REMICS | 09/15/00 | 29,810 | 27.69 | 8 | 8 | |||||||
| Fannie Mae REMICS | 04/02/03 | 451,328 | 17.90 | 81 | 81 | |||||||
| Fannie Mae REMICS | 05/28/03 | 89,257 | 17.21 | 15 | 15 | |||||||
| Fannie Mae REMICS | 01/07/04 | 70,631 | 21.24 | 15 | 15 | |||||||
| Fannie Mae REMICS | 04/25/05 | 96,664 | 17.12 | 17 | 17 | |||||||
| Fannie Mae REMICS | 04/25/05 | 59,659 | 18.84 | 11 | 11 | |||||||
| Fannie Mae REMICS | 04/25/05 | 86,205 | 21.25 | 18 | 18 | |||||||
| Farmers Exchange Capital III | 10/01/14 | 2,460,000 | 100.00 | 2,460 | 2,500 | |||||||
| First Union National Bank-Bank of America NA Commercial Mortgage Trust | 12/20/11 | 2,390,276 | 0.30 | 7 | 4 | |||||||
| Freddie Mac REMICS | 06/11/03 | 13,899 | 17.48 | 2 | 2 | |||||||
| Freddie Mac REMICS | 03/05/04 | 111,942 | 18.95 | 21 | 21 | |||||||
| Freddie Mac Strips | 12/12/00 | 19,836 | 25.58 | 5 | 5 | |||||||
| Freddie Mac Strips | 05/29/03 | 58,855 | 13.15 | 8 | 8 | |||||||
| Freddie Mac Strips | 08/19/03 | 56,084 | 25.40 | 14 | 14 | |||||||
| Freddie Mac Strips | 02/13/04 | 54,476 | 20.41 | 11 | 11 | |||||||
| Innovation Ventures LLC / Innovation Ventures Finance Corp. | 10/24/14 | 1,900,000 | 98.75 | 1,876 | 1,874 | |||||||
| Macquarie Bank, Ltd. | 10/22/14 | 3,000,000 | 100.00 | 3,000 | 2,998 | |||||||
| Navient Student Loan Trust | 10/15/14 | 5,085,000 | 99.95 | 5,083 | 5,083 | |||||||
| OHA Credit Partners IX, Ltd. | 10/01/13 | 4,144,933 | 99.91 | 4,141 | 4,109 | |||||||
| Paragon Offshore PLC | 10/21/14 | 3,900,000 | 81.66 | 3,185 | 2,983 | |||||||
| RREF LLC | 09/17/14 | 1,561,660 | 100.00 | 1,562 | 1,562 | |||||||
| SunTrust Student Loan Trust | 02/24/12 | 5,000,000 | 86.68 | 4,334 | 4,792 | |||||||
| Tate & Lyle International Finance PLC | 05/13/14 | 7,600,000 | 100.17 | 7,613 | 7,610 | |||||||
| 60,209 | ||||||||||||
| For a description of restricted securities see note 9 in the Notes to Financial Statements. | ||||||||||||
| Futures Contracts | ||||||||||||
| Amounts in thousands (except contract amounts) | ||||||||||||
| Unrealized | ||||||||||||
| Appreciation | ||||||||||||
| Number of | Notional | Expiration | (Depreciation) | |||||||||
| Contracts | Amount | Date | $ | |||||||||
| Long Positions | ||||||||||||
| Australia Government 10 Year Treasury Bond Futures | 42 | AUD | 5,157 | 12/14 | 4 | |||||||
| Australia Government 3 Year Treasury Bond Futures | 242 | AUD | 26,574 | 12/14 | 16 | |||||||
| Eurodollar Futures | 220 | USD | 54,857 | 03/15 | 38 | |||||||
| Eurodollar Futures | 60 | USD | 14,725 | 12/16 | 49 | |||||||
| United States Treasury 2 Year Note Futures | 1,134 | USD | 248,984 | 12/14 | 503 | |||||||
| United States Treasury 5 Year Note Futures | 4,109 | USD | 490,737 | 12/14 | 2,323 | |||||||
| United States Treasury 10 Year Note Futures | 3,127 | USD | 395,126 | 12/14 | 1,124 | |||||||
| United States Treasury Long Bond Futures | 2,177 | USD | 307,161 | 12/14 | 1,981 | |||||||
| United States Treasury Ultra Long-Term Bond Futures | 119 | USD | 18,661 | 12/14 | 308 | |||||||
| Short Positions | ||||||||||||
| Canada Government 10 Year Bond Futures | 137 | CAD | 18,773 | 12/14 | (99 | ) | ||||||
| Euro-Bobl Futures | 316 | EUR | 40,464 | 12/14 | (151 | ) | ||||||
| Euro-BTP Futures | 139 | EUR | 18,115 | 12/14 | (226 | ) | ||||||
| Euro-Bund Futures | 292 | EUR | 44,066 | 12/14 | (192 | ) | ||||||
| Euro-Buxl 30 Year Bond Futures | 17 | EUR | 2,470 | 12/14 | (14 | ) | ||||||
| Eurodollar Futures | 260 | USD | 64,844 | 12/14 | (4 | ) | ||||||
| Eurodollar Futures | 220 | USD | 54,409 | 03/16 | (58 | ) | ||||||
| Eurodollar Futures | 60 | USD | 14,618 | 12/17 | (52 | ) | ||||||
| Euro-OAT Futures | 148 | EUR | 21,439 | 12/14 | (354 | ) | ||||||
| See accompanying notes which are an integral part of the financial statements. | ||||||||||||
| 410 Russell Strategic Bond Fund | ||||||||||||
Russell Investment Company Russell Strategic Bond Fund
Schedule of Investments, continued — October 31, 2014
| Futures Contracts | |||||||
| Amounts in thousands (except contract amounts) | |||||||
| Euro-Schatz Futures | 48 | EUR | 5,327 | 12/14 | — | ||
| Japan Government 10 Year Bond Futures | 41 | JPY | 6,007,730 | 12/14 | (293 | ) | |
| Long Gilt Futures | 464 | GBP | 53,406 | 12/14 | (853 | ) | |
| United States Treasury 2 Year Note Futures | 1,685 | USD | 369,963 | 12/14 | (1,108 | ) | |
| United States Treasury 5 Year Note Futures | 482 | USD | 57,565 | 12/14 | (334 | ) | |
| United States Treasury Long Bond Futures | 37 | USD | 5,220 | 12/14 | (58 | ) | |
| Total Unrealized Appreciation (Depreciation) on Open Futures Contracts (å) | 2,550 | ||||||
| Options Written | |||||||||||
| Amounts in thousands (except contract amounts) | |||||||||||
| Number of | Strike | Notional | Expiration | Fair Value | |||||||
| Call/Put | Contracts | Price | Amount | Date | $ | ||||||
| Inflationary Floor – CPURNSA Index | Call | 1 | 0.00 | USD | 8,490 | 11/23/20 | (3 | ) | |||
| Swaptions | |||||||||||
| (Fund Receives/Fund Pays) | |||||||||||
| USD 5.000%/USD Three Month LIBOR | Put | 1 | 0.00 | 29,710 | 01/14/19 | (389 | ) | ||||
| Total Liability for Options Written (premiums received $867) | (392 | ) | |||||||||
| Transactions in options written contracts for the period ended October 31, 2014 were as follows: | |||||||||||
| Number of | Premiums | ||||||||||
| Contracts | Received | ||||||||||
| Outstanding October 31, 2013 | 190 | $ | 1,588 | ||||||||
| Opened | 152 | 4,202 | |||||||||
| Closed | (90 | ) | (2,197 | ) | |||||||
| Expired | (250 | ) | (2,726 | ) | |||||||
| Outstanding October 31, 2014 | 2 | $ | 867 | ||||||||
| Foreign Currency Exchange Contracts | |||||||
| Amounts in thousands | |||||||
| Unrealized | |||||||
| Appreciation | |||||||
| Amount | Amount | (Depreciation) | |||||
| Counterparty | Sold | Bought | Settlement Date | $ | |||
| Austrailia and New Zealand Banking Group | AUD | 32,252 | CAD | 31,922 | 11/21/14 | (37 | ) |
| Austrailia and New Zealand Banking Group | AUD | 4,903 | JPY | 456,337 | 11/21/14 | (246 | ) |
| Austrailia and New Zealand Banking Group | AUD | 16,090 | NZD | 18,031 | 11/21/14 | (111 | ) |
| Austrailia and New Zealand Banking Group | AUD | 23,993 | NZD | 26,746 | 11/21/14 | (275 | ) |
| Bank of America | USD | 1,380 | AUD | 1,558 | 11/28/14 | (11 | ) |
| Bank of America | USD | 199 | BRL | 499 | 11/04/14 | 3 | |
| Bank of America | USD | 249 | CAD | 280 | 11/04/14 | — | |
| Bank of America | AUD | 15,784 | EUR | 10,839 | 11/21/14 | (289 | ) |
| Bank of America | BRL | 499 | USD | 200 | 11/04/14 | (1 | ) |
| Bank of America | CAD | 280 | USD | 250 | 11/04/14 | 2 | |
| Bank of America | EUR | 13,074 | JPY | 1,768,034 | 11/21/14 | (643 | ) |
| Bank of America | GBP | 417 | USD | 669 | 11/28/14 | 2 | |
| Bank of America | JPY | 3,991,370 | USD | 37,206 | 11/21/14 | 1,666 | |
| Bank of America | NZD | 858 | USD | 667 | 11/28/14 | (1 | ) |
| Barclays | USD | 1,882 | EUR | 1,480 | 11/28/14 | (27 | ) |
| Barclays | USD | 17,586 | JPY | 1,919,600 | 11/04/14 | (497 | ) |
| Barclays | USD | 14,164 | JPY | 1,527,049 | 11/21/14 | (567 | ) |
| Barclays | USD | 21,729 | JPY | 2,346,536 | 11/21/14 | (836 | ) |
| Barclays | USD | 68,971 | NOK | 444,688 | 11/21/14 | (3,080 | ) |
| Barclays | USD | 13,827 | SEK | 100,155 | 11/21/14 | (263 | ) |
| Barclays | USD | 21,983 | SEK | 158,269 | 11/21/14 | (549 | ) |
| Barclays | AUD | 5,547 | NZD | 6,184 | 11/21/14 | (63 | ) |
| Barclays | CAD | 10,341 | USD | 9,190 | 11/28/14 | 20 | |
| Barclays | JPY | 3,028,607 | GBP | 16,937 | 11/21/14 | 124 | |
| Barclays | JPY | 251,600 | USD | 2,310 | 11/04/14 | 70 | |
| Barclays | JPY | 1,668,000 | USD | 15,205 | 11/04/14 | 355 | |
| Barclays | KRW | 716,510 | USD | 676 | 11/28/14 | 7 | |
| BNP Paribas | USD | 179 | BRL | 447 | 11/04/14 | 1 | |
| BNP Paribas | USD | 180 | BRL | 451 | 11/04/14 | 2 | |
| BNP Paribas | USD | 180 | BRL | 445 | 11/04/14 | — | |
| BNP Paribas | USD | 183 | BRL | 459 | 11/04/14 | 2 | |
See accompanying notes which are an integral part of the financial statements.
Russell Strategic Bond Fund 411
| Russell Investment Company | |||||||
| Russell Strategic Bond Fund | |||||||
| Schedule of Investments, continued — October 31, 2014 | |||||||
| Foreign Currency Exchange Contracts | |||||||
| Amounts in thousands | |||||||
| Unrealized | |||||||
| Appreciation | |||||||
| Amount | Amount | (Depreciation) | |||||
| Counterparty | Sold | Bought | Settlement Date | $ | |||
| BNP Paribas | USD | 200 | BRL | 499 | 11/04/14 | 1 | |
| BNP Paribas | USD | 18,662 | EUR | 14,845 | 11/04/14 | (59 | ) |
| BNP Paribas | USD | 4,502 | MXN | 60,484 | 11/06/14 | (11 | ) |
| BNP Paribas | BRL | 450 | USD | 180 | 11/04/14 | (2 | ) |
| BNP Paribas | BRL | 745 | USD | 300 | 11/04/14 | — | |
| BNP Paribas | BRL | 1,106 | USD | 441 | 11/04/14 | (6 | ) |
| BNP Paribas | EUR | 14,845 | USD | 18,702 | 11/04/14 | 98 | |
| BNP Paribas | MXN | 60,484 | USD | 4,559 | 11/06/14 | 68 | |
| Citibank | USD | 5,464 | AUD | 6,310 | 11/04/14 | 89 | |
| Citibank | USD | 3,487 | EUR | 2,774 | 11/04/14 | (11 | ) |
| Citibank | USD | 307 | TRY | 690 | 11/28/14 | 2 | |
| Citibank | AUD | 16,190 | EUR | 11,110 | 11/21/14 | (305 | ) |
| Citibank | AUD | 6,310 | USD | 5,499 | 11/04/14 | (54 | ) |
| Citibank | EUR | 20,136 | JPY | 2,727,578 | 11/21/14 | (950 | ) |
| Citibank | EUR | 2,774 | USD | 3,496 | 11/04/14 | 19 | |
| Citibank | GBP | 2,707 | USD | 4,336 | 11/28/14 | 6 | |
| Citibank | NOK | 6,139 | USD | 934 | 11/28/14 | 24 | |
| Citibank | SEK | 100,303 | JPY | 1,479,900 | 11/21/14 | (407 | ) |
| Citibank | ZAR | 190 | USD | 17 | 11/28/14 | — | |
| Commonwealth Bank of Australia | USD | 22,910 | CHF | 22,049 | 11/07/14 | 7 | |
| Commonwealth Bank of Australia | USD | 57,274 | CHF | 55,122 | 11/07/14 | 18 | |
| Commonwealth Bank of Australia | USD | 22,886 | EUR | 18,266 | 11/07/14 | 4 | |
| Commonwealth Bank of Australia | USD | 34,330 | EUR | 27,399 | 11/07/14 | 7 | |
| Commonwealth Bank of Australia | USD | 55,368 | EUR | 43,820 | 11/07/14 | (454 | ) |
| Commonwealth Bank of Australia | USD | 57,226 | EUR | 45,666 | 12/05/14 | 12 | |
| Commonwealth Bank of Australia | USD | 34,109 | SEK | 252,413 | 11/07/14 | 74 | |
| Commonwealth Bank of Australia | AUD | 768 | USD | 673 | 11/28/14 | (2 | ) |
| Commonwealth Bank of Australia | CHF | 21,157 | USD | 22,148 | 11/07/14 | 159 | |
| Commonwealth Bank of Australia | CHF | 52,891 | USD | 55,370 | 11/07/14 | 396 | |
| Commonwealth Bank of Australia | CHF | 22,049 | USD | 22,914 | 12/05/14 | (8 | ) |
| Commonwealth Bank of Australia | CHF | 55,122 | USD | 57,284 | 12/05/14 | (20 | ) |
| Commonwealth Bank of Australia | EUR | 17,528 | USD | 22,147 | 11/07/14 | 182 | |
| Commonwealth Bank of Australia | EUR | 26,292 | USD | 33,221 | 11/07/14 | 273 | |
| Commonwealth Bank of Australia | EUR | 45,666 | USD | 57,216 | 11/07/14 | (11 | ) |
| Commonwealth Bank of Australia | EUR | 18,266 | USD | 22,890 | 12/05/14 | (5 | ) |
| Commonwealth Bank of Australia | EUR | 27,399 | USD | 34,335 | 12/05/14 | (7 | ) |
| Commonwealth Bank of Australia | SEK | 241,000 | USD | 33,428 | 11/07/14 | 791 | |
| Commonwealth Bank of Australia | SEK | 252,413 | USD | 34,111 | 12/05/14 | (75 | ) |
| Credit Suisse | USD | 42,039 | EUR | 33,546 | 11/21/14 | 3 | |
| Credit Suisse | USD | 1,441 | SEK | 10,454 | 11/28/14 | (25 | ) |
| Deutsche Bank | USD | 7,438 | EUR | 5,917 | 11/04/14 | (24 | ) |
| Deutsche Bank | USD | 11,329 | JPY | 1,236,600 | 11/04/14 | (320 | ) |
| Deutsche Bank | AUD | 18,101 | NZD | 20,117 | 11/21/14 | (255 | ) |
| Deutsche Bank | EUR | 5,917 | USD | 7,475 | 11/04/14 | 60 | |
| Deutsche Bank | JPY | 1,696,477 | GBP | 9,488 | 11/21/14 | 71 | |
| Deutsche Bank | JPY | 1,236,600 | USD | 11,366 | 11/04/14 | 357 | |
| Deutsche Bank | NOK | 289,130 | USD | 44,133 | 11/21/14 | 1,293 | |
| Goldman Sachs | USD | 9,518 | AUD | 10,992 | 11/04/14 | 155 | |
| Goldman Sachs | USD | 40,071 | GBP | 24,897 | 11/21/14 | (248 | ) |
| Goldman Sachs | USD | 20,322 | JPY | 2,192,483 | 11/21/14 | (800 | ) |
| Goldman Sachs | USD | 19,261 | SEK | 138,593 | 11/21/14 | (491 | ) |
| Goldman Sachs | AUD | 4,451 | USD | 3,897 | 11/04/14 | (20 | ) |
| Goldman Sachs | AUD | 6,541 | USD | 5,691 | 11/04/14 | (65 | ) |
| Goldman Sachs | EUR | 32,744 | USD | 41,730 | 11/21/14 | 692 | |
| Goldman Sachs | JPY | 522,028 | USD | 4,866 | 11/21/14 | 218 | |
| Goldman Sachs | NZD | 24,500 | USD | 19,089 | 11/21/14 | 22 | |
| Goldman Sachs | SEK | 296,819 | USD | 41,029 | 11/21/14 | 831 | |
| HSBC | USD | 515 | CHF | 490 | 11/28/14 | (5 | ) |
| HSBC | USD | 76 | CNY | 469 | 11/28/14 | — | |
| HSBC | USD | 513 | EUR | 405 | 11/28/14 | (6 | ) |
| HSBC | USD | 12,137 | JPY | 1,324,800 | 11/04/14 | (342 | ) |
| HSBC | CHF | 147 | USD | 154 | 11/28/14 | 1 | |
| HSBC | GBP | 640 | USD | 1,025 | 11/28/14 | 1 | |
| HSBC | JPY | 1,324,800 | USD | 12,084 | 11/04/14 | 290 | |
| HSBC | JPY | 483,086 | USD | 4,487 | 11/28/14 | 186 | |
| HSBC | KRW | 10,316,731 | USD | 9,743 | 11/28/14 | 99 | |
| HSBC | PLN | 1,045 | USD | 312 | 11/28/14 | 2 | |
| See accompanying notes which are an integral part of the financial statements. | |||||||
| 412 Russell Strategic Bond Fund | |||||||
| Russell Investment Company | |||||||
| Russell Strategic Bond Fund | |||||||
| Schedule of Investments, continued — October 31, 2014 | |||||||
| Foreign Currency Exchange Contracts | |||||||
| Amounts in thousands | |||||||
| Unrealized | |||||||
| Appreciation | |||||||
| Amount | Amount | (Depreciation) | |||||
| Counterparty | Sold | Bought | Settlement Date | $ | |||
| HSBC | RUB | 20,450 | USD | 486 | 11/28/14 | 14 | |
| HSBC | SGD | 2,351 | USD | 1,846 | 11/28/14 | 16 | |
| HSBC | TWD | 11,625 | USD | 383 | 11/28/14 | — | |
| JPMorgan Chase | USD | 514 | AUD | 585 | 11/28/14 | — | |
| JPMorgan Chase | USD | 514 | AUD | 585 | 11/28/14 | — | |
| JPMorgan Chase | USD | 1,032 | AUD | 1,170 | 11/28/14 | (4 | ) |
| JPMorgan Chase | USD | 355 | BRL | 892 | 11/04/14 | 5 | |
| JPMorgan Chase | USD | 16,639 | CAD | 18,897 | 01/22/15 | 94 | |
| JPMorgan Chase | USD | 23,308 | JPY | 2,544,178 | 11/04/14 | (658 | ) |
| JPMorgan Chase | USD | 299 | JPY | 33,600 | 11/28/14 | — | |
| JPMorgan Chase | USD | 25,618 | JPY | 2,722,718 | 12/18/14 | (1,368 | ) |
| JPMorgan Chase | USD | 29,958 | KRW | 31,895,974 | 01/22/15 | (202 | ) |
| JPMorgan Chase | USD | 3,522 | MXN | 48,301 | 01/22/15 | 48 | |
| JPMorgan Chase | USD | 25,596 | MYR | 84,595 | 01/22/15 | (23 | ) |
| JPMorgan Chase | USD | 677 | NOK | 4,590 | 11/28/14 | 3 | |
| JPMorgan Chase | USD | 17,233 | NOK | 114,521 | 01/22/15 | (300 | ) |
| JPMorgan Chase | USD | 1,357 | NZD | 1,745 | 11/28/14 | — | |
| JPMorgan Chase | USD | 9,564 | PLN | 31,877 | 01/22/15 | (134 | ) |
| JPMorgan Chase | USD | 34,596 | SEK | 249,354 | 01/22/15 | (821 | ) |
| JPMorgan Chase | USD | 19,122 | TWD | 580,055 | 01/22/15 | (30 | ) |
| JPMorgan Chase | USD | 2,810 | ZAR | 31,890 | 01/22/15 | 42 | |
| JPMorgan Chase | AUD | 87,427 | USD | 76,384 | 12/18/14 | (316 | ) |
| JPMorgan Chase | BRL | 445 | USD | 180 | 11/04/14 | — | |
| JPMorgan Chase | BRL | 447 | USD | 179 | 11/04/14 | (1 | ) |
| JPMorgan Chase | BRL | 3,175 | USD | 1,273 | 01/22/15 | 20 | |
| JPMorgan Chase | BRL | 41,939 | USD | 16,561 | 01/22/15 | 12 | |
| JPMorgan Chase | CLP | 11,375,839 | USD | 19,069 | 01/22/15 | (562 | ) |
| JPMorgan Chase | COP | 3,165,260 | USD | 1,518 | 01/22/15 | (8 | ) |
| JPMorgan Chase | COP | 53,773,670 | USD | 25,640 | 01/22/15 | (290 | ) |
| JPMorgan Chase | CZK | 286,286 | USD | 13,266 | 01/22/15 | 359 | |
| JPMorgan Chase | EUR | 22,254 | USD | 28,240 | 11/21/14 | 350 | |
| JPMorgan Chase | EUR | 57,546 | USD | 72,894 | 11/28/14 | 769 | |
| JPMorgan Chase | EUR | 57,690 | USD | 73,623 | 12/18/14 | 1,307 | |
| JPMorgan Chase | GBP | 12,810 | USD | 20,486 | 12/18/14 | 1 | |
| JPMorgan Chase | IDR | 248,004,958 | USD | 19,840 | 01/22/15 | (401 | ) |
| JPMorgan Chase | ILS | 63 | USD | 17 | 11/28/14 | — | |
| JPMorgan Chase | INR | 30,420 | USD | 495 | 11/28/14 | 2 | |
| JPMorgan Chase | JPY | 2,544,178 | USD | 23,379 | 11/04/14 | 729 | |
| JPMorgan Chase | JPY | 74,600 | USD | 665 | 11/28/14 | 1 | |
| JPMorgan Chase | JPY | 149,200 | USD | 1,329 | 11/28/14 | 1 | |
| JPMorgan Chase | NOK | 2,070 | USD | 305 | 11/28/14 | (2 | ) |
| JPMorgan Chase | NZD | 10,678 | USD | 8,320 | 11/21/14 | 10 | |
| JPMorgan Chase | NZD | 652 | USD | 508 | 11/28/14 | 1 | |
| JPMorgan Chase | NZD | 653 | USD | 509 | 11/28/14 | 1 | |
| JPMorgan Chase | NZD | 1,305 | USD | 1,028 | 11/28/14 | 13 | |
| JPMorgan Chase | NZD | 148,675 | USD | 117,373 | 12/18/14 | 1,974 | |
| JPMorgan Chase | PEN | 68,536 | USD | 23,270 | 01/22/15 | 31 | |
| JPMorgan Chase | RUB | 633,980 | USD | 15,341 | 11/24/14 | 682 | |
| JPMorgan Chase | SGD | 52,285 | USD | 41,061 | 01/22/15 | 371 | |
| Morgan Stanley | USD | 220 | BRL | 552 | 11/04/14 | 3 | |
| Morgan Stanley | BRL | 552 | USD | 220 | 11/04/14 | (3 | ) |
| Morgan Stanley | MXN | 25,549 | USD | 1,883 | 11/28/14 | (12 | ) |
| Morgan Stanley | NZD | 859 | USD | 672 | 11/28/14 | 4 | |
| National Australia Bank | AUD | 8,420 | USD | 7,357 | 11/28/14 | (40 | ) |
| Royal Bank of Canada | USD | 522 | CAD | 585 | 11/28/14 | (3 | ) |
| Royal Bank of Canada | USD | 34,377 | CAD | 38,788 | 12/05/14 | 12 | |
| Royal Bank of Canada | USD | 2,117 | GBP | 1,315 | 11/21/14 | (13 | ) |
| Royal Bank of Canada | USD | 22,236 | NOK | 143,001 | 11/07/14 | (1,037 | ) |
| Royal Bank of Canada | USD | 33,213 | NOK | 224,241 | 11/07/14 | 29 | |
| Royal Bank of Canada | USD | 55,355 | NOK | 373,736 | 11/07/14 | 49 | |
| Royal Bank of Canada | USD | 22,120 | NOK | 149,494 | 12/05/14 | 20 | |
| Royal Bank of Canada | CAD | 38,788 | USD | 34,400 | 11/07/14 | (12 | ) |
| Royal Bank of Canada | NOK | 149,494 | USD | 22,142 | 11/07/14 | (20 | ) |
| Royal Bank of Canada | NOK | 214,501 | USD | 33,355 | 11/07/14 | 1,556 | |
| Royal Bank of Canada | NOK | 357,502 | USD | 55,591 | 11/07/14 | 2,593 | |
| Royal Bank of Canada | NOK | 158,574 | USD | 24,146 | 11/21/14 | 650 | |
| Royal Bank of Canada | NOK | 373,736 | USD | 55,301 | 12/05/14 | (50 | ) |
| See accompanying notes which are an integral part of the financial statements. | |||||||
| Russell Strategic Bond Fund 413 | |||||||
| Russell Investment Company | |||||||
| Russell Strategic Bond Fund | |||||||
| Schedule of Investments, continued — October 31, 2014 | |||||||
| Foreign Currency Exchange Contracts | |||||||
| Amounts in thousands | |||||||
| Unrealized | |||||||
| Appreciation | |||||||
| Amount | Amount | (Depreciation) | |||||
| Counterparty | Sold | Bought | Settlement Date | $ | |||
| Royal Bank of Canada | NZD | 44,568 | USD | 34,564 | 12/05/14 | (72 | ) |
| Royal Bank of Scotland | USD | 9,077 | JPY | 980,092 | 11/28/14 | (350 | ) |
| Royal Bank of Scotland | MXN | 2,235 | USD | 164 | 11/28/14 | (1 | ) |
| Royal Bank of Scotland | NZD | 7,974 | USD | 6,278 | 11/28/14 | 76 | |
| Standard Chartered | USD | 21,632 | AUD | 24,784 | 11/07/14 | 173 | |
| Standard Chartered | USD | 32,448 | AUD | 37,176 | 11/07/14 | 260 | |
| Standard Chartered | USD | 58,061 | AUD | 66,067 | 11/07/14 | 66 | |
| Standard Chartered | USD | 23,180 | AUD | 26,427 | 12/05/14 | 26 | |
| Standard Chartered | USD | 34,769 | AUD | 39,640 | 12/05/14 | 39 | |
| Standard Chartered | USD | 198 | BRL | 485 | 11/04/14 | (3 | ) |
| Standard Chartered | USD | 1,379 | BRL | 3,369 | 11/04/14 | (19 | ) |
| Standard Chartered | USD | 410 | INR | 25,160 | 11/28/14 | (2 | ) |
| Standard Chartered | USD | 22,592 | JPY | 2,532,676 | 11/07/14 | (44 | ) |
| Standard Chartered | USD | 54,826 | JPY | 6,012,608 | 11/07/14 | (1,297 | ) |
| Standard Chartered | USD | 56,493 | JPY | 6,331,690 | 12/05/14 | (111 | ) |
| Standard Chartered | USD | 21,483 | NZD | 27,661 | 11/07/14 | 72 | |
| Standard Chartered | USD | 22,810 | NZD | 29,410 | 12/05/14 | 46 | |
| Standard Chartered | AUD | 26,427 | USD | 23,224 | 11/07/14 | (26 | ) |
| Standard Chartered | AUD | 39,640 | USD | 34,837 | 11/07/14 | (39 | ) |
| Standard Chartered | AUD | 61,960 | USD | 54,081 | 11/07/14 | (433 | ) |
| Standard Chartered | AUD | 66,067 | USD | 57,949 | 12/05/14 | (65 | ) |
| Standard Chartered | BRL | 485 | USD | 199 | 11/04/14 | 3 | |
| Standard Chartered | BRL | 3,369 | USD | 1,390 | 11/04/14 | 30 | |
| Standard Chartered | JPY | 2,405,043 | USD | 21,930 | 11/07/14 | 519 | |
| Standard Chartered | JPY | 6,331,690 | USD | 56,481 | 11/07/14 | 111 | |
| Standard Chartered | JPY | 2,532,676 | USD | 22,597 | 12/05/14 | 44 | |
| Standard Chartered | NZD | 29,410 | USD | 22,871 | 11/07/14 | (47 | ) |
| State Street | USD | 1,434 | AUD | 1,643 | 11/07/14 | 11 | |
| State Street | USD | 2,151 | AUD | 2,464 | 11/07/14 | 17 | |
| State Street | USD | 130 | AUD | 148 | 12/05/14 | — | |
| State Street | USD | 194 | AUD | 221 | 12/05/14 | — | |
| State Street | USD | 34,679 | CAD | 38,788 | 11/07/14 | (266 | ) |
| State Street | USD | 647 | CAD | 730 | 12/05/14 | — | |
| State Street | USD | 2,332 | EUR | 1,846 | 11/07/14 | (19 | ) |
| State Street | USD | 855 | EUR | 682 | 12/05/14 | — | |
| State Street | USD | 1,371 | GBP | 850 | 11/28/14 | (11 | ) |
| State Street | USD | 2,910 | JPY | 319,082 | 11/07/14 | (69 | ) |
| State Street | USD | 560 | JPY | 62,760 | 12/05/14 | (1 | ) |
| State Street | USD | 1,010 | NOK | 6,493 | 11/07/14 | (47 | ) |
| State Street | USD | 1,132 | NOK | 7,651 | 12/05/14 | 1 | |
| State Street | USD | 1,358 | NZD | 1,749 | 11/07/14 | 5 | |
| State Street | USD | 234 | NZD | 302 | 12/05/14 | — | |
| State Street | AUD | 27,517 | JPY | 2,561,145 | 11/21/14 | (1,382 | ) |
| State Street | AUD | 4,107 | USD | 3,585 | 11/07/14 | (29 | ) |
| State Street | AUD | 369 | USD | 324 | 12/05/14 | — | |
| State Street | CHF | 892 | USD | 934 | 11/07/14 | 7 | |
| State Street | CHF | 2,231 | USD | 2,335 | 11/07/14 | 17 | |
| State Street | CHF | 310 | USD | 323 | 12/05/14 | — | |
| State Street | CHF | 776 | USD | 806 | 12/05/14 | — | |
| State Street | EUR | 738 | USD | 933 | 11/07/14 | 8 | |
| State Street | EUR | 1,108 | USD | 1,400 | 11/07/14 | 11 | |
| State Street | EUR | 273 | USD | 342 | 12/05/14 | — | |
| State Street | EUR | 409 | USD | 513 | 12/05/14 | — | |
| State Street | JPY | 127,633 | USD | 1,164 | 11/07/14 | 28 | |
| State Street | JPY | 25,104 | USD | 224 | 12/05/14 | — | |
| State Street | NOK | 9,740 | USD | 1,515 | 11/07/14 | 71 | |
| State Street | NOK | 16,233 | USD | 2,524 | 11/07/14 | 118 | |
| State Street | NOK | 19,129 | USD | 2,830 | 12/05/14 | (3 | ) |
| State Street | SEK | 11,414 | USD | 1,583 | 11/07/14 | 37 | |
| State Street | SEK | 9,940 | USD | 1,363 | 11/28/14 | 16 | |
| State Street | SEK | 6,650 | USD | 899 | 12/05/14 | (2 | ) |
| UBS | USD | 37 | BRL | 93 | 11/04/14 | — | |
| UBS | USD | 300 | BRL | 745 | 11/04/14 | — | |
| UBS | USD | 681 | BRL | 1,680 | 11/04/14 | (3 | ) |
| UBS | USD | 1,453 | BRL | 3,645 | 11/04/14 | 19 | |
| UBS | USD | 380 | CAD | 430 | 11/28/14 | 1 | |
| UBS | USD | 563 | CLP | 330,200 | 11/28/14 | 10 | |
| See accompanying notes which are an integral part of the financial statements. | |||||||
| 414 Russell Strategic Bond Fund | |||||||
| Russell Investment Company | |||||||
| Russell Strategic Bond Fund | |||||||
| Schedule of Investments, continued — October 31, 2014 | |||||||
| Foreign Currency Exchange Contracts | |||||||
| Amounts in thousands | |||||||
| Unrealized | |||||||
| Appreciation | |||||||
| Amount | Amount | (Depreciation) | |||||
| Counterparty | Sold | Bought | Settlement Date | $ | |||
| UBS | USD | 120,568 | EUR | 95,907 | 11/04/14 | (383 | ) |
| UBS | USD | 423 | TRY | 935 | 11/28/14 | (5 | ) |
| UBS | BRL | 1,195 | USD | 496 | 11/04/14 | 14 | |
| UBS | BRL | 4,483 | USD | 1,891 | 11/04/14 | 82 | |
| UBS | BRL | 1,680 | USD | 676 | 12/02/14 | 3 | |
| UBS | CLP | 180,067 | USD | 307 | 11/28/14 | (5 | ) |
| UBS | EUR | 95,907 | USD | 122,690 | 11/04/14 | 2,504 | |
| UBS | GBP | 52,600 | USD | 83,936 | 11/21/14 | (196 | ) |
| UBS | PEN | 870 | USD | 298 | 11/28/14 | 2 | |
| Westpac | NZD | 12,358 | USD | 9,697 | 11/28/14 | 86 | |
| Total Unrealized Appreciation (Depreciation) on Open Foreign Currency Exchange Contracts | 1,346 | ||||||
Index Swap Contracts (*)
Amounts in thousands
| Fund Receives | Notional | Termination | Fair Value | |||
| Underlying Security | Counterparty | Amount | Date | $ | ||
| Barclays U.S. Aggregate Total Return Value Unhedged | ||||||
| USD Index | Barclays | USD | 56,550 | 11/28/14 | (11 | ) |
| Barclays U.S. Aggregate Total Return Value Unhedged | ||||||
| USD Index | Barclays | USD | 190,858 | 11/28/14 | (40 | ) |
| Barclays U.S. Aggregate Total Return Value Unhedged | ||||||
| USD Index | Barclays | USD | 83,622 | 11/28/14 | (15 | ) |
| Barclays U.S. Aggregate Total Return Value Unhedged | ||||||
| USD Index | Barclays | USD | 31,943 | 03/02/15 | (6 | ) |
| Barclays U.S. Aggregate Total Return Value Unhedged | ||||||
| USD Index | Barclays | USD | 94,799 | 03/02/15 | (18 | ) |
| Barclays U.S. Aggregate Total Return Value Unhedged | ||||||
| USD Index | Barclays | USD | 67,554 | 04/30/15 | (16 | ) |
| Barclays U.S. Aggregate Total Return Value Unhedged | ||||||
| USD Index | Barclays | USD | 6,960 | 10/30/15 | (1 | ) |
| Barclays U.S. Aggregate Total Return Value Unhedged | ||||||
| USD Index | Barclays | USD | 100,000 | 10/30/15 | (911 | ) |
| Barclays U.S. Aggregate Total Return Value Unhedged | ||||||
| USD Index | Barclays | USD | 85,514 | 10/30/15 | (8 | ) |
| Barclays U.S. Aggregate Total Return Value Unhedged | ||||||
| USD Index | Barclays | USD | 30,825 | 10/30/15 | (3 | ) |
| Total Fair Value of Open Index Swap Contracts Premiums Paid (Received) - $— (å) | (1,029 | ) | ||||
| (*) | Total return swaps (which includes index swaps) are agreements between counterparties to exchange cash flows, one based on market-linked returns of an individual asset or a basket of assets (i.e. an index), and the other on a fixed or floating rate. The floating rate fees were all based on 1 Month LIBOR rate plus a fee ranging from 0.09% to 0.10%. |
| Interest Rate Swap Contracts | ||||||||||
| Amounts in thousands | ||||||||||
| Termination | Fair Value | |||||||||
| Counterparty | Notional Amount | Fund Receives | Fund Pays | Date | $ | |||||
| Barclays | USD | 17,000 | 3.145 | % | Three Month LIBOR | 03/15/26 | 340 | |||
| Barclays | USD | 3,845 | Three Month LIBOR | 2.481 | % | 11/15/27 | (75 | ) | ||
| Barclays | USD | 3,860 | Three Month LIBOR | 2.417 | % | 11/15/27 | (36 | ) | ||
| Barclays | USD | 7,600 | Three Month LIBOR | 3.490 | % | 03/15/46 | (396 | ) | ||
| Citigroup | USD | 7,680 | Three Month LIBOR | 2.714 | % | 08/15/42 | 440 | |||
| Citigroup | USD | 5,110 | Three Month LIBOR | 3.676 | % | 11/15/43 | (745 | ) | ||
| Deutsche Bank | KRW 1,220,000 | 2.510 | % | Three Month KSDA | 12/17/19 | 15 | ||||
| Deutsche Bank | KRW 1,880,000 | 2.360 | % | Three Month KSDA | 12/17/19 | 12 | ||||
| Deutsche Bank | KRW 3,930,000 | 2.410 | % | Three Month KSDA | 12/17/19 | 33 | ||||
| Deutsche Bank | KRW | 653,000 | 2.755 | % | Three Month KSDA | 12/17/24 | 16 | |||
| Deutsche Bank | KRW 1,630,000 | 2.845 | % | Three Month KSDA | 12/17/24 | 52 | ||||
| Goldman Sachs | USD | 17,900 | 2.804 | % | Three Month LIBOR | 04/09/26 | (210 | ) | ||
| Goldman Sachs | USD | 8,060 | Three Month LIBOR | 3.125 | % | 04/09/46 | 178 | |||
| JPMorgan Chase | GBP | 77,400 | 2.445 | % | Six Month LIBOR | 12/21/18 | 651 | |||
| See accompanying notes which are an integral part of the financial statements. | ||||||||||
| Russell Strategic Bond Fund 415 | ||||||||||
| Russell Investment Company | ||||||||||||||||||
| Russell Strategic Bond Fund | ||||||||||||||||||
| Schedule of Investments, continued — October 31, 2014 | ||||||||||||||||||
| Interest Rate Swap Contracts | ||||||||||||||||||
| Amounts in thousands | ||||||||||||||||||
| Termination | Fair Value | |||||||||||||||||
| Counterparty | Notional Amount | Fund Receives | Fund Pays | Date | $ | |||||||||||||
| JPMorgan Chase | KRW 1,200,000 | 2.513 | % | Three Month KSDA | 12/17/19 | 15 | ||||||||||||
| JPMorgan Chase | KRW 1,410,000 | 2.209 | % | Three Month KSDA | 12/17/19 | — | ||||||||||||
| JPMorgan Chase | KRW 1,890,000 | 2.602 | % | Three Month KSDA | 12/17/19 | 32 | ||||||||||||
| JPMorgan Chase | KRW 3,013,000 | 2.595 | % | Three Month KSDA | 12/17/19 | 50 | ||||||||||||
| JPMorgan Chase | KRW 3,140,000 | 2.385 | % | Three Month KSDA | 12/17/19 | 23 | ||||||||||||
| JPMorgan Chase | HKD | 150,000 | Three Month HIBOR | 2.365 | % | 03/29/21 | (490 | ) | ||||||||||
| JPMorgan Chase | SGD | 24,600 | Six Month SIBOR | 2.270 | % | 03/31/21 | (408 | ) | ||||||||||
| Total Fair Value on Open Interest Rate Swap Contracts Premiums Paid (Received) - $515 (å) | (503 | ) | ||||||||||||||||
| Credit Default Swap Contracts | ||||||||||||||||||
| Amounts in thousands | ||||||||||||||||||
| Credit Indices | ||||||||||||||||||
| Fund (Pays)/ | ||||||||||||||||||
| Receives | Termination | Fair Value | ||||||||||||||||
| Reference Entity | Counterparty | Notional Amount | Fixed Rate Date | $ | ||||||||||||||
| CMBX NA Index | Bank of America | USD | 230 | (0.500 | %) | 02/17/51 | 9 | |||||||||||
| CMBX NA Index | Bank of America | USD | 775 | 0.500 | % | 01/17/47 | (23 | ) | ||||||||||
| CMBX NA Index | Bank of America | USD | 385 | 0.500 | % | 05/11/63 | (7 | ) | ||||||||||
| CMBX NA Index | Credit Suisse | USD | 825 | 0.500 | % | 05/11/63 | (16 | ) | ||||||||||
| CMBX NA Index | Credit Suisse | USD | 465 | 0.500 | % | 01/17/47 | (14 | ) | ||||||||||
| CMBX NA Index | Credit Suisse | USD | 315 | 0.500 | % | 01/17/47 | (9 | ) | ||||||||||
| CMBX NA Index | Credit Suisse | USD | 385 | 3.000 | % | 01/17/47 | (7 | ) | ||||||||||
| CMBX NA Index | Credit Suisse | USD | 465 | (0.500 | %) | 02/17/51 | 19 | |||||||||||
| CMBX NA Index | Deutsche Bank | USD | 770 | 0.500 | % | 05/11/63 | (15 | ) | ||||||||||
| CMBX NA Index | Deutsche Bank | USD | 110 | (0.500 | %) | 02/17/51 | 4 | |||||||||||
| CMBX NA Index | Goldman Sachs | USD | 330 | 0.500 | % | 05/11/63 | (6 | ) | ||||||||||
| CMBX NA Index | Goldman Sachs | USD | 140 | (0.500 | %) | 02/17/51 | 6 | |||||||||||
| CMBX NA Index | JPMorgan Chase | USD | 425 | 0.500 | % | 05/11/63 | (8 | ) | ||||||||||
| Total Fair Value on Open Credit Indices Premiums Paid (Received) - ($16) | (67 | ) | ||||||||||||||||
| Total Fair Value on Open Credit Default Swap Contracts Premiums Paid (Received) - ($16) (å) | (67 | ) | ||||||||||||||||
| Presentation of Portfolio Holdings | ||||||||||||||||||
| Amounts in thousands | ||||||||||||||||||
| Fair Value | ||||||||||||||||||
| Portfolio Summary | Level 1 | Level 2 | Level 3 | Total | % of Net Assets | |||||||||||||
| Long-Term Investments | ||||||||||||||||||
| Asset-Backed Securities | $ | — | $ | 688,533 | $ | 3,947 | $ | 692,480 | 9.5 | |||||||||
| Corporate Bonds and Notes | — | 1,170,559 | 30,263 | 1,200,822 | 16.4 | |||||||||||||
| International Debt | — | 403,229 | — | 403,229 | 5.5 | |||||||||||||
| Loan Agreements | — | 38,303 | — | 38,303 | 0.5 | |||||||||||||
| Mortgage-Backed Securities | — | 1,829,849 | 6,136 | 1,835,985 | 25.1 | |||||||||||||
| Municipal Bonds | — | 58,430 | — | 58,430 | 0.8 | |||||||||||||
| Non-US Bonds | — | 316,636 | — | 316,636 | 4.3 | |||||||||||||
| United States Government Agencies | — | 30,867 | — | 30,867 | 0.4 | |||||||||||||
| United States Government Treasuries | — | 1,475,090 | — | 1,475,090 | 20.1 | |||||||||||||
| Common Stocks | 563 | — | — | 563 | —* | |||||||||||||
| Preferred Stocks | 9,728 | — | — | 9,728 | 0.2 | |||||||||||||
| Options Purchased | — | 1,651 | — | 1,651 | —* | |||||||||||||
| Short-Term Investments | — | 1,822,205 | 8 | 1,822,213 | 24.9 | |||||||||||||
| Total Investments | 10,291 | 7,835,352 | 40,354 | 7,885,997 | 107.7 | |||||||||||||
| Other Assets and Liabilities, Net | (7.7 | ) | ||||||||||||||||
| 100.0 | ||||||||||||||||||
| See accompanying notes which are an integral part of the financial statements. | ||||||||||||||||||
| 416 Russell Strategic Bond Fund | ||||||||||||||||||
| Russell Investment Company | |||||||||||||
| Russell Strategic Bond Fund | |||||||||||||
| Schedule of Investments, continued — October 31, 2014 | |||||||||||||
| Presentation of Portfolio Holdings | |||||||||||||
| Amounts in thousands | |||||||||||||
| Fair Value | |||||||||||||
| Portfolio Summary | Level 1 | Level 2 | Level 3 | Total | % of Net Assets | ||||||||
| Other Financial Instruments | |||||||||||||
| Futures Contracts | 2,550 | — | — | 2,550 | —* | ||||||||
| Options Written | — | (392 | ) | — | (392 | ) | (—)* | ||||||
| Foreign Currency Exchange Contracts | — | 1,346 | — | 1,346 | —* | ||||||||
| Index Swap Contracts | — | (1,029 | ) | — | (1,029 | ) | (—)* | ||||||
| Interest Rate Swap Contracts | — | (503 | ) | — | (503 | ) | (—)* | ||||||
| Credit Default Swap Contracts | — | (67 | ) | — | (67 | ) | (—)* | ||||||
| Total Other Financial Instruments** | $ | 2,550 | $ | (645 | ) | $ | — | $ | 1,905 | ||||
| * | Less than .05% of net assets. |
| ** | Futures and foreign currency exchange contract values reflect the unrealized appreciation (depreciation) on the instruments. |
For a description of the Levels see note 2 in the Notes to Financial Statements.
For disclosure on transfers between Levels 1, 2 and 3 during the period ended October 31, 2014, see note 2 in the Notes to Financial Statements.
Investments in which significant unobservable inputs (Level 3) were used in determining fair value for the period ended October 31, 2014 were less than 1% of net assets.
See accompanying notes which are an integral part of the financial statements.
Russell Strategic Bond Fund 417
| Russell Investment Company | |||||||||
| Russell Strategic Bond Fund | |||||||||
| Fair Value of Derivative Instruments — October 31, 2014 | |||||||||
| Amounts in thousands | |||||||||
| Foreign | |||||||||
| Credit | Currency | Interest Rate | |||||||
| Derivatives not accounted for as hedging instruments | Contracts | Contracts | Contracts | ||||||
| Location: Statement of Assets and Liabilities - Assets | |||||||||
| Investments, at fair value* | $ | — | $ | — | $ | 1,651 | |||
| Variation margin on futures contracts** | — | — | 6,346 | ||||||
| Unrealized appreciation on foreign currency exchange contracts | — | 25,070 | — | ||||||
| Interest rate swap contracts, at fair value | — | — | 1,857 | ||||||
| Credit default swap contracts, at fair value | 38 | — | — | ||||||
| Total | $ | 38 | $ | 25,070 | $ | 9,854 | |||
| Location: Statement of Assets and Liabilities - Liabilities | |||||||||
| Variation margin on futures contracts** | $ | — | $ | — | $ | 3,796 | |||
| Unrealized depreciation on foreign currency exchange contracts | — | 23,724 | — | ||||||
| Options written, at fair value | — | — | 392 | ||||||
| Index swap contracts, at fair value | — | — | 1,029 | ||||||
| Interest rate swap contracts, at fair value | — | — | 2,360 | ||||||
| Credit default swap contracts, at fair value | 105 | — | — | ||||||
| Total | $ | 105 | $ | 23,724 | $ | 7,577 | |||
| Foreign | |||||||||
| Credit | Currency | Interest Rate | |||||||
| Derivatives not accounted for as hedging instruments | Contracts | Contracts | Contracts | ||||||
| Location: Statement of Operations - Net realized gain (loss) | |||||||||
| Investments*** | $ | — | $ | — | $ | (9 | ) | ||
| Futures contracts | — | — | 57,655 | ||||||
| Options written | — | — | 3,641 | ||||||
| Index swap contracts | — | — | 23,939 | ||||||
| Interest rate swap contracts | — | — | (1,705 | ) | |||||
| Credit default swap contracts | 4,967 | — | — | ||||||
| Foreign currency-related transactions**** | — | 45,811 | — | ||||||
| Total | $ | 4,967 | $ | 45,811 | $ | 83,521 | |||
| Location: Statement of Operations - Net change in unrealized appreciation (depreciation) | |||||||||
| Investments***** | $ | — | $ | — | $ | (1,898 | ) | ||
| Futures contracts | — | — | (17,756 | ) | |||||
| Options written | — | — | (450 | ) | |||||
| Index swap contracts | — | — | (3,480 | ) | |||||
| Interest rate swap contracts | — | — | (7,896 | ) | |||||
| Credit default swap contracts | (1,588 | ) | — | — | |||||
| Foreign currency-related transactions****** | — | (6,577 | ) | — | |||||
| Total | $ | (1,588 | ) | $ | (6,577 | ) | $ | (31,480 | ) |
| * | Fair value of purchased options. |
| ** | Includes cumulative appreciation/depreciation of futures contracts as reported in the Schedule of Investments. Only variation margin is reported within the Statement of Assets and Liabilities. |
| *** | Includes net realized gain (loss) on purchased options as reported in the Statement of Operations. |
| **** | Only includes net realized gain (loss) on forward and spot contracts. May differ from the net realized gain (loss) on foreign currency-related transactions reported within the Statement of Operations. |
| ***** | Includes net unrealized gain (loss) on purchased options as reported in the Schedule of Investments. |
| ****** | Only includes change in unrealized gain (loss) on forward and spot contracts. May differ from the net change in unrealized gain (loss) on foreign currency-related transactions reported within the Statement of Operations. |
For further disclosure on derivatives see note 2 in the Notes to Financial Statements.
See accompanying notes which are an integral part of the financial statements.
418 Russell Strategic Bond Fund
Russell Investment Company Russell Strategic Bond Fund
Balance Sheet Offsetting of Financial and Derivative Instruments — October 31, 2014
| Amounts in thousands | ||||||||
| Offsetting of Financial Assets and Derivative Assets | ||||||||
| Gross | Net Amounts | |||||||
| Amounts | of Assets | |||||||
| Gross | Offset in the | Presented in | ||||||
| Amounts of | Statement of | the Statement | ||||||
| Recognized | Assets and | of Assets and | ||||||
| Description | Location: Statement of Assets and Liabilities - Assets | Assets | Liabilities | Liabilities | ||||
| Options Purchased Contracts | Investments, at fair value | $ | 1,651 | $ | — $ | 1,651 | ||
| Foreign Currency Exchange Contracts | Unrealized appreciation on foreign currency exchange contracts | 25,070 | — | 25,070 | ||||
| Futures Contracts | Variation margin on futures contracts | 16,626 | — | 16,626 | ||||
| Interest Rate Swap Contracts | Interest rate swap contracts, at fair value | 1,857 | — | 1,857 | ||||
| Credit Default Swap Contracts | Credit default swap contracts, at fair value | 38 | — | 38 | ||||
| Total | $ | 45,242 | $ | — $ | 45,242 | |||
| Financial Assets, Derivative Assets, and Collateral Held by Counterparty | ||||||||
| Gross Amounts Not Offset in | ||||||||
| the Statement of Assets and | ||||||||
| Liabilities | ||||||||
| Net Amounts | ||||||||
| of Assets | ||||||||
| Presented in | ||||||||
| the Statement | Financial and | |||||||
| of Assets and | Derivative | Collateral | ||||||
| Counterparty | Liabilities | Instruments | Received^ | Net Amount | ||||
| Bank of America | $ | 1,682 | $ | 944 | $ | — $ | 738 | |
| Barclays | 13,436 | 1,465 | 2,146 | 9,825 | ||||
| BNP Paribas | 173 | 79 | 94 | — | ||||
| Citigroup | 1,043 | 68 | 975 | — | ||||
| Commonwealth Bank of Australia | 1,922 | 579 | — | 1,343 | ||||
| Credit Suisse | 4,729 | 19 | 499 | 4,211 | ||||
| Deutsche Bank | 2,339 | 613 | — | 1,726 | ||||
| Goldman Sachs | 2,208 | 1,809 | 399 | — | ||||
| HSBC | 662 | 301 | — | 361 | ||||
| JPMorgan Chase | 7,601 | 5,609 | 1,067 | 925 | ||||
| Morgan Stanley | 7 | 7 | — | — | ||||
| Royal Bank of Canada | 4,905 | 1,204 | — | 3,701 | ||||
| Royal Bank of Scotland | 76 | 1 | — | 75 | ||||
| Standard Chartered | 1,389 | 1,377 | — | 12 | ||||
| State Street | 349 | 343 | — | 6 | ||||
| UBS | 2,635 | 396 | 2,239 | — | ||||
| Westpac | 86 | — | — | 86 | ||||
| Total | $ | 45,242 | $ | 14,814 | $ | 7,419 | $ | 23,009 |
See accompanying notes which are an integral part of the financial statements.
Russell Strategic Bond Fund 419
Russell Investment Company
Russell Strategic Bond Fund
Balance Sheet Offsetting of Financial and Derivative Instruments, continued —October 31, 2014
| Amounts in thousands | ||||||||
| Offsetting of Financial Liabilities and Derivative Liabilities | ||||||||
| Gross | Net Amounts | |||||||
| Amounts | of Assets | |||||||
| Gross | Offset in the | Presented in | ||||||
| Amounts of | Statement of | the Statement | ||||||
| Recognized | Assets and | of Assets and | ||||||
| Description | Location: Statement of Assets and Liabilities - Liabilities | Liabilities | Liabilities | Liabilities | ||||
| Futures Contracts | Variation margin on futures contracts | $ | 3,258 | $ | — $ | 3,258 | ||
| Foreign Currency Exchange Contracts | Unrealized depreciation on foreign currency exchange contracts | 23,724 | — | 23,724 | ||||
| Options Written Contracts | Options written, at fair value | 392 | — | 392 | ||||
| Index Swap Contracts | Index swap contracts, at fair value | 1,029 | — | 1,029 | ||||
| Interest Rate Swap Contracts | Interest rate swap contracts, at fair value | 2,360 | — | 2,360 | ||||
| Credit Default Swap Contracts | Credit default swap contracts, at fair value | 105 | — | 105 | ||||
| Total | $ | 30,868 | $ | — $ | 30,868 | |||
| Financial Liabilities, Derivative Liabilities, and Collateral Pledged by Counterparty | ||||||||
| Gross Amounts Not Offset in | ||||||||
| the Statement of Assets and | ||||||||
| Liabilities | ||||||||
| Net Amounts | ||||||||
| of Liabilities | ||||||||
| Presented in | ||||||||
| the Statement | Financial and | |||||||
| of Assets and | Derivative | Collateral | ||||||
| Counterparty | Liabilities | Instruments | Pledged^ | Net Amount | ||||
| Australia and New Zealand Banking Group | $ | 669 | $ | — $ | — $ | 669 | ||
| Bank of America | 975 | 944 | — | 31 | ||||
| Barclays | 7,804 | 1,465 | 6,339 | — | ||||
| BNP Paribas | 79 | 79 | — | — | ||||
| Citigroup | 2,501 | 68 | 2,433 | — | ||||
| Commonwealth Bank of Australia | 581 | 579 | — | 2 | ||||
| Credit Suisse | 426 | 19 | 407 | — | ||||
| Deutsche Bank | 613 | 613 | — | — | ||||
| Goldman Sachs | 4,078 | 1,809 | 2,269 | — | ||||
| HSBC | 534 | 301 | 233 | — | ||||
| JPMorgan Chase | 6,486 | 5,609 | 877 | — | ||||
| Morgan Stanley | 15 | 7 | — | 8 | ||||
| National Australia Bank | 40 | — | — | 40 | ||||
| Royal Bank of Canada | 1,208 | 1,204 | — | 4 | ||||
| Royal Bank of Scotland | 351 | 1 | — | 350 | ||||
| Standard Chartered | 2,086 | 1,377 | — | 709 | ||||
| State Street | 1,830 | 343 | — | 1,487 | ||||
| UBS | 592 | 396 | — | 196 | ||||
| Total | $ | 30,868 | $ | 14,814 | $ | 12,558 | $ | 3,496 |
^ Collateral received or pledged amounts may not reconcile to those disclosed in the Statement of Assets and Liabilities due to the inclusion of off-Balance Sheet collateral and adjustments made to exclude overcollateralization.
For further disclosure on derivatives and counterparty risk see note 2 in the Notes to Financial Statements.
See accompanying notes which are an integral part of the financial statements.
420 Russell Strategic Bond Fund
| Russell Investment Company | ||
| Russell Strategic Bond Fund | ||
| Statement of Assets and Liabilities — October 31, 2014 | ||
| Amounts in thousands | ||
| Assets | ||
| Investments, at identified cost | $ | 7,792,140 |
| Investments, at fair value(>) | 7,885,997 | |
| Cash | 55,086 | |
| Cash (restricted)(a)(b)(c) | 21,231 | |
| Foreign currency holdings(^) | 11,346 | |
| Unrealized appreciation on foreign currency exchange contracts | 25,070 | |
| Receivables: | ||
| Dividends and interest | 35,282 | |
| Dividends from affiliated Russell funds | 95 | |
| Investments sold | 351,571 | |
| Fund shares sold | 10,228 | |
| Variation margin on futures contracts | 16,626 | |
| Other receivable | 352 | |
| Prepaid expenses | 22 | |
| Interest rate swap contracts, at fair value(•) | 1,857 | |
| Credit default swap contracts, at fair value(+) | 38 | |
| Total assets | 8,414,801 | |
| Liabilities | ||
| Payables: | ||
| Due to broker (d)(e)(f) | 9,553 | |
| Investments purchased | 1,039,688 | |
| Fund shares redeemed | 4,382 | |
| Accrued fees to affiliates | 4,281 | |
| Other accrued expenses | 469 | |
| Variation margin on futures contracts | 3,258 | |
| Other payable | 171 | |
| Unrealized depreciation on foreign currency exchange contracts | 23,724 | |
| Options written, at fair value(x) | 392 | |
| Index swap contracts, at fair value(8) | 1,029 | |
| Interest rate swap contracts, at fair value(•) | 2,360 | |
| Credit default swap contracts, at fair value(+) | 105 | |
| Total liabilities | 1,089,412 | |
| Net Assets | $ | 7,325,389 |
See accompanying notes which are an integral part of the financial statements.
Russell Strategic Bond Fund 421
| Russell Investment Company | |||
| Russell Strategic Bond Fund | |||
| Statement of Assets and Liabilities, continued — October 31, 2014 | |||
| Amounts in thousands | |||
| Net Assets Consist of: | |||
| Undistributed (overdistributed) net investment income | $ | 13,662 | |
| Accumulated net realized gain (loss) | 136,878 | ||
| Unrealized appreciation (depreciation) on: | |||
| Investments | 93,857 | ||
| Futures contracts | 2,550 | ||
| Options written | 475 | ||
| Index swap contracts | (1,029 | ) | |
| Interest rate swap contracts | (1,018 | ) | |
| Credit default swap contracts | (51 | ) | |
| Foreign currency-related transactions | 919 | ||
| Other investments | (1,756 | ) | |
| Shares of beneficial interest | 6,524 | ||
| Additional paid-in capital | 7,074,378 | ||
| Net Assets | $ | 7,325,389 | |
| Net Asset Value, offering and redemption price per share: | |||
| Net asset value per share: Class A(#) | $ | 11.26 | |
| Maximum offering price per share (Net asset value plus sales charge of 3.75%): Class A | $ | 11.70 | |
| Class A — Net assets | $ | 64,810,402 | |
| Class A — Shares outstanding ($.01 par value) | 5,757,528 | ||
| Net asset value per share: Class C(#) | $ | 11.25 | |
| Class C — Net assets | $ | 69,413,550 | |
| Class C — Shares outstanding ($.01 par value) | 6,169,593 | ||
| Net asset value per share: Class E(#) | $ | 11.18 | |
| Class E — Net assets | $ | 146,157,752 | |
| Class E — Shares outstanding ($.01 par value) | 13,077,626 | ||
| Net asset value per share: Class I(#) | $ | 11.14 | |
| Class I — Net assets | $ 1,214,058,918 | ||
| Class I — Shares outstanding ($.01 par value) | 108,962,541 | ||
| Net asset value per share: Class S(#) | $ | 11.29 | |
| Class S — Net assets | $ 4,052,321,663 | ||
| Class S — Shares outstanding ($.01 par value) | 358,945,075 | ||
| Net asset value per share: Class Y(#) | $ | 11.15 | |
| Class Y — Net assets | $ 1,778,626,857 | ||
| Class Y — Shares outstanding ($.01 par value) | 159,448,261 | ||
| Amounts in thousands | |||
| (^) Foreign currency holdings - cost | $ | 10,972 | |
| (x) Premiums received on options written | $ | 867 | |
| (+) Credit default swap contracts - premiums paid (received) | $ | (16 | ) |
| (•) Interest rate swap contracts - premiums paid (received) | $ | 515 | |
| (>) Investments in affiliates, Russell U.S. Cash Management Fund | $ | 1,064,168 | |
| (8) Index swap contracts - premiums paid (received) | $ | — | |
| (a) Cash Collateral for Futures | $ | 15,151 | |
| (b) Cash Collateral for Swaps | $ | 5,530 | |
| (c) Cash Collateral for TBAs | $ | 550 | |
| (d) Due to Broker for Futures | $ | 2,481 | |
| (e) Due to Broker for Swaps | $ | 6,282 | |
| (f) Due to Broker for TBAs | $ | 790 | |
| (#) Net asset value per share equals class level net assets divided by class level shares of beneficial interest outstanding. | |||
See accompanying notes which are an integral part of the financial statements.
422 Russell Strategic Bond Fund
| Russell Investment Company | |||
| Russell Strategic Bond Fund | |||
| Statement of Operations — For the Period Ended October 31, 2014 | |||
| Amounts in thousands | |||
| Investment Income | |||
| Dividends | $ | 851 | |
| Dividends from affiliated Russell funds | 1,158 | ||
| Interest | 173,245 | ||
| Total investment income | 175,254 | ||
| Expenses | |||
| Advisory fees | 37,417 | ||
| Administrative fees | 3,564 | ||
| Custodian fees | 1,379 | ||
| Distribution fees - Class A | 159 | ||
| Distribution fees - Class C | 555 | ||
| Transfer agent fees - Class A | 127 | ||
| Transfer agent fees - Class C | 148 | ||
| Transfer agent fees - Class E | 316 | ||
| Transfer agent fees - Class I | 1,443 | ||
| Transfer agent fees - Class S | 7,904 | ||
| Transfer agent fees - Class Y | 90 | ||
| Professional fees | 338 | ||
| Registration fees | 240 | ||
| Shareholder servicing fees - Class C | 185 | ||
| Shareholder servicing fees - Class E | 395 | ||
| Trustees’ fees | 180 | ||
| Printing fees | 175 | ||
| Miscellaneous | 363 | ||
| Expenses before reductions | 54,978 | ||
| Expense reductions | (1,543 | ) | |
| Net expenses | 53,435 | ||
| Net investment income (loss) | 121,819 | ||
| Net Realized and Unrealized Gain (Loss) | |||
| Net realized gain (loss) on: | |||
| Investments | 61,432 | ||
| Futures contracts | 57,655 | ||
| Options written | 3,641 | ||
| Index swap contracts | 23,939 | ||
| Interest rate swap contracts | (1,705 | ) | |
| Credit default swap contracts | 4,967 | ||
| Foreign currency-related transactions | 45,996 | ||
| Net realized gain (loss) | 195,925 | ||
| Net change in unrealized appreciation (depreciation) on: | |||
| Investments | 20,658 | ||
| Futures contracts | (17,756 | ) | |
| Options written | (450 | ) | |
| Index swap contracts | (3,480 | ) | |
| Interest rate swap contracts | (7,896 | ) | |
| Credit default swap contracts | (1,588 | ) | |
| Investment matured | 752 | ||
| Foreign currency-related transactions | (7,258 | ) | |
| Other investments | 1,656 | ||
| Net change in unrealized appreciation (depreciation) | (15,362 | ) | |
| Net realized and unrealized gain (loss) | 180,563 | ||
| Net Increase (Decrease) in Net Assets from Operations | $ | 302,382 | |
| See accompanying notes which are an integral part of the financial statements. | |||
| Russell Strategic Bond Fund 423 | |||
| Russell Investment Company | ||||||
| Russell Strategic Bond Fund | ||||||
| Statements of Changes in Net Assets | ||||||
| For the Periods Ended October 31, | ||||||
| Amounts in thousands | 2014 | 2013 | ||||
| Increase (Decrease) in Net Assets | ||||||
| Operations | ||||||
| Net investment income (loss) | $ | 121,819 | $ | 143,850 | ||
| Net realized gain (loss) | 195,925 | (16,447 | ) | |||
| Net change in unrealized appreciation (depreciation) | (15,362 | ) | (154,114 | ) | ||
| Net increase (decrease) in net assets from operations | 302,382 | (26,711 | ) | |||
| Distributions | ||||||
| From net investment income | ||||||
| Class A | (817 | ) | (1,402 | ) | ||
| Class C | (388 | ) | (834 | ) | ||
| Class E | (2,057 | ) | (2,805 | ) | ||
| Class I | (19,251 | ) | (25,449 | ) | ||
| Class S | (60,800 | ) | (73,969 | ) | ||
| Class Y | (35,186 | ) | (51,551 | ) | ||
| From net realized gain | ||||||
| Class A | (267 | ) | (2,132 | ) | ||
| Class C | (326 | ) | (2,198 | ) | ||
| Class E | (762 | ) | (3,451 | ) | ||
| Class I | (5,216 | ) | (27,486 | ) | ||
| Class S | (17,438 | ) | (78,305 | ) | ||
| Class Y | (10,492 | ) | (53,055 | ) | ||
| Net decrease in net assets from distributions | (153,000 | ) | (322,637 | ) | ||
| Share Transactions* | ||||||
| Net increase (decrease) in net assets from share transactions | (1,099,296 | ) | 578,561 | |||
| Total Net Increase (Decrease) in Net Assets | (949,914 | ) | 229,213 | |||
| Net Assets | ||||||
| Beginning of period | 8,275,303 | 8,046,090 | ||||
| End of period | $ | 7,325,389 | $ | 8,275,303 | ||
| Undistributed (overdistributed) net investment income included in net assets | $ | 13,662 | $ | (17,605 | ) | |
See accompanying notes which are an integral part of the financial statements.
424 Russell Strategic Bond Fund
Russell Investment Company Russell Strategic Bond Fund
Statements of Changes in Net Assets, continued
* Share transaction amounts (in thousands) for the periods ended October 31, 2014 and October 31, 2013 were as follows:
| 2014 | 2013 | |||||||||||
| Shares | Dollars | Shares | Dollars | |||||||||
| Class A | ||||||||||||
| Proceeds from shares sold | 1,254 | $ | 13,901 | 2,628 | $ | 29,571 | ||||||
| Proceeds from reinvestment of distributions | 98 | 1,075 | 308 | 3,449 | ||||||||
| Payments for shares redeemed | (1,433 | ) | (15,855 | ) | (5,951 | ) | (66,900 | ) | ||||
| Net increase (decrease) | (81 | ) | (879 | ) | (3,015 | ) | (33,880 | ) | ||||
| Class C | ||||||||||||
| Proceeds from shares sold | 1,026 | 11,337 | 1,682 | 18,931 | ||||||||
| Proceeds from reinvestment of distributions | 64 | 705 | 267 | 2,997 | ||||||||
| Payments for shares redeemed | (2,280 | ) | (25,183 | ) | (3,917 | ) | (43,594 | ) | ||||
| Net increase (decrease) | (1,190 | ) | (13,141 | ) | (1,968 | ) | (21,666 | ) | ||||
| Class E | ||||||||||||
| Proceeds from shares sold | 1,986 | 21,847 | 4,371 | 48,237 | ||||||||
| Proceeds from reinvestment of distributions | 240 | 2,622 | 533 | 5,933 | ||||||||
| Payments for shares redeemed | (5,809 | ) | (63,626 | ) | (2,677 | ) | (29,469 | ) | ||||
| Net increase (decrease) | (3,583 | ) | (39,157 | ) | 2,227 | 24,701 | ||||||
| Class I | ||||||||||||
| Proceeds from shares sold | 22,733 | 249,278 | 27,879 | 308,288 | ||||||||
| Proceeds from reinvestment of distributions | 2,218 | 24,188 | 4,720 | 52,329 | ||||||||
| Payments for shares redeemed | (32,665 | ) | (356,739 | ) | (31,195 | ) | (344,263 | ) | ||||
| Net increase (decrease) | (7,714 | ) | (83,273 | ) | 1,404 | 16,354 | ||||||
| Class S | ||||||||||||
| Proceeds from shares sold | 99,685 | 1,106,890 | 118,603 | 1,325,897 | ||||||||
| Proceeds from reinvestment of distributions | 7,023 | 77,580 | 13,447 | 150,912 | ||||||||
| Payments for shares redeemed | (123,689 | ) | (1,365,779 | ) | (83,413 | ) | (930,044 | ) | ||||
| Net increase (decrease) | (16,981 | ) | (181,309 | ) | 48,637 | 546,765 | ||||||
| Class Y | ||||||||||||
| Proceeds from shares sold | 6,036 | 66,065 | 24,701 | 270,554 | ||||||||
| Proceeds from reinvestment of distributions | 4,189 | 45,678 | 9,425 | 104,607 | ||||||||
| Payments for shares redeemed | (81,852 | ) | (893,280 | ) | (29,852 | ) | (328,874 | ) | ||||
| Net increase (decrease) | (71,627 | ) | (781,537 | ) | 4,274 | 46,287 | ||||||
| Total increase (decrease) | (101,176 | ) | $ | (1,099,296 | ) | 51,559 | $ | 578,561 | ||||
See accompanying notes which are an integral part of the financial statements.
Russell Strategic Bond Fund 425
| Russell Investment Company | ||||||||||||||||
| Russell Strategic Bond Fund | ||||||||||||||||
| Financial Highlights — For the Periods Ended | ||||||||||||||||
| For a Share Outstanding Throughout Each Period. | ||||||||||||||||
| $ | $ | $ | $ | $ | $ | |||||||||||
| Net Asset Value, | Net | Net Realized | Total from | Distributions | Distributions | |||||||||||
| Beginning of | Investment | and Unrealized | Investment | from Net | from Net | |||||||||||
| Period | Income (Loss)(a)(d) | Gain (Loss) | Operations | Investment Income | Realized Gain | |||||||||||
| Class A | ||||||||||||||||
| October 31, 2014 | 11.01 | .15 | .29 | .44 | (.14) | (.05) | ||||||||||
| October 31, 2013 | 11.50 | .17 | (.24) | (.07) | (.18) | (.24) | ||||||||||
| October 31, 2012 | 10.95 | .26 | .64 | .90 | (.25) | (.10) | ||||||||||
| October 31, 2011 | 11.24 | .32 | (.02) | .30 | (.33) | (.26) | ||||||||||
| October 31, 2010 | 10.37 | .37 | .92 | 1.29 | (.42) | — | ||||||||||
| Class C | ||||||||||||||||
| October 31, 2014 | 11.01 | .07 | .27 | .34 | (.05) | (.05) | ||||||||||
| October 31, 2013 | 11.49 | .08 | (.23) | (.15) | (.09) | (.24) | ||||||||||
| October 31, 2012 | 10.95 | .17 | .64 | .81 | (.17) | (.10) | ||||||||||
| October 31, 2011 | 11.24 | .24 | (.03) | .21 | (.24) | (.26) | ||||||||||
| October 31, 2010 | 10.37 | .30 | .91 | 1.21 | (.34) | — | ||||||||||
| Class E | ||||||||||||||||
| October 31, 2014 | 10.94 | .15 | .28 | .43 | (.14) | (.05) | ||||||||||
| October 31, 2013 | 11.42 | .16 | (.22) | (.06) | (.18) | (.24) | ||||||||||
| October 31, 2012 | 10.88 | .26 | .64 | .90 | (.26) | (.10) | ||||||||||
| October 31, 2011 | 11.17 | .33 | (.02) | .31 | (.34) | (.26) | ||||||||||
| October 31, 2010 | 10.31 | .39 | .90 | 1.29 | (.43) | — | ||||||||||
| Class I | ||||||||||||||||
| October 31, 2014 | 10.91 | .18 | .28 | .46 | (.18) | (.05) | ||||||||||
| October 31, 2013 | 11.39 | .20 | (.23) | (.03) | (.21) | (.24) | ||||||||||
| October 31, 2012 | 10.85 | .29 | .64 | .93 | (.29) | (.10) | ||||||||||
| October 31, 2011 | 11.14 | .35 | (.02) | .33 | (.36) | (.26) | ||||||||||
| October 31, 2010 | 10.28 | .41 | .91 | 1.32 | (.46) | — | ||||||||||
| Class S | ||||||||||||||||
| October 31, 2014 | 11.05 | .18 | .28 | .46 | (.17) | (.05) | ||||||||||
| October 31, 2013 | 11.53 | .19 | (.22) | (.03) | (.21) | (.24) | ||||||||||
| October 31, 2012 | 10.98 | .28 | .65 | .93 | (.28) | (.10) | ||||||||||
| October 31, 2011 | 11.27 | .35 | (.03) | .32 | (.35) | (.26) | ||||||||||
| October 31, 2010 | 10.39 | .41 | .92 | 1.33 | (.45) | — | ||||||||||
| Class Y | ||||||||||||||||
| October 31, 2014 | 10.92 | .19 | .27 | .46 | (.18) | (.05) | ||||||||||
| October 31, 2013 | 11.40 | .21 | (.22) | (.01) | (.23) | (.24) | ||||||||||
| October 31, 2012 | 10.86 | .30 | .64 | .94 | (.30) | (.10) | ||||||||||
| October 31, 2011 | 11.15 | .37 | (.03) | .34 | (.37) | (.26) | ||||||||||
| October 31, 2010 | 10.29 | .42 | .91 | 1.33 | (.47) | — | ||||||||||
See accompanying notes which are an integral part of the financial statements.
426 Russell Strategic Bond Fund
| % | % | % | |||||||||||||||
| $ | $ | Ratio of Expenses | Ratio of Expenses | Ratio of Net | |||||||||||||
| Net Asset Value, | % | Net Assets, | to Average | to Average | Investment Income | % | |||||||||||
| $ | End of | Total | End of Period | Net Assets, | Net Assets, | to Average | Portfolio | ||||||||||
| Total Distributions | Period | Return(c) | (000 | ) | Gross | Net(d) | Net Assets(d) | Turnover Rate | |||||||||
| (.19 | ) | 11.26 | 4.03 | 64,810 | 1.03 | 1.00 | 1.35 | 133 | |||||||||
| (.42 | ) | 11.01 | (.62 | ) | 64,310 | 1.03 | 1.01 | 1.50 | 104 | ||||||||
| (.35 | ) | 11.50 | 8.44 | 101,799 | 1.02 | 1.00 | 2.32 | 186 | |||||||||
| (.59 | ) | 10.95 | 2.92 | 100,094 | 1.03 | 1.00 | 2.92 | 233 | |||||||||
| (.42 | ) | 11.24 | 12.90 | 66,054 | 1.01 | .96 | 3.48 | 206 | |||||||||
| (.10 | ) | 11.25 | 3.15 | 69,413 | 1.78 | 1.75 | .60 | 133 | |||||||||
| (.33 | ) | 11.01 | (1.34 | ) | 81,015 | 1.78 | 1.76 | .74 | 104 | ||||||||
| (.27 | ) | 11.49 | 7.56 | 107,160 | 1.77 | 1.75 | 1.56 | 186 | |||||||||
| (.50 | ) | 10.95 | 1.95 | 100,729 | 1.78 | 1.75 | 2.22 | 233 | |||||||||
| (.34 | ) | 11.24 | 12.03 | 114,841 | 1.76 | 1.71 | 2.78 | 206 | |||||||||
| (.19 | ) | 11.18 | 3.96 | 146,158 | 1.03 | 1.00 | 1.34 | 133 | |||||||||
| (.42 | ) | 10.94 | (.59 | ) | 182,211 | 1.03 | 1.02 | 1.46 | 104 | ||||||||
| (.36 | ) | 11.42 | 8.46 | 164,834 | 1.02 | .97 | 2.33 | 186 | |||||||||
| (.60 | ) | 10.88 | 2.91 | 150,015 | 1.03 | .94 | 3.02 | 233 | |||||||||
| (.43 | ) | 11.17 | 13.07 | 155,358 | 1.01 | .87 | 3.62 | 206 | |||||||||
| (.23 | ) | 11.14 | 4.20 | 1,214,059 | .70 | .70 | 1.64 | 133 | |||||||||
| (.45 | ) | 10.91 | (.24 | ) | 1,272,388 | .70 | .70 | 1.79 | 104 | ||||||||
| (.39 | ) | 11.39 | 8.78 | 1,312,829 | .69 | .69 | 2.63 | 186 | |||||||||
| (.62 | ) | 10.85 | 3.27 | 1,318,893 | .70 | .69 | 3.27 | 233 | |||||||||
| (.46 | ) | 11.14 | 13.17 | 1,339,399 | .68 | .64 | 3.86 | 206 | |||||||||
| (.22 | ) | 11.29 | 4.19 | 4,052,322 | .78 | .75 | 1.60 | 133 | |||||||||
| (.45 | ) | 11.05 | (.34 | ) | 4,152,586 | .78 | .76 | 1.72 | 104 | ||||||||
| (.38 | ) | 11.53 | 8.71 | 3,773,716 | .77 | .75 | 2.55 | 186 | |||||||||
| (.61 | ) | 10.98 | 3.15 | 3,220,163 | .78 | .75 | 3.19 | 233 | |||||||||
| (.45 | ) | 11.27 | 13.13 | 2,536,795 | .76 | .71 | 3.77 | 206 | |||||||||
| (.23 | ) | 11.15 | 4.31 | 1,778,627 | .59 | .59 | 1.75 | 133 | |||||||||
| (.47 | ) | 10.92 | (.15 | ) | 2,522,793 | .58 | .58 | 1.90 | 104 | ||||||||
| (.40 | ) | 11.40 | 8.89 | 2,585,753 | .59 | .59 | 2.73 | 186 | |||||||||
| (.63 | ) | 10.86 | 3.36 | 2,756,966 | .60 | .59 | 3.38 | 233 | |||||||||
| (.47 | ) | 11.15 | 13.35 | 2,946,842 | .59 | .56 | 3.97 | 206 | |||||||||
See accompanying notes which are an integral part of the financial statements.
Russell Strategic Bond Fund 427
Russell Investment Company Russell Investment Grade Bond Fund
Portfolio Management Discussion and Analysis — October 31, 2014 (Unaudited)

| Russell Investment Grade Bond Fund - Class A‡ | �� | Russell Investment Grade Bond Fund - Class S‡‡‡ | |||||
| Total | Total | ||||||
| Return | Return | ||||||
| 1 Year | (0.17 | )% | 1 Year | 3.97 | % | ||
| 5 Years | 3.63 | %§ | 5 Years | 4.67 | %§ | ||
| 10 Years | 4.04 | %§ | 10 Years | 4.66 | %§ | ||
| Russell Investment Grade Bond Fund - Class C‡‡ | Russell Investment Grade Bond Fund - Class Y | ||||||
| Total | Total | ||||||
| Return | Return | ||||||
| 1 Year | 2.94 | % | 1 Year | 4.21 | % | ||
| 5 Years | 3.63 | %§ | 5 Years | 4.87 | %§ | ||
| 10 Years | 3.84 | %§ | 10 Years | 4.81 | %§ | ||
| Russell Investment Grade Bond Fund - Class E | Barclays U.S. Aggregate Bond Index** | ||||||
| Total | Total | ||||||
| Return | Return | ||||||
| 1 Year | 3.71 | % | 1 Year | 4.14 | % | ||
| 5 Years | 4.46 | %§ | 5 Years | 4.22 | %§ | ||
| 10 Years | 4.46 | %§ | 10 Years | 4.64 | %§ | ||
| Russell Investment Grade Bond Fund - Class I | |||||||
| Total | |||||||
| Return | |||||||
| 1 Year | 4.05 | % | |||||
| 5 Years | 4.76 | %§ | |||||
| 10 Years | 4.74 | %§ | |||||
428 Russell Investment Grade Bond Fund
Russell Investment Company Russell Investment Grade Bond Fund
Portfolio Management Discussion and Analysis, continued — October 31, 2014 (Unaudited)
| The Russell Investment Grade Bond Fund (the “Fund”) employs | a better ability for issuers to pay their debt burden. This may |
| a multi-manager approach whereby portions of the Fund | also be generalized as a “risk on” market where investors are |
| are allocated to different money managers. Fund assets not | generally bullish about the economy, where credit spreads tighten |
| allocated to money managers are managed by Russell Investment | and yields rise. Environments that feature mass sell offs in fixed |
| Management Company (“RIMCo”), the Fund’s advisor. RIMCo | income risk assets (e.g., the recent global financial crisis) will |
| may change the allocation of the Fund’s assets among money | tend to be unfavorable for the Fund. Given the Fund’s strategy |
| managers at any time. An exemptive order from the Securities | and positioning, these broad factors had a negative impact on |
| and Exchange Commission (“SEC”) permits RIMCo to engage | Fund performance over the year. A short duration position was |
| or terminate a money manager at any time, subject to approval | a primary detractor to results, as yields unexpectedly decreased |
| by the Fund’s Board, without a shareholder vote. Pursuant to the | over the period. |
| terms of the exemptive order, the Fund is required to notify its | |
| shareholders within 90 days of when a money manager begins | How did the investment strategies and techniques employed |
| providing services. As of October 31, 2014, the Fund had five | by the Fund and its money managers affect its benchmark- |
| money managers. | relative performance? |
| Among most share classes, the Russell Investment Grade Bond | |
| What is the Fund’s investment objective? | Fund underperformed its benchmark during the fiscal year. A |
| The Fund seeks to provide current income and the preservation | key detractor during the period was the Fund’s short duration |
| of capital. | position in the first part of 2014 as the U.S. yield curve flattened |
| How did the Fund perform relative to its benchmark for the | against expectations. To a lesser extent, selection across agency |
| fiscal year ended October 31, 2014? | mortgage-backed securities also detracted from performance. |
| However, exposure to non-agency mortgage-backed securities | |
| For the fiscal year ended October 31, 2014, the Fund’s Class A, | such as sub-prime mortgages added value over the period given |
| Class C, Class E, Class I, Class S and Class Y Shares gained 3.70%, | general housing improvements, and security selection within |
| 2.94%, 3.71%, 4.05%, 3.97% and 4.21%, respectively. This is | investment grade corporate bonds had positive results in the |
| compared to the Fund’s benchmark, the Barclays U.S. Aggregate | setting of U.S. economic strengthening. |
| Bond Index, which gained 4.14% during the same period. The | |
| Fund’s performance includes operating expenses, whereas index | Logan Circle Partners, L.P. (“Logan Circle”) outperformed the |
| returns are unmanaged and do not include expenses of any kind. | Fund’s benchmark for the fiscal year. Market conditions were |
| For the fiscal year ended October 31, 2014, the Morningstar® | generally favorable to the manager’s portfolio and positive results |
| were specifically achieved via positive security selection within | |
| Intermediate-Term Bond, a group of funds that Morningstar | investment grade corporate credit. Allocations to country interest |
| considers to have investment strategies similar to those of the | rates and an overweight position to hard currency emerging |
| Fund, gained 4.08%. This return serves as a peer comparison | market debt also materially contributed to positive benchmark- |
| and is expressed net of operating expenses. | relative performance. Issuer selection within agency and |
| How did the market conditions described in the Market | commercial mortgage-backed securities was also beneficial over |
| Summary report affect the Fund’s performance? | the one-year period. An allocation to asset-backed securities, a |
| Despite a rough start at the beginning of the one-year period, the | sector including auto, credit card, and student loans, added the |
| U.S. bond market turned around in 2014 resulting in generally | least value over the period, but was still a positive contributor to |
| positive performance among bonds over the fiscal year. Various | results. |
| positive factors included: strengthening data for U.S. growth amid | Loomis, Sayles & Company, L.P. (“Loomis”) was hired in June |
| heightened geopolitical tension in select emerging economies, | 2014 and outperformed the Fund’s benchmark for the portion of |
| which drove a U.S. Treasury rally and robust U.S. dollar | the fiscal year it was a manager in the Fund. During this time, |
| appreciation; continued improvements in housing fundamentals; | yield curve positioning was a most positive contributor, namely |
| ongoing low interest rates that fueled issuance activity; and | a long duration position amid longer-maturity bonds as the U.S. |
| sustained investor demand. | yield curve continued to flatten. Sector positioning was marginally |
| The Fund will tend to perform well in markets where non- | positive, with a minor underweight to corporate bonds adding |
| treasury sectors lead. These are generally environments where | value alongside a modest bias toward non-agency (such as sub- |
| the economy is stable and a higher coupon can be clipped, or | prime) over agency mortgages. A material preference for financial |
| environments where corporate profits are increasing, providing | corporate bonds over industrial corporate bonds also contributed |
| positively. | |
Russell Investment Grade Bond Fund 429
Russell Investment Company Russell Investment Grade Bond Fund
Portfolio Management Discussion and Analysis, continued — October 31, 2014 (Unaudited)
| Macro Currency Group (“Macro”) underperformed the Fund’s | In March 2014, RIMCo implemented a three-pronged strategy | |
| benchmark for the fiscal year. Despite positive attribution from | to seek to generate active returns through currency positioning | |
| top-down, macro selections within a thematic strategy based on | by supplementing the Fund’s existing active currency mandate | |
| developed market central bank policies, allocations amid market | with a more mechanistic strategy and to further reduce the | |
| volatility detracted from performance. In response to heightened | Fund’s reliance on traditional fixed income market risks. This | |
| volatility, Macro deployed an additional thematic strategy toward | approach incorporates a currency overlay, an index replication | |
| the end of the summer of 2014. This latter strategy included a | and an enhanced cash strategy. The currency overlay utilizes | |
| long position to the Japanese Yen (JPY) versus a short position to | currency forward contracts to take long and short positions in | |
| the Australian Dollar (AUD) that led to negative results when the | global foreign exchange markets. Because the currency overlay | |
| AUD failed to sell-off at the same rate as JPY. | is an out-of-benchmark position, RIMCo implemented an index | |
| Metropolitan West Asset Management, LLC (“Met West”) | replication strategy in connection with the currency overlay to | |
| outperformed the Fund’s benchmark for the fiscal year. Exposure | provide benchmark-like exposure to its | overall strategy. The |
| to, and security selection within, non-agency residential | enhanced cash strategy is designed to provide for modest returns | |
| mortgage-backed securities consistently contributed positively | on the cash held in connection with the currency overlay and | |
| throughout the one-year period. General allocations to asset- | index replication strategies. For the portion of the fiscal year in | |
| and commercial-mortgage backed securities, or sectors tied to | which it was employed in the Fund, the currency overlay strategy | |
| securitized assets such as credit cards, student loans, shopping | was positive for Fund performance, as was the underlying index | |
| malls, or apartment complexes, also contributed positively, but | replication strategy, due to its slightly greater interest rate | |
| to a lesser extent. Selections to corporate bonds detracted from | sensitivity as yields fell. | |
| performance throughout the period, whereas detractions from | ||
| positioning along the U.S. yield curve only negatively impacted | RIMCo also implemented tactical ‘tilts’ in March 2014 based | |
| performance at the start of the period. | on its judgments regarding shorter-term opportunities to seek to | |
| Neuberger Berman Fixed Income LLC (“Neuberger”) | generate returns and/or mitigate risk by purchasing and shorting | |
| outperformed the Fund’s benchmark for the fiscal year. Market | U.S. Treasury futures and currency forward contracts. These tilts | |
| conditions were most favorable to the manager’s investment-grade | detracted modestly during the period as negative impacts from | |
| corporate bond allocations, where security selections within | RIMCo’s Treasury futures selections outweighed positive results | |
| investment grade financials and industrials added the greatest | from currency forward contracts. | |
| value to performance results. Issuer selections across securitized | ||
| sectors, including agency, non-agency, and commercial-mortgage | Describe any changes to the Fund’s structure or the money | |
| backed bonds, were also positive contributors to performance for | manager line-up. | |
| the period. | In June 2014, RIMCo terminated Pacific Investment Management | |
| Company as a money manager for the Fund and hired Loomis, | ||
| Pacific Investment Management Company LLC (“PIMCO”) | Sayles & Company, L.P. as a money manager for the Fund. There | |
| was terminated in June 2014 and underperformed the Fund’s | were some minor re-weightings among managers and strategies | |
| benchmark for the portion of the fiscal year it was a manager in the | within the Fund as a result of these changes. | |
| Fund. Adverse yield curve and interest rate positioning was the | ||
| primary driver to negative results. In particular, an underweight | Money Managers as of October 31, | |
| to longer-term securities was a key detractor. | 2014 | Styles |
| RIMCo manages the portion of the Fund’s assets that RIMCo | Logan Circle Partners, L.P. | Fully Discretionary |
| determines not to allocate to the money managers. Assets not | Loomis, Sayles & Company, L.P. | Fully Discretionary |
| allocated to managers include the Fund’s liquidity reserves and | Macro Currency Group – an investment | Fully Discretionary |
| assets which may be managed directly by RIMCo to modify the | group within Principal Global Investors LLC¹ | |
| Metropolitan West Asset Management, LLC | Fully Discretionary | |
| Fund’s overall portfolio characteristics to seek to achieve the | Neuberger Berman Fixed Income LLC | Enhanced Core |
| desired risk/return profile for the Fund. | ||
| During the period, RIMCo utilized futures and swaps to seek to | ¹ Principal Global Investors LLC is the asset management arm of the Principal | |
| achieve the Fund benchmark’s duration exposures with respect to | Financial Group® (The Principal®), which includes various member companies | |
| the portion of the Fund allocated to cash reserves. While this was | including Principal Global Investors LLC, Principal Global Investors (Europe) | |
| Limited, and others. The Macro Currency Group is the specialist currency | ||
| a positive in terms of absolute return contribution, it detracted | investment group within Principal Global Investors. Where used herein, Macro | |
| relative to the benchmark. | Currency Group means Principal Global Investors LLC. | |
430 Russell Investment Grade Bond Fund
Russell Investment Company Russell Investment Grade Bond Fund
Portfolio Management Discussion and Analysis, continued — October 31, 2014 (Unaudited)
The views expressed in this report reflect those of the portfolio
managers only through the end of the period covered by
the report. These views do not necessarily represent the
views of RIMCo, or any other person in RIMCo or any other
affiliated organization. These views are subject to change
at any time based upon market conditions or other events,
and RIMCo disclaims any responsibility to update the views
contained herein. These views should not be relied on as
investment advice and, because investment decisions for
a Russell Investment Company (“RIC”) Fund are based on
numerous factors, should not be relied on as an indication
of investment decisions of any RIC Fund.
| * | Assumes initial investment on November 1, 2004. |
| ** | The Barclays U.S. Aggregate Bond Index is an index, with income reinvested, generally representative of intermediate-term government bonds, investment-grade corporate debt securities and mortgage-backed securities. |
| ‡ | The Fund first issued Class A Shares on June 1, 2010. The returns shown for Class A Shares prior to that date are the returns of Class E Shares. The performance shown has been adjusted to reflect the deduction of the maximum Class A sales charge of 3.75%. Annual returns for each Class will differ only to the extent that the Class A Shares do not have the same expenses as Class E Shares. |
| ‡‡ | The Fund first issued Class C Shares on October 22, 2007. The returns shown for Class C Shares prior to that date are the returns of the Fund’s Class E Shares and do not reflect deduction of Rule 12b-1 distribution fees that apply to Class C Shares. Had they done so, the returns shown for those periods would have been lower. However, the returns for Class C Shares would be substantially similar to those of Class E Shares because they are invested in the same portfolio of securities. Annual returns for each Class will differ only to the extent that the Class C Shares do not have the same expenses as the Class E Shares. |
| ‡‡‡ | The Fund first issued Class S Shares on October 22, 2007. The returns shown for Class S Shares prior to that date are the returns of the Fund’s Class I Shares. However, the returns for Class S Shares would be substantially similar to those of Class I Shares because they are invested in the same portfolio of securities. Annual returns for each Class will differ only to the extent that the Class S Shares do not have the same expenses as the Class I Shares. |
| § | Annualized. |
Performance is historical and assumes reinvestment of all dividends and capital gains. Investment return and principal value will fluctuate so that an investor’s shares, when redeemed, may be worth more or less than when purchased. Past performance is not indicative of future results. The returns shown do not reflect the deduction of taxes that a shareholder would pay on Fund distributions or the redemption of Fund shares.
Russell Investment Grade Bond Fund 431
Russell Investment Company Russell Investment Grade Bond Fund
Shareholder Expense Example — October 31, 2014 (Unaudited)
| Fund Expenses | Please note that the expenses shown in the table are meant | |||||
| The following disclosure provides important information | to highlight your ongoing costs only and do not reflect any | |||||
| regarding the Fund’s Shareholder Expense Example | transactional costs. Therefore, the information under the heading | |||||
| (“Example”). | “Hypothetical Performance (5% return before expenses)” is | |||||
| useful in comparing ongoing costs only, and will not help you | ||||||
| Example | determine the relative total costs of owning different funds. In | |||||
| As a shareholder of the Fund, you incur two types of costs: (1) | addition, if these transactional costs were included, your costs | |||||
| transaction costs, and (2) ongoing costs, including advisory and | would have been higher. | |||||
| administrative fees; distribution (12b-1) and/or service fees; | Hypothetical | |||||
| and other Fund expenses. The Example is intended to help | Performance (5% | |||||
| you understand your ongoing costs (in dollars) of investing in | Actual | return before | ||||
| the Fund and to compare these costs with the ongoing costs of | Class A | Performance | expenses) | |||
| Beginning Account Value | ||||||
| investing in other mutual funds. The Example is based on an | May 1, 2014 | $ | 1,000.00 | $ | 1,000.00 | |
| investment of $1,000 invested at the beginning of the period and | Ending Account Value | |||||
| held for the entire period indicated, which for this Fund is from | October 31, 2014 | $ | 1,022.60 | $ | 1,021.07 | |
| May 1, 2014 to October 31, 2014. | Expenses Paid During Period* | $ | 4.18 | $ | 4.18 | |
| Actual Expenses | * Expenses are equal to the Fund's annualized expense ratio of 0.82% | |||||
| (representing the six month period annualized), multiplied by the average | ||||||
| The information in the table under the heading “Actual | account value over the period, multiplied by 184/365 (to reflect the one-half | |||||
| Performance” provides information about actual account values | year period). | |||||
| and actual expenses. You may use the information in this column, | ||||||
| together with the amount you invested, to estimate the expenses | Hypothetical | |||||
| Performance (5% | ||||||
| that you paid over the period. Simply divide your account value by | Actual | return before | ||||
| $1,000 (for example, an $8,600 account value divided by $1,000 | Class C | Performance | expenses) | |||
| = 8.6), then multiply the result by the number in the first column | Beginning Account Value | |||||
| in the row entitled “Expenses Paid During Period” to estimate | May 1, 2014 | $ | 1,000.00 | $ | 1,000.00 | |
| Ending Account Value | ||||||
| the expenses you paid on your account during this period. | October 31, 2014 | $ | 1,018.40 | $ | 1,017.39 | |
| Expenses Paid During Period* | $ | 7.89 | $ | 7.88 | ||
| Hypothetical Example for Comparison Purposes | ||||||
| The information in the table under the heading “Hypothetical | * Expenses are equal to the Fund's annualized expense ratio of 1.55% | |||||
| Performance (5% return before expenses)” provides information | (representing the six month period annualized), multiplied by the average | |||||
| account value over the period, multiplied by 184/365 (to reflect the one-half | ||||||
| about hypothetical account values and hypothetical expenses | year period). | |||||
| based on the Fund’s actual expense ratio and an assumed rate of | ||||||
| return of 5% per year before expenses, which is not the Fund’s | Hypothetical | |||||
| actual return. The hypothetical account values and expenses | Performance (5% | |||||
| Actual | return before | |||||
| may not be used to estimate the actual ending account balance or | Class E | Performance | expenses) | |||
| expenses you paid for the period. You may use this information | Beginning Account Value | |||||
| to compare the ongoing costs of investing in the Fund and other | May 1, 2014 | $ | 1,000.00 | $ | 1,000.00 | |
| funds. To do so, compare this 5% hypothetical example with the | Ending Account Value | |||||
| October 31, 2014 | $ | 1,022.20 | $ | 1,021.17 | ||
| 5% hypothetical examples that appear in the shareholder reports | Expenses Paid During Period* | $ | 4.08 | $ | 4.08 | |
| of other funds. | ||||||
| * Expenses are equal to the Fund's annualized expense ratio of 0.80% | ||||||
| (representing the six month period annualized), multiplied by the average | ||||||
| account value over the period, multiplied by 184/365 (to reflect the one-half | ||||||
| year period). | ||||||
432 Russell Investment Grade Bond Fund
Russell Investment Company Russell Investment Grade Bond Fund
Shareholder Expense Example, continued — October 31, 2014 (Unaudited)
| Hypothetical | |||||
| Performance (5% | |||||
| Actual | return before | ||||
| Class I | Performance | expenses) | |||
| Beginning Account Value | |||||
| May 1, 2014 | $ | 1,000.00 | $ | 1,000.00 | |
| Ending Account Value | |||||
| October 31, 2014 | $ | 1,023.90 | $ | 1,022.84 | |
| Expenses Paid During Period* | $ | 2.40 | $ | 2.40 | |
| * Expenses are equal to the Fund's annualized expense ratio of 0.47% | |||||
| (representing the six month period annualized), multiplied by the average | |||||
| account value over the period, multiplied by 184/365 (to reflect the one-half | |||||
| year period). | |||||
| Hypothetical | |||||
| Performance (5% | |||||
| Actual | return before | ||||
| Class S | Performance | expenses) | |||
| Beginning Account Value | |||||
| May 1, 2014 | $ | 1,000.00 | $ | 1,000.00 | |
| Ending Account Value | |||||
| October 31, 2014 | $ | 1,023.50 | $ | 1,022.43 | |
| Expenses Paid During Period* | $ | 2.81 | $ | 2.80 | |
| * Expenses are equal to the Fund's annualized expense ratio of 0.55% | |||||
| (representing the six month period annualized), multiplied by the average | |||||
| account value over the period, multiplied by 184/365 (to reflect the one-half | |||||
| year period). | |||||
| Hypothetical | |||||
| Performance (5% | |||||
| Actual | return before | ||||
| Class Y | Performance | expenses) | |||
| Beginning Account Value | |||||
| May 1, 2014 | $ | 1,000.00 | $ | 1,000.00 | |
| Ending Account Value | |||||
| October 31, 2014 | $ | 1,024.90 | $ | 1,023.39 | |
| Expenses Paid During Period* | $ | 1.84 | $ | 1.84 | |
| * Expenses are equal to the Fund's annualized expense ratio of 0.36% | |||||
| (representing the six month period annualized), multiplied by the average | |||||
| account value over the period, multiplied by 184/365 (to reflect the one-half | |||||
| year period). | |||||
Russell Investment Grade Bond Fund 433
| Russell Investment Company | |||||||||
| Russell Investment Grade Bond Fund | |||||||||
| Schedule of Investments — October 31, 2014 | |||||||||
| Amounts in thousands (except share amounts) | Amounts in thousands (except share amounts) | ||||||||
| Principal | Fair | Principal | Fair | ||||||
| Amount ($) | Value | Amount ($) | Value | ||||||
| or Shares | $ | or Shares | $ | ||||||
| Long-Term Investments - 88.7% | Series 2012-1 Class A3 | ||||||||
| 0.780% due 06/15/16 | 1,018 | 1,019 | |||||||
| Asset-Backed Securities - 8.4% | Bayview Financial Acquisition Trust | ||||||||
| Access Group, Inc. | Series 2006-A Class 1A3 | ||||||||
| Series 2004-2 Class A3 | 5.865% due 02/28/41 | 410 | 421 | ||||||
| 0.424% due 10/25/24 (Ê) | 700 | 655 | Bear Stearns Asset Backed Securities | ||||||
| Accredited Mortgage Loan Trust | I Trust | ||||||||
| Series 2007-1 Class A4 | Series 2005-TC2 Class A3 | ||||||||
| 0.372% due 02/25/37 (Ê) | 2,583 | 2,025 | 0.525% due 08/25/35 (Ê) | 436 | 433 | ||||
| Ally Auto Receivables Trust | BMW Vehicle Owner Trust | ||||||||
| Series 2011-1 Class A4 | Series 2011-A Class A4 | ||||||||
| 2.230% due 03/15/16 | 310 | 310 | 1.030% due 02/26/18 | 1,192 | 1,194 | ||||
| Series 2012-1 Class A4 | BNC Mortgage Loan Trust | ||||||||
| 1.210% due 07/15/16 | 770 | 773 | Series 2008-4 Class A3A | ||||||
| Series 2012-3 Class A3 | 0.402% due 11/25/37 (Ê) | 98 | 97 | ||||||
| 0.850% due 08/15/16 | 2,420 | 2,423 | Brazos Higher Education Authority | ||||||
| Series 2012-4 Class A3 | Series 2010-1 Class A2 | ||||||||
| 0.590% due 01/17/17 | 2,487 | 2,489 | 1.438% due 02/25/35 (Ê) | 1,100 | 1,138 | ||||
| Series 2013-1 Class A3 | Series 2011-2 Class A3 | ||||||||
| 0.630% due 05/15/17 | 1,186 | 1,187 | 1.234% due 10/27/36 (Ê) | 725 | 737 | ||||
| Series 2014-2 Class A3 | California Republic Auto Receivables | ||||||||
| 1.250% due 04/15/19 | 415 | 416 | Trust | ||||||
| Ally Master Owner Trust | 1.570% due 12/16/19 | 894 | 894 | ||||||
| Series 2013-1 Class A2 | Capital Auto Receivables Asset Trust | ||||||||
| 1.000% due 02/15/18 | 2,330 | 2,335 | Series 2013-1 Class B | ||||||
| Alm Loan Funding | 1.290% due 04/20/18 | 1,450 | 1,453 | ||||||
| Series 2012-7A Class A1 | CarFinance Capital Auto Trust | ||||||||
| 1.651% due 10/19/24 (Å)(Ê) | 750 | 746 | Series 2014-1A Class A | ||||||
| American Express Credit Account | 1.460% due 12/17/18 (Þ) | 781 | 783 | ||||||
| Master Trust | Carnow Auto Receivables Trust | ||||||||
| Series 2012-2 Class A | Series 2014-1A Class A | ||||||||
| 0.680% due 03/15/18 | 690 | 691 | 0.960% due 01/17/17 (Þ) | 780 | 780 | ||||
| American Express Issuance Trust | Carrington Mortgage Loan Trust | ||||||||
| 0.582% due 08/15/19 | 892 | 895 | Series 2005-NC3 Class M1 | ||||||
| American Homes 4 Rent | 0.592% due 06/25/35 (Ê) | 1,547 | 1,545 | ||||||
| Series 2014-SFR2 Class A | Series 2005-NC5 Class A2 | ||||||||
| 3.786% due 10/17/36 (Þ) | 980 | 988 | 0.472% due 10/25/35 (Ê) | 18 | 18 | ||||
| American Money Management Corp. | CCG Receivables Trust | ||||||||
| 1.680% due 07/27/26 | 750 | 745 | Series 2013-1 Class A2 | ||||||
| Americredit Automobile Receivables | 1.050% due 08/14/20 (Þ) | 632 | 633 | ||||||
| Trust | Series 2014-1 Class A2 | ||||||||
| 1.920% due 11/08/19 | 240 | 241 | 1.060% due 11/15/21 (Þ) | 765 | 765 | ||||
| AmeriCredit Automobile Receivables | Centex Home Equity Loan Trust | ||||||||
| Trust | Series 2003-B Class AF4 | ||||||||
| Series 2012-5 Class A3 | 3.735% due 02/25/32 | 2,253 | 2,268 | ||||||
| 0.620% due 06/08/17 | 604 | 604 | Series 2005-D Class M1 | ||||||
| Series 2013-2 Class A2 | 0.582% due 10/25/35 (Ê) | 1,545 | 1,513 | ||||||
| 0.530% due 11/08/16 | 187 | 187 | CFC LLC | ||||||
| Series 2013-3 Class A2 | Series 2013-1A Class A | ||||||||
| 0.680% due 10/11/16 | 651 | 651 | 1.650% due 07/17/17 (Þ) | 321 | 321 | ||||
| Series 2014-1 Class A2 | Chase Issuance Trust | ||||||||
| 0.570% due 07/10/17 | 1,432 | 1,432 | Series 2012-A3 Class A3 | ||||||
| Series 2014-2 Class A2B | 0.790% due 06/15/17 | 2,155 | 2,159 | ||||||
| 0.433% due 10/10/17 (Ê) | 2,215 | 2,215 | Chesapeake Funding LLC | ||||||
| Ameriquest Mortgage Securities, Inc. | Series 2014-1A Class C | ||||||||
| 0.580% due 07/25/35 | 1,518 | 1,517 | 1.353% due 03/07/26 (Ê)(Þ) | 365 | 365 | ||||
| Series 2005-R10 Class A2B | CIT Education Loan Trust | ||||||||
| 0.372% due 01/25/36 (Ê) | 125 | 125 | Series 2007-1 Class A | ||||||
| Argent Securities, Inc. | 0.324% due 03/25/42 (Ê)(Þ) | 866 | 823 | ||||||
| Series 2005-W2 Class A2B1 | Citibank Credit Card Issuance Trust | ||||||||
| 0.352% due 10/25/35 (Ê) | 256 | 255 | Series 2006-A7 Class A7 | ||||||
| Asset Backed Funding Certificates | 0.294% due 12/17/18 (Ê) | 2,060 | 2,054 | ||||||
| Series 2005-WMC1 Class M1 | Series 2014-A8 Class A8 | ||||||||
| 0.812% due 06/25/35 (Ê) | 609 | 600 | 1.730% due 04/09/20 | 1,057 | 1,061 | ||||
| Bank of America Auto Trust | |||||||||
See accompanying notes which are an integral part of the financial statements.
434 Russell Investment Grade Bond Fund
| Russell Investment Company | ||||||||||
| Russell Investment Grade Bond Fund | ||||||||||
| Schedule of Investments, continued — October 31, 2014 | ||||||||||
| Amounts in thousands (except share amounts) | Amounts in thousands (except share amounts) | |||||||||
| Principal | Fair | Principal | Fair | |||||||
| Amount ($) | Value | Amount ($) | Value | |||||||
| or Shares | $ | or Shares | $ | |||||||
| CountryPlace Manufactured Housing | 1.607% due 07/17/26 | 730 | 724 | |||||||
| Contract Trust | Ford Credit Auto Lease Trust | |||||||||
| Series 2005-1 Class A4 | 1.100% due 11/15/17 | 823 | 825 | |||||||
| 5.200% due 12/15/35 (Þ) | 675 | 712 | Ford Credit Auto Owner Trust | |||||||
| Countrywide Asset-Backed Certificates | 1.420% due 08/15/19 | 1,364 | 1,368 | |||||||
| Series 2006-BC1 Class 1A | Series 2011-B Class A4 | |||||||||
| 0.352% due 04/25/36 (Ê) | 443 | 396 | 1.350% due 12/15/16 | 339 | 340 | |||||
| Series 2006-BC4 Class 2A2 | Series 2012-A Class A3 | |||||||||
| 0.312% due 11/25/36 (Ê) | 1,185 | 1,110 | 0.840% due 08/15/16 | 288 | 288 | |||||
| CPS Auto Receivables Trust | Series 2012-D Class A3 | |||||||||
| Series 2014-C Class A | 0.510% due 04/15/17 | 653 | 653 | |||||||
| 1.310% due 02/15/19 (Þ) | 554 | 554 | Series 2014-2 Class A | |||||||
| Credit Acceptance Auto Loan Trust | ||||||||||
| Series 2014-2A Class A | 2.310% due 04/15/26 (Þ) | 669 | 671 | |||||||
| 1.880% due 03/15/22 (Þ) | 465 | 465 | Series 2014-A Class A2 | |||||||
| Credit-Based Asset Servicing and | 0.480% due 11/15/16 | 668 | 668 | |||||||
| Securitization LLC | Global SC Finance SRL | |||||||||
| Series 2004-CB7 Class AF5 | 3.090% due 07/17/29 | 863 | 851 | |||||||
| 4.922% due 10/25/34 | 371 | 387 | Higher Education Funding I | |||||||
| Series 2005-CB5 Class AV2 | Series 2014-1 Class A | |||||||||
| 0.415% due 08/25/35 (Ê) | 9 | 9 | 1.288% due 05/25/34 (Ê)(Þ) | 706 | 714 | |||||
| Discover Card Execution Note Trust | Honda Auto Receivables Owner Trust | |||||||||
| 0.525% due 11/15/19 | 585 | 587 | 0.480% due 12/15/16 | 931 | 931 | |||||
| 2.120% due 12/15/21 | 600 | 603 | 1.310% due 10/15/20 | 559 | 558 | |||||
| Series 2012-A1 Class A1 | Series 2012-1 Class A4 | |||||||||
| 0.810% due 08/15/17 | 2,120 | 2,123 | 0.970% due 04/16/18 | 750 | 752 | |||||
| Series 2014-A5 Class A | Series 2012-2 Class A3 | |||||||||
| 1.390% due 04/15/20 | 783 | 783 | 0.700% due 02/16/16 | 734 | 735 | |||||
| DT Auto Owner Trust | HSBC Home Equity Loan Trust | |||||||||
| Series 2013-2A Class A | Series 2006-1 Class A1 | |||||||||
| 0.810% due 09/15/16 (Þ) | 269 | 270 | 0.317% due 01/20/36 (Ê) | 719 | 715 | |||||
| Education Loan Asset-Backed Trust I | Hyundai Auto Receivables Trust | |||||||||
| Series 2013-1 Class B1 | Series 2011-C Class A4 | |||||||||
| 1.152% due 11/25/33 (Ê)(Þ) | 1,740 | 1,620 | 1.300% due 02/15/18 | 1,756 | 1,766 | |||||
| Educational Funding of the South, Inc. | Series 2012-A Class A3 | |||||||||
| Series 2011-1 Class A2 | 0.720% due 03/15/16 | 4 | 4 | |||||||
| 0.884% due 04/25/35 (Ê) | 742 | 744 | Series 2013-A Class A3 | |||||||
| EFS Volunteer No. 3 LLC | 0.560% due 07/17/17 | 2,051 | 2,053 | |||||||
| Series 2012-1 Class A3 | JGWPT XXX LLC | |||||||||
| 1.155% due 04/25/33 (Ê)(Þ) | 775 | 786 | Series 2013-3A Class A | |||||||
| Exeter Automobile Receivables Trust | 4.080% due 01/17/73 (Þ) | 464 | 488 | |||||||
| Series 2013-1A Class A | JGWPT XXXII LLC | |||||||||
| 1.290% due 10/16/17 (Þ) | 333 | 334 | Series 2014-2A Class A | |||||||
| Series 2014-3A Class A | 3.610% due 01/17/73 (Þ) | 609 | 619 | |||||||
| 1.320% due 01/15/19 (Þ) | 775 | 775 | Lehman ABS Manufactured Housing | |||||||
| Fannie Mae Grantor Trust | Contract Trust | |||||||||
| Series 2003-T4 Class 1A | Series 2001-B Class A4 | |||||||||
| 0.372% due 09/26/33 (Ê) | 112 | 110 | 5.270% due 04/15/40 | 451 | 483 | |||||
| Series 2003-T4 Class 2A5 | Morgan Stanley ABS Capital I, Inc. Trust | |||||||||
| 5.407% due 09/26/33 | 736 | 805 | Series 2003-NC6 Class M1 | |||||||
| Fannie Mae REMICS | 1.352% due 06/25/33 (Ê) | 266 | 258 | |||||||
| Series 1999-56 Class Z | Series 2003-NC7 Class M1 | |||||||||
| 7.000% due 12/18/29 | 95 | 108 | 1.202% due 06/25/33 (Ê) | 224 | 211 | |||||
| Fannie Mae Whole Loan | Navient Student Loan Trust | |||||||||
| Series 2003-W5 Class A | Series 2014-2 Class A | |||||||||
| 0.372% due 04/25/33 (Ê) | 45 | 44 | 0.797% due 03/25/43 (Ê) | 1,506 | 1,497 | |||||
| Series 2003-W9 Class A | Series 2014-3 Class A | |||||||||
| 0.392% due 06/25/33 (Ê) | 64 | 62 | 0.777% due 03/25/43 (Ê) | 1,956 | 1,958 | |||||
| Flagship CLO | Series 2014-AA Class A2A | |||||||||
| Series 2014-8A Class A | 2.740% due 02/15/29 (Þ) | 1,285 | 1,284 | |||||||
| 1.773% due 01/16/26 (Å)(Ê) | 620 | 620 | Nelnet Student Loan Trust | |||||||
| Flagship Credit Auto Trust | Series 2011-1A Class A | |||||||||
| Series 2014-2 Class A | 1.002% due 02/25/43 (Ê)(Þ) | 1,383 | 1,403 | |||||||
| 1.430% due 12/16/19 (Þ) | 745 | 745 | Series 2014-4A Class A2 | |||||||
| Flatiron CLO, Ltd. | 1.102% due 11/25/43 (Ê)(Þ) | 725 | 725 | |||||||
| See accompanying notes which are an integral part of the financial statements. | ||||||||||
| Russell Investment Grade Bond Fund 435 | ||||||||||
| Russell Investment Company | ||||||||||
| Russell Investment Grade Bond Fund | ||||||||||
| Schedule of Investments, continued — October 31, 2014 | ||||||||||
| Amounts in thousands (except share amounts) | Amounts in thousands (except share amounts) | |||||||||
| Principal | Fair | Principal | Fair | |||||||
| Amount ($) | Value | Amount ($) | Value | |||||||
| or Shares | $ | or Shares | $ | |||||||
| New Century Home Equity Loan Trust | Series 2013-A Class A2 | |||||||||
| Series 2005-2 Class M1 | 0.800% due 10/17/16 (Þ) | 196 | 196 | |||||||
| 0.582% due 06/25/35 (Ê) | 1,924 | 1,912 | Series 2014-1 Class A2A | |||||||
| Series 2005-4 Class A2C | 0.660% due 06/15/17 | 1,139 | 1,139 | |||||||
| 0.522% due 09/25/35 (Ê) | 1,269 | 1,260 | Series 2014-4 Class B | |||||||
| Nissan Auto Lease Trust | 1.820% due 05/15/19 | 1,264 | 1,268 | |||||||
| Series 2012-B Class A4 | Saxon Asset Securities Trust | |||||||||
| 0.740% due 09/17/18 | 455 | 455 | Series 2004-1 Class A | |||||||
| Nissan Auto Receivables Owner Trust | 0.695% due 03/25/35 (Ê) | 57 | 50 | |||||||
| Series 2011-B Class A3 | SLM Private Education Loan Trust | |||||||||
| 0.950% due 02/16/16 | 186 | 186 | Series 2010-A Class 2A | |||||||
| Series 2011-B Class A4 | 3.403% due 05/16/44 (Ê)(Þ) | 2,987 | 3,162 | |||||||
| 1.240% due 01/16/18 | 1,870 | 1,878 | Series 2012-B Class A2 | |||||||
| North Carolina State Education | 3.480% due 10/15/30 (Þ) | 1,470 | 1,534 | |||||||
| Assistance Authority | SLM Student Loan Trust | |||||||||
| Series 2011-2 Class A2 | 0.979% due 10/25/28 | 320 | 290 | |||||||
| 1.034% due 07/25/25 (Ê) | 750 | 754 | 1.229% due 04/27/43 | 300 | 280 | |||||
| OHA Credit Partners VII, Ltd. | Series 2006-2 Class A6 | |||||||||
| Series 2012-7A Class A | 0.404% due 01/25/41 (Ê) | 950 | 876 | |||||||
| 1.652% due 11/20/23 (Ê)(Þ) | 750 | 746 | Series 2006-8 Class A6 | |||||||
| Park Place Securities, Inc. | ||||||||||
| Series 2004-WCW2 Class M1 | 0.394% due 01/25/41 (Ê) | 950 | 865 | |||||||
| 1.082% due 10/25/34 (Ê) | 583 | 583 | Series 2007-6 Class B | |||||||
| Series 2005-WCH1 Class M2 | 1.084% due 04/27/43 (Ê) | 149 | 138 | |||||||
| 0.672% due 01/25/36 (Ê) | 1,081 | 1,075 | Series 2008-2 Class B | |||||||
| Series 2005-WHQ2 Class A1B | 1.434% due 01/25/29 (Ê) | 160 | 146 | |||||||
| 0.422% due 05/25/35 (Ê) | 848 | 845 | Series 2008-3 Class B | |||||||
| Popular ABS Mortgage Pass-Through | 1.434% due 04/25/29 (Ê) | 160 | 147 | |||||||
| Trust | Series 2008-4 Class A4 | |||||||||
| Series 2005-6 Class A3 | 1.884% due 07/25/22 (Ê) | 2,400 | 2,524 | |||||||
| 4.348% due 01/25/36 | 124 | 114 | Series 2008-4 Class B | |||||||
| Prestige Auto Receivables Trust | 2.084% due 04/25/29 (Ê) | 160 | 161 | |||||||
| Series 2013-1A Class A2 | Series 2008-5 Class B | |||||||||
| 1.090% due 02/15/18 (Þ) | 440 | 441 | 2.084% due 07/25/29 (Ê) | 230 | 236 | |||||
| Series 2014-1A Class A3 | Series 2008-6 Class B | |||||||||
| 1.520% due 04/15/20 (Þ) | 900 | 900 | 2.084% due 07/25/29 (Ê) | 160 | 160 | |||||
| RAMP Trust | Series 2008-7 Class B | |||||||||
| Series 2003-RS2 Class AII | 2.084% due 07/25/29 (Ê) | 160 | 161 | |||||||
| 0.832% due 03/25/33 (Ê) | 50 | 45 | Series 2008-8 Class B | |||||||
| Series 2003-RS11 Class AI6A | 2.484% due 10/25/29 (Ê) | 160 | 169 | |||||||
| 5.980% due 12/25/33 | 173 | 186 | Series 2008-9 Class B | |||||||
| RASC Trust | 2.484% due 10/25/29 (Ê) | 230 | 244 | |||||||
| Series 2001-KS3 Class AII | Series 2013-4 Class A | |||||||||
| 0.612% due 09/25/31 (Ê) | 26 | 24 | 0.705% due 06/25/27 (Ê) | 653 | 653 | |||||
| Series 2003-KS4 Class AIIB | Specialty Underwriting & Residential | |||||||||
| 0.732% due 06/25/33 (Ê) | 96 | 86 | Finance Trust | |||||||
| Renaissance Home Equity Loan Trust | Series 2003-BC1 Class A | |||||||||
| Series 2005-2 Class AF4 | 0.832% due 01/25/34 (Ê) | 25 | 22 | |||||||
| 4.934% due 08/25/35 | 585 | 568 | Structured Asset Securities Corp. | |||||||
| Series 2006-1 Class AF6 | Series 2005-WF4 Class A4 | |||||||||
| 5.746% due 05/25/36 | 226 | 167 | 0.512% due 11/25/35 (Ê) | 287 | 286 | |||||
| Santander Drive Auto Receivables Trust | Tidewater Auto Receivables Trust | |||||||||
| 1.000% due 01/16/18 | 912 | 912 | Series 2014-AA Class A3 | |||||||
| 1.620% due 02/15/19 | 957 | 962 | 1.400% due 07/15/18 (Þ) | 1,475 | 1,475 | |||||
| Series 2012-5 Class A3 | Toyota Auto Receivables Owner Trust | |||||||||
| 0.830% due 12/15/16 | 230 | 230 | Series 2013-A Class A3 | |||||||
| Series 2013-1 Class A3 | 0.550% due 01/17/17 | 755 | 756 | |||||||
| 0.620% due 06/15/17 | 1,077 | 1,078 | Series 2014-C Class A2 | |||||||
| Series 2013-1 Class B | 0.510% due 02/15/17 | 978 | 978 | |||||||
| 1.160% due 01/15/19 | 1,795 | 1,799 | Volkswagen Auto Loan Enhanced Trust | |||||||
| Series 2012-1 Class A3 | ||||||||||
| Series 2013-2 Class A3 | 0.850% due 08/22/16 | 775 | 776 | |||||||
| 0.700% due 09/15/17 | 4,458 | 4,462 | ||||||||
| Series 2013-3 Class A3 | Volkswagen Credit Auto Master Trust | |||||||||
| 0.700% due 10/16/17 | 3,610 | 3,612 | 0.506% due 07/22/19 | 652 | 652 | |||||
| World Omni Auto Receivables Trust | ||||||||||
| See accompanying notes which are an integral part of the financial statements. | ||||||||||
| 436 Russell Investment Grade Bond Fund | ||||||||||
| Russell Investment Company | ||||||||||
| Russell Investment Grade Bond Fund | ||||||||||
| Schedule of Investments, continued — October 31, 2014 | ||||||||||
| Amounts in thousands (except share amounts) | Amounts in thousands (except share amounts) | |||||||||
| Principal | Fair | Principal | Fair | |||||||
| Amount ($) | Value | Amount ($) | Value | |||||||
| or Shares | $ | or Shares | $ | |||||||
| Series 2011-A Class A4 | Series FRN | |||||||||
| 1.910% due 04/15/16 | 1,599 | 1,601 | 0.620% due 02/12/16 (Ê) | 647 | 648 | |||||
| Series 2014-B Class A4 | BAE Systems Holdings, Inc. | |||||||||
| 1.680% due 12/15/20 | 722 | 718 | 3.800% due 10/07/24 (Å) | 1,070 | 1,077 | |||||
| 132,216 | Bank of America Corp. | |||||||||
| Corporate Bonds and Notes - 19.0% | 2.000% due 01/11/18 | 2,660 | 2,667 | |||||||
| 21st Century Fox America, Inc. | 2.600% due 01/15/19 | 1,534 | 1,549 | |||||||
| 3.700% due 09/15/24 (Þ) | 1,928 | 1,959 | 4.100% due 07/24/23 | 423 | 441 | |||||
| 6.150% due 02/15/41 | 775 | 954 | 4.200% due 08/26/24 | 1,785 | 1,798 | |||||
| 8.250% due 10/17/96 | 65 | 89 | 4.250% due 10/22/26 | 1,113 | 1,105 | |||||
| Actavis Funding SCS Co. | 5.000% due 01/21/44 | 336 | 367 | |||||||
| 1.300% due 06/15/17 | 350 | 345 | 4.875% due 04/01/44 | 810 | 867 | |||||
| Actavis, Inc. | Bank of America NA | |||||||||
| 1.875% due 10/01/17 | 655 | 649 | Series BKNT | |||||||
| Allstate Corp. (The) | 5.300% due 03/15/17 | 400 | 434 | |||||||
| 5.750% due 08/15/53 | 980 | 1,042 | 0.534% due 06/15/17 (Ê) | 1,340 | 1,330 | |||||
| Altria Group, Inc. | 6.100% due 06/15/17 | 1,900 | 2,108 | |||||||
| 10.200% due 02/06/39 | 539 | 923 | Bank of New York Mellon Corp. (The) | |||||||
| 4.250% due 08/09/42 | 945 | 885 | 1.969% due 06/20/17 | 765 | 780 | |||||
| American Airlines Pass-Through Trust | Series G | |||||||||
| 4.950% due 01/15/23 | 1,180 | 1,260 | 2.200% due 05/15/19 | 640 | 642 | |||||
| American Campus Communities | Bayer US Finance LLC | |||||||||
| Operating Partnership, LP | 2.375% due 10/08/19 (Þ) | 705 | 706 | |||||||
| 4.125% due 07/01/24 | 680 | 689 | 3.000% due 10/08/21 (Þ) | 840 | 844 | |||||
| American Electric Power Co., Inc. | ||||||||||
| 1.650% due 12/15/17 | 440 | 441 | 3.375% due 10/08/24 (Þ) | 678 | 680 | |||||
| American Honda Finance Corp. | Bear Stearns Cos. LLC (The) | |||||||||
| 2.250% due 08/15/19 | 3,264 | 3,280 | 5.550% due 01/22/17 | 690 | 750 | |||||
| American International Group, Inc. | 7.250% due 02/01/18 | 425 | 494 | |||||||
| 5.850% due 01/16/18 | 1,410 | 1,589 | Becton Dickinson and Co. | |||||||
| 8.175% due 05/15/58 | 160 | 217 | 3.250% due 11/12/20 | 590 | 595 | |||||
| American Tower Trust I | Bellsouth Capital Funding Corp. | |||||||||
| 3.070% due 03/15/23 (Þ) | 1,000 | 991 | 7.875% due 02/15/30 | 635 | 848 | |||||
| Ameriprise Financial, Inc. | Boston Properties, LP | |||||||||
| 3.700% due 10/15/24 | 485 | 492 | 5.625% due 11/15/20 | 1,140 | 1,304 | |||||
| Amgen, Inc. | Boston Scientific Corp. | |||||||||
| 1.250% due 05/22/17 | 710 | 705 | 6.000% due 01/15/20 | 1,335 | 1,531 | |||||
| Burlington Northern and Santa Fe | ||||||||||
| Anadarko Petroleum Corp. | Railway Co. Pass-Through Trust | |||||||||
| 6.450% due 09/15/36 | 391 | 482 | Series 2005-4 | |||||||
| 4.500% due 07/15/44 | 400 | 393 | 4.967% due 04/01/23 | 116 | 128 | |||||
| Anheuser-Busch InBev Finance, Inc. | Burlington Northern Santa Fe LLC | |||||||||
| 3.700% due 02/01/24 | 755 | 777 | 6.875% due 12/01/27 | 90 | 114 | |||||
| 4.625% due 02/01/44 | 1,120 | 1,165 | 4.900% due 04/01/44 | 469 | 505 | |||||
| Anheuser-Busch InBev Worldwide, Inc. | 4.550% due 09/01/44 | 260 | 264 | |||||||
| 2.875% due 02/15/16 | 390 | 401 | Capital One Financial Corp. | |||||||
| 1.375% due 07/15/17 | 1,935 | 1,939 | 2.450% due 04/24/19 | 1,693 | 1,698 | |||||
| 5.375% due 01/15/20 | 1,085 | 1,232 | Capital One N.A. | |||||||
| Apache Corp. | 2.950% due 07/23/21 | 756 | 751 | |||||||
| 3.250% due 04/15/22 | 445 | 449 | CareFusion Corp. | |||||||
| 6.000% due 01/15/37 | 374 | 436 | 6.375% due 08/01/19 | 415 | 482 | |||||
| Apollo Management Holdings, LP | Catholic Health Initiatives | |||||||||
| 4.000% due 05/30/24 (Þ) | 790 | 796 | 4.350% due 11/01/42 | 350 | 338 | |||||
| Apple, Inc. | CBS Corp. | |||||||||
| 0.489% due 05/03/18 (Ê) | 1,875 | 1,878 | 4.300% due 02/15/21 | 955 | 1,026 | |||||
| 2.850% due 05/06/21 | 485 | 492 | CenterPoint Energy Resources Corp. | |||||||
| ARC Properties Operating Partnership, | 6.125% due 11/01/17 | 125 | 142 | |||||||
| LP/Clark Acquisition LLC | Citigroup, Inc. | |||||||||
| 2.000% due 02/06/17 | 750 | 732 | 1.350% due 03/10/17 | 1,245 | 1,245 | |||||
| AT&T, Inc. | 6.000% due 08/15/17 | 475 | 530 | |||||||
| 2.950% due 05/15/16 | 2,530 | 2,610 | 6.125% due 11/21/17 | 1,980 | 2,226 | |||||
| 4.300% due 12/15/42 | 296 | 276 | 2.500% due 09/26/18 | 2,025 | 2,050 | |||||
| 5.375% due 08/09/20 | 500 | 568 | ||||||||
| See accompanying notes which are an integral part of the financial statements. | ||||||||||
| Russell Investment Grade Bond Fund 437 | ||||||||||
| Russell Investment Company | ||||||||||
| Russell Investment Grade Bond Fund | ||||||||||
| Schedule of Investments, continued — October 31, 2014 | ||||||||||
| Amounts in thousands (except share amounts) | Amounts in thousands (except share amounts) | |||||||||
| Principal | Fair | Principal | Fair | |||||||
| Amount ($) | Value | Amount ($) | Value | |||||||
| or Shares | $ | or Shares | $ | |||||||
| Cleveland Clinic Bonds | Enterprise Products Operating LLC | |||||||||
| 4.858% due 01/01/14 | 290 | 287 | 2.550% due 10/15/19 | 1,170 | 1,170 | |||||
| CNA Financial Corp. | 5.250% due 01/31/20 | 760 | 856 | |||||||
| 7.350% due 11/15/19 | 643 | 779 | 3.750% due 02/15/25 | 321 | 323 | |||||
| Comcast Corp. | 5.100% due 02/15/45 | 630 | 667 | |||||||
| 4.200% due 08/15/34 | 759 | 766 | ERAC USA Finance LLC | |||||||
| 6.950% due 08/15/37 | 855 | 1,160 | 2.350% due 10/15/19 (Þ) | 1,756 | 1,744 | |||||
| 4.650% due 07/15/42 | 1,205 | 1,268 | ERP Operating Limited Partnership | |||||||
| 4.750% due 03/01/44 | 201 | 216 | 2.375% due 07/01/19 (ö) | 1,726 | 1,726 | |||||
| Commonwealth Edison Co. | Exelon Generation Co. LLC | |||||||||
| 5.800% due 03/15/18 | 865 | 982 | 5.600% due 06/15/42 | 655 | 705 | |||||
| ConAgra Foods, Inc. | Express Scripts Holding Co. | |||||||||
| 4.950% due 08/15/20 | 825 | 909 | 3.125% due 05/15/16 | 830 | 859 | |||||
| Consolidated Edison Co. of New York, | 6.125% due 11/15/41 | 360 | 446 | |||||||
| Inc. | Farmers Exchange Capital | |||||||||
| 4.450% due 03/15/44 | 183 | 192 | 7.200% due 07/15/48 (Þ) | 700 | 861 | |||||
| Continental Airlines Pass-Through Trust | Farmers Exchange Capital II | |||||||||
| 9.000% due 07/08/16 | 373 | 414 | 6.151% due 11/01/53 (Þ) | 700 | 765 | |||||
| 5.983% due 04/19/22 | 1,362 | 1,506 | Fifth Third Bank | |||||||
| Corporate Office Properties, LP | 2.375% due 04/25/19 | 605 | 608 | |||||||
| 3.700% due 06/15/21 | 1,169 | 1,161 | FirstEnergy Corp. | |||||||
| Crown Castle Towers LLC | Series C | |||||||||
| 4.174% due 08/15/17 (Þ) | 1,550 | 1,627 | 7.375% due 11/15/31 | 197 | 234 | |||||
| CSX Corp. | FirstEnergy Transmission, LLC | |||||||||
| 4.500% due 08/01/54 | 355 | 353 | 5.450% due 07/15/44 | 959 | 987 | |||||
| CVS Caremark Corp. | Ford Motor Credit Co. LLC | |||||||||
| 2.250% due 08/12/19 | 2,435 | 2,424 | 1.700% due 05/09/16 | 1,000 | 1,008 | |||||
| CVS Pass-Through Trust | 1.684% due 09/08/17 | 2,483 | 2,471 | |||||||
| 4.163% due 08/10/36 | 91 | 92 | 2.597% due 11/04/19 | 1,430 | 1,425 | |||||
| Daimler Finance NA LLC | Forest Laboratories, Inc. | |||||||||
| 1.250% due 01/11/16 (Þ) | 255 | 256 | 4.875% due 02/15/21 (Þ) | 1,760 | 1,877 | |||||
| Delta Air Lines Pass-Through Trust | Freeport-McMoRan, Inc. | |||||||||
| Series 2010-1 | 3.100% due 03/15/20 | 1,100 | 1,096 | |||||||
| 6.200% due 07/02/18 | 266 | 295 | 3.875% due 03/15/23 | 755 | 746 | |||||
| Devon Energy Corp. | General Electric Capital Corp. | |||||||||
| 4.000% due 07/15/21 | 485 | 510 | 0.404% due 02/15/17 (Ê) | 900 | 899 | |||||
| Dignity Health | 4.375% due 09/16/20 | 700 | 769 | |||||||
| 5.267% due 11/01/64 | 202 | 204 | ||||||||
| DIRECTV Holdings LLC / DIRECTV | 5.875% due 01/14/38 | 965 | 1,184 | |||||||
| Financing Co., Inc. | Series GMTN | |||||||||
| 3.125% due 02/15/16 | 1,210 | 1,243 | 0.880% due 07/12/16 (Ê) | 1,001 | 1,009 | |||||
| 5.000% due 03/01/21 | 3,073 | 3,384 | 3.100% due 01/09/23 | 685 | 686 | |||||
| 4.450% due 04/01/24 | 595 | 621 | 6.150% due 08/07/37 | 670 | 844 | |||||
| Discover Bank | General Electric Co. | |||||||||
| Series BKNT | 5.250% due 12/06/17 | 815 | 907 | |||||||
| 3.200% due 08/09/21 | 735 | 735 | 4.500% due 03/11/44 | 1,270 | 1,354 | |||||
| Dominion Resources, Inc. | General Mills, Inc. | |||||||||
| Series C | 0.433% due 01/28/16 (Ê) | 700 | 700 | |||||||
| 4.050% due 09/15/42 | 412 | 389 | 1.400% due 10/20/17 | 865 | 864 | |||||
| Dow Chemical Co. (The) | 2.200% due 10/21/19 | 1,251 | 1,243 | |||||||
| 4.625% due 10/01/44 | 745 | 732 | Series FRN | |||||||
| Duke Energy Progress, Inc. | 0.533% due 01/29/16 (Ê) | 1,020 | 1,021 | |||||||
| 3.000% due 09/15/21 | 1,020 | 1,040 | General Motors Financial Co., Inc. | |||||||
| eBay, Inc. | 3.000% due 09/25/17 | 1,834 | 1,871 | |||||||
| 0.433% due 07/28/17 (Ê) | 935 | 928 | Genworth Holdings, Inc. | |||||||
| 0.715% due 08/01/19 (Ê) | 775 | 758 | 7.700% due 06/15/20 | 630 | 756 | |||||
| El Paso Pipeline Partners Operating Co. | 4.800% due 02/15/24 | 272 | 282 | |||||||
| LLC | Georgia Power Co. | |||||||||
| 6.500% due 04/01/20 | 332 | 380 | 4.300% due 03/15/42 | 445 | 457 | |||||
| 5.000% due 10/01/21 | 843 | 900 | Georgia-Pacific LLC | |||||||
| Energy Transfer Partners, LP | 8.875% due 05/15/31 | 695 | 1,061 | |||||||
| 4.150% due 10/01/20 | 580 | 604 | Gilead Sciences, Inc. | |||||||
| 6.050% due 06/01/41 | 680 | 755 | 4.800% due 04/01/44 | 649 | 703 | |||||
| See accompanying notes which are an integral part of the financial statements. | ||||||||||
| 438 Russell Investment Grade Bond Fund | ||||||||||
| Russell Investment Company | |||||||||
| Russell Investment Grade Bond Fund | |||||||||
| Schedule of Investments, continued — October 31, 2014 | |||||||||
| Amounts in thousands (except share amounts) | Amounts in thousands (except share amounts) | ||||||||
| Principal | Fair | Principal | Fair | ||||||
| Amount ($) | Value | Amount ($) | Value | ||||||
| or Shares | $ | or Shares | $ | ||||||
| Glencore Funding LLC | KCP&L Greater Missouri Operations Co. | ||||||||
| 4.625% due 04/29/24 (Þ) | 1,450 | 1,465 | 8.270% due 11/15/21 | 425 | 536 | ||||
| Goldman Sachs Group, Inc. (The) | Kinder Morgan Energy Partners, LP | ||||||||
| 6.250% due 09/01/17 | 1,025 | 1,149 | 3.500% due 03/01/16 | 735 | 757 | ||||
| 2.900% due 07/19/18 | 1,175 | 1,202 | 3.500% due 03/01/21 | 765 | 761 | ||||
| 2.625% due 01/31/19 | 1,436 | 1,447 | 4.150% due 02/01/24 | 520 | 515 | ||||
| 2.550% due 10/23/19 | 2,582 | 2,566 | 5.500% due 03/01/44 | 465 | 466 | ||||
| 5.750% due 01/24/22 | 640 | 737 | KLA-Tencor Corp. | ||||||
| 3.625% due 01/22/23 | 501 | 502 | 4.650% due 11/01/24 | 758 | 760 | ||||
| 1.830% due 11/29/23 | 490 | 506 | Kroger Co. (The) | ||||||
| 4.000% due 03/03/24 | 888 | 907 | 2.300% due 01/15/19 | 765 | 766 | ||||
| Lehman Brothers Holdings Capital Trust | |||||||||
| 6.750% due 10/01/37 | 2,325 | 2,850 | VII | ||||||
| 4.800% due 07/08/44 | 1,305 | 1,348 | 5.857% due 11/29/49 (ƒ)(Ø) | 1,450 | — | ||||
| Halliburton Co. | Lehman Brothers Holdings, Inc. | ||||||||
| 4.750% due 08/01/43 | 270 | 289 | 6.500% due 07/19/17 (Ø) | 390 | — | ||||
| HCP, Inc. | 6.750% due 12/28/17 (Ø) | 990 | — | ||||||
| 3.750% due 02/01/16 | 555 | 575 | Life Technologies Corp. | ||||||
| 6.300% due 09/15/16 | 135 | 148 | 6.000% due 03/01/20 | 980 | 1,131 | ||||
| 2.625% due 02/01/20 | 1,725 | 1,712 | Lorillard Tobacco Co. | ||||||
| Health Care REIT, Inc. | 6.875% due 05/01/20 | 1,934 | 2,283 | ||||||
| 6.125% due 04/15/20 | 1,000 | 1,158 | Manufacturers & Traders Trust Co. | ||||||
| 4.950% due 01/15/21 | 245 | 269 | 5.585% due 12/28/20 | 180 | 187 | ||||
| 6.500% due 03/15/41 | 530 | 670 | Marathon Petroleum Corp. | ||||||
| Hess Corp. | 3.500% due 03/01/16 | 490 | 506 | ||||||
| 3.500% due 07/15/24 | 410 | 407 | 4.750% due 09/15/44 | 1,233 | 1,240 | ||||
| Hewlett-Packard Co. | Massachusetts Institute of Technology | ||||||||
| 3.300% due 12/09/16 | 1,605 | 1,665 | 3.959% due 07/01/38 | 249 | 254 | ||||
| 3.750% due 12/01/20 | 1,185 | 1,216 | McKesson Corp. | ||||||
| 4.650% due 12/09/21 | 590 | 633 | 2.284% due 03/15/19 | 1,415 | 1,409 | ||||
| 6.000% due 09/15/41 | 765 | 853 | 4.883% due 03/15/44 | 469 | 497 | ||||
| Historic TW, Inc. | Medco Health Solutions, Inc. | ||||||||
| 8.050% due 01/15/16 | 565 | 612 | 4.125% due 09/15/20 | 675 | 723 | ||||
| Home Depot, Inc. | Merck & Co., Inc. | ||||||||
| 4.400% due 03/15/45 | 680 | 712 | 0.591% due 05/18/18 (Ê) | 1,870 | 1,877 | ||||
| Hospira, Inc. | MetLife, Inc. | ||||||||
| 5.200% due 08/12/20 | 1,125 | 1,218 | 10.750% due 08/01/39 | 950 | 1,542 | ||||
| 5.800% due 08/12/23 | 200 | 221 | 4.721% due 12/15/44 | 542 | 573 | ||||
| Humana, Inc. | Metropolitan Life Global Funding I | ||||||||
| 4.950% due 10/01/44 | 630 | 648 | 3.875% due 04/11/22 (Þ) | 900 | 954 | ||||
| Huntington National Bank (The) | Mizuho Bank, Ltd. | ||||||||
| Series BKNT | 1.300% due 04/16/17 (Þ) | 615 | 612 | ||||||
| 1.300% due 11/20/16 | 1,240 | 1,242 | Morgan Stanley | ||||||
| International Paper Co. | 0.681% due 10/18/16 (Ê) | 545 | 546 | ||||||
| 4.800% due 06/15/44 | 364 | 358 | 5.550% due 04/27/17 | 410 | 449 | ||||
| IPALCO Enterprises, Inc. | 2.125% due 04/25/18 | 2,290 | 2,296 | ||||||
| 7.250% due 04/01/16 (Þ) | 1,250 | 1,331 | 3.875% due 04/29/24 | 2,077 | 2,104 | ||||
| Johnson Controls, Inc. | 3.700% due 10/23/24 | 1,229 | 1,227 | ||||||
| 4.625% due 07/02/44 | 1,060 | 1,064 | Series GMTN | ||||||
| JPMorgan Chase Capital XXIII | 5.450% due 01/09/17 | 600 | 651 | ||||||
| 1.234% due 05/15/47 (Ê) | 3,495 | 2,831 | 6.625% due 04/01/18 | 905 | 1,036 | ||||
| JPMorgan Chase & Co. | |||||||||
| 1.350% due 02/15/17 | 1,210 | 1,212 | 5.500% due 07/24/20 | 535 | 604 | ||||
| 2.200% due 10/22/19 | 960 | 948 | 4.350% due 09/08/26 | 960 | 963 | ||||
| 3.875% due 02/01/24 | 735 | 761 | Mutual of Omaha Insurance Co. | ||||||
| 4.297% due 07/15/54 (Þ) | 700 | 712 | |||||||
| 3.875% due 09/10/24 | 2,020 | 2,007 | National City Bank | ||||||
| JPMorgan Chase Bank NA | Series BKNT | ||||||||
| Series BKNT | 0.603% due 06/07/17 (Ê) | 900 | 893 | ||||||
| 5.875% due 06/13/16 | 85 | 91 | Nationwide Mutual Insurance Co. | ||||||
| 6.000% due 10/01/17 | 1,800 | 2,016 | 5.810% due 12/15/24 (Þ) | 700 | 699 | ||||
| Juniper Networks, Inc. | NextEra Energy Capital Holdings, Inc. | ||||||||
| 3.100% due 03/15/16 | 815 | 835 | 2.700% due 09/15/19 | 316 | 321 | ||||
| See accompanying notes which are an integral part of the financial statements. | |||||||||
| Russell Investment Grade Bond Fund 439 | |||||||||
Russell Investment Company Russell Investment Grade Bond Fund
Schedule of Investments, continued — October 31, 2014
| Amounts in thousands (except share amounts) | Amounts in thousands (except share amounts) | |||||||||
| Principal | Fair | Principal | Fair | |||||||
| Amount ($) | Value | Amount ($) | Value | |||||||
| or Shares | $ | or Shares | $ | |||||||
| 3.625% due 06/15/23 | 900 | 916 | 4.125% due 02/01/22 | 311 | 324 | |||||
| Niagara Mohawk Power Corp. | Sempra Energy | |||||||||
| 4.278% due 10/01/34 (Þ) | 546 | 559 | 9.800% due 02/15/19 | 1,651 | 2,155 | |||||
| NiSource Finance Corp. | 3.550% due 06/15/24 | 550 | 561 | |||||||
| 6.400% due 03/15/18 | 250 | 286 | SL Green Realty Corp. / SL Green | |||||||
| Noble Energy, Inc. | Operating Partnership / Reckson | |||||||||
| 5.250% due 11/15/43 | 382 | 411 | Operating Partnership | |||||||
| North Shore Long Island Jewish Health | 7.750% due 03/15/20 | 550 | 661 | |||||||
| Care, Inc. | Southern Co. (The) | |||||||||
| 4.800% due 11/01/42 | 575 | 576 | 1.300% due 08/15/17 | 536 | 534 | |||||
| NYU Hospitals Center | 2.150% due 09/01/19 | 2,562 | 2,552 | |||||||
| 5.750% due 07/01/43 | 180 | 215 | Southern Power Co. | |||||||
| Oncor Electric Delivery Co. LLC | 5.250% due 07/15/43 | 290 | 324 | |||||||
| 6.800% due 09/01/18 | 1,350 | 1,591 | Southwestern Electric Power Co. | |||||||
| ONEOK Partners, LP | 3.550% due 02/15/22 | 524 | 543 | |||||||
| 3.200% due 09/15/18 | 725 | 750 | St. Jude Medical, Inc. | |||||||
| Oracle Corp. | 3.250% due 04/15/23 | 1,105 | 1,100 | |||||||
| 2.250% due 10/08/19 | 2,535 | 2,541 | Synchrony Financial | |||||||
| 4.300% due 07/08/34 | 438 | 451 | 3.000% due 08/15/19 | 1,225 | 1,238 | |||||
| 4.500% due 07/08/44 | 650 | 671 | Sysco Corp. | |||||||
| PACCAR Financial Corp. | 3.500% due 10/02/24 | 755 | 766 | |||||||
| 0.504% due 02/08/16 (Ê) | 260 | 261 | 4.350% due 10/02/34 | 116 | 119 | |||||
| 0.423% due 06/06/17 (Ê) | 50 | 50 | 4.500% due 10/02/44 | 421 | 432 | |||||
| 0.833% due 12/06/18 (Ê) | 510 | 513 | Tennessee Gas Pipeline Co. LLC | |||||||
| Pacific Gas & Electric Co. | 8.000% due 02/01/16 | 1,605 | 1,738 | |||||||
| 4.750% due 02/15/44 | 1,241 | 1,331 | The Mosaic Co. | |||||||
| Pacific LifeCorp | 5.450% due 11/15/33 | 414 | 462 | |||||||
| 5.125% due 01/30/43 (Þ) | 279 | 291 | Thermo Fisher Scientific, Inc. | |||||||
| PacifiCorp | 2.400% due 02/01/19 | 620 | 624 | |||||||
| 2.950% due 02/01/22 | 945 | 965 | TIAA Asset Management Finance Co. | |||||||
| Panhandle Eastern Pipe Line Co., LP | LLC | |||||||||
| 8.125% due 06/01/19 | 1,725 | 2,108 | 2.950% due 11/01/19 (Þ) | 324 | 324 | |||||
| Pfizer, Inc. | 4.125% due 11/01/24 (Þ) | 137 | 138 | |||||||
| 0.384% due 05/15/17 (Ê) | 1,300 | 1,299 | Time Warner Cable, Inc. | |||||||
| 6.200% due 03/15/19 | 350 | 409 | 5.000% due 02/01/20 | 570 | 638 | |||||
| Plains All American Pipeline, LP and | 6.550% due 05/01/37 | 605 | 761 | |||||||
| PAA Finance Corp. | 7.300% due 07/01/38 | 785 | 1,080 | |||||||
| 3.600% due 11/01/24 | 846 | 841 | Time Warner, Inc. | |||||||
| PNC Bank NA | 2.100% due 06/01/19 | 725 | 715 | |||||||
| 3.300% due 10/30/24 | 1,130 | 1,126 | 4.875% due 03/15/20 | 1,570 | 1,730 | |||||
| Precision Castparts Corp. | Toyota Motor Credit Corp. | |||||||||
| 2.500% due 01/15/23 | 685 | 665 | 0.521% due 05/17/16 (Ê) | 1,820 | 1,824 | |||||
| Principal Financial Group, Inc. | Travelers Cos., Inc. (The) | |||||||||
| 3.300% due 09/15/22 | 713 | 717 | 4.600% due 08/01/43 | 735 | 787 | |||||
| Procter & Gamble Co. (The) | U.S. Bancorp | |||||||||
| 0.319% due 11/04/16 (Ê) | 1,500 | 1,501 | 2.200% due 04/25/19 | 1,185 | 1,191 | |||||
| Progress Energy, Inc. | UDR, Inc. | |||||||||
| 7.750% due 03/01/31 | 702 | 1,000 | 4.625% due 01/10/22 | 827 | 892 | |||||
| Prudential Holdings LLC | United Airlines | |||||||||
| 8.695% due 12/18/23 (Þ) | 646 | 827 | 4.000% due 10/11/27 | 590 | 597 | |||||
| Public Service Co. of New Mexico | UnitedHealth Group, Inc. | |||||||||
| 7.950% due 05/15/18 | 675 | 805 | 6.000% due 06/15/17 | 4 | 5 | |||||
| Quest Diagnostics, Inc. | 1.400% due 10/15/17 | 590 | 593 | |||||||
| 3.200% due 04/01/16 | 70 | 72 | ||||||||
| Qwest Corp. | 3.875% due 10/15/20 | 650 | 699 | |||||||
| 6.750% due 12/01/21 | 500 | 575 | US Bancorp | |||||||
| Reynolds American, Inc. | 2.950% due 07/15/22 | 570 | 559 | |||||||
| 4.750% due 11/01/42 | 625 | 603 | US Bank NA | |||||||
| Series BKNT | ||||||||||
| SABMiller Holdings, Inc. | 0.435% due 09/11/17 (Ê) | 800 | 799 | |||||||
| 3.750% due 01/15/22 (Þ) | 1,000 | 1,033 | ||||||||
| Samsung Electronics America, Inc. | 1.375% due 09/11/17 | 455 | 456 | |||||||
| 1.750% due 04/10/17 (Þ) | 1,565 | 1,574 | Ventas Realty, LP | |||||||
| SCANA Corp. | 1.550% due 09/26/16 | 775 | 781 | |||||||
| See accompanying notes which are an integral part of the financial statements. | ||||||||||
| 440 Russell Investment Grade Bond Fund | ||||||||||
| Russell Investment Company | |||||||||
| Russell Investment Grade Bond Fund | |||||||||
| Schedule of Investments, continued — October 31, 2014 | |||||||||
| Amounts in thousands (except share amounts) | Amounts in thousands (except share amounts) | ||||||||
| Principal | Fair | Principal | Fair | ||||||
| Amount ($) | Value | Amount ($) | Value | ||||||
| or Shares | $ | or Shares | $ | ||||||
| 2.700% due 04/01/20 | 1,050 | 1,042 | 3.850% due 09/30/23 | 720 | 753 | ||||
| Verizon Communications, Inc. | BNP Paribas SA | ||||||||
| 3.000% due 11/01/21 | 1,380 | 1,369 | 1.375% due 03/17/17 | 1,350 | 1,350 | ||||
| 5.150% due 09/15/23 | 6,907 | 7,735 | BP Capital Markets PLC | ||||||
| 6.400% due 09/15/33 | 347 | 423 | 2.248% due 11/01/16 | 895 | 916 | ||||
| 5.050% due 03/15/34 | 925 | 979 | 3.245% due 05/06/22 | 885 | 888 | ||||
| 4.400% due 11/01/34 | 520 | 508 | 3.994% due 09/26/23 | 630 | 656 | ||||
| 4.750% due 11/01/41 | 665 | 670 | British Sky Broadcasting Group PLC | ||||||
| 6.550% due 09/15/43 | 182 | 230 | 6.100% due 02/15/18 (Þ) | 600 | 675 | ||||
| British Telecommunications PLC | |||||||||
| 4.862% due 08/21/46 (Þ) | 359 | 366 | 2.350% due 02/14/19 | 670 | 672 | ||||
| 5.012% due 08/21/54 (Å) | 230 | 234 | CDP Financial, Inc. | ||||||
| Viacom, Inc. | 5.600% due 11/25/39 (Þ) | 445 | 564 | ||||||
| 2.500% due 12/15/16 | 740 | 759 | Cenovus Energy, Inc. | ||||||
| 5.850% due 09/01/43 | 192 | 217 | 5.700% due 10/15/19 | 1,062 | 1,213 | ||||
| Virginia Electric and Power Co. | Cent CLO 19, Ltd. | ||||||||
| 4.450% due 02/15/44 | 277 | 293 | Series 2013-19A Class A1A | ||||||
| Volkswagen Group of America Finance | 1.564% due 10/29/25 (Ê)(Þ) | 923 | 914 | ||||||
| LLC | Colombia Government International | ||||||||
| 2.125% due 05/23/19 (Þ) | 1,260 | 1,253 | Bond | ||||||
| Wal-Mart Stores, Inc. | 4.000% due 02/26/24 | 237 | 243 | ||||||
| 3.300% due 04/22/24 | 1,030 | 1,052 | Corp. Andina de Fomento | ||||||
| 6.500% due 08/15/37 | 860 | 1,159 | 4.375% due 06/15/22 | 769 | 826 | ||||
| 5.000% due 10/25/40 | 1,183 | 1,363 | Corp. Nacional del Cobre de Chile | ||||||
| WEA Finance LLC | 4.875% due 11/04/44 (Þ) | 113 | 112 | ||||||
| 1.750% due 09/15/17 | 310 | 311 | Credit Suisse | ||||||
| 2.700% due 09/17/19 | 1,970 | 1,983 | 6.000% due 02/15/18 | 250 | 280 | ||||
| WellPoint, Inc. | Credit Suisse NY | ||||||||
| 1.875% due 01/15/18 | 700 | 701 | 3.625% due 09/09/24 | 1,010 | 1,014 | ||||
| 4.650% due 08/15/44 | 383 | 390 | Series GMTN | ||||||
| Wells Fargo & Co. | 1.375% due 05/26/17 | 1,835 | 1,830 | ||||||
| 2.125% due 04/22/19 | 2,235 | 2,235 | Deutsche Bank AG | ||||||
| 4.100% due 06/03/26 | 915 | 928 | Series 3FXD | ||||||
| 1.400% due 02/13/17 | 1,055 | 1,055 | |||||||
| 4.650% due 11/04/44 | 1,832 | 1,826 | Ecopetrol SA | ||||||
| Westpac Banking Corp. | 5.875% due 05/28/45 | 285 | 293 | ||||||
| 1.200% due 05/19/17 | 1,085 | 1,084 | Ensco PLC | ||||||
| Williams Cos., Inc. (The) | 4.500% due 10/01/24 | 309 | 313 | ||||||
| 8.750% due 03/15/32 | 212 | 270 | European Investment Bank | ||||||
| Williams Partners LP | 0.875% due 04/18/17 | 835 | 836 | ||||||
| 5.250% due 03/15/20 | 1,250 | 1,388 | Fomento Economico Mexicano SAB de | ||||||
| 3.900% due 01/15/25 | 685 | 680 | CV | ||||||
| WR Berkley Corp. | 4.375% due 05/10/43 | 515 | 481 | ||||||
| 4.750% due 08/01/44 | 258 | 256 | Government of the Cayman Islands | ||||||
| ZFS Finance USA Trust II | 5.950% due 11/24/19 (Þ) | 340 | 392 | ||||||
| 6.450% due 12/15/65 (Þ) | 3,585 | 3,818 | Grupo Bimbo, SAB. de CV | ||||||
| ZFS Finance USA Trust V | 4.875% due 06/27/44 | 565 | 554 | ||||||
| 6.500% due 05/09/37 (Þ) | 2,705 | 2,908 | HBOS PLC | ||||||
| 299,150 | Series GMTN | ||||||||
| International Debt - 5.0% | 6.750% due 05/21/18 (Þ) | 2,425 | 2,724 | ||||||
| America Movil SAB de CV | HSBC Bank PLC | ||||||||
| 4.375% due 07/16/42 | 905 | 860 | 3.100% due 05/24/16 (Þ) | 1,500 | 1,555 | ||||
| Arbor Realty Collateralized Loan | HSBC Holdings PLC | ||||||||
| Obligation, Ltd. | 4.250% due 03/14/24 | 475 | 488 | ||||||
| Series 2014-1A Class A | 6.375% due 12/31/49 (ƒ) | 680 | 694 | ||||||
| 1.903% due 05/15/24 (Ê)(Þ) | 1,275 | 1,273 | Hutchison Whampoa International 14, | ||||||
| Baidu, Inc. | Ltd. | ||||||||
| 3.250% due 08/06/18 | 690 | 709 | 1.625% due 10/31/17 (Þ) | 243 | 243 | ||||
| Bank of Nova Scotia | Hutchison Whampoa, Ltd. | ||||||||
| 0.423% due 05/09/16 (Ê)(~) | 1,170 | 1,170 | 3.625% due 10/31/24 (Þ) | 256 | 254 | ||||
| Barrick Gold Corp. | ING Investment Management CLO | ||||||||
| 4.100% due 05/01/23 | 500 | 483 | 1.366% due 04/15/24 (Å) | 850 | 836 | ||||
| BHP Billiton Finance USA, Ltd. | Intesa Sanpaolo SpA | ||||||||
| See accompanying notes which are an integral part of the financial statements. | |||||||||
| Russell Investment Grade Bond Fund 441 | |||||||||
| Russell Investment Company | |||||||||
| Russell Investment Grade Bond Fund | |||||||||
| Schedule of Investments, continued — October 31, 2014 | |||||||||
| Amounts in thousands (except share amounts) | Amounts in thousands (except share amounts) | ||||||||
| Principal | Fair | Principal | Fair | ||||||
| Amount ($) | Value | Amount ($) | Value | ||||||
| or Shares | $ | or Shares | $ | ||||||
| 2.375% due 01/13/17 | 855 | 865 | Shell International Finance BV | ||||||
| 5.017% due 06/26/24 (Þ) | 1,499 | 1,465 | 0.444% due 11/15/16 (Ê) | 725 | 727 | ||||
| JPMorgan Chase & Co. | SMART Trust | ||||||||
| Series MPLE | Series 2011-2USA Class A4A | ||||||||
| 2.920% due 09/19/17 (Þ) | CAD | 1,940 | 1,760 | 2.310% due 04/14/17 (Þ) | 964 | 969 | |||
| Kaupthing Bank Hf | Series 2012-1USA Class A4A | ||||||||
| 7.125% due 05/19/16 (Ø)(Þ) | 1,480 | — | 2.010% due 12/14/17 (Þ) | 2,900 | 2,916 | ||||
| Korea Electric Power Corp. | Suncor Energy, Inc. | ||||||||
| 5.125% due 04/23/34 (Þ) | 155 | 171 | 5.950% due 12/01/34 | 435 | 529 | ||||
| Lloyds Banking Group PLC | Suntory Holdings, Ltd. | ||||||||
| 4.500% due 11/04/24 | 390 | 390 | 1.650% due 09/29/17 (Þ) | 1,715 | 1,716 | ||||
| Macquarie Bank, Ltd. | Sydney Airport Finance Co. Pty, Ltd. | ||||||||
| 0.864% due 10/27/17 (Å)(Ê) | 750 | 750 | 3.900% due 03/22/23 (Þ) | 946 | 972 | ||||
| Mexichem SAB de CV | Teck Resources, Ltd. | ||||||||
| 5.875% due 09/17/44 | 185 | 185 | 6.250% due 07/15/41 | 172 | 171 | ||||
| Mexico Government International Bond | Telecom Italia Capital SA | ||||||||
| 5.550% due 01/21/45 | 1,007 | 1,143 | 7.175% due 06/18/19 | 224 | 255 | ||||
| Motor PLC | Telecom Italia SpA | ||||||||
| Series 2012-12A Class A1C | 5.303% due 05/30/24 | 180 | 182 | ||||||
| 1.286% due 02/25/20 (Þ) | 242 | 242 | Tencent Holdings, Ltd. | ||||||
| National Australia Bank, Ltd. | 3.375% due 05/02/19 (Þ) | 560 | 569 | ||||||
| 2.750% due 03/09/17 | 1,275 | 1,320 | Teva Pharmaceutical Finance Co. BV | ||||||
| Nexen Energy ULC | 2.950% due 12/18/22 | 865 | 839 | ||||||
| 7.500% due 07/30/39 | 845 | 1,187 | Thomson Reuters Corp. | ||||||
| Nokia OYJ | 5.650% due 11/23/43 | 825 | 908 | ||||||
| 5.375% due 05/15/19 | 435 | 468 | Toronto-Dominion Bank (The) | ||||||
| Nomura Holdings, Inc. | 0.400% due 07/13/16 (Ê) | 1,750 | 1,750 | ||||||
| 2.000% due 09/13/16 | 825 | 835 | Total Capital Canada, Ltd. | ||||||
| Oak Hill Credit Partners | 2.750% due 07/15/23 | 455 | 441 | ||||||
| Series 2013-9A Class A1 | Total Capital International SA | ||||||||
| 1.631% due 10/20/25 (Å)(Ê) | 862 | 855 | 1.000% due 08/12/16 | 1,885 | 1,894 | ||||
| Ooredoo International Finance, Ltd. | Total Capital SA | ||||||||
| 3.875% due 01/31/28 | 340 | 329 | 2.125% due 08/10/18 | 510 | 518 | ||||
| Orange SA | Trade MAPS 1, Ltd. | ||||||||
| 5.500% due 02/06/44 | 800 | 886 | Series 2013-1A Class A | ||||||
| Petrobras Global Finance BV | 0.852% due 12/10/18 (Ê)(Þ) | 1,645 | 1,645 | ||||||
| 1.852% due 05/20/16 (Ê) | 500 | 500 | TransCanada PipeLines, Ltd. | ||||||
| 4.875% due 03/17/20 | 506 | 514 | 5.000% due 10/16/43 | 1,065 | 1,140 | ||||
| Petroleos Mexicanos | Transocean, Inc. | ||||||||
| 4.875% due 01/24/22 | 540 | 576 | 6.375% due 12/15/21 | 1,355 | 1,424 | ||||
| 6.375% due 01/23/45 | 271 | 311 | 7.350% due 12/15/41 | 865 | 911 | ||||
| Rabobank Nederland | Turkey Government International Bond | ||||||||
| 11.000% due 06/29/49 (ƒ)(Þ) | 1,333 | 1,740 | 7.500% due 11/07/19 | 528 | 622 | ||||
| Red River CLO, Ltd. | Tyco Electronics Group SA | ||||||||
| Series 2006-1A Class A | 6.550% due 10/01/17 | 705 | 803 | ||||||
| 0.510% due 07/27/18 (Ê)(Þ) | 306 | 304 | UBS AG | ||||||
| Republic of Colombia | 2.375% due 08/14/19 | 1,385 | 1,388 | ||||||
| 5.625% due 02/26/44 | 275 | 307 | Vale Overseas, Ltd. | ||||||
| Rio Tinto Finance USA PLC | 4.625% due 09/15/20 | 785 | 828 | ||||||
| 1.375% due 06/17/16 | 620 | 625 | Validus Holdings, Ltd. | ||||||
| 3.500% due 03/22/22 | 660 | 673 | 8.875% due 01/26/40 | 555 | 783 | ||||
| Royal Bank of Scotland Group PLC | Vodafone Group PLC | ||||||||
| 1.875% due 03/31/17 | 2,620 | 2,628 | 6.150% due 02/27/37 | 172 | 201 | ||||
| 5.125% due 05/28/24 | 735 | 745 | Willis Group Holdings PLC | ||||||
| Samarco Mineracao SA | 4.125% due 03/15/16 | 840 | 870 | ||||||
| 5.750% due 10/24/23 | 400 | 415 | 79,219 | ||||||
| Saudi Electricity Global Sukuk Co. 2 | Mortgage-Backed Securities - 31.4% | ||||||||
| 5.060% due 04/08/43 (Þ) | 1,190 | 1,207 | American Home Mortgage Investment | ||||||
| Scentre Group Trust 1 / Scentre Group | Trust | ||||||||
| Trust 2 | Series 2004-4 Class 4A | ||||||||
| 2.375% due 11/05/19 (Þ) | 1,052 | 1,047 | 2.331% due 02/25/45 (Ê) | 89 | 88 | ||||
| Seagate HDD Cayman | Aventura Mall Trust | ||||||||
| 4.750% due 06/01/23 | 665 | 686 | |||||||
| See accompanying notes which are an integral part of the financial statements. | |||||||||
| 442 Russell Investment Grade Bond Fund | |||||||||
| Russell Investment Company | |||||||||
| Russell Investment Grade Bond Fund | |||||||||
| Schedule of Investments, continued — October 31, 2014 | |||||||||
| Amounts in thousands (except share amounts) | Amounts in thousands (except share amounts) | ||||||||
| Principal | Fair | Principal | Fair | ||||||
| Amount ($) | Value | Amount ($) | Value | ||||||
| or Shares | $ | or Shares | $ | ||||||
| Series 2013-AVM Class A | Series 2005-PWR7 Class A3 | ||||||||
| 3.743% due 12/05/32 (Þ) | 1,347 | 1,423 | 5.116% due 02/11/41 | 652 | 655 | ||||
| Banc of America Commercial Mortgage | Series 2007-PW15 Class A4 | ||||||||
| Trust | 5.331% due 02/11/44 | 1,089 | 1,170 | ||||||
| Series 2006-4 Class A1A | Bear Stearns Structured Products, Inc. | ||||||||
| 5.617% due 07/10/46 | 1,241 | 1,325 | Series 2007-R6 Class 1A1 | ||||||
| Banc of America Funding Corp. | 2.509% due 01/26/36 (Ê) | 291 | 232 | ||||||
| Series 2005-5 Class 1A11 | Series 2007-R6 Class 2A1 | ||||||||
| 5.500% due 09/25/35 | 209 | 215 | 2.555% due 12/26/46 (Ê) | 146 | 111 | ||||
| Series 2005-D Class A1 | CD Commercial Mortgage Trust | ||||||||
| 2.631% due 05/25/35 (Ê) | 108 | 110 | Series 2005-CD1 Class C | ||||||
| Series 2006-G Class 2A3 | 5.226% due 07/15/44 | 290 | 297 | ||||||
| 0.327% due 07/20/36 (Ê) | 194 | 194 | CD Mortgage Trust | ||||||
| Banc of America Merrill Lynch | Series 2006-CD2 Class A1B | ||||||||
| Commercial Mortgage, Inc. | 5.300% due 01/15/46 | 1,670 | 1,741 | ||||||
| Series 2006-3 Class A4 | Citigroup Commercial Mortgage Trust | ||||||||
| 5.889% due 07/10/44 | 1,287 | 1,365 | 4.023% due 03/10/47 | 825 | 876 | ||||
| Series 2006-6 Class A4 | Series 2014-GC25 Class A4 | ||||||||
| 5.356% due 10/10/45 | 1,925 | 2,033 | 3.635% due 10/10/47 | 416 | 427 | ||||
| Series 2007-1 Class A4 | Citigroup Mortgage Loan Trust, Inc. | ||||||||
| 5.451% due 01/15/49 | 947 | 1,022 | Series 2005-3 Class 2A2B | ||||||
| Series 2007-2 Class AAB | 2.564% due 08/25/35 (Ê) | 225 | 127 | ||||||
| 5.562% due 04/10/49 | 466 | 476 | Series 2005-11 Class A2A | ||||||
| Series 2008-1 Class A4 | 2.510% due 10/25/35 (Ê) | 129 | 128 | ||||||
| 6.245% due 02/10/51 | 690 | 772 | Series 2007-AR8 Class 2A1A | ||||||
| Banc of America Mortgage Securities, | 2.681% due 07/25/37 (Ê) | 194 | 180 | ||||||
| Inc. | COMM Mortgage Trust | ||||||||
| Series 2004-1 Class 5A1 | Series 2013-CR11 Class A4 | ||||||||
| 6.500% due 09/25/33 | 9 | 9 | 4.258% due 10/10/46 | 383 | 415 | ||||
| Series 2004-2 Class 5A1 | Series 2014-PAT Class A | ||||||||
| 6.500% due 10/25/31 | 11 | 11 | 0.953% due 08/13/27 (Ê)(Þ) | 716 | 714 | ||||
| Series 2004-11 Class 2A1 | Series 2014-UBS5 Class A4 | ||||||||
| 5.750% due 01/25/35 | 138 | 141 | 3.838% due 09/10/47 | 825 | 860 | ||||
| Series 2005-H Class 2A5 | Commercial Mortgage Pass-Through | ||||||||
| 2.689% due 09/25/35 (Ê) | 382 | 361 | Certificates | ||||||
| Series 2006-2 Class A15 | Series 2007-C9 Class A4 | ||||||||
| 6.000% due 07/25/46 | 6 | 6 | 5.796% due 12/10/49 | 1,227 | 1,350 | ||||
| Series 2006-B Class 1A1 | Series 2013-CR8 Class XA | ||||||||
| 2.497% due 10/20/46 (Ê) | 66 | 42 | Interest Only STRIP | ||||||
| Bayview Commercial Asset Trust | 0.747% due 06/10/46 | 31,537 | 1,195 | ||||||
| Series 2005-3A Class A1 | Series 2013-CR12 Class A4 | ||||||||
| 0.472% due 11/25/35 (Ê)(Þ) | 550 | 503 | 4.046% due 10/10/46 | 965 | 1,031 | ||||
| BCAP LLC Trust | Series 2013-WWP Class A2 | ||||||||
| Series 2011-R11 Class 15A1 | 3.424% due 03/10/31 (Þ) | 193 | 196 | ||||||
| 2.594% due 10/26/33 (Ê)(Þ) | 1,684 | 1,715 | Series 2014-CR20 Class A4 | ||||||
| Series 2011-R11 Class 20A5 | 3.590% due 11/10/47 | 359 | 368 | ||||||
| 2.602% due 03/26/35 (Ê)(Þ) | 443 | 449 | Series 2014-LC17 Class A5 | ||||||
| Bear Stearns Adjustable Rate Mortgage | 3.917% due 10/10/47 | 120 | 126 | ||||||
| Trust | Commercial Mortgage Trust | ||||||||
| Series 2004-8 Class 2A1 | 3.983% due 10/10/46 | 423 | 449 | ||||||
| 2.607% due 11/25/34 (Ê) | 256 | 248 | 3.147% due 02/10/47 | 339 | 354 | ||||
| Series 2004-9 Class 22A1 | 4.006% due 04/10/47 | 169 | 179 | ||||||
| 3.012% due 11/25/34 (Ê) | 61 | 61 | |||||||
| Series 2004-10 Class 22A1 | 3.731% due 08/10/49 | 171 | 175 | ||||||
| 2.557% due 01/25/35 (Ê) | 52 | 52 | Series 2001-J2A Class E | ||||||
| Series 2005-2 Class A1 | 6.922% due 07/16/34 (Þ) | 670 | 741 | ||||||
| 2.580% due 03/25/35 (Ê) | 839 | 848 | Series 2013-CR6 Class A4 | ||||||
| Series 2005-12 Class 13A1 | 3.101% due 03/10/46 | 925 | 929 | ||||||
| 5.457% due 02/25/36 (Ê) | 50 | 44 | Countrywide Alternative Loan Trust | ||||||
| 5.750% due 10/25/33 | 90 | 92 | |||||||
| Bear Stearns Alt-A Trust | Countrywide Home Loan Mortgage Pass- | ||||||||
| Series 2004-13 Class A1 | |||||||||
| 0.892% due 11/25/34 (Ê) | 1,118 | 1,111 | Through Trust | ||||||
| Bear Stearns Commercial Mortgage | Series 2004-22 Class A3 | ||||||||
| Securities Trust | 2.431% due 11/25/34 (Ê) | 171 | 162 | ||||||
| See accompanying notes which are an integral part of the financial statements. | |||||||||
| Russell Investment Grade Bond Fund 443 | |||||||||
Russell Investment Company Russell Investment Grade Bond Fund
Schedule of Investments, continued — October 31, 2014
| Amounts in thousands (except share amounts) | Amounts in thousands (except share amounts) | |||||||||
| Principal | Fair | Principal | Fair | |||||||
| Amount ($) | Value | Amount ($) | Value | |||||||
| or Shares | $ | or Shares | $ | |||||||
| Series 2004-HYB9 Class 1A1 | 6.500% due 2019 | 21 | 24 | |||||||
| 2.489% due 02/20/35 (Ê) | 346 | 339 | 3.375% due 2020 | 1,362 | 1,447 | |||||
| Series 2005-3 Class 1A2 | 3.480% due 2020 | 1,307 | 1,396 | |||||||
| 0.442% due 04/25/35 (Ê) | 646 | 593 | 3.976% due 2020 | 1,163 | 1,271 | |||||
| Credit Suisse Commercial Mortgage | ||||||||||
| Trust | 5.000% due 2020 | 124 | 132 | |||||||
| Series 2006-C4 Class A3 | 5.500% due 2020 | 915 | 969 | |||||||
| 5.467% due 09/15/39 | 583 | 618 | 6.500% due 2020 | 11 | 13 | |||||
| Series 2007-C2 Class A3 | 3.880% due 2021 | 1,309 | 1,425 | |||||||
| 5.542% due 01/15/49 | 310 | 334 | 4.000% due 2021 | 52 | 55 | |||||
| Series 2007-C5 Class A3 | 4.300% due 2021 | 1,055 | 1,172 | |||||||
| 5.694% due 09/15/40 (Ê) | 425 | 424 | 4.410% due 2021 | 583 | 654 | |||||
| Series 2007-C5 Class A4 | 4.640% due 2021 | 1,320 | 1,482 | |||||||
| 5.695% due 09/15/40 | 1,200 | 1,308 | ||||||||
| Series 2008-C1 Class A2FL | 5.500% due 2021 | 23 | 25 | |||||||
| 2.553% due 02/15/41 (Ê)(Þ) | 1,460 | 1,482 | 4.500% due 2022 | 122 | 129 | |||||
| Series 2008-C1 Class A3 | 5.000% due 2022 | 111 | 120 | |||||||
| 5.974% due 02/15/41 | 1,570 | 1,739 | 5.500% due 2022 | 111 | 121 | |||||
| Credit Suisse First Boston Mortgage | 3.800% due 2023 | 419 | 435 | |||||||
| Securities Corp. | 4.500% due 2023 | 93 | 100 | |||||||
| Series 2001-CP4 Class D | 5.000% due 2023 | 175 | 188 | |||||||
| 6.610% due 12/15/35 | 197 | 198 | 4.000% due 2024 | 265 | 284 | |||||
| Series 2004-C5 Class B | ||||||||||
| 4.929% due 11/15/37 | 1,080 | 1,079 | 4.500% due 2024 | 183 | 198 | |||||
| Series 2005-9 Class 2A1 | 5.000% due 2024 | 24 | 26 | |||||||
| 5.500% due 10/25/35 | 500 | 485 | 8.000% due 2024 | 24 | 28 | |||||
| Series 2005-C6 Class B | 8.500% due 2024 | 6 | 6 | |||||||
| 5.230% due 12/15/40 | 630 | 649 | 9.000% due 2024 | 2 | 2 | |||||
| CSMC Trust | 3.500% due 2025 | 196 | 208 | |||||||
| Series 2014-USA Class A1 | 4.000% due 2025 | 604 | 647 | |||||||
| 3.304% due 09/15/37 (Þ) | 260 | 263 | 4.500% due 2025 | 363 | 394 | |||||
| Series 2014-USA Class A2 | 7.000% due 2025 | 5 | 5 | |||||||
| 3.953% due 09/15/37 (Þ) | 985 | 1,029 | ||||||||
| CW Capital Cobalt, Ltd. | 8.500% due 2025 | 12 | 12 | |||||||
| Series 2007-C3 Class A4 | 3.000% due 2026 | 260 | 270 | |||||||
| 5.771% due 05/15/46 | 1,512 | 1,657 | 3.240% due 2026 | 348 | 355 | |||||
| DBRR Trust | 3.500% due 2026 | 1,167 | 1,235 | |||||||
| Series 2011-LC2 Class A4A | 4.000% due 2026 | 494 | 530 | |||||||
| 4.537% due 07/12/44 (Þ) | 690 | 761 | 5.000% due 2026 | 366 | 405 | |||||
| Deutsche Alt-A Securities, Inc. Mortgage | 7.000% due 2026 | 11 | 11 | |||||||
| Loan Trust | ||||||||||
| Series 2005-AR1 Class 2A3 | 9.000% due 2026 | 2 | 3 | |||||||
| 2.011% due 08/25/35 (Ê) | 845 | 673 | 2.500% due 2027 | 43 | 43 | |||||
| Downey Savings & Loan Association | 3.000% due 2027 | 1,099 | 1,144 | |||||||
| Mortgage Loan Trust | 5.500% due 2027 | 199 | 224 | |||||||
| Series 2004-AR3 Class 1A1B | 7.000% due 2027 | 2 | 2 | |||||||
| 2.458% due 07/19/44 (Ê) | 65 | 64 | 9.000% due 2027 | 1 | 1 | |||||
| Extended Stay America Trust | ||||||||||
| Series 2013-ESH7 Class A27 | 2.500% due 2028 | 4,004 | 4,081 | |||||||
| 2.958% due 12/05/31 (Þ) | 1,100 | 1,117 | 3.380% due 2028 | 417 | 435 | |||||
| Fannie Mae | 3.500% due 2028 | 158 | 167 | |||||||
| 5.433% due 2016 | 1,631 | 1,689 | 5.000% due 2028 | 178 | 197 | |||||
| 5.500% due 2016 | 43 | 45 | 3.000% due 2029 | 469 | 487 | |||||
| 6.500% due 2016 | 8 | 8 | 3.500% due 2029 | 174 | 184 | |||||
| 5.000% due 2017 | 48 | 50 | 8.000% due 2030 | 32 | 37 | |||||
| 5.500% due 2017 | 40 | 42 | 8.000% due 2031 | 37 | 43 | |||||
| 6.500% due 2017 | 28 | 30 | 3.500% due 2032 | 1,997 | 2,098 | |||||
| 7.500% due 2017 | — | — | 6.000% due 2032 | 67 | 76 | |||||
| 8.500% due 2017 | — | — | 6.150% due 2032(Ê) | 331 | 337 | |||||
| 5.000% due 2018 | 188 | 198 | 8.000% due 2032 | 2 | 3 | |||||
| 5.500% due 2018 | 261 | 276 | 3.000% due 2033 | 3,010 | 3,082 | |||||
| 6.500% due 2018 | 38 | 43 | 3.500% due 2033 | 747 | 783 | |||||
| 5.000% due 2019 | 252 | 268 | 4.500% due 2033 | 1,080 | 1,182 | |||||
| See accompanying notes which are an integral part of the financial statements. | ||||||||||
| 444 Russell Investment Grade Bond Fund | ||||||||||
| Russell Investment Company | |||||||||||
| Russell Investment Grade Bond Fund | |||||||||||
| Schedule of Investments, continued — October 31, 2014 | |||||||||||
| Amounts in thousands (except share amounts) | Amounts in thousands (except share amounts) | ||||||||||
| Principal | Fair | Principal | Fair | ||||||||
| Amount ($) | Value | Amount ($) | Value | ||||||||
| or Shares | $ | or Shares | $ | ||||||||
| 5.000% due 2033 | 398 | 442 | Series 2003-343 Class 6 | ||||||||
| 5.500% due 2033 | 534 | 602 | Interest Only STRIP | ||||||||
| 6.000% due 2033 | 39 | 45 | 5.000% due 10/25/33 | 177 | 32 | ||||||
| Series 2003-345 Class 18 | |||||||||||
| 6.150% due 2033(Ê) | 252 | 256 | Interest Only STRIP | ||||||||
| 3.500% due 2034 | 2,135 | 2,236 | 4.500% due 12/25/18 | 230 | 14 | ||||||
| 4.500% due 2034 | 34 | 36 | Series 2003-345 Class 19 | ||||||||
| 5.000% due 2034 | 83 | 92 | Interest Only STRIP | ||||||||
| 5.500% due 2034 | 1,048 | 1,179 | 4.500% due 01/25/19 | 251 | 15 | ||||||
| 6.000% due 2034 | 776 | 884 | Series 2005-365 Class 12 | ||||||||
| 5.000% due 2035 | 986 | 1,094 | Interest Only STRIP | ||||||||
| 5.500% due 12/25/35 | 386 | 61 | |||||||||
| 5.500% due 2035 | 166 | 187 | Series 2006-369 Class 8 | ||||||||
| 6.000% due 2035 | 939 | 1,070 | Interest Only STRIP | ||||||||
| 5.000% due 2036 | 197 | 219 | 5.500% due 04/25/36 | 81 | 13 | ||||||
| 5.500% due 2036 | 1,342 | 1,506 | Fannie Mae Grantor Trust | ||||||||
| 6.000% due 2036 | 211 | 240 | Series 2002-T5 Class A1 | ||||||||
| 6.500% due 2036 | 16 | 18 | 0.392% due 05/25/32 (Ê) | 298 | 293 | ||||||
| 5.000% due 2037 | 161 | 179 | Series 2002-T19 Class A1 | ||||||||
| 5.500% due 2037 | 2,974 | 3,341 | 6.500% due 07/25/42 | 71 | 81 | ||||||
| Fannie Mae REMIC Trust | |||||||||||
| 6.000% due 2037 | 710 | 806 | Series 2004-W12 Class 1A3 | ||||||||
| 6.500% due 2037 | 63 | 75 | 7.000% due 07/25/44 | 1,059 | 1,231 | ||||||
| 5.000% due 2038 | 8 | 9 | Fannie Mae REMICS | ||||||||
| 5.500% due 2038 | 622 | 698 | Series 2003-35 Class FY | ||||||||
| 4.500% due 2039 | 966 | 1,050 | 0.552% due 05/25/18 (Ê) | 121 | 121 | ||||||
| 5.000% due 2039 | 95 | 106 | Series 2005-117 Class LC | ||||||||
| 5.500% due 2039 | 119 | 133 | 5.500% due 11/25/35 | 662 | 720 | ||||||
| Series 2009-70 Class PS | |||||||||||
| 3.500% due 2040 | 259 | 268 | Interest Only STRIP | ||||||||
| 4.000% due 2040 | 627 | 668 | 6.598% due 01/25/37 (Ê) | 3,443 | 531 | ||||||
| 4.500% due 2040 | 1,534 | 1,667 | Series 2009-96 Class DB | ||||||||
| 5.000% due 2040 | 866 | 962 | 4.000% due 11/25/29 | 987 | 1,061 | ||||||
| 3.500% due 2041 | 2,736 | 2,840 | Series 2013-111 Class PL | ||||||||
| 4.000% due 2041 | 2,990 | 3,183 | 2.000% due 12/25/42 | 955 | 860 | ||||||
| 4.500% due 2041 | 25 | 27 | Fannie Mae Whole Loan | ||||||||
| 4.500% due 2041 | 2,418 | 2,635 | Series 2003-W2 Class 1A1 | ||||||||
| 6.500% due 07/25/42 | 94 | 108 | |||||||||
| 5.000% due 2041 | 1,502 | 1,667 | Series 2004-W2 Class 2A2 | ||||||||
| 5.500% due 2041 | 422 | 470 | 7.000% due 02/25/44 | 430 | 497 | ||||||
| 3.000% due 2042 | 3,893 | 3,904 | Series 2004-W12 Class 1A1 | ||||||||
| 3.500% due 2042 | 1,393 | 1,444 | 6.000% due 07/25/44 | 470 | 536 | ||||||
| 4.000% due 2042 | 1,479 | 1,573 | Fannie Mae-Aces | ||||||||
| 4.500% due 2042 | 186 | 203 | Series 2012-M12 Class 1A | ||||||||
| 3.000% due 2043 | 8,697 | 8,725 | 2.840% due 08/25/22 | 1,911 | 1,943 | ||||||
| 3.500% due 2043 | 8,546 | 8,879 | Series 2012-M15 Class A | ||||||||
| 2.656% due 10/25/22 | 127 | 128 | |||||||||
| 4.000% due 2043 | 2,696 | 2,874 | Series 2014-M12 Class FA | ||||||||
| 4.500% due 2043 | 234 | 256 | 0.453% due 10/25/21 (Ê) | 1,650 | 1,658 | ||||||
| 4.000% due 2044 | 250 | 265 | FDIC Guaranteed Notes Trust | ||||||||
| 15 Year TBA(Ï) | Series 2010-S1 Class 1A | ||||||||||
| 2.500 | % | 12,160 | 12,330 | 0.703% due 02/25/48 (Ê)(Þ) | 189 | 189 | |||||
| 3.000 | % | 6,145 | 6,373 | FDIC Trust | |||||||
| 3.500 | % | 5,675 | 5,996 | Series 2010-R1 Class A | |||||||
| 30 Year TBA(Ï) | 2.184% due 05/25/50 (Þ) | 776 | 781 | ||||||||
| 3.000 | % | 24,630 | 24,634 | Federal Home Loan Bank | |||||||
| 3.500 | % | 30,900 | 31,952 | 3.000% due 01/01/43 | 410 | 411 | |||||
| 4.000 | % | 32,025 | 34,002 | 3.000% due 04/01/43 | 105 | 106 | |||||
| 4.500 | % | 16,040 | 17,383 | 4.500% due 07/01/41 | 104 | 113 | |||||
| 5.000 | % | 11,670 | 12,913 | 3.500% due 06/01/42 | 117 | 121 | |||||
| 5.500 | % | 1,840 | 2,055 | 4.000% due 07/01/42 | 215 | 228 | |||||
| 6.000 | % | 3,455 | 3,910 | Federal Home Loan Mortgage Corp. | |||||||
| Multifamily Structured Pass-Through | |||||||||||
| Certificates | |||||||||||
| See accompanying notes which are an integral part of the financial statements. | |||||||||||
| Russell Investment Grade Bond Fund 445 | |||||||||||
Russell Investment Company Russell Investment Grade Bond Fund
Schedule of Investments, continued — October 31, 2014
| Amounts in thousands (except share amounts) | Amounts in thousands (except share amounts) | |||||||||
| Principal | Fair | Principal | Fair | |||||||
| Amount ($) | Value | Amount ($) | Value | |||||||
| or Shares | $ | or Shares | $ | |||||||
| Series 2011-K702 Class X1 | 5.000% due 2034 | 577 | 640 | |||||||
| Interest Only STRIP | 5.500% due 2034 | 86 | 97 | |||||||
| 1.528% due 02/25/18 | 5,091 | 224 | 6.500% due 2034 | 1 | 1 | |||||
| Series 2012-K501 Class X1A | ||||||||||
| Interest Only STRIP | 5.000% due 2035 | 89 | 98 | |||||||
| 1.717% due 08/25/16 | 17,426 | 390 | 5.500% due 2035 | 370 | 416 | |||||
| Series 2012-K706 Class X1 | 5.500% due 2036 | 245 | 274 | |||||||
| Interest Only STRIP | 6.000% due 2036 | 46 | 52 | |||||||
| 1.584% due 10/25/18 | 8,845 | 484 | 5.000% due 2037 | 9 | 10 | |||||
| Series 2014-K038 Class A2 | 5.500% due 2037 | 116 | 129 | |||||||
| 3.389% due 03/25/24 | 362 | 378 | 6.000% due 2037 | 219 | 247 | |||||
| Series 2014-K040 Class A2 | 5.000% due 2038 | 3 | 3 | |||||||
| 3.241% due 09/25/24 | 462 | 475 | ||||||||
| Series 2014-K715 Class A2 | 5.500% due 2038 | 933 | 1,045 | |||||||
| 2.856% due 01/25/21 | 970 | 998 | 6.000% due 2038 | 732 | 834 | |||||
| Series 2014-K716 Class A2 | 4.500% due 2039 | 471 | 513 | |||||||
| 3.130% due 06/25/21 | 533 | 555 | 5.500% due 2039 | 26 | 29 | |||||
| Federal Home Loan Mortgage Corp. | 6.000% due 2039 | 131 | 148 | |||||||
| Multifamily Structured Products | 4.000% due 2040 | 2,131 | 2,279 | |||||||
| 2.364% due 02/25/23 | 1,516 | 1,527 | 4.500% due 2040 | 1,798 | 1,963 | |||||
| Federal Home Loan Mortgage Corp. | 5.000% due 2040 | 128 | 142 | |||||||
| Structured Pass-Through Securities | ||||||||||
| Series 2002-51 Class 1A | 5.500% due 2040 | 17 | 19 | |||||||
| 6.500% due 09/25/43 | 1,216 | 1,393 | 6.000% due 2040 | 62 | 70 | |||||
| FHA Project Citi 68 NP | 4.000% due 2041 | 6,105 | 6,535 | |||||||
| 7.430% due 06/27/21 | 26 | 26 | 4.500% due 2041 | 1,331 | 1,443 | |||||
| Freddie Mac | 5.000% due 2041 | 990 | 1,098 | |||||||
| 9.000% due 2016 | 8 | 9 | 3.000% due 2042 | 2,253 | 2,260 | |||||
| 6.000% due 2017 | 54 | 57 | 3.500% due 2042 | 1,602 | 1,657 | |||||
| 8.000% due 2017 | 1 | 1 | 4.000% due 2042 | 607 | 647 | |||||
| 4.500% due 2018 | 106 | 111 | 3.000% due 2043 | 2,830 | 2,838 | |||||
| 5.000% due 2018 | 24 | 25 | 3.500% due 2043 | 3,494 | 3,621 | |||||
| 4.500% due 2019 | 38 | 40 | 4.000% due 2043 | 2,512 | 2,690 | |||||
| 5.000% due 2019 | 83 | 88 | 3.500% due 2044 | 114 | 118 | |||||
| 6.000% due 2022 | 6 | 6 | 4.000% due 2044 | 6,273 | 6,692 | |||||
| 4.000% due 2024 | 70 | 75 | 4.500% due 2044 | 161 | 174 | |||||
| 5.500% due 2024 | 114 | 124 | 15 Year TBA(Ï) | |||||||
| 9.000% due 2024 | 4 | 4 | 3.000% | 1,220 | 1,263 | |||||
| 6.500% due 2025 | 3 | 4 | 30 Year TBA(Ï) | |||||||
| 8.000% due 2025 | 5 | 5 | 3.000% | 3,825 | 3,828 | |||||
| 9.000% due 2025 | 4 | 4 | 3.500% | 7,100 | 7,424 | |||||
| 3.000% due 2026 | 158 | 164 | 4.000% | 6,510 | 6,906 | |||||
| 4.000% due 2026 | 74 | 80 | 5.500% | 1,200 | 1,337 | |||||
| 9.000% due 2026 | 1 | 1 | Freddie Mac Multifamily Structured | |||||||
| 4.000% due 2027 | 98 | 105 | Pass-Through Ceriticates | |||||||
| 3.527% due 10/25/23 | 1,089 | 1,152 | ||||||||
| 5.000% due 2027 | 2 | 3 | Freddie Mac REMICS | |||||||
| 6.500% due 2027 | — | — | Series 2002-2533 Class Z | |||||||
| 3.500% due 2028 | 214 | 227 | 5.500% due 12/15/32 | 1,966 | 2,193 | |||||
| 5.000% due 2028 | 176 | 195 | Series 2006-3123 Class HT | |||||||
| 6.000% due 2028 | 178 | 201 | 5.000% due 03/15/26 | 696 | 747 | |||||
| 6.500% due 2028 | 56 | 64 | Series 2006-R006 Class ZA | |||||||
| 6.500% due 2029 | 60 | 70 | 6.000% due 04/15/36 | 1,695 | 1,912 | |||||
| 6.500% due 2031 | 84 | 98 | Series 2010-3653 Class B | |||||||
| 4.500% due 04/15/30 | 1,545 | 1,676 | ||||||||
| 5.500% due 2032 | 192 | 216 | Series 2012-3989 Class BW | |||||||
| 6.000% due 2032 | 17 | 20 | 3.500% due 01/15/27 | 3,180 | 3,275 | |||||
| 6.500% due 2032 | 24 | 27 | Series 2012-4019 Class JD | |||||||
| 7.000% due 2032 | 112 | 128 | 3.000% due 05/15/41 | 628 | 641 | |||||
| 7.500% due 2032 | 17 | 20 | FREMF Mortgage Trust | |||||||
| 5.500% due 2033 | 276 | 308 | Series 2013-K24 Class B | |||||||
| 4.500% due 2034 | 63 | 68 | 3.623% due 11/25/45 (Þ) | 1,565 | 1,551 | |||||
| GE Business Loan Trust | ||||||||||
| See accompanying notes which are an integral part of the financial statements. | ||||||||||
| 446 Russell Investment Grade Bond Fund | ||||||||||
| Russell Investment Company | ||||||||||
| Russell Investment Grade Bond Fund | ||||||||||
| Schedule of Investments, continued — October 31, 2014 | ||||||||||
| Amounts in thousands (except share amounts) | Amounts in thousands (except share amounts) | |||||||||
| Principal | Fair | Principal | Fair | |||||||
| Amount ($) | Value | Amount ($) | Value | |||||||
| or Shares | $ | or Shares | $ | |||||||
| Series 2003-2A Class A | 3.500% | 8,920 | 9,332 | |||||||
| 0.523% due 11/15/31 (Ê)(Þ) | 1,032 | 991 | 4.000% | 5,770 | 6,169 | |||||
| GE Capital Commercial Mortgage Corp. | 4.500% | 705 | 769 | |||||||
| Series 2005-C1 Class A5 | Government National Mortgage | |||||||||
| 4.772% due 06/10/48 | 1,066 | 1,071 | Association | |||||||
| Series 2005-C3 Class A7B | Series 2004-93 Class PC | |||||||||
| 5.035% due 07/10/45 | 750 | 766 | 5.000% due 04/16/34 | 1,866 | 1,961 | |||||
| Ginnie Mae | Series 2007-26 Class SD | |||||||||
| 3.500% due 07/20/44 | 371 | 389 | Interest Only STRIP | |||||||
| 4.000% due 07/20/44 | 2,453 | 2,627 | 6.648% due 05/16/37 (Ê) | 2,920 | 473 | |||||
| Ginnie Mae I | Series 2010-74 | |||||||||
| 8.000% due 2017 | 2 | 2 | Interest Only STRIP | |||||||
| 10.500% due 2020 | 1 | 1 | 0.430% due 03/16/50 | 6,772 | 161 | |||||
| 8.000% due 2022 | 5 | 6 | Series 2010-124 Class C | |||||||
| 8.500% due 2022 | 6 | 7 | 3.392% due 03/16/45 | 525 | 543 | |||||
| Series 2010-H04 Class BI | ||||||||||
| 8.500% due 2024 | 3 | 3 | Interest Only STRIP | |||||||
| 8.000% due 2025 | 12 | 12 | 1.386% due 04/20/60 | 4,384 | 220 | |||||
| 9.000% due 2025 | 7 | 7 | Series 2010-H12 Class PT | |||||||
| 8.000% due 2026 | 28 | 32 | 5.470% due 11/20/59 | 3,207 | 3,406 | |||||
| 7.000% due 2029 | 1 | 2 | Series 2010-H22 Class JI | |||||||
| 8.000% due 2029 | 2 | 2 | Interest Only STRIP | |||||||
| 8.500% due 2029 | 16 | 16 | 2.499% due 11/20/60 | 7,279 | 726 | |||||
| 8.000% due 2030 | 14 | 14 | Series 2011-38 Class C | |||||||
| 4.408% due 09/16/51 | 550 | 583 | ||||||||
| 7.000% due 2031 | 108 | 126 | Series 2011-H02 Class BI | |||||||
| 7.000% due 2032 | 31 | 32 | Interest Only STRIP | |||||||
| 7.000% due 2033 | 12 | 13 | 0.411% due 02/20/61 | 19,043 | 333 | |||||
| 3.000% due 2042 | 528 | 538 | Series 2012-115 Class IO | |||||||
| 3.000% due 2043 | 684 | 698 | Interest Only STRIP | |||||||
| 3.500% due 2043 | 240 | 251 | 0.431% due 04/16/54 | 6,431 | 289 | |||||
| Ginnie Mae II | Series 2012-H11 Class CI | |||||||||
| 7.500% due 2032 | 3 | 3 | Interest Only STRIP | |||||||
| 4.500% due 2039 | 1,366 | 1,495 | 2.904% due 04/20/62 | 5,022 | 499 | |||||
| Series 2012-H23 Class FI | ||||||||||
| 5.500% due 2039 | 190 | 214 | Interest Only STRIP | |||||||
| 3.500% due 2040(Ê) | 5,064 | 5,332 | 0.792% due 10/20/62 | 6,407 | 181 | |||||
| 4.000% due 2040(Ê) | 966 | 1,034 | Series 2013-40 Class IO | |||||||
| 4.500% due 2040 | 2,445 | 2,680 | Interest Only STRIP | |||||||
| 4.000% due 2041 | 414 | 443 | 1.076% due 06/16/54 | 5,293 | 355 | |||||
| 4.500% due 2041 | 2,255 | 2,469 | Series 2013-H03 Class HI | |||||||
| Interest Only STRIP | ||||||||||
| 5.500% due 2041 | 26 | 29 | 2.588% due 12/20/62 | 4,556 | 487 | |||||
| 3.000% due 2042 | 254 | 259 | Series 2013-H06 Class HI | |||||||
| 3.500% due 2042 | 785 | 822 | Interest Only STRIP | |||||||
| 4.000% due 2042 | 1,577 | 1,689 | 2.932% due 01/20/63 | 10,149 | 998 | |||||
| 4.500% due 2042 | 636 | 696 | Series 2013-H07 Class JL | |||||||
| 3.000% due 2043 | 708 | 723 | Interest Only STRIP | |||||||
| 3.500% due 2043 | 1,669 | 1,749 | 2.635% due 03/20/63 | 10,865 | 1,263 | |||||
| 3.500% due 2044 | 425 | 445 | GS Mortgage Securities Corp. II | |||||||
| Series 2012-BWTR Class A | ||||||||||
| 4.000% due 2044 | 2,718 | 2,911 | 2.954% due 11/05/34 (Þ) | 460 | 456 | |||||
| 4.500% due 2044 | 952 | 1,040 | Series 2013-GC16 Class A4 | |||||||
| 5.390% due 2059 | 601 | 639 | 4.271% due 11/10/46 | 350 | 379 | |||||
| 4.700% due 2061 | 1,288 | 1,390 | GS Mortgage Securities Trust | |||||||
| 4.810% due 2061 | 2,687 | 2,910 | 2.933% due 06/05/31 | 341 | 350 | |||||
| 5.245% due 2061 | 816 | 902 | Series 2014-GC18 Class A4 | |||||||
| 4.564% due 2062 | 2,666 | 2,931 | 4.074% due 01/10/47 | 625 | 666 | |||||
| 4.845% due 2062 | 388 | 422 | GSMPS Mortgage Loan Trust | |||||||
| Series 2004-4 Class 1AF | ||||||||||
| 4.652% due 2063 | 305 | 337 | 0.552% due 06/25/34 (Ê)(Þ) | 436 | 378 | |||||
| 4.661% due 2063 | 138 | 153 | GSR Mortgage Loan Trust | |||||||
| 4.732% due 2063 | 260 | 285 | Series 2005-AR7 Class 6A1 | |||||||
| 30 Year TBA(Ï) | 4.989% due 11/25/35 (Ê) | 744 | 732 | |||||||
| 3.000% | 1,590 | 1,620 | HarborView Mortgage Loan Trust | |||||||
| See accompanying notes which are an integral part of the financial statements. | ||||||||||
| Russell Investment Grade Bond Fund 447 | ||||||||||
| Russell Investment Company | ||||||||||
| Russell Investment Grade Bond Fund | ||||||||||
| Schedule of Investments, continued — October 31, 2014 | ||||||||||
| Amounts in thousands (except share amounts) | Amounts in thousands (except share amounts) | |||||||||
| Principal | Fair | Principal | Fair | |||||||
| Amount ($) | Value | Amount ($) | Value | |||||||
| or Shares | $ | or Shares | $ | |||||||
| Series 2004-4 Class 3A | Series 2007-7 Class A4 | |||||||||
| 1.278% due 06/19/34 (Ê) | 58 | 56 | 5.745% due 06/12/50 | 640 | 697 | |||||
| Series 2005-4 Class 3A1 | Series 2007-8 Class ASB | |||||||||
| 2.613% due 07/19/35 (Ê) | 194 | 176 | 5.815% due 08/12/49 | 435 | 437 | |||||
| Homestar Mortgage Acceptance Corp. | Morgan Stanley Bank of America Merrill | |||||||||
| Series 2004-5 Class A1 | Lynch Trust | |||||||||
| 0.602% due 10/25/34 (Ê) | 1,788 | 1,793 | 3.787% due 02/15/47 | 165 | 172 | |||||
| Impac CMB Trust | 4.051% due 04/15/47 | 245 | 261 | |||||||
| Series 2004-5 Class 1A1 | Morgan Stanley Capital I Trust | |||||||||
| 0.872% due 10/25/34 (Ê) | 232 | 225 | 3.350% due 07/13/29 | 456 | 470 | |||||
| IndyMac INDX Mortgage Loan Trust | 2.111% due 03/15/45 | 1,400 | 1,422 | |||||||
| Series 2004-AR6 Class 5A1 | Series 2007-HQ12 Class A2 | |||||||||
| 2.518% due 10/25/34 (Ê) | 1,096 | 1,045 | 5.592% due 04/12/49 | 175 | 177 | |||||
| Series 2005-AR15 Class A2 | Morgan Stanley Capital I, Inc. | |||||||||
| 4.535% due 09/25/35 (Ê) | 135 | 118 | Series 2005-HQ5 Class A4 | |||||||
| JPMBB Commercial Mortgage Securities | 5.168% due 01/14/42 | 98 | 98 | |||||||
| 3.801% due 09/15/47 | 360 | 375 | Morgan Stanley Mortgage Loan Trust | |||||||
| JPMorgan Chase Commercial Mortgage | Series 2004-6AR Class 1A | |||||||||
| Securities Trust | 0.602% due 07/25/34 (Ê) | 1,345 | 1,315 | |||||||
| 3.997% due 04/15/47 | 395 | 419 | Mortgage Pass-Through Certificates | |||||||
| 3.461% due 07/15/47 | 355 | 368 | Series | |||||||
| Series 2003-C1 Class D | Series 2001-CIB2 Class D | |||||||||
| 5.192% due 01/12/37 | 70 | 70 | 6.847% due 04/15/35 | 355 | 360 | |||||
| Series 2004-LN2 Class B | Mortgage-Linked Amortizing Notes | |||||||||
| 5.199% due 07/15/41 | 500 | 513 | Series 2012-1 Class A10 | |||||||
| Series 2005-LDP2 Class A3 | 2.060% due 01/15/22 | 904 | 920 | |||||||
| 4.697% due 07/15/42 | 1 | 1 | Motel 6 Trust | |||||||
| Series 2007-CB20 Class ASB | Series 2012-MTL6 Class A2 | |||||||||
| 5.688% due 02/12/51 | 576 | 602 | 1.948% due 10/05/25 (Þ) | 540 | 539 | |||||
| Series 2011-C3 Class A3 | Series 2012-MTL6 Class XA1 | |||||||||
| 4.388% due 02/15/46 (Þ) | 1,325 | 1,434 | Interest Only STRIP | |||||||
| Series 2014-FBLU Class C | 3.005% due 10/05/25 (Þ) | 6,760 | 17 | |||||||
| 2.154% due 12/15/28 (Ê)(Þ) | 675 | 674 | NCUA Guaranteed Notes | |||||||
| JPMorgan Chase Commercial Mortgage | Series 2010-R1 Class 2A | |||||||||
| Trust | 1.840% due 10/07/20 | 2,008 | 2,023 | |||||||
| 4.106% due 07/15/46 (Þ) | 1,405 | 1,508 | NorthStar Mortgage Trust | |||||||
| JPMorgan Mortgage Trust | Series 2012-1 Class A | |||||||||
| 1.990% due 11/25/33 | 276 | 275 | 1.355% due 08/25/29 (Ê)(Þ) | 156 | 156 | |||||
| Series 2004-A2 Class 3A1 | Prime Mortgage Trust | |||||||||
| Series 2004-CL1 Class 1A2 | ||||||||||
| 2.468% due 05/25/34 (Ê) | 559 | 552 | 0.552% due 02/25/34 (Ê) | 30 | 28 | |||||
| Series 2005-A1 Class 6T1 | ||||||||||
| 2.640% due 02/25/35 (Ê) | 48 | 48 | Provident Series 2005-2 Funding Class Mortgage 1A1A Loan Trust | |||||||
| Series 2005-A3 Class 4A1 | 2.408% due 10/25/35 (Ê) | 315 | 308 | |||||||
| 2.632% due 06/25/35 (Ê) | 199 | 202 | RALI Trust | |||||||
| LB-UBS Commercial Mortgage Trust | Series 2005-QA10 Class A41 | |||||||||
| Series 2005-C2 Class AJ | 3.404% due 09/25/35 (Ê) | 417 | 336 | |||||||
| 5.205% due 04/15/30 | 655 | 665 | Series 2005-QO3 Class A1 | |||||||
| Series 2007-C6 Class A4 | 0.552% due 10/25/45 (Ê) | 487 | 374 | |||||||
| 5.858% due 07/15/40 | 1,100 | 1,166 | Series 2006-QO7 Class 3A2 | |||||||
| Mastr Alternative Loan Trust | 0.357% due 09/25/46 (Ê) | 612 | 410 | |||||||
| Series 2003-4 Class B1 | ||||||||||
| 5.934% due 06/25/33 | 159 | 159 | RBSCF Series Trust 2010-RR4 | |||||||
| Series 2004-10 Class 5A6 | 6.040% due 12/16/49 (Þ) | 301 | 320 | |||||||
| 5.750% due 09/25/34 | 232 | 240 | RBSSP Resecuritization Trust | |||||||
| Merrill Lynch Mortgage Investors Trust | Series 2010-3 Class 9A1 | |||||||||
| MLMI Series | 5.500% due 02/26/35 (Þ) | 1,514 | 1,569 | |||||||
| Series 2005-A10 Class A | Structured Adjustable Rate Mortgage | |||||||||
| 0.362% due 02/25/36 (Ê) | 154 | 141 | Trust | |||||||
| Merrill Lynch Mortgage Trust | 2.360% due 06/25/34 | 490 | 485 | |||||||
| Series 2005-CIP1 Class AM | ||||||||||
| 5.107% due 07/12/38 | 1,575 | 1,613 | Structured Series 2005-AR5 Asset Mortgage Class Investments A2 | |||||||
| ML-CFC Commercial Mortgage Trust | 0.407% due 07/19/35 (Ê) | 142 | 137 | |||||||
| Series 2007-5 Class A4 | ||||||||||
| 5.378% due 08/12/48 | 483 | 517 | Structured Asset Securities Corp. | |||||||
| See accompanying notes which are an integral part of the financial statements. | ||||||||||
| 448 Russell Investment Grade Bond Fund | ||||||||||
| Russell Investment Company | |||||||||
| Russell Investment Grade Bond Fund | |||||||||
| Schedule of Investments, continued — October 31, 2014 | |||||||||
| Amounts in thousands (except share amounts) | Amounts in thousands (except share amounts) | ||||||||
| Principal | Fair | Principal | Fair | ||||||
| Amount ($) | Value | Amount ($) | Value | ||||||
| or Shares | $ | or Shares | $ | ||||||
| Series 2003-34A Class 5A4 | San Diego Tobacco Settlement Revenue | ||||||||
| 2.456% due 11/25/33 (Ê) | 1,105 | 1,109 | Funding Corp. Revenue Bonds | ||||||
| WaMu Mortgage Pass-Through | 7.125% due 06/01/32 | 230 | 223 | ||||||
| Certificates Series Trust | South Carolina Student Loan Corp. | ||||||||
| Series 2003-AR9 Class 1A7 | Revenue Bonds | ||||||||
| 2.407% due 09/25/33 (Ê) | 47 | 48 | 0.354% due 12/01/20 (Ê) | 447 | 444 | ||||
| Series 2003-AR10 Class A7 | State of California General Obligation | ||||||||
| 2.421% due 10/25/33 (Ê) | 412 | 420 | Unlimited | ||||||
| Series 2005-AR13 Class A1A1 | 6.650% due 03/01/22 | 425 | 526 | ||||||
| 0.442% due 10/25/45 (Ê) | 1,549 | 1,481 | State of Illinois General Obligation | ||||||
| Series 2007-OA2 Class 2A | Unlimited | ||||||||
| 0.815% due 01/25/47 (Ê) | 239 | 173 | 4.350% due 06/01/18 | 1,470 | 1,539 | ||||
| Wells Fargo Mortgage Backed Securities | 5.877% due 03/01/19 | 335 | 372 | ||||||
| 2.614% due 06/25/35 | 12 | 12 | 4.950% due 06/01/23 | 500 | 522 | ||||
| Wells Fargo Mortgage Backed Securities | 5.100% due 06/01/33 | 1,025 | 1,005 | ||||||
| Trust | 13,792 | ||||||||
| 2.612% due 10/25/33 | 1,108 | 1,112 | United States Government Agencies - 1.0% | ||||||
| Series 2003-17 Class 2A10 | Fannie Mae | ||||||||
| 5.500% due 01/25/34 | 483 | 508 | 1.000% due 09/27/17 | 250 | 250 | ||||
| Series 2004-CC Class A1 | 1.750% due 06/20/19 | 790 | 791 | ||||||
| 2.615% due 01/25/35 (Ê) | 139 | 139 | |||||||
| Series 2006-2 Class 2A3 | 2.625% due 09/06/24 | 1,389 | 1,383 | ||||||
| 5.500% due 03/25/36 | 189 | 181 | 7.125% due 01/15/30 | 240 | 358 | ||||
| Series 2006-AR2 Class 2A1 | 7.250% due 05/15/30 | 230 | 346 | ||||||
| 2.615% due 03/25/36 | 229 | 229 | 6.625% due 11/15/30 | 415 | 598 | ||||
| Series 2006-AR8 Class 1A3 | Federal Farm Credit Banks | ||||||||
| 2.611% due 04/25/36 (Ê) | 966 | 962 | 5.125% due 08/25/16 | 310 | 335 | ||||
| WFRBS Commercial Mortgage Trust | Federal Home Loan Banks | ||||||||
| Interest Only STRIP | 2.875% due 09/11/20 | 875 | 913 | ||||||
| 1.360% due 08/15/47 | 7,987 | 647 | Federal National Mortgage Association | ||||||
| Series 2012-C7 Class A2 | 0.500% due 03/30/16 | 700 | 701 | ||||||
| 3.431% due 06/15/45 | 1,630 | 1,684 | 2.000% due 09/26/17 | 350 | 358 | ||||
| Series 2014-C19 Class A3 | 1.625% due 11/27/18 | 200 | 201 | ||||||
| 3.660% due 03/15/47 | 480 | 502 | 1.875% due 02/19/19 | 345 | 350 | ||||
| 493,976 | 1.600% due 12/24/20 | 1,205 | 1,164 | ||||||
| Municipal Bonds - 0.9% | 6.000% due 04/18/36 | 95 | 102 | ||||||
| Brazos Higher Education Authority | |||||||||
| Revenue Bonds | Freddie Mac | ||||||||
| 0.584% due 12/26/24 (Ê) | 338 | 332 | 2.000% due 08/25/16 | 2,815 | 2,887 | ||||
| City of Houston Texas General | 0.875% due 10/14/16 | 1,700 | 1,711 | ||||||
| Obligation Limited | 1.000% due 09/29/17 | 250 | 250 | ||||||
| 6.290% due 03/01/32 | 765 | 956 | 1.250% due 10/02/19 | 1,000 | 975 | ||||
| City of New York New York General | 2.375% due 01/13/22 | 460 | 463 | ||||||
| Obligation Unlimited | 6.250% due 07/15/32 | 624 | 878 | ||||||
| 6.646% due 12/01/31 | 400 | 475 | Tennessee Valley Authority | ||||||
| La Paz County Industrial Development | 6.150% due 01/15/38 | 345 | 472 | ||||||
| Authority Revenue Bonds | 3.500% due 12/15/42 | 564 | 531 | ||||||
| 7.000% due 03/01/34 | 910 | 914 | |||||||
| Metropolitan Transportation Authority | 16,017 | ||||||||
| Revenue Bonds | United States Government Treasuries - 23.0% | ||||||||
| 6.814% due 11/15/40 | 355 | 486 | United States Treasury Inflation Indexed | ||||||
| Municipal Electric Authority of Georgia | Bonds | ||||||||
| Revenue Bonds | 0.125% due 04/15/16 | 3,249 | 3,285 | ||||||
| 6.637% due 04/01/57 | 990 | 1,260 | 0.125% due 04/15/17 | 1,435 | 1,457 | ||||
| 7.055% due 04/01/57 | 1,410 | 1,653 | 0.125% due 07/15/24 | 1,282 | 1,247 | ||||
| New Jersey Transportation Trust Fund | 1.375% due 02/15/44 | 3,919 | 4,322 | ||||||
| Authority Revenue Bonds | United States Treasury Notes | ||||||||
| 5.754% due 12/15/28 | 500 | 571 | 0.375% due 11/15/15 | 5,000 | 5,011 | ||||
| New York City Water & Sewer System | 1.375% due 11/30/15 | 2,360 | 2,390 | ||||||
| Revenue Bonds | 0.250% due 12/15/15 | 2,695 | 2,697 | ||||||
| 6.491% due 06/15/42 | 1,700 | 1,969 | 2.125% due 12/31/15 | 940 | 961 | ||||
| New York State Dormitory Authority | 0.375% due 01/15/16 | 9,985 | 10,003 | ||||||
| Revenue Bonds | |||||||||
| 5.628% due 03/15/39 | 450 | 545 | 2.000% due 01/31/16 | 915 | 935 | ||||
| See accompanying notes which are an integral part of the financial statements. | |||||||||
| Russell Investment Grade Bond Fund 449 | |||||||||
| Russell Investment Company | |||||||||||
| Russell Investment Grade Bond Fund | |||||||||||
| Schedule of Investments, continued — October 31, 2014 | |||||||||||
| Amounts in thousands (except share amounts) | Amounts in thousands (except share amounts) | ||||||||||
| Principal | Fair | Principal | Fair | ||||||||
| Amount ($) | Value | Amount ($) | Value | ||||||||
| or Shares | $ | or Shares | $ | ||||||||
| 0.375% due 02/15/16 | 1,500 | 1,503 | 5.500% due 08/15/28 | 500 | 666 | ||||||
| 2.125% due 02/29/16 | 1,000 | 1,025 | 5.250% due 02/15/29 | 3,025 | 3,961 | ||||||
| 0.375% due 03/31/16 | 2,500 | 2,503 | 5.375% due 02/15/31 | 8,089 | 10,925 | ||||||
| 0.250% due 04/15/16 | 3,605 | 3,602 | 4.500% due 02/15/36 | 2,742 | 3,474 | ||||||
| 0.375% due 05/31/16 | 35,545 | 35,570 | 4.375% due 02/15/38 | 3,850 | 4,788 | ||||||
| 1.500% due 06/30/16 | 6,300 | 6,415 | 3.125% due 02/15/42 | 2,000 | 2,033 | ||||||
| 0.500% due 07/31/16 | 11,845 | 11,869 | 2.750% due 08/15/42 | 4,580 | 4,311 | ||||||
| 1.500% due 07/31/16 | 750 | 764 | 2.750% due 11/15/42 | 3,345 | 3,145 | ||||||
| 4.875% due 08/15/16 | 2,155 | 2,324 | 2.875% due 05/15/43 | 695 | 669 | ||||||
| 0.500% due 08/31/16 | 15,690 | 15,712 | 3.750% due 11/15/43 | 2,150 | 2,439 | ||||||
| 1.000% due 08/31/16 | 6,620 | 6,686 | 3.375% due 05/15/44 | 13,939 | 14,787 | ||||||
| 0.875% due 09/15/16 | 1,615 | 1,627 | 3.125% due 08/15/44 | 15,265 | 15,453 | ||||||
| 0.500% due 09/30/16 | 9,398 | 9,402 | 361,061 | ||||||||
| 0.625% due 10/15/16 | 2,000 | 2,005 | Total Long-Term Investments | ||||||||
| 0.375% due 10/31/16 | 3,000 | 2,992 | (cost $1,375,858) | 1,395,431 | |||||||
| 1.000% due 10/31/16 | 570 | 575 | |||||||||
| 3.250% due 12/31/16 | 1,000 | 1,057 | Preferred Stocks - 0.2% | ||||||||
| 1.000% due 03/31/17 | 1,500 | 1,511 | Technology - 0.2% | ||||||||
| 0.875% due 05/15/17 | 2,460 | 2,467 | |||||||||
| 0.875% due 07/15/17 | 1,215 | 1,217 | Verizon Communications, Inc. | 82,000 | 2,124 | ||||||
| 0.500% due 07/31/17 | 500 | 495 | Total Preferred Stocks | ||||||||
| 0.875% due 08/15/17 | 11,749 | 11,752 | (cost $2,062) | 2,124 | |||||||
| 1.875% due 09/30/17 | 1,000 | 1,027 | |||||||||
| 0.875% due 10/15/17 | 14,509 | 14,489 | |||||||||
| 0.875% due 01/31/18 | 450 | 447 | Options Purchased - 0.0% | ||||||||
| 0.750% due 02/28/18 | 1,690 | 1,669 | (Number of Contracts) | ||||||||
| 0.750% due 03/31/18 | 1,750 | 1,726 | Swaptions | ||||||||
| 2.625% due 04/30/18 | 1,200 | 1,259 | (Fund Receives/Fund Pays) | ||||||||
| USD 0.450%/USD Three Month LIBOR | |||||||||||
| 1.375% due 06/30/18 | 2,000 | 2,009 | Mar 2018 0.00 Put (2) | 4,370 | (ÿ) | 172 | |||||
| 1.500% due 08/31/18 | 6,775 | 6,823 | USD 0.450%/USD Three Month LIBOR | ||||||||
| 1.375% due 09/30/18 | 4,845 | 4,852 | Apr 2018 0.00 Put (1) | 2,810 | (ÿ) | 113 | |||||
| 2.750% due 02/15/19 | 500 | 526 | USD 5.000%/USD Three Month LIBOR | ||||||||
| 1.625% due 03/31/19 | 1,740 | 1,749 | Jan 2019 0.00 Put (1) | 1,630 | (ÿ) | 56 | |||||
| 3.125% due 05/15/19 | 300 | 321 | Total Options Purchased | ||||||||
| 0.875% due 07/31/19 | 685 | 663 | (cost $600) | 341 | |||||||
| 3.625% due 08/15/19 | 620 | 678 | |||||||||
| 1.000% due 08/31/19 | 2,215 | 2,152 | Short-Term Investments - 23.5% | ||||||||
| 1.625% due 08/31/19 | 18,760 | 18,788 | Abbey National Treasury Services PLC | ||||||||
| 1.750% due 09/30/19 | 3,459 | 3,482 | 3.875% due 11/10/14 (Þ) | 1,010 | 1,011 | ||||||
| 1.375% due 10/31/19 | 1,500 | 1,492 | Anheuser-Busch InBev Worldwide, Inc. | ||||||||
| 1.125% due 03/31/20 | 250 | 242 | 3.625% due 04/15/15 | 570 | 578 | ||||||
| 1.875% due 06/30/20 | 500 | 502 | 0.800% due 07/15/15 | 610 | 612 | ||||||
| 2.000% due 09/30/20 | 300 | 302 | ARI Fleet Lease Trust | ||||||||
| 1.750% due 10/31/20 | 500 | 496 | 0.250% due 04/15/15 (Þ) | 319 | 319 | ||||||
| 2.125% due 01/31/21 | 5,840 | 5,900 | Bank of America Corp. | ||||||||
| 2.000% due 02/28/21 | 1,875 | 1,879 | 4.750% due 08/01/15 | 500 | 514 | ||||||
| 3.125% due 05/15/21 | 100 | 107 | 1.500% due 10/09/15 | 2,970 | 2,992 | ||||||
| 8.125% due 05/15/21 | 785 | 1,085 | Barclays Bank PLC | ||||||||
| 2.125% due 06/30/21 | 750 | 755 | 2.750% due 02/23/15 | 600 | 604 | ||||||
| 2.125% due 08/15/21 | 7,875 | 7,925 | BBVA US Senior SAU | ||||||||
| 2.125% due 09/30/21 | 2,220 | 2,232 | 4.664% due 10/09/15 | 1,425 | 1,477 | ||||||
| Caisse Centrale Desjardins | |||||||||||
| 2.000% due 02/15/22 | 5,710 | 5,682 | 0.513% due 10/29/15 (Ê)(Þ) | 1,930 | 1,933 | ||||||
| 1.625% due 08/15/22 | 250 | 241 | CCG Receivables Trust | ||||||||
| 6.250% due 08/15/23 | 100 | 132 | Series 2014-1 Class A1 | ||||||||
| 2.375% due 08/15/24 | 45,594 | 45,772 | 0.270% due 05/14/15 (Þ) | 523 | 523 | ||||||
| 6.625% due 02/15/27 | 55 | 79 | Citigroup, Inc. | ||||||||
| Zero coupon due 11/15/27 | 2,215 | 1,546 | 2.650% due 03/02/15 | 600 | 604 | ||||||
| See accompanying notes which are an integral part of the financial statements. | |||||||||||
| 450 Russell Investment Grade Bond Fund | |||||||||||
| Russell Investment Company | |||||||||||
| Russell Investment Grade Bond Fund | |||||||||||
| Schedule of Investments, continued — October 31, 2014 | |||||||||||
| Amounts in thousands (except share amounts) | Amounts in thousands (except share amounts) | ||||||||||
| Principal | Fair | Principal | Fair | ||||||||
| Amount ($) | Value | Amount ($) | Value | ||||||||
| or Shares | $ | or Shares | $ | ||||||||
| ConocoPhillips | Royal Bank of Canada | ||||||||||
| 4.600% due 01/15/15 | 1,545 | 1,557 | 1.920% due 07/30/15 | 735 | 744 | ||||||
| Credit Suisse | 0.800% due 10/30/15 | 560 | 562 | ||||||||
| 0.467% due 04/10/15 (~) | 750 | 750 | Russell U.S. Cash Management Fund | 267,029,875 | (8) | 267,030 | |||||
| Credit Suisse NY | Sheffield Receivables Corp. | ||||||||||
| 0.555% due 08/24/15 (Ê)(~) | 2,065 | 2,066 | Zero coupon due 01/23/15 (~) | 620 | 620 | ||||||
| CVS Health Corp. | Southern Copper Corp. | ||||||||||
| 3.250% due 05/18/15 | 630 | 639 | 6.375% due 07/27/15 | 435 | 451 | ||||||
| ENI Finance USA, Inc. | Standard Chartered PLC | ||||||||||
| Zero coupon due 11/07/14 (ç)(~) | 500 | 500 | 3.850% due 04/27/15 (Þ) | 2,005 | 2,035 | ||||||
| Exelon Corp. | Susquehanna Auto Receivables Trust | ||||||||||
| 4.900% due 06/15/15 | 350 | 359 | Series 2014-1A Class A1 | ||||||||
| Fannie Mae | 0.240% due 08/17/15 (Þ) | 2,043 | 2,043 | ||||||||
| 7.000% due 03/01/15 | — | — | Telefonos de Mexico SAB de CV | ||||||||
| 5.500% due 05/01/15 | 21 | 22 | 5.500% due 01/27/15 | 865 | 874 | ||||||
| 6.500% due 06/01/15 | — | — | Tidewater Auto Receivables Trust | ||||||||
| Federal Home Loan Bank Discount | Series 2014-AA Class A1 | ||||||||||
| Notes | 0.400% due 06/15/15 (Þ) | 160 | 160 | ||||||||
| Zero coupon due 11/14/14 (ç)(~) | 3,365 | 3,365 | Time Warner Cable, Inc. | ||||||||
| Zero coupon due 11/26/14 (ç)(~) | 13,820 | 13,819 | 3.500% due 02/01/15 | 975 | 982 | ||||||
| United States Treasury Bills | |||||||||||
| Zero coupon due 11/28/14 (ç)(~) | 5,690 | 5,690 | Zero coupon due 11/06/14 | 29 | 29 | ||||||
| 0.050% due 01/14/15 (~) | 2,505 | 2,505 | United States Treasury Inflation Indexed | ||||||||
| 0.090% due 01/23/15 (~) | 2,210 | 2,210 | Bonds | ||||||||
| Zero coupon due 01/28/15 (~) | 5,160 | 5,159 | 0.500% due 04/15/15 | 1,515 | 1,512 | ||||||
| Federal Home Loan Banks | United States Treasury Notes | ||||||||||
| 2.500% due 05/26/15 | 1,690 | 1,682 | 0.250% due 08/15/15 | 20,000 | 20,019 | ||||||
| Honda Auto Receivables | Verizon Communications, Inc. | ||||||||||
| Series 2011-3 Class A3 | 4.900% due 09/15/15 | 1,493 | 1,549 | ||||||||
| 0.880% due 09/21/15 | 8 | 8 | Vodafone Group PLC | ||||||||
| Honda Auto Receivables Owner Trust | Zero coupon due 04/10/15 (~) | 2,065 | 2,060 | ||||||||
| Series 2013-2 Class A2 | Volkswagen Auto Lease Trust | ||||||||||
| 0.370% due 10/16/15 | 104 | 104 | Series 2012-A Class A3 | ||||||||
| HSBC USA, Inc. | 0.870% due 07/20/15 | 45 | 45 | ||||||||
| 0.390% due 02/13/15 | 860 | 865 | Volvo Treasury AB | ||||||||
| Hyundai Auto Lease Securitization Trust | 5.950% due 04/01/15 (Þ) | 1,085 | 1,108 | ||||||||
| Series 2012-A Class A3 | Wells Fargo & Co. | ||||||||||
| 0.920% due 08/17/15 (Þ) | 589 | 589 | 0.433% due 10/28/15 (Ê) | 990 | 991 | ||||||
| JPMorgan Chase & Co. | Westlake Automobile Receivables Trust | ||||||||||
| 0.540% due 01/20/15 | 1,795 | 1,807 | Series 2014-1A Class A1 | ||||||||
| Kaupthing Bank Hf | 0.350% due 06/15/15 (Þ) | 311 | 311 | ||||||||
| 7.625% due 02/28/15 (Ø)(Þ) | 1,210 | 290 | Working Capital Management Co. L.P. | ||||||||
| Kellogg Co. | 0.160% due 11/12/14 (ç)(~) | 535 | 535 | ||||||||
| 0.464% due 02/13/15 (Ê) | 1,225 | 1,226 | Yum! Brands, Inc. | ||||||||
| 1.125% due 05/15/15 | 800 | 802 | 4.250% due 09/15/15 | 435 | 447 | ||||||
| Kubota Credit Owner Trust | Total Short-Term Investments | ||||||||||
| Series 2014-1A Class A1 | (cost $370,556) | 369,901 | |||||||||
| 0.220% due 05/15/15 (Þ) | 229 | 229 | |||||||||
| MMAF Equipment Finance LLC | Total Investments 112.4% | ||||||||||
| Series 2014-AA Class A1 | (identified cost $1,749,076) | 1,767,797 | |||||||||
| 0.200% due 07/02/15 (Þ) | 1,657 | 1,657 | |||||||||
| Novartis Capital Corp. | |||||||||||
| 2.900% due 04/24/15 | 265 | 268 | Other Assets and Liabilities, | ||||||||
| PACCAR Financial Corp. | Net - (12.4%) | (194,340 | ) | ||||||||
| 0.362% due 05/05/15 (Ê) | 1,200 | 1,201 | |||||||||
| Private Export Funding Corp. | Net Assets - 100.0% | 1,573,457 | |||||||||
| Zero coupon due 05/12/15 (~) | 1,100 | 1,098 | |||||||||
| Province of Ontario Canada | |||||||||||
| 0.950% due 05/26/15 | 1,975 | 1,983 | |||||||||
| Reckitt Benckiser Treasury Services PLC | |||||||||||
| Zero coupon due 04/02/15 (~) | 2,180 | 2,177 | |||||||||
| See accompanying notes which are an integral part of the financial statements. | |||||||||||
| Russell Investment Grade Bond Fund 451 | |||||||||||
| Russell Investment Company | |||||||||||||||||
| Russell Investment Grade Bond Fund | |||||||||||||||||
| Schedule of Investments, continued — October 31, 2014 | |||||||||||||||||
| Restricted Securities | |||||||||||||||||
| Amounts in thousands (except share and cost per unit amounts) | |||||||||||||||||
| Principal Cost per | Cost | Fair Value | |||||||||||||||
| % of Net Assets | Acquisition | Amount ($) | Unit | (000 | ) | (000 | ) | ||||||||||
| Securities | Date | or shares | $ | $ | $ | ||||||||||||
| 0.3 | % | ||||||||||||||||
| Alm Loan Funding | 10/04/12 | 750,000 | 100.00 | 750 | 746 | ||||||||||||
| BAE Systems Holdings, Inc. | 09/30/14 | 1,070,000 | 99.70 | 1,067 | 1,077 | ||||||||||||
| Flagship CLO | 10/02/14 | 620,000 | 100.00 | 620 | 620 | ||||||||||||
| ING Investment Management CLO | 04/28/14 | 850,000 | 98.81 | 840 | 836 | ||||||||||||
| Macquarie Bank, Ltd. | 10/22/14 | 750,000 | 100.00 | 750 | 750 | ||||||||||||
| Oak Hill Credit Partners | 10/01/13 | 862,372 | 99.91 | 862 | 855 | ||||||||||||
| Verizon Communications, Inc. | 10/23/14 | 230,000 | 102.80 | 236 | 234 | ||||||||||||
| 5,118 | |||||||||||||||||
| For a description of restricted securities see note 9 in the Notes to Financial Statements. | |||||||||||||||||
| Futures Contracts | |||||||||||||||||
| Amounts in thousands (except contract amounts) | |||||||||||||||||
| Unrealized | |||||||||||||||||
| Appreciation | |||||||||||||||||
| Number of | Notional | Expiration | (Depreciation) | ||||||||||||||
| Contracts | Amount | Date | $ | ||||||||||||||
| Long Positions | |||||||||||||||||
| Eurodollar Futures | 55 | USD | 13,714 | 03/15 | 9 | ||||||||||||
| Eurodollar Futures | 15 | USD | 3,681 | 12/16 | 12 | ||||||||||||
| United States Treasury 2 Year Note Futures | 124 | USD | 27,226 | 12/14 | 63 | ||||||||||||
| United States Treasury 5 Year Note Futures | 559 | USD | 66,761 | 12/14 | 424 | ||||||||||||
| United States Treasury 10 Year Note Futures | 357 | USD | 45,110 | 12/14 | 262 | ||||||||||||
| United States Treasury Long Bond Futures | 149 | USD | 21,023 | 12/14 | 238 | ||||||||||||
| United States Treasury Ultra Long-Term Bond Futures | 13 | USD | 2,039 | 12/14 | 34 | ||||||||||||
| Short Positions | |||||||||||||||||
| Eurodollar Futures | 55 | USD | 13,602 | 03/16 | (15 | ) | |||||||||||
| Eurodollar Futures | 15 | USD | 3,655 | 12/17 | (13 | ) | |||||||||||
| United States Treasury 2 Year Note Futures | 367 | USD | 80,579 | 12/14 | (241 | ) | |||||||||||
| Total Unrealized Appreciation (Depreciation) on Open Futures Contracts (å) | 773 | ||||||||||||||||
| Options Written | |||||||||||||||||
| Amounts in thousands (except contract amounts) | |||||||||||||||||
| Number of | Strike | Notional | Expiration | Fair Value | |||||||||||||
| Call/Put | Contracts | Price | Amount | Date | $ | ||||||||||||
| Inflationary Floor – CPURNSA Index | Call | 1 | 0.00 | USD | 1,930 | 11/23/20 | (1 | ) | |||||||||
| Swaptions | |||||||||||||||||
| (Fund Receives/Fund Pays) | |||||||||||||||||
| USD 5.000%/USD Three Month LIBOR | Put | 1 | 0.00 | 6,145 | 01/14/19 | (80 | ) | ||||||||||
| Total Liability for Options Written (premiums received $181) | (81 | ) | |||||||||||||||
| Transactions in options written contracts for the period ended October 31, 2014 were as follows: | |||||||||||||||||
| Number of | Premiums | ||||||||||||||||
| Contracts | Received | ||||||||||||||||
| Outstanding October 31, 2013 | 62 | $ | 369 | ||||||||||||||
| Opened | 65 | 566 | |||||||||||||||
| Closed | (41 | ) | (301 | ) | |||||||||||||
| Expired | (84 | ) | (453 | ) | |||||||||||||
| Outstanding October 31, 2014 | 2 | $ | 181 | ||||||||||||||
| Foreign Currency Exchange Contracts | |||||||||||||||||
| Amounts in thousands | |||||||||||||||||
| Unrealized | |||||||||||||||||
| Appreciation | |||||||||||||||||
| Amount | Amount | (Depreciation) | |||||||||||||||
| Counterparty | Sold | Bought | Settlement Date | $ | |||||||||||||
| Austrailia and New Zealand Banking Group | AUD | 5,521 | CAD | 5,465 | 11/21/14 | (6 | ) | ||||||||||
| See accompanying notes which are an integral part of the financial statements. | |||||||||||||||||
| 452 Russell Investment Grade Bond Fund | |||||||||||||||||
| Russell Investment Company | |||||||
| Russell Investment Grade Bond Fund | |||||||
| Schedule of Investments, continued — October 31, 2014 | |||||||
| Foreign Currency Exchange Contracts | |||||||
| Amounts in thousands | |||||||
| Unrealized | |||||||
| Appreciation | |||||||
| Amount | Amount | (Depreciation) | |||||
| Counterparty | Sold | Bought | Settlement Date | $ | |||
| Austrailia and New Zealand Banking Group | AUD | 839 | JPY | 78,088 | 11/21/14 | (42 | ) |
| Austrailia and New Zealand Banking Group | AUD | 2,754 | NZD | 3,086 | 11/21/14 | (19 | ) |
| Austrailia and New Zealand Banking Group | AUD | 4,116 | NZD | 4,588 | 11/21/14 | (48 | ) |
| Bank of America | AUD | 2,702 | EUR | 1,855 | 11/21/14 | (49 | ) |
| Bank of America | EUR | 2,238 | JPY | 302,651 | 11/21/14 | (110 | ) |
| Bank of America | JPY | 681,320 | USD | 6,351 | 11/21/14 | 284 | |
| Barclays | USD | 488 | EUR | 384 | 11/28/14 | (7 | ) |
| Barclays | USD | 2,425 | JPY | 261,444 | 11/21/14 | (97 | ) |
| Barclays | USD | 3,709 | JPY | 400,571 | 11/21/14 | (143 | ) |
| Barclays | USD | 11,834 | NOK | 76,299 | 11/21/14 | (529 | ) |
| Barclays | USD | 2,391 | SEK | 17,316 | 11/21/14 | (45 | ) |
| Barclays | USD | 3,767 | SEK | 27,120 | 11/21/14 | (94 | ) |
| Barclays | AUD | 952 | NZD | 1,061 | 11/21/14 | (11 | ) |
| Barclays | CAD | 2,006 | USD | 1,783 | 11/28/14 | 4 | |
| Barclays | JPY | 518,209 | GBP | 2,898 | 11/21/14 | 21 | |
| Citibank | AUD | 2,771 | EUR | 1,902 | 11/21/14 | (52 | ) |
| Citibank | EUR | 3,447 | JPY | 466,923 | 11/21/14 | (163 | ) |
| Citibank | SEK | 17,342 | JPY | 255,869 | 11/21/14 | (70 | ) |
| Commonwealth Bank of Australia | USD | 7,244 | CHF | 6,972 | 11/07/14 | 2 | |
| Commonwealth Bank of Australia | USD | 9,314 | CHF | 8,964 | 11/07/14 | 3 | |
| Commonwealth Bank of Australia | USD | 4,135 | EUR | 3,300 | 11/07/14 | 1 | |
| Commonwealth Bank of Australia | USD | 7,237 | EUR | 5,776 | 11/07/14 | 1 | |
| Commonwealth Bank of Australia | USD | 9,023 | EUR | 7,141 | 11/07/14 | (74 | ) |
| Commonwealth Bank of Australia | USD | 9,306 | EUR | 7,426 | 12/05/14 | 2 | |
| Commonwealth Bank of Australia | USD | 4,109 | SEK | 30,405 | 11/07/14 | 9 | |
| Commonwealth Bank of Australia | CHF | 6,704 | USD | 7,018 | 11/07/14 | 50 | |
| Commonwealth Bank of Australia | CHF | 8,619 | USD | 9,023 | 11/07/14 | 65 | |
| Commonwealth Bank of Australia | CHF | 6,972 | USD | 7,245 | 12/05/14 | (2 | ) |
| Commonwealth Bank of Australia | CHF | 8,964 | USD | 9,315 | 12/05/14 | (3 | ) |
| Commonwealth Bank of Australia | EUR | 3,174 | USD | 4,010 | 11/07/14 | 33 | |
| Commonwealth Bank of Australia | EUR | 5,554 | USD | 7,018 | 11/07/14 | 58 | |
| Commonwealth Bank of Australia | EUR | 7,426 | USD | 9,304 | 11/07/14 | (2 | ) |
| Commonwealth Bank of Australia | EUR | 3,300 | USD | 4,136 | 12/05/14 | (1 | ) |
| Commonwealth Bank of Australia | EUR | 5,776 | USD | 7,238 | 12/05/14 | (1 | ) |
| Commonwealth Bank of Australia | SEK | 29,091 | USD | 4,035 | 11/07/14 | 94 | |
| Commonwealth Bank of Australia | SEK | 30,405 | USD | 4,109 | 12/05/14 | (9 | ) |
| Credit Suisse | USD | 7,192 | EUR | 5,739 | 11/21/14 | 1 | |
| Deutsche Bank | AUD | 3,106 | NZD | 3,452 | 11/21/14 | (44 | ) |
| Deutsche Bank | JPY | 290,196 | GBP | 1,623 | 11/21/14 | 12 | |
| Goldman Sachs | USD | 6,859 | GBP | 4,262 | 11/21/14 | (43 | ) |
| Goldman Sachs | USD | 3,469 | JPY | 374,273 | 11/21/14 | (136 | ) |
| Goldman Sachs | USD | 3,300 | SEK | 23,748 | 11/21/14 | (84 | ) |
| Goldman Sachs | EUR | 5,605 | USD | 7,143 | 11/21/14 | 118 | |
| Goldman Sachs | JPY | 89,150 | USD | 831 | 11/21/14 | 37 | |
| Goldman Sachs | SEK | 50,860 | USD | 7,030 | 11/21/14 | 143 | |
| HSBC | JPY | 122,838 | USD | 1,141 | 11/28/14 | 47 | |
| JPMorgan Chase | EUR | 3,810 | USD | 4,835 | 11/21/14 | 60 | |
| JPMorgan Chase | NZD | 6,042 | USD | 4,708 | 11/21/14 | 6 | |
| Royal Bank of Canada | USD | 4,141 | CAD | 4,672 | 12/05/14 | 1 | |
| Royal Bank of Canada | USD | 362 | GBP | 225 | 11/21/14 | (2 | ) |
| Royal Bank of Canada | USD | 4,001 | NOK | 27,011 | 11/07/14 | 4 | |
| Royal Bank of Canada | USD | 7,046 | NOK | 45,312 | 11/07/14 | (329 | ) |
| Royal Bank of Canada | USD | 9,002 | NOK | 60,775 | 11/07/14 | 8 | |
| Royal Bank of Canada | USD | 6,994 | NOK | 47,270 | 12/05/14 | 6 | |
| Royal Bank of Canada | CAD | 4,672 | USD | 4,144 | 11/07/14 | (1 | ) |
| Royal Bank of Canada | NOK | 25,893 | USD | 4,026 | 11/07/14 | 188 | |
| Royal Bank of Canada | NOK | 47,270 | USD | 7,001 | 11/07/14 | (6 | ) |
| Royal Bank of Canada | NOK | 58,258 | USD | 9,059 | 11/07/14 | 423 | |
| Royal Bank of Canada | NOK | 27,208 | USD | 4,143 | 11/21/14 | 111 | |
| Royal Bank of Canada | NOK | 60,775 | USD | 8,993 | 12/05/14 | (8 | ) |
| Royal Bank of Canada | NZD | 5,349 | USD | 4,148 | 12/05/14 | (9 | ) |
| Skandinaviska Enskilda Bank | NOK | 49,587 | USD | 7,572 | 11/21/14 | 225 | |
| Standard Chartered | USD | 3,917 | AUD | 4,488 | 11/07/14 | 31 | |
| Standard Chartered | USD | 6,855 | AUD | 7,853 | 11/07/14 | 55 | |
| Standard Chartered | USD | 9,442 | AUD | 10,744 | 11/07/14 | 11 | |
| See accompanying notes which are an integral part of the financial statements. | |||||||
| Russell Investment Grade Bond Fund 453 | |||||||
| Russell Investment Company | |||||||
| Russell Investment Grade Bond Fund | |||||||
| Schedule of Investments, continued — October 31, 2014 | |||||||
| Foreign Currency Exchange Contracts | |||||||
| Amounts in thousands | |||||||
| Unrealized | |||||||
| Appreciation | |||||||
| Amount | Amount | (Depreciation) | |||||
| Counterparty | Sold | Bought | Settlement Date | $ | |||
| Standard Chartered | USD | 4,188 | AUD | 4,775 | 12/05/14 | 5 | |
| Standard Chartered | USD | 7,329 | AUD | 8,356 | 12/05/14 | 8 | |
| Standard Chartered | USD | 7,144 | JPY | 800,823 | 11/07/14 | (14 | ) |
| Standard Chartered | USD | 8,934 | JPY | 979,810 | 11/07/14 | (211 | ) |
| Standard Chartered | USD | 9,187 | JPY | 1,029,629 | 12/05/14 | (18 | ) |
| Standard Chartered | USD | 6,807 | NZD | 8,765 | 11/07/14 | 23 | |
| Standard Chartered | USD | 7,212 | NZD | 9,299 | 12/05/14 | 15 | |
| Standard Chartered | AUD | 4,775 | USD | 4,196 | 11/07/14 | (5 | ) |
| Standard Chartered | AUD | 8,356 | USD | 7,343 | 11/07/14 | (8 | ) |
| Standard Chartered | AUD | 10,097 | USD | 8,813 | 11/07/14 | (71 | ) |
| Standard Chartered | AUD | 10,744 | USD | 9,423 | 12/05/14 | (11 | ) |
| Standard Chartered | JPY | 762,074 | USD | 6,949 | 11/07/14 | 164 | |
| Standard Chartered | JPY | 1,029,629 | USD | 9,185 | 11/07/14 | 18 | |
| Standard Chartered | JPY | 800,823 | USD | 7,145 | 12/05/14 | 14 | |
| Standard Chartered | NZD | 9,299 | USD | 7,232 | 11/07/14 | (15 | ) |
| State Street | USD | 251 | AUD | 287 | 11/07/14 | 2 | |
| State Street | USD | 439 | AUD | 503 | 11/07/14 | 4 | |
| State Street | USD | 8 | AUD | 9 | 12/05/14 | — | |
| State Street | USD | 14 | AUD | 16 | 12/05/14 | — | |
| State Street | USD | 4,177 | CAD | 4,672 | 11/07/14 | (31 | ) |
| State Street | USD | 62 | CAD | 70 | 12/05/14 | — | |
| State Street | USD | 360 | EUR | 285 | 11/07/14 | (3 | ) |
| State Street | USD | 104 | EUR | 83 | 12/05/14 | — | |
| State Street | USD | 454 | JPY | 49,820 | 11/07/14 | (11 | ) |
| State Street | USD | 57 | JPY | 6,394 | 12/05/14 | — | |
| State Street | USD | 304 | NOK | 1,958 | 11/07/14 | (14 | ) |
| State Street | USD | 331 | NOK | 2,237 | 12/05/14 | — | |
| State Street | USD | 415 | NZD | 534 | 11/07/14 | 1 | |
| State Street | USD | 47 | NZD | 61 | 12/05/14 | — | |
| State Street | AUD | 4,711 | JPY | 438,476 | 11/21/14 | (236 | ) |
| State Street | AUD | 647 | USD | 564 | 11/07/14 | (5 | ) |
| State Street | AUD | 20 | USD | 18 | 12/05/14 | — | |
| State Street | CHF | 268 | USD | 281 | 11/07/14 | 2 | |
| State Street | CHF | 345 | USD | 361 | 11/07/14 | 3 | |
| State Street | CHF | 72 | USD | 75 | 12/05/14 | — | |
| State Street | CHF | 93 | USD | 97 | 12/05/14 | — | |
| State Street | EUR | 127 | USD | 160 | 11/07/14 | 1 | |
| State Street | EUR | 222 | USD | 280 | 11/07/14 | 2 | |
| State Street | EUR | 37 | USD | 46 | 12/05/14 | — | |
| State Street | EUR | 65 | USD | 81 | 12/05/14 | — | |
| State Street | JPY | 38,749 | USD | 353 | 11/07/14 | 8 | |
| State Street | JPY | 4,973 | USD | 44 | 12/05/14 | — | |
| State Street | NOK | 1,119 | USD | 174 | 11/07/14 | 8 | |
| State Street | NOK | 2,517 | USD | 391 | 11/07/14 | 18 | |
| State Street | NOK | 2,876 | USD | 426 | 12/05/14 | — | |
| State Street | SEK | 1,313 | USD | 182 | 11/07/14 | 4 | |
| State Street | SEK | 687 | USD | 93 | 12/05/14 | — | |
| UBS | GBP | 8,994 | USD | 14,352 | 11/21/14 | (34 | ) |
| Total Unrealized Appreciation (Depreciation) on Open Foreign Currency Exchange Contracts | (512 | ) | |||||
See accompanying notes which are an integral part of the financial statements.
454 Russell Investment Grade Bond Fund
| Russell Investment Company | |||||||||||
| Russell Investment Grade Bond Fund | |||||||||||
| Schedule of Investments, continued — October 31, 2014 | |||||||||||
| Index Swap Contracts (*) | |||||||||||
| Amounts in thousands | |||||||||||
| Fund Receives | Notional | Termination | Fair Value | ||||||||
| Underlying Security | Counterparty | Amount | Date | $ | |||||||
| Barclays U.S. Aggregate Total Return Value Unhedged | |||||||||||
| USD Index | Barclays | USD | 34,334 | 11/28/14 | (7 | ) | |||||
| Barclays U.S. Aggregate Total Return Value Unhedged | |||||||||||
| USD Index | Barclays | USD | 40,393 | 11/28/14 | (8 | ) | |||||
| Barclays U.S. Aggregate Total Return Value Unhedged | |||||||||||
| USD Index | Barclays | USD | 19,578 | 03/02/15 | (4 | ) | |||||
| Total Fair Value of Open Index Swap Contracts Premiums Paid (Received) - $— (å) | (19 | ) | |||||||||
| (*) Total return swaps (which includes index swaps) are agreements between counterparties to exchange cash flows, one based on market-linked | |||||||||||
| returns of an individual asset or a basket of assets (i.e. an index), and the other on a fixed or floating rate. The floating rate fees were all based | |||||||||||
| on the 3 Month LIBOR rate plus a fee ranging from 0.09% to 0.10%. | |||||||||||
| Interest Rate Swap Contracts | |||||||||||
| Amounts in thousands | |||||||||||
| Termination | Fair Value | ||||||||||
| Counterparty | Notional Amount | Fund Receives | Fund Pays | Date | $ | ||||||
| Barclays | USD | 3,420 | 3.145 | % | Three Month LIBOR | 03/15/26 | 68 | ||||
| Barclays | USD | 695 | Three Month LIBOR | 2.417 | % | 11/15/27 | (6 | ) | |||
| Barclays | USD | 695 | Three Month LIBOR | 2.481 | % | 11/15/27 | (14 | ) | |||
| Barclays | USD | 1,530 | Three Month LIBOR | 3.490 | % | 03/15/46 | (80 | ) | |||
| Citigroup | USD | 1,390 | Three Month LIBOR | 2.714 | % | 08/15/42 | 80 | ||||
| Citigroup | USD | 1,060 | Three Month LIBOR | 3.676 | % | 11/15/43 | (154 | ) | |||
| Goldman Sachs | USD | 3,820 | 2.804 | % | Three Month LIBOR | 04/09/26 | (45 | ) | |||
| Goldman Sachs | USD | 1,720 | Three Month LIBOR | 3.125 | % | 04/09/46 | 38 | ||||
| Total Fair Value on Open Interest Rate Swap Contracts Premiums Paid (Received) - $— (å) | (113 | ) | |||||||||
See accompanying notes which are an integral part of the financial statements.
Russell Investment Grade Bond Fund 455
| Russell Investment Company | |||||||||||||
| Russell Investment Grade Bond Fund | |||||||||||||
| Schedule of Investments, continued — October 31, 2014 | |||||||||||||
| Presentation of Portfolio Holdings | |||||||||||||
| Amounts in thousands | |||||||||||||
| Fair Value | |||||||||||||
| Portfolio Summary | Level 1 | Level 2 | Level 3 | Total | % of Net Assets | ||||||||
| Long-Term Investments | |||||||||||||
| Asset-Backed Securities | $ | — | $ | 132,216 | $ | — | $ | 132,216 | 8.4 | ||||
| Corporate Bonds and Notes | — | 295,078 | 4,072 | 299,150 | 19.0 | ||||||||
| International Debt | — | 75,030 | 4,189 | 79,219 | 5.0 | ||||||||
| Mortgage-Backed Securities | — | 492,021 | 1,955 | 493,976 | 31.4 | ||||||||
| Municipal Bonds | — | 13,792 | — | 13,792 | 0.9 | ||||||||
| United States Government Agencies | — | 16,017 | — | 16,017 | 1.0 | ||||||||
| United States Government Treasuries | — | 361,061 | — | 361,061 | 23.0 | ||||||||
| Preferred Stocks | 2,124 | — | — | 2,124 | 0.2 | ||||||||
| Options Purchased | — | 341 | — | 341 | —* | ||||||||
| Short-Term Investments | — | 369,901 | — | 369,901 | 23.5 | ||||||||
| Total Investments | 2,124 | 1,755,457 | 10,216 | 1,767,797 | 112.4 | ||||||||
| Other Assets and Liabilities, Net | (12.4 | ) | |||||||||||
| 100.0 | |||||||||||||
| Other Financial Instruments | |||||||||||||
| Futures Contracts | 773 | — | — | 773 | —* | ||||||||
| Options Written | — | (81 | ) | — | (81 | ) | (—)* | ||||||
| Foreign Currency Exchange Contracts | — | (512 | ) | — | (512 | ) | (—)* | ||||||
| Index Swap Contracts | — | (19 | ) | — | (19 | ) | (—)* | ||||||
| Interest Rate Swap Contracts | — | (113 | ) | — | (113 | ) | (—)* | ||||||
| Total Other Financial Instruments** | $ | 773 | $ | (725 | ) | $ | — | $ | 48 | ||||
| * Less than .05% of net assets. | |||||||||||||
| ** Futures and foreign currency exchange contract values reflect the unrealized appreciation (depreciation) on the instruments. | |||||||||||||
| For a description of the Levels see note 2 in the Notes to Financial Statements. | |||||||||||||
| For disclosure on transfers between Levels 1, 2 and 3 during the period ended October 31, 2014, see note 2 in the Notes to Financial | |||||||||||||
| Statements. | |||||||||||||
See accompanying notes which are an integral part of the financial statements.
456 Russell Investment Grade Bond Fund
| Russell Investment Company | |||||||||
| Russell Investment Grade Bond Fund | |||||||||
| Fair Value of Derivative Instruments — October 31, 2014 | |||||||||
| Amounts in thousands | |||||||||
| Foreign | |||||||||
| Currency | Interest Rate | ||||||||
| Derivatives not accounted for as hedging instruments | Contracts | Contracts | |||||||
| Location: Statement of Assets and Liabilities - Assets | |||||||||
| Investments, at fair value* | $ | — | $ | 341 | |||||
| Unrealized appreciation on foreign currency exchange contracts | 2,414 | — | |||||||
| Variation margin on futures contracts** | — | 1,042 | |||||||
| Interest rate swap contracts, at fair value | — | 186 | |||||||
| Total | $ | 2,414 | $ | 1,569 | |||||
| Location: Statement of Assets and Liabilities - Liabilities | |||||||||
| Variation margin on futures contracts** | $ | — | $ | 269 | |||||
| Unrealized depreciation on foreign currency exchange contracts | 2,926 | — | |||||||
| Options written, at fair value | — | 81 | |||||||
| Index swap contracts, at fair value | — | 19 | |||||||
| Interest rate swap contracts, at fair value | — | 299 | |||||||
| Total | $ | 2,926 | $ | 668 | |||||
| Foreign | |||||||||
| Credit | Currency | Interest Rate | |||||||
| Derivatives not accounted for as hedging instruments | Contracts | Contracts | Contracts | ||||||
| Location: Statement of Operations - Net realized gain (loss) | |||||||||
| Futures contracts | $ | — | $ | — | $ | 6,464 | |||
| Options written | — | — | 590 | ||||||
| Index swap contracts | — | — | 3,727 | ||||||
| Interest rate swap contracts | — | — | 247 | ||||||
| Credit default swap contracts | 1,538 | — | — | ||||||
| Foreign currency-related transactions **** | — | 594 | — | ||||||
| Total | $ | 1,538 | $ | 594 | $ | 11,028 | |||
| Location: Statement of Operations - Net change in unrealized appreciation (depreciation) | |||||||||
| Investments ***** | $ | — | $ | — | $ | (392 | ) | ||
| Futures contracts | — | — | (1,496 | ) | |||||
| Options written | — | — | (97 | ) | |||||
| Index swap contracts | — | — | 14 | ||||||
| Interest rate swap contracts | — | — | (2,110 | ) | |||||
| Credit default swap contracts | (624 | ) | — | — | |||||
| Foreign currency-related transactions *** | — | (116 | ) | — | |||||
| Total | $ | (624 | ) | $ | (116 | ) | $ | (4,081 | ) |
| * | Fair value of purchased options. |
| ** | Includes cumulative appreciation/depreciation of futures contracts as reported in the Schedule of Investments. Only variation margin is reported within the Statement of Assets and Liabilities. |
| *** | Only includes change in unrealized gain (loss) on forward and spot contracts. May differ from the net change in unrealized gain (loss) on foreign currency-related transactions reported within the Statement of Operations. |
| **** | Only includes net realized gain (loss) on forward and spot contracts. May differ from the net realized gain (loss) on foreign currency-related transactions reported within the Statement of Operations. |
| ***** | Includes net unrealized gain (loss) on purchased options as reported in the Schedule of Investments. |
For further disclosure on derivatives see note 2 in the Notes to Financial Statements.
See accompanying notes which are an integral part of the financial statements.
Russell Investment Grade Bond Fund 457
Russell Investment Company Russell Investment Grade Bond Fund
Balance Sheet Offsetting of Financial and Derivative Instruments — October 31, 2014
| Amounts in thousands | ||||||||
| Offsetting of Financial Assets and Derivative Assets | ||||||||
| Gross | Net Amounts | |||||||
| Amounts | of Assets | |||||||
| Gross | Offset in the | Presented in | ||||||
| Amounts of | Statement of | the Statement | ||||||
| Recognized | Assets and | of Assets and | ||||||
| Description | Location: Statement of Assets and Liabilities - Assets | Assets | Liabilities | Liabilities | ||||
| Options Purchased Contracts | Investments, at fair value | $ | 341 | $ | — $ | 341 | ||
| Foreign Currency Exchange Contracts | Unrealized appreciation on foreign currency exchange contracts | 2,414 | — | 2,414 | ||||
| Futures Contracts | Variation margin on futures contracts | 26 | — | 26 | ||||
| Interest Rate Swap Contracts | Interest rate swap contracts, at fair value | 186 | — | 186 | ||||
| Total | $ | 2,967 | $ | — $ | 2,967 | |||
| Financial Assets, Derivative Assets, and Collateral Held by Counterparty | ||||||||
| Gross Amounts Not Offset in | ||||||||
| the Statement of Assets and | ||||||||
| Liabilities | ||||||||
| Net Amounts | ||||||||
| of Assets | ||||||||
| Presented in | ||||||||
| the Statement | Financial and | |||||||
| of Assets and | Derivative | Collateral | ||||||
| Counterparty | Liabilities | Instruments | Received^ | Net Amount | ||||
| Bank of America | $ | 284 | $ | 160 | $ | — $ | 124 | |
| Barclays | 262 | 205 | — | 57 | ||||
| Citigroup | 170 | 1 | — | 169 | ||||
| Commonwealth Bank of Australia | 319 | 93 | — | 226 | ||||
| Credit Suisse | 1 | — | — | 1 | ||||
| Deutsche Bank | 98 | 12 | — | 86 | ||||
| Goldman Sachs | 359 | 301 | 58 | — | ||||
| HSBC | 47 | — | — | 47 | ||||
| JPMorgan Chase | 65 | — | — | 65 | ||||
| Royal Bank of Canada | 738 | 355 | — | 383 | ||||
| Skandinaviska Enskilda Bank | 225 | — | — | 225 | ||||
| Standard Chartered | 344 | 344 | — | — | ||||
| State Street | 55 | 55 | — | — | ||||
| Total | $ | 2,967 | $ | 1,526 | $ | 58 | $ | 1,383 |
See accompanying notes which are an integral part of the financial statements.
458 Russell Investment Grade Bond Fund
Russell Investment Company Russell Investment Grade Bond Fund
Balance Sheet Offsetting of Financial and Derivative Instruments, continued —October 31, 2014
| Amounts in thousands | ||||||||
| Offsetting of Financial Liabilities and Derivative Liabilities | ||||||||
| Gross | Net Amounts | |||||||
| Amounts | of Assets | |||||||
| Gross | Offset in the | Presented in | ||||||
| Amounts of | Statement of | the Statement | ||||||
| Recognized | Assets and | of Assets and | ||||||
| Description | Location: Statement of Assets and Liabilities - Liabilities | Liabilities | Liabilities | Liabilities | ||||
| Futures Contracts | Variation margin on futures contracts | $ | 277 | $ | — $ | 277 | ||
| Foreign Currency Exchange Contracts | Unrealized depreciation on foreign currency exchange contracts | 2,926 | — | 2,926 | ||||
| Options Written Contracts | Options written, at fair value | 81 | — | 81 | ||||
| Index Swap Contracts | Index swap contracts, at fair value | 19 | — | 19 | ||||
| Interest Rate Swap Contracts | Interest rate swap contracts, at fair value | 299 | — | 299 | ||||
| Total | $ | 3,602 | $ | — $ | 3,602 | |||
| Financial Liabilities, Derivative Liabilities, and Collateral Pledged by Counterparty | ||||||||
| Gross Amounts Not Offset in | ||||||||
| the Statement of Assets and | ||||||||
| Liabilities | ||||||||
| Net Amounts | ||||||||
| of Liabilities | ||||||||
| Presented in | ||||||||
| the Statement | Financial and | |||||||
| of Assets and | Derivative | Collateral | ||||||
| Counterparty | Liabilities | Instruments | Pledged^ | Net Amount | ||||
| Australia and New Zealand Banking Group | $ | 114 | $ | — $ | — $ | 114 | ||
| Bank of America | 160 | 160 | — | — | ||||
| Barclays | 1,125 | 205 | 533 | 387 | ||||
| Citigroup | 442 | 1 | 277 | 164 | ||||
| Commonwealth Bank of Australia | 93 | 93 | — | — | ||||
| Deutsche Bank | 44 | 12 | — | 32 | ||||
| Goldman Sachs | 552 | 301 | 251 | — | ||||
| HSBC | 30 | — | — | 30 | ||||
| Royal Bank of Canada | 355 | 355 | — | — | ||||
| Standard Chartered | 352 | 344 | — | 8 | ||||
| State Street | 302 | 55 | — | 247 | ||||
| UBS | 33 | — | — | 33 | ||||
| Total | $ | 3,602 | $ | 1,526 | $ | 1,061 | $ | 1,015 |
^ Collateral received or pledged amounts may not reconcile to those disclosed in the Statement of Assets and Liabilities due to the inclusion of off-Balance Sheet collateral and adjustments made to exclude overcollateralization.
For further disclosure on derivatives and counterparty risk see note 2 in the Notes to Financial Statements.
See accompanying notes which are an integral part of the financial statements.
Russell Investment Grade Bond Fund 459
| Russell Investment Company | ||
| Russell Investment Grade Bond Fund | ||
| Statement of Assets and Liabilities — October 31, 2014 | ||
| Amounts in thousands | ||
| Assets | ||
| Investments, at identified cost | $ | 1,749,076 |
| Investments, at fair value(>) | 1,767,797 | |
| Cash | 1,539 | |
| Cash (restricted)(a)(b) | 4,123 | |
| Foreign currency holdings(^) | 26 | |
| Unrealized appreciation on foreign currency exchange contracts | 2,414 | |
| Receivables: | ||
| Dividends and interest | 6,495 | |
| Dividends from affiliated Russell funds | 21 | |
| Investments sold | 29,697 | |
| Fund shares sold | 2,205 | |
| Investments matured(†) | 223 | |
| Variation margin on futures contracts | 26 | |
| Prepaid expenses | 4 | |
| Interest rate swap contracts, at fair value | 186 | |
| Total assets | 1,814,756 | |
| Liabilities | ||
| Payables: | ||
| Due to broker(c) | 114 | |
| Investments purchased | 235,521 | |
| Fund shares redeemed | 1,229 | |
| Accrued fees to affiliates | 626 | |
| Other accrued expenses | 207 | |
| Variation margin on futures contracts | 277 | |
| Unrealized depreciation on foreign currency exchange contracts | 2,926 | |
| Options written, at fair value(x) | 81 | |
| Index swap contracts, at fair value(8) | 19 | |
| Interest rate swap contracts, at fair value(•) | 299 | |
| Total liabilities | 241,299 | |
| Net Assets | $ | 1,573,457 |
See accompanying notes which are an integral part of the financial statements.
460 Russell Investment Grade Bond Fund
| Russell Investment Company | |||
| Russell Investment Grade Bond Fund | |||
| Statement of Assets and Liabilities, continued — October 31, 2014 | |||
| Amounts in thousands | |||
| Net Assets Consist of: | |||
| Undistributed (overdistributed) net investment income | $ | 921 | |
| Accumulated net realized gain (loss) | 26,722 | ||
| Unrealized appreciation (depreciation) on: | |||
| Investments | 18,721 | ||
| Futures contracts | 773 | ||
| Options written | 100 | ||
| Index swap contracts | (19 | ) | |
| Interest rate swap contracts | (113 | ) | |
| Investments matured | (537 | ) | |
| Foreign currency-related transactions | (512 | ) | |
| Shares of beneficial interest | 701 | ||
| Additional paid-in capital | 1,526,700 | ||
| Net Assets | $ | 1,573,457 | |
| Net Asset Value, offering and redemption price per share: | |||
| Net asset value per share: Class A(#) | $ | 22.48 | |
| Maximum offering price per share (Net asset value plus sales charge of 3.75%): Class A | $ | 23.36 | |
| Class A — Net assets | $ | 8,036,694 | |
| Class A — Shares outstanding ($.01 par value) | 357,527 | ||
| Net asset value per share: Class C(#) | $ | 22.33 | |
| Class C — Net assets | $ | 20,977,989 | |
| Class C — Shares outstanding ($.01 par value) | 939,437 | ||
| Net asset value per share: Class E(#) | $ | 22.46 | |
| Class E — Net assets | $ | 34,377,819 | |
| Class E — Shares outstanding ($.01 par value) | 1,530,455 | ||
| Net asset value per share: Class I(#) | $ | 22.47 | |
| Class I — Net assets | $ | 297,899,711 | |
| Class I — Shares outstanding ($.01 par value) | 13,257,261 | ||
| Net asset value per share: Class S(#) | $ | 22.45 | |
| Class S — Net assets | $ | 847,288,791 | |
| Class S — Shares outstanding ($.01 par value) | 37,739,861 | ||
| Net asset value per share: Class Y(#) | $ | 22.49 | |
| Class Y — Net assets | $ | 364,876,182 | |
| Class Y — Shares outstanding ($.01 par value) | 16,226,321 | ||
| Amounts in thousands | |||
| (^) Foreign currency holdings - cost | $ | 26 | |
| (x) Premiums received on options written | $ | 181 | |
| (†) Investments matured - cost | $ | 760 | |
| (>) Investments in affiliates, Russell U.S. Cash Management Fund | $ | 267,030 | |
| (•) Interest rate swap contracts - premiums paid (received) | $ | — | |
| (8) Index swap contracts - premiums paid (received) | $ | — | |
| (a) Cash Collateral for Futures | $ | 3,226 | |
| (b) Cash Collateral for Swaps | $ | 897 | |
| (c) Due to Broker for Swaps | $ | 114 | |
| (#) Net asset value per share equals class level net assets divided by class level shares of beneficial interest outstanding. | |||
See accompanying notes which are an integral part of the financial statements.
Russell Investment Grade Bond Fund 461
| Russell Investment Company | |||
| Russell Investment Grade Bond Fund | |||
| Statement of Operations — For the Period Ended October 31, 2014 | |||
| Amounts in thousands | |||
| Investment Income | |||
| Dividends | $ | 365 | |
| Dividends from affiliated Russell funds | 239 | ||
| Interest | 34,044 | ||
| Total investment income | 34,648 | ||
| Expenses | |||
| Advisory fees | 4,149 | ||
| Administrative fees | 790 | ||
| Custodian fees | 470 | ||
| Distribution fees - Class A | 21 | ||
| Distribution fees - Class C | 171 | ||
| Transfer agent fees - Class A | 17 | ||
| Transfer agent fees - Class C | 46 | ||
| Transfer agent fees - Class E | 72 | ||
| Transfer agent fees - Class I | 388 | ||
| Transfer agent fees - Class S | 1,671 | ||
| Transfer agent fees - Class Y | 19 | ||
| Professional fees | 162 | ||
| Registration fees | 127 | ||
| Shareholder servicing fees - Class C | 57 | ||
| Shareholder servicing fees - Class E | 91 | ||
| Trustees’ fees | 41 | ||
| Printing fees | 53 | ||
| Miscellaneous | 100 | ||
| Total expenses | 8,445 | ||
| Net investment income (loss) | 26,203 | ||
| Net Realized and Unrealized Gain (Loss) | |||
| Net realized gain (loss) on: | |||
| Investments | 22,421 | ||
| Futures contracts | 6,464 | ||
| Options written | 590 | ||
| Index swap contracts | 3,727 | ||
| Interest rate swap contracts | 247 | ||
| Credit default swap contracts | 1,538 | ||
| Foreign currency-related transactions | (196 | ) | |
| Net realized gain (loss) | 34,791 | ||
| Net change in unrealized appreciation (depreciation) on: | |||
| Investments | 7,410 | ||
| Futures contracts | (1,496 | ) | |
| Options written | (97 | ) | |
| Index swap contracts | 14 | ||
| Interest rate swap contracts | (2,110 | ) | |
| Credit default swap contracts | (624 | ) | |
| Investment matured | (4 | ) | |
| Foreign currency-related transactions | (75 | ) | |
| Net change in unrealized appreciation (depreciation) | 3,018 | ||
| Net realized and unrealized gain (loss) | 37,809 | ||
| Net Increase (Decrease) in Net Assets from Operations | $ | 64,012 | |
See accompanying notes which are an integral part of the financial statements.
462 Russell Investment Grade Bond Fund
| Russell Investment Company | ||||||
| Russell Investment Grade Bond Fund | ||||||
| Statements of Changes in Net Assets | ||||||
| For the Periods Ended October 31, | ||||||
| Amounts in thousands | 2014 | 2013 | ||||
| Increase (Decrease) in Net Assets | ||||||
| Operations | ||||||
| Net investment income (loss) | $ | 26,203 | $ | 28,465 | ||
| Net realized gain (loss) | 34,791 | (16,909 | ) | |||
| Net change in unrealized appreciation (depreciation) | 3,018 | (37,747 | ) | |||
| Net increase (decrease) in net assets from operations | 64,012 | (26,191 | ) | |||
| Distributions | ||||||
| From net investment income | ||||||
| Class A | (89 | ) | (115 | ) | ||
| Class C | (80 | ) | (93 | ) | ||
| Class E | (387 | ) | (410 | ) | ||
| Class I | (4,542 | ) | (4,928 | ) | ||
| Class S | (11,025 | ) | (9,886 | ) | ||
| Class Y | (6,490 | ) | (8,955 | ) | ||
| From net realized gain | ||||||
| Class A | — | (376 | ) | |||
| Class C | — | (1,105 | ) | |||
| Class E | — | (1,347 | ) | |||
| Class I | — | (12,578 | ) | |||
| Class S | — | (25,101 | ) | |||
| Class Y | — | (18,483 | ) | |||
| Net decrease in net assets from distributions | (22,613 | ) | (83,377 | ) | ||
| Share Transactions* | ||||||
| Net increase (decrease) in net assets from share transactions | (310,764 | ) | 35,108 | |||
| Total Net Increase (Decrease) in Net Assets | (269,365 | ) | (74,460 | ) | ||
| Net Assets | ||||||
| Beginning of period | 1,842,822 | 1,917,282 | ||||
| End of period | $ | 1,573,457 | $ | 1,842,822 | ||
| Undistributed (overdistributed) net investment income included in net assets | $ | 921 | $ | (2,548 | ) | |
See accompanying notes which are an integral part of the financial statements.
Russell Investment Grade Bond Fund 463
Russell Investment Company Russell Investment Grade Bond Fund
Statements of Changes in Net Assets, continued
* Share transaction amounts (in thousands) for the periods ended October 31, 2014 and October 31, 2013 were as follows:
| 2014 | 2013 | |||||||||||
| Shares | Dollars | Shares | Dollars | |||||||||
| Class A | ||||||||||||
| Proceeds from shares sold | 70 | $ | 1,552 | 277 | $ | 6,180 | ||||||
| Proceeds from reinvestment of distributions | 4 | 86 | 21 | 477 | ||||||||
| Payments for shares redeemed | (178 | ) | (3,900 | ) | (354 | ) | (7,851 | ) | ||||
| Net increase (decrease) | (104 | ) | (2,262 | ) | (56 | ) | (1,194 | ) | ||||
| Class C | ||||||||||||
| Proceeds from shares sold | 73 | 1,598 | 179 | 4,028 | ||||||||
| Proceeds from reinvestment of distributions | 3 | 80 | 53 | 1,183 | ||||||||
| Payments for shares redeemed | (298 | ) | (6,543 | ) | (649 | ) | (14,279 | ) | ||||
| Net increase (decrease) | (222 | ) | (4,865 | ) | (417 | ) | (9,068 | ) | ||||
| Class E | ||||||||||||
| Proceeds from shares sold | 241 | 5,319 | 525 | 11,624 | ||||||||
| Proceeds from reinvestment of distributions | 16 | 355 | 71 | 1,577 | ||||||||
| Payments for shares redeemed | (628 | ) | (13,792 | ) | (586 | ) | (12,931 | ) | ||||
| Net increase (decrease) | (371 | ) | (8,118 | ) | 10 | 270 | ||||||
| Class I | ||||||||||||
| Proceeds from shares sold | 2,448 | 53,989 | 3,707 | 82,711 | ||||||||
| Proceeds from reinvestment of distributions | 202 | 4,451 | 765 | 17,100 | ||||||||
| Payments for shares redeemed | (4,914 | ) | (108,541 | ) | (6,703 | ) | (148,290 | ) | ||||
| Net increase (decrease) | (2,264 | ) | (50,101 | ) | (2,231 | ) | (48,479 | ) | ||||
| Class S | ||||||||||||
| Proceeds from shares sold | 13,652 | 299,938 | 14,543 | 322,655 | ||||||||
| Proceeds from reinvestment of distributions | 495 | 10,919 | 1,552 | 34,649 | ||||||||
| Payments for shares redeemed | (13,765 | ) | (303,095 | ) | (13,556 | ) | (298,372 | ) | ||||
| Net increase (decrease) | 382 | 7,762 | 2,539 | 58,932 | ||||||||
| Class Y | ||||||||||||
| Proceeds from shares sold | 2,228 | 49,137 | 8,984 | 199,546 | ||||||||
| Proceeds from reinvestment of distributions | 294 | 6,490 | 1,227 | 27,438 | ||||||||
| Payments for shares redeemed | (14,064 | ) | (308,807 | ) | (8,757 | ) | (192,337 | ) | ||||
| Net increase (decrease) | (11,542 | ) | (253,180 | ) | 1,454 | 34,647 | ||||||
| Total increase (decrease) | (14,121 | ) | $ | (310,764 | ) | 1,299 | $ | 35,108 | ||||
See accompanying notes which are an integral part of the financial statements.
464 Russell Investment Grade Bond Fund
(This page intentionally left blank)
| Russell Investment Company | ||||||||||||||||
| Russell Investment Grade Bond Fund | ||||||||||||||||
| Financial Highlights — For the Periods Ended | ||||||||||||||||
| For a Share Outstanding Throughout Each Period. | ||||||||||||||||
| $ | $ | $ | $ | $ | $ | |||||||||||
| Net Asset Value, | Net | Net Realized | Total from | Distributions | Distributions | |||||||||||
| Beginning of | Investment | and Unrealized | Investment | from Net | from Net | |||||||||||
| Period | Income (Loss)(a)(d) | Gain (Loss) | Operations | Investment Income | Realized Gain | |||||||||||
| Class A | ||||||||||||||||
| October 31, 2014 | 21.91 | .28 | .53 | .81 | (.24 | ) | — | |||||||||
| October 31, 2013 | 23.15 | .25 | (.58 | ) | (.33 | ) | (.21 | ) | (.70 | ) | ||||||
| October 31, 2012 | 22.31 | .36 | 1.10 | 1.46 | (.38 | ) | (.24 | ) | ||||||||
| October 31, 2011 | 22.85 | .47 | .21 | .68 | (.53 | ) | (.69 | ) | ||||||||
| October 31, 2010 (3) | 21.87 | .14 | 1.00 | 1.14 | (.16 | ) | — | |||||||||
| Class C | ||||||||||||||||
| October 31, 2014 | 21.77 | .12 | .52 | .64 | (.08 | ) | — | |||||||||
| October 31, 2013 | 23.03 | .09 | (.59 | ) | (.50 | ) | (.06 | ) | (.70 | ) | ||||||
| October 31, 2012 | 22.20 | .21 | 1.08 | 1.29 | (.22 | ) | (.24 | ) | ||||||||
| October 31, 2011 | 22.74 | .32 | .19 | .51 | (.36 | ) | (.69 | ) | ||||||||
| October 31, 2010 | 21.31 | .36 | 1.61 | 1.97 | (.45 | ) | (.09 | ) | ||||||||
| Class E | ||||||||||||||||
| October 31, 2014 | 21.89 | .28 | .53 | .81 | (.24 | ) | — | |||||||||
| October 31, 2013 | 23.13 | .25 | (.58 | ) | (.33 | ) | (.21 | ) | (.70 | ) | ||||||
| October 31, 2012 | 22.28 | .39 | 1.09 | 1.48 | (.39 | ) | (.24 | ) | ||||||||
| October 31, 2011 | 22.82 | .51 | .18 | .69 | (.54 | ) | (.69 | ) | ||||||||
| October 31, 2010 | 21.38 | .55 | 1.62 | 2.17 | (.64 | ) | (.09 | ) | ||||||||
| Class I | ||||||||||||||||
| October 31, 2014 | 21.90 | .36 | .52 | .88 | (.31 | ) | — | |||||||||
| October 31, 2013 | 23.14 | .33 | (.59 | ) | (.26 | ) | (.28 | ) | (.70 | ) | ||||||
| October 31, 2012 | 22.29 | .45 | 1.09 | 1.54 | (.45 | ) | (.24 | ) | ||||||||
| October 31, 2011 | 22.83 | .56 | .19 | .75 | (.60 | ) | (.69 | ) | ||||||||
| October 31, 2010 | 21.39 | .60 | 1.62 | 2.22 | (.69 | ) | (.09 | ) | ||||||||
| Class S | ||||||||||||||||
| October 31, 2014 | 21.88 | .34 | .52 | .86 | (.29 | ) | — | |||||||||
| October 31, 2013 | 23.12 | .31 | (.58 | ) | (.27 | ) | (.27 | ) | (.70 | ) | ||||||
| October 31, 2012 | 22.27 | .43 | 1.09 | 1.52 | (.43 | ) | (.24 | ) | ||||||||
| October 31, 2011 | 22.81 | .54 | .19 | .73 | (.58 | ) | (.69 | ) | ||||||||
| October 31, 2010 | 21.38 | .54 | 1.65 | 2.19 | (.67 | ) | (.09 | ) | ||||||||
| Class Y | ||||||||||||||||
| October 31, 2014 | 21.91 | .38 | .54 | .92 | (.34 | ) | — | |||||||||
| October 31, 2013 | 23.15 | .35 | (.58 | ) | (.23 | ) | (.31 | ) | (.70 | ) | ||||||
| October 31, 2012 | 22.30 | .48 | 1.08 | 1.56 | (.47 | ) | (.24 | ) | ||||||||
| October 31, 2011 | 22.84 | .59 | .18 | .77 | (.62 | ) | (.69 | ) | ||||||||
| October 31, 2010 | 21.40 | .59 | 1.64 | 2.23 | (.70 | ) | (.09 | ) | ||||||||
See accompanying notes which are an integral part of the financial statements.
466 Russell Investment Grade Bond Fund
| % | % | % | |||||||||||||||
| $ | $ | Ratio of Expenses | Ratio of Expenses | Ratio of Net | |||||||||||||
| Net Asset Value, | % | Net Assets, | to Average | to Average | Investment Income | % | |||||||||||
| $ | End of | Total | End of Period | Net Assets, | Net Assets, | to Average | Portfolio | ||||||||||
| Total Distributions | Period | Return(b)(c) | (000 | ) | Gross(e) | Net(d)(e) | Net Assets(d)(e) | Turnover Rate(b) | |||||||||
| (.24 | ) | 22.48 | 3.70 | 8,036 | .81 | .81 | 1.27 | 178 | |||||||||
| (.91 | ) | 21.91 | (1.48 | ) | 10,114 | .79 | .79 | 1.15 | 136 | ||||||||
| (.62 | ) | 23.15 | 6.68 | 11,983 | .79 | .79 | 1.59 | 159 | |||||||||
| (1.22 | ) | 22.31 | 3.27 | 3,966 | .80 | .80 | 2.14 | 187 | |||||||||
| (.16 | ) | 22.85 | 5.20 | 1,002 | .81 | .81 | 1.55 | 157 | |||||||||
| (.08 | ) | 22.33 | 2.94 | 20,978 | 1.56 | 1.56 | .54 | 178 | |||||||||
| (.76 | ) | 21.77 | (2.23 | ) | 25,285 | 1.54 | 1.54 | .39 | 136 | ||||||||
| (.46 | ) | 23.03 | 5.92 | 36,340 | 1.54 | 1.54 | .92 | 159 | |||||||||
| (1.05 | ) | 22.20 | 2.42 | 32,369 | 1.55 | 1.55 | 1.48 | 187 | |||||||||
| (.54 | ) | 22.74 | 9.48 | 38,798 | 1.54 | 1.54 | 1.66 | 157 | |||||||||
| (.24 | ) | 22.46 | 3.71 | 34,378 | .81 | .81 | 1.28 | 178 | |||||||||
| (.91 | ) | 21.89 | (1.46 | ) | 41,621 | .79 | .78 | 1.15 | 136 | ||||||||
| (.63 | ) | 23.13 | 6.76 | 43,762 | .79 | .74 | 1.74 | 159 | |||||||||
| (1.23 | ) | 22.28 | 3.31 | 45,365 | .80 | .72 | 2.32 | 187 | |||||||||
| (.73 | ) | 22.82 | 10.38 | 54,743 | .79 | .68 | 2.50 | 157 | |||||||||
| (.31 | ) | 22.47 | 4.05 | 297,900 | .48 | .48 | 1.62 | 178 | |||||||||
| (.98 | ) | 21.90 | (1.15 | ) | 339,903 | .46 | .46 | 1.47 | 136 | ||||||||
| (.69 | ) | 23.14 | 7.05 | 410,807 | .46 | .46 | 2.01 | 159 | |||||||||
| (1.29 | ) | 22.29 | 3.57 | 380,063 | .47 | .47 | 2.57 | 187 | |||||||||
| (.78 | ) | 22.83 | 10.64 | 428,647 | .46 | .44 | 2.76 | 157 | |||||||||
| (.29 | ) | 22.45 | 3.97 | 847,289 | .56 | .56 | 1.54 | 178 | |||||||||
| (.97 | ) | 21.88 | (1.23 | ) | 817,400 | .54 | .54 | 1.38 | 136 | ||||||||
| (.67 | ) | 23.12 | 6.93 | 805,089 | .54 | .54 | 1.92 | 159 | |||||||||
| (1.27 | ) | 22.27 | 3.50 | 657,013 | .55 | .55 | 2.44 | 187 | |||||||||
| (.76 | ) | 22.81 | 10.55 | 456,448 | .54 | .54 | 2.43 | 157 | |||||||||
| (.34 | ) | 22.49 | 4.21 | 364,876 | .36 | .36 | 1.71 | 178 | |||||||||
| (1.01 | ) | 21.91 | (.99 | ) | 608,499 | .34 | .34 | 1.59 | 136 | ||||||||
| (.71 | ) | 23.15 | 7.15 | 609,301 | .36 | .36 | 2.11 | 159 | |||||||||
| (1.31 | ) | 22.30 | 3.67 | 600,991 | .37 | .37 | 2.66 | 187 | |||||||||
| (.79 | ) | 22.84 | 10.77 | 681,001 | .36 | .36 | 2.70 | 157 | |||||||||
See accompanying notes which are an integral part of the financial statements.
Russell Investment Grade Bond Fund 467
Russell Investment Company Russell Short Duration Bond Fund
Portfolio Management Discussion and Analysis — October 31, 2014 (Unaudited)

| Russell Short Duration Bond Fund - Class A‡ | Russell Short Duration Bond Fund - Class S | ||||||
| Total | Total | ||||||
| Return | Return | ||||||
| 1 Year | (2.71 | )% | 1 Year | 1.30 | % | ||
| 5 Years | 1.65 | %§ | 5 Years | 2.68 | %§ | ||
| 10 Years | 2.50 | %§ | 10 Years | 3.15 | %§ | ||
| Russell Short Duration Bond Fund - Class C | Russell Short Duration Bond Fund - Class Y‡‡ | ||||||
| Total | Total | ||||||
| Return | Return | ||||||
| 1 Year | 0.26 | % | 1 Year | 1.38 | % | ||
| 5 Years | 1.64 | %§ | 5 Years | 2.76 | %§ | ||
| 10 Years | 2.12 | %§ | 10 Years | 3.21 | %§ | ||
| Russell Short Duration Bond Fund - Class E | BofA Merrill Lynch 1-3 Yr U.S. Treasuries Index** | ||||||
| Total | Total | ||||||
| Return | Return | ||||||
| 1 Year | 1.06 | % | 1 Year | 0.67 | % | ||
| 5 Years | 2.42 | %§ | 5 Years | 1.04 | %§ | ||
| 10 Years | 2.89 | %§ | 10 Years | 2.52 | %§ | ||
468 Russell Short Duration Bond Fund
Russell Investment Company Russell Short Duration Bond Fund
Portfolio Management Discussion and Analysis, continued — October 31, 2014 (Unaudited)
| The Russell Short Duration Bond Fund (the “Fund”) employs | where corporate profits are increasing, enabling issuers to pay |
| a multi-manager approach whereby portions of the Fund | down their debt burden. This may also be generalized as a |
| are allocated to different money managers. Fund assets not | “risk on” market where investors are generally bullish about the |
| allocated to money managers are managed by Russell Investment | economy. However, the Fund may also perform well versus U.S. |
| Management Company (“RIMCo”), the Fund’s advisor. RIMCo | Treasuries in a “risk off” flight-to-quality environment given that |
| may change the allocation of the Fund’s assets among money | a majority of the Fund’s holdings consist of high-grade, short- |
| managers at any time. An exemptive order from the Securities | duration securities, which are securities that investors may find |
| and Exchange Commission (“SEC”) permits RIMCo to engage | as a reasonable alternative to U.S. Treasuries. Environments |
| or terminate a money manager at any time, subject to approval | that feature sharp rises in interest rates or mass sell-offs in fixed |
| by the Fund’s Board, without a shareholder vote. Pursuant to the | income risk assets (e.g., the recent global financial crisis) will |
| terms of the exemptive order, the Fund is required to notify its | tend to be unfavorable for Fund performance. Given the Fund’s |
| shareholders within 90 days of when a money manager begins | strategy and positioning, the “risk on” market sentiment provided |
| providing services. As of October 31, 2014, the Fund had three | a favorable environment for Fund performance over the fiscal |
| money managers. | year. Non-treasury allocations were primary contributors to |
| What is the Fund’s investment objective? | benchmark-relative results, as U.S. economic growth conditions |
| showed signs of improvement and a “risk on” environment | |
| The Fund seeks to provide current income and preservation of | overshadowed much of the period. |
| capital with a focus on short duration securities. | |
| How did the investment strategies and techniques employed | |
| How did the Fund perform relative to its benchmark for the | by the Fund and its money managers affect its benchmark- |
| fiscal year ended October 31, 2014? | relative performance? |
| For the fiscal year ended October 31, 2014, the Fund’s Class | With the exception of the Fund’s Class C Shares, the Fund |
| A, Class C, Class E, Class S and Class Y Shares gained 1.06%, | outperformed its benchmark for the fiscal year. In general, ex- |
| 0.26%, 1.06%, 1.30% and 1.38%, respectively. This is compared | benchmark non-treasury credit exposures were a primary driver |
| to the Fund’s benchmark, the BofA Merrill Lynch 1-3 Year U.S. | of positive results. More specifically, the Fund’s allocation to, and |
| Treasuries Index, which gained 0.67% during the same period. | security selection within, investment grade corporate bonds was |
| The Fund’s performance includes operating expenses, whereas | a lead contributor. Allocations across mortgage bond sectors also |
| index returns are unmanaged and do not include expenses of any | contributed positively over the period, as did selections to non- |
| kind. | U.S. developed market interest rates. Although a longer duration |
| For the fiscal year ended October 31, 2014, the Morningstar® | versus the benchmark’s duration was positive for benchmark- |
| Short-Term Bond, a group of funds that Morningstar considers to | relative results, the Fund’s concentrated yield curve exposure at |
| have investment strategies similar to those of the Fund, gained | the front-end of the yield curve had a net negative impact from an |
| 1.31%. This return serves as a peer comparison and is expressed | overall interest rate perspective. |
| net of operating expenses. | Logan Circle Partners, L.P. (“Logan Circle”) outperformed the |
| How did the market conditions described in the Market | Fund’s benchmark for the fiscal year. Security selection across |
| Summary report affect the Fund’s performance? | ex-benchmark exposures was especially positive for results. |
| Despite a rough start at the beginning of the one-year period, the | Specifically, an overweight to investment grade financials and |
| U.S. bond market turned around in 2014, resulting in generally | exposure to higher-beta securities (securities with high sensitivity |
| positive performance among bonds over the fiscal year. Various | to market movements) across domestic, developed and emerging |
| positive factors included: strengthening data for U.S. growth amid | markets was a consistently positive contributor to performance. |
| heightened geopolitical tension in select emerging economies, | Allocations within agency and commercial mortgage-backed |
| which drove a U.S. Treasury sell-off and robust U.S. dollar | securities were also materially beneficial. |
| appreciation; continued improvements in housing fundamentals; | Pacific Investment Management Company (“PIMCO”) was |
| ongoing low interest rates that fueled issuance activity, which was | terminated in October 2014 and outperformed the Fund’s |
| met with high demand; and decreasing yields that compressed | benchmark for the portion of the fiscal year in which it was a |
| credit spreads, which is generally positive for bonds. | manager for the Fund. Allocations to non-agency mortgage- |
| The Fund will tend to perform well in markets where non-treasury | backed securities such as sub-prime mortgages and investment |
| sectors lead. These are generally environments where the economy | grade corporate bonds were key drivers to performance, albeit |
| is stable and a higher coupon can be collected, or environments | credit selections in general contributed positively. However, |
| duration positioning detracted from performance over the period. | |
Russell Short Duration Bond Fund 469
Russell Investment Company Russell Short Duration Bond Fund
Portfolio Management Discussion and Analysis, continued — October 31, 2014 (Unaudited)
| Scout Investments, Inc. (“Scout”) was hired in October 2014 | instruments such as U.S. Treasury futures. These tilts detracted | |
| but did not manage Fund assets until the end of the month, | modestly during the period due to RIMCo’s U.S. Treasury futures | |
| and therefore did not have a meaningful impact on the Fund’s | selections. | |
| performance for the period. | Inaddition,inconnectionwiththehireofTHLinJune2014,RIMCo | |
| THL Credit Advisors LLC (“THL”) was hired in June 2014 as | implemented a strategy designed to replicate the performance of | |
| a bank loan specialist in the Fund and outperformed the Fund’s | the Fund’s benchmark in order to provide the Fund additional | |
| benchmark for the portion of the fiscal year in which it was a | diversification and help balance the credit risk associated with | |
| manager in the Fund. Outperformance relative to the Fund’s | THL’s bank loan investments. This strategy typically holds ten to | |
| benchmark was primarily from the high credit exposure of THL’s | twenty optimally chosen index constituents, and had a modestly | |
| bank loan holdings, which outperformed lower risk assets over the | positive impact to benchmark-relative performance. | |
| period. However, THL underperformed in September 2014 when | ||
| credit risk assets were not rewarded. | Describe any changes to the Fund’s structure or the money | |
| manager line-up. | ||
| Wellington Management Company, LLP (“Wellington”) was | In June 2014, Wellington was terminated from the Fund and THL, | |
| terminated from the Fund in June 2014 and outperformed the | a bank loan specialist, was added to the Fund. At the same time, | |
| Fund’s benchmark for the portion of the fiscal year in which | RIMCo implemented the index replication strategy described | |
| it was a manager for the Fund. Positive selections to U.S. and | above. | |
| U.K. interest rates at the end of calendar year 2013 led to strong | ||
| performance at the start of the period. Although these positions | In October 2014, PIMCO was terminated from the Fund and Scout | |
| detracted at the start of calendar year 2014, tactical management | was added to the Fund. There were some minor re-weightings of | |
| of the Fund added value as positive security selection to | other managers within the Fund as a result of these changes. | |
| investment grade corporate bonds within the U.S. and periphery | Money Managers as of October 31, | |
| Europe continued positive performance. | 2014 | Styles |
| RIMCo manages the portion of the Fund’s assets that RIMCo | Logan Circle Partners, L.P. | Fully Discretionary |
| determines not to allocate to the money managers. Assets not | Scout Investments, Inc. | Fully Discretionary |
| allocated to managers include the Fund’s liquidity reserves and | THL Credit Advisors LLC | Sector Specialist |
| assets which may be managed directly by RIMCo to modify the | The views expressed in this report reflect those of the portfolio | |
| Fund’s overall portfolio characteristics to seek to achieve the | managers only through the end of the period covered by | |
| desired risk/return profile for the Fund. | the report. These views do not necessarily represent the | |
| During the period, RIMCo utilized futures contracts to seek to | views of RIMCo, or any other person in RIMCo or any other | |
| achieve the Fund benchmark’s duration exposures with respect | affiliated organization. These views are subject to change | |
| to the portion of the Fund allocated to cash reserves. While this | at any time based upon market conditions or other events, | |
| exposure was a detractor in absolute terms, due to the general | and RIMCo disclaims any responsibility to update the views | |
| increase in 2-yr U.S. Treasury yields over the period, it had a | contained herein. These views should not be relied on as | |
| neutral impact to benchmark-relative performance. RIMCo also | investment advice and, because investment decisions for | |
| implemented tactical ‘tilts’ based on its judgments regarding | a Russell Investment Company (“RIC”) Fund are based on | |
| shorter-term opportunities to seek to generate returns and/ | numerous factors, should not be relied on as an indication | |
| or mitigate risk during the period by investing in derivative | of investment decisions of any RIC Fund. | |
470 Russell Short Duration Bond Fund
Russell Investment Company
Russell Short Duration Bond Fund
Portfolio Management Discussion and Analysis, continued — October 31, 2014 (Unaudited)
| * | Assumes initial investment on November 1, 2004. |
| ** | BofA Merrill Lynch 1-3 Yr Treasuries Index is an index composed of approximately 160 issues in the form of publicly placed, coupon-bearing U.S. Treasury debt. Issues must carry a term of maturity of at least one year, and par amounts outstanding must be no less than $10 million at the start and at the close of the performance measurement periods. |
| ‡ | The Fund first issued Class A Shares on March 1, 2007. The returns shown for Class A Shares prior to that date are the returns of Class E Shares. The performance shown has been adjusted to reflect the deduction of the maximum Class A sales charge of 3.75%. Annual returns for each Class will differ only to the extent that the Class A Shares do not have the same expenses as Class E Shares. |
| ‡‡ | The Fund first issued Class Y Shares on September 29, 2008. The returns shown for Class Y Shares prior to that date are the returns of the Fund’s Class S Shares. Class Y Shares will have substantially similar annual returns as the Class S Shares because the Shares of each Class are invested in the same portfolio of securities. Annual returns for each Class will differ only to the extent that the Class Y Shares do not have the same expenses as the Class S Shares. |
| § | Annualized. |
Performance is historical and assumes reinvestment of all dividends and capital gains. Investment return and principal value will fluctuate so that an investor’s shares, when redeemed, may be worth more or less than when purchased. Past performance is not indicative of future results. The returns shown do not reflect the deduction of taxes that a shareholder would pay on Fund distributions or the redemption of Fund shares.
Russell Short Duration Bond Fund 471
Russell Investment Company Russell Short Duration Bond Fund
Shareholder Expense Example — October 31, 2014 (Unaudited)
| Fund Expenses | Please note that the expenses shown in the table are meant | |||||
| The following disclosure provides important information | to highlight your ongoing costs only and do not reflect any | |||||
| regarding the Fund’s Shareholder Expense Example | transactional costs. Therefore, the information under the heading | |||||
| (“Example”). | “Hypothetical Performance (5% return before expenses)” is | |||||
| useful in comparing ongoing costs only, and will not help you | ||||||
| Example | determine the relative total costs of owning different funds. In | |||||
| As a shareholder of the Fund, you incur two types of costs: (1) | addition, if these transactional costs were included, your costs | |||||
| transaction costs, and (2) ongoing costs, including advisory and | would have been higher. | |||||
| administrative fees; distribution (12b-1) and/or service fees; | Hypothetical | |||||
| and other Fund expenses. The Example is intended to help | Performance (5% | |||||
| you understand your ongoing costs (in dollars) of investing in | Actual | return before | ||||
| the Fund and to compare these costs with the ongoing costs of | Class A | Performance | expenses) | |||
| Beginning Account Value | ||||||
| investing in other mutual funds. The Example is based on an | May 1, 2014 | $ | 1,000.00 | $ | 1,000.00 | |
| investment of $1,000 invested at the beginning of the period and | Ending Account Value | |||||
| held for the entire period indicated, which for this Fund is from | October 31, 2014 | $ | 1,002.60 | $ | 1,021.02 | |
| May 1, 2014 to October 31, 2014. | Expenses Paid During Period* | $ | 4.19 | $ | 4.23 | |
| Actual Expenses | * Expenses are equal to the Fund's annualized expense ratio of 0.83% | |||||
| (representing the six month period annualized), multiplied by the average | ||||||
| The information in the table under the heading “Actual | account value over the period, multiplied by 184/365 (to reflect the one-half | |||||
| Performance” provides information about actual account values | year period). May reflect amounts waived and/or reimbursed. Without any | |||||
| and actual expenses. You may use the information in this column, | waivers and/or reimbursements, expenses would have been higher. | |||||
| together with the amount you invested, to estimate the expenses | ||||||
| Hypothetical | ||||||
| that you paid over the period. Simply divide your account value by | Performance (5% | |||||
| $1,000 (for example, an $8,600 account value divided by $1,000 | Actual | return before | ||||
| = 8.6), then multiply the result by the number in the first column | Class C | Performance | expenses) | |||
| Beginning Account Value | ||||||
| in the row entitled “Expenses Paid During Period” to estimate | May 1, 2014 | $ | 1,000.00 | $ | 1,000.00 | |
| the expenses you paid on your account during this period. | Ending Account Value | |||||
| October 31, 2014 | $ | 998.20 | $ | 1,017.24 | ||
| Hypothetical Example for Comparison Purposes | Expenses Paid During Period* | $ | 7.96 | $ | 8.03 | |
| The information in the table under the heading “Hypothetical | ||||||
| Performance (5% return before expenses)” provides information | * Expenses are equal to the Fund's annualized expense ratio of 1.58% | |||||
| (representing the six month period annualized), multiplied by the average | ||||||
| about hypothetical account values and hypothetical expenses | account value over the period, multiplied by 184/365 (to reflect the one-half | |||||
| based on the Fund’s actual expense ratio and an assumed rate of | year period). May reflect amounts waived and/or reimbursed. Without any | |||||
| return of 5% per year before expenses, which is not the Fund’s | waivers and/or reimbursements, expenses would have been higher. | |||||
| actual return. The hypothetical account values and expenses | ||||||
| Hypothetical | ||||||
| may not be used to estimate the actual ending account balance or | Performance (5% | |||||
| expenses you paid for the period. You may use this information | Actual | return before | ||||
| to compare the ongoing costs of investing in the Fund and other | Class E | Performance | expenses) | |||
| funds. To do so, compare this 5% hypothetical example with the | Beginning Account Value | |||||
| May 1, 2014 | $ | 1,000.00 | $ | 1,000.00 | ||
| 5% hypothetical examples that appear in the shareholder reports | Ending Account Value | |||||
| of other funds. | October 31, 2014 | $ | 1,002.60 | $ | 1,021.02 | |
| Expenses Paid During Period* | $ | 4.19 | $ | 4.23 | ||
| * Expenses are equal to the Fund's annualized expense ratio of 0.83% | ||||||
| (representing the six month period annualized), multiplied by the average | ||||||
| account value over the period, multiplied by 184/365 (to reflect the one-half | ||||||
| year period). May reflect amounts waived and/or reimbursed. Without any | ||||||
| waivers and/or reimbursements, expenses would have been higher. | ||||||
472 Russell Short Duration Bond Fund
Russell Investment Company Russell Short Duration Bond Fund
Shareholder Expense Example, continued — October 31, 2014 (Unaudited)
| Hypothetical | ||||||
| Performance (5% | ||||||
| Actual | return before | |||||
| Class S | Performance | expenses) | ||||
| Beginning Account Value | ||||||
| May 1, 2014 | $ | 1,000.00 | $ | 1,000.00 | ||
| Ending Account Value | ||||||
| October 31, 2014 | $ | 1,003.90 | $ | 1,022.28 | ||
| Expenses Paid During Period* | $ | 2.93 | $ | 2.96 | ||
| * Expenses are equal to the Fund's annualized expense ratio of 0.58% | ||||||
| (representing the six month period annualized), multiplied by the average | ||||||
| account value over the period, multiplied by 184/365 (to reflect the one-half | ||||||
| year period). May reflect amounts waived and/or reimbursed. Without any | ||||||
| waivers and/or reimbursements, expenses would have been higher. | ||||||
| Hypothetical | ||||||
| Performance (5% | ||||||
| Actual | return before | |||||
| Class Y | Performance | expenses) | ||||
| Beginning Account Value | ||||||
| May 1, 2014 | $ | 1,000.00 | $ | 1,000.00 | ||
| Ending Account Value | ||||||
| October 31, 2014 | $ | 1,003.70 | $ | 1,022.63 | ||
| Expenses Paid During Period* | $ | 2.58 | $ | 2.60 | ||
| * Expenses are equal to the Fund's annualized expense ratio of 0.51% | ||||||
| (representing the six month period annualized), multiplied by the average | ||||||
| account value over the period, multiplied by 184/365 (to reflect the one-half | ||||||
| year period). May reflect amounts waived and/or reimbursed. Without any | ||||||
| waivers and/or reimbursements, expenses would have been higher. | ||||||
Russell Short Duration Bond Fund 473
| Russell Investment Company | |||||||||
| Russell Short Duration Bond Fund | |||||||||
| Schedule of Investments — October 31, 2014 | |||||||||
| Amounts in thousands (except share amounts) | Amounts in thousands (except share amounts) | ||||||||
| Principal | Fair | Principal | Fair | ||||||
| Amount ($) | Value | Amount ($) | Value | ||||||
| or Shares | $ | or Shares | $ | ||||||
| Long-Term Investments - 78.6% | Series 2007-4 Class A2 | ||||||||
| 5.530% due 04/25/47 | 251 | 245 | |||||||
| Asset-Backed Securities - 7.6% | Countrywide Asset-Backed Certificates | ||||||||
| Access Group, Inc. | Trust | ||||||||
| Series 2005-A Class A2 | Series 2005-1 Class AF4 | ||||||||
| 0.454% due 04/27/26 (Ê) | 618 | 618 | 5.147% due 02/25/33 | 121 | 122 | ||||
| Ally Auto Receivables Trust | Series 2005-4 Class AF3 | ||||||||
| Series 2012-SN1 Class A4 | 4.456% due 10/25/35 | 11 | 11 | ||||||
| 0.700% due 12/21/15 | 1,995 | 1,995 | |||||||
| Ally Master Owner Trust | Education Series 2013-1 Loan Asset-Backed Class B1 Trust I | ||||||||
| Series 2010-2 Class A | 1.152% due 11/25/33 (Ê)(Þ) | 2,992 | 2,785 | ||||||
| 4.250% due 04/15/17 (Þ) | 3,000 | 3,040 | |||||||
| Series 2012-1 Class A2 | Enterprise Series 2012-2 Fleet Financing Class A2 LLC | ||||||||
| 1.440% due 02/15/17 | 445 | 446 | 0.720% due 04/20/18 (Þ) | 1,128 | 1,129 | ||||
| Series 2012-3 Class A2 | Equity One Mortgage Pass-Through Trust | ||||||||
| 1.210% due 06/15/17 | 4,100 | 4,118 | Series 2003-4 Class M1 | ||||||
| Series 2012-4 Class A | 5.283% due 10/25/34 | 326 | 321 | ||||||
| 1.720% due 07/15/19 | 7,500 | 7,561 | Exeter Automobile Receivables Trust | ||||||
| Series 2013-1 Class A2 | Series 2013-1A Class A | ||||||||
| 1.000% due 02/15/18 | 615 | 616 | 1.290% due 10/16/17 (Þ) | 368 | 369 | ||||
| AmeriCredit Automobile Receivables | Series 2014-1A Class A | ||||||||
| Trust | 1.290% due 05/15/18 (Þ) | 1,992 | 1,994 | ||||||
| Series 2012-4 Class A3 | Series 2014-3A Class A | ||||||||
| 0.670% due 06/08/17 | 5,264 | 5,266 | 1.320% due 01/15/19 (Å) | 4,700 | 4,700 | ||||
| ARI Fleet Lease Trust | Federal Home Loan Mortgage Corp. | ||||||||
| Series 2013-A Class A3 | Structured Pass Through Securities | ||||||||
| 0.920% due 07/15/21 (Þ) | 1,560 | 1,561 | Series 2000-30 Class A5 | ||||||
| Asset Backed Securities Corp. Home | 7.658% due 12/25/30 | 2,173 | 2,302 | ||||||
| Equity Loan Trust | Freddie Mac REMICS | ||||||||
| Series 2004-HE6 Class A1 | Series 2010-3662 Class ZB | ||||||||
| 0.702% due 09/25/34 (Ê) | 5 | 5 | 5.500% due 08/15/36 | 803 | 901 | ||||
| Capital Auto Receivables Asset Trust | Hertz Fleet Lease Funding, LP | ||||||||
| Series 2013-1 Class B | Series 2013-3 Class C | ||||||||
| 1.290% due 04/20/18 | 1,665 | 1,668 | 1.602% due 12/10/27 (Ê)(Þ) | 2,240 | 2,240 | ||||
| Capital One Multi-Asset Execution Trust | Series 2014-1 Class C | ||||||||
| Series 2005-B1 Class B1 | 1.302% due 04/10/28 (Ê)(Þ) | 1,475 | 1,475 | ||||||
| 4.900% due 12/15/17 | 2,075 | 2,100 | |||||||
| CarFinance Capital Auto Trust | Hertz Series Vehicle 2009-2A Financing Class LLC A2 | ||||||||
| Series 2013-2A Class A | 5.290% due 03/25/16 (Þ) | 838 | 846 | ||||||
| 1.750% due 11/15/17 (Þ) | 1,413 | 1,420 | |||||||
| Series 2014-1A Class A | Series 2011-1A Class A1 | ||||||||
| 1.460% due 12/17/18 (Þ) | 1,125 | 1,128 | 2.200% due 03/25/16 (Þ) | 1,140 | 1,144 | ||||
| JCP&L Transition Funding LLC | |||||||||
| CCG Receivables Trust | Series 2002-A Class A4 | ||||||||
| Series 2013-1 Class A2 | 6.160% due 06/05/19 | 137 | 146 | ||||||
| 1.050% due 08/14/20 (Þ) | 711 | 712 | |||||||
| Series 2014-1 Class A2 | Nissan Series Master 2012-A Owner Class Trust A Receivables | ||||||||
| 1.060% due 11/15/21 (Þ) | 1,240 | 1,239 | 0.623% due 05/15/17 (Ê) | 1,235 | 1,237 | ||||
| CFC LLC | Prestige Auto Receivables Trust | ||||||||
| Series 2013-1A Class A | Series 2013-1A Class A2 | ||||||||
| 1.650% due 07/17/17 (Þ) | 360 | 360 | 1.090% due 02/15/18 (Þ) | 498 | 499 | ||||
| Chase Education Loan Trust | Series 2014-1A Class A3 | ||||||||
| Series 2007-A Class B | 1.520% due 04/15/20 (Þ) | 1,300 | 1,300 | ||||||
| 0.454% due 06/28/40 (Ê) | 3,010 | 2,760 | |||||||
| Chesapeake Funding LLC | Renaissance Series 2005-4 Home Class Equity A3 Loan Trust | ||||||||
| Series 2012-1A Class A | 5.565% due 02/25/36 | 78 | 76 | ||||||
| 0.903% due 11/07/23 (Ê)(Þ) | 730 | 732 | Series 2007-2 Class AF2 | ||||||
| CIT Marine Trust | |||||||||
| Series 1999-A Class A4 | 5.675% due 06/25/37 | 350 | 184 | ||||||
| 6.250% due 11/15/19 | 10 | 10 | Santander Drive Auto Receivables Trust | ||||||
| Series 2012-1 Class B | |||||||||
| Countrywide Asset-Backed Certificates | 2.720% due 05/16/16 | 227 | 227 | ||||||
| Series 2001-BC3 Class A | |||||||||
| 0.632% due 12/25/31 (Ê) | 1 | — | Series 2012-2 Class B | ||||||
| Series 2006-3 Class 2A2 | 2.090% due 08/15/16 | 407 | 407 | ||||||
| 0.332% due 06/25/36 (Ê) | 126 | 123 | Series 2012-4 Class A3 | ||||||
| 1.040% due 08/15/16 | 9 | 9 | |||||||
| See accompanying notes which are an integral part of the financial statements. | |||||||||
| 474 Russell Short Duration Bond Fund | |||||||||
Russell Investment Company Russell Short Duration Bond Fund
Schedule of Investments, continued — October 31, 2014
| Amounts in thousands (except share amounts) | Amounts in thousands (except share amounts) | ||||||||
| Principal | Fair | Principal | Fair | ||||||
| Amount ($) | Value | Amount ($) | Value | ||||||
| or Shares | $ | or Shares | $ | ||||||
| Series 2012-4 Class B | 5.500% due 02/01/18 | 3,262 | 3,651 | ||||||
| 1.830% due 03/15/17 | 1,230 | 1,234 | Bank of America Corp. | ||||||
| Series 2013-1 Class B | 6.500% due 08/01/16 | 1,800 | 1,963 | ||||||
| 1.160% due 01/15/19 | 2,490 | 2,496 | Bank of New York Mellon Corp. (The) | ||||||
| Series 2014-4 Class B | Series G | ||||||||
| 1.820% due 05/15/19 | 1,020 | 1,023 | 2.200% due 05/15/19 | 1,035 | 1,039 | ||||
| SLM Private Education Loan Trust | Bayer US Finance LLC | ||||||||
| Series 2010-A Class 2A | 2.375% due 10/08/19 (Å) | 1,080 | 1,082 | ||||||
| 3.403% due 05/16/44 (Ê)(Þ) | 2,605 | 2,758 | Bear Stearns Cos. LLC (The) | ||||||
| Series 2011-A Class A1 | 5.550% due 01/22/17 | 2,560 | 2,784 | ||||||
| 1.153% due 10/15/24 (Ê)(Þ) | 1,479 | 1,486 | Boston Scientific Corp. | ||||||
| Series 2012-B Class A1 | 6.400% due 06/15/16 | 1,347 | 1,459 | ||||||
| 1.253% due 12/15/21 (Ê)(Þ) | 178 | 178 | Branch Banking and Trust Company | ||||||
| Series 2012-B Class A2 | Series BKNT | ||||||||
| 3.480% due 10/15/30 (Þ) | 1,950 | 2,035 | 1.050% due 12/01/16 | 2,890 | 2,892 | ||||
| Series 2012-C Class A1 | Capital One Financial Corp. | ||||||||
| 1.253% due 08/15/23 (Ê)(Þ) | 2,370 | 2,383 | 2.450% due 04/24/19 | 2,480 | 2,487 | ||||
| SLM Student Loan Trust | Chevron Corp. | ||||||||
| Series 2008-7 Class A2 | 1.718% due 06/24/18 | 1,075 | 1,085 | ||||||
| 0.734% due 10/25/17 (Ê) | 667 | 668 | Cintas Corp. No. 2 | ||||||
| Series 2014-A Class A1 | 2.850% due 06/01/16 | 1,465 | 1,508 | ||||||
| 0.753% due 07/15/22 (Ê)(Þ) | 549 | 549 | Citigroup, Inc. | ||||||
| SMART Trust | 1.194% due 07/25/16 (Ê) | 5,900 | 5,957 | ||||||
| Series 2011-2USA Class A4A | Coventry Health Care, Inc. | ||||||||
| 2.310% due 04/14/17 (Þ) | 1,675 | 1,684 | 5.950% due 03/15/17 | 775 | 857 | ||||
| Series 2012-1USA Class A4A | Crown Castle Towers LLC | ||||||||
| 2.010% due 12/14/17 (Þ) | 4,060 | 4,083 | 5.495% due 01/15/17 (Þ) | 1,480 | 1,574 | ||||
| South Carolina Student Loan Corp. | Daimler Finance NA LLC | ||||||||
| Series 2008-1 Class A2 | 1.375% due 08/01/17 (Þ) | 1,450 | 1,447 | ||||||
| 0.784% due 03/01/18 (Ê) | 46 | 46 | DIRECTV Holdings LLC / DIRECTV | ||||||
| Series 2008-1 Class A3 | Financing Co., Inc. | ||||||||
| 0.984% due 03/02/20 (Ê) | 700 | 702 | 3.500% due 03/01/16 | 1,125 | 1,163 | ||||
| Tidewater Auto Receivables Trust | Dynegy Finance I, Inc. / Dynegy Finance | ||||||||
| Series 2012-AA Class A3 | II, Inc. | ||||||||
| 1.990% due 04/15/19 (Þ) | 828 | 832 | 7.375% due 11/01/22 (Å) | 1,335 | 1,412 | ||||
| Series 2014-AA Class A3 | EnLink Midstream Partners, LP | ||||||||
| 1.400% due 07/15/18 (Þ) | 2,380 | 2,380 | 2.700% due 04/01/19 | 2,045 | 2,064 | ||||
| Westlake Automobile Receivables Trust | Express Scripts Holding Co. | ||||||||
| Series 2014-1A Class A2 | 2.250% due 06/15/19 | 1,585 | 1,576 | ||||||
| 0.700% due 05/15/17 (Þ) | 3,467 | 3,465 | Ford Motor Credit Co. LLC | ||||||
| 90,149 | 3.984% due 06/15/16 | 500 | 522 | ||||||
| Corporate Bonds and Notes - 13.2% | 8.000% due 12/15/16 | 1,000 | 1,133 | ||||||
| AbbVie, Inc. | 4.250% due 02/03/17 | 2,460 | 2,605 | ||||||
| 1.750% due 11/06/17 | 1,878 | 1,883 | 3.000% due 06/12/17 | 700 | 722 | ||||
| Advanced Micro Devices, Inc. | |||||||||
| 7.750% due 08/01/20 | 450 | 423 | Forest Laboratories, Inc. | ||||||
| 4.875% due 02/15/21 (Þ) | 4,405 | 4,697 | |||||||
| 7.500% due 08/15/22 | 2,000 | 1,830 | General Electric Capital Corp. | ||||||
| Aflac, Inc. | 0.460% due 01/14/16 (Ê) | 900 | 901 | ||||||
| 2.650% due 02/15/17 | 1,400 | 1,445 | 2.900% due 01/09/17 | 4,790 | 4,987 | ||||
| Air Lease Corp. | |||||||||
| 2.125% due 01/15/18 | 1,095 | 1,083 | General Mills, Inc. | ||||||
| American Express Credit Corp. | 1.400% due 10/20/17 | 1,300 | 1,299 | ||||||
| 1.125% due 06/05/17 | 2,910 | 2,896 | Goldman Sachs Group, Inc. (The) | ||||||
| 3.625% due 02/07/16 | 4,190 | 4,324 | |||||||
| American International Group, Inc. | Hartford Financial Services Group, Inc. | ||||||||
| 5.850% due 01/16/18 | 425 | 479 | (The) | ||||||
| Amgen, Inc. | 4.000% due 10/15/17 | 1,705 | 1,822 | ||||||
| 2.300% due 06/15/16 | 300 | 306 | Hewlett-Packard Co. | ||||||
| Anadarko Petroleum Corp. | 3.300% due 12/09/16 | 3,050 | 3,164 | ||||||
| 5.950% due 09/15/16 | 2,650 | 2,880 | |||||||
| Anheuser-Busch InBev Worldwide, Inc. | 3.750% due 12/01/20 | 1,605 | 1,646 | ||||||
| 5.375% due 01/15/20 | 955 | 1,084 | Home Depot, Inc. (The) | ||||||
| Apple, Inc. | 2.250% due 09/10/18 | 1,600 | 1,627 | ||||||
| 2.850% due 05/06/21 | 640 | 650 | HSBC Finance Corp. | ||||||
| AT&T, Inc. | 0.664% due 06/01/16 (Ê) | 200 | 200 | ||||||
| See accompanying notes which are an integral part of the financial statements. | |||||||||
| Russell Short Duration Bond Fund 475 | |||||||||
| Russell Investment Company | |||||||||
| Russell Short Duration Bond Fund | |||||||||
| Schedule of Investments, continued — October 31, 2014 | |||||||||
| Amounts in thousands (except share amounts) | Amounts in thousands (except share amounts) | ||||||||
| Principal | Fair | Principal | Fair | ||||||
| Amount ($) | Value | Amount ($) | Value | ||||||
| or Shares | $ | or Shares | $ | ||||||
| Humana, Inc. | 5.000% due 02/01/20 | 1,695 | 1,897 | ||||||
| 2.625% due 10/01/19 | 1,415 | 1,417 | Toyota Motor Credit Corp. | ||||||
| Innovation Ventures LLC / Innovation | 1.250% due 10/05/17 | 885 | 884 | ||||||
| Ventures Finance Corp. | United Technologies Corp. | ||||||||
| 9.500% due 08/15/19 (Å) | 650 | 641 | 1.800% due 06/01/17 | 1,015 | 1,033 | ||||
| Intel Corp. | Verizon Communications, Inc. | ||||||||
| 1.350% due 12/15/17 | 685 | 683 | 1.984% due 09/14/18 (Ê) | 100 | 105 | ||||
| International Business Machines Corp. | 2.625% due 02/21/20 (Å) | 6,515 | 6,480 | ||||||
| 5.700% due 09/14/17 | 980 | 1,101 | Series FRN | ||||||
| International Lease Finance Corp. | 1.764% due 09/15/16 (Ê) | 4,500 | 4,601 | ||||||
| 2.184% due 06/15/16 (Ê) | 4,370 | 4,354 | Wells Fargo & Co. | ||||||
| 3.875% due 04/15/18 | 800 | 802 | 0.761% due 07/20/16 (Ê) | 4,300 | 4,319 | ||||
| JPMorgan Chase & Co. | 1.250% due 07/20/16 | 1,400 | 1,409 | ||||||
| 1.350% due 02/15/17 | 1,740 | 1,742 | Williams Partners, LP | ||||||
| Series GMTN | 4.125% due 11/15/20 | 1,262 | 1,327 | ||||||
| 0.855% due 02/26/16 (Ê) | 1,500 | 1,505 | ZFS Finance USA Trust II | ||||||
| JPMorgan Chase Bank NA | 6.450% due 12/15/65 (Þ) | 2,005 | 2,135 | ||||||
| 0.564% due 06/13/16 (Ê) | 1,400 | 1,396 | ZFS Finance USA Trust V | ||||||
| Kinder Morgan Energy Partners, LP | 6.500% due 05/09/37 (Þ) | 2,145 | 2,306 | ||||||
| 3.500% due 03/01/21 | 1,110 | 1,104 | |||||||
| Lehman Brothers Holdings Capital Trust | 156,366 | ||||||||
| VII | International Debt - 4.5% | ||||||||
| 5.857% due 11/29/49 (ƒ)(Ø) | 270 | — | ABN AMRO Bank NV | ||||||
| 1.033% due 10/28/16 (Å)(Ê) | 1,100 | 1,109 | |||||||
| Lorillard Tobacco Co. | AP NMT Acquisition BV Term Loan B | ||||||||
| 6.875% due 05/01/20 | 1,180 | 1,393 | 6.750% due 08/13/21 | 500 | 485 | ||||
| MassMutual Global Funding II | Arbor Realty Collateralized Loan | ||||||||
| 2.000% due 04/05/17 (Þ) | 1,090 | 1,111 | Obligation, Ltd. | ||||||
| MetLife, Inc. | Series 2014-1A Class A | ||||||||
| 6.750% due 06/01/16 | 3,300 | 3,602 | 1.903% due 05/15/24 (Ê)(Þ) | 1,915 | 1,912 | ||||
| 1.756% due 12/15/17 | 1,130 | 1,139 | Series 2014-1A Class B | ||||||
| Metropolitan Life Global Funding I | 4.653% due 05/15/24 (Ê)(Þ) | 1,240 | 1,243 | ||||||
| 1.300% due 04/10/17 (Þ) | 800 | 802 | Baidu Inc. | ||||||
| National Rural Utilities Cooperative | 3.250% due 08/06/18 | 1,372 | 1,411 | ||||||
| Finance Corp. | Bank of Nova Scotia (The) | ||||||||
| 1.900% due 11/01/15 | 805 | 817 | 0.540% due 04/11/17 (Ê) | 1,500 | 1,499 | ||||
| New York Life Global Funding | British Sky Broadcasting Group PLC | ||||||||
| 0.335% due 09/06/16 | 1,800 | 1,800 | 6.100% due 02/15/18 (Þ) | 875 | 984 | ||||
| 1.125% due 03/01/17 (Þ) | 1,270 | 1,272 | Credit Suisse NY | ||||||
| Oracle Corp. | Series GMTN | ||||||||
| 2.250% due 10/08/19 | 4,680 | 4,690 | 1.375% due 05/26/17 | 1,450 | 1,446 | ||||
| PepsiCo, Inc. | Deutsche Bank AG | ||||||||
| 5.000% due 06/01/18 | 1,420 | 1,580 | 6.000% due 09/01/17 | 1,290 | 1,446 | ||||
| Pfizer, Inc. | Deutsche Telekom International Finance | ||||||||
| 6.200% due 03/15/19 | 1,295 | 1,513 | BV | ||||||
| Pricoa Global Funding I | 2.250% due 03/06/17 (Þ) | 2,840 | 2,902 | ||||||
| 1.350% due 08/18/17 (Þ) | 3,600 | 3,596 | Hutchison Whampoa International 11, | ||||||
| Quebecor World Capital Corp. | Ltd. | ||||||||
| 4.875% due 01/02/49 (Ø) | 205 | — | 3.500% due 01/13/17 (Þ) | 1,500 | 1,566 | ||||
| 6.125% due 11/15/49 (Ø) | 70 | — | ING Bank NV | ||||||
| QVC, Inc. | 3.750% due 03/07/17 (Þ) | 2,750 | 2,897 | ||||||
| 3.125% due 04/01/19 | 2,925 | 2,940 | Intesa Sanpaolo SpA | ||||||
| Samsung Electronics America, Inc. | 2.375% due 01/13/17 | 4,320 | 4,368 | ||||||
| 1.750% due 04/10/17 (Þ) | 1,815 | 1,826 | Korea Gas Corp. | ||||||
| SBA Tower Trust | 2.875% due 07/29/18 (Þ) | 1,430 | 1,460 | ||||||
| Series 2014-1A Class C | Morgan Stanley | ||||||||
| 2.898% due 10/15/19 (Å) | 1,415 | 1,419 | 3.125% due 08/05/21 | CAD | 2,760 | 2,425 | |||
| Southern Co. (The) | Motor PLC | ||||||||
| 2.150% due 09/01/19 | 1,575 | 1,569 | Series 2012-12A Class A1C | ||||||
| Synchrony Financial | 1.286% due 02/25/20 (Þ) | 846 | 847 | ||||||
| 3.000% due 08/15/19 | 1,830 | 1,850 | Nomura Holdings, Inc. | ||||||
| Thermo Fisher Scientific, Inc. | 2.000% due 09/13/16 | 1,605 | 1,625 | ||||||
| 1.300% due 02/01/17 | 1,600 | 1,598 | Petrobras Global Finance BV | ||||||
| Time Warner Cable, Inc. | 1.852% due 05/20/16 (Ê) | 2,200 | 2,200 | ||||||
| See accompanying notes which are an integral part of the financial statements. | |||||||||
| 476 Russell Short Duration Bond Fund | |||||||||
| Russell Investment Company | |||||||||
| Russell Short Duration Bond Fund | |||||||||
| Schedule of Investments, continued — October 31, 2014 | |||||||||
| Amounts in thousands (except share amounts) | Amounts in thousands (except share amounts) | ||||||||
| Principal | Fair | Principal | Fair | ||||||
| Amount ($) | Value | Amount ($) | Value | ||||||
| or Shares | $ | or Shares | $ | ||||||
| Rio Tinto Finance USA PLC | 3.250% due 01/31/22 (Ê) | 995 | 969 | ||||||
| 1.375% due 06/17/16 | 2,720 | 2,740 | CEC Entertainment, Inc. Term Loan | ||||||
| 2.250% due 12/14/18 | 770 | 776 | 4.250% due 02/14/21 (Ê) | 995 | 962 | ||||
| Royal Bank of Scotland Group PLC | Cengage Learning Acquisitions, Inc. 1st | ||||||||
| 1.875% due 03/31/17 | 3,835 | 3,847 | Lien Term Loan | ||||||
| 4.700% due 07/03/18 | 1,945 | 2,020 | 7.000% due 03/31/20 (Ê) | 493 | 493 | ||||
| SMART Trust | Charter Commercial Operating LLC | ||||||||
| Series 2011-4USA Class A3A | Term Loan G | ||||||||
| 1.810% due 11/14/15 (Þ) | 660 | 661 | 4.250% due 09/12/21 | 1,000 | 1,006 | ||||
| Telemovil Finance Co Ltd. | Charter Communications Operating LLC | ||||||||
| 8.000% due 10/01/17 (Þ) | 1,800 | 1,868 | 1st Lien Term Loan E | ||||||
| Tencent Holdings, Ltd. | 3.000% due 07/01/20 | 995 | 976 | ||||||
| 3.375% due 05/02/19 (Þ) | 850 | 864 | Checkout Holding Corp. 1st Lien Term | ||||||
| Thomson Reuters Corp. | Loan B | ||||||||
| 1.650% due 09/29/17 | 1,740 | 1,746 | 4.500% due 04/09/21 (Ê) | 998 | 971 | ||||
| Trade MAPS 1, Ltd. | Chrysler Group LLC 1st Lien Term | ||||||||
| Series 2013-1A Class A | Loan B | ||||||||
| 0.852% due 12/10/18 (Ê)(Þ) | 2,190 | 2,190 | 3.250% due 12/31/18 | 1,990 | 1,969 | ||||
| Transocean, Inc. | Ciena Corp. Term Loan B | ||||||||
| 4.950% due 11/15/15 | 825 | 855 | 5.250% due 07/14/19 | 998 | 986 | ||||
| 5.050% due 12/15/16 | 1,345 | 1,412 | Cincinnati Bell, Inc. 1st Lien Term | ||||||
| Loan B | |||||||||
| UBS Series AG BKNT | 4.000% due 09/10/20 (Ê) | 995 | 978 | ||||||
| 5.875% due 12/20/17 | 1,280 | 1,442 | Community Health Systems, Inc. Term | ||||||
| Venture CDO Ltd. | Loan D | ||||||||
| 0.448% due 07/22/21 (Þ) | 41 | 40 | 4.250% due 01/27/21 (Ê) | 1,490 | 1,490 | ||||
| Consolidated Communications, Inc. Term | |||||||||
| Willis Group Holdings PLC | Loan B | ||||||||
| 4.125% due 03/15/16 | 535 | 554 | 4.250% due 12/23/20 (Ê) | 995 | 990 | ||||
| 52,840 | ConvergeOne Holdings Corp. 1st Lien | ||||||||
| Loan Agreements - 9.2% | Term Loan | ||||||||
| 4L Technologies, Inc. Term Loan | 6.000% due 06/17/20 (Ê) | 998 | 989 | ||||||
| 5.500% due 05/08/20 (Ê) | 1,000 | 993 | CROWN Americas LLC Term Loan B | ||||||
| Ability Network, Inc. 1st Lien Term Loan | Zero coupon due 10/22/21 | 1,000 | 999 | ||||||
| 6.000% due 05/14/21 (Ê) | 998 | 985 | Crowne Group LLC Term Loan | ||||||
| Accudyne Industries Borrower SCA Term | 6.000% due 09/29/20 | 500 | 493 | ||||||
| Loan | CWGS Group LLC 1st Lien Term Loan B | ||||||||
| 4.000% due 12/13/19 (Ê) | 975 | 957 | 5.750% due 02/20/20 | 987 | 988 | ||||
| Activision Blizzard, Inc. 1st Lien Term | DealerTrack Technologies, Inc. Term | ||||||||
| Loan B | Loan B | ||||||||
| 3.250% due 10/11/20 (Ê) | 1,000 | 1,000 | 3.500% due 02/28/21 (Ê) | 954 | 937 | ||||
| Affinion Group, Inc. Term Loan B | DigitalGlobe, Inc. 1st Lien Term Loan B | ||||||||
| 6.750% due 04/30/18 (Ê) | 995 | 962 | 3.750% due 01/31/20 | 995 | 988 | ||||
| Albertsons LLC Term Loan B4 | Eastman Kodak Co.1st Lien Term Loan | ||||||||
| 4.500% due 08/25/21 (Ê) | 1,000 | 1,000 | 7.250% due 09/03/19 (Ê) | 995 | 996 | ||||
| Albertson's LLC Term Loan B4-1 | Eco Services Term Loan | ||||||||
| 4.500% due 08/25/21 | 250 | 250 | 5.750% due 10/08/21 | 500 | 498 | ||||
| Allison Transmission, Inc. Term Loan B3 | Emerald Performance Materials, LLC | ||||||||
| 3.500% due 08/23/19 | 1,000 | 991 | Second Lien Term Loan | ||||||
| American Airlines, Inc. Exit Term Loan | 7.750% due 08/01/22 (Ê) | 250 | 246 | ||||||
| 3.750% due 06/27/19 (Ê) | 995 | 981 | Emerald US, Inc. Term Loan | ||||||
| Asurion LLC Term Loan B2 | Zero coupon due 05/09/21 | 1,000 | 981 | ||||||
| 4.250% due 07/08/20 (Ê) | 995 | 981 | EnergySolutions LLC Term Loan | ||||||
| Avago Technologies Cayman, Ltd. Term | 6.750% due 05/29/20 (Ê) | 998 | 1,001 | ||||||
| Loan B | Envision Acquisition Co. LLC 1st Lien | ||||||||
| 3.750% due 05/06/21 | 998 | 994 | Term Loan B | ||||||
| Brickman Group, Ltd. LLC Term Loan | 5.750% due 11/04/20 | 499 | 499 | ||||||
| 4.000% due 12/18/20 (Ê) | 149 | 146 | Evergreen Skills Luxembourg S.A.R.L. | ||||||
| Burger King Corp. Term Loan B | Initial Term Loan | ||||||||
| 4.500% due 09/24/21 | 1,100 | 1,099 | 1.000% due 04/28/21 (Ê) | 744 | 734 | ||||
| BWAY Holding Co. Term Loan B | Expro Financial Services SARL Term | ||||||||
| 5.500% due 08/14/20 (Ê) | 1,496 | 1,502 | Loan B | ||||||
| Calpine Construction Finance Co., LP | 5.750% due 08/21/21 | 800 | 783 | ||||||
| 1st Lien Term Loan B2 | |||||||||
| See accompanying notes which are an integral part of the financial statements. | |||||||||
| Russell Short Duration Bond Fund 477 | |||||||||
| Russell Investment Company | |||||||||
| Russell Short Duration Bond Fund | |||||||||
| Schedule of Investments, continued — October 31, 2014 | |||||||||
| Amounts in thousands (except share amounts) | Amounts in thousands (except share amounts) | ||||||||
| Principal | Fair | Principal | Fair | ||||||
| Amount ($) | Value | Amount ($) | Value | ||||||
| or Shares | $ | or Shares | $ | ||||||
| FairPoint Communications, Inc. Term | MH Sub I LLC Delayed Draw Term | ||||||||
| Loan | Loans | ||||||||
| 7.500% due 02/14/19 (Ê) | 995 | 1,002 | 4.000% due 07/08/21 | 65 | 65 | ||||
| First Data Corp. Term Loan | Michaels Stores, Inc. Term Loan | ||||||||
| 3.653% due 03/24/18 (Ê) | 500 | 495 | 4.000% due 01/28/20 | 499 | 492 | ||||
| Fitness International LLC Term Loan B | Microsemi Corp. 1st Lien Term Loan | ||||||||
| 5.500% due 07/01/20 (Ê) | 499 | 494 | 3.250% due 02/19/20 | 500 | 492 | ||||
| FMG Resources Pty, Ltd. 1st Lien Term | Millennium Laboratories, Inc. Term | ||||||||
| Loan B | Loan B | ||||||||
| 3.750% due 06/30/19 | 995 | 970 | 5.250% due 04/16/21 (Ê) | 998 | 997 | ||||
| Gates Global LLC Term Loan | Minerals Technologies, Inc. Term Loan B | ||||||||
| 4.250% due 07/03/21 (Ê) | 1,000 | 987 | 4.000% due 05/07/21 | 1,000 | 996 | ||||
| GENEX Holdings, Inc. 1st Lien Term | Mood Media Corp. Term Loan | ||||||||
| Loan | 7.000% due 05/01/19 | 995 | 971 | ||||||
| 5.250% due 05/30/21 | 499 | 495 | MSC Software Corp. 1st Lien Term Loan | ||||||
| GENEX Holdings, Inc. 2nd Lien Term | 5.000% due 05/29/20 (Ê) | 998 | 988 | ||||||
| Loan | Numericable U.S. LLC 1st Lien Term | ||||||||
| 8.750% due 05/30/22 | 250 | 246 | Loan B1 | ||||||
| Go Daddy Operating Co. LLC Term Loan | 4.500% due 04/23/20 (Ê) | 536 | 537 | ||||||
| 4.750% due 05/13/21 (Ê) | 998 | 994 | Numericable U.S. LLC 1st Lien Term | ||||||
| Gray Television, Inc. Term Loan B | Loan B2 | ||||||||
| 3.750% due 06/13/21 (Ê) | 998 | 984 | 4.500% due 04/23/20 (Ê) | 464 | 465 | ||||
| Grifols Worldwide Operations, Ltd. Term | NVA Holdings, Inc. 1st Lien Term Loan | ||||||||
| Loan B | 4.750% due 08/14/21 | 1,000 | 991 | ||||||
| 3.154% due 02/27/21 | 995 | 982 | NVA Holdings, Inc. 2nd Lien Term Loan | ||||||
| Harland Clarke Holdings Corp. Term | 8.000% due 08/14/22 | 250 | 247 | ||||||
| Loan B4 | Open Text Corp. Term Loan B | ||||||||
| 6.000% due 08/04/19 (Ê) | 1,481 | 1,484 | 3.250% due 01/04/21 | 995 | 981 | ||||
| Hertz Corp. Term Loan B1 | Orion Engineered Carbons GMBH Term | ||||||||
| 3.750% due 03/11/18 | 995 | 982 | Loan | ||||||
| Hilton Worldwide Finance LLC Term | 5.000% due 07/25/21 | 1,000 | 992 | ||||||
| Loan | P2 Newco Acquisition Inc. 2nd Lien | ||||||||
| 3.500% due 10/25/20 (Ê) | 912 | 903 | Term Loan | ||||||
| HJ Heinz Co. Term Loan B2 | 9.500% due 10/22/21 (Ê) | 250 | 245 | ||||||
| 3.500% due 06/05/20 (Ê) | 500 | 497 | Paragon Offshore Finance Co. Term | ||||||
| Ikaria, Inc. 1st Lien Term Loan | Loan B | ||||||||
| 5.000% due 02/12/21 | 941 | 941 | 3.750% due 07/18/21 | 500 | 468 | ||||
| IMG Worldwide Holdings LLC 1st Lien | Peak 10 Corp. 1st Lien Term Loan | ||||||||
| Term | 5.000% due 06/17/21 | 998 | 992 | ||||||
| 5.250% due 05/06/21 (Ê) | 998 | 980 | PGX Holdings, Inc. 1st Lien Term Loan | ||||||
| Indigo Merger Sub I, Inc. 1st Lien Term | 6.250% due 09/29/20 | 500 | 496 | ||||||
| Loan | Pilot Travel Centers LLC Term Loan B | ||||||||
| 5.000% due 07/08/21 | 933 | 927 | 4.250% due 10/03/21 | 1,500 | 1,500 | ||||
| INMAR, Inc. Term Loan | Pinnacle Entertainment, Inc. 1st Lien | ||||||||
| 4.250% due 01/27/21 (Ê) | 998 | 973 | Term Loan B2 | ||||||
| Interactive Data Corp. Term Loan | 3.750% due 08/13/20 | 877 | 868 | ||||||
| 4.750% due 05/02/21 (Ê) | 998 | 997 | Pinnacle Foods Finance LLC 1st Lien | ||||||
| La Quinta Intermediate Holdings LLC | Term Loan G | ||||||||
| Term Loan B | 3.250% due 04/29/20 (Ê) | 874 | 856 | ||||||
| 4.000% due 04/14/21 | 924 | 916 | Pinnacle Foods Finance LLC Term Loan | ||||||
| Las Vegas Sands LLC 1st Lien Term | H | ||||||||
| Loan B | 3.250% due 04/29/20 | 249 | 244 | ||||||
| 3.250% due 12/18/20 | 995 | 992 | Portillo's Holdings, LLC First Lien Term | ||||||
| MacDermid, Inc. 1st Lien Term Loan | Loan | ||||||||
| 4.000% due 06/07/20 (Ê) | 2,024 | 1,981 | 4.750% due 08/01/21 (Ê) | 250 | 246 | ||||
| Mallinckrodt International Finance S.A. | Portillo's Holdings, LLC Second Lien | ||||||||
| Term Loan B | Term Loan | ||||||||
| 3.500% due 03/19/21 | 1,000 | 990 | 8.000% due 08/01/22 (Ê) | 250 | 248 | ||||
| MCC Iowa LLC Term Loan J | PowerTeam Services, LLC 2nd Lien | ||||||||
| 3.750% due 06/30/21 | 500 | 491 | Term Loan | ||||||
| Mergermarket USA, Inc. 1st Lien Term | 8.250% due 11/06/20 (Ê) | 500 | 485 | ||||||
| Loan | Renaissance Learning, Inc. Term Loan | ||||||||
| 4.500% due 02/04/21 (Ê) | 995 | 949 | 4.500% due 04/10/21 (Ê) | 995 | 976 | ||||
| RHP Hotel Properties LP Term Loan B | |||||||||
See accompanying notes which are an integral part of the financial statements.
478 Russell Short Duration Bond Fund
Russell Investment Company Russell Short Duration Bond Fund
Schedule of Investments, continued — October 31, 2014
| Amounts in thousands (except share amounts) | Amounts in thousands (except share amounts) | ||||||||
| Principal | Fair | Principal | Fair | ||||||
| Amount ($) | Value | Amount ($) | Value | ||||||
| or Shares | $ | or Shares | $ | ||||||
| 3.750% due 01/15/21 | 998 | 989 | VeriFone, Inc. Term Loan B | ||||||
| Roundy's Supermarkets, Inc. 1st Lien | 3.500% due 06/30/21 | 998 | 985 | ||||||
| Term Loan B | Veyance Technologies, Inc. Term Loan | ||||||||
| 5.750% due 03/03/21 (Ê) | 995 | 883 | 5.250% due 09/08/17 (Ê) | 498 | 496 | ||||
| Rovi Solutions Corp. Syndicated Loans | Virgin Media Investment Holdings, Ltd. | ||||||||
| Term Loan B | Term Loan | ||||||||
| 3.750% due 07/02/21 | 998 | 969 | 3.500% due 06/07/20 (Ê) | 1,000 | 985 | ||||
| RP Crown Parent LLC Term Loan | Visant Corp. Term Loan | ||||||||
| 6.000% due 12/21/18 | 995 | 962 | 7.000% due 09/23/21 | 1,000 | 985 | ||||
| RPI Finance Trust 1st Lien Term Loan | Walker & Dunlop, Inc. Term Loan B | ||||||||
| B2 | 5.250% due 12/20/20 (Ê) | 1,492 | 1,474 | ||||||
| 3.250% due 05/09/18 | 995 | 990 | Windstream Corp. 1st Lien Term Loan | ||||||
| Scientific Games International, Inc. Term | B4 | ||||||||
| Loan B1 | 3.500% due 01/23/20 | 995 | 985 | ||||||
| 4.250% due 10/18/20 (Ê) | 1,444 | 1,412 | WMG Acquisition Corp. Term Loan B | ||||||
| 6.000% due 10/01/21 (Ê) | 200 | 195 | 3.750% due 07/01/20 (Ê) | 995 | 962 | ||||
| Sensata Technologies B.V. Term Loan | Yonkers Racing Corp. 1st Lien Term | ||||||||
| 3.500% due 08/15/21 | 583 | 581 | Loan | ||||||
| Signode Industrial Group US, Inc. Term | 4.250% due 08/16/19 | 976 | 871 | ||||||
| Loan B | Zebra Technologies Corp. Term Loan B | ||||||||
| 4.000% due 03/21/21 | 859 | 843 | 4.750% due 09/30/21 | 1,000 | 1,006 | ||||
| SourceHOV LLC 1st Lien Term Loan B | 108,536 | ||||||||
| 7.750% due 10/29/19 | 500 | 486 | Mortgage-Backed Securities - 15.7% | ||||||
| Southwire Co. 1st Lien Term Loan B | A10 Term Asset Financing LLC | ||||||||
| 4.750% due 02/10/21 | 995 | 966 | Series 2014-1 Class A1 | ||||||
| Spansion LLC Term Loan | 1.720% due 04/15/33 (Þ) | 2,630 | 2,631 | ||||||
| 3.750% due 12/19/19 (Ê) | 995 | 977 | Banc of America Commercial Mortgage | ||||||
| Spectrum Brands, Inc. Term Loan C | Trust | ||||||||
| 3.500% due 09/04/19 (Ê) | 995 | 984 | Series 2006-2 Class AM | ||||||
| Stena International SA Term Loan B | 5.765% due 05/10/45 | 1,270 | 1,359 | ||||||
| 4.000% due 03/03/21 | 995 | 975 | Series 2007-2 Class AM | ||||||
| Sungard Availability Services Capital, | 5.622% due 04/10/49 | 1,245 | 1,353 | ||||||
| Inc. Term Loan | Series 2008-1 Class A3 | ||||||||
| 6.000% due 03/31/19 (Ê) | 2,338 | 2,081 | 6.208% due 02/10/51 | 93 | 93 | ||||
| The Active Network, Inc. 1st Lien Term | Banc of America Funding Trust | ||||||||
| Loan | Series 2005-D Class A1 | ||||||||
| 5.500% due 11/15/20 (Ê) | 995 | 985 | 2.631% due 05/25/35 (Ê) | 251 | 257 | ||||
| The Hillman Group, Inc. Term Loan | Series 2006-A Class 1A1 | ||||||||
| 4.500% due 06/30/21 | 998 | 988 | 2.640% due 02/20/36 (Ê) | 532 | 528 | ||||
| The ServiceMaster Co. LLC Term Loan B | Series 2006-F Class 1A2 | ||||||||
| 4.250% due 07/01/21 | 750 | 743 | 2.616% due 07/20/36 (Ê) | 46 | 33 | ||||
| The Winebow Group LLC Term Loan | Banc of America Merrill Lynch | ||||||||
| 4.750% due 07/01/21 | 998 | 988 | Commercial Mortgage, Inc. | ||||||
| Total Safety U.S., Inc. 1st Lien Term | Series 2004-4 Class B | ||||||||
| Loan B | 4.985% due 07/10/42 | 915 | 916 | ||||||
| 5.750% due 03/13/20 | 995 | 985 | Series 2004-6 Class A5 | ||||||
| TransFirst Holdings, Inc. Term Loan | 4.811% due 12/10/42 | 32 | 32 | ||||||
| 4.250% due 12/27/17 (Ê) | 250 | 249 | Series 2005-2 Class AM | ||||||
| Travelport Finance (Luxembourg) SARL | 4.913% due 07/10/43 | 1,315 | 1,334 | ||||||
| Term Loan | Series 2005-5 Class B | ||||||||
| 6.000% due 09/02/21 | 1,000 | 999 | 5.214% due 10/10/45 | 400 | 411 | ||||
| Tribune Media Co. Term Loan | Series 2005-6 Class B | ||||||||
| 4.000% due 12/27/20 (Ê) | 500 | 495 | 5.176% due 09/10/47 | 695 | 722 | ||||
| TriNet HR Corp. Term Loan B | Banc of America Mortgage Securities, | ||||||||
| 2.990% due 07/03/17 | 875 | 859 | Inc. | ||||||
| TWCC Holding Corp. 2nd Lien Term | Series 2004-I Class 2A2 | ||||||||
| Loan | 2.709% due 10/25/34 (Ê) | 1,000 | 1,003 | ||||||
| 7.000% due 06/26/20 (Ê) | 500 | 490 | BCAP LLC Trust | ||||||
| TWCC Holding Corp. Term Loan | Series 2011-R11 Class 15A1 | ||||||||
| 3.500% due 02/13/17 (Ê) | 1,000 | 985 | 2.594% due 10/26/33 (Ê)(Þ) | 1,315 | 1,339 | ||||
| United Airlines, Inc. Term Loan B1 | Series 2011-R11 Class 20A5 | ||||||||
| 3.750% due 09/15/21 | 1,000 | 987 | 2.602% due 03/26/35 (Ê)(Þ) | 665 | 673 | ||||
| US Shipping Corp. Term Loan | Series 2013-RR4 Class 1A1 | ||||||||
| 5.500% due 04/30/18 | 500 | 488 | 0.322% due 09/26/35 (Ê)(Þ) | 220 | 209 | ||||
| See accompanying notes which are an integral part of the financial statements. | |||||||||
| Russell Short Duration Bond Fund 479 | |||||||||
| Russell Investment Company | |||||||||
| Russell Short Duration Bond Fund | |||||||||
| Schedule of Investments, continued — October 31, 2014 | |||||||||
| Amounts in thousands (except share amounts) | Amounts in thousands (except share amounts) | ||||||||
| Principal | Fair | Principal | Fair | ||||||
| Amount ($) | Value | Amount ($) | Value | ||||||
| or Shares | $ | or Shares | $ | ||||||
| Bear Stearns ARM Trust | Credit Suisse First Boston Mortgage | ||||||||
| Series 2003-1 Class 5A1 | Securities Corp. | ||||||||
| 2.234% due 04/25/33 (Ê) | — | — | Series 2004-C5 Class B | ||||||
| Series 2003-8 Class 2A1 | 4.929% due 11/15/37 | 3,070 | 3,068 | ||||||
| 2.737% due 01/25/34 (Ê) | 78 | 80 | Series 2005-C2 Class A3 | ||||||
| Series 2004-5 Class 2A | 4.691% due 04/15/37 | 571 | 571 | ||||||
| 2.953% due 07/25/34 (Ê) | 645 | 642 | Series 2005-C3 Class AJ | ||||||
| Bear Stearns Commercial Mortgage | 4.771% due 07/15/37 | 725 | 735 | ||||||
| Securities Trust | Series 2005-C6 Class B | ||||||||
| Series 2002-TOP6 Class G | 5.230% due 12/15/40 | 925 | 953 | ||||||
| 6.000% due 10/15/36 (Þ) | 1,829 | 1,898 | Series 2005-C6 Class D | ||||||
| Series 2005-PWR7 Class A3 | 5.230% due 12/15/40 | 975 | 968 | ||||||
| 5.116% due 02/11/41 | 242 | 243 | DBRR Trust | ||||||
| Series 2005-T18 Class B | Series 2013-EZ2 Class A | ||||||||
| 5.035% due 02/13/42 | 400 | 406 | 0.853% due 02/25/45 (Ê)(Þ) | 314 | 312 | ||||
| Bear Stearns Structured Products, Inc. | Deutsche Mortgage Securities, Inc. Re- | ||||||||
| Series 2007-R6 Class 2A1 | REMIC Trust Certificates | ||||||||
| 2.555% due 12/26/46 (Ê) | 5 | 4 | Series 2005-WF1 Class 1A3 | ||||||
| BHMS Mortgage Trust | 5.234% due 06/26/35 (Ê)(Þ) | 156 | 157 | ||||||
| Series 2014-ATLS Class AFL | Extended Stay America Trust | ||||||||
| 1.652% due 07/05/33 (Ê)(Þ) | 2,400 | 2,403 | Series 2013-ESH7 Class A27 | ||||||
| Capmark Mortgage Securities, Inc. | 2.958% due 12/05/31 (Þ) | 1,675 | 1,700 | ||||||
| Series 1997-C2 Class G | Fannie Mae | ||||||||
| 6.750% due 04/15/29 | 541 | 595 | 7.000% due 2017 | 15 | 16 | ||||
| CD Commercial Mortgage Trust | 4.500% due 2019 | 59 | 63 | ||||||
| Series 2005-CD1 Class C | 5.700% due 2019 | 907 | 1,023 | ||||||
| 5.226% due 07/15/44 | 450 | 460 | 4.500% due 2020 | 1,295 | 1,374 | ||||
| CHL Mortgage Pass-Through Trust | |||||||||
| Series 2003-40 Class A5 | 4.500% due 2021 | 60 | 63 | ||||||
| 4.500% due 10/25/18 | 738 | 754 | 7.000% due 2022 | 132 | 140 | ||||
| Series 2006-1 Class A2 | 4.500% due 2025 | 666 | 721 | ||||||
| 6.000% due 03/25/36 | 495 | 455 | 2.230% due 2033(Ê) | 36 | 38 | ||||
| Citigroup Commercial Mortgage Trust | 15 Year TBA(Ï) | ||||||||
| Series 2005-CD1 Class AJ | 3.500% | 6,920 | 7,311 | ||||||
| 5.226% due 07/15/44 | 1,055 | 1,089 | 30 Year TBA(Ï) | ||||||
| Citigroup Mortgage Loan Trust, Inc. | 4.500% | 2,365 | 2,563 | ||||||
| Series 2007-10 Class 2A3A | Fannie Mae Grantor Trust | ||||||||
| 2.917% due 09/25/37 (Ê) | — | — | Series 2001-T3 Class A1 | ||||||
| Commercial Mortgage Asset Trust | 7.500% due 11/25/40 | 237 | 277 | ||||||
| Series 1999-C1 Class D | Series 2001-T4 Class A1 | ||||||||
| 6.900% due 01/17/32 | 39 | 39 | 7.500% due 07/25/41 | 649 | 775 | ||||
| Series 2001-J2A Class E | Series 2001-T8 Class A2 | ||||||||
| 6.922% due 07/16/34 (Þ) | 760 | 840 | 9.500% due 07/25/41 | 16 | 20 | ||||
| Commercial Mortgage Pass Through | Series 2001-T10 Class A1 | ||||||||
| Certificates | 7.000% due 12/25/41 | 46 | 54 | ||||||
| Series 2007-GG9 Class A2 | Series 2001-T10 Class A2 | ||||||||
| 5.381% due 03/10/39 | 194 | 195 | 7.500% due 12/25/41 | 806 | 932 | ||||
| Series 2007-GG9 Class A4 | Series 2002-T4 Class A3 | ||||||||
| 5.444% due 03/10/39 | 700 | 753 | 7.500% due 12/25/41 | 7 | 8 | ||||
| Commercial Mortgage Trust | Series 2002-T19 Class A1 | ||||||||
| Series 2005-C6 Class AJ | 6.500% due 07/25/42 | 412 | 471 | ||||||
| 5.209% due 06/10/44 | 1,955 | 2,006 | Series 2004-T1 Class 1A2 | ||||||
| Series 2005-CD1 Class AM | 6.500% due 01/25/44 | 724 | 827 | ||||||
| 5.226% due 07/15/44 | 580 | 598 | |||||||
| Credit Suisse Commercial Mortgage | Series 2004-T2 Class 1A3 | ||||||||
| Trust | 7.000% due 11/25/43 | 603 | 685 | ||||||
| Series 2006-C2 Class A1A | Fannie Mae REMICS | ||||||||
| 5.668% due 03/15/39 | 3,892 | 4,078 | Series 2002-57 Class PG | ||||||
| Series 2006-C3 Class A1A | 5.500% due 09/25/17 | 195 | 204 | ||||||
| 5.806% due 06/15/38 | 329 | 349 | Series 2004-70 Class EB | ||||||
| Series 2006-C5 Class A1A | 5.000% due 10/25/24 | 127 | 138 | ||||||
| 5.297% due 12/15/39 | 529 | 565 | Series 2007-18 Class BD | ||||||
| Series 2007-C1 Class A3 | 5.750% due 05/25/36 | 667 | 680 | ||||||
| 5.383% due 02/15/40 | 82 | 87 | Series 2007-73 Class A1 | ||||||
| 0.212% due 07/25/37 (Ê) | 81 | 79 | |||||||
| See accompanying notes which are an integral part of the financial statements. | |||||||||
| 480 Russell Short Duration Bond Fund | |||||||||
Russell Investment Company Russell Short Duration Bond Fund
Schedule of Investments, continued — October 31, 2014
| Amounts in thousands (except share amounts) | Amounts in thousands (except share amounts) | ||||||||
| Principal | Fair | Principal | Fair | ||||||
| Amount ($) | Value | Amount ($) | Value | ||||||
| or Shares | $ | or Shares | $ | ||||||
| Series 2009-96 Class DB | Series 2003-2632 Class AB | ||||||||
| 4.000% due 11/25/29 | 204 | 219 | 4.500% due 06/15/18 | 1,205 | 1,266 | ||||
| Series 2010-141 Class MD | Series 2003-2657 Class WT | ||||||||
| 2.000% due 10/25/40 | 336 | 337 | 4.500% due 08/15/18 | 270 | 283 | ||||
| Series 2010-150 Class PC | Series 2005-2922 Class JN | ||||||||
| 3.000% due 10/25/40 | 635 | 654 | 4.500% due 02/15/20 | 2,190 | 2,249 | ||||
| Fannie Mae Whole Loan | Series 2006-R006 Class ZA | ||||||||
| Series 2002-W3 Class A4 | 6.000% due 04/15/36 | 1,375 | 1,550 | ||||||
| 6.500% due 11/25/41 | 284 | 325 | Series 2006-R007 Class ZA | ||||||
| Series 2003-W2 Class 1A1 | 6.000% due 05/15/36 | 1,592 | 1,794 | ||||||
| 6.500% due 07/25/42 | 146 | 168 | Series 2010-3704 Class DC | ||||||
| Series 2004-W2 Class 2A2 | 4.000% due 11/15/36 | 359 | 383 | ||||||
| 7.000% due 02/25/44 | 512 | 592 | Series 2011-3816 Class D | ||||||
| Series 2004-W9 Class 2A1 | 3.500% due 08/15/28 | 1,406 | 1,466 | ||||||
| 6.500% due 02/25/44 | 27 | 31 | Series 2012-4029 Class BG | ||||||
| Series 2004-W11 Class 1A2 | 2.500% due 07/15/41 | 222 | 222 | ||||||
| 6.500% due 05/25/44 | 219 | 255 | Series 2013-4157 Class MA | ||||||
| Series 2004-W12 Class 1A1 | 2.000% due 01/15/53 | 966 | 947 | ||||||
| 6.000% due 07/25/44 | 2,583 | 2,946 | GE Capital Commercial Mortgage Corp. | ||||||
| Series 2005-W1 Class 1A2 | Series 2005-C3 Class F | ||||||||
| 6.500% due 10/25/44 | 139 | 163 | 5.158% due 07/10/45 (Þ) | 2,030 | 2,052 | ||||
| Fannie Mae-Aces | GE Commercial Mortgage Corp. Trust | ||||||||
| Series 2013-M7 Class ASQ2 | Series 2007-C1 Class A1A | ||||||||
| 1.233% due 03/26/18 | 552 | 552 | 5.483% due 12/10/49 (Ê) | 1,579 | 1,713 | ||||
| Series 2014-M3 Class ASQ2 | Ginnie Mae II | ||||||||
| 0.558% due 03/25/16 | 622 | 621 | 3.500% due 2040(Ê) | 8,488 | 8,950 | ||||
| Series 2014-M9 Class ASQ2 | 4.000% due 2040(Ê) | 523 | 558 | ||||||
| 1.462% due 04/25/17 | 680 | 686 | 5.390% due 2059 | 3,289 | 3,497 | ||||
| FDIC Guaranteed Notes Trust | 5.508% due 2059 | 2,706 | 2,876 | ||||||
| Series 2010-S1 Class 1A | |||||||||
| 0.703% due 02/25/48 (Ê)(Þ) | 189 | 189 | 5.500% due 2060 | 2,805 | 3,058 | ||||
| FDIC Trust | 4.672% due 2062 | 748 | 811 | ||||||
| Series 2010-R1 Class A | 4.674% due 2062 | 1,706 | 1,848 | ||||||
| 2.184% due 05/25/50 (Þ) | 2,554 | 2,570 | 4.816% due 2062 | 1,713 | 1,865 | ||||
| Series 2011-R1 Class A | 4.856% due 2062 | 2,613 | 2,832 | ||||||
| 2.672% due 07/25/26 (Þ) | 1,009 | 1,034 | 4.732% due 2063 | 1,583 | 1,734 | ||||
| Federal Home Loan Mortgage Corp. | GMAC Commercial Mortgage Securities, | ||||||||
| Multifamily Structured Pass Through | Inc. | ||||||||
| Certificates | Series 2005-C1 Class A5 | ||||||||
| Series 2011-K702 Class X1 | 4.697% due 05/10/43 | 380 | 384 | ||||||
| Interest Only STRIP | Government National Mortgage | ||||||||
| 1.528% due 02/25/18 | 30,929 | 1,362 | Association | ||||||
| Series 2011-K703 Class A1 | Series 2010-14 Class A | ||||||||
| 1.873% due 01/25/18 | 204 | 207 | 4.500% due 06/16/39 | 225 | 242 | ||||
| Series 2012-K501 Class X1A | Series 2010-74 | ||||||||
| Interest Only STRIP | Interest Only STRIP | ||||||||
| 1.717% due 08/25/16 | 10,188 | 228 | 0.430% due 03/16/50 | 8,457 | 200 | ||||
| Series 2012-K706 Class X1 | Series 2010-124 Class C | ||||||||
| Interest Only STRIP | 3.392% due 03/16/45 | 675 | 698 | ||||||
| 1.584% due 10/25/18 | 11,289 | 618 | Series 2010-H04 Class BI | ||||||
| Federal Home Loan Mortgage Corp. | Interest Only STRIP | ||||||||
| Structured Pass Through Securities | 1.386% due 04/20/60 | 5,189 | 260 | ||||||
| Series 2002-51 Class 1A | Series 2010-H12 Class PT | ||||||||
| 6.500% due 09/25/43 | 147 | 169 | 5.470% due 11/20/59 | 1,135 | 1,206 | ||||
| Series 2003-58 Class 2A | Series 2010-H22 Class JI | ||||||||
| 6.500% due 09/25/43 | 35 | 40 | Interest Only STRIP | ||||||
| Freddie Mac | 2.499% due 11/20/60 | 4,295 | 428 | ||||||
| 6.000% due 2018 | 25 | 26 | Series 2011-H21 Class HI | ||||||
| 5.500% due 2019 | 619 | 660 | Interest Only STRIP | ||||||
| 5.500% due 2022 | 374 | 408 | 1.807% due 11/20/61 | 9,904 | 667 | ||||
| 5.500% due 2029 | 156 | 175 | Series 2012-99 Class CI | ||||||
| Freddie Mac REMICS | Interest Only STRIP | ||||||||
| Series 2003-2559 Class PB | 1.054% due 10/16/49 | 7,014 | 511 | ||||||
| 5.500% due 08/15/30 | 1 | 1 | |||||||
| See accompanying notes which are an integral part of the financial statements. | |||||||||
| Russell Short Duration Bond Fund 481 | |||||||||
Russell Investment Company Russell Short Duration Bond Fund
Schedule of Investments, continued — October 31, 2014
| Amounts in thousands (except share amounts) | Amounts in thousands (except share amounts) | ||||||||
| Principal | Fair | Principal | Fair | ||||||
| Amount ($) | Value | Amount ($) | Value | ||||||
| or Shares | $ | or Shares | $ | ||||||
| Series 2012-115 Class IO | Series 2005-CB12 Class AJ | ||||||||
| Interest Only STRIP | 4.987% due 09/12/37 | 1,100 | 1,121 | ||||||
| 0.431% due 04/16/54 | 7,613 | 342 | Series 2005-CB13 Class A4 | ||||||
| Series 2012-132 Class IO | 5.244% due 01/12/43 | 2,070 | 2,136 | ||||||
| Interest Only STRIP | Series 2005-LDP2 Class C | ||||||||
| 1.129% due 06/16/54 | 13,455 | 943 | 4.911% due 07/15/42 | 460 | 464 | ||||
| Series 2012-H11 Class CI | Series 2006-LDP6 Class ASB | ||||||||
| Interest Only STRIP | 5.490% due 04/15/43 | 376 | 379 | ||||||
| 2.904% due 04/20/62 | 6,185 | 615 | Series 2006-LDP9 Class A1A | ||||||
| Series 2013-H03 Class HI | 5.257% due 05/15/47 | 1,991 | 2,093 | ||||||
| Interest Only STRIP | Series 2007-CB20 Class AM | ||||||||
| 2.588% due 12/20/62 | 5,286 | 565 | 5.877% due 02/12/51 | 160 | 177 | ||||
| Series 2013-H06 Class HI | Series 2014-CBM Class A | ||||||||
| Interest Only STRIP | |||||||||
| 2.932% due 01/20/63 | 11,740 | 1,154 | 1.057% due 10/15/29 (Ê)(Þ) | 2,145 | 2,145 | ||||
| Series 2013-H07 Class JL | Series 2014-FBLU Class C | ||||||||
| Interest Only STRIP | 2.154% due 12/15/28 (Ê)(Þ) | 2,300 | 2,296 | ||||||
| 2.635% due 03/20/63 | 12,569 | 1,462 | JPMorgan Mortgage Trust | ||||||
| Series 2004-A2 Class 1A1 | |||||||||
| GS Series Mortgage 2014-GC18 Securities Class Trust A1 | 2.609% due 05/25/34 (Ê) | 172 | 169 | ||||||
| 1.298% due 01/10/47 | 372 | 372 | Series 2005-A4 Class 1A1 | ||||||
| GSMPS Mortgage Loan Trust | 5.296% due 07/25/35 (Ê) | 57 | 58 | ||||||
| Series 1998-1 Class A | Series 2006-A6 Class 1A2 | ||||||||
| 8.000% due 09/19/27 (Þ) | 41 | 42 | 2.535% due 10/25/36 (Ê) | 25 | 23 | ||||
| Series 1998-2 Class A | LB Commercial Mortgage Trust | ||||||||
| 7.633% due 05/19/27 (Þ) | 183 | 185 | Series 1998-C4 Class G | ||||||
| Series 1998-3 Class A | 5.600% due 10/15/35 (Þ) | 30 | 30 | ||||||
| 7.750% due 09/19/27 (Þ) | 8 | 9 | LB-UBS Commercial Mortgage Trust | ||||||
| Series 1999-3 Class A | 5.017% due 09/15/40 | 1,235 | 1,266 | ||||||
| 8.000% due 08/19/29 (Þ) | 17 | 17 | Series 2005-C2 Class AJ | ||||||
| Series 2005-RP1 Class 1A4 | 5.205% due 04/15/30 | 2,300 | 2,336 | ||||||
| 8.500% due 01/25/35 (Þ) | 178 | 193 | Series 2005-C3 Class AJ | ||||||
| Series 2006-RP1 Class 1A2 | 4.843% due 07/15/40 | 395 | 400 | ||||||
| 7.500% due 01/25/36 (Þ) | 367 | 371 | Series 2005-C3 Class AM | ||||||
| Series 2006-RP1 Class 1A3 | 4.794% due 07/15/40 | 2,007 | 2,039 | ||||||
| 8.000% due 01/25/36 (Þ) | 95 | 99 | Series 2005-C3 Class B | ||||||
| Series 2006-RP1 Class 1A4 | 4.895% due 07/15/40 | 1,250 | 1,267 | ||||||
| 8.500% due 01/25/36 (Þ) | 71 | 76 | Series 2005-C7 Class B | ||||||
| GSR Mortgage Loan Trust | 5.350% due 11/15/40 | 360 | 371 | ||||||
| Series 2005-AR6 Class 2A1 | Series 2006-C6 Class A1A | ||||||||
| 2.660% due 09/25/35 (Ê) | 214 | 215 | 5.342% due 09/15/39 | 2 | 2 | ||||
| Series 2006-2F Class 3A3 | Mastr Adjustable Rate Mortgages Trust | ||||||||
| 6.000% due 02/25/36 | 38 | 31 | Series 2005-1 Class B1 | ||||||
| Series 2006-3F Class 2A3 | 3.333% due 03/25/35 (Ê) | 224 | 21 | ||||||
| 5.750% due 03/25/36 | 9 | 8 | Mastr Reperforming Loan Trust | ||||||
| Series 2006-8F Class 4A17 | Series 2005-1 Class 1A3 | ||||||||
| 6.000% due 09/25/36 | 1 | 1 | 7.000% due 08/25/34 (Þ) | 455 | 467 | ||||
| Series 2007-AR1 Class 1A1 | Series 2005-2 Class 1A4 | ||||||||
| 2.746% due 03/25/37 (Ê) | 2 | 1 | 8.000% due 05/25/35 (Þ) | 318 | 339 | ||||
| JPMorgan Chase Commercial Mortgage | Merrill Lynch Mortgage Investors Trust | ||||||||
| Series 1998-C1 Class A3 | |||||||||
| Securities Trust | 6.720% due 11/15/26 | 1,002 | 1,051 | ||||||
| Series 2001-CIB2 Class C | |||||||||
| 6.739% due 04/15/35 | 129 | 129 | Series 1998-C3 Class IO | ||||||
| Interest Only STRIP | |||||||||
| Series 2001-CIB2 Class D | 0.898% due 12/15/30 | 1,155 | 24 | ||||||
| 6.847% due 04/15/35 | 638 | 646 | |||||||
| Series 2002-C2 Class E | Series 2005-A10 Class A | ||||||||
| 5.757% due 12/12/34 | 278 | 294 | 0.362% due 02/25/36 (Ê) | 38 | 35 | ||||
| Merrill Lynch Mortgage Trust | |||||||||
| Series 2003-C1 Class D | Series 2004-KEY2 Class B | ||||||||
| 5.192% due 01/12/37 | 285 | 286 | 4.947% due 08/12/39 | 4 | 4 | ||||
| Series 2004-LN2 Class A2 | Series 2005-CIP1 Class AM | ||||||||
| 5.115% due 07/15/41 | 195 | 196 | 5.107% due 07/12/38 | 2,848 | 2,916 | ||||
| Series 2004-LN2 Class B | Series 2005-LC1 Class A4 | ||||||||
| 5.199% due 07/15/41 | 150 | 154 | 5.291% due 01/12/44 | 861 | 891 | ||||
| See accompanying notes which are an integral part of the financial statements. | |||||||||
| 482 Russell Short Duration Bond Fund | |||||||||
| Russell Investment Company | |||||||||
| Russell Short Duration Bond Fund | |||||||||
| Schedule of Investments, continued — October 31, 2014 | |||||||||
| Amounts in thousands (except share amounts) | Amounts in thousands (except share amounts) | ||||||||
| Principal | Fair | Principal | Fair | ||||||
| Amount ($) | Value | Amount ($) | Value | ||||||
| or Shares | $ | or Shares | $ | ||||||
| Series 2006-C2 Class AM | Sequoia Mortgage Trust | ||||||||
| 5.782% due 08/12/43 | 625 | 667 | Series 2004-9 Class A2 | ||||||
| Morgan Stanley Capital I Trust | 0.690% due 10/20/34 (Ê) | 738 | 711 | ||||||
| Series 2005-HQ6 Class D | Structured Asset Securities Corp. | ||||||||
| 5.202% due 08/13/42 | 1,000 | 1,013 | Mortgage Pass Through Certificates | ||||||
| Series 2006-HQ8 Class A4 | Series 2001-21A Class 1A1 | ||||||||
| 5.412% due 03/12/44 | 571 | 591 | 2.218% due 01/25/32 (Ê) | — | — | ||||
| Series 2006-IQ12 Class AM | Series 2003-34A Class 6A | ||||||||
| 5.370% due 12/15/43 | 265 | 282 | 2.576% due 11/25/33 (Ê) | 211 | 207 | ||||
| Series 2007-HQ12 Class A2 | Suntrust Adjustable Rate Mortgage Loan | ||||||||
| 5.592% due 04/12/49 | 1,332 | 1,347 | Trust | ||||||
| Morgan Stanley Dean Witter Capital I | Series 2007-2 Class 3A3 | ||||||||
| Trust | 2.742% due 04/25/37 (Ê) | 1 | 1 | ||||||
| Series 2001-TOP3 Class C | Wachovia Bank Commercial Mortgage | ||||||||
| 6.790% due 07/15/33 | 162 | 168 | Trust | ||||||
| Morgan Stanley Re-REMIC Trust | Series 2004-C15 Class A4 | ||||||||
| Series 2010-GG10 Class A4A | 4.803% due 10/15/41 | 6 | 6 | ||||||
| 5.797% due 08/15/45 (Þ) | 3,892 | 4,221 | Series 2004-C15 Class B | ||||||
| Mortgage-Linked Amortizing Notes | 4.892% due 10/15/41 | 320 | 320 | ||||||
| Series 2012-1 Class A10 | Series 2005-C17 Class A4 | ||||||||
| 2.060% due 01/15/22 | 5,359 | 5,452 | 5.083% due 03/15/42 | 54 | 55 | ||||
| Motel 6 Trust | Series 2007-C31 Class A4 | ||||||||
| Series 2012-MTL6 Class A1 | 5.509% due 04/15/47 | 1,380 | 1,477 | ||||||
| 1.500% due 10/05/25 (Þ) | 2,014 | 2,011 | Series 2007-C32 Class A2 | ||||||
| Series 2012-MTL6 Class A2 | 5.711% due 06/15/49 | 102 | 103 | ||||||
| 1.948% due 10/05/25 (Þ) | 1,800 | 1,798 | Series 2007-WHL8 Class A1 | ||||||
| Series 2012-MTL6 Class XA1 | 0.233% due 06/15/20 (Ê)(Þ) | 692 | 690 | ||||||
| Interest Only STRIP | Washington Mutual Commercial | ||||||||
| 3.005% due 10/05/25 (Þ) | 11,200 | 28 | Mortgage Securities Trust | ||||||
| NCUA Guaranteed Notes | Series 2006-SL1 Class A | ||||||||
| Series 2010-R1 Class 2A | 4.312% due 11/23/43 (Þ) | 60 | 60 | ||||||
| 1.840% due 10/07/20 | 718 | 723 | Washington Mutual Mortgage Pass- | ||||||
| Series 2010-R3 Class 3A | Through Certificates Trust | ||||||||
| 2.400% due 12/08/20 | 499 | 505 | Series 2003-AR7 Class A7 | ||||||
| Nomura Asset Acceptance Corp. | 2.300% due 08/25/33 (Ê) | 91 | 91 | ||||||
| Alternative Loan Trust | Series 2007-HY3 Class 4A1 | ||||||||
| Series 2004-AR4 Class 1A1 | 2.355% due 03/25/37 (Ê) | 8 | 7 | ||||||
| 2.658% due 12/25/34 | 377 | 380 | Wells Fargo Mortgage Backed Securities | ||||||
| Series 2005-WF1 Class 2A2 | Trust | ||||||||
| 4.786% due 03/25/35 | 72 | 74 | Series 2005-AR2 Class 2A1 | ||||||
| NorthStar Mortgage Trust | 2.614% due 03/25/35 (Ê) | 182 | 181 | ||||||
| Series 2012-1 Class A | Series 2006-AR2 Class 2A1 | ||||||||
| 1.355% due 08/25/29 (Ê)(Þ) | 185 | 185 | 2.615% due 03/25/36 | 379 | 378 | ||||
| Prudential Commercial Mortgage Trust | Series 2006-AR2 Class 2A3 | ||||||||
| Series 2003-PWR1 Class E | 2.615% due 03/25/36 (Ê) | 1,080 | 1,065 | ||||||
| 5.259% due 02/11/36 (Þ) | 256 | 256 | Series 2006-AR10 Class 4A1 | ||||||
| RBSCF Trust | 2.610% due 07/25/36 (Ê) | 6 | 6 | ||||||
| Series 2010-RR3 Class MSCA | Series 2006-AR17 Class A1 | ||||||||
| 5.909% due 06/16/49 (Þ) | 384 | 415 | 2.612% due 10/25/36 (Ê) | 1,280 | 1,240 | ||||
| Series 2010-RR4 | 185,871 | ||||||||
| 6.040% due 12/16/49 (Þ) | 515 | 548 | Non-US Bonds - 0.9% | ||||||
| Series 2010-RR4 Class WBCA | Brazil Notas do Tesouro Nacional | ||||||||
| 5.509% due 04/16/47 (Þ) | 2,500 | 2,623 | Series NTNF | ||||||
| RBSSP Resecuritization Trust | 10.000% due 01/01/17 | BRL | 5,954 | 2,375 | |||||
| Series 2010-3 Class 9A1 | Brazilian Government International Bond | ||||||||
| 5.500% due 02/26/35 (Þ) | 1,282 | 1,328 | 2.875% due 04/01/21 | EUR | 2,020 | 2,633 | |||
| Reperforming Loan REMIC Trust | Mexican Bonos | ||||||||
| Series 2005-R2 Class 2A4 | Series M | ||||||||
| 8.500% due 06/25/35 (Þ) | 93 | 98 | 6.250% due 06/16/16 | MXN | 12,825 | 992 | |||
| Rialto Capital Management LLC | 6.500% due 06/10/21 | MXN | 32,192 | 2,513 | |||||
| Series 2014-LT5 Class A | |||||||||
| 2.850% due 05/15/24 (Þ) | 891 | 891 | New Zealand Government Bond | ||||||
| Rialto Real Estate Fund LP | 3.000% due 04/15/20 | NZD | 3,412 | 2,547 | |||||
| Series 2014-LT6 Class A | 11,060 | ||||||||
| 2.750% due 09/15/24 (Å) | 598 | 599 | United States Government Treasuries - 27.5% | ||||||
| See accompanying notes which are an integral part of the financial statements. | |||||||||
| Russell Short Duration Bond Fund 483 | |||||||||
| Russell Investment Company | ||||||||||
| Russell Short Duration Bond Fund | ||||||||||
| Schedule of Investments, continued — October 31, 2014 | ||||||||||
| Amounts in thousands (except share amounts) | Amounts in thousands (except share amounts) | |||||||||
| Principal | Fair | Principal | Fair | |||||||
| Amount ($) | Value | Amount ($) | Value | |||||||
| or Shares | $ | or Shares | $ | |||||||
| United States Treasury Notes | 0.700% due 07/15/15 | 1,085 | 1,086 | |||||||
| 4.500% due 11/15/15 | 9,285 | 9,699 | Fannie Mae | |||||||
| 0.250% due 11/30/15 | 400 | 400 | 4.771% due 09/01/15 | 618 | 627 | |||||
| 0.250% due 12/15/15 | 8,820 | 8,827 | Fannie Mae-Aces | |||||||
| 2.125% due 12/31/15 | 12,155 | 12,425 | Series 2013-M5 Class ASQ2 | |||||||
| 2.000% due 01/31/16 | 7,820 | 7,992 | 0.595% due 08/25/15 | 605 | 605 | |||||
| 0.375% due 02/15/16 | 760 | 761 | Series 2014-M2 Class ASQ2 | |||||||
| 0.250% due 04/15/16 | 5,735 | 5,731 | 0.478% due 09/25/15 | 431 | 431 | |||||
| 0.875% due 09/15/16 | 4,010 | 4,039 | Ford Credit Auto Lease Trust | |||||||
| Series 2012-B Class A3 | ||||||||||
| 0.500% due 09/30/16 | 34,420 | 34,436 | 0.570% due 09/15/15 | 307 | 307 | |||||
| 1.000% due 09/30/16 | 2,190 | 2,211 | Ford Motor Credit Co. LLC | |||||||
| 0.375% due 10/31/16 | 1,340 | 1,337 | 7.000% due 04/15/15 | 1,715 | 1,762 | |||||
| 1.000% due 10/31/16 | 9,130 | 9,217 | 2.750% due 05/15/15 | 1,000 | 1,010 | |||||
| 0.875% due 11/30/16 | 10,020 | 10,087 | Freddie Mac REMICS | |||||||
| 0.625% due 12/15/16 | 10,000 | 10,011 | Series 2010-3640 Class JA | |||||||
| 0.875% due 12/31/16 | 13,885 | 13,964 | 1.500% due 03/15/15 | 72 | 72 | |||||
| 3.250% due 12/31/16 | 13,165 | 13,912 | Goldman Sachs Group, Inc. (The) | |||||||
| 3.125% due 01/31/17 | 12,735 | 13,438 | 3.300% due 05/03/15 | 2,935 | 2,974 | |||||
| 3.250% due 03/31/17 | 11,915 | 12,637 | Honda Auto Receivables Owner Trust | |||||||
| 8.750% due 05/15/17 | 2,650 | 3,182 | Series 2011-3 Class A3 | |||||||
| 2.375% due 07/31/17 | 9,025 | 9,397 | 0.880% due 09/21/15 | 8 | 8 | |||||
| 0.625% due 08/31/17 | 59,125 | 58,668 | International Lease Finance Corp. | |||||||
| 1.875% due 08/31/17 | 8,330 | 8,558 | 4.875% due 04/01/15 | 3,200 | 3,238 | |||||
| 0.875% due 10/15/17 | 40,715 | 40,658 | Kinder Morgan Energy Partners, LP | |||||||
| 1.000% due 05/31/18 | 14,600 | 14,487 | 5.125% due 11/15/14 | 1,100 | 1,101 | |||||
| MetLife, Inc. | ||||||||||
| 1.000% due 09/30/19 | 5,205 | 5,049 | 5.000% due 06/15/15 | 1,065 | 1,094 | |||||
| 1.750% due 09/30/19 | 2,050 | 2,064 | Morgan Stanley | |||||||
| 2.125% due 09/30/21 | 12,175 | 12,243 | 4.200% due 11/20/14 | 1,600 | 1,603 | |||||
| 325,430 | 6.000% due 04/28/15 | 1,000 | 1,026 | |||||||
| Total Long-Term Investments | 0.711% due 10/15/15 (Ê) | 2,390 | 2,397 | |||||||
| (cost $933,424) | 930,252 | |||||||||
| 5.375% due 10/15/15 | 2,675 | 2,792 | ||||||||
| Series GMTN | ||||||||||
| Short-Term Investments - 22.7% | 4.100% due 01/26/15 | 3,000 | 3,024 | |||||||
| Ally Financial, Inc. | Navient Corp. | |||||||||
| 2.434% due 12/01/14 (Ê) | 1,000 | 1,001 | 3.875% due 09/10/15 | 1,255 | 1,268 | |||||
| 8.300% due 02/12/15 | 200 | 203 | Norske Skogindustrier ASA | |||||||
| 4.625% due 06/26/15 | 100 | 102 | 6.125% due 10/15/15 (Þ) | 535 | 490 | |||||
| Series 8 | PC Financial Partnership | |||||||||
| 6.750% due 12/01/14 | 1,400 | 1,404 | 5.000% due 11/15/14 | 900 | 901 | |||||
| Bank of America Corp. | Porsche Financial Auto Securitization | |||||||||
| 4.500% due 04/01/15 | 6,000 | 6,097 | Trust | |||||||
| 0.180% due 05/26/15 | 594 | 594 | ||||||||
| 4.750% due 08/01/15 | 1,760 | 1,810 | Regions Financial Corp. | |||||||
| Series MTNC | 7.750% due 11/10/14 | 29 | 29 | |||||||
| 5.000% due 01/15/15 | 885 | 893 | Royal Bank of Scotland Group PLC | |||||||
| BBVA US Senior SAU | 2.550% due 09/18/15 | 1,275 | 1,293 | |||||||
| 4.664% due 10/09/15 | 1,690 | 1,751 | Russell U.S. Cash Management Fund | 110,218,550 | (8) | 110,219 | ||||
| Caterpillar Financial Services Corp. | Santander US Debt SAU | |||||||||
| 1.100% due 05/29/15 | 705 | 708 | 3.724% due 01/20/15 (Þ) | 2,100 | 2,113 | |||||
| Citigroup, Inc. | Southern Copper Corp. | |||||||||
| 2.650% due 03/02/15 | 1,400 | 1,410 | 6.375% due 07/27/15 | 300 | 311 | |||||
| Cooperatieve Centrale Raiffeisen- | ||||||||||
| Boerenleenbank BA | Sumitomo Mitsui Banking Corp. | |||||||||
| 0.180% due 10/13/15 | 815 | 828 | 1.350% due 07/18/15 | 1,700 | 1,709 | |||||
| Covidien International Finance SA | Symantec Corp. | |||||||||
| 1.350% due 05/29/15 | 670 | 673 | 2.750% due 09/15/15 | 1,485 | 1,505 | |||||
| CVS Health Corp. | TD Ameritrade Holding Corp. | |||||||||
| 3.250% due 05/18/15 | 890 | 903 | 4.150% due 12/01/14 | 1,690 | 1,695 | |||||
| eBay, Inc. | Telefonos de Mexico SAB de CV | |||||||||
| See accompanying notes which are an integral part of the financial statements. | ||||||||||
| 484 Russell Short Duration Bond Fund | ||||||||||
Russell Investment Company Russell Short Duration Bond Fund
Schedule of Investments, continued — October 31, 2014
| Amounts in thousands (except share amounts) | |||||
| Principal | Fair | ||||
| Amount ($) | Value | ||||
| or Shares | $ | ||||
| 5.500% due 01/27/15 | 845 | 854 | |||
| Teva Pharmaceutical Finance II BV / | |||||
| Teva Pharmaceutical Finance III LLC | |||||
| 3.000% due 06/15/15 | 965 | 980 | |||
| United States Treasury Notes | |||||
| 0.250% due 05/15/15 | 79,355 | 79,411 | |||
| 0.375% due 06/30/15 | 4,450 | 4,457 | |||
| 1.250% due 08/31/15 | 5,570 | 5,620 | |||
| 1.250% due 09/30/15 | 7,465 | 7,540 | |||
| UnitedHealth Group, Inc. | |||||
| 0.850% due 10/15/15 | 1,560 | 1,566 | |||
| Viacom, Inc. | |||||
| 1.250% due 02/27/15 | 700 | 701 | |||
| Volvo Treasury AB | |||||
| 5.950% due 04/01/15 (Þ) | 1,135 | 1,159 | |||
| Yum! Brands, Inc. | |||||
| 4.250% due 09/15/15 | 1,570 | 1,614 | |||
| Total Short-Term Investments | |||||
| (cost $268,575) | 268,969 | ||||
| Total Investments 101.3% | |||||
| (identified cost $1,201,999) | 1,199,221 | ||||
| Other Assets and Liabilities, | |||||
| Net - (1.3%) | (15,689 | ) | |||
| Net Assets - 100.0% | 1,183,532 | ||||
See accompanying notes which are an integral part of the financial statements.
Russell Short Duration Bond Fund 485
| Russell Investment Company | |||||||||||||||||
| Russell Short Duration Bond Fund | |||||||||||||||||
| Schedule of Investments, continued — October 31, 2014 | |||||||||||||||||
| Restricted Securities | |||||||||||||||||
| Amounts in thousands (except share and cost per unit amounts) | |||||||||||||||||
| Principal Cost per | Cost | Fair Value | |||||||||||||||
| % of Net Assets | Acquisition | Amount ($) | Unit | (000 | ) | (000 | ) | ||||||||||
| Securities | Date | or shares | $ | $ | $ | ||||||||||||
| 1.5 | % | ||||||||||||||||
| ABN AMRO Bank NV | 10/23/13 | 1,100,000 | 100.00 | 1,100 | 1,109 | ||||||||||||
| Bayer US Finance LLC | 10/01/14 | 1,080,000 | 99.55 | 1,075 | 1,082 | ||||||||||||
| Dynegy Finance I, Inc. / Dynegy Finance II, Inc. | 10/10/14 | 1,335,000 | 103.57 | 1,383 | 1,412 | ||||||||||||
| Exeter Automobile Receivables Trust | 10/09/14 | 4,700,000 | 99.99 | 4,700 | 4,700 | ||||||||||||
| Innovation Ventures LLC / Innovation Ventures Finance Corp. | 10/24/14 | 650,000 | 98.75 | 642 | 641 | ||||||||||||
| Rialto Real Estate Fund LP | 09/17/14 | 598,480 | 100.00 | 598 | 599 | ||||||||||||
| SBA Tower Trust | 10/07/14 | 1,415,000 | 100.00 | 1,415 | 1,419 | ||||||||||||
| Verizon Communications, Inc. | 10/07/14 | 6,515,000 | 99.64 | 6,492 | 6,480 | ||||||||||||
| 17,442 | |||||||||||||||||
| For a description of restricted securities see note 9 in the Notes to Financial Statements. | |||||||||||||||||
| Futures Contracts | |||||||||||||||||
| Amounts in thousands (except contract amounts) | |||||||||||||||||
| Unrealized | |||||||||||||||||
| Appreciation | |||||||||||||||||
| Number of | Notional | Expiration | (Depreciation) | ||||||||||||||
| Contracts | Amount | Date | $ | ||||||||||||||
| Long Positions | |||||||||||||||||
| United States Treasury 2 Year Note Futures | 1,148 | USD | 252,058 | 12/14 | 431 | ||||||||||||
| Short Positions | |||||||||||||||||
| United States Treasury 5 Year Note Futures | 534 | USD | 63,776 | 12/14 | (331 | ) | |||||||||||
| United States Treasury 10 Year Note Futures | 309 | USD | 39,045 | 12/14 | (228 | ) | |||||||||||
| Total Unrealized Appreciation (Depreciation) on Open Futures Contracts (å) | (128 | ) | |||||||||||||||
| Options Written | |||||||||||||||||
| Amounts in thousands (except contract amounts) | |||||||||||||||||
| Transactions in options written contracts for the period ended October 31, 2014 were as follows: | |||||||||||||||||
| Number of | Premiums | ||||||||||||||||
| Contracts | Received | ||||||||||||||||
| Outstanding October 31, 2013 | 63 | $ | 424 | ||||||||||||||
| Opened | 965 | 1,130 | |||||||||||||||
| Closed | (30 | ) | (722 | ) | |||||||||||||
| Expired | (998 | ) | (832 | ) | |||||||||||||
| Outstanding October 31, 2014 | — | $ | — | ||||||||||||||
| Foreign Currency Exchange Contracts | |||||||||||||||||
| Amounts in thousands | |||||||||||||||||
| Unrealized | |||||||||||||||||
| Appreciation | |||||||||||||||||
| Amount | Amount | (Depreciation) | |||||||||||||||
| Counterparty | Sold | Bought | Settlement Date | $ | |||||||||||||
| Bank of America | USD | 60 | BRL | 150 | 11/04/14 | — | |||||||||||
| Bank of America | BRL | 150 | USD | 60 | 11/04/14 | — | |||||||||||
| Barclays | CAD | 2,768 | USD | 2,460 | 11/28/14 | 5 | |||||||||||
| Barclays | EUR | 973 | USD | 1,237 | 11/28/14 | 18 | |||||||||||
| BNP Paribas | USD | 60 | BRL | 150 | 11/04/14 | — | |||||||||||
| BNP Paribas | USD | 100 | BRL | 250 | 11/04/14 | 1 | |||||||||||
| BNP Paribas | USD | 117 | BRL | 294 | 11/04/14 | 2 | |||||||||||
| BNP Paribas | USD | 134 | BRL | 334 | 11/04/14 | 1 | |||||||||||
| BNP Paribas | USD | 1,235 | MXN | 16,586 | 11/06/14 | (3 | ) | ||||||||||
| BNP Paribas | BRL | 250 | USD | 100 | 11/04/14 | (1 | ) | ||||||||||
| BNP Paribas | BRL | 778 | USD | 310 | 11/04/14 | (4 | ) | ||||||||||
| BNP Paribas | MXN | 16,586 | USD | 1,250 | 11/06/14 | 18 | |||||||||||
| Deutsche Bank | USD | 1,281 | EUR | 1,019 | 11/04/14 | (4 | ) | ||||||||||
| Deutsche Bank | USD | 3,207 | JPY | 350,100 | 11/04/14 | (91 | ) | ||||||||||
| Deutsche Bank | EUR | 1,019 | USD | 1,287 | 11/04/14 | 10 | |||||||||||
| See accompanying notes which are an integral part of the financial statements. | |||||||||||||||||
| 486 Russell Short Duration Bond Fund | |||||||||||||||||
| Russell Investment Company | ||||||||||||||
| Russell Short Duration Bond Fund | ||||||||||||||
| Schedule of Investments, continued — October 31, 2014 | ||||||||||||||
| Foreign Currency Exchange Contracts | ||||||||||||||
| Amounts in thousands | ||||||||||||||
| Unrealized | ||||||||||||||
| Appreciation | ||||||||||||||
| Amount | Amount | (Depreciation) | ||||||||||||
| Counterparty | Sold | Bought | Settlement Date | $ | ||||||||||
| Deutsche Bank | JPY | 350,100 | USD | 3,218 | 11/04/14 | 102 | ||||||||
| Goldman Sachs | USD | 1,764 | AUD | 2,037 | 11/04/14 | 29 | ||||||||
| Goldman Sachs | AUD | 2,037 | USD | 1,783 | 11/04/14 | (9 | ) | |||||||
| HSBC | JPY | 199,409 | USD | 1,852 | 11/28/14 | 77 | ||||||||
| JPMorgan Chase | USD | 133 | BRL | 334 | 11/04/14 | 2 | ||||||||
| JPMorgan Chase | USD | 4,924 | JPY | 537,490 | 11/04/14 | (139 | ) | |||||||
| JPMorgan Chase | BRL | 334 | USD | 134 | 11/04/14 | (1 | ) | |||||||
| JPMorgan Chase | JPY | 537,490 | USD | 4,939 | 11/04/14 | 154 | ||||||||
| Morgan Stanley | USD | 140 | BRL | 351 | 11/04/14 | 2 | ||||||||
| Morgan Stanley | BRL | 351 | USD | 140 | 11/04/14 | (2 | ) | |||||||
| Royal Bank of Scotland | MXN | 1,021 | USD | 75 | 11/28/14 | (1 | ) | |||||||
| Royal Bank of Scotland | NZD | 3,193 | USD | 2,514 | 11/28/14 | 31 | ||||||||
| Standard Chartered | USD | 506 | BRL | 1,236 | 11/04/14 | (7 | ) | |||||||
| Standard Chartered | BRL | 1,236 | USD | 510 | 11/04/14 | 11 | ||||||||
| Standard Chartered | SEK | 27 | USD | 4 | 11/28/14 | — | ||||||||
| UBS | USD | 23 | BRL | 58 | 11/04/14 | — | ||||||||
| UBS | USD | 454 | BRL | 1,139 | 11/04/14 | 6 | ||||||||
| UBS | USD | 28,037 | EUR | 22,302 | 11/04/14 | (89 | ) | |||||||
| UBS | BRL | 1,197 | USD | 505 | 11/04/14 | 22 | ||||||||
| UBS | EUR | 22,302 | USD | 28,530 | 11/04/14 | 582 | ||||||||
| Total Unrealized Appreciation (Depreciation) on Open Foreign Currency Exchange Contracts | 722 | |||||||||||||
| Presentation of Portfolio Holdings | ||||||||||||||
| Amounts in thousands | ||||||||||||||
| Fair Value | ||||||||||||||
| Portfolio Summary | Level 1 | Level 2 | Level 3 | Total | % of Net Assets | |||||||||
| Long-Term Investments | ||||||||||||||
| Asset-Backed Securities | $ | — | $ | 86,066 | $ | 4,083 | $ | 90,149 | 7.6 | |||||
| Corporate Bonds and Notes | — | 156,366 | — | 156,366 | 13.2 | |||||||||
| International Debt | — | 49,685 | 3,155 | 52,840 | 4.5 | |||||||||
| Loan Agreements | — | 108,536 | — | 108,536 | 9.2 | |||||||||
| Mortgage-Backed Securities | — | 184,148 | 1,723 | 185,871 | 15.7 | |||||||||
| Non-US Bonds | — | 11,060 | — | 11,060 | 0.9 | |||||||||
| United States Government Treasuries | — | 325,430 | — | 325,430 | 27.5 | |||||||||
| Short-Term Investments | — | 268,969 | — | 268,969 | 22.7 | |||||||||
| Total Investments | — | 1,190,260 | 8,961 | 1,199,221 | 101.3 | |||||||||
| Other Assets and Liabilities, Net | (1.3 | ) | ||||||||||||
| 100.0 | ||||||||||||||
| Other Financial Instruments | ||||||||||||||
| Futures Contracts | (128 | ) | — | — | (128 | ) | (—)* | |||||||
| Foreign Currency Exchange Contracts | — | 722 | — | 722 | 0.1 | |||||||||
| Total Other Financial Instruments** | $ | (128 | ) | $ | 722 | $ | — | $ | 594 | |||||
| * | Less than .05% of net assets. |
| ** | Futures and foreign currency exchange contract values reflect the unrealized appreciation (depreciation) on the instruments. |
For a description of the Levels see note 2 in the Notes to Financial Statements.
For disclosure on transfers between Levels 1, 2 and 3 during the period ended October 31, 2014, see note 2 in the Notes to Financial Statements.
Investments in which significant unobservable inputs (Level 3) were used in determining fair value for the period ended October 31, 2014, were less than 1% of net assets.
See accompanying notes which are an integral part of the financial statements.
Russell Short Duration Bond Fund 487
| Russell Investment Company | ||||||||
| Russell Short Duration Bond Fund | ||||||||
| Fair Value of Derivative Instruments — October 31, 2014 | ||||||||
| Amounts in thousands | ||||||||
| Foreign | ||||||||
| Currency | Interest Rate | |||||||
| Derivatives not accounted for as hedging instruments | Contracts | Contracts | ||||||
| Location: Statement of Assets and Liabilities - Assets | ||||||||
| Unrealized appreciation on foreign currency exchange contracts | $ | 1,073 | $ | — | ||||
| Variation margin on futures contracts* | — | 431 | ||||||
| Total | $ | 1,073 | $ | 431 | ||||
| Location: Statement of Assets and Liabilities - Liabilities | ||||||||
| Variation margin on futures contracts* | $ | — | $ | 559 | ||||
| Unrealized depreciation on foreign currency exchange contracts | 351 | — | ||||||
| Total | $ | 351 | $ | 559 | ||||
| Foreign | ||||||||
| Credit | Currency | Interest Rate | ||||||
| Derivatives not accounted for as hedging instruments | Contracts | Contracts | Contracts | |||||
| Location: Statement of Operations - Net realized gain (loss) | ||||||||
| Futures contracts | $ | — | $ | — | $ | (573 | ) | |
| Options written | — | — | 1,192 | |||||
| Interest rate swap contracts | — | — | (3,481 | ) | ||||
| Credit default swap contracts | 1,808 | — | — | |||||
| Foreign currency-related transactions** | — | 1,184 | — | |||||
| Total | $ | 1,808 | $ | 1,184 | $ | (2,862 | ) | |
| Location: Statement of Operations - Net change in unrealized appreciation (depreciation) | ||||||||
| Futures contracts | $ | — | $ | — | $ | (158 | ) | |
| Options written | — | — | (199 | ) | ||||
| Interest rate swap contracts | — | — | 879 | |||||
| Credit default swap contracts | (486 | ) | — | — | ||||
| Foreign currency-related transactions*** | — | 864 | — | |||||
| Total | $ | (486 | ) | $ | 864 | $ | 522 | |
| * | Includes cumulative appreciation/depreciation of futures contracts as reported in the Schedule of Investments. Only variation margin is reported within the Statement of Assets and Liabilities. |
| ** | Only includes net realized gain (loss) on forward and spot contracts. May differ from the net realized gain (loss) on foreign currency-related transactions reported within the Statement of Operations. |
| *** | Only includes change in unrealized gain (loss) on forward and spot contracts. May differ from the net change in unrealized gain (loss) on foreign currency-related transactions reported within the Statement of Operations. |
For further disclosure on derivatives see note 2 in the Notes to Financial Statements.
See accompanying notes which are an integral part of the financial statements.
488 Russell Short Duration Bond Fund
Russell Investment Company Russell Short Duration Bond Fund
Balance Sheet Offsetting of Financial and Derivative Instruments — October 31, 2014
| Amounts in thousands | ||||||||
| Offsetting of Financial Assets and Derivative Assets | ||||||||
| Gross | Net Amounts | |||||||
| Amounts | of Assets | |||||||
| Gross | Offset in the | Presented in | ||||||
| Amounts of | Statement of | the Statement | ||||||
| Recognized | Assets and | of Assets and | ||||||
| Description | Location: Statement of Assets and Liabilities - Assets | Assets | Liabilities | Liabilities | ||||
| Foreign Currency Exchange Contracts | Unrealized appreciation on foreign currency exchange contracts | $ | 1,073 | $ | — $ | 1,073 | ||
| Futures Contracts | Variation margin on futures contracts | 170 | — | 170 | ||||
| Total | $ | 1,243 | $ | — $ | 1,243 | |||
| Financial Assets, Derivative Assets, and Collateral Held by Counterparty | ||||||||
| Gross Amounts Not Offset in | ||||||||
| the Statement of Assets and | ||||||||
| Liabilities | ||||||||
| Net Amounts | ||||||||
| of Assets | ||||||||
| Presented in | ||||||||
| the Statement | Financial and | |||||||
| of Assets and | Derivative | Collateral | ||||||
| Counterparty | Liabilities | Instruments | Received^ | Net Amount | ||||
| Bank of America | $ | 1 | $ | — $ | — $ | 1 | ||
| Barclays | 23 | — | — | 23 | ||||
| BNP Paribas | 22 | 8 | — | 14 | ||||
| Deutsche Bank | 111 | 95 | — | 16 | ||||
| Goldman Sachs | 29 | 9 | 20 | — | ||||
| HSBC | 247 | — | — | 247 | ||||
| JPMorgan Chase | 156 | 140 | — | 16 | ||||
| Morgan Stanley | 2 | 2 | — | — | ||||
| Royal Bank of Scotland | 31 | 1 | — | 30 | ||||
| Standard Chartered | 11 | 7 | — | 4 | ||||
| UBS | 610 | 89 | 521 | — | ||||
| Total | $ | 1,243 | $ | 351 | $ | 541 | $ | 351 |
See accompanying notes which are an integral part of the financial statements.
Russell Short Duration Bond Fund 489
Russell Investment Company
Russell Short Duration Bond Fund
Balance Sheet Offsetting of Financial and Derivative Instruments, continued —October 31, 2014
| Amounts in thousands | ||||||||
| Offsetting of Financial Liabilities and Derivative Liabilities | ||||||||
| Gross | Net Amounts | |||||||
| Amounts | of Assets | |||||||
| Gross | Offset in the | Presented in | ||||||
| Amounts of | Statement of | the Statement | ||||||
| Recognized | Assets and | of Assets and | ||||||
| Description | Location: Statement of Assets and Liabilities - Liabilities | Liabilities | Liabilities | Liabilities | ||||
| Futures Contracts | Variation margin on futures contracts | $ | 72 | $ | — $ | 72 | ||
| Foreign Currency Exchange Contracts | Unrealized depreciation on foreign currency exchange contracts | 351 | — | 351 | ||||
| Total | $ | 423 | $ | — $ | 423 | |||
| Financial Liabilities, Derivative Liabilities, and Collateral Pledged by Counterparty | ||||||||
| Gross Amounts Not Offset in | ||||||||
| the Statement of Assets and | ||||||||
| Liabilities | ||||||||
| Net Amounts | ||||||||
| of Liabilities | ||||||||
| Presented in | ||||||||
| the Statement | Financial and | |||||||
| of Assets and | Derivative | Collateral | ||||||
| Counterparty | Liabilities | Instruments | Pledged^ | Net Amount | ||||
| BNP Paribas | $ | 8 | $ | 8 | $ | — $ | — | |
| Deutsche Bank | 95 | 95 | — | — | ||||
| Goldman Sachs | 28 | 9 | 19 | — | ||||
| HSBC | 53 | — | 53 | — | ||||
| JPMorgan Chase | 140 | 140 | — | — | ||||
| Morgan Stanley | 2 | 2 | — | — | ||||
| Royal Bank of Scotland | 1 | 1 | — | — | ||||
| Standard Chartered | 7 | 7 | — | — | ||||
| UBS | 89 | 89 | — | — | ||||
| Total | $ | 423 | $ | 351 | $ | 72 | $ | — |
^ Collateral received or pledged amounts may not reconcile to those disclosed in the Statement of Assets and Liabilities due to the inclusion of off-Balance Sheet collateral and adjustments made to exclude overcollateralization.
For further disclosure on derivatives and counterparty risk see note 2 in the Notes to Financial Statements.
See accompanying notes which are an integral part of the financial statements.
490 Russell Short Duration Bond Fund
| Russell Investment Company | ||
| Russell Short Duration Bond Fund | ||
| Statement of Assets and Liabilities — October 31, 2014 | ||
| Amounts in thousands | ||
| Assets | ||
| Investments, at identified cost | $ | 1,201,999 |
| Investments, at fair value(>) | 1,199,221 | |
| Cash (restricted)(a)(b) | 818 | |
| Foreign currency holdings(^) | 45 | |
| Unrealized appreciation on foreign currency exchange contracts | 1,073 | |
| Receivables: | ||
| Dividends and interest | 4,685 | |
| Dividends from affiliated Russell funds | 8 | |
| Investments sold | 35,219 | |
| Fund shares sold | 1,682 | |
| Variation margin on futures contracts | 170 | |
| Prepaid expenses | 4 | |
| Total assets | 1,242,925 | |
| Liabilities | ||
| Payables: | ||
| Due to custodian | 9,031 | |
| Due to broker (c) | 1,054 | |
| Investments purchased | 46,350 | |
| Fund shares redeemed | 1,706 | |
| Accrued fees to affiliates | 602 | |
| Other accrued expenses | 162 | |
| Variation margin on futures contracts | 72 | |
| Unfunded loan commitment | 65 | |
| Unrealized depreciation on foreign currency exchange contracts | 351 | |
| Total liabilities | 59,393 | |
| Net Assets | $ | 1,183,532 |
See accompanying notes which are an integral part of the financial statements.
Russell Short Duration Bond Fund 491
| Russell Investment Company | |||
| Russell Short Duration Bond Fund | |||
| Statement of Assets and Liabilities, continued — October 31, 2014 | |||
| Amounts in thousands | |||
| Net Assets Consist of: | |||
| Undistributed (overdistributed) net investment income | $ | 2,557 | |
| Accumulated net realized gain (loss) | 7,286 | ||
| Unrealized appreciation (depreciation) on: | |||
| Investments | (2,778 | ) | |
| Futures contracts | (128 | ) | |
| Foreign currency-related transactions | 717 | ||
| Shares of beneficial interest | 612 | ||
| Additional paid-in capital | 1,175,266 | ||
| Net Assets | $ | 1,183,532 | |
| Net Asset Value, offering and redemption price per share: | |||
| Net asset value per share: Class A(#) | $ | 19.35 | |
| Maximum offering price per share (Net asset value plus sales charge of 3.75%): Class A | $ | 20.10 | |
| Class A — Net assets | $ | 29,638,962 | |
| Class A — Shares outstanding ($.01 par value) | 1,532,041 | ||
| Net asset value per share: Class C(#) | $ | 19.21 | |
| Class C — Net assets | $ | 82,675,676 | |
| Class C — Shares outstanding ($.01 par value) | 4,304,795 | ||
| Net asset value per share: Class E(#) | $ | 19.38 | |
| Class E — Net assets | $ | 36,083,112 | |
| Class E — Shares outstanding ($.01 par value) | 1,861,640 | ||
| Net asset value per share: Class S(#) | $ | 19.36 | |
| Class S — Net assets | $ | 771,202,289 | |
| Class S — Shares outstanding ($.01 par value) | 39,836,737 | ||
| Net asset value per share: Class Y(#) | $ | 19.37 | |
| Class Y — Net assets | $ | 263,932,456 | |
| Class Y — Shares outstanding ($.01 par value) | 13,628,942 | ||
| Amounts in thousands | |||
| (^) Foreign currency holdings - cost | $ | 46 | |
| (>) Investments in affiliates, Russell U.S. Cash Management Fund | $ | 110,219 | |
| (a) Cash Collateral for Futures | $ | 350 | |
| (b) Cash Collateral for Swaps | $ | 468 | |
| (c) Due to Broker for Swaps | $ | 1,054 | |
| (#) Net asset value per share equals class level net assets divided by class level shares of beneficial interest outstanding. | |||
See accompanying notes which are an integral part of the financial statements.
492 Russell Short Duration Bond Fund
| Russell Investment Company | |||
| Russell Short Duration Bond Fund | |||
| Statement of Operations — For the Period Ended October 31, 2014 | |||
| Amounts in thousands | |||
| Investment Income | |||
| Dividends | $ | 31 | |
| Dividends from affiliated Russell funds | 62 | ||
| Interest | 24,579 | ||
| Total investment income | 24,672 | ||
| Expenses | |||
| Advisory fees | 5,542 | ||
| Administrative fees | 587 | ||
| Custodian fees | 351 | ||
| Distribution fees - Class A | 78 | ||
| Distribution fees - Class C | 736 | ||
| Transfer agent fees - Class A | 63 | ||
| Transfer agent fees - Class C | 196 | ||
| Transfer agent fees - Class E | 79 | ||
| Transfer agent fees - Class S | 1,578 | ||
| Transfer agent fees - Class Y | 12 | ||
| Professional fees | 138 | ||
| Registration fees | 102 | ||
| Shareholder servicing fees - Class C | 245 | ||
| Shareholder servicing fees - Class E | 98 | ||
| Trustees’ fees | 31 | ||
| Printing fees | 31 | ||
| Miscellaneous | 74 | ||
| Expenses before reductions | 9,941 | ||
| Expense reductions | (1,611 | ) | |
| Net expenses | 8,330 | ||
| Net investment income (loss) | 16,342 | ||
| Net Realized and Unrealized Gain (Loss) | |||
| Net realized gain (loss) on: | |||
| Investments | 4,776 | ||
| Futures contracts | (573 | ) | |
| Options written | 1,192 | ||
| Interest rate swap contracts | (3,481 | ) | |
| Credit default swap contracts | 1,808 | ||
| Foreign currency-related transactions | 3,123 | ||
| Net realized gain (loss) | 6,845 | ||
| Net change in unrealized appreciation (depreciation) on: | |||
| Investments | (8,746 | ) | |
| Futures contracts | (158 | ) | |
| Options written | (199 | ) | |
| Interest rate swap contracts | 879 | ||
| Credit default swap contracts | (486 | ) | |
| Foreign currency-related transactions | 841 | ||
| Other investments | 4 | ||
| Net change in unrealized appreciation (depreciation) | (7,865 | ) | |
| Net realized and unrealized gain (loss) | (1,020 | ) | |
| Net Increase (Decrease) in Net Assets from Operations | $ | 15,322 | |
See accompanying notes which are an integral part of the financial statements.
Russell Short Duration Bond Fund 493
| Russell Investment Company | ||||||
| Russell Short Duration Bond Fund | ||||||
| Statements of Changes in Net Assets | ||||||
| For the Periods Ended October 31, | ||||||
| Amounts in thousands | 2014 | 2013 | ||||
| Increase (Decrease) in Net Assets | ||||||
| Operations | ||||||
| Net investment income (loss) | $ | 16,342 | $ | 15,199 | ||
| Net realized gain (loss) | 6,845 | 3,565 | ||||
| Net change in unrealized appreciation (depreciation) | (7,865 | ) | (10,902 | ) | ||
| Net increase (decrease) in net assets from operations | 15,322 | 7,862 | ||||
| Distributions | ||||||
| From net investment income | ||||||
| Class A | (283 | ) | (477 | ) | ||
| Class C | (262 | ) | (734 | ) | ||
| Class E | (364 | ) | (283 | ) | ||
| Class S | (9,093 | ) | (12,577 | ) | ||
| Class Y | (3,419 | ) | (4,083 | ) | ||
| From net realized gain | ||||||
| Class A | (47 | ) | (418 | ) | ||
| Class C | (150 | ) | (1,375 | ) | ||
| Class E | (53 | ) | (201 | ) | ||
| Class S | (1,108 | ) | (8,293 | ) | ||
| Class Y | (339 | ) | (2,672 | ) | ||
| Net decrease in net assets from distributions | (15,118 | ) | (31,113 | ) | ||
| Share Transactions* | ||||||
| Net increase (decrease) in net assets from share transactions | (136,954 | ) | 84,970 | |||
| Total Net Increase (Decrease) in Net Assets | (136,750 | ) | 61,719 | |||
| Net Assets | ||||||
| Beginning of period | 1,320,282 | 1,258,563 | ||||
| End of period | $ | 1,183,532 | $ | 1,320,282 | ||
| Undistributed (overdistributed) net investment income included in net assets | $ | 2,557 | $ | 450 | ||
See accompanying notes which are an integral part of the financial statements.
494 Russell Short Duration Bond Fund
Russell Investment Company Russell Short Duration Bond Fund
Statements of Changes in Net Assets, continued
* Share transaction amounts (in thousands) for the periods ended October 31, 2014 and October 31, 2013 were as follows:
| 2014 | 2013 | |||||||||||
| Shares | Dollars | Shares | Dollars | |||||||||
| Class A | ||||||||||||
| Proceeds from shares sold | 571 | $ | 11,076 | 1,205 | $ | 23,461 | ||||||
| Proceeds from reinvestment of distributions | 16 | 301 | 41 | 809 | ||||||||
| Payments for shares redeemed | (965 | ) | (18,717 | ) | (1,265 | ) | (24,582 | ) | ||||
| Net increase (decrease) | (378 | ) | (7,340 | ) | (19 | ) | (312 | ) | ||||
| Class C | ||||||||||||
| Proceeds from shares sold | 1,029 | 19,814 | 3,349 | 64,899 | ||||||||
| Proceeds from reinvestment of distributions | 20 | 397 | 105 | 2,041 | ||||||||
| Payments for shares redeemed | (2,990 | ) | (57,581 | ) | (3,962 | ) | (76,532 | ) | ||||
| Net increase (decrease) | (1,941 | ) | (37,370 | ) | (508 | ) | (9,592 | ) | ||||
| Class E | ||||||||||||
| Proceeds from shares sold | 325 | 6,303 | 1,489 | 28,745 | ||||||||
| Proceeds from reinvestment of distributions | 19 | 367 | 18 | 353 | ||||||||
| Payments for shares redeemed | (612 | ) | (11,879 | ) | (402 | ) | (7,806 | ) | ||||
| Net increase (decrease) | (268 | ) | (5,209 | ) | 1,105 | 21,292 | ||||||
| Class S | ||||||||||||
| Proceeds from shares sold | 13,457 | 261,049 | 23,003 | 447,507 | ||||||||
| Proceeds from reinvestment of distributions | 521 | 10,092 | 1,059 | 20,623 | ||||||||
| Payments for shares redeemed | (18,841 | ) | (365,325 | ) | (20,049 | ) | (389,280 | ) | ||||
| Net increase (decrease) | (4,863 | ) | (94,184 | ) | 4,013 | 78,850 | ||||||
| Class Y | ||||||||||||
| Proceeds from shares sold | 4,157 | 80,655 | 4,968 | 96,311 | ||||||||
| Proceeds from reinvestment of distributions | 194 | 3,758 | 347 | 6,756 | ||||||||
| Payments for shares redeemed | (3,978 | ) | (77,264 | ) | (5,568 | ) | (108,335 | ) | ||||
| Net increase (decrease) | 373 | 7,149 | (253 | ) | (5,268 | ) | ||||||
| Total increase (decrease) | (7,077 | ) | $ | (136,954 | ) | 4,338 | $ | 84,970 | ||||
See accompanying notes which are an integral part of the financial statements.
Russell Short Duration Bond Fund 495
| Russell Investment Company | ||||||||||||||||
| Russell Short Duration Bond Fund | ||||||||||||||||
| Financial Highlights — For the Periods Ended | ||||||||||||||||
| 1For a Share Outstanding Throughout Each Period. | ||||||||||||||||
| $ | $ | $ | $ | $ | $ | |||||||||||
| Net Asset Value, | Net | Net Realized | Total from | Distributions | Distributions | |||||||||||
| Beginning of | Investment | and Unrealized | Investment | from Net | from Net | |||||||||||
| Period | Income (Loss)(a)(d) | Gain (Loss) | Operations | Investment Income | Realized Gain | |||||||||||
| Class A | ||||||||||||||||
| October 31, 2014 | 19.35 | .22 | (.01 | ) | .21 | (.18 | ) | (.03 | ) | |||||||
| October 31, 2013 | 19.70 | .19 | (.11 | ) | .08 | (.23 | ) | (.20 | ) | |||||||
| October 31, 2012 | 19.15 | .26 | .57 | .83 | (.28 | ) | — | |||||||||
| October 31, 2011 | 19.48 | .34 | (.31 | ) | .03 | (.36 | ) | — | ||||||||
| October 31, 2010 | 18.86 | .43 | .73 | 1.16 | (.54 | ) | — | |||||||||
| Class C | ||||||||||||||||
| October 31, 2014 | 19.23 | .08 | (.02 | ) | .06 | (.05 | ) | (.03 | ) | |||||||
| October 31, 2013 | 19.59 | .05 | (.11 | ) | (.06 | ) | (.10 | ) | (.20 | ) | ||||||
| October 31, 2012 | 19.06 | .11 | .57 | .68 | (.15 | ) | — | |||||||||
| October 31, 2011 | 19.41 | .19 | (.31 | ) | (.12 | ) | (.23 | ) | — | |||||||
| October 31, 2010 | 18.79 | .28 | .74 | 1.02 | (.40 | ) | — | |||||||||
| Class E | ||||||||||||||||
| October 31, 2014 | 19.38 | .22 | (.01 | ) | .21 | (.18 | ) | (.03 | ) | |||||||
| October 31, 2013 | 19.73 | .17 | (.08 | ) | .09 | (.24 | ) | (.20 | ) | |||||||
| October 31, 2012 | 19.18 | .26 | .57 | .83 | (.28 | ) | — | |||||||||
| October 31, 2011 | 19.52 | .34 | (.32 | ) | .02 | (.36 | ) | — | ||||||||
| October 31, 2010 | 18.89 | .43 | .73 | 1.16 | (.53 | ) | — | |||||||||
| Class S | ||||||||||||||||
| October 31, 2014 | 19.36 | .27 | (.01 | ) | .26 | (.23 | ) | (.03 | ) | |||||||
| October 31, 2013 | 19.71 | .24 | (.11 | ) | .13 | (.28 | ) | (.20 | ) | |||||||
| October 31, 2012 | 19.15 | .30 | .58 | .88 | (.32 | ) | — | |||||||||
| October 31, 2011 | 19.49 | .39 | (.32 | ) | .07 | (.41 | ) | — | ||||||||
| October 31, 2010 | 18.86 | .47 | .74 | 1.21 | (.58 | ) | — | |||||||||
| Class Y | ||||||||||||||||
| October 31, 2014 | 19.36 | .29 | (.01 | ) | .28 | (.24 | ) | (.03 | ) | |||||||
| October 31, 2013 | 19.71 | .26 | (.11 | ) | .15 | (.30 | ) | (.20 | ) | |||||||
| October 31, 2012 | 19.15 | .33 | .57 | .90 | (.34 | ) | — | |||||||||
| October 31, 2011 | 19.49 | .41 | (.32 | ) | .09 | (.43 | ) | — | ||||||||
| October 31, 2010 | 18.86 | .50 | .72 | 1.22 | (.60 | ) | — | |||||||||
See accompanying notes which are an integral part of the financial statements.
496 Russell Short Duration Bond Fund
| % | % | % | |||||||||||||||
| $ | $ | Ratio of Expenses | Ratio of Expenses | Ratio of Net | |||||||||||||
| Net Asset Value, | % | Net Assets, | to Average | to Average | Investment Income | % | |||||||||||
| $ | End of | Total | End of Period | Net Assets, | Net Assets, | to Average | Portfolio | ||||||||||
| Total Distributions | Period | Return(c) | (000 | ) | Gross | Net(d) | Net Assets(d) | Turnover Rate | |||||||||
| (.21 | ) | 19.35 | 1.04 | 29,639 | 1.01 | .85 | 1.14 | 220 | |||||||||
| (.43 | ) | 19.35 | .42 | 36,961 | 1.00 | .87 | .99 | 180 | |||||||||
| (.28 | ) | 19.70 | 4.37 | 37,994 | 1.00 | .86 | 1.33 | 245 | |||||||||
| (.36 | ) | 19.15 | .18 | 29,061 | 1.01 | .88 | 1.75 | 339 | |||||||||
| (.54 | ) | 19.48 | 6.23 | 25,171 | 1.02 | .94 | 2.25 | 195 | |||||||||
| (.08 | ) | 19.21 | .28 | 82,676 | 1.76 | 1.60 | .39 | 220 | |||||||||
| (.30 | ) | 19.23 | (.32 | ) | 120,088 | 1.75 | 1.62 | .24 | 180 | ||||||||
| (.15 | ) | 19.59 | 3.59 | 132,292 | 1.75 | 1.61 | .56 | 245 | |||||||||
| (.23 | ) | 19.06 | (.60 | ) | 112,900 | 1.76 | 1.63 | 1.01 | 339 | ||||||||
| (.40 | ) | 19.41 | 5.44 | 109,450 | 1.77 | 1.69 | 1.48 | 195 | |||||||||
| (.21 | ) | 19.38 | 1.08 | 36,083 | 1.01 | .85 | 1.15 | 220 | |||||||||
| (.44 | ) | 19.38 | .42 | 41,281 | 1.00 | .87 | .93 | 180 | |||||||||
| (.28 | ) | 19.73 | 4.36 | 20,230 | 1.00 | .86 | 1.33 | 245 | |||||||||
| (.36 | ) | 19.18 | .13 | 21,347 | 1.01 | .88 | 1.76 | 339 | |||||||||
| (.53 | ) | 19.52 | 6.27 | 26,856 | 1.02 | .94 | 2.25 | 195 | |||||||||
| (.26 | ) | 19.36 | 1.30 | 771,202 | .76 | .60 | 1.40 | 220 | |||||||||
| (.48 | ) | 19.36 | .67 | 865,268 | .75 | .62 | 1.23 | 180 | |||||||||
| (.32 | ) | 19.71 | 4.66 | 801,758 | .75 | .62 | 1.56 | 245 | |||||||||
| (.41 | ) | 19.15 | .37 | 631,819 | .76 | .63 | 2.00 | 339 | |||||||||
| (.58 | ) | 19.49 | 6.54 | 545,704 | .77 | .69 | 2.48 | 195 | |||||||||
| (.27 | ) | 19.37 | 1.41 | 263,932 | .56 | .51 | 1.49 | 220 | |||||||||
| (.50 | ) | 19.36 | .78 | 256,684 | .56 | .51 | 1.36 | 180 | |||||||||
| (.34 | ) | 19.71 | 4.75 | 266,289 | .56 | .51 | 1.70 | 245 | |||||||||
| (.43 | ) | 19.15 | .46 | 298,724 | .59 | .53 | 2.10 | 339 | |||||||||
| (.60 | ) | 19.49 | 6.58 | 224,969 | .59 | .59 | 2.60 | 195 | |||||||||
See accompanying notes which are an integral part of the financial statements.
Russell Short Duration Bond Fund 497
Russell Investment Company Russell Tax Exempt Bond Fund
Portfolio Management Discussion and Analysis — October 31, 2014 (Unaudited)
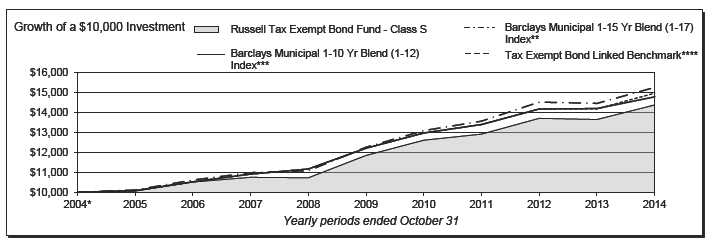
| Russell Tax Exempt Bond Fund - Class A‡ | Barclays Municipal 1-10 Yr Blend (1-12) Index*** | ||||||
| Total | Total | ||||||
| Return | Return | ||||||
| 1 Year | 1.15 | % | 1 Year | 4.14 | % | ||
| 5 Years | 2.88 | %§ | 5 Years | 3.92 | %§ | ||
| 10 Years | 3.03 | %§ | 10 Years | 3.99 | %§ | ||
| Tax Exempt Bond Linked Benchmark**** | |||||||
| Russell Tax Exempt Bond Fund - Class C | Total | ||||||
| Total | Return | ||||||
| Return | 1 Year | 5.56 | % | ||||
| 1 Year | 4.32 | % | 5 Years | 4.18 | %§ | ||
| 5 Years | 2.93 | %§ | 10 Years | 4.12 | %§ | ||
| 10 Years | 2.67 | %§ | |||||
| Russell Tax Exempt Bond Fund - Class E | |||||||
| Total | |||||||
| Return | |||||||
| 1 Year | 5.14 | % | |||||
| 5 Years | 3.71 | %§ | |||||
| 10 Years | 3.44 | %§ | |||||
| Russell Tax Exempt Bond Fund - Class S | |||||||
| Total | |||||||
| Return | |||||||
| 1 Year | 5.37 | % | |||||
| 5 Years | 3.96 | %§ | |||||
| 10 Years | 3.70 | %§ | |||||
| Barclays Municipal 1-15 Yr Blend (1-17) Index** | |||||||
| Total | |||||||
| Return | |||||||
| 1 Year | 5.56 | % | |||||
| 5 Years | 4.48 | %§ | |||||
| 10 Years | 4.32 | %§ | |||||
| 498 Russell Tax Exempt Bond Fund | |||||||
Russell Investment Company
Russell Tax Exempt Bond Fund
Portfolio Management Discussion and Analysis, continued — October 31, 2014 (Unaudited)
| The Russell Tax | Exempt Bond Fund (the “Fund”) employs | this fiscal year as rate rise concerns started to abate. Despite the | |
| a multi-manager | approach whereby portions of the Fund | returning demand for municipal bonds, new issue supply this year | |
| are allocated to different money managers. Fund assets not | was lower than last year. Partly attributable to this supply/demand | ||
| allocated to money managers are managed by Russell Investment | imbalance, this year’s environment was generally supportive for | ||
| Management Company (“RIMCo”), the Fund’s advisor. RIMCo | the municipal credit exposures in the Fund. Furthermore, as | ||
| may change the allocation of the Fund’s assets among money | investors continued to reach for higher yields in lower quality | ||
| managers at any time. An exemptive order from the Securities | credits, lower quality bonds outperformed high quality bonds, | ||
| and Exchange Commission (“SEC”) permits RIMCo to engage | benefiting the Fund’s exposures to these lower quality issuers. | ||
| or terminate a money manager at any time, subject to approval | |||
| by the Fund’s Board, without a shareholder vote. Pursuant to the | How did the investment strategies and techniques employed | ||
| terms of the exemptive order, the Fund is required to notify its | by the Fund and its money managers affect its benchmark- | ||
| shareholders within 90 days of when a money manager begins | relative performance? | ||
| providing services. As of October 31, 2014, the Fund had two | The Fund underperformed its benchmark during the fiscal year. | ||
| money managers. | Security selection in the first part of the period (such as Puerto | ||
| Rico exposure) coupled with yield curve positioning in the latter | |||
| What is the Fund’s investment objective? | part of the period were the primary causes of underperformance. | ||
| The Fund seeks to provide federal tax-exempt current income | However, security selection turned positive mid-way through the | ||
| consistent with the preservation of capital. The Fund will invest, | period and helped to mitigate further losses. | ||
| under normal circumstances, at least 80% of the value of its | AllianceBernstein, L.P. (“Alliance”) underperformed the Fund’s | ||
| assets in investments the income from which is exempt from | benchmark for the fiscal year. Issuer selection was the primary | ||
| federal income tax. | cause of underperformance, though yield curve positioning and | ||
| How did the Fund perform relative to its benchmark for the | general sector allocations also detracted from benchmark-relative | ||
| fiscal year ended October 31, 2014? | performance to a lesser extent. | ||
| For the fiscal year ended October 31, 2014, the Fund’s Class | MacKay Shields LLC (“MacKay”) outperformed the Fund’s | ||
| A, Class C, Class E and Class S Shares gained 5.09%, 4.32%, | benchmark for the fiscal year. Yield curve positioning was the | ||
| 5.14% and 5.37%, respectively. This is compared to the Fund’s | most positive factor, as an underweight to longer-dated bonds | ||
| benchmark, the Barclays Municipal 1-15 Year Blend (1-17) | contributed positively in the first part of the period. However, | ||
| Index, which gained 5.56% during the same period. The Fund’s | MacKay re-positioned the portfolio to overweight 10+ year | ||
| performance includes operating expenses, whereas index returns | maturity bonds in calendar year 2014, which positively impacted | ||
| are unmanaged and do not include expenses of any kind. | benchmark-relative performance | as the yield curve flattened | |
| For the fiscal year ended October 31, 2014, the Morningstar® | overall throughout the latter half of the fiscal year. | ||
| Muni National Intermediate, a group of funds that Morningstar | RIMCo manages the portion of the Fund’s assets that RIMCo | ||
| considers to have investment strategies similar to those of the | determines not to allocate to the money managers. Assets not | ||
| Fund, gained 5.52%. This result serves as a peer comparison and | allocated to managers include the Fund’s liquidity reserves and | ||
| is expressed net of operating expenses. | assets which may be managed directly by RIMCo to modify the | ||
| Fund’s overall portfolio characteristics to seek to achieve the | |||
| How did the market conditions described in the Market | desired risk/return profile for the Fund. | ||
| Summary report affect the Fund’s performance? | |||
| The Fund suffered negative returns in the first two months of the | During the period, the Fund did not use derivatives. | ||
| fiscal year primarily from an increase in yields which negatively | Describe any changes to the Fund’s structure or the money | ||
| impacted municipal bond prices. However, the Fund benefited | manager line-up. | ||
| for the remainder of the fiscal year as yields changed course and | There were no changes to the Fund’s structure or money manager | ||
| trended lower. Specifically, the municipal yield curve flattened, | lineup during the fiscal year. | ||
| which benefited the Fund’s overweight to long duration bonds. | |||
| Therefore, on the whole, the Fund benefited from the interest rate | Money Managers as of October 31, | ||
| environment in fiscal year 2014. | 2014 | Styles | |
| After experiencing a period of material outflows from investors | AllianceBernstein, L.P. | Sector Specialist | |
| during the last fiscal year, the municipal bond market saw inflows | MacKay Shields LLC | Sector Specialist | |
| Russell Tax Exempt Bond Fund 499 | |||
Russell Investment Company
Russell Tax Exempt Bond Fund
Portfolio Management Discussion and Analysis, continued — October 31, 2014 (Unaudited)
The views expressed in this report reflect those of the portfolio
managers only through the end of the period covered by
the report. These views do not necessarily represent the
views of RIMCo, or any other person in RIMCo or any other
affiliated organization. These views are subject to change
at any time based upon market conditions or other events,
and RIMCo disclaims any responsibility to update the views
contained herein. These views should not be relied on as
investment advice and, because investment decisions for
a Russell Investment Company (“RIC”) Fund are based on
numerous factors, should not be relied on as an indication
of investment decisions of any RIC Fund.
| * | Assumes initial investment on November 1, 2004. |
| ** | The Barclays Municipal 1-15 Yr Blend (1-17) Index is an index, with income reinvested, representative of municipal bonds with maturities ranging from 1-15 years. |
| *** | The Barclays Municipal 1-10 Yr Blend (1-12) Index is an index, with income reinvested, representative of municipal bonds with maturities ranging from 1-10 years. |
| **** | The Tax Exempt Bond Linked Benchmark provides a means to compare the Fund’s average annual returns to a secondary benchmark that takes into account historical changes in the Fund’s primary benchmark. The Tax Exempt Bond Linked Benchmark represents the returns of the Barclays Municipal 1-10 Yr Blend (1-12) Index through June 30, 2013 and the returns of the Barclays Municipal 1-15 Yr Blend (1-17) Index thereafter. . |
| ‡ | The Fund first issued Class A Shares on June 1, 2010. The returns shown for Class A Shares prior to that date are the returns of Class E Shares. The performance shown has been adjusted to reflect the deduction of the maximum Class A sales charge of 3.75%. Annual returns for each Class will differ only to the extent that the Class A Shares do not have the same expenses as Class E Shares. |
| § | Annualized. |
Performance is historical and assumes reinvestment of all dividends and capital gains. Investment return and principal value will fluctuate so that an investor’s shares, when redeemed, may be worth more or less than when purchased. Past performance is not indicative of future results. The returns shown do not reflect the deduction of taxes that a shareholder would pay on Fund distributions or the redemption of Fund shares.
500 Russell Tax Exempt Bond Fund
Russell Investment Company Russell Tax Exempt Bond Fund
Shareholder Expense Example — October 31, 2014 (Unaudited)
| Fund Expenses | Please note that the expenses shown in the table are meant | |||||
| The following disclosure provides important information | to highlight your ongoing costs only and do not reflect any | |||||
| regarding the Fund’s Shareholder Expense Example | transactional costs. Therefore, the information under the heading | |||||
| (“Example”). | “Hypothetical Performance (5% return before expenses)” is | |||||
| useful in comparing ongoing costs only, and will not help you | ||||||
| Example | determine the relative total costs of owning different funds. In | |||||
| As a shareholder of the Fund, you incur two types of costs: (1) | addition, if these transactional costs were included, your costs | |||||
| transaction costs, and (2) ongoing costs, including advisory and | would have been higher. | |||||
| administrative fees; distribution (12b-1) and/or service fees; | Hypothetical | |||||
| and other Fund expenses. The Example is intended to help | Performance (5% | |||||
| you understand your ongoing costs (in dollars) of investing in | Actual | return before | ||||
| the Fund and to compare these costs with the ongoing costs of | Class A | Performance | expenses) | |||
| Beginning Account Value | ||||||
| investing in other mutual funds. The Example is based on an | May 1, 2014 | $ | 1,000.00 | $ | 1,000.00 | |
| investment of $1,000 invested at the beginning of the period and | Ending Account Value | |||||
| held for the entire period indicated, which for this Fund is from | October 31, 2014 | $ | 1,025.10 | $ | 1,021.07 | |
| May 1, 2014 to October 31, 2014. | Expenses Paid During Period* | $ | 4.19 | $ | 4.18 | |
| Actual Expenses | * Expenses are equal to the Fund's annualized expense ratio of 0.82% | |||||
| (representing the six month period annualized), multiplied by the average | ||||||
| The information in the table under the heading “Actual | account value over the period, multiplied by 184/365 (to reflect the one-half | |||||
| Performance” provides information about actual account values | year period). May reflect amounts waived and/or reimbursed. Without any | |||||
| and actual expenses. You may use the information in this column, | waivers and/or reimbursements, expenses would have been higher. | |||||
| together with the amount you invested, to estimate the expenses | ||||||
| Hypothetical | ||||||
| that you paid over the period. Simply divide your account value by | Performance (5% | |||||
| $1,000 (for example, an $8,600 account value divided by $1,000 | Actual | return before | ||||
| = 8.6), then multiply the result by the number in the first column | Class C | Performance | expenses) | |||
| Beginning Account Value | ||||||
| in the row entitled “Expenses Paid During Period” to estimate | May 1, 2014 | $ | 1,000.00 | $ | 1,000.00 | |
| the expenses you paid on your account during this period. | Ending Account Value | |||||
| October 31, 2014 | $ | 1,021.20 | $ | 1,017.49 | ||
| Hypothetical Example for Comparison Purposes | Expenses Paid During Period* | $ | 7.79 | $ | 7.78 | |
| The information in the table under the heading “Hypothetical | ||||||
| Performance (5% return before expenses)” provides information | * Expenses are equal to the Fund's annualized expense ratio of 1.53% | |||||
| (representing the six month period annualized), multiplied by the average | ||||||
| about hypothetical account values and hypothetical expenses | account value over the period, multiplied by 184/365 (to reflect the one-half | |||||
| based on the Fund’s actual expense ratio and an assumed rate of | year period). May reflect amounts waived and/or reimbursed. Without any | |||||
| return of 5% per year before expenses, which is not the Fund’s | waivers and/or reimbursements, expenses would have been higher. | |||||
| actual return. The hypothetical account values and expenses | ||||||
| Hypothetical | ||||||
| may not be used to estimate the actual ending account balance or | Performance (5% | |||||
| expenses you paid for the period. You may use this information | Actual | return before | ||||
| to compare the ongoing costs of investing in the Fund and other | Class E | Performance | expenses) | |||
| funds. To do so, compare this 5% hypothetical example with the | Beginning Account Value | |||||
| May 1, 2014 | $ | 1,000.00 | $ | 1,000.00 | ||
| 5% hypothetical examples that appear in the shareholder reports | Ending Account Value | |||||
| of other funds. | October 31, 2014 | $ | 1,025.40 | $ | 1,021.27 | |
| Expenses Paid During Period* | $ | 3.98 | $ | 3.97 | ||
| * Expenses are equal to the Fund's annualized expense ratio of 0.78% | ||||||
| (representing the six month period annualized), multiplied by the average | ||||||
| account value over the period, multiplied by 184/365 (to reflect the one-half | ||||||
| year period). May reflect amounts waived and/or reimbursed. Without any | ||||||
| waivers and/or reimbursements, expenses would have been higher. | ||||||
| Russell Tax Exempt Bond Fund 501 | ||||||
Russell Investment Company Russell Tax Exempt Bond Fund
Shareholder Expense Example, continued — October 31, 2014 (Unaudited)
| Hypothetical | ||||||
| Performance (5% | ||||||
| Actual | return before | |||||
| Class S | Performance | expenses) | ||||
| Beginning Account Value | ||||||
| May 1, 2014 | $ | 1,000.00 | $ | 1,000.00 | ||
| Ending Account Value | ||||||
| October 31, 2014 | $ | 1,026.70 | $ | 1,022.53 | ||
| Expenses Paid During Period* | $ | 2.71 | $ | 2.70 | ||
| * Expenses are equal to the Fund's annualized expense ratio of 0.53% | ||||||
| (representing the six month period annualized), multiplied by the average | ||||||
| account value over the period, multiplied by 184/365 (to reflect the one-half | ||||||
| year period). May reflect amounts waived and/or reimbursed. Without any | ||||||
| waivers and/or reimbursements, expenses would have been higher. | ||||||
502 Russell Tax Exempt Bond Fund
| Russell Investment Company | |||||||||
| Russell Tax Exempt Bond Fund | |||||||||
| Schedule of Investments — October 31, 2014 | |||||||||
| Amounts in thousands (except share amounts) | |||||||||
| Principal | Fair | ||||||||
| Amount ($) | Rate | Date of | Value | ||||||
| or Shares | % | Maturity | $ | ||||||
| Municipal Bonds - 95.6% | |||||||||
| Alabama - 1.3% | |||||||||
| Alabama 21st Century Authority Revenue Bonds | 1,120 | 5.000 | 06/01/18 | 1,274 | |||||
| Alabama 21st Century Authority Revenue Bonds | 545 | 5.000 | 06/01/20 | 629 | |||||
| Alabama Public School & College Authority Revenue Bonds | 1,000 | 5.000 | 05/01/15 | 1,023 | |||||
| Alabama Special Care Facilities Financing Authority-Birmingham Alabama Revenue | |||||||||
| Bonds(µ) | 500 | 6.000 | 06/01/34 | 588 | |||||
| Birmingham Water Works Board Revenue Bonds(µ) | 1,275 | 5.000 | 01/01/17 | 1,390 | |||||
| County of Jefferson Alabama General Obligation Limited(µ) | 4,100 | 5.000 | 04/01/22 | 4,101 | |||||
| County of Jefferson Alabama Sewer Revenue Bonds | 2,230 | 5.000 | 10/01/22 | 2,522 | |||||
| Homewood Educational Building Authority Revenue Bonds(µ) | 485 | 5.000 | 12/01/26 | 552 | |||||
| Limestone County Board of Education Special Tax Bonds | 1,000 | 5.000 | 11/01/30 | 1,137 | |||||
| Limestone County Board of Education Special Tax Bonds | 1,000 | 5.000 | 11/01/31 | 1,133 | |||||
| Mobile County Board of School Commissioners Revenue Bonds | 1,445 | 5.000 | 03/01/32 | 1,623 | |||||
| 15,972 | |||||||||
| Alaska - 0.1% | |||||||||
| City of Valdez Alaska Revenue Bonds | 750 | 5.000 | 01/01/21 | 885 | |||||
| Northern Tobacco Securitization Corp. Revenue Bonds | 350 | 5.000 | 06/01/32 | 295 | |||||
| 1,180 | |||||||||
| Arizona - 2.0% | |||||||||
| Apache County Industrial Development Authority Revenue Bonds | 3,000 | 4.500 | 03/01/30 | 3,198 | |||||
| Arizona Health Facilities Authority Revenue Bonds | 2,000 | 5.250 | 01/01/18 | 2,259 | |||||
| Arizona Health Facilities Authority Revenue Bonds | 2,000 | 5.000 | 02/01/18 | 2,245 | |||||
| Arizona Health Facilities Authority Revenue Bonds | 2,000 | 5.250 | 01/01/22 | 2,245 | |||||
| Arizona Water Infrastructure Finance Authority Revenue Bonds | 1,000 | 5.000 | 10/01/18 | 1,157 | |||||
| Maricopa County Pollution Control Corp. Revenue Bonds(Ê) | 2,310 | 5.200 | 06/01/43 | 2,573 | |||||
| Navajo County Pollution Control Corp. Revenue Bonds(Ê) | 2,000 | 0.450 | 06/01/34 | 2,000 | |||||
| Salt River Project Agricultural Improvement & Power District Revenue Bonds | 1,635 | 5.000 | 01/01/25 | 1,893 | |||||
| Salt Verde Financial Corp. Revenue Bonds | 1,045 | 5.250 | 12/01/24 | 1,259 | |||||
| Student & Academic Services LLC Revenue Bonds | 200 | 5.000 | 06/01/26 | 234 | |||||
| Student & Academic Services LLC Revenue Bonds | 425 | 5.000 | 06/01/27 | 495 | |||||
| Student & Academic Services LLC Revenue Bonds | 390 | 5.000 | 06/01/28 | 451 | |||||
| Town of Marana Arizona Revenue Bonds | 2,240 | 5.000 | 07/01/26 | 2,592 | |||||
| Town of Marana Arizona Revenue Bonds | 800 | 5.000 | 07/01/27 | 928 | |||||
| Town of Marana Arizona Revenue Bonds | 1,735 | 5.000 | 07/01/28 | 2,001 | |||||
| 25,530 | |||||||||
| California - 8.1% | |||||||||
| Brentwood Infrastructure Financing Authority Special Assessment(µ) | 1,000 | 5.000 | 09/02/29 | 1,152 | |||||
| Burbank Unified School District General Obligation Unlimited | 1,125 | 5.000 | 08/01/26 | 1,334 | |||||
| California Health Facilities Financing Authority Revenue Bonds | 1,550 | 5.000 | 07/01/16 | 1,663 | |||||
| California Health Facilities Financing Authority Revenue Bonds | 1,000 | 5.000 | 11/15/29 | 1,104 | |||||
| California State Public Works Board Revenue Bonds | 1,000 | 5.000 | 12/01/16 | 1,094 | |||||
| California Statewide Communities Development Authority Revenue Bonds | 1,115 | 3.500 | 11/01/18 | 1,147 | |||||
| California Statewide Communities Development Authority Revenue Bonds | 2,260 | 5.000 | 04/01/19 | 2,636 | |||||
| California Statewide Communities Development Authority Revenue Bonds | 1,405 | 6.000 | 05/15/23 | 1,587 | |||||
| California Statewide Communities Development Authority Revenue Bonds | 1,565 | 6.125 | 11/01/33 | 1,752 | |||||
| California Statewide Communities Development Authority Revenue Bonds | 1,000 | 5.000 | 08/01/34 | 1,138 | |||||
| California Watereuse Finance Authority Revenue Bonds | 1,230 | 5.500 | 05/01/36 | 1,464 | |||||
| Centinela Valley Union High School District General Obligation Unlimited | 500 | 5.750 | 08/01/27 | 615 | |||||
| Centinela Valley Union High School District General Obligation Unlimited | 1,000 | 5.750 | 08/01/28 | 1,226 | |||||
| Centinela Valley Union High School District General Obligation Unlimited | 650 | 5.750 | 08/01/29 | 792 | |||||
| City of Fresno California Airport Revenue Bonds(µ) | 225 | 5.000 | 07/01/22 | 260 | |||||
| City of Los Angeles Department of Airports Revenue Bonds | 1,655 | 5.000 | 05/15/29 | 1,954 | |||||
| City of Vallejo California Water Revenue Bonds | 2,755 | 5.250 | 05/01/27 | 3,201 | |||||
| City of Vallejo California Water Revenue Bonds | 3,105 | 5.250 | 05/01/29 | 3,572 | |||||
| County of Los Angeles California Certificate Of Participation | 200 | 5.000 | 09/01/20 | 239 | |||||
| County of Los Angeles California Certificate Of Participation | 500 | 5.000 | 03/01/21 | 597 | |||||
| County of Los Angeles California Certificate Of Participation | 125 | 5.000 | 09/01/21 | 150 | |||||
| County of Los Angeles California Certificate Of Participation | 430 | 5.000 | 09/01/22 | 518 | |||||
| County of Sacramento California Airport System Revenue Bonds | 2,000 | 5.000 | 07/01/22 | 2,260 | |||||
| Dinuba Redevlopment Agency Tax Allocation Bonds | 590 | 5.000 | 09/01/33 | 660 | |||||
| See accompanying notes which are an integral part of the financial statements. | |||||||||
| Russell Tax Exempt Bond Fund 503 | |||||||||
| Russell Investment Company | |||||||||
| Russell Tax Exempt Bond Fund | |||||||||
| Schedule of Investments, continued — October 31, 2014 | |||||||||
| Amounts in thousands (except share amounts) | |||||||||
| Principal | Fair | ||||||||
| Amount ($) | Rate | Date of | Value | ||||||
| or Shares | % | Maturity | $ | ||||||
| El Monte Union High School District General Obligation Unlimited(µ) | 4,750 | 5.500 | 06/01/34 | 5,448 | |||||
| Emeryville Redevelopment Agency Successor Agency Tax Allocation Bonds | 1,980 | 5.000 | 09/01/20 | 2,350 | |||||
| Golden State Tobacco Securitization Corp. Revenue Bonds(µ) | 750 | 4.600 | 06/01/23 | 821 | |||||
| Golden State Tobacco Securitization Corp. Revenue Bonds | 4,250 | 4.500 | 06/01/27 | 3,974 | |||||
| Jurupa California Public Authority Special Tax Revenue Bonds | 425 | 3.500 | 09/01/17 | 454 | |||||
| Kings River Conservation District Certificate Of Participation | 340 | 5.000 | 05/01/15 | 347 | |||||
| Los Angeles Department of Water & Power Revenue Bonds | 1,280 | 5.000 | 01/01/16 | 1,335 | |||||
| Modesto Irrigation District Revenue Bonds | 1,425 | 5.000 | 07/01/17 | 1,591 | |||||
| Northern California Power Agency Revenue Bonds | 1,000 | 5.000 | 06/01/15 | 1,027 | |||||
| Sacramento Unified School District General Obligation Unlimited(µ) | 4,000 | 5.000 | 07/01/31 | 4,532 | |||||
| San Francisco City & County Public Utilities Commission Water Revenue Bonds | 2,685 | 5.000 | 11/01/27 | 3,193 | |||||
| South Orange County Public Financing Authority Special Tax | 900 | 5.000 | 08/15/29 | 1,028 | |||||
| Southern California Public Power Authority Revenue Bonds | 1,500 | 5.000 | 07/01/18 | 1,729 | |||||
| Southern California Public Power Authority Revenue Bonds | 1,000 | 5.000 | 07/01/23 | 1,218 | |||||
| State of California Department of Water Resources Power Supply Revenue Revenue | |||||||||
| Bonds | 1,000 | 5.000 | 05/01/16 | 1,069 | |||||
| State of California Department of Water Resources Power Supply Revenue Revenue | |||||||||
| Bonds | 1,000 | 5.000 | 05/01/17 | 1,111 | |||||
| State of California Department of Water Resources Power Supply Revenue Revenue | |||||||||
| Bonds | 2,500 | 5.000 | 05/01/19 | 2,934 | |||||
| State of California Department of Water Resources Revenue Bonds | 2,500 | 5.000 | 12/01/20 | 3,037 | |||||
| State of California Department of Water Resources Revenue Bonds | 1,000 | 5.000 | 12/01/21 | 1,141 | |||||
| State of California General Obligation Unlimited(µ) | 1,000 | 6.000 | 02/01/17 | 1,123 | |||||
| State of California General Obligation Unlimited | 1,000 | 5.000 | 10/01/17 | 1,125 | |||||
| State of California General Obligation Unlimited | 2,000 | 5.000 | 02/01/20 | 2,367 | |||||
| State of California General Obligation Unlimited | 1,250 | 5.000 | 07/01/20 | 1,473 | |||||
| State of California General Obligation Unlimited | 2,500 | 5.500 | 04/01/21 | 2,970 | |||||
| State of California General Obligation Unlimited | 1,000 | 5.250 | 07/01/21 | 1,176 | |||||
| State of California General Obligation Unlimited | 1,000 | 5.250 | 03/01/22 | 1,190 | |||||
| State of California General Obligation Unlimited | 3,500 | 5.000 | 10/01/24 | 3,975 | |||||
| State of California General Obligation Unlimited | 7,095 | 5.000 | 11/01/25 | 8,553 | |||||
| State of California General Obligation Unlimited | 2,500 | 5.250 | 09/01/28 | 2,951 | |||||
| State of California General Obligation Unlimited | 2,685 | 5.000 | 10/01/29 | 2,994 | |||||
| State of California General Obligation Unlimited | 450 | 5.000 | 02/01/31 | 516 | |||||
| Tuolumne Wind Project Authority Revenue Bonds | 1,500 | 5.000 | 01/01/18 | 1,689 | |||||
| 102,556 | |||||||||
| Colorado - 2.1% | |||||||||
| City & County of Denver Colorado Airport System Revenue Bonds | 1,965 | 5.000 | 11/15/25 | 2,317 | |||||
| City of Colorado Springs Colorado Utilities System Revenue Bonds | 4,000 | 5.000 | 11/15/18 | 4,635 | |||||
| Colorado Educational & Cultural Facilities Authority Revenue Bonds | 2,000 | 5.000 | 04/01/18 | 2,233 | |||||
| Colorado Educational & Cultural Facilities Authority Revenue Bonds | 1,000 | 5.000 | 08/15/30 | 1,103 | |||||
| Colorado Health Facilities Authority Revenue Bonds | 1,000 | 5.250 | 06/01/23 | 1,061 | |||||
| Colorado Regional Transportation District Certificates of Participation | 6,725 | 5.000 | 06/01/27 | 7,768 | |||||
| Colorado State Educational & Cultural Facilities Authority Revenue Bonds | 250 | 2.000 | 12/01/15 | 254 | |||||
| Colorado State Educational & Cultural Facilities Authority Revenue Bonds | 300 | 2.000 | 12/01/16 | 308 | |||||
| Denver Convention Center Hotel Authority Revenue Bonds | 1,265 | 5.000 | 12/01/35 | 1,292 | |||||
| Denver Urban Renewal Authority Tax Allocation | 1,575 | 5.000 | 12/01/21 | 1,843 | |||||
| E-470 Public Highway Authority Revenue Bonds(µ) | 850 | 5.000 | 09/01/17 | 911 | |||||
| E-470 Public Highway Authority Revenue Bonds | 2,250 | 5.375 | 09/01/26 | 2,600 | |||||
| 26,325 | |||||||||
| Connecticut - 2.7% | |||||||||
| City of Bridgeport General Obligation Unlimited | 965 | 5.000 | 07/01/29 | 1,119 | |||||
| City of Hartford Connecticut General Obligation Unlimited(µ) | 375 | 5.000 | 10/01/18 | 431 | |||||
| City of New Haven Connecticut General Obligation Unlimited(µ) | 2,000 | 5.000 | 08/01/21 | 2,342 | |||||
| Connecticut State Health & Educational Facility Authority Revenue Bonds | 2,500 | 5.000 | 07/01/25 | 2,852 | |||||
| State of Connecticut General Obligation Unlimited | 2,490 | 5.000 | 01/01/16 | 2,626 | |||||
| State of Connecticut General Obligation Unlimited | 16,840 | 5.000 | 06/15/17 | 18,738 | |||||
| State of Connecticut Special Tax Revenue Revenue Bonds | 4,470 | 5.000 | 10/01/25 | 5,365 | |||||
| 33,473 | |||||||||
| Delaware - 0.2% | |||||||||
| Delaware Transportation Authority Revenue Bonds(µ)(ae) | 1,305 | 5.000 | 07/01/15 | 1,347 | |||||
| See accompanying notes which are an integral part of the financial statements. | |||||||||
| 504 Russell Tax Exempt Bond Fund | |||||||||
| Russell Investment Company | |||||||||
| Russell Tax Exempt Bond Fund | |||||||||
| Schedule of Investments, continued — October 31, 2014 | |||||||||
| Amounts in thousands (except share amounts) | |||||||||
| Principal | Fair | ||||||||
| Amount ($) | Rate | Date of | Value | ||||||
| or Shares | % | Maturity | $ | ||||||
| Delaware Transportation Authority Revenue Bonds | 1,000 | 5.000 | 07/01/17 | 1,116 | |||||
| 2,463 | |||||||||
| District of Columbia - 0.1% | |||||||||
| Metropolitan Washington Airports Authority Revenue Bonds | 1,500 | 5.000 | 10/01/35 | 1,709 | |||||
| Florida - 7.8% | |||||||||
| Citizens Property Insurance Corp. Revenue Bonds(µ) | 1,000 | 5.000 | 03/01/15 | 1,015 | |||||
| Citizens Property Insurance Corp. Revenue Bonds | 2,500 | 5.000 | 06/01/18 | 2,836 | |||||
| Citizens Property Insurance Corp. Revenue Bonds | 2,495 | 5.000 | 06/01/19 | 2,887 | |||||
| Citizens Property Insurance Corp. Revenue Bonds | 2,500 | 5.000 | 06/01/20 | 2,931 | |||||
| Citizens Property Insurance Corp. Revenue Bonds | 7,385 | 5.000 | 06/01/22 | 8,713 | |||||
| City of Lakeland Florida Department of Electric Utilities Revenue Bonds(µ) | 2,000 | 5.000 | 10/01/17 | 2,229 | |||||
| City of North Port Florida Special Assessment(µ) | 715 | 5.000 | 07/01/25 | 826 | |||||
| City of North Port Florida Special Assessment(µ) | 1,135 | 5.000 | 07/01/26 | 1,301 | |||||
| City of Pembroke Pines Florida Revenue Bonds(µ) | 1,000 | 5.000 | 10/01/16 | 1,085 | |||||
| City of Tampa Florida Revenue Bonds | 500 | 5.000 | 11/15/15 | 525 | |||||
| City of Tampa Florida Revenue Bonds | 1,000 | 4.000 | 09/01/33 | 1,036 | |||||
| Collier County Industrial Development Authority Revenue Bonds | 1,695 | 5.500 | 10/01/26 | 1,904 | |||||
| County of Miami-Dade Florida Revenue Bonds | 3,000 | 5.000 | 10/01/28 | 3,417 | |||||
| County of Miami-Dade Florida Revenue Bonds | 3,600 | 5.000 | 10/01/29 | 4,079 | |||||
| County of Miami-Dade Florida Revenue Bonds | 4,310 | Zero coupon | 10/01/35 | 1,721 | |||||
| County of Miami-Dade Florida Water & Sewer System Revenue Bonds(µ) | 1,500 | 5.250 | 10/01/19 | 1,781 | |||||
| County of Orange Florida Sales Tax Revenue Revenue Bonds | 8,885 | 5.000 | 01/01/20 | 10,529 | |||||
| Escambia County Health Facilities Authority Revenue Bonds | 2,345 | 6.000 | 08/15/36 | 2,718 | |||||
| Florida Department of Children & Family Services Certificate Of Participation(µ) | 1,175 | 5.000 | 10/01/15 | 1,225 | |||||
| JEA Electric System Revenue Bonds | 1,000 | 5.000 | 10/01/17 | 1,121 | |||||
| JEA Electric System Revenue Bonds | 645 | 5.000 | 10/01/20 | 760 | |||||
| Kissimmee Utility Authority Revenue Bonds(µ) | 1,000 | 5.000 | 10/01/17 | 1,117 | |||||
| Miami Beach Florida Health Facilities Revenue Bonds | 200 | 4.000 | 11/15/16 | 214 | |||||
| Miami Beach Florida Health Facilities Revenue Bonds | 125 | 4.000 | 11/15/18 | 138 | |||||
| Miami Beach Health Facilities Authority Revenue Bonds | 1,280 | 5.000 | 11/15/29 | 1,456 | |||||
| Miami-Dade County Expressway Authority Revenue Bonds | 350 | 5.000 | 07/01/18 | 400 | |||||
| Mid-Bay Bridge Authority Revenue Bonds | 2,500 | 7.250 | 10/01/34 | 3,043 | |||||
| Orlando Utilities Commission Revenue Bonds | 3,000 | 5.000 | 10/01/19 | 3,540 | |||||
| Orlando-Orange County Expressway Authority Revenue Bonds | 4,145 | 5.000 | 07/01/20 | 4,919 | |||||
| Palm Beach County Health Facilities Authority Revenue Bonds | 1,000 | 3.000 | 12/01/17 | 1,054 | |||||
| Reedy Creek Improvement District General Obligation Limited | 850 | 5.000 | 06/01/20 | 1,006 | |||||
| Reedy Creek Improvement District General Obligation Limited | 5,000 | 5.000 | 06/01/25 | 5,904 | |||||
| Reedy Creek Improvement District General Obligation Limited | 4,870 | 5.000 | 06/01/26 | 5,694 | |||||
| South Miami Health Facilities Authority Revenue Bonds | 750 | 5.000 | 08/15/18 | 839 | |||||
| State of Florida General Obligation Unlimited | 8,450 | 5.000 | 06/01/15 | 8,685 | |||||
| State of Florida General Obligation Unlimited | 1,000 | 5.000 | 06/01/16 | 1,073 | |||||
| State of Florida General Obligation Unlimited | 3,515 | 5.000 | 06/01/17 | 3,647 | |||||
| State of Florida Revenue Bonds | 1,300 | 5.000 | 07/01/16 | 1,399 | |||||
| 98,767 | |||||||||
| Georgia - 2.3% | |||||||||
| City of Atlanta Department of Aviation Revenue Bonds | 2,000 | 5.000 | 01/01/16 | 2,108 | |||||
| City of Atlanta Department of Aviation Revenue Bonds | 2,500 | 5.000 | 01/01/20 | 2,951 | |||||
| City of Atlanta Georgia Water & Wastewater Revenue Bonds | 1,000 | 6.000 | 11/01/20 | 1,233 | |||||
| City of Atlanta Georgia Water & Wastewater Revenue Bonds(µ) | 2,000 | 5.500 | 11/01/23 | 2,360 | |||||
| City of Atlanta Georgia Water & Wastewater Revenue Bonds | 1,300 | 6.000 | 11/01/25 | 1,585 | |||||
| Municipal Electric Authority of Georgia Revenue Bonds(µ) | 850 | 6.250 | 01/01/17 | 953 | |||||
| Private Colleges & Universities Authority Revenue Bonds | 1,500 | 5.000 | 09/01/16 | 1,625 | |||||
| Private Colleges & Universities Authority Revenue Bonds | 565 | 5.000 | 04/01/17 | 619 | |||||
| Private Colleges & Universities Authority Revenue Bonds | 500 | 5.000 | 04/01/18 | 560 | |||||
| Private Colleges & Universities Authority Revenue Bonds | 1,260 | 5.000 | 04/01/27 | 1,435 | |||||
| Savannah Hospital Authority Revenue Bonds | 1,000 | 5.500 | 07/01/28 | 1,162 | |||||
| State of Georgia General Obligation Unlimited | 10,590 | 5.000 | 07/01/17 | 11,834 | |||||
| 28,425 | |||||||||
| Guam - 0.9% | |||||||||
| Guam Government Waterworks Authority Revenue Bonds | 1,240 | 5.000 | 07/01/28 | 1,374 | |||||
| See accompanying notes which are an integral part of the financial statements. | |||||||||
| Russell Tax Exempt Bond Fund 505 | |||||||||
| Russell Investment Company | |||||||||
| Russell Tax Exempt Bond Fund | |||||||||
| Schedule of Investments, continued — October 31, 2014 | |||||||||
| Amounts in thousands (except share amounts) | |||||||||
| Principal | Fair | ||||||||
| Amount ($) | Rate | Date of | Value | ||||||
| or Shares | % | Maturity | $ | ||||||
| Guam Government Waterworks Authority Revenue Bonds | 5,200 | 5.000 | 07/01/29 | 5,758 | |||||
| Guam Power Authority Revenue Bonds | 1,000 | 5.000 | 10/01/34 | 1,096 | |||||
| Territory of Guam General Obligation Unlimited | 1,000 | 6.750 | 11/15/29 | 1,143 | |||||
| Territory of Guam Revenue Bonds | 500 | 5.375 | 12/01/24 | 554 | |||||
| Territory of Guam Revenue Bonds | 785 | 5.000 | 01/01/32 | 869 | |||||
| 10,794 | |||||||||
| Hawaii - 0.4% | |||||||||
| City & County Honolulu Hawaii Wastewater System Revenue Bonds(µ) | 1,500 | 5.000 | 07/01/19 | 1,710 | |||||
| Hawaii Housing & Community Development Corp. Revenue Bonds | 35 | 3.700 | 01/01/22 | 35 | |||||
| State of Hawaii Department of Budget & Finance Revenue Bonds(µ)(Ê) | 1,990 | 0.208 | 07/01/24 | 1,895 | |||||
| State of Hawaii General Obligation Unlimited | 1,000 | 5.000 | 02/01/15 | 1,012 | |||||
| 4,652 | |||||||||
| Idaho - 0.5% | |||||||||
| Idaho Housing & Finance Association Revenue Bonds(µ) | 1,330 | 5.250 | 07/15/21 | 1,490 | |||||
| Idaho Housing & Finance Association Revenue Bonds | 1,665 | 5.250 | 07/15/26 | 1,850 | |||||
| Idaho Housing & Finance Association Revenue Bonds | 1,670 | 5.000 | 07/15/31 | 1,880 | |||||
| Idaho State Building Authority Revenue Bonds | 940 | 5.000 | 09/01/23 | 1,099 | |||||
| 6,319 | |||||||||
| Illinois - 5.3% | |||||||||
| Chicago O'Hare International Airport Revenue Bonds(µ) | 1,000 | 5.000 | 01/01/19 | 1,049 | |||||
| Chicago Public Building Commission Revenue Bonds(µ) | 1,580 | 5.250 | 12/01/18 | 1,773 | |||||
| City of Chicago Illinois General Obligation Unlimited(µ) | 2,500 | 5.000 | 01/01/17 | 2,517 | |||||
| City of Chicago Illinois General Obligation Unlimited | 1,500 | 5.000 | 01/01/24 | 1,568 | |||||
| City of Chicago Illinois General Obligation Unlimited(µ) | 2,825 | 5.250 | 01/01/24 | 3,082 | |||||
| City of Chicago Illinois General Obligation Unlimited(µ)(Ê) | 500 | 0.060 | 01/01/42 | 500 | |||||
| City of Chicago Illinois Midway Airport Revenue Bonds | 940 | 5.000 | 01/01/30 | 1,069 | |||||
| City of Chicago Illinois Midway Airport Revenue Bonds | 4,160 | 5.000 | 01/01/34 | 4,638 | |||||
| City of Chicago Illinois Wastewater Transmission Revenue Bonds | 600 | 5.000 | 01/01/18 | 675 | |||||
| City of Chicago Illinois Wastewater Transmission Revenue Bonds | 505 | 5.000 | 01/01/29 | 574 | |||||
| City of Chicago Illinois Waterworks Revenue Bonds | 1,000 | 5.000 | 11/01/34 | 1,121 | |||||
| City of Chicago Motor Fuel Tax Revenue Bonds | 1,560 | 5.000 | 01/01/28 | 1,729 | |||||
| City of Chicago Motor Fuel Tax Revenue Bonds | 725 | 5.000 | 01/01/29 | 795 | |||||
| City of Freeport Illinois General Obligation Unlimited(µ) | 435 | 2.000 | 12/01/17 | 445 | |||||
| City of Freeport Illinois General Obligation Unlimited(µ) | 650 | 2.000 | 12/01/18 | 660 | |||||
| City of Peoria Illinois General Obligation Unlimited | 625 | 5.000 | 01/01/22 | 693 | |||||
| Cook County Community College District No. 508 General Obligation Unlimited | 1,500 | 5.250 | 12/01/28 | 1,749 | |||||
| Illinois Finance Authority Revenue Bonds | 1,000 | 5.000 | 03/01/15 | 1,015 | |||||
| Illinois Finance Authority Revenue Bonds | 1,000 | 5.375 | 10/01/23 | 1,120 | |||||
| Illinois Finance Authority Revenue Bonds | 1,000 | 5.375 | 10/01/24 | 1,115 | |||||
| Illinois Finance Authority Revenue Bonds | 1,000 | 6.000 | 10/01/28 | 1,122 | |||||
| Illinois Sport Facilities Authorities Revenue Bonds | 1,000 | 5.250 | 06/15/31 | 1,131 | |||||
| Metropolitan Pier & Exposition Authority Revenue Bonds | 1,500 | 5.000 | 12/15/22 | 1,640 | |||||
| Railsplitter Tobacco Settlement Authority Revenue Bonds | 1,000 | 5.000 | 06/01/18 | 1,131 | |||||
| Railsplitter Tobacco Settlement Authority Revenue Bonds | 1,000 | 5.000 | 06/01/19 | 1,146 | |||||
| State of Illinois General Obligation Unlimited | 2,000 | 5.000 | 04/01/21 | 2,249 | |||||
| State of Illinois General Obligation Unlimited | 3,000 | 5.000 | 07/01/21 | 3,375 | |||||
| State of Illinois General Obligation Unlimited | 1,000 | 5.000 | 08/01/22 | 1,123 | |||||
| State of Illinois General Obligation Unlimited | 2,290 | 5.000 | 08/01/25 | 2,495 | |||||
| State of Illinois Revenue Bonds(µ) | 1,000 | 5.000 | 06/15/16 | 1,073 | |||||
| State of Illinois Revenue Bonds | 12,500 | 5.000 | 06/15/21 | 14,888 | |||||
| State of Illinois Sports Facilities Authority Revenue Bonds | 1,125 | 5.000 | 06/15/18 | 1,251 | |||||
| State of Illinois Sports Facilities Authority Revenue Bonds | 500 | 5.000 | 06/15/19 | 562 | |||||
| State of Illinois Unemployment Compensation Trust Fund Revenue Bonds | 2,300 | 5.000 | 12/15/15 | 2,424 | |||||
| University of Illinois Revenue Bonds | 1,115 | 5.000 | 04/01/20 | 1,313 | |||||
| Village of Bellwood Illinois General Obligation Unlimited | 1,000 | 5.875 | 12/01/27 | 1,136 | |||||
| Village of Franklin Park Illinois General Obligation Unlimited(µ) | 295 | 5.000 | 07/01/18 | 332 | |||||
| West Chicago Park District General Obligation Unlimited(µ) | 795 | 5.250 | 12/01/29 | 859 | |||||
| 67,137 | |||||||||
| Indiana - 0.5% | |||||||||
| Ball State University Revenue Bonds(µ) | 1,000 | 5.000 | 07/01/16 | 1,075 | |||||
| City of Indianapolis Indiana Gas Utility Revenue Bonds(µ) | 1,000 | 5.000 | 08/15/23 | 1,164 | |||||
| See accompanying notes which are an integral part of the financial statements. | |||||||||
| 506 Russell Tax Exempt Bond Fund | |||||||||
| Russell Investment Company | |||||||||
| Russell Tax Exempt Bond Fund | |||||||||
| Schedule of Investments, continued — October 31, 2014 | |||||||||
| Amounts in thousands (except share amounts) | |||||||||
| Principal | Fair | ||||||||
| Amount ($) | Rate | Date of | Value | ||||||
| or Shares | % | Maturity | $ | ||||||
| Indiana Finance Authority Revenue Bonds | 1,000 | 4.900 | 01/01/16 | 1,052 | |||||
| Indianapolis Local Public Improvement Bond Bank Revenue Bonds | 1,150 | 5.000 | 06/01/16 | 1,224 | |||||
| Indianapolis Local Public Improvement Bond Bank Revenue Bonds | 1,000 | 5.000 | 02/01/18 | 1,133 | |||||
| 5,648 | |||||||||
| Iowa - 0.5% | |||||||||
| Iowa Finance Authority Revenue Bonds | 4,000 | 5.000 | 07/01/28 | 4,537 | |||||
| Iowa Higher Education Loan Authority Revenue Bonds | 1,625 | 5.000 | 12/01/18 | 1,885 | |||||
| 6,422 | |||||||||
| Kansas - 0.4% | |||||||||
| Seward County Unified School District General Obligation | 4,000 | 5.000 | 09/01/30 | 4,533 | |||||
| Wichita Kansas Health Care Facilities Revenue Bonds | 250 | 3.375 | 11/15/20 | 248 | |||||
| 4,781 | |||||||||
| Louisiana - 1.4% | |||||||||
| Louisiana Public Facilities Authority Revenue Bonds | 1,000 | 5.000 | 07/01/19 | 1,151 | |||||
| Louisiana State Citizens Property Insurance Corp. Revenue Bonds(µ) | 2,460 | 6.750 | 06/01/26 | 2,870 | |||||
| Louisiana State Public Facilities Authority Revenue Bonds | 1,615 | 5.000 | 09/01/29 | 1,866 | |||||
| Louisiana State University & Agricultural & Mechanical College Revenue Bonds | 1,000 | 5.000 | 07/01/16 | 1,074 | |||||
| State of Louisiana Gasoline & Fuels Tax Revenue Bonds | 7,000 | 5.000 | 05/01/21 | 8,428 | |||||
| State of Louisiana Revenue Bonds | 1,300 | 5.000 | 06/15/28 | 1,560 | |||||
| 16,949 | |||||||||
| Maryland - 0.4% | |||||||||
| County of Montgomery Maryland General Obligation Unlimited | 1,350 | 5.000 | 07/01/19 | 1,587 | |||||
| County of Prince George's Maryland General Obligation Limited | 1,000 | 5.000 | 07/15/16 | 1,079 | |||||
| Maryland Economic Development Corp. Revenue Bonds | 1,250 | 5.125 | 06/01/20 | 1,360 | |||||
| Maryland Economic Development Corp. Revenue Bonds | 885 | 6.200 | 09/01/22 | 1,050 | |||||
| Maryland Health & Higher Educational Facilities Authority Revenue Bonds(Ê) | 465 | 5.000 | 05/15/48 | 477 | |||||
| 5,553 | |||||||||
| Massachusetts - 0.8% | |||||||||
| City of Boston Massachusetts General Obligation Unlimited | 4,675 | 5.000 | 03/01/21 | 5,671 | |||||
| Commonwealth of Massachusetts General Obligation Limited | 930 | 5.500 | 11/01/15 | 979 | |||||
| Commonwealth of Massachusetts General Obligation Limited | 1,000 | 5.500 | 10/01/16 | 1,097 | |||||
| Massachusetts Clean Water Trust (The) Revenue Bonds | 1,090 | 5.000 | 08/01/16 | 1,178 | |||||
| Massachusetts Department of Transportation Revenue Bonds | 1,380 | 5.000 | 01/01/15 | 1,391 | |||||
| 10,316 | |||||||||
| Michigan - 2.6% | |||||||||
| Brighton Area School District General Obligation Unlimited | 1,525 | 5.000 | 05/01/26 | 1,741 | |||||
| City of Detroit Michigan Sewage Disposal System Revenue Bonds | 3,500 | 5.000 | 07/01/32 | 3,750 | |||||
| City of Detroit Michigan Water Supply System Revenue Bonds(µ) | 1,015 | 5.000 | 07/01/18 | 1,070 | |||||
| City of Detroit Michigan Water Supply System Revenue Bonds(µ) | 170 | 4.500 | 07/01/25 | 173 | |||||
| Detroit City School District General Obligation Unlimited(µ) | 1,000 | 6.000 | 05/01/19 | 1,177 | |||||
| Kent Hospital Finance Authority Revenue Bonds | 1,505 | 5.000 | 11/15/19 | 1,746 | |||||
| Michigan Finance Authority Revenue Bonds | 1,500 | 5.000 | 06/01/19 | 1,648 | |||||
| Michigan Finance Authority Revenue Bonds | 1,000 | 5.000 | 11/01/27 | 1,137 | |||||
| Michigan Financial Authority Revenue Bonds | 4,655 | 5.000 | 07/01/28 | 5,114 | |||||
| Michigan Financial Authority Revenue Bonds | 1,375 | 5.000 | 07/01/29 | 1,505 | |||||
| Michigan State Finance Authority Revenue Bonds | 3,625 | 5.000 | 07/01/16 | 3,851 | |||||
| Michigan State Finance Authority Revenue Bonds | 1,000 | 5.000 | 07/01/30 | 1,094 | |||||
| Michigan Strategic Fund Revenue Bonds | 1,015 | 5.250 | 06/01/32 | 1,039 | |||||
| Royal Oak School District General Obligation Unlimited | 1,025 | 5.000 | 05/01/17 | 1,133 | |||||
| Royal Oak School District General Obligation Unlimited | 785 | 5.000 | 05/01/18 | 892 | |||||
| Saline Economic Development Corp. Revenue Bonds | 485 | 5.250 | 06/01/32 | 496 | |||||
| Wayne County Airport Authority Revenue Bonds | 2,000 | 5.000 | 12/01/17 | 2,236 | |||||
| Wayne County Airport Authority Revenue Bonds(µ) | 2,500 | 4.500 | 12/01/24 | 2,718 | |||||
| Wayne County Airport Authority Revenue Bonds | 435 | 5.000 | 12/01/29 | 504 | |||||
| 33,024 | |||||||||
| Minnesota - 1.5% | |||||||||
| City of Minneapolis Minnesota Revenue Bonds | 1,250 | 5.000 | 08/01/17 | 1,355 | |||||
| City of Minneapolis Minnesota Revenue Bonds | 1,855 | 6.375 | 11/15/23 | 2,189 | |||||
| City of Rochester Minnesota Revenue Bonds(Ê) | 1,125 | 4.000 | 11/15/30 | 1,252 | |||||
| City of Saint Louis Park Minnesota Revenue Bonds | 1,165 | 5.500 | 07/01/17 | 1,300 | |||||
| City of Saint Louis Park Minnesota Revenue Bonds | 725 | 5.500 | 07/01/18 | 831 | |||||
| See accompanying notes which are an integral part of the financial statements. | |||||||||
| Russell Tax Exempt Bond Fund 507 | |||||||||
| Russell Investment Company | |||||||||
| Russell Tax Exempt Bond Fund | |||||||||
| Schedule of Investments, continued — October 31, 2014 | |||||||||
| Amounts in thousands (except share amounts) | |||||||||
| Principal | Fair | ||||||||
| Amount ($) | Rate | Date of | Value | ||||||
| or Shares | % | Maturity | $ | ||||||
| Elk River Independent School District No. 728 General Obligation Unlimited | 5,175 | 4.000 | 02/01/15 | 5,223 | |||||
| Elk River Independent School District No. 728 General Obligation Unlimited | 2,465 | 5.000 | 02/01/16 | 2,607 | |||||
| Minnesota Municipal Power Agency Revenue Bonds | 2,220 | 5.250 | 10/01/21 | 2,313 | |||||
| State of Minnesota General Obligation Unlimited | 1,990 | 5.000 | 06/01/17 | 2,215 | |||||
| 19,285 | |||||||||
| Mississippi - 0.3% | |||||||||
| Mississippi Development Bank Revenue Bonds(µ) | 1,000 | 5.000 | 07/01/15 | 1,030 | |||||
| Mississippi Development Bank Special Obligation Revenue Bonds | 1,000 | 5.000 | 04/01/28 | 1,154 | |||||
| Mississippi Hospital Equipment & Facilities Authority Revenue Bonds | 1,555 | 5.000 | 10/01/17 | 1,732 | |||||
| 3,916 | |||||||||
| Missouri - 1.2% | |||||||||
| Bi-State Development Agency of the Missouri-Illinois Metropolitan District Revenue | |||||||||
| Bonds | 800 | 5.000 | 10/01/28 | 910 | |||||
| Bi-State Development Agency of the Missouri-Illinois Metropolitan District Revenue | |||||||||
| Bonds | 1,775 | 5.000 | 10/01/33 | 2,008 | |||||
| City of Kansas City Missouri Revenue Bonds | 1,185 | 5.000 | 09/01/26 | 1,342 | |||||
| City of Kansas City Missouri Revenue Bonds | 500 | 5.000 | 09/01/27 | 563 | |||||
| City of Kansas City Missouri Revenue Bonds | 1,000 | 5.000 | 09/01/28 | 1,119 | |||||
| City of Kansas City Missouri Revenue Bonds | 1,000 | 5.000 | 09/01/29 | 1,116 | |||||
| City of Saint Louis Missouri Airport Revenue Bonds | 1,680 | 6.125 | 07/01/24 | 2,005 | |||||
| Health & Educational Facilities Authority of the State of Missouri Revenue Bonds(µ)(Ê) | 1,500 | 0.040 | 10/01/24 | 1,500 | |||||
| Missouri Highway & Transportation Commission Revenue Bonds(ae) | 2,500 | 5.250 | 05/01/17 | 2,795 | |||||
| Nixa Public Schools General Obligation Unlimited Bond | 500 | 5.000 | 03/01/33 | 560 | |||||
| Poplar Bluff R-I School District Certificate Of Participation(µ) | 100 | 3.000 | 03/01/17 | 105 | |||||
| Poplar Bluff R-I School District Certificate Of Participation(µ) | 100 | 3.000 | 03/01/18 | 106 | |||||
| Poplar Bluff R-I School District Certificate Of Participation(µ) | 500 | 5.000 | 03/01/30 | 574 | |||||
| 14,703 | |||||||||
| Nebraska - 0.6% | |||||||||
| Nebraska Public Power District Revenue Bonds | 2,000 | 4.000 | 01/01/21 | 2,247 | |||||
| Nebraska Public Power District Revenue Bonds | 3,795 | 5.000 | 01/01/28 | 4,394 | |||||
| Nebraska Public Power District Revenue Bonds | 1,000 | 5.000 | 01/01/29 | 1,149 | |||||
| 7,790 | |||||||||
| Nevada - 1.5% | |||||||||
| City of Reno Nevada General Obligation Limited | 1,100 | 5.000 | 06/01/18 | 1,251 | |||||
| City of Reno Nevada General Obligation Limited | 1,000 | 5.000 | 06/01/22 | 1,156 | |||||
| Clark County Department of Aviation Revenue Bonds(µ) | 2,500 | 5.000 | 07/01/22 | 2,903 | |||||
| County of Clark Nevada Revenue Bonds | 1,000 | 5.000 | 07/01/16 | 1,073 | |||||
| County of Clark Nevada Revenue Bonds | 4,760 | 5.000 | 07/01/28 | 5,488 | |||||
| County of Clark Nevada Revenue Bonds | 2,965 | 5.000 | 07/01/29 | 3,402 | |||||
| State of Nevada General Obligation Limited | 2,590 | 5.000 | 04/01/21 | 3,114 | |||||
| 18,387 | |||||||||
| New Jersey - 4.6% | |||||||||
| Camden County Improvement Authority Revenue Bonds | 1,000 | 5.000 | 02/15/18 | 1,119 | |||||
| Camden County Improvement Authority Revenue Bonds | 1,000 | 5.000 | 02/15/19 | 1,137 | |||||
| Camden County Improvement Authority Revenue Bonds | 2,000 | 5.000 | 02/15/30 | 2,243 | |||||
| Camden County Improvement Authority Revenue Bonds | 2,000 | 5.000 | 02/15/31 | 2,232 | |||||
| Casino Reinvestment Development Authority Revenue Bonds | 700 | 5.000 | 11/01/18 | 779 | |||||
| Casino Reinvestment Development Authority Revenue Bonds | 1,000 | 4.000 | 11/01/19 | 1,074 | |||||
| New Jersey Economic Development Authority Revenue Bonds | 1,020 | 5.375 | 06/15/15 | 1,052 | |||||
| New Jersey Economic Development Authority Revenue Bonds(µ) | 1,500 | 5.500 | 06/15/16 | 1,625 | |||||
| New Jersey Economic Development Authority Revenue Bonds | 2,500 | 5.000 | 09/01/18 | 2,817 | |||||
| New Jersey Economic Development Authority Revenue Bonds | 2,765 | 5.000 | 06/15/20 | 3,197 | |||||
| New Jersey Economic Development Authority Revenue Bonds | 75 | 5.000 | 06/15/21 | 87 | |||||
| New Jersey Economic Development Authority Revenue Bonds | 2,000 | 5.000 | 06/15/22 | 2,323 | |||||
| New Jersey Economic Development Authority Revenue Bonds | 2,045 | 5.000 | 06/15/23 | 2,350 | |||||
| New Jersey Economic Development Authority Revenue Bonds | 750 | 5.000 | 07/01/29 | 821 | |||||
| New Jersey Educational Facilities Authority Revenue Bonds | 2,000 | 5.000 | 07/01/16 | 2,152 | |||||
| New Jersey Health Care Facilities Financing Authority Revenue Bonds(µ) | 1,000 | 5.000 | 09/15/17 | 1,125 | |||||
| New Jersey State Turnpike Authority Revenue Bonds | 5,540 | 5.000 | 01/01/22 | 6,610 | |||||
| New Jersey State Turnpike Authority Revenue Bonds | 3,485 | 5.000 | 01/01/23 | 4,184 | |||||
| New Jersey State Turnpike Authority Revenue Bonds | 3,080 | 5.000 | 01/01/24 | 3,662 | |||||
| See accompanying notes which are an integral part of the financial statements. | |||||||||
| 508 Russell Tax Exempt Bond Fund | |||||||||
| Russell Investment Company | |||||||||
| Russell Tax Exempt Bond Fund | |||||||||
| Schedule of Investments, continued — October 31, 2014 | |||||||||
| Amounts in thousands (except share amounts) | |||||||||
| Principal | Fair | ||||||||
| Amount ($) | Rate | Date of | Value | ||||||
| or Shares | % | Maturity | $ | ||||||
| New Jersey State Turnpike Authority Revenue Bonds | 2,500 | 5.000 | 01/01/27 | 2,909 | |||||
| New Jersey Transportation Trust Fund Authority Revenue Bonds(µ)(ae) | 1,500 | 5.000 | 06/15/15 | 1,545 | |||||
| New Jersey Transportation Trust Fund Authority Revenue Bonds(µ) | 1,000 | 5.000 | 12/15/16 | 1,089 | |||||
| New Jersey Transportation Trust Fund Authority Revenue Bonds | 1,000 | 5.000 | 12/15/18 | 1,133 | |||||
| New Jersey Transportation Trust Fund Authority Revenue Bonds | 1,120 | 5.250 | 06/15/30 | 1,268 | |||||
| New Jersey Transportation Trust Fund Authority Revenue Bonds | 3,750 | 5.500 | 06/15/31 | 4,362 | |||||
| State of New Jersey General Obligation Unlimited(µ) | 2,080 | 5.500 | 07/15/18 | 2,405 | |||||
| Tobacco Settlement Financing Corp. Revenue Bonds | 60 | 4.500 | 06/01/23 | 60 | |||||
| Tobacco Settlement Financing Corp. Revenue Bonds | 2,030 | 4.625 | 06/01/26 | 1,863 | |||||
| Tobacco Settlement Financing Corp. Revenue Bonds | 1,245 | 5.000 | 06/01/29 | 1,062 | |||||
| 58,285 | |||||||||
| New Mexico - 0.3% | |||||||||
| City of Albuquerque New Mexico General Obligation Unlimited | 2,320 | 5.000 | 07/01/17 | 2,584 | |||||
| County of Taos New Mexico Revenue Bonds(µ) | 750 | 3.000 | 04/01/17 | 772 | |||||
| 3,356 | |||||||||
| New York - 10.7% | |||||||||
| Albany Industrial Development Agency Revenue Bonds | 2,380 | 5.250 | 11/15/32 | 2,602 | |||||
| Buffalo & Erie County Industrial Land Development Corp. Revenue Bonds | 1,350 | 5.750 | 10/01/26 | 1,598 | |||||
| Build NYC Resource Corp. Revenue Bonds(µ) | 930 | 5.000 | 12/15/18 | 1,055 | |||||
| Build NYC Resource Corp. Revenue Bonds | 1,445 | 5.000 | 08/01/19 | 1,653 | |||||
| Chautauqua Tobacco Asset Securitization Corp. Revenue Bonds | 1,700 | 3.125 | 06/01/22 | 1,700 | |||||
| City of New York General Obligation Unlimited Bond | 2,550 | 5.000 | 08/01/21 | 3,046 | |||||
| City of New York General Obligation Unlimited Bond | 2,445 | 5.000 | 08/01/22 | 2,937 | |||||
| City of New York New York General Obligation Unlimited | 2,170 | 5.000 | 08/01/16 | 2,343 | |||||
| City of New York New York General Obligation Unlimited | 1,500 | 5.000 | 08/01/19 | 1,755 | |||||
| City of New York New York General Obligation Unlimited | 2,105 | 5.000 | 08/01/20 | 2,496 | |||||
| Metropolitan Transportation Authority Revenue Bonds | 1,000 | 5.000 | 11/15/17 | 1,127 | |||||
| Metropolitan Transportation Authority Revenue Bonds | 1,000 | 5.000 | 11/15/21 | 1,202 | |||||
| Metropolitan Transportation Authority Revenue Bonds | 1,410 | 5.000 | 11/15/24 | 1,681 | |||||
| Metropolitan Transportation Authority Revenue Bonds | 8,320 | 5.000 | 11/15/25 | 9,884 | |||||
| Metropolitan Transportation Authority Revenue Bonds | 4,015 | 5.000 | 11/15/28 | 4,710 | |||||
| Metropolitan Transportation Authority Revenue Bonds | 1,430 | 6.500 | 11/15/28 | 1,731 | |||||
| New York City Health & Hospital Corp. Revenue Bonds | 1,500 | 5.000 | 02/15/17 | 1,642 | |||||
| New York City Industrial Development Agency Revenue Bonds(µ) | 1,535 | 5.000 | 01/01/31 | 1,616 | |||||
| New York City Transitional Finance Authority Future Tax Secured Revenue Bonds | 3,030 | 5.000 | 02/01/15 | 3,065 | |||||
| New York City Transitional Finance Authority Future Tax Secured Revenue Bonds | 3,855 | 5.000 | 11/01/15 | 4,039 | |||||
| New York City Transitional Finance Authority Future Tax Secured Revenue Bonds | 1,000 | 5.000 | 11/01/18 | 1,156 | |||||
| New York City Transitional Finance Authority Future Tax Secured Revenue Bonds | 2,500 | 5.000 | 11/15/18 | 2,895 | |||||
| New York City Transitional Finance Authority Future Tax Secured Revenue Bonds | 890 | 5.000 | 11/01/20 | 1,066 | |||||
| New York City Transitional Finance Authority Future Tax Secured Revenue Bonds | 2,175 | 5.000 | 05/01/21 | 2,610 | |||||
| New York City Transitional Finance Authority Future Tax Secured Revenue Bonds | 2,180 | 5.000 | 11/01/21 | 2,630 | |||||
| New York City Trust for Cultural Resources Revenue Bonds | 940 | 5.000 | 07/01/21 | 1,101 | |||||
| New York City Water & Sewer System Revenue Bonds(µ)(ae) | 375 | 5.000 | 12/15/14 | 377 | |||||
| New York City Water & Sewer System Revenue Bonds(µ) | 490 | 5.000 | 06/15/21 | 493 | |||||
| New York Liberty Development Corp. Revenue Bonds(Å) | 4,000 | 5.150 | 11/15/34 | 4,069 | |||||
| New York State Dormitory Authority Revenue Bonds | 3,415 | 5.000 | 07/01/16 | 3,592 | |||||
| New York State Dormitory Authority Revenue Bonds | 1,755 | 5.000 | 07/01/17 | 1,953 | |||||
| New York State Dormitory Authority Revenue Bonds | 1,000 | 5.000 | 10/01/19 | 1,184 | |||||
| New York State Dormitory Authority Revenue Bonds | 1,000 | 5.250 | 02/15/21 | 1,165 | |||||
| New York State Dormitory Authority Revenue Bonds | 180 | 5.000 | 07/01/21 | 216 | |||||
| New York State Dormitory Authority Revenue Bonds | 2,400 | 5.000 | 05/01/22 | 2,784 | |||||
| New York State Dormitory Authority Revenue Bonds | 725 | 5.000 | 05/15/23 | 876 | |||||
| New York State Dormitory Authority Revenue Bonds | 6,700 | 5.000 | 12/15/23 | 8,198 | |||||
| New York State Dormitory Authority Revenue Bonds | 700 | 5.000 | 07/01/24 | 834 | |||||
| New York State Dormitory Authority Revenue Bonds | 6,790 | 5.000 | 07/01/26 | 8,069 | |||||
| New York State Dormitory Authority Revenue Bonds | 2,500 | 5.250 | 07/01/29 | 2,915 | |||||
| New York State Environmental Facilities Corp. Revenue Bonds | 770 | 5.000 | 06/15/22 | 878 | |||||
| New York State Environmental Facilities Corp. Revenue Bonds | 1,640 | 5.000 | 09/15/23 | 1,839 | |||||
| New York State Thruway Authority Revenue Bonds | 2,300 | 5.000 | 03/15/19 | 2,676 | |||||
| New York State Thruway Authority Revenue Bonds | 12,485 | 5.000 | 05/01/19 | 14,451 | |||||
| New York State Thruway Authority Revenue Bonds | 3,480 | 5.000 | 03/15/27 | 4,090 | |||||
| See accompanying notes which are an integral part of the financial statements. | |||||||||
| Russell Tax Exempt Bond Fund 509 | |||||||||
| Russell Investment Company | |||||||||
| Russell Tax Exempt Bond Fund | |||||||||
| Schedule of Investments, continued — October 31, 2014 | |||||||||
| Amounts in thousands (except share amounts) | |||||||||
| Principal | Fair | ||||||||
| Amount ($) | Rate | Date of | Value | ||||||
| or Shares | % | Maturity | $ | ||||||
| New York State Urban Development Corp. Revenue Bonds | 2,500 | 5.000 | 03/15/17 | 2,762 | |||||
| State of New York General Obligation Unlimited | 2,000 | 5.000 | 12/15/21 | 2,439 | |||||
| Triborough Bridge & Tunnel Authority Revenue Bonds | 950 | 5.000 | 11/15/17 | 1,073 | |||||
| Triborough Bridge & Tunnel Authority Revenue Bonds(µ) | 1,000 | 5.500 | 11/15/20 | 1,220 | |||||
| Triborough Bridge & Tunnel Authority Revenue Bonds(Ê) | 900 | 5.000 | 11/15/38 | 943 | |||||
| Troy Capital Resource Corp. Revenue Bonds | 1,000 | 5.000 | 09/01/20 | 1,170 | |||||
| Westchester County Local Development Corp. Revenue Bonds | 1,350 | 5.000 | 05/01/34 | 1,479 | |||||
| 135,085 | |||||||||
| North Carolina - 0.7% | |||||||||
| North Carolina Capital Facilities Finance Agency Revenue Bonds | 750 | 5.000 | 04/01/19 | 862 | |||||
| North Carolina Eastern Municipal Power Agency Revenue Bonds | 650 | 5.000 | 01/01/16 | 684 | |||||
| State of North Carolina General Obligation Unlimited | 2,500 | 5.000 | 05/01/20 | 2,997 | |||||
| State of North Carolina Revenue Bonds | 1,660 | 5.000 | 05/01/16 | 1,773 | |||||
| State of North Carolina Revenue Bonds | 1,000 | 5.000 | 05/01/19 | 1,165 | |||||
| University of North Carolina at Chapel Hill Revenue Bonds | 1,205 | 5.000 | 12/01/31 | 1,353 | |||||
| 8,834 | |||||||||
| North Dakota - 0.2% | |||||||||
| Burleigh County Health Care Revenue Bonds | 460 | 5.000 | 07/01/29 | 507 | |||||
| City of Williston North Dakota Revenue Bonds(µ) | 1,425 | 4.000 | 11/01/20 | 1,510 | |||||
| County of Burleigh North Dakota Revenue Bonds | 500 | 5.000 | 07/01/31 | 548 | |||||
| 2,565 | |||||||||
| Ohio - 5.3% | |||||||||
| Buckeye Tobacco Settlement Financing Authority Revenue Bonds | 2,700 | 5.125 | 06/01/24 | 2,249 | |||||
| Buckeye Tobacco Settlement Financing Authority Revenue Bonds | 2,400 | 5.875 | 06/01/30 | 1,967 | |||||
| City of Akron Ohio Revenue Bonds | 1,000 | 5.000 | 12/01/24 | 1,188 | |||||
| City of Cincinnati Ohio General Obligation Unlimited | 1,815 | 5.000 | 12/01/30 | 2,095 | |||||
| City of Cincinnati Ohio General Obligation Unlimited | 800 | 5.000 | 12/01/31 | 921 | |||||
| County of Hamilton Ohio Revenue Bonds | 2,065 | 5.250 | 06/01/32 | 2,302 | |||||
| County of Montgomery Ohio Revenue Bonds | 1,100 | 5.750 | 11/15/22 | 1,328 | |||||
| Cuyahoga County Ohio Certificates of Participation | 14,065 | 5.000 | 12/01/27 | 16,301 | |||||
| Cuyahoga County Ohio Certificates of Participation | 1,990 | 5.000 | 12/01/28 | 2,294 | |||||
| Kent State University Revenue Bonds(µ) | 2,000 | 5.000 | 05/01/16 | 2,136 | |||||
| Lakewood City School District General Obligation | 260 | 5.000 | 11/01/29 | 301 | |||||
| Lakewood City School District General Obligation | 875 | 5.000 | 11/01/30 | 1,010 | |||||
| Lakewood City School District General Obligation | 1,000 | 5.000 | 11/01/34 | 1,139 | |||||
| Ohio State Water Development Authority Revenue Bonds | 3,845 | 5.250 | 06/01/16 | 4,140 | |||||
| Ohio State Water Development Authority Revenue Bonds | 6,085 | 5.000 | 06/01/21 | 7,367 | |||||
| Ohio State Water Development Authority Revenue Bonds | 5,000 | 5.000 | 12/01/21 | 6,091 | |||||
| State of Ohio Revenue Bonds | 4,105 | 5.000 | 06/15/16 | 4,410 | |||||
| State of Ohio Revenue Bonds | 3,500 | 5.000 | 12/15/22 | 4,197 | |||||
| State of Ohio Revenue Bonds | 2,815 | 5.000 | 12/15/23 | 3,343 | |||||
| Toledo-Lucas County Port Authority Revenue Bonds | 1,965 | 5.000 | 07/01/29 | 2,118 | |||||
| 66,897 | |||||||||
| Oklahoma - 0.1% | |||||||||
| Oklahoma County Finance Authority Revenue Bonds | 1,000 | 5.000 | 09/01/21 | 1,139 | |||||
| Oregon - 0.6% | |||||||||
| City of Portland Oregon Sewer System Revenue Bonds | 2,000 | 5.000 | 06/15/18 | 2,295 | |||||
| Hospital Facilities Authority of Multnomah County Oregon Revenue Bonds | 650 | 5.000 | 10/01/19 | 697 | |||||
| Morrow County School District No. 1 General Obligation Unlimited(µ) | 1,955 | 5.500 | 06/15/21 | 2,423 | |||||
| State of Oregon Department of Transportation Revenue Bonds | 2,000 | 5.250 | 11/15/14 | 2,004 | |||||
| 7,419 | |||||||||
| Pennsylvania - 5.5% | |||||||||
| Allegheny County Hospital Development Authority Revenue Bonds | 2,000 | 5.000 | 09/01/16 | 2,167 | |||||
| Allegheny County Industrial Development Authority Revenue Bonds | 920 | 6.500 | 05/01/17 | 995 | |||||
| Berks County Municipal Authority Revenue Bonds | 1,960 | 5.250 | 11/01/24 | 2,264 | |||||
| Berks County Vocational Technical School Authority Revenue Bonds(µ) | 1,260 | 5.000 | 06/01/15 | 1,283 | |||||
| Bethlehem Authority Revenue Bonds | 1,000 | 4.000 | 11/15/16 | 1,063 | |||||
| Bethlehem Authority Revenue Bonds | 1,000 | 5.000 | 11/15/17 | 1,113 | |||||
| City of Philadelphia Pennsylvania General Obligation Unlimited(µ) | 1,000 | 5.000 | 08/01/24 | 1,123 | |||||
| City of Philadelphia Pennsylvania General Obligation Unlimited | 3,210 | 5.250 | 07/15/27 | 3,681 | |||||
| See accompanying notes which are an integral part of the financial statements. | |||||||||
| 510 Russell Tax Exempt Bond Fund | |||||||||
| Russell Investment Company | |||||||||
| Russell Tax Exempt Bond Fund | |||||||||
| Schedule of Investments, continued — October 31, 2014 | |||||||||
| Amounts in thousands (except share amounts) | |||||||||
| Principal | Fair | ||||||||
| Amount ($) | Rate | Date of | Value | ||||||
| or Shares | % | Maturity | $ | ||||||
| Commonwealth of Pennsylvania General Obligation Unlimited | 3,870 | 5.000 | 04/01/16 | 4,123 | |||||
| Commonwealth of Pennsylvania General Obligation Unlimited(µ) | 1,300 | 5.375 | 07/01/17 | 1,462 | |||||
| County of Allegheny Pennsylvania General Obligation Unlimited(µ) | 1,000 | 5.000 | 10/01/15 | 1,043 | |||||
| Dallas PENN Area Municipal Authority University Revenue Bonds | 430 | 4.000 | 05/01/18 | 463 | |||||
| Delaware County Vocational & Technical School Authority Revenue Bonds(µ) | 665 | 5.000 | 11/01/25 | 754 | |||||
| Delaware County Vocational & Technical School Authority Revenue Bonds(µ) | 970 | 5.000 | 11/01/26 | 1,093 | |||||
| Delaware County Vocational & Technical School Authority Revenue Bonds(µ) | 1,120 | 5.000 | 11/01/27 | 1,259 | |||||
| Delaware County Vocational & Technical School Authority Revenue Bonds(µ) | 1,140 | 5.000 | 11/01/28 | 1,279 | |||||
| Delaware County Vocational & Technical School Authority Revenue Bonds(µ) | 1,500 | 5.250 | 11/01/33 | 1,694 | |||||
| Indiana County Hospital Authority Revenue Bonds | 550 | 5.500 | 06/01/29 | 614 | |||||
| Montgomery County Industrial Development Authority Revenue Bonds | 1,000 | 5.000 | 11/15/17 | 1,080 | |||||
| North Penn Water Authority Revenue Bonds | 1,190 | 5.000 | 11/01/30 | 1,368 | |||||
| Pennsylvania Economic Development Financing Authority Revenue Bonds | 2,600 | 5.000 | 07/01/16 | 2,800 | |||||
| Pennsylvania Economic Development Financing Authority Revenue Bonds | 1,000 | 5.000 | 07/01/18 | 1,149 | |||||
| Pennsylvania Economic Development Financing Authority Revenue Bonds | 2,270 | 5.000 | 01/01/22 | 2,520 | |||||
| Pennsylvania Economic Development Financing Authority Revenue Bonds | 2,000 | 5.000 | 07/01/22 | 2,145 | |||||
| Pennsylvania Economic Development Financing Authority Revenue Bonds | 4,460 | 5.000 | 01/01/23 | 4,693 | |||||
| Pennsylvania Higher Educational Facilities Authority Revenue Bonds | 1,000 | 5.000 | 09/01/17 | 1,122 | |||||
| Pennsylvania Higher Educational Facilities Authority Revenue Bonds(µ) | 3,000 | 5.000 | 06/15/20 | 3,077 | |||||
| Pennsylvania Higher Educational Facilities Authority Revenue Bonds | 1,125 | 6.000 | 07/01/21 | 1,292 | |||||
| Pennsylvania Higher Educational Facilities Authority Revenue Bonds | 1,940 | 5.250 | 05/01/24 | 2,253 | |||||
| Pennsylvania Intergovernmental Cooperation Authority Special Tax | 1,000 | 5.000 | 06/15/17 | 1,114 | |||||
| Pennsylvania State Public School Building Authority Revenue Bonds | 1,000 | 5.000 | 06/15/28 | 1,139 | |||||
| Pennsylvania State Public School Building Authority Revenue Bonds | 1,000 | 5.000 | 06/15/29 | 1,135 | |||||
| Philadelphia Authority for Industrial Development Revenue Bonds | 1,000 | 5.875 | 06/15/22 | 1,051 | |||||
| Philadelphia Authority for Industrial Development Revenue Bonds(µ)(Ê) | 1,000 | 0.060 | 03/01/27 | 1,000 | |||||
| Philadelphia Authority for Industrial Development Revenue Bonds | 2,000 | 8.000 | 01/01/33 | 2,147 | |||||
| State Public School Building Authority Revenue Bonds | 2,000 | 5.000 | 04/01/20 | 2,304 | |||||
| State Public School Building Authority Revenue Bonds | 3,030 | 5.000 | 04/01/25 | 3,464 | |||||
| State Public School Building Authority Revenue Bonds | 3,000 | 5.000 | 04/01/32 | 3,333 | |||||
| University of Pittsburgh-of the Commonwealth System of Higher Education Revenue | |||||||||
| Bonds | 1,000 | 5.500 | 09/15/21 | 1,183 | |||||
| 68,842 | |||||||||
| Puerto Rico - 3.2% | |||||||||
| Commonwealth of Puerto Rico General Obligation Unlimited(ae) | 620 | 5.250 | 07/01/16 | 670 | |||||
| Commonwealth of Puerto Rico General Obligation Unlimited(µ) | 4,420 | 5.500 | 07/01/20 | 4,602 | |||||
| Commonwealth of Puerto Rico General Obligation Unlimited(µ) | 450 | 5.250 | 07/01/27 | 452 | |||||
| Commonwealth of Puerto Rico General Obligation Unlimited | 2,000 | 5.000 | 07/01/35 | 1,973 | |||||
| Government Development Bank for Puerto Rico Revenue Bonds(µ) | 2,830 | 4.750 | 12/01/15 | 2,891 | |||||
| Puerto Rico Commonwealth Aqueduct and Sewer Authority Revenue Bonds | 250 | 5.000 | 07/01/15 | 254 | |||||
| Puerto Rico Commonwealth Aqueduct and Sewer Authority Revenue Bonds | 1,825 | 5.000 | 07/01/28 | 1,832 | |||||
| Puerto Rico Commonwealth General Obligation Unlimited | 735 | 6.000 | 07/01/16 | 770 | |||||
| Puerto Rico Commonwealth General Obligation Unlimited | 1,380 | 5.500 | 07/01/21 | 1,436 | |||||
| Puerto Rico Convention Center District Authority Revenue Bonds | 1,400 | 5.000 | 07/01/18 | 1,413 | |||||
| Puerto Rico Electric Power Authority Revenue Bonds | 5,000 | 5.500 | 07/01/15 | 5,093 | |||||
| Puerto Rico Electric Power Authority Revenue Bonds(µ) | 2,105 | 5.500 | 07/01/16 | 2,172 | |||||
| Puerto Rico Electric Power Authority Revenue Bonds(µ) | 215 | 4.000 | 07/01/23 | 209 | |||||
| Puerto Rico Electric Power Authority Revenue Bonds(µ) | 1,350 | 5.000 | 07/01/26 | 1,349 | |||||
| Puerto Rico Electric Power Authority Revenue Bonds(µ) | 205 | 4.375 | 07/01/30 | 191 | |||||
| Puerto Rico Highways & Transportation Authority Revenue Bonds | 300 | 4.125 | 07/01/18 | 297 | |||||
| Puerto Rico Highways & Transportation Authority Revenue Bonds | 55 | 5.500 | 07/01/19 | 57 | |||||
| Puerto Rico Highways & Transportation Authority Revenue Bonds(µ) | 950 | 5.500 | 07/01/22 | 989 | |||||
| Puerto Rico Highways & Transportation Authority Revenue Bonds(µ) | 135 | 5.000 | 07/01/27 | 134 | |||||
| Puerto Rico Highways & Transportation Authority Revenue Bonds(µ) | 500 | 5.500 | 07/01/28 | 524 | |||||
| Puerto Rico Highways & Transportation Authority Revenue Bonds | 360 | 5.500 | 07/01/29 | 344 | |||||
| Puerto Rico Housing Finance Authority Revenue Bonds | 180 | 5.500 | 12/01/15 | 188 | |||||
| Puerto Rico Housing Finance Authority Revenue Bonds | 1,830 | 5.500 | 12/01/16 | 1,982 | |||||
| Puerto Rico Infrastructure Finance Authority Revenue Bonds(µ) | 625 | 5.500 | 07/01/17 | 634 | |||||
| Puerto Rico Infrastructure Finance Authority Revenue Bonds | 2,225 | 5.500 | 07/01/27 | 2,160 | |||||
| Puerto Rico Municipal Finance Agency General Obligation Unlimited(µ) | 3,050 | 5.000 | 08/01/27 | 3,057 | |||||
| Puerto Rico Municipal Finance Agency Revenue Bonds(µ) | 115 | 5.250 | 08/01/22 | 116 | |||||
| See accompanying notes which are an integral part of the financial statements. | |||||||||
| Russell Tax Exempt Bond Fund 511 | |||||||||
| Russell Investment Company | |||||||||
| Russell Tax Exempt Bond Fund | |||||||||
| Schedule of Investments, continued — October 31, 2014 | |||||||||
| Amounts in thousands (except share amounts) | |||||||||
| Principal | Fair | ||||||||
| Amount ($) | Rate | Date of | Value | ||||||
| or Shares | % | Maturity | $ | ||||||
| Puerto Rico Public Buildings Authority Revenue Bonds(µ) | 3,130 | 5.500 | 07/01/16 | 3,190 | |||||
| Puerto Rico Public Buildings Authority Revenue Bonds | 1,000 | 5.500 | 07/01/17 | 1,009 | |||||
| University of Puerto Rico Revenue Bonds | 100 | 5.000 | 06/01/23 | 97 | |||||
| 40,085 | |||||||||
| Rhode Island - 0.1% | |||||||||
| Rhode Island Health & Educational Building Corp. Revenue Bonds | 1,500 | 5.000 | 09/01/22 | 1,827 | |||||
| South Carolina - 0.7% | |||||||||
| Piedmont Municipal Power Agency Revenue Bonds | 1,000 | 5.000 | 01/01/20 | 1,162 | |||||
| South Carolina State Public Service Authority Revenue Bonds | 1,000 | 5.000 | 12/01/16 | 1,092 | |||||
| Spartanburg Regional Health Services Bonds | 5,560 | 5.000 | 04/15/32 | 6,226 | |||||
| 8,480 | |||||||||
| Tennessee - 0.7% | |||||||||
| Chattanooga Health Educational & Housing Facility Board Revenue Bonds | 1,800 | 5.000 | 10/01/25 | 1,817 | |||||
| Chattanooga Industrial Development Board Revenue Bonds(µ) | 4,000 | 5.000 | 10/01/30 | 4,284 | |||||
| City of Memphis Tennessee Electric System Revenue Bonds | 1,135 | 5.000 | 12/01/15 | 1,194 | |||||
| Shelby County Health Educational & Housing Facilities Board Revenue Bonds(µ)(Ê) | 1,400 | 0.050 | 06/01/42 | 1,400 | |||||
| 8,695 | |||||||||
| Texas - 9.1% | |||||||||
| Arlington Texas Higher Education Finance Corp. Revenue Bonds | 200 | 5.875 | 03/01/24 | 212 | |||||
| Arlington Texas Higher Education Finance Corp. Revenue Bonds | 1,000 | 5.000 | 08/15/26 | 1,204 | |||||
| Arlington Texas Higher Education Finance Corp. Revenue Bonds | 525 | 6.625 | 03/01/29 | 549 | |||||
| Canadian River Municipal Water Authority Corp. Revenue Bonds(µ) | 800 | 5.000 | 02/15/17 | 843 | |||||
| Canadian River Municipal Water Authority Corp. Revenue Bonds(µ) | 415 | 5.000 | 02/15/18 | 436 | |||||
| City of Austin Texas Water & Wastewater System Revenue Bonds(µ) | 1,000 | 5.250 | 11/15/14 | 1,002 | |||||
| City of Beaumont Texas Waterworks & Sewer System Revenue Bonds | 425 | 4.000 | 09/01/18 | 470 | |||||
| City of Bryan Texas Electric System Revenue Bonds | 1,000 | 5.000 | 07/01/15 | 1,031 | |||||
| City of Corpus Christi Texas Utility System Revenue Bonds | 1,660 | 5.000 | 07/15/22 | 1,960 | |||||
| City of Fort Worth Texas Water & Sewer System Revenue Bonds | 1,340 | 5.000 | 02/15/17 | 1,475 | |||||
| City of Houston Texas Airport System Revenue Bonds | 1,500 | 5.000 | 07/01/17 | 1,669 | |||||
| City of Houston Texas Airport System Revenue Bonds | 900 | 5.000 | 07/01/29 | 1,035 | |||||
| City of Houston Texas General Obligation Limited | 1,375 | 5.250 | 03/01/28 | 1,543 | |||||
| City of Houston Texas Revenue Bonds | 1,890 | 5.000 | 09/01/20 | 2,183 | |||||
| City of Lubbock Texas General Obligation Limited | 5,000 | 5.000 | 02/15/19 | 5,810 | |||||
| City of San Antonio Texas Water System Revenue Bonds | 2,250 | 5.000 | 05/15/24 | 2,655 | |||||
| City Public Service Board of San Antonio Texas Revenue Bonds | 1,000 | 5.000 | 02/01/18 | 1,135 | |||||
| Clifton Higher Education Finance Corp. Revenue Bonds | 425 | 3.000 | 08/15/17 | 452 | |||||
| Clifton Higher Education Finance Corp. Revenue Bonds | 400 | 4.000 | 08/15/18 | 444 | |||||
| Conroe Independent School District General Obligation Unlimited | 1,085 | 5.000 | 02/15/25 | 1,276 | |||||
| County of Fort Bend Texas General Obligation Limited(µ) | 1,000 | 5.000 | 03/01/16 | 1,062 | |||||
| County of Travis Texas General Obligation Limited | 1,000 | 5.000 | 03/01/15 | 1,016 | |||||
| Dallas/Fort Worth International Airport Revenue Bonds | 280 | 5.000 | 11/01/22 | 303 | |||||
| Dallas/Fort Worth International Airport Revenue Bonds | 200 | 5.000 | 11/01/23 | 217 | |||||
| Dallas/Fort Worth International Airport Revenue Bonds | 250 | 5.000 | 11/01/24 | 270 | |||||
| Dallas/Fort Worth International Airport Revenue Bonds | 1,700 | 5.000 | 11/01/26 | 1,961 | |||||
| Dallas/Fort Worth International Airport Revenue Bonds | 1,000 | 5.250 | 11/01/28 | 1,179 | |||||
| Dallas/Fort Worth International Airport Revenue Bonds | 2,000 | 5.250 | 11/01/29 | 2,349 | |||||
| Dallas/Fort Worth International Airport Revenue Bonds | 1,825 | 5.000 | 11/01/30 | 2,069 | |||||
| Dallas/Fort Worth International Airport Revenue Bonds | 1,500 | 5.250 | 11/01/30 | 1,758 | |||||
| Dallas-Fort Worth International Airport Revenue Bonds | 3,395 | 5.000 | 11/01/27 | 3,937 | |||||
| Decatur Hospital Authority Revenue Bonds | 1,250 | 5.250 | 09/01/29 | 1,361 | |||||
| Goose Creek Consolidated Independent School District General Obligation Unlimited | 915 | 5.000 | 02/15/24 | 1,071 | |||||
| Grand Prairie Independent School District General Obligation Unlimited | 750 | 5.000 | 02/15/19 | 822 | |||||
| Harris County Cultural Education Facilities Finance Corp. Revenue Bonds | 1,385 | 6.375 | 01/01/33 | 1,574 | |||||
| Houston Independent School District General Obligation Limited | 1,250 | 4.000 | 02/15/16 | 1,309 | |||||
| Karnes County Hospital District Revenue Bonds | 1,100 | 4.000 | 02/01/19 | 1,176 | |||||
| Karnes County Hospital District Revenue Bonds | 2,020 | 5.000 | 02/01/29 | 2,214 | |||||
| Lower Colorado River Authority Revenue Bonds | 5 | 5.000 | 05/15/16 | 5 | |||||
| Lower Colorado River Authority Revenue Bonds | 3,585 | 5.500 | 05/15/31 | 4,226 | |||||
| New Hope Cultural Education Facilities Corp. Revenue Bonds | 565 | 5.000 | 04/01/21 | 633 | |||||
| New Hope Cultural Education Facilities Corp. Revenue Bonds | 450 | 5.000 | 04/01/22 | 505 | |||||
| See accompanying notes which are an integral part of the financial statements. | |||||||||
| 512 Russell Tax Exempt Bond Fund | |||||||||
| Russell Investment Company | |||||||||
| Russell Tax Exempt Bond Fund | |||||||||
| Schedule of Investments, continued — October 31, 2014 | |||||||||
| Amounts in thousands (except share amounts) | |||||||||
| Principal | Fair | ||||||||
| Amount ($) | Rate | Date of | Value | ||||||
| or Shares | % | Maturity | $ | ||||||
| New Hope Cultural Education Facilities Corp. Revenue Bonds | 500 | 5.000 | 04/01/29 | 546 | |||||
| New Hope Cultural Education Facilities Corp. Revenue Bonds | 180 | 4.625 | 04/01/23 | 196 | |||||
| North Texas Tollway Authority Revenue Bonds | 960 | 6.000 | 01/01/24 | 1,084 | |||||
| North Texas Tollway Authority Revenue Bonds(Ê) | 1,235 | 5.750 | 01/01/38 | 1,307 | |||||
| Reagan Hospital District County of Reagan General Obligation Bonds | 860 | 2.500 | 02/01/19 | 874 | |||||
| Reagan Hospital District County of Reagan General Obligation Bonds | 910 | 3.250 | 02/01/21 | 940 | |||||
| Reagan Hospital District County of Reagan General Obligation Bonds | 485 | 3.750 | 02/01/23 | 511 | |||||
| Reagan Hospital District County of Reagan General Obligation Bonds | 500 | 5.000 | 02/01/29 | 538 | |||||
| Reagan Hospital District County of Reagan General Obligation Bonds | 3,000 | 5.000 | 02/01/34 | 3,154 | |||||
| State of Texas General Obligation Unlimited | 2,910 | 5.000 | 04/01/22 | 3,548 | |||||
| Tarrant County Cultural Education Facilities Finance Corp. Revenue Bonds | 1,500 | 5.000 | 11/15/16 | 1,632 | |||||
| Texas A&M University Revenue Bonds | 1,000 | 5.000 | 05/15/15 | 1,026 | |||||
| Texas Municipal Gas Acquisition & Supply Corp. III Revenue Bonds | 900 | 5.000 | 12/15/24 | 1,022 | |||||
| Texas Municipal Gas Acquisition & Supply Corp. III Revenue Bonds | 3,515 | 5.000 | 12/15/27 | 3,890 | |||||
| Texas Municipal Gas Acquisition & Supply Corp. Revenue Bonds | 4,700 | 6.250 | 12/15/26 | 5,799 | |||||
| Texas Private Activity Bond Surface Transportation Corp. Revenue Bonds | 1,445 | 7.500 | 12/31/31 | 1,758 | |||||
| Texas Private Activity Bond Surface Transportation Corp. Revenue Bonds | 1,250 | 7.500 | 06/30/33 | 1,538 | |||||
| Texas Public Finance Authority Revenue Bonds | 10,560 | 5.000 | 01/01/17 | 11,587 | |||||
| Texas Public Finance Authority Revenue Bonds | 10,985 | 4.000 | 07/01/17 | 11,826 | |||||
| Texas Transportation Commission State Highway Fund Revenue Bonds(ae) | 2,500 | 5.000 | 04/01/16 | 2,667 | |||||
| West Harris County Regional Water Authority Revenue Bonds | 250 | 4.000 | 12/15/17 | 275 | |||||
| 114,119 | |||||||||
| Utah - 0.5% | |||||||||
| County of Salt Lake Reseach Facility Authority Revenue Bonds | 2,000 | 5.000 | 12/01/33 | 2,141 | |||||
| Intermountain Power Agency Revenue Bonds | 2,000 | 5.000 | 07/01/16 | 2,151 | |||||
| Utah State Charter School Finance Authority Revenue Bonds | 465 | 5.250 | 10/15/28 | 543 | |||||
| Utah State Charter School Finance Authority Revenue Bonds | 1,215 | 5.000 | 10/15/33 | 1,367 | |||||
| 6,202 | |||||||||
| Virgin Islands - 1.4% | |||||||||
| Virgin Islands Public Finance Authority Revenue Bonds | 5,000 | 5.000 | 10/01/18 | 5,575 | |||||
| Virgin Islands Public Finance Authority Revenue Bonds | 1,000 | 4.000 | 10/01/22 | 1,079 | |||||
| Virgin Islands Public Finance Authority Revenue Bonds | 7,400 | 5.000 | 10/01/29 | 8,293 | |||||
| Virgin Islands Public Finance Authority Revenue Bonds | 670 | 5.250 | 10/01/29 | 750 | |||||
| Virgin Islands Public Finance Authority Revenue Bonds | 2,110 | 6.750 | 10/01/37 | 2,429 | |||||
| 18,126 | |||||||||
| Virginia - 1.0% | |||||||||
| Bon Secours Health System, Inc. Obligated Group Revenue Bonds | 1,400 | 5.000 | 11/01/30 | 1,565 | |||||
| Chesterfield County Economic Development Authority Revenue Bonds | 650 | 5.000 | 05/01/23 | 721 | |||||
| Commonwealth of Virginia General Obligation Unlimited | 1,000 | 5.000 | 06/01/23 | 1,142 | |||||
| County of Fairfax Virginia General Obligation Unlimited | 3,000 | 5.000 | 04/01/18 | 3,426 | |||||
| Virginia College Building Authority Revenue Bonds | 2,350 | 5.000 | 02/01/22 | 2,844 | |||||
| Virginia Commonwealth Transportation Board Revenue Bonds | 1,950 | 5.000 | 03/15/18 | 2,218 | |||||
| Virginia Public School Authority Revenue Bonds | 1,000 | 5.000 | 08/01/17 | 1,118 | |||||
| 13,034 | |||||||||
| Washington - 3.2% | |||||||||
| County of King Washington Sewer Revenue Revenue Bonds | 3,085 | 5.000 | 01/01/28 | 3,618 | |||||
| Energy Northwest Revenue Bonds | 2,500 | 5.000 | 07/01/15 | 2,580 | |||||
| Energy Northwest Revenue Bonds | 1,000 | 7.125 | 07/01/16 | 1,112 | |||||
| Energy Northwest Revenue Bonds | 2,000 | 5.000 | 07/01/19 | 2,351 | |||||
| Greater Wenatchee Regional Events Center Public Facilities Dist Revenue Bonds | 1,060 | 3.750 | 09/01/19 | 1,096 | |||||
| Greater Wenatchee Regional Events Center Public Facilities Dist Revenue Bonds | 1,000 | 4.500 | 09/01/22 | 1,065 | |||||
| King County School District No. 405 Bellevue General Obligation Unlimited(µ) | 1,000 | 5.000 | 12/01/14 | 1,004 | |||||
| Mason County School District No. 309 Shelton General Obligation Unlimited(µ) | 1,115 | 5.000 | 12/01/18 | 1,255 | |||||
| Pierce County School District No. 3 Puyallup General Obligation Unlimited(µ)(ae) | 1,000 | 5.000 | 12/01/15 | 1,051 | |||||
| Port of Seattle Washington Revenue Bonds | 1,000 | 5.000 | 06/01/22 | 1,156 | |||||
| Snohomish County School District No. 15 Edmonds General Obligation Unlimited(µ)(ae) | 2,000 | 5.000 | 06/01/16 | 2,145 | |||||
| State of Washington General Obligation Unlimited | 10,445 | 5.000 | 07/01/17 | 11,657 | |||||
| State of Washington Revenue Bonds | 8,000 | 5.000 | 09/01/20 | 9,501 | |||||
| Washington Health Care Facilities Authority Revenue Bonds | 270 | 5.000 | 03/01/18 | 302 | |||||
| Washington State Health Care Facilities Authority Revenue Bonds | 700 | 5.000 | 07/01/30 | 801 | |||||
| 40,694 | |||||||||
| See accompanying notes which are an integral part of the financial statements. | |||||||||
| Russell Tax Exempt Bond Fund 513 | |||||||||
| Russell Investment Company | |||||||||
| Russell Tax Exempt Bond Fund | |||||||||
| Schedule of Investments, continued — October 31, 2014 | |||||||||
| Amounts in thousands (except share amounts) | |||||||||
| Principal | Fair | ||||||||
| Amount ($) | Rate | Date of | Value | ||||||
| or Shares | % | Maturity | $ | ||||||
| West Virginia - 0.2% | |||||||||
| Mason County Pollution Control Revenue Bonds | 1,000 | 1.625 | 10/01/22 | 1,004 | |||||
| West Virginia University Revenue Bonds | 1,350 | 5.000 | 10/01/21 | 1,620 | |||||
| 2,624 | |||||||||
| Wisconsin - 1.7% | |||||||||
| City of Marshfield Wisconsin Electric System Revenue Bonds | 4,000 | 5.500 | 12/01/30 | 4,587 | |||||
| State of Wisconsin General Obligation | 4,250 | 5.000 | 11/01/20 | 5,104 | |||||
| Wisconsin Department of Transportation Revenue Bonds(µ) | 1,500 | 5.000 | 07/01/19 | 1,760 | |||||
| Wisconsin Department of Transportation Revenue Bonds | 5,950 | 5.000 | 07/01/22 | 7,249 | |||||
| Wisconsin Public Finance Authority Revenue Bonds | 1,250 | 5.125 | 11/15/29 | 1,256 | |||||
| Wisconsin School Districts Temporary Borrowing Program Revenue Notes | 2,000 | 1.000 | 10/09/15 | 2,015 | |||||
| 21,971 | |||||||||
| Wyoming - 0.3% | |||||||||
| County of Laramie Wyoming Revenue Bonds | 1,000 | 4.000 | 05/01/22 | 1,064 | |||||
| County of Sweetwater Wyoming Revenue Bonds | 1,000 | 5.000 | 12/15/16 | 1,075 | |||||
| County of Sweetwater Wyoming Revenue Bonds | 1,000 | 5.000 | 12/15/18 | 1,090 | |||||
| 3,229 | |||||||||
| Total Municipal Bonds (cost $1,154,027) | 1,203,584 | ||||||||
| Short-Term Investments - 3.7% | |||||||||
| Russell U.S. Cash Management Fund | 46,061,499 | (8) | 46,061 | ||||||
| Total Short-Term Investments (cost $46,061) | 46,061 | ||||||||
| Total Investments 99.3% (identified cost $1,200,088) | 1,249,645 | ||||||||
| Other Assets and Liabilities, Net - 0.7% | 8,964 | ||||||||
| Net Assets - 100.0% | 1,258,609 | ||||||||
See accompanying notes which are an integral part of the financial statements.
514 Russell Tax Exempt Bond Fund
| Russell Investment Company | |||||||||||||||
| Russell Tax Exempt Bond Fund | |||||||||||||||
| Schedule of Investments, continued — October 31, 2014 | |||||||||||||||
| Restricted Securities | |||||||||||||||
| Amounts in thousands (except share and cost per unit amounts) | |||||||||||||||
| Principal | Cost per | Cost | Fair Value | ||||||||||||
| % of Net Assets | Acquisition | Amount ($) | Unit | (000 | ) | (000 | ) | ||||||||
| Securities | Date | or shares | $ | $ | $ | ||||||||||
| 0.3% | |||||||||||||||
| New York Liberty Development Corp. Revenue Bonds | 10/29/14 | 4,000,000 | 100.00 | 4,000 | 4,069 | ||||||||||
| 4,069 | |||||||||||||||
| For a description of restricted securities see note 9 in the Notes to Financial Statements. | |||||||||||||||
| Presentation of Portfolio Holdings | |||||||||||||||
| Amount in thousands | |||||||||||||||
| Fair Value | |||||||||||||||
| Portfolio Summary | Level 1 | Level 2 | Level 3 | Total | % of Net Assets | ||||||||||
| Municipal Bonds | |||||||||||||||
| Alabama | $ | — | $ | 15,972 | $ | — | $ | 15,972 | 1.3 | ||||||
| Alaska | — | 1,180 | — | 1,180 | 0.1 | ||||||||||
| Arizona | — | 25,530 | — | 25,530 | 2.0 | ||||||||||
| California | — | 102,556 | — | 102,556 | 8.1 | ||||||||||
| Colorado | — | 26,325 | — | 26,325 | 2.1 | ||||||||||
| Connecticut | — | 33,473 | — | 33,473 | 2.7 | ||||||||||
| Delaware | — | 2,463 | — | 2,463 | 0.2 | ||||||||||
| District of Columbia | — | 1,709 | — | 1,709 | 0.1 | ||||||||||
| Florida | — | 98,767 | — | 98,767 | 7.8 | ||||||||||
| Georgia | — | 28,425 | — | 28,425 | 2.3 | ||||||||||
| Guam | — | 10,794 | — | 10,794 | 0.9 | ||||||||||
| Hawaii | — | 4,652 | — | 4,652 | 0.4 | ||||||||||
| Idaho | — | 6,319 | — | 6,319 | 0.5 | ||||||||||
| Illinois | — | 67,137 | — | 67,137 | 5.3 | ||||||||||
| Indiana | — | 5,648 | — | 5,648 | 0.5 | ||||||||||
| Iowa | — | 6,422 | — | 6,422 | 0.5 | ||||||||||
| Kansas | — | 4,781 | — | 4,781 | 0.4 | ||||||||||
| Louisiana | — | 16,949 | — | 16,949 | 1.4 | ||||||||||
| Maryland | — | 5,553 | — | 5,553 | 0.4 | ||||||||||
| Massachusetts | — | 10,316 | — | 10,316 | 0.8 | ||||||||||
| Michigan | — | 33,024 | — | 33,024 | 2.6 | ||||||||||
| Minnesota | — | 19,285 | — | 19,285 | 1.5 | ||||||||||
| Mississippi | — | 3,916 | — | 3,916 | 0.3 | ||||||||||
| Missouri | — | 14,703 | — | 14,703 | 1.2 | ||||||||||
| Nebraska | — | 7,790 | — | 7,790 | 0.6 | ||||||||||
| Nevada | — | 18,387 | — | 18,387 | 1.5 | ||||||||||
| New Jersey | — | 58,285 | — | 58,285 | 4.6 | ||||||||||
| New Mexico | — | 3,356 | — | 3,356 | 0.3 | ||||||||||
| New York | — | 135,085 | — | 135,085 | 10.7 | ||||||||||
| North Carolina | — | 8,834 | — | 8,834 | 0.7 | ||||||||||
| North Dakota | — | 2,565 | — | 2,565 | 0.2 | ||||||||||
| Ohio | — | 66,897 | — | 66,897 | 5.3 | ||||||||||
| Oklahoma | — | 1,139 | — | 1,139 | 0.1 | ||||||||||
| Oregon | — | 7,419 | — | 7,419 | 0.6 | ||||||||||
| Pennsylvania | — | 68,842 | — | 68,842 | 5.5 | ||||||||||
| Puerto Rico | — | 40,085 | — | 40,085 | 3.2 | ||||||||||
| Rhode Island | — | 1,827 | — | 1,827 | 0.1 | ||||||||||
| South Carolina | — | 8,480 | — | 8,480 | 0.7 | ||||||||||
| Tennessee | — | 8,695 | — | 8,695 | 0.7 | ||||||||||
| Texas | — | 114,119 | — | 114,119 | 9.1 | ||||||||||
| Utah | — | 6,202 | — | 6,202 | 0.5 | ||||||||||
| Virgin Islands | — | 18,126 | — | 18,126 | 1.4 | ||||||||||
| Virginia | — | 13,034 | — | 13,034 | 1.0 | ||||||||||
| Washington | — | 40,694 | — | 40,694 | 3.2 | ||||||||||
| West Virginia | — | 2,624 | — | 2,624 | 0.2 | ||||||||||
| Wisconsin | — | 21,971 | — | 21,971 | 1.7 | ||||||||||
| Wyoming | — | 3,229 | — | 3,229 | 0.3 | ||||||||||
| Short-Term Investments | — | 46,061 | — | 46,061 | 3.7 | ||||||||||
| Total Investments | $ | — | $ | 1,249,645 | $ | — | $ | 1,249,645 | 99.3 | ||||||
| Other Assets and Liabilities, Net | 0.7 | ||||||||||||||
| 100.0 | |||||||||||||||
| See accompanying notes which are an integral part of the financial statements. | |||||||||||||||
| Russell Tax Exempt Bond Fund 515 | |||||||||||||||
| Russell Investment Company | |||||
| Russell Tax Exempt Bond Fund | |||||
| Schedule of Investments, continued — October 31, 2014 | |||||
| Presentation of Portfolio Holdings | |||||
| Amount in thousands | |||||
| Fair Value | |||||
| Portfolio Summary | Level 1 | Level 2 | Level 3 | Total | % of Net Assets |
For a description of the Levels see note 2 in the Notes to Financial Statements.
For disclosure on transfers between Levels 1, 2 and 3 during the period ended October 31, 2014, see note 2 in the Notes to Financial Statements.
See accompanying notes which are an integral part of the financial statements.
516 Russell Tax Exempt Bond Fund
| Russell Investment Company | ||
| Russell Tax Exempt Bond Fund | ||
| Statement of Assets and Liabilities — October 31, 2014 | ||
| Amounts in thousands | ||
| Assets | ||
| Investments, at identified cost | $ | 1,200,088 |
| Investments, at fair value(>) | 1,249,645 | |
| Receivables: | ||
| Dividends and interest | 16,920 | |
| Dividends from affiliated Russell funds | 4 | |
| Investments sold | 4,286 | |
| Fund shares sold | 3,321 | |
| Prepaid expenses | 3 | |
| Total assets | 1,274,179 | |
| Liabilities | ||
| Payables: | ||
| Investments purchased | 14,501 | |
| Fund shares redeemed | 428 | |
| Accrued fees to affiliates | 564 | |
| Other accrued expenses | 77 | |
| Total liabilities | 15,570 | |
| Net Assets | $ | 1,258,609 |
See accompanying notes which are an integral part of the financial statements.
Russell Tax Exempt Bond Fund 517
| Russell Investment Company | |||
| Russell Tax Exempt Bond Fund | |||
| Statement of Assets and Liabilities, continued — October 31, 2014 | |||
| Amounts in thousands | |||
| Net Assets Consist of: | |||
| Undistributed (overdistributed) net investment income | $ | 2,462 | |
| Accumulated net realized gain (loss) | (2,718 | ) | |
| Unrealized appreciation (depreciation) on investments | 49,557 | ||
| Shares of beneficial interest | 543 | ||
| Additional paid-in capital | 1,208,765 | ||
| Net Assets | $ | 1,258,609 | |
| Net Asset Value, offering and redemption price per share: | |||
| Net asset value per share: Class A(#) | $ | 23.27 | |
| Maximum offering price per share (Net asset value plus sales charge of 3.75%): Class A | $ | 24.18 | |
| Class A — Net assets | $ | 17,406,089 | |
| Class A — Shares outstanding ($.01 par value) | 748,016 | ||
| Net asset value per share: Class C(#) | $ | 23.14 | |
| Class C — Net assets | $ | 26,956,228 | |
| Class C — Shares outstanding ($.01 par value) | 1,164,772 | ||
| Net asset value per share: Class E(#) | $ | 23.23 | |
| Class E — Net assets | $ | 60,439,426 | |
| Class E — Shares outstanding ($.01 par value) | 2,602,134 | ||
| Net asset value per share: Class S(#) | $ | 23.19 | |
| Class S — Net assets | $ 1,153,807,238 | ||
| Class S — Shares outstanding ($.01 par value) | 49,754,939 | ||
| Amounts in thousands | |||
| (>) Investments in Affiliates, Russell U.S. Cash Management Fund | $ | 46,061 | |
| (#) Net asset value per share equals class level net assets divided by class level shares of beneficial interest outstanding. | |||
See accompanying notes which are an integral part of the financial statements.
518 Russell Tax Exempt Bond Fund
| Russell Investment Company | |||
| Russell Tax Exempt Bond Fund | |||
| Statement of Operations — For the Period Ended October 31, 2014 | |||
| Amounts in thousands | |||
| Investment Income | |||
| Dividends from affiliated Russell funds | $ | 56 | |
| Interest | 31,558 | ||
| Total investment income | 31,614 | ||
| Expenses | |||
| Advisory fees | 3,152 | ||
| Administrative fees | 500 | ||
| Custodian fees | 133 | ||
| Distribution fees - Class A | 39 | ||
| Distribution fees - Class C | 202 | ||
| Transfer agent fees - Class A | 31 | ||
| Transfer agent fees - Class C | 54 | ||
| Transfer agent fees - Class E | 111 | ||
| Transfer agent fees - Class S | 1,905 | ||
| Professional fees | 71 | ||
| Registration fees | 119 | ||
| Shareholder servicing fees - Class C | 67 | ||
| Shareholder servicing fees - Class E | 139 | ||
| Trustees’ fees | 24 | ||
| Printing fees | 26 | ||
| Miscellaneous | 52 | ||
| Expenses before reductions | 6,625 | ||
| Expense reductions | (561 | ) | |
| Net expenses | 6,064 | ||
| Net investment income (loss) | 25,550 | ||
| Net Realized and Unrealized Gain (Loss) | |||
| Net realized gain (loss) on investments | (1,752 | ) | |
| Net change in unrealized appreciation (depreciation) on investments | 31,378 | ||
| Net realized and unrealized gain (loss) | 29,626 | ||
| Net Increase (Decrease) in Net Assets from Operations | $ | 55,176 | |
See accompanying notes which are an integral part of the financial statements.
Russell Tax Exempt Bond Fund 519
| Russell Investment Company | ||||||
| Russell Tax Exempt Bond Fund | ||||||
| Statements of Changes in Net Assets | ||||||
| For the Periods Ended October 31, | ||||||
| Amounts in thousands | 2014 | 2013 | ||||
| Increase (Decrease) in Net Assets | ||||||
| Operations | ||||||
| Net investment income (loss) | $ | 25,550 | $ | 17,301 | ||
| Net realized gain (loss) | (1,752 | ) | 152 | |||
| Net change in unrealized appreciation (depreciation) | 31,378 | (21,953 | ) | |||
| Net increase (decrease) in net assets from operations | 55,176 | (4,500 | ) | |||
| Distributions | ||||||
| From net investment income | ||||||
| Class A | (334 | ) | (334 | ) | ||
| Class C | (385 | ) | (394 | ) | ||
| Class E | (1,199 | ) | (861 | ) | ||
| Class S | (22,836 | ) | (15,465 | ) | ||
| Net decrease in net assets from distributions | (24,754 | ) | (17,054 | ) | ||
| Share Transactions* | ||||||
| Net increase (decrease) in net assets from share transactions | 349,263 | 202,161 | ||||
| Total Net Increase (Decrease) in Net Assets | 379,685 | 180,607 | ||||
| Net Assets | ||||||
| Beginning of period | 878,924 | 698,317 | ||||
| End of period | $ | 1,258,609 | $ | 878,924 | ||
| Undistributed (overdistributed) net investment income included in net assets | $ | 2,462 | $ | 1,667 | ||
See accompanying notes which are an integral part of the financial statements.
520 Russell Tax Exempt Bond Fund
Russell Investment Company Russell Tax Exempt Bond Fund
Statements of Changes in Net Assets, continued
* Share transaction amounts (in thousands) for the periods ended October 31, 2014 and October 31, 2013 were as follows:
| 2014 | 2013 | |||||||||||
| Shares | Dollars | Shares | Dollars | |||||||||
| Class A | ||||||||||||
| Proceeds from shares sold | 301 | $ | 6,894 | 431 | $ | 9,915 | ||||||
| Proceeds from reinvestment of distributions | 14 | 330 | 15 | 331 | ||||||||
| Payments for shares redeemed | (312 | ) | (7,098 | ) | (331 | ) | (7,553 | ) | ||||
| Net increase (decrease) | 3 | 126 | 115 | 2,693 | ||||||||
| Class C | ||||||||||||
| Proceeds from shares sold | 361 | 8,250 | 482 | 11,070 | ||||||||
| Proceeds from reinvestment of distributions | 17 | 375 | 17 | 383 | ||||||||
| Payments for shares redeemed | (464 | ) | (10,554 | ) | (617 | ) | (14,009 | ) | ||||
| Net increase (decrease) | (86 | ) | (1,929 | ) | (118 | ) | (2,556 | ) | ||||
| Class E | ||||||||||||
| Proceeds from shares sold | 681 | 15,554 | 886 | 20,198 | ||||||||
| Proceeds from reinvestment of distributions | 52 | 1,172 | 37 | 835 | ||||||||
| Payments for shares redeemed | (393 | ) | (8,939 | ) | (344 | ) | (7,841 | ) | ||||
| Net increase (decrease) | 340 | 7,787 | 579 | 13,192 | ||||||||
| Class S | ||||||||||||
| Proceeds from shares sold | 22,545 | 514,118 | 16,258 | 370,892 | ||||||||
| Proceeds from reinvestment of distributions | 988 | 22,507 | 667 | 15,203 | ||||||||
| Payments for shares redeemed | (8,498 | ) | (193,346 | ) | (8,674 | ) | (197,263 | ) | ||||
| Net increase (decrease) | 15,035 | 343,279 | 8,251 | 188,832 | ||||||||
| Total increase (decrease) | 15,292 | $ | 349,263 | 8,827 | $ | 202,161 | ||||||
See accompanying notes which are an integral part of the financial statements.
Russell Tax Exempt Bond Fund 521
| Russell Investment Company | ||||||||||||||||
| Russell Tax Exempt Bond Fund | ||||||||||||||||
| Financial Highlights — For the Periods Ended | ||||||||||||||||
| For a Share Outstanding Throughout Each Period. | ||||||||||||||||
| $ | $ | $ | $ | $ | ||||||||||||
| Net Asset Value, | Net | Net Realized | Total from | Distributions | ||||||||||||
| Beginning of | Investment | and Unrealized | Investment | from Net | $ | |||||||||||
| Period | Income (Loss)(a)(d) | Gain (Loss) | Operations | Investment Income | Total Distributions | |||||||||||
| Class A | ||||||||||||||||
| October 31, 2014 | 22.62 | .50 | .64 | 1.14 | (.49 | ) | (.49 | ) | ||||||||
| October 31, 2013 | 23.24 | .45 | (.63 | ) | (.18 | ) | (.44 | ) | (.44 | ) | ||||||
| October 31, 2012 | 22.48 | .52 | .79 | 1.31 | (.55 | ) | (.55 | ) | ||||||||
| October 31, 2011 | 22.64 | .62 | (.16 | ) | .46 | (.62 | ) | (.62 | ) | |||||||
| October 31, 2010(1) | 22.31 | .27 | .29 | .56 | (.23 | ) | (.23 | ) | ||||||||
| Class C | ||||||||||||||||
| October 31, 2014 | 22.50 | .34 | .62 | .96 | (.32 | ) | (.32 | ) | ||||||||
| October 31, 2013 | 23.11 | .28 | (.61 | ) | (.33 | ) | (.28 | ) | (.28 | ) | ||||||
| October 31, 2012 | 22.36 | .37 | .77 | 1.14 | (.39 | ) | (.39 | ) | ||||||||
| October 31, 2011 | 22.53 | .47 | (.18 | ) | .29 | (.46 | ) | (.46 | ) | |||||||
| October 31, 2010 | 21.87 | .51 | .66 | 1.17 | (.51 | ) | (.51 | ) | ||||||||
| Class E | ||||||||||||||||
| October 31, 2014 | 22.58 | .51 | .64 | 1.15 | (.50 | ) | (.50 | ) | ||||||||
| October 31, 2013 | 23.19 | .45 | (.61 | ) | (.16 | ) | (.45 | ) | (.45 | ) | ||||||
| October 31, 2012 | 22.44 | .54 | .76 | 1.30 | (.55 | ) | (.55 | ) | ||||||||
| October 31, 2011 | 22.61 | .63 | (.17 | ) | .46 | (.63 | ) | (.63 | ) | |||||||
| October 31, 2010 | 21.94 | .68 | .67 | 1.35 | (.68 | ) | (.68 | ) | ||||||||
| Class S | ||||||||||||||||
| October 31, 2014 | 22.55 | .56 | .63 | 1.19 | (.55 | ) | (.55 | ) | ||||||||
| October 31, 2013 | 23.16 | .51 | (.61 | ) | (.10 | ) | (.51 | ) | (.51 | ) | ||||||
| October 31, 2012 | 22.41 | .60 | .76 | 1.36 | (.61 | ) | (.61 | ) | ||||||||
| October 31, 2011 | 22.57 | .69 | (.16 | ) | .53 | (.69 | ) | (.69 | ) | |||||||
| October 31, 2010 | 21.91 | .73 | .66 | 1.39 | (.73 | ) | (.73 | ) | ||||||||
See accompanying notes which are an integral part of the financial statements.
522 Russell Tax Exempt Bond Fund
| % | % | % | ||||||||||||
| $ | $ | Ratio of Expenses | Ratio of Expenses | Ratio of Net | ||||||||||
| Net Asset Value, | % | Net Assets, | to Average | to Average | Investment Income | % | ||||||||
| End of | Total | End of Period | Net Assets, | Net Assets, | to Average | Portfolio | ||||||||
| Period | Return(b)(c) | (000 | ) | Gross(e) | Net(d)(e) | Net Assets(d)(e) | Turnover Rate(b) | |||||||
| 23.27 | 5.09 | 17,406 | .84 | .82 | 2.18 | 15 | ||||||||
| 22.62 | (.77 | ) | 16,851 | .84 | .82 | 1.95 | 23 | |||||||
| 23.24 | 5.89 | 14,649 | .84 | .83 | 2.28 | 29 | ||||||||
| 22.48 | 2.11 | 2,918 | .83 | .83 | 2.80 | 29 | ||||||||
| 22.64 | 2.51 | 1,791 | .85 | .85 | 2.85 | 24 | ||||||||
| 23.14 | 4.32 | 26,956 | 1.59 | 1.53 | 1.47 | 15 | ||||||||
| 22.50 | (1.44 | ) | 28,147 | 1.59 | 1.53 | 1.24 | 23 | |||||||
| 23.11 | 5.12 | 31,628 | 1.58 | 1.54 | 1.62 | 29 | ||||||||
| 22.36 | 1.35 | 22,694 | 1.59 | 1.54 | 2.12 | 29 | ||||||||
| 22.53 | 5.43 | 28,301 | 1.59 | 1.51 | 2.31 | 24 | ||||||||
| 23.23 | 5.14 | 60,440 | .84 | .78 | 2.22 | 15 | ||||||||
| 22.58 | (.68 | ) | 51,073 | .84 | .78 | 1.99 | 23 | |||||||
| 23.19 | 5.87 | 39,034 | .83 | .79 | 2.37 | 29 | ||||||||
| 22.44 | 2.12 | 29,512 | .84 | .79 | 2.86 | 29 | ||||||||
| 22.61 | 6.25 | 33,042 | .84 | .76 | 3.05 | 24 | ||||||||
| 23.19 | 5.37 | 1,153,807 | .59 | .53 | 2.47 | 15 | ||||||||
| 22.55 | (.44 | ) | 782,853 | .59 | .53 | 2.24 | 23 | |||||||
| 23.16 | 6.14 | 613,006 | .58 | .54 | 2.63 | 29 | ||||||||
| 22.41 | 2.43 | 540,458 | .59 | .54 | 3.11 | 29 | ||||||||
| 22.57 | 6.47 | 492,584 | .59 | .51 | 3.30 | 24 | ||||||||
See accompanying notes which are an integral part of the financial statements.
Russell Tax Exempt Bond Fund 523
Russell Investment Company Russell Commodity Strategies Fund
Portfolio Management Discussion and Analysis — October 31, 2014 (Unaudited)

| Russell Commodity Strategies Fund - Class A‡ | Russell Commodity Strategies Fund - Class S | ||||||
| Total | Total | ||||||
| Return | Return | ||||||
| 1 Year | (13.88 | )% | 1 Year | (8.57 | )% | ||
| Inception* | (3.67 | )%§ | Inception* | (2.14 | )%§ | ||
| Russell Commodity Strategies Fund - Class C | Russell Commodity Strategies Fund - Class Y | ||||||
| Total | Total | ||||||
| Return | Return | ||||||
| 1 Year | (9.39 | )% | 1 Year | (8.31 | )% | ||
| Inception* | (3.11 | )%§ | Inception* | (1.97 | )%§ | ||
| Russell Commodity Strategies Fund - Class E | Bloomberg Commodity Index** | ||||||
| Total | Total | ||||||
| Return | Return | ||||||
| 1 Year | (8.74 | )% | 1 Year | (5.94 | )% | ||
| Inception* | (2.40 | )%§ | Inception* | (1.44 | )%§ | ||
524 Russell Commodity Strategies Fund
Russell Investment Company Russell Commodity Strategies Fund
Portfolio Management Discussion and Analysis, continued — October 31, 2014 (Unaudited)
| The Russell Commodity Strategies Fund (the “Fund”) employs | as the magnitude of the overhang in global supplies became more | ||
| a multi-manager approach whereby portions of the Fund | apparent. Agriculture was another sector where developments | ||
| are allocated to different money managers. Fund assets not | on the supply side drove prices lower and generated losses for | ||
| allocated to money managers are managed by Russell Investment | the benchmark and Fund. Record harvest predictions for corn | ||
| Management Company (“RIMCo”), the Fund’s advisor. RIMCo | and soybeans were the important stories for these commodities | ||
| may change the allocation of the Fund’s assets among money | during the third quarter of 2014 and prices declined to multi- | ||
| managers at any time. An exemptive order from the Securities | year lows. The industrial metals sector was one of the bright spots | ||
| and Exchange Commission (“SEC”) permits RIMCo to engage | during the year, owing positive performance to supply shortages | ||
| or terminate a money manager at any time, subject to approval | in the case of nickel, as well as decent Chinese demand for other | ||
| by the Fund’s Board, without a shareholder vote. Pursuant to the | base metals. Precious metals were volatile during the year but | ||
| terms of the exemptive order, the Fund is required to notify its | ultimately ended lower as a strong U.S. dollar and expectations | ||
| shareholders within 90 days of when a money manager begins | for higher real rates in the U.S. weighed on gold prices. | ||
| providing services. As of October 31, 2014, the Fund had three | |||
| money managers. | How did the investment strategies and techniques employed | ||
| by the Fund and its money managers affect its benchmark- | |||
| What is the Fund’s investment objective? | relative performance? | ||
| The Fund seeks to provide long term total return. | CoreCommodity | Management, LLC | (“CoreCommodity”) |
| How did the Fund perform relative to its benchmark for the | outperformed the | Fund’s benchmark | for the fiscal year. |
| fiscal year ended October 31, 2014? | CoreCommodity generated excess returns relative to the | ||
| benchmark through its quantitative and qualitative approach to | |||
| For the fiscal year ended October 31, 2014, the Fund’s Class A, | contract selection. CoreCommodity concentrated active positions | ||
| Class C, Class E, Class S, and Class Y Shares lost 8.62%, 9.39%, | primarily in the agriculture and energy space, where opportunities | ||
| 8.74%, 8.57% and 8.31%, respectively. This is compared to the | for spread volatility were most abundant. A deferred position | ||
| Fund’s benchmark, the Bloomberg Commodity Index, which lost | in the natural gas markets in January detracted heavily from | ||
| 5.94% during the same period. The Fund’s performance includes | benchmark-relative returns as spot prices and spreads rallied | ||
| operating expenses, whereas index returns are unmanaged and do | sharply due to the extreme cold weather event experienced during | ||
| not include expenses of any kind. | the month. CoreCommodity was able to make up these losses | ||
| For the fiscal year ended October 31, 2014, the Morningstar® | through successful trading in WTI crude oil and lean hogs during | ||
| Commodities Broad Basket, a group of funds that Morningstar | the year. | ||
| considers to have investment strategies similar to those of the | Credit Suisse Asset Management, LLC (“Credit Suisse”) | ||
| Fund, lost 7.63%. This result serves as a peer comparison and is | outperformed the Fund’s benchmark for the fiscal year. Credit | ||
| expressed net of operating expenses. | Suisse was successful in adding value through contract selection | ||
| How did the market conditions described in the Market | over the course of the year, primarily by tactically buying deferred | ||
| Summary report affect the Fund’s performance? | commodity contracts within the energy and agriculture sectors. | ||
| Commodity markets experienced another difficult year for | Credit Suisse continues to serve as a solid core strategy in the | ||
| the period ending October 31, 2014. The various sectors that | Fund, deploying active strategies with lower benchmark-relative | ||
| comprise the Bloomberg Commodity Index were each influenced | volatility when compared with the other strategies in the Fund. | ||
| by a diverse set of supply side stories and an overall global | Goldman Sachs | Asset Management, L.P. (“GSAM”) | |
| demand environment that had very few bullish developments. | underperformed the Fund’s benchmark for the fiscal year. | ||
| Industrial metals and livestock were the only sectors that posted | GSAM lost value during the period due primarily to positions | ||
| gains during the year while energy, precious metals and many | in the energy space. GSAM relies on proprietary fundamental | ||
| agricultural commodities declined. Supply-side developments | research to take directional positions in individual commodities | ||
| were the key drivers for most commodity prices during the period. | and sectors. GSAM’s overweight to energy commodities such as | ||
| Energy markets started 2014 on a strong note, with natural gas | crude oil and unleaded gasoline were additive during the second | ||
| rallying sharply in January on the back of unseasonably cold | quarter of 2014, but these same positions detracted significantly | ||
| weather, only to have many of these gains retracted as supplies | during the third quarter as energy markets sharply declined. | ||
| were quickly rebuilt during the summer months. Crude oil was | Underweight positions in agriculture markets and an out-of- | ||
| generally well supported during the first three quarters of the fiscal | benchmark position in palladium were able to offset some of these | ||
| year period, but prices fell sharply during the third quarter of 2014 | losses during the period, but GSAM ultimately finished as the | ||
| Fund’s worst performing manager. | |||
| Russell Commodity Strategies Fund 525 | |||
Russell Investment Company Russell Commodity Strategies Fund
Portfolio Management Discussion and Analysis, continued — October 31, 2014 (Unaudited)
| RIMCo manages the portion of the Fund’s assets that RIMCo | Describe any changes to the Fund’s structure or the money | ||
| determines not to allocate to the money managers. Assets not | manager line-up. | ||
| allocated to managers include the Fund’s liquidity reserves and | As discussed above, in April of 2014, RIMCo implemented the | ||
| assets which may be managed directly by RIMCo to modify the | total return swap with Cargill Incorporated at a 15% allocation | ||
| Fund’s overall portfolio characteristics to seek to achieve the | in the Fund. | ||
| desired risk/return profile for the Fund. | |||
| Strategies employed by RIMCo in the Fund include an allocation to | Money Managers as of October 31, | ||
| a RIMCo-developed backwardation strategy and, as of April 2014, | 2014 | Styles | |
| implementation of a total return swap with Cargill Incorporated. | CoreCommodity Management, LLC | Fully Active Commodity | |
| Credit Suisse Asset Management, LLC | Enhanced Index | ||
| RIMCo’s backwardation strategy seeks to achieve excess return | Goldman Sachs Asset Management, L.P. | Fully Active Commodity | |
| through the use of a quantitative model that selects and weights | The views expressed in this report reflect those of the portfolio | ||
| exposure to individual commodities based upon their relative | managers only through the end of the period covered by | ||
| attractiveness. The total return swap strategy seeks to exploit the | the report. These views do not necessarily represent the | ||
| grains and livestock trading expertise of global food giant Cargill | views of RIMCo, or any other person in RIMCo or any other | ||
| Incorporated. The backwardation strategy underperformed the | affiliated organization. These views are subject to change | ||
| Fund’s benchmark over the period due to persistent overweights | at any time based upon market conditions or other events, | ||
| to energy commodities, which declined in value during the third | and RIMCo disclaims any responsibility to update the views | ||
| quarter of 2014. The total return swap strategy outperformed | contained herein. These views should not be relied on as | ||
| the Fund’s benchmark since its inclusion in the Fund in April | investment advice and, because investment decisions for | ||
| 2014. This strategy added value primarily through underweight | a Russell Investment Company (“RIC”) Fund are based on | ||
| positions in grains markets. The swap also provided exposure | numerous factors, should not be relied on as an indication | ||
| to out-of-benchmark commodities such as palm oil, rapeseed | of investment decisions of any RIC Fund. | ||
| and milling wheat, several of which were additive to the swap’s | |||
| performance since inception. | |||
| * | Assumes initial investment on June 30, 2010. | ||
| ** | The Bloomberg Commodity Index is made up of 22 exchange-traded futures on physical commodities. The index currently represents 20 commodities, which are | ||
| weighted to account for economic significance and market liquidity. | |||
| ‡ | The performance shown has been adjusted to reflect the deduction of the maximum Class A sales charge of 5.75%. | ||
| § | Annualized. | ||
| Performance is historical and assumes reinvestment of all dividends and capital gains. Investment return and principal value will fluctuate so that an investor’s | |||
| shares, when redeemed, may be worth more or less than when purchased. Past performance is not indicative of future results. The returns shown do not reflect the | |||
| deduction of taxes that a shareholder would pay on Fund distributions or the redemption of Fund shares. | |||
| 526 Russell Commodity Strategies Fund | |||
Russell Investment Company Russell Commodity Strategies Fund
Shareholder Expense Example — October 31, 2014 (Unaudited)
| Fund Expenses | Please note that the expenses shown in the table are meant | |||||
| The following disclosure provides important information | to highlight your ongoing costs only and do not reflect any | |||||
| regarding the Fund’s Shareholder Expense Example | transactional costs. Therefore, the information under the heading | |||||
| (“Example”). | “Hypothetical Performance (5% return before expenses)” is | |||||
| useful in comparing ongoing costs only, and will not help you | ||||||
| Example | determine the relative total costs of owning different funds. In | |||||
| As a shareholder of the Fund, you incur two types of costs: (1) | addition, if these transactional costs were included, your costs | |||||
| transaction costs, and (2) ongoing costs, including advisory and | would have been higher. | |||||
| administrative fees; distribution (12b-1) and/or service fees; | Hypothetical | |||||
| and other Fund expenses. The Example is intended to help | Performance (5% | |||||
| you understand your ongoing costs (in dollars) of investing in | Actual | return before | ||||
| the Fund and to compare these costs with the ongoing costs of | Class A | Performance | expenses) | |||
| Beginning Account Value | ||||||
| investing in other mutual funds. The Example is based on an | May 1, 2014 | $ | 1,000.00 | $ | 1,000.00 | |
| investment of $1,000 invested at the beginning of the period and | Ending Account Value | |||||
| held for the entire period indicated, which for this Fund is from | October 31, 2014 | $ | 856.30 | $ | 1,017.74 | |
| May 1, 2014 to October 31, 2014. | Expenses Paid During Period* | $ | 6.92 | $ | 7.53 | |
| Actual Expenses | * Expenses are equal to the Fund's annualized expense ratio of 1.48% | |||||
| (representing the six month period annualized), multiplied by the average | ||||||
| The information in the table under the heading “Actual | account value over the period, multiplied by 184/365 (to reflect the one-half | |||||
| Performance” provides information about actual account values | year period). May reflect amounts waived and/or reimbursed. Without any | |||||
| and actual expenses. You may use the information in this column, | waivers and/or reimbursements, expenses would have been higher. | |||||
| together with the amount you invested, to estimate the expenses | ||||||
| Hypothetical | ||||||
| that you paid over the period. Simply divide your account value by | Performance (5% | |||||
| $1,000 (for example, an $8,600 account value divided by $1,000 | Actual | return before | ||||
| = 8.6), then multiply the result by the number in the first column | Class C | Performance | expenses) | |||
| Beginning Account Value | ||||||
| in the row entitled “Expenses Paid During Period” to estimate | May 1, 2014 | $ | 1,000.00 | $ | 1,000.00 | |
| the expenses you paid on your account during this period. | Ending Account Value | |||||
| October 31, 2014 | $ | 853.00 | $ | 1,013.91 | ||
| Hypothetical Example for Comparison Purposes | Expenses Paid During Period* | $ | 10.46 | $ | 11.37 | |
| The information in the table under the heading “Hypothetical | ||||||
| Performance (5% return before expenses)” provides information | * Expenses are equal to the Fund's annualized expense ratio of 2.24% | |||||
| (representing the six month period annualized), multiplied by the average | ||||||
| about hypothetical account values and hypothetical expenses | account value over the period, multiplied by 184/365 (to reflect the one-half | |||||
| based on the Fund’s actual expense ratio and an assumed rate of | year period). May reflect amounts waived and/or reimbursed. Without any | |||||
| return of 5% per year before expenses, which is not the Fund’s | waivers and/or reimbursements, expenses would have been higher. | |||||
| actual return. The hypothetical account values and expenses | ||||||
| Hypothetical | ||||||
| may not be used to estimate the actual ending account balance or | Performance (5% | |||||
| expenses you paid for the period. You may use this information | Actual | return before | ||||
| to compare the ongoing costs of investing in the Fund and other | Class E | Performance | expenses) | |||
| funds. To do so, compare this 5% hypothetical example with the | Beginning Account Value | |||||
| May 1, 2014 | $ | 1,000.00 | $ | 1,000.00 | ||
| 5% hypothetical examples that appear in the shareholder reports | Ending Account Value | |||||
| of other funds. | October 31, 2014 | $ | 856.20 | $ | 1,017.69 | |
| Expenses Paid During Period* | $ | 6.97 | $ | 7.58 | ||
| * Expenses are equal to the Fund's annualized expense ratio of 1.49% | ||||||
| (representing the six month period annualized), multiplied by the average | ||||||
| account value over the period, multiplied by 184/365 (to reflect the one-half | ||||||
| year period). May reflect amounts waived and/or reimbursed. Without any | ||||||
| waivers and/or reimbursements, expenses would have been higher. | ||||||
| Russell Commodity Strategies Fund 527 | ||||||
Russell Investment Company Russell Commodity Strategies Fund
Shareholder Expense Example, continued — October 31, 2014 (Unaudited)
| Hypothetical | ||||||
| Performance (5% | ||||||
| Actual | return before | |||||
| Class S | Performance | expenses) | ||||
| Beginning Account Value | ||||||
| May 1, 2014 | $ | 1,000.00 | $ | 1,000.00 | ||
| Ending Account Value | ||||||
| October 31, 2014 | $ | 857.10 | $ | 1,018.95 | ||
| Expenses Paid During Period* | $ | 5.80 | $ | 6.31 | ||
| * Expenses are equal to the Fund's annualized expense ratio of 1.24% | ||||||
| (representing the six month period annualized), multiplied by the average | ||||||
| account value over the period, multiplied by 184/365 (to reflect the one-half | ||||||
| year period). May reflect amounts waived and/or reimbursed. Without any | ||||||
| waivers and/or reimbursements, expenses would have been higher. | ||||||
| Hypothetical | ||||||
| Performance (5% | ||||||
| Actual | return before | |||||
| Class Y | Performance | expenses) | ||||
| Beginning Account Value | ||||||
| May 1, 2014 | $ | 1,000.00 | $ | 1,000.00 | ||
| Ending Account Value | ||||||
| October 31, 2014 | $ | 857.80 | $ | 1,019.91 | ||
| Expenses Paid During Period* | $ | 4.92 | $ | 5.35 | ||
| * Expenses are equal to the Fund's annualized expense ratio of 1.05% | ||||||
| (representing the six month period annualized), multiplied by the average | ||||||
| account value over the period, multiplied by 184/365 (to reflect the one-half | ||||||
| year period). May reflect amounts waived and/or reimbursed. Without any | ||||||
| waivers and/or reimbursements, expenses would have been higher. | ||||||
528 Russell Commodity Strategies Fund
Russell Investment Company Russell Commodity Strategies Fund
Consolidated Schedule of Investments — October 31, 2014
Amounts in thousands (except share amounts)
| Principal | Fair | ||||
| Amount ($) | Value | ||||
| or Shares | $ | ||||
| Short-Term Investments - 94.8% | |||||
| Russell U.S. Cash Management Fund | 662,115,878 | (8) | 662,116 | ||
| United States Treasury Bills | |||||
| Zero coupon due 11/20/14 | 37,000 | 37,000 | |||
| Zero coupon due 03/05/15 | 70,000 | 69,990 | |||
| United States Treasury Notes | |||||
| 0.250% due 01/31/15 | 227,000 | 227,089 | |||
| Total Short-Term Investments | |||||
| (cost $996,222) | 996,195 | ||||
| Total Investments 94.8% | |||||
| (identified cost $996,222) | 996,195 | ||||
| Other Assets and Liabilities, | |||||
| Net - 5.2% | 54,483 | ||||
| Net Assets - 100.0% | 1,050,678 | ||||
See accompanying notes which are an integral part of the financial statements.
Russell Commodity Strategies Fund 529
Russell Investment Company Russell Commodity Strategies Fund
Consolidated Schedule of Investments, continued — October 31, 2014
| Index Swap Contracts (*) | ||||||
| Amounts in thousands | ||||||
| Fund Receives | Notional | Termination | Fair Value | |||
| Underlying Security | Counterparty | Amount | Date | $ | ||
| Bloomberg Aluminum Subindex | Merrill Lynch | USD | 2,438 | 04/02/15 | (1 | ) |
| Bloomberg Aluminum Subindex | Merrill Lynch | USD | 2,535 | 04/02/15 | (1 | ) |
| Bloomberg Aluminum Subindex | Merrill Lynch | USD | 3,014 | 04/02/15 | (1 | ) |
| Bloomberg Aluminum Subindex | Merrill Lynch | USD | 1,259 | 04/02/15 | — | |
| Bloomberg Coffee Subindex | Merrill Lynch | USD | 2,343 | 04/02/15 | (1 | ) |
| Bloomberg Coffee Subindex | Merrill Lynch | USD | 801 | 04/02/15 | — | |
| Bloomberg Coffee Subindex | Merrill Lynch | USD | 696 | 04/02/15 | — | |
| Bloomberg Coffee Subindex | UBS | USD | 1,161 | 02/25/15 | — | |
| Bloomberg Coffee Subindex | UBS | USD | 1,205 | 02/25/15 | — | |
| Bloomberg Commodity Index 2 Month Forward Total | ||||||
| Return | BNP Paribas | USD | 18,293 | 11/25/14 | (211 | ) |
| Bloomberg Commodity Index 2 Month Forward Total | ||||||
| Return | Morgan Stanley | USD | 46,121 | 11/25/14 | (532 | ) |
| Bloomberg Commodity Index 2 Month Forward Total | ||||||
| Return | Societe Generale | USD | 40,611 | 11/25/14 | (468 | ) |
| Bloomberg Commodity Index 2 Month Forward Total | ||||||
| Return | UBS | USD | 26,199 | 11/25/14 | (302 | ) |
| Bloomberg Commodity Index | Merrill Lynch | USD | 14,710 | 03/02/15 | (2 | ) |
| Bloomberg Commodity Index | UBS | USD | 81,695 | 03/04/15 | (10 | ) |
| Bloomberg Commodity Index | UBS | USD | 59,208 | 03/04/15 | (7 | ) |
| Bloomberg Commodity Index | UBS | USD | 6,163 | 03/04/15 | (1 | ) |
| Bloomberg Commodity Index | UBS | USD | 4,788 | 03/04/15 | (1 | ) |
| Bloomberg Commodity Index Total Return | BNP Paribas | USD | 35,225 | 11/25/14 | (398 | ) |
| Bloomberg Commodity Index Total Return | Morgan Stanley | USD | 6,576 | 11/25/14 | (74 | ) |
| Bloomberg Commodity Index Total Return | Societe Generale | USD | 14,043 | 11/25/14 | (159 | ) |
| Bloomberg Commodity Index Total Return | UBS | USD | 21,337 | 11/25/14 | (241 | ) |
| Bloomberg Copper Subindex | Merrill Lynch | USD | 1,326 | 04/02/15 | — | |
| Bloomberg Copper Subindex | Merrill Lynch | USD | 1,496 | 04/02/15 | — | |
| Bloomberg Copper Subindex | Merrill Lynch | USD | 2,835 | 04/02/15 | — | |
| Bloomberg Copper Subindex | Merrill Lynch | USD | 1,972 | 04/02/15 | — | |
| Bloomberg Copper Subindex | UBS | USD | 2,203 | 08/13/15 | — | |
| Bloomberg Cotton Subindex | Merrill Lynch | USD | 758 | 04/02/15 | — | |
| Bloomberg Cotton Subindex | Merrill Lynch | USD | 1,242 | 04/02/15 | — | |
| Bloomberg Gold Subindex | Merrill Lynch | USD | 3,901 | 03/16/15 | (1 | ) |
| Bloomberg Gold Subindex | Merrill Lynch | USD | 4,513 | 03/16/15 | (1 | ) |
| Bloomberg Gold Subindex | Merrill Lynch | USD | 746 | 03/16/15 | — | |
| Bloomberg Gold Subindex | Merrill Lynch | USD | 1,041 | 03/16/15 | — | |
| Bloomberg Heating Oil Subindex | Merrill Lynch | USD | 2,002 | 01/14/15 | — | |
| Bloomberg Heating Oil Subindex | Merrill Lynch | USD | 3,314 | 01/14/15 | (1 | ) |
| Bloomberg Kansas Wheat Subindex | Merrill Lynch | USD | 701 | 04/02/15 | — | |
| Bloomberg Kansas Wheat Subindex | Merrill Lynch | USD | 1,146 | 04/02/15 | — | |
| Bloomberg Lean Hogs Subindex | Merrill Lynch | USD | 859 | 04/02/15 | — | |
| Bloomberg Lean Hogs Subindex | Merrill Lynch | USD | 1,280 | 04/02/15 | — | |
| Bloomberg Lean Hogs Subindex | UBS | USD | 1,207 | 03/11/15 | — | |
| Bloomberg Live Cattle Subindex | Merrill Lynch | USD | 807 | 04/02/15 | — | |
| Bloomberg Live Cattle Subindex | Merrill Lynch | USD | 1,103 | 04/02/15 | — | |
| Bloomberg Live Cattle Subindex | Merrill Lynch | USD | 2,263 | 04/02/15 | (1 | ) |
| Bloomberg Live Cattle Subindex | Merrill Lynch | USD | 2,607 | 04/02/15 | (1 | ) |
| Bloomberg Natural Gas Subindex | Merrill Lynch | USD | 1,940 | 04/02/15 | — | |
| Bloomberg Natural Gas Subindex | Merrill Lynch | USD | 1,984 | 04/02/15 | — | |
| Bloomberg Natural Gas Subindex | Merrill Lynch | USD | 1,171 | 04/02/15 | — | |
| Bloomberg Natural Gas Subindex | Merrill Lynch | USD | 978 | 04/02/15 | — | |
| Bloomberg Natural Gas Subindex | UBS | USD | 3,819 | 02/20/15 | (1 | ) |
| Bloomberg Nickel Subindex | Merrill Lynch | USD | 3,140 | 01/14/15 | (1 | ) |
| Bloomberg Nickel Subindex | Merrill Lynch | USD | 1,968 | 01/14/15 | — | |
| Bloomberg Platinum Subindex | Merrill Lynch | USD | 1,776 | 04/02/15 | — | |
| Bloomberg Platinum Subindex | Merrill Lynch | USD | 843 | 04/02/15 | — | |
| Bloomberg Platinum Subindex | Merrill Lynch | USD | 587 | 04/02/15 | — | |
| Bloomberg Platinum Subindex | Merrill Lynch | USD | 7,471 | 04/02/15 | (1 | ) |
| Bloomberg Platinum Subindex | Merrill Lynch | USD | 701 | 04/02/15 | — | |
| Bloomberg Soybean Oil Subindex | Merrill Lynch | USD | 1,029 | 04/02/15 | — | |
| Bloomberg Soybean Oil Subindex | Merrill Lynch | USD | 1,378 | 04/02/15 | — | |
| Bloomberg Soybean Oil Subindex | Merrill Lynch | USD | 1,352 | 04/02/15 | — | |
| Bloomberg Soybeans Subindex | Merrill Lynch | USD | 2,428 | 04/02/15 | — | |
| Bloomberg Soybeans Subindex | Merrill Lynch | USD | 884 | 04/02/15 | — | |
| Bloomberg Soybeans Subindex | UBS | USD | 3,914 | 07/23/15 | — | |
| Bloomberg SoyMeal Subindex | Merrill Lynch | USD | 1,362 | 04/02/15 | — | |
| Bloomberg SoyMeal Subindex | Merrill Lynch | USD | 827 | 04/02/15 | — | |
| Bloomberg SoyMeal Subindex | UBS | USD | 859 | 09/21/15 | — | |
| See accompanying notes which are an integral part of the financial statements. | ||||||
| 530 Russell Commodity Strategies Fund | ||||||
Russell Investment Company Russell Commodity Strategies Fund
Consolidated Schedule of Investments, continued — October 31, 2014
| Index Swap Contracts (*) | ||||||
| Amounts in thousands | ||||||
| Fund Receives | Notional | Termination | Fair Value | |||
| Underlying Security | Counterparty | Amount | Date | $ | ||
| Bloomberg Sugar Subindex | Merrill Lynch | USD | 1,376 | 04/02/15 | — | |
| Bloomberg Sugar Subindex | Merrill Lynch | USD | 1,317 | 04/02/15 | — | |
| Bloomberg Sugar Subindex | Merrill Lynch | USD | 3,149 | 04/02/15 | — | |
| Bloomberg Sugar Subindex | UBS | USD | 820 | 02/25/15 | — | |
| Bloomberg Unleaded Gasoline Subindex | Merrill Lynch | USD | 973 | 04/02/15 | — | |
| Bloomberg Unleaded Gasoline Subindex | Merrill Lynch | USD | 1,851 | 04/02/15 | — | |
| Bloomberg Unleaded Gasoline Subindex | UBS | USD | 2,094 | 03/27/15 | — | |
| Bloomberg WTI Crude Oil Subindex 6 Month Forward | UBS | USD | 8,506 | 08/27/15 | (2 | ) |
| Bloomberg WTI Crude Oil Subindex 6 Month Forward | UBS | USD | 4,730 | 08/27/15 | (1 | ) |
| Bloomberg Zinc Subindex | Merrill Lynch | USD | 506 | 03/30/15 | — | |
| Bloomberg Zinc Subindex | Merrill Lynch | USD | 2,939 | 03/30/15 | (1 | ) |
| Bloomberg Zinc Subindex | Merrill Lynch | USD | 178 | 03/30/15 | — | |
| Bloomberg Zinc Subindex | Merrill Lynch | USD | 465 | 03/30/15 | — | |
| Bloomberg Zinc Subindex | UBS | USD | 2,008 | 08/13/15 | — | |
| BNP Strategy RL Commodity Index(#) | BNP Paribas | USD | 47,633 | 11/28/14 | — | |
| Cargill Pro-Alpha Index(##) | Cargill | USD | 160,727 | 03/31/15 | — | |
| Macquarie Commodity Customized Product(###) | Macquarie | USD | 36,788 | 11/25/14 | (411 | ) |
| Merrill Lynch Commodity Index eXtra | Merrill Lynch | USD | 24,336 | 11/25/14 | (256 | ) |
| Merrill Lynch Commodity Index eXtra Brent Annual | ||||||
| Excess Return | Merrill Lynch | USD | 8,119 | 04/02/15 | (2 | ) |
| Merrill Lynch Commodity Index eXtra Brent Annual | ||||||
| Excess Return | Merrill Lynch | USD | 8,968 | 04/02/15 | (2 | ) |
| Merrill Lynch Commodities Index eXtra (Palladium) | ||||||
| Excess Return | Merrill Lynch | USD | 4,352 | 04/02/15 | (1 | ) |
| Merrill Lynch Commodities Index eXtra (Palladium) | ||||||
| Excess Return | Merrill Lynch | USD | 2,399 | 04/02/15 | (1 | ) |
| Merrill Lynch Commodities Index eXtra (Palladium) | ||||||
| Excess Return | Merrill Lynch | USD | 4,640 | 04/02/15 | (1 | ) |
| Merrill Lynch Commodities Index eXtra (Palladium) | ||||||
| Excess Return | Merrill Lynch | USD | 7,592 | 04/02/15 | (1 | ) |
| Russell CoreCommodity Diversified I Index(####) | Newedge | USD | 168,654 | 09/09/31 | (331 | ) |
| S&P GSCI Aluminum Index Excess Return | Merrill Lynch | USD | 180 | 01/14/15 | — | |
| S&P GSCI Aluminum Index Excess Return | Merrill Lynch | USD | 751 | 01/14/15 | — | |
| S&P GSCI Coffee Index Excess Return | Merrill Lynch | USD | 292 | 04/02/15 | — | |
| S&P GSCI Copper Index Excess Return | Merrill Lynch | USD | 192 | 01/14/15 | — | |
| S&P GSCI Copper Index Excess Return | Merrill Lynch | USD | 471 | 01/14/15 | — | |
| S&P GSCI Cotton Index Excess Return | Merrill Lynch | USD | 339 | 04/02/15 | — | |
| S&P GSCI Feeder Cattle Index Excess Return | Merrill Lynch | USD | 390 | 04/02/15 | — | |
| S&P GSCI GasOil Index Excess Return | Merrill Lynch | USD | 2,830 | 01/14/15 | (1 | ) |
| S&P GSCI Heating Oil Index Excess Return | Merrill Lynch | USD | 422 | 01/14/15 | — | |
| S&P GSCI Heating Oil Index Excess Return | Merrill Lynch | USD | 1,773 | 01/14/15 | — | |
| S&P GSCI Index Excess Return | UBS | USD | 1,459 | 03/04/15 | — | |
| S&P GSCI Index Excess Return | UBS | USD | 1,145 | 03/04/15 | — | |
| S&P GSCI Index Excess Return | UBS | USD | 37,289 | 03/04/15 | (5 | ) |
| S&P GSCI Lead Index Excess Return | Merrill Lynch | USD | 171 | 01/14/15 | — | |
| S&P GSCI Lean Hogs Index Excess Return | Merrill Lynch | USD | 794 | 04/02/15 | — | |
| S&P GSCI Live Cattle Index Excess Return | Merrill Lynch | USD | 691 | 04/02/15 | — | |
| S&P GSCI Live Cattle Index Excess Return | Merrill Lynch | USD | 884 | 04/02/15 | — | |
| S&P GSCI Nickel Index Excess Return | Merrill Lynch | USD | 227 | 01/14/15 | — | |
| S&P GSCI Palladium Index Excess Return | Merrill Lynch | USD | 2,397 | 01/14/15 | (1 | ) |
| S&P GSCI Palladium Index Excess Return | Merrill Lynch | USD | 808 | 01/14/15 | — | |
| S&P GSCI Palladium Index Excess Return | Merrill Lynch | USD | 378 | 01/14/15 | — | |
| S&P GSCI Platinum Index Excess Return | Merrill Lynch | USD | 1,908 | 01/14/15 | — | |
| S&P GSCI Soybeans Index Excess Return | UBS | USD | 796 | 07/23/15 | — | |
| S&P GSCI Sugar Index Excess Return | Merrill Lynch | USD | 572 | 01/14/15 | — | |
| S&P GSCI Unleaded Gasoline Index Excess Return | Merrill Lynch | USD | 1,976 | 01/14/15 | — | |
| S&P GSCI Zinc Index Excess Return | Merrill Lynch | USD | 620 | 01/14/15 | — | |
| WTI Excess Return Index | Merrill Lynch | USD | 8,921 | 04/02/15 | (2 | ) |
| Total Fair Value of Open Index Swap Contracts Premiums Paid (Received) - $— (å) | (3,437 | ) | ||||
| (*) Total return swaps (which includes index swaps) are agreements between counterparties to exchange cash flows, one based on a market-linked | ||||||
| return of an individual asset or a basket of assets (i.e. an index), and the other on a fixed or floating rate. The fixed fees embedded in the total return | ||||||
| swaps held as of October 31, 2014 ranged from 0.00% to 0.35%. The floating rate fees were all based on the 3-month Treasury Bill rate plus a fee | ||||||
| ranging from 0.138% to 0.296%. Some total return swaps may also have performance based fees embedded in the value of the swap. For the period | ||||||
| ended October 31, 2014, total performance based fees were $8,121. | ||||||
| See accompanying notes which are an integral part of the financial statements. | ||||||
| Russell Commodity Strategies Fund 531 | ||||||
Russell Investment Company Russell Commodity Strategies Fund
Consolidated Schedule of Investments, continued — October 31, 2014
| Presentation of Portfolio Holdings | |||||||||||||||
| Amounts in thousands | |||||||||||||||
| Fair Value | |||||||||||||||
| Portfolio Summary | Level 1 | Level 2 | Level 3 | Total | % of Net Assets | ||||||||||
| Short-Term Investments | — | 996,195 | — | 996,195 | 94.8 | ||||||||||
| Total Investments | — | 996,195 | — | 996,195 | 94.8 | ||||||||||
| Other Assets and Liabilities, Net | 5.2 | ||||||||||||||
| 100.0 | |||||||||||||||
| Other Financial Instruments | |||||||||||||||
| Index Swap Contracts | — | (3,437 | ) | — | (3,437 | ) | (0.3 | ) | |||||||
| Total Other Financial Instruments* | $ | — | $ | (3,437 | ) | $ | — | $ | (3,437 | ) | |||||
* Futures and foreign currency exchange contract values reflect the unrealized appreciation (depreciation) on the instruments.
For a description of the Levels see note 2 in the Notes to Financial Statements.
For disclosure on transfers between Levels 1, 2 and 3 during the period ended October 31, 2014, see note 2 in the Notes to Financial Statements.
See accompanying notes which are an integral part of the financial statements.
532 Russell Commodity Strategies Fund
Russell Investment Company Russell Commodity Strategies Fund
Consolidated Fair Value of Derivative Instruments — October 31, 2014
Amounts in thousands
| Commodity | |||
| Derivatives not accounted for as hedging instruments | Contracts | ||
| Location: Statement of Assets and Liabilities - Liabilities | |||
| Index swap contracts, at fair value | $ | 3,437 | |
| Commodity | |||
| Derivatives not accounted for as hedging instruments | Contracts | ||
| Location: Statement of Operations - Net realized gain (loss) | |||
| Futures contracts | $ | 452 | |
| Index swap contracts | (86,199 | ) | |
| Total | $ | (85,747 | ) |
| Location: Statement of Operations - Net change in unrealized appreciation (depreciation) | |||
| Futures contracts | $ | (1,127 | ) |
| Index swap contracts | 4,876 | ||
| Total | $ | 3,749 | |
| For further disclosure on derivatives see note 2 in the Notes to Financial Statements. | |||
See accompanying notes which are an integral part of the financial statements.
Russell Commodity Strategies Fund 533
Russell Investment Company Russell Commodity Strategies Fund
Consolidated Balance Sheet Offsetting of Financial and Derivative Instruments —October 31, 2014
| Amounts in thousands | ||||||||
| Offsetting of Financial Liabilities and Derivative Liabilities | ||||||||
| Gross | Net Amounts | |||||||
| Amounts | of Assets | |||||||
| Gross | Offset in the | Presented in | ||||||
| Amounts of | Statement of | the Statement | ||||||
| Recognized | Assets and | of Assets and | ||||||
| Description | Location: Statement of Assets and Liabilities - Liabilities | Liabilities | Liabilities | Liabilities | ||||
| Index Swap Contracts | Index swap contracts, at fair value | $ | 3,437 | $ | — $ | 3,437 | ||
| Total | $ | 3,437 | $ | — $ | 3,437 | |||
| Financial Liabilities, Derivative Liabilities, and Collateral Pledged by Counterparty | ||||||||
| Gross Amounts Not Offset in | ||||||||
| the Statement of Assets and | ||||||||
| Liabilities | ||||||||
| Net Amounts | ||||||||
| of Liabilities | ||||||||
| Presented in | ||||||||
| the Statement | Financial and | |||||||
| of Assets and | Derivative | Collateral | ||||||
| Counterparty | Liabilities | Instruments | Pledged^ | Net Amount | ||||
| BNP Paribas | $ | 608 | $ | — $ | 608 | $ | — |
| Macquarie | 411 | — | 411 | — | |||
| Merrill Lynch | 283 | — | 283 | — | |||
| Morgan Stanley | 606 | — | 606 | — | |||
| Newedge | 330 | — | — | 330 | |||
| Societe Generale | 626 | — | 626 | — | |||
| UBS | 573 | — | 573 | — | |||
| Total | $ | 3,437 | $ | — $ | 3,107 | $ | 330 |
^ Collateral received or pledged amounts may not reconcile to those disclosed in the Statement of Assets and Liabilities due to the inclusion of off-Balance Sheet collateral and adjustments made to exclude overcollateralization.
For further disclosure on derivatives and counterparty risk see note 2 in the Notes to Financial Statements.
See accompanying notes which are an integral part of the financial statements.
534 Russell Commodity Strategies Fund
| Russell Investment Company | ||
| Russell Commodity Strategies Fund | ||
| Consolidated Statement of Assets and Liabilities(†) — October 31, 2014 | ||
| Amounts in thousands | ||
| Assets | ||
| Investments, at identified cost | $ | 996,222 |
| Investments, at fair value(>) | 996,195 | |
| Cash | 2,222 | |
| Cash (restricted)(a) | 81,926 | |
| Receivables: | ||
| Dividends and interest | 142 | |
| Dividends from affiliated Russell funds | 55 | |
| Investments sold | 2,420 | |
| Fund shares sold | 1,896 | |
| Total assets | 1,084,856 | |
| Liabilities | ||
| Payables: | ||
| Due to broker (b) | 3,130 | |
| Investments purchased | 25,686 | |
| Fund shares redeemed | 731 | |
| Accrued fees to affiliates | 990 | |
| Other accrued expenses | 204 | |
| Index swap contracts, at fair value(8) | 3,437 | |
| Total liabilities | 34,178 | |
| Net Assets | $ | 1,050,678 |
(†) The Statement of Assets and Liabilities is consolidated and includes the balances of Russell Cayman Commodity Strategies Fund Ltd. (wholly owned subsidiary). Accordingly, all interfund balances and transactions have been eliminated. Refer to note 3 in the Notes to Financial Statements.
See accompanying notes which are an integral part of the financial statements.
Russell Commodity Strategies Fund 535
Russell Investment Company Russell Commodity Strategies Fund
Consolidated Statement of Assets and Liabilities(†) , continued — October 31, 2014
| Amounts in thousands | |||
| Net Assets Consist of: | |||
| Undistributed (overdistributed) net investment income | $ | (8,713 | ) |
| Accumulated net realized gain (loss) | 97 | ||
| Unrealized appreciation (depreciation) on: | |||
| Investments | (27 | ) | |
| Index swap contracts | (3,437 | ) | |
| Shares of beneficial interest | 1,365 | ||
| Additional paid-in capital | 1,061,393 | ||
| Net Assets | $ | 1,050,678 | |
| Net Asset Value, offering and redemption price per share: | |||
| Net asset value per share: Class A(#) | $ | 7.64 | |
| Maximum offering price per share (Net asset value plus sales charge of 5.75%): Class A | $ | 8.11 | |
| Class A — Net assets | $ | 11,211,877 | |
| Class A — Shares outstanding ($.01 par value) | 1,468,106 | ||
| Net asset value per share: Class C(#) | $ | 7.44 | |
| Class C — Net assets | $ | 8,453,912 | |
| Class C — Shares outstanding ($.01 par value) | 1,136,747 | ||
| Net asset value per share: Class E(#) | $ | 7.63 | |
| Class E — Net assets | $ | 17,427,681 | |
| Class E — Shares outstanding ($.01 par value) | 2,283,691 | ||
| Net asset value per share: Class S(#) | $ | 7.69 | |
| Class S — Net assets | $ | 793,988,632 | |
| Class S — Shares outstanding ($.01 par value) | 103,232,118 | ||
| Net asset value per share: Class Y(#) | $ | 7.73 | |
| Class Y — Net assets | $ | 219,595,682 | |
| Class Y — Shares outstanding ($.01 par value) | 28,398,997 | ||
| Amounts in thousands | |||
| (>) Investments in affiliates, Russell U.S. Cash Management Fund | $ | 662,116 | |
| (8) Index swap contracts - premiums paid (received) | $ | — | |
| (a) Cash Collateral for Swaps | $ | 81,926 | |
| (b) Due to Broker for Swaps | $ | 3,130 | |
| (#) Net asset value per share equals class level net assets divided by class level shares of beneficial interest outstanding. | |||
| (†) The Statement of Assets and Liabilities is consolidated and includes the balances of Russell Cayman Commodity Strategies Fund Ltd. (wholly owned | |||
| subsidiary). Accordingly, all interfund balances and transactions have been eliminated. Refer to note 3 in the Notes to Financial Statements. | |||
See accompanying notes which are an integral part of the financial statements.
536 Russell Commodity Strategies Fund
Russell Investment Company Russell Commodity Strategies Fund
Consolidated Statement of Operations(†) — For the Period Ended October 31, 2014
| Amounts in thousands | |||
| Investment Income | |||
| Dividends | $ | 17 | |
| Dividends from affiliated Russell funds | 627 | ||
| Interest | 573 | ||
| Total investment income | 1,217 | ||
| Expenses | |||
| Advisory fees | 17,340 | ||
| Administrative fees | 666 | ||
| Custodian fees | 477 | ||
| Distribution fees - Class A | 45 | ||
| Distribution fees - Class C | 78 | ||
| Transfer agent fees - Class A | 36 | ||
| Transfer agent fees - Class C | 21 | ||
| Transfer agent fees - Class E | 38 | ||
| Transfer agent fees - Class S | 1,700 | ||
| Transfer agent fees - Class Y | 12 | ||
| Professional fees | 202 | ||
| Registration fees | 107 | ||
| Shareholder servicing fees - Class C | 26 | ||
| Shareholder servicing fees - Class E | 47 | ||
| Trustees’ fees | 28 | ||
| Printing fees | 162 | ||
| Miscellaneous | 107 | ||
| Expenses before reductions | 21,092 | ||
| Expense reductions | (6,604 | ) | |
| Net expenses | 14,488 | ||
| Net investment income (loss) | (13,271 | ) | |
| Net Realized and Unrealized Gain (Loss) | |||
| Net realized gain (loss) on: | |||
| Investments | 336 | ||
| Futures contracts | 452 | ||
| Index swap contracts | (86,199 | ) | |
| Net realized gain (loss) | (85,411 | ) | |
| Net change in unrealized appreciation (depreciation) on: | |||
| Investments | (252 | ) | |
| Futures contracts | (1,127 | ) | |
| Index swap contracts | 4,876 | ||
| Net change in unrealized appreciation (depreciation) | 3,497 | ||
| Net realized and unrealized gain (loss) | (81,914 | ) | |
| Net Increase (Decrease) in Net Assets from Operations | $ | (95,185 | ) |
| (†) The Statement of Operations is consolidated and includes the balances of Russell Cayman Commodity Strategies Fund Ltd. (wholly owned | |||
| subsidiary). Accordingly, all interfund balances and transactions have been eliminated. Refer to note 3 in the Notes to Financial Statements. | |||
See accompanying notes which are an integral part of the financial statements.
Russell Commodity Strategies Fund 537
| Russell Investment Company | ||||||
| Russell Commodity Strategies Fund | ||||||
| Consolidated Statements of Changes in Net Assets(†) | ||||||
| For the Periods Ended October 31, | ||||||
| Amounts in thousands | 2014 | 2013 | ||||
| Increase (Decrease) in Net Assets | ||||||
| Operations | ||||||
| Net investment income (loss) | $ | (13,271 | ) | $ | (13,466 | ) |
| Net realized gain (loss) | (85,411 | ) | (160,443 | ) | ||
| Net change in unrealized appreciation (depreciation) | 3,497 | 15,500 | ||||
| Net increase (decrease) in net assets from operations | (95,185 | ) | (158,409 | ) | ||
| Distributions | ||||||
| From net investment income | ||||||
| Class A | (—)** | — | ||||
| Class C | (—)** | — | ||||
| Class E | (—)** | — | ||||
| Class S | (—)** | — | ||||
| Class Y | (—)** | — | ||||
| From net realized gain | ||||||
| Class A | (1 | ) | — | |||
| Class C | (1 | ) | — | |||
| Class E | (1 | ) | — | |||
| Class S | (39 | ) | — | |||
| Class Y | (17 | ) | — | |||
| Net decrease in net assets from distributions | (59 | ) | — | |||
| Share Transactions* | ||||||
| Net increase (decrease) in net assets from share transactions | (88,866 | ) | 132,698 | |||
| Total Net Increase (Decrease) in Net Assets | (184,110 | ) | (25,711 | ) | ||
| Net Assets | ||||||
| Beginning of period | 1,234,788 | 1,260,499 | ||||
| End of period | $ | 1,050,678 | $ | 1,234,788 | ||
| Undistributed (overdistributed) net investment income included in net assets | $ | (8,713 | ) | $ | (8,582 | ) |
| ** Less than $500. | ||||||
| (†) The Statements of Changes in Net Assets is consolidated and includes the balances of Russell Cayman Commodity Strategies Fund | ||||||
| Ltd. (wholly owned subsidiary). Accordingly, all interfund balances and transactions have been eliminated. | ||||||
| Refer to note 3 in the Notes to Financial Statements. | ||||||
See accompanying notes which are an integral part of the financial statements.
538 Russell Commodity Strategies Fund
| Russell Investment Company | ||||||||||||
| Russell Commodity Strategies Fund | ||||||||||||
| Statements of Changes in Net Assets, continued | ||||||||||||
| * Share transaction amounts (in thousands) for the periods ended October 31, 2014 and October 31, 2013 were as follows: | ||||||||||||
| 2014 | 2013 | |||||||||||
| Shares | Dollars | Shares | Dollars | |||||||||
| Class A | ||||||||||||
| Proceeds from shares sold | 656 | $ | 5,522 | 1,256 | $ | 11,085 | ||||||
| Proceeds from reinvestment of distributions | —** | 1 | — | — | ||||||||
| Payments for shares redeemed | (1,609 | ) | (13,641 | ) | (1,077 | ) | (9,639 | ) | ||||
| Net increase (decrease) | (953 | ) | (8,118 | ) | 179 | 1,446 | ||||||
| Class C | ||||||||||||
| Proceeds from shares sold | 182 | 1,506 | 328 | 2,873 | ||||||||
| Proceeds from reinvestment of distributions | —** | 1 | — | — | ||||||||
| Payments for shares redeemed | (440 | ) | (3,618 | ) | (435 | ) | (3,801 | ) | ||||
| Net increase (decrease) | (258 | ) | (2,111 | ) | (107 | ) | (928 | ) | ||||
| Class E | ||||||||||||
| Proceeds from shares sold | 461 | 3,809 | 964 | 8,478 | ||||||||
| Proceeds from reinvestment of distributions | —** | 1 | — | — | ||||||||
| Payments for shares redeemed | (650 | ) | (5,416 | ) | (290 | ) | (2,555 | ) | ||||
| Net increase (decrease) | (189 | ) | (1,606 | ) | 674 | 5,923 | ||||||
| Class S | ||||||||||||
| Proceeds from shares sold | 34,740 | 292,802 | 37,257 | 331,052 | ||||||||
| Proceeds from reinvestment of distributions | 4 | 39 | — | — | ||||||||
| Payments for shares redeemed | (30,449 | ) | (256,580 | ) | (18,401 | ) | (163,390 | ) | ||||
| Net increase (decrease) | 4,295 | 36,261 | 18,856 | 167,662 | ||||||||
| Class Y | ||||||||||||
| Proceeds from shares sold | 2,572 | 21,636 | 7,404 | 66,756 | ||||||||
| Proceeds from reinvestment of distributions | 2 | 17 | — | — | ||||||||
| Payments for shares redeemed | (15,938 | ) | (134,945 | ) | (12,351 | ) | (108,161 | ) | ||||
| Net increase (decrease) | (13,364 | ) | (113,292 | ) | (4,947 | ) | (41,405 | ) | ||||
| Total increase (decrease) | (10,469 | ) | $ | (88,866 | ) | 14,655 | $ | 132,698 | ||||
| ** Less than 500 | ||||||||||||
See accompanying notes which are an integral part of the financial statements.
Russell Commodity Strategies Fund 539
| Russell Investment Company | ||||||||||||||||||||
| Russell Commodity Strategies Fund | ||||||||||||||||||||
| Consolidated Financial Highlights — For the Periods Ended | ||||||||||||||||||||
| For a Share Outstanding Throughout Each Period. | ||||||||||||||||||||
| $ | $ | $ | $ | $ | $ | |||||||||||||||
| Net Asset Value, | Net | Net Realized | Total from | Distributions | Distributions | $ | ||||||||||||||
| Beginning of | Investment | and Unrealized | Investment | from Net | from Net | Return of | ||||||||||||||
| Period | Income (Loss)(a) | Gain (Loss) | Operations | Investment Income | Realized Gain | Capital | ||||||||||||||
| Class A | ||||||||||||||||||||
| October 31, 2014 | 8.35 | (.12 | ) | (.59 | ) | (.71 | ) | —(f) | —(f) | — | ||||||||||
| October 31, 2013 | 9.50 | (.12 | ) | (1.03 | ) | (1.15 | ) | — | — | — | ||||||||||
| October 31, 2012 | 10.55 | (.13 | ) | (.53 | ) | (.66 | ) | (.15 | ) | (.02 | ) | (.22 | ) | |||||||
| October 31, 2011 | 11.65 | (.15 | ) | .53 | .38 | (1.48 | ) | —(f) | — | |||||||||||
| October 31, 2010(2) | 10.00 | (.05 | ) | 1.70 | 1.65 | — | — | — | ||||||||||||
| Class C | ||||||||||||||||||||
| October 31, 2014 | 8.20 | (.18 | ) | (.58 | ) | (.76 | ) | —(f) | —(f) | — | ||||||||||
| October 31, 2013 | 9.39 | (.19 | ) | (1.00 | ) | (1.19 | ) | — | — | — | ||||||||||
| October 31, 2012 | 10.45 | (.20 | ) | (.53 | ) | (.73 | ) | (.09 | ) | (.02 | ) | (.22 | ) | |||||||
| October 31, 2011 | 11.61 | (.23 | ) | .52 | .29 | (1.45 | ) | —(f) | — | |||||||||||
| October 31, 2010(2) | 10.00 | (.08 | ) | 1.69 | 1.61 | — | — | — | ||||||||||||
| Class E | ||||||||||||||||||||
| October 31, 2014 | 8.35 | (.12 | ) | (.60 | ) | (.72 | ) | —(f) | —(f) | — | ||||||||||
| October 31, 2013 | 9.50 | (.12 | ) | (1.03 | ) | (1.15 | ) | — | — | — | ||||||||||
| October 31, 2012 | 10.54 | (.13 | ) | (.52 | ) | (.65 | ) | (.15 | ) | (.02 | ) | (.22 | ) | |||||||
| October 31, 2011 | 11.64 | (.15 | ) | .52 | .37 | (1.47 | ) | —(f) | — | |||||||||||
| October 31, 2010(2) | 10.00 | (.06 | ) | 1.70 | 1.64 | — | — | — | ||||||||||||
| Class S | ||||||||||||||||||||
| October 31, 2014 | 8.40 | (.10 | ) | (.61 | ) | (.71 | ) | —(f) | —(f) | — | ||||||||||
| October 31, 2013 | 9.52 | (.10 | ) | (1.02 | ) | (1.12 | ) | — | — | — | ||||||||||
| October 31, 2012 | 10.58 | (.11 | ) | (.53 | ) | (.64 | ) | (.18 | ) | (.02 | ) | (.22 | ) | |||||||
| October 31, 2011 | 11.65 | (.12 | ) | .53 | .41 | (1.48 | ) | —(f) | — | |||||||||||
| October 31, 2010(2) | 10.00 | (.04 | ) | 1.69 | 1.65 | — | — | — | ||||||||||||
| Class Y | ||||||||||||||||||||
| October 31, 2014 | 8.42 | (.08 | ) | (.61 | ) | (.69 | ) | —(f) | —(f) | — | ||||||||||
| October 31, 2013 | 9.54 | (.08 | ) | (1.04 | ) | (1.12 | ) | — | — | — | ||||||||||
| October 31, 2012 | 10.59 | (.09 | ) | (.53 | ) | (.62 | ) | (.19 | ) | (.02 | ) | (.22 | ) | |||||||
| October 31, 2011 | 11.65 | (.10 | ) | .53 | .43 | (1.49 | ) | —(f) | — | |||||||||||
| October 31, 2010(2) | 10.00 | (.04 | ) | 1.69 | 1.65 | — | — | — | ||||||||||||
See accompanying notes which are an integral part of the financial statements.
540 Russell Commodity Strategies Fund
| % | % | % | ||||||||||||||||
| $ | $ | Ratio of Expenses | Ratio of Expenses | Ratio of Net | ||||||||||||||
| Net Asset Value, | % | Net Assets, | to Average | to Average | Investment Income | % | ||||||||||||
| $ | End of | Total | End of Period | Net Assets, | Net Assets, | to Average | Portfolio | |||||||||||
| Total Distributions | Period | Return(b)(c) | (000 | ) | Gross(d) | Net(d)(e) | Net Assets(d)(e) | Turnover Rate(b) | ||||||||||
| —(f) | 7.64 | (8.50 | ) | 11,212 | 2.08 | 1.52 | (1.41 | ) | 302 | |||||||||
| — | 8.35 | (12.11 | ) | 20,224 | 2.04 | 1.52 | (1.37 | ) | 145 | |||||||||
| (.39 | ) | 9.50 | (6.28 | ) | 21,301 | 2.08 | 1.55 | (1.39 | ) | 60 | ||||||||
| (1.48 | ) | 10.55 | 2.85 | 21,609 | 1.78 | 1.48 | (1.30 | ) | 123 | |||||||||
| — | 11.65 | 16.50 | 5,144 | 1.91 | 1.41 | (1.48 | ) | 11 | ||||||||||
| —(f) | 7.44 | (9.26 | ) | 8,454 | 2.83 | 2.27 | (2.16 | ) | 302 | |||||||||
| — | 8.20 | (12.67 | ) | 11,436 | 2.79 | 2.27 | (2.12 | ) | 145 | |||||||||
| (.33 | ) | 9.39 | (7.01 | ) | 14,104 | 2.83 | 2.30 | (2.15 | ) | 60 | ||||||||
| (1.45 | ) | 10.45 | 2.07 | 14,748 | 2.53 | 2.23 | (2.05 | ) | 123 | |||||||||
| — | 11.61 | 16.10 | 3,323 | 2.66 | 2.16 | (2.23 | ) | 11 | ||||||||||
| —(f) | 7.63 | (8.62 | ) | 17,427 | 2.08 | 1.52 | (1.41 | ) | 302 | |||||||||
| — | 8.35 | (12.11 | ) | 20,652 | 2.04 | 1.52 | (1.36 | ) | 145 | |||||||||
| (.39 | ) | 9.50 | (6.23 | ) | 17,078 | 2.08 | 1.54 | (1.38 | ) | 60 | ||||||||
| (1.47 | ) | 10.54 | 2.81 | 14,850 | 1.78 | 1.48 | (1.30 | ) | 123 | |||||||||
| — | 11.64 | 16.40 | 14,962 | 1.90 | 1.41 | (1.48 | ) | 11 | ||||||||||
| —(f) | 7.69 | (8.45 | ) | 793,989 | 1.83 | 1.27 | (1.16 | ) | 302 | |||||||||
| — | 8.40 | (11.76 | ) | 830,645 | 1.79 | 1.27 | (1.12 | ) | 145 | |||||||||
| (.42 | ) | 9.52 | (6.10 | ) | 762,582 | 1.83 | 1.30 | (1.14 | ) | 60 | ||||||||
| (1.48 | ) | 10.58 | 3.15 | 690,537 | 1.53 | 1.23 | (1.05 | ) | 123 | |||||||||
| — | 11.65 | 16.50 | 428,347 | 1.66 | 1.16 | (1.23 | ) | 11 | ||||||||||
| —(f) | 7.73 | (8.19 | ) | 219,596 | 1.63 | 1.08 | (.97 | ) | 302 | |||||||||
| — | 8.42 | (11.74 | ) | 351,831 | 1.60 | 1.08 | (.93 | ) | 145 | |||||||||
| (.43 | ) | 9.54 | (5.82 | ) | 445,434 | 1.65 | 1.11 | (.95 | ) | 60 | ||||||||
| (1.49 | ) | 10.59 | 3.31 | 494,246 | 1.35 | 1.05 | (.87 | ) | 123 | |||||||||
| — | 11.65 | 16.50 | 545,188 | 1.48 | .98 | (1.05 | ) | 11 | ||||||||||
See accompanying notes which are an integral part of the financial statements.
Russell Commodity Strategies Fund 541
Russell Investment Company Russell Global Infrastructure Fund
Portfolio Management Discussion and Analysis — October 31, 2014 (Unaudited)

| Russell Global Infrastructure Fund - Class A‡ | Russell Global Infrastructure Fund - Class S | ||||||
| Total | Total | ||||||
| Return | Return | ||||||
| 1 Year | 6.46 | % | 1 Year | 13.11 | % | ||
| Inception* | 9.54 | %§ | Inception* | 11.41 | %§ | ||
| Russell Global Infrastructure Fund - Class C | Russell Global Infrastructure Fund - Class Y | ||||||
| Total | Total | ||||||
| Return | Return | ||||||
| 1 Year | 12.00 | % | 1 Year | 13.39 | % | ||
| Inception* | 10.30 | %§ | Inception* | 11.61 | %§ | ||
| Russell Global Infrastructure Fund - Class E | S&P Global Infrastructure Index Net (USD)SM** | ||||||
| Total | Total | ||||||
| Return | Return | ||||||
| 1 Year | 12.92 | % | 1 Year | 13.36 | % | ||
| Inception* | 11.13 | %§ | Inception* | 9.97 | %§ | ||
542 Russell Global Infrastructure Fund
Russell Investment Company Russell Global Infrastructure Fund
Portfolio Management Discussion and Analysis, continued — October 31, 2014 (Unaudited)
| The Russell Global Infrastructure Fund (the “Fund”) employs | Cohen & Steers Capital Management, Inc. (“Cohen”) outperformed |
| a multi-manager approach whereby portions of the Fund | the Fund’s benchmark for the fiscal year. Cohen implements a |
| are allocated to different money managers. Fund assets not | “growth at a reasonable price” strategy incorporating both top- |
| allocated to money managers are managed by Russell Investment | down and bottom-up components. The key driver of Cohen’s |
| Management Company (“RIMCo”), the Fund’s advisor. RIMCo | outperformance was out-of-benchmark exposure to several |
| may change the allocation of the Fund’s assets among money | North American pipeline master limited partnerships (“MLPs”). |
| managers at any time. An exemptive order from the Securities | Underweight positioning in European utilities also benefited |
| and Exchange Commission (“SEC”) permits RIMCo to engage | performance. An underweight to North American electric utilities |
| or terminate a money manager at any time, subject to approval | was a modest detractor from performance. |
| by the Fund’s Board, without a shareholder vote. Pursuant to the | Colonial First State Asset Management (Australia) Limited |
| terms of the exemptive order, the Fund is required to notify its | (“Colonial”) outperformed the Fund’s benchmark for the fiscal |
| shareholders within 90 days of when a money manager begins | year. Colonial utilizes a fundamental relative value strategy that |
| providing services. As of October 31, 2014, the Fund had four | features significant ex-benchmark exposure. Stock selection in |
| money managers. | the toll roads and multi-utilities sectors drove outperformance. |
| What is the Fund’s investment objective? | Also contributing were an underweight to the marine ports sector |
| The Fund seeks to provide long term growth of capital and current | and out-of-benchmark exposure to railroads. An underweight to |
| income. | the oil and gas pipeline sector was the most notable detractor from |
| performance. | |
| How did the Fund perform relative to its benchmark for the | Lazard Asset Management LLC (“Lazard”) was added to the Fund |
| fiscal year ended October 31, 2014? | in March 2014 and underperformed the Fund’s benchmark for |
| For the fiscal year ended October 31, 2014, the Fund’s Class A, | the period of the fiscal year in which it was a money manager for |
| Class C, Class E, Class S, and Class Y Shares gained 12.95%, | the Fund. Underperformance was driven by a concentrated out- |
| 12.00%, 12.92%, 13.11% and 13.39%, respectively. This is | of-benchmark position in Vinci, a European construction and toll |
| compared to the Fund’s benchmark, the S&P Global Infrastructure | road company that sold off during the fiscal year. Lazard’s portfolio |
| Index (Net), which gained 13.36% during the same period. The | did not have any exposure to the oil and gas pipeline sector, |
| Fund’s performance includes operating expenses, whereas index | which was among the strongest areas of the listed infrastructure |
| returns are unmanaged and do not include expenses of any kind. | market. Positive contributors to performance included an out-of- |
| For the fiscal year ended October 31, 2014, the Morningstar® | benchmark position in railroads and stock selection within the |
| World Stock, a group of funds that Morningstar considers to have | multi-utilities sector. |
| investment strategies similar to those of the Fund, gained 6.85%. | Nuveen Asset Management, Inc. (“Nuveen”) outperformed the |
| This return serves as a peer comparison and is expressed net of | Fund’s benchmark for the fiscal year. Nuveen utilizes a bottom-up |
| operating expenses. | relative value strategy that features a high degree of turnover. The |
| How did the market conditions described in the Market | primary drivers of outperformance were an underweight to the |
| Summary report affect the Fund’s performance? | German integrated utilities and stock selection within the marine |
| ForthefiscalyearendedOctober31,2014,theglobalinfrastructure | ports and toll roads sectors. An underweight to North American |
| market, as measured by the S&P Global Infrastructure Index (Net), | electric utilities detracted from performance during the period. |
| delivered a 13.36% return. In contrast to the prior fiscal year, | |
| cyclically sensitive user-demand stocks tended to underperform, | RIMCo manages the portion of the Fund’s assets that RIMCo |
| while more defensive, yield-oriented sectors outperformed. At | determines not to allocate to the money managers. Assets not |
| the sub-industry level, marine ports and airports were among the | allocated to managers include the Fund’s liquidity reserves and |
| biggest laggards, while pipelines and electric utilities were the | assets which may be managed directly by RIMCo to modify the |
| best performers. Toll roads and multi-utilities slightly lagged the | Fund’s overall portfolio characteristics to seek to achieve the |
| index. From a regional perspective, North America was the best | desired risk/return profile for the Fund. |
| performer, while emerging markets and AsiaPac ex-Japan trailed | |
| the index. | RIMCo utilized a strategy during the period to implement sector |
| tilting and modify the portfolio’s beta profile through the use/ | |
| How did the investment strategies and techniques employed | purchase of infrastructure stocks (beta is a measure of a portfolio’s |
| by the Fund and its money managers affect its benchmark- | volatility and its sensitivity to the direction of the market). The |
| relative performance? | strategy seeks to position the portfolio to meet RIMCo’s overall |
| Russell Global Infrastructure Fund 543 | |
Russell Investment Company Russell Global Infrastructure Fund
Portfolio Management Discussion and Analysis, continued — October 31, 2014 (Unaudited)
| preferred positioning objectives, while optimizing the portfolio | Money Managers as of October 31, | |
| to minimize tracking error relative to the Fund’s money manager | 2014 | Styles |
| portfolios. The strategy outperformed relative to the Fund’s | ||
| Cohen & Steers Capital Management, Inc | Public Market Equity | |
| benchmark as a result of exposure to several out-of-benchmark | Colonial First State Asset Management | |
| stocks in the environmental facilities and gas utilities sectors. | (Australia) Limited | Public Market Equity |
| During the fiscal year, the Fund used index futures contracts | Lazard Asset Management, LLC | Public Market Equity |
| to equitize the Fund’s cash. The use of these derivatives had | Nuveen Asset Management, LLC | Public Market Equity |
| a modestly positive impact on performance, as equity markets | The views expressed in this report reflect those of the portfolio | |
| delivered positive returns ahead of cash. | managers only through the end of the period covered by | |
| the report. These views do not necessarily represent the | ||
| Describe any changes to the Fund’s structure or the money | views of RIMCo, or any other person in RIMCo or any other | |
| manager line-up. | affiliated organization. These views are subject to change | |
| In March 2014, RIMCo hired Lazard Asset Management LLC as | at any time based upon market conditions or other events, | |
| a money manager for the Fund. RIMCo’s rationale for adding | and RIMCo disclaims any responsibility to update the views | |
| Lazard was three-pronged: improving Fund diversification; | contained herein. These views should not be relied on as | |
| adding a best in class manager with a differentiated source of | investment advice and, because investment decisions for | |
| potential return generation; and bringing the Fund more into line | a Russell Investment Company (“RIC”) Fund are based on | |
| with RIMCo’s tactical preferred positioning. | numerous factors, should not be relied on as an indication | |
| There were no other changes to the Fund’s structure or money | of investment decisions of any RIC Fund. | |
| manager line up during the fiscal year. | ||
| * | Assumes initial investment on September 30, 2010. |
| ** | The S&P Global Infrastructure Index Net (USD)SM provides liquid and tradable exposure to 75 companies around the world that represent the listed infrastructure universe. The index has balanced weights across three distinct infrastructure classes: utilities, transportation and energy. |
| ‡ | The performance shown has been adjusted to reflect the deduction of the maximum Class A sales charge of 5.75%. |
| § | Annualized. |
Performance is historical and assumes reinvestment of all dividends and capital gains. Investment return and principal value will fluctuate so that an investor’s shares, when redeemed, may be worth more or less than when purchased. Past performance is not indicative of future results. The returns shown do not reflect the deduction of taxes that a shareholder would pay on Fund distributions or the redemption of Fund shares.
544 Russell Global Infrastructure Fund
Russell Investment Company Russell Global Infrastructure Fund
Shareholder Expense Example — October 31, 2014 (Unaudited)
| Fund Expenses | Please note that the expenses shown in the table are meant | |||||
| The following disclosure provides important information | to highlight your ongoing costs only and do not reflect any | |||||
| regarding the Fund’s Shareholder Expense Example | transactional costs. Therefore, the information under the heading | |||||
| (“Example”). | “Hypothetical Performance (5% return before expenses)” is | |||||
| useful in comparing ongoing costs only, and will not help you | ||||||
| Example | determine the relative total costs of owning different funds. In | |||||
| As a shareholder of the Fund, you incur two types of costs: (1) | addition, if these transactional costs were included, your costs | |||||
| transaction costs, and (2) ongoing costs, including advisory and | would have been higher. | |||||
| administrative fees; distribution (12b-1) and/or service fees; | Hypothetical | |||||
| and other Fund expenses. The Example is intended to help | Performance (5% | |||||
| you understand your ongoing costs (in dollars) of investing in | Actual | return before | ||||
| the Fund and to compare these costs with the ongoing costs of | Class A | Performance | expenses) | |||
| Beginning Account Value | ||||||
| investing in other mutual funds. The Example is based on an | May 1, 2014 | $ | 1,000.00 | $ | 1,000.00 | |
| investment of $1,000 invested at the beginning of the period and | Ending Account Value | |||||
| held for the entire period indicated, which for this Fund is from | October 31, 2014 | $ | 1,028.40 | $ | 1,017.80 | |
| May 1, 2014 to October 31, 2014. | Expenses Paid During Period* | $ | 7.52 | $ | 7.48 | |
| Actual Expenses | * Expenses are equal to the Fund's annualized expense ratio of 1.47% | |||||
| (representing the six month period annualized), multiplied by the average | ||||||
| The information in the table under the heading “Actual | account value over the period, multiplied by 184/365 (to reflect the one-half | |||||
| Performance” provides information about actual account values | year period). May reflect amounts waived and/or reimbursed. Without any | |||||
| and actual expenses. You may use the information in this column, | waivers and/or reimbursements, expenses would have been higher. | |||||
| together with the amount you invested, to estimate the expenses | ||||||
| Hypothetical | ||||||
| that you paid over the period. Simply divide your account value by | Performance (5% | |||||
| $1,000 (for example, an $8,600 account value divided by $1,000 | Actual | return before | ||||
| = 8.6), then multiply the result by the number in the first column | Class C | Performance | expenses) | |||
| Beginning Account Value | ||||||
| in the row entitled “Expenses Paid During Period” to estimate | May 1, 2014 | $ | 1,000.00 | $ | 1,000.00 | |
| the expenses you paid on your account during this period. | Ending Account Value | |||||
| October 31, 2014 | $ | 1,024.00 | $ | 1,014.01 | ||
| Hypothetical Example for Comparison Purposes | Expenses Paid During Period* | $ | 11.33 | $ | 11.27 | |
| The information in the table under the heading “Hypothetical | ||||||
| Performance (5% return before expenses)” provides information | * Expenses are equal to the Fund's annualized expense ratio of 2.22% | |||||
| (representing the six month period annualized), multiplied by the average | ||||||
| about hypothetical account values and hypothetical expenses | account value over the period, multiplied by 184/365 (to reflect the one-half | |||||
| based on the Fund’s actual expense ratio and an assumed rate of | year period). May reflect amounts waived and/or reimbursed. Without any | |||||
| return of 5% per year before expenses, which is not the Fund’s | waivers and/or reimbursements, expenses would have been higher. | |||||
| actual return. The hypothetical account values and expenses | ||||||
| Hypothetical | ||||||
| may not be used to estimate the actual ending account balance or | Performance (5% | |||||
| expenses you paid for the period. You may use this information | Actual | return before | ||||
| to compare the ongoing costs of investing in the Fund and other | Class E | Performance | expenses) | |||
| funds. To do so, compare this 5% hypothetical example with the | Beginning Account Value | |||||
| May 1, 2014 | $ | 1,000.00 | $ | 1,000.00 | ||
| 5% hypothetical examples that appear in the shareholder reports | Ending Account Value | |||||
| of other funds. | October 31, 2014 | $ | 1,028.20 | $ | 1,017.80 | |
| Expenses Paid During Period* | $ | 7.51 | $ | 7.48 | ||
| * Expenses are equal to the Fund's annualized expense ratio of 1.47% | ||||||
| (representing the six month period annualized), multiplied by the average | ||||||
| account value over the period, multiplied by 184/365 (to reflect the one-half | ||||||
| year period). May reflect amounts waived and/or reimbursed. Without any | ||||||
| waivers and/or reimbursements, expenses would have been higher. | ||||||
Russell Global Infrastructure Fund 545
Russell Investment Company Russell Global Infrastructure Fund
Shareholder Expense Example, continued — October 31, 2014 (Unaudited)
| Hypothetical | ||||||
| Performance (5% | ||||||
| Actual | return before | |||||
| Class S | Performance | expenses) | ||||
| Beginning Account Value | ||||||
| May 1, 2014 | $ | 1,000.00 | $ | 1,000.00 | ||
| Ending Account Value | ||||||
| October 31, 2014 | $ | 1,029.60 | $ | 1,019.06 | ||
| Expenses Paid During Period* | $ | 6.24 | $ | 6.21 | ||
| * Expenses are equal to the Fund's annualized expense ratio of 1.22% | ||||||
| (representing the six month period annualized), multiplied by the average | ||||||
| account value over the period, multiplied by 184/365 (to reflect the one-half | ||||||
| year period). May reflect amounts waived and/or reimbursed. Without any | ||||||
| waivers and/or reimbursements, expenses would have been higher. | ||||||
| Hypothetical | ||||||
| Performance (5% | ||||||
| Actual | return before | |||||
| Class Y | Performance | expenses) | ||||
| Beginning Account Value | ||||||
| May 1, 2014 | $ | 1,000.00 | $ | 1,000.00 | ||
| Ending Account Value | ||||||
| October 31, 2014 | $ | 1,031.30 | $ | 1,019.96 | ||
| Expenses Paid During Period* | $ | 5.32 | $ | 5.30 | ||
| * Expenses are equal to the Fund's annualized expense ratio of 1.04% | ||||||
| (representing the six month period annualized), multiplied by the average | ||||||
| account value over the period, multiplied by 184/365 (to reflect the one-half | ||||||
| year period). May reflect amounts waived and/or reimbursed. Without any | ||||||
| waivers and/or reimbursements, expenses would have been higher. | ||||||
546 Russell Global Infrastructure Fund
| Russell Investment Company | ||||||||||
| Russell Global Infrastructure Fund | ||||||||||
| Schedule of Investments — October 31, 2014 | ||||||||||
| Amounts in thousands (except share amounts) | Amounts in thousands (except share amounts) | |||||||||
| Principal | Fair | Principal | Fair | |||||||
| Amount ($) | Value | Amount ($) | Value | |||||||
| or Shares | $ | or Shares | $ | |||||||
| Common Stocks - 96.0% | Enersis SA - ADR | 159,913 | 2,525 | |||||||
| Australia - 8.7% | 7,423 | |||||||||
| AGL Energy, Ltd. | 120,187 | 1,437 | ||||||||
| Asciano, Ltd. | 2,953,108 | 16,294 | China - 1.9% | |||||||
| Aurizon Holdings, Ltd. | 864,010 | 3,558 | COSCO Pacific, Ltd. | 13,301,010 | 17,494 | |||||
| AusNet Services(Æ) | 5,449,469 | 6,594 | ENN Energy Holdings, Ltd. | 436,351 | 2,830 | |||||
| DUET Group | 5,639,266 | 12,208 | Jiangsu Expressway Co., Ltd. Class H | 6,707,945 | 7,491 | |||||
| Macquarie Atlas Roads Group | 2,628,930 | 7,010 | Kangda International Environmental Co., | |||||||
| Spark Infrastructure Group | 5,806,443 | 9,708 | Ltd.(Æ) | 1,918,970 | 886 | |||||
| Sydney Airport | 1,600,091 | 6,210 | Sinopec Kantons Holdings, Ltd.(Ñ) | 2,141,348 | 1,778 | |||||
| Transurban Group - ADR(Æ) | 12,790,732 | 91,510 | Towngas China Co., Ltd. | 3,007,345 | 3,157 | |||||
| 154,529 | 33,636 | |||||||||
| Austria - 0.4% | France - 9.2% | |||||||||
| Flughafen Wien AG | 82,859 | 7,605 | Aeroports de Paris | 163,001 | 19,274 | |||||
| Eutelsat Communications SA(Ñ) | 753,667 | 24,424 | ||||||||
| Belgium - 0.1% | GDF Suez | 741,988 | 17,997 | |||||||
| bpost SA | 61,006 | 1,510 | Groupe Eurotunnel SA | 3,667,386 | 46,326 | |||||
| Elia System Operator SA | 12,286 | 609 | Rubis SCA | 306,902 | 18,049 | |||||
| 2,119 | Suez Environnement Co. | 213,041 | 3,585 | |||||||
| Vinci SA | 582,333 | 33,185 | ||||||||
| Bermuda - 0.1% | 162,840 | |||||||||
| Beijing Enterprises Water Group, Ltd. | 91,597 | 66 | ||||||||
| Brookfield Renewable Energy Partners, | Germany - 2.9% | |||||||||
| LP | 25,620 | 810 | E.ON SE | 1,459,968 | 25,120 | |||||
| 876 | Fraport AG Frankfurt Airport Services | |||||||||
| Worldwide | 384,997 | 23,795 | ||||||||
| Brazil - 1.5% | RWE AG | 59,943 | 2,123 | |||||||
| Alupar Investimento SA | 156,915 | 1,152 | 51,038 | |||||||
| CCR SA | 975,017 | 7,260 | ||||||||
| Cia de Saneamento Basico do Estado de | Hong Kong - 3.0% | |||||||||
| Sao Paulo - ADR(Æ)(Ñ) | 1,100,108 | 8,537 | APT Satellite Holdings, Ltd.(Æ) | 668,123 | 972 | |||||
| CPFL Energias Renovaveis SA(Æ) | 98,580 | 517 | Beijing Enterprises Holdings, Ltd. | 470,617 | 3,841 | |||||
| Light SA | 265,830 | 2,183 | China Everbright International, Ltd. | 3,320,229 | 4,581 | |||||
| Ultrapar Participacoes SA | 138,189 | 3,014 | China Merchants Holdings International | |||||||
| Wilson Sons, Ltd. Class BDR | 207,927 | 2,937 | Co., Ltd. | 10,415,571 | 32,905 | |||||
| 25,600 | China Resources Power Holdings Co., | |||||||||
| Ltd. | 318,881 | 927 | ||||||||
| Canada - 8.4% | Hong Kong & China Gas Co., Ltd. | 757,589 | 1,768 | |||||||
| AltaGas, Ltd. - ADR(Ñ) | 210,875 | 8,700 | MTR Corp., Ltd. | 184,303 | 751 | |||||
| Brookfield Infrastructure Partners, LP(Ñ) | 100,773 | 4,090 | Power Assets Holdings, Ltd. | 692,042 | 6,680 | |||||
| Canadian Pacific Railway, Ltd. | 8,461 | 1,760 | 52,425 | |||||||
| Canadian Utilities, Ltd. Class A | 38,893 | 1,345 | ||||||||
| Enbridge, Inc. | 1,033,725 | 48,927 | India - 0.2% | |||||||
| Gibson Energy, Inc. | 109,067 | 3,172 | GAIL India, Ltd. - GDR | 30,698 | 1,627 | |||||
| Inter Pipeline, Ltd.(Ñ) | 64,607 | 2,036 | Power Grid Corp. of India, Ltd. | 1,046,689 | 2,485 | |||||
| Keyera Corp. | 27,744 | 2,207 | 4,112 | |||||||
| Pembina Pipeline Corp.(Ñ) | 377,740 | 15,672 | ||||||||
| Progressive Waste Solutions, Ltd. | 51,041 | 1,492 | Indonesia - 0.1% | |||||||
| TransAlta Renewables, Inc. | 142,784 | 1,539 | Jasa Marga Persero Tbk PT | 1,591,323 | 836 | |||||
| TransCanada Corp. | 977,500 | 48,180 | Tower Bersama Infrastructure Tbk PT | 2,208,044 | 1,626 | |||||
| Veresen, Inc.(Ñ) | 39,294 | 617 | 2,462 | |||||||
| Westshore Terminals Investment Corp. | 298,536 | 9,099 | ||||||||
| 148,836 | Italy - 8.0% | |||||||||
| ASTM SpA | 132,264 | 1,589 | ||||||||
| Chile - 0.4% | Atlantia SpA | 3,005,644 | 70,811 | |||||||
| Aguas Andinas SA Class A | 4,713,926 | 2,842 | Ei Towers SpA(Æ) | 30,080 | 1,508 | |||||
| Empresa Nacional de Electricidad SA | Enel SpA | 1,792,629 | 9,143 | |||||||
| - ADR | 44,038 | 2,056 | Hera SpA | 3,879,559 | 10,209 | |||||
| Snam Rete Gas SpA | 4,186,345 | 22,611 | ||||||||
| See accompanying notes which are an integral part of the financial statements. | ||||||||||
| Russell Global Infrastructure Fund 547 | ||||||||||
| Russell Investment Company | ||||||||||
| Russell Global Infrastructure Fund | ||||||||||
| Schedule of Investments, continued — October 31, 2014 | ||||||||||
| Amounts in thousands (except share amounts) | Amounts in thousands (except share amounts) | |||||||||
| Principal | Fair | Principal | Fair | |||||||
| Amount ($) | Value | Amount ($) | Value | |||||||
| or Shares | $ | or Shares | $ | |||||||
| Societa Iniziative Autostradali e Servizi | Portugal - 0.2% | |||||||||
| SpA | 629,979 | 6,304 | Energias de Portugal SA | 450,028 | 1,935 | |||||
| Terna Rete Elettrica Nazionale SpA | 3,856,090 | 19,416 | REN - Redes Energeticas Nacionais | |||||||
| 141,591 | SGPS SA | 287,332 | 890 | |||||||
| 2,825 | ||||||||||
| Japan - 3.5% | ||||||||||
| Chubu Electric Power Co., Inc. | 97,266 | 1,144 | Singapore - 1.1% | |||||||
| East Japan Railway Co. | 107,307 | 8,259 | CitySpring Infrastructure Trust(Æ) | 3,887,938 | 1,543 | |||||
| Japan Airport Terminal Co., Ltd. | 95,571 | 3,676 | ComfortDelGro Corp., Ltd. | 1,121,047 | 2,304 | |||||
| Kamigumi Co., Ltd. | 1,906,260 | 18,040 | HanKore Environment Tech Group, Ltd. | |||||||
| Kansai Electric Power Co., Inc. (The) | 89,900 | 872 | (Æ)(Ñ) | 1,400,118 | 943 | |||||
| Mitsubishi Logistics Corp. | 48,745 | 722 | Hutchison Port Holdings Trust Class U | 14,275,698 | 9,636 | |||||
| Osaka Gas Co., Ltd. | 476,021 | 1,869 | Hyflux, Ltd. | 566,494 | 445 | |||||
| Toho Gas Co., Ltd. | 1,033,582 | 5,503 | Keppel Infrastructure Trust(Æ) | 868,188 | 710 | |||||
| Tokyo Gas Co., Ltd. | 3,560,148 | 20,152 | Parkway Life Real Estate Investment | |||||||
| West Japan Railway Co. | 47,501 | 2,239 | Trust(Æ)(ö) | 1,164,709 | 2,167 | |||||
| 62,476 | SATS, Ltd. | 3,270 | 8 | |||||||
| Singapore Post, Ltd. | 1,129,194 | 1,731 | ||||||||
| Luxembourg - 0.8% | 19,487 | |||||||||
| SES SA | 424,368 | 14,651 | ||||||||
| South Korea - 0.1% | ||||||||||
| Malaysia - 0.4% | Korea Electric Power Corp. | 19,770 | 859 | |||||||
| Petronas Gas BHD | 469,851 | 3,211 | Macquarie Korea Infrastructure Fund | 188,830 | 1,260 | |||||
| Westports Holdings BHD | 4,519,719 | 4,122 | 2,119 | |||||||
| 7,333 | ||||||||||
| Spain - 2.8% | ||||||||||
| Marshall Islands - 0.3% | Abertis Infraestructuras SA(Ñ) | 1,396,456 | 29,058 | |||||||
| Teekay Corp. | 71,768 | 4,196 | Enagas SA | 74,264 | 2,490 | |||||
| VTTI Energy Partners, LP(Æ)(Ñ) | 56,756 | 1,376 | Ferrovial SA | 265,544 | 5,417 | |||||
| 5,572 | Iberdrola SA | 1,582,680 | 11,188 | |||||||
| Red Electrica Corp. SA | 8,488 | 741 | ||||||||
| Mexico - 1.4% | 48,894 | |||||||||
| Grupo Aeroportuario del Centro Norte | ||||||||||
| Sab de CV - ADR(Æ)(Ñ) | 27,387 | 1,084 | Switzerland - 2.0% | |||||||
| Grupo Aeroportuario del Pacifico SAB de | Flughafen Zuerich AG | 55,191 | 35,134 | |||||||
| CV - ADR | 104,692 | 7,135 | ||||||||
| Grupo Aeroportuario del Sureste SAB de | United Kingdom - 5.8% | |||||||||
| CV - ADR | 59,777 | 8,051 | BBA Aviation PLC | 2,735,226 | 15,476 | |||||
| Infraestructura Energetica Nova SAB | Inmarsat PLC | 158,014 | 1,732 | |||||||
| de CV | 633,784 | 3,879 | National Grid PLC | 2,157,798 | 31,964 | |||||
| OHL Mexico SAB de CV(Æ) | 297,599 | 838 | National Grid PLC - ADR(Ñ) | 161,719 | 12,030 | |||||
| Promotora y Operadora de | Pennon Group PLC | 729,226 | 9,723 | |||||||
| Infraestructura SAB de CV(Æ) | 278,787 | 3,555 | Scottish & Southern Energy PLC | 1,078,410 | 27,585 | |||||
| 24,542 | Severn Trent PLC Class H | 36,748 | 1,173 | |||||||
| Shanks Group PLC | 936,992 | 1,458 | ||||||||
| Netherlands - 0.8% | Transocean Partners LLC(Æ)(Ñ) | 27,030 | 679 | |||||||
| Koninklijke Vopak NV | 297,542 | 14,900 | 101,820 | |||||||
| New Zealand - 0.6% | United States - 30.8% | |||||||||
| Auckland International Airport, Ltd.(Æ) | 1,969,949 | 5,943 | Access Midstream Partners, LP(Ñ) | 33,631 | 2,095 | |||||
| Infratil, Ltd. | 763,609 | 1,705 | AES Corp. | 966,996 | 13,606 | |||||
| Port of Tauranga, Ltd.(Ñ) | 278,965 | 3,540 | Alliant Energy Corp. | 177,906 | 11,014 | |||||
| 11,188 | American Tower Corp. Class A(ö) | 153,376 | 14,954 | |||||||
| American Water Works Co., Inc. | 86,864 | 4,636 | ||||||||
| Norway - 0.0% | Atmos Energy Corp. | 187,510 | 9,938 | |||||||
| Hafslund ASA Class B | 69,785 | 523 | California Water Service Group | 169,282 | 4,406 | |||||
| Philippines - 0.5% | CenterPoint Energy, Inc. | 150,160 | 3,686 | |||||||
| International Container Terminal | Cheniere Energy, Inc.(Æ) | 70,981 | 5,324 | |||||||
| Services, Inc. | 3,567,862 | 9,223 | CMS Energy Corp. | 212,648 | 6,947 | |||||
| Cone Midstream Partners, LP(Æ) | 76,876 | 2,326 | ||||||||
| Connecticut Water Service, Inc. | 59,036 | 2,194 | ||||||||
| See accompanying notes which are an integral part of the financial statements. | ||||||||||
| 548 Russell Global Infrastructure Fund | ||||||||||
Russell Investment Company Russell Global Infrastructure Fund
Schedule of Investments, continued — October 31, 2014
| Amounts in thousands (except share amounts) | Amounts in thousands (except share amounts) | ||||||||||||
| Principal | Fair | Principal | Fair | ||||||||||
| Amount ($) | Value | Amount ($) | Value | ||||||||||
| or Shares | $ | or Shares | $ | ||||||||||
| Corrections Corp. of America(ö) | 64,736 | 2,381 | Xcel Energy, Inc. | 22,403 | 750 | ||||||||
| Covanta Holding Corp. | 164,051 | 3,621 | 546,362 | ||||||||||
| Crown Castle International Corp.(ö) | 94,039 | 7,346 | |||||||||||
| CSX Corp. | 464,602 | 16,554 | Total Common Stocks | ||||||||||
| Dominion Midstream Partners, LP(Æ) | 54,307 | 1,621 | (cost $1,507,065) | 1,702,141 | |||||||||
| Dominion Resources, Inc. | 353,650 | 25,215 | |||||||||||
| DTE Energy Co. | 42,500 | 3,492 | Short-Term Investments - 3.2% | ||||||||||
| Duke Energy Corp. | 290,922 | 23,899 | United States - 3.2% | ||||||||||
| Edison International | 43,018 | 2,692 | Russell U.S. Cash Management Fund | 55,724,286 | (8) | 55,724 | |||||||
| Energy Transfer Equity, LP | 62,631 | 3,655 | Total Short-Term Investments | ||||||||||
| Enterprise Products Partners, LP(Ñ) | 68,429 | 2,525 | (cost $55,724) | 55,724 | |||||||||
| Equities Midstream Partners, LP(Ñ) | 60,699 | 5,377 | |||||||||||
| Exelon Corp. | 748,012 | 27,370 | Other Securities - 6.7% | ||||||||||
| FirstEnergy Corp. | 284,989 | 10,642 | Russell U.S. Cash Collateral Fund(×) | 118,375,715 | (8) | 118,376 | |||||||
| Genesee & Wyoming, Inc. Class A(Æ) | 13,481 | 1,297 | Total Other Securities | ||||||||||
| Geo Group, Inc. (The)(ö) | 5,142 | 205 | (cost $118,376) | 118,376 | |||||||||
| Great Plains Energy, Inc. | 46,805 | 1,261 | |||||||||||
| ITC Holdings Corp. | 242,071 | 9,588 | Total Investments 105.9% | ||||||||||
| Kinder Morgan, Inc.(Ñ) | 495,552 | 19,178 | (identified cost $1,681,165) | 1,876,241 | |||||||||
| Kinder Morgan, Inc.(Æ) | 35,991 | 3,424 | |||||||||||
| Laclede Group, Inc. (The) | 22,516 | 1,143 | Other Assets and Liabilities, Net | ||||||||||
| Macquarie Infrastructure Co. LLC | 6,431 | 461 | - | (5.9 | %) | (103,732 | ) | ||||||
| Magellan Midstream Partners, LP(Ñ) | 24,243 | 1,985 | Net Assets - 100.0% | 1,772,509 | |||||||||
| MarkWest Energy Partners, LP | 17,651 | 1,236 | |||||||||||
| MPLX, LP(Ñ) | 24,824 | 1,655 | |||||||||||
| NextEra Energy, Inc. | 319,213 | 31,992 | |||||||||||
| NextEra Energy, Inc.(Æ)(Ñ) | 34,818 | 1,273 | |||||||||||
| NiSource, Inc. | 288,659 | 12,141 | |||||||||||
| Norfolk Southern Corp. | 173,877 | 19,238 | |||||||||||
| Northeast Utilities | 149,445 | 7,375 | |||||||||||
| NRG Yield, Inc. Class A | 12,405 | 620 | |||||||||||
| OGE Energy Corp. | 92,592 | 3,453 | |||||||||||
| Oiltanking Partners, LP | 70,951 | 3,234 | |||||||||||
| ONE Gas, Inc. | 17,776 | 675 | |||||||||||
| ONEOK, Inc. | 154,775 | 9,122 | |||||||||||
| PG&E Corp. | 768,065 | 38,649 | |||||||||||
| Plains GP Holdings, LP Class A(Ñ) | 189,002 | 5,421 | |||||||||||
| Portland General Electric Co. | 56,152 | 2,045 | |||||||||||
| PPL Corp. | 679,551 | 23,778 | |||||||||||
| Questar Corp. | 197,925 | 4,772 | |||||||||||
| SBA Communications Corp. Class A(Æ) | 35,492 | 3,987 | |||||||||||
| SemGroup Corp. Class A | 108,459 | 8,324 | |||||||||||
| Sempra Energy | 149,804 | 16,478 | |||||||||||
| Shell Midstream Partners, LP(Æ) | 119,598 | 4,029 | |||||||||||
| SJW Corp. | 71,300 | 2,279 | |||||||||||
| Southern Co. | 86,635 | 4,016 | |||||||||||
| SP Plus Corp.(Æ) | 20,268 | 442 | |||||||||||
| Spectra Energy Corp. | 471,550 | 18,452 | |||||||||||
| Summit Midstream Partners, LP | 27,072 | 1,272 | |||||||||||
| Tallgrass Energy Partners, LP(Ñ) | 37,369 | 1,630 | |||||||||||
| Targa Resources Corp.(Ñ) | 18,342 | 2,359 | |||||||||||
| Union Pacific Corp. | 111,218 | 12,951 | |||||||||||
| Unitil Corp. | 23,121 | 806 | |||||||||||
| Waste Connections, Inc. | 128,243 | 6,399 | |||||||||||
| Westar Energy, Inc. Class A | 95,266 | 3,602 | |||||||||||
| Western Gas Equity Partners, LP(Ñ) | 25,775 | 1,591 | |||||||||||
| Williams Cos., Inc. (The) | 617,151 | 34,258 | |||||||||||
See accompanying notes which are an integral part of the financial statements.
Russell Global Infrastructure Fund 549
| Russell Investment Company | ||||||||
| Russell Global Infrastructure Fund | ||||||||
| Schedule of Investments, continued — October 31, 2014 | ||||||||
| Futures Contracts | ||||||||
| Amounts in thousands (except contract amounts) | ||||||||
| Unrealized | ||||||||
| Appreciation | ||||||||
| Number of | Notional | Expiration | (Depreciation) | |||||
| Contracts | Amount | Date | $ | |||||
| Long Positions | ||||||||
| CAC 40 Index Futures | 88 | EUR | 3,723 | 11/14 | 182 | |||
| DAX Index Futures | 9 | EUR | 2,094 | 12/14 | 16 | |||
| EURO STOXX 50 Index Futures | 58 | EUR | 1,799 | 12/14 | 5 | |||
| FTSE 100 Index Futures | 37 | GBP | 2,407 | 12/14 | (24 | ) | ||
| Hang Seng Index Futures | 26 | HKD | 31,126 | 11/14 | 93 | |||
| IBEX 35 Index Futures | 27 | EUR | 2,816 | 11/14 | 126 | |||
| S&P E-Mini Utilities Select Sector Index Futures | 242 | USD | 11,047 | 12/14 | 555 | |||
| S&P Mid 500 E-Mini Index Futures | 76 | USD | 7,643 | 12/14 | 235 | |||
| S&P/TSX 60 Index Futures | 35 | CAD | 5,935 | 12/14 | (76 | ) | ||
| SPI 200 Index Futures | 42 | AUD | 5,794 | 12/14 | 122 | |||
| TOPIX Index Futures | 21 | JPY | 280,770 | 12/14 | 116 | |||
| Total Unrealized Appreciation (Depreciation) on Open Futures Contracts (å) | 1,350 | |||||||
| Foreign Currency Exchange Contracts | ||||||||
| Amounts in thousands | ||||||||
| Unrealized | ||||||||
| Appreciation | ||||||||
| Amount | Amount | (Depreciation) | ||||||
| Counterparty | Sold | Bought | Settlement Date | $ | ||||
| Bank of America | AUD | 100 | USD | 90 | 12/17/14 | 3 | ||
| Bank of America | CAD | 200 | USD | 182 | 12/17/14 | 5 | ||
| Bank of America | EUR | 200 | USD | 253 | 12/17/14 | 2 | ||
| Bank of America | EUR | 300 | USD | 389 | 12/17/14 | 12 | ||
| Bank of America | GBP | 100 | USD | 163 | 12/17/14 | 3 | ||
| Bank of America | HKD | 1,000 | USD | 129 | 12/17/14 | — | ||
| Bank of America | JPY | 10,000 | USD | 94 | 12/17/14 | 5 | ||
| Bank of America | JPY | 10,000 | USD | 93 | 12/17/14 | 4 | ||
| Bank of Montreal | AUD | 500 | USD | 437 | 12/17/14 | (1 | ) | |
| Bank of Montreal | CAD | 500 | USD | 442 | 12/17/14 | (1 | ) | |
| Bank of Montreal | EUR | 800 | USD | 1,024 | 12/17/14 | 21 | ||
| Bank of Montreal | GBP | 200 | USD | 319 | 12/17/14 | (1 | ) | |
| Bank of Montreal | HKD | 1,500 | USD | 193 | 12/17/14 | — | ||
| Bank of Montreal | JPY | 10,000 | USD | 94 | 12/17/14 | 5 | ||
| Bank of New York | USD | 260 | AUD | 300 | 12/17/14 | 3 | ||
| Bank of New York | USD | 4,269 | AUD | 4,700 | 12/17/14 | (145 | ) | |
| Bank of New York | USD | 268 | CAD | 300 | 12/17/14 | (3 | ) | |
| Bank of New York | USD | 381 | EUR | 300 | 12/17/14 | (5 | ) | |
| Bank of New York | USD | 325 | GBP | 200 | 12/17/14 | (5 | ) | |
| Bank of New York | USD | 129 | HKD | 1,000 | 12/17/14 | — | ||
| Bank of New York | USD | 91 | JPY | 10,000 | 12/17/14 | (2 | ) | |
| Bank of New York | AUD | 150 | USD | 134 | 12/17/14 | 3 | ||
| Bank of New York | CAD | 150 | USD | 136 | 12/17/14 | 3 | ||
| Bank of New York | EUR | 300 | USD | 388 | 12/17/14 | 12 | ||
| Bank of New York | EUR | 600 | USD | 778 | 12/17/14 | 26 | ||
| Bank of New York | GBP | 100 | USD | 163 | 12/17/14 | 3 | ||
| Bank of New York | HKD | 1,000 | USD | 129 | 12/17/14 | — | ||
| Bank of New York | HKD | 2,000 | USD | 258 | 12/17/14 | — | ||
| Bank of New York | JPY | 10,000 | USD | 94 | 12/17/14 | 5 | ||
| Barclays | AUD | 100 | USD | 87 | 12/17/14 | (1 | ) | |
| Barclays | CAD | 100 | USD | 89 | 12/17/14 | 1 | ||
| Barclays | GBP | 100 | USD | 162 | 12/17/14 | 2 | ||
| Barclays | JPY | 10,000 | USD | 92 | 12/17/14 | 3 | ||
| Brown Brothers Harriman | AUD | 300 | USD | 264 | 12/17/14 | 1 | ||
| Brown Brothers Harriman | CAD | 300 | USD | 270 | 12/17/14 | 4 | ||
| Brown Brothers Harriman | EUR | 1,000 | USD | 1,286 | 12/17/14 | 33 | ||
| Brown Brothers Harriman | GBP | 200 | USD | 328 | 12/17/14 | 8 | ||
| Brown Brothers Harriman | HKD | 3,000 | USD | 387 | 12/17/14 | — | ||
| Brown Brothers Harriman | JPY | 20,000 | USD | 184 | 12/17/14 | 6 | ||
| Citibank | USD | 482 | EUR | 382 | 11/04/14 | (3 | ) | |
| Citibank | AUD | 350 | USD | 305 | 12/17/14 | (2 | ) | |
| Citibank | CAD | 163 | USD | 145 | 11/04/14 | 1 | ||
| Citibank | CAD | 150 | USD | 133 | 12/17/14 | — | ||
| Citibank | EUR | 350 | USD | 448 | 12/17/14 | 9 | ||
| See accompanying notes which are an integral part of the financial statements. | ||||||||
| 550 Russell Global Infrastructure Fund | ||||||||
| Russell Investment Company | |||||||
| Russell Global Infrastructure Fund | |||||||
| Schedule of Investments, continued — October 31, 2014 | |||||||
| Foreign Currency Exchange Contracts | |||||||
| Amounts in thousands | |||||||
| Unrealized | |||||||
| Appreciation | |||||||
| Amount | Amount | (Depreciation) | |||||
| Counterparty | Sold | Bought | Settlement Date | $ | |||
| Citibank | GBP | 461 | USD | 738 | 11/03/14 | — | |
| Citibank | GBP | 60 | USD | 96 | 12/17/14 | — | |
| Citibank | HKD | 2,000 | USD | 258 | 12/17/14 | — | |
| Citibank | JPY | 20,000 | USD | 188 | 12/17/14 | 11 | |
| Commonwealth Bank of Australia | USD | 4,140 | EUR | 3,207 | 12/17/14 | (120 | ) |
| Commonwealth Bank of Australia | USD | 2,131 | JPY | 227,280 | 12/17/14 | (106 | ) |
| Credit Suisse | USD | 176 | EUR | 139 | 11/03/14 | (1 | ) |
| Credit Suisse | USD | 112 | HKD | 865 | 11/03/14 | — | |
| Credit Suisse | CAD | 213 | USD | 190 | 11/03/14 | 1 | |
| Deutsche Bank | USD | 262 | AUD | 300 | 12/17/14 | 1 | |
| Deutsche Bank | USD | 438 | AUD | 500 | 12/17/14 | 1 | |
| Deutsche Bank | USD | 267 | CAD | 300 | 12/17/14 | (1 | ) |
| Deutsche Bank | USD | 442 | CAD | 500 | 12/17/14 | 1 | |
| Deutsche Bank | USD | 1,025 | EUR | 800 | 12/17/14 | (23 | ) |
| Deutsche Bank | USD | 1,273 | EUR | 1,000 | 12/17/14 | (20 | ) |
| Deutsche Bank | USD | 322 | GBP | 200 | 12/17/14 | (2 | ) |
| Deutsche Bank | USD | 323 | GBP | 200 | 12/17/14 | (3 | ) |
| Deutsche Bank | USD | 129 | HKD | 1,000 | 12/17/14 | — | |
| Deutsche Bank | USD | 387 | HKD | 3,000 | 12/17/14 | — | |
| Deutsche Bank | USD | 94 | JPY | 10,000 | 12/17/14 | (5 | ) |
| Deutsche Bank | USD | 281 | JPY | 30,000 | 12/17/14 | (14 | ) |
| Deutsche Bank | AUD | 350 | USD | 307 | 12/17/14 | — | |
| Deutsche Bank | CAD | 400 | USD | 357 | 12/17/14 | 2 | |
| Deutsche Bank | EUR | 850 | USD | 1,075 | 12/17/14 | 10 | |
| Deutsche Bank | GBP | 200 | USD | 320 | 12/17/14 | — | |
| Deutsche Bank | HKD | 2,000 | USD | 258 | 12/17/14 | — | |
| Deutsche Bank | JPY | 20,000 | USD | 184 | 12/17/14 | 6 | |
| Deutsche Bank | MXN | 1,756 | USD | 130 | 11/03/14 | — | |
| HSBC | USD | 4,141 | EUR | 3,207 | 12/17/14 | (122 | ) |
| HSBC | USD | 1,618 | HKD | 12,538 | 12/17/14 | (1 | ) |
| JPMorgan Chase | USD | 4,141 | EUR | 3,207 | 12/17/14 | (121 | ) |
| JPMorgan Chase | USD | 3,581 | GBP | 2,222 | 12/17/14 | (29 | ) |
| JPMorgan Chase | USD | 1,618 | HKD | 12,538 | 12/17/14 | (1 | ) |
| National Australia Bank | USD | 2,544 | HKD | 19,728 | 11/03/14 | — | |
| National Australia Bank | HKD | 8,375 | USD | 1,080 | 11/03/14 | — | |
| Northern Trust | AUD | 100 | USD | 92 | 12/17/14 | 4 | |
| Northern Trust | AUD | 700 | USD | 613 | 12/17/14 | (1 | ) |
| Northern Trust | CAD | 100 | USD | 91 | 12/17/14 | 2 | |
| Northern Trust | CAD | 600 | USD | 537 | 12/17/14 | 5 | |
| Northern Trust | EUR | 300 | USD | 387 | 12/17/14 | 12 | |
| Northern Trust | EUR | 1,000 | USD | 1,268 | 12/17/14 | 15 | |
| Northern Trust | GBP | 100 | USD | 161 | 12/17/14 | 1 | |
| Northern Trust | GBP | 300 | USD | 484 | 12/17/14 | 4 | |
| Northern Trust | HKD | 1,000 | USD | 129 | 12/17/14 | — | |
| Northern Trust | HKD | 3,000 | USD | 386 | 12/17/14 | — | |
| Northern Trust | JPY | 10,000 | USD | 94 | 12/17/14 | 5 | |
| Northern Trust | JPY | 20,000 | USD | 185 | 12/17/14 | 6 | |
| State Street | USD | 5,758 | AUD | 6,544 | 11/06/14 | 1 | |
| State Street | USD | 86 | AUD | 100 | 12/17/14 | 1 | |
| State Street | USD | 87 | AUD | 100 | 12/17/14 | — | |
| State Street | USD | 176 | AUD | 200 | 12/17/14 | (1 | ) |
| State Street | USD | 177 | AUD | 200 | 12/17/14 | (1 | ) |
| State Street | USD | 179 | AUD | 200 | 12/17/14 | (4 | ) |
| State Street | USD | 261 | AUD | 300 | 12/17/14 | 2 | |
| State Street | USD | 262 | AUD | 300 | 12/17/14 | 2 | |
| State Street | USD | 350 | AUD | 400 | 12/17/14 | 1 | |
| State Street | USD | 353 | AUD | 400 | 12/17/14 | (2 | ) |
| State Street | USD | 629 | AUD | 700 | 12/17/14 | (15 | ) |
| State Street | USD | 90 | CAD | 100 | 12/17/14 | (2 | ) |
| State Street | USD | 179 | CAD | 200 | 12/17/14 | (2 | ) |
| State Street | USD | 181 | CAD | 200 | 12/17/14 | (3 | ) |
| State Street | USD | 267 | CAD | 300 | 12/17/14 | (1 | ) |
| State Street | USD | 267 | CAD | 300 | 12/17/14 | (1 | ) |
| State Street | USD | 268 | CAD | 300 | 12/17/14 | (2 | ) |
| State Street | USD | 269 | CAD | 300 | 12/17/14 | (3 | ) |
| State Street | USD | 444 | CAD | 500 | 12/17/14 | (1 | ) |
| See accompanying notes which are an integral part of the financial statements. | |||||||
| Russell Global Infrastructure Fund 551 | |||||||
| Russell Investment Company | |||||||
| Russell Global Infrastructure Fund | |||||||
| Schedule of Investments, continued — October 31, 2014 | |||||||
| Foreign Currency Exchange Contracts | |||||||
| Amounts in thousands | |||||||
| Unrealized | |||||||
| Appreciation | |||||||
| Amount | Amount | (Depreciation) | |||||
| Counterparty | Sold | Bought | Settlement Date | $ | |||
| State Street | USD | 447 | CAD | 500 | 12/17/14 | (4 | ) |
| State Street | USD | 720 | CAD | 800 | 12/17/14 | (11 | ) |
| State Street | USD | 780 | CHF | 750 | 11/04/14 | — | |
| State Street | USD | 104 | EUR | 83 | 11/04/14 | — | |
| State Street | USD | 223 | EUR | 178 | 11/04/14 | — | |
| State Street | USD | 3,271 | EUR | 2,617 | 11/04/14 | 7 | |
| State Street | USD | 504 | EUR | 400 | 12/17/14 | (3 | ) |
| State Street | USD | 518 | EUR | 400 | 12/17/14 | (16 | ) |
| State Street | USD | 631 | EUR | 500 | 12/17/14 | (4 | ) |
| State Street | USD | 633 | EUR | 500 | 12/17/14 | (6 | ) |
| State Street | USD | 640 | EUR | 500 | 12/17/14 | (13 | ) |
| State Street | USD | 759 | EUR | 600 | 12/17/14 | (7 | ) |
| State Street | USD | 885 | EUR | 700 | 12/17/14 | (7 | ) |
| State Street | USD | 1,015 | EUR | 800 | 12/17/14 | (12 | ) |
| State Street | USD | 1,274 | EUR | 1,000 | 12/17/14 | (19 | ) |
| State Street | USD | 1,685 | EUR | 1,300 | 12/17/14 | (54 | ) |
| State Street | USD | 1,774 | GBP | 1,109 | 11/04/14 | — | |
| State Street | USD | 160 | GBP | 100 | 12/17/14 | — | |
| State Street | USD | 161 | GBP | 100 | 12/17/14 | (1 | ) |
| State Street | USD | 161 | GBP | 100 | 12/17/14 | (1 | ) |
| State Street | USD | 162 | GBP | 100 | 12/17/14 | (2 | ) |
| State Street | USD | 162 | GBP | 100 | 12/17/14 | (2 | ) |
| State Street | USD | 163 | GBP | 100 | 12/17/14 | (3 | ) |
| State Street | USD | 321 | GBP | 200 | 12/17/14 | (1 | ) |
| State Street | USD | 321 | GBP | 200 | 12/17/14 | (2 | ) |
| State Street | USD | 323 | GBP | 200 | 12/17/14 | (3 | ) |
| State Street | USD | 487 | GBP | 300 | 12/17/14 | (8 | ) |
| State Street | USD | 4,066 | HKD | 31,529 | 11/04/14 | — | |
| State Street | USD | 129 | HKD | 1,000 | 12/17/14 | — | |
| State Street | USD | 129 | HKD | 1,000 | 12/17/14 | — | |
| State Street | USD | 129 | HKD | 1,000 | 12/17/14 | — | |
| State Street | USD | 129 | HKD | 1,000 | 12/17/14 | — | |
| State Street | USD | 129 | HKD | 1,000 | 12/17/14 | — | |
| State Street | USD | 258 | HKD | 2,000 | 12/17/14 | — | |
| State Street | USD | 258 | HKD | 2,000 | 12/17/14 | — | |
| State Street | USD | 387 | HKD | 3,000 | 12/17/14 | — | |
| State Street | USD | 516 | HKD | 4,000 | 12/17/14 | — | |
| State Street | USD | 504 | IDR | 6,109,332 | 11/03/14 | 1 | |
| State Street | USD | 3,808 | JPY | 427,780 | 11/06/14 | — | |
| State Street | USD | 91 | JPY | 10,000 | 12/17/14 | (2 | ) |
| State Street | USD | 92 | JPY | 10,000 | 12/17/14 | (2 | ) |
| State Street | USD | 92 | JPY | 10,000 | 12/17/14 | (3 | ) |
| State Street | USD | 92 | JPY | 10,000 | 12/17/14 | (3 | ) |
| State Street | USD | 93 | JPY | 10,000 | 12/17/14 | (4 | ) |
| State Street | USD | 185 | JPY | 20,000 | 12/17/14 | (7 | ) |
| State Street | USD | 187 | JPY | 20,000 | 12/17/14 | (9 | ) |
| State Street | USD | 278 | JPY | 30,000 | 12/17/14 | (11 | ) |
| State Street | USD | 280 | JPY | 30,000 | 12/17/14 | (13 | ) |
| State Street | USD | 10 | NOK | 65 | 11/04/14 | — | |
| State Street | USD | 409 | NZD | 525 | 11/05/14 | — | |
| State Street | USD | 203 | SGD | 260 | 11/05/14 | — | |
| State Street | AUD | 100 | USD | 87 | 12/17/14 | (1 | ) |
| State Street | AUD | 100 | USD | 89 | 12/17/14 | 2 | |
| State Street | AUD | 250 | USD | 227 | 12/17/14 | 8 | |
| State Street | AUD | 1,000 | USD | 877 | 12/17/14 | — | |
| State Street | BRL | — | USD | — | 11/03/14 | — | |
| State Street | BRL | 93 | USD | 38 | 11/03/14 | — | |
| State Street | BRL | 514 | USD | 210 | 11/03/14 | 2 | |
| State Street | BRL | 1,768 | USD | 734 | 11/03/14 | 22 | |
| State Street | BRL | 281 | USD | 113 | 11/04/14 | — | |
| State Street | CAD | 7 | USD | 6 | 11/03/14 | — | |
| State Street | CAD | 8 | USD | 7 | 11/03/14 | — | |
| State Street | CAD | 14,000 | USD | 12,421 | 11/05/14 | (1 | ) |
| State Street | CAD | 100 | USD | 91 | 12/17/14 | 2 | |
| State Street | CAD | 150 | USD | 137 | 12/17/14 | 4 | |
| State Street | CAD | 200 | USD | 182 | 12/17/14 | 5 | |
| State Street | CAD | 200 | USD | 177 | 12/17/14 | — | |
| State Street | CAD | 1,000 | USD | 886 | 12/17/14 | — | |
| See accompanying notes which are an integral part of the financial statements. | |||||||
| 552 Russell Global Infrastructure Fund | |||||||
| Russell Investment Company | ||||||||||||
| Russell Global Infrastructure Fund | ||||||||||||
| Schedule of Investments, continued — October 31, 2014 | ||||||||||||
| Foreign Currency Exchange Contracts | ||||||||||||
| Amounts in thousands | ||||||||||||
| Unrealized | ||||||||||||
| Appreciation | ||||||||||||
| Amount | Amount | (Depreciation) | ||||||||||
| Counterparty | Sold | Bought | Settlement Date | $ | ||||||||
| State Street | EUR | 1,297 | USD | 1,622 | 11/04/14 | (4 | ) | |||||
| State Street | EUR | 1,839 | USD | 2,299 | 11/04/14 | (5 | ) | |||||
| State Street | EUR | 2,513 | USD | 3,149 | 11/05/14 | — | ||||||
| State Street | EUR | 100 | USD | 129 | 12/17/14 | 4 | ||||||
| State Street | EUR | 200 | USD | 256 | 12/17/14 | 5 | ||||||
| State Street | EUR | 250 | USD | 321 | 12/17/14 | 8 | ||||||
| State Street | EUR | 800 | USD | 1,034 | 12/17/14 | 32 | ||||||
| State Street | EUR | 1,500 | USD | 1,880 | 12/17/14 | (1 | ) | |||||
| State Street | GBP | 60 | USD | 97 | 12/17/14 | 1 | ||||||
| State Street | GBP | 60 | USD | 98 | 12/17/14 | 2 | ||||||
| State Street | GBP | 100 | USD | 162 | 12/17/14 | 2 | ||||||
| State Street | GBP | 400 | USD | 640 | 12/17/14 | — | ||||||
| State Street | HKD | 488 | USD | 63 | 11/03/14 | — | ||||||
| State Street | HKD | 1,000 | USD | 129 | 12/17/14 | — | ||||||
| State Street | HKD | 4,000 | USD | 516 | 12/17/14 | — | ||||||
| State Street | JPY | 10,000 | USD | 94 | 12/17/14 | 5 | ||||||
| State Street | JPY | 10,000 | USD | 92 | 12/17/14 | 3 | ||||||
| State Street | JPY | 35,000 | USD | 312 | 12/17/14 | — | ||||||
| State Street | MXN | 1,842 | USD | 137 | 11/04/14 | — | ||||||
| UBS | USD | 4,422 | CAD | 4,866 | 12/17/14 | (109 | ) | |||||
| Total Unrealized Appreciation (Depreciation) on Open Foreign Currency Exchange Contracts | (739 | ) | ||||||||||
| Presentation of Portfolio Holdings | ||||||||||||
| Amounts in thousands | ||||||||||||
| Fair Value | ||||||||||||
| Portfolio Summary | Level 1 | Level 2 | Level 3 | Total | % of Net Assets | |||||||
| Common Stocks | ||||||||||||
| Australia | $ | 154,529 | $ | — | $ | — | $ | 154,529 | 8.7 | |||
| Austria | 7,605 | — | — | 7,605 | 0.4 | |||||||
| Belgium | 2,119 | — | — | 2,119 | 0.1 | |||||||
| Bermuda | 876 | — | — | 876 | 0.1 | |||||||
| Brazil | 25,600 | — | — | 25,600 | 1.5 | |||||||
| Canada | 148,836 | — | — | 148,836 | 8.4 | |||||||
| Chile | 7,423 | — | — | 7,423 | 0.4 | |||||||
| China | 33,636 | — | — | 33,636 | 1.9 | |||||||
| France | 162,840 | — | — | 162,840 | 9.2 | |||||||
| Germany | 51,038 | — | — | 51,038 | 2.9 | |||||||
| Hong Kong | 52,425 | — | — | 52,425 | 3.0 | |||||||
| India | 4,112 | — | — | 4,112 | 0.2 | |||||||
| Indonesia | 2,462 | — | — | 2,462 | 0.1 | |||||||
| Italy | 141,591 | — | — | 141,591 | 8.0 | |||||||
| Japan | 62,476 | — | — | 62,476 | 3.5 | |||||||
| Luxembourg | 14,651 | — | — | 14,651 | 0.8 | |||||||
| Malaysia | 7,333 | — | — | 7,333 | 0.4 | |||||||
| Marshall Islands | 5,572 | — | — | 5,572 | 0.3 | |||||||
| Mexico | 24,542 | — | — | 24,542 | 1.4 | |||||||
| Netherlands | 14,900 | — | — | 14,900 | 0.8 | |||||||
| New Zealand | 11,188 | — | — | 11,188 | 0.6 | |||||||
| Norway | 523 | — | — | 523 | —* | |||||||
| Philippines | 9,223 | — | — | 9,223 | 0.5 | |||||||
| Portugal | 2,825 | — | — | 2,825 | 0.2 | |||||||
| Singapore | 19,487 | — | — | 19,487 | 1.1 | |||||||
| South Korea | 2,119 | — | — | 2,119 | 0.1 | |||||||
| Spain | 48,894 | — | — | 48,894 | 2.8 | |||||||
| Switzerland | 35,134 | — | — | 35,134 | 2.0 | |||||||
| United Kingdom | 101,820 | — | — | 101,820 | 5.8 | |||||||
| United States | 546,362 | — | — | 546,362 | 30.8 | |||||||
| Short-Term Investments | — | 55,724 | — | 55,724 | 3.2 | |||||||
| Other Securities | — | 118,376 | — | 118,376 | 6.7 | |||||||
| Total Investments | 1,702,141 | 174,100 | — | 1,876,241 | 105.9 | |||||||
| Other Assets and Liabilities, Net | (5.9 | ) | ||||||||||
| See accompanying notes which are an integral part of the financial statements. | ||||||||||||
| Russell Global Infrastructure Fund 553 | ||||||||||||
| Russell Investment Company | ||||||||||||
| Russell Global Infrastructure Fund | ||||||||||||
| Schedule of Investments, continued — October 31, 2014 | ||||||||||||
| Presentation of Portfolio Holdings | ||||||||||||
| Amounts in thousands | ||||||||||||
| Fair Value | ||||||||||||
| Portfolio Summary | Level 1 | Level 2 | Level 3 | Total | % of Net Assets | |||||||
| 100.0 | ||||||||||||
| Other Financial Instruments | ||||||||||||
| Futures Contracts | 1,350 | — | — | 1,350 | 0.1 | |||||||
| Foreign Currency Exchange Contracts | 22 | (761 | ) | — | (739 | ) | (—*) | |||||
| Total Other Financial Instruments** | $ | 1,372 | $ | (761 | ) | $ | — | $ | 611 | |||
| * Less than .05% of net assets. | ||||||||||||
| ** Futures and foreign currency exchange contract values reflect the unrealized appreciation/depreciation on the instruments. | ||||||||||||
| For a description of the Levels see note 2 in the Notes to Financial Statements. | ||||||||||||
| For disclosure on transfers between Levels 1, 2 and 3 during the period ended October 31, 2014, see note 2 in the Notes to Financial | ||||||||||||
| Statements. | ||||||||||||
See accompanying notes which are an integral part of the financial statements.
554 Russell Global Infrastructure Fund
| Russell Investment Company | |||||
| Russell Global Infrastructure Fund | |||||
| Fair Value of Derivative Instruments — October 31, 2014 | |||||
| Amounts in thousands | |||||
| Foreign | |||||
| Equity | Currency | ||||
| Derivatives not accounted for as hedging instruments | Contracts | Contracts | |||
| Location: Statement of Assets and Liabilities - Assets | |||||
| Unrealized appreciation on foreign currency exchange contracts | $ | — | $ | 392 | |
| Variation margin on futures contracts* | 1,450 | — | |||
| Total | $ | 1,450 | $ | 392 | |
| Location: Statement of Assets and Liabilities - Liabilities | |||||
| Variation margin on futures contracts* | $ | 100 | $ | — | |
| Unrealized depreciation on foreign currency exchange contracts | — | 1,131 | |||
| Total | $ | 100 | $ | 1,131 | |
| Foreign | |||||
| Equity | Currency | ||||
| Derivatives not accounted for as hedging instruments | Contracts | Contracts | |||
| Location: Statement of Operations - Net realized gain (loss) | |||||
| Futures contracts | $ | 5,987 | $ | — | |
| Foreign currency-related transactions** | — | (524 | ) | ||
| Total | $ | 5,987 | $ | (524 | ) |
| Location: Statement of Operations - Net change in unrealized appreciation (depreciation) | |||||
| Futures contracts | $ | 514 | $ | — | |
| Foreign currency-related transactions*** | — | (1,361 | ) | ||
| Total | $ | 514 | $ | (1,361 | ) |
| * | Includes cumulative appreciation/depreciation of futures contracts as reported in the Schedule of Investments. Only variation margin is reported within the Statement of Assets and Liabilities. |
| ** | Only includes net realized gain (loss) on forward and spot contracts. May differ from the net realized gain (loss) on foreign currency-related transactions reported within the Statement of Operations. |
| *** | Only includes change in unrealized gain (loss) on forward and spot contracts. May differ from the net change in unrealized gain (loss) on foreign currency-related transactions reported within the Statement of Operations. |
For further disclosure on derivatives see note 2 in the Notes to Financial Statements.
See accompanying notes which are an integral part of the financial statements.
Russell Global Infrastructure Fund 555
Russell Investment Company Russell Global Infrastructure Fund
Balance Sheet Offsetting of Financial and Derivative Instruments — October 31, 2014
| Amounts in thousands | ||||||||
| Offsetting of Financial Assets and Derivative Assets | ||||||||
| Gross | Net Amounts | |||||||
| Amounts | of Assets | |||||||
| Gross | Offset in the | Presented in | ||||||
| Amounts of | Statement of | the Statement | ||||||
| Recognized | Assets and | of Assets and | ||||||
| Description | Location: Statement of Assets and Liabilities - Assets | Assets | Liabilities | Liabilities | ||||
| Securities on Loan* | Investments, at fair value | $ | 112,761 | $ | — $ | 112,761 | ||
| Foreign Currency Exchange Contracts | Unrealized appreciation on foreign currency exchange contracts | 392 | — | 392 | ||||
| Futures Contracts | Variation margin on futures contracts | 736 | — | 736 | ||||
| Total | $ | 113,889 | $ | — $ | 113,889 | |||
| Financial Assets, Derivative Assets, and Collateral Held by Counterparty | ||||||||
| Gross Amounts Not Offset in | ||||||||
| the Statement of Assets and | ||||||||
| Liabilities | ||||||||
| Net Amounts | ||||||||
| of Assets | ||||||||
| Presented in | ||||||||
| the Statement | Financial and | |||||||
| of Assets and | Derivative | Collateral | ||||||
| Counterparty | Liabilities | Instruments | Received^ | Net Amount | ||||
| Bank of America | $ | 34 | $ | — $ | — $ | 34 | ||
| Bank of Montreal | 26 | 3 | — | 23 | ||||
| Bank of New York | 55 | 55 | — | — | ||||
| Barclays | 25,356 | 1 | 25,350 | 5 | ||||
| Brown Brothers Harriman | 52 | — | — | 52 | ||||
| Citigroup | 20,653 | 2 | 20,631 | 20 | ||||
| Credit Suisse | 10,622 | — | 10,620 | 2 | ||||
| Deutsche Bank | 8,764 | 20 | 8,744 | — | ||||
| Fidelity | 65 | — | 65 | — | ||||
| Goldman Sachs | 807 | — | 807 | — | ||||
| JPMorgan Chase | 7,315 | — | 7,315 | — | ||||
| Merrill Lynch | 1,063 | — | 1,063 | — | ||||
| Morgan Stanley | 2,839 | — | 2,102 | 737 | ||||
| Northern Trust | 55 | 1 | — | 54 | ||||
| State Street | 122 | 89 | — | 33 | ||||
| UBS | 36,061 | — | 36,061 | — | ||||
| Total | $ | 113,889 | $ | 171 | $ | 112,758 | $ | 960 |
See accompanying notes which are an integral part of the financial statements.
556 Russell Global Infrastructure Fund
Russell Investment Company
Russell Global Infrastructure Fund
Balance Sheet Offsetting of Financial and Derivative Instruments, continued —October 31, 2014
| Amounts in thousands | ||||||||
| Offsetting of Financial Liabilities and Derivative Liabilities | ||||||||
| Gross | Net Amounts | |||||||
| Amounts | of Assets | |||||||
| Gross | Offset in the | Presented in | ||||||
| Amounts of | Statement of | the Statement | ||||||
| Recognized | Assets and | of Assets and | ||||||
| Description | Location: Statement of Assets and Liabilities - Liabilities | Liabilities | Liabilities | Liabilities | ||||
| Futures Contracts | Variation margin on futures contracts | $ | 3 | $ | — $ | 3 | ||
| Foreign Currency Exchange Contracts | Unrealized depreciation on foreign currency exchange contracts | 1,131 | — | 1,131 | ||||
| Total | $ | 1,134 | $ | — $ | 1,134 | |||
| Financial Liabilities, Derivative Liabilities, and Collateral Pledged by Counterparty | ||||||||
| Gross Amounts Not Offset in | ||||||||
| the Statement of Assets and | ||||||||
| Liabilities | ||||||||
| Net Amounts | ||||||||
| of Liabilities | ||||||||
| Presented in | ||||||||
| the Statement | Financial and | |||||||
| of Assets and | Derivative | Collateral | ||||||
| Counterparty | Liabilities | Instruments | Pledged^ | Net Amount | ||||
| Bank of Montreal | $ | 3 | $ | 3 | $ | — $ | — | |
| Bank of New York | 160 | 55 | — | 105 | ||||
| Barclays | 1 | 1 | — | — | ||||
| Citigroup | 5 | 2 | — | 3 | ||||
| Commonwealth Bank of Australia | 226 | — | — | 226 | ||||
| Credit Suisse | 1 | — | — | 1 | ||||
| Deutsche Bank | 67 | 20 | — | 47 | ||||
| HSBC | 123 | — | — | 123 | ||||
| JPMorgan Chase | 151 | — | — | 151 | ||||
| Morgan Stanley | 4 | — | 4 | — | ||||
| Northern Trust | 1 | 1 | — | — | ||||
| State Street | 283 | 89 | — | 194 | ||||
| UBS | 109 | — | — | 109 | ||||
| Total | $ | 1,134 | $ | 171 | $ | 4 | $ | 959 |
* Fair value of securities on loan as reported in the footnotes to the Statement of Assets and Liabilities.
^ Collateral received or pledged amounts may not reconcile to those disclosed in the Statement of Assets and Liabilities due to the inclusion of off-Balance Sheet collateral and adjustments made to exclude overcollateralization.
For further disclosure on derivatives and counterparty risk see note 2 in the Notes to Financial Statements.
See accompanying notes which are an integral part of the financial statements.
Russell Global Infrastructure Fund 557
| Russell Investment Company | ||
| Russell Global Infrastructure Fund | ||
| Statement of Assets and Liabilities — October 31, 2014 | ||
| Amounts in thousands | ||
| Assets | ||
| Investments, at identified cost | $ | 1,681,165 |
| Investments, at fair value(*)(>) | 1,876,241 | |
| Cash | 32 | |
| Cash (restricted)(a) | 3,541 | |
| Foreign currency holdings(^) | 3,531 | |
| Unrealized appreciation on foreign currency exchange contracts | 392 | |
| Receivables: | ||
| Dividends and interest | 1,861 | |
| Dividends from affiliated Russell funds | 6 | |
| Investments sold | 96,627 | |
| Fund shares sold | 2,208 | |
| Foreign capital gains taxes recoverable | 321 | |
| Variation margin on futures contracts | 736 | |
| Prepaid expenses | 4 | |
| Total assets | 1,985,500 | |
| Liabilities | ||
| Payables: | ||
| Investments purchased | 89,939 | |
| Fund shares redeemed | 1,649 | |
| Accrued fees to affiliates | 1,615 | |
| Other accrued expenses | 182 | |
| Variation margin on futures contracts | 3 | |
| Deferred capital gains tax liability | 96 | |
| Unrealized depreciation on foreign currency exchange contracts | 1,131 | |
| Payable upon return of securities loaned | 118,376 | |
| Total liabilities | 212,991 | |
| Net Assets | $ | 1,772,509 |
See accompanying notes which are an integral part of the financial statements.
558 Russell Global Infrastructure Fund
| Russell Investment Company | |||
| Russell Global Infrastructure Fund | |||
| Statement of Assets and Liabilities, continued — October 31, 2014 | |||
| Amounts in thousands | |||
| Net Assets Consist of: | |||
| Undistributed (overdistributed) net investment income | $ | 1,853 | |
| Accumulated net realized gain (loss) | 98,787 | ||
| Unrealized appreciation (depreciation) on: | |||
| Investments (net of deferred tax liability for foreign capital gains taxes) | 194,980 | ||
| Futures contracts | 1,350 | ||
| Foreign currency-related transactions | (875 | ) | |
| Shares of beneficial interest | 1,369 | ||
| Additional paid-in capital | 1,475,045 | ||
| Net Assets | $ | 1,772,509 | |
| Net Asset Value, offering and redemption price per share: | |||
| Net asset value per share: Class A(#) | $ | 12.93 | |
| Maximum offering price per share (Net asset value plus sales charge of 5.75%): Class A | $ | 13.72 | |
| Class A — Net assets | $ | 9,902,726 | |
| Class A — Shares outstanding ($.01 par value) | 766,106 | ||
| Net asset value per share: Class C(#) | $ | 12.89 | |
| Class C — Net assets | $ | 9,145,369 | |
| Class C — Shares outstanding ($.01 par value) | 709,319 | ||
| Net asset value per share: Class E(#) | $ | 12.93 | |
| Class E — Net assets | $ | 28,884,717 | |
| Class E — Shares outstanding ($.01 par value) | 2,233,786 | ||
| Net asset value per share: Class S(#) | $ | 12.94 | |
| Class S — Net assets | $ 1,243,851,894 | ||
| Class S — Shares outstanding ($.01 par value) | 96,099,278 | ||
| Net asset value per share: Class Y(#) | $ | 12.95 | |
| Class Y — Net assets | $ | 480,723,891 | |
| Class Y — Shares outstanding ($.01 par value) | 37,130,428 | ||
| Amounts in thousands | |||
| (^) Foreign currency holdings - cost | $ | 3,605 | |
| (*) Securities on loan included in investments | $ | 112,761 | |
| (>) Investments in affiliates, Russell U.S. Cash Management Fund and Russell U.S. Cash Collateral Fund | $ | 174,100 | |
| (a) Cash Collateral for Futures | $ | 3,541 | |
| (#) Net asset value per share equals class level net assets divided by class level shares of beneficial interest outstanding. | |||
See accompanying notes which are an integral part of the financial statements.
Russell Global Infrastructure Fund 559
| Russell Investment Company | |||
| Russell Global Infrastructure Fund | |||
| Statement of Operations — For the Period Ended October 31, 2014 | |||
| Amounts in thousands | |||
| Investment Income | |||
| Dividends | $ | 56,740 | |
| Dividends from affiliated Russell funds | 42 | ||
| Interest | 3 | ||
| Securities lending income | 1,301 | ||
| Less foreign taxes withheld | (4,238 | ) | |
| Total investment income | 53,848 | ||
| Expenses | |||
| Advisory fees | 20,416 | ||
| Administrative fees | 778 | ||
| Custodian fees | 602 | ||
| Distribution fees - Class A | 21 | ||
| Distribution fees - Class C | 57 | ||
| Transfer agent fees - Class A | 17 | ||
| Transfer agent fees - Class C | 15 | ||
| Transfer agent fees - Class E | 62 | ||
| Transfer agent fees - Class S | 2,204 | ||
| Transfer agent fees - Class Y | 21 | ||
| Professional fees | 86 | ||
| Registration fees | 120 | ||
| Shareholder servicing fees - Class C | 19 | ||
| Shareholder servicing fees - Class E | 77 | ||
| Trustees’ fees | 37 | ||
| Printing fees | 133 | ||
| Miscellaneous | 82 | ||
| Expenses before reductions | 24,747 | ||
| Expense reductions | (5,441 | ) | |
| Net expenses | 19,306 | ||
| Net investment income (loss) | 34,542 | ||
| Net Realized and Unrealized Gain (Loss) | |||
| Net realized gain (loss) on: | |||
| Investments (net of deferred tax liability for foreign capital gains taxes) | 111,514 | ||
| Futures contracts | 5,987 | ||
| Foreign currency-related transactions | (1,134 | ) | |
| Net realized gain (loss) | 116,367 | ||
| Net change in unrealized appreciation (depreciation) on: | |||
| Investments (net of deferred tax liability for foreign capital gains taxes) | 59,907 | ||
| Futures contracts | 514 | ||
| Foreign currency-related transactions | (1,519 | ) | |
| Net change in unrealized appreciation (depreciation) | 58,902 | ||
| Net realized and unrealized gain (loss) | 175,269 | ||
| Net Increase (Decrease) in Net Assets from Operations | $ | 209,811 | |
See accompanying notes which are an integral part of the financial statements.
560 Russell Global Infrastructure Fund
| Russell Investment Company | ||||||
| Russell Global Infrastructure Fund | ||||||
| Statements of Changes in Net Assets | ||||||
| For the Periods Ended October 31, | ||||||
| Amounts in thousands | 2014 | 2013 | ||||
| Increase (Decrease) in Net Assets | ||||||
| Operations | ||||||
| Net investment income (loss) | $ | 34,542 | $ | 23,202 | ||
| Net realized gain (loss) | 116,367 | 65,413 | ||||
| Net change in unrealized appreciation (depreciation) | 58,902 | 64,677 | ||||
| Net increase (decrease) in net assets from operations | 209,811 | 153,292 | ||||
| Distributions | ||||||
| From net investment income | ||||||
| Class A | (172 | ) | (132 | ) | ||
| Class C | (102 | ) | (72 | ) | ||
| Class E | (615 | ) | (406 | ) | ||
| Class S | (24,417 | ) | (14,911 | ) | ||
| Class Y | (11,314 | ) | (9,415 | ) | ||
| From net realized gain | ||||||
| Class A | (389 | ) | (110 | ) | ||
| Class C | (314 | ) | (107 | ) | ||
| Class E | (1,138 | ) | (431 | ) | ||
| Class S | (39,513 | ) | (13,203 | ) | ||
| Class Y | (22,036 | ) | (7,223 | ) | ||
| Net decrease in net assets from distributions | (100,010 | ) | (46,010 | ) | ||
| Share Transactions* | ||||||
| Net increase (decrease) in net assets from share transactions | 444,174 | 222,815 | ||||
| Total Net Increase (Decrease) in Net Assets | 553,975 | 330,097 | ||||
| Net Assets | ||||||
| Beginning of period | 1,218,534 | 888,437 | ||||
| End of period | $ | 1,772,509 | $ | 1,218,534 | ||
| Undistributed (overdistributed) net investment income included in net assets | $ | 1,853 | $ | 2,849 | ||
See accompanying notes which are an integral part of the financial statements.
Russell Global Infrastructure Fund 561
Russell Investment Company Russell Global Infrastructure Fund
Statements of Changes in Net Assets, continued
* Share transaction amounts (in thousands) for the periods ended October 31, 2014 and October 31, 2013 were as follows:
| 2014 | 2013 | |||||||||||
| Shares | Dollars | Shares | Dollars | |||||||||
| Class A | ||||||||||||
| Proceeds from shares sold | 286 | $ | 3,616 | 253 | $ | 2,930 | ||||||
| Proceeds from reinvestment of distributions | 46 | 549 | 21 | 233 | ||||||||
| Payments for shares redeemed | (179 | ) | (2,262 | ) | (92 | ) | (1,050 | ) | ||||
| Net increase (decrease) | 153 | 1,903 | 182 | 2,113 | ||||||||
| Class C | ||||||||||||
| Proceeds from shares sold | 306 | 3,837 | 158 | 1,838 | ||||||||
| Proceeds from reinvestment of distributions | 35 | 413 | 16 | 176 | ||||||||
| Payments for shares redeemed | (112 | ) | (1,392 | ) | (99 | ) | (1,143 | ) | ||||
| Net increase (decrease) | 229 | 2,858 | 75 | 871 | ||||||||
| Class E | ||||||||||||
| Proceeds from shares sold | 1,185 | 14,168 | 385 | 4,445 | ||||||||
| Proceeds from reinvestment of distributions | 137 | 1,639 | 70 | 779 | ||||||||
| Payments for shares redeemed | (861 | ) | (11,157 | ) | (332 | ) | (3,831 | ) | ||||
| Net increase (decrease) | 461 | 4,650 | 123 | 1,393 | ||||||||
| Class S | ||||||||||||
| Proceeds from shares sold | 48,590 | 588,704 | 19,337 | 223,515 | ||||||||
| Proceeds from reinvestment of distributions | 5,180 | 62,277 | 2,469 | 27,484 | ||||||||
| Payments for shares redeemed | (18,904 | ) | (238,015 | ) | (9,883 | ) | (113,958 | ) | ||||
| Net increase (decrease) | 34,866 | 412,966 | 11,923 | 137,041 | ||||||||
| Class Y | ||||||||||||
| Proceeds from shares sold | 10,880 | 131,264 | 10,329 | 120,220 | ||||||||
| Proceeds from reinvestment of distributions | 2,793 | 33,350 | 1,493 | 16,638 | ||||||||
| Payments for shares redeemed | (11,227 | ) | (142,817 | ) | (4,740 | ) | (55,461 | ) | ||||
| Net increase (decrease) | 2,446 | 21,797 | 7,082 | 81,397 | ||||||||
| Total increase (decrease) | 38,155 | $ | 444,174 | 19,385 | $ | 222,815 | ||||||
See accompanying notes which are an integral part of the financial statements.
562 Russell Global Infrastructure Fund
(This page intentionally left blank)
| Russell Investment Company | ||||||||||||||||||
| Russell Global Infrastructure Fund | ||||||||||||||||||
| Financial Highlights — For the Periods Ended | ||||||||||||||||||
| For a Share Outstanding Throughout Each Period. | ||||||||||||||||||
| $ | $ | $ | $ | $ | $ | |||||||||||||
| Net Asset Value, | Net | Net Realized | Total from | Distributions | Distributions | |||||||||||||
| Beginning of | Investment | and Unrealized | Investment | from Net | from Net | |||||||||||||
| Period | Income (Loss)(a)(d) | Gain (Loss) | Operations | Investment Income | Realized Gain | |||||||||||||
| Class A | ||||||||||||||||||
| October 31, 2014 | 12.32 | .23 | 1.27 | 1.50 | (.25 | ) | (.64 | ) | ||||||||||
| October 31, 2013 | 11.18 | .23 | 1.41 | 1.64 | (.24 | ) | (.26 | ) | ||||||||||
| October 31, 2012 | 10.11 | .25 | 1.07 | 1.32 | (.25 | ) | —(f) | |||||||||||
| October 31, 2011 | 10.42 | .25 | (.22 | ) | .03 | (.26 | ) | (.08 | ) | |||||||||
| October 31, 2010(3) | 10.00 | ---(f) | .42 | .42 | — | — | ||||||||||||
| Class C | ||||||||||||||||||
| October 31, 2014 | 12.30 | .13 | 1.26 | 1.39 | (.16 | ) | (.64 | ) | ||||||||||
| October 31, 2013 | 11.16 | .15 | 1.41 | 1.56 | (.16 | ) | (.26 | ) | ||||||||||
| October 31, 2012 | 10.09 | .17 | 1.06 | 1.23 | (.16 | ) | —(f) | |||||||||||
| October 31, 2011 | 10.42 | .17 | (.22 | ) | (.05 | ) | (.20 | ) | (.08 | ) | ||||||||
| October 31, 2010(3) | 10.00 | (.01 | ) | .43 | .42 | — | — | |||||||||||
| Class E | ||||||||||||||||||
| October 31, 2014 | 12.32 | .23 | 1.27 | 1.50 | (.25 | ) | (.64 | ) | ||||||||||
| October 31, 2013 | 11.18 | .23 | 1.41 | 1.64 | (.24 | ) | (.26 | ) | ||||||||||
| October 31, 2012 | 10.12 | .24 | 1.07 | 1.31 | (.25 | ) | —(f) | |||||||||||
| October 31, 2011 | 10.42 | .28 | (.24 | ) | .04 | (.26 | ) | (.08 | ) | |||||||||
| October 31, 2010(3) | 10.00 | ---(f) | .42 | .42 | — | — | ||||||||||||
| Class S | ||||||||||||||||||
| October 31, 2014 | 12.33 | .26 | 1.27 | 1.53 | (.28 | ) | (.64 | ) | ||||||||||
| October 31, 2013 | 11.19 | .26 | 1.41 | 1.67 | (.27 | ) | (.26 | ) | ||||||||||
| October 31, 2012 | 10.13 | .27 | 1.07 | 1.34 | (.28 | ) | —(f) | |||||||||||
| October 31, 2011 | 10.42 | .26 | (.19 | ) | .07 | (.28 | ) | (.08 | ) | |||||||||
| October 31, 2010(3) | 10.00 | ---(f) | .42 | .42 | — | — | ||||||||||||
| Class Y | ||||||||||||||||||
| October 31, 2014 | 12.34 | .28 | 1.28 | 1.56 | (.31 | ) | (.64 | ) | ||||||||||
| October 31, 2013 | 11.19 | .27 | 1.43 | 1.70 | (.29 | ) | (.26 | ) | ||||||||||
| October 31, 2012 | 10.13 | .29 | 1.07 | 1.36 | (.30 | ) | —(f) | |||||||||||
| October 31, 2011 | 10.42 | .27 | (.19 | ) | .08 | (.29 | ) | (.08 | ) | |||||||||
| October 31, 2010(3) | 10.00 | ---(f) | .42 | .42 | — | — | ||||||||||||
See accompanying notes which are an integral part of the financial statements.
564 Russell Global Infrastructure Fund
| % | % | % | ||||||||||||||||
| $ | $ | Ratio of Expenses | Ratio of Expenses | Ratio of Net | ||||||||||||||
| Net Asset Value, | % | Net Assets, | to Average | to Average | Investment Income | % | ||||||||||||
| $ | End of | Total | End of Period | Net Assets, | Net Assets, | to Average | Portfolio | |||||||||||
| Total Distributions | Period | Return(b)(c) | (000 | ) | Gross(e) | Net(d)(e) | Net Assets(d)(e) | Turnover Rate(b) | ||||||||||
| (.89 | ) | 12.93 | 12.95 | 9,903 | 1.81 | 1.47 | 1.83 | 119 | ||||||||||
| (.50 | ) | 12.32 | 15.24 | 7,556 | 1.82 | 1.49 | 2.02 | 127 | ||||||||||
| (.25 | ) | 11.18 | 13.07 | 4,819 | 1.83 | 1.47 | 2.35 | 125 | ||||||||||
| (.34 | ) | 10.11 | .39 | 4,312 | 1.87 | 1.50 | 2.43 | 145 | ||||||||||
| — | 10.42 | 4.20 | 330 | 2.05 | 1.69 | (.50 | ) | 8 | ||||||||||
| (.80 | ) | 12.89 | 12.00 | 9,145 | 2.56 | 2.22 | 1.07 | 119 | ||||||||||
| (.42 | ) | 12.30 | 14.41 | 5,900 | 2.58 | 2.24 | 1.26 | 127 | ||||||||||
| (.16 | ) | 11.16 | 12.32 | 4,514 | 2.58 | 2.22 | 1.62 | 125 | ||||||||||
| (.28 | ) | 10.09 | (.48 | ) | 4,338 | 2.62 | 2.25 | 1.62 | 145 | |||||||||
| — | 10.42 | 4.20 | 760 | 2.80 | 2.44 | (1.27 | ) | 8 | ||||||||||
| (.89 | ) | 12.93 | 12.92 | 28,885 | 1.81 | 1.47 | 1.87 | 119 | ||||||||||
| (.50 | ) | 12.32 | 15.23 | 21,848 | 1.83 | 1.49 | 1.99 | 127 | ||||||||||
| (.25 | ) | 11.18 | 13.08 | 18,444 | 1.83 | 1.47 | 2.32 | 125 | ||||||||||
| (.34 | ) | 10.12 | .38 | 14,990 | 1.86 | 1.50 | 2.69 | 145 | ||||||||||
| — | 10.42 | 4.20 | 1,015 | 2.05 | 1.69 | (.16 | ) | 8 | ||||||||||
| (.92 | ) | 12.94 | 13.21 | 1,243,852 | 1.56 | 1.22 | 2.06 | 119 | ||||||||||
| (.53 | ) | 12.33 | 15.59 | 755,311 | 1.57 | 1.24 | 2.24 | 127 | ||||||||||
| (.28 | ) | 11.19 | 13.38 | 551,759 | 1.58 | 1.22 | 2.60 | 125 | ||||||||||
| (.36 | ) | 10.13 | .65 | 460,800 | 1.61 | 1.25 | 2.50 | 145 | ||||||||||
| — | 10.42 | 4.20 | 254,350 | 1.80 | 1.44 | .07 | 8 | |||||||||||
| (.95 | ) | 12.95 | 13.39 | 480,724 | 1.36 | 1.04 | 2.28 | 119 | ||||||||||
| (.55 | ) | 12.34 | 15.79 | 427,919 | 1.37 | 1.06 | 2.33 | 127 | ||||||||||
| (.30 | ) | 11.19 | 13.58 | 308,901 | 1.39 | 1.06 | 2.79 | 125 | ||||||||||
| (.37 | ) | 10.13 | .79 | 340,308 | 1.43 | 1.09 | 2.55 | 145 | ||||||||||
| — | 10.42 | 4.20 | 368,468 | 1.63 | 1.29 | (.17 | ) | 8 | ||||||||||
See accompanying notes which are an integral part of the financial statements.
Russell Global Infrastructure Fund 565
Russell Investment Company
Russell Global Real Estate Securities Fund
Portfolio Management Discussion and Analysis — October 31, 2014 (Unaudited)
| Russell Global Real Estate Securities Fund - Class A‡ | FTSE EPRA/NAREIT Developed Real Estate Index (Net)** | ||||||
| Total | Total | ||||||
| Return | Return | ||||||
| 1 Year | 3.65 | % | 1 Year | 9.84 | % | ||
| 5 Years | 12.54 | %§ | 5 Years | 12.17 | %§ | ||
| 10 Years | 6.18 | %§ | 10 Years | N/A | |||
| Russell Global Real Estate Securities Fund - Class C | Russell Developed Index (Net)*** | ||||||
| Total | Total | ||||||
| Return | Return | ||||||
| 1 Year | 9.14 | % | 1 Year | 8.33 | % | ||
| 5 Years | 13.02 | %§ | 5 Years | 11.78 | %§ | ||
| 10 Years | 6.00 | %§ | 10 Years | 7.21 | %§ | ||
| Russell Global Real Estate Securities Fund - Class E | Global Real Estate Linked Benchmark**** | ||||||
| Total | Total | ||||||
| Return | Return | ||||||
| 1 Year | 9.95 | % | 1 Year | 9.84 | % | ||
| 5 Years | 13.87 | %§ | 5 Years | 15.28 | %§ | ||
| 10 Years | 6.79 | %§ | 10 Years | 7.06 | %§ | ||
| Russell Global Real Estate Securities Fund - Class S | |||||||
| Total | |||||||
| Return | |||||||
| 1 Year | 10.23 | % | |||||
| 5 Years | 14.16 | %§ | |||||
| 10 Years | 7.06 | %§ | |||||
| Russell Global Real Estate Securities Fund - Class Y‡‡ | |||||||
| Total | |||||||
| Return | |||||||
| 1 Year | 10.45 | % | |||||
| 5 Years | 14.37 | %§ | |||||
| 10 Years | 7.18 | %§ | |||||
566 Russell Global Real Estate Securities Fund
Russell Investment Company
Russell Global Real Estate Securities Fund
Portfolio Management Discussion and Analysis, continued — October 31, 2014 (Unaudited)
| The Russell Global Real Estate Securities Fund (the “Fund”) | year U.S. Treasury yield declined and U.S. real estate investment |
| employs a multi-manager approach whereby portions of the Fund | trusts (“REITs”) rallied to close out the period. |
| are allocated to different money managers. Fund assets not | Within the global property securities market, companies with |
| allocated to money managers are managed by Russell Investment | stronger balance sheets tended to outperform more highly levered |
| Management Company (“RIMCo”), the Fund’s advisor. RIMCo | stocks, while property developers lagged relative to REITs. In an |
| may change the allocation of the Fund’s assets among money | environment of diverging growth by geography, North America |
| managers at any time. An exemptive order from the Securities | significantly outperformed relative to the Asia-Pacific region and |
| and Exchange Commission (“SEC”) permits RIMCo to engage | Europe, representing a reversal of the trend seen in the prior |
| or terminate a money manager at any time, subject to approval | fiscal year. With respect to property sectors, the shorter lease |
| by the Fund’s Board, without a shareholder vote. Pursuant to the | duration categories, including lodging and residential, generally |
| terms of the exemptive order, the Fund is required to notify its | delivered the strongest performance, while the more defensive, |
| shareholders within 90 days of when a money manager begins | yield-oriented health care and net lease sectors were among the |
| providing services. As of October 31, 2014, the Fund had three | weakest-performing property types. |
| money managers. | |
| What is the Fund’s investment objective? | How did the investment strategies and techniques employed |
| by the Fund and its money managers affect its benchmark- | |
| The Fund seeks to provide current income and long term capital | relative performance? |
| growth. | AEW Capital Management, L.P. (“AEW”) was terminated from the |
| How did the Fund perform relative to its benchmark for the | Fund in June 2014 and outperformed the Fund’s benchmark for |
| fiscal year ended October 31, 2014? | the portion of the fiscal year in which it was a money manager for |
| For the fiscal year ended October 31, 2014, the Fund’s Class | the Fund. AEW utilized a value-oriented strategy that integrated |
| A, Class C, Class E, Class S and Class Y Shares gained 9.98%, | quantitative analysis with property and capital markets expertise. |
| 9.14%, 9.95%, 10.23% and 10.45%, respectively. This is | Stock selection within the U.S. office, residential, and retail |
| compared to the Fund’s benchmark, the FTSE EPRA/NAREIT | sectors drove outperformance relative to the benchmark. Modest |
| Developed Real Estate Index (Net), which gained 9.84% during | out-of-benchmark exposure to the emerging markets detracted |
| the same period. The Fund’s performance includes operating | from performance. |
| expenses, whereas index returns are unmanaged and do not | Cohen & Steers Capital Management, Inc. (“Cohen”) outperformed |
| include expenses of any kind. | the Fund’s benchmark for the fiscal year. Cohen seeks to generate |
| For the fiscal year ended October 31, 2014, the Morningstar® | excess returns through a combination of bottom-up stock selection |
| Global Real Estate, a group of funds that Morningstar considers | and top-down regional allocation decisions. The key driver of |
| to have investment strategies similar to those of the Fund, gained | performance was stock selection within the U.S. diversified and |
| 9.28%. This result serves as a peer comparison and is expressed | retail sectors, in addition to an overweight position in the United |
| net of operating expenses. | Kingdom. Overweight positioning in several Japanese property |
| developers detracted from performance. | |
| How did the market conditions described in the Market | INVESCO Advisers, Inc. (“Invesco”) outperformed the Fund’s |
| Summary report affect the Fund’s performance? | benchmark for the fiscal year. Invesco manages a broadly |
| For the fiscal year ended October 31, 2014, the global listed | diversified portfolio with a focus on companies that operate in |
| property market, as measured by the FTSE EPRA/NAREIT | attractive markets, own top-tier assets, have strong management |
| Developed Real Estate Index (Net), delivered a 9.84% return. Real | teams, and maintain sound balance sheets. This focus on asset |
| estate securities began the fiscal year with a moderate correction | and balance sheet strength was beneficial during the fiscal year, |
| in response to outflows of non-dedicated investor capital. These | as overweight positioning in the highest-quality U.S. office and |
| declines were followed in early 2014 by a recovery in momentum, | retail REITs drove outperformance. Stock selection in Japan was |
| with the sector posting gains through the spring months. Strong | also a modest contributor to performance, while an underweight |
| earnings and flat to declining interest rates provided support to | to U.S. data center REITs detracted. |
| real estate companies, which outperformed relative to the broader | |
| equity market through most of the fiscal year. However, property | Morgan Stanley Investment Management, Inc., Morgan Stanley |
| stocks responded negatively in September to significant equity | Investment Management Limited and Morgan Stanley Investment |
| issuance and concerns over valuation levels in light of strong | Management Company (together, “Morgan Stanley”) were added |
| recent performance. The sector then finished the fiscal year on | to the Fund in June 2014 and outperformed the Fund’s benchmark |
| an upward trajectory, resuming positive performance as the 10- | for the portion of the fiscal year in which they were a money |
Russell Global Real Estate Securities Fund 567
Russell Investment Company
Russell Global Real Estate Securities Fund
Portfolio Management Discussion and Analysis, continued — October 31, 2014 (Unaudited)
| manager for the Fund. As a result of Morgan Stanley’s value- | a money manager for the Fund. Morgan Stanley’s investment | |
| oriented process, the portfolio was heavily overweight to Hong | approach is value-driven, with an emphasis on bottom-up stock | |
| Kong and China, which outpaced the overall benchmark. Also | selection in each of the three global regions. Morgan Stanley | |
| contributing to performance were an underweight to Continental | tends to make relatively significant region and country allocation | |
| Europe and a preference for the larger retail-focused companies | tilts, which RIMCo believes provides the Fund an additional | |
| within Australia. Overweight positioning in Japan was a detractor | source of potential excess return. | |
| from performance. | There were no other changes to the Fund’s structure or money | |
| RIMCo manages the portion of the Fund’s assets that RIMCo | manager line up during the fiscal year. | |
| determines not to allocate to the money managers. Assets not | ||
| allocated to managers include the Fund’s liquidity reserves and | Money Managers as of October 31, | |
| assets which may be managed directly by RIMCo to modify the | 2014 | Styles |
| Fund’s overall portfolio characteristics to seek to achieve the | Cohen & Steers Capital Management, Inc. | Market-Oriented |
| desired risk/return profile for the Fund. | INVESCO Advisers, Inc. which acts as a | |
| money manager to the Fund | ||
| During the period, RIMCo continued to utilize a strategy to | through its INVESCO Real Estate division | Market-Oriented |
| implement regional tilting through the direct purchase of real | Morgan Stanley Investment Management | |
| estate stocks. Using the output from a quantitative model, the | Inc., Morgan Stanley Investment | |
| strategy seeks to position the portfolio to meet RIMCo’s overall | Management Limited and Morgan Stanley | |
| preferred positioning with respect to regional exposures, while | Investment Management Company | Value |
| optimizing the portfolio to minimize tracking error relative to the | The views expressed in this report reflect those of the portfolio | |
| Fund’s money manager portfolios. The strategy outperformed | managers only through the end of the period covered by | |
| relative to the Fund’s benchmark as a result of an underweight to | the report. These views do not necessarily represent the | |
| Japan, which was among the weakest markets globally. | views of RIMCo, or any other person in RIMCo or any other | |
| affiliated organization. These views are subject to change | ||
| During the period, the Fund used index futures and swap | at any time based upon market conditions or other events, | |
| contracts to equitize the Fund’s cash. The use of these derivatives | and RIMCo disclaims any responsibility to update the views | |
| had a modestly positive impact on performance, as equity markets | contained herein. These views should not be relied on as | |
| delivered positive returns ahead of cash. | investment advice and, because investment decisions for | |
| Describe any changes to the Fund’s structure or the money | a Russell Investment Company (“RIC”) Fund are based on | |
| manager line-up. | numerous factors, should not be relied on as an indication | |
| In June 2014, RIMCo terminated AEW Capital Management | of investment decisions of any RIC Fund. | |
| as a money manager for the Fund and hired Morgan Stanley as | ||
568 Russell Global Real Estate Securities Fund
Russell Investment Company
Russell Global Real Estate Securities Fund
Portfolio Management Discussion and Analysis, continued — October 31, 2014 (Unaudited)
| * | Assumes initial investment on November 1, 2004. |
| ** | FTSE EPRA/NAREIT Developed Real Estate Index (Net) (date of inception February 18, 2005) is an index composed of all the data based on the last closing price of the month for all tax-qualified REITs listed on the New York Stock Exchange, American Stock Exchange, and the NASDAQ National Market System. |
| The data is market value-weighted. The total return calculation is based upon whether it is 1-month, 3-months or 12-months. Only those REITs listed for the entire period as used in the total return calculation. | |
| *** | The Russell Developed Index (Net) measures the performance of the investable securities in developed countries globally. |
| **** | The Global Real Estate Linked Benchmark provides a means to compare the Fund’s average annual returns to a secondary benchmark that takes into account historical changes in the Fund’s primary benchmark. The Global Real Estate Linked Benchmark represents the returns of the FSTE NAREIT Equity REIT Index through September 30, 2010 and the returns of the FTSE EPRA/NAREIT Developed Real Estate Index (net) thereafter. |
| ‡ | The Fund first issued Class A Shares on March 1, 2007. The returns shown for Class A Shares prior to that date are the returns of Class E Shares. The performance shown has been adjusted to reflect the deduction of the maximum Class A sales charge of 5.75%. Annual returns for each Class will differ only to the extent that the Class A Shares do not have the same expenses as Class E Shares. |
| ‡‡ | The Fund first issued Class Y Shares on September 29, 2008. The returns shown for Class Y Shares prior to that date are the returns of the Fund’s Class S Shares. Class Y Shares will have substantially similar annual returns as the Class S Shares because the Shares of each Class are invested in the same portfolio of securities. Annual returns for each Class will differ only to the extent that the Class Y Shares do not have the same expenses as the Class S Shares. |
| § | Annualized. |
Performance is historical and assumes reinvestment of all dividends and capital gains. Investment return and principal value will fluctuate so that an investor’s shares, when redeemed, may be worth more or less than when purchased. Past performance is not indicative of future results. The returns shown do not reflect the deduction of taxes that a shareholder would pay on Fund distributions or the redemption of Fund shares.
Russell Global Real Estate Securities Fund 569
Russell Investment Company
Russell Global Real Estate Securities Fund
Shareholder Expense Example — October 31, 2014 (Unaudited)
| Fund Expenses | Please note that the expenses shown in the table are meant | |||||
| The following disclosure provides important information | to highlight your ongoing costs only and do not reflect any | |||||
| regarding the Fund’s Shareholder Expense Example | transactional costs. Therefore, the information under the heading | |||||
| (“Example”). | “Hypothetical Performance (5% return before expenses)” is | |||||
| useful in comparing ongoing costs only, and will not help you | ||||||
| Example | determine the relative total costs of owning different funds. In | |||||
| As a shareholder of the Fund, you incur two types of costs: (1) | addition, if these transactional costs were included, your costs | |||||
| transaction costs, and (2) ongoing costs, including advisory and | would have been higher. | |||||
| administrative fees; distribution (12b-1) and/or service fees; | Hypothetical | |||||
| and other Fund expenses. The Example is intended to help | Performance (5% | |||||
| you understand your ongoing costs (in dollars) of investing in | Actual | return before | ||||
| the Fund and to compare these costs with the ongoing costs of | Class A | Performance | expenses) | |||
| Beginning Account Value | ||||||
| investing in other mutual funds. The Example is based on an | May 1, 2014 | $ | 1,000.00 | $ | 1,000.00 | |
| investment of $1,000 invested at the beginning of the period and | Ending Account Value | |||||
| held for the entire period indicated, which for this Fund is from | October 31, 2014 | $ | 1,064.30 | $ | 1,018.35 | |
| May 1, 2014 to October 31, 2014. | Expenses Paid During Period* | $ | 7.08 | $ | 6.92 | |
| Actual Expenses | * Expenses are equal to the Fund's annualized expense ratio of 1.36% | |||||
| (representing the six month period annualized), multiplied by the average | ||||||
| The information in the table under the heading “Actual | account value over the period, multiplied by 184/365 (to reflect the one-half | |||||
| Performance” provides information about actual account values | year period). | |||||
| and actual expenses. You may use the information in this column, | ||||||
| together with the amount you invested, to estimate the expenses | Hypothetical | |||||
| Performance (5% | ||||||
| that you paid over the period. Simply divide your account value by | Actual | return before | ||||
| $1,000 (for example, an $8,600 account value divided by $1,000 | Class C | Performance | expenses) | |||
| = 8.6), then multiply the result by the number in the first column | Beginning Account Value | |||||
| in the row entitled “Expenses Paid During Period” to estimate | May 1, 2014 | $ | 1,000.00 | $ | 1,000.00 | |
| Ending Account Value | ||||||
| the expenses you paid on your account during this period. | October 31, 2014 | $ | 1,060.20 | $ | 1,014.57 | |
| Expenses Paid During Period* | $ | 10.96 | $ | 10.71 | ||
| Hypothetical Example for Comparison Purposes | ||||||
| The information in the table under the heading “Hypothetical | * Expenses are equal to the Fund's annualized expense ratio of 2.11% | |||||
| Performance (5% return before expenses)” provides information | (representing the six month period annualized), multiplied by the average | |||||
| account value over the period, multiplied by 184/365 (to reflect the one-half | ||||||
| about hypothetical account values and hypothetical expenses | year period). | |||||
| based on the Fund’s actual expense ratio and an assumed rate of | ||||||
| return of 5% per year before expenses, which is not the Fund’s | �� | Hypothetical | ||||
| actual return. The hypothetical account values and expenses | Performance (5% | |||||
| Actual | return before | |||||
| may not be used to estimate the actual ending account balance or | Class E | Performance | expenses) | |||
| expenses you paid for the period. You may use this information | Beginning Account Value | |||||
| to compare the ongoing costs of investing in the Fund and other | May 1, 2014 | $ | 1,000.00 | $ | 1,000.00 | |
| funds. To do so, compare this 5% hypothetical example with the | Ending Account Value | |||||
| October 31, 2014 | $ | 1,064.00 | $ | 1,018.35 | ||
| 5% hypothetical examples that appear in the shareholder reports | Expenses Paid During Period* | $ | 7.08 | $ | 6.92 | |
| of other funds. | ||||||
| * Expenses are equal to the Fund's annualized expense ratio of 1.36% | ||||||
| (representing the six month period annualized), multiplied by the average | ||||||
| account value over the period, multiplied by 184/365 (to reflect the one-half | ||||||
| year period). | ||||||
570 Russell Global Real Estate Securities Fund
Russell Investment Company
Russell Global Real Estate Securities Fund
Shareholder Expense Example, continued — October 31, 2014 (Unaudited)
| Hypothetical | |||||
| Performance (5% | |||||
| Actual | return before | ||||
| Class S | Performance | expenses) | |||
| Beginning Account Value | |||||
| May 1, 2014 | $ | 1,000.00 | $ | 1,000.00 | |
| Ending Account Value | |||||
| October 31, 2014 | $ | 1,065.40 | $ | 1,019.61 | |
| Expenses Paid During Period* | $ | 5.78 | $ | 5.65 | |
| * Expenses are equal to the Fund's annualized expense ratio of 1.11% | |||||
| (representing the six month period annualized), multiplied by the average | |||||
| account value over the period, multiplied by 184/365 (to reflect the one-half | |||||
| year period). | |||||
| Hypothetical | |||||
| Performance (5% | |||||
| Actual | return before | ||||
| Class Y | Performance | expenses) | |||
| Beginning Account Value | |||||
| May 1, 2014 | $ | 1,000.00 | $ | 1,000.00 | |
| Ending Account Value | |||||
| October 31, 2014 | $ | 1,066.50 | $ | 1,020.62 | |
| Expenses Paid During Period* | $ | 4.74 | $ | 4.63 | |
| * Expenses are equal to the Fund's annualized expense ratio of 0.91% | |||||
| (representing the six month period annualized), multiplied by the average | |||||
| account value over the period, multiplied by 184/365 (to reflect the one-half | |||||
| year period). | |||||
Russell Global Real Estate Securities Fund 571
| Russell Investment Company | |||||||||||
| Russell Global Real Estate Securities Fund | |||||||||||
| Schedule of Investments — October 31, 2014 | |||||||||||
| Amounts in thousands (except share amounts) | Amounts in thousands (except share amounts) | ||||||||||
| Principal | Fair | Principal | Fair | ||||||||
| Amount ($) | Value | Amount ($) | Value | ||||||||
| or Shares | $ | or Shares | $ | ||||||||
| Common Stocks - 97.3% | Sponda OYJ | 632,879 | 2,895 | ||||||||
| Australia - 6.1% | 3,689 | ||||||||||
| Australand Property Group(ö) | 44,149 | 173 | |||||||||
| BGP Holdings PLC(Å)(Æ) | 4,619,419 | — | France - 3.4% | ||||||||
| CFS Retail Property Trust Group(ö) | 2,826,600 | 5,224 | Altarea(Æ)(ö) | 990 | 166 | ||||||
| Dexus Property Group(ö) | 13,500,969 | 14,376 | Fonciere Des Regions(ö) | 15,932 | 1,463 | ||||||
| Federation Centres(ö) | 2,560,193 | 6,128 | Gecina SA(ö) | 73,218 | 9,909 | ||||||
| Goodman Group(ö) | 4,130,968 | 20,139 | Icad, Inc.(ö) | 44,611 | 3,549 | ||||||
| GPT Group (The)(ö) | 1,063,045 | 3,854 | Klepierre - GDR(ö) | 301,894 | 13,052 | ||||||
| Investa Office Fund(ö) | 206,955 | 648 | Mercialys SA(ö) | 114,270 | 2,524 | ||||||
| Mirvac Group(ö) | 2,111,095 | 3,335 | Unibail-Rodamco SE(ö) | 126,884 | 32,509 | ||||||
| Scentre Group(Æ)(ö) | 6,476,539 | 20,176 | 63,172 | ||||||||
| Stockland(ö) | 3,212,807 | 11,988 | |||||||||
| Westfield Corp.(Æ)(ö) | 3,835,362 | 26,731 | Germany - 1.9% | ||||||||
| 112,772 | Alstria Office AG(Ñ)(ö) | 167,912 | 2,082 | ||||||||
| Deutsche Annington Immobilien SE | 94,500 | 2,732 | |||||||||
| Austria - 0.1% | Deutsche Euroshop AG | 23,053 | 1,030 | ||||||||
| Atrium European Real Estate, Ltd.(Æ) | 143,351 | 751 | Deutsche Wohnen AG | 707,296 | 15,937 | ||||||
| Buwog AG(Æ) | 17,754 | 328 | LEG Immobilien AG | 181,827 | 12,543 | ||||||
| Conwert Immobilien Invest SE(Æ) | 116,860 | 1,294 | Prime Office AG(Æ) | 128,843 | 470 | ||||||
| 2,373 | 34,794 | ||||||||||
| Belgium - 0.0% | Hong Kong - 9.4% | ||||||||||
| Cofinimmo SA(ö) | 366 | 43 | Champion(Æ)(ö) | 670,012 | 295 | ||||||
| China Overseas Land & Investment, Ltd. | 440,000 | 1,277 | |||||||||
| Brazil - 0.3% | Hang Lung Properties, Ltd. - ADR | 924,000 | 2,883 | ||||||||
| BR Malls Participacoes SA | 274,093 | 2,201 | Henderson Land Development Co., Ltd. | 1,373,736 | 9,273 | ||||||
| BR Properties SA | 195,700 | 989 | Hongkong Land Holdings, Ltd. | 4,194,967 | 29,239 | ||||||
| Iguatem Emp De Shopping Centers | Hysan Development Co., Ltd. | 1,730,436 | 7,888 | ||||||||
| SA(Æ) | 141,600 | 1,434 | Kerry Properties, Ltd. | 464,000 | 1,592 | ||||||
| 4,624 | Link Real Estate Investment Trust (The) | ||||||||||
| (ö) | 5,617,797 | 32,996 | |||||||||
| Canada - 2.0% | New World Development Co., Ltd. | 14,656,527 | 18,408 | ||||||||
| Allied Properties Real Estate Investment | Sino Land Co., Ltd. | 1,118,000 | 1,848 | ||||||||
| Trust(ö) | 363,989 | 11,488 | |||||||||
| Boardwalk Real Estate Investment | Sun Hung Kai Properties, Ltd. | 3,134,982 | 46,731 | ||||||||
| Trust(ö) | 79,760 | 5,053 | Swire Properties, Ltd. | 1,298,000 | 4,159 | ||||||
| Brookfield Canada Office Pro REIT(Æ) | Wharf Holdings, Ltd. (The) | 2,128,424 | 15,726 | ||||||||
| (ö) | 52,543 | 1,261 | 172,315 | ||||||||
| Calloway Real Estate Investment Trust(ö) | 19,271 | 472 | Ireland - 0.0% | ||||||||
| Canadian Apartment Properties REIT(ö) | 10,720 | 238 | Hibernia Reit Public Limited Co.(Æ) | 241,962 | 334 | ||||||
| Canadian Real Estate Investment | |||||||||||
| Trust(ö) | 104,800 | 4,602 | Italy - 0.0% | ||||||||
| Chartwell Retirement Residences | 204,617 | 2,088 | Beni Stabili SpA SIIQ(Ñ)(ö) | 1,252,255 | 862 | ||||||
| Crombie Real Estate Investment | |||||||||||
| Trust(Æ)(ö) | 66,940 | 776 | Japan - 13.5% | ||||||||
| First Capital Realty, Inc. Class A | 115,948 | 1,894 | Activia Properties, Inc.(ö) | 728 | 5,859 | ||||||
| H&R Real Estate Investment Trust(ö) | 207,949 | 4,139 | Advance Residence Investment Corp.(ö) | 242 | 563 | ||||||
| RioCan Real Estate Investment Trust(Ñ) | Aeon Mall Co., Ltd. | 224,800 | 4,055 | ||||||||
| (ö) | 237,783 | 5,601 | Frontier Real Estate Investment Corp.(ö) | 144 | 658 | ||||||
| 37,612 | GLP J-Reit(ö) | 849 | 949 | ||||||||
| Hulic Co., Ltd. | 1,203,600 | 12,923 | |||||||||
| China - 0.1% | Hulic Reit, Inc.(Ñ)(ö) | 2,956 | 4,398 | ||||||||
| China Resources Land, Ltd. | 372,000 | 885 | Invincible Investment Corp.(Æ) | 601 | 203 | ||||||
| Guangzhou R&F Properties Co., Ltd. | 472,800 | 515 | Japan Hotel REIT Investment Corp.(ö) | 3,231 | 1,976 | ||||||
| 1,400 | Japan Logistics Fund, Inc.(ö) | 1,117 | 2,489 | ||||||||
| Japan Prime Realty Investment Corp. | |||||||||||
| Finland - 0.2% | Class A(Ñ)(ö) | 1,046 | 3,818 | ||||||||
| Citycon OYJ | 245,550 | 794 | Japan Real Estate Investment Corp.(ö) | 2,952 | 15,979 | ||||||
| Japan Retail Fund Investment Corp.(ö) | 1,846 | 3,676 | |||||||||
| Kenedix Office Investment Corp.(ö) | 730 | 3,847 | |||||||||
| See accompanying notes which are an integral part of the financial statements. | |||||||||||
| 572 Russell Global Real Estate Securities Fund | |||||||||||
| Russell Investment Company | ||||||||||
| Russell Global Real Estate Securities Fund | ||||||||||
| Schedule of Investments, continued — October 31, 2014 | ||||||||||
| Amounts in thousands (except share amounts) | Amounts in thousands (except share amounts) | |||||||||
| Principal | Fair | Principal | Fair | |||||||
| Amount ($) | Value | Amount ($) | Value | |||||||
| or Shares | $ | or Shares | $ | |||||||
| Mitsubishi Estate Co., Ltd. | 1,760,008 | 43,802 | Sweden - 0.8% | |||||||
| Mitsui Fudosan Co., Ltd. | 2,068,350 | 64,587 | Atrium Ljungberg AB(Æ) | 60,027 | 840 | |||||
| Mori Hills REIT Investment Corp. Class | Castellum AB | 254,089 | 3,895 | |||||||
| A(ö) | 2,957 | 4,109 | Fabege AB | 167,859 | 2,152 | |||||
| Mori Trust Sogo Reit, Inc.(ö) | 91 | 162 | Fastighets AB Balder Class B(Æ) | 9,832 | 128 | |||||
| Nippon Building Fund, Inc.(ö) | 2,368 | 13,113 | Hemfosa Fastigheter AB(Æ) | 243,877 | 4,029 | |||||
| Nippon Healthcare Investment Corp.(Æ) | 15 | 20 | Hufvudstaden AB Class A | 175,500 | 2,273 | |||||
| Nippon Prologis REIT, Inc.(ö) | 2,903 | 6,686 | Wihlborgs Fastigheter AB | 90,049 | 1,576 | |||||
| Nomura Master Real Estate Fund, Inc. | 14,893 | |||||||||
| (Æ) | 4,292 | 5,155 | ||||||||
| Nomura Real Estate Office Fund, Inc. | Switzerland - 0.2% | |||||||||
| Class A(ö) | 1,111 | 4,886 | Mobimo Holding AG(Æ) | 995 | 196 | |||||
| NTT Urban Development Corp. | 30,700 | 339 | PSP Swiss Property AG | 35,967 | 3,084 | |||||
| Orix JREIT, Inc.(ö) | 1,515 | 1,996 | Swiss Prime Site AG Class A(Æ) | 6,830 | 519 | |||||
| Sumitomo Realty & Development Co., | 3,799 | |||||||||
| Ltd. | 952,000 | 34,703 | United Kingdom - 6.5% | |||||||
| Tokyo Tatemono Co., Ltd. | 266,000 | 2,238 | Big Yellow Group PLC(ö) | 802,213 | 7,013 | |||||
| Tokyu REIT, Inc.(ö) | 254 | 349 | British Land Co. PLC (The)(ö) | 610,383 | 7,113 | |||||
| United Urban Investment Corp.(ö) | 2,068 | 3,224 | Capital & Counties Properties PLC | 210,209 | 1,147 | |||||
| 246,762 | Capital & Regional PLC | 1,452,342 | 1,115 | |||||||
| Luxembourg - 0.3% | Derwent London PLC(ö) | 278,753 | 13,248 | |||||||
| Gagfah SA(Æ) | 270,848 | 5,057 | Grainger PLC | 377,248 | 1,141 | |||||
| Great Portland Estates PLC(ö) | 769,650 | 8,452 | ||||||||
| Netherlands - 1.1% | Hammerson PLC(ö) | 2,675,917 | 26,241 | |||||||
| Corio NV(ö) | 172,758 | 8,402 | Helical Bar PLC | 500 | 3 | |||||
| Eurocommercial Properties NV | 24,583 | 1,121 | Intu Properties PLC Class H(ö) | 290,567 | 1,582 | |||||
| Nieuwe Steen Investments NV(ö) | 956,990 | 4,754 | Land Securities Group PLC(ö) | 1,975,999 | 34,992 | |||||
| Vastned Retail NV(ö) | 9,818 | 448 | LXB Retail Properties(Æ) | 879,038 | 1,941 | |||||
| Wereldhave NV(ö) | 61,445 | 5,036 | Quintain Estates & Development | |||||||
| 19,761 | PLC(Æ) | 1,951,311 | 2,560 | |||||||
| Safestore Holdings PLC(ö) | 319,336 | 1,063 | ||||||||
| Norway - 0.3% | Segro PLC(ö) | 846,639 | 5,149 | |||||||
| Entra ASA(Å)(Æ) | 59,221 | 654 | Shaftesbury PLC(ö) | 61,224 | 701 | |||||
| Norwegian Property ASA(Æ) | 2,863,933 | 4,373 | ST Modwen Properties PLC | 149,117 | 865 | |||||
| 5,027 | UNITE Group PLC (The) | 521,208 | 3,560 | |||||||
| Urban&Civic plc(Æ) | 216,165 | 773 | ||||||||
| Singapore - 3.5% | 118,659 | |||||||||
| Ascendas Real Estate Investment | ||||||||||
| Trust(Æ)(ö) | 2,645,099 | 4,591 | United States - 47.3% | |||||||
| CapitaCommercial Trust(ö) | 3,905,788 | 5,077 | Acadia Realty Trust(ö) | 40,530 | 1,265 | |||||
| CapitaLand, Ltd. | 6,683,000 | 16,490 | Alexandria Real Estate Equities, Inc.(ö) | 34,343 | 2,850 | |||||
| CapitaMall Trust Class A(ö) | 2,629,966 | 4,033 | American Assets Trust, Inc.(ö) | 119,431 | 4,579 | |||||
| CDL Hospitality Trusts(ö) | 35,394 | 48 | American Homes 4 Rent Class A(ö) | 323,171 | 5,665 | |||||
| City Developments, Ltd. | 1,068,248 | 7,858 | American Realty Capital Healthcare | |||||||
| Global Logistic Properties, Ltd. | 8,022,985 | 17,174 | Trust, Inc.(ö) | 6,542 | 74 | |||||
| Keppel Land, Ltd. | 808,891 | 2,103 | American Realty Capital Properties, | |||||||
| Keppel REIT Management, Ltd.(ö) | 2,882,496 | 2,737 | Inc.(ö) | 15,770 | 140 | |||||
| Mapletree Logistics Trust(Æ)(ö) | 21,476 | 20 | Apartment Investment & Management | |||||||
| SPH REIT(Æ)(ö) | 734,000 | 603 | Co. Class A(ö) | 253,110 | 9,059 | |||||
| Suntec Real Estate Investment Trust(ö) | 1,324,729 | 1,841 | AvalonBay Communities, Inc.(ö) | 273,428 | 42,611 | |||||
| UOL Group, Ltd. | 200,689 | 1,008 | Aviv REIT, Inc.(ö) | 186,497 | 6,290 | |||||
| Wing Tai Holdings, Ltd. | 21,000 | 29 | Belmond, Ltd. Class A(Æ) | 496,569 | 5,691 | |||||
| 63,612 | Boston Properties, Inc.(ö) | 215,509 | 27,316 | |||||||
| Brixmor Property Group, Inc.(ö) | 193,852 | 4,722 | ||||||||
| Spain - 0.3% | Brookdale Senior Living, Inc. Class | |||||||||
| Hispania Activos Inmobiliarios SAU(Æ) | 203,238 | 2,496 | A(Æ) | 86,961 | 2,931 | |||||
| Lar Espana Real Estate Socimi SA(Æ)(ö) | 191,740 | 2,211 | Camden Property Trust(ö) | 75,028 | 5,752 | |||||
| 4,707 | CBL & Associates Properties, Inc.(ö) | 83 | 2 | |||||||
| Chesapeake Lodging Trust(ö) | 48,188 | 1,592 | ||||||||
| See accompanying notes which are an integral part of the financial statements. | ||||||||||
| Russell Global Real Estate Securities Fund 573 | ||||||||||
| Russell Investment Company | ||||||||||||||
| Russell Global Real Estate Securities Fund | ||||||||||||||
| Schedule of Investments, continued — October 31, 2014 | ||||||||||||||
| Amounts in thousands (except share amounts) | Amounts in thousands (except share amounts) | |||||||||||||
| Principal | Fair | Principal | Fair | |||||||||||
| Amount ($) | Value | Amount ($) | Value | |||||||||||
| or Shares | $ | or Shares | $ | |||||||||||
| Corporate Office Properties Trust(ö) | 37,921 | 1,037 | Retail Opportunity Investments Corp.(ö) | 286,673 | 4,684 | |||||||||
| Cousins Properties, Inc.(ö) | 988,584 | 12,861 | Retail Properties of America, Inc. Class | |||||||||||
| CubeSmart Class A(ö) | 295,448 | 6,219 | A(ö) | 275,270 | 4,319 | |||||||||
| DCT Industrial Trust, Inc.(ö) | 21,720 | 186 | Rexford Industrial Realty, Inc.(ö) | 59,781 | 924 | |||||||||
| DDR Corp.(ö) | 1,315,132 | 23,857 | RLJ Lodging Trust(ö) | 275,373 | 8,872 | |||||||||
| DiamondRock Hospitality Co.(ö) | 5,327 | 76 | Senior Housing Properties Trust(ö) | 289,414 | 6,538 | |||||||||
| Digital Realty Trust, Inc.(ö) | 143 | 10 | Simon Property Group, Inc.(ö) | 457,230 | 81,940 | |||||||||
| Douglas Emmett, Inc.(ö) | 302,042 | 8,496 | SL Green Realty Corp.(ö) | 242,004 | 28,000 | |||||||||
| Duke Realty Corp.(ö) | 112,410 | 2,131 | Sovran Self Storage, Inc.(ö) | 100,456 | 8,548 | |||||||||
| DuPont Fabros Technology, Inc.(ö) | 1,182 | 37 | Spirit Realty Capital, Inc.(ö) | 32 | — | |||||||||
| EastGroup Properties, Inc.(ö) | 45,057 | 3,103 | Starwood Hotels & Resorts Worldwide, | |||||||||||
| Empire State Realty Trust, Inc. Class | Inc. | 155,163 | 11,895 | |||||||||||
| A(ö) | 523,206 | 8,350 | Starwood Waypoint Residential Trust(Æ) | |||||||||||
| Equity Commonwealth(Æ)(ö) | 261,973 | 6,997 | (ö) | 194,358 | 5,088 | |||||||||
| Equity Lifestyle Properties, Inc. Class | Strategic Hotels & Resorts, Inc.(Æ)(ö) | 46,042 | 592 | |||||||||||
| A(ö) | 90,276 | 4,433 | Summit Hotel Properties, Inc.(ö) | 25,061 | 292 | |||||||||
| Equity Residential(ö) | 849,325 | 59,079 | Sun Communities, Inc.(ö) | 129,947 | 7,533 | |||||||||
| Essex Property Trust, Inc.(ö) | 71,657 | 14,458 | Sunstone Hotel Investors, Inc.(ö) | 575,004 | 8,803 | |||||||||
| Extended Stay America, Inc. | 133,785 | 3,085 | Tanger Factory Outlet Centers, Inc.(ö) | 167,460 | 5,990 | |||||||||
| Extra Space Storage, Inc.(ö) | 161,116 | 9,370 | Taubman Centers, Inc.(ö) | 966 | 73 | |||||||||
| Federal Realty Investment Trust(ö) | 88,268 | 11,634 | UDR, Inc.(ö) | 405,705 | 12,264 | |||||||||
| FelCor Lodging Trust, Inc.(ö) | 22,133 | 237 | Ventas, Inc.(ö) | 159,111 | 10,901 | |||||||||
| First Industrial Realty Trust, Inc.(ö) | 231,426 | 4,520 | Vornado Realty Trust(ö) | 321,008 | 35,144 | |||||||||
| Forest City Enterprises, Inc. Class A(Æ) | 66,653 | 1,392 | Washington Prime Group, Inc.(Ñ)(ö) | 104,247 | 1,838 | |||||||||
| General Growth Properties, Inc.(ö) | 1,503,413 | 38,953 | WP Carey, Inc.(ö) | 22,449 | 1,520 | |||||||||
| Glimcher Realty Trust(ö) | 5,053 | 69 | 867,699 | |||||||||||
| HCP, Inc.(ö) | 73,501 | 3,232 | ||||||||||||
| Health Care, Inc.(Ñ)(ö) | 291,735 | 20,745 | Total Common Stocks | |||||||||||
| Healthcare Realty Trust, Inc.(ö) | 363,655 | 9,626 | (cost $1,413,043) | 1,783,966 | ||||||||||
| Healthcare Trust of America, Inc. Class | ||||||||||||||
| A(ö) | 463,102 | 5,946 | Short-Term Investments - 2.0% | |||||||||||
| Hilton Worldwide Holdings, Inc.(Æ) | 472,528 | 11,927 | United States - 2.0% | |||||||||||
| Home Properties, Inc.(ö) | 157,405 | 10,123 | Russell U.S. Cash Management Fund | 37,869,704 | (8) | 37,870 | ||||||||
| Host Hotels & Resorts, Inc.(ö) | 1,331,588 | 31,039 | Total Short-Term Investments | |||||||||||
| Hudson Pacific Properties, Inc.(ö) | 308,100 | 8,414 | (cost $37,870) | 37,870 | ||||||||||
| Kilroy Realty Corp.(ö) | 94,504 | 6,402 | ||||||||||||
| Kimco Realty Corp.(ö) | 10,110 | 252 | Other Securities - 2.3% | |||||||||||
| La Quinta Holdings, Inc.(Æ) | 34,984 | 714 | Russell U.S. Cash Collateral Fund(×) | 41,411,098 | (8) | 41,411 | ||||||||
| LaSalle Hotel Properties(ö) | 235,120 | 9,219 | Total Other Securities | |||||||||||
| Liberty Property Trust(ö) | 249,754 | 8,684 | (cost $41,411) | 41,411 | ||||||||||
| Macerich Co. (The)(ö) | 126,292 | 8,904 | ||||||||||||
| Mack-Cali Realty Corp.(ö) | 163,567 | 3,064 | Total Investments 101.6% | |||||||||||
| Mid-America Apartment Communities, | (identified cost $1,492,324) | 1,863,247 | ||||||||||||
| Inc.(ö) | 172,075 | 12,159 | ||||||||||||
| National Health Investors, Inc.(ö) | 60,500 | 3,988 | Other Assets and Liabilities, Net | |||||||||||
| National Retail Properties, Inc.(Ñ)(ö) | 285,046 | 10,866 | -(1.6 | %) | (29,602 | ) | ||||||||
| New York REIT, Inc.(ö) | 21,042 | 236 | Net Assets - 100.0% | 1,833,645 | ||||||||||
| Omega Healthcare Investors, Inc.(ö) | 5,294 | 202 | ||||||||||||
| Parkway Properties, Inc.(ö) | 318,366 | 6,383 | ||||||||||||
| Pebblebrook Hotel Trust(ö) | 1,245 | 53 | ||||||||||||
| Pennsylvania Real Estate Investment | ||||||||||||||
| Trust(ö) | 83 | 2 | ||||||||||||
| Piedmont Office Realty Trust, Inc. Class | ||||||||||||||
| A(Ñ)(ö) | 324,617 | 6,314 | ||||||||||||
| Prologis, Inc.(ö) | 952,654 | 39,678 | ||||||||||||
| PS Business Parks, Inc.(ö) | 13,400 | 1,129 | ||||||||||||
| Public Storage(ö) | 157,274 | 28,992 | ||||||||||||
| Realty Income Corp.(Ñ)(ö) | 183,716 | 8,456 | ||||||||||||
| Regency Centers Corp.(ö) | 396,424 | 24,063 | ||||||||||||
| See accompanying notes which are an integral part of the financial statements. | ||||||||||||||
| 574 Russell Global Real Estate Securities Fund | ||||||||||||||
| Russell Investment Company | ||||||||||||||
| Russell Global Real Estate Securities Fund | ||||||||||||||
| Schedule of Investments, continued — October 31, 2014 | ||||||||||||||
| Restricted Securities | ||||||||||||||
| Amounts in thousands (except share and cost per unit amounts) | ||||||||||||||
| Principal | Cost per | Cost | Fair Value | |||||||||||
| % of Net Assets | Acquisition | Amount ($) | Unit | (000 | ) | (000 | ) | |||||||
| Securities | Date | or shares | $ | $ | $ | |||||||||
| 0.0% | ||||||||||||||
| BGP Holdings PLC | 08/06/09 | AUD | 4,619,419 | — | — | — | ||||||||
| Entra ASA | 10/17/14 | NOK | 59,221 | 9.93 | 588 | 654 | ||||||||
| 654 | ||||||||||||||
| For a description of restricted securities see note 9 in the Notes to Financial Statements. | ||||||||||||||
| Futures Contracts | ||||||||||||||
| Amounts in thousands (except contract amounts) | ||||||||||||||
| Unrealized | ||||||||||||||
| Appreciation | ||||||||||||||
| Number of | Notional | Expiration | (Depreciation) | |||||||||||
| Contracts | Amount | Date | $ | |||||||||||
| Long Positions | ||||||||||||||
| Dow Jones US Real Estate Index Futures | 156 | USD | 4,543 | 12/14 | 299 | |||||||||
| FTSE EPRA Europe Index Futures | 291 | EUR | 5,311 | 12/14 | 289 | |||||||||
| Hang Seng Index Futures | 20 | HKD | 23,943 | 11/14 | 76 | |||||||||
| MSCI Singapore ETS Futures | 26 | SGD | 1,921 | 11/14 | 27 | |||||||||
| S&P Mid 400 E-Mini Index Futures | 1 | USD | 142 | 12/14 | 8 | |||||||||
| S&P TSX 60 Index Futures | 10 | CAD | 1,696 | 12/14 | 5 | |||||||||
| SPI 200 Index Futures | 21 | AUD | 2,897 | 12/14 | 111 | |||||||||
| TOPIX Index Futures | 45 | JPY | 601,650 | 12/14 | 269 | |||||||||
| Total Unrealized Appreciation (Depreciation) on Open Futures Contracts (å) | 1,084 | |||||||||||||
| Foreign Currency Exchange Contracts | ||||||||||||||
| Amounts in thousands | ||||||||||||||
| Unrealized | ||||||||||||||
| Appreciation | ||||||||||||||
| Amount | Amount | (Depreciation) | ||||||||||||
| Counterparty | Sold | Bought | Settlement Date | $ | ||||||||||
| Bank of America | USD | 262 | AUD | 300 | 12/17/14 | 1 | ||||||||
| Bank of America | USD | 90 | CAD | 100 | 12/17/14 | (1 | ) | |||||||
| Bank of America | USD | 637 | EUR | 500 | 12/17/14 | (10 | ) | |||||||
| Bank of America | USD | 258 | HKD | 2,000 | 12/17/14 | — | ||||||||
| Bank of America | USD | 368 | JPY | 40,000 | 12/17/14 | (13 | ) | |||||||
| Bank of America | USD | 79 | SGD | 100 | 12/17/14 | (1 | ) | |||||||
| Bank of America | AUD | 100 | USD | 87 | 12/17/14 | (1 | ) | |||||||
| Bank of America | CAD | 100 | USD | 89 | 12/17/14 | 1 | ||||||||
| Bank of America | EUR | 100 | USD | 126 | 12/17/14 | 1 | ||||||||
| Bank of America | HKD | 1,000 | USD | 129 | 12/17/14 | — | ||||||||
| Bank of America | JPY | 10,000 | USD | 92 | 12/17/14 | 3 | ||||||||
| Bank of America | SGD | 100 | USD | 79 | 12/17/14 | 1 | ||||||||
| Bank of Montreal | USD | 262 | AUD | 300 | 12/17/14 | 1 | ||||||||
| Bank of Montreal | USD | 221 | CAD | 250 | 12/17/14 | — | ||||||||
| Bank of Montreal | USD | 640 | EUR | 500 | 12/17/14 | (13 | ) | |||||||
| Bank of Montreal | USD | 387 | HKD | 3,000 | 12/17/14 | — | ||||||||
| Bank of Montreal | USD | 754 | JPY | 80,000 | 12/17/14 | (42 | ) | |||||||
| Bank of Montreal | USD | 157 | SGD | 200 | 12/17/14 | (1 | ) | |||||||
| Bank of New York | AUD | 100 | USD | 89 | 12/17/14 | 2 | ||||||||
| Bank of New York | AUD | 200 | USD | 173 | 12/17/14 | (3 | ) | |||||||
| Bank of New York | CAD | 200 | USD | 177 | 12/17/14 | — | ||||||||
| Bank of New York | EUR | 300 | USD | 376 | 12/17/14 | (1 | ) | |||||||
| Bank of New York | HKD | 2,000 | USD | 258 | 12/17/14 | — | ||||||||
| Bank of New York | JPY | 30,000 | USD | 273 | 12/17/14 | 6 | ||||||||
| Bank of New York | JPY | 30,000 | USD | 278 | 12/17/14 | 11 | ||||||||
| Bank of New York | SGD | 100 | USD | 78 | 12/17/14 | — | ||||||||
| Deutsche Bank | USD | 4 | EUR | 3 | 11/04/14 | — | ||||||||
| Deutsche Bank | USD | 4 | EUR | 3 | 11/04/14 | — | ||||||||
| Deutsche Bank | EUR | 4 | USD | 5 | 11/04/14 | — | ||||||||
| Deutsche Bank | EUR | 300 | USD | 380 | 12/17/14 | 3 | ||||||||
| Deutsche Bank | HKD | 1,000 | USD | 129 | 12/17/14 | — | ||||||||
| Deutsche Bank | JPY | 20,000 | USD | 184 | 12/17/14 | 6 | ||||||||
| HSBC | USD | 1,058 | HKD | 8,199 | 12/17/14 | (1 | ) | |||||||
| JPMorgan Chase | USD | 466 | EUR | 372 | 11/04/14 | — | ||||||||
| See accompanying notes which are an integral part of the financial statements. | ||||||||||||||
| Russell Global Real Estate Securities Fund 575 | ||||||||||||||
| Russell Investment Company | ||||||||
| Russell Global Real Estate Securities Fund | ||||||||
| Schedule of Investments, continued — October 31, 2014 | ||||||||
| Foreign Currency Exchange Contracts | ||||||||
| Amounts in thousands | ||||||||
| Unrealized | ||||||||
| Appreciation | ||||||||
| Amount | Amount | (Depreciation) | ||||||
| Counterparty | Sold | Bought | Settlement Date | $ | ||||
| JPMorgan Chase | USD | 540 | EUR | 431 | 11/04/14 | — | ||
| JPMorgan Chase | USD | 12 | GBP | 8 | 11/05/14 | — | ||
| JPMorgan Chase | USD | 1,058 | HKD | 8,199 | 12/17/14 | (1 | ) | |
| JPMorgan Chase | USD | 516 | SGD | 653 | 12/17/14 | (8 | ) | |
| JPMorgan Chase | GBP | 7 | USD | 11 | 11/05/14 | — | ||
| Northern Trust | AUD | 300 | USD | 263 | 12/17/14 | — | ||
| Northern Trust | EUR | 300 | USD | 380 | 12/17/14 | 4 | ||
| Northern Trust | HKD | 1,000 | USD | 129 | 12/17/14 | — | ||
| Northern Trust | JPY | 20,000 | USD | 185 | 12/17/14 | 6 | ||
| Northern Trust | SGD | 100 | USD | 79 | 12/17/14 | 1 | ||
| Standard Chartered | USD | 517 | SGD | 653 | 12/17/14 | (9 | ) | |
| State Street | USD | 173 | AUD | 200 | 12/17/14 | 3 | ||
| State Street | USD | 878 | AUD | 1,000 | 12/17/14 | — | ||
| State Street | USD | 1,955 | AUD | 2,153 | 12/17/14 | (66 | ) | |
| State Street | USD | 305 | BRL | 730 | 11/03/14 | (10 | ) | |
| State Street | USD | 89 | CAD | 100 | 12/17/14 | — | ||
| State Street | USD | 536 | CAD | 600 | 12/17/14 | (4 | ) | |
| State Street | USD | 840 | CAD | 925 | 12/17/14 | (21 | ) | |
| State Street | USD | 43 | EUR | 34 | 11/03/14 | — | ||
| State Street | USD | 113 | EUR | 90 | 11/03/14 | (1 | ) | |
| State Street | USD | 126 | EUR | 100 | 11/03/14 | (1 | ) | |
| State Street | USD | 145 | EUR | 115 | 11/03/14 | (1 | ) | |
| State Street | USD | 248 | EUR | 197 | 11/03/14 | (2 | ) | |
| State Street | USD | 100 | EUR | 79 | 11/04/14 | (1 | ) | |
| State Street | USD | 106 | EUR | 84 | 11/04/14 | — | ||
| State Street | USD | 8 | EUR | 7 | 11/05/14 | — | ||
| State Street | USD | 86 | EUR | 68 | 11/05/14 | — | ||
| State Street | USD | 379 | EUR | 300 | 12/17/14 | (3 | ) | |
| State Street | USD | 2,154 | EUR | 1,700 | 12/17/14 | (23 | ) | |
| State Street | USD | 3,555 | EUR | 2,754 | 12/17/14 | (102 | ) | |
| State Street | USD | 79 | HKD | 610 | 11/03/14 | — | ||
| State Street | USD | 97 | HKD | 750 | 11/03/14 | — | ||
| State Street | USD | 159 | HKD | 1,231 | 11/03/14 | — | ||
| State Street | USD | 161 | HKD | 1,249 | 11/03/14 | — | ||
| State Street | USD | 16 | HKD | 124 | 11/04/14 | — | ||
| State Street | USD | 46 | HKD | 359 | 11/04/14 | — | ||
| State Street | USD | 278 | HKD | 2,152 | 11/04/14 | — | ||
| State Street | USD | 129 | HKD | 1,000 | 12/17/14 | — | ||
| State Street | USD | 1,161 | HKD | 9,000 | 12/17/14 | — | ||
| State Street | USD | 12 | JPY | 1,301 | 11/04/14 | — | ||
| State Street | USD | 138 | JPY | 14,917 | 11/04/14 | (5 | ) | |
| State Street | USD | 326 | JPY | 35,240 | 11/04/14 | (12 | ) | |
| State Street | USD | 21 | JPY | 2,250 | 11/05/14 | (1 | ) | |
| State Street | USD | 43 | JPY | 4,713 | 11/05/14 | (1 | ) | |
| State Street | USD | 46 | JPY | 4,975 | 11/05/14 | (1 | ) | |
| State Street | USD | 55 | JPY | 5,968 | 11/05/14 | (2 | ) | |
| State Street | USD | 62 | JPY | 6,756 | 11/05/14 | (2 | ) | |
| State Street | USD | 159 | JPY | 17,349 | 11/05/14 | (5 | ) | |
| State Street | USD | 266 | JPY | 28,948 | 11/05/14 | (8 | ) | |
| State Street | USD | 198 | JPY | 22,178 | 11/06/14 | — | ||
| State Street | USD | 210 | JPY | 23,524 | 11/06/14 | — | ||
| State Street | USD | 399 | JPY | 44,750 | 11/06/14 | (1 | ) | |
| State Street | USD | 661 | JPY | 74,127 | 11/06/14 | (1 | ) | |
| State Street | USD | 969 | JPY | 105,555 | 11/07/14 | (29 | ) | |
| State Street | USD | 464 | JPY | 50,000 | 12/17/14 | (19 | ) | |
| State Street | USD | 1,668 | JPY | 180,000 | 12/17/14 | (65 | ) | |
| State Street | USD | 4,054 | JPY | 432,487 | 12/17/14 | (204 | ) | |
| State Street | USD | 78 | SGD | 100 | 12/17/14 | (1 | ) | |
| State Street | USD | 392 | SGD | 500 | 12/17/14 | (3 | ) | |
| State Street | AUD | 21 | USD | 19 | 11/03/14 | — | ||
| State Street | AUD | 159 | USD | 141 | 11/05/14 | — | ||
| State Street | AUD | 314 | USD | 277 | 11/05/14 | 1 | ||
| State Street | AUD | 86 | USD | 76 | 11/06/14 | — | ||
| State Street | AUD | 94 | USD | 83 | 11/06/14 | — | ||
| State Street | AUD | 150 | USD | 131 | 12/17/14 | (1 | ) | |
| State Street | AUD | 200 | USD | 174 | 12/17/14 | (1 | ) | |
| State Street | AUD | 200 | USD | 177 | 12/17/14 | 1 | ||
| See accompanying notes which are an integral part of the financial statements. | ||||||||
| 576 Russell Global Real Estate Securities Fund | ||||||||
| Russell Investment Company | |||||||||
| Russell Global Real Estate Securities Fund | |||||||||
| Schedule of Investments, continued — October 31, 2014 | |||||||||
| Foreign Currency Exchange Contracts | |||||||||
| Amounts in thousands | |||||||||
| Unrealized | |||||||||
| Appreciation | |||||||||
| Amount | Amount | (Depreciation) | |||||||
| Counterparty | Sold | Bought | Settlement Date | $ | |||||
| State Street | CAD | 100 | USD | 89 | 12/17/14 | 1 | |||
| State Street | CAD | 100 | USD | 90 | 12/17/14 | 1 | |||
| State Street | CAD | 100 | USD | 89 | 12/17/14 | 1 | |||
| State Street | EUR | 43 | USD | 54 | 11/05/14 | — | |||
| State Street | EUR | 100 | USD | 127 | 12/17/14 | 2 | |||
| State Street | EUR | 100 | USD | 126 | 12/17/14 | 1 | |||
| State Street | EUR | 300 | USD | 382 | 12/17/14 | 6 | |||
| State Street | EUR | 300 | USD | 380 | 12/17/14 | 4 | |||
| State Street | HKD | 85 | USD | 11 | 11/03/14 | — | |||
| State Street | HKD | 3,996 | USD | 515 | 11/03/14 | — | |||
| State Street | HKD | 387 | USD | 50 | 11/04/14 | — | |||
| State Street | HKD | 5,260 | USD | 678 | 11/04/14 | — | |||
| State Street | HKD | 2,000 | USD | 258 | 12/17/14 | — | |||
| State Street | HKD | 2,000 | USD | 258 | 12/17/14 | — | |||
| State Street | JPY | 1,778 | USD | 16 | 11/04/14 | 1 | |||
| State Street | JPY | 9,071 | USD | 84 | 11/04/14 | 3 | |||
| State Street | JPY | 12,214 | USD | 113 | 11/04/14 | 4 | |||
| State Street | JPY | 21,045 | USD | 195 | 11/04/14 | 7 | |||
| State Street | JPY | 41,366 | USD | 383 | 11/04/14 | 17 | |||
| State Street | JPY | 1,760 | USD | 16 | 11/05/14 | — | |||
| State Street | JPY | 2,398 | USD | 22 | 11/05/14 | 1 | |||
| State Street | JPY | 4,020 | USD | 37 | 11/05/14 | 1 | |||
| State Street | JPY | 7,763 | USD | 71 | 11/05/14 | 2 | |||
| State Street | JPY | 10,408 | USD | 96 | 11/05/14 | 3 | |||
| State Street | JPY | 14,507 | USD | 133 | 11/05/14 | 4 | |||
| State Street | JPY | 15,214 | USD | 140 | 11/05/14 | 4 | |||
| State Street | JPY | 4,390 | USD | 39 | 11/06/14 | — | |||
| State Street | JPY | 12,665 | USD | 113 | 11/06/14 | — | |||
| State Street | JPY | 16,175 | USD | 145 | 11/06/14 | 1 | |||
| State Street | JPY | 17,743 | USD | 158 | 11/06/14 | — | |||
| State Street | JPY | 20,432 | USD | 183 | 11/06/14 | 1 | |||
| State Street | JPY | 21,003 | USD | 188 | 11/06/14 | 1 | |||
| State Street | JPY | 25,109 | USD | 225 | 11/06/14 | 1 | |||
| State Street | JPY | 44,639 | USD | 400 | 11/06/14 | 2 | |||
| State Street | JPY | 45,051 | USD | 402 | 11/06/14 | 1 | |||
| State Street | JPY | 82,899 | USD | 740 | 11/06/14 | 2 | |||
| State Street | JPY | 10,000 | USD | 91 | 12/17/14 | 2 | |||
| State Street | JPY | 10,000 | USD | 92 | 12/17/14 | 3 | |||
| State Street | JPY | 40,000 | USD | 368 | 12/17/14 | 11 | |||
| State Street | JPY | 40,000 | USD | 374 | 12/17/14 | 18 | |||
| State Street | SGD | 18 | USD | 14 | 11/03/14 | — | |||
| State Street | SGD | 46 | USD | 36 | 11/04/14 | — | |||
| State Street | SGD | 100 | USD | 79 | 12/17/14 | 1 | |||
| Total Unrealized Appreciation (Depreciation) on Open Foreign Currency Exchange Contracts | (543 | ) | |||||||
| Index Swap Contracts (*) | |||||||||
| Amounts in thousands | |||||||||
| Fund Receives | Notional | Termination | Fair Value | ||||||
| Underlying Security | Counterparty | Amount | Date | $ | |||||
| iShares U.S. Real Estate ETF Index | Bank of America | USD | 14,546 | 08/31/15 | 153 | ||||
| Total Fair Value of Open Index Swap Contracts Premiums Paid (Received) - $— (å) | 153 | ||||||||
| (*) Total return swaps (which includes index swaps) are agreements between counterparties to exchange cash flows, one based on a market-linked | |||||||||
| returns of an individual asset or a basket of assets (i.e. an index), and the other on a fixed or floating rate. | |||||||||
| Presentation of Portfolio Holdings | |||||||||
| Amounts in thousands | |||||||||
| Fair Value | |||||||||
| Portfolio Summary | Level 1 | Level 2 | Level 3 | Total | % of Net Assets | ||||
| Common Stocks | |||||||||
| See accompanying notes which are an integral part of the financial statements. | |||||||||
| Russell Global Real Estate Securities Fund 577 | |||||||||
| Russell Investment Company | |||||||||||||
| Russell Global Real Estate Securities Fund | |||||||||||||
| Schedule of Investments, continued — October 31, 2014 | |||||||||||||
| Presentation of Portfolio Holdings | |||||||||||||
| Amounts in thousands | |||||||||||||
| Fair Value | |||||||||||||
| Portfolio Summary | Level 1 | Level 2 | Level 3 | Total | % of Net Assets | ||||||||
| Australia | $ | 112,599 | $ | — | $ | 173 | $ | 112,772 | 6.1 | ||||
| Austria | 2,373 | — | — | 2,373 | 0.1 | ||||||||
| Belgium | 43 | — | — | 43 | —* | ||||||||
| Brazil | 4,624 | — | — | 4,624 | 0.3 | ||||||||
| Canada | 37,612 | — | — | 37,612 | 2.0 | ||||||||
| China | 1,400 | — | — | 1,400 | 0.1 | ||||||||
| Finland | 3,689 | — | — | 3,689 | 0.2 | ||||||||
| France | 63,172 | — | — | 63,172 | 3.4 | ||||||||
| Germany | 34,794 | — | — | 34,794 | 1.9 | ||||||||
| Hong Kong | 172,315 | — | — | 172,315 | 9.4 | ||||||||
| Ireland | 334 | — | — | 334 | —* | ||||||||
| Italy | 862 | — | — | 862 | —* | ||||||||
| Japan | 246,762 | — | — | 246,762 | 13.5 | ||||||||
| Luxembourg | 5,057 | — | — | 5,057 | 0.3 | ||||||||
| Netherlands | 19,761 | — | — | 19,761 | 1.1 | ||||||||
| Norway | 5,027 | — | — | 5,027 | 0.3 | ||||||||
| Singapore | 63,612 | — | — | 63,612 | 3.5 | ||||||||
| Spain | 4,707 | — | — | 4,707 | 0.3 | ||||||||
| Sweden | 14,893 | — | — | 14,893 | 0.8 | ||||||||
| Switzerland | 3,799 | — | — | 3,799 | 0.2 | ||||||||
| United Kingdom | 118,659 | — | — | 118,659 | 6.5 | ||||||||
| United States | 867,699 | — | — | 867,699 | 47.3 | ||||||||
| Short-Term Investments | — | 37,870 | — | 37,870 | 2.0 | ||||||||
| Other Securities | — | 41,411 | — | 41,411 | 2.3 | ||||||||
| Total Investments | 1,783,793 | 79,281 | 173 | 1,863,247 | 101.6 | ||||||||
| Other Assets and Liabilities, Net | (1.6 | ) | |||||||||||
| 100.0 | |||||||||||||
| Other Financial Instruments | |||||||||||||
| Futures Contracts | 1,084 | — | — | 1,084 | 0.1 | ||||||||
| Foreign Currency Exchange Contracts | 2 | (545 | ) | — | (543 | ) | (—)* | ||||||
| Index Swap Contracts | — | 153 | — | 153 | —* | ||||||||
| Total Other Financial Instruments** | $ | 1,086 | $ | (392 | ) | $ | — | $ | 694 | ||||
| * Less than .05% of net assets. | |||||||||||||
| ** Futures and foreign currency exchange contract values reflect the unrealized appreciation/depreciation on the instruments. | |||||||||||||
| For a description of the Levels see note 2 in the Notes to Financial Statements. | |||||||||||||
| For disclosure on transfers between Levels 1, 2 and 3 during the period ended October 31, 2014, see note 2 in the Notes to Financial | |||||||||||||
| Statements. | |||||||||||||
| Investments in which significant unobservable inputs (Level 3) were used in determining a fair value for the period ended October | |||||||||||||
| 31, 2014 were less than 1% of net assets. | |||||||||||||
See accompanying notes which are an integral part of the financial statements.
578 Russell Global Real Estate Securities Fund
| Russell Investment Company | ||||||
| Russell Global Real Estate Securities Fund | ||||||
| Fair Value of Derivative Instruments — October 31, 2014 | ||||||
| Amounts in thousands | ||||||
| Foreign | ||||||
| Equity | Currency | |||||
| Derivatives not accounted for as hedging instruments | Contracts | Contracts | ||||
| Location: Statement of Assets and Liabilities - Assets | ||||||
| Unrealized appreciation on foreign currency exchange contracts | $ | — | $ | 159 | ||
| Variation margin on futures contracts* | 1,084 | — | ||||
| Index swap contracts, at fair value | 153 | — | ||||
| Total | $ | 1,237 | $ | 159 | ||
| Location: Statement of Assets and Liabilities - Liabilities | ||||||
| Unrealized depreciation on foreign currency exchange contracts | $ | — | $ | 702 | ||
| Foreign | ||||||
| Equity | Currency | |||||
| Derivatives not accounted for as hedging instruments | Contracts | Contracts | ||||
| Location: Statement of Operations - Net realized gain (loss) | ||||||
| Futures contracts | $ | 3,087 | $ | — | ||
| Index swap contracts | 2,840 | — | ||||
| Foreign currency-related transactions** | — | (509 | ) | |||
| Total | $ | 5,927 | $ | (509 | ) | |
| Location: Statement of Operations - Net change in unrealized appreciation (depreciation) | ||||||
| Futures contracts | $ | 595 | $ | — | ||
| Index swap contracts | (616 | ) | — | |||
| Foreign currency-related transactions*** | — | (1,028 | ) | |||
| Total | $ | (21 | ) | $ | (1,028 | ) |
| * | Includes cumulative appreciation/depreciation of futures contracts as reported in the Schedule of Investments. Only variation margin is reported within the Statement of Assets and Liabilities. |
| ** | Only includes net realized gain (loss) on forward and spot contracts. May differ from the net realized gain (loss) on foreign currency-related transactions reported within the Statement of Operations. |
| *** | Only includes change in unrealized gain (loss) on forward and spot contracts. May differ from the net change in unrealized gain (loss) on foreign currency-related transactions reported within the Statement of Operations. |
For further disclosure on derivatives see note 2 in the Notes to Financial Statements.
See accompanying notes which are an integral part of the financial statements.
Russell Global Real Estate Securities Fund 579
Russell Investment Company
Russell Global Real Estate Securities Fund
Balance Sheet Offsetting of Financial and Derivative Instruments — October 31, 2014
| Amounts in thousands | ||||||||
| Offsetting of Financial Assets and Derivative Assets | ||||||||
| Gross | Net Amounts | |||||||
| Amounts | of Assets | |||||||
| Gross | Offset in the | Presented in | ||||||
| Amounts of | Statement of | the Statement | ||||||
| Recognized | Assets and | of Assets and | ||||||
| Description | Location: Statement of Assets and Liabilities - Assets | Assets | Liabilities | Liabilities | ||||
| Securities on Loan* | Investments, at fair value | $ | 40,342 | $ | — $ | 40,342 | ||
| Foreign Currency Exchange Contracts | Unrealized appreciation on foreign currency exchange contracts | 159 | — | 159 | ||||
| Futures Contracts | Variation margin on futures contracts | 485 | — | 485 | ||||
| Index Swap Contracts | Index swap contracts, at fair value | 153 | — | 153 | ||||
| Total | $ | 41,139 | $ | — $ | 41,139 | |||
| Financial Assets, Derivative Assets, and Collateral Held by Counterparty | ||||||||
| Gross Amounts Not Offset in | ||||||||
| the Statement of Assets and | ||||||||
| Liabilities | ||||||||
| Net Amounts | ||||||||
| of Assets | ||||||||
| Presented in | ||||||||
| the Statement | Financial and | |||||||
| of Assets and | Derivative | Collateral | ||||||
| Counterparty | Liabilities | Instruments | Received^ | Net Amount | ||||
| Bank of America | $ | 158 | $ | 25 | $ | — $ | 133 | |
| Bank of Montreal | 1 | 1 | — | — | ||||
| Bank of New York | 19 | 4 | — | 15 | ||||
| Barclays | 12,576 | — | 12,576 | — | ||||
| Credit Suisse | 595 | — | 595 | — | ||||
| Deutsche Bank | 1,688 | — | 1,678 | 10 | ||||
| JPMorgan Chase | 4,804 | — | 4,804 | — | ||||
| Merrill Lynch | 7,185 | — | 7,185 | — | ||||
| Morgan Stanley | 12,341 | — | 12,341 | — | ||||
| Northern Trust | 12 | 1 | — | 11 | ||||
| State Street | 112 | 55 | — | 57 | ||||
| UBS | 1,648 | — | 1,162 | 486 | ||||
| Total | $ | 41,139 | $ | 86 | $ | 40,341 | $ | 712 |
See accompanying notes which are an integral part of the financial statements.
580 Russell Global Real Estate Securities Fund
Russell Investment Company
Russell Global Real Estate Securities Fund
Balance Sheet Offsetting of Financial and Derivative Instruments, continued —October 31, 2014
| Amounts in thousands | ||||||||
| Offsetting of Financial Liabilities and Derivative Liabilities | ||||||||
| Gross | Net Amounts | |||||||
| Amounts | of Assets | |||||||
| Gross | Offset in the | Presented in | ||||||
| Amounts of | Statement of | the Statement | ||||||
| Recognized | Assets and | of Assets and | ||||||
| Description | Location: Statement of Assets and Liabilities - Liabilities | Liabilities | Liabilities | Liabilities | ||||
| Foreign Currency Exchange Contracts | Unrealized depreciation on foreign currency exchange contracts | $ | 702 | $ | — $ | 702 | ||
| Total | $ | 702 | $ | — $ | 702 | |||
| Financial Liabilities, Derivative Liabilities, and Collateral Pledged by Counterparty | ||||||||
| Gross Amounts Not Offset in | ||||||||
| the Statement of Assets and | ||||||||
| Liabilities | ||||||||
| Net Amounts | ||||||||
| of Liabilities | ||||||||
| Presented in | ||||||||
| the Statement | Financial and | |||||||
| of Assets and | Derivative | Collateral | ||||||
| Counterparty | Liabilities | Instruments | Pledged^ | Net Amount | ||||
| Bank of America | $ | 25 | $ | 25 | $ | — $ | — |
| Bank of Montreal | 56 | 1 | — | 55 | |||
| Bank of New York | 4 | 4 | — | — | |||
| HSBC | 1 | — | — | 1 | |||
| JPMorgan Chase | 9 | — | — | 9 | |||
| Northern Trust | 1 | 1 | — | — | |||
| Standard Chartered | 9 | — | — | 9 | |||
| State Street | 597 | 55 | — | 542 | |||
| Total | $ | 702 | $ | 86 | $ | — $ | 616 |
* Fair value of securities on loan as reported in the footnotes to the Statement of Assets and Liabilities.
^ Collateral received or pledged amounts may not reconcile to those disclosed in the Statement of Assets and Liabilities due to the inclusion of off-Balance Sheet collateral and adjustments made to exclude overcollateralization.
For further disclosure on derivatives and counterparty risk see note 2 in the Notes to Financial Statements.
See accompanying notes which are an integral part of the financial statements.
Russell Global Real Estate Securities Fund 581
| Russell Investment Company | ||
| Russell Global Real Estate Securities Fund | ||
| Statement of Assets and Liabilities — October 31, 2014 | ||
| Amounts in thousands | ||
| Assets | ||
| Investments, at identified cost | $ | 1,492,324 |
| Investments, at fair value(*)(>) | 1,863,247 | |
| Cash (restricted)(a)(b) | 3,900 | |
| Foreign currency holdings(^) | 1,638 | |
| Unrealized appreciation on foreign currency exchange contracts | 159 | |
| Receivables: | ||
| Dividends and interest | 1,765 | |
| Dividends from affiliated Russell funds | 3 | |
| Investments sold | 16,514 | |
| Fund shares sold | 2,007 | |
| Foreign capital gains taxes recoverable | 383 | |
| Variation margin on futures contracts | 485 | |
| Prepaid expenses | 5 | |
| Index swap contracts, at fair value(8) | 153 | |
| Total assets | 1,890,259 | |
| Liabilities | ||
| Payables: | ||
| Due to custodian | 8 | |
| Investments purchased | 11,168 | |
| Fund shares redeemed | 1,542 | |
| Accrued fees to affiliates | 1,575 | |
| Other accrued expenses | 208 | |
| Unrealized depreciation on foreign currency exchange contracts | 702 | |
| Payable upon return of securities loaned | 41,411 | |
| Total liabilities | 56,614 | |
| Net Assets | $ | 1,833,645 |
See accompanying notes which are an integral part of the financial statements.
582 Russell Global Real Estate Securities Fund
| Russell Investment Company | |||
| Russell Global Real Estate Securities Fund | |||
| Statement of Assets and Liabilities, continued — October 31, 2014 | |||
| Amounts in thousands | |||
| Net Assets Consist of: | |||
| Undistributed (overdistributed) net investment income | $ | (24,484 | ) |
| Accumulated net realized gain (loss) | 52,951 | ||
| Unrealized appreciation (depreciation) on: | |||
| Investments (net of deferred tax liability for foreign capital gains taxes) | 370,923 | ||
| Futures contracts | 1,084 | ||
| Index swap contracts | 153 | ||
| Foreign currency-related transactions | (496 | ) | |
| Shares of beneficial interest | 451 | ||
| Additional paid-in capital | 1,433,063 | ||
| Net Assets | $ | 1,833,645 | |
| Net Asset Value, offering and redemption price per share: | |||
| Net asset value per share: Class A(#) | $ | 39.99 | |
| Maximum offering price per share (Net asset value plus sales charge of 5.75%): Class A | $ | 42.43 | |
| Class A — Net assets | $ | 30,324,006 | |
| Class A — Shares outstanding ($.01 par value) | 758,328 | ||
| Net asset value per share: Class C(#) | $ | 38.96 | |
| Class C — Net assets | $ | 41,935,859 | |
| Class C — Shares outstanding ($.01 par value) | 1,076,447 | ||
| Net asset value per share: Class E(#) | $ | 40.02 | |
| Class E — Net assets | $ | 35,654,602 | |
| Class E — Shares outstanding ($.01 par value) | 890,813 | ||
| Net asset value per share: Class S(#) | $ | 40.73 | |
| Class S — Net assets | $ 1,556,497,596 | ||
| Class S — Shares outstanding ($.01 par value) | 38,215,342 | ||
| Net asset value per share: Class Y(#) | $ | 40.71 | |
| Class Y — Net assets | $ | 169,232,607 | |
| Class Y — Shares outstanding ($.01 par value) | 4,157,041 | ||
| Amounts in thousands | |||
| (^) Foreign currency holdings - cost | $ | 1,649 | |
| (*) Securities on loan included in investments | $ | 40,342 | |
| (>) Investments in affiliates, Russell U.S. Cash Management Fund and Russell U.S. Cash Collateral Fund | $ | 79,281 | |
| (a) Cash Collateral for Futures | $ | 2,400 | |
| (b) Cash Collateral for Swaps | $ | 1,500 | |
| (#) Net asset value per share equals class level net assets divided by class level shares of beneficial interest outstanding. | |||
See accompanying notes which are an integral part of the financial statements.
Russell Global Real Estate Securities Fund 583
| Russell Investment Company | |||
| Russell Global Real Estate Securities Fund | |||
| Statement of Operations — For the Period Ended October 31, 2014 | |||
| Amounts in thousands | |||
| Investment Income | |||
| Dividends | $ | 50,461 | |
| Dividends from affiliated Russell funds | 36 | ||
| Securities lending income | 379 | ||
| Less foreign taxes withheld | (2,375 | ) | |
| Total investment income | 48,501 | ||
| Expenses | |||
| Advisory fees | 14,025 | ||
| Administrative fees | 835 | ||
| Custodian fees | 541 | ||
| Distribution fees - Class A | 72 | ||
| Distribution fees - Class C | 312 | ||
| Transfer agent fees - Class A | 58 | ||
| Transfer agent fees - Class C | 83 | ||
| Transfer agent fees - Class E | 77 | ||
| Transfer agent fees - Class S | 2,881 | ||
| Transfer agent fees - Class Y | 9 | ||
| Professional fees | 103 | ||
| Registration fees | 116 | ||
| Shareholder servicing fees - Class C | 104 | ||
| Shareholder servicing fees - Class E | 96 | ||
| Trustees’ fees | 41 | ||
| Printing fees | 170 | ||
| Miscellaneous | 87 | ||
| Total expenses | 19,610 | ||
| Net investment income (loss) | 28,891 | ||
| Net Realized and Unrealized Gain (Loss) | |||
| Net realized gain (loss) on: | |||
| Investments (net of deferred tax liability for foreign capital gains taxes) | 132,678 | ||
| Futures contracts | 3,087 | ||
| Index swap contracts | 2,840 | ||
| Foreign currency-related transactions | (574 | ) | |
| Net realized gain (loss) | 138,031 | ||
| Net change in unrealized appreciation (depreciation) on: | |||
| Investments (net of deferred tax liability for foreign capital gains taxes) | 9,346 | ||
| Futures contracts | 595 | ||
| Index swap contracts | (616 | ) | |
| Foreign currency-related transactions | (956 | ) | |
| Net change in unrealized appreciation (depreciation) | 8,369 | ||
| Net realized and unrealized gain (loss) | 146,400 | ||
| Net Increase (Decrease) in Net Assets from Operations | $ | 175,291 | |
See accompanying notes which are an integral part of the financial statements.
584 Russell Global Real Estate Securities Fund
| Russell Investment Company | ||||||
| Russell Global Real Estate Securities Fund | ||||||
| Statements of Changes in Net Assets | ||||||
| For the Periods Ended October 31, | ||||||
| Amounts in thousands | 2014 | 2013 | ||||
| Increase (Decrease) in Net Assets | ||||||
| Operations | ||||||
| Net investment income (loss) | $ | 28,891 | $ | 29,719 | ||
| Net realized gain (loss) | 138,031 | 160,513 | ||||
| Net change in unrealized appreciation (depreciation) | 8,369 | 10,090 | ||||
| Net increase (decrease) in net assets from operations | 175,291 | 200,322 | ||||
| Distributions | ||||||
| From net investment income | ||||||
| Class A | (790 | ) | (1,506 | ) | ||
| Class C | (869 | ) | (2,043 | ) | ||
| Class E | (1,056 | ) | (1,959 | ) | ||
| Class S | (42,159 | ) | (67,126 | ) | ||
| Class Y | (6,667 | ) | (19,334 | ) | ||
| From net realized gain | ||||||
| Class A | (2,078 | ) | (95 | ) | ||
| Class C | (3,209 | ) | (151 | ) | ||
| Class E | (2,783 | ) | (125 | ) | ||
| Class S | (98,839 | ) | (4,040 | ) | ||
| Class Y | (17,188 | ) | (1,189 | ) | ||
| Net decrease in net assets from distributions | (175,638 | ) | (97,568 | ) | ||
| Share Transactions* | ||||||
| Net increase (decrease) in net assets from share transactions | 113,645 | (17,894 | ) | |||
| Total Net Increase (Decrease) in Net Assets | 113,298 | 84,860 | ||||
| Net Assets | ||||||
| Beginning of period | 1,720,347 | 1,635,487 | ||||
| End of period | $ | 1,833,645 | $ | 1,720,347 | ||
| Undistributed (overdistributed) net investment income included in net assets | $ | (24,484 | ) | $ | (28,122 | ) |
See accompanying notes which are an integral part of the financial statements.
Russell Global Real Estate Securities Fund 585
Russell Investment Company
Russell Global Real Estate Securities Fund
Statements of Changes in Net Assets, continued
* Share transaction amounts (in thousands) for the periods ended October 31, 2014 and October 31, 2013 were as follows:
| 2014 | 2013 | |||||||||||
| Shares | Dollars | Shares | Dollars | |||||||||
| Class A | ||||||||||||
| Proceeds from shares sold | 103 | $ | 3,890 | 147 | $ | 5,895 | ||||||
| Proceeds from reinvestment of distributions | 79 | 2,851 | 41 | 1,589 | ||||||||
| Payments for shares redeemed | (142 | ) | (5,384 | ) | (199 | ) | (7,843 | ) | ||||
| Net increase (decrease) | 40 | 1,357 | (11 | ) | (359 | ) | ||||||
| Class C | ||||||||||||
| Proceeds from shares sold | 93 | 3,442 | 211 | 8,261 | ||||||||
| Proceeds from reinvestment of distributions | 114 | 3,982 | 57 | 2,145 | ||||||||
| Payments for shares redeemed | (245 | ) | (9,048 | ) | (285 | ) | (11,005 | ) | ||||
| Net increase (decrease) | (38 | ) | (1,624 | ) | (17 | ) | (599 | ) | ||||
| Class E | ||||||||||||
| Proceeds from shares sold | 229 | 8,700 | 227 | 9,035 | ||||||||
| Proceeds from reinvestment of distributions | 105 | 3,788 | 53 | 2,054 | ||||||||
| Payments for shares redeemed | (396 | ) | (15,293 | ) | (276 | ) | (10,958 | ) | ||||
| Net increase (decrease) | (62 | ) | (2,805 | ) | 4 | 131 | ||||||
| Class S | ||||||||||||
| Proceeds from shares sold | 8,905 | 342,900 | 8,430 | 340,158 | ||||||||
| Proceeds from reinvestment of distributions | 3,815 | 139,698 | 1,780 | 70,314 | ||||||||
| Payments for shares redeemed | (7,865 | ) | (303,450 | ) | (7,147 | ) | (289,225 | ) | ||||
| Net increase (decrease) | 4,855 | 179,148 | 3,063 | 121,247 | ||||||||
| Class Y | ||||||||||||
| Proceeds from shares sold | 494 | 19,122 | 525 | 20,909 | ||||||||
| Proceeds from reinvestment of distributions | 653 | 23,855 | 520 | 20,523 | ||||||||
| Payments for shares redeemed | (2,709 | ) | (105,408 | ) | (4,466 | ) | (179,746 | ) | ||||
| Net increase (decrease) | (1,562 | ) | (62,431 | ) | (3,421 | ) | (138,314 | ) | ||||
| Total increase (decrease) | 3,233 | $ | 113,645 | (382 | ) | $ | (17,894 | ) | ||||
See accompanying notes which are an integral part of the financial statements.
586 Russell Global Real Estate Securities Fund
(This page intentionally left blank)
| Russell Investment Company | |||||||||||||||||||
| Russell Global Real Estate Securities Fund | |||||||||||||||||||
| Financial Highlights — For the Periods Ended | |||||||||||||||||||
| For a Share Outstanding Throughout Each Period. | |||||||||||||||||||
| $ | |||||||||||||||||||
| $ | Net | $ | $ | $ | $ | ||||||||||||||
| Net Asset Value, | Investment | Net Realized | Total from | Distributions | Distributions | ||||||||||||||
| Beginning of | Income (Loss)(a) | and Unrealized | Investment | from Net | from Net | $ Distribution | |||||||||||||
| Period | (d) | Gain (Loss) | Operations | Investment Income | Realized Gain | In Excess(h) | |||||||||||||
| Class A | |||||||||||||||||||
| October 31, 2014 | 40.49 | .54 | 2.97 | 3.51 | (1.07 | ) | (2.94 | ) | — | ||||||||||
| October 31, 2013 | 38.18 | .58 | 3.94 | 4.52 | (2.08 | ) | (.13 | ) | — | ||||||||||
| October 31, 2012 | 33.52 | .63 | 4.72 | 5.35 | (.69 | ) | — | — | |||||||||||
| October 31, 2011 | 35.24 | .51 | (1.38 | ) | (.87 | ) | (.81 | ) | — | (.04 | ) | ||||||||
| October 31, 2010 | 26.38 | .90 | 8.78 | 9.68 | (.82 | ) | — | — | |||||||||||
| Class C | |||||||||||||||||||
| October 31, 2014 | 39.55 | .24 | 2.90 | 3.14 | (.79 | ) | (2.94 | ) | — | ||||||||||
| October 31, 2013 | 37.34 | .28 | 3.85 | 4.13 | (1.79 | ) | (.13 | ) | — | ||||||||||
| October 31, 2012 | 32.83 | .36 | 4.60 | 4.96 | (.45 | ) | — | — | |||||||||||
| October 31, 2011 | 34.52 | .23 | (1.34 | ) | (1.11 | ) | (.55 | ) | — | (.03 | ) | ||||||||
| October 31, 2010 | 25.85 | .64 | 8.62 | 9.26 | (.59 | ) | — | — | |||||||||||
| Class E | |||||||||||||||||||
| October 31, 2014 | 40.52 | .54 | 2.97 | 3.51 | (1.07 | ) | (2.94 | ) | — | ||||||||||
| October 31, 2013 | 38.20 | .58 | 3.95 | 4.53 | (2.08 | ) | (.13 | ) | — | ||||||||||
| October 31, 2012 | 33.54 | .63 | 4.72 | 5.35 | (.69 | ) | — | — | |||||||||||
| October 31, 2011 | 35.26 | .50 | (1.38 | ) | (.88 | ) | (.80 | ) | — | (.04 | ) | ||||||||
| October 31, 2010 | 26.38 | .88 | 8.81 | 9.69 | (.81 | ) | — | — | |||||||||||
| Class S | |||||||||||||||||||
| October 31, 2014 | 41.16 | .64 | 3.04 | 3.68 | (1.17 | ) | (2.94 | ) | — | ||||||||||
| October 31, 2013 | 38.78 | .67 | 4.02 | 4.69 | (2.18 | ) | (.13 | ) | — | ||||||||||
| October 31, 2012 | 34.03 | .73 | 4.79 | 5.52 | (.77 | ) | — | — | |||||||||||
| October 31, 2011 | 35.77 | .60 | (1.41 | ) | (.81 | ) | (.88 | ) | — | (.05 | ) | ||||||||
| October 31, 2010 | 26.76 | .98 | 8.93 | 9.91 | (.90 | ) | — | — | |||||||||||
| Class Y | |||||||||||||||||||
| October 31, 2014 | 41.15 | .73 | 3.01 | 3.74 | (1.24 | ) | (2.94 | ) | — | ||||||||||
| October 31, 2013 | 38.76 | .84 | 3.94 | 4.78 | (2.25 | ) | (.13 | ) | — | ||||||||||
| October 31, 2012 | 34.03 | .81 | 4.77 | 5.58 | (.85 | ) | — | — | |||||||||||
| October 31, 2011 | 35.76 | .67 | (1.40 | ) | (.73 | ) | (.95 | ) | — | (.05 | ) | ||||||||
| October 31, 2010 | 26.75 | 1.04 | 8.92 | 9.96 | (.95 | ) | — | — | |||||||||||
See accompanying notes which are an integral part of the financial statements.
588 Russell Global Real Estate Securities Fund
| % | % | % | |||||||||||||||
| $ | $ | Ratio of Expenses | Ratio of Expenses | Ratio of Net | |||||||||||||
| Net Asset Value, | % | Net Assets, | to Average | to Average | Investment Income | % | |||||||||||
| $ | End of | Total | End of Period | Net Assets, | Net Assets, | to Average | Portfolio | ||||||||||
| Total Distributions | Period | Return(c) | (000 | ) | Gross | Net(d) | Net Assets(d) | Turnover Rate | |||||||||
| (4.01 | ) | 39.99 | 9.98 | 30,324 | 1.36 | 1.36 | 1.41 | 69 | |||||||||
| (2.21 | ) | 40.49 | 12.17 | 29,098 | 1.35 | 1.35 | 1.47 | 78 | |||||||||
| (.69 | ) | 38.18 | 16.03 | 27,867 | 1.35 | 1.35 | 1.79 | 64 | |||||||||
| (.85 | ) | 33.52 | (2.51 | ) | 25,724 | 1.36 | 1.36 | 1.44 | 69 | ||||||||
| (.82 | ) | 35.24 | 37.23 | 25,564 | 1.34 | 1.34 | 2.83 | 141 | |||||||||
| (3.73 | ) | 38.96 | 9.14 | 41,936 | 2.11 | 2.11 | .66 | 69 | |||||||||
| (1.92 | ) | 39.55 | 11.34 | 44,084 | 2.10 | 2.10 | .73 | 78 | |||||||||
| (.45 | ) | 37.34 | 15.17 | 42,262 | 2.10 | 2.10 | 1.05 | 64 | |||||||||
| (.58 | ) | 32.83 | (3.28 | ) | 43,207 | 2.11 | 2.11 | .67 | 69 | ||||||||
| (.59 | ) | 34.52 | 36.24 | 53,155 | 2.09 | 2.09 | 2.08 | 141 | |||||||||
| (4.01 | ) | 40.02 | 9.95 | 35,655 | 1.36 | 1.36 | 1.42 | 69 | |||||||||
| (2.21 | ) | 40.52 | 12.18 | 38,596 | 1.35 | 1.35 | 1.46 | 78 | |||||||||
| (.69 | ) | 38.20 | 16.01 | 36,250 | 1.35 | 1.35 | 1.79 | 64 | |||||||||
| (.84 | ) | 33.54 | (2.51 | ) | 35,132 | 1.36 | 1.36 | 1.43 | 69 | ||||||||
| (.81 | ) | 35.26 | 37.22 | 38,484 | 1.34 | 1.34 | 2.79 | 141 | |||||||||
| (4.11 | ) | 40.73 | 10.23 | 1,556,497 | 1.11 | 1.11 | 1.65 | 69 | |||||||||
| (2.31 | ) | 41.16 | 12.46 | 1,373,266 | 1.10 | 1.10 | 1.68 | 78 | |||||||||
| (.77 | ) | 38.78 | 16.32 | 1,174,848 | 1.10 | 1.10 | 2.05 | 64 | |||||||||
| (.93 | ) | 34.03 | (2.28 | ) | 1,107,094 | 1.11 | 1.11 | 1.68 | 69 | ||||||||
| (.90 | ) | 35.77 | 37.58 | 1,168,039 | 1.09 | 1.09 | 3.08 | 141 | |||||||||
| (4.18 | ) | 40.71 | 10.45 | 169,233 | .91 | .91 | 1.88 | 69 | |||||||||
| (2.38 | ) | 41.15 | 12.69 | 235,303 | .90 | .90 | 2.03 | 78 | |||||||||
| (.85 | ) | 38.76 | 16.53 | 354,260 | .92 | .92 | 2.26 | 64 | |||||||||
| (1.00 | ) | 34.03 | (2.10 | ) | 376,191 | .93 | .93 | 1.86 | 69 | ||||||||
| (.95 | ) | 35.76 | 37.83 | 399,759 | .91 | .91 | 3.28 | 141 | |||||||||
See accompanying notes which are an integral part of the financial statements.
Russell Global Real Estate Securities Fund 589
Russell Investment Company
Russell Multi-Strategy Alternative Fund
Portfolio Management Discussion and Analysis — October 31, 2014 (Unaudited)

| Russell Multi-Strategy Alternative Fund - Class A‡ | Barclays U.S. 1-3 Month Treasury Bill Index** | ||||||
| Total | Total | ||||||
| Return | Return | ||||||
| 1 Year | (6.75 | )% | 1 Year | 0.03 | % | ||
| Inception* | (2.43 | )%§ | Inception* | 0.05 | %§ | ||
| HFRX Equal Weighted Strategies Index*** | |||||||
| Russell Multi-Strategy Alternative Fund - Class C | Total | ||||||
| Total | Return | ||||||
| Return | 1 Year | 1.01 | % | ||||
| 1 Year | (1.75 | )% | Inception* | 3.31 | %§ | ||
| Inception* | (0.52 | )%§ | |||||
| Russell Multi-Strategy Alternative Fund - Class E | |||||||
| Total | |||||||
| Return | |||||||
| 1 Year | (1.01 | )% | |||||
| Inception* | 0.17 | %§ | |||||
| Russell Multi-Strategy Alternative Fund - Class S | |||||||
| Total | |||||||
| Return | |||||||
| 1 Year | (0.78 | )% | |||||
| Inception* | 0.41 | %§ | |||||
| Russell Multi-Strategy Alternative Fund - Class Y | |||||||
| Total | |||||||
| Return | |||||||
| 1 Year | (0.60 | )% | |||||
| Inception* | 0.62 | %§ | |||||
590 Russell Multi-Strategy Alternative Fund
Russell Investment Company
Russell Multi-Strategy Alternative Fund
Portfolio Management Discussion and Analysis, continued — October 31, 2014 (Unaudited)
| The Russell Multi-Strategy Alternative Fund (the “Fund”) | results across equity hedge, tactical trading, and relative value |
| employs a multi-manager approach whereby portions of the Fund | strategies, while event driven managers struggled amid recent |
| are allocated to different money managers. Fund assets not | headwinds. Within the two top performing strategies - tactical |
| allocated to money managers are managed by Russell Investment | trading and equity hedge - systematic macro was the best |
| Management Company (“RIMCo”), the Fund’s advisor. RIMCo | performing tactical trading sub-strategy, while the quantitative |
| may change the allocation of the Fund’s assets among money | equity sub-strategy generated strong results for equity hedge. |
| managers at any time. An exemptive order from the Securities | Conversely, event driven managers suffered losses from exposures |
| and Exchange Commission (“SEC”) permits RIMCo to engage | to credit and idiosyncratic / deal-specific equity holdings. |
| or terminate a money manager at any time, subject to approval | Throughout the fiscal year period, the Fund tactically managed |
| by the Fund’s Board, without a shareholder vote. Pursuant to the | its strategic allocations amid choppy market conditions, shifting |
| terms of the exemptive order, the Fund is required to notify its | its allocations between defensively positioned managers and |
| shareholders within 90 days of when a money manager begins | fundamental long/short equity exposures within the U.S. and |
| providing services. As of October 31, 2014, the Fund had nine | Japan; catalyst driven equity exposure within the U.S. and Europe; |
| money managers. | and global discretionary macro strategies. The Fund experienced |
| What is the Fund’s investment objective? | a modest whipsawing of performance as market conditions caused |
| The Fund seeks to achieve long term capital growth with low | positions that contributed positively to portfolio performance in |
| correlation to, and lower volatility than, global equity markets. | one quarter to sell off in a subsequent quarter. Heading into fiscal |
| year end, the Fund suffered losses as a divergence in growth | |
| How did the Fund perform relative to its benchmark for the | expectations and the direction of monetary policy between the |
| fiscal year ended October 31, 2014? | U.S. and other major economies led to a breakout in some asset |
| For the fiscal year ended October 31, 2014, the Fund’s Class A, | classes and increased volatility in others. In general, most risk |
| Class C, Class E, Class S and Class Y Shares lost 1.05%, 1.75%, | assets experienced heightened levels of volatility, with the U.S. |
| 1.01%, 0.78%, and 0.60%, respectively. This is compared to | dollar gaining strength across most currencies, equities and |
| the Fund’s benchmark, the Barclays U.S. 1-3 Month Treasury Bill | credit suffering from whipsawing price action, and commodities |
| Index, which gained 0.03% during the same period. The Fund’s | dramatically selling off. Despite resiliency from the Fund’s credit |
| secondary benchmark, the HFRX Equal Weighted Strategies | and equity money managers in previous quarters, most of the |
| Index, gained 1.01% during the same period. The HFRX Equal | Fund’s event driven credit and fundamental equity managers |
| Weighted Strategies Index is composed of hedge fund strategies | suffered losses as global equity markets declined and credit |
| that RIMCo believes are representative of the Fund’s investment | spreads widened. Tactical trading managers, however, were able |
| strategies. The Fund’s performance includes operating expenses, | to offset some of the losses as the shift in the macroeconomic |
| whereas index returns are unmanaged and do not include | landscape generated profits in currencies, rates, and emerging |
| expenses of any kind. | market positions. |
| For the fiscal year ended October 31, 2014, the Morningstar® | How did the investment strategies and techniques employed |
| Multi-Alternative, a group of funds that Morningstar considers to | by the Fund and its money managers affect its benchmark |
| have investment strategies similar to those of the Fund, gained | relative performance? |
| 2.73%. This result serves as a peer comparison and is expressed | Amundi Investment Advisors USA (“Amundi”) was terminated |
| net of operating expenses. | in September 2014 and underperformed the HFRX RV: Volatility |
| RIMCo may assign a money manager a specific benchmark | Index for the portion of the fiscal year in which it was a money |
| other than the Fund’s index. However, the Fund’s secondary | manager for the Fund. The portfolio’s directional long exposure |
| benchmark is generally representative of the aggregate of each | to volatility was the primary driver of underperformance, as |
| money manager’s benchmark index and the Fund’s primary index | modest losses were caused by declining global volatility during |
| remains the benchmark for the Fund. | the period. |
| How did the market conditions described in the Market | AQR Capital Management, LLC (“AQR”) outperformed the HFRX |
| Summary report affect the Fund’s performance? | Macro/CTA Index for the fiscal year. The tactical rebalancing |
| For the fiscal year ending October 31, 2014, global hedge fund | between AQR’s managed futures and risk-parity strategies |
| strategies, as measured by the HFRX Global Hedge Fund Index, | boosted performance over the year. Exposures to equities and |
| gained 0.96%. Performance was primarily driven by positive | select currencies benefited, while select commodity exposures |
| detracted from performance. | |
Russell Multi-Strategy Alternative Fund 591
Russell Investment Company
Russell Multi-Strategy Alternative Fund
Portfolio Management Discussion and Analysis, continued — October 31, 2014 (Unaudited)
| Brigade Capital Management, LLC (“Brigade”) outperformed the | situations and deal-specific names. Gains were modestly offset |
| HFRX ED: Distressed Restructuring Index for the fiscal year. | by Scoggin’s opportunistic selection of certain sovereign credits. |
| The large majority of Brigade’s returns were earned from long | The Cambridge Strategy (Asset Management) Limited |
| positions in high-yield bonds and loans, which benefited from the | (“Cambridge”) outperformed the HFRX Macro/CTA Index for |
| resiliency of the high yield market. Due to rallying credit markets, | the fiscal year. Cambridge generated profits during the year from |
| gains were modestly offset by Brigade’s short positions. | exposures to currencies, interest rates, and emerging market |
| DCI, LLC (“DCI”) outperformed the HFRX Relative Value Index | equities, while select commodity exposures detracted from |
| for the fiscal year. DCI benefited over the period from positive | performance. |
| mispricing effects and other idiosyncratic credit positions. Due | 2100 Xenon Group LLC (“Xenon”) was terminated in September |
| to tightening credit spreads, gains were modestly offset by the | 2014 and underperformed the HFRX Macro/CTA Index for the |
| manager’s short positions. | portion of the fiscal year in which it was a money manager for the |
| Galtere Ltd./Galtere N.A. (“Galtere”) was terminated in September | Fund. Xenon’s trend-following strategy struggled over the period |
| 2014 and underperformed the HFRX Macro: Discretionary | as volatile macroeconomic conditions and central bank policies |
| Thematic Index for the portion of the fiscal year in which it was | proved difficult for model based strategies. |
| a money manager for the Fund. Performance for Galtere was | Pacific Investment Management Company (“PIMCO”) |
| negatively affected by a broad sell-off across the commodities | outperformed the HFRX Relative Value Index for the fiscal year. |
| complex during the year, with notable losses stemming from | PIMCO’s performance was driven by tactically trading interest |
| specific agricultural commodities and metals. | rate strategies in the U.S., U.K., and Australia, as well as through |
| Lazard Asset Management, LLC (“Lazard”) underperformed | relative value exposure in both agency/non-agency securities. |
| the HFRX Japan Index for the fiscal year. Despite a rally in | RIMCo manages the portion of the Fund’s assets that RIMCo |
| Japanese equities during the year, poor management of net | determines not to allocate to the money managers. Assets not |
| exposures coupled with detrimental stock selection resulted in | allocated to managers include the Fund’s liquidity reserves and |
| underperformance. | assets which may be managed directly by RIMCo to modify the |
| Levin Capital Strategies, L.P. (“Levin”) was terminated in | Fund’s overall exposures to seek to achieve the desired risk/ |
| September 2014 and underperformed the HFRX EH: Short Bias | return profile for the Fund. |
| Index for the portion of the fiscal year in which it was a money | In September 2014, RIMCo implemented a direct managed |
| manager for the Fund. Levin’s short bias U.S. equity strategy | positioning strategy within the Fund. The strategy was |
| experienced losses as equity markets steadily rallied over the | implemented on a discretionary basis for strategic and tactical |
| course of the fiscal year. | reasons, including hedging and exposure management purposes. |
| Omega Advisors, Inc. (“Omega”) underperformed the HFRX EH: | The strategy utilizes index futures for both equities and fixed |
| Fundamental Value Index for the fiscal year mainly due to equity | income exposures. Examples of trades include gaining or |
| exposures within the energy sector. | offsetting exposures to certain factors/styles/geographies that |
| Passport Capital, LLC (“Passport”) was added to the Fund in | currently do or do not exist through manager holdings; increasing |
| September 2014 and underperformed the HFRX Equity Hedge | or reducing specific directional exposures (e.g., the Fund’s level of |
| Index for the portion of the fiscal year in which it was a money | U.S. equity exposure); and implementing more effective hedges. |
| manager in the Fund. Passport’s energy sector exposure detracted | Since its implementation, the strategy has performed in-line with |
| from performance over the last two months of the fiscal period. | expectations. |
| TCW/Scoggin, LLC (“Scoggin”) outperformed the HFRX Event | Describe any changes to the Fund’s structure or allocation |
| Driven Index for the fiscal year. Despite a sell-off within specific | to the Underlying Funds. |
| event driven equities names in October, Scoggin managed to | In September 2014, RIMCo terminated Amundi, Levin, Galtere |
| generate positive performance from stock selection within special | and Xenon as money managers for the Fund and hired Passport |
| as a money manager for the Fund. |
592 Russell Multi-Strategy Alternative Fund
Russell Investment Company
Russell Multi-Strategy Alternative Fund
Portfolio Management Discussion and Analysis, continued — October 31, 2014 (Unaudited)
| Money Managers as of October 31, | Money Managers as of October 31, | ||
| 2014 | Styles | 2014 | Styles |
| AQR Capital Management, LLC | Tactical Trading - | DCI, LLC | Relative Value - Fixed |
| Systematic Macro | Income - Credit Long/ | ||
| - Managed Futures / | Short | ||
| Quantitative Macro | Pacific Investment Management Company | Relative Value - Fixed | |
| Brigade Capital Management, L.P. | Event Driven - Credit | LLC | Income - Diversified |
| - Opportunistic | The views expressed in this report reflect those of the portfolio | ||
| The Cambridge Strategy (Asset | Tactical Trading - | managers only through the end of the period covered by | |
| Management) Limited | Discretionary Macro - | the report. These views do not necessarily represent the | |
| Global Diversified | |||
| TCW/Scoggin, LLC | Event Driven - Equity - | views of RIMCo, or any other person in RIMCo or any other | |
| Special Situations | affiliated organization. These views are subject to change | ||
| Lazard Asset Management, LLC | Equity Hedge - | at any time based upon market conditions or other events, | |
| Fundamental - Japan - | and RIMCo disclaims any responsibility to update the views | ||
| Variable Net | contained herein. These views should not be relied on as | ||
| Omega Advisors, Inc. | Equity Hedge - | investment advice and, because investment decisions for | |
| Fundamental - US - Long | |||
| Biased | a Russell Investment Company (“RIC”) Fund are based on | ||
| Passport Capital LLC | Equity Hedge - | numerous factors, should not be relied on as an indication | |
| Fundamental - Global - | of investment decisions of any RIC Fund. | ||
| Variable Net | |||
| * | Assumes initial investment on August 6, 2012. |
| ** | The Barclays 1-3 Month U.S. Treasury Bill Index includes all publicy issued zero-coupon U.S. Treasury Bills that have a remaining maturity of less than 3 months and more than 1 month, are rated investment grade, and have $250 million or more of outstanding face value. |
| *** | The HFRX Equal Weighted Strategies Index is designed to be representative of the overall composition of the hedge fund universe. It is comprised of all eligible hedge fund strategies; including but not limited to convertible arbitrage, distressed securities, equity hedge, equity market neutral, event driven, macro, merger arbitrage, and relative value arbitrage. The HFRX Equal Weighted Strategies Index applies an equal weight to all constituent strategy indices. |
| ‡ | The performance shown has been adjusted to reflect the deduction of the maximum Class A sales charge of 5.75%. |
| § | Annualized. |
Performance is historical and assumes reinvestment of all dividends and capital gains. Investment return and principal value will fluctuate so that an investor’s shares, when redeemed, may be worth more or less than when purchased. Past performance is not indicative of future results. The returns shown do not reflect the deduction of taxes that a shareholder would pay on Fund distributions or the redemption of Fund shares.
Russell Multi-Strategy Alternative Fund 593
Russell Investment Company
Russell Multi-Strategy Alternative Fund
Shareholder Expense Example — October 31, 2014 (Unaudited)
| Fund Expenses | Please note that the expenses shown in the table are meant | |||||
| The following disclosure provides important information | to highlight your ongoing costs only and do not reflect any | |||||
| regarding the Fund’s Shareholder Expense Example | transactional costs. Therefore, the information under the heading | |||||
| (“Example”). | “Hypothetical Performance (5% return before expenses)” is | |||||
| useful in comparing ongoing costs only, and will not help you | ||||||
| Example | determine the relative total costs of owning different funds. In | |||||
| As a shareholder of the Fund, you incur two types of costs: (1) | addition, if these transactional costs were included, your costs | |||||
| transaction costs, and (2) ongoing costs, including advisory and | would have been higher. | |||||
| administrative fees; distribution (12b-1) and/or service fees; | Hypothetical | |||||
| and other Fund expenses. The Example is intended to help | Performance (5% | |||||
| you understand your ongoing costs (in dollars) of investing in | Actual | return before | ||||
| the Fund and to compare these costs with the ongoing costs of | Class A | Performance | expenses) | |||
| Beginning Account Value | ||||||
| investing in other mutual funds. The Example is based on an | May 1, 2014 | $ | 1,000.00 | $ | 1,000.00 | |
| investment of $1,000 invested at the beginning of the period and | Ending Account Value | |||||
| held for the entire period indicated, which for this Fund is from | October 31, 2014 | $ | 988.10 | $ | 1,013.71 | |
| May 1, 2014 to October 31, 2014. | Expenses Paid During Period* | $ | 11.43 | $ | 11.57 | |
| Actual Expenses | * Expenses are equal to the Fund's annualized expense ratio of 2.28% | |||||
| (representing the six month period annualized), multiplied by the average | ||||||
| The information in the table under the heading “Actual | account value over the period, multiplied by 184/365 (to reflect the one-half | |||||
| Performance” provides information about actual account values | year period). May reflect amounts waived and/or reimbursed. Without any | |||||
| and actual expenses. You may use the information in this column, | waivers and/or reimbursements, expenses would have been higher. | |||||
| together with the amount you invested, to estimate the expenses | ||||||
| Hypothetical | ||||||
| that you paid over the period. Simply divide your account value by | Performance (5% | |||||
| $1,000 (for example, an $8,600 account value divided by $1,000 | Actual | return before | ||||
| = 8.6), then multiply the result by the number in the first column | Class C | Performance | expenses) | |||
| Beginning Account Value | ||||||
| in the row entitled “Expenses Paid During Period” to estimate | May 1, 2014 | $ | 1,000.00 | $ | 1,000.00 | |
| the expenses you paid on your account during this period. | Ending Account Value | |||||
| October 31, 2014 | $ | 985.00 | $ | 1,009.93 | ||
| Hypothetical Example for Comparison Purposes | Expenses Paid During Period* | $ | 15.16 | $ | 15.35 | |
| The information in the table under the heading “Hypothetical | ||||||
| Performance (5% return before expenses)” provides information | * Expenses are equal to the Fund's annualized expense ratio of 3.03% | |||||
| (representing the six month period annualized), multiplied by the average | ||||||
| about hypothetical account values and hypothetical expenses | account value over the period, multiplied by 184/365 (to reflect the one-half | |||||
| based on the Fund’s actual expense ratio and an assumed rate of | year period). May reflect amounts waived and/or reimbursed. Without any | |||||
| return of 5% per year before expenses, which is not the Fund’s | waivers and/or reimbursements, expenses would have been higher. | |||||
| actual return. The hypothetical account values and expenses | ||||||
| Hypothetical | ||||||
| may not be used to estimate the actual ending account balance or | Performance (5% | |||||
| expenses you paid for the period. You may use this information | Actual | return before | ||||
| to compare the ongoing costs of investing in the Fund and other | Class E | Performance | expenses) | |||
| funds. To do so, compare this 5% hypothetical example with the | Beginning Account Value | |||||
| May 1, 2014 | $ | 1,000.00 | $ | 1,000.00 | ||
| 5% hypothetical examples that appear in the shareholder reports | Ending Account Value | |||||
| of other funds. | October 31, 2014 | $ | 988.10 | $ | 1,013.71 | |
| Expenses Paid During Period* | $ | 11.43 | $ | 11.57 | ||
| * Expenses are equal to the Fund's annualized expense ratio of 2.28% | ||||||
| (representing the six month period annualized), multiplied by the average | ||||||
| account value over the period, multiplied by 184/365 (to reflect the one-half | ||||||
| year period). May reflect amounts waived and/or reimbursed. Without any | ||||||
| waivers and/or reimbursements, expenses would have been higher. | ||||||
594 Russell Multi-Strategy Alternative Fund
Russell Investment Company
Russell Multi-Strategy Alternative Fund
Shareholder Expense Example, continued — October 31, 2014 (Unaudited)
| Hypothetical | ||||||
| Performance (5% | ||||||
| Actual | return before | |||||
| Class S | Performance | expenses) | ||||
| Beginning Account Value | ||||||
| May 1, 2014 | $ | 1,000.00 | $ | 1,000.00 | ||
| Ending Account Value | ||||||
| October 31, 2014 | $ | 989.10 | $ | 1,014.97 | ||
| Expenses Paid During Period* | $ | 10.18 | $ | 10.31 | ||
| * Expenses are equal to the Fund's annualized expense ratio of 2.03% | ||||||
| (representing the six month period annualized), multiplied by the average | ||||||
| account value over the period, multiplied by 184/365 (to reflect the one-half | ||||||
| year period). May reflect amounts waived and/or reimbursed. Without any | ||||||
| waivers and/or reimbursements, expenses would have been higher. | ||||||
| Hypothetical | ||||||
| Performance (5% | ||||||
| Actual | return before | |||||
| Class Y | Performance | expenses) | ||||
| Beginning Account Value | ||||||
| May 1, 2014 | $ | 1,000.00 | $ | 1,000.00 | ||
| Ending Account Value | ||||||
| October 31, 2014 | $ | 990.10 | $ | 1,015.98 | ||
| Expenses Paid During Period* | $ | 9.18 | $ | 9.30 | ||
| * Expenses are equal to the Fund's annualized expense ratio of 1.83% | ||||||
| (representing the six month period annualized), multiplied by the average | ||||||
| account value over the period, multiplied by 184/365 (to reflect the one-half | ||||||
| year period). May reflect amounts waived and/or reimbursed. Without any | ||||||
| waivers and/or reimbursements, expenses would have been higher. | ||||||
Russell Multi-Strategy Alternative Fund 595
| Russell Investment Company | |||||||||
| Russell Multi-Strategy Alternative Fund | |||||||||
| Consolidated Schedule of Investments — October 31, 2014 | |||||||||
| Amounts in thousands (except share amounts) | Amounts in thousands (except share amounts) | ||||||||
| Principal | Fair | Principal | Fair | ||||||
| Amount ($) | Value | Amount ($) | Value | ||||||
| or Shares | $ | or Shares | $ | ||||||
| Long-Term Investments - 17.7% | Cornerstone Chemical Co. | ||||||||
| Asset-Backed Securities - 0.1% | 9.375% due 03/15/18 (Þ) | 415 | 414 | ||||||
| Carrington Mortgage Loan Trust | DISH DBS Corp. | ||||||||
| Series 2006-NC5 Class A5 | 5.000% due 03/15/23 | 390 | 389 | ||||||
| 0.262% due 01/25/37 (Ê) | 561 | 434 | Dynegy Finance I, Inc. / Dynegy | ||||||
| Countrywide Asset-Backed | Finance II, Inc. | ||||||||
| Certificates Trust | 7.375% due 11/01/22 (Å) | 455 | 481 | ||||||
| Series 2004-5 Class M1 | 7.625% due 11/01/24 (Å) | 410 | 435 | ||||||
| 1.007% due 08/25/34 (Ê) | 300 | 283 | Energy Transfer Equity, LP | ||||||
| Series 2005-11 Class AF3 | 5.875% due 01/15/24 | 880 | 924 | ||||||
| 4.778% due 02/25/36 (Ê) | 234 | 238 | EXCO Resources, Inc. | ||||||
| Series 2006-5 Class 2A2 | 8.500% due 04/15/22 | 610 | 531 | ||||||
| 0.332% due 08/25/36 (Ê) | 201 | 196 | GenOn Americas Generation LLC | ||||||
| 1,151 | 8.500% due 10/01/21 | 870 | 822 | ||||||
| Corporate Bonds and Notes - 5.1% | 9.125% due 05/01/31 | 615 | 575 | ||||||
| Advanced Micro Devices, Inc. | Guitar Center, Inc. | ||||||||
| 7.500% due 08/15/22 | 760 | 695 | 6.500% due 04/15/19 | 370 | 337 | ||||
| AK Steel Corp. | 9.625% due 04/15/20 | 590 | 433 | ||||||
| 7.625% due 10/01/21 | 495 | 496 | |||||||
| Albertsons Holdings LLC/Saturn | Harland Clarke Holdings Corp. | ||||||||
| 9.250% due 03/01/21 (Þ) | 1,140 | 1,154 | |||||||
| Acquisition Merger Sub, Inc. | Illinois Power Generating Co. | ||||||||
| 7.750% due 10/15/22 (Å) | 845 | 832 | 6.300% due 04/01/20 | 630 | 575 | ||||
| Albertsons, Inc. | Immucor, Inc. | ||||||||
| 7.450% due 08/01/29 | 290 | 267 | 11.125% due 08/15/19 | 665 | 725 | ||||
| 8.000% due 05/01/31 | 1,400 | 1,340 | JC Penney Corp. | ||||||
| Alpha Natural Resources, Inc. | 8.125% due 10/01/19 | 710 | 682 | ||||||
| 3.750% due 12/15/17 | 265 | 168 | JC Penney Corp., Inc. | ||||||
| 6.000% due 06/01/19 | 575 | 287 | 5.650% due 06/01/20 | 335 | 276 | ||||
| American Achievement Corp. | Kennedy-Wilson, Inc. | ||||||||
| 10.875% due 04/15/16 (Þ) | 720 | 707 | 5.875% due 04/01/24 | 365 | 372 | ||||
| American Energy - Woodford LLC/ | Kindred Healthcare, Inc. | ||||||||
| AEW Finance Corp. | 6.375% due 04/15/22 | 840 | 827 | ||||||
| 9.000% due 09/15/22 (Þ) | 415 | 365 | Lantheus Medical Imaging, Inc. | ||||||
| American Energy-Permian Basin, | 9.750% due 05/15/17 | 565 | 533 | ||||||
| LLC / AEPB Finance Corp. | Lehman Brothers Holdings, Inc. | ||||||||
| 7.125% due 11/01/20 (Þ) | 680 | 588 | 1.000% due 01/24/49 | 5,000 | 737 | ||||
| 7.375% due 11/01/21 (Þ) | 455 | 398 | Liberty Interactive LLC | ||||||
| APX Group, Inc. | 4.000% due 11/15/29 | 234 | 150 | ||||||
| 6.375% due 12/01/19 | 190 | 187 | 8.250% due 02/01/30 | 310 | 338 | ||||
| 8.750% due 12/01/20 | 1,190 | 1,029 | 3.750% due 02/15/30 | 2,023 | 1,268 | ||||
| Aurora Diagnostics Holdings / | Linn Energy LLC | ||||||||
| Aurora Diagnostics Financing, | 6.500% due 09/15/21 | 250 | 229 | ||||||
| Inc. | Linn Energy LLC / Linn Energy | ||||||||
| 10.750% due 01/15/18 | 845 | 710 | Finance Corp. | ||||||
| BMC Software Finance, Inc. | 6.500% due 05/15/19 | 170 | 159 | ||||||
| 8.125% due 07/15/21 (Þ) | 1,150 | 1,101 | MMC Energy, Inc. | ||||||
| Bon-Ton Department Stores, Inc. | 8.875% due 10/15/20 | 995 | — | ||||||
| (The) | Mohegan Tribal Gaming Authority | ||||||||
| 8.000% due 06/15/21 | 585 | 509 | 9.750% due 09/01/21 | 655 | 675 | ||||
| Boxer Parent Co., Inc. | Momentive Performance Materials, | ||||||||
| 9.000% due 10/15/19 (Þ) | 310 | 278 | Inc. | ||||||
| Caesars Entertainment Operating | 3.880% due 10/24/21 | 995 | 861 | ||||||
| Co., Inc. | Monitronics International, Inc. | ||||||||
| 9.000% due 02/15/20 | 2,570 | 1,937 | 9.125% due 04/01/20 | 1,150 | 1,185 | ||||
| Cenveo Corp. | MTR Gaming Group, Inc. | ||||||||
| 8.500% due 09/15/22 | 195 | 179 | 11.500% due 08/01/19 | 485 | 533 | ||||
| Chester Downs & Marina LLC / | New Albertsons, Inc. | ||||||||
| 7.750% due 06/15/26 | 35 | 33 | |||||||
| Chester Downs Finance Corp. | 8.700% due 05/01/30 | 120 | 118 | ||||||
| 9.250% due 02/01/20 (Þ) | 1,280 | 1,139 | |||||||
| Clear Channel Communications, | PF Chang's China Bistro, Inc. | ||||||||
| 10.250% due 06/30/20 (Þ) | 505 | 502 | |||||||
| Inc. | Radio One, Inc. | ||||||||
| 12.000% due 02/01/21 | 348 | 303 | |||||||
| See accompanying notes which are an integral part of the financial statements. | |||||||||
| 596 Russell Multi-Strategy Alternative Fund | |||||||||
Russell Investment Company
Russell Multi-Strategy Alternative Fund
Consolidated Schedule of Investments, continued — October 31, 2014
| Amounts in thousands (except share amounts) | Amounts in thousands (except share amounts) | |||||||||
| Principal | Fair | Principal | Fair | |||||||
| Amount ($) | Value | Amount ($) | Value | |||||||
| or Shares | $ | or Shares | $ | |||||||
| 9.250% due 02/15/20 (Þ) | 335 | 332 | 6.750% due 08/13/21 | 695 | 675 | |||||
| Rain CII Carbon LLC / CII Carbon | Aricent Technologies 1st Lien Term | |||||||||
| Corp. | Loan | |||||||||
| 8.250% due 01/15/21 (Þ) | 970 | 989 | 5.500% due 04/14/21 | 399 | 398 | |||||
| Rite Aid Corp. | Banco do Brasil SA | |||||||||
| 7.700% due 02/15/27 | 740 | 821 | 3.875% due 10/10/22 | 900 | 850 | |||||
| Rockies Express Pipeline LLC | Bluewater Holding BV | |||||||||
| 6.000% due 01/15/19 (Þ) | 280 | 297 | 10.000% due 12/10/19 (Þ) | 500 | 495 | |||||
| 5.625% due 04/15/20 (Þ) | 920 | 961 | Cathedral Lake CLO, Ltd. | |||||||
| Roundy's Supermarkets, Inc. | Series 2014-1A Class C | |||||||||
| 10.250% due 12/15/20 (Þ) | 395 | 357 | 3.881% due 01/15/26 (Ê)(Þ) | 250 | 229 | |||||
| Sabine Pass Liquefaction LLC | Cemex SAB de CV | |||||||||
| 5.625% due 02/01/21 | 300 | 314 | 7.250% due 01/15/21 (Þ) | 500 | 539 | |||||
| 6.250% due 03/15/22 (Þ) | 290 | 313 | CFIP CLO Ltd. | |||||||
| Series 2014-1A Class D | ||||||||||
| 5.625% due 04/15/23 | 1,485 | 1,537 | 3.730% due 04/13/25 (Å) | 250 | 228 | |||||
| SandRidge Energy, Inc. | Covenant Care Partners CLO I, Ltd. | |||||||||
| 7.500% due 02/15/23 | 1,590 | 1,415 | ||||||||
| Shingle Springs Tribal Gaming | 3.684% due 07/20/26 | 250 | 227 | |||||||
| Cutwater, Ltd. | ||||||||||
| Authority | 3.931% due 07/15/26 (Þ) | 100 | 92 | |||||||
| 9.750% due 09/01/21 (Þ) | 1,350 | 1,502 | Drillships Ocean Ventures, Inc. | |||||||
| Signode Industrial Group Lux SA/ | Term Loan | |||||||||
| Signode Industrial Group US, Inc. | 5.500% due 07/25/21 | 613 | 588 | |||||||
| 6.375% due 05/01/22 (Þ) | 1,105 | 1,072 | Dubai World, Ltd. Term Loan B1 | |||||||
| Sprint Capital Corp. | 1.500% due 09/30/18 | 554 | 429 | |||||||
| 6.875% due 11/15/28 | 950 | 924 | Gallatin Funding, Ltd. | |||||||
| 8.750% due 03/15/32 | 920 | 1,028 | 3.922% due 07/15/23 (Å) | 225 | 224 | |||||
| Sprint Corp. | 5.832% due 07/15/23 (Å) | 220 | 220 | |||||||
| 7.125% due 06/15/24 (Þ) | 1,440 | 1,480 | IAMGOLD Corp. | |||||||
| SUPERVALU, Inc. | 6.750% due 10/01/20 (Þ) | 1,315 | 1,085 | |||||||
| 6.750% due 06/01/21 | 525 | 515 | ICICI Bank, Ltd. | |||||||
| Texas Competitive Electric Holdings | 4.750% due 11/25/16 (Þ) | 100 | 105 | |||||||
| Co. LLC / TCEH Finance, Inc. | KCA DEUTAG Alpha, Ltd. 1st Lien | |||||||||
| 11.500% due 10/01/20 (Þ) | 1,000 | 803 | Term Loan B | |||||||
| The ServiceMaster Co. | 6.250% due 05/16/20 | 344 | 332 | |||||||
| 7.450% due 08/15/27 | 220 | 223 | LBG Capital No 1 PLC | |||||||
| T-Mobile USA, Inc. | 8.500% due 12/29/49 (ƒ)(Þ) | 100 | 111 | |||||||
| 6.375% due 03/01/25 | 280 | 288 | Lloyds Bank PLC | |||||||
| Toys R Us, Inc. | 12.000% due 12/29/49 (ƒ)(Þ) | 300 | 434 | |||||||
| 10.375% due 08/15/17 | 1,440 | 1,122 | Madison Park Funding XI, Ltd. | |||||||
| TransDigm, Inc. | Series 2013-11A Class D | |||||||||
| 6.000% due 07/15/22 | 240 | 243 | 3.731% due 10/23/25 (Å)(Ê) | 250 | 236 | |||||
| 6.500% due 07/15/24 | 320 | 329 | Mallinckrodt PLC | |||||||
| Walter Energy, Inc. | 5.750% due 08/01/22 (Þ) | 480 | 503 | |||||||
| 9.500% due 10/15/19 (Þ) | 250 | 217 | Morgan Stanley | |||||||
| 9.875% due 12/15/20 | 760 | 216 | Series GMTN | |||||||
| 8.500% due 04/15/21 | 665 | 173 | 0.502% due 01/16/17 (Ê) | EUR | 100 | 125 | ||||
| WLH PNW Finance Corp. | OFSI Fund V, Ltd. | |||||||||
| 7.000% due 08/15/22 | 555 | 572 | Series 2013-5A Class B1L | |||||||
| Zebra Technologies Corp. | 4.478% due 04/17/25 (Ê)(Þ) | 270 | 260 | |||||||
| 7.250% due 10/15/22 (Å) | 355 | 374 | OHA Loan Funding, Ltd. | |||||||
| Series 2013-1A Class D | ||||||||||
| 49,205 | 3.831% due 07/23/25 (Ê)(Þ) | 250 | 236 | |||||||
| International Debt - 2.2% | OZLM VI, Ltd. | |||||||||
| Air Canada | Series 2014-6A Class C | |||||||||
| 7.750% due 04/15/21 (Þ) | 725 | 759 | 3.730% due 04/17/26 (Ê)(Þ) | 625 | 578 | |||||
| Alinta Energy Finance Pty., Ltd. | Palmer Square CLO, Ltd. | |||||||||
| Delayed Draw Term Loan | 6.021% due 10/17/22 | 250 | 250 | |||||||
| 6.375% due 08/13/18 | 57 | 57 | PHOTONIS Technologies SAS 1st | |||||||
| Alinta, Ltd. Term Loan | Lien Term Loan | |||||||||
| 6.375% due 05/08/19 | 855 | 862 | 8.500% due 09/18/19 | 274 | 271 | |||||
| AP NMT Acquisition BV Term Loan | Republic of Argentina | |||||||||
| B | 8.280% due 12/31/33 | 7,964 | 6,331 | |||||||
| See accompanying notes which are an integral part of the financial statements. | ||||||||||
| Russell Multi-Strategy Alternative Fund 597 | ||||||||||
| Russell Investment Company | ||||||||||
| Russell Multi-Strategy Alternative Fund | ||||||||||
| Consolidated Schedule of Investments, continued — October 31, 2014 | ||||||||||
| Amounts in thousands (except share amounts) | Amounts in thousands (except share amounts) | |||||||||
| Principal | Fair | Principal | Fair | |||||||
| Amount ($) | Value | Amount ($) | Value | |||||||
| or Shares | $ | or Shares | $ | |||||||
| Sberbank of Russia Via SB Capital | Graton Economic Development | |||||||||
| SA | Authority Term Loan B | |||||||||
| 4.950% due 02/07/17 (Þ) | 600 | 602 | 9.000% due 08/22/18 | 625 | 642 | |||||
| SLM Student Loan Trust | GTCR Valor Cos., Inc. 1st Lien | |||||||||
| Series 2003-2 Class A5 | Term Loan | |||||||||
| 0.344% due 12/15/23 (Ê) | EUR | 659 | 818 | 6.000% due 05/30/21 | 153 | 149 | ||||
| Slovenia Government International | GTCR Valor Cos., Inc. Delayed | |||||||||
| Bond | Draw Term Loan | |||||||||
| 5.250% due 02/18/24 | 400 | 431 | 6.000% due 05/30/21 | 116 | 113 | |||||
| SoftBank Corp. | Hilton Worldwide Finance LLC | |||||||||
| 4.500% due 04/15/20 (Þ) | 525 | 532 | Term Loan | |||||||
| Sound Point CLO II, Ltd. | 4.000% due 10/25/20 (Ê) | 946 | 936 | |||||||
| Series 2013-1A Class B1L | HJ Heinz Co. Term Loan B2 | |||||||||
| 3.985% due 04/26/25 (Å)(Ê) | 280 | 267 | 3.500% due 06/05/20 (Ê) | 485 | 482 | |||||
| Sound Point CLO III, Ltd. | Hoffmaster Group, Inc. 1st Lien | |||||||||
| Series 2013-2A Class D | ||||||||||
| 4.131% due 07/15/25 (Ê)(Þ) | 470 | 445 | Term Loan B | |||||||
| YPF SA | 5.250% due 05/09/20 | 464 | 462 | |||||||
| 8.750% due 04/04/24 (Þ) | 510 | 527 | Indra Holdings Corp. 1st Lien Term | |||||||
| 21,351 | Loan | |||||||||
| Loan Agreements - 4.0% | 5.250% due 05/01/21 | 274 | 271 | |||||||
| Albaugh LLC Term Loan B | INEOS / Sasol HDPE LLC Term | |||||||||
| 6.000% due 05/28/21 | 489 | 480 | Loan | |||||||
| Albertson's LLC Term Loan B2 | 4.750% due 07/14/21 | 404 | 401 | |||||||
| 4.750% due 03/21/19 | 890 | 887 | JC Penney Corp., Inc. 1st Lien Term | |||||||
| Albertsons LLC Term Loan B4 | Loan | |||||||||
| 4.500% due 08/25/21 (Ê) | 845 | 845 | 6.000% due 05/21/18 | 777 | 766 | |||||
| Albertson's LLC Term Loan B4-1 | JC Penney Corp., Inc. Term Loan B | |||||||||
| 4.500% due 08/25/21 | 50 | 50 | 5.000% due 06/20/19 | 534 | 521 | |||||
| AMF Bowling Centers, Inc. Term | Kindred Healthcare, Inc. Term Loan | |||||||||
| Loan B | 4.000% due 04/09/21 | 599 | 592 | |||||||
| 7.250% due 09/18/21 | 605 | 599 | Maschantucket Western Pequot | |||||||
| Aquilex, LLC 1st Lien Term Loan B | Tribe Term Loan B | |||||||||
| 6.250% due 12/31/20 | 462 | 455 | 9.375% due 06/30/20 | 1,605 | 1,340 | |||||
| Axalta Coating Systems U.S. | Medpace Holdings, Inc. 1st Lien | |||||||||
| Holdings, Inc. Term Loan | Term Loan B | |||||||||
| 3.750% due 02/01/20 | 282 | 277 | 4.750% due 04/01/21 | 329 | 327 | |||||
| BMC Software Finance, Inc. Term | Millennium Laboratories, Inc. Term | |||||||||
| Loan | Loan B | |||||||||
| 5.000% due 09/10/20 (Ê) | 715 | 706 | 5.250% due 04/16/21 (Ê) | 444 | 444 | |||||
| Burger King Corp. Term Loan B | MModal LLC Term Loan B | |||||||||
| 4.500% due 09/24/21 | 740 | 739 | 9.000% due 01/31/20 | 1,000 | 975 | |||||
| Chromaflo Technologies Corp. 2nd | Mohegan Tribal Gaming Authority | |||||||||
| Lien Term Loan | Term Loan B | |||||||||
| 8.250% due 05/27/20 | 115 | 115 | 5.500% due 11/19/19 | 1,151 | 1,117 | |||||
| Clear Channel Communications, | Mount Airy Lodge LLC 1st Lien | |||||||||
| Inc. 1st Lien Term Loan D | Term Loan | |||||||||
| 6.904% due 01/30/19 | 2,582 | 2,434 | 13.000% due 04/01/18 | 592 | 610 | |||||
| Curo Health Services LLC 1st Lien | Murray Energy Corp. Term Loan | |||||||||
| Term Loan | 5.250% due 12/05/19 | 348 | 345 | |||||||
| 5.750% due 05/07/20 | 908 | 887 | New Albertson's, Inc. Term Loan B | |||||||
| Dell International LLC Term Loan B | 4.750% due 06/27/21 | 345 | 340 | |||||||
| 4.500% due 04/29/20 (Ê) | 1,220 | 1,221 | Nine West Group, Inc. Term Loan | |||||||
| Empire Generating Co. LLC Term | 6.250% due 01/08/20 | 405 | 375 | |||||||
| Loan B | NN, Inc. Term Loan B | |||||||||
| 5.250% due 03/14/21 | 781 | 778 | 6.000% due 08/27/21 | 435 | 432 | |||||
| Empire Generating Co. LLC Term | OCI Beaumont LLC Term Loan B3 | |||||||||
| Loan C | 5.000% due 08/20/19 | 750 | 755 | |||||||
| 5.250% due 03/14/21 | 55 | 55 | Onex Carestream Finance LP 1st | |||||||
| Energy Future Intermediate Holding | Lien Term Loan | |||||||||
| Co. LLC Term Loan | 5.000% due 06/07/19 | 357 | 357 | |||||||
| 4.250% due 06/19/16 | 1,225 | 1,222 | ||||||||
| See accompanying notes which are an integral part of the financial statements. | ||||||||||
| 598 Russell Multi-Strategy Alternative Fund | ||||||||||
| Russell Investment Company |
| Russell Multi-Strategy Alternative Fund |
| Consolidated Schedule of Investments, continued — October 31, 2014 |
| Amounts in thousands (except share amounts) | Amounts in thousands (except share amounts) | |||||||||
| Principal | Fair | Principal | Fair | |||||||
| Amount ($) | Value | Amount ($) | Value | |||||||
| or Shares | $ | or Shares | $ | |||||||
| Onex Carestream Finance LP 2nd | Toys "R" Us-Delaware, Inc. Term | |||||||||
| Lien Term Loan | Loan | |||||||||
| 9.500% due 06/07/19 | 836 | 828 | 6.000% due 09/01/16 | 505 | 458 | |||||
| Panda Patriot LLC Term Loan B1 | Toys "R" Us-Delaware, Inc. Term | |||||||||
| 7.500% due 08/21/20 | 765 | 773 | Loan B4 | |||||||
| 6.750% due 12/19/20 | 385 | 389 | 9.750% due 03/15/20 | 645 | 586 | |||||
| Panda Sherman Power LLC Term | Tribune Media Co. Term Loan | |||||||||
| Loan | 4.000% due 12/27/20 (Ê) | 277 | 274 | |||||||
| 9.000% due 09/13/18 | 674 | 684 | Tribune Publishing Co. Term Loan | |||||||
| Preferred Proppants LLC Term Loan | 5.750% due 07/07/21 | 595 | 591 | |||||||
| 6.750% due 08/12/20 | 750 | 713 | Vince Intermediate Holding LLC | |||||||
| Red Lobster Management LLC Term | Term Loan | |||||||||
| Loan | 5.750% due 11/04/19 | 458 | 457 | |||||||
| 6.250% due 07/28/21 | 660 | 658 | Visant Corp. Term Loan | |||||||
| Rite Aid Corp. 2nd Lien Term Loan | 7.000% due 09/23/21 | 615 | 606 | |||||||
| 5.750% due 08/21/20 | 265 | 266 | Vogue International LLC Term Loan | |||||||
| Roundy's Supermarkets, Inc. 1st | B | |||||||||
| Lien Term Loan B | 5.250% due 02/14/20 | 547 | 547 | |||||||
| 5.750% due 03/03/21 (Ê) | 244 | 216 | Wilton Brands LLC Term Loan | |||||||
| Scientific Games International, Inc. | 7.500% due 08/30/18 (Ê) | 956 | 899 | |||||||
| Term Loan B1 | 38,569 | |||||||||
| 6.000% due 10/01/21 (Ê) | 545 | 533 | Mortgage-Backed Securities - 0.9% | |||||||
| Sears Roebuck Acceptance Corp. | Adjustable Rate Mortgage Trust | |||||||||
| 1st Lien Term Loan B | Series 2005-5 Class 2A1 | |||||||||
| 5.500% due 06/30/18 | 622 | 604 | 2.758% due 09/25/35 (Ê) | 814 | 719 | |||||
| Signode Industrial Group US, Inc. | Bear Stearns Alt-A Trust | |||||||||
| Series 2005-10 Class 24A1 | ||||||||||
| Term Loan B | 2.356% due 01/25/36 (Ê) | 736 | 566 | |||||||
| 4.000% due 03/21/21 | 90 | 88 | Series 2006-3 Class 31A1 | |||||||
| SIRVA Worldwide, Inc. Term Loan | 2.774% due 05/25/36 (Ê) | 814 | 469 | |||||||
| 7.500% due 03/27/19 (Ê) | 552 | 557 | Bear Stearns Structured Products, | |||||||
| Spencer Spirit Holdings, Inc. Term | ||||||||||
| Loan B | Series Inc. 2007-R6 Class 1A1 | |||||||||
| 6.750% due 06/30/21 | 643 | 635 | 2.509% due 01/26/36 (Ê) | 922 | 733 | |||||
| Stallion Oilfield Holdings, Inc. Term | Countrywide Alternative Loan Trust | |||||||||
| Loan B | Series 2003-11T1 Class A3 | |||||||||
| 8.000% due 06/19/18 | 165 | 157 | 0.602% due 07/25/18 (Ê) | 90 | 87 | |||||
| Surgery Center Holdings, Inc. 1st | Countrywide Home Loans Mortgage | |||||||||
| Lien Term Loan | Pass-Through Trust | |||||||||
| 5.250% due 07/09/20 | 315 | 314 | Series 2004-12 Class 11A1 | |||||||
| Surgery Center Holdings, Inc. 2nd | 3.026% due 08/25/34 (Ê) | 397 | 350 | |||||||
| Lien Term Loan | Series 2004-16 Class 1A4A | |||||||||
| 8.500% due 07/09/21 | 220 | 216 | 0.962% due 09/25/34 (Ê) | 124 | 114 | |||||
| Texas Competitive Electric Holdings | Series 2004-25 Class 1A1 | |||||||||
| Co. LLC Extended Term Loan | 0.532% due 02/25/35 (Ê) | 121 | 111 | |||||||
| 4.647% due 10/10/17 (Ê) | 950 | 691 | Series 2004-25 Class 2A1 | |||||||
| The Talbots, Inc. 1st Lien Term | 0.542% due 02/25/34 (Ê) | 150 | 135 | |||||||
| Loan | DSLA Mortgage Loan Trust | |||||||||
| 4.750% due 03/19/20 | 174 | 168 | Series 2004-AR3 Class 2A1 | |||||||
| The Talbots, Inc. 2nd Lien Term | 2.498% due 07/19/44 (Ê) | 122 | 122 | |||||||
| Fannie Mae Aces | ||||||||||
| Loan | Series 2012-M16 Class X | |||||||||
| 8.250% due 03/19/21 | 340 | 332 | Interest Only STRIP | |||||||
| Toys "R" Us Delaware, Inc. Term | 0.998% due 09/25/22 | 18,568 | 1,069 | |||||||
| Loan B | GE Commercial Mortgage Corp. | |||||||||
| 1.000% due 05/25/18 (v) | 184 | 147 | Trust | |||||||
| Toys "R" Us Delaware, Inc. Term | Series 2007-C1 Class A1A | |||||||||
| Loan B3 | 5.483% due 12/10/49 | 866 | 939 | |||||||
| 1.000% due 05/25/18 (v) | 28 | 23 | Harborview Mortgage Loan Trust | |||||||
| Toys "R" Us Property Co. I LLC | 2.591% due 12/19/35 | 362 | 276 | |||||||
| Term Loan B | Merrill Lynch Mortgage Investors | |||||||||
| 6.000% due 08/21/19 | 693 | 657 | Trust | |||||||
| See accompanying notes which are an integral part of the financial statements. | ||||||||||
| Russell Multi-Strategy Alternative Fund 599 | ||||||||||
| Russell Investment Company |
| Russell Multi-Strategy Alternative Fund |
| Consolidated Schedule of Investments, continued — October 31, 2014 |
| Amounts in thousands (except share amounts) | Amounts in thousands (except share amounts) | ||||||||
| Principal | Fair | Principal | Fair | ||||||
| Amount ($) | Value | Amount ($) | Value | ||||||
| or Shares | $ | or Shares | $ | ||||||
| Series 2003-A2 Class 2A3 | 9.500% due 06/26/19 | EUR | 525 | 622 | |||||
| 2.006% due 03/25/33 (Ê) | 404 | 398 | France Government Bond OAT | ||||||
| Morgan Stanley Capital I, Inc. | Series OATe | ||||||||
| Series 2010-IQ14 Class A2FX | 0.250% due 07/25/18 | EUR | 207 | 269 | |||||
| 5.610% due 04/15/49 | 343 | 344 | 1.100% due 07/25/22 | EUR | 433 | 607 | |||
| Sequoia Mortgage Trust | 0.250% due 07/25/24 | EUR | 203 | 264 | |||||
| Series 2003-4 Class 2A1 | Series OATi | ||||||||
| 0.553% due 07/20/33 (Ê) | 195 | 183 | 1.300% due 07/25/19 | EUR | 642 | 879 | |||
| Wachovia Bank Commercial | 2.100% due 07/25/23 | EUR | 110 | 167 | |||||
| Mortgage Trust | Generalitat de Catalunya | ||||||||
| Series 2007-WHL8 Class A2 | 4.750% due 06/04/18 | EUR | 400 | 539 | |||||
| 0.293% due 06/15/20 (Ê)(Þ) | 1,000 | 978 | |||||||
| Wells Fargo Mortgage Backed | Hellenic Republic Bonds | ||||||||
| 4.500% due 07/03/17 | JPY | 110,000 | 908 | ||||||
| Securities | Zero coupon due 10/15/42 | EUR | 39,250 | 426 | |||||
| Series 2004-DD Class 2A6 | |||||||||
| 2.617% due 01/25/33 (Ê) | 694 | 691 | Keystone Financing LLC | ||||||
| 9.500% due 10/15/19 | GBP | 310 | 481 | ||||||
| 8,284 | LightPoint Pan-European CLO PLC | ||||||||
| Municipal Bonds - 0.4% | Series 2006-1 Class A | ||||||||
| Commonwealth of Puerto Rico | 0.476% due 01/31/22 (Ê) | EUR | 270 | 337 | |||||
| General Obligation Unlimited | Magi Funding PLC | ||||||||
| 8.000% due 07/01/35 | 1,855 | 1,619 | Series 2006-A Class A | ||||||
| 5.000% due 07/01/41 | 60 | 40 | 0.671% due 04/11/21 (Å)(Ê) | EUR | 141 | 176 | |||
| Puerto Rico Sales Tax Financing | New Zealand Government Bond | ||||||||
| Corp. Revenue Bonds | 2.000% due 09/20/25 | NZD | 1,700 | 1,321 | |||||
| 0.000% due 08/01/54 (ƒ) | 4,015 | 294 | Tyrol Acquisition 2 SAS Term Loan | ||||||
| Texas Public Finance Authority | A2 | ||||||||
| Revenue Bonds | 1.000% due 01/29/16 | EUR | 573 | 694 | |||||
| 8.250% due 07/01/24 | 1,220 | 1,222 | United Kingdom Gilt Inflation | ||||||
| Tobacco Settlement Financing Corp. | Linked | ||||||||
| Revenue Bonds | Series 3MO | ||||||||
| 4.750% due 06/01/34 | 385 | 287 | 1.875% due 11/22/22 | GBP | 875 | 1,706 | |||
| 5.000% due 06/01/41 | 1,045 | 778 | 0.125% due 03/22/24 | GBP | 318 | 543 | |||
| 4,240 | 22,766 | ||||||||
| Non-US Bonds - 2.4% | United States Government Treasuries - 2.6% | ||||||||
| Adria Topco BV PIK Term Loan | United States Treasury Inflation | ||||||||
| 9.000% due 06/19/19 | EUR | 150 | 183 | Indexed Bonds | |||||
| AP NMT Acquisition BV Term Loan | 1.625% due 01/15/18 | 454 | 484 | ||||||
| B | 0.125% due 04/15/18 | 2,881 | 2,917 | ||||||
| 7.000% due 08/06/21 | EUR | 115 | 141 | 2.125% due 01/15/19 | 332 | 364 | |||
| Avoca CLO IV PLC | 0.125% due 04/15/19 | 812 | 818 | ||||||
| Series 2006-X Class A1A | 0.125% due 01/15/22 | 210 | 207 | ||||||
| 0.833% due 02/18/22 (Ê) | EUR | 37 | 46 | 0.125% due 07/15/22 | 414 | 408 | |||
| Barclays Bank PLC | |||||||||
| Series RCI | 0.125% due 01/15/23 | 1,134 | 1,109 | ||||||
| 14.000% due 12/31/49 (ƒ) | GBP | 300 | 624 | 0.375% due 07/15/23 | 1,022 | 1,022 | |||
| Bonos y Obligaciones del Estado | 0.625% due 01/15/24 | 306 | 311 | ||||||
| Government International Bonds | 0.125% due 07/15/24 | 401 | 390 | ||||||
| 3.800% due 04/30/24 | EUR | 4,800 | 6,943 | United States Treasury Notes | |||||
| 5.150% due 10/31/28 | EUR | 500 | 798 | 0.089% due 04/30/16 (Ê) | 1,400 | 1,400 | |||
| Bundesrepublik Deutschland | 2.125% due 01/31/21 | 2,700 | 2,728 | ||||||
| Bundesobligation Inflation Linked | 2.000% due 05/31/21 | 8,300 | 8,297 | ||||||
| Bond | 1.750% due 05/15/23 | 1,600 | 1,540 | ||||||
| Series I/L | 2.500% due 08/15/23 | 1,600 | 1,633 | ||||||
| 0.750% due 04/15/18 | EUR | 530 | 693 | 3.750% due 11/15/43 | 900 | 1,021 | |||
| 1.750% due 04/15/20 | EUR | 328 | 464 | 24,649 | |||||
| 0.100% due 04/15/23 | EUR | 826 | 1,087 | Total Long-Term Investments | |||||
| Claris Asset Backed Securities | (cost $174,398) | 170,215 | |||||||
| Series 2011-1 Class REGS | |||||||||
| 0.794% due 10/31/60 | EUR | 1,434 | 1,775 | ||||||
| Depfa Funding II, LP | Consumer Common Stocks Discretionary - 25.1% - 5.0% | ||||||||
| 6.500% due 12/31/49 | EUR | 100 | 73 | ||||||
| Domestic Group AB | Barnes & Noble, Inc.(Æ) | 100,000 | 2,182 | ||||||
| See accompanying notes which are an integral part of the financial statements. | |||||||||
| 600 Russell Multi-Strategy Alternative Fund | |||||||||
| Russell Investment Company | |||||||
| Russell Multi-Strategy Alternative Fund | |||||||
| Consolidated Schedule of Investments, continued — October 31, 2014 | |||||||
| Amounts in thousands (except share amounts) | Amounts in thousands (except share amounts) | ||||||
| Principal | Fair | Principal | Fair | ||||
| Amount ($) | Value | Amount ($) | Value | ||||
| or Shares | $ | or Shares | $ | ||||
| Caesars Acquisition Co. Class A(Æ) | 4,745 | 50 | JX Holdings, Inc. | 60,200 | 255 | ||
| Caesars Entertainment Corp.(Æ) | 85,200 | 1,039 | Kinder Morgan, Inc. | 45,800 | 1,772 | ||
| CBS Corp. Class B | 10,000 | 542 | Marathon Petroleum Corp. | 31,972 | 2,906 | ||
| Century Communities, Inc.(Æ) | 2,500 | 46 | Nordic American Offshore, Ltd. | 27,500 | 440 | ||
| Charter Communications, Inc. Class | Parsley Energy, Inc. Class A(Æ) | 1,900 | 32 | ||||
| A(Æ) | 21,000 | 3,326 | Phillips 66(Æ) | 23,042 | 1,809 | ||
| Cie Generale des Etablissements | QEP Resources, Inc. | 65,500 | 1,642 | ||||
| Michelin Class B | 15,644 | 1,356 | SandRidge Energy, Inc.(Æ) | 528,945 | 2,063 | ||
| Comcast Corp. Class A | 17,700 | 976 | Schlumberger, Ltd.(Û) | 45,597 | 4,499 | ||
| Daiwa House Industry Co., Ltd. | 49,600 | 920 | SolarCity Corp.(Æ) | 41,822 | 2,475 | ||
| Diamond Resorts International, Inc. | SunCoke Energy, Inc.(Æ) | 84,000 | 2,007 | ||||
| (Æ) | 20,000 | 519 | Sunoco, LP(Æ) | 10,000 | 461 | ||
| DISH Network Corp. Class A(Æ) | 18,700 | 1,190 | TerraForm Power, Inc. Class A | 6,400 | 182 | ||
| Dollar General Corp.(Æ) | 65,335 | 4,095 | Transocean Partners LLC(Æ) | 13,600 | 342 | ||
| eBay, Inc.(Æ) | 34,600 | 1,817 | Triangle Petroleum Corp.(Æ) | 100,000 | 775 | ||
| ELIOR SCA(Æ) | 46,200 | 706 | Vantage Drilling Co.(Æ) | 50,000 | 48 | ||
| Goodyear Tire & Rubber Co. (The) | 3,000 | 71 | Vivint Solar, Inc.(Æ) | 4,400 | 62 | ||
| KAR Auction Services, Inc. | 33,200 | 1,008 | WPX Energy, Inc.(Æ) | 54,300 | 1,038 | ||
| Kering | 5,910 | 1,140 | YPF SA - ADR | 100,000 | 3,517 | ||
| Liberty Media Corp. - Interactive(Æ) | 32,958 | 862 | 35,433 | ||||
| Liberty Ventures Class A(Æ) | 97,686 | 3,429 | |||||
| Makita Corp. | 16,200 | 893 | Financial Services - 5.6% | ||||
| Melco Crown Entertainment, Ltd. | AerCap Holdings NV(Æ) | 41,200 | 1,786 | ||||
| - ADR | 26,300 | 714 | AIA Group, Ltd. | 174,100 | 971 | ||
| Men's Wearhouse, Inc. (The) | 30,000 | 1,411 | Ally Financial, Inc.(Æ) | 75,000 | 1,702 | ||
| Mitsubishi Corp. | 18,800 | 362 | Alpha Bank AE(Æ) | 1,050,000 | 684 | ||
| Netflix, Inc.(Æ)(Û) | 11,028 | 4,331 | Altisource Portfolio Solutions SA(Æ) | 16,407 | 1,225 | ||
| New Media Investment Group, Inc. | 10,439 | 199 | American International Group, Inc. | 39,000 | 2,089 | ||
| Nikon Corp. | 7,100 | 95 | Atento SA(Æ) | 900 | 11 | ||
| Nintendo Co., Ltd. | 2,600 | 276 | Chimera Investment Corp.(ö) | 574,200 | 1,791 | ||
| PVH Corp. | 13,400 | 1,532 | Citigroup, Inc. | 40,700 | 2,179 | ||
| SCREEN Holdings Co., Ltd. | 150,000 | 793 | Discover Financial Services | 16,042 | 1,023 | ||
| Sirius XM Holdings, Inc.(Æ) | 558,100 | 1,914 | E*Trade Financial Corp.(Æ) | 82,000 | 1,829 | ||
| Starbucks Corp. | 13,611 | 1,028 | Ellington Financial LLC | 2,000 | 45 | ||
| Takashimaya Co., Ltd. | 71,000 | 591 | Federal National Mortgage | ||||
| Time Warner Cable, Inc. | 24,611 | 3,623 | Association(Æ) | 100,000 | 216 | ||
| Time Warner, Inc. | 5,000 | 400 | Fifth Street Asset Management, Inc. | ||||
| Toshiba Corp. | 225,000 | 969 | Class A(Æ) | 2,500 | 34 | ||
| Tribune Media Co.(Æ) | 26,700 | 1,789 | Gaming and Leisure Properties, Inc. | ||||
| Vipshop Holdings, Ltd. - ADR(Æ) | 5,056 | 1,159 | (ö) | 45,622 | 1,426 | ||
| Wynn Resorts, Ltd. | 5,153 | 979 | Harbinger Group, Inc.(Æ) | 56,900 | 748 | ||
| 48,332 | ING Groep NV(Æ) | 4,900 | 21 | ||||
| Intercontinental Exchange, Inc. | 1,029 | 214 | |||||
| Consumer Staples - 0.3% | Jafco Co., Ltd. | 25,800 | 970 | ||||
| Anheuser-Busch InBev NV - ADR | 26,833 | 2,978 | Japan Retail Fund Investment Corp. | ||||
| (ö) | 471 | 938 | |||||
| Energy - 3.7% | JPMorgan Chase & Co. | 8,300 | 502 | ||||
| Anadarko Petroleum Corp.(Û) | 68,983 | 6,331 | KKR & Co., LP | 45,274 | 976 | ||
| Cabot Oil & Gas Corp. | 17,000 | 529 | McGraw Hill Financial, Inc. | 36,944 | 3,343 | ||
| Civeo Corp. | 25,000 | 305 | Mitsubishi UFJ Financial Group, | ||||
| Denbury Resources, Inc. | 27,400 | 340 | Inc.(Û) | 221,800 | 1,248 | ||
| Eclipse Resources Corp.(Æ) | 4,700 | 62 | Mizuho Financial Group, Inc.(Û) | 628,600 | 1,119 | ||
| Golar LNG, Ltd.(Æ) | 5,500 | 309 | Monitise PLC(Æ) | 2,658,000 | 1,382 | ||
| Gulf Coast Ultra Deep Royalty | Navient Corp. | 98,900 | 1,956 | ||||
| Trust(Æ) | 235,875 | 377 | |||||
| Halliburton Co. | 15,500 | 855 | |||||
| See accompanying notes which are an integral part of the financial statements. | |||||||
| Russell Multi-Strategy Alternative Fund 601 | |||||||
| Russell Investment Company | |||||||
| Russell Multi-Strategy Alternative Fund | |||||||
| Consolidated Schedule of Investments, continued — October 31, 2014 | |||||||
| Amounts in thousands (except share amounts) | Amounts in thousands (except share amounts) | ||||||
| Principal | Fair | Principal | Fair | ||||
| Amount ($) | Value | Amount ($) | Value | ||||
| or Shares | $ | or Shares | $ | ||||
| New Residential Investment Corp. | Dow Chemical Co. (The) | 38,102 | 1,882 | ||||
| (ö) | 68,700 | 851 | Eastman Chemical Co. | 15,737 | 1,271 | ||
| Newcastle Investment Corp.(ö) | 24,100 | 582 | LIXIL Group Corp. | 22,400 | 479 | ||
| Nomad Holdings Ltd.(Æ) | 86,000 | 991 | LyondellBasell Industries NV Class | ||||
| Nomura Holdings, Inc.(Û) | 179,500 | 1,079 | A | 10,500 | 962 | ||
| NorthStar Asset Management Group, | Nippon Steel & Sumitomo Metal | ||||||
| Inc.(Æ) | 50,000 | 906 | Corp. | 208,000 | 537 | ||
| ORIX Corp.(Û) | 88,000 | 1,182 | Nissan Chemical Industries, Ltd. | 50,400 | 912 | ||
| PennyMac Financial Services, Inc. | Nitto Denko Corp. | 15,700 | 832 | ||||
| Class A(Æ) | 48,800 | 813 | Orion Engineered Carbons SA(Æ) | 6,900 | 104 | ||
| PennyMac Mortgage Investment | Rinnai Corp. | 12,500 | 1,092 | ||||
| Trust(ö) | 45,600 | 985 | Shin-Etsu Chemical Co., Ltd.(Û) | 17,300 | 1,085 | ||
| Piraeus Bank SA(Æ) | 405,000 | 589 | Ube Industries, Ltd. | 251,000 | 380 | ||
| Realogy Holdings Corp.(Æ) | 19,900 | 816 | 18,263 | ||||
| SLM Corp. | 16,300 | 156 | |||||
| Sumitomo Mitsui Financial Group, | Producer Durables - 1.1% | ||||||
| Inc.(Û) | 28,500 | 1,116 | Amada Co., Ltd. | 97,100 | 824 | ||
| Sumitomo Mitsui Trust Holdings, | AMR Corp.(Æ) | 75,000 | — | ||||
| Inc.(Û) | 276,000 | 1,091 | Danaher Corp. | 39,181 | 3,150 | ||
| Tencent Holdings, Ltd.(Æ) | 196,972 | 3,139 | Eagle Bulk Shipping, Inc.(Æ) | 13,364 | 217 | ||
| Tetragon Financial Group, Ltd. | 283,384 | 2,947 | Keyence Corp. | 1,100 | 514 | ||
| Tokyo Tatemono Co., Ltd. | 101,000 | 850 | Komatsu, Ltd. | 22,400 | 520 | ||
| Tokyu Fudosan Holdings Corp. | 103,400 | 713 | Nippon Yusen KK | 145,000 | 369 | ||
| Twenty-First Century Fox, Inc.(Æ) | 116,512 | 4,017 | Ricoh Co., Ltd. | 37,800 | 386 | ||
| Voya Financial, Inc. | 25,000 | 981 | Stanley Black & Decker, Inc. | 22,653 | 2,121 | ||
| Taisei Corp. | 172,000 | 942 | |||||
| 54,232 | United Continental Holdings, Inc. | ||||||
| Health Care - 2.2% | (Æ) | 32,300 | 1,706 | ||||
| AbbVie, Inc. | 46,250 | 2,935 | 10,749 | ||||
| Actavis PLC(Æ) | 13,123 | 3,185 | |||||
| AstraZeneca PLC - ADR | 15,000 | 1,094 | Technology - 3.9% | ||||
| Avanir Pharmaceuticals, Inc. Class | Amadeus IT Holding SA Class A | 24,800 | 911 | ||||
| A(Æ) | 1,300 | 17 | Apple, Inc. | 29,132 | 3,146 | ||
| Bluebird Bio, Inc.(Æ) | 300 | 13 | CommScope Holding Co., Inc.(Æ) | 18,000 | 388 | ||
| Endo International PLC(Æ) | 10,000 | 669 | Facebook, Inc. Class A(Æ) | 50,559 | 3,791 | ||
| Gilead Sciences, Inc.(Æ)(Û) | 24,403 | 2,733 | Google, Inc. Class C(Æ)(Û) | 10,453 | 5,918 | ||
| HCA Holdings, Inc.(Æ) | 36,000 | 2,522 | Groupon, Inc. Class A(Æ) | 89,700 | 656 | ||
| Intuitive Surgical, Inc.(Æ) | 2,625 | 1,301 | GungHo Online Entertainment, Inc. | 24,100 | 161 | ||
| Keysight Technologies, Inc.(Æ) | 25,000 | 788 | Hitachi, Ltd. | 54,000 | 413 | ||
| McKesson Corp. | 7,000 | 1,424 | LinkedIn Corp. Class A(Æ) | 4,472 | 1,024 | ||
| Pfizer, Inc. | 25,000 | 749 | Loral Space & Communications, | ||||
| Prothena Corp. PLC(Æ) | 800 | 18 | Inc.(Æ) | 12,400 | 949 | ||
| Shire PLC - ADR | 3,300 | 659 | Micron Technology, Inc.(Æ) | 140,000 | 4,633 | ||
| Sientra, Inc.(Æ) | 500 | 9 | Microsoft Corp. | 20,000 | 939 | ||
| UnitedHealth Group, Inc.(Û) | 25,569 | 2,429 | Mmodal, Inc.(Æ) | 13,683 | 195 | ||
| Valeant Pharmaceuticals | Motorola Solutions, Inc. | 24,800 | 1,600 | ||||
| International, Inc.(Æ) | 5,000 | 665 | Nichicon Corp. | 40,408 | 267 | ||
| Vanda Pharmaceuticals, Inc.(Æ) | 500 | 6 | Nidec Corp.(Û) | 12,200 | 784 | ||
| VWR Corp.(Æ) | 1,500 | 34 | Salesforce.com, Inc.(Æ) | 18,861 | 1,207 | ||
| Sony Corp. | 36,400 | 671 | |||||
| 21,250 | SunEdison, Inc.(Æ) | 133,200 | 2,599 | ||||
| Materials and Processing - 1.9% | Telenet Group Holding NV(Æ) | 44,800 | 2,533 | ||||
| Asahi Kasei Corp. | 51,000 | 410 | Yahoo!, Inc.(Æ) | 98,075 | 4,516 | ||
| Ashland, Inc. | 9,600 | 1,037 | Zayo Group Holdings, Inc.(Æ) | 900 | 21 | ||
| Aspen Aerogels, Inc.(Æ) | 400 | 4 | 37,322 | ||||
| CF Industries Holdings, Inc. | 27,986 | 7,276 | |||||
| See accompanying notes which are an integral part of the financial statements. | |||||||
| 602 Russell Multi-Strategy Alternative Fund | |||||||
Russell Investment Company
Russell Multi-Strategy Alternative Fund
Consolidated Schedule of Investments, continued — October 31, 2014
| Amounts in thousands (except share amounts) | Amounts in thousands (except share amounts) | ||||||||||
| Principal | Fair | Principal | Fair | ||||||||
| Amount ($) | Value | Amount ($) | Value | ||||||||
| or Shares | $ | or Shares | $ | ||||||||
| Utilities - 1.4% | May 2015 34.00 Put (1) | USD | 1,645 | (ÿ) | 6 | ||||||
| Atlas Energy, LP | 73,376 | 2,754 | Aug 2015 35.00 Put (1) | USD | 1,660 | (ÿ) | 20 | ||||
| Atlas Pipeline Partners, LP | 58,028 | 2,130 | Aug 2015 36.50 Put (1) | USD | 1,660 | (ÿ) | 47 | ||||
| Atlas Resource Partners, LP | 65,215 | 1,077 | Apr 2015 38.00 Put (1) | USD | 6,926 | (ÿ) | 289 | ||||
| Black Hills Corp. | 25,000 | 1,368 | Cross Currency Options | ||||||||
| Energy Transfer Equity, LP | 42,778 | 2,496 | (USD/TRY) | ||||||||
| Nov 2014 2.12 Put (1) | USD | 1,545 | (ÿ) | 8 | |||||||
| Globalstar, Inc.(Æ) | 190,000 | 450 | eBay, Inc. | ||||||||
| Linn Energy LLC | 33,775 | 842 | Jan 2015 50.00 Call (200) | USD | 20 | (ÿ) | 76 | ||||
| Penn West Petroleum, Ltd. Class | Eurodollar 1 Year | ||||||||||
| A - ADR | 25,000 | 113 | Midcurve Futures | ||||||||
| SoftBank Corp. | 25,861 | 1,828 | Dec 2014 99.13 Call (500) | USD | 1,250 | (ÿ) | 131 | ||||
| 13,058 | Eurodollar 2 Year | ||||||||||
| Midcurve Futures | |||||||||||
| Total Common Stocks | Dec 2014 98.25 Put (1,384) | USD | 3,460 | (ÿ) | 605 | ||||||
| (cost $225,471) | 241,617 | Goodyear Tire & Rubber | |||||||||
| Co. (The) | |||||||||||
| Apr 2015 22.00 Call (250) | USD | 25 | (ÿ) | 85 | |||||||
| Investments in Other Funds - 0.3% | Hertz Global Holdings, | ||||||||||
| Financial Services - 0.3% | Inc. | ||||||||||
| Market Vectors Gold Miners ETF | 134,600 | 2,317 | Jan 2015 25.00 Call (250) | USD | 25 | (ÿ) | 23 | ||||
| Total Investments in Other Funds | Inflationary Floor – | ||||||||||
| (cost $3,222) | 2,317 | US0003M Index | |||||||||
| Aug 2019 1.60 Call (1) | USD | 15,300 | (ÿ) | 156 | |||||||
| Preferred Stocks - 0.3% | Aug 2019 1.63 Call (1) | USD | 16,100 | (ÿ) | 103 | ||||||
| Financial Services - 0.3% | Aug 2019 1.63 Put (1) | USD | 9,600 | (ÿ) | 61 | ||||||
| Ally Financial, Inc. | 2,700 | 2,704 | iShares PHLX | ||||||||
| Federal National Mortgage | Semiconductor ETF | ||||||||||
| Association(ƒ) | 50,000 | 213 | Nov 2014 87.00 Put (200) | USD | 20 | (ÿ) | 40 | ||||
| 2,917 | iShares Russell 2000 | ||||||||||
| Total Preferred Stocks | ETF | ||||||||||
| Nov 2014 110.00 Put (2,320) | USD | 232 | (ÿ) | 96 | |||||||
| (cost $2,971) | 2,917 | Nov 2014 116.00 Put (1,000) | USD | 100 | (ÿ) | 179 | |||||
| Now, Inc. | |||||||||||
| Options Purchased - 0.5% | Nov 2014 35.00 Put (300) | USD | 30 | (ÿ) | 150 | ||||||
| (Number of Contracts) | Penn West Petroleum, | ||||||||||
| Allergan, Inc. | Ltd. | ||||||||||
| Jan 2015 150.00 Call (150) | USD | 15 | (ÿ) | 637 | Jan 2015 10.00 Call (750) | USD | 75 | (ÿ) | 4 | ||
| Applied Materials, Inc. | Pfizer, Inc. | ||||||||||
| Jan 2015 20.00 Call (250) | USD | 25 | (ÿ) | 66 | Dec 2014 28.00 Call (500) | USD | 50 | (ÿ) | 95 | ||
| Apr 2015 20.00 Call (500) | USD | 50 | (ÿ) | 159 | SPDR S&P 500 ETF | ||||||
| Caesars Entertainment | Trust | ||||||||||
| Corp. | Nov 2014 200.00 Put (1,250) | USD | 125 | (ÿ) | 229 | ||||||
| Jan 2015 10.00 Call (500) | USD | 50 | (ÿ) | 195 | Swaptions | ||||||
| Constellium NV | (Fund Receives/Fund Pays) | ||||||||||
| Feb 2015 21.00 Call (750) | USD | 75 | (ÿ) | 133 | USD 5.000%/USD HY22 CDX Index | ||||||
| Cross Currency Options | Dec 2014 0.00 Put (1) | 9,900 | (ÿ) | 16 | |||||||
| (EUR/GBP) | Dec 2014 0.00 Put (1) | 3,465 | (ÿ) | 8 | |||||||
| Dec 2014 0.80 Put (1) | EUR | 33,300 | (ÿ) | 925 | USD 5.000%/USD HY23 CDX Index | ||||||
| Cross Currency Options | Dec 2014 0.00 Put (1) | 5,000 | (ÿ) | 9 | |||||||
| (EUR/USD) | Three Month Sterling | ||||||||||
| Dec 2014 1.34 Put (1) | EUR | 2,300 | (ÿ) | 199 | Midcurve Futures | ||||||
| Cross Currency Options | Nov 2014 98.13 Put (832) | GBP | 1,040 | (ÿ) | — | ||||||
| (USD/CNY) | Nov 2014 98.50 Put (833) | GBP | 1,041 | (ÿ) | 4 | ||||||
| Jan 2015 6.15 Call (1) | USD | 29,900 | (ÿ) | 120 | Total Options Purchased | ||||||
| Cross Currency Options | (cost $6,360) | 5,036 | |||||||||
| (USD/JPY) | |||||||||||
| Dec 2014 114.00 Call (1) | USD | 33,650 | (ÿ) | 151 | Warrants & Rights - 0.3% | ||||||
| Cross Currency Options | |||||||||||
| (USD/NOK) | Kinder Morgan, Inc.(Æ) | ||||||||||
| Nov 2014 6.50 Put (1) | USD | 69,200 | (ÿ) | 11 | 2017 Warrants | 39,700 | 138 | ||||
| Cross Currency Options | MModal(Æ) | ||||||||||
| (USD/RUB) | 2017 Warrants | 9,579 | — | ||||||||
See accompanying notes which are an integral part of the financial statements.
Russell Multi-Strategy Alternative Fund 603
Russell Investment Company
Russell Multi-Strategy Alternative Fund
Consolidated Schedule of Investments, continued — October 31, 2014
| Amounts in thousands (except share amounts) | Amounts in thousands (except share amounts) | |||||||||||||
| Principal | Fair | Principal | Fair | |||||||||||
| Amount ($) | Value | Amount ($) | Value | |||||||||||
| or Shares | $ | or Shares | $ | |||||||||||
| Morgan Stanley BV(Æ) | Agreement with JPMorgan Chase and | |||||||||||||
| 2015 Warrants | 84,194 | 2,486 | State Street Bank (Tri-Party) of $464 | |||||||||||
| 2,624 | dated October 23, 2014 at 0.080% to | |||||||||||||
| Total Warrants & Rights | be repurchased at $464 on November | |||||||||||||
| (cost $3,168) | 2,624 | 6, 2014 collateralized by: $400 | ||||||||||||
| par various United States Treasury | ||||||||||||||
| Short-Term Investments - 49.5% | Obligations, valued at $527. | 464 | 464 | |||||||||||
| Dubai World, Ltd. Term Loan A1 | Agreement with JPMorgan Chase and | |||||||||||||
| 1.000% due 09/30/15 | 147 | 114 | State Street Bank (Tri-Party) of $613 | |||||||||||
| Federal Home Loan Bank Discount | dated October 23, 2014 at 0.080% to | |||||||||||||
| Notes | be repurchased at $613 on November | |||||||||||||
| Zero coupon due 12/10/14 (ç)(~) | 300 | 300 | 6, 2014 collateralized by: $600 | |||||||||||
| Zero coupon due 12/17/14 (ç)(~) | 3,300 | 3,300 | par various United States Treasury | |||||||||||
| Federal Home Loan Discount Notes | Obligations, valued at $617. | 613 | 613 | |||||||||||
| 0.060% due 12/12/14 (ç)(~) | 700 | 700 | Total Repurchase Agreements | |||||||||||
| Freddie Mac Discount Notes | (cost $9,477) | 9,477 | ||||||||||||
| Zero coupon due 03/11/15 (~) | 6,200 | 6,199 | ||||||||||||
| Hellenic Treasury Bills | Total Investments 94.7% | |||||||||||||
| Zero coupon due 01/09/15 (~) | 1,000 | 1,240 | ||||||||||||
| Morgan Stanley | (identified cost $901,759) | 910,745 | ||||||||||||
| 0.711% due 10/15/15 (Ê) | 1,200 | 1,204 | ||||||||||||
| Navient Corp. | Securities Sold Short - (5.2)% | |||||||||||||
| 3.875% due 09/10/15 | 600 | 606 | Long-Term Investments - (0.3)% | |||||||||||
| Russell U.S. Cash Management Fund | 290,554,103 | (∞) | 290,554 | United States Government Treasuries - (0.3)% | ||||||||||
| Texas Competitive Electric Holdings | United States Treasury Notes | |||||||||||||
| Co., LLC Term Loan | 2.125% due 06/30/21 | (600 | ) | (604 | ) | |||||||||
| 4.647% due 10/10/15 | 3,666 | 2,651 | 3.750% due 11/15/43 | (1,800 | ) | (2,042 | ) | |||||||
| United States Treasury Bills | (2,646 | ) | ||||||||||||
| Zero coupon due 11/06/14 (ç)(~) | 1,000 | 1,000 | Total Long-Term Investments | |||||||||||
| Zero coupon due 11/20/14 (ç)(~) | 6,000 | 6,000 | (proceeds $2,427) | (2,646 | ) | |||||||||
| 0.046% due 11/28/14 (ç)(~) | 21,408 | 21,408 | ||||||||||||
| 0.053% due 12/04/14 (ç)(~) | 4,650 | 4,650 | Common Stocks - (3.0)% | |||||||||||
| Zero coupon due 12/11/14 (ç)(~) | 11,000 | 11,000 | Consumer Discretionary - (0.8)% | |||||||||||
| 0.041% due 12/18/14 (ç)(~) | 50,000 | 49,999 | Amazon.com, Inc.(Æ) | (6,175 | ) | (1,886 | ) | |||||||
| 0.041% due 12/18/14 (ç)(Û) | 5,000 | 5,000 | Best Buy Co., Inc. | (37,236 | ) | (1,271 | ) | |||||||
| Zero coupon due 12/26/14 (ç)(~) | 20,000 | 20,000 | Expedia, Inc. | (15,000 | ) | (1,274 | ) | |||||||
| Zero coupon due 01/02/15 (~) | 23,000 | 23,000 | Goodyear Tire & Rubber Co. (The) | (3,000 | ) | (71 | ) | |||||||
| 0.060% due 01/29/15 | 9,219 | 9,218 | Honda Motor Co., Ltd. | (17,200 | ) | (533 | ) | |||||||
| Zero coupon due 02/05/15 (~) | 4,931 | 4,930 | Japan Display, Inc.(Æ) | (49,300 | ) | (140 | ) | |||||||
| Zero coupon due 03/19/15 (Û)(~) | 3,000 | 3,000 | Kyocera Corp. | (9,000 | ) | (404 | ) | |||||||
| Zero coupon due 04/09/15 (~) | 10,471 | 10,469 | Nikon Corp. | (35,200 | ) | (471 | ) | |||||||
| Total Short-Term Investments | Nissan Motor Co., Ltd. | (61,400 | ) | (545 | ) | |||||||||
| (cost $476,692) | 476,542 | Target Corp. | (15,458 | ) | (956 | ) | ||||||||
| Yaskawa Electric Corp. | (27,300 | ) | (341 | ) | ||||||||||
| Repurchase Agreements - 1.0% | (7,892 | ) | ||||||||||||
| Agreement with Bank of America and | Consumer Staples - (0.1)% | |||||||||||||
| State Street Bank (Tri-Party) of | Ezaki Glico Co., Ltd. | (3,400 | ) | (108 | ) | |||||||||
| $5,100 dated October 31, 2014 at | Whole Foods Market, Inc. | (25,861 | ) | (1,017 | ) | |||||||||
| 0.160% to be repurchased at $5,100 | ||||||||||||||
| on November 3, 2014 collateralized | (1,125 | ) | ||||||||||||
| by: $5,229 par various United States | Energy - (0.1)% | |||||||||||||
| Treasury Obligations, valued at | Petroleo Brasileiro SA - ADR(Æ) | (104,919 | ) | (1,228 | ) | |||||||||
| $5,201. | 5,100 | 5,100 | Health Care - (0.1)% | |||||||||||
| Agreement with Goldman Sachs and | Sysmex Corp. | (9,700 | ) | (407 | ) | |||||||||
| State Street Bank (Tri-Party) of | ||||||||||||||
| $3,300 dated October 31, 2014 at | Materials and Processing - (0.8)% | |||||||||||||
| 0.150% to be repurchased at $3,300 | Fastenal Co. | (38,986 | ) | (1,717 | ) | |||||||||
| on November 3, 2014 collateralized | First Quantum Minerals, Ltd.(Æ) | (206,761 | ) | (3,118 | ) | |||||||||
| by: $3,269 par various United States | Kaneka Corp. | (94,000 | ) | (506 | ) | |||||||||
| Agency Obligations, valued at $3,405. | 3,300 | 3,300 | Kuraray Co., Ltd. | (22,000 | ) | (250 | ) | |||||||
| See accompanying notes which are an integral part of the financial statements. | ||||||||||||||
| 604 Russell Multi-Strategy Alternative Fund | ||||||||||||||
Russell Investment Company
Russell Multi-Strategy Alternative Fund
Consolidated Schedule of Investments, continued — October 31, 2014
| Amounts in thousands (except share amounts) | ||||||
| Principal | Fair | |||||
| Amount ($) | Value | |||||
| or Shares | $ | |||||
| Newmont Mining Corp. | (76,708 | ) | (1,439 | ) | ||
| Toray Industries, Inc. | (78,000 | ) | (513 | ) | ||
| United States Steel Corp. | (10,000 | ) | (401 | ) | ||
| (7,944 | ) | |||||
| Producer Durables - (0.4)% | ||||||
| General Electric Co. | (76,903 | ) | (1,985 | ) | ||
| Hirose Electric Co., Ltd. | (2,400 | ) | (289 | ) | ||
| Hitachi Construction Machinery Co., | ||||||
| Ltd. | (28,400 | ) | (565 | ) | ||
| House Foods Group, Inc. | (8,000 | ) | (136 | ) | ||
| Kewpie Corp. | (12,300 | ) | (210 | ) | ||
| Kubota Corp. | (22,000 | ) | (340 | ) | ||
| (3,525 | ) | |||||
| Technology - (0.7)% | ||||||
| ASML Holding NV Class G | (30,309 | ) | (3,021 | ) | ||
| GungHo Online Entertainment, Inc. | (24,100 | ) | (113 | ) | ||
| Rohm Co., Ltd. | (2,500 | ) | (148 | ) | ||
| Ryosan Co., Ltd. | (3,600 | ) | (75 | ) | ||
| Splunk, Inc.(Æ) | (27,222 | ) | (1,799 | ) | ||
| Taiyo Yuden Co., Ltd. | (36,000 | ) | (358 | ) | ||
| Workday, Inc. Class A(Æ) | (16,819 | ) | (1,606 | ) | ||
| (7,120 | ) | |||||
| Total Common Stocks | ||||||
| (proceeds $31,209) | (29,241 | ) | ||||
| Investments in Other Funds - (1.9)% | ||||||
| Financial Services - (1.9)% | ||||||
| Energy Select Sector SPDR Fund | (16,537 | ) | (1,446 | ) | ||
| iShares MSCI Emerging Markets ETF | (192,198 | ) | (8,101 | ) | ||
| iShares Russell 2000 ETF | (72,929 | ) | (8,501 | ) | ||
| Total Investments in Other Funds | ||||||
| (proceeds $17,900) | (18,048 | ) | ||||
| Total Securities Sold Short | ||||||
| (proceeds $51,536) | (49,935 | ) | ||||
| Other Assets and Liabilities, | ||||||
| Net - 10.5% | 101,245 | |||||
| Net Assets - 100.0% | 962,055 | |||||
See accompanying notes which are an integral part of the financial statements.
Russell Multi-Strategy Alternative Fund 605
Russell Investment Company
Russell Multi-Strategy Alternative Fund
Consolidated Schedule of Investments, continued — October 31, 2014
| Restricted Securities | |||||||||||||
| Amounts in thousands (except share and cost per unit amounts) | |||||||||||||
| Principal | Cost per | Cost | Fair Value | ||||||||||
| % of Net Assets | Acquisition | Amount ($) | Unit | (000 | ) | (000 | ) | ||||||
| Securities | Date | or shares | $ | $ | $ | ||||||||
| 0.4% | |||||||||||||
| Albertsons Holdings LLC/Saturn Acquisition Merger Sub, Inc. | 10/08/14 | 845,000 | 98.55 | 833 | 832 | ||||||||
| CFIP CLO Ltd. | 03/27/14 | 250,000 | 94.75 | 237 | 228 | ||||||||
| Dynegy Finance I, Inc. / Dynegy Finance II, Inc. | 10/10/14 | 455,000 | 100.00 | 455 | 481 | ||||||||
| Dynegy Finance I, Inc. / Dynegy Finance II, Inc. | 10/10/14 | 410,000 | 100.00 | 410 | 435 | ||||||||
| Gallatin Funding, Ltd. | 05/22/14 | 220,000 | 98.56 | 217 | 220 | ||||||||
| Gallatin Funding, Ltd. | 05/22/14 | 225,000 | 98.80 | 222 | 224 | ||||||||
| Madison Park Funding XI, Ltd. | 08/16/13 | 250,000 | 95.65 | 239 | 236 | ||||||||
| Magi Funding PLC | 01/17/13 | EUR | 141,242 | 130.98 | 185 | 176 | |||||||
| Sound Point CLO II, Ltd. | 03/01/13 | 280,000 | 95.63 | 268 | 267 | ||||||||
| Zebra Technologies Corp. | 09/30/14 | 355,000 | 100.00 | 355 | 374 | ||||||||
| 3,473 | |||||||||||||
| For a description of restricted securities see note 9 in the Notes to Financial Statements. | |||||||||||||
| Futures Contracts | |||||||||||||
| Amounts in thousands (except contract amounts) | |||||||||||||
| Unrealized | |||||||||||||
| Appreciation | |||||||||||||
| Number of | Notional | Expiration | (Depreciation) | ||||||||||
| Contracts | Amount | Date | $ | ||||||||||
| Long Positions | |||||||||||||
| Aluminum Futures | 13 | USD | 671 | 11/14 | (8 | ) | |||||||
| Aluminum Futures | 37 | USD | 1,910 | 12/14 | 5 | ||||||||
| Aluminum Futures | 10 | USD | 511 | 01/15 | 18 | ||||||||
| Australia Bank Bill 90 Day Futures | 282 | AUD | 280,156 | 03/15 | 125 | ||||||||
| Australia Government 10 Year Treasury Bond Futures | 53 | AUD | 6,508 | 12/14 | 105 | ||||||||
| Australia Government 3 Year Treasury Bond Futures | 127 | AUD | 13,946 | 12/14 | 31 | ||||||||
| Bovespa Index Futures | 20 | BRL | 1,058 | 12/14 | (48 | ) | |||||||
| Brent Crude Oil Futures | 25 | USD | 2,147 | 11/14 | (58 | ) | |||||||
| Canada Government 10 Year Bond Futures | 51 | CAD | 6,988 | 12/14 | 56 | ||||||||
| Cocoa Futures | 24 | GBP | 577 | 12/14 | (40 | ) | |||||||
| Cocoa Futures | 24 | GBP | 564 | 03/15 | (5 | ) | |||||||
| Coffee Futures | 1 | USD | 71 | 12/14 | (3 | ) | |||||||
| Coffee Futures | 9 | USD | 649 | 03/15 | (6 | ) | |||||||
| Copper Futures | 18 | USD | 3,037 | 11/14 | (85 | ) | |||||||
| Copper Futures | 14 | USD | 2,354 | 12/14 | (40 | ) | |||||||
| Copper Futures | 3 | USD | 503 | 01/15 | (1 | ) | |||||||
| Corn Futures | 92 | USD | 1,733 | 12/14 | 54 | ||||||||
| Cotton No. 2 Futures | 23 | USD | 741 | 12/14 | (13 | ) | |||||||
| Cotton No. 2 Futures | 8 | USD | 252 | 03/15 | 1 | ||||||||
| Dow Jones Mini E-CBOT Futures | 60 | USD | 5,193 | 12/14 | 72 | ||||||||
| Euribor Interest Rate Futures | 6 | EUR | 1,499 | 03/15 | (1 | ) | |||||||
| Euribor Interest Rate Futures | 22 | EUR | 5,495 | 06/15 | (1 | ) | |||||||
| Euribor Interest Rate Futures | 31 | EUR | 7,743 | 09/15 | (2 | ) | |||||||
| Euribor Interest Rate Futures | 41 | EUR | 10,239 | 12/15 | (1 | ) | |||||||
| Euribor Interest Rate Futures | 51 | EUR | 12,733 | 03/16 | (2 | ) | |||||||
| Euribor Interest Rate Futures | 60 | EUR | 14,977 | 06/16 | — | ||||||||
| Euribor Interest Rate Futures | 62 | EUR | 15,472 | 09/16 | 2 | ||||||||
| EURO STOXX 50 Index Futures | 101 | EUR | 3,132 | 12/14 | (191 | ) | |||||||
| EURO STOXX Banks Futures | 202 | EUR | 1,425 | 12/14 | (124 | ) | |||||||
| Euro-Bobl Futures | 240 | EUR | 30,732 | 12/14 | 103 | ||||||||
| Euro-Bund Futures | 84 | EUR | 12,676 | 12/14 | 183 | ||||||||
| Euro-Buxl 30 Year Bond Futures | 14 | EUR | 2,034 | 12/14 | 78 | ||||||||
| Eurodollar Futures | 65 | USD | 16,208 | 03/15 | 4 | ||||||||
| Eurodollar Futures | 84 | USD | 20,918 | 06/15 | 3 | ||||||||
| Eurodollar Futures | 70 | USD | 17,396 | 09/15 | (4 | ) | |||||||
| Eurodollar Futures | 53 | USD | 13,139 | 12/15 | (8 | ) | |||||||
| Eurodollar Futures | 45 | USD | 11,129 | 03/16 | (10 | ) | |||||||
| Eurodollar Futures | 42 | USD | 10,361 | 06/16 | (10 | ) | |||||||
| Eurodollar Futures | 41 | USD | 10,088 | 09/16 | (8 | ) | |||||||
| Euro-Schatz Futures | 135 | EUR | 14,981 | 12/14 | 6 | ||||||||
| EuroSwiss Interest Rate Futures | 3 | CHF | 751 | 06/15 | — | ||||||||
| FTSE China A50 Index | 236 | USD | 1,762 | 11/14 | 62 | ||||||||
| FTSE/MIB Index Futures | 30 | EUR | 2,957 | 12/14 | (261 | ) | |||||||
| Gas Oil Futures | 48 | USD | 3,560 | 11/14 | (173 | ) | |||||||
| See accompanying notes which are an integral part of the financial statements. | |||||||||||||
| 606 Russell Multi-Strategy Alternative Fund | |||||||||||||
Russell Investment Company
Russell Multi-Strategy Alternative Fund
Consolidated Schedule of Investments, continued — October 31, 2014
| Futures Contracts | |||||||
| Amounts in thousands (except contract amounts) | |||||||
| Gold 100 oz. Futures | 24 | USD | 2,812 | 12/14 | (260 | ) | |
| Hang Seng Index Futures | 7 | HKD | 8,380 | 11/14 | 1 | ||
| H-Shares Index Futures | 37 | HKD | 19,874 | 11/14 | 40 | ||
| IBEX 35 Index Futures | 3 | EUR | 313 | 11/14 | 8 | ||
| Japan Government 10 Year Bond Futures | 4 | JPY | 586,120 | 12/14 | 28 | ||
| Japan Government Mini 10 Year Bond Futures | 142 | JPY | 2,082,572 | 12/14 | 102 | ||
| Lead Futures | 1 | USD | 50 | 11/14 | (6 | ) | |
| Lead Futures | 3 | USD | 150 | 12/14 | (18 | ) | |
| Lean Hogs Futures | 9 | USD | 317 | 12/14 | (31 | ) | |
| Live Cattle Futures | 22 | USD | 1,461 | 12/14 | 31 | ||
| Long Gilt Futures | 43 | GBP | 4,949 | 12/14 | 124 | ||
| Mexico Bolsa Index Futures | 150 | MXN | 67,593 | 12/14 | (124 | ) | |
| MSCI Taiwan Index Futures | 31 | USD | 1,035 | 11/14 | 15 | ||
| NASDAQ 100 E-Mini Index Futures | 69 | USD | 5,728 | 12/14 | 125 | ||
| Natural Gas Futures | 4 | USD | 155 | 11/14 | (3 | ) | |
| Nickel Futures | 2 | USD | 189 | 11/14 | (34 | ) | |
| Nickel Futures | 7 | USD | 662 | 12/14 | (115 | ) | |
| NIKKEI 225 Index Futures | 47 | JPY | 775,030 | 12/14 | 427 | ||
| Russell 2000 Mini Index Futures | 17 | USD | 1,991 | 12/14 | 17 | ||
| S&P Mid 400 E-Mini Index Futures | 17 | USD | 2,406 | 12/14 | 32 | ||
| S&P Mid 500 E-Mini Index Futures | 107 | USD | 10,761 | 12/14 | 209 | ||
| S&P/TSX 60 Index Futures | 5 | CAD | 848 | 12/14 | (28 | ) | |
| SGX CNX NIFTY Index Futures | 109 | USD | 1,823 | 11/14 | 58 | ||
| Silver Futures | 3 | USD | 242 | 12/14 | (15 | ) | |
| Soybean Futures | 1 | USD | 52 | 01/15 | 1 | ||
| Soybean Meal Futures | 31 | USD | 1,206 | 12/14 | 74 | ||
| Soybean Oil Futures | 18 | USD | 376 | 12/14 | 25 | ||
| SPI 200 Index Futures | 20 | AUD | 2,759 | 12/14 | 24 | ||
| Sterling Interest Rate Futures | 113 | GBP | 14,029 | 03/15 | 27 | ||
| Sterling Interest Rate Futures | 82 | GBP | 10,167 | 06/15 | 33 | ||
| Sterling Interest Rate Futures | 65 | GBP | 8,046 | 09/15 | 33 | ||
| Sterling Interest Rate Futures | 62 | GBP | 7,661 | 12/15 | 30 | ||
| Sterling Interest Rate Futures | 54 | GBP | 6,662 | 03/16 | 27 | ||
| Sterling Interest Rate Futures | 51 | GBP | 6,281 | 06/16 | 26 | ||
| Sterling Interest Rate Futures | 51 | GBP | 6,271 | 09/16 | 26 | ||
| Swiss Market Index Futures | 39 | CHF | 3,442 | 12/14 | 49 | ||
| TAIEX Futures | 5 | TWD | 8,975 | 11/14 | 8 | ||
| TOPIX Index Futures | 3 | JPY | 40,110 | 12/14 | 10 | ||
| United States Treasury 2 Year Note Futures | 157 | USD | 34,471 | 12/14 | 40 | ||
| United States Treasury 5 Year Note Futures | 95 | USD | 11,346 | 12/14 | 26 | ||
| United States Treasury 10 Year Note Futures | 218 | USD | 27,546 | 12/14 | 190 | ||
| United States Treasury Long Bond Futures | 33 | USD | 4,656 | 12/14 | 85 | ||
| Wheat Futures | 40 | USD | 1,065 | 12/14 | (69 | ) | |
| WIG 20 Index Futures | 226 | PLN | 11,146 | 12/14 | (52 | ) | |
| WTI Crude Oil Futures | 2 | USD | 161 | 11/14 | (16 | ) | |
| Zinc Futures | 1 | USD | 58 | 11/14 | (1 | ) | |
| Zinc Futures | 15 | USD | 867 | 12/14 | (26 | ) | |
| Zinc Futures | 2 | USD | 116 | 01/15 | 6 | ||
| Short Positions | |||||||
| Aluminum Futures | 13 | USD | 671 | 11/14 | 9 | ||
| Aluminum Futures | 26 | USD | 1,342 | 12/14 | (63 | ) | |
| Aluminum Futures | 10 | USD | 511 | 01/15 | (19 | ) | |
| Amsterdam Index Futures | 4 | EUR | 328 | 11/14 | (31 | ) | |
| Bankers Acceptance Futures | 2 | CAD | 494 | 06/15 | — | ||
| BIST 30 Index Futures | 726 | TRY | 7,184 | 12/14 | (30 | ) | |
| Brent Crude Oil Futures | 25 | USD | 2,147 | 11/14 | 180 | ||
| Brent Crude Oil Futures | 20 | USD | 1,727 | 12/14 | 2 | ||
| CAC 40 Index Futures | 54 | EUR | 2,284 | 11/14 | (90 | ) | |
| Canada Bankers Acceptance Futures | 12 | CAD | 2,961 | 03/15 | (1 | ) | |
| Cocoa Futures | 24 | GBP | 577 | 12/14 | 9 | ||
| Cocoa Futures | 1 | USD | 29 | 03/15 | — | ||
| Coffee Futures | 1 | USD | 71 | 12/14 | 1 | ||
| Copper Futures | 18 | USD | 3,037 | 11/14 | 81 | ||
| Copper Futures | 37 | USD | 4,291 | 12/14 | 26 | ||
| Copper Futures | 3 | USD | 503 | 01/15 | — | ||
| Corn Futures | 143 | USD | 2,694 | 12/14 | (94 | ) | |
| Cotton No. 2 Futures | 34 | USD | 1,096 | 12/14 | 12 | ||
| Cotton No. 2 Futures | 20 | USD | 629 | 03/15 | (4 | ) | |
| DAX Index Futures | 11 | EUR | 2,560 | 12/14 | (101 | ) | |
| EURO STOXX 50 Index Futures | 35 | EUR | 1,085 | 12/14 | (45 | ) | |
| See accompanying notes which are an integral part of the financial statements. | |||||||
| Russell Multi-Strategy Alternative Fund 607 | |||||||
Russell Investment Company
Russell Multi-Strategy Alternative Fund
Consolidated Schedule of Investments, continued — October 31, 2014
| Futures Contracts | |||||||||
| Amounts in thousands (except contract amounts) | |||||||||
| Eurodollar Futures | 311 | USD | 77,101 | 12/15 | (125 | ) | |||
| Eurodollar Futures | 174 | USD | 42,704 | 12/16 | (142 | ) | |||
| Eurodollar Futures | 495 | USD | 120,984 | 06/17 | (463 | ) | |||
| EuroSwiss Interest Rate Futures | 19 | CHF | 4,752 | 03/15 | 1 | ||||
| FTSE 100 Index Futures | 36 | GBP | 2,342 | 12/14 | (80 | ) | |||
| FTSE/JSE TOP 40 Index Futures | 54 | ZAR | 24,129 | 12/14 | 57 | ||||
| FTSE/MIB Index Futures | 8 | EUR | 788 | 12/14 | (24 | ) | |||
| Gas Oil Futures | 48 | USD | 3,560 | 11/14 | 412 | ||||
| Gas Oil Futures | 45 | USD | 3,336 | 12/14 | 169 | ||||
| Gasoline RBOB Futures | 24 | USD | 2,165 | 11/14 | 84 | ||||
| Gold 100 oz. Futures | 47 | USD | 5,507 | 12/14 | 344 | ||||
| KOSPI 200 Index Futures | 4 | KRW | 500,400 | 12/14 | (9 | ) | |||
| Lead Futures | 1 | USD | 50 | 11/14 | 6 | ||||
| Lead Futures | 2 | USD | 100 | 12/14 | 4 | ||||
| Lean Hogs Futures | 15 | USD | 528 | 12/14 | 22 | ||||
| Live Cattle Futures | 12 | USD | 797 | 12/14 | (33 | ) | |||
| MSCI Emerging Markets Mini Index Futures | 142 | USD | 7,196 | 12/14 | 244 | ||||
| MSCI SING IX ETS Futures | 15 | SGD | 1,108 | 11/14 | (17 | ) | |||
| New York Harbor ULSD Futures | 29 | USD | 3,058 | 11/14 | 78 | ||||
| Nickel Futures | 2 | USD | 189 | 11/14 | 33 | ||||
| Nickel Futures | 6 | USD | 567 | 12/14 | 60 | ||||
| Platinum Futures | 25 | USD | 1,544 | 01/15 | 124 | ||||
| Russell 1000 Mini Index Futures | 15 | USD | 1,678 | 12/14 | (93 | ) | |||
| S&P Mid 400 E-Mini Index Futures | 18 | USD | 2,548 | 12/14 | (151 | ) | |||
| S&P Mid 500 E-Mini Index Futures | 509 | USD | 51,190 | 12/14 | (1,966 | ) | |||
| SGX CNX NIFTY Index Futures | 98 | USD | 1,639 | 11/14 | (44 | ) | |||
| Silver Futures | 17 | USD | 1,369 | 12/14 | 164 | ||||
| Soybean Futures | 23 | USD | 1,207 | 01/15 | (122 | ) | |||
| Soybean Meal Futures | 15 | USD | 584 | 12/14 | (109 | ) | |||
| Soybean Oil Futures | 56 | USD | 1,169 | 12/14 | 61 | ||||
| Sugar 11 Futures | 121 | USD | 2,174 | 02/15 | (8 | ) | |||
| United States Treasury 5 Year Note Futures | 43 | USD | 5,135 | 12/14 | (37 | ) | |||
| United States Treasury 10 Year Note Futures | 40 | USD | 5,054 | 12/14 | (37 | ) | |||
| Wheat Futures | 128 | USD | 3,469 | 12/14 | 27 | ||||
| WTI Crude Oil Futures | 14 | USD | 1,128 | 11/14 | 48 | ||||
| Zinc Futures | 1 | USD | 58 | 11/14 | 1 | ||||
| Zinc Futures | 8 | USD | 462 | 12/14 | (11 | ) | |||
| Zinc Futures | 2 | USD | 116 | 01/15 | (5 | ) | |||
| Total Unrealized Appreciation (Depreciation) on Open Futures Contracts (å) | (731 | ) | |||||||
| Options Written | |||||||||
| Amounts in thousands (except contract amounts) | |||||||||
| Number of | Strike | Notional | Expiration | Fair Value | |||||
| Call/Put | Contracts | Price | Amount | Date | $ | ||||
| Cross Currency Options (EUR/INR) | Call | 1 | 83.10 | EUR | 16,650 | 12/01/14 | (2 | ) | |
| Cross Currency Options (EUR/USD) | Put | 1 | 1.32 | EUR | 4,600 | 12/15/14 | (288 | ) | |
| Cross Currency Options (USD/JPY) | Put | 1 | 109.60 | USD | 33,650 | 12/03/14 | (154 | ) | |
| Cross Currency Options (USD/JPY) | Put | 1 | 90.00 | USD | 87,900 | 01/19/15 | — | ||
| Cross Currency Options (USD/RUB) | Call | 1 | 45.00 | USD | 69,200 | 04/08/15 | (3,221 | ) | |
| Cross Currency Options (USD/TRY) | Call | 1 | 2.40 | USD | 13,200 | 11/11/14 | — | ||
| Eurodollar 1 Year Midcurve Futures | Call | 500 | 99.00 | USD | 1,250 | 12/12/14 | (241 | ) | |
| Inflationary Floor – US0003M Index | Call | 2 | 1.00 | USD | 62,800 | 08/15/19 | (244 | ) | |
| Inflationary Floor – US0003M Index | Put | 1 | 1.00 | USD | 11,600 | 08/15/19 | (36 | ) | |
| SPDR S&P 500 ETF Trust | Put | 250 | 194.00 | USD | 25 | 11/07/14 | (3 | ) | |
| SunCoke Energy, Inc. | Call | 50 | 20.00 | USD | 5 | 11/22/14 | (19 | ) | |
| Swaptions | |||||||||
| (Fund Receives/Fund Pays) | |||||||||
| USD 0.850%/USD 3 Month LIBOR | Put | 3 | 0.00 | 1,600 | 12/17/14 | — | |||
| USD 0.900%/USD 3 Month LIBOR | Put | 3 | 0.00 | 1,300 | 12/17/14 | — | |||
| USD 0.900%/USD 3 Month LIBOR | Put | 1 | 0.00 | 200 | 01/21/15 | — | |||
| USD 0.950%/USD 3 Month LIBOR | Put | 6 | 0.00 | 3,700 | 12/17/14 | (1 | ) | ||
| USD 1.000%/USD 3 Month LIBOR | Put | 1 | 0.00 | 100 | 12/17/14 | — | |||
| Three Month Sterling Midcurve Futures | Put | 1,665 | 98.25 | GBP | 2,081 | 11/19/14 | — | ||
| Total Liability for Options Written (premiums received $2,516) | (4,209 | ) | |||||||
| See accompanying notes which are an integral part of the financial statements. | |||||||||
| 608 Russell Multi-Strategy Alternative Fund | |||||||||
Russell Investment Company
Russell Multi-Strategy Alternative Fund
Consolidated Schedule of Investments, continued — October 31, 2014
| Transactions in options written contracts for the period ended October 31, 2014 were as follows: | ||||||||||
| Number of | Premiums | |||||||||
| Contracts | Received | |||||||||
| Outstanding October 31, 2013 | 6,063 | $ | 10,025 | |||||||
| Opened | 39,771 | 30,183 | ||||||||
| Closed | (21,498) | (24,394 | ) | |||||||
| Expired | (21,848) | (13,298 | ) | |||||||
| Outstanding October 31, 2014 | 2,488 | $ | 2,516 | |||||||
| Foreign Currency Exchange Contracts | ||||||||||
| Amounts in thousands | ||||||||||
| Unrealized | ||||||||||
| Appreciation | ||||||||||
| Amount | Amount | (Depreciation) | ||||||||
| Counterparty | Sold | Bought | Settlement Date | $ | ||||||
| Bank of America | USD | 109 | ILS | 410 | 11/05/14 | (1 | ) | |||
| Bank of America | USD | 134 | ILS | 501 | 11/05/14 | (2 | ) | |||
| Bank of America | EUR | 4,945 | USD | 6,301 | 11/04/14 | 105 | ||||
| Bank of America | EUR | 9 | USD | 11 | 12/12/14 | — | ||||
| Bank of America | EUR | 18 | USD | 23 | 12/12/14 | — | ||||
| Bank of America | GBP | 452 | USD | 730 | 12/11/14 | 7 | ||||
| Bank of America | ILS | 410 | USD | 109 | 01/14/15 | 1 | ||||
| Bank of America | MXN | 13,282 | USD | 995 | 12/18/14 | 11 | ||||
| Barclays | USD | 28,400 | CNH | 175,670 | 02/09/15 | 47 | ||||
| Barclays | USD | 94 | EUR | 74 | 12/12/14 | (1 | ) | |||
| Barclays | USD | 202 | EUR | 160 | 12/12/14 | (2 | ) | |||
| Barclays | USD | 270 | EUR | 212 | 12/12/14 | (4 | ) | |||
| Barclays | USD | 2,180 | EUR | 1,715 | 12/17/14 | (30 | ) | |||
| Barclays | USD | 4,256 | EUR | 3,310 | 12/17/14 | (107 | ) | |||
| Barclays | USD | 4,345 | EUR | 3,330 | 12/17/14 | (171 | ) | |||
| Barclays | USD | 4,350 | EUR | 3,330 | 12/17/14 | (176 | ) | |||
| Barclays | USD | 4,357 | EUR | 3,450 | 12/17/14 | (33 | ) | |||
| Barclays | USD | 4,376 | EUR | 3,330 | 12/17/14 | (201 | ) | |||
| Barclays | USD | 4,391 | EUR | 3,430 | 12/17/14 | (91 | ) | |||
| Barclays | USD | 6,465 | EUR | 4,995 | 12/17/14 | (203 | ) | |||
| Barclays | USD | 8,716 | EUR | 6,860 | 12/17/14 | (117 | ) | |||
| Barclays | USD | 8,733 | EUR | 6,860 | 12/17/14 | (134 | ) | |||
| Barclays | USD | 8,755 | EUR | 6,860 | 12/17/14 | (156 | ) | |||
| Barclays | USD | 8,762 | EUR | 6,860 | 12/17/14 | (163 | ) | |||
| Barclays | USD | 10,780 | EUR | 8,325 | 12/17/14 | (345 | ) | |||
| Barclays | USD | 10,785 | EUR | 8,325 | 12/17/14 | (350 | ) | |||
| Barclays | USD | 10,826 | EUR | 8,325 | 12/17/14 | (391 | ) | |||
| Barclays | USD | 10,857 | EUR | 8,325 | 12/17/14 | (421 | ) | |||
| Barclays | USD | 10,857 | EUR | 8,325 | 12/17/14 | (422 | ) | |||
| Barclays | USD | 10,907 | EUR | 8,625 | 12/17/14 | (95 | ) | |||
| Barclays | USD | 12,938 | EUR | 9,990 | 12/17/14 | (416 | ) | |||
| Barclays | USD | 13,188 | EUR | 10,290 | 12/17/14 | (289 | ) | |||
| Barclays | USD | 28,038 | GBP | 17,493 | 12/17/14 | (64 | ) | |||
| Barclays | USD | 6,160 | HUF | 1,474,599 | 12/17/14 | (169 | ) | |||
| Barclays | USD | 3,365 | ILS | 12,585 | 12/17/14 | (53 | ) | |||
| Barclays | USD | 6,730 | INR | 413,947 | 11/28/14 | (22 | ) | |||
| Barclays | USD | 1,078 | JPY | 116,100 | 11/04/14 | (44 | ) | |||
| Barclays | USD | 15,479 | JPY | 1,728,222 | 11/05/14 | (93 | ) | |||
| Barclays | USD | 3,430 | JPY | 362,569 | 12/17/14 | (201 | ) | |||
| Barclays | USD | 3,430 | JPY | 361,759 | 12/17/14 | (208 | ) | |||
| Barclays | USD | 6,860 | JPY | 724,791 | 12/17/14 | (404 | ) | |||
| Barclays | USD | 6,860 | JPY | 725,065 | 12/17/14 | (402 | ) | |||
| Barclays | USD | 7,992 | JPY | 840,747 | 12/17/14 | (504 | ) | |||
| Barclays | USD | 6,730 | MXN | 90,634 | 12/17/14 | (17 | ) | |||
| Barclays | USD | 6,860 | MXN | 91,637 | 12/17/14 | (73 | ) | |||
| Barclays | USD | 1,655 | NOK | 10,640 | 12/17/14 | (80 | ) | |||
| Barclays | USD | 3,365 | RUB | 142,642 | 12/05/14 | (77 | ) | |||
| Barclays | USD | 20,085 | RUB | 826,915 | 04/02/15 | (1,626 | ) | |||
| Barclays | USD | 3,310 | TRY | 7,590 | 12/17/14 | 71 | ||||
| Barclays | USD | 3,310 | TRY | 7,532 | 12/17/14 | 45 | ||||
| Barclays | USD | 3,330 | TRY | 7,358 | 12/17/14 | (52 | ) | |||
| Barclays | USD | 3,365 | TRY | 7,469 | 12/17/14 | (38 | ) | |||
| Barclays | USD | 3,430 | TRY | 7,851 | 12/17/14 | 68 | ||||
| Barclays | USD | 6,730 | TRY | 15,137 | 12/17/14 | 13 | ||||
| See accompanying notes which are an integral part of the financial statements. | ||||||||||
| Russell Multi-Strategy Alternative Fund 609 | ||||||||||
Russell Investment Company
Russell Multi-Strategy Alternative Fund
Consolidated Schedule of Investments, continued — October 31, 2014
| Foreign Currency Exchange Contracts | |||||||
| Amounts in thousands | |||||||
| Unrealized | |||||||
| Appreciation | |||||||
| Amount | Amount | (Depreciation) | |||||
| Counterparty | Sold | Bought | Settlement Date | $ | |||
| Barclays | USD | 6,660 | ZAR | 72,513 | 12/17/14 | (133 | ) |
| Barclays | USD | 6,730 | ZAR | 74,146 | 12/17/14 | (56 | ) |
| Barclays | AUD | 3,430 | JPY | 315,114 | 12/17/14 | (203 | ) |
| Barclays | AUD | 13,835 | USD | 12,759 | 12/17/14 | 620 | |
| Barclays | AUD | 6,730 | USD | 5,903 | 12/18/14 | (1 | ) |
| Barclays | BRL | 8,376 | USD | 3,480 | 11/10/14 | 106 | |
| Barclays | CNH | 190,036 | USD | 30,900 | 11/21/14 | (65 | ) |
| Barclays | EUR | 6,660 | GBP | 5,328 | 12/17/14 | 173 | |
| Barclays | EUR | 6,860 | GBP | 5,414 | 12/17/14 | 59 | |
| Barclays | EUR | 8,275 | GBP | 6,458 | 12/17/14 | (45 | ) |
| Barclays | EUR | 987 | USD | 1,250 | 12/12/14 | 13 | |
| Barclays | EUR | 3,330 | USD | 4,375 | 12/17/14 | 201 | |
| Barclays | EUR | 3,330 | USD | 4,334 | 12/17/14 | 160 | |
| Barclays | EUR | 3,450 | USD | 4,363 | 12/17/14 | 39 | |
| Barclays | EUR | 6,860 | USD | 8,696 | 12/17/14 | 97 | |
| Barclays | EUR | 6,860 | USD | 8,762 | 12/17/14 | 163 | |
| Barclays | EUR | 6,860 | USD | 8,692 | 12/17/14 | 93 | |
| Barclays | EUR | 8,211 | USD | 10,396 | 12/17/14 | 104 | |
| Barclays | EUR | 8,575 | USD | 10,892 | 12/17/14 | 143 | |
| Barclays | JPY | 314,439 | AUD | 3,430 | 12/17/14 | 209 | |
| Barclays | JPY | 116,100 | USD | 1,078 | 12/02/14 | 44 | |
| Barclays | JPY | 53,528 | USD | 500 | 12/17/14 | 23 | |
| Barclays | JPY | 359,184 | USD | 3,310 | 12/17/14 | 111 | |
| Barclays | JPY | 359,868 | USD | 3,310 | 12/17/14 | 105 | |
| Barclays | JPY | 545,813 | USD | 5,145 | 12/17/14 | 284 | |
| Barclays | JPY | 733,501 | USD | 6,730 | 12/17/14 | 197 | |
| Barclays | JPY | 733,659 | USD | 6,860 | 12/17/14 | 325 | |
| Barclays | JPY | 734,855 | USD | 6,730 | 12/17/14 | 185 | |
| Barclays | NOK | 22,696 | USD | 3,365 | 12/17/14 | 5 | |
| Barclays | NZD | 3,365 | USD | 2,628 | 12/17/14 | 15 | |
| Barclays | RUB | 282,998 | USD | 6,730 | 11/28/14 | 194 | |
| Barclays | RUB | 142,248 | USD | 3,430 | 12/17/14 | 163 | |
| Barclays | RUB | 142,800 | USD | 3,430 | 12/17/14 | 150 | |
| Barclays | RUB | 142,847 | USD | 3,430 | 12/17/14 | 149 | |
| Barclays | SEK | 6,325 | USD | 904 | 12/17/14 | 47 | |
| Barclays | THB | 214,105 | USD | 6,660 | 12/17/14 | 99 | |
| Barclays | TRY | 7,463 | USD | 3,330 | 12/17/14 | 6 | |
| Barclays | TRY | 33,300 | USD | 14,998 | 12/17/14 | 163 | |
| Barclays | ZAR | 38,521 | USD | 3,430 | 12/17/14 | (37 | ) |
| Barclays | ZAR | 71,482 | USD | 6,569 | 12/17/14 | 135 | |
| Barclays | ZAR | 72,476 | USD | 6,660 | 12/17/14 | 137 | |
| BNP Paribas | USD | 3,430 | BRL | 8,248 | 11/04/14 | (101 | ) |
| BNP Paribas | USD | 480 | CLP | 279,144 | 11/06/14 | 5 | |
| BNP Paribas | USD | 9,158 | COP | 17,737,890 | 11/05/14 | (537 | ) |
| BNP Paribas | USD | 132 | EUR | 104 | 11/04/14 | (1 | ) |
| BNP Paribas | USD | 1,111 | EUR | 870 | 11/04/14 | (21 | ) |
| BNP Paribas | USD | 13,341 | EUR | 10,464 | 11/04/14 | (228 | ) |
| BNP Paribas | USD | 7,328 | GBP | 4,441 | 12/17/14 | (225 | ) |
| BNP Paribas | USD | 13,320 | MXN | 175,319 | 12/17/14 | (334 | ) |
| BNP Paribas | USD | 487 | MXN | 6,567 | 12/18/14 | (1 | ) |
| BNP Paribas | USD | 10,111 | SGD | 12,654 | 12/17/14 | (263 | ) |
| BNP Paribas | USD | 10,380 | TRY | 23,547 | 12/17/14 | 110 | |
| BNP Paribas | CLP | 131,499 | USD | 224 | 11/06/14 | (4 | ) |
| BNP Paribas | ILS | 23,817 | USD | 6,660 | 12/17/14 | 390 | |
| BNP Paribas | NZD | 3,996 | USD | 3,299 | 12/17/14 | 197 | |
| BNP Paribas | TRY | 33,300 | USD | 14,998 | 12/17/14 | 163 | |
| BNP Paribas | BRL | 8,249 | USD | 3,426 | 11/07/14 | 100 | |
| Citigroup | USD | 163 | AUD | 176 | 12/17/14 | (9 | ) |
| Citigroup | USD | 185 | AUD | 211 | 12/17/14 | (1 | ) |
| Citigroup | USD | 238 | AUD | 272 | 12/17/14 | 1 | |
| Citigroup | USD | 539 | AUD | 615 | 12/17/14 | — | |
| Citigroup | USD | 738 | AUD | 845 | 12/17/14 | 3 | |
| Citigroup | USD | 1,085 | AUD | 1,235 | 12/17/14 | (2 | ) |
| Citigroup | USD | 1,101 | AUD | 1,183 | 12/17/14 | (63 | ) |
| Citigroup | USD | 1,388 | AUD | 1,507 | 12/17/14 | (66 | ) |
| Citigroup | USD | 1,389 | AUD | 1,500 | 12/17/14 | (73 | ) |
| See accompanying notes which are an integral part of the financial statements. | |||||||
| 610 Russell Multi-Strategy Alternative Fund | |||||||
Russell Investment Company
Russell Multi-Strategy Alternative Fund
Consolidated Schedule of Investments, continued — October 31, 2014
| Foreign Currency Exchange Contracts | ||||||||
| Amounts in thousands | ||||||||
| Unrealized | ||||||||
| Appreciation | ||||||||
| Amount | Amount | (Depreciation) | ||||||
| Counterparty | Sold | Bought | Settlement Date | $ | ||||
| Citigroup | USD | 1,389 | AUD | 1,495 | 12/17/14 | (77 | ) | |
| Citigroup | USD | 1,421 | AUD | 1,531 | 12/17/14 | (77 | ) | |
| Citigroup | USD | 2,241 | AUD | 2,435 | 12/17/14 | (105 | ) | |
| Citigroup | USD | 2,377 | AUD | 2,747 | 12/17/14 | 33 | ||
| Citigroup | USD | 2,996 | AUD | 3,330 | 12/17/14 | (74 | ) | |
| Citigroup | USD | 3,000 | AUD | 3,330 | 12/17/14 | (79 | ) | |
| Citigroup | USD | 3,003 | AUD | 3,330 | 12/17/14 | (81 | ) | |
| Citigroup | USD | 4,519 | AUD | 5,175 | 12/17/14 | 21 | ||
| Citigroup | USD | 130 | BRL | 318 | 11/04/14 | (2 | ) | |
| Citigroup | USD | 2 | BRL | 5 | 12/17/14 | — | ||
| Citigroup | USD | 43 | BRL | 105 | 12/17/14 | (1 | ) | |
| Citigroup | USD | 64 | BRL | 150 | 12/17/14 | (4 | ) | |
| Citigroup | USD | 115 | BRL | 270 | 12/17/14 | (8 | ) | |
| Citigroup | USD | 138 | BRL | 320 | 12/17/14 | (11 | ) | |
| Citigroup | USD | 139 | BRL | 320 | 12/17/14 | (11 | ) | |
| Citigroup | USD | 139 | BRL | 327 | 12/17/14 | (8 | ) | |
| Citigroup | USD | 139 | BRL | 322 | 12/17/14 | (11 | ) | |
| Citigroup | USD | 141 | BRL | 324 | 12/17/14 | (12 | ) | |
| Citigroup | USD | 330 | BRL | 758 | 12/17/14 | (28 | ) | |
| Citigroup | USD | 36 | CAD | 40 | 12/17/14 | — | ||
| Citigroup | USD | 54 | CAD | 60 | 12/17/14 | (1 | ) | |
| Citigroup | USD | 121 | CAD | 136 | 12/17/14 | — | ||
| Citigroup | USD | 180 | CAD | 203 | 12/17/14 | — | ||
| Citigroup | USD | 204 | CAD | 223 | 12/17/14 | (7 | ) | |
| Citigroup | USD | 249 | CAD | 278 | 12/17/14 | (2 | ) | |
| Citigroup | USD | 249 | CAD | 272 | 12/17/14 | (8 | ) | |
| Citigroup | USD | 310 | CAD | 348 | 12/17/14 | (1 | ) | |
| Citigroup | USD | 323 | CAD | 353 | 12/17/14 | (10 | ) | |
| Citigroup | USD | 532 | CAD | 585 | 12/17/14 | (14 | ) | |
| Citigroup | USD | 604 | CAD | 660 | 12/17/14 | (19 | ) | |
| Citigroup | USD | 892 | CAD | 1,001 | 12/17/14 | (6 | ) | |
| Citigroup | USD | 1,229 | CAD | 1,337 | 12/17/14 | (44 | ) | |
| Citigroup | USD | 2,293 | CAD | 2,514 | 12/17/14 | (66 | ) | |
| Citigroup | USD | 110 | CHF | 105 | 12/17/14 | (1 | ) | |
| Citigroup | USD | 8 | CLP | 5,000 | 12/17/14 | — | ||
| Citigroup | USD | 2,400 | CNH | 14,945 | 02/09/15 | 20 | ||
| Citigroup | USD | 509 | COP | 1,044,143 | 11/05/14 | (2 | ) | |
| Citigroup | USD | 111 | COP | 218,114 | 12/17/14 | (6 | ) | |
| Citigroup | USD | 112 | COP | 218,114 | 12/17/14 | (6 | ) | |
| Citigroup | USD | 156 | COP | 303,772 | 12/17/14 | (9 | ) | |
| Citigroup | USD | 7 | CZK | 150 | 12/17/14 | — | ||
| Citigroup | USD | 14 | CZK | 300 | 12/17/14 | (1 | ) | |
| Citigroup | USD | 19 | CZK | 400 | 12/17/14 | (1 | ) | |
| Citigroup | USD | 36 | CZK | 750 | 12/17/14 | (2 | ) | |
| Citigroup | USD | 58 | CZK | 1,250 | 12/17/14 | (2 | ) | |
| Citigroup | USD | 61 | CZK | 1,300 | 12/17/14 | (2 | ) | |
| Citigroup | USD | 75 | CZK | 1,600 | 12/17/14 | (3 | ) | |
| Citigroup | USD | 75 | CZK | 1,600 | 12/17/14 | (3 | ) | |
| Citigroup | USD | 95 | CZK | 2,000 | 12/17/14 | (5 | ) | |
| Citigroup | USD | 298 | CZK | 6,250 | 12/17/14 | (16 | ) | |
| Citigroup | USD | 1,162 | CZK | 24,400 | 12/17/14 | (62 | ) | |
| Citigroup | USD | 34 | EUR | 27 | 12/17/14 | — | ||
| Citigroup | USD | 50 | EUR | 40 | 12/17/14 | — | ||
| Citigroup | USD | 59 | EUR | 45 | 12/17/14 | (3 | ) | |
| Citigroup | USD | 84 | EUR | 65 | 12/17/14 | (3 | ) | |
| Citigroup | USD | 98 | EUR | 77 | 12/17/14 | (1 | ) | |
| Citigroup | USD | 188 | EUR | 149 | 12/17/14 | (2 | ) | |
| Citigroup | USD | 302 | EUR | 234 | 12/17/14 | (8 | ) | |
| Citigroup | USD | 305 | EUR | 240 | 12/17/14 | (4 | ) | |
| Citigroup | USD | 365 | EUR | 287 | 12/17/14 | (5 | ) | |
| Citigroup | USD | 397 | EUR | 314 | 12/17/14 | (4 | ) | |
| Citigroup | USD | 463 | EUR | 358 | 12/17/14 | (14 | ) | |
| Citigroup | USD | 495 | EUR | 383 | 12/17/14 | (15 | ) | |
| Citigroup | USD | 495 | EUR | 390 | 12/17/14 | (6 | ) | |
| Citigroup | USD | 635 | EUR | 490 | 12/17/14 | (21 | ) | |
| Citigroup | USD | 668 | EUR | 521 | 12/17/14 | (15 | ) | |
| Citigroup | USD | 716 | EUR | 553 | 12/17/14 | (23 | ) | |
| See accompanying notes which are an integral part of the financial statements. | ||||||||
| Russell Multi-Strategy Alternative Fund 611 | ||||||||
Russell Investment Company
Russell Multi-Strategy Alternative Fund
Consolidated Schedule of Investments, continued — October 31, 2014
| Foreign Currency Exchange Contracts | ||||||||
| Amounts in thousands | ||||||||
| Unrealized | ||||||||
| Appreciation | ||||||||
| Amount | Amount | (Depreciation) | ||||||
| Counterparty | Sold | Bought | Settlement Date | $ | ||||
| Citigroup | USD | 719 | EUR | 569 | 12/17/14 | (7 | ) | |
| Citigroup | USD | 796 | EUR | 615 | 12/17/14 | (25 | ) | |
| Citigroup | USD | 897 | EUR | 714 | 12/17/14 | (2 | ) | |
| Citigroup | USD | 978 | EUR | 766 | 12/17/14 | (18 | ) | |
| Citigroup | USD | 1,219 | EUR | 955 | 12/17/14 | (22 | ) | |
| Citigroup | USD | 1,600 | EUR | 1,256 | 12/17/14 | (25 | ) | |
| Citigroup | USD | 2,319 | EUR | 1,811 | 12/17/14 | (49 | ) | |
| Citigroup | USD | 2,561 | EUR | 2,003 | 12/17/14 | (51 | ) | |
| Citigroup | USD | 4,205 | EUR | 3,310 | 12/17/14 | (56 | ) | |
| Citigroup | USD | 4,289 | EUR | 3,365 | 12/17/14 | (71 | ) | |
| Citigroup | USD | 6,542 | EUR | 5,175 | 12/17/14 | (56 | ) | |
| Citigroup | USD | 6,543 | EUR | 5,175 | 12/17/14 | (56 | ) | |
| Citigroup | USD | 6,543 | EUR | 5,175 | 12/17/14 | (57 | ) | |
| Citigroup | USD | 6,587 | EUR | 5,220 | 12/17/14 | (43 | ) | |
| Citigroup | USD | 8,548 | EUR | 6,730 | 12/17/14 | (112 | ) | |
| Citigroup | USD | 8,570 | EUR | 6,730 | 12/17/14 | (134 | ) | |
| Citigroup | USD | 10,772 | EUR | 8,325 | 12/17/14 | (337 | ) | |
| Citigroup | USD | 21,632 | EUR | 16,650 | 12/17/14 | (761 | ) | |
| Citigroup | USD | 8 | GBP | 5 | 12/17/14 | — | ||
| Citigroup | USD | 8 | GBP | 5 | 12/17/14 | — | ||
| Citigroup | USD | 10 | GBP | 6 | 12/17/14 | — | ||
| Citigroup | USD | 24 | GBP | 15 | 12/17/14 | — | ||
| Citigroup | USD | 40 | GBP | 25 | 12/17/14 | — | ||
| Citigroup | USD | 52 | GBP | 32 | 12/17/14 | (1 | ) | |
| Citigroup | USD | 66 | GBP | 41 | 12/17/14 | — | ||
| Citigroup | USD | 90 | GBP | 56 | 12/17/14 | (1 | ) | |
| Citigroup | USD | 92 | GBP | 57 | 12/17/14 | (1 | ) | |
| Citigroup | USD | 111 | GBP | 69 | 12/17/14 | (1 | ) | |
| Citigroup | USD | 176 | GBP | 109 | 12/17/14 | (1 | ) | |
| Citigroup | USD | 212 | GBP | 132 | 12/17/14 | (1 | ) | |
| Citigroup | USD | 220 | GBP | 138 | 12/17/14 | — | ||
| Citigroup | USD | 241 | GBP | 149 | 12/17/14 | (4 | ) | |
| Citigroup | USD | 256 | GBP | 157 | 12/17/14 | (5 | ) | |
| Citigroup | USD | 274 | GBP | 169 | 12/17/14 | (5 | ) | |
| Citigroup | USD | 348 | GBP | 213 | 12/17/14 | (8 | ) | |
| Citigroup | USD | 410 | GBP | 251 | 12/17/14 | (9 | ) | |
| Citigroup | USD | 603 | GBP | 369 | 12/17/14 | (13 | ) | |
| Citigroup | USD | 1,190 | GBP | 740 | 12/17/14 | (7 | ) | |
| Citigroup | USD | 1,501 | GBP | 931 | 12/17/14 | (13 | ) | |
| Citigroup | USD | 1,812 | GBP | 1,111 | 12/17/14 | (36 | ) | |
| Citigroup | USD | 2,380 | GBP | 1,441 | 12/17/14 | (76 | ) | |
| Citigroup | USD | 5 | HKD | 38 | 12/17/14 | — | ||
| Citigroup | USD | 83 | HKD | 645 | 12/17/14 | — | ||
| Citigroup | USD | 2 | HUF | 500 | 12/17/14 | — | ||
| Citigroup | USD | 14 | HUF | 3,500 | 12/17/14 | — | ||
| Citigroup | USD | 14 | HUF | 3,500 | 12/17/14 | — | ||
| Citigroup | USD | 17 | HUF | 4,000 | 12/17/14 | — | ||
| Citigroup | USD | 27 | HUF | 6,500 | 12/17/14 | — | ||
| Citigroup | USD | 35 | HUF | 8,500 | 12/17/14 | — | ||
| Citigroup | USD | 39 | HUF | 9,500 | 12/17/14 | (1 | ) | |
| Citigroup | USD | 46 | HUF | 11,000 | 12/17/14 | (1 | ) | |
| Citigroup | USD | 54 | HUF | 13,000 | 12/17/14 | (1 | ) | |
| Citigroup | USD | 56 | HUF | 13,500 | 12/17/14 | (1 | ) | |
| Citigroup | USD | 60 | HUF | 14,500 | 12/17/14 | (1 | ) | |
| Citigroup | USD | 84 | HUF | 20,500 | 12/17/14 | — | ||
| Citigroup | USD | 99 | HUF | 24,000 | 12/17/14 | (1 | ) | |
| Citigroup | USD | 108 | HUF | 26,500 | 12/17/14 | — | ||
| Citigroup | USD | 137 | HUF | 33,500 | 12/17/14 | — | ||
| Citigroup | USD | 720 | HUF | 172,500 | 12/17/14 | (19 | ) | |
| Citigroup | USD | 8 | IDR | 100,000 | 12/17/14 | — | ||
| Citigroup | USD | 13 | IDR | 150,000 | 12/17/14 | — | ||
| Citigroup | USD | 21 | IDR | 250,000 | 12/17/14 | — | ||
| Citigroup | USD | 84 | IDR | 1,000,000 | 12/17/14 | (2 | ) | |
| Citigroup | USD | 95 | IDR | 1,150,000 | 12/17/14 | — | ||
| Citigroup | USD | 168 | IDR | 2,000,000 | 12/17/14 | (3 | ) | |
| Citigroup | USD | 1 | ILS | 5 | 12/17/14 | — | ||
| Citigroup | USD | 7 | ILS | 25 | 12/17/14 | — | ||
| See accompanying notes which are an integral part of the financial statements. | ||||||||
| 612 Russell Multi-Strategy Alternative Fund | ||||||||
Russell Investment Company
Russell Multi-Strategy Alternative Fund
Consolidated Schedule of Investments, continued — October 31, 2014
| Foreign Currency Exchange Contracts | ||||||||
| Amounts in thousands | ||||||||
| Unrealized | ||||||||
| Appreciation | ||||||||
| Amount | Amount | (Depreciation) | ||||||
| Counterparty | Sold | Bought | Settlement Date | $ | ||||
| Citigroup | USD | 15 | ILS | 55 | 12/17/14 | — | ||
| Citigroup | USD | 39 | ILS | 145 | 12/17/14 | (1 | ) | |
| Citigroup | USD | 1,730 | ILS | 6,444 | 12/17/14 | (34 | ) | |
| Citigroup | USD | 1,730 | ILS | 6,449 | 12/17/14 | (33 | ) | |
| Citigroup | USD | 1,730 | ILS | 6,448 | 12/17/14 | (33 | ) | |
| Citigroup | USD | 1,730 | ILS | 6,448 | 12/17/14 | (33 | ) | |
| Citigroup | USD | 1,730 | ILS | 6,444 | 12/17/14 | (34 | ) | |
| Citigroup | USD | 3,365 | ILS | 12,582 | 12/17/14 | (53 | ) | |
| Citigroup | USD | 3,450 | ILS | 12,933 | 12/17/14 | (46 | ) | |
| Citigroup | USD | 3,460 | ILS | 12,894 | 12/17/14 | (66 | ) | |
| Citigroup | USD | 8 | INR | 500 | 12/17/14 | — | ||
| Citigroup | USD | 16 | INR | 1,000 | 12/17/14 | — | ||
| Citigroup | USD | 24 | INR | 1,500 | 12/17/14 | — | ||
| Citigroup | USD | 24 | INR | 1,500 | 12/17/14 | — | ||
| Citigroup | USD | 41 | INR | 2,500 | 12/17/14 | — | ||
| Citigroup | USD | 65 | INR | 4,026 | 12/17/14 | — | ||
| Citigroup | USD | 73 | INR | 4,508 | 12/17/14 | (1 | ) | |
| Citigroup | USD | 73 | INR | 4,490 | 12/17/14 | (1 | ) | |
| Citigroup | USD | 92 | INR | 5,656 | 12/17/14 | — | ||
| Citigroup | USD | 92 | INR | 5,637 | 12/17/14 | (1 | ) | |
| Citigroup | USD | 92 | INR | 5,636 | 12/17/14 | (1 | ) | |
| Citigroup | USD | 92 | INR | 5,697 | 12/17/14 | — | ||
| Citigroup | USD | 33 | JPY | 3,500 | 12/17/14 | (2 | ) | |
| Citigroup | USD | 114 | JPY | 12,500 | 12/17/14 | (3 | ) | |
| Citigroup | USD | 119 | JPY | 13,000 | 12/17/14 | (4 | ) | |
| Citigroup | USD | 369 | JPY | 38,768 | 12/17/14 | (24 | ) | |
| Citigroup | USD | 399 | JPY | 41,353 | 12/17/14 | (30 | ) | |
| Citigroup | USD | 450 | JPY | 47,915 | 12/17/14 | (23 | ) | |
| Citigroup | USD | 512 | JPY | 54,374 | 12/17/14 | (28 | ) | |
| Citigroup | USD | 788 | JPY | 84,320 | 12/17/14 | (37 | ) | |
| Citigroup | USD | 873 | JPY | 94,034 | 12/17/14 | (36 | ) | |
| Citigroup | USD | 1,199 | JPY | 131,256 | 12/17/14 | (29 | ) | |
| Citigroup | USD | 1,233 | JPY | 133,756 | 12/17/14 | (42 | ) | |
| Citigroup | USD | 1,382 | JPY | 147,017 | 12/17/14 | (72 | ) | |
| Citigroup | USD | 1,488 | JPY | 160,469 | 12/17/14 | (58 | ) | |
| Citigroup | USD | 1,540 | JPY | 168,554 | 12/17/14 | (39 | ) | |
| Citigroup | USD | 1,879 | JPY | 203,128 | 12/17/14 | (70 | ) | |
| Citigroup | USD | 1,882 | JPY | 205,744 | 12/17/14 | (49 | ) | |
| Citigroup | USD | 2,639 | JPY | 279,540 | 12/17/14 | (150 | ) | |
| Citigroup | USD | 3,070 | JPY | 327,843 | 12/17/14 | (150 | ) | |
| Citigroup | USD | 3,406 | JPY | 364,351 | 12/17/14 | (161 | ) | |
| Citigroup | USD | 4,995 | JPY | 535,270 | 12/17/14 | (227 | ) | |
| Citigroup | USD | 60,661 | JPY | 6,506,661 | 12/17/14 | (2,707 | ) | |
| Citigroup | USD | 14 | KRW | 15,000 | 12/17/14 | — | ||
| Citigroup | USD | 34 | KRW | 35,000 | 12/17/14 | (1 | ) | |
| Citigroup | USD | 43 | KRW | 45,000 | 12/17/14 | (1 | ) | |
| Citigroup | USD | 108 | KRW | 115,000 | 12/17/14 | (1 | ) | |
| Citigroup | USD | 124 | KRW | 130,000 | 12/17/14 | (2 | ) | |
| Citigroup | USD | 203 | KRW | 215,000 | 12/17/14 | (2 | ) | |
| Citigroup | USD | 268 | KRW | 280,071 | 12/17/14 | (7 | ) | |
| Citigroup | USD | 324 | KRW | 340,000 | 12/17/14 | (7 | ) | |
| Citigroup | USD | 392 | KRW | 407,562 | 12/17/14 | (12 | ) | |
| Citigroup | USD | 392 | KRW | 401,083 | 12/17/14 | (18 | ) | |
| Citigroup | USD | 576 | KRW | 610,000 | 12/17/14 | (6 | ) | |
| Citigroup | USD | 629 | KRW | 644,425 | 12/17/14 | (27 | ) | |
| Citigroup | USD | 785 | KRW | 807,739 | 12/17/14 | (30 | ) | |
| Citigroup | USD | 785 | KRW | 799,119 | 12/17/14 | (39 | ) | |
| Citigroup | USD | 41 | MXN | 550 | 12/17/14 | (1 | ) | |
| Citigroup | USD | 46 | MXN | 600 | 12/17/14 | (1 | ) | |
| Citigroup | USD | 46 | MXN | 600 | 12/17/14 | (1 | ) | |
| Citigroup | USD | 65 | MXN | 850 | 12/17/14 | (2 | ) | |
| Citigroup | USD | 72 | MXN | 950 | 12/17/14 | (2 | ) | |
| Citigroup | USD | 152 | MXN | 2,000 | 12/17/14 | (4 | ) | |
| Citigroup | USD | 330 | MXN | 4,450 | 12/17/14 | — | ||
| Citigroup | USD | 527 | MXN | 6,950 | 12/17/14 | (13 | ) | |
| Citigroup | USD | 6,730 | MXN | 90,644 | 12/17/14 | (16 | ) | |
| Citigroup | USD | 85 | MYR | 272 | 12/17/14 | (3 | ) | |
| See accompanying notes which are an integral part of the financial statements. | ||||||||
| Russell Multi-Strategy Alternative Fund 613 | ||||||||
Russell Investment Company
Russell Multi-Strategy Alternative Fund
Consolidated Schedule of Investments, continued — October 31, 2014
| Foreign Currency Exchange Contracts | |||||||||
| Amounts in thousands | |||||||||
| Unrealized | |||||||||
| Appreciation | |||||||||
| Amount | Amount | (Depreciation) | |||||||
| Counterparty | Sold | Bought | Settlement Date | $ | |||||
| Citigroup | USD | 112 | MYR | 359 | 12/17/14 | (3 | ) | ||
| Citigroup | USD | 224 | MYR | 715 | 12/17/14 | (7 | ) | ||
| Citigroup | USD | 337 | MYR | 1,082 | 12/17/14 | (9 | ) | ||
| Citigroup | USD | 562 | MYR | 1,792 | 12/17/14 | (18 | ) | ||
| Citigroup | USD | 73 | NOK | 460 | 12/17/14 | (5 | ) | ||
| Citigroup | USD | 128 | NOK | 798 | 12/17/14 | (10 | ) | ||
| Citigroup | USD | 143 | NOK | 892 | 12/17/14 | (11 | ) | ||
| Citigroup | USD | 302 | NOK | 1,950 | 12/17/14 | (13 | ) | ||
| Citigroup | USD | 508 | NOK | 3,280 | 12/17/14 | (22 | ) | ||
| Citigroup | USD | 522 | NOK | 3,315 | 12/17/14 | (31 | ) | ||
| Citigroup | USD | 536 | NOK | 3,447 | 12/17/14 | (26 | ) | ||
| Citigroup | USD | 756 | NOK | 4,821 | 12/17/14 | (42 | ) | ||
| Citigroup | USD | 931 | NOK | 5,923 | 12/17/14 | (54 | ) | ||
| Citigroup | USD | 999 | NOK | 6,188 | 12/17/14 | (83 | ) | ||
| Citigroup | USD | 175 | NZD | 218 | 12/17/14 | (6 | ) | ||
| Citigroup | USD | 318 | NZD | 407 | 12/17/14 | (2 | ) | ||
| Citigroup | USD | 457 | NZD | 579 | 12/17/14 | (8 | ) | ||
| Citigroup | USD | 550 | NZD | 682 | 12/17/14 | (21 | ) | ||
| Citigroup | USD | 584 | NZD | 737 | 12/17/14 | (12 | ) | ||
| Citigroup | USD | 829 | NZD | 1,060 | 12/17/14 | (7 | ) | ||
| Citigroup | USD | 990 | NZD | 1,210 | 12/17/14 | (51 | ) | ||
| Citigroup | USD | 1,035 | NZD | 1,256 | 12/17/14 | (60 | ) | ||
| Citigroup | USD | 1,039 | NZD | 1,256 | 12/17/14 | (64 | ) | ||
| Citigroup | USD | 1,052 | NZD | 1,276 | 12/17/14 | (62 | ) | ||
| Citigroup | USD | 1,052 | NZD | 1,283 | 12/17/14 | (57 | ) | ||
| Citigroup | USD | 1,054 | NZD | 1,282 | 12/17/14 | (58 | ) | ||
| Citigroup | USD | 2,704 | NZD | 3,330 | 12/17/14 | (119 | ) | ||
| Citigroup | USD | 2,710 | NZD | 3,430 | 12/17/14 | (47 | ) | ||
| Citigroup | USD | 5,290 | NZD | 6,730 | 12/17/14 | (66 | ) | ||
| Citigroup | USD | 10,761 | NZD | 13,800 | 12/17/14 | (49 | ) | ||
| Citigroup | USD | 12,106 | NZD | 15,525 | 12/17/14 | (55 | ) | ||
| Citigroup | USD | 2 | PHP | 100 | 12/17/14 | — | |||
| Citigroup | USD | 16 | PHP | 700 | 12/17/14 | — | |||
| Citigroup | USD | 17 | PHP | 750 | 12/17/14 | — | |||
| Citigroup | USD | 26 | PHP | 1,150 | 12/17/14 | (1 | ) | ||
| Citigroup | USD | 85 | PHP | 3,700 | 12/17/14 | (2 | ) | ||
| Citigroup | USD | 6 | PLN | 20 | 12/17/14 | — | |||
| Citigroup | USD | 12 | PLN | 40 | 12/17/14 | — | |||
| Citigroup | USD | 32 | PLN | 105 | 12/17/14 | (1 | ) | ||
| Citigroup | USD | 80 | PLN | 265 | 12/17/14 | (2 | ) | ||
| Citigroup | USD | 88 | PLN | 286 | 12/17/14 | (3 | ) | ||
| Citigroup | USD | 111 | PLN | 364 | 12/17/14 | (3 | ) | ||
| Citigroup | USD | 117 | PLN | 384 | 12/17/14 | (3 | ) | ||
| Citigroup | USD | 118 | PLN | 381 | 12/17/14 | (5 | ) | ||
| Citigroup | USD | 1 | RUB | 50 | 12/17/14 | — | |||
| Citigroup | USD | 2 | RUB | 100 | 12/17/14 | — | |||
| Citigroup | USD | 4 | RUB | 150 | 12/17/14 | — | |||
| Citigroup | USD | 6 | RUB | 250 | 12/17/14 | — | |||
| Citigroup | USD | 7 | RUB | 250 | 12/17/14 | (1 | ) | ||
| Citigroup | USD | 7 | RUB | 300 | 12/17/14 | — | |||
| Citigroup | USD | 12 | RUB | 500 | 12/17/14 | — | |||
| Citigroup | USD | 12 | RUB | 500 | 12/17/14 | — | |||
| Citigroup | USD | 20 | RUB | 750 | 12/17/14 | (2 | ) | ||
| Citigroup | USD | 21 | RUB | 850 | 12/17/14 | (1 | ) | ||
| Citigroup | USD | 29 | RUB | 1,200 | 12/17/14 | (1 | ) | ||
| Citigroup | USD | 31 | RUB | 1,250 | 12/17/14 | (3 | ) | ||
| Citigroup | USD | 32 | RUB | 1,300 | 12/17/14 | (2 | ) | ||
| Citigroup | USD | 33 | RUB | 1,350 | 12/17/14 | (2 | ) | ||
| Citigroup | USD | 36 | RUB | 1,450 | 12/17/14 | (2 | ) | ||
| Citigroup | USD | 40 | RUB | 1,500 | 12/17/14 | (5 | ) | ||
| Citigroup | USD | 42 | RUB | 1,700 | 12/17/14 | (3 | ) | ||
| Citigroup | USD | 42 | RUB | 1,700 | 12/17/14 | (3 | ) | ||
| Citigroup | USD | 49 | RUB | 2,050 | 12/17/14 | (2 | ) | ||
| Citigroup | USD | 59 | RUB | 2,450 | 12/17/14 | (3 | ) | ||
| Citigroup | USD | 63 | RUB | 2,400 | 12/17/14 | (8 | ) | ||
| Citigroup | USD | 71 | RUB | 3,000 | 12/17/14 | (2 | ) | ||
| Citigroup | USD | 81 | RUB | 3,500 | 12/17/14 | — | |||
| See accompanying notes which are an integral part of the financial statements. | |||||||||
| 614 Russell Multi-Strategy Alternative Fund | |||||||||
Russell Investment Company
Russell Multi-Strategy Alternative Fund
Consolidated Schedule of Investments, continued — October 31, 2014
| Foreign Currency Exchange Contracts | ||||||||
| Amounts in thousands | ||||||||
| Unrealized | ||||||||
| Appreciation | ||||||||
| Amount | Amount | (Depreciation) | ||||||
| Counterparty | Sold | Bought | Settlement Date | $ | ||||
| Citigroup | USD | 110 | RUB | 4,150 | 12/17/14 | (15 | ) | |
| Citigroup | USD | 124 | RUB | 4,650 | 12/17/14 | (17 | ) | |
| Citigroup | USD | 128 | RUB | 5,500 | 12/17/14 | (2 | ) | |
| Citigroup | USD | 427 | RUB | 16,200 | 12/17/14 | (55 | ) | |
| Citigroup | USD | 5 | SEK | 38 | 12/17/14 | — | ||
| Citigroup | USD | 45 | SEK | 318 | 12/17/14 | (2 | ) | |
| Citigroup | USD | 180 | SEK | 1,277 | 12/17/14 | (7 | ) | |
| Citigroup | USD | 186 | SEK | 1,315 | 12/17/14 | (8 | ) | |
| Citigroup | USD | 207 | SEK | 1,449 | 12/17/14 | (11 | ) | |
| Citigroup | USD | 209 | SEK | 1,509 | 12/17/14 | (5 | ) | |
| Citigroup | USD | 240 | SEK | 1,723 | 12/17/14 | (7 | ) | |
| Citigroup | USD | 264 | SEK | 1,829 | 12/17/14 | (16 | ) | |
| Citigroup | USD | 531 | SEK | 3,790 | 12/17/14 | (18 | ) | |
| Citigroup | USD | 543 | SEK | 3,913 | 12/17/14 | (13 | ) | |
| Citigroup | USD | 607 | SEK | 4,332 | 12/17/14 | (20 | ) | |
| Citigroup | USD | 658 | SEK | 4,705 | 12/17/14 | (21 | ) | |
| Citigroup | USD | 710 | SEK | 5,141 | 12/17/14 | (13 | ) | |
| Citigroup | USD | 991 | SEK | 7,136 | 12/17/14 | (25 | ) | |
| Citigroup | USD | 1,092 | SEK | 7,865 | 12/17/14 | (27 | ) | |
| Citigroup | USD | 106 | SGD | 135 | 12/17/14 | (1 | ) | |
| Citigroup | USD | 235 | SGD | 300 | 12/17/14 | (1 | ) | |
| Citigroup | USD | 698 | SGD | 873 | 12/17/14 | (18 | ) | |
| Citigroup | USD | 2,664 | SGD | 3,342 | 12/17/14 | (63 | ) | |
| Citigroup | USD | 29 | TRY | 65 | 12/17/14 | — | ||
| Citigroup | USD | 41 | TRY | 90 | 12/17/14 | (1 | ) | |
| Citigroup | USD | 43 | TRY | 95 | 12/17/14 | (1 | ) | |
| Citigroup | USD | 59 | TRY | 130 | 12/17/14 | (1 | ) | |
| Citigroup | USD | 63 | TRY | 140 | 12/17/14 | (1 | ) | |
| Citigroup | USD | 85 | TRY | 190 | 12/17/14 | — | ||
| Citigroup | USD | 86 | TRY | 195 | 12/17/14 | 1 | ||
| Citigroup | USD | 88 | TRY | 200 | 12/17/14 | 1 | ||
| Citigroup | USD | 95 | TRY | 215 | 12/17/14 | 1 | ||
| Citigroup | USD | 117 | TRY | 265 | 12/17/14 | 1 | ||
| Citigroup | USD | 122 | TRY | 270 | 12/17/14 | (2 | ) | |
| Citigroup | USD | 158 | TRY | 350 | 12/17/14 | (3 | ) | |
| Citigroup | USD | 444 | TRY | 990 | 12/17/14 | (3 | ) | |
| Citigroup | USD | 7 | TWD | 200 | 12/17/14 | — | ||
| Citigroup | USD | 52 | TWD | 1,550 | 12/17/14 | (1 | ) | |
| Citigroup | USD | 85 | TWD | 2,550 | 12/17/14 | (2 | ) | |
| Citigroup | USD | 125 | TWD | 3,800 | 12/17/14 | — | ||
| Citigroup | USD | 156 | TWD | 4,650 | 12/17/14 | (3 | ) | |
| Citigroup | USD | 193 | TWD | 5,750 | 12/17/14 | (4 | ) | |
| Citigroup | USD | 14 | ZAR | 150 | 12/17/14 | — | ||
| Citigroup | USD | 14 | ZAR | 150 | 12/17/14 | — | ||
| Citigroup | USD | 18 | ZAR | 200 | 12/17/14 | — | ||
| Citigroup | USD | 18 | ZAR | 200 | 12/17/14 | — | ||
| Citigroup | USD | 23 | ZAR | 250 | 12/17/14 | — | ||
| Citigroup | USD | 28 | ZAR | 300 | 12/17/14 | (1 | ) | |
| Citigroup | USD | 45 | ZAR | 504 | 12/17/14 | — | ||
| Citigroup | USD | 49 | ZAR | 550 | 12/17/14 | 1 | ||
| Citigroup | USD | 50 | ZAR | 546 | 12/17/14 | (1 | ) | |
| Citigroup | USD | 62 | ZAR | 700 | 12/17/14 | 1 | ||
| Citigroup | USD | 64 | ZAR | 700 | 12/17/14 | (1 | ) | |
| Citigroup | USD | 65 | ZAR | 700 | 12/17/14 | (2 | ) | |
| Citigroup | USD | 73 | ZAR | 800 | 12/17/14 | (1 | ) | |
| Citigroup | USD | 81 | ZAR | 900 | 12/17/14 | — | ||
| Citigroup | USD | 89 | ZAR | 1,000 | 12/17/14 | 1 | ||
| Citigroup | USD | 100 | ZAR | 1,100 | 12/17/14 | (1 | ) | |
| Citigroup | USD | 126 | ZAR | 1,400 | 12/17/14 | — | ||
| Citigroup | USD | 130 | ZAR | 1,450 | 12/17/14 | — | ||
| Citigroup | USD | 161 | ZAR | 1,800 | 12/17/14 | 1 | ||
| Citigroup | USD | 197 | ZAR | 2,150 | 12/17/14 | (3 | ) | |
| Citigroup | AUD | 3,430 | JPY | 321,904 | 12/17/14 | (142 | ) | |
| Citigroup | AUD | 1 | USD | — | 12/17/14 | — | ||
| Citigroup | AUD | 10 | USD | 9 | 12/17/14 | — | ||
| Citigroup | AUD | 10 | USD | 9 | 12/17/14 | — | ||
| Citigroup | AUD | 30 | USD | 26 | 12/17/14 | — | ||
| See accompanying notes which are an integral part of the financial statements. | ||||||||
| Russell Multi-Strategy Alternative Fund 615 | ||||||||
Russell Investment Company
Russell Multi-Strategy Alternative Fund
Consolidated Schedule of Investments, continued — October 31, 2014
| Foreign Currency Exchange Contracts | |||||||||
| Amounts in thousands | |||||||||
| Unrealized | |||||||||
| Appreciation | |||||||||
| Amount | Amount | (Depreciation) | |||||||
| Counterparty | Sold | Bought | Settlement Date | $ | |||||
| Citigroup | AUD | 51 | USD | 44 | 12/17/14 | — | |||
| Citigroup | AUD | 56 | USD | 52 | 12/17/14 | 3 | |||
| Citigroup | AUD | 85 | USD | 74 | 12/17/14 | (1 | ) | ||
| Citigroup | AUD | 95 | USD | 87 | 12/17/14 | 4 | |||
| Citigroup | AUD | 190 | USD | 165 | 12/17/14 | (1 | ) | ||
| Citigroup | AUD | 201 | USD | 182 | 12/17/14 | 6 | |||
| Citigroup | AUD | 232 | USD | 206 | 12/17/14 | 3 | |||
| Citigroup | AUD | 263 | USD | 228 | 12/17/14 | (3 | ) | ||
| Citigroup | AUD | 294 | USD | 262 | 12/17/14 | 5 | |||
| Citigroup | AUD | 319 | USD | 289 | 12/17/14 | 9 | |||
| Citigroup | AUD | 332 | USD | 290 | 12/17/14 | (1 | ) | ||
| Citigroup | AUD | 338 | USD | 294 | 12/17/14 | (2 | ) | ||
| Citigroup | AUD | 338 | USD | 294 | 12/17/14 | (2 | ) | ||
| Citigroup | AUD | 344 | USD | 309 | 12/17/14 | 8 | |||
| Citigroup | AUD | 351 | USD | 306 | 12/17/14 | (2 | ) | ||
| Citigroup | AUD | 454 | USD | 396 | 12/17/14 | (2 | ) | ||
| Citigroup | AUD | 487 | USD | 436 | 12/17/14 | 9 | |||
| Citigroup | AUD | 491 | USD | 433 | 12/17/14 | 3 | |||
| Citigroup | AUD | 547 | USD | 493 | 12/17/14 | 13 | |||
| Citigroup | AUD | 554 | USD | 485 | 12/17/14 | (1 | ) | ||
| Citigroup | AUD | 563 | USD | 492 | 12/17/14 | (2 | ) | ||
| Citigroup | AUD | 1,176 | USD | 1,037 | 12/17/14 | 6 | |||
| Citigroup | AUD | 1,224 | USD | 1,081 | 12/17/14 | 7 | |||
| Citigroup | AUD | 6,730 | USD | 5,917 | 12/17/14 | 12 | |||
| Citigroup | BRL | 8,710 | USD | 3,450 | 11/07/14 | (62 | ) | ||
| Citigroup | BRL | 5 | USD | 2 | 12/17/14 | — | |||
| Citigroup | BRL | 10 | USD | 4 | 12/17/14 | — | |||
| Citigroup | BRL | 20 | USD | 8 | 12/17/14 | — | |||
| Citigroup | BRL | 25 | USD | 10 | 12/17/14 | — | |||
| Citigroup | BRL | 35 | USD | 14 | 12/17/14 | — | |||
| Citigroup | BRL | 40 | USD | 16 | 12/17/14 | — | |||
| Citigroup | BRL | 40 | USD | 17 | 12/17/14 | 1 | |||
| Citigroup | BRL | 45 | USD | 18 | 12/17/14 | — | |||
| Citigroup | BRL | 50 | USD | 20 | 12/17/14 | — | |||
| Citigroup | BRL | 75 | USD | 31 | 12/17/14 | 2 | |||
| Citigroup | BRL | 75 | USD | 30 | 12/17/14 | 1 | |||
| Citigroup | BRL | 85 | USD | 35 | 12/17/14 | 2 | |||
| Citigroup | BRL | 105 | USD | 42 | 12/17/14 | — | |||
| Citigroup | BRL | 120 | USD | 49 | 12/17/14 | 1 | |||
| Citigroup | BRL | 125 | USD | 51 | 12/17/14 | 2 | |||
| Citigroup | BRL | 130 | USD | 53 | 12/17/14 | 1 | |||
| Citigroup | BRL | 185 | USD | 74 | 12/17/14 | 1 | |||
| Citigroup | BRL | 185 | USD | 75 | 12/17/14 | 2 | |||
| Citigroup | BRL | 245 | USD | 102 | 12/17/14 | 4 | |||
| Citigroup | BRL | 280 | USD | 117 | 12/17/14 | 5 | |||
| Citigroup | BRL | 1,340 | USD | 581 | 12/17/14 | 47 | |||
| Citigroup | CAD | 27 | USD | 24 | 12/17/14 | 1 | |||
| Citigroup | CAD | 27 | USD | 24 | 12/17/14 | 1 | |||
| Citigroup | CAD | 79 | USD | �� | 70 | 12/17/14 | 1 | ||
| Citigroup | CAD | 83 | USD | 73 | 12/17/14 | — | |||
| Citigroup | CAD | 93 | USD | 83 | 12/17/14 | 1 | |||
| Citigroup | CAD | 93 | USD | 83 | 12/17/14 | 1 | |||
| Citigroup | CAD | 100 | USD | 89 | 12/17/14 | 1 | |||
| Citigroup | CAD | 173 | USD | 155 | 12/17/14 | 1 | |||
| Citigroup | CAD | 181 | USD | 162 | 12/17/14 | 2 | |||
| Citigroup | CAD | 227 | USD | 204 | 12/17/14 | 3 | |||
| Citigroup | CAD | 278 | USD | 247 | 12/17/14 | 1 | |||
| Citigroup | CAD | 324 | USD | 287 | 12/17/14 | — | |||
| Citigroup | CAD | 365 | USD | 323 | 12/17/14 | — | |||
| Citigroup | CAD | 389 | USD | 352 | 12/17/14 | 8 | |||
| Citigroup | CAD | 421 | USD | 370 | 12/17/14 | (3 | ) | ||
| Citigroup | CAD | 537 | USD | 491 | 12/17/14 | 15 | |||
| Citigroup | CAD | 583 | USD | 524 | 12/17/14 | 8 | |||
| Citigroup | CAD | 650 | USD | 574 | 12/17/14 | (2 | ) | ||
| Citigroup | CAD | 836 | USD | 742 | 12/17/14 | 2 | |||
| Citigroup | CAD | 928 | USD | 850 | 12/17/14 | 28 | |||
| Citigroup | CAD | 1,062 | USD | 978 | 12/17/14 | 37 | |||
| See accompanying notes which are an integral part of the financial statements. | |||||||||
| 616 Russell Multi-Strategy Alternative Fund | |||||||||
Russell Investment Company
Russell Multi-Strategy Alternative Fund
Consolidated Schedule of Investments, continued — October 31, 2014
| Foreign Currency Exchange Contracts | |||||||
| Amounts in thousands | |||||||
| Unrealized | |||||||
| Appreciation | |||||||
| Amount | Amount | (Depreciation) | |||||
| Counterparty | Sold | Bought | Settlement Date | $ | |||
| Citigroup | CAD | 1,334 | USD | 1,221 | 12/17/14 | 39 | |
| Citigroup | CAD | 1,342 | USD | 1,229 | 12/17/14 | 40 | |
| Citigroup | CAD | 3,872 | USD | 3,450 | 12/17/14 | 18 | |
| Citigroup | CHF | 10 | USD | 10 | 12/17/14 | — | |
| Citigroup | CHF | 10 | USD | 10 | 12/17/14 | — | |
| Citigroup | CHF | 16 | USD | 18 | 12/17/14 | 1 | |
| Citigroup | CLP | 20,000 | USD | 33 | 12/17/14 | (2 | ) |
| Citigroup | CLP | 40,952 | USD | 69 | 12/17/14 | (2 | ) |
| Citigroup | CLP | 58,944 | USD | 99 | 12/17/14 | (3 | ) |
| Citigroup | CLP | 58,944 | USD | 100 | 12/17/14 | (2 | ) |
| Citigroup | CLP | 60,283 | USD | 101 | 12/17/14 | (4 | ) |
| Citigroup | CLP | 80,378 | USD | 135 | 12/17/14 | (4 | ) |
| Citigroup | COP | 1,044,143 | USD | 509 | 11/05/14 | 2 | |
| Citigroup | COP | 5,000 | USD | 2 | 12/17/14 | — | |
| Citigroup | COP | 5,000 | USD | 3 | 12/17/14 | — | |
| Citigroup | COP | 5,000 | USD | 3 | 12/17/14 | — | |
| Citigroup | COP | 15,000 | USD | 8 | 12/17/14 | — | |
| Citigroup | COP | 20,000 | USD | 10 | 12/17/14 | — | |
| Citigroup | COP | 20,000 | USD | 10 | 12/17/14 | — | |
| Citigroup | COP | 25,000 | USD | 12 | 12/17/14 | — | |
| Citigroup | COP | 30,000 | USD | 15 | 12/17/14 | — | |
| Citigroup | COP | 40,000 | USD | 20 | 12/17/14 | — | |
| Citigroup | COP | 45,000 | USD | 22 | 12/17/14 | 1 | |
| Citigroup | COP | 100,000 | USD | 50 | 12/17/14 | 1 | |
| Citigroup | COP | 155,000 | USD | 76 | 12/17/14 | 1 | |
| Citigroup | COP | 520,000 | USD | 267 | 12/17/14 | 16 | |
| Citigroup | CZK | 100 | USD | 5 | 12/17/14 | — | |
| Citigroup | CZK | 150 | USD | 7 | 12/17/14 | — | |
| Citigroup | CZK | 400 | USD | 19 | 12/17/14 | 1 | |
| Citigroup | CZK | 400 | USD | 19 | 12/17/14 | 1 | |
| Citigroup | CZK | 550 | USD | 25 | 12/17/14 | — | |
| Citigroup | CZK | 1,100 | USD | 51 | 12/17/14 | 1 | |
| Citigroup | CZK | 3,150 | USD | 144 | 12/17/14 | 2 | |
| Citigroup | CZK | 3,300 | USD | 151 | 12/17/14 | 2 | |
| Citigroup | CZK | 3,500 | USD | 160 | 12/17/14 | 3 | |
| Citigroup | CZK | 9,831 | USD | 461 | 12/17/14 | 18 | |
| Citigroup | CZK | 13,140 | USD | 620 | 12/17/14 | 27 | |
| Citigroup | CZK | 13,140 | USD | 621 | 12/17/14 | 28 | |
| Citigroup | CZK | 13,140 | USD | 618 | 12/17/14 | 26 | |
| Citigroup | EUR | 3,430 | GBP | 2,704 | 12/17/14 | 24 | |
| Citigroup | EUR | 3,430 | GBP | 2,707 | 12/17/14 | 29 | |
| Citigroup | EUR | 3,430 | GBP | 2,704 | 12/17/14 | 24 | |
| Citigroup | EUR | 15,738 | GBP | 12,512 | 12/17/14 | 281 | |
| Citigroup | EUR | 15 | USD | 19 | 12/17/14 | 1 | |
| Citigroup | EUR | 45 | USD | 59 | 12/17/14 | 3 | |
| Citigroup | EUR | 92 | USD | 118 | 12/17/14 | 3 | |
| Citigroup | EUR | 195 | USD | 253 | 12/17/14 | 8 | |
| Citigroup | EUR | 199 | USD | 253 | 12/17/14 | 4 | |
| Citigroup | EUR | 207 | USD | 266 | 12/17/14 | 7 | |
| Citigroup | EUR | 247 | USD | 315 | 12/17/14 | 5 | |
| Citigroup | EUR | 382 | USD | 493 | 12/17/14 | 14 | |
| Citigroup | EUR | 384 | USD | 487 | 12/17/14 | 6 | |
| Citigroup | EUR | 400 | USD | 506 | 12/17/14 | 5 | |
| Citigroup | EUR | 454 | USD | 597 | 12/17/14 | 28 | |
| Citigroup | EUR | 455 | USD | 588 | 12/17/14 | 17 | |
| Citigroup | EUR | 462 | USD | 599 | 12/17/14 | 19 | |
| Citigroup | EUR | 468 | USD | 614 | 12/17/14 | 28 | |
| Citigroup | EUR | 474 | USD | 619 | 12/17/14 | 24 | |
| Citigroup | EUR | 474 | USD | 615 | 12/17/14 | 21 | |
| Citigroup | EUR | 560 | USD | 738 | 12/17/14 | 35 | |
| Citigroup | EUR | 641 | USD | 814 | 12/17/14 | 11 | |
| Citigroup | EUR | 786 | USD | 992 | 12/17/14 | 6 | |
| Citigroup | EUR | 948 | USD | 1,230 | 12/17/14 | 41 | |
| Citigroup | EUR | 1,105 | USD | 1,399 | 12/17/14 | 14 | |
| Citigroup | EUR | 1,185 | USD | 1,525 | 12/17/14 | 40 | |
| Citigroup | EUR | 1,476 | USD | 1,865 | 12/17/14 | 14 | |
| Citigroup | EUR | 1,565 | USD | 2,066 | 12/17/14 | 105 | |
| See accompanying notes which are an integral part of the financial statements. | |||||||
| Russell Multi-Strategy Alternative Fund 617 | |||||||
Russell Investment Company
Russell Multi-Strategy Alternative Fund
Consolidated Schedule of Investments, continued — October 31, 2014
| Foreign Currency Exchange Contracts | ||||||||
| Amounts in thousands | ||||||||
| Unrealized | ||||||||
| Appreciation | ||||||||
| Amount | Amount | (Depreciation) | ||||||
| Counterparty | Sold | Bought | Settlement Date | $ | ||||
| Citigroup | EUR | 2,114 | USD | 2,737 | 12/17/14 | 87 | ||
| Citigroup | EUR | 2,127 | USD | 2,728 | 12/17/14 | 62 | ||
| Citigroup | EUR | 2,183 | USD | 2,805 | 12/17/14 | 69 | ||
| Citigroup | EUR | 3,360 | USD | 4,339 | 12/17/14 | 128 | ||
| Citigroup | EUR | 3,360 | USD | 4,336 | 12/17/14 | 125 | ||
| Citigroup | EUR | 3,360 | USD | 4,330 | 12/17/14 | 118 | ||
| Citigroup | EUR | 3,430 | USD | 4,345 | 12/17/14 | 45 | ||
| Citigroup | EUR | 3,430 | USD | 4,339 | 12/17/14 | 39 | ||
| Citigroup | EUR | 6,720 | USD | 8,665 | 12/17/14 | 242 | ||
| Citigroup | EUR | 6,860 | USD | 8,670 | 12/17/14 | 71 | ||
| Citigroup | EUR | 6,860 | USD | 8,676 | 12/17/14 | 77 | ||
| Citigroup | EUR | 6,860 | USD | 8,676 | 12/17/14 | 77 | ||
| Citigroup | EUR | 8,575 | USD | 10,896 | 12/17/14 | 147 | ||
| Citigroup | EUR | 9,744 | USD | 12,352 | 12/17/14 | 138 | ||
| Citigroup | EUR | 9,744 | USD | 12,311 | 12/17/14 | 97 | ||
| Citigroup | EUR | 10,290 | USD | 13,069 | 12/17/14 | 170 | ||
| Citigroup | EUR | 32,126 | USD | 41,526 | 12/17/14 | 1,257 | ||
| Citigroup | EUR | 33,300 | USD | 43,132 | 12/17/14 | 1,391 | ||
| Citigroup | GBP | 5,411 | EUR | 6,900 | 12/17/14 | (4 | ) | |
| Citigroup | GBP | 10,351 | EUR | 13,240 | 12/17/14 | 44 | ||
| Citigroup | GBP | 10,352 | EUR | 13,240 | 12/17/14 | 41 | ||
| Citigroup | GBP | 10,354 | EUR | 13,240 | 12/17/14 | 38 | ||
| Citigroup | GBP | 5 | USD | 8 | 12/17/14 | — | ||
| Citigroup | GBP | 57 | USD | 92 | 12/17/14 | 1 | ||
| Citigroup | GBP | 93 | USD | 153 | 12/17/14 | 4 | ||
| Citigroup | GBP | 93 | USD | 150 | 12/17/14 | 1 | ||
| Citigroup | GBP | 147 | USD | 237 | 12/17/14 | 2 | ||
| Citigroup | GBP | 175 | USD | 282 | 12/17/14 | 3 | ||
| Citigroup | GBP | 213 | USD | 346 | 12/17/14 | 7 | ||
| Citigroup | GBP | 260 | USD | 421 | 12/17/14 | 6 | ||
| Citigroup | GBP | 288 | USD | 462 | 12/17/14 | 3 | ||
| Citigroup | GBP | 289 | USD | 466 | 12/17/14 | 4 | ||
| Citigroup | GBP | 436 | USD | 696 | 12/17/14 | (1 | ) | |
| Citigroup | GBP | 438 | USD | 704 | 12/17/14 | 4 | ||
| Citigroup | GBP | 451 | USD | 724 | 12/17/14 | 2 | ||
| Citigroup | GBP | 478 | USD | 767 | 12/17/14 | 3 | ||
| Citigroup | GBP | 532 | USD | 857 | 12/17/14 | 7 | ||
| Citigroup | GBP | 702 | USD | 1,116 | 12/17/14 | (6 | ) | |
| Citigroup | GBP | 711 | USD | 1,145 | 12/17/14 | 9 | ||
| Citigroup | GBP | 834 | USD | 1,333 | 12/17/14 | (1 | ) | |
| Citigroup | GBP | 949 | USD | 1,516 | 12/17/14 | (1 | ) | |
| Citigroup | GBP | 1,075 | USD | 1,752 | 12/17/14 | 33 | ||
| Citigroup | GBP | 3,480 | USD | 5,589 | 12/17/14 | 24 | ||
| Citigroup | HUF | 310,000 | USD | 1,288 | 12/17/14 | 28 | ||
| Citigroup | IDR | 50,000 | USD | 4 | 12/17/14 | — | ||
| Citigroup | IDR | 150,000 | USD | 12 | 12/17/14 | — | ||
| Citigroup | IDR | 250,000 | USD | 20 | 12/17/14 | — | ||
| Citigroup | IDR | 250,000 | USD | 20 | 12/17/14 | — | ||
| Citigroup | IDR | 300,000 | USD | 24 | 12/17/14 | — | ||
| Citigroup | IDR | 450,000 | USD | 36 | 12/17/14 | (1 | ) | |
| Citigroup | IDR | 650,000 | USD | 52 | 12/17/14 | (1 | ) | |
| Citigroup | IDR | 2,350,000 | USD | 196 | 12/17/14 | 3 | ||
| Citigroup | ILS | 147 | USD | 41 | 11/05/14 | 2 | ||
| Citigroup | ILS | 197 | USD | 55 | 11/05/14 | 3 | ||
| Citigroup | ILS | 10 | USD | 3 | 12/17/14 | — | ||
| Citigroup | ILS | 15 | USD | 4 | 12/17/14 | — | ||
| Citigroup | ILS | 30 | USD | 8 | 12/17/14 | — | ||
| Citigroup | ILS | 45 | USD | 12 | 12/17/14 | — | ||
| Citigroup | ILS | 45 | USD | 12 | 12/17/14 | — | ||
| Citigroup | ILS | 60 | USD | 16 | 12/17/14 | 1 | ||
| Citigroup | ILS | 75 | USD | 20 | 12/17/14 | 1 | ||
| Citigroup | ILS | 80 | USD | 22 | 12/17/14 | 1 | ||
| Citigroup | ILS | 100 | USD | 28 | 12/17/14 | 1 | ||
| Citigroup | ILS | 105 | USD | 29 | 12/17/14 | 1 | ||
| Citigroup | ILS | 125 | USD | 34 | 12/17/14 | 1 | ||
| Citigroup | ILS | 140 | USD | 39 | 12/17/14 | 2 | ||
| Citigroup | ILS | 185 | USD | 52 | 12/17/14 | 3 | ||
| See accompanying notes which are an integral part of the financial statements. | ||||||||
| 618 Russell Multi-Strategy Alternative Fund | ||||||||
Russell Investment Company
Russell Multi-Strategy Alternative Fund
Consolidated Schedule of Investments, continued — October 31, 2014
| Foreign Currency Exchange Contracts | |||||||
| Amounts in thousands | |||||||
| Unrealized | |||||||
| Appreciation | |||||||
| Amount | Amount | (Depreciation) | |||||
| Counterparty | Sold | Bought | Settlement Date | $ | |||
| Citigroup | ILS | 480 | USD | 134 | 12/17/14 | 8 | |
| Citigroup | JPY | 319,107 | AUD | 3,430 | 12/17/14 | 167 | |
| Citigroup | JPY | 319,264 | AUD | 3,430 | 12/17/14 | 166 | |
| Citigroup | JPY | 747,898 | USD | 6,730 | 11/05/14 | 72 | |
| Citigroup | JPY | 1,554 | USD | 14 | 12/17/14 | 1 | |
| Citigroup | JPY | 4,478 | USD | 42 | 12/17/14 | 2 | |
| Citigroup | JPY | 4,995 | USD | 46 | 12/17/14 | 2 | |
| Citigroup | JPY | 4,995 | USD | 46 | 12/17/14 | 2 | |
| Citigroup | JPY | 4,995 | USD | 46 | 12/17/14 | 2 | |
| Citigroup | JPY | 4,995 | USD | 46 | 12/17/14 | 2 | |
| Citigroup | JPY | 4,995 | USD | 46 | 12/17/14 | 2 | |
| Citigroup | JPY | 7,600 | USD | 70 | 12/17/14 | 2 | |
| Citigroup | JPY | 11,000 | USD | 101 | 12/17/14 | 3 | |
| Citigroup | JPY | 18,898 | USD | 177 | 12/17/14 | 8 | |
| Citigroup | JPY | 28,677 | USD | 273 | 12/17/14 | 18 | |
| Citigroup | JPY | 39,017 | USD | 364 | 12/17/14 | 16 | |
| Citigroup | JPY | 45,173 | USD | 416 | 12/17/14 | 14 | |
| Citigroup | JPY | 52,849 | USD | 493 | 12/17/14 | 22 | |
| Citigroup | JPY | 53,837 | USD | 513 | 12/17/14 | 34 | |
| Citigroup | JPY | 55,369 | USD | 512 | 12/17/14 | 19 | |
| Citigroup | JPY | 57,875 | USD | 536 | 12/17/14 | 21 | |
| Citigroup | JPY | 76,463 | USD | 714 | 12/17/14 | 33 | |
| Citigroup | JPY | 101,701 | USD | 942 | 12/17/14 | 36 | |
| Citigroup | JPY | 115,416 | USD | 1,070 | 12/17/14 | 42 | |
| Citigroup | JPY | 134,324 | USD | 1,255 | 12/17/14 | 59 | |
| Citigroup | JPY | 151,738 | USD | 1,393 | 12/17/14 | 42 | |
| Citigroup | JPY | 216,244 | USD | 1,991 | 12/17/14 | 65 | |
| Citigroup | JPY | 233,687 | USD | 2,204 | 12/17/14 | 122 | |
| Citigroup | JPY | 295,084 | USD | 2,811 | 12/17/14 | 183 | |
| Citigroup | JPY | 343,098 | USD | 3,072 | 12/17/14 | 16 | |
| Citigroup | JPY | 343,310 | USD | 3,278 | 12/17/14 | 220 | |
| Citigroup | JPY | 344,702 | USD | 3,278 | 12/17/14 | 207 | |
| Citigroup | JPY | 345,013 | USD | 3,278 | 12/17/14 | 205 | |
| Citigroup | JPY | 346,373 | USD | 3,263 | 12/17/14 | 178 | |
| Citigroup | JPY | 346,414 | USD | 3,307 | 12/17/14 | 222 | |
| Citigroup | JPY | 377,826 | USD | 3,480 | 12/17/14 | 115 | |
| Citigroup | JPY | 515,175 | USD | 4,802 | 12/17/14 | 213 | |
| Citigroup | JPY | 538,456 | USD | 4,995 | 12/17/14 | 199 | |
| Citigroup | JPY | 538,880 | USD | 4,995 | 12/17/14 | 195 | |
| Citigroup | JPY | 539,045 | USD | 4,995 | 12/17/14 | 194 | |
| Citigroup | JPY | 539,269 | USD | 4,995 | 12/17/14 | 192 | |
| Citigroup | JPY | 539,289 | USD | 4,995 | 12/17/14 | 192 | |
| Citigroup | JPY | 539,384 | USD | 4,995 | 12/17/14 | 191 | |
| Citigroup | JPY | 547,580 | USD | 5,040 | 12/17/14 | 163 | |
| Citigroup | JPY | 732,766 | USD | 6,730 | 12/17/14 | 203 | |
| Citigroup | JPY | 754,273 | USD | 6,730 | 12/17/14 | 12 | |
| Citigroup | JPY | 1,461,382 | USD | 13,460 | 12/17/14 | 444 | |
| Citigroup | KRW | 15,000 | USD | 14 | 12/17/14 | — | |
| Citigroup | KRW | 15,000 | USD | 15 | 12/17/14 | 1 | |
| Citigroup | KRW | 15,000 | USD | 14 | 12/17/14 | — | |
| Citigroup | KRW | 20,000 | USD | 19 | 12/17/14 | — | |
| Citigroup | KRW | 25,000 | USD | 24 | 12/17/14 | 1 | |
| Citigroup | KRW | 35,000 | USD | 33 | 12/17/14 | — | |
| Citigroup | KRW | 45,000 | USD | 44 | 12/17/14 | 2 | |
| Citigroup | KRW | 60,000 | USD | 58 | 12/17/14 | 2 | |
| Citigroup | KRW | 60,000 | USD | 59 | 12/17/14 | 3 | |
| Citigroup | KRW | 85,000 | USD | 83 | 12/17/14 | 4 | |
| Citigroup | KRW | 90,000 | USD | 84 | 12/17/14 | — | |
| Citigroup | KRW | 105,000 | USD | 99 | 12/17/14 | 1 | |
| Citigroup | KRW | 105,000 | USD | 98 | 12/17/14 | — | |
| Citigroup | KRW | 170,000 | USD | 161 | 12/17/14 | 2 | |
| Citigroup | KRW | 240,000 | USD | 223 | 12/17/14 | (1 | ) |
| Citigroup | KRW | 275,000 | USD | 256 | 12/17/14 | — | |
| Citigroup | KRW | 350,000 | USD | 326 | 12/17/14 | (1 | ) |
| Citigroup | KRW | 640,000 | USD | 597 | 12/17/14 | — | |
| Citigroup | KRW | 1,695,000 | USD | 1,662 | 12/17/14 | 79 | |
| Citigroup | MXN | 150 | USD | 11 | 12/17/14 | — | |
| See accompanying notes which are an integral part of the financial statements. | |||||||
| Russell Multi-Strategy Alternative Fund 619 | |||||||
Russell Investment Company
Russell Multi-Strategy Alternative Fund
Consolidated Schedule of Investments, continued — October 31, 2014
| Foreign Currency Exchange Contracts | |||||||||
| Amounts in thousands | |||||||||
| Unrealized | |||||||||
| Appreciation | |||||||||
| Amount | Amount | (Depreciation) | |||||||
| Counterparty | Sold | Bought | Settlement Date | $ | |||||
| Citigroup | MXN | 300 | USD | 22 | 12/17/14 | — | |||
| Citigroup | MXN | 400 | USD | 29 | 12/17/14 | — | |||
| Citigroup | MXN | 400 | USD | 30 | 12/17/14 | — | |||
| Citigroup | MXN | 400 | USD | 30 | 12/17/14 | — | |||
| Citigroup | MXN | 500 | USD | 37 | 12/17/14 | — | |||
| Citigroup | MXN | 600 | USD | 44 | 12/17/14 | — | |||
| Citigroup | MXN | 700 | USD | 52 | 12/17/14 | — | |||
| Citigroup | MXN | 850 | USD | 64 | 12/17/14 | 1 | |||
| Citigroup | MXN | 850 | USD | 64 | 12/17/14 | 1 | |||
| Citigroup | MXN | 1,000 | USD | 75 | 12/17/14 | 1 | |||
| Citigroup | MXN | 1,094 | USD | 82 | 12/17/14 | 1 | |||
| Citigroup | MXN | 1,094 | USD | 82 | 12/17/14 | 1 | |||
| Citigroup | MXN | 1,300 | USD | 97 | 12/17/14 | — | |||
| Citigroup | MXN | 1,353 | USD | 103 | 12/17/14 | 3 | |||
| Citigroup | MXN | 1,360 | USD | 102 | 12/17/14 | 2 | |||
| Citigroup | MXN | 1,363 | USD | 104 | 12/17/14 | 3 | |||
| Citigroup | MXN | 1,550 | USD | 116 | 12/17/14 | 1 | |||
| Citigroup | MXN | 1,631 | USD | 124 | 12/17/14 | 3 | |||
| Citigroup | MXN | 1,650 | USD | 124 | 12/17/14 | 2 | |||
| Citigroup | MXN | 1,900 | USD | 144 | 12/17/14 | 3 | |||
| Citigroup | MXN | 2,350 | USD | 173 | 12/17/14 | (1 | ) | ||
| Citigroup | MXN | 2,705 | USD | 206 | 12/17/14 | 5 | |||
| Citigroup | MXN | 3,050 | USD | 225 | 12/17/14 | (1 | ) | ||
| Citigroup | MXN | 3,300 | USD | 244 | 12/17/14 | — | |||
| Citigroup | MXN | 6,730 | USD | 498 | 12/17/14 | — | |||
| Citigroup | MXN | 91,081 | USD | 6,730 | 12/17/14 | (16 | ) | ||
| Citigroup | MYR | 10 | USD | 3 | 12/17/14 | — | |||
| Citigroup | MYR | 15 | USD | 5 | 12/17/14 | — | |||
| Citigroup | MYR | 25 | USD | 8 | 12/17/14 | — | |||
| Citigroup | MYR | 25 | USD | 8 | 12/17/14 | — | |||
| Citigroup | MYR | 30 | USD | 9 | 12/17/14 | — | |||
| Citigroup | MYR | 30 | USD | 9 | 12/17/14 | — | |||
| Citigroup | MYR | 35 | USD | 11 | 12/17/14 | — | |||
| Citigroup | MYR | 50 | USD | 15 | 12/17/14 | — | |||
| Citigroup | MYR | 55 | USD | 17 | 12/17/14 | 1 | |||
| Citigroup | MYR | 55 | USD | 17 | 12/17/14 | — | |||
| Citigroup | MYR | 55 | USD | 17 | 12/17/14 | — | |||
| Citigroup | MYR | 70 | USD | 22 | 12/17/14 | 1 | |||
| Citigroup | MYR | 70 | USD | 22 | 12/17/14 | 1 | |||
| Citigroup | MYR | 70 | USD | 22 | 12/17/14 | — | |||
| Citigroup | MYR | 90 | USD | 28 | 12/17/14 | — | |||
| Citigroup | MYR | 115 | USD | 36 | 12/17/14 | 1 | |||
| Citigroup | MYR | 130 | USD | 40 | 12/17/14 | — | |||
| Citigroup | MYR | 135 | USD | 41 | 12/17/14 | — | |||
| Citigroup | MYR | 235 | USD | 72 | 12/17/14 | 1 | |||
| Citigroup | MYR | 290 | USD | 89 | 12/17/14 | 1 | |||
| Citigroup | MYR | 315 | USD | 95 | 12/17/14 | — | |||
| Citigroup | MYR | 325 | USD | 99 | 12/17/14 | 1 | |||
| Citigroup | MYR | 335 | USD | 102 | 12/17/14 | — | |||
| Citigroup | MYR | 345 | USD | 107 | 12/17/14 | 2 | |||
| Citigroup | MYR | 360 | USD | 110 | 12/17/14 | 1 | |||
| Citigroup | MYR | 500 | USD | 152 | 12/17/14 | — | |||
| Citigroup | MYR | 2,040 | USD | 642 | 12/17/14 | 24 | |||
| Citigroup | NOK | 100 | USD | 16 | 12/17/14 | 1 | |||
| Citigroup | NOK | 539 | USD | 81 | 12/17/14 | 2 | |||
| Citigroup | NOK | 1,161 | USD | 177 | 12/17/14 | 5 | |||
| Citigroup | NOK | 1,305 | USD | 202 | 12/17/14 | 9 | |||
| Citigroup | NOK | 1,521 | USD | 237 | 12/17/14 | 12 | |||
| Citigroup | NOK | 1,793 | USD | 272 | 12/17/14 | 6 | |||
| Citigroup | NOK | 1,966 | USD | 297 | 12/17/14 | 6 | |||
| Citigroup | NOK | 2,126 | USD | 331 | 12/17/14 | 16 | |||
| Citigroup | NOK | 2,221 | USD | 347 | 12/17/14 | 18 | |||
| Citigroup | NOK | 2,594 | USD | 391 | 12/17/14 | 7 | |||
| Citigroup | NOK | 4,145 | USD | 630 | 12/17/14 | 17 | |||
| Citigroup | NOK | 4,951 | USD | 751 | 12/17/14 | 19 | |||
| Citigroup | NOK | 6,291 | USD | 957 | 12/17/14 | 26 | |||
| Citigroup | NOK | 6,353 | USD | 945 | 12/17/14 | 4 | |||
| See accompanying notes which are an integral part of the financial statements. | |||||||||
| 620 Russell Multi-Strategy Alternative Fund | |||||||||
Russell Investment Company
Russell Multi-Strategy Alternative Fund
Consolidated Schedule of Investments, continued — October 31, 2014
| Foreign Currency Exchange Contracts | ||||||||
| Amounts in thousands | ||||||||
| Unrealized | ||||||||
| Appreciation | ||||||||
| Amount | Amount | (Depreciation) | ||||||
| Counterparty | Sold | Bought | Settlement Date | $ | ||||
| Citigroup | NOK | 22,697 | USD | 3,365 | 12/17/14 | 5 | ||
| Citigroup | NOK | 22,714 | USD | 3,365 | 12/17/14 | 2 | ||
| Citigroup | NOK | 30,774 | USD | 4,869 | 12/17/14 | 314 | ||
| Citigroup | NZD | 114 | USD | 92 | 12/17/14 | 4 | ||
| Citigroup | NZD | 116 | USD | 95 | 12/17/14 | 5 | ||
| Citigroup | NZD | 119 | USD | 95 | 12/17/14 | 3 | ||
| Citigroup | NZD | 148 | USD | 121 | 12/17/14 | 6 | ||
| Citigroup | NZD | 157 | USD | 129 | 12/17/14 | 7 | ||
| Citigroup | NZD | 233 | USD | 189 | 12/17/14 | 8 | ||
| Citigroup | NZD | 282 | USD | 219 | 12/17/14 | 1 | ||
| Citigroup | NZD | 290 | USD | 235 | 12/17/14 | 10 | ||
| Citigroup | NZD | 295 | USD | 229 | 12/17/14 | 1 | ||
| Citigroup | NZD | 304 | USD | 247 | 12/17/14 | 12 | ||
| Citigroup | NZD | 349 | USD | 270 | 12/17/14 | — | ||
| Citigroup | NZD | 368 | USD | 289 | 12/17/14 | 3 | ||
| Citigroup | NZD | 385 | USD | 310 | 12/17/14 | 12 | ||
| Citigroup | NZD | 480 | USD | 389 | 12/17/14 | 16 | ||
| Citigroup | NZD | 565 | USD | 446 | 12/17/14 | 8 | ||
| Citigroup | NZD | 656 | USD | 512 | 12/17/14 | 3 | ||
| Citigroup | NZD | 1,324 | USD | 1,020 | 12/17/14 | (7 | ) | |
| Citigroup | NZD | 1,419 | USD | 1,097 | 12/17/14 | (4 | ) | |
| Citigroup | NZD | 1,731 | USD | 1,333 | 12/17/14 | (11 | ) | |
| Citigroup | NZD | 3,280 | USD | 2,720 | 12/17/14 | 174 | ||
| Citigroup | NZD | 3,365 | USD | 2,625 | 12/17/14 | 13 | ||
| Citigroup | NZD | 3,365 | USD | 2,627 | 12/17/14 | 15 | ||
| Citigroup | NZD | 6,730 | USD | 5,250 | 12/17/14 | 26 | ||
| Citigroup | NZD | 6,730 | USD | 5,244 | 12/17/14 | 20 | ||
| Citigroup | NZD | 6,730 | USD | 5,248 | 12/17/14 | 24 | ||
| Citigroup | NZD | 10,290 | USD | 8,139 | 12/17/14 | 151 | ||
| Citigroup | PHP | 607 | USD | 14 | 12/17/14 | — | ||
| Citigroup | PHP | 1,596 | USD | 37 | 12/17/14 | 1 | ||
| Citigroup | PHP | 1,596 | USD | 37 | 12/17/14 | 1 | ||
| Citigroup | PHP | 1,601 | USD | 37 | 12/17/14 | 1 | ||
| Citigroup | PHP | 1,950 | USD | 44 | 12/17/14 | 1 | ||
| Citigroup | PHP | 2,050 | USD | 46 | 12/17/14 | 1 | ||
| Citigroup | PHP | 2,050 | USD | 46 | 12/17/14 | — | ||
| Citigroup | PHP | 3,000 | USD | 66 | 12/17/14 | — | ||
| Citigroup | PHP | 3,750 | USD | 84 | 12/17/14 | 1 | ||
| Citigroup | PHP | 3,850 | USD | 86 | 12/17/14 | — | ||
| Citigroup | PHP | 4,050 | USD | 91 | 12/17/14 | 1 | ||
| Citigroup | PHP | 4,100 | USD | 92 | 12/17/14 | 1 | ||
| Citigroup | PHP | 7,100 | USD | 159 | 12/17/14 | 1 | ||
| Citigroup | PLN | 5 | USD | 2 | 12/17/14 | — | ||
| Citigroup | PLN | 10 | USD | 3 | 12/17/14 | — | ||
| Citigroup | PLN | 25 | USD | 8 | 12/17/14 | — | ||
| Citigroup | PLN | 30 | USD | 9 | 12/17/14 | — | ||
| Citigroup | PLN | 75 | USD | 23 | 12/17/14 | 1 | ||
| Citigroup | PLN | 90 | USD | 27 | 12/17/14 | — | ||
| Citigroup | PLN | 120 | USD | 37 | 12/17/14 | 1 | ||
| Citigroup | PLN | 165 | USD | 50 | 12/17/14 | 1 | ||
| Citigroup | PLN | 195 | USD | 59 | 12/17/14 | 1 | ||
| Citigroup | PLN | 230 | USD | 69 | 12/17/14 | 1 | ||
| Citigroup | PLN | 235 | USD | 70 | 12/17/14 | 1 | ||
| Citigroup | PLN | 255 | USD | 76 | 12/17/14 | — | ||
| Citigroup | PLN | 265 | USD | 80 | 12/17/14 | 1 | ||
| Citigroup | PLN | 275 | USD | 82 | 12/17/14 | 1 | ||
| Citigroup | PLN | 305 | USD | 92 | 12/17/14 | 2 | ||
| Citigroup | PLN | 400 | USD | 121 | 12/17/14 | 2 | ||
| Citigroup | PLN | 435 | USD | 135 | 12/17/14 | 6 | ||
| Citigroup | PLN | 945 | USD | 293 | 12/17/14 | 13 | ||
| Citigroup | RUB | 150 | USD | 4 | 12/17/14 | — | ||
| Citigroup | RUB | 200 | USD | 5 | 12/17/14 | — | ||
| Citigroup | RUB | 700 | USD | 18 | 12/17/14 | 2 | ||
| Citigroup | RUB | 4,950 | USD | 127 | 12/17/14 | 14 | ||
| Citigroup | RUB | 5,448 | USD | 144 | 12/17/14 | 19 | ||
| Citigroup | RUB | 5,485 | USD | 145 | 12/17/14 | 19 | ||
| Citigroup | RUB | 5,500 | USD | 140 | 12/17/14 | 13 | ||
| See accompanying notes which are an integral part of the financial statements. | ||||||||
| Russell Multi-Strategy Alternative Fund 621 | ||||||||
Russell Investment Company
Russell Multi-Strategy Alternative Fund
Consolidated Schedule of Investments, continued — October 31, 2014
| Foreign Currency Exchange Contracts | ||||||||
| Amounts in thousands | ||||||||
| Unrealized | ||||||||
| Appreciation | ||||||||
| Amount | Amount | (Depreciation) | ||||||
| Counterparty | Sold | Bought | Settlement Date | $ | ||||
| Citigroup | RUB | 7,300 | USD | 193 | 12/17/14 | 25 | ||
| Citigroup | RUB | 8,245 | USD | 217 | 12/17/14 | 28 | ||
| Citigroup | RUB | 8,855 | USD | 232 | 12/17/14 | 28 | ||
| Citigroup | RUB | 11,117 | USD | 290 | 12/17/14 | 35 | ||
| Citigroup | RUB | 142,825 | USD | 3,430 | 12/17/14 | 150 | ||
| Citigroup | SEK | 122,621 | EUR | 13,320 | 12/17/14 | 89 | ||
| Citigroup | SEK | 100 | USD | 14 | 12/17/14 | — | ||
| Citigroup | SEK | 184 | USD | 26 | 12/17/14 | 1 | ||
| Citigroup | SEK | 631 | USD | 87 | 12/17/14 | 1 | ||
| Citigroup | SEK | 758 | USD | 106 | 12/17/14 | 3 | ||
| Citigroup | SEK | 760 | USD | 106 | 12/17/14 | 4 | ||
| Citigroup | SEK | 1,525 | USD | 214 | 12/17/14 | 7 | ||
| Citigroup | SEK | 1,750 | USD | 244 | 12/17/14 | 7 | ||
| Citigroup | SEK | 1,861 | USD | 259 | 12/17/14 | 7 | ||
| Citigroup | SEK | 2,234 | USD | 310 | 12/17/14 | 8 | ||
| Citigroup | SEK | 2,610 | USD | 360 | 12/17/14 | 6 | ||
| Citigroup | SEK | 2,987 | USD | 411 | 12/17/14 | 6 | ||
| Citigroup | SEK | 4,995 | USD | 680 | 12/17/14 | 4 | ||
| Citigroup | SEK | 6,995 | USD | 952 | 12/17/14 | 5 | ||
| Citigroup | SEK | 7,139 | USD | 1,017 | 12/17/14 | 50 | ||
| Citigroup | SEK | 7,139 | USD | 1,016 | 12/17/14 | 49 | ||
| Citigroup | SEK | 8,566 | USD | 1,225 | 12/17/14 | 65 | ||
| Citigroup | SEK | 8,620 | USD | 1,208 | 12/17/14 | 41 | ||
| Citigroup | SEK | 9,055 | USD | 1,231 | 12/17/14 | 5 | ||
| Citigroup | SEK | 9,775 | USD | 1,376 | 12/17/14 | 52 | ||
| Citigroup | SEK | 10,096 | USD | 1,427 | 12/17/14 | 60 | ||
| Citigroup | SEK | 10,188 | USD | 1,430 | 12/17/14 | 50 | ||
| Citigroup | SEK | 10,849 | USD | 1,531 | 12/17/14 | 62 | ||
| Citigroup | SEK | 10,850 | USD | 1,528 | 12/17/14 | 58 | ||
| Citigroup | SGD | 20 | USD | 16 | 12/17/14 | — | ||
| Citigroup | SGD | 25 | USD | 20 | 12/17/14 | — | ||
| Citigroup | SGD | 25 | USD | 20 | 12/17/14 | — | ||
| Citigroup | SGD | 30 | USD | 24 | 12/17/14 | — | ||
| Citigroup | SGD | 35 | USD | 28 | 12/17/14 | — | ||
| Citigroup | SGD | 40 | USD | 32 | 12/17/14 | — | ||
| Citigroup | SGD | 45 | USD | 35 | 12/17/14 | — | ||
| Citigroup | SGD | 45 | USD | 35 | 12/17/14 | — | ||
| Citigroup | SGD | 60 | USD | 47 | 12/17/14 | 1 | ||
| Citigroup | SGD | 65 | USD | 52 | 12/17/14 | 1 | ||
| Citigroup | SGD | 65 | USD | 51 | 12/17/14 | 1 | ||
| Citigroup | SGD | 65 | USD | 51 | 12/17/14 | 1 | ||
| Citigroup | SGD | 70 | USD | 55 | 12/17/14 | — | ||
| Citigroup | SGD | 75 | USD | 59 | 12/17/14 | 1 | ||
| Citigroup | SGD | 80 | USD | 63 | 12/17/14 | 1 | ||
| Citigroup | SGD | 85 | USD | 68 | 12/17/14 | 2 | ||
| Citigroup | SGD | 95 | USD | 76 | 12/17/14 | 2 | ||
| Citigroup | SGD | 115 | USD | 90 | 12/17/14 | 1 | ||
| Citigroup | SGD | 120 | USD | 94 | 12/17/14 | — | ||
| Citigroup | SGD | 130 | USD | 102 | 12/17/14 | 1 | ||
| Citigroup | SGD | 135 | USD | 108 | 12/17/14 | 3 | ||
| Citigroup | SGD | 145 | USD | 114 | 12/17/14 | 1 | ||
| Citigroup | SGD | 155 | USD | 122 | 12/17/14 | 1 | ||
| Citigroup | SGD | 165 | USD | 131 | 12/17/14 | 3 | ||
| Citigroup | SGD | 215 | USD | 168 | 12/17/14 | 1 | ||
| Citigroup | SGD | 225 | USD | 177 | 12/17/14 | 2 | ||
| Citigroup | SGD | 240 | USD | 190 | 12/17/14 | 3 | ||
| Citigroup | SGD | 245 | USD | 193 | 12/17/14 | 2 | ||
| Citigroup | SGD | 2,210 | USD | 1,769 | 12/17/14 | 49 | ||
| Citigroup | TRY | 5 | USD | 2 | 12/17/14 | — | ||
| Citigroup | TRY | 5 | USD | 2 | 12/17/14 | — | ||
| Citigroup | TRY | 10 | USD | 4 | 12/17/14 | — | ||
| Citigroup | TRY | 10 | USD | 4 | 12/17/14 | — | ||
| Citigroup | TRY | 35 | USD | 16 | 12/17/14 | — | ||
| Citigroup | TRY | 40 | USD | 17 | 12/17/14 | (1 | ) | |
| Citigroup | TRY | 45 | USD | 20 | 12/17/14 | (1 | ) | |
| Citigroup | TRY | 45 | USD | 20 | 12/17/14 | — | ||
| Citigroup | TRY | 45 | USD | 20 | 12/17/14 | — | ||
| See accompanying notes which are an integral part of the financial statements. | ||||||||
| 622 Russell Multi-Strategy Alternative Fund | ||||||||
Russell Investment Company
Russell Multi-Strategy Alternative Fund
Consolidated Schedule of Investments, continued — October 31, 2014
| Foreign Currency Exchange Contracts | ||||||||
| Amounts in thousands | ||||||||
| Unrealized | ||||||||
| Appreciation | ||||||||
| Amount | Amount | (Depreciation) | ||||||
| Counterparty | Sold | Bought | Settlement Date | $ | ||||
| Citigroup | TRY | 50 | USD | 22 | 12/17/14 | — | ||
| Citigroup | TRY | 55 | USD | 24 | 12/17/14 | — | ||
| Citigroup | TRY | 56 | USD | 25 | 12/17/14 | — | ||
| Citigroup | TRY | 56 | USD | 25 | 12/17/14 | — | ||
| Citigroup | TRY | 57 | USD | 25 | 12/17/14 | — | ||
| Citigroup | TRY | 67 | USD | 30 | 12/17/14 | — | ||
| Citigroup | TRY | 67 | USD | 30 | 12/17/14 | 1 | ||
| Citigroup | TRY | 71 | USD | 32 | 12/17/14 | 1 | ||
| Citigroup | TRY | 155 | USD | 67 | 12/17/14 | (2 | ) | |
| Citigroup | TRY | 155 | USD | 66 | 12/17/14 | (3 | ) | |
| Citigroup | TRY | 170 | USD | 74 | 12/17/14 | (2 | ) | |
| Citigroup | TRY | 180 | USD | 77 | 12/17/14 | (3 | ) | |
| Citigroup | TRY | 205 | USD | 90 | 12/17/14 | (1 | ) | |
| Citigroup | TRY | 260 | USD | 112 | 12/17/14 | (4 | ) | |
| Citigroup | TRY | 15,043 | USD | 6,730 | 12/17/14 | 29 | ||
| Citigroup | TWD | 50 | USD | 2 | 12/17/14 | — | ||
| Citigroup | TWD | 126 | USD | 4 | 12/17/14 | — | ||
| Citigroup | TWD | 250 | USD | 8 | 12/17/14 | — | ||
| Citigroup | TWD | 300 | USD | 10 | 12/17/14 | — | ||
| Citigroup | TWD | 500 | USD | 16 | 12/17/14 | — | ||
| Citigroup | TWD | 600 | USD | 20 | 12/17/14 | — | ||
| Citigroup | TWD | 950 | USD | 31 | 12/17/14 | — | ||
| Citigroup | TWD | 970 | USD | 33 | 12/17/14 | 1 | ||
| Citigroup | TWD | 1,600 | USD | 53 | 12/17/14 | — | ||
| Citigroup | TWD | 1,750 | USD | 58 | 12/17/14 | — | ||
| Citigroup | TWD | 1,850 | USD | 62 | 12/17/14 | 1 | ||
| Citigroup | TWD | 1,865 | USD | 63 | 12/17/14 | 1 | ||
| Citigroup | TWD | 1,869 | USD | 63 | 12/17/14 | 1 | ||
| Citigroup | TWD | 1,869 | USD | 63 | 12/17/14 | 1 | ||
| Citigroup | TWD | 1,950 | USD | 65 | 12/17/14 | — | ||
| Citigroup | TWD | 1,950 | USD | 64 | 12/17/14 | — | ||
| Citigroup | TWD | 2,250 | USD | 74 | 12/17/14 | — | ||
| Citigroup | TWD | 3,050 | USD | 100 | 12/17/14 | — | ||
| Citigroup | TWD | 3,050 | USD | 101 | 12/17/14 | 1 | ||
| Citigroup | TWD | 3,400 | USD | 112 | 12/17/14 | — | ||
| Citigroup | TWD | 5,350 | USD | 177 | 12/17/14 | 1 | ||
| Citigroup | TWD | 5,550 | USD | 183 | 12/17/14 | — | ||
| Citigroup | ZAR | 50 | USD | 4 | 12/17/14 | — | ||
| Citigroup | ZAR | 300 | USD | 27 | 12/17/14 | — | ||
| Citigroup | ZAR | 300 | USD | 27 | 12/17/14 | — | ||
| Citigroup | ZAR | 300 | USD | 26 | 12/17/14 | (1 | ) | |
| Citigroup | ZAR | 300 | USD | 27 | 12/17/14 | — | ||
| Citigroup | ZAR | 500 | USD | 44 | 12/17/14 | (1 | ) | |
| Citigroup | ZAR | 600 | USD | 52 | 12/17/14 | (2 | ) | |
| Citigroup | ZAR | 1,050 | USD | 93 | 12/17/14 | (2 | ) | |
| Citigroup | ZAR | 6,730 | USD | 612 | 12/17/14 | 6 | ||
| Citigroup | ZAR | 7,556 | USD | 666 | 12/17/14 | (14 | ) | |
| Citigroup | ZAR | 19,212 | USD | 1,715 | 12/17/14 | (14 | ) | |
| Citigroup | ZAR | 19,299 | USD | 1,715 | 12/17/14 | (22 | ) | |
| Credit Suisse | USD | 163 | AUD | 176 | 12/17/14 | (9 | ) | |
| Credit Suisse | USD | 185 | AUD | 211 | 12/17/14 | (1 | ) | |
| Credit Suisse | USD | 238 | AUD | 272 | 12/17/14 | 1 | ||
| Credit Suisse | USD | 539 | AUD | 615 | 12/17/14 | — | ||
| Credit Suisse | USD | 738 | AUD | 845 | 12/17/14 | 3 | ||
| Credit Suisse | USD | 1,085 | AUD | 1,235 | 12/17/14 | (2 | ) | |
| Credit Suisse | USD | 1,101 | AUD | 1,183 | 12/17/14 | (63 | ) | |
| Credit Suisse | USD | 1,388 | AUD | 1,507 | 12/17/14 | (66 | ) | |
| Credit Suisse | USD | 1,389 | AUD | 1,500 | 12/17/14 | (73 | ) | |
| Credit Suisse | USD | 1,389 | AUD | 1,495 | 12/17/14 | (77 | ) | |
| Credit Suisse | USD | 1,421 | AUD | 1,531 | 12/17/14 | (77 | ) | |
| Credit Suisse | USD | 2,241 | AUD | 2,435 | 12/17/14 | (105 | ) | |
| Credit Suisse | USD | 2,567 | AUD | 2,887 | 12/17/14 | (34 | ) | |
| Credit Suisse | USD | 2 | BRL | 5 | 12/17/14 | — | ||
| Credit Suisse | USD | 43 | BRL | 105 | 12/17/14 | (1 | ) | |
| Credit Suisse | USD | 64 | BRL | 150 | 12/17/14 | (4 | ) | |
| Credit Suisse | USD | 115 | BRL | 270 | 12/17/14 | (8 | ) | |
| Credit Suisse | USD | 138 | BRL | 320 | 12/17/14 | (11 | ) | |
| See accompanying notes which are an integral part of the financial statements. | ||||||||
| Russell Multi-Strategy Alternative Fund 623 | ||||||||
Russell Investment Company
Russell Multi-Strategy Alternative Fund
Consolidated Schedule of Investments, continued — October 31, 2014
| Foreign Currency Exchange Contracts | ||||||||
| Amounts in thousands | ||||||||
| Unrealized | ||||||||
| Appreciation | ||||||||
| Amount | Amount | (Depreciation) | ||||||
| Counterparty | Sold | Bought | Settlement Date | $ | ||||
| Credit Suisse | USD | 139 | BRL | 320 | 12/17/14 | (11 | ) | |
| Credit Suisse | USD | 139 | BRL | 327 | 12/17/14 | (8 | ) | |
| Credit Suisse | USD | 139 | BRL | 322 | 12/17/14 | (11 | ) | |
| Credit Suisse | USD | 141 | BRL | 324 | 12/17/14 | (12 | ) | |
| Credit Suisse | USD | 330 | BRL | 758 | 12/17/14 | (28 | ) | |
| Credit Suisse | USD | 36 | CAD | 40 | 12/17/14 | — | ||
| Credit Suisse | USD | 54 | CAD | 60 | 12/17/14 | (1 | ) | |
| Credit Suisse | USD | 121 | CAD | 136 | 12/17/14 | — | ||
| Credit Suisse | USD | 179 | CAD | 196 | 12/17/14 | (5 | ) | |
| Credit Suisse | USD | 180 | CAD | 203 | 12/17/14 | — | ||
| Credit Suisse | USD | 204 | CAD | 223 | 12/17/14 | (7 | ) | |
| Credit Suisse | USD | 249 | CAD | 278 | 12/17/14 | (2 | ) | |
| Credit Suisse | USD | 249 | CAD | 272 | 12/17/14 | (8 | ) | |
| Credit Suisse | USD | 310 | CAD | 348 | 12/17/14 | (1 | ) | |
| Credit Suisse | USD | 323 | CAD | 353 | 12/17/14 | (10 | ) | |
| Credit Suisse | USD | 532 | CAD | 585 | 12/17/14 | (14 | ) | |
| Credit Suisse | USD | 604 | CAD | 660 | 12/17/14 | (19 | ) | |
| Credit Suisse | USD | 892 | CAD | 1,001 | 12/17/14 | (6 | ) | |
| Credit Suisse | USD | 1,229 | CAD | 1,337 | 12/17/14 | (44 | ) | |
| Credit Suisse | USD | 5,734 | CAD | 6,241 | 12/17/14 | (203 | ) | |
| Credit Suisse | USD | 1 | CHF | 1 | 12/17/14 | — | ||
| Credit Suisse | USD | 7 | CHF | 6 | 12/17/14 | — | ||
| Credit Suisse | USD | 44 | CHF | 41 | 12/17/14 | (1 | ) | |
| Credit Suisse | USD | 110 | CHF | 105 | 12/17/14 | (1 | ) | |
| Credit Suisse | USD | 68 | CLP | 39,603 | 11/06/14 | 1 | ||
| Credit Suisse | USD | 444 | CLP | 255,773 | 11/06/14 | 1 | ||
| Credit Suisse | USD | 8 | CLP | 5,000 | 12/17/14 | — | ||
| Credit Suisse | USD | 422 | CLP | 250,000 | 12/17/14 | 11 | ||
| Credit Suisse | USD | 111 | COP | 218,114 | 12/17/14 | (6 | ) | |
| Credit Suisse | USD | 112 | COP | 218,114 | 12/17/14 | (6 | ) | |
| Credit Suisse | USD | 156 | COP | 303,772 | 12/17/14 | (9 | ) | |
| Credit Suisse | USD | 7 | CZK | 150 | 12/17/14 | — | ||
| Credit Suisse | USD | 14 | CZK | 300 | 12/17/14 | (1 | ) | |
| Credit Suisse | USD | 19 | CZK | 400 | 12/17/14 | (1 | ) | |
| Credit Suisse | USD | 36 | CZK | 750 | 12/17/14 | (2 | ) | |
| Credit Suisse | USD | 58 | CZK | 1,250 | 12/17/14 | (2 | ) | |
| Credit Suisse | USD | 61 | CZK | 1,300 | 12/17/14 | (2 | ) | |
| Credit Suisse | USD | 75 | CZK | 1,600 | 12/17/14 | (3 | ) | |
| Credit Suisse | USD | 75 | CZK | 1,600 | 12/17/14 | (3 | ) | |
| Credit Suisse | USD | 95 | CZK | 2,000 | 12/17/14 | (5 | ) | |
| Credit Suisse | USD | 298 | CZK | 6,250 | 12/17/14 | (16 | ) | |
| Credit Suisse | USD | 1,162 | CZK | 24,400 | 12/17/14 | (62 | ) | |
| Credit Suisse | USD | 986 | EUR | 782 | 11/03/14 | (6 | ) | |
| Credit Suisse | USD | 673 | EUR | 529 | 11/04/14 | (11 | ) | |
| Credit Suisse | USD | 3 | EUR | 2 | 12/17/14 | — | ||
| Credit Suisse | USD | 4 | EUR | 3 | 12/17/14 | — | ||
| Credit Suisse | USD | 34 | EUR | 27 | 12/17/14 | — | ||
| Credit Suisse | USD | 50 | EUR | 40 | 12/17/14 | — | ||
| Credit Suisse | USD | 59 | EUR | 45 | 12/17/14 | (3 | ) | |
| Credit Suisse | USD | 84 | EUR | 65 | 12/17/14 | (3 | ) | |
| Credit Suisse | USD | 98 | EUR | 77 | 12/17/14 | (1 | ) | |
| Credit Suisse | USD | 141 | EUR | 109 | 12/17/14 | (5 | ) | |
| Credit Suisse | USD | 188 | EUR | 149 | 12/17/14 | (2 | ) | |
| Credit Suisse | USD | 302 | EUR | 234 | 12/17/14 | (8 | ) | |
| Credit Suisse | USD | 305 | EUR | 240 | 12/17/14 | (4 | ) | |
| Credit Suisse | USD | 365 | EUR | 287 | 12/17/14 | (5 | ) | |
| Credit Suisse | USD | 397 | EUR | 314 | 12/17/14 | (4 | ) | |
| Credit Suisse | USD | 432 | EUR | 328 | 12/17/14 | (22 | ) | |
| Credit Suisse | USD | 463 | EUR | 358 | 12/17/14 | (14 | ) | |
| Credit Suisse | USD | 495 | EUR | 383 | 12/17/14 | (15 | ) | |
| Credit Suisse | USD | 495 | EUR | 390 | 12/17/14 | (6 | ) | |
| Credit Suisse | USD | 635 | EUR | 490 | 12/17/14 | (21 | ) | |
| Credit Suisse | USD | 668 | EUR | 521 | 12/17/14 | (15 | ) | |
| Credit Suisse | USD | 716 | EUR | 553 | 12/17/14 | (23 | ) | |
| Credit Suisse | USD | 719 | EUR | 569 | 12/17/14 | (7 | ) | |
| Credit Suisse | USD | 796 | EUR | 615 | 12/17/14 | (25 | ) | |
| Credit Suisse | USD | 897 | EUR | 714 | 12/17/14 | (2 | ) | |
| See accompanying notes which are an integral part of the financial statements. | ||||||||
| 624 Russell Multi-Strategy Alternative Fund | ||||||||
Russell Investment Company
Russell Multi-Strategy Alternative Fund
Consolidated Schedule of Investments, continued — October 31, 2014
| Foreign Currency Exchange Contracts | ||||||||
| Amounts in thousands | ||||||||
| Unrealized | ||||||||
| Appreciation | ||||||||
| Amount | Amount | (Depreciation) | ||||||
| Counterparty | Sold | Bought | Settlement Date | $ | ||||
| Credit Suisse | USD | 978 | EUR | 766 | 12/17/14 | (18 | ) | |
| Credit Suisse | USD | 1,219 | EUR | 955 | 12/17/14 | (22 | ) | |
| Credit Suisse | USD | 1,600 | EUR | 1,256 | 12/17/14 | (25 | ) | |
| Credit Suisse | USD | 2,319 | EUR | 1,811 | 12/17/14 | (49 | ) | |
| Credit Suisse | USD | 2,561 | EUR | 2,003 | 12/17/14 | (51 | ) | |
| Credit Suisse | USD | 3,727 | EUR | 2,834 | 12/17/14 | (174 | ) | |
| Credit Suisse | USD | 4,551 | EUR | 3,542 | 12/17/14 | (111 | ) | |
| Credit Suisse | USD | 3 | GBP | 2 | 12/17/14 | — | ||
| Credit Suisse | USD | 8 | GBP | 5 | 12/17/14 | — | ||
| Credit Suisse | USD | 8 | GBP | 5 | 12/17/14 | — | ||
| Credit Suisse | USD | 10 | GBP | 6 | 12/17/14 | — | ||
| Credit Suisse | USD | 24 | GBP | 15 | 12/17/14 | — | ||
| Credit Suisse | USD | 40 | GBP | 25 | 12/17/14 | — | ||
| Credit Suisse | USD | 52 | GBP | 32 | 12/17/14 | (1 | ) | |
| Credit Suisse | USD | 66 | GBP | 41 | 12/17/14 | — | ||
| Credit Suisse | USD | 90 | GBP | 56 | 12/17/14 | (1 | ) | |
| Credit Suisse | USD | 92 | GBP | 57 | 12/17/14 | (1 | ) | |
| Credit Suisse | USD | 111 | GBP | 69 | 12/17/14 | (1 | ) | |
| Credit Suisse | USD | 176 | GBP | 109 | 12/17/14 | (1 | ) | |
| Credit Suisse | USD | 212 | GBP | 132 | 12/17/14 | (1 | ) | |
| Credit Suisse | USD | 220 | GBP | 138 | 12/17/14 | — | ||
| Credit Suisse | USD | 241 | GBP | 149 | 12/17/14 | (4 | ) | |
| Credit Suisse | USD | 256 | GBP | 157 | 12/17/14 | (5 | ) | |
| Credit Suisse | USD | 274 | GBP | 169 | 12/17/14 | (5 | ) | |
| Credit Suisse | USD | 348 | GBP | 213 | 12/17/14 | (8 | ) | |
| Credit Suisse | USD | 410 | GBP | 251 | 12/17/14 | (9 | ) | |
| Credit Suisse | USD | 603 | GBP | 369 | 12/17/14 | (13 | ) | |
| Credit Suisse | USD | 1,190 | GBP | 740 | 12/17/14 | (7 | ) | |
| Credit Suisse | USD | 1,501 | GBP | 931 | 12/17/14 | (13 | ) | |
| Credit Suisse | USD | 1,812 | GBP | 1,111 | 12/17/14 | (36 | ) | |
| Credit Suisse | USD | 2,093 | GBP | 1,285 | 12/17/14 | (38 | ) | |
| Credit Suisse | USD | 2,380 | GBP | 1,441 | 12/17/14 | (76 | ) | |
| Credit Suisse | USD | 4,565 | GBP | 2,801 | 12/17/14 | (86 | ) | |
| Credit Suisse | USD | 1 | HKD | 6 | 12/17/14 | — | ||
| Credit Suisse | USD | 5 | HKD | 38 | 12/17/14 | — | ||
| Credit Suisse | USD | 15 | HKD | 117 | 12/17/14 | — | ||
| Credit Suisse | USD | 65 | HKD | 507 | 12/17/14 | — | ||
| Credit Suisse | USD | 83 | HKD | 645 | 12/17/14 | — | ||
| Credit Suisse | USD | 2 | HUF | 500 | 12/17/14 | — | ||
| Credit Suisse | USD | 14 | HUF | 3,500 | 12/17/14 | — | ||
| Credit Suisse | USD | 14 | HUF | 3,500 | 12/17/14 | — | ||
| Credit Suisse | USD | 17 | HUF | 4,000 | 12/17/14 | — | ||
| Credit Suisse | USD | 27 | HUF | 6,500 | 12/17/14 | — | ||
| Credit Suisse | USD | 35 | HUF | 8,500 | 12/17/14 | — | ||
| Credit Suisse | USD | 39 | HUF | 9,500 | 12/17/14 | (1 | ) | |
| Credit Suisse | USD | 46 | HUF | 11,000 | 12/17/14 | (1 | ) | |
| Credit Suisse | USD | 53 | HUF | 13,000 | 12/17/14 | (1 | ) | |
| Credit Suisse | USD | 56 | HUF | 13,500 | 12/17/14 | (1 | ) | |
| Credit Suisse | USD | 60 | HUF | 14,500 | 12/17/14 | (1 | ) | |
| Credit Suisse | USD | 84 | HUF | 20,500 | 12/17/14 | — | ||
| Credit Suisse | USD | 99 | HUF | 24,000 | 12/17/14 | (1 | ) | |
| Credit Suisse | USD | 108 | HUF | 26,500 | 12/17/14 | — | ||
| Credit Suisse | USD | 136 | HUF | 33,500 | 12/17/14 | — | ||
| Credit Suisse | USD | 347 | HUF | 86,000 | 12/17/14 | 3 | ||
| Credit Suisse | USD | 720 | HUF | 172,500 | 12/17/14 | (19 | ) | |
| Credit Suisse | USD | 8 | IDR | 100,000 | 12/17/14 | — | ||
| Credit Suisse | USD | 8 | IDR | 100,000 | 12/17/14 | — | ||
| Credit Suisse | USD | 13 | IDR | 150,000 | 12/17/14 | — | ||
| Credit Suisse | USD | 21 | IDR | 250,000 | 12/17/14 | — | ||
| Credit Suisse | USD | 84 | IDR | 1,000,000 | 12/17/14 | (2 | ) | |
| Credit Suisse | USD | 95 | IDR | 1,150,000 | 12/17/14 | — | ||
| Credit Suisse | USD | 168 | IDR | 2,000,000 | 12/17/14 | (3 | ) | |
| Credit Suisse | USD | 1 | ILS | 5 | 12/17/14 | — | ||
| Credit Suisse | USD | 7 | ILS | 25 | 12/17/14 | — | ||
| Credit Suisse | USD | 15 | ILS | 55 | 12/17/14 | — | ||
| Credit Suisse | USD | 39 | ILS | 145 | 12/17/14 | (1 | ) | |
| Credit Suisse | USD | 8 | INR | 500 | 12/17/14 | — | ||
| See accompanying notes which are an integral part of the financial statements. | ||||||||
| Russell Multi-Strategy Alternative Fund 625 | ||||||||
Russell Investment Company
Russell Multi-Strategy Alternative Fund
Consolidated Schedule of Investments, continued — October 31, 2014
| Foreign Currency Exchange Contracts | ||||||||
| Amounts in thousands | ||||||||
| Unrealized | ||||||||
| Appreciation | ||||||||
| Amount | Amount | (Depreciation) | ||||||
| Counterparty | Sold | Bought | Settlement Date | $ | ||||
| Credit Suisse | USD | 16 | INR | 1,000 | 12/17/14 | — | ||
| Credit Suisse | USD | 24 | INR | 1,500 | 12/17/14 | — | ||
| Credit Suisse | USD | 24 | INR | 1,500 | 12/17/14 | — | ||
| Credit Suisse | USD | 41 | INR | 2,500 | 12/17/14 | — | ||
| Credit Suisse | USD | 65 | INR | 4,026 | 12/17/14 | — | ||
| Credit Suisse | USD | 73 | INR | 4,508 | 12/17/14 | (1 | ) | |
| Credit Suisse | USD | 73 | INR | 4,490 | 12/17/14 | (1 | ) | |
| Credit Suisse | USD | 92 | INR | 5,656 | 12/17/14 | — | ||
| Credit Suisse | USD | 92 | INR | 5,637 | 12/17/14 | (1 | ) | |
| Credit Suisse | USD | 92 | INR | 5,636 | 12/17/14 | (1 | ) | |
| Credit Suisse | USD | 92 | INR | 5,697 | 12/17/14 | — | ||
| Credit Suisse | USD | 1 | JPY | 56 | 12/17/14 | — | ||
| Credit Suisse | USD | 33 | JPY | 3,500 | 12/17/14 | (2 | ) | |
| Credit Suisse | USD | 114 | JPY | 12,500 | 12/17/14 | (3 | ) | |
| Credit Suisse | USD | 119 | JPY | 13,000 | 12/17/14 | (4 | ) | |
| Credit Suisse | USD | 369 | JPY | 38,768 | 12/17/14 | (24 | ) | |
| Credit Suisse | USD | 399 | JPY | 41,353 | 12/17/14 | (30 | ) | |
| Credit Suisse | USD | 450 | JPY | 47,915 | 12/17/14 | (23 | ) | |
| Credit Suisse | USD | 512 | JPY | 54,374 | 12/17/14 | (28 | ) | |
| Credit Suisse | USD | 788 | JPY | 84,320 | 12/17/14 | (37 | ) | |
| Credit Suisse | USD | 873 | JPY | 94,034 | 12/17/14 | (35 | ) | |
| Credit Suisse | USD | 1,198 | JPY | 131,256 | 12/17/14 | (29 | ) | |
| Credit Suisse | USD | 1,233 | JPY | 133,756 | 12/17/14 | (42 | ) | |
| Credit Suisse | USD | 1,382 | JPY | 147,017 | 12/17/14 | (72 | ) | |
| Credit Suisse | USD | 1,540 | JPY | 168,554 | 12/17/14 | (38 | ) | |
| Credit Suisse | USD | 1,879 | JPY | 203,128 | 12/17/14 | (70 | ) | |
| Credit Suisse | USD | 1,882 | JPY | 205,744 | 12/17/14 | (49 | ) | |
| Credit Suisse | USD | 2,639 | JPY | 279,540 | 12/17/14 | (150 | ) | |
| Credit Suisse | USD | 3,070 | JPY | 327,843 | 12/17/14 | (150 | ) | |
| Credit Suisse | USD | 3,406 | JPY | 364,351 | 12/17/14 | (161 | ) | |
| Credit Suisse | USD | 8,311 | JPY | 911,711 | 12/17/14 | (191 | ) | |
| Credit Suisse | USD | 22,495 | JPY | 2,336,596 | 12/17/14 | (1,683 | ) | |
| Credit Suisse | USD | 14 | KRW | 15,000 | 12/17/14 | — | ||
| Credit Suisse | USD | 34 | KRW | 35,000 | 12/17/14 | (1 | ) | |
| Credit Suisse | USD | 43 | KRW | 45,000 | 12/17/14 | (1 | ) | |
| Credit Suisse | USD | 108 | KRW | 115,000 | 12/17/14 | (1 | ) | |
| Credit Suisse | USD | 124 | KRW | 130,000 | 12/17/14 | (2 | ) | |
| Credit Suisse | USD | 203 | KRW | 215,000 | 12/17/14 | (2 | ) | |
| Credit Suisse | USD | 268 | KRW | 280,071 | 12/17/14 | (7 | ) | |
| Credit Suisse | USD | 324 | KRW | 340,000 | 12/17/14 | (7 | ) | |
| Credit Suisse | USD | 392 | KRW | 407,562 | 12/17/14 | (12 | ) | |
| Credit Suisse | USD | 392 | KRW | 401,083 | 12/17/14 | (18 | ) | |
| Credit Suisse | USD | 576 | KRW | 610,000 | 12/17/14 | (6 | ) | |
| Credit Suisse | USD | 629 | KRW | 644,425 | 12/17/14 | (27 | ) | |
| Credit Suisse | USD | 785 | KRW | 807,739 | 12/17/14 | (30 | ) | |
| Credit Suisse | USD | 785 | KRW | 799,119 | 12/17/14 | (39 | ) | |
| Credit Suisse | USD | 2,423 | KRW | 2,540,000 | 12/17/14 | (50 | ) | |
| Credit Suisse | USD | 41 | MXN | 550 | 12/17/14 | (1 | ) | |
| Credit Suisse | USD | 46 | MXN | 600 | 12/17/14 | (1 | ) | |
| Credit Suisse | USD | 46 | MXN | 600 | 12/17/14 | (1 | ) | |
| Credit Suisse | USD | 65 | MXN | 850 | 12/17/14 | (2 | ) | |
| Credit Suisse | USD | 72 | MXN | 950 | 12/17/14 | (2 | ) | |
| Credit Suisse | USD | 152 | MXN | 2,000 | 12/17/14 | (4 | ) | |
| Credit Suisse | USD | 330 | MXN | 4,450 | 12/17/14 | — | ||
| Credit Suisse | USD | 527 | MXN | 6,950 | 12/17/14 | (13 | ) | |
| Credit Suisse | USD | 85 | MYR | 272 | 12/17/14 | (3 | ) | |
| Credit Suisse | USD | 112 | MYR | 359 | 12/17/14 | (3 | ) | |
| Credit Suisse | USD | 224 | MYR | 715 | 12/17/14 | (7 | ) | |
| Credit Suisse | USD | 228 | MYR | 740 | 12/17/14 | (3 | ) | |
| Credit Suisse | USD | 337 | MYR | 1,082 | 12/17/14 | (9 | ) | |
| Credit Suisse | USD | 562 | MYR | 1,792 | 12/17/14 | (18 | ) | |
| Credit Suisse | USD | 73 | NOK | 460 | 12/17/14 | (5 | ) | |
| Credit Suisse | USD | 128 | NOK | 798 | 12/17/14 | (10 | ) | |
| Credit Suisse | USD | 143 | NOK | 892 | 12/17/14 | (11 | ) | |
| Credit Suisse | USD | 302 | NOK | 1,950 | 12/17/14 | (13 | ) | |
| Credit Suisse | USD | 508 | NOK | 3,280 | 12/17/14 | (22 | ) | |
| Credit Suisse | USD | 522 | NOK | 3,315 | 12/17/14 | (31 | ) | |
| See accompanying notes which are an integral part of the financial statements. | ||||||||
| 626 Russell Multi-Strategy Alternative Fund | ||||||||
Russell Investment Company
Russell Multi-Strategy Alternative Fund
Consolidated Schedule of Investments, continued — October 31, 2014
| Foreign Currency Exchange Contracts | ||||||||
| Amounts in thousands | ||||||||
| Unrealized | ||||||||
| Appreciation | ||||||||
| Amount | Amount | (Depreciation) | ||||||
| Counterparty | Sold | Bought | Settlement Date | $ | ||||
| Credit Suisse | USD | 536 | NOK | 3,447 | 12/17/14 | (26 | ) | |
| Credit Suisse | USD | 756 | NOK | 4,821 | 12/17/14 | (42 | ) | |
| Credit Suisse | USD | 931 | NOK | 5,923 | 12/17/14 | (54 | ) | |
| Credit Suisse | USD | 999 | NOK | 6,188 | 12/17/14 | (83 | ) | |
| Credit Suisse | USD | 5,113 | NOK | 31,747 | 12/17/14 | (414 | ) | |
| Credit Suisse | USD | 175 | NZD | 218 | 12/17/14 | (6 | ) | |
| Credit Suisse | USD | 318 | NZD | 407 | 12/17/14 | (2 | ) | |
| Credit Suisse | USD | 457 | NZD | 579 | 12/17/14 | (8 | ) | |
| Credit Suisse | USD | 550 | NZD | 682 | 12/17/14 | (21 | ) | |
| Credit Suisse | USD | 584 | NZD | 737 | 12/17/14 | (12 | ) | |
| Credit Suisse | USD | 829 | NZD | 1,060 | 12/17/14 | (7 | ) | |
| Credit Suisse | USD | 990 | NZD | 1,210 | 12/17/14 | (51 | ) | |
| Credit Suisse | USD | 1,035 | NZD | 1,256 | 12/17/14 | (60 | ) | |
| Credit Suisse | USD | 1,039 | NZD | 1,256 | 12/17/14 | (64 | ) | |
| Credit Suisse | USD | 1,052 | NZD | 1,276 | 12/17/14 | (62 | ) | |
| Credit Suisse | USD | 1,052 | NZD | 1,283 | 12/17/14 | (57 | ) | |
| Credit Suisse | USD | 1,054 | NZD | 1,282 | 12/17/14 | (58 | ) | |
| Credit Suisse | USD | 1,783 | NZD | 2,213 | 12/17/14 | (65 | ) | |
| Credit Suisse | USD | 2 | PHP | 100 | 12/17/14 | — | ||
| Credit Suisse | USD | 16 | PHP | 700 | 12/17/14 | — | ||
| Credit Suisse | USD | 17 | PHP | 750 | 12/17/14 | — | ||
| Credit Suisse | USD | 26 | PHP | 1,150 | 12/17/14 | (1 | ) | |
| Credit Suisse | USD | 85 | PHP | 3,700 | 12/17/14 | (2 | ) | |
| Credit Suisse | USD | 6 | PLN | 20 | 12/17/14 | — | ||
| Credit Suisse | USD | 12 | PLN | 40 | 12/17/14 | — | ||
| Credit Suisse | USD | 32 | PLN | 105 | 12/17/14 | (1 | ) | |
| Credit Suisse | USD | 80 | PLN | 265 | 12/17/14 | (2 | ) | |
| Credit Suisse | USD | 88 | PLN | 286 | 12/17/14 | (3 | ) | |
| Credit Suisse | USD | 111 | PLN | 364 | 12/17/14 | (3 | ) | |
| Credit Suisse | USD | 117 | PLN | 384 | 12/17/14 | (3 | ) | |
| Credit Suisse | USD | 118 | PLN | 381 | 12/17/14 | (5 | ) | |
| Credit Suisse | USD | 1 | RUB | 50 | 12/17/14 | — | ||
| Credit Suisse | USD | 2 | RUB | 100 | 12/17/14 | — | ||
| Credit Suisse | USD | 4 | RUB | 150 | 12/17/14 | — | ||
| Credit Suisse | USD | 6 | RUB | 250 | 12/17/14 | — | ||
| Credit Suisse | USD | 7 | RUB | 250 | 12/17/14 | (1 | ) | |
| Credit Suisse | USD | 7 | RUB | 300 | 12/17/14 | — | ||
| Credit Suisse | USD | 12 | RUB | 500 | 12/17/14 | — | ||
| Credit Suisse | USD | 12 | RUB | 500 | 12/17/14 | — | ||
| Credit Suisse | USD | 20 | RUB | 750 | 12/17/14 | (2 | ) | |
| Credit Suisse | USD | 21 | RUB | 850 | 12/17/14 | (1 | ) | |
| Credit Suisse | USD | 29 | RUB | 1,200 | 12/17/14 | (1 | ) | |
| Credit Suisse | USD | 31 | RUB | 1,250 | 12/17/14 | (3 | ) | |
| Credit Suisse | USD | 32 | RUB | 1,300 | 12/17/14 | (2 | ) | |
| Credit Suisse | USD | 33 | RUB | 1,350 | 12/17/14 | (2 | ) | |
| Credit Suisse | USD | 36 | RUB | 1,450 | 12/17/14 | (2 | ) | |
| Credit Suisse | USD | 40 | RUB | 1,500 | 12/17/14 | (5 | ) | |
| Credit Suisse | USD | 42 | RUB | 1,700 | 12/17/14 | (3 | ) | |
| Credit Suisse | USD | 42 | RUB | 1,700 | 12/17/14 | (3 | ) | |
| Credit Suisse | USD | 49 | RUB | 2,050 | 12/17/14 | (2 | ) | |
| Credit Suisse | USD | 59 | RUB | 2,450 | 12/17/14 | (3 | ) | |
| Credit Suisse | USD | 63 | RUB | 2,400 | 12/17/14 | (8 | ) | |
| Credit Suisse | USD | 71 | RUB | 3,000 | 12/17/14 | (2 | ) | |
| Credit Suisse | USD | 81 | RUB | 3,500 | 12/17/14 | — | ||
| Credit Suisse | USD | 110 | RUB | 4,150 | 12/17/14 | (15 | ) | |
| Credit Suisse | USD | 124 | RUB | 4,650 | 12/17/14 | (17 | ) | |
| Credit Suisse | USD | 128 | RUB | 5,500 | 12/17/14 | (2 | ) | |
| Credit Suisse | USD | 259 | RUB | 10,500 | 12/17/14 | (18 | ) | |
| Credit Suisse | USD | 427 | RUB | 16,200 | 12/17/14 | (55 | ) | |
| Credit Suisse | USD | 5 | SEK | 38 | 12/17/14 | — | ||
| Credit Suisse | USD | 45 | SEK | 318 | 12/17/14 | (2 | ) | |
| Credit Suisse | USD | 180 | SEK | 1,277 | 12/17/14 | (7 | ) | |
| Credit Suisse | USD | 186 | SEK | 1,315 | 12/17/14 | (8 | ) | |
| Credit Suisse | USD | 207 | SEK | 1,449 | 12/17/14 | (11 | ) | |
| Credit Suisse | USD | 209 | SEK | 1,509 | 12/17/14 | (5 | ) | |
| Credit Suisse | USD | 240 | SEK | 1,723 | 12/17/14 | (7 | ) | |
| Credit Suisse | USD | 264 | SEK | 1,829 | 12/17/14 | (16 | ) | |
| See accompanying notes which are an integral part of the financial statements. | ||||||||
| Russell Multi-Strategy Alternative Fund 627 | ||||||||
Russell Investment Company
Russell Multi-Strategy Alternative Fund
Consolidated Schedule of Investments, continued — October 31, 2014
| Foreign Currency Exchange Contracts | |||||||||
| Amounts in thousands | |||||||||
| Unrealized | |||||||||
| Appreciation | |||||||||
| Amount | Amount | (Depreciation) | |||||||
| Counterparty | Sold | Bought | Settlement Date | $ | |||||
| Credit Suisse | USD | 531 | SEK | 3,790 | 12/17/14 | (18 | ) | ||
| Credit Suisse | USD | 543 | SEK | 3,913 | 12/17/14 | (13 | ) | ||
| Credit Suisse | USD | 607 | SEK | 4,332 | 12/17/14 | (20 | ) | ||
| Credit Suisse | USD | 658 | SEK | 4,705 | 12/17/14 | (21 | ) | ||
| Credit Suisse | USD | 709 | SEK | 5,141 | 12/17/14 | (13 | ) | ||
| Credit Suisse | USD | 991 | SEK | 7,136 | 12/17/14 | (25 | ) | ||
| Credit Suisse | USD | 1,092 | SEK | 7,865 | 12/17/14 | (27 | ) | ||
| Credit Suisse | USD | 2,973 | SEK | 21,692 | 12/17/14 | (35 | ) | ||
| Credit Suisse | USD | 11,736 | SEK | 81,987 | 12/17/14 | (632 | ) | ||
| Credit Suisse | USD | 106 | SGD | 135 | 12/17/14 | (1 | ) | ||
| Credit Suisse | USD | 235 | SGD | 300 | 12/17/14 | (1 | ) | ||
| Credit Suisse | USD | 698 | SGD | 873 | 12/17/14 | (18 | ) | ||
| Credit Suisse | USD | 885 | SGD | 1,120 | 12/17/14 | (13 | ) | ||
| Credit Suisse | USD | 2,664 | SGD | 3,342 | 12/17/14 | (63 | ) | ||
| Credit Suisse | USD | 29 | TRY | 65 | 12/17/14 | — | |||
| Credit Suisse | USD | 41 | TRY | 90 | 12/17/14 | (1 | ) | ||
| Credit Suisse | USD | 43 | TRY | 95 | 12/17/14 | (1 | ) | ||
| Credit Suisse | USD | 59 | TRY | 130 | 12/17/14 | (1 | ) | ||
| Credit Suisse | USD | 63 | TRY | 140 | 12/17/14 | (1 | ) | ||
| Credit Suisse | USD | 85 | TRY | 190 | 12/17/14 | — | |||
| Credit Suisse | USD | 86 | TRY | 195 | 12/17/14 | 1 | |||
| Credit Suisse | USD | 88 | TRY | 200 | 12/17/14 | 1 | |||
| Credit Suisse | USD | 95 | TRY | 215 | 12/17/14 | 1 | |||
| Credit Suisse | USD | 117 | TRY | 265 | 12/17/14 | 1 | |||
| Credit Suisse | USD | 122 | TRY | 270 | 12/17/14 | (2 | ) | ||
| Credit Suisse | USD | 159 | TRY | 350 | 12/17/14 | (3 | ) | ||
| Credit Suisse | USD | 219 | TRY | 500 | 12/17/14 | 3 | |||
| Credit Suisse | USD | 444 | TRY | 990 | 12/17/14 | (3 | ) | ||
| Credit Suisse | USD | 7 | TWD | 200 | 12/17/14 | — | |||
| Credit Suisse | USD | 52 | TWD | 1,550 | 12/17/14 | (1 | ) | ||
| Credit Suisse | USD | 85 | TWD | 2,550 | 12/17/14 | (2 | ) | ||
| Credit Suisse | USD | 125 | TWD | 3,800 | 12/17/14 | — | |||
| Credit Suisse | USD | 156 | TWD | 4,650 | 12/17/14 | (3 | ) | ||
| Credit Suisse | USD | 193 | TWD | 5,750 | 12/17/14 | (4 | ) | ||
| Credit Suisse | USD | 14 | ZAR | 150 | 12/17/14 | — | |||
| Credit Suisse | USD | 14 | ZAR | 150 | 12/17/14 | — | |||
| Credit Suisse | USD | 18 | ZAR | 200 | 12/17/14 | — | |||
| Credit Suisse | USD | 18 | ZAR | 200 | 12/17/14 | — | |||
| Credit Suisse | USD | 23 | ZAR | 250 | 12/17/14 | — | |||
| Credit Suisse | USD | 28 | ZAR | 300 | 12/17/14 | (1 | ) | ||
| Credit Suisse | USD | 45 | ZAR | 504 | 12/17/14 | — | |||
| Credit Suisse | USD | 49 | ZAR | 550 | 12/17/14 | 1 | |||
| Credit Suisse | USD | 50 | ZAR | 546 | 12/17/14 | (1 | ) | ||
| Credit Suisse | USD | 62 | ZAR | 700 | 12/17/14 | 1 | |||
| Credit Suisse | USD | 64 | ZAR | 700 | 12/17/14 | (1 | ) | ||
| Credit Suisse | USD | 65 | ZAR | 700 | 12/17/14 | (2 | ) | ||
| Credit Suisse | USD | 71 | ZAR | 800 | 12/17/14 | 1 | |||
| Credit Suisse | USD | 73 | ZAR | 800 | 12/17/14 | (1 | ) | ||
| Credit Suisse | USD | 81 | ZAR | 900 | 12/17/14 | — | |||
| Credit Suisse | USD | 89 | ZAR | 1,000 | 12/17/14 | 1 | |||
| Credit Suisse | USD | 100 | ZAR | 1,100 | 12/17/14 | (1 | ) | ||
| Credit Suisse | USD | 126 | ZAR | 1,400 | 12/17/14 | — | |||
| Credit Suisse | USD | 130 | ZAR | 1,450 | 12/17/14 | — | |||
| Credit Suisse | USD | 161 | ZAR | 1,800 | 12/17/14 | 1 | |||
| Credit Suisse | USD | 197 | ZAR | 2,150 | 12/17/14 | (3 | ) | ||
| Credit Suisse | AUD | 1 | USD | — | 12/17/14 | — | |||
| Credit Suisse | AUD | 10 | USD | 9 | 12/17/14 | — | |||
| Credit Suisse | AUD | 10 | USD | 9 | 12/17/14 | — | |||
| Credit Suisse | AUD | 30 | USD | 26 | 12/17/14 | — | |||
| Credit Suisse | AUD | 51 | USD | 44 | 12/17/14 | — | |||
| Credit Suisse | AUD | 56 | USD | 52 | 12/17/14 | 3 | |||
| Credit Suisse | AUD | 85 | USD | 74 | 12/17/14 | (1 | ) | ||
| Credit Suisse | AUD | 95 | USD | 87 | 12/17/14 | 4 | |||
| Credit Suisse | AUD | 190 | USD | 165 | 12/17/14 | (1 | ) | ||
| Credit Suisse | AUD | 201 | USD | 182 | 12/17/14 | 6 | |||
| Credit Suisse | AUD | 232 | USD | 206 | 12/17/14 | 3 | |||
| Credit Suisse | AUD | 263 | USD | 228 | 12/17/14 | (3 | ) | ||
| See accompanying notes which are an integral part of the financial statements. | |||||||||
| 628 Russell Multi-Strategy Alternative Fund | |||||||||
Russell Investment Company
Russell Multi-Strategy Alternative Fund
Consolidated Schedule of Investments, continued — October 31, 2014
| Foreign Currency Exchange Contracts | ||||||||
| Amounts in thousands | ||||||||
| Unrealized | ||||||||
| Appreciation | ||||||||
| Amount | Amount | (Depreciation) | ||||||
| Counterparty | Sold | Bought | Settlement Date | $ | ||||
| Credit Suisse | AUD | 294 | USD | 262 | 12/17/14 | 5 | ||
| Credit Suisse | AUD | 319 | USD | 289 | 12/17/14 | 9 | ||
| Credit Suisse | AUD | 332 | USD | 290 | 12/17/14 | (1 | ) | |
| Credit Suisse | AUD | 338 | USD | 294 | 12/17/14 | (2 | ) | |
| Credit Suisse | AUD | 338 | USD | 294 | 12/17/14 | (2 | ) | |
| Credit Suisse | AUD | 344 | USD | 309 | 12/17/14 | 8 | ||
| Credit Suisse | AUD | 351 | USD | 306 | 12/17/14 | (2 | ) | |
| Credit Suisse | AUD | 454 | USD | 396 | 12/17/14 | (2 | ) | |
| Credit Suisse | AUD | 487 | USD | 436 | 12/17/14 | 9 | ||
| Credit Suisse | AUD | 491 | USD | 433 | 12/17/14 | 3 | ||
| Credit Suisse | AUD | 547 | USD | 493 | 12/17/14 | 13 | ||
| Credit Suisse | AUD | 554 | USD | 485 | 12/17/14 | (1 | ) | |
| Credit Suisse | AUD | 563 | USD | 492 | 12/17/14 | (2 | ) | |
| Credit Suisse | AUD | 1,176 | USD | 1,037 | 12/17/14 | 6 | ||
| Credit Suisse | AUD | 1,224 | USD | 1,081 | 12/17/14 | 7 | ||
| Credit Suisse | AUD | 1,239 | USD | 1,066 | 12/17/14 | (22 | ) | |
| Credit Suisse | AUD | 9,164 | USD | 8,501 | 12/17/14 | 461 | ||
| Credit Suisse | BRL | 5 | USD | 2 | 12/17/14 | — | ||
| Credit Suisse | BRL | 10 | USD | 4 | 12/17/14 | — | ||
| Credit Suisse | BRL | 20 | USD | 8 | 12/17/14 | — | ||
| Credit Suisse | BRL | 25 | USD | 10 | 12/17/14 | — | ||
| Credit Suisse | BRL | 35 | USD | 14 | 12/17/14 | — | ||
| Credit Suisse | BRL | 40 | USD | 17 | 12/17/14 | 1 | ||
| Credit Suisse | BRL | 40 | USD | 16 | 12/17/14 | 1 | ||
| Credit Suisse | BRL | 45 | USD | 18 | 12/17/14 | — | ||
| Credit Suisse | BRL | 50 | USD | 20 | 12/17/14 | — | ||
| Credit Suisse | BRL | 75 | USD | 30 | 12/17/14 | 1 | ||
| Credit Suisse | BRL | 75 | USD | 31 | 12/17/14 | 2 | ||
| Credit Suisse | BRL | 85 | USD | 35 | 12/17/14 | 2 | ||
| Credit Suisse | BRL | 90 | USD | 35 | 12/17/14 | (1 | ) | |
| Credit Suisse | BRL | 105 | USD | 42 | 12/17/14 | — | ||
| Credit Suisse | BRL | 120 | USD | 49 | 12/17/14 | 1 | ||
| Credit Suisse | BRL | 125 | USD | 51 | 12/17/14 | 2 | ||
| Credit Suisse | BRL | 130 | USD | 53 | 12/17/14 | 1 | ||
| Credit Suisse | BRL | 185 | USD | 74 | 12/17/14 | 1 | ||
| Credit Suisse | BRL | 185 | USD | 75 | 12/17/14 | 2 | ||
| Credit Suisse | BRL | 245 | USD | 102 | 12/17/14 | 4 | ||
| Credit Suisse | BRL | 280 | USD | 117 | 12/17/14 | 5 | ||
| Credit Suisse | BRL | 1,340 | USD | 581 | 12/17/14 | 47 | ||
| Credit Suisse | CAD | 27 | USD | 24 | 12/17/14 | 1 | ||
| Credit Suisse | CAD | 27 | USD | 24 | 12/17/14 | 1 | ||
| Credit Suisse | CAD | 37 | USD | 33 | 12/17/14 | 1 | ||
| Credit Suisse | CAD | 79 | USD | 70 | 12/17/14 | 1 | ||
| Credit Suisse | CAD | 83 | USD | 73 | 12/17/14 | — | ||
| Credit Suisse | CAD | 93 | USD | 83 | 12/17/14 | 1 | ||
| Credit Suisse | CAD | 93 | USD | 83 | 12/17/14 | 1 | ||
| Credit Suisse | CAD | 100 | USD | 89 | 12/17/14 | 1 | ||
| Credit Suisse | CAD | 173 | USD | 155 | 12/17/14 | 1 | ||
| Credit Suisse | CAD | 181 | USD | 162 | 12/17/14 | 2 | ||
| Credit Suisse | CAD | 227 | USD | 204 | 12/17/14 | 3 | ||
| Credit Suisse | CAD | 278 | USD | 247 | 12/17/14 | 1 | ||
| Credit Suisse | CAD | 324 | USD | 287 | 12/17/14 | — | ||
| Credit Suisse | CAD | 365 | USD | 323 | 12/17/14 | — | ||
| Credit Suisse | CAD | 389 | USD | 352 | 12/17/14 | 8 | ||
| Credit Suisse | CAD | 421 | USD | 370 | 12/17/14 | (3 | ) | |
| Credit Suisse | CAD | 537 | USD | 491 | 12/17/14 | 15 | ||
| Credit Suisse | CAD | 583 | USD | 524 | 12/17/14 | 8 | ||
| Credit Suisse | CAD | 609 | USD | 540 | 12/17/14 | — | ||
| Credit Suisse | CAD | 650 | USD | 574 | 12/17/14 | (2 | ) | |
| Credit Suisse | CAD | 836 | USD | 742 | 12/17/14 | 2 | ||
| Credit Suisse | CAD | 928 | USD | 850 | 12/17/14 | 28 | ||
| Credit Suisse | CAD | 1,062 | USD | 978 | 12/17/14 | 37 | ||
| Credit Suisse | CAD | 1,334 | USD | 1,221 | 12/17/14 | 39 | ||
| Credit Suisse | CAD | 1,342 | USD | 1,229 | 12/17/14 | 40 | ||
| Credit Suisse | CHF | 1 | USD | 1 | 12/17/14 | — | ||
| Credit Suisse | CHF | 1 | USD | 1 | 12/17/14 | — | ||
| Credit Suisse | CHF | 2 | USD | 2 | 12/17/14 | — | ||
| See accompanying notes which are an integral part of the financial statements. | ||||||||
| Russell Multi-Strategy Alternative Fund 629 | ||||||||
Russell Investment Company
Russell Multi-Strategy Alternative Fund
Consolidated Schedule of Investments, continued — October 31, 2014
| Foreign Currency Exchange Contracts | ||||||||
| Amounts in thousands | ||||||||
| Unrealized | ||||||||
| Appreciation | ||||||||
| Amount | Amount | (Depreciation) | ||||||
| Counterparty | Sold | Bought | Settlement Date | $ | ||||
| Credit Suisse | CHF | 2 | USD | 2 | 12/17/14 | — | ||
| Credit Suisse | CHF | 4 | USD | 4 | 12/17/14 | — | ||
| Credit Suisse | CHF | 10 | USD | 10 | 12/17/14 | — | ||
| Credit Suisse | CHF | 10 | USD | 10 | 12/17/14 | — | ||
| Credit Suisse | CHF | 16 | USD | 18 | 12/17/14 | 1 | ||
| Credit Suisse | CHF | 28 | USD | 29 | 12/17/14 | — | ||
| Credit Suisse | CHF | 41 | USD | 43 | 12/17/14 | — | ||
| Credit Suisse | CHF | 51 | USD | 53 | 12/17/14 | — | ||
| Credit Suisse | CHF | 54 | USD | 57 | 12/17/14 | 1 | ||
| Credit Suisse | CHF | 107 | USD | 113 | 12/17/14 | 2 | ||
| Credit Suisse | CLP | 258,855 | USD | 442 | 11/06/14 | (7 | ) | |
| Credit Suisse | CLP | 20,000 | USD | 33 | 12/17/14 | (2 | ) | |
| Credit Suisse | CLP | 40,952 | USD | 69 | 12/17/14 | (2 | ) | |
| Credit Suisse | CLP | 58,944 | USD | 100 | 12/17/14 | (2 | ) | |
| Credit Suisse | CLP | 58,944 | USD | 99 | 12/17/14 | (3 | ) | |
| Credit Suisse | CLP | 60,283 | USD | 101 | 12/17/14 | (4 | ) | |
| Credit Suisse | CLP | 80,378 | USD | 135 | 12/17/14 | (4 | ) | |
| Credit Suisse | COP | 5,000 | USD | 2 | 12/17/14 | — | ||
| Credit Suisse | COP | 5,000 | USD | 3 | 12/17/14 | — | ||
| Credit Suisse | COP | 5,000 | USD | 3 | 12/17/14 | — | ||
| Credit Suisse | COP | 15,000 | USD | 8 | 12/17/14 | — | ||
| Credit Suisse | COP | 20,000 | USD | 10 | 12/17/14 | — | ||
| Credit Suisse | COP | 20,000 | USD | 10 | 12/17/14 | — | ||
| Credit Suisse | COP | 25,000 | USD | 12 | 12/17/14 | — | ||
| Credit Suisse | COP | 30,000 | USD | 15 | 12/17/14 | — | ||
| Credit Suisse | COP | 40,000 | USD | 20 | 12/17/14 | — | ||
| Credit Suisse | COP | 45,000 | USD | 22 | 12/17/14 | 1 | ||
| Credit Suisse | COP | 100,000 | USD | 50 | 12/17/14 | 1 | ||
| Credit Suisse | COP | 110,000 | USD | 55 | 12/17/14 | 2 | ||
| Credit Suisse | COP | 120,000 | USD | 59 | 12/17/14 | 1 | ||
| Credit Suisse | COP | 155,000 | USD | 76 | 12/17/14 | 1 | ||
| Credit Suisse | COP | 520,000 | USD | 267 | 12/17/14 | 16 | ||
| Credit Suisse | CZK | 100 | USD | 5 | 12/17/14 | — | ||
| Credit Suisse | CZK | 150 | USD | 7 | 12/17/14 | — | ||
| Credit Suisse | CZK | 400 | USD | 19 | 12/17/14 | 1 | ||
| Credit Suisse | CZK | 400 | USD | 19 | 12/17/14 | 1 | ||
| Credit Suisse | CZK | 550 | USD | 25 | 12/17/14 | — | ||
| Credit Suisse | CZK | 1,100 | USD | 51 | 12/17/14 | 1 | ||
| Credit Suisse | CZK | 3,150 | USD | 144 | 12/17/14 | 2 | ||
| Credit Suisse | CZK | 3,300 | USD | 151 | 12/17/14 | 2 | ||
| Credit Suisse | CZK | 3,500 | USD | 160 | 12/17/14 | 3 | ||
| Credit Suisse | CZK | 7,200 | USD | 336 | 12/17/14 | 11 | ||
| Credit Suisse | CZK | 9,831 | USD | 461 | 12/17/14 | 18 | ||
| Credit Suisse | CZK | 13,140 | USD | 618 | 12/17/14 | 26 | ||
| Credit Suisse | CZK | 13,140 | USD | 621 | 12/17/14 | 28 | ||
| Credit Suisse | CZK | 13,140 | USD | 620 | 12/17/14 | 27 | ||
| Credit Suisse | EUR | 15 | USD | 19 | 12/17/14 | 1 | ||
| Credit Suisse | EUR | 26 | USD | 33 | 12/17/14 | 1 | ||
| Credit Suisse | EUR | 45 | USD | 59 | 12/17/14 | 3 | ||
| Credit Suisse | EUR | 90 | USD | 113 | 12/17/14 | — | ||
| Credit Suisse | EUR | 92 | USD | 118 | 12/17/14 | 3 | ||
| Credit Suisse | EUR | 195 | USD | 253 | 12/17/14 | 8 | ||
| Credit Suisse | EUR | 199 | USD | 253 | 12/17/14 | 4 | ||
| Credit Suisse | EUR | 207 | USD | 266 | 12/17/14 | 7 | ||
| Credit Suisse | EUR | 247 | USD | 315 | 12/17/14 | 5 | ||
| Credit Suisse | EUR | 382 | USD | 493 | 12/17/14 | 14 | ||
| Credit Suisse | EUR | 384 | USD | 487 | 12/17/14 | 6 | ||
| Credit Suisse | EUR | 400 | USD | 506 | 12/17/14 | 5 | ||
| Credit Suisse | EUR | 454 | USD | 597 | 12/17/14 | 28 | ||
| Credit Suisse | EUR | 455 | USD | 588 | 12/17/14 | 17 | ||
| Credit Suisse | EUR | 462 | USD | 599 | 12/17/14 | 20 | ||
| Credit Suisse | EUR | 468 | USD | 614 | 12/17/14 | 28 | ||
| Credit Suisse | EUR | 474 | USD | 615 | 12/17/14 | 21 | ||
| Credit Suisse | EUR | 474 | USD | 619 | 12/17/14 | 24 | ||
| Credit Suisse | EUR | 560 | USD | 738 | 12/17/14 | 35 | ||
| Credit Suisse | EUR | 641 | USD | 814 | 12/17/14 | 11 | ||
| Credit Suisse | EUR | 699 | USD | 875 | 12/17/14 | (1 | ) | |
| See accompanying notes which are an integral part of the financial statements. | ||||||||
| 630 Russell Multi-Strategy Alternative Fund | ||||||||
Russell Investment Company
Russell Multi-Strategy Alternative Fund
Consolidated Schedule of Investments, continued — October 31, 2014
| Foreign Currency Exchange Contracts | |||||||
| Amounts in thousands | |||||||
| Unrealized | |||||||
| Appreciation | |||||||
| Amount | Amount | (Depreciation) | |||||
| Counterparty | Sold | Bought | Settlement Date | $ | |||
| Credit Suisse | EUR | 782 | USD | 987 | 12/17/14 | 6 | |
| Credit Suisse | EUR | 786 | USD | 992 | 12/17/14 | 6 | |
| Credit Suisse | EUR | 948 | USD | 1,230 | 12/17/14 | 41 | |
| Credit Suisse | EUR | 1,105 | USD | 1,399 | 12/17/14 | 14 | |
| Credit Suisse | EUR | 1,185 | USD | 1,525 | 12/17/14 | 40 | |
| Credit Suisse | EUR | 1,476 | USD | 1,865 | 12/17/14 | 14 | |
| Credit Suisse | EUR | 1,565 | USD | 2,066 | 12/17/14 | 105 | |
| Credit Suisse | EUR | 2,183 | USD | 2,805 | 12/17/14 | 70 | |
| Credit Suisse | EUR | 3,021 | USD | 3,977 | 12/17/14 | 190 | |
| Credit Suisse | EUR | 3,666 | USD | 4,710 | 12/17/14 | 114 | |
| Credit Suisse | GBP | 5 | USD | 8 | 12/17/14 | — | |
| Credit Suisse | GBP | 17 | USD | 28 | 12/17/14 | 1 | |
| Credit Suisse | GBP | 57 | USD | 92 | 12/17/14 | 1 | |
| Credit Suisse | GBP | 93 | USD | 153 | 12/17/14 | 4 | |
| Credit Suisse | GBP | 93 | USD | 150 | 12/17/14 | 1 | |
| Credit Suisse | GBP | 147 | USD | 237 | 12/17/14 | 2 | |
| Credit Suisse | GBP | 175 | USD | 282 | 12/17/14 | 3 | |
| Credit Suisse | GBP | 213 | USD | 346 | 12/17/14 | 7 | |
| Credit Suisse | GBP | 260 | USD | 421 | 12/17/14 | 6 | |
| Credit Suisse | GBP | 288 | USD | 462 | 12/17/14 | 3 | |
| Credit Suisse | GBP | 289 | USD | 466 | 12/17/14 | 4 | |
| Credit Suisse | GBP | 436 | USD | 696 | 12/17/14 | (1 | ) |
| Credit Suisse | GBP | 438 | USD | 704 | 12/17/14 | 4 | |
| Credit Suisse | GBP | 451 | USD | 724 | 12/17/14 | 2 | |
| Credit Suisse | GBP | 478 | USD | 767 | 12/17/14 | 3 | |
| Credit Suisse | GBP | 568 | USD | 906 | 12/17/14 | (2 | ) |
| Credit Suisse | GBP | 702 | USD | 1,116 | 12/17/14 | (6 | ) |
| Credit Suisse | GBP | 805 | USD | 1,284 | 12/17/14 | (4 | ) |
| Credit Suisse | GBP | 834 | USD | 1,333 | 12/17/14 | (1 | ) |
| Credit Suisse | GBP | 949 | USD | 1,516 | 12/17/14 | (1 | ) |
| Credit Suisse | GBP | 1,416 | USD | 2,345 | 12/17/14 | 81 | |
| Credit Suisse | GBP | 4,789 | USD | 7,928 | 12/17/14 | 270 | |
| Credit Suisse | HKD | 16 | USD | 2 | 12/17/14 | — | |
| Credit Suisse | HKD | 22 | USD | 3 | 12/17/14 | — | |
| Credit Suisse | HKD | 26 | USD | 3 | 12/17/14 | — | |
| Credit Suisse | HKD | 34 | USD | 4 | 12/17/14 | — | |
| Credit Suisse | HKD | 34 | USD | 4 | 12/17/14 | — | |
| Credit Suisse | HKD | 45 | USD | 6 | 12/17/14 | — | |
| Credit Suisse | HKD | 65 | USD | 8 | 12/17/14 | — | |
| Credit Suisse | HKD | 72 | USD | 9 | 12/17/14 | — | |
| Credit Suisse | HKD | 74 | USD | 10 | 12/17/14 | — | |
| Credit Suisse | HKD | 105 | USD | 14 | 12/17/14 | — | |
| Credit Suisse | HKD | 115 | USD | 15 | 12/17/14 | — | |
| Credit Suisse | HKD | 118 | USD | 15 | 12/17/14 | — | |
| Credit Suisse | HKD | 122 | USD | 16 | 12/17/14 | — | |
| Credit Suisse | HKD | 209 | USD | 27 | 12/17/14 | — | |
| Credit Suisse | HKD | 442 | USD | 57 | 12/17/14 | — | |
| Credit Suisse | HKD | 922 | USD | 119 | 12/17/14 | — | |
| Credit Suisse | HUF | 103,000 | USD | 424 | 12/17/14 | 6 | |
| Credit Suisse | HUF | 310,000 | USD | 1,288 | 12/17/14 | 28 | |
| Credit Suisse | IDR | 50,000 | USD | 4 | 12/17/14 | — | |
| Credit Suisse | IDR | 150,000 | USD | 12 | 12/17/14 | — | |
| Credit Suisse | IDR | 250,000 | USD | 20 | 12/17/14 | — | |
| Credit Suisse | IDR | 250,000 | USD | 20 | 12/17/14 | — | |
| Credit Suisse | IDR | 300,000 | USD | 24 | 12/17/14 | — | |
| Credit Suisse | IDR | 450,000 | USD | 36 | 12/17/14 | (1 | ) |
| Credit Suisse | IDR | 650,000 | USD | 52 | 12/17/14 | (1 | ) |
| Credit Suisse | IDR | 2,350,000 | USD | 196 | 12/17/14 | 3 | |
| Credit Suisse | IDR | 3,000,000 | USD | 243 | 12/17/14 | (4 | ) |
| Credit Suisse | ILS | 10 | USD | 3 | 12/17/14 | — | |
| Credit Suisse | ILS | 15 | USD | 4 | 12/17/14 | — | |
| Credit Suisse | ILS | 30 | USD | 8 | 12/17/14 | — | |
| Credit Suisse | ILS | 45 | USD | 12 | 12/17/14 | — | |
| Credit Suisse | ILS | 45 | USD | 12 | 12/17/14 | — | |
| Credit Suisse | ILS | 60 | USD | 16 | 12/17/14 | 1 | |
| Credit Suisse | ILS | 75 | USD | 20 | 12/17/14 | 1 | |
| Credit Suisse | ILS | 80 | USD | 22 | 12/17/14 | 1 | |
| See accompanying notes which are an integral part of the financial statements. | |||||||
| Russell Multi-Strategy Alternative Fund 631 | |||||||
Russell Investment Company
Russell Multi-Strategy Alternative Fund
Consolidated Schedule of Investments, continued — October 31, 2014
| Foreign Currency Exchange Contracts | ||||||||
| Amounts in thousands | ||||||||
| Unrealized | ||||||||
| Appreciation | ||||||||
| Amount | Amount | (Depreciation) | ||||||
| Counterparty | Sold | Bought | Settlement Date | $ | ||||
| Credit Suisse | ILS | 100 | USD | 28 | 12/17/14 | 1 | ||
| Credit Suisse | ILS | 105 | USD | 29 | 12/17/14 | 1 | ||
| Credit Suisse | ILS | 125 | USD | 34 | 12/17/14 | 1 | ||
| Credit Suisse | ILS | 140 | USD | 39 | 12/17/14 | 2 | ||
| Credit Suisse | ILS | 185 | USD | 52 | 12/17/14 | 3 | ||
| Credit Suisse | ILS | 480 | USD | 134 | 12/17/14 | 8 | ||
| Credit Suisse | ILS | 3,660 | USD | 1,004 | 12/17/14 | 40 | ||
| Credit Suisse | JPY | 42 | USD | — | 12/17/14 | — | ||
| Credit Suisse | JPY | 347 | USD | 3 | 12/17/14 | — | ||
| Credit Suisse | JPY | 581 | USD | 5 | 12/17/14 | — | ||
| Credit Suisse | JPY | 4,478 | USD | 42 | 12/17/14 | 2 | ||
| Credit Suisse | JPY | 7,600 | USD | 70 | 12/17/14 | 2 | ||
| Credit Suisse | JPY | 11,000 | USD | 101 | 12/17/14 | 3 | ||
| Credit Suisse | JPY | 18,898 | USD | 177 | 12/17/14 | 8 | ||
| Credit Suisse | JPY | 28,677 | USD | 273 | 12/17/14 | 18 | ||
| Credit Suisse | JPY | 39,017 | USD | 364 | 12/17/14 | 16 | ||
| Credit Suisse | JPY | 45,173 | USD | 416 | 12/17/14 | 14 | ||
| Credit Suisse | JPY | 52,849 | USD | 493 | 12/17/14 | 22 | ||
| Credit Suisse | JPY | 53,837 | USD | 513 | 12/17/14 | 34 | ||
| Credit Suisse | JPY | 55,369 | USD | 512 | 12/17/14 | 19 | ||
| Credit Suisse | JPY | 57,875 | USD | 536 | 12/17/14 | 21 | ||
| Credit Suisse | JPY | 76,463 | USD | 714 | 12/17/14 | 33 | ||
| Credit Suisse | JPY | 101,701 | USD | 942 | 12/17/14 | 36 | ||
| Credit Suisse | JPY | 115,416 | USD | 1,070 | 12/17/14 | 42 | ||
| Credit Suisse | JPY | 134,324 | USD | 1,255 | 12/17/14 | 59 | ||
| Credit Suisse | JPY | 151,738 | USD | 1,393 | 12/17/14 | 42 | ||
| Credit Suisse | JPY | 216,244 | USD | 1,992 | 12/17/14 | 66 | ||
| Credit Suisse | JPY | 233,687 | USD | 2,204 | 12/17/14 | 122 | ||
| Credit Suisse | JPY | 295,084 | USD | 2,811 | 12/17/14 | 183 | ||
| Credit Suisse | JPY | 343,098 | USD | 3,072 | 12/17/14 | 16 | ||
| Credit Suisse | JPY | 343,310 | USD | 3,278 | 12/17/14 | 220 | ||
| Credit Suisse | JPY | 344,702 | USD | 3,278 | 12/17/14 | 207 | ||
| Credit Suisse | JPY | 345,013 | USD | 3,278 | 12/17/14 | 205 | ||
| Credit Suisse | JPY | 346,373 | USD | 3,263 | 12/17/14 | 178 | ||
| Credit Suisse | JPY | 346,414 | USD | 3,307 | 12/17/14 | 222 | ||
| Credit Suisse | JPY | 2,947,572 | USD | 27,059 | 12/17/14 | 807 | ||
| Credit Suisse | KRW | 15,000 | USD | 15 | 12/17/14 | 1 | ||
| Credit Suisse | KRW | 15,000 | USD | 14 | 12/17/14 | — | ||
| Credit Suisse | KRW | 15,000 | USD | 14 | 12/17/14 | — | ||
| Credit Suisse | KRW | 20,000 | USD | 19 | 12/17/14 | — | ||
| Credit Suisse | KRW | 25,000 | USD | 24 | 12/17/14 | 1 | ||
| Credit Suisse | KRW | 35,000 | USD | 33 | 12/17/14 | — | ||
| Credit Suisse | KRW | 45,000 | USD | 44 | 12/17/14 | 2 | ||
| Credit Suisse | KRW | 60,000 | USD | 58 | 12/17/14 | 2 | ||
| Credit Suisse | KRW | 60,000 | USD | 59 | 12/17/14 | 3 | ||
| Credit Suisse | KRW | 85,000 | USD | 83 | 12/17/14 | 4 | ||
| Credit Suisse | KRW | 90,000 | USD | 84 | 12/17/14 | — | ||
| Credit Suisse | KRW | 105,000 | USD | 98 | 12/17/14 | — | ||
| Credit Suisse | KRW | 105,000 | USD | 99 | 12/17/14 | — | ||
| Credit Suisse | KRW | 170,000 | USD | 161 | 12/17/14 | 2 | ||
| Credit Suisse | KRW | 240,000 | USD | 223 | 12/17/14 | (1 | ) | |
| Credit Suisse | KRW | 275,000 | USD | 257 | 12/17/14 | — | ||
| Credit Suisse | KRW | 350,000 | USD | 326 | 12/17/14 | (1 | ) | |
| Credit Suisse | KRW | 640,000 | USD | 597 | 12/17/14 | — | ||
| Credit Suisse | KRW | 1,695,000 | USD | 1,662 | 12/17/14 | 79 | ||
| Credit Suisse | MXN | 150 | USD | 11 | 12/17/14 | — | ||
| Credit Suisse | MXN | 300 | USD | 23 | 12/17/14 | — | ||
| Credit Suisse | MXN | 400 | USD | 29 | 12/17/14 | — | ||
| Credit Suisse | MXN | 400 | USD | 30 | 12/17/14 | — | ||
| Credit Suisse | MXN | 400 | USD | 30 | 12/17/14 | — | ||
| Credit Suisse | MXN | 500 | USD | 37 | 12/17/14 | — | ||
| Credit Suisse | MXN | 600 | USD | 44 | 12/17/14 | — | ||
| Credit Suisse | MXN | 700 | USD | 52 | 12/17/14 | — | ||
| Credit Suisse | MXN | 850 | USD | 64 | 12/17/14 | 1 | ||
| Credit Suisse | MXN | 850 | USD | 64 | 12/17/14 | 1 | ||
| Credit Suisse | MXN | 1,000 | USD | 75 | 12/17/14 | 1 | ||
| Credit Suisse | MXN | 1,094 | USD | 82 | 12/17/14 | 1 | ||
| See accompanying notes which are an integral part of the financial statements. | ||||||||
| 632 Russell Multi-Strategy Alternative Fund | ||||||||
Russell Investment Company
Russell Multi-Strategy Alternative Fund
Consolidated Schedule of Investments, continued — October 31, 2014
| Foreign Currency Exchange Contracts | ||||||||
| Amounts in thousands | ||||||||
| Unrealized | ||||||||
| Appreciation | ||||||||
| Amount | Amount | (Depreciation) | ||||||
| Counterparty | Sold | Bought | Settlement Date | $ | ||||
| Credit Suisse | MXN | 1,094 | USD | 82 | 12/17/14 | 1 | ||
| Credit Suisse | MXN | 1,300 | USD | 97 | 12/17/14 | 1 | ||
| Credit Suisse | MXN | 1,353 | USD | 103 | 12/17/14 | 3 | ||
| Credit Suisse | MXN | 1,360 | USD | 102 | 12/17/14 | 2 | ||
| Credit Suisse | MXN | 1,363 | USD | 104 | 12/17/14 | 3 | ||
| Credit Suisse | MXN | 1,550 | USD | 116 | 12/17/14 | 1 | ||
| Credit Suisse | MXN | 1,631 | USD | 124 | 12/17/14 | 3 | ||
| Credit Suisse | MXN | 1,650 | USD | 124 | 12/17/14 | 2 | ||
| Credit Suisse | MXN | 1,900 | USD | 144 | 12/17/14 | 3 | ||
| Credit Suisse | MXN | 2,350 | USD | 173 | 12/17/14 | (1 | ) | |
| Credit Suisse | MXN | 2,705 | USD | 206 | 12/17/14 | 5 | ||
| Credit Suisse | MXN | 3,050 | USD | 225 | 12/17/14 | (1 | ) | |
| Credit Suisse | MXN | 3,300 | USD | 244 | 12/17/14 | — | ||
| Credit Suisse | MXN | 8,200 | USD | 616 | 12/17/14 | 8 | ||
| Credit Suisse | MYR | 10 | USD | 3 | 12/17/14 | — | ||
| Credit Suisse | MYR | 15 | USD | 5 | 12/17/14 | — | ||
| Credit Suisse | MYR | 25 | USD | 8 | 12/17/14 | — | ||
| Credit Suisse | MYR | 25 | USD | 8 | 12/17/14 | — | ||
| Credit Suisse | MYR | 30 | USD | 9 | 12/17/14 | — | ||
| Credit Suisse | MYR | 30 | USD | 9 | 12/17/14 | — | ||
| Credit Suisse | MYR | 35 | USD | 11 | 12/17/14 | — | ||
| Credit Suisse | MYR | 50 | USD | 15 | 12/17/14 | — | ||
| Credit Suisse | MYR | 55 | USD | 17 | 12/17/14 | — | ||
| Credit Suisse | MYR | 55 | USD | 17 | 12/17/14 | — | ||
| Credit Suisse | MYR | 55 | USD | 17 | 12/17/14 | 1 | ||
| Credit Suisse | MYR | 70 | USD | 22 | 12/17/14 | 1 | ||
| Credit Suisse | MYR | 70 | USD | 22 | 12/17/14 | 1 | ||
| Credit Suisse | MYR | 70 | USD | 22 | 12/17/14 | — | ||
| Credit Suisse | MYR | 90 | USD | 28 | 12/17/14 | — | ||
| Credit Suisse | MYR | 115 | USD | 36 | 12/17/14 | 1 | ||
| Credit Suisse | MYR | 130 | USD | 40 | 12/17/14 | — | ||
| Credit Suisse | MYR | 135 | USD | 41 | 12/17/14 | — | ||
| Credit Suisse | MYR | 235 | USD | 72 | 12/17/14 | 1 | ||
| Credit Suisse | MYR | 290 | USD | 89 | 12/17/14 | 1 | ||
| Credit Suisse | MYR | 315 | USD | 95 | 12/17/14 | — | ||
| Credit Suisse | MYR | 325 | USD | 99 | 12/17/14 | 1 | ||
| Credit Suisse | MYR | 335 | USD | 102 | 12/17/14 | — | ||
| Credit Suisse | MYR | 345 | USD | 107 | 12/17/14 | 2 | ||
| Credit Suisse | MYR | 360 | USD | 110 | 12/17/14 | 1 | ||
| Credit Suisse | MYR | 410 | USD | 126 | 12/17/14 | 1 | ||
| Credit Suisse | MYR | 500 | USD | 152 | 12/17/14 | — | ||
| Credit Suisse | MYR | 2,040 | USD | 642 | 12/17/14 | 24 | ||
| Credit Suisse | NOK | 100 | USD | 16 | 12/17/14 | 1 | ||
| Credit Suisse | NOK | 539 | USD | 81 | 12/17/14 | 2 | ||
| Credit Suisse | NOK | 1,161 | USD | 177 | 12/17/14 | 5 | ||
| Credit Suisse | NOK | 1,305 | USD | 202 | 12/17/14 | 9 | ||
| Credit Suisse | NOK | 1,521 | USD | 237 | 12/17/14 | 12 | ||
| Credit Suisse | NOK | 1,793 | USD | 272 | 12/17/14 | 6 | ||
| Credit Suisse | NOK | 1,966 | USD | 297 | 12/17/14 | 6 | ||
| Credit Suisse | NOK | 2,126 | USD | 331 | 12/17/14 | 16 | ||
| Credit Suisse | NOK | 2,221 | USD | 347 | 12/17/14 | 18 | ||
| Credit Suisse | NOK | 2,594 | USD | 391 | 12/17/14 | 7 | ||
| Credit Suisse | NOK | 4,145 | USD | 630 | 12/17/14 | 17 | ||
| Credit Suisse | NOK | 4,951 | USD | 751 | 12/17/14 | 18 | ||
| Credit Suisse | NOK | 6,291 | USD | 957 | 12/17/14 | 26 | ||
| Credit Suisse | NOK | 6,353 | USD | 945 | 12/17/14 | 4 | ||
| Credit Suisse | NOK | 26,468 | USD | 4,150 | 12/17/14 | 231 | ||
| Credit Suisse | NOK | 30,773 | USD | 4,869 | 12/17/14 | 314 | ||
| Credit Suisse | NZD | 114 | USD | 92 | 12/17/14 | 4 | ||
| Credit Suisse | NZD | 116 | USD | 95 | 12/17/14 | 5 | ||
| Credit Suisse | NZD | 119 | USD | 95 | 12/17/14 | 3 | ||
| Credit Suisse | NZD | 148 | USD | 121 | 12/17/14 | 6 | ||
| Credit Suisse | NZD | 157 | USD | 129 | 12/17/14 | 7 | ||
| Credit Suisse | NZD | 233 | USD | 189 | 12/17/14 | 8 | ||
| Credit Suisse | NZD | 282 | USD | 219 | 12/17/14 | 1 | ||
| Credit Suisse | NZD | 290 | USD | 235 | 12/17/14 | 10 | ||
| Credit Suisse | NZD | 295 | USD | 229 | 12/17/14 | 1 | ||
| See accompanying notes which are an integral part of the financial statements. | ||||||||
| Russell Multi-Strategy Alternative Fund 633 | ||||||||
Russell Investment Company
Russell Multi-Strategy Alternative Fund
Consolidated Schedule of Investments, continued — October 31, 2014
| Foreign Currency Exchange Contracts | |||||||||
| Amounts in thousands | |||||||||
| Unrealized | |||||||||
| Appreciation | |||||||||
| Amount | Amount | (Depreciation) | |||||||
| Counterparty | Sold | Bought | Settlement Date | $ | |||||
| Credit Suisse | NZD | 304 | USD | 247 | 12/17/14 | 12 | |||
| Credit Suisse | NZD | 349 | USD | 270 | 12/17/14 | — | |||
| Credit Suisse | NZD | 368 | USD | 289 | 12/17/14 | 3 | |||
| Credit Suisse | NZD | 385 | USD | 310 | 12/17/14 | 12 | |||
| Credit Suisse | NZD | 480 | USD | 389 | 12/17/14 | 16 | |||
| Credit Suisse | NZD | 565 | USD | 446 | 12/17/14 | 8 | |||
| Credit Suisse | NZD | 656 | USD | 512 | 12/17/14 | 3 | |||
| Credit Suisse | NZD | 1,324 | USD | 1,021 | 12/17/14 | (7 | ) | ||
| Credit Suisse | NZD | 1,419 | USD | 1,097 | 12/17/14 | (4 | ) | ||
| Credit Suisse | NZD | 1,731 | USD | 1,333 | 12/17/14 | (10 | ) | ||
| Credit Suisse | NZD | 3,280 | USD | 2,720 | 12/17/14 | 175 | |||
| Credit Suisse | PHP | 607 | USD | 14 | 12/17/14 | — | |||
| Credit Suisse | PHP | 1,596 | USD | 37 | 12/17/14 | 1 | |||
| Credit Suisse | PHP | 1,596 | USD | 37 | 12/17/14 | 1 | |||
| Credit Suisse | PHP | 1,601 | USD | 37 | 12/17/14 | 1 | |||
| Credit Suisse | PHP | 1,950 | USD | 44 | 12/17/14 | 1 | |||
| Credit Suisse | PHP | 2,050 | USD | 46 | 12/17/14 | — | |||
| Credit Suisse | PHP | 2,050 | USD | 46 | 12/17/14 | 1 | |||
| Credit Suisse | PHP | 3,000 | USD | 66 | 12/17/14 | — | |||
| Credit Suisse | PHP | 3,750 | USD | 84 | 12/17/14 | 1 | |||
| Credit Suisse | PHP | 3,850 | USD | 86 | 12/17/14 | — | |||
| Credit Suisse | PHP | 4,050 | USD | 91 | 12/17/14 | 1 | |||
| Credit Suisse | PHP | 4,100 | USD | 92 | 12/17/14 | 1 | |||
| Credit Suisse | PHP | 7,100 | USD | 159 | 12/17/14 | 1 | |||
| Credit Suisse | PHP | 18,900 | USD | 423 | 12/17/14 | 3 | |||
| Credit Suisse | PLN | 5 | USD | 2 | 12/17/14 | — | |||
| Credit Suisse | PLN | 10 | USD | 3 | 12/17/14 | — | |||
| Credit Suisse | PLN | 25 | USD | 8 | 12/17/14 | — | |||
| Credit Suisse | PLN | 30 | USD | 9 | 12/17/14 | — | |||
| Credit Suisse | PLN | 75 | USD | 23 | 12/17/14 | 1 | |||
| Credit Suisse | PLN | 90 | USD | 27 | 12/17/14 | — | |||
| Credit Suisse | PLN | 120 | USD | 37 | 12/17/14 | 1 | |||
| Credit Suisse | PLN | 165 | USD | 50 | 12/17/14 | 1 | |||
| Credit Suisse | PLN | 195 | USD | 59 | 12/17/14 | 1 | |||
| Credit Suisse | PLN | 230 | USD | 70 | 12/17/14 | 2 | |||
| Credit Suisse | PLN | 230 | USD | 69 | 12/17/14 | 1 | |||
| Credit Suisse | PLN | 235 | USD | 70 | 12/17/14 | 1 | |||
| Credit Suisse | PLN | 255 | USD | 76 | 12/17/14 | — | |||
| Credit Suisse | PLN | 265 | USD | 80 | 12/17/14 | 1 | |||
| Credit Suisse | PLN | 275 | USD | 82 | 12/17/14 | 1 | |||
| Credit Suisse | PLN | 305 | USD | 92 | 12/17/14 | 2 | |||
| Credit Suisse | PLN | 400 | USD | 121 | 12/17/14 | 2 | |||
| Credit Suisse | PLN | 435 | USD | 135 | 12/17/14 | 6 | |||
| Credit Suisse | PLN | 945 | USD | 293 | 12/17/14 | 13 | |||
| Credit Suisse | RUB | 150 | USD | 4 | 12/17/14 | — | |||
| Credit Suisse | RUB | 200 | USD | 5 | 12/17/14 | — | |||
| Credit Suisse | RUB | 700 | USD | 18 | 12/17/14 | 2 | |||
| Credit Suisse | RUB | 4,950 | USD | 127 | 12/17/14 | 14 | |||
| Credit Suisse | RUB | 5,448 | USD | 144 | 12/17/14 | 19 | |||
| Credit Suisse | RUB | 5,485 | USD | 145 | 12/17/14 | 19 | |||
| Credit Suisse | RUB | 5,500 | USD | 140 | 12/17/14 | 13 | |||
| Credit Suisse | RUB | 7,300 | USD | 193 | 12/17/14 | 25 | |||
| Credit Suisse | RUB | 8,245 | USD | 217 | 12/17/14 | 28 | |||
| Credit Suisse | RUB | 8,855 | USD | 232 | 12/17/14 | 28 | |||
| Credit Suisse | RUB | 11,117 | USD | 290 | 12/17/14 | 35 | |||
| Credit Suisse | RUB | 64,100 | USD | 1,634 | 12/17/14 | 162 | |||
| Credit Suisse | SEK | 100 | USD | 14 | 12/17/14 | — | |||
| Credit Suisse | SEK | 184 | USD | 26 | 12/17/14 | 1 | |||
| Credit Suisse | SEK | 631 | USD | 87 | 12/17/14 | 1 | |||
| Credit Suisse | SEK | 758 | USD | 106 | 12/17/14 | 3 | |||
| Credit Suisse | SEK | 760 | USD | 106 | 12/17/14 | 4 | |||
| Credit Suisse | SEK | 1,525 | USD | 214 | 12/17/14 | 7 | |||
| Credit Suisse | SEK | 1,750 | USD | 244 | 12/17/14 | 7 | |||
| Credit Suisse | SEK | 1,861 | USD | 259 | 12/17/14 | 7 | |||
| Credit Suisse | SEK | 2,234 | USD | 310 | 12/17/14 | 8 | |||
| Credit Suisse | SEK | 2,610 | USD | 360 | 12/17/14 | 6 | |||
| Credit Suisse | SEK | 2,987 | USD | 411 | 12/17/14 | 6 | |||
| See accompanying notes which are an integral part of the financial statements. | |||||||||
| 634 Russell Multi-Strategy Alternative Fund | |||||||||
Russell Investment Company
Russell Multi-Strategy Alternative Fund
Consolidated Schedule of Investments, continued — October 31, 2014
| Foreign Currency Exchange Contracts | ||||||||
| Amounts in thousands | ||||||||
| Unrealized | ||||||||
| Appreciation | ||||||||
| Amount | Amount | (Depreciation) | ||||||
| Counterparty | Sold | Bought | Settlement Date | $ | ||||
| Credit Suisse | SEK | 4,995 | USD | 680 | 12/17/14 | 4 | ||
| Credit Suisse | SEK | 6,995 | USD | 952 | 12/17/14 | 5 | ||
| Credit Suisse | SEK | 7,139 | USD | 1,016 | 12/17/14 | 49 | ||
| Credit Suisse | SEK | 7,139 | USD | 1,017 | 12/17/14 | 50 | ||
| Credit Suisse | SEK | 8,566 | USD | 1,225 | 12/17/14 | 65 | ||
| Credit Suisse | SEK | 8,620 | USD | 1,208 | 12/17/14 | 41 | ||
| Credit Suisse | SEK | 9,055 | USD | 1,231 | 12/17/14 | 4 | ||
| Credit Suisse | SEK | 9,775 | USD | 1,376 | 12/17/14 | 52 | ||
| Credit Suisse | SEK | 10,096 | USD | 1,427 | 12/17/14 | 60 | ||
| Credit Suisse | SEK | 10,188 | USD | 1,430 | 12/17/14 | 50 | ||
| Credit Suisse | SEK | 10,849 | USD | 1,531 | 12/17/14 | 62 | ||
| Credit Suisse | SEK | 10,850 | USD | 1,528 | 12/17/14 | 58 | ||
| Credit Suisse | SEK | 85,141 | USD | 11,897 | 12/17/14 | 365 | ||
| Credit Suisse | SGD | 20 | USD | 16 | 12/17/14 | — | ||
| Credit Suisse | SGD | 25 | USD | 20 | 12/17/14 | — | ||
| Credit Suisse | SGD | 25 | USD | 20 | 12/17/14 | — | ||
| Credit Suisse | SGD | 30 | USD | 24 | 12/17/14 | — | ||
| Credit Suisse | SGD | 35 | USD | 28 | 12/17/14 | — | ||
| Credit Suisse | SGD | 40 | USD | 32 | 12/17/14 | — | ||
| Credit Suisse | SGD | 45 | USD | 35 | 12/17/14 | — | ||
| Credit Suisse | SGD | 45 | USD | 35 | 12/17/14 | — | ||
| Credit Suisse | SGD | 60 | USD | 47 | 12/17/14 | 1 | ||
| Credit Suisse | SGD | 65 | USD | 52 | 12/17/14 | 1 | ||
| Credit Suisse | SGD | 65 | USD | 51 | 12/17/14 | 1 | ||
| Credit Suisse | SGD | 65 | USD | 51 | 12/17/14 | 1 | ||
| Credit Suisse | SGD | 70 | USD | 55 | 12/17/14 | — | ||
| Credit Suisse | SGD | 75 | USD | 59 | 12/17/14 | 1 | ||
| Credit Suisse | SGD | 80 | USD | 63 | 12/17/14 | 1 | ||
| Credit Suisse | SGD | 85 | USD | 68 | 12/17/14 | 2 | ||
| Credit Suisse | SGD | 95 | USD | 76 | 12/17/14 | 2 | ||
| Credit Suisse | SGD | 115 | USD | 90 | 12/17/14 | 1 | ||
| Credit Suisse | SGD | 120 | USD | 94 | 12/17/14 | — | ||
| Credit Suisse | SGD | 130 | USD | 102 | 12/17/14 | 1 | ||
| Credit Suisse | SGD | 135 | USD | 108 | 12/17/14 | 3 | ||
| Credit Suisse | SGD | 145 | USD | 114 | 12/17/14 | 1 | ||
| Credit Suisse | SGD | 155 | USD | 122 | 12/17/14 | 1 | ||
| Credit Suisse | SGD | 165 | USD | 131 | 12/17/14 | 3 | ||
| Credit Suisse | SGD | 215 | USD | 168 | 12/17/14 | 1 | ||
| Credit Suisse | SGD | 225 | USD | 177 | 12/17/14 | 2 | ||
| Credit Suisse | SGD | 240 | USD | 190 | 12/17/14 | 3 | ||
| Credit Suisse | SGD | 245 | USD | 193 | 12/17/14 | 2 | ||
| Credit Suisse | SGD | 570 | USD | 444 | 12/17/14 | 1 | ||
| Credit Suisse | SGD | 2,210 | USD | 1,769 | 12/17/14 | 49 | ||
| Credit Suisse | TRY | 5 | USD | 2 | 12/17/14 | — | ||
| Credit Suisse | TRY | 5 | USD | 2 | 12/17/14 | — | ||
| Credit Suisse | TRY | 10 | USD | 4 | 12/17/14 | — | ||
| Credit Suisse | TRY | 10 | USD | 4 | 12/17/14 | — | ||
| Credit Suisse | TRY | 35 | USD | 16 | 12/17/14 | — | ||
| Credit Suisse | TRY | 40 | USD | 17 | 12/17/14 | (1 | ) | |
| Credit Suisse | TRY | 45 | USD | 20 | 12/17/14 | (1 | ) | |
| Credit Suisse | TRY | 45 | USD | 20 | 12/17/14 | — | ||
| Credit Suisse | TRY | 45 | USD | 20 | 12/17/14 | — | ||
| Credit Suisse | TRY | 50 | USD | 22 | 12/17/14 | — | ||
| Credit Suisse | TRY | 55 | USD | 24 | 12/17/14 | — | ||
| Credit Suisse | TRY | 56 | USD | 25 | 12/17/14 | — | ||
| Credit Suisse | TRY | 56 | USD | 25 | 12/17/14 | — | ||
| Credit Suisse | TRY | 57 | USD | 25 | 12/17/14 | — | ||
| Credit Suisse | TRY | 67 | USD | 30 | 12/17/14 | — | ||
| Credit Suisse | TRY | 67 | USD | 30 | 12/17/14 | 1 | ||
| Credit Suisse | TRY | 71 | USD | 32 | 12/17/14 | 1 | ||
| Credit Suisse | TRY | 130 | USD | 55 | 12/17/14 | (3 | ) | |
| Credit Suisse | TRY | 155 | USD | 66 | 12/17/14 | (3 | ) | |
| Credit Suisse | TRY | 155 | USD | 67 | 12/17/14 | (2 | ) | |
| Credit Suisse | TRY | 170 | USD | 74 | 12/17/14 | (2 | ) | |
| Credit Suisse | TRY | 180 | USD | 77 | 12/17/14 | (3 | ) | |
| Credit Suisse | TRY | 205 | USD | 90 | 12/17/14 | (1 | ) | |
| Credit Suisse | TRY | 260 | USD | 112 | 12/17/14 | (4 | ) | |
| See accompanying notes which are an integral part of the financial statements. | ||||||||
| Russell Multi-Strategy Alternative Fund 635 | ||||||||
Russell Investment Company
Russell Multi-Strategy Alternative Fund
Consolidated Schedule of Investments, continued — October 31, 2014
| Foreign Currency Exchange Contracts | |||||||
| Amounts in thousands | |||||||
| Unrealized | |||||||
| Appreciation | |||||||
| Amount | Amount | (Depreciation) | |||||
| Counterparty | Sold | Bought | Settlement Date | $ | |||
| Credit Suisse | TWD | 50 | USD | 2 | 12/17/14 | — | |
| Credit Suisse | TWD | 126 | USD | 4 | 12/17/14 | — | |
| Credit Suisse | TWD | 250 | USD | 8 | 12/17/14 | — | |
| Credit Suisse | TWD | 300 | USD | 10 | 12/17/14 | — | |
| Credit Suisse | TWD | 500 | USD | 16 | 12/17/14 | — | |
| Credit Suisse | TWD | 600 | USD | 20 | 12/17/14 | — | |
| Credit Suisse | TWD | 950 | USD | 31 | 12/17/14 | — | |
| Credit Suisse | TWD | 970 | USD | 33 | 12/17/14 | 1 | |
| Credit Suisse | TWD | 1,600 | USD | 53 | 12/17/14 | — | |
| Credit Suisse | TWD | 1,750 | USD | 58 | 12/17/14 | — | |
| Credit Suisse | TWD | 1,850 | USD | 62 | 12/17/14 | 1 | |
| Credit Suisse | TWD | 1,865 | USD | 63 | 12/17/14 | 1 | |
| Credit Suisse | TWD | 1,869 | USD | 63 | 12/17/14 | 1 | |
| Credit Suisse | TWD | 1,869 | USD | 63 | 12/17/14 | 1 | |
| Credit Suisse | TWD | 1,950 | USD | 64 | 12/17/14 | — | |
| Credit Suisse | TWD | 1,950 | USD | 65 | 12/17/14 | — | |
| Credit Suisse | TWD | 2,250 | USD | 74 | 12/17/14 | — | |
| Credit Suisse | TWD | 3,050 | USD | 101 | 12/17/14 | 1 | |
| Credit Suisse | TWD | 3,050 | USD | 100 | 12/17/14 | — | |
| Credit Suisse | TWD | 3,400 | USD | 112 | 12/17/14 | — | |
| Credit Suisse | TWD | 5,350 | USD | 177 | 12/17/14 | 1 | |
| Credit Suisse | TWD | 5,550 | USD | 183 | 12/17/14 | — | |
| Credit Suisse | TWD | 13,100 | USD | 433 | 12/17/14 | 2 | |
| Credit Suisse | ZAR | 50 | USD | 4 | 12/17/14 | — | |
| Credit Suisse | ZAR | 300 | USD | 27 | 12/17/14 | — | |
| Credit Suisse | ZAR | 300 | USD | 27 | 12/17/14 | — | |
| Credit Suisse | ZAR | 300 | USD | 26 | 12/17/14 | (1 | ) |
| Credit Suisse | ZAR | 300 | USD | 27 | 12/17/14 | — | |
| Credit Suisse | ZAR | 500 | USD | 44 | 12/17/14 | (1 | ) |
| Credit Suisse | ZAR | 600 | USD | 52 | 12/17/14 | (2 | ) |
| Credit Suisse | ZAR | 1,050 | USD | 93 | 12/17/14 | (2 | ) |
| Deutsche Bank | USD | 39 | EUR | 31 | 12/02/14 | — | |
| Deutsche Bank | USD | 487 | MXN | 6,565 | 12/18/14 | (1 | ) |
| Deutsche Bank | ILS | 4,134 | USD | 1,159 | 11/05/14 | 71 | |
| ED&F Man Capital Markets | USD | 6,730 | INR | 413,624 | 11/28/14 | (28 | ) |
| ED&F Man Capital Markets | USD | 6,730 | MXN | 91,056 | 12/17/14 | 14 | |
| ED&F Man Capital Markets | USD | 6,620 | NOK | 42,895 | 12/17/14 | (270 | ) |
| ED&F Man Capital Markets | USD | 8,596 | NOK | 55,104 | 12/17/14 | (438 | ) |
| ED&F Man Capital Markets | USD | 9,688 | RUB | 402,564 | 04/09/15 | (718 | ) |
| ED&F Man Capital Markets | USD | 6,620 | ZAR | 74,670 | 12/17/14 | 101 | |
| ED&F Man Capital Markets | CAD | 9,687 | USD | 8,625 | 12/17/14 | 39 | |
| ED&F Man Capital Markets | EUR | 13,720 | GBP | 10,828 | 12/17/14 | 118 | |
| ED&F Man Capital Markets | JPY | 1,796,868 | USD | 16,650 | 12/17/14 | 646 | |
| ED&F Man Capital Markets | RUB | 117,519 | USD | 2,988 | 08/27/15 | 457 | |
| ED&F Man Capital Markets | SEK | 61,354 | USD | 8,621 | 12/17/14 | 312 | |
| ED&F Man Capital Markets | TRY | 14,961 | USD | 6,730 | 12/17/14 | 65 | |
| Federal Reserve Bank of Boston | USD | 10,380 | ILS | 38,680 | 12/17/14 | (200 | ) |
| Federal Reserve Bank of Boston | USD | 8,035 | MXN | 105,667 | 12/17/14 | (209 | ) |
| Federal Reserve Bank of Boston | USD | 15,084 | NOK | 93,921 | 12/17/14 | (1,181 | ) |
| Federal Reserve Bank of Boston | CHF | 12,397 | USD | 13,479 | 12/17/14 | 590 | |
| Federal Reserve Bank of Boston | EUR | 10,924 | NOK | 89,140 | 12/17/14 | (497 | ) |
| Federal Reserve Bank of Boston | ILS | 12,183 | USD | 3,310 | 12/17/14 | 104 | |
| Federal Reserve Bank of Boston | ILS | 30,220 | USD | 8,449 | 12/17/14 | 495 | |
| Federal Reserve Bank of Boston | PLN | 21,332 | USD | 6,660 | 12/17/14 | 341 | |
| Federal Reserve Bank of Boston | SEK | 122,709 | EUR | 13,320 | 12/17/14 | 77 | |
| Federal Reserve Bank of Boston | TRY | 29,094 | USD | 13,100 | 12/17/14 | 139 | |
| Federal Reserve Bank of Boston | ZAR | 75,056 | USD | 6,720 | 12/17/14 | (36 | ) |
| Federal Reserve Bank of Boston | ZAR | 123,258 | USD | 11,322 | 12/17/14 | 228 | |
| Goldman Sachs | USD | 109 | ILS | 407 | 11/05/14 | (1 | ) |
| Goldman Sachs | CLP | 190,075 | USD | 324 | 11/06/14 | (6 | ) |
| Goldman Sachs | ILS | 407 | USD | 109 | 01/14/15 | 1 | |
| HSBC | USD | 422 | ILS | 1,590 | 11/05/14 | (3 | ) |
| HSBC | ILS | 1,590 | USD | 422 | 01/14/15 | 3 | |
| HSBC | NZD | 1,869 | USD | 1,473 | 11/04/14 | 16 | |
| Jefferies | USD | 6,660 | HUF | 1,593,590 | 12/17/14 | (186 | ) |
| Jefferies | USD | 9,930 | JPY | 1,075,414 | 12/17/14 | (351 | ) |
| See accompanying notes which are an integral part of the financial statements. | |||||||
| 636 Russell Multi-Strategy Alternative Fund | |||||||
Russell Investment Company
Russell Multi-Strategy Alternative Fund
Consolidated Schedule of Investments, continued — October 31, 2014
| Foreign Currency Exchange Contracts | |||||||
| Amounts in thousands | |||||||
| Unrealized | |||||||
| Appreciation | |||||||
| Amount | Amount | (Depreciation) | |||||
| Counterparty | Sold | Bought | Settlement Date | $ | |||
| Jefferies | USD | 6,860 | MXN | 91,642 | 12/17/14 | (72 | ) |
| Jefferies | USD | 3,310 | TRY | 7,568 | 12/17/14 | 62 | |
| Jefferies | EUR | 33,100 | GBP | 25,849 | 12/17/14 | (155 | ) |
| Jefferies | GBP | 8,275 | USD | 13,428 | 12/17/14 | 195 | |
| Jefferies | THB | 181,362 | USD | 5,641 | 12/17/14 | 83 | |
| Jefferies | ZAR | 18,944 | USD | 1,655 | 12/17/14 | (50 | ) |
| JPMorgan Chase | USD | 27 | EUR | 21 | 12/12/14 | — | |
| JPMorgan Chase | USD | 32 | EUR | 25 | 12/12/14 | (1 | ) |
| JPMorgan Chase | USD | 41 | EUR | 33 | 12/12/14 | — | |
| JPMorgan Chase | USD | 119 | EUR | 94 | 12/12/14 | (2 | ) |
| JPMorgan Chase | USD | 135 | EUR | 107 | 12/12/14 | (1 | ) |
| JPMorgan Chase | USD | 158 | EUR | 125 | 12/12/14 | (1 | ) |
| JPMorgan Chase | USD | 265 | EUR | 209 | 12/12/14 | (3 | ) |
| JPMorgan Chase | USD | 572 | EUR | 451 | 12/12/14 | (7 | ) |
| JPMorgan Chase | USD | 755 | EUR | 604 | 12/12/14 | 1 | |
| JPMorgan Chase | USD | 420 | ILS | 1,569 | 11/05/14 | (7 | ) |
| JPMorgan Chase | USD | 3,450 | INR | 212,864 | 12/17/14 | (14 | ) |
| JPMorgan Chase | USD | 487 | MXN | 6,551 | 12/18/14 | (2 | ) |
| JPMorgan Chase | BRL | 8,566 | USD | 3,430 | 11/04/14 | (27 | ) |
| JPMorgan Chase | CAD | 25 | USD | 22 | 11/17/14 | — | |
| JPMorgan Chase | CNH | 188,158 | USD | 30,800 | 02/09/15 | 330 | |
| JPMorgan Chase | EUR | 33 | USD | 41 | 11/03/14 | — | |
| JPMorgan Chase | EUR | 32 | USD | 41 | 12/12/14 | 1 | |
| JPMorgan Chase | EUR | 8,575 | USD | 10,892 | 12/17/14 | 143 | |
| JPMorgan Chase | ILS | 23,830 | USD | 6,660 | 12/17/14 | 388 | |
| JPMorgan Chase | JPY | 116,100 | USD | 1,067 | 11/04/14 | 33 | |
| JPMorgan Chase | JPY | 3,594,569 | USD | 33,300 | 12/17/14 | 1,284 | |
| JPMorgan Chase | RON | 29,575 | EUR | 6,660 | 12/17/14 | (42 | ) |
| JPMorgan Chase | RON | 14,027 | USD | 4,163 | 12/17/14 | 183 | |
| JPMorgan Chase | RUB | 825,115 | USD | 20,085 | 04/02/15 | 1,667 | |
| JPMorgan Chase | RUB | 402,829 | USD | 9,688 | 04/09/15 | 712 | |
| Merrill Lynch | USD | 6,660 | MXN | 87,685 | 12/17/14 | (165 | ) |
| Merrill Lynch | USD | 18 | TWD | 555 | 10/30/14 | — | |
| Morgan Stanley | USD | 30,900 | CNH | 190,995 | 11/21/14 | 222 | |
| Morgan Stanley | USD | 9,106 | COP | 18,689,429 | 11/12/14 | (30 | ) |
| Morgan Stanley | USD | 1,483 | NZD | 1,869 | 11/04/14 | (26 | ) |
| Morgan Stanley | USD | 42,402 | TRY | 96,366 | 12/17/14 | 528 | |
| Morgan Stanley | COP | 18,782,033 | USD | 9,158 | 11/05/14 | 29 | |
| Morgan Stanley | GBP | 8,937 | USD | 14,503 | 12/17/14 | 211 | |
| Morgan Stanley | NZD | 1,869 | USD | 1,479 | 12/02/14 | 26 | |
| Morgan Stanley | RUB | 744,888 | USD | 17,595 | 12/17/14 | 486 | |
| Newedge | PLN | 20,737 | USD | 6,468 | 12/17/14 | 325 | |
| Skandinaviska Enskilda Bank | USD | 13,320 | NOK | 82,978 | 12/17/14 | (1,036 | ) |
| Societe Generale | USD | 3,310 | TRY | 7,578 | 12/17/14 | 66 | |
| Societe Generale | GBP | 25,819 | EUR | 33,100 | 12/17/14 | 202 | |
| Societe Generale | GBP | 25,819 | EUR | 33,100 | 12/17/14 | 202 | |
| Societe Generale | MXN | 1,128 | USD | 86 | 12/18/14 | 2 | |
| State Street | USD | 102 | EUR | 80 | 11/21/14 | (2 | ) |
| State Street | USD | 108 | EUR | 80 | 11/21/14 | (7 | ) |
| State Street | USD | 259 | EUR | 190 | 11/21/14 | (21 | ) |
| State Street | USD | 355 | EUR | 280 | 11/21/14 | (4 | ) |
| State Street | USD | 746 | EUR | 590 | 11/21/14 | (6 | ) |
| State Street | USD | 26 | EUR | 20 | 11/24/14 | (1 | ) |
| State Street | USD | 27 | EUR | 20 | 11/24/14 | (2 | ) |
| State Street | USD | 51 | EUR | 40 | 11/24/14 | (1 | ) |
| State Street | USD | 54 | EUR | 40 | 11/24/14 | (4 | ) |
| State Street | USD | 55 | EUR | 40 | 11/24/14 | (5 | ) |
| State Street | USD | 55 | EUR | 40 | 11/24/14 | (5 | ) |
| State Street | USD | 67 | EUR | 50 | 11/24/14 | (4 | ) |
| State Street | USD | 82 | EUR | 60 | 11/24/14 | (7 | ) |
| State Street | USD | 94 | EUR | 70 | 11/24/14 | (6 | ) |
| State Street | USD | 96 | EUR | 70 | 11/24/14 | (8 | ) |
| State Street | USD | 177 | EUR | 140 | 11/24/14 | (2 | ) |
| State Street | USD | 304 | EUR | 240 | 11/24/14 | (4 | ) |
| State Street | USD | 334 | EUR | 260 | 11/24/14 | (8 | ) |
| State Street | USD | 392 | EUR | 310 | 11/24/14 | (3 | ) |
| See accompanying notes which are an integral part of the financial statements. | |||||||
| Russell Multi-Strategy Alternative Fund 637 | |||||||
Russell Investment Company
Russell Multi-Strategy Alternative Fund
Consolidated Schedule of Investments, continued — October 31, 2014
| Foreign Currency Exchange Contracts | ||||||||
| Amounts in thousands | ||||||||
| Unrealized | ||||||||
| Appreciation | ||||||||
| Amount | Amount | (Depreciation) | ||||||
| Counterparty | Sold | Bought | Settlement Date | $ | ||||
| State Street | USD | 649 | EUR | 510 | 11/24/14 | (10 | ) | |
| State Street | USD | 1,807 | EUR | 1,310 | 11/24/14 | (166 | ) | |
| State Street | USD | 88 | EUR | 70 | 11/25/14 | — | ||
| State Street | USD | 164 | EUR | 128 | 12/17/14 | (3 | ) | |
| State Street | USD | 508 | EUR | 402 | 12/17/14 | (4 | ) | |
| State Street | USD | 1,881 | EUR | 1,455 | 12/17/14 | (57 | ) | |
| State Street | USD | 27 | EUR | 20 | 01/16/15 | (2 | ) | |
| State Street | USD | 130 | EUR | 100 | 01/16/15 | (4 | ) | |
| State Street | USD | 168 | EUR | 130 | 01/16/15 | (5 | ) | |
| State Street | USD | 168 | EUR | 130 | 01/16/15 | (5 | ) | |
| State Street | USD | 246 | EUR | 190 | 01/16/15 | (8 | ) | |
| State Street | USD | 300 | EUR | 220 | 01/16/15 | (24 | ) | |
| State Street | USD | 14 | EUR | 10 | 01/20/15 | (1 | ) | |
| State Street | USD | 39 | EUR | 30 | 01/20/15 | (1 | ) | |
| State Street | USD | 82 | EUR | 60 | 01/20/15 | (6 | ) | |
| State Street | USD | 233 | EUR | 180 | 01/20/15 | (7 | ) | |
| State Street | USD | 315 | EUR | 230 | 01/20/15 | (27 | ) | |
| State Street | USD | 38 | EUR | 30 | 02/19/15 | (1 | ) | |
| State Street | USD | 63 | EUR | 50 | 02/19/15 | (1 | ) | |
| State Street | USD | 68 | EUR | 50 | 02/19/15 | (5 | ) | |
| State Street | USD | 68 | EUR | 50 | 02/19/15 | (6 | ) | |
| State Street | USD | 81 | EUR | 60 | 02/19/15 | (6 | ) | |
| State Street | USD | 82 | EUR | 60 | 02/19/15 | (7 | ) | |
| State Street | USD | 154 | EUR | 120 | 02/19/15 | (4 | ) | |
| State Street | USD | 26 | EUR | 20 | 04/24/15 | — | ||
| State Street | USD | 2,533 | GBP | 1,575 | 12/17/14 | (15 | ) | |
| State Street | USD | 48 | GBP | 30 | 02/18/15 | — | ||
| State Street | USD | 49 | GBP | 30 | 02/18/15 | (1 | ) | |
| State Street | USD | 51 | GBP | 30 | 02/18/15 | (3 | ) | |
| State Street | USD | 68 | GBP | 40 | 02/18/15 | (4 | ) | |
| State Street | USD | 80 | GBP | 50 | 02/18/15 | (1 | ) | |
| State Street | USD | 81 | GBP | 50 | 02/18/15 | (1 | ) | |
| State Street | USD | 86 | GBP | 50 | 02/18/15 | (6 | ) | |
| State Street | USD | 102 | GBP | 60 | 02/18/15 | (6 | ) | |
| State Street | USD | 120 | GBP | 70 | 02/18/15 | (8 | ) | |
| State Street | USD | 262 | GBP | 160 | 02/18/15 | (6 | ) | |
| State Street | USD | 17 | GBP | 10 | 02/19/15 | (1 | ) | |
| State Street | USD | 64 | GBP | 40 | 02/19/15 | — | ||
| State Street | USD | 68 | GBP | 40 | 02/19/15 | (4 | ) | |
| State Street | USD | 85 | GBP | 50 | 02/19/15 | (6 | ) | |
| State Street | USD | 97 | GBP | 60 | 02/19/15 | (2 | ) | |
| State Street | USD | 113 | GBP | 70 | 02/19/15 | (1 | ) | |
| State Street | USD | 137 | GBP | 80 | 02/19/15 | (9 | ) | |
| State Street | USD | 146 | GBP | 90 | 02/19/15 | (2 | ) | |
| State Street | USD | 205 | GBP | 120 | 02/19/15 | (13 | ) | |
| State Street | USD | 409 | GBP | 250 | 02/19/15 | (9 | ) | |
| State Street | USD | 1,600 | JPY | 172,437 | 11/20/14 | (65 | ) | |
| State Street | USD | 10,000 | JPY | 1,094,260 | 11/20/14 | (257 | ) | |
| State Street | USD | 2,809 | JPY | 301,895 | 12/17/14 | (120 | ) | |
| State Street | EUR | 60 | USD | 82 | 11/21/14 | 7 | ||
| State Street | EUR | 770 | USD | 1,072 | 11/21/14 | 107 | ||
| State Street | EUR | 1,470 | USD | 2,047 | 11/21/14 | 205 | ||
| State Street | EUR | 10 | USD | 13 | 11/24/14 | 1 | ||
| State Street | EUR | 20 | USD | 25 | 11/24/14 | — | ||
| State Street | EUR | 30 | USD | 41 | 11/24/14 | 3 | ||
| State Street | EUR | 30 | USD | 40 | 11/24/14 | 2 | ||
| State Street | EUR | 30 | USD | 40 | 11/24/14 | 2 | ||
| State Street | EUR | 30 | USD | 40 | 11/24/14 | 3 | ||
| State Street | EUR | 40 | USD | 55 | 11/24/14 | 5 | ||
| State Street | EUR | 40 | USD | 55 | 11/24/14 | 4 | ||
| State Street | EUR | 50 | USD | 68 | 11/24/14 | 6 | ||
| State Street | EUR | 60 | USD | 78 | 11/24/14 | 3 | ||
| State Street | EUR | 130 | USD | 165 | 11/24/14 | 2 | ||
| State Street | EUR | 140 | USD | 184 | 11/24/14 | 8 | ||
| State Street | EUR | 290 | USD | 399 | 11/24/14 | 36 | ||
| State Street | EUR | 510 | USD | 692 | 11/24/14 | 53 | ||
| State Street | EUR | 3,050 | USD | 4,247 | 11/24/14 | 425 | ||
| See accompanying notes which are an integral part of the financial statements. | ||||||||
| 638 Russell Multi-Strategy Alternative Fund | ||||||||
Russell Investment Company
Russell Multi-Strategy Alternative Fund
Consolidated Schedule of Investments, continued — October 31, 2014
| Foreign Currency Exchange Contracts | ||||||||
| Amounts in thousands | ||||||||
| Unrealized | ||||||||
| Appreciation | ||||||||
| Amount | Amount | (Depreciation) | ||||||
| Counterparty | Sold | Bought | Settlement Date | $ | ||||
| State Street | EUR | 20 | USD | 27 | 11/25/14 | 2 | ||
| State Street | EUR | 40 | USD | 53 | 11/25/14 | 2 | ||
| State Street | EUR | 40 | USD | 54 | 11/25/14 | 4 | ||
| State Street | EUR | 50 | USD | 69 | 11/25/14 | 6 | ||
| State Street | EUR | 60 | USD | 84 | 11/25/14 | 8 | ||
| State Street | EUR | 90 | USD | 124 | 11/25/14 | 11 | ||
| State Street | EUR | 100 | USD | 138 | 11/25/14 | 13 | ||
| State Street | EUR | 110 | USD | 150 | 11/25/14 | 12 | ||
| State Street | EUR | 215 | USD | 298 | 11/25/14 | 28 | ||
| State Street | EUR | 230 | USD | 316 | 11/25/14 | 28 | ||
| State Street | EUR | 740 | USD | 939 | 12/15/14 | 11 | ||
| State Street | EUR | 3,934 | USD | 5,077 | 12/17/14 | 146 | ||
| State Street | EUR | 790 | USD | 1,082 | 01/16/15 | 92 | ||
| State Street | EUR | 10 | USD | 14 | 01/20/15 | 1 | ||
| State Street | EUR | 30 | USD | 39 | 01/20/15 | 1 | ||
| State Street | EUR | 80 | USD | 107 | 01/20/15 | 7 | ||
| State Street | EUR | 170 | USD | 233 | 01/20/15 | 20 | ||
| State Street | EUR | 220 | USD | 301 | 01/20/15 | 26 | ||
| State Street | EUR | 60 | USD | 76 | 02/19/15 | 1 | ||
| State Street | EUR | 100 | USD | 127 | 02/19/15 | 2 | ||
| State Street | EUR | 100 | USD | 134 | 02/19/15 | 8 | ||
| State Street | EUR | 110 | USD | 147 | 02/19/15 | 9 | ||
| State Street | EUR | 130 | USD | 166 | 02/19/15 | 3 | ||
| State Street | EUR | 1,977 | USD | 2,698 | 02/19/15 | 219 | ||
| State Street | EUR | 60 | USD | 78 | 04/22/15 | 3 | ||
| State Street | EUR | 120 | USD | 156 | 04/23/15 | 5 | ||
| State Street | EUR | 40 | USD | 51 | 04/24/15 | — | ||
| State Street | EUR | 60 | USD | 76 | 04/24/15 | — | ||
| State Street | GBP | 302 | USD | 489 | 12/15/14 | 6 | ||
| State Street | GBP | 500 | USD | 819 | 12/17/14 | 19 | ||
| State Street | GBP | 60 | USD | 96 | 02/18/15 | — | ||
| State Street | GBP | 80 | USD | 131 | 02/18/15 | 3 | ||
| State Street | GBP | 90 | USD | 149 | 02/18/15 | 5 | ||
| State Street | GBP | 679 | USD | 1,140 | 02/18/15 | 54 | ||
| State Street | GBP | 40 | USD | 64 | 02/19/15 | 1 | ||
| State Street | GBP | 50 | USD | 85 | 02/19/15 | 6 | ||
| State Street | GBP | 60 | USD | 96 | 02/19/15 | — | ||
| State Street | GBP | 130 | USD | 212 | 02/19/15 | 5 | ||
| State Street | GBP | 130 | USD | 215 | 02/19/15 | 7 | ||
| State Street | GBP | 954 | USD | 1,598 | 02/19/15 | 74 | ||
| State Street | JPY | 4,720,170 | USD | 46,133 | 11/20/14 | 4,107 | ||
| State Street | JPY | 101,034 | USD | 942 | 12/17/14 | 42 | ||
| State Street | JPY | 200,861 | USD | 1,882 | 12/17/14 | 93 | ||
| UBS | USD | 18,754 | EUR | 14,758 | 11/04/14 | (260 | ) | |
| UBS | USD | 485 | MXN | 6,521 | 12/18/14 | (2 | ) | |
| UBS | EUR | 21,780 | USD | 27,863 | 11/04/14 | 568 | ||
| UBS | EUR | 14,758 | USD | 18,757 | 12/02/14 | 260 | ||
| UBS | ILS | 23,816 | USD | 6,660 | 12/17/14 | 392 | ||
| UBS | MXN | 13,213 | USD | 995 | 12/18/14 | 16 | ||
| Total Unrealized Appreciation (Depreciation) on Open Foreign Currency Exchange Contracts | 9,663 | |||||||
Index Swap Contracts (*)
Amounts in thousands
| Fund Receives | Notional | Termination | Fair Value | ||
| Underlying Security | Counterparty | Amount | Date | $ | |
| Russian Depositary (USD) Index | JPMorgan Chase | USD | 6,587 | 01/14/15 | 68 |
| Total Fair Value of Open Index Swap Contracts Premiums Paid (Received) - $— (å) | 68 | ||||
| (*) | Total return swaps (which includes index swaps) are agreements between counterparties to exchange cash flows, one based on market-linked return of an individual asset or a basket of assets (i.e. an index), and the other on a fixed or floating rate. The floating rate fee was based on the 1 month LIBOR rate. |
See accompanying notes which are an integral part of the financial statements.
Russell Multi-Strategy Alternative Fund 639
Russell Investment Company
Russell Multi-Strategy Alternative Fund
Consolidated Schedule of Investments, continued — October 31, 2014
| Interest Rate Swap Contracts | ||||||||||||||||
| Amounts in thousands | ||||||||||||||||
| Termination | Fair Value | |||||||||||||||
| Counterparty | Notional Amount | Fund Receives | Fund Pays | Date | $ | |||||||||||
| Citigroup | NOK | 125,000 | Six Month NIBOR | 2.035% | 01/14/17 | (419 | ) | |||||||||
| Citigroup | AUD | 7,700 | 4.000 | % | Three Month BBSW | 10/09/17 | 145 | |||||||||
| Citigroup | MXN | 43,000 | 6.630 | % | Mexico Interbank 28 Day Deposit Rate | 12/18/23 | 145 | |||||||||
| Citigroup | CAD | 500 | 3.300 | % | Canadian Dealer Offer Rate | 06/19/24 | 37 | |||||||||
| Citigroup | CAD | 700 | Canadian Dealer Offer Rate | 3.500% | 06/20/44 | (72 | ) | |||||||||
| Mexico Interbank 28 Day | ||||||||||||||||
| Credit Suisse | MXN | 13,200 | Deposit Rate | 3.865% | 06/16/16 | (2 | ) | |||||||||
| Mexico Interbank 28 Day | ||||||||||||||||
| Credit Suisse | MXN | 13,100 | Deposit Rate | 3.850% | 06/17/16 | (2 | ) | |||||||||
| Credit Suisse | AUD | 2,200 | 3.000 | % | Three Month BBSW | 08/21/16 | 12 | |||||||||
| Credit Suisse | MXN | 8,300 | 5.610 | % | Mexico Interbank 28 Day Deposit Rate | 07/07/21 | — | |||||||||
| Credit Suisse | GBP | 1,400 | Six Month LIBOR | 3.000% | 03/21/23 | (29 | ) | |||||||||
| Credit Suisse | USD | 2,200 | 3.000 | % | Three Month LIBOR | 03/21/23 | (9 | ) | ||||||||
| Credit Suisse | USD | 3,100 | Three Month LIBOR | 2.000% | 06/19/23 | 63 | ||||||||||
| Credit Suisse | JPY | 40,000 | Six Month LIBOR | 1.000% | 09/18/23 | (16 | ) | |||||||||
| Credit Suisse | JPY | 342,000 | Six Month LIBOR | 1.500% | 06/19/28 | (259 | ) | |||||||||
| Credit Suisse | CAD | 900 | 3.400 | % | Canadian Dealer Offer Rate | 06/20/29 | 61 | |||||||||
| Credit Suisse | GBP | 400 | Six Month LIBOR | 3.750% | 09/18/43 | (39 | ) | |||||||||
| Credit Suisse | CAD | 200 | Canadian Dealer Offer Rate | 3.500% | 06/20/44 | (21 | ) | |||||||||
| JPMorgan Chase | HUF 90,000,000 2.490% | Three Month BUBOR | 02/27/15 | 338 | ||||||||||||
| JPMorgan Chase | SEK 2,600,000 | 0.880 | % | Three Month STIBOR | 03/18/15 | 559 | ||||||||||
| JPMorgan Chase | NZD | 73,300 | 3.778 | % | Three Month BBR | 09/03/15 | 22 | |||||||||
| JPMorgan Chase | MXN 1,450,000 | 5.400 | % | Mexico Interbank 28 Day Deposit Rate | 10/11/17 | (5 | ) | |||||||||
| JPMorgan Chase | MXN | 40,000 | 6.535 | % | Mexico Interbank 28 Day Deposit Rate | 01/10/24 | 108 | |||||||||
| JPMorgan Chase | ZAR | 200,000 | 9.280 | % | Three Month JIBAR | 03/27/24 | 375 | |||||||||
| Mexico Interbank 28 Day | ||||||||||||||||
| JPMorgan Chase | MXN | 80,000 | Deposit Rate | 6.130% | 05/27/24 | (3 | ) | |||||||||
| Morgan Stanley | GBP | 500 | Six Month LIBOR | 3.758% | 09/18/43 | (50 | ) | |||||||||
| UBS | AUD | 7,600 | 4.000 | % | Three Month BBSW | 10/09/17 | 144 | |||||||||
| Total Fair Value on Open Interest Rate Swap Contracts Premiums Paid (Received) - $96 (å) | 1,083 | |||||||||||||||
| Credit Default Swap Contracts | ||||||||||||||||
| Amounts in thousands | ||||||||||||||||
| Corporate Issues | ||||||||||||||||
| Implied | Fund (Pays)/ | |||||||||||||||
| Credit | Receives | Termination | Fair Value | |||||||||||||
| Reference Entity | Counterparty | Spread | Notional Amount | Fixed Rate | Date | $ | ||||||||||
| ACCOR | JPMorgan Chase | 0.979 | % | EUR | 1,000 | 1.000 | % | 06/20/19 | 3 | |||||||
| ACCOR | JPMorgan Chase | 1.026 | % | EUR | 1,000 | 1.000 | % | 09/20/19 | — | |||||||
| ACCOR | JPMorgan Chase | 1.069 | % | EUR | 1,000 | 1.000 | % | 12/20/19 | (3 | ) | ||||||
| Adecco S.A. | JPMorgan Chase | 0.568 | % | EUR | 1,000 | (1.000 | %) | 06/20/19 | (26 | ) | ||||||
| Adecco S.A. | JPMorgan Chase | 0.630 | % | EUR | 2,000 | (1.000 | %) | 12/20/19 | (50 | ) | ||||||
| AK Steel Corp. | JPMorgan Chase | 5.707 | % | USD | 500 | (5.000 | %) | 09/20/19 | 12 | |||||||
| Aktiebolaget Electrolux | JPMorgan Chase | 0.584 | % | EUR | 1,000 | (1.000 | %) | 03/20/19 | (24 | ) | ||||||
| Aktiebolaget Electrolux | JPMorgan Chase | 0.693 | % | EUR | 2,000 | (1.000 | %) | 12/20/19 | (42 | ) | ||||||
| Alcoa, Inc. | JPMorgan Chase | 0.376 | % | USD | 2,000 | 1.000 | % | 12/20/19 | 65 | |||||||
| Alcoa, Inc. | JPMorgan Chase | 1.284 | % | USD | 1,000 | (1.000 | %) | 09/20/19 | 12 | |||||||
| Alcoa, Inc. | JPMorgan Chase | 1.284 | % | USD | 1,000 | (1.000 | %) | 09/20/19 | 12 | |||||||
| Alcoa, Inc. | JPMorgan Chase | 1.370 | % | USD | 3,000 | (1.000 | %) | 12/20/19 | 51 | |||||||
| Alcoa, Inc. | JPMorgan Chase | 1.370 | % | USD | 1,000 | (1.000 | %) | 12/20/19 | 17 | |||||||
| Altria Group Inc. | JPMorgan Chase | 0.307 | % | USD | 3,000 | 1.000 | % | 03/20/19 | 93 | |||||||
| Altria Group, Inc. | JPMorgan Chase | 0.307 | % | USD | 1,000 | (1.000 | %) | 03/20/19 | (31 | ) | ||||||
| Amerada Hess Corp. | JPMorgan Chase | 0.777 | % | USD | 1,000 | 1.000 | % | 09/20/19 | 11 | |||||||
| American Axle & Manufacturing, Inc. | JPMorgan Chase | 2.714 | % | USD | 1,000 | (5.000 | %) | 09/20/19 | (109 | ) | ||||||
| American Axle & Manufacturing, Inc. | JPMorgan Chase | 2.714 | % | USD | 1,000 | 5.000 | % | 09/20/19 | 109 | |||||||
| American Electric Power Company, Inc. | JPMorgan Chase | 0.240 | % | USD | 1,000 | (1.000 | %) | 06/20/19 | (36 | ) | ||||||
| American Electric Power Company, Inc. | JPMorgan Chase | 0.240 | % | USD | 1,000 | (1.000 | %) | 06/20/19 | (36 | ) | ||||||
| See accompanying notes which are an integral part of the financial statements. | ||||||||||||||||
| 640 Russell Multi-Strategy Alternative Fund | ||||||||||||||||
Russell Investment Company
Russell Multi-Strategy Alternative Fund
Consolidated Schedule of Investments, continued — October 31, 2014
| Credit Default Swap Contracts | |||||||||||
| Amounts in thousands | |||||||||||
| Corporate Issues | |||||||||||
| Implied | Fund (Pays)/ | ||||||||||
| Credit | Receives | Termination | Fair Value | ||||||||
| Reference Entity | Counterparty | Spread | Notional Amount | Fixed Rate | Date | $ | |||||
| American Electric Power Company, Inc. | JPMorgan Chase | 0.270 | % | USD | 3,000 | (1.000 | %) | 12/20/19 | (113 | ) | |
| AmerisourceBergen Corp. | JPMorgan Chase | 0.431 | % | USD | 2,000 | (1.000 | %) | 12/20/19 | (59 | ) | |
| Amgen, Inc. | JPMorgan Chase | 0.382 | % | USD | 2,000 | (1.000 | %) | 06/20/19 | (58 | ) | |
| Amkor Technology, Inc. | JPMorgan Chase | 0.428 | % | USD | 2,000 | 1.000 | % | 03/20/19 | 51 | ||
| Amkor Technology, Inc. | JPMorgan Chase | 3.690 | % | USD | 500 | (5.000 | %) | 12/20/19 | (34 | ) | |
| Anadarko Petroleum Corp. | JPMorgan Chase | 0.818 | % | USD | 1,000 | (1.000 | %) | 06/20/19 | (9 | ) | |
| Anadarko Petroleum Corp. | JPMorgan Chase | 0.864 | % | USD | 500 | (1.000 | %) | 09/20/19 | (4 | ) | |
| Anadarko Petroleum Corp. | JPMorgan Chase | 0.909 | % | USD | 2,000 | (1.000 | %) | 12/20/19 | (11 | ) | |
| Anadarko Petroleum Corp. | JPMorgan Chase | 0.909 | % | USD | 3,000 | (1.000 | %) | 12/20/19 | (17 | ) | |
| Anheuser-Busch InBev | JPMorgan Chase | 0.533 | % | EUR | 1,000 | (1.000 | %) | 06/20/19 | (28 | ) | |
| Anheuser-Busch InBev | JPMorgan Chase | 0.533 | % | EUR | 3,000 | 1.000 | % | 06/20/19 | 85 | ||
| Anheuser-Busch InBev | JPMorgan Chase | 0.592 | % | EUR | 500 | 1.000 | % | 12/20/19 | 14 | ||
| Anheuser-Busch InBev | JPMorgan Chase | 0.592 | % | EUR | 1,000 | 1.000 | % | 12/20/19 | 27 | ||
| Apache Corp. | JPMorgan Chase | 0.908 | % | USD | 1,000 | 1.000 | % | 09/20/19 | 5 | ||
| Apache Corp. | JPMorgan Chase | 0.908 | % | USD | 1,000 | 1.000 | % | 09/20/19 | 5 | ||
| ArcelorMittal | JPMorgan Chase | 2.507 | % | EUR | 1,000 | 1.000 | % | 09/20/19 | (85 | ) | |
| ArcelorMittal | JPMorgan Chase | 2.507 | % | EUR | 1,000 | 1.000 | % | 09/20/19 | (85 | ) | |
| ArcelorMittal | JPMorgan Chase | 2.610 | % | EUR | 1,000 | 1.000 | % | 12/20/19 | (95 | ) | |
| ArcelorMittal | JPMorgan Chase | 2.610 | % | EUR | 500 | 1.000 | % | 12/20/19 | (48 | ) | |
| Archer-Daniels-Midland Co. | JPMorgan Chase | 0.390 | % | USD | 2,000 | (1.000 | %) | 12/20/19 | (63 | ) | |
| Arrow Electonics, Inc. | JPMorgan Chase | 0.743 | % | USD | 1,000 | (1.000 | %) | 06/20/19 | (13 | ) | |
| Arrow Electonics, Inc. | JPMorgan Chase | 0.743 | % | USD | 1,000 | (1.000 | %) | 06/20/19 | (13 | ) | |
| Arrow Electonics, Inc. | JPMorgan Chase | 0.869 | % | USD | 3,000 | (1.000 | %) | 12/20/19 | (23 | ) | |
| Arrow Electonics, Inc. | JPMorgan Chase | 1.484 | % | USD | 1,500 | 5.000 | % | 12/20/18 | 218 | ||
| ArvinMeritor | JPMorgan Chase | 3.663 | % | USD | 2,000 | (5.000 | %) | 12/20/19 | (135 | ) | |
| AutoZone, Inc. | JPMorgan Chase | 0.374 | % | USD | 2,000 | 1.000 | % | 12/20/18 | 53 | ||
| AutoZone, Inc. | JPMorgan Chase | 0.394 | % | USD | 1,000 | 1.000 | % | 06/20/19 | 29 | ||
| AutoZone, Inc. | JPMorgan Chase | 0.394 | % | USD | 2,000 | 1.000 | % | 06/20/19 | 57 | ||
| Avnet, Inc. | JPMorgan Chase | 0.828 | % | USD | 2,000 | (1.000 | %) | 06/20/19 | (18 | ) | |
| Avnet, Inc. | JPMorgan Chase | 0.957 | % | USD | 3,000 | (1.000 | %) | 12/20/19 | (10 | ) | |
| Avon Products, Inc. | JPMorgan Chase | 3.254 | % | USD | 500 | 1.000 | % | 09/20/19 | (49 | ) | |
| Avon Products, Inc. | JPMorgan Chase | 3.254 | % | USD | 500 | 1.000 | % | 09/20/19 | (49 | ) | |
| Avon Products, Inc. | JPMorgan Chase | 3.254 | % | USD | 500 | 1.000 | % | 09/20/19 | (49 | ) | |
| Avon Products, Inc. | JPMorgan Chase | 3.254 | % | USD | 500 | 1.000 | % | 09/20/19 | (49 | ) | |
| AstraZeneca PLC | JPMorgan Chase | 0.352 | % | EUR | 3,000 | (1.000 | %) | 12/20/19 | (129 | ) | |
| AstraZeneca PLC | JPMorgan Chase | 0.335 | % | EUR | 1,000 | (1.000 | %) | 06/20/19 | (42 | ) | |
| BAE Systems PLC | JPMorgan Chase | 0.593 | % | EUR | 1,000 | 1.000 | % | 09/20/19 | 26 | ||
| BAE Systems PLC | JPMorgan Chase | 0.593 | % | EUR | 1,000 | 1.000 | % | 09/20/19 | 26 | ||
| BAE Systems PLC | JPMorgan Chase | 0.612 | % | EUR | 1,000 | 1.000 | % | 12/20/19 | 27 | ||
| Barrick Gold Corp. | JPMorgan Chase | 1.501 | % | USD | 1,000 | (1.000 | %) | 06/20/19 | 21 | ||
| BASF SE | JPMorgan Chase | 0.349 | % | EUR | 1,000 | (1.000 | %) | 09/20/19 | (41 | ) | |
| BASF SE | JPMorgan Chase | 0.349 | % | EUR | 500 | (1.000 | %) | 09/20/19 | (21 | ) | |
| BASF SE | JPMorgan Chase | 0.368 | % | EUR | 2,000 | (1.000 | %) | 12/20/19 | (84 | ) | |
| Bayer AG | JPMorgan Chase | 0.338 | % | EUR | 1,000 | (1.000 | %) | 06/20/19 | (40 | ) | |
| Bayer AG | JPMorgan Chase | 0.380 | % | EUR | 3,000 | (1.000 | %) | 12/20/19 | (124 | ) | |
| Bayerische Motoren Werke | |||||||||||
| Aktiengesellschaft | JPMorgan Chase | 0.416 | % | EUR | 2,000 | (1.000 | %) | 06/20/19 | (70 | ) | |
| Bayerische Motoren Werke | |||||||||||
| Aktiengesellschaft | JPMorgan Chase | 0.416 | % | EUR | 1,000 | 1.000 | % | 06/20/19 | 35 | ||
| Bayerische Motoren Werke | |||||||||||
| Aktiengesellschaft | JPMorgan Chase | 0.449 | % | EUR | 3,000 | (1.000 | %) | 12/20/19 | (110 | ) | |
| Berkshire Hathaway, Inc. | JPMorgan Chase | 0.503 | % | USD | 2,000 | 1.000 | % | 06/20/19 | 47 | ||
| Berkshire Hathaway, Inc. | JPMorgan Chase | 0.503 | % | USD | 1,000 | (1.000 | %) | 06/20/19 | (24 | ) | |
| Berkshire Hathaway, Inc. | JPMorgan Chase | 0.503 | % | USD | 2,000 | 1.000 | % | 06/20/19 | 47 | ||
| Berkshire Hathaway, Inc. | JPMorgan Chase | 0.534 | % | USD | 1,000 | 1.000 | % | 09/20/19 | 23 | ||
| Best Buy Co., Inc. | JPMorgan Chase | 2.372 | % | USD | 1,000 | (5.000 | %) | 06/20/19 | (119 | ) | |
| Best Buy Co., Inc. | JPMorgan Chase | 2.686 | % | USD | 2,000 | (5.000 | %) | 12/20/19 | (229 | ) | |
See accompanying notes which are an integral part of the financial statements.
Russell Multi-Strategy Alternative Fund 641
Russell Investment Company
Russell Multi-Strategy Alternative Fund
Consolidated Schedule of Investments, continued — October 31, 2014
| Credit Default Swap Contracts | |||||||||||
| Amounts in thousands | |||||||||||
| Corporate Issues | |||||||||||
| Implied | Fund (Pays)/ | ||||||||||
| Credit | Receives | Termination | Fair Value | ||||||||
| Reference Entity | Counterparty | Spread | Notional Amount | Fixed Rate | Date | $ | |||||
| Best Buy Co., Inc. | JPMorgan Chase | 2.686 | % | USD | 1,000 | (5.000 | %) | 12/20/19 | (115 | ) | |
| BHP Billiton Ltd. | JPMorgan Chase | 0.628 | % | USD | 1,000 | 1.000 | % | 12/20/19 | 20 | ||
| BHP Billiton Ltd. | JPMorgan Chase | 0.628 | % | USD | 2,000 | 1.000 | % | 12/20/19 | 39 | ||
| Bombardier, Inc. | JPMorgan Chase | 2.740 | % | USD | 500 | 5.000 | % | 09/20/19 | 53 | ||
| Bombardier, Inc. | JPMorgan Chase | 2.740 | % | USD | 500 | 5.000 | % | 09/20/19 | 53 | ||
| Bombardier, Inc. | JPMorgan Chase | 2.740 | % | USD | 500 | 5.000 | % | 09/20/19 | 53 | ||
| Bombardier, Inc. | JPMorgan Chase | 2.876 | % | USD | 1,000 | 5.000 | % | 12/20/19 | 104 | ||
| Bouygues | JPMorgan Chase | 0.720 | % | EUR | 1,000 | (1.000 | %) | 06/20/19 | (17 | ) | |
| Bouygues | JPMorgan Chase | 0.800 | % | EUR | 3,000 | (1.000 | %) | 12/20/19 | (42 | ) | |
| BP PLC | JPMorgan Chase | 0.630 | % | EUR | 500 | 1.000 | % | 06/20/19 | 11 | ||
| BP PLC | JPMorgan Chase | 0.703 | % | EUR | 1,000 | 1.000 | % | 12/20/19 | 20 | ||
| Bristol-Myers Squibb Co. | JPMorgan Chase | 0.200 | % | USD | 1,000 | (1.000 | %) | 09/20/19 | (39 | ) | |
| Bristol-Myers Squibb Co. | JPMorgan Chase | 0.200 | % | USD | 1,000 | (1.000 | %) | 09/20/19 | (39 | ) | |
| Bristol-Myers Squibb Co. | JPMorgan Chase | 0.212 | % | USD | 3,000 | (1.000 | %) | 12/20/19 | (122 | ) | |
| British American Tobacco PLC | JPMorgan Chase | 0.422 | % | EUR | 1,000 | 1.000 | % | 06/20/19 | 35 | ||
| British American Tobacco PLC | JPMorgan Chase | 0.422 | % | EUR | 1,500 | 1.000 | % | 06/20/19 | 52 | ||
| British Telecommunications PLC | JPMorgan Chase | 0.676 | % | EUR | 1,000 | 1.000 | % | 12/20/19 | 22 | ||
| British Telecommunications PLC | JPMorgan Chase | 0.676 | % | EUR | 1,000 | 1.000 | % | 12/20/19 | 22 | ||
| CA, Inc. | JPMorgan Chase | 0.270 | % | USD | 1,000 | 1.000 | % | 03/20/19 | 33 | ||
| CA, Inc. | JPMorgan Chase | 0.785 | % | USD | 1,000 | 1.000 | % | 09/20/19 | 11 | ||
| CA, Inc. | JPMorgan Chase | 0.785 | % | USD | 1,000 | 1.000 | % | 09/20/19 | 11 | ||
| CA, Inc. | JPMorgan Chase | 0.785 | % | USD | 1,000 | 1.000 | % | 09/20/19 | 11 | ||
| CA, Inc. | JPMorgan Chase | 0.830 | % | USD | 500 | 1.000 | % | 12/20/19 | 5 | ||
| Cable & Wireless PLC | JPMorgan Chase | 2.245 | % | EUR | 500 | (5.000 | %) | 09/20/19 | (84 | ) | |
| Cable & Wireless PLC | JPMorgan Chase | 2.361 | % | EUR | 1,000 | (5.000 | %) | 12/20/19 | (167 | ) | |
| Cable & Wireless PLC | JPMorgan Chase | 2.361 | % | EUR | 3,000 | (5.000 | %) | 12/20/19 | (502 | ) | |
| Campbell Soup Co. | JPMorgan Chase | 0.514 | % | USD | 1,000 | 1.000 | % | 06/20/19 | 23 | ||
| Campbell Soup Co. | JPMorgan Chase | 0.514 | % | USD | 1,000 | 1.000 | % | 06/20/19 | 23 | ||
| Campbell Soup Co. | JPMorgan Chase | 0.553 | % | USD | 1,000 | 1.000 | % | 09/20/19 | 22 | ||
| Campbell Soup Co. | JPMorgan Chase | 0.588 | % | USD | 1,000 | 1.000 | % | 12/20/19 | 22 | ||
| Canadian Resources, Ltd. | JPMorgan Chase | 0.711 | % | USD | 1,000 | (1.000 | %) | 09/20/19 | (15 | ) | |
| Cardinal Health, Inc. | JPMorgan Chase | 0.265 | % | USD | 1,000 | (1.000 | %) | 06/20/19 | (34 | ) | |
| Cardinal Health, Inc. | JPMorgan Chase | 0.265 | % | USD | 1,000 | (1.000 | %) | 06/20/19 | (34 | ) | |
| Cardinal Health, Inc. | JPMorgan Chase | 0.300 | % | USD | 3,000 | (1.000 | %) | 12/20/19 | (108 | ) | |
| Carnival Corp. | JPMorgan Chase | 0.745 | % | USD | 1,000 | 1.000 | % | 12/20/19 | 14 | ||
| Carnival Corp. | JPMorgan Chase | 0.745 | % | USD | 2,000 | 1.000 | % | 12/20/19 | 27 | ||
| Carrefour | JPMorgan Chase | 0.699 | % | EUR | 1,000 | (1.000 | %) | 06/20/19 | (19 | ) | |
| Carrefour | JPMorgan Chase | 0.755 | % | EUR | 1,000 | (1.000 | %) | 12/20/19 | (17 | ) | |
| Carrefour | JPMorgan Chase | 0.755 | % | EUR | 3,000 | (1.000 | %) | 12/20/19 | (51 | ) | |
| Caterpillar, Inc. | JPMorgan Chase | 0.365 | % | USD | 1,000 | (1.000 | %) | 09/20/19 | (31 | ) | |
| Caterpillar, Inc. | JPMorgan Chase | 0.365 | % | USD | 1,000 | (1.000 | %) | 09/20/19 | (31 | ) | |
| CBS Corp. | JPMorgan Chase | 0.579 | % | USD | 1,000 | (1.000 | %) | 09/20/19 | (21 | ) | |
| CBS Corp. | JPMorgan Chase | 0.579 | % | USD | 1,000 | (1.000 | %) | 09/20/19 | (21 | ) | |
| CBS Corp. | JPMorgan Chase | 0.616 | % | USD | 3,000 | (1.000 | %) | 12/20/19 | (61 | ) | |
| CBS Corp. | JPMorgan Chase | 0.616 | % | USD | 1,500 | (1.000 | %) | 12/20/19 | (30 | ) | |
| Centrica PLC | JPMorgan Chase | 0.587 | % | EUR | 1,000 | (1.000 | %) | 06/20/19 | (25 | ) | |
| Centrica PLC | JPMorgan Chase | 0.635 | % | EUR | 3,000 | (1.000 | %) | 12/20/19 | (74 | ) | |
| CenturyLink, Inc. | JPMorgan Chase | 0.505 | % | USD | 2,000 | 1.000 | % | 03/20/19 | 45 | ||
| CenturyLink, Inc. | JPMorgan Chase | 1.532 | % | USD | 500 | 1.000 | % | 06/20/19 | (11 | ) | |
| CenturyLink, Inc. | JPMorgan Chase | 1.532 | % | USD | 1,000 | (1.000 | %) | 06/20/19 | 22 | ||
| CenturyLink, Inc. | JPMorgan Chase | 1.532 | % | USD | 2,000 | 1.000 | % | 06/20/19 | (45 | ) | |
| CenturyLink, Inc. | JPMorgan Chase | 1.630 | % | USD | 500 | 1.000 | % | 09/20/19 | (14 | ) | |
| CenturyLink, Inc. | JPMorgan Chase | 1.630 | % | USD | 1,000 | 1.000 | % | 09/20/19 | (28 | ) | |
| CenturyLink, Inc. | JPMorgan Chase | 1.720 | % | USD | 500 | 1.000 | % | 12/20/19 | (17 | ) | |
| Chesapeake Energy Corp. | JPMorgan Chase | 2.126 | % | USD | 500 | (5.000 | %) | 09/20/19 | (67 | ) | |
| Chesapeake Energy Corp. | JPMorgan Chase | 2.126 | % | USD | 500 | 5.000 | % | 09/20/19 | 68 | ||
| See accompanying notes which are an integral part of the financial statements. | |||||||||||
| 642 Russell Multi-Strategy Alternative Fund | |||||||||||
Russell Investment Company
Russell Multi-Strategy Alternative Fund
Consolidated Schedule of Investments, continued — October 31, 2014
| Credit Default Swap Contracts | |||||||||||
| Amounts in thousands | |||||||||||
| Corporate Issues | |||||||||||
| Implied | Fund (Pays)/ | ||||||||||
| Credit | Receives | Termination | Fair Value | ||||||||
| Reference Entity | Counterparty | Spread | Notional Amount | Fixed Rate | Date | $ | |||||
| Cisco Systems, Inc. | JPMorgan Chase | 0.379 | % | USD | 1,000 | (1.000 | %) | 12/20/19 | (32 | ) | |
| Clariant AG | JPMorgan Chase | 0.919 | % | EUR | 1,000 | (1.000 | %) | 12/20/19 | (6 | ) | |
| CMS Energy Corp. | JPMorgan Chase | 0.595 | % | USD | 1,000 | 1.000 | % | 09/20/19 | 20 | ||
| CNH Industrial | JPMorgan Chase | 2.160 | % | EUR | 1,000 | 5.000 | % | 09/20/19 | 172 | ||
| CNH Industrial | JPMorgan Chase | 2.251 | % | EUR | 1,500 | 5.000 | % | 12/20/19 | 261 | ||
| Comcast | JPMorgan Chase | 0.359 | % | USD | 1,000 | (1.000 | %) | 09/20/19 | (32 | ) | |
| Comcast | JPMorgan Chase | 0.388 | % | USD | 1,000 | (1.000 | %) | 12/20/19 | (32 | ) | |
| Comcast | JPMorgan Chase | 0.388 | % | USD | 3,000 | (1.000 | %) | 12/20/19 | (95 | ) | |
| Community Health Systems, Inc. | JPMorgan Chase | 2.759 | % | USD | 1,000 | (5.000 | %) | 12/20/19 | (111 | ) | |
| Community Health Systems, Inc. | JPMorgan Chase | 2.759 | % | USD | 500 | (5.000 | %) | 12/20/19 | (56 | ) | |
| Con Way, Inc. | JPMorgan Chase | 1.421 | % | USD | 2,000 | 1.000 | % | 12/20/19 | (39 | ) | |
| ConAgra Foods, Inc. | JPMorgan Chase | 0.428 | % | USD | 1,000 | (1.000 | %) | 03/20/19 | (26 | ) | |
| ConAgra Foods, Inc. | JPMorgan Chase | 0.503 | % | USD | 1,000 | 1.000 | % | 09/20/19 | 25 | ||
| ConAgra Foods, Inc. | JPMorgan Chase | 0.535 | % | USD | 1,000 | 1.000 | % | 12/20/19 | 24 | ||
| ConocoPhillips | JPMorgan Chase | 0.374 | % | USD | 1,000 | (1.000 | %) | 09/20/19 | (31 | ) | |
| ConocoPhillips | JPMorgan Chase | 0.374 | % | USD | 1,000 | (1.000 | %) | 09/20/19 | (31 | ) | |
| ConocoPhillips | JPMorgan Chase | 0.395 | % | USD | 3,000 | (1.000 | %) | 12/20/19 | (94 | ) | |
| ConocoPhillips | JPMorgan Chase | 0.395 | % | USD | 1,000 | (1.000 | %) | 12/20/19 | (31 | ) | |
| Constellation Brands, Inc. | JPMorgan Chase | 1.022 | % | USD | 1,000 | 5.000 | % | 06/20/19 | 183 | ||
| Constellation Brands, Inc. | JPMorgan Chase | 1.146 | % | USD | 500 | 5.000 | % | 12/20/19 | 97 | ||
| Constellation Brands, Inc. | JPMorgan Chase | 1.146 | % | USD | 1,000 | 5.000 | % | 12/20/19 | 194 | ||
| Continental AG | JPMorgan Chase | 0.699 | % | EUR | 1,000 | 1.000 | % | 09/20/19 | 20 | ||
| Cooper Tire & Rubber Co. | JPMorgan Chase | 2.515 | % | USD | 500 | 5.000 | % | 09/20/19 | 59 | ||
| Cooper Tire & Rubber Co. | JPMorgan Chase | 2.515 | % | USD | 1,000 | 5.000 | % | 09/20/19 | 118 | ||
| CSC Holdings LLC | JPMorgan Chase | 2.196 | % | USD | 1,000 | 5.000 | % | 09/20/19 | 133 | ||
| CSX Corp. | JPMorgan Chase | 0.213 | % | USD | 1,000 | (1.000 | %) | 09/20/19 | (39 | ) | |
| CSX Corp. | JPMorgan Chase | 0.226 | % | USD | 1,000 | (1.000 | %) | 12/20/19 | (40 | ) | |
| CSX Corp. | JPMorgan Chase | 0.226 | % | USD | 3,000 | (1.000 | %) | 12/20/19 | (120 | ) | |
| Cummins, Inc. | JPMorgan Chase | 0.338 | % | USD | 1,000 | (1.000 | %) | 12/20/19 | (34 | ) | |
| CVS Caremark | JPMorgan Chase | 0.259 | % | USD | 1,000 | (1.000 | %) | 09/20/19 | (36 | ) | |
| CVS Caremark | JPMorgan Chase | 0.273 | % | USD | 3,000 | (1.000 | %) | 12/20/19 | (112 | ) | |
| CVS Caremark | JPMorgan Chase | 0.273 | % | USD | 1,000 | (1.000 | %) | 12/20/19 | (37 | ) | |
| CVS Caremark | JPMorgan Chase | 0.273 | % | USD | 1,000 | (1.000 | %) | 12/20/19 | (37 | ) | |
| Cytec Industries, Inc. | JPMorgan Chase | 0.601 | % | USD | 2,000 | 1.000 | % | 03/20/19 | 36 | ||
| Cytec Industries, Inc. | JPMorgan Chase | 0.626 | % | USD | 1,000 | 1.000 | % | 03/20/19 | 17 | ||
| Cytec Industries, Inc. | JPMorgan Chase | 0.675 | % | USD | 1,000 | 1.000 | % | 06/20/19 | 16 | ||
| Cytec Industries, Inc. | JPMorgan Chase | 0.675 | % | USD | 1,000 | 1.000 | % | 06/20/19 | 16 | ||
| Cytec Industries, Inc. | JPMorgan Chase | 0.675 | % | USD | 1,000 | 1.000 | % | 06/20/19 | 16 | ||
| Cytec Industries, Inc. | JPMorgan Chase | 1.497 | % | USD | 2,000 | 1.000 | % | 03/20/19 | (40 | ) | |
| Daimler AG | JPMorgan Chase | 0.409 | % | EUR | 1,000 | (1.000 | %) | 06/20/19 | (36 | ) | |
| DaimlerChrysler NA Holdings | JPMorgan Chase | 0.443 | % | EUR | 3,000 | (1.000 | %) | 12/20/19 | (111 | ) | |
| Darden Restaurants, Inc. | JPMorgan Chase | 1.642 | % | USD | 1,000 | 1.000 | % | 06/20/19 | (27 | ) | |
| Deere & Co. | JPMorgan Chase | 0.382 | % | USD | 1,000 | 1.000 | % | 12/20/19 | 32 | ||
| Deluxe Corp. | JPMorgan Chase | 2.720 | % | USD | 500 | 5.000 | % | 09/20/19 | 54 | ||
| Deutsche Bank | JPMorgan Chase | 1.485 | % | EUR | 1,000 | 1.000 | % | 06/20/19 | (26 | ) | |
| Deutsche Lufthansa Aktiengesellschaft | JPMorgan Chase | 1.485 | % | EUR | 1,000 | (1.000 | %) | 06/20/19 | 26 | ||
| Diageo PLC | JPMorgan Chase | 0.400 | % | EUR | 1,500 | 1.000 | % | 09/20/19 | 54 | ||
| Diageo PLC | JPMorgan Chase | 0.400 | % | EUR | 1,000 | 1.000 | % | 06/20/19 | 36 | ||
| Diageo PLC | JPMorgan Chase | 0.446 | % | EUR | 500 | 1.000 | % | 12/20/19 | 18 | ||
| Dillard's, Inc. | JPMorgan Chase | 1.957 | % | USD | 500 | 5.000 | % | 12/20/19 | 76 | ||
| DIRECT TV | JPMorgan Chase | 0.374 | % | USD | 1,000 | 1.000 | % | 12/20/18 | 27 | ||
| DISH DBS Corp. | JPMorgan Chase | 1.889 | % | USD | 500 | 5.000 | % | 09/20/19 | 74 | ||
| DISH DBS Corp. | JPMorgan Chase | 2.000 | % | USD | 500 | 5.000 | % | 12/20/19 | 74 | ||
| DISH DBS Corp. | JPMorgan Chase | 2.000 | % | USD | 1,000 | 5.000 | % | 12/20/19 | 148 | ||
| DISH DBS Corp. | JPMorgan Chase | 2.000 | % | USD | 1,000 | 5.000 | % | 12/20/19 | 148 | ||
| Dixons Retail PLC | JPMorgan Chase | 0.817 | % | EUR | 1,000 | (5.000 | %) | 06/20/19 | (247 | ) | |
| See accompanying notes which are an integral part of the financial statements. | |||||||||||
| Russell Multi-Strategy Alternative Fund 643 | |||||||||||
Russell Investment Company
Russell Multi-Strategy Alternative Fund
Consolidated Schedule of Investments, continued — October 31, 2014
| Credit Default Swap Contracts | |||||||||||
| Amounts in thousands | |||||||||||
| Corporate Issues | |||||||||||
| Implied | Fund (Pays)/ | ||||||||||
| Credit | Receives | Termination | Fair Value | ||||||||
| Reference Entity | Counterparty | Spread | Notional Amount | Fixed Rate | Date | $ | |||||
| Dixons Retail PLC | JPMorgan Chase | 0.855 | % | EUR | 1,000 | 5.000 | % | 06/20/19 | 244 | ||
| Dominion Resources, Inc. | JPMorgan Chase | 0.394 | % | USD | 1,000 | (1.000 | %) | 09/20/19 | (30 | ) | |
| Dominion Resources, Inc. | JPMorgan Chase | 0.420 | % | USD | 3,000 | (1.000 | %) | 12/20/19 | (90 | ) | |
| Dominion Resources, Inc. | JPMorgan Chase | 0.420 | % | USD | 1,000 | (1.000 | %) | 12/20/19 | (30 | ) | |
| E. I. du Pont de Nemours and Co. | JPMorgan Chase | 0.347 | % | USD | 3,000 | 1.000 | % | 06/20/19 | 92 | ||
| E. ON SE | JPMorgan Chase | 0.605 | % | EUR | 3,500 | (1.000 | %) | 12/20/19 | (93 | ) | |
| E. ON SE | JPMorgan Chase | 0.540 | % | EUR | 1,000 | (1.000 | %) | 06/20/19 | (28 | ) | |
| Enbridge Energy Partners L.P. | JPMorgan Chase | 0.899 | % | USD | 1,000 | 1.000 | % | 09/20/19 | 6 | ||
| Enbridge, Inc. | JPMorgan Chase | 0.374 | % | USD | 3,000 | (1.000 | %) | 12/20/18 | (80 | ) | |
| Enbridge, Inc. | JPMorgan Chase | 0.839 | % | USD | 1,000 | 1.000 | % | 06/20/19 | 8 | ||
| Enbridge, Inc. | JPMorgan Chase | 0.839 | % | USD | 2,000 | 1.000 | % | 06/20/19 | 17 | ||
| Enbridge, Inc. | JPMorgan Chase | 0.839 | % | USD | 1,000 | 1.000 | % | 06/20/19 | 8 | ||
| Encana Corp. | JPMorgan Chase | 1.023 | % | USD | 1,000 | (1.000 | %) | 09/20/19 | — | ||
| Encana Corp. | JPMorgan Chase | 1.080 | % | USD | 1,000 | (1.000 | %) | 12/20/19 | 3 | ||
| Energy Transfer Partners LP | JPMorgan Chase | 0.586 | % | EUR | 1,000 | (1.000 | %) | 03/20/19 | (24 | ) | |
| Energy Transfer Partners LP | JPMorgan Chase | 0.862 | % | USD | 3,000 | 1.000 | % | 06/20/19 | 22 | ||
| Enterprise Products Operating LLC | JPMorgan Chase | 0.581 | % | USD | 2,000 | 1.000 | % | 12/20/19 | 44 | ||
| Enterprise Products Operating LLC | JPMorgan Chase | 0.591 | % | EUR | 2,000 | 1.000 | % | 03/20/19 | 47 | ||
| ERP Operating LP | JPMorgan Chase | 0.545 | % | USD | 3,000 | (1.000 | %) | 12/20/19 | (71 | ) | |
| ERP Operating LP | JPMorgan Chase | 0.545 | % | USD | 2,000 | (1.000 | %) | 12/20/19 | (47 | ) | |
| ERP Operating LP | JPMorgan Chase | 0.545 | % | USD | 1,000 | (1.000 | %) | 12/20/19 | (24 | ) | |
| European Aeronautic Defence and Space Co. | JPMorgan Chase | 0.435 | % | EUR | 1,000 | (1.000 | %) | 03/20/19 | (32 | ) | |
| European Aeronautic Defence and Space Co. | JPMorgan Chase | 0.435 | % | EUR | 1,000 | 1.000 | % | 03/20/19 | 32 | ||
| European Aeronautic Defence and Space Co. | JPMorgan Chase | 0.518 | % | EUR | 1,000 | (1.000 | %) | 12/20/19 | (32 | ) | |
| Exelon Corp. | JPMorgan Chase | 0.413 | % | USD | 1,000 | (1.000 | %) | 06/20/19 | (28 | ) | |
| Exelon Corp. | JPMorgan Chase | 0.413 | % | USD | 500 | (1.000 | %) | 09/20/19 | (14 | ) | |
| Exelon Corp. | JPMorgan Chase | 0.475 | % | USD | 4,000 | (1.000 | %) | 12/20/19 | (109 | ) | |
| Exelon Corp. | JPMorgan Chase | 0.475 | % | USD | 1,000 | (1.000 | %) | 12/20/19 | (27 | ) | |
| Exelon Corp. | JPMorgan Chase | 0.568 | % | EUR | 1,500 | (1.000 | %) | 12/20/18 | (35 | ) | |
| Expedia, Inc. | JPMorgan Chase | 0.883 | % | USD | 1,000 | (1.000 | %) | 06/20/19 | (6 | ) | |
| Expedia, Inc. | JPMorgan Chase | 0.950 | % | USD | 1,000 | (1.000 | %) | 09/20/19 | (3 | ) | |
| Expedia, Inc. | JPMorgan Chase | 1.010 | % | USD | 3,000 | (1.000 | %) | 12/20/19 | (2 | ) | |
| Expedia, Inc. | JPMorgan Chase | 1.010 | % | USD | 1,000 | (1.000 | %) | 12/20/19 | (1 | ) | |
| Experian Finance PLC | JPMorgan Chase | 0.582 | % | EUR | 1,000 | 1.000 | % | 06/20/19 | 25 | ||
| Experian Finance PLC | JPMorgan Chase | 0.612 | % | EUR | 1,000 | 1.000 | % | 09/20/19 | 25 | ||
| Federated Dept. Stores | JPMorgan Chase | 0.653 | % | USD | 1,000 | (1.000 | %) | 09/20/19 | (17 | ) | |
| Federated Dept. Stores | JPMorgan Chase | 0.653 | % | USD | 500 | (1.000 | %) | 09/20/19 | (9 | ) | |
| Federated Dept. Stores | JPMorgan Chase | 0.653 | % | USD | 500 | (1.000 | %) | 09/20/19 | (9 | ) | |
| Federated Dept. Stores | JPMorgan Chase | 0.703 | % | USD | 3,000 | (1.000 | %) | 12/20/19 | (47 | ) | |
| Federated Dept. Stores | JPMorgan Chase | 0.703 | % | USD | 1,000 | (1.000 | %) | 12/20/19 | (16 | ) | |
| FedEx Corp. | JPMorgan Chase | 0.438 | % | USD | 500 | 1.000 | % | 09/20/19 | 14 | ||
| FirstEnergy Corp. | JPMorgan Chase | 0.916 | % | USD | 1,000 | (1.000 | %) | 06/20/19 | (5 | ) | |
| FirstEnergy Corp. | JPMorgan Chase | 0.916 | % | USD | 1,000 | (1.000 | %) | 06/20/19 | (5 | ) | |
| FirstEnergy Corp. | JPMorgan Chase | 1.051 | % | USD | 3,000 | (1.000 | %) | 12/20/19 | 4 | ||
| Ford Motor Co. | JPMorgan Chase | 1.154 | % | USD | 2,000 | 5.000 | % | 09/20/19 | 370 | ||
| Ford Motor Co. | JPMorgan Chase | 1.154 | % | USD | 1,000 | 5.000 | % | 09/20/19 | 185 | ||
| Freescale Semiconductor | JPMorgan Chase | 3.267 | % | USD | 500 | (5.000 | %) | 09/20/19 | (41 | ) | |
| Freescale Semiconductor | JPMorgan Chase | 3.420 | % | USD | 2,000 | (5.000 | %) | 12/20/19 | (157 | ) | |
| Fresenius SE & Co. KGaA | JPMorgan Chase | 0.950 | % | EUR | 1,000 | 1.000 | % | 12/20/19 | 5 | ||
| Fresenius SE & Co. KGaA | JPMorgan Chase | 0.950 | % | EUR | 1,500 | 1.000 | % | 12/20/19 | 7 | ||
| Frontier Communications Corp. | JPMorgan Chase | 2.293 | % | USD | 1,000 | (5.000 | %) | 03/20/19 | (117 | ) | |
| General Mills, Inc. | JPMorgan Chase | 0.351 | % | USD | 2,000 | 1.000 | % | 09/20/19 | 64 | ||
| General Mills, Inc. | JPMorgan Chase | 0.351 | % | USD | 1,000 | 1.000 | % | 09/20/19 | 32 | ||
| GKN Holdings PLC | JPMorgan Chase | 0.852 | % | EUR | 1,000 | (1.000 | %) | 09/20/19 | (10 | ) | |
| GKN Holdings PLC | JPMorgan Chase | 0.899 | % | EUR | 2,500 | (1.000 | %) | 12/20/19 | (19 | ) | |
| GKN Holdings PLC | JPMorgan Chase | 0.899 | % | EUR | 500 | (1.000 | %) | 12/20/19 | (4 | ) | |
| See accompanying notes which are an integral part of the financial statements. | |||||||||||
| 644 Russell Multi-Strategy Alternative Fund | |||||||||||
Russell Investment Company
Russell Multi-Strategy Alternative Fund
Consolidated Schedule of Investments, continued — October 31, 2014
| Credit Default Swap Contracts | |||||||||||
| Amounts in thousands | |||||||||||
| Corporate Issues | |||||||||||
| Implied | Fund (Pays)/ | ||||||||||
| Credit | Receives | Termination | Fair Value | ||||||||
| Reference Entity | Counterparty | Spread | Notional Amount | Fixed Rate | Date | $ | |||||
| GKN Holdings PLC | JPMorgan Chase | 1.193 | % | USD | 3,000 | 1.000 | % | 12/20/18 | (20 | ) | |
| GlaxoSmithKline PLC | JPMorgan Chase | 0.352 | % | EUR | 2,000 | 1.000 | % | 06/20/19 | 78 | ||
| Glencore International AG | JPMorgan Chase | 0.629 | % | USD | 1,000 | 1.000 | % | 03/20/19 | 17 | ||
| Glencore International AG | JPMorgan Chase | 1.264 | % | EUR | 1,000 | 1.000 | % | 09/20/19 | (14 | ) | |
| Glencore International AG | JPMorgan Chase | 1.293 | % | EUR | 1,000 | 1.000 | % | 09/20/19 | (16 | ) | |
| Glencore International AG | JPMorgan Chase | 1.293 | % | EUR | 1,000 | 1.000 | % | 09/20/19 | (16 | ) | |
| Halliburton | JPMorgan Chase | 0.482 | % | USD | 1,000 | (1.000 | %) | 09/20/19 | (26 | ) | |
| Halliburton | JPMorgan Chase | 0.511 | % | USD | 3,000 | (1.000 | %) | 12/20/19 | (76 | ) | |
| Hammerson PLC | JPMorgan Chase | 0.594 | % | EUR | 1,000 | (1.000 | %) | 09/20/19 | (26 | ) | |
| Harsbro, Inc. | JPMorgan Chase | 0.585 | % | USD | 1,000 | 1.000 | % | 06/20/19 | 20 | ||
| HCA Healthcare | JPMorgan Chase | 2.058 | % | USD | 500 | (5.000 | %) | 09/20/19 | (70 | ) | |
| HCA Healthcare | JPMorgan Chase | 2.058 | % | USD | 500 | 5.000 | % | 09/20/19 | 70 | ||
| HCA Healthcare | JPMorgan Chase | 2.147 | % | USD | 500 | (5.000 | %) | 12/20/19 | (71 | ) | |
| HCA Healthcare | JPMorgan Chase | 2.147 | % | USD | 3,000 | (5.000 | %) | 12/20/19 | (423 | ) | |
| HCA Healthcare | JPMorgan Chase | 2.147 | % | USD | 1,000 | (5.000 | %) | 12/20/19 | (141 | ) | |
| Health Care REIT, Inc. | JPMorgan Chase | 0.679 | % | USD | 2,000 | 1.000 | % | 06/20/19 | 31 | ||
| Health Care REIT, Inc. | JPMorgan Chase | 0.763 | % | USD | 1,000 | 1.000 | % | 12/20/19 | 13 | ||
| Health Care REIT, Inc. | JPMorgan Chase | 0.763 | % | USD | 1,000 | 1.000 | % | 12/20/19 | 13 | ||
| Heidel-Fin, Inc. | JPMorgan Chase | 1.514 | % | EUR | 1,000 | (5.000 | %) | 12/20/19 | (224 | ) | |
| Heineken NV | JPMorgan Chase | 0.382 | % | EUR | 1,000 | 1.000 | % | 06/20/19 | 37 | ||
| Heineken NV | JPMorgan Chase | 0.382 | % | EUR | 1,000 | 1.000 | % | 06/20/19 | 37 | ||
| Heineken NV | JPMorgan Chase | 0.427 | % | EUR | 1,000 | 1.000 | % | 12/20/19 | 38 | ||
| Hess Corp. | JPMorgan Chase | 0.777 | % | USD | 1,000 | 1.000 | % | 06/20/19 | 11 | ||
| Hewlett-Packard | JPMorgan Chase | 0.765 | % | USD | 2,500 | (1.000 | %) | 06/20/19 | (29 | ) | |
| Hewlett-Packard | JPMorgan Chase | 0.765 | % | USD | 500 | (1.000 | %) | 06/20/19 | (6 | ) | |
| Hewlett-Packard | JPMorgan Chase | 0.765 | % | USD | 1,000 | 1.000 | % | 06/20/19 | 12 | ||
| Hewlett-Packard | JPMorgan Chase | 0.889 | % | USD | 3,000 | (1.000 | %) | 12/20/19 | (20 | ) | |
| Honeywell International, Inc. | JPMorgan Chase | 0.176 | % | USD | 1,000 | (1.000 | %) | 09/20/19 | (41 | ) | |
| Honeywell International, Inc. | JPMorgan Chase | 0.185 | % | USD | 3,000 | (1.000 | %) | 12/20/19 | (126 | ) | |
| Honeywell International, Inc. | JPMorgan Chase | 0.185 | % | USD | 2,000 | (1.000 | %) | 12/20/19 | (84 | ) | |
| Iberdrola SA | JPMorgan Chase | 0.696 | % | EUR | 2,000 | 1.000 | % | 06/20/19 | 38 | ||
| Iberdrola SA | JPMorgan Chase | 0.740 | % | EUR | 1,000 | 1.000 | % | 09/20/19 | 17 | ||
| IBM Corp. | JPMorgan Chase | 0.494 | % | USD | 2,000 | 1.000 | % | 06/20/19 | 48 | ||
| IBM Corp. | JPMorgan Chase | 0.494 | % | USD | 1,000 | 1.000 | % | 06/20/19 | 24 | ||
| IBM Corp. | JPMorgan Chase | 0.562 | % | USD | 1,000 | 1.000 | % | 12/20/19 | 23 | ||
| Imperial Tobacco Group PLC | JPMorgan Chase | 0.697 | % | EUR | 1,000 | 1.000 | % | 06/20/19 | 19 | ||
| Imperial Tobacco Group PLC | JPMorgan Chase | 0.735 | % | EUR | 1,000 | 1.000 | % | 09/20/19 | 17 | ||
| Imperial Tobacco Group PLC | JPMorgan Chase | 0.735 | % | EUR | 1,000 | 1.000 | % | 09/20/19 | 17 | ||
| Ingersoll-Rand Co. | JPMorgan Chase | 0.470 | % | USD | 1,000 | 1.000 | % | 12/20/19 | 27 | ||
| International Paper Co. | JPMorgan Chase | 0.747 | % | USD | 1,000 | (1.000 | %) | 12/20/19 | (14 | ) | |
| ITV PLC | JPMorgan Chase | 0.858 | % | USD | 1,500 | 1.000 | % | 03/20/19 | 11 | ||
| ITV PLC | JPMorgan Chase | 1.176 | % | EUR | 1,500 | (5.000 | %) | 12/20/18 | (302 | ) | |
| ITV PLC | JPMorgan Chase | 1.367 | % | EUR | 1,000 | 5.000 | % | 09/20/19 | 223 | ||
| ITV PLC | JPMorgan Chase | 1.367 | % | EUR | 500 | 5.000 | % | 09/20/19 | 112 | ||
| ITV PLC | JPMorgan Chase | 1.367 | % | EUR | 1,000 | 5.000 | % | 09/20/19 | 223 | ||
| Johnson & Johnson | JPMorgan Chase | 0.456 | % | EUR | 1,000 | (1.000 | %) | 12/20/18 | (30 | ) | |
| Johnson Controls, Inc. | JPMorgan Chase | 0.496 | % | USD | 2,000 | (1.000 | %) | 06/20/19 | (48 | ) | |
| Johnson Controls, Inc. | JPMorgan Chase | 0.561 | % | USD | 3,000 | (1.000 | %) | 12/20/19 | (69 | ) | |
| Kellogg Co. | JPMorgan Chase | 0.719 | % | USD | 2,000 | 1.000 | % | 12/20/19 | 30 | ||
| Kering SA | JPMorgan Chase | 0.667 | % | EUR | 500 | 1.000 | % | 09/20/19 | 11 | ||
| Kering SA | JPMorgan Chase | 0.667 | % | EUR | 1,500 | 1.000 | % | 09/20/19 | 32 | ||
| Kering SA | JPMorgan Chase | 0.667 | % | EUR | 1,000 | 1.000 | % | 09/20/19 | 22 | ||
| Kinder Morgan Energy Partners LP | JPMorgan Chase | 0.778 | % | USD | 3,000 | 1.000 | % | 06/20/19 | 33 | ||
| Kinder Morgan Energy Partners LP | JPMorgan Chase | 0.778 | % | USD | 1,000 | (1.000 | %) | 06/20/19 | (11 | ) | |
| Kinder Morgan Energy Partners LP | JPMorgan Chase | 0.990 | % | USD | 2,000 | (1.000 | %) | 12/20/18 | (3 | ) | |
| Kinder Morgan Energy Partners LP | JPMorgan Chase | 0.990 | % | USD | 2,000 | 1.000 | % | 12/20/18 | 3 | ||
| See accompanying notes which are an integral part of the financial statements. | |||||||||||
| Russell Multi-Strategy Alternative Fund 645 | |||||||||||
Russell Investment Company
Russell Multi-Strategy Alternative Fund
Consolidated Schedule of Investments, continued — October 31, 2014
| Credit Default Swap Contracts | |||||||||||
| Amounts in thousands | |||||||||||
| Corporate Issues | |||||||||||
| Implied | Fund (Pays)/ | ||||||||||
| Credit | Receives | Termination | Fair Value | ||||||||
| Reference Entity | Counterparty | Spread | Notional Amount | Fixed Rate | Date | $ | |||||
| Kinder Morgan Energy Partners LP | JPMorgan Chase | 1.275 | % | USD | 2,000 | 1.000 | % | 12/20/19 | (24 | ) | |
| Kingfisher PLC | JPMorgan Chase | 0.623 | % | EUR | 1,000 | (1.000 | %) | 03/20/19 | (22 | ) | |
| Kingfisher PLC | JPMorgan Chase | 0.728 | % | EUR | 3,000 | (1.000 | %) | 12/20/19 | (56 | ) | |
| Koninklijke Ahold NV | JPMorgan Chase | 0.412 | % | USD | 1,000 | (1.000 | %) | 03/20/19 | (26 | ) | |
| Koninklijke Ahold NV | JPMorgan Chase | 0.512 | % | EUR | 5,000 | (1.000 | %) | 12/20/19 | (163 | ) | |
| Koninklijke Ahold NV | JPMorgan Chase | 0.687 | % | EUR | 2,000 | 1.000 | % | 06/20/19 | 39 | ||
| Koninklijke Ahold NV | JPMorgan Chase | 0.727 | % | EUR | 1,000 | 1.000 | % | 09/20/19 | 18 | ||
| Koninklijke DSM NV | JPMorgan Chase | 0.521 | % | EUR | 1,000 | 1.000 | % | 06/20/19 | 29 | ||
| Kroger Co. | JPMorgan Chase | 0.468 | % | USD | 1,000 | (1.000 | %) | 09/20/19 | (26 | ) | |
| Kroger Co. | JPMorgan Chase | 0.468 | % | USD | 1,000 | (1.000 | %) | 09/20/19 | (26 | ) | |
| Ladbrokes PLC | JPMorgan Chase | 2.969 | % | EUR | 1,000 | 1.000 | % | 09/20/19 | (110 | ) | |
| Ladbrokes PLC | JPMorgan Chase | 3.084 | % | EUR | 500 | 1.000 | % | 12/20/19 | (61 | ) | |
| Lanxess AG | JPMorgan Chase | 1.060 | % | EUR | 1,000 | 1.000 | % | 09/20/19 | (2 | ) | |
| Lanxess AG | JPMorgan Chase | 1.108 | % | EUR | 1,000 | 1.000 | % | 12/20/19 | (5 | ) | |
| Lennar Corp. | JPMorgan Chase | 1.704 | % | USD | 1,000 | 5.000 | % | 06/20/19 | 150 | ||
| Lennar Corp. | JPMorgan Chase | 1.704 | % | USD | 2,000 | (5.000 | %) | 06/20/19 | (300 | ) | |
| Lennar Corp. | JPMorgan Chase | 1.704 | % | USD | 1,000 | 5.000 | % | 06/20/19 | 150 | ||
| Lennar Corp. | JPMorgan Chase | 1.801 | % | USD | 1,000 | 5.000 | % | 09/20/19 | 152 | ||
| Lennar Corp. | JPMorgan Chase | 1.906 | % | USD | 2,000 | 5.000 | % | 12/20/19 | 307 | ||
| Lockheed Martin Corp. | JPMorgan Chase | 0.197 | % | USD | 1,000 | (1.000 | %) | 09/20/19 | (40 | ) | |
| Lockheed Martin Corp. | JPMorgan Chase | 0.210 | % | USD | 2,000 | (1.000 | %) | 12/20/19 | (82 | ) | |
| Lockheed Martin Corp. | JPMorgan Chase | 0.210 | % | USD | 1,500 | (1.000 | %) | 12/20/19 | (61 | ) | |
| Louisiana-Pacific Corp. | JPMorgan Chase | 2.160 | % | USD | 1,000 | (5.000 | %) | 06/20/19 | (129 | ) | |
| Louisiana-Pacific Corp. | JPMorgan Chase | 2.449 | % | USD | 1,000 | 5.000 | % | 06/20/19 | 126 | ||
| Louisiana-Pacific Corp. | JPMorgan Chase | 2.449 | % | USD | 3,000 | (5.000 | %) | 12/20/19 | (378 | ) | |
| Louisiana-Pacific Corp. | JPMorgan Chase | 2.449 | % | USD | 3,000 | 5.000 | % | 12/20/19 | 377 | ||
| Lowe's Companies, Inc. | JPMorgan Chase | 0.217 | % | USD | 1,000 | 1.000 | % | 03/20/19 | 35 | ||
| Lowe's Companies, Inc. | JPMorgan Chase | 0.235 | % | USD | 1,000 | (1.000 | %) | 06/20/19 | (36 | ) | |
| Lowe's Companies, Inc. | JPMorgan Chase | 0.265 | % | USD | 1,000 | (1.000 | %) | 12/20/19 | (38 | ) | |
| Lowe's Companies, Inc. | JPMorgan Chase | 0.265 | % | USD | 3,000 | (1.000 | %) | 12/20/19 | (114 | ) | |
| LVMH Moët Hennessy - Louis Vuitton | JPMorgan Chase | 0.343 | % | EUR | 1,000 | 1.000 | % | 06/20/19 | 40 | ||
| LVMH Moët Hennessy - Louis Vuitton | JPMorgan Chase | 0.388 | % | EUR | 1,000 | 1.000 | % | 12/20/19 | 41 | ||
| LVMH Moët Hennessy - Louis Vuitton | JPMorgan Chase | 0.388 | % | EUR | 1,500 | 1.000 | % | 12/20/19 | 61 | ||
| M.D.C. Holdings, Inc. | JPMorgan Chase | 1.503 | % | USD | 1,000 | (1.000 | %) | 06/20/19 | 21 | ||
| M.D.C. Holdings, Inc. | JPMorgan Chase | 1.705 | % | USD | 2,000 | (1.000 | %) | 12/20/19 | 66 | ||
| M.D.C. Holdings, Inc. | JPMorgan Chase | 1.705 | % | USD | 1,500 | (1.000 | %) | 12/20/19 | 49 | ||
| Marks and Spencer PLC | JPMorgan Chase | 1.178 | % | EUR | 2,000 | 1.000 | % | 09/20/19 | (19 | ) | |
| Marks and Spencer PLC | JPMorgan Chase | 1.236 | % | EUR | 2,000 | (1.000 | %) | 09/20/19 | 27 | ||
| Marriott International, Inc. | JPMorgan Chase | 0.440 | % | USD | 1,000 | 1.000 | % | 09/20/19 | 28 | ||
| Marriott International, Inc. | JPMorgan Chase | 0.468 | % | USD | 1,500 | 1.000 | % | 12/20/19 | 41 | ||
| Marsh & McLennan | JPMorgan Chase | 0.256 | % | USD | 2,000 | (1.000 | %) | 12/20/19 | (77 | ) | |
| Masco Corp. | JPMorgan Chase | 1.287 | % | USD | 1,000 | (5.000 | %) | 06/20/19 | (170 | ) | |
| Masco Corp. | JPMorgan Chase | 1.381 | % | USD | 1,000 | (5.000 | %) | 09/20/19 | (174 | ) | |
| Masco Corp. | JPMorgan Chase | 1.467 | % | USD | 4,000 | (5.000 | %) | 12/20/19 | (709 | ) | |
| Mattel, Inc. | JPMorgan Chase | 0.849 | % | USD | 3,500 | 1.000 | % | 12/20/19 | 30 | ||
| McKesson Corp. | JPMorgan Chase | 0.222 | % | USD | 2,000 | (1.000 | %) | 06/20/19 | (73 | ) | |
| McKesson Corp. | JPMorgan Chase | 0.255 | % | USD | 4,000 | (1.000 | %) | 12/20/19 | (154 | ) | |
| MeadWestvaco Corp. | JPMorgan Chase | 0.217 | % | USD | 2,000 | (1.000 | %) | 03/20/19 | (70 | ) | |
| MeadWestvaco Corp. | JPMorgan Chase | 0.769 | % | USD | 1,000 | 1.000 | % | 06/20/19 | 11 | ||
| MeadWestvaco Corp. | JPMorgan Chase | 0.769 | % | USD | 1,000 | 1.000 | % | 06/20/19 | 11 | ||
| MeadWestvaco Corp. | JPMorgan Chase | 0.769 | % | USD | 1,000 | 1.000 | % | 06/20/19 | 11 | ||
| MeadWestvaco Corp. | JPMorgan Chase | 0.769 | % | USD | 1,000 | 1.000 | % | 06/20/19 | 11 | ||
| Metro AG | JPMorgan Chase | 1.071 | % | EUR | 1,000 | (1.000 | %) | 06/20/19 | 3 | ||
| Metro AG | JPMorgan Chase | 1.179 | % | EUR | 1,000 | (1.000 | %) | 12/20/19 | 10 | ||
| Metro AG | JPMorgan Chase | 1.179 | % | EUR | 3,000 | (1.000 | %) | 12/20/19 | 29 | ||
| MGM Studios | JPMorgan Chase | 2.711 | % | USD | 1,000 | 5.000 | % | 09/20/19 | 108 | ||
| See accompanying notes which are an integral part of the financial statements. | |||||||||||
| 646 Russell Multi-Strategy Alternative Fund | |||||||||||
Russell Investment Company
Russell Multi-Strategy Alternative Fund
Consolidated Schedule of Investments, continued — October 31, 2014
| Credit Default Swap Contracts | |||||||||||
| Amounts in thousands | |||||||||||
| Corporate Issues | |||||||||||
| Implied | Fund (Pays)/ | ||||||||||
| Credit | Receives | Termination | Fair Value | ||||||||
| Reference Entity | Counterparty | Spread | Notional Amount | Fixed Rate | Date | $ | |||||
| MGM Studios | JPMorgan Chase | 2.833 | % | USD | 1,500 | 5.000 | % | 12/20/19 | 159 | ||
| MGM Studios | JPMorgan Chase | 2.833 | % | USD | 500 | 5.000 | % | 12/20/19 | 53 | ||
| MGM Studios | JPMorgan Chase | 2.833 | % | USD | 500 | 5.000 | % | 12/20/19 | 53 | ||
| Mondelez International, Inc. | JPMorgan Chase | 0.378 | % | USD | 1,000 | 1.000 | % | 06/20/19 | 29 | ||
| Mondelez International, Inc. | JPMorgan Chase | 0.432 | % | USD | 1,000 | (1.000 | %) | 06/20/19 | (29 | ) | |
| Motorola Solutions, Inc. | JPMorgan Chase | 0.958 | % | USD | 4,000 | 1.000 | % | 12/20/19 | 13 | ||
| Nabors Industries, Inc. | JPMorgan Chase | 1.414 | % | USD | 1,000 | (1.000 | %) | 12/20/19 | 19 | ||
| Nabors Industries, Inc. | JPMorgan Chase | 1.414 | % | USD | 2,000 | (1.000 | %) | 12/20/19 | 38 | ||
| Nabors Industries, Inc. | JPMorgan Chase | 1.414 | % | USD | 1,000 | (1.000 | %) | 12/20/19 | 19 | ||
| National Grid PLC | JPMorgan Chase | 0.438 | % | EUR | 1,000 | 1.000 | % | 06/20/19 | 34 | ||
| National Grid PLC | JPMorgan Chase | 0.467 | % | EUR | 1,000 | 1.000 | % | 09/20/19 | 34 | ||
| New York Times Co. | JPMorgan Chase | 1.553 | % | USD | 1,000 | (1.000 | %) | 09/20/19 | 25 | ||
| New York Times Co. | JPMorgan Chase | 1.648 | % | USD | 2,000 | (1.000 | %) | 12/20/19 | 60 | ||
| Newell Rubbermaid, Inc. | JPMorgan Chase | 0.495 | % | USD | 1,000 | 1.000 | % | 03/20/19 | 23 | ||
| Newell Rubbermaid, Inc. | JPMorgan Chase | 0.536 | % | USD | 1,000 | 1.000 | % | 06/20/19 | 22 | ||
| Newell Rubbermaid, Inc. | JPMorgan Chase | 0.536 | % | USD | 1,000 | 1.000 | % | 06/20/19 | 22 | ||
| Newell Rubbermaid, Inc. | JPMorgan Chase | 0.574 | % | USD | 1,000 | 1.000 | % | 09/20/19 | 21 | ||
| News America, Inc. | JPMorgan Chase | 0.410 | % | USD | 1,000 | (1.000 | %) | 09/20/19 | (29 | ) | |
| News America, Inc. | JPMorgan Chase | 0.410 | % | USD | 1,000 | (1.000 | %) | 09/20/19 | (29 | ) | |
| News America, Inc. | JPMorgan Chase | 0.433 | % | USD | 1,000 | (1.000 | %) | 12/20/19 | (29 | ) | |
| News America, Inc. | JPMorgan Chase | 0.433 | % | USD | 2,000 | (1.000 | %) | 12/20/19 | (59 | ) | |
| Next PLC | JPMorgan Chase | 0.593 | % | EUR | 1,000 | 1.000 | % | 09/20/19 | 26 | ||
| Next PLC | JPMorgan Chase | 0.593 | % | EUR | 500 | 1.000 | % | 09/20/19 | 13 | ||
| Next PLC | JPMorgan Chase | 0.593 | % | EUR | 1,000 | 1.000 | % | 09/20/19 | 26 | ||
| Nokia OYJ | JPMorgan Chase | 1.504 | % | EUR | 1,000 | 5.000 | % | 12/20/19 | 224 | ||
| Nokia OYJ | JPMorgan Chase | 1.504 | % | EUR | 1,000 | (5.000 | %) | 12/20/19 | (224 | ) | |
| Norfolk Southern Corp. | JPMorgan Chase | 0.190 | % | USD | 1,000 | (1.000 | %) | 09/20/19 | (40 | ) | |
| Norfolk Southern Corp. | JPMorgan Chase | 0.190 | % | USD | 1,000 | (1.000 | %) | 09/20/19 | (40 | ) | |
| Norfolk Southern Corp. | JPMorgan Chase | 0.202 | % | USD | 3,000 | (1.000 | %) | 12/20/19 | (123 | ) | |
| Norfolk Southern Corp. | JPMorgan Chase | 0.202 | % | USD | 1,000 | (1.000 | %) | 12/20/19 | (41 | ) | |
| Northrop Grumman Corp. | JPMorgan Chase | 0.279 | % | USD | 3,000 | (1.000 | %) | 12/20/19 | (111 | ) | |
| Northrop Grumman Corp. | JPMorgan Chase | 0.279 | % | USD | 1,000 | (1.000 | %) | 12/20/19 | (37 | ) | |
| Northrop Grumman Corp. | JPMorgan Chase | 0.292 | % | USD | 1,000 | (1.000 | %) | 09/20/19 | (35 | ) | |
| Northrop Grumman Corp. | JPMorgan Chase | 0.292 | % | USD | 1,000 | (1.000 | %) | 09/20/19 | (35 | ) | |
| NRG Energy, Inc. | JPMorgan Chase | 2.531 | % | USD | 1,000 | 5.000 | % | 06/20/19 | 112 | ||
| NRG Energy, Inc. | JPMorgan Chase | 2.691 | % | USD | 500 | 5.000 | % | 09/20/19 | 55 | ||
| NRG Energy, Inc. | JPMorgan Chase | 2.838 | % | USD | 1,000 | 5.000 | % | 12/20/19 | 107 | ||
| NRG Energy, Inc. | JPMorgan Chase | 2.838 | % | USD | 1,000 | 5.000 | % | 12/20/19 | 107 | ||
| Nucor Corp. | JPMorgan Chase | 0.562 | % | USD | 1,000 | (1.000 | %) | 12/20/19 | (23 | ) | |
| NXP BV | JPMorgan Chase | 1.953 | % | EUR | 1,000 | 5.000 | % | 09/20/19 | 185 | ||
| NXP BV | JPMorgan Chase | 2.046 | % | EUR | 1,000 | 5.000 | % | 12/20/19 | 187 | ||
| Occidental Petroleum Corp. | JPMorgan Chase | 0.638 | % | USD | 2,000 | 1.000 | % | 03/20/19 | 33 | ||
| Omnicom Group, Inc. | JPMorgan Chase | 0.352 | % | USD | 1,000 | 1.000 | % | 06/20/19 | 30 | ||
| Omnicom Group, Inc. | JPMorgan Chase | 0.352 | % | USD | 3,000 | (1.000 | %) | 06/20/19 | (91 | ) | |
| Omnicom Group, Inc. | JPMorgan Chase | 0.397 | % | USD | 3,000 | (1.000 | %) | 12/20/19 | (94 | ) | |
| Oneok, Inc. | JPMorgan Chase | 0.970 | % | USD | 500 | 1.000 | % | 06/20/19 | 1 | ||
| Oneok, Inc. | JPMorgan Chase | 0.970 | % | USD | 1,000 | 1.000 | % | 06/20/19 | 2 | ||
| Pearson PLC | JPMorgan Chase | 1.176 | % | EUR | 1,500 | 5.000 | % | 12/20/18 | 302 | ||
| Pepsico, Inc. | JPMorgan Chase | 0.377 | % | USD | 1,000 | 1.000 | % | 09/20/19 | 31 | ||
| Pepsico, Inc. | JPMorgan Chase | 0.400 | % | USD | 1,000 | 1.000 | % | 12/20/19 | 31 | ||
| Pernod Ricard | JPMorgan Chase | 0.610 | % | EUR | 2,000 | 1.000 | % | 06/20/19 | 48 | ||
| Pernod Ricard | JPMorgan Chase | 0.682 | % | EUR | 1,000 | 1.000 | % | 12/20/19 | 22 | ||
| Pfizer, Inc. | JPMorgan Chase | 0.214 | % | USD | 1,000 | (1.000 | %) | 09/20/19 | (39 | ) | |
| Pfizer, Inc. | JPMorgan Chase | 0.227 | % | USD | 3,000 | (1.000 | %) | 12/20/19 | (120 | ) | |
| Pfizer, Inc. | JPMorgan Chase | 0.227 | % | USD | 2,000 | (1.000 | %) | 12/20/19 | (80 | ) | |
| Pioneer Natural Resources Co. | JPMorgan Chase | 0.426 | % | EUR | 1,000 | (1.000 | %) | 03/20/19 | (33 | ) | |
| See accompanying notes which are an integral part of the financial statements. | |||||||||||
| Russell Multi-Strategy Alternative Fund 647 | |||||||||||
Russell Investment Company
Russell Multi-Strategy Alternative Fund
Consolidated Schedule of Investments, continued — October 31, 2014
| Credit Default Swap Contracts | |||||||||||
| Amounts in thousands | |||||||||||
| Corporate Issues | |||||||||||
| Implied | Fund (Pays)/ | ||||||||||
| Credit | Receives | Termination | Fair Value | ||||||||
| Reference Entity | Counterparty | Spread | Notional Amount | Fixed Rate | Date | $ | |||||
| Pioneer Natural Resources Co. | JPMorgan Chase | 0.811 | % | USD | 1,000 | 1.000 | % | 12/20/19 | 10 | ||
| PolyOne Corp. | JPMorgan Chase | 1.715 | % | USD | 1,000 | 5.000 | % | 06/20/19 | 150 | ||
| PolyOne Corp. | JPMorgan Chase | 1.848 | % | USD | 1,000 | 5.000 | % | 09/20/19 | 151 | ||
| PolyOne Corp. | JPMorgan Chase | 1.970 | % | USD | 1,000 | 5.000 | % | 12/20/19 | 151 | ||
| PostNL NV | JPMorgan Chase | 1.088 | % | EUR | 1,000 | (1.000 | %) | 06/20/19 | 4 | ||
| PostNL NV | JPMorgan Chase | 1.182 | % | EUR | 3,000 | (1.000 | %) | 12/20/19 | 30 | ||
| Potash Corp. of Saskatchewan, Inc. | JPMorgan Chase | 0.501 | % | USD | 1,000 | 1.000 | % | 06/20/19 | 24 | ||
| Publicis Groupe | JPMorgan Chase | 0.495 | % | EUR | 1,000 | (1.000 | %) | 09/20/19 | (32 | ) | |
| PulteGroup, Inc. | JPMorgan Chase | 1.541 | % | USD | 500 | 5.000 | % | 06/20/19 | 79 | ||
| PulteGroup, Inc. | JPMorgan Chase | 1.541 | % | USD | 1,000 | 5.000 | % | 06/20/19 | 158 | ||
| PulteGroup, Inc. | JPMorgan Chase | 1.640 | % | USD | 500 | 5.000 | % | 09/20/19 | 80 | ||
| PulteGroup, Inc. | JPMorgan Chase | 1.740 | % | USD | 500 | 5.000 | % | 12/20/19 | 81 | ||
| Quest Diagnostics, Inc. | JPMorgan Chase | 0.937 | % | USD | 1,500 | 1.000 | % | 06/20/19 | 6 | ||
| Quest Diagnostics, Inc. | JPMorgan Chase | 1.008 | % | USD | 500 | 1.000 | % | 09/20/19 | — | ||
| R.R. Donnelley & Sons Co. | JPMorgan Chase | 2.565 | % | USD | 1,000 | (5.000 | %) | 12/20/19 | (121 | ) | |
| R.R. Donnelley & Sons Co. | JPMorgan Chase | 2.565 | % | USD | 1,000 | (5.000 | %) | 12/20/19 | (121 | ) | |
| R.R. Donnelley & Sons Co. | JPMorgan Chase | 2.565 | % | USD | 2,000 | 5.000 | % | 12/20/19 | 242 | ||
| R.R. Donnelley & Sons Co. | JPMorgan Chase | 2.565 | % | USD | 2,000 | (5.000 | %) | 12/20/19 | (242 | ) | |
| Raytheon Co. | JPMorgan Chase | 0.194 | % | USD | 2,000 | (1.000 | %) | 09/20/19 | (79 | ) | |
| Raytheon Co. | JPMorgan Chase | 0.206 | % | USD | 3,000 | (1.000 | %) | 12/20/19 | (123 | ) | |
| Republic Services, Inc. | JPMorgan Chase | 0.468 | % | USD | 1,500 | 1.000 | % | 12/20/19 | 41 | ||
| Rexel USA | JPMorgan Chase | 2.810 | % | EUR | 500 | 5.000 | % | 12/20/19 | 69 | ||
| Reynolds American, Inc. | JPMorgan Chase | 0.624 | % | USD | 1,000 | (1.000 | %) | 06/20/19 | (18 | ) | |
| Reynolds American, Inc. | JPMorgan Chase | 0.624 | % | USD | 2,000 | 1.000 | % | 06/20/19 | 36 | ||
| Reynolds American, Inc. | JPMorgan Chase | 0.624 | % | USD | 2,000 | 1.000 | % | 06/20/19 | 36 | ||
| Reynolds American, Inc. | JPMorgan Chase | 0.674 | % | USD | 500 | 1.000 | % | 09/20/19 | 8 | ||
| Rite Aid Corp. | JPMorgan Chase | 3.497 | % | USD | 1,000 | (5.000 | %) | 12/20/19 | (75 | ) | |
| Rolls-Royce PLC | JPMorgan Chase | 0.519 | % | EUR | 1,000 | (1.000 | %) | 06/20/19 | (29 | ) | |
| Rolls-Royce PLC | JPMorgan Chase | 0.519 | % | EUR | 1,000 | (1.000 | %) | 06/20/19 | (29 | ) | |
| Rolls-Royce PLC | JPMorgan Chase | 0.519 | % | EUR | 500 | 1.000 | % | 06/20/19 | 15 | ||
| Rolls-Royce PLC | JPMorgan Chase | 0.577 | % | EUR | 1,500 | (1.000 | %) | 12/20/19 | (43 | ) | |
| Rolls-Royce PLC | JPMorgan Chase | 0.577 | % | EUR | 2,000 | (1.000 | %) | 12/20/19 | (57 | ) | |
| Royal Caribbean Cruises, Ltd. | JPMorgan Chase | 1.509 | % | USD | 1,000 | 5.000 | % | 06/20/19 | 160 | ||
| Royal Caribbean Cruises, Ltd. | JPMorgan Chase | 1.609 | % | USD | 500 | 5.000 | % | 09/20/19 | 81 | ||
| Royal Caribbean Cruises, Ltd. | JPMorgan Chase | 1.609 | % | USD | 2,000 | 5.000 | % | 09/20/19 | 325 | ||
| Royal Dutch Shell PLC | JPMorgan Chase | 0.412 | % | EUR | 1,000 | 1.000 | % | 12/20/19 | 39 | ||
| Royal Dutch Shell PLC | JPMorgan Chase | 0.412 | % | EUR | 1,000 | 1.000 | % | 12/20/19 | 39 | ||
| RWE AG | JPMorgan Chase | 0.698 | % | EUR | 3,000 | (1.000 | %) | 12/20/19 | (62 | ) | |
| SABMillier PLC | JPMorgan Chase | 0.429 | % | EUR | 2,000 | 1.000 | % | 06/20/19 | 69 | ||
| SABMillier PLC | JPMorgan Chase | 0.455 | % | EUR | 500 | 1.000 | % | 09/20/19 | 17 | ||
| Safeway, Ltd. | JPMorgan Chase | 1.529 | % | EUR | 1,000 | (1.000 | %) | 06/20/19 | 28 | ||
| Safeway, Ltd. | JPMorgan Chase | 1.671 | % | EUR | 3,000 | (1.000 | %) | 12/20/19 | 120 | ||
| Sanofi-Aventis SA | JPMorgan Chase | 0.391 | % | EUR | 1,000 | 1.000 | % | 12/20/19 | 40 | ||
| Sanofi-Aventis SA | JPMorgan Chase | 0.391 | % | EUR | 1,000 | 1.000 | % | 12/20/19 | 40 | ||
| SBC Communications, Inc. | JPMorgan Chase | 0.468 | % | USD | 3,000 | 1.000 | % | 09/20/19 | 79 | ||
| SBC Communications, Inc. | JPMorgan Chase | 0.468 | % | USD | 1,000 | 1.000 | % | 09/20/19 | 26 | ||
| Schneider Electric SA | JPMorgan Chase | 0.350 | % | EUR | 1,000 | (1.000 | %) | 03/20/19 | (37 | ) | |
| Sealed Air | JPMorgan Chase | 1.779 | % | USD | 500 | (1.000 | %) | 09/20/19 | 17 | ||
| Sealed Air | JPMorgan Chase | 1.779 | % | USD | 1,000 | (1.000 | %) | 09/20/19 | 35 | ||
| Sempra Energy | JPMorgan Chase | 0.358 | % | USD | 1,000 | (1.000 | %) | 09/20/19 | (32 | ) | |
| SES | JPMorgan Chase | 0.526 | % | EUR | 1,000 | 1.000 | % | 03/20/19 | 27 | ||
| SES | JPMorgan Chase | 0.562 | % | EUR | 1,000 | 1.000 | % | 06/20/19 | 27 | ||
| Simon Property Group LP | JPMorgan Chase | 0.443 | % | USD | 2,000 | (1.000 | %) | 12/20/19 | (58 | ) | |
| Simon Property Group LP | JPMorgan Chase | 0.443 | % | USD | 1,000 | (1.000 | %) | 12/20/19 | (29 | ) | |
| Simon Property Group LP | JPMorgan Chase | 0.443 | % | USD | 1,000 | (1.000 | %) | 12/20/19 | (29 | ) | |
| Sodexo | JPMorgan Chase | 0.463 | % | EUR | 1,000 | 1.000 | % | 06/20/19 | 32 | ||
| See accompanying notes which are an integral part of the financial statements. | |||||||||||
| 648 Russell Multi-Strategy Alternative Fund | |||||||||||
Russell Investment Company
Russell Multi-Strategy Alternative Fund
Consolidated Schedule of Investments, continued — October 31, 2014
| Credit Default Swap Contracts | |||||||||||
| Amounts in thousands | |||||||||||
| Corporate Issues | |||||||||||
| Implied | Fund (Pays)/ | ||||||||||
| Credit | Receives | Termination | Fair Value | ||||||||
| Reference Entity | Counterparty | Spread | Notional Amount | Fixed Rate | Date | $ | |||||
| Sodexo | JPMorgan Chase | 0.463 | % | EUR | 1,000 | 1.000 | % | 06/20/19 | 32 | ||
| Sodexo | JPMorgan Chase | 0.509 | % | EUR | 1,000 | 1.000 | % | 12/20/19 | 33 | ||
| Solvay | JPMorgan Chase | 0.559 | % | EUR | 1,000 | (1.000 | %) | 09/20/19 | (28 | ) | |
| Solvay | JPMorgan Chase | 0.559 | % | EUR | 1,000 | 1.000 | % | 09/20/19 | 28 | ||
| Solvay | JPMorgan Chase | 0.559 | % | EUR | 1,000 | 1.000 | % | 09/20/19 | 28 | ||
| Spectra Energy Capital LLC | JPMorgan Chase | 0.667 | % | USD | 1,000 | 1.000 | % | 03/20/19 | 15 | ||
| Spectra Energy Capital LLC | JPMorgan Chase | 0.727 | % | USD | 1,000 | 1.000 | % | 06/20/19 | 13 | ||
| Spectra Energy Capital LLC | JPMorgan Chase | 0.727 | % | USD | 1,000 | 1.000 | % | 06/20/19 | 13 | ||
| Sprint Nextel Corp. | JPMorgan Chase | 3.374 | % | USD | 1,000 | (5.000 | %) | 12/20/19 | (80 | ) | |
| Sprint Nextel Corp. | JPMorgan Chase | 3.374 | % | USD | 500 | (5.000 | %) | 12/20/19 | (40 | ) | |
| Sprint Nextel Corp. | JPMorgan Chase | 3.374 | % | USD | 1,000 | (5.000 | %) | 12/20/19 | (80 | ) | |
| Stanley Black & Decker, Inc. | JPMorgan Chase | 0.598 | % | USD | 1,000 | 1.000 | % | 06/20/19 | 19 | ||
| Staples, Inc. | JPMorgan Chase | 1.785 | % | USD | 1,000 | 1.000 | % | 09/20/19 | (35 | ) | |
| Staples, Inc. | JPMorgan Chase | 1.900 | % | USD | 1,000 | 1.000 | % | 12/20/19 | (42 | ) | |
| Staples, Inc. | JPMorgan Chase | 1.900 | % | USD | 1,000 | 1.000 | % | 12/20/19 | (42 | ) | |
| Starwood Hotels & Resorts Worldwide, Inc. | JPMorgan Chase | 0.505 | % | USD | 1,000 | (1.000 | %) | 03/20/19 | (22 | ) | |
| Starwood Hotels & Resorts Worldwide, Inc. | JPMorgan Chase | 0.555 | % | USD | 1,000 | 1.000 | % | 06/20/19 | 21 | ||
| Starwood Hotels & Resorts Worldwide, Inc. | JPMorgan Chase | 0.555 | % | USD | 1,000 | 1.000 | % | 06/20/19 | 21 | ||
| Starwood Hotels & Resorts Worldwide, Inc. | JPMorgan Chase | 0.600 | % | USD | 1,000 | (1.000 | %) | 09/20/19 | (20 | ) | |
| Starwood Hotels & Resorts Worldwide, Inc. | JPMorgan Chase | 0.600 | % | USD | 1,000 | 1.000 | % | 09/20/19 | 20 | ||
| Stora Enso | JPMorgan Chase | 1.826 | % | EUR | 1,000 | (5.000 | %) | 09/20/19 | (194 | ) | |
| Stora Enso | JPMorgan Chase | 1.911 | % | EUR | 500 | (5.000 | %) | 12/20/19 | (99 | ) | |
| Stora Enso | JPMorgan Chase | 1.911 | % | EUR | 1,500 | (5.000 | %) | 12/20/19 | (295 | ) | |
| Suedzucker Mannheim Ochsenfurt AG | JPMorgan Chase | 1.232 | % | EUR | 1,000 | (1.000 | %) | 09/20/19 | 12 | ||
| Suedzucker Mannheim Ochsenfurt AG | JPMorgan Chase | 1.291 | % | EUR | 1,000 | (1.000 | %) | 12/20/19 | 17 | ||
| Suedzucker Mannheim Ochsenfurt AG | JPMorgan Chase | 1.291 | % | EUR | 2,000 | (1.000 | %) | 12/20/19 | 34 | ||
| Swedish Match AB | JPMorgan Chase | 0.526 | % | EUR | 1,000 | 1.000 | % | 06/20/19 | 29 | ||
| Syngenta AG | JPMorgan Chase | 0.359 | % | EUR | 1,000 | (1.000 | %) | 12/20/19 | (43 | ) | |
| Target Corp. | JPMorgan Chase | 0.452 | % | USD | 1,000 | (1.000 | %) | 12/20/19 | (28 | ) | |
| Target Corp. | JPMorgan Chase | 0.452 | % | USD | 1,000 | (1.000 | %) | 12/20/19 | (28 | ) | |
| Telefonaktiebolaget LM Ericsson | JPMorgan Chase | 0.530 | % | EUR | 1,000 | (1.000 | %) | 12/20/19 | (31 | ) | |
| Telenor ASA | JPMorgan Chase | 0.343 | % | EUR | 1,000 | (1.000 | %) | 03/20/19 | (37 | ) | |
| Telenor ASA | JPMorgan Chase | 0.402 | % | EUR | 2,000 | (1.000 | %) | 12/20/19 | (79 | ) | |
| Telenor ASA | JPMorgan Chase | 0.402 | % | EUR | 1,000 | (1.000 | %) | 12/20/19 | (40 | ) | |
| Telstra Corp., Ltd. | JPMorgan Chase | 0.457 | % | USD | 1,000 | 1.000 | % | 12/20/19 | 28 | ||
| Telstra Corp., Ltd. | JPMorgan Chase | 0.457 | % | USD | 1,000 | 1.000 | % | 12/20/19 | 28 | ||
| Tenet Healthcare Corp. | JPMorgan Chase | 2.245 | % | USD | 500 | (5.000 | %) | 03/20/19 | (59 | ) | |
| Tenet Healthcare Corp. | JPMorgan Chase | 2.250 | % | USD | 500 | 5.000 | % | 03/20/19 | 60 | ||
| Tenet Healthcare Corp. | JPMorgan Chase | 2.433 | % | USD | 500 | (5.000 | %) | 06/20/19 | (58 | ) | |
| Tenet Healthcare Corp. | JPMorgan Chase | 2.766 | % | USD | 2,000 | (5.000 | %) | 12/20/19 | (221 | ) | |
| Tenet Healthcare Corp. | JPMorgan Chase | 2.766 | % | USD | 2,000 | (5.000 | %) | 12/20/19 | (221 | ) | |
| Tesco PLC | JPMorgan Chase | 1.412 | % | EUR | 1,000 | 1.000 | % | 06/20/19 | (22 | ) | |
| Tesco PLC | JPMorgan Chase | 1.412 | % | EUR | 1,000 | (1.000 | %) | 06/20/19 | 22 | ||
| Tesco PLC | JPMorgan Chase | 1.475 | % | EUR | 500 | (1.000 | %) | 09/20/19 | 13 | ||
| Tesco PLC | JPMorgan Chase | 1.475 | % | EUR | 500 | 1.000 | % | 09/20/19 | (13 | ) | |
| Tesco PLC | JPMorgan Chase | 1.530 | % | EUR | 3,000 | (1.000 | %) | 12/20/19 | 94 | ||
| Tesco PLC | JPMorgan Chase | 1.530 | % | EUR | 1,000 | (1.000 | %) | 12/20/19 | 31 | ||
| Tesoro Corp. | JPMorgan Chase | 1.853 | % | USD | 1,000 | (5.000 | %) | 09/20/19 | (150 | ) | |
| Tesoro Corp. | JPMorgan Chase | 1.967 | % | USD | 3,000 | (5.000 | %) | 12/20/19 | (453 | ) | |
| The AES Corp. | JPMorgan Chase | 1.896 | % | USD | 1,000 | 5.000 | % | 06/20/19 | 141 | ||
| The AES Corp. | JPMorgan Chase | 1.896 | % | USD | 1,000 | 5.000 | % | 06/20/19 | 141 | ||
| The AES Corp. | JPMorgan Chase | 2.111 | % | USD | 1,000 | 5.000 | % | 12/20/19 | 143 | ||
| The AES Corp. | JPMorgan Chase | 2.111 | % | USD | 1,000 | 5.000 | % | 12/20/19 | 143 | ||
| The Boeing Co. | JPMorgan Chase | 0.271 | % | USD | 2,000 | (1.000 | %) | 12/20/19 | (75 | ) | |
| The Boeing Co. | JPMorgan Chase | 0.271 | % | USD | 3,000 | (1.000 | %) | 12/20/19 | (113 | ) | |
| The Dow Chemical Co. | JPMorgan Chase | 0.735 | % | USD | 1,000 | (1.000 | %) | 12/20/19 | (14 | ) | |
| See accompanying notes which are an integral part of the financial statements. | |||||||||||
| Russell Multi-Strategy Alternative Fund 649 | |||||||||||
Russell Investment Company
Russell Multi-Strategy Alternative Fund
Consolidated Schedule of Investments, continued — October 31, 2014
| Credit Default Swap Contracts | |||||||||||
| Amounts in thousands | |||||||||||
| Corporate Issues | |||||||||||
| Implied | Fund (Pays)/ | ||||||||||
| Credit | Receives | Termination | Fair Value | ||||||||
| Reference Entity | Counterparty | Spread | Notional Amount | Fixed Rate | Date | $ | |||||
| The Gap, Inc. | JPMorgan Chase | 1.025 | % | USD | 1,000 | (1.000 | %) | 09/20/19 | — | ||
| The Gap, Inc. | JPMorgan Chase | 1.025 | % | USD | 2,000 | 1.000 | % | 09/20/19 | — | ||
| The Gap, Inc. | JPMorgan Chase | 1.025 | % | USD | 1,000 | (1.000 | %) | 09/20/19 | — | ||
| The Gap, Inc. | JPMorgan Chase | 1.092 | % | USD | 3,000 | (1.000 | %) | 12/20/19 | 10 | ||
| The Goodyear Tire Co. | JPMorgan Chase | 2.765 | % | USD | 1,000 | (5.000 | %) | 09/20/19 | (106 | ) | |
| The Goodyear Tire Co. | JPMorgan Chase | 2.932 | % | USD | 2,000 | (5.000 | %) | 12/20/19 | (205 | ) | |
| The Hillshire Brands Co. | JPMorgan Chase | 0.568 | % | EUR | 1,500 | 1.000 | % | 12/20/18 | 36 | ||
| The McClatchy Co. | JPMorgan Chase | 5.172 | % | USD | 500 | (5.000 | %) | 06/20/19 | 1 | ||
| The McClatchy Co. | JPMorgan Chase | 5.598 | % | USD | 1,000 | (5.000 | %) | 12/20/19 | 21 | ||
| The Sherwin-Williams Co. | JPMorgan Chase | 0.270 | % | USD | 1,000 | (1.000 | %) | 03/20/19 | (33 | ) | |
| The Sherwin-Williams Co. | JPMorgan Chase | 0.295 | % | USD | 3,000 | (1.000 | %) | 06/20/19 | (99 | ) | |
| The Sherwin-Williams Co. | JPMorgan Chase | 0.295 | % | USD | 3,000 | 1.000 | % | 06/20/19 | 99 | ||
| The Walt Disney Co. | JPMorgan Chase | 0.177 | % | USD | 2,000 | 1.000 | % | 06/20/19 | 77 | ||
| The Walt Disney Co. | JPMorgan Chase | 0.177 | % | USD | 1,000 | (1.000 | %) | 06/20/19 | (39 | ) | |
| The Walt Disney Co. | JPMorgan Chase | 0.177 | % | USD | 1,000 | (1.000 | %) | 06/20/19 | (39 | ) | |
| The Walt Disney Co. | JPMorgan Chase | 0.203 | % | USD | 2,000 | (1.000 | %) | 12/20/19 | (82 | ) | |
| The Walt Disney Co. | JPMorgan Chase | 0.203 | % | USD | 4,000 | (1.000 | %) | 12/20/19 | (164 | ) | |
| Time Warner Cable, Inc. | JPMorgan Chase | 0.460 | % | USD | 1,000 | (1.000 | %) | 09/20/19 | (27 | ) | |
| Time Warner Cable, Inc. | JPMorgan Chase | 0.490 | % | USD | 1,000 | (1.000 | %) | 12/20/19 | (26 | ) | |
| Time Warner Cable, Inc. | JPMorgan Chase | 0.490 | % | USD | 2,000 | (1.000 | %) | 12/20/19 | (53 | ) | |
| Time Warner Cable, Inc. | JPMorgan Chase | 0.490 | % | USD | 1,000 | (1.000 | %) | 12/20/19 | (26 | ) | |
| Total SA | JPMorgan Chase | 0.411 | % | EUR | 1,000 | (1.000 | %) | 09/20/19 | (37 | ) | |
| Total SA | JPMorgan Chase | 0.432 | % | EUR | 3,000 | (1.000 | %) | 12/20/19 | (113 | ) | |
| Transocean, Inc. | JPMorgan Chase | 3.444 | % | USD | 1,000 | 1.000 | % | 09/20/19 | (106 | ) | |
| Transocean, Inc. | JPMorgan Chase | 3.444 | % | USD | 1,000 | 1.000 | % | 09/20/19 | (106 | ) | |
| Transocean, Inc. | JPMorgan Chase | 3.444 | % | USD | 1,000 | 1.000 | % | 09/20/19 | (106 | ) | |
| Tyson Foods, Inc. | JPMorgan Chase | 0.711 | % | USD | 1,000 | (1.000 | %) | 09/20/19 | (15 | ) | |
| Tyson Foods, Inc. | JPMorgan Chase | 0.754 | % | USD | 4,000 | (1.000 | %) | 12/20/19 | (53 | ) | |
| United Health Group, Inc. | JPMorgan Chase | 0.338 | % | USD | 1,000 | (1.000 | %) | 12/20/19 | (34 | ) | |
| United Health Group, Inc. | JPMorgan Chase | 0.338 | % | USD | 3,000 | (1.000 | %) | 12/20/19 | (103 | ) | |
| United Health Group, Inc. | JPMorgan Chase | 0.338 | % | USD | 1,000 | (1.000 | %) | 12/20/19 | (34 | ) | |
| United Parcel Service, Inc. | JPMorgan Chase | 0.167 | % | USD | 1,000 | (1.000 | %) | 09/20/19 | (41 | ) | |
| United Rentals, Inc. | JPMorgan Chase | 2.142 | % | USD | 1,000 | 5.000 | % | 12/20/19 | 142 | ||
| United Technologies Corp. | JPMorgan Chase | 0.219 | % | USD | 1,000 | (1.000 | %) | 09/20/19 | (38 | ) | |
| United Utilities PLC | JPMorgan Chase | 0.828 | % | EUR | 1,000 | 1.000 | % | 06/20/19 | 11 | ||
| United Utilities PLC | JPMorgan Chase | 0.828 | % | EUR | 500 | 1.000 | % | 06/20/19 | 6 | ||
| United Utilities PLC | JPMorgan Chase | 0.828 | % | EUR | 1,000 | 1.000 | % | 06/20/19 | 11 | ||
| Universal Health Services, Inc. | JPMorgan Chase | 1.001 | % | USD | 2,000 | 1.000 | % | 06/20/19 | 2 | ||
| Universal Health Services, Inc. | JPMorgan Chase | 1.001 | % | USD | 1,000 | (1.000 | %) | 06/20/19 | (1 | ) | |
| Universal Health Services, Inc. | JPMorgan Chase | 1.001 | % | USD | 1,000 | (1.000 | %) | 06/20/19 | (1 | ) | |
| Universal Health Services, Inc. | JPMorgan Chase | 1.072 | % | USD | 2,000 | 1.000 | % | 09/20/19 | (5 | ) | |
| Universal Health Services, Inc. | JPMorgan Chase | 1.136 | % | USD | 500 | 1.000 | % | 12/20/19 | (3 | ) | |
| UPM-Kymmene OYJ | JPMorgan Chase | 1.675 | % | EUR | 1,000 | (5.000 | %) | 09/20/19 | (203 | ) | |
| UPM-Kymmene OYJ | JPMorgan Chase | 1.756 | % | EUR | 1,000 | (5.000 | %) | 12/20/19 | (207 | ) | |
| US Steel Corp. | JPMorgan Chase | 2.693 | % | USD | 1,000 | (5.000 | %) | 12/20/19 | (114 | ) | |
| Valeo | JPMorgan Chase | 0.699 | % | EUR | 1,000 | (1.000 | %) | 06/20/19 | (19 | ) | |
| Valero Energy Corp. | JPMorgan Chase | 0.756 | % | EUR | 1,000 | (1.000 | %) | 12/20/19 | (17 | ) | |
| Valero Energy Corp. | JPMorgan Chase | 0.756 | % | EUR | 500 | (1.000 | %) | 12/20/19 | (8 | ) | |
| Valero Energy Corp. | JPMorgan Chase | 0.756 | % | EUR | 2,000 | (1.000 | %) | 12/20/19 | (34 | ) | |
| Valero Energy Corp. | JPMorgan Chase | 0.833 | % | USD | 1,000 | (1.000 | %) | 06/20/19 | (9 | ) | |
| Valero Energy Corp. | JPMorgan Chase | 0.833 | % | USD | 1,000 | (1.000 | %) | 06/20/19 | (9 | ) | |
| Valero Energy Corp. | JPMorgan Chase | 0.961 | % | USD | 3,000 | (1.000 | %) | 12/20/19 | (9 | ) | |
| Verizon Communications, Inc. | JPMorgan Chase | 0.530 | % | USD | 1,000 | 1.000 | % | 09/20/19 | 23 | ||
| Verizon Communications, Inc. | JPMorgan Chase | 0.559 | % | USD | 3,000 | 1.000 | % | 12/20/19 | 69 | ||
| Viacom | JPMorgan Chase | 0.524 | % | USD | 1,000 | (1.000 | %) | 09/20/19 | (24 | ) | |
| Viacom | JPMorgan Chase | 0.557 | % | USD | 4,000 | (1.000 | %) | 12/20/19 | (92 | ) | |
| See accompanying notes which are an integral part of the financial statements. | |||||||||||
| 650 Russell Multi-Strategy Alternative Fund | |||||||||||
Russell Investment Company
Russell Multi-Strategy Alternative Fund
Consolidated Schedule of Investments, continued — October 31, 2014
| Credit Default Swap Contracts | |||||||||||
| Amounts in thousands | |||||||||||
| Corporate Issues | |||||||||||
| Implied | Fund (Pays)/ | ||||||||||
| Credit | Receives | Termination | Fair Value | ||||||||
| Reference Entity | Counterparty | Spread | Notional Amount | Fixed Rate | Date | $ | |||||
| Vinci | JPMorgan Chase | 0.740 | % | EUR | 1,000 | 1.000 | % | 09/20/19 | 17 | ||
| Vinci | JPMorgan Chase | 0.778 | % | EUR | 1,000 | 1.000 | % | 12/20/19 | 16 | ||
| Vivendi SA | JPMorgan Chase | 0.561 | % | USD | 2,000 | 1.000 | % | 12/20/18 | 38 | ||
| Vodafone Group PLC | JPMorgan Chase | 0.625 | % | EUR | 1,000 | (1.000 | %) | 06/20/19 | (23 | ) | |
| Vodafone Group PLC | JPMorgan Chase | 0.695 | % | EUR | 2,000 | (1.000 | %) | 12/20/19 | (42 | ) | |
| Vodafone Group PLC | JPMorgan Chase | 0.695 | % | EUR | 2,000 | (1.000 | %) | 12/20/19 | (42 | ) | |
| Vornado Realty LP | JPMorgan Chase | 0.647 | % | USD | 3,000 | 1.000 | % | 06/20/19 | 51 | ||
| Vulcan Materials Co. | JPMorgan Chase | 1.526 | % | USD | 1,000 | 5.000 | % | 12/20/19 | 173 | ||
| Vulcan Materials Co. | JPMorgan Chase | 1.526 | % | USD | 1,000 | 5.000 | % | 12/20/19 | 173 | ||
| Wal-Mart Stores, Inc. | JPMorgan Chase | 0.155 | % | USD | 4,000 | (1.000 | %) | 12/20/19 | (174 | ) | |
| Wal-Mart Stores, Inc. | JPMorgan Chase | 0.155 | % | USD | 2,000 | (1.000 | %) | 12/20/19 | (87 | ) | |
| Waste Management, Inc. | JPMorgan Chase | 0.436 | % | USD | 1,000 | 1.000 | % | 06/20/19 | 27 | ||
| Waste Management, Inc. | JPMorgan Chase | 0.436 | % | USD | 1,000 | 1.000 | % | 06/20/19 | 27 | ||
| Weatherford International Ltd. | JPMorgan Chase | 1.540 | % | USD | 2,000 | (1.000 | %) | 12/20/19 | 50 | ||
| Weyerhaeuser Co. | JPMorgan Chase | 0.502 | % | USD | 1,000 | 1.000 | % | 06/20/19 | 24 | ||
| Weyerhaeuser Co. | JPMorgan Chase | 0.502 | % | USD | 500 | 1.000 | % | 06/20/19 | 12 | ||
| Weyerhaeuser Co. | JPMorgan Chase | 0.502 | % | USD | 1,500 | 1.000 | % | 06/20/19 | 35 | ||
| Weyerhaeuser Co. | JPMorgan Chase | 0.540 | % | USD | 1,000 | 1.000 | % | 09/20/19 | 23 | ||
| Whirlpool Corp. | JPMorgan Chase | 0.568 | % | USD | 1,000 | (1.000 | %) | 06/20/19 | (21 | ) | |
| Whirlpool Corp. | JPMorgan Chase | 0.568 | % | USD | 1,500 | (1.000 | %) | 06/20/19 | (31 | ) | |
| Whirlpool Corp. | JPMorgan Chase | 0.568 | % | USD | 500 | 1.000 | % | 06/20/19 | 10 | ||
| Whirlpool Corp. | JPMorgan Chase | 0.649 | % | USD | 1,500 | (1.000 | %) | 12/20/19 | (28 | ) | |
| Whirlpool Corp. | JPMorgan Chase | 0.649 | % | USD | 3,000 | (1.000 | %) | 12/20/19 | (56 | ) | |
| Williams Co., Inc. | JPMorgan Chase | 1.035 | % | USD | 1,000 | 1.000 | % | 03/20/19 | — | ||
| Williams Co., Inc. | JPMorgan Chase | 1.127 | % | USD | 1,000 | 1.000 | % | 06/20/19 | (5 | ) | |
| Williams Co., Inc. | JPMorgan Chase | 1.288 | % | USD | 2,000 | 1.000 | % | 12/20/19 | (26 | ) | |
| Windstream Corp. | JPMorgan Chase | 2.329 | % | USD | 1,000 | (5.000 | %) | 03/20/19 | (115 | ) | |
| Wolters Kluwer NV | JPMorgan Chase | 0.475 | % | EUR | 1,000 | (1.000 | %) | 06/20/19 | (32 | ) | |
| Wolters Kluwer NV | JPMorgan Chase | 0.475 | % | EUR | 3,000 | 1.000 | % | 06/20/19 | 95 | ||
| Wolters Kluwer NV | JPMorgan Chase | 0.507 | % | EUR | 1,000 | 1.000 | % | 09/20/19 | 31 | ||
| WPP GRP PLC | JPMorgan Chase | 0.523 | % | EUR | 3,000 | (1.000 | %) | 12/20/19 | (96 | ) | |
| YUM! Brands, Inc. | JPMorgan Chase | 0.448 | % | USD | 1,000 | 1.000 | % | 06/20/19 | 26 | ||
| YUM! Brands, Inc. | JPMorgan Chase | 0.448 | % | USD | 2,000 | 1.000 | % | 06/20/19 | 52 | ||
| YUM! Brands, Inc. | JPMorgan Chase | 0.479 | % | USD | 500 | 1.000 | % | 09/20/19 | 13 | ||
| Total Fair Value on Open Corporate Issues Premiums Paid (Received) - ($3,982) | (4,660 | ) | |||||||||
| Credit Indices | |||||||||||
| Fund (Pays)/ | |||||||||||
| Receives | Termination | Fair Value | |||||||||
| Reference Entity | Counterparty | Notional Amount | Fixed Rate | Date | $ | ||||||
| CDX NA High Yield Index | JPMorgan Chase | USD | 5,000 | (5.000 | %) | 12/20/19 | (381 | ) | |||
| CDX NA High Yield Index | JPMorgan Chase | USD | 12,000 | (5.000 | %) | 12/20/19 | (894 | ) | |||
| iTraxx Europe Index | Credit Suisse | EUR | 300 | (1.000 | %) | 06/20/19 | (8 | ) | |||
| Total Fair Value on Open Credit Indices Premiums Paid (Received) - ($1,151) | (1,283 | ) | |||||||||
| Total Fair Value on Open Credit Default Swap Contracts Premiums Paid (Received) - ($5,133) (å) | (5,943 | ) | |||||||||
| See accompanying notes which are an integral part of the financial statements. | |||||||||||
| Russell Multi-Strategy Alternative Fund 651 | |||||||||||
Russell Investment Company
Russell Multi-Strategy Alternative Fund
Consolidated Schedule of Investments, continued — October 31, 2014
| Consolidated Presentation of Portfolio Holdings | ||||||||||||||
| Amounts in thousands | ||||||||||||||
| Fair Value | ||||||||||||||
| Portfolio Summary | Level 1 | Level 2 | Level 3 | Total | % of Net Assets | |||||||||
| Long-Term Investments | ||||||||||||||
| Asset-Backed Securities | $ | — | $ | 1,151 | $ | — | $ | 1,151 | 0.1 | |||||
| Corporate Bonds and Notes | — | 49,205 | — | 49,205 | 5.1 | |||||||||
| International Debt | — | 21,351 | — | 21,351 | 2.2 | |||||||||
| Loan Agreements | — | 38,569 | — | 38,569 | 4.0 | |||||||||
| Mortgage-Backed Securities | — | 8,284 | — | 8,284 | 0.9 | |||||||||
| Municipal Bonds | — | 4,240 | — | 4,240 | 0.4 | |||||||||
| Non-US Bonds | — | 22,766 | — | 22,766 | 2.4 | |||||||||
| United States Government Treasuries | — | 24,649 | — | 24,649 | 2.6 | |||||||||
| Common Stocks | ||||||||||||||
| Consumer Discretionary | 48,332 | — | — | 48,332 | 5.0 | |||||||||
| Consumer Staples | 2,978 | — | — | 2,978 | 0.3 | |||||||||
| Energy | 35,433 | — | — | 35,433 | 3.7 | |||||||||
| Financial Services | 54,232 | — | — | 54,232 | 5.6 | |||||||||
| Health Care | 21,250 | — | — | 21,250 | 2.2 | |||||||||
| Materials and Processing | 18,263 | — | — | 18,263 | 1.9 | |||||||||
| Producer Durables | 10,749 | — | — | 10,749 | 1.1 | |||||||||
| Technology | 37,127 | — | 195 | 37,322 | 3.9 | |||||||||
| Utilities | 13,058 | — | — | 13,058 | 1.4 | |||||||||
| Investments in Other Funds | 2,317 | — | — | 2,317 | 0.3 | |||||||||
| Preferred Stocks | 2,917 | — | — | 2,917 | 0.3 | |||||||||
| Options Purchased | 2,907 | 2,129 | — | 5,036 | 0.5 | |||||||||
| Warrants & Rights | 138 | 2,486 | — | 2,624 | 0.3 | |||||||||
| Short-Term Investments | — | 476,542 | — | 476,542 | 49.5 | |||||||||
| Repurchase Agreements | — | 9,477 | — | 9,477 | 1.0 | |||||||||
| Total Investments | 249,701 | 660,849 | 195 | 910,745 | 94.7 | |||||||||
| Securities Sold Short*** | ||||||||||||||
| Long-Term Investments | — | (2,646 | ) | — | (2,646 | ) | (0.3 | ) | ||||||
| Common Stock | (29,241 | ) | — | — | (29,241 | ) | (3.0 | ) | ||||||
| Investments in Other Funds | (18,048 | ) | — | — | (18,048 | ) | (1.9 | ) | ||||||
| Other Assets and Liabilities, Net | 10.5 | |||||||||||||
| 100.0 | ||||||||||||||
| Other Financial Instruments | ||||||||||||||
| Futures Contracts | (731 | ) | — | — | (731 | ) | (0.1 | ) | ||||||
| Options Written | (262 | ) | (3,947 | ) | — | (4,209 | ) | (0.4 | ) | |||||
| Foreign Currency Exchange Contracts | (6 | ) | 9,669 | — | 9,663 | 1.0 | ||||||||
| Index Swap Contracts | — | 68 | — | 68 | —* | |||||||||
| Interest Rate Swap Contracts | — | 1,083 | — | 1,083 | 0.1 | |||||||||
| Credit Default Swap Contracts | — | (5,943 | ) | — | (5,943 | ) | (0.6 | ) | ||||||
| Total Other Financial Instruments** | $ | (999 | ) | $ | 930 | $ | — | $ | (69 | ) | ||||
| * Less than .05% of net assets. | ||||||||||||||
| ** Futures and foreign currency exchange contract values reflect the unrealized appreciation (depreciation) on the instruments. | ||||||||||||||
| *** Refer to Schedule of Investments for detailed sector breakout. | ||||||||||||||
| For a description of the Levels see note 2 in the Notes to Financial Statements. | ||||||||||||||
| For disclosure on transfers between Levels 1, 2 and 3 during the period ended October 31, 2014, see note 2 in the Notes to Financial | ||||||||||||||
| Statements. | ||||||||||||||
| Investments in which significant unobservable inputs (Level 3) were used in determining a fair value for the period ended October | ||||||||||||||
| 31, 2014 were less than 1% of net assets. | ||||||||||||||
| See accompanying notes which are an integral part of the financial statements. | ||||||||||||||
| 652 Russell Multi-Strategy Alternative Fund | ||||||||||||||
Russell Investment Company
Russell Multi-Strategy Alternative Fund
Consolidated Fair Value of Derivative Instruments — October 31, 2014
Amounts in thousands
| Foreign | |||||||||||||||
| Equity | Credit | Currency | Interest Rate Commodity | ||||||||||||
| Derivatives not accounted for as hedging instruments | Contracts | Contracts | Contracts | Contracts | Contracts | ||||||||||
| Location: Statement of Assets and Liabilities - Assets | |||||||||||||||
| Investments, at fair value* | $ | 2,167 | $ | — | $ | 1,775 | $ | 1,094 | $ | — | |||||
| Unrealized appreciation on foreign currency exchange contracts | — | — | 44,702 | — | — | ||||||||||
| Variation margin on futures contracts*** | 1,822 | — | — | 1,130 | 2,172 | ||||||||||
| Index swap contracts, at fair value | — | — | — | 68 | — | ||||||||||
| Interest rate swap contracts, at fair value | — | — | — | 2,009 | — | ||||||||||
| Credit default swap contracts, at fair value | — | 16,036 | — | — | — | ||||||||||
| Total | $ | 3,989 | $ | 16,036 | $ | 46,477 | $ | 4,301 | $ | 2,172 | |||||
| Location: Statement of Assets and Liabilities - Liabilities | |||||||||||||||
| Variation margin on futures contracts*** | $ | 3,509 | $ | — | $ | — | $ | 852 | $ | 1,494 | |||||
| Unrealized depreciation on foreign currency exchange contracts | — | — | 35,039 | — | — | ||||||||||
| Options written, at fair value | 22 | — | 3,665 | 522 | — | ||||||||||
| Interest rate swap contracts, at fair value | — | — | — | 926 | — | ||||||||||
| Credit default swap contracts, at fair value | — | 21,979 | — | — | — | ||||||||||
| Total | $ | 3,531 | $ | 21,979 | $ | 38,704 | $ | 2,300 | $ | 1,494 | |||||
| Foreign | |||||||||||||||
| Equity | Credit | Currency | Interest Rate Commodity | ||||||||||||
| Derivatives not accounted for as hedging instruments | Contracts | Contracts | Contracts | Contracts | Contracts | ||||||||||
| Location: Statement of Operations - Net realized gain (loss) | |||||||||||||||
| Investments** | $ | (26,788 | ) | $ | — | $ | (2,720 | ) | $ | (2,653 | ) | $ | (137 | ) | |
| Futures contracts | 1,233 | — | 29 | (3,561 | ) | (1,535 | ) | ||||||||
| Options written | 8,067 | — | 5,572 | 1,680 | 379 | ||||||||||
| Index swap contracts | (34 | ) | — | — | — | — | |||||||||
| Interest rate swap contracts | — | — | — | (405 | ) | — | |||||||||
| Credit default swap contracts | — | 2,836 | — | — | — | ||||||||||
| Currency swap contracts | — | — | (58 | ) | — | — | |||||||||
| Foreign currency-related transactions****** | — | — | 17,521 | — | — | ||||||||||
| Total | $ | (17,522 | ) | $ | 2,836 | $ | 20,344 | $ | (4,939 | ) | $ | (1,293 | ) | ||
| Location: Statement of Operations - Net change in unrealized | |||||||||||||||
| appreciation (depreciation) | |||||||||||||||
| Investments***** | $ | (6,976 | ) | $ | — | $ | (1,345 | ) | $ | 1,702 | $ | 3 | |||
| Futures contracts | (3,780 | ) | — | 218 | 564 | 1,415 | |||||||||
| Options written | 5,106 | — | (1,550 | ) | (1,106 | ) | — | ||||||||
| Index swap contracts | 70 | — | — | — | — | ||||||||||
| Interest rate swap contracts | — | — | — | 1,319 | — | ||||||||||
| Credit default swap contracts | — | (1,091 | ) | — | — | — | |||||||||
| Foreign currency-related transactions**** | — | — | 10,253 | — | — | ||||||||||
| Total | $ | (5,580 | ) | $ | (1,091 | ) | $ | 7,576 | $ | 2,479 | $ | 1,418 | |||
| * | Fair value of purchased options. |
| ** | Includes net realized gain (loss) on purchased options as reported in the Statement of Operations. |
| *** | Includes cumulative appreciation/depreciation of futures contracts as reported in the Schedule of Investments. Only variation margin is reported within the Statement of Assets and Liabilities. |
| **** | Only includes change in unrealized gain (loss) on forward and spot contracts. May differ from the net change in unrealized gain (loss) on foreign currency-related transactions reported within the Statement of Operations. |
| ***** | Includes net unrealized gain (loss) on purchased options as reported in the Schedule of Investments. |
| ****** | Only includes net realized gain (loss) on forward and spot contracts. May differ from the net realized gain (loss) on foreign currency-related transactions reported within the Statement of Operations. |
For further disclosure on derivatives see note 2 in the Notes to Financial Statements.
See accompanying notes which are an integral part of the financial statements.
Russell Multi-Strategy Alternative Fund 653
Russell Investment Company
Russell Multi-Strategy Alternative Fund
Consolidated Balance Sheet Offsetting of Financial and Derivative Instruments —October 31, 2014
| Amounts in thousands | ||||||||
| Offsetting of Financial Assets and Derivative Assets | ||||||||
| Gross | Net Amounts | |||||||
| Amounts | of Assets | |||||||
| Gross | Offset in the | Presented in | ||||||
| Amounts of | Statement of | the Statement | ||||||
| Recognized | Assets and | of Assets and | ||||||
| Description | Location: Statement of Assets and Liabilities - Assets | Assets | Liabilities | Liabilities | ||||
| Options Purchased Contracts | Investments, at fair value | $ | 5,036 | $ — | $ 5,036 | |||
| Repurchase Agreements | Investments, at fair value | 9,477 | — | 9,477 | ||||
| Foreign Currency Exchange Contracts | Unrealized appreciation on foreign currency exchange contracts | 44,702 | — | 44,702 | ||||
| Futures Contracts | Variation margin on futures contracts | 12,487 | — | 12,487 | ||||
| Index Swap Contracts | Index swap contracts, at fair value | 68 | — | 68 | ||||
| Interest Rate Swap Contracts | Interest rate swap contracts, at fair value | 2,009 | — | 2,009 | ||||
| Credit Default Swap Contracts | Credit default swap contracts, at fair value | 16,036 | — | 16,036 | ||||
| Total | $ | 89,815 | $ — | $ 89,815 | ||||
| Financial Assets, Derivative Assets, and Collateral Held by Counterparty | ||||||||
| Gross Amounts Not Offset in | ||||||||
| the Statement of Assets and | ||||||||
| Liabilities | ||||||||
| Net Amounts | ||||||||
| of Assets | ||||||||
| Presented in | ||||||||
| the Statement | Financial and | |||||||
| of Assets and | Derivative | Collateral | ||||||
| Counterparty | Liabilities | Instruments | Received^ | Net Amount | ||||
| Bank of America | $ | 5,225 | $ | 4 | $ | 5,221 | $ | — |
| Barclays | 6,821 | 51 | 474 | 6,296 | ||||
| BNP Paribas | 965 | 5 | — | 960 | ||||
| Citigroup | 13,369 | 4,036 | 117 | 9,216 | ||||
| Credit Suisse | 7,726 | 7,591 | 82 | 53 | ||||
| Deutsche Bank | 228 | 37 | — | 191 | ||||
| ED&F Man Capital Markets | 1,751 | — | — | 1,751 | ||||
| Federal Reserve Bank of Boston | 1,972 | — | — | 1,972 | ||||
| Goldman Sachs | 5,921 | 108 | 3,864 | 1,949 | ||||
| HSBC | 19 | 3 | — | 16 | ||||
| Jefferies | 340 | — | — | 340 | ||||
| JPMorgan Chase | 35,852 | 16,050 | 7,305 | 12,497 | ||||
| Merrill Lynch | 1 | — | 1 | — | ||||
| Morgan Stanley | 1,502 | 26 | — | 1,476 | ||||
| Newedge | 325 | — | — | 325 | ||||
| Societe Generale | 472 | — | — | 472 | ||||
| State Street | 5,946 | 521 | — | 5,425 | ||||
| UBS | 1,380 | 262 | 548 | 570 | ||||
| Total | $ | 89,815 | $ | 28,694 | $ | 17,612 | $ | 43,509 |
See accompanying notes which are an integral part of the financial statements.
654 Russell Multi-Strategy Alternative Fund
Russell Investment Company
Russell Multi-Strategy Alternative Fund
Consolidated Balance Sheet Offsetting of Financial and Derivative Instruments, continued — October 31, 2014
| Amounts in thousands | ||||||||
| Offsetting of Financial Liabilities and Derivative Liabilities | ||||||||
| Gross | Net Amounts | |||||||
| Amounts | of Assets | |||||||
| Gross | Offset in the | Presented in | ||||||
| Amounts of | Statement of | the Statement | ||||||
| Recognized | Assets and | of Assets and | ||||||
| Description | Location: Statement of Assets and Liabilities - Liabilities | Liabilities | Liabilities | Liabilities | ||||
| Futures Contracts | Variation margin on futures contracts | $ | 9,223 | $ — | $ 9,223 | |||
| Foreign Currency Exchange Contracts | Unrealized depreciation on foreign currency exchange contracts | 35,039 | — | 35,039 | ||||
| Options Written Contracts | Options written, at fair value | 4,209 | — | 4,209 | ||||
| Interest Rate Swap Contracts | Interest rate swap contracts, at fair value | 926 | — | 926 | ||||
| Credit Default Swap Contracts | Credit default swap contracts, at fair value | 21,979 | — | 21,979 | ||||
| Total | $ | 71,376 | $ — | $ 71,376 | ||||
| Financial Liabilities, Derivative Liabilities, and Collateral Pledged by Counterparty | ||||||||
| Gross Amounts Not Offset in | ||||||||
| the Statement of Assets and | ||||||||
| Liabilities | ||||||||
| Net Amounts | ||||||||
| of Liabilities | ||||||||
| Presented in | ||||||||
| the Statement | Financial and | |||||||
| of Assets and | Derivative | Collateral | ||||||
| Counterparty | Liabilities | Instruments | Pledged^ | Net Amount | ||||
| Bank of America | $4 | $ 4 | $ — | $ — | ||||
| Barclays | 9,018 | 51 | 525 | 8,442 | ||||
| BNP Paribas | 1,716 | 5 | — | 1,711 | ||||
| Citigroup | 10,476 | 4,036 | 2,214 | 4,226 | ||||
| Credit Suisse | 8,144 | 7,591 | 553 | — | ||||
| Deutsche Bank | 37 | 37 | — | — | ||||
| ED&F Man Capital Markets | 1,452 | — | — | 1,452 | ||||
| Federal Reserve Bank of Boston | 2,120 | — | — | 2,120 | ||||
| Goldman Sachs | 119 | 108 | — | 11 | ||||
| HSBC | 3 | 3 | — | — | ||||
| Jefferies | 814 | — | — | 814 | ||||
| JPMorgan Chase | 34,541 | 16,050 | 18,491 | — | ||||
| Merrill Lynch | 531 | — | 531 | — | ||||
| Morgan Stanley | 106 | 26 | 80 | — | ||||
| Skandinaviska Enskilda Bank | 1,036 | — | — | 1,036 | ||||
| State Street | 997 | 521 | — | 476 | ||||
| UBS | 262 | 262 | — | — | ||||
| Total | $71,376 | $ | 28,694 | $ | 22,394 | $ | 20,288 | |
* Fair value of securities on loan as reported in the footnotes to the Statement of Assets and Liabilities.
^ Collateral received or pledged amounts may not reconcile to those disclosed in the Statement of Assets and Liabilities due to the inclusion of off-Balance Sheet collateral and adjustments made to exclude overcollateralization.
For further disclosure on derivatives and counterparty risk see note 2 in the Notes to Financial Statements.
See accompanying notes which are an integral part of the financial statements.
Russell Multi-Strategy Alternative Fund 655
| Russell Investment Company | ||
| Russell Multi-Strategy Alternative Fund | ||
| Consolidated Statement of Assets and Liabilities(†) — October 31, 2014 | ||
| Amounts in thousands | ||
| Assets | ||
| Investments, at identified cost | $ | 901,759 |
| Investments, at fair value(>) | 910,745 | |
| Cash | 696 | |
| Cash (restricted)(a)(b) | 32,005 | |
| Deposits with brokers for securities sold short | 52,904 | |
| Foreign currency holdings(^) | 15,972 | |
| Unrealized appreciation on foreign currency exchange contracts | 44,702 | |
| Receivables: | ||
| Dividends and interest | 2,473 | |
| Dividends from affiliated Russell funds | 25 | |
| Investments sold | 24,238 | |
| Fund shares sold | 1,397 | |
| Investments matured(<) | 405 | |
| Variation margin on futures contracts | 12,487 | |
| Prepaid expenses | 1 | |
| Index swap contracts, at fair value(∞) | 68 | |
| Interest rate swap contracts, at fair value(•) | 2,009 | |
| Credit default swap contracts, at fair value(+) | 16,036 | |
| Total assets | 1,116,163 | |
| Liabilities | ||
| Payables: | ||
| Due to broker (c)(d)(e) | 7,993 | |
| Deposits owed to brokers for securities sold short | 3 | |
| Investments purchased | 20,914 | |
| Fund shares redeemed | 2,029 | |
| Accrued fees to affiliates | 1,387 | |
| Other accrued expenses | 352 | |
| Variation margin on futures contracts | 9,223 | |
| Dividends for securities sold short | 77 | |
| Unfunded loan commitment | 42 | |
| Unrealized depreciation on foreign currency exchange contracts | 35,039 | |
| Options written, at fair value(x) | 4,209 | |
| Securities sold short, at fair value(‡) | 49,935 | |
| Interest rate swap contracts, at fair value(•) | 926 | |
| Credit default swap contracts, at fair value(+) | 21,979 | |
| Total liabilities | 154,108 | |
| Net Assets | $ | 962,055 |
(†) The Statement of Assets and Liabilities is consolidated and includes the balances of Russell Cayman Multi-Strategy Alternative Fund Ltd. (wholly owned subsidiary). Accordingly, all interfund balances and transactions have been eliminated. Refer to note 3 in the Notes to Financial Statements.
See accompanying notes which are an integral part of the financial statements.
656 Russell Multi-Strategy Alternative Fund
Russell Investment Company
Russell Multi-Strategy Alternative Fund
Consolidated Statement of Assets and Liabilities(†) , continued — October 31, 2014
| Amounts in thousands | |||
| Net Assets Consist of: | |||
| Undistributed (overdistributed) net investment income | $ | 16,229 | |
| Accumulated net realized gain (loss) | (35,686 | ) | |
| Unrealized appreciation (depreciation) on: | |||
| Investments | 8,986 | ||
| Futures contracts | (731 | ) | |
| Options written | (1,693 | ) | |
| Index swap contracts | 68 | ||
| Interest rate swap contracts | 987 | ||
| Credit default swap contracts | (810 | ) | |
| Securities sold short | 1,601 | ||
| Investments matured | 28 | ||
| Foreign currency-related transactions | 9,035 | ||
| Shares of beneficial interest | 962 | ||
| Additional paid-in capital | 963,079 | ||
| Net Assets | $ | 962,055 | |
| Net Asset Value, offering and redemption price per share: | |||
| Net asset value per share: Class A(#) | $ | 9.97 | |
| Maximum offering price per share (Net asset value plus sales charge of 5.75%): Class A | $ | 10.58 | |
| Class A — Net assets | $ | 2,849,455 | |
| Class A — Shares outstanding ($.01 par value) | 285,875 | ||
| Net asset value per share: Class C(#) | $ | 9.84 | |
| Class C — Net assets | $ | 7,781,604 | |
| Class C — Shares outstanding ($.01 par value) | 791,132 | ||
| Net asset value per share: Class E(#) | $ | 9.96 | |
| Class E — Net assets | $ | 16,195,606 | |
| Class E — Shares outstanding ($.01 par value) | 1,626,308 | ||
| Net asset value per share: Class S(#) | $ | 9.99 | |
| Class S — Net assets | $ | 634,610,356 | |
| Class S — Shares outstanding ($.01 par value) | 63,517,798 | ||
| Net asset value per share: Class Y(#) | $ | 10.02 | |
| Class Y — Net assets | $ | 300,617,837 | |
| Class Y — Shares outstanding ($.01 par value) | 30,002,100 | ||
| Amounts in thousands | |||
| (^) Foreign currency holdings - cost | $ | 16,224 | |
| (x) Premiums received on options written | $ | 2,516 | |
| (+) Credit default swap contracts - premiums paid (received) | $ | (5,133 | ) |
| (•) Interest rate swap contracts - premiums paid (received) | $ | 96 | |
| (<) Investments matured - cost | $ | 733 | |
| (‡) Proceeds on securities sold short | $ | 51,536 | |
| (>) Investments in affiliates, Russell U.S. Cash Management Fund | $ | 290,554 | |
| (∞) Index swap contracts - premiums paid (received) | $ | — | |
| (a) Cash Collateral for Futures | $ | 7,760 | |
| (b) Cash Collateral for Swaps | $ | 24,245 | |
| (c) Due to Broker for Futures | $ | 3,078 | |
| (d) Due to Broker for Swaps | $ | 738 | |
| (e) Due to Broker for Options | $ | 4,177 |
| (#) | Net asset value per share equals class level net assets divided by class level shares of beneficial interest outstanding. |
| (†) | The Statement of Assets and Liabilities is consolidated and includes the balances of Russell Cayman Multi-Strategy Alternative Fund Ltd. (wholly owned |
subsidiary). Accordingly, all interfund balances and transactions have been eliminated. Refer to note 3 in the Notes to Financial Statements.
See accompanying notes which are an integral part of the financial statements.
Russell Multi-Strategy Alternative Fund 657
Russell Investment Company
Russell Multi-Strategy Alternative Fund
Consolidated Statement of Operations(†) — For the Period Ended October 31, 2014
| Amounts in thousands | |||
| Investment Income | |||
| Dividends | $ | 7,270 | |
| Dividends from affiliated Russell funds | 291 | ||
| Interest | 10,430 | ||
| Total investment income | 17,991 | ||
| Expenses | |||
| Advisory fees | 15,088 | ||
| Administrative fees | 480 | ||
| Custodian fees | 1,114 | ||
| Distribution fees - Class A | 8 | ||
| Distribution fees - Class C | 64 | ||
| Transfer agent fees - Class A | 6 | ||
| Transfer agent fees - Class C | 17 | ||
| Transfer agent fees - Class E | 34 | ||
| Transfer agent fees - Class S | 1,255 | ||
| Transfer agent fees - Class Y | 14 | ||
| Professional fees | 188 | ||
| Registration fees | 57 | ||
| Shareholder servicing fees - Class C | 21 | ||
| Shareholder servicing fees - Class E | 42 | ||
| Trustees’ fees | 22 | ||
| Printing fees | 146 | ||
| Dividends from securities sold short | 124 | ||
| Interest expense paid on securities sold short | 676 | ||
| Miscellaneous | 120 | ||
| Expenses before reductions | 19,476 | ||
| Expense reductions | (516 | ) | |
| Net expenses | 18,960 | ||
| Net investment income (loss) | (969 | ) | |
| Net Realized and Unrealized Gain (Loss) | |||
| Net realized gain (loss) on: | |||
| Investments | (22,774 | ) | |
| Futures contracts | (3,834 | ) | |
| Options written | 15,698 | ||
| Index swap contracts | (34 | ) | |
| Interest rate swap contracts | (405 | ) | |
| Credit default swap contracts | 2,836 | ||
| Currency swap contracts | (58 | ) | |
| Securities sold short | (553 | ) | |
| Foreign currency-related transactions | 13,805 | ||
| Net realized gain (loss) | 4,681 | ||
| Net change in unrealized appreciation (depreciation) on: | |||
| Investments | (25,353 | ) | |
| Futures contracts | (1,583 | ) | |
| Options written | 2,450 | ||
| Index swap contracts | 70 | ||
| Interest rate swap contracts | 1,319 | ||
| Credit default swap contracts | (1,091 | ) | |
| Securities sold short | 1,784 | ||
| Investment matured | (14 | ) | |
| Foreign currency-related transactions | 9,811 | ||
| See accompanying notes which are an integral part of the financial statements. | |||
| 658 Russell Multi-Strategy Alternative Fund | |||
Russell Investment Company
Russell Multi-Strategy Alternative Fund
Consolidated Statement of Operations(†) — For the Period Ended October 31, 2014
| Amounts in thousands | |||
| Net change in unrealized appreciation (depreciation) | (12,607 | ) | |
| Net realized and unrealized gain (loss) | (7,926 | ) | |
| Net Increase (Decrease) in Net Assets from Operations | $ | (8,895 | ) |
| (†) The Statement of Operations is consolidated and includes the balances of Russell Cayman Multi-Strategy Alternative Fund Ltd. (wholly owned | |||
| subsidiary). Accordingly, all interfund balances and transactions have been eliminated. Refer to note 3 in the Notes to Financial Statements. | |||
See accompanying notes which are an integral part of the financial statements.
Russell Multi-Strategy Alternative Fund 659
| Russell Investment Company | ||||||
| Russell Multi-Strategy Alternative Fund | ||||||
| Consolidated Statements of Changes in Net Assets(†) | ||||||
| For the Periods Ended October 31, | ||||||
| Amounts in thousands | 2014 | 2013 | ||||
| Increase (Decrease) in Net Assets | ||||||
| Operations | ||||||
| Net investment income (loss) | $ | (969 | ) | $ | (2,695 | ) |
| Net realized gain (loss) | 4,681 | (11,857 | ) | |||
| Net change in unrealized appreciation (depreciation) | (12,607 | ) | 31,213 | |||
| Net increase (decrease) in net assets from operations | (8,895 | ) | 16,661 | |||
| Distributions | ||||||
| From net investment income | ||||||
| Class A | (8 | ) | — | |||
| Class C | (—)** | — | ||||
| Class E | (58 | ) | — | |||
| Class S | (3,305 | ) | — | |||
| Class Y | (2,375 | ) | — | |||
| From net realized gain | ||||||
| Class A | (12 | ) | — | |||
| Class C | (38 | ) | — | |||
| Class E | (76 | ) | — | |||
| Class S | (2,568 | ) | — | |||
| Class Y | (1,412 | ) | — | |||
| Net decrease in net assets from distributions | (9,852 | ) | — | |||
| Share Transactions* | ||||||
| Net increase (decrease) in net assets from share transactions | 67,260 | 161,509 | ||||
| Total Net Increase (Decrease) in Net Assets | 48,513 | 178,170 | ||||
| Net Assets | ||||||
| Beginning of period | 913,542 | 735,372 | ||||
| End of period | $ | 962,055 | $ | 913,542 | ||
| Undistributed (overdistributed) net investment income included in net assets | $ | 16,229 | $ | 2,978 | ||
| ** | Less than $500. |
| (†) | The Statements of Changes in Net Assets is consolidated and includes the balances of Russell Cayman Multi-Strategy Alternative Fund Ltd. (wholly owned |
subsidiary). Accordingly, all interfund balances and transactions have been eliminated. Refer to note 3 in the Notes to Financial Statements.
See accompanying notes which are an integral part of the financial statements.
660 Russell Multi-Strategy Alternative Fund
Russell Investment Company
Russell Multi-Strategy Alternative Fund
Statements of Changes in Net Assets, continued
* Share transaction amounts (in thousands) for the periods ended October 31, 2014 and October 31, 2013 were as follows:
| 2014 | 2013 | |||||||||||
| Shares | Dollars | Shares | Dollars | |||||||||
| Class A | ||||||||||||
| Proceeds from shares sold | 142 | $ | 1,445 | 378 | $ | 3,840 | ||||||
| Proceeds from reinvestment of distributions | 2 | 20 | — | — | ||||||||
| Payments for shares redeemed | (148 | ) | (1,503 | ) | (116 | ) | (1,174 | ) | ||||
| Net increase (decrease) | (4 | ) | (38 | ) | 262 | 2,666 | ||||||
| Class C | ||||||||||||
| Proceeds from shares sold | 554 | 5,626 | 565 | 5,728 | ||||||||
| Proceeds from reinvestment of distributions | 4 | 38 | — | — | ||||||||
| Payments for shares redeemed | (403 | ) | (4,053 | ) | (81 | ) | (822 | ) | ||||
| Net increase (decrease) | 155 | 1,611 | 484 | 4,906 | ||||||||
| Class E | ||||||||||||
| Proceeds from shares sold | 341 | 3,458 | 538 | 5,475 | ||||||||
| Proceeds from reinvestment of distributions | 13 | 133 | — | — | ||||||||
| Payments for shares redeemed | (397 | ) | (4,019 | ) | (216 | ) | (2,197 | ) | ||||
| Net increase (decrease) | (43 | ) | (428 | ) | 322 | 3,278 | ||||||
| Class S | ||||||||||||
| Proceeds from shares sold | 21,148 | 215,387 | 23,582 | 240,463 | ||||||||
| Proceeds from reinvestment of distributions | 569 | 5,844 | — | — | ||||||||
| Payments for shares redeemed | (13,843 | ) | (140,361 | ) | (8,486 | ) | (86,477 | ) | ||||
| Net increase (decrease) | 7,874 | 80,870 | 15,096 | 153,986 | ||||||||
| Class Y | ||||||||||||
| Proceeds from shares sold | 836 | 8,524 | 1,706 | 17,397 | ||||||||
| Proceeds from reinvestment of distributions | 369 | 3,788 | — | — | ||||||||
| Payments for shares redeemed | (2,658 | ) | (27,067 | ) | (2,039 | ) | (20,724 | ) | ||||
| Net increase (decrease) | (1,453 | ) | (14,755 | ) | (333 | ) | (3,327 | ) | ||||
| Total increase (decrease) | 6,529 | $ | 67,260 | 15,831 | $ | 161,509 | ||||||
See accompanying notes which are an integral part of the financial statements.
Russell Multi-Strategy Alternative Fund 661
| Russell Investment Company | |||||||||||||||||
| Russell Multi-Strategy Alternative Fund | |||||||||||||||||
| Consolidated Financial Highlights — For the Periods Ended | |||||||||||||||||
| For a Share Outstanding Throughout Each Period. | |||||||||||||||||
| $ | $ | $ | $ | $ | $ | ||||||||||||
| Net Asset Value, | Net | Net Realized | Total from | Distributions | Distributions | ||||||||||||
| Beginning of | Investment | and Unrealized | Investment | from Net | from Net | ||||||||||||
| Period | Income (Loss)(a)(d) | Gain (Loss) | Operations | Investment Income | Realized Gain | ||||||||||||
| Class A | |||||||||||||||||
| October 31, 2014 | 10.15 | (.04 | ) | (.06 | ) | (.10 | ) | (.03 | ) | (.05 | ) | ||||||
| October 31, 2013 | 9.95 | (.06 | ) | .26 | .20 | — | — | ||||||||||
| October 31, 2012(5) | 10.00 | (.01 | ) | (.04 | ) | (.05 | ) | — | — | ||||||||
| Class C | |||||||||||||||||
| October 31, 2014 | 10.07 | (.11 | ) | (.07 | ) | (.18 | ) | —(f) | (.05 | ) | |||||||
| October 31, 2013 | 9.94 | (.13 | ) | .26 | .13 | — | — | ||||||||||
| October 31, 2012(5) | 10.00 | (.03 | ) | (.03 | ) | (.06 | ) | — | — | ||||||||
| Class E | |||||||||||||||||
| October 31, 2014 | 10.15 | (.04 | ) | (.07 | ) | (.11 | ) | (.03 | ) | (.05 | ) | ||||||
| October 31, 2013 | 9.95 | (.06 | ) | .26 | .20 | — | — | ||||||||||
| October 31, 2012(5) | 10.00 | (.01 | ) | (.04 | ) | (.05 | ) | — | — | ||||||||
| Class S | |||||||||||||||||
| October 31, 2014 | 10.18 | (.02 | ) | (.06 | ) | (.08 | ) | (.06 | ) | (.05 | ) | ||||||
| October 31, 2013 | 9.95 | (.04 | ) | .27 | .23 | — | — | ||||||||||
| October 31, 2012(5) | 10.00 | —(f) | (.05 | ) | (.05 | ) | — | — | |||||||||
| Class Y | |||||||||||||||||
| October 31, 2014 | 10.20 | —(f) | (.05 | ) | (.05 | ) | (.08 | ) | (.05 | ) | |||||||
| October 31, 2013 | 9.96 | (.02 | ) | .26 | .24 | — | — | ||||||||||
| October 31, 2012(5) | 10.00 | —(f) | (.04 | ) | (.04 | ) | — | — | |||||||||
See accompanying notes which are an integral part of the financial statements.
662 Russell Multi-Strategy Alternative Fund
| % | % | % | ||||||||||||||||
| $ | $ | Ratio of Expenses | Ratio of Expenses | Ratio of Net | ||||||||||||||
| Net Asset Value, | % | Net Assets, | to Average | to Average | Investment Income | % | ||||||||||||
| $ | End of | Total | End of Period | Net Assets, | Net Assets, | to Average | Portfolio | |||||||||||
| Total Distributions | Period | Return(b)(c) | (000) | Gross(e) | Net(d)(e)(g) | Net Assets(d)(e) | Turnover Rate(b) | |||||||||||
| (.08 | ) | 9.97 | (1.05 | ) | 2,850 | 2.31 | 2.25 | (.39 | ) | 478 | ||||||||
| — | 10.15 | 2.01 | 2,946 | 2.47 | 2.39 | (.59 | ) | 316 | ||||||||||
| — | 9.95 | (.50 | ) | 279 | 2.47 | 2.39 | (.42 | ) | 97 | |||||||||
| (.05 | ) | 9.84 | (1.85 | ) | 7,782 | 3.06 | 3.00 | (1.12 | ) | 478 | ||||||||
| — | 10.07 | 1.27 | 6,400 | 3.21 | 3.14 | (1.33 | ) | 316 | ||||||||||
| — | 9.94 | (.60 | ) | 1,505 | 3.20 | 3.12 | (1.51 | ) | 97 | |||||||||
| (.08 | ) | 9.96 | (1.11 | ) | 16,195 | 2.30 | 2.25 | (.40 | ) | 478 | ||||||||
| — | 10.15 | 1.97 | 16,936 | 2.47 | 2.39 | (.63 | ) | 316 | ||||||||||
| — | 9.95 | (.50 | ) | 13,401 | 2.52 | 2.43 | (.62 | ) | 97 | |||||||||
| (.11 | ) | 9.99 | (.88 | ) | 634,610 | 2.05 | 2.00 | (.15 | ) | 478 | ||||||||
| — | 10.18 | 2.27 | 566,322 | 2.22 | 2.14 | (.38 | ) | 316 | ||||||||||
| — | 9.95 | (.50 | ) | 403,576 | 2.23 | 2.15 | (.18 | ) | 97 | |||||||||
| (.13 | ) | 10.02 | (.60 | ) | 300,618 | 1.85 | 1.80 | .05 | 478 | |||||||||
| — | 10.20 | 2.41 | 320,938 | 2.02 | 1.94 | (.20 | ) | 316 | ||||||||||
| — | 9.96 | (.40 | ) | 316,611 | 2.03 | 1.96 | .14 | 97 | ||||||||||
See accompanying notes which are an integral part of the financial statements.
Russell Multi-Strategy Alternative Fund 663
Russell Investment Company
Russell Strategic Call Overwriting Fund
Portfolio Management Discussion and Analysis — October 31, 2014 (Unaudited)
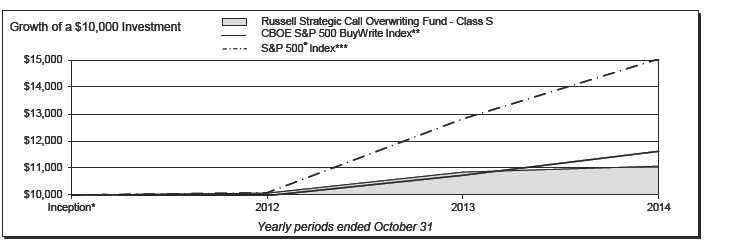
| Russell Strategic Call Overwriting Fund - Class S | S&P 500® Index*** | ||||||
| Total | Total | ||||||
| Return | Return | ||||||
| 1 Year | 2.03 | % | 1 Year | 17.27 | % | ||
| Inception* | 4.69 | %§ | Inception* | 20.27 | %§ | ||
| CBOE S&P 500 BuyWrite Index** | |||||||
| Total | |||||||
| Return | |||||||
| 1 Year | 8.27 | % | |||||
| Inception* | 7.02 | %§ | |||||
664 Russell Strategic Call Overwriting Fund
Russell Investment Company
Russell Strategic Call Overwriting Fund
Portfolio Management Discussion and Analysis, continued — October 31, 2014 (Unaudited)
| profile through a more diversified option tenor selection relative | ||
| What is the Fund’s investment objective? | to the benchmark and is designed to adapt to market and volatility | |
| moves relative to a static, monthly option buy write approach. | ||
| The Russell Strategic Call Overwriting Fund (the “Fund”) seeks to | Because of this, the Fund takes directional views based on | |
| provide total return with lower volatility than U.S. equity markets. | momentum and statistically overbought or oversold conditions. | |
| How did the Fund perform relative to its benchmark for the | The Fund does so by utilizing weekly, bi-weekly and monthly | |
| fiscal year ended October 31, 2014? | options that are slightly in-the-money to slightly out-of-the- | |
| For the fiscal year ended October 31, 2014, the Fund’s Class S | money. | |
| Shares gained 2.03%. This is compared to the Fund’s benchmark, | Since the Fund seeks a smoother overwriting profile through | |
| the CBOE S&P 500® BuyWrite Index, which gained 8.27% | overlapping and diversified option tenors, the Fund took | |
| during the same period. The Fund’s performance includes | recurring defensive positions and, as a result, underperformed | |
| operating expenses, whereas index returns are unmanaged and | its benchmark during the fiscal year. The Fund’s quantitative | |
| do not include expenses of any kind. | models indicated defensive positions, however these indications | |
| For the fiscal year ended October 31, 2014, the Morningstar® | were short lived as subsequent market rallies were swift which | |
| Large Blend, a group of funds that Morningstar considers to | is historically out of the ordinary. The Fund saw its upside | |
| have investment strategies similar to those of the Fund, gained | performance potential capped during the strong market upswings, | |
| 14.34%. This result serves as a peer comparison and is expressed | particularly in February. | |
| net of operating expenses. | Describe any changes to the Fund’s structure or money | |
| How did the market conditions described in the Market | manager line-up. | |
| Summary report affect the Fund’s performance? | There were no changes to the Fund’s structure during the fiscal | |
| Fund performance was negatively impacted by the low levels of | year. | |
| premiums (cash) received from the S&P 500® option overlay for | The views expressed in this report reflect those of the portfolio | |
| most of the fiscal year period. This is a result of the historically | managers only through the end of the period covered by | |
| low levels of implied volatility (the volatility of an underlying | the report. These views do not necessarily represent the | |
| instrument implied by an options’ price) as measured by the | views of RIMCo, or any other person in RIMCo or any other | |
| CBOE Volatility Index (“VIX”). The VIX averaged 13.95% | affiliated organization. These views are subject to change | |
| during the fiscal year. | at any time based upon market conditions or other events, | |
| How did the investment strategies and techniques employed | and RIMCo disclaims any responsibility to update the views | |
| by the Fund and its money managers affect its benchmark- | contained herein. These views should not be relied on as | |
| relative performance? | investment advice and, because investment decisions for | |
| The Fund seeks to be less time and path dependant relative to the | a Russell Investment Company (“RIC”) Fund are based on | |
| buy write approach of the Fund’s benchmark, which only trades | numerous factors, should not be relied on as an indication | |
| options once per month. The Fund seeks a smoother overwriting | of investment decisions of any RIC Fund. | |
| * | Assumes initial investment on August 15, 2012. | |
| ** | CBOE S&P 500 BuyWrite Index is a passive total return index based on (1) buying an S&P® stock index portfolio, and (2) “writing” (or selling) the near-term | |
| S&P 500 Index “covered” call option, generally on the third Friday of each month. The SPX call written will have about one month remaining to expiration, with | ||
| an exercise price just above the prevailing index level (i.e., slightly out of the money). The SPX call is held until expiration and cash settled, at which time a new | ||
| one-month, near-the-money call is written. | ||
| *** | The Standard & Poor’s 500® Index is composed of 500 common stocks which are chosen by Standard & Poor’s Corporation to best capture the price | |
| performance of a large cross-section of the U.S. publicly traded stock market. The index is structured to approximate the general distribution of industries in the | ||
| U.S. economy. | ||
| § | Annualized. | |
| Performance is historical and assumes reinvestment of all dividends and capital gains. Investment return and principal value will fluctuate so that an investor’s | ||
| shares, when redeemed, may be worth more or less than when purchased. Past performance is not indicative of future results. The returns shown do not reflect the | ||
| deduction of taxes that a shareholder would pay on Fund distributions or the redemption of Fund shares. | ||
| Russell Strategic Call Overwriting Fund 665 | ||
Russell Investment Company
Russell Strategic Call Overwriting Fund
Shareholder Expense Example — October 31, 2014 (Unaudited)
| Fund Expenses | Please note that the expenses shown in the table are meant | |||||
| The following disclosure provides important information | to highlight your ongoing costs only and do not reflect any | |||||
| regarding the Fund’s Shareholder Expense Example | transactional costs. Therefore, the information under the heading | |||||
| (“Example”). | “Hypothetical Performance (5% return before expenses)” is | |||||
| useful in comparing ongoing costs only, and will not help you | ||||||
| Example | determine the relative total costs of owning different funds. In | |||||
| As a shareholder of the Fund, you incur two types of costs: (1) | addition, if these transactional costs were included, your costs | |||||
| transaction costs, and (2) ongoing costs, including advisory and | would have been higher. | |||||
| administrative fees; and other Fund expenses. The Example is | Hypothetical | |||||
| intended to help you understand your ongoing costs (in dollars) | Performance (5% | |||||
| of investing in the Fund and to compare these costs with the | Actual | return before | ||||
| ongoing costs of investing in other mutual funds. The Example | Class S | Performance | expenses) | |||
| Beginning Account Value | ||||||
| is based on an investment of $1,000 invested at the beginning of | May 1, 2014 | $ | 1,000.00 | $ | 1,000.00 | |
| the period and held for the entire period indicated, which for this | Ending Account Value | |||||
| Fund is from May 1, 2014 to October 31, 2014. | October 31, 2014 | $ | 997.90 | $ | 1,020.32 | |
| Expenses Paid During Period* | $ | 4.88 | $ | 4.94 | ||
| Actual Expenses | ||||||
| The information in the table under the heading “Actual | * Expenses are equal to the Fund's annualized expense ratio of 0.97% | |||||
| (representing the six month period annualized), multiplied by the average | ||||||
| Performance” provides information about actual account values | account value over the period, multiplied by 184/365 (to reflect the one-half | |||||
| and actual expenses. You may use the information in this column, | year period). May reflect amounts waived and/or reimbursed. Without any | |||||
| together with the amount you invested, to estimate the expenses | waivers and/or reimbursements, expenses would have been higher. | |||||
| that you paid over the period. Simply divide your account value by | ||||||
| $1,000 (for example, an $8,600 account value divided by $1,000 | ||||||
| = 8.6), then multiply the result by the number in the first column | ||||||
| in the row entitled “Expenses Paid During Period” to estimate | ||||||
| the expenses you paid on your account during this period. | ||||||
| Hypothetical Example for Comparison Purposes | ||||||
| The information in the table under the heading “Hypothetical | ||||||
| Performance (5% return before expenses)” provides information | ||||||
| about hypothetical account values and hypothetical expenses | ||||||
| based on the Fund’s actual expense ratio and an assumed rate of | ||||||
| return of 5% per year before expenses, which is not the Fund’s | ||||||
| actual return. The hypothetical account values and expenses | ||||||
| may not be used to estimate the actual ending account balance or | ||||||
| expenses you paid for the period. You may use this information | ||||||
| to compare the ongoing costs of investing in the Fund and other | ||||||
| funds. To do so, compare this 5% hypothetical example with the | ||||||
| 5% hypothetical examples that appear in the shareholder reports | ||||||
| of other funds. | ||||||
| 666 Russell Strategic Call Overwriting Fund | ||||||
| Russell Investment Company | ||||||||
| Russell Strategic Call Overwriting Fund | ||||||||
| Schedule of Investments — October 31, 2014 | ||||||||
| Amounts in thousands (except share amounts) | Amounts in thousands (except share amounts) | |||||||
| Principal | Fair | Principal | Fair | |||||
| Amount ($) or | Value | Amount ($) or | Value | |||||
| Shares | $ | Shares | $ | |||||
| Common Stocks - 88.5% | Nike, Inc. Class B | 4,257 | 396 | |||||
| Consumer Discretionary - 11.7% | Nu Skin Enterprises, Inc. Class A | 284 | 15 | |||||
| Abercrombie & Fitch Co. Class A | 705 | 24 | Pandora Media, Inc.(Æ) | 1,810 | 35 | |||
| Advance Auto Parts, Inc. | 242 | 36 | PulteGroup, Inc. | 2,943 | 56 | |||
| Amazon.com, Inc.(Æ)(ì) | 2,052 | 627 | PVH Corp. | 797 | 91 | |||
| AMC Networks, Inc. Class A(Æ) | 208 | 13 | Regal Entertainment Group Class A | 1,672 | 37 | |||
| Ascena Retail Group, Inc.(Æ) | 3,338 | 42 | Sally Beauty Holdings, Inc.(Æ) | 375 | 11 | |||
| AutoNation, Inc.(Æ) | 793 | 45 | Scripps Networks Interactive, Inc. Class A | 597 | 46 | |||
| Bally Technologies, Inc.(Æ) | 834 | 67 | SeaWorld Entertainment, Inc. | 715 | 14 | |||
| Best Buy Co., Inc. | 2,196 | 75 | Starbucks Corp. | 3,726 | 282 | |||
| Cablevision Systems Corp. Class A | 2,094 | 39 | Taylor Morrison Home Corp. Class A(Æ) | 957 | 16 | |||
| CarMax, Inc.(Æ) | 2,143 | 120 | Tempur Sealy International, Inc.(Æ) | 219 | 11 | |||
| Charter Communications, Inc. Class A(Æ) | 238 | 38 | Tesla Motors, Inc.(Æ) | 344 | 83 | |||
| Chico's FAS, Inc. | 1,305 | 20 | Tiffany & Co. | 1,156 | 111 | |||
| Choice Hotels International, Inc. | 141 | 8 | Time Warner, Inc. | 4,934 | 392 | |||
| Cinemark Holdings, Inc. | 781 | 28 | TJX Cos., Inc. | 4,732 | 300 | |||
| Clear Channel Outdoor Holdings, Inc. Class | TripAdvisor, Inc.(Æ) | 769 | 68 | |||||
| A | 2,880 | 21 | Urban Outfitters, Inc.(Æ) | 1,573 | 48 | |||
| Comcast Corp. Class A(Æ)(ì) | 14,746 | 816 | Visteon Corp.(Æ) | 226 | 21 | |||
| Costco Wholesale Corp. | 2,784 | 371 | Wal-Mart Stores, Inc.(ì) | 8,670 | 661 | |||
| Deckers Outdoor Corp.(Æ) | 368 | 32 | Walt Disney Co. (The)(ì) | 9,323 | 852 | |||
| DIRECTV(Æ) | 3,658 | 317 | Whirlpool Corp. | 556 | 96 | |||
| Dollar General Corp.(Æ) | 2,083 | 131 | Wyndham Worldwide Corp. | 1,531 | 119 | |||
| DR Horton, Inc. | 2,712 | 62 | 10,150 | |||||
| DreamWorks Animation SKG, Inc. Class | ||||||||
| A(Æ) | 725 | 16 | Consumer Staples - 7.3% | |||||
| DSW, Inc. Class A | 958 | 28 | Altria Group, Inc. | 14,066 | 680 | |||
| Dunkin' Brands Group, Inc. | 958 | 44 | Bunge, Ltd. | 647 | 57 | |||
| eBay, Inc.(Æ) | 5,552 | 291 | Campbell Soup Co. | 2,795 | 124 | |||
| Expedia, Inc. | 692 | 59 | Coca-Cola Co. (The)(ì) | 10,630 | 445 | |||
| Ford Motor Co. | 21,357 | 301 | Colgate-Palmolive Co. | 5,464 | 365 | |||
| Fortune Brands Home & Security, Inc. | 621 | 27 | Constellation Brands, Inc. Class A(Æ) | 597 | 55 | |||
| Fossil Group, Inc.(Æ) | 397 | 40 | CVS Health Corp. | 6,712 | 576 | |||
| GameStop Corp. Class A | 1,714 | 73 | GNC Holdings, Inc. Class A | 545 | 23 | |||
| Gannett Co., Inc. | 1,865 | 59 | Herbalife, Ltd. | 359 | 19 | |||
| Gentex Corp. | 1,627 | 53 | Hormel Foods Corp. | 2,326 | 125 | |||
| Goodyear Tire & Rubber Co. (The) | 2,724 | 66 | Keurig Green Mountain, Inc. | 526 | 80 | |||
| Graham Holdings Co. Class B | 55 | 43 | Kimberly-Clark Corp. | 2,584 | 295 | |||
| H&R Block, Inc. | 2,631 | 85 | Kraft Foods Group, Inc.(Æ) | 3,305 | 186 | |||
| Harman International Industries, Inc. | 482 | 52 | Molson Coors Brewing Co. Class B | 1,487 | 111 | |||
| Hasbro, Inc. | 1,340 | 77 | Mondelez International, Inc. Class A | 9,898 | 349 | |||
| Home Depot, Inc.(ì) | 8,950 | 873 | PepsiCo, Inc.(ì) | 9,278 | 892 | |||
| Hyatt Hotels Corp. Class A(Æ) | 488 | 29 | Philip Morris International, Inc.(ì) | 4,891 | 435 | |||
| International Game Technology | 2,651 | 43 | Procter & Gamble Co. (The)(ì) | 13,742 | 1,199 | |||
| Interpublic Group of Cos., Inc. (The) | 1,780 | 34 | Safeway, Inc. | 2,324 | 81 | |||
| JC Penney Co., Inc.(Æ) | 10,549 | 80 | Tyson Foods, Inc. Class A | 2,568 | 104 | |||
| Lamar Advertising Co. Class A | 451 | 23 | Walgreen Co. | 1,585 | 102 | |||
| Lear Corp. | 1,030 | 95 | 6,303 | |||||
| Leggett & Platt, Inc. | 680 | 27 | ||||||
| Lennar Corp. Class A | 954 | 41 | Energy - 8.3% | |||||
| Liberty Media Corp. - Interactive(Æ) | 1,594 | 42 | Anadarko Petroleum Corp. | 3,508 | 322 | |||
| Liberty Ventures Class A(Æ) | 226 | 8 | Apache Corp. | 2,959 | 228 | |||
| Madison Square Garden Co. (The) Class A(Æ) | 323 | 24 | Cheniere Energy, Inc.(Æ) | 1,236 | 93 | |||
| McDonald's Corp. | 5,682 | 533 | Chevron Corp.(ì) | 9,365 | 1,123 | |||
| Michael Kors Holdings, Ltd.(Æ) | 852 | 67 | Cobalt International Energy, Inc.(Æ) | 440 | 5 | |||
| Netflix, Inc.(Æ) | 367 | 144 | ConocoPhillips | 8,741 | 631 | |||
| Newell Rubbermaid, Inc. | 1,515 | 50 | CONSOL Energy, Inc. | 4,549 | 167 | |||
| News Corp. Class A(Æ) | 1,262 | 20 | Denbury Resources, Inc. | 5,120 | 64 | |||
| Nielsen NV | 237 | 10 | EQT Corp. | 2,257 | 212 | |||
| See accompanying notes which are an integral part of the financial statements. | ||||||||
| Russell Strategic Call Overwriting Fund 667 | ||||||||
| Russell Investment Company | |
| Russell Strategic Call Overwriting Fund | |
| Schedule of Investments, continued — October 31, 2014 | |
| Amounts in thousands (except share amounts) | Amounts in thousands (except share amounts) |
| Principal | Fair | Principal | Fair | ||||
| Amount ($) or | Value | Amount ($) or | Value | ||||
| Shares | $ | Shares | $ | ||||
| Exxon Mobil Corp.(ì) | 21,225 | 2,053 | Leucadia National Corp. | 2,584 | 61 | ||
| First Solar, Inc.(Æ) | 501 | 30 | Lincoln National Corp. | 2,048 | 112 | ||
| Halliburton Co. | 7,112 | 392 | Macerich Co. (The)(ö) | 665 | 47 | ||
| Helmerich & Payne, Inc. | 1,227 | 107 | MasterCard, Inc. Class A | 6,458 | 541 | ||
| HollyFrontier Corp. | 948 | 43 | MBIA, Inc.(Æ) | 504 | 5 | ||
| Kosmos Energy, Ltd.(Æ) | 1,026 | 10 | MetLife, Inc. | 6,203 | 336 | ||
| Nabors Industries, Ltd. | 4,749 | 85 | NASDAQ OMX Group, Inc. (The) | 2,333 | 101 | ||
| Noble Corp. PLC | 1,228 | 26 | Old Republic International Corp. | 1,160 | 17 | ||
| Occidental Petroleum Corp. | 4,488 | 399 | People's United Financial, Inc. | 6,651 | 97 | ||
| Paragon Offshore PLC(Æ) | 409 | 2 | Public Storage(ö) | 857 | 158 | ||
| Peabody Energy Corp. | 473 | 5 | Raymond James Financial, Inc. | 1,908 | 107 | ||
| QEP Resources, Inc. | 1,612 | 40 | Realty Income Corp.(ö) | 772 | 36 | ||
| Rowan Companies PLC(Æ) | 1,570 | 38 | RenaissanceRe Holdings, Ltd. | 1,137 | 117 | ||
| Schlumberger, Ltd.(ì) | 8,132 | 802 | SEI Investments Co. | 2,715 | 105 | ||
| SM Energy Co. | 785 | 44 | Simon Property Group, Inc.(ö) | 2,224 | 399 | ||
| Superior Energy Services, Inc. | 1,913 | 48 | SL Green Realty Corp.(ö) | 803 | 93 | ||
| Tesoro Corp. | 1,113 | 79 | StanCorp Financial Group, Inc. | 824 | 57 | ||
| Ultra Petroleum Corp.(Æ) | 832 | 19 | Synovus Financial Corp. | 1,170 | 30 | ||
| Whiting Petroleum Corp.(Æ) | 1,117 | 68 | TD Ameritrade Holding Corp. | 4,432 | 150 | ||
| WPX Energy, Inc.(Æ) | 2,077 | 40 | Torchmark Corp. | 2,565 | 136 | ||
| 7,175 | Total System Services, Inc. | 2,598 | 88 | ||||
| Twenty-First Century Fox, Inc.(Æ) | 10,120 | 349 | |||||
| Financial Services - 16.6% | Unum Group | 5,074 | 170 | ||||
| Affiliated Managers Group, Inc.(Æ) | 867 | 173 | US Bancorp | 9,816 | 418 | ||
| Alliance Data Systems Corp.(Æ) | 375 | 106 | Visa, Inc. Class A | 3,025 | 730 | ||
| American Express Co.(ì) | 6,880 | 619 | Waddell & Reed Financial, Inc. Class A | 2,936 | 140 | ||
| American International Group, Inc. | 8,619 | 462 | Washington Prime Group, Inc.(ö) | 1,284 | 23 | ||
| American Tower Corp. Class A(ö) | 1,011 | 99 | Weingarten Realty Investors(ö) | 1,406 | 51 | ||
| Apartment Investment & Management Co. | Wells Fargo & Co.(ì) | 25,452 | 1,351 | ||||
| Class A(ö) | 2,311 | 83 | Weyerhaeuser Co.(ö) | 3,853 | 130 | ||
| Assurant, Inc. | 1,255 | 86 | WR Berkley Corp. | 1,829 | 94 | ||
| Bank of America Corp.(ì) | 47,474 | 815 | XL Group PLC Class A | 3,586 | 121 | ||
| BankUnited, Inc. | 3,208 | 96 | Zions Bancorporation | 4,152 | 120 | ||
| Berkshire Hathaway, Inc. Class B(Æ)(ì) | 9,794 | 1,373 | 14,427 | ||||
| CBRE Group, Inc. Class A(Æ) | 2,909 | 93 | |||||
| Chimera Investment Corp.(ö) | 2,226 | 7 | Health Care - 12.5% | ||||
| Cincinnati Financial Corp. | 3,366 | 170 | Abbott Laboratories(ì) | 7,702 | 336 | ||
| Citigroup, Inc.(ì) | 12,560 | 672 | AbbVie, Inc.(ì) | 7,637 | 485 | ||
| Comerica, Inc. | 912 | 44 | Actavis PLC(Æ) | 174 | 42 | ||
| Crown Castle International Corp.(ö) | 1,126 | 88 | Aetna, Inc. | 1,106 | 91 | ||
| DDR Corp.(ö) | 3,346 | 61 | Allergan, Inc. | 636 | 121 | ||
| Duke Realty Corp.(ö) | 4,212 | 80 | Allscripts Healthcare Solutions, Inc.(Æ) | 993 | 14 | ||
| E*Trade Financial Corp.(Æ) | 4,055 | 90 | Amgen, Inc. | 4,291 | 696 | ||
| Eaton Vance Corp. | 3,867 | 142 | Baxter International, Inc. | 3,771 | 264 | ||
| Equifax, Inc. | 652 | 49 | Biogen Idec, Inc.(Æ) | 1,635 | 525 | ||
| Federal Realty Investment Trust(ö) | 676 | 89 | Bristol-Myers Squibb Co. | 8,156 | 475 | ||
| Federated Investors, Inc. Class B | 2,001 | 63 | Bruker Corp.(Æ) | 746 | 15 | ||
| Fidelity National Information Services, Inc. | 1,695 | 99 | CareFusion Corp.(Æ) | 2,178 | 125 | ||
| First Horizon National Corp. | 3,802 | 49 | Catamaran Corp.(Æ) | 762 | 36 | ||
| FNF Group | 4,299 | 128 | Celgene Corp.(Æ) | 568 | 61 | ||
| FNFV Group(Æ) | 1,432 | 19 | Dentsply International, Inc. | 1,764 | 90 | ||
| Genworth Financial, Inc. Class A(Æ) | 4,514 | 63 | Eli Lilly & Co. | 5,710 | 379 | ||
| Goldman Sachs Group, Inc. (The) | 2,470 | 469 | Express Scripts Holding Co.(Æ) | 4,536 | 348 | ||
| Hudson City Bancorp, Inc. | 5,916 | 57 | Gilead Sciences, Inc.(Æ) | 7,706 | 863 | ||
| Huntington Bancshares, Inc. | 11,657 | 116 | HCA Holdings, Inc.(Æ) | 842 | 59 | ||
| Intercontinental Exchange, Inc. | 514 | 107 | Health Net, Inc.(Æ) | 409 | 19 | ||
| JPMorgan Chase & Co.(ì) | 17,526 | 1,060 | Henry Schein, Inc.(Æ) | 1,290 | 155 | ||
| Kilroy Realty Corp.(ö) | 1,430 | 97 | Hill-Rom Holdings, Inc. | 428 | 19 | ||
| Legg Mason, Inc. | 2,165 | 113 | Hospira, Inc.(Æ) | 668 | 36 | ||
| See accompanying notes which are an integral part of the financial statements. | |||||||
| 668 Russell Strategic Call Overwriting Fund | |||||||
Russell Investment Company
Russell Strategic Call Overwriting Fund
Schedule of Investments, continued — October 31, 2014
| Amounts in thousands (except share amounts) | Amounts in thousands (except share amounts) | ||||||
| Principal | Fair | Principal | Fair | ||||
| Amount ($) or | Value | Amount ($) or | Value | ||||
| Shares | $ | Shares | $ | ||||
| IDEXX Laboratories, Inc.(Æ) | 612 | 87 | Booz Allen Hamilton Holding Corp. Class A | 1,211 | 32 | ||
| Incyte Corp.(Æ) | 500 | 34 | Caterpillar, Inc. | 4,132 | 419 | ||
| Johnson & Johnson(ì) | 14,881 | 1,604 | Chicago Bridge & Iron Co. | 461 | 25 | ||
| Medivation, Inc.(Æ) | 424 | 45 | Cintas Corp. | 713 | 52 | ||
| Medtronic, Inc. | 7,884 | 537 | Copa Holdings Class A | 212 | 25 | ||
| Merck & Co., Inc.(ì) | 15,711 | 910 | Delta Air Lines, Inc. | 3,227 | 130 | ||
| Myriad Genetics, Inc.(Æ) | 401 | 16 | Emerson Electric Co. | 5,760 | 369 | ||
| Patterson Cos., Inc. | 1,312 | 57 | Flir Systems, Inc. | 1,971 | 66 | ||
| PerkinElmer, Inc. | 2,078 | 90 | Flowserve Corp. | 2,221 | 151 | ||
| Pfizer, Inc.(ì) | 36,879 | 1,105 | GATX Corp. | 511 | 32 | ||
| Regeneron Pharmaceuticals, Inc.(Æ) | 412 | 162 | General Electric Co.(ì) | 52,542 | 1,356 | ||
| ResMed, Inc. | 905 | 47 | Honeywell International, Inc. | 5,132 | 493 | ||
| Sirona Dental Systems, Inc.(Æ) | 468 | 37 | IDEX Corp. | 1,808 | 135 | ||
| Tenet Healthcare Corp.(Æ) | 1,398 | 78 | IHS, Inc. Class A(Æ) | 339 | 44 | ||
| United Therapeutics Corp.(Æ) | 369 | 48 | Jacobs Engineering Group, Inc.(Æ) | 2,018 | 96 | ||
| UnitedHealth Group, Inc. | 6,346 | 603 | Joy Global, Inc. | 1,124 | 59 | ||
| Varian Medical Systems, Inc.(Æ) | 1,286 | 108 | Kennametal, Inc. | 1,039 | 40 | ||
| 10,822 | L-3 Communications Holdings, Inc. | 1,344 | 163 | ||||
| Mettler-Toledo International, Inc.(Æ) | 372 | 96 | |||||
| Materials and Processing - 3.2% | Navistar International Corp.(Æ) | 312 | 11 | ||||
| Airgas, Inc. | 844 | 94 | Oshkosh Corp. | 638 | 29 | ||
| Albemarle Corp. | 615 | 36 | Pall Corp. | 1,100 | 101 | ||
| Allegheny Technologies, Inc. | 1,360 | 45 | Pitney Bowes, Inc. | 2,023 | 50 | ||
| Ball Corp. | 1,447 | 93 | Quanta Services, Inc.(Æ) | 1,940 | 66 | ||
| Bemis Co., Inc. | 1,486 | 57 | Robert Half International, Inc. | 1,651 | 90 | ||
| Cabot Corp. | 555 | 26 | Rockwell Collins, Inc. | 1,531 | 129 | ||
| Domtar Corp. | 658 | 27 | RR Donnelley & Sons Co. | 1,424 | 25 | ||
| Dow Chemical Co. (The) | 6,661 | 329 | Ryder System, Inc. | 494 | 44 | ||
| EI du Pont de Nemours & Co. | 5,336 | 369 | Snap-on, Inc. | 769 | 102 | ||
| FMC Corp. | 1,114 | 64 | Southwest Airlines Co. | 2,791 | 96 | ||
| Huntsman Corp. | 1,323 | 32 | Teekay Corp. | 526 | 31 | ||
| International Flavors & Fragrances, Inc. | 520 | 52 | Textron, Inc. | 2,068 | 86 | ||
| Lennox International, Inc. | 551 | 49 | TransDigm Group, Inc. | 332 | 62 | ||
| Masco Corp. | 3,011 | 66 | Trimble Navigation, Ltd.(Æ) | 1,732 | 47 | ||
| MeadWestvaco Corp. | 1,933 | 85 | Union Pacific Corp. | 6,272 | 730 | ||
| Monsanto Co. | 3,444 | 396 | United Parcel Service, Inc. Class B | 5,059 | 531 | ||
| Newmont Mining Corp. | 2,293 | 43 | United Technologies Corp. | 5,341 | 571 | ||
| Owens-Illinois, Inc.(Æ) | 1,379 | 36 | Waters Corp.(Æ) | 1,344 | 149 | ||
| Packaging Corp. of America | 995 | 72 | WESCO International, Inc.(Æ) | 875 | 72 | ||
| Praxair, Inc. | 1,988 | 251 | Xylem, Inc. | 2,411 | 88 | ||
| Reliance Steel & Aluminum Co. | 589 | 40 | 8,580 | ||||
| Rockwood Holdings, Inc. | 1,147 | 88 | |||||
| Royal Gold, Inc. | 2,332 | 133 | Technology - 14.8% | ||||
| Sealed Air Corp. | 2,145 | 78 | 3D Systems Corp.(Æ) | 304 | 12 | ||
| Steel Dynamics, Inc. | 1,639 | 38 | Akamai Technologies, Inc.(Æ) | 1,200 | 72 | ||
| Tahoe Resources, Inc.(Æ) | 1,578 | 27 | Ansys, Inc.(Æ) | 309 | 24 | ||
| United States Steel Corp. | 2,527 | 101 | AOL, Inc.(Æ) | 413 | 18 | ||
| Vulcan Materials Co. | 817 | 50 | Apple, Inc.(ì) | 29,269 | 3,161 | ||
| 2,777 | Avago Technologies, Ltd. Class A | 839 | 72 | ||||
| Avnet, Inc. | 1,478 | 64 | |||||
| Producer Durables - 9.9% | Cadence Design Systems, Inc.(Æ) | 4,432 | 80 | ||||
| 3M Co.(ì) | 4,400 | 677 | Cisco Systems, Inc.(ì) | 26,614 | 651 | ||
| Accenture PLC Class A | 3,500 | 284 | Computer Sciences Corp. | 949 | 57 | ||
| AECOM Technology Corp.(Æ) | 197 | 6 | Cree, Inc.(Æ) | 943 | 30 | ||
| AGCO Corp. | 898 | 40 | Electronic Arts, Inc.(Æ) | 3,031 | 124 | ||
| Allison Transmission Holdings, Inc. Class A | 500 | 16 | Facebook, Inc. Class A(Æ) | 8,223 | 617 | ||
| Ametek, Inc. | 860 | 45 | Fortinet, Inc.(Æ) | 757 | 20 | ||
| Avery Dennison Corp. | 1,187 | 56 | Freescale Semiconductor, Ltd.(Æ) | 543 | 11 | ||
| Boeing Co. (The) | 4,507 | 563 | Google, Inc. Class C(Æ)(ì) | 2,605 | 1,468 | ||
| See accompanying notes which are an integral part of the financial statements. | |||||||
| Russell Strategic Call Overwriting Fund 669 | |||||||
| Russell Investment Company | ||||||||||||||
| Russell Strategic Call Overwriting Fund | ||||||||||||||
| Schedule of Investments, continued — October 31, 2014 | ||||||||||||||
| Amounts in thousands (except share amounts) | Amounts in thousands (except share amounts) | |||||||||||||
| Principal | Fair | Principal | Fair | |||||||||||
| Amount ($) or | Value | Amount ($) or | Value | |||||||||||
| Shares | $ | Shares | $ | |||||||||||
| Harris Corp. | 882 | 61 | Jan 2015 27.00 Call (150) | USD | 15 | (ÿ) | 12 | |||||||
| Hewlett-Packard Co. | 9,771 | 351 | Jan 2015 30.00 Call (450) | USD | 45 | (ÿ) | 27 | |||||||
| IAC/InterActiveCorp | 410 | 28 | Feb 2015 27.00 Call (150) | USD | 15 | (ÿ) | 16 | |||||||
| Feb 2015 30.00 Call (450) | USD | 45 | (ÿ) | 36 | ||||||||||
| Informatica Corp.(Æ) | 1,102 | 39 | Nov 2014 13.00 Put (1,050) | USD | 105 | (ÿ) | 13 | |||||||
| Intel Corp.(ì) | 12,135 | 413 | Dec 2014 18.00 Put (950) | USD | 95 | (ÿ) | 318 | |||||||
| International Business Machines Corp.(ì) | 3,241 | 533 | Jan 2015 18.00 Put (750) | USD | 75 | (ÿ) | 233 | |||||||
| JDS Uniphase Corp.(Æ) | 3,969 | 53 | Total Options Purchased | |||||||||||
| Lam Research Corp. | 1,621 | 126 | (cost $888) | 784 | ||||||||||
| Leidos Holdings, Inc. | 900 | 33 | ||||||||||||
| Linear Technology Corp. | 4,274 | 183 | Short-Term Investments - 12.7% | |||||||||||
| LinkedIn Corp. Class A(Æ) | 183 | 42 | Russell U.S. Cash Management Fund | 11,019,150(∞) | 11,019 | |||||||||
| Marvell Technology Group, Ltd. | 1,954 | 26 | Total Short-Term Investments | |||||||||||
| Maxim Integrated Products, Inc. | 1,820 | 53 | (cost $11,019) | 11,019 | ||||||||||
| Microchip Technology, Inc. | 2,564 | 111 | ||||||||||||
| Micron Technology, Inc.(Æ) | 7,807 | 258 | Total Investments 102.1% | |||||||||||
| Microsoft Corp.(ì) | 39,090 | 1,835 | (identified cost $65,672) | 88,576 | ||||||||||
| NetSuite, Inc.(Æ) | 320 | 35 | ||||||||||||
| Oracle Corp.(ì) | 20,062 | 783 | Other Assets and Liabilities, Net | |||||||||||
| QUALCOMM, Inc.(ì) | 9,016 | 708 | -(2.1%) | (1,803 | ) | |||||||||
| SBA Communications Corp. Class A(Æ) | 1,097 | 123 | Net Assets - 100.0% | 86,773 | ||||||||||
| Seagate Technology PLC | 121 | 8 | ||||||||||||
| Skyworks Solutions, Inc. | 674 | 39 | ||||||||||||
| Splunk, Inc.(Æ) | 453 | 30 | ||||||||||||
| Teradyne, Inc. | 2,531 | 47 | ||||||||||||
| Texas Instruments, Inc. | 6,986 | 347 | ||||||||||||
| VeriSign, Inc.(Æ) | 1,322 | 79 | ||||||||||||
| Vishay Intertechnology, Inc. | 1,240 | 17 | ||||||||||||
| VMware, Inc. Class A(Æ) | 362 | 30 | ||||||||||||
| Zynga, Inc. Class A(Æ) | 1,760 | 4 | ||||||||||||
| 12,876 | ||||||||||||||
| Utilities - 4.2% | ||||||||||||||
| AGL Resources, Inc. | 769 | 41 | ||||||||||||
| Ameren Corp. | 3,981 | 168 | ||||||||||||
| American Electric Power Co., Inc. | 4,308 | 251 | ||||||||||||
| AT&T, Inc.(ì) | 18,800 | 655 | ||||||||||||
| Calpine Corp.(Æ) | 2,233 | 51 | ||||||||||||
| CMS Energy Corp. | 7,106 | 232 | ||||||||||||
| Duke Energy Corp. | 5,607 | 461 | ||||||||||||
| Frontier Communications Corp. | 4,965 | 32 | ||||||||||||
| NiSource, Inc. | 4,424 | 186 | ||||||||||||
| NRG Energy, Inc. | 3,627 | 109 | ||||||||||||
| Pepco Holdings, Inc. | 4,275 | 117 | ||||||||||||
| Pinnacle West Capital Corp. | 2,955 | 182 | ||||||||||||
| Questar Corp. | 1,644 | 40 | ||||||||||||
| SCANA Corp. | 2,626 | 144 | ||||||||||||
| Verizon Communications, Inc.(ì) | 18,621 | 936 | ||||||||||||
| Westar Energy, Inc. Class A | 1,532 | 58 | ||||||||||||
| 3,663 | ||||||||||||||
| Total Common Stocks | ||||||||||||||
| (cost $53,765) | 76,773 | |||||||||||||
| Options Purchased - 0.9% | ||||||||||||||
| (Number of Contracts) | ||||||||||||||
| SPX Volatility Index | ||||||||||||||
| Nov 2014 21.00 Call (550) | USD | 55 | (ÿ) | 33 | ||||||||||
| Nov 2014 40.00 Call (550) | USD | 55 | (ÿ) | 4 | ||||||||||
| Dec 2014 21.00 Call (350) | USD | 35 | (ÿ) | 35 | ||||||||||
| Dec 2014 25.00 Call (450) | USD | 45 | (ÿ) | 29 | ||||||||||
| Jan 2015 21.00 Call (200) | USD | 20 | (ÿ) | 28 | ||||||||||
| See accompanying notes which are an integral part of the financial statements. | ||||||||||||||
| 670 Russell Strategic Call Overwriting Fund | ||||||||||||||
| Russell Investment Company | ||||||
| Russell Strategic Call Overwriting Fund | ||||||
| Schedule of Investments, continued — October 31, 2014 | ||||||
| Futures Contracts | ||||||
| Amounts in thousands (except contract amounts) | ||||||
| Unrealized | ||||||
| Appreciation | ||||||
| Number of | Notional | Expiration | (Depreciation) | |||
| Contracts | Amount | Date | $ | |||
| Long Positions | ||||||
| S&P Mid 500 E-Mini Index Futures | 77 | USD | 7,744 | 12/14 | 141 | |
| Total Unrealized Appreciation (Depreciation) on Open Futures Contracts (å) | 141 | |||||
| Options Written | ||||||||||||
| Amounts in thousands (except contract amounts) | ||||||||||||
| Number of | Strike | Notional | Expiration | Fair Value | ||||||||
| Call/Put | Contracts | Price | Amount | Date | $ | |||||||
| S&P 500 Index | Call | 95 | 2,010.00 | USD | 10 | 11/07/14 | (150 | ) | ||||
| S&P 500 Index | Call | 60 | 2,010.00 | USD | 6 | 11/14/14 | (129 | ) | ||||
| S&P 500 Index | Call | 60 | 1,950.00 | USD | 6 | 11/22/14 | (408 | ) | ||||
| S&P 500 Index | Call | 200 | 1,975.00 | USD | 20 | 11/22/14 | (999 | ) | ||||
| SPX Volatility Index | Put | 500 | 16.00 | USD | 50 | 11/19/14 | (80 | ) | ||||
| SPX Volatility Index | Put | 550 | 21.00 | USD | 55 | 11/19/14 | (319 | ) | ||||
| SPX Volatility Index | Put | 950 | 16.00 | USD | 95 | 12/17/14 | (176 | ) | ||||
| SPX Volatility Index | Put | 750 | 16.00 | USD | 75 | 01/21/15 | (127 | ) | ||||
| Total Liability for Options Written (premiums received $2,226) | (2,388 | ) | ||||||||||
| Transactions in options written contracts for the period ended October 31, 2014 were as follows: | ||||||||||||
| Number of | Premiums | |||||||||||
| Contracts | Received | |||||||||||
| Outstanding October 31, 2013 | 930 | $ | 331 | |||||||||
| Opened | 105,476 | 76,454 | ||||||||||
| Closed | (102,141 | ) | (74,440 | ) | ||||||||
| Expired | (1,100 | ) | (119 | ) | ||||||||
| Outstanding October 31, 2014 | 3,165 | $ | 2,226 | |||||||||
| Presentation of Portfolio Holdings | |||||||||||||
| Amounts in thousands | |||||||||||||
| Fair Value | |||||||||||||
| Portfolio Summary | Level 1 | Level 2 | Level 3 | Total | % of Net Assets | ||||||||
| Common Stocks | |||||||||||||
| Consumer Discretionary | $ | 10,150 | $ | — | $ | — | $ | 10,150 | 11.7 | ||||
| Consumer Staples | 6,303 | — | — | 6,303 | 7.3 | ||||||||
| Energy | 7,175 | — | — | 7,175 | 8.3 | ||||||||
| Financial Services | 14,427 | — | — | 14,427 | 16.6 | ||||||||
| Health Care | 10,822 | — | — | 10,822 | 12.5 | ||||||||
| Materials and Processing | 2,777 | — | — | 2,777 | 3.2 | ||||||||
| Producer Durables | 8,580 | — | — | 8,580 | 9.9 | ||||||||
| Technology | 12,876 | — | — | 12,876 | 14.8 | ||||||||
| Utilities | 3,663 | — | — | 3,663 | 4.2 | ||||||||
| Options Purchased | 784 | — | — | 784 | 0.9 | ||||||||
| Short-Term Investments | — | 11,019 | — | 11,019 | 12.7 | ||||||||
| Total Investments | 77,557 | 11,019 | — | 88,576 | 102.1 | ||||||||
| Other Assets and Liabilities, Net | (2.1 | ) | |||||||||||
| 100.0 | |||||||||||||
| Other Financial Instruments | |||||||||||||
| Futures Contracts | 141 | — | — | 141 | 0.2 | ||||||||
| Options Written | (2,388 | ) | — | — | (2,388 | ) | (2.8 | ) | |||||
| Total Other Financial Instruments* | $ | (2,247 | ) | $ | — | $ | — | $ | (2,247 | ) | |||
| * Futures and foreign currency exchange contract values reflect the unrealized appreciation (depreciation) on the instruments. | |||||||||||||
| See accompanying notes which are an integral part of the financial statements. | |||||||||||||
| Russell Strategic Call Overwriting Fund 671 | |||||||||||||
Russell Investment Company
Russell Strategic Call Overwriting Fund
Schedule of Investments, continued — October 31, 2014
| Presentation of Portfolio Holdings | |||||
| Amounts in thousands | |||||
| Fair Value | |||||
| Portfolio Summary | Level 1 | Level 2 | Level 3 | Total | % of Net Assets |
| For a description of the Levels see note 2 in the Notes to Financial Statements. | |||||
| For disclosure on transfers between Levels 1, 2 and 3 during the period ended October 31, 2014, see note 2 in the Notes to Financial | |||||
| Statements. | |||||
See accompanying notes which are an integral part of the financial statements.
672 Russell Strategic Call Overwriting Fund
| Russell Investment Company | |||
| Russell Strategic Call Overwriting Fund | |||
| Fair Value of Derivative Instruments — October 31, 2014 | |||
| Amounts in thousands | |||
| Equity | |||
| Derivatives not accounted for as hedging instruments | Contracts | ||
| Location: Statement of Assets and Liabilities - Assets | |||
| Investments, at fair value* | $ | 784 | |
| Variation margin on futures contracts** | 141 | ||
| Total | $ | 925 | |
| Location: Statement of Assets and Liabilities - Liabilities | |||
| Options written, at fair value | $ | 2,388 | |
| Equity | |||
| Derivatives not accounted for as hedging instruments | Contracts | ||
| Location: Statement of Operations - Net realized gain (loss) | |||
| Investments*** | $ | (149 | ) |
| Futures contracts | 818 | ||
| Options written | (9,468 | ) | |
| Total | $ | (8,799 | ) |
| Location: Statement of Operations - Net change in unrealized appreciation (depreciation) | |||
| Investments**** | $ | (65 | ) |
| Futures contracts | 83 | ||
| Options written | (282 | ) | |
| Total | $ | (264 | ) |
| * | Fair value of purchased options. |
| ** | Includes cumulative appreciation/depreciation of futures contracts as reported in the Schedule of Investments. Only variation margin is reported within the Statement of Assets and Liabilities. |
| *** | Includes net realized gain (loss) on purchased options as reported in the Statement of Operations. |
| **** | Includes net unrealized gain (loss) on purchased options as reported in the Schedule of Investments. |
For further disclosure on derivatives see note 2 in the Notes to Financial Statements.
See accompanying notes which are an integral part of the financial statements.
Russell Strategic Call Overwriting Fund 673
Russell Investment Company
Russell Strategic Call Overwriting Fund
Balance Sheet Offsetting of Financial and Derivative Instruments — October 31, 2014
| Amounts in thousands | ||||||||
| Offsetting of Financial Assets and Derivative Assets | ||||||||
| Gross | Net Amounts | |||||||
| Amounts | of Assets | |||||||
| Gross | Offset in the | Presented in | ||||||
| Amounts of | Statement of | the Statement | ||||||
| Recognized | Assets and | of Assets and | ||||||
| Description | Location: Statement of Assets and Liabilities - Assets | Assets | Liabilities | Liabilities | ||||
| Options Purchased Contracts | Investments, at fair value | $ | 784 | $ — | $ 784 | |||
| Futures Contracts | Variation margin on futures contracts | 32 | — | 32 | ||||
| Total | $ | 816 | $ — | $ 816 | ||||
| Financial Assets, Derivative Assets, and Collateral Held by Counterparty | ||||||||
| Gross Amounts Not Offset in | ||||||||
| the Statement of Assets and | ||||||||
| Liabilities | ||||||||
| Net Amounts | ||||||||
| of Assets | ||||||||
| Presented in | ||||||||
| the Statement | Financial and | |||||||
| of Assets and | Derivative | Collateral | ||||||
| Counterparty | Liabilities | Instruments | Received^ | Net Amount | ||||
| Goldman Sachs | $784 | $ — | $784 | $ — | |||
| Merrill Lynch | 32 | — | — | 32 | |||
| Total | $816 | $ — | $784 | $32 | |||
See accompanying notes which are an integral part of the financial statements.
674 Russell Strategic Call Overwriting Fund
Russell Investment Company
Russell Strategic Call Overwriting Fund
Balance Sheet Offsetting of Financial and Derivative Instruments, continued —October 31, 2014
| Amounts in thousands | |||||||||||
| Offsetting of Financial Liabilities and Derivative Liabilities | |||||||||||
| Gross | Net Amounts | ||||||||||
| Amounts | of Assets | ||||||||||
| Gross | Offset in the | Presented in | |||||||||
| Amounts of | Statement of | the Statement | |||||||||
| Recognized | Assets and | of Assets and | |||||||||
| Description | Location: Statement of Assets and Liabilities - Liabilities | Liabilities | Liabilities | Liabilities | |||||||
| Options Written Contracts | Options written, at fair value | $ | 2,388 | $ | — | $ 2,388 | |||||
| Total | $ | 2,388 | $ | — | $ 2,388 | ||||||
| Financial Liabilities, Derivative Liabilities, and Collateral Pledged by Counterparty | |||||||||||
| Gross Amounts Not Offset in | |||||||||||
| the Statement of Assets and | |||||||||||
| Liabilities | |||||||||||
| Net Amounts | |||||||||||
| of Liabilities | |||||||||||
| Presented in | |||||||||||
| the Statement | Financial and | ||||||||||
| of Assets and | Derivative | Collateral | |||||||||
| Counterparty | Liabilities | Instruments | Pledged^ | Net Amount | |||||||
| Goldman Sachs | $2,388 | $ | — $ | 2,388 | $ | — | |||||
| Total | $2,388 | $ | — $ | 2,388 | $ | — | |||||
^ Collateral received or pledged amounts may not reconcile to those disclosed in the Statement of Assets and Liabilities due to the inclusion of off-Balance Sheet collateral and adjustments made to exclude overcollateralization.
For further disclosure on derivatives and counterparty risk see note 2 in the Notes to Financial Statements.
See accompanying notes which are an integral part of the financial statements.
Russell Strategic Call Overwriting Fund 675
| Russell Investment Company | ||
| Russell Strategic Call Overwriting Fund | ||
| Statement of Assets and Liabilities — October 31, 2014 | ||
| Amounts in thousands | ||
| Assets | ||
| Investments, at identified cost | $ | 65,672 |
| Investments, at fair value(>) | 88,576 | |
| Cash (restricted)(a)(b) | 9,816 | |
| Receivables: | ||
| Dividends and interest | 73 | |
| Dividends from affiliated Russell funds | 1 | |
| Investments sold | 1,688 | |
| Fund shares sold | 26 | |
| Variation margin on futures contracts | 32 | |
| Total assets | 100,212 | |
| Liabilities | ||
| Payables: | ||
| Due to custodian | 47 | |
| Due to broker (c) | 6,260 | |
| Investments purchased | 4,625 | |
| Fund shares redeemed | 3 | |
| Accrued fees to affiliates | 58 | |
| Other accrued expenses | 58 | |
| Options written, at fair value(x) | 2,388 | |
| Total liabilities | 13,439 | |
| Net Assets | $ | 86,773 |
See accompanying notes which are an integral part of the financial statements.
676 Russell Strategic Call Overwriting Fund
| Russell Investment Company | |||
| Russell Strategic Call Overwriting Fund | |||
| Statement of Assets and Liabilities, continued — October 31, 2014 | |||
| Amounts in thousands | |||
| Net Assets Consist of: | |||
| Undistributed (overdistributed) net investment income | $ | 21 | |
| Accumulated net realized gain (loss) | (17,504 | ) | |
| Unrealized appreciation (depreciation) on: | |||
| Investments | 22,904 | ||
| Futures contracts | 141 | ||
| Options written | (162 | ) | |
| Shares of beneficial interest | 81 | ||
| Additional paid-in capital | 81,292 | ||
| Net Assets | $ | 86,773 | |
| Net Asset Value, offering and redemption price per share: | |||
| Net asset value per share: Class S(#) | $ | 10.77 | |
| Class S — Net assets | $ | 86,773,204 | |
| Class S — Shares outstanding ($.01 par value) | 8,060,217 | ||
| Amounts in thousands | |||
| (x) Premiums received on options written | $ | 2,226 | |
| (>) Investments in affiliates, Russell U.S. Cash Management Fund | $ | 11,019 | |
| (a) Cash Collateral for Futures | $ | 550 | |
| (b) Cash Collateral for Options | $ | 9,266 | |
| (c) Due to Broker for Options | $ | 6,260 | |
| (#) Net asset value per share equals class level net assets divided by class level shares of beneficial interest outstanding. | |||
See accompanying notes which are an integral part of the financial statements.
Russell Strategic Call Overwriting Fund 677
| Russell Investment Company | |||
| Russell Strategic Call Overwriting Fund | |||
| Statement of Operations — For the Period Ended October 31, 2014 | |||
| Amounts in thousands | |||
| Investment Income | |||
| Dividends | $ | 1,562 | |
| Dividends from affiliated Russell funds | 9 | ||
| Total investment income | 1,571 | ||
| Expenses | |||
| Advisory fees | 678 | ||
| Administrative fees | 40 | ||
| Custodian fees | 36 | ||
| Transfer agent fees - Class S | 170 | ||
| Professional fees | 51 | ||
| Registration fees | 17 | ||
| Trustees’ fees | 2 | ||
| Printing fees | 4 | ||
| Miscellaneous | 11 | ||
| Expenses before reductions | 1,009 | ||
| Expense reductions | (187 | ) | |
| Net expenses | 822 | ||
| Net investment income (loss) | 749 | ||
| Net Realized and Unrealized Gain (Loss) | |||
| Net realized gain (loss) on: | |||
| Investments | 1,346 | ||
| Futures contracts | 818 | ||
| Options written | (9,468 | ) | |
| Net realized gain (loss) | (7,304 | ) | |
| Net change in unrealized appreciation (depreciation) on: | |||
| Investments | 8,506 | ||
| Futures contracts | 83 | ||
| Options written | (282 | ) | |
| Net change in unrealized appreciation (depreciation) | 8,307 | ||
| Net realized and unrealized gain (loss) | 1,003 | ||
| Net Increase (Decrease) in Net Assets from Operations | $ | 1,752 | |
See accompanying notes which are an integral part of the financial statements.
678 Russell Strategic Call Overwriting Fund
| Russell Investment Company | |||||||
| Russell Strategic Call Overwriting Fund | |||||||
| Statements of Changes in Net Assets | |||||||
| For the Periods Ended October 31, | |||||||
| Amounts in thousands | 2014 | 2013 | |||||
| Increase (Decrease) in Net Assets | |||||||
| Operations | |||||||
| Net investment income (loss) | $ | 749 | $ | 830 | |||
| Net realized gain (loss) | (7,304 | ) | (10,074 | ) | |||
| Net change in unrealized appreciation (depreciation) | 8,307 | 14,739 | |||||
| Net increase (decrease) in net assets from operations | 1,752 | 5,495 | |||||
| Distributions | |||||||
| From net investment income | |||||||
| Class S | (755 | ) | (882 | ) | |||
| From net realized gain | |||||||
| Class S | — | (427 | ) | ||||
| Net decrease in net assets from distributions | (755 | ) | (1,309 | ) | |||
| Share Transactions* | |||||||
| Net increase (decrease) in net assets from share transactions | 2,235 | 19,414 | |||||
| Total Net Increase (Decrease) in Net Assets | 3,232 | 23,600 | |||||
| Net Assets | |||||||
| Beginning of period | 83,541 | 59,941 | |||||
| End of period | $ | 86,773 | $ | 83,541 | |||
| Undistributed (overdistributed) net investment income included in net assets | $ | 21 | $ | 28 | |||
See accompanying notes which are an integral part of the financial statements.
Russell Strategic Call Overwriting Fund 679
Russell Investment Company
Russell Strategic Call Overwriting Fund
Statements of Changes in Net Assets, continued
* Share transaction amounts (in thousands) for the periods ended October 31, 2014 and October 31, 2013 were as follows:
| 2014 | 2013 | |||||||||||
| Shares | Dollars | Shares | Dollars | |||||||||
| Class S | ||||||||||||
| Proceeds from shares sold | 1,570 | $ | 17,006 | 2,366 | $ | 24,372 | ||||||
| Proceeds from reinvestment of distributions | 69 | 754 | 129 | 1,309 | ||||||||
| Payments for shares redeemed | (1,428 | ) | (15,525 | ) | (603 | ) | (6,267 | ) | ||||
| Total increase (decrease) | 211 | $ | 2,235 | 1,892 | $ | 19,414 | ||||||
See accompanying notes which are an integral part of the financial statements.
680 Russell Strategic Call Overwriting Fund
(This page intentionally left blank)
| Russell Investment Company | ||||||||||||||
| Russell Strategic Call Overwriting Fund | ||||||||||||||
| Financial Highlights — For the Periods Ended | ||||||||||||||
| For a Share Outstanding Throughout Each Period. | ||||||||||||||
| $ | $ | $ | $ | $ | $ | |||||||||
| Net Asset Value, | Net | Net Realized | Total from | Distributions | Distributions | |||||||||
| Beginning of | Investment | and Unrealized | Investment | from Net | from Net | |||||||||
| Period | Income (Loss)(a) | Gain (Loss) | Operations | Investment Income | Realized Gain | |||||||||
| Class S | ||||||||||||||
| October 31, 2014 | 10.64 | .10 | .13 | .23 | (.10) | — | ||||||||
| October 31, 2013 | 10.06 | .12 | .65 | .77 | (.13) | (.06) | ||||||||
| October 31, 2012(6) | 10.00 | .02 | .05 | .07 | (.01) | — | ||||||||
See accompanying notes which are an integral part of the financial statements.
682 Russell Strategic Call Overwriting Fund
| % | % | % | ||||||||||||||
| $ | $ | Ratio of Expenses | Ratio of Expenses | Ratio of Net | ||||||||||||
| Net Asset Value, | % | Net Assets, | to Average | to Average | Investment Income | % | ||||||||||
| $ | End of | Total | End of Period | Net Assets, | Net Assets, | to Average | Portfolio | |||||||||
| Total Distributions | Period | Return(b)(c) | (000) | Gross(e) | Net(d)(e) | Net Assets(d)(e) | Turnover Rate(b) | |||||||||
| (.10) | 10.77 | 2.13 | 86,773 | 1.19 | .97 | .88 | 5 | |||||||||
| (.19) | 10.64 | 7.78 | 83,541 | 1.45 | .97 | 1.11 | 3 | |||||||||
| (.01) | 10.06 | .68 | 59,941 | 1.88 | .97 | .73 | — | |||||||||
See accompanying notes which are an integral part of the financial statements.
Russell Strategic Call Overwriting Fund 683
Russell Investment Company Russell Funds
Notes to Schedules of Investments — October 31, 2014
Footnotes:
| (Æ) | Nonincome-producing security. |
| (Ï) | Forward commitment. |
| (Ê) | Adjustable or floating rate security. Rate shown reflects rate in effect at period end. |
| (ƒ) | Perpetual floating rate security. Rate shown reflects rate in effect at period end. |
| (ö) | Real Estate Investment Trust (REIT). |
| (µ) | Bond is insured by a guarantor. |
| (Ø) | In default. |
| (ç) | At amortized cost, which approximates market value. |
(~ ) Rate noted is yield-to-maturity from date of acquisition.
| (æ) | Pre-refunded: These bonds are collateralized by U.S. Treasury securities, which are held in escrow by a trustee and used to pay principal and interest in the tax-exempt issue and to retire the bonds in full at the earliest refunding date. |
| (§) | All or a portion of the shares of this security are held as collateral in connection with futures contracts purchased (sold) or swap contracts entered into by the Fund. |
| (x) | The security is purchased with the cash collateral from securities loaned. |
| (Ñ) | All or a portion of the shares of this security are on loan. |
| (Þ) | Restricted security. Security may have contractual restrictions on resale, may have been offered in a private placement transaction, and is not registered under the Securities Act of 1933. |
| (Å) | Illiquid and restricted security. |
| (Û) | All or a portion of the shares of this security are held as collateral in connection with securities sold short. |
| (ÿ) | Notional Amount in thousands. |
| (∞) | Unrounded units. |
| (å) | Currency balances were held in connection with futures contracts purchased (sold), options written, or swaps entered into by the Fund. See Statement of Assets and Liabilities. |
| (ì) | All or a portion of the shares of this security are held as collateral in connection with options written contracts. |
| (v) | Loan agreement still pending. Rate not available at period end. |
| (#) | BNP Strategy RL Commodity Index – The return of the swap is based upon the performance of a basket of individual Bloomberg Commodity sub indexes. The underlying investment strategy follows a rules-based quantitative approach that selects and assigns weights to individual commodities using a methodology that is designed to evaluate commodities’ forward-looking return prospects. |
| The commodities that are included in the investable universe consist of the 22 contracts included in the Bloomberg Commodity Total Return Index. The portfolio construction process assigns position weights that are based on commodities’ relative attractiveness as well as pre-determined commodity and sector minimum/weighting bands. | |
| (##) | Cargill Pro-Alpha Index – The return of the swap is derived from the return on a basket of commodities futures contracts that was developed by Cargill, using its insights into the commodities markets. The underlying investment strategy is based on a long-biased managed futures strategy using contract selection, commodity over and underweights and out-of-benchmark positions to strive to add value versus the Bloomberg Commodity Index Total Return. |
| (###) | Macquarie Commodity Customized Product – The return of the swap is derived from the return on a basket of commodities futures contracts derived from the 22 commodities held in the Bloomberg Commodity Index, the Fund’s benchmark. The underlying investment strategy is to invest in futures contracts with longer maturities relative to those included in the benchmark. It seeks to initiate long commodity exposure at preferred points of the individual commodity forward curves. |
| (####) | Russell CoreCommodity Diversified I Index – The return of the swap is derived from the return on a basket of commodities futures contracts that is expected to remain fully exposed to the 22 commodities held in the Bloomberg Commodity Index Total Return, the Fund’s benchmark. The underlying investment strategy is to invest in futures contracts with longer dated maturities relative to those included in the benchmark. It seeks to initiate long utilized commodity exposure at preferred points of the individual commodity forward curve. Additionally, the strategy utilized quantitative models to selectively over and underweight specific commodities and commodities sectors in order to add excess return relative to the benchmark. |
Abbreviations:
ADR - American Depositary Receipt
ADS - American Depositary Share
BBR - Bank Bill Rate
BBSW - Bank Bill Swap Reference Rate
BUBOR – Budapest Interbank Offered Rate
CIBOR - Copenhagen Interbank Offered Rate
CME - Chicago Mercantile Exchange
CMO - Collateralized Mortgage Obligation
CVO - Contingent Value Obligation
684 Notes to Schedules of Investments
Russell Investment Company Russell Funds
Notes to Schedules of Investments, continued — October 31, 2014
| EMU - European Economic and Monetary Union | ||
| EURIBOR - Euro Interbank Offered Bank | ||
| FDIC - Federal Deposit Insurance Company | ||
| GDR - Global Depositary Receipt | ||
| GDS - Global Depositary Share | ||
| GSCI – Goldman Sachs Commodity Index | ||
| HIBOR – Hong Kong Interbank Offer Rate | ||
| JIBAR – Johannesburg Interbank Agreed Rate | ||
| KSDA – Korean Securities Dealers Association | ||
| LIBOR - London Interbank Offered Rate | ||
| NIBOR - Norwegian Interbank Offered Rate | ||
| PIK - Payment in Kind | ||
| REMIC - Real Estate Mortgage Investment Conduit | ||
| STIBOR – Stockholm Interbank Offered Rate | ||
| STRIP - Separate Trading of Registered Interest and Principal of Securities | ||
| SFE - Sydney Futures Exchange | ||
| TBA - To Be Announced Security | ||
| UK - United Kingdom | ||
| WTI – West Texas Intermediate | ||
| Foreign Currency Abbreviations: | ||
| ARS - Argentine peso | HKD - Hong Kong dollar | PKR - Pakistani rupee |
| AUD - Australian dollar | HUF - Hungarian forint | PLN - Polish zloty |
| BRL - Brazilian real | IDR - Indonesian rupiah | RON – Romanian New Leu |
| CAD - Canadian dollar | ILS - Israeli shekel | RUB - Russian ruble |
| CHF - Swiss franc | INR - Indian rupee | SEK - Swedish krona |
| CLP - Chilean peso | ISK - Icelandic krona | SGD - Singapore dollar |
| CNH – Chinese offshore spot | ITL - Italian lira | SKK - Slovakian koruna |
| CNY - Chinese renminbi yuan | JPY - Japanese yen | THB - Thai baht |
| COP - Colombian peso | KES - Kenyan schilling | TRY - Turkish lira |
| CRC - Costa Rican colon | KRW - South Korean won | TWD - Taiwanese dollar |
| CZK - Czech koruna | MXN - Mexican peso | USD - United States dollar |
| DKK - Danish krone | MYR - Malaysian ringgit | UYU – Uruguayan peso |
| DOP - Dominican peso | NOK - Norwegian krone | VEB - Venezuelan bolivar |
| EGP - Egyptian pound | NGN – Nigerian naira | VND - Vietnamese dong |
| EUR - Euro | NZD - New Zealand dollar | ZAR - South African rand |
| GBP - British pound sterling | PEN - Peruvian nuevo sol | |
| GHS - Ghana cedi | PHP - Philippine peso | |
Notes to Schedules of Investments 685
Russell Investment Company Russell Funds
Notes to Financial Highlights — October 31, 2014
| (1) | For the period June 1, 2010 (commencement of operations) to October 31, 2010. |
| (2) | For the period July 1, 2010 (commencement of operations) to October 31, 2010. |
| (3) | For the period October 1, 2010 (commencement of operations) to October 31, 2010. |
| (4) | For the period February 7, 2012 (commencement of operations) to October 31, 2012. |
| (5) | For the period August 7, 2012 (commencement of operations) to October 31, 2012. |
| (6) | For the period August 16, 2012 (commencement of operations) to October 31, 2012. |
| (7) | For the period August 1, 2014 (commencement of operations) to October 31, 2014. |
| (a) | Average daily shares outstanding were used for this calculation. |
| (b) | The ratios for periods less than one year are not annualized. |
| (c) | Total return for Class A does not reflect a front-end sales charge. If sales charges were included, the total return would be lower. |
| (d) | May reflect amounts waived and/or reimbursed by Russell Investment Management Company (“RIMCo”) and /or Russell Fund Services Company (“RFSC”). |
| (e) | The ratios for periods less than one year are annualized. |
| (f) | Less than $.01 per share. |
| (g) | For the Russell U.S. Defensive Equity Fund, the respective annualized net expense ratios, not including the dividends and interest expense from short sales, were as follows: |
| For the period ended | Class A | Class C | Class E | Class I | Class S | Class Y | ||||||
| October 31, 2014 | N/A | N/A | N/A | N/A | N/A | N/A | ||||||
| October 31, 2013 | N/A | N/A | N/A | N/A | N/A | N/A | ||||||
| October 31, 2012 | 1.09 | % | 1.83 | % | 1.03 | % | 0.76 | % | 0.83 | % | 0.65 | % |
| October 31, 2011 | 1.08 | % | 1.83 | % | 1.01 | % | 0.75 | % | 0.83 | % | 0.65 | % |
| October 31, 2010 | 1.06 | % | 1.81 | % | 0.95 | % | 0.71 | % | 0.81 | % | 0.64 | % |
For the Russell U.S. Dynamic Equity Fund, the respective annualized net expense ratios, not including the dividends and interest expense from short sales, were as follows:
| For the period ended | Class A | Class C | Class E | Class I | Class S | Class Y | ||||||
| October 31, 2014 | 1.34 | % | 2.10 | % | 1.35 | % | 1.00 | % | 1.10 | % | 0.90 | % |
| October 31, 2013 | 1.35 | % | 2.11 | % | 1.36 | % | 0.98 | % | 1.11 | % | 0.91 | % |
For the Russell U.S. Strategic Equity Fund, the respective annualized net expense ratios, not including the dividends and interest expense from short sales, were as follows:
| For the period ended | Class A | Class C | Class E | Class S | ||||
| October 31, 2014 | 1.03 | % | 1.78 | % | 1.03 | % | 0.78 | % |
| October 31, 2013 | 1.10 | % | 1.85 | % | 1.10 | % | 0.85 | % |
| October 31, 2012 | 1.10 | % | 1.85 | % | 1.10 | % | 0.85 | % |
For the Russell Multi-Strategy Alternative Fund, the respective annualized net expense ratios, not including the dividends and interest expense from short sales, were as follows:
| For the period ended | Class A | Class C | Class E | Class S | Class Y | |||||
| October 31, 2014 | 2.17 | % | 2.91 | % | 2.17 | % | 1.92 | % | 1.72 | % |
| October 31, 2013 | 2.20 | % | 2.95 | % | 2.18 | % | 1.93 | % | 1.73 | % |
| October 31, 2012 | 2.20 | % | 2.93 | % | 2.16 | % | 1.96 | % | 1.75 | % |
| (h) | Distributions in excess of accumulated earnings and profits but not in excess of current earnings and profits computed on a tax basis. |
| (i) | Less than .005% of average net assets. |
686 Notes to Financial Highlights
Russell Investment Company Russell Funds
Notes to Financial Statements — October 31, 2014
1. Organization
Russell Investment Company (the “Investment Company” or “RIC”) is a series investment company with 39 different investment portfolios referred to as funds. These financial statements report on 24 of these funds (each a “Fund” and collectively the “Funds”). The Investment Company is registered under the Investment Company Act of 1940, as amended (“Investment Company Act”), as an open-end management investment company. It is organized and operated as a Massachusetts business trust under a Second Amended and Restated Master Trust Agreement dated October 1, 2008 as amended (“Master Trust Agreement”). The Investment Company’s Master Trust Agreement permits the Board of Trustees (the “Board”) to issue an unlimited number of shares of beneficial interest.
2. Significant Accounting Policies
The Funds’ financial statements are prepared in accordance with U.S. generally accepted accounting principles (“U.S. GAAP”) which require the use of management estimates and assumptions at the date of the financial statements. Actual results could differ from those estimates. The following is a summary of the significant accounting policies consistently followed by each Fund in the preparation of its financial statements.
Security Valuation
The Funds value portfolio securities according to Board-approved securities valuation procedures which include market and fair value procedures. The Board has delegated the responsibility for administration of the securities valuation procedures to Russell Fund Services Company (“RFSC”).
U.S. GAAP defines fair value as the price that a Fund would receive to sell an asset or pay to transfer a liability in an orderly transaction between market participants at the measurement date. It establishes a fair value hierarchy that prioritizes inputs to valuation methods and requires a separate disclosure of the fair value hierarchy for each major category of assets and liabilities, that segregates fair value measurements into levels (Level 1, 2, and 3). The inputs or methodology used for valuing securities are not necessarily an indication of the risk associated with investing in those securities. Levels 1, 2 and 3 of the fair value hierarchy are defined as follows:
• • | Level 1 — Quoted prices (unadjusted) in active markets or exchanges for identical assets and liabilities. Level 2 — Inputs other than quoted prices included within Level 1 that are observable, which may include, but are not limited to, quoted prices for similar assets or liabilities in markets that are active, quoted prices for identical or similar assets or liabilities in markets that are not active, inputs such as interest rates, yield curves, implied volatilities, credit spreads or other market corroborated inputs. |
• | Level 3 — Significant unobservable inputs based on the best information available in the circumstances, to the extent observable inputs are not available, which may include assumptions made by RFSC, acting at the discretion of the Board, that are used in determining the fair value of investments. |
The availability of observable inputs can vary from security to security and is affected by a wide variety of factors, including, for example, the type of security, whether the security is new and not yet established in the marketplace, the liquidity of markets, and other characteristics particular to the security. To the extent that valuation is based on models or inputs that are less observable or unobservable in the market, the determination of fair value requires more judgment. Accordingly, the degree of judgment exercised in determining fair value is greatest for instruments categorized in Level 3.
The inputs used to measure fair value may fall into different levels of the fair value hierarchy. In such cases, for disclosure purposes, the level in the fair value hierarchy within which the fair value measurement falls is determined based on the lowest level input that is significant to the fair value measurement in its entirety.
The valuation techniques and significant inputs used in determining the fair market values of financial instruments categorized as Level 1 and Level 2 of the fair value hierarchy are as follows: Equity securities, including common and preferred stock, that are traded on a national securities exchange (or reported on the NASDAQ national market) are stated at the last reported sales price on the day of valuation. To the extent these securities are actively traded, and valuation adjustments are not applied, they are categorized as Level 1 of the fair value hierarchy. Certain foreign equity securities may be fair valued using a pricing service that considers the correlation of the trading patterns of the foreign security to the intraday trading in the U.S. markets for investments such as American Depositary Receipts, financial futures, exchange traded funds, and the movement of certain indexes of securities, based on the statistical analysis of historical
Notes to Financial Statements 687
Russell Investment Company Russell Funds
Notes to Financial Statements, continued — October 31, 2014
relationships. Preferred stock and other equities traded on inactive markets or valued by reference to similar instruments are categorized as Level 2 of the fair value hierarchy.
Fixed income securities including corporate, convertible, U.S. government agency, municipal bonds and notes, U.S. treasury obligations, sovereign issues, bank loans, bank notes and non-U.S. bonds are normally valued by pricing service providers that use broker dealer quotations or valuation estimates from their internal pricing models. The pricing service providers’ internal models use inputs that are observable such as issuer details, interest rates, yield curves, prepayment speeds, credit risks/spreads and default rates. Such fixed income securities that use similar valuation techniques and inputs as described above are categorized as Level 2 of the fair value hierarchy.
Fixed income securities purchased on a delayed-delivery basis and marked-to-market daily until settlement at the forward settlement date are categorized as Level 2 of the fair value hierarchy.
Mortgage and asset-backed securities are usually issued as separate tranches, or classes, of securities within each deal. These securities are also normally valued by pricing service providers that use broker dealer quotations or valuation estimates from their internal pricing models. The pricing models for these securities usually consider tranche-level attributes, including estimated cash flows of each tranche, market-based yield spreads for each tranche, and current market data, as well as incorporate deal collateral performance, as available. Mortgage and asset-backed securities that use these and similar valuation techniques and inputs as described above are categorized as Level 2 of the fair value hierarchy.
Investments in privately held investment funds will be valued based upon the net asset value (“NAV”) of such investments and are categorized as Level 2 of the fair value hierarchy if the privately-held investment funds’ redemption terms require 90 days notice or less. If the redemption terms require greater than 90 days notice for redemptions, then the investment will be categorized as Level 3. The Funds have adopted the authoritative guidance under U.S. GAAP for estimating the fair value of investments in funds that have calculated NAV per share in accordance with the specialized accounting guidance for investment companies. Accordingly, the Funds estimate the fair value of an investment in a fund using the NAV per share without further adjustment as a practical expedient, if the NAV per share of the investment is determined in accordance with the specialized accounting guidance for investment companies as of the reporting entity’s measurement date.
Short-term investments having a maturity of 60 days or less are generally valued at amortized cost, which approximates fair market value. These investments are categorized as Level 2 of the fair value hierarchy.
Derivative instruments are instruments such as foreign currency contracts, futures contracts, options contracts, or swap agreements that derive their value from underlying asset prices, indices, reference rates, and other inputs or a combination of these factors. Derivatives may be classified into two groups depending upon the way that they are traded: privately traded over-the-counter (“OTC”) derivatives that do not go through an exchange or intermediary and exchange-traded derivatives that are traded through specialized derivatives exchanges or other regulated exchanges. OTC derivatives are normally valued on the basis of broker dealer quotations or pricing service providers. Depending on the product and the terms of the transaction, the value of the derivative instrument can be estimated by a pricing service provider using a series of techniques, including simulation pricing models. The pricing models use inputs that are observed from actively quoted markets such as issuer details, indices, spreads, interest rates, yield curves, dividends and exchange rates. OTC derivatives that use these and similar valuation techniques and inputs as described above are categorized as Level 2 of the fair value hierarchy. Exchange-traded derivatives are valued based on the last reported sales price on the day of valuation and are categorized as Level 1 of the fair value hierarchy.
Centrally cleared swaps listed or traded on a multilateral or trade facility platform, such as a registered exchange, are valued at the daily settlement price determined by the respective exchange. For centrally cleared credit default swaps the clearing facility requires its members to provide actionable levels across complete term structures. These levels along with external third party prices are used to produce daily settlement prices. These securities are categorized as Level 2 of the fair value hierarchy. Centrally cleared interest rate swaps are valued using a pricing model that references the underlying rates including the overnight index swap rate and London Interbank Offered Rate (“LIBOR”) forward rate to produce the daily settlement price. These securities are categorized as Level 2 of the fair value hierarchy.
Events or circumstances affecting the values of Fund securities that occur between the closing of the principal markets on which they trade and the time the NAV of Fund shares is determined may be reflected in the calculation of NAV for each applicable Fund when the Fund deems that the particular event or circumstance would materially affect such Fund’s NAV. Funds that invest primarily in frequently traded exchange-listed securities will use fair value pricing in limited circumstances since reliable market quotations will often be readily available. Funds that invest in foreign securities are likely to use fair value pricing more often since
688 Notes to Financial Statements
Russell Investment Company Russell Funds
Notes to Financial Statements, continued — October 31, 2014
significant events may occur between the close of foreign markets and the time of pricing which would trigger fair value pricing of the foreign securities. Although there are observable inputs assigned on a security level, prices are derived from factors using proprietary models or matrix pricing. For this reason, significant events will cause movement between Levels 1 and 2. Examples of significant events that could trigger fair value pricing of one or more securities are: a material market movement of the U.S. securities market (defined in the fair value procedures as the movement by a single major U.S. index greater than a certain percentage) or other significant event; foreign market holidays if, on a daily basis, a Fund’s foreign exposure exceeds 20% in aggregate (all closed markets combined); a company development; a natural disaster or emergency situation; or an armed conflict.
The NAV of a Fund’s portfolio that includes foreign securities may change on days when shareholders will not be able to purchase or redeem Fund shares, since foreign securities can trade on non-business days.
The Russell U.S. Core Equity, Russell U.S. Defensive Equity, Russell U.S. Dynamic Equity, Russell U.S. Strategic Equity, Select U.S. Equity, Russell U.S. Large Cap Equity, Russell U.S. Mid Cap Equity, Russell U.S. Small Cap Equity, Russell International Developed Markets, Russell Global Equity, Select International Equity, Russell Tax-Managed U.S. Large Cap, Russell Tax-Managed U.S. Mid & Small Cap, Russell Global Infrastructure, Russell Global Real Estate Securities, Russell Multi-Strategy Alternative and Russell Strategic Call Overwriting Funds had no transfers between Levels 1, 2 and 3 for the period ended October 31, 2014.
The Russell Global Opportunistic Credit, Russell Strategic Bond, Russell Investment Grade Bond and Russell Short Duration Bond Funds had transfers out of Level 2 into Level 3 representing financial instruments for which pricing had been determined using observable inputs that became unobservable. The amounts transferred were as follows:
| Russell Global Opportunistic Credit Fund | $ | 2,309,565 |
| Russell Strategic Bond Fund | 2,496,988 | |
| Russell Investment Grade Bond Fund | 111,491 | |
| Russell Short Duration Bond Fund | 3,776 |
The Russell Emerging Markets, Russell Global Opportunistic Credit, Russell Strategic Bond, Russell Investment Grade Bond, Russell Short Duration Bond, Russell Tax Exempt Bond and Russell Commodity Strategies Funds had transfers out of Level 3 into Level 2 representing financial instruments for which pricing had been determined using unobservable inputs that became observable. The amounts transferred were as follows:
| Russell Emerging Markets Fund | $ | 203,211 |
| Russell Global Opportunistic Credit Fund | 2,940,174 | |
| Russell Strategic Bond Fund | 20,647,568 | |
| Russell Investment Grade Bond Fund | 6,255,187 | |
| Russell Short Duration Bond Fund | 4,669,265 | |
| Russell Tax Exempt Bond Fund | 1,895,475 | |
| Russell Commodity Strategies Fund | 279,775 |
Level 3 Fair Value Investments
The valuation techniques and significant inputs used in determining the fair values of financial instruments classified as Level 3 of the fair value hierarchy are as follows: Securities and other assets for which market quotes are not readily available, or are not reliable, are valued at fair value as determined in good faith by RFSC and are categorized as Level 3 of the fair value hierarchy. Market quotes are considered not readily available in circumstances where there is an absence of current or reliable market-based data (e.g., trade information or broker quotes). When RFSC applies fair valuation methods that use significant unobservable inputs to determine a Fund’s NAV, securities will not be priced on the basis of quotes from the primary market in which they are traded, but instead may be priced by another method that RFSC believes accurately reflects fair value and will be categorized as Level 3 of the fair value hierarchy. Fair value pricing may require subjective determinations about the value of a security. While the securities valuation procedures are intended to result in a calculation of a Fund’s NAV that fairly reflects security values as of the time of pricing, the process cannot guarantee that fair values determined by RFSC would accurately reflect the price that a Fund could obtain for a security if it were to dispose of that security as of the time of pricing (for instance, in a forced or distressed sale). The prices used by a Fund may differ from the value that would be realized if the securities were sold.
RFSC employs third party pricing vendors to provide fair value measurements. RFSC oversees third-party pricing service providers in order to support the valuation process throughout the year.
Notes to Financial Statements 689
Russell Investment Company Russell Funds
Notes to Financial Statements, continued — October 31, 2014
The significant unobservable input used in fair value measurement of certain of the Funds’ preferred equity securities is the redemption value calculated on a fully-diluted basis if converted to common stock. Significant increases (decreases) in the redemption value would have a direct and proportional impact to fair value.
The significant unobservable input used in the fair value measurement of certain of the Funds’ debt securities is the yield to worst ratio. Significant increases (decreases) in the yield to worst ratio would result in a lower (higher) fair value measurement.
These significant unobservable inputs are further disclosed in the Schedule of Investments for each respective fund as applicable.
If third party evaluated vendor pricing is neither available nor deemed to be indicative of fair value, RFSC may elect to obtain indicative market quotations (“broker quotes”) directly from the broker or passed through from a third party vendor. In the event that the source of fair value is from a single source broker quote, these securities are classified as Level 3 per the fair value hierarchy. Broker quotes are typically received from established market participants. Although independently received on a daily basis, RFSC does not have the transparency to view the underlying inputs which support the broker quotes. Significant changes in the broker quote would have direct and proportional changes in the fair value of the security. There is a third-party pricing exception to the quantitative disclosure requirement when prices are not determined by the reporting entity. RFSC is exercising this exception and has made a reasonable attempt to obtain quantitative information from the third party pricing vendors regarding the unobservable inputs used.
For fair valuations using significant unobservable inputs, U.S. GAAP requires a reconciliation of the beginning to ending balances for reported fair values that present changes attributable to total realized and unrealized gains or losses, purchases and sales, and transfers in/out of the Level 3 category during the period. Additionally, U.S. GAAP requires quantitative information regarding the significant unobservable inputs used in the determination of fair value of assets categorized as Level 3 in the fair value hierarchy. In accordance with the requirements of U.S. GAAP, a fair value hierarchy, Level 3 reconciliation and additional disclosure about fair value measurements, if any, have been included in the Presentation of Portfolio Holdings for each respective Fund.
Investment Transactions
Investment transactions are reflected as of the trade date for financial reporting purposes. This may cause the NAV stated in the financial statements to be different from the NAV at which shareholders may transact. Realized gains and losses from securities transactions, if applicable, are recorded on the basis of specific identified cost incurred by each money manager within a particular Fund.
Investment Income
Dividend income is recorded net of applicable withholding taxes on the ex-dividend date, except that certain dividends from foreign securities are recorded as soon thereafter as the Funds are informed subsequent to the ex-dividend date. Interest income is recorded daily on the accrual basis. The fixed income Funds classify gains and losses realized on prepayments received on mortgage-backed securities as an adjustment to interest income. All premiums and discounts, including original issue discounts, are amortized/ accreted using the effective interest method. Debt obligation securities may be placed in a non-accrual status and related interest income may be reduced by stopping current accruals and writing off interest receivable when the collection of all or a portion of interest has become doubtful.
Federal Income Taxes
Since the Investment Company is a Massachusetts business trust, each Fund is a separate corporate taxpayer and determines its net investment income and capital gains (or losses) and the amounts to be distributed to each Fund’s shareholders without regard to the income and capital gains (or losses) of the other Funds.
For each year, each Fund intends to qualify as a regulated investment company under sub-chapter M of the Internal Revenue Code (the “Code”) and intends to distribute all of its taxable income and capital gains. Therefore, no federal income tax provision is required for the Funds.
The Russell Commodity Strategies Fund and the Russell Multi-Strategy Alternative Fund ("Funds with commodity exposure") intend to gain exposure indirectly to commodities markets by investing in wholly-owned subsidiaries which are organized as companies under the laws of the Cayman Islands and may invest in commodity index-linked instruments and other commodity-linked instruments and derivative instruments. In order for the Funds to qualify as regulated investment companies under sub-chapter M of the Code, the Funds must derive at least 90 percent of their gross income each taxable year from certain qualifying sources of income. The Internal Revenue Service (“IRS”) has issued a revenue ruling which holds that income derived from
690 Notes to Financial Statements
Russell Investment Company Russell Funds
Notes to Financial Statements, continued — October 31, 2014
commodity-linked swaps is not qualifying income under subchapter M of the Code. However, the IRS has also issued private letter rulings to other taxpayers in which the IRS specifically concluded that income from certain commodity-linked notes is qualifying income and that income derived from a wholly owned subsidiary will also constitute qualifying income. Although those private letter rulings can be relied on only by the taxpayers to whom they were issued, based on the reasoning in such rulings, the The Russell Commodity Strategies Fund and the Russell Multi-Strategy Alternative Fund may seek to gain exposure to the commodity markets primarily through investments in commodity-linked instruments and through investments in their respective wholly owned subsidiaries. The Russell Commodity Strategies Fund has also requested its own such private letter ruling, although the IRS has suspended the issuance of such rulings pending further internal review. The Russell Multi-Strategy Alternative Fund has not requested such a ruling due to the IRS suspension. There can be no assurance that the IRS will issue the requested ruling to the Russell Commodity Strategies Fund, or that the IRS will not change its position based on private letter rulings that income derived from commodity-linked notes and wholly-owned subsidiaries is qualifying income. The ability of the Funds with commodity exposure to qualify for regulated investment company status under the Code could be jeopardized if they are unable to treat their income from commodity-linked instruments and a wholly-owned subsidiary as qualifying income. Furthermore, the tax treatment of commodity-linked instruments, other commodity-linked derivatives and the Funds with commodity exposure’s investments in their respective wholly owned subsidiaries may otherwise be adversely affected by future legislation, Treasury Regulations and/ or guidance issued by the IRS that could affect the character, timing and/or amount of the Funds’ taxable income or any gains and distributions made by the Funds with commodity exposure.
The Funds comply with the authoritative guidance for uncertainty in income taxes which requires management to determine whether a tax position of the Funds is more likely than not to be sustained upon examination, including resolution of any related appeals or litigation processes, based on the technical merits of the position. For tax positions meeting the more likely than not threshold, the tax amount recognized in the financial statements is reduced by the largest benefit that has a greater than 50% likelihood of being realized upon ultimate settlement with the relevant taxing authority. Management determined that no accruals need to be made in the financial statements due to uncertain tax positions. Management continually reviews and adjusts the Funds’ liability for income taxes based on analyses of tax laws and regulations, as well as their interpretations, and other relevant factors.
Each Fund files a U.S. tax return. At October 31, 2014, the Funds had recorded no liabilities for net unrecognized tax benefits relating to uncertain income tax positions they have taken or expect to take in future tax returns. While the statute of limitations remains open to examine the Funds’ U.S. tax returns filed for the fiscal years ended October 31, 2011 through October 31, 2013, no examinations are in progress or anticipated at this time. The Funds are not aware of any tax positions for which it is reasonably possible that the total amounts of unrecognized tax benefits will significantly change in the next twelve months.
Dividends and Distributions to Shareholders
For all Funds, income and capital gain distributions, if any, are recorded on the ex-dividend date. Income distributions are generally declared and paid according to the following schedule:
| Declared | Payable | Funds |
| Monthly | Early in the following month | Russell Global Opportunistic Credit, Russell Strategic Bond, |
| Russell Investment Grade Bond, Russell Short Duration Bond | ||
| and Russell Tax Exempt Bond Funds | ||
| Quarterly | April, July, October and December | Russell U.S. Core Equity, Russell U.S. Defensive Equity, Russell |
| U.S. Dynamic Equity, Russell U.S. Strategic Equity, Select U.S. | ||
| Equity, Russell U.S. Large Cap Equity, Russell U.S. Mid Cap | ||
| Equity, Russell Global Infrastructure, Russell Global Real Estate | ||
| Securities and Russell Strategic Call Overwriting Funds | ||
| Annually | Mid-December | Russell U.S. Small Cap Equity, Russell International Developed |
| Markets, Russell Global Equity, Select International Equity, | ||
| Russell Emerging Markets, Russell Tax-Managed U.S. Large Cap, | ||
| Russell Tax-Managed U.S. Mid & Small Cap, Russell Commodity | ||
| Strategies and Russell Multi-Strategy Alternative Funds |
Capital gain distributions are generally declared and paid annually. An additional distribution may be paid by the Funds to avoid imposition of federal income and excise tax on any remaining undistributed capital gains and net investment income.
The timing and characterization of certain income and capital gain distributions are determined in accordance with federal tax regulations which may differ from U.S. GAAP. As a result, net investment income and net realized gain (or loss) on investment
Notes to Financial Statements 691
Russell Investment Company Russell Funds
Notes to Financial Statements, continued — October 31, 2014
and foreign currency-related transactions for a reporting period may differ significantly from distributions during such period. The differences between tax regulations and U.S. GAAP primarily relate to investments in options, futures, forward contracts, swap contracts, passive foreign investment companies, foreign-denominated investments, mortgage-backed securities, certain securities sold at a loss, wash sale deferrals and capital loss carryforwards. Accordingly, the Funds may periodically make reclassifications among certain of their capital accounts without impacting their net asset values.
Expenses
The Funds pay their own expenses other than those expressly assumed by Russell Investment Management Company (“RIMCo”), the Funds’ adviser, or RFSC. Most expenses can be directly attributed to the individual Funds. Expenses which cannot be directly attributed to a specific Fund are allocated among all Funds principally based on their relative net assets.
Class Allocation
Each of the Funds presented herein may offer certain of the following classes of shares: Class A, Class C, Class E, Class I, Class S and Class Y. All share classes have identical voting, dividend, liquidation and other rights and the same terms and conditions. The separate classes of shares differ principally in the applicable transfer agent fees, distribution fees and shareholder servicing fees. Shareholders of each class bear certain expenses that pertain to that particular class. Realized and unrealized gains (losses), investment income and expenses, with the exception of class level expenses, are allocated daily to each class of shares based upon the relative proportion of net assets of each class.
Foreign Currency Translations
The books and records of the Funds are maintained in U.S. dollars. Foreign currency amounts and transactions of the Funds are translated into U.S. dollars on the following basis:
| (a) | Fair value of investment securities, other assets and liabilities at the closing rate of exchange on the valuation date. |
| (b) | Purchases and sales of investment securities and income at the closing rate of exchange prevailing on the respective trade |
dates of such transactions.
Net realized gains or losses from foreign currency-related transactions arise from: sales and maturities of short-term securities; sales of foreign currencies; currency gains or losses realized between the trade and settlement dates on securities transactions; the difference between the amounts of dividends, interest, and foreign withholding taxes recorded on the Funds’ books and the U.S. dollar equivalent of the amounts actually received or paid. Net unrealized gains or losses from foreign currency-related transactions arise from changes in the value of assets and liabilities, other than investments in securities, as a result of changes in the exchange rates.
The Funds do not isolate that portion of the results of operations of the Funds that arises as a result of changes in exchange rates from that portion that arises from changes in market prices of investments during the year. Such fluctuations are included with the net realized and unrealized gain or loss from investments. However, for federal income tax purposes, the Funds do isolate the effects of changes in foreign exchange rates from the fluctuations arising from changes in market prices for realized gain (or loss) on debt obligations.
Capital Gains Taxes
The Russell International Developed Markets, Russell Global Equity, Russell Emerging Markets, Russell Global Opportunistic Credit, Russell Global Infrastructure, Russell Global Real Estate Securities and Russell Multi-Strategy Alternative Funds may be subject to capital gains taxes and repatriation taxes imposed by certain countries in which they invest. The Funds may record a deferred capital gains tax liability with respect to the unrealized appreciation on foreign securities for potential capital gains and repatriation taxes at October 31, 2014. The accrual for capital gains and repatriation taxes is included in net unrealized appreciation (depreciation) on investments in the Statements of Assets and Liabilities. The amounts related to capital gains and repatriation taxes are included in net realized gain (loss) on investments in the Statements of Operations for the following Funds:
| Deferred Capital | |||||
| Gains Tax | Capital Gains | ||||
| Liability | Taxes | ||||
| Russell International Developed Markets Fund | $ | 228,742 | $ | 12,264 | |
| Russell Emerging Markets Fund | 3,980,275 | 1,818,682 | |||
| Russell Global Opportunistic Credit Fund | — | 2,698 | |||
| 692 Notes to Financial Statements | |||||
Russell Investment Company Russell Funds
Notes to Financial Statements, continued — October 31, 2014
| Deferred Capital | |||||
| Gains Tax | Capital Gains | ||||
| Liability | Taxes | ||||
| Russell Global Infrastructure Fund | 95,549 | 157,361 | |||
Derivatives
To the extent permitted by the investment objectives, restrictions and policies set forth in the Funds’ Prospectuses and Statement of Additional Information, the Funds may participate in various derivative-based transactions. Derivative securities are instruments or agreements whose value is derived from an underlying security or index. They include options, futures, swaps and forwards. These instruments offer unique characteristics and risks that facilitate the Funds’ investment strategies.
The Funds typically use derivatives in three ways: exposing cash to markets, hedging and return enhancement. In addition, certain Funds may enter into foreign exchange contracts for trade settlement purposes. The Funds, other than the Russell Tax Exempt Bond Fund, Russell Commodity Strategies Fund and Russell Multi-Strategy Alternative Fund, may pursue their strategy of being fully invested by exposing cash to the performance of appropriate markets by purchasing securities and/or derivatives. This is intended to cause the Funds to perform as though cash were actually invested in those markets.
Hedging may be used by certain Funds to limit or control risks, such as adverse movements in exchange rates and interest rates. Return enhancement can be accomplished through the use of derivatives in a Fund, including using derivatives as a substitute for holding physical securities, and using them to express various macro views (e.g., interest rate movements, currency movements, and macro credit strategies). By purchasing certain instruments, the Funds may more effectively achieve the desired portfolio characteristics that assist them in meeting their investment objectives. Depending on how the derivatives are structured and utilized, the risks associated with them may vary widely. These risks include, but are not limited to, market risk, liquidity risk, leveraging risk, counterparty risk, basis risk, reinvestment risk, political risk, prepayment risk, extension risk and credit risk.
Futures, certain options and cleared swaps are traded or cleared on an exchange or central exchange clearing house. Exchange-traded or cleared transactions generally present less counterparty risk to a Fund. The exchange’s clearinghouse stands between the Fund and the broker to the contract and therefore, credit risk is generally limited to the failure of the clearinghouse and the clearing member. Cleared swap contracts are subject to clearing house rules, including initial and variation margin requirement, daily settlement of obligations and the clearinghouse guarantee of payments to the broker. There is, however, still counterparty risk due to the insolvency of the broker with respect to any margin held in the brokers’ customer accounts. While clearing members are required to segregate customer assets from their own assets, in the event of insolvency, there may be a shortfall in the amount of margin held by the broker for its clients. Collateral and margin requirements for exchange-traded or exchange-cleared derivatives are established through regulation, as well as set by the broker or applicable clearinghouse. Margin for exchange-traded and exchange cleared transactions are detailed in the Statements of Assets and Liabilities as cash held at the broker for futures contracts and cash held at the broker for swap contracts, respectively. Securities pledged by a Fund for exchange-traded and cleared transactions are noted as collateral or margin requirements in the Schedule of Investments.
The effects of derivative instruments, categorized by risk exposure, on the Statements of Assets and Liabilities and the Statements of Operations, for the period ended October 31, 2014, if applicable, are disclosed in the Fair Value of Derivative Instruments table following each applicable Fund’s Schedule of Investments.
Foreign Currency Exchange Contracts
In connection with investment transactions consistent with the Funds’ investment objectives and strategies, certain Funds may enter into foreign currency exchange spot contracts and forward foreign currency exchange contracts (“FX contracts”). From time to time, certain Funds may enter into FX contracts to hedge certain foreign currency-denominated assets. FX contracts are recorded at fair value. Certain risks may arise upon entering into these FX contracts from the potential inability of counterparties to meet the terms of their FX contracts and are generally limited to the amount of unrealized gain on the FX contracts, if any, that are disclosed in the Statements of Assets and Liabilities.
For the period ended October 31, 2014, the following Funds entered into foreign currency exchange contracts primarily for the strategies listed below:
| Funds | Strategies |
| Russell International Developed Markets Fund | Exposing cash to markets and trade settlement |
| Russell Global Equity Fund | Exposing cash to markets and trade settlement |
Notes to Financial Statements 693
| Russell Investment Company | |
| Russell Funds | |
| Notes to Financial Statements, continued — October 31, 2014 | |
| Funds | Strategies |
| Select International Equity Fund | Exposing cash to markets and trade settlement |
| Russell Emerging Markets Fund | Exposing cash to markets and trade settlement |
| Russell Global Opportunistic Credit Fund | Return enhancement and hedging |
| Russell Strategic Bond Fund | Return enhancement and hedging |
| Russell Investment Grade Bond Fund | Return enhancement and hedging |
| Russell Short Duration Bond Fund | Return enhancement and hedging |
| Russell Global Infrastructure Fund | Exposing cash to markets and trade settlement |
| Russell Global Real Estate Securities Fund | Exposing cash to markets and trade settlement |
| Russell Multi-Strategy Alternative Fund | Return enhancement and hedging |
The Funds’ foreign currency contract notional dollar values outstanding fluctuate throughout the fiscal year as required to meet strategic requirements. The following tables illustrate the quarterly volume of foreign currency contracts. For the purpose of this disclosure, volume is measured by the amounts bought and sold in USD.
| Outstanding Contract Amounts Sold | |||||||||
| Quarter Ended | January 31, 2014 | April 30, 2014 | July 31, 2014 | October 31, 2014 | |||||
| Russell U.S. Defensive Equity Fund | $ | — $ | — $ | 802 | $ | — | |||
| Russell International Developed Markets Fund | 3,149,221,351 | 1,248,703,240 | 1,382,606,677 | 1,292,613,327 | |||||
| Russell Global Equity Fund | 419,070,117 | 385,995,771 | 381,337,149 | 358,399,617 | |||||
| Select International Equity Fund | — | — | - | 70,052,994 | — | ||||
| Russell Emerging Markets Fund | 1,203,877,799 | 724,566,182 | 438,357,503 | 346,530,098 | |||||
| Russell Global Opportunistic Credit Fund | 286,230,295 | 613,562,071 | 475,976,516 | 558,354,584 | |||||
| Russell Strategic Bond Fund | 2,392,913,199 | 4,604,708,717 | 4,218,802,341 | 3,910,414,733 | |||||
| Russell Investment Grade Bond Fund | 371,696,916 | 771,269,667 | 517,338,181 | 477,914,634 | |||||
| Russell Short Duration Bond Fund | 189,260,605 | 263,880,611 | 142,450,715 | 92,077,728 | |||||
| Russell Global Infrastructure Fund | 280,897,708 | 129,826,572 | 122,430,527 | 130,469,967 | |||||
| Russell Global Real Estate Securities Fund | 74,813,640 | 52,674,202 | 61,927,824 | 45,967,880 | |||||
| Russell Multi-Strategy Alternative Fund | 1,491,561,116 | 2,045,690,639 | 2,870,623,382 | 2,925,996,971 | |||||
| Outstanding Contract Amounts Bought | |||||||||
| Quarter Ended | January 31, 2014 | April 30, 2014 | July 31, 2014 | October 31, 2014 | |||||
| Russell U.S. Defensive Equity Fund | $ | — $ | — $ | 803 | $ | — | |||
| Russell International Developed Markets Fund | 3,144,141,858 | 1,252,471,497 | 1,380,546,147 | 1,277,982,125 | |||||
| Russell Global Equity Fund | 422,610,226 | 387,091,521 | 383,886,058 | 364,109,844 | |||||
| Select International Fund | — | — | 70,053,688 | — | |||||
| Russell Emerging Markets Fund | 1,200,059,754 | 726,443,978 | 438,879,872 | 347,519,645 | |||||
| Russell Global Opportunistic Credit Fund | 287,495,558 | 611,164,647 | 479,496,734 | 558,716,349 | |||||
| Russell Strategic Bond Fund | 2,397,101,486 | 4,596,605,000 | 4,228,643,514 | 3,909,873,912 | |||||
| Russell Investment Grade Bond Fund | 372,234,885 | 770,741,231 | 518,351,674 | 477,402,268 | |||||
| Russell Short Duration Bond Fund | 190,345,452 | 263,286,186 | 142,979,798 | 92,793,045 | |||||
| Russell Global Infrastructure Fund | 279,766,254 | 130,168,988 | 122,307,446 | 129,732,970 | |||||
| Russell Global Real Estate Securities Fund | 74,478,935 | 52,852,531 | 61,788,615 | 45,420,992 | |||||
| Russell Multi-Strategy Alternative Fund | 1,496,548,853 | 2,044,645,211 | 2,868,754,568 | 2,935,412,927 | |||||
Options
The Funds may purchase and sell (write) call and put options on securities and securities indices, provided such options are traded on a national securities exchange or in an over-the-counter market. The Funds may also purchase and sell (write) call and put options on foreign currencies.
When a Fund writes a covered call or a put option, an amount equal to the premium received by the Fund is included in the Fund’s Statement of Assets and Liabilities as an asset and as an equivalent liability. The amount of the liability is subsequently marked-to-market to reflect the current fair value of the option written. The Fund receives a premium on the sale of a call option but gives up the opportunity to profit from any increase in the value of the underlying instrument above the exercise price of the option, and when the Fund writes a put option it is exposed to a decline in the price of the underlying instrument.
694 Notes to Financial Statements
Russell Investment Company Russell Funds
Notes to Financial Statements, continued — October 31, 2014
Whether an option which the Fund has written expires on its stipulated expiration date or the Fund enters into a closing purchase transaction, the Fund realizes a gain (or loss, if the cost of a closing purchase transaction exceeds the premium received when the option was sold) without regard to any unrealized gain or loss on the underlying security, and the liability related to such option is extinguished. If a call option which the Fund has written is exercised, the Fund realizes a capital gain or loss from the sale of the underlying security, and the proceeds from such sale are increased by the premium originally received. When a put option which a Fund has written is exercised, the amount of the premium originally received will reduce the cost of the security which a Fund purchases upon exercise of the option.
The Funds’ use of written options involves, to varying degrees, elements of market risk in excess of the amount recognized in the Statements of Assets and Liabilities. The face or contract amounts of these instruments reflect the extent of the Funds’ exposure to market risk. The risks may be caused by an imperfect correlation between movements in the price of the instrument and the price of the underlying securities and interest rates.
A Fund may enter into a swaption (swap option). In a swaption, the buyer gains the right but not the obligation to enter into a specified swap agreement with the issuer on a specified future date. The writer of the contract receives the premium and bears the risk of unfavorable changes in the preset rate on the underlying interest rate swap.
As of October 31, 2014, the Russell Strategic Call Overwriting Fund pledged securities valued at $31,795,370 as collateral in connection with options.
For the period ended October 31, 2014, the Funds purchased/sold options primarily for the strategies listed below:
| Funds | Strategies |
| Russell U.S. Defensive Equity Fund | Exposing cash to markets |
| Russell Global Opportunistic Credit Fund | Return enhancement and hedging |
| Russell Strategic Bond Fund | Return enhancement and hedging |
| Russell Investment Grade Bond Fund | Return enhancement and hedging |
| Russell Short Duration Bond Fund | Return enhancement and hedging |
| Russell Multi-Strategy Alternative Fund | Return enhancement and hedging |
| Russell Strategic Call Overwriting Fund | Return enhancement and hedging |
The Funds’ options contracts outstanding fluctuate throughout the fiscal year as required to meet strategic requirements. The following table illustrates the quarterly volume of options contracts. For purpose of this disclosure, volume is measured by contracts outstanding at period end.
| Number of Options Contracts Outstanding | |||||
| Quarter Ended | January 31, 2014 | April 30, 2014 | July 31, 2014 | October 31, 2014 | |
| Russell U.S. Defensive Equity Fund | — | 84 | 102 | 167 | |
| Russell Global Opportunistic Credit Fund | 6 | — | — | — | |
| Russell Strategic Bond Fund | 234 | 102 | 22 | 6 | |
| Russell Investment Grade Bond Fund | 87 | 51 | 6 | 6 | |
| Russell Short Duration Bond Fund | 527 | 469 | 3 | — | |
| Russell Multi-Strategy Alternative Fund | 19,608 | 18,840 | 18,843 | 15,223 | |
| Russell Strategic Call Overwriting Fund | 5,600 | 9,215 | 9,670 | 9,215 | |
Futures Contracts
The Funds may invest in futures contracts (i.e., interest rate, foreign currency, index futures contracts) and commodity futures contracts (Russell Commodity Strategies Fund and Russell Multi-Strategy Alternative Fund only). The face or contract amounts of these instruments reflect the extent of the Funds’ exposure to off balance sheet risk. The primary risks associated with the use of futures contracts are an imperfect correlation between the change in fair value of the securities held by the Funds and the prices of futures contracts and the possibility of an illiquid market. Upon entering into a futures contract, the Funds are required to deposit with a broker an amount, termed the initial margin, which typically represents 5% to 10% of the purchase price indicated in the futures contract. Payments to and from the broker, known as variation margin, are typically required to be made on a daily basis as the price of the futures contract fluctuates. Changes in initial settlement value are accounted for as unrealized appreciation (depreciation) until the contracts are terminated, at which time realized gains and losses are recognized.
For the period ended October 31, 2014, the following Funds entered into futures contracts primarily for the strategies listed below:
Notes to Financial Statements 695
| Russell Investment Company | |
| Russell Funds | |
| Notes to Financial Statements, continued — October 31, 2014 | |
| Funds | Strategies |
| Russell U.S. Core Equity Fund | Exposing cash to markets |
| Russell U.S. Defensive Equity Fund | Exposing cash to markets |
| Russell U.S. Dynamic Equity Fund | Exposing cash to markets |
| Russell U.S. Strategic Equity Fund | Exposing cash to markets |
| Select U.S. Equity Fund | Exposing cash to markets |
| Russell U.S. Large Cap Equity Fund | Exposing cash to markets |
| Russell U.S. Mid Cap Equity Fund | Exposing cash to markets |
| Russell U.S. Small Cap Equity Fund | Exposing cash to markets |
| Russell International Developed Markets Fund | Return enhancement and exposing cash to markets |
| Russell Global Equity Fund | Return enhancement and exposing cash to markets |
| Select International Equity Fund | Return enhancement and exposing cash to markets |
| Russell Emerging Markets Fund | Exposing cash to markets |
| Russell Tax-Managed U.S. Large Cap Fund | Exposing cash to markets |
| Russell Tax-Managed U.S. Mid & Small Cap Fund | Exposing cash to markets |
| Russell Global Opportunistic Credit Fund | Return enhancement and exposing cash to markets |
| Russell Strategic Bond Fund | Return enhancement, hedging and exposing cash to markets |
| Russell Investment Grade Bond Fund | Return enhancement, hedging and exposing cash to markets |
| Russell Short Duration Bond Fund | Return enhancement, hedging and exposing cash to markets |
| Russell Commodity Strategies Fund | Return enhancement |
| Russell Global Infrastructure Fund | Exposing cash to markets |
| Russell Global Real Estate Securities Fund | Exposing cash to markets |
| Russell Multi-Strategy Alternative Fund | Return enhancement and hedging |
| Russell Strategic Call Overwriting Fund | Hedging and exposing cash to markets |
The Funds' futures contracts outstanding fluctuate throughout the fiscal year as required to meet strategic requirements. The following table illustrates the quarterly volume of futures contracts. For purpose of this disclosure, volume is measured by contracts outstanding at period end.
| Number of Futures Contracts Outstanding | ||||
| Quarter Ended | January 31, 2014 | April 30, 2014 | July 31, 2014 | October 31, 2014 |
| Russell U.S. Core Equity Fund | 1,049 | 834 | 629 | 655 |
| Russell U.S. Defensive Equity Fund | 501 | — | 129 | 193 |
| Russell U.S. Dynamic Equity Fund | 696 | 279 | 334 | 236 |
| Russell U.S. Strategic Equity Fund | 1,730 | 2,287 | 1,567 | 1,675 |
| Select U.S. Equity Fund | — | — | 28 | 56 |
| Russell U.S. Large Cap Equity Fund | 366 | 355 | 325 | 311 |
| Russell U.S. Mid Cap Equity Fund | 65 | 103 | 92 | 67 |
| Russell U.S. Small Cap Equity Fund | 1,115 | 1,119 | 1,989 | 1,143 |
| Russell International Developed Markets Fund | 11,391 | 7,430 | 9,086 | 8,189 |
| Russell Global Equity Fund | 8,811 | 10,032 | 9,475 | 10,025 |
| Select International Equity Fund | — | — | — | 71 |
| Russell Emerging Markets Fund | 7,655 | 3,802 | 3,367 | 3,070 |
| Russell Tax-Managed U.S. Large Cap Fund | 891 | 738 | 1,006 | 925 |
| Russell Tax-Managed U.S. Mid & Small Cap Fund | 192 | 193 | 221 | 180 |
| Russell Global Opportunistic Credit Fund | 563 | 484 | 1,093 | 1,023 |
| Russell Strategic Bond Fund | 20,898 | 27,866 | 25,161 | 15,576 |
| Russell Investment Grade Bond Fund | 2,521 | 3,762 | 1,717 | 1,709 |
| Russell Short Duration Bond Fund | 5,656 | 5,806 | 3,582 | 1,991 |
| Russell Commodity Strategies Fund | 984 | 374 | 260 | — |
| Russell Global Infrastructure Fund | 839 | 648 | 771 | 661 |
| Russell Global Real Estate Securities Fund | 763 | 580 | 678 | 570 |
| Russell Multi-Strategy Alternative Fund | 21,209 | 13,544 | 14,235 | 8,748 |
| Russell Strategic Call Overwriting Fund | 42 | 28 | 73 | 77 |
Swap Agreements
The Funds may enter into swap agreements, on either an asset-based or liability-based basis, depending on whether they are hedging their assets or their liabilities, and will usually enter into swaps on a net basis, i.e., the two payment streams are netted out,with the Funds receiving or paying, as the case may be, only the net amount of the two payments. When a Fund engages in a swap, it exchanges its obligations to pay or rights to receive payments for the obligations or rights to receive payments of another party (i.e., an exchange of floating rate payments for fixed rate payments).
696 Notes to Financial Statements
Russell Investment Company Russell Funds
Notes to Financial Statements, continued — October 31, 2014
Certain Funds may enter into several different types of swap agreements including credit default, interest rate, commodity-linked (Russell Commodity Strategies Fund and Russell Multi-Strategy Alternative Fund only), index (total return) and currency swaps. Credit default swaps are a counterparty agreement which allows the transfer of third party credit risk (the possibility that an issuer will default on its obligation by failing to pay principal or interest in a timely manner) from one party to another. The lender faces the credit risk from a third party and the counterparty in the swap agrees to insure this risk in exchange for regular periodic payments. Interest rate swaps are a counterparty agreement, can be customized to meet each party’s needs, and involve the exchange of a fixed or variable payment per period for a payment that is not fixed. Index swap agreements are a counterparty agreement intended to expose cash to markets or to effect investment transactions consistent with those Funds’ investment objectives and strategies. Currency swaps are an agreement where two parties exchange specified amounts of different currencies which are followed by each paying the other a series of interest payments that are based on the principal cash flow. At maturity the principal amounts are returned.
The Funds expect to enter into these transactions primarily to preserve a return or spread on a particular investment or to protect against any increase in the price of securities they anticipate purchasing at a later date, or for return enhancement. The net amount of the excess, if any, of the Funds’ obligations over their entitlements with respect to each swap will be accrued on a daily basis and an amount of cash or liquid assets having an aggregate NAV at least equal to the accrued excess will be segregated. To the extent that the Funds enter into swaps on other than a net basis, the amount earmarked on the Funds’ records will be the full amount of the Funds’ obligations, if any, with respect to such swaps, accrued on a daily basis. If there is a default by the other party to such a transaction, the Funds will have contractual remedies pursuant to the agreement related to the transaction.
A Fund may not receive the expected amount under a swap agreement if the other party to the agreement defaults or becomes bankrupt. The market for swap agreements is largely unregulated. The Funds may enter into swap agreements with counterparties that meet the credit quality limitations of RIMCo. The Funds will not enter into any swap unless the counterparty has a minimum senior unsecured credit rating or long term counterparty credit rating, including reassignments, of BBB- or better as defined by Standard & Poor’s or an equivalent rating from any nationally recognized statistical rating organization (using highest of split ratings) at the time of entering into such transaction.
Credit Default Swaps
The fixed income funds and the Russell Multi-Strategy Alternative Fund may enter into credit default swaps. A credit default swap can refer to corporate issues, sovereign issues, asset-backed securities or an index of assets, each known as the reference entity or underlying asset. Funds may act as either the buyer or the seller of a credit default swap involving one party making a stream of payments to another party in exchange for the right to receive a specified return in the event of a default or other credit event. Depending upon the terms of the contract, the credit default swap may be closed via physical settlement. However, due to the possible or potential instability in the market, there is a risk that the Funds may be unable to deliver the underlying debt security to the other party to the agreement. Additionally, the Funds may not receive the expected amount under the swap agreement if the other party to the agreement defaults or becomes bankrupt. In an unhedged credit default swap, Funds enter into a credit default swap without owning the underlying asset or debt issued by the reference entity. Credit default swaps allow Funds to acquire or reduce credit exposure to a particular issuer, asset or basket of assets.
As the seller of protection in a credit default swap, a Fund would be required to pay the par or other agreed-upon value (or otherwise perform according to the swap contract) of a reference debt obligation to the counterparty in the event of a default (or other specified credit event); the counterparty would be required to surrender the reference debt obligation. In return, the Fund would receive from the counterparty a periodic stream of payments over the term of the contract provided that no credit event has occurred. If no credit event occurs, the Fund would keep the stream of payments and would have no payment obligations. As a seller of protection, the Fund would effectively add leverage to its portfolio because in addition to its total net assets, that Fund would be subject to investment exposure on the notional amount of the swap.
Each fixed income fund and the Russell Multi-Strategy Alternative Fund may also purchase protection via credit default swap contracts in order to offset the risk of default of debt securities held in its portfolio or to take a short position in a debt security, in which case the Fund would function as the counterparty referenced in the preceding paragraph.
If a credit event occurs and cash settlement is not elected, a variety of other obligations may be delivered in lieu of the specific referenced obligation. The ability to deliver other obligations may result in a cheapest-to-deliver option (the buyer of protection’s right to choose the deliverable obligation with the lowest value following a credit event). The Funds may use credit default swaps to provide a measure of protection against defaults of the issuers (i.e., to reduce risk where Funds own or have exposure to the
Notes to Financial Statements 697
Russell Investment Company Russell Funds
Notes to Financial Statements, continued — October 31, 2014
referenced obligation) or to take an active long or short position with respect to the likelihood (as measured by the credit default swap’s spread) of a particular issuer’s default.
Deliverable obligations for credit default swaps on asset-backed securities in most instances are limited to the specific referenced obligation as performance for asset-backed securities can vary across deals. Prepayments, principal paydowns, and other writedown or loss events on the underlying mortgage loans will reduce the outstanding principal balance of the referenced obligation. These reductions may be temporary or permanent as defined under the terms of the swap agreement and the notional amount for the swap agreement generally will be adjusted by corresponding amounts. The fixed income funds and the Russell Multi-Strategy Alternative Fund may use credit default swaps on asset-backed securities to provide a measure of protection against defaults (or other defined credit events) of the referenced obligation or to take an active long or short position with respect to the likelihood of a particular referenced obligation’s default (or other defined credit events).
Credit default swap agreements on credit indices involve one party making a stream of payments to another party in exchange for the right to receive a specified return in the event of a write-down, principal shortfall, interest shortfall or default of all or part of the referenced entities comprising the credit index. A credit index is a basket of credit instruments or exposures designed to be representative of some part of the credit market as a whole. These indices are made up of reference credits that are judged by a poll of dealers to be the most liquid entities in the credit default swap market based on the sector of the index. Components of the indices may include, but are not limited to, investment grade securities, high yield securities, asset-backed securities, emerging markets, and/or various credit ratings within each sector. Credit indices are traded using credit default swaps with standardized terms including a fixed spread and standard maturity dates. An index credit default swap references all the names in the index, and if there is a default, the credit event is settled based on that name’s weight in the index. The composition of the indices changes periodically, usually every six months, and for most indices, each name has an equal weight in the index. Traders may use credit default swaps on indices to speculate on changes in credit quality.
Implied credit spreads, represented in absolute terms, utilized in determining the fair value of credit default swap agreements on corporate issues as of period end are disclosed in the Schedules of Investments and generally serve as an indicator of the current status of the payment/performance risk and represent the likelihood or risk of default (or other defined credit event) for the credit derivative. The implied credit spread of a particular referenced entity reflects the cost of entering into a credit default swap and may include upfront payments required to be made to enter into the agreement. For credit default swap agreements on asset-backed securities and credit indices, the quoted market prices and resulting values serve as the indicator of the current status of the payment/performance risk. Wider credit spreads and increasing fair values, in absolute terms when compared to the notional amount of the swap, generally represent a deterioration of the referenced entity’s credit soundness and a greater likelihood or risk of default or other credit event occurring as defined under the terms of the agreement. The maximum potential amount of future payments (undiscounted) that Funds as a seller of protection could be required to make under a credit default swap agreement equals the notional amount of the agreement. Notional amounts of all credit default swap agreements outstanding as of October 31, 2014, for which a Fund is the seller of protection are disclosed in the Schedules of Investments. These potential amounts would be partially offset by any recovery values of the respective referenced obligations, upfront payments received upon entering into the agreement, or net amounts received from the settlement of buy protection credit default swap agreements entered into by a Fund for the same referenced entity or entities.
Credit default swaps could result in losses if the Funds do not correctly evaluate the creditworthiness of the company or companies on which the credit default swap is based. Credit default swap agreements may involve greater risks than if the Funds had invested in the reference obligation directly since, in addition to risks relating to the reference obligation, credit default swaps are subject to illiquidity and counterparty risk. A Fund will generally incur a greater degree of risk when it sells a credit default swap than when it purchases a credit default swap. As a buyer of a credit default swap, a Fund may lose its investment and recover nothing should a credit event fail to occur and the swap is held to its termination date. As seller of a credit default swap, if a credit event were to occur, the value of any deliverable obligation received by a Fund, coupled with the upfront or periodic payments previously received, may be less than what it pays to the buyer, resulting in a loss of value to the Fund.
If the creditworthiness of a Fund’s swap counterparty declines, the risk that the counterparty may not perform could increase, potentially resulting in a loss to the Fund. To limit the counterparty risk involved in swap agreements, the Funds will only enter into swap agreements with counterparties that meet certain standards of creditworthiness. Although there can be no assurance that the Funds will be able to do so, the Funds may be able to reduce or eliminate their exposure under a swap agreement either by assignment or other disposition, or by entering into an offsetting swap agreement with the same party or another creditworthy party.
698 Notes to Financial Statements
Russell Investment Company Russell Funds
Notes to Financial Statements, continued — October 31, 2014
| The Funds may have limited ability to eliminate their exposure under a credit default swap if the credit of the reference entity or | ||||
| underlying asset has declined. | ||||
| For the period ended October 31, 2014, the Funds entered into credit default swaps primarily for the strategies listed below: | ||||
| Funds | Strategies | |||
| Russell Global Opportunistic Credit Fund | Exposing cash to markets | |||
| Russell Strategic Bond Fund | Return enhancement, hedging and exposing cash to markets | |||
| Russell Investment Grade Bond Fund | Return enhancement, hedging and exposing cash to markets | |||
| Russell Short Duration Bond Fund | Return enhancement and hedging | |||
| Russell Multi-Strategy Alternative Fund | Return enhancement and hedging | |||
| The Funds credit default swap contract notional amounts outstanding fluctuate throughout the fiscal year as required to meet | ||||
| strategic requirements. The following table illustrates the quarterly volume of credit default swap contracts. For the purpose of this | ||||
| disclosure, the volume is measured by the local notional amounts outstanding at each quarter end. | ||||
| Credit Default Swap Notional Amounts Outstanding | ||||
| Quarter Ended | January 31, 2014 | April 30, 2014 | July 31, 2014 | October 31, 2014 |
| Russell Global Opportunistic Credit Fund | 115,000,000 | 95,000,000 | 116,000,000 | 75,000,000 |
| Russell Strategic Bond Fund | 98,806,448 | 397,500,448 | 240,545,448 | 5,620,000 |
| Russell Investment Grade Bond Fund | 28,264,499 | 112,314,499 | 7,000,000 | — |
| Russell Short Duration Bond Fund | 52,792,900 | 113,525,441 | 111,078,574 | — |
| Russell Multi-Strategy Alternative Fund | 316,000,000 | 499,000,000 | 527,300,000 | 859,800,000 |
| Interest Rate Swaps | ||||
| The use of interest rate swaps is a highly specialized activity which involves investment techniques and risks different from those | ||||
| associated with ordinary portfolio securities transactions. If RIMCo or a money manager using this technique is incorrect in its | ||||
| forecast of fair values, interest rates and other applicable factors, the investment performance of a Fund might diminish compared | ||||
| to what it would have been if this investment technique were not used. | ||||
| Interest rate swaps do not involve the delivery of securities or other underlying assets or principal. Accordingly, the risk of loss with | ||||
| respect to interest rate swaps is limited to the net amount of interest payments that the Funds are contractually obligated to make. | ||||
| If the other party to an interest rate swap defaults, the Funds’ risk of loss consists of the net amount of interest payments that the | ||||
| Funds are contractually entitled to receive. Since interest rate swaps are individually negotiated, the Funds expect to achieve an | ||||
| acceptable degree of correlation between their rights to receive interest on their portfolio securities and their rights and obligations | ||||
| to receive and pay interest pursuant to interest rate swaps. Certain standardized swaps, including interest rate swaps, are subject | ||||
| to mandatory clearing, and more are expected to be in the future. The counterparty risk for cleared derivatives are generally lower | ||||
| than for uncleared derivatives. However, clearing may subject the Fund to increased costs or margin requirements. | ||||
| For the period ended October 31, 2014, the Funds entered into interest rate swaps primarily for the strategies listed below: | ||||
| Funds | Strategies | |||
| Russell Strategic Bond Fund | Return enhancement and hedging | |||
| Russell Investment Grade Bond Fund | Return enhancement and hedging | |||
| Russell Short Duration Bond Fund | Return enhancement and hedging | |||
| Russell Multi-Strategy Alternative Fund | Return enhancement and hedging | |||
| The Funds’ interest rate swap contract notional amounts outstanding fluctuate throughout the fiscal year as required to meet | ||||
| strategic requirements. The following table illustrates the quarterly volume of interest rate swap contracts. For the purpose of this | ||||
| disclosure, the volume is measured by the local notional amounts outstanding at each quarter end. | ||||
| Interest Rate Swap Notional Amounts Outstanding | ||||
| Quarter Ended | January 31, 2014 | April 30, 2014 | July 31, 2014 | October 31, 2014 |
| Russell Strategic Bond Fund | 1,637,195,000 | 1,594,030,000 | 4,085,740,000 | 20,286,055,000 |
| Russell Investment Grade Bond Fund | 502,330,000 | 192,330,000 | 14,330,000 | 14,330,000 |
| Russell Short Duration Bond Fund | 339,406,000 | 318,625,000 | 348,700,000 | — |
| Russell Multi-Strategy Alternative Fund | 2,303,700,000 | 36,917,900,000 | 99,805,900,000 | 95,055,300,000 |
| Notes to Financial Statements 699 | ||||
Russell Investment Company Russell Funds
Notes to Financial Statements, continued — October 31, 2014
| Index Swaps | ||||||||||
| Certain Funds may enter into index swap agreements to expose cash to markets or to effect investment transactions consistent | ||||||||||
| with these Funds’ investment objectives and strategies. Index swap agreements are two party contracts entered into primarily by | ||||||||||
| institutional investors for periods ranging from a few weeks to more than one year. In a standard index swap transaction, the two | ||||||||||
| parties agree to exchange the returns (or differentials in rates of return) earned or realized on particular investments or instruments. | ||||||||||
| The returns to be exchanged between the parties are calculated with respect to a “notional amount” (i.e., a specified dollar amount | ||||||||||
| that is hypothetically invested in a “basket” of securities representing a particular index). | ||||||||||
| For the period ended October 31, 2014, the Funds entered into index swaps primarily for the strategies listed below: | ||||||||||
| Funds | Strategies | |||||||||
| Russell Emerging Markets Fund | Exposing cash to markets | |||||||||
| Russell Strategic Bond Fund | Exposing cash to markets | |||||||||
| Russell Investment Grade Bond Fund | Exposing cash to markets | |||||||||
| Russell Commodity Strategies Fund | Return enhancement | |||||||||
| Russell Global Real Estate Securities Fund | Exposing cash to markets | |||||||||
| Russell Multi-Strategy Alternative Fund | Return enhancement and hedging | |||||||||
| The Funds’ index swap contract notional amounts outstanding fluctuate throughout the fiscal year as required to meet strategic | ||||||||||
| requirements. The following table illustrates the quarterly volume of index swap contracts. For the purpose of this disclosure, | ||||||||||
| volume is measured by local notional amounts outstanding at each quarter end. | ||||||||||
| Index Swap Notional Amounts Outstanding | ||||||||||
| Quarter Ended | January 31, 2014 | April 30, 2014 | July 31, 2014 | October 31, 2014 | ||||||
| Russell Emerging Markets Fund | 63,594,916 | 36,270,029 | 38,863,377 | 41,327,971 | ||||||
| Russell Strategic Bond Fund | 567,675,880 | 547,656,301 | 634,290,642 | 748,625,000 | ||||||
| Russell Investment Grade Bond Fund | 149,566,327 | 69,904,452 | 84,346,150 | 94,305,000 | ||||||
| Russell Commodity Strategies Fund | 1,141,593,313 | 1,205,598,327 | 1,157,923,717 | 1,043,950,168 | ||||||
| Russell Global Real Estate Securities Fund | 12,370,124 | 13,399,334 | 14,048,226 | 14,546,168 | ||||||
| Russell Multi-Strategy Alternative Fund | 5,434,171 | 8,960,468 | 14,677,878 | 6,587,140 | ||||||
| Currency Swaps | ||||||||||
| Certain Funds may enter into currency swap agreements to enhance returns or for hedging purposes. Currency swap agreements are | ||||||||||
| agreements where two parties exchange specified amounts of different currencies which are followed by paying the other a series of | ||||||||||
| interest payments that are based on the principal cash flow. At maturity, the principal amounts are exchanged. | ||||||||||
| For the period ended October 31, 2014, the Funds entered into currency swaps primarily for the strategies listed below: | ||||||||||
| Funds | Strategies | |||||||||
| Russell Multi-Strategy Alternative Fund | Return enhancement and hedging | |||||||||
| The following tables illustrate the quarterly volume of currency swaps contracts. For the purpose of this disclosure, volume is | ||||||||||
| measured by the amounts bought and sold in USD. | ||||||||||
| Outstanding Contract Amounts Bought | ||||||||||
| Quarter Ended | January 31, 2014 | April 30, 2014 | July 31, 2014 | October 31, 2014 | ||||||
| Russell Multi-Strategy Alternative Fund | $ | — $ | 11,839,644 | $ | 11,666,978 | $ | — | |||
| Outstanding Contract Amounts Sold | ||||||||||
| Quarter Ended | January 31, 2014 | April 30, 2014 | July 31, 2014 | October 31, 2014 | ||||||
| Russell Multi-Strategy Alternative Fund | $ | — $ | 11,941,720 | $ | 12,011,723 | $ | — | |||
| Commodity-Linked Instruments | ||||||||||
| The Russell Commodity Strategies and the Russell Multi-Strategy Alternative Funds invest in commodity-linked derivative | ||||||||||
| instruments, such as swap agreements and futures. At least part of their value is derived from the value of an underlying commodity | ||||||||||
| index, commodity futures contract, or other readily measurable economic variable. The prices of commodity-linked derivative | ||||||||||
| instruments may move in different directions than investments in traditional equity and debt securities when the value of those | ||||||||||
| traditional securities is declining due to adverse economic conditions. As an example, during periods of rising inflation, debt | ||||||||||
| securities have historically tended to decline in value due to the general increase in prevailing interest rates. Conversely, during | ||||||||||
| 700 Notes to Financial Statements | ||||||||||
Russell Investment Company Russell Funds
Notes to Financial Statements, continued — October 31, 2014
those same periods of rising inflation, historically the prices of certain commodities, such as oil and metals, have tended to increase. Of course, there cannot be any guarantee that such commodity-linked derivative instruments will perform in that manner in the future, and at certain times the price movements of commodity-linked derivative investments have been parallel to those of debt and equity securities.
The Russell Commodity Strategies and the Russell Multi-Strategy Alternative Funds may invest in commodity-linked notes. Commodity linked notes pay a return linked to the performance of a commodity over a defined period. On the maturity date, the note pays the initial principal amount plus return, if any, based on the percentage change in the underlying commodity.
Master Agreements
The Funds are parties to International Swaps and Derivatives Association, Inc. Master Agreements (“ISDA Master Agreements”) with counterparties that govern transactions in over-the-counter derivative and foreign exchange contracts entered into by the Funds and those counterparties. The ISDA Master Agreements contain provisions for general obligations, representations, agreements, collateral and events of default or termination. Events of termination include conditions that may entitle counterparties to elect to terminate early and cause settlement of all outstanding transactions under the applicable ISDA Master Agreement. Any election to terminate early could be material to the financial statements. Since different types of forward and OTC financial derivative transactions have different mechanics and are sometimes traded out of different legal entities of a particular counterparty organization, each type of transaction may be covered by a different ISDA Master Agreement, resulting in the need for multiple agreements with a single counterparty. As the ISDA Master Agreements are specific to unique operations of different asset types, they allow a Fund to net its total exposure to a counterparty in the event of a default with respect to all the transactions governed under a single agreement with a counterparty.
Master Repurchase Agreements (“Master Repo Agreements”) govern transactions between a Fund and select counterparties. The Master Repo Agreements maintain provisions for, among other things, initiation, income payments, events of default, and maintenance of collateral for repurchase and reverse repurchase agreements.
Master Securities Forward Transaction Agreements (“Master Forward Agreements”) govern the considerations and factors surrounding the settlement of certain forward settling transactions, such as delayed delivery by and between a Fund and select counterparties. The Master Forward Agreements maintain provisions for, among other things, initiation and confirmation, payment and transfer, events of default, termination, and maintenance of collateral.
Disclosure about Offsetting Assets and Liabilities
Balance sheet disclosure is based on various netting agreements between brokers and counterparties, such as ISDA, Master Repo and Master Forward Agreements. Certain funds employ multiple counterparties. The quantitative disclosure begins with disaggregation of counterparties by legal entity and the roll up of the data to reflect a single counterparty in the table within the Funds’ financial statements. Net exposure represents the net receivable (payable) that would be due from/to the counterparty in the event of default. Exposure from OTC derivatives can only be netted across transactions governed under the same Master Agreement with the same legal entity.
Loan Agreements
The Russell Global Opportunistic Credit, Russell Strategic Bond, Russell Investment Grade Bond, Russell Short Duration Bond and Russell Multi-Strategy Alternative Funds may invest in direct debt instruments, which are interests in amounts owed by corporate, governmental, or other borrowers to lenders or lending syndicates. The Funds' investments in loans may be in the form of participations in loans or assignments of all or a portion of loans from third parties. A loan is often administered by a bank or other financial institution (the “agent”) that acts as agent for all holders. The agent administers the terms of the loan, as specified in the loan agreement. When investing in a loan participation, the Funds have the right to receive payments of principal, interest and any fees to which they are entitled only from the agent selling the loan agreement and only upon receipt by the agent of payments from the borrower. The Funds generally have no right to enforce compliance with the terms of the loan agreement with the borrower. As a result, the Funds may be subject to the credit risk of both the borrower and the agent that is selling the loan agreement. When the Funds purchase assignments from agents they acquire direct rights against the borrower on the loan. As of October 31, 2014, the Russell Short Duration Bond Fund had $65,098 and the Russell Multi-Strategy Alternative Fund had $41,977 in unfunded loan commitments.
Notes to Financial Statements 701
Russell Investment Company Russell Funds
Notes to Financial Statements, continued — October 31, 2014
Certificates of Participation
Certain Funds may purchase certificates of participation, also known as participation notes or participation interest notes. Certificates of participation are issued by banks or broker-dealers and are designed to replicate the performance of foreign companies or foreign securities markets and can be used by the Fund as an alternative means to access the securities market of a frontier emerging market country. The performance results of certificates of participation will not replicate exactly the performance of the foreign companies or foreign securities markets that they seek to replicate due to transaction and other expenses. Investments in certificates of participation involve certain risks in addition to those associated with a direct investment in the underlying foreign companies or foreign securities markets whose return they seek to replicate. There can be no assurance that there will be a trading market or that the trading price of certificates of participation will equal the underlying value of the foreign company or foreign securities market that it seeks to replicate. The Funds rely on the creditworthiness of the counterparty issuing the certificates of participation and have no rights against the issuer of the underlying security. The Funds minimize this risk by entering into agreements only with counterparties that RIMCo deems creditworthy. Due to liquidity and transfer restrictions, the secondary markets on which the certificates of participation are traded may be less liquid than the markets for other securities, or may be completely illiquid.
Credit linked Notes
The Russell Global Opportunistic Credit and Russell Multi-Strategy Alternative Funds may purchase credit linked notes. Credit linked notes are obligations between two or more parties where the payment of principal and/or interest is based on the performance of some obligation, basket of obligations, index or economic indicator (a “reference instrument”). In addition to the credit risk associated with the reference instrument and interest rate risk, the buyer and seller of a credit linked note or similar structured investment are subject to counterparty risk.
Short Sales
The Russell U.S. Dynamic Equity, Russell U.S. Strategic Equity and Russell Multi-Strategy Alternative Funds may enter into short sale transactions. In a short sale, the seller sells a security that it does not own, typically a security borrowed from a broker or dealer. Because the seller remains liable to return the underlying security that it borrowed from the broker or dealer, the seller must purchase the security prior to the date on which delivery to the broker or dealer is required. The Funds will incur a loss as a result of the short sale if the price of the security increases between the date of the short sale and the date on which the Funds must return the borrowed security. The Funds will realize a gain if the security declines in price between those dates. Short sales expose the Funds to the risk of liability for the fair value of the security that is sold (the amount of which increases as the fair value of the underlying security increases), in addition to the costs associated with establishing, maintaining and closing out the short position.
Although the Funds’ potential for gain as a result of a short sale is limited to the price at which it sold the security short less the cost of borrowing the security, its potential for loss is theoretically unlimited because there is no limit to the cost of replacing the borrowed security. When the Funds make a short sale, the Funds may use all or a portion of the cash proceeds of short sales to purchase other securities or for any other permissible Fund purpose. To the extent necessary to meet collateral requirements, the Funds are required to pledge assets in a segregated account maintained by the Funds’ custodian for the benefit of the broker. The Funds also may use securities they own to meet any such collateral obligations. Until the Funds replace a borrowed security in connection with a short sale, the Funds will: (a) maintain daily a segregated account, containing liquid assets at such a level that the amount deposited in the segregated account plus the amount deposited with the broker as collateral will equal the current requirement under Regulation T promulgated by the Board of Governors of the Federal Reserve System under the authority of Sections 7 and 8 of the Securities Exchange Act of 1934, as amended; or (b) otherwise cover its short position in accordance with positions taken by the staff of the Securities and Exchange Commission (e.g., taking an offsetting long position in the security sold short). As of October 31, 2014, the Russell U.S. Dynamic Equity Fund held $95,304,373, the Russell U.S. Strategic Equity Fund held $87,564,256 and the Russell Multi-Strategy Alternative Fund held $37,839,047 as collateral for short sales.
Emerging Markets Securities
The Funds may invest in emerging markets securities. Investing in emerging markets securities can pose some risks different from, and greater than, risks of investing in U.S. or developed markets securities. These risks include: a risk of loss due to political instability; exposure to economic structures that are generally less diverse and mature, and to political systems which may have less stability, than those of more developed countries; smaller market capitalization of securities markets, which may suffer periods of relative illiquidity; significant price volatility; restrictions on foreign investment; and possible difficulties in the repatriation of investment income and capital. In addition, foreign investors may be required to register the proceeds of sales and future economic or political crises could lead to price controls, forced mergers, expropriation or confiscatory taxation, seizure, nationalization, or
702 Notes to Financial Statements
Russell Investment Company Russell Funds
Notes to Financial Statements, continued — October 31, 2014
creation of government monopolies. The currencies of emerging market countries may experience significant declines against the U.S. dollar, and devaluation may occur subsequent to investments in these currencies by the Funds. Emerging market securities may be subject to currency transfer restrictions and may experience delays and disruptions in settlement procedures. Inflation and rapid fluctuations in inflation rates have had, and may continue to have, negative effects on the economies and securities markets of certain emerging market countries.
Emerging Markets Debt
The Funds may invest in emerging markets debt. A Fund's emerging markets debt securities may include obligations of governments and corporations. As with any fixed income securities, emerging markets debt securities are subject to the risk of being downgraded in credit rating and to the risk of default. In the event of a default on any investments in foreign debt obligations, it may be more difficult for a Fund to obtain or to enforce a judgment against the issuers of such securities. With respect to debt issued by emerging market governments, such issuers may be unwilling to pay interest and repay principal when due, either due to an inability to pay or submission to political pressure not to pay, and as a result may default, declare temporary suspensions of interest payments or require that the conditions for payment be renegotiated.
Repurchase Agreements
The fixed income funds and the Russell Multi-Strategy Alternative and Russell Strategic Call Overwriting Funds may enter into repurchase agreements. A repurchase agreement is an agreement under which a Fund acquires a fixed income security from a commercial bank, broker or dealer and simultaneously agrees to resell such security to the seller at an agreed upon price and date (normally within a few days or weeks). The resale price reflects an agreed upon interest rate effective for the period the security is held by a Fund and is unrelated to the interest rate on the security. The securities acquired by a Fund constitute collateral for the repurchase obligation. In these transactions, the securities acquired by a Fund (including accrued interest earned thereon) must have a total value in excess of the value of the repurchase agreement and must be held by the custodian bank until repurchased. A Fund will not invest more than 15% of its net assets (taken at current fair value) in repurchase agreements maturing in more than seven days.
Mortgage-Related and Other Asset-Backed Securities
Certain Funds may invest in mortgage or other asset-backed securities (“ABS”). These securities may include mortgage instruments issued by U.S. government agencies (“agency mortgages”) or those issued by private entities (“non-agency mortgages”). Specific types of instruments may include mortgage pass-through securities, collateralized mortgage obligations (“CMO”), commercial mortgage-backed securities, mortgage dollar rolls, CMO residuals, stripped mortgage-backed securities and other securities that directly or indirectly represent a participation in, or are secured by a payable from, mortgage loans on real property. The value of a Fund’s mortgage-backed securities (“MBS”) may be affected by, among other things, changes or perceived changes in interest rates, factors concerning the interests in and structure of the issuer or the originator of the mortgage, or the quality of the underlying assets. The mortgages underlying the securities may default or decline in quality or value. Through its investments in MBS, a Fund has exposure to subprime loans, Alt-A loans and non-conforming loans as well as to the mortgage and credit markets generally. Underlying collateral related to subprime, Alt-A and non-conforming mortgage loans has become increasingly susceptible to defaults and declines in quality or value, especially in a declining residential real estate market. In addition, regulatory or tax changes may adversely affect the mortgage securities markets as a whole.
Mortgage-Backed Securities
MBS often have stated maturities of up to thirty years when they are issued, depending upon the length of the mortgages underlying the securities. In practice, however, unscheduled or early payments of principal and interest on the underlying mortgages may make the securities’ effective maturity shorter than this, and the prevailing interest rates may be higher or lower than the current yield of a Fund’s portfolio at the time resulting in reinvestment risk.
Rising or high interest rates may result in slower than expected principal payments which may tend to extend the duration of MBS, making them more volatile and more sensitive to changes in interest rates. This is known as extension risk.
MBS may have less potential for capital appreciation than comparable fixed income securities due to the likelihood of increased prepayments of mortgages resulting from foreclosures or declining interest rates. These foreclosed or refinanced mortgages are paid off at face value (par) or less, causing a loss, particularly for any investor who may have purchased the security at a premium or a price above par. In such an environment, this risk limits the potential price appreciation of these securities.
Notes to Financial Statements 703
Russell Investment Company Russell Funds
Notes to Financial Statements, continued — October 31, 2014
Agency Mortgage-Backed Securities
Certain MBS may be issued or guaranteed by the U.S. government or a government sponsored entity, such as Fannie Mae (the Federal National Mortgage Association) or Freddie Mac (the Federal Home Loan Mortgage Corporation). Although these instruments may be guaranteed by the U.S. government or a government sponsored entity, many such MBS are not backed by the full faith and credit of the United States and are still exposed to the risk of non-payment.
Privately Issued Mortgage-Backed Securities
MBS held by a Fund may be issued by private issuers including commercial banks, savings associations, mortgage companies, investment banking firms, finance companies and special purpose finance entities (called special purpose vehicles or SPVs) and other entities that acquire and package mortgage loans for resale as MBS. These privately issued non-agency MBS may offer higher yields than those issued by government agencies, but also may be subject to greater price changes than governmental issues. Subprime loans refer to loans made to borrowers with weakened credit histories or with a lower capacity to make timely payments on their loans. Alt-A loans refer to loans extended to borrowers who have incomplete documentation of income, assets, or other variables that are important to the credit underwriting processes. Non-conforming mortgages are loans that do not meet the standards that allow purchase by government-sponsored enterprises. MBS with exposure to subprime loans, Alt-A loans or nonconforming loans have had in many cases higher default rates than those loans that meet government underwriting requirements. The risk of non-payment is greater for MBS that are backed by mortgage pools that contain subprime, Alt-A and non-conforming loans, but a level of risk exists for all loans.
Unlike agency MBS issued or guaranteed by the U.S. government or a government-sponsored entity (e.g., Fannie Mae (the Federal National Mortgage Association) and Freddie Mac (the Federal Home Loan Mortgage Corporation)), MBS issued by private issuers do not have a government or government-sponsored entity guarantee, but may have credit enhancements provided by external entities such as banks or financial institutions or achieved through the structuring of the transaction itself. Examples of such credit support arising out of the structure of the transaction include the issue of senior and subordinated securities (e.g., the issuance of securities by an SPV in multiple classes or “tranches,” with one or more classes being senior to other subordinated classes as to the payment of principal and interest, with the result that defaults on the underlying mortgage loans are borne first by the holders of the subordinated class); creation of “reserve funds” (in which case cash or investments, sometimes funded from a portion of the payments on the underlying mortgage loans, are held in reserve against future losses); and “overcollateralization” (in which case the scheduled payments on, or the principal amount of, the underlying mortgage loans exceeds that required to make payment on the securities and pay any servicing or other fees). However, there can be no guarantee that credit enhancements, if any, will be sufficient to prevent losses in the event of defaults on the underlying mortgage loans. In addition, MBS that are issued by private issuers are not subject to the underwriting requirements for the underlying mortgages that are applicable to those MBS that have a government or government-sponsored entity guarantee. As a result, the mortgage loans underlying private MBS may, and frequently do, have less favorable collateral, credit risk or other underwriting characteristics than government or government-sponsored MBS and have wider variances in a number of terms including interest rate, term, size, purpose and borrower characteristics. Privately issued pools more frequently include second mortgages, high loan-to-value mortgages and manufactured housing loans. The coupon rates and maturities of the underlying mortgage loans in a private-label MBS pool may vary to a greater extent than those included in a government guaranteed pool, and the pool may include subprime mortgage loans.
Privately issued MBS are not traded on an exchange and there may be a limited market for the securities, especially when there is a perceived weakness in the mortgage and real estate market sectors. Without an active trading market, MBS held in a Fund’s portfolio may be particularly difficult to value because of the complexities involved in assessing the value of the underlying mortgage loans.
Asset-Backed Securities
ABS may include MBS, loans, receivables or other assets. The value of the Funds’ ABS may be affected by, among other things, actual or perceived changes in interest rates, factors concerning the interests in and structure of the issuer or the originator of the receivables, the market’s assessment of the quality of underlying assets or actual or perceived changes in the credit worthiness of the individual borrowers, the originator, the servicing agent or the financial institution providing the credit support.
Payment of principal and interest may be largely dependent upon the cash flows generated by the assets backing the securities. Rising or high interest rates tend to extend the duration of ABS, making them more volatile and more sensitive to changes in interest rates. The underlying assets are sometimes subject to prepayments which can shorten the security’s weighted average life and may lower its return. Defaults on loans underlying ABS have become an increasing risk for ABS that are secured by home equity loans related to sub-prime, Alt-A or non-conforming mortgage loans, especially in a declining residential real estate market.
704 Notes to Financial Statements
Russell Investment Company Russell Funds
Notes to Financial Statements, continued — October 31, 2014
ABS (other than MBS) present certain risks that are not presented by MBS. Primarily, these securities may not have the benefit of any security interest in the related assets. Credit card receivables are generally unsecured and the debtors are entitled to the protection of a number of state and federal consumer credit laws, many of which give such debtors the right to set off certain amounts owed on the credit cards, thereby reducing the balance due. There is the possibility that recoveries on repossessed collateral may not, in some cases, be available to support payments on these securities. ABS are often backed by a pool of assets representing the obligations of a number of different parties. To lessen the effect of failures by obligors on underlying assets to make payments, the securities may contain elements of credit support which fall into two categories: (i) liquidity protection, and (ii) protection against losses resulting from ultimate default by an obligor on the underlying assets. Liquidity protection refers to the provision of advances, generally by the entity administering the pool of assets, to ensure that the receipt of payments on the underlying pool occurs in a timely fashion. Protection against losses results from payment of the insurance obligations on at least a portion of the assets in the pool. This protection may be provided through guarantees, policies or letters of credit obtained by the issuer or sponsor from third parties, through various means of structuring the transaction or through a combination of such approaches. The Funds will not pay any additional or separate fees for credit support. The degree of credit support provided for each issue is generally based on historical information respecting the level of credit risk associated with the underlying assets.
Delinquency or loss in excess of that anticipated or failure of the credit support could adversely affect the return on an investment in such a security. The availability of ABS may be affected by legislative or regulatory developments. It is possible that such developments may require the Funds to dispose of any then existing holdings of such securities.
Forward Commitments
The Fund’s may contract to purchase securities for a fixed price at a future date beyond customary settlement time consistent with a Funds investment strategies. The price of the underlying securities and the date when the securities will be delivered and paid for are fixed at the time the transaction is negotiated. The Funds may dispose of a forward commitment transaction prior to settlement if it is appropriate to do so and may realize short-term gains (or losses) upon such sale. When effecting such transactions, cash or liquid high-grade debt obligations of the Funds in a dollar amount sufficient to make payment for the portfolio securities to be purchased will be earmarked on the Fund’s records at the trade date and until the transaction is settled. A forward commitment transaction involves a risk of loss if the value of the security to be purchased declines prior to the settlement date or the other party to the transaction fails to complete the transaction.
A to be announced (“TBA”) security is a forward mortgage-backed securities trade in which the fixed income funds may invest. The securities are purchased and sold on a forward commitment basis with an approximate principal amount and maturity date. The actual principal amount and maturity date will be determined upon settlement when the specific mortgage pools are assigned. These securities are within the parameters of industry “good delivery” standards.
Inflation-Indexed Bonds
The fixed income funds and the Russell Multi-Strategy Alternative Fund may invest in inflation-indexed securities, which are typically bonds or notes designed to provide a return higher than the rate of inflation (based on a designated index) if held to maturity. A common type of inflation-indexed security is a U.S. Treasury Inflation-Protected Security (“TIPS”). The principal of a TIPS increases with inflation and decreases with deflation, as measured by the Consumer Price Index. When a TIPS matures, the adjusted principal or original principal is paid, whichever is greater. TIPS pay interest twice a year, at a fixed rate. The rate is applied to the adjusted principal; so, like the principal, interest payments rise with inflation and fall with deflation.
Guarantees
In the normal course of business, the Funds enter into contracts that contain a variety of representations which provide general indemnifications. The Funds’ maximum exposure under these arrangements is unknown as this would involve future claims that may be made against the Funds that have not yet occurred. However, the Funds expect the risk of loss to be remote.
Market, Credit and Counterparty Risk
In the normal course of business, the Funds trade financial instruments and enter into financial transactions where risk of potential loss exists due to changes in the market (market risk) or failure of the other party to a transaction to perform (credit risk). Similar to credit risk, the Funds may also be exposed to counterparty risk or risk that an institution or other entity with which the Funds have unsettled or open transactions will default. The potential loss could exceed the value of the relevant assets recorded in the financial statements (the “Assets”). The Assets consist principally of cash due from counterparties and investments. The extent of the Funds'
Notes to Financial Statements 705
Russell Investment Company Russell Funds
Notes to Financial Statements, continued — October 31, 2014
exposure to market, credit and counterparty risks with respect to the Assets approximates their carrying value as recorded in the Funds' Statements of Assets and Liabilities.
Global economies and financial markets are becoming increasingly interconnected and political and economic conditions (including recent instability and volatility) and events (including natural disasters) in one country, region or financial market may adversely impact issuers in a different country, region or financial market. As a result, issuers of securities held by a Fund may experience significant declines in the value of their assets and even cease operations. Such conditions and/or events may not have the same impact on all types of securities and may expose a Fund to greater market and liquidity risk and potential difficulty in valuing portfolio instruments held. This could cause a Fund to underperform other types of investments.
3. Investment in Russell Cayman Commodity Strategies Fund Ltd. and Russell Cayman Multi-Strategy Alternative Fund Ltd.
The Russell Cayman Commodity Strategies Fund Ltd. and Russell Cayman Multi-Strategy Alternative Fund Ltd. (each a “Subsidiary”) are Cayman Island exempted companies and wholly owned subsidiaries of the Russell Commodity Strategies Fund and Russell Multi-Strategy Alternative Fund, respectively. Each Subsidiary acts as an investment vehicle for its respective Fund in order to effect certain investments on behalf of the Fund consistent with the Fund’s investment objectives and policies specified in the Fund’s prospectus and statement of additional information. Each Fund is the sole shareholder of its respective Subsidiary and it is intended that each Fund will remain the sole shareholder and, as a result, will continue to control the Subsidiary. As of October 31, 2014, net assets of the Russell Commodity Strategies Fund were $ 1,050,678,227 of which $ 174,659,422 or approximately 17%, represents the Fund’s ownership of the shares of its Subsidiary, and net assets of the Russell Multi-Strategy Alternative Fund were $ 962,054,857 of which $28,270,836 or approximately 3%, represents the Fund’s ownership of the shares of its Subsidiary.
The Russell Commodity Strategies and Russell Multi-Strategy Alternative Funds may invest up to 25% of their total assets in their Subsidiary, which may invest without limitation in commodity-linked derivative instruments, such as swaps and futures that provide exposure to the performance of commodities markets. Each Subsidiary may also invest in fixed income securities. The financial statements for each of the Russell Commodity Strategies Fund and Russell Multi-Strategy Alternative Fund have been consolidated and include the accounts of both the Fund and its respective Subsidiary. All inter-company transactions and balances have been eliminated upon consolidation.
4. Investment Transactions
Securities
During the period ended October 31, 2014, purchases and sales of investment securities (excluding U.S. Government and Agency obligations, short-term investments, options, futures and repurchase agreements) were as follows:
706 Notes to Financial Statements
Russell Investment Company Russell Funds
Notes to Financial Statements, continued — October 31, 2014
| Purchases | Sales | |||||
| Russell U.S. Core Equity Fund | $ | 1,375,509,005 | $ | 1,919,060,422 | ||
| Russell U.S. Defensive Equity Fund | 1,319,215,423 | 1,551,100,763 | ||||
| Russell U.S. Dynamic Equity Fund | 1,056,668,025 | 1,112,574,424 | ||||
| Russell U.S. Strategic Equity Fund | 2,908,607,806 | 2,765,314,147 | ||||
| Select U.S. Equity Fund | 134,355,045 | 2,168,467 | ||||
| Russell U.S. Large Cap Equity Fund | 327,804,111 | 296,494,522 | ||||
| Russell U.S. Mid Cap Equity Fund | 184,637,917 | 168,038,362 | ||||
| Russell U.S. Small Cap Equity Fund | 2,351,554,703 | 1,711,926,630 | ||||
| Russell International Developed Markets Fund | 3,062,683,396 | 3,956,296,893 | ||||
| Russell Global Equity Fund | 1,234,639,303 | 1,261,068,381 | ||||
| Select International Equity Fund | 118,158,519 | 5,739,426 | ||||
| Russell Emerging Markets Fund | 2,492,989,433 | 1,708,172,807 | ||||
| Russell Tax-Managed U.S. Large Cap Fund | 904,931,353 | 604,810,946 | ||||
| Russell Tax-Managed U.S. Mid & Small Cap Fund | 253,025,688 | 209,588,378 | ||||
| Russell Global Opportunistic Credit Fund | 1,641,583,017 | 1,007,268,857 | ||||
| Russell Strategic Bond Fund | 4,004,366,349 | 3,420,733,439 | ||||
| Russell Investment Grade Bond Fund | 862,350,168 | 824,380,818 | ||||
| Russell Short Duration Bond Fund | 916,716,100 | 948,646,666 | ||||
| Russell Tax Exempt Bond Fund | 506,880,866 | 148,443,726 | ||||
| Russell Commodity Strategies Fund | 1,000,647,037 | 1,061,376,637 | ||||
| Russell Global Infrastructure Fund | 2,227,771,032 | 1,877,246,623 | ||||
| Russell Global Real Estate Securities Fund | 1,194,202,729 | 1,221,027,117 | ||||
| Russell Multi-Strategy Alternative Fund | 1,870,354,289 | 2,539,547,733 | ||||
| Russell Strategic Call Overwriting Fund | 3,812,245 | 12,670,513 | ||||
Purchases and sales of U.S. Government and Agency obligations (excluding short-term investments, options, futures and repurchase agreements) were as follows:
| Purchases | Sales | |||||
| Russell Strategic Bond Fund | $ | 5,818,746,789 | $ | 5,899,256,675 | ||
| Russell Investment Grade Bond Fund | 1,868,892,980 | 1,895,714,846 | ||||
| Russell Short Duration Bond Fund | 1,769,043,352 | 1,588,732,418 | ||||
| Russell Multi-Strategy Alternative Fund | 416,283,084 | 424,652,066 |
Securities Lending
The Investment Company has a securities lending program whereby each Fund can loan securities with a value up to 33 1/3% of each Fund’s total assets. The Fund receives cash (U.S. currency), U.S. Government or U.S. Government Agency obligations as collateral against the loaned securities. As of October 31, 2014, to the extent that a loan was collateralized by cash, such collateral was invested by the securities lending agent, Brown Brothers Harriman & Co. (“BBH”), in the Russell U.S. Cash Collateral Fund, an unregistered fund advised by RIMCo. The collateral received is recorded on a lending Fund’s Statement of Assets and Liabilities along with the related obligation to return the collateral.
Income generated from the investment of cash collateral, less negotiated rebate fees paid to participating brokers and transaction costs, is divided between the Fund and BBH and is recorded as income for the Fund. To the extent that a loan is secured by non-cash collateral, brokers pay the Fund negotiated lenders’ fees, which are divided between the Fund and BBH and are recorded as securities lending income for the Fund. All collateral received will be in an amount at least equal to 102% (for loans of U.S. securities) or 105% (for loans of non-U.S. securities) of the fair value of the loaned securities at the inception of each loan. The fair value of the loaned securities is determined at the close of business of the Fund and any additional required collateral is delivered to the Fund the next day. Should the borrower of the securities fail financially, there is a risk of delay in recovery of the securities or loss of rights in the collateral. Consequently, loans are made only to borrowers which are deemed to be creditworthy by BBH and approved by RIMCo.
Notes to Financial Statements 707
Russell Investment Company Russell Funds
Notes to Financial Statements, continued — October 31, 2014
Brokerage Commissions
The Funds effect certain transactions through Recapture Services, a division of BNY ConvergeEX Execution Solutions LLC (“BNY”) and its global network of unaffiliated correspondent brokers as well as State Street Global Markets, LLC (“SSGM”) and its global network of unaffiliated correspondent brokers. BNY and SSGM are registered brokers and are not affiliates of the Funds or RIMCo. Trades placed through Recapture Services and SSGM and their correspondents are used (i) to obtain brokerage and research services for RIMCo to assist RIMCo in its investment decision-making process in its capacity as Adviser to the Funds or (ii) to generate commission rebates to the Funds on whose behalf the trades were made. For purposes of trading to obtain brokerage and research services for RIMCo or to generate commission rebates to the Funds, the Funds’ money managers are requested to, and RIMCo may, with respect to transactions it places, effect transactions with or through Recapture Services, SSGM and their correspondents or other brokers. In addition, RIMCo recommends targets for the amount of trading that money managers direct through Recapture Services and SSGM based upon several factors including asset class and investment style, among others. Research services provided to RIMCo by Recapture Services, SSGM or other brokers include performance measurement statistics, fund analytics systems and market monitoring systems. Research services will generally be obtained from unaffiliated third parties at market rates, which may be included in commission costs. Research provided to RIMCo may benefit the particular Funds generating the trading activity and may also benefit other Funds within RIC and other funds and clients managed or advised by RIMCo or its affiliates. Similarly, the Funds may benefit from research provided with respect to trading by those other funds and clients.
Decisions concerning the acquisition of research services by RIMCo are approved and monitored by a Frank Russell Company ("FRC") Soft Commission Committee (“SCC”), which consists principally of employees in research and investment management roles. The SCC acts as an oversight body with respect to purchases of research services acquired by RIMCo using soft commissions generated by funds managed by FRC affiliates, including the Funds.
Recapture Services, SSGM or other brokers may also rebate to the Funds a portion of commissions earned on certain trading by the Funds through Recapture Services, and SSGM and their correspondents in the form of commission recapture. Commission recapture is paid solely to those Funds generating the applicable commission. Commission recapture is generated on the instructions of the SCC once RIMCo’s research needs have been met, as determined annually in the Soft Money Commission budgeting process.
Recapture Services and SSGM retain a portion of all commissions generated, regardless of whether the trades were used to provide research services to RIMCo or commission recapture to the Funds. Trades through Recapture Services, SSGM and their correspondents for transition services and manager funding (i.e. brokerage arrangements designed to reduce costs and optimize performance during the transition of Fund assets upon the hiring, termination or additional funding of a money manager) are at ordinary and customary commission rates and do not result in commission rebates or accrued credits for the procurement of research related services.
Additionally, a money manager may independently effect transactions through Recapture Services, SSGM and their correspondents or a broker affiliated with the money manager or another broker to obtain research services for its own use. Research services provided to a money manager may benefit the Fund generating the trading activity but may also benefit other funds and clients managed or advised by the money manager. Similarly, the Funds may benefit from research services provided with respect to trading by those other funds and clients.
Additionally, the Funds paid brokerage commissions to non-affiliated brokers who provided brokerage and research services to RIMCo.
5. Related Party Transactions, Fees and Expenses
Adviser and Administrator
RIMCo is the Funds’ adviser and RFSC, a wholly-owned subsidiary of RIMCo, is the Funds' administrator and transfer agent. RIMCo is a wholly-owned subsidiary of FRC (a subsidiary of The Northwestern Mutual Life Insurance Company as of October 31, 2014). FRC provides ongoing money manager research to RIC and RIMCo. Please refer to Note 11, Subsequent Events for an update regarding this information.
The Funds are permitted to invest their cash (i.e., cash awaiting investment or cash held to meet redemption requests or to pay expenses) in the Russell U.S. Cash Management Fund, an unregistered Fund advised by RIMCo. As of October 31, 2014, the Funds had invested $3,703,716,238 in the Russell U.S. Cash Management Fund. In addition, a portion of the collateral received from the Investment Company’s securities lending program in the amount of $606,237,007 is invested in the Russell U.S. Cash Collateral Fund, an unregistered fund advised by RIMCo.
708 Notes to Financial Statements
Russell Investment Company Russell Funds
Notes to Financial Statements, continued — October 31, 2014
The advisory fee and the administrative fee of up to 0.05% specified in the table below are based on the average daily net assets of each Fund and are payable monthly.
| Annual Rate | |||||||
| Funds | Adviser | Administrator* | |||||
| Russell U.S. Core Equity Fund | .55 | % | .05 | % | |||
| Russell U.S. Defensive Equity Fund | .55 | .05 | |||||
| Russell U.S. Dynamic Equity Fund | .80 | .05 | |||||
| Russell U.S. Strategic Equity Fund | .75 | .05 | |||||
| Select U.S. Equity Fund | .30 | .05 | |||||
| Russell U.S. Large Cap Equity Fund | .70 | .05 | |||||
| Russell U.S. Mid Cap Equity Fund | .80 | .05 | |||||
| Russell U.S. Small Cap Equity Fund | .70 | .05 | |||||
| Russell International Developed Markets Fund | .70 | .05 | |||||
| Russell Global Equity Fund | .95 | .05 | |||||
| Select International Equity Fund | .45 | .05 | |||||
| Russell Emerging Markets Fund | 1.15 | .05 | |||||
| Russell Tax-Managed U.S. Large Cap Fund | .70 | .05 | |||||
| Russell Tax-Managed U.S. Mid & Small Cap Fund | .98 | .05 | |||||
| Russell Global Opportunistic Credit Fund | 1.00 | .05 | |||||
| Russell Strategic Bond Fund | .50 | .05 | |||||
| Russell Investment Grade Bond Fund | .25 | .05 | |||||
| Russell Short Duration Bond Fund | .45 | .05 | |||||
| Russell Tax Exempt Bond Fund | .30 | .05 | |||||
| Russell Commodity Strategies Fund** | 1.25 | .05 | |||||
| Russell Global Infrastructure Fund | 1.25 | .05 | |||||
| Russell Global Real Estate Securities Fund | .80 | .05 | |||||
| Russell Multi-Strategy Alternative Fund** | 1.50 | .05 | |||||
| Russell Strategic Call Overwriting Fund | .80 | .05 | |||||
| * | Administrative fees are assessed on Fund Complex level assets based on a tiered fee schedule. |
| ** | Annual rates do not reflect the consolidated rates inclusive of Subsidiary Fees. |
The following shows the respective totals for advisory and administrative fees for the period ended October 31, 2014.
Notes to Financial Statements 709
Russell Investment Company Russell Funds
Notes to Financial Statements, continued — October 31, 2014
| Advisory | Administrative | |||||
| Russell U.S. Core Equity Fund | $ | 10,745,659 | $ | 930,574 | ||
| Russell U.S. Defensive Equity Fund | 7,256,401 | 628,342 | ||||
| Russell U.S. Dynamic Equity Fund | 5,797,535 | 345,095 | ||||
| Russell U.S. Strategic Equity Fund | 25,305,246 | 1,606,655 | ||||
| Select U.S. Equity Fund | 91,422 | 14,484 | ||||
| Russell U.S. Large Cap Equity Fund | 2,751,674 | 187,183 | ||||
| Russell U.S. Mid Cap Equity Fund | 1,475,967 | 87,857 | ||||
| Russell U.S. Small Cap Equity Fund | 14,959,132 | 1,017,466 | ||||
| Russell International Developed Markets Fund | 31,273,734 | 2,127,992 | ||||
| Russell Global Equity Fund | 31,900,142 | 1,599,125 | ||||
| Select International Equity Fund | 109,186 | 11,530 | ||||
| Russell Emerging Markets Fund | 31,661,568 | 1,310,790 | ||||
| Russell Tax-Managed U.S. Large Cap Fund | 7,268,062 | 494,333 | ||||
| Russell Tax-Managed U.S. Mid & Small Cap Fund | 2,793,443 | 135,732 | ||||
| Russell Global Opportunistic Credit Fund | 14,230,320 | 677,498 | ||||
| Russell Strategic Bond Fund | 37,416,731 | 3,564,230 | ||||
| Russell Investment Grade Bond Fund | 4,149,076 | 790,483 | ||||
| Russell Short Duration Bond Fund | 5,541,780 | 586,562 | ||||
| Russell Tax Exempt Bond Fund | 3,152,096 | 500,270 | ||||
| Russell Commodity Strategies Fund | 17,339,807 | 665,860 | ||||
| Russell Global Infrastructure Fund | 20,416,366 | 777,656 | ||||
| Russell Global Real Estate Securities Fund | 14,025,485 | 834,879 | ||||
| Russell Multi-Strategy Alternative Fund | 15,088,341 | 479,825 | ||||
| Russell Strategic Call Overwriting Fund | 678,036 | 40,365 | ||||
RIMCo has agreed to certain waivers of its advisory and administrative fees as follows:
For the Russell U.S. Strategic Equity Fund, RIMCo has contractually agreed, at least until February 28, 2015, to waive up to the full amount of its 0.75% advisory fee and then to reimburse the Fund for other direct Fund-level expenses, excluding dividend and interest expenses on short sales and extraordinary expenses, to the extent that direct Fund-level expenses exceed 0.59% of the average daily net assets of that Fund on an annual basis. This waiver and reimbursement may not be terminated during the relevant period except with Board approval. Direct Fund-level expenses for the Russell U.S. Strategic Equity Fund do not include 12b-1 fees, shareholder services fees, transfer agency fees or the expenses of other investment companies in which the Fund invests which are borne indirectly by the Fund. The total amount of the waiver for the period ended October 31, 2014 was $7,664,947. There were no reimbursements for the period ended October 31, 2014.
For the Select U.S. Equity Fund, RIMCo has contractually agreed, at least until February 29, 2016, to waive up to the full amount of its 0.30% advisory fee and then to reimburse the Fund for other direct Fund-level expenses, excluding dividend and interest expenses on short sales and extraordinary expenses, to the extent such direct Fund-level expenses exceed 0.35% of the average daily net assets of that Fund on an annual basis. This waiver and reimbursement may not be terminated during the relevant period except with Board approval. Direct Fund-level expenses for the Select U.S. Equity Fund do not include 12b-1 fees, shareholder services fees, transfer agency fees or the expenses of other investment companies in which the Fund invests which are borne indirectly by the Fund. The total amount of the waiver for the period ended October 31, 2014 was $75,499. There were no reimbursements for the period ended October 31, 2014.
For the Russell U.S. Large Cap Equity Fund, RIMCo has contractually agreed, at least until February 28, 2015, to waive up to the full amount of its 0.70% advisory fee and then to reimburse the Fund for other direct Fund-level expenses to the extent that direct Fund-level expenses exceed 0.67% of the average daily net assets of that Fund on an annual basis. This waiver and reimbursement may not be terminated during the relevant period except with Board approval. Direct Fund-level expenses for the Russell U.S. Large Cap Equity Fund do not include 12b-1 fees, shareholder services fees, transfer agency fees, extraordinary expenses or the expenses of other investment companies in which the Fund invests which are borne indirectly by the Fund. The total amount of
710 Notes to Financial Statements
Russell Investment Company Russell Funds
Notes to Financial Statements, continued — October 31, 2014
the waiver for the period ended October 31, 2014 was $ 559,659. There were no reimbursements for the period ended October 31, 2014.
For the Russell U.S. Mid Cap Equity Fund, RIMCo has contractually agreed, at least until February 28, 2015, to waive up to the full amount of its 0.80% advisory fee and then to reimburse the Fund for other direct Fund-level expenses to the extent that direct Fund-level expenses exceed 0.77% of the average daily net assets of that Fund on an annual basis. This waiver and reimbursement may not be terminated during the relevant period except with Board approval. Direct Fund-level expenses for the Russell U.S. Mid Cap Equity Fund do not include 12b-1 fees, shareholder services fees, transfer agency fees, extraordinary expenses or the expenses of other investment companies in which the Fund invests which are borne indirectly by the Fund. The total amount of the waiver for the period ended October 31, 2014 was $ 374,604. There were no reimbursements for the period ended October 31, 2014.
For the Select International Equity Fund, RIMCo has contractually agreed, at least until February 29, 2016, to waive up to the full amount of its 0.45% advisory fee and then to reimburse the Fund for other direct Fund-level expenses, excluding dividend and interest expenses on short sales and extraordinary expenses, to the extent such direct Fund-level expenses exceed 0.44% of the average daily net assets of that Fund on an annual basis. This waiver and reimbursement may not be terminated during the relevant period except with Board approval. Direct Fund-level expenses for the Russell International Equity Fund do not include 12b-1 fees, shareholder services fees, transfer agency fees or the expenses of other investment companies in which the Fund invests which are borne indirectly by the Fund. The total amount of the waiver for the period ended October 31, 2014 was $102,207. There were no reimbursements for the period ended October 31, 2014.
For the Russell Tax-Managed U.S. Mid & Small Cap Fund, RIMCo has contractually agreed, at least until February 28, 2015, to waive up to the full amount of its 0.98% advisory fee and then to reimburse the Fund for other direct Fund-level expenses to the extent that direct Fund-level expenses exceed 1.10% of the average daily net assets of that Fund on an annual basis. This waiver and reimbursement may not be terminated during the relevant period except with Board approval. Direct Fund-level expenses for the Russell Tax-Managed U.S. Mid & Small Cap Fund do not include 12b-1 fees, shareholder services fees, transfer agency fees, extraordinary expenses or the expenses of other investment companies in which the Fund invests which are borne indirectly by the Fund. The total amount of the waiver for the period ended October 31, 2014 was $ 65,234. There were no reimbursements for the period ended October 31, 2014.
For the Russell Global Opportunistic Credit Fund, RIMCo has contractually agreed, at least until February 28, 2015, to waive 0.28% of its 1.00% advisory fee. This waiver may not be terminated during the relevant period except with Board approval. The total amount of the waiver for the period ended October 31, 2014 was $ 3,984,489.
For the Russell Short Duration Bond Fund, RIMCo has contractually agreed, at least until February 28, 2015, to waive 0.05% of its 0.45% advisory fee. This waiver may not be terminated during the relevant period except with Board approval. The total amount of the waiver for the period ended October 31, 2015 was $ 615,753.
For the Russell Commodity Strategies Fund, RIMCo has contractually agreed, at least until February 28, 2015, to waive 0.27% of its 1.25% advisory fee. Additionally, the Russell Cayman Commodity Strategies Fund Ltd. (the “Commodity Strategies Subsidiary”) pays RIMCo an advisory fee at the annual rate of 1.25% and pays RFSC an administrative fee at the annual rate of 0.05% of the Commodity Strategies Subsidiary’s net assets(the “Commodity Strategies Fees”). Pursuant to a contractual agreement with the Russell Commodity Strategies Fund, RIMCo and RFSC have contractually agreed to permanently waive all or a portion of the advisory and administrative fees paid by the Russell Commodity Strategies Fund to RIMCo and RFSC in an amount equal to the amount of the Commodity Strategies Subsidiary Fees received by RIMCo and RFSC, if any. This waiver may not be terminated by RIMCo and RFSC. The total amount of the advisory waiver for the period ended October 31, 2014 was $6,411,067. The total amount of the administrative fee waiver for the period ended October 31, 2014 was $108,985.
For the Russell Global Infrastructure Fund, RIMCo has contractually agreed, at least until February 28, 2015, to waive 0.31% of its 1.25% advisory fee. This waiver may not be terminated during the relevant period except with Board approval. The total amount of the waiver for the period ended October 31, 2014 was $ 5,211,529.
For the Russell Cayman Multi-Strategy Alternative Fund Ltd., a wholly-owned subsidiary of the Russell Multi-Strategy Alternative Fund (the “Multi-Strategy Alternative Subsidiary”), organized as a company under the laws of the Cayman Islands, pays RIMCo an advisory fee at the annual rate of 1.50% and pays RFSC an administrative fee at the rate of 0.05% of the Multi-Strategy Alternative Subsidiary’s net assets (the “Multi-Strategy Alternative Subsidiary Fees”). Pursuant to a contractual agreement with the Russell Multi-Strategy Alternative Fund, RIMCo and RFSC have agreed to permanently waive all or a portion of the advisory and administrative fees paid by the Russell Multi-Strategy Alternative Fund to RIMCo and RFSC in the amount equal to the amount of
Notes to Financial Statements 711
Russell Investment Company Russell Funds
Notes to Financial Statements, continued — October 31, 2014
the Multi-Strategy Alternative Subsidiary Fees received by RIMCo and RFSC, if any. This waiver may not be terminated by RIMCo or RFSC. The total amount of the advisory fee waiver for the period ended October 31, 2014 was $ 498,916. The total amount of the administrative fee waiver for the period ended October 31, 2014 was $ 16,631.
For the Russell Strategic Call Overwriting Fund, RIMCo has contractually agreed, at least until February 28, 2015, to waive up to the full amount of its 0.80% advisory fee and then to reimburse the Fund for other direct Fund-level expenses, excluding extraordinary expenses to the extent such direct Fund-level expenses exceed 0.77% of the average daily net assets of that Fund on an annual basis. This waiver and reimbursement may not be terminated during the relevant period except with Board approval. Direct Fund-level expenses for the Russell Strategic Call Overwriting Fund do not include 12b-1 fees, shareholder services fees, transfer agency fees or the expenses of other investment companies in which the Fund invests which are borne indirectly by the Fund. The total amount of the waiver for the period ended October 31, 2014 was $ 187,450.
RIMCo does not have the ability to recover amounts waived or reimbursed from previous periods.
Transfer and Dividend Disbursing Agent
RFSC serves as transfer agent and provides dividend disbursing services to the Funds. For this service, RFSC is paid a fee based upon the average daily net assets of the Funds for transfer agency and dividend disbursing services. Transfer agency fees are class-level expenses and may differ by class. RFSC retains a portion of this fee for services provided to the Funds and pays the balance to unaffiliated agents who assist in providing these services. Transfer agency fees paid by the Funds presented herein for the period ended October 31, 2014 were as follows:
| Amount | |||
| Russell U.S. Core Equity Fund | $ | 1,830,483 | |
| Russell U.S. Defensive Equity Fund | 1,090,404 | ||
| Russell U.S. Dynamic Equity Fund | 230,107 | ||
| Russell U.S. Strategic Equity Fund | 6,748,065 | ||
| Select U.S. Equity Fund | 1,341 | ||
| Russell U.S. Large Cap Equity Fund | 786,192 | ||
| Russell U.S. Mid Cap Equity Fund | 368,992 | ||
| Russell U.S. Small Cap Equity Fund | 3,169,943 | ||
| Russell International Developed Markets Fund | 6,057,119 | ||
| Russell Global Equity Fund | 4,577,453 | ||
| Select International Equity Fund | 1,068 | ||
| Russell Emerging Markets Fund | 4,353,590 | ||
| Russell Tax-Managed U.S. Large Cap Fund | 2,076,589 | ||
| Russell Tax-Managed U.S. Mid & Small Cap Fund | 570,090 | ||
| Russell Global Opportunistic Credit Fund | 1,991,470 | ||
| Russell Strategic Bond Fund | 10,028,147 | ||
| Russell Investment Grade Bond Fund | 2,213,218 | ||
| Russell Short Duration Bond Fund | 1,927,726 | ||
| Russell Tax Exempt Bond Fund | 2,101,397 | ||
| Russell Commodity Strategies Fund | 1,806,887 | ||
| Russell Global Infrastructure Fund | 2,318,915 | ||
| Russell Global Real Estate Securities Fund | 3,107,625 | ||
| Russell Multi-Strategy Alternative Fund | 1,326,237 | ||
| Russell Strategic Call Overwriting Fund | 169,509 | ||
Effective March 1, 2013, RFSC has contractually agreed to waive, at least through February 28, 2014, a portion of its transfer agency fees for certain classes as follows:
712 Notes to Financial Statements
Russell Investment Company Russell Funds
Notes to Financial Statements, continued — October 31, 2014
| Funds/Classes | Waivers | |
| Russell U.S. Dynamic Equity Fund-Class | .05 | % |
| Russell Tax-Managed U.S. Mid & Small Cap Fund-Class C, E & S | .03 | |
| Russell Global Opportunistic Credit Fund-Class A, C, E & S | .09 | |
| Russell Strategic Bond Fund-Class A, C & S | .02 | |
| Russell Short Duration Bond Fund-Class A, C, E & S | .08 | |
| Russell Tax Exempt Bond Fund-Class C, E & S | .04 | |
| Russell Global Infrastructure Fund-Class A,C, E & S | .02 |
Effective January 1, 2014, RFSC has contractually agreed to waive, through February 28, 2015, a portion of its transfer agency fees for certain classes within Funds as follows:
| Funds/Classes | Waivers | |
| Russell Global Opportunistic Credit Fund-Class A,C,E & S | .12 | % |
| Russell Strategic Bond Fund Fund-Class A,C,E & S | .04 | |
| Russell Commodity Strategies Fund-Class A,C,E & S | .01 |
Effective March 1, 2014, RFSC has contractually agreed to waive, through February 28, 2015, a portion of its transfer agency fees for certain classes within Funds as follows:
| Funds/Classes | Waivers | |
| Russell U.S. Strategic Equity Fund-Class A,C,E & S | .02 | % |
| Russell Tax-Managed U.S. Mid & Small Cap Fund-Class C, E & S | .03 | |
| Russell Short Duration Bond Fund-Class A, C, E & S | .09 | |
| Russell Tax Exempt Bond Fund-Class C, E & S | .04 | |
| Russell Global Infrastructure Fund-Class A, C, E & S | .02 |
For the period ended October 31, 2014, the total transfer agent fee waivers are as follows:
| Amount | ||
| Russell U.S. Dynamic Equity Fund | $ | 4,574 |
| Russell U.S. Strategic Equity Fund | 674,806 | |
| Russell Tax-Managed U.S. Mid & Small Cap Fund | 135,365 | |
| Russell Global Opportunistic Credit Fund | 1,183,347 | |
| Russell Strategic Bond Fund | 1,543,450 | |
| Russell Short Duration Bond Fund | 994,769 | |
| Russell Tax Exempt Bond Fund | 561,109 | |
| Russell Commodity Strategies Fund | 83,842 | |
| Russell Global Infrastructure Fund | 229,760 |
Distributor and Shareholder Servicing
Russell Financial Services, Inc. (the “Distributor”), a wholly owned subsidiary of RIMCo, serves as a distributor for RIC, pursuant to a distribution agreement with RIC.
The Investment Company has a distribution plan pursuant to Rule 12b-1 (the “Plan”) under the Investment Company Act. Under this Plan, the Investment Company is authorized to make payments to the Distributor, or any selling agents, as defined in the Plan, for sales support services provided and related expenses incurred which were primarily intended to result in the sale of the Class A and Class C shares subject to the distribution plan. 12b-1 distribution payments are 0.25% or 0.75% of the average daily net assets of a Fund’s Class A or Class C shares, respectively, on an annual basis.
In addition, the Investment Company has adopted a Shareholder Services Plan (the “Services Plan”) under which the Funds may make payments to the Distributor or any servicing agent for any activities or expenses primarily intended to assist, support or service the servicing agents’ clients who beneficially own Class C or Class E shares of the Funds. The shareholder servicing payments shall not exceed 0.25% of the average daily net assets of a Fund’s Class C and Class E shares on an annual basis.
Pursuant to the rules of the Financial Industry Regulatory Authority (“FINRA”), these limitations are imposed at the class level of each Fund rather than on a per shareholder basis. Therefore, long-term shareholders may pay more than the economic equivalent of the maximum sales charges permitted by FINRA.
Notes to Financial Statements 713
Russell Investment Company Russell Funds
Notes to Financial Statements, continued — October 31, 2014
The aggregate initial sales charges, deferred sales charges and asset-based sales charges on Class A, Class C and Class E Shares of the Funds may not exceed 7.25%, 6.25% and 6.25%, respectively, of total gross sales, subject to certain exclusions, for the period ended October 31, 2014, the Distributor retained the following amounts in sales charges:
| Contingent Deferred Sales Charges | Class A Shares | |
| Russell U.S. Core Equity Fund | $ | 1,250 |
| Russell U.S. Defensive Equity Fund | 1,250 | |
| Russell U.S. Strategic Equity Fund | 10 | |
| Russell U.S. Large Cap Equity Fund | 1,567 | |
| Russell U.S. Mid Cap Equity Fund | 108 | |
| Russell U.S. Small Cap Equity Fund | 1,272 | |
| Russell International Developed Markets Fund | 1,677 | |
| Russell Global Equity Fund | 121 | |
| Russell Emerging Markets Fund | 1,304 | |
| Russell Tax-Managed U.S. Large Cap Fund | 817 | |
| Russell Tax-Managed U.S. Mid & Small Cap Fund | 12 | |
| Russell Global Opportunistic Credit Fund | 954 | |
| Russell Strategic Bond Fund | 2,372 | |
| Russell Investment Grade Bond Fund | 600 | |
| Russell Short Duration Bond Fund | 3,794 | |
| Russell Tax Exempt Bond Fund | 2,317 | |
| Russell Commodity Strategies Fund | 7,844 | |
| Russell Global Infrastructure Fund | 1250 | |
| Russell Global Real Estate Securities Fund | 1,105 |
For the period ended October 31, 2014, the sales commissions paid to the selling agents for the sales of Class A shares were as follows:
| Aggregate | Class A Front-End | |||||
| Front -End | Sales Charges | |||||
| Sales Charges | Retained by | |||||
| on Class A Shares | Distributor | |||||
| Russell U.S. Core Equity Fund | $ | 45,488 | $ | 7,793 | ||
| Russell U.S. Defensive Equity Fund | 50,915 | 8,558 | ||||
| Russell U.S. Dynamic Equity Fund | 15,904 | 2,753 | ||||
| Russell U.S. Strategic Equity Fund | 16,865 | 2,917 | ||||
| Russell U.S. Large Cap Equity Fund | 51,947 | 8,916 | ||||
| Russell U.S. Mid Cap Equity Fund | 27,912 | 4,821 | ||||
| Russell U.S. Small Cap Equity Fund | 46,247 | 7,756 | ||||
| Russell International Developed Markets Fund | 70,667 | 12,834 | ||||
| Russell Global Equity Fund | 32,910 | 5,652 | ||||
| Russell Emerging Markets Fund | 74,352 | 12,862 | ||||
| Russell Tax-Managed U.S. Large Cap Fund | 106,201 | 19,629 | ||||
| Russell Tax-Managed U.S. Mid & Small Cap Fund | 54,682 | 9,147 | ||||
| Russell Global Opportunistic Credit Fund | 13,166 | 2,648 | ||||
| Russell Strategic Bond Fund | 70,798 | 14,487 | ||||
| Russell Investment Grade Bond Fund | 10,877 | 2,220 | ||||
| Russell Short Duration Bond Fund | 17,567 | 3,603 | ||||
| Russell Tax Exempt Bond Fund | 38,394 | 7,362 | ||||
| Russell Commodity Strategies Fund | 32,009 | 5,439 | ||||
| Russell Global Infrastructure Fund | 37,924 | 6,460 | ||||
| Russell Global Real Estate Securities Fund | 64,462 | 10,612 | ||||
| Russell Multi-Strategy Alternative Fund | 19,361 | 3,333 | ||||
Accrued Fees Payable to Affiliates
Accrued fees payable to affiliates for the period ended October 31, 2014, were as follows:
| Russel U.S Core | Russell U.S. Defensive Equity | Russell U.S. Dynamic Equity | Russell U.S. Strategic Equity | Select U.S. Equity | ||||||
| Equity Fund | Fund | Fund | Fund | Fund | ||||||
| Advisory fees | $ | 813,739 | $ | 543,430 | $ | 469,649 | $ | 1,570,180 | $ | 4,211 |
| Administration fees | 70,440 | 47,896 | 27,959 | 142,277 | 5,438 | |||||
| Distribution fees | 40,493 | 36,194 | 7,466 | 11,124 | — | |||||
| Shareholder servicing fees | 13,580 | 12,362 | 2,741 | 23,140 | — | |||||
| Transfer agent fees | 145,497 | 85,046 | 15,935 | 534,419 | 503 | |||||
| 714 Notes to Financial Statements | ||||||||||
Russell Investment Company Russell Funds
Notes to Financial Statements, continued — October 31, 2014
| Russell U.S. | Russell U.S. | Russell U.S. | ||||||||||||
| Russell U.S. Core | Defensive Equity | Dynamic Equity | Strategic Equity | Select U.S. Equity | ||||||||||
| Equity Fund | Fund | Fund | Fund | Fund | ||||||||||
| Trustee fees | 7,613 | 3,666 | 2,009 | 7,548 | 659 | |||||||||
| $ | 1,091,362 | $ | 728,594 | $ | 525,759 | $ | 2,288,688 | $ | 10,811 | |||||
| Russell | ||||||||||||||
| International | ||||||||||||||
| Russell U.S. Large | Russell U.S. Mid | Russell U.S. Small | Developed | Russell Global | ||||||||||
| Cap Equity Fund | Cap Equity Fund | Cap Equity Fund | Markets Fund | Equity Fund | ||||||||||
| Advisory fees | $ | 219,069 | $ | 117,576 | $ | 1,359,620 | $ | 2,368,818 | $ | 2,570,611 | ||||
| Administration fees | 16,776 | 7,821 | 92,476 | 161,182 | 128,881 | |||||||||
| Distribution fees | 2,314 | 2,073 | 24,645 | 29,457 | 11,328 | |||||||||
| Shareholder servicing fees | 293 | 388 | 14,982 | 24,341 | 13,701 | |||||||||
| Transfer agent fees | 69,923 | 32,710 | 274,070 | 479,134 | 378,729 | |||||||||
| Trustee fees | 883 | 455 | 3,291 | 17,387 | 9,133 | |||||||||
| $ | 309,258 | $ | 161,023 | $ | 1,769,084 | $ | 3,080,319 | $ | 3,112,383 | |||||
| Russell Tax- | Russell Tax- | Russell Global | ||||||||||||
| Select International Russell Emerging | Managed U.S. | Managed U.S. Mid | Opportunistic | |||||||||||
| Equity Fund | Markets Fund | Large Cap Fund | & Small Cap Fund | Credit Fund | ||||||||||
| Advisory fees | $ | 4,584 | $ | 2,843,141 | $ | 711,244 | $ | 246,983 | $ | 965,268 | ||||
| Administration fees | 4,388 | 117,799 | 48,378 | 12,094 | 63,830 | |||||||||
| Distribution fees | — | 22,573 | 15,480 | 8,111 | 9,627 | |||||||||
| Shareholder servicing fees | — | 16,234 | 13,124 | 3,550 | 8,919 | |||||||||
| Transfer agent fees | 405 | 388,157 | 201,535 | 38,404 | 77,654 | |||||||||
| Trustee fees | 533 | 3,424 | 1,305 | 586 | 792 | |||||||||
| $ | 9,910 | $ | 3,391,328 | $ | 991,066 | $ | 309,728 | $ | 1,126,090 | |||||
| Russell Short | ||||||||||||||
| Russell Strategic | Russell Investment | Duration Bond | Russell Tax Exempt Russell Commodity | |||||||||||
| Bond Fund | Grade Bond Fund | Fund | Bond Fund | Strategies Fund | ||||||||||
| Advisory fees | $ | 3,127,489 | $ | 337,461 | $ | 401,299 | $ | 317,211 | $ | 793,502 | ||||
| Administration fees | 297,815 | 64,270 | 47,765 | 50,345 | 42,721 | |||||||||
| Distribution fees | 57,924 | 15,121 | 58,573 | 21,102 | 7,922 | |||||||||
| Shareholder servicing fees | 45,731 | 11,778 | 25,348 | 18,578 | 5,579 | |||||||||
| Transfer agent fees | 725,069 | 190,443 | 64,550 | 155,335 | 136,314 | |||||||||
| Trustee fees | 27,119 | 6,665 | 4,678 | 1,776 | 4,133 | |||||||||
| $ | 4,281,147 | $ | 625,738 | $ | 602,213 | $ | 564,347 | $ | 990,171 | |||||
| Russell Global Real | Russell Multi- | Russell Strategic | ||||||||||||
| Russell Global | Estate Securities | Strategy | Call Overwriting | |||||||||||
| Infrastructure Fund | Fund | Alternative Fund | Fund | |||||||||||
| Advisory fees | $ | 1,337,155 | $ | 1,184,014 | $ | 1,221,553 | $ | 39,755 | ||||||
| Administration fees | 69,200 | 70,467 | 38,774 | 3,473 | ||||||||||
| Distribution fees | 7,591 | 31,642 | 5,580 | — | ||||||||||
| Shareholder servicing fees | 7,762 | 15,673 | 5,073 | — | ||||||||||
| Transfer agent fees | 191,235 | 268,571 | 112,947 | 14,581 | ||||||||||
| Trustee fees | 2,002 | 5,127 | 2,575 | 245 | ||||||||||
| $ | 1,614,945 | $ | 1,575,494 | $ | 1,386,502 | $ | 58,054 | |||||||
Affiliated Brokerage Commissions
The Funds effect certain transactions through Russell Implementation Services Inc. (“RIS”). RIS is a registered broker and investment adviser and an affiliate of RIMCo. RIS uses a multi-venue trade management approach whereby RIS allocates trades among RIS’ network of independent brokers for execution, clearing and other services. Trades placed through RIS and its independent brokers are made (i) to manage trading associated with changes in money managers, rebalancing across existing money managers, cash flows and other portfolio transitions, (ii) to execute portfolio securities transactions for each Fund’s assets that RIMCo determines not to allocate to money managers including assets RIMCo may manage to manage risk in a Fund’s investment portfolio and for each Fund’s cash reserves or (iii) to execute a money manager’s portfolio securities transactions for the segment
Notes to Financial Statements 715
Russell Investment Company Russell Funds
Notes to Financial Statements, continued — October 31, 2014
of a Fund’s portfolio assigned to the money manager. RIMCo has authorized RIS to effect certain futures, swaps, over-the-counter derivatives transactions, and cleared swaps, including foreign currency spot, forwards and options trading on behalf of the Funds.
The Funds are permitted to purchase or sell securities from or to certain related affiliated funds under specified conditions outlined in procedures adopted by the Board. The procedures have been designed to ensure that any purchase or sale of securities by the Funds from or to another fund or portfolio that are, or could be, considered an affiliate by virtue of having a common investment adviser (or affiliated investment advisers), common Trustees and/or common officers complies with Rule 17a -7 of the Act.
During the period ended October 31, 2014, the Funds have engaged in purchases and sales of securities pursuant to Rule 17a -7 of the Act. As defined by the procedures, each transaction is effected at the current market price.
Board of Trustees
The Russell Fund Complex consists of RIC, which has 39 funds, Russell Investment Funds (“RIF”), which has 9 funds and Russell Exchange Traded Funds Trust (“RET”), which has 1 fund. Each of the Trustees is a Trustee of RIC, RIF and RET. During the period, the Russell Fund Complex paid each of its independent Trustees a retainer of $87,000 per year (effective January 1, 2014, $96,000); each of its interested Trustees a retainer of $75,000 per year; and each Trustee $7,000 for each regularly scheduled meeting attended in person and $3,500 for each special meeting and the Annual 38a-1 meeting attended in person, and for each Audit Committee meeting, Nominating and Governance Committee meeting, Investment Committee meeting or any other committee meeting established and approved by the Board that is attended in person. Each Trustee receives a $1,000 fee for attending regularly scheduled and special meetings by phone instead of receiving the full fee had the member attended in person (except for telephonic meetings called pursuant to the Funds’ valuation and pricing procedures) and a $500 fee for attending the committee meeting by phone instead of receiving the full fee had the member attended in person. Trustees’ out of pocket expenses are also paid by the Russell Fund Complex. The Audit Committee Chair and Investment Committee Chair are each paid a fee of $15,000 per year and the Nominating and Governance Committee Chair is paid a fee of $12,000 per year. The chairman of the Board receives additional annual compensation of $75,000 (effective January 1, 2014, $85,000). Ms. Cavanaugh and the Trustee Emeritus are not compensated by the Russell Fund Complex for service as a Trustee.
6. Federal Income Taxes
At October 31, 2014, the following Funds had net tax basis capital loss carryforwards which may be applied against any net realized taxable gains in each succeeding year or until their respective expiration dates, whichever occurs first. Available capital loss carryforwards and expiration dates are as follows:
| No Expiration | ||||||||||||||||
| Funds | 10/31/2015 | 10/31/2016 | 10/31/2017 | 10/31/2018 | 10/31/2019 | Short Term | Long-Term | Totals | ||||||||
| Russell U.S. Defensive | ||||||||||||||||
| Equity Fund | $ | — | $ | 2,873,483 | $ | — | $ | 140,570,399 | $ | — | $ | — | $ | — | $ | 143,443,882 |
| Russell U.S. Small Cap | ||||||||||||||||
| Equity Fund | 14,476,423 | — | — | — | — | — | — | 14,476,423 | ||||||||
| Russell International | ||||||||||||||||
| Developed Markets | ||||||||||||||||
| Fund | — | — | 378,055,256 | 51,503,855 | — | — | — | 429,559,111 | ||||||||
| Select International | ||||||||||||||||
| Equity Fund | — | — | — | — | — | 53,700 | 88,985 | 142,685 | ||||||||
| Russell Tax Exempt | ||||||||||||||||
| Bond Fund | — | 438,558 | — | — | 525,860 | 50,882 | 1,700,709 | 2,716,009 | ||||||||
| Russell Multi-Strategy | ||||||||||||||||
| Alternative Fund | — | — | — | — | — | 33,254,915 | — | 33,254,915 | ||||||||
| Russell Strategic Call | ||||||||||||||||
| Overwriting Fund | — | — | — | — | — | 7,788,486 | 9,630,872 | 17,419,358 | ||||||||
Under the Regulated Investment Company Modernization Act of 2010, the Funds will be permitted to carry forward capital losses incurred in taxable years beginning after December 22, 2010 for an unlimited period. However, any losses incurred during those future taxable years will be required to be utilized prior to the losses incurred in pre-enactment taxable years. As a result of this ordering rule, pre-enactment capital loss carryforwards may be more likely to expire unused. Additionally, post-enactment capital losses that are carried forward will retain their character as either short-term or long-term capital losses rather than being considered all short-term as under previous law.
716 Notes to Financial Statements
Russell Investment Company Russell Funds
Notes to Financial Statements, continued — October 31, 2014
At October 31, 2014, the cost of investments and net unrealized appreciation (depreciation), undistributed ordinary income and undistributed long-term gains for income tax purposes were as follows:
| Russell U.S. Core Russell U.S. Defensive Russell U.S. Dynamic Russell U.S. Strategic | Select U.S. Equity | |||||||||||||||||
| Equity Fund | Equity Fund | Equity Fund | Equity Fund | Fund | ||||||||||||||
| Cost of Investments | $ | 1,467,536,673 | $ | 1,038,533,610 | $ | 673,036,748 | $ | 3,209,318,671 | $ | 137,146,535 | ||||||||
| Unrealized Appreciation | $ | 371,893,363 | $ | 171,890,894 | $ | 109,622,870 | $ | 546,700,410 | $ | 6,501,368 | ||||||||
| Unrealized Depreciation | (32,815,598 | ) | (8,927,902 | ) | (18,495,832 | ) | (50,123,300 | ) | (2,782,906 | ) | ||||||||
| Net Unrealized Appreciation (Depreciation) | $ | 339,077,765 | $ | 162,962,992 | $ | 91,127,038 | $ | 496,577,110 | $ | 3,718,462 | ||||||||
| Undistributed Ordinary Income | $ | 38,982,559 | $ | 383,969 | $ | 41,213,369 | $ | 110,853,414 | $ | 193,409 | ||||||||
| Undistributed Long-Term Capital Gains | ||||||||||||||||||
| (Capital Loss Carryforward) | $ | 211,362,963 | $ | (143,443,882 | ) $ | 61,801,151 | $ | 212,639,325 | $ | 37,630 | ||||||||
| Tax Composition of Distributions | ||||||||||||||||||
| Ordinary Income | $ | 23,794,450 | $ | 16,925,395 | $ | 58,260,616 | $ | 214,641,390 | $ | 315,245 | ||||||||
| Long-Term Capital Gains | $ | — | $ | — | $ | 22,187,997 | $ | 56,014,418 | $ | — | ||||||||
| Russell International | |||||||||||||||||
| Russell U.S. Large Russell U.S. Mid Cap | Russell U.S. Small Developed Markets Russell Global Equity | ||||||||||||||||
| Cap Equity Fund | Equity Fund | Cap Equity Fund | Fund | Fund | |||||||||||||
| Cost of Investments | $ | 367,266,919 | $ | 178,482,653 | $ | 2,336,798,312 | $ | 3,826,983,281 | $ | 2,648,642,018 | |||||||
| Unrealized Appreciation | $ | 69,037,879 | $ | 31,991,095 | $ | 325,469,737 | $ | 381,728,422 | $ | 758,881,135 | |||||||
| Unrealized Depreciation | (3,453,261 | ) | (2,778,060 | ) | (86,548,478 | ) | (146,050,549 | ) | (60,261,402 | ) | |||||||
| Net Unrealized Appreciation (Depreciation) | $ | 65,584,618 | $ | 29,213,035 | $ | 238,921,259 | $ | 235,677,873 | $ | 698,619,733 | |||||||
| Undistributed Ordinary Income | $ | 9,943,445 | $ | 5,724,565 | $ | 21,868,432 | $ | 73,258,005 | $ | 83,607,563 | |||||||
| Undistributed Long-Term Capital Gains | |||||||||||||||||
| (Capital Loss Carryforward) | $ | 29,055,252 | $ | 10,735,477 | $ | 147,816,389 | $ | (429,559,111 | ) $ | 120,927,815 | |||||||
| Tax Composition of Distributions | |||||||||||||||||
| Ordinary Income | $ | 15,981,828 | $ | 11,358,847 | $ | 73,176,524 | $ | 112,953,781 | $ | 29,026,686 | |||||||
| Long-Term Capital Gains | $ | 12,563,057 | $ | 7,629,495 | $ | 148,969,377 | $ | — | $ | 50,163,675 | |||||||
| Russell Tax-Managed | Russell Global | |||||||||||||||||
| Select International Russell Emerging | Russell Tax-Managed U.S. Mid & Small Cap Opportunistic Credit | |||||||||||||||||
| Equity Fund | Markets Fund | U.S. Large Cap Fund | Fund | Fund | ||||||||||||||
| Cost of Investments | $ | 118,216,912 | $ | 2,904,864,857 | $ | 995,334,778 | $ | 248,237,893 | $ | 1,589,540,559 | ||||||||
| Unrealized Appreciation | $ | 884,316 | $ | 349,588,989 | $ | 284,854,531 | $ | 89,468,894 | $ | 24,432,127 | ||||||||
| Unrealized Depreciation | (7,749,702 | ) | (132,028,724 | ) | (8,961,337 | ) | (3,192,337 | ) | (53,297,214 | ) | ||||||||
| Net Unrealized Appreciation (Depreciation) | $ | (6,865,386 | ) $ | 217,560,265 | $ | 275,893,194 | $ | 86,276,557 | $ | (28,865,087 | ) | |||||||
| Undistributed Ordinary Income | $ | 469,589 | $ | 49,950,701 | $ | 6,074,029 | $ | — | $ | 20,373,352 | ||||||||
| Undistributed Long-Term Capital Gains | ||||||||||||||||||
| (Capital Loss Carryforward) | $ | (142,685 | ) $ | 34,014,186 | $ | 56,651,428 | $ | 18,424,452 | $ | 9,072,842 | ||||||||
| Tax Composition of Distributions | ||||||||||||||||||
| Ordinary Income | $ | — | $ | 15,619,289 | $ | 3,019,826 | $ | 4,371,349 | $ | 65,505,007 | ||||||||
| Long-Term Capital Gains | $ | — | $ | 62,477,057 | $ | — | $ | 15,846,777 | $ | 5,560,896 | ||||||||
| Russell Strategic Bond | Russell Investment Russell Short Duration Russell Tax Exempt Russell Commodity | |||||||||||||||||||||
| Fund | Grade Bond Fund | Bond Fund | Bond Fund | Strategies Fund | ||||||||||||||||||
| Cost of Investments | $ | 7,798,631,435 | $ | 1,751,267,543 | $ | 1,202,133,103 | $ | 1,200,178,270 | $ | 996,489,863 | ||||||||||||
| Unrealized Appreciation | $ | 140,767,512 | $ | 26,139,972 | $ | 4,233,473 | $ | 50,557,431 | $ | 9 | ||||||||||||
| Unrealized Depreciation | (53,401,973 | ) | (9,610,924 | ) | (7,146,026 | ) | (1,091,181 | ) | (294,942 | ) | ||||||||||||
| Net Unrealized Appreciation (Depreciation) | $ | 87,365,539 | $ | 16,529,048 | $ | (2,912,553 | ) $ | 49,466,250 | $ | (294,933 | ) | |||||||||||
| Undistributed Ordinary Income | $ | 113,204,183 | $ | 18,980,875 | $ | 7,433,680 | $ | 2,550,873 | $ | — | ||||||||||||
| Undistributed Long-Term Capital Gains | ||||||||||||||||||||||
| (Capital Loss Carryforward) | $ | 53,629,475 | $ | 10,983,358 | $ | 3,201,891 | $ | (2,716,009 | ) $ | — | ||||||||||||
| Tax Composition of Distributions | ||||||||||||||||||||||
| Ordinary Income | $ | 118,498,285 | $ | 22,612,735 | $ | 13,180,054 | $ | 39,185 | $ | — | ||||||||||||
| Tax-Exempt Income | $ | — | $ | — | $ | — | 24,715,462 | $ | — | |||||||||||||
| Long-Term Capital Gains | $ | 34,501,329 | $ | — | $ | 1,937,797 | $ | — | $ | 58,663 | ||||||||||||
Notes to Financial Statements 717
Russell Investment Company Russell Funds
Notes to Financial Statements, continued — October 31, 2014
| Russell Global | Russell Global Real Russell Multi-Strategy Russell Strategic Call | ||||||||||||||||
| Infrastructure Fund | Estate Securities Fund | Alternative Fund | Overwriting Fund | ||||||||||||||
| Cost of Investments | $ | 1,699,296,214 | $ | 1,582,919,175 | $ | 906,442,971 | $ | 65,881,827 | |||||||||
| Unrealized Appreciation | $ | 196,945,802 | $ | 293,435,464 | $ | 15,410,747 | $ | 23,187,957 | |||||||||
| Unrealized Depreciation | (20,000,928 | ) | (13,107,490 | ) | (11,109,218 | ) | (493,585 | ) | |||||||||
| Net Unrealized Appreciation (Depreciation) | $ | 176,944,874 | $ | 280,327,974 | $ | 4,301,529 | $ | 22,694,372 | |||||||||
| Undistributed Ordinary Income | $ | 48,919,052 | $ | 29,814,618 | $ | 26,881,411 | $ | 21,753 | |||||||||
| Undistributed Long-Term Capital Gains | |||||||||||||||||
| (Capital Loss Carryforward) | $ | 69,882,526 | $ | 89,199,694 | $ | (33,254,915 | ) $ | (17,419,358 | ) | ||||||||
| Tax Composition of Distributions | |||||||||||||||||
| Ordinary Income | $ | 69,052,872 | $ | 70,117,907 | $ | 9,851,950 | $ | 755,367 | |||||||||
| Long-Term Capital Gains | $ | 30,957,023 | $ | 105,520,412 | $ | — | $ | — | |||||||||
As permitted by tax regulations, the Funds intend to defer a late year ordinary loss incurred from January 1, 2014 to October 31, 2014 and treat it as arising in the fiscal year 2015. As of October 31, 2014, Russell Commodity Strategies and Russell Tax Managed Mid& Small Cap Funds had deferred ordinary losses of 8,401,501 and 1,239,684 respectively.
7. Interfund Lending Program
The Funds have been granted permission from the Securities and Exchange Commission to participate in a joint lending and borrowing facility. Funds may borrow money from each other for temporary purposes. All such borrowing and lending will be subject to a participating Fund’s fundamental investment limitations. A Fund will lend through the program only when the returns are higher than those available from an investment in repurchase agreements or short-term reserves and the portfolio manager determines it is in the best interest of the Fund. The Funds will borrow through the program only when the costs are equal to or lower than the cost of bank loans. Interfund loans and borrowings normally extend overnight, but can have a maximum duration of seven days. Loans may be called on one business day’s notice. A participating Fund may have to borrow from a bank at a higher interest rate if an interfund loan is called or not renewed. Any delay in repayment to the lending fund could result in reduced returns or additional borrowing costs. For the period ended October 31, 2014, the Funds presented herein did not borrow or lend through the interfund lending program.
8. Record Ownership
As of October 31, 2014, the following table includes shareholders of record with greater than 10% of the total outstanding shares of each respective Fund:
| # of Shareholders | % | ||||
| Russell U.S. Core Equity Fund | 2 | 27.6 | |||
| Russell U.S. Defensive Equity Fund | 2 | 34.4 | |||
| Russell U.S. Dynamic Equity Fund | 3 | 73.5 | |||
| Russell U.S. Strategic Equity Fund | 1 | 11.3 | |||
| Select U.S. Equity Fund | 3 | 46.7 | |||
| Russell U.S. Mid Cap Equity Fund | 1 | 13.6 | |||
| Russell U.S. Small Cap Equity Fund | 1 | 10.5 | |||
| Russell Global Equity Fund | 1 | 10.8 | |||
| Select International Equity Fund | 2 | 34.5 | |||
| Russell Tax-Managed U.S. Large Cap Fund | 1 | 15.4 | |||
| Russell Tax-Managed U.S. Mid & Small Cap Fund | 1 | 10.1 | |||
| Russell Global Opportunistic Credit Fund | 1 | 10.3 | |||
| Russell Strategic Bond Fund | 1 | 13.6 | |||
| Russell Short Duration Bond Fund | 1 | 11.6 | |||
| Russell Tax Exempt Bond Fund | 1 | 16.2 | |||
| Russell Global Infrastructure Fund | 1 | 11.6 | |||
| Russell Multi-Strategy Alternative Fund | 1 | 11.0 | |||
| 9. Restricted Securities | |||||
718 Notes to Financial Statements
Russell Investment Company Russell Funds
Notes to Financial Statements, continued — October 31, 2014
| Restricted securities are subject to contractual limitations on resale, are often issued in private placement transactions, and are not |
| registered under the Securities Act of 1933, as amended (the “Act”). The most common types of restricted securities are those sold |
| under Rule 144A of the Act and commercial paper sold under Section 4(2) of the Act. |
| A Fund may invest a portion of its net assets not to exceed 15% in securities that are illiquid. This limitation is applied at the time |
| of purchase. Illiquid securities are securities that may not be readily marketable, and that cannot be sold within seven days in |
| the ordinary course of business at the approximate amount at which the Fund has valued the securities. Restricted securities are |
| generally considered to be illiquid. |
| See each Fund’s Schedule of Investments for a list of restricted securities held by a Fund that are illiquid. |
| 10. Pending Legal Proceedings |
| On October 17, 2013, Fred McClure filed a derivative lawsuit against RIMCo on behalf of ten funds: the Russell Commodity |
| Strategies Fund, Russell Emerging Markets Fund, Russell Global Equity Fund, Russell Global Infrastructure Fund, Russell Global |
| Opportunistic Credit Fund, Russell International Developed Markets Fund, Russell Multi-Strategy Alternative Fund, Russell |
| Strategic Bond Fund, Russell U.S. Small Cap Equity Fund and Russell Global Real Estate Securities Fund. The lawsuit, which |
| was filed in the United States District Court for the District of Massachusetts, seeks recovery under Section 36(b) of the Investment |
| Company Act, as amended, for the alleged payment of excessive investment management fees to RIMCo. On December 8, 2014, |
| Fred McClure files a second derivative lawsuit in the United States District Court for the District of Massachusetts. This second suit |
| involves the same ten funds, and the allegations are similar, although the second suit adds a claim alleging the RFSC charged the |
| funds excessive administrative fees under Section 36(b). The plaintiff seeks recovery of the amount of excessive compensation or |
| payments received from these ten funds and earnings that would have accrued to plaintiff had that compensation not been paid or, |
| alternatively, rescission of the contracts and restitution of all excessive fees paid. RIMCo intends to vigorously defend the action. |
| 11. Subsequent Events |
| Management has evaluated the events and/or transactions that have occurred through the date the financial statements were issued |
| and noted the following items requiring additional disclosure: |
| A special meeting of the Funds’ shareholders was held on November 3, 2014 and November 25, 2014 in order for shareholders to |
| vote on two proposals: |
| 1. For all Funds, to approve a new investment advisory agreement between RIMCo and each Fund, as a result of a transaction |
| involving the sale of RIMCo’s parent company to the London Stock Exchange Group PLC (“LSEG”) (the “Post-Transaction |
| Agreement”). |
| 2. For all Funds except the Russell Strategic Call Overwriting, Select U.S. Equity and Select International Equity Funds, to approve |
| a new investment advisory agreement between RIMCo and each Fund that reflects updated terms and, if approved by shareholders, |
| would go into effect in lieu of the Post-Transaction Agreement following the transaction or, if the transaction is not consummated, |
| would replace the Funds’ existing investment advisory agreement (together with the “Post-Transaction Agreement,” the “New |
| Advisory Agreements”). Specifically, this agreement would provide RIMCo with greater flexibility in managing the Funds and |
| update the Funds’ existing agreement to reflect current industry practices. |
| On December 2, 2014, FRC and its subsidiaries, including RIMCo, became wholly-owned subsidiaries of LSEG. LSEG is a |
| diversified international exchange group. |
| The New Advisory Agreements were approved by the shareholders of each Fund, as applicable, and went into effect upon |
| consummation of the transaction on December 2, 2014. |
| On November 3, 2014, the Board declared dividends payable from net investment income. Dividends will be payable on November |
| 5, 2014, to shareholders of record on November 4, 2014. |
| On December 1, 2014, the Board declared dividends payable from net investment income. Dividends will be payable on December |
| 3, 2014, to shareholders of record on December 2, 2014. |
| On December 19, 2014, the Board declared dividends payable from net investment income. Dividends will be payable on December |
| 23, 2014, to shareholders of record on December 22, 2014. |
Notes to Financial Statements 719
Report of Independent Registered Public Accounting Firm
To the Board of Trustees and Shareholders
of Russell Investment Company
In our opinion, the accompanying statements of assets and liabilities, including the schedules of investments, and the related statements of operations and of changes in net assets and the financial highlights present fairly, in all material respects, the financial position of Russell U.S. Core Equity Fund, Russell U.S. Defensive Equity Fund, Russell U.S. Dynamic Equity Fund, Russell U.S. Strategic Equity Fund, Select U.S. Equity Fund, Russell U.S. Large Cap Equity Fund, Russell U.S. Mid Cap Equity Fund, Russell U.S. Small Cap Equity Fund, Russell International Developed Markets Fund, Russell Global Equity Fund, Select International Equity Fund, Russell Emerging Markets Fund, Russell Tax-Managed U.S. Large Cap Fund, Russell Tax-Managed U.S. Mid & Small Cap Fund, Russell Global Opportunistic Credit Fund, Russell Strategic Bond Fund, Russell Investment Grade Bond Fund, Russell Short Duration Bond Fund, Russell Tax Exempt Bond Fund, Russell Commodity Strategies Fund and its subsidiary, Russell Global Infrastructure Fund, Russell Global Real Estate Securities Fund, Russell Multi-Strategy Alternative Fund and its subsidiary and Russell Strategic Call Overwriting Fund (twenty-four of the portfolios constituting Russell Investment Company, hereafter collectively referred to as the “Funds”) at October 31, 2014, the results of each of their operations for the period then ended, the changes in each of their net assets for each of the two years in the period then ended, as applicable, and the financial highlights for each of the periods presented, in conformity with accounting principles generally accepted in the United States of America. These financial statements and financial highlights (hereafter referred to as “financial statements”) are the responsibility of the Funds’ management. Our responsibility is to express an opinion on these financial statements based on our audits. We conducted our audits of these financial statements in accordance with the standards of the Public Company Accounting Oversight Board (United States). Those standards require that we plan and perform the audit to obtain reasonable assurance about whether the financial statements are free of material misstatement. An audit includes examining, on a test basis, evidence supporting the amounts and disclosures in the financial statements, assessing the accounting principles used and significant estimates made by management, and evaluating the overall financial statement presentation. We believe that our audits, which included confirmation of securities at October 31, 2014 by correspondence with the custodian, brokers and transfer agent, provide a reasonable basis for our opinion.

720 Report of Independent Registered Public Accounting Firm
Russell Investment Company Russell Funds
Tax Information — October 31, 2014 (Unaudited)
For the tax year ended October 31, 2014, the Funds hereby designate 100%, or the maximum amount allowable, of its net taxable income as qualified dividends taxed at individual net capital gain rates.
For the tax year ended October 31, 2014, the Funds hereby designate under Section 871(k)(2)(c) of the Code, the maximum amount allowable as a short term capital gain dividend for purposes of the tax imposed under Section 871(a)(1)(A) of the Code. This applies to nonresident alien shareholders only.
The Form 1099 you receive in January 2015 will show the tax status of all distributions paid to your account in calendar year 2014.
The Funds designate dividends distributed during the fiscal year as qualifying for the dividends received deduction for corporate shareholders as follows:
| Russell U.S Core Equity Fund | 51.7 | % |
| Russell U.S. Defensive Equity Fund | 100.0 | % |
| Russell U.S. Dynamic Equity Fund | 18.0 | % |
| Russell U.S. Strategic Equity Fund | 36.6 | % |
| Russell U.S. Large Cap Equity Fund | 43.0 | % |
| Russell U.S. Mid Cap Equity Fund | 29.2 | % |
| Russell U.S. Small Cap Equity Fund | 81.8 | % |
| Russell International Developed Markets Fund | 0.0 | % |
| Russell Global Equity Fund | 27.7 | % |
| Russell Emerging Markets Fund | 0.0 | % |
| Russell Tax-Managed U.S. Large Cap Fund | 100.0 | % |
| Russell Tax-Managed U.S. Mid & Small Cap Fund | 0 | % |
| Russell Global Opportunistic Credit Fund | 0 | % |
| Russell Strategic Bond Fund | 0 | % |
| Russell Investment Grade Bond Fund | 0 | % |
| Russell Short Duration Bond Fund | 0 | % |
| Russell Tax Exempt Bond Fund | 0 | % |
| Russell Commodity Strategies Fund | 0 | % |
| Russell Global Infrastructure Fund | 15.0 | % |
| Russell Global Real Estate Securities Fund | 0 | % |
| Russell Multi-Strategy Alternative Fund | 5.2 | % |
| Russell Strategic Call Overwriting Fund | 100.0 | % |
| Select U.S. Equity Fund | 93.9 | % |
| Select International Equity Fund | 0.0 | % |
Pursuant to Section 852 of the Internal Revenue Code, the Funds designate the following amounts as long-term capital gain dividends for their taxable year ended October 31, 2014:
| Russell U.S. Small Cap Fund | $ | 148,969,377 |
| Russell U.S. Strategic Equity Fund | 56,014,418 | |
| Russell U.S. Mid Cap Equity Fund | 7,629,495 | |
| Russell U.S. Large Cap Equity Fund | 12,563,057 | |
| Russell U.S. Dynamic Equity Fund | 22,187,997 |
Tax Information 721
Russell Investment Company Russell Funds
Tax Information — October 31, 2014 (Unaudited)
| Russell Tax-Managed U.S. Mid & Small Cap Fund | 15,846,777 |
| Russell Global Opportunistic Credit Fund | 5,560,896 |
| Russell Strategic Bond Fund | 34,501,329 |
| Russell Short Duration Bond Fund | 1,937,797 |
| Russell Global Infrastructure Fund | 30,957,023 |
| Russell Global Equity Fund | 50,163,675 |
| Russell Global Real Estate Securities Fund | 105,520,412 |
| Russell Emerging Markets Fund | 62,477,057 |
| Russell Commodity Strategies Fund | 58,663 |
Please consult a tax adviser for any questions about federal or state income tax laws.
The Funds listed below paid foreign taxes and recognized foreign source income during the taxable year ended October 31, 2014. Pursuant to Section 853 of the Internal Revenue Code, the Funds designate the following per share amounts of foreign taxes paid and income earned from foreign sources:
| Foreign | Foreign | |||||||
| Taxes | Source | |||||||
| Foreign | Paid | Foreign Source | Income Per | |||||
| Fund Name | Taxes Paid | Per Share | Income | Share | ||||
| Russell International Developed Markets Fund | $ | 6,434,869 | $ | 0.0563 | $ | 133,019,556 | $ | 1.1632 |
| Russell Global Equity Fund | 2,598,684 | 0.0092 | 44,673,595 | 0.158 | ||||
| Russell Emerging Markets Fund | 8,275,754 | 0.0517 | 51,663,213 | 0.3225 | ||||
| Russell Global Infrastructure Fund | 2,304,526 | 0.0168 | 39,903,634 | 0.2914 | ||||
| Russell Global Real Estate Securities Fund | 1,669,624 | 0.037 | 28,481,026 | 0.6315 | ||||
| Select International Equity Fund | 43,041 | 0.0036 | 553,134 | 0.0466 |
Pursuant to Section 852(b)(5)(A) of the Internal Revenue Code, the Russell Tax Exempt Bond Fund designates $24,715,462 of distributions from net investment income as exempt interest dividends during the taxable year ended October 31, 2014.
722 Tax Information
Russell Investment Company Russell Funds
Affiliated Brokerage Transactions — October 31, 2014 (Unaudited)
As mentioned in the Note 5 in the Notes to Financial Statements contained in this annual report, the Funds utilize Russell Implementation Services Inc. (“RIS”) and its independent brokers. RIS is a registered broker dealer and investment adviser and an affiliate with RIMCo. Trades placed through RIS and its independent brokers are made (i) to manage trading associated with changes in money manager, rebalancing across existing money managers, cash flows and other portfolio transitions, (ii) to execute portfolio securities transactions for each Fund’s assets that RIMCo determines not to allocate to money managers including assets RIMCo may manage to manage risk in a Fund’s investment portfolio and for each Fund’s cash reserves or (iii) to execute a money manager’s portfolio securities transactions for the segment of a Fund’s portfolio assigned to the money manager. RIMCo has authorized RIS to effect certain futures, swaps, over-the-counter derivatives transactions, and cleared swaps, including foreign currency spot, forwards and options trading on behalf of the Funds.
Amounts retained by RIS for the period ended October 31, 2014 were as follows:
| Affiliated Broker | Fund Name | 2014 | |
| RIMCo | |||
| Russell U.S. Core Equity Fund | $ | 27,635 | |
| Russell U.S. Defensive Equity Fund | 99,603 | ||
| Russell U.S. Dynamic Equity Fund | 69,454 | ||
| Russell U.S. Strategic Equity Fund | 23,096 | ||
| Russell U.S. Large Cap Equity Fund | 3,858 | ||
| Russell U.S. Mid Cap Equity Fund | 7,869 | ||
| Russell U.S. Small Cap Equity Fund | 623,703 | ||
| Russell International Developed Markets Fund | 1,116,825 | ||
| Russell Global Equity Fund | 134,690 | ||
| Russell Emerging Markets Fund | 640,228 | ||
| Russell Tax-Managed U.S. Large Cap Fund | 89,787 | ||
| Russell Tax-Managed U.S. Mid & Small Cap Fund | 88,692 | ||
| Russell Strategic Bond Fund | 265,657 | ||
| Russell Investment Grade Bond Fund | 162,934 | ||
| Russell Short Duration Bond Fund | 105,209 | ||
| Russell Global Infrastructure Fund | 575,051 | ||
| Russell Global Real Estate Securities Fund | 228,920 |
Affiliated Brokerage Transactions 723
Russell Investment Company Russell Funds
Basis for Approval of Investment Advisory Contracts — (Unaudited)
Approval of Existing Investment Advisory Agreements ( for all Funds except the Select U.S. Equity and Select International Equity Funds)
The Investment Company Act of 1940, as amended (the “1940 Act”), requires that the Board of Trustees (the “Board”), including a majority of its members who are not considered to be “interested persons” under the 1940 Act (the “Independent Trustees”) voting separately, approve the continuation of the advisory agreements with RIMCo (the “Existing Agreements”) and the portfolio management contract with each Money Manager of the Funds (collectively, the “portfolio management contracts”) on at least an annual basis and that the terms and conditions of each Existing Agreement and the terms and conditions of each portfolio management contract provide for its termination if continuation is not approved annually. The Board, including all of the Independent Trustees, considered and approved the continuation of the Existing Agreements and the portfolio management contracts at a meeting held in person on May 19-20, 2014 (the “Existing Agreement Evaluation Meeting”). During the course of a year, the Trustees receive a wide variety of materials regarding, among other things, the investment performance of the Funds, sales and redemptions of the Funds’ shares, management of the Funds and other services provided by RIMCo and compliance with applicable regulatory requirements. In preparation for the annual review, the Independent Trustees, with the advice and assistance of their independent counsel (“Independent Counsel”), also requested and the Board considered (1) information and reports prepared by RIMCo relating to the services provided by RIMCo (and its affiliates) to the Funds; (2) information and reports prepared by RIMCo relating to the profitability of each Fund to RIMCo; (3) information (the “Third-Party Information”) received from an independent, nationally recognized provider of investment company information comparing the performance of certain of the Funds and their respective operating expenses over various periods of time with other peer funds not managed by RIMCo, believed by the provider to be generally comparable in investment objectives to the Funds; and (4) information prepared by RIMCo (the “RIMCo Comparative Information”) comparing the performance of certain Funds and their respective operating expenses over various periods of time with other peer funds not managed by RIMCo, believed by RIMCo to be generally comparable in investment objectives to the Funds. In the case of each Fund, its other peer funds, whether identified as such in the Third-Party Information or the RIMCo Comparative Information, are collectively hereinafter referred to as the Fund’s “Comparable Funds,” and, with the Fund, such Comparable Funds are collectively hereinafter referred to as the Fund’s “Performance Universe” in the case of performance comparisons and the Fund’s “Expense Universe” in the case of operating expense comparisons. In the case of certain, but not all, Funds, the Third-Party Information reflected changes in the Comparable Funds requested by RIMCo, which changes were noted in the Third-Party Information. The foregoing and other information received by the Board, including the Independent Trustees, in connection with its evaluations of the Existing Agreements and portfolio management contracts are collectively called the “Existing Agreement Evaluation Information.” The Trustees’ evaluations also reflected the knowledge and familiarity gained as Board members of the Funds and the other RIMCo-managed funds for which the Board has supervisory responsibility (“Other Russell Funds”) with respect to services provided by RIMCo, RIMCo’s affiliates and each Money Manager. The Trustees received a memorandum from counsel to the Funds (“Fund Counsel”) discussing the legal standards for their consideration of the continuations of the Existing Agreements and the portfolio management contracts, and the Independent Trustees separately received a memorandum regarding their responsibilities from Independent Counsel.
At a meeting held in person on April 29, 2014 (the “Existing Agreement Information Review Meeting,” and together with the Existing Agreement Evaluation Meeting, the “Existing Agreement Evaluation Meetings”), the Independent Trustees in preparation for the Existing Agreement Evaluation Meeting met first with representatives of RIMCo and then in a private session with Independent Counsel at which no representatives of RIMCo or the Funds’ management were present to review the Existing Agreement Evaluation Information received to that date and, on the basis of that review, requested additional Existing Agreement Evaluation Information. At the Existing Agreement Evaluation Meeting, the Independent Trustees again met in person in a private session with Independent Counsel to review additional Existing Agreement Evaluation Information received to that date. At the Existing Agreement Evaluation Meeting, the Board, including the Independent Trustees, considered the proposed continuance of the Existing Agreements and the portfolio management contracts with RIMCo, Fund management, Independent Counsel and Fund Counsel. Presentations made by RIMCo at the Existing Agreement Evaluation Meetings as part of this review encompassed the Funds and all Other Russell Funds. Information received by the Board, including the Independent Trustees, at the Existing Agreement Evaluation Meetings is included in the Existing Agreement Evaluation Information. Prior to voting at the Existing Agreement Evaluation Meeting, the non-management members of the Board, including the Independent Trustees, met in executive session with Independent Counsel to consider additional Existing Agreement Evaluation Information received from RIMCo and management at the Existing Agreement Evaluation Meeting. The discussion below reflects all of these reviews.
724 Basis for Approval of Investment Advisory Contracts
Russell Investment Company Russell Funds
Basis for Approval of Investment Advisory Contracts, continued — (Unaudited)
In evaluating the portfolio management contracts, the Board considered that each of the Funds (the “Manager-of-Managers Funds”), other than the Russell Strategic Call Overwriting Fund, employs a manager-of-managers method of investment and RIMCo’s advice that such Funds, in employing a manager-of-managers method of investment, operate in a manner that is distinctly different from most other investment companies. In the case of most other investment companies, an investment advisory fee is paid by the investment company to its adviser which, in turn, employs and compensates individual portfolio managers to make specific securities selections consistent with the adviser’s style and investment philosophy. RIMCo has engaged multiple unaffiliated Money Managers for all Funds except the Russell Strategic Call Overwriting Fund, which is currently managed only by RIMCo. A Money Manager may have (1) a discretionary asset management assignment pursuant to which it is allocated a portion of a Manager-of-Manager Fund’s assets to manage directly in its discretion; (2) a non-discretionary assignment pursuant to which it provides a model portfolio to RIMCo representing its investment recommendations, based upon which RIMCo purchases and sells securities for a Manager-of-Managers Fund; or (3) both a discretionary and a non-discretionary assignment.
The Board considered that RIMCo (rather than any Money Manager in the case of Manager-of-Managers Funds) is responsible under the Existing Agreements for determining, implementing and maintaining the investment program for each Fund. Assets of each Manager-of-Managers Fund generally have been allocated among the multiple discretionary Money Managers selected by RIMCo, subject to Board approval, for that Fund. RIMCo manages the investment of each Manager-of-Managers Fund’s cash and also may manage directly any portion of each Manager-of-Managers Fund’s assets that RIMCo determines not to allocate to the discretionary Money Managers and portions of a Manager-of-Managers Fund during transitions between Money Managers. RIMCo also may manage portions of a Manager-of-Managers Fund based upon model portfolios provided by non-discretionary Money Managers. In all cases, Fund assets are managed directly by RIMCo pursuant to authority provided by the Existing Agreements.
RIMCo is responsible for selecting, subject to Board approval, Money Managers for each Manager-of-Managers Fund and for actively managing allocations and reallocations of its assets among the Money Managers or their strategies and RIMCo itself. The Board has been advised that RIMCo’s goal with respect to the Manager-of-Managers Funds is to construct and manage diversified portfolios in a risk-aware manner. Each discretionary Money Manager for a Manager-of-Managers Fund in effect performs the function of an individual portfolio manager who is responsible for selecting portfolio securities for the portion of the Fund assigned to it by RIMCo (each, a “segment”) in accordance with the Manager-of-Managers Fund’s applicable investment objective, policies and restrictions, any constraints placed by RIMCo upon their selection of portfolio securities and the Money Manager’s specified role in a Fund. For each Manager-of-Managers Fund, RIMCo is responsible for, among other things, communicating performance expectations to each Money Manager; supervising compliance by each Money Manager with each Fund’s investment objective and policies; authorizing Money Managers to engage in or provide recommendations with respect to certain investment strategies for a Manager-of-Managers Fund; and recommending annually to the Board whether portfolio management contracts should be renewed, modified or terminated. In addition to its annual recommendation as to the renewal, modification or termination of portfolio management contracts, RIMCo is responsible for recommending to the Board additions of new Money Managers or replacements of existing Money Managers at any time when, based on RIMCo’s research and ongoing review and analysis, such actions are appropriate. RIMCo may impose specific investment or strategy constraints from time to time for each Money Manager intended to capitalize on the strengths of that Money Manager or to coordinate the investment activities of Money Managers for the Manager-of-Managers Fund in a complementary manner. Therefore, RIMCo’s selection of Money Managers is made not only on the basis of performance considerations but also on the basis of anticipated compatibility with other Money Managers in the same Manager-of-Managers Fund. In light of the foregoing, the overall performance of each Manager-of-Managers Fund over appropriate periods has reflected, in great part, the performance of RIMCo in designing the Fund’s investment program, structuring the Manager-of-Managers Fund, selecting an effective Money Manager with a particular investment style or sub-style for a segment that is complementary to the styles of the Money Managers of other Fund segments, and allocating assets among the Money Managers or their strategies in a manner designed to achieve the objectives of the Manager-of-Managers Fund.
The Board considered that the prospectuses for the Manager-of-Managers Funds and other public disclosures emphasize to investors RIMCo’s role as the principal investment manager for each such Fund, rather than the investment selection role of the Funds’ Money Managers, and describe the manner in which the Funds operate so that investors may take that information into account when deciding to purchase shares of any Manager-of-Managers Fund. The Board further considered that Manager-of-Managers Fund investors in pursuing their investment goals and objectives likely purchased their shares on the basis of this information and RIMCo’s reputation for and performance record in managing the structure of the Manager-of-Managers Funds.
Basis for Approval of Investment Advisory Contracts 725
Russell Investment Company Russell Funds
Basis for Approval of Investment Advisory Contracts, continued — (Unaudited)
The Board also considered the demands and complexity of managing the Manager-of-Managers Funds pursuant to the manager-of-managers structure, the special expertise of RIMCo with respect to the manager-of-managers structure of the Funds and the likelihood that, at the current expense ratio of each Manager-of-Managers Fund, there would be no acceptable alternative investment managers to replace RIMCo on comparable terms given the need to continue the manager-of-managers strategy of such Fund selected by shareholders in purchasing their shares.
In addition to these general factors relating to the structure of the Manager-of-Managers Funds, the Trustees considered, with respect to each Fund, various specific factors in evaluating renewal of the Existing Agreements, including the following:
1. The nature, scope and overall quality of the investment management and other services provided, and expected to be provided, to the Fund by RIMCo;
2. The advisory fee paid by the Fund to RIMCo (the “Advisory Fee”) and the fact that it encompasses all investment advisory fees paid by the Fund, including the fees for any Money Managers of such Fund;
3. Information provided by RIMCo as to other fees and benefits received by RIMCo or its affiliates from the Fund, including any administrative or transfer agent fees and any fees received for management or administration of securities lending cash collateral, soft dollar arrangements and commissions in connection with portfolio securities transactions;
4. Information provided by RIMCo as to expenses incurred by the Fund;
5. Information provided by RIMCo as to the profits that RIMCo derives from its mutual fund operations generally and from the Fund; and
6. Information provided by RIMCo concerning economies of scale and whether any scale economies are adequately shared with the Fund.
In evaluating the nature, scope and overall quality of the investment management and other services provided, and which are expected to be provided, to the Funds, including Fund portfolio management services, the Board discussed with senior representatives of RIMCo the impact on the Funds’ operations of changes in RIMCo’s senior management and other personnel providing investment management and other services to the Funds during the past year. The Board was not advised of any expected diminution in the nature, scope or quality of the investment advisory or other services provided to the Funds from such changes. The Board also discussed the impact of organizational changes on the compliance programs of the Funds and RIMCo with the Funds’ Chief Compliance Officer (the “CCO”) and received assurances from the CCO that such changes have not resulted in any diminution in the scope and quality of the Funds’ compliance programs.
RIMCo is a wholly owned subsidiary of Frank Russell Company (“FRC”). FRC, in turn, is an indirect majority-owned subsidiary of The Northwestern Mutual Life Insurance Company (“NM”). Prior to the Existing Agreement Information Review Meeting, NM publicly announced its intention to evaluate strategic alternatives for its majority interest in FRC. RIMCo has advised the Board that this review could result in a transaction (“Transaction”) causing a change of control of RIMCo. At the Existing Agreement Information Review Meeting, the Board was advised by RIMCo that an unspecified number of parties had expressed an interest in a Transaction with NM but, to RIMCo’s knowledge, no formal proposals had been received to the date of the Existing Agreement Information Review Meeting. RIMCo, however, expected that proposals from one or more unidentified parties would be received shortly. RIMCo expressed its belief that any Transaction would not affect the activities of RIMCo in respect of the Funds or the structure of the Manager-of-Managers Funds. However, the Board received no assurances in this regard directly from NM. Any Transaction would result, among other things, in an assignment and termination of the Existing Agreements, as required by the 1940 Act, and by the terms and conditions of the Existing Agreements. In the event of a Transaction, the Board would be required to consider the approval of the terms and conditions of a replacement agreement (“Post-Transaction Agreement”) for the Existing Agreements and thereafter to submit the Post-Transaction Agreement to each Fund’s shareholders for approval, as required by the 1940 Act. At the Existing Agreement Evaluation Meeting, the Board was advised by RIMCo that NM had entered into exclusive discussions with London Stock Exchange Group plc regarding a possible Transaction. At both of the Existing Agreement Evaluation Meetings, the Board discussed with RIMCo the need to assure continuity of services required for the Funds’ operations.
As noted above, RIMCo, in addition to managing the investment of each Manager-of-Managers Fund’s cash, may directly manage a portion of certain Manager-of-Managers Funds (the “Participating Funds”) pursuant to the relevant Existing Agreement, the
726 Basis for Approval of Investment Advisory Contracts
Russell Investment Company Russell Funds
Basis for Approval of Investment Advisory Contracts, continued — (Unaudited)
actual allocation being determined from time to time by the Participating Funds’ RIMCo portfolio manager. Beginning in 2012, RIMCo implemented a strategy of managing a portion of the assets of the Participating Funds to modify such Funds’ overall portfolio characteristics by investing in securities or other instruments that RIMCo believes will achieve the desired risk/return profiles for such Funds. RIMCo monitors and assesses Fund characteristics, including risk, using a variety of measurements, such as tracking error, and may seek to manage Fund characteristics consistent with the Funds’ investment objectives and strategies. For U.S. equity Funds, fund characteristics may be managed with the goal to increase or decrease exposures (such as volatility, momentum, value, growth, capitalization size, industry or sector). For non-U.S. equity, global infrastructure and global real estate Funds, fund characteristics may be managed with the goal to increase or decrease exposures (such as volatility, momentum, value, growth, capitalization size, industry, sector or region). For fixed-income and alternative Funds, fund characteristics may be managed with the goal to increase or decrease exposures (such as sector, industry, currency, credit or mortgage exposure or country risk, yield curve positioning, or interest rates). For all Funds, fund characteristics may be managed to offset undesired relative over or underweights in order to seek to achieve the desired risk/return profile for each Fund. RIMCo may use an index replication or sampling strategy by selecting an index which represents the desired exposure, or may utilize quantitative or qualitative analysis or quantitative models designed to assess Fund characteristics and identify a portfolio which provides the desired exposure. Based on this, for the portion of a Fund’s assets directly managed by RIMCo, RIMCo may invest in common stocks, exchange-traded funds, exchange-traded notes, REITs, short-term investments and/or derivatives, including futures, forwards, options and/or swaps, in order to seek to achieve the desired risk/ return profile for the Fund. Derivatives may be used to take long or short positions. In addition, RIMCo may choose to use the cash equitization process to manage Fund characteristics in order to seek to achieve the desired risk/return profile for the Fund. RIMCo also may manage Fund assets directly to effect a Fund’s investment strategies. RIMCo’s direct management of assets for these purposes is hereinafter referred to as the “Direct Management Services.” RIMCo also may reallocate Fund assets among Money Managers, increase Fund cash reserves or determine not to be fully invested. RIMCo’s Direct Management Services generally are not intended to be a primary driver of Manager-of-Managers Funds’ investment results, although the services may have a positive or negative impact on investment results, but rather are intended to enhance incrementally the ability of Funds to carry out their investment programs. At the Existing Agreement Evaluation Meetings, RIMCo advised the Board of a likely expansion of its Direct Management Services. In connection with this expansion, RIMCo stated that it may provide Direct Management Services to additional Funds and expected that a larger portion of certain Funds, including the Russell Tax-Managed U.S. Mid & Small Cap Fund, will be managed directly by RIMCo pursuant to the Direct Management Services. Additional Funds to be managed pursuant to the Direct Management Services may include some or all fixed income Funds. The Board considered that during the period, and to the extent that RIMCo employs its Direct Management Services other than via the cash equitization process in respect of Participating Funds, RIMCo is not required to pay investment advisory fees to a Money Manager with respect to assets that are directly managed and that the profits derived by RIMCo generally and from the Participating Funds consequently may be increased incrementally, although RIMCo may incur additional costs in providing Direct Management Services. The Board, however, also considered the potential benefits of the Direct Management Services to Participating Funds; the limited amount of assets that to the date of the Existing Agreement Evaluation Meetings were being managed directly by RIMCo pursuant to the Direct Management Services; and the fact that the aggregate Advisory Fees paid by the Participating Funds are not increased as a result of RIMCo’s direct management of Fund assets as part of the Direct Management Services or otherwise.
In evaluating the reasonableness of the Funds’ Advisory Fees in light of Fund performance, the Board considered that, in the Existing Agreement Evaluation Information and at past meetings, RIMCo noted differences between the investment strategies of certain Funds and their respective Comparable Funds in pursuing their investment objectives. The Board noted RIMCo’s further past advice that the strategies pursued by the Funds, among other things, are intended to result in less volatile, more moderate returns relative to each Fund’s performance benchmark rather than more volatile, more extreme returns that its Comparable Funds may experience over time.
The Third-Party Information included, among other things, comparisons of the Funds’ Advisory Fees with the investment advisory fees of their Comparable Funds on an actual basis (i.e., giving effect to any voluntary fee waivers implemented by RIMCo and the advisers to such Fund’s Comparable Funds). The Third-Party Information, among other things, showed that the Russell U.S. Dynamic Equity Fund, Russell Tax-Managed U.S. Large Cap Fund, Russell Tax-Managed U.S. Mid & Small Cap Fund, Russell Global Equity Fund, Russell Emerging Markets Fund, Russell Strategic Bond Fund, Russell Short Duration Bond Fund, Russell Global Opportunistic Credit Fund, Russell Commodity Strategies Fund, Russell Global Infrastructure Fund, Russell Global Real Estate Securities Fund and Russell Multi-Strategy Alternative Fund each had an Advisory Fee which, compared with its Comparable Funds’ investment advisory fees on an actual basis, was ranked in the fourth or fifth quintile of its Expense Universe for that expense component. In these rankings, the first quintile represents funds with the lowest investment advisory fees among funds in the Expense Universe and the fifth quintile represents funds with the highest investment advisory fees among the Expense Universe funds. The comparisons were based upon the
Basis for Approval of Investment Advisory Contracts 727
Russell Investment Company Russell Funds
Basis for Approval of Investment Advisory Contracts, continued — (Unaudited)
latest fiscal years for the Expense Universe funds. The Board considered that the actual Advisory Fee for each of the Russell Global Real Estate Securities Fund and Russell Multi-Strategy Alternative Fund was less than 5 basis points from the third quintile of its Expense Universe. The Board further considered RIMCo’s explanation of the reasons for the Funds’ actual Advisory Fee rankings and its belief that the Funds’ Advisory Fees are fair and reasonable under the circumstances, notwithstanding such comparisons.
In discussing the Funds’ Advisory Fees generally, RIMCo noted, among other things, that its Advisory Fees for the Funds encompass services that may not be provided by investment advisers to the Funds’ Comparable Funds, such as cash equitization and, in the case of the Manager-of-Managers Funds, management of portfolio transition costs when Money Managers are added, terminated or replaced.
RIMCo also observed that its “margins” in providing investment advisory services to the Manager-of-Managers Funds tend to be lower than competitors’ margins because of the demands and complexities of managing the Funds’ manager-of-managers structure, including RIMCo’s payment of a significant portion of the Manager-of-Managers Funds’ Advisory Fees to their Money Managers. RIMCo expressed the view that Advisory Fees should be considered in the context of a Fund’s total expense ratio to obtain a complete picture. The Board, however, considered each Fund’s Advisory Fee on both a standalone basis and in the context of the Fund’s total expense ratio.
RIMCo attributed the high relative actual Advisory Fees of the Russell U.S. Dynamic Equity Fund, Russell Global Equity Fund, Russell Emerging Markets Fund, and Russell Tax-Managed U.S. Large Cap Fund to the practice among smaller Expense Universe funds to apply expense waivers intended to improve their total expense comparisons first to investment advisory fees, making meaningful comparisons of actual advisory fees difficult. In addition, RIMCo noted that very few of the Comparable Funds in the Russell Tax-Managed U.S. Large Cap Fund’s Expense Universe offer the tax-managed characteristics of the Fund.
RIMCo attributed the high relative actual Advisory Fee of the Russell Tax-Managed U.S. Mid & Small Cap Fund to the fact that none of the Expense Universe funds offers any of the tax-managed characteristics of the Fund.
RIMCo attributed the high relative actual Advisory Fees of the Russell Short Duration Bond Fund and Russell Commodity Strategies Fund to significant changes in their respective Expense Universes during the past year that adversely affected their Expense Universe rankings.
With respect to the Russell Global Infrastructure Fund, RIMCo noted that its Advisory Fee reflected an expectation that additional Money Managers would be engaged following the Fund’s launch and that the Money Managers would require fees reflecting the market for the particular skills and expertise to conduct the Fund’s investment program. RIMCo noted further than an additional Money Manager was hired in February 2014. The Board considered RIMCo’s advice at the Existing Agreement Evaluation Meeting that, in response to discussions with the Board at the Existing Agreement Information Review Meeting, it would implement a voluntary Advisory Fee waiver of 2 basis points for the Russell Global Infrastructure Fund, effective June 1, 2014. If the new voluntary fee waiver had been in effect during the period covered by the Third-Party Information, the Fund’s Advisory Fee would have been less than 5 basis points from the third quintile of the Fund’s Expense Universe. The voluntary Advisory Fee waiver may be terminated unilaterally by RIMCo at any time.
With respect to the Russell Commodity Strategies Fund, RIMCo noted that the Fund is the only multi-manager fund in the Expense Universe and, as such, offers a unique value proposition which justifies its higher relative actual Advisory Fee. The Board also considered RIMCo’s advice at the Existing Agreement Evaluation Meeting that, in response to discussions with the Board at the Existing Agreement Information Review Meeting, it would implement a voluntary Advisory Fee waiver of 3 basis points for the Russell Commodity Strategies Fund, effective June 1, 2014. The voluntary Advisory Fee waiver may be terminated unilaterally by RIMCo at any time.
With respect to the Russell Global Opportunistic Credit Fund, RIMCo noted that, unlike other funds in its Expense Universe, the Fund provides investors with a broad array of aggressive fixed income investing strategies generally not comparable to the other funds in its Expense Universe and that the Fund’s higher relative actual Advisory Fee is justified by this broader strategy.
Based upon information provided by RIMCo, the Board considered for each Fund whether economies of scale have been realized and whether the Advisory Fee for such Fund appropriately reflects or should be revised to reflect any such economies. The Board considered, among other things, the variability of Money Manager investment advisory fees and other factors associated with the manager-of-managers structure employed by the Funds as well as net Fund redemptions or purchases in recent years.
728 Basis for Approval of Investment Advisory Contracts
Russell Investment Company Russell Funds
Basis for Approval of Investment Advisory Contracts, continued — (Unaudited)
The Board also considered, as a general matter, that fees payable to RIMCo by institutional clients with investment objectives similar to those of the Funds and Other Russell Funds are lower, and, in some cases, may be substantially lower, than the rates paid by the Funds and Other Russell Funds. The Trustees considered the differences in the nature and scope of services RIMCo provides to institutional clients and the Funds. RIMCo explained, among other things, that institutional clients have fewer compliance, administrative and other needs than the Funds. RIMCo also noted that since the Funds must constantly issue and redeem their shares, they are more difficult to manage than institutional accounts, where assets are relatively stable. In addition, RIMCo noted that the Funds are subject to heightened regulatory requirements relative to institutional clients. The Board noted that RIMCo provides office space and facilities to the Funds and all of the Funds’ officers. Accordingly, the Trustees concluded that the services provided to the Funds are sufficiently different from the services provided to the other clients that comparisons are not probative and should not be given significant weight.
With respect to the Funds’ total expenses, the Third-Party Information showed that the total expenses for the Russell U.S. Dynamic Equity Fund, Russell Tax-Managed U.S. Mid & Small Cap Fund, Russell Short Duration Bond Fund, Russell Strategic Bond Fund, Russell Global Opportunistic Credit Fund, Russell Commodity Strategies Fund, Russell Emerging Markets Fund, Russell Global Equity Fund, Russell Tax Exempt Bond Fund, Russell Tax-Managed U.S. Large Cap Fund, and Russell Global Infrastructure Fund each ranked in the fourth or fifth quintile of its Expense Universe based upon the latest fiscal years for the Expense Universe funds. The total expenses for each of the other Funds ranked in the third quintile of its Expense Universe, or better. In these rankings, the first quintile represents the funds with the lowest total expenses among funds in the Expense Universe and the fifth quintile represents funds with the highest total expenses among the Expense Universe funds. In the case of each of the aforementioned Funds other than the Russell Tax Exempt Bond Fund, a significant factor in the Fund’s total expense ranking was the Fund’s Advisory Fee when compared to the investment advisory fees of other Expense Universe funds. The Board considered that the total expenses for each of the Russell Tax-Managed U.S. Large Cap Fund, Russell Global Equity Fund, Russell Emerging Markets Fund, and Russell Tax Exempt Bond Fund were within 5 basis points or less from the third quintile of the Fund’s Expense Universe. With respect to each of the other Funds with total expenses ranked in the fourth or fifth quintile of their Expense Universes, RIMCo expressed its belief that the Funds’ overall expense ratio was reasonable, notwithstanding the Third-Party Information comparisons. RIMCo provided explanations of the high relative total expense for certain Funds.
With respect to the Russell U.S. Dynamic Equity Fund, the Board considered RIMCo’s explanation that the Fund’s expense ratio increased by approximately 5 basis points as a result of a full year of an increase to the Fund’s contractual expense limitation amount.
With respect to the Russell Tax-Managed U.S. Mid & Small Cap Fund, the Board considered RIMCo’s advice that none of the funds in its Expense Universe pursued a tax-managed or tax-aware strategy comparable to the Fund’s strategy. RIMCo expressed its belief that the higher relative total expenses are justified by the Fund’s strategy.
With respect to the Russell Commodity Strategies Fund, the Board considered RIMCo’s expressed belief that, because of the small size of the Fund’s Expense Universe, any change in the number of Comparable Funds may be expected to have, and has had, an impact on the ranking of the Fund’s total expenses. In addition to the sensitivity and volatility of the Expense Universe to constituent changes, RIMCo again noted that the Fund was the only multi-manager fund in its Expense Universe and offers a unique value proposition to its peers, justifying its relatively higher total expense ratio. The Board also considered RIMCo’s advice at the Existing Agreement Evaluation Meeting that it would implement a voluntary Advisory Fee waiver of 3 basis points, effective June 1, 2014 and that the waiver would have a beneficial impact on the Fund’s expense ratio while in effect.
With respect to the Russell Global Opportunistic Credit Fund, the Board considered information provided by RIMCo comparing the Fund’s total expenses to a “custom” peer group selected by RIMCo believed to be more comparable to the Fund. This comparison showed somewhat improved comparative results but the Fund still ranked in the fourth quintile of this custom peer group.
With respect to the Russell Strategic Bond Fund, the Board considered that, effective January 1, 2014, the contractual waiver of certain transfer agency fees was increased, which would reduce the Fund’s expense ratio for Class S shares by approximately 2 basis points.
With respect to the Russell Short Duration Bond Fund, the Board considered that an additional 3 basis points of transfer agency fees for classes A, C, E, and S would be waived, effective May 1, 2014.
With respect to the Russell Global Infrastructure Fund, the Board considered RIMCo’s advice at the Existing Agreement Evaluation Meeting that it would implement a voluntary Advisory Fee waiver of 2 basis points, effective June 1, 2014 and that the waiver would have a beneficial impact on the Fund’s expense ratio while in effect.
Basis for Approval of Investment Advisory Contracts 729
Russell Investment Company Russell Funds
Basis for Approval of Investment Advisory Contracts, continued — (Unaudited)
On the basis of the Existing Agreement Evaluation Information, and other information previously received by the Board from RIMCo during the course of the current year or prior years, or presented at or in connection with the Existing Agreement Evaluation Meetings by RIMCo, the Board, in respect of each Fund, found, after giving effect to any applicable waivers and/or reimbursements and considering any differences in the composition and investment strategies of its respective Comparable Funds, (1) the Advisory Fee charged by RIMCo was reasonable in light of the nature, scope and overall quality of the investment management and other services provided, and expected to be provided, to the Fund; (2) the relative expense ratio of the Fund either was comparable to those of its Comparable Funds or RIMCo had provided an explanation satisfactory to the Board as to why the relative expense ratio was not comparable to those of its Comparable Funds; (3) RIMCo’s methodology of allocating expenses of operating funds in the complex was reasonable; (4) other benefits and fees received by RIMCo or its affiliates from the Fund were not excessive; (5) RIMCo’s profitability with respect to the Fund was not excessive in light of the nature, scope and overall quality of the investment management and other services provided by RIMCo; and (6) the Advisory Fee charged by RIMCo appropriately reflects any economies of scale realized by such Fund in light of various factors, including the variability of Money Manager investment advisory fees and other factors associated with the manager-of-managers structure.
The Board concluded that, under the circumstances and based on RIMCo’s performance information and reviews for each Fund, the performance of each of the Funds would be consistent with continuation of its Existing Agreement. The Board, in assessing the performance of Funds with at least three years of performance history, focused upon performance for the 3-year period ended December 31, 2013 as most relevant but also considered Fund performance for the 1-year and, where applicable, 5-year periods ended such date. In reviewing the Funds’ performance generally, the Board took into consideration various steps taken by RIMCo beginning in 2012 to enhance the performance of certain Manager-of-Managers Funds, including changes in Money Managers, and, in the case of Participating Funds, RIMCo’s implementation of its Direct Management Services, which may not yet be fully reflected in Fund investment results.
With respect to the Russell U.S. Core Equity Fund, the Third-Party Information showed that the Fund’s performance for the 3-year period ended December 31, 2013 was in the fourth quintile of its Performance Universe, but that its performance for the 1- and 5-year periods ended such date was in each case in the third quintile of its Performance Universe. In the 3-year period, RIMCo noted, among other things, that the Fund’s overweight to high beta stocks and stocks with positive price momentum detracted from the Fund’s relative performance as that category underperformed.
With respect to the Russell Commodity Strategies Fund, the Third-Party Information showed that the Fund’s performance was ranked in the third quintile of its Performance Universe for the 1-year period ended December 31, 2013, but was ranked in the fourth quintile of the Performance Universe for the 3-year period ended such date. RIMCo advised the Board that the Fund’s underperformance relative to some other funds in the Performance Universe was primarily attributable to differences in the Comparable Funds’ benchmarks and performance objectives. Additionally, several constituent funds in the Performance Universe seek to improve performance relative to their benchmarks by investing in lower quality credit instruments while the Fund maintains an average credit rating of AA or better. RIMCo noted that the Fund outperformed its benchmark in the 3-year period.
With respect to the Russell Tax Exempt Bond Fund, the Third-Party Information showed that the Fund’s performance was ranked in the fourth quintile of its Performance Universe for the 3- and 5-year periods ended December 31, 2013, but was ranked in the first quintile of the Performance Universe for the 1-year period ended such date. The Board considered RIMCo’s explanation of the Fund’s relative underperformance for the 3- and 5-year periods. Among other things, RIMCo noted that the Comparable Funds’ tendency to maintain longer portfolio durations than the Fund generally maintains in its portfolio was a benefit for the Comparable Funds during interest rate rallies during the periods.
With respect to the Russell Strategic Bond Fund, the Third-Party Information showed that the Fund’s performance for each of the 1-, 3- and 5-year periods ended December 31, 2013 was ranked in the fourth quintile of its Performance Universe. RIMCo noted that the credit quality of the Fund’s portfolio is significantly higher than the portfolio credit quality of its Comparable Funds. Lower quality credit outperformed higher quality credit as credit markets rallied over the 3-year performance measurement period. RIMCo noted that the Fund outperformed its benchmark in each of the 1-, 3- and 5-year periods.
With respect to the Russell Global Real Estate Securities Fund, the Third-Party Information showed that the Fund’s performance was ranked in the third quintile of its Performance Universe for the 1- and 5-year periods ended December 31, 2013, but was ranked in the fourth quintile of the Performance Universe for the 3-year period ended such date. RIMCo attributed the relative underperformance for
730 Basis for Approval of Investment Advisory Contracts
Russell Investment Company Russell Funds
Basis for Approval of Investment Advisory Contracts, continued — (Unaudited)
the 3-year period to the Fund’s exposure to Asia property developers, particularly Hong Kong and Singapore, based on Money Manager favorable views of their share valuations and growth expectations for the regions.
With respect to the Russell Investment Grade Bond Fund, the Third-Party Information showed that the Fund’s performance was ranked in the fourth quintile of its Performance Universe for the 1- and 3-year periods ended December 31, 2013, but was ranked in the third quintile for the 5-year period ended such date. The Board considered that RIMCo attributed the relative underperformance for the 3-year period primarily to the fact that the Comparable Funds tend to have meaningfully lower credit quality than the Fund and its benchmark.
With respect to the Russell Multi-Strategy Alternative Fund, the Third-Party Information showed that the Fund’s performance was ranked in the fifth quintile of its Performance Universe for the 1-year period ended December 31, 2013. The Board considered that RIMCo attributed the relative underperformance to differences in benchmarks, performance objectives and the types of strategies employed. The Board considered RIMCo’s explanation that the primary goal of the Fund is to outperform its benchmark while maintaining a lower volatility and lower correlation to global equity markets, whereas many of the constituents in the Fund’s custom peer group are benchmarked to equity or hedge fund indices. In this regard, RIMCo noted that relative to peers the Fund maintained significantly less exposure to U.S. equities, which rallied during the period.
In evaluating performance, the Board considered each Fund’s absolute performance and performance relative to appropriate benchmarks and indices in addition to such Fund’s performance relative to its Comparable Funds. In assessing the Funds’ performance relative to their Comparable Funds or benchmarks or in absolute terms, the Board also considered RIMCo’s stated investment strategy of managing the Funds in a risk-aware manner. The Board also considered the Money Manager changes that have been made since 2012 and that the performance of Money Managers continues to impact Fund performance for periods prior and subsequent to their termination, and that any incremental positive or negative impact of the Direct Management Services, which continue to evolve in nature and scope, was not yet fully reflected in the Fund’s investment results. Lastly, the Board considered potential new strategies discussed at the Existing Agreement Evaluation Meetings and prior Board meetings that may be employed by RIMCo in respect of certain Funds.
After considering the foregoing and other relevant factors, the Board concluded in respect of each Fund that continuation of its Existing Agreement would be in the best interests of such Fund and its shareholders and voted to approve the continuation of each Existing Agreement.
At the Existing Agreement Evaluation Meetings, with respect to the evaluation of the terms of portfolio management contracts with Money Managers, the Board received and considered information from RIMCo reporting, among other things, for each Money Manager, the Money Manager’s performance over various periods; RIMCo’s assessment of the performance of each Money Manager; any significant business relationships between the Money Manager and RIMCo or Russell Financial Services, Inc., the Funds’ underwriter; and RIMCo’s recommendation to retain the Money Manager at the current fee rate, to retain the Money Manager at a reduced fee rate or to terminate the Money Manager. The Board received reports during the course of the year from the Funds’ CCO regarding her assessments of Money Manager compliance programs and any compliance issues. RIMCo did not identify any benefits received by Money Managers or their affiliates as a result of their relationships with the Funds other than benefits from their soft dollar arrangements. The Existing Agreement Evaluation Information described, and at the Existing Agreement Evaluation Meetings the Funds’ CCO discussed, oversight of Money Manager soft dollar arrangements. The Existing Agreement Evaluation Information expressed RIMCo’s belief that, based upon certifications from Money Managers and pre-hire and ongoing reviews of Money Manager soft dollar arrangements, policies and procedures, the Money Managers’ soft dollar arrangements, policies and procedures are consistent with applicable legal standards and with disclosures made by Money Managers in their investment adviser registration statements filed with the Securities and Exchange Commission and by the Funds in their registration statements. The Board was advised that, in the case of Money Managers using soft dollar arrangements, the CCO monitors, among other things, the commissions paid by the Funds and percentage of Fund transactions effected pursuant to the soft dollar arrangements, as well as the products or services purchased by the Money Managers with soft dollars generated by Fund portfolio transactions. The CCO and RIMCo do not obtain, and the Existing Agreement Evaluation Information therefore did not include, information regarding the value of soft dollar benefits derived by Money Managers from Fund portfolio transactions. At the Existing Agreement Evaluation Meeting, RIMCo noted that it planned to recommend termination of certain Money Managers to the Board at the May 2014 meeting. RIMCo recommended that each of the other Money Managers be retained at its current or a reduced fee rate. In doing so, RIMCo, as it has in the past, advised the Board that it does not regard Money Manager profitability as relevant to its evaluation of the portfolio management contracts with Money Managers because the willingness of Money Managers to serve in such capacity depends upon arm’s-length negotiations with RIMCo; RIMCo is aware of the standard fee rates charged by Money Managers to other clients; and RIMCo believes that the fees agreed upon with Money Managers are reasonable in light of the
Basis for Approval of Investment Advisory Contracts 731
Russell Investment Company Russell Funds
Basis for Approval of Investment Advisory Contracts, continued — (Unaudited)
anticipated quality of investment advisory services to be rendered. The Board accepted RIMCo’s explanation of the relevance of Money Manager profitability in light of RIMCo’s belief that such fees are reasonable; the Board’s findings as to the reasonableness of the Advisory Fee paid by each Fund; and the fact that each Money Manager’s fee is paid by RIMCo.
Based substantially upon RIMCo’s recommendations, together with the Existing Agreement Evaluation Information, the Board concluded that the fees paid to the Money Managers of each Fund are reasonable in light of the quality of the investment advisory services provided and that continuation of the portfolio management contract with each Money Manager of each Fund would be in the best interests of the Fund and its shareholders.
In their deliberations, the Trustees did not identify any particular information as to the Existing Agreements or, other than RIMCo’s recommendation, the portfolio management contract with any Money Manager that was all-important or controlling and each Trustee attributed different weights to the various factors considered. The Trustees evaluated all information available to them on a Fund-by-Fund basis and their determinations were made in respect of each Fund.
Subsequent to the Existing Agreement Evaluation Meeting, the Board received a proposal from RIMCo at a meeting held on May 20, 2014 to effect Money Manager changes for the Russell Investment Grade Bond Fund, Russell Short Duration Bond Fund, Russell Tax-Managed U.S. Mid & Small Cap Fund, Russell Tax-Managed U.S. Large Cap Fund, Russell Global Real Estate Securities Fund, Russell U.S. Dynamic Equity Fund and Russell Global Opportunistic Credit Fund. In the case of each proposed change, the Trustees approved the terms of the proposed portfolio management contract based upon RIMCo’s recommendation to hire the Money Manager at the proposed fee rate; information as to reason for the proposed change; information as to the Money Manager’s role in the management of the Fund’s investment portfolio (including the amount of Fund assets to be allocated to the Money Manager) and RIMCo’s evaluation of the anticipated quality of the investment advisory services to be provided by the Money Manager; information as to any significant business relationships between the Money Manager and RIMCo or Russell Financial Services, Inc., the Fund’s underwriter; the CCO’s evaluation of the Money Manager’s compliance program, policies and procedures, and certification that they were consistent with applicable legal standards; RIMCo’s explanation as to the lack of relevance of Money Manager profitability to the evaluation of portfolio management contracts with Money Managers because the willingness of Money Managers to serve in such capacity depends upon arm’s-length negotiations with RIMCo; RIMCo’s awareness of the standard fee rates charged by the Money Manager to other clients; RIMCo’s belief that the proposed investment advisory fees would be reasonable in light of the anticipated quality of investment advisory services to be rendered; the increase or decrease in aggregate Money Manager fees to be paid by RIMCo from its Advisory Fee as a result of the engagement of the Money Manager; and the expected costs of transitioning Fund assets to the Money Manager. The Trustees also considered their findings at the Existing Agreement Evaluation Meeting as to the reasonableness of the aggregate Advisory Fees paid by the Funds, and the fact that the aggregate Advisory Fees paid by the Funds would not increase as a result of the implementation of the proposed Money Manager changes because the Money Managers’ investment advisory fees are paid by RIMCo.
Subsequent to the Existing Agreement Evaluation Meeting, the Board received a proposal from RIMCo at a meeting held on August 26, 2014 to effect Money Manager changes for the Russell International Developed Markets Fund, Russell Multi-Strategy Alternative Fund, Russell Global Infrastructure Fund, Russell Tax-Managed U.S. Large Cap Fund, Russell Emerging Markets Fund and Russell International Developed Markets Fund. In the case of each proposed change, the Trustees approved the terms of the proposed portfolio management contract based upon RIMCo’s recommendation to hire the Money Manager at the proposed fee rate; information as to reason for the proposed change; information as to the Money Manager’s role in the management of the Fund’s investment portfolio (including the amount of Fund assets to be allocated to the Money Manager) and RIMCo’s evaluation of the anticipated quality of the investment advisory services to be provided by the Money Manager; information as to any significant business relationships between the Money Manager and RIMCo or Russell Financial Services, Inc., the Fund’s underwriter; the CCO’s evaluation of the Money Manager’s compliance program, policies and procedures, and certification that they were consistent with applicable legal standards; RIMCo’s explanation as to the lack of relevance of Money Manager profitability to the evaluation of portfolio management contracts with Money Managers because the willingness of Money Managers to serve in such capacity depends upon arm’s-length negotiations with RIMCo; RIMCo’s awareness of the standard fee rates charged by the Money Manager to other clients; RIMCo’s belief that the proposed investment advisory fees would be reasonable in light of the anticipated quality of investment advisory services to be rendered; the increase or decrease in aggregate Money Manager fees to be paid by RIMCo from its Advisory Fee as a result of the engagement of the Money Manager; and the expected costs of transitioning Fund assets to the Money Manager. The Trustees also considered their findings at the Existing Agreement Evaluation Meeting as to the reasonableness of the aggregate Advisory Fees paid by the Funds, and the fact that the aggregate Advisory Fees paid by the Funds would not increase as a result of the implementation of the proposed Money Manager changes because the Money Managers’ investment advisory fees are paid by RIMCo.
732 Basis for Approval of Investment Advisory Contracts
Russell Investment Company Russell Funds
Basis for Approval of Investment Advisory Contracts, continued — (Unaudited)
Initial Approval of the Investment Advisory Agreements for the Select U.S. Equity and Select International Equity Funds
In the case of new Funds, the 1940 Act requires that the Board, including a majority of the Independent Trustees voting separately, initially approve the advisory agreements with RIMCo (the “New Fund Agreements”), and approve the continuation of each New Fund Agreement on at least an annual basis, and that the terms and conditions of each New Fund Agreement provide for its termination if continuation is not approved annually. The Board, including all of the Independent Trustees, initially considered and approved the adoption of the New Fund Agreements for the Select U.S. Equity Fund and the Select International Equity Fund (the “New Funds”) at a meeting held in person on February 25, 2014 (the “New Fund Agreement Evaluation Meeting”).
In preparation for the review, the Board, including the Independent Trustees, considered (1) information and reports prepared by RIMCo relating to the services proposed to be provided by RIMCo (and its affiliates) to the New Funds, including the fact that the New Funds do not employ a multi-manager approach and that RIMCo will trade securities and other financial instruments directly on behalf of the New Funds; and (2) information prepared by RIMCo, not an independent source, comparing the proposed fees and expenses of the New Funds with other peer funds not managed by RIMCo, believed by RIMCo to be generally comparable in investment objectives to the New Funds (the “RIMCo Comparable Funds”). The foregoing and other information received by the Board, including the Independent Trustees, in connection with its evaluations of the New Fund Agreements are collectively called the “New Fund Agreement Evaluation Information.” The Trustees’ evaluations also reflected the knowledge and familiarity gained as Board members of the Other Russell Funds with respect to services provided by RIMCo and RIMCo’s affiliates, and advice previously received from counsel to the Funds and counsel to the Independent Trustees regarding the Trustees’ responsibilities in considering the New Fund Agreements.
At the New Fund Agreement Evaluation Meeting, the Board was advised that RIMCo’s goal with respect to the New Funds was to construct and manage portfolios utilizing a smart-beta strategy, which generally is viewed as a combination or blend of active and passive strategies, to address the defined contribution market and the registered investment advisor market. The Board considered RIMCo’s advice that it is expected that certain “funds of funds” also managed by RIMCo will pursue their investment objectives by investing in the New Funds, among other underlying Funds, and that the New Funds are expected to provide lower advisory fees and total expense ratios, along with lower excess returns and tracking error targets than pure active funds with a stock selection component.
Based upon the New Fund Agreement Evaluation Information, including presentations by RIMCo at the New Fund Agreement Evaluation Meeting, the Trustees considered, with respect to each New Fund, various specific factors in evaluating approval of the New Fund Agreements, including the following:
1. The nature, scope and overall quality of the investment management and other services provided, and expected to be provided, to the New Fund by RIMCo;
2. The advisory fee paid by the New Fund to RIMCo (the “Advisory Fee”);
3. Information provided by RIMCo as to other fees and benefits received by RIMCo or its affiliates from the New Fund, including any administrative or transfer agent fees and any fees received for management or administration of securities lending cash collateral, soft dollar arrangements and commissions in connection with portfolio securities transactions;
4. Information provided by RIMCo as to expenses to be incurred by the New Fund; and
5. Information provided by RIMCo as to the profits that RIMCo expects to derive from its operations with respect to the New Fund.
The Board noted, among other things, that as newly organized funds, the New Funds, at the time of the New Fund Agreement Evaluation Meeting, had no historical operating, performance, expense ratio or profitability information. Moreover, the Board noted, in considering the structure of the Advisory Fee and whether economies of scale are reflected appropriately, the uncertainties as to the Funds’ ability to attract assets.
On the basis of the New Fund Agreement Evaluation Information, and other information previously received by the Board from RIMCo during the course of the current year or prior years, or presented at or in connection with the New Fund Agreement Evaluation Meeting by RIMCo, the Board, in respect of each New Fund, found, after giving effect to any applicable waivers and/or reimbursements (1) the Advisory Fee rate and structure to be charged by RIMCo was reasonable in light of the nature, scope and overall quality of the investment management and other services expected to be provided to the New Fund; (2) the projected relative expense ratio of the New Fund was comparable to those of its RIMCo Comparable Funds; (3) other benefits and fees expected to be received by RIMCo or its
Basis for Approval of Investment Advisory Contracts 733
Russell Investment Company Russell Funds
Basis for Approval of Investment Advisory Contracts, continued — (Unaudited)
affiliates from the New Fund were not excessive; and (4) RIMCo’ projected profitability with respect to the New Fund was not excessive in light of the expected nature, scope and overall quality of the investment management and other services to be provided by RIMCo.
After considering the foregoing and other relevant factors, the Board concluded that approval of the New Fund Agreements would be in the best interests of each New Fund and voted to approve the New Fund Agreement for each New Fund.
Approval of the Post-Transaction Agreement (for all Funds)
On May 20, 2014, London Stock Exchange Group plc (“LSEG”) announced that it had entered into exclusive discussions with NM for the potential acquisition of FRC although there was no certainty that any agreement for a transaction would be reached. On June 26, 2014, the Board was advised by FRC, and LSEG publicly announced, that LSEG had entered into a definitive agreement and plan of merger to acquire FRC, including both its index and investment management businesses. In its announcement (the “LSEG Announcement”), LSEG stated, among other things, that the investment management business would be the subject of “a comprehensive review to determine its positioning and fit with the Group” and that LSEG is “committed to maintaining a clear focus on client service, fund performance and management and employee stability, whilst ensuring appropriate standalone governance.” On June 27, 2014, the Board met by conference telephone call to discuss preliminarily the LSEG Announcement with representatives of FRC, RIMCo and LSEG.
In preparation for its evaluation of the Post-Transaction Agreement, the Independent Trustees, with the advice and assistance of Independent Counsel, requested information to evaluate the Post-Transaction Agreement. In their requests for such information, the Independent Trustees advised RIMCo of their intention to rely upon the Existing Agreement Evaluation Information and New Fund Agreement Evaluation Information in their evaluation of the Post-Transaction Agreement, if and to the extent the Existing Agreement Evaluation Information and New Fund Agreement Evaluation Information continued to be accurate and complete as of July 29, 2014. The Independent Trustees requested that RIMCo provide any updated and additional information needed for the Board to consider whether the Post-Transaction Agreement should be approved. The foregoing information and other information provided by RIMCo and LSEG to the Board, including the Independent Trustees, in connection with its evaluation of the Post-Transaction Agreement hereinafter is referred to collectively as the “Post-Transaction Agreement Evaluation Information.”
At a meeting held in person on July 17, 2014 (the “Post-Transaction Agreement Information Review Meeting”), the Board in further preparation for its evaluation of the Post-Transaction Agreement reviewed Post-Transaction Agreement Evaluation Information received to the date of that Meeting, first with senior representatives of FRC, RIMCo, Fund management and LSEG, and then in a private session with Independent Counsel, at which no representatives of FRC, RIMCo, LSEG, or Fund management were present, and, on the basis of that review, requested additional information regarding the Transaction and its impact on RIMCo and the Funds.
The Board met in person on July 29, 2014 to consider approval of the Post-Transaction Agreement (the “Post-Transaction Agreement Evaluation Meeting”). At the Post-Transaction Agreement Evaluation Meeting, the Independent Trustees first met to review additional Post-Transaction Agreement Information received to that date with representatives of FRC, RIMCo, Fund management, and LSEG. Presentations made by FRC, RIMCo and LSEG at the Post-Transaction Agreement Information Review Meeting and the Post-Transaction Agreement Evaluation Meeting (together, the “Transaction Board Meetings”), as part of this review, encompassed all of the Funds and the Other Russell Funds. Information received by the Board, including the Independent Trustees, at the Transaction Board Meetings is included in the Post-Transaction Agreement Evaluation Information. Presentations made by FRC, RIMCo and LSEG at the Transaction Board Meetings are included in the Post-Transaction Agreement Evaluation Information. Prior to voting at the Post-Transaction Agreement Evaluation Meeting, the Independent Trustees met in executive session with Independent Counsel, at which no representatives of FRC, RIMCo, LSEG, or Fund management were present, to review additional Post-Transaction Agreement Evaluation Information received prior to and at the Meeting. The discussion below reflects all of these reviews.
The Board’s evaluation of the Post-Transaction Agreement reflected the Post-Transaction Agreement Evaluation Information and other information received by the Board during the course of the year or prior years (including the Existing Agreement Evaluation Information and New Fund Agreement Evaluation Information, as supplemented by RIMCo through the date of the Post-Transaction Agreement Evaluation Meeting) and the findings made by the Board in respect of the Existing Agreement and New Fund Agreements at the Existing Agreement Evaluation Meeting and the New Fund Agreement Evaluation Meeting (together with the Existing Agreement Evaluation Meeting, the “Existing Agreement Evaluation Meetings”). The Independent Trustees’ evaluations of the Post-Transaction Agreement also reflected the knowledge and familiarity gained as Board members of the Funds and Other Russell Funds with respect to services provided by RIMCo, RIMCo’s affiliates, and each Money Manager to the Funds under the Existing Agreement and services proposed to be provided to the Funds under the Post-Transaction Agreement. The Board noted the short period of time since the Existing
734 Basis for Approval of Investment Advisory Contracts
Russell Investment Company Russell Funds
Basis for Approval of Investment Advisory Contracts, continued — (Unaudited)
Agreement Evaluation Meetings and that information provided by RIMCo to update and supplement the Existing Agreement Evaluation Information and New Fund Agreement Evaluation Information through the date of the Post-Transaction Agreement Evaluation Meeting did not affect the conclusions reached by the Board at either of the Existing Agreement Evaluation Meetings.
In approving the Post-Transaction Agreement, the Board considered all factors it believed relevant in exercising its business judgment, including the following:
(1) the reputation, financial strength and resources of LSEG;
(2) LSEG is a diversified international market infrastructure and capital markets business;
(3) LSEG’s advice that it has a strong track record of successful acquisitions and owning regulated businesses and that its regulatory and compliance history is strong;
(4) LSEG is not engaged in the mutual fund or investment management businesses, with the result that there will be no overlap of mutual fund products to address in the transfer of ownership of FRC’s investment management business from NM and other current shareholders to LSEG;
(5) LSEG’s advice that the outcome of the comprehensive review and its effect on FRC’s investment management business would not be prejudged and that one part of the review is to determine whether the FRC investment management business would be more valuable as part of the LSEG organization or as part of an organization with existing investment management activities;
(6) LSEG’s assurances that there were no circumstances that could be envisaged at the time of the Post-Transaction Agreement Evaluation Meeting under which the Funds may be left without an investment manager to conduct their investment programs and that, whatever the outcome of the comprehensive review and for as long as it owns the FRC investment management business, it is committed to maintaining the existing clear focus on client service and fund performance in FRC’s investment management business;
(7) LSEG’s stated intention that the FRC investment management business will operate independently of the rest of LSEG and its expectation that the impact of the Transaction on the Funds will be broadly neutral, with no material improvements or disadvantages, although the Funds may benefit to some extent from the ownership of the FRC investment management business by a company with world class technology, operational competencies, and financial strength;
(8) LSEG’s advice that, as part of the comprehensive review, it will provide continued strong support and investment for growth and innovation, and pay particular attention to creating appropriate standalone governance and operations for FRC’s investment management business while also focusing on maintaining strong management and employee continuity;
(9) the Post-Transaction Agreement Evaluation Information did not identify any conflicts of interest that would arise following completion of the Transaction but LSEG did advise the Board that it is continuing to work with FRC to establish the scope of affiliated business and to assess whether modifications to FRC’s compliance policies and procedures and/or other steps are appropriate. The Board was advised that it would be apprised of any material issues that are subsequently identified.
(10) LSEG’s expectation that there will be no diminution in the nature, scope and overall quality of services provided to the Funds and their shareholders, including administrative, regulatory and compliance services, as a result of the Transaction. In this regard, the Post-Transaction Agreement Evaluation Information stated, among other things:
| • | LSEG intends to maintain the existing nature and quality of services provided to the Funds by RIMCo. | |
| • | In connection with or as a result of the Transaction, LSEG anticipates that RIMCo will maintain the resources, | |
| operations, staffing and other functions required for the operation or administration of the Funds. | ||
| • | No changes are expected by LSEG in RIMCo’s investment strategies and practices in respect of the Funds as a | |
| result of the Transaction, including the manager-of-managers structure employed by the Funds (except the Select U.S. Equity, Select | ||
| International Equity and Russell Strategic Call Overwriting Funds) that are not Funds of Funds (the “Manager-of-Managers Funds”) | ||
| and employed indirectly by the Funds of Funds through their investments in the Manager-of-Managers Funds. | ||
| Basis for Approval of Investment Advisory Contracts 735 | ||
Russell Investment Company Russell Funds
Basis for Approval of Investment Advisory Contracts, continued — (Unaudited)
(11) advice from RIMCo and LSEG that there is no intention to propose any immediate changes to any of the Funds’ third-party service providers, thereby assuring continuation of services needed for the Funds’ operations and minimizing complications in connection with the transfer of ownership of FRC’s investment management business from NM and other current shareholders to LSEG;
(12) at the New Fund Agreement Evaluation Meeting, the Board had performed an initial review of the New Fund Agreements, and at its April 29, 2014 meeting and the Existing Agreement Evaluation Meeting, the Board had performed a full annual review of the Existing Agreement, each as required by the 1940 Act, and had approved or reapproved each Existing Agreement, concluding, among other things, that the Advisory Fee for each Fund was reasonable in light of the nature, scope and overall quality of the investment management and other services provided, and/or expected to be provided, to the Fund;
(13) the terms and conditions of the Post-Transaction Agreement are substantially the same as those of the Existing Agreement, which will terminate automatically upon completion of the Transaction, and the Post-Transaction Agreement will not change any Fund’s Advisory Fee (on a contractual or actual basis), expense ratio, profitability, economies of scale, or other fees or benefits received by RIMCo and its affiliates as a result of their relationships with the Fund;
(14) FRC and/or its affiliates and LSEG, not the Funds, will bear all costs of meetings, preparation of proxy materials and solicitation in connection with obtaining approvals of the Post-Transaction Agreement;
(15) there will be no changes to the Independent Trustees of the Board in connection with the Transaction, assuring continuity of the Funds’ supervision and oversight;
(16) LSEG’s assurances that for a period of two years following the effective date of the Post-Transaction Agreement, it will use reasonable best efforts not to engage in activities that would impose an “unfair burden” on the Funds within the meaning of Section 15(f) of the 1940 Act;
(17) the Board’s belief that shareholders have purchased and retained their Fund shares based upon the reputation, investment record, and investment philosophies and strategies employed by RIMCo in managing the Funds (including the manager-of-managers structure employed by the Manager-of-Managers Funds and employed indirectly by the Funds of Funds through their investments in the Manager-of-Managers Funds); and
(18) the demands and complexity of managing the Manager-of-Managers Funds pursuant to the manager-of-managers structure, the special expertise of RIMCo with respect to the manager-of-managers structure of those Funds, and the Board’s belief that, at the current expense ratio of each Manager-of-Managers Fund, there would likely be no acceptable alternative investment managers to replace RIMCo on comparable terms given the need to continue the manager-of-managers strategy selected by shareholders in purchasing their shares of Manager-of-Managers Funds which employ a manager-of-managers structure or Funds of Funds that indirectly employ a manager-of-managers strategy through their investments in the Underlying Funds.
In evaluating the Post-Transaction Agreement, the Board considered the possibility that, depending upon the results of the comprehensive review, the FRC investment management business would be conducted pursuant to the Post-Transaction Agreement as an independent part of the LSEG organization following completion of the Transaction, without any significant diminution expected in the nature, scope and overall quality of services provided to the Funds, and without any expected effect on the Funds’ Advisory Fees (contractual or actual), expenses, profitability, economies of scale, or other fees or benefits to FRC or RIMCo or their affiliates from their Fund relationships. However, the Independent Trustees were unable on the basis of the Post-Transaction Agreement Evaluation Information to determine the outcome of the comprehensive review or its effects, if any, on the FRC investment management business generally or on any of the investment advisory and other services that RIMCo and other FRC affiliates provide to the Funds under the Existing Agreement. Among other things, the Board could not determine whether or for how long FRC’s investment management business will continue as part of the LSEG organization following conclusion of the comprehensive review. In its deliberations, the Board considered the above and other relevant factors in light of the uncertain outcome and effects of the comprehensive review and, consequently, identified the principal factor in determining whether to approve the Post-Transaction Agreement as the need to provide for uninterrupted investment advisory and other services required for the operations of the Funds following the automatic termination of the Existing Agreement upon completion of the Transaction. No other single factor reviewed by the Board was identified by the Board as a principal factor in determining whether to approve the Post-Transaction Agreement and each Board member attributed different weights to the various factors. The Trustees evaluated all information available to them on a Fund-by-Fund basis and their determinations were made separately in respect of each Fund. After careful consideration of all factors, principally the need for continuation of investment advisory and other services required for the operation of the Funds following termination of the Existing Agreement, the Board believed
736 Basis for Approval of Investment Advisory Contracts
Russell Investment Company Russell Funds
Basis for Approval of Investment Advisory Contracts, continued — (Unaudited)
that approval of the Post-Transaction Agreement would be in the best interests of each Fund and its shareholders for a period ending two years from the date of the Post-Transaction Agreement, but advised Fund management of its intention (subject to the outcome of the comprehensive review) to evaluate the continuance of the Post-Transaction Agreement within one year of its effectiveness, although not required to do so by the terms of the Post-Transaction Agreement or the 1940 Act. The Independent Trustees were advised by Independent Counsel throughout the process of evaluating the Post-Transaction Agreement. Prior to the Post-Transaction Agreement Information Review Meeting, the Board received a memorandum from Fund Counsel discussing its responsibilities in connection with its evaluation of the Post-Transaction Agreement and the Independent Trustees separately received a memorandum discussing such responsibilities from Independent Counsel.
Approval of the New Agreement (for all Funds except the Select U.S. Equity, Select International Equity and Russell Strategic Call Overwriting Funds)
At the in-person Transaction Board Meetings, the Board considered approval of a new investment advisory agreement between each Fund (except the Select U.S. Equity, Select International Equity and Russell Strategic Call Overwriting Funds) and RIMCo that reflects updated terms and, if approved by shareholders, will go into effect in lieu of the Post-Transaction Agreement following the Transaction or, if the Transaction is not consummated, will replace the Fund’s Existing Agreement (the “New Agreement”). In preparation for its evaluation of the New Agreement, the Board reviewed information from RIMCo regarding the New Agreement (the “New Agreement Evaluation Information”) at the Post-Transaction Agreement Information Review Meeting. At the Post-Transaction Agreement Information Review Meeting, the Independent Trustees met first with representatives of RIMCo and Fund management and then in a private session with Independent Counsel, at which no representatives of RIMCo or Fund management were present, to review the New Agreement Evaluation Information.
The Independent Trustees considered approval of the New Agreement at the Post-Transaction Agreement Evaluation Meeting. The Board, including the Independent Trustees, first met with representatives of RIMCo and Fund management to discuss the New Agreement Evaluation Information. Prior to voting on approval of the New Agreement, the Independent Trustees met in a private session with Independent Counsel, at which no representatives of RIMCo or Fund management were present, to review additional New Agreement Evaluation Information received prior to and at the Post-Transaction Agreement Evaluation Meeting. The discussion reflects all of these reviews.
Presentations made by RIMCo at the Transaction Board Meetings regarding the New Agreement encompassed all of the Funds.
In evaluating the New Agreement, the Board considered all factors it believed relevant in exercising its business judgment, including the following:
(1) the Board had performed a full annual review of the Existing Agreement at the Existing Agreement Evaluation Meeting and had reapproved the Existing Agreement, concluding, among other things, that the Advisory Fee of each Fund was reasonable in light of the nature, scope and overall quality of the investment management and other services provided, and expected to be provided, to each Fund;
(2) the New Agreement reflects current industry practices and also expressly addresses RIMCo’s overall investment management responsibilities, including the delegation of such management to Money Managers with discretionary authority, the implementation of recommendations from Money Managers with non-discretionary authority, direct management of all of a Fund’s assets by RIMCo, or any combination thereof;
(3) RIMCo believes that the permission afforded by the New Agreement to use non-discretionary Money Managers with respect to a Fund’s entire portfolio will enhance RIMCo’s ability to determine how best to manage the Fund’s assets, and will allow RIMCo the flexibility to more efficiently and effectively manage Fund assets consistent with a Fund’s objective and to create a more customized investment program for each Fund, depending upon the particular characteristics and objectives of that Fund;
(4) in the case of certain Funds, RIMCo believes that a more extensive use of non-discretionary Money Managers may provide an opportunity to better manage transaction costs and the tax impact associated with trading portfolio securities;
(5) the New Agreement will not change any Fund’s investment objective nor will it change any Fund’s Advisory Fee rate or total expense ratio;
Basis for Approval of Investment Advisory Contracts 737
Russell Investment Company Russell Funds
Basis for Approval of Investment Advisory Contracts, continued — (Unaudited)
(6) the Advisory Fee paid by each Fund to RIMCo encompasses all investment advisory fees paid by the Fund, including the fees for any Money Managers of such Fund. Fees paid by RIMCo from the Advisory Fee to non-discretionary Money Managers, who provide model portfolios to RIMCo representing their investment recommendations, based upon which RIMCo purchases and sells portfolio investments for a Fund, may be less than fees that would be paid to discretionary Money Managers, who make and implement their investment decisions to buy or sell portfolio investments for a Fund. While the Board did not receive any information concerning any additional benefits to RIMCo in connection with an expanded use of non-discretionary Money Managers, during the time, and to the extent, that RIMCo utilizes non-discretionary Money Managers rather than discretionary Money Managers in respect of the Funds, RIMCo may retain a larger portion of the Advisory Fee and the profits derived by RIMCo generally and from the Funds consequently may be increased; and
(7) if in the future RIMCo determines to change the “multi-manager” approach of any of the existing Funds, RIMCo will discuss such change in advance with the Board and seek any Board approval determined appropriate by RIMCo. In addition, if this were to occur, shareholders would be notified in advance of a change in their Fund’s multi-manager approach. This process will provide notice to shareholders of any material change in their Fund’s investment program and also may help to mitigate any potential conflict of interest inherent in RIMCo’s expanded use of non-discretionary Money Managers.
In their deliberations, the Trustees did not identify any particular information as to the New Agreement that was all-important or controlling and each Trustee attributed different weights to the various factors considered. The Trustees evaluated all information available to them on a Fund-by-Fund basis and their determinations were made in respect of each Fund. After careful consideration of the above and all other factors considered to be relevant by the Board, the Board believed that approval of the New Agreement would be in the best interests of each Fund and its shareholders. The Independent Trustees were represented by Independent Counsel throughout the process of evaluating the New Agreement.
738 Basis for Approval of Investment Advisory Contracts
Russell Investment Company Russell Funds
Shareholder Requests for Additional Information — October 31, 2014 ((Unaudited))
A complete unaudited schedule of investments is made available generally no later than 60 days after the end of the first and third quarters of each fiscal year. These reports are available (i) free of charge, upon request, by calling the Funds at (800) 787-7354; (ii) at www.russell. com; (iii) on the Securities and Exchange Commission’s website at www.sec.gov; and (iv) at the Securities and Exchange Commission’s public reference room.
The Board has delegated to RIMCo, as RIC’s investment adviser, the primary responsibility for monitoring, evaluating and voting proxies solicited by or with respect to issuers of securities in which assets of the Funds may be invested. RIMCo has established a proxy voting committee and has adopted written proxy voting policies and procedures (“P&P”) and proxy voting guidelines (“Guidelines”). The Funds maintain a Portfolio Holdings Disclosure Policy that governs the timing and circumstances of disclosure to shareholders and third parties of information regarding the portfolio investments held by the Funds. A description of the P&P, Guidelines, Portfolio Holdings Disclosure Policy and additional information about Fund Trustees are contained in the Funds’ Statement of Additional Information (“SAI”). The SAI and information regarding how the Funds voted proxies relating to portfolio securities during the most recent 12-month period ended June 30, 2014 are available (i) free of charge, upon request, by calling the Funds at (800) 787-7354; (ii) at www.russell.com; and (iii) on the Securities and Exchange Commission’s website at www. sec.gov.
To reduce expenses, we may mail only one copy of the Funds’ prospectuses and each annual and semi-annual report to those addresses shared by two or more accounts. If you wish to receive individual copies of these documents, please contact your Financial Intermediary.
Some Financial Intermediaries may offer electronic delivery of the Funds prospectuses and annual and semi-annual reports. Please contact your Financial Intermediary for further details.
Financial statements of the Funds can be obtained at no charge by calling the Funds at (800) 787-7354.
Shareholder Requests for Additional Information 739
Russell Investment Company
Russell Funds
Disclosure of Information about Fund Trustees and Officers — October 31, 2014 (Unaudited)
The following tables provide information for each officer and trustee of the Russell Fund Complex. The Russell Fund Complex consists of Russell Investment Company (“RIC”), which has 39 funds, Russell Investment Funds (“RIF”), which has 9 funds, and Russell Exchange Traded Funds Trust (“RET”), which has 1 fund. Each of the trustees is a trustee of RIC, RIF and RET. The first table provides information for the interested trustees. The second table provides information for the independent trustees. The third table provides information for the Trustee Emeritus. The fourth table provides information for the officers. Furthermore, each Trustee possesses the following specific attributes: Mr. Alston has business, financial and investment experience as a senior executive of an international real estate firm and is trained as a lawyer; Ms. Blake has had experience as a certified public accountant and has had experience as a member of boards of directors/trustees of other investment companies; Ms. Burgermeister has had experience as a certified public accountant and as a member of boards of directors/trustees of other investment companies; Mr. Connealy has had experience with other investment companies and their investment advisers first as a partner in the investment management practice of PricewaterhouseCoopers LLP and, subsequently, as the senior financial executive of two other investment organizations sponsoring and managing investment companies; Ms. Krysty has had business, financial and investment experience as the founder and senior executive of a registered investment adviser focusing on high net worth individuals as well as a certified public accountant and a member of the boards of other corporations and non-profit organizations; Mr. Tennison has had business, financial and investment experience as a senior executive of a corporation with international activities and was trained as an accountant; and Mr. Thompson has had experience in business, governance, investment and financial reporting matters as a senior executive of an organization sponsoring and managing other investment companies, and, subsequently, has served as a board member of other investment companies, and has been determined by the Board to be an audit committee financial expert. Ms. Cavanaugh has had experience with other financial services companies, including companies engaged in the sponsorship, management and distribution of investment companies. As a senior officer and/or director of the Funds, the Adviser and various affiliates of the Adviser providing services to the Funds, Ms. Cavanaugh is in a position to provide the Board with such parties’ perspectives on the management, operations and distribution of the Funds.
| Name, | Position(s) Held | Term | Principal Occupation(s) | No. of | Other | |
| Age, | With Fund and | of | During the | Portfolios | Directorships | |
| Address | Length of | Office* | Past 5 Years | in Russell | Held by Trustee | |
| Time Served | Fund | During the | ||||
| Complex | Past 5 Years | |||||
| Overseen | ||||||
| by Trustee | ||||||
| INTERESTED TRUSTEE | ||||||
| # Sandra Cavanaugh, | President and Chief | Until successor | • President and CEO RIC, RIF and | 49 | None | |
| Born May 10, 1954 | Executive Officer | is chosen and | RET | |||
| 1301 Second Avenue, | since 2010 | qualified by | • Chairman of the Board, Co-President | |||
| 18th Floor, Seattle, WA | Trustee since 2010 | Trustees | and CEO, Russell Financial Services, | |||
| 98101 | Appointed until | Inc. (“RFS”) | ||||
| successor is | • Chairman of the Board, President | |||||
| duly elected and | and CEO, Russell Fund Services | |||||
| qualified | Company (“RFSC”) | |||||
| • Director, RIMCo | ||||||
| • Chairman of the Board, President and | ||||||
| CEO Russell Insurance Agency, Inc. | ||||||
| (“RIA”) (insurance agency) | ||||||
| • May 2009 to December 2009, | ||||||
| Executive Vice President, Retail | ||||||
| Channel, SunTrust Bank | ||||||
| • 2007 to January 2009, Senior Vice | ||||||
| President, National Sales — Retail | ||||||
| Distribution, JPMorgan Chase/ | ||||||
| Washington Mutual, Inc. (investment | ||||||
| company) | ||||||
| * | Each Trustee is subject to mandatory retirement at age 72. | |||||
| # | Ms. Cavanaugh is also an officer and/or director of one or more affiliates of RIC, RIF and RET and is therefore classified as an Interested Trustee. | |||||
740 Disclosure of Information about Fund Trustees and Officers
Russell Investment Company
Russell Funds
Disclosure of Information about Fund Trustees and Officers, continued —October 31, 2014 (Unaudited)
| Name, | Position(s) Held | Term | Principal Occupation(s) | No. of | Other |
| Age, | With Fund and | of | During the | Portfolios | Directorships |
| Address | Length of | Office * | Past 5 Years | in Russell | Held by Trustee |
| Time Served | Fund | During the | |||
| Complex | Past 5 Years | ||||
| Overseen | |||||
| by Trustee | |||||
| INDEPENDENT TRUSTEES | |||||
| Thaddas L. Alston, | Trustee since 2006 | Appointed until | Senior Vice President, Larco | 49 | None |
| Born April 7, 1945 | Chairman of | successor is | Investments, Ltd. (real estate firm) | ||
| 1301 Second Avenue, | the Investment | duly elected and | |||
| 18th Floor, Seattle, WA | Committee since | qualified | |||
| 98101 | 2010 | Appointed until | |||
| successor is | |||||
| duly elected and | |||||
| qualified | |||||
| Kristianne Blake, | Trustee since 2000 | Appointed until | • Director and Chairman of the Audit | 49 | • Director, |
| Born January 22, 1954 | Chairman since 2005 | successor is | Committee, Avista Corp (electric | Avista Corp | |
| 1301 Second Avenue, | duly elected and | utilities) | (electric | ||
| 18th Floor, Seattle, WA | qualified | • Regent, University of Washington | utilities) | ||
| 98101 | Annual | • President, Kristianne Gates Blake, | • Until June | ||
| P.S. (accounting services) | 30, 2014, | ||||
| • Until June 30, 2014, Director, Ecova | Director, | ||||
| (total energy and sustainability | Ecova (total | ||||
| management) | energy and | ||||
| • Until December 31, 2013, Trustee | sustainability | ||||
| and Chairman of the Operations | management) | ||||
| Committee, Principal Investors Funds | • Until | ||||
| and Principal Variable Contracts | December 31, | ||||
| Funds (investment company) | 2013, Trustee, | ||||
| • From April 2004 through December | Principal | ||||
| 2012, Director, Laird Norton Wealth | Investors | ||||
| Management and Laird Norton Tyee | Funds | ||||
| Trust (investment company) | (investment | ||||
| company) | |||||
| • Until | |||||
| December 31, | |||||
| 2013, Trustee | |||||
| Principal | |||||
| Variable | |||||
| Contracts | |||||
| Funds | |||||
| (investment | |||||
| company) | |||||
| • From April | |||||
| 2004 through | |||||
| December | |||||
| 2012, | |||||
| Director, Laird | |||||
| Norton Wealth | |||||
| Management | |||||
| and Laird | |||||
| Norton | |||||
| Tyee Trust | |||||
| (investment | |||||
| company) | |||||
Disclosure of Information about Fund Trustees and Officers 741
Russell Investment Company
Russell Funds
Disclosure of Information about Fund Trustees and Officers, continued —October 31, 2014 (Unaudited)
| Name, | Position(s) Held | Term | Principal Occupation(s) | No. of | Other | |
| Age, | With Fund and | of | During the | Portfolios | Directorships | |
| Address | Length of | Office * | Past 5 Years | in Russell | Held by Trustee | |
| Time Served | Fund | During the | ||||
| Complex | Past 5 Years | |||||
| Overseen | ||||||
| by Trustee | ||||||
| INDEPENDENT TRUSTEES (continued) | ||||||
| Cheryl Burgermeister, | Trustee since 2012 | Appointed until | • Retired | 49 | • Trustee and | |
| Born June 26, 1951 | successor is | • Trustee and Chairperson of Audit | Chairperson | |||
| 1301 Second Avenue, | duly elected and | Committee, Select Sector SPDR | of Audit | |||
| 18th Floor, Seattle, WA | qualified | Funds (investment company) | Committee, | |||
| 98101 | Select Sector | |||||
| SPDR Funds | ||||||
| (investment | ||||||
| company) | ||||||
| • Trustee, ALPS | ||||||
| Series Trust | ||||||
| (investment | ||||||
| company) | ||||||
| Daniel P. Connealy, | Trustee since 2003 | Appointed until | • Retired | 49 | None | |
| Born June 6, 1946 | successor is | • June 2004 to June 2014, Senior Vice | ||||
| 1301 Second Avenue, | duly elected and | President and Chief Financial Officer, | ||||
| 18th Floor, Seattle, WA | qualified | Waddell & Reed Financial, Inc. | ||||
| 98101 | (investment company) | |||||
| Katherine W. Krysty, | Trustee since 2014 | Appointed until | • Retired | 49 | None | |
| Born December 3, 1951 | successor is | • January 2011 through March 2013, | ||||
| 1301 Second Avenue | duly elected and | President Emerita, Laird Norton | ||||
| 18th Floor, Seattle, WA | qualified | Wealth Management (investment | ||||
| 98101 | company) | |||||
| • April 2003 through December | ||||||
| 2010, Chief Executive Officer of | ||||||
| Laird Norton Wealth Management | ||||||
| (investment company) | ||||||
| Raymond P. Tennison, Jr., | Trustee since 2000 | Appointed until | • Retired | 49 | None | |
| Born December 21, 1955 | Chairman of | successor is | • From January 2008 to December | |||
| 1301 Second Avenue | the Nominating | duly elected and | 2011, Vice Chairman of the Board, | |||
| 18th Floor, Seattle, WA | and Governance | qualified | Simpson Investment Company (paper | |||
| 98101 | Committee since | Appointed until | and forest products) | |||
| 2007 | successor is | • Until November 2010, President, | ||||
| duly elected and | Simpson Investment Company | |||||
| qualified | and several additional subsidiary | |||||
| companies, including Simpson | ||||||
| Timber Company, Simpson Paper | ||||||
| Company and Simpson Tacoma Kraft | ||||||
| Company | ||||||
| * | Each Trustee is subject to mandatory retirement at age 72. | |||||
742 Disclosure of Information about Fund Trustees and Officers
Russell Investment Company
Russell Funds
Disclosure of Information about Fund Trustees and Officers, continued —October 31, 2014 (Unaudited)
| Name, | Position(s) Held | Term | Principal Occupation(s) | No. of | Other | |
| Age, | With Fund and | of | During the | Portfolios | Directorships | |
| Address | Length of | Office * | Past 5 Years | in Russell | Held by Trustee | |
| Time Served | Fund | During the | ||||
| Complex | Past 5 Years | |||||
| Overseen | ||||||
| by Trustee | ||||||
| INDEPENDENT TRUSTEES (continued) | ||||||
| Jack R. Thompson, | Trustee since 2005 | Appointed until | • September 2007 to September | 49 | • Director, | |
| Born March 21, 1949 | Chairman of the | successor is | 2010, Director, Board Chairman and | Board | ||
| 1301 Second Avenue, | Audit Committee | duly elected and | Chairman of the Audit Committee, | Chairman and | ||
| 18th Floor, Seattle, WA | since 2012 | qualified | LifeVantage Corporation (health | Chairman | ||
| 98101 | Appointed until | products company) | of the Audit | |||
| successor is | • September 2003 to September | Committee, | ||||
| duly elected and | 2009, Independent Board Chair and | LifeVantage | ||||
| qualified | Chairman of the Audit Committee, | Corporation | ||||
| Sparx Asia Funds (investment | until | |||||
| company) | September | |||||
| 2010 (health | ||||||
| products | ||||||
| company) | ||||||
| • Director, | ||||||
| Sparx Asia | ||||||
| Funds | ||||||
| until 2009 | ||||||
| (investment | ||||||
| company) | ||||||
| * | Each Trustee is subject to mandatory retirement at age 72. | |||||
| Name, | Position(s) Held | Term | Principal Occupation(s) | No. of | Other | |
| Age, | With Fund and | of | During the | Portfolios | Directorships | |
| Address | Length of | Office * | Past 5 Years | in Russell | Held by Trustee | |
| Time Served | Fund | During the | ||||
| Complex | Past 5 Years | |||||
| Overseen | ||||||
| by Trustee | ||||||
| TRUSTEE EMERITUS | ||||||
| George F. Russell, Jr., | Trustee Emeritus and | Until resignation | • Director Emeritus, Frank Russell | 48 | None | |
| Born July 3, 1932 | Chairman Emeritus | or removal | Company (investment consultant to | |||
| 1301 Second Avenue, | since 1999 | institutional investors (“FRC”)) and | ||||
| 18th Floor, Seattle, WA | RIMCo | |||||
| 98101 | • Chairman Emeritus, RIC and RIF; | |||||
| Russell Implementation Services Inc. | ||||||
| (broker-dealer and investment adviser | ||||||
| (“RIS”)); Russell 20-20 Association | ||||||
| (non-profit corporation); and Russell | ||||||
| Trust Company (non-depository trust | ||||||
| company (“RTC”)) | ||||||
| • Chairman, Sunshine Management | ||||||
| Services, LLC (investment adviser) | ||||||
Disclosure of Information about Fund Trustees and Officers 743
Russell Investment Company
Russell Funds
Disclosure of Information about Fund Trustees and Officers, continued —October 31, 2014 (Unaudited)
| Name, | Positions(s) Held | Term | Principal Occupation(s) |
| Age, | With Fund and | of | During the |
| Address | Length of | Office | Past 5 Years |
| Time Served | |||
| OFFICERS | |||
| Cheryl Wichers, | Chief Compliance | Until removed | • Chief Compliance Officer, RIC, RIF and RET |
| Born December 16, 1966 | Officer since 2005 | by Independent | • Chief Compliance Officer, RFSC and U.S. One Inc. |
| 1301 Second Avenue | Trustees | • 2005 to 2011 Chief Compliance Officer, RIMCo | |
| 18th Floor, Seattle, WA | |||
| 98101 | |||
| Sandra Cavanaugh, | President and Chief | Until successor | • CEO, U.S. Private Client Services, Russell Investments |
| Born May 10, 1954 | Executive Officer | is chosen and | • President and CEO, RIC, RIF and RET |
| 1301 Second Avenue, | since 2010 | qualified by | • Chairman of the Board, Co-President and CEO, RFS |
| 18th Floor, Seattle, WA | Trustees | • Chairman of the Board, President and CEO, RFSC | |
| 98101 | • Director, RIMCo | ||
| • Chairman of the Board, President and CEO, RIA | |||
| • May 2009 to December 2009, Executive Vice President, Retail | |||
| Channel, SunTrust Bank | |||
| • 2007 to January 2009, Senior Vice President, National Sales — | |||
| Retail Distribution, JPMorgan Chase/Washington Mutual, Inc. | |||
| Mark E. Swanson, | Treasurer and Chief | Until successor | • Treasurer, Chief Accounting Officer and CFO, RIC, RIF and RET |
| Born November 26, 1963 | Accounting Officer | is chosen and | • Director, RIMCo, RFSC, Russell Trust Company (“RTC”) and RFS |
| 1301 Second Avenue | since 1998 | qualified by | • Global Head of Fund Services, Russell Investments |
| 18th Floor, Seattle, WA | Trustees | • October 2011 to December 2013, Head of North America Operations | |
| 98101 | Russell Investments | ||
| • May 2009 to October 2011, Global Head of Fund Operations, Russell | |||
| Investments | |||
| • 1999 to May 2009, Director, Fund Administration | |||
| Jeffrey T. Hussey, | Chief Investment | Until removed by | • Global Chief Investment Officer, Russell Investments |
| Born May 2, 1969 | Officer since 2013 | Trustees | • Chief Investment Officer, RIC, RIF and RET |
| 1301 Second Avenue, | • Chairman of the Board, President and CEO, RIMCo | ||
| 18th Floor, Seattle WA | • Director, RTC, RIS and Russell Investments Delaware, Inc. | ||
| 98101 | • Board of Managers, Russell Institutional Funds Management, Inc. | ||
| • 2003 to 2013 Chief Investment Officer, Fixed Income, Russell | |||
| Investments | |||
| Mary Beth R. Albaneze, | Secretary since 2010 | Until successor | • Associate General Counsel, Russell Investments |
| Born April 25, 1969 | is chosen and | • Secretary, RIMCo, RFSC and RFS | |
| 1301 Second Avenue, | qualified by | • Secretary and Chief Legal Officer, RIC, RIF and RET | |
| 18th Floor, Seattle, WA | Trustees | • Assistant Secretary, RFS, RIA and U.S. One Inc. | |
| 98101 | • 1999 to 2010 Assistant Secretary, RIC and RIF | ||
744 Disclosure of Information about Fund Trustees and Officers
| Russell Investment Company | |
| Russell Funds | |
| Adviser, Money Manager and Service Providers — October 31, 2014 | |
| Interested Trustee | J.P. Morgan Investment Management Inc., New York, NY |
| Sandra Cavanaugh | Jacobs Levy Equity Management, Inc., Florham Park, NJ |
| Independent Trustees | PanAgora Asset Management Inc, Boston, MA |
| Thaddas L. Alston | Russell U.S. Dynamic Equity Fund |
| Kristianne Blake | AJO, LP, Philadelphia, PA |
| Cheryl Burgermeister | Cornerstone Capital Management, LLC, Minneapolis, MN |
| Daniel P. Connealy | Jacobs Levy Equity Management, Inc., Florham Park, NJ |
| Katherine W. Krysty | Schneider Capital Management Corporation, Wayne, PA |
| Raymond P. Tennison, Jr. | Suffolk Capital Management, LLC, New York, NY |
| Jack R. Thompson | Russell U.S. Strategic Equity Fund |
| Trustee Emeritus | AJO, LP, Philadelphia, PA |
| George F. Russell, Jr. | Barrow, Hanley, Mewhinney & Strauss, LLC, Dallas, TX |
| Officers | Columbus Circle Investors, Stamford, CT |
| Cornerstone Capital Management, LLC, Minneapolis, MN | |
| Sandra Cavanaugh, President and Chief Executive Officer | Institutional Capital LLC, Chicago, IL |
| Cheryl Wichers, Chief Compliance Officer | Jacobs Levy Equity Management, Inc., Florham Park, NJ |
| Jeffrey T. Hussey, Chief Investment Officer | PanAgora Asset Management Inc, Boston, MA |
| Mark E. Swanson, Treasurer and Chief Accounting Officer | Schneider Capital Management Corporation, Wayne, PA |
| Mary Beth Rhoden Albaneze, Secretary | Suffolk Capital Management, LLC, New York, NY |
| Adviser | Russell U.S. Large Cap Equity Fund |
| Russell Investment Management Company | Ceredex Value Advisors LLC, Orlando, FL |
| 1301 Second Avenue | Columbus Circle Investors, Stamford, CT |
| Seattle, WA 98101 | Institutional Capital LLC, Chicago, IL |
| Administrator and Transfer and Dividend Disbursing | Jacobs Levy Equity Management Inc., Florham Park, NJ |
| Agent | Sustainable Growth Advisers, LP, Stamford, CT |
| Russell Fund Services Company | Russell U.S. Mid Cap Equity Fund |
| 1301 Second Avenue | Arbor Capital Management, LLC, Minneapolis, MN |
| Seattle, WA 98101 | Ceredex Value Advisors LLC, Orlando, FL |
| Custodian | Jacobs Levy Equity Management Inc., Florham Park, NJ |
| State Street Bank and Trust Company | Russell U.S. Small Cap Equity Fund |
| 1 Iron Street | Cardinal Capital Management, L.L.C., Greenwich, CT |
| Boston, MA 02210 | Chartwell Investment Partners, Berwyn, PA |
| Office of Shareholder Inquiries | Copeland Capital Management, LLC, Conshohocken, PA |
| 1301 Second Avenue | DePrince, Race & Zollo, Inc., Winter Park, FL |
| Seattle, WA 98101 | EAM Investors, LLC, Cardiff by the Sea, CA |
| (800) 787-7354 | Falcon Point Capital, LLC, San Francisco, CA |
| Legal Counsel | Jacobs Levy Equity Management Inc., Florham Park, NJ |
| Dechert LLP | Netols Asset Management, Inc., Mequon, WI |
| One International Place, 40th Floor | Next Century Growth Investors, LLC, Minneapolis, MN |
| 100 Oliver Street | PENN Capital Management Company, Inc., Philadelphia, PA |
| Boston, MA 02110 | Signia Capital Management, LLC, Spokane, WA |
| Distributor | Russell International Developed Markets Fund |
| Russell Financial Services, Inc. | AQR Capital Management, LLC, Greenwich, CT |
| 1301 Second Avenue | Barrow, Hanley, Mewhinney & Strauss, LLC, Dallas, TX |
| Seattle, WA 98101 | MFS Institutional Advisors Inc., Boston, MA |
| Numeric Investors LLC, Boston, MA | |
| Independent Registered Public Accounting Firm | Pzena Investment Management, LLC, New York, NY |
| PricewaterhouseCoopers LLP | Wellington Management Company, LLP, Boston, MA |
| 1420 5th Avenue, Suite 1900 | William Blair & Company, LLC, Chicago, IL |
| Seattle, WA 98101 | Russell Global Equity Fund |
| Money Managers | Harris Associates L.P., Chicago, IL |
| Russell U.S. Core Equity Fund | MFS Institutional Advisors Inc., Boston, MA |
| Barrow, Hanley, Mewhinney & Strauss, LLC, Dallas, TX | Polaris Capital Management, LLC, Boston, MA |
| Columbus Circle Investors, Stamford, CT | Sanders Capital, LLC, New York, NY |
| Institutional Capital LLC, Chicago, IL | Wellington Management Company, LLP, Boston, MA |
| Jacobs Levy Equity Management, Inc., Florham Park, NJ | |
| Schneider Capital Management Corporation, Wayne, PA | Russell Emerging Markets Fund |
| Suffolk Capital Management, LLC, New York, NY | |
| Sustainable Growth Advisers, LP, Stamford, CT | AllianceBernstein L.P., New York, NY |
| Delaware Management Company, a Series of Delaware | |
| Management Business Trust, Philadelphia, PA | |
| Russell U.S. Defensive Equity Fund | Genesis Asset Managers, LLP, Guernsey, Channel Islands |
| INTECH Investment Management LLC, West Palm Beach, FL | |
| Adviser, Money Manager and Service Providers 745 | |
| Russell Investment Company | |
| Russell Funds | |
| Adviser, Money Manager and Service Providers — October 31, 2014 | |
| Harding Loevner LP, Bridgewater, NJ | Russell Commodity Strategies Fund |
| Numeric Investors LLC, Boston, MA | CoreCommodity Management, LLC, Stamford, CT |
| Oaktree Capital Management, L.P., Los Angeles, CA | Credit Suisse Asset Management, LLC, New York, NY |
| UBS Global Asset Management (Americas) Inc., Chicago, IL | Goldman Sachs Asset Management, L.P., New York, NY |
| Westwood Management Corporation, Dallas, TX | Russell Global Infrastructure Fund |
| Russell Tax-Managed U.S. Large Cap Fund | Cohen & Steers Capital Management, Inc., New York, NY |
| Armstrong Shaw Associates Inc., New Canaan, CT | Colonial First State Asset Management (Australia) Limited, |
| J.P. Morgan Investment Management Inc., New York, NY | Sydney, Australia |
| MarVista Investment Partners LLC, Los Angeles, CA | Lazard Asset Management LLC, New York, NY |
| NWQ Investment Management Company, LLC, | Nuveen Asset Management, LLC, Chicago, IL |
| Los Angeles, CA | Russell Global Real Estate Securities Fund |
| Sustainable Growth Advisers, LP, Stamford, CT | Cohen & Steers Capital Management, Inc., New York, NY |
| Russell Tax-Managed U.S. Mid & Small Cap Fund | INVESCO Advisers, Inc. which acts as a money manager |
| Chartwell Investment Partners, Berwyn, PA | to the Fund through its INVESCO Real Estate Division, |
| Luther King Capital Management Corporation, Fort Worth, | Dallas, TX |
| TX 76102 | Morgan Stanley Investment Management Inc., New York, NY |
| Netols Asset Management Inc., Mequon, WI | Russell Multi-Strategy Alternative Fund |
| Summit Creek Advisors LLC, Minneapolis, MN | AQR Capital Management, LLC, Greenwich, CT |
| Russell Global Opportunistic Credit Fund | Brigade Capital Management, LLC, New York, NY |
| DDJ Capital Management LLC, Waltham, MA | DCI, LLC, San Francisco, CA |
| Lazard Asset Management LLC, New York, NY | Lazard Asset Management LLC, New York, NY |
| Oaktree Capital Management, L.P., Los Angeles, CA | Omega Advisors, Inc., New York, NY |
| Stone Harbor Investment Partners LP, New York, NY | Pacific Investment Management Company LLC, Newport |
| THL Credit Advisors, LLC, Boston, MA | Beach, CA |
| Russell Strategic Bond Fund | Passport Capital, LLC, San Francisco, CA |
| Brookfield Investment Management Inc., New York, NY | TWC/Scoggin LLC, Los Angeles, CA |
| Colchester Global Investors Limited, London, United | The Cambridge Strategy (Asset Mgmt) Limited, London, |
| Kingdom | United Kingdom |
| Logan Circle Partners, L.P., Philadelphia, PA | *Principal Global Investors LLC is the asset management arm of the Principal |
| Macro Currency Group — an investment group within | Financial Group® (The Principal®), which includes various member com- |
| Principal Global Investors LLC, Des Moines, IA* | panies including Principal Global Investors, LLC, Principal Global Investors |
| Metropolitan West Asset Management, LLC, Los Angeles, CA | (Europe) Limited, and others. The Macro Currency Group is the specialist cur- |
| Scout Investments, Inc, Kansas City, MO | rency investment group within Principal Global Investors. Where used herein, |
| Wellington Management Company, LLP, Boston, MA | Macro Currency Group means Principal Global Investors, LLC. |
| Russell Investment Grade Bond Fund | |
| Logan Circle Partners, L.P., Philadelphia, PA | Note: Select U.S. Equity, Select International Equity and Russell Strategic Call |
| Loomis, Sayles & Company, L.P., Boston, MA | Overwriting Funds are directly managed by RIMCo. |
| Macro Currency Group — an investment group within | |
| Principal Global Investors LLC, Des Moines, IA* | This report is prepared from the books and records of the Funds |
| Metropolitan West Asset Management, LLC, Los Angeles, CA | and is submitted for the general information of shareholders and |
| Neuberger Berman Fixed Income LLC, Chicago, IL | is not authorized for distribution to prospective investors unless |
| Russell Short Duration Bond Fund | accompanied or preceded by an effective Prospectus. Nothing |
| Logan Circle Partners, L.P., Philadelphia, PA | herein contained is to be considered an offer of sale or a solicitation |
| Scout Investments, Inc, Kansas City, MO | of an offer to buy shares of Russell Investment Company. Such |
| THL Credit Advisors, LLC, Boston, MA | |
| Russell Tax Exempt Bond Fund | offering is made only by Prospectus, which includes details as to |
| AllianceBernstein L.P., New York, NY | offering price and other material information. |
| MacKay Shields LLC, New York, NY | |
| 746 Adviser, Money Manager and Service Providers | |
| Russell Investment Company | 1301 Second Avenue | 800-787-7354 | |
| Seattle, Washington 98101 | Fax: | 206-505-3495 | |
| www.russell.com |

![]()
2014 ANNUAL REPORT
LifePoints® Funds
OCTOBER 31, 2014
| FUND | SHARE CLASS | |
| Conservative Strategy Fund | A, C, E, R1, R4, R5, S | |
| Moderate Strategy Fund | A, C, E, R1, R4, R5, S | |
| Balanced Strategy Fund | A, C, E, R1, R4, R5, S | |
| Growth Strategy Fund | A, C, E, R1, R4, R5, S | |
| Equity Growth Strategy Fund | A, C, E, R1, R4, R5, S | |
| 2015 Strategy Fund | R1, R4, R5 | |
| 2020 Strategy Fund | A, E, R1, R4, R5, S | |
| 2025 Strategy Fund | R1, R4, R5 | |
| 2030 Strategy Fund | A, E, R1, R4, R5, S | |
| 2035 Strategy Fund | R1, R4, R5, R4, R5 | |
| 2040 Strategy Fund | A, E, R1, R4, R5, S | |
| 2045 Strategy Fund | R1, R4, R5 | |
| 2050 Strategy Fund | R1, R4, R5 | |
| 2055 Strategy Fund | R1, R4, R5 | |
| In Retirement Fund | A, R1, R4, R5 |
Russell Investment Company
Russell Investment Company is a series investment company with 39 different investment portfolios referred to as Funds. These financial statements report on 15 of these Funds.
Russell Investment Company LifePoints® Funds
Annual Report
October 31, 2014
Table of Contents
| Page | |
| To Our Shareholders | 3 |
| Market Summary | 4 |
| Conservative Strategy Fund | 12 |
| Moderate Strategy Fund | 26 |
| Balanced Strategy Fund | 40 |
| Growth Strategy Fund | 54 |
| Equity Growth Strategy Fund | 68 |
| 2015 Strategy Fund | 82 |
| 2020 Strategy Fund | 94 |
| 2025 Strategy Fund | 108 |
| 2030 Strategy Fund | 120 |
| 2035 Strategy Fund | 134 |
| 2040 Strategy Fund | 146 |
| 2045 Strategy Fund | 160 |
| 2050 Strategy Fund | 172 |
| 2055 Strategy Fund | 184 |
| In Retirement Fund | 196 |
| Notes to Financial Highlights | 210 |
| Notes to Financial Statements | 211 |
| Report of Independent Registered Public Accounting Firm | 226 |
| Tax Information | 227 |
| Basis for Approval of Investment Advisory Contracts | 229 |
| Shareholder Requests for Additional Information | 242 |
| Disclosure of Information about Fund Trustees and Officers | 243 |
| Adviser and Service Providers | 248 |
Russell Investment Company - LifePoints® Funds.
Copyright © Russell Investments 2014. All rights reserved.
Russell Investments is a trade name and registered trademark of Frank Russell Company, a Washington USA corporation, which operates through subsidiaries worldwide and is part of London Stock Exchange Group.
Fund objectives, risks, charges and expenses should be carefully considered before investing. A prospectus containing this and other important information must precede or accompany this material. Please read the prospectus carefully before investing.
Securities distributed through Russell Financial Services, Inc., member FINRA and part of Russell Investments.
Indices and benchmarks are unmanaged and cannot be invested in directly. Returns represent past performance, are not a guarantee of future performance, and are not indicative of any specific investment. Index return information is provided by vendors and although deemed reliable, is not guaranteed by Russell Investments or its affiliates.
Russell Investments is the owner of the trademarks, service marks, and copyrights related to its respective indexes.
Performance quoted represents past performance and does not guarantee future results. The investment return and principal value of an investment will fluctuate so that shares, when redeemed, may be worth more or less than their original cost. Current performance may be lower or higher than the performance data quoted. Current to the most recent month-end performance data may be obtained by visiting www.russell.com/us/fundperformance.
To Our Shareholders
Dear Shareholder,
After strong performance in 2013, equity markets in the U.S. continued to move higher through the end of October 2014. The broad-based Russell 3000® Index was up 9.90% year-to-date as of October 31, 2014, and its one-year total return as of October 31, 2014 was 16.07%.
A number of factors contributed to this strong performance. After a somewhat slow start, the U.S economy has shown its resilience as corporate profits remain robust. Unemployment dropped below 6% in October for the first time since July 2008. And inflation remained tame, standing at just 1.7% on October 3, 2014.
At the same time, global markets contended with their fair share of concerns: instability in the Middle East, an Ebola outbreak in western Africa that spread fears across the globe, and unrest in the Ukraine. Add to that doubts about Europe’s economic recovery and a burst of volatility in the U.S. equity and Treasury markets in October and you might wonder how U.S. markets had such a strong year.
What all of this shows us is that the markets can – and often do – react to short-term events. But what matters most is to have a thoughtful financial plan, a long-term investment horizon, and a diversified, multi-asset portfolio that can weather periods of market volatility. We believe your financial advisor can also play a critical role in helping you stay on track and focus on your financial goals.
On the following pages you can gain additional insights on the markets and your investments by reviewing our Russell Investment Company’s 2014 Annual Report for the fiscal year ended October 31, 2014, including portfolio management discussions and fund performance information.
Thank you for the trust you have placed in our firm. All of us at Russell Investments appreciate the opportunity to help you achieve financial security.
Best regards,

Sandra Cavanaugh
CEO, U.S. Private Client Services
To Our Shareholders 3
Russell Investment Company
Market Summary as of October 31, 2014 (Unaudited)
U.S. Equity Markets
The U.S. equity market performed well over the fiscal year ended October 31, 2014 despite reactions to monetary policy and various geopolitical concerns. Broadly measured by the Russell 3000® Index, U.S. stocks returned 16.07% over the period, which is the sixth straight fiscal year ending October 31st that the Russell 3000® Index has finished with a positive absolute return.
The Russell 3000® Index finished higher in nine of the fiscal year’s twelve months, with exceptions in January, July and September 2014. Within U.S. large cap stocks, the Russell 1000® Growth Index outperformed the Russell 1000® Value Index as stocks with lower valuations (lower price-to-book and price-to-cash flow ratios) lagged the market. In particular, stocks with high historical 5-year earnings growth, including certain industries within technology and health care sectors, led the market upward. Similarly, within U.S. Small Cap, the Russell 2000® Growth Index outperformed the Russell 2000® Value Index returning 8.26% compared to 7.89%. The fiscal year was led by larger capitalization stocks as the Russell Top 200® Index returned 17.43% compared with the Russell Midcap® Index, Russell 2000® Index, and the Russell Microcap® Index, which returned 15.32%, 8.06% and 7.34%, respectively. The fiscal year was also led by defensive stocks as the Russell 1000® Defensive Index® returned 16.91% while the Russell 1000® Dynamic Index® returned 16.59%. Stocks of companies with less financial leverage (lower debt-to-capital ratios) generally outperformed those with more debt in their capital structures.
Toward the end of calendar year 2013, the U.S. equity market performed well as the Russell 3000® Index returned 2.90% in November and 2.64% in December despite investor concerns over macroeconomic events. One concern was focused on the pending reduction of quantitative easing (tapering) by the U.S. Federal Reserve (the “Fed”), although some uncertainty around the timing and amount was resolved in December when it was announced the Fed would reduce asset purchases from $85 billion to $75 billion in January. Also in December, the U.S. Congress passed legislation to prevent another government “shutdown” that may have occurred in early 2014 had there been no action.
U.S. equities rebounded from a challenging start to 2014 with the Russell 3000® Index recording positive returns in five of the first six months of the year. Investors shrugged off disappointing U.S. non-farm payroll numbers for December and January, which were generally blamed on unusually cold weather. Markets jumped considerably in February on “dovish” comments from new Fed Chair Janet Yellen in her first Congressional testimony. In March, high dividend yield stocks briefly underperformed after comments from Yellen suggesting that U.S. short term interest rates may rise sooner than some were expecting. Toward the end of March, the market’s focus shifted to profit taking among high momentum stocks which were viewed as overbought by some investors. The final U.S. gross domestic product (“GDP”) growth rate for the fourth quarter of 2013 came in at 2.6%, slightly behind forecasts. Elsewhere, a series of concerns about Ukraine, Crimea and Russia kept a lid on global market appreciation over the first few months of 2014.
The Russell 3000® Index gained 4.87% from April through June, ending the period at a new record high. The equity market was led by high dividend yield stocks early in the period, as investors bid up interest rate sensitive stocks in pursuit of more yield from equity oriented investments as long term interest rates fell. Economic data released during the quarter generally provided indications of a continued economic expansion. The standout anomaly was the third revision to U.S. first-quarter real GDP (an inflation adjusted GDP measure), which was sharply revised downward to -2.9% largely driven by a decrease in personal consumption expenditures. The Fed downwardly revised its 2014 GDP forecasts from 2.9% to 2.2%. Elsewhere, non-farm payrolls remained healthy, with June being the fifth straight month of growth above 200,000 jobs, which is the first time this has happened in 14 years. Meanwhile, the Fed cut its monthly asset purchases by $10 billion at each monthly meeting, reducing the amount to $35 billion at June’s meeting.
During the summer (July 2014 through September 2014), the Russell 3000® Index finished virtually unchanged from where it started, returning 0.01%. However, U.S. equities suffered negative returns in July and September. Geopolitical
4 Market Summary
Russell Investment Company
Market Summary as of October 31, 2014, continued — (Unaudited)
risks and negative investor reaction to the Fed’s monthly statement, which was perceived as being more hawkish, dragged down equities in July, while the sell-off in the final days of September was driven in part by fears of a potentially larger than anticipated rise in interest rates. This led interest rate sensitive industries, such as REITs and Utilities, to underperform. Non-farm payrolls missed estimates in August at 180,000, the second weakest number this year, although this followed six months of 200,000+ additions. Unemployment fell to 6.1% in August, partially due to a marginal tick down in the participation rate. Meanwhile, the Fed continued its monthly reductions in quantitative easing as it prepared to fully halt the program in October. The U.S. dollar experienced its strongest three month period against other G10 currencies since 2008 after enjoying an eleven week run of successive gains.
In October, volatility in the market picked up significantly, partially driven by concerns over a European slowdown, the strength of the ISIS terror group in the Middle East, and the Russian/Ukrainian conflict. Excess supply of oil was a concern for the energy sector, with and the price of WTI crude falling below $80 a barrel. The market was down over 5.50% in the first half of October with consumer staples, health care, utilities and real estate investment trusts outperforming during the downturn and for the month as a whole. However, the second half of October was much more positive with the market recouping all of its earlier losses, as favorable third quarter earnings boosted investor confidence. It was another good month for the Biotech industry despite many market participants expressing concern over the level of valuations within the industry. On October 29, 2014 the Fed officially announced the end to its 6 year long bond buying program that was intended to jumpstart the U.S. economy after the massive recession in 2008. The Fed is generally expected by analysts to increase interest rates modestly sometime in mid 2015.
Non-U.S. Developed Equity Markets
For the fiscal year ended October 31, 2014, the non-U.S. equity market, as measured by the Russell Developed ex-U.S. Large Cap® Index (the “Index”), was up 0.17%. Equity prices increased to new highs during the period, despite the continued tepid global growth environment and elevated valuations, before pulling back in the last few months of the fÿÿÿÿiscal year. U.S. Dollar strength was a significant headwind during the period as other major currencies fell against the U.S. dollar - the Euro (-7.87%), Yen (-12.64%), Canadian dollar (-6.51%), Swiss Franc (-6.06%), and British Pound (-0.01%). Concerns heightened in the latter part of the fiscal period over European growth further slowing from an already modest pace, particularly in the larger economies such as Germany. At the end of the fiscal year political uncertainties in Eastern Europe and the Middle East continued to hang over the market.
During the fourth quarter of 2013, the global ex-U.S. market posted solid gains as the Index was up 5.8%. Several important U.S. macro indicators came in on the upside during November and December, fueling the positive momentum in the U.S. economy and spurring market anticipation of a near-term deceleration in the pace of U.S. Federal Reserve (“Fed”) quantitative easing (“QE”). U.S. gross domestic product (“GDP”) grew 2.8% year-over-year in the third quarter of 2013, while Institute for Supply Management® manufacturing and non-farm payrolls both beat consensus forecasts. The beginning of QE’s wind down was officially announced towards mid-December in the amount of $10 billion tapering to start in January 2014. The relatively low amount of tapering, coupled with new Fed Chair Janet Yellen’s dovish commentary on future monetary policy stance, were positively acknowledged by the markets.
Geo-politics and policymaker rhetoric dominated headlines in what was a relatively volatile first quarter of 2014. The Index registered positive returns of 1.2%, after recovering strongly from a sharp decline at the end of January. The quarter began with concerns over the outlook for growth in emerging markets (“EM”), amid ongoing speculation regarding the Fed’s plans for the reversal of QE. Political upheaval in a number of EM countries also caused concern, most notably in Ukraine and Venezuela, as the currencies of a series of EM countries sold-off. However, comments from Fed Chair Janet Yellen soothed investor concerns as she stated that “a highly accommodative policy will remain appropriate for a considerable time after asset purchases end.” European Central Bank (“ECB”) Chairman Draghi added to the positive mood as he re-iterated the ECB was “ready and willing” to act. However, an uptick in political risk weighed on markets at the beginning of March as fallout from Crimea’s independence referendum and its resulting decision to join with Russia stoked wider international
Market Summary 5
Russell Investment Company
Market Summary as of October 31, 2014, continued — (Unaudited)
tensions. Despite sanctions between Russia and its Western critics, a feared escalation of tensions did not materialize and markets rebounded. Although macro data out of China worsened towards the second half of March, comments from the country’s Premier Li served to boost equity markets and spark a reversal in sentiment as he reassured investors that the government would support the economy.
A challenging start to the second quarter of 2014 saw equity markets track lower as policymaker inaction and an intensification of geopolitical events in Ukraine and the Middle East led to heightened investor risk aversion. However, non-U.S. equities maintained a largely positive trajectory through the quarter, as the Index advanced 4.4%.
The ECB’s announcement of renewed stimulus efforts in early June, as well as moderation of tensions between Russia and the West, contributed to an improvement in market sentiment toward the end of the second quarter. Consistently dovish comments from Fed Chair Janet Yellen, in particular her assertion that “a high degree of monetary accommodation remains warranted,” were also well received. Emerging markets also enjoyed a strong quarter, boosted by a series of welcome election results, most notably in India, and less dire concern toward the Chinese government’s restraint in policy support in the face of a decelerating economy.
Equity markets tracked lower over the third quarter of 2014, as the strengthening recovery in the U.S. wasn’t enough to offset a resurgence of geopolitical tension in the Middle East and sluggishness in Europe. Once again, monetary policy was key to equity performance across the world. Markets seemed unperturbed by the imminent end of QE in the U.S., preferring to focus on the country’s strong economic fundamentals, but concerns over interest rate hikes prompted Fed Janet Chair Yellen to insist that interest rates would remain low for a “considerable time.” Low inflation and high unemployment in the Eurozone pushed the ECB to cut deposit and interest rates to record lows and pledge to start buying covered bonds. By quarter-end, however, poor economic data highlighted that further stimulatory action would likely be necessary. Emerging markets had a patchy quarter, with underwhelming data from China doing little to quell concerns that the country may yet face a hard economic landing.
Overall, the non-U.S. markets fell 5.9% in the third quarter of 2014, as measured by the Index. Japan shed 2.57% as the after-effects of the consumer-tax hike continued to weigh on inflation and consumer sentiment. European markets were the biggest laggard, dropping 7.5% on the back of persistently bad economic news from the region’s key economies: Italy fell into recession in the second quarter, France stagnated and Germany saw business confidence slump to its lowest level in 17 months. Emerging market equities declined 3.3% in U.S. dollar terms during the quarter, largely driven by a September sell-off. Over the period, strength in the U.S. economy and a likelihood of further monetary easing in Europe and Japan weren’t enough to overcome broader fears over the health of the global economy. Though emerging markets fell overall, they contained several bright spots, especially in East Asia.
The largest capitalization stocks and those with higher dividend yields were strong performers over the year which generally favored more defensively oriented companies such as those found in the health care sector which led the other sectors by a large margin. Positive returns were also generated from telecommunication and utilities sectors. Information technology was the only other sector that outperformed for the fiscal year. Materials and energy sectors posted strong gains in the first half of the fiscal year but ended the fiscal year as the worst performers over growing concerns of economic growth and U.S. dollar strength.
Regionally, Asia ex-Japan was the clear leader, led largely by strong performance in Hong Kong as concerns over China eased in the latter part of the fiscal year. Europe was weak as the larger economies such as Germany and France pulled back on poor economic data, concerns over growth, and questions whether the European Central Bank will act in a timely manner to stimulate the fledgling economy.
The fiscal year did not show a clear trend between value and growth styles, though stocks that exhibited higher price-to-book ratios and strong historical growth were generally favored over the fiscal year.
6 Market Summary
Russell Investment Company
Market Summary as of October 31, 2014, continued — (Unaudited)
Emerging Markets
The Russell Emerging Markets® Index (the “Index”) gained 1.86% over the fiscal year ended October 31, 2014. In what was another volatile fiscal year period, macroeconomic events continued to impact emerging market equities against a backdrop of interest rate uncertainty and geopolitical headwinds. With central banks in the developed world extending quantitative easing measures, emerging markets rallied into early September of 2014. Positive geopolitical events highlighted by Prime Minister Modi’s assumption of power in India underpinned gains. However, this was offset by the turmoil caused by the ongoing Ukraine crisis. The rally in emerging markets reversed course in September 2014 largely driven by speculation of rising interest rates. A combination of geopolitics and weak data further added to the downturn.
In November and December of 2013, the Index lost 2.3%. Ongoing speculation as to when the U.S. Federal Reserve (“Fed”) would begin to reduce its stimulus measures continued to impact emerging markets over the period and the asset class suffered outflows. When the news finally arrived in mid-December that the Fed was to cut its quantitative easing (“QE”) program by $10 billion, emerging markets did not react too sharply and actually rallied into year-end. The November announcement of an agreement which would see Iran reduce its nuclear program in exchange for a lifting of international sanctions was negative for some net oil exporters such as Russia and Colombia. China was boosted by a raft of reforms announced at the Third Plenary Session of the 18th Congress. The Indian market was boosted by a drop in the price of oil, which may help to reduce inflation, and a gross domestic product (“GDP”) reading which showed the economy had grown. Brazil’s macro fundamentals remained challenging and GDP growth slowed. The Brazilian central bank moved to hike rates as it continued to fight high inflation. In emerging Europe, Purchasing Managers Indices (“PMI”) ticked up and GDP growth accelerated. However, the Turkish market was hampered by Fed taper fears and by a corruption scandal, which engulfed Prime Minister Erdogan’s cabinet, highlighting the increasing tensions between the PM and the country’s judiciary.
The first quarter of 2014 turned out to be volatile, with the Index slipping -0.2%. The asset class was off to a tough start amid uncertainty surrounding the Fed’s plans for QE reduction and increasing concerns over the Chinese economy. Uncertainty linked to Fed tapering began to evaporate in February and emerging markets rebounded, bolstered by comments from new Fed chair Janet Yellen. However, a rise in political risk spurred bouts of renewed volatility, primarily due to Crimea’s independence referendum and its resulting decision to join with Russia. Meanwhile, Chinese macro data continued to deteriorate. In conjunction with comments from Premier Li, this sparked a reversal in sentiment amid expectations that the government may take action to support the economy. Despite tit-for-tat sanctions between Russia and its Western critics, a feared escalation of tensions did not materialize and combined with a drop in risk aversion in China, emerging markets rebounded. In this environment, there was a high dispersion in country returns while EM currencies also registered some sizeable movements. China (-5.6%) underperformed as PMI manufacturing data continued to worsen and the central bank moved to tighten liquidity conditions. Indonesia (+21.7%) bounced back as markets reacted positively to news that popular Jakarta governor, Joko Widodo, would run for president. Data showing that its current account deficit had narrowed also helped to restore investor confidence and spurred a gain in the rupiah. The Philippines (+8.9%) and Thailand (+8.7%) also outperformed while Korea (-2.1%) lagged. India (+8.9%) recorded solid gains, boosted by central bank action, which contributed to a 3.2% gain in the rupee, and by polls which indicated the opposition BJP may win upcoming elections. In Latin America, Colombia (+4.2%) and Brazil (+1.8%) were the only countries to outperform. In Brazil, expectations that the central bank’s interest rate hiking cycle was coming to an end, and polls which indicated lower approval ratings for president Rousseff, sparked resurgence in the local market. Russia (-14.4%) was the worst performing country in the Index, as events in Crimea were the catalyst for a significant sell-off which also saw the ruble fall 6.5%. Emerging Europe was mixed with Greece (+15.8%) benefiting from increased stability in the Eurozone. In contrast, Hungary (-8.8%) lagged, as the central bank cut interest rates more than anticipated. Turkey (+3.2%) epitomized the high levels of volatility, with its perceived fragility to Fed tapering resulting in sizeable capital outflows and a sell-off in the lira early in the quarter. However, the central bank’s decision to hike rates 300bps served to stabilize the currency, and as wider concerns over emerging markets eased, the local market more than recouped losses. South Africa (+4.4%) finished in positive territory
Market Summary 7
Russell Investment Company
Market Summary as of October 31, 2014, continued — (Unaudited)
while Egypt (+14.7%) registered strong gains ahead of Presidential elections. From an investment style perspective, growth was strongly outperforming value coming into the first quarter of 2014, particularly stocks with the highest price-to-book valuations and high return-on-equity. However, mid-March saw a sharp reversal with value stocks, in particular deep value stocks, outperforming significantly. On a market capitalization basis, small capitalization equities outperformed large capitalization equities, as measured by the Russell Emerging Markets Small Cap Index (+2.6% over the quarter).
The second quarter of 2014 saw the Index rally +7%. Diminished concerns over a nearer term rise in global interest rates provided a tailwind to market returns. However, the main catalyst for gains was a series of favorable election results, most notably in India (+17%) where Narendra Modi’s BJP party became the first to attain a majority in the lower house for more than 30 years. Elections in South Africa, Egypt and frontier market Ukraine also completed relatively smoothly, with no major surprises. The Chinese market (+5.0%) witnessed some large swings through the period. Concerns over PMI data early in the quarter dissipated as renewed fears over a hard landing were allayed by upside data surprises and as investors appeared more at ease with the government’s restraint in implementing large scale policy intervention through the current period of transition. Elsewhere in Asia, the Philippines (+9.6%) outperformed, despite the publication of a weak first quarter GDP report which was hit by the effects of typhoon Yolanda. However, the market gained on expectations that higher private consumption and reconstruction spending may boost full year GDP growth as the World Bank increased its Philippine outlook. After initial fears, a military coup in Thailand (+8.4%) was interpreted as a stabilizing factor, generating more optimistic sentiment in financial markets. Indonesia (-1.3%) was the regional laggard, hampered by uncertainty over July’s Presidential election. India was the standout country in the Index, buoyed by high expectations that the new administration would succeed in delivering economic reforms to restore growth and battle high inflation. In Latin America, Brazil (+7.0%) rallied as polls showed support for President Rousseff was declining ahead of October’s Presidential election. However, fundamentals for the country’s economy remained weak with the Brazilian central bank raising its already above target inflation outlook for 2014 and the World Bank cutting its GDP growth forecast to 1.5%. Peru (+8.5%) outperformed, while Chile (+2.0%) lagged as the economy continued to slow. An easing in tensions between Russia (+11.7%) and the West, and a cooling of events in Ukraine, was beneficial for various emerging European markets. Turkey (+15.0%) enjoyed a strong quarter, as its current account deficit continued to recede. Greece (-9.8%) was the worst performing country in the Index as data for the Eurozone remained weak and some Greek bank equities declined sharply on concerns over the banks’ exposure to Ukraine and Bulgaria. South Africa (+5.1%) capped a solid quarter, as the ruling ANC party held control of the national assembly, albeit with a reduced majority. The United Arab Emirates (-6.1%) underperformed, particularly in June.
Following a very strong second quarter, the Index declined 3.1% in the third quarter of 2014, largely driven by a September sell-off. Emerging markets sold off on speculation around rising interest rates and U.S. dollar strength: the 5-year U.S. Treasury rate rose by 16 basis points over the quarter and the dollar strengthened relative to most currencies. China ended the quarter in mildly positive territory (+1.6%) despite enduring some poor economic data towards the end of the period. While the government had been making positive statements about reform, investors remained concerned – given falling industrial production and a surprise drop in lending – that it won’t be sufficient for the country to hit its growth targets for the year. Meanwhile, geopolitics played a large role in the performance of emerging markets over the period. Brazil fell 9.2% amid a resurgence in support for the incumbent presidential candidate, Dilma Rousseff. The Russian markets slumped 15.8% as geopolitical tensions in Ukraine rumbled on, and sanctions imposed by Europe and the U.S. began to bite. A significant portion of returns for both Russia and Brazil were driven by currency weakness relative to the U.S. dollar. Over the quarter, the Brazilian and Russian currencies declined by more than 10% against the U.S. dollar. Emerging markets in Europe had a poor quarter overall, with Hungary falling 12.1% and Turkey by 11.5%. Turkey is considered particularly vulnerable to interest rate hikes due to its high current account deficit. Thailand rose sharply (+8.0%) after the appointment of a new prime minister appeared to assure a period of greater stability. Indonesia climbed (+2.9%) following the election of Joko Widodo. Elsewhere, India continued to do well (+1.7%) as recently elected Prime Minister Narendra Modi pressed forward with a reformist agenda. Notably, GDP growth of 5.7% year-over-year recorded in the second quarter was the fastest rate since the first quarter of 2012. In the Middle East, the United Arab Emirates enjoyed a strong quarter,
8 Market Summary
Russell Investment Company
Market Summary as of October 31, 2014, continued — (Unaudited)
with its market rising by 18.4% to add to its leading year-to-datereturns. Mexico (+0.6%) also gained despite the sell-off in September and the Philippines (+2.8%) posted strong GDP growth which helped drive gains. Additional laggards included Greece, which ended down 19.9%, and South Korea, which was also among the biggest detractors as markets fell by 5.8%. With China being one of its biggest export markets, South Korea is especially vulnerable to the economic travails of its giant northern neighbor. Taiwan also declined (-4.3%), as the recent strong run of its technology companies led to profit taking. Elsewhere, Malaysia (-2.4%), Peru (-3.8%) and Chile (-5.1%) all slipped lower.
The Index was up 1% in October with positive upside largely coming from China (+4%). Expectations around state-owned enterprise reform fueled the rally in spite of slowed manufacturing numbers. Turkey (+10%) also rallied as its central bank kept interest rates steady. In contrast, Greece (-15.6%) sold off due to elevated election risks and concerns as to whether it would be able to cover its financing needs.
U.S./Global Fixed Income Markets
The fiscal year ended October 31, 2014 was a positive period for global fixed income markets overall, although not without a few surprises along the way. Sovereign yields ended the period moderately lower than they began across all regions, buoying returns across fixed income sectors. Globally, credit sectors largely outperformed similar-duration government bonds as spreads generally held or narrowed modestly over the period.
The fiscal year began with positive momentum, emanating from the U.S. in particular. This was following a volatile end to the 2013 fiscal year period, as investors grappled with the prospect of a gradual end to the Fed’s monetary expansion and later uncertainty surrounding the U.S. debt ceiling and possible government shutdown. Year-on-year 2013 third quarter U.S. gross domestic product (“GDP”) growth surprised materially to the upside, at 4.1% compared to expectations of 2.0%. Then in January 2014, the U.S. unemployment rate dipped to below 7%, where it would stay for the remainder of the fiscal year. Later in January, market optimism stumbled briefly as disappointing U.S. non-farm payroll data was released and concerngrew over the global economic outlook for China as the potential for accelerating credit defaults became more apparent. However, this was more than offset by a fourth quarter 2013 U.S. GDP growth reading coming in ahead of expectations, as well as the smooth leadership transition at the U.S. Federal Reserve (the “Fed”). Chairwoman Janet Yellen’s first testimony to the U.S. Congress was positively received by global financial markets, during which she stressed continuity, if not a slightly more dovish stance than her predecessor. The result was a positive end to 2013 and a positive first quarter of 2014 for global fixed income markets, particularly for credit sectors.
The moderate rally in global fixed income markets extended through the second quarter of 2014 amid economic data that supported a progressive economic recovery in the U.S. and bottoming-out in Europe. Given gradual tapering in the Fed’s asset purchasing program and positive U.S. growth outlook, the mid-year rally in U.S. Treasuries caught many market participants by surprise. The rally was driven by a lull in new issuance squeezing supply (and yields) of longer-term bonds as well as demand from price-insensitive buyers (de-risking pension funds, the Fed and China). While the impact of a particularly harsh winter became more evident in the second quarter, accentuated by a meaningful downwards revision in first quarter GDP growth, fixed income markets proved resilient. Improving unemployment, job gains and consumer confidence re-affirmed the market’s optimism, as did Chairwoman Yellen’s commitment to maintain an accommodative stance even as unemployment and inflation approached target levels.
Market calm turned to concern during the last four months of the fiscal year amid heightened uncertainty surrounding geopolitical events and the robustness of global growth. Despite generally positive economic data out of the U.S., Israeli-Palestinian tension in the Gaza Strip escalated dramatically in July, putting investors a little more on edge, although the immediate market impact was relatively muted. More impactful was news of a Malaysia Airlines passenger jet being shot down over Ukraine later in the month, raising the stakes in the conflict between Kiev and pro-Moscow rebels in which Russia and the West backed opposing sides. The Ukraine conflict continued to escalate throughout July and August, but was halted by a tense cease-fire in September. As a result, the third quarter of 2014 was challenging for global
Market Summary 9
Russell Investment Company
Market Summary as of October 31, 2014, continued — (Unaudited)
fixed income markets, particularly credit sectors. Safe-haven U.S. and core European government bonds posted modestly positive returns.
On the other hand, the U.S. economy continued to show strength, with employment gains, consumer confidence and second quarter GDP growth coming in largely ahead of expectations. However, weak economic data out of core Europe and China scared credit markets, tempering the outlook for growth globally. Moves by the European Central Bank to loosen monetary policy, including its own form of asset purchasing program, put further downward pressure on government bond yields, most notably in Europe, but with sympathy downward moves in North America and Asia-Pacific. Volatility spiked in October amid weak data releases out of Europe (namely Germany) and China, sending yields and risk assets plummeting globally, only to nearly revert to prior levels days later. Growing fears over the spread of Ebola from Africa also contributed to investors being more on edge as the first cases were reported in the U.S. and Europe. By fiscal year-end, global government bond yields remained lower for the year, while credit spreads, which had contracted during the first two-thirds of the period, ended flat overall.
A key indicator of global fixed income performance, the Barclays Global Aggregate Index, returned 5.32% for the fiscal year, in USD hedged terms, buoyed by moderately lower government bond yields and broadly flat credit spreads.
Over the fiscal year, European bonds outperformed those of other regions (returning 8.8% as measured by the Barclays European Aggregate Index) on the back of strong Treasury returns, most notably among lower-rated “peripheral” countries such as Ireland, Spain, Italy and Slovenia, as spreads between peripheral and “core” countries (e.g., Germany) narrowed materially. U.S. bonds posted solid gains (returning 4.1% as measured by the Barclays U.S. Aggregate Index) as U.S. Treasury yields ended the year modestly lower and credit spreads held. Asia-Pacific bonds lagged (returning -5% as measured by the Barclays Asian Pacific Aggregate Index) as a slowing Chinese growth outlook weighed on the region, offsetting the Bank of Japan’s commitment to, and later ramp-up in, aggressive monetary policy support.
Strong new issuance volumes characterized most credit sectors, particularly in the U.S., over the fiscal year, in both corporate and securitized markets. Sectors generally performed in-line with spreads, with corporate credit outperforming securitized credit across regions (returning 3.4% vs. 2.7% on a global basis, respectively, as measured by Barclays Global Aggregate Index - Corporates and Barclays Global Aggregate Index - Securitized). Overall, lower-quality investment grade corporates outperformed higher-quality investment grade corporates, and utilities and industrials outperformed financials. U.S. agency mortgage-backed securities (“MBS”) performed well (returning 4.1% as measured by Barclays U.S. Aggregate Index – Agency MBS) despite concerns of reduced demand from tapering Fed purchases.
Similar to fiscal year 2013, non-Agency MBS again outperformed most other sectors, aided by favorable supply and demand forces and solid housing fundamentals. High yield corporate credit performed in-line with investment grade corporate credit on an equivalent-duration basis, as slightly wider spreads offset higher running yields. The lowest-quality segments of the sector underperformed significantly, failing to fully recover from global growth concerns that rattled markets in the latter part of the fiscal year. Emerging market (“EM”) debt outperformed developed fixed income markets, largely as a result of a bounce-back from weakness at the end of the previous fiscal year, and reflecting the valuation gap between emerging and developed market assets. Local currency bonds (those denominated in the currency of the issuing EM country) significantly underperformed hard currency bonds (those issued by EM issuers but denominated in “hard currencies” such as the U.S. dollar or Euro), largely as a result of EM currency weakness amid global and market-specific growth and geopolitical concerns.
10 Market Summary
(This page intentionally left blank)
Russell Investment Company Conservative Strategy Fund
Portfolio Management Discussion and Analysis — October 31, 2014 (Unaudited)
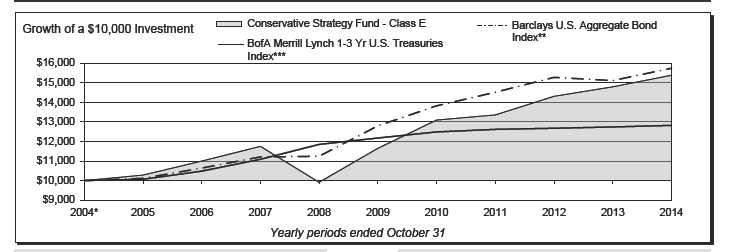
| Conservative Strategy Fund - Class A‡ | Conservative Strategy Fund - Class R5‡‡‡ | ||||||
| Total | Total | ||||||
| Return | Return | ||||||
| 1 Year | (2.08 | )% | 1 Year | 3.83 | % | ||
| 5 Years | 4.48 | %§ | 5 Years | 5.58 | %§ | ||
| 10 Years | 3.78 | %§ | 10 Years | 4.20 | %§ | ||
| Conservative Strategy Fund - Class C | Conservative Strategy Fund - Class S | ||||||
| Total | Total | ||||||
| Return | Return | ||||||
| 1 Year | 3.21 | % | 1 Year | 4.25 | % | ||
| 5 Years | 4.91 | %§ | 5 Years | 5.99 | %§ | ||
| 10 Years | 3.61 | %§ | 10 Years | 4.66 | %§ | ||
| Conservative Strategy Fund - Class E | Barclays U.S. Aggregate Bond Index** | ||||||
| Total | Total | ||||||
| Return | Return | ||||||
| 1 Year | 3.99 | % | 1 Year | 4.14 | % | ||
| 5 Years | 5.72 | %§ | 5 Years | 4.22 | %§ | ||
| 10 Years | 4.40 | %§ | 10 Years | 4.64 | %§ | ||
| Conservative Strategy Fund - Class R1‡‡ | BofA Merrill Lynch 1- 3 Yr U.S. Treasuries Index*** | ||||||
| Total | |||||||
| Total | Return | ||||||
| Return | |||||||
| 1 Year | 4.40 | % | 1 Year | 0.67 | % | ||
| 5 Years | 6.11 | %§ | 5 Years | 1.04 | %§ | ||
| 10 Years | 4.72 | %§ | 10 Years | 2.52 | %§ | ||
| Conservative Strategy Fund - Class R4‡‡‡ | |||||||
| Total | |||||||
| Return | |||||||
| 1 Year | 4.14 | % | |||||
| 5 Years | 5.86 | %§ | |||||
| 10 Years | 4.46 | %§ | |||||
12 Conservative Strategy Fund
| Russell Investment Company | |
| Conservative Strategy Fund | |
| Portfolio Management Discussion and Analysis, continued — October 31, 2014 | |
| (Unaudited) | |
| The Conservative Strategy Fund (the “Fund”) is a fund of funds | How did the market conditions described in the Market |
| that invests in other Russell Investment Company mutual funds | Summary report affect the Fund’s performance? |
| (the “Underlying Funds”). The Underlying Funds employ a multi- | Fixed income markets had overall positive performance for the |
| manager approach whereby portions of the Underlying Funds | fiscal year, as interest rates generally trended lower over the |
| are allocated to different money managers. Underlying Fund | period, providing a tailwind to aggregate fixed income markets. |
| assets not allocated to money managers are managed by Russell | During the fiscal year, the Fund had a strategic allocation to |
| Investment Management Company (“RIMCo”), the Fund’s and | short duration fixed income, as represented by its allocation to |
| Underlying Funds’ advisor. RIMCo, as the Underlying Funds’ | the Russell Short Duration Bond Fund, which in a lower yield |
| advisor, may change the allocation of the Underlying Funds’ | environment detracted from the Fund’s benchmark-relative |
| assets among money managers at any time. An exemptive order | performance. |
| from the Securities and Exchange Commission (“SEC”) permits | |
| RIMCo to engage or terminate a money manager in an Underlying | It was a positive equity market for the fiscal year ending October |
| Fund at any time, subject to approval by the Underlying Fund’s | 31, 2014. U.S. equities returned 16.07% over the period (as |
| measured by the Russell 3000® Index), while non-U.S. equities | |
| Board, without a shareholder vote. Pursuant to the terms of the | |
| exemptive order, an Underlying Fund is required to notify its | returned 0.17% (as measured by the Russell Developed ex-U.S. |
| shareholders within 90 days of when a money manager begins | Large Cap Index). The outperformance of U.S. equities over fixed |
| providing services. | income was a key positive driver to the Fund’s benchmark-relative |
| performance, as fixed income markets finished at 4.14% for the | |
| What is the Fund’s investment objective? | fiscal year as measured by the Fund’s benchmark. |
| TheFundseekstoprovidecurrentincomeandcapitalpreservation, | Global REITs and listed infrastructure (as represented by the |
| and as a secondary objective, long term capital appreciation. | FTSE EPRA/NAREIT Developed Real Estate Index (Net) and |
| How did the Fund perform relative to its benchmark for the | S&P Global Infrastructure Index (Net)) finished the fiscal year |
| fiscal year ended October 31, 2014? | up 9.84% and 13.36%, respectively. These asset classes also |
| For the fiscal year ended October 31, 2014, the Fund’s Class A, | outperformed fixed income markets, which was beneficial to |
| Class C, Class E, Class R1, Class R4, Class R5 and Class S Shares | the Fund’s performance through its allocation to the Russell |
| gained 3.92%, 3.21%, 3.99%, 4.40%, 4.14%, 3.83% and 4.25%, | Global Real Estate Securities and Russell Global Infrastructure |
| respectively. This is compared to the Fund’s primary benchmark, | Funds. Commodities largely underperformed broader equity and |
| the Barclays U.S. Aggregate Bond Index, which gained 4.14% | fixed income markets with a loss of 5.94% for the fiscal year (as |
| during the same period. The Fund’s performance includes | represented by the Bloomberg Commodity Index Total Return). |
| operating expenses, whereas index returns are unmanaged and | Thus, the Fund’s allocation to the Russell Commodity Strategies |
| do not include expenses of any kind. | Fund was a headwind to Fund performance. |
| For the fiscal year ended October 31, 2014, the Morningstar® | How did the investment strategies and techniques employed |
| Conservative Allocation, a group of funds that Morningstar | by the Fund and the Underlying Funds affect the Fund’s |
| considers to have investment strategies similar to those of the | performance? |
| Fund, gained 5.40%. This result serves as a peer comparison and | The Fund is a fund of funds and its performance is based on |
| is expressed net of operating expenses. | RIMCo’s strategic asset allocations and the performance of the |
| The Fund generally performed in-line with the Barclays U.S. | Underlying Funds in which the Fund invests. |
| Aggregate Bond Index, with some share classes underperforming | The Fund’s strategic allocation to fixed income Underlying |
| and some share classes outperforming the index. The Fund’s | Funds negatively impacted its benchmark-relative performance. |
| strategic allocation to fixed income Underlying Funds negatively | Allocations to the Russell Global Opportunistic Credit Fund and |
| impacted the Fund’s benchmark-relative performance, with the | Russell Short Duration Bond Fund detracted, as these Underlying |
| Fund’s allocation to the Russell Short Duration Bond Fund having | Funds underperformed the Fund’s benchmark. In particular, the |
| the largest detrimental impact. Benchmark-relative performance | Russell Short Duration Bond Fund underperformed the Fund’s |
| was generally aided by the Fund’s mix of out-of-benchmark | benchmark, as having a strategic short duration bias over the |
| allocations to equity, global real estate, and listed infrastructure | year was a headwind as interest rates generally moved lower. |
| Underlying Funds, which outperformed fixed income Underlying | Allocations to the Russell Strategic Bond Fund and Russell |
| Funds over the period. | Investment Grade Bond Fund were slightly positive from a |
| benchmark-relative perspective. With the exception of the | |
| Russell Global Opportunistic Credit Fund, results from active | |
| Conservative Strategy Fund 13 | |
| Russell Investment Company | |
| Conservative Strategy Fund | |
| Portfolio Management Discussion and Analysis, continued — October 31, 2014 | |
| (Unaudited) | |
| management were positive. For the Russell Strategic Bond Fund, | of these Underlying Funds was generally negative. The Russell |
| exposure to non-agency mortgages and emerging market debt | Global Infrastructure Fund, Russell Commodity Strategies Fund, |
| were key contributors to the Underlying Fund’s benchmark- | and Russell Multi-Strategy Alternative Fund underperformed |
| relative outperformance. Currency selection was also positive, | their respective asset class benchmarks while the Russell Global |
| particularly a long U.S. Dollar position versus short positions to | Real Estate Securities Fund outperformed its respective asset |
| the Australian Dollar Euro, and Japanese Yen. | class benchmark. In particular, the Russell Global Infrastructure |
| With respect to the Fund’s global equity exposure, the Fund’s | Fund was underweight to North American electric utilities and |
| strategic allocation to the Russell International Developed Markets | the oil and gas pipelines sectors, which were among the strongest |
| Fund and Russell Emerging Markets Fund detracted from the | performing sectors for the year. For the Russell Global Real |
| Fund’s benchmark-relative performance, while its allocation to | Estate Securities Fund, security selection within the U.S. was |
| the Russell Global Equity Fund positively impacted performance. | positive while an overweight to and security selection within |
| From an active management standpoint, the Russell International | Japan detracted from performance. |
| Developed Markets Fund outperformed the broad non-U.S. equity | Describe any changes to the Fund’s structure or allocation |
| market as represented by the Russell Developed ex-U.S. Large | to the Underlying Funds. |
| Cap™ Index Net, while the Russell Global Equity Fund performed | RIMCo has the discretion to vary the Fund’s actual allocation |
| in-line with the broad global equity market as represented by the | from the target strategic asset allocation by up to +/- 5% at |
| Russell Developed Large Cap Net Index. The Russell Emerging | the equity, fixed income or alternative category level based on |
| Markets Fund underperformed its emerging markets benchmark. | RIMCo’s capital markets research. Performance of the Fund’s |
| Effective stock selection in Continental Europe was a tailwind | short-term asset allocation modifications ended the fiscal year |
| to performance for the Russell International Developed Markets | modestly positive. This was driven by beneficial tilts away from |
| Fund against its benchmark, while an overweight to and stock | target strategic allocations. |
| selection within information technology benefited performance of | |
| the Russell Global Equity Fund against its benchmark. For the | Entering the fiscal year, the Fund was underweight the Russell |
| Russell Emerging Markets Fund, unsuccessful stock selection | Commodity Strategies Fund and Russell Global Real Estate |
| in China, South Korea, Russia, and Taiwan were detractors from | Securities Fund by 0.50% each, and overweight the Russell |
| performance. | Global Infrastructure Fund and Russell U.S. Core Equity Fund |
| by 0.50% each, relative to the target strategic asset allocation | |
| The Fund’s strategic allocation to U.S. large cap equity Underlying | weights. This positioning was driven by a cautious medium term |
| Funds benefited the Fund’s benchmark-relative performance, as | outlook on commodities and a desire to mitigate the real estate |
| broad U.S. equities outperformed core fixed income for the period. | exposure’s contribution to interest rate sensitivity for the total |
| Underlying active management detracted, as each of the large cap | portfolio. |
| U.S. equity Underlying Funds underperformed its respective U.S. | |
| equity market segment as represented by its primary benchmark. | On November 20, 2013, the Fund tilted 2.00% away from the |
| In particular, the Russell U.S. Core Equity Fund underperformed | Russell Investment Grade Bond Fund and 2.00% towards the |
| the Russell 1000® Index due to an underweight to electric utilities | Russell Short Duration Bond Fund. This tilt was driven by a |
| and real estate investment trusts (REITs), which outperformed | negative outlook for duration in the near term and intent to |
| for the year. In addition, the Fund’s strategic allocation to the | shorten the Fund’s duration exposure. |
| Russell U.S. Small Cap Equity Fund benefited the Fund’s | On January 13, 2014, the Fund implemented a new target strategic |
| benchmark-relative performance, though the Underlying Fund | asset allocation that incorporated a higher exposure to equities |
| underperformed its Russell 2000® Index benchmark. | and real assets, and within equities, the addition of the Russell |
| The Fund’s strategic allocation to alternative Underlying Funds | Emerging Markets Fund and Russell U.S. Small Cap Equity Fund |
| had a mixed impact on benchmark-relative performance. The | based on RIMCo’s capital markets research. |
| Fund’s allocations to the Russell Global Real Estate Securities | In connection with this reallocation, the Fund also shifted its |
| Fund and Russell Global Infrastructure Fund were positive as | tactical allocations relative to the new strategic asset allocation |
| these Underlying Funds outperformed the Fund’s benchmark. | weights as follows: |
| The Fund’s strategic allocation to the Russell Multi-Strategy | - 1.00% overweight to the Russell U.S. Defensive Equity Fund |
| Alternative Fund and Russell Commodity Strategies Fund | and 1.00% underweight to the Russell Commodity Strategies |
| detracted, as these Underlying Funds underperformed the Fund’s | Fund due to limited commodity price appreciation expectations |
| benchmark. From an active management standpoint, performance | over the medium term. |
14 Conservative Strategy Fund
| Russell Investment Company | |
| Conservative Strategy Fund | |
| Portfolio Management Discussion and Analysis, continued — October 31, 2014 | |
| (Unaudited) | |
| - 1.00% overweight to the Russell U.S. Defensive Equity Fund and | emerging markets relative to broad global equities. This position |
| 1.00% underweight to the Russell Global Real Estate Securities | was closed at a loss. |
| Fund due to caution over the interest rate sensitivity of REITs in | On July 22, 2014, the Fund closed its underweight to the Russell |
| an environment of potential rising rates. This resulted in a total | U.S. Small Cap Equity Fund primarily driven by the Underlying |
| of 2.00% overweight to the Russell U.S. Defensive Equity Fund. | Fund meeting performance expectations. The Russell U.S. Small |
| - 2.50% overweight to the Russell International Developed | Cap Equity Fund was funded back to target weight by reducing |
| Markets Fund and 2.50% underweight to the Russell U.S. Small | the overweight to the Russell U.S. Defensive Equity Fund in order |
| Cap Equity Fund due to concerns of stretched valuations within | to maintain the existing overweight to the Russell International |
| U.S. small cap equities. | Developed Markets Fund. |
| - 1.00% overweight to the Russell Global Equity Fund and | At the end of the fiscal year, the Fund maintained a broad |
| 1.00% underweight to the Russell Emerging Markets Fund due | overweight to equity Underlying Funds relative to real asset |
| to concerns of strong negative momentum exhibited in emerging | Underlying Funds, and an overweight to the Russell Short |
| markets. | Duration Bond Fund within fixed income. By the end of the |
| At the end of May 2014, half of the 2.50% underweight to the | fiscal year, the aggregate positioning was modestly positive to |
| Russell U.S. Small Cap Equity Fund was removed in order to | performance. |
| capture partial gains from the position. | The views expressed in this report reflect those of the portfolio |
| On June 11, 2014, the Fund took an additional 0.25% | managers only through the end of the period covered by |
| underweight to the Russell Global Real Estate Securities Fund | the report. These views do not necessarily represent the |
| given the recent strong performance of the REITs asset class but | views of RIMCo, or any other person in RIMCo or any other |
| continued concern over rate sensitivity. The Fund also took a | affiliated organization. These views are subject to change |
| 0.25% underweight to the Russell Global Infrastructure Fund, | at any time based upon market conditions or other events, |
| recognizing strong recent performance and stretched valuations. | and RIMCo disclaims any responsibility to update the views |
| Both positions were offset by equal overweights to the Russell | contained herein. These views should not be relied on as |
| U.S. Dynamic Equity Fund. | investment advice and, because investment decisions for |
| On July 9, 2014, the Fund removed its underweight to the Russell | a Russell Investment Company (“RIC”) Fund are based on |
| Emerging Markets Fund relative to the Russell Global Equity | numerous factors, should not be relied on as an indication |
| Fund, as recent positive momentum suggested further strength in | of investment decisions of any RIC Fund. |
* Assumes initial investment on November 1, 2004.
** The Barclays U.S. Aggregate Bond Index is an index, with income reinvested, generally representative of intermediate-term government bonds, investment-grade corporate debt securities and mortgage-backed securities.
*** BofA Merrill Lynch 1-3 Yr U.S. Treasuries Index is an index composed of approximately 160 issues in the form of publicly placed, coupon-bearing U.S. Treasury debt. Issues must carry a term to maturity of at least one year and par amounts outstanding must be no less than $10 million at the start and at the close of the performance measurement periods.
‡ The performance shown has been adjusted to reflect the deduction of the maximum Class A sales charge of 5.75%.
‡‡ The Fund first issued Class R1 Shares on December 29, 2006. The returns shown for Class R1 Shares prior to that date are the returns of the Fund’s Class S Shares.
‡‡‡ The Fund first issued Class R4 and Class R5 Shares on October 1, 2014. The returns shown for Class R4 and Class R5 Shares prior to that date are the returns of the Fund’s Class R2 and Class R3 Shares, respectively.
§ Annualized.
Performance is historical and assumes reinvestment of all dividends and capital gains. Investment return and principal value will fluctuate so that an investor’s shares, when redeemed, may be worth more or less than when purchased. Past performance is not indicative of future results. The returns shown do not reflect the deduction of taxes that a shareholder would pay on Fund distributions or the redemption of Fund shares.
Conservative Strategy Fund 15
Russell Investment Company Conservative Strategy Fund
Shareholder Expense Example — October 31, 2014 (Unaudited)
| Fund Expenses | Please note that the expenses shown in the table are meant | |||||
| The following disclosure provides important information | to highlight your ongoing costs only and do not reflect any | |||||
| regarding the Fund’s Shareholder Expense Example | transactional costs. Therefore, the information under the heading | |||||
| (“Example”). | “Hypothetical Performance (5% return before expenses)” is | |||||
| useful in comparing ongoing costs only, and will not help you | ||||||
| Example | determine the relative total costs of owning different funds. In | |||||
| As a shareholder of the Fund, you incur two types of costs: (1) | addition, if these transactional costs were included, your costs | |||||
| transaction costs, and (2) ongoing costs, including advisory and | would have been higher. | |||||
| administrative fees; distribution (12b-1) and/or service fees; | Hypothetical | |||||
| and other Fund expenses. The Example is intended to help | Performance (5% | |||||
| you understand your ongoing costs (in dollars) of investing in | Actual | return before | ||||
| the Fund and to compare these costs with the ongoing costs of | Class A | Performance | expenses) | |||
| Beginning Account Value | ||||||
| investing in other mutual funds. The Example is based on an | May 1, 2014 | $ | 1,000.00 | $ | 1,000.00 | |
| investment of $1,000 invested at the beginning of the period and | Ending Account Value | |||||
| held for the entire period indicated, which for this Fund is from | October 31, 2014 | $ | 1,015.70 | $ | 1,022.43 | |
| May 1, 2014 to October 31, 2014. | Expenses Paid During Period* | $ | 2.79 | $ | 2.80 | |
| Actual Expenses | * Expenses are equal to the Fund's annualized expense ratio of 0.55% | |||||
| (representing the six month period annualized), multiplied by the average | ||||||
| The information in the table under the heading “Actual | account value over the period, multiplied by 184/365 (to reflect the one-half | |||||
| Performance” provides information about actual account values | year period). May reflect amounts waived and/or reimbursed. Without any | |||||
| and actual expenses. You may use the information in this column, | waivers and/or reimbursements, expenses would have been higher. | |||||
| together with the amount you invested, to estimate the expenses | ||||||
| Hypothetical | ||||||
| that you paid over the period. Simply divide your account value by | Performance (5% | |||||
| $1,000 (for example, an $8,600 account value divided by $1,000 | Actual | return before | ||||
| = 8.6), then multiply the result by the number in the first column | Class C | Performance | expenses) | |||
| Beginning Account Value | ||||||
| in the row entitled “Expenses Paid During Period” to estimate | May 1, 2014 | $ | 1,000.00 | $ | 1,000.00 | |
| the expenses you paid on your account during this period. | Ending Account Value | |||||
| October 31, 2014 | $ | 1,011.50 | $ | 1,018.65 | ||
| Hypothetical Example for Comparison Purposes | Expenses Paid During Period* | $ | 6.59 | $ | 6.61 | |
| The information in the table under the heading “Hypothetical | ||||||
| Performance (5% return before expenses)” provides information | * Expenses are equal to the Fund's annualized expense ratio of 1.30% | |||||
| (representing the six month period annualized), multiplied by the average | ||||||
| about hypothetical account values and hypothetical expenses | account value over the period, multiplied by 184/365 (to reflect the one-half | |||||
| based on the Fund’s actual expense ratio and an assumed rate of | year period). May reflect amounts waived and/or reimbursed. Without any | |||||
| return of 5% per year before expenses, which is not the Fund’s | waivers and/or reimbursements, expenses would have been higher. | |||||
| actual return. The hypothetical account values and expenses | ||||||
| Hypothetical | ||||||
| may not be used to estimate the actual ending account balance or | Performance (5% | |||||
| expenses you paid for the period. You may use this information | Actual | return before | ||||
| to compare the ongoing costs of investing in the Fund and other | Class E | Performance | expenses) | |||
| funds. To do so, compare this 5% hypothetical example with the | Beginning Account Value | |||||
| May 1, 2014 | $ | 1,000.00 | $ | 1,000.00 | ||
| 5% hypothetical examples that appear in the shareholder reports | Ending Account Value | |||||
| of other funds. | October 31, 2014 | $ | 1,015.60 | $ | 1,022.43 | |
| Expenses Paid During Period* | $ | 2.79 | $ | 2.80 | ||
| * Expenses are equal to the Fund's annualized expense ratio of 0.55% | ||||||
| (representing the six month period annualized), multiplied by the average | ||||||
| account value over the period, multiplied by 184/365 (to reflect the one-half | ||||||
| year period). May reflect amounts waived and/or reimbursed. Without any | ||||||
| waivers and/or reimbursements, expenses would have been higher. | ||||||
16 Conservative Strategy Fund
Russell Investment Company Conservative Strategy Fund
Shareholder Expense Example, continued — October 31, 2014 (Unaudited)
| Hypothetical | Hypothetical | |||||||||||
| Performance (5% | Performance (5% | |||||||||||
| Actual | return before | Actual | return before | |||||||||
| Class R1 | Performance | expenses) | Class S | Performance | expenses) | |||||||
| Beginning Account Value | Beginning Account Value | |||||||||||
| May 1, 2014 | $ | 1,000.00 | $ | 1,000.00 | May 1, 2014 | $ | 1,000.00 | $ | 1,000.00 | |||
| Ending Account Value | Ending Account Value | |||||||||||
| October 31, 2014 | $ | 1,017.60 | $ | 1,024.35 | October 31, 2014 | $ | 1,016.90 | $ | 1,023.69 | |||
| Expenses Paid During Period* | $ | 0.86 | $ | 0.87 | Expenses Paid During Period* | $ | 1.53 | $ | 1.53 | |||
| * Expenses are equal to the Fund's annualized expense ratio of 0.17% | * Expenses are equal to the Fund's annualized expense ratio of 0.30% | |||||||||||
| (representing the six month period annualized), multiplied by the average | (representing the six month period annualized), multiplied by the average | |||||||||||
| account value over the period, multiplied by 184/365 (to reflect the one-half | account value over the period, multiplied by 184/365 (to reflect the one-half | |||||||||||
| year period). May reflect amounts waived and/or reimbursed. Without any | year period). May reflect amounts waived and/or reimbursed. Without any | |||||||||||
| waivers and/or reimbursements, expenses would have been higher. | waivers and/or reimbursements, expenses would have been higher. | |||||||||||
| Hypothetical | ||||||||||||
| Performance (5% | ||||||||||||
| Actual | return before | |||||||||||
| Class R4(1) | Performance | expenses) | ||||||||||
| Beginning Account Value | ||||||||||||
| May 1, 2014 | $ | 1,000.00 | $ | 1,000.00 | ||||||||
| Ending Account Value | ||||||||||||
| October 31, 2014 | $ | 1,016.30 | $ | 1,023.09 | ||||||||
| Expenses Paid During Period* | $ | 2.13 | $ | 2.14 | ||||||||
| * Expenses are equal to the Fund's annualized expense ratio of 0.42% | ||||||||||||
| (representing the six month period annualized), multiplied by the average | ||||||||||||
| account value over the period, multiplied by 184/365 (to reflect the one-half | ||||||||||||
| year period). | ||||||||||||
| (1) As of October 1, 2014, Class R2 Shares were reclassified as Class R4 | ||||||||||||
| Shares, and all Class R2 shareholders were issued shares of Class R4. The | ||||||||||||
| shareholder expense example for the period ended October 31, 2014 reflects | ||||||||||||
| the expenses and performance of Class R2 Shares for the period May 1 through | ||||||||||||
| October 1, 2014, and Class R4 Shares for the period October 2, 2014 through | ||||||||||||
| October 31, 2014. | ||||||||||||
| Hypothetical | ||||||||||||
| Performance (5% | ||||||||||||
| Actual | return before | |||||||||||
| Class R5(2) | Performance | expenses) | ||||||||||
| Beginning Account Value | ||||||||||||
| May 1, 2014 | $ | 1,000.00 | $ | 1,000.00 | ||||||||
| Ending Account Value | ||||||||||||
| October 31, 2014 | $ | 1,014.80 | $ | 1,021.83 | ||||||||
| Expenses Paid During Period* | $ | 3.40 | $ | 3.41 | ||||||||
| * Expenses are equal to the Fund's annualized expense ratio of 0.67% | ||||||||||||
| (representing the six month period annualized), multiplied by the average | ||||||||||||
| account value over the period, multiplied by 184/365 (to reflect the one-half | ||||||||||||
| year period). | ||||||||||||
| (2) As of October 1, 2014, Class R3 Shares were reclassified as Class R5 | ||||||||||||
| Shares, and all Class R3 shareholders were issued shares of Class R5. The | ||||||||||||
| shareholder expense example for the period ended October 31, 2014 reflects | ||||||||||||
| the expenses and performance of Class R3 Shares for the period May 1 through | ||||||||||||
| October 1, 2014, and Class R5 Shares for the period October 2, 2014 through | ||||||||||||
| October 31, 2014. | ||||||||||||
Conservative Strategy Fund 17
| Russell Investment Company | |||||||||
| Conservative Strategy Fund | |||||||||
| Schedule of Investments — October 31, 2014 | |||||||||
| Amounts in thousands (except share amounts) | Amounts in thousands (except share amounts) | ||||||||
| Fair | Fair | ||||||||
| Value | Value | ||||||||
| Shares | $ | Shares | $ | ||||||
| Investments 100.0% | Fixed Income - 71.9% | ||||||||
| Other Russell Investment Company | Russell Global Opportunistic Credit Fund | 2,122,502 | 21,225 | ||||||
| Series Mutual Funds - Class Y | Russell Investment Grade Bond Fund | 3,060,818 | 68,838 | ||||||
| Shares | Russell Short Duration Bond Fund | 7,104,066 | 137,534 | ||||||
| Russell Strategic Bond Fund | 13,756,054 | 153,380 | |||||||
| Alternative - 8.5% | 380,977 | ||||||||
| Russell Commodity Strategies Fund | 1,007,601 | 7,779 | International Equities - 9.5% | ||||||
| Russell Global Infrastructure Fund | 1,545,547 | 20,015 | Russell Emerging Markets Fund | 567,309 | 10,597 | ||||
| Russell Global Real Estate Securities Fund | 165,011 | 6,718 | Russell Global Equity Fund | 1,813,877 | 21,386 | ||||
| Russell Multi-Strategy Alternative Fund | 1,051,726 | 10,538 | Russell International Developed Markets | ||||||
| 45,050 | Fund | 516,043 | 18,526 | ||||||
| Domestic Equities - 10.1% | 50,509 | ||||||||
| Russell U.S. Core Equity Fund | 309,660 | 13,374 | |||||||
| Russell U.S. Defensive Equity Fund | 407,032 | 18,736 | Total Investments 100.0% | ||||||
| Russell U.S. Dynamic Equity Fund | 842,971 | 10,697 | (identified cost $468,254) | 530,104 | |||||
| Russell U.S. Small Cap Equity Fund | 344,584 | 10,761 | Other Assets and Liabilities, Net | ||||||
| 53,568 | - 0.0 | % | 31 | ||||||
| Net Assets - 100.0% | 530,135 | ||||||||
| Presentation of Portfolio Holdings | |||||||||
| Categories | % of Net Assets | ||||||||
| Alternative | 8.5 | ||||||||
| Domestic Equities | 10.1 | ||||||||
| Fixed Income | 71.9 | ||||||||
| International Equities | 9.5 | ||||||||
| Total Investments | 100.0 | ||||||||
| Other Assets and Liabilities, Net | —* | ||||||||
| 100.0 | |||||||||
| * Less than .05% of net assets. | |||||||||
| See accompanying notes which are an integral part of the financial statements. | |||||||||
| 18 Conservative Strategy Fund | |||||||||
| Russell Investment Company | ||
| Conservative Strategy Fund | ||
| Statement of Assets and Liabilities — October 31, 2014 | ||
| Amounts in thousands | ||
| Assets | ||
| Investments, at identified cost | $ | 468,254 |
| Investments, at fair value | 530,104 | |
| Receivables: | ||
| Investments sold | 1,449 | |
| Fund shares sold | 557 | |
| Prepaid expenses | 2 | |
| Total assets | 532,112 | |
| Liabilities | ||
| Payables: | ||
| Fund shares redeemed | 1,620 | |
| Accrued fees to affiliates | 325 | |
| Other accrued expenses | 32 | |
| Total liabilities | 1,977 | |
| Net Assets | $ | 530,135 |
| Net Assets Consist of: | ||
| Undistributed (overdistributed) net investment income | $ | 80 |
| Accumulated net realized gain (loss) | 8,037 | |
| Unrealized appreciation (depreciation) on investments | 61,850 | |
| Shares of beneficial interest | 476 | |
| Additional paid-in capital | 459,692 | |
| Net Assets | $ | 530,135 |
| Net Asset Value, offering and redemption price per share: | ||
| Net asset value per share: Class A(#) | $ | 11.16 |
| Maximum offering price per share (Net asset value plus sales charge of 5.75%): Class A | $ | 11.84 |
| Class A — Net assets | $ | 124,287,991 |
| Class A — Shares outstanding ($.01 par value) | 11,132,689 | |
| Net asset value per share: Class C(#) | $ | 11.06 |
| Class C — Net assets | $ | 210,014,473 |
| Class C — Shares outstanding ($.01 par value) | 18,982,170 | |
| Net asset value per share: Class E(#) | $ | 11.21 |
| Class E — Net assets | $ | 20,901,436 |
| Class E — Shares outstanding ($.01 par value) | 1,864,677 | |
| Net asset value per share: Class R1(#) | $ | 11.23 |
| Class R1 — Net assets | $ | 38,079,075 |
| Class R1 — Shares outstanding ($.01 par value) | 3,390,773 | |
| Net asset value per share: Class R4(#) | $ | 11.18 |
| Class R4 — Net assets | $ | 25,501,649 |
| Class R4 — Shares outstanding ($.01 par value) | 2,281,462 | |
| Net asset value per share: Class R5(#) | $ | 11.25 |
| Class R5 — Net assets | $ | 27,767,667 |
| Class R5 — Shares outstanding ($.01 par value) | 2,467,765 | |
| Net asset value per share: Class S(#) | $ | 11.24 |
| Class S — Net assets | $ | 83,582,372 |
| Class S — Shares outstanding ($.01 par value) | 7,437,433 | |
| (#) Net asset value per share equals class level net assets divided by class level shares of beneficial interest outstanding. | ||
See accompanying notes which are an integral part of the financial statements.
Conservative Strategy Fund 19
| Russell Investment Company | |||
| Conservative Strategy Fund | |||
| Statement of Operations — For the Period Ended October 31, 2014 | |||
| Amounts in thousands | |||
| Investment Income | |||
| Income distributions from Underlying Funds | $ | 9,780 | |
| Expenses | |||
| Advisory fees | 1,098 | ||
| Administrative fees | 250 | ||
| Custodian fees | 34 | ||
| Distribution fees - Class A | 319 | ||
| Distribution fees - Class C | 1,611 | ||
| Distribution fees - Class R3 | 79 | ||
| Distribution fees - Class R5 | 6 | ||
| Transfer agent fees - Class A | 255 | ||
| Transfer agent fees - Class C | 430 | ||
| Transfer agent fees - Class E | 44 | ||
| Transfer agent fees - Class R1 | 78 | ||
| Transfer agent fees - Class R2 | 54 | ||
| Transfer agent fees - Class R3 | 63 | ||
| Transfer agent fees - Class R4 | 4 | ||
| Transfer agent fees - Class R5 | 5 | ||
| Transfer agent fees - Class S | 165 | ||
| Professional fees | 37 | ||
| Registration fees | 126 | ||
| Shareholder servicing fees - Class C | 537 | ||
| Shareholder servicing fees - Class E | 55 | ||
| Shareholder servicing fees - Class R2 | 67 | ||
| Shareholder servicing fees - Class R3 | 79 | ||
| Shareholder servicing fees - Class R4 | 5 | ||
| Shareholder servicing fees - Class R5 | 6 | ||
| Trustees’ fees | 13 | ||
| Printing fees | 39 | ||
| Miscellaneous | 33 | ||
| Expenses before reductions | 5,492 | ||
| Expense reductions | (1,184 | ) | |
| Net expenses | 4,308 | ||
| Net investment income (loss) | 5,472 | ||
| Net Realized and Unrealized Gain (Loss) | |||
| Net realized gain (loss) on: | |||
| Investments | 9,340 | ||
| Capital gain distributions from Underlying Funds | 2,613 | ||
| Net realized gain (loss) | 11,953 | ||
| Net change in unrealized appreciation (depreciation) on investments | 2,655 | ||
| Net realized and unrealized gain (loss) | 14,608 | ||
| Net Increase (Decrease) in Net Assets from Operations | $ | 20,080 | |
See accompanying notes which are an integral part of the financial statements.
20 Conservative Strategy Fund
| Russell Investment Company | ||||||
| Conservative Strategy Fund | ||||||
| Statements of Changes in Net Assets | ||||||
| For the Periods Ended October 31, | ||||||
| Amounts in thousands | 2014 | 2013 | ||||
| Increase (Decrease) in Net Assets | ||||||
| Operations | ||||||
| Net investment income (loss) | $ | 5,472 | $ | 15,142 | ||
| Net realized gain (loss) | 11,953 | 11,611 | ||||
| Net change in unrealized appreciation (depreciation) | 2,655 | (7,452 | ) | |||
| Net increase (decrease) in net assets from operations | 20,080 | 19,301 | ||||
| Distributions | ||||||
| From net investment income | ||||||
| Class A | (1,571 | ) | (3,543 | ) | ||
| Class C | (1,119 | ) | (4,440 | ) | ||
| Class E | (264 | ) | (862 | ) | ||
| Class R1 | (635 | ) | (1,188 | ) | ||
| Class R2 | (351 | ) | (1,172 | ) | ||
| Class R3 | (351 | ) | (1,400 | ) | ||
| Class R4 | (46 | ) | — | |||
| Class R5 | (30 | ) | — | |||
| Class S | (1,196 | ) | (2,428 | ) | ||
| From net realized gain | ||||||
| Class A | (2,625 | ) | (267 | ) | ||
| Class C | (4,395 | ) | (441 | ) | ||
| Class E | (433 | ) | (68 | ) | ||
| Class R1 | (819 | ) | (74 | ) | ||
| Class R2 | (641 | ) | (88 | ) | ||
| Class R3 | (767 | ) | (116 | ) | ||
| Class S | (1,563 | ) | (170 | ) | ||
| Net decrease in net assets from distributions | (16,806 | ) | (16,257 | ) | ||
| Share Transactions* | ||||||
| Net increase (decrease) in net assets from share transactions | (64,398 | ) | (58,302 | ) | ||
| Total Net Increase (Decrease) in Net Assets | (61,124 | ) | (55,258 | ) | ||
| Net Assets | ||||||
| Beginning of period | 591,259 | 646,517 | ||||
| End of period | $ | 530,135 | $ | 591,259 | ||
| Undistributed (overdistributed) net investment income included in net assets | $ | 80 | $ | 171 | ||
See accompanying notes which are an integral part of the financial statements.
Conservative Strategy Fund 21
| Russell Investment Company | ||||||||||||
| Conservative Strategy Fund | ||||||||||||
| Statements of Changes in Net Assets, continued | ||||||||||||
| * Share transaction amounts (in thousands) for the periods ended October 31, 2014 and October 31, 2013 were as follows: | ||||||||||||
| 2014 | 2013 | |||||||||||
| Shares | Dollars | Shares | Dollars | |||||||||
| Class A | ||||||||||||
| Proceeds from shares sold | 1,512 | $ | 16,753 | 3,514 | $ | 38,659 | ||||||
| Proceeds from reinvestment of distributions | 382 | 4,148 | 339 | 3,693 | ||||||||
| Payments for shares redeemed | (3,066 | ) | (33,814 | ) | (3,635 | ) | (39,917 | ) | ||||
| Net increase (decrease) | (1,172 | ) | (12,913 | ) | 218 | 2,435 | ||||||
| Class C | ||||||||||||
| Proceeds from shares sold | 3,965 | 43,476 | 6,987 | 76,283 | ||||||||
| Proceeds from reinvestment of distributions | 507 | 5,443 | 441 | 4,775 | ||||||||
| Payments for shares redeemed | (6,141 | ) | (67,176 | ) | (7,801 | ) | (84,914 | ) | ||||
| Net increase (decrease) | (1,669 | ) | (18,257 | ) | (373 | ) | (3,856 | ) | ||||
| Class E | ||||||||||||
| Proceeds from shares sold | 471 | 5,223 | 913 | 10,059 | ||||||||
| Proceeds from reinvestment of distributions | 63 | 694 | 83 | 912 | ||||||||
| Payments for shares redeemed | (842 | ) | (9,345 | ) | (2,366 | ) | (26,053 | ) | ||||
| Net increase (decrease) | (308 | ) | (3,428 | ) | (1,370 | ) | (15,082 | ) | ||||
| Class R1 | ||||||||||||
| Proceeds from shares sold | 928 | 10,320 | 2,233 | 24,625 | ||||||||
| Proceeds from reinvestment of distributions | 133 | 1,454 | 115 | 1,262 | ||||||||
| Payments for shares redeemed | (1,539 | ) | (17,041 | ) | (2,138 | ) | (23,609 | ) | ||||
| Net increase (decrease) | (478 | ) | (5,267 | ) | 210 | 2,278 | ||||||
| Class R2 | ||||||||||||
| Proceeds from shares sold | 885 | 9,789 | 1,700 | 18,716 | ||||||||
| Proceeds from reinvestment of distributions | 91 | 992 | 116 | 1,260 | ||||||||
| Payments for shares redeemed | (4,168 | ) | (46,122 | ) | (2,633 | ) | (28,845 | ) | ||||
| Net increase (decrease) | (3,192 | ) | (35,341 | ) | (817 | ) | (8,869 | ) | ||||
| Class R3 | ||||||||||||
| Proceeds from shares sold | 475 | 5,294 | 1,020 | 11,270 | ||||||||
| Proceeds from reinvestment of distributions | 102 | 1,118 | 138 | 1,516 | ||||||||
| Payments for shares redeemed | (4,367 | ) | (48,637 | ) | (3,126 | ) | (34,498 | ) | ||||
| Net increase (decrease) | (3,790 | ) | (42,225 | ) | (1,968 | ) | (21,712 | ) | ||||
| Class R4 | ||||||||||||
| Proceeds from shares sold | 2,341 | 25,961 | — | — | ||||||||
| Proceeds from reinvestment of distributions | 4 | 45 | — | — | ||||||||
| Payments for shares redeemed | (63 | ) | (703 | ) | — | — | ||||||
| Net increase (decrease) | 2,282 | 25,303 | — | — | ||||||||
| Class R5 | ||||||||||||
| Proceeds from shares sold | 2,568 | 28,651 | — | — | ||||||||
| Proceeds from reinvestment of distributions | 3 | 30 | — | — | ||||||||
| Payments for shares redeemed | (103 | ) | (1,147 | ) | — | — | ||||||
| Net increase (decrease) | 2,468 | 27,534 | — | — | ||||||||
| Class S | ||||||||||||
| Proceeds from shares sold | 3,132 | 34,774 | 4,804 | 52,939 | ||||||||
| Proceeds from reinvestment of distributions | 249 | 2,726 | 230 | 2,517 | ||||||||
| Payments for shares redeemed | (3,354 | ) | (37,304 | ) | (6,241 | ) | (68,952 | ) | ||||
| Net increase (decrease) | 27 | 196 | (1,207 | ) | (13,496 | ) | ||||||
| Total increase (decrease) | (5,832 | ) | $ | (64,398 | ) | (5,307 | ) | $ | (58,302 | ) | ||
| See accompanying notes which are an integral part of the financial statements. | ||||||||||||
| 22 Conservative Strategy Fund | ||||||||||||
(This page intentionally left blank)
| Russell Investment Company | |||||||||||||||
| Conservative Strategy Fund | |||||||||||||||
| Financial Highlights — For the Periods Ended | |||||||||||||||
| For a Share Outstanding Throughout Each Period. | |||||||||||||||
| $ | |||||||||||||||
| $ | Net | $ | $ | $ | $ | ||||||||||
| Net Asset Value, | Investment | Net Realized | Total from | Distributions | Distributions | ||||||||||
| Beginning of | Income (Loss) | and Unrealized | Investment | from Net | from Net | ||||||||||
| Period | (a)(b)(e) | Gain (Loss) | Operations | Investment Income | Realized Gain | ||||||||||
| Class A | |||||||||||||||
| October 31, 2014 | 11.09 | .14 | .28 | .42 | (.13 | ) | (.22 | ) | |||||||
| October 31, 2013 | 11.02 | .28 | .08 | .36 | (.27 | ) | (.02 | ) | |||||||
| October 31, 2012 | 10.53 | .24 | .50 | .74 | (.25 | ) | — | ||||||||
| October 31, 2011 | 10.71 | .39 | (.19 | ) | .20 | (.38 | ) | — | |||||||
| October 31, 2010 | 9.79 | .28 | .93 | 1.21 | (.29 | ) | — | ||||||||
| Class C | |||||||||||||||
| October 31, 2014 | 10.99 | .05 | .30 | .35 | (.06 | ) | (.22 | ) | |||||||
| October 31, 2013 | 10.94 | .19 | .09 | .28 | (.21 | ) | (.02 | ) | |||||||
| October 31, 2012 | 10.46 | .16 | .49 | .65 | (.17 | ) | — | ||||||||
| October 31, 2011 | 10.64 | .31 | (.17 | ) | .14 | (.32 | ) | — | |||||||
| October 31, 2010 | 9.75 | .20 | .90 | 1.10 | (.21 | ) | — | ||||||||
| Class E | |||||||||||||||
| October 31, 2014 | 11.13 | .14 | .29 | .43 | (.13 | ) | (.22 | ) | |||||||
| October 31, 2013 | 11.05 | .30 | .07 | .37 | (.27 | ) | (.02 | ) | |||||||
| October 31, 2012 | 10.56 | .25 | .49 | .74 | (.25 | ) | — | ||||||||
| October 31, 2011 | 10.73 | .47 | (.26 | ) | .21 | (.38 | ) | — | |||||||
| October 31, 2010 | 9.82 | .28 | .92 | 1.20 | (.29 | ) | — | ||||||||
| Class R1 | |||||||||||||||
| October 31, 2014 | 11.15 | .18 | .30 | .48 | (.18 | ) | (.22 | ) | |||||||
| October 31, 2013 | 11.08 | .31 | .10 | .41 | (.32 | ) | (.02 | ) | |||||||
| October 31, 2012 | 10.59 | .28 | .51 | .79 | (.30 | ) | — | ||||||||
| October 31, 2011 | 10.76 | .40 | (.14 | ) | .26 | (.43 | ) | — | |||||||
| October 31, 2010 | 9.85 | .29 | .93 | 1.22 | (.31 | ) | — | ||||||||
| Class R4(3) | |||||||||||||||
| October 31, 2014 | 11.10 | .15 | .30 | .45 | (.15 | ) | (.22 | ) | |||||||
| October 31, 2013 | 11.03 | .32 | .06 | .38 | (.29 | ) | (.02 | ) | |||||||
| October 31, 2012 | 10.54 | .27 | .49 | .76 | (.27 | ) | — | ||||||||
| October 31, 2011 | 10.72 | .30 | (.07 | ) | .23 | (.41 | ) | — | |||||||
| October 31, 2010 | 9.81 | .28 | .92 | 1.20 | (.29 | ) | — | ||||||||
| Class R5(4) | |||||||||||||||
| October 31, 2014 | 11.17 | .13 | .29 | .42 | (.12 | ) | (.22 | ) | |||||||
| October 31, 2013 | 11.09 | .30 | .06 | .36 | (.26 | ) | (.02 | ) | |||||||
| October 31, 2012 | 10.60 | .28 | .44 | .72 | (.23 | ) | — | ||||||||
| October 31, 2011 | 10.77 | .41 | (.20 | ) | .21 | (.38 | ) | — | |||||||
| October 31, 2010 | 9.85 | .26 | .92 | 1.18 | (.26 | ) | — | ||||||||
| Class S | |||||||||||||||
| October 31, 2014 | 11.16 | .16 | .30 | .46 | (.16 | ) | (.22 | ) | |||||||
| October 31, 2013 | 11.09 | .31 | .08 | .39 | (.30 | ) | (.02 | ) | |||||||
| October 31, 2012 | 10.60 | .28 | .49 | .77 | (.28 | ) | — | ||||||||
| October 31, 2011 | 10.77 | .44 | (.20 | ) | .24 | (.41 | ) | — | |||||||
| October 31, 2010 | 9.85 | .30 | .93 | 1.23 | (.31 | ) | — | ||||||||
See accompanying notes which are an integral part of the financial statements.
24 Conservative Strategy Fund
| % | % | % | ||||||||||||||
| $ | $ | Ratio of Expenses | Ratio of Expenses | Ratio of Net | ||||||||||||
| Net Asset Value, | % | Net Assets, | to Average | to Average | Investment Income | % | ||||||||||
| $ | End of | Total | End of Period | Net Assets, | Net Assets, | to Average | Portfolio | |||||||||
| Total Distributions | Period | Return(d) | (000 | ) | Gross(g) | Net(e)(g) | Net Assets(b)(e) | Turnover Rate | ||||||||
| (.35 | ) | 11.16 | 3.92 | 124,288 | .75 | .56 | 1.22 | 26 | ||||||||
| (.29 | ) | 11.09 | 3.35 | 136,433 | .73 | .57 | 2.55 | 21 | ||||||||
| (.25 | ) | 11.02 | 7.15 | 133,172 | .72 | .56 | 2.28 | 22 | ||||||||
| (.38 | ) | 10.53 | 1.98 | 110,375 | .74 | .55 | 3.55 | 19 | ||||||||
| (.29 | ) | 10.71 | 12.55 | 103,561 | .73 | .54 | 2.74 | 38 | ||||||||
| (.28 | ) | 11.06 | 3.21 | 210,015 | 1.50 | 1.31 | .47 | 26 | ||||||||
| (.23 | ) | 10.99 | 2.61 | 227,048 | 1.48 | 1.32 | 1.76 | 21 | ||||||||
| (.17 | ) | 10.94 | 6.28 | 230,038 | 1.47 | 1.31 | 1.51 | 22 | ||||||||
| (.32 | ) | 10.46 | 1.33 | 191,953 | 1.49 | 1.30 | 2.83 | 19 | ||||||||
| (.21 | ) | 10.64 | 11.48 | 174,211 | 1.48 | 1.29 | 1.95 | 38 | ||||||||
| (.35 | ) | 11.21 | 3.99 | 20,901 | .75 | .56 | 1.22 | 26 | ||||||||
| (.29 | ) | 11.13 | 3.40 | 24,180 | .74 | .57 | 2.75 | 21 | ||||||||
| (.25 | ) | 11.05 | 7.11 | 39,156 | .72 | .56 | 2.32 | 22 | ||||||||
| (.38 | ) | 10.56 | 2.01 | 42,668 | .74 | .55 | 4.21 | 19 | ||||||||
| (.29 | ) | 10.73 | 12.39 | 89,672 | .72 | .54 | 2.77 | 38 | ||||||||
| (.40 | ) | 11.23 | 4.40 | 38,079 | .50 | .17 | 1.63 | 26 | ||||||||
| (.34 | ) | 11.15 | 3.79 | 43,145 | .48 | .17 | 2.81 | 21 | ||||||||
| (.30 | ) | 11.08 | 7.57 | 40,536 | .47 | .14 | 2.59 | 22 | ||||||||
| (.43 | ) | 10.59 | 2.51 | 29,187 | .49 | .12 | 3.66 | 19 | ||||||||
| (.31 | ) | 10.76 | 12.64 | 18,008 | .48 | .27 | 2.83 | 38 | ||||||||
| (.37 | ) | 11.18 | 4.14 | 25,502 | .75 | .42 | 1.38 | 26 | ||||||||
| (.31 | ) | 11.10 | 3.51 | 35,427 | .73 | .42 | 2.95 | 21 | ||||||||
| (.27 | ) | 11.03 | 7.32 | 44,214 | .72 | .39 | 2.51 | 22 | ||||||||
| (.41 | ) | 10.54 | 2.19 | 40,304 | .74 | .37 | 2.74 | 19 | ||||||||
| (.29 | ) | 10.72 | 12.43 | 8,458 | .73 | .52 | 2.69 | 38 | ||||||||
| (.34 | ) | 11.25 | 3.83 | 27,768 | 1.00 | .67 | 1.16 | 26 | ||||||||
| (.28 | ) | 11.17 | 3.30 | 42,335 | .98 | .67 | 2.76 | 21 | ||||||||
| (.23 | ) | 11.09 | 6.91 | 63,878 | .98 | .64 | 2.60 | 22 | ||||||||
| (.38 | ) | 10.60 | 1.99 | 183,681 | .99 | .62 | 3.66 | 19 | ||||||||
| (.26 | ) | 10.77 | 12.18 | 209,751 | .97 | .77 | 2.52 | 38 | ||||||||
| (.38 | ) | 11.24 | 4.25 | 83,582 | .50 | .31 | 1.46 | 26 | ||||||||
| (.32 | ) | 11.16 | 3.59 | 82,691 | .48 | .32 | 2.82 | 21 | ||||||||
| (.28 | ) | 11.09 | 7.37 | 95,523 | .47 | .31 | 2.61 | 22 | ||||||||
| (.41 | ) | 10.60 | 2.32 | 92,126 | .49 | .30 | 4.00 | 19 | ||||||||
| (.31 | ) | 10.77 | 12.73 | 93,182 | .47 | .29 | 2.93 | 38 | ||||||||
See accompanying notes which are an integral part of the financial statements.
Conservative Strategy Fund 25
Russell Investment Company
Moderate Strategy Fund
Portfolio Management Discussion and Analysis — October 31, 2014 (Unaudited)

| Moderate Strategy Fund - Class A‡ | Moderate Strategy Fund - Class R5‡‡‡ | ||||||
| Total | Total | ||||||
| Return | Return | ||||||
| 1 Year | (0.88 | )% | 1 Year | 5.10 | % | ||
| 5 Years | 6.03 | %§ | 5 Years | 7.13 | %§ | ||
| 10 Years | 4.46 | %§ | 10 Years | 4.88 | %§ | ||
| Moderate Strategy Fund - Class C | Moderate Strategy Fund - Class S | ||||||
| Total | Total | ||||||
| Return | Return | ||||||
| 1 Year | 4.39 | % | 1 Year | 5.44 | % | ||
| 5 Years | 6.48 | %§ | 5 Years | 7.55 | %§ | ||
| 10 Years | 4.30 | %§ | 10 Years | 5.34 | %§ | ||
| Moderate Strategy Fund - Class E | Barclays U.S. Aggregate Bond Index** | ||||||
| Total | Total | ||||||
| Return | Return | ||||||
| 1 Year | 5.18 | % | 1 Year | 4.14 | % | ||
| 5 Years | 7.29 | %§ | 5 Years | 4.22 | %§ | ||
| 10 Years | 5.08 | %§ | 10 Years | 4.64 | %§ | ||
| Russell 1000® Index*** | |||||||
| Moderate Strategy Fund - Class R1‡‡ | |||||||
| Total | |||||||
| Total | Return | ||||||
| Return | |||||||
| 1 Year | 5.67 | % | 1 Year | 16.78 | % | ||
| 5 Years | 7.68 | %§ | 5 Years | 16.98 | %§ | ||
| 10 Years | 5.35 | %§ | 10 Years | 8.54 | %§ | ||
| Moderate Strategy Fund - Class R4‡‡‡ | |||||||
| Total | |||||||
| Return | |||||||
| 1 Year | 5.31 | % | |||||
| 5 Years | 7.42 | %§ | |||||
| 10 Years | 5.15 | %§ | |||||
26 Moderate Strategy Fund
| Russell Investment Company | |
| Moderate Strategy Fund | |
| Portfolio Management Discussion and Analysis, continued — October 31, 2014 | |
| (Unaudited) | |
| The Moderate Strategy Fund (the “Fund”) is a fund of funds that | due to the Fund’s allocation to the Russell Global Opportunistic |
| invests in other Russell Investment Company mutual funds (the | Credit Fund. The Fund’s strategic exposure to other asset classes |
| “Underlying Funds”). The Underlying Funds employ a multi- | beyond aggregate fixed income was positive, as other asset classes |
| manager approach whereby portions of the Underlying Funds | such as equities outperformed fixed income. |
| are allocated to different money managers. Underlying Fund | It was a positive equity market for the fiscal year ending October |
| assets not allocated to money managers are managed by Russell | 31, 2014. U.S. stocks (as measured by the Russell 3000® Index) |
| Investment Management Company (“RIMCo”), the Fund’s and | returned 16.07% over the period, while non-U.S. equities |
| Underlying Funds’ advisor. RIMCo, as the Underlying Funds’ | returned 0.17% (as measured by the Russell Developed ex-U.S. |
| advisor, may change the allocation of the Underlying Funds’ | Large Cap Index). The outperformance of U.S. equities over fixed |
| assets among money managers at any time. An exemptive order | income was a key positive driver to the Fund’s benchmark-relative |
| from the Securities and Exchange Commission (“SEC”) permits | performance, as fixed income markets finished at 4.14% for the |
| RIMCo to engage or terminate a money manager in an Underlying | fiscal year as measured by the Fund’s benchmark. |
| Fund at any time, subject to approval by the Underlying Fund’s | |
| Board, without a shareholder vote. Pursuant to the terms of the | Global REITs and listed infrastructure (as represented by the |
| exemptive order, an Underlying Fund is required to notify its | FTSE/EPRA/ NAREIT Developed Real Estate Index (Net) and |
| shareholders within 90 days of when a money manager begins | S&P Global Infrastructure Index (Net)) finished the fiscal year |
| providing services. | up 9.84% and 13.36% respectively. These asset classes also |
| outperformed fixed income markets, which was beneficial to | |
| What is the Fund’s investment objective? | the Fund’s performance through its allocation to the Russell |
| The Fund seeks to provide current income and moderate long | Global Real Estate Securities and Russell Global Infrastructure |
| term capital appreciation. | Funds. Commodities largely underperformed broader equity and |
| fixed income markets with a loss of 5.94% for the fiscal year (as | |
| How did the Fund perform relative to its benchmark for the | represented by the Bloomberg Commodity Index Total Return). |
| fiscal year ended October 31, 2014? | Thus, the Fund’s allocation to the Russell Commodity Strategies |
| For the fiscal year ended October 31, 2014, the Fund’s Class A, | Fund was a headwind to Fund performance. |
| Class C, Class E, Class R1, Class R4, Class R5 and Class S Shares | |
| gained 5.19%, 4.39%, 5.18%, 5.67%, 5.31%, 5.10% and 5.44%, | How did the investment strategies and techniques employed |
| respectively. This is compared to the Fund’s primary benchmark, | by the Fund and the Underlying Funds affect the Fund’s |
| the Barclays U.S. Aggregate Bond Index, which gained 4.14% | performance? |
| during the same period. The Fund’s performance includes | The Fund is a fund of funds and its performance is based on |
| operating expenses, whereas index returns are unmanaged and | RIMCo’s strategic asset allocations and the performance of the |
| do not include expenses of any kind. | Underlying Funds in which the Fund invests. |
| For the fiscal year ended October 31, 2014, the Morningstar® | The Fund’s strategic allocation to fixed income Underlying |
| Conservative Allocation, a group of funds that Morningstar | Funds negatively impacted its benchmark-relative performance. |
| considers to have investment strategies similar to those of the | An allocation to the Russell Global Opportunistic Credit |
| Fund, gained 5.40%. This result serves as a peer comparison and | Fund detracted, as it underperformed the Fund’s benchmark. |
| is expressed net of operating expenses. | Allocations to the Russell Strategic Bond Fund and Russell |
| The Fund’s outperformance relative to the Barclays U.S. Aggregate | Investment Grade Bond Fund were slightly positive. With the |
| Bond Index was due to the Fund’s mix of out-of-benchmark | exception of the Russell Global Opportunistic Credit Fund, |
| allocations to equity, global real estate, and listed infrastructure | results from active management were positive. For the Russell |
| Underlying Funds, which outperformed fixed income Underlying | Strategic Bond Fund, exposure to non-agency mortgages and |
| Funds over the period. | emerging market debt were key contributors to the Underlying |
| Fund’s benchmark-relative outperformance. Currency selection | |
| How did the market conditions described in the Market | was also positive, particularly a long U.S. Dollar position versus |
| Summary report affect the Fund’s performance? | short positions to the Australian Dollar, Euro and Japanese Yen. |
| Fixed income markets had overall positive performance for the | With respect to the Fund’s global equity exposure, the Fund’s |
| fiscal year, as interest rates generally trended lower over the | strategic allocation to the Russell International Developed Markets |
| period, providing a tailwind to aggregate fixed income markets. | Fund and Russell Emerging Markets Fund detracted from the |
| However, the Fund’s exposure to the fixed income asset class had | Fund’s benchmark-relative performance, while its allocation to |
| a modestly negative effect on benchmark-relative performance | the Russell Global Equity Fund positively impacted performance. |
| Moderate Strategy Fund 27 | |
| Russell Investment Company | ||
| Moderate Strategy Fund | ||
| Portfolio Management Discussion and Analysis, continued — October 31, 2014 | ||
| (Unaudited) | ||
| From an active management standpoint, the Russell International | Describe any changes to the Fund’s structure or allocation | |
| Developed Markets Fund outperformed the broad non-U.S. equity | to the Underlying Funds. | |
| market as represented by the Russell Developed ex-U.S. Large | RIMCo has the discretion to vary the Fund’s actual allocation | |
| Cap™ Index Net, while the Russell Global Equity Fund performed | from the target strategic asset allocation by up to +/- 5% at | |
| in-line with the broad global equity market as represented by the | the equity, fixed income or alternative category level based on | |
| Russell Developed Large Cap Net Index. The Russell Emerging | RIMCo’s capital markets research. Performance of the Fund’s | |
| Markets Fund underperformed its emerging markets benchmark. | short-term asset allocation modifications ended the fiscal year | |
| Effective stock selection in Continental Europe was a tailwind | modestly positive. This was driven by beneficial tilts away from | |
| to performance for the Russell International Developed Markets | target strategic allocations. | |
| Fund against its benchmark, while an overweight to and stock | ||
| selection within information technology benefited performance of | Entering the fiscal year, the Fund was underweight the Russell | |
| the Russell Global Equity Fund against its benchmark. For the | Commodity Strategies Fund and Russell Global Real Estate | |
| Russell Emerging Markets Fund, unsuccessful stock selection | Securities Fund by 0.75% each, underweight the Russell U.S. | |
| in China, South Korea, Russia, and Taiwan were detractors from | Small Cap Equity Fund by 1.00%, overweight the Russell | |
| performance. | Emerging Markets Fund by 1.00%, and overweight the Russell | |
| Global Infrastructure Fund and Russell U.S. Core Equity Fund | ||
| The Fund’s strategic allocation to U.S. large cap Underlying | by 0.75% each, relative to the target strategic asset allocation | |
| Funds benefited the Fund’s benchmark-relative performance, as | weights. Within real assets, this positioning was driven by a | |
| broad U.S. equities outperformed core fixed income for the period. | cautious medium term outlook on commodities and a desire to | |
| Underlying active management detracted, as each of the large cap | mitigate the real estate exposure’s contribution to interest rate | |
| U.S. equity Underlying Funds underperformed its respective U.S. | sensitivity for the total portfolio. Within equities, the positioning | |
| equity market segment as represented by its primary benchmark. | was driven by recognition of stretched valuations in U.S. small | |
| In particular, the Russell U.S. Core Equity Fund underperformed | cap and attractive valuations in emerging markets. | |
| the Russell 1000® Index due to an underweight to electric utilities | ||
| and real estate investment trusts (REITs), which outperformed | On January 13, 2014, the Fund implemented a new target strategic | |
| for the year. In addition, the Fund’s strategic allocation to the | asset allocation that incorporated a higher exposure to equities | |
| Russell U.S. Small Cap Equity Fund benefited the Fund’s | and real assets based on RIMCo’s capital markets research. | |
| benchmark-relative performance, though the Underlying Fund | In connection with this reallocation, the Fund also shifted its | |
| underperformed its Russell 2000® Index benchmark. | tactical allocations relative to the new strategic asset allocation | |
| The Fund’s strategic allocation to alternative Underlying Funds | weights as follows: | |
| had a mixed impact on benchmark-relative performance. The | - 0.75% overweight to the Russell U.S. Defensive Equity Fund | |
| Fund’s allocations to the Russell Global Real Estate Securities | and 0.75% underweight to the Russell Commodity Strategies | |
| Fund and Russell Global Infrastructure Fund were positive as | Fund due to limited commodity price appreciation expectations | |
| these Underlying Funds outperformed the Fund’s benchmark. | over the medium term. | |
| The Fund’s | strategic allocation to the Russell Multi-Strategy | - 0.75% overweight to the Russell U.S. Defensive Equity Fund and |
| Alternative | Fund and Russell Commodity Strategies Fund | 0.75% underweight to the Russell Global Real Estate Securities |
| detracted, as these Underlying Funds underperformed the Fund’s | Fund due to caution over the interest rate sensitivity of REITs in | |
| benchmark. From an active management standpoint, performance | an environment of potential rising rates. This resulted in a total | |
| of these Underlying Funds was generally negative. The Russell | of 1.50% overweight to the Russell U.S. Defensive Equity Fund. | |
| Global Infrastructure Fund, Russell Commodity Strategies Fund, | ||
| and Russell Multi-Strategy Alternative Fund underperformed | - 2.00% overweight to the Russell International Developed | |
| their respective asset class benchmarks while the Russell Global | Markets Fund and 2.00% underweight to the Russell U.S. Small | |
| Real Estate Securities Fund outperformed its respective asset | Cap Equity Fund due to concerns of stretched valuations within | |
| class benchmark. In particular, the Russell Global Infrastructure | small cap. | |
| Fund was underweight to North American electric utilities and | - 0.75% overweight to the Russell Global Equity Fund and | |
| the oil and gas pipelines sectors, which were among the strongest | 0.75% underweight to the Russell Emerging Markets Fund due | |
| performing sectors for the year. For the Russell Global Real | to concerns of strong negative momentum exhibited in emerging | |
| Estate Securities Fund, security selection within the U.S. was | markets. | |
| positive while an overweight to and security selection within | ||
| Japan detracted from performance. | ||
28 Moderate Strategy Fund
| Russell Investment Company | |
| Moderate Strategy Fund | |
| Portfolio Management Discussion and Analysis, continued — October 31, 2014 | |
| (Unaudited) | |
| At the end of May 2014, half of the 2.50% underweight to the | the overweight to the Russell U.S. Defensive Equity Fund in order |
| Russell U.S. Small Cap Equity Fund was removed in order to | to maintain the existing overweight to the Russell International |
| capture partial gains from the position. | Developed Markets Fund. |
| On June 11, 2014, the Fund took an additional 0.25% | At the end of the fiscal year, the Fund maintained a broad |
| underweight to the Russell Global Real Estate Securities Fund | overweight to equity Underlying Funds relative to real asset |
| given the recent strong performance of the REITs asset class but | Underlying Funds. By the end of the fiscal year, the aggregate |
| continued concern over rate sensitivity. The Fund also took a | positioning was modestly positive to performance. |
| 0.25% underweight to the Russell Global Infrastructure Fund, | |
| recognizing strong recent performance and stretched valuations. | The views expressed in this report reflect those of the portfolio |
| Both positions were offset by equal overweights to the Russell | managers only through the end of the period covered by |
| U.S. Dynamic Equity Fund. | the report. These views do not necessarily represent the |
| views of RIMCo, or any other person in RIMCo or any other | |
| On July 9, 2014, the Fund removed its underweight to the Russell | affiliated organization. These views are subject to change |
| Emerging Markets Fund relative to the Russell Global Equity | at any time based upon market conditions or other events, |
| Fund, as recent positive momentum suggested further strength in | and RIMCo disclaims any responsibility to update the views |
| emerging markets relative to broad global equities. This position | contained herein. These views should not be relied on as |
| was closed at a loss. | investment advice and, because investment decisions for |
| On July 22, 2014, the Fund closed its underweight to the Russell | a Russell Investment Company (“RIC”) Fund are based on |
| U.S. Small Cap Equity Fund primarily driven by the Underlying | numerous factors, should not be relied on as an indication |
| Fund meeting performance expectations. The Russell U.S. Small | of investment decisions of any RIC Fund. |
| Cap Equity Fund was funded back to target weight by reducing | |
* Assumes initial investment on November 1, 2004.
** The Barclays U.S. Aggregate Bond Index is an index, with income reinvested, generally representative of intermediate-term government bonds, investment grade corporate debt securities and mortgage-backed securities.
*** Russell 1000® Index includes the 1,000 largest companies in the Russell 3000® Index. The Russell 1000® Index represents the universe of stocks from which most active money managers typically select. The Russell 1000® Index return reflects adjustments from income dividends and capital gain distributions reinvested as of the ex-dividend dates.
‡ The performance shown has been adjusted to reflect the deduction of the maximum Class A sales charge of 5.75%.
‡‡ The Fund first issued Class R1 Shares on October 3, 2006. The returns shown for Class R1 Shares prior to that date are the returns of the Fund’s Class S Shares.
‡‡‡ The Fund first issued Class R4 and Class R5 Shares on October 1, 2014. The returns shown for Class R4 and Class R5 Shares prior to that date are the returns of the Fund’s Class R2 and Class R3 Shares, respectively.
§ Annualized.
Performance is historical and assumes reinvestment of all dividends and capital gains. Investment return and principal value will fluctuate so that an investor’s shares, when redeemed, may be worth more or less than when purchased. Past performance is not indicative of future results. The returns shown do not reflect the deduction of taxes that a shareholder would pay on Fund distributions or the redemption of Fund shares.
Moderate Strategy Fund 29
| Russell Investment Company | ||||||
| Moderate Strategy Fund | ||||||
| Shareholder Expense Example — October 31, 2014 (Unaudited) | ||||||
| Fund Expenses | Please note that the expenses shown in the table are meant | |||||
| The following disclosure provides important information | to highlight your ongoing costs only and do not reflect any | |||||
| regarding the Fund’s Shareholder Expense Example | transactional costs. Therefore, the information under the heading | |||||
| (“Example”). | “Hypothetical Performance (5% return before expenses)” is | |||||
| useful in comparing ongoing costs only, and will not help you | ||||||
| Example | determine the relative total costs of owning different funds. In | |||||
| As a shareholder of the Fund, you incur two types of costs: (1) | addition, if these transactional costs were included, your costs | |||||
| transaction costs, and (2) ongoing costs, including advisory and | would have been higher. | |||||
| administrative fees; distribution (12b-1) and/or service fees; | Hypothetical | |||||
| and other Fund expenses. The Example is intended to help | Performance (5% | |||||
| you understand your ongoing costs (in dollars) of investing in | Actual | return before | ||||
| the Fund and to compare these costs with the ongoing costs of | Class A | Performance | expenses) | |||
| Beginning Account Value | ||||||
| investing in other mutual funds. The Example is based on an | May 1, 2014 | $ | 1,000.00 | $ | 1,000.00 | |
| investment of $1,000 invested at the beginning of the period and | Ending Account Value | |||||
| held for the entire period indicated, which for this Fund is from | October 31, 2014 | $ | 1,020.10 | $ | 1,022.43 | |
| May 1, 2014 to October 31, 2014. | Expenses Paid During Period* | $ | 2.80 | $ | 2.80 | |
| Actual Expenses | * Expenses are equal to the Fund's annualized expense ratio of 0.55% | |||||
| (representing the six month period annualized), multiplied by the average | ||||||
| The information in the table under the heading “Actual | account value over the period, multiplied by 184/365 (to reflect the one-half | |||||
| Performance” provides information about actual account values | year period). May reflect amounts waived and/or reimbursed. Without any | |||||
| and actual expenses. You may use the information in this column, | waivers and/or reimbursements, expenses would have been higher. | |||||
| together with the amount you invested, to estimate the expenses | ||||||
| Hypothetical | ||||||
| that you paid over the period. Simply divide your account value by | Performance (5% | |||||
| $1,000 (for example, an $8,600 account value divided by $1,000 | Actual | return before | ||||
| = 8.6), then multiply the result by the number in the first column | Class C | Performance | expenses) | |||
| Beginning Account Value | ||||||
| in the row entitled “Expenses Paid During Period” to estimate | May 1, 2014 | $ | 1,000.00 | $ | 1,000.00 | |
| the expenses you paid on your account during this period. | Ending Account Value | |||||
| October 31, 2014 | $ | 1,015.80 | $ | 1,018.65 | ||
| Hypothetical Example for Comparison Purposes | Expenses Paid During Period* | $ | 6.61 | $ | 6.61 | |
| The information in the table under the heading “Hypothetical | ||||||
| Performance (5% return before expenses)” provides information | * Expenses are equal to the Fund's annualized expense ratio of 1.30% | |||||
| (representing the six month period annualized), multiplied by the average | ||||||
| about hypothetical account values and hypothetical expenses | account value over the period, multiplied by 184/365 (to reflect the one-half | |||||
| based on the Fund’s actual expense ratio and an assumed rate of | year period). May reflect amounts waived and/or reimbursed. Without any | |||||
| return of 5% per year before expenses, which is not the Fund’s | waivers and/or reimbursements, expenses would have been higher. | |||||
| actual return. The hypothetical account values and expenses | ||||||
| Hypothetical | ||||||
| may not be used to estimate the actual ending account balance or | Performance (5% | |||||
| expenses you paid for the period. You may use this information | Actual | return before | ||||
| to compare the ongoing costs of investing in the Fund and other | Class E | Performance | expenses) | |||
| funds. To do so, compare this 5% hypothetical example with the | Beginning Account Value | |||||
| May 1, 2014 | $ | 1,000.00 | $ | 1,000.00 | ||
| 5% hypothetical examples that appear in the shareholder reports | Ending Account Value | |||||
| of other funds. | October 31, 2014 | $ | 1,020.00 | $ | 1,022.43 | |
| Expenses Paid During Period* | $ | 2.80 | $ | 2.80 | ||
| * Expenses are equal to the Fund's annualized expense ratio of 0.55% | ||||||
| (representing the six month period annualized), multiplied by the average | ||||||
| account value over the period, multiplied by 184/365 (to reflect the one-half | ||||||
| year period). May reflect amounts waived and/or reimbursed. Without any | ||||||
| waivers and/or reimbursements, expenses would have been higher. | ||||||
30 Moderate Strategy Fund
| Russell Investment Company | |||||||||||||
| Moderate Strategy Fund | |||||||||||||
| Shareholder Expense Example, continued — October 31, 2014 (Unaudited) | |||||||||||||
| Hypothetical | Hypothetical | ||||||||||||
| Performance (5% | Performance (5% | ||||||||||||
| Actual | return before | Actual | return before | ||||||||||
| Class R1 | Performance | expenses) | Class S | Performance | expenses) | ||||||||
| Beginning Account Value | Beginning Account Value | ||||||||||||
| May 1, 2014 | $ | 1,000.00 | $ | 1,000.00 | May 1, 2014 | $ | 1,000.00 | $ | 1,000.00 | ||||
| Ending Account Value | Ending Account Value | ||||||||||||
| October 31, 2014 | $ | 1,022.80 | $ | 1,024.35 | October 31, 2014 | $ | 1,021.30 | $ | 1,023.69 | ||||
| Expenses Paid During Period* | $ | 0.87 | $ | 0.87 | Expenses Paid During Period* | $ | 1.53 | $ | 1.53 | ||||
| * Expenses are equal to the Fund's annualized expense ratio of 0.17% | * Expenses are equal to the Fund's annualized expense ratio of 0.30% | ||||||||||||
| (representing the six month period annualized), multiplied by the average | (representing the six month period annualized), multiplied by the average | ||||||||||||
| account value over the period, multiplied by 184/365 (to reflect the one-half | account value over the period, multiplied by 184/365 (to reflect the one-half | ||||||||||||
| year period). May reflect amounts waived and/or reimbursed. Without any | year period). May reflect amounts waived and/or reimbursed. Without any | ||||||||||||
| waivers and/or reimbursements, expenses would have been higher. | waivers and/or reimbursements, expenses would have been higher. | ||||||||||||
| Hypothetical | |||||||||||||
| Performance (5% | |||||||||||||
| Actual | return before | ||||||||||||
| Class R4(1) | Performance | expenses) | |||||||||||
| Beginning Account Value | |||||||||||||
| May 1, 2014 | $ | 1,000.00 | $ | 1,000.00 | |||||||||
| Ending Account Value | |||||||||||||
| October 31, 2014 | $ | 1,020.60 | $ | 1,023.09 | |||||||||
| Expenses Paid During Period* | $ | 2.14 | $ | 2.14 | |||||||||
| * Expenses are equal to the Fund's annualized expense ratio of 0.42% | |||||||||||||
| (representing the six month period annualized), multiplied by the average | |||||||||||||
| account value over the period, multiplied by 184/365 (to reflect the one-half | |||||||||||||
| year period). | |||||||||||||
| (1) As of October 1, 2014, Class R2 Shares were reclassified as Class R4 | |||||||||||||
| Shares, and all Class R2 shareholders were issued shares of Class R4. The | |||||||||||||
| shareholder expense example for the period ended October 31, 2014 reflects | |||||||||||||
| the expenses and performance of Class R2 Shares for the period May 1 through | |||||||||||||
| October 1, 2014, and Class R4 Shares for the period October 2, 2014 through | |||||||||||||
| October 31, 2014. | |||||||||||||
| Hypothetical | |||||||||||||
| Performance (5% | |||||||||||||
| Actual | return before | ||||||||||||
| Class R5(2) | Performance | expenses) | |||||||||||
| Beginning Account Value | |||||||||||||
| May 1, 2014 | $ | 1,000.00 | $ | 1,000.00 | |||||||||
| Ending Account Value | |||||||||||||
| October 31, 2014 | $ | 1,019.10 | $ | 1,021.83 | |||||||||
| Expenses Paid During Period* | $ | 3.41 | $ | 3.41 | |||||||||
| * Expenses are equal to the Fund's annualized expense ratio of 0.67% | |||||||||||||
| (representing the six month period annualized), multiplied by the average | |||||||||||||
| account value over the period, multiplied by 184/365 (to reflect the one-half | |||||||||||||
| year period). | |||||||||||||
| (2) As of October 1, 2014, Class R3 Shares were reclassified as Class R5 | |||||||||||||
| Shares, and all Class R3 shareholders were issued shares of Class R5. The | |||||||||||||
| shareholder expense example for the period ended October 31, 2014 reflects | |||||||||||||
| the expenses and performance of Class R3 Shares for the period May 1 through | |||||||||||||
| October 1, 2014, and Class R5 Shares for the period October 2, 2014 through | |||||||||||||
| October 31, 2014. | |||||||||||||
| Moderate Strategy Fund 31 | |||||||||||||
| Russell Investment Company | |||||||||||
| Moderate Strategy Fund | |||||||||||
| Schedule of Investments — October 31, 2014 | |||||||||||
| Amounts in thousands (except share amounts) | Amounts in thousands (except share amounts) | ||||||||||
| Fair | Fair | ||||||||||
| Value | Value | ||||||||||
| Shares | $ | Shares | $ | ||||||||
| Investments 100.0% | Fixed Income - 54.8% | ||||||||||
| Other Russell Investment Company | Russell Global Opportunistic Credit Fund | 3,383,203 | 33,832 | ||||||||
| Series Mutual Funds - Class Y | Russell Investment Grade Bond Fund | 6,745,405 | 151,704 | ||||||||
| Shares | Russell Strategic Bond Fund | 24,922,117 | 277,882 | ||||||||
| 463,418 | |||||||||||
| Alternative - 12.0% | International Equities - 16.9% | ||||||||||
| Russell Commodity Strategies Fund | 2,363,245 | 18,244 | Russell Emerging Markets Fund | 1,765,873 | 32,986 | ||||||
| Russell Global Infrastructure Fund | 3,125,904 | 40,480 | Russell Global Equity Fund | 4,359,848 | 51,403 | ||||||
| Russell Global Real Estate Securities Fund | 423,623 | 17,246 | Russell International Developed Markets | ||||||||
| Russell Multi-Strategy Alternative Fund | 2,523,222 | 25,283 | Fund | 1,630,742 | 58,544 | ||||||
| 101,253 | 142,933 | ||||||||||
| Domestic Equities - 16.3% | |||||||||||
| Russell U.S. Core Equity Fund | 993,700 | 42,918 | Total Investments 100.0% | ||||||||
| Russell U.S. Defensive Equity Fund | 840,155 | 38,672 | (identified cost $715,262) | 845,278 | |||||||
| Russell U.S. Dynamic Equity Fund | 1,689,321 | 21,437 | Other Assets and Liabilities, Net | ||||||||
| Russell U.S. Small Cap Equity Fund | 1,109,399 | 34,647 | -(0.0 | %) | (161 | ) | |||||
| 137,674 | Net Assets - 100.0% | 845,117 | |||||||||
| Presentation of Portfolio Holdings | |||||||||||
| Categories | % of Net Assets | ||||||||||
| Alternative | 12.0 | ||||||||||
| Domestic Equities | 16.3 | ||||||||||
| Fixed Income | 54.8 | ||||||||||
| International Equities | 16.9 | ||||||||||
| Total Investments | 100.0 | ||||||||||
| Other Assets and Liabilities, Net | (—*) | ||||||||||
| 100.0 | |||||||||||
| * Less than .05% of net assets. | |||||||||||
See accompanying notes which are an integral part of the financial statements.
32 Moderate Strategy Fund
| Russell Investment Company | ||
| Moderate Strategy Fund | ||
| Statement of Assets and Liabilities — October 31, 2014 | ||
| Amounts in thousands | ||
| Assets | ||
| Investments, at identified cost | $ | 715,262 |
| Investments, at fair value | 845,278 | |
| Receivables: | ||
| Investments sold | 1,155 | |
| Fund shares sold | 899 | |
| Prepaid expenses | 2 | |
| Total assets | 847,334 | |
| Liabilities | ||
| Payables: | ||
| Fund shares redeemed | 1,674 | |
| Accrued fees to affiliates | 501 | |
| Other accrued expenses | 42 | |
| Total liabilities | 2,217 | |
| Net Assets | $ | 845,117 |
| Net Assets Consist of: | ||
| Undistributed (overdistributed) net investment income | $ | 127 |
| Accumulated net realized gain (loss) | 998 | |
| Unrealized appreciation (depreciation) on investments | 130,016 | |
| Shares of beneficial interest | 705 | |
| Additional paid-in capital | 713,271 | |
| Net Assets | $ | 845,117 |
| Net Asset Value, offering and redemption price per share: | ||
| Net asset value per share: Class A(#) | $ | 12.02 |
| Maximum offering price per share (Net asset value plus sales charge of 5.75%): Class A | $ | 12.75 |
| Class A — Net assets | $ | 222,874,433 |
| Class A — Shares outstanding ($.01 par value) | 18,546,896 | |
| Net asset value per share: Class C(#) | $ | 11.90 |
| Class C — Net assets | $ | 301,445,101 |
| Class C — Shares outstanding ($.01 par value) | 25,326,619 | |
| Net asset value per share: Class E(#) | $ | 12.04 |
| Class E — Net assets | $ | 37,484,953 |
| Class E — Shares outstanding ($.01 par value) | 3,113,985 | |
| Net asset value per share: Class R1(#) | $ | 12.07 |
| Class R1 — Net assets | $ | 53,016,284 |
| Class R1 — Shares outstanding ($.01 par value) | 4,393,618 | |
| Net asset value per share: Class R4(#) | $ | 12.03 |
| Class R4 — Net assets | $ | 45,827,997 |
| Class R4 — Shares outstanding ($.01 par value) | 3,808,820 | |
| Net asset value per share: Class R5(#) | $ | 12.08 |
| Class R5 — Net assets | $ | 36,598,006 |
| Class R5 — Shares outstanding ($.01 par value) | 3,029,186 | |
| Net asset value per share: Class S(#) | $ | 12.06 |
| Class S — Net assets | $ | 147,870,293 |
| Class S — Shares outstanding ($.01 par value) | 12,259,363 | |
| (#) Net asset value per share equals class level net assets divided by class level shares of beneficial interest outstanding. | ||
See accompanying notes which are an integral part of the financial statements.
Moderate Strategy Fund 33
| Russell Investment Company | |||
| Moderate Strategy Fund | |||
| Statement of Operations — For the Period Ended October 31, 2014 | |||
| Amounts in thousands | |||
| Investment Income | |||
| Income distributions from Underlying Funds | $ | 18,192 | |
| Expenses | |||
| Advisory fees | 1,792 | ||
| Administrative fees | 408 | ||
| Custodian fees | 34 | ||
| Distribution fees - Class A | 580 | ||
| Distribution fees - Class C | 2,312 | ||
| Distribution fees - Class R3 | 108 | ||
| Distribution fees - Class R5 | 7 | ||
| Transfer agent fees - Class A | 464 | ||
| Transfer agent fees - Class C | 617 | ||
| Transfer agent fees - Class E | 84 | ||
| Transfer agent fees - Class R1 | 116 | ||
| Transfer agent fees - Class R2 | 107 | ||
| Transfer agent fees - Class R3 | 86 | ||
| Transfer agent fees - Class R4 | 7 | ||
| Transfer agent fees - Class R5 | 6 | ||
| Transfer agent fees - Class S | 305 | ||
| Professional fees | 44 | ||
| Registration fees | 136 | ||
| Shareholder servicing fees - Class C | 771 | ||
| Shareholder servicing fees - Class E | 105 | ||
| Shareholder servicing fees - Class R2 | 134 | ||
| Shareholder servicing fees - Class R3 | 108 | ||
| Shareholder servicing fees - Class R4 | 9 | ||
| Shareholder servicing fees - Class R5 | 7 | ||
| Trustees’ fees | 21 | ||
| Printing fees | 56 | ||
| Miscellaneous | 49 | ||
| Expenses before reductions | 8,473 | ||
| Expense reductions | (1,804 | ) | |
| Net expenses | 6,669 | ||
| Net investment income (loss) | 11,523 | ||
| Net Realized and Unrealized Gain (Loss) | |||
| Net realized gain (loss) on: | |||
| Investments | 21,970 | ||
| Capital gain distributions from Underlying Funds | 7,206 | ||
| Net realized gain (loss) | 29,176 | ||
| Net change in unrealized appreciation (depreciation) on investments | 3,053 | ||
| Net realized and unrealized gain (loss) | 32,229 | ||
| Net Increase (Decrease) in Net Assets from Operations | $ | 43,752 | |
See accompanying notes which are an integral part of the financial statements.
34 Moderate Strategy Fund
| Russell Investment Company | ||||||
| Moderate Strategy Fund | ||||||
| Statements of Changes in Net Assets | ||||||
| For the Periods Ended October 31, | ||||||
| Amounts in thousands | 2014 | 2013 | ||||
| Increase (Decrease) in Net Assets | ||||||
| Operations | ||||||
| Net investment income (loss) | $ | 11,523 | $ | 22,046 | ||
| Net realized gain (loss) | 29,176 | 27,212 | ||||
| Net change in unrealized appreciation (depreciation) | 3,053 | 17,060 | ||||
| Net increase (decrease) in net assets from operations | 43,752 | 66,318 | ||||
| Distributions | ||||||
| From net investment income | ||||||
| Class A | (3,305 | ) | (5,368 | ) | ||
| Class C | (2,454 | ) | (5,597 | ) | ||
| Class E | (624 | ) | (1,625 | ) | ||
| Class R1 | (1,092 | ) | (1,818 | ) | ||
| Class R2 | (869 | ) | (1,715 | ) | ||
| Class R3 | (633 | ) | (1,812 | ) | ||
| Class R4 | (50 | ) | — | |||
| Class R5 | (13 | ) | — | |||
| Class S | (2,574 | ) | (3,968 | ) | ||
| Net decrease in net assets from distributions | (11,614 | ) | (21,903 | ) | ||
| Share Transactions* | ||||||
| Net increase (decrease) in net assets from share transactions | (137,187 | ) | (97,378 | ) | ||
| Total Net Increase (Decrease) in Net Assets | (105,049 | ) | (52,963 | ) | ||
| Net Assets | ||||||
| Beginning of period | 950,166 | 1,003,129 | ||||
| End of period | $ | 845,117 | $ | 950,166 | ||
| Undistributed (overdistributed) net investment income included in net assets | $ | 127 | $ | 218 | ||
See accompanying notes which are an integral part of the financial statements.
Moderate Strategy Fund 35
| Russell Investment Company | ||||||||||||
| Moderate Strategy Fund | ||||||||||||
| Statements of Changes in Net Assets, continued | ||||||||||||
| * Share transaction amounts (in thousands) for the periods ended October 31, 2014 and October 31, 2013 were as follows: | ||||||||||||
| 2014 | 2013 | |||||||||||
| Shares | Dollars | Shares | Dollars | |||||||||
| Class A | ||||||||||||
| Proceeds from shares sold | 2,832 | $ | 33,368 | 3,981 | $ | 44,691 | ||||||
| Proceeds from reinvestment of distributions | 280 | 3,269 | 480 | 5,304 | ||||||||
| Payments for shares redeemed | (4,908 | ) | (57,900 | ) | (5,128 | ) | (57,660 | ) | ||||
| Net increase (decrease) | (1,796 | ) | (21,263 | ) | (667 | ) | (7,665 | ) | ||||
| Class C | ||||||||||||
| Proceeds from shares sold | 4,472 | 52,299 | 6,652 | 74,250 | ||||||||
| Proceeds from reinvestment of distributions | 211 | 2,424 | 504 | 5,520 | ||||||||
| Payments for shares redeemed | (7,046 | ) | (82,235 | ) | (8,065 | ) | (90,126 | ) | ||||
| Net increase (decrease) | (2,363 | ) | (27,512 | ) | (909 | ) | (10,356 | ) | ||||
| Class E | ||||||||||||
| Proceeds from shares sold | 825 | 9,699 | 1,449 | 16,283 | ||||||||
| Proceeds from reinvestment of distributions | 53 | 623 | 146 | 1,611 | ||||||||
| Payments for shares redeemed | (1,825 | ) | (21,496 | ) | (4,235 | ) | (47,719 | ) | ||||
| Net increase (decrease) | (947 | ) | (11,174 | ) | (2,640 | ) | (29,825 | ) | ||||
| Class R1 | ||||||||||||
| Proceeds from shares sold | 1,180 | 14,006 | 2,534 | 28,553 | ||||||||
| Proceeds from reinvestment of distributions | 93 | 1,092 | 164 | 1,818 | ||||||||
| Payments for shares redeemed | (2,834 | ) | (33,336 | ) | (2,759 | ) | (31,147 | ) | ||||
| Net increase (decrease) | (1,561 | ) | (18,238 | ) | (61 | ) | (776 | ) | ||||
| Class R2 | ||||||||||||
| Proceeds from shares sold | 733 | 8,630 | 1,875 | 21,116 | ||||||||
| Proceeds from reinvestment of distributions | 74 | 869 | 155 | 1,715 | ||||||||
| Payments for shares redeemed | (6,612 | ) | (78,318 | ) | (2,817 | ) | (31,704 | ) | ||||
| Net increase (decrease) | (5,805 | ) | (68,819 | ) | (787 | ) | (8,873 | ) | ||||
| Class R3 | ||||||||||||
| Proceeds from shares sold | 550 | 6,494 | 1,281 | 14,486 | ||||||||
| Proceeds from reinvestment of distributions | 54 | 633 | 163 | 1,812 | ||||||||
| Payments for shares redeemed | (5,568 | ) | (66,109 | ) | (4,284 | ) | (48,372 | ) | ||||
| Net increase (decrease) | (4,964 | ) | (58,982 | ) | (2,840 | ) | (32,074 | ) | ||||
| Class R4 | ||||||||||||
| Proceeds from shares sold | 3,907 | 46,370 | — | — | ||||||||
| Proceeds from reinvestment of distributions | 4 | 50 | — | — | ||||||||
| Payments for shares redeemed | (102 | ) | (1,208 | ) | — | — | ||||||
| Net increase (decrease) | 3,809 | 45,212 | — | — | ||||||||
| Class R5 | ||||||||||||
| Proceeds from shares sold | 3,104 | 36,976 | — | — | ||||||||
| Proceeds from reinvestment of distributions | 1 | 13 | — | — | ||||||||
| Payments for shares redeemed | (76 | ) | (901 | ) | — | — | ||||||
| Net increase (decrease) | 3,029 | 36,088 | — | — | ||||||||
| Class S | ||||||||||||
| Proceeds from shares sold | 4,075 | 48,156 | 5,238 | 59,110 | ||||||||
| Proceeds from reinvestment of distributions | 215 | 2,528 | 354 | 3,918 | ||||||||
| Payments for shares redeemed | (5,346 | ) | (63,183 | ) | (6,273 | ) | (70,837 | ) | ||||
| Net increase (decrease) | (1,056 | ) | (12,499 | ) | (681 | ) | (7,809 | ) | ||||
| Total increase (decrease) | (11,654 | ) | $ | (137,187 | ) | (8,585 | ) | $ | (97,378 | ) | ||
See accompanying notes which are an integral part of the financial statements.
36 Moderate Strategy Fund
(This page intentionally left blank)
| Russell Investment Company | |||||||||||||
| Moderate Strategy Fund | |||||||||||||
| Financial Highlights — For the Periods Ended | |||||||||||||
| For a Share Outstanding Throughout Each Period. | |||||||||||||
| $ | |||||||||||||
| $ | Net | $ | $ | $ | |||||||||
| Net Asset Value, | Investment | Net Realized | Total from | Distributions | |||||||||
| Beginning of | Income (Loss) | and Unrealized | Investment | from Net | |||||||||
| Period | (a)(b)(e) | Gain (Loss) | Operations | Investment Income | |||||||||
| Class A | |||||||||||||
| October 31, 2014 | 11.59 | .17 | .43 | .60 | (.17) | ||||||||
| October 31, 2013 | 11.06 | .26 | .53 | .79 | (.26) | ||||||||
| October 31, 2012 | 10.51 | .24 | .55 | .79 | (.24) | ||||||||
| October 31, 2011 | 10.68 | .38 | (.18) | .20 | (.37) | ||||||||
| October 31, 2010 | 9.55 | .25 | 1.14 | 1.39 | (.26) | ||||||||
| Class C | |||||||||||||
| October 31, 2014 | 11.49 | .08 | .42 | .50 | (.09) | ||||||||
| October 31, 2013 | 10.99 | .18 | .52 | .70 | (.20) | ||||||||
| October 31, 2012 | 10.44 | .16 | .55 | .71 | (.16) | ||||||||
| October 31, 2011 | 10.62 | .28 | (.15) | .13 | (.31) | ||||||||
| October 31, 2010 | 9.50 | .17 | 1.13 | 1.30 | (.18) | ||||||||
| Class E | |||||||||||||
| October 31, 2014 | 11.61 | .18 | .42 | .60 | (.17) | ||||||||
| October 31, 2013 | 11.08 | .29 | .50 | .79 | (.26) | ||||||||
| October 31, 2012 | 10.52 | .23 | .57 | .80 | (.24) | ||||||||
| October 31, 2011 | 10.68 | .45 | (.24) | .21 | (.37) | ||||||||
| October 31, 2010 | 9.55 | .26 | 1.13 | 1.39 | (.26) | ||||||||
| Class R1 | |||||||||||||
| October 31, 2014 | 11.63 | .23 | .42 | .65 | (.21) | ||||||||
| October 31, 2013 | 11.11 | .31 | .51 | .82 | (.30) | ||||||||
| October 31, 2012 | 10.56 | .27 | .57 | .84 | (.29) | ||||||||
| October 31, 2011 | 10.72 | .38 | (.12) | .26 | (.42) | ||||||||
| October 31, 2010 | 9.59 | .27 | 1.14 | 1.41 | (.28) | ||||||||
| Class R4(3) | |||||||||||||
| October 31, 2014 | 11.60 | .20 | .41 | .61 | (.18) | ||||||||
| October 31, 2013 | 11.08 | .29 | .51 | .80 | (.28) | ||||||||
| October 31, 2012 | 10.52 | .26 | .56 | .82 | (.26) | ||||||||
| October 31, 2011 | 10.69 | .23 | -(h) | .23 | (.40) | ||||||||
| October 31, 2010 | 9.56 | .25 | 1.14 | 1.39 | (.26) | ||||||||
| Class R5(4) | |||||||||||||
| October 31, 2014 | 11.64 | .17 | .42 | .59 | (.15) | ||||||||
| October 31, 2013 | 11.12 | .30 | .47 | .77 | (.25) | ||||||||
| October 31, 2012 | 10.56 | .27 | .51 | .78 | (.22) | ||||||||
| October 31, 2011 | 10.72 | .38 | (.17) | .21 | (.37) | ||||||||
| October 31, 2010 | 9.59 | .23 | 1.13 | 1.36 | (.23) | ||||||||
| Class S | |||||||||||||
| October 31, 2014 | 11.63 | .20 | .43 | .63 | (.20) | ||||||||
| October 31, 2013 | 11.11 | .30 | .51 | .81 | (.29) | ||||||||
| October 31, 2012 | 10.55 | .27 | .56 | .83 | (.27) | ||||||||
| October 31, 2011 | 10.72 | .37 | (.14) | .23 | (.40) | ||||||||
| October 31, 2010 | 9.58 | .28 | 1.14 | 1.42 | (.28) | ||||||||
See accompanying notes which are an integral part of the financial statements.
38 Moderate Strategy Fund
| % | % | % | ||||||||||||||
| $ | $ | Ratio of Expenses | Ratio of Expenses | Ratio of Net | ||||||||||||
| Net Asset Value, | % | Net Assets, | to Average | to Average | Investment Income | % | ||||||||||
| $ | End of | Total | End of Period | Net Assets, | Net Assets, | to Average | Portfolio | |||||||||
| Total Distributions | Period | Return(d) | (000 | ) | Gross(g) | Net(e)(g) | Net Assets(b)(e) | Turnover Rate | ||||||||
| (.17 | ) | 12.02 | 5.19 | 222,875 | .73 | .56 | 1.45 | 14 | ||||||||
| (.26 | ) | 11.59 | 7.22 | 235,684 | .72 | .57 | 2.35 | 13 | ||||||||
| (.24 | ) | 11.06 | 7.67 | 232,467 | .71 | .56 | 2.21 | 23 | ||||||||
| (.37 | ) | 10.51 | 1.95 | 207,292 | .73 | .55 | 3.53 | 15 | ||||||||
| (.26 | ) | 10.68 | 14.75 | 220,380 | .71 | .54 | 2.51 | 48 | ||||||||
| (.09 | ) | 11.90 | 4.39 | 301,445 | 1.48 | 1.31 | .70 | 14 | ||||||||
| (.20 | ) | 11.49 | 6.42 | 318,120 | 1.47 | 1.32 | 1.60 | 13 | ||||||||
| (.16 | ) | 10.99 | 6.91 | 314,391 | 1.46 | 1.31 | 1.48 | 23 | ||||||||
| (.31 | ) | 10.44 | 1.20 | 288,055 | 1.48 | 1.30 | 2.66 | 15 | ||||||||
| (.18 | ) | 10.62 | 13.87 | 270,529 | 1.46 | 1.29 | 1.74 | 48 | ||||||||
| (.17 | ) | 12.04 | 5.18 | 37,485 | .73 | .56 | 1.51 | 14 | ||||||||
| (.26 | ) | 11.61 | 7.17 | 47,129 | .72 | .57 | 2.56 | 13 | ||||||||
| (.24 | ) | 11.08 | 7.75 | 74,240 | .71 | .56 | 2.14 | 23 | ||||||||
| (.37 | ) | 10.52 | 2.00 | 72,800 | .73 | .55 | 4.21 | 15 | ||||||||
| (.26 | ) | 10.68 | 14.74 | 155,540 | .71 | .54 | 2.54 | 48 | ||||||||
| (.21 | ) | 12.07 | 5.67 | 53,016 | .48 | .17 | 1.92 | 14 | ||||||||
| (.30 | ) | 11.63 | 7.57 | 69,274 | .47 | .17 | 2.71 | 13 | ||||||||
| (.29 | ) | 11.11 | 8.10 | 66,823 | .46 | .14 | 2.48 | 23 | ||||||||
| (.42 | ) | 10.56 | 2.49 | 44,486 | .48 | .12 | 3.55 | 15 | ||||||||
| (.28 | ) | 10.72 | 14.97 | 28,704 | .47 | .27 | 2.64 | 48 | ||||||||
| (.18 | ) | 12.03 | 5.31 | 45,828 | .73 | .42 | 1.68 | 14 | ||||||||
| (.28 | ) | 11.60 | 7.31 | 67,330 | .72 | .42 | 2.56 | 13 | ||||||||
| (.26 | ) | 11.08 | 7.95 | 73,019 | .71 | .39 | 2.38 | 23 | ||||||||
| (.40 | ) | 10.52 | 2.17 | 60,610 | .73 | .37 | 2.14 | 15 | ||||||||
| (.26 | ) | 10.69 | 14.74 | 7,221 | .71 | .52 | 2.50 | 48 | ||||||||
| (.15 | ) | 12.08 | 5.10 | 36,598 | .98 | .67 | 1.46 | 14 | ||||||||
| (.25 | ) | 11.64 | 7.01 | 57,788 | .97 | .67 | 2.63 | 13 | ||||||||
| (.22 | ) | 11.12 | 7.55 | 86,756 | .97 | .64 | 2.56 | 23 | ||||||||
| (.37 | ) | 10.56 | 1.97 | 248,661 | .98 | .62 | 3.51 | 15 | ||||||||
| (.23 | ) | 10.72 | 14.39 | 288,375 | .96 | .77 | 2.32 | 48 | ||||||||
| (.20 | ) | 12.06 | 5.44 | 147,870 | .48 | .31 | 1.71 | 14 | ||||||||
| (.29 | ) | 11.63 | 7.41 | 154,841 | .47 | .32 | 2.63 | 13 | ||||||||
| (.27 | ) | 11.11 | 8.02 | 155,433 | .46 | .31 | 2.52 | 23 | ||||||||
| (.40 | ) | 10.55 | 2.21 | 153,148 | .48 | .30 | 3.49 | 15 | ||||||||
| (.28 | ) | 10.72 | 15.09 | 126,620 | .46 | .29 | 2.77 | 48 | ||||||||
See accompanying notes which are an integral part of the financial statements.
Moderate Strategy Fund 39
Russell Investment Company Balanced Strategy Fund
Portfolio Management Discussion and Analysis — October 31, 2014 (Unaudited)
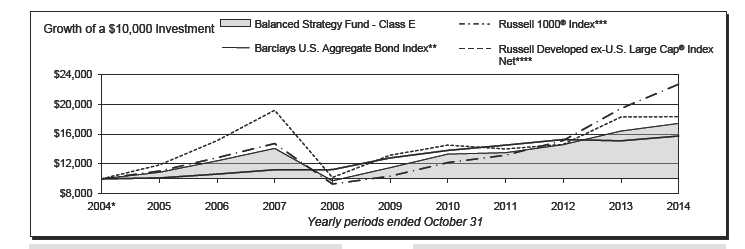
| Balanced Strategy Fund - Class A‡ | Balanced Strategy Fund - Class R5‡‡‡ | ||||||
| Total | Total | ||||||
| Return | Return | ||||||
| 1 Year | 0.15 | % | 1 Year | 6.17 | % | ||
| 5 Years | 7.42 | %§ | 5 Years | 8.57 | %§ | ||
| 10 Years | 5.10 | %§ | 10 Years | 5.53 | %§ | ||
| Balanced Strategy Fund - Class C | Balanced Strategy Fund - Class S | ||||||
| Total | Total | ||||||
| Return | Return | ||||||
| 1 Year | 5.51 | % | 1 Year | 6.52 | % | ||
| 5 Years | 7.88 | %§ | 5 Years | 8.97 | %§ | ||
| 10 Years | 4.93 | %§ | 10 Years | 5.99 | %§ | ||
| Balanced Strategy Fund - Class E | Barclays U.S. Aggregate Bond Index** | ||||||
| Total | Total | ||||||
| Return | Return | ||||||
| 1 Year | 6.26 | % | 1 Year | 4.14 | % | ||
| 5 Years | 8.68 | %§ | 5 Years | 4.22 | %§ | ||
| 10 Years | 5.72 | %§ | 10 Years | 4.64 | %§ | ||
| Russell 1000® Index*** | |||||||
| Balanced Strategy Fund - Class R1‡‡ | |||||||
| Total | |||||||
| Total | Return | ||||||
| Return | |||||||
| 1 Year | 6.63 | % | 1 Year | 16.78 | % | ||
| 5 Years | 9.10 | %§ | 5 Years | 16.98 | %§ | ||
| 10 Years | 6.05 | %§ | 10 Years | 8.54 | %§ | ||
| Russell Developed ex-U.S. Large Cap® Index Net**** | |||||||
| Balanced Strategy Fund - Class R4‡‡‡ | Total | ||||||
| Total | �� | Return | |||||
| Return | 1 Year | 0.17 | % | ||||
| 1 Year | 6.39 | % | 5 Years | 6.85 | %§ | ||
| 5 Years | 8.84 | %§ | 10 Years | 6.25 | %§ | ||
| 10 Years | 5.78 | %§ | |||||
| 40 Balanced Strategy Fund | |||||||
| Russell Investment Company | |
| Balanced Strategy Fund | |
| Portfolio Management Discussion and Analysis, continued — October 31, 2014 | |
| (Unaudited) | |
| The Balanced Strategy Fund (the “Fund”) is a fund of funds that | income was a key positive driver to the Fund’s benchmark-relative |
| invests in other Russell Investment Company mutual funds (the | performance, as fixed income markets finished at 4.14% for the |
| “Underlying Funds”). The Underlying Funds employ a multi- | fiscal year as measured by the Fund’s benchmark. |
| manager approach whereby portions of the Underlying Funds | Fixed income markets had overall positive performance for the |
| are allocated to different money managers. Underlying Fund | fiscal year, as interest rates generally trended lower over the |
| assets not allocated to money managers are managed by Russell | period, providing a tailwind to aggregate fixed income markets. |
| Investment Management Company (“RIMCo”), the Fund’s and | However, the Fund’s exposure to the fixed income asset class had |
| Underlying Funds’ advisor. RIMCo, as the Underlying Funds’ | a modestly negative effect on benchmark-relative performance |
| advisor, may change the allocation of the Underlying Funds’ | due to the Fund’s allocation to the Russell Global Opportunistic |
| assets among money managers at any time. An exemptive order | Credit Fund. The Fund’s strategic exposure to other asset classes |
| from the Securities and Exchange Commission (“SEC”) permits | beyond aggregate fixed income was positive, as other asset classes |
| RIMCo to engage or terminate a money manager in an Underlying | such as equities outperformed fixed income. |
| Fund at any time, subject to approval by the Underlying Fund’s | |
| Board, without a shareholder vote. Pursuant to the terms of the | Global REITs and listed infrastructure (as represented by the |
| exemptive order, an Underlying Fund is required to notify its | FTSE/EPRA/ NAREIT Developed Real Estate Index (Net) and |
| shareholders within 90 days of when a money manager begins | S&P Global Infrastructure Index (Net)) finished the fiscal year |
| providing services. | up 9.84% and 13.36% respectively. These asset classes also |
| outperformed fixed income markets, which was beneficial to | |
| What is the Fund’s investment objective? | the Fund’s performance through its allocation to the Russell |
| The Fund seeks to provide above average long term capital | Global Real Estate Securities and Russell Global Infrastructure |
| appreciation and a moderate level of current income. | Funds. Commodities largely underperformed broader equity and |
| fixed income markets with a loss of 5.94% for the fiscal year (as | |
| How did the Fund perform relative to its benchmark for the | represented by the Bloomberg Commodity Index Total Return). |
| fiscal year ended October 31, 2014? | Thus, the Fund’s allocation to the Russell Commodity Strategies |
| For the fiscal year ended October 31, 2014, the Fund’s Class A, | Fund was a headwind to Fund performance. |
| Class C, Class E, Class R1, Class R4, Class R5 and Class S Shares | |
| gained 6.30%, 5.51%, 6.26%, 6.63%, 6.39%, 6.17% and 6.52%, | How did the investment strategies and techniques employed |
| respectively. This is compared to the Fund’s primary benchmark, | by the Fund and the Underlying Funds affect the Fund’s |
| the Barclays U.S. Aggregate Bond Index, which gained 4.14% | performance? |
| during the same period. The Fund’s performance includes | The Fund is a fund of funds and its performance is based on |
| operating expenses, whereas index returns are unmanaged and | RIMCo’s strategic asset allocations and the performance of the |
| do not include expenses of any kind. | Underlying Funds in which the Fund invests. |
| For the fiscal year ended October 31, 2014, the Morningstar® | With respect to the Fund’s global equity exposure, the Fund’s |
| Moderate Allocation, a group of funds that Morningstar considers | strategic allocation to the Russell International Developed Markets |
| to have investment strategies similar to those of the Fund, gained | Fund and Russell Emerging Markets Fund detracted from the |
| 8.28%. This result serves as a peer comparison and is expressed | Fund’s benchmark-relative performance, while its allocation to |
| net of operating expenses. | the Russell Global Equity Fund positively impacted performance. |
| The Fund’s outperformance relative to the Barclays U.S. Aggregate | From an active management standpoint, the Russell International |
| Bond Index was due to the Fund’s mix of out-of-benchmark | Developed Markets Fund outperformed the broad non-U.S. equity |
| allocations to equity, global real estate, and listed infrastructure | market as represented by the Russell Developed ex-U.S. Large |
| Underlying Funds, which outperformed fixed income Underlying | Cap™ Index Net, while the Russell Global Equity Fund performed |
| Funds over the period. | in-line with the broad global equity market as represented by the |
| Russell Developed Large Cap Net Index. The Russell Emerging | |
| How did the market conditions described in the Market | Markets Fund underperformed its emerging markets benchmark. |
| Summary report affect the Fund’s performance? | Effective stock selection in Continental Europe was a tailwind |
| It was a positive equity market for the fiscal year ending October | to performance for the Russell International Developed Markets |
| 31, 2014. U.S. stocks (as measured by the Russell 3000® Index) | Fund against its benchmark, while an overweight to and stock |
| returned 16.07% over the period, while non-U.S. equities | selection within information technology benefited performance of |
| returned 0.17% (as measured by the Russell Developed ex-U.S. | the Russell Global Equity Fund against its benchmark. For the |
| Large Cap Index). The outperformance of U.S. equities over fixed | Russell Emerging Markets Fund, unsuccessful stock selection |
| Balanced Strategy Fund 41 | |
| Russell Investment Company | ||
| Balanced Strategy Fund | ||
| Portfolio Management Discussion and Analysis, continued — October 31, 2014 | ||
| (Unaudited) | ||
| in China, South Korea, Russia, and Taiwan were detractors from | Describe any changes to the Fund’s structure or allocation | |
| performance. | to the Underlying Funds. | |
| The Fund’s strategic allocation to U.S. large cap Underlying | RIMCo has the discretion to vary the Fund’s actual allocation | |
| Funds benefited the Fund’s benchmark-relative performance, as | from the target strategic asset allocation by up to +/- 5% at | |
| broad U.S. equities outperformed core fixed income for the period. | the equity, fixed income or alternative category level based on | |
| Underlying active management detracted, as each of the large cap | RIMCo’s capital markets research. Performance of the Fund’s | |
| U.S. equity Underlying Funds underperformed its respective U.S. | short-term asset allocation modifications ended the fiscal year | |
| equity market segment as represented by its primary benchmark. | modestly positive. This was driven by beneficial tilts away from | |
| In particular, the Russell U.S. Core Equity Fund underperformed | target strategic allocations. | |
| the Russell 1000® Index due to an underweight to electric utilities | Entering the fiscal year, the Fund was underweight the Russell | |
| and real estate investment trusts (REITs), which outperformed | Commodity Strategies Fund, Russell Global Real Estate Securities | |
| for the year. In addition, the Fund’s strategic allocation to the | Fund, and Russell U.S. Small Cap Equity Fund by 1.00% each, | |
| Russell U.S. Small Cap Equity Fund benefited the Fund’s | and overweight the Russell Emerging Markets Fund, Russell | |
| benchmark-relative performance, though the Underlying Fund | Global Infrastructure Fund and Russell U.S. Core Equity Fund | |
| underperformed its Russell 2000® Index benchmark. | by 1.00% each, relative to the target strategic asset allocation | |
| The Fund’s strategic allocation to fixed income Underlying | weights. The positioning to the real asset Underlying Funds was | |
| Funds negatively impacted its benchmark-relative performance. | driven by a cautious medium term outlook on commodities and | |
| An allocation to the Russell Global Opportunistic Credit Fund | a desire to mitigate the real estate exposure’s contribution to | |
| detracted, as it underperformed the Fund’s benchmark. An | interest rate sensitivity for the total portfolio. Within equities, the | |
| allocation to the Russell Strategic Bond Fund was slightly | positioning was driven by recognition of stretched valuations in | |
| positive. With the exception of the Russell Global Opportunistic | U.S. small cap and attractive valuations in emerging markets. | |
| Credit Fund, results from active management were positive. | On January 13, 2014, the Fund implemented a new target strategic | |
| For the Russell Strategic Bond Fund, exposure to non-agency | asset allocation that incorporated a higher exposure to equities | |
| mortgages and emerging market debt were key contributors to | and real assets based on RIMCo’s capital markets research. | |
| the Underlying Fund’s benchmark-relative outperformance. | ||
| Currency selection was also positive, particularly a long U.S. | In connection with this reallocation, the Fund also shifted its | |
| Dollar positions versus short positions to the Australian Dollar, | tactical allocations relative to the new strategic asset allocation | |
| Euro and Japanese Yen. | weights as follows: | |
| The Fund’s strategic allocation to alternative Underlying Funds | - 1.00% overweight to the Russell U.S. Defensive Equity Fund | |
| had a mixed impact on benchmark-relative performance. The | and 1.00% underweight to the Russell Commodity Strategies | |
| Fund’s allocations to the Russell Global Real Estate Securities | Fund due to limited commodity price appreciation expectations | |
| Fund and Russell Global Infrastructure Fund were positive as | over the medium term. | |
| these Underlying Funds outperformed the Fund’s benchmark. | - 1.00% overweight to the Russell U.S. Defensive Equity Fund and | |
| The Fund’s | strategic allocation to the Russell Multi-Strategy | 1.00% underweight to the Russell Global Real Estate Securities |
| Alternative | Fund and Russell Commodity Strategies Fund | Fund due to caution over the interest rate sensitivity of REITs in |
| detracted, as these Underlying Funds underperformed the Fund’s | an environment of potential rising rates. This resulted in a total | |
| benchmark. From an active management standpoint, performance | of 2.00% overweight to the Russell U.S. Defensive Equity Fund. | |
| of these Underlying Funds was generally negative. The Russell | - 2.50% overweight to the Russell International Developed | |
| Global Infrastructure Fund, Russell Commodity Strategies Fund, | Markets Fund and 2.50% underweight to the Russell U.S. Small | |
| and Russell Multi-Strategy Alternative Fund underperformed | Cap Equity Fund due to concerns of stretched valuations within | |
| their respective asset class benchmarks while the Russell Global | U.S. small cap equities. | |
| Real Estate Securities Fund outperformed its respective asset | ||
| class benchmark. In particular, the Russell Global Infrastructure | - 1.00% overweight to the Russell Global Equity Fund and | |
| Fund was underweight to North American electric utilities and | 1.00% underweight to the Russell Emerging Markets Fund due | |
| the oil and gas pipelines sectors, which were among the strongest | to concerns of strong negative momentum exhibited in emerging | |
| performing sectors for the year. For the Russell Global Real | markets. | |
| Estate Securities Fund, security selection within the U.S. was | At the end of May 2014, half of the 2.50% underweight to the | |
| positive while an overweight to and security selection within | Russell U.S. Small Cap Equity Fund was removed in order to | |
| Japan detracted from performance. | capture partial gains from the position. | |
42 Balanced Strategy Fund
| Russell Investment Company | |
| Balanced Strategy Fund | |
| Portfolio Management Discussion and Analysis, continued — October 31, 2014 | |
| (Unaudited) | |
| On June 11, 2014, the Fund took an additional 0.50% | to maintain the existing overweight to the Russell International |
| underweight to the Russell Global Real Estate Securities Fund | Developed Markets Fund. |
| given the recent strong performance of the REITs asset class but | At the end of the fiscal year, the Fund maintained a broad |
| continued concern over rate sensitivity. The Fund also took a | overweight to equity Underlying Funds relative to real asset |
| 0.50% underweight to the Russell Global Infrastructure Fund, | Underlying Funds. By the end of the fiscal year, the aggregate |
| recognizing strong recent performance and stretched valuations. | positioning was modestly positive to performance. |
| Both positions were offset by equal overweights to the Russell | |
| U.S. Dynamic Equity Fund. | The views expressed in this report reflect those of the portfolio |
| On July 9, 2014, the Fund removed its underweight to the Russell | managers only through the end of the period covered by |
| Emerging Markets Fund relative to the Russell Global Equity | the report. These views do not necessarily represent the |
| Fund, as recent positive momentum suggested further strength in | views of RIMCo, or any other person in RIMCo or any other |
| emerging markets relative to broad global equities. This position | affiliated organization. These views are subject to change |
| was closed at a loss. | at any time based upon market conditions or other events, |
| and RIMCo disclaims any responsibility to update the views | |
| On July 22, 2014, the Fund closed its underweight to the Russell | contained herein. These views should not be relied on as |
| U.S. Small Cap Equity Fund primarily driven by the Underlying | investment advice and, because investment decisions for |
| Fund meeting performance expectations. The Russell U.S. Small | a Russell Investment Company (“RIC”) Fund are based on |
| Cap Equity Fund was funded back to target weight by reducing | numerous factors, should not be relied on as an indication |
| the overweight to the Russell U.S. Defensive Equity Fund in order | of investment decisions of any RIC Fund. |
* Assumes initial investment on November 1, 2004.
** The Barclays U.S. Aggregate Bond Index is an index, with income reinvested, generally representative of intermediate-term government bonds, investment-grade corporate debt securities and mortgage-backed securities.
*** Russell 1000® Index includes the 1,000 largest companies in the Russell 3000® Index. The Russell 1000® Index represents the universe of stocks from which most active money managers typically select. The Russell 1000® Index return reflects adjustments from income dividends and capital gain distributions reinvested as of the ex-dividend dates.
**** Russell Developed ex-U.S. Large Cap® Index (net of tax on dividends from foreign holdings) is an index which offers investors access to the large-cap segment of the global equity market, excluding companies assigned to the United States. It is constructed to provide a comprehensive and unbiased barometer for the large-cap segment and is completely reconstituted annually to accurately reflect the changes in the market over time.
‡ The performance shown has been adjusted to reflect the deduction of the maximum Class A sales charge of 5.75%.
‡‡ The Fund first issued Class R1 Shares on June 6, 2006. The returns shown for Class R1 Shares prior to that date are the returns of the Fund’s Class S Shares.
‡‡‡ The Fund first issued Class R4 and Class R5 Shares on October 1, 2014. The returns shown for Class R4 and Class R5 Shares prior to that date are the returns of the Fund’s Class R2 and Class R3 Shares, respectively.
§ Annualized.
Performance is historical and assumes reinvestment of all dividends and capital gains. Investment return and principal value will fluctuate so that an investor’s shares, when redeemed, may be worth more or less than when purchased. Past performance is not indicative of future results. The returns shown do not reflect the deduction of taxes that a shareholder would pay on Fund distributions or the redemption of Fund shares.
Balanced Strategy Fund 43
| Russell Investment Company | ||||||
| Balanced Strategy Fund | ||||||
| Shareholder Expense Example — October 31, 2014 (Unaudited) | ||||||
| Fund Expenses | Please note that the expenses shown in the table are meant | |||||
| The following disclosure provides important information | to highlight your ongoing costs only and do not reflect any | |||||
| regarding the Fund’s Shareholder Expense Example | transactional costs. Therefore, the information under the heading | |||||
| (“Example”). | “Hypothetical Performance (5% return before expenses)” is | |||||
| useful in comparing ongoing costs only, and will not help you | ||||||
| Example | determine the relative total costs of owning different funds. In | |||||
| As a shareholder of the Fund, you incur two types of costs: (1) | addition, if these transactional costs were included, your costs | |||||
| transaction costs, and (2) ongoing costs, including advisory and | would have been higher. | |||||
| administrative fees; distribution (12b-1) and/or service fees; | Hypothetical | |||||
| and other Fund expenses. The Example is intended to help | Performance (5% | |||||
| you understand your ongoing costs (in dollars) of investing in | Actual | return before | ||||
| the Fund and to compare these costs with the ongoing costs of | Class A | Performance | expenses) | |||
| Beginning Account Value | ||||||
| investing in other mutual funds. The Example is based on an | May 1, 2014 | $ | 1,000.00 | $ | 1,000.00 | |
| investment of $1,000 invested at the beginning of the period and | Ending Account Value | |||||
| held for the entire period indicated, which for this Fund is from | October 31, 2014 | $ | 1,023.40 | $ | 1,022.43 | |
| May 1, 2014 to October 31, 2014. | Expenses Paid During Period* | $ | 2.81 | $ | 2.80 | |
| Actual Expenses | * Expenses are equal to the Fund's annualized expense ratio of 0.55% | |||||
| (representing the six month period annualized), multiplied by the average | ||||||
| The information in the table under the heading “Actual | account value over the period, multiplied by 184/365 (to reflect the one-half | |||||
| Performance” provides information about actual account values | year period). May reflect amounts waived and/or reimbursed. Without any | |||||
| and actual expenses. You may use the information in this column, | waivers and/or reimbursements, expenses would have been higher. | |||||
| together with the amount you invested, to estimate the expenses | ||||||
| Hypothetical | ||||||
| that you paid over the period. Simply divide your account value by | Performance (5% | |||||
| $1,000 (for example, an $8,600 account value divided by $1,000 | Actual | return before | ||||
| = 8.6), then multiply the result by the number in the first column | Class C | Performance | expenses) | |||
| Beginning Account Value | ||||||
| in the row entitled “Expenses Paid During Period” to estimate | May 1, 2014 | $ | 1,000.00 | $ | 1,000.00 | |
| the expenses you paid on your account during this period. | Ending Account Value | |||||
| October 31, 2014 | $ | 1,019.10 | $ | 1,018.65 | ||
| Hypothetical Example for Comparison Purposes | Expenses Paid During Period* | $ | 6.62 | $ | 6.61 | |
| The information in the table under the heading “Hypothetical | ||||||
| Performance (5% return before expenses)” provides information | * Expenses are equal to the Fund's annualized expense ratio of 1.30% | |||||
| (representing the six month period annualized), multiplied by the average | ||||||
| about hypothetical account values and hypothetical expenses | account value over the period, multiplied by 184/365 (to reflect the one-half | |||||
| based on the Fund’s actual expense ratio and an assumed rate of | year period). May reflect amounts waived and/or reimbursed. Without any | |||||
| return of 5% per year before expenses, which is not the Fund’s | waivers and/or reimbursements, expenses would have been higher. | |||||
| actual return. The hypothetical account values and expenses | ||||||
| Hypothetical | ||||||
| may not be used to estimate the actual ending account balance or | Performance (5% | |||||
| expenses you paid for the period. You may use this information | Actual | return before | ||||
| to compare the ongoing costs of investing in the Fund and other | Class E | Performance | expenses) | |||
| funds. To do so, compare this 5% hypothetical example with the | Beginning Account Value | |||||
| May 1, 2014 | $ | 1,000.00 | $ | 1,000.00 | ||
| 5% hypothetical examples that appear in the shareholder reports | Ending Account Value | |||||
| of other funds. | October 31, 2014 | $ | 1,023.20 | $ | 1,022.43 | |
| Expenses Paid During Period* | $ | 2.80 | $ | 2.80 | ||
| * Expenses are equal to the Fund's annualized expense ratio of 0.55% | ||||||
| (representing the six month period annualized), multiplied by the average | ||||||
| account value over the period, multiplied by 184/365 (to reflect the one-half | ||||||
| year period). May reflect amounts waived and/or reimbursed. Without any | ||||||
| waivers and/or reimbursements, expenses would have been higher. | ||||||
44 Balanced Strategy Fund
| Russell Investment Company | |||||||||||||||
| Balanced Strategy Fund | |||||||||||||||
| Shareholder Expense Example, continued — October 31, 2014 (Unaudited) | |||||||||||||||
| Hypothetical | Hypothetical | ||||||||||||||
| Performance (5% | Performance (5% | ||||||||||||||
| Actual | return before | Actual | return before | ||||||||||||
| Class R1 | Performance | expenses) | Class S | Performance | expenses) | ||||||||||
| Beginning Account Value | Beginning Account Value | ||||||||||||||
| May 1, 2014 | $ | 1,000.00 | $ | 1,000.00 | May 1, 2014 | $ | 1,000.00 | $ | 1,000.00 | ||||||
| Ending Account Value | Ending Account Value | ||||||||||||||
| October 31, 2014 | $ | 1,024.90 | $ | 1,024.35 | October 31, 2014 | $ | 1,024.60 | $ | 1,023.69 | ||||||
| Expenses Paid During Period* | $ | 0.87 | $ | 0.87 | Expenses Paid During Period* | $ | 1.53 | $ | 1.53 | ||||||
| * Expenses are equal to the Fund's annualized expense ratio of 0.17% | * Expenses are equal to the Fund's annualized expense ratio of 0.30% | ||||||||||||||
| (representing the six month period annualized), multiplied by the average | (representing the six month period annualized), multiplied by the average | ||||||||||||||
| account value over the period, multiplied by 184/365 (to reflect the one-half | account value over the period, multiplied by 184/365 (to reflect the one-half | ||||||||||||||
| year period). May reflect amounts waived and/or reimbursed. Without any | year period). May reflect amounts waived and/or reimbursed. Without any | ||||||||||||||
| waivers and/or reimbursements, expenses would have been higher. | waivers and/or reimbursements, expenses would have been higher. | ||||||||||||||
| Hypothetical | |||||||||||||||
| Performance (5% | |||||||||||||||
| Actual | return before | ||||||||||||||
| Class R4(1) | Performance | expenses) | |||||||||||||
| Beginning Account Value | |||||||||||||||
| May 1, 2014 | $ | 1,000.00 | $ | 1,000.00 | |||||||||||
| Ending Account Value | |||||||||||||||
| October 31, 2014 | $ | 1,023.60 | $ | 1,023.09 | |||||||||||
| Expenses Paid During Period* | $ | 2.14 | $ | 2.14 | |||||||||||
| * Actual Expenses are equal to the Fund's annualized expense ratio of 0.42% | |||||||||||||||
| (representing the six month period annualized), multiplied by the average | |||||||||||||||
| account value over the period, multiplied by 184/365 (to reflect the one-half | |||||||||||||||
| year period). May reflect amounts waived and/or reimbursed. Without any | |||||||||||||||
| waivers and/or reimbursements, expenses would have been higher. | |||||||||||||||
| (1) As of October 1, 2014, Class R2 Shares were reclassifies as Class R4 Shares, | |||||||||||||||
| and all Class R2 shareholders were issued shares of Class R4. The shareholder | |||||||||||||||
| expense example for the period ended October 31, 2014 reflects the expenses | |||||||||||||||
| and performance of Class R2 Shares for the period May 1 through October 1, | |||||||||||||||
| R4 Shares for the period October 2, 2014 through October 31,2014, and Class | |||||||||||||||
| 2014 | |||||||||||||||
| Hypothetical | |||||||||||||||
| Performance (5% | |||||||||||||||
| Actual | return before | ||||||||||||||
| Class R5(2) | Performance | expenses) | |||||||||||||
| Beginning Account Value | |||||||||||||||
| May 1, 2014 | $ | 1,000.00 | $ | 1,000.00 | |||||||||||
| Ending Account Value | |||||||||||||||
| October 31, 2014 | $ | 1,022.10 | $ | 1,021.83 | |||||||||||
| Expenses Paid During Period* | $ | 3.41 | $ | 3.41 | |||||||||||
| * Actual Expenses are equal to the Fund's annualized expense ratio of 0.67% | |||||||||||||||
| (representing the six month period annualized), multiplied by the average | |||||||||||||||
| account value over the period, multiplied by 184/365 (to reflect the one-half | |||||||||||||||
| year period). May reflect amounts waived and/or reimbursed. Without any | |||||||||||||||
| waivers and/or reimbursements, expenses would have been higher. | |||||||||||||||
| (2) As of October 1, 2014, Class R3 Shares were reclassifies as Class R5 Shares, | |||||||||||||||
| and all Class R3 shareholders were issued shares of Class R5. The shareholder | |||||||||||||||
| expense example for the period ended October 31, 2014 reflects the expenses | |||||||||||||||
| and performance of Class R3 Shares for the period May 1 through October 1, | |||||||||||||||
| R4 Shares for the period October 2, 2014 through October 31,2014, and Class | |||||||||||||||
| 2014. | |||||||||||||||
Balanced Strategy Fund 45
| Russell Investment Company | |||||||||||
| Balanced Strategy Fund | |||||||||||
| Schedule of Investments — October 31, 2014 | |||||||||||
| Amounts in thousands (except share amounts) | Amounts in thousands (except share amounts) | ||||||||||
| Fair | Fair | ||||||||||
| Value | Value | ||||||||||
| Shares | $ | Shares | $ | ||||||||
| Investments 100.0% | Fixed Income - 31.8% | ||||||||||
| Other Russell Investment Company | Russell Global Opportunistic Credit Fund | 14,205,642 | 142,056 | ||||||||
| Series Mutual Funds - Class Y | Russell Strategic Bond Fund | 88,812,013 | 990,254 | ||||||||
| Shares | 1,132,310 | ||||||||||
| International Equities - 28.0% | |||||||||||
| Alternative - 10.8% | Russell Emerging Markets Fund | 12,828,631 | 239,639 | ||||||||
| Russell Commodity Strategies Fund | 8,358,160 | 64,525 | Russell Global Equity Fund | 30,639,942 | 361,245 | ||||||
| Russell Global Infrastructure Fund | 12,459,885 | 161,356 | Russell International Developed Markets | ||||||||
| Russell Global Real Estate Securities Fund | 1,342,655 | 54,659 | Fund | 10,978,824 | 394,140 | ||||||
| Russell Multi-Strategy Alternative Fund | 10,548,518 | 105,696 | 995,024 | ||||||||
| 386,236 | |||||||||||
| Domestic Equities - 29.4% | Total Investments 100.0% | ||||||||||
| Russell U.S. Core Equity Fund | 6,715,002 | 290,021 | (identified cost $3,069,803) | 3,559,569 | |||||||
| Russell U.S. Defensive Equity Fund | 5,346,483 | 246,099 | Other Assets and Liabilities, Net | ||||||||
| Russell U.S. Dynamic Equity Fund | 19,946,218 | 253,117 | -(0.0 | %) | (1,055 | ) | |||||
| Russell U.S. Small Cap Equity Fund | 8,221,641 | 256,762 | |||||||||
| 1,045,999 | Net Assets - 100.0% | 3,558,514 | |||||||||
| Presentation of Portfolio Holdings | |||||||||||
| Categories | % of Net Assets | ||||||||||
| Alternative | 10.8 | ||||||||||
| Domestic Equities | 29.4 | ||||||||||
| Fixed Income | 31.8 | ||||||||||
| International Equities | 28.0 | ||||||||||
| Total Investments | 100.0 | ||||||||||
| Other Assets and Liabilities, Net | (—*) | ||||||||||
| 100.0 | |||||||||||
| * Less than .05% of net assets. | |||||||||||
See accompanying notes which are an integral part of the financial statements.
46 Balanced Strategy Fund
| Russell Investment Company | |||
| Balanced Strategy Fund | |||
| Statement of Assets and Liabilities — October 31, 2014 | |||
| Amounts in thousands | |||
| Assets | |||
| Investments, at identified cost | $ | 3,069,803 | |
| Investments, at fair value | 3,559,569 | ||
| Receivables: | |||
| Investments sold | 2,674 | ||
| Fund shares sold | 3,263 | ||
| Prepaid expenses | 8 | ||
| Total assets | 3,565,514 | ||
| Liabilities | |||
| Payables: | |||
| Fund shares redeemed | 4,778 | ||
| Accrued fees to affiliates | 2,131 | ||
| Other accrued expenses | 91 | ||
| Total liabilities | 7,000 | ||
| Net Assets | $ | 3,558,514 | |
| Net Assets Consist of: | |||
| Undistributed (overdistributed) net investment income | $ | 69 | |
| Accumulated net realized gain (loss) | (15,758 | ) | |
| Unrealized appreciation (depreciation) on investments | 489,766 | ||
| Shares of beneficial interest | 2,870 | ||
| Additional paid-in capital | 3,081,567 | ||
| Net Assets | $ | 3,558,514 | |
| Net Asset Value, offering and redemption price per share: | |||
| Net asset value per share: Class A(#) | $ | 12.43 | |
| Maximum offering price per share (Net asset value plus sales charge of 5.75%): Class A | $ | 13.19 | |
| Class A — Net assets | $ 1,058,976,445 | ||
| Class A — Shares outstanding ($.01 par value) | 85,214,476 | ||
| Net asset value per share: Class C(#) | $ | 12.26 | |
| Class C — Net assets | $ 1,252,252,547 | ||
| Class C — Shares outstanding ($.01 par value) | 102,164,038 | ||
| Net asset value per share: Class E(#) | $ | 12.48 | |
| Class E — Net assets | $ | 64,209,722 | |
| Class E — Shares outstanding ($.01 par value) | 5,146,027 | ||
| Net asset value per share: Class R1(#) | $ | 12.55 | |
| Class R1 — Net assets | $ | 265,650,482 | |
| Class R1 — Shares outstanding ($.01 par value) | 21,165,060 | ||
| Net asset value per share: Class R4(#) | $ | 12.46 | |
| Class R4 — Net assets | $ | 206,600,086 | |
| Class R4 — Shares outstanding ($.01 par value) | 16,584,560 | ||
| Net asset value per share: Class R5(#) | $ | 12.48 | |
| Class R5 — Net assets | $ | 144,430,207 | |
| Class R5 — Shares outstanding ($.01 par value) | 11,575,340 | ||
| Net asset value per share: Class S(#) | $ | 12.55 | |
| Class S — Net assets | $ | 566,394,695 | |
| Class S — Shares outstanding ($.01 par value) | 45,135,518 | ||
| (#) Net asset value per share equals class level net assets divided by class level shares of beneficial interest outstanding. | |||
See accompanying notes which are an integral part of the financial statements.
Balanced Strategy Fund 47
| Russell Investment Company | |||
| Balanced Strategy Fund | |||
| Statement of Operations — For the Period Ended October 31, 2014 | |||
| Amounts in thousands | |||
| Investment Income | |||
| Income distributions from Underlying Funds | $ | 86,950 | |
| Expenses | |||
| Advisory fees | 7,476 | ||
| Administrative fees | 1,704 | ||
| Custodian fees | 33 | ||
| Distribution fees - Class A | 2,709 | ||
| Distribution fees - Class C | 9,607 | ||
| Distribution fees - Class R3 | 401 | ||
| Distribution fees - Class R5 | 29 | ||
| Transfer agent fees - Class A | 2,167 | ||
| Transfer agent fees - Class C | 2,562 | ||
| Transfer agent fees - Class E | 151 | ||
| Transfer agent fees - Class R1 | 559 | ||
| Transfer agent fees - Class R2 | 455 | ||
| Transfer agent fees - Class R3 | 321 | ||
| Transfer agent fees - Class R4 | 34 | ||
| Transfer agent fees - Class R5 | 23 | ||
| Transfer agent fees - Class S | 1,204 | ||
| Professional fees | 97 | ||
| Registration fees | 201 | ||
| Shareholder servicing fees - Class C | 3,202 | ||
| Shareholder servicing fees - Class E | 189 | ||
| Shareholder servicing fees - Class R2 | 569 | ||
| Shareholder servicing fees - Class R3 | 401 | ||
| Shareholder servicing fees - Class R4 | 42 | ||
| Shareholder servicing fees - Class R5 | 29 | ||
| Trustees’ fees | 89 | ||
| Printing fees | 230 | ||
| Miscellaneous | 155 | ||
| Expenses before reductions | 34,639 | ||
| Expense reductions | (6,951 | ) | |
| Net expenses | 27,688 | ||
| Net investment income (loss) | 59,262 | ||
| Net Realized and Unrealized Gain (Loss) | |||
| Net realized gain (loss) on: | |||
| Investments | 117,980 | ||
| Capital gain distributions from Underlying Funds | 42,802 | ||
| Net realized gain (loss) | 160,782 | ||
| Net change in unrealized appreciation (depreciation) on investments | 1,410 | ||
| Net realized and unrealized gain (loss) | 162,192 | ||
| Net Increase (Decrease) in Net Assets from Operations | $ | 221,454 | |
See accompanying notes which are an integral part of the financial statements.
48 Balanced Strategy Fund
| Russell Investment Company | ||||||
| Balanced Strategy Fund | ||||||
| Statements of Changes in Net Assets | ||||||
| For the Periods Ended October 31, | ||||||
| Amounts in thousands | 2014 | 2013 | ||||
| Increase (Decrease) in Net Assets | ||||||
| Operations | ||||||
| Net investment income (loss) | $ | 59,262 | $ | 69,898 | ||
| Net realized gain (loss) | 160,782 | 136,734 | ||||
| Net change in unrealized appreciation (depreciation) | 1,410 | 241,004 | ||||
| Net increase (decrease) in net assets from operations | 221,454 | 447,636 | ||||
| Distributions | ||||||
| From net investment income | ||||||
| Class A | (18,205 | ) | (20,594 | ) | ||
| Class C | (15,502 | ) | (18,373 | ) | ||
| Class E | (1,317 | ) | (2,361 | ) | ||
| Class R1 | (5,758 | ) | (6,331 | ) | ||
| Class R2 | (4,638 | ) | (5,498 | ) | ||
| Class R3 | (3,049 | ) | (4,700 | ) | ||
| Class S | (11,365 | ) | (11,704 | ) | ||
| Net decrease in net assets from distributions | (59,834 | ) | (69,561 | ) | ||
| Share Transactions* | ||||||
| Net increase (decrease) in net assets from share transactions | (495,609 | ) | (324,203 | ) | ||
| Total Net Increase (Decrease) in Net Assets | (333,989 | ) | 53,872 | |||
| Net Assets | ||||||
| Beginning of period | 3,892,503 | 3,838,631 | ||||
| End of period | $ | 3,558,514 | $ | 3,892,503 | ||
| Undistributed (overdistributed) net investment income included in net assets | $ | 69 | $ | 640 | ||
See accompanying notes which are an integral part of the financial statements.
Balanced Strategy Fund 49
Russell Investment Company Balanced Strategy Fund
Statements of Changes in Net Assets, continued
* Share transaction amounts (in thousands) for the periods ended October 31, 2014 and October 31, 2013 were as follows:
| 2014 | 2013 | |||||||||||
| Shares | Dollars | Shares | Dollars | |||||||||
| Class A | ||||||||||||
| Proceeds from shares sold | 9,587 | $ | 116,453 | 12,198 | $ | 137,145 | ||||||
| Proceeds from reinvestment of distributions | 1,508 | 18,065 | 1,877 | 20,428 | ||||||||
| Payments for shares redeemed | (17,848 | ) | (216,878 | ) | (21,274 | ) | (239,033 | ) | ||||
| Net increase (decrease) | (6,753 | ) | (82,360 | ) | (7,199 | ) | (81,460 | ) | ||||
| Class C | ||||||||||||
| Proceeds from shares sold | 14,256 | 171,050 | 17,845 | 199,121 | ||||||||
| Proceeds from reinvestment of distributions | 1,301 | 15,337 | 1,689 | 18,155 | ||||||||
| Payments for shares redeemed | (23,915 | ) | (287,105 | ) | (29,068 | ) | (325,179 | ) | ||||
| Net increase (decrease) | (8,358 | ) | (100,718 | ) | (9,534 | ) | (107,903 | ) | ||||
| Class E | ||||||||||||
| Proceeds from shares sold | 761 | 9,246 | 2,007 | 22,469 | ||||||||
| Proceeds from reinvestment of distributions | 109 | 1,312 | 215 | 2,347 | ||||||||
| Payments for shares redeemed | (3,176 | ) | (38,737 | ) | (6,721 | ) | (75,697 | ) | ||||
| Net increase (decrease) | (2,306 | ) | (28,179 | ) | (4,499 | ) | (50,881 | ) | ||||
| Class R1 | ||||||||||||
| Proceeds from shares sold | 4,136 | 50,681 | 6,986 | 79,065 | ||||||||
| Proceeds from reinvestment of distributions | 475 | 5,758 | 576 | 6,331 | ||||||||
| Payments for shares redeemed | (8,952 | ) | (109,134 | ) | (7,793 | ) | (87,878 | ) | ||||
| Net increase (decrease) | (4,341 | ) | (52,695 | ) | (231 | ) | (2,482 | ) | ||||
| Class R2 | ||||||||||||
| Proceeds from shares sold | 1,953 | 23,694 | 5,601 | 63,007 | ||||||||
| Proceeds from reinvestment of distributions | 386 | 4,637 | 504 | 5,498 | ||||||||
| Payments for shares redeemed | (25,555 | ) | (311,696 | ) | (7,686 | ) | (86,053 | ) | ||||
| Net increase (decrease) | (23,216 | ) | (283,365 | ) | (1,581 | ) | (17,548 | ) | ||||
| Class R3 | ||||||||||||
| Proceeds from shares sold | 1,637 | 19,960 | 2,961 | 33,399 | ||||||||
| Proceeds from reinvestment of distributions | 254 | 3,049 | 430 | 4,699 | ||||||||
| Payments for shares redeemed | (19,686 | ) | (239,955 | ) | (9,752 | ) | (110,423 | ) | ||||
| Net increase (decrease) | (17,795 | ) | (216,946 | ) | (6,361 | ) | (72,325 | ) | ||||
| Class R4 | ||||||||||||
| Proceeds from shares sold | 16,937 | 206,514 | — | — | ||||||||
| Payments for shares redeemed | (352 | ) | (4,277 | ) | — | — | ||||||
| Net increase (decrease) | 16,585 | 202,237 | — | — | ||||||||
| Class R5 | ||||||||||||
| Proceeds from shares sold | 11,750 | 143,535 | — | — | ||||||||
| Payments for shares redeemed | (175 | ) | (2,123 | ) | — | — | ||||||
| Net increase (decrease) | 11,575 | 141,412 | — | — | ||||||||
| Class S | ||||||||||||
| Proceeds from shares sold | 12,171 | 148,836 | 18,052 | 205,811 | ||||||||
| Proceeds from reinvestment of distributions | 922 | 11,161 | 1,035 | 11,376 | ||||||||
| Payments for shares redeemed | (19,157 | ) | (234,992 | ) | (18,351 | ) | (208,791 | ) | ||||
| Net increase (decrease) | (6,064 | ) | (74,995 | ) | 736 | 8,396 | ||||||
| Total increase (decrease) | (40,673 | ) | $ | (495,609 | ) | (28,669 | ) | $ | (324,203 | ) | ||
See accompanying notes which are an integral part of the financial statements.
50 Balanced Strategy Fund
(This page intentionally left blank)
| Russell Investment Company | |||||||||||
| Balanced Strategy Fund | |||||||||||
| Financial Highlights — For the Periods Ended | |||||||||||
| For a Share Outstanding Throughout Each Period. | |||||||||||
| $ | |||||||||||
| $ | Net | $ | $ | $ | |||||||
| Net Asset Value, | Investment | Net Realized | Total from | Distributions | |||||||
| Beginning of | Income (Loss) | and Unrealized | Investment | from Net | |||||||
| Period | (a)(b)(e) | Gain (Loss) | Operations | Investment Income | |||||||
| Class A | |||||||||||
| October 31, 2014 | 11.89 | .21 | .53 | .74 | (.20 | ) | |||||
| October 31, 2013 | 10.78 | .22 | 1.10 | 1.32 | (.21 | ) | |||||
| October 31, 2012 | 10.20 | .22 | .57 | .79 | (.21 | ) | |||||
| October 31, 2011 | 10.33 | .29 | (.13) | .16 | (.29 | ) | |||||
| October 31, 2010 | 9.12 | .22 | 1.21 | 1.43 | (.22 | ) | |||||
| Class C | |||||||||||
| October 31, 2014 | 11.76 | .12 | .52 | .64 | (.14 | ) | |||||
| October 31, 2013 | 10.69 | .14 | 1.09 | 1.23 | (.16 | ) | |||||
| October 31, 2012 | 10.11 | .14 | .58 | .72 | (.14 | ) | |||||
| October 31, 2011 | 10.27 | .21 | (.14) | .07 | (.23 | ) | |||||
| October 31, 2010 | 9.07 | .14 | 1.21 | 1.35 | (.15 | ) | |||||
| Class E | |||||||||||
| October 31, 2014 | 11.94 | .22 | .52 | .74 | (.20 | ) | |||||
| October 31, 2013 | 10.82 | .25 | 1.08 | 1.33 | (.21 | ) | |||||
| October 31, 2012 | 10.23 | .22 | .58 | .80 | (.21 | ) | |||||
| October 31, 2011 | 10.36 | .39 | (.24) | .15 | (.28 | ) | |||||
| October 31, 2010 | 9.15 | .22 | 1.21 | 1.43 | (.22 | ) | |||||
| Class R1 | |||||||||||
| October 31, 2014 | 12.00 | .27 | .52 | .79 | (.24 | ) | |||||
| October 31, 2013 | 10.86 | .27 | 1.12 | 1.39 | (.25 | ) | |||||
| October 31, 2012 | 10.28 | .25 | .59 | .84 | (.26 | ) | |||||
| October 31, 2011 | 10.41 | .30 | (.10) | .20 | (.33 | ) | |||||
| October 31, 2010 | 9.19 | .23 | 1.23 | 1.46 | (.24 | ) | |||||
| Class R4(3) | |||||||||||
| October 31, 2014 | 11.92 | .24 | .51 | .75 | (.21 | ) | |||||
| October 31, 2013 | 10.80 | .24 | 1.11 | 1.35 | (.23 | ) | |||||
| October 31, 2012 | 10.21 | .23 | .59 | .82 | (.23 | ) | |||||
| October 31, 2011 | 10.36 | .17 | (.01) | .16 | (.31 | ) | |||||
| October 31, 2010 | 9.14 | .21 | 1.23 | 1.44 | (.22 | ) | |||||
| Class R5(4) | |||||||||||
| October 31, 2014 | 11.94 | .22 | .51 | .73 | (.19 | ) | |||||
| October 31, 2013 | 10.83 | .23 | 1.08 | 1.31 | (.20 | ) | |||||
| October 31, 2012 | 10.23 | .24 | .56 | .80 | (.20 | ) | |||||
| October 31, 2011 | 10.36 | .30 | (.15) | .15 | (.28 | ) | |||||
| October 31, 2010 | 9.15 | .20 | 1.20 | 1.40 | (.19 | ) | |||||
| Class S | |||||||||||
| October 31, 2014 | 12.00 | .25 | .52 | .77 | (.22 | ) | |||||
| October 31, 2013 | 10.87 | .25 | 1.12 | 1.37 | (.24 | ) | |||||
| October 31, 2012 | 10.28 | .24 | .59 | .83 | (.24 | ) | |||||
| October 31, 2011 | 10.42 | .32 | (.15) | .17 | (.31 | ) | |||||
| October 31, 2010 | 9.19 | .24 | 1.23 | 1.47 | (.24 | ) | |||||
See accompanying notes which are an integral part of the financial statements.
52 Balanced Strategy Fund
| % | % | % | ||||||||||||||
| $ | $ | Ratio of Expenses | Ratio of Expenses | Ratio of Net | ||||||||||||
| Net Asset Value, | % | Net Assets, | to Average | to Average | Investment Income | % | ||||||||||
| $ | End of | Total | End of Period | Net Assets, | Net Assets, | to Average | Portfolio | |||||||||
| Total Distributions | Period | Return(d) | (000 | ) | Gross(g) | Net(e)(g) | Net Assets(b)(e) | Turnover Rate | ||||||||
| (.20 | ) | 12.43 | 6.30 | 1,058,976 | .72 | .56 | 1.74 | 19 | ||||||||
| (.21 | ) | 11.89 | 12.47 | 1,093,788 | .71 | .57 | 1.99 | 11 | ||||||||
| (.21 | ) | 10.78 | 7.94 | 1,068,990 | .70 | .56 | 2.07 | 20 | ||||||||
| (.29 | ) | 10.20 | 1.51 | 1,058,489 | .71 | .55 | 2.79 | 9 | ||||||||
| (.22 | ) | 10.33 | 15.86 | 1,095,814 | .70 | .54 | 2.25 | 24 | ||||||||
| (.14 | ) | 12.26 | 5.51 | 1,252,253 | 1.47 | 1.31 | .98 | 19 | ||||||||
| (.16 | ) | 11.76 | 11.60 | 1,300,173 | 1.46 | 1.32 | 1.22 | 11 | ||||||||
| (.14 | ) | 10.69 | 7.22 | 1,283,125 | 1.45 | 1.31 | 1.32 | 20 | ||||||||
| (.23 | ) | 10.11 | .64 | 1,264,734 | 1.46 | 1.30 | 2.03 | 9 | ||||||||
| (.15 | ) | 10.27 | 14.99 | 1,310,397 | 1.45 | 1.29 | 1.49 | 24 | ||||||||
| (.20 | ) | 12.48 | 6.26 | 64,210 | .72 | .56 | 1.81 | 19 | ||||||||
| (.21 | ) | 11.94 | 12.50 | 88,974 | .71 | .57 | 2.22 | 11 | ||||||||
| (.21 | ) | 10.82 | 7.98 | 129,301 | .70 | .56 | 2.16 | 20 | ||||||||
| (.28 | ) | 10.23 | 1.42 | 167,108 | .71 | .55 | 3.64 | 9 | ||||||||
| (.22 | ) | 10.36 | 15.81 | 526,084 | .70 | .54 | 2.24 | 24 | ||||||||
| (.24 | ) | 12.55 | 6.63 | 265,650 | .47 | .17 | 2.24 | 19 | ||||||||
| (.25 | ) | 12.00 | 13.00 | 306,020 | .46 | .17 | 2.36 | 11 | ||||||||
| (.26 | ) | 10.86 | 8.36 | 279,572 | .45 | .14 | 2.34 | 20 | ||||||||
| (.33 | ) | 10.28 | 1.94 | 207,763 | .47 | .12 | 2.84 | 9 | ||||||||
| (.24 | ) | 10.41 | 16.14 | 113,700 | .45 | .27 | 2.35 | 24 | ||||||||
| (.21 | ) | 12.46 | 6.39 | 206,600 | .72 | .42 | 1.99 | 19 | ||||||||
| (.23 | ) | 11.92 | 12.67 | 276,656 | .71 | .42 | 2.15 | 11 | ||||||||
| (.23 | ) | 10.80 | 8.23 | 267,734 | .70 | .39 | 2.24 | 20 | ||||||||
| (.31 | ) | 10.21 | 1.52 | 250,510 | .72 | .37 | 1.64 | 9 | ||||||||
| (.22 | ) | 10.36 | 15.95 | 31,620 | .70 | .52 | 2.19 | 24 | ||||||||
| (.19 | ) | 12.48 | 6.17 | 144,430 | .97 | .67 | 1.82 | 19 | ||||||||
| (.20 | ) | 11.94 | 12.32 | 212,516 | .96 | .67 | 2.01 | 11 | ||||||||
| (.20 | ) | 10.83 | 7.95 | 261,491 | .95 | .64 | 2.34 | 20 | ||||||||
| (.28 | ) | 10.23 | 1.43 | 697,038 | .96 | .62 | 2.82 | 9 | ||||||||
| (.19 | ) | 10.36 | 15.52 | 840,066 | .95 | .77 | 2.03 | 24 | ||||||||
| (.22 | ) | 12.55 | 6.52 | 566,395 | .47 | .31 | 2.03 | 19 | ||||||||
| (.24 | ) | 12.00 | 12.77 | 614,376 | .46 | .32 | 2.20 | 11 | ||||||||
| (.24 | ) | 10.87 | 8.26 | 548,418 | .45 | .31 | 2.30 | 20 | ||||||||
| (.31 | ) | 10.28 | 1.65 | 526,437 | .47 | .30 | 3.03 | 9 | ||||||||
| (.24 | ) | 10.42 | 16.25 | 561,801 | .45 | .29 | 2.49 | 24 | ||||||||
See accompanying notes which are an integral part of the financial statements.
Balanced Strategy Fund 53
Russell Investment Company
Growth Strategy Fund
Portfolio Management Discussion and Analysis — October 31, 2014 (Unaudited)
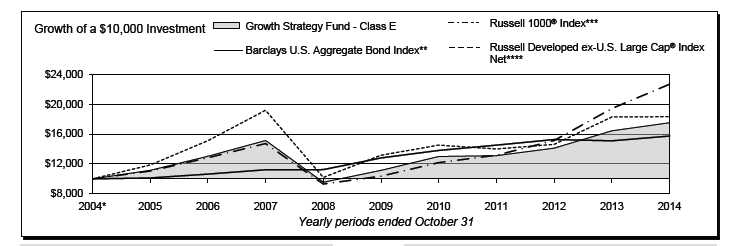
| Growth Strategy Fund - Class A‡ | Growth Strategy Fund - Class R5‡‡‡ | ||||||
| Total | Total | ||||||
| Return | Return | ||||||
| 1 Year | 0.38 | % | 1 Year | 6.37 | % | ||
| 5 Years | 8.17 | %§ | 5 Years | 9.33 | %§ | ||
| 10 Years | 5.13 | %§ | 10 Years | 5.57 | %§ | ||
| Growth Strategy Fund - Class C | Growth Strategy Fund - Class S | ||||||
| Total | Total | ||||||
| Return | Return | ||||||
| 1 Year | 5.77 | % | 1 Year | 6.81 | % | ||
| 5 Years | 8.64 | %§ | 5 Years | 9.74 | %§ | ||
| 10 Years | 4.98 | %§ | 10 Years | 6.03 | %§ | ||
| Growth Strategy Fund - Class E | Barclays U.S. Aggregate Bond Index** | ||||||
| Total | Total | ||||||
| Return | Return | ||||||
| 1 Year | 6.57 | % | 1 Year | 4.14 | % | ||
| 5 Years | 9.48 | %§ | 5 Years | 4.22 | %§ | ||
| 10 Years | 5.77 | %§ | 10 Years | 4.64 | %§ | ||
| Russell 1000® Index*** | |||||||
| Growth Strategy Fund - Class R1‡‡ | |||||||
| Total | |||||||
| Total | Return | ||||||
| Return | |||||||
| 1 Year | 6.95 | % | 1 Year | 16.78 | % | ||
| 5 Years | 9.87 | %§ | 5 Years | 16.98 | %§ | ||
| 10 Years | 6.09 | %§ | 10 Years | 8.54 | %§ | ||
| Russell Developed ex-U.S. Large Cap® Index Net**** | |||||||
| Growth Strategy Fund - Class R4‡‡‡ | Total | ||||||
| Total | Return | ||||||
| Return | 1 Year | 0.17 | % | ||||
| 1 Year | 6.63 | % | 5 Years | 6.85 | %§ | ||
| 5 Years | 9.59 | %§ | 10 Years | 6.25 | %§ | ||
| 10 Years | 5.83 | %§ | |||||
| Russell Investment Company | |
| Growth Strategy Fund | |
| Portfolio Management Discussion and Analysis, continued — October 31, 2014 | |
| (Unaudited) | |
| The Growth Strategy Fund (the “Fund”) is a fund of funds that | U.S. Large Cap Index). Given the significant outperformance of |
| invests in other Russell Investment Company mutual funds (the | U.S. equities over non-U.S. equities, the Fund’s non-U.S. equity |
| “Underlying Funds”). The Underlying Funds employ a multi- | exposure detracted from its performance against its U.S. large cap |
| manager approach whereby portions of the Underlying Funds | benchmark. |
| are allocated to different money managers. Underlying Fund | While fixed income markets were overall positive for the year |
| assets not allocated to money managers are managed by Russell | as interest rates generally trended lower, fixed income markets |
| Investment Management Company (“RIMCo”), the Fund’s and | underperformed broad equity markets and therefore the Fund’s |
| Underlying Funds’ advisor. RIMCo, as the Underlying Funds’ | fixed income exposure detracted from benchmark-relative |
| advisor, may change the allocation of the Underlying Funds’ | returns. In particular, the Fund’s exposure to global high yield |
| assets among money managers at any time. An exemptive order | and emerging market debt through its investments in fixed income |
| from the Securities and Exchange Commission (“SEC”) permits | Underlying Funds detracted as these asset classes notably lagged |
| RIMCo to engage or terminate a money manager in an Underlying | U.S. equities. |
| Fund at any time, subject to approval by the Underlying Fund’s | |
| Board, without a shareholder vote. Pursuant to the terms of the | Global REITs and listed infrastructure (as represented by the |
| exemptive order, an Underlying Fund is required to notify its | FTSE/EPRA/ NAREIT Developed Real Estate Index (Net) and |
| shareholders within 90 days of when a money manager begins | S&P Global Infrastructure Index (Net)) finished the fiscal year up |
| providing services. | 9.84% and 13.36% respectively. However, listed infrastructure |
| and global REITs underperformed U.S. equity markets, detracted | |
| What is the Fund’s investment objective? | from the Fund’s benchmark-relative performance through its |
| The Fund seeks to provide high long term capital appreciation, | allocations to the Russell Global Real Estate Securities and |
| and as a secondary objective, current income. | Russell Global Infrastructure Funds. Commodities largely |
| underperformed broader equity markets with a loss of 5.94% | |
| How did the Fund perform relative to its benchmark for the | for the fiscal year (as represented by the Bloomberg Commodity |
| fiscal year ended October 31, 2014? | Index Total Return). Thus, the Fund’s allocation to the Russell |
| For the fiscal year ended October 31, 2014, the Fund’s Class | Commodity Strategies Fund was another headwind to Fund |
| A, Class C, Class E, Class R1, Class R4, Class R5 and Class | performance. |
| S Shares gained 6.52%, 5.77%, 6.57%, 6.95%, 6.63%, 6.37% | |
| and 6.81%, respectively. This is compared to the Fund’s primary | How did the investment strategies and techniques employed |
| benchmark, the Russell 1000® Index, which gained 16.78% | by the Fund and the money managers of the Underlying |
| during the same period. The Fund’s performance includes | Funds affect the Fund’s performance? |
| operating expenses, whereas index returns are unmanaged and | The Fund is a fund of funds and its performance is based on |
| do not include expenses of any kind. | RIMCo’s strategic asset allocations and the performance of the |
| For the fiscal year ended October 31, 2014, the Morningstar® | Underlying Funds in which the Fund invests. |
| Aggressive Allocation, a group of funds that Morningstar considers | Due to the general underperformance of non-U.S. equities |
| to have investment strategies similar to those of the Fund, gained | versus U.S. equities, the Fund’s strategic global equity exposure |
| 8.83%. This result serves as a peer comparison and is expressed | detracted from benchmark-relative results. From an active |
| net of operating expenses. | management standpoint, the Russell International Developed |
| The Fund’s underperformance relative to the Russell 1000® Index | Markets Fund outperformed the broad non-U.S. equity market |
| was due in part to the Fund’s out-of-benchmark allocations to non- | as represented by the Russell Developed ex-U.S. Large Cap™ |
| U.S. equity, fixed income, listed infrastructure, real estate and | Index Net, while the Russell Global Equity Fund performed in- |
| commodity Underlying Funds, and a bias to the U.S. small cap | line with the broad global equity market as represented by the |
| Underlying Fund, which generally underperformed the U.S. large | Russell Developed Large Cap Net Index. The Russell Emerging |
| cap equity market as represented by the Russell 1000® Index. | Markets Fund underperformed its emerging markets benchmark. |
| Effective stock selection in Continental Europe was a tailwind | |
| How did the market conditions described in the Market | to performance for the Russell International Developed Markets |
| Summary report affect the Fund’s performance? | Fund against its benchmark, while an overweight to and stock |
| It was a positive equity market for the fiscal year ending October | selection within information technology benefited performance of |
| 31, 2014. U.S. equities returned 16.07% over the period (as | the Russell Global Equity Fund against its benchmark. For the |
| measured by the Russell 3000® Index), while non-U.S. equities | Russell Emerging Markets Fund, unsuccessful stock selection |
| returned 0.17% (as measured by the Russell Developed ex- | |
Growth Strategy Fund 55
| Russell Investment Company | |
| Growth Strategy Fund | |
| Portfolio Management Discussion and Analysis, continued — October 31, 2014 | |
| (Unaudited) | |
| in China, South Korea, Russia, and Taiwan were detractors from | market bonds and a position in short duration resulted in a |
| performance. | headwind to benchmark-relative performance. |
| The Fund’s strategic allocation to U.S. large cap equity Underlying | Describe any changes to the Fund’s structure or allocation |
| Funds negatively impacted the Fund’s benchmark-relative | to the Underlying Funds. |
| performance, as each of the U.S. large cap equity Underlying | RIMCo has the discretion to vary the Fund’s actual allocation |
| Funds underperformed the Fund’s benchmark as well as its U.S. | from the target strategic asset allocation by up to +/- 5% at |
| equity market segment as represented by its primary benchmark. | the equity, fixed income or alternative category level based on |
| In particular, underweight positions in the “non-cyclical” and/or | RIMCo’s capital markets research. Performance of the Fund’s |
| interest rate sensitive sectors such as electric utilities and real | short-term asset allocation modifications ended the fiscal year |
| estate investment trusts (REITs) generally detracted from these | modestly positive. This was driven by beneficial tilts away from |
| Underlying Funds’ performance, as these industries outperformed | target strategic allocations. |
| for the year. In addition, the Fund’s strategic allocation to the | |
| Russell U.S. Small Cap Equity Fund detracted from a benchmark- | Entering the fiscal year the Fund was underweight the Russell |
| relative perspective, due in part to the underperformance of U.S. | Commodity Strategies Fund, Russell Global Real Estate Securities |
| small cap equities versus U.S. large cap equities. The Russell | Fund, and Russell U.S. Small Cap Equity Fund by 1.25% each, |
| U.S. Small Cap Equity Fund also underperformed its Russell | and overweight the Russell Emerging Markets Fund, Russell |
| 2000® Index benchmark. | Global Infrastructure Fund and Russell U.S. Core Equity Fund |
| by 1.25% each, relative to the target strategic asset allocation | |
| The Fund’s strategic allocation to alternative Underlying Funds | weights. The underweight to the real asset Underlying Funds |
| had a negative effect on benchmark-relative performance. The | was driven by a cautious medium term outlook on commodities |
| Fund’s allocations to the Russell Global Real Estate Securities | and a desire to mitigate the real estate exposure’s contribution |
| Fund, Russell Global Infrastructure Fund, Russell Multi- | to interest rate sensitivity for the total portfolio. Within equities, |
| Strategy Alternative Fund, and Russell Commodity Strategies | the positioning was driven by recognition of stretched valuations |
| Fund detracted, as these Underlying Funds underperformed | in U.S. small cap and attractive valuations in emerging markets. |
| the Fund’s benchmark. From an active management standpoint, | |
| performance of these Underlying Funds was generally negative. | On January 13, 2014, the Fund implemented a new target strategic |
| The Russell Global Infrastructure Fund, Russell Commodity | asset allocation that incorporated a higher exposure to equities |
| Strategies Fund, and Russell Multi-Strategy Alternative Fund | and real assets based on RIMCo’s capital markets research. |
| underperformed their respective asset class benchmarks while | In connection with this reallocation, the Fund also shifted its |
| the Russell Global Real Estate Securities Fund outperformed | tactical allocations relative to the new strategic asset allocation |
| its asset class benchmark. In particular, the Russell Global | weights as follows: |
| Infrastructure fund was underweight to North American electric | - 1.00% overweight to the Russell U.S. Defensive Equity Fund |
| utilities and the oil and gas pipelines sector, which were among | and 1.00% underweight to the Russell Commodity Strategies |
| the strongest performing sectors for the year. For the Russell | Fund due to limited commodity price appreciation expectations |
| Global Real Estate Securities Fund, security selection within the | over the medium term. |
| U.S. was positive while an overweight to and security selection | |
| within Japan detracted from performance. | - 1.00% overweight to the Russell U.S. Defensive Equity Fund and |
| 1.00% underweight to the Russell Global Real Estate Securities | |
| The Fund’s strategic allocation to fixed income Underlying Funds | Fund due to caution over the interest rate sensitivity of REITs in |
| negatively impacted benchmark-relative performance, as the | an environment of potential rising rates. This resulted in a total |
| Russell Strategic Bond Fund and Russell Global Opportunistic | of 2.00% overweight to the Russell U.S. Defensive Equity Fund. |
| Credit Fund underperformed U.S. equities as measured by the | |
| Fund’s benchmark. With the exception of the Russell Global | - 2.50% overweight to the Russell International Developed |
| Opportunistic Credit Fund, results from active management were | Markets Fund and 2.50% underweight to the Russell U.S. Small |
| positive For the Russell Strategic Bond Fund, exposure to non- | Cap Equity Fund due to concerns of stretched valuations within |
| agency mortgages and emerging market debt were key contributors | U.S. small cap equities. |
| to the Underlying Fund’s benchmark-relative outperformance. | At the end of May 2014, half of the 2.50% underweight to the |
| Currency selection was also positive, particularly a long U.S. | Russell U.S. Small Cap Equity Fund was removed in order to |
| Dollar position versus short positions to the Australian Dollar, | capture partial gains from the position. |
| Euro, and Japanese Yen. For the Russell Global Opportunistic | On June 11, 2014, the Fund took an additional 0.50% |
| Credit Fund, exposure to local currency denominated emerging | underweight to the Russell Global Real Estate Securities Fund |
| 56 Growth Strategy Fund | |
| Russell Investment Company | |
| Growth Strategy Fund | |
| Portfolio Management Discussion and Analysis, continued — October 31, 2014 | |
| (Unaudited) | |
| given the recent strong performance of the REITs asset class but | At the end of the fiscal year, the Fund maintained a broad |
| continued concern over rate sensitivity. The Fund also took a | overweight to equity Underlying Funds relative to real asset |
| 0.50% underweight to the Russell Global Infrastructure Fund, | Underlying Funds. By the end of the fiscal year, the aggregate |
| recognizing strong recent performance and stretched valuations. | positioning was modestly positive to performance. |
| Both positions were offset by equal overweights to the Russell | |
| U.S. Dynamic Equity Fund. | The views expressed in this report reflect those of the portfolio |
| managers only through the end of the period covered by | |
| On July 9, 2014, the Fund removed its underweight to the Russell | the report. These views do not necessarily represent the |
| Emerging Markets Fund relative to the Russell Global Equity | views of RIMCo, or any other person in RIMCo or any other |
| Fund, as recent positive momentum suggested further strength in | affiliated organization. These views are subject to change |
| emerging markets relative to broad global equities. This position | at any time based upon market conditions or other events, |
| was closed at a loss. | and RIMCo disclaims any responsibility to update the views |
| On July 22, 2014, the Fund closed its underweight to the Russell | contained herein. These views should not be relied on as |
| U.S. Small Cap Equity Fund primarily driven by the Underlying | investment advice and, because investment decisions for |
| Fund meeting performance expectations. The Russell U.S. Small | a Russell Investment Company (“RIC”) Fund are based on |
| Cap Equity Fund was funded back to target weight by reducing | numerous factors, should not be relied on as an indication |
| the overweight to the Russell U.S. Defensive Equity Fund in order | of investment decisions of any RIC Fund. |
| to maintain the existing overweight to the Russell International | |
| Developed Markets Fund. | |
| * | Assumes initial investment on November 1, 2004. |
| ** | The Barclays U.S. Aggregate Bond Index is an index, with income reinvested, generally representative of intermediate-term government bonds, investment grade corporate debt securities and mortgage-backed securities. |
| *** | Russell 1000® Index includes the 1,000 largest companies in the Russell 3000® Index. The Russell 1000® Index represents the universe of stocks from which most active money managers typically select. The Russell 1000® Index return reflects adjustments from income dividends and capital gain distributions reinvested as of the ex-dividend dates. |
| **** | Russell Developed ex-U.S. Large Cap® Index (net of tax on dividends from foreign holdings) is an index which offers investors access to the large-cap segment of the global equity market, excluding companies assigned to the United States. It is constructed to provide a comprehensive and unbiased barometer for the large-cap segment and is completely reconstituted annually to accurately reflect the changes in the market over time. |
| ‡ | The performance shown has been adjusted to reflect the deduction of the maximum Class A sales charge of 5.75%. |
| ‡‡ | The Fund first issued Class R1 Shares on May 19, 2006. The returns shown for Class R1 Shares prior to that date are the returns of the Fund’s Class S Shares. |
| ‡‡‡ | The Fund first issued Class R4 and Class R5 Shares on October 1, 2014. The returns shown for Class R4 and Class R5 Shares prior to that date are the returns of the Fund’s Class R2 and Class R3 Shares, respectively. |
| § | Annualized. |
Performance is historical and assumes reinvestment of all dividends and capital gains. Investment return and principal value will fluctuate so that an investor’s shares, when redeemed, may be worth more or less than when purchased. Past performance is not indicative of future results. The returns shown do not reflect the deduction of taxes that a shareholder would pay on Fund distributions or the redemption of Fund shares.
Growth Strategy Fund 57
Russell Investment Company Growth Strategy Fund
Shareholder Expense Example — October 31, 2014 (Unaudited)
| Fund Expenses | Please note that the expenses shown in the table are meant | |||||
| The following disclosure provides important information | to highlight your ongoing costs only and do not reflect any | |||||
| regarding the Fund’s Shareholder Expense Example | transactional costs. Therefore, the information under the heading | |||||
| (“Example”). | “Hypothetical Performance (5% return before expenses)” is | |||||
| useful in comparing ongoing costs only, and will not help you | ||||||
| Example | determine the relative total costs of owning different funds. In | |||||
| As a shareholder of the Fund, you incur two types of costs: (1) | addition, if these transactional costs were included, your costs | |||||
| transaction costs, and (2) ongoing costs, including advisory and | would have been higher. | |||||
| administrative fees; distribution (12b-1) and/or service fees; | Hypothetical | |||||
| and other Fund expenses. The Example is intended to help | Performance (5% | |||||
| you understand your ongoing costs (in dollars) of investing in | Actual | return before | ||||
| the Fund and to compare these costs with the ongoing costs of | Class A | Performance | expenses) | |||
| Beginning Account Value | ||||||
| investing in other mutual funds. The Example is based on an | May 1, 2014 | $ | 1,000.00 | $ | 1,000.00 | |
| investment of $1,000 invested at the beginning of the period and | Ending Account Value | |||||
| held for the entire period indicated, which for this Fund is from | October 31, 2014 | $ | 1,019.00 | $ | 1,022.43 | |
| May 1, 2014 to October 31, 2014. | Expenses Paid During Period* | $ | 2.80 | $ | 2.80 | |
| Actual Expenses | * Expenses are equal to the Fund's annualized expense ratio of 0.55% | |||||
| (representing the six month period annualized), multiplied by the average | ||||||
| The information in the table under the heading “Actual | account value over the period, multiplied by 184/365 (to reflect the one-half | |||||
| Performance” provides information about actual account values | year period). May reflect amounts waived and/or reimbursed. Without any | |||||
| and actual expenses. You may use the information in this column, | waivers and/or reimbursements, expenses would have been higher. | |||||
| together with the amount you invested, to estimate the expenses | ||||||
| Hypothetical | ||||||
| that you paid over the period. Simply divide your account value by | Performance (5% | |||||
| $1,000 (for example, an $8,600 account value divided by $1,000 | Actual | return before | ||||
| = 8.6), then multiply the result by the number in the first column | Class C | Performance | expenses) | |||
| Beginning Account Value | ||||||
| in the row entitled “Expenses Paid During Period” to estimate | May 1, 2014 | $ | 1,000.00 | $ | 1,000.00 | |
| the expenses you paid on your account during this period. | Ending Account Value | |||||
| October 31, 2014 | $ | 1,015.40 | $ | 1,018.65 | ||
| Hypothetical Example for Comparison Purposes | Expenses Paid During Period* | $ | 6.60 | $ | 6.61 | |
| The information in the table under the heading “Hypothetical | ||||||
| Performance (5% return before expenses)” provides information | * Expenses are equal to the Fund's annualized expense ratio of 1.30% | |||||
| (representing the six month period annualized), multiplied by the average | ||||||
| about hypothetical account values and hypothetical expenses | account value over the period, multiplied by 184/365 (to reflect the one-half | |||||
| based on the Fund’s actual expense ratio and an assumed rate of | year period). May reflect amounts waived and/or reimbursed. Without any | |||||
| return of 5% per year before expenses, which is not the Fund’s | waivers and/or reimbursements, expenses would have been higher. | |||||
| actual return. The hypothetical account values and expenses | ||||||
| Hypothetical | ||||||
| may not be used to estimate the actual ending account balance or | Performance (5% | |||||
| expenses you paid for the period. You may use this information | Actual | return before | ||||
| to compare the ongoing costs of investing in the Fund and other | Class E | Performance | expenses) | |||
| funds. To do so, compare this 5% hypothetical example with the | Beginning Account Value | |||||
| May 1, 2014 | $ | 1,000.00 | $ | 1,000.00 | ||
| 5% hypothetical examples that appear in the shareholder reports | Ending Account Value | |||||
| of other funds. | October 31, 2014 | $ | 1,019.70 | $ | 1,022.43 | |
| Expenses Paid During Period* | $ | 2.80 | $ | 2.80 | ||
| * Expenses are equal to the Fund's annualized expense ratio of 0.55% | ||||||
| (representing the six month period annualized), multiplied by the average | ||||||
| account value over the period, multiplied by 184/365 (to reflect the one-half | ||||||
| year period). May reflect amounts waived and/or reimbursed. Without any | ||||||
| waivers and/or reimbursements, expenses would have been higher. | ||||||
| 58 Growth Strategy Fund | ||||||
Russell Investment Company Growth Strategy Fund
Shareholder Expense Example, continued — October 31, 2014 (Unaudited)
| Hypothetical | Hypothetical | |||||||||||
| Performance (5% | Performance (5% | |||||||||||
| Actual | return before | Actual | return before | |||||||||
| Class R1 | Performance | expenses) | Class S | Performance | expenses) | |||||||
| Beginning Account Value | Beginning Account Value | |||||||||||
| May 1, 2014 | $ | 1,000.00 | $ | 1,000.00 | May 1, 2014 | $ | 1,000.00 | $ | 1,000.00 | |||
| Ending Account Value | Ending Account Value | |||||||||||
| October 31, 2014 | $ | 1,021.60 | $ | 1,024.35 | October 31, 2014 | $ | 1,020.90 | $ | 1,023.69 | |||
| Expenses Paid During Period* | $ | 0.87 | $ | 0.87 | Expenses Paid During Period* | $ | 1.53 | $ | 1.53 | |||
| * Expenses are equal to the Fund's annualized expense ratio of 0.17% | * Expenses are equal to the Fund's annualized expense ratio of 0.30% | |||||||||||
| (representing the six month period annualized), multiplied by the average | (representing the six month period annualized), multiplied by the average | |||||||||||
| account value over the period, multiplied by 184/365 (to reflect the one-half | account value over the period, multiplied by 184/365 (to reflect the one-half | |||||||||||
| year period). May reflect amounts waived and/or reimbursed. Without any | year period). May reflect amounts waived and/or reimbursed. Without any | |||||||||||
| waivers and/or reimbursements, expenses would have been higher. | waivers and/or reimbursements, expenses would have been higher. | |||||||||||
| Hypothetical | ||||||||||||
| Performance (5% | ||||||||||||
| Actual | return before | |||||||||||
| Class R4(1) | Performance | expenses) | ||||||||||
| Beginning Account Value | ||||||||||||
| May 1, 2014 | $ | 1,000.00 | $ | 1,000.00 | ||||||||
| Ending Account Value | ||||||||||||
| October 31, 2014 | $ | 1,020.40 | $ | 1,023.09 | ||||||||
| Expenses Paid During Period* | $ | 2.14 | $ | 2.14 | ||||||||
| * Expenses are equal to the Fund's annualized expense ratio of 0.42% | ||||||||||||
| (representing the six month period annualized), multiplied by the average | ||||||||||||
| account value over the period, multiplied by 184/365 (to reflect the one-half | ||||||||||||
| year period). | ||||||||||||
| (1) As of October 1, 2014, Class R2 Shares were reclassified as Class R4 | ||||||||||||
| Shares, and all Class R2 shareholders were issued shares of Class R4. The | ||||||||||||
| shareholder expense example for the period ended October 31, 2014 reflects | ||||||||||||
| the expenses and performance of Class R2 Shares for the period May 1 through | ||||||||||||
| October 1, 2014, and Class R4 Shares for the period October 2, 2014 through | ||||||||||||
| October 31, 2014. | ||||||||||||
| Hypothetical | ||||||||||||
| Performance (5% | ||||||||||||
| Actual | return before | |||||||||||
| Class R5(2) | Performance | expenses) | ||||||||||
| Beginning Account Value | ||||||||||||
| May 1, 2014 | $ | 1,000.00 | $ | 1,000.00 | ||||||||
| Ending Account Value | ||||||||||||
| October 31, 2014 | $ | 1,018.40 | $ | 1,021.83 | ||||||||
| Expenses Paid During Period* | $ | 3.41 | $ | 3.41 | ||||||||
| * Expenses are equal to the Fund's annualized expense ratio of 0.67% | ||||||||||||
| (representing the six month period annualized), multiplied by the average | ||||||||||||
| account value over the period, multiplied by 184/365 (to reflect the one-half | ||||||||||||
| year period). | ||||||||||||
| (2) As of October 1, 2014, Class R3 Shares were reclassified as Class R5 | ||||||||||||
| Shares, and all Class R3 shareholders were issued shares of Class R5. The | ||||||||||||
| shareholder expense example for the period ended October 31, 2014 reflects | ||||||||||||
| the expenses and performance of Class R3 Shares for the period May 1 through | ||||||||||||
| October 1, 2014, and Class R5 Shares for the period October 2, 2014 through | ||||||||||||
| October 31, 2014. | ||||||||||||
Growth Strategy Fund 59
Russell Investment Company Growth Strategy Fund
Schedule of Investments — October 31, 2014
| Amounts in thousands (except share amounts) | Amounts in thousands (except share amounts) | ||||||||||
| Fair | Fair | ||||||||||
| Value | Value | ||||||||||
| Shares | $ | Shares | $ | ||||||||
| Investments 100.0% | Fixed Income - 15.8% | ||||||||||
| Other Russell Investment Company | Russell Global Opportunistic Credit Fund | 13,552,023 | 135,520 | ||||||||
| Series Mutual Funds - Class Y | Russell Strategic Bond Fund | 20,132,487 | 224,477 | ||||||||
| Shares | 359,997 | ||||||||||
| International Equities - 34.9% | |||||||||||
| Alternative - 15.3% | Russell Emerging Markets Fund | 10,655,660 | 199,047 | ||||||||
| Russell Commodity Strategies Fund | 10,306,652 | 79,568 | Russell Global Equity Fund | 25,529,587 | 300,994 | ||||||
| Russell Global Infrastructure Fund | 9,765,646 | 126,465 | Russell International Developed Markets | ||||||||
| Russell Global Real Estate Securities Fund | 1,290,271 | 52,527 | Fund | 8,294,704 | 297,780 | ||||||
| Russell Multi-Strategy Alternative Fund | 8,961,605 | 89,795 | 797,821 | ||||||||
| 348,355 | |||||||||||
| Domestic Equities - 34.0% | Total Investments 100.0% | ||||||||||
| Russell U.S. Core Equity Fund | 4,843,702 | 209,200 | (identified cost $1,954,632) | 2,282,528 | |||||||
| Russell U.S. Defensive Equity Fund | 3,676,317 | 169,221 | Other Assets and Liabilities, Net | ||||||||
| Russell U.S. Dynamic Equity Fund | 14,613,966 | 185,451 | -(0.0 | %) | (795 | ) | |||||
| Russell U.S. Small Cap Equity Fund | 6,803,813 | 212,483 | |||||||||
| 776,355 | Net Assets - 100.0% | 2,281,733 | |||||||||
| Presentation of Portfolio Holdings | |||||||||||
| Categories | % of Net Assets | ||||||||||
| Alternative | 15.3 | ||||||||||
| Domestic Equities | 34.0 | ||||||||||
| Fixed Income | 15.8 | ||||||||||
| International Equities | 34.9 | ||||||||||
| Total Investments | 100.0 | ||||||||||
| Other Assets and Liabilities, Net | (—*) | ||||||||||
| 100.0 | |||||||||||
| * Less than .05% of net assets. | |||||||||||
See accompanying notes which are an integral part of the financial statements.
60 Growth Strategy Fund
| Russell Investment Company | |||
| Growth Strategy Fund | |||
| Statement of Assets and Liabilities — October 31, 2014 | |||
| Amounts in thousands | |||
| Assets | |||
| Investments, at identified cost | $ | 1,954,632 | |
| Investments, at fair value | 2,282,528 | ||
| Receivables: | |||
| Investments sold | 1,104 | ||
| Fund shares sold | 1,851 | ||
| Prepaid expenses | 6 | ||
| Total assets | 2,285,489 | ||
| Liabilities | |||
| Payables: | |||
| Fund shares redeemed | 2,348 | ||
| Accrued fees to affiliates | 1,344 | ||
| Other accrued expenses | 64 | ||
| Total liabilities | 3,756 | ||
| Net Assets | $ | 2,281,733 | |
| Net Assets Consist of: | |||
| Undistributed (overdistributed) net investment income | $ | 368 | |
| Accumulated net realized gain (loss) | (178,963 | ) | |
| Unrealized appreciation (depreciation) on investments | 327,896 | ||
| Shares of beneficial interest | 1,890 | ||
| Additional paid-in capital | 2,130,542 | ||
| Net Assets | $ | 2,281,733 | |
| Net Asset Value, offering and redemption price per share: | |||
| Net asset value per share: Class A(#) | $ | 12.14 | |
| Maximum offering price per share (Net asset value plus sales charge of 5.75%): Class A | $ | 12.88 | |
| Class A — Net assets | $ | 759,360,946 | |
| Class A — Shares outstanding ($.01 par value) | 62,537,215 | ||
| Net asset value per share: Class C(#) | $ | 11.85 | |
| Class C — Net assets | $ | 761,494,476 | |
| Class C — Shares outstanding ($.01 par value) | 64,268,608 | ||
| Net asset value per share: Class E(#) | $ | 12.19 | |
| Class E — Net assets | $ | 50,878,041 | |
| Class E — Shares outstanding ($.01 par value) | 4,175,168 | ||
| Net asset value per share: Class R1(#) | $ | 12.27 | |
| Class R1 — Net assets | $ | 149,939,993 | |
| Class R1 — Shares outstanding ($.01 par value) | 12,219,374 | ||
| Net asset value per share: Class R4(#) | $ | 12.18 | |
| Class R4 — Net assets | $ | 148,650,322 | |
| Class R4 — Shares outstanding ($.01 par value) | 12,203,988 | ||
| Net asset value per share: Class R5(#) | $ | 12.19 | |
| Class R5 — Net assets | $ | 94,140,896 | |
| Class R5 — Shares outstanding ($.01 par value) | 7,721,396 | ||
| Net asset value per share: Class S(#) | $ | 12.27 | |
| Class S — Net assets | $ | 317,268,416 | |
| Class S — Shares outstanding ($.01 par value) | 25,858,342 | ||
| (#) Net asset value per share equals class level net assets divided by class level shares of beneficial interest outstanding. | |||
See accompanying notes which are an integral part of the financial statements.
Growth Strategy Fund 61
| Russell Investment Company | |||
| Growth Strategy Fund | |||
| Statement of Operations — For the Period Ended October 31, 2014 | |||
| Amounts in thousands | |||
| Investment Income | |||
| Income distributions from Underlying Funds | $ | 58,917 | |
| Expenses | |||
| Advisory fees | 4,738 | ||
| Administrative fees | 1,080 | ||
| Custodian fees | 32 | ||
| Distribution fees - Class A | 1,932 | ||
| Distribution fees - Class C | 5,807 | ||
| Distribution fees - Class R3 | 258 | ||
| Distribution fees - Class R5 | 19 | ||
| Transfer agent fees - Class A | 1,546 | ||
| Transfer agent fees - Class C | 1,549 | ||
| Transfer agent fees - Class E | 124 | ||
| Transfer agent fees - Class R1 | 307 | ||
| Transfer agent fees - Class R2 | 333 | ||
| Transfer agent fees - Class R3 | 207 | ||
| Transfer agent fees - Class R4 | 24 | ||
| Transfer agent fees - Class R5 | 15 | ||
| Transfer agent fees - Class S | 633 | ||
| Professional fees | 71 | ||
| Registration fees | 175 | ||
| Shareholder servicing fees - Class C | 1,936 | ||
| Shareholder servicing fees - Class E | 155 | ||
| Shareholder servicing fees - Class R2 | 417 | ||
| Shareholder servicing fees - Class R3 | 258 | ||
| Shareholder servicing fees - Class R4 | 30 | ||
| Shareholder servicing fees - Class R5 | 19 | ||
| Trustees’ fees | 56 | ||
| Printing fees | 116 | ||
| Miscellaneous | 103 | ||
| Expenses before reductions | 21,940 | ||
| Expense reductions | (4,450 | ) | |
| Net expenses | 17,490 | ||
| Net investment income (loss) | 41,427 | ||
| Net Realized and Unrealized Gain (Loss) | |||
| Net realized gain (loss) on: | |||
| Investments | 93,673 | ||
| Capital gain distributions from Underlying Funds | 32,367 | ||
| Net realized gain (loss) | 126,040 | ||
| Net change in unrealized appreciation (depreciation) on investments | (20,561 | ) | |
| Net realized and unrealized gain (loss) | 105,479 | ||
| Net Increase (Decrease) in Net Assets from Operations | $ | 146,906 | |
See accompanying notes which are an integral part of the financial statements.
62 Growth Strategy Fund
| Russell Investment Company | ||||||
| Growth Strategy Fund | ||||||
| Statements of Changes in Net Assets | ||||||
| For the Periods Ended October 31, | ||||||
| Amounts in thousands | 2014 | 2013 | ||||
| Increase (Decrease) in Net Assets | ||||||
| Operations | ||||||
| Net investment income (loss) | $ | 41,427 | $ | 31,907 | ||
| Net realized gain (loss) | 126,040 | 84,917 | ||||
| Net change in unrealized appreciation (depreciation) | (20,561 | ) | 237,090 | |||
| Net increase (decrease) in net assets from operations | 146,906 | 353,914 | ||||
| Distributions | ||||||
| From net investment income | ||||||
| Class A | (13,746 | ) | (11,303 | ) | ||
| Class C | (10,736 | ) | (7,472 | ) | ||
| Class E | (1,171 | ) | (1,446 | ) | ||
| Class R1 | (3,452 | ) | (2,742 | ) | ||
| Class R2 | (3,542 | ) | (3,345 | ) | ||
| Class R3 | (2,050 | ) | (2,463 | ) | ||
| Class R4 | (71 | ) | — | |||
| Class S | (6,291 | ) | (4,464 | ) | ||
| Net decrease in net assets from distributions | (41,059 | ) | (33,235 | ) | ||
| Share Transactions* | ||||||
| Net increase (decrease) in net assets from share transactions | (231,318 | ) | (200,354 | ) | ||
| Total Net Increase (Decrease) in Net Assets | (125,471 | ) | 120,325 | |||
| Net Assets | ||||||
| Beginning of period | 2,407,204 | 2,286,879 | ||||
| End of period | $ | 2,281,733 | $ | 2,407,204 | ||
| Undistributed (overdistributed) net investment income included in net assets | $ | 368 | $ | — | ||
See accompanying notes which are an integral part of the financial statements.
Growth Strategy Fund 63
Russell Investment Company Growth Strategy Fund
Statements of Changes in Net Assets, continued
* Share transaction amounts (in thousands) for the periods ended October 31, 2014 and October 31, 2013 were as follows:
| 2014 | 2013 | |||||||||||
| Shares | Dollars | Shares | Dollars | |||||||||
| Class A | ||||||||||||
| Proceeds from shares sold | 6,504 | $ | 77,288 | 8,780 | $ | 94,875 | ||||||
| Proceeds from reinvestment of distributions | 1,166 | 13,678 | 1,088 | 11,242 | ||||||||
| Payments for shares redeemed | (11,364 | ) | (135,185 | ) | (14,172 | ) | (152,980 | ) | ||||
| Net increase (decrease) | (3,694 | ) | (44,219 | ) | (4,304 | ) | (46,863 | ) | ||||
| Class C | ||||||||||||
| Proceeds from shares sold | 9,321 | 108,245 | 10,827 | 115,124 | ||||||||
| Proceeds from reinvestment of distributions | 928 | 10,629 | 735 | 7,392 | ||||||||
| Payments for shares redeemed | (13,211 | ) | (153,923 | ) | (15,294 | ) | (162,157 | ) | ||||
| Net increase (decrease) | (2,962 | ) | (35,049 | ) | (3,732 | ) | (39,641 | ) | ||||
| Class E | ||||||||||||
| Proceeds from shares sold | 644 | 7,635 | 1,464 | 15,727 | ||||||||
| Proceeds from reinvestment of distributions | 99 | 1,167 | 139 | 1,437 | ||||||||
| Payments for shares redeemed | (2,541 | ) | (30,300 | ) | (5,058 | ) | (55,138 | ) | ||||
| Net increase (decrease) | (1,798 | ) | (21,498 | ) | (3,455 | ) | (37,974 | ) | ||||
| Class R1 | ||||||||||||
| Proceeds from shares sold | 2,426 | 29,121 | 4,554 | 49,364 | ||||||||
| Proceeds from reinvestment of distributions | 290 | 3,452 | 262 | 2,742 | ||||||||
| Payments for shares redeemed | (4,677 | ) | (55,804 | ) | (4,670 | ) | (50,844 | ) | ||||
| Net increase (decrease) | (1,961 | ) | (23,231 | ) | 146 | 1,262 | ||||||
| Class R2 | ||||||||||||
| Proceeds from shares sold | 1,396 | 16,665 | 3,044 | 32,844 | ||||||||
| Proceeds from reinvestment of distributions | 301 | 3,542 | 323 | 3,345 | ||||||||
| Payments for shares redeemed | (18,804 | ) | (223,963 | ) | (5,985 | ) | (64,276 | ) | ||||
| Net increase (decrease) | (17,107 | ) | (203,756 | ) | (2,618 | ) | (28,087 | ) | ||||
| Class R3 | ||||||||||||
| Proceeds from shares sold | 869 | 10,368 | 1,939 | 20,813 | ||||||||
| Proceeds from reinvestment of distributions | 174 | 2,049 | 238 | 2,463 | ||||||||
| Payments for shares redeemed | (12,713 | ) | (151,231 | ) | (7,368 | ) | (79,877 | ) | ||||
| Net increase (decrease) | (11,670 | ) | (138,814 | ) | (5,191 | ) | (56,601 | ) | ||||
| Class R4 | ||||||||||||
| Proceeds from shares sold | 12,581 | 149,479 | — | — | ||||||||
| Proceeds from reinvestment of distributions | 6 | 71 | — | — | ||||||||
| Payments for shares redeemed | (383 | ) | (4,512 | ) | — | — | ||||||
| Net increase (decrease) | 12,204 | 145,038 | — | — | ||||||||
| Class R5 | ||||||||||||
| Proceeds from shares sold | 7,811 | 92,873 | — | — | ||||||||
| Payments for shares redeemed | (90 | ) | (1,064 | ) | — | — | ||||||
| Net increase (decrease) | 7,721 | 91,809 | — | — | ||||||||
| Class S | ||||||||||||
| Proceeds from shares sold | 7,643 | 91,934 | 9,700 | 106,476 | ||||||||
| Proceeds from reinvestment of distributions | 524 | 6,225 | 421 | 4,410 | ||||||||
| Payments for shares redeemed | (8,269 | ) | (99,757 | ) | (9,490 | ) | (103,336 | ) | ||||
| Net increase (decrease) | (102 | ) | (1,598 | ) | 631 | 7,550 | ||||||
| Total increase (decrease) | (19,369 | ) | $ | (231,318 | ) | (18,523 | ) | $ | (200,354 | ) | ||
See accompanying notes which are an integral part of the financial statements.
64 Growth Strategy Fund
(This page intentionally left blank)
| Russell Investment Company | |||||||||||||
| Growth Strategy Fund | |||||||||||||
| Financial Highlights — For the Periods Ended | |||||||||||||
| For a Share Outstanding Throughout Each Period. | |||||||||||||
| $ | |||||||||||||
| $ | Net | $ | $ | $ | |||||||||
| Net Asset Value, | Investment | Net Realized | Total from | Distributions | |||||||||
| Beginning of | Income (Loss) | and Unrealized | Investment | from Net | |||||||||
| Period | (a)(b)(e) | Gain (Loss) | Operations | Investment Income | |||||||||
| Class A | |||||||||||||
| October 31, 2014 | 11.60 | .23 | .52 | .75 | (.21) | ||||||||
| October 31, 2013 | 10.11 | .17 | 1.48 | 1.65 | (.16) | ||||||||
| October 31, 2012 | 9.56 | .17 | .55 | .72 | (.17) | ||||||||
| October 31, 2011 | 9.68 | .21 | (.13) | .08 | (.20) | ||||||||
| October 31, 2010 | 8.43 | .15 | 1.24 | 1.39 | (.14) | ||||||||
| Class C | |||||||||||||
| October 31, 2014 | 11.36 | .13 | .52 | .65 | (.16) | ||||||||
| October 31, 2013 | 9.93 | .08 | 1.46 | 1.54 | (.11) | ||||||||
| October 31, 2012 | 9.41 | .10 | .53 | .63 | (.11) | ||||||||
| October 31, 2011 | 9.57 | .13 | (.12) | .01 | (.17) | ||||||||
| October 31, 2010 | 8.36 | .08 | 1.23 | 1.31 | (.10) | ||||||||
| Class E | |||||||||||||
| October 31, 2014 | 11.64 | .24 | .52 | .76 | (.21) | ||||||||
| October 31, 2013 | 10.15 | .18 | 1.47 | 1.65 | (.16) | ||||||||
| October 31, 2012 | 9.59 | .18 | .54 | .72 | (.16) | ||||||||
| October 31, 2011 | 9.69 | .29 | (.20) | .09 | (.19) | ||||||||
| October 31, 2010 | 8.44 | .15 | 1.24 | 1.39 | (.14) | ||||||||
| Class R1 | |||||||||||||
| October 31, 2014 | 11.72 | .29 | .52 | .81 | (.26) | ||||||||
| October 31, 2013 | 10.21 | .20 | 1.50 | 1.70 | (.19) | ||||||||
| October 31, 2012 | 9.65 | .21 | .56 | .77 | (.21) | ||||||||
| October 31, 2011 | 9.75 | .22 | (.09) | .13 | (.23) | ||||||||
| October 31, 2010 | 8.49 | .16 | 1.26 | 1.42 | (.16) | ||||||||
| Class R4(3) | |||||||||||||
| October 31, 2014 | 11.64 | .26 | .50 | .76 | (.22) | ||||||||
| October 31, 2013 | 10.14 | .19 | 1.48 | 1.67 | (.17) | ||||||||
| October 31, 2012 | 9.59 | .19 | .54 | .73 | (.18) | ||||||||
| October 31, 2011 | 9.70 | .10 | -(h) | .10 | (.21) | ||||||||
| October 31, 2010 | 8.45 | .15 | 1.24 | 1.39 | (.14) | ||||||||
| Class R5(4) | |||||||||||||
| October 31, 2014 | 11.65 | .24 | .49 | .73 | (.19) | ||||||||
| October 31, 2013 | 10.16 | .17 | 1.47 | 1.64 | (.15) | ||||||||
| October 31, 2012 | 9.59 | .20 | .52 | .72 | (.15) | ||||||||
| October 31, 2011 | 9.71 | .21 | (.14) | .07 | (.19) | ||||||||
| October 31, 2010 | 8.46 | .13 | 1.25 | 1.38 | (.13) | ||||||||
| Class S | |||||||||||||
| October 31, 2014 | 11.72 | .26 | .53 | .79 | (.24) | ||||||||
| October 31, 2013 | 10.21 | .19 | 1.50 | 1.69 | (.18) | ||||||||
| October 31, 2012 | 9.65 | .20 | .55 | .75 | (.19) | ||||||||
| October 31, 2011 | 9.76 | .24 | (.14) | .10 | (.21) | ||||||||
| October 31, 2010 | 8.49 | .17 | 1.26 | 1.43 | (.16) | ||||||||
See accompanying notes which are an integral part of the financial statements.
66 Growth Strategy Fund
| % | % | % | ||||||||||||||
| $ | $ | Ratio of Expenses | Ratio of Expenses | Ratio of Net | ||||||||||||
| Net Asset Value, | % | Net Assets, | to Average | to Average | Investment Income | % | ||||||||||
| $ | End of | Total | End of Period | Net Assets, | Net Assets, | to Average | Portfolio | |||||||||
| Total Distributions | Period | Return(d) | (000 | ) | Gross(g) | Net(e)(g) | Net Assets(b)(e) | Turnover Rate | ||||||||
| (.21 | ) | 12.14 | 6.52 | 759,361 | .72 | .56 | 1.91 | 22 | ||||||||
| (.16 | ) | 11.60 | 16.55 | 768,352 | .71 | .57 | 1.53 | 11 | ||||||||
| (.17 | ) | 10.11 | 7.64 | 713,412 | .70 | .56 | 1.79 | 23 | ||||||||
| (.20 | ) | 9.56 | .75 | 734,024 | .73 | .55 | 2.12 | 7 | ||||||||
| (.14 | ) | 9.68 | 16.67 | 791,754 | .71 | .54 | 1.68 | 31 | ||||||||
| (.16 | ) | 11.85 | 5.77 | 761,495 | 1.47 | 1.31 | 1.12 | 22 | ||||||||
| (.11 | ) | 11.36 | 15.62 | 763,893 | 1.46 | 1.32 | .76 | 11 | ||||||||
| (.11 | ) | 9.93 | 6.84 | 704,704 | 1.45 | 1.31 | 1.05 | 23 | ||||||||
| (.17 | ) | 9.41 | .05 | 738,624 | 1.48 | 1.30 | 1.36 | 7 | ||||||||
| (.10 | ) | 9.57 | 15.74 | 798,130 | 1.46 | 1.29 | .93 | 31 | ||||||||
| (.21 | ) | 12.19 | 6.57 | 50,878 | .72 | .56 | 2.04 | 22 | ||||||||
| (.16 | ) | 11.64 | 16.47 | 69,531 | .71 | .57 | 1.67 | 11 | ||||||||
| (.16 | ) | 10.15 | 7.69 | 95,667 | .70 | .56 | 1.87 | 23 | ||||||||
| (.19 | ) | 9.59 | .88 | 130,274 | .72 | .55 | 2.92 | 7 | ||||||||
| (.14 | ) | 9.69 | 16.65 | 406,837 | .71 | .54 | 1.67 | 31 | ||||||||
| (.26 | ) | 12.27 | 6.95 | 149,940 | .47 | .17 | 2.43 | 22 | ||||||||
| (.19 | ) | 11.72 | 16.93 | 166,211 | .46 | .17 | 1.87 | 11 | ||||||||
| (.21 | ) | 10.21 | 8.15 | 143,252 | .45 | .14 | 2.08 | 23 | ||||||||
| (.23 | ) | 9.65 | 1.23 | 116,928 | .48 | .12 | 2.22 | 7 | ||||||||
| (.16 | ) | 9.75 | 16.92 | 74,972 | .46 | .26 | 1.81 | 31 | ||||||||
| (.22 | ) | 12.18 | 6.63 | 148,650 | .72 | .42 | 2.19 | 22 | ||||||||
| (.17 | ) | 11.64 | 16.73 | 199,046 | .71 | .42 | 1.74 | 11 | ||||||||
| (.18 | ) | 10.14 | 7.81 | 200,007 | .70 | .39 | 1.97 | 23 | ||||||||
| (.21 | ) | 9.59 | 1.00 | 196,374 | .73 | .37 | 1.03 | 7 | ||||||||
| (.14 | ) | 9.70 | 16.64 | 23,018 | .71 | .52 | 1.63 | 31 | ||||||||
| (.19 | ) | 12.19 | 6.37 | 94,141 | .97 | .67 | 2.01 | 22 | ||||||||
| (.15 | ) | 11.65 | 16.37 | 135,920 | .96 | .67 | 1.57 | 11 | ||||||||
| (.15 | ) | 10.16 | 7.65 | 171,237 | .95 | .64 | 2.03 | 23 | ||||||||
| (.19 | ) | 9.59 | .70 | 500,954 | .98 | .62 | 2.12 | 7 | ||||||||
| (.13 | ) | 9.71 | 16.41 | 618,128 | .96 | .77 | 1.45 | 31 | ||||||||
| (.24 | ) | 12.27 | 6.81 | 317,268 | .47 | .31 | 2.16 | 22 | ||||||||
| (.18 | ) | 11.72 | 16.80 | 304,251 | .46 | .32 | 1.71 | 11 | ||||||||
| (.19 | ) | 10.21 | 7.96 | 258,600 | .45 | .31 | 2.01 | 23 | ||||||||
| (.21 | ) | 9.65 | 1.01 | 254,107 | .48 | .30 | 2.37 | 7 | ||||||||
| (.16 | ) | 9.76 | 17.02 | 312,660 | .46 | .29 | 1.93 | 31 | ||||||||
See accompanying notes which are an integral part of the financial statements.
Growth Strategy Fund 67
| Russell Investment Company |
| Equity Growth Strategy Fund |
| Portfolio Management Discussion and Analysis — October 31, 2014 (Unaudited) |
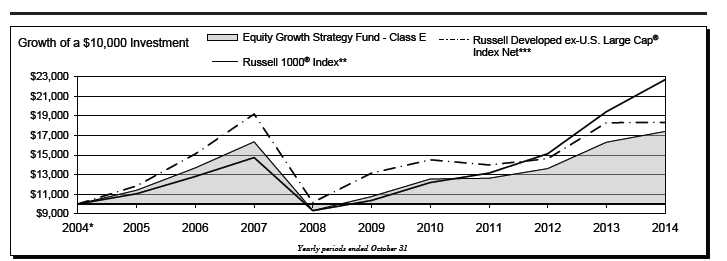
| Equity Growth Strategy Fund - Class A‡ | Equity Growth Strategy Fund - Class R5‡‡‡ | ||||||
| Total | Total | ||||||
| Return | Return | ||||||
| 1 Year | 0.53 | % | 1 Year | 6.61 | % | ||
| 5 Years | 8.79 | %§ | 5 Years | 9.98 | %§ | ||
| 10 Years | 5.09 | %§ | 10 Years | 5.51 | %§ | ||
| Equity Growth Strategy Fund - Class C | Equity Growth Strategy Fund - Class S | ||||||
| Total | Total | ||||||
| Return | Return | ||||||
| 1 Year | 5.87 | % | 1 Year | 7.04 | % | ||
| 5 Years | 9.29 | %§ | 5 Years | 10.40 | %§ | ||
| 10 Years | 4.92 | %§ | 10 Years | 5.98 | %§ | ||
| Equity Growth Strategy Fund - Class E | Russell 1000® Index** | ||||||
| Total | Total | ||||||
| Return | Return | ||||||
| 1 Year | 6.76 | % | 1 Year | 16.78 | % | ||
| 5 Years | 10.10 | %§ | 5 Years | 16.98 | %§ | ||
| 10 Years | 5.70 | %§ | 10 Years | 8.54 | %§ | ||
| Russell Developed ex-U.S. Large Cap® Index Net*** | |||||||
| Equity Growth Strategy Fund - Class R1‡‡ | |||||||
| Total | |||||||
| Total | Return | ||||||
| Return | |||||||
| 1 Year | 7.17 | % | 1 Year | 0.17 | % | ||
| 5 Years | 10.52 | %§ | 5 Years | 6.85 | %§ | ||
| 10 Years | 6.04 | %§ | 10 Years | 6.25 | %§ | ||
| Equity Growth Strategy Fund - Class R4‡‡‡ | |||||||
| Total | |||||||
| Return | |||||||
| 1 Year | 6.87 | % | |||||
| 5 Years | 10.26 | %§ | |||||
| 10 Years | 5.78 | %§ | |||||
68 Equity Growth Strategy Fund
Russell Investment Company
Equity Growth Strategy Fund
| Portfolio Management Discussion and Analysis, continued — October 31, 2014 | |||
| (Unaudited) | |||
| The Equity Growth Strategy Fund (the “Fund”) is a fund of funds | U.S. equities over non-U.S. equities, the Fund’s non-U.S. equity | ||
| that invests in other Russell Investment Company mutual funds | exposure detracted from its performance against its U.S. large cap | ||
| (the “Underlying Funds”). The Underlying Funds employ a multi- | benchmark. | ||
| manager approach whereby portions of the Underlying Funds | Global REITs and listed infrastructure (as represented by the | ||
| are allocated to different money managers. Underlying Fund | FTSE/EPRA/ NAREIT Developed Real Estate Index (Net) and | ||
| assets not allocated to money managers are managed by Russell | S&P Global Infrastructure Index (Net)) finished the fiscal year up | ||
| Investment Management Company (“RIMCo”), the Fund’s and | 9.84% and 13.36% respectively. However, listed infrastructure | ||
| Underlying Funds’ advisor. RIMCo, as the Underlying Funds’ | and global REITs underperformed U.S. equity markets, detracted | ||
| advisor, may change the allocation of the Underlying Funds’ | from the Fund’s benchmark-relative performance through its | ||
| assets among money managers at any time. An exemptive order | allocations to the Russell Global Real Estate Securities and | ||
| from the Securities and Exchange Commission (“SEC”) permits | Russell Global Infrastructure Funds. Commodities largely | ||
| RIMCo to engage or terminate a money manager in an Underlying | underperformed broader equity markets with a loss of 5.94% | ||
| Fund at any time, subject to approval by the Underlying Fund’s | for the fiscal year (as represented by the Bloomberg Commodity | ||
| Board, without a shareholder vote. Pursuant to the terms of the | Index Total Return). Thus, the Fund’s allocation to the Russell | ||
| exemptive order, an Underlying Fund is required to notify its | Commodity Strategies Fund was another headwind to Fund | ||
| shareholders within 90 days of when a money manager begins | performance. | ||
| providing services. | |||
| While fixed income markets were overall positive for the year | |||
| What is the Fund’s investment objective? | as interest rates generally trended lower, fixed income markets | ||
| The Fund seeks to provide high long term capital appreciation. | underperformed broad equity markets and therefore the Fund’s | ||
| fixed income exposure detracted from benchmark-relative | |||
| How did the Fund perform relative to its benchmark for the | returns. In particular, the Fund’s exposure to global high yield | ||
| fiscal year ended October 31, 2014? | and emerging market debt through its investments in fixed income | ||
| For the fiscal year ended October 31, 2014, the Fund’s Class | Underlying Funds detracted as these asset classes notably lagged | ||
| A, Class C, Class E, Class R1, Class R4, Class R5 and Class | U.S. equities. | ||
| S Shares gained 6.70%, 5.87%, 6.76%, 7.17%, 6.87%, 6.61% | |||
| and 7.04%, respectively. This is compared to the Fund’s primary | How did the investment strategies and techniques employed | ||
| benchmark, the Russell 1000® Index, which gained 16.78% | by the Fund and the money managers of the Underlying | ||
| during the same period. The Fund’s performance includes | Funds affect the Fund’s performance? | ||
| operating expenses, whereas index returns are unmanaged and | Due to the general underperformance of non-U.S. equities | ||
| do not include expenses of any kind. | versus U.S. equities, the Fund’s strategic global equity exposure | ||
| For the fiscal year ended October 31, 2014, the Morningstar® | detracted from benchmark-relative | results. From | an active |
| Aggressive Allocation, a group of funds that Morningstar considers | management standpoint, the Russell | International | Developed |
| to have investment strategies similar to those of the Fund, gained | Markets Fund outperformed the broad non-U.S. equity market | ||
| 8.83%. This result serves as a peer comparison and is expressed | as represented by the Russell Developed ex-U.S. Large Cap™ | ||
| net of operating expenses. | Index Net, while the Russell Global Equity Fund performed in- | ||
| The Fund’s underperformance relative to the Russell 1000® Index | line with the broad global equity market as represented by the | ||
| Russell Developed Large Cap Net Index. The Russell Emerging | |||
| was due in part to the Fund’s out-of-benchmark allocations to non- | Markets Fund underperformed its emerging markets benchmark. | ||
| U.S. equity, fixed income, listed infrastructure, real estate and | Effective stock selection in Continental Europe was a tailwind | ||
| commodity Underlying Funds, and a bias to the U.S. small cap | to performance for the Russell International Developed Markets | ||
| Underlying Fund, which generally underperformed the U.S. large | Fund against its benchmark, while an overweight to and stock | ||
| cap equity market as represented by the Russell 1000® Index. | |||
| selection within information technology benefited performance of | |||
| How did the market conditions described in the Market | the Russell Global Equity Fund against its benchmark. For the | ||
| Summary report affect the Fund’s performance? | Russell Emerging Markets Fund, unsuccessful stock selection | ||
| It was a positive equity market for the fiscal year ending October | in China, South Korea, Russia, and Taiwan were detractors from | ||
| 31, 2014. U.S. equities returned 16.07% over the period (as | performance. | ||
| measured by the Russell 3000® Index), while non-U.S. equities | The Fund is a fund of funds and its performance is based on | ||
| returned 0.17% (as measured by the Russell Developed ex- | RIMCo’s strategic asset allocations and the performance of the | ||
| U.S. Large Cap Index). Given the significant outperformance of | Underlying Funds in which the Fund invests. | ||
| Equity Growth Strategy Fund 69 | |||
Russell Investment Company
Equity Growth Strategy Fund
| Portfolio Management Discussion and Analysis, continued — October 31, 2014 | |
| (Unaudited) | |
| The Fund’s strategic allocation to U.S. large cap equity Underlying | short-term asset allocation modifications ended the fiscal year |
| Funds negatively impacted the Fund’s benchmark-relative | modestly positive. This was driven by beneficial tilts away from |
| performance, as each of the U.S. large cap equity Underlying | target strategic allocations. |
| Funds underperformed the Fund’s benchmark as well as its U.S. | Entering the fiscal year the Fund was underweight the Russell |
| equity market segment as represented by its primary benchmark. | Commodity Strategies Fund, Russell Global Real Estate Securities |
| In particular, underweight positions in the “non-cyclical” and/or | Fund, and Russell U.S. Small Cap Equity Fund by 1.25% each, |
| interest rate sensitive sectors such as electric utilities and real | and overweight the Russell Emerging Markets Fund, Russell |
| estate investment trusts (REITs) generally detracted from these | Global Infrastructure Fund and Russell U.S. Core Equity Fund |
| Underlying Funds’ performance, as these industries outperformed | by 1.25% each, relative to the target strategic asset allocation |
| for the year. In addition, the Fund’s strategic allocation to the | weights. The underweight to the real asset Underlying Funds |
| Russell U.S. Small Cap Equity Fund detracted from a benchmark- | was driven by a cautious medium term outlook on commodities |
| relative perspective, due in part to the underperformance of U.S. | and a desire to mitigate the real estate exposure’s contribution |
| small cap equities versus U.S. large cap equities. The Russell | to interest rate sensitivity for the total portfolio. Within equities, |
| U.S. Small Cap Equity Fund also underperformed its Russell | the positioning was driven by recognition of stretched valuations |
| 2000® Index benchmark. | |
| in U.S. small cap and attractive valuations in emerging markets. | |
| The Fund’s strategic allocation to alternative Underlying Funds | On January 13, 2014, the Fund implemented a new target strategic |
| had a negative effect on benchmark-relative performance. The | asset allocation that incorporated a higher exposure to equities |
| Fund’s allocations to the Russell Global Real Estate Securities | and real assets based on RIMCo’s capital markets research. |
| Fund, Russell Global Infrastructure Fund, Russell Multi- | |
| Strategy Alternative Fund, and Russell Commodity Strategies | In connection with this reallocation, the Fund also shifted its |
| Fund detracted, as these Underlying Funds underperformed | tactical allocations relative to the new strategic asset allocation |
| the Fund’s benchmark. From an active management standpoint, | weights as follows: |
| performance of these Underlying Funds was generally negative. | - 1.00% overweight to the Russell U.S. Defensive Equity Fund |
| The Russell Global Infrastructure Fund, Russell Commodity | and 1.00% underweight to the Russell Commodity Strategies |
| Strategies Fund, and Russell Multi-Strategy Alternative Fund | Fund due to limited commodity price appreciation expectations |
| underperformed their respective asset class benchmarks while | over the medium term. |
| the Russell Global Real Estate Securities Fund outperformed | - 1.00% overweight to the Russell U.S. Defensive Equity Fund and |
| its asset class benchmark. In particular, the Russell Global | 1.00% underweight to the Russell Global Real Estate Securities |
| Infrastructure fund was underweight to North American electric | Fund due to caution over the interest rate sensitivity of REITs in |
| utilities and the oil and gas pipelines sectors, which were among | an environment of potential rising rates. This resulted in a total |
| the strongest performing sectors for the year. For the Russell | of 2.00% overweight to the Russell U.S. Defensive Equity Fund. |
| Global Real Estate Securities Fund, security selection within the | |
| U.S. was positive while an overweight to and security selection | - 2.50% overweight to the Russell International Developed |
| within Japan detracted from performance. | Markets Fund and 2.50% underweight to the Russell U.S. Small |
| Cap Equity Fund due to concerns of stretched valuations within | |
| The Fund’s strategic allocation to the Russell Global | U.S. small cap equities. |
| Opportunistic Credit Fund negatively impacted benchmark- | |
| relative performance, as this Underlying Fund underperformed | - 1.00% overweight to the Russell Global Equity Fund and |
| U.S. equities as measured by the Fund’s benchmark. Active | 1.00% underweight to the Russell Emerging Markets Fund due |
| management results were negative, as exposure to local currency | to concerns of strong negative momentum exhibited in emerging |
| denominated emerging market bonds and a position in short | markets. |
| duration resulted in a headwind to this Underlying Fund’s | At the end of May 2014, half of the 2.50% underweight to the |
| benchmark-relative performance. | Russell U.S. Small Cap Equity Fund was removed in order to |
| capture partial gains from the position. | |
| Describe any changes to the Fund’s structure or allocation | |
| to the Underlying Funds. | On June 11, 2014, the Fund took an additional 0.50% |
| RIMCo has the discretion to vary the Fund’s actual allocation | underweight to the Russell Global Real Estate Securities Fund |
| from the target strategic asset allocation by up to +/- 5% at | given the recent strong performance of the REITs asset class but |
| the equity, fixed income or alternative category level based on | continued concern over rate sensitivity. The Fund also took a |
| RIMCo’s capital markets research. Performance of the Fund’s | 0.50% underweight to the Russell Global Infrastructure Fund, |
| recognizing strong recent performance and stretched valuations. | |
| 70 Equity Growth Strategy Fund | |
Russell Investment Company
Equity Growth Strategy Fund
| Portfolio Management Discussion and Analysis, continued — October 31, 2014 | |
| (Unaudited) | |
| Both positions were offset by equal overweights to the Russell | At the end of the fiscal year, the Fund maintained a broad |
| U.S. Dynamic Equity Fund. | overweight to equity Underlying Funds relative to real asset |
| On July 9, 2014, the Fund removed its underweight to the Russell | Underlying Funds. By the end of the fiscal year, the aggregate |
| Emerging Markets Fund relative to the Russell Global Equity | positioning was modestly positive to performance. |
| Fund, as recent positive momentum suggested further strength in | The views expressed in this report reflect those of the portfolio |
| emerging markets relative to broad global equities. This position | managers only through the end of the period covered by |
| was closed at a loss. | the report. These views do not necessarily represent the |
| On July 22, 2014, the Fund closed its underweight to the Russell | views of RIMCo, or any other person in RIMCo or any other |
| U.S. Small Cap Equity Fund primarily driven by the Underlying | affiliated organization. These views are subject to change |
| Fund meeting performance expectations. The Russell U.S. Small | at any time based upon market conditions or other events, |
| Cap Equity Fund was funded back to target weight by reducing | and RIMCo disclaims any responsibility to update the views |
| the overweight to the Russell U.S. Defensive Equity Fund in order | contained herein. These views should not be relied on as |
| to maintain the existing overweight to the Russell International | investment advice and, because investment decisions for |
| Developed Markets Fund. | a Russell Investment Company (“RIC”) Fund are based on |
| numerous factors, should not be relied on as an indication | |
| of investment decisions of any RIC Fund. | |
| * | Assumes initial investment on November 1, 2004. |
| ** | Russell 1000® Index includes the 1,000 largest companies in the Russell 3000® Index. The Russell 1000® Index represents the universe of stocks from which most active money managers typically select. The Russell 1000® Index return reflects adjustments from income dividends and capital gain distributions reinvested as of the ex-dividend dates. |
| *** | Russell Developed ex-U.S. Large Cap Index® (net of tax on dividends from foreign holdings) is an index which offers investors access to the large-cap segment of the global equity market, excluding companies assigned to the United States. It is constructed to provide a comprehensive and unbiased barometer for the large-cap segment and is completely reconstituted annually to accurately reflect the changes in the market over time. |
| ‡ | The performance shown has been adjusted to reflect the deduction of the maximum Class A sales charge of 5.75%. |
| ‡‡ | The Fund first issued Class R1 Shares on May 19, 2006. The returns shown for Class R1 Shares prior to that date are the returns of the Fund’s Class S Shares. |
| ‡‡‡ | The Fund first issued Class R4 and Class R5 Shares on October 1, 2014. The returns shown for Class R4 and Class R5 Shares prior to that date are the returns of the Fund’s Class R2 and Class R3 Shares, respectively. |
| § | Annualized. |
Performance is historical and assumes reinvestment of all dividends and capital gains. Investment return and principal value will fluctuate so that an investor’s shares, when redeemed, may be worth more or less than when purchased. Past performance is not indicative of future results. The returns shown do not reflect the deduction of taxes that a shareholder would pay on Fund distributions or the redemption of Fund shares.
Equity Growth Strategy Fund 71
Russell Investment Company Equity Growth Strategy Fund
Shareholder Expense Example — October 31, 2014 (Unaudited)
| Fund Expenses | Please note that the expenses shown in the table are meant | |||||
| The following disclosure provides important information | to highlight your ongoing costs only and do not reflect any | |||||
| regarding the Fund’s Shareholder Expense Example | transactional costs. Therefore, the information under the heading | |||||
| (“Example”). | “Hypothetical Performance (5% return before expenses)” is | |||||
| useful in comparing ongoing costs only, and will not help you | ||||||
| Example | determine the relative total costs of owning different funds. In | |||||
| As a shareholder of the Fund, you incur two types of costs: (1) | addition, if these transactional costs were included, your costs | |||||
| transaction costs, and (2) ongoing costs, including advisory and | would have been higher. | |||||
| administrative fees; distribution (12b-1) and/or service fees; | Hypothetical | |||||
| and other Fund expenses. The Example is intended to help | Performance (5% | |||||
| you understand your ongoing costs (in dollars) of investing in | Actual | return before | ||||
| the Fund and to compare these costs with the ongoing costs of | Class A | Performance | expenses) | |||
| Beginning Account Value | ||||||
| investing in other mutual funds. The Example is based on an | May 1, 2014 | $ | 1,000.00 | $ | 1,000.00 | |
| investment of $1,000 invested at the beginning of the period and | Ending Account Value | |||||
| held for the entire period indicated, which for this Fund is from | October 31, 2014 | $ | 1,019.40 | $ | 1,022.43 | |
| May 1, 2014 to October 31, 2014. | Expenses Paid During Period* | $ | 2.80 | $ | 2.80 | |
| Actual Expenses | * Expenses are equal to the Fund's annualized expense ratio of 0.55% | |||||
| (representing the six month period annualized), multiplied by the average | ||||||
| The information in the table under the heading “Actual | account value over the period, multiplied by 184/365 (to reflect the one-half | |||||
| Performance” provides information about actual account values | year period). May reflect amounts waived and/or reimbursed. Without any | |||||
| and actual expenses. You may use the information in this column, | waivers and/or reimbursements, expenses would have been higher. | |||||
| together with the amount you invested, to estimate the expenses | ||||||
| Hypothetical | ||||||
| that you paid over the period. Simply divide your account value by | Performance (5% | |||||
| $1,000 (for example, an $8,600 account value divided by $1,000 | Actual | return before | ||||
| = 8.6), then multiply the result by the number in the first column | Class C | Performance | expenses) | |||
| Beginning Account Value | ||||||
| in the row entitled “Expenses Paid During Period” to estimate | May 1, 2014 | $ | 1,000.00 | $ | 1,000.00 | |
| the expenses you paid on your account during this period. | Ending Account Value | |||||
| October 31, 2014 | $ | 1,015.30 | $ | 1,018.65 | ||
| Hypothetical Example for Comparison Purposes | Expenses Paid During Period* | $ | 6.60 | $ | 6.61 | |
| The information in the table under the heading “Hypothetical | ||||||
| Performance (5% return before expenses)” provides information | * Expenses are equal to the Fund's annualized expense ratio of 1.30% | |||||
| (representing the six month period annualized), multiplied by the average | ||||||
| about hypothetical account values and hypothetical expenses | account value over the period, multiplied by 184/365 (to reflect the one-half | |||||
| based on the Fund’s actual expense ratio and an assumed rate of | year period). May reflect amounts waived and/or reimbursed. Without any | |||||
| return of 5% per year before expenses, which is not the Fund’s | waivers and/or reimbursements, expenses would have been higher. | |||||
| actual return. The hypothetical account values and expenses | ||||||
| Hypothetical | ||||||
| may not be used to estimate the actual ending account balance or | Performance (5% | |||||
| expenses you paid for the period. You may use this information | Actual | return before | ||||
| to compare the ongoing costs of investing in the Fund and other | Class E | Performance | expenses) | |||
| funds. To do so, compare this 5% hypothetical example with the | Beginning Account Value | |||||
| May 1, 2014 | $ | 1,000.00 | $ | 1,000.00 | ||
| 5% hypothetical examples that appear in the shareholder reports | Ending Account Value | |||||
| of other funds. | October 31, 2014 | $ | 1,019.80 | $ | 1,022.43 | |
| Expenses Paid During Period* | $ | 2.80 | $ | 2.80 | ||
| * Expenses are equal to the Fund's annualized expense ratio of 0.55% | ||||||
| (representing the six month period annualized), multiplied by the average | ||||||
| account value over the period, multiplied by 184/365 (to reflect the one-half | ||||||
| year period). May reflect amounts waived and/or reimbursed. Without any | ||||||
| waivers and/or reimbursements, expenses would have been higher. | ||||||
72 Equity Growth Strategy Fund
Russell Investment Company Equity Growth Strategy Fund
Shareholder Expense Example, continued — October 31, 2014 (Unaudited)
| Hypothetical | Hypothetical | |||||||||||
| Performance (5% | Performance (5% | |||||||||||
| Actual | return before | Actual | return before | |||||||||
| Class R1 | Performance | expenses) | Class S | Performance | expenses) | |||||||
| Beginning Account Value | Beginning Account Value | |||||||||||
| May 1, 2014 | $ | 1,000.00 | $ | 1,000.00 | May 1, 2014 | $ | 1,000.00 | $ | 1,000.00 | |||
| Ending Account Value | Ending Account Value | |||||||||||
| October 31, 2014 | $ | 1,022.20 | $ | 1,024.35 | October 31, 2014 | $ | 1,021.50 | $ | 1,023.69 | |||
| Expenses Paid During Period* | $ | 0.87 | $ | 0.87 | Expenses Paid During Period* | $ | 1.53 | $ | 1.53 | |||
| * Expenses are equal to the Fund's annualized expense ratio of 0.17% | * Expenses are equal to the Fund's annualized expense ratio of 0.30% | |||||||||||
| (representing the six month period annualized), multiplied by the average | (representing the six month period annualized), multiplied by the average | |||||||||||
| account value over the period, multiplied by 184/365 (to reflect the one-half | account value over the period, multiplied by 184/365 (to reflect the one-half | |||||||||||
| year period). May reflect amounts waived and/or reimbursed. Without any | year period). May reflect amounts waived and/or reimbursed. Without any | |||||||||||
| waivers and/or reimbursements, expenses would have been higher. | waivers and/or reimbursements, expenses would have been higher. | |||||||||||
| Hypothetical | ||||||||||||
| Performance (5% | ||||||||||||
| Actual | return before | |||||||||||
| Class R4(1) | Performance | expenses) | ||||||||||
| Beginning Account Value | ||||||||||||
| May 1, 2014 | $ | 1,000.00 | $ | 1,000.00 | ||||||||
| Ending Account Value | ||||||||||||
| October 31, 2014 | $ | 1,020.30 | $ | 1,023.09 | ||||||||
| Expenses Paid During Period* | $ | 2.14 | $ | 2.14 | ||||||||
| * Expenses are equal to the Fund's annualized expense ratio of 0.42% | ||||||||||||
| (representing the six month period annualized), multiplied by the average | ||||||||||||
| account value over the period, multiplied by 184/365 (to reflect the one-half | ||||||||||||
| year period). | ||||||||||||
| (1) As of October 1, 2014, Class R2 Shares were reclassified as Class R4 | ||||||||||||
| Shares, and all Class R2 shareholders were issued shares of Class R4. The | ||||||||||||
| shareholder expense example for the period ended October 31, 2014 reflects | ||||||||||||
| the expenses and performance of Class R2 Shares for the period May 1 through | ||||||||||||
| October 1, 2014, and Class R4 Shares for the period October 2, 2014 through | ||||||||||||
| October 31, 2014. | ||||||||||||
| Hypothetical | ||||||||||||
| Performance (5% | ||||||||||||
| Actual | return before | |||||||||||
| Class R5(2) | Performance | expenses) | ||||||||||
| Beginning Account Value | ||||||||||||
| May 1, 2014 | $ | 1,000.00 | $ | 1,000.00 | ||||||||
| Ending Account Value | ||||||||||||
| October 31, 2014 | $ | 1,018.60 | $ | 1,021.83 | ||||||||
| Expenses Paid During Period* | $ | 3.41 | $ | 3.41 | ||||||||
| * Expenses are equal to the Fund's annualized expense ratio of 0.67% | ||||||||||||
| (representing the six month period annualized), multiplied by the average | ||||||||||||
| account value over the period, multiplied by 184/365 (to reflect the one-half | ||||||||||||
| year period). | ||||||||||||
| (2) As of October 1, 2014, Class R3 Shares were reclassified as Class R5 | ||||||||||||
| Shares, and all Class R3 shareholders were issued shares of Class R5. The | ||||||||||||
| shareholder expense example for the period ended October 31, 2014 reflects | ||||||||||||
| the expenses and performance of Class R3 Shares for the period May 1 through | ||||||||||||
| October 1, 2014, and Class R5 Shares for the period October 2, 2014 through | ||||||||||||
| October 31, 2014. | ||||||||||||
Equity Growth Strategy Fund 73
Russell Investment Company Equity Growth Strategy Fund
Schedule of Investments — October 31, 2014
| Amounts in thousands (except share amounts) | Amounts in thousands (except share amounts) | ||||||||||
| Fair | Fair | ||||||||||
| Value | Value | ||||||||||
| Shares | $ | Shares | $ | ||||||||
| Investments 100.0% | Fixed Income - 7.8% | ||||||||||
| Other Russell Investment Company | Russell Global Opportunistic Credit Fund | 7,351,860 | 73,519 | ||||||||
| Series Mutual Funds - Class Y | International Equities - 40.0% | ||||||||||
| Shares | Russell Emerging Markets Fund | 4,924,400 | 91,988 | ||||||||
| Alternative - 14.8% | Russell Global Equity Fund | 11,287,290 | 133,077 | ||||||||
| Russell Commodity Strategies Fund | 2,864,006 | 22,110 | Russell International Developed Markets | ||||||||
| Russell Global Infrastructure Fund | 4,007,304 | 51,895 | Fund | 4,199,636 | 150,767 | ||||||
| Russell Global Real Estate Securities Fund | 470,488 | 19,153 | 375,832 | ||||||||
| Russell Multi-Strategy Alternative Fund | 4,570,628 | 45,798 | |||||||||
| 138,956 | Total Investments 100.0% | ||||||||||
| Domestic Equities - 37.4% | (identified cost $809,269) | 939,856 | |||||||||
| Russell U.S. Core Equity Fund | 2,203,219 | 95,157 | Other Assets and Liabilities, Net | ||||||||
| Russell U.S. Defensive Equity Fund | 1,397,137 | 64,310 | -(0.0 | %) | (276 | ) | |||||
| Russell U.S. Dynamic Equity Fund | 7,501,309 | 95,192 | Net Assets - 100.0% | 939,580 | |||||||
| Russell U.S. Small Cap Equity Fund | 3,102,482 | 96,890 | |||||||||
| 351,549 | |||||||||||
| Presentation of Portfolio Holdings | |||||||||||
| Categories | % of Net Assets | ||||||||||
| Alternative | 14.8 | ||||||||||
| Domestic Equities | 37.4 | ||||||||||
| Fixed Income | 7.8 | ||||||||||
| International Equities | 40.0 | ||||||||||
| Total Investments | 100.0 | ||||||||||
| Other Assets and Liabilities, Net | (—*) | ||||||||||
| 100.0 | |||||||||||
| * Less than .05% of net assets. | |||||||||||
See accompanying notes which are an integral part of the financial statements.
74 Equity Growth Strategy Fund
| Russell Investment Company | |||
| Equity Growth Strategy Fund | |||
| Statement of Assets and Liabilities — October 31, 2014 | |||
| Amounts in thousands | |||
| Assets | |||
| Investments, at identified cost | $ | 809,269 | |
| Investments, at fair value | 939,856 | ||
| Receivables: | |||
| Investments sold | 1,563 | ||
| Fund shares sold | 838 | ||
| Prepaid expenses | 3 | ||
| Total assets | 942,260 | ||
| Liabilities | |||
| Payables: | |||
| Fund shares redeemed | 2,049 | ||
| Accrued fees to affiliates | 551 | ||
| Other accrued expenses | 80 | ||
| Total liabilities | 2,680 | ||
| Net Assets | $ | 939,580 | |
| Net Assets Consist of: | |||
| Undistributed (overdistributed) net investment income | $ | — | |
| Accumulated net realized gain (loss) | (183,164 | ) | |
| Unrealized appreciation (depreciation) on investments | 130,587 | ||
| Shares of beneficial interest | 831 | ||
| Additional paid-in capital | 991,326 | ||
| Net Assets | $ | 939,580 | |
| Net Asset Value, offering and redemption price per share: | |||
| Net asset value per share: Class A(#) | $ | 11.75 | |
| Maximum offering price per share (Net asset value plus sales charge of 5.75%): Class A | $ | 12.47 | |
| Class A — Net assets | $ | 233,233,111 | |
| Class A — Shares outstanding ($.01 par value) | 19,850,941 | ||
| Net asset value per share: Class C(#) | $ | 10.64 | |
| Class C — Net assets | $ | 327,124,714 | |
| Class C — Shares outstanding ($.01 par value) | 30,738,815 | ||
| Net asset value per share: Class E(#) | $ | 11.49 | |
| Class E — Net assets | $ | 23,055,639 | |
| Class E — Shares outstanding ($.01 par value) | 2,006,406 | ||
| Net asset value per share: Class R1(#) | $ | 11.81 | |
| Class R1 — Net assets | $ | 66,147,564 | |
| Class R1 — Shares outstanding ($.01 par value) | 5,602,151 | ||
| Net asset value per share: Class R4(#) | $ | 11.53 | |
| Class R4 — Net assets | $ | 57,342,747 | |
| Class R4 — Shares outstanding ($.01 par value) | 4,972,166 | ||
| Net asset value per share: Class R5(#) | $ | 11.40 | |
| Class R5 — Net assets | $ | 53,252,998 | |
| Class R5 — Shares outstanding ($.01 par value) | 4,670,579 | ||
| Net asset value per share: Class S(#) | $ | 11.79 | |
| Class S — Net assets | $ | 179,423,687 | |
| Class S — Shares outstanding ($.01 par value) | 15,221,165 | ||
| (#) Net asset value per share equals class level net assets divided by class level shares of beneficial interest outstanding. | |||
See accompanying notes which are an integral part of the financial statements.
Equity Growth Strategy Fund 75
| Russell Investment Company | |||
| Equity Growth Strategy Fund | |||
| Statement of Operations — For the Period Ended October 31, 2014 | |||
| Amounts in thousands | |||
| Investment Income | |||
| Income distributions from Underlying Funds | $ | 28,435 | |
| Expenses | |||
| Advisory fees | 2,003 | ||
| Administrative fees | 456 | ||
| Custodian fees | 32 | ||
| Distribution fees - Class A | 599 | ||
| Distribution fees - Class C | 2,512 | ||
| Distribution fees - Class R3 | 142 | ||
| Distribution fees - Class R5 | 11 | ||
| Transfer agent fees - Class A | 479 | ||
| Transfer agent fees - Class C | 670 | ||
| Transfer agent fees - Class E | 54 | ||
| Transfer agent fees - Class R1 | 146 | ||
| Transfer agent fees - Class R2 | 151 | ||
| Transfer agent fees - Class R3 | 114 | ||
| Transfer agent fees - Class R4 | 9 | ||
| Transfer agent fees - Class R5 | 9 | ||
| Transfer agent fees - Class S | 371 | ||
| Professional fees | 44 | ||
| Registration fees | 140 | ||
| Shareholder servicing fees - Class C | 837 | ||
| Shareholder servicing fees - Class E | 68 | ||
| Shareholder servicing fees - Class R2 | 189 | ||
| Shareholder servicing fees - Class R3 | 142 | ||
| Shareholder servicing fees - Class R4 | 11 | ||
| Shareholder servicing fees - Class R5 | 11 | ||
| Trustees’ fees | 24 | ||
| Printing fees | 9 | ||
| Miscellaneous | 27 | ||
| Expenses before reductions | 9,260 | ||
| Expense reductions | (1,962 | ) | |
| Net expenses | 7,298 | ||
| Net investment income (loss) | 21,137 | ||
| Net Realized and Unrealized Gain (Loss) | |||
| Net realized gain (loss) on: | |||
| Investments | 48,275 | ||
| Capital gain distributions from Underlying Funds | 16,358 | ||
| Net realized gain (loss) | 64,633 | ||
| Net change in unrealized appreciation (depreciation) on investments | (21,360 | ) | |
| Net realized and unrealized gain (loss) | 43,273 | ||
| Net Increase (Decrease) in Net Assets from Operations | $ | 64,410 | |
See accompanying notes which are an integral part of the financial statements.
76 Equity Growth Strategy Fund
| Russell Investment Company | ||||||
| Equity Growth Strategy Fund | ||||||
| Statements of Changes in Net Assets | ||||||
| For the Periods Ended October 31, | ||||||
| Amounts in thousands | 2014 | 2013 | ||||
| Increase (Decrease) in Net Assets | ||||||
| Operations | ||||||
| Net investment income (loss) | $ | 21,137 | $ | 10,465 | ||
| Net realized gain (loss) | 64,633 | 41,344 | ||||
| Net change in unrealized appreciation (depreciation) | (21,360 | ) | 130,719 | |||
| Net increase (decrease) in net assets from operations | 64,410 | 182,528 | ||||
| Distributions | ||||||
| From net investment income | ||||||
| Class A | (4,936 | ) | (2,856 | ) | ||
| Class C | (5,972 | ) | (3,229 | ) | ||
| Class E | (590 | ) | (531 | ) | ||
| Class R1 | (1,940 | ) | (1,129 | ) | ||
| Class R2 | (1,843 | ) | (1,309 | ) | ||
| Class R3 | (1,300 | ) | (997 | ) | ||
| Class R4 | (71 | ) | — | |||
| Class R5 | (39 | ) | — | |||
| Class S | (4,296 | ) | (2,845 | ) | ||
| Net decrease in net assets from distributions | (20,987 | ) | (12,896 | ) | ||
| Share Transactions* | ||||||
| Net increase (decrease) in net assets from share transactions | (149,281 | ) | (120,742 | ) | ||
| Total Net Increase (Decrease) in Net Assets | (105,858 | ) | 48,890 | |||
| Net Assets | ||||||
| Beginning of period | 1,045,438 | 996,548 | ||||
| End of period | $ | 939,580 | $ | 1,045,438 | ||
| Undistributed (overdistributed) net investment income included in net assets | $ | — | $ | (760 | ) | |
See accompanying notes which are an integral part of the financial statements.
Equity Growth Strategy Fund 77
Russell Investment Company Equity Growth Strategy Fund
Statements of Changes in Net Assets, continued
* Share transaction amounts (in thousands) for the periods ended October 31, 2014 and October 31, 2013 were as follows:
| 2014 | 2013 | |||||||||||
| Shares | Dollars | Shares | Dollars | |||||||||
| Class A | ||||||||||||
| Proceeds from shares sold | 2,106 | $ | 24,222 | 3,828 | $ | 39,732 | ||||||
| Proceeds from reinvestment of distributions | 428 | 4,887 | 288 | 2,829 | ||||||||
| Payments for shares redeemed | (4,203 | ) | (48,408 | ) | (5,610 | ) | (57,399 | ) | ||||
| Net increase (decrease) | (1,669 | ) | (19,299 | ) | (1,494 | ) | (14,838 | ) | ||||
| Class C | ||||||||||||
| Proceeds from shares sold | 4,395 | 45,746 | 4,372 | 41,214 | ||||||||
| Proceeds from reinvestment of distributions | 570 | 5,897 | 357 | 3,188 | ||||||||
| Payments for shares redeemed | (6,685 | ) | (69,992 | ) | (8,180 | ) | (76,583 | ) | ||||
| Net increase (decrease) | (1,720 | ) | (18,349 | ) | (3,451 | ) | (32,181 | ) | ||||
| Class E | ||||||||||||
| Proceeds from shares sold | 383 | 4,297 | 703 | 7,088 | ||||||||
| Proceeds from reinvestment of distributions | 53 | 588 | 55 | 529 | ||||||||
| Payments for shares redeemed | (1,156 | ) | (12,993 | ) | (2,609 | ) | (26,416 | ) | ||||
| Net increase (decrease) | (720 | ) | (8,108 | ) | (1,851 | ) | (18,799 | ) | ||||
| Class R1 | ||||||||||||
| Proceeds from shares sold | 900 | 10,457 | 3,000 | 30,495 | ||||||||
| Proceeds from reinvestment of distributions | 169 | 1,940 | 114 | 1,129 | ||||||||
| Payments for shares redeemed | (3,231 | ) | (37,049 | ) | (2,126 | ) | (21,974 | ) | ||||
| Net increase (decrease) | (2,162 | ) | (24,652 | ) | 988 | 9,650 | ||||||
| Class R2 | ||||||||||||
| Proceeds from shares sold | 794 | 9,007 | 1,739 | 17,432 | ||||||||
| Proceeds from reinvestment of distributions | 164 | 1,843 | 136 | 1,309 | ||||||||
| Payments for shares redeemed | (9,379 | ) | (106,077 | ) | (2,927 | ) | (29,438 | ) | ||||
| Net increase (decrease) | (8,421 | ) | (95,227 | ) | (1,052 | ) | (10,697 | ) | ||||
| Class R3 | ||||||||||||
| Proceeds from shares sold | 547 | 6,123 | 1,047 | 10,407 | ||||||||
| Proceeds from reinvestment of distributions | 118 | 1,300 | 105 | 997 | ||||||||
| Payments for shares redeemed | (7,101 | ) | (78,999 | ) | (3,208 | ) | (32,245 | ) | ||||
| Net increase (decrease) | (6,436 | ) | (71,576 | ) | (2,056 | ) | (20,841 | ) | ||||
| Class R4 | ||||||||||||
| Proceeds from shares sold | 5,079 | 57,055 | — | — | ||||||||
| Proceeds from reinvestment of distributions | 6 | 71 | — | — | ||||||||
| Payments for shares redeemed | (113 | ) | (1,277 | ) | — | — | ||||||
| Net increase (decrease) | 4,972 | 55,849 | — | — | ||||||||
| Class R5 | ||||||||||||
| Proceeds from shares sold | 4,796 | 53,263 | — | — | ||||||||
| Proceeds from reinvestment of distributions | 4 | 39 | — | — | ||||||||
| Payments for shares redeemed | (129 | ) | (1,418 | ) | — | — | ||||||
| Net increase (decrease) | 4,671 | 51,884 | — | — | ||||||||
| Class S | ||||||||||||
| Proceeds from shares sold | 3,281 | 37,891 | 5,906 | 61,416 | ||||||||
| Proceeds from reinvestment of distributions | 362 | 4,148 | 280 | 2,758 | ||||||||
| Payments for shares redeemed | (5,357 | ) | (61,842 | ) | (9,436 | ) | (97,210 | ) | ||||
| Net increase (decrease) | (1,714 | ) | (19,803 | ) | (3,250 | ) | (33,036 | ) | ||||
| Total increase (decrease) | (13,199 | ) | $ | (149,281 | ) | (12,166 | ) | $ | (120,742 | ) | ||
See accompanying notes which are an integral part of the financial statements.
78 Equity Growth Strategy Fund
(This page intentionally left blank)
Russell Investment Company Equity Growth Strategy Fund
Financial Highlights — For the Periods Ended
For a Share Outstanding Throughout Each Period.
| $ | Net | $ | $ | $ | ||||||||||
| Net Asset Value, | Investment | Net Realized | Total from | Distributions | ||||||||||
| Beginning of | Income (Loss) | and Unrealized | Investment | from Net | ||||||||||
| Period | (a)(b)(e) | Gain (Loss) | Operations | Investment Income | ||||||||||
| Class A | ||||||||||||||
| October 31, 2014 | 11.24 | .26 | .49 | .75 | (.24 | ) | ||||||||
| October 31, 2013 | 9.50 | .12 | 1.75 | 1.87 | (.13 | ) | ||||||||
| October 31, 2012 | 8.93 | .15 | .54 | .69 | (.12 | ) | ||||||||
| October 31, 2011 | 9.00 | .14 | (.09 | ) | .05 | (.12 | ) | |||||||
| October 31, 2010 | 7.80 | .10 | 1.19 | 1.29 | (.09 | ) | ||||||||
| Class C | ||||||||||||||
| October 31, 2014 | 10.23 | .14 | .46 | .60 | (.19 | ) | ||||||||
| October 31, 2013 | 8.69 | .04 | 1.59 | 1.63 | (.09 | ) | ||||||||
| October 31, 2012 | 8.21 | .07 | .51 | .58 | (.10 | ) | ||||||||
| October 31, 2011 | 8.34 | .07 | (.09 | ) | (.02 | ) | (.11 | ) | ||||||
| October 31, 2010 | 7.27 | .04 | 1.11 | 1.15 | (.08 | ) | ||||||||
| Class E | ||||||||||||||
| October 31, 2014 | 10.99 | .26 | .48 | .74 | (.24 | ) | ||||||||
| October 31, 2013 | 9.30 | .13 | 1.69 | 1.82 | (.13 | ) | ||||||||
| October 31, 2012 | 8.75 | .14 | .53 | .67 | (.12 | ) | ||||||||
| October 31, 2011 | 8.81 | .20 | (.14 | ) | .06 | (.12 | ) | |||||||
| October 31, 2010 | 7.64 | .10 | 1.17 | 1.27 | (.10 | ) | ||||||||
| Class R1 | ||||||||||||||
| October 31, 2014 | 11.29 | .34 | .46 | .80 | (.28 | ) | ||||||||
| October 31, 2013 | 9.53 | .15 | 1.77 | 1.92 | (.16 | ) | ||||||||
| October 31, 2012 | 8.95 | .18 | .55 | .73 | (.15 | ) | ||||||||
| October 31, 2011 | 8.99 | .16 | (.08 | ) | .08 | (.12 | ) | |||||||
| October 31, 2010 | 7.78 | .12 | 1.19 | 1.31 | (.10 | ) | ||||||||
| Class R4(3) | ||||||||||||||
| October 31, 2014 | 11.03 | .30 | .45 | .75 | (.25 | ) | ||||||||
| October 31, 2013 | 9.32 | .14 | 1.71 | 1.85 | (.14 | ) | ||||||||
| October 31, 2012 | 8.77 | .16 | .52 | .68 | (.13 | ) | ||||||||
| October 31, 2011 | 8.82 | .09 | (.02 | ) | .07 | (.12 | ) | |||||||
| October 31, 2010 | 7.64 | .10 | 1.18 | 1.28 | (.10 | ) | ||||||||
| Class R5(4) | ||||||||||||||
| October 31, 2014 | 10.91 | .26 | .45 | .71 | (.22 | ) | ||||||||
| October 31, 2013 | 9.23 | .11 | 1.69 | 1.80 | (.12 | ) | ||||||||
| October 31, 2012 | 8.68 | .16 | .51 | .67 | (.12 | ) | ||||||||
| October 31, 2011 | 8.76 | .13 | (.09 | ) | .04 | (.12 | ) | |||||||
| October 31, 2010 | 7.60 | .08 | 1.17 | 1.25 | (.09 | ) | ||||||||
| Class S | ||||||||||||||
| October 31, 2014 | 11.27 | .30 | .48 | .78 | (.26 | ) | ||||||||
| October 31, 2013 | 9.52 | .15 | 1.75 | 1.90 | (.15 | ) | ||||||||
| October 31, 2012 | 8.95 | .17 | .54 | .71 | (.14 | ) | ||||||||
| October 31, 2011 | 9.00 | .17 | (.10 | ) | .07 | (.12 | ) | |||||||
| October 31, 2010 | 7.78 | .12 | 1.20 | 1.32 | (.10 | ) | ||||||||
See accompanying notes which are an integral part of the financial statements.
80 Equity Growth Strategy Fund
| % | % | % | |||||||||||||||
| $ | $ | Ratio of Expenses | Ratio of Expenses | Ratio of Net | |||||||||||||
| Net Asset Value, | % | Net Assets, | to Average | to Average | Investment Income | % | |||||||||||
| $ | End of | Total | End of Period | Net Assets, | Net Assets, | to Average | Portfolio | ||||||||||
| Total Distributions | Period | Return(d) | (000 | ) | Gross(g) | Net(e)(g) | Net Assets(b)(e) | Turnover Rate | |||||||||
| (.24 | ) | 11.75 | 6.70 | 233,233 | .72 | .56 | 2.28 | 23 | |||||||||
| (.13 | ) | 11.24 | 19.86 | 241,814 | .71 | .57 | 1.17 | 14 | |||||||||
| (.12 | ) | 9.50 | 7.90 | 218,585 | .71 | .56 | 1.61 | 24 | |||||||||
| (.12 | ) | 8.93 | .46 | 232,317 | .74 | .55 | 1.52 | 7 | |||||||||
| (.09 | ) | 9.00 | 16.70 | 262,968 | .72 | .54 | 1.23 | 28 | |||||||||
| (.19 | ) | 10.64 | 5.87 | 327,125 | 1.47 | 1.31 | 1.37 | 23 | |||||||||
| (.09 | ) | 10.23 | 18.95 | 331,940 | 1.46 | 1.32 | .42 | 14 | |||||||||
| (.10 | ) | 8.69 | 7.12 | 311,910 | 1.46 | 1.31 | .86 | 24 | |||||||||
| (.11 | ) | 8.21 | (.34 | ) | 347,822 | 1.49 | 1.30 | .76 | 7 | ||||||||
| (.08 | ) | 8.34 | 15.95 | 391,560 | 1.47 | 1.29 | .51 | 28 | |||||||||
| (.24 | ) | 11.49 | 6.76 | 23,055 | .72 | .56 | 2.35 | 23 | |||||||||
| (.13 | ) | 10.99 | 19.74 | 29,977 | .72 | .57 | 1.29 | 14 | |||||||||
| (.12 | ) | 9.30 | 7.84 | 42,548 | .71 | .56 | 1.60 | 24 | |||||||||
| (.12 | ) | 8.75 | .59 | 56,276 | .73 | .55 | 2.12 | 7 | |||||||||
| (.10 | ) | 8.81 | 16.66 | 171,027 | .72 | .54 | 1.23 | 28 | |||||||||
| (.28 | ) | 11.81 | 7.17 | 66,147 | .47 | .17 | 2.97 | 23 | |||||||||
| (.16 | ) | 11.29 | 20.37 | 87,682 | .46 | .17 | 1.40 | 14 | |||||||||
| (.15 | ) | 9.53 | 8.29 | 64,614 | .46 | .14 | 1.95 | 24 | |||||||||
| (.12 | ) | 8.95 | .87 | 53,489 | .49 | .12 | 1.76 | 7 | |||||||||
| (.10 | ) | 8.99 | 17.00 | 39,248 | .47 | .27 | 1.39 | 28 | |||||||||
| (.25 | ) | 11.53 | 6.87 | 57,343 | .72 | .42 | 2.61 | 23 | |||||||||
| (.14 | ) | 11.03 | 20.07 | 92,890 | .71 | .42 | 1.34 | 14 | |||||||||
| (.13 | ) | 9.32 | 7.94 | 88,307 | .71 | .39 | 1.83 | 24 | |||||||||
| (.12 | ) | 8.77 | .75 | 85,039 | .75 | .37 | .96 | 7 | |||||||||
| (.10 | ) | 8.82 | 16.79 | 23,017 | .72 | .52 | 1.20 | 28 | |||||||||
| (.22 | ) | 11.40 | 6.61 | 53,253 | .97 | .67 | 2.34 | 23 | |||||||||
| (.12 | ) | 10.91 | 19.71 | 70,233 | .97 | .67 | 1.14 | 14 | |||||||||
| (.12 | ) | 9.23 | 7.81 | 78,384 | .96 | .64 | 1.78 | 24 | |||||||||
| (.12 | ) | 8.68 | .37 | 239,637 | .99 | .62 | 1.47 | 7 | |||||||||
| (.09 | ) | 8.76 | 16.54 | 290,176 | .97 | .78 | 1.03 | 28 | |||||||||
| (.26 | ) | 11.79 | 7.04 | 179,424 | .47 | .31 | 2.56 | 23 | |||||||||
| (.15 | ) | 11.27 | 20.15 | 190,902 | .46 | .32 | 1.46 | 14 | |||||||||
| (.14 | ) | 9.52 | 8.06 | 192,200 | .47 | .31 | 1.82 | 24 | |||||||||
| (.12 | ) | 8.95 | .74 | 179,547 | .49 | .30 | 1.81 | 7 | |||||||||
| (.10 | ) | 9.00 | 17.13 | 189,067 | .47 | .29 | 1.48 | 28 | |||||||||
See accompanying notes which are an integral part of the financial statements.
Equity Growth Strategy Fund 81
Russell Investment Company 2015 Strategy Fund
Portfolio Management Discussion and Analysis — October 31, 2014 (Unaudited)
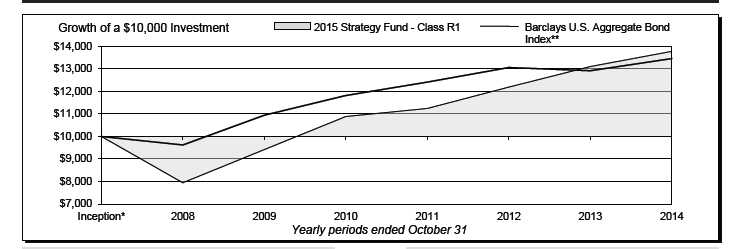
| 2015 Strategy Fund - Class R1 | 2015 Strategy Fund - Class R5‡ | ||||||
| Total | Total | ||||||
| Return | Return | ||||||
| 1 Year | 5.15 | % | 1 Year | 4.62 | % | ||
| 5 Years | 7.92 | %§ | 5 Years | 7.37 | %§ | ||
| Inception* | 4.99 | %§ | Inception* | 4.46 | %§ | ||
| 2015 Strategy Fund - Class R4‡ | Barclays U.S. Aggregate Bond Index** | ||||||
| Total | Total | ||||||
| Return | Return | ||||||
| 1 Year | 4.89 | % | 1 Year | 4.14 | % | ||
| 5 Years | 7.62 | %§ | 5 Years | 4.22 | %§ | ||
| Inception* | 4.72 | %§ | Inception* | 4.61 | %§ | ||
82 2015 Strategy Fund
Russell Investment Company
2015 Strategy Fund
| Portfolio Management Discussion and Analysis, continued — October 31, 2014 | |
| (Unaudited) | |
| The 2015 Strategy Fund (the “Fund”) is a fund of funds that | It was a positive equity market for the fiscal year ending October |
| invests in other Russell Investment Company mutual funds (the | 31, 2014. U.S. equities returned 16.07% over the period (as |
| “Underlying Funds”). The Underlying Funds employ a multi- | measured by the Russell 3000® Index), while non-U.S. equities |
| manager approach whereby portions of the Underlying Funds | returned 0.17% (as measured by the Russell Developed ex-U.S. |
| are allocated to different money managers. Underlying Fund | Large Cap Index). The outperformance of U.S. equities over fixed |
| assets not allocated to money managers are managed by Russell | income was a key positive driver to the Fund’s benchmark-relative |
| Investment Management Company (“RIMCo”), the Fund’s and | performance, as fixed income markets finished at 4.14% for the |
| Underlying Funds’ advisor. RIMCo, as the Underlying Funds’ | fiscal year as measured by the Fund’s benchmark. |
| advisor, may change the allocation of the Underlying Funds’ | Global REITs (as represented by the FTSE EPRA/NAREIT |
| assets among money managers at any time. An exemptive order | Developed Real Estate Index (Net)) finished the fiscal year up |
| from the Securities and Exchange Commission (“SEC”) permits | 9.84%, outperforming fixed income markets. This benefited the |
| RIMCo to engage or terminate a money manager in an Underlying | Fund’s performance through its allocation to the Russell Global |
| Fund at any time, subject to approval by the Underlying Fund’s | Real Estate Securities Fund. Commodities largely underperformed |
| Board, without a shareholder vote. Pursuant to the terms of the | broader equity and fixed income markets with a loss of 5.94% |
| exemptive order, an Underlying Fund is required to notify its | for the fiscal year (as represented by the Bloomberg Commodity |
| shareholders within 90 days of when a money manager begins | Index Total Return). Thus, the Fund’s allocation to the Russell |
| providing services. | Commodity Strategies Fund was a headwind to Fund performance. |
| What is the Fund’s investment objective? | On August 1, 2014, the Russell Global Infrastructure Fund |
| The Fund seeks to provide capital growth and income consistent | was added as an Underlying Fund in which the Fund invests. |
| with its current asset allocation which will change over time, with | This listed infrastructure exposure detracted from the Fund’s |
| an increasing allocation to fixed income funds. | performance during the period, as the S&P Global Infrastructure |
| Index (Net) lost 0.24% from August 1, 2014 through October 31, | |
| The Fund pursues this objective by investing in a diversified | 2014, while the Barclays U.S. Aggregate Index gained 1.40% |
| portfolio that, as of October 31, 2014, consisted of approximately | during the same period. |
| 29% equity Underlying Funds, 64% fixed income Underlying | |
| Funds and 7% alternative Underlying Funds. The Fund’s | Fixed income markets had overall positive performance for the |
| allocation to fixed income Underlying Funds will be fixed at 66% | fiscal year, as interest rates generally trended lower over the |
| in approximately the year 2015. | period, providing a tailwind to aggregate fixed income markets. |
| During the fiscal year, the Fund had a strategic allocation to | |
| How did the Fund perform relative to its benchmark for the | short duration fixed income, as represented by its allocation to |
| fiscal year ended October 31, 2014? | the Russell Short Duration Bond Fund, which in a lower yield |
| For the fiscal year ended October 31, 2014, the Fund’s Class R1, | environment detracted from the Fund’s benchmark-relative |
| Class R4 and Class R5 Shares gained 5.15%, 4.89 % and 4.62%, | performance. |
| respectively. This is compared to the Fund’s primary benchmark, | |
| the Barclays U.S. Aggregate Bond Index, which gained 4.14 | How did the investment strategies and techniques employed |
| % during the same period. The Fund’s performance includes | by the Fund and the Underlying Funds affect the Fund’s |
| operating expenses, whereas index returns are unmanaged and | performance? |
| do not include expenses of any kind. | The Fund is a fund of funds and its performance is based on |
| For the fiscal year ended October 31, 2014, the Morningstar® | RIMCo’s strategic asset allocations and the performance of the |
| Underlying Funds in which the Fund invests. | |
| Target Date 2011-2015 gained 5.85%. This result serves as a | |
| peer comparison and is expressed net of operating expenses. | The Fund’s strategic allocation to fixed income Underlying |
| Funds negatively impacted its benchmark-relative performance. | |
| The Fund’s outperformance relative to the Barclays U.S. | Allocations to the Russell Global Opportunistic Credit Fund (an |
| Aggregate Bond Index was due to the Fund’s out-of-benchmark | Underlying Fund after August 1, 2014) and Russell Short Duration |
| allocation to equity and global real estate Underlying Funds, | Bond Fund detracted, as these Underlying Funds underperformed |
| which outperformed fixed income Underlying Funds over the | the Fund’s benchmark. In particular, the Russell Short Duration |
| period. | Bond Fund underperformed the Fund’s benchmark, as having |
| How did the market conditions described in the Market | a strategic short duration bias over the year was a headwind as |
| Summary report affect the Fund’s performance? | interest rates generally moved lower. Allocations to the Russell |
| Strategic Bond Fund and Russell Investment Grade Bond Fund | |
| 2015 Strategy Fund 83 | |
Russell Investment Company
2015 Strategy Fund
Portfolio Management Discussion and Analysis, continued — October 31, 2014 (Unaudited)
| were slightly positive from a benchmark-relative perspective. | The Fund’s strategic allocation to alternative Underlying Funds |
| Results of Underlying Fund active management were positive. | had a mixed impact on benchmark-relative performance. The |
| For the Russell Strategic Bond Fund, exposure to non-agency | Fund’s allocation to the Russell Global Real Estate Securities |
| mortgages and emerging market debt were key contributors to | Fund was positive, while the allocations to the Russell Global |
| the Underlying Fund’s benchmark-relative outperformance. | Infrastructure Fund (an Underlying Fund after August 1, 2014) |
| Currency selection was also positive, particularly a long U.S. | and Russell Commodity Strategies Fund were negative. From an |
| Dollar position versus short positions to the Australian Dollar | active management standpoint, performance of these Underlying |
| Euro, and Japanese Yen. | Funds was generally mixed. The Russell Commodity Strategies |
| With respect to the Fund’s global equity exposure, the Fund’s | Fund underperformed its respective asset class benchmark |
| strategic allocations to the Russell Emerging Markets Fund, | while the Russell Global Real Estate Securities Fund and |
| Russell International Developed Markets Fund (an Underlying | Russell Global Infrastructure Fund (after August 1, 2014) |
| Fund until August 1, 2014) and Select International Equity Fund | outperformed their respective asset class benchmarks. For the |
| (an Underlying Fund after August 1, 2014) detracted from the | Russell Commodity Strategies Fund, an overweight to energy |
| Fund’s benchmark-relative performance, while its allocation to | commodities detracted from Fund performance. For the Russell |
| the Russell Global Equity Fund positively impacted performance. | Global Real Estate Securities Fund, security selection within the |
| From an active management standpoint, the Select International | U.S. was positive while an overweight to and security selection |
| Equity Fund underperformed the broad non-U.S. equity market | within Japan detracted from performance. |
| as represented by the Russell Developed ex-U.S. Large Cap™ | Describe any changes to the Fund’s structure or allocation |
| Index Net, while the Russell Global Equity Fund performed in- | to the Underlying Funds. |
| line with the broad global equity market as represented by the | On August 1, 2014, RIMCo modified the Fund’s target asset |
| Russell Developed Large Cap Net Index. The Russell Emerging | allocation and as a result, the Fund increased its exposure to |
| Markets Fund underperformed its emerging markets benchmark. | equity and alternative Underlying Funds and decreased its |
| For the Select International Equity Fund, a bias toward low | exposure to fixed income Underlying Funds. In connection with |
| price-to-book ratio stocks detracted from the Underlying Fund’s | this change, on August 1, 2014, the Russell U.S. Core Equity |
| benchmark-relative performance as lower price-to-book stocks | Fund and Russell International Developed Markets Fund were |
| strongly underperformed the market in non-U.S. developed | replaced as Underlying Funds with the Select U.S. Equity Fund |
| regions. For the Russell Emerging Markets Fund, unsuccessful | and Select International Equity Fund, respectively. The Fund |
| stock selection in China, South Korea, Russia, and Taiwan were | also added an allocation to the Russell Global Infrastructure |
| detractors from performance. | Fund and Russell Global Opportunistic Credit Fund to provide |
| The Fund’s strategic allocation to U.S. large cap equity Underlying | further diversification. |
| Funds benefited the Fund’s benchmark-relative performance, as | On July 9, 2014, the Fund implemented a 0.50% underweight to |
| broad U.S. equities outperformed core fixed income for the period. | the Russell Commodity Strategies and 0.75% underweight to the |
| From an active management perspective, each of the large cap | Russell Global Real Estate Securities Funds, driven by limited |
| U.S. equity Underlying Funds underperformed its respective U.S. | commodity price appreciation expectations over the medium |
| equity market segment as represented by its primary benchmark. | term and caution over the interest rate sensitivity of REITs in |
| In particular, the Select U.S. Equity Fund (an Underlying Fund | an environment of potential rising interest rates. This was offset |
| after August 1, 2014) underperformed during the period it was an | by a 0.75% overweight to the Russell Global Equity Fund. This |
| Underlying Fund, driven by an overweight to stocks with lower | contributed positively to Fund performance during the period, as |
| than benchmark valuation ratios (lower price-to-earnings, price- | commodities and global REITs underperformed global equities. |
| to-book, and price-to-cash flow ratios). In addition, the Fund’s | |
| strategic allocation to the Russell U.S. Small Cap Equity Fund | On October 30, 2014, the Fund implemented a 0.25% overweight |
| benefited the Fund’s benchmark-relative performance, though | to the Select U.S. Equity Fund and away from the Russell Global |
| the Underlying Fund underperformed its Russell 2000® Index | Infrastructure Fund based on a cautious stance to interest |
| benchmark. | rate sensitive asset classes in a potentially rising interest rate |
| environment. |
84 2015 Strategy Fund
Russell Investment Company
2015 Strategy Fund
Portfolio Management Discussion and Analysis, continued — October 31, 2014 (Unaudited)
The views expressed in this report reflect those of the portfolio
managers only through the end of the period covered by
the report. These views do not necessarily represent the
views of RIMCo, or any other person in RIMCo or any other
affiliated organization. These views are subject to change
at any time based upon market conditions or other events,
and RIMCo disclaims any responsibility to update the views
contained herein. These views should not be relied on as
investment advice and, because investment decisions for
a Russell Investment Company (“RIC”) Fund are based on
numerous factors, should not be relied on as an indication
of investment decisions of any RIC Fund.
| * | Assumes initial investment on March 31, 2008. |
| ** | The Barclays U.S. Aggregate Bond Index is an index, with income reinvested, generally representative of intermediate-term government bonds, investment grade corporate debt securities and mortgage-backed securities. |
| ‡ | The Fund first issued Class R4 and Class R5 Shares on October 1, 2014. The returns shown for Class R4 and Class R5 Shares prior to that date are the returns of the Fund’s Class R2 and Class R3 Shares, respectively. |
| § | Annualized. |
Performance is historical and assumes reinvestment of all dividends and capital gains. Investment return and principal value will fluctuate so that an investor’s shares, when redeemed, may be worth more or less than when purchased. Past performance is not indicative of future results. The returns shown do not reflect the deduction of taxes that a shareholder would pay on Fund distributions or the redemption of Fund shares.
2015 Strategy Fund 85
Russell Investment Company 2015 Strategy Fund
Shareholder Expense Example — October 31, 2014 (Unaudited)
| Fund Expenses | Please note that the expenses shown in the table are meant | ||||||
| The following disclosure provides important information | to highlight your ongoing costs only and do not reflect any | ||||||
| regarding the Fund’s Shareholder Expense Example | transactional costs. Therefore, the information under the heading | ||||||
| (“Example”). | “Hypothetical Performance (5% return before expenses)” is | ||||||
| useful in comparing ongoing costs only, and will not help you | |||||||
| Example | determine the relative total costs of owning different funds. In | ||||||
| As a shareholder of the Fund, you incur ongoing costs, including | addition, if these transactional costs were included, your costs | ||||||
| distribution (12b-1) and/or service fees and other Fund expenses. | would have been higher. | ||||||
| The Example is intended to help you understand your ongoing | Hypothetical | ||||||
| costs (in dollars) of investing in the Fund and to compare these | Performance (5% | ||||||
| costs with the ongoing costs of investing in other mutual funds. | Actual | return before | |||||
| The Example is based on an investment of $1,000 invested at the | Class R1 | Performance | expenses) | ||||
| Beginning Account Value | |||||||
| beginning of the period and held for the entire period indicated, | May 1, 2014 | $ | 1,000.00 | $ | 1,000.00 | ||
| which for this Fund is from May 1, 2014 to October 31, 2014. | Ending Account Value | ||||||
| October 31, 2014 | $ | 1,019.60 | $ | 1,025.21 | |||
| Actual Expenses | Expenses Paid During Period* | $ | — | $ | — | ||
| The information in the table under the heading “Actual | |||||||
| Performance” provides information about actual account values | * There were no expenses charged to the Class. | ||||||
| and actual expenses. You may use the information in this column, | Hypothetical | ||||||
| together with the amount you invested, to estimate the expenses | Performance (5% | ||||||
| that you paid over the period. Simply divide your account value by | Actual | return before | |||||
| Class R4(1) | Performance | expenses) | |||||
| $1,000 (for example, an $8,600 account value divided by $1,000 | Beginning Account Value | ||||||
| = 8.6), then multiply the result by the number in the first column | May 1, 2014 | $ | 1,000.00 | $ | 1,000.00 | ||
| in the row entitled “Expenses Paid During Period” to estimate | Ending Account Value | ||||||
| the expenses you paid on your account during this period. | October 31, 2014 | $ | 1,018.40 | $ | 1,023.95 | ||
| Expenses Paid During Period* | $ | 1.27 | $ | 1.28 | |||
| Hypothetical Example for Comparison Purposes | |||||||
| * Expenses are equal to the Fund's annualized expense ratio of 0.25% | |||||||
| The information in the table under the heading “Hypothetical | (representing the six month period annualized), multiplied by the average | ||||||
| Performance (5% return before expenses)” provides information | account value over the period, multiplied by 184/365 (to reflect the one-half | ||||||
| about hypothetical account values and hypothetical expenses | year period). | ||||||
| based on the Fund’s actual expense ratio and an assumed rate of | (1) As of October 1, 2014, Class R2 Shares were reclassified as Class R4 | ||||||
| Shares, and all Class R2 shareholders were issued shares of Class R4. The | |||||||
| return of 5% per year before expenses, which is not the Fund’s | shareholder expense example for the period ended October 31, 2014 reflects | ||||||
| actual return. The hypothetical account values and expenses | the expenses and performance of Class R2 Shares for the period May 1 through | ||||||
| may not be used to estimate the actual ending account balance or | October 1, 2014, and Class R4 Shares for the period October 2, 2014 through | ||||||
| expenses you paid for the period. You may use this information | October 31, 2014. | ||||||
| to compare the ongoing costs of investing in the Fund and other | Hypothetical | ||||||
| funds. To do so, compare this 5% hypothetical example with the | Performance (5% | ||||||
| 5% hypothetical examples that appear in the shareholder reports | Actual | return before | |||||
| Class R5(2) | Performance | expenses) | |||||
| of other funds. | Beginning Account Value | ||||||
| May 1, 2014 | $ | 1,000.00 | $ | 1,000.00 | |||
| Ending Account Value | |||||||
| October 31, 2014 | $ | 1,017.10 | $ | 1,022.68 | |||
| Expenses Paid During Period* | $ | 2.54 | $ | 2.55 | |||
| * Expenses are equal to the Fund's annualized expense ratio of 0.50% | |||||||
| (representing the six month period annualized), multiplied by the average | |||||||
| account value over the period, multiplied by 184/365 (to reflect the one-half | |||||||
| year period). | |||||||
| (2) As of October 1, 2014, Class R3 Shares were reclassified as Class R5 | |||||||
| Shares, and all Class R3 shareholders were issued shares of Class R5. The | |||||||
| shareholder expense example for the period ended October 31, 2014 reflects | |||||||
| the expenses and performance of Class R3 Shares for the period May 1 through | |||||||
| October 1, 2014, and Class R5 Shares for the period October 2, 2014 through | |||||||
| October 31, 2014. | |||||||
| 86 2015 Strategy Fund | |||||||
| Russell Investment Company | |||||||||||
| 2015 Strategy Fund | |||||||||||
| Schedule of Investments — October 31, 2014 | |||||||||||
| Amounts in thousands (except share amounts) | Amounts in thousands (except share amounts) | ||||||||||
| Fair | Fair | ||||||||||
| Value | Value | ||||||||||
| Shares | $ | Shares | $ | ||||||||
| Investments 100.0% | Fixed Income - 64.3% | ||||||||||
| Other Russell Investment Company | Russell Global Opportunistic Credit Fund | 81,761 | 817 | ||||||||
| Series Mutual Funds - Class Y | Russell Investment Grade Bond Fund | 170,239 | 3,829 | ||||||||
| Shares | Russell Short Duration Bond Fund | 133,968 | 2,594 | ||||||||
| Russell Strategic Bond Fund | 775,370 | 8,645 | |||||||||
| Alternative - 5.6% | 15,885 | ||||||||||
| Russell Commodity Strategies Fund | 54,074 | 418 | International Equities - 14.3% | ||||||||
| Russell Global Infrastructure Fund | 37,004 | 479 | Russell Emerging Markets Fund | 28,033 | 524 | ||||||
| Russell Global Real Estate Securities Fund | 11,771 | 479 | Russell Global Equity Fund | 102,659 | 1,210 | ||||||
| 1,376 | Select International Equity Fund | 190,109 | 1,791 | ||||||||
| Domestic Equities - 15.8% | 3,525 | ||||||||||
| Russell U.S. Defensive Equity Fund | 13,362 | 615 | |||||||||
| Russell U.S. Dynamic Equity Fund | 24,526 | 311 | Total Investments 100.0% | ||||||||
| Russell U.S. Small Cap Equity Fund | 15,265 | 477 | (identified cost $21,826) | 24,701 | |||||||
| Select U.S. Equity Fund | 241,316 | 2,512 | Other Assets and Liabilities, Net | ||||||||
| 3,915 | -(0.0 | %) | (5 | ) | |||||||
| Net Assets - 100.0% | 24,696 | ||||||||||
| Presentation of Portfolio Holdings | |||||||||||
| Categories | % of Net Assets | ||||||||||
| Alternative | 5.6 | ||||||||||
| Domestic Equities | 15.8 | ||||||||||
| Fixed Income | 64.3 | ||||||||||
| International Equities | 14.3 | ||||||||||
| Total Investments | 100.0 | ||||||||||
| Other Assets and Liabilities, Net | (—*) | ||||||||||
| 100.0 | |||||||||||
| * Less than .05% of net assets. | |||||||||||
See accompanying notes which are an integral part of the financial statements.
2015 Strategy Fund 87
| Russell Investment Company | ||
| 2015 Strategy Fund | ||
| Statement of Assets and Liabilities — October 31, 2014 | ||
| Amounts in thousands | ||
| Assets | ||
| Investments, at identified cost | $ | 21,826 |
| Investments, at fair value | 24,701 | |
| Receivables: | ||
| Investments sold | 812 | |
| Fund shares sold | 17 | |
| Total assets | 25,530 | |
| Liabilities | ||
| Payables: | ||
| Fund shares redeemed | 829 | |
| Accrued fees to affiliates | 5 | |
| Total liabilities | 834 | |
| Net Assets | $ | 24,696 |
| Net Assets Consist of: | ||
| Undistributed (overdistributed) net investment income | $ | 1 |
| Accumulated net realized gain (loss) | 3,340 | |
| Unrealized appreciation (depreciation) on investments | 2,875 | |
| Shares of beneficial interest | 24 | |
| Additional paid-in capital | 18,456 | |
| Net Assets | $ | 24,696 |
| Net Asset Value, offering and redemption price per share: | ||
| Net asset value per share: Class R1(#) | $ | 10.28 |
| Class R1 — Net assets | $ | 10,954,197 |
| Class R1 — Shares outstanding ($.01 par value) | 1,065,220 | |
| Net asset value per share: Class R4(#) | $ | 10.27 |
| Class R4 — Net assets | $ | 6,038,246 |
| Class R4 — Shares outstanding ($.01 par value) | 587,669 | |
| Net asset value per share: Class R5(#) | $ | 10.28 |
| Class R5 — Net assets | $ | 7,703,975 |
| Class R5 — Shares outstanding ($.01 par value) | 749,764 | |
| (#) Net asset value per share equals class level net assets divided by class level shares of beneficial interest outstanding. | ||
See accompanying notes which are an integral part of the financial statements.
88 2015 Strategy Fund
| Russell Investment Company | |||
| 2015 Strategy Fund | |||
| Statement of Operations — For the Period Ended October 31, 2014 | |||
| Amounts in thousands | |||
| Investment Income | |||
| Income distributions from Underlying Funds | $ | 610 | |
| Expenses | |||
| Distribution fees - Class R3 | 24 | ||
| Distribution fees - Class R5 | 2 | ||
| Shareholder servicing fees - Class R2 | 12 | ||
| Shareholder servicing fees - Class R3 | 24 | ||
| Shareholder servicing fees - Class R4 | 1 | ||
| Shareholder servicing fees - Class R5 | 2 | ||
| Total expenses | 65 | ||
| Net investment income (loss) | 545 | ||
| Net Realized and Unrealized Gain (Loss) | |||
| Net realized gain (loss) on: | |||
| Investments | 3,334 | ||
| Capital gain distributions from Underlying Funds | 264 | ||
| Net realized gain (loss) | 3,598 | ||
| Net change in unrealized appreciation (depreciation) on investments | (2,635 | ) | |
| Net realized and unrealized gain (loss) | 963 | ||
| Net Increase (Decrease) in Net Assets from Operations | $ | 1,508 | |
See accompanying notes which are an integral part of the financial statements.
2015 Strategy Fund 89
| Russell Investment Company | ||||||
| 2015 Strategy Fund | ||||||
| Statements of Changes in Net Assets | ||||||
| For the Periods Ended October 31, | ||||||
| Amounts in thousands | 2014 | 2013 | ||||
| Increase (Decrease) in Net Assets | ||||||
| Operations | ||||||
| Net investment income (loss) | $ | 545 | $ | 1,584 | ||
| Net realized gain (loss) | 3,598 | 2,667 | ||||
| Net change in unrealized appreciation (depreciation) | (2,635 | ) | (1,263 | ) | ||
| Net increase (decrease) in net assets from operations | 1,508 | 2,988 | ||||
| Distributions | ||||||
| From net investment income | ||||||
| Class R1 | (306 | ) | (1,141 | ) | ||
| Class R2 | (74 | ) | (164 | ) | ||
| Class R3 | (127 | ) | (280 | ) | ||
| Class R4 | (17 | ) | — | |||
| Class R5 | (20 | ) | — | |||
| From net realized gain | ||||||
| Class R1 | (1,302 | ) | (500 | ) | ||
| Class R2 | (379 | ) | (77 | ) | ||
| Class R3 | (779 | ) | (140 | ) | ||
| Net decrease in net assets from distributions | (3,004 | ) | (2,302 | ) | ||
| Share Transactions* | ||||||
| Net increase (decrease) in net assets from share transactions | (8,617 | ) | (22,261 | ) | ||
| Total Net Increase (Decrease) in Net Assets | (10,113 | ) | (21,575 | ) | ||
| Net Assets | ||||||
| Beginning of period | 34,809 | 56,384 | ||||
| End of period | $ | 24,696 | $ | 34,809 | ||
| Undistributed (overdistributed) net investment income included in net assets | $ | 1 | $ | — | ||
See accompanying notes which are an integral part of the financial statements.
90 2015 Strategy Fund
Russell Investment Company 2015 Strategy Fund
Statements of Changes in Net Assets, continued
* Share transaction amounts (in thousands) for the periods ended October 31, 2014 and October 31, 2013 were as follows:
| 2014 | 2013 | |||||||||||
| Shares | Dollars | Shares | Dollars | |||||||||
| Class R1 | ||||||||||||
| Proceeds from shares sold | 361 | $ | 3,708 | 1,343 | $ | 14,097 | ||||||
| Proceeds from reinvestment of distributions | 162 | 1,608 | 160 | 1,641 | ||||||||
| Payments for shares redeemed | (1,164 | ) | (11,901 | ) | (3,628 | ) | (37,564 | ) | ||||
| Net increase (decrease) | (641 | ) | (6,585 | ) | (2,125 | ) | (21,826 | ) | ||||
| Class R2 | ||||||||||||
| Proceeds from shares sold | 171 | 1,751 | 298 | 3,134 | ||||||||
| Proceeds from reinvestment of distributions | 45 | 453 | 23 | 241 | ||||||||
| Payments for shares redeemed | (715 | ) | (7,307 | ) | (347 | ) | (3,642 | ) | ||||
| Net increase (decrease) | (499 | ) | (5,103 | ) | (26 | ) | (267 | ) | ||||
| Class R3 | ||||||||||||
| Proceeds from shares sold | 333 | 3,428 | 414 | 4,318 | ||||||||
| Proceeds from reinvestment of distributions | 91 | 906 | 41 | 420 | ||||||||
| Payments for shares redeemed | (1,457 | ) | (14,869 | ) | (467 | ) | (4,906 | ) | ||||
| Net increase (decrease) | (1,033 | ) | (10,535 | ) | (12 | ) | (168 | ) | ||||
| Class R4 | ||||||||||||
| Proceeds from shares sold | 594 | 6,046 | — | — | ||||||||
| Proceeds from reinvestment of distributions | 2 | 17 | — | — | ||||||||
| Payments for shares redeemed | (8 | ) | (84 | ) | — | — | ||||||
| Net increase (decrease) | 588 | 5,979 | — | — | ||||||||
| Class R5 | ||||||||||||
| Proceeds from shares sold | 942 | 9,581 | — | — | ||||||||
| Proceeds from reinvestment of distributions | 2 | 20 | — | — | ||||||||
| Payments for shares redeemed | (194 | ) | (1,974 | ) | — | — | ||||||
| Net increase (decrease) | 750 | 7,627 | — | — | ||||||||
| Total increase (decrease) | (835 | ) | $ | (8,617 | ) | (2,163 | ) | $ | (22,261 | ) | ||
See accompanying notes which are an integral part of the financial statements.
2015 Strategy Fund 91
| Russell Investment Company | |||||||||||||||
| 2015 Strategy Fund | |||||||||||||||
| Financial Highlights — For the Periods Ended | |||||||||||||||
| For a Share Outstanding Throughout Each Period. | |||||||||||||||
| $ | |||||||||||||||
| $ | Net | $ | $ | $ | $ | ||||||||||
| Net Asset Value, | Investment | Net Realized | Total from | Distributions | Distributions | ||||||||||
| Beginning of | Income (Loss) | and Unrealized | Investment | from Net | from Net | ||||||||||
| Period | (a)(b)(e) | Gain (Loss) | Operations | Investment Income | Realized Gain | ||||||||||
| Class R1 | |||||||||||||||
| October 31, 2014 | 10.76 | .21 | .30 | .51 | (.20) | (.79) | |||||||||
| October 31, 2013 | 10.44 | .36 | .40 | .76 | (.31) | (.13) | |||||||||
| October 31, 2012 | 9.92 | .27 | .54 | .81 | (.27) | (.02) | |||||||||
| October 31, 2011 | 10.05 | .38 | (.06) | .32 | (.42) | (.03) | |||||||||
| October 31, 2010 | 8.96 | .24 | 1.13 | 1.37 | (.28) | — | |||||||||
| Class R4(3) | |||||||||||||||
| October 31, 2014 | 10.75 | .16 | .33 | .49 | (.18) | (.79) | |||||||||
| October 31, 2013 | 10.43 | .28 | .45 | .73 | (.28) | (.13) | |||||||||
| October 31, 2012 | 9.91 | .27 | .51 | .78 | (.24) | (.02) | |||||||||
| October 31, 2011 | 10.04 | .38 | (.08) | .30 | (.40) | (.03) | |||||||||
| October 31, 2010 | 8.96 | .25 | 1.09 | 1.34 | (.26) | — | |||||||||
| Class R5(4) | |||||||||||||||
| October 31, 2014 | 10.75 | .15 | .32 | .47 | (.15) | (.79) | |||||||||
| October 31, 2013 | 10.44 | .26 | .44 | .70 | (.26) | (.13) | |||||||||
| October 31, 2012 | 9.91 | .24 | .52 | .76 | (.21) | (.02) | |||||||||
| October 31, 2011 | 10.04 | .33 | (.06) | .27 | (.37) | (.03) | |||||||||
| October 31, 2010 | 8.95 | .23 | 1.10 | 1.33 | (.24) | — | |||||||||
See accompanying notes which are an integral part of the financial statements.
92 2015 Strategy Fund
| % | % | % | ||||||||||||||
| $ | $ | Ratio of Expenses | Ratio of Expenses | Ratio of Net | ||||||||||||
| Net Asset Value, | % | Net Assets, | to Average | to Average | Investment Income | % | ||||||||||
| $ | End of | Total | End of Period | Net Assets, | Net Assets, | to Average | Portfolio | |||||||||
| Total Distributions | Period | Return | (000 | ) | Gross(g) | Net(e)(g) | Net Assets(b)(e) | Turnover Rate | ||||||||
| (.99) | 10.28 | 5.15 | 10,954 | — | — | 2.04 | 46 | |||||||||
| (.44) | 10.76 | 7.49 | 18,349 | — | — | 3.43 | 36 | |||||||||
| (.29) | 10.44 | 8.45 | 40,004 | — | — | 2.63 | 28 | |||||||||
| (.45) | 9.92 | 3.29 | 35,040 | — | — | 3.83 | 26 | |||||||||
| (.28) | 10.05 | 15.60 | 23,319 | .70 | — | 2.56 | 44 | |||||||||
| (.97) | 10.27 | 4.89 | 6,038 | .25 | .25 | 1.61 | 46 | |||||||||
| (.41) | 10.75 | 7.21 | 5,363 | .25 | .25 | 2.64 | 36 | |||||||||
| (.26) | 10.43 | 8.13 | 5,473 | .25 | .25 | 2.63 | 28 | |||||||||
| (.43) | 9.91 | 3.02 | 7,321 | .25 | .25 | 3.81 | 26 | |||||||||
| (.26) | 10.04 | 15.23 | 7,207 | 1.00 | .25 | 2.63 | 44 | |||||||||
| (.94) | 10.28 | 4.62 | 7,704 | .50 | .50 | 1.44 | 46 | |||||||||
| (.39) | 10.75 | 6.85 | 11,097 | .50 | .50 | 2.47 | 36 | |||||||||
| (.23) | 10.44 | 7.90 | 10,907 | .50 | .50 | 2.38 | 28 | |||||||||
| (.40) | 9.91 | 2.78 | 15,093 | .50 | .50 | 3.26 | 26 | |||||||||
| (.24) | 10.04 | 15.08 | 10,836 | 1.26 | .50 | 2.40 | 44 | |||||||||
See accompanying notes which are an integral part of the financial statements.
2015 Strategy Fund 93
Russell Investment Company 2020 Strategy Fund
Portfolio Management Discussion and Analysis — October 31, 2014 (Unaudited)

| 2020 Strategy Fund - Class A‡ | 2020 Strategy Fund - Class R5‡‡‡ | ||||||
| Total | Total | ||||||
| Return | Return | ||||||
| 1 Year | (0.61 | )% | 1 Year | 5.15 | % | ||
| 5 Years | 7.08 | %§ | 5 Years | 8.07 | %§ | ||
| Inception* | 4.48 | %§ | Inception* | 4.85 | %§ | ||
| 2020 Strategy Fund - Class E | 2020 Strategy Fund - Class S | ||||||
| Total | Total | ||||||
| Return | Return | ||||||
| 1 Year | 5.52 | % | 1 Year | 5.70 | % | ||
| 5 Years | 8.39 | %§ | 5 Years | 8.64 | %§ | ||
| Inception* | 5.14 | %§ | Inception* | 5.38 | %§ | ||
| 2020 Strategy Fund - Class R1‡‡ | Barclays U.S. Aggregate Bond Index** | ||||||
| Total | Total | ||||||
| Return | Return | ||||||
| 1 Year | 5.70 | % | 1 Year | 4.14 | % | ||
| 5 Years | 8.64 | %§ | 5 Years | 4.22 | %§ | ||
| Inception* | 5.38 | %§ | Inception* | 4.71 | %§ | ||
| 2020 Strategy Fund - Class R4‡‡‡ | |||||||
| Total | |||||||
| Return | |||||||
| 1 Year | 5.51 | % | |||||
| 5 Years | 8.37 | %§ | |||||
| Inception* | 5.13 | %§ | |||||
94 2020 Strategy Fund
Russell Investment Company
2020 Strategy Fund
| Portfolio Management Discussion and Analysis, continued — October 31, 2014 | |
| (Unaudited) | |
| The 2020 Strategy Fund (the “Fund”) is a fund of funds that | It was a positive equity market for the fiscal year ending October |
| invests in other Russell Investment Company mutual funds (the | 31, 2014. U.S. equities returned 16.07% over the period (as |
| “Underlying Funds”). The Underlying Funds employ a multi- | measured by the Russell 3000® Index), while non-U.S. equities |
| manager approach whereby portions of the Underlying Funds | returned 0.17% (as measured by the Russell Developed ex-U.S. |
| are allocated to different money managers. Underlying Fund | Large Cap Index). The outperformance of U.S. equities over fixed |
| assets not allocated to money managers are managed by Russell | income was a key positive driver to the Fund’s benchmark-relative |
| Investment Management Company (“RIMCo”), the Fund’s and | performance, as fixed income markets finished at 4.14% for the |
| Underlying Funds’ advisor. RIMCo, as the Underlying Funds’ | fiscal year as measured by the Fund’s benchmark. |
| advisor, may change the allocation of the Underlying Funds’ | Global REITs (as represented by the FTSE EPRA/NAREIT |
| assets among money managers at any time. An exemptive order | Developed Real Estate Index (Net)) finished the fiscal year up |
| from the Securities and Exchange Commission (“SEC”) permits | 9.84%, outperforming fixed income markets. This benefited the |
| RIMCo to engage or terminate a money manager in an Underlying | Fund’s performance through its allocation to the Russell Global |
| Fund at any time, subject to approval by the Underlying Fund’s | Real Estate Securities Fund. Commodities largely underperformed |
| Board, without a shareholder vote. Pursuant to the terms of the | broader equity and fixed income markets with a loss of 5.94% |
| exemptive order, an Underlying Fund is required to notify its | for the fiscal year (as represented by the Bloomberg Commodity |
| shareholders within 90 days of when a money manager begins | Index Total Return). Thus, the Fund’s allocation to the Russell |
| providing services. | Commodity Strategies Fund was a headwind to Fund performance. |
| What is the Fund’s investment objective? | On August 1, 2014, the Russell Global Infrastructure Fund |
| The Fund seeks to provide capital growth and income consistent | was added as an Underlying Fund in which the Fund invests. |
| with its current asset allocation which will change over time, with | This listed infrastructure exposure detracted from the Fund’s |
| an increasing allocation to fixed income funds. | performance during the period, as the S&P Global Infrastructure |
| Index (Net) lost 0.24% from August 1, 2014 through October 31, | |
| The Fund pursues this objective by investing in a diversified | 2014, while the Barclays U.S. Aggregate Index gained 1.40% |
| portfolio that, as of October 31, 2014, consisted of approximately | during the same period. |
| 39% equity Underlying Funds, 54% fixed income Underlying | |
| Funds and 7% alternative Underlying Funds. The Fund’s | |
| allocation to fixed income Underlying Funds will be fixed at 66% | Fixed income markets had overall positive performance for the |
| in approximately the year 2020. | fiscal year, as interest rates generally trended lower over the |
| period, providing a tailwind to aggregate fixed income markets. | |
| How did the Fund perform relative to its benchmark for the | During the fiscal year, the Fund had a strategic allocation to |
| fiscal year ended October 31, 2014? | short duration fixed income, as represented by its allocation to |
| For the fiscal year ended October 31, 2014, the Fund’s Class A, | the Russell Short Duration Bond Fund, which in a lower yield |
| Class E, Class R1, Class R4, Class R5 and Class S Shares gained | environment detracted from the Fund’s benchmark-relative |
| 5.48%, 5.52%, 5.70%, 5.51%, 5.15 % and 5.70%, respectively. | performance. |
| This is compared to the Fund’s primary benchmark, the Barclays | |
| U.S. Aggregate Bond Index, which gained 4.14% during the same | How did the investment strategies and techniques employed |
| period. The Fund’s performance includes operating expenses, | by the Fund and the Underlying Funds affect the Fund’s |
| whereas index returns are unmanaged and do not include | performance? |
| expenses of any kind. | The Fund is a fund of funds and its performance is based on |
| For the fiscal year ended October 31, 2014, the Morningstar® | RIMCo’s strategic asset allocations and the performance of the |
| Target Date 2016-2020 gained 6.41%. This result serves as a | Underlying Funds in which the Fund invests. |
| peer comparison and is expressed net of operating expenses. | The Fund’s strategic allocation to fixed income Underlying |
| The Fund’s outperformance relative to the Barclays U.S. | Funds negatively impacted its benchmark-relative performance. |
| Aggregate Bond Index was due to the Fund’s out-of-benchmark | Allocations to the Russell Global Opportunistic Credit Fund (an |
| allocation to equity and global real estate Underlying Funds, | Underlying Fund after August 1, 2014) and Russell Short Duration |
| which outperformed fixed income Underlying Funds over the | Bond Fund detracted, as these Underlying Funds underperformed |
| period. | the Fund’s benchmark. In particular, the Russell Short Duration |
| Bond Fund underperformed the Fund’s benchmark, as having | |
| How did the market conditions described in the Market | a strategic short duration bias over the year was a headwind as |
| Summary report affect the Fund’s performance? | interest rates generally moved lower. Allocations to the Russell |
| 2020 Strategy Fund 95 | |
Russell Investment Company
2020 Strategy Fund
| Portfolio Management Discussion and Analysis, continued — October 31, 2014 | ||
| (Unaudited) | ||
| Strategic Bond Fund and Russell Investment Grade Bond Fund | The Fund’s strategic allocation to alternative Underlying Funds | |
| were slightly positive from a benchmark-relative perspective. | had a mixed impact on benchmark-relative performance. The | |
| Results of Underlying Fund active management were positive. | Fund’s allocation to the Russell Global Real Estate Securities | |
| For the Russell Strategic Bond Fund, exposure to non-agency | Fund was positive, while the allocations to the Russell Global | |
| mortgages and emerging market debt were key contributors to | Infrastructure Fund (an Underlying Fund after August 1, 2014) | |
| the Underlying Fund’s benchmark-relative outperformance. | and Russell Commodity Strategies Fund were negative. From an | |
| Currency selection was also positive, particularly a long U.S. | active management standpoint, performance of these Underlying | |
| Dollar position versus short positions to the Australian Dollar | Funds was generally mixed. The Russell Commodity Strategies | |
| Euro, and Japanese Yen. | Fund underperformed its respective asset class benchmark | |
| With respect to the Fund’s global equity exposure, the Fund’s | while the Russell Global Real Estate Securities Fund and | |
| strategic allocations to the Russell Emerging Markets Fund, | Russell Global Infrastructure Fund (after August 1, 2014) | |
| Russell International Developed Markets Fund (an Underlying | outperformed their respective asset class benchmarks. For the | |
| Fund until August 1, 2014) and Select International Equity Fund | Russell Commodity Strategies Fund, an overweight to energy | |
| (an Underlying Fund after August 1, 2014) detracted from the | commodities detracted from Fund performance. For the Russell | |
| Fund’s benchmark-relative performance, while its allocation to | Global Real Estate Securities Fund, security selection within the | |
| the Russell Global Equity Fund positively impacted performance. | U.S. was positive while an overweight to and security selection | |
| From an active management standpoint, the Select International | within Japan detracted from performance. | |
| Equity Fund underperformed the broad non-U.S. equity market | Describe any changes to the Fund’s structure or allocation | |
| as represented by the Russell Developed ex-U.S. Large Cap™ | to the Underlying Funds. | |
| Index Net, while the Russell Global Equity Fund performed in- | On August 1, 2014, RIMCo modified the Fund’s target asset | |
| line with the broad global equity market as represented by the | allocation and as a result, the Fund increased its exposure to | |
| Russell Developed Large Cap Net Index. The Russell Emerging | equity and alternative Underlying Funds and decreased its | |
| Markets Fund underperformed its emerging markets benchmark. | exposure to fixed income Underlying Funds. In connection with | |
| For the Select International Equity Fund, a bias toward low | this change, on August 1, 2014, the Russell U.S. Core Equity | |
| price-to-book ratio stocks detracted from the Underlying Fund’s | Fund and Russell International Developed Markets Fund were | |
| benchmark-relative performance as lower price-to-book stocks | replaced as Underlying Funds with the Select U.S. Equity Fund | |
| strongly underperformed the market in non-U.S. developed | and Select International Equity Fund, respectively. The Fund | |
| regions. For the Russell Emerging Markets Fund, unsuccessful | also added an allocation to the Russell Global Infrastructure | |
| stock selection in China, South Korea, Russia, and Taiwan were | Fund and Russell Global Opportunistic Credit Fund to provide | |
| detractors from performance. | further diversification. | |
| The Fund’s strategic allocation to U.S. large cap equity Underlying | On July 9, 2014, the Fund implemented a 0.60% underweight to | |
| Funds benefited the Fund’s benchmark-relative performance, as | the Russell Commodity Strategies and Russell 0.30% underweight | |
| broad U.S. equities outperformed core fixed income for the period. | to the Global Real Estate Securities Funds, driven by limited | |
| From an active management perspective, each of the large cap | commodity price appreciation expectations over the medium | |
| U.S. equity Underlying Funds underperformed its respective U.S. | term and caution over the interest rate sensitivity of REITs in | |
| equity market segment as represented by its primary benchmark. | an environment of potential rising interest rates. This was offset | |
| In particular, the Select U.S. Equity Fund (an Underlying Fund | by a 0.90% overweight to the Russell Global Equity Fund. This | |
| after August 1, 2014) underperformed during the period it was an | contributed positively to Fund performance during the period, as | |
| Underlying Fund, driven by an overweight to stocks with lower | commodities and global REITs underperformed global equities. | |
| than benchmark valuation ratios (lower price-to-earnings, price- | ||
| to-book, and price-to-cash flow ratios). In addition, the Fund’s | On October 30, 2014, the Fund implemented a 0.30% overweight | |
| strategic allocation to the Russell U.S. Small Cap Equity Fund | to the Select U.S. Equity Fund and away from the Russell Global | |
| benefited the Fund’s benchmark-relative performance, though | Infrastructure Fund based on a cautious stance to interest | |
| the Underlying Fund underperformed its Russell 2000® Index | rate sensitive asset classes in a potentially rising interest rate | |
| benchmark. | environment. | |
96 2020 Strategy Fund
Russell Investment Company
2020 Strategy Fund
Portfolio Management Discussion and Analysis, continued — October 31, 2014 (Unaudited)
The views expressed in this report reflect those of the portfolio
managers only through the end of the period covered by
the report. These views do not necessarily represent the
views of RIMCo, or any other person in RIMCo or any other
affiliated organization. These views are subject to change
at any time based upon market conditions or other events,
and RIMCo disclaims any responsibility to update the views
contained herein. These views should not be relied on as
investment advice and, because investment decisions for
a Russell Investment Company (“RIC”) Fund are based on
numerous factors, should not be relied on as an indication
of investment decisions of any RIC Fund.
| * | Assumes initial investment on January 3, 2005. |
| ** | The Barclays U.S. Aggregate Bond Index is an index, with income reinvested, generally representative of intermediate-term government bonds, investment grade corporate debt securities and mortgage-backed securities. |
| ‡ | The Fund first issued Class A Shares on September 1, 2005. The returns shown for Class A Shares prior to that date are the returns of Class E Shares. The performance shown has been adjusted to reflect the deduction of the maximum Class A sales charge of 5.75%. |
| ‡‡ | The Fund first issued Class R1 Shares on June 7, 2006. The returns shown for Class R1 Shares prior to that date are the returns of the Fund’s Class S Shares. |
| ‡‡‡ | The Fund first issued Class R4 and Class R5 Shares on October 1, 2014. The returns shown for Class R4 and Class R5 Shares prior to that date are the returns of the Fund’s Class R2 and Class R3 Shares, respectively. |
| § | Annualized. |
Performance is historical and assumes reinvestment of all dividends and capital gains. Investment return and principal value will fluctuate so that an investor’s shares, when redeemed, may be worth more or less than when purchased. Past performance is not indicative of future results. The returns shown do not reflect the deduction of taxes that a shareholder would pay on Fund distributions or the redemption of Fund shares.
2020 Strategy Fund 97
Russell Investment Company 2020 Strategy Fund
Shareholder Expense Example — October 31, 2014 (Unaudited)
| Fund Expenses | Please note that the expenses shown in the table are meant | |||||
| The following disclosure provides important information | to highlight your ongoing costs only and do not reflect any | |||||
| regarding the Fund’s Shareholder Expense Example | transactional costs. Therefore, the information under the heading | |||||
| (“Example”). | “Hypothetical Performance (5% return before expenses)” is | |||||
| useful in comparing ongoing costs only, and will not help you | ||||||
| Example | determine the relative total costs of owning different funds. In | |||||
| As a shareholder of the Fund, you incur ongoing costs, including | addition, if these transactional costs were included, your costs | |||||
| distribution (12b-1) and/or service fees and other Fund expenses. | would have been higher. | |||||
| The Example is intended to help you understand your ongoing | Hypothetical | |||||
| costs (in dollars) of investing in the Fund and to compare these | Performance (5% | |||||
| costs with the ongoing costs of investing in other mutual funds. | Actual | return before | ||||
| The Example is based on an investment of $1,000 invested at the | Class A | Performance | expenses) | |||
| Beginning Account Value | ||||||
| beginning of the period and held for the entire period indicated, | May 1, 2014 | $ | 1,000.00 | $ | 1,000.00 | |
| which for this Fund is from May 1, 2014 to October 31, 2014. | Ending Account Value | |||||
| October 31, 2014 | $ | 1,019.00 | $ | 1,023.95 | ||
| Actual Expenses | Expenses Paid During Period* | $ | 1.27 | $ | 1.28 | |
| The information in the table under the heading “Actual | ||||||
| Performance” provides information about actual account values | * Expenses are equal to the Fund's annualized expense ratio of 0.25% | |||||
| (representing the six month period annualized), multiplied by the average | ||||||
| and actual expenses. You may use the information in this column, | account value over the period, multiplied by 184/365 (to reflect the one-half | |||||
| together with the amount you invested, to estimate the expenses | year period). | |||||
| that you paid over the period. Simply divide your account value by | ||||||
| $1,000 (for example, an $8,600 account value divided by $1,000 | Hypothetical | |||||
| Performance (5% | ||||||
| = 8.6), then multiply the result by the number in the first column | Actual | return before | ||||
| in the row entitled “Expenses Paid During Period” to estimate | Class E | Performance | expenses) | |||
| the expenses you paid on your account during this period. | Beginning Account Value | |||||
| May 1, 2014 | $ | 1,000.00 | $ | 1,000.00 | ||
| Hypothetical Example for Comparison Purposes | Ending Account Value | |||||
| October 31, 2014 | $ | 1,019.40 | $ | 1,023.95 | ||
| The information in the table under the heading “Hypothetical | Expenses Paid During Period* | $ | 1.27 | $ | 1.28 | |
| Performance (5% return before expenses)” provides information | ||||||
| about hypothetical account values and hypothetical expenses | * Expenses are equal to the Fund's annualized expense ratio of 0.25% | |||||
| based on the Fund’s actual expense ratio and an assumed rate of | (representing the six month period annualized), multiplied by the average | |||||
| account value over the period, multiplied by 184/365 (to reflect the one-half | ||||||
| return of 5% per year before expenses, which is not the Fund’s | year period). | |||||
| actual return. The hypothetical account values and expenses | ||||||
| may not be used to estimate the actual ending account balance or | Hypothetical | |||||
| expenses you paid for the period. You may use this information | Performance (5% | |||||
| Actual | return before | |||||
| to compare the ongoing costs of investing in the Fund and other | Class R1 | Performance | expenses) | |||
| funds. To do so, compare this 5% hypothetical example with the | Beginning Account Value | |||||
| 5% hypothetical examples that appear in the shareholder reports | May 1, 2014 | $ | 1,000.00 | $ | 1,000.00 | |
| of other funds. | Ending Account Value | |||||
| October 31, 2014 | $ | 1,020.80 | $ | 1,025.21 | ||
| Expenses Paid During Period* | $ | — | $ | — | ||
| * There were no expenses charged to the Class. | ||||||
98 2020 Strategy Fund
Russell Investment Company 2020 Strategy Fund
Shareholder Expense Example, continued — October 31, 2014 (Unaudited)
| Hypothetical | ||||||
| Performance (5% | ||||||
| Actual | return before | |||||
| Class R4(1) | Performance | expenses) | ||||
| Beginning Account Value | ||||||
| May 1, 2014 | $ | 1,000.00 | $ | 1,000.00 | ||
| Ending Account Value | ||||||
| October 31, 2014 | $ | 1,019.40 | $ | 1,023.95 | ||
| Expenses Paid During Period* | $ | 1.27 | $ | 1.28 | ||
| * Expenses are equal to the Fund's annualized expense ratio of 0.25% | ||||||
| (representing the six month period annualized), multiplied by the average | ||||||
| account value over the period, multiplied by 184/365 (to reflect the one-half | ||||||
| year period). | ||||||
| (1) As of October 1, 2014, Class R2 Shares were reclassified as Class R4 | ||||||
| Shares, and all Class R2 shareholders were issued shares of Class R4. The | ||||||
| shareholder expense example for the period ended October 31, 2014 reflects | ||||||
| the expenses and performance of Class R2 Shares for the period May 1 through | ||||||
| October 1, 2014, and Class R4 Shares for the period October 2, 2014 through | ||||||
| October 31, 2014. | ||||||
| Hypothetical | ||||||
| Performance (5% | ||||||
| Actual | return before | |||||
| Class R5(2) | Performance | expenses) | ||||
| Beginning Account Value | ||||||
| May 1, 2014 | $ | 1,000.00 | $ | 1,000.00 | ||
| Ending Account Value | ||||||
| October 31, 2014 | $ | 1,017.20 | $ | 1,022.68 | ||
| Expenses Paid During Period* | $ | 2.54 | $ | 2.55 | ||
| * Expenses are equal to the Fund's annualized expense ratio of 0.50% | ||||||
| (representing the six month period annualized), multiplied by the average | ||||||
| account value over the period, multiplied by 184/365 (to reflect the one-half | ||||||
| year period). | ||||||
| (2) As of October 1, 2014, Class R3 Shares were reclassified as Class R5 | ||||||
| Shares, and all Class R3 shareholders were issued shares of Class R5. The | ||||||
| shareholder expense example for the period ended October 31, 2014 reflects | ||||||
| the expenses and performance of Class R3 Shares for the period May 1 through | ||||||
| October 1, 2014, and Class R5 Shares for the period October 2, 2014 through | ||||||
| October 31, 2014. | ||||||
| Hypothetical | ||||||
| Performance (5% | ||||||
| Actual | return before | |||||
| Class S | Performance | expenses) | ||||
| Beginning Account Value | ||||||
| May 1, 2014 | $ | 1,000.00 | $ | 1,000.00 | ||
| Ending Account Value | ||||||
| October 31, 2014 | $ | 1,019.90 | $ | 1,025.21 | ||
| Expenses Paid During Period* | $ | — | $ | — | ||
| * There were no expenses charged to the Class. | ||||||
2020 Strategy Fund 99
Russell Investment Company 2020 Strategy Fund
Schedule of Investments — October 31, 2014
| Amounts in thousands (except share amounts) | Amounts in thousands (except share amounts) | ||||||||||
| Fair | Fair | ||||||||||
| Value | Value | ||||||||||
| Shares | $ | Shares | $ | ||||||||
| Investments 100.0% | Fixed Income - 54.0% | ||||||||||
| Other Russell Investment Company | Russell Global Opportunistic Credit Fund | 362,536 | 3,625 | ||||||||
| Series Mutual Funds - Class Y | Russell Investment Grade Bond Fund | 693,176 | 15,590 | ||||||||
| Shares | Russell Short Duration Bond Fund | 324,963 | 6,291 | ||||||||
| Russell Strategic Bond Fund | 3,260,459 | 36,354 | |||||||||
| Alternative - 5.8% | 61,860 | ||||||||||
| Russell Commodity Strategies Fund | 255,847 | 1,975 | International Equities - 19.5% | ||||||||
| Russell Global Infrastructure Fund | 180,110 | 2,332 | Russell Emerging Markets Fund | 196,203 | 3,665 | ||||||
| Russell Global Real Estate Securities Fund | 57,472 | 2,340 | Russell Global Equity Fund | 644,415 | 7,598 | ||||||
| 6,647 | Select International Equity Fund | 1,179,153 | 11,107 | ||||||||
| Domestic Equities - 20.7% | 22,370 | ||||||||||
| Russell U.S. Defensive Equity Fund | 64,682 | 2,977 | |||||||||
| Russell U.S. Dynamic Equity Fund | 171,357 | 2,175 | Total Investments 100.0% | ||||||||
| Russell U.S. Small Cap Equity Fund | 113,629 | 3,549 | (identified cost $97,614) | 114,562 | |||||||
| Select U.S. Equity Fund | 1,439,378 | 14,984 | Other Assets and Liabilities, Net | ||||||||
| 23,685 | -(0.0 | %) | (49 | ) | |||||||
| Net Assets - 100.0% | 114,513 | ||||||||||
| Presentation of Portfolio Holdings | |||||||||||
| Categories | % of Net Assets | ||||||||||
| Alternative | 5.8 | ||||||||||
| Domestic Equities | 20.7 | ||||||||||
| Fixed Income | 54.0 | ||||||||||
| International Equities | 19.5 | ||||||||||
| Total Investments | 100.0 | ||||||||||
| Other Assets and Liabilities, Net | (—*) | ||||||||||
| 100.0 | |||||||||||
| * Less than .05% of net assets. | |||||||||||
See accompanying notes which are an integral part of the financial statements.
100 2020 Strategy Fund
| Russell Investment Company | ||
| 2020 Strategy Fund | ||
| Statement of Assets and Liabilities — October 31, 2014 | ||
| Amounts in thousands | ||
| Assets | ||
| Investments, at identified cost | $ | 97,614 |
| Investments, at fair value | 114,562 | |
| Receivables: | ||
| Investments sold | 416 | |
| Fund shares sold | 98 | |
| Total assets | 115,076 | |
| Liabilities | ||
| Payables: | ||
| Fund shares redeemed | 544 | |
| Accrued fees to affiliates | 19 | |
| Total liabilities | 563 | |
| Net Assets | $ | 114,513 |
| Net Assets Consist of: | ||
| Undistributed (overdistributed) net investment income | $ | 2 |
| Accumulated net realized gain (loss) | 27,754 | |
| Unrealized appreciation (depreciation) on investments | 16,948 | |
| Shares of beneficial interest | 95 | |
| Additional paid-in capital | 69,714 | |
| Net Assets | $ | 114,513 |
| Net Asset Value, offering and redemption price per share: | ||
| Net asset value per share: Class A(#) | $ | 12.11 |
| Maximum offering price per share (Net asset value plus sales charge of 5.75%): Class A | $ | 12.85 |
| Class A — Net assets | $ | 539,840 |
| Class A — Shares outstanding ($.01 par value) | 44,565 | |
| Net asset value per share: Class E(#) | $ | 12.13 |
| Class E — Net assets | $ | 2,311,592 |
| Class E — Shares outstanding ($.01 par value) | 190,624 | |
| Net asset value per share: Class R1(#) | $ | 12.11 |
| Class R1 — Net assets | $ | 51,257,225 |
| Class R1 — Shares outstanding ($.01 par value) | 4,232,768 | |
| Net asset value per share: Class R4(#) | $ | 12.11 |
| Class R4 — Net assets | $ | 12,844,143 |
| Class R4 — Shares outstanding ($.01 par value) | 1,061,034 | |
| Net asset value per share: Class R5(#) | $ | 12.08 |
| Class R5 — Net assets | $ | 37,373,440 |
| Class R5 — Shares outstanding ($.01 par value) | 3,092,561 | |
| Net asset value per share: Class S(#) | $ | 12.11 |
| Class S — Net assets | $ | 10,187,142 |
| Class S — Shares outstanding ($.01 par value) | 841,307 | |
| (#) Net asset value per share equals class level net assets divided by class level shares of beneficial interest outstanding. | ||
See accompanying notes which are an integral part of the financial statements.
2020 Strategy Fund 101
| Russell Investment Company | |||
| 2020 Strategy Fund | |||
| Statement of Operations — For the Period Ended October 31, 2014 | |||
| Amounts in thousands | |||
| Investment Income | |||
| Income distributions from Underlying Funds | $ | 3,516 | |
| Expenses | |||
| Distribution fees - Class A | 2 | ||
| Distribution fees - Class R3 | 111 | ||
| Distribution fees - Class R5 | 8 | ||
| Shareholder servicing fees - Class E | 6 | ||
| Shareholder servicing fees - Class R2 | 36 | ||
| Shareholder servicing fees - Class R3 | 111 | ||
| Shareholder servicing fees - Class R4 | 2 | ||
| Shareholder servicing fees - Class R5 | 8 | ||
| Total expenses | 284 | ||
| Net investment income (loss) | 3,232 | ||
| Net Realized and Unrealized Gain (Loss) | |||
| Net realized gain (loss) on: | |||
| Investments | 28,882 | ||
| Capital gain distributions from Underlying Funds | 1,795 | ||
| Net realized gain (loss) | 30,677 | ||
| Net change in unrealized appreciation (depreciation) on investments | (24,957 | ) | |
| Net realized and unrealized gain (loss) | 5,720 | ||
| Net Increase (Decrease) in Net Assets from Operations | $ | 8,952 | |
See accompanying notes which are an integral part of the financial statements.
102 2020 Strategy Fund
| Russell Investment Company | ||||||
| 2020 Strategy Fund | ||||||
| Statements of Changes in Net Assets | ||||||
| For the Periods Ended October 31, | ||||||
| Amounts in thousands | 2014 | 2013 | ||||
| Increase (Decrease) in Net Assets | ||||||
| Operations | ||||||
| Net investment income (loss) | $ | 3,232 | $ | 6,093 | ||
| Net realized gain (loss) | 30,677 | 9,652 | ||||
| Net change in unrealized appreciation (depreciation) | (24,957 | ) | 3,755 | |||
| Net increase (decrease) in net assets from operations | 8,952 | 19,500 | ||||
| Distributions | ||||||
| From net investment income | ||||||
| Class A | (21 | ) | (25 | ) | ||
| Class E | (42 | ) | (58 | ) | ||
| Class R1 | (1,711 | ) | (3,377 | ) | ||
| Class R2 | (244 | ) | (511 | ) | ||
| Class R3 | (750 | ) | (1,535 | ) | ||
| Class R4 | (32 | ) | — | |||
| Class R5 | (69 | ) | — | |||
| Class S | (362 | ) | (590 | ) | ||
| From net realized gain | ||||||
| Class A | (28 | ) | — | |||
| Class E | (42 | ) | — | |||
| Class R1 | (1,733 | ) | — | |||
| Class R2 | (289 | ) | — | |||
| Class R3 | (1,084 | ) | — | |||
| Class S | (389 | ) | — | |||
| Net decrease in net assets from distributions | (6,796 | ) | (6,096 | ) | ||
| Share Transactions* | ||||||
| Net increase (decrease) in net assets from share transactions | (81,283 | ) | (58,301 | ) | ||
| Total Net Increase (Decrease) in Net Assets | (79,127 | ) | (44,897 | ) | ||
| Net Assets | ||||||
| Beginning of period | 193,640 | 238,537 | ||||
| End of period | $ | 114,513 | $ | 193,640 | ||
| Undistributed (overdistributed) net investment income included in net assets | $ | 2 | $ | 2 | ||
See accompanying notes which are an integral part of the financial statements.
2020 Strategy Fund 103
Russell Investment Company 2020 Strategy Fund
Statements of Changes in Net Assets, continued
* Share transaction amounts (in thousands) for the periods ended October 31, 2014 and October 31, 2013 were as follows:
| 2014 | 2013 | |||||||||||
| Shares | Dollars | Shares | Dollars | |||||||||
| Class A | ||||||||||||
| Proceeds from shares sold | — | $ | — | 52 | $ | 600 | ||||||
| Proceeds from reinvestment of distributions | 4 | 49 | 2 | 24 | ||||||||
| Payments for shares redeemed | (82 | ) | (977 | ) | (12 | ) | (139 | ) | ||||
| Net increase (decrease) | (78 | ) | (928 | ) | 42 | 485 | ||||||
| Class E | ||||||||||||
| Proceeds from shares sold | 31 | 372 | 17 | 197 | ||||||||
| Proceeds from reinvestment of distributions | 7 | 84 | 5 | 58 | ||||||||
| Payments for shares redeemed | (35 | ) | (419 | ) | (48 | ) | (544 | ) | ||||
| Net increase (decrease) | 3 | 37 | (26 | ) | (289 | ) | ||||||
| Class R1 | ||||||||||||
| Proceeds from shares sold | 1,226 | 14,626 | 2,561 | 29,401 | ||||||||
| Proceeds from reinvestment of distributions | 293 | 3,442 | 300 | 3,376 | ||||||||
| Payments for shares redeemed | (5,079 | ) | (60,796 | ) | (5,917 | ) | (67,478 | ) | ||||
| Net increase (decrease) | (3,560 | ) | (42,728 | ) | (3,056 | ) | (34,701 | ) | ||||
| Class R2 | ||||||||||||
| Proceeds from shares sold | 416 | 4,962 | 357 | 4,119 | ||||||||
| Proceeds from reinvestment of distributions | 46 | 533 | 46 | 511 | ||||||||
| Payments for shares redeemed | (1,902 | ) | (22,754 | ) | (1,123 | ) | (12,815 | ) | ||||
| Net increase (decrease) | (1,440 | ) | (17,259 | ) | (720 | ) | (8,185 | ) | ||||
| Class R3 | ||||||||||||
| Proceeds from shares sold | 711 | 8,460 | 1,530 | 17,460 | ||||||||
| Proceeds from reinvestment of distributions | 157 | 1,834 | 137 | 1,535 | ||||||||
| Payments for shares redeemed | (5,849 | ) | (69,696 | ) | (2,750 | ) | (31,485 | ) | ||||
| Net increase (decrease) | (4,981 | ) | (59,402 | ) | (1,083 | ) | (12,490 | ) | ||||
| Class R4 | ||||||||||||
| Proceeds from shares sold | 1,066 | 12,744 | — | — | ||||||||
| Proceeds from reinvestment of distributions | 3 | 32 | — | — | ||||||||
| Payments for shares redeemed | (8 | ) | (91 | ) | — | — | ||||||
| Net increase (decrease) | 1,061 | 12,685 | — | — | ||||||||
| Class R5 | ||||||||||||
| Proceeds from shares sold | 3,176 | 37,886 | — | — | ||||||||
| Proceeds from reinvestment of distributions | 6 | 69 | — | — | ||||||||
| Payments for shares redeemed | (89 | ) | (1,068 | ) | — | — | ||||||
| Net increase (decrease) | 3,093 | 36,887 | — | — | ||||||||
| Class S | ||||||||||||
| Proceeds from shares sold | 223 | 2,666 | 436 | 4,993 | ||||||||
| Proceeds from reinvestment of distributions | 64 | 751 | 52 | 590 | ||||||||
| Payments for shares redeemed | (1,169 | ) | (13,992 | ) | (759 | ) | (8,704 | ) | ||||
| Net increase (decrease) | (882 | ) | (10,575 | ) | (271 | ) | (3,121 | ) | ||||
| Total increase (decrease) | (6,784 | ) | $ | (81,283 | ) | (5,114 | ) | $ | (58,301 | ) | ||
See accompanying notes which are an integral part of the financial statements.
104 2020 Strategy Fund
(This page intentionally left blank)
| Russell Investment Company | |||||||||||||||
| 2020 Strategy Fund | |||||||||||||||
| Financial Highlights — For the Periods Ended | |||||||||||||||
| For a Share Outstanding Throughout Each Period. | |||||||||||||||
| $ | |||||||||||||||
| $ | Net | $ | $ | $ | $ | ||||||||||
| Net Asset Value, | Investment | Net Realized | Total from | Distributions | Distributions | ||||||||||
| Beginning of | Income (Loss) | and Unrealized | Investment | from Net | from Net | ||||||||||
| Period | (a)(b)(e) | Gain (Loss) | Operations | Investment Income | Realized Gain | ||||||||||
| Class A | |||||||||||||||
| October 31, 2014 | 11.92 | .27 | .37 | .64 | (.22) | (.23) | |||||||||
| October 31, 2013 | 11.17 | .24 | .80 | 1.04 | (.29) | — | |||||||||
| October 31, 2012 | 10.55 | .32 | .54 | .86 | (.24) | — | |||||||||
| October 31, 2011 | 10.63 | .42 | (.11 | ) | .31 | (.39) | — | ||||||||
| October 31, 2010 | 9.42 | .25 | 1.23 | 1.48 | (.27) | — | |||||||||
| Class E | |||||||||||||||
| October 31, 2014 | 11.94 | .22 | .42 | .64 | (.22) | (.23) | |||||||||
| October 31, 2013 | 11.19 | .30 | .74 | 1.04 | (.29) | — | |||||||||
| October 31, 2012 | 10.57 | .25 | .62 | .87 | (.25) | — | |||||||||
| October 31, 2011 | 10.63 | .88 | (.56 | ) | .32 | (.38) | — | ||||||||
| October 31, 2010 | 9.42 | .26 | 1.22 | 1.48 | (.27) | — | |||||||||
| Class R1 | |||||||||||||||
| October 31, 2014 | 11.93 | .27 | .39 | .66 | (.25) | (.23) | |||||||||
| October 31, 2013 | 11.18 | .34 | .73 | 1.07 | (.32) | — | |||||||||
| October 31, 2012 | 10.56 | .27 | .63 | .90 | (.28) | — | |||||||||
| October 31, 2011 | 10.64 | .40 | (.07 | ) | .33 | (.41) | — | ||||||||
| October 31, 2010 | 9.43 | .28 | 1.22 | 1.50 | (.29) | — | |||||||||
| Class R4(3) | |||||||||||||||
| October 31, 2014 | 11.92 | .22 | .42 | .64 | (.22) | ||||||||||
| October 31, 2013 | 11.17 | .30 | .74 | 1.04 | (.29) | — | |||||||||
| October 31, 2012 | 10.54 | .27 | .60 | .87 | (.24) | — | |||||||||
| October 31, 2011 | 10.62 | .36 | (.06 | ) | .30 | (.38) | — | ||||||||
| October 31, 2010 | 9.41 | .26 | 1.22 | 1.48 | (.27) | — | |||||||||
| Class R(4) | |||||||||||||||
| October 31, 2014 | 11.90 | .21 | .39 | .60 | (.19) | (.23) | |||||||||
| October 31, 2013 | 11.15 | .27 | .74 | 1.01 | (.26) | — | |||||||||
| October 31, 2012 | 10.52 | .23 | .62 | .85 | (.22) | — | |||||||||
| October 31, 2011 | 10.61 | .35 | (.08 | ) | .27 | (.36) | — | ||||||||
| October 31, 2010 | 9.40 | .24 | 1.21 | 1.45 | (.24) | — | |||||||||
| Class S | |||||||||||||||
| October 31, 2014 | 11.93 | .28 | .38 | .66 | (.25) | (.23) | |||||||||
| October 31, 2013 | 11.18 | .32 | .75 | 1.07 | (.32) | — | |||||||||
| October 31, 2012 | 10.56 | .27 | .63 | .90 | (.28) | — | |||||||||
| October 31, 2011 | 10.64 | .39 | (.06 | ) | .33 | (.41) | — | ||||||||
| October 31, 2010 | 9.42 | .30 | 1.21 | 1.51 | (.29) | — | |||||||||
See accompanying notes which are an integral part of the financial statements.
106 2020 Strategy Fund
| % | % | % | ||||||||||||||
| $ | $ | Ratio of Expenses | Ratio of Expenses | Ratio of Net | ||||||||||||
| Net Asset Value, | % | Net Assets, | to Average | to Average | Investment Income | % | ||||||||||
| $ | End of | Total | End of Period | Net Assets, | Net Assets, | to Average | Portfolio | |||||||||
| Total Distributions | Period | Return(d) | (000 | ) | Gross(g) | Net(e)(g) | Net Assets(b)(e) | Turnover Rate | ||||||||
| (.45 | ) | 12.11 | 5.48 | 540 | .25 | .25 | 2.24 | 42 | ||||||||
| (.29 | ) | 11.92 | 9.52 | 1,460 | .25 | .25 | 2.11 | 15 | ||||||||
| (.24 | ) | 11.17 | 8.33 | 902 | .25 | .25 | 3.02 | 21 | ||||||||
| (.39 | ) | 10.55 | 2.89 | 1,913 | .25 | .25 | 3.85 | 24 | ||||||||
| (.27 | ) | 10.63 | 15.93 | 2,542 | .70 | .25 | 2.46 | 32 | ||||||||
| (.45 | ) | 12.13 | 5.52 | 2,312 | .25 | .25 | 1.80 | 42 | ||||||||
| (.29 | ) | 11.94 | 9.48 | 2,240 | .25 | .25 | 2.62 | 15 | ||||||||
| (.25 | ) | 11.19 | 8.39 | 2,380 | .25 | .25 | 2.30 | 21 | ||||||||
| (.38 | ) | 10.57 | 3.07 | 2,455 | .25 | .25 | 8.23 | 24 | ||||||||
| (.27 | ) | 10.63 | 15.91 | 15,771 | .71 | .25 | 2.62 | 32 | ||||||||
| (.48 | ) | 12.11 | 5.70 | 51,257 | — | — | 2.24 | 42 | ||||||||
| (.32 | ) | 11.93 | 9.77 | 92,947 | — | — | 2.95 | 15 | ||||||||
| (.28 | ) | 11.18 | 8.68 | 121,239 | — | — | 2.51 | 21 | ||||||||
| (.41 | ) | 10.56 | 3.17 | 111,545 | — | — | 3.63 | 24 | ||||||||
| (.29 | ) | 10.64 | 16.31 | 84,152 | .45 | — | 2.84 | 32 | ||||||||
| (.45 | ) | 12.11 | 5.51 | 12,844 | .25 | .25 | 1.82 | 42 | ||||||||
| (.29 | ) | 11.92 | 9.48 | 17,172 | .25 | .25 | 2.65 | 15 | ||||||||
| (.24 | ) | 11.17 | 8.46 | 24,126 | .25 | .25 | 2.55 | 21 | ||||||||
| (.38 | ) | 10.54 | 2.88 | 44,217 | .25 | .25 | 3.25 | 24 | ||||||||
| (.27 | ) | 10.62 | 15.94 | 44,060 | .71 | .25 | 2.59 | 32 | ||||||||
| (.42 | ) | 12.08 | 5.15 | 37,373 | .50 | .50 | 1.73 | 42 | ||||||||
| (.26 | ) | 11.90 | 9.23 | 59,271 | .50 | .50 | 2.38 | 15 | ||||||||
| (.22 | ) | 11.15 | 8.19 | 67,605 | .50 | .50 | 2.17 | 21 | ||||||||
| (.36 | ) | 10.52 | 2.56 | 91,714 | .50 | .50 | 3.20 | 24 | ||||||||
| (.24 | ) | 10.61 | 15.66 | 90,563 | .96 | .50 | 2.41 | 32 | ||||||||
| (.48 | ) | 12.11 | 5.70 | 10,187 | — | — | 2.32 | 42 | ||||||||
| (.32 | ) | 11.93 | 9.77 | 20,550 | — | — | 2.80 | 15 | ||||||||
| (.28 | ) | 11.18 | 8.68 | 22,285 | — | — | 2.53 | 21 | ||||||||
| (.41 | ) | 10.56 | 3.17 | 18,962 | — | — | 3.60 | 24 | ||||||||
| (.29 | ) | 10.64 | 16.30 | 15,600 | .47 | — | 2.96 | 32 | ||||||||
See accompanying notes which are an integral part of the financial statements.
2020 Strategy Fund 107
Russell Investment Company 2025 Strategy Fund
Portfolio Management Discussion and Analysis — October 31, 2014 (Unaudited)
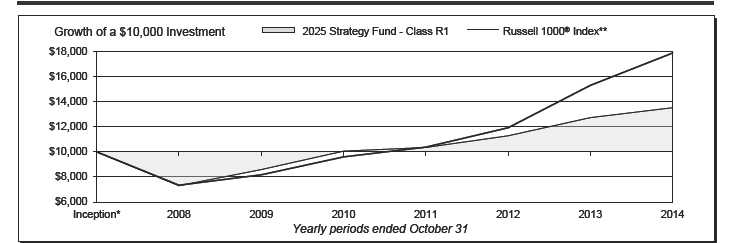
| 2025 Strategy Fund - Class R1 | 2025 Strategy Fund - Class R5‡ | ||||||
| Total | Total | ||||||
| Return | Return | ||||||
| 1 Year | 6.23 | % | 1 Year | 5.70 | % | ||
| 5 Years | 9.51 | %§ | 5 Years | 8.96 | %§ | ||
| Inception* | 4.69 | %§ | Inception* | 4.15 | %§ | ||
| 2025 Strategy Fund - Class R4‡ | Russell 1000® Index** | ||||||
| Total | Total | ||||||
| Return | Return | ||||||
| 1 Year | 5.87 | % | 1 Year | 16.78 | % | ||
| 5 Years | 9.26 | %§ | 5 Years | 16.98 | %§ | ||
| Inception* | 4.43 | %§ | Inception* | 9.23 | %§ | ||
108 2025 Strategy Fund
Russell Investment Company
2025 Strategy Fund
| Portfolio Management Discussion and Analysis, continued — October 31, 2014 | |
| (Unaudited) | |
| The 2025 Strategy Fund (the “Fund”) is a fund of funds that | It was a positive equity market for the fiscal year ending October |
| invests in other Russell Investment Company mutual funds (the | 31, 2014. U.S. equities returned 16.07% over the period (as |
| “Underlying Funds”). The Underlying Funds employ a multi- | measured by the Russell 3000® Index), while non-U.S. equities |
| manager approach whereby portions of the Underlying Funds | returned 0.17% (as measured by the Russell Developed Ex-US |
| are allocated to different money managers. Underlying Fund | Large Cap Index). Given the significant outperformance of U.S. |
| assets not allocated to money managers are managed by Russell | equities over non-U.S. equities, the Fund’s non-U.S. equity |
| Investment Management Company (“RIMCo”), the Fund’s and | exposure detracted from its performance against its U.S. large |
| Underlying Funds’ advisor. RIMCo, as the Underlying Funds’ | cap benchmark. |
| advisor, may change the allocation of the Underlying Funds’ | Global REITs (as represented by the FTSE EPRA/NAREIT |
| assets among money managers at any time. An exemptive order | Developed Real Estate Index (Net)) finished the fiscal year up |
| from the Securities and Exchange Commission (“SEC”) permits | 9.84%. However, global REITs underperformed U.S. equity |
| RIMCo to engage or terminate a money manager in an Underlying | markets, which detracted from the Fund’s benchmark-relative |
| Fund at any time, subject to approval by the Underlying Fund’s | performance through its allocation to the Russell Global Real |
| Board, without a shareholder vote. Pursuant to the terms of the | Estate Securities Fund. Commodities largely underperformed |
| exemptive order, an Underlying Fund is required to notify its | broader equity markets with a loss of 5.94% for the fiscal year (as |
| shareholders within 90 days of when a money manager begins | represented by the Bloomberg Commodity Index Total Return). |
| providing services. | Thus, the Fund’s allocation to the Russell Commodity Strategies |
| What is the Fund’s investment objective? | Fund was another headwind to Fund performance. On August |
| The Fund seeks to provide capital growth and income consistent | 1, 2014, the Russell Global Infrastructure Fund was added as |
| with its current asset allocation which will change over time, with | an Underlying Fund in which the Fund invests. This listed |
| an increasing allocation to fixed income funds. | infrastructure exposure detracted from the Fund’s performance |
| during the period, as the S&P Global Infrastructure Index (Net) | |
| The Fund pursues this objective by investing in a diversified | lost 0.24% from August 1, 2014 through October 31, 2014, while |
| portfolio that, as of October 31, 2014, consisted of approximately | the Russell 1000® Index finished the same period up 4.81%. |
| 50% equity Underlying Funds, 43% fixed income Underlying | |
| Funds and 7% alternative Underlying Funds. The Fund’s | While fixed income markets were overall positive for the year |
| allocation to fixed income funds Underlying Funds will be fixed | as interest rates generally trended lower, fixed income markets |
| at 66% in approximately the year 2025. | underperformed broad equity markets and therefore the Fund’s |
| fixed income exposure detracted from benchmark-relative returns. | |
| How did the Fund perform relative to its benchmark for the | |
| fiscal year ended October 31, 2014? | How did the investment strategies and techniques employed |
| For the fiscal year ended October 31, 2014, the Fund’s Class R1, | by the Fund and the Underlying Funds affect the Fund’s |
| Class R4 and Class R5 Shares gained 6.23%, 5.87% and 5.70%, | performance? |
| respectively. This is compared to the Fund’s primary benchmark, | The Fund is a fund of funds and its performance is based on |
| the Russell 1000® Index, which gained 16.78% during the same | RIMCo’s strategic asset allocations and the performance of the |
| period. The Fund’s performance includes operating expenses, | Underlying Funds in which the Fund invests. |
| whereas index returns are unmanaged and do not include | The Fund’s strategic allocation to fixed income Underlying Funds |
| expenses of any kind. | negatively impacted benchmark-relative performance, as the |
| For the fiscal year ended October 31, 2014, the Morningstar® | fixed income Underlying Funds underperformed U.S. equities as |
| Target Date 2021-2025 gained 7.37%. This result serves as a | measured by the Fund’s benchmark. Results of Underlying Fund |
| peer comparison and is expressed net of operating expenses. | active management were positive. For the Russell Strategic Bond |
| The Fund’s underperformance relative to the Russell 1000® Index | Fund, exposure to non-agency mortgages and emerging market |
| debt were key contributors to the Underlying Fund’s benchmark- | |
| was due to the Fund’s out-of-benchmark allocations to non-U.S. | relative outperformance. Currency selection was also positive, |
| equity, fixed income and commodity Underlying Funds, which | particularly a long U.S. Dollar position versus short positions to |
| generally underperformed the U.S. large cap equity market as | the Australian Dollar, Euro and Japanese Yen. |
| represented by the Russell 1000® Index. | |
| Due to the general underperformance of non-U.S. equities versus | |
| How did the market conditions described in the Market | U.S. equities, the Fund’s strategic global equity exposure detracted |
| Summary report affect the Fund’s performance? | from benchmark-relative results. From an active management |
| standpoint, the Select International Equity Fund underperformed | |
2025 Strategy Fund 109
Russell Investment Company
2025 Strategy Fund
| Portfolio Management Discussion and Analysis, continued — October 31, 2014 | |
| (Unaudited) | |
| the broad non-U.S. equity market as represented by the Russell | U.S. was positive while an overweight to and security selection |
| Developed ex-U.S. Large Cap™ Index Net, while the Russell | within Japan detracted from performance. |
| Global Equity Fund performed in-line with the broad global equity | |
| market as represented by the Russell Developed Large Cap Net | Describe any changes to the Fund’s structure or allocation |
| Index. The Russell Emerging Markets Fund underperformed its | to the Underlying Funds. |
| emerging markets benchmark. For the Select International Equity | On August 1, 2014, RIMCo modified the Fund’s target asset |
| Fund, a bias toward low price-to-book ratio stocks detracted from | allocation and as a result, the Fund increased its exposure to |
| the Underlying Fund’s benchmark-relative performance as lower | equity and alternative Underlying Funds and decreased its |
| price-to-book stocks strongly underperformed the market in non- | exposure to fixed income Underlying Funds. In connection with |
| U.S. developed regions. For the Russell Emerging Markets Fund, | this change, on August 1, 2014, the Russell U.S. Core Equity |
| unsuccessful stock selection in China, South Korea, Russia, and | Fund and Russell International Developed Markets Fund were |
| Taiwan were detractors from performance. | replaced as Underlying Funds with the Select U.S. Equity Fund |
| and Select International Equity Fund, respectively. The Fund | |
| The Fund’s strategic allocation to U.S. large cap equity Underlying | also added an allocation to the Russell Global Infrastructure |
| Funds negatively impacted the Fund’s benchmark-relative | Fund and Russell Global Opportunistic Credit Fund to provide |
| performance, as each of the U.S. large cap equity Underlying | further diversification. |
| Funds underperformed the Fund’s benchmark as well as its U.S. | |
| equity market segment as represented by its primary benchmark. | On July 9, 2014, the Fund implemented a 0.60% underweight to |
| In particular, the Select U.S. Equity Fund (an Underlying Fund | the Russell Commodity Strategies and 0.30% underweight to the |
| after August 1, 2014) underperformed during the period it was an | Russell Global Real Estate Securities Funds, driven by limited |
| Underlying Fund, driven by an overweight to stocks with lower | commodity price appreciation expectations over the medium |
| than benchmark valuation ratios (lower price-to-earnings, price- | term and caution over the interest rate sensitivity of REITs in |
| to-book, and price-to-cash flow ratios). In addition, the Fund’s | an environment of potential rising interest rates. This was offset |
| strategic allocation to the Russell U.S. Small Cap Equity Fund | by a 0.90% overweight to the Russell Global Equity Fund. This |
| detracted the Fund’s benchmark-relative performance, as small | contributed positively to Fund performance during the period, as |
| cap equities underperformed U.S. large cap equities during the | commodities and global REITs underperformed global equities. |
| period. | On October 30, 2014, the Fund implemented a 0.30% overweight |
| The Fund’s strategic allocation to alternative Underlying Funds | to the Select U.S. Equity Fund and away from the Russell Global |
| had a negative effect on benchmark-relative performance. The | Infrastructure Fund based on a cautious stance to interest |
| Fund’s allocations to the Russell Global Real Estate Securities | rate sensitive asset classes in a potentially rising interest rate |
| Fund, Russell Global Infrastructure Fund (an Underlying Fund | environment. |
| after August 1, 2014) and Russell Commodity Strategies Fund | The views expressed in this report reflect those of the portfolio |
| detracted, as these Underlying Funds underperformed the Fund’s | managers only through the end of the period covered by |
| benchmark. From an active management standpoint, performance | the report. These views do not necessarily represent the |
| of these Underlying Funds was generally mixed. The Russell | views of RIMCo, or any other person in RIMCo or any other |
| Commodity Strategies Fund underperformed its respective asset | affiliated organization. These views are subject to change |
| class benchmark while the Russell Global Real Estate Securities | at any time based upon market conditions or other events, |
| Fund and Russell Global Infrastructure Fund (after August 1, | and RIMCo disclaims any responsibility to update the views |
| 2014) outperformed their respective asset class benchmarks. For | contained herein. These views should not be relied on as |
| the Russell Commodity Strategies Fund, an overweight to energy | investment advice and, because investment decisions for |
| commodities detracted from Fund performance. For the Russell | a Russell Investment Company (“RIC”) Fund are based on |
| Global Real Estate Securities Fund, security selection within the | numerous factors, should not be relied on as an indication |
| of investment decisions of any RIC Fund. | |
110 2025 Strategy Fund
Russell Investment Company
2025 Strategy Fund
Portfolio Management Discussion and Analysis, continued — October 31, 2014 (Unaudited)
| * | Assumes initial investment on March 31, 2008. |
| ** | Russell 1000® Index includes the 1,000 largest companies in the Russell 3000® Index. The Russell 1000® Index represents the universe of stocks from which most active money managers typically select. The Russell 1000® Index return reflects adjustments from income dividends and capital gain distributions reinvested as of the ex-dividend dates. |
| ‡ | The Fund first issued Class R4 and Class R5 Shares on October 1, 2014. The returns shown for Class R4 and Class R5 Shares prior to that date are the returns of the Fund’s Class R2 and Class R3 Shares, respectively. |
| § | Annualized. |
Performance is historical and assumes reinvestment of all dividends and capital gains. Investment return and principal value will fluctuate so that an investor’s shares, when redeemed, may be worth more or less than when purchased. Past performance is not indicative of future results. The returns shown do not reflect the deduction of taxes that a shareholder would pay on Fund distributions or the redemption of Fund shares.
2025 Strategy Fund 111
Russell Investment Company 2025 Strategy Fund
Shareholder Expense Example — October 31, 2014 (Unaudited)
112 2025 Strategy Fund
| Fund Expenses | Please note that the expenses shown in the table are meant | |||||
| The following disclosure provides important information | to highlight your ongoing costs only and do not reflect any | |||||
| regarding the Fund’s Shareholder Expense Example | transactional costs. Therefore, the information under the heading | |||||
| (“Example”). | “Hypothetical Performance (5% return before expenses)” is | |||||
| useful in comparing ongoing costs only, and will not help you | ||||||
| Example | determine the relative total costs of owning different funds. In | |||||
| As a shareholder of the Fund, you incur ongoing costs, including | addition, if these transactional costs were included, your costs | |||||
| distribution (12b-1) and/or service fees and other Fund expenses. | would have been higher. | |||||
| The Example is intended to help you understand your ongoing | Hypothetical | |||||
| costs (in dollars) of investing in the Fund and to compare these | Performance (5% | |||||
| costs with the ongoing costs of investing in other mutual funds. | Actual | return before | ||||
| The Example is based on an investment of $1,000 invested at the | Class R1 | Performance | expenses) | |||
| Beginning Account Value | ||||||
| beginning of the period and held for the entire period indicated, | May 1, 2014 | $ | 1,000.00 | $ | 1,000.00 | |
| which for this Fund is from May 1, 2014 to October 31, 2014. | Ending Account Value | |||||
| October 31, 2014 | $ | 1,019.60 | $ | 1,025.21 | ||
| Actual Expenses | Expenses Paid During Period* | $ | — | $ | — | |
| The information in the table under the heading “Actual | ||||||
| Performance” provides information about actual account values | * There were no expenses charged to the Class. | |||||
| and actual expenses. You may use the information in this column, | Hypothetical | |||||
| together with the amount you invested, to estimate the expenses | Performance (5% | |||||
| that you paid over the period. Simply divide your account value by | Actual | return before | ||||
| Class R4(1) | Performance | expenses) | ||||
| $1,000 (for example, an $8,600 account value divided by $1,000 | Beginning Account Value | |||||
| = 8.6), then multiply the result by the number in the first column | May 1, 2014 | $ | 1,000.00 | $ | 1,000.00 | |
| in the row entitled “Expenses Paid During Period” to estimate | Ending Account Value | |||||
| the expenses you paid on your account during this period. | October 31, 2014 | $ | 1,018.40 | $ | 1,023.95 | |
| Expenses Paid During Period* | $ | 1.27 | $ | 1.28 | ||
| Hypothetical Example for Comparison Purposes | ||||||
| * Expenses are equal to the Fund's annualized expense ratio of 0.25% | ||||||
| The information in the table under the heading “Hypothetical | (representing the six month period annualized), multiplied by the average | |||||
| Performance (5% return before expenses)” provides information | account value over the period, multiplied by 184/365 (to reflect the one-half | |||||
| about hypothetical account values and hypothetical expenses | year period). | |||||
| based on the Fund’s actual expense ratio and an assumed rate of | (1) As of October 1, 2014, Class R2 Shares were reclassified as Class R4 Shares, | |||||
| and all Class R2 shareholders were issued shares of Class R4. The shareholder | ||||||
| return of 5% per year before expenses, which is not the Fund’s | expense example for the period ended October 31, 2014 reflects the expenses | |||||
| actual return. The hypothetical account values and expenses | and performance of Class R2 Shares for the period May 1 through October 1, | |||||
| may not be used to estimate the actual ending account balance or | R4 Shares for period October 2, 2014 through October 31,2014, and Class | |||||
| expenses you paid for the period. You may use this information | 2014 | |||||
| to compare the ongoing costs of investing in the Fund and other | Hypothetical | |||||
| funds. To do so, compare this 5% hypothetical example with the | Performance (5% | |||||
| 5% hypothetical examples that appear in the shareholder reports | Actual | return before | ||||
| Class R5(2) | Performance | expenses) | ||||
| of other funds. | Beginning Account Value | |||||
| May 1, 2014 | $ | 1,000.00 | $ | 1,000.00 | ||
| Ending Account Value | ||||||
| October 31, 2014 | $ | 1,017.00 | $ | 1,022.68 | ||
| Expenses Paid During Period* | $ | 2.54 | $ | 2.55 | ||
| * Expenses are equal to the Fund's annualized expense ratio of 0.50% | ||||||
| (representing the six month period annualized), multiplied by the average | ||||||
| account value over the period, multiplied by 184/365 (to reflect the one-half | ||||||
| year period). | ||||||
| (2) As of October 1, 2014, Class R3 Shares were reclassified as Class R5 Shares, | ||||||
| and all Class R3 shareholders were issued shares of Class R5. The shareholder | ||||||
| expense example for the period ended October 31, 2014 reflects the expenses | ||||||
| and performance of Class R3 Shares for the period May 1 through October 1, | ||||||
| R5 Shares for period October 2, 2014 through October 31,2014, and Class | ||||||
| 2014 | ||||||
Russell Investment Company 2025 Strategy Fund
Schedule of Investments — October 31, 2014
| Amounts in thousands (except share amounts) | Amounts in thousands (except share amounts) | ||||||||||
| Fair | Fair | ||||||||||
| Value | Value | ||||||||||
| Shares | $ | Shares | $ | ||||||||
| Investments 100.0% | Fixed Income - 42.6% | ||||||||||
| Other Russell Investment Company | Russell Global Opportunistic Credit Fund | 102,166 | 1,021 | ||||||||
| Series Mutual Funds - Class Y | Russell Investment Grade Bond Fund | 180,880 | 4,068 | ||||||||
| Shares | Russell Strategic Bond Fund | 850,747 | 9,486 | ||||||||
| 14,575 | |||||||||||
| Alternative - 6.3% | International Equities - 25.2% | ||||||||||
| Russell Commodity Strategies Fund | 83,139 | 642 | Russell Emerging Markets Fund | 81,081 | 1,514 | ||||||
| Russell Global Infrastructure Fund | 58,553 | 758 | Russell Global Equity Fund | 242,885 | 2,864 | ||||||
| Russell Global Real Estate Securities Fund | 18,664 | 760 | Select International Equity Fund | 448,626 | 4,226 | ||||||
| 2,160 | 8,604 | ||||||||||
| Domestic Equities - 25.9% | |||||||||||
| Russell U.S. Defensive Equity Fund | 20,198 | 930 | Total Investments 100.0% | ||||||||
| Russell U.S. Dynamic Equity Fund | 70,661 | 897 | (identified cost $30,134) | 34,199 | |||||||
| Russell U.S. Small Cap Equity Fund | 48,791 | 1,524 | Other Assets and Liabilities, Net | ||||||||
| Select U.S. Equity Fund | 529,241 | 5,509 | -(0.0 | %) | (3 | ) | |||||
| 8,860 | Net Assets - 100.0% | 34,196 | |||||||||
| Presentation of Portfolio Holdings | |||||||||||
| Categories | % of Net Assets | ||||||||||
| Alternative | 6.3 | ||||||||||
| Domestic Equities | 25.9 | ||||||||||
| Fixed Income | 42.6 | ||||||||||
| International Equities | 25.2 | ||||||||||
| Total Investments | 100.0 | ||||||||||
| Other Assets and Liabilities, Net | (—*) | ||||||||||
| 100.0 | |||||||||||
| * Less than .05% of net assets. | |||||||||||
See accompanying notes which are an integral part of the financial statements.
2025 Strategy Fund 113
| Russell Investment Company | ||
| 2025 Strategy Fund | ||
| Statement of Assets and Liabilities — October 31, 2014 | ||
| Amounts in thousands | ||
| Assets | ||
| Investments, at identified cost | $ | 30,134 |
| Investments, at fair value | 34,199 | |
| Receivables: | ||
| Investments sold | 134 | |
| Fund shares sold | 30 | |
| Total assets | 34,363 | |
| Liabilities | ||
| Payables: | ||
| Fund shares redeemed | 161 | |
| Accrued fees to affiliates | 6 | |
| Total liabilities | 167 | |
| Net Assets | $ | 34,196 |
| Net Assets Consist of: | ||
| Undistributed (overdistributed) net investment income | $ | 1 |
| Accumulated net realized gain (loss) | 6,609 | |
| Unrealized appreciation (depreciation) on investments | 4,065 | |
| Shares of beneficial interest | 32 | |
| Additional paid-in capital | 23,489 | |
| Net Assets | $ | 34,196 |
| Net Asset Value, offering and redemption price per share: | ||
| Net asset value per share: Class R1(#) | $ | 10.67 |
| Class R1 — Net assets | $ | 14,572,685 |
| Class R1 — Shares outstanding ($.01 par value) | 1,365,778 | |
| Net asset value per share: Class R4(#) | $ | 10.67 |
| Class R4 — Net assets | $ | 7,743,148 |
| Class R4 — Shares outstanding ($.01 par value) | 725,368 | |
| Net asset value per share: Class R5(#) | $ | 10.64 |
| Class R5 — Net assets | $ | 11,879,996 |
| Class R5 — Shares outstanding ($.01 par value) | 1,116,343 | |
| (#) Net asset value per share equals class level net assets divided by class level shares of beneficial interest outstanding. | ||
See accompanying notes which are an integral part of the financial statements.
114 2025 Strategy Fund
| Russell Investment Company | |||
| 2025 Strategy Fund | |||
| Statement of Operations — For the Period Ended October 31, 2014 | |||
| Amounts in thousands | |||
| Investment Income | |||
| Income distributions from Underlying Funds | $ | 931 | |
| Expenses | |||
| Distribution fees - Class R3 | 32 | ||
| Distribution fees - Class R5 | 2 | ||
| Shareholder servicing fees - Class R2 | 16 | ||
| Shareholder servicing fees - Class R3 | 32 | ||
| Shareholder servicing fees - Class R4 | 2 | ||
| Shareholder servicing fees - Class R5 | 2 | ||
| Total expenses | 86 | ||
| Net investment income (loss) | 845 | ||
| Net Realized and Unrealized Gain (Loss) | |||
| Net realized gain (loss) on: | |||
| Investments | 6,567 | ||
| Capital gain distributions from Underlying Funds | 478 | ||
| Net realized gain (loss) | 7,045 | ||
| Net change in unrealized appreciation (depreciation) on investments | (5,480 | ) | |
| Net realized and unrealized gain (loss) | 1,565 | ||
| Net Increase (Decrease) in Net Assets from Operations | $ | 2,410 | |
See accompanying notes which are an integral part of the financial statements.
2025 Strategy Fund 115
| Russell Investment Company | ||||||
| 2025 Strategy Fund | ||||||
| Statements of Changes in Net Assets | ||||||
| For the Periods Ended October 31, | ||||||
| Amounts in thousands | 2014 | 2013 | ||||
| Increase (Decrease) in Net Assets | ||||||
| Operations | ||||||
| Net investment income (loss) | $ | 845 | $ | 1,343 | ||
| Net realized gain (loss) | 7,045 | 2,220 | ||||
| Net change in unrealized appreciation (depreciation) | (5,480 | ) | 2,443 | |||
| Net increase (decrease) in net assets from operations | 2,410 | 6,006 | ||||
| Distributions | ||||||
| From net investment income | ||||||
| Class R1 | (464 | ) | (903 | ) | ||
| Class R2 | (112 | ) | (144 | ) | ||
| Class R3 | (238 | ) | (297 | ) | ||
| Class R4 | (15 | ) | — | |||
| Class R5 | (15 | ) | — | |||
| From net realized gain | ||||||
| Class R1 | (1,048 | ) | (695 | ) | ||
| Class R2 | (292 | ) | (116 | ) | ||
| Class R3 | (727 | ) | (273 | ) | ||
| Net decrease in net assets from distributions | (2,911 | ) | (2,428 | ) | ||
| Share Transactions* | ||||||
| Net increase (decrease) in net assets from share transactions | (11,341 | ) | (13,000 | ) | ||
| Total Net Increase (Decrease) in Net Assets | (11,842 | ) | (9,422 | ) | ||
| Net Assets | ||||||
| Beginning of period | 46,038 | 55,460 | ||||
| End of period | $ | 34,196 | $ | 46,038 | ||
| Undistributed (overdistributed) net investment income included in net assets | $ | 1 | $ | — | ||
See accompanying notes which are an integral part of the financial statements.
116 2025 Strategy Fund
Russell Investment Company 2025 Strategy Fund
Statements of Changes in Net Assets, continued
* Share transaction amounts (in thousands) for the periods ended October 31, 2014 and October 31, 2013 were as follows:
| 2014 | 2013 | |||||||||||
| Shares | Dollars | Shares | Dollars | |||||||||
| Class R1 | ||||||||||||
| Proceeds from shares sold | 499 | $ | 5,244 | 980 | $ | 10,064 | ||||||
| Proceeds from reinvestment of distributions | 146 | 1,512 | 161 | 1,598 | ||||||||
| Payments for shares redeemed | (1,382 | ) | (14,628 | ) | (2,523 | ) | (25,740 | ) | ||||
| Net increase (decrease) | (737 | ) | (7,872 | ) | (1,382 | ) | (14,078 | ) | ||||
| Class R2 | ||||||||||||
| Proceeds from shares sold | 239 | 2,529 | 222 | 2,290 | ||||||||
| Proceeds from reinvestment of distributions | 39 | 404 | 26 | 260 | ||||||||
| Payments for shares redeemed | (901 | ) | (9,509 | ) | (248 | ) | (2,544 | ) | ||||
| Net increase (decrease) | (623 | ) | (6,576 | ) | — | 6 | ||||||
| Class R3 | ||||||||||||
| Proceeds from shares sold | 359 | 3,786 | 603 | 6,161 | ||||||||
| Proceeds from reinvestment of distributions | 94 | 965 | 58 | 570 | ||||||||
| Payments for shares redeemed | (1,992 | ) | (20,945 | ) | (559 | ) | (5,659 | ) | ||||
| Net increase (decrease) | (1,539 | ) | (16,194 | ) | 102 | 1,072 | ||||||
| Class R4 | ||||||||||||
| Proceeds from shares sold | 733 | 7,700 | — | — | ||||||||
| Proceeds from reinvestment of distributions | 1 | 15 | — | — | ||||||||
| Payments for shares redeemed | (9 | ) | (95 | ) | — | — | ||||||
| Net increase (decrease) | 725 | 7,620 | — | — | ||||||||
| Class R5 | ||||||||||||
| Proceeds from shares sold | 1,207 | 12,632 | — | — | ||||||||
| Proceeds from reinvestment of distributions | 1 | 15 | — | — | ||||||||
| Payments for shares redeemed | (92 | ) | (966 | ) | — | — | ||||||
| Net increase (decrease) | 1,116 | 11,681 | — | — | ||||||||
| Total increase (decrease) | (1,058 | ) | $ | (11,341 | ) | (1,280 | ) | $ | (13,000 | ) | ||
See accompanying notes which are an integral part of the financial statements.
2025 Strategy Fund 117
| Russell Investment Company | ||||||||||||||||
| 2025 Strategy Fund | ||||||||||||||||
| Financial Highlights — For the Periods Ended | ||||||||||||||||
| For a Share Outstanding Throughout Each Period. | ||||||||||||||||
| $ | ||||||||||||||||
| $ | Net | $ | $ | $ | $ | |||||||||||
| Net Asset Value, | Investment | Net Realized | Total from | Distributions | Distributions | |||||||||||
| Beginning of | Income (Loss) | and Unrealized | Investment | from Net | from Net | |||||||||||
| Period | (a)(b)(e) | Gain (Loss) | Operations | Investment Income | Realized Gain | |||||||||||
| Class R1 | ||||||||||||||||
| October 31, 2014 | 10.80 | .25 | .39 | .64 | (.24) | (.53) | ||||||||||
| October 31, 2013 | 10.01 | .28 | .96 | 1.24 | (.26) | (.19) | ||||||||||
| October 31, 2012 | 9.44 | .22 | .61 | .83 | (.23) | (.03) | ||||||||||
| October 31, 2011 | 9.49 | .30 | (.02) | .28 | (.33) | -(h) | ||||||||||
| October 31, 2010 | 8.31 | .20 | 1.20 | 1.40 | (.22) | — | ||||||||||
| Class R4(3) | ||||||||||||||||
| October 31, 2014 | 10.81 | .19 | .42 | .61 | (.22) | (.53) | ||||||||||
| October 31, 2013 | 10.01 | .23 | 1.00 | 1.23 | (.24) | (.19) | ||||||||||
| October 31, 2012 | 9.44 | .22 | .58 | .80 | (.20) | (.03) | ||||||||||
| October 31, 2011 | 9.48 | .30 | (.04) | .26 | (.30) | -(h) | ||||||||||
| October 31, 2010 | 8.30 | .20 | 1.18 | 1.38 | (.20) | — | ||||||||||
| Class R5(4) | ||||||||||||||||
| October 31, 2014 | 10.77 | .19 | .40 | .59 | (.19) | (.53) | ||||||||||
| October 31, 2013 | 9.98 | .20 | .99 | 1.19 | (.21) | (.19) | ||||||||||
| October 31, 2012 | 9.41 | .19 | .58 | .77 | (.17) | (.03) | ||||||||||
| October 31, 2011 | 9.46 | .25 | (.02) | .23 | (.28) | -(h) | ||||||||||
| October 31, 2010 | 8.29 | .17 | 1.18 | 1.35 | (.18) | — | ||||||||||
See accompanying notes which are an integral part of the financial statements.
118 2025 Strategy Fund
| % | % | % | |||||||||||||
| $ | $ | Ratio of Expenses | Ratio of Expenses | Ratio of Net | |||||||||||
| Net Asset Value, | % | Net Assets, | to Average | to Average | Investment Income | % | |||||||||
| $ | End of | Total | End of Period | Net Assets, | Net Assets, | to Average | Portfolio | ||||||||
| Total Distributions | Period | Return | (000) | Gross(g) | Net(e)(g) | Net Assets(b)(e) | Turnover Rate | ||||||||
| (.77) | 10.67 | 6.23 | 14,573 | — | — | 2.41 | 67 | ||||||||
| (.45) | 10.80 | 12.93 | 22,717 | — | — | 2.75 | 28 | ||||||||
| (.26) | 10.01 | 9.00 | 34,875 | — | — | 2.32 | 37 | ||||||||
| (.33) | 9.44 | 2.91 | 28,255 | — | — | 3.07 | 27 | ||||||||
| (.22) | 9.49 | 17.14 | 19,470 | .72 | — | 2.30 | 26 | ||||||||
| (.75) | 10.67 | 5.87 | 7,743 | .25 | .25 | 1.83 | 67 | ||||||||
| (.43) | 10.81 | 12.68 | 6,736 | .25 | .25 | 2.20 | 28 | ||||||||
| (.23) | 10.01 | 8.67 | 6,235 | .25 | .25 | 2.28 | 37 | ||||||||
| (.30) | 9.44 | 2.74 | 8,188 | .25 | .25 | 3.05 | 27 | ||||||||
| (.20) | 9.48 | 16.89 | 8,541 | 1.01 | .25 | 2.27 | 26 | ||||||||
| (.72) | 10.64 | 5.70 | 11,880 | .50 | .50 | 1.84 | 67 | ||||||||
| (.40) | 10.77 | 12.41 | 16,585 | .50 | .50 | 1.99 | 28 | ||||||||
| (.20) | 9.98 | 8.40 | 14,350 | .50 | .50 | 2.00 | 37 | ||||||||
| (.28) | 9.41 | 2.42 | 16,037 | .50 | .50 | 2.57 | 27 | ||||||||
| (.18) | 9.46 | 16.54 | 11,365 | 1.24 | .50 | 1.87 | 26 | ||||||||
See accompanying notes which are an integral part of the financial statements.
2025 Strategy Fund 119
Russell Investment Company 2030 Strategy Fund
Portfolio Management Discussion and Analysis — October 31, 2014 (Unaudited)
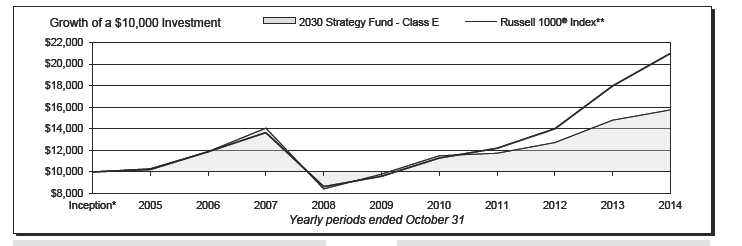
| 2030 Strategy Fund - Class A‡ | 2030 Strategy Fund - Class R5‡‡‡ | ||||||
| Total | Total | ||||||
| Return | Return | ||||||
| 1 Year | 0.24 | % | 1 Year | 6.17 | % | ||
| 5 Years | 8.77 | %§ | 5 Years | 9.76 | %§ | ||
| Inception* | 4.18 | %§ | Inception* | 4.50 | %§ | ||
| 2030 Strategy Fund - Class E | 2030 Strategy Fund - Class S | ||||||
| Total | Total | ||||||
| Return | Return | ||||||
| 1 Year | 6.43 | % | 1 Year | 6.63 | % | ||
| 5 Years | 9.99 | %§ | 5 Years | 10.30 | %§ | ||
| Inception* | 4.73 | %§ | Inception* | 5.01 | %§ | ||
| 2030 Strategy Fund - Class R1‡‡ | Russell 1000® Index** | ||||||
| Total | Total | ||||||
| Return | Return | ||||||
| 1 Year | 6.72 | % | 1 Year | 16.78 | % | ||
| 5 Years | 10.30 | %§ | 5 Years | 16.98 | %§ | ||
| Inception* | 5.01 | %§ | Inception* | 7.84 | %§ | ||
| 2030 Strategy Fund - Class R4‡‡‡ | |||||||
| Total | |||||||
| Return | |||||||
| 1 Year | 6.45 | % | |||||
| 5 Years | 10.02 | %§ | |||||
| Inception* | 4.74 | %§ | |||||
120 2030 Strategy Fund
Russell Investment Company
2030 Strategy Fund
| Portfolio Management Discussion and Analysis, continued — October 31, 2014 | |
| (Unaudited) | |
| The 2030 Strategy Fund (the “Fund”) is a fund of funds that | It was a positive equity market for the fiscal year ending October |
| invests in other Russell Investment Company mutual funds (the | 31, 2014. U.S. equities returned 16.07% over the period (as |
| “Underlying Funds”). The Underlying Funds employ a multi- | measured by the Russell 3000® Index), while non-U.S. equities |
| manager approach whereby portions of the Underlying Funds | returned 0.17% (as measured by the Russell Developed Ex-US |
| are allocated to different money managers. Underlying Fund | Large Cap Index). Given the significant outperformance of U.S. |
| assets not allocated to money managers are managed by Russell | equities over non-U.S. equities, the Fund’s non-U.S. equity |
| Investment Management Company (“RIMCo”), the Fund’s and | exposure detracted from its performance against its U.S. large |
| Underlying Funds’ advisor. RIMCo, as the Underlying Funds’ | cap benchmark. |
| advisor, may change the allocation of the Underlying Funds’ | Global REITs (as represented by the FTSE EPRA/NAREIT |
| assets among money managers at any time. An exemptive order | Developed Real Estate Index (Net)) finished the fiscal year up |
| from the Securities and Exchange Commission (“SEC”) permits | 9.84%. However, global REITs underperformed U.S. equity |
| RIMCo to engage or terminate a money manager in an Underlying | markets, which detracted from the Fund’s benchmark-relative |
| Fund at any time, subject to approval by the Underlying Fund’s | performance through its allocation to the Russell Global Real |
| Board, without a shareholder vote. Pursuant to the terms of the | Estate Securities Fund. Commodities largely underperformed |
| exemptive order, an Underlying Fund is required to notify its | broader equity markets with a loss of 5.94% for the fiscal year (as |
| shareholders within 90 days of when a money manager begins | represented by the Bloomberg Commodity Index Total Return). |
| providing services. | Thus, the Fund’s allocation to the Russell Commodity Strategies |
| What is the Fund’s investment objective? | Fund was another headwind to Fund performance. On August |
| The Fund seeks to provide capital growth and income consistent | 1, 2014, the Russell Global Infrastructure Fund was added as |
| with its current asset allocation which will change over time, with | an Underlying Fund in which the Fund invests. This listed |
| an increasing allocation to fixed income funds. | infrastructure exposure detracted from the Fund’s performance |
| during the period, as the S&P Global Infrastructure Index (Net) | |
| The Fund pursues this objective by investing in a diversified | lost 0.24% from August 1, 2014 through October 31, 2014, while |
| portfolio that, as of October 31, 2014, consisted of approximately | the Russell 1000® Index finished the same period up 4.81%. |
| 62% equity Underlying Funds, 30% fixed income Underlying | |
| Funds and 8% alternative Underlying Funds. The Fund’s | While fixed income markets were overall positive for the year |
| allocation to fixed income Underlying Funds will be fixed at 66% | as interest rates generally trended lower, fixed income markets |
| in approximately the year 2030. | underperformed broad equity markets and therefore the Fund’s |
| fixed income exposure detracted from benchmark-relative returns. | |
| How did the Fund perform relative to its benchmark for the | |
| fiscal year ended October 31, 2014? | How did the investment strategies and techniques employed |
| For the fiscal year ended October 31, 2014, the Fund’s Class A, | by the Fund and the Underlying Funds affect the Fund’s |
| Class E, Class R1, Class R4, Class R5 and Class S Shares gained | performance? |
| 6.40%, 6.43%, 6.72%, 6.45%, 6.17% and 6.63%, respectively. | The Fund is a fund of funds and its performance is based on |
| This is compared to the Fund’s primary benchmark, the Russell | RIMCo’s strategic asset allocations and the performance of the |
| 1000® Index, which gained 16.78% during the same period. The | Underlying Funds in which the Fund invests. |
| Fund’s performance includes operating expenses, whereas index | The Fund’s strategic allocation to fixed income Underlying Funds |
| returns are unmanaged and do not include expenses of any kind. | negatively impacted benchmark-relative performance, as the |
| For the fiscal year ended October 31, 2014, the Morningstar® | fixed income Underlying Funds underperformed U.S. equities as |
| Target Date 2026-2030 gained 7.63%. This result serves as a | measured by the Fund’s benchmark. Results of Underlying Fund |
| peer comparison and is expressed net of operating expenses. | active management were positive. For the Russell Strategic Bond |
| The Fund’s underperformance relative to the Russell 1000® Index | Fund, exposure to non-agency mortgages and emerging market |
| debt were key contributors to the Underlying Fund’s benchmark- | |
| was due to the Fund’s out-of-benchmark allocations to non-U.S. | relative outperformance. Currency selection was also positive, |
| equity, fixed income and commodity Underlying Funds, which | particularly a long U.S. Dollar position versus short positions to |
| generally underperformed the U.S. large cap equity market as | the Australian Dollar, Euro, and Japanese Yen. |
| represented by the Russell 1000® Index. | |
| Due to the general underperformance of non-U.S. equities versus | |
| How did the market conditions described in the Market | U.S. equities, the Fund’s strategic global equity exposure detracted |
| Summary report affect the Fund’s performance? | from benchmark-relative results. From an active management |
| standpoint, the Select International Equity Fund underperformed | |
| 2030 Strategy Fund 121 | |
Russell Investment Company
2030 Strategy Fund
| Portfolio Management Discussion and Analysis, continued — October 31, 2014 | |
| (Unaudited) | |
| the broad non-U.S. equity market as represented by the Russell | U.S. was positive while an overweight to and security selection |
| Developed ex-U.S. Large Cap™ Index Net, while the Russell | within Japan detracted from performance. |
| Global Equity Fund performed in-line with the broad global equity | |
| market as represented by the Russell Developed Large Cap Net | Describe any changes to the Fund’s structure or allocation |
| Index. The Russell Emerging Markets Fund underperformed its | to the Underlying Funds. |
| emerging markets benchmark. For the Select International Equity | On August 1, 2014, RIMCo modified the Fund’s target asset |
| Fund, a bias toward low price-to-book ratio stocks detracted from | allocation and as a result, the Fund increased its exposure to |
| the Underlying Fund’s benchmark-relative performance as lower | equity and alternative Underlying Funds and decreased its |
| price-to-book stocks strongly underperformed the market in non- | exposure to fixed income Underlying Funds. In connection with |
| U.S. developed regions. For the Russell Emerging Markets Fund, | this change, on August 1, 2014, the Russell U.S. Core Equity |
| unsuccessful stock selection in China, South Korea, Russia, and | Fund and Russell International Developed Markets Fund were |
| Taiwan were detractors from performance | replaced as Underlying Funds with the Select U.S. Equity Fund |
| and Select International Equity Fund, respectively. The Fund | |
| The Fund’s strategic allocation to U.S. large cap equity Underlying | also added an allocation to the Russell Global Infrastructure |
| Funds negatively impacted the Fund’s benchmark-relative | Fund and Russell Global Opportunistic Credit Fund to provide |
| performance, as each of the U.S. large cap equity Underlying | further diversification. |
| Funds underperformed the Fund’s benchmark as well as its U.S. | |
| equity market segment as represented by its primary benchmark. | On July 9, 2014, the Fund implemented a1.00% underweight to |
| In particular, the Select U.S. Equity Fund (an Underlying Fund | the Russell Commodity Strategies and 0.50% underweight to the |
| after August 1, 2014) underperformed during the period it was an | Russell Global Real Estate Securities Funds, driven by limited |
| Underlying Fund, driven by an overweight to stocks with lower | commodity price appreciation expectations over the medium |
| than benchmark valuation ratios (lower price-to-earnings, price- | term and caution over the interest rate sensitivity of REITs in |
| to-book, and price-to-cash flow ratios). In addition, the Fund’s | an environment of potential rising interest rates. This was offset |
| strategic allocation to the Russell U.S. Small Cap Equity Fund | by a 1.50% overweight to the Russell Global Equity Fund. This |
| detracted the Fund’s benchmark-relative performance, as small | contributed positively to Fund performance during the period, as |
| cap equities underperformed U.S. large cap equities during the | commodities and global REITs underperformed global equities. |
| period. | On October 30, 2014, the Fund implemented a 0.50% overweight |
| The Fund’s strategic allocation to alternative Underlying Funds | to the Select U.S. Equity Fund and away from the Russell Global |
| had a negative effect on benchmark-relative performance. The | Infrastructure Fund based on a cautious stance to interest |
| Fund’s allocations to the Russell Global Real Estate Securities | rate sensitive asset classes in a potentially rising interest rate |
| Fund, Russell Global Infrastructure Fund (an Underlying Fund | environment. |
| after August 1, 2014) and Russell Commodity Strategies Fund | The views expressed in this report reflect those of the portfolio |
| detracted, as these Underlying Funds underperformed the Fund’s | managers only through the end of the period covered by |
| benchmark. From an active management standpoint, performance | the report. These views do not necessarily represent the |
| of these Underlying Funds was generally mixed. The Russell | views of RIMCo, or any other person in RIMCo or any other |
| Commodity Strategies Fund underperformed its respective asset | affiliated organization. These views are subject to change |
| class benchmark while the Russell Global Real Estate Securities | at any time based upon market conditions or other events, |
| Fund and Russell Global Infrastructure Fund (after August 1, | and RIMCo disclaims any responsibility to update the views |
| 2014) outperformed their respective asset class benchmarks. For | contained herein. These views should not be relied on as |
| the Russell Commodity Strategies Fund, an overweight to energy | investment advice and, because investment decisions for |
| commodities detracted from Fund performance. For the Russell | a Russell Investment Company (“RIC”) Fund are based on |
| Global Real Estate Securities Fund, security selection within the | numerous factors, should not be relied on as an indication |
| of investment decisions of any RIC Fund. | |
| 122 2030 Strategy Fund | |
Russell Investment Company
2030 Strategy Fund
Portfolio Management Discussion and Analysis, continued — October 31, 2014 (Unaudited)
| * | Assumes initial investment on January 3, 2005. |
| ** | Russell 1000® Index includes the 1,000 largest companies in the Russell 3000® Index. The Russell 1000® Index represents the universe of stocks from which most active money managers typically select. The Russell 1000® Index return reflects adjustments from income dividends and capital gain distributions reinvested as of the ex-dividend dates. |
| ‡ | The Fund first issued Class A Shares on September 1, 2005. The returns shown for Class A Shares prior to that date are the returns of Class E Shares. The performance shown has been adjusted to reflect the deduction of the maximum Class A sales charge of 5.75%. |
| ‡‡ | The Fund first issued Class R1 Shares on June 7, 2006. The returns shown for Class R1 Shares prior to that date are the returns of the Fund’s Class S Shares. |
| ‡‡‡ | The Fund first issued Class R4 and Class R5 Shares on October 1, 2014. The returns shown for Class R4 and Class R5 Shares prior to that date are the returns of the Fund’s Class R2 Shares and Class R3 Shares, respectively. |
| § | Annualized. |
Performance is historical and assumes reinvestment of all dividends and capital gains. Investment return and principal value will fluctuate so that an investor’s shares, when redeemed, may be worth more or less than when purchased. Past performance is not indicative of future results. The returns shown do not reflect the deduction of taxes that a shareholder would pay on Fund distributions or the redemption of Fund shares.
2030 Strategy Fund 123
Russell Investment Company 2030 Strategy Fund
Shareholder Expense Example — October 31, 2014 (Unaudited)
| Fund Expenses | Please note that the expenses shown in the table are meant | |||||
| The following disclosure provides important information | to highlight your ongoing costs only and do not reflect any | |||||
| regarding the Fund’s Shareholder Expense Example | transactional costs. Therefore, the information under the heading | |||||
| (“Example”). | “Hypothetical Performance (5% return before expenses)” is | |||||
| useful in comparing ongoing costs only, and will not help you | ||||||
| Example | determine the relative total costs of owning different funds. In | |||||
| As a shareholder of the Fund, you incur ongoing costs, including | addition, if these transactional costs were included, your costs | |||||
| distribution (12b-1) and/or service fees and other Fund expenses. | would have been higher. | |||||
| The Example is intended to help you understand your ongoing | Hypothetical | |||||
| costs (in dollars) of investing in the Fund and to compare these | Performance (5% | |||||
| costs with the ongoing costs of investing in other mutual funds. | Actual | return before | ||||
| The Example is based on an investment of $1,000 invested at the | Class A | Performance | expenses) | |||
| Beginning Account Value | ||||||
| beginning of the period and held for the entire period indicated, | May 1, 2014 | $ | 1,000.00 | $ | 1,000.00 | |
| which for this Fund is from May 1, 2014 to October 31, 2014. | Ending Account Value | |||||
| October 31, 2014 | $ | 1,017.70 | $ | 1,023.95 | ||
| Actual Expenses | Expenses Paid During Period* | $ | 1.27 | $ | 1.28 | |
| The information in the table under the heading “Actual | ||||||
| Performance” provides information about actual account values | * Expenses are equal to the Fund's annualized expense ratio of 0.25% | |||||
| (representing the six month period annualized), multiplied by the average | ||||||
| and actual expenses. You may use the information in this column, | account value over the period, multiplied by 184/365 (to reflect the one-half | |||||
| together with the amount you invested, to estimate the expenses | year period). | |||||
| that you paid over the period. Simply divide your account value by | ||||||
| $1,000 (for example, an $8,600 account value divided by $1,000 | Hypothetical | |||||
| Performance (5% | ||||||
| = 8.6), then multiply the result by the number in the first column | Actual | return before | ||||
| in the row entitled “Expenses Paid During Period” to estimate | Class E | Performance | expenses) | |||
| the expenses you paid on your account during this period. | Beginning Account Value | |||||
| May 1, 2014 | $ | 1,000.00 | $ | 1,000.00 | ||
| Hypothetical Example for Comparison Purposes | Ending Account Value | |||||
| October 31, 2014 | $ | 1,017.60 | $ | 1,023.95 | ||
| The information in the table under the heading “Hypothetical | Expenses Paid During Period* | $ | 1.27 | $ | 1.28 | |
| Performance (5% return before expenses)” provides information | ||||||
| about hypothetical account values and hypothetical expenses | * Expenses are equal to the Fund's annualized expense ratio of 0.25% | |||||
| based on the Fund’s actual expense ratio and an assumed rate of | (representing the six month period annualized), multiplied by the average | |||||
| account value over the period, multiplied by 184/365 (to reflect the one-half | ||||||
| return of 5% per year before expenses, which is not the Fund’s | year period). | |||||
| actual return. The hypothetical account values and expenses | ||||||
| may not be used to estimate the actual ending account balance or | Hypothetical | |||||
| expenses you paid for the period. You may use this information | Performance (5% | |||||
| Actual | return before | |||||
| to compare the ongoing costs of investing in the Fund and other | Class R1 | Performance | expenses) | |||
| funds. To do so, compare this 5% hypothetical example with the | Beginning Account Value | |||||
| 5% hypothetical examples that appear in the shareholder reports | May 1, 2014 | $ | 1,000.00 | $ | 1,000.00 | |
| of other funds. | Ending Account Value | |||||
| October 31, 2014 | $ | 1,019.10 | $ | 1,025.21 | ||
| Expenses Paid During Period* | $ | — | $ | — | ||
| * There were no expenses charged to the Class. | ||||||
124 2030 Strategy Fund
Russell Investment Company 2030 Strategy Fund
Shareholder Expense Example, continued — October 31, 2014 (Unaudited)
| Hypothetical | ||||||
| Performance (5% | ||||||
| Actual | return before | |||||
| Class R4(1) | Performance | expenses) | ||||
| Beginning Account Value | ||||||
| May 1, 2014 | $ | 1,000.00 | $ | 1,000.00 | ||
| Ending Account Value | ||||||
| October 31, 2014 | $ | 1,017.80 | $ | 1,023.95 | ||
| Expenses Paid During Period* | $ | 1.27 | $ | 1.28 | ||
| * Expenses are equal to the Fund's annualized expense ratio of 0.25% | ||||||
| (representing the six month period annualized), multiplied by the average | ||||||
| account value over the period, multiplied by 184/365 (to reflect the one-half | ||||||
| year period). | ||||||
| (1) As of October 1, 2014, Class R2 Shares were reclassified as Class R4 | ||||||
| Shares, and all Class R2 shareholders were issued shares of Class R4. The | ||||||
| shareholder expense example for the period ended October 31, 2014 reflects | ||||||
| the expenses and performance of Class R2 Shares for the period May 1 through | ||||||
| October 1, 2014, and Class R4 Shares for the period October 2, 2014 through | ||||||
| October 31, 2014. | ||||||
| Hypothetical | ||||||
| Performance (5% | ||||||
| Actual | return before | |||||
| Class R5(2) | Performance | expenses) | ||||
| Beginning Account Value | ||||||
| May 1, 2014 | $ | 1,000.00 | $ | 1,000.00 | ||
| Ending Account Value | ||||||
| October 31, 2014 | $ | 1,016.50 | $ | 1,022.68 | ||
| Expenses Paid During Period* | $ | 2.54 | $ | 2.55 | ||
| * Expenses are equal to the Fund's annualized expense ratio of 0.50% | ||||||
| (representing the six month period annualized), multiplied by the average | ||||||
| account value over the period, multiplied by 184/365 (to reflect the one-half | ||||||
| year period). | ||||||
| (2) As of October 1, 2014, Class R3 Shares were reclassified as Class R5 | ||||||
| Shares, and all Class R3 shareholders were issued shares of Class R5. The | ||||||
| shareholder expense example for the period ended October 31, 2014 reflects | ||||||
| the expenses and performance of Class R3 Shares for the period May 1 through | ||||||
| October 1, 2014, and Class R5 Shares for the period October 2, 2014 through | ||||||
| October 31, 2014. | ||||||
| Hypothetical | ||||||
| Performance (5% | ||||||
| Actual | return before | |||||
| Class S | Performance | expenses) | ||||
| Beginning Account Value | ||||||
| May 1, 2014 | $ | 1,000.00 | $ | 1,000.00 | ||
| Ending Account Value | ||||||
| October 31, 2014 | $ | 1,018.30 | $ | 1,025.21 | ||
| Expenses Paid During Period* | $ | — | $ | — | ||
| * | There were no expenses charged to the Class. |
2030 Strategy Fund 125
Russell Investment Company 2030 Strategy Fund
Schedule of Investments — October 31, 2014
| Amounts in thousands (except share amounts) | Amounts in thousands (except share amounts) | |||||||||
| Fair | Fair | |||||||||
| Value | Value | |||||||||
| Shares | $ | Shares | $ | |||||||
| Investments 100.0% | Fixed Income - 29.7% | |||||||||
| Other Russell Investment Company | Russell Global Opportunistic Credit Fund | 291,964 | 2,919 | |||||||
| Series Mutual Funds - Class Y | Russell Investment Grade Bond Fund | 245,484 | 5,521 | |||||||
| Shares | Russell Strategic Bond Fund | 2,528,492 | 28,193 | |||||||
| 36,633 | ||||||||||
| Alternative - 6.4% | International Equities - 31.8% | |||||||||
| Russell Commodity Strategies Fund | 287,160 | 2,217 | Russell Emerging Markets Fund | 407,079 | 7,605 | |||||
| Russell Global Infrastructure Fund | 220,470 | 2,855 | Russell Global Equity Fund | 1,107,395 | 13,056 | |||||
| Russell Global Real Estate Securities Fund | 70,491 | 2,869 | Select International Equity Fund | 1,978,367 | 18,636 | |||||
| 7,941 | 39,297 | |||||||||
| Domestic Equities - 32.1% | ||||||||||
| Russell U.S. Defensive Equity Fund | 77,692 | 3,576 | Total Investments 100.0% | |||||||
| Russell U.S. Dynamic Equity Fund | 339,728 | 4,311 | (identified cost $105,872) | 123,460 | ||||||
| Russell U.S. Small Cap Equity Fund | 239,587 | 7,483 | Other Assets and Liabilities, Net | |||||||
| Select U.S. Equity Fund | 2,326,529 | 24,219 | -(0.0 | %) | (18 | ) | ||||
| 39,589 | Net Assets - 100.0% | 123,442 | ||||||||
| Presentation of Portfolio Holdings | |||
| Categories | % of Net Assets | ||
| Alternative | 6.4 | ||
| Domestic Equities | 32.1 | ||
| Fixed Income | 29.7 | ||
| International Equities | 31.8 | ||
| Total Investments | 100.0 | ||
| Other Assets and Liabilities, Net | (—*) | ||
| 100.0 | |||
| * Less than .05% of net assets. | |||
See accompanying notes which are an integral part of the financial statements.
126 2030 Strategy Fund
| Russell Investment Company | ||
| 2030 Strategy Fund | ||
| hav | ||
| Statement of Assets and Liabilities — October 31, 2014 | ||
| Amounts in thousands | ||
| Assets | ||
| Investments, at identified cost | $ | 105,872 |
| Investments, at fair value | 123,460 | |
| Receivables: | ||
| Investments sold | 312 | |
| Fund shares sold | 241 | |
| Total assets | 124,013 | |
| Liabilities | ||
| Payables: | ||
| Fund shares redeemed | 551 | |
| Accrued fees to affiliates | 20 | |
| Total liabilities | 571 | |
| Net Assets | $ | 123,442 |
| Net Assets Consist of: | ||
| Undistributed (overdistributed) net investment income | $ | 2 |
| Accumulated net realized gain (loss) | 32,634 | |
| Unrealized appreciation (depreciation) on investments | 17,588 | |
| Shares of beneficial interest | 99 | |
| Additional paid-in capital | 73,119 | |
| Net Assets | $ | 123,442 |
| Net Asset Value, offering and redemption price per share: | ||
| Net asset value per share: Class A(#) | $ | 12.55 |
| Maximum offering price per share (Net asset value plus sales charge of 5.75%): Class A | $ | 13.32 |
| Class A — Net assets | $ | 2,011,414 |
| Class A — Shares outstanding ($.01 par value) | 160,261 | |
| Net asset value per share: Class E(#) | $ | 12.46 |
| Class E — Net assets | $ | 362,226 |
| Class E — Shares outstanding ($.01 par value) | 29,070 | |
| Net asset value per share: Class R1(#) | $ | 12.48 |
| Class R1 — Net assets | $ | 50,599,448 |
| Class R1 — Shares outstanding ($.01 par value) | 4,055,421 | |
| Net asset value per share: Class R4(#) | $ | 12.46 |
| Class R4 — Net assets | $ | 16,829,647 |
| Class R4 — Shares outstanding ($.01 par value) | 1,350,702 | |
| Net asset value per share: Class R5(#) | $ | 12.47 |
| Class R5 — Net assets | $ | 39,471,782 |
| Class R5 — Shares outstanding ($.01 par value) | 3,166,602 | |
| Net asset value per share: Class S(#) | $ | 12.47 |
| Class S — Net assets | $ | 14,167,748 |
| Class S — Shares outstanding ($.01 par value) | 1,135,797 | |
| (#) Net asset value per share equals class level net assets divided by class level shares of beneficial interest outstanding. | ||
See accompanying notes which are an integral part of the financial statements.
2030 Strategy Fund 127
| Russell Investment Company | |||
| 2030 Strategy Fund | |||
| Statement of Operations — For the Period Ended October 31, 2014 | |||
| Amounts in thousands | |||
| Investment Income | |||
| Income distributions from Underlying Funds | $ | 4,005 | |
| Expenses | |||
| Distribution fees - Class A | 6 | ||
| Distribution fees - Class R3 | 103 | ||
| Distribution fees - Class R5 | 8 | ||
| Shareholder servicing fees - Class E | 1 | ||
| Shareholder servicing fees - Class R2 | 43 | ||
| Shareholder servicing fees - Class R3 | 103 | ||
| Shareholder servicing fees - Class R4 | 3 | ||
| Shareholder servicing fees - Class R5 | 8 | ||
| Total expenses | 275 | ||
| Net investment income (loss) | 3,730 | ||
| Net Realized and Unrealized Gain (Loss) | |||
| Net realized gain (loss) on: | |||
| Investments | 36,066 | ||
| Capital gain distributions from Underlying Funds | 2,347 | ||
| Net realized gain (loss) | 38,413 | ||
| Net change in unrealized appreciation (depreciation) on investments | (32,008 | ) | |
| Net realized and unrealized gain (loss) | 6,405 | ||
| Net Increase (Decrease) in Net Assets from Operations | $ | 10,135 | |
See accompanying notes which are an integral part of the financial statements.
128 2030 Strategy Fund
| Russell Investment Company | ||||||
| 2030 Strategy Fund | ||||||
| Statements of Changes in Net Assets | ||||||
| For the Periods Ended October 31, | ||||||
| Amounts in thousands | 2014 | 2013 | ||||
| Increase (Decrease) in Net Assets | ||||||
| Operations | ||||||
| Net investment income (loss) | $ | 3,730 | $ | 3,658 | ||
| Net realized gain (loss) | 38,413 | 6,165 | ||||
| Net change in unrealized appreciation (depreciation) | (32,008 | ) | 18,028 | |||
| Net increase (decrease) in net assets from operations | 10,135 | 27,851 | ||||
| Distributions | ||||||
| From net investment income | ||||||
| Class A | (43 | ) | (40 | ) | ||
| Class E | (11 | ) | (11 | ) | ||
| Class R1 | (1,851 | ) | (1,889 | ) | ||
| Class R2 | (384 | ) | (378 | ) | ||
| Class R3 | (906 | ) | (862 | ) | ||
| Class R4 | (25 | ) | — | |||
| Class R5 | (34 | ) | — | |||
| Class S | (474 | ) | (481 | ) | ||
| Net decrease in net assets from distributions | (3,728 | ) | (3,661 | ) | ||
| Share Transactions* | ||||||
| Net increase (decrease) in net assets from share transactions | (61,941 | ) | (31,882 | ) | ||
| Total Net Increase (Decrease) in Net Assets | (55,534 | ) | (7,692 | ) | ||
| Net Assets | ||||||
| Beginning of period | 178,976 | 186,668 | ||||
| End of period | $ | 123,442 | $ | 178,976 | ||
| Undistributed (overdistributed) net investment income included in net assets | $ | 2 | $ | — | ||
See accompanying notes which are an integral part of the financial statements.
2030 Strategy Fund 129
Russell Investment Company 2030 Strategy Fund
Statements of Changes in Net Assets, continued
* Share transaction amounts (in thousands) for the periods ended October 31, 2014 and October 31, 2013 were as follows:
| 2014 | 2013 | |||||||||||
| Shares | Dollars | Shares | Dollars | |||||||||
| Class A | ||||||||||||
| Proceeds from shares sold | 2 | $ | 29 | 2 | $ | 29 | ||||||
| Proceeds from reinvestment of distributions | 4 | 43 | 4 | 40 | ||||||||
| Payments for shares redeemed | (38 | ) | (467 | ) | (6 | ) | (70 | ) | ||||
| Net increase (decrease) | (32 | ) | (395 | ) | — | (1 | ) | |||||
| Class E | ||||||||||||
| Proceeds from shares sold | 19 | 235 | 19 | 208 | ||||||||
| Proceeds from reinvestment of distributions | 1 | 11 | 1 | 11 | ||||||||
| Payments for shares redeemed | (35 | ) | (436 | ) | (32 | ) | (361 | ) | ||||
| Net increase (decrease) | (15 | ) | (190 | ) | (12 | ) | (142 | ) | ||||
| Class R1 | ||||||||||||
| Proceeds from shares sold | 1,289 | 15,782 | 1,889 | 21,168 | ||||||||
| Proceeds from reinvestment of distributions | 153 | 1,851 | 175 | 1,889 | ||||||||
| Payments for shares redeemed | (4,362 | ) | (53,588 | ) | (3,407 | ) | (38,023 | ) | ||||
| Net increase (decrease) | (2,920 | ) | (35,955 | ) | (1,343 | ) | (14,966 | ) | ||||
| Class R2 | ||||||||||||
| Proceeds from shares sold | 243 | 2,983 | 353 | 3,947 | ||||||||
| Proceeds from reinvestment of distributions | 32 | 384 | 35 | 378 | ||||||||
| Payments for shares redeemed | (1,959 | ) | (23,939 | ) | (758 | ) | (8,378 | ) | ||||
| Net increase (decrease) | (1,684 | ) | (20,572 | ) | (370 | ) | (4,053 | ) | ||||
| Class R3 | ||||||||||||
| Proceeds from shares sold | 706 | 8,631 | 1,284 | 14,318 | ||||||||
| Proceeds from reinvestment of distributions | 75 | 906 | 81 | 862 | ||||||||
| Payments for shares redeemed | (5,085 | ) | (62,031 | ) | (1,924 | ) | (21,527 | ) | ||||
| Net increase (decrease) | (4,304 | ) | (52,494 | ) | (559 | ) | (6,347 | ) | ||||
| Class R4 | ||||||||||||
| Proceeds from shares sold | 1,357 | 16,576 | — | — | ||||||||
| Proceeds from reinvestment of distributions | 2 | 25 | — | — | ||||||||
| Payments for shares redeemed | (8 | ) | (100 | ) | — | — | ||||||
| Net increase (decrease) | 1,351 | 16,501 | — | — | ||||||||
| Class R5 | ||||||||||||
| Proceeds from shares sold | 3,289 | 40,186 | — | — | ||||||||
| Proceeds from reinvestment of distributions | 3 | 34 | — | — | ||||||||
| Payments for shares redeemed | (126 | ) | (1,545 | ) | — | — | ||||||
| Net increase (decrease) | 3,166 | 38,675 | — | — | ||||||||
| Class S | ||||||||||||
| Proceeds from shares sold | 321 | 3,940 | 465 | 5,176 | ||||||||
| Proceeds from reinvestment of distributions | 39 | 474 | 45 | 481 | ||||||||
| Payments for shares redeemed | (970 | ) | (11,925 | ) | (1,081 | ) | (12,030 | ) | ||||
| Net increase (decrease) | (610 | ) | (7,511 | ) | (571 | ) | (6,373 | ) | ||||
| Total increase (decrease) | (5,048 | ) | $ | (61,941 | ) | (2,855 | ) | $ | (31,882 | ) | ||
See accompanying notes which are an integral part of the financial statements.
130 2030 Strategy Fund
(This page intentionally left blank)
| Russell Investment Company | ||||||||||||
| 2030 Strategy Fund | ||||||||||||
| Financial Highlights — For the Periods Ended | ||||||||||||
| For a Share Outstanding Throughout Each Period. | ||||||||||||
| $ | ||||||||||||
| $ | Net | $ | $ | $ | ||||||||
| Net Asset Value, | Investment | Net Realized | Total from | Distributions | ||||||||
| Beginning of | Income (Loss) | and Unrealized | Investment | from Net | ||||||||
| Period | (a)(b)(e) | Gain (Loss) | Operations | Investment Income | ||||||||
| Class A | ||||||||||||
| October 31, 2014 | 12.05 | .26 | .50 | .76 | (.26 | ) | ||||||
| October 31, 2013 | 10.55 | .21 | 1.50 | 1.71 | (.21 | ) | ||||||
| October 31, 2012 | 9.92 | .17 | .64 | .81 | (.18 | ) | ||||||
| October 31, 2011 | 9.92 | .23 | .01 | .24 | (.24 | ) | ||||||
| October 31, 2010 | 8.60 | .17 | 1.32 | 1.49 | (.17 | ) | ||||||
| Class E | ||||||||||||
| October 31, 2014 | 11.96 | .28 | .48 | .76 | (.26 | ) | ||||||
| October 31, 2013 | 10.48 | .21 | 1.48 | 1.69 | (.21 | ) | ||||||
| October 31, 2012 | 9.84 | .19 | .63 | .82 | (.18 | ) | ||||||
| October 31, 2011 | 9.87 | .79 | (.59 | ) | .20 | (.23 | ) | |||||
| October 31, 2010 | 8.56 | .16 | 1.32 | 1.48 | (.17 | ) | ||||||
| Class R1 | ||||||||||||
| October 31, 2014 | 11.98 | .33 | .47 | .80 | (.30 | ) | ||||||
| October 31, 2013 | 10.49 | .24 | 1.49 | 1.73 | (.24 | ) | ||||||
| October 31, 2012 | 9.86 | .20 | .64 | .84 | (.21 | ) | ||||||
| October 31, 2011 | 9.87 | .24 | .02 | .26 | (.27 | ) | ||||||
| October 31, 2010 | 8.57 | .19 | 1.30 | 1.49 | (.19 | ) | ||||||
| Class R4(3) | ||||||||||||
| October 31, 2014 | 11.96 | .27 | .49 | .76 | (.26 | ) | ||||||
| October 31, 2013 | 10.48 | .21 | 1.48 | 1.69 | (.21 | ) | ||||||
| October 31, 2012 | 9.84 | .20 | .61 | .81 | (.17 | ) | ||||||
| October 31, 2011 | 9.85 | .21 | .02 | .23 | (.24 | ) | ||||||
| October 31, 2010 | 8.55 | .16 | 1.31 | 1.47 | (.17 | ) | ||||||
| Class R5(4) | ||||||||||||
| October 31, 2014 | 11.97 | .26 | .47 | .73 | (.23 | ) | ||||||
| October 31, 2013 | 10.48 | .19 | 1.48 | 1.67 | (.18 | ) | ||||||
| October 31, 2012 | 9.84 | .16 | .63 | .79 | (.15 | ) | ||||||
| October 31, 2011 | 9.85 | .21 | (.01 | ) | .20 | (.21 | ) | |||||
| October 31, 2010 | 8.55 | .14 | 1.31 | 1.45 | (.15 | ) | ||||||
| Class S | ||||||||||||
| October 31, 2014 | 11.98 | .33 | .46 | .79 | (.30 | ) | ||||||
| October 31, 2013 | 10.49 | .24 | 1.49 | 1.73 | (.24 | ) | ||||||
| October 31, 2012 | 9.86 | .20 | .64 | .84 | (.21 | ) | ||||||
| October 31, 2011 | 9.87 | .25 | .01 | .26 | (.27 | ) | ||||||
| October 31, 2010 | 8.57 | .18 | 1.31 | 1.49 | (.19 | ) | ||||||
See accompanying notes which are an integral part of the financial statements.
132 2030 Strategy Fund
| % | % | % | ||||||||||||||
| $ | $ | Ratio of Expenses | Ratio of Expenses | Ratio of Net | ||||||||||||
| Net Asset Value, | % | Net Assets, | to Average | to Average | Investment Income | % | ||||||||||
| $ | End of | Total | End of Period | Net Assets, | Net Assets, | to Average | Portfolio | |||||||||
| Total Distributions | Period | Return(d) | (000 | ) | Gross(g) | Net(e)(g) | Net Assets(b)(e) | Turnover Rate | ||||||||
| (.26) | 12.55 | 6.40 | 2,011 | .25 | .25 | 2.14 | 60 | |||||||||
| (.21) | 12.05 | 16.42 | 2,321 | .25 | .25 | 1.85 | 16 | |||||||||
| (.18) | 10.55 | 8.32 | 2,033 | .25 | .25 | 1.70 | 26 | |||||||||
| (.24) | 9.92 | 2.39 | 1,820 | .25 | .25 | 2.21 | 28 | |||||||||
| (.17) | 9.92 | 17.51 | 1,603 | .74 | .25 | 1.93 | 25 | |||||||||
| (.26) | 12.46 | 6.43 | 362 | .25 | .25 | 2.25 | 60 | |||||||||
| (.21) | 11.96 | 16.34 | 527 | .25 | .25 | 1.84 | 16 | |||||||||
| (.18) | 10.48 | 8.46 | 589 | .25 | .25 | 1.90 | 26 | |||||||||
| (.23) | 9.84 | 2.02 | 975 | .25 | .25 | 7.79 | 28 | |||||||||
| (.17) | 9.87 | 17.48 | 14,733 | .73 | .25 | 1.77 | 25 | |||||||||
| (.30) | 12.48 | 6.72 | 50,599 | — | — | 2.66 | 60 | |||||||||
| (.24) | 11.98 | 16.71 | 83,569 | — | — | 2.18 | 16 | |||||||||
| (.21) | 10.49 | 8.65 | 87,265 | — | — | 1.99 | 26 | |||||||||
| (.27) | 9.86 | 2.55 | 79,046 | — | — | 2.39 | 28 | |||||||||
| (.19) | 9.87 | 17.63 | 53,702 | .48 | — | 1.98 | 25 | |||||||||
| (.26) | 12.46 | 6.45 | 16,830 | .25 | .25 | 2.21 | 60 | |||||||||
| (.21) | 11.96 | 16.33 | 20,147 | .25 | .25 | 1.86 | 16 | |||||||||
| (.17) | 10.48 | 8.43 | 21,520 | .25 | .25 | 1.96 | 26 | |||||||||
| (.24) | 9.84 | 2.27 | 38,352 | .25 | .25 | 2.03 | 28 | |||||||||
| (.17) | 9.85 | 17.39 | 39,163 | .73 | .25 | 2.05 | 25 | |||||||||
| (.23) | 12.47 | 6.17 | 39,472 | .50 | .50 | 2.12 | 60 | |||||||||
| (.18) | 11.97 | 16.13 | 51,507 | .50 | .50 | 1.66 | 16 | |||||||||
| (.15) | 10.48 | 8.15 | 50,961 | .50 | .50 | 1.64 | 26 | |||||||||
| (.21) | 9.84 | 2.03 | 71,140 | .50 | .50 | 2.09 | 28 | |||||||||
| (.15) | 9.85 | 17.09 | 72,164 | .98 | .50 | 1.72 | 25 | |||||||||
| (.30) | 12.47 | 6.63 | 14,168 | — | — | 2.68 | 60 | |||||||||
| (.24) | 11.98 | 16.71 | 20,905 | — | — | 2.15 | 16 | |||||||||
| (.21) | 10.49 | 8.65 | 24,300 | — | — | 1.98 | 26 | |||||||||
| (.27) | 9.86 | 2.55 | 22,043 | — | — | 2.48 | 28 | |||||||||
| (.19) | 9.87 | 17.77 | 19,124 | .48 | — | 1.52 | 25 | |||||||||
See accompanying notes which are an integral part of the financial statements.
2030 Strategy Fund 133
Russell Investment Company 2035 Strategy Fund
Portfolio Management Discussion and Analysis — October 31, 2014 (Unaudited)
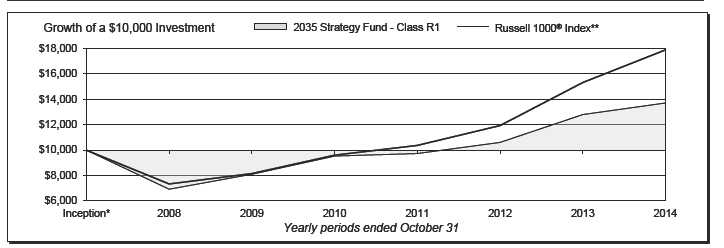
| 2035 Strategy Fund - Class R1 | 2035 Strategy Fund - Class R5‡ | ||||||
| Total | Total | ||||||
| Return | Return | ||||||
| 1 Year | 7.12 | % | 1 Year | 6.60 | % | ||
| 5 Years | 11.08 | %§ | 5 Years | 10.54 | %§ | ||
| Inception* | 4.91 | %§ | Inception* | 4.39 | %§ | ||
| 2035 Strategy Fund - Class R4‡ | Russell 1000® Index** | ||||||
| Total | Total | ||||||
| Return | Return | ||||||
| 1 Year | 6.86 | % | 1 Year | 16.78 | % | ||
| 5 Years | 10.78 | %§ | 5 Years | 16.98 | %§ | ||
| Inception* | 4.64 | %§ | Inception* | 9.23 | %§ | ||
134 2035 Strategy Fund
Russell Investment Company
2035 Strategy Fund
Portfolio Management Discussion and Analysis, continued — October 31, 2014 (Unaudited)
| The 2035 Strategy Fund (the “Fund”) is a fund of funds that | It was a positive equity market for the fiscal year ending October |
| invests in other Russell Investment Company mutual funds (the | 31, 2014. U.S. equities returned 16.07% over the period (as |
| “Underlying Funds”). The Underlying Funds employ a multi- | measured by the Russell 3000® Index), while non-U.S. equities |
| manager approach whereby portions of the Underlying Funds | returned 0.17% (as measured by the Russell Developed Ex-US |
| are allocated to different money managers. Underlying Fund | Large Cap Index). Given the significant outperformance of U.S. |
| assets not allocated to money managers are managed by Russell | equities over non-U.S. equities, the Fund’s non-U.S. equity |
| Investment Management Company (“RIMCo”), the Fund’s and | exposure detracted from its performance against its U.S. large |
| Underlying Funds’ advisor. RIMCo, as the Underlying Funds’ | cap benchmark. |
| advisor, may change the allocation of the Underlying Funds’ | Global REITs (as represented by the FTSE EPRA/NAREIT |
| assets among money managers at any time. An exemptive order | Developed Real Estate Index (Net)) finished the fiscal year up |
| from the Securities and Exchange Commission (“SEC”) permits | 9.84%. However, global REITs underperformed U.S. equity |
| RIMCo to engage or terminate a money manager in an Underlying | markets, which detracted from the Fund’s benchmark-relative |
| Fund at any time, subject to approval by the Underlying Fund’s | performance through its allocation to the Russell Global Real |
| Board, without a shareholder vote. Pursuant to the terms of the | Estate Securities Fund. Commodities largely underperformed |
| exemptive order, an Underlying Fund is required to notify its | broader equity markets with a loss of 5.94% for the fiscal year (as |
| shareholders within 90 days of when a money manager begins | represented by the Bloomberg Commodity Index Total Return). |
| providing services. | Thus, the Fund’s allocation to the Russell Commodity Strategies |
| What is the Fund’s investment objective? | Fund was another headwind to Fund performance. On August |
| The Fund seeks to provide capital growth and income consistent | 1, 2014, the Russell Global Infrastructure Fund was added as |
| with its current asset allocation which will change over time, with | an Underlying Fund in which the Fund invests. This listed |
| an increasing allocation to fixed income funds. | infrastructure exposure detracted from the Fund’s performance |
| during the period, as the S&P Global Infrastructure Index (Net) | |
| The Fund pursues this objective by investing in a diversified | lost 0.24% from August 1, 2014 through October 31, 2014, while |
| portfolio that, as of October 31, 2014, consisted of 77% equity | the Russell 1000® Index finished the same period up 4.81%. |
| Underlying Funds, 13% fixed income Underlying Funds and | |
| 10% alternative Underlying Funds. The Fund’s allocation to fixed | While fixed income markets were overall positive for the year |
| income Underlying Funds will be fixed at 66% in approximately | as interest rates generally trended lower, fixed income markets |
| the year 2035. | underperformed broad equity markets and therefore the Fund’s |
| fixed income exposure detracted from benchmark-relative returns. | |
| How did the Fund perform relative to its benchmark for the | |
| fiscal year ended October 31, 2014? | How did the investment strategies and techniques employed |
| For the fiscal year ended October 31, 2014, the Fund’s Class R1, | by the Fund and the Underlying Funds affect the Fund’s |
| Class R4 and Class R5 Shares gained 7.12%, 6.86%, and 6.60%, | performance? |
| respectively. This is compared to the Fund’s primary benchmark, | The Fund is a fund of funds and its performance is based on |
| the Russell 1000® Index, which gained 16.78% during the same | RIMCo’s strategic asset allocations and the performance of the |
| period. The Fund’s performance includes operating expenses, | Underlying Funds in which the Fund invests. |
| whereas index returns are unmanaged and do not include | The Fund’s strategic allocation to fixed income Underlying Funds |
| expenses of any kind. | negatively impacted benchmark-relative performance, as the |
| For the fiscal year ended October 31, 2014, the Morningstar® | fixed income Underlying Funds underperformed U.S. equities as |
| Target Date 2031-2035 gained 8.41%. This result serves as a | measured by the Fund’s benchmark. Results of Underlying Fund |
| peer comparison and is expressed net of operating expenses. | active management were positive. For the Russell Strategic Bond |
| The Fund’s underperformance relative to the Russell 1000® Index | Fund, exposure to non-agency mortgages and emerging market |
| debt were key contributors to the Underlying Fund’s benchmark- | |
| was due to the Fund’s out-of-benchmark allocations to non-U.S. | relative outperformance. Currency selection was also positive, |
| equity, fixed income and commodity Underlying Funds, which | particularly a long U.S. Dollar position versus short positions to |
| generally underperformed the U.S. large cap equity market as | the Australian Dollar, Euro, and Japanese Yen. |
| represented by the Russell 1000® Index. | |
| Due to the general underperformance of non-U.S. equities versus | |
| How did the market conditions described in the Market | U.S. equities, the Fund’s strategic global equity exposure detracted |
| Summary report affect the Fund’s performance? | from benchmark-relative results. From an active management |
| standpoint, the Select International Equity Fund underperformed |
2035 Strategy Fund 135
Russell Investment Company
2035 Strategy Fund
Portfolio Management Discussion and Analysis, continued — October 31, 2014 (Unaudited)
136 2035 Strategy Fund
| the broad non-U.S. equity market as represented by the Russell | U.S. was positive while an overweight to and security selection |
| Developed ex-U.S. Large Cap™ Index Net, while the Russell | within Japan detracted from performance. |
| Global Equity Fund performed in-line with the broad global equity | |
| market as represented by the Russell Developed Large Cap Net | Describe any changes to the Fund’s structure or allocation |
| Index. The Russell Emerging Markets Fund underperformed its | to the Underlying Funds. |
| emerging markets benchmark. For the Select International Equity | On August 1, 2014, RIMCo modified the Fund’s target asset |
| Fund, a bias toward low price-to-book ratio stocks detracted from | allocation and as a result, the Fund increased its exposure to |
| the Underlying Fund’s benchmark-relative performance as lower | equity and alternative Underlying Funds and decreased its |
| price-to-book stocks strongly underperformed the market in non- | exposure to fixed income Underlying Funds. In connection with |
| U.S. developed regions. For the Russell Emerging Markets Fund, | this change, on August 1, 2014, the Russell U.S. Core Equity |
| unsuccessful stock selection in China, South Korea, Russia, and | Fund and Russell International Developed Markets Fund were |
| Taiwan were detractors from performance | replaced as Underlying Funds with the Select U.S. Equity Fund |
| and Select International Equity Fund, respectively. The Fund | |
| The Fund’s strategic allocation to U.S. large cap equity Underlying | also added an allocation to the Russell Global Infrastructure |
| Funds negatively impacted the Fund’s benchmark-relative | Fund and Russell Global Opportunistic Credit Fund to provide |
| performance, as each of the U.S. large cap equity Underlying | further diversification. |
| Funds underperformed the Fund’s benchmark as well as its U.S. | |
| equity market segment as represented by its primary benchmark. | On July 9, 2014, the Fund implemented a1.00% underweight to |
| In particular, the Select U.S. Equity Fund (an Underlying Fund | the Russell Commodity Strategies and 0.50% underweight to the |
| after August 1, 2014) underperformed during the period it was an | Russell Global Real Estate Securities Funds, driven by limited |
| Underlying Fund, driven by an overweight to stocks with lower | commodity price appreciation expectations over the medium |
| than benchmark valuation ratios (lower price-to-earnings, price- | term and caution over the interest rate sensitivity of REITs in an |
| to-book, and price-to-cash flow ratios). In addition, the Fund’s | environment of potential rising interest rates. This was offset by |
| strategic allocation to the Russell U.S. Small Cap Equity Fund | a 1.50% overweight to the Russell Global Equity Fund. This |
| detracted the Fund’s benchmark-relative performance, as small | contributed positively to Fund performance during the period, as |
| cap equities underperformed U.S. large cap equities during the | commodities and global REITs underperformed global equities. |
| period. | On October 30, 2014, the Fund implemented a 0.50% overweight |
| The Fund’s strategic allocation to alternative Underlying Funds | to the Select U.S. Equity Fund and away from the Russell Global |
| had a negative effect on benchmark-relative performance. The | Infrastructure Fund based on a cautious stance to interest |
| Fund’s allocations to the Russell Global Real Estate Securities | rate sensitive asset classes in a potentially rising interest rate |
| Fund, Russell Global Infrastructure Fund (an Underlying Fund | environment. |
| after August 1, 2014) and Russell Commodity Strategies Fund | The views expressed in this report reflect those of the portfolio |
| detracted, as these Underlying Funds underperformed the Fund’s | managers only through the end of the period covered by |
| benchmark. From an active management standpoint, performance | the report. These views do not necessarily represent the |
| of these Underlying Funds was generally mixed. The Russell | views of RIMCo, or any other person in RIMCo or any other |
| Commodity Strategies Fund underperformed its respective asset | affiliated organization. These views are subject to change |
| class benchmark while the Russell Global Real Estate Securities | at any time based upon market conditions or other events, |
| Fund and Russell Global Infrastructure Fund (after August 1, | and RIMCo disclaims any responsibility to update the views |
| 2014) outperformed their respective asset class benchmarks. For | contained herein. These views should not be relied on as |
| the Russell Commodity Strategies Fund, an overweight to energy | investment advice and, because investment decisions for |
| commodities detracted from Fund performance. For the Russell | a Russell Investment Company (“RIC”) Fund are based on |
| Global Real Estate Securities Fund, security selection within the | numerous factors, should not be relied on as an indication |
| of investment decisions of any RIC Fund. |
Russell Investment Company
2035 Strategy Fund
Portfolio Management Discussion and Analysis, continued — October 31, 2014 (Unaudited)
| * | Assumes initial investment on March 31, 2008. |
| ** | Russell 1000® Index includes the 1,000 largest companies in the Russell 3000® Index. The Russell 1000® Index represents the universe of stocks from which most active money managers typically select. The Russell 1000® Index return reflects adjustments from income dividends and capital gain distributions reinvested as of the ex-dividend dates. |
| ‡ | The Fund first issued Class R4 and Class R5 Shares on October 1, 2014. The returns shown for Class R4 and Class R5 Shares prior to that date are the returns of the Fund’s Class R2 Shares and Class R3 Shares, respectively. |
| § | Annualized. |
Performance is historical and assumes reinvestment of all dividends and capital gains. Investment return and principal value will fluctuate so that an investor’s shares, when redeemed, may be worth more or less than when purchased. Past performance is not indicative of future results. The returns shown do not reflect the deduction of taxes that a shareholder would pay on Fund distributions or the redemption of Fund shares.
2035 Strategy Fund 137
Russell Investment Company 2035 Strategy Fund
Shareholder Expense Example — October 31, 2014 (Unaudited)
138 2035 Strategy Fund
| Fund Expenses | Hypothetical | ||||||
| The following disclosure provides important information | Performance (5% | ||||||
| Actual | return before | ||||||
| regarding the Fund’s Shareholder Expense Example | Class R1 | Performance | expenses) | ||||
| (“Example”). | Beginning Account Value | ||||||
| May 1, 2014 | $ | 1,000.00 | $ | 1,000.00 | |||
| Example | Ending Account Value | ||||||
| As a shareholder of the Fund, you incur ongoing costs, including | October 31, 2014 | $ | 1,017.20 | $ | 1,025.21 | ||
| distribution (12b-1) and/or service fees and other Fund expenses. | Expenses Paid During Period* | $ | — | $ | — | ||
| The Example is intended to help you understand your ongoing | * There were no expenses charged to the Class. | ||||||
| costs (in dollars) of investing in the Fund and to compare these | |||||||
| costs with the ongoing costs of investing in other mutual funds. | Hypothetical | ||||||
| Performance (5% | |||||||
| The Example is based on an investment of $1,000 invested at the | Actual | return before | |||||
| beginning of the period and held for the entire period indicated, | Class R4(1) | Performance | expenses) | ||||
| which for this Fund is from May 1, 2014 to October 31, 2014. | Beginning Account Value | ||||||
| May 1, 2014 | $ | 1,000.00 | $ | 1,000.00 | |||
| Actual Expenses | Ending Account Value | ||||||
| The information in the table under the heading “Actual | October 31, 2014 | $ | 1,016.00 | $ | 1,023.95 | ||
| Expenses Paid During Period* | $ | 1.27 | $ | 1.28 | |||
| Performance” provides information about actual account values | |||||||
| and actual expenses. You may use the information in this column, | * Expenses are equal to the Fund's annualized expense ratio of 0.25% | ||||||
| together with the amount you invested, to estimate the expenses | (representing the six month period annualized), multiplied by the average | ||||||
| account value over the period, multiplied by 184/365 (to reflect the one-half | |||||||
| that you paid over the period. Simply divide your account value by | year period). | ||||||
| $1,000 (for example, an $8,600 account value divided by $1,000 | (1) As of October 1, 2014, Class R2 Shares were reclassified as Class R4 | ||||||
| = 8.6), then multiply the result by the number in the first column | Shares, and all Class R2 shareholders were issued shares of Class R4. The | ||||||
| in the row entitled “Expenses Paid During Period” to estimate | shareholder expense example for the period ended October 31, 2014 reflects | ||||||
| the expenses and performance of Class R2 Shares for the period May 1 through | |||||||
| the expenses you paid on your account during this period. | October 1, 2014, and Class R4 Shares for the period October 2, 2014 through | ||||||
| Hypothetical Example for Comparison Purposes | October 31, 2014. | ||||||
| The information in the table under the heading “Hypothetical | Hypothetical | ||||||
| Performance (5% return before expenses)” provides information | Performance (5% | ||||||
| Actual | return before | ||||||
| about hypothetical account values and hypothetical expenses | Class R5(2) | Performance | expenses) | ||||
| based on the Fund’s actual expense ratio and an assumed rate of | Beginning Account Value | ||||||
| return of 5% per year before expenses, which is not the Fund’s | May 1, 2014 | $ | 1,000.00 | $ | 1,000.00 | ||
| actual return. The hypothetical account values and expenses | Ending Account Value | ||||||
| may not be used to estimate the actual ending account balance or | October 31, 2014 | $ | 1,015.60 | $ | 1,022.68 | ||
| expenses you paid for the period. You may use this information | Expenses Paid During Period* | $ | 2.54 | $ | 2.55 | ||
| to compare the ongoing costs of investing in the Fund and other | * Expenses are equal to the Fund's annualized expense ratio of 0.50% | ||||||
| funds. To do so, compare this 5% hypothetical example with the | (representing the six month period annualized), multiplied by the average | ||||||
| 5% hypothetical examples that appear in the shareholder reports | account value over the period, multiplied by 184/365 (to reflect the one-half | ||||||
| year period). | |||||||
| of other funds. | (2) As of October 1, 2014, Class R3 Shares were reclassified as Class R5 | ||||||
| Please note that the expenses shown in the table are meant | Shares, and all Class R3 shareholders were issued shares of Class R5. The | ||||||
| shareholder expense example for the period ended October 31, 2014 reflects | |||||||
| to highlight your ongoing costs only and do not reflect any | the expenses and performance of Class R3 Shares for the period May 1 through | ||||||
| transactional costs. Therefore, the information under the heading | October 1, 2014, and Class R5 Shares for the period October 2, 2014 through | ||||||
| “Hypothetical Performance (5% return before expenses)” is | October 31, 2014. | ||||||
| useful in comparing ongoing costs only, and will not help you | |||||||
| determine the relative total costs of owning different funds. In | |||||||
| addition, if these transactional costs were included, your costs | |||||||
| would have been higher. | |||||||
| Russell Investment Company | |||||||||||
| 2035 Strategy Fund | |||||||||||
| Schedule of Investments — October 31, 2014 | |||||||||||
| Amounts in thousands (except share amounts) | Amounts in thousands (except share amounts) | ||||||||||
| Fair | Fair | ||||||||||
| Value | Value | ||||||||||
| Shares | $ | Shares | $ | ||||||||
| Investments 100.0% | Fixed Income - 13.2% | ||||||||||
| Other Russell Investment Company | Russell Global Opportunistic Credit Fund | 22,705 | 227 | ||||||||
| Series Mutual Funds - Class Y | Russell Strategic Bond Fund | 297,485 | 3,317 | ||||||||
| Shares | 3,544 | ||||||||||
| International Equities - 39.3% | |||||||||||
| Alternative - 7.8% | Russell Emerging Markets Fund | 118,704 | 2,218 | ||||||||
| Russell Commodity Strategies Fund | 78,913 | 609 | Russell Global Equity Fund | 288,837 | 3,405 | ||||||
| Russell Global Infrastructure Fund | 57,986 | 751 | Select International Equity Fund | 522,839 | 4,925 | ||||||
| Russell Global Real Estate Securities Fund | 18,457 | 751 | 10,548 | ||||||||
| 2,111 | |||||||||||
| Domestic Equities - 39.7% | Total Investments 100.0% | ||||||||||
| Russell U.S. Defensive Equity Fund | 17,537 | 807 | (identified cost $23,476) | 26,853 | |||||||
| Russell U.S. Dynamic Equity Fund | 97,147 | 1,233 | Other Assets and Liabilities, Net | ||||||||
| Russell U.S. Small Cap Equity Fund | 67,897 | 2,120 | -(0.0 | %) | (3 | ) | |||||
| Select U.S. Equity Fund | 623,397 | 6,490 | |||||||||
| 10,650 | Net Assets - 100.0% | 26,850 | |||||||||
| Presentation of Portfolio Holdings | |||||||||||
| Categories | % of Net Assets | ||||||||||
| Alternative | 7.8 | ||||||||||
| Domestic Equities | 39.7 | ||||||||||
| Fixed Income | 13.2 | ||||||||||
| International Equities | 39.3 | ||||||||||
| Total Investments | 100.0 | ||||||||||
| Other Assets and Liabilities, Net | (—*) | ||||||||||
| 100.0 | |||||||||||
| * Less than .05% of net assets. | |||||||||||
See accompanying notes which are an integral part of the financial statements.
2035 Strategy Fund 139
| Russell Investment Company | ||
| 2035 Strategy Fund | ||
| g | ||
| Statement of Assets and Liabilities — October 31, 2014 | ||
| Amounts in thousands | ||
| Assets | ||
| Investments, at identified cost | $ | 23,476 |
| Investments, at fair value | 26,853 | |
| Receivables: | ||
| Investments sold | 303 | |
| Fund shares sold | 16 | |
| Total assets | 27,172 | |
| Liabilities | ||
| Payables: | ||
| Fund shares redeemed | 316 | |
| Accrued fees to affiliates | 6 | |
| Total liabilities | 322 | |
| Net Assets | $ | 26,850 |
| Net Assets Consist of: | ||
| Undistributed (overdistributed) net investment income | $ | 1 |
| Accumulated net realized gain (loss) | 5,534 | |
| Unrealized appreciation (depreciation) on investments | 3,377 | |
| Shares of beneficial interest | 24 | |
| Additional paid-in capital | 17,914 | |
| Net Assets | $ | 26,850 |
| Net Asset Value, offering and redemption price per share: | ||
| Net asset value per share: Class R1(#) | $ | 11.39 |
| Class R1 — Net assets | $ | 7,842,422 |
| Class R1 — Shares outstanding ($.01 par value) | 688,417 | |
| Net asset value per share: Class R4(#) | $ | 11.38 |
| Class R4 — Net assets | $ | 7,695,392 |
| Class R4 — Shares outstanding ($.01 par value) | 676,045 | |
| Net asset value per share: Class R5(#) | $ | 11.38 |
| Class R5 — Net assets | $ | 11,312,119 |
| Class R5 — Shares outstanding ($.01 par value) | 994,360 | |
| (#) Net asset value per share equals class level net assets divided by class level shares of beneficial interest outstanding. | ||
See accompanying notes which are an integral part of the financial statements.
140 2035 Strategy Fund
| Russell Investment Company | |||
| 2035 Strategy Fund | |||
| Statement of Operations — For the Period Ended October 31, 2014 | |||
| Amounts in thousands | |||
| Investment Income | |||
| Income distributions from Underlying Funds | $ | 761 | |
| Expenses | |||
| Distribution fees - Class R3 | 26 | ||
| Distribution fees - Class R5 | 2 | ||
| Shareholder servicing fees - Class R2 | 15 | ||
| Shareholder servicing fees - Class R3 | 26 | ||
| Shareholder servicing fees - Class R4 | 2 | ||
| Shareholder servicing fees - Class R5 | 2 | ||
| Total expenses | 73 | ||
| Net investment income (loss) | 688 | ||
| Net Realized and Unrealized Gain (Loss) | |||
| Net realized gain (loss) on: | |||
| Investments | 5,420 | ||
| Capital gain distributions from Underlying Funds | 469 | ||
| Net realized gain (loss) | 5,889 | ||
| Net change in unrealized appreciation (depreciation) on investments | (4,673 | ) | |
| Net realized and unrealized gain (loss) | 1,216 | ||
| Net Increase (Decrease) in Net Assets from Operations | $ | 1,904 | |
See accompanying notes which are an integral part of the financial statements.
2035 Strategy Fund 141
| Russell Investment Company | ||||||
| 2035 Strategy Fund | ||||||
| Statements of Changes in Net Assets | ||||||
| For the Periods Ended October 31, | ||||||
| Amounts in thousands | 2014 | 2013 | ||||
| Increase (Decrease) in Net Assets | ||||||
| Operations | ||||||
| Net investment income (loss) | $ | 688 | $ | 459 | ||
| Net realized gain (loss) | 5,889 | 604 | ||||
| Net change in unrealized appreciation (depreciation) | (4,673 | ) | 4,339 | |||
| Net increase (decrease) in net assets from operations | 1,904 | 5,402 | ||||
| Distributions | ||||||
| From net investment income | ||||||
| Class R1 | (297 | ) | (240 | ) | ||
| Class R2 | (140 | ) | (89 | ) | ||
| Class R3 | (245 | ) | (131 | ) | ||
| Class R4 | (5 | ) | — | |||
| Class R5 | (—)** | — | ||||
| From net realized gain | ||||||
| Class R1 | (254 | ) | (318 | ) | ||
| Class R2 | (132 | ) | (148 | ) | ||
| Class R3 | (256 | ) | (259 | ) | ||
| Net decrease in net assets from distributions | (1,329 | ) | (1,185 | ) | ||
| Share Transactions* | ||||||
| Net increase (decrease) in net assets from share transactions | (3,663 | ) | (245 | ) | ||
| Total Net Increase (Decrease) in Net Assets | (3,088 | ) | 3,972 | |||
| Net Assets | ||||||
| Beginning of period | 29,938 | 25,966 | ||||
| End of period | $ | 26,850 | $ | 29,938 | ||
| Undistributed (overdistributed) net investment income included in net assets | $ | 1 | $ | — | ||
| ** Less than $500. | ||||||
See accompanying notes which are an integral part of the financial statements.
142 2035 Strategy Fund
Russell Investment Company 2035 Strategy Fund
Statements of Changes in Net Assets, continued
* Share transaction amounts (in thousands) for the periods ended October 31, 2014 and October 31, 2013 were as follows:
| 2014 | 2013 | |||||||||||
| Shares | Dollars | Shares | Dollars | |||||||||
| Class R1 | ||||||||||||
| Proceeds from shares sold | 405 | $ | 4,535 | 1,083 | $ | 11,018 | ||||||
| Proceeds from reinvestment of distributions | 50 | 551 | 58 | 557 | ||||||||
| Payments for shares redeemed | (779 | ) | (8,750 | ) | (1,316 | ) | (13,541 | ) | ||||
| Net increase (decrease) | (324 | ) | (3,664 | ) | (175 | ) | (1,966 | ) | ||||
| Class R2 | ||||||||||||
| Proceeds from shares sold | 197 | 2,223 | 180 | 1,861 | ||||||||
| Proceeds from reinvestment of distributions | 25 | 272 | 25 | 237 | ||||||||
| Payments for shares redeemed | (783 | ) | (8,720 | ) | (208 | ) | (2,141 | ) | ||||
| Net increase (decrease) | (561 | ) | (6,225 | ) | (3 | ) | (43 | ) | ||||
| Class R3 | ||||||||||||
| Proceeds from shares sold | 303 | 3,388 | 425 | 4,266 | ||||||||
| Proceeds from reinvestment of distributions | 45 | 500 | 41 | 391 | ||||||||
| Payments for shares redeemed | (1,459 | ) | (16,194 | ) | (288 | ) | (2,893 | ) | ||||
| Net increase (decrease) | (1,111 | ) | (12,306 | ) | 178 | 1,764 | ||||||
| Class R4 | ||||||||||||
| Proceeds from shares sold | 680 | 7,552 | — | — | ||||||||
| Proceeds from reinvestment of distributions | —** | 5 | — | — | ||||||||
| Payments for shares redeemed | (4 | ) | (49 | ) | — | — | ||||||
| Net increase (decrease) | 676 | 7,508 | — | — | ||||||||
| Class R5 | ||||||||||||
| Proceeds from shares sold | 1,039 | 11,528 | — | — | ||||||||
| Proceeds from reinvestment of distributions | —** | 1 | — | — | ||||||||
| Payments for shares redeemed | (44 | ) | (505 | ) | — | — | ||||||
| Net increase (decrease) | 995 | 11,024 | — | — | ||||||||
| Total increase (decrease) | (325 | ) | $ | (3,663 | ) | — | $ | (245 | ) | |||
| ** | Less than $500. |
See accompanying notes which are an integral part of the financial statements.
2035 Strategy Fund 143
Russell Investment Company 2035 Strategy Fund
Financial Highlights — For the Periods Ended
For a Share Outstanding Throughout Each Period.
| $ | ||||||||||||||||
| $ | Net | $ | $ | $ | $ | |||||||||||
| Net Asset Value, | Investment | Net Realized | Total from | Distributions | Distributions | |||||||||||
| Beginning of | Income (Loss) | and Unrealized | Investment | from Net | from Net | |||||||||||
| Period | (a)(b)(e) | Gain (Loss) | Operations | Investment Income | Realized Gain | |||||||||||
| Class R1 | ||||||||||||||||
| October 31, 2014 | 11.16 | .33 | .45 | .78 | (.30 | ) | (.25 | ) | ||||||||
| October 31, 2013 | 9.68 | .17 | 1.75 | 1.92 | (.18 | ) | (.26 | ) | ||||||||
| October 31, 2012 | 9.10 | .17 | .63 | .80 | (.17 | ) | (.05 | ) | ||||||||
| October 31, 2011 | 9.13 | .20 | —(h) | .20 | (.23 | ) | — | |||||||||
| October 31, 2010 | 7.92 | .16 | 1.22 | 1.38 | (.17 | ) | — | |||||||||
| Class R4(3) | ||||||||||||||||
| October 31, 2014 | 11.15 | .24 | .51 | .75 | (.27 | ) | (.25 | ) | ||||||||
| October 31, 2013 | 9.67 | .16 | 1.74 | 1.90 | (.16 | ) | (.26 | ) | ||||||||
| October 31, 2012 | 9.09 | .14 | .63 | .77 | (.14 | ) | (.05 | ) | ||||||||
| October 31, 2011 | 9.12 | .20 | (.03) | .17 | (.20 | ) | — | |||||||||
| October 31, 2010 | 7.92 | .14 | 1.21 | 1.35 | (.15 | ) | — | |||||||||
| Class R5(4) | ||||||||||||||||
| October 31, 2014 | 11.15 | .24 | .48 | .72 | (.24 | ) | (.25 | ) | ||||||||
| October 31, 2013 | 9.67 | .12 | 1.75 | 1.87 | (.13 | ) | (.26 | ) | ||||||||
| October 31, 2012 | 9.08 | .13 | .62 | .75 | (.11 | ) | (.05 | ) | ||||||||
| October 31, 2011 | 9.11 | .15 | —(h) | .15 | (.18 | ) | — | |||||||||
| October 31, 2010 | 7.91 | .10 | 1.23 | 1.33 | (.13 | ) | — | |||||||||
See accompanying notes which are an integral part of the financial statements.
144 2035 Strategy Fund
| % | % | % | ||||||||||||||
| $ | $ | Ratio of Expenses | Ratio of Expenses | Ratio of Net | ||||||||||||
| Net Asset Value, | % | Net Assets, | to Average | to Average | Investment Income | % | ||||||||||
| $ | End of | Total | End of Period | Net Assets, | Net Assets, | to Average | Portfolio | |||||||||
| Total Distributions | Period | Return | (000 | ) | Gross(g) | Net(e)(g) | Net Assets(b)(e) | Turnover Rate | ||||||||
| (.55 | ) | 11.39 | 7.12 | 7,843 | — | — | 2.91 | 80 | ||||||||
| (.44 | ) | 11.16 | 20.63 | 11,299 | — | — | 1.68 | 44 | ||||||||
| (.22 | ) | 9.68 | 8.99 | 11,495 | — | — | 1.78 | 47 | ||||||||
| (.23 | ) | 9.10 | 2.10 | 9,728 | — | — | 2.13 | 42 | ||||||||
| (.17 | ) | 9.13 | 17.61 | 7,252 | 1.03 | — | 1.87 | 19 | ||||||||
| (.52 | ) | 11.38 | 6.86 | 7,695 | .25 | .25 | 2.14 | 80 | ||||||||
| (.42 | ) | 11.15 | 20.36 | 6,258 | .25 | .25 | 1.52 | 44 | ||||||||
| (.19 | ) | 9.67 | 8.72 | 5,457 | .25 | .25 | 1.49 | 47 | ||||||||
| (.20 | ) | 9.09 | 1.81 | 4,944 | .25 | .25 | 2.12 | 42 | ||||||||
| (.15 | ) | 9.12 | 17.22 | 6,021 | 1.30 | .25 | 1.64 | 19 | ||||||||
| (.49 | ) | 11.38 | 6.60 | 11,312 | .50 | .50 | 2.18 | 80 | ||||||||
| (.39 | ) | 11.15 | 20.06 | 12,381 | .50 | .50 | 1.21 | 44 | ||||||||
| (.16 | ) | 9.67 | 8.50 | 9,014 | .50 | .50 | 1.36 | 47 | ||||||||
| (.18 | ) | 9.08 | 1.60 | 9,473 | .50 | .50 | 1.64 | 42 | ||||||||
| (.13 | ) | 9.11 | 16.98 | 6,728 | 1.54 | .50 | 1.22 | 19 | ||||||||
See accompanying notes which are an integral part of the financial statements.
2035 Strategy Fund 145
Russell Investment Company 2040 Strategy Fund
Portfolio Management Discussion and Analysis — October 31, 2014 (Unaudited)
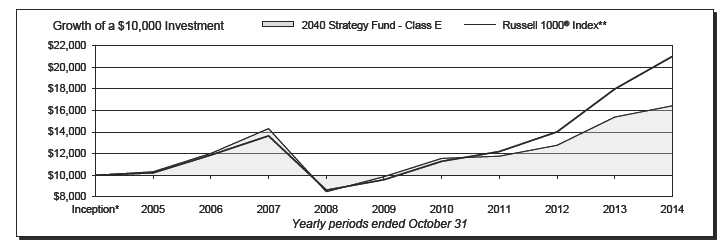
| 2040 Strategy Fund - Class A‡ | 2040 Strategy Fund - Class R5‡‡‡ | ||||||
| Total | Total | ||||||
| Return | Return | ||||||
| 1 Year | 0.74 | % | 1 Year | 6.51 | % | ||
| 5 Years | 9.48 | %§ | 5 Years | 10.50 | %§ | ||
| Inception* | 4.56 | %§ | Inception* | 4.93 | %§ | ||
| 2040 Strategy Fund - Class E | 2040 Strategy Fund - Class S | ||||||
| Total | Total | ||||||
| Return | Return | ||||||
| 1 Year | 6.80 | % | 1 Year | 7.11 | % | ||
| 5 Years | 10.75 | %§ | 5 Years | 11.07 | %§ | ||
| Inception* | 5.18 | %§ | Inception* | 5.46 | %§ | ||
| 2040 Strategy Fund - Class R1‡‡ | Russell 1000® Index** | ||||||
| Total | Total | ||||||
| Return | Return | ||||||
| 1 Year | 7.11 | % | 1 Year | 16.78 | % | ||
| 5 Years | 11.07 | %§ | 5 Years | 16.98 | %§ | ||
| Inception* | 5.46 | %§ | Inception* | 7.84 | %§ | ||
| 2040 Strategy Fund - Class R4‡‡‡ | |||||||
| Total | |||||||
| Return | |||||||
| 1 Year | 6.84 | % | |||||
| 5 Years | 10.80 | %§ | |||||
| Inception* | 5.19 | %§ | |||||
146 2040 Strategy Fund
Russell Investment Company
2040 Strategy Fund
Portfolio Management Discussion and Analysis, continued — October 31, 2014 (Unaudited)
2040 Strategy Fund 147
| The 2040 Strategy Fund (the “Fund”) is a fund of funds that | It was a positive equity market for the fiscal year ending October |
| invests in other Russell Investment Company mutual funds (the | 31, 2014. U.S. equities returned 16.07% over the period (as |
| “Underlying Funds”). The Underlying Funds employ a multi- | measured by the Russell 3000® Index), while non-U.S. equities |
| manager approach whereby portions of the Underlying Funds | returned 0.17% (as measured by the Russell Developed Ex-US |
| are allocated to different money managers. Underlying Fund | Large Cap Index). Given the significant outperformance of U.S. |
| assets not allocated to money managers are managed by Russell | equities over non-U.S. equities, the Fund’s non-U.S. equity |
| Investment Management Company (“RIMCo”), the Fund’s and | exposure detracted from its performance against its U.S. large |
| Underlying Funds’ advisor. RIMCo, as the Underlying Funds’ | cap benchmark. |
| advisor, may change the allocation of the Underlying Funds’ | Global REITs (as represented by the FTSE EPRA/NAREIT |
| assets among money managers at any time. An exemptive order | Developed Real Estate Index (Net)) finished the fiscal year up |
| from the Securities and Exchange Commission (“SEC”) permits | 9.84%. However, global REITs underperformed U.S. equity |
| RIMCo to engage or terminate a money manager in an Underlying | markets, which detracted from the Fund’s benchmark-relative |
| Fund at any time, subject to approval by the Underlying Fund’s | performance through its allocation to the Russell Global Real |
| Board, without a shareholder vote. Pursuant to the terms of the | Estate Securities Fund. Commodities largely underperformed |
| exemptive order, an Underlying Fund is required to notify its | broader equity markets with a loss of 5.94% for the fiscal year (as |
| shareholders within 90 days of when a money manager begins | represented by the Bloomberg Commodity Index Total Return). |
| providing services. | Thus, the Fund’s allocation to the Russell Commodity Strategies |
| What is the Fund’s investment objective? | Fund was another headwind to Fund performance. On August |
| The Fund seeks to provide capital growth and income consistent | 1, 2014, the Russell Global Infrastructure Fund was added as |
| with its current asset allocation which will change over time, with | an Underlying Fund in which the Fund invests. This listed |
| an increasing allocation to fixed income funds. | infrastructure exposure detracted from the Fund’s performance |
| during the period, as the S&P Global Infrastructure Index (Net) | |
| The Fund pursues this objective by investing in a diversified | lost 0.24% from August 1, 2014 through October 31, 2014, while |
| portfolio that, as of October 31, 2014, consisted of approximately | the Russell 1000® Index finished the same period up 4.81%. |
| 83% equity Underlying Funds, 7% fixed income Underlying Funds | |
| and 10% alternative Underlying Funds. The Fund’s allocation to | While fixed income markets were overall positive for the year |
| fixed income funds will be fixed at 66% in approximately the year | as interest rates generally trended lower, fixed income markets |
| 2040. | underperformed broad equity markets and therefore the Fund’s |
| fixed income exposure detracted from benchmark-relative returns. | |
| How did the Fund perform relative to its benchmark for the | |
| fiscal year ended October 31, 2014? | How did the investment strategies and techniques employed |
| For the fiscal year ended October 31, 2014, the Fund’s Class A, | by the Fund and the Underlying Funds affect the Fund’s |
| Class E, Class R1, Class R4, Class R5 and Class S Shares gained | performance? |
| 6.85%, 6.80%, 7.11%, 6.84%, 6.51% and 7.11% respectively. | The Fund is a fund of funds and its performance is based on |
| This is compared to the Fund’s primary benchmark, the Russell | RIMCo’s strategic asset allocations and the performance of the |
| 1000® Index, which gained 16.78% during the same period. The | Underlying Funds in which the Fund invests. |
| Fund’s performance includes operating expenses, whereas index | The Fund’s strategic allocation to fixed income Underlying Funds |
| returns are unmanaged and do not include expenses of any kind. | negatively impacted benchmark-relative performance, as the |
| For the fiscal year ended October 31, 2014, the Morningstar® | fixed income Underlying Funds underperformed U.S. equities as |
| Target Date 2036-2040 gained 8.37%. This result serves as a | measured by the Fund’s benchmark. Results of Underlying Fund |
| peer comparison and is expressed net of operating expenses. | active management were positive. For the Russell Strategic Bond |
| The Fund’s underperformance relative to the Russell 1000® Index | Fund, exposure to non-agency mortgages and emerging market |
| was due to the Fund’s out-of-benchmark allocations to non-U.S. | debt were key contributors to the Underlying Fund’s benchmark- |
| relative outperformance. Currency selection was also positive, | |
| equity, fixed income and commodity Underlying Funds, which | particularly a long U.S. Dollar position versus short positions to |
| generally underperformed the U.S. large cap equity market as | the Australian Dollar, Euro, and Japanese Yen. |
| represented by the Russell 1000® Index. | |
| Due to the general underperformance of non-U.S. equities versus | |
| How did the market conditions described in the Market | U.S. equities, the Fund’s strategic global equity exposure detracted from benchmark-relative results. From an active management |
| Summary report affect the Fund’s performance? | |
| standpoint, the Select International Equity Fund underperformed |
Russell Investment Company
2040 Strategy Fund
Portfolio Management Discussion and Analysis, continued — October 31, 2014 (Unaudited)
| the broad non-U.S. equity market as represented by the Russell | U.S. was positive while an overweight to and security selection |
| Developed ex-U.S. Large Cap™ Index Net, while the Russell | within Japan detracted from performance. |
| Global Equity Fund performed in-line with the broad global equity | |
| market as represented by the Russell Developed Large Cap Net | Describe any changes to the Fund’s structure or allocation |
| Index. The Russell Emerging Markets Fund underperformed its | to the Underlying Funds. |
| emerging markets benchmark. For the Select International Equity | On August 1, 2014, RIMCo modified the Fund’s target asset |
| Fund, a bias toward low price-to-book ratio stocks detracted from | allocation and as a result, the Fund increased its exposure to |
| the Underlying Fund’s benchmark-relative performance as lower | equity and alternative Underlying Funds and decreased its |
| price-to-book stocks strongly underperformed the market in non- | exposure to fixed income Underlying Funds. In connection with |
| U.S. developed regions. For the Russell Emerging Markets Fund, | this change, on August 1, 2014, the Russell U.S. Core Equity |
| unsuccessful stock selection in China, South Korea, Russia, and | Fund and Russell International Developed Markets Fund were |
| Taiwan were detractors from performance. | replaced as Underlying Funds with the Select U.S. Equity Fund |
| and Select International Equity Fund, respectively. The Fund | |
| The Fund’s strategic allocation to U.S. large cap equity Underlying | also added an allocation to the Russell Global Infrastructure |
| Funds negatively impacted the Fund’s benchmark-relative | Fund and Russell Global Opportunistic Credit Fund to provide |
| performance, as each of the U.S. large cap equity Underlying | further diversification. |
| Funds underperformed the Fund’s benchmark as well as its U.S. | |
| equity market segment as represented by its primary benchmark. | On July 9, 2014, the Fund implemented a1.00%underweight to |
| In particular, the Select U.S. Equity Fund (an Underlying Fund | the Russell Commodity Strategies and 0.50% underweight to the |
| after August 1, 2014) underperformed during the period it was an | Russell Global Real Estate Securities Funds, driven by limited |
| Underlying Fund, driven by an overweight to stocks with lower | commodity price appreciation expectations over the medium |
| than benchmark valuation ratios (lower price-to-earnings, price- | term and caution over the interest rate sensitivity of REITs in |
| to-book, and price-to-cash flow ratios. In addition, the Fund’s | an environment of potential rising interest rates. This was offset |
| strategic allocation to the Russell U.S. Small Cap Equity Fund | by a 1.50% overweight to the Russell Global Equity Fund. This |
| detracted the Fund’s benchmark-relative performance, as small | contributed positively to Fund performance during the period, as |
| cap equities underperformed U.S. large cap equities during the | commodities and global REITs underperformed global equities. |
| period. | On October 30, 2014, the Fund implemented a 0.50% overweight |
| The Fund’s strategic allocation to alternative Underlying Funds | to the Select U.S. Equity Fund and away from the Russell Global |
| had a negative effect on benchmark-relative performance. The | Infrastructure Fund based on a cautious stance to interest |
| Fund’s allocations to the Russell Global Real Estate Securities | rate sensitive asset classes in a potentially rising interest rate |
| Fund, Russell Global Infrastructure Fund (an Underlying Fund | environment. |
| after August 1, 2014) and Russell Commodity Strategies Fund | The views expressed in this report reflect those of the portfolio |
| detracted, as these Underlying Funds underperformed the Fund’s | managers only through the end of the period covered by |
| benchmark. From an active management standpoint, performance | the report. These views do not necessarily represent the |
| of these Underlying Funds was generally mixed. The Russell | views of RIMCo, or any other person in RIMCo or any other |
| Commodity Strategies Fund underperformed its respective asset | affiliated organization. These views are subject to change |
| class benchmark while the Russell Global Real Estate Securities | at any time based upon market conditions or other events, |
| Fund and Russell Global Infrastructure Fund (after August 1, | and RIMCo disclaims any responsibility to update the views |
| 2014) outperformed their respective asset class benchmarks. For | contained herein. These views should not be relied on as |
| the Russell Commodity Strategies Fund, an overweight to energy | investment advice and, because investment decisions for |
| commodities detracted from Fund performance. For the Russell | a Russell Investment Company (“RIC”) Fund are based on |
| Global Real Estate Securities Fund, security selection within the | numerous factors, should not be relied on as an indication |
| of investment decisions of any RIC Fund. |
148 2040 Strategy Fund
Russell Investment Company
2040 Strategy Fund
Portfolio Management Discussion and Analysis, continued — October 31, 2014 (Unaudited)
| * | Assumes initial investment on January 3, 2005. |
| ** | Russell 1000® Index includes the 1,000 largest companies in the Russell 3000® Index. The Russell 1000® Index represents the universe of stocks from which most active money managers typically select. The Russell 1000® Index return reflects adjustments from income dividends and capital gain distributions reinvested as of the ex-dividend dates. |
| ‡ | The Fund first issued Class A Shares on September 1, 2005. The returns shown for Class A Shares prior to that date are the returns of Class E Shares. The performance shown has been adjusted to reflect the deduction of the maximum Class A sales charge of 5.75%. |
| ‡‡ | The Fund first issued Class R1 Shares on June 7, 2006. The returns shown for Class R1 Shares prior to that date are the returns of the Fund’s Class S Shares. |
| ‡‡‡ | The Fund first issued Class R4 and Class R5 Shares on October 1, 2014. The returns shown for Class R4 and Class R5 Shares prior to that date are the returns of the Fund’s Class R2 Shares and Class R3 Shares, respectively. |
| § | Annualized. |
Performance is historical and assumes reinvestment of all dividends and capital gains. Investment return and principal value will fluctuate so that an investor’s shares, when redeemed, may be worth more or less than when purchased. Past performance is not indicative of future results. The returns shown do not reflect the deduction of taxes that a shareholder would pay on Fund distributions or the redemption of Fund shares.
2040 Strategy Fund 149
Russell Investment Company 2040 Strategy Fund
Shareholder Expense Example — October 31, 2014 (Unaudited)
| Fund Expenses | Please note that the expenses shown in the table are meant | |||||
| The following disclosure provides important information | to highlight your ongoing costs only and do not reflect any | |||||
| regarding the Fund’s Shareholder Expense Example | transactional costs. Therefore, the information under the heading | |||||
| (“Example”). | “Hypothetical Performance (5% return before expenses)” is | |||||
| useful in comparing ongoing costs only, and will not help you | ||||||
| Example | determine the relative total costs of owning different funds. In | |||||
| As a shareholder of the Fund, you incur ongoing costs, including | addition, if these transactional costs were included, your costs | |||||
| distribution (12b-1) and/or service fees and other Fund expenses. | would have been higher. | |||||
| The Example is intended to help you understand your ongoing | Hypothetical | |||||
| costs (in dollars) of investing in the Fund and to compare these | Performance (5% | |||||
| costs with the ongoing costs of investing in other mutual funds. | Actual | return before | ||||
| The Example is based on an investment of $1,000 invested at the | Class A | Performance | expenses) | |||
| Beginning Account Value | ||||||
| beginning of the period and held for the entire period indicated, | May 1, 2014 | $ | 1,000.00 | $ | 1,000.00 | |
| which for this Fund is from May 1, 2014 to October 31, 2014. | Ending Account Value | |||||
| October 31, 2014 | $ | 1,016.30 | $ | 1,023.95 | ||
| Actual Expenses | Expenses Paid During Period* | $ | 1.27 | $ | 1.28 | |
| The information in the table under the heading “Actual | ||||||
| Performance” provides information about actual account values | * Expenses are equal to the Fund's annualized expense ratio of 0.25% | |||||
| (representing the six month period annualized), multiplied by the average | ||||||
| and actual expenses. You may use the information in this column, | account value over the period, multiplied by 184/365 (to reflect the one-half | |||||
| together with the amount you invested, to estimate the expenses | year period). | |||||
| that you paid over the period. Simply divide your account value by | ||||||
| $1,000 (for example, an $8,600 account value divided by $1,000 | Hypothetical | |||||
| Performance (5% | ||||||
| = 8.6), then multiply the result by the number in the first column | Actual | return before | ||||
| in the row entitled “Expenses Paid During Period” to estimate | Class E | Performance | expenses) | |||
| the expenses you paid on your account during this period. | Beginning Account Value | |||||
| May 1, 2014 | $ | 1,000.00 | $ | 1,000.00 | ||
| Hypothetical Example for Comparison Purposes | Ending Account Value | |||||
| October 31, 2014 | $ | 1,015.80 | $ | 1,023.95 | ||
| The information in the table under the heading “Hypothetical | Expenses Paid During Period* | $ | 1.27 | $ | 1.28 | |
| Performance (5% return before expenses)” provides information | ||||||
| about hypothetical account values and hypothetical expenses | * Expenses are equal to the Fund's annualized expense ratio of 0.25% | |||||
| based on the Fund’s actual expense ratio and an assumed rate of | (representing the six month period annualized), multiplied by the average | |||||
| account value over the period, multiplied by 184/365 (to reflect the one-half | ||||||
| return of 5% per year before expenses, which is not the Fund’s | year period). | |||||
| actual return. The hypothetical account values and expenses | ||||||
| may not be used to estimate the actual ending account balance or | Hypothetical | |||||
| expenses you paid for the period. You may use this information | Performance (5% | |||||
| Actual | return before | |||||
| to compare the ongoing costs of investing in the Fund and other | Class R1 | Performance | expenses) | |||
| funds. To do so, compare this 5% hypothetical example with the | Beginning Account Value | |||||
| 5% hypothetical examples that appear in the shareholder reports | May 1, 2014 | $ | 1,000.00 | $ | 1,000.00 | |
| of other funds. | Ending Account Value | |||||
| October 31, 2014 | $ | 1,017.50 | $ | 1,025.21 | ||
| Expenses Paid During Period* | $ | — | $ | — | ||
| * | There were no expenses charged to the Class. |
150 2040 Strategy Fund
Russell Investment Company 2040 Strategy Fund
Shareholder Expense Example, continued — October 31, 2014 (Unaudited)
| Hypothetical | ||||||
| Performance (5% | ||||||
| Actual | return before | |||||
| Class R4(1) | Performance | expenses) | ||||
| Beginning Account Value | ||||||
| May 1, 2014 | $ | 1,000.00 | $ | 1,000.00 | ||
| Ending Account Value | ||||||
| October 31, 2014 | $ | 1,016.20 | $ | 1,023.95 | ||
| Expenses Paid During Period* | $ | 1.27 | $ | 1.28 | ||
| * Expenses are equal to the Fund's annualized expense ratio of 0.25% | ||||||
| (representing the six month period annualized), multiplied by the average | ||||||
| account value over the period, multiplied by 184/365 (to reflect the one-half | ||||||
| year period). | ||||||
| (1) As of October 1, 2014, Class R2 Shares were reclassified as Class R4 | ||||||
| Shares, and all Class R2 shareholders were issued shares of Class R4. The | ||||||
| shareholder expense example for the period ended October 31, 2014 reflects | ||||||
| the expenses and performance of Class R2 Shares for the period May 1 through | ||||||
| October 1, 2014, and Class R4 Shares for the period October 2, 2014 through | ||||||
| October 31, 2014. | ||||||
| Hypothetical | ||||||
| Performance (5% | ||||||
| Actual | return before | |||||
| Class R5(2) | Performance | expenses) | ||||
| Beginning Account Value | ||||||
| May 1, 2014 | $ | 1,000.00 | $ | 1,000.00 | ||
| Ending Account Value | ||||||
| October 31, 2014 | $ | 1,015.10 | $ | 1,022.68 | ||
| Expenses Paid During Period* | $ | 2.54 | $ | 2.55 | ||
| * Expenses are equal to the Fund's annualized expense ratio of 0.50% | ||||||
| (representing the six month period annualized), multiplied by the average | ||||||
| account value over the period, multiplied by 184/365 (to reflect the one-half | ||||||
| year period). | ||||||
| (2) As of October 1, 2014, Class R3 Shares were reclassified as Class R5 | ||||||
| Shares, and all Class R3 shareholders were issued shares of Class R5. The | ||||||
| shareholder expense example for the period ended October 31, 2014 reflects | ||||||
| the expenses and performance of Class R3 Shares for the period May 1 through | ||||||
| October 1, 2014, and Class R5 Shares for the period October 2, 2014 through | ||||||
| October 31, 2014. | ||||||
| Hypothetical | ||||||
| Performance (5% | ||||||
| Actual | return before | |||||
| Class S | Performance | expenses) | ||||
| Beginning Account Value | ||||||
| May 1, 2014 | $ | 1,000.00 | $ | 1,000.00 | ||
| Ending Account Value | ||||||
| October 31, 2014 | $ | 1,017.50 | $ | 1,025.21 | ||
| Expenses Paid During Period* | $ | — | $ | — | ||
| * | There were no expenses charged to the Class. |
2040 Strategy Fund 151
Russell Investment Company 2040 Strategy Fund
Schedule of Investments — October 31, 2014
| Amounts in thousands (except share amounts) | Amounts in thousands (except share amounts) | |||||||||
| Fair | Fair | |||||||||
| Value | Value | |||||||||
| Shares | $ | Shares | $ | |||||||
| Investments 100.0% | Fixed Income - 6.9% | |||||||||
| Other Russell Investment Company | Russell Strategic Bond Fund | 633,807 | 7,067 | |||||||
| Series Mutual Funds - Class Y | International Equities - 42.0% | |||||||||
| Shares | Russell Emerging Markets Fund | 491,499 | 9,181 | |||||||
| Alternative - 8.5% | Russell Global Equity Fund | 1,171,309 | 13,810 | |||||||
| Russell Commodity Strategies Fund | 326,678 | 2,522 | Select International Equity Fund | 2,115,195 | 19,925 | |||||
| Russell Global Infrastructure Fund | 236,124 | 3,058 | 42,916 | |||||||
| Russell Global Real Estate Securities Fund | 75,506 | 3,074 | ||||||||
| 8,654 | Total Investments 100.0% | |||||||||
| Domestic Equities - 42.6% | (identified cost $86,075) | 102,077 | ||||||||
| Russell U.S. Defensive Equity Fund | 66,556 | 3,063 | Other Assets and Liabilities, Net | |||||||
| Russell U.S. Dynamic Equity Fund | 402,754 | 5,111 | -(0.0 | %) | (11 | ) | ||||
| Russell U.S. Small Cap Equity Fund | 278,600 | 8,701 | Net Assets - 100.0% | 102,066 | ||||||
| Select U.S. Equity Fund | 2,551,897 | 26,565 | ||||||||
| 43,440 | ||||||||||
| Presentation of Portfolio Holdings | |||
| Categories | % of Net Assets | ||
| Alternative | 8.5 | ||
| Domestic Equities | 42.6 | ||
| Fixed Income | 6.9 | ||
| International Equities | 42.0 | ||
| Total Investments | 100.0 | ||
| Other Assets and Liabilities, Net | (—*) | ||
| 100.0 | |||
| * Less than .05% of net assets. | |||
See accompanying notes which are an integral part of the financial statements.
152 2040 Strategy Fund
| Russell Investment Company | ||
| 2040 Strategy Fund | ||
| Statement of Assets and Liabilities — October 31, 2014 | ||
| Amounts in thousands | ||
| Assets | ||
| Investments, at identified cost | $ | 86,075 |
| Investments, at fair value | 102,077 | |
| Receivables: | ||
| Investments sold | 178 | |
| Fund shares sold | 147 | |
| Total assets | 102,402 | |
| Liabilities | ||
| Payables: | ||
| Fund shares redeemed | 323 | |
| Accrued fees to affiliates | 13 | |
| Total liabilities | 336 | |
| Net Assets | $ | 102,066 |
| Net Assets Consist of: | ||
| Undistributed (overdistributed) net investment income | $ | 2 |
| Accumulated net realized gain (loss) | 31,052 | |
| Unrealized appreciation (depreciation) on investments | 16,002 | |
| Shares of beneficial interest | 78 | |
| Additional paid-in capital | 54,932 | |
| Net Assets | $ | 102,066 |
| Net Asset Value, offering and redemption price per share: | ||
| Net asset value per share: Class A(#) | $ | 13.08 |
| Maximum offering price per share (Net asset value plus sales charge of 5.75%): Class A | $ | 13.88 |
| Class A — Net assets | $ | 1,114,238 |
| Class A — Shares outstanding ($.01 par value) | 85,213 | |
| Net asset value per share: Class E(#) | $ | 13.08 |
| Class E — Net assets | $ | 604,639 |
| Class E — Shares outstanding ($.01 par value) | 46,239 | |
| Net asset value per share: Class R1(#) | $ | 13.09 |
| Class R1 — Net assets | $ | 46,350,876 |
| Class R1 — Shares outstanding ($.01 par value) | 3,541,517 | |
| Net asset value per share: Class R4(#) | $ | 13.09 |
| Class R4 — Net assets | $ | 11,026,787 |
| Class R4 — Shares outstanding ($.01 par value) | 842,542 | |
| Net asset value per share: Class R5(#) | $ | 13.06 |
| Class R5 — Net assets | $ | 25,262,606 |
| Class R5 — Shares outstanding ($.01 par value) | 1,934,817 | |
| Net asset value per share: Class S(#) | $ | 13.09 |
| Class S — Net assets | $ | 17,706,868 |
| Class S — Shares outstanding ($.01 par value) | 1,352,776 | |
| (#) Net asset value per share equals class level net assets divided by class level shares of beneficial interest outstanding. | ||
See accompanying notes which are an integral part of the financial statements.
2040 Strategy Fund 153
| Russell Investment Company | |||
| 2040 Strategy Fund | |||
| Statement of Operations — For the Period Ended October 31, 2014 | |||
| Amounts in thousands | |||
| Investment Income | |||
| Income distributions from Underlying Funds | $ | 3,481 | |
| Expenses | |||
| Distribution fees - Class A | 3 | ||
| Distribution fees - Class R3 | 69 | ||
| Distribution fees - Class R5 | 5 | ||
| Shareholder servicing fees - Class E | 3 | ||
| Shareholder servicing fees - Class R2 | 27 | ||
| Shareholder servicing fees - Class R3 | 69 | ||
| Shareholder servicing fees - Class R4 | 2 | ||
| Shareholder servicing fees - Class R5 | 5 | ||
| Total expenses | 183 | ||
| Net investment income (loss) | 3,298 | ||
| Net Realized and Unrealized Gain (Loss) | |||
| Net realized gain (loss) on: | |||
| Investments | 32,050 | ||
| Capital gain distributions from Underlying Funds | 2,223 | ||
| Net realized gain (loss) | 34,273 | ||
| Net change in unrealized appreciation (depreciation) on investments | (28,866 | ) | |
| Net realized and unrealized gain (loss) | 5,407 | ||
| Net Increase (Decrease) in Net Assets from Operations | $ | 8,705 | |
See accompanying notes which are an integral part of the financial statements.
154 2040 Strategy Fund
| Russell Investment Company | ||||||
| 2040 Strategy Fund | ||||||
| �� | ||||||
| Statements of Changes in Net Assets | ||||||
| For the Periods Ended October 31, | ||||||
| Amounts in thousands | 2014 | 2013 | ||||
| Increase (Decrease) in Net Assets | ||||||
| Operations | ||||||
| Net investment income (loss) | $ | 3,298 | $ | 2,311 | ||
| Net realized gain (loss) | 34,273 | 4,473 | ||||
| Net change in unrealized appreciation (depreciation) | (28,866 | ) | 19,245 | |||
| Net increase (decrease) in net assets from operations | 8,705 | 26,029 | ||||
| Distributions | ||||||
| From net investment income | ||||||
| Class A | (25 | ) | (15 | ) | ||
| Class E | (26 | ) | (17 | ) | ||
| Class R1 | (1,693 | ) | (1,124 | ) | ||
| Class R2 | (277 | ) | (205 | ) | ||
| Class R3 | (735 | ) | (514 | ) | ||
| Class R4 | (5 | ) | — | |||
| Class S | (536 | ) | (437 | ) | ||
| Net decrease in net assets from distributions | (3,297 | ) | (2,312 | ) | ||
| Share Transactions* | ||||||
| Net increase (decrease) in net assets from share transactions | (43,151 | ) | (21,566 | ) | ||
| Total Net Increase (Decrease) in Net Assets | (37,743 | ) | 2,151 | |||
| Net Assets | ||||||
| Beginning of period | 139,809 | 137,658 | ||||
| End of period | $ | 102,066 | $ | 139,809 | ||
| Undistributed (overdistributed) net investment income included in net assets | $ | 2 | $ | 1 | ||
See accompanying notes which are an integral part of the financial statements.
2040 Strategy Fund 155
Russell Investment Company 2040 Strategy Fund
Statements of Changes in Net Assets, continued
* Share transaction amounts (in thousands) for the periods ended October 31, 2014 and October 31, 2013 were as follows:
| 2014 | 2013 | |||||||||||
| Shares | Dollars | Shares | Dollars | |||||||||
| Class A | ||||||||||||
| Proceeds from shares sold | 1 | $ | 5 | — | $ | 5 | ||||||
| Proceeds from reinvestment of distributions | 2 | 25 | 1 | 15 | ||||||||
| Payments for shares redeemed | (1 | ) | (10 | ) | (3 | ) | (39 | ) | ||||
| Net increase (decrease) | 2 | 20 | (2 | ) | (19 | ) | ||||||
| Class E | ||||||||||||
| Proceeds from shares sold | 26 | 340 | 28 | 315 | ||||||||
| Proceeds from reinvestment of distributions | 2 | 26 | 1 | 17 | ||||||||
| Payments for shares redeemed | (70 | ) | (925 | ) | (34 | ) | (403 | ) | ||||
| Net increase (decrease) | (42 | ) | (559 | ) | (5 | ) | (71 | ) | ||||
| Class R1 | ||||||||||||
| Proceeds from shares sold | 1,254 | 16,093 | 1,528 | 17,606 | ||||||||
| Proceeds from reinvestment of distributions | 133 | 1,693 | 103 | 1,124 | ||||||||
| Payments for shares redeemed | (3,151 | ) | (40,713 | ) | (1,921 | ) | (22,093 | ) | ||||
| Net increase (decrease) | (1,764 | ) | (22,927 | ) | (290 | ) | (3,363 | ) | ||||
| Class R2 | ||||||||||||
| Proceeds from shares sold | 183 | 2,352 | 285 | 3,297 | ||||||||
| Proceeds from reinvestment of distributions | 22 | 277 | 19 | 205 | ||||||||
| Payments for shares redeemed | (1,182 | ) | (15,121 | ) | (592 | ) | (6,825 | ) | ||||
| Net increase (decrease) | (977 | ) | (12,492 | ) | (288 | ) | (3,323 | ) | ||||
| Class R3 | ||||||||||||
| Proceeds from shares sold | 513 | 6,570 | 1,089 | 12,355 | ||||||||
| Proceeds from reinvestment of distributions | 58 | 735 | 48 | 514 | ||||||||
| Payments for shares redeemed | (3,499 | ) | (44,490 | ) | (1,823 | ) | (20,818 | ) | ||||
| Net increase (decrease) | (2,928 | ) | (37,185 | ) | (686 | ) | (7,949 | ) | ||||
| Class R4 | ||||||||||||
| Proceeds from shares sold | 844 | 10,762 | — | — | ||||||||
| Proceeds from reinvestment of distributions | —** | 5 | — | — | ||||||||
| Payments for shares redeemed | (2 | ) | (28 | ) | — | — | ||||||
| Net increase (decrease) | 842 | 10,739 | — | — | ||||||||
| Class R5 | ||||||||||||
| Proceeds from shares sold | 2,014 | 25,607 | — | — | ||||||||
| Payments for shares redeemed | (79 | ) | (1,007 | ) | — | — | ||||||
| Net increase (decrease) | 1,935 | 24,600 | — | — | ||||||||
| Class S | ||||||||||||
| Proceeds from shares sold | 486 | 6,250 | 781 | 8,914 | ||||||||
| Proceeds from reinvestment of distributions | 42 | 536 | 40 | 437 | ||||||||
| Payments for shares redeemed | (946 | ) | (12,133 | ) | (1,411 | ) | (16,192 | ) | ||||
| Net increase (decrease) | (418 | ) | (5,347 | ) | (590 | ) | (6,841 | ) | ||||
| Total increase (decrease) | (3,350 | ) | $ | (43,151 | ) | (1,861 | ) | $ | (21,566 | ) | ||
| ** Less than $500. | ||||||||||||
See accompanying notes which are an integral part of the financial statements.
156 2040 Strategy Fund
(This page intentionally left blank)
| Russell Investment Company | |||||||||||||
| 2040 Strategy Fund | |||||||||||||
| Financial Highlights — For the Periods Ended | |||||||||||||
| 7For a Share Outstanding Throughout Each Period. | |||||||||||||
| $ | |||||||||||||
| $ | Net | $ | $ | $ | |||||||||
| Net Asset Value, | Investment | Net Realized | Total from | Distributions | |||||||||
| Beginning of | Income (Loss) | and Unrealized | Investment | from Net | |||||||||
| Period | (a)(b)(e) | Gain (Loss) | Operations | Investment Income | |||||||||
| Class A | |||||||||||||
| October 31, 2014 | 12.53 | .30 | .55 | .85 | (.30 | ) | |||||||
| October 31, 2013 | 10.58 | .17 | 1.95 | 2.12 | (.17 | ) | |||||||
| October 31, 2012 | 9.89 | .17 | .67 | .84 | (.15 | ) | |||||||
| October 31, 2011 | 9.92 | .21 | (.02) | .19 | (.22 | ) | |||||||
| October 31, 2010 | 8.61 | .16 | 1.31 | 1.47 | (.16 | ) | |||||||
| Class E | |||||||||||||
| October 31, 2014 | 12.53 | .32 | .52 | .84 | (.29 | ) | |||||||
| October 31, 2013 | 10.57 | .17 | 1.96 | 2.13 | (.17 | ) | |||||||
| October 31, 2012 | 9.89 | .16 | .68 | .84 | (.16 | ) | |||||||
| October 31, 2011 | 9.92 | .79 | (.61) | .18 | (.21 | ) | |||||||
| October 31, 2010 | 8.62 | .16 | 1.31 | 1.47 | (.17 | ) | |||||||
| Class R1 | |||||||||||||
| October 31, 2014 | 12.54 | .36 | .52 | .88 | (.33 | ) | |||||||
| October 31, 2013 | 10.59 | .21 | 1.94 | 2.15 | (.20 | ) | |||||||
| October 31, 2012 | 9.90 | .18 | .69 | .87 | (.18 | ) | |||||||
| October 31, 2011 | 9.93 | .22 | —(h) | .22 | (.25 | ) | |||||||
| October 31, 2010 | 8.62 | .18 | 1.32 | 1.50 | (.19 | ) | |||||||
| Class R4(3) | |||||||||||||
| October 31, 2014 | 12.54 | .31 | .54 | .85 | (.30 | ) | |||||||
| October 31, 2013 | 10.58 | .18 | 1.95 | 2.13 | (.17 | ) | |||||||
| October 31, 2012 | 9.89 | .18 | .66 | .84 | (.15 | ) | |||||||
| October 31, 2011 | 9.91 | .18 | .02 | .20 | (.22 | ) | |||||||
| October 31, 2010 | 8.61 | .15 | 1.31 | 1.46 | (.16 | ) | |||||||
| Class R5(4) | |||||||||||||
| October 31, 2014 | 12.52 | .32 | .49 | .81 | (.27 | ) | |||||||
| October 31, 2013 | 10.56 | .15 | 1.95 | 2.10 | (.14 | ) | |||||||
| October 31, 2012 | 9.87 | .14 | .67 | .81 | (.12 | ) | |||||||
| October 31, 2011 | 9.90 | .19 | (.03) | .16 | (.19 | ) | |||||||
| October 31, 2010 | 8.60 | .14 | 1.30 | 1.44 | (.14 | ) | |||||||
| Class S | |||||||||||||
| October 31, 2014 | 12.54 | .36 | .52 | .88 | (.33 | ) | |||||||
| October 31, 2013 | 10.59 | .21 | 1.94 | 2.15 | (.20 | ) | |||||||
| October 31, 2012 | 9.90 | .18 | .69 | .87 | (.18 | ) | |||||||
| October 31, 2011 | 9.93 | .22 | —(h) | .22 | (.25 | ) | |||||||
| October 31, 2010 | 8.62 | .18 | 1.32 | 1.50 | (.19 | ) | |||||||
See accompanying notes which are an integral part of the financial statements.
158 2040 Strategy Fund
| % | % | % | ||||||||||||||
| $ | $ | Ratio of Expenses | Ratio of Expenses | Ratio of Net | ||||||||||||
| Net Asset Value, | % | Net Assets, | to Average | to Average | Investment Income | % | ||||||||||
| $ | End of | Total | End of Period | Net Assets, | Net Assets, | to Average | Portfolio | |||||||||
| Total Distributions | Period | Return(d) | (000 | ) | Gross(g) | Net(e)(g) | Net Assets(b)(e) | Turnover Rate | ||||||||
| (.30 | ) | 13.08 | 6.85 | 1,114 | .25 | .25 | 2.29 | 64 | ||||||||
| (.17 | ) | 12.53 | 20.33 | 1,048 | .25 | .25 | 1.52 | 14 | ||||||||
| (.15 | ) | 10.58 | 8.69 | 902 | .25 | .25 | 1.71 | 26 | ||||||||
| (.22 | ) | 9.89 | 1.86 | 1,062 | .25 | .25 | 2.03 | 23 | ||||||||
| (.16 | ) | 9.92 | 17.29 | 902 | .76 | .25 | 1.79 | 19 | ||||||||
| (.29 | ) | 13.08 | 6.80 | 605 | .25 | .25 | 2.49 | 64 | ||||||||
| (.17 | ) | 12.53 | 20.45 | 1,100 | .25 | .25 | 1.49 | 14 | ||||||||
| (.16 | ) | 10.57 | 8.59 | 979 | .25 | .25 | 1.55 | 26 | ||||||||
| (.21 | ) | 9.89 | 1.79 | 939 | .25 | .25 | 7.73 | 23 | ||||||||
| (.17 | ) | 9.92 | 17.18 | 16,638 | .75 | .25 | 1.77 | 19 | ||||||||
| (.33 | ) | 13.09 | 7.11 | 46,351 | — | — | 2.83 | 64 | ||||||||
| (.20 | ) | 12.54 | 20.61 | 66,546 | — | — | 1.79 | 14 | ||||||||
| (.18 | ) | 10.59 | 8.99 | 59,225 | — | — | 1.76 | 26 | ||||||||
| (.25 | ) | 9.90 | 2.12 | 52,962 | — | — | 2.19 | 23 | ||||||||
| (.19 | ) | 9.93 | 17.57 | 36,998 | .49 | — | 1.94 | 19 | ||||||||
| (.30 | ) | 13.09 | 6.84 | 11,027 | .25 | .25 | 2.39 | 64 | ||||||||
| (.17 | ) | 12.54 | 20.41 | 12,257 | .25 | .25 | 1.58 | 14 | ||||||||
| (.15 | ) | 10.58 | 8.64 | 13,393 | .25 | .25 | 1.81 | 26 | ||||||||
| (.22 | ) | 9.89 | 1.94 | 33,320 | .25 | .25 | 1.70 | 23 | ||||||||
| (.16 | ) | 9.91 | 17.19 | 32,308 | .75 | .25 | 1.67 | 19 | ||||||||
| (.27 | ) | 13.06 | 6.51 | 25,262 | .50 | .50 | 2.47 | 64 | ||||||||
| (.14 | ) | 12.52 | 20.14 | 36,644 | .50 | .50 | 1.34 | 14 | ||||||||
| (.12 | ) | 10.56 | 8.39 | 38,165 | .50 | .50 | 1.38 | 26 | ||||||||
| (.19 | ) | 9.87 | 1.61 | 54,269 | .50 | .50 | 1.85 | 23 | ||||||||
| (.14 | ) | 9.90 | 16.92 | 53,208 | 1.00 | .50 | 1.48 | 19 | ||||||||
| (.33 | ) | 13.09 | 7.11 | 17,707 | — | — | 2.79 | 64 | ||||||||
| (.20 | ) | 12.54 | 20.61 | 22,214 | — | — | 1.87 | 14 | ||||||||
| (.18 | ) | 10.59 | 8.99 | 24,994 | — | — | 1.75 | 26 | ||||||||
| (.25 | ) | 9.90 | 2.12 | 21,638 | — | — | 2.18 | 23 | ||||||||
| (.19 | ) | 9.93 | 17.57 | 17,541 | .50 | — | 1.94 | 19 | ||||||||
See accompanying notes which are an integral part of the financial statements.
2040 Strategy Fund 159
Russell Investment Company 2045 Strategy Fund
Portfolio Management Discussion and Analysis — October 31, 2014 (Unaudited)
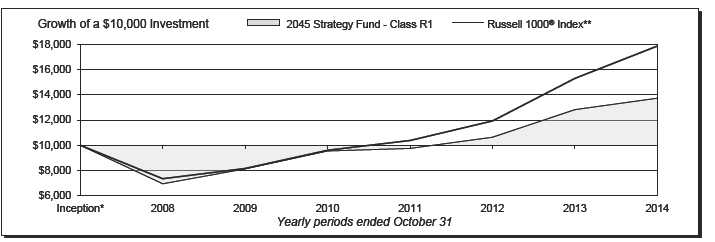
| 2045 Strategy Fund - Class R1 | 2045 Strategy Fund - Class R5‡ | ||||||
| Total | Total | ||||||
| Return | Return | ||||||
| 1 Year | 7.08 | % | 1 Year | 6.48 | % | ||
| 5 Years | 11.07 | %§ | 5 Years | 10.54 | %§ | ||
| Inception* | 4.94 | %§ | Inception* | 4.41 | %§ | ||
| 2045 Strategy Fund - Class R4‡ | Russell 1000® Index** | ||||||
| Total | Total | ||||||
| Return | Return | ||||||
| 1 Year | 6.80 | % | 1 Year | 16.78 | % | ||
| 5 Years | 10.84 | %§ | 5 Years | 16.98 | %§ | ||
| Inception* | 4.70 | %§ | Inception* | 9.23 | %§ | ||
160 2045 Strategy Fund
Russell Investment Company
2045 Strategy Fund
Portfolio Management Discussion and Analysis, continued — October 31, 2014 (Unaudited)
| The 2045 Strategy Fund (the “Fund”) is a fund of funds that | It was a positive equity market for the fiscal year ending October |
| invests in other Russell Investment Company mutual funds (the | 31, 2014. U.S. equities returned 16.07% over the period (as |
| “Underlying Funds”). The Underlying Funds employ a multi- | measured by the Russell 3000® Index), while non-U.S. equities |
| manager approach whereby portions of the Underlying Funds | returned 0.17% (as measured by the Russell Developed Ex-US |
| are allocated to different money managers. Underlying Fund | Large Cap Index). Given the significant outperformance of U.S. |
| assets not allocated to money managers are managed by Russell | equities over non-U.S. equities, the Fund’s non-U.S. equity |
| Investment Management Company (“RIMCo”), the Fund’s and | exposure detracted from its performance against its U.S. large |
| Underlying Funds’ advisor. RIMCo, as the Underlying Funds’ | cap benchmark. |
| advisor, may change the allocation of the Underlying Funds’ | Global REITs (as represented by the FTSE EPRA/NAREIT |
| assets among money managers at any time. An exemptive order | Developed Real Estate Index (Net)) finished the fiscal year up |
| from the Securities and Exchange Commission (“SEC”) permits | 9.84%. However, global REITs underperformed U.S. equity |
| RIMCo to engage or terminate a money manager in an Underlying | markets, which detracted from the Fund’s benchmark-relative |
| Fund at any time, subject to approval by the Underlying Fund’s | performance through its allocation to the Russell Global Real |
| Board, without a shareholder vote. Pursuant to the terms of the | Estate Securities Fund. Commodities largely underperformed |
| exemptive order, an Underlying Fund is required to notify its | broader equity markets with a loss of 5.94% for the fiscal year (as |
| shareholders within 90 days of when a money manager begins | represented by the Bloomberg Commodity Index Total Return). |
| providing services. | Thus, the Fund’s allocation to the Russell Commodity Strategies |
| What is the Fund’s investment objective? | Fund was another headwind to Fund performance. On August |
| The Fund seeks to provide capital growth and income consistent | 1, 2014, the Russell Global Infrastructure Fund was added as |
| with its current asset allocation which will change over time, with | an Underlying Fund in which the Fund invests. This listed |
| an increasing allocation to fixed income funds. | infrastructure exposure detracted from the Fund’s performance |
| during the period, as the S&P Global Infrastructure Index (Net) | |
| The Fund pursues this objective by investing in a diversified | lost 0.24% from August 1, 2014 through October 31, 2014, while |
| portfolio that, as of October 31, 2014, consisted of approximately | the Russell 1000® Index finished the same period up 4.81%. |
| 83% equity Underlying Funds, 7% fixed income Underlying | |
| Funds and 10% alternative Underlying Funds. The Fund’s | While fixed income markets were overall positive for the year |
| allocation to fixed income Underlying Funds will be fixed at 66% | as interest rates generally trended lower, fixed income markets |
| in approximately the year 2045. | underperformed broad equity markets and therefore the Fund’s |
| fixed income exposure detracted from benchmark-relative returns. | |
| How did the Fund perform relative to its benchmark for the | |
| fiscal year ended October 31, 2014? | How did the investment strategies and techniques employed |
| For the fiscal year ended October 31, 2014, the Fund’s Class R1, | by the Fund and the Underlying Funds affect the Fund’s |
| Class R4 and Class R5 Shares gained 7.08%, 6.80% and 6.48%, | performance? |
| respectively. This is compared to the Fund’s primary benchmark, | The Fund is a fund of funds and its performance is based on |
| the Russell 1000® Index, which gained 16.78% during the same | RIMCo’s strategic asset allocations and the performance of the |
| period. The Fund’s performance includes operating expenses, | Underlying Funds in which the Fund invests. |
| whereas index returns are unmanaged and do not include | The Fund’s strategic allocation to fixed income Underlying Funds |
| expenses of any kind. | negatively impacted benchmark-relative performance, as the |
| For the fiscal year ended October 31, 2014, the Morningstar® | fixed income Underlying Funds underperformed U.S. equities as |
| Target Date 2041-2045 gained 8.86%. This result serves as a | measured by the Fund’s benchmark. Results of Underlying Fund |
| peer comparison and is expressed net of operating expenses. | active management were positive. For the Russell Strategic Bond |
| The Fund’s underperformance relative to the Russell 1000® Index | Fund, exposure to non-agency mortgages and emerging market |
| debt were key contributors to the Underlying Fund’s benchmark- | |
| was due to the Fund’s out-of-benchmark allocations to non-U.S. | relative outperformance. Currency selection was also positive, |
| equity, fixed income and commodity Underlying Funds, which | particularly a long U.S. Dollar position versus short positions to |
| generally underperformed the U.S. large cap equity market as | the Australian Dollar, Euro, and Japanese Yen. |
| represented by the Russell 1000® Index. | |
| Due to the general underperformance of non-U.S. equities versus | |
| How did the market conditions described in the Market | U.S. equities, the Fund’s strategic global equity exposure detracted |
| Summary report affect the Fund’s performance? | from benchmark-relative results. From an active management |
| standpoint, the Select International Equity Fund underperformed |
2045 Strategy Fund 161
Russell Investment Company
2045 Strategy Fund
Portfolio Management Discussion and Analysis, continued — October 31, 2014 (Unaudited)
| the broad non-U.S. equity market as represented by the Russell | U.S. was positive while an overweight to and security selection |
| Developed ex-U.S. Large Cap™ Index Net, while the Russell | within Japan detracted from performance. |
| Global Equity Fund performed in-line with the broad global equity | |
| market as represented by the Russell Developed Large Cap Net | Describe any changes to the Fund’s structure or allocation |
| Index. The Russell Emerging Markets Fund underperformed its | to the Underlying Funds. |
| emerging markets benchmark. For the Select International Equity | On August 1, 2014, RIMCo modified the Fund’s target asset |
| Fund, a bias toward low price-to-book ratio stocks detracted from | allocation and as a result, the Fund increased its exposure to |
| the Underlying Fund’s benchmark-relative performance as lower | equity and alternative Underlying Funds and decreased its |
| price-to-book stocks strongly underperformed the market in non- | exposure to fixed income Underlying Funds. In connection with |
| U.S. developed regions. For the Russell Emerging Markets Fund, | this change, on August 1, 2014, the Russell U.S. Core Equity |
| unsuccessful stock selection in China, South Korea, Russia, and | Fund and Russell International Developed Markets Fund were |
| Taiwan were detractors from performance. | replaced as Underlying Funds with the Select U.S. Equity Fund |
| and Select International Equity Fund, respectively. The Fund | |
| The Fund’s strategic allocation to U.S. large cap equity Underlying | also added an allocation to the Russell Global Infrastructure |
| Funds negatively impacted the Fund’s benchmark-relative | Fund and Russell Global Opportunistic Credit Fund to provide |
| performance, as each of the U.S. large cap equity Underlying | further diversification. |
| Funds underperformed the Fund’s benchmark as well as its U.S. | |
| equity market segment as represented by its primary benchmark. | On July 9, 2014, the Fund implemented a 1.00% underweight to |
| In particular, the Select U.S. Equity Fund (an Underlying Fund | the Russell Commodity Strategies and 0.50% underweight to the |
| after August 1, 2014) underperformed during the period it was an | Russell Global Real Estate Securities Funds, driven by limited |
| Underlying Fund, driven by an overweight to stocks with lower | commodity price appreciation expectations over the medium |
| than benchmark valuation ratios (lower price-to-earnings, price- | term and caution over the interest rate sensitivity of REITs in |
| to-book, and price-to-cash flow ratios). In addition, the Fund’s | an environment of potential rising interest rates. This was offset |
| strategic allocation to the Russell U.S. Small Cap Equity Fund | by a 1.50%overweight to the Russell Global Equity Fund. This |
| detracted the Fund’s benchmark-relative performance, as small | contributed positively to Fund performance during the period, as |
| cap equities underperformed U.S. large cap equities during the | commodities and global REITs underperformed global equities. |
| period. | On October 30, 2014, the Fund implemented a 0.50% overweight |
| The Fund’s strategic allocation to alternative Underlying Funds | to the Select U.S. Equity Fund and away from the Russell Global |
| had a negative effect on benchmark-relative performance. The | Infrastructure Fund based on a cautious stance to interest |
| Fund’s allocations to the Russell Global Real Estate Securities | rate sensitive asset classes in a potentially rising interest rate |
| Fund, Russell Global Infrastructure Fund (an Underlying Fund | environment. |
| after August 1, 2014) and Russell Commodity Strategies Fund | The views expressed in this report reflect those of the portfolio |
| detracted, as these Underlying Funds underperformed the Fund’s | managers only through the end of the period covered by |
| benchmark. From an active management standpoint, performance | the report. These views do not necessarily represent the |
| of these Underlying Funds was generally mixed. The Russell | views of RIMCo, or any other person in RIMCo or any other |
| Commodity Strategies Fund underperformed its respective asset | affiliated organization. These views are subject to change |
| class benchmark while the Russell Global Real Estate Securities | at any time based upon market conditions or other events, |
| Fund and Russell Global Infrastructure Fund (after August 1, | and RIMCo disclaims any responsibility to update the views |
| 2014) outperformed their respective asset class benchmarks. For | contained herein. These views should not be relied on as |
| the Russell Commodity Strategies Fund, an overweight to energy | investment advice and, because investment decisions for |
| commodities detracted from Fund performance. For the Russell | a Russell Investment Company (“RIC”) Fund are based on |
| Global Real Estate Securities Fund, security selection within the | numerous factors, should not be relied on as an indication |
| of investment decisions of any RIC Fund. |
162 2045 Strategy Fund
Russell Investment Company
2045 Strategy Fund
Portfolio Management Discussion and Analysis, continued — October 31, 2014 (Unaudited)
| * | Assumes initial investment on March 31, 2008. |
| ** | Russell 1000® Index includes the 1,000 largest companies in the Russell 3000® Index. The Russell 1000® Index represents the universe of stocks from which most active money managers typically select. The Russell 1000® Index return reflects adjustments from income dividends and capital gain distributions reinvested as of the ex-dividend dates. |
| ‡ | The Fund first issued Class R4 and Class R5 Shares on October 1, 2014. The returns shown for Class R4 and Class R5 Shares prior to that date are the returns of the Fund’s Class R2 and Class R3 Shares, respectively. |
| § | Annualized. |
Performance is historical and assumes reinvestment of all dividends and capital gains. Investment return and principal value will fluctuate so that an investor’s shares, when redeemed, may be worth more or less than when purchased. Past performance is not indicative of future results. The returns shown do not reflect the deduction of taxes that a shareholder would pay on Fund distributions or the redemption of Fund shares.
2045 Strategy Fund 163
Russell Investment Company 2045 Strategy Fund
Shareholder Expense Example — October 31, 2014 (Unaudited)
| Fund Expenses | Please note that the expenses shown in the table are meant | ||||||
| The following disclosure provides important information | to highlight your ongoing costs only and do not reflect any | ||||||
| regarding the Fund’s Shareholder Expense Example | transactional costs. Therefore, the information under the heading | ||||||
| (“Example”). | “Hypothetical Performance (5% return before expenses)” is | ||||||
| useful in comparing ongoing costs only, and will not help you | |||||||
| Example | determine the relative total costs of owning different funds. In | ||||||
| As a shareholder of the Fund, you incur ongoing costs, including | addition, if these transactional costs were included, your costs | ||||||
| distribution (12b-1) and/or service fees and other Fund expenses. | would have been higher. | ||||||
| The Example is intended to help you understand your ongoing | Hypothetical | ||||||
| costs (in dollars) of investing in the Fund and to compare these | Performance (5% | ||||||
| costs with the ongoing costs of investing in other mutual funds. | Actual | return before | |||||
| The Example is based on an investment of $1,000 invested at the | Class R1 | Performance | expenses) | ||||
| Beginning Account Value | |||||||
| beginning of the period and held for the entire period indicated, | May 1, 2014 | $ | 1,000.00 | $ | 1,000.00 | ||
| which for this Fund is from May 1, 2014 to October 31, 2014. | Ending Account Value | ||||||
| October 31, 2014 | $ | 1,017.20 | $ | 1,025.21 | |||
| Actual Expenses | Expenses Paid During Period* | $ | — | $ | — | ||
| The information in the table under the heading “Actual | |||||||
| Performance” provides information about actual account values | * There were no expenses charged to the Class. | ||||||
| and actual expenses. You may use the information in this column, | Hypothetical | ||||||
| together with the amount you invested, to estimate the expenses | Performance (5% | ||||||
| that you paid over the period. Simply divide your account value by | Actual | return before | |||||
| Class R4(1) | Performance | expenses) | |||||
| $1,000 (for example, an $8,600 account value divided by $1,000 | Beginning Account Value | ||||||
| = 8.6), then multiply the result by the number in the first column | May 1, 2014 | $ | 1,000.00 | $ | 1,000.00 | ||
| in the row entitled “Expenses Paid During Period” to estimate | Ending Account Value | ||||||
| the expenses you paid on your account during this period. | October 31, 2014 | $ | 1,015.90 | $ | 1,023.95 | ||
| Expenses Paid During Period* | $ | 1.27 | $ | 1.28 | |||
| Hypothetical Example for Comparison Purposes | |||||||
| * Expenses are equal to the Fund's annualized expense ratio of 0.25% | |||||||
| The information in the table under the heading “Hypothetical | (representing the six month period annualized), multiplied by the average | ||||||
| Performance (5% return before expenses)” provides information | account value over the period, multiplied by 184/365 (to reflect the one-half | ||||||
| about hypothetical account values and hypothetical expenses | year period). | ||||||
| based on the Fund’s actual expense ratio and an assumed rate of | (1) As of October 1, 2014, Class R2 Shares were reclassified as Class R4 | ||||||
| Shares, and all Class R2 shareholders were issued shares of Class R4. The | |||||||
| return of 5% per year before expenses, which is not the Fund’s | shareholder expense example for the period ended October 31, 2014 reflects | ||||||
| actual return. The hypothetical account values and expenses | the expenses and performance of Class R2 Shares for the period May 1 through | ||||||
| may not be used to estimate the actual ending account balance or | October 1, 2014, and Class R4 Shares for the period October 2, 2014 through | ||||||
| expenses you paid for the period. You may use this information | October 31, 2014. | ||||||
| to compare the ongoing costs of investing in the Fund and other | Hypothetical | ||||||
| funds. To do so, compare this 5% hypothetical example with the | Performance (5% | ||||||
| 5% hypothetical examples that appear in the shareholder reports | Actual | return before | |||||
| Class R5(2) | Performance | expenses) | |||||
| of other funds. | Beginning Account Value | ||||||
| May 1, 2014 | $ | 1,000.00 | $ | 1,000.00 | |||
| Ending Account Value | |||||||
| October 31, 2014 | $ | 1,014.10 | $ | 1,022.68 | |||
| Expenses Paid During Period* | $ | 2.54 | $ | 2.55 | |||
| * Expenses are equal to the Fund's annualized expense ratio of 0.50% | |||||||
| (representing the six month period annualized), multiplied by the average | |||||||
| account value over the period, multiplied by 184/365 (to reflect the one-half | |||||||
| year period). | |||||||
| (2) As of October 1, 2014, Class R3 Shares were reclassified as Class R5 | |||||||
| Shares, and all Class R3 shareholders were issued shares of Class R5. The | |||||||
| shareholder expense example for the period ended October 31, 2014 reflects | |||||||
| the expenses and performance of Class R3 Shares for the period May 1 through | |||||||
| October 1, 2014, and Class R5 Shares for the period October 2, 2014 through | |||||||
| October 31, 2014. | |||||||
164 2045 Strategy Fund
| Russell Investment Company | |||||||||
| 2045 Strategy Fund | |||||||||
| Schedule of Investments — October 31, 2014 | |||||||||
| Amounts in thousands (except share amounts) | Amounts in thousands (except share amounts) | ||||||||
| Fair | Fair | ||||||||
| Value | Value | ||||||||
| Shares | $ | Shares | $ | ||||||
| Investments 100.0% | Fixed Income - 6.9% | ||||||||
| Other Russell Investment Company | Russell Strategic Bond Fund | 83,952 | 936 | ||||||
| Series Mutual Funds - Class Y | International Equities - 42.0% | ||||||||
| Shares | Russell Emerging Markets Fund | 66,049 | 1,234 | ||||||
| Alternative - 8.5% | Russell Global Equity Fund | 156,865 | 1,849 | ||||||
| Russell Commodity Strategies Fund | 43,538 | 336 | Select International Equity Fund | 282,405 | 2,660 | ||||
| Russell Global Infrastructure Fund | 31,526 | 409 | 5,743 | ||||||
| Russell Global Real Estate Securities Fund | 10,101 | 411 | |||||||
| 1,156 | Total Investments 100.0% | ||||||||
| Domestic Equities - 42.6% | (identified cost $11,900) | 13,659 | |||||||
| Russell U.S. Defensive Equity Fund | 8,916 | 410 | Other Assets and Liabilities, Net | ||||||
| Russell U.S. Dynamic Equity Fund | 53,986 | 685 | - 0.0 | % | 1 | ||||
| Russell U.S. Small Cap Equity Fund | 37,505 | 1,171 | Net Assets - 100.0% | 13,660 | |||||
| Select U.S. Equity Fund | 341,733 | 3,558 | |||||||
| 5,824 | |||||||||
| Presentation of Portfolio Holdings | |||||||||
| Categories | % of Net Assets | ||||||||
| Alternative | 8.5 | ||||||||
| Domestic Equities | 42.6 | ||||||||
| Fixed Income | 6.9 | ||||||||
| International Equities | 42.0 | ||||||||
| Total Investments | 100.0 | ||||||||
| Other Assets and Liabilities, Net | —* | ||||||||
| 100.0 | |||||||||
| * Less than .05% of net assets. | |||||||||
See accompanying notes which are an integral part of the financial statements.
2045 Strategy Fund 165
| Russell Investment Company | ||
| 2045 Strategy Fund | ||
| Statement of Assets and Liabilities — October 31, 2014 | ||
| Amounts in thousands | ||
| Assets | ||
| Investments, at identified cost | $ | 11,900 |
| Investments, at fair value | 13,659 | |
| Receivables: | ||
| Investments sold | 65 | |
| Fund shares sold | 32 | |
| Total assets | 13,756 | |
| Liabilities | ||
| Payables: | ||
| Fund shares redeemed | 93 | |
| Accrued fees to affiliates | 3 | |
| Total liabilities | 96 | |
| Net Assets | $ | 13,660 |
| Net Assets Consist of: | ||
| Accumulated net realized gain (loss) | $ | 2,887 |
| Unrealized appreciation (depreciation) on investments | 1,759 | |
| Shares of beneficial interest | 12 | |
| Additional paid-in capital | 9,002 | |
| Net Assets | $ | 13,660 |
| Net Asset Value, offering and redemption price per share: | ||
| Net asset value per share: Class R1(#) | $ | 11.16 |
| Class R1 — Net assets | $ | 5,297,183 |
| Class R1 — Shares outstanding ($.01 par value) | 474,552 | |
| Net asset value per share: Class R4(#) | $ | 11.18 |
| Class R4 — Net assets | $ | 4,110,688 |
| Class R4 — Shares outstanding ($.01 par value) | 367,680 | |
| Net asset value per share: Class R5(#) | $ | 11.13 |
| Class R5 — Net assets | $ | 4,252,021 |
| Class R5 — Shares outstanding ($.01 par value) | 381,884 | |
| (#) Net asset value per share equals class level net assets divided by class level shares of beneficial interest outstanding. | ||
See accompanying notes which are an integral part of the financial statements.
166 2045 Strategy Fund
| Russell Investment Company | |||
| 2045 Strategy Fund | |||
| Statement of Operations — For the Period Ended October 31, 2014 | |||
| Amounts in thousands | |||
| Investment Income | |||
| Income distributions from Underlying Funds | $ | 391 | |
| Expenses | |||
| Distribution fees - Class R3 | 10 | ||
| Distribution fees - Class R5 | 1 | ||
| Shareholder servicing fees - Class R2 | 9 | ||
| Shareholder servicing fees - Class R3 | 10 | ||
| Shareholder servicing fees - Class R4 | 1 | ||
| Shareholder servicing fees - Class R5 | 1 | ||
| Total expenses | 32 | ||
| Net investment income (loss) | 359 | ||
| Net Realized and Unrealized Gain (Loss) | |||
| Net realized gain (loss) on: | |||
| Investments | 2,862 | ||
| Capital gain distributions from Underlying Funds | 244 | ||
| Net realized gain (loss) | 3,106 | ||
| Net change in unrealized appreciation (depreciation) on investments | (2,491 | ) | |
| Net realized and unrealized gain (loss) | 615 | ||
| Net Increase (Decrease) in Net Assets from Operations | $ | 974 | |
See accompanying notes which are an integral part of the financial statements.
2045 Strategy Fund 167
| Russell Investment Company | ||||||
| 2045 Strategy Fund | ||||||
| Statements of Changes in Net Assets | ||||||
| For the Periods Ended October 31, | ||||||
| Amounts in thousands | 2014 | 2013 | ||||
| Increase (Decrease) in Net Assets | ||||||
| Operations | ||||||
| Net investment income (loss) | $ | 359 | $ | 217 | ||
| Net realized gain (loss) | 3,106 | 85 | ||||
| Net change in unrealized appreciation (depreciation) | (2,491 | ) | 2,333 | |||
| Net increase (decrease) in net assets from operations | 974 | 2,635 | ||||
| Distributions | ||||||
| From net investment income | ||||||
| Class R1 | (181 | ) | (107 | ) | ||
| Class R2 | (78 | ) | (45 | ) | ||
| Class R3 | (101 | ) | (65 | ) | ||
| Class R4 | (1 | ) | — | |||
| From net realized gain | ||||||
| Class R1 | (55 | ) | (114 | ) | ||
| Class R2 | (27 | ) | (56 | ) | ||
| Class R3 | (38 | ) | (95 | ) | ||
| Net decrease in net assets from distributions | (481 | ) | (482 | ) | ||
| Share Transactions* | ||||||
| Net increase (decrease) in net assets from share transactions | (3,110 | ) | 2,334 | |||
| Total Net Increase (Decrease) in Net Assets | (2,617 | ) | 4,487 | |||
| Net Assets | ||||||
| Beginning of period | 16,277 | 11,790 | ||||
| End of period | $ | 13,660 | $ | 16,277 | ||
| Undistributed (overdistributed) net investment income included in net assets | $ | — | $ | 2 | ||
See accompanying notes which are an integral part of the financial statements.
168 2045 Strategy Fund
Russell Investment Company 2045 Strategy Fund
Statements of Changes in Net Assets, continued
* Share transaction amounts (in thousands) for the periods ended October 31, 2014 and October 31, 2013 were as follows:
| 2014 | 2013 | |||||||||||
| Shares | Dollars | Shares | Dollars | |||||||||
| Class R1 | ||||||||||||
| Proceeds from shares sold | 291 | $ | 3,195 | 360 | $ | 3,589 | ||||||
| Proceeds from reinvestment of distributions | 22 | 236 | 24 | 221 | ||||||||
| Payments for shares redeemed | (465 | ) | (5,113 | ) | (339 | ) | (3,356 | ) | ||||
| Net increase (decrease) | (152 | ) | (1,682 | ) | 45 | 454 | ||||||
| Class R2 | ||||||||||||
| Proceeds from shares sold | 96 | 1,059 | 93 | 928 | ||||||||
| Proceeds from reinvestment of distributions | 10 | 105 | 11 | 102 | ||||||||
| Payments for shares redeemed | (421 | ) | (4,591 | ) | (89 | ) | (894 | ) | ||||
| Net increase (decrease) | (315 | ) | (3,427 | ) | 15 | 136 | ||||||
| Class R3 | ||||||||||||
| Proceeds from shares sold | 132 | 1,444 | 350 | 3,393 | ||||||||
| Proceeds from reinvestment of distributions | 13 | 139 | 17 | 159 | ||||||||
| Payments for shares redeemed | (714 | ) | (7,727 | ) | (187 | ) | (1,808 | ) | ||||
| Net increase (decrease) | (569 | ) | (6,144 | ) | 180 | 1,744 | ||||||
| Class R4 | ||||||||||||
| Proceeds from shares sold | 370 | 4,023 | — | — | ||||||||
| Proceeds from reinvestment of distributions | —** | 1 | — | — | ||||||||
| Payments for shares redeemed | (2 | ) | (21 | ) | — | — | ||||||
| Net increase (decrease) | 368 | 4,003 | — | — | ||||||||
| Class R5 | ||||||||||||
| Proceeds from shares sold | 409 | 4,435 | — | — | ||||||||
| Payments for shares redeemed | (27 | ) | (295 | ) | — | — | ||||||
| Net increase (decrease) | 382 | 4,140 | — | — | ||||||||
| Total increase (decrease) | (286 | ) | $ | (3,110 | ) | 240 | $ | 2,334 | ||||
| **Less than $500 | ||||||||||||
See accompanying notes which are an integral part of the financial statements.
2045 Strategy Fund 169
| Russell Investment Company | ||||||||||||||||
| 2045 Strategy Fund | ||||||||||||||||
| Financial Highlights — For the Periods Ended | ||||||||||||||||
| For a Share Outstanding Throughout Each Period. | ||||||||||||||||
| $ | ||||||||||||||||
| $ | Net | $ | $ | $ | $ | |||||||||||
| Net Asset Value, | Investment | Net Realized | Total from | Distributions | Distributions | |||||||||||
| Beginning of | Income (Loss) | and Unrealized | Investment | from Net | from Net | |||||||||||
| Period | (a)(b)(e) | Gain (Loss) | Operations | Investment Income | Realized Gain | |||||||||||
| Class R1 | ||||||||||||||||
| October 31, 2014 | 10.78 | .30 | .45 | .75 | (.28 | ) | (.09 | ) | ||||||||
| October 31, 2013 | 9.29 | .18 | 1.67 | 1.85 | (.17 | ) | (.19 | ) | ||||||||
| October 31, 2012 | 9.10 | .14 | .62 | .76 | (.16 | ) | (.41 | ) | ||||||||
| October 31, 2011 | 9.13 | .20 | ---(h) | .20 | (.23 | ) | — | |||||||||
| October 31, 2010 | 7.93 | .17 | 1.20 | 1.37 | (.17 | ) | — | |||||||||
| Class R4(3) | ||||||||||||||||
| October 31, 2014 | 10.80 | .24 | .49 | .73 | (.26 | ) | (.09 | ) | ||||||||
| October 31, 2013 | 9.30 | .15 | 1.69 | 1.84 | (.15 | ) | (.19 | ) | ||||||||
| October 31, 2012 | 9.11 | .14 | .60 | .74 | (.14 | ) | (.41 | ) | ||||||||
| October 31, 2011 | 9.12 | .23 | (.05 | ) | .18 | (.19 | ) | — | ||||||||
| October 31, 2010 | 7.92 | .13 | 1.22 | 1.35 | (.15 | ) | — | |||||||||
| Class R5(4) | ||||||||||||||||
| October 31, 2014 | 10.76 | .25 | .44 | .69 | (.23 | ) | (.09 | ) | ||||||||
| October 31, 2013 | 9.27 | .12 | 1.69 | 1.81 | (.13 | ) | (.19 | ) | ||||||||
| October 31, 2012 | 9.08 | .12 | .60 | .72 | (.12 | ) | (.41 | ) | ||||||||
| October 31, 2011 | 9.11 | .15 | —(h) | .15 | (.18 | ) | — | |||||||||
| October 31, 2010 | 7.91 | .10 | 1.23 | 1.33 | (.13 | ) | — | |||||||||
See accompanying notes which are an integral part of the financial statements.
170 2045 Strategy Fund
| % | % | % | ||||||||||||||
| $ | $ | Ratio of Expenses | Ratio of Expenses | Ratio of Net | ||||||||||||
| Net Asset Value, | % | Net Assets, | to Average | to Average | Investment Income | % | ||||||||||
| $ | End of | Total | End of Period | Net Assets, | Net Assets, | to Average | Portfolio | |||||||||
| Total Distributions | Period | Return | (000 | ) | Gross(g) | Net(e)(g) | Net Assets(b)(e) | Turnover Rate | ||||||||
| (.37 | ) | 11.16 | 7.08 | 5,297 | — | — | 2.78 | 84 | ||||||||
| (.36 | ) | 10.78 | 20.59 | 6,750 | — | — | 1.77 | 28 | ||||||||
| (.57 | ) | 9.29 | 9.13 | 5,391 | — | — | 1.59 | 57 | ||||||||
| (.23 | ) | 9.10 | 2.12 | 3,791 | — | — | 2.06 | 77 | ||||||||
| (.17 | ) | 9.13 | 17.47 | 2,347 | 1.58 | — | 2.02 | 31 | ||||||||
| (.35 | ) | 11.18 | 6.80 | 4,111 | .25 | .25 | 2.16 | 84 | ||||||||
| (.34 | ) | 10.80 | 20.37 | 3,404 | .25 | .25 | 1.48 | 28 | ||||||||
| (.55 | ) | 9.30 | 8.82 | 2,796 | .25 | .25 | 1.58 | 57 | ||||||||
| (.19 | ) | 9.11 | 1.98 | 2,651 | .25 | .25 | 2.37 | 77 | ||||||||
| (.15 | ) | 9.12 | 17.23 | 6,692 | 1.79 | .25 | 1.53 | 31 | ||||||||
| (.32 | ) | 11.13 | 6.48 | 4,252 | .50 | .50 | 2.24 | 84 | ||||||||
| (.32 | ) | 10.76 | 20.07 | 6,123 | .50 | .50 | 1.26 | 28 | ||||||||
| (.53 | ) | 9.27 | 8.56 | 3,603 | .50 | .50 | 1.30 | 57 | ||||||||
| (.18 | ) | 9.08 | 1.64 | 3,511 | .50 | .50 | 1.55 | 77 | ||||||||
| (.13 | ) | 9.11 | 17.00 | 2,147 | 2.03 | .50 | 1.13 | 31 | ||||||||
See accompanying notes which are an integral part of the financial statements.
2045 Strategy Fund 171
Russell Investment Company 2050 Strategy Fund
Portfolio Management Discussion and Analysis — October 31, 2014 (Unaudited)

| 2050 Strategy Fund - Class R1 | 2050 Strategy Fund - Class R5‡ | ||||||
| Total | Total | ||||||
| Return | Return | ||||||
| 1 Year | 7.12 | % | 1 Year | 6.51 | % | ||
| 5 Years | 11.09 | %§ | 5 Years | 10.55 | %§ | ||
| Inception* | 5.23 | %§ | Inception* | 4.69 | %§ | ||
| 2050 Strategy Fund - Class R4‡ | Russell 1000® Index** | ||||||
| Total | Total | ||||||
| Return | Return | ||||||
| 1 Year | 6.81 | % | 1 Year | 16.78 | % | ||
| 5 Years | 10.84 | %§ | 5 Years | 16.98 | %§ | ||
| Inception* | 4.97 | %§ | Inception* | 9.23 | %§ | ||
172 2050 Strategy Fund
Russell Investment Company
2050 Strategy Fund
Portfolio Management Discussion and Analysis, continued — October 31, 2014 (Unaudited)
| The 2050 Strategy Fund (the “Fund”) is a fund of funds that | It was a positive equity market for the fiscal year ending October |
| invests in other Russell Investment Company mutual funds (the | 31, 2014. U.S. equities returned 16.07% over the period (as |
| “Underlying Funds”). The Underlying Funds employ a multi- | measured by the Russell 3000® Index), while non-U.S. equities |
| manager approach whereby portions of the Underlying Funds | returned 0.17% (as measured by the Russell Developed Ex-US |
| are allocated to different money managers. Underlying Fund | Large Cap Index). Given the significant outperformance of U.S. |
| assets not allocated to money managers are managed by Russell | equities over non-U.S. equities, the Fund’s non-U.S. equity |
| Investment Management Company (“RIMCo”), the Fund’s and | exposure detracted from its performance against its U.S. large |
| Underlying Funds’ advisor. RIMCo, as the Underlying Funds’ | cap benchmark. |
| advisor, may change the allocation of the Underlying Funds’ | Global REITs (as represented by the FTSE EPRA/NAREIT |
| assets among money managers at any time. An exemptive order | Developed Real Estate Index (Net)) finished the fiscal year up |
| from the Securities and Exchange Commission (“SEC”) permits | 9.84%. However, global REITs underperformed U.S. equity |
| RIMCo to engage or terminate a money manager in an Underlying | markets, which detracted from the Fund’s benchmark-relative |
| Fund at any time, subject to approval by the Underlying Fund’s | performance through its allocation to the Russell Global Real |
| Board, without a shareholder vote. Pursuant to the terms of the | Estate Securities Fund. Commodities largely underperformed |
| exemptive order, an Underlying Fund is required to notify its | broader equity markets with a loss of 5.94% for the fiscal year (as |
| shareholders within 90 days of when a money manager begins | represented by the Bloomberg Commodity Index Total Return). |
| providing services. | Thus, the Fund’s allocation to the Russell Commodity Strategies |
| What is the Fund’s investment objective? | Fund was another headwind to Fund performance. On August |
| The Fund seeks to provide capital growth and income consistent | 1, 2014, the Russell Global Infrastructure Fund was added as |
| with its current asset allocation which will change over time, with | an Underlying Fund in which the Fund invests. This listed |
| an increasing allocation to fixed income funds. | infrastructure exposure detracted from the Fund’s performance |
| during the period, as the S&P Global Infrastructure Index (Net) | |
| The Fund pursues this objective by investing in a diversified | lost 0.24% from August 1, 2014 through October 31, 2014, while |
| portfolio that, as of October 31, 2014, consisted of approximately | the Russell 1000® Index finished the same period up 4.81%. |
| 83% equity Underlying Funds, 7% fixed income Underlying | |
| Funds and 10% alternative Underlying Funds, with an increasing | While fixed income markets were overall positive for the year |
| allocation to fixed income Underlying Funds over time. The | as interest rates generally trended lower, fixed income markets |
| Fund’s allocation to fixed income funds Underlying Funds will be | underperformed broad equity markets and therefore the Fund’s |
| fixed at 66% in approximately the year 2050. | fixed income exposure detracted from benchmark-relative returns. |
| How did the Fund perform relative to its benchmark for the | How did the investment strategies and techniques employed |
| fiscal year ended October 31, 2014? | by the Fund and the Underlying Funds affect the Fund’s |
| For the fiscal year ended October 31, 2014, the Fund’s Class R1, | performance? |
| Class R4 and Class R5 Shares gained 7.12%, 6.81% and 6.51%, | The Fund is a fund of funds and its performance is based on |
| respectively. This is compared to the Fund’s primary benchmark, | RIMCo’s strategic asset allocations and the performance of the |
| the Russell 1000® Index, which gained 16.78% during the same | Underlying Funds in which the Fund invests. |
| period. The Fund’s performance includes operating expenses, | The Fund’s strategic allocation to fixed income Underlying Funds |
| whereas index returns are unmanaged and do not include | negatively impacted benchmark-relative performance, as the |
| expenses of any kind. | fixed income Underlying Funds underperformed U.S. equities as |
| For the fiscal year ended October 31, 2014, the Morningstar® | measured by the Fund’s benchmark. Results of Underlying Fund |
| Target Date 2050+ gained 9.14%. This result serves as a peer | active management were positive. For the Russell Strategic Bond |
| comparison and is expressed net of operating expenses. | Fund, exposure to non-agency mortgages and emerging market |
| The Fund’s underperformance relative to the Russell 1000® Index | debt were key contributors to the Underlying Fund’s benchmark- |
| relative outperformance. Currency selection was also positive, | |
| was due to the Fund’s out-of-benchmark allocations to non-U.S. | particularly a long U.S. Dollar position versus short positions to |
| equity, fixed income and commodity Underlying Funds, which | the Australian Dollar, Euro, and Japanese Yen. |
| generally underperformed the U.S. large cap equity market as | |
| represented by the Russell 1000® Index. | Due to the general underperformance of non-U.S. equities versus |
| U.S. equities, the Fund’s strategic global equity exposure detracted | |
| How did the market conditions described in the Market | from benchmark-relative results. From an active management |
| Summary report affect the Fund’s performance? | standpoint, the Select International Equity Fund underperformed |
2050 Strategy Fund 173
Russell Investment Company
2050 Strategy Fund
Portfolio Management Discussion and Analysis, continued — October 31, 2014 (Unaudited)
174 2050 Strategy Fund
| the broad non-U.S. equity market as represented by the Russell | U.S. was positive while an overweight to and security selection |
| Developed ex-U.S. Large Cap™ Index Net, while the Russell | within Japan detracted from performance. |
| Global Equity Fund performed in-line with the broad global equity | |
| market as represented by the Russell Developed Large Cap Net | Describe any changes to the Fund’s structure or allocation |
| Index. The Russell Emerging Markets Fund underperformed its | to the Underlying Funds. |
| emerging markets benchmark. For the Select International Equity | On August 1, 2014, RIMCo modified the Fund’s target asset |
| Fund, a bias toward low price-to-book ratio stocks detracted from | allocation and as a result, the Fund increased its exposure to |
| the Underlying Fund’s benchmark-relative performance as lower | equity and alternative Underlying Funds and decreased its |
| price-to-book stocks strongly underperformed the market in non- | exposure to fixed income Underlying Funds. In connection with |
| U.S. developed regions. For the Russell Emerging Markets Fund, | this change, on August 1, 2014, the Russell U.S. Core Equity |
| unsuccessful stock selection in China, South Korea, Russia, and | Fund and Russell International Developed Markets Fund were |
| Taiwan were detractors from performance. | replaced as Underlying Funds with the Select U.S. Equity Fund |
| and Select International Equity Fund, respectively. The Fund | |
| The Fund’s strategic allocation to U.S. large cap equity Underlying | also added an allocation to the Russell Global Infrastructure |
| Funds negatively impacted the Fund’s benchmark-relative | Fund and Russell Global Opportunistic Credit Fund to provide |
| performance, as each of the U.S. large cap equity Underlying | further diversification. |
| Funds underperformed the Fund’s benchmark as well as its U.S. | |
| equity market segment as represented by its primary benchmark. | On July 9, 2014, the Fund implemented a 1.00% underweight to |
| In particular, the Select U.S. Equity Fund (an Underlying Fund | the Russell Commodity Strategies and 0.50% underweight to the |
| after August 1, 2014) underperformed during the period it was an | Russell Global Real Estate Securities Funds, driven by limited |
| Underlying Fund, driven by an overweight to stocks with lower | commodity price appreciation expectations over the medium |
| than benchmark valuation ratios (lower price-to-earnings, price- | term and caution over the interest rate sensitivity of REITs in |
| to-book, and price-to-cash flow ratios). In addition, the Fund’s | an environment of potential rising interest rates. This was offset |
| strategic allocation to the Russell U.S. Small Cap Equity Fund | by a 1.50% overweight to the Russell Global Equity Fund. This |
| detracted the Fund’s benchmark-relative performance, as small | contributed positively to Fund performance during the period, as |
| cap equities underperformed U.S. large cap equities during the | commodities and global REITs underperformed global equities. |
| period. | On October 30, 2014, the Fund implemented a 0.50% overweight |
| The Fund’s strategic allocation to alternative Underlying Funds | to the Select U.S. Equity Fund and away from the Russell Global |
| had a negative effect on benchmark-relative performance. The | Infrastructure Fund based on a cautious stance to interest |
| Fund’s allocations to the Russell Global Real Estate Securities | rate sensitive asset classes in a potentially rising interest rate |
| Fund, Russell Global Infrastructure Fund (an Underlying Fund | environment. |
| after August 1, 2014) and Russell Commodity Strategies Fund | The views expressed in this report reflect those of the portfolio |
| detracted, as these Underlying Funds underperformed the Fund’s | managers only through the end of the period covered by |
| benchmark. From an active management standpoint, performance | the report. These views do not necessarily represent the |
| of these Underlying Funds was generally mixed. The Russell | views of RIMCo, or any other person in RIMCo or any other |
| Commodity Strategies Fund underperformed its respective asset | affiliated organization. These views are subject to change |
| class benchmark while the Russell Global Real Estate Securities | at any time based upon market conditions or other events, |
| Fund and Russell Global Infrastructure Fund (after August 1, | and RIMCo disclaims any responsibility to update the views |
| 2014) outperformed their respective asset class benchmarks. For | contained herein. These views should not be relied on as |
| the Russell Commodity Strategies Fund, an overweight to energy | investment advice and, because investment decisions for |
| commodities detracted from Fund performance. For the Russell | a Russell Investment Company (“RIC”) Fund are based on |
| Global Real Estate Securities Fund, security selection within the | numerous factors, should not be relied on as an indication |
| of investment decisions of any RIC Fund. |
Russell Investment Company
2050 Strategy Fund
Portfolio Management Discussion and Analysis, continued — October 31, 2014 (Unaudited)
| * | Assumes initial investment on March 31, 2008. |
| ** | Russell 1000® Index includes the 1,000 largest companies in the Russell 3000® Index. The Russell 1000® Index represents the universe of stocks from which most active money managers typically select. The Russell 1000® Index return reflects adjustments from income dividends and capital gain distributions reinvested as of the ex-dividend dates. |
| ‡ | The Fund first issued Class R4 and Class R5 Shares on October 1, 2014. The returns shown for Class R4 and Class R5 Shares prior to that date are the returns of the Fund’s Class R2 and Class R3 Shares, respectively. |
| § | Annualized. |
Performance is historical and assumes reinvestment of all dividends and capital gains. Investment return and principal value will fluctuate so that an investor’s shares, when redeemed, may be worth more or less than when purchased. Past performance is not indicative of future results. The returns shown do not reflect the deduction of taxes that a shareholder would pay on Fund distributions or the redemption of Fund shares.
2050 Strategy Fund 175
Russell Investment Company 2050 Strategy Fund
Shareholder Expense Example — October 31, 2014 (Unaudited)
| Fund Expenses | Please note that the expenses shown in the table are meant | ||||||
| The following disclosure provides important information | to highlight your ongoing costs only and do not reflect any | ||||||
| regarding the Fund’s Shareholder Expense Example | transactional costs. Therefore, the information under the heading | ||||||
| (“Example”). | “Hypothetical Performance (5% return before expenses)” is | ||||||
| useful in comparing ongoing costs only, and will not help you | |||||||
| Example | determine the relative total costs of owning different funds. In | ||||||
| As a shareholder of the Fund, you incur ongoing costs, including | addition, if these transactional costs were included, your costs | ||||||
| distribution (12b-1) and/or service fees and other Fund expenses. | would have been higher. | ||||||
| The Example is intended to help you understand your ongoing | Hypothetical | ||||||
| costs (in dollars) of investing in the Fund and to compare these | Performance (5% | ||||||
| costs with the ongoing costs of investing in other mutual funds. | Actual | return before | |||||
| The Example is based on an investment of $1,000 invested at the | Class R1 | Performance | expenses) | ||||
| Beginning Account Value | |||||||
| beginning of the period and held for the entire period indicated, | May 1, 2014 | $ | 1,000.00 | $ | 1,000.00 | ||
| which for this Fund is from May 1, 2014 to October 31, 2014. | Ending Account Value | ||||||
| October 31, 2014 | $ | 1,016.60 | $ | 1,025.21 | |||
| Actual Expenses | Expenses Paid During Period* | $ | — | $ | — | ||
| The information in the table under the heading “Actual | |||||||
| Performance” provides information about actual account values | * There were no expenses charged to the Class. | ||||||
| and actual expenses. You may use the information in this column, | Hypothetical | ||||||
| together with the amount you invested, to estimate the expenses | Performance (5% | ||||||
| that you paid over the period. Simply divide your account value by | Actual | return before | |||||
| Class R4(1) | Performance | expenses) | |||||
| $1,000 (for example, an $8,600 account value divided by $1,000 | Beginning Account Value | ||||||
| = 8.6), then multiply the result by the number in the first column | May 1, 2014 | $ | 1,000.00 | $ | 1,000.00 | ||
| in the row entitled “Expenses Paid During Period” to estimate | Ending Account Value | ||||||
| the expenses you paid on your account during this period. | October 31, 2014 | $ | 1,016.10 | $ | 1,023.95 | ||
| Expenses Paid During Period* | $ | 1.27 | $ | 1.28 | |||
| Hypothetical Example for Comparison Purposes | |||||||
| * Expenses are equal to the Fund's annualized expense ratio of 0.25% | |||||||
| The information in the table under the heading “Hypothetical | (representing the six month period annualized), multiplied by the average | ||||||
| Performance (5% return before expenses)” provides information | account value over the period, multiplied by 184/365 (to reflect the one-half | ||||||
| about hypothetical account values and hypothetical expenses | year period). | ||||||
| based on the Fund’s actual expense ratio and an assumed rate of | (1) As of October 1, 2014, Class R2 Shares were reclassified as Class R4 | ||||||
| Shares, and all Class R2 shareholders were issued shares of Class R4. The | |||||||
| return of 5% per year before expenses, which is not the Fund’s | shareholder expense example for the period ended October 31, 2014 reflects | ||||||
| actual return. The hypothetical account values and expenses | the expenses and performance of Class R2 Shares for the period May 1 through | ||||||
| may not be used to estimate the actual ending account balance or | October 1, 2014, and Class R4 Shares for the period October 2, 2014 through | ||||||
| expenses you paid for the period. You may use this information | October 31, 2014. | ||||||
| to compare the ongoing costs of investing in the Fund and other | Hypothetical | ||||||
| funds. To do so, compare this 5% hypothetical example with the | Performance (5% | ||||||
| 5% hypothetical examples that appear in the shareholder reports | Actual | return before | |||||
| Class R5(2) | Performance | expenses) | |||||
| of other funds. | Beginning Account Value | ||||||
| May 1, 2014 | $ | 1,000.00 | $ | 1,000.00 | |||
| Ending Account Value | |||||||
| October 31, 2014 | $ | 1,014.30 | $ | 1,022.68 | |||
| Expenses Paid During Period* | $ | 2.54 | $ | 2.55 | |||
| * Expenses are equal to the Fund's annualized expense ratio of 0.50% | |||||||
| (representing the six month period annualized), multiplied by the average | |||||||
| account value over the period, multiplied by 184/365 (to reflect the one-half | |||||||
| year period). | |||||||
| (2) As of October 1, 2014, Class R3 Shares were reclassified as Class R5 | |||||||
| Shares, and all Class R3 shareholders were issued shares of Class R5. The | |||||||
| shareholder expense example for the period ended October 31, 2014 reflects | |||||||
| the expenses and performance of Class R3 Shares for the period May 1 through | |||||||
| October 1, 2014, and Class R5 Shares for the period October 2, 2014 through | |||||||
| October 31, 2014. | |||||||
176 2050 Strategy Fund
| Russell Investment Company | |||||||||
| 2050 Strategy Fund | |||||||||
| Schedule of Investments — October 31, 2014 | |||||||||
| Amounts in thousands (except share amounts) | Amounts in thousands (except share amounts) | ||||||||
| Fair | Fair | ||||||||
| Value | Value | ||||||||
| Shares | $ | Shares | $ | ||||||
| Investments 100.0% | Fixed Income - 7.0% | ||||||||
| Other Russell Investment Company | Russell Strategic Bond Fund | 95,005 | 1,059 | ||||||
| Series Mutual Funds - Class Y | International Equities - 42.0% | ||||||||
| Shares | Russell Emerging Markets Fund | 73,419 | 1,372 | ||||||
| Alternative - 8.5% | Russell Global Equity Fund | 174,584 | 2,058 | ||||||
| Russell Commodity Strategies Fund | 48,967 | 378 | Select International Equity Fund | 315,539 | 2,972 | ||||
| Russell Global Infrastructure Fund | 35,299 | 457 | 6,402 | ||||||
| Russell Global Real Estate Securities Fund | 11,240 | 458 | |||||||
| 1,293 | Total Investments 100.0% | ||||||||
| Domestic Equities - 42.5% | (identified cost $12,715) | 15,233 | |||||||
| Russell U.S. Defensive Equity Fund | 9,933 | 458 | Other Assets and Liabilities, Net | ||||||
| Russell U.S. Dynamic Equity Fund | 60,064 | 762 | - 0.0 | % | 2 | ||||
| Russell U.S. Small Cap Equity Fund | 41,505 | 1,296 | Net Assets - 100.0% | 15,235 | |||||
| Select U.S. Equity Fund | 380,703 | 3,963 | |||||||
| 6,479 | |||||||||
| Presentation of Portfolio Holdings | |||||||||
| Categories | % of Net Assets | ||||||||
| Alternative | 8.5 | ||||||||
| Domestic Equities | 42.5 | ||||||||
| Fixed Income | 7.0 | ||||||||
| International Equities | 42.0 | ||||||||
| Total Investments | 100.0 | ||||||||
| Other Assets and Liabilities, Net | —* | ||||||||
| 100.0 | |||||||||
| * Less than .05% of net assets. | |||||||||
See accompanying notes which are an integral part of the financial statements.
2050 Strategy Fund 177
| Russell Investment Company | ||
| 2050 Strategy Fund | ||
| Statement of Assets and Liabilities — October 31, 2014 | ||
| Amounts in thousands | ||
| Assets | ||
| Investments, at identified cost | $ | 12,715 |
| Investments, at fair value | 15,233 | |
| Receivables: | ||
| Investments sold | 94 | |
| Fund shares sold | 43 | |
| Total assets | 15,370 | |
| Liabilities | ||
| Payables: | ||
| Fund shares redeemed | 132 | |
| Accrued fees to affiliates | 3 | |
| Total liabilities | 135 | |
| Net Assets | $ | 15,235 |
| Net Assets Consist of: | ||
| Accumulated net realized gain (loss) | $ | 4,355 |
| Unrealized appreciation (depreciation) on investments | 2,518 | |
| Shares of beneficial interest | 16 | |
| Additional paid-in capital | 8,346 | |
| Net Assets | $ | 15,235 |
| Net Asset Value, offering and redemption price per share: | ||
| Net asset value per share: Class R1(#) | $ | 9.52 |
| Class R1 — Net assets | $ | 7,542,307 |
| Class R1 — Shares outstanding ($.01 par value) | 792,346 | |
| Net asset value per share: Class R4(#) | $ | 9.54 |
| Class R4 — Net assets | $ | 2,169,850 |
| Class R4 — Shares outstanding ($.01 par value) | 227,536 | |
| Net asset value per share: Class R5(#) | $ | 9.51 |
| Class R5 — Net assets | $ | 5,522,653 |
| Class R5 — Shares outstanding ($.01 par value) | 580,607 | |
| (#) Net asset value per share equals class level net assets divided by class level shares of beneficial interest outstanding. | ||
See accompanying notes which are an integral part of the financial statements.
178 2050 Strategy Fund
| Russell Investment Company | |||
| 2050 Strategy Fund | |||
| Statement of Operations — For the Period Ended October 31, 2014 | |||
| Amounts in thousands | |||
| Investment Income | |||
| Income distributions from Underlying Funds | $ | 512 | |
| Expenses | |||
| Distribution fees - Class R3 | 13 | ||
| Distribution fees - Class R5 | 1 | ||
| Shareholder servicing fees - Class R2 | 7 | ||
| Shareholder servicing fees - Class R3 | 13 | ||
| Shareholder servicing fees - Class R4 | —** | ||
| Shareholder servicing fees - Class R5 | 1 | ||
| Total expenses | 35 | ||
| Net investment income (loss) | 477 | ||
| Net Realized and Unrealized Gain (Loss) | |||
| Net realized gain (loss) on: | |||
| Investments | 4,261 | ||
| Capital gain distributions from Underlying Funds | 323 | ||
| Net realized gain (loss) | 4,584 | ||
| Net change in unrealized appreciation (depreciation) on investments | (3,804 | ) | |
| Net realized and unrealized gain (loss) | 780 | ||
| Net Increase (Decrease) in Net Assets from Operations | $ | 1,257 | |
| ** | Less than $500. |
See accompanying notes which are an integral part of the financial statements.
2050 Strategy Fund 179
| Russell Investment Company | ||||||
| 2050 Strategy Fund | ||||||
| Statements of Changes in Net Assets | ||||||
| For the Periods Ended October 31, | ||||||
| Amounts in thousands | 2014 | 2013 | ||||
| Increase (Decrease) in Net Assets | ||||||
| Operations | ||||||
| Net investment income (loss) | $ | 477 | $ | 273 | ||
| Net realized gain (loss) | 4,584 | 143 | ||||
| Net change in unrealized appreciation (depreciation) | (3,804 | ) | 2,871 | |||
| Net increase (decrease) in net assets from operations | 1,257 | 3,287 | ||||
| Distributions | ||||||
| From net investment income | ||||||
| Class R1 | (277 | ) | (171 | ) | ||
| Class R2 | (81 | ) | (42 | ) | ||
| Class R3 | (121 | ) | (59 | ) | ||
| Class R4 | (—)** | — | ||||
| From net realized gain | ||||||
| Class R1 | (96 | ) | (82 | ) | ||
| Class R2 | (30 | ) | (23 | ) | ||
| Class R3 | (50 | ) | (39 | ) | ||
| Net decrease in net assets from distributions | (655 | ) | (416 | ) | ||
| Share Transactions* | ||||||
| Net increase (decrease) in net assets from share transactions | (5,260 | ) | 2,151 | |||
| Total Net Increase (Decrease) in Net Assets | (4,658 | ) | 5,022 | |||
| Net Assets | ||||||
| Beginning of period | 19,893 | 14,871 | ||||
| End of period | $ | 15,235 | $ | 19,893 | ||
| Undistributed (overdistributed) net investment income included in net assets | $ | — | $ | 2 | ||
| ** Less than $500. | ||||||
See accompanying notes which are an integral part of the financial statements.
180 2050 Strategy Fund
Russell Investment Company 2050 Strategy Fund
Statements of Changes in Net Assets, continued
* Share transaction amounts (in thousands) for the periods ended October 31, 2014 and October 31, 2013 were as follows:
| 2014 | 2013 | |||||||||||
| Shares | Dollars | Shares | Dollars | |||||||||
| Class R1 | ||||||||||||
| Proceeds from shares sold | 623 | $ | 5,840 | 589 | $ | 4,978 | ||||||
| Proceeds from reinvestment of distributions | 40 | 373 | 31 | 252 | ||||||||
| Payments for shares redeemed | (1,037 | ) | (9,732 | ) | (568 | ) | (4,809 | ) | ||||
| Net increase (decrease) | (374 | ) | (3,519 | ) | 52 | 421 | ||||||
| Class R2 | ||||||||||||
| Proceeds from shares sold | 106 | 995 | 102 | 864 | ||||||||
| Proceeds from reinvestment of distributions | 12 | 111 | 8 | 65 | ||||||||
| Payments for shares redeemed | (499 | ) | (4,661 | ) | (67 | ) | (554 | ) | ||||
| Net increase (decrease) | (381 | ) | (3,555 | ) | 43 | 375 | ||||||
| Class R3 | ||||||||||||
| Proceeds from shares sold | 213 | 1,993 | 426 | 3,538 | ||||||||
| Proceeds from reinvestment of distributions | 18 | 171 | 12 | 98 | ||||||||
| Payments for shares redeemed | (845 | ) | (7,839 | ) | (268 | ) | (2,281 | ) | ||||
| Net increase (decrease) | (614 | ) | (5,675 | ) | 170 | 1,355 | ||||||
| Class R4 | ||||||||||||
| Proceeds from shares sold | 234 | 2,176 | — | — | ||||||||
| Payments for shares redeemed | (7 | ) | (62 | ) | — | — | ||||||
| Net increase (decrease) | 227 | 2,114 | — | — | ||||||||
| Class R5 | ||||||||||||
| Proceeds from shares sold | 603 | 5,586 | — | — | ||||||||
| Payments for shares redeemed | (22 | ) | (211 | ) | — | — | ||||||
| Net increase (decrease) | 581 | 5,375 | — | — | ||||||||
| Total increase (decrease) | (561 | ) | $ | (5,260 | ) | 265 | $ | 2,151 | ||||
See accompanying notes which are an integral part of the financial statements.
2050 Strategy Fund 181
| Russell Investment Company | |||||||||||||||
| 2050 Strategy Fund | |||||||||||||||
| Financial Highlights — For the Periods Ended | |||||||||||||||
| For a Share Outstanding Throughout Each Period. | |||||||||||||||
| $ | |||||||||||||||
| $ | Net | $ | $ | $ | $ | ||||||||||
| Net Asset Value, | Investment | Net Realized | Total from | Distributions | Distributions | ||||||||||
| Beginning of | Income (Loss) | and Unrealized | Investment | from Net | from Net | ||||||||||
| Period | (a)(b)(e) | Gain (Loss) | Operations | Investment Income | Realized Gain | ||||||||||
| Class R1 | |||||||||||||||
| October 31, 2014 | 9.20 | .27 | .37 | .64 | (.24 | ) | (.08 | ) | |||||||
| October 31, 2013 | 7.84 | .15 | 1.43 | 1.58 | (.15 | ) | (.07 | ) | |||||||
| October 31, 2012 | 9.19 | .11 | .48 | .59 | (.16 | ) | (1.78 | ) | |||||||
| October 31, 2011 | 9.22 | .18 | .04 | .22 | (.23 | ) | (.02 | ) | |||||||
| October 31, 2010 | 8.03 | .14 | 1.24 | 1.38 | (.17 | ) | (.02 | ) | |||||||
| Class R4(3) | |||||||||||||||
| October 31, 2014 | 9.22 | .23 | .39 | .62 | (.22 | ) | (.08 | ) | |||||||
| October 31, 2013 | 7.85 | .12 | 1.45 | 1.57 | (.13 | ) | (.07 | ) | |||||||
| October 31, 2012 | 9.19 | .12 | .46 | .58 | (.14 | ) | (1.78 | ) | |||||||
| October 31, 2011 | 9.21 | .25 | (.07 | ) | .18 | (.18 | ) | (.02 | ) | ||||||
| October 31, 2010 | 8.02 | .14 | 1.22 | 1.36 | (.15 | ) | (.02 | ) | |||||||
| Class R5(4) | |||||||||||||||
| October 31, 2014 | 9.20 | .21 | .38 | .59 | (.20 | ) | (.08 | ) | |||||||
| October 31, 2013 | 7.84 | .10 | 1.44 | 1.54 | (.11 | ) | (.07 | ) | |||||||
| October 31, 2012 | 9.18 | .11 | .44 | .55 | (.11 | ) | (1.78 | ) | |||||||
| October 31, 2011 | 9.21 | .16 | .01 | .17 | (.18 | ) | (.02 | ) | |||||||
| October 31, 2010 | 8.02 | .10 | 1.24 | 1.34 | (.13 | ) | (.02 | ) | |||||||
See accompanying notes which are an integral part of the financial statements.
182 2050 Strategy Fund
| % | % | % | ||||||||||||||
| $ | $ | Ratio of Expenses | Ratio of Expenses | Ratio of Net | ||||||||||||
| Net Asset Value, | % | Net Assets, | to Average | to Average | Investment Income | % | ||||||||||
| $ | End of | Total | End of Period | Net Assets, | Net Assets, | to Average | Portfolio | |||||||||
| Total Distributions | Period | Return | (000 | ) | Gross(g) | Net(e)(g) | Net Assets(b)(e) | Turnover Rate | ||||||||
| (.32 | ) | 9.52 | 7.12 | 7,542 | — | — | 2.89 | 84 | ||||||||
| (.22 | ) | 9.20 | 20.61 | 10,729 | — | — | 1.75 | 27 | ||||||||
| (1.94 | ) | 7.84 | 9.00 | 8,731 | — | — | 1.44 | 78 | ||||||||
| (.25 | ) | 9.19 | 2.28 | 5,861 | — | — | 1.92 | 72 | ||||||||
| (.19 | ) | 9.22 | 17.46 | 2,454 | .93 | — | 1.58 | 28 | ||||||||
| (.30 | ) | 9.54 | 6.81 | 2,170 | .25 | .25 | 2.45 | 84 | ||||||||
| (.20 | ) | 9.22 | 20.42 | 3,515 | .25 | .25 | 1.44 | 27 | ||||||||
| (1.92 | ) | 7.85 | 8.82 | 2,658 | .25 | .25 | 1.52 | 78 | ||||||||
| (.20 | ) | 9.19 | 1.96 | 2,408 | .25 | .25 | 2.61 | 72 | ||||||||
| (.17 | ) | 9.21 | 17.20 | 15,616 | 1.21 | .25 | 1.62 | 28 | ||||||||
| (.28 | ) | 9.51 | 6.51 | 5,523 | .50 | .50 | 2.20 | 84 | ||||||||
| (.18 | ) | 9.20 | 20.03 | 5,649 | .50 | .50 | 1.17 | 27 | ||||||||
| (1.89 | ) | 7.84 | 8.50 | 3,482 | .50 | .50 | 1.43 | 78 | ||||||||
| (.20 | ) | 9.18 | 1.78 | 4,877 | .50 | .50 | 1.65 | 72 | ||||||||
| (.15 | ) | 9.21 | 16.94 | 3,693 | 1.45 | .50 | 1.23 | 28 | ||||||||
See accompanying notes which are an integral part of the financial statements.
2050 Strategy Fund 183
Russell Investment Company 2055 Strategy Fund
Portfolio Management Discussion and Analysis — October 31, 2014 (Unaudited)
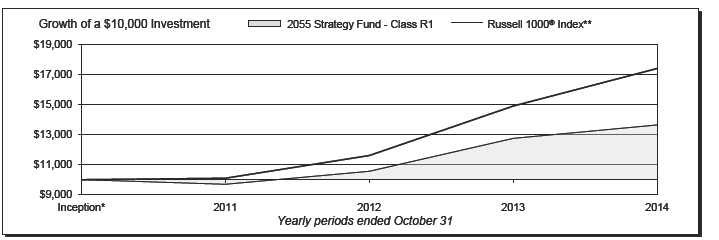
| 2055 Strategy Fund - Class R1 | 2055 Strategy Fund - Class R5‡ | ||||||
| Total | Total | ||||||
| Return | Return | ||||||
| 1 Year | 7.01 | % | 1 Year | 6.55 | % | ||
| Inception* | 8.43 | %§ | Inception* | 7.91 | %§ | ||
| 2055 Strategy Fund - Class R4‡ | Russell 1000® Index** | ||||||
| Total | Total | ||||||
| Return | Return | ||||||
| 1 Year | 6.93 | % | 1 Year | 16.78 | % | ||
| Inception* | 8.18 | %§ | Inception* | 15.54 | %§ | ||
184 2055 Strategy Fund
Russell Investment Company
2055 Strategy Fund
Portfolio Management Discussion and Analysis, continued — October 31, 2014 (Unaudited)
| The 2055 Strategy Fund (the “Fund”) is a fund of funds that | It was a positive equity market for the fiscal year ending October |
| invests in other Russell Investment Company mutual funds (the | 31, 2014. U.S. equities returned 16.07% over the period (as |
| “Underlying Funds”). The Underlying Funds employ a multi- | measured by the Russell 3000® Index), while non-U.S. equities |
| manager approach whereby portions of the Underlying Funds | returned 0.17% (as measured by the Russell Developed Ex-US |
| are allocated to different money managers. Underlying Fund | Large Cap Index). Given the significant outperformance of U.S. |
| assets not allocated to money managers are managed by Russell | equities over non-U.S. equities, the Fund’s non-U.S. equity |
| Investment Management Company (“RIMCo”), the Fund’s and | exposure detracted from its performance against its U.S. large |
| Underlying Funds’ advisor. RIMCo, as the Underlying Funds’ | cap benchmark. |
| advisor, may change the allocation of the Underlying Funds’ | Global REITs (as represented by the FTSE EPRA/NAREIT |
| assets among money managers at any time. An exemptive order | Developed Real Estate Index (Net)) finished the fiscal year up |
| from the Securities and Exchange Commission (“SEC”) permits | 9.84%. However, global REITs underperformed U.S. equity |
| RIMCo to engage or terminate a money manager in an Underlying | markets, which detracted from the Fund’s benchmark-relative |
| Fund at any time, subject to approval by the Underlying Fund’s | performance through its allocation to the Russell Global Real |
| Board, without a shareholder vote. Pursuant to the terms of the | Estate Securities Fund. Commodities largely underperformed |
| exemptive order, an Underlying Fund is required to notify its | broader equity markets with a loss of 5.94% for the fiscal year (as |
| shareholders within 90 days of when a money manager begins | represented by the Bloomberg Commodity Index Total Return). |
| providing services. | Thus, the Fund’s allocation to the Russell Commodity Strategies |
| What is the Fund’s investment objective? | Fund was another headwind to Fund performance. On August |
| The Fund seeks to provide capital growth and income consistent | 1, 2014, the Russell Global Infrastructure Fund was added as |
| with its current asset allocation which will change over time, with | an Underlying Fund in which the Fund invests. This listed |
| an increasing allocation to fixed income funds. | infrastructure exposure detracted from the Fund’s performance |
| during the period, as the S&P Global Infrastructure Index (Net) | |
| The Fund pursues this objective by investing in a diversified | lost 0.24% from August 1, 2014 through October 31, 2014, while |
| portfolio that, as of October 31, 2014, consisted of approximately | the Russell 1000® Index finished the same period up 4.81%. |
| 83% equity Underling Funds, 7% fixed income Underlying | |
| Funds and 10% alternative Underlying Funds, with an increasing | While fixed income markets were overall positive for the year |
| allocation to fixed income Underlying Funds over time. The | as interest rates generally trended lower, fixed income markets |
| Fund’s allocation to fixed income funds Underlying Funds will be | underperformed broad equity markets and therefore the Fund’s |
| fixed at 66% in approximately the year 2055. | fixed income exposure detracted from benchmark-relative returns. |
| How did the Fund perform relative to its benchmark for the | How did the investment strategies and techniques employed |
| fiscal year ended October 31, 2014? | by the Fund and the Underlying Funds affect the Fund’s |
| For the fiscal year ended October 31, 2014, the Fund’s Class R1, | performance? |
| Class R4 and Class R5 Shares gained 7.01%, 6.93% and 6.55%, | The Fund is a fund of funds and its performance is based on |
| respectively. This is compared to the Fund’s primary benchmark, | RIMCo’s strategic asset allocations and the performance of the |
| the Russell 1000® Index, which gained 16.78% during the same | Underlying Funds in which the Fund invests. |
| period. The Fund’s performance includes operating expenses, | The Fund’s strategic allocation to fixed income Underlying Funds |
| whereas index returns are unmanaged and do not include | negatively impacted benchmark-relative performance, as the |
| expenses of any kind. | fixed income Underlying Funds underperformed U.S. equities as |
| For the fiscal year ended October 31, 2014, the Morningstar® | measured by the Fund’s benchmark. Results of Underlying Fund |
| Target Date 2050®+ gained 9.14%. This result serves as a peer | active management were positive. For the Russell Strategic Bond |
| comparison and is expressed net of operating expenses. | Fund, exposure to non-agency mortgages and emerging market |
| The Fund’s underperformance relative to the Russell 1000® Index | debt were key contributors to the Underlying Fund’s benchmark- |
| relative outperformance. Currency selection was also positive, | |
| was due to the Fund’s out-of-benchmark allocations to non-U.S. | particularly a long U.S. Dollar position versus short positions to |
| equity, fixed income and commodity Underlying Funds, which | the Australian Dollar, Euro, and Japanese Yen. |
| generally underperformed the U.S. large cap equity market as | |
| represented by the Russell 1000® Index. | Due to the general underperformance of non-U.S. equities versus |
| U.S. equities, the Fund’s strategic global equity exposure detracted | |
| How did the market conditions described in the Market | from benchmark-relative results. From an active management |
| Summary report affect the Fund’s performance? | standpoint, the Select International Equity Fund underperformed |
2055 Strategy Fund 185
Russell Investment Company
2055 Strategy Fund
Portfolio Management Discussion and Analysis, continued — October 31, 2014 (Unaudited)
| the broad non-U.S. equity market as represented by the Russell | U.S. was positive while an overweight to and security selection |
| Developed ex-U.S. Large Cap™ Index Net, while the Russell | within Japan detracted from performance. |
| Global Equity Fund performed in-line with the broad global equity | |
| market as represented by the Russell Developed Large Cap Net | Describe any changes to the Fund’s structure or allocation |
| Index. The Russell Emerging Markets Fund underperformed its | to the Underlying Funds. |
| emerging markets benchmark. For the Select International Equity | ROn August 1, 2014, RIMCo modified the Fund’s target asset |
| Fund, a bias toward low price-to-book ratio stocks detracted from | allocation and as a result, the Fund increased its exposure to |
| the Underlying Fund’s benchmark-relative performance as lower | equity and alternative Underlying Funds and decreased its |
| price-to-book stocks strongly underperformed the market in non- | exposure to fixed income Underlying Funds. In connection with |
| U.S. developed regions. For the Russell Emerging Markets Fund, | this change, on August 1, 2014, the Russell U.S. Core Equity |
| unsuccessful stock selection in China, South Korea, Russia, and | Fund and Russell International Developed Markets Fund were |
| Taiwan were detractors from performance. | replaced as Underlying Funds with the Select U.S. Equity Fund |
| and Select International Equity Fund, respectively. The Fund | |
| The Fund’s strategic allocation to U.S. large cap equity Underlying | also added an allocation to the Russell Global Infrastructure |
| Funds negatively impacted the Fund’s benchmark-relative | Fund and Russell Global Opportunistic Credit Fund to provide |
| performance, as each of the U.S. large cap equity Underlying | further diversification. |
| Funds underperformed the Fund’s benchmark as well as its U.S. | |
| equity market segment as represented by its primary benchmark. | On July 9, 2014, the Fund implemented a 1.00% underweight to |
| In particular, the Select U.S. Equity Fund (an Underlying Fund | the Russell Commodity Strategies and 0.50% underweight to the |
| after August 1, 2014) underperformed during the period it was an | Russell Global Real Estate Securities Funds, driven by limited |
| Underlying Fund, driven by an overweight to stocks with lower | commodity price appreciation expectations over the medium |
| than benchmark valuation ratios (lower price-to-earnings, price- | term and caution over the interest rate sensitivity of REITs in an |
| to-book, and price-to-cash flow ratios). In addition, the Fund’s | environment of potential rising interest rates. This was offset by an |
| strategic allocation to the Russell U.S. Small Cap Equity Fund | overweight to the Russell Global Equity Fund. This contributed |
| detracted the Fund’s benchmark-relative performance, as small | positively to Fund performance during the period, as commodities |
| cap equities underperformed U.S. large cap equities during the | and global REITs underperformed global equities. |
| period. | On October 30, 2014, the Fund implemented a 0.50% overweight |
| The Fund’s strategic allocation to alternative Underlying Funds | to the Select U.S. Equity Fund and away from the Russell Global |
| had a negative effect on benchmark-relative performance. The | Infrastructure Fund based on a cautious stance to interest |
| Fund’s allocations to the Russell Global Real Estate Securities | rate sensitive asset classes in a potentially rising interest rate |
| Fund, Russell Global Infrastructure Fund (an Underlying Fund | environment. |
| after August 1, 2014) and Russell Commodity Strategies Fund | The views expressed in this report reflect those of the portfolio |
| detracted, as these Underlying Funds underperformed the Fund’s | managers only through the end of the period covered by |
| benchmark. From an active management standpoint, performance | the report. These views do not necessarily represent the |
| of these Underlying Funds was generally mixed. The Russell | views of RIMCo, or any other person in RIMCo or any other |
| Commodity Strategies Fund underperformed its respective asset | affiliated organization. These views are subject to change |
| class benchmark while the Russell Global Real Estate Securities | at any time based upon market conditions or other events, |
| Fund and Russell Global Infrastructure Fund (after August 1, | and RIMCo disclaims any responsibility to update the views |
| 2014) outperformed their respective asset class benchmarks. For | contained herein. These views should not be relied on as |
| the Russell Commodity Strategies Fund, an overweight to energy | investment advice and, because investment decisions for |
| commodities detracted from Fund performance. For the Russell | a Russell Investment Company (“RIC”) Fund are based on |
| Global Real Estate Securities Fund, security selection within the | numerous factors, should not be relied on as an indication |
| of investment decisions of any RIC Fund. |
186 2055 Strategy Fund
Russell Investment Company
2055 Strategy Fund
Portfolio Management Discussion and Analysis, continued — October 31, 2014 (Unaudited)
| * | Assumes initial investment on December 31, 2010. |
| ** �� | Russell 1000® Index includes the 1,000 largest companies in the Russell 3000® Index. The Russell 1000® Index represents the universe of stocks from which most active money managers typically select. The Russell 1000® Index return reflects adjustments from income dividends and capital gain distributions reinvested as of the ex-dividend dates. |
| ‡ | The Fund first issued Class R4 and Class R5 Shares on October 1, 2014. The returns shown for Class R4 and Class R5 Shares prior to that date are the returns of the Fund’s Class R2 and Class R3 Shares, respectively. |
| § | Annualized. |
Performance is historical and assumes reinvestment of all dividends and capital gains. Investment return and principal value will fluctuate so that an investor’s shares, when redeemed, may be worth more or less than when purchased. Past performance is not indicative of future results. The returns shown do not reflect the deduction of taxes that a shareholder would pay on Fund distributions or the redemption of Fund shares.
2055 Strategy Fund 187
Russell Investment Company 2055 Strategy Fund
Shareholder Expense Example — October 31, 2014 (Unaudited)
| Fund Expenses | Please note that the expenses shown in the table are meant | ||||||
| The following disclosure provides important information | to highlight your ongoing costs only and do not reflect any | ||||||
| regarding the Fund’s Shareholder Expense Example | transactional costs. Therefore, the information under the heading | ||||||
| (“Example”). | “Hypothetical Performance (5% return before expenses)” is | ||||||
| useful in comparing ongoing costs only, and will not help you | |||||||
| Example | determine the relative total costs of owning different funds. In | ||||||
| As a shareholder of the Fund, you incur ongoing costs, including | addition, if these transactional costs were included, your costs | ||||||
| distribution (12b-1) and/or service fees and other Fund expenses. | would have been higher. | ||||||
| The Example is intended to help you understand your ongoing | Hypothetical | ||||||
| costs (in dollars) of investing in the Fund and to compare these | Performance (5% | ||||||
| costs with the ongoing costs of investing in other mutual funds. | Actual | return before | |||||
| The Example is based on an investment of $1,000 invested at the | Class R1 | Performance | expenses) | ||||
| Beginning Account Value | |||||||
| beginning of the period and held for the entire period indicated, | May 1, 2014 | $ | 1,000.00 | $ | 1,000.00 | ||
| which for this Fund is from May 1, 2014 to October 31, 2014. | Ending Account Value | ||||||
| October 31, 2014 | $ | 1,017.20 | $ | 1,025.21 | |||
| Actual Expenses | Expenses Paid During Period* | $ | — | $ | — | ||
| The information in the table under the heading “Actual | |||||||
| Performance” provides information about actual account values | * There were no expenses charged to the Class. | ||||||
| and actual expenses. You may use the information in this column, | Hypothetical | ||||||
| together with the amount you invested, to estimate the expenses | Performance (5% | ||||||
| that you paid over the period. Simply divide your account value by | Actual | return before | |||||
| Class R4(1) | Performance | expenses) | |||||
| $1,000 (for example, an $8,600 account value divided by $1,000 | Beginning Account Value | ||||||
| = 8.6), then multiply the result by the number in the first column | May 1, 2014 | $ | 1,000.00 | $ | 1,000.00 | ||
| in the row entitled “Expenses Paid During Period” to estimate | Ending Account Value | ||||||
| the expenses you paid on your account during this period. | October 31, 2014 | $ | 1,016.00 | $ | 1,023.95 | ||
| Expenses Paid During Period* | $ | 1.27 | $ | 1.28 | |||
| Hypothetical Example for Comparison Purposes | |||||||
| * Expenses are equal to the Fund's annualized expense ratio of 0.25% | |||||||
| The information in the table under the heading “Hypothetical | (representing the six month period annualized), multiplied by the average | ||||||
| Performance (5% return before expenses)” provides information | account value over the period, multiplied by 184/365 (to reflect the one-half | ||||||
| about hypothetical account values and hypothetical expenses | year period). | ||||||
| based on the Fund’s actual expense ratio and an assumed rate of | (1) As of October 1, 2014, Class R2 Shares were reclassified as Class R4 | ||||||
| Shares, and all Class R2 shareholders were issued shares of Class R4. The | |||||||
| return of 5% per year before expenses, which is not the Fund’s | shareholder expense example for the period ended October 31, 2014 reflects | ||||||
| actual return. The hypothetical account values and expenses | the expenses and performance of Class R2 Shares for the period May 1 through | ||||||
| may not be used to estimate the actual ending account balance or | October 1, 2014, and Class R4 Shares for the period October 2, 2014 through | ||||||
| expenses you paid for the period. You may use this information | October 31, 2014. | ||||||
| to compare the ongoing costs of investing in the Fund and other | Hypothetical | ||||||
| funds. To do so, compare this 5% hypothetical example with the | Performance (5% | ||||||
| 5% hypothetical examples that appear in the shareholder reports | Actual | return before | |||||
| Class R5(2) | Performance | expenses) | |||||
| of other funds. | Beginning Account Value | ||||||
| May 1, 2014 | $ | 1,000.00 | $ | 1,000.00 | |||
| Ending Account Value | |||||||
| October 31, 2014 | $ | 1,014.30 | $ | 1,022.68 | |||
| Expenses Paid During Period* | $ | 2.54 | $ | 2.55 | |||
| * Expenses are equal to the Fund's annualized expense ratio of 0.50% | |||||||
| (representing the six month period annualized), multiplied by the average | |||||||
| account value over the period, multiplied by 184/365 (to reflect the one-half | |||||||
| year period). | |||||||
| (2) As of October 1, 2014, Class R3 Shares were reclassified as Class R5 | |||||||
| Shares, and all Class R3 shareholders were issued shares of Class R5. The | |||||||
| shareholder expense example for the period ended October 31, 2014 reflects | |||||||
| the expenses and performance of Class R3 Shares for the period May 1 through | |||||||
| October 1, 2014, and Class R5 Shares for the period October 2, 2014 through | |||||||
| October 31, 2014. | |||||||
188 2055 Strategy Fund
| Russell Investment Company | |||||||||
| 2055 Strategy Fund | |||||||||
| Schedule of Investments — October 31, 2014 | |||||||||
| Amounts in thousands (except share amounts) | Amounts in thousands (except share amounts) | ||||||||
| Fair | Fair | ||||||||
| Value | Value | ||||||||
| Shares | $ | Shares | $ | ||||||
| Investments 100.0% | Fixed Income - 6.9% | ||||||||
| Other Russell Investment Company | Russell Strategic Bond Fund | 17,645 | 197 | ||||||
| Series Mutual Funds - Class Y | International Equities - 42.0% | ||||||||
| Shares | Russell Emerging Markets Fund | 13,761 | 257 | ||||||
| Alternative - 8.5% | Russell Global Equity Fund | 32,612 | 384 | ||||||
| Russell Commodity Strategies Fund | 9,114 | 70 | Select International Equity Fund | 58,656 | 553 | ||||
| Russell Global Infrastructure Fund | 6,567 | 85 | 1,194 | ||||||
| Russell Global Real Estate Securities Fund | 2,105 | 86 | |||||||
| 241 | Total Investments 100.0% | ||||||||
| Domestic Equities - 42.6% | (identified cost $2,646) | 2,844 | |||||||
| Russell U.S. Defensive Equity Fund | 1,852 | 85 | Other Assets and Liabilities, Net | ||||||
| Russell U.S. Dynamic Equity Fund | 11,230 | 142 | - 0.0 | % | 1 | ||||
| Russell U.S. Small Cap Equity Fund | 7,878 | 246 | Net Assets - 100.0% | 2,845 | |||||
| Select U.S. Equity Fund | 70,968 | 739 | |||||||
| 1,212 | |||||||||
| Presentation of Portfolio Holdings | |||||||||
| Categories | % of Net Assets | ||||||||
| Alternative | 8.5 | ||||||||
| Domestic Equities | 42.6 | ||||||||
| Fixed Income | 6.9 | ||||||||
| International Equities | 42.0 | ||||||||
| Total Investments | 100.0 | ||||||||
| Other Assets and Liabilities, Net | —* | ||||||||
| 100.0 | |||||||||
| * Less than .05% of net assets. | |||||||||
See accompanying notes which are an integral part of the financial statements.
2055 Strategy Fund 189
| Russell Investment Company | ||
| 2055 Strategy Fund | ||
| Statement of Assets and Liabilities — October 31, 2014 | ||
| Amounts in thousands | ||
| Assets | ||
| Investments, at identified cost | $ | 2,646 |
| Investments, at fair value | 2,844 | |
| Receivables: | ||
| Fund shares sold | 9 | |
| Total assets | 2,853 | |
| Liabilities | ||
| Payables: | ||
| Investments purchased | 6 | |
| Fund shares redeemed | 1 | |
| Accrued fees to affiliates | 1 | |
| Total liabilities | 8 | |
| Net Assets | $ | 2,845 |
| Net Assets Consist of: | ||
| Accumulated net realized gain (loss) | $ | 272 |
| Unrealized appreciation (depreciation) on investments | 198 | |
| Shares of beneficial interest | 2 | |
| Additional paid-in capital | 2,373 | |
| Net Assets | $ | 2,845 |
| Net Asset Value, offering and redemption price per share: | ||
| Net asset value per share: Class R1(#) | $ | 12.51 |
| Class R1 — Net assets | $ | 579,215 |
| Class R1 — Shares outstanding ($.01 par value) | 46,306 | |
| Net asset value per share: Class R4(#) | $ | 12.52 |
| Class R4 — Net assets | $ | 1,554,452 |
| Class R4 — Shares outstanding ($.01 par value) | 124,192 | |
| Net asset value per share: Class R5(#) | $ | 12.50 |
| Class R5 — Net assets | $ | 711,640 |
| Class R5 — Shares outstanding ($.01 par value) | 56,912 | |
| (#) Net asset value per share equals class level net assets divided by class level shares of beneficial interest outstanding. | ||
See accompanying notes which are an integral part of the financial statements.
190 2055 Strategy Fund
| Russell Investment Company | |||
| 2055 Strategy Fund | |||
| Statement of Operations — For the Period Ended October 31, 2014 | |||
| Amounts in thousands | |||
| Investment Income | |||
| Income distributions from Underlying Funds | $ | 66 | |
| Expenses | |||
| Distribution fees - Class R3 | 1 | ||
| Distribution fees - Class R5 | —** | ||
| Shareholder servicing fees - Class R2 | 3 | ||
| Shareholder servicing fees - Class R3 | 1 | ||
| Shareholder servicing fees - Class R4 | 1 | ||
| Shareholder servicing fees - Class R5 | —** | ||
| Total expenses | 6 | ||
| Net investment income (loss) | 60 | ||
| Net Realized and Unrealized Gain (Loss) | |||
| Net realized gain (loss) on: | |||
| Investments | 239 | ||
| Capital gain distributions from Underlying Funds | 40 | ||
| Net realized gain (loss) | 279 | ||
| Net change in unrealized appreciation (depreciation) on investments | (199 | ) | |
| Net realized and unrealized gain (loss) | 80 | ||
| Net Increase (Decrease) in Net Assets from Operations | $ | 140 | |
| ** | Less than $500. |
See accompanying notes which are an integral part of the financial statements.
2055 Strategy Fund 191
| Russell Investment Company | |||||||
| 2055 Strategy Fund | |||||||
| Statements of Changes in Net Assets | |||||||
| For the Periods Ended October 31, | |||||||
| Amounts in thousands | 2014 | 2013 | |||||
| Increase (Decrease) in Net Assets | |||||||
| Operations | |||||||
| Net investment income (loss) | $ | 60 | $ | 24 | |||
| Net realized gain (loss) | 279 | 4 | |||||
| Net change in unrealized appreciation (depreciation) | (199 | ) | 319 | ||||
| Net increase (decrease) in net assets from operations | 140 | 347 | |||||
| Distributions | |||||||
| From net investment income | |||||||
| Class R1 | (18 | ) | (5 | ) | |||
| Class R2 | (32 | ) | (16 | ) | |||
| Class R3 | (10 | ) | (4 | ) | |||
| Class R4 | (—)** | — | |||||
| From net realized gain | |||||||
| Class R1 | (2 | ) | (2 | ) | |||
| Class R2 | (4 | ) | (11 | ) | |||
| Class R3 | (2 | ) | (3 | ) | |||
| Net decrease in net assets from distributions | (68 | ) | (41 | ) | |||
| Share Transactions* | |||||||
| Net increase (decrease) in net assets from share transactions | 428 | 678 | |||||
| Total Net Increase (Decrease) in Net Assets | 500 | 984 | |||||
| Net Assets | |||||||
| Beginning of period | 2,345 | 1,361 | |||||
| End of period | $ | 2,845 | $ | 2,345 | |||
| ** Less than $500. | |||||||
See accompanying notes which are an integral part of the financial statements.
192 2055 Strategy Fund
| Russell Investment Company | |||||||||||||
| 2055 Strategy Fund | |||||||||||||
| Statements of Changes in Net Assets, continued | |||||||||||||
| * Share transaction amounts (in thousands) for the periods ended October 31, 2014 and October 31, 2013 were as follows: | |||||||||||||
| 2014 | 2013 | ||||||||||||
| Shares | Dollars | Shares | Dollars | ||||||||||
| Class R1 | |||||||||||||
| Proceeds from shares sold | 146 | $ | 1,767 | 57 | $ | 642 | |||||||
| Proceeds from reinvestment of distributions | 2 | 20 | 1 | 7 | |||||||||
| Payments for shares redeemed | (155 | ) | (1,855 | ) | (21 | ) | (238 | ) | |||||
| Net increase (decrease) | (7 | ) | (68 | ) | 37 | 411 | |||||||
| Class R2 | |||||||||||||
| Proceeds from shares sold | 23 | 286 | 31 | 342 | |||||||||
| Proceeds from reinvestment of distributions | 3 | 36 | 3 | 27 | |||||||||
| Payments for shares redeemed | (133 | ) | (1,626 | ) | (20 | ) | (216 | ) | |||||
| Net increase (decrease) | (107 | ) | (1,304 | ) | 14 | 153 | |||||||
| Class R3 | |||||||||||||
| Proceeds from shares sold | 28 | 347 | 28 | 306 | |||||||||
| Proceeds from reinvestment of distributions | 1 | 12 | 1 | 8 | |||||||||
| Payments for shares redeemed | (63 | ) | (766 | ) | (18 | ) | (200 | ) | |||||
| Net increase (decrease) | (34 | ) | (407 | ) | 11 | 114 | |||||||
| Class R4 | |||||||||||||
| Proceeds from shares sold | 125 | 1,525 | — | — | |||||||||
| Proceeds from reinvestment of distributions | — | —** | — | — | |||||||||
| Payments for shares redeemed | (1 | ) | (11 | ) | — | — | |||||||
| Net increase (decrease) | 124 | 1,514 | — | — | |||||||||
| Class R5 | |||||||||||||
| Proceeds from shares sold | 59 | 717 | — | — | |||||||||
| Payments for shares redeemed | (2 | ) | (24 | ) | — | — | |||||||
| Net increase (decrease) | 57 | 693 | — | — | |||||||||
| Total increase (decrease) | 33 | $ | 428 | 62 | $ | 678 | |||||||
| ** | Less than $500. |
See accompanying notes which are an integral part of the financial statements.
2055 Strategy Fund 193
| Russell Investment Company | ||||||||||||||||
| 2055 Strategy Fund | ||||||||||||||||
| Financial Highlights — For the Periods Ended | ||||||||||||||||
| For a Share Outstanding Throughout Each Period. | ||||||||||||||||
| $ | ||||||||||||||||
| $ | Net | $ | $ | $ | $ | |||||||||||
| Net Asset Value, | Investment | Net Realized | Total from | Distributions | Distributions | |||||||||||
| Beginning of | Income (Loss) | and Unrealized | Investment | from Net | from Net | |||||||||||
| Period | (a)(b)(e) | Gain (Loss) | Operations | Investment Income | Realized Gain | |||||||||||
| Class R1 | ||||||||||||||||
| October 31, 2014 | 12.04 | .34 | .49 | .83 | (.32 | ) | (.04 | ) | ||||||||
| October 31, 2013 | 10.27 | .15 | 1.93 | 2.08 | (.19 | ) | (.12 | ) | ||||||||
| October 31, 2012 | 9.63 | .16 | .68 | .84 | (.18 | ) | (.02 | ) | ||||||||
| October 31, 2011(1) | 10.00 | .06 | (.37 | ) | (.31 | ) | (.06 | ) | — | |||||||
| Class R4(3) | ||||||||||||||||
| October 31, 2014 | 12.03 | .28 | .54 | .82 | (.29 | ) | (.04 | ) | ||||||||
| October 31, 2013 | 10.27 | .16 | 1.88 | 2.04 | (.16 | ) | (.12 | ) | ||||||||
| October 31, 2012 | 9.63 | .15 | .66 | .81 | (.15 | ) | (.02 | ) | ||||||||
| October 31, 2011(1) | 10.00 | .03 | (.36 | ) | (.33 | ) | (.04 | ) | — | |||||||
| Class R5(4) | ||||||||||||||||
| October 31, 2014 | 12.03 | .22 | .56 | .78 | (.27 | ) | (.04 | ) | ||||||||
| October 31, 2013 | 10.27 | .12 | 1.90 | 2.02 | (.14 | ) | (.12 | ) | ||||||||
| October 31, 2012 | 9.63 | .11 | .68 | .79 | (.13 | ) | (.02 | ) | ||||||||
| October 31, 2011(1) | 10.00 | .02 | (.37 | ) | (.35 | ) | (.02 | ) | — | |||||||
See accompanying notes which are an integral part of the financial statements.
194 2055 Strategy Fund
| % | % | % | |||||||||||||||
| $ | $ | Ratio of Expenses | Ratio of Expenses | Ratio of Net | |||||||||||||
| Net Asset Value, | % | Net Assets, | to Average | to Average | Investment Income | % | |||||||||||
| $ | End of | Total | End of Period | Net Assets, | Net Assets, | to Average | Portfolio | ||||||||||
| Total Distributions | Period | Return(c) | (000 | ) | Gross(f)(g) | Net(e)(f)(g) | Net Assets(b)(c)(e) | Turnover Rate(c) | |||||||||
| (.36 | ) | 12.51 | 7.01 | 579 | — | — | 2.81 | 132 | |||||||||
| (.31 | ) | 12.04 | 20.74 | 648 | — | — | 1.31 | 27 | |||||||||
| (.20 | ) | 10.27 | 8.92 | 171 | — | — | 1.66 | 23 | |||||||||
| (.06 | ) | 9.63 | (3.09 | ) | 97 | — | — | .63 | 47 | ||||||||
| (.33 | ) | 12.52 | 6.93 | 1,554 | .25 | .25 | 2.26 | 132 | |||||||||
| (.28 | ) | 12.03 | 20.35 | 1,290 | .25 | .25 | 1.43 | 27 | |||||||||
| (.17 | ) | 10.27 | 8.64 | 957 | .25 | .25 | 1.48 | 23 | |||||||||
| (.04 | ) | 9.63 | (3.31 | ) | 793 | .25 | .25 | .28 | 47 | ||||||||
| (.31 | ) | 12.50 | 6.55 | 712 | .50 | .50 | 1.80 | 132 | |||||||||
| (.26 | ) | 12.03 | 20.09 | 407 | .50 | .50 | 1.04 | 27 | |||||||||
| (.15 | ) | 10.27 | 8.41 | 233 | .50 | .50 | 1.08 | 23 | |||||||||
| (.02 | ) | 9.63 | (3.49 | ) | 106 | .50 | .50 | .21 | 47 | ||||||||
See accompanying notes which are an integral part of the financial statements.
2055 Strategy Fund 195
Russell Investment Company In Retirement Fund
Portfolio Management Discussion and Analysis — October 31, 2014 (Unaudited)
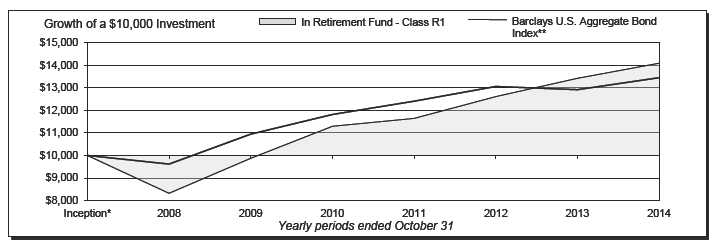
| In Retirement Fund - Class A‡‡ | In Retirement Fund - Class R5‡‡ | ||||||
| Total | Total | ||||||
| Return | Return | ||||||
| 1 Year | (1.23 | )% | 1 Year | 4.43 | % | ||
| 5 Years | 5.85 | %§ | 5 Years | 6.84 | %§ | ||
| Inception* | 4.15 | %§ | Inception* | 4.82 | %§ | ||
| In Retirement Fund - Class R1 | Barclays U.S. Aggregate Bond Index** | ||||||
| Total | Total | ||||||
| Return | Return | ||||||
| 1 Year | 5.00 | % | 1 Year | 4.14 | % | ||
| 5 Years | 7.39 | %§ | 5 Years | 4.22 | %§ | ||
| Inception* | 5.35 | %§ | Inception* | 4.61 | %§ | ||
| In Retirement Fund - Class R4‡‡ | |||||||
| Total | |||||||
| Return | |||||||
| 1 Year | 4.81 | % | |||||
| 5 Years | 7.13 | %§ | |||||
| Inception* | 5.11 | %§ | |||||
196 In Retirement Fund
Russell Investment Company
In Retirement Fund
Portfolio Management Discussion and Analysis, continued — October 31, 2014 (Unaudited)
| The In Retirement Fund (the “Fund”) is a fund of funds that | income was a key positive driver to the Fund’s benchmark-relative |
| invests in other Russell Investment Company mutual funds (the | performance, as fixed income markets finished at 4.14% for the |
| “Underlying Funds”). The Underlying Funds employ a multi- | fiscal year as measured by the Fund’s benchmark. |
| manager approach whereby portions of the Underlying Funds | Global REITs (as represented by the FTSE EPRA/NAREIT |
| are allocated to different money managers. Underlying Fund | Developed Real Estate Index (Net)) finished the fiscal year up |
| assets not allocated to money managers are managed by Russell | 9.84%, outperforming fixed income markets. This benefited the |
| Investment Management Company (“RIMCo”), the Fund’s and | Fund’s performance through its allocation to the Russell Global |
| Underlying Funds’ advisor. RIMCo, as the Underlying Funds’ | Real Estate Securities Fund. Commodities largely underperformed |
| advisor, may change the allocation of the Underlying Funds’ | broader equity and fixed income markets with a loss of 5.94% |
| assets among money managers at any time. An exemptive order | for the fiscal year (as represented by the Bloomberg Commodity |
| from the Securities and Exchange Commission (“SEC”) permits | Index Total Return). Thus, the Fund’s allocation to the Russell |
| RIMCo to engage or terminate a money manager in an Underlying | Commodity Strategies Fund was a headwind to Fund performance. |
| Fund at any time, subject to approval by the Underlying Fund’s | On August 1, 2014, the Russell Global Infrastructure Fund |
| Board, without a shareholder vote. Pursuant to the terms of the | was added as an Underlying Fund in which the Fund invests. |
| exemptive order, an Underlying Fund is required to notify its | This listed infrastructure exposure detracted from the Fund’s |
| shareholders within 90 days of when a money manager begins | performance during the period, as the S&P Global Infrastructure |
| providing services. | Index (Net) lost 0.24% from August 1, 2014 through October 31, |
| What is the Fund’s investment objective? | 2014, while the Barclays U.S. Aggregate Index gained 1.40% |
| The Fund seeks to provide income and capital growth. | during the same period. |
| The Fund pursues this objective by investing in a diversified | Fixed income markets had overall positive performance for the |
| portfolio that, as of October 31, 2014, consisted of 27% equity | fiscal year, as interest rates generally trended lower over the |
| Underlying Funds, 66% fixed income Underlying Funds and 7% | period, providing a tailwind to aggregate fixed income markets. |
| alternative Underlying Funds. | During the fiscal year, the Fund had a strategic allocation to |
| short duration fixed income, as represented by its allocation to | |
| How did the Fund perform relative to its benchmark for the | the Russell Short Duration Bond Fund, which in a lower yield |
| fiscal year ended October 31, 2014? | environment detracted from the Fund’s benchmark-relative |
| For the fiscal year ended October 31, 2014, the Fund’s Class | performance. |
| A, Class R1, Class R4 and Class R5 Shares gained 4.75%, | |
| 5.00%, 4.81% and 4.43%, respectively. This is compared to the | How did the investment strategies and techniques employed |
| Fund’s primary benchmark, the Barclays U.S. Aggregate Bond | by the Fund and the Underlying Funds affect the Fund’s |
| Index, which gained 4.14% during the same period. The Fund’s | performance? |
| performance includes operating expenses, whereas index returns | The Fund is a fund of funds and its performance is based on |
| are unmanaged and do not include expenses of any kind. | RIMCo’s strategic asset allocations and the performance of the |
| For the fiscal year ended October 31, 2014, the Morningstar® | Underlying Funds in which the Fund invests. |
| Retirement Income gained 5.23%. This result serves as a peer | The Fund’s strategic allocation to fixed income Underlying |
| comparison and is expressed net of operating expenses. | Funds negatively impacted its benchmark-relative performance. |
| Allocations to the Russell Global Opportunistic Credit Fund (an | |
| The Fund’s outperformance relative to the Barclays U.S. | Underlying Fund after August 1, 2014) and Russell Short Duration |
| Aggregate Bond Index was due to the Fund’s out-of-benchmark | Bond Fund detracted, as these Underlying Funds underperformed |
| allocation to equity and global real estate Underlying Funds, | the Fund’s benchmark. In particular, the Russell Short Duration |
| which outperformed fixed income Underlying Funds over the | Bond Fund underperformed the Fund’s benchmark, as having |
| period. | a strategic short duration bias over the year was a headwind as |
| How did the market conditions described in the Market | interest rates generally moved lower. Allocations to the Russell |
| Summary report affect the Fund’s performance? | Strategic Bond Fund and Russell Investment Grade Bond Fund |
| It was a positive equity market for the fiscal year ending October | were slightly positive from a benchmark-relative perspective. |
| 31, 2014. U.S. equities returned 16.07% over the period (as | Results of Underlying Fund active management were positive. |
| measured by the Russell 3000® Index), while non-U.S. equities | For the Russell Strategic Bond Fund, exposure to non-agency |
| returned 0.17% (as measured by the Russell Developed ex-U.S. | mortgages and emerging market debt were key contributors to |
| Large Cap Index). The outperformance of U.S. equities over fixed | the Underlying Fund’s benchmark-relative outperformance. |
In Retirement Fund 197
Russell Investment Company
In Retirement Fund
Portfolio Management Discussion and Analysis, continued — October 31, 2014 (Unaudited)
| Currency selection was also positive, particularly a long U.S. | while the Russell Global Real Estate Securities Fund and |
| Dollar position versus short positions to the Australian Dollar | Russell Global Infrastructure Fund (after August 1, 2014) |
| Euro, and Japanese Yen. | outperformed their respective asset class benchmarks. For the |
| With respect to the Fund’s global equity exposure, the Fund’s | Russell Commodity Strategies Fund, an overweight to energy |
| strategic allocations to the Russell Emerging Markets Fund, | commodities detracted from Fund performance. For the Russell |
| Russell International Developed Markets Fund (an Underlying | Global Real Estate Securities Fund, security selection within the |
| Fund until August 1, 2014) and Select International Equity Fund | U.S. was positive while an overweight to and security selection |
| (an Underlying Fund after August 1, 2014) detracted from the | within Japan detracted from performance. |
| Fund’s benchmark-relative performance, while its allocation to | Describe any changes to the Fund’s structure or allocation |
| the Russell Global Equity Fund positively impacted performance. | to the Underlying Funds. |
| From an active management standpoint, the Select International | On August 1, 2014, RIMCo modified the Fund’s target asset |
| Equity Fund underperformed the broad non-U.S. equity market | allocation and as a result, the Fund increased its exposure to |
| as represented by the Russell Developed ex-U.S. Large Cap™ | equity and alternative Underlying Funds and decreased its |
| Index Net, while the Russell Global Equity Fund performed in- | exposure to fixed income Underlying Funds. In connection with |
| line with the broad global equity market as represented by the | this change, on August 1, 2014, the Russell U.S. Core Equity |
| Russell Developed Large Cap Net Index. The Russell Emerging | Fund and Russell International Developed Markets Fund were |
| Markets Fund underperformed its emerging markets benchmark. | replaced as Underlying Funds with the Select U.S. Equity Fund |
| For the Select International Equity Fund, a bias toward low | and Select International Equity Fund, respectively. The Fund |
| price-to-book ratio stocks detracted from the Underlying Fund’s | also added an allocation to the Russell Global Infrastructure |
| benchmark-relative performance as lower price-to-book stocks | Fund and Russell Global Opportunistic Credit Fund to provide |
| strongly underperformed the market in non-U.S. developed | further diversification. |
| regions. For the Russell Emerging Markets Fund, unsuccessful | |
| stock selection in China, South Korea, Russia, and Taiwan were | On July 9, 2014, the Fund implemented a 0.40% underweight to |
| detractors from performance. | the Russell Commodity Strategies and 0.20% underweight to the |
| Russell Global Real Estate Securities Funds, driven by limited | |
| The Fund’s strategic allocation to U.S. large cap equity Underlying | commodity price appreciation expectations over the medium |
| Funds benefited the Fund’s benchmark-relative performance, as | term and caution over the interest rate sensitivity of REITs in |
| broad U.S. equities outperformed core fixed income for the period. | an environment of potential rising interest rates. This was offset |
| From an active management perspective, each of the large cap | by a 0.60% overweight to the Russell Global Equity Fund. This |
| U.S. equity Underlying Funds underperformed its respective U.S. | contributed positively to Fund performance during the period, as |
| equity market segment as represented by its primary benchmark. | commodities and global REITs underperformed global equities. |
| In particular, the Select U.S. Equity Fund (an Underlying Fund | |
| after August 1, 2014) underperformed during the period it was an | On October 30, 2014, the Fund implemented a 0.20% overweight |
| Underlying Fund, driven by an overweight to stocks with lower | to the Select U.S. Equity Fund and away from the Russell Global |
| than benchmark valuation ratios (lower price-to-earnings, price- | Infrastructure Fund based on a cautious stance to interest |
| to-book, and price-to-cash flow ratios). In addition, the Fund’s | rate sensitive asset classes in a potentially rising interest rate |
| strategic allocation to the Russell U.S. Small Cap Equity Fund | environment. |
| benefited the Fund’s benchmark-relative performance, though | The views expressed in this report reflect those of the portfolio |
| the Underlying Fund underperformed its Russell 2000® Index | |
| managers only through the end of the period covered by | |
| benchmark. | the report. These views do not necessarily represent the |
| The Fund’s strategic allocation to alternative Underlying Funds | views of RIMCo, or any other person in RIMCo or any other |
| had a mixed impact on benchmark-relative performance. The | affiliated organization. These views are subject to change |
| Fund’s allocation to the Russell Global Real Estate Securities | at any time based upon market conditions or other events, |
| Fund was positive, while the allocations to the Russell Global | and RIMCo disclaims any responsibility to update the views |
| Infrastructure Fund (an Underlying Fund after August 1, 2014) | contained herein. These views should not be relied on as |
| and Russell Commodity Strategies Fund were negative. From an | investment advice and, because investment decisions for |
| active management standpoint, performance of these Underlying | a Russell Investment Company (“RIC”) Fund are based on |
| Funds was generally mixed. The Russell Commodity Strategies | numerous factors, should not be relied on as an indication |
| Fund underperformed its respective asset class benchmark | of investment decisions of any RIC Fund. |
198 In Retirement Fund
Russell Investment Company
In Retirement Fund
Portfolio Management Discussion and Analysis, continued — October 31, 2014 (Unaudited)
| * | Assumes initial investment on March 31, 2008. |
| ** | The Barclays U.S. Aggregate Bond Index is an index, with income reinvested, generally representative of intermediate-term government bonds, investment grade corporate debt securities and mortgage-backed securities. |
| ‡ | The Fund first issued Class A Shares on February 25, 2011. The returns shown for Class A Shares prior to that date are the returns of Class R2 Shares. The performance shown has been adjusted to reflect the deduction of the maximum Class A sales charge of 5.75%. |
| ‡‡ | The Fund first issued Class R4 and Class R5 Shares on October 1, 2014. The returns shown for Class R4 and Class R5 Shares prior to that date are the returns of the Fund’s Class R2 and Class R3 Shares, respectively. |
| § | Annualized. |
Performance is historical and assumes reinvestment of all dividends and capital gains. Investment return and principal value will fluctuate so that an investor’s shares, when redeemed, may be worth more or less than when purchased. Past performance is not indicative of future results. The returns shown do not reflect the deduction of taxes that a shareholder would pay on Fund distributions or the redemption of Fund shares.
In Retirement Fund 199
Russell Investment Company In Retirement Fund
Shareholder Expense Example — October 31, 2014 (Unaudited)
| Fund Expenses | Please note that the expenses shown in the table are meant | ||||||
| The following disclosure provides important information | to highlight your ongoing costs only and do not reflect any | ||||||
| regarding the Fund’s Shareholder Expense Example | transactional costs. Therefore, the information under the heading | ||||||
| (“Example”). | “Hypothetical Performance (5% return before expenses)” is | ||||||
| useful in comparing ongoing costs only, and will not help you | |||||||
| Example | determine the relative total costs of owning different funds. In | ||||||
| As a shareholder of the Fund, you incur ongoing costs, including | addition, if these transactional costs were included, your costs | ||||||
| distribution (12b-1) and/or service fees and other Fund expenses. | would have been higher. | ||||||
| The Example is intended to help you understand your ongoing | Hypothetical | ||||||
| costs (in dollars) of investing in the Fund and to compare these | Performance (5% | ||||||
| costs with the ongoing costs of investing in other mutual funds. | Actual | return before | |||||
| The Example is based on an investment of $1,000 invested at the | Class A | Performance | expenses) | ||||
| Beginning Account Value | |||||||
| beginning of the period and held for the entire period indicated, | May 1, 2014 | $ | 1,000.00 | $ | 1,000.00 | ||
| which for this Fund is from May 1, 2014 to October 31, 2014. | Ending Account Value | ||||||
| October 31, 2014 | $ | 1,017.90 | $ | 1,023.95 | |||
| Actual Expenses | Expenses Paid During Period* | $ | 1.27 | $ | 1.28 | ||
| The information in the table under the heading “Actual | |||||||
| Performance” provides information about actual account values | * Expenses are equal to the Fund's annualized expense ratio of 0.25% | ||||||
| (representing the six month period annualized), multiplied by the average | |||||||
| and actual expenses. You may use the information in this column, | account value over the period, multiplied by 184/365 (to reflect the one-half | ||||||
| together with the amount you invested, to estimate the expenses | year period). | ||||||
| that you paid over the period. Simply divide your account value by | |||||||
| $1,000 (for example, an $8,600 account value divided by $1,000 | Hypothetical | ||||||
| Performance (5% | |||||||
| = 8.6), then multiply the result by the number in the first column | Actual | return before | |||||
| in the row entitled “Expenses Paid During Period” to estimate | Class R1 | Performance | expenses) | ||||
| the expenses you paid on your account during this period. | Beginning Account Value | ||||||
| May 1, 2014 | $ | 1,000.00 | $ | 1,000.00 | |||
| Hypothetical Example for Comparison Purposes | Ending Account Value | ||||||
| October 31, 2014 | $ | 1,019.50 | $ | 1,025.21 | |||
| The information in the table under the heading “Hypothetical | Expenses Paid During Period* | $ | — | $ | — | ||
| Performance (5% return before expenses)” provides information | |||||||
| about hypothetical account values and hypothetical expenses | * There were no expenses charged to the Class. | ||||||
| based on the Fund’s actual expense ratio and an assumed rate of | |||||||
| Hypothetical | |||||||
| return of 5% per year before expenses, which is not the Fund’s | Performance (5% | ||||||
| actual return. The hypothetical account values and expenses | Actual | return before | |||||
| may not be used to estimate the actual ending account balance or | Class R4(1) | Performance | expenses) | ||||
| expenses you paid for the period. You may use this information | Beginning Account Value | ||||||
| May 1, 2014 | $ | 1,000.00 | $ | 1,000.00 | |||
| to compare the ongoing costs of investing in the Fund and other | Ending Account Value | ||||||
| funds. To do so, compare this 5% hypothetical example with the | October 31, 2014 | $ | 1,019.10 | $ | 1,023.95 | ||
| 5% hypothetical examples that appear in the shareholder reports | Expenses Paid During Period* | $ | 1.27 | $ | 1.28 | ||
| of other funds. | |||||||
| * Expenses are equal to the Fund's annualized expense ratio of 0.25% | |||||||
| (representing the six month period annualized), multiplied by the average | |||||||
| account value over the period, multiplied by 184/365 (to reflect the one-half | |||||||
| year period). | |||||||
| (1) As of October 1, 2014, Class R2 Shares were reclassified as Class R4 | |||||||
| Shares, and all Class R2 shareholders were issued shares of Class R4. The | |||||||
| shareholder expense example for the period ended October 31, 2014 reflects | |||||||
| the expenses and performance of Class R2 Shares for the period May 1 through | |||||||
| October 1, 2014, and Class R4 Shares for the period October 2, 2014 through | |||||||
| October 31, 2014. | |||||||
200 In Retirement Fund
Russell Investment Company In Retirement Fund
Shareholder Expense Example, continued ��� October 31, 2014 (Unaudited)
| Hypothetical | ||||||
| Performance (5% | ||||||
| Actual | return before | |||||
| Class R5(2) | Performance | expenses) | ||||
| Beginning Account Value | ||||||
| May 1, 2014 | $ | 1,000.00 | $ | 1,000.00 | ||
| Ending Account Value | ||||||
| October 31, 2014 | $ | 1,016.90 | $ | 1,022.68 | ||
| Expenses Paid During Period* | $ | 2.54 | $ | 2.55 | ||
| * Expenses are equal to the Fund's annualized expense ratio of 0.50% | ||||||
| (representing the six month period annualized), multiplied by the average | ||||||
| account value over the period, multiplied by 184/365 (to reflect the one-half | ||||||
| year period). | ||||||
| (2) As of October 1, 2014, Class R3 Shares were reclassified as Class R5 | ||||||
| Shares, and all Class R3 shareholders were issued shares of Class R5. The | ||||||
| shareholder expense example for the period ended October 31, 2014 reflects | ||||||
| the expenses and performance of Class R3 Shares for the period May 1 through | ||||||
| October 1, 2014, and Class R5 Shares for the period October 2, 2014 through | ||||||
| October 31, 2014. | ||||||
In Retirement Fund 201
| Russell Investment Company | |||||||||||
| In Retirement Fund | |||||||||||
| Schedule of Investments — October 31, 2014 | |||||||||||
| Amounts in thousands (except share amounts) | Amounts in thousands (except share amounts) | ||||||||||
| Fair | Fair | ||||||||||
| Value | Value | ||||||||||
| Shares | $ | Shares | $ | ||||||||
| Investments 100.0% | Fixed Income - 65.9% | ||||||||||
| Other Russell Investment Company | Russell Global Opportunistic Credit Fund | 103,709 | 1,037 | ||||||||
| Series Mutual Funds - Class Y | Russell Investment Grade Bond Fund | 227,163 | 5,109 | ||||||||
| Shares | Russell Short Duration Bond Fund | 184,256 | 3,567 | ||||||||
| Russell Strategic Bond Fund | 971,051 | 10,827 | |||||||||
| Alternative - 5.8% | 20,540 | ||||||||||
| Russell Commodity Strategies Fund | 71,394 | 551 | International Equities - 13.3% | ||||||||
| Russell Global Infrastructure Fund | 48,271 | 625 | Russell Emerging Markets Fund | 32,823 | 613 | ||||||
| Russell Global Real Estate Securities Fund | 15,269 | 622 | Russell Global Equity Fund | 119,191 | 1,405 | ||||||
| 1,798 | Select International Equity Fund | 225,047 | 2,120 | ||||||||
| Domestic Equities - 15.0% | 4,138 | ||||||||||
| Russell U.S. Defensive Equity Fund | 16,850 | 776 | |||||||||
| Russell U.S. Dynamic Equity Fund | 29,396 | 373 | Total Investments 100.0% | ||||||||
| Russell U.S. Small Cap Equity Fund | 18,109 | 566 | (identified cost $26,607) | 31,146 | |||||||
| Select U.S. Equity Fund | 283,901 | 2,955 | Other Assets and Liabilities, Net | ||||||||
| 4,670 | -(0.0 | %) | (5 | ) | |||||||
| Net Assets - 100.0% | 31,141 | ||||||||||
| Presentation of Portfolio Holdings | |||||||||||
| Categories | % of Net Assets | ||||||||||
| Alternative | 5.8 | ||||||||||
| Domestic Equities | 15.0 | ||||||||||
| Fixed Income | 65.9 | ||||||||||
| International Equities | 13.3 | ||||||||||
| Total Investments | 100.0 | ||||||||||
| Other Assets and Liabilities, Net | (—*) | ||||||||||
| 100.0 | |||||||||||
| * Less than .05% of net assets. | |||||||||||
See accompanying notes which are an integral part of the financial statements.
202 In Retirement Fund
| Russell Investment Company | ||
| In Retirement Fund | ||
| Statement of Assets and Liabilities — October 31, 2014 | ||
| Amounts in thousands | ||
| Assets | ||
| Investments, at identified cost | $ | 26,607 |
| Investments, at fair value | 31,146 | |
| Receivables: | ||
| Investments sold | 116 | |
| Fund shares sold | 19 | |
| Total assets | 31,281 | |
| Liabilities | ||
| Payables: | ||
| Fund shares redeemed | 134 | |
| Accrued fees to affiliates | 6 | |
| Total liabilities | 140 | |
| Net Assets | $ | 31,141 |
| Net Assets Consist of: | ||
| Undistributed (overdistributed) net investment income | $ | 1 |
| Accumulated net realized gain (loss) | 6,949 | |
| Unrealized appreciation (depreciation) on investments | 4,539 | |
| Shares of beneficial interest | 29 | |
| Additional paid-in capital | 19,623 | |
| Net Assets | $ | 31,141 |
| Net Asset Value, offering and redemption price per share: | ||
| Net asset value per share: Class A(#) | $ | 10.88 |
| Maximum offering price per share (Net asset value plus sales charge of 5.75%): Class A | $ | 11.54 |
| Class A — Net assets | $ | 486,032 |
| Class A — Shares outstanding ($.01 par value) | 44,662 | |
| Net asset value per share: Class R1(#) | $ | 10.72 |
| Class R1 — Net assets | $ | 14,897,021 |
| Class R1 — Shares outstanding ($.01 par value) | 1,389,075 | |
| Net asset value per share: Class R4(#) | $ | 10.73 |
| Class R4 — Net assets | $ | 5,804,118 |
| Class R4 — Shares outstanding ($.01 par value) | 541,104 | |
| Net asset value per share: Class R5(#) | $ | 10.70 |
| Class R5 — Net assets | $ | 9,953,704 |
| Class R5 — Shares outstanding ($.01 par value) | 929,960 | |
| (#) Net asset value per share equals class level net assets divided by class level shares of beneficial interest outstanding. | ||
See accompanying notes which are an integral part of the financial statements.
In Retirement Fund 203
| Russell Investment Company | |||
| In Retirement Fund | |||
| Statement of Operations — For the Period Ended October 31, 2014 | |||
| Amounts in thousands | |||
| Investment Income | |||
| Income distributions from Underlying Funds | $ | 846 | |
| Expenses | |||
| Distribution fees - Class A | 1 | ||
| Distribution fees - Class R3 | 31 | ||
| Distribution fees - Class R5 | 2 | ||
| Shareholder servicing fees - Class R2 | 15 | ||
| Shareholder servicing fees - Class R3 | 31 | ||
| Shareholder servicing fees - Class R4 | 1 | ||
| Shareholder servicing fees - Class R5 | 2 | ||
| Total expenses | 83 | ||
| Net investment income (loss) | 763 | ||
| Net Realized and Unrealized Gain (Loss) | |||
| Net realized gain (loss) on: | |||
| Investments | 7,495 | ||
| Capital gain distributions from Underlying Funds | 361 | ||
| Net realized gain (loss) | 7,856 | ||
| Net change in unrealized appreciation (depreciation) on investments | (6,489 | ) | |
| Net realized and unrealized gain (loss) | 1,367 | ||
| Net Increase (Decrease) in Net Assets from Operations | $ | 2,130 | |
See accompanying notes which are an integral part of the financial statements.
204 In Retirement Fund
| Russell Investment Company | ||||||
| In Retirement Fund | ||||||
| Statements of Changes in Net Assets | ||||||
| For the Periods Ended October 31, | ||||||
| Amounts in thousands | 2014 | 2013 | ||||
| Increase (Decrease) in Net Assets | ||||||
| Operations | ||||||
| Net investment income (loss) | $ | 763 | $ | 1,928 | ||
| Net realized gain (loss) | 7,856 | 2,917 | ||||
| Net change in unrealized appreciation (depreciation) | (6,489 | ) | (994 | ) | ||
| Net increase (decrease) in net assets from operations | 2,130 | 3,851 | ||||
| Distributions | ||||||
| From net investment income | ||||||
| Class A | (8 | ) | (25 | ) | ||
| Class R1 | (486 | ) | (1,058 | ) | ||
| Class R2 | (91 | ) | (274 | ) | ||
| Class R3 | (179 | ) | (551 | ) | ||
| Class R4 | (17 | ) | — | |||
| Class R5 | (24 | ) | — | |||
| From net realized gain | ||||||
| Class A | (21 | ) | (4 | ) | ||
| Class R1 | (1,259 | ) | (151 | ) | ||
| Class R2 | (273 | ) | (44 | ) | ||
| Class R3 | (729 | ) | (95 | ) | ||
| Net decrease in net assets from distributions | (3,087 | ) | (2,202 | ) | ||
| Share Transactions* | ||||||
| Net increase (decrease) in net assets from share transactions | (24,603 | ) | (16,981 | ) | ||
| Total Net Increase (Decrease) in Net Assets | (25,560 | ) | (15,332 | ) | ||
| Net Assets | ||||||
| Beginning of period | 56,701 | 72,033 | ||||
| End of period | $ | 31,141 | $ | 56,701 | ||
| Undistributed (overdistributed) net investment income included in net assets | $ | 1 | $ | 43 | ||
See accompanying notes which are an integral part of the financial statements.
In Retirement Fund 205
Russell Investment Company In Retirement Fund
Statements of Changes in Net Assets, continued
* Share transaction amounts (in thousands) for the periods ended October 31, 2014 and October 31, 2013 were as follows:
| 2014 | 2013 | |||||||||||
| Shares | Dollars | Shares | Dollars | |||||||||
| Class A | ||||||||||||
| Proceeds from shares sold | — | $ | — | — | $ | — | ||||||
| Proceeds from reinvestment of distributions | 3 | 29 | 3 | 29 | ||||||||
| Payments for shares redeemed | (3 | ) | (29 | ) | (55 | ) | (601 | ) | ||||
| Net increase (decrease) | — | — | (52 | ) | (572 | ) | ||||||
| Class R1 | ||||||||||||
| Proceeds from shares sold | 494 | 5,253 | 821 | 8,761 | ||||||||
| Proceeds from reinvestment of distributions | 167 | 1,739 | 115 | 1,206 | ||||||||
| Payments for shares redeemed | (1,973 | ) | (21,007 | ) | (1,693 | ) | (18,011 | ) | ||||
| Net increase (decrease) | (1,312 | ) | (14,015 | ) | (757 | ) | (8,044 | ) | ||||
| Class R2 | ||||||||||||
| Proceeds from shares sold | 261 | 2,766 | 264 | 2,817 | ||||||||
| Proceeds from reinvestment of distributions | 35 | 364 | 30 | 318 | ||||||||
| Payments for shares redeemed | (1,013 | ) | (10,830 | ) | (614 | ) | (6,537 | ) | ||||
| Net increase (decrease) | (717 | ) | (7,700 | ) | (320 | ) | (3,402 | ) | ||||
| Class R3 | ||||||||||||
| Proceeds from shares sold | 212 | 2,253 | 860 | 9,148 | ||||||||
| Proceeds from reinvestment of distributions | 87 | 907 | 62 | 646 | ||||||||
| Payments for shares redeemed | (2,041 | ) | (21,663 | ) | (1,387 | ) | (14,757 | ) | ||||
| Net increase (decrease) | (1,742 | ) | (18,503 | ) | (465 | ) | (4,963 | ) | ||||
| Class R4 | ||||||||||||
| Proceeds from shares sold | 555 | 5,898 | — | — | ||||||||
| Proceeds from reinvestment of distributions | 1 | 17 | — | — | ||||||||
| Payments for shares redeemed | (15 | ) | (162 | ) | — | — | ||||||
| Net increase (decrease) | 541 | 5,753 | — | — | ||||||||
| Class R5 | ||||||||||||
| Proceeds from shares sold | 961 | 10,191 | — | — | ||||||||
| Proceeds from reinvestment of distributions | 2 | 24 | — | — | ||||||||
| Payments for shares redeemed | (33 | ) | (353 | ) | — | — | ||||||
| Net increase (decrease) | 930 | 9,862 | — | — | ||||||||
| Total increase (decrease) | (2,300 | ) | $ | (24,603 | ) | (1,594 | ) | $ | (16,981 | ) | ||
See accompanying notes which are an integral part of the financial statements.
206 In Retirement Fund
(This page intentionally left blank)
| Russell Investment Company | ||||||||||||||||
| In Retirement Fund | ||||||||||||||||
| Financial Highlights — For the Periods Ended | ||||||||||||||||
| For a Share Outstanding Throughout Each Period. | ||||||||||||||||
| $ | ||||||||||||||||
| $ | Net | $ | $ | $ | $ | |||||||||||
| Net Asset Value, | Investment | Net Realized | Total from | Distributions | Distributions | |||||||||||
| Beginning of | Income (Loss) | and Unrealized | Investment | from Net | from Net | |||||||||||
| Period | (a)(b)(e) | Gain (Loss) | Operations | Investment Income | Realized Gain | |||||||||||
| Class A | ||||||||||||||||
| October 31, 2014 | 11.05 | .17 | .33 | .50 | (.19 | ) | (.48 | ) | ||||||||
| October 31, 2013 | 10.74 | .36 | .29 | .65 | (.29 | ) | (.05 | ) | ||||||||
| October 31, 2012 | 10.10 | .25 | .55 | .80 | (.12 | ) | (.04 | ) | ||||||||
| October 31, 2011(2) | 10.25 | .14 | (.15 | ) | (.01 | ) | (.14 | ) | — | |||||||
| Class R1 | ||||||||||||||||
| October 31, 2014 | 10.90 | .21 | .31 | .52 | (.22 | ) | (.48 | ) | ||||||||
| October 31, 2013 | 10.60 | .33 | .34 | .67 | (.32 | ) | (.05 | ) | ||||||||
| October 31, 2012 | 10.10 | .27 | .55 | .82 | (.28 | ) | (.04 | ) | ||||||||
| October 31, 2011 | 10.28 | .24 | .07 | .31 | (.45 | ) | (.04 | ) | ||||||||
| October 31, 2010 | 9.27 | .27 | 1.04 | 1.31 | (.30 | ) | — | |||||||||
| Class R4(3) | ||||||||||||||||
| October 31, 2014 | 10.90 | .17 | .33 | .50 | (.19 | ) | (.48 | ) | ||||||||
| October 31, 2013 | 10.60 | .32 | .32 | .64 | (.29 | ) | (.05 | ) | ||||||||
| October 31, 2012 | 10.10 | .27 | .52 | .79 | (.25 | ) | (.04 | ) | ||||||||
| October 31, 2011 | 10.28 | .27 | .01 | .28 | (.42 | ) | (.04 | ) | ||||||||
| October 31, 2010 | 9.27 | .28 | 1.01 | 1.29 | (.28 | ) | — | |||||||||
| Class R5(4) | ||||||||||||||||
| October 31, 2014 | 10.88 | .16 | .30 | .46 | (.16 | ) | (.48 | ) | ||||||||
| October 31, 2013 | 10.58 | .27 | .34 | .61 | (.26 | ) | (.05 | ) | ||||||||
| October 31, 2012 | 10.08 | .24 | .53 | .77 | (.23 | ) | (.04 | ) | ||||||||
| October 31, 2011 | 10.27 | .19 | .07 | .26 | (.41 | ) | (.04 | ) | ||||||||
| October 31, 2010 | 9.26 | .23 | 1.04 | 1.27 | (.26 | ) | — | |||||||||
See accompanying notes which are an integral part of the financial statements.
208 In Retirement Fund
| % | % | % | |||||||||||||||
| $ | $ | Ratio of Expenses | Ratio of Expenses | Ratio of Net | |||||||||||||
| Net Asset Value, | % | Net Assets, | to Average | to Average | Investment Income | % | |||||||||||
| $ | End of | Total | End of Period | Net Assets, | Net Assets, | to Average | Portfolio | ||||||||||
| Total Distributions | Period | Return(c)(d) | (000 | ) | Gross(f)(g) | Net(e)(f)(g) | Net Assets(b)(c)(e) | Turnover Rate(c) | |||||||||
| (.67 | ) | 10.88 | 4.75 | 486 | .25 | .25 | 1.60 | 34 | |||||||||
| (.34 | ) | 11.05 | 6.15 | 493 | .25 | .25 | 3.30 | 19 | |||||||||
| (.16 | ) | 10.74 | 8.01 | 1,035 | .25 | .25 | 2.43 | 20 | |||||||||
| (.14 | ) | 10.10 | (.06 | ) | 1,012 | .25 | .25 | 1.40 | 43 | ||||||||
| (.70 | ) | 10.72 | 5.00 | 14,897 | — | — | 1.95 | 34 | |||||||||
| (.37 | ) | 10.90 | 6.48 | 29,451 | — | — | 3.10 | 19 | |||||||||
| (.32 | ) | 10.60 | 8.32 | 36,665 | — | — | 2.66 | 20 | |||||||||
| (.49 | ) | 10.10 | 3.10 | 36,059 | — | — | 2.35 | 43 | |||||||||
| (.30 | ) | 10.28 | 14.43 | 736 | 2.13 | — | 2.80 | 52 | |||||||||
| (.67 | ) | 10.73 | 4.81 | 5,804 | .25 | .25 | 1.56 | 34 | |||||||||
| (.34 | ) | 10.90 | 6.16 | 7,818 | .25 | .25 | 2.95 | 19 | |||||||||
| (.29 | ) | 10.60 | 8.05 | 10,996 | .25 | .25 | 2.59 | 20 | |||||||||
| (.46 | ) | 10.10 | 2.84 | 17,288 | .25 | .25 | 2.60 | 43 | |||||||||
| (.28 | ) | 10.28 | 14.16 | 3,809 | 2.47 | .25 | 2.86 | 52 | |||||||||
| (.64 | ) | 10.70 | 4.43 | 9,954 | .50 | .50 | 1.47 | 34 | |||||||||
| (.31 | ) | 10.88 | 5.90 | 18,939 | .50 | .50 | 2.57 | 19 | |||||||||
| (.27 | ) | 10.58 | 7.78 | 23,337 | .50 | .50 | 2.35 | 20 | |||||||||
| (.45 | ) | 10.08 | 2.55 | 36,445 | .50 | .50 | 1.90 | 43 | |||||||||
| (.26 | ) | 10.27 | 13.88 | 1,426 | 2.71 | .50 | 2.39 | 52 | |||||||||
See accompanying notes which are an integral part of the financial statements.
In Retirement Fund 209
Russell Investment Company LifePoints® Funds
Notes to Financial Highlights — October 31, 2014
| (1) | For the period January 1, 2011 (commencement of operations) to October 31, 2011. |
| (2) | For the period February 28, 2011 (commencement of operations) to October 31, 2011. |
| (3) | As of October 1, 2014, Class R2 shares were reclassified as Class R4 shares and all shareholders were issued shares of Class R4. Class R2 shares are no longer offered. The financial highlights for the period ended October 31, 2014 reflect a consolidation of the financial activity of Class R2 shares for the period November 1, 2013 through October 1, 2014 and the financial activity of Class R4 shares for the period October 2, 2014 through October 31, 2014. All prior periods reflect the financial activity of Class R2 shares. |
| (4) | As of October 1, 2014, Class R3 shares were reclassified as Class R5 shares and all shareholders were issued shares of Class R5. Class R3 shares are no longer offered. The financial highlights for the period ended October 31, 2014 reflect a consolidation of the financial activity of Class R3 shares for the period November 1, 2013 through October 1, 2014 and the financial activity of Class R5 shares for the period October 2, 2014 through October 31, 2014. All prior periods reflect the financial activity of Class R3 shares. |
| (a) | Average daily shares outstanding were used for this calculation. |
| (b) | Recognition of net investment income by the Fund is affected by the timing of the declaration of dividends by the Underlying Funds in which the Fund invests. |
| (c) | The ratios for periods less than one year are not annualized. |
| (d) | Total return for Class A does not reflect a front-end sales charge. If sales charges were included, the total return would be lower. |
| (e) | May reflect amounts waived and/or reimbursed by Russell Investment Management Company (“RIMCo”) and/or Russell Fund Services Company (“RFSC”). |
| (f) | The ratios for periods less than one year are annualized. |
| (g) | The calculation includes only those expenses charged directly to the Fund and does not include expenses charged to the Underlying Funds in which the Fund invests. |
| (h) | Less than $.01 per share. |
210 Notes to Financial Highlights
Russell Investment Company LifePoints® Funds
Notes to Financial Statements — October 31, 2014
| 1. Organization | |||||||||
| Russell Investment Company (the “Investment Company” or “RIC”) is a series investment company with 39 different investment | |||||||||
| portfolios referred to as funds (each a “Fund” and collectively the “Funds”). These financial statements report on 15 of these Funds. | |||||||||
| The Investment Company is registered under the Investment Company Act of 1940, as amended (“Investment Company Act”), as | |||||||||
| an open-end management investment company. It is organized and operated as a Massachusetts business trust under a Second | |||||||||
| Amended and Restated Master Trust Agreement dated October 1, 2008, as amended (“Master Trust Agreement”). The Investment | |||||||||
| Company’s Master Trust Agreement permits the Board of Trustees (the “Board”) to issue an unlimited number of shares of beneficial | |||||||||
| interest. | |||||||||
| Target Portfolio Funds | |||||||||
| Each of the Target Portfolio Funds listed in the table below is a “fund of funds” and diversifies its assets by investing, at present, | |||||||||
| in shares of several other RIC Funds (the “Underlying Funds”). Each Fund seeks to achieve its specific investment objective by | |||||||||
| investing in different combinations of Underlying Funds. Each Fund currently intends to invest only in the Underlying Funds. The | |||||||||
| following table shows each Fund’s target strategic asset allocation to equity Underlying Funds, fixed income Underlying Funds and | |||||||||
| alternative Underlying Funds. The equity Underlying Funds in which the Funds may invest include the Russell U.S. Core Equity, | |||||||||
| Russell U.S. Defensive Equity, Russell U.S. Dynamic Equity, Russell U.S. Small Cap Equity, Russell International Developed | |||||||||
| Markets, Russell Global Equity and Russell Emerging Markets Funds. The fixed income Underlying Funds in which the Funds may | |||||||||
| invest include the Russell Global Opportunistic Credit, Russell Strategic Bond, Russell Investment Grade Bond and Russell Short | |||||||||
| Duration Bond Funds. The alternative Underlying Funds in which the Funds may invest include the Russell Commodity Strategies, | |||||||||
| Russell Global Infrastructure, Russell Global Real Estate Securities and Russell Multi-Strategy Alternative Funds. Each Fund | |||||||||
| intends its strategy of investing in combinations of equity, fixed income and alternative Underlying Funds to result in investment | |||||||||
| diversification that an investor could otherwise achieve only by holding numerous individual investments. | |||||||||
| Russell Investment Management Company (“RIMCo”), the Funds’ investment adviser, may modify the target asset allocation for | |||||||||
| any Fund, including changes to the Underlying Funds in which a Fund invests from time to time. RIMCo’s allocation decisions | |||||||||
| are generally based on capital markets research, including factors such as RIMCo’s outlook for the economy, financial markets | |||||||||
| generally, and/or relative market valuation of the asset classes represented by each Underlying Fund. A Fund’ actual allocation may | |||||||||
| vary from the target strategic asset allocation at any point in time (1) due to market movements, (2) by up to +/- 5% at the equity, | |||||||||
| fixed income or alternative category level based on RIMCo’s capital markets research, and/or (3) due to the implementation over a | |||||||||
| period of time of a change to the target strategic asset allocation including the addition of a new Underlying Fund. There may be no | |||||||||
| changes in the asset allocation or to the Underlying Funds in a given year or such changes may be made one or more times in a year. | |||||||||
| In the future, the Funds may also invest in other Underlying Funds that pursue investment strategies not pursued by the current | |||||||||
| Underlying Funds or represent asset classes which are not currently represented by the Underlying Funds. | |||||||||
| The following table shows the Target Portfolio Funds’ target strategic asset allocations to equity Underlying Funds, fixed income | |||||||||
| Underlying Funds and alternative Underlying Funds as of March 1, 2014. | |||||||||
| Asset Allocation Targets as of March 1, 2014* | |||||||||
| Conservative | Moderate | Balanced | Growth | Equity Growth | |||||
| Underlying Funds | Strategy Fund | Strategy Fund | Strategy Fund | Strategy Fund | Strategy Fund | ||||
| Alternative Underlying Funds** | 10% | 14% | 14 | % | 19 | % | 19 | % | |
| Equity Underlying Funds | 18% | 31% | 54 | % | 65 | % | 73 | % | |
| Fixed Income Underlying Funds | 72% | 55% | 32 | % | 16 | % | 8 | % | |
| * | Prospectus dated March 1, 2014. Actual asset allocation may vary. | ||||||||
| ** | Alternative Underlying Funds pursue investment strategies that differ from those of traditional broad market equity or fixed income funds or that seek | ||||||||
| returns with a low correlation to global equity markets. | |||||||||
| Target Date Funds | |||||||||
| Each of the Target Date Funds listed in the table below is a “fund of funds” and seeks to achieve its objective by investing in | |||||||||
| shares of several of the Underlying Funds which represent various asset classes. Each Fund currently intends to invest only in the | |||||||||
| Underlying Funds. The following table shows each Fund’s target strategic asset allocation to equity Underlying Funds, fixed income | |||||||||
| Underlying Funds and alternative Underlying Funds. The equity Underlying Funds in which the Funds may invest include the | |||||||||
| Russell U.S. Defensive Equity, Russell U.S. Dynamic Equity, Select U.S. Equity, | Russell U.S. Small Cap Equity, Russell Global | ||||||||
| Equity, Select International Equity and Russell Emerging Markets Funds. The fixed income Underlying Funds in which the Funds | |||||||||
Notes to Financial Statements 211
Russell Investment Company LifePoints® Funds
Notes to Financial Statements, continued — October 31, 2014
| may invest include the Russell Global Opportunistic Credit, Russell Strategic Bond, Russell Investment Grade Bond and Russell | |||||||||||
| Short Duration Bond Funds. The alternative Underlying Funds in which the Funds may invest include the Russell Commodity | |||||||||||
| Strategies, Russell Global Infrastructure and Russell Global Real Estate Securities Funds. The 2015 Strategy, 2020 Strategy, | |||||||||||
| 2025 Strategy, 2030 Strategy, 2035 Strategy, 2040 Strategy, 2045 Strategy, 2050 Strategy and 2055 Strategy Funds are referred | |||||||||||
| to herein as the “Strategy Funds.” The allocation of each Strategy Fund’s assets to the Underlying Funds in which it invests will | |||||||||||
| become more conservative over time until approximately the year indicated in the Fund name, the “target year,” at which time the | |||||||||||
| allocation will remain fixed. The Strategy Funds are designed for investors who plan to retire close to the target year indicated in | |||||||||||
| the Fund name. The allocation of the In Retirement Fund’s assets to the Underlying Funds in which it invests does not shift over | |||||||||||
| time. The In Retirement Fund is intended for investors who have reached retirement age and are no longer contributing to their | |||||||||||
| retirement savings. RIMCo may modify the target asset allocation for any Fund, including changes to the Underlying Funds in | |||||||||||
| which a Fund invests, from time to time. RIMCo’s allocation decisions are generally based on strategic capital markets research | |||||||||||
| including factors such as RIMCo’s outlook for the economy, financial markets generally, and/or relative market valuation of the asset | |||||||||||
| classes represented by each Underlying Fund. A Fund’s actual allocation may vary from the target strategic asset allocation at any | |||||||||||
| point in time (1) due to market movements, (2) by up to +/- 5% at the equity, fixed income or alternative category level based on | |||||||||||
| RIMCo’s capital markets research, and/or (3) due to the implementation over a period of time of a change to the target strategic asset | |||||||||||
| allocation including the addition of a new Underlying Fund. There may be no changes in the asset allocation or to the Underlying | |||||||||||
| Funds in a given year or such changes may be made one or more times in a year. | |||||||||||
| In the future, the Funds may also invest in other Underlying Funds that pursue investment strategies not pursued by the current | |||||||||||
| Underlying Funds or represent asset classes which are not currently represented by the Underlying Funds. | |||||||||||
| The following table shows the Target Date Funds’ approximate expected allocations to equity Underlying Funds, fixed income | |||||||||||
| Underlying Funds and alternative Underlying Funds effective on or about August 1, 2014. | |||||||||||
| Asset Allocation Targets as of August 1, 2014* | |||||||||||
| 2015 | 2020 | 2025 | 2030 | 2035 | |||||||
| Underlying Funds | Strategy Fund | Strategy Fund | Strategy Fund | Strategy Fund | Strategy Fund | ||||||
| Alternative Underlying Funds** | 7 | % | 7 | % | 8 | % | 8 | % | 10 | % | |
| Equity Underlying Funds | 29 | % | 39 | % | 49 | % | 62 | % | 77 | % | |
| Fixed Income Underlying Funds | 64 | % | 54 | % | 43 | % | 30 | % | 13 | % | |
| Asset Allocation Targets as of August 1, 2014* | |||||||||||
| 2040 | 2045 | 2050 | 2055 | In Retirement | |||||||
| Underlying Funds | Strategy Fund | Strategy Fund | Strategy Fund | Strategy Fund | Fund | ||||||
| Alternative Underlying Funds** | 11 | % | 11 | % | 11 | % | 11 | % | 7 | % | |
| Equity Underlying Funds | 82 | % | 82 | % | 82 | % | 82 | % | 27 | % | |
| Fixed Income Underlying Funds | 7 | % | 7 | % | 7 | % | 7 | % | 66 | % | |
| * | Prospectus dated March 1, 2014 as supplemented through August 1, 2014. | ||||||||||
| ** | Alternative Underlying Funds pursue investment strategies that differ from those of traditional broad market equity or fixed income funds or that seek | ||||||||||
| returns with a low correlation to global equity markets. | |||||||||||
| 2. Significant Accounting Policies | |||||||||||
| The Funds’ financial statements are prepared in accordance with U.S. generally accepted accounting principles (“U.S. GAAP”) | |||||||||||
| which require the use of management estimates and assumptions at the date of the financial statements. Actual results could differ | |||||||||||
| from those estimates. The following is a summary of the significant accounting policies consistently followed by each Fund in the | |||||||||||
| preparation of its financial statements. | |||||||||||
| Security Valuation | |||||||||||
| The Funds value their portfolio securities, the shares of the Underlying Funds, at the current net asset value per share of each | |||||||||||
| Underlying Fund. | |||||||||||
| Fair value of securities is defined as the price that the Funds would receive upon selling an investment in a timely transaction to | |||||||||||
| an independent buyer in the principal or most advantageous market for the investment. To increase consistency and comparability | |||||||||||
| in fair value measurement, the fair value hierarchy was established to maximize the use of observable market data and minimize | |||||||||||
| the use of unobservable inputs and to establish classification of fair value measurements for disclosure purposes. Inputs refer | |||||||||||
| broadly to the assumptions that market participants would use in pricing the asset or liability, including assumptions about risk | |||||||||||
| (e.g., the risk inherent in a particular valuation technique, such as a pricing model or the risks inherent in the inputs to a particular | |||||||||||
| 212 Notes to Financial Statements | |||||||||||
Russell Investment Company LifePoints® Funds
Notes to Financial Statements, continued — October 31, 2014
| valuation technique). Inputs may be observable or unobservable. Observable inputs reflect the assumptions market participants | |
| would use in pricing the asset or liability developed based on market data obtained from sources independent of the reporting entity. | |
| Unobservable inputs reflect the reporting entity’s own assumptions about the assumptions market participants would use in pricing | |
| the asset or liability developed based on the best information available in the circumstances. | |
| The fair value hierarchy of inputs is summarized in the three broad levels listed below. | |
| • | Level 1 — Quoted prices (unadjusted) in active markets or exchanges for identical assets and liabilities. |
| • | Level 2 — Inputs other than quoted prices included within Level 1 that are observable, which may include, but are not |
| limited to, quoted prices for similar assets or liabilities in markets that are active, quoted prices for identical or similar assets | |
| or liabilities in markets that are not active, inputs such as interest rates, yield curves, implied volatilities, credit spreads or | |
| other market corroborated inputs. | |
| • | Level 3 — Significant unobservable inputs based on the best information available in the circumstances, to the extent |
| observable inputs are not available, which may include assumptions made by Russell Fund Services Company ("RFSC"), | |
| acting at the discretion of the Board, that are used in determining the fair value of investments. | |
| All the Funds' investments for the period ended October 31, 2014, were valued using Level 1 inputs. | |
| Investment Transactions | |
| Investment transactions are reflected as of the trade date for financial reporting purposes. This may cause the net asset value | |
| (“NAV”) stated in the financial statements to be different from the NAV at which shareholders may transact. Realized gains and | |
| losses from securities transactions, if applicable, are recorded on the basis of specific identified cost incurred within a particular | |
| Underlying Fund. | |
| Investment Income | |
| Distributions of income and capital gains from the Underlying Funds are recorded on the ex-dividend date. | |
| Federal Income Taxes | |
| Since the Investment Company is a Massachusetts business trust, each Fund is a separate corporate taxpayer and determines its | |
| net investment income and capital gains (or losses) and the amounts to be distributed to each Fund’s shareholders without regard | |
| to the income and capital gains (or losses) of the other Funds. | |
| For each year, each Fund intends to qualify as a regulated investment company under sub-chapter M of the Internal Revenue Code | |
| (the “Code”) and intends to distribute all of its taxable income and capital gains. Therefore, no federal income tax provision is | |
| required for the Funds. | |
| Each Fund files a U.S. tax return. At October 31, 2014, the Funds had recorded no liabilities for net unrecognized tax benefits | |
| relating to uncertain income tax positions they have taken or expect to take in future tax returns. While the statute of limitations | |
| remains open to examine the Funds’ U.S. tax returns filed for the fiscal years ended October 31, 2011 through October 31, 2013, | |
| no examinations are in progress or anticipated at this time. The Funds are not aware of any tax positions for which it is reasonably | |
| possible that the total amounts of unrecognized tax benefits will significantly change in the next twelve months. | |
| The Funds comply with the authoritative guidance for uncertainty in income taxes which requires management to determine whether | |
| a tax position of the Funds is more likely than not to be sustained upon examination, including resolution of any related appeals or | |
| litigation processes, based on the technical merits of the position. For tax positions meeting the more likely than not threshold, the | |
| tax amount recognized in the financial statements is reduced by the largest benefit that has a greater than 50% likelihood of being | |
| realized upon ultimate settlement with the relevant taxing authority. Management determined that no accruals need to be made in | |
| the financial statements due to uncertain tax positions. Management continually reviews and adjusts the Funds’ liability for income | |
| taxes based on analyses of tax laws and regulations, as well as their interpretations, and other relevant factors. | |
| Dividends and Distributions to Shareholders | |
| Income dividends, capital gain distributions and return of capital, if any, are recorded on the ex-dividend date. Income dividends | |
| are generally declared and paid quarterly. Capital gain distributions are generally declared and paid annually. An additional | |
| distribution may be paid by the Funds to avoid imposition of federal income and excise tax on any remaining undistributed capital | |
| gains and net investment income. | |
Notes to Financial Statements 213
Russell Investment Company LifePoints® Funds
Notes to Financial Statements, continued — October 31, 2014
The timing and characterization of certain income and capital gain distributions are determined in accordance with federal tax regulations which may differ from U.S. GAAP. As a result, net investment income and net realized gain (or loss) from investment transactions for a reporting period may differ significantly from distributions during such period. The differences between tax regulations and U.S. GAAP primarily relate to investments in the Underlying Funds sold at a loss, wash sale deferrals and capital loss carryforwards. Accordingly, the Funds may periodically make reclassifications among certain of their capital accounts without impacting their net asset values.
Expenses
Expenses included in the accompanying financial statements reflect the expenses of each Fund and do not include those expenses incurred by the Underlying Funds. Because the Underlying Funds have varied expense and fee levels and the Funds may own different proportions of the Underlying Funds at different times, the amount of the Underlying Funds’ fees and expenses incurred indirectly by the Funds will vary.
Class Allocation
Each of the Funds presented herein may offer certain of the following classes of shares: Class A, Class C, Class E, Class R1, Class R4, Class R5 and Class S. All share classes have identical voting, dividend, liquidation and other rights and the same terms and conditions. The separate classes of shares differ principally in the applicable sales charges, distribution fees and shareholder servicing fees. Shareholders of each class bear certain expenses that pertain to that particular class. Realized and unrealized gains (losses), investment income, and expenses with the exception of class level expenses, are allocated daily to each class of shares based upon the relative proportion of net assets of each class.
Guarantees
In the normal course of business, the Funds enter into contracts that contain a variety of representations which provide general indemnifications. The Funds’ maximum exposure under these arrangements is unknown as this would involve future claims that may be made against the Funds that have not yet occurred. However, the Funds expect the risk of loss to be remote.
Market, Credit and Counterparty Risk
In the normal course of business, the Underlying Funds trade financial instruments and enter into financial transactions where risk of potential loss exists due to changes in the market (market risk) or failure of the other party to a transaction to perform (credit risk). Similar to credit risk, the Underlying Funds may also be exposed to counterparty risk or risk that an institution or other entity with which the Underlying Funds have unsettled or open transactions will default. The potential loss could exceed the value of the relevant assets recorded in the Underlying Funds’ financial statements (the “Assets”). The Assets consist principally of cash due from counterparties and investments. The extent of the Underlying Funds’ exposure to market, credit and counterparty risks with respect to the Assets approximates their carrying value as recorded in the Underlying Funds’ Statements of Assets and Liabilities.
Global economies and financial markets are becoming increasingly interconnected and political and economic conditions (including recent instability and volatility) and events (including natural disasters) in one country, region or financial market may adversely impact issuers in a different country, region or financial market. As a result, issuers of securities held by an Underlying Fund may experience significant declines in the value of their assets and even cease operations. Such conditions and/or events may not have the same impact on all types of securities and may expose an Underlying Fund to greater market and liquidity risk and potential difficulty in valuing portfolio instruments held. This could cause an Underlying Fund to underperform other types of investments.
3. Investment Transactions
Securities
During the period ended October 31, 2014, purchases and sales of the Underlying Funds were as follows:
214 Notes to Financial Statements
Russell Investment Company LifePoints® Funds
Notes to Financial Statements, continued — October 31, 2014
| Purchases | Sales | |||
| Conservative Strategy Fund | $ | 143,089,298 | $ | 216,608,816 |
| Moderate Strategy Fund | 129,044,471 | 259,463,115 | ||
| Balanced Strategy Fund | 706,753,139 | 1,161,463,228 | ||
| Growth Strategy Fund | 516,337,899 | 715,252,777 | ||
| Equity Growth Strategy Fund | 235,483,466 | 369,314,989 | ||
| 2015 Strategy Fund | 14,317,800 | 25,131,031 | ||
| 2020 Strategy Fund | 66,898,559 | 149,928,524 | ||
| 2025 Strategy Fund | 26,818,469 | 39,752,591 | ||
| 2030 Strategy Fund | 92,100,995 | 151,240,285 | ||
| 2035 Strategy Fund | 22,810,985 | 26,648,934 | ||
| 2040 Strategy Fund | 78,358,836 | 119,286,962 | ||
| 2045 Strategy Fund | 12,359,731 | 15,351,235 | ||
| 2050 Strategy Fund | 15,495,125 | 20,614,000 | ||
| 2055 Strategy Fund | 3,926,522 | 3,468,009 | ||
| In Retirement Fund | 14,905,290 | 41,475,465 |
4. Related Party Transactions, Fees and Expenses
Adviser, Administrator, Transfer and Dividend Disbursing Agent
RIMCo advises the Funds and RFSC is the Funds’ administrator and transfer and disbursing agent. RFSC is a wholly-owned subsidiary of RIMCo. RIMCo is a wholly-owned subsidiary of Frank Russell Company (a subsidiary of The Northwestern Mutual Life Insurance Company as of October 31, 2014). Frank Russell Company provides ongoing money manager research to RIC and RIMCo. Please refer to note 10, Subsequent Events for an update regarding this information.
Target Portfolio Funds
With respect to the Target Portfolio Funds, the advisory fee of 0.20% and administrative fee of up to 0.05% are based upon the average daily net assets of the Funds and are payable monthly. The following shows the total amount of each of these fees paid by the Funds for the period ended October 31, 2014:
| Advisory | Administrative | |||
| Conservative Strategy Fund | $ | 1,097,823 | $ | 250,206 |
| Moderate Strategy Fund | 1,792,010 | 408,469 | ||
| Balanced Strategy Fund | 7,475,512 | 1,703,615 | ||
| Growth Strategy Fund | 4,738,131 | 1,079,627 | ||
| Equity Growth Strategy Fund | 2,002,630 | 456,436 |
RFSC is paid a fee based upon the average daily net assets of the Funds for transfer agency and dividend disbursing services. RFSC retains a portion of this fee for its services provided to the Funds and pays the balance to unaffiliated agents who assist in providing these services. The following shows the total amount of this fee paid by the Funds for the period ended October 31, 2014:
| Amount | ||
| Conservative Strategy Fund | $ | 1,097,823 |
| Moderate Strategy Fund | 1,792,010 | |
| Balanced Strategy Fund | 7,475,512 | |
| Growth Strategy Fund | 4,738,131 | |
| Equity Growth Strategy Fund | 2,002,630 |
Target Date Funds
For the 2015 Strategy, 2020 Strategy, 2025 Strategy, 2030 Strategy, 2035 Strategy, 2040 Strategy, 2045 Strategy, 2050 Strategy, 2055 Strategy and In Retirement Funds, effective October 1, 2010, RIMCo agreed to assume the responsibility of payment for all operating expenses other than Rule 12b-1 distribution fees, shareholder services fees, extraordinary expenses or the expenses of other investment companies in which the Funds invest which are borne directly by the Funds.
Notes to Financial Statements 215
Russell Investment Company LifePoints® Funds
Notes to Financial Statements, continued — October 31, 2014
Waivers and Reimbursements
Target Portfolio Funds
Until February 28, 2015, RIMCo has contractually agreed to waive up to the full amount of its 0.20% advisory fee and then reimburse each Fund for other direct Fund-level expenses to the extent that direct Fund-level expenses exceed 0.12% of the average daily net assets of the Fund on an annual basis. Direct Fund-level operating expenses do not include transfer agency fees, Rule 12b-1 distribution fees, shareholder servicing fees, extraordinary expenses or the expenses of other investment companies in which the Funds invest which are borne indirectly by the Funds. These waivers and reimbursements may not be terminated during the relevant period except with Board approval.
Until February 28, 2015, RFSC has contractually agreed to waive 0.15% of its transfer agency fees for Class R1, R2, R3, R4 and R5 Shares. This waiver may not be terminated during the relevant period except with Board approval.
Until February 28, 2015, RFSC has contractually agreed to waive 0.02% of its transfer agency fees for Class A, C, E and S Shares. This waiver may not be terminated during the relevant period except with Board approval.
As of October 31, 2014, RIMCo and RFSC waived the following expenses:
| RIMCo Waiver | RFSC Waiver | Total | ||||
| Conservative Strategy Fund | $ | 971,465 | $ | 212,113 | $ | 1,183,578 |
| Moderate Strategy Fund | 1,464,383 | 339,764 | 1,804,147 | |||
| Balanced Strategy Fund | 5,500,668 | 1,449,874 | 6,950,542 | |||
| Growth Strategy Fund | 3,525,900 | 924,148 | 4,450,048 | |||
| Equity Growth Strategy Fund | 1,535,205 | 426,887 | 1,962,092 | |||
Distributor and Shareholder Servicing
Russell Financial Services, Inc. (the “Distributor”), a wholly owned subsidiary of RIMCo, is the distributor for the Investment Company, pursuant to a distribution agreement with the Investment Company.
The Investment Company has distribution plans pursuant to Rule 12b-1 (the “Plans”) under the Investment Company Act. Under the Plans, the Investment Company is authorized to make payments to the Distributor or any selling agents, as defined in the Plans, for sales support services provided, and related expenses incurred which are primarily intended to result in the sale of the Class A, Class C, Class R3 and Class R5 Shares subject to the Plans. The 12b-1 distribution payments shall not exceed 0.25% of the average daily net assets of a Fund’s Class A, Class R3 or Class R5 Shares or 0.75% of the average daily net assets of a Fund’s Class C Shares on an annual basis.
Under the Plan for Class R4 and Class R5 Shares, the Funds may make payments to the Distributor or any servicing agent for any activities or expenses primarily intended to assist, support or service the servicing agents’ clients who beneficially own Class R4 and Class R5 Shares of the Funds. The shareholder servicing payments shall not exceed 0.25% of the average daily net assets of a Fund’s Class R4 and Class R5 Shares on an annual basis.
In addition, the Investment Company has adopted a Shareholder Services Plan under which the Funds may make payments to the Distributor or any servicing agent for any activities or expenses primarily intended to assist, support or service the servicing agents’ clients who beneficially own Class C, Class E, Class R2 and Class R3 Shares of the Funds. The shareholder servicing payments shall not exceed 0.25% of the average daily net assets of a Fund’s Class C, Class E, Class R2 and Class R3 Shares on an annual basis.
Pursuant to the rules of the Financial Industry Regulatory Authority (“FINRA”), the aggregate initial sales charges, deferred sales charges and asset-based sales charges on Class A, Class C, Class E, Class R2, Class R3, Class R4 and Class R5 Shares of the Funds may not exceed 7.25%, 6.25%, 6.25%, 6.25%, 6.25%, 6.25% and 6.25%, respectively, of total gross sales, subject to certain exclusions. These limitations are imposed at the class level on each class of shares of each Fund rather than on a per shareholder basis. Therefore, long-term shareholders of the Class A, Class C, Class E, Class R2, Class R3, Class R4 or Class R5 Shares may pay more than the economic equivalent of the maximum sales charges permitted by FINRA.
216 Notes to Financial Statements
Russell Investment Company LifePoints® Funds
Notes to Financial Statements, continued — October 31, 2014
| For the period ended October 31, 2014, the Distributor retained the following amounts in sales charges: | ||||||
| Contingent Deferred Sales Charges | Class A Shares | |||||
| Balanced Strategy Fund | $ | 766 | ||||
| Equity Growth Strategy Fund | 4,935 | |||||
| For the period ended October 31, 2014, the sales commissions paid to the selling agents for the sale of Class A Shares were as | ||||||
| follows: | ||||||
| Aggregate | Class A Front-End | |||||
| Front-End | Sales Charges | |||||
| Sales Charges | Retained by | |||||
| on Class A Shares | Distributor | |||||
| Conservative Strategy Fund | $ | 294,902 | $ | 55,425 | ||
| Moderate Strategy Fund | 569,706 | 99,799 | ||||
| Balanced Strategy Fund | 2,803,851 | 481,564 | ||||
| Growth Strategy Fund | 2,313,415 | 377,710 | ||||
| Equity Growth Strategy Fund | 598,442 | 98,174 | ||||
| 2030 Strategy Fund | 248 | 32 | ||||
| 2040 Strategy Fund | 293 | 38 | ||||
| Accrued Fees Payable to Affiliates | ||||||
| Accrued fees payable to affiliates for the period ended October 31, 2014, were as follows: | ||||||
| Conservative Moderate Strategy Balanced Strategy Growth Strategy | Equity Growth | ||||||||||
| Strategy Fund | Fund | Fund | Fund | Strategy Fund | |||||||
| Advisory fees | $ | 6,057 | $ | 19,559 | $ | 146,259 | $ | 93,069 | $ | 39,295 | |
| Administration fees | 19,046 | 30,325 | 125,737 | 80,333 | 32,865 | ||||||
| Distribution fees | 165,450 | 244,825 | 1,031,252 | 647,312 | 260,446 | ||||||
| Shareholder servicing fees | 60,138 | 88,657 | 346,807 | 218,595 | 94,927 | ||||||
| Transfer agent fees | 71,871 | 114,878 | 468,423 | 297,135 | 120,579 | ||||||
| Trustee fees | 2,101 | 3,245 | 12,629 | 7,477 | 3,335 | ||||||
| $ | 324,663 | $ | 501,489 | $ | 2,131,107 | $ | 1,343,921 | $ | 551,447 | ||
| 2015 Strategy 2020 Strategy 2025 Strategy 2030 Strategy | 2035 Strategy | ||||||||||
| Fund | Fund | Fund | Fund | Fund | |||||||
| Distribution fees | $ | 1,906 | $ | 7,962 | $ | 2,434 | $ | 8,640 | $ | 2,267 | |
| Shareholder servicing fees | 3,244 | 11,006 | 4,043 | 11,768 | 3,841 | ||||||
| $ | 5,150 | $ | 18,968 | $ | 6,477 | $ | 20,408 | $ | 6,108 | ||
| 2040 Strategy 2045 Strategy 2050 Strategy 2055 Strategy | |||||||||||
| Fund | Fund | Fund | Fund | In Retirement Fund | |||||||
| Distribution fees | $ | 5,425 | $ | 844 | $ | 1,095 | $ | 136 | $ | 2,202 | |
| Shareholder servicing fees | 7,566 | 1,678 | 1,541 | 452 | 3,333 | ||||||
| $ | 12,991 | $ | 2,522 | $ | 2,636 | $ | 588 | $ | 5,535 | ||
Board of Trustees
The Russell Fund Complex consists of RIC, which has 39 funds, Russell Investment Funds (“RIF”), which has 9 funds and Russell
Exchange Traded Funds Trust (“RET”), which has 1 fund. Each of the Trustees is a Trustee of RIC, RIF and RET. During the
period, the Russell Fund Complex paid each of its independent Trustees a retainer of $87,000 per year (effective January 1, 2014,
$96,000); each of its interested Trustees a retainer of $75,000 per year; and each Trustee $7,000 for each regularly scheduled
meeting attended in person and $3,500 for each special meeting and the Annual 38a-1 meeting attended in person, and for each
Audit Committee meeting, Nominating and Governance Committee meeting, Investment Committee meeting or any other committee
meeting established and approved by the Board that is attended in person. Each Trustee receives a $1,000 fee for attending
regularly scheduled and special meetings by phone instead of receiving the full fee had the member attended in person (except for
telephonic meetings called pursuant to the Funds’ valuation and pricing procedures) and a $500 fee for attending the committee
Notes to Financial Statements 217
Russell Investment Company LifePoints® Funds
Notes to Financial Statements, continued — October 31, 2014
meeting by phone instead of receiving the full fee had the member attended in person. Trustees’ out of pocket expenses are also paid by the Russell Fund Complex. The Audit Committee Chair and Investment Committee Chair are each paid a fee of $15,000 per year and the Nominating and Governance Committee Chair is paid a fee of $12,000 per year. The chairman of the Board receives additional annual compensation of $75,000 (effective January 1, 2014, $85,000). Ms. Cavanaugh and the Trustee Emeritus are not compensated by the Russell Fund Complex for service as a Trustee.
Transactions with Affiliated Companies (amounts in thousands)
An affiliated company is a company in which a Fund has ownership of at least 5% of the voting securities or which the Fund controls, is controlled by or is under common control with. Transactions during the period ended October 31, 2014 with Underlying Funds which are, or were, an affiliated company are as follows:
| Realized Gain | Income | Capital Gains | |||||||||||
| Fair Value | Purchases Cost | Sales Cost | (Loss) | Distributions | Distributions | ||||||||
| Conservative Strategy Fund | |||||||||||||
| Russell Commodity Strategies Fund | $ | 7,779 | $ | 1,460 | $ | 1,912 | $ | (172 | ) | $ | — | $ | — |
| Russell Global Infrastructure Fund | 20,015 | 11,653 | 7,461 | 452 | 829 | 363 | |||||||
| Russell Global Real Estate Securities Fund | 6,718 | 1,930 | 2,799 | 921 | 345 | 543 | |||||||
| Russell U.S. Core Equity Fund | 13,374 | 1,722 | 3,009 | 1,778 | 183 | — | |||||||
| Russell Multi-Strategy Alternative Fund | 10,538 | 784 | 1,856 | 31 | 134 | — | |||||||
| Russell U.S. Defensive Equity Fund | 18,736 | 10,628 | 8,420 | 1,036 | 270 | — | |||||||
| Russell U.S. Small Cap Equity Fund | 10,761 | 12,720 | 2,229 | 29 | — | — | |||||||
| Russell U.S. Dynamic Equity Fund | 10,697 | 7,919 | 3,387 | 141 | 481 | 181 | |||||||
| Russell Global Opportunistic Credit Fund | 21,225 | 13,036 | 3,438 | 1 | 904 | 67 | |||||||
| Russell Investment Grade Bond Fund | 68,838 | 3,062 | 53,799 | 573 | 1,188 | — | |||||||
| Russell Short Duration Bond Fund | 137,534 | 51,665 | 20,639 | 20 | 1,700 | 149 | |||||||
| Russell Strategic Bond Fund | 153,380 | 8,067 | 82,020 | 868 | 2,960 | 918 | |||||||
| Russell Emerging Markets Fund | 10,597 | 12,315 | 2,071 | 74 | — | — | |||||||
| Russell Global Equity Fund | 21,386 | 3,209 | 7,472 | 2,412 | 260 | 392 | |||||||
| Russell International Developed Markets Fund | 18,526 | 2,919 | 6,757 | 1,176 | 526 | — | |||||||
| $ | 530,104 | $ | 143,089 | $ | 207,269 | $ | 9,340 | $ | 9,780 | $ | 2,613 | ||
| Moderate Strategy Fund | |||||||||||||
| Russell Commodity Strategies Fund | $ | 18,244 | $ | 1,846 | $ | 3,184 | $ | (303 | ) | $ | — | $ | 1 |
| Russell Global Infrastructure Fund | 40,480 | 14,991 | 12,187 | 833 | 1,899 | 889 | |||||||
| Russell Global Real Estate Securities Fund | 17,246 | 3,653 | 5,503 | 1,788 | 859 | 1,334 | |||||||
| Russell U.S. Core Equity Fund | 42,918 | 4,209 | 8,593 | 3,848 | 598 | — | |||||||
| Russell Multi-Strategy Alternative Fund | 25,283 | 911 | 3,461 | 53 | 328 | — | |||||||
| Russell U.S. Defensive Equity Fund | 38,672 | 15,627 | 18,469 | 3,166 | 616 | — | |||||||
| Russell U.S. Dynamic Equity Fund | 21,437 | 7,889 | 5,583 | 323 | 1,564 | 594 | |||||||
| Russell U.S. Small Cap Equity Fund | 34,647 | 30,836 | 5,094 | 1 | 424 | 835 | |||||||
| Russell Global Opportunistic Credit Fund | 33,832 | 20,060 | 4,935 | 4 | 1,475 | 109 | |||||||
| Russell Investment Grade Bond Fund | 151,704 | 3,834 | 45,822 | 671 | 2,506 | — | |||||||
| Russell Strategic Bond Fund | 277,882 | 8,790 | 78,636 | 1,094 | 5,195 | 1,413 | |||||||
| Russell Emerging Markets Fund | 32,986 | 9,346 | 8,686 | (420 | ) | 292 | 958 | ||||||
| Russell Global Equity Fund | 51,403 | 2,972 | 19,103 | 7,663 | 710 | 1,073 | |||||||
| Russell International Developed Markets Fund | 58,544 | 4,080 | 18,237 | 3,249 | 1,726 | — | |||||||
| $ | 845,278 | $ | 129,044 | $ | 237,493 | $ | 21,970 | $ | 18,192 | $ | 7,206 | ||
| Balanced Strategy Fund | |||||||||||||
| Russell Commodity Strategies Fund | $ | 64,525 | $ | 3,141 | $ | 51,454 | $ | (7,704 | ) | $ | — | $ | 5 |
| Russell Global Infrastructure Fund | 161,356 | 49,494 | 51,929 | 4,588 | 8,094 | 3,918 | |||||||
| Russell Global Real Estate Securities Fund | 54,659 | 11,460 | 22,047 | 8,773 | 3,001 | 4,698 | |||||||
| Russell Multi-Strategy Alternative Fund | 105,696 | 2,369 | 8,604 | 85 | 1,355 | — | |||||||
| Russell U.S. Core Equity Fund | 290,021 | 6,264 | 56,506 | 33,426 | 4,056 | — | |||||||
| Russell U.S. Defensive Equity Fund | 246,099 | 119,622 | 98,586 | 10,339 | 3,672 | — | |||||||
| Russell U.S. Small Cap Equity Fund | 256,762 | 174,862 | 28,103 | 2,494 | 5,277 | 10,397 | |||||||
| Russell U.S. Dynamic Equity Fund | 253,117 | 81,049 | 42,290 | 8,005 | 17,845 | 6,763 | |||||||
| Russell Global Opportunistic Credit Fund | 142,056 | 45,194 | 17,758 | (28 | ) | 6,768 | 676 | ||||||
| Russell Strategic Bond Fund | 990,254 | 26,377 | 402,263 | 11,965 | 19,128 | 5,679 | |||||||
| Russell Emerging Markets Fund | 239,639 | 105,300 | 36,892 | 3,041 | 1,539 | 5,043 | |||||||
| 218 Notes to Financial Statements | |||||||||||||
Russell Investment Company LifePoints® Funds
Notes to Financial Statements, continued — October 31, 2014
| Realized Gain | Income | Capital Gains | ||||||||||||
| Fair Value | Purchases Cost | Sales Cost | (Loss) | Distributions | Distributions | |||||||||
| Russell International Developed Markets Fund | 394,140 | 13,728 | 136,913 | 30,099 | 12,494 | — | ||||||||
| Russell Global Equity Fund | 361,245 | 67,893 | 90,138 | 12,897 | 3,721 | 5,623 | ||||||||
| $ | 3,559,569 | $ | 706,753 | $ | 1,043,483 | $ | 117,980 | $ | 86,950 | $ | 42,802 | |||
| Growth Strategy Fund | ||||||||||||||
| Russell Commodity Strategies Fund | $ | 79,568 | $ | 4,753 | $ | 31,111 | $ | (4,417 | ) | $ | — | $ | 5 | |
| Russell Global Infrastructure Fund | 126,465 | 26,349 | 32,687 | 3,051 | 6,505 | 3,197 | ||||||||
| Russell Global Real Estate Securities Fund | 52,527 | 9,136 | 18,294 | 3,480 | 2,644 | 4,025 | ||||||||
| Russell Multi-Strategy Alternative Fund | 89,795 | 2,772 | 4,781 | 14 | 1,116 | — | ||||||||
| Russell U.S. Defensive Equity Fund | 169,221 | 74,131 | 59,054 | 5,666 | 2,509 | — | ||||||||
| Russell U.S. Core Equity Fund | 209,200 | 3,140 | 62,774 | 34,558 | 2,949 | — | ||||||||
| Russell U.S. Dynamic Equity Fund | 185,451 | 52,996 | 25,573 | 4,754 | 13,289 | 5,038 | ||||||||
| Russell U.S. Small Cap Equity Fund | 212,483 | 134,028 | 17,811 | 1,129 | 4,692 | 9,243 | ||||||||
| Russell Global Opportunistic Credit Fund | 135,520 | 56,823 | 14,523 | (103 | ) | 6,221 | 556 | |||||||
| Russell Strategic Bond Fund | 224,477 | 8,177 | 140,436 | 6,272 | 4,570 | 1,512 | ||||||||
| Russell Emerging Markets Fund | 199,047 | 90,361 | 26,397 | 2,313 | 1,209 | 3,964 | ||||||||
| Russell Global Equity Fund | 300,994 | 41,795 | 65,730 | 10,214 | 3,195 | 4,827 | ||||||||
| Russell International Developed Markets Fund | 297,780 | 11,877 | 122,409 | 26,742 | 10,018 | — | ||||||||
| $ | 2,282,528 | $ | 516,338 | $ | 621,580 | $ | 93,673 | $ | 58,917 | $ | 32,367 | |||
| Equity Growth Strategy Fund | ||||||||||||||
| Russell Commodity Strategies Fund | $ | 22,110 | $ | 1,601 | $ | 30,598 | $ | (4,496 | ) | $ | — | $ | 2 | |
| Russell Global Infrastructure Fund | 51,895 | 11,434 | 16,467 | 1,493 | 2,766 | 1,368 | ||||||||
| Russell Global Real Estate Securities Fund | 19,153 | 4,287 | 16,207 | 5,997 | 1,306 | 2,373 | ||||||||
| Russell Multi-Strategy Alternative Fund | 45,798 | 2,005 | 7,234 | 57 | 597 | — | ||||||||
| Russell U.S. Core Equity Fund | 95,157 | 1,570 | 38,232 | 21,668 | 1,387 | — | ||||||||
| Russell U.S. Defensive Equity Fund | 64,310 | 26,816 | 27,817 | 2,745 | 1,000 | — | ||||||||
| Russell U.S. Dynamic Equity Fund | 95,192 | 22,314 | 24,498 | 3,785 | 8,175 | 3,107 | ||||||||
| Russell U.S. Small Cap Equity Fund | 96,890 | 58,295 | 12,406 | 1,113 | 2,461 | 4,848 | ||||||||
| Russell Global Opportunistic Credit Fund | 73,519 | 35,934 | 13,743 | (2 | ) | 3,455 | 298 | |||||||
| Russell Emerging Markets Fund | 91,988 | 29,746 | 15,835 | 822 | 706 | 2,315 | ||||||||
| Russell Global Equity Fund | 133,077 | 34,527 | 41,609 | 5,040 | 1,355 | 2,047 | ||||||||
| Russell International Developed Markets Fund | 150,767 | 6,954 | 76,394 | 10,053 | 5,227 | — | ||||||||
| $ | 939,856 | $ | 235,483 | $ | 321,040 | $ | 48,275 | $ | 28,435 | $ | 16,358 | |||
| 2015 Strategy Fund | ||||||||||||||
| Russell Commodity Strategies Fund | $ | 418 | $ | 191 | $ | 773 | $ | (59 | ) | $ | — | $ | — | |
| Russell Global Infrastructure Fund | 479 | 655 | 176 | (2 | ) | 2 | — | |||||||
| Russell Global Real Estate Securities Fund | 479 | 253 | 595 | 122 | 38 | 60 | ||||||||
| Russell U.S. Core Equity Fund | — | 195 | 981 | 867 | 14 | — | ||||||||
| Russell U.S. Defensive Equity Fund | 615 | 264 | 1,093 | 707 | 21 | — | ||||||||
| Russell U.S. Dynamic Equity Fund | 311 | 239 | 703 | 118 | 72 | 28 | ||||||||
| Russell U.S. Small Cap Equity Fund | 477 | 293 | 468 | 120 | 37 | 72 | ||||||||
| Select U.S. Equity Fund | 2,512 | 2,967 | 554 | 11 | 6 | — | ||||||||
| Russell Global Opportunistic Credit Fund | 817 | 980 | 149 | (3 | ) | 12 | — | |||||||
| Russell Investment Grade Bond Fund | 3,829 | 812 | 4,012 | 87 | 88 | — | ||||||||
| Russell Short Duration Bond Fund | 2,594 | 2,217 | 1,016 | 1 | 27 | 2 | ||||||||
| Russell Strategic Bond Fund | 8,645 | 1,707 | 7,042 | 203 | 207 | 56 | ||||||||
| Russell Emerging Markets Fund | 524 | 346 | 342 | 13 | 5 | 16 | ||||||||
| Russell Global Equity Fund | 1,210 | 618 | 1,254 | 268 | 19 | 30 | ||||||||
| Russell International Developed Markets Fund | — | 417 | 2,373 | 896 | 62 | — | ||||||||
| Select International Equity Fund | 1,791 | 2,164 | 266 | (15 | ) | — | — | |||||||
| $ | 24,701 | $ | 14,318 | $ | 21,797 | $ | 3,334 | $ | 610 | $ | 264 | |||
| 2020 Strategy Fund | ||||||||||||||
| Russell Commodity Strategies Fund | $ | 1,975 | $ | 450 | $ | 5,236 | $ | (548 | ) | $ | — | $ | — | |
| Russell Global Infrastructure Fund | 2,332 | 3,161 | 826 | (3 | ) | 10 | — | |||||||
| Russell Global Real Estate Securities Fund | 2,340 | 964 | 2,764 | 1,488 | 217 | 358 | ||||||||
| Russell U.S. Core Equity Fund | — | 579 | 6,533 | 7,641 | 104 | — | ||||||||
| Russell U.S. Defensive Equity Fund | 2,977 | 529 | 5,371 | 5,597 | 120 | — | ||||||||
| Notes to Financial Statements 219 | ||||||||||||||
| Russell Investment Company | |||||||||||||
| LifePoints® Funds | |||||||||||||
| Notes to Financial Statements, continued — October 31, 2014 | |||||||||||||
| Realized Gain | Income | Capital Gains | |||||||||||
| Fair Value | Purchases Cost | Sales Cost | (Loss) | Distributions | Distributions | ||||||||
| Russell U.S. Dynamic Equity Fund | 2,175 | 1,345 | 5,911 | 1,268 | 655 | 250 | |||||||
| Russell U.S. Small Cap Equity Fund | 3,549 | 1,423 | 2,463 | 1,320 | 282 | 556 | |||||||
| Select U.S. Equity Fund | 14,984 | 17,427 | 3,035 | 55 | 34 | — | |||||||
| Russell Global Opportunistic Credit Fund | 3,625 | 4,296 | 609 | (9 | ) | 49 | — | ||||||
| Russell Investment Grade Bond Fund | 15,590 | 5,484 | 17,345 | 289 | 354 | — | |||||||
| Russell Short Duration Bond Fund | 6,291 | 7,459 | 1,151 | (1 | ) | 28 | — | ||||||
| Russell Strategic Bond Fund | 36,354 | 4,795 | 44,381 | 2,657 | 1,043 | 315 | |||||||
| Russell Emerging Markets Fund | 3,665 | 2,043 | 2,477 | 202 | 39 | 126 | |||||||
| Russell Global Equity Fund | 7,598 | 2,398 | 6,223 | 1,986 | 126 | 190 | |||||||
| Russell International Developed Markets Fund | — | 1,418 | 15,369 | 6,978 | 455 | — | |||||||
| Select International Equity Fund | 11,107 | 13,128 | 1,353 | (38 | ) | — | — | ||||||
| $ | 114,562 | $ | 66,899 | $ | 121,047 | $ | 28,882 | $ | 3,516 | $ | 1,795 | ||
| 2025 Strategy Fund | |||||||||||||
| Russell Commodity Strategies Fund | $ | 642 | $ | 313 | $ | 1,584 | $ | (164 | ) | $ | — | $ | — |
| Russell Global Infrastructure Fund | 758 | 964 | 206 | (1 | ) | 3 | — | ||||||
| Russell Global Real Estate Securities Fund | 760 | 386 | 814 | 166 | 53 | 81 | |||||||
| Russell U.S. Core Equity Fund | — | 438 | 2,864 | 2,280 | 39 | — | |||||||
| Russell U.S. Defensive Equity Fund | 930 | 339 | 1,701 | 1,192 | 33 | ��� | |||||||
| Russell U.S. Dynamic Equity Fund | 897 | 704 | 2,346 | 463 | 233 | 89 | |||||||
| Russell U.S. Small Cap Equity Fund | 1,524 | 884 | 914 | 130 | 76 | 149 | |||||||
| Select U.S. Equity Fund | 5,509 | 6,042 | 749 | 13 | 12 | — | |||||||
| Russell Global Opportunistic Credit Fund | 1,021 | 1,153 | 115 | (2 | ) | 13 | — | ||||||
| Russell Investment Grade Bond Fund | 4,068 | 4,351 | 1,306 | (8 | ) | 36 | — | ||||||
| Russell Strategic Bond Fund | 9,486 | 3,500 | 12,495 | 270 | 256 | 72 | |||||||
| Russell Emerging Markets Fund | 1,514 | 998 | 733 | 36 | 11 | 36 | |||||||
| Russell Global Equity Fund | 2,864 | 1,006 | 1,633 | 280 | 34 | 51 | |||||||
| Russell International Developed Markets Fund | — | 893 | 5,342 | 1,926 | 132 | — | |||||||
| Select International Equity Fund | 4,226 | 4,847 | 384 | (14 | ) | — | — | ||||||
| $ | 34,199 | $ | 26,818 | $ | 33,186 | $ | 6,567 | $ | 931 | $ | 478 | ||
| 2030 Strategy Fund | |||||||||||||
| Russell Commodity Strategies Fund | $ | 2,217 | $ | 878 | $ | 9,130 | $ | (1,055 | ) | $ | — | $ | — |
| Russell Global Infrastructure Fund | 2,855 | 3,882 | 1,025 | (10 | ) | 13 | — | ||||||
| Russell Global Real Estate Securities Fund | 2,869 | 1,148 | 3,070 | 1,570 | 248 | 410 | |||||||
| Russell U.S. Core Equity Fund | — | 731 | 12,117 | 13,407 | 200 | — | |||||||
| Russell U.S. Defensive Equity Fund | 3,576 | 440 | 5,814 | 6,246 | 139 | — | |||||||
| Russell U.S. Dynamic Equity Fund | 4,311 | 2,255 | 10,484 | 2,295 | 1,216 | 465 | |||||||
| Russell U.S. Small Cap Equity Fund | 7,483 | 3,498 | 3,960 | 1,038 | 427 | 842 | |||||||
| Select U.S. Equity Fund | 24,219 | 26,307 | 3,041 | 36 | 55 | — | |||||||
| Russell Global Opportunistic Credit Fund | 2,919 | 3,319 | 352 | (7 | ) | 39 | — | ||||||
| Russell Investment Grade Bond Fund | 5,521 | 6,293 | 825 | 4 | 25 | — | |||||||
| Russell Strategic Bond Fund | 28,193 | 12,269 | 30,779 | 538 | 714 | 190 | |||||||
| Russell Emerging Markets Fund | 7,605 | 4,650 | 3,137 | 186 | 58 | 189 | |||||||
| Russell Global Equity Fund | 13,056 | 3,332 | 6,143 | 1,736 | 167 | 251 | |||||||
| Russell International Developed Markets Fund | — | 2,081 | 24,021 | 10,135 | 704 | — | |||||||
| Select International Equity Fund | 18,636 | 21,018 | 1,276 | (53 | ) | — | — | ||||||
| $ | 123,460 | $ | 92,101 | $ | 115,174 | $ | 36,066 | $ | 4,005 | $ | 2,347 | ||
| 2035 Strategy Fund | |||||||||||||
| Russell Commodity Strategies Fund | $ | 609 | $ | 563 | $ | 1,867 | $ | (164 | ) | $ | — | $ | — |
| Russell Global Infrastructure Fund | 751 | 936 | 185 | (2 | ) | 3 | — | ||||||
| Russell Global Real Estate Securities Fund | 751 | 475 | 1,048 | 140 | 61 | 92 | |||||||
| Russell U.S. Core Equity Fund | — | 630 | 3,495 | 2,319 | 51 | — | |||||||
| Russell U.S. Defensive Equity Fund | 807 | 337 | 1,387 | 788 | 28 | — | |||||||
| Russell U.S. Dynamic Equity Fund | 1,233 | 904 | 2,609 | 476 | 278 | 106 | |||||||
| Russell U.S. Small Cap Equity Fund | 2,120 | 1,089 | 762 | 32 | 86 | 169 | |||||||
| Select U.S. Equity Fund | 6,490 | 6,586 | 350 | 2 | 14 | — | |||||||
| Russell Global Opportunistic Credit Fund | 227 | 244 | 14 | — | 3 | — | |||||||
| Russell Strategic Bond Fund | 3,317 | 1,677 | 1,429 | (1 | ) | 51 | 12 | ||||||
| 220 Notes to Financial Statements | |||||||||||||
| Russell Investment Company | |||||||||||||
| LifePoints® Funds | |||||||||||||
| Notes to Financial Statements, continued — October 31, 2014 | |||||||||||||
| Realized Gain | Income | Capital Gains | |||||||||||
| Fair Value | Purchases Cost | Sales Cost | (Loss) | Distributions | Distributions | ||||||||
| Russell Emerging Markets Fund | 2,218 | 1,602 | 655 | 16 | 12 | 39 | |||||||
| Russell Global Equity Fund | 3,405 | 1,204 | 1,337 | 93 | 34 | 51 | |||||||
| Russell International Developed Markets Fund | — | 1,192 | 5,919 | 1,729 | 140 | — | |||||||
| Select International Equity Fund | 4,925 | 5,372 | 172 | (8 | ) | — | — | ||||||
| $ | 26,853 | $ | 22,811 | $ | 21,229 | $ | 5,420 | $ | 761 | $ | 469 | ||
| 2040 Strategy Fund | |||||||||||||
| Russell Commodity Strategies Fund | $ | 2,522 | $ | 1,114 | $ | 7,586 | $ | (770 | ) | $ | — | $ | — |
| Russell Global Infrastructure Fund | 3,058 | 3,852 | 792 | (7 | ) | 13 | — | ||||||
| Russell Global Real Estate Securities Fund | 3,074 | 1,338 | 3,565 | 1,474 | 274 | 436 | |||||||
| Russell U.S. Core Equity Fund | — | 902 | 12,452 | 12,666 | 216 | — | |||||||
| Russell U.S. Defensive Equity Fund | 3,063 | 474 | 4,824 | 4,916 | 118 | — | |||||||
| Russell U.S. Dynamic Equity Fund | 5,111 | 2,567 | 10,980 | 2,365 | 1,315 | 502 | |||||||
| Russell U.S. Small Cap Equity Fund | 8,701 | 4,351 | 3,618 | 532 | 407 | 803 | |||||||
| Select U.S. Equity Fund | 26,565 | 28,250 | 2,730 | 36 | 60 | — | |||||||
| Russell Strategic Bond Fund | 7,067 | 1,787 | 8,643 | 314 | 196 | 58 | |||||||
| Russell Emerging Markets Fund | 9,181 | 6,170 | 2,809 | 109 | 56 | 182 | |||||||
| Russell Global Equity Fund | 13,810 | 3,390 | 5,194 | 1,289 | 160 | 242 | |||||||
| Russell International Developed Markets Fund | — | 2,021 | 23,001 | 9,162 | 666 | — | |||||||
| Select International Equity Fund | 19,925 | 22,143 | 1,043 | (36 | ) | — | — | ||||||
| $ | 102,077 | $ | 78,359 | $ | 87,237 | $ | 32,050 | $ | 3,481 | $ | 2,223 | ||
| 2045 Strategy Fund | |||||||||||||
| Russell Commodity Strategies Fund | $ | 336 | $ | 343 | $ | 1,038 | $ | (73 | ) | $ | — | $ | — |
| Russell Global Infrastructure Fund | 409 | 508 | 100 | (1 | ) | 2 | — | ||||||
| Russell Global Real Estate Securities Fund | 411 | 269 | 605 | 50 | 32 | 48 | |||||||
| Russell U.S. Core Equity Fund | — | 351 | 1,940 | 1,217 | 26 | — | |||||||
| Russell U.S. Defensive Equity Fund | 410 | 206 | 819 | 407 | 14 | — | |||||||
| Russell U.S. Dynamic Equity Fund | 685 | 488 | 1,412 | 245 | 144 | 55 | |||||||
| Russell U.S. Small Cap Equity Fund | 1,171 | 695 | 500 | 21 | 45 | 88 | |||||||
| Select U.S. Equity Fund | 3,558 | 3,657 | 238 | — | 8 | — | |||||||
| Russell Strategic Bond Fund | 936 | 564 | 1,280 | 9 | 23 | 6 | |||||||
| Russell Emerging Markets Fund | 1,234 | 968 | 421 | 6 | 6 | 20 | |||||||
| Russell Global Equity Fund | 1,849 | 726 | 787 | 55 | 18 | 27 | |||||||
| Russell International Developed Markets Fund | — | 645 | 3,218 | 932 | 73 | — | |||||||
| Select International Equity Fund | 2,660 | 2,940 | 131 | (6 | ) | — | — | ||||||
| $ | 13,659 | $ | 12,360 | $ | 12,489 | $ | 2,862 | $ | 391 | $ | 244 | ||
| 2050 Strategy Fund | |||||||||||||
| Russell Commodity Strategies Fund | $ | 378 | $ | 379 | $ | 1,268 | $ | (90 | ) | $ | — | $ | — |
| Russell Global Infrastructure Fund | 457 | 634 | 177 | (3 | ) | 2 | — | ||||||
| Russell Global Real Estate Securities Fund | 458 | 362 | 759 | 122 | 41 | 64 | |||||||
| Russell U.S. Core Equity Fund | — | 471 | 2,153 | 1,757 | 34 | — | |||||||
| Russell U.S. Defensive Equity Fund | 458 | 257 | 953 | 595 | 18 | — | |||||||
| Russell U.S. Dynamic Equity Fund | 762 | 665 | 1,853 | 306 | 191 | 73 | |||||||
| Russell U.S. Small Cap Equity Fund | 1,296 | 890 | 794 | 14 | 59 | 116 | |||||||
| Select U.S. Equity Fund | 3,963 | 4,600 | 795 | (4 | ) | 9 | — | ||||||
| Russell Strategic Bond Fund | 1,059 | 631 | 1,567 | 29 | 29 | 8 | |||||||
| Russell Emerging Markets Fund | 1,372 | 1,170 | 638 | 10 | 8 | 27 | |||||||
| Russell Global Equity Fund | 2,058 | 919 | 1,172 | 94 | 24 | 35 | |||||||
| Russell International Developed Markets Fund | — | 865 | 3,711 | 1,449 | 97 | — | |||||||
| Select International Equity Fund | 2,972 | 3,652 | 513 | (18 | ) | — | — | ||||||
| $ | 15,233 | $ | 15,495 | $ | 16,353 | $ | 4,261 | $ | 512 | $ | 323 | ||
| 2055 Strategy Fund | |||||||||||||
| Russell Commodity Strategies Fund | $ | 70 | $ | 153 | $ | 235 | $ | (16 | ) | $ | — | $ | — |
| Russell Global Infrastructure Fund | 85 | 103 | 18 | — | — | — | |||||||
| Russell Global Real Estate Securities Fund | 86 | 125 | 155 | (1 | ) | 6 | 8 | ||||||
| Russell U.S. Core Equity Fund | — | 309 | 591 | 121 | 5 | — | |||||||
| Russell U.S. Defensive Equity Fund | 85 | 160 | 252 | 30 | 2 | — | |||||||
| Notes to Financial Statements 221 | |||||||||||||
| Russell Investment Company | |||||||||||||
| LifePoints® Funds | |||||||||||||
| Notes to Financial Statements, continued — October 31, 2014 | |||||||||||||
| Realized Gain | Income | Capital Gains | |||||||||||
| Fair Value | Purchases Cost | Sales Cost | (Loss) | Distributions | Distributions | ||||||||
| Russell U.S. Dynamic Equity Fund | 142 | 255 | 358 | 19 | 24 | 9 | |||||||
| Russell U.S. Small Cap Equity Fund | 246 | 227 | 127 | (3 | ) | 7 | 14 | ||||||
| Select U.S. Equity Fund | 739 | 733 | 23 | — | 2 | — | |||||||
| Russell Strategic Bond Fund | 197 | 255 | 299 | — | 4 | 1 | |||||||
| Russell Emerging Markets Fund | 257 | 257 | 101 | (4 | ) | 1 | 3 | ||||||
| Russell Global Equity Fund | 384 | 318 | 220 | (4 | ) | 3 | 5 | ||||||
| Russell International Developed Markets Fund | — | 433 | 834 | 98 | 12 | — | |||||||
| Select International Equity Fund | 553 | 599 | 16 | (1 | ) | — | — | ||||||
| $ | 2,844 | $ | 3,927 | $ | 3,229 | $ | 239 | $ | 66 | $ | 40 | ||
| In Retirement Fund | |||||||||||||
| Russell Commodity Strategies Fund | $ | 551 | $ | 115 | $ | 1,109 | $ | (109 | ) | $ | — | $ | — |
| Russell Global Infrastructure Fund | 625 | 801 | 175 | (2 | ) | 3 | — | ||||||
| Russell Global Real Estate Securities Fund | 622 | 267 | 665 | 405 | 52 | 86 | |||||||
| Russell U.S. Core Equity Fund | — | 193 | 1,144 | 1,365 | 18 | — | |||||||
| Russell U.S. Defensive Equity Fund | 776 | 250 | 1,353 | 1,347 | 28 | — | |||||||
| Russell U.S. Dynamic Equity Fund | 373 | 259 | 922 | 190 | 95 | 36 | |||||||
| Russell U.S. Small Cap Equity Fund | 566 | 274 | 430 | 221 | 42 | 84 | |||||||
| Select U.S. Equity Fund | 2,955 | 3,409 | 570 | 8 | 7 | — | |||||||
| Russell Global Opportunistic Credit Fund | 1,037 | 1,253 | 199 | (3 | ) | 14 | — | ||||||
| Russell Investment Grade Bond Fund | 5,109 | 803 | 7,097 | 162 | 126 | — | |||||||
| Russell Short Duration Bond Fund | 3,567 | 1,657 | 2,580 | 59 | 48 | 5 | |||||||
| Russell Strategic Bond Fund | 10,827 | 1,737 | 12,408 | 1,542 | 294 | 87 | |||||||
| Russell Emerging Markets Fund | 613 | 393 | 359 | 75 | 6 | 18 | |||||||
| Russell Global Equity Fund | 1,405 | 607 | 1,853 | 654 | 29 | 45 | |||||||
| Russell International Developed Markets Fund | — | 368 | 2,844 | 1,590 | 84 | — | |||||||
| Select International Equity Fund | 2,120 | 2,519 | 272 | (9 | ) | — | — | ||||||
| $ | 31,146 | $ | 14,905 | $ | 33,980 | $ | 7,495 | $ | 846 | $ | 361 | ||
5. Federal Income Taxes
At October 31, 2014, the following Funds had net tax basis capital loss carryforwards which may be applied against any net realized taxable gains in each succeeding year or until their respective expiration dates, whichever occurs first. Available capital loss carryforwards and expiration dates are as follows:
| No Expiration | ||||||||||
| 10/31/2018 | 10/31/2019 | Short Term | Long-Term | Totals | ||||||
| Balanced Strategy Fund | $ | — | $ | 1,799,627 | $ | — | $ | — | $ | 1,799,627 |
| Growth Strategy Fund | 150,186,884 | 25,244,054 | — | — | 175,430,938 | |||||
| Equity Growth Strategy Fund | 160,757,894 | 19,352,964 | — | — | 180,110,858 | |||||
Under the Regulated Investment Company Modernization Act of 2010, the Funds will be permitted to carry forward capital losses incurred in taxable years beginning after December 22, 2010 for an unlimited period. However, any losses incurred during those future taxable years will be required to be utilized prior to the losses incurred in pre-enactment taxable years. As a result of this ordering rule, pre-enactment capital loss carryforwards may be more likely to expire unused. Additionally, post-enactment capital losses that are carried forward will retain their character as either short-term or long-term capital losses rather than being considered all short-term as under previous law.
At October 31, 2014, the cost of investments and net unrealized appreciation (depreciation), undistributed ordinary income and undistributed long-term capital gains for income tax purposes were as follows:
222 Notes to Financial Statements
Russell Investment Company LifePoints® Funds
Notes to Financial Statements, continued — October 31, 2014
| Conservative Strategy Moderate Strategy Balanced Strategy | ||||||||||||
| Fund | Fund | Fund | ||||||||||
| Cost of Investments | $ | 471,875,217 | $ | 722,929,384 | $ | 3,083,761,310 | ||||||
| Unrealized Appreciation | $ | 60,042,218 | $ | 126,989,218 | $ | 497,627,212 | ||||||
| Unrealized Depreciation | (1,813,023 | ) | (4,640,684 | ) | (21,819,577 | ) | ||||||
| Net Unrealized Appreciation (Depreciation) | $ | 58,229,195 | $ | 122,348,534 | $ | 475,807,635 | ||||||
| Undistributed Ordinary Income | $ | 1,225,467 | $ | 126,839 | $ | 68,970 | ||||||
| Undistributed Long-Term Capital Gains | ||||||||||||
| (Capital Loss Carryforward) | $ | 10,514,093 | $ | 8,665,487 | $ | (1,799,627 | ) | |||||
| Tax Composition of Distributions | ||||||||||||
| Ordinary Income | $ | 6,438,257 | $ | 11,613,837 | $ | 59,833,404 | ||||||
| Long-Term Capital Gains | $ | 10,367,136 | $ | — $ | — | |||||||
| Growth Strategy Fund | Equity Growth Strategy Fund | 2015 Strategy Fund | ||||||||||
| Cost of Investments | $ | 1,958,163,877 | $ | 812,322,430 | $ | 21,934,004 | ||||||
| Unrealized Appreciation | $ | 349,086,313 | $ | 152,687,284 | $ | 2,969,514 | ||||||
| Unrealized Depreciation | (24,721,950 | ) | (25,153,911 | ) | (202,437 | ) | ||||||
| Net Unrealized Appreciation (Depreciation) | $ | 324,364,363 | $ | 127,533,373 | $ | 2,767,077 | ||||||
| Undistributed Ordinary Income | $ | 368,103 | $ | — $ | 47,443 | |||||||
| Undistributed Long-Term Capital Gains | ||||||||||||
| (Capital Loss Carryforward) | $ | (175,430,938 | ) $ | (180,110,858 | ) $ | 3,401,778 | ||||||
| Tax Composition of Distributions | ||||||||||||
| Ordinary Income | $ | 41,059,327 | $ | 20,377,411 | $ | 596,531 | ||||||
| Long-Term Capital Gains | $ | — $ | — $ | 2,407,717 | ||||||||
| Distributions in Excess | $ | — $ | 609,963 | $ | — | |||||||
| 2020 Strategy Fund 2025 Strategy Fund 2030 Strategy Fund | ||||||||||||
| Cost of Investments | $ | 98,289,572 | $ | 30,326,768 | $ | 106,750,354 | ||||||
| Unrealized Appreciation | $ | 17,483,566 | $ | 4,233,204 | $ | 18,278,321 | ||||||
| Unrealized Depreciation | (1,210,893 | ) | (360,779 | ) | (1,568,341 | ) | ||||||
| Net Unrealized Appreciation (Depreciation) | $ | 16,272,673 | $ | 3,872,425 | $ | 16,709,980 | ||||||
| Undistributed Ordinary Income | $ | 83,064 | $ | 89,052 | $ | 2,354 | ||||||
| Undistributed Long-Term Capital Gains | ||||||||||||
| (Capital Loss Carryforward) | $ | 28,348,723 | $ | 6,713,366 | $ | 33,512,737 | ||||||
| Tax Composition of Distributions | ||||||||||||
| Ordinary Income | $ | 3,231,574 | $ | 844,226 | $ | 3,728,385 | ||||||
| Long-Term Capital Gains | $ | 3,565,418 | $ | 2,066,836 | $ | — | ||||||
| 2035 Strategy Fund 2040 Strategy Fund 2045 Strategy Fund | ||||||||||||
| Cost of Investments | $ | 23,651,857 | $ | 86,775,093 | $ | 12,013,111 | ||||||
| Unrealized Appreciation | $ | 3,547,761 | $ | 16,942,680 | $ | 1,828,192 | ||||||
| Unrealized Depreciation | (346,160 | ) | (1,640,670 | ) | (181,968 | ) | ||||||
| Net Unrealized Appreciation (Depreciation) | $ | 3,201,601 | $ | 15,302,010 | $ | 1,646,224 | ||||||
| Undistributed Ordinary Income | $ | 60,322 | $ | 2,029 | $ | 54,853 | ||||||
| Undistributed Long-Term Capital Gains | ||||||||||||
| (Capital Loss Carryforward) | $ | 5,650,040 | $ | 31,752,137 | $ | 2,945,612 | ||||||
| Tax Composition of Distributions | ||||||||||||
| Ordinary Income | $ | 848,597 | $ | 3,297,350 | $ | 410,394 | ||||||
| Long-Term Capital Gains | $ | 480,299 | $ | — $ | 70,693 | |||||||
Notes to Financial Statements 223
Russell Investment Company LifePoints® Funds
Notes to Financial Statements, continued — October 31, 2014
| 2050 Strategy Fund 2055 Strategy Fund In Retirement Fund | ||||||||||
| Cost of Investments | $ | 12,823,445 | $ | 2,659,278 | $ | 26,944,804 | ||||
| Unrealized Appreciation | $ | 2,621,479 | $ | 219,156 | $ | 4,471,445 | ||||
| Unrealized Depreciation | (211,957 | ) | (33,950 | ) | (270,028 | ) | ||||
| Net Unrealized Appreciation (Depreciation) | $ | 2,409,522 | $ | 185,206 | $ | 4,201,417 | ||||
| Undistributed Ordinary Income | $ | 65,679 | $ | — $ | 9,483 | |||||
| Undistributed Long-Term Capital Gains | ||||||||||
| (Capital Loss Carryforward) | $ | 4,398,507 | $ | 284,817 | $ | 7,277,819 | ||||
| Tax Composition of Distributions | ||||||||||
| Ordinary Income | $ | 563,467 | $ | 65,740 | $ | 910,901 | ||||
| Long-Term Capital Gains | $ | 91,803 | $ | 2,686 | $ | 2,176,426 | ||||
6. Interfund Lending Program
The Funds have been granted permission from the Securities and Exchange Commission to participate in a joint lending and borrowing facility. Funds may borrow money from each other for temporary purposes. All such borrowing and lending will be subject to a participating Fund’s fundamental investment limitations. A Fund will lend through the program only when the returns are higher than those available from an investment in repurchase agreements or short-term reserves and the portfolio manager determines it is in the best interest of the Fund. The Funds will borrow through the program only when the costs are equal to or lower than the cost of bank loans. Interfund loans and borrowings normally extend overnight, but can have a maximum duration of seven days. Loans may be called on one business day’s notice. A participating Fund may have to borrow from a bank at a higher interest rate if an interfund loan is called or not renewed. Any delay in repayment to the lending fund could result in reduced returns or additional borrowing costs. For the period ended October 31, 2014, the Funds presented herein did not borrow or lend through the interfund lending program.
7. Record Ownership
As of October 31, 2014, the following table includes shareholders of record with greater than 10% of the total outstanding shares of each respective Fund:
| # of Shareholders | % | ||||
| 2015 Strategy Fund | 1 | 11.4 | |||
| 2020 Strategy Fund | 2 | 31.9 | |||
| 2025 Strategy Fund | 2 | 30.1 | |||
| 2030 Strategy Fund | 2 | 30.5 | |||
| 2035 Strategy Fund | 1 | 10.3 | |||
| 2040 Strategy Fund | 2 | 35.5 | |||
| 2045 Strategy Fund | 2 | 23.6 | |||
| 2050 Strategy Fund | 1 | 15.2 | |||
| 2055 Strategy Fund | 1 | 35.6 | |||
| In Retirement Fund | 2 | 24.5 |
8. Pending Legal Proceedings
On October 17, 2013, Fred McClure filed a derivative lawsuit against Russell Investment Management Company (“RIMCo”) on behalf of ten funds: the Russell Commodity Strategies Fund, Russell Emerging Markets Fund, Russell Global Equity Fund, Russell Global Infrastructure Fund, Russell Global Opportunistic Credit Fund, Russell International Developed Markets Fund, Russell Multi-Strategy Alternative Fund, Russell Strategic Bond Fund, Russell U.S. Small Cap Equity Fund and Russell Global Real Estate Securities Fund. The lawsuit, which was filed in the United States District Court for the District of Massachusetts, seeks recovery under Section 36(b) of the Investment Company Act, as amended, for the alleged payment of excessive investment management fees to RIMCo. On December 8, 2014, Fred McClure filed a second derivative lawsuit in the United States District Court for the District of Massachusetts. This second suit involves the same ten funds, and the allegations are similar, although the second suit adds a claim alleging that RFSC charged the funds excessive administrative fees under Section 36(b). The plaintiff seeks recovery of the amount excessive of compensation or payments received from these ten funds and earnings that would have accrued to plaintiff had that compensation not been paid or, alternatively, rescission of the contracts and restitution of all excessive fees paid. RIMCo intends to vigorously defend the action.
224 Notes to Financial Statements
Russell Investment Company LifePoints® Funds
Notes to Financial Statements, continued — October 31, 2014
9. Reclassification
Effective October 1, 2014, there was a reclassification of Class R2 and Class R3 Shares for the Funds. For each Fund, Class R2 and Class R3 Shares were reclassified as Class R4 and Class R5 Shares, respectively. Class R2 and Class R3 Shares are no longer offered. Therefore, the amounts presented for the period ended October 31, 2014 in the Statements of Assets and Liabilities, the Statements of Operations, and the Statements of Changes in Net Assets reflect the financial activity of Class R2 and Class R3 Shares for the period November 1, 2013 through October 1, 2014, and the financial activity of Class R4 and Class R5 Shares for the period October 2, 2014 through October 31, 2014.
10. Subsequent Events
Management has evaluated the events and/or transactions that have occurred through the date the financial statements were issued and noted no items requiring adjustments of the financial statements or additional disclosures except the following: A special meeting of the Funds’ shareholders was held on November 3, 2014 and November 25, 2014 in order for shareholders to vote on two proposals: 1. To approve a new investment advisory agreement between RIMCo and each Fund, as a result of a transaction involving the sale of RIMCo’s parent company to the London Stock Exchange Group PLC (“LSEG”) (the “Post-Transaction Agreement”).
2. To approve a new investment advisory agreement between RIMCo and each Fund that reflects updated terms and if approved by shareholders, would go into effect in lieu of the Post-Transaction Agreement following the transaction or, if the transactions is not consummated, would replace the Funds’ existing investment advisory agreement (the “New Agreement). Specifically, the New Agreement would provide RIMCo with greater flexibility in managing the Funds and update the Funds’ existing agreement to reflect current industry practices.
On December 2, 2014, FRC and its subsidiaries, including RIMCo, became wholly-owned subsidiaries of LSEG. LSEG is a diversified international exchange group.
The Post-Transaction and New Agreements were approved by the Funds’ shareholders and the New Agreement went into effect upon the consummation of the transaction on December 2, 2014.
Notes to Financial Statements 225
Report of Independent Registered Public Accounting Firm
To the Board of Trustees and Shareholders
of Russell Investment Company
In our opinion, the accompanying statements of assets and liabilities, including the schedules of investments, and the related statements of operations and of changes in net assets and the financial highlights present fairly, in all material respects, the financial position of Conservative Strategy Fund, Moderate Strategy Fund, Balanced Strategy Fund, Growth Strategy Fund, Equity Growth Strategy Fund, 2015 Strategy Fund, 2020 Strategy Fund, 2025 Strategy Fund, 2030 Strategy Fund, 2035 Strategy Fund, 2040 Strategy Fund, 2045 Strategy Fund, 2050 Strategy Fund, 2055 Strategy Fund and In Retirement Fund (fifteen of the portfolios constituting Russell Investment Company LifePoints Funds, hereafter collectively referred to as the “Funds”) at October 31, 2014, the results of each of their operations for the year then ended, the changes in each of their net assets for each of the two years in the period then ended and the financial highlights for each of the periods presented, in conformity with accounting principles generally accepted in the United States of America. These financial statements and financial highlights (hereafter referred to as “financial statements”) are the responsibility of the Funds’ management. Our responsibility is to express an opinion on these financial statements based on our audits. We conducted our audits of these financial statements in accordance with the standards of the Public Company Accounting Oversight Board (United States). Those standards require that we plan and perform the audit to obtain reasonable assurance about whether the financial statements are free of material misstatement. An audit includes examining, on a test basis, evidence supporting the amounts and disclosures in the financial statements, assessing the accounting principles used and significant estimates made by management, and evaluating the overall financial statement presentation. We believe that our audits, which included confirmation of securities at October 31, 2014 by correspondence with the transfer agent, provide a reasonable basis for our opinion.

226 Report of Independent Registered Public Accounting Firm
Russell Investment Company LifePoints® Funds
Tax Information— October 31, 2014 (Unaudited)
For the tax year ended October 31, 2014, the Funds hereby designate 100%, or the maximum amount allowable, of its net taxable income as qualified dividends taxed at individual net capital gain rates.
For the tax year ended October 31, 2014, the Funds hereby designate under Section 871(k)(2)(c) of the Code, the maximum amount allowable as a short term capital gain dividend for purposes of the tax imposed under Section 871(a)(1)(A) of the Code. This applies to nonresident alien shareholders only.
The Form 1099 you receive in January 2015 will show the tax status of all distributions paid to your account in calendar year 2014.
The Funds designate dividends distributed during the fiscal year as qualifying for the dividends received deduction for corporate shareholders as follows:
| Conservative Strategy Fund | 9.9 | % |
| Moderate Strategy Fund | 17.8 | % |
| Balanced Strategy Fund | 26.3 | % |
| Growth Strategy Fund | 29.4 | % |
| Equity Growth Strategy Fund | 29.6 | % |
| 2015 Strategy Fund | 14.0 | % |
| 2020 Strategy Fund | 17.8 | % |
| 2025 Strategy Fund | 19.1 | % |
| 2030 Strategy Fund | 24.4 | % |
| 2035 Strategy Fund | 26.4 | % |
| 2040 Strategy Fund | 27.4 | % |
| 2045 Strategy Fund | 24.8 | % |
| 2050 Strategy Fund | 24.6 | % |
| 2055 Strategy Fund | 29.1 | % |
| In Retirement Fund | 13.5 | % |
Pursuant to Section 852 of the Internal Revenue Code, the Funds designate the following amounts as long-term capital gain dividends for their taxable year ended October 31, 2014:
| Conservative Strategy Fund | $ | 10,367,136 |
| 2015 Strategy Fund | $ | 2,407,717 |
| 2020 Strategy Fund | $ | 3,565,418 |
| 2025 Strategy Fund | $ | 2,066,836 |
| 2035 Strategy Fund | $ | 480,299 |
| 2045 Strategy Fund | $ | 70,693 |
| 2050 Strategy Fund | $ | 91,803 |
| 2055 Strategy Fund | $ | 2,686 |
| In Retirement Fund | $ | 2,176,426 |
| Please consult a tax adviser for any questions about federal or state income tax laws. | ||
Tax Information 227
Russell Investment Company LifePoints® Funds
Tax Information, continued — October 31, 2014 (Unaudited)
The Funds listed below paid foreign taxes and recognized foreign source income during the taxable year ended October 31, 2014. Pursuant to Section 853 of the Internal Revenue Code, the Funds designate the following per share amounts of foreign taxes paid and income earned from foreign sources:
| Foreign Taxes | Foreign Source Income | Foreign Source | ||||||
| Fund Name | Foreign Taxes Paid | Paid Per Share | Income Per Share | |||||
| Conservative Strategy Fund | $ | 107,141 | $ | 0.0023 | $ | 1,624,388 | $ | 0.0342 |
| Moderate Strategy Fund | 291,406 | 0.0041 | 4,333,636 | 0.0615 | ||||
| Balanced Strategy Fund | 1,822,240 | 0.0063 | 26,227,610 | 0.0914 | ||||
| Growth Strategy Fund | 1,464,565 | 0.0077 | 20,779,040 | 0.1100 | ||||
| Equity Growth Strategy Fund | 679,605 | 0.0082 | 9,721,369 | 0.1170 | ||||
| 2015 Strategy Fund | 4,135 | 0.0017 | 52,336 | 0.0218 | ||||
| 2020 Strategy Fund | 25,470 | 0.0027 | 308,819 | 0.0326 | ||||
| 2025 Strategy Fund | 9,716 | 0.0030 | 114,279 | 0.0356 | ||||
| 2030 Strategy Fund | 44,668 | 0.0045 | 507,203 | 0.0512 | ||||
| 2035 Strategy Fund | 12,334 | 0.0052 | 136,835 | 0.0580 | ||||
| 2040 Strategy Fund | 50,562 | 0.0065 | 558,632 | 0.0716 | ||||
| 2045 Strategy Fund | 6,778 | 0.0055 | 74,811 | 0.0611 | ||||
| 2050 Strategy Fund | 7,547 | 0.0047 | 83,350 | 0.0521 | ||||
| 2055 Strategy Fund | 1,411 | 0.0062 | 15,567 | 0.0685 | ||||
| In Retirement Fund | 4,980 | 0.0017 | 63,613 | 0.0219 |
228 Tax Information
Russell Investment Company LifePoints® Funds
Basis for Approval of Investment Advisory Contracts— (Unaudited)
Approval of Existing Investment Advisory Agreement
The Investment Company Act of 1940, as amended (the “1940 Act”), requires that the Board of Trustees (the “Board”), including a majority of its members who are not considered to be “interested persons” under the 1940 Act (the “Independent Trustees”) voting separately, approve the continuation of the advisory agreements with RIMCo (the “Existing Agreements”) and the portfolio management contract with each Money Manager of the funds (collectively, the “portfolio management contracts”) in which the Funds invest (the “Underlying Funds”) on at least an annual basis and that the terms and conditions of each Existing Agreement and the terms and conditions of each portfolio management contract provide for its termination if continuation is not approved annually. The Board, including all of the Independent Trustees, considered and approved the continuation of the Existing Agreements and the portfolio management contracts at a meeting held in person on May 19-20, 2014 (the “Existing Agreement Evaluation Meeting”). During the course of a year, the Trustees receive a wide variety of materials regarding, among other things, the investment performance of the Funds, sales and redemptions of the Funds’ and Underlying Funds’ shares, management of the Funds and the Underlying Funds and other services provided by RIMCo and compliance with applicable regulatory requirements. In preparation for the annual review, the Independent Trustees, with the advice and assistance of their independent counsel (“Independent Counsel”), also requested and the Board considered (1) information and reports prepared by RIMCo relating to the services provided by RIMCo (and its affiliates) to the Funds and the Underlying Funds; (2) information and reports prepared by RIMCo relating to the profitability of each Fund and Underlying Fund to RIMCo; (3) information (the “Third-Party Information”) received from an independent, nationally recognized provider of investment company information comparing the performance of certain of the Funds and the Underlying Funds and their respective operating expenses over various periods of time with other peer funds not managed by RIMCo, believed by the provider to be generally comparable in investment objectives to the Funds and the Underlying Funds; and (4) information prepared by RIMCo (the “RIMCo Comparative Information”) comparing the performance of certain Underlying Funds and their respective operating expenses over various periods of time with other peer funds not managed by RIMCo, believed by RIMCo to be generally comparable in investment objectives to the Underlying Funds. In the case of each Fund, its other peer funds, whether identified as such in the Third-Party Information or the RIMCo Comparative Information, are collectively hereinafter referred to as the Fund’s “Comparable Funds,” and, with the Fund, such Comparable Funds are collectively hereinafter referred to as the Fund’s “Performance Universe” in the case of performance comparisons and the Fund’s “Expense Universe” in the case of operating expense comparisons. In the case of certain, but not all, Funds, the Third-Party Information reflected changes in the Comparable Funds requested by RIMCo, which changes were noted in the Third-Party Information. The foregoing and other information received by the Board, including the Independent Trustees, in connection with its evaluations of the Existing Agreements and portfolio management contracts are collectively called the “Existing Agreement Evaluation Information.” The Trustees’ evaluations also reflected the knowledge and familiarity gained as Board members of the Funds and the other RIMCo-managed funds for which the Board has supervisory responsibility (“Other Russell Funds”) with respect to services provided by RIMCo, RIMCo’s affiliates and each Money Manager. The Trustees received a memorandum from counsel to the Funds and the Underlying Funds (“Fund Counsel”) discussing the legal standards for their consideration of the continuations of the Existing Agreements and the portfolio management contracts, and the Independent Trustees separately received a memorandum regarding their responsibilities from Independent Counsel.
At a meeting held in person on April 29, 2014 (the “Existing Agreement Information Review Meeting,” and together with the Existing Agreement Evaluation Meeting, the “Existing Agreement Evaluation Meetings”), the Independent Trustees in preparation for the Existing Agreement Evaluation Meeting met first with representatives of RIMCo and then in a private session with Independent Counsel at which no representatives of RIMCo or the Funds’ management were present to review the Existing Agreement Evaluation Information received to that date and, on the basis of that review, requested additional Existing Agreement Evaluation Information. At the Existing Agreement Evaluation Meeting, the Independent Trustees again met in person in a private session with Independent Counsel to review additional Existing Agreement Evaluation Information received to that date. At the Existing Agreement Evaluation Meeting, the Board, including the Independent Trustees, considered the proposed continuance of the Existing Agreements and the portfolio management contracts with RIMCo, Fund management, Independent Counsel and Fund Counsel. Presentations made by RIMCo at the Existing Agreement Evaluation Meetings as part of this review encompassed the Funds and all Other Russell Funds. Information received by the Board, including the Independent Trustees, at the Existing Agreement Evaluation Meetings is included in the Existing Agreement Evaluation Information. Prior to voting at the Existing Agreement Evaluation Meeting, the non-management members of the Board, including the Independent Trustees, met in executive session with Independent Counsel to consider additional Existing Agreement Evaluation Information received from RIMCo and management at the Existing Agreement Evaluation Meeting. The discussion below reflects all of these reviews.
In evaluating the portfolio management contracts, the Board considered that each of the Underlying Funds employs a manager-of-managers method of investment and RIMCo’s advice that the Underlying Funds, in employing a manager-of-managers method of
Basis for Approval of Investment Advisory Contracts 229
Russell Investment Company LifePoints® Funds
Basis for Approval of Investment Advisory Contracts, continued— (Unaudited)
investment, operate in a manner that is distinctly different from most other investment companies. In the case of most other investment companies, an investment advisory fee is paid by the investment company to its adviser which, in turn, employs and compensates individual portfolio managers to make specific securities selections consistent with the adviser’s style and investment philosophy. RIMCo has engaged multiple unaffiliated Money Managers for all Underlying Funds. A Money Manager may have (1) a discretionary asset management assignment pursuant to which it is allocated a portion of an Underlying Fund’s assets to manage directly in its discretion; (2) a non-discretionary assignment pursuant to which it provides a model portfolio to RIMCo representing its investment recommendations, based upon which RIMCo purchases and sells securities for an Underlying Fund; or (3) both a discretionary and a non-discretionary assignment.
The Board considered that RIMCo (rather than any Money Manager in the case of Underlying Funds) is responsible under the Existing Agreements for allocating assets of each Fund among its Underlying Funds and for determining, implementing and maintaining the investment program for each Underlying Fund. The assets of each Fund are invested in different combinations of the Underlying Funds pursuant to target asset allocations set by RIMCo. RIMCo may modify the target asset allocation for any Fund and/or the Underlying Funds in which the Funds invest. Assets of each Underlying Fund generally have been allocated among the multiple discretionary Money Managers selected by RIMCo, subject to Board approval, for that Underlying Fund. RIMCo manages the investment of each Underlying Fund’s cash and also may manage directly any portion of each Underlying Fund’s assets that RIMCo determines not to allocate to the discretionary Money Managers and portions of an Underlying Fund during transitions between Money Managers. RIMCo also may manage portions of an Underlying Fund based upon model portfolios provided by non-discretionary Money Managers. In all cases, Underlying Fund assets are managed directly by RIMCo pursuant to authority provided by the Existing Agreements
RIMCo is responsible for selecting, subject to Board approval, Money Managers for each Underlying Fund and for actively managing allocations and reallocations of its assets among the Money Managers or their strategies and RIMCo itself. The Board has been advised that RIMCo’s goal with respect to the Underlying Funds is to construct and manage diversified portfolios in a risk-aware manner. Each discretionary Money Manager for an Underlying Fund in effect performs the function of an individual portfolio manager who is responsible for selecting portfolio securities for the portion of the Underlying Fund assigned to it by RIMCo (each, a “segment”) in accordance with the Underlying Fund’s applicable investment objective, policies and restrictions, any constraints placed by RIMCo upon their selection of portfolio securities and the Money Manager’s specified role in an Underlying Fund. For each Underlying Fund, RIMCo is responsible for, among other things, communicating performance expectations to each Money Manager; supervising compliance by each Money Manager with each Underlying Fund’s investment objective and policies; authorizing Money Managers to engage in or provide recommendations with respect to certain investment strategies for an Underlying Fund; and recommending annually to the Board whether portfolio management contracts should be renewed, modified or terminated. In addition to its annual recommendation as to the renewal, modification or termination of portfolio management contracts, RIMCo is responsible for recommending to the Board additions of new Money Managers or replacements of existing Money Managers at any time when, based on RIMCo’s research and ongoing review and analysis, such actions are appropriate. RIMCo may impose specific investment or strategy constraints from time to time for each Money Manager intended to capitalize on the strengths of that Money Manager or to coordinate the investment activities of Money Managers for an Underlying Fund in a complementary manner. Therefore, RIMCo’s selection of Money Managers is made not only on the basis of performance considerations but also on the basis of anticipated compatibility with other Money Managers in the same Underlying Fund. In light of the foregoing, the overall performance of each Underlying Fund over appropriate periods has reflected, in great part, the performance of RIMCo in designing the Underlying Fund’s investment program, structuring an Underlying Fund, selecting an effective Money Manager with a particular investment style or sub-style for a segment that is complementary to the styles of the Money Managers of other Underlying Fund segments, and allocating assets among the Money Managers or their strategies in a manner designed to achieve the objectives of the Underlying Fund.
The Board considered that the prospectuses for the Funds and the Underlying Funds and other public disclosures emphasize to investors RIMCo’s role as the principal investment manager for each Underlying Fund, rather than the investment selection role of the Underlying Funds’ Money Managers, and describe the manner in which the Funds or Underlying Funds operate so that investors may take that information into account when deciding to purchase shares of any such Fund. The Board further considered that Fund investors in pursuing their investment goals and objectives likely purchased their shares on the basis of this information and RIMCo’s reputation for and performance record in managing the Underlying Funds’ manager-of-managers structure.
The Board also considered the demands and complexity of managing the Underlying Funds pursuant to the manager-of-managers structure, the special expertise of RIMCo with respect to the manager-of-managers structure of the Underlying Funds and the likelihood that, at the current expense ratio of each Underlying Fund, there would be no acceptable alternative investment managers to replace
230 Basis for Approval of Investment Advisory Contracts
Russell Investment Company LifePoints® Funds
Basis for Approval of Investment Advisory Contracts, continued — (Unaudited)
RIMCo on comparable terms given the need to continue the manager-of-managers strategy of such Underlying Fund selected by shareholders in purchasing their shares of a Fund or Underlying Fund.
In evaluating the portfolio management contracts at the 2013 Agreement Evaluation Meetings, the Board considered that each of the Underlying Funds employs a manager-of-managers method of investment and RIMCo’s advice that the Underlying Funds, in employing a manager-of-managers method of investment, operate in a manner that is distinctly different from most other investment companies. In the case of most other investment companies, an advisory fee is paid by the investment company to its adviser which, in turn, employs and compensates individual portfolio managers to make specific securities selections consistent with the adviser’s style and investment philosophy. RIMCo has engaged multiple unaffiliated Money Managers for all Underlying Funds.
In addition to these general factors relating to the manager-of-managers structure of the Underlying Funds, the Trustees considered, with respect to each Fund and Underlying Fund, various specific factors in evaluating renewal of the Existing Agreements, including the following:
1. The nature, scope and overall quality of the investment management and other services provided, and expected to be provided, to the Fund or the Underlying Fund by RIMCo;
2. The advisory fee paid by the Fund or the Underlying Fund to RIMCo (the “Advisory Fee”) and the fact that it encompasses all investment advisory fees paid by the Fund or Underlying Fund, including the fees for any Money Managers of such Underlying Fund;
3. Information provided by RIMCo as to other fees and benefits received by RIMCo or its affiliates from the Fund or Underlying Fund, including any administrative or transfer agent fees and any fees received for management or administration of securities lending cash collateral, soft dollar arrangements and commissions in connection with portfolio securities transactions;
4. Information provided by RIMCo as to expenses incurred by the Fund or the Underlying Fund;
5. Information provided by RIMCo as to the profits that RIMCo derives from its mutual fund operations generally and from the Fund or Underlying Fund; and
6. Information provided by RIMCo concerning economies of scale and whether any scale economies are adequately shared with the Fund or the Underlying Fund.
In evaluating the nature, scope and overall quality of the investment management and other services provided, and which are expected to be provided, to the Funds, including Fund portfolio management services, the Board discussed with senior representatives of RIMCo the impact on the Funds’ operations of changes in RIMCo’s senior management and other personnel providing investment management and other services to the Funds during the past year. The Board was not advised of any expected diminution in the nature, scope or quality of the investment advisory or other services provided to the Funds or the Underlying Funds from such changes. The Board also discussed the impact of organizational changes on the compliance programs of the Funds, the Underlying Funds and RIMCo with the Funds’ Chief Compliance Officer (the “CCO”) and received assurances from the CCO that such changes have not resulted in any diminution in the scope and quality of the compliance programs of the Funds or the Underlying Funds.
RIMCo is a wholly owned subsidiary of Frank Russell Company (“FRC”). FRC, in turn, is an indirect majority-owned subsidiary of The Northwestern Mutual Life Insurance Company (“NM”). Prior to the Existing Agreement Information Review Meeting, NM publicly announced its intention to evaluate strategic alternatives for its majority interest in FRC. RIMCo has advised the Board that this review could result in a transaction (“Transaction”) causing a change of control of RIMCo. At the Existing Agreement Information Review Meeting, the Board was advised by RIMCo that an unspecified number of parties had expressed an interest in a Transaction with NM but, to RIMCo’s knowledge, no formal proposals had been received to the date of the Existing Agreement Information Review Meeting. RIMCo, however, expected that proposals from one or more unidentified parties would be received shortly. RIMCo expressed its belief that any Transaction would not affect the activities of RIMCo in respect of the Funds or the structure of the Underlying Funds. However, the Board received no assurances in this regard directly from NM. Any Transaction would result, among other things, in an assignment and termination of the Existing Agreements, as required by the 1940 Act and by the terms and conditions of the Existing Agreements. In the event of a Transaction, the Board would be required to consider the approval of the terms and conditions of a replacement agreement (“Post-Transaction Agreement”) for the Existing Agreements and thereafter to submit the Post-Transaction Agreement to each Fund’s shareholders for approval, as required by the 1940 Act. At the Existing Agreement Evaluation Meeting, the Board was advised by RIMCo that NM had entered into exclusive discussions with London Stock Exchange Group plc regarding
Basis for Approval of Investment Advisory Contracts 231
Russell Investment Company LifePoints® Funds
Basis for Approval of Investment Advisory Contracts, continued— (Unaudited)
a possible Transaction. At both of the Existing Agreement Evaluation Meetings, the Board discussed with RIMCo the need to assure continuity of services required for the Funds’ operations.
As noted above, RIMCo, in addition to managing the investment of each Underlying Fund’s cash, may directly manage a portion of certain Underlying Funds (the “Participating Underlying Funds”) pursuant to the relevant Existing Agreement, the actual allocation being determined from time to time by the Participating Underlying Funds’ RIMCo portfolio manager. Beginning in 2012, RIMCo implemented a strategy of managing a portion of the assets of the Participating Underlying Funds to modify such Funds’ overall portfolio characteristics by investing in securities or other instruments that RIMCo believes will achieve the desired risk/return profiles for such Participating Underlying Funds. RIMCo monitors and assesses Participating Underlying Fund characteristics, including risk, using a variety of measurements, such as tracking error, and may seek to manage Participating Underlying Fund characteristics consistent with the Funds’ investment objectives and strategies. For U.S. equity Participating Underlying Funds, fund characteristics may be managed with the goal to increase or decrease exposures (such as volatility, momentum, value, growth, capitalization size, industry or sector). For non-U.S. equity, global infrastructure and global real estate Participating Underlying Funds, fund characteristics may be managed with the goal to increase or decrease exposures (such as volatility, momentum, value, growth, capitalization size, industry, sector or region). For fixed-income and alternative Participating Underlying Funds, fund characteristics may be managed with the goal to increase or decrease exposures (such as sector, industry, currency, credit or mortgage exposure or country risk, yield curve positioning, or interest rates). For all Funds, fund characteristics may be managed to offset undesired relative over or underweights in order to seek to achieve the desired risk/return profile for each Participating Underlying Fund. RIMCo may use an index replication or sampling strategy by selecting an index which represents the desired exposure, or may utilize quantitative or qualitative analysis or quantitative models designed to assess Participating Underlying Fund characteristics and identify a portfolio which provides the desired exposure. Based on this, for the portion of a Participating Underlying Fund’s assets directly managed by RIMCo, RIMCo may invest in common stocks, exchange-traded funds, exchange-traded notes, REITs, short-term investments and/or derivatives, including futures, forwards, options and/or swaps, in order to seek to achieve the desired risk/return profile for the Participating Underlying Fund. Derivatives may be used to take long or short positions. In addition, RIMCo may choose to use the cash equitization process to manage Participating Underlying Fund characteristics in order to seek to achieve the desired risk/return profile for the Participating Underlying Fund. RIMCo also may manage Participating Underlying Fund assets directly to effect a Participating Underlying Fund’s investment strategies. RIMCo’s direct management of assets for these purposes is hereinafter referred to as the “Direct Management Services.” RIMCo also may reallocate Underlying Fund assets among Money Managers, increase Underlying Fund cash reserves or determine not to be fully invested. RIMCo’s Direct Management Services generally are not intended to be a primary driver of Participating Underlying Funds’ investment results, although the services may have a positive or negative impact on investment results, but rather are intended to enhance incrementally the ability of Participating Underlying Funds to carry out their investment programs. At the Existing Agreement Evaluation Meetings, RIMCo advised the Board of a likely expansion of its Direct Management Services. In connection with this expansion, RIMCo stated that it may provide Direct Management Services to additional Underlying Funds and expected that a larger portion of certain Underlying Funds will be managed directly by RIMCo pursuant to the Direct Management Services. Additional Underlying Funds to be managed pursuant to the Direct Management Services may include some or all fixed income Underlying Funds. The Board considered that during the period, and to the extent that RIMCo employs its Direct Management Services other than via the cash equitization process in respect of Participating Underlying Funds, RIMCo is not required to pay investment advisory fees to a Money Manager with respect to Participating Underlying Fund assets that are directly managed and that the profits derived by RIMCo generally and from the Participating Underlying Funds consequently may be increased incrementally, although RIMCo may incur additional costs in providing Direct Management Services. The Board, however, also considered the potential benefits of the Direct Management Services to Participating Underlying Funds and the Funds; the limited amount of assets that to the date of the Existing Agreement Evaluation Meetings were being managed directly by RIMCo pursuant to the Direct Management Services; and the fact that the aggregate Advisory Fees paid by the Participating Underlying Funds are not increased as a result of RIMCo’s direct management of Participating Underlying Fund assets as part of the Direct Management Services or otherwise.
In evaluating the reasonableness of the Funds’ and Underlying Funds’ Advisory Fees in light of Fund and Underlying Fund performance, the Board considered that, in the Existing Agreement Evaluation Information and at past meetings, RIMCo noted differences between the investment strategies of certain Underlying Funds and their respective Comparable Funds in pursuing their investment objectives. The Board noted RIMCo’s further past advice that the strategies pursued by the Underlying Funds, among other things, are intended to result in less volatile, more moderate returns relative to each Underlying Fund’s performance benchmark rather than more volatile, more extreme returns that its Comparable Funds may experience over time.
232 Basis for Approval of Investment Advisory Contracts
Russell Investment Company LifePoints® Funds
Basis for Approval of Investment Advisory Contracts, continued — (Unaudited)
The Third-Party Information included, among other things, comparisons of the Funds’ Advisory Fees with the investment advisory fees of their Comparable Funds on an actual basis (i.e., giving effect to any voluntary fee waivers implemented by RIMCo and the advisers to such Fund’s Comparable Funds). The Third-Party Information, among other things, showed that the Conservative Strategy Fund, Balanced Strategy Fund, Growth Strategy Fund and Equity Growth Strategy Fund each had an Advisory Fee which, compared with its Comparable Funds’ investment advisory fees on an actual basis, was ranked in the fourth quintile of its Expense Universe for that expense component. In these rankings, the first quintile represents funds with the lowest investment advisory fees among funds in the Expense Universe and the fifth quintile represents funds with the highest investment advisory fees among the Expense Universe funds. The comparisons were based upon the latest fiscal years for the Expense Universe funds. The Board considered that the actual Advisory Fee for each of the Conservative Strategy Fund, Balanced Strategy Fund, Growth Strategy Fund and Equity Growth Strategy Fund was less than 5 basis points from the third quintile of its Expense Universe. The Board further considered RIMCo’s explanation of the reasons for the Funds’ actual Advisory Fee rankings and its belief that the Funds’ Advisory Fees are fair and reasonable under the circumstances, notwithstanding such comparisons.
In discussing the Advisory Fees for the Underlying Funds generally, RIMCo noted, among other things, that its Advisory Fees for the Underlying Funds encompass services that may not be provided by investment advisers to the Underlying Funds’ Comparable Funds, such as cash equitization and management of portfolio transition costs when Money Managers are added, terminated or replaced. RIMCo also observed that its “margins” in providing investment advisory services to the Underlying Funds tend to be lower than competitors’ margins because of the demands and complexities of managing the Underlying Funds’ manager-of-managers structure, including RIMCo’s payment of a significant portion of the Underlying Funds’ Advisory Fees to their Money Managers. RIMCo expressed the view that Advisory Fees should be considered in the context of a Fund’s or Underlying Fund’s total expense ratio to obtain a complete picture. The Board, however, considered each Fund’s and Underlying Fund’s Advisory Fee on both a standalone basis and in the context of the Fund’s or Underlying Fund’s total expense ratio.
Based upon information provided by RIMCo, the Board considered for each Fund and Underlying Fund whether economies of scale have been realized and whether the Advisory Fee for such Fund or Underlying Fund appropriately reflects or should be revised to reflect any such economies. The Board considered, among other things, the variability of Money Manager investment advisory fees and other factors associated with the manager-of-managers structure employed by the Underlying Funds as well as net Fund redemptions or purchases in recent years.
The Board also considered, as a general matter, that fees payable to RIMCo by institutional clients with investment objectives similar to those of the Funds, the Underlying Funds and Other Russell Funds are lower, and, in some cases, may be substantially lower, than the rates paid by the Funds, the Underlying Funds and Other Russell Funds. The Trustees considered the differences in the nature and scope of services RIMCo provides to institutional clients and the Funds and the Underlying Funds. RIMCo explained, among other things, that institutional clients have fewer compliance, administrative and other needs than the Funds and the Underlying Funds. RIMCo also noted that since the Funds and the Underlying Funds must constantly issue and redeem their shares, they are more difficult to manage than institutional accounts, where assets are relatively stable. In addition, RIMCo noted that the Funds and the Underlying Funds are subject to heightened regulatory requirements relative to institutional clients. The Board noted that RIMCo provides office space and facilities to the Funds and the Underlying Funds and all of the Funds’ and Underlying Funds’ officers. Accordingly, the Trustees concluded that the services provided to the Funds and Underlying Funds are sufficiently different from the services provided to the other clients that comparisons are not probative and should not be given significant weight.
With respect to the Funds’ total expenses, the Third-Party Information showed that the total expenses for each of the Balanced Strategy Fund, Growth Strategy Fund and Equity Growth Strategy Fund were ranked in the fourth or fifth quintile of its Expense Universe. In these rankings, the first quintile represents the funds with the lowest total expenses among funds in the Expense Universe and the fifth quintile represents the funds with the highest total expenses among the Expense Universe funds.
The Board considered RIMCo’s explanation that administration fees, transfer agency fees, and the indirect expenses of Underlying Funds contributed to the fourth or fifth quintile ranking for the Balanced Strategy Fund, Growth Strategy Fund and Equity Growth Strategy Fund. The Board considered RIMCo’s explanation that each Fund as part of its investment strategy maintains a larger allocation to non-U.S. equity securities than its Comparable Funds. The Board also considered RIMCo’s expressed belief that certain asset classes such as commodities, global high yield debt and infrastructure play an important role in a diversified portfolio. RIMCo noted that non-U.S. equity funds and certain diversifying return streams (such as commodities, alternatives and infrastructure) generally have higher expense ratios than U.S. equity funds and fixed income funds. The Board considered RIMCo’s explanation that the larger allocations to non-U.S. equities and certain diversifying return streams (such as commodities, alternatives and infrastructure), and
Basis for Approval of Investment Advisory Contracts 233
Russell Investment Company LifePoints® Funds
Basis for Approval of Investment Advisory Contracts, continued— (Unaudited)
resulting higher indirect expenses of the Underlying Funds’ investments, made meaningful comparisons with each Fund’s respective Comparable Funds difficult.
On the basis of the Existing Agreement Evaluation Information, and other information previously received by the Board from RIMCo during the course of the current year or prior years, or presented at or in connection with the Existing Agreement Evaluation Meetings by RIMCo, the Board, in respect of each Fund and Underlying Fund, found, after giving effect to any applicable waivers and/or reimbursements and considering any differences in the composition and investment strategies of its respective Comparable Funds, (1) the Advisory Fee charged by RIMCo was reasonable in light of the nature, scope and overall quality of the investment management and other services provided, and expected to be provided, to the Fund or Underlying Fund; (2) the relative expense ratio of each Fund and Underlying Fund either was comparable to those of its Comparable Funds or RIMCo had provided an explanation satisfactory to the Board as to why the relative expense ratio was not comparable to those of its Comparable Funds; (3) RIMCo’s methodology of allocating expenses of operating funds in the complex was reasonable; (4) other benefits and fees received by RIMCo or its affiliates from the Funds or Underlying Funds were not excessive; (5) RIMCo’s profitability with respect to the Funds and each Underlying Fund was not excessive in light of the nature, scope and overall quality of the investment management and other services provided by RIMCo; and (6) the Advisory Fee charged by RIMCo appropriately reflects any economies of scale realized by such Fund or Underlying Fund in light of various factors, including the variability of Money Manager investment advisory fees and other factors associated with the manager-of-managers structure employed by the Underlying Funds.
The Board concluded that, under the circumstances and based on RIMCo’s performance information and reviews for each Fund and Underlying Fund, the performance of each of the Funds would be consistent with continuation of its Existing Agreement. The Board, in assessing the performance of Funds and Underlying Funds with at least three years of performance history, focused upon performance for the 3-year period ended December 31, 2013 as most relevant, but also considered the Funds’ and Underlying Funds’ performance for the 1-year and, where applicable, 5-year periods ended such date. In reviewing the performance of the Funds and the Underlying Funds generally, the Board took into consideration the various steps taken by RIMCo beginning in 2012 to enhance the performance of certain Underlying Funds, including changes in Money Managers, and, in the case of Participating Underlying Funds, RIMCo’s implementation of its Direct Management Services, which may not yet be fully reflected in Participating Underlying Fund and Fund investment results.
With respect to the Conservative Strategy Fund, Moderate Strategy Fund, Balanced Strategy Fund, Growth Strategy Fund and Equity Growth Strategy Fund, the Third-Party Information showed that each Fund’s performance was ranked in the fourth or fifth quintile of its Performance Universe for the 3-year period ended December 31, 2013. The Board considered RIMCo’s explanation that the underperformance of these Funds relative to their respective peer groups was mainly due to asset allocation differences. RIMCo noted, among other things, that the Conservative Strategy Fund and Equity Growth Strategy Fund tend to have higher allocations to fixed income and lower allocations to equities than their respective Comparable Funds, and that equities have largely outperformed fixed income over the 3-year period. RIMCo also explained that each of the Conservative Strategy Fund, Moderate Strategy Fund, Balanced Strategy Fund, Growth Strategy Fund and Equity Growth Strategy Fund tend to hold more diversified growth-oriented assets beyond traditional equities (such as global real estate, infrastructure, commodities, global high yield debt, emerging market debt, and hedge fund strategies), which have lagged in the strong equity markets. This exposure, according to RIMCo, is intended to provide diversification benefits and dampen volatility.
The Board also considered that in January 2014, the Funds implemented a change in strategic asset allocations, which decreased positions in core fixed income, international developed equity and commodities, and increased positions in small cap, emerging markets and infrastructure. According to RIMCo, these changes brought the Funds’ allocations directionally closer towards the average equity and fixed income allocations of the Comparable Funds, although the Funds continue to maintain more diversified growth asset exposure and a larger globally diversified equity allocation than their Comparable Funds.
With respect to the 2015 Strategy Fund, 2020 Strategy Fund and 2030 Strategy Fund, the Third-Party Information showed that each Fund’s performance was ranked in the fourth quintile of its Performance Universe for the 1- and 3-year periods ended December 31, 2013, but its performance was ranked in the third quintile of its Performance Universe for the 5-year period ended such date. With respect to the 2025 Strategy Fund and 2045 Strategy Fund, the Third-Party Information showed that each Fund’s performance was ranked in the fifth quintile of its Performance Universe for the 3-year period ended December 31, 2013, and its performance ranked in the fourth quintile of its Performance Universe for the 1- and 5-year periods ended such date. With respect to the 2035 Strategy Fund and 2040 Strategy Fund, the Third-Party Information showed that each Fund’s performance was ranked in the fourth quintile of its Performance Universe for the 3-year period ended December 31, 2013, but its performance ranked in the third quintile of
234 Basis for Approval of Investment Advisory Contracts
Russell Investment Company LifePoints® Funds
Basis for Approval of Investment Advisory Contracts, continued — (Unaudited)
its Performance Universe for the 1- and 5-year periods ended such date. With respect to the 2050 Strategy Fund, the Third-Party Information showed that the Fund’s performance was ranked in the fourth quintile of its Performance Universe for the 1-, 3- and 5-year periods ended December 31, 2013. With respect to the 2055 Strategy Fund, the Third-Party Information showed that the Fund’s performance was ranked in the fifth quintile of its Performance Universe for the 1-year period ended December 31, 2013.
The Board considered RIMCo’s explanation that the underperformance of the Target Date Funds relative to their respective peer groups over the three-year period (the 1-year period for the 2055 Strategy Fund) was mainly due to asset allocation differences. RIMCo explained that within the growth-oriented asset allocation, each of the Target Date Funds tend to hold more diversified growth-oriented assets beyond traditional equities (such as global real estate, infrastructure and commodities), which have lagged in the strong equity markets. This exposure, according to RIMCo, is intended to provide diversification benefits and dampen volatility. RIMCo also noted that it is considering changes to the glide path that dictates asset allocation between return-seeking growth assets (equity and real asset) and capital preservation assets (core fixed income) for the Target Date Funds, which is expected to bring a number of the Target Date Funds closer to the average equity and fixed income allocations of the Comparable Funds and may reduce differences in peer relative average performance going forward.
In evaluating performance, the Board considered each Fund’s and Underlying Fund’s absolute performance and performance relative to appropriate benchmarks and indices in addition to such Fund’s performance relative to its Comparable Funds. In assessing the Funds’ performance relative to their Comparable Funds or benchmarks or in absolute terms, the Board also considered RIMCo’s stated investment strategy of managing the Underlying Funds in a risk-aware manner. The Board also considered the Underlying Fund Money Manager changes that have been made since 2012 and that the performance of Money Managers continues to impact Fund and Underlying Fund performance for periods prior and subsequent to their termination, and that any incremental positive or negative impact of the Direct Management Services to Participating Underlying Funds, which continue to evolve in nature and scope, was not yet fully reflected in the investment results of the Participating Underlying Funds or the Funds. Lastly, the Board considered potential new strategies discussed at the Existing Agreement Evaluation Meetings and prior Board meetings that may be employed by RIMCo in respect of certain Underlying Funds.
After considering the foregoing and other relevant factors, the Board concluded in respect of each Fund and Underlying Fund that continuation of its Existing Agreement would be in the best interests of such Fund and its shareholders and voted to approve the continuation of each Existing Agreement.
At the Existing Agreement Evaluation Meetings, with respect to the evaluation of the terms of portfolio management contracts with Money Managers for the Underlying Funds, the Board received and considered information from RIMCo reporting, among other things, for each Money Manager, the Money Manager’s performance over various periods; RIMCo’s assessment of the performance of each Money Manager; any significant business relationships between the Money Manager and RIMCo or Russell Financial Services, Inc., the Funds’ and Underlying Funds’ underwriter; and RIMCo’s recommendation to retain the Money Manager at the current fee rate, to retain the Money Manager at a reduced fee rate or to terminate the Money Manager. The Board received reports during the course of the year from the Funds’ CCO regarding her assessments of Money Manager compliance programs and any compliance issues. RIMCo did not identify any benefits received by Money Managers or their affiliates as a result of their relationships with the Underlying Funds other than benefits from their soft dollar arrangements. The Existing Agreement Evaluation Information described, and at the Existing Agreement Evaluation Meetings the Funds’ CCO discussed, oversight of Money Manager soft dollar arrangements. The Existing Agreement Evaluation Information expressed RIMCo’s belief that, based upon certifications from Money Managers and pre-hire and ongoing reviews of Money Manager soft dollar arrangements, policies and procedures, the Money Managers’ soft dollar arrangements, policies and procedures are consistent with applicable legal standards and with disclosures made by Money Managers in their investment adviser registration statements filed with the Securities and Exchange Commission and by the Underlying Funds in their registration statements. The Board was advised that, in the case of Money Managers using soft dollar arrangements, the CCO monitors, among other things, the commissions paid by the Underlying Funds and percentage of Underlying Fund transactions effected pursuant to the soft dollar arrangements, as well as the products or services purchased by the Money Managers with soft dollars generated by Underlying Fund portfolio transactions. The CCO and RIMCo do not obtain, and the Existing Agreement Evaluation Information therefore did not include, information regarding the value of soft dollar benefits derived by Money Managers from Underlying Fund portfolio transactions. At the Existing Agreement Evaluation Meeting, RIMCo noted that it planned to recommend termination of certain Money Managers to the Board at the May 2014 meeting. RIMCo recommended that each of the other Money Managers be retained at its current or a reduced fee rate. In doing so, RIMCo, as it has in the past, advised the Board that it does not regard Money Manager profitability as relevant to its evaluation of the portfolio management contracts with Money Managers because the willingness
Basis for Approval of Investment Advisory Contracts 235
Russell Investment Company LifePoints® Funds
Basis for Approval of Investment Advisory Contracts, continued— (Unaudited)
of Money Managers to serve in such capacity depends upon arm’s-length negotiations with RIMCo; RIMCo is aware of the standard fee rates charged by Money Managers to other clients; and RIMCo believes that the fees agreed upon with Money Managers are reasonable in light of the anticipated quality of investment advisory services to be rendered. The Board accepted RIMCo’s explanation of the relevance of Money Manager profitability in light of RIMCo’s belief that such fees are reasonable; the Board’s findings as to the reasonableness of the Advisory Fee paid by each Fund and Underlying Fund; and the fact that each Money Manager’s fee is paid by RIMCo.
Based substantially upon RIMCo’s recommendations, together with the Existing Agreement Evaluation Information, the Board concluded that the fees paid to the Money Managers of each Underlying Fund are reasonable in light of the quality of the investment advisory services provided and that continuation of the portfolio management contract with each Money Manager of each Underlying Fund would be in the best interests of such Underlying Fund and its shareholders.
In their deliberations, the Trustees did not identify any particular information as to the Existing Agreements or, other than RIMCo’s recommendation, the portfolio management contract with any Money Manager for an Underlying Fund that was all-important or controlling and each Trustee attributed different weights to the various factors considered. The Trustees evaluated all information available to them on a Fund-by-Fund basis and their determinations were made in respect of each Fund and Underlying Fund.
Subsequent to the Existing Agreement Evaluation Meeting, the Board received a proposal from RIMCo at a meeting held on May 20, 2014 to effect Money Manager changes for the Russell Investment Grade Bond Fund, Russell Short Duration Bond Fund, Russell Global Real Estate Securities Fund, Russell U.S. Dynamic Equity Fund and Russell Global Opportunistic Credit Fund. In the case of each proposed change, the Trustees approved the terms of the proposed portfolio management contract based upon RIMCo’s recommendation to hire the Money Manager at the proposed fee rate; information as to reason for the proposed change; information as to the Money Manager’s role in the management of the Underlying Fund’s investment portfolio (including the amount of Underlying Fund assets to be allocated to the Money Manager) and RIMCo’s evaluation of the anticipated quality of the investment advisory services to be provided by the Money Manager; information as to any significant business relationships between the Money Manager and RIMCo or Russell Financial Services, Inc., the Underlying Fund’s underwriter; the CCO’s evaluation of the Money Manager’s compliance program, policies and procedures, and certification that they were consistent with applicable legal standards; RIMCo’s explanation as to the lack of relevance of Money Manager profitability to the evaluation of portfolio management contracts with Money Managers because the willingness of Money Managers to serve in such capacity depends upon arm’s-length negotiations with RIMCo; RIMCo’s awareness of the standard fee rates charged by the Money Manager to other clients; RIMCo’s belief that the proposed investment advisory fees would be reasonable in light of the anticipated quality of investment advisory services to be rendered; the increase or decrease in aggregate Money Manager fees to be paid by RIMCo from its Advisory Fee as a result of the engagement of the Money Manager; and the expected costs of transitioning Underlying Fund assets to the Money Manager. The Trustees also considered their findings at the Existing Agreement Evaluation Meeting as to the reasonableness of the aggregate Advisory Fees paid by the Underlying Funds, and the fact that the aggregate Advisory Fees paid by the Underlying Funds would not increase as a result of the implementation of the proposed Money Manager changes because the Money Managers’ investment advisory fees are paid by RIMCo.
Subsequent to the Existing Agreement Evaluation Meeting, the Board received a proposal from RIMCo at a meeting held on August 26, 2014 to effect Money Manager changes for the Russell International Developed Markets Fund and Russell Multi-Strategy Alternative Fund and at that same meeting to effect a Money Manager change for each of the Russell Global Infrastructure Fund, Russell Emerging Markets Fund and Russell International Developed Markets Fund resulting from a Money Manager change of control for one of each Underlying Fund’s Money Managers. In the case of each proposed change, the Trustees approved the terms of the proposed portfolio management contract based upon RIMCo’s recommendation to hire the Money Manager at the proposed fee rate; information as to reason for the proposed change; information as to the Money Manager’s role in the management of the Underlying Fund’s investment portfolio (including the amount of Underlying Fund assets to be allocated to the Money Manager) and RIMCo’s evaluation of the anticipated quality of the investment advisory services to be provided by the Money Manager; information as to any significant business relationships between the Money Manager and RIMCo or Russell Financial Services, Inc., the Underlying Fund’s underwriter; the CCO’s evaluation of the Money Manager’s compliance program, policies and procedures, and certification that they were consistent with applicable legal standards; RIMCo’s explanation as to the lack of relevance of Money Manager profitability to the evaluation of portfolio management contracts with Money Managers because the willingness of Money Managers to serve in such capacity depends upon arm’s-length negotiations with RIMCo; RIMCo’s awareness of the standard fee rates charged by the Money Manager to other clients; RIMCo’s belief that the proposed investment advisory fees would be reasonable in light of the anticipated quality of investment advisory services to be rendered; the increase or decrease in aggregate Money Manager fees to be paid by RIMCo from its Advisory
236 Basis for Approval of Investment Advisory Contracts
Russell Investment Company LifePoints® Funds
Basis for Approval of Investment Advisory Contracts, continued — (Unaudited)
Fee as a result of the engagement of the Money Manager; and the expected costs of transitioning Underlying Fund assets to the Money Manager. The Trustees also considered their findings at the Existing Agreement Evaluation Meeting as to the reasonableness of the aggregate Advisory fees paid by the Underlying Funds, and the fact that the aggregate Advisory fees paid by the Underlying Funds would not increase as a result of the implementation of the proposed Money Manager changes because the Money Managers’ investment advisory fees are paid by RIMCo.
Approval of the Post-Transaction Agreement
On May 20, 2014, London Stock Exchange Group plc (“LSEG”) announced that it had entered into exclusive discussions with NM for the potential acquisition of FRC although there was no certainty that any agreement for a transaction would be reached. On June 26, 2014, the Board was advised by FRC, and LSEG publicly announced, that LSEG had entered into a definitive agreement and plan of merger to acquire FRC, including both its index and investment management businesses. In its announcement (the “LSEG Announcement”), LSEG stated, among other things, that the investment management business would be the subject of “a comprehensive review to determine its positioning and fit with the Group” and that LSEG is “committed to maintaining a clear focus on client service, fund performance and management and employee stability, whilst ensuring appropriate standalone governance.” On June 27, 2014, the Board met by conference telephone call to discuss preliminarily the LSEG Announcement with representatives of FRC, RIMCo and LSEG.
In preparation for its evaluation of the Post-Transaction Agreement, the Independent Trustees, with the advice and assistance of Independent Counsel, requested information to evaluate the Post-Transaction Agreement. In their requests for such information, the Independent Trustees advised RIMCo of their intention to rely upon the Existing Agreement Evaluation Information in their evaluation of the Post-Transaction Agreement, if and to the extent the Existing Agreement Evaluation Information continued to be accurate and complete as of July 29, 2014. The Independent Trustees requested that RIMCo provide any updated and additional information needed for the Board to consider whether the Post-Transaction Agreement should be approved. The foregoing information and other information provided by RIMCo and LSEG to the Board, including the Independent Trustees, in connection with its evaluation of the Post-Transaction Agreement hereinafter is referred to collectively as the “Post-Transaction Agreement Evaluation Information.”
At a meeting held in person on July 17, 2014 (the “Post-Transaction Agreement Information Review Meeting”), the Board in further preparation for its evaluation of the Post-Transaction Agreement reviewed Post-Transaction Agreement Evaluation Information received to the date of that Meeting, first with senior representatives of FRC, RIMCo, Fund management and LSEG, and then in a private session with Independent Counsel, at which no representatives of FRC, RIMCo, LSEG, or Fund management were present, and, on the basis of that review, requested additional information regarding the Transaction and its impact on RIMCo and the Funds.
The Board met in person on July 29, 2014 to consider approval of the Post-Transaction Agreement (the “Post-Transaction Agreement Evaluation Meeting”). At the Post-Transaction Agreement Evaluation Meeting, the Independent Trustees first met to review additional Post-Transaction Agreement Information received to that date with representatives of FRC, RIMCo, Fund management, and LSEG. Presentations made by FRC, RIMCo and LSEG at the Post-Transaction Agreement Information Review Meeting and the Post-Transaction Agreement Evaluation Meeting (together, the “Transaction Board Meetings”), as part of this review, encompassed all of the Funds and the Other Russell Funds. Information received by the Board, including the Independent Trustees, at the Transaction Board Meetings is included in the Post-Transaction Agreement Evaluation Information. Presentations made by FRC, RIMCo and LSEG at the Transaction Board Meetings are included in the Post-Transaction Agreement Evaluation Information. Prior to voting at the Post-Transaction Agreement Evaluation Meeting, the Independent Trustees met in executive session with Independent Counsel, at which no representatives of FRC, RIMCo, LSEG, or Fund management were present, to review additional Post-Transaction Agreement Evaluation Information received prior to and at the Meeting. The discussion below reflects all of these reviews.
The Board’s evaluation of the Post-Transaction Agreement reflected the Post-Transaction Agreement Evaluation Information and other information received by the Board during the course of the year or prior years (including the Existing Agreement Evaluation Information, as supplemented by RIMCo through the date of the Post-Transaction Agreement Evaluation Meeting) and the findings made by the Board in respect of the Existing Agreement at the Existing Agreement Evaluation Meeting. The Independent Trustees’ evaluations of the Post-Transaction Agreement also reflected the knowledge and familiarity gained as Board members of the Funds and Other Russell Funds with respect to services provided by RIMCo, RIMCo’s affiliates, and each Money Manager to the Funds under the Existing Agreement and services proposed to be provided to the Funds under the Post-Transaction Agreement. The Board noted the short period of time since the Existing Agreement Evaluation Meeting and that information provided by RIMCo to update and
Basis for Approval of Investment Advisory Contracts 237
Russell Investment Company LifePoints® Funds
Basis for Approval of Investment Advisory Contracts, continued— (Unaudited)
supplement the Existing Agreement Evaluation Information through the date of the Post-Transaction Agreement Evaluation Meeting did not affect the conclusions reached by the Board at the Existing Agreement Evaluation Meeting.
In approving the Post-Transaction Agreement, the Board considered all factors it believed relevant in exercising its business judgment, including the following:
(1) the reputation, financial strength and resources of LSEG;
(2) LSEG is a diversified international market infrastructure and capital markets business;
(3) LSEG’s advice that it has a strong track record of successful acquisitions and owning regulated businesses and that its regulatory and compliance history is strong;
(4) LSEG is not engaged in the mutual fund or investment management businesses, with the result that there will be no overlap of mutual fund products to address in the transfer of ownership of FRC’s investment management business from NM and other current shareholders to LSEG;
(5) LSEG’s advice that the outcome of the comprehensive review and its effect on FRC’s investment management business would not be prejudged and that one part of the review is to determine whether the FRC investment management business would be more valuable as part of the LSEG organization or as part of an organization with existing investment management activities;
(6) LSEG’s assurances that there were no circumstances that could be envisaged at the time of the Post-Transaction Agreement Evaluation Meeting under which the Funds may be left without an investment manager to conduct their investment programs and that, whatever the outcome of the comprehensive review and for as long as it owns the FRC investment management business, it is committed to maintaining the existing clear focus on client service and fund performance in FRC’s investment management business;
(7) LSEG’s stated intention that the FRC investment management business will operate independently of the rest of LSEG and its expectation that the impact of the Transaction on the Funds will be broadly neutral, with no material improvements or disadvantages, although the Funds may benefit to some extent from the ownership of the FRC investment management business by a company with world class technology, operational competencies, and financial strength;
(8) LSEG’s advice that, as part of the comprehensive review, it will provide continued strong support and investment for growth and innovation, and pay particular attention to creating appropriate standalone governance and operations for FRC’s investment management business while also focusing on maintaining strong management and employee continuity;
(9) the Post-Transaction Agreement Evaluation Information did not identify any conflicts of interest that would arise following completion of the Transaction but LSEG did advise the Board that it is continuing to work with FRC to establish the scope of affiliated business and to assess whether modifications to FRC’s compliance policies and procedures and/or other steps are appropriate. The Board was advised that it would be apprised of any material issues that are subsequently identified.
(10) LSEG’s expectation that there will be no diminution in the nature, scope and overall quality of services provided to the Funds and their shareholders, including administrative, regulatory and compliance services, as a result of the Transaction. In this regard, the Post-Transaction Agreement Evaluation Information stated, among other things:
LSEG intends to maintain the existing nature and quality of services provided to the Funds by RIMCo.
In connection with or as a result of the Transaction, LSEG anticipates that RIMCo will maintain the resources, operations, staffing and other functions required for the operation or administration of the Funds.
No changes are expected by LSEG in RIMCo’s investment strategies and practices in respect of the Funds as a result of the Transaction, including the manager-of-managers structure employed by the Funds that are not Funds of Funds (the “Manager-of-Managers Funds”) and employed indirectly by the Funds of Funds through their investments in the Manager-of-Managers Funds.
(11) advice from RIMCo and LSEG that there is no intention to propose any immediate changes to any of the Funds’ third-party service providers, thereby assuring continuation of services needed for the Funds’ operations and minimizing complications in connection with the transfer of ownership of FRC’s investment management business from NM and other current shareholders to LSEG;
238 Basis for Approval of Investment Advisory Contracts
Russell Investment Company LifePoints® Funds
Basis for Approval of Investment Advisory Contracts, continued — (Unaudited)
(12) at the Existing Agreement Evaluation Meetings, the Board had performed a full annual review of the Existing Agreement, as required by the 1940 Act, and had reapproved the Existing Agreement, concluding, among other things, that the Advisory Fee for each Fund was reasonable in light of the nature, scope and overall quality of the investment management and other services provided, and expected to be provided, to the Fund;
(13) the terms and conditions of the Post-Transaction Agreement are substantially the same as those of the Existing Agreement, which will terminate automatically upon completion of the Transaction, and the Post-Transaction Agreement will not change any Fund’s Advisory Fee (on a contractual or actual basis), expense ratio, profitability, economies of scale, or other fees or benefits received by RIMCo and its affiliates as a result of their relationships with the Fund;
(14) FRC and/or its affiliates and LSEG, not the Funds, will bear all costs of meetings, preparation of proxy materials and solicitation in connection with obtaining approvals of the Post-Transaction Agreement;
(15) there will be no changes to the Independent Trustees of the Board in connection with the Transaction, assuring continuity of the Funds’ supervision and oversight;
(16) LSEG’s assurances that for a period of two years following the effective date of the Post-Transaction Agreement, it will use reasonable best efforts not to engage in activities that would impose an “unfair burden” on the Funds within the meaning of Section 15(f) of the 1940 Act;
(17) the Board’s belief that shareholders have purchased and retained their Fund shares based upon the reputation, investment record, and investment philosophies and strategies employed by RIMCo in managing the Funds (including the manager-of-managers structure employed by the Manager-of-Managers Funds and employed indirectly by the Funds of Funds through their investments in the Manager-of-Managers Funds); and
(18) the demands and complexity of managing the Manager-of-Managers Funds pursuant to the manager-of-managers structure, the special expertise of RIMCo with respect to the manager-of-managers structure of those Funds, and the Board’s belief that, at the current expense ratio of each Manager-of-Managers Fund, there would likely be no acceptable alternative investment managers to replace RIMCo on comparable terms given the need to continue the manager-of-managers strategy selected by shareholders in purchasing their shares of Manager-of-Managers Funds which employ a manager-of-managers structure or Funds of Funds that indirectly employ a manager-of-managers strategy through their investments in the Underlying Funds.
In evaluating the Post-Transaction Agreement, the Board considered the possibility that, depending upon the results of the comprehensive review, the FRC investment management business would be conducted pursuant to the Post-Transaction Agreement as an independent part of the LSEG organization following completion of the Transaction, without any significant diminution expected in the nature, scope and overall quality of services provided to the Funds, and without any expected effect on the Funds’ Advisory Fees (contractual or actual), expenses, profitability, economies of scale, or other fees or benefits to FRC or RIMCo or their affiliates from their Fund relationships. However, the Independent Trustees were unable on the basis of the Post-Transaction Agreement Evaluation Information to determine the outcome of the comprehensive review or its effects, if any, on the FRC investment management business generally or on any of the investment advisory and other services that RIMCo and other FRC affiliates provide to the Funds under the Existing Agreement. Among other things, the Board could not determine whether or for how long FRC’s investment management business will continue as part of the LSEG organization following conclusion of the comprehensive review. In its deliberations, the Board considered the above and other relevant factors in light of the uncertain outcome and effects of the comprehensive review and, consequently, identified the principal factor in determining whether to approve the Post-Transaction Agreement as the need to provide for uninterrupted investment advisory and other services required for the operations of the Funds following the automatic termination of the Existing Agreement upon completion of the Transaction. No other single factor reviewed by the Board was identified by the Board as a principal factor in determining whether to approve the Post-Transaction Agreement and each Board member attributed different weights to the various factors. The Trustees evaluated all information available to them on a Fund-by-Fund basis and their determinations were made separately in respect of each Fund. After careful consideration of all factors, principally the need for continuation of investment advisory and other services required for the operation of the Funds following termination of the Existing Agreement, the Board believed that approval of the Post-Transaction Agreement would be in the best interests of each Fund and its shareholders for a period ending two years from the date of the Post-Transaction Agreement, but advised Fund management of its intention (subject to the outcome of the comprehensive review) to evaluate the continuance of the Post-Transaction Agreement within one year of its effectiveness, although not required to do so by the terms of the Post-Transaction Agreement or the 1940 Act. The Independent Trustees were advised by
Basis for Approval of Investment Advisory Contracts 239
Russell Investment Company LifePoints® Funds
Basis for Approval of Investment Advisory Contracts, continued— (Unaudited)
Independent Counsel throughout the process of evaluating the Post-Transaction Agreement. Prior to the Post-Transaction Agreement Information Review Meeting, the Board received a memorandum from Fund Counsel discussing its responsibilities in connection with its evaluation of the Post-Transaction Agreement and the Independent Trustees separately received a memorandum discussing such responsibilities from Independent Counsel.
Approval of the New Agreement
At the in-person Transaction Board Meetings, the Board considered approval of a new investment advisory agreement between each Fund and RIMCo that reflects updated terms and, if approved by shareholders, will go into effect in lieu of the Post-Transaction Agreement following the Transaction or, if the Transaction is not consummated, will replace the Fund’s Existing Agreement (the “New Agreement”). In preparation for its evaluation of the New Agreement, the Board reviewed information from RIMCo regarding the New Agreement (the “New Agreement Evaluation Information”) at the Post-Transaction Agreement Information Review Meeting. At the Post- Transaction Agreement Information Review Meeting, the Independent Trustees met first with representatives of RIMCo and Fund management and then in a private session with Independent Counsel, at which no representatives of RIMCo or Fund management were present, to review the New Agreement Evaluation Information.
The Independent Trustees considered approval of the New Agreement at the Post-Transaction Agreement Evaluation Meeting. The Board, including the Independent Trustees, first met with representatives of RIMCo and Fund management to discuss the New Agreement Evaluation Information. Prior to voting on approval of the New Agreement, the Independent Trustees met in a private session with Independent Counsel, at which no representatives of RIMCo or Fund management were present, to review additional New Agreement Evaluation Information received prior to and at the Post-Transaction Agreement Evaluation Meeting. The discussion reflects all of these reviews.
Presentations made by RIMCo at the Transaction Board Meetings regarding the New Agreement encompassed all of the Funds.
In evaluating the New Agreement, the Board considered all factors it believed relevant in exercising its business judgment, including the following:
(1) the Board had performed a full annual review of the Existing Agreement at the Existing Agreement Evaluation Meeting and had reapproved the Existing Agreement, concluding, among other things, that the Advisory Fee of each Fund was reasonable in light of the nature, scope and overall quality of the investment management and other services provided, and expected to be provided, to each Fund;
(2) the New Agreement reflects current industry practices and also expressly addresses RIMCo’s overall investment management responsibilities, including the delegation of such management to Money Managers with discretionary authority, the implementation of recommendations from Money Managers with non-discretionary authority, direct management of all of a Fund’s assets by RIMCo, or any combination thereof;
(3) RIMCo believes that the permission afforded by the New Agreement to use non-discretionary Money Managers with respect to a Fund’s entire portfolio will enhance RIMCo’s ability to determine how best to manage the Fund’s assets, and will allow RIMCo the flexibility to more efficiently and effectively manage Fund assets consistent with a Fund’s objective and to create a more customized investment program for each Fund, depending upon the particular characteristics and objectives of that Fund;
(4) in the case of certain Funds, RIMCo believes that a more extensive use of non-discretionary Money Managers may provide an opportunity to better manage transaction costs and the tax impact associated with trading portfolio securities;
(5) the New Agreement will not change any Fund’s investment objective nor will it change any Fund’s Advisory Fee rate or total expense ratio;
(6) the Advisory Fee paid by each Fund to RIMCo encompasses all investment advisory fees paid by the Fund, including the fees for any Money Managers of such Fund. Fees paid by RIMCo from the Advisory Fee to non-discretionary Money Managers, who provide model portfolios to RIMCo representing their investment recommendations, based upon which RIMCo purchases and sells portfolio investments for a Fund, may be less than fees that would be paid to discretionary Money Managers, who make and implement their investment decisions to buy or sell portfolio investments for a Fund. While the Board did not receive any information concerning any additional benefits to RIMCo in connection with an expanded use of non-discretionary Money Managers, during the time, and to the extent, that RIMCo utilizes non-discretionary Money Managers rather than discretionary Money Managers in respect of the Funds,
240 Basis for Approval of Investment Advisory Contracts
Russell Investment Company LifePoints® Funds
Basis for Approval of Investment Advisory Contracts, continued — (Unaudited)
RIMCo may retain a larger portion of the Advisory Fee and the profits derived by RIMCo generally and from the Funds consequently may be increased; and
(7) if in the future RIMCo determines to change the “multi-manager” approach of any of the existing Funds, RIMCo will discuss such change in advance with the Board and seek any Board approval determined appropriate by RIMCo. In addition, if this were to occur, shareholders would be notified in advance of a change in their Fund’s multi-manager approach. This process will provide notice to shareholders of any material change in their Fund’s investment program and also may help to mitigate any potential conflict of interest inherent in RIMCo’s expanded use of non-discretionary Money Managers.
In their deliberations, the Trustees did not identify any particular information as to the New Agreement that was all-important or controlling and each Trustee attributed different weights to the various factors considered. The Trustees evaluated all information available to them on a Fund-by-Fund basis and their determinations were made in respect of each Fund. After careful consideration of the above and all other factors considered to be relevant by the Board, the Board believed that approval of the New Agreement would be in the best interests of each Fund and its shareholders. The Independent Trustees were represented by Independent Counsel throughout the process of evaluating the New Agreement.
Basis for Approval of Investment Advisory Contracts 241
Russell Investment Company LifePoints® Funds
Shareholder Requests for Additional Information — October 31, 2014 (Unaudited)
A complete unaudited schedule of investments is made available generally no later than 60 days after the end of the first and third quarters of each fiscal year. These reports are available (i) free of charge, upon request, by calling the Funds at (800) 787-7354; (ii) at www.russell.com; (iii) on the Securities and Exchange Commission’s website at www.sec.gov; and (iv) at the Securities and Exchange Commission’s public reference room.
The Board has delegated to RIMCo, as RIC’s investment adviser, the primary responsibility for monitoring, evaluating and voting proxies solicited by or with respect to issuers of securities in which assets of the Underlying Funds may be invested. RIMCo has established a proxy voting committee and has adopted written proxy voting policies and procedures (“P&P”) and proxy voting guidelines (“Guidelines”). The Funds maintain a Portfolio Holdings Disclosure Policy that governs the timing and circumstances of disclosure to shareholders and third parties of information regarding the portfolio investments held by the Funds. A description of the P&P, Guidelines, Portfolio Holdings Disclosure Policy and additional information about Fund Trustees are contained in the Funds’ Statement of Additional Information (“SAI”). The SAI and information regarding how the Underlying Funds voted proxies relating to portfolio securities during the most recent 12-month period ended June 30, 2014 are available (i) free of charge, upon request, by calling the Funds at (800) 787-7354; (ii) at www.russell.com; and (iii) on the Securities and Exchange Commission’s website at www. sec.gov.
To reduce expenses, we may mail only one copy of the Funds’ prospectuses and each annual and semi-annual report to those addresses shared by two or more accounts. If you wish to receive individual copies of these documents, please contact your Financial Intermediary.
Some Financial Intermediaries may offer electronic delivery of the Funds prospectuses and annual and semi-annual reports. Please contact your Financial Intermediary for further details.
Financial statements of the Underlying Funds can be obtained at no charge by calling the Funds at (800) 787-7354.
242 Shareholder Requests for Additional Information
Russell Investment Company
LifePoints® Funds
Disclosure of Information about Fund Trustees and Officers — October 31, 2014 (Unaudited)
The following tables provide information for each officer and trustee of the Russell Fund Complex. The Russell Fund Complex consists of Russell Investment Company (“RIC”), which has 39 funds, Russell Investment Funds (“RIF”), which has 9 funds, and Russell Exchange Traded Funds Trust (“RET”), which has 1 fund. Each of the trustees is a trustee of RIC, RIF and RET. The first table provides information for the interested trustees. The second table provides information for the independent trustees. The third table provides information for the Trustee Emeritus. The fourth table provides information for the officers. Furthermore, each Trustee possesses the following specific attributes: Mr. Alston has business, financial and investment experience as a senior executive of an international real estate firm and is trained as a lawyer; Ms. Blake has had experience as a certified public accountant and has had experience as a member of boards of directors/trustees of other investment companies; Ms. Burgermeister has had experience as a certified public accountant and as a member of boards of directors/trustees of other investment companies; Mr. Connealy has had experience with other investment companies and their investment advisers first as a partner in the investment management practice of PricewaterhouseCoopers LLP and, subsequently, as the senior financial executive of two other investment organizations sponsoring and managing investment companies; Ms. Krysty has had business, financial and investment experience as the founder and senior executive of a registered investment adviser focusing on high net worth individuals as well as a certified public accountant and a member of the boards of other corporations and non-profit organizations; Mr. Tennison has had business, financial and investment experience as a senior executive of a corporation with international activities and was trained as an accountant; and Mr. Thompson has had experience in business, governance, investment and financial reporting matters as a senior executive of an organization sponsoring and managing other investment companies, and, subsequently, has served as a board member of other investment companies, and has been determined by the Board to be an audit committee financial expert. Ms. Cavanaugh has had experience with other financial services companies, including companies engaged in the sponsorship, management and distribution of investment companies. As a senior officer and/or director of the Funds, the Adviser and various affiliates of the Adviser providing services to the Funds, Ms. Cavanaugh is in a position to provide the Board with such parties’ perspectives on the management, operations and distribution of the Funds.
| Name, | Position(s) Held | Term | Principal Occupation(s) | No. of | Other | |
| Age, | With Fund and | of | During the | Portfolios | Directorships | |
| Address | Length of | Office* | Past 5 Years | in Russell | Held by Trustee | |
| Time Served | Fund | During the | ||||
| Complex | Past 5 Years | |||||
| Overseen | ||||||
| by Trustee | ||||||
| INTERESTED TRUSTEE | ||||||
| # Sandra Cavanaugh, | President and Chief | Until successor | • President and CEO RIC, RIF and | 49 | None | |
| Born May 10, 1954 | Executive Officer | is chosen and | RET | |||
| 1301 Second Avenue, | since 2010 | qualified by | • Chairman of the Board, Co-President | |||
| 18th Floor, Seattle, WA | Trustee since 2010 | Trustees | and CEO, Russell Financial Services, | |||
| 98101 | Appointed until | Inc. (“RFS”) | ||||
| successor is | • Chairman of the Board, President | |||||
| duly elected and | and CEO, Russell Fund Services | |||||
| qualified | Company (“RFSC”) | |||||
| • Director, RIMCo | ||||||
| • Chairman of the Board, President and | ||||||
| CEO Russell Insurance Agency, Inc. | ||||||
| (“RIA”) (insurance agency) | ||||||
| • May 2009 to December 2009, | ||||||
| Executive Vice President, Retail | ||||||
| Channel, SunTrust Bank | ||||||
| • 2007 to January 2009, Senior Vice | ||||||
| President, National Sales — Retail | ||||||
| Distribution, JPMorgan Chase/ | ||||||
| Washington Mutual, Inc. (investment | ||||||
| company) | ||||||
| * | Each Trustee is subject to mandatory retirement at age 72. | |||||
| # | Ms. Cavanaugh is also an officer and/or director of one or more affiliates of RIC, RIF and RET and is therefore classified as an Interested Trustee. | |||||
Disclosure of Information about Fund Trustees and Officers 243
Russell Investment Company
LifePoints® Funds
Disclosure of Information about Fund Trustees and Officers, continued —October 31, 2014 (Unaudited)
| Name, | Position(s) Held | Term | Principal Occupation(s) | No. of | Other | |
| Age, | With Fund and | of | During the | Portfolios | Directorships | |
| Address | Length of | Office * | Past 5 Years | in Russell | Held by Trustee | |
| Time Served | Fund | During the | ||||
| Complex | Past 5 Years | |||||
| Overseen | ||||||
| by Trustee | ||||||
| INDEPENDENT TRUSTEES | ||||||
| Thaddas L. Alston, | Trustee since 2006 | Appointed until | Senior Vice President, Larco | 49 | None | |
| Born April 7, 1945 | Chairman of | successor is | Investments, Ltd. (real estate firm) | |||
| 1301 Second Avenue, | the Investment | duly elected and | ||||
| 18th Floor, Seattle, WA | Committee since | qualified | ||||
| 98101 | 2010 | Appointed until | ||||
| successor is | ||||||
| duly elected and | ||||||
| qualified | ||||||
| Kristianne Blake, | Trustee since 2000 | Appointed until | • Director and Chairman of the Audit | 49 | • Director, | |
| Born January 22, 1954 | Chairman since 2005 | successor is | Committee, Avista Corp (electric | Avista Corp | ||
| 1301 Second Avenue, | duly elected and | utilities) | (electric | |||
| 18th Floor, Seattle, WA | qualified | • Regent, University of Washington | utilities) | |||
| 98101 | Annual | • President, Kristianne Gates Blake, | • Until June | |||
| P.S. (accounting services) | 30, 2014, | |||||
| • Until June 30, 2014, Director, Ecova | Director, | |||||
| (total energy and sustainability | Ecova (total | |||||
| management) | energy and | |||||
| • Until December 31, 2013, Trustee | sustainability | |||||
| and Chairman of the Operations | management) | |||||
| Committee, Principal Investors Funds | • Until | |||||
| and Principal Variable Contracts | December 31, | |||||
| Funds (investment company) | 2013, Trustee, | |||||
| • From April 2004 through December | Principal | |||||
| 2012, Director, Laird Norton Wealth | Investors | |||||
| Management and Laird Norton Tyee | Funds | |||||
| Trust (investment company) | (investment | |||||
| company) | ||||||
| • Until | ||||||
| December 31, | ||||||
| 2013, Trustee | ||||||
| Principal | ||||||
| Variable | ||||||
| Contracts | ||||||
| Funds | ||||||
| (investment | ||||||
| company) | ||||||
| • From April | ||||||
| 2004 through | ||||||
| December | ||||||
| 2012, | ||||||
| Director, Laird | ||||||
| Norton Wealth | ||||||
| Management | ||||||
| and Laird | ||||||
| Norton | ||||||
| Tyee Trust | ||||||
| (investment | ||||||
| company) | ||||||
| * | Each Trustee is subject to mandatory retirement at age 72. | |||||
| 244 Disclosure of Information about Fund Trustees and Officers | ||||||
Russell Investment Company
LifePoints® Funds
Disclosure of Information about Fund Trustees and Officers, continued —October 31, 2014 (Unaudited)
| Name, | Position(s) Held | Term | Principal Occupation(s) | No. of | Other | |
| Age, | With Fund and | of | During the | Portfolios | Directorships | |
| Address | Length of | Office * | Past 5 Years | in Russell | Held by Trustee | |
| Time Served | Fund | During the | ||||
| Complex | Past 5 Years | |||||
| Overseen | ||||||
| by Trustee | ||||||
| INDEPENDENT TRUSTEES (continued) | ||||||
| Cheryl Burgermeister, | Trustee since 2012 | Appointed until | • Retired | 49 | • Trustee and | |
| Born June 26, 1951 | successor is | • Trustee and Chairperson of Audit | Chairperson | |||
| 1301 Second Avenue, | duly elected and | Committee, Select Sector SPDR | of Audit | |||
| 18th Floor, Seattle, WA | qualified | Funds (investment company) | Committee, | |||
| 98101 | Select Sector | |||||
| SPDR Funds | ||||||
| (investment | ||||||
| company) | ||||||
| • Trustee, ALPS | ||||||
| Series Trust | ||||||
| (investment | ||||||
| company) | ||||||
| Daniel P. Connealy, | Trustee since 2003 | Appointed until | • Retired | 49 | None | |
| Born June 6, 1946 | successor is | • June 2004 to June 2014, Senior Vice | ||||
| 1301 Second Avenue, | duly elected and | President and Chief Financial Officer, | ||||
| 18th Floor, Seattle, WA | qualified | Waddell & Reed Financial, Inc. | ||||
| 98101 | (investment company) | |||||
| Katherine W. Krysty, | Trustee since 2014 | Appointed until | • Retired | 49 | None | |
| Born December 3, 1951 | successor is | • January 2011 through March 2013, | ||||
| 1301 Second Avenue | duly elected and | President Emerita, Laird Norton | ||||
| 18th Floor, Seattle, WA | qualified | Wealth Management (investment | ||||
| 98101 | company) | |||||
| • April 2003 through December | ||||||
| 2010, Chief Executive Officer of | ||||||
| Laird Norton Wealth Management | ||||||
| (investment company) | ||||||
| Raymond P. Tennison, Jr., | Trustee since 2000 | Appointed until | • Retired | 49 | None | |
| Born December 21, 1955 | Chairman of | successor is | • From January 2008 to December | |||
| 1301 Second Avenue | the Nominating | duly elected and | 2011, Vice Chairman of the Board, | |||
| 18th Floor, Seattle, WA | and Governance | qualified | Simpson Investment Company (paper | |||
| 98101 | Committee since | Appointed until | and forest products) | |||
| 2007 | successor is | • Until November 2010, President, | ||||
| duly elected and | Simpson Investment Company | |||||
| qualified | and several additional subsidiary | |||||
| companies, including Simpson | ||||||
| Timber Company, Simpson Paper | ||||||
| Company and Simpson Tacoma Kraft | ||||||
| Company | ||||||
| * | Each Trustee is subject to mandatory retirement at age 72. | |||||
Disclosure of Information about Fund Trustees and Officers 245
Russell Investment Company
LifePoints® Funds
Disclosure of Information about Fund Trustees and Officers, continued —October 31, 2014 (Unaudited)
| Name, | Position(s) Held | Term | Principal Occupation(s) | No. of | Other | |
| Age, | With Fund and | of | During the | Portfolios | Directorships | |
| Address | Length of | Office * | Past 5 Years | in Russell | Held by Trustee | |
| Time Served | Fund | During the | ||||
| Complex | Past 5 Years | |||||
| Overseen | ||||||
| by Trustee | ||||||
| INDEPENDENT TRUSTEES (continued) | ||||||
| Jack R. Thompson, | Trustee since 2005 | Appointed until | • September 2007 to September | 49 | • Director, | |
| Born March 21, 1949 | Chairman of the | successor is | 2010, Director, Board Chairman and | Board | ||
| 1301 Second Avenue, | Audit Committee | duly elected and | Chairman of the Audit Committee, | Chairman and | ||
| 18th Floor, Seattle, WA | since 2012 | qualified | LifeVantage Corporation (health | Chairman | ||
| 98101 | Appointed until | products company) | of the Audit | |||
| successor is | • September 2003 to September | Committee, | ||||
| duly elected and | 2009, Independent Board Chair and | LifeVantage | ||||
| qualified | Chairman of the Audit Committee, | Corporation | ||||
| Sparx Asia Funds (investment | until | |||||
| company) | September | |||||
| 2010 (health | ||||||
| products | ||||||
| company) | ||||||
| • Director, | ||||||
| Sparx Asia | ||||||
| Funds | ||||||
| until 2009 | ||||||
| (investment | ||||||
| company) | ||||||
| * | Each Trustee is subject to mandatory retirement at age 72. | |||||
| Name, | Position(s) Held | Term | Principal Occupation(s) | No. of | Other | |
| Age, | With Fund and | of | During the | Portfolios | Directorships | |
| Address | Length of | Office * | Past 5 Years | in Russell | Held by Trustee | |
| Time Served | Fund | During the | ||||
| Complex | Past 5 Years | |||||
| Overseen | ||||||
| by Trustee | ||||||
| TRUSTEE EMERITUS | ||||||
| George F. Russell, Jr., | Trustee Emeritus and | Until resignation | • Director Emeritus, Frank Russell | 49 | None | |
| Born July 3, 1932 | Chairman Emeritus | or removal | Company (investment consultant to | |||
| 1301 Second Avenue, | since 1999 | institutional investors (“FRC”)) and | ||||
| 18th Floor, Seattle, WA | RIMCo | |||||
| 98101 | • Chairman Emeritus, RIC and RIF; | |||||
| Russell Implementation Services Inc. | ||||||
| (broker-dealer and investment adviser | ||||||
| (“RIS”)); Russell 20-20 Association | ||||||
| (non-profit corporation); and Russell | ||||||
| Trust Company (non-depository trust | ||||||
| company (“RTC”)) | ||||||
| • Chairman, Sunshine Management | ||||||
| Services, LLC (investment adviser) | ||||||
246 Disclosure of Information about Fund Trustees and Officers
Russell Investment Company
LifePoints® Funds
Disclosure of Information about Fund Trustees and Officers, continued —October 31, 2014 (Unaudited)
| Name, | Positions(s) Held | Term | Principal Occupation(s) |
| Age, | With Fund and | of | During the |
| Address | Length of | Office | Past 5 Years |
| Time Served | |||
| OFFICERS | |||
| Cheryl Wichers, | Chief Compliance | Until removed | • Chief Compliance Officer, RIC, RIF and RET |
| Born December 16, 1966 | Officer since 2005 | by Independent | • Chief Compliance Officer, RFSC and U.S. One Inc. |
| 1301 Second Avenue | Trustees | • 2005 to 2011 Chief Compliance Officer, RIMCo | |
| 18th Floor, Seattle, WA | |||
| 98101 | |||
| Sandra Cavanaugh, | President and Chief | Until successor | • CEO, U.S. Private Client Services, Russell Investments |
| Born May 10, 1954 | Executive Officer | is chosen and | • President and CEO, RIC, RIF and RET |
| 1301 Second Avenue, | since 2010 | qualified by | • Chairman of the Board, Co-President and CEO, RFS |
| 18th Floor, Seattle, WA | Trustees | • Chairman of the Board, President and CEO, RFSC | |
| 98101 | • Director, RIMCo | ||
| • Chairman of the Board, President and CEO, RIA | |||
| • May 2009 to December 2009, Executive Vice President, Retail | |||
| Channel, SunTrust Bank | |||
| • 2007 to January 2009, Senior Vice President, National Sales — | |||
| Retail Distribution, JPMorgan Chase/Washington Mutual, Inc. | |||
| Mark E. Swanson, | Treasurer and Chief | Until successor | • Treasurer, Chief Accounting Officer and CFO, RIC, RIF and RET |
| Born November 26, 1963 | Accounting Officer | is chosen and | • Director, RIMCo, RFSC, Russell Trust Company (“RTC”) and RFS |
| 1301 Second Avenue | since 1998 | qualified by | • Global Head of Fund Services, Russell Investments |
| 18th Floor, Seattle, WA | Trustees | • October 2011 to December 2013, Head of North America Operations | |
| 98101 | Russell Investments | ||
| • May 2009 to October 2011, Global Head of Fund Operations, Russell | |||
| Investments | |||
| • 1999 to May 2009, Director, Fund Administration | |||
| Jeffrey T. Hussey, | Chief Investment | Until removed by | • Global Chief Investment Officer, Russell Investments |
| Born May 2, 1969 | Officer since 2013 | Trustees | • Chief Investment Officer, RIC, RIF and RET |
| 1301 Second Avenue, | • Chairman of the Board, President and CEO, RIMCo | ||
| 18th Floor, Seattle WA | • Director, RTC, RIS and Russell Investments Delaware, Inc. | ||
| 98101 | • Board of Managers, Russell Institutional Funds Management, Inc. | ||
| • 2003 to 2013 Chief Investment Officer, Fixed Income, Russell | |||
| Investments | |||
| Mary Beth R. Albaneze, | Secretary since 2010 | Until successor | • Associate General Counsel, Russell Investments |
| Born April 25, 1969 | is chosen and | • Secretary, RIMCo, RFSC and RFS | |
| 1301 Second Avenue, | qualified by | • Secretary and Chief Legal Officer, RIC, RIF and RET | |
| 18th Floor, Seattle, WA | Trustees | • Assistant Secretary, RFS, RIA and U.S. One Inc. | |
| 98101 | • 1999 to 2010 Assistant Secretary, RIC and RIF | ||
Disclosure of Information about Fund Trustees and Officers 247
Russell Investment Company LifePoints® Funds
Adviser and Service Providers — October 31, 2014
| Interested Trustees | Administrator and Transfer and Dividend Disbursing |
| Sandra Cavanaugh | Agent |
| Independent Trustees | Russell Fund Services Company |
| Thaddas L. Alston | 1301 Second Avenue |
| Kristianne Blake | Seattle, WA 98101 |
| Cheryl Burgermeister | Custodian |
| Daniel P. Connealy | State Street Bank and Trust Company |
| Katherine W. Krysty | 1 Iron Street |
| Raymond P. Tennison, Jr. | Boston, MA 02210 |
| Jack R. Thompson | Office of Shareholder Inquiries |
| Trustee Emeritus | 1301 Second Avenue |
| George F. Russell, Jr. | Seattle, WA 98101 |
| Officers | (800) 787-7354 |
| Sandra Cavanaugh, President and Chief Executive Officer | Legal Counsel |
| Cheryl Wichers, Chief Compliance Officer | Dechert LLP |
| Jeffrey T. Hussey, Chief Investment Officer | One International Place, 40th Floor |
| Mark E. Swanson, Treasurer and Chief Accounting Officer | 100 Oliver Street |
| Mary Beth R. Albaneze, Secretary | Boston, MA 02110 |
| Adviser | Distributor |
| Russell Investment Management Company | Russell Financial Services, Inc. |
| 1301 Second Avenue | 1301 Second Avenue |
| Seattle, WA 98101 | Seattle, WA 98101 |
| Independent Registered Public Accounting Firm | |
| PricewaterhouseCoopers LLP | |
| 1420 5th Avenue, Suite 1900 | |
| Seattle, WA 98101 |
This report is prepared from the books and records of the Funds and is submitted for the general information of shareholders and is not authorized for distribution to prospective investors unless accompanied or preceded by an effective Prospectus. Nothing herein contained is to be considered an offer of sale or a solicitation of an offer to buy shares of Russell Investment Company. Such offering is made only by Prospectus, which includes details as to offering price and other material information.
248 Adviser and Service Providers
| Russell Investment Company | 1301 Second Avenue | 800-787-7354 | |
| Seattle, Washington 98101 | Fax: | 206-505-3495 | |
| www.russell.com |

Item 2. Code of Ethics. [Annual Report Only]
| (a) | As of the end of the period covered by the report, the registrant has adopted a code of ethics that applies to the registrant's principal executive officer and principal financial officer (“Code”). | |
| (b) | That Code comprises written standards that are reasonably designed to deter wrongdoing and to promote: | |
| 1) | honest and ethical conduct, including the ethical handling of actual or apparent conflicts of interest between personal and professional relationships; | |
| 2) | full, fair, accurate, timely and understandable disclosure in reports and documents that a registrant files with, or submits to, the Securities and Exchange Commission (“SEC”) and in other public communications made by each Mutual Fund; | |
| 3) | compliance with applicable laws and governmental rules and regulations; | |
| 4) | the prompt internal reporting to an appropriate person or persons identified in the Code of violations of the Code; and | |
| 5) | accountability for adherence to the Code. | |
| (c) | The Code was restated as of August 2013; the restatement did not involve any material change. | |
| (d) | As of the end of the period covered by the report, there have been no waivers granted from a provision of the Code that applies to the registrant’s principal executive officer and principal financial officer. | |
| (e) | Not applicable. | |
| (f) | The registrant has filed with the SEC, pursuant to Item 12(a)(1), a copy of the Code that applies to the registrant’s principal executive officer, principal financial officer, principal accounting officer or controller, or persons performing similar functions, as an exhibit to its annual report on this Form N-CSR. | |
Item 3. Audit Committee Financial Expert. [Annual Report Only]
Registrant's board of trustees has determined that the Registrant has at least one audit committee financial expert serving on its audit committee. Jack R. Thompson has been determined to be the Audit Committee Financial Expert and is also determined to be “independent” for purposes of Item 3, paragraph (a)(2)(i) and (ii) of Form N-CSR.
Item 4. Principal Accountant Fees and Services. [Annual Report Only] Audit Fees
(a) The aggregate fees billed for each of the last two fiscal years for professional services rendered by the principal accountant for the audit of the registrant’s annual financial statements or services that are normally provided by the accountant in connection with statutory and regulatory filings or engagements for those fiscal years were as follows: 2013 $1,278,172 2014 $1,214,967
| Audit-Related Fees | |||
| (b) The aggregate fees billed in each of the last two fiscal years for assurance and related | |||
| services by the principal accountant that are reasonably related to the performance of the audit of | |||
| the registrant’s financial statements and are not reported under paragraph (a) of this Item and the | |||
| nature of the services comprising those fees were as follows: | |||
| Fees | Nature of Services | ||
| 2013 | $ | 422,400 | Performance of agreed-upon procedures with respect to |
| 04/30/13 semi-annual reports | |||
| to | |||
| 2014 | $ | 444,900 | Performance of agreed-upon procedures with respect to |
| 04/30/14 semi-annual reports | |||
| Tax Fees | |||
| (c) The aggregate fees billed in each of the last two fiscal years for professional services | |||
| rendered by the principal accountant for tax compliance, tax advice, and tax planning and the | |||
| nature of the services comprising the fees were as follows: | |||
| Fees | Nature of Services | ||
| 2013 | $ | 340,300 | Tax services |
| 2014 | $ | 358,100 | Tax services |
| All Other Fees | |||
| (d) The aggregate fees billed in each of the last two fiscal years for products and services | |||
| provided by the principal accountant, other than the services reported in paragraphs (a) through | |||
| (c) of this Item and the nature of the services comprising those fees were as follows: | |||
| Fees | Nature of Services | ||
| 2012 | $ | 107,520 | Review excise reconciliations, transfer agent internal |
| controls analysis, overhead/travel | |||
| 2013 | $ | 0 | Review excise reconciliations, transfer agent internal |
| controls analysis, overhead/travel, anti-money laundering | |||
| 2014 | $ | 0 | Review excise reconciliations, transfer agent internal |
| controls analysis, overhead/travel | |||
| (e) (1) Registrant’s audit committee has adopted the following pre-approval policies and | |||
| procedures for certain services provided by Registrant’s accountants: | |||
Russell Investment Company
Russell Investment Funds
Russell Exchange Traded Funds Trust
Audit and Non-Audit Services Pre-Approval Policy
Effective Date: August 30, 2013
I. Statement of Purpose.
This Policy has been adopted by the joint Audit Committee (the “Audit Committee”) of Russell Investment Company (“RIC”), Russell Investment Funds (“RIF”) and Russell Exchange Traded Funds Trust (“RET”) to apply to any and all engagements of the independent auditor to RIC, RIF and RET, respectively, for audit, non-audit, tax or other services. The term “Fund” shall collectively refer to RIC, RIF and RET. The term “Investment Adviser” shall refer to the Funds’ advisor, Russell Investment Management Company (“RIMCo”). This Policy does not delegate to management the responsibilities set forth herein for the pre-approval of services performed by the Funds’ independent auditor.
II. Statement of Principles.
Under the Sarbanes-Oxley Act of 2002 (the “Act”), the Audit Committee of a Fund’s Board of Trustees (the “Audit Committee”) is charged with responsibility for the appointment, compensation and oversight of the work of the independent auditor for the fund. As part of these responsibilities, the Audit Committee is required to pre-approve the audit services and permissible non-audit services (“non-audit services”) performed by the independent auditor for the fund to assure that the independence of the auditor is not in any way compromised or impaired. In determining whether an auditor is independent, there are three guiding principles under the Act that must be considered. In general, the independence of the auditor to the fund would be deemed impaired if the auditor provides a service whereby it:
- Functions in the role of management of the Fund, the adviser of the Fund or any other affiliate* of the Fund;
- Is in the position of auditing its own work; or
- Serves in an advocacy role for the fund, the adviser of the fund or any other affiliate of the fund.
Accordingly, it is the Funds’ policy that the independent auditor for the Funds must not be engaged to perform any service that contravenes any of the three guidelines set forth above, or which in any way could be deemed to impair or compromise the independence of the auditor for the Funds. This Policy is designed to accomplish those requirements and will henceforth be applied to all engagements by the Funds of its independent auditor, whether for audit, audit-related, tax, or other non-audit services.
* For purposes of this Policy, an affiliate of the Funds is defined as the Funds’ investment adviser (but not a sub-adviser whose role is primarily portfolio management and whose activities are overseen by the principal investment adviser), and any entity controlling, controlled by, or under common control with the investment adviser that provides ongoing services to the Fund.
Rules adopted by the United States Securities and Exchange Commission (the “SEC”) establish two distinct approaches to the pre-approval of services by the Audit Committee. The proposed services either may receive general pre-approval through adoption by the Audit Committee of a list of authorized services for the fund, together with a budget of expected costs for those services (“general pre-approval”), or specific pre-approval by the Audit Committee of all services provided to the fund on a case-by-case basis (“specific pre-approval”).
The Funds’ Audit Committee believes that the combination of these two approaches reflected in this Policy will result in an effective and efficient procedure for the pre-approval of permissible services performed by the Funds’ independent audit. The Funds’ Audit and Non-Audit Pre-Approved Services Schedule lists the audit, audit-related, tax and other services that have the general pre-approval of the Audit Committee. As set forth in this Policy, unless a particular service has received general pre-approval, those services will require specific pre-approval by the Audit Committee before any such services can be provided by the independent auditor. Any proposed service to the Funds that exceeds the pre-approved budget for those services will also require specific pre-approval by the appropriate Audit Committee.
In assessing whether a particular audit or non-audit service should be approved, the Audit Committee will take into account the ratio between the total amounts paid for audit, audit-related, tax and other services, based on historical patterns, with a view toward assuring that the level of fees paid for non-audit services as they relate to the fees paid for audit services does not compromise or impair the independence of the auditor. The Audit Committee will review the list of general pre-approved services, including the pre-approved budget for those services, at least annually and more frequently if deemed appropriate by the Audit Committee, and may implement changes thereto from time to time.
III. Delegation.
As provided in the Act and in the SEC’s rules, the Audit Committee from time to time may delegate either general or specific pre-approval authority to one or more of its members. Any member to whom such authority is delegated must report, for informational purposes only, any pre-approval decisions to the Audit Committee at its next scheduled meeting.
IV. Audit Services.
The annual audit services engagement terms and fees for the independent auditor for the Funds require specific pre-approval of the Audit Committee. Audit services include the annual financial statement audit and other procedures required to be performed by the independent auditor in order to be able to form an opinion on the financial statements for the Funds for that year. These other procedures include reviews of information systems, procedural reviews and testing performed in order to understand and rely on the Funds’ systems of internal control, and consultations relating to the audit. Audit services also include the attestation engagement for the independent auditor’s report on the report from management on financial reporting internal controls. The Audit Committee will review the audit services engagement as necessary or appropriate in the sole judgment of the Audit Committee.
In addition to the pre-approval by the Audit Committee of the annual engagement of the independent auditor to perform audit services, the Audit Committee may grant general pre-approval to other audit services, which are those services that only the independent auditor reasonably can provide. These may include statutory audits and services associated with the Funds’ SEC registration statement on Form N-1A, periodic reports and documents filed with the SEC or other documents issued in connection with the Funds’ securities offerings.
The Audit Committee has pre-approved the audit services set forth in Schedule A of the Audit and Non-Audit Pre-Approved Services Schedule. All other audit services not listed in Schedule A of the Audit and Non-Audit Pre-Approved Services Schedule must be specifically pre-approved by the Audit Committee.
V. Audit-Related Services.
Audit-related services are assurance and related services that are reasonably related to the performance of the audit or review of the financial statements for the Funds, or the separate financial statements for a series of the Funds that are traditionally performed by the independent auditor. Because the Audit Committee believes that the provision of audit-related services does not compromise or impair the independence of the auditor and is consistent with the SEC’s rules on auditor independence, the Audit Committee may grant pre-approval to audit related services. “Audit related services” include, among others, accounting consultations related to accounting, financial reporting or disclosure matters not classified as “audit services;” assistance with understanding and implementing new accounting and financial report or disclosure matters not classified as “audit services;” assistance with understanding and implementing new accounting and financial reporting guidance from rulemaking authorities; agreed upon or expanded audit procedures related to accounting and/or billing records required to respond to or comply with financial, accounting or regulatory reporting matters; and assistance with internal reporting requirements under Form N-SAR and Form N-CSR.
The Audit Committee has pre-approved the audit-related services set forth in Schedule B of the Audit and Non-Audit Pre-Approved Services Schedule. All other audit-related services not listed in Schedule B of the Audit and Non-Audit Pre-Approved Services Schedule must be specifically pre-approved by the Audit Committee.
VI. Tax Services.
The Audit Committee believes that the independent auditor can provide tax services to the Funds, such as tax compliance, tax planning and tax advice, without impairing the auditor’s independence and the SEC has stated that the independent auditor may provide such services. Consequently, the Audit Committee believes that it may grant general pre-approval to those tax services that have historically been provided by the auditor, that the Audit Committee has reviewed and believes would not impair the independence of the auditor, and that are consistent with the SEC’s rules on auditor independence. However, the Audit Committee will not permit the retention of the independent auditor to provide tax advice in connection with any transaction recommended by the independent auditor, the sole business purpose of which may be tax
avoidance and the tax treatment of which may not be supported by the United States Internal Revenue Code and related regulations or the applicable tax statutes and regulations that apply to the Funds’ investments outside the United States. The Audit Committees will consult with the Treasurer of the Funds or outside counsel to determine that the Funds’ tax planning and reporting positions are consistent with this policy.
The Audit Committee has pre-approved the tax services set forth in Schedule C of the Audit and Non-Audit Pre-Approved Services Schedule. All other tax services not listed in Schedule C of the Audit and Non-Audit Pre-Approved Services Schedule must be specifically pre-approved by the Audit Committee.
VII. All Other Services.
The Audit Committee believes, based on the SEC’s rules prohibiting the independent auditor from providing specific non-audit services, that other types of non-audit services are permitted. Accordingly, the Audit Committee believes that it may grant general pre-approval to those permissible non-audit services classified as “all other” services that the Audit Committee believes are routine and recurring services, would not impair or compromise the independence of the auditor and are consistent with the SEC’s rules on auditor independence.
The Audit Committee has pre-approved the permissible “all other services” set forth in Schedule D of the Audit and Non-Audit Pre-Approved Services Schedule. Permissible “all other services” not listed in Schedule D of the Audit and Non-Audit Pre-Approved Services Schedule must be specifically pre-approved by the Audit Committee.
A list of the SEC’s prohibited non-audit services are as follows:
- Bookkeeping or other services relating to the accounting records or financial statements of the Funds
- Financial information system design and implementation
- Appraisal or valuation services, fairness opinions or contribution-in-kind reports
- Actuarial services
- Internal audit outsourcing services
- Management functions
- Human resources services
- Broker-dealer, investment adviser or investment banking services
- Legal services
· Expert services unrelated to the audit
The SEC’s rules and relevant official interpretations and guidance should be consulted to determine the scope of these prohibited services and the applicability of any exceptions to certain of the prohibitions. Under no circumstance may an executive, manager or associate of the Funds, or the Investment Advisor, authorize the independent auditor for the Funds to provide prohibited non-audit services.
VIII. Pre-Approval Fee Levels or Budgeted Amounts.
Pre-Approval fee levels or budgeted amounts for all services to be provided by the independent auditor will be established annually by the Audit Committee and shall be subject to periodic subsequent review during the year if deemed appropriate by the Audit Committee (separate amounts may be specified for the Fund and for other affiliates in the investment company complex subject to pre-approval). Any proposed services exceeding these levels or amounts will require specific pre-approval by the Audit Committee. The Audit Committee will be mindful of the overall relationship of fees for audit and non-audit services in determining whether to pre-approve any such services. For each fiscal year, the Audit Committee may determine the appropriateness of the ratio between the total amount of fees for Audit, Audit-related, and Tax services for the Funds (including any Audit-related or Tax services fees for affiliates subject to pre-approval), and the total amount of fees for certain permissible non-audit services classified as “all other services” for the Funds (including any such services for affiliates subject to pre-approval by the Audit Committee).
IX. Procedures.
All requests or applications for services to be provided by the independent auditor that do not require specific pre-approval by the Audit Committee will be submitted to the “RIC/RIF/RET Clearance Committee” (the “Clearance Committee”) (which shall be comprised of not less than three members, including the Treasurer of the Funds who shall serve as its Chairperson) and must include a detailed description of the services to be rendered and the estimated costs of those services. The Clearance Committee will determine whether such services are included within the list of services that have received general pre-approval by the Audit Committee. The Audit Committee will be informed not less frequently than quarterly by the Chairperson of the Clearance Committee of any such services rendered by the independent auditor for the Funds and the fees paid to the independent auditors for such services.
Requests or applications to provide services that require specific pre-approval by the Audit Committee will be submitted to the Audit Committee by both the independent auditor and the Clearance Committee and must include a joint certification by the engagement partner of the independent auditor and the Chairperson of the Clearing Committee that, in their view, the request or application is consistent with the SEC’s rules governing auditor independence.
The Internal Audit Department of Frank Russell Company, the parent company of RIMCo, and the officers of RIC, RIF and RET will report to the Chairman of the Audit Committee any breach
of this Policy that comes to the attention of the Internal Audit Department of Frank Russell Company or an officer of RIC, RIF or RET.
X. Additional Requirements.
The Audit Committee has determined to take additional measures on an annual basis to meet its responsibility to oversee the work performed by the independent auditor and to assure the independent auditor’s continuing independence from the Funds and its affiliates, including Frank Russell Company. Such efforts will include, but not be limited to, reviewing a written annual statement from the independent auditor delineating all relationships between the independent auditor and RIC, RIF, RET and Frank Russell Company and its subsidiaries and affiliates, consistent with Independence Standards Board Standard No. 1, and discussing with the independent auditor its methods and procedures for ensuring its independence.
(e) (2) The percentage of services described in each of paragraphs (b) through (d) of this Item that were approved by the audit committee pursuant to paragraph (c)(7)(i)(C) of Rule 2-01 of Regulation S-X is as follows:
| Audit Fees | 0 | % |
| Audit-Related Fees | 0 | % |
| Tax Fees | 0 | % |
| All Other Fees | 0 | % |
(f) For services, 50 percent or more of which were pre-approved, the percentage of hours expended on the principal accountant’s engagement to audit the registrant’s financial statements for the most recent fiscal year that were attributed to work performed by persons other than the principal accountant’s full-time, permanent employees was 0%.
(g) The aggregate non-audit fees billed by registrant’s accountant for services rendered to the registrant, and rendered to the registrant’s investment adviser (not including any sub-adviser whose role is primarily portfolio management and is subcontracted with or overseen by another investment adviser), and any entity controlling, controlled by, or under common control with the adviser that provides ongoing services to the registrant for each of the last two fiscal years of the registrant were as follows: 2013 $0 2014 $0
(h) The registrant’s audit committee of the board of trustees has considered whether the provision of nonaudit services that were rendered to the registrant’s investment adviser (not including any subadviser whose role is primarily portfolio management and is subcontracted with or overseen by another investment adviser), and any entity controlling, controlled by, or under common control with the investment adviser that provides ongoing services to the registrant that were not pre-approved pursuant to paragraph (c)(7)(ii) of Rule 2-01 of Regulation S-X is compatible with maintaining the principal accountant’s independence.
Item 5. Audit Committee of Listed Registrants. [Not Applicable]
Item 6. [Schedules of Investments are included as part of the Report to Shareholders filed under Item 1 of this form]
Items 7-9. [Not Applicable]
Item 10. Submission of Matters to a Vote of Security Holders
There have been no changes to the procedures by which shareholders may recommend nominees to the Registrant’s Board of Trustees that would require disclosure herein.
Item 11. Controls and Procedures
(a) Registrant's principal executive officer and principal financial officer have concluded that Registrant's disclosure controls and procedures (as defined in Rule 30a-2(c) under the Investment Company Act of 1940 (the “Act”)) are effective, based on their evaluation of these controls and procedures as of a date within 90 days of the date this report is filed with the Securities and Exchange Commission.
(b) There were no significant changes in Registrant's internal control over financial reporting that occurred during the period covered by this report that has materially affected or is likely to materially affect Registrant's internal control over financial reporting.
Item 12. Exhibit List
(a) Registrant’s code of ethics described in Item 2
(b) Certification for principal executive officer of Registrant as required by Rule 30a-2(a) under the Act and certification for principal financial officer of Registrant as required by Rule 30a-2(a) under the Act.
SIGNATURES
Pursuant to the requirements of the Securities Exchange Act of 1934 and the Investment Company Act of 1940, the Registrant has duly caused this report to be signed on its behalf by the undersigned, thereunto duly authorized.
| Russell Investment Company |
| By: /s/ Sandra Cavanaugh |
| Sandra Cavanaugh |
| President and CEO, Russell Investment Company; Chairman of the Board, President and |
| CEO, Russell Fund Services Company |
| Date: December 31, 2014 |
Pursuant to the requirements of the Securities Exchange Act of 1934 and the Investment Company Act of 1940, this report has been signed below by the following persons on behalf of the Registrant and in the capacities and on the dates indicated.
| By: /s/ Sandra Cavanaugh |
| Sandra Cavanaugh |
| President and CEO, Russell Investment Company; Chairman of the Board, President and |
| CEO, Russell Fund Services Company |
| Date: December 31, 2014 |
| By: /s/ Mark E. Swanson |
| Mark E. Swanson |
| Treasurer and Chief Accounting Officer and CFO, Russell Investment Company; |
| Global Head of Fund Services, Russell Investment Management Company and |
| Russell Financial Services Company |
| Date: December 31, 2014 |