OMB APPROVAL
OMB Number:
3235-0570
Expires: January
31, 2017
Estimated average
burden hours per
response: 20.6
UNITED STATES
SECURITIES AND EXCHANGE COMMISSION
Washington, D.C. 20549
FORM N-CSR
CERTIFIED SHAREHOLDER REPORT OF REGISTERED MANAGEMENT
INVESTMENT COMPANIES
Investment Company Act file number: 811-03153
Russell Investment Company
(Exact name of registrant as specified in charter)
1301 2nd Avenue 18th Floor, Seattle Washington 98101
(Address of principal executive offices) (Zip code)
Mary Beth R. Albaneze, Secretary and Chief Legal Officer
1301 2nd Avenue
18th Floor
Seattle, Washington 98101
206-505-4846
______________________________________________
(Name and address of agent for service)
Registrant's telephone number, including area code: 800-787-7354
Date of fiscal year end: October 31
Date of reporting period: November 1, 2015 to October 31, 2016
Item 1. Reports to Stockholders
Russell Investment
Company
Russell Investment Company is a
series investment company with
41 different investment portfolios
referred to as Funds. These
financial statements report on 27
of these Funds.
Russell Investment Company
Russell Funds
Annual Report
October 31, 2016
Table of Contents
| Page | |
| To Our Shareholders | 3 |
| Market Summary | 4 |
| Russell U.S. Core Equity Fund | 9 |
| Russell U.S. Defensive Equity Fund | 29 |
| Russell U.S. Dynamic Equity Fund | 51 |
| Russell U.S. Strategic Equity Fund | 73 |
| Russell U.S. Large Cap Equity Fund | 95 |
| Russell U.S. Mid Cap Equity Fund | 115 |
| Russell U.S. Small Cap Equity Fund | 135 |
| Russell International Developed Markets Fund | 163 |
| Russell Global Equity Fund | 197 |
| Russell Emerging Markets Fund | 227 |
| Russell Tax-Managed U.S. Large Cap Fund | 259 |
| Russell Tax-Managed U.S. Mid & Small Cap Fund | 279 |
| Russell Tax-Managed International Equity Fund | 301 |
| Russell Global Opportunistic Credit Fund | 331 |
| Unconstrained Total Return Fund | 377 |
| Russell Strategic Bond Fund | 405 |
| Russell Investment Grade Bond Fund | 453 |
| Russell Short Duration Bond Fund | 491 |
| Russell Tax Exempt High Yield Bond Fund | 521 |
| Russell Tax Exempt Bond Fund | 549 |
| Russell Commodity Strategies Fund | 581 |
| Russell Global Infrastructure Fund | 603 |
| Russell Global Real Estate Securities Fund | 627 |
| Russell Multi-Strategy Income Fund | 653 |
| Russell Strategic Call Overwriting Fund | 696 |
| Select U.S. Equity Fund | 715 |
| Select International Equity Fund | 741 |
| Notes to Schedules of Investments | 771 |
| Notes to Financial Highlights | 773 |
| Notes to Financial Statements | 775 |
| Report of Independent Registered Public Accounting Firm | 812 |
| Tax Information | 813 |
| Affiliated Brokerage Transactions | 815 |
| Basis for Approval of Investment Advisory Contracts | 816 |
| Shareholder Requests for Additional Information | 821 |
| Disclosure of Information about Fund Trustees and Officers | 822 |
| Adviser, Money Managers and Service Providers | 827 |
Russell Investment Company - Russell Funds.
Copyright © Russell Investments 2016. All rights reserved.
Russell Investments’ ownership is composed of a majority stake held by funds managed by TA Associates with
minority stakes held by funds managed by Reverence Capital Partners and Russell Investments’ management.
Frank Russell Company is the owner of the Russell trademarks contained in this material and all trademark rights
related to the Russell trademarks, which the members of the Russell Investment group of companies are permitted
to use under license from Frank Russell Company. The members of the Russell Investments group of companies
are not affiliated in any manner with Frank Russell Company or any entity operating under the “FTSE RUSSELL”
brand.
Fund objectives, risks, charges and expenses should be carefully considered before in-
vesting. A prospectus containing this and other important information must precede or
accompany this material. Please read the prospectus carefully before investing.
Securities distributed through Russell Investments Financial Services, LLC, member FINRA, part of
Russell Investments.
Indices and benchmarks are unmanaged and cannot be invested in directly. Returns represent past performance,
are not a guarantee of future performance, and are not indicative of any specific investment. Index return
information is provided by vendors and although deemed reliable, is not guaranteed by Russell Investments or its
affiliates.
S&P® is a registered trademark of Standard & Poor’s Financial Services LLC.
Performance quoted represents past performance and does not guarantee future results. The investment return
and principal value of an investment will fluctuate so that shares, when redeemed, may be worth more or less than
their original cost. Current performance may be lower or higher than the performance data quoted. Current to the
most recent month-end performance data may be obtained by visiting https://russellinvestments.com/us/funds/
performance-prices.
To Our Shareholders
Fellow Shareholder,
2016 goes down as a year of great restlessness, and certainly a bruising year for forecasters. To call the political landscape
restive seems understated, but for all the referendums, coups and national elections, the markets remained orderly,
delivering returns right down the middle of the road. In fact, you might say that it was a remarkably positive result in view
of how plausible major market sell offs would have been!
With record stock market highs, why the rattled nerves? Our current climate appears increasingly unconventional, and
delivering returns moving forward could prove increasingly challenging, especially in the U.S. where corporate profits are
thinning out and interest rates are likely headed up. Our global team of market strategists continues to keep a close eye on
a potential interest rate hike from the Federal Reserve in December, as well as two possible hikes in 2017, supported by the
modest economic growth and a gradual firming in inflation we’ve seen this year. The numbers from the U.S. labor market
in 2016 remained healthy, and showed no signs of imbalances in business investment. We are, however, keeping a close
eye on warning signs stemming from the corporate sector, including a troubling rise in corporate leverage throughout 2016.
U.S. corporate earnings appear to have bottomed, while the most recent earnings growth was positive but tepid. While our
team still has an underweight U.S. equities view, their modeling shows only a modest risk of recession, and they continue
with a ‘buy-the-dips and sell-the-rallies’ investment strategy.
At the same time, change is inseparable with opportunity. Our strategists and portfolio managers work diligently to ensure
that portfolios are well positioned to take advantage of new opportunities, while seeking to avoid as much of the downside as
possible. If bond yields rise, if inflation increases in some regions while deflation occurs elsewhere, a dynamic investment
process can respond. We also are active currency investors in certain portfolios, looking to see if the U.S. dollar will
test previous highs or whether the British pound remains at risk, as investors focus on the full implications of Brexit’s
implementation.
We believe more than ever that securing your desired investment outcomes takes a dynamic process, comprehensive
asset class coverage, and the tools required to identify and manage risk. But as important as that contribution can be,
we also believe it’s never been more vital for shareholders to have solid, long-term financial plans, realistic goals, and
regular check-ins with personal financial advisors. The following pages provide additional insights on the markets and the
performance of Russell Investments mutual funds for the fiscal year ending October 31, 2016.
Thank you for your continued trust. As always, our purpose at Russell Investments is to improve the financial security of
people like you. We take that purpose very seriously.
Best regards,

Len Brennan
Chief Executive Officer, Russell Investments
To Our Shareholders 3
Russell Investment Company
Market Summary as of October 31, 2016 (Unaudited)
U.S. Equity Markets
Broadly measured by the Russell 3000® Index, U.S. stocks returned 4.24% for the one year period which is the eighth
straight fiscal year ending October 31st that the Russell 3000® Index has finished with a positive absolute return. The
Russell 3000® Index finished with a positive absolute return in eight of the fiscal year’s twelve months.
Within U.S. large capitalization stocks, factors that were rewarded during the fiscal year included moderate beta (beta is
a measure of a stock’s sensitivity to the direction of the market) and high dividend yield. Factors that trailed the market
included high historical earnings growth, high forecasted growth, positive price momentum, and low price-to-earnings
ratios. Additionally, defensive stocks outperformed dynamic stocks across all market capitalization tiers. From a sector
perspective, utilities, telecommunication services, information technology, and real estate investment trusts (“REITs”)
outperformed the Russell 1000® Index by 13.31%, 6.58%, 9.71%, and 1.27%, respectively. Sectors that failed to find
traction during the one year period were health care, consumer discretionary, energy, and financial services trailing by
8.59%, 6.16%, 2.71%, and 2.21%, respectively.
In early November 2015, non-farm payroll growth for October was reported significantly above consensus at 271,000.
This caused certain industries that may benefit from rising interest rates to react favorably, most notably banks, which
outperformed the Russell 3000® Index by over 3.60% in November. Leveraged industries that are seen as bond substitutes
due to high dividend yields, such as electric utilities and REITs, underperformed the Russell 3000® Index in November
by 2.15% and 0.75%, respectively. In mid-December the U.S. Federal Reserve (the “Fed”) raised short term interest rates
for the first time since the global financial crisis. There was not a significant market reaction in December when the Fed
raised rates because the increase was mostly priced in by the market once the positive non-farm payroll growth report was
released in November, which signaled a high probability of an interest rate increase in December. Fed Chair Yellen stated
that, despite recent international developments, domestically “the economy has been performing well, and we expect it to
continue to do so.”
In The Russell 3000® Index ended the January through March period of 2016 with a positive absolute return of 0.97%
although the quarter was defined by two very distinct periods. The first half of the quarter was characterized by slowing
growth in China coupled with an ongoing commodities rout (especially in oil), which created significant market volatility
and substantial risk-off sentiment. Interest rate sensitive sectors and traditional non-cyclical sectors such as utilities,
consumer staples, and REITs were big outperformers and traded at an unusual valuation premium to the broader market.
However, in the latter part of the quarter there was a rebound in the traditional cyclical areas of the market driven in part
by more dovish rhetoric from the Fed alongside oil price stabilization. Gross domestic product (“GDP”) growth during
the fourth quarter of 2015 was revised further upwards to 1.4% (quarter-over-quarter). Nonfarm payrolls also rose by
242,000 in February and the core inflation rate (2.3% year-over-year in February) was slightly above expectations of 2.2%.
However, at the first quarter Federal Open Market Committee (“FOMC”) meeting, Fed Chair Yellen explained that even
though domestic “economic forecasts have not changed much since December”, this was being overshadowed by “global
economic and financial developments”, posing a risk to growth. As a result, FOMC “dots” reduced to two the number of
likely interest rate hikes in 2016 down from four earlier in the year.
The Russell 3000® Index finished with a positive absolute return of 2.63% from April through June. The U.S. equity
market gained over the period despite the U.K. Brexit referendum on European Union membership. The U.K.’s decision to
potentially leave the EU threw worldwide markets into turmoil during the month of June. This caused valuations to become
even more stretched within utilities, REITs and consumer staples stocks and was a catalyst for discussion about what
some in the industry called a “low volatility bubble.” The final revision to first quarter GDP growth was upward to 1.1%,
beating consensus estimates of 1.0%. However, a weak May U.S. jobs report came out in early June with non-farm payrolls
advancing by only 38,000 versus the 164,000 expected and this reduced expectations about Fed rate hikes. Inflation also
continued to remain below target at 1.0% year-over-year, while retail sales were up 2.5% year-over-year in May. Mixed
4 Market Summary
Russell Investment Company
Market Summary as of October 31, 2016, continued — (Unaudited)
U.S. economic data, combined with global uncertainties, caused the Fed to take a more dovish stance relating to increasing
interest rates over the intermediate term.
During the third quarter, the Russell 3000® Index rose 4.4%, as the recession fears that characterized the end of the second
quarter began to dissipate. The Fed ended the latest round of deliberations on whether to raise rates, with a hawkish hold.
This, combined with moderately favorable economic data and second quarter earnings reports, caused low volatility stocks
to underperform while banks and technology stocks outperformed. The final revision for second quarter GDP growth was
increased to 1.4% quarter-over-quarter. U.S. retail sales cooled over the period, declining 0.3% month-over-month in the
latest reading for August. The non-farm payrolls numbers reported during the quarter impressed markets, increasing by a
robust 406,000 over July and August combined, which beat consensus estimates of 360,000. The FOMC left interest rates
unchanged at 0.5%, but strongly signaled that “the case for an increase in the federal funds rate has strengthened”. While
signaling that a rate hike was likely in the months ahead, Fed officials lowered their economic growth forecast and trimmed
the number of rate hikes they foresaw in 2017 from three to two.
In October, the Russell 3000® Index lost 2.16%. Investors gravitated toward larger market capitalization higher beta stocks
despite the market decline. Even though higher beta stocks outperformed, some of the lower beta parts of the market such
as electric utilities and consumer staples held-up reasonably well. Medium and small capitalization stocks fell more than
the broad market while REITs and health care stocks lagged as investors focused on the interest rate cycle and election
worries. Value stocks were unusually cheap and generally held-up better than their growth counterparts. Financials,
specifically bank stocks, rallied as the Fed moved closer toward a potential December rate hike and the yield on the 10-
year U.S. treasury hit its highest level since May of 2016. September U.S. non-farm payrolls released in October rose by
156,000 slightly trailing consensus estimates of 168,000. The market reaction was muted overall as the possibility of the
Fed raising short term rates in December seemed to still be on track.
Non-U.S. Developed Equity Markets
For the fiscal year ended October 31, 2016, the developed non-U.S. equity market, as measured by the Russell Developed
ex-U.S. Large Cap® Index (the “Index”), was down -2.34%. There were significant drivers of market volatility during
the fiscal year, key among them were the U.S. Federal Reserve (the “Fed’) rate hikes, the U.K. Brexit referendum and
uncertainty around economic data in emerging markets following an emerging market slowdown during the last fiscal year.
Amid the market volatility, quality factor outperformed the most within the Index during the fiscal year as investors flocked
to quality stocks. Compared to the last fiscal year ending October 31, 2015 when commodity driven sectors, particularly
energy and materials, were the worst hit, this fiscal year saw a reversal in sector trends with these sectors gaining traction
as commodity prices stabilized. Momentum and growth factors underperformed as the fiscal year saw some trend reversals.
In the first quarter of the fiscal year ended October 31, 2016, the Fed lifted the interest rate by 25 basis points to 0.5% in
December 2015, the first time since the financial crisis, while in the rest of the developed markets the monetary policies
broadly remained dovish. With respect to China, slightly softer economic activity, Chinese yuan depreciation, tripping of
circuit breakers and a meaningful decline in foreign exchange reserves stoked concerns about the health of the Chinese
economy and global markets more broadly. The Index was down in all the three months of the first quarter of the fiscal year.
From January 2016 through June 2016, uncertainties grew as market attention became increasingly fixated upon the
U.K., culminating in the U.K. exiting the European Union on June 23rd’s Brexit referendum result, severing a 43-year
membership. Developed non-U.S. equity markets experienced several months of volatility in the first half of 2016 in the
wake of these developments.
In the last quarter of the fiscal year ending October 31, 2016, emerging markets gained traction with better than expected
economic data from China in July 2016. As the fiscal year progressed, the Fed took a more cautious stance and lowered
Market Summary 5
Russell Investment Company
Market Summary as of October 31, 2016, continued — (Unaudited)
the expected pace of rate hikes to a one hike scenario as the most likely case for the remainder of 2016. Markets stabilized
post July after witnessing months of volatility through the end of June 2016.
Asia ex-Japan and Canada were the stand out non-U.S. developed markets over the period, while the U.K. and developed
Europe ex-U.K. lagged the most. Better than expected emerging markets data and stabilization in commodity prices helped
the commodity heavy economies over the fiscal year ending October 31, 2016.
In terms of sector returns within the Index for the fiscal year ended October 31, 2016, commodity driven sectors, such as
materials and energy, had the strongest outperformance, while certain defensive sectors, especially health care, were the
biggest laggards. The financial services sector also lagged the Index, especially driven by banks.
Emerging Markets
The Russell Emerging Markets® Index, as measured in U.S. dollar terms (the “Index”), gained 9.4% over the fiscal year
ended October 31, 2016. The asset class experienced a strong reversal from a negative 2015. Political tailwinds, strong
growth and low interest rates fuelled a positive market environment.
In November and December of 2015, the Index declined 4.9%. Anticipation of a U.S. Federal Reserve rate hike was a key
negative driver over the period. This effect was most pronounced in countries with large current account deficits and dollar-
denominated debt. Currency was also a headwind for emerging markets as the U.S. dollar strengthened. Brazil declined
due to weak economic data and political uncertainty. Near the end of the year, Fitch downgraded Brazil’s credit rating from
investment grade to “junk” status (BB+). This sparked the resignation of finance minister Joaquim Levy and further loss of
trust in President Rousseff. Speculation of impeachment continued, which materialized in 2016.
The Index recorded a strong 4.8% increase in the first quarter of 2016. This was a sharp contrast to developed markets. The
market climb was driven by strong March performance, following falls in January and February. Turmoil in Chinese equity
markets and volatility in the price of oil drove a negative start to the period, in a broadly risk-off environment for equity
markets. The market rebounded from mid-February as equity market and oil price volatility stabilized. A more dovish
outlook for U.S. interest rate rises provided support to emerging markets, particularly countries with large current account
deficits. A weakening of the U.S. dollar acted as a further tailwind. Unlike most of 2015, it was a positive period for Latin
American countries. Brazil overcame a negative start to the year to climb 27.8%. Investors appeared hopeful of a change
of government and ignored weak economic data. The Brazilian Democratic Movement party withdrew from the ruling
coalition. Meanwhile, fourth quarter gross domestic product (“GDP”) growth contracted 5.9% year-over-year. Elsewhere,
Turkey enjoyed a positive start to 2016 (20.4%), aided by low interest rate prospects in the U.S. Russia climbed 16.5% as
the ruble recovered some of its 2015 depreciation. South Africa (15.1%) also benefited from speculation of accommodative
U.S. Federal Reserve policy. In Asia, China was the weakest-performing country in the first quarter. The market slipped
5.6% as economic slowdown concerns remained. After a tumultuous January, where sentiment was hampered by the
failed government-implemented market “stop” on the main stock markets, the People’s Bank of China introduced further
accommodative measures to improve market liquidity. In February, the central bank moved to daily open market operations
and cut its required reserve ratio for banks by 0.5%. Nevertheless, Standard & Poor’s cut its outlook on China to negative
due to economic outlook. India also experienced a slowdown (-3.6%). Capitalization concerns within the nation’s banking
system weighed on sentiment.
The Index recovered from a negative May to edge 1.0% higher in the second quarter of 2016. Emerging markets continued
to outperform developed markets. Fears of an impending U.S. interest rate rise weighed on sentiment, although these
concerns eased over the period. This followed U.S. Federal Reserve Chair Yellen’s more “dovish” comments in June.
Expectations of future U.S. interest rate hikes were pushed out further after the U.K. Brexit referendum to leave the
European Union. The Index echoed the developed market selloff following the Brexit vote, before a subsequent rebound
at quarter-end. It was also a turbulent but positive quarter for Brazil (14.7%). After a protracted process, President Dilma
Rousseff was eventually suspended from office. China extended its weak 2016 performance, as it underperformed to
6 Market Summary
Russell Investment Company
Market Summary as of October 31, 2016, continued — (Unaudited)
finish flat over the period (-0.2%). In addition, the yuan sold off on speculation that China may devalue its currency
following Brexit. Economic data remained healthy but weakened over the period. Elsewhere, Taiwan edged 0.2% higher.
At quarter-end, the central bank reduced its key interest rate as expected to 1.375% from 1.5% in an effort to boost
growth. Europe was the weakest-performing region within the Index. Poland was the standout laggard in the second quarter
(-15.7%), hardest hit by the U.K.’s decision to leave the European Union. Greece slid 9.6% despite surging higher in May.
Meanwhile, political developments drove market movements in Turkey (-7.9%). The market reacted negatively to Prime
Minister Ahmet Davutoglu’s resignation in May.
The Index surged 8.7% in the third quarter of 2016 in a risk-on environment. Emerging markets continued to outperform
with the strongest quarterly return in over three years. Returns were amplified after the U.S. Federal Reserve failed to
increase interest rates in September. The subsequent weakening of the U.S. dollar was a tailwind to the market. It was
a volatile period for oil. The price surged 8.5% in the week ending the quarter as OPEC members agreed in principle
to reduce output. However, the price per barrel fell 3.8% over the period. China was the strongest performing country
during the quarter (13.4%), as positive economic data increased investor confidence in the economy. Second-quarter GDP
growth was positive at 6.7% year-over-year, beating estimates of 6.6%. The modest surprise was driven by an increase in
consumption. The Caixin China services purchasing managers' index (“PMI”) climbed above 50 over the period. However,
the inflation rate fixed lower in August to 1.3% year-over-year (from 1.9% in June). Meanwhile, Brazil continued its strong
year-to-date rebound with an 11.8% climb. The impeachment process against former President Dilma Rousseff finally
concluded, with investor confidence boosted on hopes President Michel Temer would implement market-friendly reforms.
Economic data also improved from recent lows. Industrial production beat expectations at -6.0% year-over-year in June,
the strongest in close in one year, while the manufacturing PMI edged higher. South Korea (9.1%), Indonesia (9.2%) and
Taiwan (11.5%) also outperformed the broader Index return. In Korea, second quarter GDP growth beat expectations at
0.8% quarter-over-quarter. Elsewhere, Indonesia also beat second quarter GDP growth expectations at 4.0% quarter-over-
quarter. The central bank lowered its interest rate to 5.0% as inflation remained subdued. Positive sentiment towards
Taiwan was driven by strong corporate earnings, which led to large investor inflows. Mexico and Turkey were among the
worst-performing countries for the quarter, with both the peso and lira the weakest currencies against the U.S. dollar over
the period. In Mexico (-2.0%), the “Trump effect” weighed on investor confidence. Corruption scandals and the resignation
of finance minister Luis Videgaray also put pressure on President Enrique Pena Nieto. Meanwhile, in Turkey (-4.8%),
markets reacted negatively to July’s failed military coup and subsequent strengthening of power by President Erdogan.
Moody’s downgrade of the country’s credit rating to “junk” status, based on increased risks to the country’s balance of
payments and weaker expected future growth, further weighed on sentiment.
The Index was close to flat in October 2016, returning 0.03%. Rate hike speculation spurred a risk-off environment that
was detrimental to emerging markets. Oil rallied early in the month before selling off, ending flat. Energy outpace other
sectors while consumer stocks sold off on negative sentiment. From a country-perspective, Brazil rallied as Petrobras
rallied to a near two-year high. South Korea sold off with Samsung continuing to suffer from its botched Galaxy Note 7.
U.S./Global Fixed Income Markets
The fiscal year ended October 31, 2016 was characterized by a sharply risk off market early in the period followed by a
similarly sharp rebound and extended rally in risky assets (e.g. lower rated credit and emerging market currencies). Overall,
this proved positive for most fixed income sectors around the globe. Yield curves on global government bonds tended to
flatten over the period supporting longer maturity bonds and the asset class in general. Corporate and emerging sovereign
credit markets suffered from December to February, but returns turned positive as the year went on and eventually very
significantly so. A key indicator of global fixed income performance, the Bloomberg Barclays Global Aggregate Bond Index,
returned 5.17% for the fiscal year, in U.S. dollar-hedged terms, as yields fell modestly and spreads tightened during a fiscal
year where monetary policy remained generally accommodative and recession fears early in the period were never realized.
Market Summary 7
Russell Investment Company
Market Summary as of October 31, 2016, continued — (Unaudited)
Regionally, Europe outperformed the U.S. as the U.S. Federal Reserve (the “Fed”) hiked rates once in the U.S. and
greater exposure to the corporate energy sector represented headwinds to the U.S. market. The Bloomberg Barclays Pan-
European Aggregate Bond Index returned 5.81% during the period (in U.S. dollar-hedged terms), led by the corporate
sector of the market, where the European Central Bank (the “ECB”) began to buy investment grade corporate bonds as
a part of its expanded quantitative easing program. A sharp bond rally in the U.K. following the Brexit referendum also
supported European bond performance. The U.S., in comparison, returned 4.37% during the fiscal year as measured by
the Bloomberg Barclays U.S. Aggregate Bond Index. While the U.S. corporate market performed strongly as did longer
maturity U.S. bonds, Treasury yields rose at the front end of the yield curve representing a headwind to performance in the
US.
In the U.S., economic data remained broadly positive, with solid nonfarm payroll gains and a steady decline in the
unemployment rate to below 5.0%. Gross domestic product (“GDP”) growth regained steam over the period reaching as
high as 2.9% after having dipped below 1% in the first quarter of 2016. Inflation also began to tick up through the period.
The Consumer Price Index was lifted by a recovery in energy prices, but the fiscal year also witnessed modest gains in
wage and producer price inflation supporting expectations that the Fed might be on a path to raise rates again, but not until
after the fiscal year end.
In Europe, the ECB elected to further loosen monetary policy by expanding its asset purchase program to include investment
grade corporate debt. In spite of continued lackluster growth in the Eurozone, the corporate market produced over 3.0%
excess returns over equivalent duration government bonds during the period as ECB demand and support dominated any
fundamental issues. European peripheral markets were mixed during the period as idiosyncratic political events led to
more divergent performance. A series of delayed and failed bank restructurings as well as a looming referendum led Italian
bonds to lag in the market rally. Spain, on the other hand, held an election with an ambiguous result but by the end of the
period appeared on a path for the current lead party to maintain power. As a result, Spanish 10-year bond yields fell over
50 basis points.
Emerging markets suffered more than most early in the period as commodity prices fell, but ultimately rallied to produce
exceptionally strong performance for the fiscal year. China’s growth beat expectations with 6.7% reported GDP growth for
3 consecutive quarters. In Brazil, the President was impeached, which the market took very favorably. The Brazilian Real
was the strong performing major currency worldwide up over 35% against the U.S. dollar. One country that struggled in
emerging markets throughout the year was Mexico. Beaten down by market sentiment early in the year, Mexican assets
failed to rally later in the year as the possibility of a Trump presidency in the U.S. appeared to pose significant risks
to that economy. Emerging market (“EM”) debt outperformed developed markets (the Bloomberg Barclays EM Hard
Currency Aggregate Bond Index outperformed equivalent-duration U.S. Treasuries by 6.61%) as growth and sentiment
stabilized. Local currency EM bonds (those issued in the issuing country’s own currency) did not return quite as strongly
(the Bloomberg Barclays EM Local Currency Government Bond Index returned 4.85%) as the drawdown in the first quarter
of the year was much sharper for EM currencies than credit, though the subsequent rally was similarly fierce.
Strong corporate new issuance volumes continued in the fiscal year period after a brief lull in the first quarter of 2016.
Overall, corporate credit was up globally (the Bloomberg Barclays Global Aggregate Corporate Bond Index returned 3.22%
over equivalent-duration U.S. Treasuries), with particularly strong performance out of the industrial sector of the market.
Financials performed well versus government bonds, but lagged their industrial counterparts as sustained flat yield curves
weighed on banking sector profitability and organic growth outlook.
High yield corporate credit was among the best-performing segments of the market (the Bloomberg Barclays Global High
Yield Bond Index returned 8.20% over equivalent-duration Treasuries), as market sentiment flipped early in the year and
defaults were limited outside of the energy sector.
8 Market Summary
Russell Investment Company
Russell U.S. Core Equity Fund
Portfolio Management Discussion and Analysis — October 31, 2016 (Unaudited)
| Russell U.S. Core Equity Fund - Class A‡ | Russell U.S. Core Equity Fund - Class S‡‡‡ | ||||||
| Total | Total | ||||||
| Return | Return | ||||||
| 1 Year | (2.78 | )% | 1 Year | 3.45 | % | ||
| 5 Years | 10.70 | %§ | 5 Years | 12.31 | %§ | ||
| 10 Years | 4.78 | %§ | 10 Years | 5.65 | %§ | ||
| Russell U.S. Core Equity Fund - Class C‡‡ | Russell 1000® Index** | ||||||
| Total | Total | ||||||
| Return | Return | ||||||
| 1 Year | 2.39 | % | 1 Year | 4.26 | % | ||
| 5 Years | 11.19 | %§ | 5 Years | 13.51 | %§ | ||
| 10 Years | 4.75 | %§ | 10 Years | 6.83 | %§ | ||
| Russell U.S. Core Equity Fund - Class E | |||||||
| Total | |||||||
| Return | |||||||
| 1 Year | 3.18 | % | |||||
| 5 Years | 12.04 | %§ | |||||
| 10 Years | 5.43 | %§ | |||||
| Russell U.S. Core Equity Fund - Class I | |||||||
| Total | |||||||
| Return | |||||||
| 1 Year | 3.54 | % | |||||
| 5 Years | 12.40 | %§ | |||||
| 10 Years | 5.73 | %§ | |||||
Russell U.S. Core Equity Fund 9
Russell Investment Company
Russell U.S. Core Equity Fund
Portfolio Management Discussion and Analysis, continued — October 31, 2016
(Unaudited)
| The Russell U.S. Core Equity Fund (the “Fund”) employs a | a negative effect on Fund performance as the pace of interest rate |
| multi-manager approach whereby portions of the Fund are | increases was slower than the market had expected and investors |
| allocated to different money manager strategies. Fund assets not | became concerned that the odds of a recession may be increasing. |
| allocated to money managers are managed by Russell Investment | However, market conditions in the second half of the fiscal year |
| Management, LLC (“RIM”), the Fund’s advisor. RIM may change | allowed the Fund to make up a portion of the initial shortfall as |
| the allocation of the Fund’s assets among money managers at | expectations firmed-up regarding the economic outlook and the |
| any time. An exemptive order from the Securities and Exchange | timing of the next interest rate increase. |
| Commission (“SEC”) permits RIM to engage or terminate a money | |
| manager at any time, subject to approval by the Fund’s Board, | How did the investment strategies and techniques employed |
| without a shareholder vote. Pursuant to the terms of the exemptive | by the Fund and its money managers affect its benchmark- |
| order, the Fund is required to notify its shareholders within 90 | relative performance? |
| days of when a money manager begins providing services. As of | An overweight to stocks with below-benchmark price-to-earnings |
| October 31, 2016, the Fund had six money managers. | ratios detracted as did an underweight to the lowest beta stocks. |
| An underweight to REITs and to the utilities and consumer | |
| What is the Fund’s investment objective? | staples sectors also detracted. Overweights to the bank and |
| The Fund seeks to provide long term capital growth. | airlines industries held back benchmark-relative performance |
| How did the Fund perform relative to its benchmark for the | but an overweight to the telecommunications services sector |
| fiscal year ended October 31, 2016? | was beneficial. Stock selection within the health care sector (an |
| overweight to Tesaro, Inc., an underweight to Gilead Sciences) | |
| For the fiscal year ended October 31, 2016, the Fund’s Class | and within the information technology sector (an overweight |
| A, Class C, Class E, Class I and Class S Shares gained 3.15%, | to Advanced Micro Devices and NXP Semiconductors) was |
| 2.39%, 3.18%, 3.54% and 3.45%, respectively. This is compared | beneficial to the Fund’s benchmark-relative performance for the |
| to the Fund’s benchmark, the Russell 1000® Index, which gained | fiscal year. |
| 4.26% during the same period. The Fund’s performance includes | |
| operating expenses, whereas index returns are unmanaged and do | The Fund employs discretionary and non-discretionary money |
| not include expenses of any kind. | managers. The Fund’s discretionary money managers select the |
| individual portfolio securities for the assets assigned to them. | |
| For the fiscal year ended October 31, 2016, the Morningstar® | The Fund’s non-discretionary money managers provide a model |
| Large Blend Category, a group of funds that Morningstar considers | portfolio to RIM representing their investment recommendations, |
| to have investment strategies similar to those of the Fund, gained | based upon which RIM purchases and sells securities for the |
| 2.12%. This result serves as a peer comparison and is expressed | Fund. Fund assets not allocated to discretionary money managers |
| net of operating expenses. | include assets managed by RIM based upon model portfolios |
| RIM may assign a money manager a specific style or | provided by non-discretionary money managers, the Fund’s |
| capitalization benchmark other than the Fund’s index. However, | liquidity reserves and assets which may be managed directly by |
| the Fund’s primary index remains the benchmark for the Fund | RIM to effect the Fund’s investment strategies and/or to actively |
| and is representative of the aggregate of each money manager’s | manage the Fund’s overall exposures by investing in securities or |
| benchmark index. | other instruments that RIM believes will achieve the desired risk/ |
| How did the market conditions described in the Market | return profile for the Fund. |
| Summary report affect the Fund’s performance? | With respect to certain of the Fund’s money managers, Suffolk |
| During the fiscal year, the U.S. large capitalization equity market | Capital Management, LLC was the best performing manager for |
| produced positive returns. Fund exposures included tilts toward | the period and outperformed the Russell 1000® Index. Stock |
| value stocks with low price-to-earnings ratios. The Fund was | selection within the health care sector (an overweight to Tesaro, |
| tilted away from most of the interest rate sensitive areas of the | Inc. and Anacor Pharmaceuticals) and within the information |
| market, except for telecommunications services stocks which | technology sector (an overweight to Hewlett Packard and |
| were less expensive than other high dividend yield stocks. The | Broadcom Limited) was a significant driver of positive benchmark- |
| Fund was also tilted away from less economically sensitive, | relative performance. |
| high dividend yield, and low beta stocks (beta is a measure of a | Columbus Circle Investors was the worst performing manager |
| stock’s sensitivity to the direction of the market) such as utilities, | for the period and underperformed the Russell 1000® Growth |
| real estate investment trusts (“REITs”), and consumer staples. | Index. Stock selection within the consumer discretionary sector |
| Overall, the market conditions of the first half of the fiscal year had | (an overweight to Royal Caribbean Cruises and Under Armour) |
10 Russell U.S. Core Equity Fund
Russell Investment Company
Russell U.S. Core Equity Fund
Portfolio Management Discussion and Analysis, continued — October 31, 2016
(Unaudited)
| detracted. Factor exposures were not rewarded, specifically | There were no changes to the Fund’s structure or money manager | |
| tilts toward stocks with above benchmark long term growth | line up during the fiscal year. | |
| forecasts and stocks with high earnings variability. From a sector | ||
| perspective, an overweight to consumer discretionary and an | Money Managers as of October 31, | |
| underweight to consumer staples held back relative returns. | 2016 | Styles |
| Barrow, Hanley, Mewhinney & Strauss, LLC | Value | |
| RIM manages a 9% strategic allocation to a positioning strategy | Brandywine Global Investment Management, | |
| to seek to achieve the desired risk/return profile for the Fund. | LLC | Value |
| The positioning strategy utilizes the output from a quantitative | Columbus Circle Investors | Growth |
| model to seek to position the portfolio to meet RIM’s overall | Jacobs Levy Equity Management, Inc. | Defensive Value |
| preferred positioning. The positioning strategy outperformed the | Suffolk Capital Management, LLC | Market-Oriented |
| Sustainable Growth Advisers, LP | Growth | |
| Russell 1000® Index during the one year period. A tilt toward | The views expressed in this report reflect those of the | |
| high dividend yield stocks and away from stocks with the | portfolio managers only through the end of the period | |
| highest financial leverage contributed positively to benchmark- | covered by the report. These views do not necessarily | |
| relative performance. Sector allocation decisions were rewarded, | represent the views of RIM, or any other person in RIM or | |
| specifically an overweight to utilities and an underweight to | any other affiliated organization. These views are subject | |
| consumer discretionary. | to change at any time based upon market conditions or | |
| During the period, RIM used index futures contracts to equitize | other events, and RIM disclaims any responsibility to | |
| the Fund’s cash. The decision to equitize the Fund’s cash was | update the views contained herein. These views should not | |
| beneficial to Fund performance for the fiscal year as the market | be relied on as investment advice and, because investment | |
| had a positive absolute return. | decisions for a Russell Investment Company (“RIC”) Fund | |
| Describe any changes to the Fund’s structure or the money | are based on numerous factors, should not be relied on as | |
| manager line-up. | an indication of investment decisions of any RIC Fund. | |
^ In prior years, the performance of the Fund’s Class I shares was used in the line graph. Class S Shares will have substantially similar annual returns as the Class
I Shares because the Shares of each Class are invested in the same portfolio of securities. Annual returns for each Class will differ only to the extent that the
Class S Shares do not have the same expenses as the Class I Shares.
* Assumes initial investment on November 1, 2006.
** Russell 1000® Index includes the 1,000 largest companies in the Russell 3000® Index. The Russell 1000® Index represents the universe of stocks from which
most active money managers typically select. The Russell 1000® Index return reflects adjustments from income dividends and capital gain distributions
reinvested as of the ex-dividend dates.
‡ The Fund first issued Class A Shares on September 2, 2008. The returns shown for Class A Shares prior to that date are the returns of Class E Shares. The
performance shown has been adjusted to reflect the deduction of the maximum Class A sales charge of 5.75%. Annual returns for each Class will differ only to
the extent that the Class A Shares do not have the same expenses as Class E Shares.
‡‡ The Fund first issued Class C Shares on September 2, 2008. The returns shown for Class C Shares prior to that date are the returns of the Fund’s Class E Shares
and do not reflect deduction of Rule 12b-1 distribution fees that apply to Class C Shares. Had they done so, the returns shown for those periods would have been
lower. Annual returns for each Class will differ only to the extent that the Class C Shares do not have the same expenses as the Class E Shares.
‡‡‡ The Fund first issued Class S Shares on September 2, 2008. The returns shown for Class S Shares prior to that date are the returns of the Fund’s Class I
Shares. Class S Shares will have substantially similar annual returns as the Class I Shares because the Shares of each Class are invested in the same portfolio of
securities. Annual returns for each Class will differ only to the extent that the Class S Shares do not have the same expenses as the Class I Shares.
§ Annualized.
Performance is historical and assumes reinvestment of all dividends and capital gains. Investment return and principal value will fluctuate so that an investor’s
shares, when redeemed, may be worth more or less than when purchased. Past performance is not indicative of future results. The returns shown do not reflect the
deduction of taxes that a shareholder would pay on Fund distributions or the redemption of Fund shares. Additionally, the returns presented herein may differ from
the performance reported in the Financial Highlights as the returns herein are calculated in a manner consistent with standardized performance in accordance with
Securities and Exchange Commission rules, while the performance in the Financial Highlights has been calculated in accordance with U.S. Generally Accepted
Accounting Principles (“U.S. GAAP”).
Russell U.S. Core Equity Fund 11
Russell Investment Company
Russell U.S. Core Equity Fund
Shareholder Expense Example — October 31, 2016 (Unaudited)
| Fund Expenses | Please note that the expenses shown in the table are meant | |||||
| The following disclosure provides important information | to highlight your ongoing costs only and do not reflect any | |||||
| regarding the Fund’s Shareholder Expense Example | transactional costs. Therefore, the information under the heading | |||||
| (“Example”). | “Hypothetical Performance (5% return before expenses)” is | |||||
| useful in comparing ongoing costs only, and will not help you | ||||||
| Example | determine the relative total costs of owning different funds. In | |||||
| As a shareholder of the Fund, you incur two types of costs: (1) | addition, if these transactional costs were included, your costs | |||||
| transaction costs, including sales charges (loads) on certain | would have been higher. | |||||
| purchase or redemption payments, and (2) ongoing costs, | Hypothetical | |||||
| including distribution (12b-1) and/or service fees and other | Performance (5% | |||||
| Fund expenses. The Example is intended to help you understand | Actual | return before | ||||
| your ongoing costs (in dollars) of investing in the Fund and to | Class A | Performance | expenses) | |||
| Beginning Account Value | ||||||
| compare these costs with the ongoing costs of investing in other | May 1, 2016 | $ | 1,000.00 | $ | 1,000.00 | |
| mutual funds. The Example is based on an investment of $1,000 | Ending Account Value | |||||
| invested at the beginning of the period and held for the entire | October 31, 2016 | $ | 1,039.60 | $ | 1,019.81 | |
| period indicated, which for this Fund is from May 1, 2016 to | Expenses Paid During Period* | $ | 5.43 | $ | 5.38 | |
| October 31, 2016. | * Expenses are equal to the Fund's annualized expense ratio of 1.06% | |||||
| (representing the six month period annualized), multiplied by the average | ||||||
| Actual Expenses | account value over the period, multiplied by 184/366 (to reflect the one-half | |||||
| The information in the table under the heading “Actual | year period). | |||||
| Performance” provides information about actual account values | ||||||
| and actual expenses. You may use the information in this column, | Hypothetical | |||||
| Performance (5% | ||||||
| together with the amount you invested, to estimate the expenses | Actual | return before | ||||
| that you paid over the period. Simply divide your account value by | Class C | Performance | expenses) | |||
| $1,000 (for example, an $8,600 account value divided by $1,000 | Beginning Account Value | |||||
| = 8.6), then multiply the result by the number in the first column | May 1, 2016 | $ | 1,000.00 | $ | 1,000.00 | |
| Ending Account Value | ||||||
| in the row entitled “Expenses Paid During Period” to estimate | October 31, 2016 | $ | 1,035.80 | $ | 1,016.04 | |
| the expenses you paid on your account during this period. | Expenses Paid During Period* | $ | 9.26 | $ | 9.17 | |
| Hypothetical Example for Comparison Purposes | * Expenses are equal to the Fund's annualized expense ratio of 1.81% | |||||
| The information in the table under the heading “Hypothetical | (representing the six month period annualized), multiplied by the average | |||||
| account value over the period, multiplied by 184/366 (to reflect the one-half | ||||||
| Performance (5% return before expenses)” provides information | year period). | |||||
| about hypothetical account values and hypothetical expenses | ||||||
| based on the Fund’s actual expense ratio and an assumed rate of | Hypothetical | |||||
| return of 5% per year before expenses, which is not the Fund’s | Performance (5% | |||||
| Actual | return before | |||||
| actual return. The hypothetical account values and expenses | Class E | Performance | expenses) | |||
| may not be used to estimate the actual ending account balance or | Beginning Account Value | |||||
| expenses you paid for the period. You may use this information | May 1, 2016 | $ | 1,000.00 | $ | 1,000.00 | |
| to compare the ongoing costs of investing in the Fund and other | Ending Account Value | |||||
| October 31, 2016 | $ | 1,039.90 | $ | 1,019.81 | ||
| funds. To do so, compare this 5% hypothetical example with the | Expenses Paid During Period* | $ | 5.44 | $ | 5.38 | |
| 5% hypothetical examples that appear in the shareholder reports | ||||||
| of other funds. | * Expenses are equal to the Fund's annualized expense ratio of 1.06% | |||||
| (representing the six month period annualized), multiplied by the average | ||||||
| account value over the period, multiplied by 184/366 (to reflect the one-half | ||||||
| year period). | ||||||
12 Russell U.S. Core Equity Fund
Russell Investment Company
Russell U.S. Core Equity Fund
Shareholder Expense Example, continued — October 31, 2016 (Unaudited)
| Hypothetical | |||||
| Performance (5% | |||||
| Actual | return before | ||||
| Class I | Performance | expenses) | |||
| Beginning Account Value | |||||
| May 1, 2016 | $ | 1,000.00 | $ | 1,000.00 | |
| Ending Account Value | |||||
| October 31, 2016 | $ | 1,041.80 | $ | 1,021.52 | |
| Expenses Paid During Period* | $ | 3.70 | $ | 3.66 | |
| * Expenses are equal to the Fund's annualized expense ratio of 0.72% | |||||
| (representing the six month period annualized), multiplied by the average | |||||
| account value over the period, multiplied by 184/366 (to reflect the one-half | |||||
| year period). | |||||
| Hypothetical | |||||
| Performance (5% | |||||
| Actual | return before | ||||
| Class S | Performance | expenses) | |||
| Beginning Account Value | |||||
| May 1, 2016 | $ | 1,000.00 | $ | 1,000.00 | |
| Ending Account Value | |||||
| October 31, 2016 | $ | 1,041.40 | $ | 1,021.11 | |
| Expenses Paid During Period* | $ | 4.11 | $ | 4.06 | |
| * Expenses are equal to the Fund's annualized expense ratio of 0.80% | |||||
| (representing the six month period annualized), multiplied by the average | |||||
| account value over the period, multiplied by 184/366 (to reflect the one-half | |||||
| year period). | |||||
Russell U.S. Core Equity Fund 13
Russell Investment Company
Russell U.S. Core Equity Fund
Schedule of Investments — October 31, 2016
| Amounts in thousands (except share amounts) | Amounts in thousands (except share amounts) | ||||||
| Principal | Fair | Principal | Fair | ||||
| Amount ($) or | Value | Amount ($) or | Value | ||||
| Shares | $ | Shares | $ | ||||
| Common Stocks - 95.3% | Visteon Corp. | 3,300 | 233 | ||||
| Consumer Discretionary - 12.8% | Wal-Mart Stores, Inc. | 116,189 | 8,136 | ||||
| Aaron's, Inc. Class A | 20,200 | 499 | Walt Disney Co. (The) | 41,263 | 3,825 | ||
| Amazon.com, Inc.(Æ) | 9,431 | 7,449 | Whirlpool Corp. | 9,800 | 1,468 | ||
| AutoZone, Inc.(Æ) | 1,746 | 1,296 | Wynn Resorts, Ltd. | 10,616 | 1,004 | ||
| Brinker International, Inc. | 7,900 | 389 | Yum! Brands, Inc. | 2,344 | 202 | ||
| Carnival Corp. | 15,620 | 767 | |||||
| CBS Corp. Class B | 5,587 | 316 | 88,437 | ||||
| Chipotle Mexican Grill, Inc. Class A(Æ) | 5,631 | 2,031 | |||||
| Comcast Corp. Class A | 17,878 | 1,105 | Consumer Staples - 7.7% | ||||
| Altria Group, Inc. | 67,396 | 4,456 | |||||
| Cooper-Standard Holding, Inc.(Æ) | 3,300 | 301 | Archer-Daniels-Midland Co. | 13,800 | 601 | ||
| Costco Wholesale Corp. | 14,808 | 2,190 | Brown-Forman Corp. Class B - ADR | 6,100 | 282 | ||
| Coty, Inc. Class A(Æ) | 23,088 | 531 | Bunge, Ltd. | 9,600 | 595 | ||
| Delphi Automotive PLC | 23,228 | 1,511 | Coca-Cola Co. (The) | 13,259 | 562 | ||
| Dillard's, Inc. Class A | 5,951 | 365 | Colgate-Palmolive Co. | 35,632 | 2,543 | ||
| Discovery Communications, Inc. Class A(Æ) | 56,128 | 1,465 | Constellation Brands, Inc. Class A | 12,312 | 2,058 | ||
| Dollar Tree, Inc.(Æ) | 12,516 | 946 | CVS Health Corp. | 34,836 | 2,930 | ||
| eBay, Inc.(Æ) | 11,900 | 339 | Dr Pepper Snapple Group, Inc. | 10,100 | 887 | ||
| Estee Lauder Cos., Inc. (The) Class A | 10,800 | 941 | Energizer Holdings, Inc.(Æ) | 2,900 | 219 | ||
| Ford Motor Co. | 58,800 | 690 | General Mills, Inc. | 26,384 | 1,635 | ||
| Gap, Inc. (The) | 79,000 | 2,180 | JM Smucker Co. (The) | 6,890 | 905 | ||
| General Motors Co. | 85,090 | 2,689 | Kellogg Co. | 10,551 | 793 | ||
| Goodyear Tire & Rubber Co. (The) | 23,163 | 672 | Kimberly-Clark Corp. | 2,237 | 256 | ||
| Harman International Industries, Inc. | 12,000 | 956 | Kraft Heinz Co. (The) | 29,882 | 2,658 | ||
| Home Depot, Inc. (The) | 21,435 | 2,615 | Molson Coors Brewing Co. Class B | 13,182 | 1,368 | ||
| IMAX Corp.(Æ) | 37,053 | 1,121 | Mondelez International, Inc. Class A | 141,183 | 6,345 | ||
| Kohl's Corp. | 3,800 | 166 | Nu Skin Enterprises, Inc. Class A | 2,000 | 123 | ||
| Lennar Corp. Class A | 3,177 | 132 | PepsiCo, Inc. | 37,193 | 3,987 | ||
| Lowe's Cos., Inc. | 39,310 | 2,620 | Philip Morris International, Inc. | 79,258 | 7,644 | ||
| Macy's, Inc. | 25,913 | 946 | Pinnacle Foods, Inc. | 7,400 | 380 | ||
| Marriott International, Inc. Class A | 4,211 | 289 | Procter & Gamble Co. (The) | 71,665 | 6,220 | ||
| McDonald's Corp. | 6,654 | 749 | Sanderson Farms, Inc. | 3,600 | 324 | ||
| Michael Kors Holdings, Ltd.(Æ) | 10,592 | 538 | Sysco Corp. | 31,508 | 1,516 | ||
| Murphy USA, Inc.(Æ) | 800 | 55 | TreeHouse Foods, Inc.(Æ) | 13,187 | 1,154 | ||
| Netflix, Inc.(Æ) | 5,803 | 725 | United Natural Foods, Inc.(Æ) | 11,000 | 459 | ||
| Newell Brands, Inc. | 55,158 | 2,649 | Walgreens Boots Alliance, Inc. | 3,772 | 312 | ||
| News Corp. Class A | 91,800 | 1,113 | Whole Foods Market, Inc. | 68,415 | 1,935 | ||
| Nike, Inc. Class B | 81,981 | 4,114 | |||||
| Nordstrom, Inc. | 2,392 | 124 | 53,147 | ||||
| Norwegian Cruise Line Holdings, Ltd.(Æ) | 11,523 | 448 | |||||
| NVR, Inc.(Æ) | 694 | 1,057 | Energy - 6.7% | ||||
| Office Depot, Inc. | 21,900 | 69 | Anadarko Petroleum Corp. | 36,790 | 2,187 | ||
| Panera Bread Co. Class A(Æ) | 9,100 | 1,736 | Antero Resources Corp.(Æ) | 32,800 | 868 | ||
| Priceline Group, Inc. (The)(Æ) | 1,680 | 2,477 | Apache Corp. | 22,730 | 1,352 | ||
| PulteGroup, Inc. | 17,466 | 325 | Baker Hughes, Inc. | 2,600 | 144 | ||
| PVH Corp. | 14,195 | 1,519 | BP PLC - ADR | 127,466 | 4,531 | ||
| Ralph Lauren Corp. Class A | 664 | 65 | Canadian Natural Resources, Ltd. | 57,338 | 1,818 | ||
| Ross Stores, Inc. | 12,700 | 794 | Chevron Corp. | 10,253 | 1,074 | ||
| Royal Caribbean Cruises, Ltd. | 16,477 | 1,267 | ConocoPhillips | 69,907 | 3,038 | ||
| Scripps Networks Interactive, Inc. Class A | 7,803 | 502 | Core Laboratories NV | 13,877 | 1,346 | ||
| Service Corp. International | 2,272 | 58 | Devon Energy Corp. | 28,534 | 1,081 | ||
| Signet Jewelers, Ltd. | 10,698 | 869 | Diamondback Energy, Inc.(Æ) | 8,249 | 753 | ||
| Starbucks Corp. | 49,185 | 2,610 | Energen Corp.(Æ) | 5,100 | 256 | ||
| Target Corp. | 49,479 | 3,401 | EOG Resources, Inc. | 7,700 | 696 | ||
| Thomson Reuters Corp. | 3,551 | 140 | Exxon Mobil Corp. | 92,636 | 7,718 | ||
| Time Warner, Inc. | 15,499 | 1,379 | Halliburton Co. | 17,045 | 784 | ||
| TJX Cos., Inc. | 47,185 | 3,480 | Helmerich & Payne, Inc. | 7,693 | 486 | ||
| Toll Brothers, Inc.(Æ) | 7,763 | 213 | HollyFrontier Corp. | 41,800 | 1,043 | ||
| Toyota Motor Corp. - ADR | 5,240 | 606 | Magna International, Inc. Class A | 18,787 | 771 | ||
| Ulta Salon Cosmetics & Fragrance, Inc.(Æ) | 10,360 | 2,521 | Marathon Petroleum Corp. | 14,600 | 636 | ||
| Viacom, Inc. Class B | 11,942 | 449 | Occidental Petroleum Corp. | 67,952 | 4,954 | ||
See accompanying notes which are an integral part of the financial statements.
14 Russell U.S. Core Equity Fund
Russell Investment Company
Russell U.S. Core Equity Fund
Schedule of Investments, continued — October 31, 2016
| Amounts in thousands (except share amounts) | Amounts in thousands (except share amounts) | ||||||
| Principal | Fair | Principal | Fair | ||||
| Amount ($) or | Value | Amount ($) or | Value | ||||
| Shares | $ | Shares | $ | ||||
| Oceaneering International, Inc. | 12,933 | 308 | M&T Bank Corp. | 7,357 | 903 | ||
| Phillips 66 | 38,658 | 3,137 | Marsh & McLennan Cos., Inc. | 8,271 | 524 | ||
| Pioneer Natural Resources Co. | 18,627 | 3,335 | Mastercard, Inc. Class A | 52,635 | 5,633 | ||
| QEP Resources, Inc.(Æ) | 31,700 | 509 | MetLife, Inc. | 86,121 | 4,044 | ||
| Schlumberger, Ltd. | 33,690 | 2,636 | Morgan Stanley | 44,741 | 1,502 | ||
| Valero Energy Corp. | 15,700 | 930 | Navient Corp. | 10,591 | 135 | ||
| 46,391 | New York Community Bancorp, Inc. | 9,756 | 140 | ||||
| Northern Trust Corp. | 3,221 | 233 | |||||
| Financial Services - 21.4% | PNC Financial Services Group, Inc. (The) | 63,685 | 6,088 | ||||
| Aflac, Inc. | 3,893 | 268 | Popular, Inc. | 20,432 | 742 | ||
| AGNC Investment Corp.(ö) | 16,713 | 335 | Principal Financial Group, Inc. | 12,800 | 699 | ||
| Alliance Data Systems Corp. | 8,069 | 1,650 | Prologis, Inc.(ö) | 3,571 | 186 | ||
| Allstate Corp. (The) | 35,109 | 2,384 | Prudential Financial, Inc. | 2,310 | 196 | ||
| Ally Financial, Inc. | 17,700 | 320 | Public Storage(ö) | 2,974 | 636 | ||
| American Express Co. | 59,200 | 3,932 | Regions Financial Corp. | 175,589 | 1,881 | ||
| American International Group, Inc. | 34,996 | 2,159 | Reinsurance Group of America, Inc. Class A | 10,400 | 1,122 | ||
| Ameriprise Financial, Inc. | 23,474 | 2,075 | Santander Consumer USA Holdings, Inc.(Æ) | 88,921 | 1,085 | ||
| Aspen Insurance Holdings, Ltd. | 23,000 | 1,110 | Signature Bank(Æ) | 1,429 | 172 | ||
| AvalonBay Communities, Inc.(ö) | 3,430 | 587 | Simon Property Group, Inc.(ö) | 12,549 | 2,334 | ||
| Axis Capital Holdings, Ltd. | 6,200 | 353 | SL Green Realty Corp.(ö) | 4,310 | 423 | ||
| Bank of America Corp. | 711,955 | 11,747 | State Street Corp. | 91,946 | 6,456 | ||
| Bank of New York Mellon Corp. (The) | 35,305 | 1,528 | SunTrust Banks, Inc. | 8,278 | 374 | ||
| BB&T Corp. | 10,340 | 405 | Synchrony Financial | 55,764 | 1,594 | ||
| Berkshire Hathaway, Inc. Class B(Æ) | 27,053 | 3,904 | TFS Financial Corp. | 14,569 | 260 | ||
| BlackRock, Inc. Class A | 2,163 | 738 | Travelers Cos., Inc. (The) | 19,632 | 2,124 | ||
| Blackstone Group, LP (The) | 58,076 | 1,454 | Two Harbors Investment Corp. (ö) | 63,881 | 532 | ||
| Capital One Financial Corp. | 9,500 | 703 | US Bancorp | 36,953 | 1,654 | ||
| Chubb, Ltd. | 2,821 | 358 | Vantiv, Inc. Class A(Æ) | 9,300 | 543 | ||
| Citigroup, Inc. | 99,066 | 4,869 | Visa, Inc. Class A | 68,921 | 5,687 | ||
| Citizens Financial Group, Inc. | 34,681 | 914 | Voya Financial, Inc. | 53,090 | 1,622 | ||
| CME Group, Inc. Class A | 1,896 | 190 | Wells Fargo & Co. | 244,534 | 11,251 | ||
| Comerica, Inc. | 35,000 | 1,823 | XL Group, Ltd. | 109,600 | 3,803 | ||
| Crown Castle International Corp.(ö) | 1,300 | 118 | 147,280 | ||||
| Cullen/Frost Bankers, Inc. | 2,461 | 187 | |||||
| Discover Financial Services | 3,107 | 175 | Health Care - 12.6% | ||||
| E*Trade Financial Corp.(Æ) | 4,900 | 138 | Abbott Laboratories | 12,561 | 493 | ||
| East West Bancorp, Inc. | 8,500 | 336 | AbbVie, Inc. | 20,127 | 1,123 | ||
| Ecolab, Inc. | 22,449 | 2,563 | Aetna, Inc. | 5,060 | 543 | ||
| Equifax, Inc. | 8,377 | 1,038 | Agilent Technologies, Inc. | 34,400 | 1,499 | ||
| Equinix, Inc.(ö) | 5,391 | 1,926 | Akorn, Inc.(Æ) | 13,818 | 331 | ||
| Equity Residential(ö) | 19,498 | 1,204 | Allergan PLC(Æ) | 8,385 | 1,752 | ||
| Everest Re Group, Ltd. | 6,410 | 1,305 | Allscripts Healthcare Solutions, Inc.(Æ) | 33,000 | 396 | ||
| FactSet Research Systems, Inc. | 4,340 | 671 | Amgen, Inc. | 16,751 | 2,365 | ||
| Fidelity National Information Services, Inc. | 14,045 | 1,038 | Anthem, Inc. | 15,590 | 1,900 | ||
| Fifth Third Bancorp | 11,730 | 255 | Baxter International, Inc. | 4,108 | 195 | ||
| FleetCor Technologies, Inc.(Æ) | 28,455 | 4,988 | Becton Dickinson and Co. | 1,652 | 277 | ||
| Franklin Resources, Inc. | 4,011 | 135 | Biogen, Inc.(Æ) | 5,180 | 1,451 | ||
| General Growth Properties, Inc. (ö) | 6,888 | 172 | BioMarin Pharmaceutical, Inc.(Æ) | 15,328 | 1,234 | ||
| Goldman Sachs Group, Inc. (The) | 4,110 | 733 | Boston Scientific Corp.(Æ) | 50,800 | 1,118 | ||
| Hanover Insurance Group, Inc. (The) | 11,000 | 838 | Bristol-Myers Squibb Co. | 41,100 | 2,092 | ||
| Hartford Financial Services Group, Inc. | 28,001 | 1,235 | Cardinal Health, Inc. | 24,500 | 1,683 | ||
| HCP, Inc. (ö) | 5,405 | 185 | Celgene Corp.(Æ) | 6,684 | 683 | ||
| Huntington Bancshares, Inc. | 20,823 | 221 | Centene Corp.(Æ) | 1,200 | 75 | ||
| Intercontinental Exchange, Inc. | 702 | 190 | Cerner Corp.(Æ) | 51,924 | 3,042 | ||
| JPMorgan Chase & Co. | 151,049 | 10,462 | DexCom, Inc.(Æ) | 13,329 | 1,043 | ||
| KeyCorp | 125,760 | 1,776 | Edwards Lifesciences Corp.(Æ) | 18,383 | 1,750 | ||
| KKR & Co., LP | 129,381 | 1,836 | Eli Lilly & Co. | 40,060 | 2,958 | ||
| Leucadia National Corp. | 7,002 | 131 | Express Scripts Holding Co.(Æ) | 6,646 | 448 | ||
| Lincoln National Corp. | 7,400 | 363 | Gilead Sciences, Inc. | 16,459 | 1,212 | ||
| Loews Corp. | 108,700 | 4,677 | HCA Holdings, Inc.(Æ) | 19,898 | 1,523 | ||
See accompanying notes which are an integral part of the financial statements.
Russell U.S. Core Equity Fund 15
Russell Investment Company
Russell U.S. Core Equity Fund
Schedule of Investments, continued — October 31, 2016
| Amounts in thousands (except share amounts) | Amounts in thousands (except share amounts) | ||||||
| Principal | Fair | Principal | Fair | ||||
| Amount ($) or | Value | Amount ($) or | Value | ||||
| Shares | $ | Shares | $ | ||||
| Henry Schein, Inc.(Æ) | 7,430 | 1,109 | AO Smith Corp. | 4,400 | 199 | ||
| Horizon Pharma PLC(Æ) | 40,858 | 683 | Automatic Data Processing, Inc. | 25,565 | 2,226 | ||
| ICU Medical, Inc.(Æ) | 1,110 | 155 | B/E Aerospace, Inc. | 11,959 | 712 | ||
| Impax Laboratories, Inc.(Æ) | 11,000 | 221 | Babcock & Wilcox Co. (The) Class W(Æ) | 16,500 | 647 | ||
| Intuitive Surgical, Inc.(Æ) | 4,016 | 2,699 | Boeing Co. (The) | 1,812 | 258 | ||
| Jazz Pharmaceuticals PLC(Æ) | 4,141 | 453 | Carlisle Cos., Inc. | 756 | 79 | ||
| Johnson & Johnson | 108,549 | 12,591 | Caterpillar, Inc. | 7,497 | 626 | ||
| LifePoint Health, Inc.(Æ) | 9,900 | 592 | CH Robinson Worldwide, Inc. | 8,900 | 606 | ||
| Mallinckrodt PLC(Æ) | 9,562 | 567 | Chicago Bridge & Iron Co. | 16,802 | 538 | ||
| Medtronic PLC | 56,705 | 4,651 | CSX Corp. | 7,063 | 215 | ||
| Merck & Co., Inc. | 162,415 | 9,537 | Cummins, Inc. | 1,104 | 141 | ||
| Molina Healthcare, Inc.(Æ) | 3,100 | 169 | Danaher Corp. | 5,151 | 405 | ||
| Mylan NV(Æ) | 66,180 | 2,416 | Deere & Co. | 1,465 | 129 | ||
| Novo Nordisk A/S - ADR | 37,393 | 1,329 | Delta Air Lines, Inc. | 85,270 | 3,562 | ||
| Ophthotech Corp.(Æ) | 23,910 | 856 | Eaton Corp. PLC | 10,988 | 701 | ||
| Patterson Cos., Inc. | 9,910 | 423 | Emerson Electric Co. | 4,667 | 237 | ||
| Pfizer, Inc. | 194,821 | 6,178 | EnerSys | 2,500 | 163 | ||
| Quintiles IMS Holdings, Inc.(Æ) | 2,267 | 163 | Expeditors International of Washington, Inc. | 24,300 | 1,251 | ||
| Regeneron Pharmaceuticals, Inc.(Æ) | 5,774 | 1,992 | FedEx Corp. | 16,280 | 2,838 | ||
| Shire PLC - ADR | 1,056 | 178 | Fluor Corp. | 8,097 | 421 | ||
| Stryker Corp. | 19,153 | 2,209 | Fortive Corp. | 1,918 | 98 | ||
| TESARO, Inc.(Æ) | 4,459 | 539 | General Dynamics Corp. | 1,772 | 267 | ||
| Thermo Fisher Scientific, Inc. | 23,221 | 3,414 | General Electric Co. | 29,532 | 859 | ||
| UnitedHealth Group, Inc. | 15,992 | 2,260 | Hertz Global Holdings, Inc.(Æ) | 1,200 | 40 | ||
| 86,570 | Honeywell International, Inc. | 29,100 | 3,192 | ||||
| Hub Group, Inc. Class A(Æ) | 1,600 | 58 | |||||
| Materials and Processing - 2.3% | Huntington Ingalls Industries, Inc. | 5,760 | 929 | ||||
| Acuity Brands, Inc. | 1,662 | 372 | Illinois Tool Works, Inc. | 2,196 | 249 | ||
| Air Products & Chemicals, Inc. | 940 | 125 | Itron, Inc.(Æ) | 1,100 | 59 | ||
| Albemarle Corp. | 7,971 | 666 | Johnson Controls International PLC | 67,749 | 2,732 | ||
| AptarGroup, Inc. | 11,700 | 836 | Kansas City Southern | 14,915 | 1,309 | ||
| Celanese Corp. Class A | 21,800 | 1,590 | L-3 Communications Holdings, Inc. | 11,690 | 1,601 | ||
| CRH PLC - ADR | 100,500 | 3,246 | Landstar System, Inc. | 12,240 | 871 | ||
| Domtar Corp. | 3,500 | 126 | Lockheed Martin Corp. | 9,154 | 2,255 | ||
| Dow Chemical Co. (The) | 9,221 | 496 | ManpowerGroup, Inc. | 13,500 | 1,037 | ||
| Eastman Chemical Co. | 7,907 | 569 | Moog, Inc. Class A(Æ) | 2,200 | 128 | ||
| EI du Pont de Nemours & Co. | 2,053 | 141 | Norfolk Southern Corp. | 26,799 | 2,492 | ||
| International Flavors & Fragrances, Inc. | 1,300 | 170 | Northrop Grumman Corp. | 9,366 | 2,145 | ||
| International Paper Co. | 35,400 | 1,594 | Quanta Services, Inc.(Æ) | 27,558 | 792 | ||
| Louisiana-Pacific Corp.(Æ) | 31,176 | 572 | Raytheon Co. | 40,925 | 5,591 | ||
| LyondellBasell Industries NV Class A | 7,482 | 595 | Rockwell Automation, Inc. | 10,404 | 1,246 | ||
| Masco Corp. | 41,200 | 1,272 | Ryder System, Inc. | 914 | 63 | ||
| Monsanto Co. | 1,799 | 181 | S&P Global, Inc. | 8,614 | 1,050 | ||
| Platform Specialty Products Corp.(Æ) | 1,300 | 9 | Southwest Airlines Co. | 70,900 | 2,840 | ||
| PPG Industries, Inc. | 1,221 | 114 | Stanley Black & Decker, Inc. | 25,300 | 2,880 | ||
| Praxair, Inc. | 1,238 | 145 | Terex Corp. | 34,356 | 820 | ||
| Reliance Steel & Aluminum Co. | 10,571 | 727 | Textron, Inc. | 14,850 | 595 | ||
| Rio Tinto PLC - ADR | 35,800 | 1,248 | Trinity Industries, Inc. | 4,500 | 96 | ||
| Sherwin-Williams Co. (The) | 3,430 | 840 | Triumph Group, Inc. | 1,398 | 33 | ||
| WestRock Co. | 1,526 | 71 | Union Pacific Corp. | 24,313 | 2,144 | ||
| United Continental Holdings, Inc.(Æ) | 5,960 | 335 | |||||
| 15,705 | United Parcel Service, Inc. Class B | 6,865 | 740 | ||||
| United Technologies Corp. | 21,788 | 2,227 | |||||
| Producer Durables - 9.9% | Waste Management, Inc. | 3,170 | 208 | ||||
| 3M Co. | 3,099 | 512 | WESCO International, Inc.(Æ) | 2,900 | 157 | ||
| Accenture PLC Class A | 25,762 | 2,995 | WW Grainger, Inc. | 353 | 73 | ||
| Adient PLC(Æ) | 6,774 | 308 | Xylem, Inc. | 21,324 | 1,031 | ||
| AECOM(Æ) | 62,373 | 1,737 | |||||
| AerCap Holdings NV(Æ) | 34,064 | 1,400 | 68,177 | ||||
| American Airlines Group, Inc. | 48,086 | 1,952 | |||||
| Ametek, Inc. | 1,742 | 77 | |||||
See accompanying notes which are an integral part of the financial statements.
16 Russell U.S. Core Equity Fund
Russell Investment Company
Russell U.S. Core Equity Fund
Schedule of Investments, continued — October 31, 2016
| Amounts in thousands (except share amounts) | Amounts in thousands (except share amounts) | ||||||||||
| Principal | Fair | Principal | Fair | ||||||||
| Amount ($) or | Value | Amount ($) or | Value | ||||||||
| Shares | $ | Shares | $ | ||||||||
| Technology - 16.2% | China Mobile, Ltd. - ADR | 20,164 | 1,158 | ||||||||
| Activision Blizzard, Inc. | 45,140 | 1,949 | Consolidated Edison, Inc. | 11,100 | 839 | ||||||
| Advanced Micro Devices, Inc.(Æ) | 182,500 | 1,320 | Dominion Resources, Inc. | 13,714 | 1,031 | ||||||
| Alphabet, Inc. Class A(Æ) | 5,714 | 4,628 | DTE Energy Co. | 11,700 | 1,123 | ||||||
| Alphabet, Inc. Class C(Æ) | 13,563 | 10,641 | Duke Energy Corp. | 6,043 | 484 | ||||||
| Apple, Inc. | 109,336 | 12,414 | Entergy Corp. | 56,800 | 4,185 | ||||||
| Applied Materials, Inc. | 50,203 | 1,460 | Eversource Energy | 16,200 | 892 | ||||||
| ARRIS International PLC(Æ) | 19,800 | 550 | FirstEnergy Corp. | 15,000 | 514 | ||||||
| Avnet, Inc. | 34,355 | 1,441 | Great Plains Energy, Inc. | 5,000 | 142 | ||||||
| Broadcom, Ltd. | 17,284 | 2,943 | Hawaiian Electric Industries, Inc. | 16,800 | 496 | ||||||
| Brocade Communications Systems, Inc. | 37,700 | 400 | NextEra Energy, Inc. | 18,108 | 2,318 | ||||||
| Cisco Systems, Inc. | 158,788 | 4,872 | PG&E Corp. | 13,321 | 827 | ||||||
| Cognizant Technology Solutions Corp. Class | PPL Corp. | 7,700 | 264 | ||||||||
| A(Æ) | 16,090 | 826 | Public Service Enterprise Group, Inc. | 28,900 | 1,216 | ||||||
| Computer Sciences Corp. | 29,493 | 1,606 | RingCentral, Inc. Class A(Æ) | 3,500 | 72 | ||||||
| Electronic Arts, Inc.(Æ) | 12,336 | 969 | South Jersey Industries, Inc. | 3,600 | 107 | ||||||
| Facebook, Inc. Class A(Æ) | 55,502 | 7,270 | Southern Co. (The) | 42,742 | 2,204 | ||||||
| Finisar Corp.(Æ) | 22,800 | 624 | Telephone & Data Systems, Inc. | 3,900 | 101 | ||||||
| FireEye, Inc.(Æ) | 2,600 | 30 | T-Mobile US, Inc.(Æ) | 32,407 | 1,612 | ||||||
| Gartner, Inc.(Æ) | 12,200 | 1,050 | Verizon Communications, Inc. | 147,154 | 7,078 | ||||||
| Harris Corp. | 16,508 | 1,473 | 38,990 | ||||||||
| Hewlett Packard Enterprise Co. | 50,254 | 1,129 | |||||||||
| HP, Inc. | 19,800 | 287 | |||||||||
| Intel Corp. | 148,391 | 5,174 | Total Common Stocks | ||||||||
| International Business Machines Corp. | 25,000 | 3,842 | (cost $556,155) | 656,645 | |||||||
| IPG Photonics Corp.(Æ) | 5,669 | 550 | |||||||||
| Jabil Circuit, Inc. | 4,500 | 96 | Short-Term Investments - 4.9% | ||||||||
| Juniper Networks, Inc. | 49,300 | 1,299 | Russell U.S. Cash Management Fund | 32,268,505 | (8) | 32,275 | |||||
| Lam Research Corp. | 15,439 | 1,495 | United States Treasury Bills | ||||||||
| Marvell Technology Group, Ltd. | 45,200 | 589 | 0.238% due 12/22/16 (~)(§) | 1,400 | 1,399 | ||||||
| Mentor Graphics Corp. | 41,900 | 1,211 | Total Short-Term Investments | ||||||||
| Micron Technology, Inc.(Æ) | 160,394 | 2,752 | (cost $33,669) | 33,674 | |||||||
| Microsoft Corp. | 109,575 | 6,566 | |||||||||
| NetApp, Inc. | 29,700 | 1,008 | |||||||||
| Nuance Communications, Inc.(Æ) | 22,400 | 314 | Total Investments 100.2% | ||||||||
| NXP Semiconductors NV(Æ) | 23,141 | 2,314 | (identified cost $589,824) | 690,319 | |||||||
| ON Semiconductor Corp.(Æ) | 37,800 | 441 | |||||||||
| Oracle Corp. | 150,343 | 5,776 | Other Assets and Liabilities, Net | ||||||||
| QUALCOMM, Inc. | 94,970 | 6,526 | -(0.2%) | (1,136 | ) | ||||||
| Red Hat, Inc.(Æ) | 41,979 | 3,251 | Net Assets - 100.0% | 689,183 | |||||||
| Salesforce.com, Inc.(Æ) | 32,992 | 2,480 | |||||||||
| SAP SE - ADR | 25,041 | 2,200 | |||||||||
| Synaptics, Inc.(Æ) | 1,100 | 57 | |||||||||
| SYNNEX Corp. | 800 | 82 | |||||||||
| Synopsys, Inc.(Æ) | 18,600 | 1,103 | |||||||||
| Tech Data Corp.(Æ) | 11,600 | 893 | |||||||||
| Texas Instruments, Inc. | 4,753 | 337 | |||||||||
| Twitter, Inc.(Æ) | 12,200 | 219 | |||||||||
| Viavi Solutions, Inc. Class W(Æ) | 86,400 | 615 | |||||||||
| VMware, Inc. Class A(Æ) | 15,000 | 1,179 | |||||||||
| Western Digital Corp. | 11,700 | 684 | |||||||||
| Yelp, Inc. Class A(Æ) | 2,100 | 69 | |||||||||
| Zynga, Inc. Class A(Æ) | 336,100 | 944 | |||||||||
| 111,948 | |||||||||||
| Utilities - 5.7% | |||||||||||
| American Electric Power Co., Inc. | 28,928 | 1,876 | |||||||||
| American Water Works Co., Inc. | 4,600 | 341 | |||||||||
| AT&T, Inc. | 255,904 | 9,415 | |||||||||
| Calpine Corp.(Æ) | 58,446 | 695 | |||||||||
See accompanying notes which are an integral part of the financial statements.
Russell U.S. Core Equity Fund 17
Russell Investment Company
Russell U.S. Core Equity Fund
Schedule of Investments, continued — October 31, 2016
| Futures Contracts | |||||||||||||||
| Amounts in thousands (except contract amounts) | |||||||||||||||
| Unrealized | |||||||||||||||
| Appreciation | |||||||||||||||
| Number of | Notional | Expiration | (Depreciation) | ||||||||||||
| Contracts | Amount | Date | $ | ||||||||||||
| Long Positions | |||||||||||||||
| S&P 500 E-Mini Index Futures | 298 | USD | 31,589 | 12/16 | (371 | ) | |||||||||
| Total Unrealized Appreciation (Depreciation) on Open Futures Contracts (å) | (371 | ) | |||||||||||||
| Presentation of Portfolio Holdings | |||||||||||||||
| Amounts in thousands | |||||||||||||||
| Fair Value | |||||||||||||||
| Practical | |||||||||||||||
| Portfolio Summary | Level 1 | Level 2 | Level 3 | Expedient (a) | Total | % of Net Assets | |||||||||
| Common Stocks | |||||||||||||||
| Consumer Discretionary | $ | 88,437 | $ | — | $ | — | $ | — | $ | 88,437 | 12.8 | ||||
| Consumer Staples | 53,147 | — | — | — | 53,147 | 7.7 | |||||||||
| Energy | 46,391 | — | — | — | 46,391 | 6.7 | |||||||||
| Financial Services | 147,280 | — | — | — | 147,280 | 21.4 | |||||||||
| Health Care | 86,570 | — | — | — | 86,570 | 12.6 | |||||||||
| Materials and Processing | 15,705 | — | — | — | 15,705 | 2.3 | |||||||||
| Producer Durables | 68,177 | — | — | — | 68,177 | 9.9 | |||||||||
| Technology | 111,948 | — | — | — | 111,948 | 16.2 | |||||||||
| Utilities | 38,990 | — | — | — | 38,990 | 5.7 | |||||||||
| Short-Term Investments | — | 1,399 | — | 32,275 | 33,674 | 4.9 | |||||||||
| Total Investments | 656,645 | 1,399 | — | 32,275 | 690,319 | 100.2 | |||||||||
| Other Assets and Liabilities, Net | (0.2 | ) | |||||||||||||
| 100.0 | |||||||||||||||
| Other Financial Instruments | |||||||||||||||
| Liabilities | |||||||||||||||
| Futures Contracts | (371 | ) | — | — | — | (371 | ) | (0.1 | ) | ||||||
| Total Other Financial Instruments* | $ | (371 | ) | $ | — | $ | — | $ | — | $ | (371 | ) | |||
* Futures and foreign currency exchange contract values reflect the unrealized appreciation (depreciation) on the investments.
(a) Certain investments that are measured at fair value using the net asset value per share (or its equivalent) practical expedient have not been classified
in the fair value levels. The fair value amounts presented in the table are intended to permit reconciliation to the amounts presented in the Schedule of
Investments.
For a description of the Levels, see note 2 in the Notes to Financial Statements.
For disclosure on transfers between Levels 1, 2 and 3 during the period ended October 31, 2016, see note 2 in the Notes to
Financial Statements.
See accompanying notes which are an integral part of the financial statements.
18 Russell U.S. Core Equity Fund
Russell Investment Company
Russell U.S. Core Equity Fund
Fair Value of Derivative Instruments — October 31, 2016
| Amounts in thousands | ||||||
| Equity | ||||||
| Derivatives not accounted for as hedging instruments | Contracts | |||||
| Location: Statement of Assets and Liabilities - Liabilities | ||||||
| Variation margin on futures contracts* | $ | 371 | ||||
| Foreign | ||||||
| Equity | Currency | |||||
| Derivatives not accounted for as hedging instruments | Contracts | Contracts | ||||
| Location: Statement of Operations - Net realized gain (loss) | ||||||
| Futures contracts | $ | 3,046 | $ | — | ||
| Foreign currency-related transactions** | — | 1 | ||||
| Total | $ | 3,046 | $ | 1 | ||
| Location: Statement of Operations - Net change in unrealized appreciation (depreciation) | ||||||
| Futures contracts | $ | (2,725 | ) | $ | — | |
* Includes cumulative appreciation/depreciation of futures contracts as reported in the Schedule of Investments. Only variation margin is reported within the
Statement of Assets and Liabilities.
** Only includes net realized gain (loss) on forward and spot contracts. May differ from the net realized gain (loss) on foreign currency-related transactions reported
within the Statement of Operations.
For further disclosure on derivatives see note 2 in the Notes to Financial Statements.
See accompanying notes which are an integral part of the financial statements.
Russell U.S. Core Equity Fund 19
Russell Investment Company
Russell U.S. Core Equity Fund
Balance Sheet Offsetting of Financial and Derivative Instruments — October 31, 2016
| Amounts in thousands | |||||||||
| Offsetting of Financial Liabilities and Derivative Liabilities | |||||||||
| Gross | Net Amounts | ||||||||
| Amounts | of Liabilities | ||||||||
| Gross | Offset in the | Presented in | |||||||
| Amounts of | Statement of | the Statement | |||||||
| Recognized | Assets and | of Assets and | |||||||
| Description | Location: Statement of Assets and Liabilities - Liabilities | Liabilities | Liabilities | Liabilities | |||||
| Futures Contracts | Variation margin on futures contracts | $ | 57 | $ | — | $ | 57 | ||
| Total Financial and Derivative Liabilities | 57 | — | 57 | ||||||
| Financial and Derivative Liabilities not subject to a netting agreement | (57 | ) | — | (57 | ) | ||||
| Total Financial and Derivative Liabilities subject to a netting agreement | $ | — | $ | — | $ | — | |||
For further disclosure on derivatives and counterparty risk see note 2 in the Notes to Financial Statements.
See accompanying notes which are an integral part of the financial statements.
20 Russell U.S. Core Equity Fund
Russell Investment Company
Russell U.S. Core Equity Fund
Statement of Assets and Liabilities — October 31, 2016
| Amounts in thousands | ||
| Assets | ||
| Investments, at identified cost | $ | 589,824 |
| Investments, at fair value(>) | 690,319 | |
| Cash (restricted)(a) | 200 | |
| Receivables: | ||
| Dividends and interest | 960 | |
| Dividends from affiliated Russell funds | 17 | |
| Investments sold | 5,188 | |
| Fund shares sold | 185 | |
| Total assets | 696,869 | |
| Liabilities | ||
| Payables: | ||
| Investments purchased | 6,442 | |
| Fund shares redeemed | 540 | |
| Accrued fees to affiliates | 497 | |
| Other accrued expenses | 150 | |
| Variation margin on futures contracts | 57 | |
| Total liabilities | 7,686 | |
| Net Assets | $ | 689,183 |
See accompanying notes which are an integral part of the financial statements.
Russell U.S. Core Equity Fund 21
Russell Investment Company
Russell U.S. Core Equity Fund
Statement of Assets and Liabilities, continued — October 31, 2016
| Amounts in thousands | |||
| Net Assets Consist of: | |||
| Undistributed (overdistributed) net investment income | $ | 313 | |
| Accumulated net realized gain (loss) | 54,508 | ||
| Unrealized appreciation (depreciation) on: | |||
| Investments | 100,495 | ||
| Futures contracts | (371 | ) | |
| Shares of beneficial interest | 218 | ||
| Additional paid-in capital | 534,020 | ||
| Net Assets | $ | 689,183 | |
| Net Asset Value, offering and redemption price per share: | |||
| Net asset value per share: Class A(#) | $ | 31.65 | |
| Maximum offering price per share (Net asset value plus sales charge of 5.75%): Class A | $ | 33.59 | |
| Class A — Net assets | $ | 28,619,943 | |
| Class A — Shares outstanding ($.01 par value) | 904,123 | ||
| Net asset value per share: Class C(#) | $ | 31.05 | |
| Class C — Net assets | $ | 42,061,370 | |
| Class C — Shares outstanding ($.01 par value) | 1,354,829 | ||
| Net asset value per share: Class E(#) | $ | 31.69 | |
| Class E — Net assets | $ | 6,889,197 | |
| Class E — Shares outstanding ($.01 par value) | 217,378 | ||
| Net asset value per share: Class I(#) | $ | 31.58 | |
| Class I — Net assets | $ | 350,921,041 | |
| Class I — Shares outstanding ($.01 par value) | 11,113,419 | ||
| Net asset value per share: Class S(#) | $ | 31.60 | |
| Class S — Net assets | $ | 260,691,294 | |
| Class S — Shares outstanding ($.01 par value) | 8,249,803 | ||
| Amounts in thousands | |||
| (>) Investments in affiliates, Russell U.S. Cash Management Fund | $ | 32,275 | |
| (a) Cash Collateral for Futures | $ | 200 | |
| (#) Net asset value per share equals class level net assets divided by class level shares of beneficial interest outstanding. | |||
See accompanying notes which are an integral part of the financial statements.
22 Russell U.S. Core Equity Fund
Russell Investment Company
Russell U.S. Core Equity Fund
Statement of Operations — For the Period Ended October 31, 2016
| Amounts in thousands | |||
| Investment Income | |||
| Dividends | $ | 16,419 | |
| Dividends from affiliated Russell funds | 109 | ||
| Interest | 4 | ||
| Total investment income | 16,532 | ||
| Expenses | |||
| Advisory fees | 4,208 | ||
| Administrative fees | 369 | ||
| Custodian fees (1) | —** | ||
| Distribution fees - Class A | 75 | ||
| Distribution fees - Class C | 333 | ||
| Transfer agent fees - Class A | 61 | ||
| Transfer agent fees - Class C | 89 | ||
| Transfer agent fees - Class E | 14 | ||
| Transfer agent fees - Class I | 466 | ||
| Transfer agent fees - Class S | 590 | ||
| Professional fees | 69 | ||
| Registration fees | 90 | ||
| Shareholder servicing fees - Class C | 111 | ||
| Shareholder servicing fees - Class E | 18 | ||
| Trustees’ fees | 21 | ||
| Printing fees | 55 | ||
| Miscellaneous | 38 | ||
| Total expenses | 6,607 | ||
| Net investment income (loss) | 9,925 | ||
| Net Realized and Unrealized Gain (Loss) | |||
| Net realized gain (loss) on: | |||
| Investments | 61,167 | ||
| Futures contracts | 3,046 | ||
| Net realized gain (loss) | 64,213 | ||
| Net change in unrealized appreciation (depreciation) on: | |||
| Investments | (53,730 | ) | |
| Futures contracts | (2,725 | ) | |
| Net change in unrealized appreciation (depreciation) | (56,455 | ) | |
| Net realized and unrealized gain (loss) | 7,758 | ||
| Net Increase (Decrease) in Net Assets from Operations | $ | 17,683 | |
** Less than $500.
(1) Includes a reimbursement for overbilling of custody out-of-pocket fees from prior years. See note 10 in the Notes to Financial Statements.
See accompanying notes which are an integral part of the financial statements.
Russell U.S. Core Equity Fund 23
Russell Investment Company
Russell U.S. Core Equity Fund
Statements of Changes in Net Assets
| For the Periods Ended October 31, | ||||||
| Amounts in thousands | 2016 | 2015 | ||||
| Increase (Decrease) in Net Assets | ||||||
| Operations | ||||||
| Net investment income (loss) | $ | 9,925 | $ | 13,597 | ||
| Net realized gain (loss) | 64,213 | 271,961 | ||||
| Net change in unrealized appreciation (depreciation) | (56,455 | ) | (198,051 | ) | ||
| Net increase (decrease) in net assets from operations | 17,683 | 87,507 | ||||
| Distributions | ||||||
| From net investment income | ||||||
| Class A | (335 | ) | (404 | ) | ||
| Class C | (170 | ) | (300 | ) | ||
| Class E | (80 | ) | (108 | ) | ||
| Class I | (5,560 | ) | (7,732 | ) | ||
| Class S | (4,007 | ) | (5,525 | ) | ||
| Class Y | — | (1,675 | ) | |||
| From net realized gain | ||||||
| Class A | (6,287 | ) | (5,083 | ) | ||
| Class C | (9,369 | ) | (7,688 | ) | ||
| Class E | (1,460 | ) | (1,465 | ) | ||
| Class I | (86,408 | ) | (78,180 | ) | ||
| Class S | (64,637 | ) | (59,594 | ) | ||
| Class Y | — | (95,647 | ) | |||
| Net decrease in net assets from distributions | (178,313 | ) | (263,401 | ) | ||
| Share Transactions* | ||||||
| Net increase (decrease) in net assets from share transactions | (100,399 | ) | (684,853 | ) | ||
| Total Net Increase (Decrease) in Net Assets | (261,029 | ) | (860,747 | ) | ||
| Net Assets | ||||||
| Beginning of period | 950,212 | 1,810,959 | ||||
| End of period | $ | 689,183 | $ | 950,212 | ||
| Undistributed (overdistributed) net investment income included in net assets | $ | 313 | $ | 522 | ||
See accompanying notes which are an integral part of the financial statements.
24 Russell U.S. Core Equity Fund
Russell Investment Company
Russell U.S. Core Equity Fund
Statements of Changes in Net Assets, continued
* Share transaction amounts (in thousands) for the periods ended October 31, 2016 and October 31, 2015 were as follows:
| 2016 | 2015 | |||||||||||
| Shares | Dollars | Shares | Dollars | |||||||||
| Class A | ||||||||||||
| Proceeds from shares sold | 89 | $ | 2,824 | 100 | $ | 3,876 | ||||||
| Proceeds from reinvestment of distributions | 217 | 6,553 | 142 | 5,454 | ||||||||
| Payments for shares redeemed | (297 | ) | (9,325 | ) | (185 | ) | (7,192 | ) | ||||
| Net increase (decrease) | 9 | 52 | 57 | 2,138 | ||||||||
| Class C | ||||||||||||
| Proceeds from shares sold | 62 | 1,902 | 69 | 2,655 | ||||||||
| Proceeds from reinvestment of distributions | 317 | 9,385 | 209 | 7,944 | ||||||||
| Payments for shares redeemed | (345 | ) | (10,587 | ) | (232 | ) | (8,925 | ) | ||||
| Net increase (decrease) | 34 | 700 | 46 | 1,674 | ||||||||
| Class E | ||||||||||||
| Proceeds from shares sold | 11 | 341 | 13 | 525 | ||||||||
| Proceeds from reinvestment of distributions | 50 | 1,527 | 41 | 1,562 | ||||||||
| Payments for shares redeemed | (45 | ) | (1,391 | ) | (117 | ) | (4,525 | ) | ||||
| Net increase (decrease) | 16 | 477 | (63 | ) | (2,438 | ) | ||||||
| Class I | ||||||||||||
| Proceeds from shares sold | 482 | 14,832 | 804 | 30,527 | ||||||||
| Proceeds from reinvestment of distributions | 3,004 | 90,513 | 2,215 | 85,273 | ||||||||
| Payments for shares redeemed | (5,283 | ) | (167,193 | ) | (3,340 | ) | (130,628 | ) | ||||
| Net increase (decrease) | (1,797 | ) | (61,848 | ) | (321 | ) | (14,828 | ) | ||||
| Class S | ||||||||||||
| Proceeds from shares sold | 466 | 14,530 | 829 | 32,394 | ||||||||
| Proceeds from reinvestment of distributions | 2,228 | 67,163 | 1,658 | 63,868 | ||||||||
| Payments for shares redeemed | (3,857 | ) | (121,473 | ) | (2,991 | ) | (116,150 | ) | ||||
| Net increase (decrease) | (1,163 | ) | (39,780 | ) | (504 | ) | (19,888 | ) | ||||
| Class Y(1) | ||||||||||||
| Proceeds from shares sold | — | — | 158 | 6,425 | ||||||||
| Proceeds from reinvestment of distributions | — | — | 2,529 | 97,322 | ||||||||
| Payments for shares redeemed | — | — | (19,070 | ) | (755,258 | ) | ||||||
| Net increase (decrease) | — | — | (16,383 | ) | (651,511 | ) | ||||||
| Total increase (decrease) | (2,901 | ) | $ | (100,399 | ) | (17,168 | ) | $ | (684,853 | ) | ||
| (1) For the period November 1, 2014 to May 1, 2015 (final redemption). | ||||||||||||
See accompanying notes which are an integral part of the financial statements.
Russell U.S. Core Equity Fund 25
Russell Investment Company
Russell U.S. Core Equity Fund
Financial Highlights — For the Periods Ended
For a Share Outstanding Throughout Each Period.
| $ | $ | $ | $ | $ | $ | |||||||||||
| Net Asset Value, | Net | Net Realized | Total from | Distributions | Distributions | |||||||||||
| Beginning of | Investment | and Unrealized | Investment | from Net | from Net | |||||||||||
| Period | Income (Loss)(a)(d) | Gain (Loss) | Operations | Investment Income | Realized Gain | |||||||||||
| Class A | ||||||||||||||||
| October 31, 2016 | 38.50 | .34 | .45 | .79 | (.37 | ) | (7.27 | ) | ||||||||
| October 31, 2015 | 43.30 | .31 | 1.44 | 1.75 | (.44 | ) | (6.11 | ) | ||||||||
| October 31, 2014 | 38.17 | .39 | 5.12 | 5.51 | (.38 | ) | — | |||||||||
| October 31, 2013 | 30.29 | .31 | 7.88 | 8.19 | (.31 | ) | — | |||||||||
| October 31, 2012 | 27.08 | .21 | 3.23 | 3.44 | (.23 | ) | — | |||||||||
| Class C | ||||||||||||||||
| October 31, 2016 | 37.90 | .10 | .45 | .55 | (.13 | ) | (7.27 | ) | ||||||||
| October 31, 2015 | 42.78 | .02 | 1.42 | 1.44 | (.21 | ) | (6.11 | ) | ||||||||
| October 31, 2014 | 37.78 | .08 | 5.07 | 5.15 | (.15 | ) | — | |||||||||
| October 31, 2013 | 30.01 | .05 | 7.80 | 7.85 | (.08 | ) | — | |||||||||
| October 31, 2012 | 26.89 | (.01 | ) | 3.20 | 3.19 | (.07 | ) | — | ||||||||
| Class E | ||||||||||||||||
| October 31, 2016 | 38.53 | .34 | .46 | .80 | (.37 | ) | (7.27 | ) | ||||||||
| October 31, 2015 | 43.33 | .31 | 1.43 | 1.74 | (.43 | ) | (6.11 | ) | ||||||||
| October 31, 2014 | 38.17 | .40 | 5.13 | 5.53 | (.37 | ) | — | |||||||||
| October 31, 2013 | 30.29 | .32 | 7.87 | 8.19 | (.31 | ) | — | |||||||||
| October 31, 2012 | 27.06 | .23 | 3.21 | 3.44 | (.21 | ) | — | |||||||||
| Class I | ||||||||||||||||
| October 31, 2016 | 38.42 | .45 | .46 | .91 | (.48 | ) | (7.27 | ) | ||||||||
| October 31, 2015 | 43.24 | .44 | 1.43 | 1.87 | (.58 | ) | (6.11 | ) | ||||||||
| October 31, 2014 | 38.10 | .52 | 5.13 | 5.65 | (.51 | ) | — | |||||||||
| October 31, 2013 | 30.24 | .42 | 7.86 | 8.28 | (.42 | ) | — | |||||||||
| October 31, 2012 | 27.04 | .31 | 3.22 | 3.53 | (.33 | ) | — | |||||||||
| Class S | ||||||||||||||||
| October 31, 2016 | 38.45 | .42 | .45 | .87 | (.45 | ) | (7.27 | ) | ||||||||
| October 31, 2015 | 43.26 | .41 | 1.43 | 1.84 | (.54 | ) | (6.11 | ) | ||||||||
| October 31, 2014 | 38.12 | .49 | 5.13 | 5.62 | (.48 | ) | — | |||||||||
| October 31, 2013 | 30.26 | .39 | 7.86 | 8.25 | (.39 | ) | — | |||||||||
| October 31, 2012 | 27.04 | .28 | 3.23 | 3.51 | (.29 | ) | — | |||||||||
| Class Y (j) | ||||||||||||||||
| October 31, 2015 | 43.19 | .26 | 2.13 | 2.39 | (.38 | ) | (6.11 | ) | ||||||||
| October 31, 2014 | 38.06 | .58 | 5.11 | 5.69 | (.56 | ) | — | |||||||||
| October 31, 2013 | 30.21 | .46 | 7.85 | 8.31 | (.46 | ) | — | |||||||||
| October 31, 2012 | 27.02 | .33 | 3.23 | 3.56 | (.37 | ) | — | |||||||||
See accompanying notes which are an integral part of the financial statements.
26 Russell U.S. Core Equity Fund
| % | % | % | |||||||||||||||
| $ | $ | Ratio of Expenses | Ratio of Expenses | Ratio of Net | |||||||||||||
| Net Asset Value, | % | Net Assets, | to Average | to Average | Investment Income | % | |||||||||||
| $ | End of | Total | End of Period | Net Assets, | Net Assets, | to Average | Portfolio | ||||||||||
| Total Distributions | Period | Return(c) | (000 | ) | Gross (l) | Net(d)(l) | Net Assets(d) | Turnover Rate(k) | |||||||||
| (7.64 | ) | 31.65 | 3.15 | 28,620 | 1.08 | 1.08 | 1.07 | 73 | |||||||||
| (6.55 | ) | 38.50 | 4.17 | 34,474 | 1.09 | 1.09 | .79 | 90 | |||||||||
| (.38 | ) | 43.30 | 14.49 | 36,334 | 1.08 | 1.08 | .95 | 73 | |||||||||
| (.31 | ) | 38.17 | 27.19 | 33,491 | 1.07 | 1.07 | .90 | 97 | |||||||||
| (.23 | ) | 30.29 | 12.73 | 29,349 | 1.07 | 1.07 | .72 | 117 | |||||||||
| (7.40 | ) | 31.05 | 2.42 | 42,062 | 1.83 | 1.83 | .32 | 73 | |||||||||
| (6.32 | ) | 37.90 | 3.39 | 50,046 | 1.84 | 1.84 | .04 | 90 | |||||||||
| (.15 | ) | 42.78 | 13.66 | 54,530 | 1.83 | 1.83 | .21 | 73 | |||||||||
| (.08 | ) | 37.78 | 26.23 | 55,105 | 1.82 | 1.82 | .16 | 97 | |||||||||
| (.07 | ) | 30.01 | 11.89 | 53,222 | 1.82 | 1.82 | (.02 | ) | 117 | ||||||||
| (7.64 | ) | 31.69 | 3.18 | 6,889 | 1.08 | 1.08 | 1.07 | 73 | |||||||||
| (6.54 | ) | 38.53 | 4.14 | 7,752 | 1.09 | 1.09 | .80 | 90 | |||||||||
| (.37 | ) | 43.33 | 14.52 | 11,449 | 1.08 | 1.08 | .97 | 73 | |||||||||
| (.31 | ) | 38.17 | 27.18 | 19,657 | 1.07 | 1.06 | .95 | 97 | |||||||||
| (.21 | ) | 30.29 | 12.78 | 25,075 | 1.07 | 1.02 | .81 | 117 | |||||||||
| (7.75 | ) | 31.58 | 3.54 | 350,921 | .75 | .75 | 1.41 | 73 | |||||||||
| (6.69 | ) | 38.42 | 4.48 | 496,057 | .76 | .76 | 1.12 | 90 | |||||||||
| (.51 | ) | 43.24 | 14.90 | 572,064 | .75 | .75 | 1.28 | 73 | |||||||||
| (.42 | ) | 38.10 | 27.59 | 579,477 | .74 | .74 | 1.23 | 97 | |||||||||
| (.33 | ) | 30.24 | 13.13 | 597,630 | .74 | .74 | 1.07 | 117 | |||||||||
| (7.72 | ) | 31.60 | 3.43 | 260,691 | .83 | .83 | 1.33 | 73 | |||||||||
| (6.65 | ) | 38.45 | 4.42 | 361,883 | .84 | .84 | 1.04 | 90 | |||||||||
| (.48 | ) | 43.26 | 14.80 | 428,952 | .83 | .83 | 1.20 | 73 | |||||||||
| (.39 | ) | 38.12 | 27.51 | 450,265 | .82 | .82 | 1.15 | 97 | |||||||||
| (.29 | ) | 30.26 | 13.01 | 440,333 | .82 | .82 | .99 | 117 | |||||||||
| (6.49 | ) | 39.09 | 5.88 | 12,557 | .64 | .64 | 1.30 | 90 | |||||||||
| (.56 | ) | 43.19 | 15.02 | 707,630 | .63 | .63 | 1.42 | 73 | |||||||||
| (.46 | ) | 38.06 | 27.74 | 989,520 | .62 | .62 | 1.35 | 97 | |||||||||
| (.37 | ) | 30.21 | 13.24 | 1,031,582 | .64 | .64 | 1.16 | 117 | |||||||||
See accompanying notes which are an integral part of the financial statements.
Russell U.S. Core Equity Fund 27
Russell Investment Company
Russell U.S. Core Equity Fund
Related Party Transactions, Fees and Expenses
| Accrued fees payable to affiliates for the period ended October 31, 2016 were as follows: | ||
| Advisory fees | $ | 326,468 |
| Administration fees | 28,681 | |
| Distribution fees | 33,282 | |
| Shareholder servicing fees | 10,539 | |
| Transfer agent fees | 94,571 | |
| Trustee fees | 3,303 | |
| $ | 496,844 | |
| Transactions (amounts in thousands) during the period ended October 31, 2016 with Underlying Funds which are, or were, an | |||||||||||||||||||
| affiliated company are as follows: | |||||||||||||||||||
| Fair Value, | Change in | ||||||||||||||||||
| Beginning of | Realized Gain | Unrealized | Fair Value, End | Income | Capital Gains | ||||||||||||||
| Period | Purchases | Sales | (Loss) | Gain (Loss) | of Period | Distributions | Distributions | ||||||||||||
| Russell U.S. Cash Management Fund | $ | 34,093 | $ | 404,296 | $ | 406,121 | $ | 2 | $ | 5 | $ | 32,275 | $ | 109 | $ | — | |||
| $ | 34,093 | $ | 404,296 | $ | 406,121 | $ | 2 | $ | 5 | $ | 32,275 | $ | 109 | $ | — | ||||
Federal Income Taxes
At October 31, 2016, the cost of investments and net unrealized appreciation (depreciation), undistributed ordinary income and
undistributed long-term capital gains for income tax purposes were as follows:.
| Cost of Investments | $ | 596,694,298 | ||
| Unrealized Appreciation | $ | 111,767,609 | ||
| Unrealized Depreciation | (18,142,734 | ) | ||
| Net Unrealized Appreciation (Depreciation) | $ | 93,624,875 | ||
| Undistributed Ordinary Income | $ | 126,194 | ||
| Undistributed Long-Term Capital Gains | ||||
| (Capital Loss Carryforward) | $ | 61,193,570 | ||
| Tax Composition of Distributions | ||||
| Ordinary Income | $ | 43,907,230 | ||
| Long-Term Capital Gains | $ | 134,404,955 |
Net investment income and net realized gains (loss) in the financial statements may differ from taxable net investment income and net
realized gains (losses). Capital accounts within the financial statements are adjusted for permanent book-tax differences. Book-tax
differences are primarily due to foreign currency gains and losses, reclassifications of dividends, differences in treatment of income
from swaps, net operating losses, investments in partnerships, investments in passive foreign investment companies (PFICs), tax
straddle transactions, use of tax equalization and foreign capital gains taxes. These adjustments have no impact on the net assets.
At October 31, 2016, the Statement of Assets and Liabilities have been adjusted by the following amounts (in thousands):
| Undistributed net investment income | $ | 18 | |
| Accumulated net realized gain (loss) | (18 | ) | |
| Additional paid-in capital | — |
See accompanying notes which are an integral part of the financial statements.
28 Russell U.S. Core Equity Fund
Russell Investment Company
Russell U.S. Defensive Equity Fund
Portfolio Management Discussion and Analysis — October 31, 2016 (Unaudited)
| Russell U.S. Defensive Equity Fund - Class A‡ | Russell U.S. Defensive Equity Fund - Class S‡‡‡ | ||||||
| Total | Total | ||||||
| Return | Return | ||||||
| 1 Year | (1.78 | )% | 1 Year | 4.46 | % | ||
| 5 Years | 10.60 | %§ | 5 Years | 12.19 | %§ | ||
| 10 Years | 4.50 | %§ | 10 Years | 5.38 | %§ | ||
| Russell U.S. Defensive Equity Fund - Class C‡‡ | Russell U.S. Defensive Equity Fund - Class Y | ||||||
| Total | Total | ||||||
| Return | Return | ||||||
| 1 Year | 3.43 | % | 1 Year | 4.67 | % | ||
| 5 Years | 11.08 | %§ | 5 Years | 12.41 | %§ | ||
| 10 Years | 4.46 | %§ | 10 Years | 5.54 | %§ | ||
| Russell U.S. Defensive Equity Fund - Class E | Russell 1000® Defensive IndexTM** | ||||||
| Total | Total | ||||||
| Return | Return | ||||||
| 1 Year | 4.20 | % | 1 Year | 4.40 | % | ||
| 5 Years | 11.92 | %§ | 5 Years | 13.26 | %§ | ||
| 10 Years | 5.15 | %§ | 10 Years | 7.01 | %§ | ||
| Russell U.S. Defensive Equity Fund - Class I | |||||||
| Total | U.S. Defensive Equity Linked Benchmark*** | ||||||
| Return | Total | ||||||
| 1 Year | 4.55 | % | Return | ||||
| 5 Years | 12.28 | %§ | 1 Year | 4.40 | % | ||
| 10 Years | 5.45 | %§ | 5 Years | 12.90 | %§ | ||
| 10 Years | 6.54 | %§ | |||||
Russell U.S. Defensive Equity Fund 29
Russell Investment Company
Russell U.S. Defensive Equity Fund
Portfolio Management Discussion and Analysis, continued — October 31, 2016
(Unaudited)
| The Russell U.S. Defensive Equity Fund (the “Fund”) employs | Relative to its benchmark, the Russell 1000® Defensive™ Index, |
| a multi-manager approach whereby portions of the Fund are | the Fund was consistently underweight the largest stocks by |
| allocated to different money manager strategies. Fund assets not | market capitalization, the highest dividend yielding stocks, and |
| allocated to money managers are managed by Russell Investment | companies with higher leverage, while it was overweight stocks |
| Management, LLC (“RIM”), the Fund’s advisor. RIM may change | with attractive valuations. Over the period, these factors had a |
| the allocation of the Fund’s assets among money managers at | positive impact on Fund performance. |
| any time. An exemptive order from the Securities and Exchange | Sector allocation and stock selection added value over the period. |
| Commission (“SEC”) permits RIM to engage or terminate a money | An overweight to technology positively impacted benchmark- |
| manager at any time, subject to approval by the Fund’s Board, | relative performance. Stock selection within the technology and |
| without a shareholder vote. Pursuant to the terms of the exemptive | financials sector was also additive. However, positive performance |
| order, the Fund is required to notify its shareholders within 90 | was offset by underperforming holdings within the health care |
| days of when a money manager begins providing services. As of | sector. |
| October 31, 2016, the Fund had four money managers. | |
| What is the Fund’s investment objective? | How did the investment strategies and techniques employed |
| by the Fund and its money managers affect its benchmark- | |
| The Fund seeks to provide long term capital growth. | relative performance? |
| How did the Fund perform relative to its benchmark for the | The Fund employs discretionary money managers. The Fund’s |
| fiscal year ended October 31, 2016? | discretionary money managers select the individual portfolio |
| For the fiscal year ended October 31, 2016, the Fund’s Class A, | securities for the assets assigned to them. Fund assets not |
| Class C, Class E, Class I, Class S and Class Y Shares gained | allocated to discretionary money managers include the Fund’s |
| 4.21%, 3.43%, 4.20%, 4.55%, 4.46% and 4.67%, respectively. | liquidity reserves and assets which may be managed directly by |
| This is compared to the Fund’s benchmark, the Russell 1000® | RIM to effect the Fund’s investment strategies and/or to actively |
| Defensive™ Index, which gained 4.40% during the same period. | manage the Fund’s overall exposures by investing in securities or |
| The Fund’s performance includes operating expenses, whereas | other instruments that RIM believes will achieve the desired risk/ |
| index returns are unmanaged and do not include expenses of any | return profile for the Fund. |
| kind. | With respect to certain of the Fund’s money managers, Jacobs |
| For the fiscal year ended October 31, 2016, the Morningstar® | Levy Equity Management, Inc. (“Jacobs Levy”) was the best |
| Large Blend Category, a group of funds that Morningstar considers | performing manager for the one-year period and outperformed |
| to have investment strategies similar to those of the Fund, gained | the Russell 1000® Defensive™ Index. Jacobs Levy’s exposure to |
| 2.12%. This result serves as a peer comparison and is expressed | companies with more attractive valuations and lower capitalization |
| net of operating expenses. | than the benchmark contributed positively. An overweight |
| to telecommunication services and underweight to consumer | |
| RIM may assign a money manager a specific style or | discretionary was beneficial. Additionally, outperforming holdings |
| capitalization benchmark other than the Fund’s index. However, | within the technology sector (Advanced Micro Devices, Inc., |
| the Fund’s primary index remains the benchmark for the Fund | Arista Networks, Inc., Finisar Corporation, and Mentor Graphics |
| and is representative of the aggregate of each money manager’s | Corporation) and financials sector (Washington Prime Group Inc.) |
| benchmark index. | were a tailwind. |
| How did the market conditions described in the Market | Coho Partners, Ltd. was the worst performing manager for |
| Summary report affect the Fund’s performance? | the one-year period and underperformed the Russell 1000® |
| The fiscal year ended October 31, 2016 saw the Fund perform | Defensive™ Index. Stock selection was the primary detractor |
| in line with the Russell 1000® Defensive™ Index, with some of | due to underperforming holdings within the health care sector |
| the Fund’s share classes outperforming and some of the Fund’s | (Perrigo Co. PLC, AmerisourceBergen Corporation, Gilead |
| share classes underperforming the Fund’s benchmark. U.S. large | Sciences, Inc., Amgen Inc., Abott Laboratories). An overweight |
| capitalization and defensive equities experienced gains over the | to stocks exhibiting low earnings variability characteristics and |
| period. Consumer discretionary stocks declined the most during | higher yield added value over the period. Sector allocation was |
| the fiscal year while health care, materials, and technology stocks | also positive, with an overweight to energy positively impacting |
| generated modest returns. Utilities and telecommunication | performance. |
| services were the standout performers, and industrials and energy | During the period, RIM used a combination of index futures |
| generated above market returns. | contracts to equitize a portion of the Fund’s cash and sold equity |
30 Russell U.S. Defensive Equity Fund
Russell Investment Company
Russell U.S. Defensive Equity Fund
Portfolio Management Discussion and Analysis, continued — October 31, 2016
(Unaudited)
| index put options with respect to the portion of the Fund’s cash | The views expressed in this report reflect those of the | |
| that RIM determined not to equitize in order to seek gains from | portfolio managers only through the end of the period | |
| premiums received on their sale. RIM’s strategy of not equitizing | covered by the report. These views do not necessarily | |
| all of the Fund’s cash negatively impacted benchmark relative | represent the views of RIM or any other person in RIM or | |
| performance. | any other affiliated organization. These views are subject | |
| to change at any time based upon market conditions or | ||
| Describe any changes to the Fund’s structure or the money | other events, and RIM disclaims any responsibility to | |
| manager line-up. | update the views contained herein. These views should not | |
| In January 2016, Jacob Levy’s mandate was changed from a long | be relied on as investment advice and, because investment | |
| only strategy to a long/short strategy in order to seek to improve | decisions for a Russell Investment Company (“RIC”) Fund | |
| the Fund’s excess return potential. | are based on numerous factors, should not be relied on as | |
| Money Managers as of October 31, | an indication of investment decisions of any RIC Fund. | |
| 2016 | Styles | |
| Coho Partners, Ltd. | Defensive | |
| J.P. Morgan Investment Management, Inc. | Defensive | |
| Jacobs Levy Equity Management Inc. | Defensive | |
| PanAgora Asset Management Inc. | Defensive | |
^ In prior years, the performance of the Fund’s Class I shares was used in the line graph. Class S Shares will have substantially similar annual returns as the Class
I Shares because the Shares of each Class are invested in the same portfolio of securities. Annual returns for each Class will differ only to the extent that the
Class S Shares do not have the same expenses as the Class I Shares.
* Assumes initial investment on November 1, 2006.
** Russell 1000® Defensive IndexTM measures the performance of the large-cap defensive segment of the U.S. equity universe. It includes those Russell 1000®
Index companies with relatively stable business conditions which are less sensitive to economic cycles, credit cycles, and market volatility based on their
stability variables. Stability is measured in terms of volatility (price and earnings), leverage, and return on assets.
*** The U.S. Defensive Equity Linked Benchmark provides a means to compare the Fund’s average annual returns to a secondary benchmark that takes into account
historical changes in the Fund’s primary benchmark. The U.S. Defensive Equity Linked Benchmark represents the returns of the Russell 1000® Index through
August 14, 2012 and the returns of the Russell 1000® Defensive IndexTM thereafter.
‡ The Fund first issued Class A Shares on September 2, 2008. The returns shown for Class A Shares prior to that date are the returns of the Fund’s Class E
Shares. The performance shown has been adjusted to reflect the deduction of the maximum Class A sales charge of 5.75%. Annual returns for each Class will
differ only to the extent that the Class A Shares do not have the same expenses as the Class E Shares.
‡‡ The Fund first issued Class C Shares on September 2, 2008. The returns shown for Class C Shares prior to that date are the returns of the Fund’s Class E Shares
and do not reflect deduction of Rule 12b-1 distribution fees that apply to Class C Shares. Had they done so, the returns shown for those periods would have been
lower. Annual returns for each Class will differ only to the extent that the Class C Shares do not have the same expenses as the Class E Shares.
‡‡‡ The Fund first issued Class S Shares on September 2, 2008. The returns shown for Class S Shares prior to that date are the returns of the Fund’s Class I
Shares. Class S Shares will have substantially similar annual returns as the Class I Shares because the Shares of each Class are invested in the same portfolio of
securities. Annual returns for each Class will differ only to the extent that the Class S Shares do not have the same expenses as the Class I Shares.
§ Annualized.
Performance is historical and assumes reinvestment of all dividends and capital gains. Investment return and principal value will fluctuate so that an investor’s
shares, when redeemed, may be worth more or less than when purchased. Past performance is not indicative of future results. The returns shown do not reflect the
deduction of taxes that a shareholder would pay on Fund distributions or the redemption of Fund shares. Additionally, the returns presented herein may differ from
the performance reported in the Financial Highlights as the returns herein are calculated in a manner consistent with standardized performance in accordance with
Securities and Exchange Commission rules, while the performance in the Financial Highlights has been calculated in accordance with U.S. Generally Accepted
Accounting Principles (“U.S. GAAP”).
Russell U.S. Defensive Equity Fund 31
Russell Investment Company
Russell U.S. Defensive Equity Fund
Shareholder Expense Example — October 31, 2016 (Unaudited)
| Fund Expenses | Please note that the expenses shown in the table are meant | |||||
| The following disclosure provides important information | to highlight your ongoing costs only and do not reflect any | |||||
| regarding the Fund’s Shareholder Expense Example | transactional costs. Therefore, the information under the heading | |||||
| (“Example”). | “Hypothetical Performance (5% return before expenses)” is | |||||
| useful in comparing ongoing costs only, and will not help you | ||||||
| Example | determine the relative total costs of owning different funds. In | |||||
| As a shareholder of the Fund, you incur two types of costs: (1) | addition, if these transactional costs were included, your costs | |||||
| transaction costs, including sales charges (loads) on certain | would have been higher. | |||||
| purchase or redemption payments, and (2) ongoing costs, | Hypothetical | |||||
| including distribution (12b-1) and/or service fees and other | Performance (5% | |||||
| Fund expenses. The Example is intended to help you understand | Actual | return before | ||||
| your ongoing costs (in dollars) of investing in the Fund and to | Class A | Performance | expenses) | |||
| Beginning Account Value | ||||||
| compare these costs with the ongoing costs of investing in other | May 1, 2016 | $ | 1,000.00 | $ | 1,000.00 | |
| mutual funds. The Example is based on an investment of $1,000 | Ending Account Value | |||||
| invested at the beginning of the period and held for the entire | October 31, 2016 | $ | 1,020.90 | $ | 1,018.70 | |
| period indicated, which for this Fund is from May 1, 2016 to | Expenses Paid During Period* | $ | 6.50 | $ | 6.50 | |
| October 31, 2016. | * Expenses are equal to the Fund's annualized expense ratio of 1.28% | |||||
| (representing the six month period annualized), multiplied by the average | ||||||
| Actual Expenses | account value over the period, multiplied by 184/366 (to reflect the one-half | |||||
| The information in the table under the heading “Actual | year period). | |||||
| Performance” provides information about actual account values | ||||||
| and actual expenses. You may use the information in this column, | Hypothetical | |||||
| Performance (5% | ||||||
| together with the amount you invested, to estimate the expenses | Actual | return before | ||||
| that you paid over the period. Simply divide your account value by | Class C | Performance | expenses) | |||
| $1,000 (for example, an $8,600 account value divided by $1,000 | Beginning Account Value | |||||
| = 8.6), then multiply the result by the number in the first column | May 1, 2016 | $ | 1,000.00 | $ | 1,000.00 | |
| Ending Account Value | ||||||
| in the row entitled “Expenses Paid During Period” to estimate | October 31, 2016 | $ | 1,017.30 | $ | 1,014.88 | |
| the expenses you paid on your account during this period. | Expenses Paid During Period* | $ | 10.34 | $ | 10.33 | |
| Hypothetical Example for Comparison Purposes | * Expenses are equal to the Fund's annualized expense ratio of 2.04% | |||||
| The information in the table under the heading “Hypothetical | (representing the six month period annualized), multiplied by the average | |||||
| account value over the period, multiplied by 184/366 (to reflect the one-half | ||||||
| Performance (5% return before expenses)” provides information | year period). | |||||
| about hypothetical account values and hypothetical expenses | ||||||
| based on the Fund’s actual expense ratio and an assumed rate of | Hypothetical | |||||
| return of 5% per year before expenses, which is not the Fund’s | Performance (5% | |||||
| Actual | return before | |||||
| actual return. The hypothetical account values and expenses | Class E | Performance | expenses) | |||
| may not be used to estimate the actual ending account balance or | Beginning Account Value | |||||
| expenses you paid for the period. You may use this information | May 1, 2016 | $ | 1,000.00 | $ | 1,000.00 | |
| to compare the ongoing costs of investing in the Fund and other | Ending Account Value | |||||
| October 31, 2016 | $ | 1,021.00 | $ | 1,018.65 | ||
| funds. To do so, compare this 5% hypothetical example with the | Expenses Paid During Period* | $ | 6.55 | $ | 6.55 | |
| 5% hypothetical examples that appear in the shareholder reports | ||||||
| of other funds. | * Expenses are equal to the Fund's annualized expense ratio of 1.29% | |||||
| (representing the six month period annualized), multiplied by the average | ||||||
| account value over the period, multiplied by 184/366 (to reflect the one-half | ||||||
| year period). | ||||||
32 Russell U.S. Defensive Equity Fund
Russell Investment Company
Russell U.S. Defensive Equity Fund
Shareholder Expense Example, continued — October 31, 2016 (Unaudited)
| Hypothetical | ||||
| Performance (5% | ||||
| Actual | return before | |||
| Class I | Performance | expenses) | ||
| Beginning Account Value | ||||
| May 1, 2016 | $ | 1,000.00 | $ | 1,000.00 |
| Ending Account Value | ||||
| October 31, 2016 | $ | 1,022.70 | $ | 1,020.31 |
| Expenses Paid During Period* | $ | 4.88 | $ | 4.88 |
* Expenses are equal to the Fund's annualized expense ratio of 0.96%
(representing the six month period annualized), multiplied by the average
account value over the period, multiplied by 184/366 (to reflect the one-half
year period).
| Hypothetical | ||||
| Performance (5% | ||||
| Actual | return before | |||
| Class S | Performance | expenses) | ||
| Beginning Account Value | ||||
| May 1, 2016 | $ | 1,000.00 | $ | 1,000.00 |
| Ending Account Value | ||||
| October 31, 2016 | $ | 1,022.30 | $ | 1,019.91 |
| Expenses Paid During Period* | $ | 5.29 | $ | 5.28 |
* Expenses are equal to the Fund's annualized expense ratio of 1.04%
(representing the six month period annualized), multiplied by the average
account value over the period, multiplied by 184/366 (to reflect the one-half
year period).
| Hypothetical | ||||
| Performance (5% | ||||
| Actual | return before | |||
| Class Y | Performance | expenses) | ||
| Beginning Account Value | ||||
| May 1, 2016 | $ | 1,000.00 | $ | 1,000.00 |
| Ending Account Value | ||||
| October 31, 2016 | $ | 1,023.30 | $ | 1,020.91 |
| Expenses Paid During Period* | $ | 4.27 | $ | 4.27 |
* Expenses are equal to the Fund's annualized expense ratio of 0.84%
(representing the six month period annualized), multiplied by the average
account value over the period, multiplied by 184/366 (to reflect the one-half
year period).
Russell U.S. Defensive Equity Fund 33
Russell Investment Company
Russell U.S. Defensive Equity Fund
Schedule of Investments — October 31, 2016
| Amounts in thousands (except share amounts) | Amounts in thousands (except share amounts) | ||||||
| Principal | Fair | Principal | Fair | ||||
| Amount ($) or | Value | Amount ($) or | Value | ||||
| Shares | $ | Shares | $ | ||||
| Common Stocks - 93.7% | Church & Dwight Co., Inc. | 8,347 | 403 | ||||
| Consumer Discretionary - 11.3% | Clorox Co. (The) | 4,215 | 506 | ||||
| Aaron's, Inc. Class A | 22,900 | 566 | Coca-Cola Co. (The) | 83,805 | 3,553 | ||
| AMC Networks, Inc. Class A(Æ) | 16,600 | 812 | Coca-Cola European Partners PLC | 26,215 | 1,008 | ||
| AutoZone, Inc.(Æ) | 2,237 | 1,660 | Colgate-Palmolive Co. | 11,602 | 828 | ||
| Avon Products, Inc.(Æ) | 78,600 | 515 | ConAgra Foods, Inc. | 18,161 | 875 | ||
| Bed Bath & Beyond, Inc. | 4,512 | 182 | Constellation Brands, Inc. Class A | 4,014 | 671 | ||
| Best Buy Co., Inc. | 4,607 | 179 | Core-Mark Holding Co., Inc. | 26,266 | 929 | ||
| Brinker International, Inc. | 28,300 | 1,393 | CVS Health Corp.(Û) | 80,753 | 6,791 | ||
| Charter Communications, Inc. Class A(Æ) | 680 | 170 | Dr Pepper Snapple Group, Inc. | 48,158 | 4,228 | ||
| Choice Hotels International, Inc. | 3,355 | 163 | General Mills, Inc. | 1,292 | 80 | ||
| Comcast Corp. Class A | 85,756 | 5,301 | Hain Celestial Group, Inc. (The)(Æ) | 15,400 | 560 | ||
| Cooper-Standard Holding, Inc.(Æ) | 4,900 | 447 | Hershey Co. (The) | 4,495 | 461 | ||
| Costco Wholesale Corp. | 9,750 | 1,442 | Ingredion, Inc. | 3,243 | 425 | ||
| Coty, Inc. Class A | 4,043 | 93 | JM Smucker Co. (The) | 13,917 | 1,827 | ||
| Darden Restaurants, Inc. | 4,789 | 310 | Kimberly-Clark Corp. | 34,308 | 3,925 | ||
| Delphi Automotive PLC | 2,557 | 166 | Kroger Co. (The) | 129,792 | 4,021 | ||
| Dollar General Corp. | 72,133 | 4,984 | McCormick & Co., Inc. | 1,391 | 133 | ||
| Estee Lauder Cos., Inc. (The) Class A | 22,600 | 1,969 | Molson Coors Brewing Co. Class B | 17,893 | 1,857 | ||
| Foot Locker, Inc. | 21,683 | 1,448 | Mondelez International, Inc. Class A | 51,445 | 2,312 | ||
| Genuine Parts Co. | 1,938 | 176 | PepsiCo, Inc.(Û) | 89,298 | 9,573 | ||
| Harman International Industries, Inc. | 19,500 | 1,554 | Performance Food Group Co.(Æ) | 26,100 | 626 | ||
| Hasbro, Inc. | 2,714 | 226 | Philip Morris International, Inc.(Û) | 109,102 | 10,522 | ||
| Home Depot, Inc. (The) | 34,813 | 4,248 | Procter & Gamble Co. (The) | 134,416 | 11,667 | ||
| Jack in the Box, Inc. | 11,300 | 1,059 | Reynolds American, Inc. | 96,010 | 5,288 | ||
| Lear Corp. | 312 | 38 | Sanderson Farms, Inc. | 7,200 | 648 | ||
| Leggett & Platt, Inc. | 1,525 | 70 | Sysco Corp. | 36,807 | 1,771 | ||
| Liberty Broadband Corp. Class C(Æ) | 1,484 | 99 | Tyson Foods, Inc. Class A | 1,762 | 125 | ||
| Lowe's Cos., Inc. | 97,069 | 6,470 | United Natural Foods, Inc.(Æ) | 21,600 | 902 | ||
| Marriott International, Inc. Class A | 374 | 26 | Walgreens Boots Alliance, Inc. | 8,619 | 713 | ||
| McDonald's Corp. | 19,737 | 2,222 | |||||
| Michael Kors Holdings, Ltd.(Æ) | 4,389 | 223 | 84,739 | ||||
| Mohawk Industries, Inc.(Æ) | 960 | 177 | |||||
| News Corp. Class A | 84,200 | 1,020 | Energy - 4.8% | ||||
| Antero Resources Corp.(Æ) | 46,600 | 1,234 | |||||
| Nike, Inc. Class B(Û) | 54,903 | 2,755 | Chevron Corp. | 52,050 | 5,452 | ||
| NVR, Inc.(Æ) | 1,330 | 2,026 | Dril-Quip, Inc.(Æ) | 1,910 | 91 | ||
| Office Depot, Inc. | 75,800 | 239 | EQT Corp. | 1,429 | 94 | ||
| Omnicom Group, Inc. | 30,437 | 2,429 | Exxon Mobil Corp.(Û) | 165,087 | 13,755 | ||
| O'Reilly Automotive, Inc.(Æ) | 5,696 | 1,506 | FMC Technologies, Inc.(Æ) | 6,278 | 203 | ||
| Ross Stores, Inc. | 15,507 | 970 | Frank's International NV | 5,205 | 59 | ||
| Shutterfly, Inc.(Æ) | 4,900 | 240 | National Oilwell Varco, Inc. | 330 | 11 | ||
| Starbucks Corp. | 20,711 | 1,099 | Occidental Petroleum Corp. | 71,544 | 5,216 | ||
| Target Corp. | 10,935 | 752 | Oceaneering International, Inc. | 6,150 | 146 | ||
| Thor Industries, Inc. | 15,100 | 1,198 | Phillips 66 | 2,333 | 189 | ||
| Time Warner, Inc. | 12,616 | 1,123 | Royal Dutch Shell PLC Class A - ADR | 55,480 | 2,763 | ||
| TJX Cos., Inc.(Û) | 51,789 | 3,819 | TransCanada Corp. | 17,798 | 806 | ||
| Twenty-First Century Fox, Inc. Class A | 38,829 | 1,020 | World Fuel Services Corp. | 2,089 | 84 | ||
| VF Corp. | 5,956 | 323 | |||||
| Visteon Corp. | 7,000 | 494 | 30,103 | ||||
| Wal-Mart Stores, Inc.(Û) | 70,498 | 4,936 | |||||
| Walt Disney Co. (The)(Û) | 54,351 | 5,038 | Financial Services - 16.6% | ||||
| Yum! Brands, Inc. | 22,759 | 1,964 | Aflac, Inc. | 72,654 | 5,004 | ||
| AGNC Investment Corp.(ö) | 2,114 | 42 | |||||
| 71,339 | Alleghany Corp.(Æ) | 287 | 148 | ||||
| Allstate Corp. (The) | 36,503 | 2,479 | |||||
| Consumer Staples - 13.5% | American Equity Investment Life Holding | ||||||
| Altria Group, Inc. | 56,725 | 3,751 | Co. | 26,934 | 483 | ||
| Archer-Daniels-Midland Co. | 4,222 | 184 | American Express Co. | 3,210 | 213 | ||
| Blue Buffalo Pet Products, Inc.(Æ) | 3,384 | 85 | American Financial Group, Inc. | 9,140 | 681 | ||
| Brown-Forman Corp. Class B - ADR | 29,800 | 1,376 | American International Group, Inc. | 30,146 | 1,860 | ||
| Campbell Soup Co. | 10,952 | 595 | American Tower Corp.(ö) | 3,117 | 365 | ||
| Casey's General Stores, Inc. | 13,450 | 1,520 | |||||
See accompanying notes which are an integral part of the financial statements.
34 Russell U.S. Defensive Equity Fund
Russell Investment Company
Russell U.S. Defensive Equity Fund
Schedule of Investments, continued — October 31, 2016
| Amounts in thousands (except share amounts) | Amounts in thousands (except share amounts) | ||||||
| Principal | Fair | Principal | Fair | ||||
| Amount ($) or | Value | Amount ($) or | Value | ||||
| Shares | $ | Shares | $ | ||||
| Arch Capital Group, Ltd.(Æ) | 329 | 26 | RenaissanceRe Holdings, Ltd. | 1,861 | 231 | ||
| Arthur J Gallagher & Co. | 28,542 | 1,377 | Simon Property Group, Inc.(ö) | 16,137 | 3,001 | ||
| Aspen Insurance Holdings, Ltd. | 40,892 | 1,973 | Starwood Property Trust, Inc.(ö) | 7,536 | 168 | ||
| AvalonBay Communities, Inc.(ö) | 5,938 | 1,016 | State Street Corp. | 51,756 | 3,634 | ||
| Axis Capital Holdings, Ltd. | 6,353 | 362 | SunTrust Banks, Inc. | 5,825 | 263 | ||
| Bank of New York Mellon Corp. (The) | 5,233 | 226 | T Rowe Price Group, Inc. | 4,085 | 262 | ||
| BB&T Corp. | 39,230 | 1,538 | TCF Financial Corp. | 24,884 | 356 | ||
| Berkshire Hathaway, Inc. Class B(Æ) | 42,884 | 6,188 | Total System Services, Inc. | 994 | 50 | ||
| BlackRock, Inc. Class A | 3,699 | 1,262 | TransUnion(Æ) | 1,434 | 45 | ||
| Boston Properties, Inc.(ö) | 3,009 | 363 | Travelers Cos., Inc. (The) | 16,185 | 1,751 | ||
| Broadridge Financial Solutions, Inc. | 3,829 | 248 | US Bancorp | 71,381 | 3,195 | ||
| Capital One Financial Corp. | 2,543 | 188 | Validus Holdings, Ltd. | 2,443 | 125 | ||
| CBOE Holdings, Inc. | 15,400 | 973 | Visa, Inc. Class A(Û) | 66,145 | 5,458 | ||
| Chubb, Ltd. | 14,791 | 1,878 | Voya Financial, Inc. | 41,456 | 1,266 | ||
| CME Group, Inc. Class A | 563 | 56 | Wells Fargo & Co.(Û) | 187,080 | 8,608 | ||
| CNO Financial Group, Inc. | 67,000 | 1,010 | Western Alliance Bancorp(Æ) | 6,882 | 257 | ||
| Columbia Property Trust, Inc.(ö) | 4,200 | 89 | Western Union Co. (The) | 1,953 | 39 | ||
| Corrections Corp. of America(ö) | 44,197 | 639 | White Mountains Insurance Group, Ltd. | 111 | 92 | ||
| Crown Castle International Corp.(ö) | 1,962 | 179 | WR Berkley Corp. | 38,810 | 2,216 | ||
| Cullen/Frost Bankers, Inc. | 15,980 | 1,214 | XL Group, Ltd. | 84,078 | 2,918 | ||
| Discover Financial Services | 3,148 | 177 | 104,192 | ||||
| East West Bancorp, Inc. | 48,506 | 1,916 | |||||
| Endurance Specialty Holdings, Ltd. | 2,078 | 191 | Health Care - 14.6% | ||||
| Equifax, Inc. | 7,936 | 984 | Abbott Laboratories | 98,039 | 3,847 | ||
| Equity LifeStyle Properties, Inc. Class A(ö) | 11,170 | 847 | Aetna, Inc. | 39,819 | 4,275 | ||
| Equity Residential(ö) | 6,651 | 411 | Agilent Technologies, Inc. | 41,789 | 1,821 | ||
| Everest Re Group, Ltd. | 15,757 | 3,207 | Alexion Pharmaceuticals, Inc.(Æ) | 336 | 44 | ||
| FactSet Research Systems, Inc. | 7,460 | 1,154 | Allergan PLC(Æ) | 1,549 | 324 | ||
| Fidelity National Information Services, Inc. | 20,861 | 1,542 | Allscripts Healthcare Solutions, Inc.(Æ) | 27,000 | 324 | ||
| First American Financial Corp. | 758 | 30 | AmerisourceBergen Corp. Class A | 45,360 | 3,190 | ||
| Fiserv, Inc.(Æ) | 2,563 | 252 | Amgen, Inc.(Û) | 40,764 | 5,754 | ||
| FNFV Group(Æ) | 13,825 | 167 | Anthem, Inc. | 16,219 | 1,976 | ||
| Global Payments, Inc. | 4,088 | 296 | Baxter International, Inc. | 70,025 | 3,332 | ||
| Hanover Insurance Group, Inc. (The) | 25,365 | 1,933 | Becton Dickinson and Co. | 17,659 | 2,965 | ||
| Hartford Financial Services Group, Inc. | 22,500 | 992 | Biogen, Inc.(Æ) | 1,544 | 433 | ||
| Intercontinental Exchange, Inc. | 4,434 | 1,199 | Boston Scientific Corp.(Æ) | 12,057 | 265 | ||
| Invesco, Ltd. | 7,656 | 215 | Bristol-Myers Squibb Co.(Û) | 67,782 | 3,451 | ||
| Jack Henry & Associates, Inc. | 12,679 | 1,027 | Bruker Corp. | 7,083 | 145 | ||
| Jones Lang LaSalle, Inc. | 2,625 | 254 | Cardinal Health, Inc. | 61,390 | 4,217 | ||
| KeyCorp | 23,860 | 337 | Celgene Corp.(Æ) | 862 | 88 | ||
| Liberty Property Trust(ö) | 4,225 | 171 | Charles River Laboratories International, | ||||
| Loews Corp. | 7,446 | 320 | Inc.(Æ) | 1,348 | 102 | ||
| M&T Bank Corp. | 4,835 | 593 | Cigna Corp. | 1,586 | 188 | ||
| Marsh & McLennan Cos., Inc. | 58,989 | 3,739 | CR Bard, Inc. | 4,990 | 1,081 | ||
| Mastercard, Inc. Class A(Û) | 38,460 | 4,116 | DaVita, Inc.(Æ) | 1,108 | 65 | ||
| MetLife, Inc. | 6,061 | 285 | Dentsply Sirona, Inc. | 3,590 | 207 | ||
| MFA Financial, Inc.(ö) | 16,222 | 119 | Eli Lilly & Co.(Û) | 47,700 | 3,522 | ||
| Mid-America Apartment Communities, Inc. | Express Scripts Holding Co.(Æ) | 18,605 | 1,254 | ||||
| (ö) | 217 | 20 | Gilead Sciences, Inc. | 51,865 | 3,819 | ||
| Old Republic International Corp. | 4,669 | 79 | Halyard Health, Inc.(Æ) | 13,000 | 421 | ||
| Paramount Group, Inc.(ö) | 93,908 | 1,460 | Henry Schein, Inc.(Æ) | 12,055 | 1,799 | ||
| People's United Financial, Inc. | 10,051 | 163 | Humana, Inc. | 2,828 | 485 | ||
| Piedmont Office Realty Trust, Inc. Class A(ö) | 3,287 | 67 | Impax Laboratories, Inc.(Æ) | 21,900 | 440 | ||
| PNC Financial Services Group, Inc. (The) | 43,304 | 4,140 | Johnson & Johnson(Û) | 125,125 | 14,513 | ||
| Post Properties, Inc.(ö) | 7,020 | 462 | Laboratory Corp. of America Holdings(Æ) | 3,720 | 466 | ||
| Principal Financial Group, Inc. | 17,593 | 961 | LifePoint Health, Inc.(Æ) | 26,700 | 1,598 | ||
| Public Storage(ö) | 8,824 | 1,886 | McKesson Corp. | 12,119 | 1,541 | ||
| Realty Income Corp.(ö) | 861 | 51 | MEDNAX, Inc.(Æ) | 2,959 | 181 | ||
| Regency Centers Corp.(ö) | 7,344 | 529 | Medtronic PLC | 10,407 | 854 | ||
| Reinsurance Group of America, Inc. Class A | 17,477 | 1,885 | Merck & Co., Inc. | 54,126 | 3,178 | ||
See accompanying notes which are an integral part of the financial statements.
Russell U.S. Defensive Equity Fund 35
Russell Investment Company
Russell U.S. Defensive Equity Fund
Schedule of Investments, continued — October 31, 2016
| Amounts in thousands (except share amounts) | Amounts in thousands (except share amounts) | ||||||
| Principal | Fair | Principal | Fair | ||||
| Amount ($) or | Value | Amount ($) or | Value | ||||
| Shares | $ | Shares | $ | ||||
| Patterson Cos., Inc. | 1,748 | 75 | General Electric Co. | 3,496 | 102 | ||
| Pfizer, Inc. | 168,412 | 5,340 | Genpact, Ltd.(Æ) | 6,589 | 151 | ||
| Premier, Inc. Class A(Æ) | 3,832 | 122 | Honeywell International, Inc. | 46,060 | 5,052 | ||
| Quest Diagnostics, Inc. | 3,120 | 254 | IDEX Corp. | 876 | 76 | ||
| ResMed, Inc. | 6,067 | 363 | Illinois Tool Works, Inc. | 37,634 | 4,274 | ||
| St. Jude Medical, Inc. | 945 | 74 | Itron, Inc.(Æ) | 11,900 | 641 | ||
| Stryker Corp. | 20,181 | 2,328 | JB Hunt Transport Services, Inc. | 3,906 | 319 | ||
| Teleflex, Inc. | 872 | 125 | KBR, Inc. | 44,600 | 660 | ||
| Thermo Fisher Scientific, Inc. | 2,163 | 318 | L-3 Communications Holdings, Inc. | 11,270 | 1,543 | ||
| UnitedHealth Group, Inc. | 67,189 | 9,496 | Landstar System, Inc. | 17,971 | 1,279 | ||
| Universal Health Services, Inc. Class B | 1,234 | 149 | Lincoln Electric Holdings, Inc. | 7,341 | 483 | ||
| VCA, Inc.(Æ) | 2,874 | 177 | Lockheed Martin Corp. | 13,519 | 3,331 | ||
| VWR Corp.(Æ) | 7,103 | 195 | ManpowerGroup, Inc. | 21,773 | 1,672 | ||
| Zimmer Biomet Holdings, Inc. | 4,507 | 475 | Mettler-Toledo International, Inc.(Æ) | 738 | 298 | ||
| Zoetis, Inc. Class A | 4,340 | 207 | Moog, Inc. Class A(Æ) | 16,700 | 970 | ||
| 91,863 | MSC Industrial Direct Co., Inc. Class A | 1,400 | 102 | ||||
| Navistar International Corp.(Æ) | 6,200 | 138 | |||||
| Materials and Processing - 1.4% | Northrop Grumman Corp. | 13,518 | 3,096 | ||||
| Acuity Brands, Inc. | 176 | 39 | PACCAR, Inc. | 2,030 | 111 | ||
| AdvanSix, Inc.(Æ) | 794 | 13 | Parker-Hannifin Corp. | 1,510 | 185 | ||
| AptarGroup, Inc. | 7,316 | 523 | Quanta Services, Inc.(Æ) | 25,500 | 733 | ||
| Crown Holdings, Inc.(Æ) | 18,844 | 1,022 | Raytheon Co. | 18,306 | 2,501 | ||
| Domtar Corp. | 45,020 | 1,619 | Republic Services, Inc. Class A | 12,287 | 647 | ||
| EI du Pont de Nemours & Co. | 12,157 | 836 | Robert Half International, Inc. | 43,723 | 1,636 | ||
| LyondellBasell Industries NV Class A | 2,811 | 224 | Rockwell Automation, Inc. | 1,278 | 153 | ||
| Monsanto Co. | 547 | 55 | Rockwell Collins, Inc. | 2,382 | 201 | ||
| NewMarket Corp. | 145 | 58 | Snap-on, Inc. | 8,232 | 1,269 | ||
| Newmont Mining Corp. | 1,440 | 53 | Spirit AeroSystems Holdings, Inc. Class A | 4,419 | 222 | ||
| Platform Specialty Products Corp.(Æ) | 3,000 | 22 | Stanley Black & Decker, Inc. | 15,123 | 1,722 | ||
| PPG Industries, Inc. | 1,307 | 122 | Stericycle, Inc.(Æ) | 19,200 | 1,538 | ||
| Praxair, Inc. | 15,516 | 1,816 | Toro Co. (The) | 28,033 | 1,342 | ||
| Reliance Steel & Aluminum Co. | 1,293 | 89 | Trinity Industries, Inc. | 69,200 | 1,477 | ||
| Scotts Miracle-Gro Co. (The) Class A | 481 | 42 | Union Pacific Corp. | 17,437 | 1,538 | ||
| Sherwin-Williams Co. (The) | 8,106 | 1,985 | United Parcel Service, Inc. Class B | 6,548 | 706 | ||
| Silgan Holdings, Inc. | 669 | 34 | United Technologies Corp. | 21,506 | 2,198 | ||
| Sonoco Products Co. | 1,149 | 58 | Wabtec Corp. | 684 | 53 | ||
| Tahoe Resources, Inc. | 7,335 | 88 | Waste Management, Inc. | 5,395 | 354 | ||
| Westlake Chemical Corp. | 4,766 | 247 | Waters Corp.(Æ) | 967 | 134 | ||
| WESCO International, Inc.(Æ) | 20,100 | 1,089 | |||||
| 8,945 | WW Grainger, Inc. | 10,146 | 2,112 | ||||
| Producer Durables - 11.9% | Xylem, Inc. | 5,030 | 243 | ||||
| 3M Co. | 20,932 | 3,460 | 74,653 | ||||
| Accenture PLC Class A | 37,557 | 4,366 | |||||
| AO Smith Corp. | 29,012 | 1,310 | Technology - 12.2% | ||||
| Automatic Data Processing, Inc. | 55,567 | 4,838 | Activision Blizzard, Inc. | 5,949 | 257 | ||
| Avery Dennison Corp. | 3,330 | 232 | Adobe Systems, Inc.(Æ) | 6,984 | 751 | ||
| Babcock & Wilcox Co. (The) Class W(Æ) | 47,264 | 1,854 | Advanced Micro Devices, Inc.(Æ) | 157,487 | 1,139 | ||
| Boeing Co. (The) | 24,174 | 3,443 | Akamai Technologies, Inc.(Æ) | 363 | 25 | ||
| Canadian Pacific Railway, Ltd. | 970 | 139 | Alphabet, Inc. Class A(Æ) | 6,067 | 4,914 | ||
| Carlisle Cos., Inc. | 1,599 | 168 | Alphabet, Inc. Class C(Æ)(Û) | 10,979 | 8,613 | ||
| CH Robinson Worldwide, Inc. | 27,227 | 1,855 | Amdocs, Ltd. | 4,816 | 282 | ||
| Cintas Corp. | 460 | 49 | Amphenol Corp. Class A | 3,095 | 204 | ||
| Copart, Inc.(Æ) | 971 | 51 | Analog Devices, Inc. | 21,438 | 1,374 | ||
| Danaher Corp. | 15,497 | 1,217 | Anixter International, Inc.(Æ) | 22,910 | 1,506 | ||
| Eaton Corp. PLC | 2,335 | 149 | Apple, Inc. | 43,125 | 4,896 | ||
| Esterline Technologies Corp.(Æ) | 9,200 | 676 | Arista Networks, Inc.(Æ)(Û) | 20,600 | 1,746 | ||
| Flir Systems, Inc. | 1,412 | 46 | Arrow Electronics, Inc.(Æ) | 18,400 | 1,125 | ||
| Fluor Corp. | 2,117 | 110 | Avnet, Inc. | 44,418 | 1,863 | ||
| Fortive Corp. | 5,502 | 281 | Broadcom, Ltd. | 2,677 | 456 | ||
| General Dynamics Corp. | 26,918 | 4,058 | Brocade Communications Systems, Inc. | 77,500 | 822 | ||
See accompanying notes which are an integral part of the financial statements.
36 Russell U.S. Defensive Equity Fund
Russell Investment Company
Russell U.S. Defensive Equity Fund
Schedule of Investments, continued — October 31, 2016
| Amounts in thousands (except share amounts) | Amounts in thousands (except share amounts) | ||||||||
| Principal | Fair | Principal | Fair | ||||||
| Amount ($) or | Value | Amount ($) or | Value | ||||||
| Shares | $ | Shares | $ | ||||||
| CA, Inc. | 8,945 | 275 | Great Plains Energy, Inc. | 3,700 | 105 | ||||
| Cadence Design Systems, Inc.(Æ) | 3,452 | 88 | Hawaiian Electric Industries, Inc. | 32,200 | 950 | ||||
| Cisco Systems, Inc. | 123,613 | 3,792 | MDU Resources Group, Inc. | 8,584 | 225 | ||||
| Cognizant Technology Solutions Corp. Class | NextEra Energy, Inc.(Û) | 51,727 | 6,621 | ||||||
| A(Æ) | 2,145 | 110 | NiSource, Inc. | 9,053 | 211 | ||||
| Dell Technologies, Inc. - VMware Inc. Class | ONE Gas, Inc. | 13,069 | 801 | ||||||
| V(Æ) | 4,570 | 224 | PG&E Corp. | 34,248 | 2,127 | ||||
| EchoStar Corp. Class A(Æ) | 5,185 | 242 | Pinnacle West Capital Corp. | 1,054 | 80 | ||||
| F5 Networks, Inc.(Æ) | 1,274 | 176 | PPL Corp. | 4,916 | 169 | ||||
| Facebook, Inc. Class A(Æ) | 31,402 | 4,113 | Public Service Enterprise Group, Inc. | 44,610 | 1,877 | ||||
| Finisar Corp.(Æ) | 23,711 | 649 | RingCentral, Inc. Class A(Æ) | 6,400 | 132 | ||||
| Gartner, Inc.(Æ) | 14,700 | 1,265 | Sempra Energy | 8,637 | 925 | ||||
| Hewlett Packard Enterprise Co. | 9,400 | 211 | Talen Energy Corp.(Æ) | 3,549 | 49 | ||||
| HubSpot, Inc.(Æ) | 8,600 | 451 | Telephone & Data Systems, Inc. | 14,960 | 387 | ||||
| Imperva, Inc.(Æ) | 4,800 | 177 | UGI Corp. | 2,325 | 108 | ||||
| Intel Corp. | 102,252 | 3,566 | US Cellular Corp.(Æ) | 6,458 | 226 | ||||
| InterDigital, Inc. | 6,800 | 480 | Verizon Communications, Inc.(Û) | 167,676 | 8,065 | ||||
| International Business Machines Corp. | 14,305 | 2,199 | WEC Energy Group, Inc. | 6,967 | 416 | ||||
| Juniper Networks, Inc. | 72,600 | 1,912 | Westar Energy, Inc. Class A | 1,151 | 66 | ||||
| Leidos Holdings, Inc. | 2,162 | 90 | Xcel Energy, Inc. | 37,801 | 1,571 | ||||
| Linear Technology Corp. | 2,749 | 165 | 46,272 | ||||||
| Manhattan Associates, Inc.(Æ) | 326 | 17 | |||||||
| Mentor Graphics Corp. | 49,628 | 1,434 | Total Common Stocks | ||||||
| Microchip Technology, Inc. | 34,243 | 2,073 | |||||||
| Microsoft Corp. | 99,741 | 5,977 | (cost $544,977) | 588,805 | |||||
| NetApp, Inc. | 15,400 | 523 | |||||||
| NETGEAR, Inc.(Æ) | 18,700 | 944 | Short-Term Investments - 13.1% | ||||||
| Oracle Corp. | 51,964 | 1,996 | Russell U.S. Cash Management Fund | 67,128,130 | (8) | 67,141 | |||
| Palo Alto Networks, Inc.(Æ) | 7,310 | 1,125 | United States Treasury Bills | ||||||
| Red Hat, Inc.(Æ) | 15,710 | 1,217 | 0.286% due 01/19/17 (ç)(~)(§) | 7,000 | 6,996 | ||||
| Silicon Laboratories, Inc.(Æ) | 1,100 | 66 | |||||||
| Splunk, Inc.(Æ) | 5,100 | 307 | 0.398% due 03/30/17 (ç)(~)(§) | 8,000 | 7,987 | ||||
| Synaptics, Inc.(Æ) | 7,200 | 375 | Total Short-Term Investments | ||||||
| SYNNEX Corp. | 7,100 | 728 | (cost $82,109) | 82,124 | |||||
| Synopsys, Inc.(Æ) | 25,065 | 1,487 | |||||||
| TE Connectivity, Ltd. | 11,659 | 733 | Total Investments 106.8% | ||||||
| Tech Data Corp.(Æ) | 19,800 | 1,525 | |||||||
| Texas Instruments, Inc. | 20,265 | 1,436 | (identified cost $627,086) | 670,929 | |||||
| Twitter, Inc.(Æ) | 26,000 | 467 | Securities Sold Short - (7.5)% | ||||||
| Viavi Solutions, Inc. Class W(Æ) | 213,875 | 1,523 | Consumer Discretionary - (2.3)% | ||||||
| VMware, Inc. Class A(Æ) | 15,850 | 1,246 | 2U, Inc.(Æ) | (4,200 | ) | (146 | ) | ||
| Yelp, Inc. Class A(Æ) | 6,900 | 225 | CarMax, Inc.(Æ) | (19,100 | ) | (954 | ) | ||
| Zynga, Inc. Class A(Æ) | 397,400 | 1,117 | Charter Communications, Inc. Class A(Æ) | (2,830 | ) | (707 | ) | ||
| 76,699 | Deckers Outdoor Corp.(Æ) | (4,900 | ) | (256 | ) | ||||
| Dorman Products, Inc.(Æ) | (17,700 | ) | (1,137 | ) | |||||
| Utilities - 7.4% | Gentex Corp. | (60,400 | ) | (1,021 | ) | ||||
| Ameren Corp. | 2,021 | 101 | H&R Block, Inc. | (21,900 | ) | (503 | ) | ||
| American Electric Power Co., Inc. | 32,973 | 2,138 | |||||||
| American Water Works Co., Inc. | 31,064 | 2,300 | Hillenbrand, Inc. | (35,301 | ) | (1,072 | ) | ||
| AT&T, Inc.(Û) | 169,324 | 6,229 | Houghton Mifflin Harcourt Co.(Æ) | (27,000 | ) | (342 | ) | ||
| CenterPoint Energy, Inc. | 9,663 | 220 | L Brands, Inc. | (12,500 | ) | (902 | ) | ||
| CMS Energy Corp. | 23,477 | 990 | Las Vegas Sands Corp. | (8,500 | ) | (492 | ) | ||
| Consolidated Edison, Inc. | 20,879 | 1,577 | Liberty Broadband Corp. Class A(Æ) | (11,067 | ) | (719 | ) | ||
| DTE Energy Co. | 19,500 | 1,872 | Liberty Media Corp.-Liberty Media Class | ||||||
| Duke Energy Corp. | 11,731 | 939 | A(Æ) | (3,700 | ) | (103 | ) | ||
| Edison International | 17,947 | 1,319 | Newell Brands, Inc. | (1,100 | ) | (53 | ) | ||
| Entergy Corp. | 17,354 | 1,279 | Pandora Media, Inc.(Æ) | (12,400 | ) | (141 | ) | ||
| Eversource Energy | 35,519 | 1,956 | |||||||
| Exelon Corp. | 6,278 | 214 | Polaris Industries, Inc. | (11,500 | ) | (881 | ) | ||
| Fortis, Inc. | 826 | 27 | Priceline Group, Inc. (The)(Æ) | (389 | ) | (574 | ) | ||
See accompanying notes which are an integral part of the financial statements.
Russell U.S. Defensive Equity Fund 37
Russell Investment Company
Russell U.S. Defensive Equity Fund
Schedule of Investments, continued — October 31, 2016
| Amounts in thousands (except share amounts) | Amounts in thousands (except share amounts) | |||||||||||
| Principal | Fair | Principal | Fair | |||||||||
| Amount ($) or | Value | Amount ($) or | Value | |||||||||
| Shares | $ | Shares | $ | |||||||||
| Sinclair Broadcast Group, Inc. Class A | (17,600 | ) | (442 | ) | Radius Health, Inc.(Æ) | (1,600 | ) | (69 | ) | |||
| Sirius XM Holdings, Inc. | (270,600 | ) | (1,128 | ) | Select Medical Holdings Corp.(Æ) | (31,917 | ) | (415 | ) | |||
| Smith & Wesson Holding Corp.(Æ) | (8,600 | ) | (227 | ) | Surgical Care Affiliates, Inc.(Æ) | (7,900 | ) | (338 | ) | |||
| Steven Madden, Ltd.(Æ) | (21,800 | ) | (728 | ) | TESARO, Inc.(Æ) | (3,300 | ) | (399 | ) | |||
| Tiffany & Co. | (11,200 | ) | (822 | ) | (5,693 | ) | ||||||
| Under Armour, Inc. Class A(Æ) | (19,000 | ) | (591 | ) | Materials and Processing - (0.7)% | |||||||
| Williams-Sonoma, Inc. | (18,400 | ) | (850 | ) | AAON, Inc. | (20,410 | ) | (611 | ) | |||
| (14,791 | ) | Balchem Corp. | (13,290 | ) | (1,009 | ) | ||||||
| Consumer Staples - (0.2)% | Ball Corp. | (9,570 | ) | (738 | ) | |||||||
| Kraft Heinz Co. (The) | (9,700 | ) | (863 | ) | Carpenter Technology Corp. | (11,700 | ) | (370 | ) | |||
| Walgreens Boots Alliance, Inc. | (3,900 | ) | (323 | ) | Fastenal Co. | (1,500 | ) | (58 | ) | |||
| (1,186 | ) | RBC Bearings, Inc.(Æ) | (12,240 | ) | (873 | ) | ||||||
| Energy - (0.1)% | Vulcan Materials Co. | (6,290 | ) | (712 | ) | |||||||
| Helmerich & Payne, Inc. | (9,600 | ) | (606 | ) | (4,371 | ) | ||||||
| Producer Durables - (0.5)% | ||||||||||||
| Financial Services - (1.9)% | Clarcor, Inc. | (4,300 | ) | (268 | ) | |||||||
| Alexander & Baldwin, Inc. | (10,800 | ) | (451 | ) | Dycom Industries, Inc.(Æ) | (3,800 | ) | (292 | ) | |||
| Annaly Capital Management, Inc.(ö) | (95,900 | ) | (994 | ) | Granite Construction, Inc. | (7,000 | ) | (344 | ) | |||
| BGC Partners, Inc. Class A | (71,600 | ) | (615 | ) | Knight Transportation, Inc. | (8,100 | ) | (237 | ) | |||
| Capitol Federal Financial, Inc. | (55,992 | ) | (821 | ) | Old Dominion Freight Line, Inc.(Æ) | (10,500 | ) | (784 | ) | |||
| Chimera Investment Corp.(ö) | (47,100 | ) | (738 | ) | PACCAR, Inc. | (18,800 | ) | (1,033 | ) | |||
| CoreSite Realty Corp. Class A(ö) | (7,300 | ) | (538 | ) | Proto Labs, Inc.(Æ) | (4,300 | ) | (192 | ) | |||
| CVB Financial Corp. | (10,400 | ) | (175 | ) | (3,150 | ) | ||||||
| Eaton Vance Corp. | (15,300 | ) | (536 | ) | Technology - (0.7)% | |||||||
| FBL Financial Group, Inc. Class A | (600 | ) | (38 | ) | Black Knight Financial Services, Inc. Class | |||||||
| GEO Group, Inc. (The)(ö) | (12,500 | ) | (299 | ) | A(Æ) | (3,312 | ) | (130 | ) | |||
| Gramercy Property Trust(ö) | (51,110 | ) | (471 | ) | Cognex Corp. | (11,700 | ) | (604 | ) | |||
| Hilltop Holdings, Inc. | (11,700 | ) | (289 | ) | Cypress Semiconductor Corp. | (37,500 | ) | (374 | ) | |||
| Hudson Pacific Properties, Inc.(ö) | (34,800 | ) | (1,170 | ) | Envestnet, Inc.(Æ) | (9,699 | ) | (343 | ) | |||
| Kennedy-Wilson Holdings, Inc. | (39,736 | ) | (819 | ) | Lam Research Corp. | (1,910 | ) | (185 | ) | |||
| LendingClub Corp.(Æ) | (34,200 | ) | (169 | ) | NetScout Systems, Inc.(Æ) | (10,900 | ) | (299 | ) | |||
| Mercury General Corp. | (12,000 | ) | (654 | ) | Sabre Corp. | (17,700 | ) | (457 | ) | |||
| Omega Healthcare Investors, Inc.(ö) | (17,500 | ) | (557 | ) | ServiceNow, Inc.(Æ) | (7,400 | ) | (651 | ) | |||
| Potlatch Corp.(ö) | (7,400 | ) | (284 | ) | Skyworks Solutions, Inc. | (13,900 | ) | (1,070 | ) | |||
| PRA Group, Inc.(Æ) | (7,000 | ) | (223 | ) | Workday, Inc. Class A(Æ) | (2,900 | ) | (251 | ) | |||
| Select Income REIT(ö) | (40,013 | ) | (990 | ) | (4,364 | ) | ||||||
| United Bankshares, Inc. | (23,500 | ) | (886 | ) | Utilities - (0.2)% | |||||||
| (11,717 | ) | Cheniere Energy, Inc.(Æ) | (5,600 | ) | (211 | ) | ||||||
| Health Care - (0.9)% | Dynegy, Inc. Class A(Æ) | (23,500 | ) | (250 | ) | |||||||
| AbbVie, Inc. | (10,500 | ) | (586 | ) | Pattern Energy Group, Inc. Class A | (38,700 | ) | (865 | ) | |||
| Acadia Pharmaceuticals, Inc.(Æ) | (2,900 | ) | (67 | ) | (1,326 | ) | ||||||
| Alder Biopharmaceuticals, Inc.(Æ) | (3,800 | ) | (92 | ) | ||||||||
| Alexion Pharmaceuticals, Inc.(Æ) | (4,060 | ) | (530 | ) | Total Securities Sold Short | |||||||
| Bluebird Bio, Inc.(Æ) | (1,450 | ) | (69 | ) | (proceeds $45,485) | (47,204 | ) | |||||
| Chemed Corp. | (3,720 | ) | (526 | ) | ||||||||
| Five Prime Therapeutics, Inc.(Æ) | (1,500 | ) | (73 | ) | Other Assets and Liabilities, Net | |||||||
| Intercept Pharmaceuticals, Inc.(Æ) | (690 | ) | (85 | ) | - 0.7% | 4,262 | ||||||
| Kite Pharma, Inc.(Æ) | (5,600 | ) | (248 | ) | Net Assets - 100.0% | 627,987 | ||||||
| Neogen Corp.(Æ) | (13,300 | ) | (701 | ) | ||||||||
| Neurocrine Biosciences, Inc.(Æ) | (3,500 | ) | (153 | ) | ||||||||
| PAREXEL International Corp.(Æ) | (12,200 | ) | (711 | ) | ||||||||
| Quintiles IMS Holdings, Inc.(Æ) | (8,800 | ) | (631 | ) | ||||||||
See accompanying notes which are an integral part of the financial statements.
38 Russell U.S. Defensive Equity Fund
Russell Investment Company
Russell U.S. Defensive Equity Fund
Schedule of Investments, continued — October 31, 2016
| Futures Contracts | |||||||
| Amounts in thousands (except contract amounts) | |||||||
| Unrealized | |||||||
| Appreciation | |||||||
| Number of | Notional | Expiration | (Depreciation) | ||||
| Contracts | Amount | Date | $ | ||||
| Long Positions | |||||||
| S&P 500 E-Mini Index Futures | 125 | USD | 13,251 | 12/16 | (147 | ) | |
| Total Unrealized Appreciation (Depreciation) on Open Futures Contracts (å) | (147 | ) | |||||
| Options Written | ||||||||
| Amounts in thousands (except contract amounts) | ||||||||
| Number of | Strike | Notional | Expiration | Fair Value | ||||
| Call/Put | Contracts | Price | Amount | Date | $ | |||
| S&P 500 Index | Put | 64 | 2,010.00 | USD | 12,864 | 11/25/17 | (58 | ) |
| S&P 500 Index | Put | 63 | 2,025.00 | USD | 12,758 | 11/11/17 | (43 | ) |
| S&P 500 Index | Put | 63 | 2,025.00 | USD | 12,758 | 11/18/16 | (57 | ) |
| S&P 500 Index | Put | 64 | 2,050.00 | USD | 13,120 | 11/04/16 | (6 | ) |
| Total Liability for Options Written (premiums received $195) | (164 | ) | ||||||
| Transactions in options written contracts for the period ended October 31, 2016 were as follows: | ||||||
| Number of | Premiums | |||||
| Contracts | Received | |||||
| Outstanding October 31, 2015 | 207 | $ | 162 | |||
| Opened | 4,191 | 3,554 | ||||
| Closed | — | (3,521 | ) | |||
| Expired | (4,144 | ) | — | |||
| Outstanding October 31, 2016 | 254 | $ | 195 | |||
| Presentation of Portfolio Holdings | |||||||||||||||
| Amounts in thousands | |||||||||||||||
| Fair Value | |||||||||||||||
| Practical | |||||||||||||||
| Portfolio Summary | Level 1 | Level 2 | Level 3 | Expedient (a) | Total | % of Net Assets | |||||||||
| Common Stocks | |||||||||||||||
| Consumer Discretionary | $ | 71,339 | $ | — | $ | — | $ | — | $ | 71,339 | 11.3 | ||||
| Consumer Staples | 84,739 | — | — | — | 84,739 | 13.5 | |||||||||
| Energy | 30,103 | — | — | — | 30,103 | 4.8 | |||||||||
| Financial Services | 104,192 | — | — | — | 104,192 | 16.6 | |||||||||
| Health Care | 91,863 | — | — | — | 91,863 | 14.6 | |||||||||
| Materials and Processing | 8,945 | — | — | — | 8,945 | 1.4 | |||||||||
| Producer Durables | 74,653 | — | — | — | 74,653 | 11.9 | |||||||||
| Technology | 76,699 | — | — | — | 76,699 | 12.2 | |||||||||
| Utilities | 46,272 | — | — | — | 46,272 | 7.4 | |||||||||
| Short-Term Investments | — | 14,983 | — | 67,141 | 82,124 | 13.1 | |||||||||
| Total Investments | 588,805 | 14,983 | — | 67,141 | 670,929 | 106.8 | |||||||||
| Securities Sold Short*** | (47,204 | ) | — | — | — | (47,204 | ) | (7.5 | ) | ||||||
| Other Assets and Liabilities, Net | 0.7 | ||||||||||||||
| 100.0 | |||||||||||||||
See accompanying notes which are an integral part of the financial statements.
Russell U.S. Defensive Equity Fund 39
Russell Investment Company
Russell U.S. Defensive Equity Fund
Schedule of Investments, continued — October 31, 2016
| Presentation of Portfolio Holdings | ||||||||||||||||
| Amounts in thousands | ||||||||||||||||
| Fair Value | ||||||||||||||||
| Practical | ||||||||||||||||
| Portfolio Summary | Level 1 | Level 2 | Level 3 | Expedient (a) | Total | % of Net Assets | ||||||||||
| Other Financial Instruments | ||||||||||||||||
| Liabilities | ||||||||||||||||
| Futures Contracts | (147 | ) | — | — | — | (147 | ) | (—)* | ||||||||
| Options Written | (164 | ) | — | — | — | (164 | ) | (—)* | ||||||||
| Total Other Financial Instruments** | $ | (311 | ) | $ | — | $ | — | $ | — | $ | (311 | ) | ||||
* Less than 0.05% of net assets.
** Futures and foreign currency exchange contract values reflect the unrealized appreciation (depreciation) on the investments.
*** Refer to Schedule of Investments for detailed sector breakout.
(a) Certain investments that are measured at fair value using the net asset value per share (or its equivalent) practical expedient have not been classified
in the fair value levels. The fair value amounts presented in the table are intended to permit reconciliation to the amounts presented in the Schedule of
Investments.
For a description of the Levels, see note 2 in the Notes to Financial Statements.
For a disclosure on transfers between Levels 1, 2 and 3 during the period ended October 31, 2016, see note 2 in the Notes to
Financial Statements.
See accompanying notes which are an integral part of the financial statements.
40 Russell U.S. Defensive Equity Fund
Russell Investment Company
Russell U.S. Defensive Equity Fund
Fair Value of Derivative Instruments — October 31, 2016
Amounts in thousands
| Equity | ||||||
| Derivatives not accounted for as hedging instruments | Contracts | |||||
| Location: Statement of Assets and Liabilities - Liabilities | ||||||
| Variation margin on futures contracts* | $ | 147 | ||||
| Options written, at fair value | 164 | |||||
| Total | $ | 311 | ||||
| Foreign | ||||||
| Equity | Currency | |||||
| Derivatives not accounted for as hedging instruments | Contracts | Contracts | ||||
| Location: Statement of Operations - Net realized gain (loss) | ||||||
| Futures contracts | $ | 3,332 | $ | — | ||
| Options written | 2,688 | — | ||||
| Foreign currency-related transactions | — | 1 | ||||
| Total | $ | 6,020 | $ | 1 | ||
| Location: Statement of Operations - Net change in unrealized appreciation (depreciation) | ||||||
| Futures contracts | $ | (900 | ) | $ | — | |
| Options written | (55 | ) | — | |||
| Total | $ | (955 | ) | $ | — | |
* Includes cumulative appreciation/depreciation of futures contracts as reported in the Schedule of Investments. Only variation margin is reported within the
Statement of Assets and Liabilities.
For further disclosure on derivatives see note 2 in the Notes to Financial Statements.
See accompanying notes which are an integral part of the financial statements.
Russell U.S. Defensive Equity Fund 41
Russell Investment Company
Russell U.S. Defensive Equity Fund
Balance Sheet Offsetting of Financial and Derivative Instruments — October 31, 2016
| Amounts in thousands | ||||||||||||
| Offsetting of Financial Liabilities and Derivative Liabilities | ||||||||||||
| Gross | Net Amounts | |||||||||||
| Amounts | of Liabilities | |||||||||||
| Gross | Offset in the | Presented in | ||||||||||
| Amounts of | Statement of | the Statement | ||||||||||
| Recognized | Assets and | of Assets and | ||||||||||
| Description | Location: Statement of Assets and Liabilities - Liabilities | Liabilities | Liabilities | Liabilities | ||||||||
| Futures Contracts | Variation margin on futures contracts | $ | 22 | $ | — | $ | 22 | |||||
| Options Written Contracts | Options written, at fair value | 164 | — | 164 | ||||||||
| Short Sales | Securities sold short, at market value | 47,204 | — | 47,204 | ||||||||
| Total Financial and Derivative Liabilities | 47,390 | — | 47,390 | |||||||||
| Financial and Derivative Liabilities not subject to a netting agreement | (186 | ) | — | (186 | ) | |||||||
| Total Financial and Derivative Liabilities subject to a netting agreement | $ | 47,204 | $ | — | $ | 47,204 | ||||||
| Financial Liabilities, Derivative Liabilities, and Collateral Pledged by Counterparty | ||||||||||||
| Gross Amounts Not Offset in | ||||||||||||
| the Statement of Assets and | ||||||||||||
| Liabilities | ||||||||||||
| Net Amounts | ||||||||||||
| of Liabilities | ||||||||||||
| Presented in | ||||||||||||
| the Statement | Financial and | |||||||||||
| of Assets and | Derivative | Collateral | ||||||||||
| Counterparty | Liabilities | Instruments | Pledged^ | Net Amount | ||||||||
| State Street | 47,204 | $ | — | $ | 47,204 | $ | — | |||||
| Total | $ | 47,204 | $ | — | $ | 47,204 | $ | — | ||||
^ Collateral received or pledged amounts may not reconcile to those disclosed in the Statement of Assets and Liabilities due to the inclusion of off-Balance
Sheet collateral and adjustments made to exclude overcollateralization.
For further disclosure on derivatives and counterparty risk see note 2 in the Notes to Financial Statements.
See accompanying notes which are an integral part of the financial statements.
42 Russell U.S. Defensive Equity Fund
Russell Investment Company
Russell U.S. Defensive Equity Fund
Statement of Assets and Liabilities — October 31, 2016
| Amounts in thousands | ||
| Assets | ||
| Investments, at identified cost | $ | 627,086 |
| Investments, at fair value(>) | 670,929 | |
| Cash (restricted)(a)(b) | 6,147 | |
| Receivables: | ||
| Dividends and interest | 520 | |
| Dividends from affiliated Russell funds | 36 | |
| Investments sold | 4,004 | |
| Fund shares sold | 53 | |
| Total assets | 681,689 | |
| Liabilities | ||
| Payables: | ||
| Due to custodian | 41 | |
| Due to broker (c) | 1,500 | |
| Investments purchased | 3,875 | |
| Fund shares redeemed | 266 | |
| Accrued fees to affiliates | 433 | |
| Other accrued expenses | 197 | |
| Variation margin on futures contracts | 22 | |
| Options written, at fair value(x) | 164 | |
| Securities sold short, at fair value(‡) | 47,204 | |
| Total liabilities | 53,702 | |
| Net Assets | $ | 627,987 |
See accompanying notes which are an integral part of the financial statements.
Russell U.S. Defensive Equity Fund 43
Russell Investment Company
Russell U.S. Defensive Equity Fund
Statement of Assets and Liabilities, continued — October 31, 2016
| Amounts in thousands | |||
| Net Assets Consist of: | |||
| Undistributed (overdistributed) net investment income | $ | 255 | |
| Accumulated net realized gain (loss) | 37,591 | ||
| Unrealized appreciation (depreciation) on: | |||
| Investments | 43,843 | ||
| Futures contracts | (147 | ) | |
| Options written | 31 | ||
| Securities sold short | (1,719 | ) | |
| Shares of beneficial interest | 128 | ||
| Additional paid-in capital | 548,005 | ||
| Net Assets | $ | 627,987 | |
| Net Asset Value, offering and redemption price per share: | |||
| Net asset value per share: Class A(#) | $ | 49.22 | |
| Maximum offering price per share (Net asset value plus sales charge of 5.75%): Class A | $ | 52.22 | |
| Class A — Net assets | $ | 28,449,778 | |
| Class A — Shares outstanding ($.01 par value) | 577,964 | ||
| Net asset value per share: Class C(#) | $ | 48.98 | |
| Class C — Net assets | $ | 43,815,416 | |
| Class C — Shares outstanding ($.01 par value) | 894,621 | ||
| Net asset value per share: Class E(#) | $ | 49.29 | |
| Class E — Net assets | $ | 5,780,714 | |
| Class E — Shares outstanding ($.01 par value) | 117,274 | ||
| Net asset value per share: Class I(#) | $ | 49.22 | |
| Class I — Net assets | $ | 152,494,160 | |
| Class I — Shares outstanding ($.01 par value) | 3,098,329 | ||
| Net asset value per share: Class S(#) | $ | 49.29 | |
| Class S — Net assets | $ | 181,534,213 | |
| Class S — Shares outstanding ($.01 par value) | 3,682,868 | ||
| Net asset value per share: Class Y(#) | $ | 49.22 | |
| Class Y — Net assets | $ | 215,912,800 | |
| Class Y — Shares outstanding ($.01 par value) | 4,386,490 | ||
| Amounts in thousands | |||
| (x) Premiums received on options written | $ | 195 | |
| (‡) Proceeds on securities sold short | $ | 45,485 | |
| (>) Investments in affiliates, Russell U.S. Cash Management Fund | $ | 67,141 | |
| (a) Cash Collateral for Futures | $ | 683 | |
| (b) Cash Collateral for Options | $ | 5,464 | |
| (c) Due to Broker for Options | $ | 1,500 | |
| (#) Net asset value per share equals class level net assets divided by class level shares of beneficial interest outstanding. | |||
See accompanying notes which are an integral part of the financial statements.
44 Russell U.S. Defensive Equity Fund
Russell Investment Company
Russell U.S. Defensive Equity Fund
Statement of Operations — For the Period Ended October 31, 2016
| Amounts in thousands | |||
| Investment Income | |||
| Dividends | $ | 19,262 | |
| Dividends from affiliated Russell funds | 351 | ||
| Interest | 54 | ||
| Total investment income | 19,667 | ||
| Expenses | |||
| Advisory fees | 4,837 | ||
| Administrative fees | 424 | ||
| Custodian fees (1) | 15 | ||
| Distribution fees - Class A | 63 | ||
| Distribution fees - Class C | 339 | ||
| Transfer agent fees - Class A | 50 | ||
| Transfer agent fees - Class C | 90 | ||
| Transfer agent fees - Class E | 12 | ||
| Transfer agent fees - Class I | 211 | ||
| Transfer agent fees - Class S | 385 | ||
| Transfer agent fees - Class Y | 19 | ||
| Professional fees | 79 | ||
| Registration fees | 91 | ||
| Shareholder servicing fees - Class C | 113 | ||
| Shareholder servicing fees - Class E | 15 | ||
| Trustees’ fees | 30 | ||
| Printing fees | 47 | ||
| Dividends from securities sold short | 1,112 | ||
| Interest expense paid on securities sold short | 390 | ||
| Miscellaneous | 37 | ||
| Total expenses | 8,359 | ||
| Net investment income (loss) | 11,308 | ||
| Net Realized and Unrealized Gain (Loss) | |||
| Net realized gain (loss) on: | |||
| Investments | 81,812 | ||
| Futures contracts | 3,332 | ||
| Options written | 2,688 | ||
| Securities sold short | (7,081 | ) | |
| Foreign currency-related transactions | 1 | ||
| Net realized gain (loss) | 80,752 | ||
| Net change in unrealized appreciation (depreciation) on: | |||
| Investments | (44,285 | ) | |
| Futures contracts | (900 | ) | |
| Options written | (55 | ) | |
| Securities sold short | (1,719 | ) | |
| Net change in unrealized appreciation (depreciation) | (46,959 | ) | |
| Net realized and unrealized gain (loss) | 33,793 | ||
| Net Increase (Decrease) in Net Assets from Operations | $ | 45,101 | |
| (1) Includes a reimbursement for overbilling of custody out-of-pocket fees from prior years. See note 10 in the Notes to Financial Statements. | |||
See accompanying notes which are an integral part of the financial statements.
Russell U.S. Defensive Equity Fund 45
Russell Investment Company
Russell U.S. Defensive Equity Fund
Statements of Changes in Net Assets
| For the Periods Ended October 31, | ||||||
| Amounts in thousands | 2016 | 2015 | ||||
| Increase (Decrease) in Net Assets | ||||||
| Operations | ||||||
| Net investment income (loss) | $ | 11,308 | $ | 15,433 | ||
| Net realized gain (loss) | 80,752 | 120,171 | ||||
| Net change in unrealized appreciation (depreciation) | (46,959 | ) | (79,135 | ) | ||
| Net increase (decrease) in net assets from operations | 45,101 | 56,469 | ||||
| Distributions | ||||||
| From net investment income | ||||||
| Class A | (282 | ) | (267 | ) | ||
| Class C | (158 | ) | (159 | ) | ||
| Class E | (65 | ) | (85 | ) | ||
| Class I | (2,490 | ) | (3,169 | ) | ||
| Class S | (2,579 | ) | (3,071 | ) | ||
| Class Y | (6,106 | ) | (8,698 | ) | ||
| Net decrease in net assets from distributions | (11,680 | ) | (15,449 | ) | ||
| Share Transactions* | ||||||
| Net increase (decrease) in net assets from share transactions | (400,831 | ) | (254,561 | ) | ||
| Total Net Increase (Decrease) in Net Assets | (367,410 | ) | (213,541 | ) | ||
| Net Assets | ||||||
| Beginning of period | 995,397 | 1,208,938 | ||||
| End of period | $ | 627,987 | $ | 995,397 | ||
| Undistributed (overdistributed) net investment income included in net assets | $ | 255 | $ | 349 | ||
See accompanying notes which are an integral part of the financial statements.
46 Russell U.S. Defensive Equity Fund
Russell Investment Company
Russell U.S. Defensive Equity Fund
Statements of Changes in Net Assets, continued
* Share transaction amounts (in thousands) for the periods ended October 31, 2016 and October 31, 2015 were as follows:
| 2016 | 2015 | |||||||||||
| Shares | Dollars | Shares | Dollars | |||||||||
| Class A | ||||||||||||
| Proceeds from shares sold | 219 | $ | 10,482 | 68 | $ | 3,155 | ||||||
| Proceeds from reinvestment of distributions | 6 | 274 | 5 | 254 | ||||||||
| Payments for shares redeemed | (99 | ) | (4,790 | ) | (169 | ) | (7,998 | ) | ||||
| Net increase (decrease) | 126 | 5,966 | (96 | ) | (4,589 | ) | ||||||
| Class C | ||||||||||||
| Proceeds from shares sold | 83 | 4,005 | 49 | 2,310 | ||||||||
| Proceeds from reinvestment of distributions | 3 | 155 | 3 | 156 | ||||||||
| Payments for shares redeemed | (164 | ) | (7,906 | ) | (190 | ) | (8,911 | ) | ||||
| Net increase (decrease) | (78 | ) | (3,746 | ) | (138 | ) | (6,445 | ) | ||||
| Class E | ||||||||||||
| Proceeds from shares sold | 12 | 571 | 10 | 460 | ||||||||
| Proceeds from reinvestment of distributions | 1 | 64 | 2 | 84 | ||||||||
| Payments for shares redeemed | (27 | ) | (1,288 | ) | (89 | ) | (4,097 | ) | ||||
| Net increase (decrease) | (14 | ) | (653 | ) | (77 | ) | (3,553 | ) | ||||
| Class I | ||||||||||||
| Proceeds from shares sold | 246 | 11,814 | 449 | 20,928 | ||||||||
| Proceeds from reinvestment of distributions | 49 | 2,364 | 66 | 3,092 | ||||||||
| Payments for shares redeemed | (1,264 | ) | (60,623 | ) | (2,101 | ) | (98,960 | ) | ||||
| Net increase (decrease) | (969 | ) | (46,445 | ) | (1,586 | ) | (74,940 | ) | ||||
| Class S | ||||||||||||
| Proceeds from shares sold | 653 | 30,978 | 548 | 25,821 | ||||||||
| Proceeds from reinvestment of distributions | 51 | 2,473 | 63 | 2,956 | ||||||||
| Payments for shares redeemed | (1,206 | ) | (57,990 | ) | (2,201 | ) | (103,997 | ) | ||||
| Net increase (decrease) | (502 | ) | (24,539 | ) | (1,590 | ) | (75,220 | ) | ||||
| Class Y | ||||||||||||
| Proceeds from shares sold | 414 | 20,053 | 1,119 | 53,548 | ||||||||
| Proceeds from reinvestment of distributions | 126 | 6,106 | 186 | 8,698 | ||||||||
| Payments for shares redeemed | (7,190 | ) | (357,573 | ) | (3,234 | ) | (152,060 | ) | ||||
| Net increase (decrease) | (6,650 | ) | (331,414 | ) | (1,929 | ) | (89,814 | ) | ||||
| Total increase (decrease) | (8,087 | ) | $ | (400,831 | ) | (5,416 | ) | $ | (254,561 | ) | ||
See accompanying notes which are an integral part of the financial statements.
Russell U.S. Defensive Equity Fund 47
Russell Investment Company
Russell U.S. Defensive Equity Fund
Financial Highlights — For the Periods Ended
For a Share Outstanding Throughout Each Period.
| $ | $ | $ | $ | $ | ||||||||||
| Net Asset Value, | Net | Net Realized | Total from | Distributions | ||||||||||
| Beginning of | Investment | and Unrealized | Investment | from Net | $ | |||||||||
| Period | Income (Loss) (a)(d) | Gain (Loss) | Operations | Investment Income | Total Distributions | |||||||||
| Class A | ||||||||||||||
| October 31, 2016 | 47.76 | .45 | 1.55 | 2.00 | (.54 | ) | (.54 | ) | ||||||
| October 31, 2015 | 46.04 | .50 | 1.72 | 2.22 | (.50 | ) | (.50 | ) | ||||||
| October 31, 2014 | 40.06 | .40 | 6.00 | 6.40 | (.42 | ) | (.42 | ) | ||||||
| October 31, 2013 | 32.65 | .43 | 7.42 | 7.85 | (.44 | ) | (.44 | ) | ||||||
| October 31, 2012 | 29.57 | .27 | 3.11 | 3.38 | (.30 | ) | (.30 | ) | ||||||
| Class C | ||||||||||||||
| October 31, 2016 | 47.52 | .10 | 1.53 | 1.63 | (.17 | ) | (.17 | ) | ||||||
| October 31, 2015 | 45.80 | .15 | 1.72 | 1.87 | (.15 | ) | (.15 | ) | ||||||
| October 31, 2014 | 39.87 | .08 | 5.95 | 6.03 | (.10 | ) | (.10 | ) | ||||||
| October 31, 2013 | 32.50 | .16 | 7.38 | 7.54 | (.17 | ) | (.17 | ) | ||||||
| October 31, 2012 | 29.45 | .03 | 3.10 | 3.13 | (.08 | ) | (.08 | ) | ||||||
| Class E | ||||||||||||||
| October 31, 2016 | 47.82 | .46 | 1.54 | 2.00 | (.53 | ) | (.53 | ) | ||||||
| October 31, 2015 | 46.08 | .52 | 1.71 | 2.23 | (.49 | ) | (.49 | ) | ||||||
| October 31, 2014 | 40.08 | .42 | 5.98 | 6.40 | (.40 | ) | (.40 | ) | ||||||
| October 31, 2013 | 32.66 | .44 | 7.41 | 7.85 | (.43 | ) | (.43 | ) | ||||||
| October 31, 2012 | 29.54 | .30 | 3.09 | 3.39 | (.27 | ) | (.27 | ) | ||||||
| Class I | ||||||||||||||
| October 31, 2016 | 47.75 | .63 | 1.53 | 2.16 | (.69 | ) | (.69 | ) | ||||||
| October 31, 2015 | 46.03 | .66 | 1.72 | 2.38 | (.66 | ) | (.66 | ) | ||||||
| October 31, 2014 | 40.06 | .55 | 5.99 | 6.54 | (.57 | ) | (.57 | ) | ||||||
| October 31, 2013 | 32.65 | .55 | 7.42 | 7.97 | (.56 | ) | (.56 | ) | ||||||
| October 31, 2012 | 29.57 | .38 | 3.11 | 3.49 | (.41 | ) | (.41 | ) | ||||||
| Class S | ||||||||||||||
| October 31, 2016 | 47.82 | .59 | 1.53 | 2.12 | (.65 | ) | (.65 | ) | ||||||
| October 31, 2015 | 46.09 | .63 | 1.72 | 2.35 | (.62 | ) | (.62 | ) | ||||||
| October 31, 2014 | 40.11 | .51 | 6.00 | 6.51 | (.53 | ) | (.53 | ) | ||||||
| October 31, 2013 | 32.69 | .53 | 7.42 | 7.95 | (.53 | ) | (.53 | ) | ||||||
| October 31, 2012 | 29.59 | .35 | 3.10 | 3.45 | (.35 | ) | (.35 | ) | ||||||
| Class Y | ||||||||||||||
| October 31, 2016 | 47.75 | .70 | 1.52 | 2.22 | (.75 | ) | (.75 | ) | ||||||
| October 31, 2015 | 46.03 | .71 | 1.73 | 2.44 | (.72 | ) | (.72 | ) | ||||||
| October 31, 2014 | 40.06 | .60 | 5.99 | 6.59 | (.62 | ) | (.62 | ) | ||||||
| October 31, 2013 | 32.65 | .59 | 7.42 | 8.01 | (.60 | ) | (.60 | ) | ||||||
| October 31, 2012 | 29.58 | .42 | 3.10 | 3.52 | (.45 | ) | (.45 | ) | ||||||
See accompanying notes which are an integral part of the financial statements.
48 Russell U.S. Defensive Equity Fund
| % | % | % | ||||||||||||
| $ | $ | Ratio of Expenses | Ratio of Expenses | Ratio of Net | ||||||||||
| Net Asset Value, | % | Net Assets, | to Average | to Average | Investment Income | % | ||||||||
| End of | Total | End of Period | Net Assets, | Net Assets, | to Average | Portfolio | ||||||||
| Period | Return(c) | (000 | ) | Gross(l) | Net(d)(g)(l) | Net Assets(d) | Turnover Rate(k) | |||||||
| 49.22 | 4.21 | 28,450 | 1.26 | 1.26 | .93 | 94 | ||||||||
| 47.76 | 4.86 | 21,590 | 1.09 | 1.09 | 1.07 | 93 | ||||||||
| 46.04 | 16.05 | 25,233 | 1.09 | 1.09 | .94 | 105 | ||||||||
| 40.06 | 24.18 | 26,019 | 1.10 | 1.10 | 1.17 | 105 | ||||||||
| 32.65 | 11.47 | 21,977 | 1.28 | 1.28 | .85 | 150 | ||||||||
| 48.98 | 3.43 | 43,815 | 2.01 | 2.01 | .20 | 94 | ||||||||
| 47.52 | 4.09 | 46,206 | 1.84 | 1.84 | .32 | 93 | ||||||||
| 45.80 | 15.15 | 50,833 | 1.84 | 1.84 | .19 | 105 | ||||||||
| 39.87 | 23.30 | 48,222 | 1.85 | 1.85 | .44 | 105 | ||||||||
| 32.50 | 10.64 | 45,352 | 2.03 | 2.03 | .10 | 150 | ||||||||
| 49.29 | 4.20 | 5,781 | 1.26 | 1.26 | .95 | 94 | ||||||||
| 47.82 | 4.87 | 6,262 | 1.09 | 1.09 | 1.10 | 93 | ||||||||
| 46.08 | 16.03 | 9,598 | 1.09 | 1.09 | .97 | 105 | ||||||||
| 40.08 | 24.23 | 17,140 | 1.10 | 1.09 | 1.21 | 105 | ||||||||
| 32.66 | 11.47 | 18,709 | 1.28 | 1.23 | .93 | 150 | ||||||||
| 49.22 | 4.55 | 152,494 | .93 | .93 | 1.29 | 94 | ||||||||
| 47.75 | 5.21 | 194,202 | .76 | .76 | 1.41 | 93 | ||||||||
| 46.03 | 16.41 | 260,235 | .76 | .76 | 1.28 | 105 | ||||||||
| 40.06 | 24.63 | 276,370 | .77 | .77 | 1.52 | 105 | ||||||||
| 32.65 | 11.83 | 280,933 | .95 | .95 | 1.19 | 150 | ||||||||
| 49.29 | 4.46 | 181,534 | 1.01 | 1.01 | 1.21 | 94 | ||||||||
| 47.82 | 5.14 | 200,122 | .84 | .84 | 1.34 | 93 | ||||||||
| 46.09 | 16.32 | 266,202 | .84 | .84 | 1.20 | 105 | ||||||||
| 40.11 | 24.53 | 275,158 | .85 | .85 | 1.45 | 105 | ||||||||
| 32.69 | 11.70 | 289,196 | 1.03 | 1.03 | 1.10 | 150 | ||||||||
| 49.22 | 4.67 | 215,913 | .81 | .81 | 1.46 | 94 | ||||||||
| 47.75 | 5.34 | 527,015 | .64 | .64 | 1.51 | 93 | ||||||||
| 46.03 | 16.54 | 596,837 | .64 | .64 | 1.39 | 105 | ||||||||
| 40.06 | 24.78 | 586,634 | .65 | .65 | 1.64 | 105 | ||||||||
| 32.65 | 11.93 | 568,935 | .85 | .85 | 1.31 | 150 | ||||||||
See accompanying notes which are an integral part of the financial statements.
Russell U.S. Defensive Equity Fund 49
Russell Investment Company
Russell U.S.Defensive Equity Fund
Related Party Transactions, Fees and Expenses
| Accrued fees payable to affiliates for the period ended October 31, 2016 were as follows: | ||
| Advisory fees | $ | 296,518 |
| Administration fees | 26,047 | |
| Distribution fees | 34,413 | |
| Shareholder servicing fees | 10,689 | |
| Transfer agent fees | 62,244 | |
| Trustee fees | 3,129 | |
| $ | 433,040 | |
| Transactions (amounts in thousands) during the period ended October 31, 2016 with Underlying Funds which are, or were, an | |||||||||||||||||||
| affiliated company are as follows: | |||||||||||||||||||
| Fair Value, | Change in | ||||||||||||||||||
| Beginning of | Realized Gain | Unrealized | Fair Value, End | Income | Capital Gains | ||||||||||||||
| Period | Purchases | Sales | (Loss) | Gain (Loss) | of Period | Distributions | Distributions | ||||||||||||
| Russell U.S. Cash Management Fund | $ | 66,229 | $ | 632,024 | $ | 631,125 | $ | 1 | $ | 12 | $ | 67,141 | $ | 351 | $ | — | |||
| $ | 66,229 | $ | 632,024 | $ | 631,125 | $ | 1 | $ | 12 | $ | 67,141 | $ | 351 | $ | — | ||||
Federal Income Taxes
At October 31, 2016, the cost of investments and net unrealized appreciation (depreciation), undistributed ordinary income and
undistributed long-term capital gains for income tax purposes were as follows:.
| Cost of Investments | $ | 632,448,137 | |||
| Unrealized Appreciation | $ | 53,720,630 | |||
| Unrealized Depreciation | (15,239,543 | ) | |||
| Net Unrealized Appreciation (Depreciation) | $ | 38,481,087 | |||
| Undistributed Long-Term Capital Gains | |||||
| (Capital Loss Carryforward) | $ | 43,168,775 | |||
| Tax Composition of Distributions | |||||
| Ordinary Income | $ | 11,475,815 | |||
| Long-Term Capital Gains | $ | 204,528 |
Net investment income and net realized gains (loss) in the financial statements may differ from taxable net investment income and net
realized gains (losses). Capital accounts within the financial statements are adjusted for permanent book-tax differences. Book-tax
differences are primarily due to foreign currency gains and losses, reclassifications of dividends, differences in treatment of income
from swaps, net operating losses, investments in partnerships, investments in passive foreign investment companies (PFICs), tax
straddle transactions, use of tax equalization and foreign capital gains taxes. These adjustments have no impact on the net assets.
At October 31, 2016, the Statement of Assets and Liabilities have been adjusted by the following amounts (in thousands):
| Undistributed net investment income | $ | 278 | |
| Accumulated net realized gain (loss) | (14,769 | ) | |
| Additional paid-in capital | 14,491 |
See accompanying notes which are an integral part of the financial statements.
50 Russell U.S.Defensive Equity Fund
Russell Investment Company
Russell U.S. Dynamic Equity Fund
Portfolio Management Discussion and Analysis — October 31, 2016 (Unaudited)

| Russell U.S. Dynamic Equity Fund - Class A‡ | Russell U.S. Dynamic Equity Fund - Class S | ||||||
| Total | Total | ||||||
| Return | Return | ||||||
| 1 Year | (3.80 | )% | 1 Year | 2.34 | % | ||
| 5 Years | 10.89 | %§ | 5 Years | 12.45 | %§ | ||
| 10 Years | 5.81 | %§ | 10 Years | 6.68 | %§ | ||
| Russell U.S. Dynamic Equity Fund - Class C | Russell U.S. Dynamic Equity Fund - Class Y‡‡ | ||||||
| Total | Total | ||||||
| Return | Return | ||||||
| 1 Year | 1.41 | % | 1 Year | 2.52 | % | ||
| 5 Years | 11.38 | %§ | 5 Years | 12.69 | %§ | ||
| 10 Years | 5.63 | %§ | 10 Years | 6.87 | %§ | ||
| Russell U.S. Dynamic Equity Fund - Class E | Russell 1000® Dynamic IndexTM** | ||||||
| Total | Total | ||||||
| Return | Return | ||||||
| 1 Year | 2.01 | % | 1 Year | 3.79 | % | ||
| 5 Years | 12.17 | %§ | 5 Years | 13.60 | %§ | ||
| 10 Years | 6.42 | %§ | 10 Years | 6.34 | %§ | ||
| U.S. Dynamic Equity Linked Benchmark*** | |||||||
| Russell U.S. Dynamic Equity Fund - Class I | Total | ||||||
| Return | |||||||
| Total | |||||||
| Return | 1 Year | 3.79 | % | ||||
| 1 Year | 2.47 | % | 5 Years | 13.99 | %§ | ||
| 5 Years | 12.59 | %§ | 10 Years | 8.38 | %§ | ||
| 10 Years | 6.82 | %§ | |||||
Russell U.S. Dynamic Equity Fund 51
Russell Investment Company
Russell U.S. Dynamic Equity Fund
Portfolio Management Discussion and Analysis, continued — October 31, 2016
(Unaudited)
| The Russell U.S. Dynamic Equity Fund (the “Fund”) employs | effect on Fund performance as the pace of interest rate increases |
| a multi-manager approach whereby portions of the Fund are | was slower than the market had expected and investors became |
| allocated to different money manager strategies. Fund assets not | concerned that the odds of a recession may be increasing. |
| allocated to money managers are managed by Russell Investment | However, market conditions in the second half of the fiscal year |
| Management, LLC (“RIM”), the Fund’s advisor. RIM may change | allowed the Fund to improve performance as expectations firmed- |
| the allocation of the Fund’s assets among money managers at | up regarding the economic outlook and the timing of next interest |
| any time. An exemptive order from the Securities and Exchange | rate increase. |
| Commission (“SEC”) permits RIM to engage or terminate a money | |
| manager at any time, subject to approval by the Fund’s Board, | How did the investment strategies and techniques employed |
| without a shareholder vote. Pursuant to the terms of the exemptive | by the Fund and its money managers affect its benchmark- |
| order, the Fund is required to notify its shareholders within 90 | relative performance? |
| days of when a money manager begins providing services. As of | An overweight to stocks with the lowest price-to-earnings ratios and |
| October 31, 2016, the Fund had four money managers. | an underweight to the lowest beta stocks detracted. However, an |
| underweight to stocks with low quality balance sheets contributed | |
| What is the Fund’s investment objective? | positively to benchmark-relative performance. An overweight to |
| The Fund seeks to provide long term capital growth. | the technology sector was beneficial, but underweights to the |
| How did the Fund perform relative to its benchmark for the | telecommunication services and consumer staples sectors were |
| fiscal year ended October 31, 2016? | not rewarded. Overweights to the airlines and pharmaceuticals |
| industries held back benchmark-relative performance. Stock | |
| For the fiscal year ended October 31, 2016, the Fund’s Class A, | selection was beneficial within the health care sector (overweight |
| Class C, Class E, Class I, Class S and Class Y Shares gained | Tesaro, Inc. and Anacor Pharmaceuticals, underweight Allergan) |
| 2.10%, 1.41%, 2.01%, 2.47%, 2.34% and 2.52%, respectively. | for the fiscal year. |
| This is compared to the Fund’s benchmark, the Russell 1000® | |
| Dynamic Index™, which gained 3.79% during the same period. | The Fund employs discretionary money managers. The Fund’s |
| The Fund’s performance includes operating expenses, whereas | discretionary money managers select the individual portfolio |
| index returns are unmanaged and do not include expenses of any | securities for the assets assigned to them. Fund assets not |
| kind. | allocated to discretionary money managers include the Fund’s |
| liquidity reserves and assets which may be managed directly by | |
| For the fiscal year ended October 31, 2016, the Morningstar® | RIM to effect the Fund’s investment strategies and/or to actively |
| Large Blend Category, a group of funds that Morningstar considers | manage the Fund’s overall exposures by investing in securities or |
| to have investment strategies similar to those of the Fund, gained | other instruments that RIM believes will achieve the desired risk/ |
| 2.12%. This result serves as a peer comparison and is expressed | return profile for the Fund. |
| net of operating expenses. | |
| With respect to certain of the Fund’s money managers, Suffolk | |
| RIM may assign a money manager a specific style or | Capital Management, LLC (“Suffolk”) was the best performing |
| capitalization benchmark other than the Fund’s index. However, | manager for the period and outperformed the Russell 1000® |
| the Fund’s primary index remains the benchmark for the Fund | Dynamic Index™. Stock selection within the health care sector |
| and is representative of the aggregate of each money manager’s | (an overweight to Tesaro, Inc. and Anacor Pharmaceuticals) |
| benchmark index. | and within the information technology sector (an overweight to |
| How did the market conditions described in the Market | Hewlett Packard and Broadcom Limited) was a significant driver |
| Summary report affect the Fund’s performance? | of positive benchmark-relative performance. Suffolk’s tilt toward |
| During the fiscal year, the U.S. large capitalization equity market | stocks with good quality balance sheets (low debt-to-capital |
| produced positive returns. Fund exposures included tilts toward | ratios) was beneficial. |
| value stocks with low price-to-earnings ratios. The Fund was | AJO, LP (“AJO”) was the worst performing manager for the |
| tilted away from most of the interest rate sensitive areas of the | period and underperformed the Russell 1000® Dynamic Index™. |
| market including real estate investment trusts, utilities and | AJO’s tilt toward stocks with the lowest price-to-earnings ratios |
| telecommunication services stocks. The Fund was also tilted | and toward stocks with high earnings variability detracted. An |
| away from less economically sensitive, high dividend yield, and | overweight to the airline industry held back relative returns. |
| low beta stocks (beta is a measure of a stock’s sensitivity to the | Stock selection within the energy sector (an overweight to Ensco |
| direction of the market) such as consumer staples. Overall, the | and Noble Corporation) detracted. |
| market conditions of the first half of the fiscal year had a negative | |
52 Russell U.S. Dynamic Equity Fund
Russell Investment Company
Russell U.S. Dynamic Equity Fund
Portfolio Management Discussion and Analysis, continued — October 31, 2016
(Unaudited)
| RIM manages an 8% strategic allocation to a positioning strategy | among the other discretionary money managers. The objective of | |
| to seek to achieve the desired risk/return profile for the Fund. The | this change was to improve the Fund’s excess return potential and | |
| positioning strategy utilizes the output from a quantitative model | decrease the number of managers/stocks in the Fund. | |
| to seek to position the portfolio to meet RIM’s overall preferred | ||
| positioning. The positioning strategy underperformed the Russell | Money Managers as of October 31, | |
| 1000® Dynamic Index™ during the one year period. A tilt toward | 2016 | Styles |
| stocks with the lowest price-to-earnings ratios held back relative | AJO, LP | Dynamic |
| performance, but overweights of low beta stocks and high dividend | Jacobs Levy Equity Management, Inc. | Dynamic |
| Pzena Investment Management, LLC | Value | |
| yield stocks were rewarded. Overweights to the financials and | Suffolk Capital Management, LLC | Dynamic |
| energy sectors and an underweight to the information technology | The views expressed in this report reflect those of the | |
| sector detracted. However, an underweight to the biotechnology | portfolio managers only through the end of the period | |
| industry was beneficial. | covered by the report. These views do not necessarily | |
| During the period, RIM used index futures contracts to equitize | represent the views of RIM, or any other person in RIM or | |
| the Fund’s cash. The decision to equitize the Fund’s cash was | any other affiliated organization. These views are subject | |
| beneficial to Fund performance for the fiscal year as the market | to change at any time based upon market conditions or | |
| had a positive absolute return. | other events, and RIM disclaims any responsibility to | |
| update the views contained herein. These views should not | ||
| Describe any changes to the Fund’s structure or the money | be relied on as investment advice and, because investment | |
| manager line-up. | decisions for a Russell Investment Company (“RIC”) Fund | |
| In March of 2016, RIM terminated Cornerstone Capital | are based on numerous factors, should not be relied on as | |
| Management, Inc. (“Cornerstone”) as a discretionary money | an indication of investment decisions of any RIC Fund. | |
| manager for the Fund and Cornerstone’s assets were allocated | ||
^ In prior years, the performance of the Fund’s Class I shares was used in the line graph. Class S Shares will have substantially similar annual returns as the Class
I Shares because the Shares of each Class are invested in the same portfolio of securities. Annual returns for each Class will differ only to the extent that the
Class S Shares do not have the same expenses as the Class I Shares.
* Assumes initial investment on November 1, 2006.
** The Russell 1000® Dynamic IndexTM measures the performance of the large-cap dynamic segment of the U.S. equity universe. It includes the Russell 1000 Index
companies with relatively less stable business conditions which are more sensitive to economic cycle, credit cycle and market volatility based on their stability
variables. Stability is measured in terms of volatility (price and earnings), leverage, and return on assets.
*** The U.S. Dynamic Equity Linked Benchmark provides a means to compare the Fund’s average annual returns to a secondary benchmark that takes into account
historical changes in the Fund’s primary benchmark. The U.S. Dynamic Equity Linked Benchmark represents the returns of the Russell 1000® Growth Index
through August 14, 2012 and the returns of the Russell 1000® Dynamic IndexTM thereafter.
‡ The Fund first issued Class A Shares on August 15, 2012. The returns shown for Class A Shares prior to that date are the returns of Class E Shares. The
performance shown has been adjusted to reflect the deduction of the maximum Class A sales charge of 5.75%. Annual returns for each Class will differ only to
the extent that the Class A Shares do not have the same expenses as Class E Shares.
‡‡ The Fund first issued Class Y Shares on August 15, 2012. The returns shown for Class Y Shares prior to that date are the returns of the Fund’s Class I Shares.
Class Y Shares will have substantially similar annual returns as the Class I Shares because the Shares of each Class are invested in the same portfolio of
securities. Annual returns for each Class will differ only to the extent that the Class Y Shares do not have the same expenses as the Class I Shares.
§ Annualized.
Performance is historical and assumes reinvestment of all dividends and capital gains. Investment return and principal value will fluctuate so that an investor’s
shares, when redeemed, may be worth more or less than when purchased. Past performance is not indicative of future results. The returns shown do not reflect the
deduction of taxes that a shareholder would pay on Fund distributions or the redemption of Fund shares. Additionally, the returns presented herein may differ from
the performance reported in the Financial Highlights as the returns herein are calculated in a manner consistent with standardized performance in accordance with
Securities and Exchange Commission rules, while the performance in the Financial Highlights has been calculated in accordance with U.S. Generally Accepted
Accounting Principles (“U.S. GAAP”).
Russell U.S. Dynamic Equity Fund 53
Russell Investment Company
Russell U.S. Dynamic Equity Fund
Shareholder Expense Example — October 31, 2016 (Unaudited)
| Fund Expenses | Please note that the expenses shown in the table are meant | |||||
| The following disclosure provides important information | to highlight your ongoing costs only and do not reflect any | |||||
| regarding the Fund’s Shareholder Expense Example | transactional costs. Therefore, the information under the heading | |||||
| (“Example”). | “Hypothetical Performance (5% return before expenses)” is | |||||
| useful in comparing ongoing costs only, and will not help you | ||||||
| Example | determine the relative total costs of owning different funds. In | |||||
| As a shareholder of the Fund, you incur two types of costs: (1) | addition, if these transactional costs were included, your costs | |||||
| transaction costs, including sales charges (loads) on certain | would have been higher. | |||||
| purchase or redemption payments, and (2) ongoing costs, | Hypothetical | |||||
| including distribution (12b-1) and/or service fees and other | Performance (5% | |||||
| Fund expenses. The Example is intended to help you understand | Actual | return before | ||||
| your ongoing costs (in dollars) of investing in the Fund and to | Class A | Performance | expenses) | |||
| Beginning Account Value | ||||||
| compare these costs with the ongoing costs of investing in other | May 1, 2016 | $ | 1,000.00 | $ | 1,000.00 | |
| mutual funds. The Example is based on an investment of $1,000 | Ending Account Value | |||||
| invested at the beginning of the period and held for the entire | October 31, 2016 | $ | 1,055.20 | $ | 1,017.44 | |
| period indicated, which for this Fund is from May 1, 2016 to | Expenses Paid During Period* | $ | 7.90 | $ | 7.76 | |
| October 31, 2016. | * Expenses are equal to the Fund's annualized expense ratio of 1.53% | |||||
| (representing the six month period annualized), multiplied by the average | ||||||
| Actual Expenses | account value over the period, multiplied by 184/366 (to reflect the one-half | |||||
| The information in the table under the heading “Actual | year period). | |||||
| Performance” provides information about actual account values | ||||||
| and actual expenses. You may use the information in this column, | Hypothetical | |||||
| Performance (5% | ||||||
| together with the amount you invested, to estimate the expenses | Actual | return before | ||||
| that you paid over the period. Simply divide your account value by | Class C | Performance | expenses) | |||
| $1,000 (for example, an $8,600 account value divided by $1,000 | Beginning Account Value | |||||
| = 8.6), then multiply the result by the number in the first column | May 1, 2016 | $ | 1,000.00 | $ | 1,000.00 | |
| Ending Account Value | ||||||
| in the row entitled “Expenses Paid During Period” to estimate | October 31, 2016 | $ | 1,050.30 | $ | 1,013.67 | |
| the expenses you paid on your account during this period. | Expenses Paid During Period* | $ | 11.75 | $ | 11.54 | |
| Hypothetical Example for Comparison Purposes | * Expenses are equal to the Fund's annualized expense ratio of 2.28% | |||||
| The information in the table under the heading “Hypothetical | (representing the six month period annualized), multiplied by the average | |||||
| account value over the period, multiplied by 184/366 (to reflect the one-half | ||||||
| Performance (5% return before expenses)” provides information | year period). | |||||
| about hypothetical account values and hypothetical expenses | ||||||
| based on the Fund’s actual expense ratio and an assumed rate of | Hypothetical | |||||
| return of 5% per year before expenses, which is not the Fund’s | Performance (5% | |||||
| Actual | return before | |||||
| actual return. The hypothetical account values and expenses | Class E | Performance | expenses) | |||
| may not be used to estimate the actual ending account balance or | Beginning Account Value | |||||
| expenses you paid for the period. You may use this information | May 1, 2016 | $ | 1,000.00 | $ | 1,000.00 | |
| to compare the ongoing costs of investing in the Fund and other | Ending Account Value | |||||
| October 31, 2016 | $ | 1,053.90 | $ | 1,017.44 | ||
| funds. To do so, compare this 5% hypothetical example with the | Expenses Paid During Period* | $ | 7.90 | $ | 7.76 | |
| 5% hypothetical examples that appear in the shareholder reports | ||||||
| of other funds. | * Expenses are equal to the Fund's annualized expense ratio of 1.53% | |||||
| (representing the six month period annualized), multiplied by the average | ||||||
| account value over the period, multiplied by 184/366 (to reflect the one-half | ||||||
| year period). | ||||||
54 Russell U.S. Dynamic Equity Fund
Russell Investment Company
Russell U.S. Dynamic Equity Fund
Shareholder Expense Example, continued — October 31, 2016 (Unaudited)
| Hypothetical | |||||
| Performance (5% | |||||
| Actual | return before | ||||
| Class I | Performance | expenses) | |||
| Beginning Account Value | |||||
| May 1, 2016 | $ | 1,000.00 | $ | 1,000.00 | |
| Ending Account Value | |||||
| October 31, 2016 | $ | 1,056.30 | $ | 1,019.10 | |
| Expenses Paid During Period* | $ | 6.20 | $ | 6.09 | |
| * Expenses are equal to the Fund's annualized expense ratio of 1.20% | |||||
| (representing the six month period annualized), multiplied by the average | |||||
| account value over the period, multiplied by 184/366 (to reflect the one-half | |||||
| year period). | |||||
| Hypothetical | |||||
| Performance (5% | |||||
| Actual | return before | ||||
| Class S | Performance | expenses) | |||
| Beginning Account Value | |||||
| May 1, 2016 | $ | 1,000.00 | $ | 1,000.00 | |
| Ending Account Value | |||||
| October 31, 2016 | $ | 1,055.80 | $ | 1,018.70 | |
| Expenses Paid During Period* | $ | 6.61 | $ | 6.50 | |
| * Expenses are equal to the Fund's annualized expense ratio of 1.28% | |||||
| (representing the six month period annualized), multiplied by the average | |||||
| account value over the period, multiplied by 184/366 (to reflect the one-half | |||||
| year period). | |||||
| Hypothetical | |||||
| Performance (5% | |||||
| Actual | return before | ||||
| Class Y | Performance | expenses) | |||
| Beginning Account Value | |||||
| May 1, 2016 | $ | 1,000.00 | $ | 1,000.00 | |
| Ending Account Value | |||||
| October 31, 2016 | $ | 1,056.10 | $ | 1,019.71 | |
| Expenses Paid During Period* | $ | 5.58 | $ | 5.48 | |
| * Expenses are equal to the Fund's annualized expense ratio of 1.08% | |||||
| (representing the six month period annualized), multiplied by the average | |||||
| account value over the period, multiplied by 184/366 (to reflect the one-half | |||||
| year period). | |||||
Russell U.S. Dynamic Equity Fund 55
Russell Investment Company
Russell U.S. Dynamic Equity Fund
Schedule of Investments — October 31, 2016
| Amounts in thousands (except share amounts) | Amounts in thousands (except share amounts) | ||||||
| Principal | Fair | Principal | Fair | ||||
| Amount ($) or | Value | Amount ($) or | Value | ||||
| Shares | $ | Shares | $ | ||||
| Common Stocks - 101.2% | Tenneco, Inc.(Æ) | 17,621 | 970 | ||||
| Consumer Discretionary - 17.0% | Thomson Reuters Corp. | 7,823 | 308 | ||||
| Aaron's, Inc. Class A | 36,600 | 904 | Time Warner, Inc. | 26,007 | 2,314 | ||
| Amazon.com, Inc.(Æ) | 13,804 | 10,903 | Time, Inc. | 24,319 | 316 | ||
| AMC Networks, Inc. Class A(Æ) | 10,670 | 522 | TJX Cos., Inc. | 4,898 | 361 | ||
| Avis Budget Group, Inc.(Æ) | 6,701 | 217 | Toll Brothers, Inc.(Æ) | 6,131 | 168 | ||
| Bed Bath & Beyond, Inc. | 19,879 | 804 | Twenty-First Century Fox, Inc. Class A | 33,368 | 877 | ||
| Best Buy Co., Inc. | 40,912 | 1,592 | Visteon Corp. | 22,693 | 1,602 | ||
| Big Lots, Inc. | 25,056 | 1,087 | Wal-Mart Stores, Inc. | 27,042 | 1,894 | ||
| Bloomin' Brands, Inc. | 34,839 | 603 | Walt Disney Co. (The) | 3,931 | 364 | ||
| Brinker International, Inc. | 3,050 | 150 | Yum! Brands, Inc. | 13,409 | 1,157 | ||
| Carnival Corp. | 6,997 | 344 | |||||
| Charter Communications, Inc. Class A(Æ) | 950 | 237 | 78,407 | ||||
| Coach, Inc. | 12,039 | 432 | |||||
| Comcast Corp. Class A | 5,558 | 344 | Consumer Staples - 2.9% | ||||
| Altria Group, Inc. | 2,112 | 140 | |||||
| Cooper Tire & Rubber Co. | 32,218 | 1,184 | Archer-Daniels-Midland Co. | 28,815 | 1,256 | ||
| Cooper-Standard Holding, Inc.(Æ) | 7,100 | 648 | Bunge, Ltd. | 16,600 | 1,029 | ||
| Costco Wholesale Corp. | 354 | 52 | Colgate-Palmolive Co. | 737 | 53 | ||
| Coty, Inc. Class A(Æ) | 1,539 | 35 | Constellation Brands, Inc. Class A | 355 | 59 | ||
| Dana, Inc. | 88,344 | 1,368 | CVS Health Corp. | 1,416 | 119 | ||
| Delphi Automotive PLC | 48,375 | 3,148 | Dean Foods Co. | 61,721 | 1,127 | ||
| Discovery Communications, Inc. Class A(Æ) | 156,733 | 4,092 | Ingredion, Inc. | 6,700 | 879 | ||
| Domino's Pizza, Inc. | 5,940 | 1,005 | Kimberly-Clark Corp. | 298 | 34 | ||
| eBay, Inc.(Æ)(Û) | 58,427 | 1,666 | Kraft Heinz Co. (The) | 35,906 | 3,194 | ||
| Fiat Chrysler Automobiles NV | 201,307 | 1,474 | Kroger Co. (The) | 40,007 | 1,239 | ||
| Ford Motor Co. | 234,493 | 2,753 | Molson Coors Brewing Co. Class B | 540 | 56 | ||
| General Motors Co.(Û) | 120,079 | 3,795 | Mondelez International, Inc. Class A | 687 | 31 | ||
| Goodyear Tire & Rubber Co. (The) | 29,026 | 843 | Monster Beverage Corp.(Æ) | 405 | 59 | ||
| Graham Holdings Co. Class B | 78 | 37 | Nu Skin Enterprises, Inc. Class A | 7,916 | 488 | ||
| Harman International Industries, Inc. | 13,380 | 1,067 | PepsiCo, Inc. | 2,360 | 253 | ||
| Hilton Worldwide Holdings, Inc. | 60,375 | 1,365 | Performance Food Group Co.(Æ) | 11,100 | 266 | ||
| Home Depot, Inc. (The) | 2,812 | 343 | Philip Morris International, Inc. | 1,874 | 181 | ||
| IMAX Corp.(Æ) | 83,579 | 2,528 | Procter & Gamble Co. (The) | 3,208 | 278 | ||
| Interpublic Group of Cos., Inc. (The) | 27,075 | 606 | Sysco Corp. | 30,347 | 1,460 | ||
| Kohl's Corp. | 3,308 | 145 | Tyson Foods, Inc. Class A | 11,308 | 801 | ||
| Las Vegas Sands Corp. | 2,426 | 140 | Walgreens Boots Alliance, Inc. | 2,931 | 243 | ||
| Lear Corp. | 13,407 | 1,646 | |||||
| Lennar Corp. Class A | 1,841 | 77 | 13,245 | ||||
| Lowe's Cos., Inc. | 2,536 | 169 | |||||
| Marriott International, Inc. Class A | 2,161 | 148 | Energy - 8.0% | ||||
| McDonald's Corp. | 868 | 98 | Anadarko Petroleum Corp. | 23,332 | 1,387 | ||
| Meritage Homes Corp.(Æ) | 2,140 | 66 | Antero Resources Corp.(Æ) | 40,700 | 1,077 | ||
| Michael Kors Holdings, Ltd.(Æ) | 28,295 | 1,437 | Apache Corp. | 1,368 | 81 | ||
| Netflix, Inc.(Æ) | 644 | 80 | Baker Hughes, Inc. | 5,789 | 321 | ||
| Newell Brands, Inc. | 64,946 | 3,119 | BP PLC - ADR | 39,300 | 1,397 | ||
| News Corp. Class A | 153,315 | 1,858 | Canadian Natural Resources, Ltd. | 46,733 | 1,482 | ||
| Nike, Inc. Class B | 65,250 | 3,274 | Cenovus Energy, Inc. | 85,450 | 1,234 | ||
| Norwegian Cruise Line Holdings, Ltd.(Æ) | 21,500 | 836 | Chevron Corp. | 4,216 | 442 | ||
| NVR, Inc.(Æ) | 595 | 906 | Cimarex Energy Co. | 2,479 | 320 | ||
| Office Depot, Inc. | 9,614 | 30 | Concho Resources, Inc.(Æ) | 170 | 22 | ||
| Omnicom Group, Inc. | 23,425 | 1,870 | ConocoPhillips | 805 | 35 | ||
| Pandora Media, Inc.(Æ) | 4,096 | 46 | Devon Energy Corp. | 1,012 | 38 | ||
| Priceline Group, Inc. (The)(Æ) | 373 | 550 | Energen Corp.(Æ) | 12,000 | 602 | ||
| PulteGroup, Inc. | 23,659 | 440 | Ensco PLC Class A | 152,877 | 1,196 | ||
| PVH Corp. | 29,337 | 3,138 | EOG Resources, Inc. | 17,059 | 1,543 | ||
| Ross Stores, Inc. | 2,171 | 136 | EQT Corp. | 460 | 30 | ||
| Royal Caribbean Cruises, Ltd. | 1,583 | 122 | Exxon Mobil Corp. | 30,586 | 2,548 | ||
| Shutterfly, Inc.(Æ) | 4,400 | 216 | Halliburton Co. | 83,425 | 3,838 | ||
| Staples, Inc. | 124,327 | 920 | Hess Corp. | 575 | 28 | ||
| Starbucks Corp. | 993 | 53 | Kinder Morgan, Inc. | 693 | 14 | ||
| Target Corp. | 5,933 | 408 | Laredo Petroleum, Inc.(Æ)(Ñ) | 31,200 | 372 | ||
See accompanying notes which are an integral part of the financial statements.
56 Russell U.S. Dynamic Equity Fund
Russell Investment Company
Russell U.S. Dynamic Equity Fund
Schedule of Investments, continued — October 31, 2016
| Amounts in thousands (except share amounts) | Amounts in thousands (except share amounts) | ||||||
| Principal | Fair | Principal | Fair | ||||
| Amount ($) or | Value | Amount ($) or | Value | ||||
| Shares | $ | Shares | $ | ||||
| Marathon Petroleum Corp. | 21,759 | 949 | Franklin Resources, Inc. | 46,750 | 1,574 | ||
| Murphy Oil Corp. | 53,585 | 1,386 | Genworth Financial, Inc. Class A(Æ) | 91,323 | 378 | ||
| Nabors Industries, Ltd. | 67,505 | 803 | Goldman Sachs Group, Inc. (The) | 19,142 | 3,412 | ||
| National Oilwell Varco, Inc. | 440 | 14 | Hartford Financial Services Group, Inc. | 40,145 | 1,771 | ||
| Newfield Exploration Co.(Æ) | 1,069 | 43 | HCP, Inc.(ö) | 3,134 | 107 | ||
| Noble Corp. PLC | 24,592 | 122 | Hospitality Properties Trust(ö) | 14,158 | 387 | ||
| Occidental Petroleum Corp. | 21,838 | 1,592 | JPMorgan Chase & Co.(Û) | 110,091 | 7,625 | ||
| Oceaneering International, Inc. | 6,821 | 162 | KeyCorp | 314,883 | 4,446 | ||
| Patterson-UTI Energy, Inc. | 28,434 | 639 | Mack-Cali Realty Corp.(ö) | 40,302 | 1,035 | ||
| Phillips 66 | 2,351 | 191 | Mastercard, Inc. Class A | 805 | 86 | ||
| Pioneer Natural Resources Co. | 24,852 | 4,449 | MetLife, Inc. | 139,597 | 6,555 | ||
| Rice Energy, Inc.(Æ) | 12,003 | 265 | Morgan Stanley | 56,625 | 1,901 | ||
| Rowan Cos. PLC Class A(Æ) | 77,095 | 1,023 | Navient Corp. | 19,669 | 251 | ||
| Royal Dutch Shell PLC Class A - ADR | 43,278 | 2,156 | NorthStar Realty Europe Corp.(ö) | 6,663 | 66 | ||
| Schlumberger, Ltd. | 2,340 | 183 | NorthStar Realty Finance Corp.(ö) | 1,978 | 29 | ||
| Southwestern Energy Co.(Æ) | 14,083 | 146 | Omega Healthcare Investors, Inc.(ö) | 7,514 | 239 | ||
| Spectra Energy Corp. | 1,503 | 63 | PayPal Holdings, Inc.(Æ) | 1,025 | 43 | ||
| Tesoro Corp. | 15,564 | 1,322 | Piedmont Office Realty Trust, Inc. Class A(ö) | 8,736 | 179 | ||
| Valero Energy Corp.(Û) | 49,112 | 2,909 | PNC Financial Services Group, Inc. (The) | 431 | 41 | ||
| Weatherford International PLC(Æ) | 119,500 | 576 | Popular, Inc. | 24,853 | 902 | ||
| 37,000 | Principal Financial Group, Inc. | 20,960 | 1,144 | ||||
| ProAssurance Corp. | 913 | 49 | |||||
| Financial Services - 22.8% | Progressive Corp. (The) | 1,771 | 56 | ||||
| Affiliated Managers Group, Inc.(Æ) | 673 | 89 | Prudential Financial, Inc. | 18,286 | 1,550 | ||
| Aflac, Inc. | 2,123 | 146 | Regions Financial Corp. | 505,232 | 5,411 | ||
| Allied World Assurance Co. Holdings AG | 1,249 | 54 | Reinsurance Group of America, Inc. Class A | 13,532 | 1,460 | ||
| Allstate Corp. (The) | 23,111 | 1,569 | Signature Bank(Æ) | 6,390 | 770 | ||
| Ally Financial, Inc. | 37,986 | 686 | Simon Property Group, Inc.(ö) | 186 | 35 | ||
| American Express Co. | 729 | 48 | Starwood Property Trust, Inc.(ö) | 2,288 | 51 | ||
| American International Group, Inc. | 66,323 | 4,092 | State Street Corp. | 27,782 | 1,951 | ||
| Ameriprise Financial, Inc. | 533 | 47 | SunTrust Banks, Inc. | 38,180 | 1,727 | ||
| Arch Capital Group, Ltd.(Æ) | 1,170 | 91 | Synchrony Financial | 41,995 | 1,201 | ||
| Arthur J Gallagher & Co. | 3,953 | 191 | Taubman Centers, Inc.(ö) | 10,129 | 734 | ||
| Aspen Insurance Holdings, Ltd. | 17,979 | 868 | Torchmark Corp. | 738 | 47 | ||
| Assured Guaranty, Ltd. | 54,654 | 1,634 | Travelers Cos., Inc. (The) | 1,954 | 211 | ||
| Axis Capital Holdings, Ltd. | 21,093 | 1,202 | UBS Group AG(Æ)(Ñ) | 90,500 | 1,273 | ||
| Bank of America Corp.(Û) | 654,999 | 10,808 | Validus Holdings, Ltd. | 2,356 | 120 | ||
| Bank of New York Mellon Corp. (The) | 113,053 | 4,892 | Visa, Inc. Class A | 2,046 | 169 | ||
| BB&T Corp. | 1,080 | 42 | Voya Financial, Inc. | 143,182 | 4,374 | ||
| Berkshire Hathaway, Inc. Class B(Æ) | 3,803 | 549 | Washington Prime Group, Inc.(ö) | 22,826 | 239 | ||
| BlackRock, Inc. Class A | 101 | 34 | Wells Fargo & Co. | 3,477 | 160 | ||
| Capital One Financial Corp. | 35,537 | 2,631 | White Mountains Insurance Group, Ltd. | 54 | 45 | ||
| CBL & Associates Properties, Inc.(ö) | 76,369 | 817 | XL Group, Ltd. | 1,727 | 60 | ||
| Charles Schwab Corp. (The) | 5,031 | 160 | Zions Bancorporation | 40,300 | 1,298 | ||
| Chubb, Ltd. | 2,270 | 288 | 105,288 | ||||
| Citigroup, Inc. | 181,026 | 8,897 | |||||
| Citizens Financial Group, Inc. | 101,900 | 2,684 | Health Care - 12.2% | ||||
| CME Group, Inc. Class A | 1,005 | 101 | Abbott Laboratories | 27,215 | 1,068 | ||
| Comerica, Inc. | 23,000 | 1,198 | AbbVie, Inc. | 12,767 | 712 | ||
| Crown Castle International Corp.(ö) | 14,500 | 1,319 | Aetna, Inc. | 9,905 | 1,063 | ||
| Discover Financial Services | 721 | 41 | Agilent Technologies, Inc. | 21,800 | 950 | ||
| E*Trade Financial Corp.(Æ) | 23,000 | 648 | Agios Pharmaceuticals, Inc.(Æ)(Ñ) | 3,800 | 182 | ||
| East West Bancorp, Inc. | 29,200 | 1,154 | Alexion Pharmaceuticals, Inc.(Æ) | 1,285 | 168 | ||
| Ecolab, Inc. | 1,532 | 175 | Allergan PLC(Æ) | 14,894 | 3,112 | ||
| Equinix, Inc.(ö) | 3,400 | 1,215 | Allscripts Healthcare Solutions, Inc.(Æ) | 27,000 | 324 | ||
| Equity Commonwealth(Æ)(ö) | 2,105 | 64 | Amgen, Inc.(Û) | 24,618 | 3,475 | ||
| Everest Re Group, Ltd. | 178 | 36 | Anthem, Inc. | 9,834 | 1,198 | ||
| First American Financial Corp. | 5,030 | 196 | Baxter International, Inc. | 4,941 | 235 | ||
| First Republic Bank | 2,087 | 155 | Becton Dickinson and Co. | 301 | 51 | ||
| Forest City Realty Trust, Inc. Class A(ö) | 60,442 | 1,305 | Biogen, Inc.(Æ)(Û) | 20,617 | 5,776 | ||
See accompanying notes which are an integral part of the financial statements.
Russell U.S. Dynamic Equity Fund 57
Russell Investment Company
Russell U.S. Dynamic Equity Fund
Schedule of Investments, continued — October 31, 2016
| Amounts in thousands (except share amounts) | Amounts in thousands (except share amounts) | ||||||
| Principal | Fair | Principal | Fair | ||||
| Amount ($) or | Value | Amount ($) or | Value | ||||
| Shares | $ | Shares | $ | ||||
| BioMarin Pharmaceutical, Inc.(Æ) | 32,810 | 2,642 | Packaging Corp. of America | 5,925 | 489 | ||
| Bristol-Myers Squibb Co. | 22,500 | 1,146 | PPG Industries, Inc. | 950 | 88 | ||
| Bruker Corp. | 11,100 | 227 | Praxair, Inc. | 3,339 | 391 | ||
| Cardinal Health, Inc. | 13,349 | 917 | Reliance Steel & Aluminum Co. | 10,247 | 705 | ||
| Celgene Corp.(Æ) | 15,758 | 1,610 | Sherwin-Williams Co. (The) | 3,450 | 845 | ||
| Cigna Corp. | 10,326 | 1,227 | Sonoco Products Co. | 2,261 | 114 | ||
| CR Bard, Inc. | 4,440 | 962 | Trinseo SA | 24,721 | 1,297 | ||
| Edwards Lifesciences Corp.(Æ) | 11,834 | 1,127 | Univar, Inc.(Æ) | 9,200 | 205 | ||
| Eli Lilly & Co. | 10,260 | 758 | Versum Materials, Inc.(Æ) | 292 | 7 | ||
| Envision Healthcare Holdings, Inc.(Æ) | 6,317 | 125 | WestRock Co. | 1,289 | 59 | ||
| Express Scripts Holding Co.(Æ) | 748 | 50 | 11,020 | ||||
| Gilead Sciences, Inc.(Û) | 64,452 | 4,746 | |||||
| HCA Holdings, Inc.(Æ) | 1,243 | 95 | Producer Durables - 9.6% | ||||
| HMS Holdings Corp.(Æ) | 5,403 | 114 | 3M Co. | 1,169 | 193 | ||
| Humana, Inc. | 310 | 53 | Accenture PLC Class A | 509 | 59 | ||
| Icon PLC(Æ) | 4,776 | 383 | Adient PLC(Æ) | 129 | 6 | ||
| Incyte Corp.(Æ) | 10,900 | 948 | AECOM(Æ) | 78,209 | 2,178 | ||
| Jazz Pharmaceuticals PLC(Æ) | 1,377 | 151 | American Airlines Group, Inc. | 1,388 | 56 | ||
| Johnson & Johnson | 14,435 | 1,674 | Automatic Data Processing, Inc. | 382 | 33 | ||
| Laboratory Corp. of America Holdings(Æ) | 693 | 87 | Babcock & Wilcox Co. (The) Class W(Æ) | 59,856 | 2,348 | ||
| LifePoint Health, Inc.(Æ) | 16,600 | 994 | Boeing Co. (The) | 14,657 | 2,088 | ||
| Ligand Pharmaceuticals, Inc. Class B(Æ) | 10,275 | 984 | Caterpillar, Inc. | 1,185 | 99 | ||
| Mallinckrodt PLC(Æ) | 3,458 | 205 | Convergys Corp. | 39,866 | 1,164 | ||
| McKesson Corp. | 7,966 | 1,013 | CoStar Group, Inc.(Æ) | 508 | 95 | ||
| Medtronic PLC | 270 | 22 | CSX Corp. | 2,922 | 89 | ||
| Merck & Co., Inc. | 27,520 | 1,616 | Cummins, Inc. | 976 | 125 | ||
| Molina Healthcare, Inc.(Æ) | 7,900 | 430 | Danaher Corp. | 621 | 49 | ||
| Mylan NV(Æ) | 84,674 | 3,091 | Deere & Co. | 1,284 | 113 | ||
| Ophthotech Corp.(Æ) | 38,210 | 1,369 | Delta Air Lines, Inc. | 3,349 | 140 | ||
| Perrigo Co. PLC | 1,193 | 99 | Dover Corp. | 23,075 | 1,543 | ||
| Pfizer, Inc. | 49,535 | 1,571 | Eaton Corp. PLC | 1,259 | 80 | ||
| Quest Diagnostics, Inc. | 10,357 | 844 | EMCOR Group, Inc. | 22,948 | 1,387 | ||
| Regeneron Pharmaceuticals, Inc.(Æ) | 421 | 145 | Emerson Electric Co. | 804 | 41 | ||
| Stryker Corp. | 477 | 55 | Euronav NV | 39,415 | 309 | ||
| TESARO, Inc.(Æ)(Ñ) | 7,441 | 899 | FedEx Corp. | 22,999 | 4,009 | ||
| Thermo Fisher Scientific, Inc. | 19,961 | 2,935 | Fortive Corp. | 310 | 16 | ||
| United Therapeutics Corp.(Æ) | 12,670 | 1,521 | General Dynamics Corp. | 323 | 49 | ||
| UnitedHealth Group, Inc. | 1,223 | 173 | General Electric Co. | 62,744 | 1,826 | ||
| Vertex Pharmaceuticals, Inc.(Æ) | 1,311 | 99 | Hawaiian Holdings, Inc.(Æ) | 25,199 | 1,135 | ||
| WellCare Health Plans, Inc.(Æ) | 10,100 | 1,146 | HD Supply Holdings, Inc.(Æ) | 5,535 | 183 | ||
| 56,567 | Hertz Global Holdings, Inc.(Æ) | 2,400 | 80 | ||||
| Honeywell International, Inc. | 736 | 81 | |||||
| Materials and Processing - 2.4% | Huntington Ingalls Industries, Inc. | 9,441 | 1,523 | ||||
| AdvanSix, Inc.(Æ) | 29 | — | Illinois Tool Works, Inc. | 386 | 44 | ||
| Air Products & Chemicals, Inc. | 584 | 78 | JB Hunt Transport Services, Inc. | 1,231 | 100 | ||
| Albemarle Corp. | 693 | 58 | Johnson Controls International PLC | 1,291 | 52 | ||
| Bemis Co., Inc. | 1,812 | 88 | L-3 Communications Holdings, Inc. Class 3 | 7,445 | 1,019 | ||
| Cabot Corp. | 28,217 | 1,471 | Lockheed Martin Corp. | 435 | 107 | ||
| Domtar Corp. | 9,390 | 338 | ManpowerGroup, Inc. | 14,100 | 1,083 | ||
| Dow Chemical Co. (The) | 4,991 | 268 | MSC Industrial Direct Co., Inc. Class A | 496 | 36 | ||
| Eastman Chemical Co. | 1,431 | 103 | Navistar International Corp.(Æ)(Ñ) | 4,100 | 91 | ||
| EI du Pont de Nemours & Co. | 5,081 | 349 | Norfolk Southern Corp. | 1,232 | 115 | ||
| Huntsman Corp. | 22,078 | 374 | Northrop Grumman Corp. | 6,111 | 1,399 | ||
| LyondellBasell Industries NV Class A | 21,574 | 1,716 | PACCAR, Inc. | 868 | 48 | ||
| Masco Corp. | 7,866 | 243 | Parker-Hannifin Corp. | 16,325 | 2,004 | ||
| Monsanto Co. | 1,050 | 106 | Quanta Services, Inc.(Æ) | 56,375 | 1,621 | ||
| Mosaic Co. (The) | 2,415 | 57 | Raytheon Co. | 1,102 | 150 | ||
| Newmont Mining Corp. | 2,189 | 81 | Republic Services, Inc. Class A | 1,981 | 104 | ||
| Nucor Corp. | 1,619 | 79 | Rockwell Automation, Inc. | 18,143 | 2,172 | ||
| Owens Corning | 28,928 | 1,411 | Spirit AeroSystems Holdings, Inc. Class A | 28,725 | 1,447 | ||
See accompanying notes which are an integral part of the financial statements.
58 Russell U.S. Dynamic Equity Fund
Russell Investment Company
Russell U.S. Dynamic Equity Fund
Schedule of Investments, continued — October 31, 2016
| Amounts in thousands (except share amounts) | Amounts in thousands (except share amounts) | ||||||
| Principal | Fair | Principal | Fair | ||||
| Amount ($) or | Value | Amount ($) or | Value | ||||
| Shares | $ | Shares | $ | ||||
| Stanley Black & Decker, Inc. | 10,183 | 1,159 | NXP Semiconductors NV(Æ) | 22,232 | 2,223 | ||
| Terex Corp. | 33,906 | 810 | ON Semiconductor Corp.(Æ) | 154,135 | 1,799 | ||
| Textron, Inc. | 32,290 | 1,294 | Oracle Corp. | 78,743 | 3,025 | ||
| Union Pacific Corp. | 35,865 | 3,163 | Palo Alto Networks, Inc.(Æ) | 7,491 | 1,152 | ||
| United Continental Holdings, Inc.(Æ)(Û) | 31,263 | 1,758 | QUALCOMM, Inc. | 37,447 | 2,573 | ||
| United Parcel Service, Inc. Class B | 1,334 | 144 | Red Hat, Inc.(Æ) | 12,300 | 953 | ||
| United Technologies Corp. | 1,623 | 166 | Salesforce.com, Inc.(Æ) | 2,677 | 201 | ||
| Waste Management, Inc. | 590 | 39 | Seagate Technology PLC | 36,375 | 1,248 | ||
| Xerox Corp. | 111,907 | 1,093 | Splunk, Inc.(Æ) | 2,200 | 132 | ||
| Xylem, Inc. | 46,756 | 2,260 | Symantec Corp.(Û) | 69,340 | 1,736 | ||
| 44,575 | Synaptics, Inc.(Æ) | 3,200 | 167 | ||||
| SYNNEX Corp. | 2,700 | 277 | |||||
| Technology - 23.9% | Synopsys, Inc.(Æ) | 5,810 | 345 | ||||
| Advanced Micro Devices, Inc.(Æ) | 98,700 | 714 | Tableau Software, Inc. Class A(Æ) | 13,645 | 656 | ||
| Alphabet, Inc. Class A(Æ) | 1,416 | 1,147 | Take-Two Interactive Software, Inc.(Æ) | 32,808 | 1,456 | ||
| Alphabet, Inc. Class C(Æ) | 8,977 | 7,043 | Tech Data Corp.(Æ) | 10,000 | 770 | ||
| Amdocs, Ltd. | 983 | 57 | Teradata Corp.(Æ) | 7,112 | 192 | ||
| Amkor Technology, Inc.(Æ) | 30,600 | 284 | Teradyne, Inc. | 39,458 | 919 | ||
| Apple, Inc. | 103,667 | 11,770 | Texas Instruments, Inc. | 869 | 62 | ||
| Applied Materials, Inc.(Û) | 60,915 | 1,771 | Twitter, Inc.(Æ)(Ñ) | 28,700 | 515 | ||
| ARRIS International PLC(Æ) | 32,000 | 889 | VeriFone Systems, Inc.(Æ) | 46,100 | 714 | ||
| Aspen Technology, Inc.(Æ) | 31,211 | 1,537 | VeriSign, Inc.(Æ) | 18,721 | 1,573 | ||
| Broadcom, Ltd. | 20,251 | 3,448 | Viavi Solutions, Inc. Class W(Æ) | 144,800 | 1,031 | ||
| CA, Inc. | 39,113 | 1,202 | Vishay Intertechnology, Inc. | 73,418 | 1,035 | ||
| Cadence Design Systems, Inc.(Æ) | 26,398 | 675 | VMware, Inc. Class A(Æ)(Ñ) | 15,900 | 1,250 | ||
| Ciena Corp.(Æ) | 30,300 | 587 | Western Digital Corp. | 19,226 | 1,124 | ||
| Cirrus Logic, Inc.(Æ) | 4,500 | 243 | Yahoo!, Inc.(Æ) | 1,326 | 55 | ||
| Cisco Systems, Inc. | 10,997 | 337 | Yelp, Inc. Class A(Æ) | 11,300 | 369 | ||
| Citrix Systems, Inc.(Æ) | 18,462 | 1,566 | Zynga, Inc. Class A(Æ) | 230,307 | 647 | ||
| Cognizant Technology Solutions Corp. Class | 110,647 | ||||||
| A(Æ) | 5,450 | 280 | |||||
| Computer Sciences Corp. | 61,420 | 3,344 | Utilities - 2.4% | ||||
| Corning, Inc. | 25,620 | 582 | AES Corp.(Û) | 113,692 | 1,338 | ||
| Dell Technologies, Inc. - VMware Inc Class | Ameren Corp. | 1,055 | 53 | ||||
| V(Æ) | 732 | 36 | American Electric Power Co., Inc. | 4,817 | 312 | ||
| Facebook, Inc. Class A(Æ) | 41,061 | 5,379 | American Water Works Co., Inc. | 661 | 49 | ||
| Finisar Corp.(Æ) | 34,200 | 936 | AT&T, Inc. | 40,275 | 1,482 | ||
| Flex, Ltd.(Æ) | 65,081 | 923 | CenturyLink, Inc. | 6,369 | 169 | ||
| Gigamon, Inc.(Æ) | 1,600 | 88 | CMS Energy Corp. | 959 | 40 | ||
| Harris Corp. | 27,435 | 2,447 | Consolidated Edison, Inc. | 3,129 | 236 | ||
| Hewlett Packard Enterprise Co. | 218,432 | 4,908 | Dominion Resources, Inc. | 1,466 | 110 | ||
| HP, Inc. | 242,980 | 3,521 | DTE Energy Co. | 1,092 | 105 | ||
| IAC/InterActiveCorp(Æ) | 24,864 | 1,602 | Duke Energy Corp. | 1,415 | 113 | ||
| Imperva, Inc.(Æ) | 1,021 | 38 | Edison International | 8,800 | 647 | ||
| Intel Corp. | 131,878 | 4,599 | Frontier Communications Corp.(Ñ) | 16,403 | 66 | ||
| InterDigital, Inc. | 3,700 | 261 | Hawaiian Electric Industries, Inc. | 1,473 | 44 | ||
| International Business Machines Corp. | 969 | 149 | NextEra Energy, Inc. | 2,098 | 269 | ||
| Intuit, Inc. | 13,330 | 1,450 | NRG Energy, Inc. | 27,472 | 292 | ||
| Jabil Circuit, Inc. | 51,200 | 1,093 | PG&E Corp. | 1,610 | 100 | ||
| Juniper Networks, Inc. | 45,600 | 1,201 | Public Service Enterprise Group, Inc. | 1,550 | 65 | ||
| KLA-Tencor Corp. | 13,900 | 1,044 | RingCentral, Inc. Class A(Æ) | 4,400 | 91 | ||
| Manhattan Associates, Inc.(Æ) | 2,845 | 144 | Southern Co. (The) | 3,280 | 169 | ||
| Marvell Technology Group, Ltd. | 105,279 | 1,372 | Telephone & Data Systems, Inc. | 10,215 | 264 | ||
| Mentor Graphics Corp. | 18,400 | 532 | T-Mobile US, Inc.(Æ) | 68,745 | 3,419 | ||
| Microsoft Corp.(Û) | 150,612 | 9,025 | US Cellular Corp.(Æ) | 700 | 25 | ||
| MicroStrategy, Inc. Class A(Æ) | 3,873 | 754 | Verizon Communications, Inc.(Û) | 34,662 | 1,667 | ||
| NCR Corp.(Æ) | 34,285 | 1,202 | WEC Energy Group, Inc. | 1,051 | 63 | ||
| NetApp, Inc. | 41,215 | 1,399 | Xcel Energy, Inc. | 1,670 | 69 | ||
| Nuance Communications, Inc.(Æ) | 56,800 | 796 | 11,257 | ||||
| NVIDIA Corp. | 1,026 | 73 | |||||
See accompanying notes which are an integral part of the financial statements.
Russell U.S. Dynamic Equity Fund 59
Russell Investment Company
Russell U.S. Dynamic Equity Fund
Schedule of Investments, continued — October 31, 2016
| Amounts in thousands (except share amounts) | Amounts in thousands (except share amounts) | ||||||||||||
| Principal | Fair | Principal | Fair | ||||||||||
| Amount ($) or | Value | Amount ($) or | Value | ||||||||||
| Shares | $ | Shares | $ | ||||||||||
| Total Common Stocks | Sarepta Therapeutics, Inc.(Æ) | (10,337 | ) | (406 | ) | ||||||||
| (cost $423,327) | 468,006 | (2,487 | ) | ||||||||||
| Materials and Processing - (0.1)% | |||||||||||||
| Short-Term Investments - 2.7% | United States Steel Corp. | (13,761 | ) | (266 | ) | ||||||||
| Russell U.S. Cash Management Fund | 12,369,409 | (8) | 12,372 | ||||||||||
| Total Short-Term Investments | Producer Durables - (0.3)% | ||||||||||||
| (cost $12,371) | 12,372 | Macquarie Infrastructure Corp. | (1,116 | ) | (91 | ) | |||||||
| Square, Inc. Class A(Æ) | (41,143 | ) | (461 | ) | |||||||||
| Other Securities - 0.7% | Stericycle, Inc.(Æ) | (6,889 | ) | (552 | ) | ||||||||
| Russell U.S. Cash Collateral Fund(×) | 3,387,730 | (8) | 3,388 | (1,104 | ) | ||||||||
| Total Other Securities | Technology - (1.2)% | ||||||||||||
| (cost $3,388) | 3,388 | Advanced Micro Devices, Inc.(Æ) | (85,764 | ) | (620 | ) | |||||||
| Ambarella, Inc.(Æ) | (2,854 | ) | (175 | ) | |||||||||
| Total Investments 104.6% | Arista Networks, Inc.(Æ) | (6,663 | ) | (565 | ) | ||||||||
| (identified cost $439,086) | 483,766 | Atlassian Corp. PLC Class A(Æ) | (16,860 | ) | (453 | ) | |||||||
| Securities Sold Short - (3.9)% | Cavium, Inc.(Æ) | (9,538 | ) | (538 | ) | ||||||||
| Consumer Discretionary - (0.8)% | FireEye, Inc.(Æ) | (30,909 | ) | (359 | ) | ||||||||
| CarMax, Inc.(Æ) | (10,115 | ) | (505 | ) | Inovalon Holdings, Inc. Class A(Æ) | (22,246 | ) | (303 | ) | ||||
| Fitbit, Inc. Class A(Æ) | (34,010 | ) | (451 | ) | MACOM Technology Solutions Holdings, | ||||||||
| Lions Gate Entertainment Corp.(Æ) | (22,760 | ) | (463 | ) | Inc.(Æ) | (11,321 | ) | (416 | ) | ||||
| Mobileye NV(Æ) | (13,708 | ) | (510 | ) | Palo Alto Networks, Inc.(Æ) | (3,880 | ) | (597 | ) | ||||
| Nord Anglia Education, Inc.(Æ) | (12,544 | ) | (270 | ) | Pure Storage, Inc. Class A(Æ) | (37,483 | ) | (463 | ) | ||||
| Pandora Media, Inc.(Æ) | (41,248 | ) | (467 | ) | Twitter, Inc.(Æ) | (14,992 | ) | (269 | ) | ||||
| Tesla Motors, Inc.(Æ) | (2,553 | ) | (505 | ) | Universal Display Corp.(Æ) | (4,450 | ) | (230 | ) | ||||
| Under Armour, Inc. Class A(Æ) | (15,619 | ) | (486 | ) | Zendesk, Inc.(Æ) | (14,130 | ) | (371 | ) | ||||
| Wayfair, Inc. Class A(Æ) | (2,961 | ) | (99 | ) | (5,359 | ) | |||||||
| (3,756 | ) | ||||||||||||
| Consumer Staples - (0.1)% | Total Securities Sold Short | ||||||||||||
| Snyders-Lance, Inc. | (15,214 | ) | (542 | ) | (proceeds $19,469) | (17,924 | ) | ||||||
| Energy - (0.1)% | Other Assets and Liabilities, Net | ||||||||||||
| Chesapeake Energy Corp.(Æ) | (59,170 | ) | (326 | ) | -(0.7%) | (3,154 | ) | ||||||
| SunPower Corp. Class A(Æ) | (26,606 | ) | (193 | ) | Net Assets - 100.0% | 462,688 | |||||||
| Weatherford International PLC(Æ) | (17,946 | ) | (86 | ) | |||||||||
| (605 | ) | ||||||||||||
| Financial Services - (0.8)% | |||||||||||||
| Acadia Realty Trust(ö) | (6,419 | ) | (216 | ) | |||||||||
| BOK Financial Corp. | (7,231 | ) | (514 | ) | |||||||||
| First Financial Bankshares, Inc. | (16,202 | ) | (587 | ) | |||||||||
| Iron Mountain, Inc.(ö) | (4,609 | ) | (155 | ) | |||||||||
| New York Community Bancorp, Inc. | (34,564 | ) | (496 | ) | |||||||||
| Realty Income Corp.(ö) | (4,465 | ) | (265 | ) | |||||||||
| TFS Financial Corp. | (28,724 | ) | (512 | ) | |||||||||
| United Bankshares, Inc. | (12,809 | ) | (483 | ) | |||||||||
| Weyerhaeuser Co.(ö) | (2,981 | ) | (89 | ) | |||||||||
| Willis Towers Watson PLC | (3,880 | ) | (488 | ) | |||||||||
| (3,805 | ) | ||||||||||||
| Health Care - (0.5)% | |||||||||||||
| Acadia Healthcare Co., Inc.(Æ) | (13,354 | ) | (480 | ) | |||||||||
| Alnylam Pharmaceuticals, Inc.(Æ) | (8,307 | ) | (296 | ) | |||||||||
| DexCom, Inc.(Æ) | (7,177 | ) | (562 | ) | |||||||||
| Juno Therapeutics, Inc.(Æ) | (8,820 | ) | (214 | ) | |||||||||
| OPKO Health, Inc.(Æ) | (56,204 | ) | (529 | ) | |||||||||
See accompanying notes which are an integral part of the financial statements.
60 Russell U.S. Dynamic Equity Fund
Russell Investment Company
Russell U.S. Dynamic Equity Fund
Schedule of Investments, continued — October 31, 2016
| Futures Contracts | |||||||||||||||
| Amounts in thousands (except contract amounts) | |||||||||||||||
| Unrealized | |||||||||||||||
| Appreciation | |||||||||||||||
| Number of | Notional | Expiration | (Depreciation) | ||||||||||||
| Contracts | Amount | Date | $ | ||||||||||||
| Long Positions | |||||||||||||||
| Russell 1000 Mini Index Futures | 33 | USD | 3,874 | 12/16 | (37 | ) | |||||||||
| S&P 500 E-Mini Index Futures | 69 | USD | 7,314 | 12/16 | (62 | ) | |||||||||
| Total Unrealized Appreciation (Depreciation) on Open Futures Contracts (å) | (99 | ) | |||||||||||||
| Presentation of Portfolio Holdings | |||||||||||||||
| Amounts in thousands | |||||||||||||||
| Fair Value | |||||||||||||||
| Practical | |||||||||||||||
| Portfolio Summary | Level 1 | Level 2 | Level 3 | Expedient (a) | Total | % of Net Assets | |||||||||
| Common Stocks | |||||||||||||||
| Consumer Discretionary | $ | 78,407 | $ | — | $ | — | $ | — | $ | 78,407 | 17.0 | ||||
| Consumer Staples | 13,245 | — | — | — | 13,245 | 2.9 | |||||||||
| Energy | 37,000 | — | — | — | 37,000 | 8.0 | |||||||||
| Financial Services | 105,288 | — | — | — | 105,288 | 22.8 | |||||||||
| Health Care | 56,567 | — | — | — | 56,567 | 12.2 | |||||||||
| Materials and Processing | 11,020 | — | — | — | 11,020 | 2.4 | |||||||||
| Producer Durables | 44,575 | — | — | — | 44,575 | 9.6 | |||||||||
| Technology | 110,647 | — | — | — | 110,647 | 23.9 | |||||||||
| Utilities | 11,257 | — | — | — | 11,257 | 2.4 | |||||||||
| Short-Term Investments | — | — | — | 12,372 | 12,372 | 2.7 | |||||||||
| Other Securities | — | — | — | 3,388 | 3,388 | 0.7 | |||||||||
| Total Investments | 468,006 | — | — | 15,760 | 483,766 | 104.6 | |||||||||
| Securities Sold Short*** | (17,924 | ) | — | — | — | (17,924 | ) | (3.9 | ) | ||||||
| Other Assets and Liabilities, Net | (0.7 | ) | |||||||||||||
| 100.0 | |||||||||||||||
| Other Financial Instruments | |||||||||||||||
| Liabilities | |||||||||||||||
| Futures Contracts | (99 | ) | — | — | — | (99 | ) | (—)* | |||||||
| Total Other Financial Instruments** | $ | (99 | ) | $ | — | $ | — | $ | — | $ | (99 | ) | |||
* Less than 0.05% of net assets.
** Futures and foreign currency exchange contract values reflect the unrealized appreciation (depreciation) on the investments.
*** Refer to Schedule of Investments for detailed sector breakout.
(a) Certain investments that are measured at fair value using the net asset value per share (or its equivalent) practical expedient have not been classified
in the fair value levels. The fair value amounts presented in the table are intended to permit reconciliation to the amounts presented in the Schedule of
Investments.
For a description of the Levels, see note 2 in the Notes to Financial Statements.
For a disclosure on transfers between Levels 1, 2 and 3 during the period ended October 31, 2016, see note 2 in the Notes to
Financial Statements.
See accompanying notes which are an integral part of the financial statements.
Russell U.S. Dynamic Equity Fund 61
Russell Investment Company
Russell U.S. Dynamic Equity Fund
Fair Value of Derivative Instruments — October 31, 2016
Amounts in thousands
| Equity | ||||
| Derivatives not accounted for as hedging instruments | Contracts | |||
| Location: Statement of Assets and Liabilities - Liabilities | ||||
| Variation margin on futures contracts* | $ | 99 | ||
| Equity | ||||
| Derivatives not accounted for as hedging instruments | Contracts | |||
| Location: Statement of Operations - Net realized gain (loss) | ||||
| Futures contracts | $ | 2,213 | ||
| Location: Statement of Operations - Net change in unrealized appreciation (depreciation) | ||||
| Futures contracts | $ | (928 | ) | |
* Includes cumulative appreciation/depreciation of futures contracts as reported in the Schedule of Investments. Only variation margin is reported within the
Statement of Assets and Liabilities.
For further disclosure on derivatives see note 2 in the Notes to Financial Statements.
See accompanying notes which are an integral part of the financial statements.
62 Russell U.S. Dynamic Equity Fund
Russell Investment Company
Russell U.S. Dynamic Equity Fund
Balance Sheet Offsetting of Financial and Derivative Instruments — October 31, 2016
| Amounts in thousands | ||||||||
| Offsetting of Financial Assets and Derivative Assets | ||||||||
| Gross | Net Amounts | |||||||
| Amounts | of Assets | |||||||
| Gross | Offset in the | Presented in | ||||||
| Amounts of | Statement of | the Statement | ||||||
| Recognized | Assets and | of Assets and | ||||||
| Description | Location: Statement of Assets and Liabilities - Assets | Assets | Liabilities | Liabilities | ||||
| Securities on Loan* | Investments, at fair value | $ | 3,293 | $ | — | $ | 3,293 | |
| Total Financial and Derivative Assets | 3,293 | — | 3,293 | |||||
| Financial and Derivative Assets not subject to a netting agreement | — | — | — | |||||
| Total Financial and Derivative Assets subject to a netting agreement | $ | 3,293 | $ | — | $ | 3,293 | ||
| Financial Assets, Derivative Assets, and Collateral Held by Counterparty | ||||||||||
| Gross Amounts Not Offset in | ||||||||||
| the Statement of Assets and | ||||||||||
| Liabilities | ||||||||||
| Net Amounts | ||||||||||
| of Assets | ||||||||||
| Presented in | ||||||||||
| the Statement | Financial and | |||||||||
| of Assets and | Derivative | Collateral | ||||||||
| Counterparty | Liabilities | Instruments | Received^ | Net Amount | ||||||
| Credit Suisse | 1,131 | $ | — | $ | 1,131 | $ | — | |||
| JPMorgan Chase | 266 | — | 266 | — | ||||||
| Merrill Lynch | 1,392 | — | 1,392 | — | ||||||
| Morgan Stanley | 504 | — | 504 | — | ||||||
| Total | $ | 3,293 | $ | — | $ | 3,293 | $ | — | ||
See accompanying notes which are an integral part of the financial statements.
Russell U.S. Dynamic Equity Fund 63
Russell Investment Company
Russell U.S. Dynamic Equity Fund
Balance Sheet Offsetting of Financial and Derivative Instruments, continued —
October 31, 2016
| Amounts in thousands | |||||||||
| Offsetting of Financial Liabilities and Derivative Liabilities | |||||||||
| Gross | Net Amounts | ||||||||
| Amounts | of Liabilities | ||||||||
| Gross | Offset in the | Presented in | |||||||
| Amounts of | Statement of | the Statement | |||||||
| Recognized | Assets and | of Assets and | |||||||
| Description | Location: Statement of Assets and Liabilities - Liabilities | Liabilities | Liabilities | Liabilities | |||||
| Futures Contracts | Variation margin on futures contracts | $ | 19 | $ | — | $ | 19 | ||
| Short Sales | Securities sold short, at market value | 17,924 | — | 17,924 | |||||
| Total Financial and Derivative Liabilities | 17,943 | — | 17,943 | ||||||
| Financial and Derivative Liabilities not subject to a netting agreement | (19 | ) | — | (19 | ) | ||||
| Total Financial and Derivative Liabilities subject to a netting agreement | $ | 17,924 | $ | — | $ | 17,924 | |||
| Financial Liabilities, Derivative Liabilities, and Collateral Pledged by Counterparty | ||||||||||
| Gross Amounts Not Offset in | ||||||||||
| the Statement of Assets and | ||||||||||
| Liabilities | ||||||||||
| Net Amounts | ||||||||||
| of Liabilities | ||||||||||
| Presented in | ||||||||||
| the Statement | Financial and | |||||||||
| of Assets and | Derivative | Collateral | ||||||||
| Counterparty | Liabilities | Instruments | Pledged^ | Net Amount | ||||||
| State Street | 17,924 | $ | — | $ | 17,924 | $ | — | |||
| Total | $ | 17,924 | $ | — | $ | 17,924 | $ | — | ||
* Fair value of securities on loan as reported in the footnotes to the Statement of Assets and Liabilities.
^ Collateral received or pledged amounts may not reconcile to those disclosed in the Statement of Assets and Liabilities due to the inclusion of off-Balance
Sheet collateral and adjustments made to exclude overcollateralization.
For further disclosure on derivatives and counterparty risk see note 2 in the Notes to Financial Statements.
See accompanying notes which are an integral part of the financial statements.
64 Russell U.S. Dynamic Equity Fund
Russell Investment Company
Russell U.S. Dynamic Equity Fund
Statement of Assets and Liabilities — October 31, 2016
| Amounts in thousands | ||
| Assets | ||
| Investments, at identified cost | $ | 439,086 |
| Investments, at fair value(*)(>) | 483,766 | |
| Cash (restricted)(a) | 905 | |
| Receivables: | ||
| Dividends and interest | 245 | |
| Dividends from affiliated Russell funds | 6 | |
| Investments sold | 5,036 | |
| Fund shares sold | 6 | |
| Total assets | 489,964 | |
| Liabilities | ||
| Payables: | ||
| Investments purchased | 5,275 | |
| Fund shares redeemed | 137 | |
| Accrued fees to affiliates | 357 | |
| Other accrued expenses | 176 | |
| Variation margin on futures contracts | 19 | |
| Securities sold short, at fair value(‡) | 17,924 | |
| Payable upon return of securities loaned | 3,388 | |
| Total liabilities | 27,276 | |
| Net Assets | $ | 462,688 |
See accompanying notes which are an integral part of the financial statements.
Russell U.S. Dynamic Equity Fund 65
Russell Investment Company
Russell U.S. Dynamic Equity Fund
Statement of Assets and Liabilities, continued — October 31, 2016
| Amounts in thousands | |||
| Net Assets Consist of: | |||
| Undistributed (overdistributed) net investment income | $ | (36 | ) |
| Accumulated net realized gain (loss) | 11,066 | ||
| Unrealized appreciation (depreciation) on: | |||
| Investments | 44,680 | ||
| Futures contracts | (99 | ) | |
| Securities sold short | 1,545 | ||
| Shares of beneficial interest | 468 | ||
| Additional paid-in capital | 405,064 | ||
| Net Assets | $ | 462,688 | |
| Net Asset Value, offering and redemption price per share: | |||
| Net asset value per share: Class A(#) | $ | 9.32 | |
| Maximum offering price per share (Net asset value plus sales charge of 5.75%): Class A | $ | 9.89 | |
| Class A — Net assets | $ | 1,757,452 | |
| Class A — Shares outstanding ($.01 par value) | 188,580 | ||
| Net asset value per share: Class C(#) | $ | 7.72 | |
| Class C — Net assets | $ | 7,509,241 | |
| Class C — Shares outstanding ($.01 par value) | 972,930 | ||
| Net asset value per share: Class E(#) | $ | 9.34 | |
| Class E — Net assets | $ | 327,606 | |
| Class E — Shares outstanding ($.01 par value) | 35,057 | ||
| Net asset value per share: Class I(#) | $ | 9.98 | |
| Class I — Net assets | $ | 12,143,779 | |
| Class I — Shares outstanding ($.01 par value) | 1,216,815 | ||
| Net asset value per share: Class S(#) | $ | 9.79 | |
| Class S — Net assets | $ | 19,856,260 | |
| Class S — Shares outstanding ($.01 par value) | 2,027,376 | ||
| Net asset value per share: Class Y(#) | $ | 9.94 | |
| Class Y — Net assets | $ | 421,093,828 | |
| Class Y — Shares outstanding ($.01 par value) | 42,384,468 | ||
| Amounts in thousands | |||
| (*) Securities on loan included in investments | $ | 3,293 | |
| (‡) Proceeds on securities sold short | $ | 19,469 | |
| (>) Investments in affiliates, Russell U.S. Cash Management Fund and Russell U.S. Cash Collateral Fund | $ | 15,760 | |
| (a) Cash Collateral for Futures | $ | 905 | |
| (#) Net asset value per share equals class level net assets divided by class level shares of beneficial interest outstanding. | |||
See accompanying notes which are an integral part of the financial statements.
66 Russell U.S. Dynamic Equity Fund
Russell Investment Company
Russell U.S. Dynamic Equity Fund
Statement of Operations — For the Period Ended October 31, 2016
| Amounts in thousands | |||
| Investment Income | |||
| Dividends | $ | 9,415 | |
| Dividends from affiliated Russell funds | 65 | ||
| Securities lending income (net) | 101 | ||
| Total investment income | 9,581 | ||
| Expenses | |||
| Advisory fees | 4,047 | ||
| Administrative fees | 244 | ||
| Custodian fees (1) | 152 | ||
| Distribution fees - Class A | 5 | ||
| Distribution fees - Class C | 69 | ||
| Transfer agent fees - Class A | 4 | ||
| Transfer agent fees - Class C | 18 | ||
| Transfer agent fees - Class E | 1 | ||
| Transfer agent fees - Class I | 18 | ||
| Transfer agent fees - Class S | 49 | ||
| Transfer agent fees - Class Y | 20 | ||
| Professional fees | 68 | ||
| Registration fees | 92 | ||
| Shareholder servicing fees - Class C | 23 | ||
| Shareholder servicing fees - Class E | 1 | ||
| Trustees’ fees | 17 | ||
| Printing fees | 19 | ||
| Dividends from securities sold short | 211 | ||
| Interest expense paid on securities sold short | 678 | ||
| Miscellaneous | 26 | ||
| Total expenses | 5,762 | ||
| Net investment income (loss) | 3,819 | ||
| Net Realized and Unrealized Gain (Loss) | |||
| Net realized gain (loss) on: | |||
| Investments | 14,194 | ||
| Futures contracts | 2,213 | ||
| Securities sold short | 4,827 | ||
| Net realized gain (loss) | 21,234 | ||
| Net change in unrealized appreciation (depreciation) on: | |||
| Investments | (9,915 | ) | |
| Futures contracts | (928 | ) | |
| Securities sold short | (2,660 | ) | |
| Net change in unrealized appreciation (depreciation) | (13,503 | ) | |
| Net realized and unrealized gain (loss) | 7,731 | ||
| Net Increase (Decrease) in Net Assets from Operations | $ | 11,550 | |
| (1) Includes a reimbursement for overbilling of custody out-of-pocket fees from prior years. See note 10 in the Notes to Financial Statements. | |||
See accompanying notes which are an integral part of the financial statements.
Russell U.S. Dynamic Equity Fund 67
Russell Investment Company
Russell U.S. Dynamic Equity Fund
Statements of Changes in Net Assets
| For the Periods Ended October 31, | ||||||
| Amounts in thousands | 2016 | 2015 | ||||
| Increase (Decrease) in Net Assets | ||||||
| Operations | ||||||
| Net investment income (loss) | $ | 3,819 | $ | 2,420 | ||
| Net realized gain (loss) | 21,234 | 71,098 | ||||
| Net change in unrealized appreciation (depreciation) | (13,503 | ) | (37,658 | ) | ||
| Net increase (decrease) in net assets from operations | 11,550 | 35,860 | ||||
| Distributions | ||||||
| From net investment income | ||||||
| Class A | (11 | ) | (1 | ) | ||
| Class C | (16 | ) | — | |||
| Class E | (2 | ) | — | |||
| Class I | (113 | ) | (68 | ) | ||
| Class S | (177 | ) | (93 | ) | ||
| Class Y | (4,140 | ) | (2,357 | ) | ||
| From net realized gain | ||||||
| Class A | (347 | ) | (318 | ) | ||
| Class C | (1,766 | ) | (2,036 | ) | ||
| Class E | (46 | ) | (294 | ) | ||
| Class I | (2,337 | ) | (3,608 | ) | ||
| Class S | (4,150 | ) | (7,441 | ) | ||
| Class Y | (66,530 | ) | (89,356 | ) | ||
| Net decrease in net assets from distributions | (79,635 | ) | (105,572 | ) | ||
| Share Transactions* | ||||||
| Net increase (decrease) in net assets from share transactions | (56,654 | ) | (66,738 | ) | ||
| Total Net Increase (Decrease) in Net Assets | (124,739 | ) | (136,450 | ) | ||
| Net Assets | ||||||
| Beginning of period | 587,427 | 723,877 | ||||
| End of period | $ | 462,688 | $ | 587,427 | ||
| Undistributed (overdistributed) net investment income included in net assets | $ | (36 | ) | $ | 327 | |
See accompanying notes which are an integral part of the financial statements.
68 Russell U.S. Dynamic Equity Fund
Russell Investment Company
Russell U.S. Dynamic Equity Fund
Statements of Changes in Net Assets, continued
* Share transaction amounts (in thousands) for the periods ended October 31, 2016 and October 31, 2015 were as follows:
| 2016 | 2015 | |||||||||||
| Shares | Dollars | Shares | Dollars | |||||||||
| Class A | ||||||||||||
| Proceeds from shares sold | 33 | $ | 319 | 47 | $ | 516 | ||||||
| Proceeds from reinvestment of distributions | 39 | 347 | 29 | 312 | ||||||||
| Payments for shares redeemed | (102 | ) | (919 | ) | (22 | ) | (242 | ) | ||||
| Net increase (decrease) | (30 | ) | (253 | ) | 54 | 586 | ||||||
| Class C | ||||||||||||
| Proceeds from shares sold | 71 | 543 | 103 | 960 | ||||||||
| Proceeds from reinvestment of distributions | 237 | 1,747 | 218 | 1,999 | ||||||||
| Payments for shares redeemed | (514 | ) | (3,903 | ) | (230 | ) | (2,158 | ) | ||||
| Net increase (decrease) | (206 | ) | (1,613 | ) | 91 | 801 | ||||||
| Class E | ||||||||||||
| Proceeds from shares sold | — | 2 | 13 | 139 | ||||||||
| Proceeds from reinvestment of distributions | 5 | 47 | 28 | 294 | ||||||||
| Payments for shares redeemed | — | (2 | ) | (167 | ) | (1,703 | ) | |||||
| Net increase (decrease) | 5 | 47 | (126 | ) | (1,270 | ) | ||||||
| Class I | ||||||||||||
| Proceeds from shares sold | 133 | 1,415 | 481 | 5,388 | ||||||||
| Proceeds from reinvestment of distributions | 229 | 2,173 | 312 | 3,513 | ||||||||
| Payments for shares redeemed | (939 | ) | (9,579 | ) | (1,211 | ) | (14,220 | ) | ||||
| Net increase (decrease) | (577 | ) | (5,991 | ) | (418 | ) | (5,319 | ) | ||||
| Class S | ||||||||||||
| Proceeds from shares sold | 358 | 3,414 | 1,131 | 12,836 | ||||||||
| Proceeds from reinvestment of distributions | 440 | 4,102 | 664 | 7,346 | ||||||||
| Payments for shares redeemed | (1,633 | ) | (15,565 | ) | (2,987 | ) | (33,807 | ) | ||||
| Net increase (decrease) | (835 | ) | (8,049 | ) | (1,192 | ) | (13,625 | ) | ||||
| Class Y | ||||||||||||
| Proceeds from shares sold | 1,300 | 12,044 | 1,306 | 14,923 | ||||||||
| Proceeds from reinvestment of distributions | 7,487 | 70,670 | 8,189 | 91,712 | ||||||||
| Payments for shares redeemed | (12,298 | ) | (123,509 | ) | (13,195 | ) | (154,546 | ) | ||||
| Net increase (decrease) | (3,511 | ) | (40,795 | ) | (3,700 | ) | (47,911 | ) | ||||
| Total increase (decrease) | (5,154 | ) | $ | (56,654 | ) | (5,291 | ) | $ | (66,738 | ) | ||
See accompanying notes which are an integral part of the financial statements.
Russell U.S. Dynamic Equity Fund 69
Russell Investment Company
Russell U.S. Dynamic Equity Fund
Financial Highlights — For the Periods Ended
For a Share Outstanding Throughout Each Period.
| $ | $ | $ | $ | $ | $ | ||||||||||||
| Net Asset Value, | Net | Net Realized | Total from | Distributions | Distributions | ||||||||||||
| Beginning of | Investment | and Unrealized | Investment | from Net | from Net | ||||||||||||
| Period | Income (Loss)(a)(d) | Gain (Loss) | Operations | Investment Income | Realized Gain | ||||||||||||
| Class A | |||||||||||||||||
| October 31, 2016 | 10.76 | .03 | .11 | .14 | (.05 | ) | (1.53 | ) | |||||||||
| October 31, 2015 | 12.12 | —(f) | .53 | .53 | —(f) | (1.89 | ) | ||||||||||
| October 31, 2014 | 12.08 | (.03 | ) | 1.53 | 1.50 | —(f) | (1.46 | ) | |||||||||
| October 31, 2013 | 9.40 | —(f) | 2.71 | 2.71 | (.03 | ) | — | ||||||||||
| October 31, 2012(3) | 9.20 | .01 | .20 | .21 | (.01 | ) | — | ||||||||||
| Class C | |||||||||||||||||
| October 31, 2016 | 9.21 | (.03 | ) | .08 | .05 | (.01 | ) | (1.53 | ) | ||||||||
| October 31, 2015 | 10.70 | (.07 | ) | .47 | .40 | — | (1.89 | ) | |||||||||
| October 31, 2014 | 10.90 | (.10 | ) | 1.36 | 1.26 | — | (1.46 | ) | |||||||||
| October 31, 2013 | 8.53 | (.07 | ) | 2.44 | 2.37 | — | — | ||||||||||
| October 31, 2012 | 7.56 | (.06 | ) | 1.03 | .97 | — | — | ||||||||||
| Class E | |||||||||||||||||
| October 31, 2016 | 10.78 | .03 | .11 | .14 | (.05 | ) | (1.53 | ) | |||||||||
| October 31, 2015 | 12.14 | —(f) | .53 | .53 | —(f) | (1.89 | ) | ||||||||||
| October 31, 2014 | 12.10 | (.02 | ) | 1.52 | 1.50 | — | (1.46 | ) | |||||||||
| October 31, 2013 | 9.41 | .01 | 2.69 | 2.70 | (.01 | ) | — | ||||||||||
| October 31, 2012 | 8.27 | —(f) | 1.14 | 1.14 | — | — | |||||||||||
| Class I | |||||||||||||||||
| October 31, 2016 | 11.40 | .07 | .12 | .19 | (.08 | ) | (1.53 | ) | |||||||||
| October 31, 2015 | 12.73 | .03 | .56 | .59 | (.03 | ) | (1.89 | ) | |||||||||
| October 31, 2014 | 12.60 | .02 | 1.60 | 1.62 | (.03 | ) | (1.46 | ) | |||||||||
| October 31, 2013 | 9.79 | .05 | 2.81 | 2.86 | (.05 | ) | — | ||||||||||
| October 31, 2012 | 8.56 | .03 | 1.21 | 1.24 | (.01 | ) | — | ||||||||||
| Class S | |||||||||||||||||
| October 31, 2016 | 11.22 | .06 | .11 | .17 | (.07 | ) | (1.53 | ) | |||||||||
| October 31, 2015 | 12.55 | .02 | .56 | .58 | (.02 | ) | (1.89 | ) | |||||||||
| October 31, 2014 | 12.45 | .01 | 1.57 | 1.58 | (.02 | ) | (1.46 | ) | |||||||||
| October 31, 2013 | 9.68 | .04 | 2.76 | 2.80 | (.03 | ) | — | ||||||||||
| October 31, 2012 | 8.48 | .03 | 1.17 | 1.20 | —(f) | — | |||||||||||
| Class Y | |||||||||||||||||
| October 31, 2016 | 11.36 | .08 | .12 | .20 | (.09 | ) | (1.53 | ) | |||||||||
| October 31, 2015 | 12.69 | .05 | .56 | .61 | (.05 | ) | (1.89 | ) | |||||||||
| October 31, 2014 | 12.56 | .03 | 1.59 | 1.62 | (.03 | ) | (1.46 | ) | |||||||||
| October 31, 2013 | 9.77 | .06 | 2.80 | 2.86 | (.07 | ) | — | ||||||||||
| October 31, 2012(3) | 9.56 | .02 | .21 | .23 | (.02 | ) | — | ||||||||||
See accompanying notes which are an integral part of the financial statements.
70 Russell U.S. Dynamic Equity Fund
| % | % | % | |||||||||||||||||
| $ | $ | Ratio of Expenses | Ratio of Expenses | Ratio of Net | |||||||||||||||
| Net Asset Value, | % | Net Assets, | to Average | to Average | Investment Income | % | |||||||||||||
| $ | End of | Total | End of Period | Net Assets, | Net Assets, | to Average | Portfolio | ||||||||||||
| Total Distributions | Period | Return(b)(c) | (000 | ) | Gross(e) | Net(d)(e)(g) | Net Assets(d)(e) | Turnover Rate(b)(k) | |||||||||||
| (1.58 | ) | 9.32 | 2.10 | 1,757 | 1.55 | 1.55 | .35 | 118 | |||||||||||
| (1.89 | ) | 10.76 | 4.58 | 2,349 | 1.50 | 1.50 | (.04 | ) | 142 | ||||||||||
| (1.46 | ) | 12.12 | 13.40 | 1,994 | 1.52 | 1.52 | (.22 | ) | 146 | ||||||||||
| (.03 | ) | 12.08 | 28.84 | 1,089 | 1.51 | 1.51 | — (i) | 142 | |||||||||||
| (.01 | ) | 9.40 | 2.30 | 206 | 1.36 | 1.35 | .31 | 120 | |||||||||||
| (1.54 | ) | 7.72 | 1.41 | 7,509 | 2.30 | 2.30 | (.40 | ) | 118 | ||||||||||
| (1.89 | ) | 9.21 | 3.81 | 10,862 | 2.25 | 2.25 | (.79 | ) | 142 | ||||||||||
| (1.46 | ) | 10.70 | 12.66 | 11,644 | 2.27 | 2.27 | (.96 | ) | 146 | ||||||||||
| — | 10.90 | 27.90 | 9,380 | 2.26 | 2.26 | (.68 | ) | 142 | |||||||||||
| — | 8.53 | 12.83 | 5,386 | 2.28 | 2.07 | (.72 | ) | 120 | |||||||||||
| (1.58 | ) | 9.34 | 2.10 | 328 | 1.55 | 1.55 | .33 | 118 | |||||||||||
| (1.89 | ) | 10.78 | 4.52 | 321 | 1.50 | 1.50 | (.02 | ) | 142 | ||||||||||
| (1.46 | ) | 12.14 | 13.46 | 1,893 | 1.52 | 1.52 | (.19 | ) | 146 | ||||||||||
| (.01 | ) | 12.10 | 28.75 | 2,959 | 1.51 | 1.51 | .10 | 142 | |||||||||||
| — | 9.41 | 13.78 | 2,443 | 1.55 | 1.32 | (.01 | ) | 120 | |||||||||||
| (1.61 | ) | 9.98 | 2.47 | 12,144 | 1.22 | 1.22 | .68 | 118 | |||||||||||
| (1.92 | ) | 11.40 | 4.90 | 20,455 | 1.17 | 1.17 | .30 | 142 | |||||||||||
| (1.49 | ) | 12.73 | 13.86 | 28,158 | 1.19 | 1.18 | .14 | 146 | |||||||||||
| (.05 | ) | 12.60 | 29.28 | 28,265 | 1.18 | 1.13 | .41 | 142 | |||||||||||
| (.01 | ) | 9.79 | 14.34 | 18,586 | 1.21 | .94 | .38 | 120 | |||||||||||
| (1.60 | ) | 9.79 | 2.34 | 19,856 | 1.30 | 1.30 | .61 | 118 | |||||||||||
| (1.91 | ) | 11.22 | 4.88 | 32,114 | 1.25 | 1.25 | .21 | 142 | |||||||||||
| (1.48 | ) | 12.55 | 13.68 | 50,903 | 1.27 | 1.27 | .05 | 146 | |||||||||||
| (.03 | ) | 12.45 | 29.04 | 72,332 | 1.26 | 1.26 | .35 | 142 | |||||||||||
| — (f) | 9.68 | 14.20 | 52,928 | 1.26 | 1.07 | .29 | 120 | ||||||||||||
| (1.62 | ) | 9.94 | 2.63 | 421,094 | 1.10 | 1.10 | .79 | 118 | |||||||||||
| (1.94 | ) | 11.36 | 5.06 | 521,326 | 1.05 | 1.05 | .41 | 142 | |||||||||||
| (1.49 | ) | 12.69 | 13.99 | 629,285 | 1.07 | 1.07 | .23 | 146 | |||||||||||
| (.07 | ) | 12.56 | 29.34 | 587,599 | 1.06 | 1.06 | .56 | 142 | |||||||||||
| (.02 | ) | 9.77 | 2.36 | 563,827 | .91 | .91 | .80 | 120 | |||||||||||
See accompanying notes which are an integral part of the financial statements.
Russell U.S. Dynamic Equity Fund 71
Russell Investment Company
Russell U.S. Dynamic Equity Fund
Related Party Transactions, Fees and Expenses
| Accrued fees payable to affiliates for the period ended October 31, 2016 were as follows: | ||
| Advisory fees | $ | 320,388 |
| Administration fees | 19,350 | |
| Distribution fees | 5,214 | |
| Shareholder servicing fees | 1,682 | |
| Transfer agent fees | 8,033 | |
| Trustee fees | 1,881 | |
| $ | 356,548 | |
| Transactions (amounts in thousands) during the period ended October 31, 2016 with Underlying Funds which are, or were, an | |||||||||||||||||||
| affiliated company are as follows: | |||||||||||||||||||
| Fair Value, | Change in | ||||||||||||||||||
| Beginning of | Realized Gain | Unrealized | Fair Value, End | Income | Capital Gains | ||||||||||||||
| Period | Purchases | Sales | (Loss) | Gain (Loss) | of Period | Distributions | Distributions | ||||||||||||
| Russell U.S. Cash Collateral Fund | $ | 4,139 | $ | 112,989 | $ | 113,740 | $ | — | $ | — | $ | 3,388 | $ | 38 | $ | — | |||
| Russell U.S. Cash Management Fund | 22,035 | 251,102 | 260,767 | 1 | 1 | 12,372 | 65 | — | |||||||||||
| $ | 26,174 | $ | 364,091 | $ | 374,507 | $ | 1 | $ | 1 | $ | 15,760 | $ | 103 | $ | — | ||||
Federal Income Taxes
At October 31, 2016, the cost of investments and net unrealized appreciation (depreciation), undistributed ordinary income and
undistributed long-term capital gains for income tax purposes were as follows:.
| Cost of Investments | $ | 447,991,691 | ||
| Unrealized Appreciation | $ | 48,155,141 | ||
| Unrealized Depreciation | (12,380,514 | ) | ||
| Net Unrealized Appreciation (Depreciation) | $ | 35,774,627 | ||
| Undistributed Ordinary Income | $ | 1,926,449 | ||
| Undistributed Long-Term Capital Gains | ||||
| (Capital Loss Carryforward) | $ | 17,913,204 | ||
| Tax Composition of Distributions | ||||
| Ordinary Income | $ | 26,370,118 | ||
| Long-Term Capital Gains | $ | 53,264,453 |
Net investment income and net realized gains (loss) in the financial statements may differ from taxable net investment income and net
realized gains (losses). Capital accounts within the financial statements are adjusted for permanent book-tax differences. Book-tax
differences are primarily due to foreign currency gains and losses, reclassifications of dividends, differences in treatment of income
from swaps, net operating losses, investments in partnerships, investments in passive foreign investment companies (PFICs), tax
straddle transaction, use of tax equalization and foreign capital gains taxes. These adjustments have no impact on the net assets.
At October 31, 2016, the Statement of Assets and Liabilities have been adjusted by the following amounts (in thousands):
| Undistributed net investment income | $ | 277 | |
| Accumulated net realized gain (loss) | (277 | ) | |
| Additional paid-in capital | — |
See accompanying notes which are an integral part of the financial statements.
72 Russell U.S. Dynamic Equity Fund
Russell Investment Company
Russell U.S. Strategic Equity Fund
Portfolio Management Discussion and Analysis — October 31, 2016 (Unaudited)

| Russell U.S. Strategic Equity Fund - Class A‡ | Russell U.S. Strategic Equity Fund - Class S | ||||||
| Total | Total | ||||||
| Return | Return | ||||||
| 1 Year | (3.40 | )% | 1 Year | 2.85 | % | ||
| Inception* | 9.67 | %§ | Inception* | 11.52 | %§ | ||
| Russell U.S. Strategic Equity Fund - Class C | Russell 1000® Index** | ||||||
| Total | Total | ||||||
| Return | Return | ||||||
| 1 Year | 1.74 | % | 1 Year | 4.26 | % | ||
| Inception* | 10.40 | %§ | Inception* | 12.94 | %§ | ||
| Russell U.S. Strategic Equity Fund - Class E | |||||||
| Total | |||||||
| Return | |||||||
| 1 Year | 2.51 | % | |||||
| Inception* | 11.23 | %§ | |||||
Russell U.S. Strategic Equity Fund 73
Russell Investment Company
Russell U.S. Strategic Equity Fund
Portfolio Management Discussion and Analysis, continued — October 31, 2016
(Unaudited)
| The Russell U.S. Strategic Equity Fund (the “Fund”) employs | a negative effect on Fund performance as the pace of interest rate |
| a multi-manager approach whereby portions of the Fund are | increases was slower than the market had expected and investors |
| allocated to different money manager strategies. Fund assets not | became concerned that the odds of a recession may be increasing. |
| allocated to money managers are managed by Russell Investment | However, market conditions in the second half of the fiscal year |
| Management, LLC (“RIM”), the Fund’s advisor. RIM may change | allowed the Fund to make up a portion of the initial shortfall as |
| the allocation of the Fund’s assets among money managers at | expectations firmed-up regarding the economic outlook and the |
| any time. An exemptive order from the Securities and Exchange | timing of the next interest rate increase. |
| Commission (“SEC”) permits RIM to engage or terminate a money | |
| manager at any time, subject to approval by the Fund’s Board, | How did the investment strategies and techniques employed |
| without a shareholder vote. Pursuant to the terms of the exemptive | by the Fund and its money managers affect its benchmark- |
| order, the Fund is required to notify its shareholders within 90 | relative performance? |
| days of when a money manager begins providing services. As of | Stock selection detracted within the consumer discretionary |
| October 31, 2016, the Fund had seven money managers. | sector (overweight Home Depot, Inc., underweight Amazon.com) |
| but stock selection was beneficial within the health care sector | |
| What is the Fund’s investment objective? | (overweight Tesaro, Inc., underweight Allergan) for the fiscal |
| The Fund seeks to provide long term capital growth. | year. An overweight to stocks with below-benchmark price-to- |
| How did the Fund perform relative to its benchmark for the | earnings ratios detracted as did an underweight to high dividend |
| fiscal year ended October 31, 2016? | yield stocks and an underweight to the lowest beta stocks. An |
| underweight to REITs and to the utilities and consumer staples | |
| For the fiscal year ended October 31, 2016, the Fund’s Class | sectors detracted. Overweights to the bank and airlines industries |
| A, Class C, Class E and Class S Shares gained 2.51%, 1.74%, | held back benchmark-relative performance but an overweight to |
| 2.51% and 2.85%, respectively. This is compared to the Fund’s | the telecommunications services sector was beneficial. |
| benchmark, the Russell 1000® Index, which gained 4.26% during | |
| the same period. The Fund’s performance includes operating | The Fund employs discretionary and non-discretionary money |
| expenses, whereas index returns are unmanaged and do not | managers. The Fund’s discretionary money managers select the |
| include expenses of any kind. | individual portfolio securities for the assets assigned to them. |
| The Fund’s non-discretionary money managers provide a model | |
| For the fiscal year ended October 31, 2016, the Morningstar® | portfolio to RIM representing their investment recommendations, |
| Large Blend Category, a group of funds that Morningstar considers | based upon which RIM purchases and sells securities for the |
| to have investment strategies similar to those of the Fund, gained | Fund. Fund assets not allocated to discretionary money managers |
| 2.12%. This result serves as a peer comparison and is expressed | include assets managed by RIM based upon model portfolios |
| net of operating expenses. | provided by non-discretionary money managers, the Fund’s |
| RIM may assign a money manager a specific style or | liquidity reserves and assets which may be managed directly by |
| capitalization benchmark other than the Fund’s index. However, | RIM to effect the Fund’s investment strategies and/or to actively |
| the Fund’s primary index remains the benchmark for the Fund | manage the Fund’s overall exposures by investing in securities or |
| and is representative of the aggregate of each money manager’s | other instruments that RIM believes will achieve the desired risk/ |
| benchmark index. | return profile for the Fund. |
| How did the market conditions described in the Market | With respect to certain of the Fund’s money managers, Suffolk |
| Summary report affect the Fund’s performance? | Capital Management, LLC (“Suffolk”) was the best performing |
| During the fiscal year, the U.S. large capitalization equity market | manager for the period and outperformed the Russell 1000® |
| produced positive returns. Fund exposures included tilts toward | Dynamic™ Index. Stock selection within the health care sector |
| value stocks with low price-to-earnings ratios. The Fund was | (an overweight to Tesaro, Inc. and Anacor Pharmaceuticals) |
| tilted away from most of the interest rate sensitive areas of the | and within the information technology sector (an overweight to |
| market, except for telecommunications services stocks which | Hewlett Packard and Broadcom Limited) was a significant driver |
| were less expensive than other high dividend yield stocks. The | of positive benchmark-relative performance. Suffolk’s tilt toward |
| Fund was also tilted away from less economically sensitive, | stocks with good quality balance sheets (low debt-to-capital |
| high dividend yield, and low beta stocks (beta is a measure of a | ratios) was beneficial. |
| stock’s sensitivity to the direction of the market) such as utilities, | Brandywine Global Investment Management, LLC (“Brandywine”) |
| real estate investment trusts (“REITs”), and consumer staples. | was the worst performing manager for the period and |
| Overall, the market conditions of the first half of the fiscal year had | underperformed the Russell 1000® Value Index. Brandywine’s |
74 Russell U.S. Strategic Equity Fund
Russell Investment Company
Russell U.S. Strategic Equity Fund
Portfolio Management Discussion and Analysis, continued — October 31, 2016
(Unaudited)
| tilt toward stocks with below-benchmark valuation ratios (low | money managers for the Fund and hired William Blair Investment | |
| price-to-earnings ratios) and toward high beta stocks detracted. | Management, LLC as a discretionary money manager. These | |
| An overweight to the consumer discretionary sector and an | changes were made in order to improve the Fund’s excess return | |
| underweight to the utilities sector held back relative returns. | potential and decrease the number of managers/stocks in the | |
| Stock selection within the health care sector (an overweight to | Fund. | |
| Valeant Pharmaceuticals and Endo International) detracted. | ||
| Money Managers as of October 31, | ||
| RIM manages an 8% strategic allocation to a positioning strategy | 2016 | Styles |
| to seek to achieve the desired risk/return profile for the Fund. | AJO, LP | Dynamic |
| The positioning strategy utilizes the output from a quantitative | Barrow, Hanley, Mewhinney & Strauss, LLC Value | |
| model to seek to position the portfolio to meet RIM’s overall | Brandywine Global Investment Management, | |
| preferred positioning. The positioning strategy outperformed the | LLC | Value |
| Russell 1000® Index during the one year period. A tilt toward | Jacobs Levy Equity Management | Defensive |
| high dividend yield stocks and away from stocks with the | PanAgora Asset Management, Inc. | Defensive |
| Suffolk Capital Management LLC | Dynamic | |
| highest financial leverage contributed positively to benchmark- | William Blair Investment Management, LLC Dynamic | |
| relative performance. Sector allocation decisions were rewarded, | The views expressed in this report reflect those of the | |
| specifically an overweight to utilities and an underweight to | portfolio managers only through the end of the period | |
| consumer discretionary. | covered by the report. These views do not necessarily | |
| During the period, RIM used index futures contracts to equitize | represent the views of RIM, or any other person in RIM or | |
| the Fund’s cash. The decision to equitize the Fund’s cash was | any other affiliated organization. These views are subject | |
| beneficial to Fund performance for the fiscal year as the market | to change at any time based upon market conditions or | |
| had a positive absolute return. | other events, and RIM disclaims any responsibility to | |
| update the views contained herein. These views should not | ||
| Describe any changes to the Fund’s structure or the money | be relied on as investment advice and, because investment | |
| manager line-up. | decisions for a Russell Investment Company (“RIC”) Fund | |
| In March of 2016, RIM terminated Columbus Circle Investors | are based on numerous factors, should not be relied on as | |
| and Cornerstone Capital Management LLC as discretionary | an indication of investment decisions of any RIC Fund. | |
* Assumes initial investment on August 6, 2012.
** Russell 1000® Index includes the 1,000 largest companies in the Russell 3000® Index. The Russell 1000® Index represents the universe of stocks from which
most active money managers typically select. The Russell 1000® Index return reflects adjustments from income dividends and capital gain distributions
reinvested as of the ex-dividend dates.
‡ The performance shown has been adjusted to reflect the deduction of the maximum Class A sales charge of 5.75%.
§ Annualized.
Performance is historical and assumes reinvestment of all dividends and capital gains. Investment return and principal value will fluctuate so that an investor’s
shares, when redeemed, may be worth more or less than when purchased. Past performance is not indicative of future results. The returns shown do not reflect the
deduction of taxes that a shareholder would pay on Fund distributions or the redemption of Fund shares. Additionally, the returns presented herein may differ from
the performance reported in the Financial Highlights as the returns herein are calculated in a manner consistent with standardized performance in accordance with
Securities and Exchange Commission rules, while the performance in the Financial Highlights has been calculated in accordance with U.S. Generally Accepted
Accounting Principles (“U.S. GAAP”).
Russell U.S. Strategic Equity Fund 75
Russell Investment Company
Russell U.S. Strategic Equity Fund
Shareholder Expense Example — October 31, 2016 (Unaudited)
| Fund Expenses | Please note that the expenses shown in the table are meant | |||||
| The following disclosure provides important information | to highlight your ongoing costs only and do not reflect any | |||||
| regarding the Fund’s Shareholder Expense Example | transactional costs. Therefore, the information under the heading | |||||
| (“Example”). | “Hypothetical Performance (5% return before expenses)” is | |||||
| useful in comparing ongoing costs only, and will not help you | ||||||
| Example | determine the relative total costs of owning different funds. In | |||||
| As a shareholder of the Fund, you incur two types of costs: (1) | addition, if these transactional costs were included, your costs | |||||
| transaction costs, including sales charges (loads) on certain | would have been higher. | |||||
| purchase or redemption payments, and (2) ongoing costs, | Hypothetical | |||||
| including distribution (12b-1) and/or service fees and other | Performance (5% | |||||
| Fund expenses. The Example is intended to help you understand | Actual | return before | ||||
| your ongoing costs (in dollars) of investing in the Fund and to | Class A | Performance | expenses) | |||
| Beginning Account Value | ||||||
| compare these costs with the ongoing costs of investing in other | May 1, 2016 | $ | 1,000.00 | $ | 1,000.00 | |
| mutual funds. The Example is based on an investment of $1,000 | Ending Account Value | |||||
| invested at the beginning of the period and held for the entire | October 31, 2016 | $ | 1,039.40 | $ | 1,019.76 | |
| period indicated, which for this Fund is from May 1, 2016 to | Expenses Paid During Period* | $ | 5.49 | $ | 5.43 | |
| October 31, 2016. | * Expenses are equal to the Fund's annualized expense ratio of 1.07% | |||||
| (representing the six month period annualized), multiplied by the average | ||||||
| Actual Expenses | account value over the period, multiplied by 184/366 (to reflect the one-half | |||||
| The information in the table under the heading “Actual | year period). May reflect amounts waived and/or reimbursed. Without any | |||||
| Performance” provides information about actual account values | waivers and/or reimbursements, expenses would have been higher. | |||||
| and actual expenses. You may use the information in this column, | ||||||
| Hypothetical | ||||||
| together with the amount you invested, to estimate the expenses | Performance (5% | |||||
| that you paid over the period. Simply divide your account value by | Actual | return before | ||||
| $1,000 (for example, an $8,600 account value divided by $1,000 | Class C | Performance | expenses) | |||
| Beginning Account Value | ||||||
| = 8.6), then multiply the result by the number in the first column | May 1, 2016 | $ | 1,000.00 | $ | 1,000.00 | |
| in the row entitled “Expenses Paid During Period” to estimate | Ending Account Value | |||||
| the expenses you paid on your account during this period. | October 31, 2016 | $ | 1,035.50 | $ | 1,015.99 | |
| Expenses Paid During Period* | $ | 9.31 | $ | 9.22 | ||
| Hypothetical Example for Comparison Purposes | ||||||
| The information in the table under the heading “Hypothetical | * Expenses are equal to the Fund's annualized expense ratio of 1.82% | |||||
| (representing the six month period annualized), multiplied by the average | ||||||
| Performance (5% return before expenses)” provides information | account value over the period, multiplied by 184/366 (to reflect the one-half | |||||
| about hypothetical account values and hypothetical expenses | year period). May reflect amounts waived and/or reimbursed. Without any | |||||
| based on the Fund’s actual expense ratio and an assumed rate of | waivers and/or reimbursements, expenses would have been higher. | |||||
| return of 5% per year before expenses, which is not the Fund’s | ||||||
| Hypothetical | ||||||
| actual return. The hypothetical account values and expenses | Performance (5% | |||||
| may not be used to estimate the actual ending account balance or | Actual | return before | ||||
| expenses you paid for the period. You may use this information | Class E | Performance | expenses) | |||
| to compare the ongoing costs of investing in the Fund and other | Beginning Account Value | |||||
| May 1, 2016 | $ | 1,000.00 | $ | 1,000.00 | ||
| funds. To do so, compare this 5% hypothetical example with the | Ending Account Value | |||||
| 5% hypothetical examples that appear in the shareholder reports | October 31, 2016 | $ | 1,039.40 | $ | 1,019.76 | |
| of other funds. | Expenses Paid During Period* | $ | 5.49 | $ | 5.43 | |
| * Expenses are equal to the Fund's annualized expense ratio of 1.07% | ||||||
| (representing the six month period annualized), multiplied by the average | ||||||
| account value over the period, multiplied by 184/366 (to reflect the one-half | ||||||
| year period). May reflect amounts waived and/or reimbursed. Without any | ||||||
| waivers and/or reimbursements, expenses would have been higher. | ||||||
76 Russell U.S. Strategic Equity Fund
Russell Investment Company
Russell U.S. Strategic Equity Fund
Shareholder Expense Example, continued — October 31, 2016 (Unaudited)
| Hypothetical | ||||
| Performance (5% | ||||
| Actual | return before | |||
| Class S | Performance | expenses) | ||
| Beginning Account Value | ||||
| May 1, 2016 | $ | 1,000.00 | $ | 1,000.00 |
| Ending Account Value | ||||
| October 31, 2016 | $ | 1,041.60 | $ | 1,021.01 |
| Expenses Paid During Period* | $ | 4.21 | $ | 4.17 |
* Expenses are equal to the Fund's annualized expense ratio of 0.82%
(representing the six month period annualized), multiplied by the average
account value over the period, multiplied by 184/366 (to reflect the one-half
year period). May reflect amounts waived and/or reimbursed. Without any
waivers and/or reimbursements, expenses would have been higher.
Russell U.S. Strategic Equity Fund 77
Russell Investment Company
Russell U.S. Strategic Equity Fund
Schedule of Investments — October 31, 2016
| Amounts in thousands (except share amounts) | Amounts in thousands (except share amounts) | ||||||
| Principal | Fair | Principal | Fair | ||||
| Amount ($) or | Value | Amount ($) or | Value | ||||
| Shares | $ | Shares | $ | ||||
| Common Stocks - 97.8% | Target Corp. | 191,676 | 13,174 | ||||
| Consumer Discretionary - 13.6% | Tenneco, Inc.(Æ) | 39,709 | 2,187 | ||||
| Amazon.com, Inc.(Æ) | 41,467 | 32,752 | Thomson Reuters Corp. | 8,917 | 351 | ||
| AutoZone, Inc.(Æ) | 6,370 | 4,728 | Time Warner, Inc. | 63,265 | 5,630 | ||
| Bed Bath & Beyond, Inc. | 44,388 | 1,794 | Time, Inc. | 41,546 | 540 | ||
| Best Buy Co., Inc.(Û) | 87,595 | 3,408 | TJX Cos., Inc. | 88,665 | 6,539 | ||
| Big Lots, Inc. | 53,545 | 2,324 | Toll Brothers, Inc.(Æ) | 27,172 | 746 | ||
| Bloomin' Brands, Inc. | 64,457 | 1,115 | Toyota Motor Corp. - ADR | 23,519 | 2,720 | ||
| Brinker International, Inc. | 49,256 | 2,425 | VF Corp. | 114,448 | 6,204 | ||
| Carnival Corp. | 78,763 | 3,867 | Viacom, Inc. Class B | 38,902 | 1,461 | ||
| CBS Corp. Class B | 26,026 | 1,474 | Visteon Corp. | 52,313 | 3,694 | ||
| Chipotle Mexican Grill, Inc. Class A(Æ) | 18,465 | 6,661 | Wal-Mart Stores, Inc. | 372,947 | 26,114 | ||
| Choice Hotels International, Inc. | 13,110 | 635 | Walt Disney Co. (The) | 180,107 | 16,694 | ||
| Coach, Inc. | 15,584 | 559 | Whirlpool Corp. | 33,100 | 4,959 | ||
| Comcast Corp. Class A | 153,543 | 9,492 | Yum! Brands, Inc. | 82,618 | 7,128 | ||
| Cooper Tire & Rubber Co. | 69,111 | 2,540 | |||||
| Costco Wholesale Corp. | 45,830 | 6,777 | 386,690 | ||||
| Coty, Inc. Class A(Æ) | 82,913 | 1,906 | |||||
| Dana, Inc. | 210,298 | 3,255 | Consumer Staples - 7.3% | ||||
| Altria Group, Inc. | 340,215 | 22,495 | |||||
| Darden Restaurants, Inc. | 4,393 | 285 | Archer-Daniels-Midland Co. | 3,394 | 148 | ||
| Delphi Automotive PLC | 102,612 | 6,677 | Blue Buffalo Pet Products, Inc.(Æ) | 12,943 | 325 | ||
| Dillard's, Inc. Class A | 26,613 | 1,631 | Campbell Soup Co. | 21,908 | 1,191 | ||
| Discovery Communications, Inc. Class A(Æ) | 319,411 | 8,340 | Clorox Co. (The) | 2,069 | 248 | ||
| eBay, Inc.(Æ)(Û) | 125,076 | 3,566 | Coca-Cola Co. (The) | 25,019 | 1,061 | ||
| Estee Lauder Cos., Inc. (The) Class A | 144,590 | 12,598 | Coca-Cola European Partners PLC | 94,883 | 3,647 | ||
| Fiat Chrysler Automobiles NV | 430,273 | 3,150 | Colgate-Palmolive Co. | 36,356 | 2,594 | ||
| Foot Locker, Inc. | 3,727 | 249 | ConAgra Foods, Inc. | 67,536 | 3,254 | ||
| Ford Motor Co. | 39,150 | 460 | CVS Health Corp. | 105,083 | 8,838 | ||
| Gap, Inc. (The) | 260,400 | 7,184 | Dean Foods Co. | 125,794 | 2,297 | ||
| General Motors Co.(Û) | 413,314 | 13,061 | Dr Pepper Snapple Group, Inc. | 132,956 | 11,672 | ||
| Goodyear Tire & Rubber Co. (The) | 165,510 | 4,805 | Ingredion, Inc. | 23,055 | 3,024 | ||
| Harman International Industries, Inc. | 24,500 | 1,953 | JM Smucker Co. (The) | 25,240 | 3,314 | ||
| Hasbro, Inc. | 9,763 | 814 | Kimberly-Clark Corp. | 48,737 | 5,576 | ||
| Home Depot, Inc. (The) | 272,388 | 33,234 | Kraft Heinz Co. (The) | 68,172 | 6,064 | ||
| IMAX Corp.(Æ) | 159,778 | 4,833 | Kroger Co. (The) | 446,499 | 13,833 | ||
| Kohl's Corp. | 6,007 | 263 | Mead Johnson Nutrition Co. Class A | 141,285 | 10,564 | ||
| Lear Corp. | 29,157 | 3,580 | Molson Coors Brewing Co. Class B | 34,651 | 3,597 | ||
| Leggett & Platt, Inc. | 6,453 | 296 | Mondelez International, Inc. Class A | 17,471 | 785 | ||
| Lennar Corp. Class A | 8,341 | 348 | Monster Beverage Corp.(Æ) | 40,518 | 5,848 | ||
| Lowe's Cos., Inc. | 75,848 | 5,055 | Nu Skin Enterprises, Inc. Class A | 4,298 | 265 | ||
| Macy's, Inc. | 109,282 | 3,988 | PepsiCo, Inc. | 230,036 | 24,660 | ||
| Magna International, Inc. Class A | 83,310 | 3,420 | Philip Morris International, Inc. | 342,266 | 33,008 | ||
| Marriott International, Inc. Class A | 12,347 | 848 | Procter & Gamble Co. (The) | 289,259 | 25,108 | ||
| McDonald's Corp. | 28,730 | 3,234 | Sanderson Farms, Inc. | 5,560 | 500 | ||
| Michael Kors Holdings, Ltd.(Æ) | 113,684 | 5,773 | Sysco Corp. | 190,730 | 9,178 | ||
| Newell Brands, Inc. | 124,043 | 5,957 | Tyson Foods, Inc. Class A | 24,383 | 1,728 | ||
| News Corp. Class A | 308,400 | 3,738 | United Natural Foods, Inc.(Æ) | 23,500 | 981 | ||
| Nike, Inc. Class B | 242,257 | 12,156 | Walgreens Boots Alliance, Inc. | 3,907 | 323 | ||
| Nordstrom, Inc. | 9,551 | 497 | |||||
| Norwegian Cruise Line Holdings, Ltd.(Æ) | 51,528 | 2,003 | 206,126 | ||||
| NVR, Inc.(Æ) | 3,714 | 5,656 | |||||
| Office Depot, Inc. | 163,447 | 515 | Energy - 6.7% | ||||
| O'Reilly Automotive, Inc.(Æ) | 38,259 | 10,117 | Anadarko Petroleum Corp. | 114,923 | 6,831 | ||
| Panera Bread Co. Class A(Æ) | 16,650 | 3,176 | Antero Resources Corp.(Æ) | 33,500 | 887 | ||
| Priceline Group, Inc. (The)(Æ) | 423 | 624 | Apache Corp. | 113,627 | 6,758 | ||
| PulteGroup, Inc. | 45,754 | 851 | Baker Hughes, Inc. | 11,477 | 636 | ||
| PVH Corp. | 56,797 | 6,076 | BP PLC - ADR | 587,722 | 20,893 | ||
| Ross Stores, Inc. | 62,242 | 3,893 | Canadian Natural Resources, Ltd. | 350,280 | 11,107 | ||
| Scripps Networks Interactive, Inc. Class A | 35,025 | 2,254 | Chevron Corp. | 144,332 | 15,119 | ||
| Signet Jewelers, Ltd. | 48,019 | 3,902 | ConocoPhillips | 226,690 | 9,850 | ||
| Starbucks Corp. | 221,920 | 11,777 | Devon Energy Corp. | 127,862 | 4,845 | ||
See accompanying notes which are an integral part of the financial statements.
78 Russell U.S. Strategic Equity Fund
Russell Investment Company
Russell U.S. Strategic Equity Fund
Schedule of Investments, continued — October 31, 2016
| Amounts in thousands (except share amounts) | Amounts in thousands (except share amounts) | ||||||
| Principal | Fair | Principal | Fair | ||||
| Amount ($) or | Value | Amount ($) or | Value | ||||
| Shares | $ | Shares | $ | ||||
| Dril-Quip, Inc.(Æ) | 5,982 | 284 | Boston Properties, Inc.(ö) | 2,642 | 318 | ||
| Ensco PLC Class A | 273,496 | 2,139 | Broadridge Financial Solutions, Inc. | 6,442 | 417 | ||
| EOG Resources, Inc. | 11,258 | 1,018 | CBL & Associates Properties, Inc. (ö) | 198,090 | 2,120 | ||
| Exxon Mobil Corp. | 425,810 | 35,478 | Charles Schwab Corp. (The) | 22,849 | 724 | ||
| First Solar, Inc.(Æ) | 5,871 | 238 | Chubb, Ltd. | 11,327 | 1,439 | ||
| FMC Technologies, Inc.(Æ) | 21,049 | 679 | Citigroup, Inc. | 559,886 | 27,518 | ||
| Frank's International NV | 22,486 | 253 | Citizens Financial Group, Inc. | 87,307 | 2,300 | ||
| Halliburton Co. | 99,051 | 4,556 | CME Group, Inc. Class A | 6,140 | 615 | ||
| Helmerich & Payne, Inc. | 40,656 | 2,566 | Comerica, Inc. | 105,800 | 5,511 | ||
| Hess Corp. | 1,876 | 90 | Crown Castle International Corp.(ö) | 7,032 | 640 | ||
| HollyFrontier Corp. | 101,752 | 2,539 | East West Bancorp, Inc. | 22,843 | 903 | ||
| Kinder Morgan, Inc. | 30,011 | 613 | Ecolab, Inc. | 6,326 | 722 | ||
| Marathon Petroleum Corp. | 30,088 | 1,311 | Equifax, Inc. | 4,611 | 572 | ||
| Murphy Oil Corp. | 32,241 | 834 | Equity Commonwealth (Æ)(ö) | 24,220 | 732 | ||
| Nabors Industries, Ltd. | 163,135 | 1,941 | Equity LifeStyle Properties, Inc. Class A(ö) | 40,709 | 3,087 | ||
| National Oilwell Varco, Inc. | 13,011 | 418 | Equity Residential(ö) | 63,625 | 3,929 | ||
| Noble Corp. PLC | 64,309 | 318 | Everest Re Group, Ltd. | 44,656 | 9,088 | ||
| Noble Energy, Inc. | 11,483 | 396 | FactSet Research Systems, Inc. | 18,267 | 2,826 | ||
| Occidental Petroleum Corp. | 186,251 | 13,580 | Fidelity National Information Services, Inc. | 3,789 | 280 | ||
| Oceaneering International, Inc. | 96,285 | 2,292 | First American Financial Corp. | 22,888 | 894 | ||
| Patterson-UTI Energy, Inc. | 85,832 | 1,929 | Fiserv, Inc.(Æ) | 8,877 | 874 | ||
| PBF Energy, Inc. Class A | 8,154 | 178 | FNFV Group(Æ) | 59,973 | 723 | ||
| Phillips 66 | 128,242 | 10,407 | Forest City Realty Trust, Inc. Class A(ö) | 149,809 | 3,234 | ||
| Pioneer Natural Resources Co. | 40,567 | 7,262 | Genworth Financial, Inc. Class A(Æ) | 194,153 | 804 | ||
| QEP Resources, Inc.(Æ) | 32,100 | 516 | Global Payments, Inc. | 18,010 | 1,306 | ||
| Rice Energy, Inc.(Æ) | 33,283 | 735 | Goldman Sachs Group, Inc. (The) | 6,237 | 1,112 | ||
| Rowan Cos. PLC Class A(Æ) | 164,778 | 2,187 | Hanover Insurance Group, Inc. (The) | 65,668 | 5,003 | ||
| Schlumberger, Ltd. | 93,922 | 7,347 | Hartford Financial Services Group, Inc. | 54,147 | 2,388 | ||
| Southwestern Energy Co.(Æ) | 40,877 | 425 | HCP, Inc. (ö) | 17,349 | 594 | ||
| Spectra Energy Corp. | 13,894 | 581 | Hospitality Properties Trust (ö) | 10,503 | 287 | ||
| Tesoro Corp. | 36,059 | 3,064 | Host Hotels & Resorts, Inc. (ö) | 13,444 | 208 | ||
| Valero Energy Corp.(Û) | 98,518 | 5,836 | Intercontinental Exchange, Inc. | 1,724 | 466 | ||
| World Fuel Services Corp. | 13,269 | 534 | Invesco, Ltd. | 27,238 | 765 | ||
| 189,470 | Jack Henry & Associates, Inc. | 3,317 | 269 | ||||
| Jones Lang LaSalle, Inc. | 9,447 | 915 | |||||
| Financial Services - 19.9% | JPMorgan Chase & Co.(Û) | 633,862 | 43,901 | ||||
| Affiliated Managers Group, Inc.(Æ) | 40,674 | 5,396 | KeyCorp | 706,857 | 9,981 | ||
| Aflac, Inc. | 5,354 | 369 | KKR & Co., LP | 579,143 | 8,218 | ||
| AGNC Investment Corp.(ö) | 33,625 | 675 | Liberty Property Trust(ö) | 5,773 | 233 | ||
| Allied World Assurance Co. Holdings AG | 9,818 | 422 | Loews Corp. | 302,400 | 13,012 | ||
| Allstate Corp. (The) | 168,289 | 11,427 | Mack-Cali Realty Corp. (ö) | 92,778 | 2,383 | ||
| Ally Financial, Inc. | 97,443 | 1,761 | Markel Corp.(Æ) | 358 | 314 | ||
| American Equity Investment Life Holding | Marsh & McLennan Cos., Inc. | 55,895 | 3,543 | ||||
| �� Co. | 24,600 | 441 | Mastercard, Inc. Class A | 298,330 | 31,927 | ||
| American Express Co. | 161,900 | 10,753 | MetLife, Inc. | 322,580 | 15,148 | ||
| American Financial Group, Inc. | 33,787 | 2,517 | MFA Financial, Inc.(ö) | 18,125 | 132 | ||
| American International Group, Inc. | 59,896 | 3,696 | Mid-America Apartment Communities, Inc. | ||||
| Ameriprise Financial, Inc. | 76,700 | 6,779 | (ö) | 920 | 85 | ||
| Annaly Capital Management, Inc.(ö) | 61,996 | 642 | Morgan Stanley | 175,159 | 5,880 | ||
| Arch Capital Group, Ltd.(Æ) | 5,259 | 410 | Navient Corp. | 51,353 | 656 | ||
| Arthur J Gallagher & Co. | 5,858 | 283 | New York Community Bancorp, Inc. | 15,448 | 222 | ||
| Aspen Insurance Holdings, Ltd. | 123,498 | 5,959 | Old Republic International Corp. | 5,193 | 88 | ||
| Assured Guaranty, Ltd. | 146,321 | 4,374 | Omega Healthcare Investors, Inc.(ö) | 18,071 | 575 | ||
| Axis Capital Holdings, Ltd. | 35,007 | 1,994 | Piedmont Office Realty Trust, Inc. Class A(ö) | 47,148 | 966 | ||
| Bank of America Corp.(Û) | 3,381,633 | 55,797 | PNC Financial Services Group, Inc. (The) | 184,511 | 17,639 | ||
| Bank of New York Mellon Corp. (The) | 162,795 | 7,044 | Popular, Inc. | 150,367 | 5,458 | ||
| BB&T Corp. | 33,500 | 1,313 | Post Properties, Inc.(ö) | 25,742 | 1,694 | ||
| Berkshire Hathaway, Inc. Class B(Æ) | 161,633 | 23,324 | Principal Financial Group, Inc. | 65,063 | 3,552 | ||
| BlackRock, Inc. Class A | 12,576 | 4,291 | ProAssurance Corp. | 6,812 | 363 | ||
| Blackstone Group, LP (The) | 259,694 | 6,500 | Progressive Corp. (The) | 11,654 | 367 | ||
See accompanying notes which are an integral part of the financial statements.
Russell U.S. Strategic Equity Fund 79
Russell Investment Company
Russell U.S. Strategic Equity Fund
Schedule of Investments, continued — October 31, 2016
| Amounts in thousands (except share amounts) | Amounts in thousands (except share amounts) | ||||||
| Principal | Fair | Principal | Fair | ||||
| Amount ($) or | Value | Amount ($) or | Value | ||||
| Shares | $ | Shares | $ | ||||
| Prudential Financial, Inc. | 38,515 | 3,266 | HCA Holdings, Inc.(Æ) | 2,946 | 225 | ||
| Public Storage(ö) | 11,590 | 2,477 | Henry Schein, Inc.(Æ) | 30,030 | 4,480 | ||
| Realty Income Corp.(ö) | 7,692 | 456 | Horizon Pharma PLC(Æ) | 181,944 | 3,042 | ||
| Regency Centers Corp.(ö) | 1,155 | 83 | Humana, Inc. | 3,701 | 635 | ||
| Regions Financial Corp. | 763,702 | 8,179 | Icon PLC(Æ) | 6,485 | 521 | ||
| Reinsurance Group of America, Inc. Class A | 76,230 | 8,222 | IDEXX Laboratories, Inc.(Æ) | 58,651 | 6,284 | ||
| RenaissanceRe Holdings, Ltd. | 2,061 | 256 | Impax Laboratories, Inc.(Æ) | 37,646 | 757 | ||
| Santander Consumer USA Holdings, Inc.(Æ) | 351,063 | 4,283 | Jazz Pharmaceuticals PLC(Æ) | 24,196 | 2,649 | ||
| Simon Property Group, Inc.(ö) | 77,391 | 14,392 | Johnson & Johnson | 431,815 | 50,086 | ||
| Starwood Property Trust, Inc.(ö) | 29,345 | 653 | Laboratory Corp. of America Holdings(Æ) | 5,760 | 722 | ||
| State Street Corp. | 288,927 | 20,286 | LifePoint Health, Inc.(Æ) | 37,400 | 2,238 | ||
| SunTrust Banks, Inc. | 62,081 | 2,808 | Ligand Pharmaceuticals, Inc. Class B(Æ) | 21,981 | 2,104 | ||
| Synchrony Financial | 128,705 | 3,680 | Mallinckrodt PLC(Æ) | 52,688 | 3,122 | ||
| T Rowe Price Group, Inc. | 14,644 | 937 | McKesson Corp. | 12,293 | 1,563 | ||
| Taubman Centers, Inc. (ö) | 22,969 | 1,664 | Medtronic PLC | 217,126 | 17,809 | ||
| Torchmark Corp. | 4,582 | 291 | Merck & Co., Inc. | 637,562 | 37,438 | ||
| Total System Services, Inc. | 9,467 | 472 | Mylan NV(Æ) | 244,639 | 8,929 | ||
| TransUnion(Æ) | 5,483 | 171 | Ophthotech Corp.(Æ) | 74,098 | 2,654 | ||
| Travelers Cos., Inc. (The) | 55,468 | 6,001 | Patterson Cos., Inc. | 17,452 | 745 | ||
| Two Harbors Investment Corp. (ö) | 324,347 | 2,702 | Pfizer, Inc. | 1,021,618 | 32,395 | ||
| US Bancorp | 175,693 | 7,864 | Premier, Inc. Class A(Æ) | 13,742 | 437 | ||
| Validus Holdings, Ltd. | 10,564 | 540 | Quest Diagnostics, Inc. | 22,544 | 1,836 | ||
| Visa, Inc. Class A | 137,926 | 11,380 | ResMed, Inc. | 16,460 | 984 | ||
| Voya Financial, Inc. | 224,047 | 6,845 | St. Jude Medical, Inc. | 3,819 | 297 | ||
| Washington Prime Group, Inc. (ö) | 74,273 | 779 | Stryker Corp. | 66,475 | 7,668 | ||
| Wells Fargo & Co. | 842,890 | 38,781 | Teleflex, Inc. | 2,130 | 305 | ||
| Western Alliance Bancorp(Æ) | 24,348 | 910 | TESARO, Inc.(Æ) | 14,401 | 1,741 | ||
| White Mountains Insurance Group, Ltd. | 536 | 445 | Thermo Fisher Scientific, Inc. | 43,289 | 6,365 | ||
| WR Berkley Corp. | 41,259 | 2,356 | United Therapeutics Corp.(Æ) | 27,259 | 3,273 | ||
| XL Group, Ltd. | 270,610 | 9,390 | UnitedHealth Group, Inc. | 164,258 | 23,215 | ||
| 566,656 | VCA, Inc.(Æ) | 8,965 | 551 | ||||
| VWR Corp.(Æ) | 25,473 | 701 | |||||
| Health Care - 13.2% | Zimmer Biomet Holdings, Inc. | 8,789 | 926 | ||||
| Abbott Laboratories | 34,374 | 1,349 | Zoetis, Inc. Class A | 294,366 | 14,071 | ||
| AbbVie, Inc. | 83,277 | 4,645 | 376,177 | ||||
| Aetna, Inc. | 36,939 | 3,965 | |||||
| Agilent Technologies, Inc. | 108,353 | 4,721 | Materials and Processing - 2.6% | ||||
| Akorn, Inc.(Æ) | 64,359 | 1,541 | Acuity Brands, Inc. | 744 | 166 | ||
| Allergan PLC(Æ) | 28,609 | 5,977 | AdvanSix, Inc.(Æ) | 739 | 12 | ||
| Allscripts Healthcare Solutions, Inc.(Æ) | 53,003 | 637 | Air Products & Chemicals, Inc. | 3,504 | 467 | ||
| AmerisourceBergen Corp. Class A | 4,447 | 313 | Albemarle Corp. | 6,339 | 530 | ||
| Amgen, Inc.(Û) | 30,618 | 4,322 | AptarGroup, Inc. | 3,239 | 231 | ||
| Anthem, Inc. | 45,855 | 5,588 | Bombardier, Inc. Class B(Æ) | 338,784 | 454 | ||
| Baxter International, Inc. | 6,654 | 317 | Cabot Corp. | 56,301 | 2,935 | ||
| Becton Dickinson and Co. | 4,575 | 768 | Celanese Corp. Class A | 75,500 | 5,505 | ||
| Biogen, Inc.(Æ)(Û) | 76,771 | 21,510 | CRH PLC - ADR | 354,700 | 11,457 | ||
| BioMarin Pharmaceutical, Inc.(Æ) | 63,508 | 5,114 | Crown Holdings, Inc.(Æ) | 36,800 | 1,996 | ||
| Bio-Rad Laboratories, Inc. Class A(Æ) | 3,910 | 618 | Domtar Corp. | 24,093 | 866 | ||
| Bristol-Myers Squibb Co. | 336,928 | 17,153 | Dow Chemical Co. (The) | 62,360 | 3,356 | ||
| Bruker Corp. | 26,519 | 543 | Eastman Chemical Co. | 41,317 | 2,971 | ||
| Cardinal Health, Inc. | 210,825 | 14,482 | EI du Pont de Nemours & Co. | 7,123 | 490 | ||
| Cerner Corp.(Æ) | 236,219 | 13,838 | Huntsman Corp. | 34,267 | 581 | ||
| Charles River Laboratories International, | International Flavors & Fragrances, Inc. | 7,592 | 993 | ||||
| Inc.(Æ) | 5,703 | 433 | International Paper Co. | 105,600 | 4,755 | ||
| Cigna Corp. | 6,091 | 724 | Louisiana-Pacific Corp.(Æ) | 139,944 | 2,568 | ||
| CR Bard, Inc. | 18,166 | 3,936 | LyondellBasell Industries NV Class A | 81,922 | 6,517 | ||
| DaVita, Inc.(Æ) | 2,061 | 121 | Masco Corp. | 8,081 | 250 | ||
| Eli Lilly & Co. | 122,259 | 9,028 | Monsanto Co. | 2,367 | 238 | ||
| Express Scripts Holding Co.(Æ) | 41,769 | 2,815 | Newmont Mining Corp. | 13,721 | 508 | ||
| Gilead Sciences, Inc.(Û) | 148,734 | 10,951 | Owens Corning | 61,802 | 3,015 | ||
See accompanying notes which are an integral part of the financial statements.
80 Russell U.S. Strategic Equity Fund
Russell Investment Company
Russell U.S. Strategic Equity Fund
Schedule of Investments, continued — October 31, 2016
| Amounts in thousands (except share amounts) | Amounts in thousands (except share amounts) | ||||||
| Principal | Fair | Principal | Fair | ||||
| Amount ($) or | Value | Amount ($) or | Value | ||||
| Shares | $ | Shares | $ | ||||
| Packaging Corp. of America | 14,954 | 1,234 | Mettler-Toledo International, Inc.(Æ) | 2,602 | 1,051 | ||
| Platform Specialty Products Corp.(Æ) | 3,245 | 24 | Moog, Inc. Class A(Æ) | 9,400 | 546 | ||
| PPG Industries, Inc. | 87,212 | 8,122 | National Instruments Corp. | 12,023 | 338 | ||
| Praxair, Inc. | 7,010 | 821 | Norfolk Southern Corp. | 103,143 | 9,592 | ||
| Reliance Steel & Aluminum Co. | 67,270 | 4,627 | Northrop Grumman Corp. | 55,707 | 12,757 | ||
| Rio Tinto PLC - ADR | 90,800 | 3,164 | Parker-Hannifin Corp. | 5,066 | 622 | ||
| Sherwin-Williams Co. (The) | 5,901 | 1,445 | Quanta Services, Inc.(Æ) | 120,351 | 3,460 | ||
| Sonoco Products Co. | 4,883 | 246 | Raytheon Co. | 127,260 | 17,385 | ||
| Tahoe Resources, Inc. | 28,739 | 347 | Republic Services, Inc. Class A | 8,142 | 429 | ||
| Trinseo SA | 52,928 | 2,776 | Robert Half International, Inc. | 3,907 | 146 | ||
| Versum Materials, Inc.(Æ) | 1,752 | 40 | Rockwell Automation, Inc. | 39,069 | 4,677 | ||
| Westlake Chemical Corp. | 17,447 | 904 | Snap-on, Inc. | 15,337 | 2,363 | ||
| WestRock Co. | 6,634 | 306 | Southwest Airlines Co. | 318,300 | 12,748 | ||
| 74,917 | Spirit AeroSystems Holdings, Inc. Class A | 67,136 | 3,381 | ||||
| Stanley Black & Decker, Inc. | 120,744 | 13,745 | |||||
| Producer Durables - 11.6% | Terex Corp. | 168,426 | 4,022 | ||||
| 3M Co. | 3,537 | 585 | Toro Co. (The) | 5,218 | 250 | ||
| Accenture PLC Class A | 147,425 | 17,137 | TransDigm Group, Inc. | 39,483 | 10,758 | ||
| Adient PLC(Æ) | 23,276 | 1,059 | Union Pacific Corp. | 261,962 | 23,100 | ||
| AECOM(Æ) | 232,304 | 6,470 | United Continental Holdings, Inc.(Æ)(Û) | 66,812 | 3,757 | ||
| AerCap Holdings NV(Æ) | 152,231 | 6,258 | United Technologies Corp. | 79,666 | 8,142 | ||
| American Airlines Group, Inc. | 178,772 | 7,258 | Verisk Analytics, Inc. Class A(Æ) | 106,985 | 8,725 | ||
| AO Smith Corp. | 22,222 | 1,004 | Wabtec Corp. | 2,899 | 224 | ||
| Avery Dennison Corp. | 13,261 | 925 | Waste Management, Inc. | 6,891 | 452 | ||
| B/E Aerospace, Inc. | 56,300 | 3,351 | Waters Corp.(Æ) | 3,368 | 469 | ||
| Babcock & Wilcox Co. (The) Class W(Æ) | 170,811 | 6,699 | Xerox Corp. | 261,856 | 2,558 | ||
| Boeing Co. (The) | 94,673 | 13,484 | Xylem, Inc. | 108,116 | 5,225 | ||
| Caterpillar, Inc. | 42,905 | 3,581 | 329,327 | ||||
| CH Robinson Worldwide, Inc. | 48,285 | 3,289 | |||||
| Chicago Bridge & Iron Co. | 82,205 | 2,632 | Technology - 17.6% | ||||
| Convergys Corp. | 78,584 | 2,295 | Activision Blizzard, Inc. | 21,044 | 908 | ||
| Copart, Inc.(Æ) | 4,109 | 216 | Adobe Systems, Inc.(Æ) | 129,482 | 13,921 | ||
| CSX Corp. | 24,881 | 759 | Advanced Micro Devices, Inc.(Æ) | 426,253 | 3,082 | ||
| Danaher Corp. | 126,745 | 9,956 | Akamai Technologies, Inc.(Æ) | 1,538 | 107 | ||
| Deere & Co. | 4,409 | 389 | Alphabet, Inc. Class A(Æ) | 35,109 | 28,435 | ||
| Delta Air Lines, Inc. | 216,149 | 9,029 | Alphabet, Inc. Class C(Æ) | 56,329 | 44,192 | ||
| Eaton Corp. PLC | 59,709 | 3,808 | Amdocs, Ltd. | 8,047 | 470 | ||
| EMCOR Group, Inc. | 55,773 | 3,372 | Analog Devices, Inc. | 5,975 | 383 | ||
| EnerSys | 3,700 | 241 | Ansys, Inc.(Æ) | 3,820 | 349 | ||
| Euronav NV | 81,415 | 639 | Apple, Inc.(Û) | 309,022 | 35,086 | ||
| Expeditors International of Washington, Inc. | 113,500 | 5,842 | Applied Materials, Inc.(Û) | 214,198 | 6,229 | ||
| FedEx Corp. | 42,734 | 7,449 | Arrow Electronics, Inc.(Æ) | 17,472 | 1,068 | ||
| Flir Systems, Inc. | 11,941 | 393 | Aspen Technology, Inc.(Æ) | 66,536 | 3,276 | ||
| Fluor Corp. | 30,813 | 1,602 | Avnet, Inc. | 121,608 | 5,101 | ||
| Fortive Corp. | 146,797 | 7,494 | Black Knight Financial Services, Inc. Class | ||||
| General Dynamics Corp. | 65,607 | 9,890 | A(Æ) | 8,823 | 347 | ||
| General Electric Co. | 66,864 | 1,946 | Broadcom, Ltd. | 39,207 | 6,676 | ||
| Genpact, Ltd.(Æ) | 17,577 | 404 | Brocade Communications Systems, Inc. | 54,900 | 582 | ||
| Hawaiian Holdings, Inc.(Æ) | 57,236 | 2,577 | CA, Inc. | 95,700 | 2,942 | ||
| Honeywell International, Inc. | 104,392 | 11,450 | Cadence Design Systems, Inc.(Æ) | 96,394 | 2,466 | ||
| Huntington Ingalls Industries, Inc. | 20,161 | 3,253 | Cisco Systems, Inc. | 802,791 | 24,630 | ||
| IDEX Corp. | 3,706 | 320 | Citrix Systems, Inc.(Æ)(Û) | 39,440 | 3,344 | ||
| Itron, Inc.(Æ) | 4,037 | 218 | Cognizant Technology Solutions Corp. Class | ||||
| JB Hunt Transport Services, Inc. | 4,329 | 353 | A(Æ) | 11,375 | 584 | ||
| Johnson Controls International PLC | 232,769 | 9,385 | Computer Sciences Corp. | 132,322 | 7,205 | ||
| L-3 Communications Holdings, Inc. | 19,600 | 2,684 | Corning, Inc. | 57,909 | 1,315 | ||
| Landstar System, Inc. | 41,200 | 2,931 | Cree, Inc.(Æ) | 15,910 | 355 | ||
| Lincoln Electric Holdings, Inc. | 26,648 | 1,754 | Dell Technologies, Inc. - VMware Inc. Class | ||||
| Lockheed Martin Corp. | 9,691 | 2,388 | V(Æ) | 17,432 | 856 | ||
| ManpowerGroup, Inc. | 21,300 | 1,636 | DST Systems, Inc. | 2,692 | 259 | ||
See accompanying notes which are an integral part of the financial statements.
Russell U.S. Strategic Equity Fund 81
Russell Investment Company
Russell U.S. Strategic Equity Fund
Schedule of Investments, continued — October 31, 2016
| Amounts in thousands (except share amounts) | Amounts in thousands (except share amounts) | |||||||||
| Principal | Fair | Principal | Fair | |||||||
| Amount ($) or | Value | Amount ($) or | Value | |||||||
| Shares | $ | Shares | $ | |||||||
| Electronic Arts, Inc.(Æ) | 7,302 | 573 | China Mobile, Ltd. - ADR | 90,354 | 5,189 | |||||
| F5 Networks, Inc.(Æ) | 7,920 | 1,095 | Consolidated Edison, Inc. | 21,596 | 1,632 | |||||
| Facebook, Inc. Class A(Æ) | 282,248 | 36,972 | Dominion Resources, Inc. | 3,009 | 226 | |||||
| Finisar Corp.(Æ) | 10,523 | 288 | DTE Energy Co. | 54,823 | 5,263 | |||||
| Flex, Ltd.(Æ) | 108,016 | 1,533 | Edison International | 11,160 | 820 | |||||
| Gartner, Inc.(Æ) | 49,714 | 4,277 | Entergy Corp. | 270,489 | 19,930 | |||||
| Harris Corp. | 53,121 | 4,739 | Eversource Energy | 63,900 | 3,518 | |||||
| Hewlett Packard Enterprise Co. | 262,448 | 5,897 | Fortis, Inc. | 3,498 | 115 | |||||
| HP, Inc. | 255,846 | 3,707 | Great Plains Energy, Inc. | 4,134 | 118 | |||||
| IAC/InterActiveCorp(Æ) | 53,079 | 3,420 | Hawaiian Electric Industries, Inc. | 65,546 | 1,934 | |||||
| Ingram Micro, Inc. Class A(Æ) | 10,593 | 394 | MDU Resources Group, Inc. | 29,249 | 767 | |||||
| Intel Corp. | 663,780 | 23,146 | NextEra Energy, Inc. | 136,407 | 17,460 | |||||
| International Business Machines Corp. | 78,477 | 12,061 | NiSource, Inc. | 32,641 | 759 | |||||
| Intuit, Inc. | 30,031 | 3,266 | NRG Energy, Inc. | 61,508 | 654 | |||||
| IPG Photonics Corp.(Æ) | 30,448 | 2,954 | ONE Gas, Inc. | 47,677 | 2,922 | |||||
| Jabil Circuit, Inc. | 14,110 | 301 | PG&E Corp. | 68,098 | 4,230 | |||||
| Juniper Networks, Inc. | 103,400 | 2,724 | Pinnacle West Capital Corp. | 9,617 | 732 | |||||
| Linear Technology Corp. | 13,378 | 803 | PPL Corp. | 146,124 | 5,018 | |||||
| Manhattan Associates, Inc.(Æ) | 7,241 | 367 | Public Service Enterprise Group, Inc. | 90,400 | 3,804 | |||||
| Marvell Technology Group, Ltd. | 27,832 | 363 | RingCentral, Inc. Class A(Æ) | 13,400 | 277 | |||||
| Mentor Graphics Corp. | 119,580 | 3,456 | Southern Co. (The) | 10,091 | 520 | |||||
| Micron Technology, Inc.(Æ) | 438,492 | 7,524 | Talen Energy Corp.(Æ) | 14,282 | 199 | |||||
| Microsoft Corp.(Û) | 967,914 | 57,997 | Telephone & Data Systems, Inc. | 21,755 | 562 | |||||
| MicroStrategy, Inc. Class A(Æ) | 8,369 | 1,630 | T-Mobile US, Inc.(Æ) | 129,409 | 6,435 | |||||
| NCR Corp.(Æ) | 83,981 | 2,943 | Verizon Communications, Inc. | 547,904 | 26,354 | |||||
| NetApp, Inc. | 67,375 | 2,287 | WEC Energy Group, Inc. | 12,542 | 749 | |||||
| NVIDIA Corp. | 12,791 | 910 | Westar Energy, Inc. Class A | 4,871 | 279 | |||||
| NXP Semiconductors NV(Æ) | 43,148 | 4,315 | Xcel Energy, Inc. | 18,862 | 784 | |||||
| ON Semiconductor Corp.(Æ) | 145,207 | 1,695 | 151,072 | |||||||
| Oracle Corp. | 574,353 | 22,067 | ||||||||
| QUALCOMM, Inc. | 296,277 | 20,360 | Total Common Stocks | |||||||
| Red Hat, Inc.(Æ) | 181,018 | 14,020 | ||||||||
| SBA Communications Corp. Class A(Æ) | 91,426 | 10,357 | (cost $2,459,839) | 2,780,267 | ||||||
| Symantec Corp.(Û) | 190,639 | 4,772 | ||||||||
| Synaptics, Inc.(Æ) | 6,800 | 354 | Short-Term Investments - 3.3% | |||||||
| Synopsys, Inc.(Æ) | 126,681 | 7,513 | Russell U.S. Cash Management Fund | 89,826,235 | (8) | 89,844 | ||||
| Take-Two Interactive Software, Inc.(Æ) | 66,966 | 2,973 | United States Treasury Bills | |||||||
| Tech Data Corp.(Æ) | 12,400 | 955 | 0.170% due 12/01/16 (~)(§) | 3,000 | 3,000 | |||||
| Teradata Corp.(Æ) | 12,222 | 329 | Total Short-Term Investments | |||||||
| Teradyne, Inc. | 113,597 | 2,646 | ||||||||
| Texas Instruments, Inc. | 212,292 | 15,041 | (cost $92,834) | 92,844 | ||||||
| Twitter, Inc.(Æ) | 29,200 | 524 | ||||||||
| VeriSign, Inc.(Æ) | 40,073 | 3,367 | Total Investments 101.1% | |||||||
| Viavi Solutions, Inc. Class W(Æ) | 131,912 | 939 | (identified cost $2,552,673) | 2,873,111 | ||||||
| Vishay Intertechnology, Inc. | 149,986 | 2,115 | Securities Sold Short - (1.3)% | |||||||
| VMware, Inc. Class A(Æ) | 29,206 | 2,296 | Consumer Discretionary - (0.3)% | |||||||
| Western Digital Corp. | 9,780 | 572 | CarMax, Inc.(Æ) | (21,718 | ) | (1,084 | ) | |||
| Xilinx, Inc. | 5,303 | 270 | Fitbit, Inc. Class A(Æ) | (82,865 | ) | (1,099 | ) | |||
| Yelp, Inc. Class A(Æ) | 7,900 | 258 | ||||||||
| Zynga, Inc. Class A(Æ) | 818,240 | 2,299 | Lions Gate Entertainment Corp.(Æ) | (48,435 | ) | (986 | ) | |||
| 499,832 | Mobileye NV(Æ) | (29,261 | ) | (1,088 | ) | |||||
| Nord Anglia Education, Inc.(Æ) | (12,756 | ) | (275 | ) | ||||||
| Utilities - 5.3% | Pandora Media, Inc.(Æ) | (97,611 | ) | (1,106 | ) | |||||
| AES Corp. | 242,674 | 2,856 | Tesla Motors, Inc.(Æ) | (5,465 | ) | (1,080 | ) | |||
| Ameren Corp. | 8,986 | 449 | Under Armour, Inc. Class A(Æ) | (33,562 | ) | (1,044 | ) | |||
| American Electric Power Co., Inc. | 89,327 | 5,792 | Wayfair, Inc. Class A(Æ) | (10,252 | ) | (342 | ) | |||
| American Water Works Co., Inc. | 7,439 | 551 | ||||||||
| AT&T, Inc. | 714,128 | 26,273 | (8,104 | ) | ||||||
| Calpine Corp.(Æ) | 259,042 | 3,083 | Consumer Staples – (0.0)% | |||||||
| CenterPoint Energy, Inc. | 35,869 | 818 | Snyders-Lance, Inc. | (32,505 | ) | (1,156 | ) | |||
See accompanying notes which are an integral part of the financial statements.
82 Russell U.S. Strategic Equity Fund
Russell Investment Company
Russell U.S. Strategic Equity Fund
Schedule of Investments, continued — October 31, 2016
| Amounts in thousands (except share amounts) | Amounts in thousands (except share amounts) | |||||||
| Principal | Fair | Principal | Fair | |||||
| Amount ($) or | Value | Amount ($) or | Value | |||||
| Shares | $ | Shares | $ | |||||
| Other Assets and Liabilities, Net | ||||||||
| Energy – (0.0)% | - 0.2% | 6,895 | ||||||
| Chesapeake Energy Corp.(Æ) | (127,441 | ) | (702 | ) | Net Assets - 100.0% | 2,841,832 | ||
| SunPower Corp. Class A(Æ) | (56,842 | ) | (412 | ) | ||||
| Weatherford International PLC(Æ) | (89,811 | ) | (433 | ) | ||||
| (1,547 | ) | |||||||
| Financial Services - (0.3)% | ||||||||
| Acadia Realty Trust (ö) | (29,661 | ) | (999 | ) | ||||
| Bank of the Ozarks, Inc. | (19,586 | ) | (724 | ) | ||||
| First Financial Bankshares, Inc. | (33,781 | ) | (1,223 | ) | ||||
| Iron Mountain, Inc. (ö) | (6,198 | ) | (209 | ) | ||||
| New York Community Bancorp, Inc. | (79,113 | ) | (1,136 | ) | ||||
| Realty Income Corp.(ö) | (11,914 | ) | (706 | ) | ||||
| TFS Financial Corp. | (61,395 | ) | (1,094 | ) | ||||
| United Bankshares, Inc. | (27,581 | ) | (1,040 | ) | ||||
| Willis Towers Watson PLC | (6,916 | ) | (871 | ) | ||||
| (8,002 | ) | |||||||
| Health Care - (0.2)% | ||||||||
| Acadia Healthcare Co., Inc.(Æ) | (28,530 | ) | (1,026 | ) | ||||
| Alnylam Pharmaceuticals, Inc.(Æ) | (13,426 | ) | (478 | ) | ||||
| DexCom, Inc.(Æ) | (14,683 | ) | (1,149 | ) | ||||
| Juno Therapeutics, Inc.(Æ) | (18,552 | ) | (451 | ) | ||||
| OPKO Health, Inc.(Æ) | (120,641 | ) | (1,136 | ) | ||||
| Sarepta Therapeutics, Inc.(Æ) | (22,094 | ) | (867 | ) | ||||
| (5,107 | ) | |||||||
| Materials and Processing – (0.0)% | ||||||||
| United States Steel Corp. | (29,589 | ) | (572 | ) | ||||
| Producer Durables - (0.1)% | ||||||||
| Macquarie Infrastructure Corp. | (2,401 | ) | (196 | ) | ||||
| Square, Inc. Class A(Æ) | (88,090 | ) | (987 | ) | ||||
| Stericycle, Inc.(Æ) | (14,688 | ) | (1,176 | ) | ||||
| (2,359 | ) | |||||||
| Technology - (0.4)% | ||||||||
| Advanced Micro Devices, Inc.(Æ) | (178,970 | ) | (1,294 | ) | ||||
| Ambarella, Inc.(Æ) | (6,082 | ) | (373 | ) | ||||
| Arista Networks, Inc.(Æ) | (14,105 | ) | (1,195 | ) | ||||
| Atlassian Corp. PLC Class A(Æ) | (36,087 | ) | (969 | ) | ||||
| Cavium, Inc.(Æ) | (22,620 | ) | (1,277 | ) | ||||
| FireEye, Inc.(Æ) | (70,211 | ) | (816 | ) | ||||
| Inovalon Holdings, Inc. Class A(Æ) | (34,002 | ) | (463 | ) | ||||
| MACOM Technology Solutions Holdings, | ||||||||
| Inc.(Æ) | (26,664 | ) | (980 | ) | ||||
| Palo Alto Networks, Inc.(Æ) | (8,525 | ) | (1,312 | ) | ||||
| Pure Storage, Inc. Class A(Æ) | (80,058 | ) | (988 | ) | ||||
| Twitter, Inc.(Æ) | (31,360 | ) | (563 | ) | ||||
| Universal Display Corp.(Æ) | (9,320 | ) | (482 | ) | ||||
| Zendesk, Inc.(Æ) | (23,399 | ) | (615 | ) | ||||
| (11,327 | ) | |||||||
| Total Securities Sold Short | ||||||||
| (proceeds $41,087) | (38,174 | ) | ||||||
See accompanying notes which are an integral part of the financial statements.
Russell U.S. Strategic Equity Fund 83
Russell Investment Company
Russell U.S. Strategic Equity Fund
Schedule of Investments, continued — October 31, 2016
| Futures Contracts | |||||||||||||||
| Amounts in thousands (except contract amounts) | |||||||||||||||
| Unrealized | |||||||||||||||
| Appreciation | |||||||||||||||
| Number of | Notional | Expiration | (Depreciation) | ||||||||||||
| Contracts | Amount | Date | $ | ||||||||||||
| Long Positions | |||||||||||||||
| S&P 500 E-Mini Index Futures | 688 | USD | 72,931 | 12/16 | (783 | ) | |||||||||
| S&P Consumer Discretionary Select Sector Index Futures | 118 | USD | 9,255 | 12/16 | (196 | ) | |||||||||
| S&P Technology Select Sector Index Futures | 189 | USD | 8,976 | 12/16 | 49 | ||||||||||
| Total Unrealized Appreciation (Depreciation) on Open Futures Contracts (å) | (930 | ) | |||||||||||||
| Presentation of Portfolio Holdings | |||||||||||||||
| Amounts in thousands | |||||||||||||||
| Fair Value | |||||||||||||||
| Practical | |||||||||||||||
| Portfolio Summary | Level 1 | Level 2 | Level 3 | Expedient (a) | Total | % of Net Assets | |||||||||
| Common Stocks | |||||||||||||||
| Consumer Discretionary | $ | 386,690 | $ | — | $ | — | $ | — | $ | 386,690 | 13.6 | ||||
| Consumer Staples | 206,126 | — | — | — | 206,126 | 7.3 | |||||||||
| Energy | 189,470 | — | — | — | 189,470 | 6.7 | |||||||||
| Financial Services | 566,656 | — | — | — | 566,656 | 19.9 | |||||||||
| Health Care | 376,177 | — | — | — | 376,177 | 13.2 | |||||||||
| Materials and Processing | 74,917 | — | — | — | 74,917 | 2.6 | |||||||||
| Producer Durables | 329,327 | — | — | — | 329,327 | 11.6 | |||||||||
| Technology | 499,832 | — | — | — | 499,832 | 17.6 | |||||||||
| Utilities | 151,072 | — | — | — | 151,072 | 5.3 | |||||||||
| Short-Term Investments | — | 3,000 | — | 89,844 | 92,844 | 3.3 | |||||||||
| Total Investments | 2,780,267 | 3,000 | — | 89,844 | 2,873,111 | 101.1 | |||||||||
| Securities Sold Short*** | (38,174 | ) | — | — | — | (38,174 | ) | (1.3 | ) | ||||||
| Other Assets and Liabilities, Net | 0.2 | ||||||||||||||
| 100.0 | |||||||||||||||
| Other Financial Instruments | |||||||||||||||
| Assets | |||||||||||||||
| Futures Contracts | 49 | — | — | — | 49 | —* | |||||||||
| Liabilities | |||||||||||||||
| Futures Contracts | (979 | ) | — | — | — | (979 | ) | (—)* | |||||||
| Total Other Financial Instruments** | $ | (930 | ) | $ | — | $ | — | $ | — | $ | (930 | ) | |||
* Less than 0.05% of net assets.
** Futures and foreign currency exchange contract values reflect the unrealized appreciation (depreciation) on the investments.
*** Refer to Schedule of Investments for detailed sector breakout.
(a) Certain investments that are measured at fair value using the net asset value per share (or its equivalent) practical expedient have not been classified
in the fair value levels. The fair value amounts presented in the table are intended to permit reconciliation to the amounts presented in the Schedule of
Investments.
For a description of the Levels see note 2 in the Notes to Financial Statements.
For a disclosure on transfers between Levels 1, 2 and 3 during the period ended October 31, 2016, see note 2 in the Notes to
Financial Statements.
See accompanying notes which are an integral part of the financial statements.
84 Russell U.S. Strategic Equity Fund
Russell Investment Company
Russell U.S. Strategic Equity Fund
Fair Value of Derivative Instruments — October 31, 2016
Amounts in thousands
| Equity | ||||
| Derivatives not accounted for as hedging instruments | Contracts | |||
| Location: Statement of Assets and Liabilities - Assets | ||||
| Variation margin on futures contracts* | $ | 49 | ||
| Location: Statement of Assets and Liabilities - Liabilities | ||||
| Variation margin on futures contracts* | $ | 979 | ||
| Equity | ||||
| Derivatives not accounted for as hedging instruments | Contracts | |||
| Location: Statement of Operations - Net realized gain (loss) | ||||
| Futures contracts | $ | 19,021 | ||
| Location: Statement of Operations - Net change in unrealized appreciation (depreciation) | ||||
| Futures contracts | $ | (8,932 | ) | |
* Includes cumulative appreciation/depreciation of futures contracts as reported in the Schedule of Investments. Only variation margin is reported within the
Statement of Assets and Liabilities.
For further disclosure on derivatives see note 2 in the Notes to Financial Statements.
See accompanying notes which are an integral part of the financial statements.
Russell U.S. Strategic Equity Fund 85
Russell Investment Company
Russell U.S. Strategic Equity Fund
Balance Sheet Offsetting of Financial and Derivative Instruments — October 31, 2016
| Amounts in thousands | |||||||||||||
| Offsetting of Financial Assets and Derivative Assets | |||||||||||||
| Gross | Net Amounts | ||||||||||||
| Amounts | of Assets | ||||||||||||
| Gross | Offset in the | Presented in | |||||||||||
| Amounts of | Statement of | the Statement | |||||||||||
| Recognized | Assets and | of Assets and | |||||||||||
| Description | Location: Statement of Assets and Liabilities - Assets | Assets | Liabilities | Liabilities | |||||||||
| Futures Contracts | Variation margin on futures contracts | $ | 17 | $ | — | $ | 17 | ||||||
| Total Financial and Derivative Assets | 17 | — | 17 | ||||||||||
| Financial and Derivative Assets not subject to a netting agreement | (17 | ) |
— | (17 | ) | ||||||||
| Total Financial and Derivative Assets subject to a netting agreement | $ | — | $ | — | $ | — | |||||||
| Offsetting of Financial Liabilities and Derivative Liabilities | |||||||||||||
| Gross | Net Amounts | ||||||||||||
| Amounts | of Liabilities | ||||||||||||
| Gross | Offset in the | Presented in | |||||||||||
| Amounts of | Statement of | the Statement | |||||||||||
| Recognized | Assets and | of Assets and | |||||||||||
| Description | Location: Statement of Assets and Liabilities - Liabilities | Liabilities | Liabilities | Liabilities | |||||||||
| Futures Contracts | Variation margin on futures contracts | $ | 115 | $ | — | $ | 115 | ||||||
| Short Sales | Securities sold short, at market value | 38,174 | — | 38,174 | |||||||||
| Total Financial and Derivative Liabilities | 38,289 | — | 38,289 | ||||||||||
| Financial and Derivative Liabilities not subject to a netting agreement | (115 | ) | — | (115 | ) | ||||||||
| Total Financial and Derivative Liabilities subject to a netting agreement | $ | 38,174 | $ | — | $ | 38,174 | |||||||
| Financial Liabilities, Derivative Liabilities, and Collateral Pledged by Counterparty | |||||||||||||
| Gross Amounts Not Offset in | |||||||||||||
| the Statement of Assets and | |||||||||||||
| Liabilities | |||||||||||||
| Net Amounts | |||||||||||||
| of Liabilities | |||||||||||||
| Presented in | |||||||||||||
| the Statement | Financial and | ||||||||||||
| of Assets and | Derivative | Collateral | |||||||||||
| Counterparty | Liabilities | Instruments | Pledged^ | Net Amount | |||||||||
| State Street | 38,174 | $ | — | $ | 38,174 | $ | — | ||||||
| Total | $ | 38,174 | $ | — | $ | 38,174 | $ | — | |||||
^ Collateral received or pledged amounts may not reconcile to those disclosed in the Statement of Assets and Liabilities due to the inclusion of off-Balance
Sheet collateral and adjustments made to exclude overcollateralization.
For further disclosure on derivatives and counterparty risk see note 2 in the Notes to Financial Statements.
See accompanying notes which are an integral part of the financial statements.
86 Russell U.S. Strategic Equity Fund
Russell Investment Company
Russell U.S. Strategic Equity Fund
Statement of Assets and Liabilities — October 31, 2016
| Amounts in thousands | ||
| Assets | ||
| Investments, at identified cost | $ | 2,552,673 |
| Investments, at fair value(>) | 2,873,111 | |
| Cash (restricted)(a) | 700 | |
| Receivables: | ||
| Dividends and interest | 4,354 | |
| Dividends from affiliated Russell funds | 40 | |
| Investments sold | 17,387 | |
| Fund shares sold | 3,865 | |
| Variation margin on futures contracts | 17 | |
| Total assets | 2,899,474 | |
| Liabilities | ||
| Payables: | ||
| Investments purchased | 14,821 | |
| Fund shares redeemed | 2,363 | |
| Accrued fees to affiliates | 1,758 | |
| Other accrued expenses | 411 | |
| Variation margin on futures contracts | 115 | |
| Securities sold short, at fair value(‡) | 38,174 | |
| Total liabilities | 57,642 | |
| Net Assets | $ | 2,841,832 |
See accompanying notes which are an integral part of the financial statements.
Russell U.S. Strategic Equity Fund 87
Russell Investment Company
Russell U.S. Strategic Equity Fund
Statement of Assets and Liabilities, continued — October 31, 2016
| Amounts in thousands | |||
| Net Assets Consist of: | |||
| Undistributed (overdistributed) net investment income | $ | 2,777 | |
| Accumulated net realized gain (loss) | 83,835 | ||
| Unrealized appreciation (depreciation) on: | |||
| Investments | 320,438 | ||
| Futures contracts | (930 | ) | |
| Securities sold short | 2,913 | ||
| Shares of beneficial interest | 2,344 | ||
| Additional paid-in capital | 2,430,455 | ||
| Net Assets | $ | 2,841,832 | |
| Net Asset Value, offering and redemption price per share: | |||
| Net asset value per share: Class A(#) | $ | 12.10 | |
| Maximum offering price per share (Net asset value plus sales charge of 5.75%): Class A | $ | 12.84 | |
| Class A — Net assets | $ | 6,316,506 | |
| Class A — Shares outstanding ($.01 par value) | 521,828 | ||
| Net asset value per share: Class C(#) | $ | 12.07 | |
| Class C — Net assets | $ | 18,154,354 | |
| Class C — Shares outstanding ($.01 par value) | 1,503,674 | ||
| Net asset value per share: Class E(#) | $ | 12.12 | |
| Class E — Net assets | $ | 74,418,611 | |
| Class E — Shares outstanding ($.01 par value) | 6,138,335 | ||
| Net asset value per share: Class S(#) | $ | 12.13 | |
| Class S — Net assets | $ | 2,742,942,770 | |
| Class S — Shares outstanding ($.01 par value) | 226,208,059 | ||
| Amounts in thousands | |||
| (‡) Proceeds on securities sold short | $ | 41,087 | |
| (>) Investments in affiliates, Russell U.S. Cash Management Fund | $ | 89,844 | |
| (a) Cash Collateral for Futures | $ | 700 | |
| (#) Net asset value per share equals class level net assets divided by class level shares of beneficial interest outstanding. | |||
See accompanying notes which are an integral part of the financial statements.
88 Russell U.S. Strategic Equity Fund
Russell Investment Company
Russell U.S. Strategic Equity Fund
Statement of Operations — For the Period Ended October 31, 2016
| Amounts in thousands | |||
| Investment Income | |||
| Dividends | $ | 72,447 | |
| Dividends from affiliated Russell funds | 332 | ||
| Interest | 12 | ||
| Total investment income | 72,791 | ||
| Expenses | |||
| Advisory fees | 25,242 | ||
| Administrative fees | 1,636 | ||
| Custodian fees(1) | 482 | ||
| Distribution fees - Class A | 18 | ||
| Distribution fees - Class C | 151 | ||
| Transfer agent fees - Class A | 14 | ||
| Transfer agent fees - Class C | 41 | ||
| Transfer agent fees - Class E | 181 | ||
| Transfer agent fees - Class S | 6,543 | ||
| Professional fees | 162 | ||
| Registration fees | 115 | ||
| Shareholder servicing fees - Class C | 50 | ||
| Shareholder servicing fees - Class E | 226 | ||
| Trustees’ fees | 124 | ||
| Printing fees | 352 | ||
| Dividends from securities sold short | 385 | ||
| Interest expense paid on securities sold short | 1,338 | ||
| Miscellaneous | 84 | ||
| Expenses before reductions | 37,144 | ||
| Expense reductions | (8,877 | ) | |
| Net expenses | 28,267 | ||
| Net investment income (loss) | 44,524 | ||
| Net Realized and Unrealized Gain (Loss) | |||
| Net realized gain (loss) on: | |||
| Investments | 103,559 | ||
| Futures contracts | 19,021 | ||
| Securities sold short | 6,491 | ||
| Net realized gain (loss) | 129,071 | ||
| Net change in unrealized appreciation (depreciation) on: | |||
| Investments | (87,404 | ) | |
| Futures contracts | (8,932 | ) | |
| Securities sold short | (2,768 | ) | |
| Net change in unrealized appreciation (depreciation) | (99,104 | ) | |
| Net realized and unrealized gain (loss) | 29,967 | ||
| Net Increase (Decrease) in Net Assets from Operations | $ | 74,491 | |
| (1) Includes a reimbursement for overbilling of custody out-of-pocket fees from prior years. See note 10 in the Notes to Financial Statements. | |||
See accompanying notes which are an integral part of the financial statements.
Russell U.S. Strategic Equity Fund 89
Russell Investment Company
Russell U.S. Strategic Equity Fund
Statements of Changes in Net Assets
| For the Periods Ended October 31, | ||||||
| Amounts in thousands | 2016 | 2015 | ||||
| Increase (Decrease) in Net Assets | ||||||
| Operations | ||||||
| Net investment income (loss) | $ | 44,524 | $ | 40,345 | ||
| Net realized gain (loss) | 129,071 | 176,615 | ||||
| Net change in unrealized appreciation (depreciation) | (99,104 | ) | (97,774 | ) | ||
| Net increase (decrease) in net assets from operations | 74,491 | 119,186 | ||||
| Distributions | ||||||
| From net investment income | ||||||
| Class A | (73 | ) | (50 | ) | ||
| Class C | (60 | ) | (8 | ) | ||
| Class E | (957 | ) | (802 | ) | ||
| Class S | (42,773 | ) | (38,937 | ) | ||
| From net realized gain | ||||||
| Class A | (337 | ) | (466 | ) | ||
| Class C | (1,134 | ) | (1,512 | ) | ||
| Class E | (5,259 | ) | (8,563 | ) | ||
| Class S | (192,312 | ) | (312,099 | ) | ||
| Net decrease in net assets from distributions | (242,905 | ) | (362,437 | ) | ||
| Share Transactions* | ||||||
| Net increase (decrease) in net assets from share transactions | (987,803 | ) | 556,021 | |||
| Total Net Increase (Decrease) in Net Assets | (1,156,217 | ) | 312,770 | |||
| Net Assets | ||||||
| Beginning of period | 3,998,049 | 3,685,279 | ||||
| End of period | $ | 2,841,832 | $ | 3,998,049 | ||
| Undistributed (overdistributed) net investment income included in net assets | $ | 2,777 | $ | 1,959 | ||
See accompanying notes which are an integral part of the financial statements.
90 Russell U.S. Strategic Equity Fund
Russell Investment Company
Russell U.S. Strategic Equity Fund
Statements of Changes in Net Assets, continued
* Share transaction amounts (in thousands) for the periods ended October 31, 2016 and October 31, 2015 were as follows:
| 2016 | 2015 | |||||||||||
| Shares | Dollars | Shares | Dollars | |||||||||
| Class A | ||||||||||||
| Proceeds from shares sold | 216 | $ | 2,544 | 220 | $ | 2,835 | ||||||
| Proceeds from reinvestment of distributions | 35 | 410 | 41 | 515 | ||||||||
| Payments for shares redeemed | (261 | ) | (3,130 | ) | (88 | ) | (1,099 | ) | ||||
| Net increase (decrease) | (10 | ) | (176 | ) | 173 | 2,251 | ||||||
| Class C | ||||||||||||
| Proceeds from shares sold | 150 | 1,756 | 649 | 8,135 | ||||||||
| Proceeds from reinvestment of distributions | 103 | 1,194 | 121 | 1,519 | ||||||||
| Payments for shares redeemed | (524 | ) | (6,250 | ) | (248 | ) | (3,128 | ) | ||||
| Net increase (decrease) | (271 | ) | (3,300 | ) | 522 | 6,526 | ||||||
| Class E | ||||||||||||
| Proceeds from shares sold | 446 | 5,285 | 1,552 | 19,739 | ||||||||
| Proceeds from reinvestment of distributions | 518 | 6,041 | 715 | 9,028 | ||||||||
| Payments for shares redeemed | (3,136 | ) | (37,642 | ) | (1,220 | ) | (15,428 | ) | ||||
| Net increase (decrease) | (2,172 | ) | (26,316 | ) | 1,047 | 13,339 | ||||||
| Class S | ||||||||||||
| Proceeds from shares sold | 31,998 | 378,797 | 89,487 | 1,147,306 | ||||||||
| Proceeds from reinvestment of distributions | 20,061 | 233,981 | 27,685 | 349,336 | ||||||||
| Payments for shares redeemed | (132,329 | ) | (1,570,789 | ) | (75,973 | ) | (962,737 | ) | ||||
| Net increase (decrease) | (80,270 | ) | (958,011 | ) | 41,199 | 533,905 | ||||||
| Total increase (decrease) | (82,723 | ) | $ | (987,803 | ) | 42,941 | $ | 556,021 | ||||
See accompanying notes which are an integral part of the financial statements.
Russell U.S. Strategic Equity Fund 91
Russell Investment Company
Russell U.S. Strategic Equity Fund
Financial Highlights — For the Periods Ended
For a Share Outstanding Throughout Each Period.
| $ | $ | $ | $ | $ | $ | ||||||||||
| Net Asset Value, | Net | Net Realized | Total from | Distributions | Distributions | ||||||||||
| Beginning of | Investment | and Unrealized | Investment | from Net | from Net | ||||||||||
| Period | Income (Loss)(a)(d) | Gain (Loss) | Operations | Investment Income | Realized Gain | ||||||||||
| Class A | |||||||||||||||
| October 31, 2016 | 12.59 | .13 | .15 | .28 | (.12 | ) | (.65 | ) | |||||||
| October 31, 2015 | 13.42 | .10 | .35 | .45 | (.10 | ) | (1.18 | ) | |||||||
| October 31, 2014 | 12.73 | .11 | 1.66 | 1.77 | (.12 | ) | (.96 | ) | |||||||
| October 31, 2013 | 10.13 | .08 | 2.65 | 2.73 | (.10 | ) | (.03 | ) | |||||||
| October 31, 2012(2) | 10.00 | .01 | .13 | .14 | (.01 | ) | — | ||||||||
| Class C | |||||||||||||||
| October 31, 2016 | 12.56 | .04 | .15 | .19 | (.03 | ) | (.65 | ) | |||||||
| October 31, 2015 | 13.39 | —(f) | .36 | .36 | (.01 | ) | (1.18 | ) | |||||||
| October 31, 2014 | 12.71 | .02 | 1.65 | 1.67 | (.03 | ) | (.96 | ) | |||||||
| October 31, 2013 | 10.12 | —(f) | 2.65 | 2.65 | (.03 | ) | (.03 | ) | |||||||
| October 31, 2012(2) | 10.00 | —(f) | .13 | .13 | (.01 | ) | — | ||||||||
| Class E | |||||||||||||||
| October 31, 2016 | 12.61 | .13 | .15 | .28 | (.12 | ) | (.65 | ) | |||||||
| October 31, 2015 | 13.44 | .10 | .35 | .45 | (.10 | ) | (1.18 | ) | |||||||
| October 31, 2014 | 12.74 | .11 | 1.66 | 1.77 | (.11 | ) | (.96 | ) | |||||||
| October 31, 2013 | 10.13 | .10 | 2.63 | 2.73 | (.09 | ) | (.03 | ) | |||||||
| October 31, 2012(2) | 10.00 | .01 | .14 | .15 | (.02 | ) | — | ||||||||
| Class S | |||||||||||||||
| October 31, 2016 | 12.61 | .16 | .16 | .32 | (.15 | ) | (.65 | ) | |||||||
| October 31, 2015 | 13.44 | .13 | .35 | .48 | (.13 | ) | (1.18 | ) | |||||||
| October 31, 2014 | 12.74 | .14 | 1.67 | 1.81 | (.15 | ) | (.96 | ) | |||||||
| October 31, 2013 | 10.13 | .13 | 2.63 | 2.76 | (.12 | ) | (.03 | ) | |||||||
| October 31, 2012(2) | 10.00 | .02 | .13 | .15 | (.02 | ) | — | ||||||||
See accompanying notes which are an integral part of the financial statements.
92 Russell U.S. Strategic Equity Fund
| % | % | % | |||||||||||||||
| $ | $ | Ratio of Expenses | Ratio of Expenses | Ratio of Net | |||||||||||||
| Net Asset Value, | % | Net Assets, | to Average | to Average | Investment Income | % | |||||||||||
| $ | End of | Total | End of Period | Net Assets, | Net Assets, | to Average | Portfolio | ||||||||||
| Total Distributions | Period | Return(b)(c) | (000 | ) | Gross(e) | Net(d)(e)(g) | Net Assets(d)(e) | Turnover Rate(b)(k) | |||||||||
| (.77 | ) | 12.10 | 2.51 | 6,317 | 1.33 | 1.07 | 1.06 | 75 | |||||||||
| (1.28 | ) | 12.59 | 3.42 | 6,700 | 1.32 | 1.05 | .78 | 102 | |||||||||
| (1.08 | ) | 13.42 | 14.72 | 4,826 | 1.32 | 1.07 | .86 | 85 | |||||||||
| (.13 | ) | 12.73 | 27.15 | 3,327 | 1.31 | 1.13 | .73 | 125 | |||||||||
| (.01 | ) | 10.13 | 1.44 | 633 | 1.36 | 1.12 | .57 | 15 | |||||||||
| (.68 | ) | 12.07 | 1.74 | 18,154 | 2.08 | 1.82 | .32 | 75 | |||||||||
| (1.19 | ) | 12.56 | 2.66 | 22,288 | 2.07 | 1.80 | .03 | 102 | |||||||||
| (.99 | ) | 13.39 | 13.86 | 16,787 | 2.07 | 1.82 | .12 | 85 | |||||||||
| (.06 | ) | 12.71 | 26.27 | 9,948 | 2.07 | 1.88 | .03 | 125 | |||||||||
| (.01 | ) | 10.12 | 1.28 | 3,479 | 2.12 | 1.87 | (.19 | ) | 15 | ||||||||
| (.77 | ) | 12.12 | 2.51 | 74,419 | 1.33 | 1.07 | 1.08 | 75 | |||||||||
| (1.28 | ) | 12.61 | 3.40 | 104,763 | 1.31 | 1.05 | .78 | 102 | |||||||||
| (1.07 | ) | 13.44 | 14.76 | 97,618 | 1.32 | 1.07 | .90 | 85 | |||||||||
| (.12 | ) | 12.74 | 27.19 | 90,808 | 1.31 | 1.13 | .86 | 125 | |||||||||
| (.02 | ) | 10.13 | 1.46 | 69,066 | 1.37 | 1.12 | .41 | 15 | |||||||||
| (.80 | ) | 12.13 | 2.85 | 2,742,942 | 1.08 | .82 | 1.33 | 75 | |||||||||
| (1.31 | ) | 12.61 | 3.66 | 3,864,298 | 1.06 | .80 | 1.03 | 102 | |||||||||
| (1.11 | ) | 13.44 | 15.05 | 3,566,048 | 1.07 | .82 | 1.13 | 85 | |||||||||
| (.15 | ) | 12.74 | 27.51 | 2,975,527 | 1.06 | .88 | 1.10 | 125 | |||||||||
| (.02 | ) | 10.13 | 1.46 | 2,072,403 | 1.11 | .87 | .96 | 15 | |||||||||
See accompanying notes which are an integral part of the financial statements.
Russell U.S. Strategic Equity Fund 93
Russell Investment Company
Russell U.S. Strategic Equity Fund
Related Party Transactions, Fees and Expenses
| Accrued fees payable to affiliates for the period ended October 31, 2016 were as follows: | ||
| Advisory fees | $ | 1,156,176 |
| Administration fees | 117,395 | |
| Distribution fees | 13,189 | |
| Shareholder servicing fees | 19,781 | |
| Transfer agent fees | 437,343 | |
| Trustee fees | 14,086 | |
| $ | 1,757,970 | |
| Transactions (amounts in thousands) during the period ended October 31, 2016 with Underlying Funds which are, or were, an | |||||||||||||||||||
| affiliated company are as follows: | |||||||||||||||||||
| Fair Value, | Change in | ||||||||||||||||||
| Beginning of | Realized Gain | Unrealized | Fair Value, End | Income | Capital Gains | ||||||||||||||
| Period | Purchases | Sales | (Loss) | Gain (Loss) | of Period | Distributions | Distributions | ||||||||||||
| Russell U.S. Cash Management Fund | $ | 149,149 | $ | 1,653,039 | $ | 1,712,358 | $ | 4 | $ | 10 | $ | 89,844 | $ | 332 | $ | — | |||
| $ | 149,149 | $ | 1,653,039 | $ | 1,712,358 | $ | 4 | $ | 10 | $ | 89,844 | $ | 332 | $ | — | ||||
Federal Income Taxes
At October 31, 2016, the cost of investments and net unrealized appreciation (depreciation), undistributed ordinary income and
undistributed long-term capital gains for income tax purposes were as follows:.
| Cost of Investments | $ | 2,593,211,406 | ||
| Unrealized Appreciation | $ | 349,465,465 | ||
| Unrealized Depreciation | (69,565,971 | ) | ||
| Net Unrealized Appreciation (Depreciation) | $ | 279,899,494 | ||
| Undistributed Ordinary Income | $ | 1,864,099 | ||
| Undistributed Long-Term Capital Gains | ||||
| (Capital Loss Carryforward) | $ | 124,358,248 | ||
| Tax Composition of Distributions | ||||
| Ordinary Income | $ | 65,272,895 | ||
| Long-Term Capital Gains | $ | 177,632,651 |
Net investment income and net realized gains (loss) in the financial statements may differ from taxable net investment income and net
realized gains (losses). Capital accounts within the financial statements are adjusted for permanent book-tax differences. Book-tax
differences are primarily due to foreign currency gains and losses, reclassifications of dividends, differences in treatment of income
from swaps, net operating losses, investments in partnerships, investments in passive foreign investment companies (PFICs), tax
straddle transactions, use of tax equalization and foreign capital gains taxes. These adjustments have no impact on the net assets.
At October 31, 2016, the Statement of Assets and Liabilities have been adjusted by the following amounts (in thousands):
| Undistributed net investment income | $ | 157 | |
| Accumulated net realized gain (loss) | (158 | ) | |
| Additional paid-in capital | 1 |
See accompanying notes which are an integral part of the financial statements.
94 Russell U.S. Strategic Equity Fund
Russell Investment Company
Russell U.S. Large Cap Equity Fund
Portfolio Management Discussion and Analysis — October 31, 2016 (Unaudited)
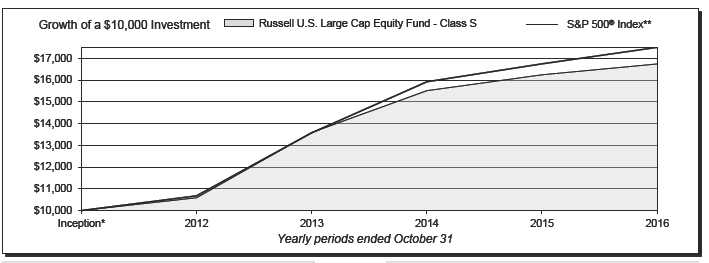
| Russell U.S. Large Cap Equity Fund - Class A‡ | Russell U.S. Large Cap Equity Fund - Class S | ||||||
| Total | Total | ||||||
| Return | Return | ||||||
| 1 Year | (3.09 | )% | 1 Year | 3.07 | % | ||
| Inception* | 9.84 | %§ | Inception* | 11.50 | %§ | ||
| Russell U.S. Large Cap Equity Fund - Class C | S&P 500® Index** | ||||||
| Total | Total | ||||||
| Return | Return | ||||||
| 1 Year | 2.09 | % | 1 Year | 4.51 | % | ||
| Inception* | 10.40 | %§ | Inception* | 12.55 | %§ | ||
Russell U.S. Large Cap Equity Fund 95
Russell Investment Company
Russell U.S. Large Cap Equity Fund
Portfolio Management Discussion and Analysis, continued — October 31, 2016
(Unaudited)
| The Russell U.S. Large Cap Equity Fund (the “Fund”) employs | the second half of the fiscal year allowed the Fund to improve | ||
| a multi-manager approach whereby portions of the Fund are | performance as expectations firmed-up regarding the economic | ||
| allocated to different money manager strategies. Fund assets not | outlook and the timing of next interest rate increase. | ||
| allocated to money managers are managed by Russell Investment | |||
| Management, LLC (“RIM”), the Fund’s advisor. RIM may change | How did the investment strategies and techniques employed | ||
| the allocation of the Fund’s assets among money managers at | by the Fund and its money managers affect its benchmark- | ||
| any time. An exemptive order from the Securities and Exchange | relative performance? | ||
| Commission (“SEC”) permits RIM to engage or terminate a money | An overweight to stocks with the lowest price-to-book ratios was | ||
| manager at any time, subject to approval by the Fund’s Board, | beneficial but underweights to high dividend yield stocks and to | ||
| without a shareholder vote. Pursuant to the terms of the exemptive | the lowest beta stocks detracted. An overweight to the financials | ||
| order, the Fund is required to notify its shareholders within 90 | sector and underweight to the consumer staples sectors was | ||
| days of when a money manager begins providing services. As of | not rewarded. An overweight to the bank industry held back | ||
| October 31, 2016, the Fund had five money managers. | benchmark-relative performance but an underweight to the | ||
| biotechnology industry was beneficial. Stock selection within | |||
| What is the Fund’s investment objective? | the consumer discretionary sector detracted, but stock selection | ||
| The Fund seeks to provide long term capital growth. | within the energy sector was positive. | ||
| How did the Fund perform relative to its benchmark for the | The Fund employs discretionary money managers. The Fund’s | ||
| fiscal year ended October 31, 2016? | discretionary money managers select the individual portfolio | ||
| For the fiscal year ended October 31, 2016, the Fund’s Class A, | securities for the assets assigned to them. Fund assets not | ||
| Class C and Class S Shares gained 2.84%, 2.09% and 3.07%, | allocated to discretionary money managers include the Fund’s | ||
| respectively. This is compared to the Fund’s benchmark, the S&P | liquidity reserves and assets which may be managed directly by | ||
| 500® Index, which gained 4.51% during the same period. The | RIM to effect the Fund’s investment strategies and/or to actively | ||
| Fund’s performance includes operating expenses, whereas index | manage the Fund’s overall exposures by investing in securities or | ||
| returns are unmanaged and do not include expenses of any kind. | other instruments that RIM believes will achieve the desired risk/ | ||
| return profile for the Fund. | |||
| For the fiscal year ended October 31, 2016, the Morningstar® | |||
| Large Blend Category, a group of funds that Morningstar considers | With respect to certain of the Fund’s money managers, Jacobs Levy | ||
| to have investment strategies similar to those of the Fund, gained | Equity Management, Inc (“Jacobs Levy”) was the best performing | ||
| 2.12%. This result serves as a peer comparison and is expressed | manager for the period and outperformed its blended benchmark | ||
| net of operating expenses. | comprised of the S&P 500® Index (60%), the Russell 1000® | ||
| Defensive™ Index (30%), and the Russell Top 200® Value Index | |||
| RIM may assign a money manager a specific style or | (10%). Jacobs Levy’s tilt toward mid-capitalization stocks within | ||
| capitalization benchmark other than the Fund’s index. However, | its blended benchmark was rewarded. Stock selection within the | ||
| the Fund’s primary index remains the benchmark for the Fund | energy sector (an overweight to Devon Energy Corporation and | ||
| and is representative of the aggregate of each money manager’s | Marathon Oil Corporation) and within the information technology | ||
| benchmark index. | sector (an overweight to Advanced Micro Devices and WMware, | ||
| How did the market conditions described in the Market | Inc.) was beneficial to benchmark-relative performance. | ||
| Summary report affect the Fund’s performance? | Columbus Circle Investors was the worst performing manager | ||
| During the fiscal year, the U.S. large capitalization equity market | for the period and underperformed the Russell 1000® Growth | ||
| produced positive returns. Fund exposures included tilts toward | Index. Stock selection within the consumer discretionary sector | ||
| value stocks with low price-to-earnings ratios and the financials | (an overweight to Royal Caribbean Cruises and Under Armour) | ||
| sector. The Fund was tilted away from less economically sensitive, | detracted. Factor exposures were not rewarded, specifically | ||
| interest rate sensitive, high dividend yield, and low beta stocks | tilts toward stocks with above benchmark long term growth | ||
| (beta is a measure of a stock’s sensitivity to the direction of | forecasts and stocks with high earnings variability. From a sector | ||
| the market) such as utilities, real estate investment trusts, and | perspective, an overweight to consumer discretionary and an | ||
| consumer staples. Overall, the market conditions of the first half | underweight to consumer staples held back relative returns. | ||
| of the fiscal year had a negative effect on Fund performance as | At the end of December 2015, RIM implemented a 6% strategic | ||
| the pace of interest rate increases was slower than the market | allocation to a positioning strategy to seek to achieve the desired | ||
| had expected and investors became concerned that the odds of | risk/return profile for the Fund. The positioning strategy utilizes | ||
| a recession may be increasing. However, market conditions in | the output from a quantitative model to seek to position the | ||
96 Russell U.S. Large Cap Equity Fund
Russell Investment Company
Russell U.S. Large Cap Equity Fund
Portfolio Management Discussion and Analysis, continued — October 31, 2016
(Unaudited)
| portfolio to meet RIM’s overall preferred positioning. During | TCW’s excess return potential. Additionally, RIM views TCW as | ||
| the period, the positioning strategy was tilted toward larger | a good complement to the Fund’s value manager, Ceredex Value | ||
| capitalization value stocks which RIM’s analysis indicates are | Advisors LLC, which focuses on dividend paying stocks. | ||
| unusually cheap relative to the broad U.S. equity market and have | |||
| moderate beta characteristics. For the portion of the fiscal year | Money Managers as of October 31, | ||
| that the positioning strategy was included in the Fund, it slightly | 2016 | Styles | |
| outperformed the S&P 500® Index. The positioning strategy’s | Ceredex Value Advisors LLC | Value | |
| overweight to stocks with below benchmark valuation ratios was | Columbus Circle Investors | Growth | |
| Jacobs Levy Equity Management | Market Oriented | ||
| beneficial, however an underweight to midcap detracted. Sector | Sustainable Growth Advisers, LP | Growth | |
| allocation decisions were mixed as an overweight to energy was | TCW Asset Management Company | Market Oriented | |
| beneficial, while an overweight to financials detracted. | The views expressed in this report reflect those of the | ||
| During the period, RIM used index futures contracts to equitize | portfolio managers only through the end of the period | ||
| the Fund’s cash. The decision to equitize the Fund’s cash was | covered by the report. These views do not necessarily | ||
| beneficial to Fund performance for the fiscal year as the market | represent the views of RIM, or any other person in RIM or | ||
| had a positive absolute return. | any other affiliated organization. These views are subject | ||
| to change at any time based upon market conditions or | |||
| Describe any changes to the Fund’s structure or the money | other events, and RIM disclaims any responsibility to | ||
| manager line-up. | update the views contained herein. These views should not | ||
| At the end of December 2015, RIM terminated Institutional | be relied on as investment advice and, because investment | ||
| Capital LLC as a discretionary money manager for the Fund | decisions for a Russell Investment Company (“RIC”) Fund | ||
| and hired TCW Asset Management Company (“TCW”) as a | are based on numerous factors, should not be relied on as | ||
| discretionary money manager due to RIM’s greater conviction in | an indication of investment decisions of any RIC Fund. | ||
* Assumes initial investment on February 6, 2012.
** The Standard & Poor’s 500® Index is composed of 500 common stocks which are chosen by Standard & Poor’s Corporation to best capture the price performance
of a large cross-section of the U.S. publicly traded stock market. The index is structured to approximate the general distribution of industries in the U.S.
economy.
‡ The performance shown has been adjusted to reflect the deduction of the maximum Class A sales charge of 5.75%.
§ Annualized.
Performance is historical and assumes reinvestment of all dividends and capital gains. Investment return and principal value will fluctuate so that an investor’s
shares, when redeemed, may be worth more or less than when purchased. Past performance is not indicative of future results. The returns shown do not reflect the
deduction of taxes that a shareholder would pay on Fund distributions or the redemption of Fund shares. Additionally, the returns presented herein may differ from
the performance reported in the Financial Highlights as the returns herein are calculated in a manner consistent with standardized performance in accordance with
Securities and Exchange Commission rules, while the performance in the Financial Highlights has been calculated in accordance with U.S. Generally Accepted
Accounting Principles (“U.S. GAAP”).
Russell U.S. Large Cap Equity Fund 97
Russell Investment Company
Russell U.S. Large Cap Equity Fund
Shareholder Expense Example — October 31, 2016 (Unaudited)
| Fund Expenses | Please note that the expenses shown in the table are meant | |||||
| The following disclosure provides important information | to highlight your ongoing costs only and do not reflect any | |||||
| regarding the Fund’s Shareholder Expense Example | transactional costs. Therefore, the information under the heading | |||||
| (“Example”). | “Hypothetical Performance (5% return before expenses)” is | |||||
| useful in comparing ongoing costs only, and will not help you | ||||||
| Example | determine the relative total costs of owning different funds. In | |||||
| As a shareholder of the Fund, you incur two types of costs: (1) | addition, if these transactional costs were included, your costs | |||||
| transaction costs, including sales charges (loads) on certain | would have been higher. | |||||
| purchase or redemption payments, and (2) ongoing costs, | Hypothetical | |||||
| including distribution (12b-1) and/or service fees and other | Performance (5% | |||||
| Fund expenses. The Example is intended to help you understand | Actual | return before | ||||
| your ongoing costs (in dollars) of investing in the Fund and to | Class A | Performance | expenses) | |||
| Beginning Account Value | ||||||
| compare these costs with the ongoing costs of investing in other | May 1, 2016 | $ | 1,000.00 | $ | 1,000.00 | |
| mutual funds. The Example is based on an investment of $1,000 | Ending Account Value | |||||
| invested at the beginning of the period and held for the entire | October 31, 2016 | $ | 1,038.80 | $ | 1,019.51 | |
| period indicated, which for this Fund is from May 1, 2016 to | Expenses Paid During Period* | $ | 5.74 | $ | 5.69 | |
| October 31, 2016. | * Expenses are equal to the Fund's annualized expense ratio of 1.12% | |||||
| (representing the six month period annualized), multiplied by the average | ||||||
| Actual Expenses | account value over the period, multiplied by 184/366 (to reflect the one-half | |||||
| The information in the table under the heading “Actual | year period). May reflect amounts waived and/or reimbursed. Without any | |||||
| Performance” provides information about actual account values | waivers and/or reimbursements, expenses would have been higher. | |||||
| and actual expenses. You may use the information in this column, | ||||||
| Hypothetical | ||||||
| together with the amount you invested, to estimate the expenses | Performance (5% | |||||
| that you paid over the period. Simply divide your account value by | Actual | return before | ||||
| $1,000 (for example, an $8,600 account value divided by $1,000 | Class C | Performance | expenses) | |||
| Beginning Account Value | ||||||
| = 8.6), then multiply the result by the number in the first column | May 1, 2016 | $ | 1,000.00 | $ | 1,000.00 | |
| in the row entitled “Expenses Paid During Period” to estimate | Ending Account Value | |||||
| the expenses you paid on your account during this period. | October 31, 2016 | $ | 1,034.00 | $ | 1,015.74 | |
| Expenses Paid During Period* | $ | 9.56 | $ | 9.48 | ||
| Hypothetical Example for Comparison Purposes | ||||||
| The information in the table under the heading “Hypothetical | * Expenses are equal to the Fund's annualized expense ratio of 1.87% | |||||
| (representing the six month period annualized), multiplied by the average | ||||||
| Performance (5% return before expenses)” provides information | account value over the period, multiplied by 184/366 (to reflect the one-half | |||||
| about hypothetical account values and hypothetical expenses | year period). May reflect amounts waived and/or reimbursed. Without any | |||||
| based on the Fund’s actual expense ratio and an assumed rate of | waivers and/or reimbursements, expenses would have been higher. | |||||
| return of 5% per year before expenses, which is not the Fund’s | ||||||
| Hypothetical | ||||||
| actual return. The hypothetical account values and expenses | Performance (5% | |||||
| may not be used to estimate the actual ending account balance or | Actual | return before | ||||
| expenses you paid for the period. You may use this information | Class S | Performance | expenses) | |||
| to compare the ongoing costs of investing in the Fund and other | Beginning Account Value | |||||
| May 1, 2016 | $ | 1,000.00 | $ | 1,000.00 | ||
| funds. To do so, compare this 5% hypothetical example with the | Ending Account Value | |||||
| 5% hypothetical examples that appear in the shareholder reports | October 31, 2016 | $ | 1,039.00 | $ | 1,020.76 | |
| of other funds. | Expenses Paid During Period* | $ | 4.46 | $ | 4.42 | |
| * Expenses are equal to the Fund's annualized expense ratio of 0.87% | ||||||
| (representing the six month period annualized), multiplied by the average | ||||||
| account value over the period, multiplied by 184/366 (to reflect the one-half | ||||||
| year period). May reflect amounts waived and/or reimbursed. Without any | ||||||
| waivers and/or reimbursements, expenses would have been higher. | ||||||
98 Russell U.S. Large Cap Equity Fund
Russell Investment Company
Russell U.S. Large Cap Equity Fund
Schedule of Investments — October 31, 2016
| Amounts in thousands (except share amounts) | Amounts in thousands (except share amounts) | ||||||
| Principal | Fair | Principal | Fair | ||||
| Amount ($) or | Value | Amount ($) or | Value | ||||
| Shares | $ | Shares | $ | ||||
| Common Stocks - 94.4% | Dr Pepper Snapple Group, Inc. | 5,500 | 483 | ||||
| Consumer Discretionary - 11.7% | Hormel Foods Corp. | 1,029 | 40 | ||||
| Amazon.com, Inc.(Æ) | 6,115 | 4,831 | JM Smucker Co. (The) | 1,470 | 193 | ||
| AutoZone, Inc.(Æ) | 1,170 | 868 | Kellogg Co. | 6,308 | 474 | ||
| Brinker International, Inc. | 1,900 | 94 | Kraft Heinz Co. (The) | 10,333 | 919 | ||
| Carnival Corp. | 1,300 | 64 | Kroger Co. (The) | 20,376 | 631 | ||
| Chipotle Mexican Grill, Inc. Class A(Æ) | 3,328 | 1,201 | Mondelez International, Inc. Class A | 55,035 | 2,473 | ||
| Coach, Inc. | 21,271 | 763 | Monster Beverage Corp.(Æ) | 315 | 45 | ||
| Comcast Corp. Class A | 75,402 | 4,664 | PepsiCo, Inc. | 30,846 | 3,306 | ||
| Costco Wholesale Corp. | 4,010 | 593 | Philip Morris International, Inc. | 21,280 | 2,052 | ||
| Coty, Inc. Class A(Æ) | 3,573 | 82 | Pinnacle Foods, Inc. | 4,400 | 226 | ||
| Dana, Inc. | 55,400 | 858 | Procter & Gamble Co. (The) | 60,514 | 5,254 | ||
| Dollar General Corp. | 383 | 26 | Reynolds American, Inc. | 4,898 | 270 | ||
| Dollar Tree, Inc.(Æ) | 6,877 | 520 | Sanderson Farms, Inc. | 300 | 27 | ||
| Domino's Pizza, Inc. | 1,850 | 313 | Sysco Corp. | 26,568 | 1,279 | ||
| eBay, Inc.(Æ) | 20,200 | 575 | United Natural Foods, Inc.(Æ) | 1,500 | 63 | ||
| Estee Lauder Cos., Inc. (The) Class A | 2,300 | 200 | Walgreens Boots Alliance, Inc. | 3,500 | 290 | ||
| Ford Motor Co. | 72,794 | 854 | Whole Foods Market, Inc. | 40,454 | 1,144 | ||
| General Motors Co. | 30,869 | 975 | |||||
| Harman International Industries, Inc. | 5,000 | 399 | 27,177 | ||||
| Home Depot, Inc. (The) | 13,290 | 1,621 | |||||
| JC Penney Co., Inc.(Æ) | 152,500 | 1,310 | Energy - 7.7% | ||||
| Anadarko Petroleum Corp. | 2,400 | 143 | |||||
| Lennar Corp. Class A | 30,700 | 1,280 | Antero Resources Corp.(Æ) | 11,200 | 296 | ||
| Lowe's Cos., Inc. | 23,230 | 1,548 | Baker Hughes, Inc. | 34,900 | 1,933 | ||
| Macy's, Inc. | 30,476 | 1,112 | Chesapeake Energy Corp.(Æ) | 32,700 | 180 | ||
| McDonald's Corp. | 484 | 54 | Chevron Corp. | 52,260 | 5,475 | ||
| Michael Kors Holdings, Ltd.(Æ) | 2,200 | 112 | Core Laboratories NV | 8,347 | 809 | ||
| Murphy USA, Inc.(Æ) | 1,300 | 89 | Diamondback Energy, Inc.(Æ) | 4,956 | 452 | ||
| Netflix, Inc.(Æ) | 3,486 | 435 | EOG Resources, Inc. | 28,193 | 2,549 | ||
| Newell Brands, Inc. | 13,700 | 658 | Exxon Mobil Corp. | 65,653 | 5,470 | ||
| News Corp. Class A | 44,300 | 537 | FMC Technologies, Inc.(Æ) | 3,500 | 113 | ||
| Nike, Inc. Class B | 30,516 | 1,531 | HollyFrontier Corp. | 5,800 | 145 | ||
| NVR, Inc.(Æ) | 149 | 227 | Laredo Petroleum, Inc.(Æ) | 9,100 | 108 | ||
| Office Depot, Inc. | 4,700 | 15 | Nabors Industries, Ltd. | 59,814 | 712 | ||
| Panera Bread Co. Class A(Æ) | 3,834 | 731 | Newfield Exploration Co.(Æ) | 14,600 | 593 | ||
| Priceline Group, Inc. (The)(Æ) | 993 | 1,464 | Noble Energy, Inc. | 9,500 | 327 | ||
| Royal Caribbean Cruises, Ltd. | 9,877 | 759 | Occidental Petroleum Corp. | 17,686 | 1,290 | ||
| Starbucks Corp. | 43,666 | 2,318 | Phillips 66 | 1,508 | 122 | ||
| Target Corp. | 2,159 | 148 | Pioneer Natural Resources Co. | 7,188 | 1,287 | ||
| Time Warner, Inc. | 1,049 | 93 | QEP Resources, Inc.(Æ) | 7,200 | 116 | ||
| TJX Cos., Inc. | 19,237 | 1,418 | Royal Dutch Shell PLC Class B - ADR | 34,530 | 1,806 | ||
| Twenty-First Century Fox, Inc. Class A | 15,437 | 405 | Schlumberger, Ltd. | 40,678 | 3,183 | ||
| Twenty-First Century Fox, Inc. Class B | 825 | 22 | Valero Energy Corp. | 7,840 | 465 | ||
| Ulta Salon Cosmetics & Fragrance, Inc.(Æ) | 7,175 | 1,746 | |||||
| VF Corp. | 456 | 25 | 27,574 | ||||
| Visteon Corp. | 700 | 49 | |||||
| Wal-Mart Stores, Inc. | 28,514 | 1,996 | Financial Services – 20.9% | ||||
| Walt Disney Co. (The) | 21,169 | 1,963 | Aflac, Inc. | 559 | 38 | ||
| Wynn Resorts, Ltd. | 5,664 | 536 | Alliance Data Systems Corp. | 4,768 | 975 | ||
| Allstate Corp. (The) | 34,537 | 2,346 | |||||
| 42,082 | American Equity Investment Life Holding | ||||||
| Co. | 2,000 | 36 | |||||
| Consumer Staples - 7.6% | American Express Co. | 3,104 | 206 | ||||
| Altria Group, Inc. | 823 | 54 | American International Group, Inc. | 12,162 | 750 | ||
| Archer-Daniels-Midland Co. | 19,461 | 848 | American Tower Corp.(ö) | 887 | 104 | ||
| Brown-Forman Corp. Class B - ADR | 3,900 | 180 | Aon PLC | 10,053 | 1,114 | ||
| Campbell Soup Co. | 25,509 | 1,386 | Aspen Insurance Holdings, Ltd. | 3,700 | 179 | ||
| Coca-Cola Co. (The) | 5,020 | 213 | Assurant, Inc. | 3,000 | 242 | ||
| Colgate-Palmolive Co. | 20,220 | 1,443 | AvalonBay Communities, Inc.(ö) | 579 | 99 | ||
| ConAgra Foods, Inc. | 35,741 | 1,722 | Axis Capital Holdings, Ltd. | 1,600 | 91 | ||
| Constellation Brands, Inc. Class A | 4,855 | 811 | Bank of America Corp. | 2,700 | 45 | ||
| CVS Health Corp. | 16,070 | 1,351 | |||||
See accompanying notes which are an integral part of the financial statements.
Russell U.S. Large Cap Equity Fund 99
Russell Investment Company
Russell U.S. Large Cap Equity Fund
Schedule of Investments, continued — October 31, 2016
| Amounts in thousands (except share amounts) | Amounts in thousands (except share amounts) | ||||||
| Principal | Fair | Principal | Fair | ||||
| Amount ($) or | Value | Amount ($) or | Value | ||||
| Shares | $ | Shares | $ | ||||
| Bank of New York Mellon Corp. (The) | 5,671 | 246 | Health Care - 12.7% | ||||
| BB&T Corp. | 4,052 | 159 | Abbott Laboratories | 1,999 | 78 | ||
| Berkshire Hathaway, Inc. Class B(Æ) | 10,845 | 1,565 | AbbVie, Inc. | 420 | 23 | ||
| BlackRock, Inc. Class A | 6,431 | 2,193 | Aetna, Inc. | 466 | 50 | ||
| Capital One Financial Corp. | 8,400 | 622 | Agilent Technologies, Inc. | 44,363 | 1,933 | ||
| Chubb, Ltd. | 15,837 | 2,012 | Agios Pharmaceuticals, Inc.(Æ) | 600 | 29 | ||
| Citigroup, Inc. | 94,962 | 4,666 | Allergan PLC(Æ) | 674 | 141 | ||
| Citizens Financial Group, Inc. | 23,300 | 614 | Allscripts Healthcare Solutions, Inc.(Æ) | 12,500 | 150 | ||
| CME Group, Inc. Class A | 931 | 93 | AmerisourceBergen Corp. Class A | 6,280 | 442 | ||
| Crown Castle International Corp.(ö) | 17,046 | 1,550 | Amgen, Inc. | 14,436 | 2,038 | ||
| Discover Financial Services | 1,764 | 99 | Anthem, Inc. | 19,311 | 2,353 | ||
| E*Trade Financial Corp.(Æ) | 9,400 | 265 | Baxter International, Inc. | 808 | 39 | ||
| East West Bancorp, Inc. | 2,500 | 99 | Becton Dickinson and Co. | 278 | 47 | ||
| Ecolab, Inc. | 13,118 | 1,498 | Biogen, Inc.(Æ) | 2,749 | 771 | ||
| Equifax, Inc. | 4,966 | 616 | Boston Scientific Corp.(Æ) | 30,500 | 671 | ||
| Equinix, Inc. Class(ö) | 4,238 | 1,513 | Bristol-Myers Squibb Co. | 22,600 | 1,151 | ||
| Equity Residential(ö) | 3,784 | 234 | Bruker Corp. | 4,000 | 82 | ||
| Everest Re Group, Ltd. | 1,300 | 265 | Cardinal Health, Inc. | 19,233 | 1,321 | ||
| FactSet Research Systems, Inc. | 960 | 149 | Celgene Corp.(Æ) | 11,223 | 1,147 | ||
| Federal Realty Investment Trust(ö) | 340 | 49 | Centene Corp.(Æ) | 3,300 | 206 | ||
| Fidelity National Information Services, Inc. | 8,396 | 621 | Cerner Corp.(Æ) | 27,694 | 1,621 | ||
| FleetCor Technologies, Inc.(Æ) | 17,385 | 3,047 | Cigna Corp. | 22,700 | 2,697 | ||
| Franklin Resources, Inc. | 807 | 27 | CR Bard, Inc. | 2,320 | 503 | ||
| General Growth Properties, Inc.(ö) | 866 | 22 | DaVita, Inc.(Æ) | 2,000 | 117 | ||
| Goldman Sachs Group, Inc. (The) | 4,896 | 873 | DexCom, Inc.(Æ) | 8,012 | 627 | ||
| Hanover Insurance Group, Inc. (The) | 2,200 | 168 | Edwards Lifesciences Corp.(Æ) | 13,900 | 1,324 | ||
| Hartford Financial Services Group, Inc. | 69,030 | 3,045 | Eli Lilly & Co. | 24,380 | 1,800 | ||
| Intercontinental Exchange, Inc. | 5,191 | 1,404 | Endo International PLC(Æ) | 9,500 | 178 | ||
| Jones Lang LaSalle, Inc. | 7,700 | 746 | Express Scripts Holding Co.(Æ) | 903 | 61 | ||
| JPMorgan Chase & Co. | 74,023 | 5,124 | Gilead Sciences, Inc. | 29,140 | 2,146 | ||
| Lincoln National Corp. | 6,500 | 319 | Henry Schein, Inc.(Æ) | 1,710 | 255 | ||
| M&T Bank Corp. | 3,740 | 459 | Humana, Inc. | 197 | 34 | ||
| Marsh & McLennan Cos., Inc. | 1,788 | 114 | Impax Laboratories, Inc.(Æ) | 2,300 | 46 | ||
| Mastercard, Inc. Class A | 29,719 | 3,181 | Intuitive Surgical, Inc.(Æ) | 2,719 | 1,828 | ||
| MetLife, Inc. | 43,131 | 2,025 | Johnson & Johnson | 49,880 | 5,784 | ||
| Morgan Stanley | 1,279 | 43 | LifePoint Health, Inc.(Æ) | 8,500 | 509 | ||
| Northern Trust Corp. | 7,300 | 529 | McKesson Corp. | 3,952 | 502 | ||
| PNC Financial Services Group, Inc. (The) | 17,483 | 1,672 | Medtronic PLC | 3,084 | 253 | ||
| Principal Financial Group, Inc. | 8,300 | 453 | Merck & Co., Inc. | 39,643 | 2,328 | ||
| Progressive Corp. (The) | 40,572 | 1,278 | Molina Healthcare, Inc.(Æ) | 2,200 | 120 | ||
| Prologis, Inc.(ö) | 693 | 36 | Novo Nordisk A/S - ADR | 22,114 | 786 | ||
| Prudential Financial, Inc. | 1,725 | 147 | Patterson Cos., Inc. | 2,200 | 94 | ||
| Public Storage(ö) | 7,647 | 1,634 | Pfizer, Inc. | 87,880 | 2,786 | ||
| Reinsurance Group of America, Inc. Class A | 2,300 | 248 | Regeneron Pharmaceuticals, Inc.(Æ) | 3,422 | 1,180 | ||
| Simon Property Group, Inc.(ö) | 6,044 | 1,124 | St. Jude Medical, Inc. | 265 | 21 | ||
| State Street Corp. | 29,163 | 2,048 | Stryker Corp. | 8,353 | 964 | ||
| SunTrust Banks, Inc. | 14,100 | 638 | Thermo Fisher Scientific, Inc. | 6,800 | 1,000 | ||
| Synchrony Financial | 42,789 | 1,223 | UnitedHealth Group, Inc. | 20,612 | 2,913 | ||
| Travelers Cos., Inc. (The) | 16,852 | 1,823 | Veeva Systems, Inc. Class A(Æ) | 1,100 | 43 | ||
| US Bancorp | 59,758 | 2,674 | Vertex Pharmaceuticals, Inc.(Æ) | 5,168 | 392 | ||
| Vantiv, Inc. Class A(Æ) | 5,600 | 327 | Zimmer Biomet Holdings, Inc. | 224 | 24 | ||
| Visa, Inc. Class A | 51,894 | 4,282 | Zoetis, Inc. Class A | 403 | 19 | ||
| Voya Financial, Inc. | 31,800 | 971 | 45,627 | ||||
| Wells Fargo & Co. | 107,997 | 4,969 | |||||
| Welltower, Inc.(ö) | 465 | 32 | Materials and Processing - 2.4% | ||||
| Willis Towers Watson PLC | 8,694 | 1,095 | Acuity Brands, Inc. | 1,027 | 230 | ||
| XL Group, Ltd. | 7,600 | 264 | AdvanSix, Inc.(Æ) | 40 | 1 | ||
| Zions Bancorporation | 41,300 | 1,330 | Air Products & Chemicals, Inc. | 254 | 34 | ||
| 74,747 | Albemarle Corp. | 4,748 | 397 | ||||
| Allegheny Technologies, Inc. | 30,100 | 411 | |||||
See accompanying notes which are an integral part of the financial statements.
100 Russell U.S. Large Cap Equity Fund
Russell Investment Company
Russell U.S. Large Cap Equity Fund
Schedule of Investments, continued — October 31, 2016
| Amounts in thousands (except share amounts) | Amounts in thousands (except share amounts) | ||||||
| Principal | Fair | Principal | Fair | ||||
| Amount ($) or | Value | Amount ($) or | Value | ||||
| Shares | $ | Shares | $ | ||||
| AptarGroup, Inc. | 2,100 | 150 | Textron, Inc. | 49,100 | 1,967 | ||
| Domtar Corp. | 700 | 25 | Union Pacific Corp. | 1,279 | 113 | ||
| Dow Chemical Co. (The) | 46,446 | 2,498 | United Continental Holdings, Inc.(Æ) | 495 | 28 | ||
| EI du Pont de Nemours & Co. | 1,510 | 104 | United Parcel Service, Inc. Class B | 648 | 70 | ||
| International Flavors & Fragrances, Inc. | 426 | 56 | United Technologies Corp. | 17,078 | 1,745 | ||
| LyondellBasell Industries NV Class A | 1,098 | 87 | Waste Management, Inc. | 2,747 | 180 | ||
| Masco Corp. | 24,795 | 766 | WESCO International, Inc.(Æ) | 2,600 | 141 | ||
| Monsanto Co. | 573 | 58 | Xerox Corp. | 46,800 | 457 | ||
| Platform Specialty Products Corp.(Æ) | 1,700 | 12 | 32,390 | ||||
| PPG Industries, Inc. | 14,652 | 1,364 | |||||
| Praxair, Inc. | 483 | 57 | Technology - 17.6% | ||||
| Sealed Air Corp. | 24,900 | 1,135 | Activision Blizzard, Inc. | 27,743 | 1,198 | ||
| Sherwin-Williams Co. (The) | 2,041 | 500 | Advanced Micro Devices, Inc.(Æ) | 49,600 | 359 | ||
| Versum Materials, Inc.(Æ) | 127 | 3 | Alphabet, Inc. Class A(Æ) | 2,803 | 2,270 | ||
| WestRock Co. | 12,600 | 582 | Alphabet, Inc. Class C(Æ) | 6,514 | 5,110 | ||
| 8,470 | Apple, Inc. | 46,240 | 5,249 | ||||
| Applied Materials, Inc. | 117,756 | 3,424 | |||||
| Producer Durables - 9.0% | Arista Networks, Inc.(Æ) | 700 | 59 | ||||
| 3M Co. | 809 | 134 | Arrow Electronics, Inc.(Æ) | 2,920 | 178 | ||
| Accenture PLC Class A | 8,027 | 933 | Avnet, Inc. | 17,700 | 743 | ||
| Adient PLC(Æ) | 6,640 | 302 | Broadcom, Ltd. | 5,356 | 912 | ||
| American Airlines Group, Inc. | 827 | 34 | Brocade Communications Systems, Inc. | 7,800 | 83 | ||
| AO Smith Corp. | 1,100 | 50 | Cisco Systems, Inc. | 121,854 | 3,739 | ||
| Automatic Data Processing, Inc. | 14,535 | 1,265 | Cognizant Technology Solutions Corp. Class | ||||
| Babcock & Wilcox Co. (The) Class W(Æ) | 15,400 | 604 | A(Æ) | 1,202 | 62 | ||
| Boeing Co. (The) | 7,277 | 1,037 | Corning, Inc. | 71,566 | 1,626 | ||
| Caterpillar, Inc. | 1,488 | 124 | Cypress Semiconductor Corp. | 82,600 | 824 | ||
| CH Robinson Worldwide, Inc. | 3,300 | 225 | Dell Technologies, Inc. - VMware Inc Class | ||||
| CSX Corp. | 49,184 | 1,501 | V(Æ) | 586 | 29 | ||
| Danaher Corp. | 790 | 62 | EchoStar Corp. Class A(Æ) | 100 | 5 | ||
| Deere & Co. | 865 | 76 | Electronic Arts, Inc.(Æ) | 410 | 32 | ||
| Delta Air Lines, Inc. | 22,254 | 929 | Facebook, Inc. Class A(Æ) | 23,654 | 3,098 | ||
| Eaton Corp. PLC | 1,706 | 109 | Finisar Corp.(Æ) | 2,066 | 57 | ||
| Emerson Electric Co. | 1,952 | 99 | Fortinet, Inc.(Æ) | 1,300 | 42 | ||
| EnerSys | 900 | 59 | Gartner, Inc.(Æ) | 2,900 | 250 | ||
| Esterline Technologies Corp.(Æ) | 800 | 59 | Hewlett Packard Enterprise Co. | 9,003 | 202 | ||
| Expeditors International of Washington, Inc. | 11,800 | 607 | HP, Inc. | 62,208 | 902 | ||
| FedEx Corp. | 13,171 | 2,296 | Intel Corp. | 137,034 | 4,777 | ||
| General Dynamics Corp. | 572 | 86 | International Business Machines Corp. | 1,164 | 179 | ||
| General Electric Co. | 169,649 | 4,936 | Juniper Networks, Inc. | 29,300 | 772 | ||
| Genpact, Ltd.(Æ) | 700 | 16 | KLA-Tencor Corp. | 6,700 | 503 | ||
| Honeywell International, Inc. | 15,469 | 1,697 | Lam Research Corp. | 9,296 | 900 | ||
| Illinois Tool Works, Inc. | 638 | 72 | Leidos Holdings, Inc. | 5,335 | 222 | ||
| Itron, Inc.(Æ) | 900 | 49 | Mentor Graphics Corp. | 6,200 | 179 | ||
| Johnson Controls International PLC | 66,403 | 2,678 | Micron Technology, Inc.(Æ) | 74,900 | 1,286 | ||
| Kansas City Southern | 7,881 | 692 | Microsoft Corp. | 122,053 | 7,313 | ||
| L-3 Communications Holdings, Inc. | 6,140 | 841 | NetApp, Inc. | 20,600 | 699 | ||
| Landstar System, Inc. | 2,700 | 192 | Nuance Communications, Inc.(Æ) | 12,700 | 178 | ||
| Lockheed Martin Corp. | 2,276 | 560 | NXP Semiconductors NV(Æ) | 7,133 | 713 | ||
| ManpowerGroup, Inc. | 4,600 | 353 | ON Semiconductor Corp.(Æ) | 32,900 | 384 | ||
| Norfolk Southern Corp. | 1,298 | 121 | Oracle Corp. | 70,823 | 2,721 | ||
| Northrop Grumman Corp. | 5,232 | 1,199 | QUALCOMM, Inc. | 4,022 | 276 | ||
| Pentair PLC | 14,600 | 805 | Red Hat, Inc.(Æ) | 27,000 | 2,091 | ||
| Quanta Services, Inc.(Æ) | 12,900 | 371 | Salesforce.com, Inc.(Æ) | 19,494 | 1,465 | ||
| Raytheon Co. | 3,819 | 522 | SAP SE - ADR | 14,798 | 1,300 | ||
| Robert Half International, Inc. | 7,300 | 273 | Seagate Technology PLC | 8,400 | 288 | ||
| S&P Global, Inc. | 5,133 | 625 | Synaptics, Inc.(Æ) | 500 | 26 | ||
| Southwest Airlines Co. | 1,472 | 59 | Synopsys, Inc.(Æ) | 5,800 | 344 | ||
| Stericycle, Inc.(Æ) | 900 | 72 | Tableau Software, Inc. Class A(Æ) | 6,200 | 298 | ||
| Terex Corp. | 40,400 | 965 | TE Connectivity, Ltd. | 507 | 32 | ||
See accompanying notes which are an integral part of the financial statements.
Russell U.S. Large Cap Equity Fund 101
Russell Investment Company
Russell U.S. Large Cap Equity Fund
Schedule of Investments, continued — October 31, 2016
| Amounts in thousands (except share amounts) | ||||
| Principal | Fair | |||
| Amount ($) or | Value | |||
| Shares | $ | |||
| Tech Data Corp.(Æ) | 5,500 | 424 | ||
| Texas Instruments, Inc. | 16,680 | 1,182 | ||
| Twitter, Inc.(Æ) | 3,900 | 70 | ||
| VeriFone Systems, Inc.(Æ) | 24,800 | 384 | ||
| Verint Systems, Inc.(Æ) | 1,800 | 65 | ||
| Viavi Solutions, Inc. Class W(Æ) | 13,600 | 97 | ||
| VMware, Inc. Class A(Æ) | 12,500 | 983 | ||
| Western Digital Corp. | 34,860 | 2,037 | ||
| Yahoo!, Inc.(Æ) | 372 | 15 | ||
| Yelp, Inc. Class A(Æ) | 500 | 16 | ||
| Zynga, Inc. Class A(Æ) | 129,900 | 365 | ||
| 63,037 | ||||
| Utilities - 4.8% | ||||
| AES Corp. | 81,700 | 962 | ||
| Ameren Corp. | 4,900 | 245 | ||
| American Electric Power Co., Inc. | 16,247 | 1,053 | ||
| American Water Works Co., Inc. | 1,100 | 81 | ||
| AT&T, Inc. | 108,185 | 3,979 | ||
| Consolidated Edison, Inc. | 679 | 51 | ||
| Dominion Resources, Inc. | 2,963 | 223 | ||
| DTE Energy Co. | 2,000 | 192 | ||
| Duke Energy Corp. | 8,820 | 706 | ||
| Edison International | 8,158 | 599 | ||
| Entergy Corp. | 4,000 | 295 | ||
| Eversource Energy | 3,500 | 193 | ||
| Exelon Corp. | 6,416 | 219 | ||
| FirstEnergy Corp. | 8,600 | 295 | ||
| Hawaiian Electric Industries, Inc. | 3,760 | 111 | ||
| NextEra Energy, Inc. | 14,237 | 1,821 | ||
| PG&E Corp. | 9,210 | 572 | ||
| Pinnacle West Capital Corp. | 3,200 | 244 | ||
| PPL Corp. | 9,766 | 336 | ||
| Public Service Enterprise Group, Inc. | 6,134 | 258 | ||
| RingCentral, Inc. Class A(Æ) | 1,300 | 27 | ||
| Sempra Energy | 892 | 96 | ||
| Southern Co. (The) | 13,954 | 720 | ||
| US Cellular Corp.(Æ) | 700 | 25 | ||
| Verizon Communications, Inc. | 81,526 | 3,921 | ||
| Xcel Energy, Inc. | 1,482 | 62 | ||
| 17,286 | ||||
| Total Common Stocks | ||||
| (cost $293,944) | 338,390 | |||
| Short-Term Investments - 5.4% | ||||
| Russell U.S. Cash Management Fund | 19,445,380 | (8) | 19,449 | |
| Total Short-Term Investments | ||||
| (cost $19,447) | 19,449 | |||
| Total Investments 99.8% | ||||
| (identified cost $313,391) | 357,839 | |||
| Other Assets and Liabilities, Net | ||||
| - 0.2% | 526 | |||
| Net Assets - 100.0% | 358,365 | |||
See accompanying notes which are an integral part of the financial statements.
102 Russell U.S. Large Cap Equity Fund
Russell Investment Company
Russell U.S. Large Cap Equity Fund
Schedule of Investments, continued — October 31, 2016
| Futures Contracts | |||||||||||||||
| Amounts in thousands (except contract amounts) | |||||||||||||||
| Unrealized | |||||||||||||||
| Appreciation | |||||||||||||||
| Number of | Notional | Expiration | (Depreciation) | ||||||||||||
| Contracts | Amount | Date | $ | ||||||||||||
| Long Positions | |||||||||||||||
| S&P 500 E-Mini Index Futures | 141 | USD | 14,947 | 12/16 | (165 | ) | |||||||||
| S&P Consumer Discretionary Select Sector Index Futures | 41 | USD | 2,167 | 12/16 | (40 | ) | |||||||||
| S&P E-Mini Industrial Select Sector Index Futures | 37 | USD | 2,109 | 12/16 | (41 | ) | |||||||||
| Total Unrealized Appreciation (Depreciation) on Open Futures Contracts (å) | (246 | ) | |||||||||||||
| Presentation of Portfolio Holdings | |||||||||||||||
| Amounts in thousands | |||||||||||||||
| Fair Value | |||||||||||||||
| Practical | |||||||||||||||
| Portfolio Summary | Level 1 | Level 2 | Level 3 | Expedient (a) | Total | % of Net Assets | |||||||||
| Common Stocks | |||||||||||||||
| Consumer Discretionary | $ | 42,082 | $ | — | $ | — | $ | — | $ | 42,082 | 11.7 | ||||
| Consumer Staples | 27,177 | — | — | — | 27,177 | 7.6 | |||||||||
| Energy | 27,574 | — | — | — | 27,574 | 7.7 | |||||||||
| Financial Services | 74,747 | — | — | — | 74,747 | 20.9 | |||||||||
| Health Care | 45,627 | — | — | — | 45,627 | 12.7 | |||||||||
| Materials and Processing | 8,470 | — | — | — | 8,470 | 2.4 | |||||||||
| Producer Durables | 32,390 | — | — | — | 32,390 | 9.0 | |||||||||
| Technology | 63,037 | — | — | — | 63,037 | 17.6 | |||||||||
| Utilities | 17,286 | — | — | — | 17,286 | 4.8 | |||||||||
| Short-Term Investments | — | — | — | 19,449 | 19,449 | 5.4 | |||||||||
| Total Investments | 338,390 | — | — | 19,449 | 357,839 | 99.8 | |||||||||
| Other Assets and Liabilities, Net | 0.2 | ||||||||||||||
| 100.0 | |||||||||||||||
| Other Financial Instruments | |||||||||||||||
| Futures Contracts | (246 | ) | — | — | — | (246 | ) | (0.1 | ) | ||||||
| Total Other Financial Instruments* | $ | (246 | ) | $ | — | $ | — | $ | — | $ | (246 | ) | |||
* Futures and foreign currency exchange contract values reflect the unrealized appreciation (depreciation) on the investments.
(a) Certain investments that are measured at fair value using the net asset value per share (or its equivalent) practical expedient have not been classified
in the fair value levels. The fair value amounts presented in the table are intended to permit reconciliation to the amounts presented in the Schedule of
Investments.
For a description of the Levels, see note 2 in the Notes to Financial Statements.
For a disclosure on transfers between Levels 1, 2 and 3 during the period ended October 31, 2016, see note 2 in the Notes to
Financial Statements.
See accompanying notes which are an integral part of the financial statements.
Russell U.S. Large Cap Equity Fund 103
Russell Investment Company
Russell U.S. Large Cap Equity Fund
Fair Value of Derivative Instruments — October 31, 2016
Amounts in thousands
| Equity | ||||
| Derivatives not accounted for as hedging instruments | Contracts | |||
| Location: Statement of Assets and Liabilities - Liabilities | ||||
| Variation margin on futures contracts* | $ | 246 | ||
| Equity | ||||
| Derivatives not accounted for as hedging instruments | Contracts | |||
| Location: Statement of Operations - Net realized gain (loss) | ||||
| Futures contracts | $ | 1,909 | ||
| Location: Statement of Operations - Net change in unrealized appreciation (depreciation) | ||||
| Futures contracts | $ | (1,383 | ) | |
* Includes cumulative appreciation/depreciation of futures contracts as reported in the Schedule of Investments. Only variation margin is reported within the
Statement of Assets and Liabilities.
For further disclosure on derivatives see note 2 in the Notes to Financial Statements.
See accompanying notes which are an integral part of the financial statements.
104 Russell U.S. Large Cap Equity Fund
Russell Investment Company
Russell U.S. Large Cap Equity Fund
Balance Sheet Offsetting of Financial and Derivative Instruments — October 31, 2016
| Amounts in thousands | |||||||||
| Offsetting of Financial Assets and Derivative Assets | |||||||||
| Gross | Net Amounts | ||||||||
| Amounts | of Assets | ||||||||
| Gross | Offset in the | Presented in | |||||||
| Amounts of | Statement of | the Statement | |||||||
| Recognized | Assets and | of Assets and | |||||||
| Description | Location: Statement of Assets and Liabilities - Assets | Assets | Liabilities | Liabilities | |||||
| Futures Contracts | Variation margin on futures contracts | $ | 10 | $ | — | $ | 10 | ||
| Total Financial and Derivative Assets | 10 | — | 10 | ||||||
| Financial and Derivative Assets not subject to a netting agreement | (10 | ) | — | (10 | ) | ||||
| Total Financial and Derivative Assets subject to a netting agreement | $ | — | $ | — | $ | — | |||
| Offsetting of Financial Liabilities and Derivative Liabilities | |||||||||
| Gross | Net Amounts | ||||||||
| Amounts | of Liabilities | ||||||||
| Gross | Offset in the | Presented in | |||||||
| Amounts of | Statement of | the Statement | |||||||
| Recognized | Assets and | of Assets and | |||||||
| Description | Location: Statement of Assets and Liabilities - Liabilities | Liabilities | Liabilities | Liabilities | |||||
| Futures Contracts | Variation margin on futures contracts | $ | 26 | $ | — | $ | 26 | ||
| Total Financial and Derivative Liabilities | 26 | — | 26 | ||||||
| Financial and Derivative Liabilities not subject to a netting agreement | (26 | ) | — | (26 | ) | ||||
| Total Financial and Derivative Liabilities subject to a netting agreement | $ | — | $ | — | $ | — | |||
For further disclosure on derivatives and counterparty risk see note 2 in the Notes to Financial Statements.
See accompanying notes which are an integral part of the financial statements.
Russell U.S. Large Cap Equity Fund 105
Russell Investment Company
Russell U.S. Large Cap Equity Fund
Statement of Assets and Liabilities — October 31, 2016
| Amounts in thousands | ||
| Assets | ||
| Investments, at identified cost | $ | 313,391 |
| Investments, at fair value(>) | 357,839 | |
| Cash (restricted)(a) | 1,019 | |
| Receivables: | ||
| Dividends and interest | 594 | |
| Dividends from affiliated Russell funds | 9 | |
| Investments sold | 2,125 | |
| Fund shares sold | 370 | |
| Variation margin on futures contracts | 10 | |
| Total assets | 361,966 | |
| Liabilities | ||
| Payables: | ||
| Investments purchased | 3,108 | |
| Fund shares redeemed | 121 | |
| Accrued fees to affiliates | 244 | |
| Other accrued expenses | 102 | |
| Variation margin on futures contracts | 26 | |
| Total liabilities | 3,601 | |
| Net Assets | $ | 358,365 |
See accompanying notes which are an integral part of the financial statements.
106 Russell U.S. Large Cap Equity Fund
Russell Investment Company
Russell U.S. Large Cap Equity Fund
Statement of Assets and Liabilities, continued — October 31, 2016
| Amounts in thousands | |||
| Net Assets Consist of: | |||
| Undistributed (overdistributed) net investment income | $ | 406 | |
| Accumulated net realized gain (loss) | 10,172 | ||
| Unrealized appreciation (depreciation) on: | |||
| Investments | 44,448 | ||
| Futures contracts | (246 | ) | |
| Shares of beneficial interest | 289 | ||
| Additional paid-in capital | 303,296 | ||
| Net Assets | $ | 358,365 | |
| Net Asset Value, offering and redemption price per share: | |||
| Net asset value per share: Class A(#) | $ | 12.37 | |
| Maximum offering price per share (Net asset value plus sales charge of 5.75%): Class A | $ | 13.12 | |
| Class A — Net assets | $ | 9,854,601 | |
| Class A — Shares outstanding ($.01 par value) | 796,757 | ||
| Net asset value per share: Class C(#) | $ | 12.32 | |
| Class C — Net assets | $ | 1,415,012 | |
| Class C — Shares outstanding ($.01 par value) | 114,825 | ||
| Net asset value per share: Class S(#) | $ | 12.40 | |
| Class S — Net assets | $ | 347,095,394 | |
| Class S — Shares outstanding ($.01 par value) | 27,982,645 | ||
| Amounts in thousands | |||
| (>) Investments in affiliates, Russell U.S. Cash Management Fund | $ | 19,449 | |
| (a) Cash Collateral for Futures | $ | 1,019 | |
| (#) Net asset value per share equals class level net assets divided by class level shares of beneficial interest outstanding. | |||
See accompanying notes which are an integral part of the financial statements.
Russell U.S. Large Cap Equity Fund 107
Russell Investment Company
Russell U.S. Large Cap Equity Fund
Statement of Operations — For the Period Ended October 31, 2016
| Amounts in thousands | |||
| Investment Income | |||
| Dividends | $ | 7,602 | |
| Dividends from affiliated Russell funds | 73 | ||
| Total investment income | 7,675 | ||
| Expenses | |||
| Advisory fees | 2,609 | ||
| Administrative fees | 180 | ||
| Custodian fees(1) | 149 | ||
| Distribution fees - Class A | 22 | ||
| Distribution fees - Class C | 11 | ||
| Transfer agent fees - Class A | 18 | ||
| Transfer agent fees - Class C | 3 | ||
| Transfer agent fees - Class S | 724 | ||
| Professional fees | 56 | ||
| Registration fees | 51 | ||
| Shareholder servicing fees - Class C | 4 | ||
| Trustees’ fees | 13 | ||
| Printing fees | 31 | ||
| Miscellaneous | 16 | ||
| Expenses before reductions | 3,887 | ||
| Expense reductions | (609 | ) | |
| Net expenses | 3,278 | ||
| Net investment income (loss) | 4,397 | ||
| Net Realized and Unrealized Gain (Loss) | |||
| Net realized gain (loss) on: | |||
| Investments | 12,265 | ||
| Futures contracts | 1,909 | ||
| Net realized gain (loss) | 14,174 | ||
| Net change in unrealized appreciation (depreciation) on: | |||
| Investments | (7,103 | ) | |
| Futures contracts | (1,383 | ) | |
| Net change in unrealized appreciation (depreciation) | (8,486 | ) | |
| Net realized and unrealized gain (loss) | 5,688 | ||
| Net Increase (Decrease) in Net Assets from Operations | $ | 10,085 | |
| (1) Includes a reimbursement for overbilling of custody out-of-pocket fees from prior years. See note 10 in the Notes to Financial Statements. | |||
See accompanying notes which are an integral part of the financial statements.
108 Russell U.S. Large Cap Equity Fund
Russell Investment Company
Russell U.S. Large Cap Equity Fund
Statements of Changes in Net Assets
| For the Periods Ended October 31, | ||||||
| Amounts in thousands | 2016 | 2015 | ||||
| Increase (Decrease) in Net Assets | ||||||
| Operations | ||||||
| Net investment income (loss) | $ | 4,397 | $ | 4,132 | ||
| Net realized gain (loss) | 14,174 | 31,040 | ||||
| Net change in unrealized appreciation (depreciation) | (8,486 | ) | (15,374 | ) | ||
| Net increase (decrease) in net assets from operations | 10,085 | 19,798 | ||||
| Distributions | ||||||
| From net investment income | ||||||
| Class A | (81 | ) | (57 | ) | ||
| Class C | (3 | ) | (1 | ) | ||
| Class S | (4,077 | ) | (4,041 | ) | ||
| From net realized gain | ||||||
| Class A | (735 | ) | (667 | ) | ||
| Class C | (129 | ) | (127 | ) | ||
| Class S | (31,697 | ) | (38,071 | ) | ||
| Net decrease in net assets from distributions | (36,722 | ) | (42,964 | ) | ||
| Share Transactions* | ||||||
| Net increase (decrease) in net assets from share transactions | (28,010 | ) | 1,606 | |||
| Total Net Increase (Decrease) in Net Assets | (54,647 | ) | (21,560 | ) | ||
| Net Assets | ||||||
| Beginning of period | 413,012 | 434,572 | ||||
| End of period | $ | 358,365 | $ | 413,012 | ||
| Undistributed (overdistributed) net investment income included in net assets | $ | 406 | $ | 207 | ||
See accompanying notes which are an integral part of the financial statements.
Russell U.S. Large Cap Equity Fund 109
Russell Investment Company
Russell U.S. Large Cap Equity Fund
Statements of Changes in Net Assets, continued
* Share transaction amounts (in thousands) for the periods ended October 31, 2016 and October 31, 2015 were as follows:
| 2016 | 2015 | |||||||||||
| Shares | Dollars | Shares | Dollars | |||||||||
| Class A | ||||||||||||
| Proceeds from shares sold | 241 | $ | 2,955 | 216 | $ | 2,862 | ||||||
| Proceeds from reinvestment of distributions | 69 | 816 | 55 | 724 | ||||||||
| Payments for shares redeemed | (210 | ) | (2,568 | ) | (86 | ) | (1,155 | ) | ||||
| Net increase (decrease) | 100 | 1,203 | 185 | 2,431 | ||||||||
| Class C | ||||||||||||
| Proceeds from shares sold | 89 | 1,054 | 56 | 739 | ||||||||
| Proceeds from reinvestment of distributions | 11 | 131 | 10 | 128 | ||||||||
| Payments for shares redeemed | (94 | ) | (1,138 | ) | (57 | ) | (743 | ) | ||||
| Net increase (decrease) | 6 | 47 | 9 | 124 | ||||||||
| Class S | ||||||||||||
| Proceeds from shares sold | 4,014 | 48,729 | 4,498 | 59,846 | ||||||||
| Proceeds from reinvestment of distributions | 3,016 | 35,764 | 3,187 | 42,107 | ||||||||
| Payments for shares redeemed | (9,345 | ) | (113,753 | ) | (7,770 | ) | (102,902 | ) | ||||
| Net increase (decrease) | (2,315 | ) | (29,260 | ) | (85 | ) | (949 | ) | ||||
| Total increase (decrease) | (2,209 | ) | $ | (28,010 | ) | 109 | $ | 1,606 | ||||
See accompanying notes which are an integral part of the financial statements.
110 Russell U.S. Large Cap Equity Fund
(This page intentionally left blank)
Russell Investment Company
Russell U.S. Large Cap Equity Fund
Financial Highlights — For the Periods Ended
For a Share Outstanding Throughout Each Period.
| $ | $ | $ | $ | $ | $ | ||||||||||||
| Net Asset Value, | Net | Net Realized | Total from | Distributions | Distributions | ||||||||||||
| Beginning of | Investment | and Unrealized | Investment | from Net | from Net | ||||||||||||
| Period | Income (Loss)(a)(d) | Gain (Loss) | Operations | Investment Income | Realized Gain | ||||||||||||
| Class A | |||||||||||||||||
| October 31, 2016 | 13.25 | .11 | .20 | .31 | (.11 | ) | (1.08 | ) | |||||||||
| October 31, 2015 | 13.99 | .09 | .52 | .61 | (.09 | ) | (1.26 | ) | |||||||||
| October 31, 2014 | 13.27 | .12 | 1.63 | 1.75 | (.13 | ) | (.90 | ) | |||||||||
| October 31, 2013 | 10.52 | .06 | 2.85 | 2.91 | (.11 | ) | (.05 | ) | |||||||||
| October 31, 2012(1) | 10.00 | .05 | .53 | .58 | (.06 | ) | — | ||||||||||
| Class C | |||||||||||||||||
| October 31, 2016 | 13.20 | .02 | .20 | .22 | (.02 | ) | (1.08 | ) | |||||||||
| October 31, 2015 | 13.96 | (.01 | ) | .51 | .50 | —(f) | (1.26 | ) | |||||||||
| October 31, 2014 | 13.25 | .02 | 1.63 | 1.65 | (.04 | ) | (.90 | ) | |||||||||
| October 31, 2013 | 10.51 | —(f) | 2.82 | 2.82 | (.03 | ) | (.05 | ) | |||||||||
| October 31, 2012(1) | 10.00 | —(f) | .52 | .52 | (.01 | ) | — | ||||||||||
| Class S | |||||||||||||||||
| October 31, 2016 | 13.28 | .15 | .19 | .34 | (.14 | ) | (1.08 | ) | |||||||||
| October 31, 2015 | 14.02 | .13 | .51 | .64 | (.12 | ) | (1.26 | ) | |||||||||
| October 31, 2014 | 13.29 | .16 | 1.63 | 1.79 | (.16 | ) | (.90 | ) | |||||||||
| October 31, 2013 | 10.52 | .13 | 2.82 | 2.95 | (.13 | ) | (.05 | ) | |||||||||
| October 31, 2012(1) | 10.00 | .07 | .52 | .59 | (.07 | ) | — | ||||||||||
See accompanying notes which are an integral part of the financial statements.
112 Russell U.S. Large Cap Equity Fund
| % | % | % | |||||||||||||||
| $ | $ | Ratio of Expenses | Ratio of Expenses | Ratio of Net | |||||||||||||
| Net Asset Value, | % | Net Assets, | to Average | to Average | Investment Income | % | |||||||||||
| $ | End of | Total | End of Period | Net Assets, | Net Assets, | to Average | Portfolio | ||||||||||
| Total Distributions | Period | Return(b)(c) | (000 | ) | Gross(e) | Net(d)(e) | Net Assets(d)(e) | Turnover Rate(b) | |||||||||
| (1.19 | ) | 12.37 | 2.84 | 9,855 | 1.28 | 1.12 | .94 | 92 | |||||||||
| (1.35 | ) | 13.25 | 4.47 | 9,233 | 1.26 | 1.12 | .69 | 84 | |||||||||
| (1.03 | ) | 13.99 | 13.85 | 7,166 | 1.26 | 1.12 | .93 | 81 | |||||||||
| (.16 | ) | 13.27 | 27.93 | 4,509 | 1.28 | 1.12 | .48 | 84 | |||||||||
| (.06 | ) | 10.52 | 5.76 | 1,037 | 1.28 | 1.11 | .64 | 55 | |||||||||
| (1.10 | ) | 12.32 | 2.09 | 1,415 | 2.03 | 1.87 | .19 | 92 | |||||||||
| (1.26 | ) | 13.20 | 3.61 | 1,432 | 2.01 | 1.87 | (.06 | ) | 84 | ||||||||
| (.94 | ) | 13.96 | 13.06 | 1,394 | 2.01 | 1.87 | .18 | 81 | |||||||||
| (.08 | ) | 13.25 | 26.99 | 838 | 2.03 | 1.87 | .02 | 84 | |||||||||
| (.01 | ) | 10.51 | 5.17 | 367 | 2.11 | 1.86 | (.01 | ) | 55 | ||||||||
| (1.22 | ) | 12.40 | 3.07 | 347,095 | 1.03 | .87 | 1.19 | 92 | |||||||||
| (1.38 | ) | 13.28 | 4.70 | 402,347 | 1.01 | .87 | .95 | 84 | |||||||||
| (1.06 | ) | 14.02 | 14.17 | 426,012 | 1.01 | .87 | 1.20 | 81 | |||||||||
| (.18 | ) | 13.29 | 28.35 | 343,541 | 1.03 | .87 | 1.06 | 84 | |||||||||
| (.07 | ) | 10.52 | 5.85 | 240,454 | 1.11 | .86 | .96 | 55 | |||||||||
See accompanying notes which are an integral part of the financial statements.
Russell U.S. Large Cap Equity Fund 113
Russell Investment Company
Russell U.S. Large Cap Equity Fund
Related Party Transactions, Fees and Expenses
| Accrued fees payable to affiliates for the period ended October 31, 2016 were as follows: | ||
| Advisory fees | $ | 162,946 |
| Administration fees | 14,895 | |
| Distribution fees | 3,009 | |
| Shareholder servicing fees | 303 | |
| Transfer agent fees | 61,601 | |
| Trustee fees | 1,297 | |
| $ | 244,051 | |
| Transactions (amounts in thousands) during the period ended October 31, 2016 with Underlying Funds which are, or were, an | |||||||||||||||||||
| affiliated company are as follows: | |||||||||||||||||||
| Fair Value, | Change in | ||||||||||||||||||
| Beginning of | Realized Gain | Unrealized | Fair Value, End | Income | Capital Gains | ||||||||||||||
| Period | Purchases | Sales | (Loss) | Gain (Loss) | of Period | Distributions | Distributions | ||||||||||||
| Russell U.S. Cash Management Fund | $ | 20,691 | $ | 170,111 | $ | 171,359 | $ | 1 | $ | 5 | $ | 19,449 | $ | 73 | $ | — | |||
| $ | 20,691 | $ | 170,111 | $ | 171,359 | $ | 1 | $ | 5 | $ | 19,449 | $ | 73 | $ | — | ||||
Federal Income Taxes
At October 31, 2016, the cost of investments and net unrealized appreciation (depreciation), undistributed ordinary income and
undistributed long-term capital gains for income tax purposes were as follows:.
| Cost of Investments | $ | 317,162,634 | ||
| Unrealized Appreciation | $ | 47,182,600 | ||
| Unrealized Depreciation | (6,506,072 | ) | ||
| Net Unrealized Appreciation (Depreciation) | $ | 40,676,528 | ||
| Undistributed Ordinary Income | $ | 359,701 | ||
| Undistributed Long-Term Capital Gains | ||||
| (Capital Loss Carryforward) | $ | 13,743,362 | ||
| Tax Composition of Distributions | ||||
| Ordinary Income | $ | 8,149,703 | ||
| Long-Term Capital Gains | $ | 28,572,325 |
Net investment income and net realized gains (loss) in the financial statements may differ from taxable net investment income and net
realized gains (losses). Capital accounts within the financial statements are adjusted for permanent book-tax differences. Book-tax
differences are primarily due to foreign currency gains and losses, reclassifications of dividends, differences in treatment of income
from swaps, net operating losses, investments in partnerships, investments in passive foreign investment companies (PFICs), tax
straddle transaction, use of tax equalization and foreign capital gains taxes. These adjustments have no impact on the net assets.
At October 31, 2016, the Statement of Assets and Liabilities have been adjusted by the following amounts (in thousands):
| Undistributed net investment income | $ | (37 | ) |
| Accumulated net realized gain (loss) | 37 | ||
| Additional paid-in capital | — |
See accompanying notes which are an integral part of the financial statements.
114 Russell U.S. Large Cap Equity Fund
Russell Investment Company
Russell U.S. Mid Cap Equity Fund
Portfolio Management Discussion and Analysis — October 31, 2016 (Unaudited)
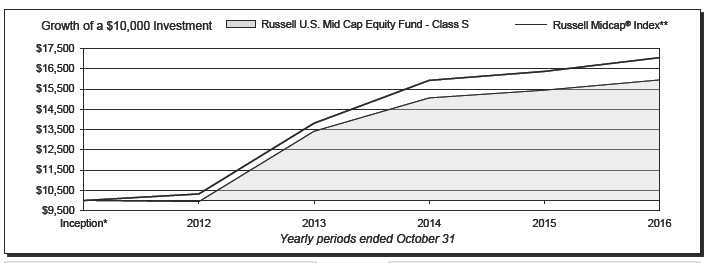
| Russell U.S. Mid Cap Equity Fund - Class A‡ | Russell U.S. Mid Cap Equity Fund - Class S | ||||||
| Total | Total | ||||||
| Return | Return | ||||||
| 1 Year | (2.97 | )% | 1 Year | 3.26 | % | ||
| Inception* | 8.70 | %§ | Inception* | 10.36 | %§ | ||
| Russell U.S. Mid Cap Equity Fund - Class C | Russell Midcap® Index** | ||||||
| Total | Total | ||||||
| Return | Return | ||||||
| 1 Year | 2.19 | % | 1 Year | 4.17 | % | ||
| Inception* | 9.26 | %§ | Inception* | 11.93 | %§ | ||
Russell U.S. Mid Cap Equity Fund 115
Russell Investment Company
Russell U.S. Mid Cap Equity Fund
Portfolio Management Discussion and Analysis, continued — October 31, 2016
(Unaudited)
| The Russell U.S. Mid Cap Equity Fund (the “Fund”) employs | Over the period, the Fund maintained exposure to securities |
| a multi-manager approach whereby portions of the Fund are | towards the bottom end of the capitalization opportunity set that |
| allocated to different money manager strategies. Fund assets not | were trading at discounted valuations, as well as companies with |
| allocated to money managers are managed by Russell Investment | lower levels of financial leverage. The Fund’s capitalization tilt |
| Management, LLC (“RIM”), the Fund’s advisor. RIM may change | detracted from performance. However, the value positioning was |
| the allocation of the Fund’s assets among money managers at | additive and offset further negative performance as value stocks |
| any time. An exemptive order from the Securities and Exchange | outperformed growth stocks. |
| Commission (“SEC”) permits RIM to engage or terminate a money | From a sector standpoint, the expectation for a slow growth U.S. |
| manager at any time, subject to approval by the Fund’s Board, | economic environment led to the Fund’s overweight in several |
| without a shareholder vote. Pursuant to the terms of the exemptive | sectors such as technology and industrials, as well as an avoidance |
| order, the Fund is required to notify its shareholders within 90 | of sectors that are traditionally considered to be interest rate |
| days of when a money manager begins providing services. As of | sensitive such as real estate. The impact of this sector positioning |
| October 31, 2016, the Fund had three money managers. | on performance was negative as interest rate sensitive pockets |
| What is the Fund’s investment objective? | outperformed. Underperforming holdings within the financials |
| The Fund seeks to provide long term capital growth. | and materials sectors also detracted from performance. |
| How did the Fund perform relative to its benchmark for the | How did the investment strategies and techniques employed |
| fiscal year ended October 31, 2016? | by the Fund and its money managers affect its benchmark- |
| For the fiscal year ended October 31, 2016, the Fund’s Class A, | relative performance? |
| Class C and Class S Shares gained 2.94%, 2.19% and 3.26%, | The Fund employs discretionary money managers. The Fund’s |
| respectively. This is compared to the Fund’s benchmark, the | discretionary money managers select the individual portfolio |
| Russell Midcap® Index, which gained 4.17% during the same | securities for the assets assigned to them. RIM manages the |
| period. The Fund’s performance includes operating expenses, | portion of the Fund’s assets that RIM determines not to allocate |
| whereas index returns are unmanaged and do not include | to the money managers. Assets not allocated to managers include |
| expenses of any kind. | the Fund’s liquidity reserves and assets which may be managed |
| directly by RIM to effect the Fund’s investment strategies and/or | |
| For the fiscal year ended October 31, 2016, the Morningstar® Mid- | to actively manage the Fund’s overall portfolio characteristics to |
| Cap Blend Category, a group of funds that Morningstar considers | seek to achieve the desired risk/return profile for the Fund. |
| to have investment strategies similar to those of the Fund, gained | |
| 2.03%. This result serves as a peer comparison and is expressed | With respect to certain of the Fund’s money managers, Jacobs |
| net of operating expenses. | Levy Equity Management, Inc. was the strongest performing |
| money manager for the fiscal year and outperformed its blended | |
| RIM may assign a money manager a specific style or | benchmark which consists of 60% the Russell Midcap® Value |
| capitalization benchmark other than the Fund’s index. However, | Index and 40% the Russell Midcap® Defensive Index. A tilt |
| the Fund’s primary index remains the benchmark for the Fund | towards companies with lower valuations was additive. A |
| and is representative of the aggregate of each money manager’s | preference for higher momentum stocks also positively impacted |
| benchmark index | performance. |
| How did the market conditions described in the Market | Elk Creek Partners, LLC faced the strongest headwinds over |
| Summary report affect the Fund’s performance? | the fiscal year and underperformed the Russell Midcap® |
| The fiscal year ended October 31, 2016 saw the Fund underperform | Growth Index. Stock selection was the primary detractor with |
| the Russell Midcap® Index. Through the end of 2015 into mid- | underperforming holdings within the health care and technology |
| February 2016, markets sold off as recessionary fears spiked on | sectors negatively impacting performance. |
| the back of weak business surveys, a lackluster U.S. earnings | During the period, RIM utilized a positioning strategy to control |
| season, and concerns surrounding the global economy. From | Fund-level exposures and risks through the purchase of a stock |
| February, markets reversed and rallied in tandem with commodity | portfolio. Using the output from a quantitative model, the strategy |
| prices as economic data strengthened. In the back half of 2016, | seeks to position the portfolio to meet RIM’s overall preferred |
| although uncertainty surrounding the political landscape and | positioning with respect to Fund exposures. Over the period, the |
| Brexit led to heightened market volatility, markets ended higher | positioning strategy was designed to provide lower capitalization |
| for the fiscal year. | and volatility exposure, and higher profitability exposure relative |
| to the Fund’s benchmark in order to manage Fund-level risk. | |
116 Russell U.S. Mid Cap Equity Fund
Russell Investment Company
Russell U.S. Mid Cap Equity Fund
Portfolio Management Discussion and Analysis, continued — October 31, 2016
(Unaudited)
| The positioning strategy underperformed the Russell Midcap® | Money Managers as of October 31, | |
| Index for the fiscal year. An overweight to the consumer | 2016 | Styles |
| discretionary sector was penalized as was an overweight to | ||
| Ceredex Value Advisors, LLC | Mid Cap Value | |
| securities towards the bottom end of the benchmark capitalization, | Elk Creek Partners, LLC | Mid Cap Growth |
| as small cap stocks underperformed mid cap stocks. A preference | Jacobs Levy Equity Management, Inc. | Mid Cap Value/Defensive |
| for stocks with lower price volatility was also a headwind. | The views expressed in this report reflect those of the | |
| During the period, RIM equitized the Fund’s cash using index | portfolio managers only through the end of the period | |
| futures contracts to provide the Fund with full market exposure. | covered by the report. These views do not necessarily | |
| This had a positive impact on the Fund’s performance. | represent the views of RIM, or any other person in RIM or | |
| any other affiliated organization. These views are subject | ||
| Describe any changes to the Fund’s structure or the money | to change at any time based upon market conditions or | |
| manager line-up. | other events, and RIM disclaims any responsibility to | |
| In July 2016, RIM converted Jacob Levy’s mandate from being | update the views contained herein. These views should not | |
| managed to a blended benchmark which consisted of 50% the | be relied on as investment advice and, because investment | |
| Russell Midcap® Index and 50% the Russell Midcap® Value | decisions for a Russell Investment Company (“RIC”) Fund | |
| Index to 60% the Russell Midcap® Value Index and 40% the | are based on numerous factors, should not be relied on as | |
| Russell Midcap® Defensive Index. This change was made in | an indication of investment decisions of any RIC Fund. | |
| order to seek to improve the Fund’s excess return potential. | ||
* Assumes initial investment on February 6, 2012.
** Russell Midcap® Index measures the performance of the mid-cap segment of the U.S. equity universe. The Russell Midcap is a subset of the Russell 1000®
Index. It includes approximately 800 of the smallest securities based on a combination of their market cap and current index membership. The Russell Midcap
represents approximately 31% of the total market capitalization of the Russell 1000 companies.
‡ The performance shown has been adjusted to reflect the deduction of the maximum Class A sales charge of 5.75%.
§ Annualized.
Performance is historical and assumes reinvestment of all dividends and capital gains. Investment return and principal value will fluctuate so that an investor’s
shares, when redeemed, may be worth more or less than when purchased. Past performance is not indicative of future results. The returns shown do not reflect the
deduction of taxes that a shareholder would pay on Fund distributions or the redemption of Fund shares. Additionally, the returns presented herein may differ from
the performance reported in the Financial Highlights as the returns herein are calculated in a manner consistent with standardized performance in accordance with
Securities and Exchange Commission rules, while the performance in the Financial Highlights has been calculated in accordance with U.S. Generally Accepted
Accounting Principles (“U.S. GAAP”).
Russell U.S. Mid Cap Equity Fund 117
Russell Investment Company
Russell U.S. Mid Cap Equity Fund
Shareholder Expense Example — October 31, 2016 (Unaudited)
| Fund Expenses | Please note that the expenses shown in the table are meant | |||||
| The following disclosure provides important information | to highlight your ongoing costs only and do not reflect any | |||||
| regarding the Fund’s Shareholder Expense Example | transactional costs. Therefore, the information under the heading | |||||
| (“Example”). | “Hypothetical Performance (5% return before expenses)” is | |||||
| useful in comparing ongoing costs only, and will not help you | ||||||
| Example | determine the relative total costs of owning different funds. In | |||||
| As a shareholder of the Fund, you incur two types of costs: (1) | addition, if these transactional costs were included, your costs | |||||
| transaction costs, including sales charges (loads) on certain | would have been higher. | |||||
| purchase or redemption payments, and (2) ongoing costs, | Hypothetical | |||||
| including distribution (12b-1) and/or service fees and other | Performance (5% | |||||
| Fund expenses. The Example is intended to help you understand | Actual | return before | ||||
| your ongoing costs (in dollars) of investing in the Fund and to | Class A | Performance | expenses) | |||
| Beginning Account Value | ||||||
| compare these costs with the ongoing costs of investing in other | May 1, 2016 | $ | 1,000.00 | $ | 1,000.00 | |
| mutual funds. The Example is based on an investment of $1,000 | Ending Account Value | |||||
| invested at the beginning of the period and held for the entire | October 31, 2016 | $ | 1,033.40 | $ | 1,019.00 | |
| period indicated, which for this Fund is from May 1, 2016 to | Expenses Paid During Period* | $ | 6.24 | $ | 6.19 | |
| October 31, 2016. | * Expenses are equal to the Fund's annualized expense ratio of 1.22% | |||||
| (representing the six month period annualized), multiplied by the average | ||||||
| Actual Expenses | account value over the period, multiplied by 184/366 (to reflect the one-half | |||||
| The information in the table under the heading “Actual | year period). May reflect amounts waived and/or reimbursed. Without any | |||||
| Performance” provides information about actual account values | waivers and/or reimbursements, expenses would have been higher. | |||||
| and actual expenses. You may use the information in this column, | ||||||
| Hypothetical | ||||||
| together with the amount you invested, to estimate the expenses | Performance (5% | |||||
| that you paid over the period. Simply divide your account value by | Actual | return before | ||||
| $1,000 (for example, an $8,600 account value divided by $1,000 | Class C | Performance | expenses) | |||
| Beginning Account Value | ||||||
| = 8.6), then multiply the result by the number in the first column | May 1, 2016 | $ | 1,000.00 | $ | 1,000.00 | |
| in the row entitled “Expenses Paid During Period” to estimate | Ending Account Value | |||||
| the expenses you paid on your account during this period. | October 31, 2016 | $ | 1,029.90 | $ | 1,015.23 | |
| Expenses Paid During Period* | $ | 10.05 | $ | 9.98 | ||
| Hypothetical Example for Comparison Purposes | ||||||
| The information in the table under the heading “Hypothetical | * Expenses are equal to the Fund's annualized expense ratio of 1.97% | |||||
| (representing the six month period annualized), multiplied by the average | ||||||
| Performance (5% return before expenses)” provides information | account value over the period, multiplied by 184/366 (to reflect the one-half | |||||
| about hypothetical account values and hypothetical expenses | year period). May reflect amounts waived and/or reimbursed. Without any | |||||
| based on the Fund’s actual expense ratio and an assumed rate of | waivers and/or reimbursements, expenses would have been higher. | |||||
| return of 5% per year before expenses, which is not the Fund’s | ||||||
| Hypothetical | ||||||
| actual return. The hypothetical account values and expenses | Performance (5% | |||||
| may not be used to estimate the actual ending account balance or | Actual | return before | ||||
| expenses you paid for the period. You may use this information | Class S | Performance | expenses) | |||
| to compare the ongoing costs of investing in the Fund and other | Beginning Account Value | |||||
| May 1, 2016 | $ | 1,000.00 | $ | 1,000.00 | ||
| funds. To do so, compare this 5% hypothetical example with the | Ending Account Value | |||||
| 5% hypothetical examples that appear in the shareholder reports | October 31, 2016 | $ | 1,035.40 | $ | 1,020.26 | |
| of other funds. | Expenses Paid During Period* | $ | 4.96 | $ | 4.93 | |
| * Expenses are equal to the Fund's annualized expense ratio of 0.97% | ||||||
| (representing the six month period annualized), multiplied by the average | ||||||
| account value over the period, multiplied by 184/366 (to reflect the one-half | ||||||
| year period). May reflect amounts waived and/or reimbursed. Without any | ||||||
| waivers and/or reimbursements, expenses would have been higher. | ||||||
118 Russell U.S. Mid Cap Equity Fund
Russell Investment Company
Russell U.S. Mid Cap Equity Fund
Schedule of Investments — October 31, 2016
| Amounts in thousands (except share amounts) | Amounts in thousands (except share amounts) | |||||||
| Principal | Fair | Principal | Fair | |||||
| Amount ($) or | Value | Amount ($) or | Value | |||||
| Shares | $ | Shares | $ | |||||
| Common Stocks - 95.9% | Six Flags Entertainment Corp. | 2,764 | 154 | |||||
| Consumer Discretionary - 12.7% | Tenneco, Inc.(Æ) | 3,487 | 192 | |||||
| Aaron's, Inc. Class A | 11,600 | 287 | Thor Industries, Inc. | 3,304 | 262 | |||
| Advance Auto Parts, Inc. | 1,982 | 278 | Toll Brothers, Inc.(Æ) | 8,233 | 226 | |||
| Aramark | 6,049 | 225 | Tractor Supply Co. | 2,408 | 151 | |||
| AutoZone, Inc.(Æ) | 660 | 490 | Ulta Salon Cosmetics & Fragrance, Inc.(Æ) | 1,283 | 312 | |||
| Bed Bath & Beyond, Inc. | 5,700 | 230 | Vail Resorts, Inc. | 2,230 | 355 | |||
| Brinker International, Inc. | 4,600 | 226 | Viacom, Inc. Class B | 1,429 | 54 | |||
| Brunswick Corp. | 3,100 | 135 | Wyndham Worldwide Corp. | 1,013 | 67 | |||
| Carter's, Inc. | 1,470 | 127 | ||||||
| Churchill Downs, Inc. | 2,350 | 320 | 18,939 | |||||
| Cinemark Holdings, Inc. | 5,894 | 235 | ||||||
| ClubCorp Holdings, Inc. | 16,676 | 193 | Consumer Staples - 4.5% | |||||
| Brown-Forman Corp. Class B - ADR | 7,600 | 351 | ||||||
| Cooper-Standard Holding, Inc.(Æ) | 1,730 | 158 | Bunge, Ltd. | 7,400 | 459 | |||
| Darden Restaurants, Inc. | 4,500 | 291 | Campbell Soup Co. | 12,000 | 652 | |||
| Delphi Automotive PLC | 574 | 37 | Casey's General Stores, Inc. | 2,140 | 242 | |||
| Dollar General Corp. | 938 | 65 | Church & Dwight Co., Inc. | 5,706 | 275 | |||
| Dollar Tree, Inc.(Æ) | 2,409 | 182 | Clorox Co. (The) | 2,435 | 292 | |||
| DR Horton, Inc. | 9,409 | 271 | ConAgra Foods, Inc. | 10,100 | 487 | |||
| Expedia, Inc. | 5,385 | 696 | Dr Pepper Snapple Group, Inc. | 7,979 | 700 | |||
| Foot Locker, Inc. | 3,012 | 201 | Energizer Holdings, Inc.(Æ) | 3,200 | 241 | |||
| Garmin, Ltd. | 5,926 | 287 | Hershey Co. (The) | 5,562 | 570 | |||
| Gentex Corp. | 16,146 | 273 | Hormel Foods Corp. | 5,340 | 206 | |||
| Genuine Parts Co. | 3,222 | 292 | JM Smucker Co. (The) | 2,430 | 319 | |||
| Hanesbrands, Inc. | 32,200 | 827 | McCormick & Co., Inc. | 2,532 | 243 | |||
| Harman International Industries, Inc. | 7,963 | 635 | Mead Johnson Nutrition Co. Class A | 1,352 | 101 | |||
| Hasbro, Inc. | 3,368 | 281 | Nu Skin Enterprises, Inc. Class A(Ñ) | 3,300 | 203 | |||
| Interpublic Group of Cos., Inc. (The) | 10,572 | 237 | Pilgrim's Pride Corp. | 249 | 5 | |||
| Jack in the Box, Inc. | 1,600 | 150 | Pinnacle Foods, Inc. | 1,200 | 62 | |||
| Lamar Advertising Co. Class A(ö) | 1,681 | 107 | Post Holdings, Inc.(Æ) | 270 | 21 | |||
| Lear Corp. | 1,668 | 205 | Rite Aid Corp.(Æ) | 20,566 | 138 | |||
| Leggett & Platt, Inc. | 4,794 | 220 | Sanderson Farms, Inc.(Ñ) | 5,300 | 477 | |||
| Lennar Corp. Class A | 5,710 | 238 | Spectrum Brands Holdings, Inc. | 382 | 52 | |||
| Liberty Broadband Corp. Class C(Æ) | 472 | 31 | Tyson Foods, Inc. Class A | 3,913 | 277 | |||
| Liberty Ventures Class A(Æ) | 4,356 | 174 | United Natural Foods, Inc.(Æ) | 8,893 | 371 | |||
| Live Nation Entertainment, Inc.(Æ) | 7,698 | 213 | ||||||
| LKQ Corp.(Æ) | 21,801 | 704 | 6,744 | |||||
| lululemon athletica, Inc.(Æ) | 408 | 23 | ||||||
| Marriott International, Inc. Class A | 7,700 | 529 | Energy - 6.0% | |||||
| MGM Resorts International(Æ) | 18,191 | 476 | Antero Resources Corp.(Æ) | 14,200 | 376 | |||
| Michael Kors Holdings, Ltd.(Æ) | 1,771 | 90 | Baker Hughes, Inc. | 16,100 | 892 | |||
| Mobileye NV(Æ) | 10,129 | 377 | Cabot Oil & Gas Corp. | 19,400 | 405 | |||
| Mohawk Industries, Inc.(Æ) | 1,533 | 282 | Cimarex Energy Co. | 1,350 | 174 | |||
| Newell Brands, Inc. | 4,250 | 204 | Concho Resources, Inc.(Æ) | 1,726 | 219 | |||
| News Corp. Class A | 399 | 5 | Devon Energy Corp. | 15,100 | 572 | |||
| Norwegian Cruise Line Holdings, Ltd.(Æ) | 7,700 | 299 | Energen Corp.(Æ) | 7,000 | 351 | |||
| NVR, Inc.(Æ) | 338 | 515 | Ensco PLC Class A | 30,900 | 242 | |||
| Omnicom Group, Inc. | 3,984 | 318 | Gulfport Energy Corp.(Æ) | 9,000 | 217 | |||
| O'Reilly Automotive, Inc.(Æ) | 2,262 | 598 | Laredo Petroleum, Inc.(Æ) | 10,600 | 126 | |||
| Panera Bread Co. Class A(Æ) | 1,120 | 214 | Marathon Petroleum Corp. | 15,400 | 671 | |||
| Party City Holdco, Inc.(Æ)(Ñ) | 9,299 | 151 | Nabors Industries, Ltd. | 12,900 | 154 | |||
| Polaris Industries, Inc. | 253 | 19 | NextEra Energy Partners, LP | 21,700 | 594 | |||
| Pool Corp. | 108 | 10 | Noble Energy, Inc. | 27,800 | 958 | |||
| PVH Corp. | 7,188 | 769 | Patterson-UTI Energy, Inc. | 16,400 | 369 | |||
| Ralph Lauren Corp. Class A | 7,800 | 765 | Pioneer Natural Resources Co. | 3,100 | 555 | |||
| Ross Stores, Inc. | 10,717 | 670 | QEP Resources, Inc.(Æ) | 19,700 | 317 | |||
| Scripps Networks Interactive, Inc. Class A | 4,196 | 270 | Range Resources Corp. | 5,536 | 187 | |||
| Service Corp. International | 970 | 25 | RSP Permian, Inc.(Æ) | 1,000 | 36 | |||
| ServiceMaster Global Holdings, Inc.(Æ) | 2,082 | 74 | Tesoro Corp. | 4,100 | 348 | |||
| Signet Jewelers, Ltd.(Ñ) | 3,478 | 283 | Weatherford International PLC(Æ) | 66,200 | 319 | |||
| Sirius XM Holdings, Inc.(Ñ) | 162,849 | 679 | Western Refining, Inc. | 4,800 | 138 | |||
See accompanying notes which are an integral part of the financial statements.
Russell U.S. Mid Cap Equity Fund 119
Russell Investment Company
Russell U.S. Mid Cap Equity Fund
Schedule of Investments, continued — October 31, 2016
| Amounts in thousands (except share amounts) | Amounts in thousands (except share amounts) | ||||||
| Principal | Fair | Principal | Fair | ||||
| Amount ($) or | Value | Amount ($) or | Value | ||||
| Shares | $ | Shares | $ | ||||
| Williams Cos., Inc. (The) | 20,500 | 599 | Fiserv, Inc.(Æ) | 2,790 | 275 | ||
| World Fuel Services Corp. | 1,800 | 72 | Forest City Realty Trust, Inc. Class A(ö) | 4,733 | 102 | ||
| 8,891 | Gaming and Leisure Properties, Inc. (ö) | 3,393 | 111 | ||||
| General Growth Properties, Inc. (ö) | 18,556 | 463 | |||||
| Financial Services - 26.2% | Hanover Insurance Group, Inc. (The) | 7,100 | 541 | ||||
| Alexandria Real Estate Equities, Inc. (ö) | 1,124 | 121 | Hartford Financial Services Group, Inc. | 33,100 | 1,460 | ||
| Alliance Data Systems Corp. | 2,036 | 416 | HCP, Inc. (ö) | 2,789 | 96 | ||
| Allied World Assurance Co. Holdings AG | 2,983 | 128 | Healthcare Trust of America, Inc. Class A(ö) | 3,245 | 99 | ||
| Allstate Corp. (The) | 11,600 | 788 | Highwoods Properties, Inc. (ö) | 2,077 | 103 | ||
| American Campus Communities, Inc. (ö) | 13,563 | 707 | Hospitality Properties Trust (ö) | 3,612 | 99 | ||
| American Equity Investment Life Holding | Host Hotels & Resorts, Inc. (ö) | 8,671 | 134 | ||||
| Co. | 4,500 | 81 | Iron Mountain, Inc. (ö) | 3,411 | 115 | ||
| American Homes 4 Rent Class A(ö) | 4,738 | 100 | Jack Henry & Associates, Inc. | 154 | 12 | ||
| Ameriprise Financial, Inc. | 5,100 | 451 | KeyCorp | 47,000 | 664 | ||
| AmTrust Financial Services, Inc. | 15,052 | 397 | Kilroy Realty Corp.(ö) | 1,638 | 118 | ||
| Annaly Capital Management, Inc.(ö) | 5,888 | 61 | Kimco Realty Corp.(ö) | 4,695 | 125 | ||
| Apartment Investment & Management Co. | Lazard, Ltd. Class A | 23,700 | 864 | ||||
| Class A(ö) | 9,453 | 417 | Liberty Property Trust(ö) | 2,776 | 112 | ||
| Apple Hospitality REIT, Inc. (ö) | 5,414 | 98 | Life Storage, Inc.(Æ) | 6,674 | 538 | ||
| Arch Capital Group, Ltd.(Æ) | 4,900 | 382 | M&T Bank Corp. | 3,680 | 452 | ||
| Aspen Insurance Holdings, Ltd. | 8,500 | 410 | Macerich Co. (The) (ö) | 1,677 | 119 | ||
| Assurant, Inc. | 3,900 | 314 | MarketAxess Holdings, Inc. | 154 | 23 | ||
| AvalonBay Communities, Inc.(ö) | 2,960 | 507 | MB Financial, Inc. | 15,400 | 560 | ||
| Axis Capital Holdings, Ltd. | 5,700 | 325 | Mid-America Apartment Communities, Inc. | ||||
| BankUnited, Inc. | 22,100 | 644 | (ö) | 7,744 | 718 | ||
| Boston Properties, Inc.(ö) | 7,266 | 875 | Morningstar, Inc. | 900 | 64 | ||
| Brixmor Property Group, Inc. (ö) | 16,344 | 415 | Nasdaq, Inc. | 1,900 | 122 | ||
| Broadridge Financial Solutions, Inc. | 1,800 | 116 | National Retail Properties, Inc.(ö) | 2,314 | 106 | ||
| Brown & Brown, Inc. | 5,800 | 214 | Northern Trust Corp. | 5,600 | 406 | ||
| Camden Property Trust (ö) | 1,400 | 114 | Omega Healthcare Investors, Inc.(Ñ)(ö) | 3,233 | 103 | ||
| CBOE Holdings, Inc. | 4,240 | 268 | Paramount Group, Inc.(ö) | 19,400 | 302 | ||
| CBRE Group, Inc. Class A(Æ) | 4,466 | 115 | Progressive Corp. (The) | 23,900 | 753 | ||
| Citizens Financial Group, Inc. | 38,200 | 1,006 | Prologis, Inc. (ö) | 3,795 | 198 | ||
| CNA Financial Corp. | 6,000 | 219 | Raymond James Financial, Inc. | 6,411 | 385 | ||
| Columbia Property Trust, Inc.(ö) | 12,900 | 272 | Realty Income Corp.(ö) | 2,375 | 141 | ||
| Comerica, Inc. | 7,100 | 370 | Regency Centers Corp.(ö) | 5,357 | 386 | ||
| Corrections Corp. of America(ö) | 8,300 | 120 | Reinsurance Group of America, Inc. Class A | 5,300 | 572 | ||
| Cousins Properties, Inc. (ö) | 51,400 | 399 | RenaissanceRe Holdings, Ltd. | 3,350 | 416 | ||
| CubeSmart (ö) | 3,948 | 103 | Retail Properties of America, Inc. Class A(ö) | 657 | 10 | ||
| CyrusOne, Inc.(ö) | 9,292 | 415 | Senior Housing Properties Trust (ö) | 4,832 | 103 | ||
| DCT Industrial Trust, Inc. (ö) | 2,177 | 102 | Signature Bank(Æ) | 6,796 | 819 | ||
| DDR Corp. (ö) | 6,299 | 96 | SL Green Realty Corp. (ö) | 4,874 | 479 | ||
| Digital Realty Trust, Inc. (ö) | 1,510 | 141 | Spirit Realty Capital, Inc. (ö) | 8,556 | 102 | ||
| Douglas Emmett, Inc. (ö) | 11,170 | 408 | Starwood Property Trust, Inc.(ö) | 4,850 | 108 | ||
| Duke Realty Corp. (ö) | 4,637 | 121 | STORE Capital Corp. (ö) | 3,597 | 98 | ||
| Dun & Bradstreet Corp. (The) | 2,970 | 371 | Sun Communities, Inc. (ö) | 1,375 | 106 | ||
| E*Trade Financial Corp.(Æ) | 11,800 | 332 | Synchrony Financial | 30,700 | 878 | ||
| East West Bancorp, Inc. | 10,300 | 407 | Synovus Financial Corp. | 2,700 | 89 | ||
| EPR Properties (ö) | 1,374 | 100 | Taubman Centers, Inc. (ö) | 1,420 | 103 | ||
| Equifax, Inc. | 3,136 | 389 | TCF Financial Corp. | 12,600 | 180 | ||
| Equinix, Inc. (ö) | 896 | 320 | UDR, Inc. (ö) | 3,531 | 123 | ||
| Equity Commonwealth (Æ)(ö) | 7,200 | 218 | Validus Holdings, Ltd. | 2,500 | 128 | ||
| Equity LifeStyle Properties, Inc. Class A(ö) | 1,451 | 110 | Vantiv, Inc. Class A(Æ) | 5,555 | 324 | ||
| Equity One, Inc. (ö) | 3,242 | 92 | Ventas, Inc. (ö) | 2,638 | 179 | ||
| Essex Property Trust, Inc. (ö) | 2,263 | 484 | VEREIT, Inc. (ö) | 12,452 | 117 | ||
| Everest Re Group, Ltd. | 3,420 | 696 | Vornado Realty Trust (ö) | 2,475 | 230 | ||
| Extra Space Storage, Inc. (ö) | 1,602 | 117 | Voya Financial, Inc. | 19,500 | 596 | ||
| FactSet Research Systems, Inc. | 1,670 | 258 | Weingarten Realty Investors (ö) | 10,730 | 389 | ||
| Federal Realty Investment Trust (ö) | 2,871 | 417 | Welltower, Inc. (ö) | 2,649 | 182 | ||
| First American Financial Corp. | 1,000 | 39 | WEX, Inc.(Æ) | 2,043 | 223 | ||
See accompanying notes which are an integral part of the financial statements.
120 Russell U.S. Mid Cap Equity Fund
Russell Investment Company
Russell U.S. Mid Cap Equity Fund
Schedule of Investments, continued — October 31, 2016
| Amounts in thousands (except share amounts) | Amounts in thousands (except share amounts) | ||||||
| Principal | Fair | Principal | Fair | ||||
| Amount ($) or | Value | Amount ($) or | Value | ||||
| Shares | $ | Shares | $ | ||||
| Weyerhaeuser Co. (ö) | 28,010 | 838 | Albemarle Corp. | 3,539 | 296 | ||
| White Mountains Insurance Group, Ltd. | 414 | 343 | AptarGroup, Inc. | 9,662 | 690 | ||
| Willis Towers Watson PLC | 8,928 | 1,124 | Ashland Global Holdings, Inc. | 922 | 103 | ||
| WP Carey, Inc. (ö) | 1,786 | 108 | Beacon Roofing Supply, Inc.(Æ) | 4,708 | 198 | ||
| XL Group, Ltd. | 41,500 | 1,440 | Bemis Co., Inc. | 4,000 | 195 | ||
| Zions Bancorporation | 31,100 | 1,002 | Caesarstone, Ltd.(Æ) | 4,785 | 169 | ||
| 38,864 | Celanese Corp. Class A | 4,700 | 343 | ||||
| Domtar Corp. | 8,100 | 291 | |||||
| Health Care - 8.6% | Eagle Materials, Inc. | 5,500 | 445 | ||||
| Abiomed, Inc.(Æ) | 167 | 17 | Eastman Chemical Co. | 1,522 | 110 | ||
| Agilent Technologies, Inc. | 22,100 | 963 | Fastenal Co. | 5,792 | 226 | ||
| Agios Pharmaceuticals, Inc.(Æ)(Ñ) | 500 | 24 | Hexcel Corp. | 10,139 | 461 | ||
| Align Technology, Inc.(Æ) | 3,057 | 263 | International Flavors & Fragrances, Inc. | 2,509 | 328 | ||
| Allscripts Healthcare Solutions, Inc.(Æ) | 14,700 | 176 | International Paper Co. | 8,000 | 360 | ||
| AmerisourceBergen Corp. Class A | 3,991 | 281 | Lennox International, Inc. | 519 | 76 | ||
| Anthem, Inc. | 720 | 88 | Martin Marietta Materials, Inc. | 3,183 | 590 | ||
| BioMarin Pharmaceutical, Inc.(Æ) | 3,281 | 264 | Masonite International Corp.(Æ) | 2,747 | 156 | ||
| Cardinal Health, Inc. | 2,500 | 172 | Newmont Mining Corp. | 2,521 | 93 | ||
| Centene Corp.(Æ) | 5,981 | 374 | Nucor Corp. | 6,270 | 306 | ||
| Cerner Corp.(Æ) | 3,595 | 211 | Owens Corning | 4,498 | 220 | ||
| Cigna Corp. | 13,300 | 1,580 | Platform Specialty Products Corp.(Æ)(Ñ) | 3,000 | 22 | ||
| Cooper Cos., Inc. (The) | 1,300 | 229 | PPG Industries, Inc. | 6,700 | 624 | ||
| CR Bard, Inc. | 132 | 29 | Reliance Steel & Aluminum Co. | 3,503 | 241 | ||
| DaVita, Inc.(Æ) | 3,637 | 213 | RPM International, Inc. | 1,366 | 65 | ||
| Dentsply Sirona, Inc. | 8,999 | 518 | Scotts Miracle-Gro Co. (The) Class A | 400 | 35 | ||
| Edwards Lifesciences Corp.(Æ) | 1,001 | 95 | Sherwin-Williams Co. (The) | 2,381 | 583 | ||
| Endo International PLC(Æ) | 9,200 | 172 | Sonoco Products Co. | 1,099 | 55 | ||
| Envision Healthcare Holdings, Inc.(Æ) | 12,718 | 251 | Tahoe Resources, Inc. | 1,241 | 15 | ||
| Exact Sciences Corp.(Æ)(Ñ) | 19,359 | 302 | Univar, Inc.(Æ) | 1,100 | 25 | ||
| Henry Schein, Inc.(Æ) | 3,625 | 541 | Valvoline, Inc.(Ñ) | 20,100 | 410 | ||
| Humana, Inc. | 4,700 | 806 | Vulcan Materials Co. | 2,713 | 307 | ||
| IDEXX Laboratories, Inc.(Æ) | 1,949 | 209 | Watsco, Inc. | 1,660 | 228 | ||
| Impax Laboratories, Inc.(Æ) | 4,400 | 88 | WestRock Co. | 5,224 | 241 | ||
| Incyte Corp.(Æ) | 1,336 | 116 | 8,534 | ||||
| Intuitive Surgical, Inc.(Æ) | 790 | 531 | |||||
| Laboratory Corp. of America Holdings(Æ) | 739 | 93 | Producer Durables - 13.4% | ||||
| LifePoint Health, Inc.(Æ) | 4,900 | 293 | Air Lease Corp. Class A | 8,100 | 245 | ||
| Medicines Co. (The)(Æ)(Ñ) | 8,693 | 286 | Alaska Air Group, Inc. | 8,600 | 621 | ||
| Myriad Genetics, Inc.(Æ)(Ñ) | 8,700 | 171 | Allison Transmission Holdings, Inc. Class A | 22,011 | 645 | ||
| NuVasive, Inc.(Æ) | 3,342 | 200 | American Airlines Group, Inc. | 9,369 | 380 | ||
| OPKO Health, Inc.(Æ)(Ñ) | 2,567 | 24 | Ametek, Inc. | 17,886 | 789 | ||
| Pacira Pharmaceuticals, Inc.(Æ) | 6,154 | 196 | Arconic, Inc. | 286 | 8 | ||
| Patterson Cos., Inc. | 8,513 | 364 | AO Smith Corp. | 14,652 | 662 | ||
| PerkinElmer, Inc. | 5,830 | 297 | Avery Dennison Corp. | 2,725 | 190 | ||
| Quest Diagnostics, Inc. | 800 | 65 | B/E Aerospace, Inc. | 5,299 | 315 | ||
| Quintiles IMS Holdings, Inc.(Æ) | 3,722 | 267 | BWX Technologies, Inc. Class W(Æ) | 5,600 | 220 | ||
| ResMed, Inc. | 3,034 | 181 | Carlisle Cos., Inc. | 2,498 | 262 | ||
| Steris PLC | 8,500 | 568 | CH Robinson Worldwide, Inc. | 8,107 | 552 | ||
| Teleflex, Inc. | 1,530 | 219 | Chicago Bridge & Iron Co. | 11,000 | 352 | ||
| United Therapeutics Corp.(Æ) | 671 | 81 | Cintas Corp. | 2,350 | 251 | ||
| Varian Medical Systems, Inc.(Æ) | 900 | 82 | CoStar Group, Inc.(Æ) | 1,289 | 241 | ||
| VCA, Inc.(Æ) | 327 | 20 | Donaldson Co., Inc. | 6,600 | 241 | ||
| Vertex Pharmaceuticals, Inc.(Æ) | 4,326 | 328 | Dycom Industries, Inc.(Æ) | 3,226 | 248 | ||
| WellCare Health Plans, Inc.(Æ) | 640 | 73 | EnerSys | 1,700 | 111 | ||
| Wright Medical Group NV(Æ) | 14,234 | 312 | Expeditors International of Washington, Inc. | 10,479 | 539 | ||
| Zimmer Biomet Holdings, Inc. | 715 | 75 | Fortive Corp. | 10,600 | 541 | ||
| 12,708 | Genpact, Ltd.(Æ) | 22,276 | 512 | ||||
| Hertz Global Holdings, Inc.(Æ) | 1,100 | 37 | |||||
| Materials and Processing - 5.7% | Hubbell, Inc. Class B | 5,600 | 585 | ||||
| Acuity Brands, Inc. | 121 | 27 | Huntington Ingalls Industries, Inc. | 200 | 32 | ||
See accompanying notes which are an integral part of the financial statements.
Russell U.S. Mid Cap Equity Fund 121
Russell Investment Company
Russell U.S. Mid Cap Equity Fund
Schedule of Investments, continued — October 31, 2016
| Amounts in thousands (except share amounts) | Amounts in thousands (except share amounts) | ||||||
| Principal | Fair | Principal | Fair | ||||
| Amount ($) or | Value | Amount ($) or | Value | ||||
| Shares | $ | Shares | $ | ||||
| IDEX Corp. | 666 | 58 | Harris Corp. | 7,200 | 642 | ||
| JB Hunt Transport Services, Inc. | 6,078 | 496 | HP, Inc. | 8,700 | 126 | ||
| Johnson Controls International PLC | 11,700 | 472 | Infinera Corp.(Æ) | 29,263 | 228 | ||
| KBR, Inc. | 17,700 | 262 | InterXion Holding NV(Æ) | 13,163 | 490 | ||
| Korn/Ferry International | 11,582 | 236 | Jabil Circuit, Inc. | 16,900 | 361 | ||
| L-3 Communications Holdings, Inc. Class 3 | 2,800 | 383 | Juniper Networks, Inc. | 22,800 | 601 | ||
| Landstar System, Inc. | 3,400 | 242 | KLA-Tencor Corp. | 691 | 52 | ||
| Lincoln Electric Holdings, Inc. | 2,200 | 145 | Linear Technology Corp. | 5,419 | 325 | ||
| Macquarie Infrastructure Corp. | 4,400 | 360 | LogMeIn, Inc. | 2,544 | 242 | ||
| ManpowerGroup, Inc. | 8,700 | 668 | Manhattan Associates, Inc.(Æ) | 301 | 15 | ||
| MAXIMUS, Inc. | 5,631 | 293 | Marvell Technology Group, Ltd. | 23,400 | 305 | ||
| Mettler-Toledo International, Inc.(Æ) | 735 | 297 | Mentor Graphics Corp. | 21,260 | 614 | ||
| Navistar International Corp.(Æ)(Ñ) | 1,700 | 38 | NetApp, Inc. | 25,800 | 876 | ||
| On Assignment, Inc.(Æ) | 8,378 | 288 | Nuance Communications, Inc.(Æ) | 10,400 | 146 | ||
| Orbital ATK, Inc. | 6,424 | 478 | NVIDIA Corp. | 5,943 | 423 | ||
| Paychex, Inc. | 11,277 | 623 | ON Semiconductor Corp.(Æ) | 31,200 | 364 | ||
| Pentair PLC | 9,400 | 518 | Rambus, Inc.(Æ) | 1,000 | 12 | ||
| Quanta Services, Inc.(Æ) | 7,500 | 216 | Sabre Corp. | 871 | 23 | ||
| Regal Beloit Corp. | 1,200 | 71 | SBA Communications Corp. Class A(Æ) | 7,224 | 818 | ||
| Robert Half International, Inc. | 6,100 | 228 | Skyworks Solutions, Inc. | 7,438 | 572 | ||
| Rockwell Automation, Inc. | 1,500 | 180 | Synaptics, Inc.(Æ) | 400 | 21 | ||
| Rockwell Collins, Inc. | 6,700 | 565 | Synchronoss Technologies, Inc.(Æ) | 22,550 | 828 | ||
| Roper Technologies, Inc. | 500 | 87 | Synopsys, Inc.(Æ) | 5,500 | 326 | ||
| RR Donnelley & Sons Co. | 2,600 | 46 | Tech Data Corp.(Æ) | 3,200 | 246 | ||
| SkyWest, Inc. | 2,900 | 87 | Twitter, Inc.(Æ) | 10,500 | 189 | ||
| Snap-on, Inc. | 2,439 | 376 | VeriFone Systems, Inc.(Æ) | 2,200 | 34 | ||
| Stanley Black & Decker, Inc. | 2,756 | 314 | Viavi Solutions, Inc. Class W(Æ) | 70,900 | 505 | ||
| Terex Corp. | 12,400 | 296 | VMware, Inc. Class A(Æ) | 2,500 | 197 | ||
| Textron, Inc. | 18,700 | 750 | Western Digital Corp. | 14,100 | 824 | ||
| Toro Co. (The) | 10,692 | 512 | Yelp, Inc. Class A(Æ) | 3,400 | 111 | ||
| Trimble, Inc.(Æ) | 9,603 | 265 | Zynga, Inc. Class A(Æ) | 122,800 | 345 | ||
| United Continental Holdings, Inc.(Æ) | 6,399 | 360 | 16,973 | ||||
| Verisk Analytics, Inc. Class A(Æ) | 3,804 | 310 | |||||
| WageWorks, Inc.(Æ) | 8,106 | 478 | Utilities - 7.4% | ||||
| WESCO International, Inc.(Æ) | 3,600 | 195 | Ameren Corp. | 5,000 | 250 | ||
| WW Grainger, Inc. | 35 | 7 | American Water Works Co., Inc. | 8,900 | 659 | ||
| XPO Logistics, Inc.(Æ)(Ñ) | 5,911 | 195 | Aqua America, Inc. | 7,800 | 239 | ||
| 19,974 | Atmos Energy Corp. | 2,100 | 156 | ||||
| CMS Energy Corp. | 7,700 | 325 | |||||
| Technology - 11.4% | Consolidated Edison, Inc. | 6,700 | 506 | ||||
| Advanced Micro Devices, Inc.(Æ) | 37,300 | 270 | DTE Energy Co. | 6,400 | 615 | ||
| Amdocs, Ltd. | 3,500 | 205 | Edison International | 9,800 | 720 | ||
| Amkor Technology, Inc.(Æ) | 12,100 | 112 | Entergy Corp. | 3,100 | 228 | ||
| Analog Devices, Inc. | 10,600 | 679 | Eversource Energy | 4,300 | 237 | ||
| Ansys, Inc.(Æ) | 3,200 | 292 | Exelon Corp. | 15,100 | 514 | ||
| Applied Materials, Inc. | 20,600 | 599 | FirstEnergy Corp. | 11,000 | 377 | ||
| ARRIS International PLC(Æ) | 10,190 | 283 | Gogo, Inc.(Æ)(Ñ) | 27,000 | 273 | ||
| Avnet, Inc. | 5,800 | 243 | Great Plains Energy, Inc. | 16,200 | 461 | ||
| Black Knight Financial Services, Inc. Class | Hawaiian Electric Industries, Inc. | 18,100 | 534 | ||||
| A(Æ)(Ñ) | 7,145 | 281 | Level 3 Communications, Inc.(Æ) | 1,731 | 97 | ||
| Brocade Communications Systems, Inc. | 26,700 | 283 | PG&E Corp. | 13,600 | 845 | ||
| Cadence Design Systems, Inc.(Æ) | 13,060 | 334 | Pinnacle West Capital Corp. | 6,900 | 525 | ||
| Coherent, Inc.(Æ) | 1,359 | 142 | Public Service Enterprise Group, Inc. | 18,500 | 779 | ||
| Cypress Semiconductor Corp. | 93,400 | 931 | Sempra Energy | 7,300 | 782 | ||
| EchoStar Corp. Class A(Æ) | 2,900 | 136 | Telephone & Data Systems, Inc. | 10,989 | 284 | ||
| Electronic Arts, Inc.(Æ) | 1,152 | 90 | US Cellular Corp.(Æ) | 3,600 | 126 | ||
| F5 Networks, Inc.(Æ) | 2,436 | 337 | WEC Energy Group, Inc. | 5,600 | 334 | ||
| Finisar Corp.(Æ) | 2,700 | 74 | Xcel Energy, Inc. | 18,900 | 785 | ||
| Gartner, Inc.(Æ) | 5,711 | 491 | |||||
| GoDaddy, Inc. Class A(Æ)(Ñ) | 9,221 | 330 | |||||
See accompanying notes which are an integral part of the financial statements.
122 Russell U.S. Mid Cap Equity Fund
Russell Investment Company
Russell U.S. Mid Cap Equity Fund
Schedule of Investments, continued — October 31, 2016
Amounts in thousands (except share amounts)
| Principal | Fair | ||||||
| Amount ($) or | Value | ||||||
| Shares | $ | ||||||
| Zayo Group Holdings, Inc.(Æ) | 8,934 | 288 | |||||
| 10,939 | |||||||
| Total Common Stocks | |||||||
| (cost $136,275) | 142,566 | ||||||
| Short-Term Investments - 3.8% | |||||||
| Russell U.S. Cash Management Fund | 5,627,861 | (8) | 5,629 | ||||
| Total Short-Term Investments | |||||||
| (cost $5,628) | 5,629 | ||||||
| Other Securities - 2.4% | |||||||
| Russell U.S. Cash Collateral Fund(×) | 3,633,144 | (8) | 3,633 | ||||
| Total Other Securities | |||||||
| (cost $3,633) | 3,633 | ||||||
| Total Investments 102.1% | |||||||
| (identified cost $145,536) | 151,828 | ||||||
| Other Assets and Liabilities, Net | |||||||
| -(2.1%) | (3,198 | ) | |||||
| Net Assets - 100.0% | 148,630 | �� | |||||
See accompanying notes which are an integral part of the financial statements.
Russell U.S. Mid Cap Equity Fund 123
Russell Investment Company
Russell U.S. Mid Cap Equity Fund
Schedule of Investments, continued — October 31, 2016
| Futures Contracts | |||||||||||||||
| Amounts in thousands (except contract amounts) | |||||||||||||||
| Unrealized | |||||||||||||||
| Appreciation | |||||||||||||||
| Number of | Notional | Expiration | (Depreciation) | ||||||||||||
| Contracts | Amount | Date | $ | ||||||||||||
| Long Positions | |||||||||||||||
| S&P Mid 400 E-Mini Index Futures | 38 | USD | 5,726 | 12/16 | (114 | ) | |||||||||
| Total Unrealized Appreciation (Depreciation) on Open Futures Contracts (å) | (114 | ) | |||||||||||||
| Presentation of Portfolio Holdings | |||||||||||||||
| Amounts in thousands | |||||||||||||||
| Fair Value | |||||||||||||||
| Practical | |||||||||||||||
| Portfolio Summary | Level 1 | Level 2 | Level 3 | Expedient (a) | Total | % of Net Assets | |||||||||
| Common Stocks | |||||||||||||||
| Consumer Discretionary | $ | 18,939 | $ | — | $ | — | $ | — | $ | 18,939 | 12.7 | ||||
| Consumer Staples | 6,744 | — | — | — | 6,744 | 4.5 | |||||||||
| Energy | 8,891 | — | — | — | 8,891 | 6.0 | |||||||||
| Financial Services | 38,864 | — | — | — | 38,864 | 26.2 | |||||||||
| Health Care | 12,708 | — | — | — | 12,708 | 8.6 | |||||||||
| Materials and Processing | 8,534 | — | — | — | 8,534 | 5.7 | |||||||||
| Producer Durables | 19,974 | — | — | — | 19,974 | 13.4 | |||||||||
| Technology | 16,973 | — | — | — | 16,973 | 11.4 | |||||||||
| Utilities | 10,939 | — | — | — | 10,939 | 7.4 | |||||||||
| Short-Term Investments | — | — | — | 5,629 | 5,629 | 3.8 | |||||||||
| Other Securities | — | — | — | 3,633 | 3,633 | 2.4 | |||||||||
| Total Investments | 142,566 | — | — | 9,262 | 151,828 | 102.1 | |||||||||
| Other Assets and Liabilities, Net | (2.1 | ) | |||||||||||||
| 100.0 | |||||||||||||||
| Other Financial Instruments | |||||||||||||||
| Liabilities | |||||||||||||||
| Futures Contracts | (114 | ) | — | — | — | (114 | ) | (0.1 | ) | ||||||
| Total Other Financial Instruments* | $ | (114 | ) | $ | — | $ | — | $ | — | $ | (114 | ) | |||
* Futures and foreign currency exchange contract values reflect the unrealized appreciation (depreciation) on the investments.
(a) Certain investments that are measured at fair value using the net asset value per share (or its equivalent) practical expedient have not been classified
in the fair value levels. The fair value amounts presented in the table are intended to permit reconciliation to the amounts presented in the Schedule of
Investments.
For a description of the Levels, see note 2 in the Notes to Financial Statements.
For a disclosure on transfers between Levels 1, 2 and 3 during the period ended October 31, 2016, see note 2 in the Notes to
Financial Statements.
See accompanying notes which are an integral part of the financial statements.
124 Russell U.S. Mid Cap Equity Fund
Russell Investment Company
Russell U.S. Mid Cap Equity Fund
Fair Value of Derivative Instruments — October 31, 2016
Amounts in thousands
| Equity | ||||
| Derivatives not accounted for as hedging instruments | Contracts | |||
| Location: Statement of Assets and Liabilities - Liabilities | ||||
| Variation margin on futures contracts* | $ | 114 | ||
| Equity | ||||
| Derivatives not accounted for as hedging instruments | Contracts | |||
| Location: Statement of Operations - Net realized gain (loss) | ||||
| Futures contracts | $ | 1,098 | ||
| Location: Statement of Operations - Net change in unrealized appreciation (depreciation) | ||||
| Futures contracts | $ | (282 | ) | |
* Includes cumulative appreciation/depreciation of futures contracts as reported in the Schedule of Investments. Only variation margin is reported within the
Statement of Assets and Liabilities.
For further disclosure on derivatives see note 2 in the Notes to Financial Statements.
See accompanying notes which are an integral part of the financial statements.
Russell U.S. Mid Cap Equity Fund 125
Russell Investment Company
Russell U.S. Mid Cap Equity Fund
Balance Sheet Offsetting of Financial and Derivative Instruments — October 31, 2016
| Amounts in thousands | |||||||||
| Offsetting of Financial Assets and Derivative Assets | |||||||||
| Gross | Net Amounts | ||||||||
| Amounts | of Assets | ||||||||
| Gross | Offset in the | Presented in | |||||||
| Amounts of | Statement of | the Statement | |||||||
| Recognized | Assets and | of Assets and | |||||||
| Description | Location: Statement of Assets and Liabilities - Assets | Assets | Liabilities | Liabilities | |||||
| Securities on Loan* | Investments, at fair value | $ | 3,547 | $ | — | $ | 3,547 | ||
| Futures Contracts | Variation margin on futures contracts | 53 | — | 53 | |||||
| Total Financial and Derivative Assets | 3,600 | — | 3,600 | ||||||
| Financial and Derivative Assets not subject to a netting agreement | (53 | ) | — | (53 | ) | ||||
| Total Financial and Derivative Assets subject to a netting agreement | $ | 3,547 | $ | — | $ | 3,547 | |||
| Financial Assets, Derivative Assets, and Collateral Held by Counterparty | ||||||||||
| Gross Amounts Not Offset in | ||||||||||
| the Statement of Assets and | ||||||||||
| Liabilities | ||||||||||
| Net Amounts | ||||||||||
| of Assets | ||||||||||
| Presented in | ||||||||||
| the Statement | Financial and | |||||||||
| of Assets and | Derivative | Collateral | ||||||||
| Counterparty | Liabilities | Instruments | Received^ | Net Amount | ||||||
| Barclays | $ | 659 | $ | — | $ | 659 | $ | — | ||
| Citigroup | 978 | — | 978 | — | ||||||
| Fidelity | 19 | — | 19 | — | ||||||
| JPMorgan Chase | 195 | — | 195 | — | ||||||
| Merrill Lynch | 19 | — | 19 | — | ||||||
| Morgan Stanley | 1,677 | — | 1,677 | — | ||||||
| Total | $ | 3,547 | $ | — | $ | 3,547 | $ | — | ||
* Fair value of securities on loan as reported in the footnotes to the Statement of Assets and Liabilities.
^ Collateral received or pledged amounts may not reconcile to those disclosed in the Statement of Assets and Liabilities due to the inclusion of off-Balance
Sheet collateral and adjustments made to exclude overcollateralization.
For further disclosure on derivatives and counterparty risk see note 2 in the Notes to Financial Statements.
See accompanying notes which are an integral part of the financial statements.
126 Russell U.S. Mid Cap Equity Fund
Russell Investment Company
Russell U.S. Mid Cap Equity Fund
Statement of Assets and Liabilities — October 31, 2016
| Amounts in thousands | ||
| Assets | ||
| Investments, at identified cost | $ | 145,536 |
| Investments, at fair value(*)(>) | 151,828 | |
| Cash (restricted)(a) | 342 | |
| Receivables: | ||
| Dividends and interest | 119 | |
| Dividends from affiliated Russell funds | 4 | |
| Investments sold | 1,170 | |
| Fund shares sold | 167 | |
| Variation margin on futures contracts | 53 | |
| Total assets | 153,683 | |
| Liabilities | ||
| Payables: | ||
| Investments purchased | 985 | |
| Fund shares redeemed | 228 | |
| Accrued fees to affiliates | 98 | |
| Other accrued expenses | 109 | |
| Payable upon return of securities loaned | 3,633 | |
| Total liabilities | 5,053 | |
| Net Assets | $ | 148,630 |
See accompanying notes which are an integral part of the financial statements.
Russell U.S. Mid Cap Equity Fund 127
Russell Investment Company
Russell U.S. Mid Cap Equity Fund
Statement of Assets and Liabilities, continued — October 31, 2016
| Amounts in thousands | |||
| Net Assets Consist of: | |||
| Undistributed (overdistributed) net investment income | $ | 101 | |
| Accumulated net realized gain (loss) | 4,293 | ||
| Unrealized appreciation (depreciation) on: | |||
| Investments | 6,292 | ||
| Futures contracts | (114 | ) | |
| Shares of beneficial interest | 135 | ||
| Additional paid-in capital | 137,923 | ||
| Net Assets | $ | 148,630 | |
| Net Asset Value, offering and redemption price per share: | |||
| Net asset value per share: Class A(#) | $ | 10.94 | |
| Maximum offering price per share (Net asset value plus sales charge of 5.75%): Class A | $ | 11.61 | |
| Class A — Net assets | $ | 4,955,519 | |
| Class A — Shares outstanding ($.01 par value) | 452,890 | ||
| Net asset value per share: Class C(#) | $ | 10.68 | |
| Class C — Net assets | $ | 2,790,315 | |
| Class C — Shares outstanding ($.01 par value) | 261,247 | ||
| Net asset value per share: Class S(#) | $ | 10.98 | |
| Class S — Net assets | $ | 140,883,925 | |
| Class S — Shares outstanding ($.01 par value) | 12,832,948 | ||
| Amounts in thousands | |||
| (*) Securities on loan included in investments | $ | 3,547 | |
| (>) Investments in affiliates, Russell U.S. Cash Management Fund and Russell U.S. Cash Collateral Fund | $ | 9,262 | |
| (a) Cash Collateral for Futures | $ | 342 | |
| (#) Net asset value per share equals class level net assets divided by class level shares of beneficial interest outstanding. | |||
See accompanying notes which are an integral part of the financial statements.
128 Russell U.S. Mid Cap Equity Fund
Russell Investment Company
Russell U.S. Mid Cap Equity Fund
Statement of Operations — For the Period Ended October 31, 2016
| Amounts in thousands | |||
| Investment Income | |||
| Dividends | $ | 3,221 | |
| Dividends from affiliated Russell funds | 32 | ||
| Securities lending income (net) | 64 | ||
| Total investment income | 3,317 | ||
| Expenses | |||
| Advisory fees | 1,402 | ||
| Administrative fees | 85 | ||
| Custodian fees (1) | 140 | ||
| Distribution fees - Class A | 13 | ||
| Distribution fees - Class C | 21 | ||
| Transfer agent fees - Class A | 10 | ||
| Transfer agent fees - Class C | 6 | ||
| Transfer agent fees - Class S | 335 | ||
| Professional fees | 60 | ||
| Registration fees | 49 | ||
| Shareholder servicing fees - Class C | 7 | ||
| Trustees’ fees | 6 | ||
| Printing fees | 29 | ||
| Miscellaneous | 15 | ||
| Expenses before reductions | 2,178 | ||
| Expense reductions | (438 | ) | |
| Net expenses | 1,740 | ||
| Net investment income (loss) | 1,577 | ||
| Net Realized and Unrealized Gain (Loss) | |||
| Net realized gain (loss) on: | |||
| Investments | 4,429 | ||
| Futures contracts | 1,098 | ||
| Net realized gain (loss) | 5,527 | ||
| Net change in unrealized appreciation (depreciation) on: | |||
| Investments | (1,213 | ) | |
| Futures contracts | (282 | ) | |
| Net change in unrealized appreciation (depreciation) | (1,495 | ) | |
| Net realized and unrealized gain (loss) | 4,032 | ||
| Net Increase (Decrease) in Net Assets from Operations | $ | 5,609 | |
| (1) Includes a reimbursement for overbilling of custody out-of-pocket fees from prior years. See note 10 in the Notes to Financial Statements. | |||
See accompanying notes which are an integral part of the financial statements.
Russell U.S. Mid Cap Equity Fund 129
Russell Investment Company
Russell U.S. Mid Cap Equity Fund
Statements of Changes in Net Assets
| For the Periods Ended October 31, | ||||||
| Amounts in thousands | 2016 | 2015 | ||||
| Increase (Decrease) in Net Assets | ||||||
| Operations | ||||||
| Net investment income (loss) | $ | 1,577 | $ | 1,043 | ||
| Net realized gain (loss) | 5,527 | 25,883 | ||||
| Net change in unrealized appreciation (depreciation) | (1,495 | ) | (22,057 | ) | ||
| Net increase (decrease) in net assets from operations | 5,609 | 4,869 | ||||
| Distributions | ||||||
| From net investment income | ||||||
| Class A | (38 | ) | (16 | ) | ||
| Class C | (2 | ) | — | |||
| Class S | (1,600 | ) | (1,116 | ) | ||
| From net realized gain | ||||||
| Class A | (721 | ) | (379 | ) | ||
| Class C | (398 | ) | (176 | ) | ||
| Class S | (25,227 | ) | (15,907 | ) | ||
| Net decrease in net assets from distributions | (27,986 | ) | (17,594 | ) | ||
| Share Transactions* | ||||||
| Net increase (decrease) in net assets from share transactions | (32,858 | ) | 12,708 | |||
| Total Net Increase (Decrease) in Net Assets | (55,235 | ) | (17 | ) | ||
| Net Assets | ||||||
| Beginning of period | 203,865 | 203,882 | ||||
| End of period | $ | 148,630 | $ | 203,865 | ||
| Undistributed (overdistributed) net investment income included in net assets | $ | 101 | $ | 61 | ||
See accompanying notes which are an integral part of the financial statements.
130 Russell U.S. Mid Cap Equity Fund
Russell Investment Company
Russell U.S. Mid Cap Equity Fund
Statements of Changes in Net Assets, continued
* Share transaction amounts (in thousands) for the periods ended October 31, 2016 and October 31, 2015 were as follows:
| 2016 | 2015 | |||||||||||
| Shares | Dollars | Shares | Dollars | |||||||||
| Class A | ||||||||||||
| Proceeds from shares sold | 117 | $ | 1,293 | 105 | $ | 1,329 | ||||||
| Proceeds from reinvestment of distributions | 73 | 750 | 31 | 395 | ||||||||
| Payments for shares redeemed | (159 | ) | (1,701 | ) | (58 | ) | (729 | ) | ||||
| Net increase (decrease) | 31 | 342 | 78 | 995 | ||||||||
| Class C | ||||||||||||
| Proceeds from shares sold | 80 | 822 | 124 | 1,544 | ||||||||
| Proceeds from reinvestment of distributions | 39 | 398 | 14 | 175 | ||||||||
| Payments for shares redeemed | (94 | ) | (976 | ) | (52 | ) | (646 | ) | ||||
| Net increase (decrease) | 25 | 244 | 86 | 1,073 | ||||||||
| Class S | ||||||||||||
| Proceeds from shares sold | 2,707 | 28,727 | 2,716 | 34,689 | ||||||||
| Proceeds from reinvestment of distributions | 2,238 | 23,128 | 1,154 | 14,631 | ||||||||
| Payments for shares redeemed | (7,769 | ) | (85,299 | ) | (3,048 | ) | (38,680 | ) | ||||
| Net increase (decrease) | (2,824 | ) | (33,444 | ) | 822 | 10,640 | ||||||
| Total increase (decrease) | (2,768 | ) | $ | (32,858 | ) | 986 | $ | 12,708 | ||||
See accompanying notes which are an integral part of the financial statements.
Russell U.S. Mid Cap Equity Fund 131
Russell Investment Company
Russell U.S. Mid Cap Equity Fund
Financial Highlights — For the Periods Ended
For a Share Outstanding Throughout Each Period.
| $ | $ | $ | $ | $ | $ | ||||||||||||||
| Net Asset Value, | Net | Net Realized | Total from | Distributions | Distributions | ||||||||||||||
| Beginning of | Investment | and Unrealized | Investment | from Net | from Net | ||||||||||||||
| Period | Income (Loss)(a)(d) | Gain (Loss) | Operations | Investment Income | Realized Gain | ||||||||||||||
| Class A | |||||||||||||||||||
| October 31, 2016 | 12.47 | .07 | .18 | .25 | (.09 | ) | (1.69 | ) | |||||||||||
| October 31, 2015 | 13.27 | .03 | .29 | .32 | (.04 | ) | (1.08 | ) | |||||||||||
| October 31, 2014 | 13.26 | .01 | 1.46 | 1.47 | (.03 | ) | (1.43 | ) | |||||||||||
| October 31, 2013 | 9.89 | .01 | 3.40 | 3.41 | (.04 | ) | — | ||||||||||||
| October 31, 2012(1) | 10.00 | —(f) | (.08 | ) | (.08 | ) | (.03 | ) | — | ||||||||||
| Class C | |||||||||||||||||||
| October 31, 2016 | 12.22 | (.01 | ) | .17 | .16 | (.01 | ) | (1.69 | ) | ||||||||||
| October 31, 2015 | 13.08 | (.06 | ) | .28 | .22 | — | (1.08 | ) | |||||||||||
| October 31, 2014 | 13.16 | (.09 | ) | 1.44 | 1.35 | — | (1.43 | ) | |||||||||||
| October 31, 2013 | 9.86 | (.07 | ) | 3.39 | 3.32 | (.02 | ) | — | |||||||||||
| October 31, 2012(1) | 10.00 | (.05 | ) | (.09 | ) | (.14 | ) | —(f) | — | ||||||||||
| Class S | |||||||||||||||||||
| October 31, 2016 | 12.50 | .10 | .18 | .28 | (.11 | ) | (1.69 | ) | |||||||||||
| October 31, 2015 | 13.30 | .07 | .28 | .35 | (.07 | ) | (1.08 | ) | |||||||||||
| October 31, 2014 | 13.29 | .04 | 1.45 | 1.49 | (.05 | ) | (1.43 | ) | |||||||||||
| October 31, 2013 | 9.90 | .06 | 3.39 | 3.45 | (.06 | ) | — | ||||||||||||
| October 31, 2012(1) | 10.00 | .03 | (.10 | ) | (.07 | ) | (.03 | ) | — | ||||||||||
See accompanying notes which are an integral part of the financial statements.
132 Russell U.S. Mid Cap Equity Fund
| % | % | % | |||||||||||||||||
| $ | $ | Ratio of Expenses | Ratio of Expenses | Ratio of Net | |||||||||||||||
| Net Asset Value, | % | Net Assets, | to Average | to Average | Investment Income | % | |||||||||||||
| $ | End of | Total | End of Period | Net Assets, | Net Assets, | to Average | Portfolio | ||||||||||||
| Total Distributions | Period | Return(b)(c) | (000 | ) | Gross(e) | Net(d)(e) | Net Assets(d)(e) | Turnover Rate(b) | |||||||||||
| (1.78 | ) | 10.94 | 2.94 | 4,956 | 1.47 | 1.22 | .68 | 127 | |||||||||||
| (1.12 | ) | 12.47 | 2.29 | 5,259 | 1.40 | 1.22 | .26 | 120 | |||||||||||
| (1.46 | ) | 13.27 | 12.05 | 4,560 | 1.42 | 1.22 | .07 | 96 | |||||||||||
| (.04 | ) | 13.26 | 34.59 | 2,896 | 1.44 | 1.22 | .11 | 122 | |||||||||||
| (.03 | ) | 9.89 | (.85 | ) | 897 | 1.44 | 1.21 | .06 | 96 | ||||||||||
| (1.70 | ) | 10.68 | 2.19 | 2,790 | 2.22 | 1.97 | (.08 | ) | 127 | ||||||||||
| (1.08 | ) | 12.22 | 1.52 | 2,882 | 2.15 | 1.97 | (.49 | ) | 120 | ||||||||||
| (1.43 | ) | 13.08 | 11.18 | 1,968 | 2.17 | 1.97 | (.70 | ) | 96 | ||||||||||
| (.02 | ) | 13.16 | 33.67 | 672 | 2.19 | 1.97 | (.63 | ) | 122 | ||||||||||
| — (f) | 9.86 | (1.36 | ) | 197 | 2.24 | 1.96 | (.64 | ) | 96 | ||||||||||
| (1.80 | ) | 10.98 | 3.26 | 140,884 | 1.22 | .97 | .92 | 127 | |||||||||||
| (1.15 | ) | 12.50 | 2.53 | 195,724 | 1.15 | .97 | .51 | 120 | |||||||||||
| (1.48 | ) | 13.30 | 12.28 | 197,354 | 1.17 | .97 | .33 | 96 | |||||||||||
| (.06 | ) | 13.29 | 34.87 | 163,367 | 1.19 | .97 | .47 | 122 | |||||||||||
| (.03 | ) | 9.90 | (.66 | ) | 121,714 | 1.25 | .96 | .40 | 96 | ||||||||||
See accompanying notes which are an integral part of the financial statements.
Russell U.S. Mid Cap Equity Fund 133
Russell Investment Company
Russell U.S. Mid Cap Equity Fund
Related Party Transactions, Fees and Expenses
| Accrued fees payable to affiliates for the period ended October 31, 2016 were as follows: | ||
| Advisory fees | $ | 61,595 |
| Administration fees | 6,339 | |
| Distribution fees | 2,927 | |
| Shareholder servicing fees | 602 | |
| Transfer agent fees | 26,237 | |
| Trustee fees | 645 | |
| $ | 98,345 | |
| Transactions (amounts in thousands) during the period ended October 31, 2016 with Underlying Funds which are, or were, an | |||||||||||||||||||
| affiliated company are as follows: | |||||||||||||||||||
| Fair Value, | Change in | ||||||||||||||||||
| Beginning of | Realized Gain | Unrealized | Fair Value, End | Income | Capital Gains | ||||||||||||||
| Period | Purchases | Sales | (Loss) | Gain (Loss) | of Period | Distributions | Distributions | ||||||||||||
| Russell U.S. Cash Collateral Fund | $ | 3,174 | $ | 53,071 | $ | 52,612 | $ | — | — | $ | 3,633 | $ | 26 | $ | — | ||||
| Russell U.S. Cash Management Fund | 7,618 | 92,964 | 94,955 | 1 | 1 | 5,629 | 32 | — | |||||||||||
| $ | 10,792 | $ | 146,035 | $ | 147,567 | $ | 1 | $ | 1 | $ | 9,262 | $ | 58 | $ | — | ||||
| Federal Income Taxes | ||||
| At October 31, 2016, the cost of investments and net unrealized appreciation (depreciation), undistributed ordinary income and | ||||
| undistributed long-term capital gains for income tax purposes were as follows:. | ||||
| Cost of Investments | $ | 147,169,262 | ||
| Unrealized Appreciation | $ | 8,973,600 | ||
| Unrealized Depreciation | (4,314,982 | ) | ||
| Net Unrealized Appreciation (Depreciation) | $ | 4,658,618 | ||
| Undistributed Ordinary Income | $ | 1,240,506 | ||
| Undistributed Long-Term Capital Gains | ||||
| (Capital Loss Carryforward) | $ | 4,672,324 | ||
| Tax Composition of Distributions | ||||
| Ordinary Income | $ | 6,087,152 | ||
| Long-Term Capital Gains | $ | 21,898,920 | ||
Net investment income and net realized gains (loss) in the financial statements may differ from taxable net investment income and net
realized gains (losses). Capital accounts within the financial statements are adjusted for permanent book-tax differences. Book-tax
differences are primarily due to foreign currency gains and losses, reclassifications of dividends, differences in treatment of income
from swaps, net operating losses, investments in partnerships, investments in passive foreign investment companies (PFICs), tax
straddle transaction, use of tax equalization and foreign capital gains taxes. These adjustments have no impact on the net assets.
At October 31, 2016, the Statement of Assets and Liabilities have been adjusted by the following amounts (in thousands):
| Undistributed net investment income | $ | 103 | |
| Accumulated net realized gain (loss) | (103 | ) | |
| Additional paid-in capital | — |
See accompanying notes which are an integral part of the financial statements.
134 Russell U.S. Mid Cap Equity Fund
Russell Investment Company
Russell U.S. Small Cap Equity Fund
Portfolio Management Discussion and Analysis — October 31, 2016 (Unaudited)
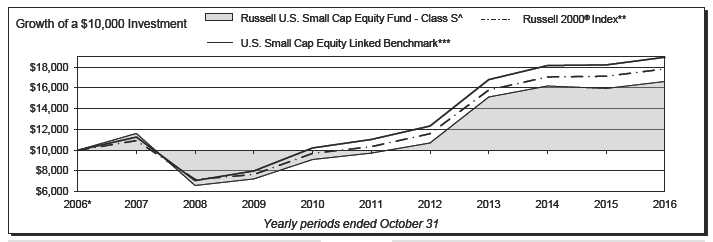
| Russell U.S. Small Cap Equity Fund - Class A‡ | Russell U.S. Small Cap Equity Fund - Class S‡‡‡‡ | ||||||
| Total | Total | ||||||
| Return | Return | ||||||
| 1 Year | (2.03 | )% | 1 Year | 4.22 | % | ||
| 5 Years | 9.74 | %§ | 5 Years | 11.32 | %§ | ||
| 10 Years | 4.36 | %§ | 10 Years | 5.22 | %§ | ||
| Russell U.S. Small Cap Equity Fund - Class C‡‡ | Russell U.S. Small Cap Equity Fund - Class Y | ||||||
| Total | Total | ||||||
| Return | Return | ||||||
| 1 Year | 3.19 | % | 1 Year | 4.42 | % | ||
| 5 Years | 10.21 | %§ | 5 Years | 11.53 | %§ | ||
| 10 Years | 4.33 | %§ | 10 Years | 5.40 | %§ | ||
| Russell U.S. Small Cap Equity Fund - Class E | Russell 2000® Index** | ||||||
| Total | Total | ||||||
| Return | Return | ||||||
| 1 Year | 3.96 | % | 1 Year | 4.11 | % | ||
| 5 Years | 11.06 | %§ | 5 Years | 11.51 | %§ | ||
| 10 Years | 5.01 | %§ | 10 Years | 5.96 | %§ | ||
| Russell U.S. Small Cap Equity Fund - Class I | U.S. Small Cap Equity Linked Benchmark*** | ||||||
| Total | Total | ||||||
| Return | Return | ||||||
| 1 Year | 4.29 | % | 1 Year | 4.11 | % | ||
| 5 Years | 11.40 | %§ | 5 Years | 11.42 | %§ | ||
| 10 Years | 5.30 | %§ | 10 Years | 6.61 | %§ | ||
| Russell U.S. Small Cap Equity Fund - Class R6‡‡‡ | |||||||
| Total | |||||||
| Return | |||||||
| 1 Year | 4.42 | % | |||||
| 5 Years | 11.53 | %§ | |||||
| 10 Years | 5.40 | %§ | |||||
Russell U.S. Small Cap Equity Fund 135
Russell Investment Company
Russell U.S. Small Cap Equity Fund
Portfolio Management Discussion and Analysis, continued — October 31, 2016
(Unaudited)
| The Russell U.S. Small Cap Equity Fund (the “Fund”) employs | political landscape and Brexit led to heightened market volatility, |
| a multi-manager approach whereby portions of the Fund are | markets ended higher for the fiscal year. |
| allocated to different money manager strategies. Fund assets not | Over the period, the Fund maintained exposure to small and |
| allocated to money managers are managed by Russell Investment | micro capitalization stocks trading at discounted valuations as |
| Management, LLC (“RIM”), the Fund’s advisor. RIM may change | well as companies with higher quality characteristics such as |
| the allocation of the Fund’s assets among money managers at | lower financial leverage and higher returns-on-equity. Within |
| any time. An exemptive order from the Securities and Exchange | the U.S. small cap market, a preference for smaller capitalization |
| Commission (“SEC”) permits RIM to engage or terminate a money | stocks negatively impacted Fund performance. The Fund’s |
| manager at any time, subject to approval by the Fund’s Board, | quality positioning was also a negative contributor as companies |
| without a shareholder vote. Pursuant to the terms of the exemptive | with low financial leverage lagged. However, the value positioning |
| order, the Fund is required to notify its shareholders within 90 | was additive, as value stocks outperformed growth stocks over the |
| days of when a money manager begins providing services. As of | fiscal year. |
| October 31, 2016, the Fund had ten money managers. | |
| From a sector standpoint, the expectation for a slow growth | |
| What is the Fund’s investment objective? | U.S, economic environment led to the Fund’s overweight in |
| The Fund seeks to provide long term capital growth. | sectors such as technology and industrials. The Fund remained |
| underweight the highly volatile biotechnology industry as well | |
| How did the Fund perform relative to its benchmark for the | as sectors that are traditionally considered to be interest rate |
| fiscal year ended October 31, 2016? | sensitive such as real estate and utilities. The Fund’s interest rate |
| For the fiscal year ended October 31, 2016, the Fund’s Class | sensitive positioning detracted from Fund performance, while |
| A, Class C, Class E, Class I, Class R6, Class S and Class Y | positive stock selection within the energy and industrials sectors |
| Shares gained 3.95%, 3.19%, 3.96%, 4.29%, 4.42%, 4.22% and | added value. |
| 4.42%, respectively. This is compared to the Fund’s benchmark, | |
| the Russell 2000® Index, which gained 4.11% during the same | How did the investment strategies and techniques employed |
| period. The Fund’s performance includes operating expenses, | by the Fund and its money managers affect its benchmark- |
| whereas index returns are unmanaged and do not include | relative performance? |
| expenses of any kind. | The Fund employs discretionary money managers. The Fund’s |
| For the fiscal year ended October 31, 2016, the Morningstar® | discretionary money managers select the individual portfolio |
| Small Blend Category, a group of funds that Morningstar considers | securities for the assets assigned to them. RIM manages the |
| to have investment strategies similar to those of the Fund, gained | portion of the Fund’s assets that RIM determines not to allocate |
| 2.91%. This result serves as a peer comparison and is expressed | to the money managers. Assets not allocated to managers include |
| net of operating expenses. | the Fund’s liquidity reserves and assets which may be managed |
| directly by RIM to effect the Fund’s investment strategies and/or | |
| RIM may assign a money manager a specific style or | to actively manage the Fund’s overall portfolio characteristics to |
| capitalization benchmark other than the Fund’s index. However, | seek to achieve the desired risk/return profile for the Fund. |
| the Fund’s primary index remains the benchmark for the Fund | |
| and is representative of the aggregate of each money manager’s | With respect to certain of the Fund’s money managers, Ancora |
| benchmark index. | Advisors, LLC was the best performing money manager for the |
| fiscal year and outperformed the Russell 2000® Index. Stock | |
| How did the market conditions described in the Market | selection within the industrials and real estate sectors was a |
| Summary report affect the Fund’s performance? | positive contributor. A preference for holdings with higher levels of |
| The fiscal year ended October 31, 2016 saw the Fund perform | financial leverage and below average profitability characteristics |
| in line with the Russell 2000® Index, with some of the Fund’s | also added value. |
| share classes outperforming and some of the Fund’s share classes | Robeco Investment Management, Inc., dba Boston Partners faced |
| underperforming the Fund’s benchmark. Through the end of 2015 | the strongest headwinds over the fiscal year and underperformed |
| into mid-February 2016, the U.S. small cap market sold off as | the Russell 2000® Value Index. Underperforming holdings within |
| recessionary fears spiked on the back of weak business surveys, | the technology and real estate sectors was the primary detractor |
| a lackluster U.S. earnings season, and concerns surrounding the | over the period. A tilt towards the energy sector also negatively |
| global economy. From February, markets reversed and rallied in | impacted performance. |
| tandem with commodity prices as economic data strengthened. | |
| In the back half of 2016, although uncertainty surrounding the | During the period, RIM utilized a positioning strategy to control |
| Fund-level exposures and risks through the purchase of a stock |
136 Russell U.S. Small Cap Equity Fund
Russell Investment Company
Russell U.S. Small Cap Equity Fund
Portfolio Management Discussion and Analysis, continued — October 31, 2016
(Unaudited)
| portfolio. Using the output from a quantitative model, the strategy | Money Managers as of October 31, | |
| seeks to position the portfolio to meet RIM’s overall preferred | 2016 | Styles |
| positioning with respect to Fund exposures along factor and | ||
| Ancora Advisors, LLC | Small Cap Core | |
| industry dimensions. Over the period, the positioning strategy | Cardinal Capital Management L.L.C. | Microcap Value/Small |
| was designed to provide lower capitalization, and higher value | Cap Value | |
| and quality exposure relative to the Fund’s benchmark in order to | Copeland Capital Management LLC | Small Cap Dividend |
| manage Fund-level risk. | Growth | |
| DePrince, Race & Zollo, Inc. | Small Cap Value | |
| The positioning strategy underperformed the Russell 2000® | EAM Investors, LLC | Micro Cap Growth |
| Index for the fiscal year. An underweight to the industrials sector | Falcon Point Capital, LLC | Small Cap Growth |
| was penalized as was an overweight to securities towards the | Jacobs Levy Equity Management, Inc. | Small Cap Value/ |
| bottom end of the benchmark capitalization, as microcap stocks | Defensive | |
| underperformed small cap stocks. An overweight to stocks trading | PENN Capital Management Company, Inc. | Micro Cap/Small Cap |
| Core | ||
| at low valuation multiples offset further losses. | Robeco Investment Management, Inc., dba | |
| During the period, RIM equitized the Fund’s cash using index | Boston Partners | Small Cap Value |
| futures contracts to provide the Fund with full market exposure. | Timpani Capital Management LLC | Small Cap Growth |
| This had a marginally positive impact on the Fund’s performance. | The views expressed in this report reflect those of the | |
| portfolio managers only through the end of the period | ||
| Describe any changes to the Fund’s structure or the money | covered by the report. These views do not necessarily | |
| manager line-up. | represent the views of RIM, or any other person in RIM or | |
| In March 2016, RIM replaced Netols Asset Management, Inc. | any other affiliated organization. These views are subject | |
| and Next Century Growth Investors, LLC with Timpani Capital | to change at any time based upon market conditions or | |
| Management LLC (“Timpani”) due to RIM’s higher confidence | other events, and RIM disclaims any responsibility to | |
| in the excess return potential of Timpani’s momentum growth | update the views contained herein. These views should not | |
| investment strategy. | be relied on as investment advice and, because investment | |
| decisions for a Russell Investment Company (“RIC”) Fund | ||
| are based on numerous factors, should not be relied on as | ||
| an indication of investment decisions of any RIC Fund. | ||
Russell U.S. Small Cap Equity Fund 137
Russell Investment Company
Russell U.S. Small Cap Equity Fund
Portfolio Management Discussion and Analysis, continued — October 31, 2016
(Unaudited)
^ In prior years, the performance of the Fund’s Class I shares was used in the line graph. Class S Shares will have substantially similar annual returns as the Class
I Shares because the Shares of each Class are invested in the same portfolio of securities. Annual returns for each Class will differ only to the extent that the
Class S Shares do not have the same expenses as the Class I Shares.
* Assumes initial investment on November 1, 2006.
** Russell 2000® Index measures the performance of the small-cap segment of the U.S. equity universe. The Russell 2000 is a subset of the Russell 3000® Index
representing approximately 10% of the total market capitalization of that index. It includes approximately 2000 of the smallest securities based on a combination
of their market cap and current index membership. The Russell 2000® Index is constructed to provide a comprehensive and unbiased small-cap opportunity
barometer and is completely reconstituted annually to ensure larger stocks do not distort the performance and characteristics of the true small-cap opportunity
set.
*** The U.S. Small Cap Equity Linked Benchmark provides a means to compare the Fund’s average annual returns to a secondary benchmark that takes into
account historical changes in the Fund’s primary benchmark. The U.S. Small Cap Equity Linked Benchmark represents the returns of the Russell 2500TM Index
through December 31, 2011 and the returns of the Russell 2000® Index thereafter.
‡ The Fund first issued Class A Shares on September 2, 2008. The returns shown for Class A Shares prior to that date are the returns of the Fund’s Class E
Shares. The performance shown has been adjusted to reflect the deduction of the maximum Class A sales charge of 5.75%. Annual returns for each Class will
differ only to the extent that the Class A Shares do not have the same expenses as the Class E Shares.
‡‡ The Fund first issued Class C Shares on September 2, 2008. The returns shown for Class C Shares prior to that date are the returns of the Fund’s Class E Shares
and do not reflect deduction of Rule 12b-1 distribution fees that apply to Class C Shares. Had they done so, the returns shown for those periods would have been
lower. Annual returns for each Class will differ only to the extent that the Class C Shares do not have the same expenses as the Class E Shares.
‡‡‡ The Fund first issued Class R6 Shares on March 1, 2016. The returns shown for Class R6 Shares prior to that date are the returns of the Fund’s Class Y
Shares. Class R6 Shares will have substantially similar annual returns as the Class Y Shares because the Shares of each Class are invested in the same portfolio
of securities. Annual returns for each Class will differ only to the extent that the Class R6 Shares do not have the same expenses as the Class Y Shares.
‡‡‡‡ The Fund first issued Class S Shares on September 2, 2008. The returns shown for Class S Shares prior to that date are the returns of the Fund’s Class I
Shares. Class S Shares will have substantially similar annual returns as the Class I Shares because the Shares of each Class are invested in the same portfolio of
securities. Annual returns for each Class will differ only to the extent that the Class S Shares do not have the same expenses as the Class I Shares.
§ Annualized.
Performance is historical and assumes reinvestment of all dividends and capital gains. Investment return and principal value will fluctuate so that an investor’s
shares, when redeemed, may be worth more or less than when purchased. Past performance is not indicative of future results. The returns shown do not reflect the
deduction of taxes that a shareholder would pay on Fund distributions or the redemption of Fund shares. Additionally, the returns presented herein may differ from
the performance reported in the Financial Highlights as the returns herein are calculated in a manner consistent with standardized performance in accordance with
Securities and Exchange Commission rules, while the performance in the Financial Highlights has been calculated in accordance with U.S. Generally Accepted
Accounting Principles (“U.S. GAAP”).
138 Russell U.S. Small Cap Equity Fund
Russell Investment Company
Russell U.S. Small Cap Equity Fund
Shareholder Expense Example — October 31, 2016 (Unaudited)
| Fund Expenses | Please note that the expenses shown in the table are meant | |||||
| The following disclosure provides important information | to highlight your ongoing costs only and do not reflect any | |||||
| regarding the Fund’s Shareholder Expense Example | transactional costs. Therefore, the information under the heading | |||||
| (“Example”). | “Hypothetical Performance (5% return before expenses)” is | |||||
| useful in comparing ongoing costs only, and will not help you | ||||||
| Example | determine the relative total costs of owning different funds. In | |||||
| As a shareholder of the Fund, you incur two types of costs: (1) | addition, if these transactional costs were included, your costs | |||||
| transaction costs, including sales charges (loads) on certain | would have been higher. | |||||
| purchase or redemption payments, and (2) ongoing costs, | Hypothetical | |||||
| including distribution (12b-1) and/or service fees and other | Performance (5% | |||||
| Fund expenses. The Example is intended to help you understand | Actual | return before | ||||
| your ongoing costs (in dollars) of investing in the Fund and to | Class A | Performance | expenses) | |||
| Beginning Account Value | ||||||
| compare these costs with the ongoing costs of investing in other | May 1, 2016 | $ | 1,000.00 | $ | 1,000.00 | |
| mutual funds. The Example is based on an investment of $1,000 | Ending Account Value | |||||
| invested at the beginning of the period and held for the entire | October 31, 2016 | $ | 1,050.00 | $ | 1,018.85 | |
| period indicated, which for this Fund is from May 1, 2016 to | Expenses Paid During Period* | $ | 6.44 | $ | 6.34 | |
| October 31, 2016. | * Expenses are equal to the Fund's annualized expense ratio of 1.25% | |||||
| (representing the six month period annualized), multiplied by the average | ||||||
| Actual Expenses | account value over the period, multiplied by 184/366 (to reflect the one-half | |||||
| The information in the table under the heading “Actual | year period). | |||||
| Performance” provides information about actual account values | ||||||
| and actual expenses. You may use the information in this column, | Hypothetical | |||||
| Performance (5% | ||||||
| together with the amount you invested, to estimate the expenses | Actual | return before | ||||
| that you paid over the period. Simply divide your account value by | Class C | Performance | expenses) | |||
| $1,000 (for example, an $8,600 account value divided by $1,000 | Beginning Account Value | |||||
| = 8.6), then multiply the result by the number in the first column | May 1, 2016 | $ | 1,000.00 | $ | 1,000.00 | |
| Ending Account Value | ||||||
| in the row entitled “Expenses Paid During Period” to estimate | October 31, 2016 | $ | 1,045.90 | $ | 1,015.08 | |
| the expenses you paid on your account during this period. | Expenses Paid During Period* | $ | 10.29 | $ | 10.13 | |
| Hypothetical Example for Comparison Purposes | * Expenses are equal to the Fund's annualized expense ratio of 2.00% | |||||
| The information in the table under the heading “Hypothetical | (representing the six month period annualized), multiplied by the average | |||||
| account value over the period, multiplied by 184/366 (to reflect the one-half | ||||||
| Performance (5% return before expenses)” provides information | year period). | |||||
| about hypothetical account values and hypothetical expenses | ||||||
| based on the Fund’s actual expense ratio and an assumed rate of | Hypothetical | |||||
| return of 5% per year before expenses, which is not the Fund’s | Performance (5% | |||||
| Actual | return before | |||||
| actual return. The hypothetical account values and expenses | Class E | Performance | expenses) | |||
| may not be used to estimate the actual ending account balance or | Beginning Account Value | |||||
| expenses you paid for the period. You may use this information | May 1, 2016 | $ | 1,000.00 | $ | 1,000.00 | |
| to compare the ongoing costs of investing in the Fund and other | Ending Account Value | |||||
| October 31, 2016 | $ | 1,050.10 | $ | 1,018.85 | ||
| funds. To do so, compare this 5% hypothetical example with the | Expenses Paid During Period* | $ | 6.44 | $ | 6.34 | |
| 5% hypothetical examples that appear in the shareholder reports | ||||||
| of other funds. | * Expenses are equal to the Fund's annualized expense ratio of 1.25% | |||||
| (representing the six month period annualized), multiplied by the average | ||||||
| account value over the period, multiplied by 184/366 (to reflect the one-half | ||||||
| year period). | ||||||
Russell U.S. Small Cap Equity Fund 139
Russell Investment Company
Russell U.S. Small Cap Equity Fund
Shareholder Expense Example, continued — October 31, 2016 (Unaudited)
| Hypothetical | ||||||
| Performance (5% | ||||||
| Actual | return before | |||||
| Class I | Performance | expenses) | ||||
| Beginning Account Value | ||||||
| May 1, 2016 | $ | 1,000.00 | $ | 1,000.00 | ||
| Ending Account Value | ||||||
| October 31, 2016 | $ | 1,051.60 | $ | 1,020.51 | ||
| Expenses Paid During Period* | $ | 4.74 | $ | 4.67 | ||
| * Expenses are equal to the Fund's annualized expense ratio of 0.92% | ||||||
| (representing the six month period annualized), multiplied by the average | ||||||
| account value over the period, multiplied by 184/366 (to reflect the one-half | ||||||
| year period). | ||||||
| Hypothetical | ||||||
| Performance (5% | ||||||
| Actual | return before | |||||
| Class R6 | Performance | expenses) | ||||
| Beginning Account Value | ||||||
| May 1, 2016 | $ | 1,000.00 | $ | 1,000.00 | ||
| Ending Account Value | ||||||
| October 31, 2016 | $ | 1,052.60 | $ | 1,020.96 | ||
| Expenses Paid During Period* | $ | 4.28 | $ | 4.22 | ||
| * Expenses are equal to the Fund's annualized expense ratio of 0.83% | ||||||
| (representing the six month period annualized), multiplied by the average | ||||||
| account value over the period, multiplied by 184/366 (to reflect the one-half | ||||||
| year period). May reflect amounts waived and/or reimbursed. Without any | ||||||
| waivers and/or reimbursements, expenses would have been higher. | ||||||
| Hypothetical | ||||||
| Performance (5% | ||||||
| Actual | return before | |||||
| Class S | Performance | expenses) | ||||
| Beginning Account Value | ||||||
| May 1, 2016 | $ | 1,000.00 | $ | 1,000.00 | ||
| Ending Account Value | ||||||
| October 31, 2016 | $ | 1,051.10 | $ | 1,020.11 | ||
| Expenses Paid During Period* | $ | 5.16 | $ | 5.08 | ||
| * Expenses are equal to the Fund's annualized expense ratio of 1.00% | ||||||
| (representing the six month period annualized), multiplied by the average | ||||||
| account value over the period, multiplied by 184/366 (to reflect the one-half | ||||||
| year period). | ||||||
| Hypothetical | ||||||
| Performance (5% | ||||||
| Actual | return before | |||||
| Class Y | Performance | expenses) | ||||
| Beginning Account Value | ||||||
| May 1, 2016 | $ | 1,000.00 | $ | 1,000.00 | ||
| Ending Account Value | ||||||
| October 31, 2016 | $ | 1,052.20 | $ | 1,021.11 | ||
| Expenses Paid During Period* | $ | 4.13 | $ | 4.06 | ||
| * Expenses are equal to the Fund's annualized expense ratio of 0.80% | ||||||
| (representing the six month period annualized), multiplied by the average | ||||||
| account value over the period, multiplied by 184/366 (to reflect the one-half | ||||||
| year period). | ||||||
140 Russell U.S. Small Cap Equity Fund
Russell Investment Company
Russell U.S. Small Cap Equity Fund
Schedule of Investments — October 31, 2016
| Amounts in thousands (except share amounts) | Amounts in thousands (except share amounts) | ||||||
| Principal | Fair | Principal | Fair | ||||
| Amount ($) or | Value | Amount ($) or | Value | ||||
| Shares | $ | Shares | $ | ||||
| Common Stocks - 94.7% | FTD Cos., Inc.(Æ) | 53,440 | 1,075 | ||||
| Consumer Discretionary - 13.1% | Full House Resorts, Inc.(Æ) | 680,547 | 1,109 | ||||
| A H Belo Corp. Class A | 133,422 | 847 | G-III Apparel Group, Ltd.(Æ) | 18,775 | 490 | ||
| Aaron's, Inc. Class A | 46,400 | 1,147 | Golden Entertainment, Inc.(Æ) | 55,452 | 635 | ||
| Acushnet Holdings Corp.(Æ) | 47,502 | 827 | Grand Canyon Education, Inc.(Æ) | 4,966 | 217 | ||
| AMC Entertainment Holdings, Inc. Class | Gray Television, Inc.(Æ) | 234,113 | 2,084 | ||||
| A(Ñ) | 34,962 | 1,100 | Group 1 Automotive, Inc. | 3,700 | 223 | ||
| American Woodmark Corp.(Æ) | 5,641 | 421 | Guess?, Inc. | 7,055 | 95 | ||
| Bassett Furniture Industries, Inc. | 5,571 | 128 | Harman International Industries, Inc. | 5,900 | 470 | ||
| Beazer Homes USA, Inc.(Æ) | 10,253 | 105 | hhgregg, Inc.(Æ)(Ñ) | 11,500 | 20 | ||
| Belmond, Ltd. Class A(Æ) | 62,918 | 815 | Horizon Global Corp.(Æ) | 265,303 | 5,317 | ||
| Big 5 Sporting Goods Corp. | 74,982 | 1,162 | HSN, Inc. | 116,510 | 4,392 | ||
| Biglari Holdings, Inc.(Æ) | 1,039 | 455 | IMAX Corp.(Æ) | 15,407 | 466 | ||
| Black Diamond, Inc.(Æ) | 48,800 | 242 | Instructure, Inc.(Æ) | 49,869 | 1,269 | ||
| Bloomin' Brands, Inc. | 149,460 | 2,586 | Intrawest Resorts Holdings, Inc.(Æ) | 48,718 | 799 | ||
| Blue Nile, Inc. | 28,002 | 978 | J Alexander's Holdings, Inc.(Æ) | 248,527 | 2,237 | ||
| Boot Barn Holdings, Inc.(Æ)(Ñ) | 38,970 | 499 | Jack in the Box, Inc. | 73,777 | 6,915 | ||
| Bravo Brio Restaurant Group, Inc.(Æ) | 15,428 | 69 | JAKKS Pacific, Inc.(Æ)(Ñ) | 47,300 | 317 | ||
| Brinker International, Inc.(Ñ) | 60,062 | 2,957 | Jamba, Inc.(Æ) | 8,215 | 87 | ||
| Brunswick Corp. | 3,900 | 170 | Johnson Outdoors, Inc. Class A | 4,100 | 148 | ||
| Build-A-Bear Workshop, Inc. Class A(Æ) | 30,516 | 412 | K12, Inc.(Æ) | 54,276 | 588 | ||
| Caleres, Inc. | 32,851 | 822 | KAR Auction Services, Inc. | 46,590 | 1,984 | ||
| Callaway Golf Co. | 255,252 | 2,606 | Kirkland's, Inc.(Æ) | 44,763 | 547 | ||
| Capella Education Co. | 27,368 | 2,001 | Lee Enterprises, Inc.(Æ)(Ñ) | 667,707 | 1,703 | ||
| Care.com, Inc.(Æ) | 53,156 | 483 | LGI Homes, Inc.(Æ)(Ñ) | 78,346 | 2,332 | ||
| Career Education Corp.(Æ) | 17,600 | 127 | Libbey, Inc. | 164,900 | 2,640 | ||
| Carrols Restaurant Group, Inc.(Æ) | 36,876 | 461 | Liberty Ventures Class A(Æ) | 147,409 | 5,882 | ||
| Central Garden & Pet Co.(Æ) | 39,029 | 949 | Lifetime Brands, Inc. | 17,400 | 246 | ||
| Century Communities, Inc.(Æ) | 157,835 | 3,109 | Lindblad Expeditions Holdings, Inc.(Æ) | 101,940 | 835 | ||
| Cheesecake Factory, Inc. (The) | 24,800 | 1,319 | Lithia Motors, Inc. Class A | 49,043 | 4,207 | ||
| Chegg, Inc.(Æ) | 139,639 | 929 | Lumber Liquidators Holdings, Inc.(Æ)(Ñ) | 82,800 | 1,284 | ||
| Cherokee, Inc.(Æ) | 75,077 | 706 | Malibu Boats, Inc. Class A(Æ) | 32,701 | 480 | ||
| Chico's FAS, Inc. | 104,922 | 1,224 | Marchex, Inc. Class B(Æ) | 69,833 | 176 | ||
| Children's Place, Inc. (The) | 22,261 | 1,691 | Marcus Corp. | 31,315 | 830 | ||
| Citi Trends, Inc. | 75,001 | 1,490 | MarineMax, Inc.(Æ) | 64,781 | 1,292 | ||
| ClubCorp Holdings, Inc. | 279,893 | 3,233 | Marriott Vacations Worldwide Corp. | 10,332 | 657 | ||
| Columbia Sportswear Co. | 70,160 | 3,974 | Matthews International Corp. Class A | 17,900 | 1,072 | ||
| Cooper Tire & Rubber Co. | 130,096 | 4,781 | MCBC Holdings, Inc. | 48,939 | 545 | ||
| Cooper-Standard Holding, Inc.(Æ) | 23,547 | 2,149 | MDC Partners, Inc. Class A(Ñ) | 627,202 | 5,300 | ||
| Crocs, Inc.(Æ) | 94,700 | 728 | Meredith Corp. | 46,918 | 2,128 | ||
| Del Frisco's Restaurant Group, Inc.(Æ) | 139,351 | 1,993 | Monro Muffler Brake, Inc. | 51,817 | 2,850 | ||
| Del Taco Restaurants, Inc.(Æ) | 263,192 | 3,529 | Movado Group, Inc. | 47,993 | 1,058 | ||
| Delta Apparel, Inc.(Æ) | 102,763 | 1,696 | National CineMedia, Inc. | 48,380 | 671 | ||
| Denny's Corp.(Æ) | 123,700 | 1,283 | Nautilus, Inc.(Æ) | 85,004 | 1,496 | ||
| Destination XL Group, Inc.(Æ) | 59,300 | 240 | Nexstar Broadcasting Group, Inc. Class A(Ñ) | 29,150 | 1,423 | ||
| DeVry Education Group, Inc.(Ñ) | 104,764 | 2,378 | Noodles & Co. Class A(Æ)(Ñ) | 10,300 | 48 | ||
| Domino's Pizza, Inc. | 2,040 | 345 | Nutrisystem, Inc. | 74,569 | 2,364 | ||
| Duluth Holdings, Inc. Class B(Æ)(Ñ) | 30,163 | 819 | NVR, Inc.(Æ) | 103 | 157 | ||
| Eldorado Resorts, Inc.(Æ)(Ñ) | 125,318 | 1,516 | Ollie's Bargain Outlet Holdings, Inc.(Æ) | 89,225 | 2,440 | ||
| Entercom Communications Corp. Class A | 36,855 | 486 | Outfront Media, Inc.(ö) | 147,171 | 3,166 | ||
| Entravision Communications Corp. Class A | 79,112 | 530 | Oxford Industries, Inc. | 63,267 | 3,968 | ||
| Ethan Allen Interiors, Inc. | 15,151 | 465 | Papa John's International, Inc. | 33,672 | 2,541 | ||
| EW Scripps Co. (The) Class A(Æ) | 118,637 | 1,573 | Peak Resorts, Inc.(Ñ) | 171,713 | 833 | ||
| Express, Inc.(Æ) | 11,825 | 142 | Penn National Gaming, Inc.(Æ) | 79,135 | 1,023 | ||
| Famous Dave's of America, Inc.(Æ) | 5,585 | 28 | Perry Ellis International, Inc.(Æ) | 14,902 | 277 | ||
| Fiesta Restaurant Group, Inc.(Æ) | 342,957 | 9,054 | Pinnacle Entertainment, Inc.(Æ) | 77,799 | 922 | ||
| Finish Line, Inc. (The) Class A | 209,453 | 4,124 | Planet Fitness, Inc. Class A(Æ)(Ñ) | 67,755 | 1,436 | ||
| FirstCash, Inc. | 30,113 | 1,421 | Pool Corp. | 58,223 | 5,390 | ||
| Five Below, Inc.(Æ) | 25,812 | 970 | QuinStreet, Inc.(Æ) | 42,100 | 122 | ||
| Flexsteel Industries, Inc. | 3,813 | 160 | Quotient Technology, Inc.(Æ) | 32,094 | 340 | ||
| Fox Factory Holding Corp.(Æ) | 43,725 | 949 | Radio One, Inc. Class D(Æ)(Ñ) | 382,468 | 956 | ||
See accompanying notes which are an integral part of the financial statements.
Russell U.S. Small Cap Equity Fund 141
Russell Investment Company
Russell U.S. Small Cap Equity Fund
Schedule of Investments, continued — October 31, 2016
| Amounts in thousands (except share amounts) | Amounts in thousands (except share amounts) | ||||||
| Principal | Fair | Principal | Fair | ||||
| Amount ($) or | Value | Amount ($) or | Value | ||||
| Shares | $ | Shares | $ | ||||
| Red Rock Resorts, Inc. Class A | 44,027 | 964 | Sanderson Farms, Inc.(Ñ) | 23,700 | 2,133 | ||
| Regis Corp.(Æ) | 25,317 | 321 | Snyders-Lance, Inc. | 216,433 | 7,699 | ||
| Rent-A-Center, Inc. Class A | 35,800 | 361 | SpartanNash Co. | 130,276 | 3,648 | ||
| Rocky Brands, Inc. | 6,810 | 73 | TreeHouse Foods, Inc.(Æ) | 5,743 | 502 | ||
| Rosetta Stone, Inc.(Æ) | 20,027 | 143 | United Natural Foods, Inc.(Æ) | 60,289 | 2,516 | ||
| Scholastic Corp. | 4,201 | 161 | 63,139 | ||||
| Scientific Games Corp. Class A(Æ)(Ñ) | 94,489 | 1,172 | |||||
| SeaWorld Entertainment, Inc.(Æ)(Ñ) | 54,111 | 758 | Energy - 3.3% | ||||
| Select Comfort Corp.(Æ) | 22,045 | 423 | Ameresco, Inc. Class A(Æ) | 34,128 | 164 | ||
| Sequential Brands Group, Inc.(Æ)(Ñ) | 168,700 | 1,215 | Approach Resources, Inc.(Æ)(Ñ) | 275,923 | 786 | ||
| Six Flags Entertainment Corp. | 21,800 | 1,213 | Arch Coal, Inc.(Æ) | 8,877 | 651 | ||
| Sonic Corp. | 17,471 | 400 | Archrock, Inc.(Æ) | 29,700 | 345 | ||
| Stamps.com, Inc.(Æ)(Ñ) | 18,953 | 1,849 | Bill Barrett Corp.(Æ)(Ñ) | 130,600 | 678 | ||
| Standard Motor Products, Inc. | 92,574 | 4,527 | Callon Petroleum Co.(Æ) | 321,716 | 4,179 | ||
| Strayer Education, Inc.(Æ) | 5,500 | 323 | Capstone Turbine Corp.(Æ)(Ñ) | 40,200 | 35 | ||
| Sturm Ruger & Co., Inc.(Ñ) | 1,227 | 75 | Carrizo Oil & Gas, Inc.(Æ) | 71,764 | 2,428 | ||
| Superior Uniform Group, Inc. | 207,262 | 3,687 | Clean Energy Fuels Corp.(Æ)(Ñ) | 53,500 | 220 | ||
| Thor Industries, Inc. | 50,471 | 4,003 | CVR Energy, Inc.(Ñ) | 9,400 | 125 | ||
| Tilly's, Inc. Class A(Æ) | 54,179 | 503 | Delek US Holdings, Inc. | 430,601 | 7,277 | ||
| Time, Inc. | 52,500 | 682 | Eclipse Resources Corp.(Æ) | 487,690 | 1,336 | ||
| Tower International, Inc. | 35,691 | 774 | Exterran Corp.(Æ) | 48,180 | 762 | ||
| Townsquare Media, Inc. Class A(Æ) | 242,596 | 2,033 | Gastar Exploration, Inc.(Æ) | 1,065,360 | 1,151 | ||
| TRI Pointe Group, Inc.(Æ) | 95,386 | 1,033 | Gulf Island Fabrication, Inc. | 31,387 | 314 | ||
| Tribune Media Co. Class A | 97,552 | 3,180 | Gulfport Energy Corp.(Æ) | 83,100 | 2,004 | ||
| Universal Electronics, Inc.(Æ) | 11,089 | 778 | Helix Energy Solutions Group, Inc.(Æ) | 140,286 | 1,223 | ||
| Vail Resorts, Inc. | 9,928 | 1,583 | Independence Contract Drilling, Inc.(Æ) | 133,345 | 531 | ||
| Viad Corp. | 9,600 | 398 | ION Geophysical Corp.(Æ) | 2,620 | 16 | ||
| Vista Outdoor, Inc.(Æ) | 39,100 | 1,512 | Mammoth Energy Services, Inc.(Æ)(Ñ) | 46,551 | 628 | ||
| VOXX International Corp. Class A(Æ) | 35,686 | 146 | Matrix Service Co.(Æ) | 83,133 | 1,471 | ||
| West Marine, Inc.(Æ) | 30,660 | 245 | Nabors Industries, Ltd. | 210,228 | 2,502 | ||
| William Lyon Homes Class A(Æ) | 150,327 | 2,685 | Newpark Resources, Inc.(Æ) | 96,662 | 609 | ||
| Wingstop, Inc.(Ñ) | 23,869 | 639 | Oasis Petroleum, Inc.(Æ) | 71,752 | 753 | ||
| Winnebago Industries, Inc. | 40,358 | 1,140 | Pacific Ethanol, Inc.(Æ) | 67,100 | 500 | ||
| Wolverine World Wide, Inc. | 93,879 | 2,004 | Parsley Energy, Inc. Class A(Æ) | 10,700 | 352 | ||
| XO Group, Inc.(Æ) | 42,887 | 789 | PBF Energy, Inc. Class A | 4,800 | 105 | ||
| YuMe, Inc.(Æ) | 18,700 | 70 | Phillips 66 Partners, LP | 68,643 | 3,034 | ||
| ZAGG, Inc.(Æ) | 115,575 | 751 | QEP Resources, Inc.(Æ) | 87,190 | 1,401 | ||
| 220,590 | Renewable Energy Group, Inc.(Æ) | 77,418 | 677 | ||||
| Rice Energy, Inc.(Æ) | 32,357 | 715 | |||||
| Consumer Staples - 3.7% | Ring Energy, Inc.(Æ) | 138,802 | 1,281 | ||||
| Andersons, Inc. (The) | 121,909 | 4,639 | RSP Permian, Inc.(Æ) | 11,330 | 409 | ||
| Boston Beer Co., Inc. Class A(Æ) | 2,570 | 399 | Sanchez Energy Corp.(Æ)(Ñ) | 179,661 | 1,144 | ||
| Cadiz, Inc.(Æ)(Ñ) | 71,600 | 530 | Seventy Seven Energy, Inc.(Æ)(Ñ) | 22,509 | 540 | ||
| Casey's General Stores, Inc. | 43,514 | 4,917 | SunCoke Energy, Inc.(Æ) | 181,192 | 1,850 | ||
| Core-Mark Holding Co., Inc. | 190,077 | 6,719 | Superior Energy Services, Inc.(Æ) | 66,096 | 936 | ||
| Craft Brew Alliance, Inc.(Æ) | 43,554 | 699 | Synergy Resources Corp.(Æ)(Ñ) | 106,900 | 731 | ||
| elf Beauty, Inc.(Æ) | 29,004 | 750 | TETRA Technologies, Inc.(Æ) | 349,200 | 1,903 | ||
| Energizer Holdings, Inc. | 48,526 | 2,257 | Unit Corp.(Æ) | 25,346 | 434 | ||
| Farmer Brothers Co.(Æ) | 19,749 | 646 | Western Refining, Inc. | 221,850 | 6,400 | ||
| Flowers Foods, Inc.(Ñ) | 139,585 | 2,166 | Westmoreland Coal Co.(Æ) | 79,700 | 708 | ||
| Freshpet, Inc.(Æ)(Ñ) | 58,300 | 496 | World Fuel Services Corp. | 18,540 | 746 | ||
| Inventure Foods, Inc.(Æ) | 449,551 | 3,803 | WPX Energy, Inc.(Æ) | 77,436 | 841 | ||
| J&J Snack Foods Corp. | 43,686 | 5,336 | 54,895 | ||||
| Lancaster Colony Corp. | 8,650 | 1,130 | |||||
| Medifast, Inc. | 30,445 | 1,250 | Financial Services - 23.6% | ||||
| MGP Ingredients, Inc. | 110,248 | 3,882 | Acadia Realty Trust(ö) | 15,372 | 518 | ||
| Nomad Foods, Ltd.(Æ) | 391,069 | 4,806 | Altisource Residential Corp.(ö) | 63,576 | 640 | ||
| Nu Skin Enterprises, Inc. Class A | 1,100 | 68 | Ambac Financial Group, Inc.(Æ) | 34,158 | 630 | ||
| Post Holdings, Inc.(Æ) | 3 | — | American Assets Trust, Inc.(ö) | 10,760 | 427 | ||
| Primo Water Corp.(Æ) | 164,134 | 2,148 | |||||
See accompanying notes which are an integral part of the financial statements.
142 Russell U.S. Small Cap Equity Fund
Russell Investment Company
Russell U.S. Small Cap Equity Fund
Schedule of Investments, continued — October 31, 2016
| Amounts in thousands (except share amounts) | Amounts in thousands (except share amounts) | ||||||
| Principal | Fair | Principal | Fair | ||||
| Amount ($) or | Value | Amount ($) or | Value | ||||
| Shares | $ | Shares | $ | ||||
| American Equity Investment Life Holding | CommunityOne Bancorp(Æ)(Ñ) | 14,313 | 204 | ||||
| Co. | 175,899 | 3,154 | Consolidated-Tomoka Land Co. | 40,231 | 2,039 | ||
| American National Bankshares, Inc. | 3,290 | 89 | CorEnergy Infrastructure Trust, Inc.(ö) | 12,563 | 340 | ||
| AMERISAFE, Inc. | 13,700 | 762 | CoreSite Realty Corp. Class A(ö) | 6,774 | 500 | ||
| Apollo Commercial Real Estate Finance, | Corporate Office Properties Trust(ö) | 137,285 | 3,664 | ||||
| Inc.(ö) | 25,523 | 432 | Corrections Corp. of America(ö) | 25,100 | 363 | ||
| Arbor Realty Trust, Inc.(ö) | 40,296 | 295 | Cousins Properties, Inc.(ö) | 369,247 | 2,869 | ||
| Ares Commercial Real Estate Corp.(ö) | 80,890 | 1,061 | Crawford & Co. Class B | 67,385 | 758 | ||
| Argo Group International Holdings, Ltd. | 48,296 | 2,685 | CU Bancorp(Æ) | 9,144 | 215 | ||
| Armada Hoffler Properties, Inc.(ö) | 40,080 | 538 | CubeSmart(ö) | 5,608 | 146 | ||
| Ashford Hospitality Trust, Inc.(ö) | 150,000 | 871 | Customers Bancorp, Inc.(Æ) | 105,600 | 2,859 | ||
| Ashford, Inc.(Æ) | 14,576 | 663 | CyrusOne, Inc.(ö) | 76,674 | 3,420 | ||
| Associated Capital Group, Inc. Class A | 11,258 | 382 | Diamond Hill Investment Group, Inc. | 10,200 | 1,857 | ||
| Assurant, Inc. | 11,000 | 886 | DiamondRock Hospitality Co.(ö) | 121,914 | 1,116 | ||
| Atlantic Capital Bancshares, Inc.(Æ) | 20,400 | 307 | Donegal Group, Inc. Class A | 2,136 | 32 | ||
| Baldwin & Lyons, Inc. Class B | 15,300 | 376 | DuPont Fabros Technology, Inc.(ö) | 87,055 | 3,553 | ||
| Banc of California, Inc.(Ñ) | 6,288 | 84 | Eagle Bancorp, Inc.(Æ) | 22,093 | 1,086 | ||
| BancFirst Corp. | 15,700 | 1,126 | East West Bancorp, Inc. | 30,700 | 1,213 | ||
| Bank Mutual Corp. | 54,439 | 425 | Easterly Government Properties, Inc.(ö) | 19,800 | 376 | ||
| Bank of Marin Bancorp | 7,110 | 361 | EastGroup Properties, Inc.(ö) | 24,107 | 1,637 | ||
| Bank of the Ozarks, Inc. | 126,252 | 4,666 | Education Realty Trust, Inc.(ö) | 21,313 | 908 | ||
| BankFinancial Corp. | 7,651 | 96 | EMC Insurance Group, Inc. | 12,584 | 306 | ||
| Banner Corp. | 3,657 | 165 | Employers Holdings, Inc. | 10,713 | 336 | ||
| Beneficial Bancorp, Inc.(Æ) | 76,736 | 1,113 | Enova International, Inc. Class W(Æ) | 53,800 | 506 | ||
| Berkshire Hills Bancorp, Inc. | 34,244 | 1,012 | Enstar Group, Ltd.(Æ) | 2,320 | 391 | ||
| BGC Partners, Inc. Class A | 171,360 | 1,472 | EPR Properties(ö) | 4,850 | 353 | ||
| Bluerock Residential Growth REIT, Inc. | Equity Commonwealth(Æ)(ö) | 93,235 | 2,817 | ||||
| Class A(ö) | 92,440 | 1,146 | Essent Group, Ltd.(Æ) | 10,249 | 271 | ||
| BNC Bancorp | 82,967 | 2,066 | Euronet Worldwide, Inc.(Æ) | 25,005 | 1,989 | ||
| Brandywine Realty Trust(ö) | 190,907 | 2,959 | Evercore Partners, Inc. Class A | 72,097 | 3,875 | ||
| Brookline Bancorp, Inc. | 345,223 | 4,419 | Ezcorp, Inc. Class A(Æ) | 126,530 | 1,234 | ||
| Calamos Asset Management, Inc. Class A | 21,000 | 136 | Farmers Capital Bank Corp. | 3,100 | 97 | ||
| Camden Property Trust(ö) | 3,900 | 318 | FB Financial Corp.(Æ) | 40,000 | 834 | ||
| Capital Bank Financial Corp. Class A | 26,440 | 866 | FBR & Co.(Å) | 81,100 | 1,127 | ||
| Capital City Bank Group, Inc. | 6,477 | 97 | FCB Financial Holdings, Inc. Class A(Æ) | 16,211 | 605 | ||
| Capital Southwest Corp. | 69,104 | 997 | Federated National Holding Co. | 21,331 | 382 | ||
| Capstar Financial Holdings, Inc.(Æ)(Ñ) | 28,803 | 490 | FelCor Lodging Trust, Inc.(ö) | 270,985 | 1,732 | ||
| Cardinal Financial Corp. | 111,090 | 2,919 | Fidelity Southern Corp. | 11,630 | 212 | ||
| CareTrust REIT, Inc.(ö) | 34,600 | 487 | Financial Institutions, Inc. | 29,693 | 797 | ||
| Cascade Bancorp(Æ) | 14,206 | 87 | First BanCorp(Æ) | 396,292 | 2,033 | ||
| CatchMark Timber Trust, Inc. Class A(ö) | 111,940 | 1,180 | First Busey Corp. | 38,832 | 897 | ||
| Cedar Realty Trust, Inc.(ö) | 280,675 | 1,900 | First Business Financial Services, Inc. | 11,960 | 225 | ||
| CenterState Banks, Inc. | 42,053 | 786 | First Defiance Financial Corp. | 20,800 | 821 | ||
| Central Pacific Financial Corp. | 136,538 | 3,499 | First Financial Corp. | 17,615 | 706 | ||
| Central Valley Community Bancorp | 18,209 | 261 | First Financial Northwest, Inc. | 2,400 | 38 | ||
| Century Bancorp, Inc. Class A | 629 | 29 | First Foundation, Inc.(Æ) | 68,500 | 1,695 | ||
| Charter Financial Corp. | 147,328 | 1,864 | First Horizon National Corp. | 268,501 | 4,138 | ||
| Chatham Lodging Trust(ö) | 30,948 | 548 | First Internet Bancorp | 703 | 18 | ||
| Chemical Financial Corp. | 36,695 | 1,576 | First Interstate BancSystem, Inc. Class A | 46,969 | 1,498 | ||
| Chemung Financial Corp. | 1,827 | 52 | First Merchants Corp. | 92,355 | 2,600 | ||
| Cherry Hill Mortgage Investment Corp.(ö) | 9,000 | 145 | First Midwest Bancorp, Inc. | 215,236 | 4,156 | ||
| Chesapeake Lodging Trust(ö) | 110,214 | 2,393 | First NBC Bank Holding Co.(Æ) | 4,120 | 22 | ||
| City Office REIT, Inc.(ö) | 61,820 | 776 | First Potomac Realty Trust(ö) | 9,399 | 84 | ||
| CNO Financial Group, Inc. | 227,344 | 3,428 | Flagstar Bancorp, Inc.(Æ) | 26,697 | 732 | ||
| CoBiz Financial, Inc. | 106,472 | 1,354 | FNB Corp. | 559,066 | 7,307 | ||
| Cohen & Steers, Inc. | 71,949 | 2,675 | FNFV Group(Æ) | 551,039 | 6,640 | ||
| Colony Capital, Inc. Class A(ö) | 27,023 | 514 | Four Corners Property Trust, Inc.(ö) | 20,866 | 419 | ||
| Colony Starwood Homes(ö) | 116,880 | 3,391 | Franklin Financial Network, Inc.(Æ) | 24,719 | 806 | ||
| Columbia Banking System, Inc. | 161,439 | 5,331 | Franklin Street Properties Corp.(ö) | 60,171 | 696 | ||
| Community Healthcare Trust, Inc.(ö) | 124,033 | 2,776 | FRP Holdings, Inc.(Æ)(Þ) | 61,631 | 1,960 | ||
| Community Trust Bancorp, Inc. | 14,358 | 525 | |||||
See accompanying notes which are an integral part of the financial statements.
Russell U.S. Small Cap Equity Fund 143
Russell Investment Company
Russell U.S. Small Cap Equity Fund
Schedule of Investments, continued — October 31, 2016
| Amounts in thousands (except share amounts) | Amounts in thousands (except share amounts) | ||||||
| Principal | Fair | Principal | Fair | ||||
| Amount ($) or | Value | Amount ($) or | Value | ||||
| Shares | $ | Shares | $ | ||||
| Fulton Financial Corp. | 117,800 | 1,755 | Meridian Bancorp, Inc. | 181,940 | 2,902 | ||
| GEO Group, Inc. (The)(ö) | 29,600 | 709 | Meta Financial Group, Inc. | 8,600 | 630 | ||
| German American Bancorp, Inc. | 2,648 | 103 | MGIC Investment Corp.(Æ) | 32,111 | 262 | ||
| Getty Realty Corp.(ö) | 16,239 | 369 | Mid-America Apartment Communities, Inc. | ||||
| Global Indemnity PLC Class A(Æ) | 2,270 | 68 | (ö) | 2,800 | 260 | ||
| Golub Capital BDC, Inc.(Ñ) | 28,690 | 508 | Midland States Bancorp, Inc. | 28,811 | 736 | ||
| Gramercy Property Trust(ö) | 250,000 | 2,305 | MidWestOne Financial Group, Inc. | 300 | 9 | ||
| Great Southern Bancorp, Inc. | 15,630 | 646 | MoneyGram International, Inc.(Æ) | 1,570 | 11 | ||
| Great Western Bancorp, Inc. | 30,400 | 980 | Monogram Residential Trust, Inc.(ö) | 46,090 | 486 | ||
| Green Dot Corp. Class A(Æ) | 48,794 | 1,083 | Morningstar, Inc. | 20,452 | 1,445 | ||
| Guaranty Bancorp | 27,597 | 524 | National Bank Holdings Corp. Class A | 228,194 | 5,554 | ||
| Hallmark Financial Services, Inc.(Æ) | 13,916 | 144 | National Commerce Corp.(Æ) | 2,100 | 59 | ||
| Hancock Holding Co. | 140,120 | 4,701 | National Health Investors, Inc.(ö) | 7,131 | 540 | ||
| Hanover Insurance Group, Inc. (The) | 53,929 | 4,109 | National Storage Affiliates Trust(ö) | 38,200 | 748 | ||
| HCI Group, Inc. | 43,910 | 1,190 | National Western Life Group, Inc. Class A | 4,672 | 1,006 | ||
| Healthcare Realty Trust, Inc.(ö) | 27,100 | 864 | Navigators Group, Inc. (The) | 25,000 | 2,330 | ||
| Heartland Financial USA, Inc. | 20,707 | 775 | New Senior Investment Group, Inc.(ö) | 208,229 | 2,170 | ||
| Hercules Technology Growth Capital, Inc. | 74,485 | 1,021 | New York REIT, Inc.(ö) | 48,462 | 457 | ||
| Heritage Commerce Corp. | 15,200 | 165 | Northfield Bancorp, Inc. | 146,000 | 2,402 | ||
| Heritage Financial Corp. | 158,189 | 2,911 | Northrim BanCorp, Inc. | 3,000 | 74 | ||
| Heritage Insurance Holdings, Inc. | 78,608 | 927 | Northwest Bancshares, Inc. | 163,549 | 2,574 | ||
| Hersha Hospitality Trust Class A(ö) | 26,810 | 478 | Old Line Bancshares, Inc. | 6,898 | 136 | ||
| Hilltop Holdings, Inc. | 4,880 | 121 | Old National Bancorp | 461,713 | 6,787 | ||
| Home Bancorp, Inc. | 3,000 | 86 | OM Asset Management PLC | 15,832 | 223 | ||
| Home BancShares, Inc. | 263,859 | 5,676 | One Liberty Properties, Inc.(ö) | 19,298 | 455 | ||
| HomeStreet, Inc.(Æ) | 53,286 | 1,468 | OneBeacon Insurance Group, Ltd. Class A | 96,506 | 1,326 | ||
| Horace Mann Educators Corp. | 10,100 | 363 | Oppenheimer Holdings, Inc. Class A | 10,263 | 144 | ||
| Houlihan Lokey, Inc. Class A | 25,778 | 628 | Owens Realty Mortgage, Inc.(ö) | 2,776 | 51 | ||
| Howard Hughes Corp. (The)(Æ) | 14,800 | 1,625 | Pacific Premier Bancorp, Inc.(Æ) | 26,230 | 678 | ||
| Iberiabank Corp. | 83,504 | 5,482 | PacWest Bancorp | 78,342 | 3,399 | ||
| Independence Holding Co. | 2,870 | 50 | Paramount Group, Inc.(ö) | 15,400 | 239 | ||
| Independence Realty Trust, Inc.(ö) | 120,680 | 1,005 | Park Sterling Corp. | 48,200 | 415 | ||
| Independent Bank Corp. | 118,039 | 1,983 | Parkway, Inc.(Æ)(ö) | 10,897 | 196 | ||
| Independent Bank Group, Inc. | 13,125 | 634 | Peapack Gladstone Financial Corp. | 15,256 | 323 | ||
| Infinity Property & Casualty Corp. | 8,320 | 682 | Pebblebrook Hotel Trust(ö) | 17,684 | 429 | ||
| InfraREIT, Inc.(ö) | 29,800 | 495 | PennyMac Financial Services, Inc. Class | ||||
| Investment Technology Group, Inc. | 29,500 | 452 | A(Æ) | 15,429 | 264 | ||
| Investors Bancorp, Inc. | 88,800 | 1,089 | Peoples Bancorp, Inc. | 12,544 | 311 | ||
| Jack Henry & Associates, Inc. | 62,283 | 5,046 | People's Utah Bancorp | 62,660 | 1,256 | ||
| JMP Group LLC | 66,710 | 378 | Physicians Realty Trust(ö) | 56,968 | 1,126 | ||
| KCG Holdings, Inc. Class A(Æ) | 61,282 | 782 | Pinnacle Financial Partners, Inc. | 15,604 | 805 | ||
| Kearny Financial Corp. | 592,814 | 8,270 | Planet Payment, Inc.(Æ) | 322,279 | 1,125 | ||
| Kemper Corp. | 83,740 | 3,144 | Popular, Inc. | 128,446 | 4,663 | ||
| Kennedy-Wilson Holdings, Inc. | 119,700 | 2,466 | Potlatch Corp.(ö) | 216,287 | 8,305 | ||
| Ladder Capital Corp. Class A(ö) | 33,845 | 429 | Preferred Apartment Communities, Inc. Class | ||||
| Lakeland Bancorp, Inc. | 139,040 | 1,967 | A(ö) | 39,400 | 513 | ||
| LaSalle Hotel Properties(ö) | 21,539 | 512 | Preferred Bank | 22,980 | 871 | ||
| LCNB Corp. | 60,561 | 1,042 | PrivateBancorp, Inc. Class A | 4,800 | 217 | ||
| LendingTree, Inc.(Æ)(Ñ) | 32,848 | 2,623 | Prosperity Bancshares, Inc. | 147,404 | 8,176 | ||
| Lexington Realty Trust(ö) | 49,993 | 507 | Provident Financial Holdings, Inc. | 6,037 | 115 | ||
| Life Storage, Inc.(Æ) | 8,640 | 697 | Provident Financial Services, Inc. | 110,767 | 2,513 | ||
| LTC Properties, Inc.(ö) | 9,419 | 472 | PS Business Parks, Inc.(ö) | 15,445 | 1,696 | ||
| Mack-Cali Realty Corp.(ö) | 13,848 | 356 | RAIT Financial Trust(ö) | 75,900 | 231 | ||
| Maiden Holdings, Ltd. | 232,682 | 3,176 | Ramco-Gershenson Properties Trust(ö) | 24,176 | 419 | ||
| Manning & Napier, Inc. Class A | 15,524 | 107 | RE/MAX Holdings, Inc. Class A | 20,291 | 882 | ||
| Marcus & Millichap, Inc.(Æ) | 7,500 | 176 | Real Industry, Inc.(Æ) | 138,500 | 741 | ||
| MB Financial, Inc. | 111,042 | 4,041 | Reinsurance Group of America, Inc. Class A | 10,300 | 1,111 | ||
| MBT Financial Corp. | 9,710 | 85 | Renasant Corp. | 1,960 | 66 | ||
| MedEquities Realty Trust, Inc.(ö) | 98,100 | 1,137 | Resource Capital Corp.(ö) | 28,003 | 347 | ||
| Medical Properties Trust, Inc.(ö) | 75,360 | 1,051 | Retail Opportunity Investments Corp.(ö) | 213,933 | 4,302 | ||
| Rexford Industrial Realty, Inc.(ö) | 20,304 | 428 | |||||
See accompanying notes which are an integral part of the financial statements.
144 Russell U.S. Small Cap Equity Fund
Russell Investment Company
Russell U.S. Small Cap Equity Fund
Schedule of Investments, continued — October 31, 2016
| Amounts in thousands (except share amounts) | Amounts in thousands (except share amounts) | ||||||
| Principal | Fair | Principal | Fair | ||||
| Amount ($) or | Value | Amount ($) or | Value | ||||
| Shares | $ | Shares | $ | ||||
| RLJ Lodging Trust(ö) | 24,748 | 488 | Achillion Pharmaceuticals, Inc.(Æ)(Ñ) | 51,201 | 322 | ||
| Ryman Hospitality Properties, Inc.(ö) | 44,806 | 2,259 | Aclaris Therapeutics, Inc.(Æ)(Ñ) | 27,096 | 576 | ||
| Sandy Spring Bancorp, Inc. | 6,500 | 206 | Acorda Therapeutics, Inc.(Æ) | 68,213 | 1,207 | ||
| Selective Insurance Group, Inc. | 54,100 | 1,999 | Adverum Biotechnologies, Inc.(Æ) | 32,494 | 96 | ||
| Seritage Growth Properties(Ñ)(ö) | 22,600 | 1,029 | Aerie Pharmaceuticals, Inc.(Æ) | 37,337 | 1,241 | ||
| Shore Bancshares, Inc. | 7,798 | 100 | Air Methods Corp.(Æ)(Ñ) | 19,770 | 523 | ||
| Sierra Bancorp | 6,150 | 110 | Akorn, Inc.(Æ) | 41,647 | 997 | ||
| Silver Bay Realty Trust Corp.(ö) | 57,948 | 971 | Allscripts Healthcare Solutions, Inc.(Æ) | 254,105 | 3,052 | ||
| Simmons First National Corp. Class A | 2,529 | 125 | AMAG Pharmaceuticals, Inc.(Æ) | 235,949 | 6,064 | ||
| SLM Corp.(Æ) | 122,760 | 865 | American Renal Associates Holdings, Inc. | ||||
| South State Corp. | 71,743 | 5,262 | (Æ)(Ñ) | 40,429 | 714 | ||
| Southern National Bancorp of Virginia, Inc. | 58,391 | 766 | AMN Healthcare Services, Inc.(Æ) | 176,248 | 5,781 | ||
| Southwest Bancorp, Inc. | 144,626 | 2,697 | Amphastar Pharmaceuticals, Inc.(Æ) | 42,629 | 773 | ||
| Starwood Property Trust, Inc.(ö) | 42,937 | 955 | Analogic Corp. | 26,463 | 2,166 | ||
| State Auto Financial Corp. | 38,462 | 881 | AngioDynamics, Inc.(Æ) | 50,383 | 803 | ||
| State Bank Financial Corp. | 89,690 | 1,978 | ANI Pharmaceuticals, Inc.(Æ) | 10,689 | 638 | ||
| State Bank Financial Corp.(Å) | 121,700 | 2,683 | Anika Therapeutics, Inc.(Æ) | 23,831 | 1,057 | ||
| Sterling Bancorp | 89,853 | 1,617 | Applied Genetic Technologies Corp.(Æ) | 18,540 | 133 | ||
| Stewart Information Services Corp. | 24,721 | 1,111 | Aptevo Therapeutics, Inc.(Æ) | 126,741 | 280 | ||
| Stock Yards Bancorp, Inc. | 12,453 | 425 | Aratana Therapeutics, Inc.(Æ) | 7,200 | 58 | ||
| Stonegate Bank | 114,074 | 3,952 | Array BioPharma, Inc.(Æ)(Ñ) | 123,502 | 704 | ||
| Summit Hotel Properties, Inc.(ö) | 31,571 | 410 | Atrion Corp. | 2,571 | 1,129 | ||
| Sunstone Hotel Investors, Inc.(ö) | 94,896 | 1,192 | aTyr Pharma, Inc.(Æ)(Ñ) | 71,898 | 198 | ||
| Synovus Financial Corp. | 6,500 | 215 | Avexis, Inc.(Æ) | 11,424 | 543 | ||
| Tanger Factory Outlet Centers, Inc.(ö) | 157,724 | 5,489 | AxoGen, Inc.(Æ) | 174,559 | 1,545 | ||
| Terreno Realty Corp.(ö) | 15,984 | 417 | BioDelivery Sciences International, Inc.(Æ) | ||||
| Territorial Bancorp, Inc. | 14,693 | 419 | (Ñ) | 482,639 | 1,110 | ||
| Texas Capital Bancshares, Inc.(Æ) | 18,449 | 1,094 | BioSpecifics Technologies Corp.(Æ) | 9,186 | 399 | ||
| Towne Bank | 22,280 | 553 | BioTelemetry, Inc.(Æ) | 106,447 | 1,884 | ||
| TriCo Bancshares | 59,827 | 1,575 | Cambrex Corp.(Æ) | 53,424 | 2,153 | ||
| TriState Capital Holdings, Inc.(Æ) | 36,171 | 638 | Capital Senior Living Corp.(Æ) | 207,718 | 3,317 | ||
| Trupanion, Inc.(Æ)(Ñ) | 39,951 | 647 | Cepheid(Æ) | 2,512 | 133 | ||
| TrustCo Bank Corp. | 202,435 | 1,417 | Chemed Corp. | 43,776 | 6,191 | ||
| Two Harbors Investment Corp.(ö) | 74,700 | 622 | Coherus Biosciences, Inc.(Æ) | 27,423 | 750 | ||
| UMB Financial Corp. | 64,201 | 3,984 | CoLucid Pharmaceuticals, Inc.(Æ)(Ñ) | 30,430 | 925 | ||
| Umpqua Holdings Corp. | 106,642 | 1,629 | Concert Pharmaceuticals, Inc.(Æ) | 34,439 | 266 | ||
| United Community Banks, Inc. | 95,536 | 2,061 | ContraVir Pharmaceuticals, Inc.(Æ)(Ñ) | 254,251 | 514 | ||
| United Financial Bancorp, Inc. | 92,167 | 1,356 | Cooper Cos., Inc. (The) | 970 | 171 | ||
| United Fire Group, Inc. | 29,108 | 1,150 | CorVel Corp.(Æ) | 59,987 | 2,073 | ||
| Universal Insurance Holdings, Inc.(Ñ) | 14,298 | 305 | Corvus Pharmaceuticals, Inc.(Æ)(Ñ) | 7,205 | 96 | ||
| Univest Corp. of Pennsylvania | 10,167 | 241 | CryoLife, Inc.(Æ) | 55,613 | 945 | ||
| Urstadt Biddle Properties, Inc. Class A(ö) | 17,499 | 376 | CTI BioPharma Corp.(Æ) | 28,700 | 11 | ||
| Voya Financial, Inc. | 30,400 | 929 | Cutera, Inc.(Æ) | 8,900 | 117 | ||
| Washington Federal, Inc. | 31,700 | 864 | Cynosure, Inc. Class A(Æ) | 141,253 | 6,024 | ||
| WashingtonFirst Bankshares, Inc. | 4,439 | 109 | CytomX Therapeutics, Inc.(Æ)(Ñ) | 21,842 | 246 | ||
| WesBanco, Inc. | 107,927 | 3,552 | Depomed, Inc.(Æ) | 46,605 | 1,042 | ||
| Westamerica Bancorporation(Ñ) | 3,613 | 179 | Derma Sciences, Inc.(Æ) | 14,552 | 65 | ||
| Western Alliance Bancorp(Æ) | 38,004 | 1,420 | Dermira, Inc.(Æ) | 20,303 | 637 | ||
| Wintrust Financial Corp. | 78,460 | 4,233 | Emergent BioSolutions, Inc.(Æ) | 14,642 | 391 | ||
| WSFS Financial Corp. | 44,955 | 1,576 | Enanta Pharmaceuticals, Inc.(Æ)(Ñ) | 15,931 | 375 | ||
| Xenia Hotels & Resorts, Inc.(ö) | 22,901 | 357 | Ensign Group, Inc. (The) | 251,136 | 4,638 | ||
| Yadkin Financial Corp. | 56,937 | 1,579 | Exactech, Inc.(Æ) | 54,865 | 1,325 | ||
| Zions Bancorporation | 8,700 | 280 | Fate Therapeutics, Inc.(Æ)(Ñ) | 10,950 | 23 | ||
| 399,660 | FibroGen, Inc.(Æ) | 3,700 | 61 | ||||
| Five Prime Therapeutics, Inc.(Æ) | 22,362 | 1,085 | |||||
| Health Care - 11.5% | Flamel Technologies SA - ADR(Æ) | 232,877 | 2,515 | ||||
| Abaxis, Inc. | 72,564 | 3,464 | Flexion Therapeutics, Inc.(Æ) | 47,161 | 901 | ||
| Abiomed, Inc.(Æ) | 34,882 | 3,662 | Foundation Medicine, Inc.(Æ) | 16,247 | 369 | ||
| Acadia Healthcare Co., Inc.(Æ) | 14,250 | 512 | GenMark Diagnostics, Inc.(Æ) | 71,639 | 764 | ||
| Accuray, Inc.(Æ) | 589,000 | 2,886 | Geron Corp.(Æ)(Ñ) | 155,188 | 287 | ||
| Glaukos Corp.(Æ) | 76,978 | 2,571 | |||||
See accompanying notes which are an integral part of the financial statements.
Russell U.S. Small Cap Equity Fund 145
Russell Investment Company
Russell U.S. Small Cap Equity Fund
Schedule of Investments, continued — October 31, 2016
| Amounts in thousands (except share amounts) | Amounts in thousands (except share amounts) | ||||||
| Principal | Fair | Principal | Fair | ||||
| Amount ($) or | Value | Amount ($) or | Value | ||||
| Shares | $ | Shares | $ | ||||
| Globus Medical, Inc. Class A(Æ) | 164,248 | 3,635 | Prestige Brands Holdings, Inc.(Æ) | 128,843 | 5,834 | ||
| HealthEquity, Inc.(Æ) | 12,014 | 399 | REGENXBIO, Inc.(Æ)(Ñ) | 41,186 | 649 | ||
| HealthSouth Corp. | 85,195 | 3,421 | Repligen Corp.(Æ) | 12,813 | 366 | ||
| Healthways, Inc.(Æ) | 33,649 | 835 | Retrophin, Inc.(Æ) | 44,776 | 844 | ||
| Heska Corp.(Æ) | 69,172 | 3,417 | Rigel Pharmaceuticals, Inc.(Æ) | 332,062 | 863 | ||
| Icon PLC(Æ) | 11,002 | 883 | RTI Surgical, Inc.(Æ) | 6,244 | 16 | ||
| ICU Medical, Inc.(Æ) | 23,355 | 3,253 | SeaSpine Holdings Corp.(Æ) | 3,489 | 33 | ||
| Ignyta, Inc.(Æ) | 10,600 | 53 | Spectranetics Corp. (The)(Æ) | 27,546 | 598 | ||
| Impax Laboratories, Inc.(Æ) | 31,909 | 641 | Steris PLC | 61,901 | 4,136 | ||
| INC Research Holdings, Inc. Class A(Æ) | 23,820 | 1,089 | Supernus Pharmaceuticals, Inc.(Æ) | 246,311 | 4,877 | ||
| Inogen, Inc.(Æ) | 56,401 | 3,027 | Surmodics, Inc.(Æ) | 71,516 | 1,781 | ||
| Inovio Pharmaceuticals, Inc.(Æ) | 41,192 | 267 | Synergy Pharmaceuticals, Inc.(Æ)(Ñ) | 108,583 | 498 | ||
| Insys Therapeutics, Inc.(Æ)(Ñ) | 20,822 | 225 | Tabula Rasa HealthCare, Inc.(Æ) | 64,160 | 752 | ||
| Integra LifeSciences Holdings Corp.(Æ) | 50,031 | 3,978 | Tandem Diabetes Care, Inc.(Æ) | 80,922 | 490 | ||
| Intellia Therapeutics, Inc.(Æ)(Ñ) | 15,871 | 219 | Theravance Biopharma, Inc.(Æ)(Ñ) | 18,696 | 470 | ||
| Intersect ENT, Inc.(Æ) | 38,516 | 562 | Tokai Pharmaceuticals, Inc.(Æ)(Ñ) | 97,731 | 108 | ||
| Invacare Corp. | 51,882 | 475 | Trevena, Inc.(Æ) | 50,271 | 245 | ||
| Invuity, Inc.(Æ) | 12,753 | 129 | Trinity Biotech PLC - ADR(Æ)(Ñ) | 235,600 | 1,607 | ||
| iRhythm Technologies, Inc.(Æ) | 1,174 | 29 | Triple-S Management Corp. Class B(Æ) | 70,594 | 1,460 | ||
| Juniper Pharmaceuticals, Inc.(Æ) | 200 | 1 | US Physical Therapy, Inc. | 1,254 | 71 | ||
| K2M Group Holdings, Inc.(Æ) | 38,552 | 658 | Utah Medical Products, Inc. | 19,823 | 1,232 | ||
| Kindred Healthcare, Inc. | 35,100 | 346 | Vanda Pharmaceuticals, Inc.(Æ) | 60,080 | 892 | ||
| Kite Pharma, Inc.(Æ)(Ñ) | 8,862 | 393 | Vascular Solutions, Inc.(Æ) | 19,721 | 899 | ||
| La Jolla Pharmaceutical Co.(Æ) | 30,502 | 534 | Verastem, Inc.(Æ) | 100,080 | 125 | ||
| Lannett Co., Inc.(Æ)(Ñ) | 16,300 | 357 | Versartis, Inc.(Æ)(Ñ) | 29,300 | 324 | ||
| LeMaitre Vascular, Inc. | 39,561 | 828 | Vical, Inc.(Æ) | 4,390 | 11 | ||
| Lexicon Pharmaceuticals, Inc.(Æ)(Ñ) | 21,276 | 316 | Voyager Therapeutics, Inc.(Æ)(Ñ) | 14,909 | 179 | ||
| Ligand Pharmaceuticals, Inc. Class B(Æ)(Ñ) | 83,301 | 7,974 | VWR Corp.(Æ) | 88,166 | 2,425 | ||
| Luminex Corp.(Æ) | 29,405 | 613 | WellCare Health Plans, Inc.(Æ) | 5,172 | 587 | ||
| MacroGenics, Inc.(Æ) | 13,804 | 327 | Wright Medical Group NV(Æ) | 33,064 | 724 | ||
| Magellan Health, Inc.(Æ) | 36,100 | 1,857 | Xencor, Inc.(Æ) | 42,055 | 895 | ||
| Masimo Corp.(Æ) | 9,000 | 495 | Zafgen, Inc.(Æ) | 62,915 | 189 | ||
| Medpace Holdings, Inc.(Æ) | 15,000 | 435 | Zeltiq Aesthetics, Inc.(Æ)(Ñ) | 2,702 | 89 | ||
| Meridian Bioscience, Inc. | 30,718 | 505 | 194,006 | ||||
| Merit Medical Systems, Inc.(Æ) | 31,934 | 701 | |||||
| MiMedx Group, Inc.(Æ)(Ñ) | 46,230 | 412 | Materials and Processing - 5.5% | ||||
| Minerva Neurosciences, Inc.(Æ) | 65,060 | 725 | A Schulman, Inc. | 99,620 | 2,864 | ||
| Molina Healthcare, Inc.(Æ) | 85,677 | 4,662 | Allegheny Technologies, Inc.(Ñ) | 49,300 | 672 | ||
| MyoKardia, Inc.(Æ)(Ñ) | 38,792 | 522 | A-Mark Precious Metals, Inc. | 300 | 5 | ||
| Myriad Genetics, Inc.(Æ)(Ñ) | 75,571 | 1,490 | Ampco-Pittsburgh Corp. | 19,191 | 207 | ||
| NanoString Technologies, Inc.(Æ) | 77,403 | 1,506 | Apogee Enterprises, Inc. | 103,976 | 4,237 | ||
| National HealthCare Corp. | 10,252 | 663 | Armstrong Flooring, Inc.(Æ) | 169,690 | 2,747 | ||
| National Research Corp. Class A | 8,674 | 133 | Armstrong World Industries, Inc.(Æ) | 114,727 | 4,302 | ||
| Natus Medical, Inc.(Æ) | 34,996 | 1,377 | Ascent Capital Group, Inc. Class A(Æ) | 26,500 | 540 | ||
| Navidea Biopharmaceuticals, Inc.(Æ) | 15,203 | 13 | Aspen Aerogels, Inc.(Æ) | 5,800 | 36 | ||
| Neogen Corp.(Æ) | 27,264 | 1,437 | Atkore International Group, Inc.(Æ) | 28,708 | 540 | ||
| NeoGenomics, Inc.(Æ) | 451,137 | 3,636 | Beacon Roofing Supply, Inc.(Æ) | 16,947 | 712 | ||
| Nevro Corp.(Æ)(Ñ) | 33,881 | 3,114 | Berry Plastics Group, Inc.(Æ) | 103,051 | 4,508 | ||
| Nobilis Health Corp.(Æ)(Ñ) | 142,635 | 478 | Cabot Microelectronics Corp. | 47,633 | 2,632 | ||
| Novan, Inc.(Æ) | 26,616 | 559 | Caesarstone, Ltd.(Æ) | 8,001 | 283 | ||
| NuVasive, Inc.(Æ) | 55,787 | 3,332 | Carpenter Technology Corp. | 8,600 | 272 | ||
| Obalon Therapeutics, Inc.(Æ) | 25,696 | 332 | Century Aluminum Co.(Æ) | 74,560 | 545 | ||
| Ophthotech Corp.(Æ) | 8,501 | 305 | Chase Corp. | 12,081 | 826 | ||
| Osiris Therapeutics, Inc.(Æ)(Ñ) | 9,387 | 38 | Comfort Systems USA, Inc. | 108,882 | 3,141 | ||
| Owens & Minor, Inc. | 62,659 | 2,033 | Compass Minerals International, Inc.(Ñ) | 84,190 | 6,049 | ||
| PDL BioPharma, Inc. | 125,345 | 404 | CompX International, Inc. | 3,096 | 35 | ||
| Penumbra, Inc.(Æ) | 40,595 | 2,677 | Domtar Corp. | 7,300 | 262 | ||
| PharmAthene, Inc.(Æ) | 27,891 | 77 | Emerge Energy Services, LP(Æ)(Ñ) | 49,002 | 635 | ||
| PharMerica Corp.(Æ) | 12,106 | 288 | Ferroglobe PLC | 98,500 | 911 | ||
| PRA Health Sciences, Inc.(Æ) | 21,582 | 1,149 | FutureFuel Corp. | 64,145 | 703 | ||
See accompanying notes which are an integral part of the financial statements.
146 Russell U.S. Small Cap Equity Fund
Russell Investment Company
Russell U.S. Small Cap Equity Fund
Schedule of Investments, continued — October 31, 2016
| Amounts in thousands (except share amounts) | Amounts in thousands (except share amounts) | ||||||
| Principal | Fair | Principal | Fair | ||||
| Amount ($) or | Value | Amount ($) or | Value | ||||
| Shares | $ | Shares | $ | ||||
| Gibraltar Industries, Inc.(Æ) | 17,777 | 692 | Briggs & Stratton Corp. | 22,900 | 426 | ||
| Global Brass & Copper Holdings, Inc. | 27,520 | 790 | Brink's Co. (The) | 60,111 | 2,377 | ||
| Gold Resource Corp. | 180,563 | 1,026 | CBIZ, Inc.(Æ) | 252,640 | 2,792 | ||
| Haynes International, Inc. | 71,071 | 2,286 | CDI Corp.(Æ) | 15,818 | 97 | ||
| Headwaters, Inc.(Æ) | 27,380 | 449 | CEB, Inc.(Æ) | 46,579 | 2,266 | ||
| Hi-Crush Partners, LP(Æ) | 75,059 | 1,272 | Celadon Group, Inc. | 175,362 | 1,140 | ||
| Huntsman Corp. | 80,075 | 1,357 | Chart Industries, Inc.(Æ) | 32,016 | 888 | ||
| Huttig Building Products, Inc.(Æ) | 179,780 | 868 | Commercial Vehicle Group, Inc.(Æ) | 62,600 | 284 | ||
| Innospec, Inc. | 25,124 | 1,514 | Control4 Corp.(Æ)(Ñ) | 96,265 | 1,087 | ||
| Insteel Industries, Inc. | 20,100 | 541 | Convergys Corp. | 23,617 | 690 | ||
| Interface, Inc. Class A | 244,763 | 3,880 | Costamare, Inc. | 14,000 | 91 | ||
| Kronos Worldwide, Inc.(Ñ) | 332,540 | 2,557 | CoStar Group, Inc.(Æ) | 4,716 | 882 | ||
| Landec Corp.(Æ) | 88,300 | 1,170 | Covanta Holding Corp. | 330,174 | 4,953 | ||
| Lawson Products, Inc.(Æ) | 2,100 | 40 | CPI Aerostructures, Inc.(Æ) | 63,792 | 427 | ||
| LB Foster Co. Class A | 21,872 | 271 | CRA International, Inc. | 26,901 | 838 | ||
| Materion Corp. | 38,253 | 1,159 | CUI Global, Inc.(Æ)(Ñ) | 37,837 | 179 | ||
| MRC Global, Inc.(Æ) | 55,000 | 811 | Curtiss-Wright Corp. | 23,409 | 2,098 | ||
| Neenah Paper, Inc. | 34,328 | 2,743 | CyberOptics Corp.(Æ) | 35,300 | 853 | ||
| NewMarket Corp. | 7,355 | 2,949 | Deluxe Corp. | 57,020 | 3,490 | ||
| NN, Inc. | 20,500 | 362 | Douglas Dynamics, Inc. | 29,778 | 956 | ||
| Olympic Steel, Inc. | 15,859 | 366 | Ducommun, Inc.(Æ) | 18,000 | 343 | ||
| Patrick Industries, Inc.(Æ) | 17,280 | 991 | DXP Enterprises, Inc.(Æ) | 10,500 | 229 | ||
| PGT, Inc.(Æ) | 75,966 | 744 | Dycom Industries, Inc.(Æ) | 36,648 | 2,819 | ||
| PolyOne Corp. | 92,298 | 2,698 | Echo Global Logistics, Inc.(Æ) | 29,500 | 625 | ||
| Quaker Chemical Corp. | 41,381 | 4,448 | EMCOR Group, Inc. | 34,820 | 2,105 | ||
| Rayonier Advanced Materials, Inc.(Ñ) | 34,900 | 451 | Energy Recovery, Inc.(Æ)(Ñ) | 58,479 | 714 | ||
| Resolute Forest Products, Inc.(Æ) | 104,958 | 499 | EnerSys | 22,100 | 1,439 | ||
| Ryerson Holding Corp.(Æ) | 3,200 | 33 | Engility Holdings, Inc.(Æ) | 30,350 | 872 | ||
| Schweitzer-Mauduit International, Inc. | 70,189 | 2,591 | Ennis, Inc. | 4,412 | 65 | ||
| Silgan Holdings, Inc. | 107,444 | 5,474 | Essendant, Inc.(Æ) | 82,269 | 1,263 | ||
| Stepan Co. | 20,212 | 1,436 | Esterline Technologies Corp.(Æ) | 8,365 | 614 | ||
| Summit Materials, Inc. Class A(Æ) | 36,450 | 683 | Exponent, Inc. | 75,997 | 4,351 | ||
| TimkenSteel Corp.(Æ) | 26,778 | 274 | Forrester Research, Inc. | 2,883 | 107 | ||
| Tronox, Ltd. Class A | 390,343 | 3,162 | FreightCar America, Inc. | 250,593 | 3,273 | ||
| UFP Technologies, Inc.(Æ) | 22,249 | 594 | Frontline, Ltd. (Ñ) | 16,100 | 115 | ||
| United States Lime & Minerals, Inc. | 2,660 | 175 | G&K Services, Inc. Class A | 42,901 | 4,063 | ||
| Universal Forest Products, Inc. | 11,700 | 1,006 | Gener8 Maritime, Inc.(Æ) | 45,000 | 190 | ||
| US Concrete, Inc.(Æ) | 31,995 | 1,597 | Generac Holdings, Inc.(Æ) | 27,800 | 1,059 | ||
| US Silica Holdings, Inc. | 18,076 | 835 | Genesee & Wyoming, Inc. Class A(Æ) | 32,278 | 2,193 | ||
| Versum Materials, Inc.(Æ) | 55,350 | 1,256 | Granite Construction, Inc. | 131,506 | 6,465 | ||
| 93,714 | Great Lakes Dredge & Dock Corp.(Å)(Æ) | 732,700 | 2,601 | ||||
| Greenbrier Cos., Inc.(Ñ) | 34,018 | 1,072 | |||||
| Producer Durables - 15.2% | H&E Equipment Services, Inc. | 40,580 | 566 | ||||
| AAR Corp. | 137,990 | 4,439 | Hardinge, Inc. | 27,215 | 264 | ||
| ABM Industries, Inc. | 30,600 | 1,196 | Harsco Corp.(Æ) | 200,056 | 1,951 | ||
| ACCO Brands Corp.(Æ) | 262,191 | 2,910 | Healthcare Services Group, Inc. | 115,221 | 4,260 | ||
| Advanced Energy Industries, Inc.(Æ) | 77,765 | 3,709 | HEICO Corp. | 69,255 | 4,679 | ||
| Aerovironment, Inc.(Æ) | 23,933 | 574 | Heidrick & Struggles International, Inc. | 25,205 | 466 | ||
| Air Transport Services Group, Inc.(Æ) | 181,447 | 2,401 | HNI Corp. | 36,081 | 1,467 | ||
| Allegiant Travel Co. Class A | 1,100 | 152 | Houston Wire & Cable Co. | 19,100 | 102 | ||
| Allied Motion Technologies, Inc. | 84,049 | 1,662 | Hub Group, Inc. Class A(Æ) | 33,090 | 1,206 | ||
| American Superconductor Corp.(Æ) | 18,499 | 119 | Hudson Technologies, Inc.(Æ) | 407,543 | 2,486 | ||
| ArcBest Corp. | 3,200 | 64 | Huron Consulting Group, Inc.(Æ) | 75,961 | 4,258 | ||
| Ardmore Shipping Corp.(Ñ) | 109,400 | 640 | Hyster-Yale Materials Handling, Inc. | 21,931 | 1,277 | ||
| Argan, Inc. | 67,049 | 3,812 | ICF International, Inc.(Æ) | 77,800 | 3,610 | ||
| Astec Industries, Inc. | 10,983 | 608 | Information Services Group, Inc.(Æ) | 651,097 | 2,572 | ||
| Atlas Air Worldwide Holdings, Inc.(Æ) | 24,287 | 1,016 | InnerWorkings, Inc.(Æ) | 321,279 | 2,830 | ||
| Babcock & Wilcox Co. (The) Class W(Æ) | 255,825 | 10,033 | Insperity, Inc. | 16,161 | 1,215 | ||
| Babcock & Wilcox Enterprises, Inc.(Æ) | 203,371 | 3,201 | Itron, Inc.(Æ) | 1,800 | 97 | ||
| Barrett Business Services, Inc. | 17,984 | 806 | John Bean Technologies Corp. | 30,256 | 2,416 | ||
See accompanying notes which are an integral part of the financial statements.
Russell U.S. Small Cap Equity Fund 147
Russell Investment Company
Russell U.S. Small Cap Equity Fund
Schedule of Investments, continued — October 31, 2016
| Amounts in thousands (except share amounts) | Amounts in thousands (except share amounts) | ||||||
| Principal | Fair | Principal | Fair | ||||
| Amount ($) or | Value | Amount ($) or | Value | ||||
| Shares | $ | Shares | $ | ||||
| Kaman Corp. Class A | 28,870 | 1,260 | Swift Transportation Co. Class A(Æ)(Ñ) | 129,889 | 2,907 | ||
| KBR, Inc. | 509,469 | 7,545 | Sykes Enterprises, Inc.(Æ) | 55,272 | 1,478 | ||
| Kelly Services, Inc. Class A | 55,737 | 1,044 | Teledyne Technologies, Inc.(Æ) | 11,835 | 1,274 | ||
| Kimball International, Inc. Class B | 216,018 | 2,700 | TeleTech Holdings, Inc. | 2,583 | 73 | ||
| KLX, Inc.(Æ) | 30,111 | 1,036 | Terex Corp. | 186,521 | 4,454 | ||
| Knight Transportation, Inc. | 18,403 | 538 | Tetra Tech, Inc. | 32,686 | 1,257 | ||
| Korn/Ferry International | 24,700 | 504 | Textainer Group Holdings, Ltd.(Æ) | 44,344 | 337 | ||
| Kratos Defense & Security Solutions, Inc.(Æ) | 210,111 | 1,181 | Titan Machinery, Inc.(Æ) | 113,670 | 1,056 | ||
| Layne Christensen Co.(Æ)(Ñ) | 101,361 | 869 | TopBuild Corp.(Æ) | 25,751 | 776 | ||
| Liquidity Services, Inc.(Æ) | 42,300 | 374 | TransDigm Group, Inc. | 6,800 | 1,853 | ||
| Littelfuse, Inc. | 32,555 | 4,541 | TriMas Corp.(Æ) | 59,480 | 1,068 | ||
| Lydall, Inc.(Æ) | 21,702 | 1,015 | Triumph Group, Inc. | 43,500 | 1,031 | ||
| Manitex International, Inc.(Æ) | 15,900 | 88 | Tutor Perini Corp.(Æ) | 178,892 | 3,408 | ||
| Manitowoc Co., Inc. (The) | 100,857 | 407 | USA Truck, Inc.(Æ) | 20,600 | 170 | ||
| Manitowoc Foodservice, Inc.(Æ) | 77,857 | 1,176 | Vectrus, Inc.(Æ) | 19,669 | 330 | ||
| ManpowerGroup, Inc. | 3,800 | 292 | Virgin America, Inc.(Æ) | 7,008 | 381 | ||
| Marten Transport, Ltd. | 46,975 | 963 | WageWorks, Inc.(Æ) | 79,571 | 4,691 | ||
| MasTec, Inc.(Æ) | 200,173 | 5,715 | Xerium Technologies, Inc.(Æ) | 6,808 | 42 | ||
| MAXIMUS, Inc. | 75,657 | 3,939 | 256,097 | ||||
| Maxwell Technologies, Inc.(Æ)(Ñ) | 65,195 | 316 | |||||
| McGrath RentCorp | 124,232 | 3,739 | Technology - 16.1% | ||||
| Mitek Systems, Inc.(Æ) | 77,517 | 523 | A10 Networks, Inc.(Æ) | 75,063 | 575 | ||
| Mobile Mini, Inc. | 15,975 | 405 | Acacia Communications, Inc.(Æ) | 960 | 67 | ||
| Modine Manufacturing Co.(Æ) | 50,580 | 554 | ACI Worldwide, Inc.(Æ) | 51,000 | 924 | ||
| Moog, Inc. Class A(Æ) | 27,593 | 1,602 | Actua Corp.(Æ) | 50,500 | 588 | ||
| MTS Systems Corp. | 12,780 | 608 | Acxiom Corp.(Æ) | 217,606 | 5,127 | ||
| MYR Group, Inc.(Æ) | 43,131 | 1,287 | ADTRAN, Inc. | 298,472 | 5,417 | ||
| Navigant Consulting, Inc.(Æ) | 39,267 | 919 | Advanced Micro Devices, Inc.(Æ) | 123,300 | 891 | ||
| Navios Maritime Acquisition Corp.(Ñ) | 19,610 | 25 | Aerohive Networks, Inc.(Æ)(Ñ) | 234,200 | 1,239 | ||
| Navistar International Corp.(Æ)(Ñ) | 24,800 | 553 | Alarm.com Holdings, Inc.(Æ)(Ñ) | 32,503 | 948 | ||
| NV5 Global, Inc.(Æ) | 61,764 | 1,766 | Alpha & Omega Semiconductor, Ltd.(Æ) | 31,363 | 663 | ||
| On Assignment, Inc.(Æ) | 131,809 | 4,536 | Ambarella, Inc.(Æ)(Ñ) | 23,590 | 1,448 | ||
| Orion Group Holdings, Inc.(Æ) | 292,264 | 2,361 | Amkor Technology, Inc.(Æ) | 42,700 | 396 | ||
| Oshkosh Corp. | 69,848 | 3,737 | Applied Micro Circuits Corp.(Æ) | 185,600 | 1,373 | ||
| PAM Transportation Services, Inc.(Æ) | 16,679 | 329 | Applied Optoelectronics, Inc.(Æ)(Ñ) | 99,288 | 1,909 | ||
| Park-Ohio Holdings Corp. | 5,591 | 179 | ARC Document Solutions, Inc.(Æ) | 43,325 | 149 | ||
| Powell Industries, Inc. | 14,014 | 496 | ARC Document Solutions, Inc.(Å)(Æ) | 308,500 | 1,058 | ||
| Power Solutions International, Inc.(Æ) | 8,500 | 81 | ARRIS International PLC(Æ) | 37,893 | 1,053 | ||
| Primoris Services Corp. | 253,228 | 5,072 | Aspen Technology, Inc.(Æ) | 25,302 | 1,246 | ||
| Quad/Graphics, Inc. | 27,553 | 655 | Autobytel, Inc.(Æ) | 199,430 | 3,261 | ||
| Quanta Services, Inc.(Æ) | 92,224 | 2,651 | Avid Technology, Inc.(Æ) | 101,970 | 670 | ||
| Rand Logistics, Inc.(Å)(Æ) | 90,100 | 65 | AXT, Inc.(Æ) | 230,689 | 1,188 | ||
| Resources Connection, Inc. | 13,533 | 201 | Barracuda Networks, Inc.(Æ) | 33,557 | 783 | ||
| Rexnord Corp.(Æ) | 45,078 | 897 | Bazaarvoice, Inc.(Æ) | 474,959 | 2,327 | ||
| Ritchie Bros Auctioneers, Inc. | 127,478 | 4,409 | Bel Fuse, Inc. Class B | 19,687 | 469 | ||
| Roadrunner Transportation Systems, Inc.(Æ) | 28,300 | 215 | Benchmark Electronics, Inc.(Æ) | 159,243 | 4,005 | ||
| RPX Corp. Class A(Æ) | 122,055 | 1,191 | Brightcove, Inc.(Æ) | 60,317 | 672 | ||
| Ryder System, Inc. | 39,047 | 2,709 | Brooks Automation, Inc. | 59,347 | 773 | ||
| Saia, Inc.(Æ) | 21,881 | 780 | CalAmp Corp.(Æ) | 373,774 | 4,829 | ||
| Scorpio Tankers, Inc. | 405,500 | 1,553 | Calix, Inc.(Æ) | 97,466 | 609 | ||
| SkyWest, Inc. | 178,416 | 5,379 | Callidus Software, Inc.(Æ) | 383,587 | 7,000 | ||
| Spartan Motors, Inc. | 119,035 | 1,018 | Carbonite, Inc.(Æ) | 307,408 | 5,241 | ||
| Spirit Airlines, Inc.(Æ) | 29,500 | 1,414 | Cavium, Inc.(Æ) | 131,132 | 7,402 | ||
| SPX Corp.(Æ) | 37,100 | 705 | CEVA, Inc.(Æ) | 97,893 | 2,942 | ||
| SPX FLOW, Inc.(Æ) | 12,939 | 325 | Ciber, Inc.(Æ) | 680,100 | 694 | ||
| Standex International Corp. | 35,547 | 2,716 | Cognex Corp. | 29,977 | 1,547 | ||
| StealthGas, Inc.(Å)(Æ)(Ñ) | 186,620 | 579 | Coherent, Inc.(Æ) | 24,934 | 2,596 | ||
| Sterling Construction Co., Inc.(Æ) | 110,500 | 804 | Cohu, Inc. | 238,106 | 2,664 | ||
| Strattec Security Corp. | 4,625 | 164 | CommerceHub, Inc.(Æ) | 150,512 | 2,263 | ||
| SuperCom, Ltd.(Å)(Æ)(Ñ) | 130,863 | 351 | CommVault Systems, Inc.(Æ) | 53,026 | 2,837 | ||
See accompanying notes which are an integral part of the financial statements.
148 Russell U.S. Small Cap Equity Fund
Russell Investment Company
Russell U.S. Small Cap Equity Fund
Schedule of Investments, continued — October 31, 2016
| Amounts in thousands (except share amounts) | Amounts in thousands (except share amounts) | ||||||
| Principal | Fair | Principal | Fair | ||||
| Amount ($) or | Value | Amount ($) or | Value | ||||
| Shares | $ | Shares | $ | ||||
| Computer Task Group, Inc. | 1,900 | 8 | Mercury Systems, Inc.(Æ) | 60,919 | 1,692 | ||
| Comtech Telecommunications Corp. | 68,335 | 711 | Methode Electronics, Inc. | 57,623 | 1,798 | ||
| Cornerstone OnDemand, Inc.(Æ) | 101,031 | 4,173 | MicroStrategy, Inc. Class A(Æ) | 6,360 | 1,239 | ||
| CSG Systems International, Inc. | 3,914 | 149 | Mindbody Inc. Class A(Æ)(Ñ) | 38,241 | 792 | ||
| CTS Corp. | 147,531 | 2,685 | MobileIron, Inc.(Æ) | 53,034 | 194 | ||
| Cypress Semiconductor Corp. | 230,303 | 2,296 | Model N, Inc.(Æ) | 94,878 | 977 | ||
| Daktronics, Inc. | 79,656 | 665 | Monotype Imaging Holdings, Inc. | 107,867 | 2,060 | ||
| Datalink Corp.(Æ) | 23,178 | 220 | Nanometrics, Inc.(Æ) | 23,887 | 499 | ||
| Diebold, Inc. | 268,085 | 5,844 | NCI, Inc. Class A | 8,400 | 99 | ||
| Digi International, Inc.(Æ) | 104,238 | 954 | NeoPhotonics Corp.(Æ) | 247,839 | 3,470 | ||
| Digimarc Corp.(Æ)(Ñ) | 14,150 | 447 | NETGEAR, Inc.(Æ) | 12,800 | 646 | ||
| DSP Group, Inc.(Æ) | 15,000 | 163 | NIC, Inc. | 1,691 | 39 | ||
| Ebix, Inc.(Ñ) | 8,897 | 498 | Nice, Ltd. - ADR | 12,147 | 807 | ||
| Electro Scientific Industries, Inc.(Æ) | 83,107 | 430 | Nimble Storage, Inc.(Æ) | 26,800 | 204 | ||
| Ellie Mae, Inc.(Æ) | 29,650 | 3,140 | NVE Corp. | 3,067 | 173 | ||
| EMCORE Corp. | 259,034 | 1,697 | Oclaro, Inc.(Æ) | 137,668 | 1,006 | ||
| EPAM Systems, Inc.(Æ) | 5,918 | 381 | ON Semiconductor Corp.(Æ) | 24,900 | 291 | ||
| ePlus, Inc.(Æ) | 3,717 | 340 | Ooma, Inc.(Æ) | 56,610 | 490 | ||
| Everbridge, Inc.(Æ) | 9,175 | 135 | Orbotech, Ltd.(Æ) | 80,027 | 2,193 | ||
| Evolent Health, Inc. Class A(Æ) | 97,379 | 2,050 | Paycom Software, Inc.(Æ)(Ñ) | 30,428 | 1,574 | ||
| Exar Corp.(Æ) | 389,268 | 3,511 | PC Connection, Inc. | 47,213 | 1,096 | ||
| Extreme Networks, Inc.(Æ) | 193,503 | 815 | PC-Telephone, Inc. | 7,800 | 40 | ||
| Fabrinet(Æ) | 67,128 | 2,548 | PDF Solutions, Inc.(Æ) | 451,742 | 8,922 | ||
| FireEye, Inc.(Æ) | 342,693 | 3,982 | Pegasystems, Inc. | 2,113 | 65 | ||
| Five9, Inc.(Æ) | 309,825 | 4,437 | Perficient, Inc.(Æ) | 36,374 | 677 | ||
| FormFactor, Inc.(Æ) | 74,157 | 666 | Perficient, Inc.(Å)(Æ) | 268,523 | 4,997 | ||
| Gigamon, Inc.(Æ) | 73,242 | 4,050 | Photronics, Inc.(Æ) | 144,272 | 1,399 | ||
| GrubHub, Inc.(Æ)(Ñ) | 40,064 | 1,527 | Plexus Corp.(Æ) | 28,322 | 1,297 | ||
| GTT Communications, Inc.(Æ) | 87,940 | 1,979 | Power Integrations, Inc. | 49,109 | 3,165 | ||
| Harmonic, Inc.(Æ) | 355,525 | 1,813 | Proofpoint, Inc.(Æ) | 60,396 | 4,734 | ||
| Hortonworks, Inc.(Æ)(Ñ) | 107,733 | 823 | Q2 Holdings, Inc.(Æ) | 73,677 | 2,070 | ||
| IAC/InterActiveCorp(Æ) | 27,640 | 1,781 | QAD, Inc. Class A | 47,341 | 1,139 | ||
| II-VI, Inc.(Æ) | 23,689 | 659 | Quantum Corp.(Æ) | 718,172 | 575 | ||
| Immersion Corp.(Æ)(Ñ) | 134,700 | 1,099 | RADCOM, Ltd.(Æ) | 66,430 | 1,348 | ||
| Imperva, Inc.(Æ) | 14,514 | 536 | Radisys Corp.(Æ) | 324,927 | 1,355 | ||
| Infinera Corp.(Æ) | 85,715 | 669 | Rambus, Inc.(Æ) | 114,495 | 1,396 | ||
| Inphi Corp.(Æ) | 12,536 | 465 | Rapid7, Inc.(Æ)(Ñ) | 41,029 | 588 | ||
| Insight Enterprises, Inc.(Æ) | 38,332 | 1,104 | RealPage, Inc.(Æ) | 47,901 | 1,303 | ||
| InterDigital, Inc. | 22,106 | 1,562 | RetailMeNot, Inc.(Æ) | 62,299 | 564 | ||
| InterXion Holding NV(Æ) | 23,473 | 874 | Revolution Lighting Technologies, Inc.(Æ)(Ñ) | 78,999 | 542 | ||
| Intevac, Inc.(Æ) | 2,294 | 13 | Rightside Group, Ltd.(Æ) | 13,700 | 115 | ||
| iRobot Corp.(Æ) | 18,870 | 957 | Rofin-Sinar Technologies, Inc.(Æ) | 18,484 | 602 | ||
| Ixia(Æ) | 51,892 | 620 | Rudolph Technologies, Inc.(Æ) | 86,796 | 1,571 | ||
| Jabil Circuit, Inc. | 134,899 | 2,879 | Sanmina Corp.(Æ) | 57,424 | 1,588 | ||
| Jive Software, Inc.(Æ) | 21,900 | 86 | ScanSource, Inc.(Æ) | 24,744 | 866 | ||
| Kemet Corp.(Æ) | 54,416 | 194 | Science Applications International Corp. | 61,240 | 4,220 | ||
| Key Tronic Corp.(Æ) | 9,993 | 77 | Seachange International, Inc.(Æ) | 73,100 | 192 | ||
| KEYW Holding Corp. (The)(Æ)(Ñ) | 148,160 | 1,554 | Shopify, Inc. Class A(Æ) | 31,440 | 1,303 | ||
| Kimball Electronics, Inc.(Æ) | 100,159 | 1,392 | ShoreTel, Inc.(Æ) | 227,359 | 1,512 | ||
| KVH Industries, Inc.(Æ) | 11,724 | 93 | Sigma Designs, Inc.(Æ) | 82,986 | 606 | ||
| Leaf Group, Ltd.(Æ) | 22,595 | 131 | Silicom, Ltd. | 11,443 | 426 | ||
| Leidos Holdings, Inc. | 49,631 | 2,063 | Silicon Laboratories, Inc.(Æ) | 17,430 | 1,045 | ||
| Limelight Networks, Inc.(Æ) | 96,084 | 171 | Silicon Motion Technology Corp. - ADR | 13,760 | 559 | ||
| Lionbridge Technologies, Inc.(Æ) | 438,480 | 2,118 | Silver Spring Networks, Inc.(Æ) | 12,000 | 169 | ||
| LogMeIn, Inc.(Ñ) | 21,947 | 2,085 | Sonus Networks, Inc.(Æ) | 110,937 | 642 | ||
| Lumentum Holdings, Inc.(Æ) | 169,431 | 5,693 | Stratasys, Ltd.(Æ)(Ñ) | 30,000 | 574 | ||
| ManTech International Corp. Class A | 36,697 | 1,425 | Super Micro Computer, Inc.(Æ) | 18,425 | 437 | ||
| Marin Software, Inc.(Æ) | 49,231 | 113 | Synaptics, Inc.(Æ) | 2,940 | 153 | ||
| Match Group, Inc.(Æ)(Ñ) | 39,132 | 707 | SYNNEX Corp. | 30,817 | 3,160 | ||
| Mentor Graphics Corp. | 115,532 | 3,339 | Syntel, Inc. | 2,238 | 45 | ||
See accompanying notes which are an integral part of the financial statements.
Russell U.S. Small Cap Equity Fund 149
Russell Investment Company
Russell U.S. Small Cap Equity Fund
Schedule of Investments, continued — October 31, 2016
| Amounts in thousands (except share amounts) | Amounts in thousands (except share amounts) | |||||||||||
| Principal | Fair | Principal | Fair | |||||||||
| Amount ($) or | Value | Amount ($) or | Value | |||||||||
| Shares | $ | Shares | $ | |||||||||
| Tech Data Corp.(Æ) | 22,500 | 1,733 | 0.170% due 12/01/16 (~)(§) | 3,000 | 2,999 | |||||||
| TechTarget, Inc.(Æ) | 139,989 | 1,131 | Total Short-Term Investments | |||||||||
| TeleNav, Inc.(Æ) | 132,901 | 724 | ||||||||||
| Tessera Technologies, Inc. | 150,432 | 5,581 | (cost $93,982) | 93,996 | ||||||||
| Tremor Video, Inc.(Æ) | 30,450 | 51 | ||||||||||
| TTM Technologies, Inc.(Æ) | 72,936 | 959 | Other Securities - 5.1% | |||||||||
| Tyler Technologies, Inc.(Æ) | 6,255 | 1,003 | Russell U.S. Cash Collateral Fund(×) | 85,476,073 | (8) | 85,476 | ||||||
| Ultra Clean Holdings(Æ) | 54,800 | 466 | Total Other Securities | |||||||||
| Ultratech, Inc.(Æ) | 48,700 | 1,037 | (cost $85,476) | 85,476 | ||||||||
| Unisys Corp.(Æ)(Ñ) | 65,959 | 689 | ||||||||||
| USA Technologies, Inc.(Æ) | 360,585 | 1,623 | Total Investments 105.3% | |||||||||
| Varonis Systems, Inc.(Æ) | 95,851 | 2,736 | (identified cost $1,626,297) | 1,780,052 | ||||||||
| Veeco Instruments, Inc.(Æ) | 47,606 | 1,033 | ||||||||||
| Viavi Solutions, Inc. Class W(Æ) | 309,640 | 2,205 | Other Assets and Liabilities, Net | |||||||||
| Virtusa Corp.(Æ) | 29,389 | 557 | -(5.3%) | (89,650 | ) | |||||||
| Vocera Communications, Inc.(Æ) | 101,361 | 1,865 | ||||||||||
| Wix.com, Ltd.(Æ) | 18,526 | 741 | Net Assets - 100.0% | 1,690,402 | ||||||||
| Xactly Corp.(Æ) | 62,963 | 812 | ||||||||||
| Xcerra Corp.(Æ) | 338,219 | 1,864 | ||||||||||
| Zynga, Inc. Class A(Æ) | 405,000 | 1,138 | ||||||||||
| 272,687 | ||||||||||||
| Utilities - 2.7% | ||||||||||||
| 8x8, Inc.(Æ) | 113,737 | 1,621 | ||||||||||
| ALLETE, Inc. | 22,500 | 1,379 | ||||||||||
| American States Water Co. | 89,480 | 3,577 | ||||||||||
| ATN International, Inc. | 7,100 | 480 | ||||||||||
| Black Hills Corp. | 15,100 | 934 | ||||||||||
| Boingo Wireless, Inc.(Æ) | 209,770 | 2,039 | ||||||||||
| Chesapeake Utilities Corp. | 13,800 | 884 | ||||||||||
| Comstock Resources, Inc.(Æ)(Ñ) | 110,706 | 1,081 | ||||||||||
| Dynegy, Inc. Class A(Æ) | 47,676 | 508 | ||||||||||
| Evolution Petroleum Corp. | 6,682 | 52 | ||||||||||
| Extraction Oil & Gas, Inc.(Æ)(Ñ) | 19,338 | 413 | ||||||||||
| FairPoint Communications, Inc.(Æ) | 34,805 | 543 | ||||||||||
| Gogo, Inc.(Æ)(Ñ) | 45,715 | 462 | ||||||||||
| Hawaiian Telcom Holdco, Inc.(Æ) | 8,300 | 170 | ||||||||||
| IDT Corp. Class B | 16,339 | 292 | ||||||||||
| j2 Global, Inc. | 82,969 | 5,903 | ||||||||||
| Northwest Natural Gas Co. | 36,418 | 2,141 | ||||||||||
| NorthWestern Corp. | 21,000 | 1,209 | ||||||||||
| NRG Yield, Inc. Class A | 204,376 | 3,011 | ||||||||||
| ONE Gas, Inc. | 18,800 | 1,152 | ||||||||||
| Orbcomm, Inc.(Æ) | 76,448 | 683 | ||||||||||
| PNM Resources, Inc. | 79,100 | 2,598 | ||||||||||
| Portland General Electric Co. | 57,811 | 2,523 | ||||||||||
| Pure Cycle Corp.(Å)(Æ) | 221,800 | 1,164 | ||||||||||
| Resolute Energy Corp.(Æ)(Ñ) | 40,434 | 1,047 | ||||||||||
| South Jersey Industries, Inc. | 302,697 | 8,975 | ||||||||||
| Spire, Inc. | 7,700 | 484 | ||||||||||
| Spok Holdings, Inc. | 17,843 | 322 | ||||||||||
| Telephone & Data Systems, Inc. | 5,600 | 145 | ||||||||||
| 45,792 | ||||||||||||
| Total Common Stocks | ||||||||||||
| (cost $1,446,839) | 1,600,580 | |||||||||||
| Short-Term Investments - 5.5% | ||||||||||||
| Russell U.S. Cash Management Fund | 90,978,476 | (8) | 90,997 | |||||||||
| United States Treasury Bills | ||||||||||||
See accompanying notes which are an integral part of the financial statements.
150 Russell U.S. Small Cap Equity Fund
Russell Investment Company
Russell U.S. Small Cap Equity Fund
Schedule of Investments, continued — October 31, 2016
| Restricted Securities | |||||||||||||
| Amounts in thousands (except share and cost per unit amounts) | |||||||||||||
| Principal | Cost per | Cost | Fair Value | ||||||||||
| % of Net Assets | Acquisition | Amount ($) | Unit | (000 | ) | (000 | ) | ||||||
| Securities | Date | or shares | $ | $ | $ | ||||||||
| 0.9% | |||||||||||||
| ARC Document Solutions, Inc. | 06/24/15 | 308,500 | 5.49 | 1,694 | 1,058 | ||||||||
| FBR & Co. | 03/11/15 | 81,100 | 22.57 | 1,831 | 1,127 | ||||||||
| Great Lakes Dredge & Dock Corp. | 03/11/15 | 732,700 | 5.17 | 3,785 | 2,601 | ||||||||
| Perficient, Inc. | 12/09/11 | 268,523 | 15.18 | 4,075 | 4,997 | ||||||||
| Pure Cycle Corp. | 09/10/13 | 221,800 | 5.16 | 1,144 | 1,164 | ||||||||
| Rand Logistics, Inc. | 03/12/15 | 90,100 | 3.04 | 274 | 65 | ||||||||
| State Bank Financial Corp. | 03/11/15 | 121,700 | 20.49 | 2,494 | 2,683 | ||||||||
| StealthGas, Inc. | 03/11/15 | 186,620 | 5.54 | 1,035 | 579 | ||||||||
| SuperCom, Ltd. | 06/18/15 | 130,863 | 7.84 | 1,026 | 351 | ||||||||
| 14,625 | |||||||||||||
| For a description of restricted securities see note 8 in the Notes to Financial Statements. | |||||||||||||
| Futures Contracts | |||||||||||||
| Amounts in thousands (except contract amounts) | |||||||||||||
| Unrealized | |||||||||||||
| Appreciation | |||||||||||||
| Number of | Notional | Expiration | (Depreciation) | ||||||||||
| Contracts | Amount | Date | $ | ||||||||||
| Long Positions | |||||||||||||
| Russell 2000 Mini Index Futures | 773 | USD | 91,933 | 12/16 | (2,743 | ) | |||||||
| Total Unrealized Appreciation (Depreciation) on Open Futures Contracts (å) | (2,743 | ) | |||||||||||
| Presentation of Portfolio Holdings | |||||||||||||||
| Amounts in thousands | |||||||||||||||
| Fair Value | |||||||||||||||
| Practical | |||||||||||||||
| Portfolio Summary | Level 1 | Level 2 | Level 3 | Expedient (a) | Total | % of Net Assets | |||||||||
| Common Stocks | |||||||||||||||
| Consumer Discretionary | $ | 220,590 | $ | — | $ | — | $ | — | $ | 220,590 | 13.1 | ||||
| Consumer Staples | 63,139 | — | — | — | 63,139 | 3.7 | |||||||||
| Energy | 54,895 | — | — | — | 54,895 | 3.3 | |||||||||
| Financial Services | 399,456 | 204 | — | — | 399,660 | 23.6 | |||||||||
| Health Care | 194,006 | — | — | — | 194,006 | 11.5 | |||||||||
| Materials and Processing | 93,714 | — | — | — | 93,714 | 5.5 | |||||||||
| Producer Durables | 256,097 | — | — | — | 256,097 | 15.2 | |||||||||
| Technology | 272,687 | — | — | — | 272,687 | 16.1 | |||||||||
| Utilities | 45,792 | — | — | — | 45,792 | 2.7 | |||||||||
| Short-Term Investments | — | 2,999 | — | 90,997 | 93,996 | 5.5 | |||||||||
| Other Securities | — | — | — | 85,476 | 85,476 | 5.1 | |||||||||
| Total Investments | 1,600,376 | 3,203 | — | 176,473 | 1,780,052 | 105.3 | |||||||||
| Other Assets and Liabilities, Net | (5.3 | ) | |||||||||||||
| 100.0 | |||||||||||||||
| Other Financial Instruments | |||||||||||||||
| Liabilities | |||||||||||||||
| Futures Contracts | (2,743 | ) | — | — | — | (2,743 | ) | (0.2 | ) | ||||||
| Total Other Financial Instruments* | $ | (2,743 | ) | $ | — | $ | — | $ | — | $ | (2,743 | ) | |||
See accompanying notes which are an integral part of the financial statements.
Russell U.S. Small Cap Equity Fund 151
Russell Investment Company
Russell U.S. Small Cap Equity Fund
Schedule of Investments, continued — October 31, 2016
* Futures and foreign currency exchange contract values reflect the unrealized appreciation (depreciation) on the investments.
(a) Certain investments that are measured at fair value using the net asset value per share (or its equivalent) practical expedient have not been classified
in the fair value levels. The fair value amounts presented in the table are intended to permit reconciliation to the amounts presented in the Schedule of
Investments.
For a description of the Levels, see note 2 in the Notes to Financial Statements.
For a disclosure on transfers between Levels 1, 2 and 3 during the period ended October 31, 2016, see note 2 in the Notes to
Financial Statements.
See accompanying notes which are an integral part of the financial statements.
152 Russell U.S. Small Cap Equity Fund
Russell Investment Company
Russell U.S. Small Cap Equity Fund
Fair Value of Derivative Instruments — October 31, 2016
Amounts in thousands
| Equity | |||||||
| Derivatives not accounted for as hedging instruments | Contracts | ||||||
| Location: Statement of Assets and Liabilities - Liabilities | |||||||
| Variation margin on futures contracts* | $ | 2,743 | |||||
| Foreign | |||||||
| Equity | Currency | ||||||
| Derivatives not accounted for as hedging instruments | Contracts | Contracts | |||||
| Location: Statement of Operations - Net realized gain (loss) | |||||||
| Futures contracts | $ | 11,438 | $ | — | |||
| Foreign currency-related transactions** | — | (1 | ) | ||||
| Total | $ | 11,438 | $ | (1 | ) | ||
| Location: Statement of Operations - Net change in unrealized appreciation (depreciation) | |||||||
| Futures contracts | $ | (3,308 | ) | $ | — | ||
* Includes cumulative appreciation/depreciation of futures contracts as reported in the Schedule of Investments. Only variation margin is reported within the
Statement of Assets and Liabilities.
** Only includes net realized gain (loss) on forward and spot contracts. May differ from the net realized gain (loss) on foreign currency-related transactions reported
within the Statement of Operations.
For further disclosure on derivatives see note 2 in the Notes to Financial Statements.
See accompanying notes which are an integral part of the financial statements.
Russell U.S. Small Cap Equity Fund 153
Russell Investment Company
Russell U.S. Small Cap Equity Fund
Balance Sheet Offsetting of Financial and Derivative Instruments — October 31, 2016
| Amounts in thousands | |||||||||
| Offsetting of Financial Assets and Derivative Assets | |||||||||
| Gross | Net Amounts | ||||||||
| Amounts | of Assets | ||||||||
| Gross | Offset in the | Presented in | |||||||
| Amounts of | Statement of | the Statement | |||||||
| Recognized | Assets and | of Assets and | |||||||
| Description | Location: Statement of Assets and Liabilities - Assets | Assets | Liabilities | Liabilities | |||||
| Securities on Loan* | Investments, at fair value | $ | 83,020 | $ | — | $ | 83,020 | ||
| Futures Contracts | Variation margin on futures contracts | 263 | — | 263 | |||||
| Total Financial and Derivative Assets | 83,283 | — | 83,283 | ||||||
| Financial and Derivative Assets not subject to a netting agreement | (263 | ) | — | (263 | ) | ||||
| Total Financial and Derivative Assets subject to a netting agreement | $ | 83,020 | $ | — | $ | 83,020 | |||
| Financial Assets, Derivative Assets, and Collateral Held by Counterparty | ||||||||||
| Gross Amounts Not Offset in | ||||||||||
| the Statement of Assets and | ||||||||||
| Liabilities | ||||||||||
| Net Amounts | ||||||||||
| of Assets | ||||||||||
| Presented in | ||||||||||
| the Statement | Financial and | |||||||||
| of Assets and | Derivative | Collateral | ||||||||
| Counterparty | Liabilities | Instruments | Received^ | Net Amount | ||||||
| Barclays | $ | 12,130 | $ | — | $ | 12,130 | $ | — | ||
| Citigroup | 8,371 | — | 8,371 | — | ||||||
| Credit Suisse | 5,533 | — | 5,533 | — | ||||||
| Deutsche Bank | 2,811 | — | 2,811 | — | ||||||
| Fidelity | 9,570 | — | 9,570 | — | ||||||
| Goldman Sachs | 8,315 | — | 8,315 | — | ||||||
| ING | 63 | — | 63 | — | ||||||
| JPMorgan Chase | 15,121 | — | 15,121 | — | ||||||
| Merrill Lynch | 544 | — | 544 | — | ||||||
| Morgan Stanley | 19,342 | — | 19,342 | — | ||||||
| UBS | 1,220 | — | 1,220 | — | ||||||
| Total | $ | 83,020 | $ | — | $ | 83,020 | $ | — | ||
* Fair value of securities on loan as reported in the footnotes to the Statement of Assets and Liabilities.
^ Collateral received or pledged amounts may not reconcile to those disclosed in the Statement of Assets and Liabilities due to the inclusion of off-Balance
Sheet collateral and adjustments made to exclude overcollateralization.
For further disclosure on derivatives and counterparty risk see note 2 in the Notes to Financial Statements.
See accompanying notes which are an integral part of the financial statements.
154 Russell U.S. Small Cap Equity Fund
Russell Investment Company
Russell U.S. Small Cap Equity Fund
Statement of Assets and Liabilities — October 31, 2016
| Amounts in thousands | ||
| Assets | ||
| Investments, at identified cost | $ | 1,626,297 |
| Investments, at fair value(*)(>) | 1,780,052 | |
| Cash (restricted)(a) | 1,800 | |
| Receivables: | ||
| Dividends and interest | 638 | |
| Dividends from affiliated Russell funds | 49 | |
| Investments sold | 12,877 | |
| Fund shares sold | 1,514 | |
| Variation margin on futures contracts | 263 | |
| Total assets | 1,797,193 | |
| Liabilities | ||
| Payables: | ||
| Investments purchased | 18,772 | |
| Fund shares redeemed | 884 | |
| Accrued fees to affiliates | 1,357 | |
| Other accrued expenses | 302 | |
| Payable upon return of securities loaned | 85,476 | |
| Total liabilities | 106,791 | |
| Commitments and Contingencies (1) | ||
| Net Assets | $ | 1,690,402 |
| (1) See note 9 in the Notes to Financial Statements for a detailed description of commitments and contingencies. | ||
See accompanying notes which are an integral part of the financial statements.
Russell U.S. Small Cap Equity Fund 155
Russell Investment Company
Russell U.S. Small Cap Equity Fund
Statement of Assets and Liabilities, continued — October 31, 2016
| Amounts in thousands | |||
| Net Assets Consist of: | |||
| Undistributed (overdistributed) net investment income | $ | 5,241 | |
| Accumulated net realized gain (loss) | (27,238 | ) | |
| Unrealized appreciation (depreciation) on: | |||
| Investments | 153,755 | ||
| Futures contracts | (2,743 | ) | |
| Shares of beneficial interest | 613 | ||
| Additional paid-in capital | 1,560,774 | ||
| Net Assets | $ | 1,690,402 | |
| Net Asset Value, offering and redemption price per share: | |||
| Net asset value per share: Class A(#) | $ | 27.32 | |
| Maximum offering price per share (Net asset value plus sales charge of 5.75%): Class A | $ | 28.99 | |
| Class A — Net assets | $ | 20,553,873 | |
| Class A — Shares outstanding ($.01 par value) | 752,397 | ||
| Net asset value per share: Class C(#) | $ | 26.00 | |
| Class C — Net assets | $ | 22,458,748 | |
| Class C — Shares outstanding ($.01 par value) | 863,774 | ||
| Net asset value per share: Class E(#) | $ | 27.45 | |
| Class E — Net assets | $ | 24,161,334 | |
| Class E — Shares outstanding ($.01 par value) | 880,247 | ||
| Net asset value per share: Class I(#) | $ | 27.72 | |
| Class I — Net assets | $ | 148,637,944 | |
| Class I — Shares outstanding ($.01 par value) | 5,361,644 | ||
| Net asset value per share: Class R6(#) | $ | 27.61 | |
| Class R6 — Net assets | $ | 401,011 | |
| Class R6 — Shares outstanding ($.01 par value) | 14,524 | ||
| Net asset value per share: Class S(#) | $ | 27.57 | |
| Class S — Net assets | $ | 1,083,721,123 | |
| Class S — Shares outstanding ($.01 par value) | 39,304,094 | ||
| Net asset value per share: Class Y(#) | $ | 27.61 | |
| Class Y — Net assets | $ | 390,467,743 | |
| Class Y — Shares outstanding ($.01 par value) | 14,141,241 | ||
| Amounts in thousands | |||
| (*) Securities on loan included in investments | $ | 83,020 | |
| (>) Investments in affiliates, Russell U.S. Cash Management Fund and Russell U.S. Cash Collateral Fund | $ | 176,473 | |
| (a) Cash Collateral for Futures | $ | 1,800 | |
| (#) Net asset value per share equals class level net assets divided by class level shares of beneficial interest outstanding. | |||
See accompanying notes which are an integral part of the financial statements.
156 Russell U.S. Small Cap Equity Fund
Russell Investment Company
Russell U.S. Small Cap Equity Fund
Statement of Operations — For the Period Ended October 31, 2016
| Amounts in thousands | |||
| Investment Income | |||
| Dividends | $ | 26,535 | |
| Dividends from affiliated Russell funds | 313 | ||
| Interest | 11 | ||
| Securities lending income (net) | 3,122 | ||
| Total investment income | 29,981 | ||
| Expenses | |||
| Advisory fees | 12,965 | ||
| Administrative fees | 894 | ||
| Custodian fees (1) | 272 | ||
| Distribution fees - Class A | 53 | ||
| Distribution fees - Class C | 182 | ||
| Transfer agent fees - Class A | 42 | ||
| Transfer agent fees - Class C | 48 | ||
| Transfer agent fees - Class E | 58 | ||
| Transfer agent fees - Class I | 187 | ||
| Transfer agent fees - Class R6 | —** | ||
| Transfer agent fees - Class S | 2,396 | ||
| Transfer agent fees - Class Y | 19 | ||
| Professional fees | 148 | ||
| Registration fees | 125 | ||
| Shareholder servicing fees - Class C | 61 | ||
| Shareholder servicing fees - Class E | 72 | ||
| Trustees’ fees | 63 | ||
| Printing fees | 322 | ||
| Miscellaneous | 54 | ||
| Expenses before reductions | 17,961 | ||
| Expense reductions | (—)** | ||
| Net expenses | 17,961 | ||
| Net investment income (loss) | 12,020 | ||
| Net Realized and Unrealized Gain (Loss) | |||
| Net realized gain (loss) on: | |||
| Investments | (7,535 | ) | |
| Futures contracts | 11,438 | ||
| Foreign currency-related transactions | (287 | ) | |
| Net realized gain (loss) | 3,616 | ||
| Net change in unrealized appreciation (depreciation) on: | |||
| Investments | 59,783 | ||
| Futures contracts | (3,308 | ) | |
| Foreign currency-related transactions | 281 | ||
| Net change in unrealized appreciation (depreciation) | 56,756 | ||
| Net realized and unrealized gain (loss) | 60,372 | ||
| Net Increase (Decrease) in Net Assets from Operations | $ | 72,392 | |
| ** Less than $500. | |||
| (1) Includes a reimbursement for overbilling of custody out-of-pocket fees from prior years. See note 10 in the Notes to Financial Statements. | |||
See accompanying notes which are an integral part of the financial statements.
Russell U.S. Small Cap Equity Fund 157
Russell Investment Company
Russell U.S. Small Cap Equity Fund
Statements of Changes in Net Assets
| For the Periods Ended October 31, | ||||||
| Amounts in thousands | 2016 | 2015 | ||||
| Increase (Decrease) in Net Assets | ||||||
| Operations | ||||||
| Net investment income (loss) | $ | 12,020 | $ | 11,155 | ||
| Net realized gain (loss) | 3,616 | 131,769 | ||||
| Net change in unrealized appreciation (depreciation) | 56,756 | (159,281 | ) | |||
| Net increase (decrease) in net assets from operations | 72,392 | (16,357 | ) | |||
| Distributions | ||||||
| From net investment income | ||||||
| Class A | (100 | ) | (17 | ) | ||
| Class C | (—)** | (—)** | ||||
| Class E | (125 | ) | (14 | ) | ||
| Class I | (1,284 | ) | (698 | ) | ||
| Class S | (8,818 | ) | (4,629 | ) | ||
| Class Y | (4,165 | ) | (2,904 | ) | ||
| From net realized gain | ||||||
| Class A | (1,532 | ) | (1,756 | ) | ||
| Class C | (1,864 | ) | (2,322 | ) | ||
| Class E | (2,105 | ) | (2,888 | ) | ||
| Class I | (10,846 | ) | (12,775 | ) | ||
| Class S | (87,215 | ) | (103,194 | ) | ||
| Class Y | (30,120 | ) | (41,652 | ) | ||
| Net decrease in net assets from distributions | (148,174 | ) | (172,849 | ) | ||
| Share Transactions* | ||||||
| Net increase (decrease) in net assets from share transactions | (304,068 | ) | (184,494 | ) | ||
| Total Net Increase (Decrease) in Net Assets | (379,850 | ) | (373,700 | ) | ||
| Net Assets | ||||||
| Beginning of period | 2,070,252 | 2,443,952 | ||||
| End of period | $ | 1,690,402 | $ | 2,070,252 | ||
| Undistributed (overdistributed) net investment income included in net assets | $ | 5,241 | $ | 8,448 | ||
| ** Less than $500. | ||||||
See accompanying notes which are an integral part of the financial statements.
158 Russell U.S. Small Cap Equity Fund
Russell Investment Company
Russell U.S. Small Cap Equity Fund
Statements of Changes in Net Assets, continued
* Share transaction amounts (in thousands) for the periods ended October 31, 2016 and October 31, 2015 were as follows:
| 2016 | 2015 | |||||||||||
| Shares | Dollars | Shares | Dollars | |||||||||
| Class A | ||||||||||||
| Proceeds from shares sold | 59 | $ | 1,581 | 91 | $ | 2,716 | ||||||
| Proceeds from reinvestment of distributions | 63 | 1,614 | 60 | 1,765 | ||||||||
| Payments for shares redeemed | (196 | ) | (5,087 | ) | (146 | ) | (4,310 | ) | ||||
| Net increase (decrease) | (74 | ) | (1,892 | ) | 5 | 171 | ||||||
| Class C | ||||||||||||
| Proceeds from shares sold | 38 | 963 | 90 | 2,610 | ||||||||
| Proceeds from reinvestment of distributions | 76 | 1,852 | 81 | 2,316 | ||||||||
| Payments for shares redeemed | (275 | ) | (6,875 | ) | (251 | ) | (7,205 | ) | ||||
| Net increase (decrease) | (161 | ) | (4,060 | ) | (80 | ) | (2,279 | ) | ||||
| Class E | ||||||||||||
| Proceeds from shares sold | 111 | 2,874 | 102 | 3,078 | ||||||||
| Proceeds from reinvestment of distributions | 83 | 2,132 | 94 | 2,782 | ||||||||
| Payments for shares redeemed | (456 | ) | (12,375 | ) | (427 | ) | (12,697 | ) | ||||
| Net increase (decrease) | (262 | ) | (7,369 | ) | (231 | ) | (6,837 | ) | ||||
| Class I | ||||||||||||
| Proceeds from shares sold | 837 | 21,825 | 1,036 | 31,023 | ||||||||
| Proceeds from reinvestment of distributions | 461 | 11,869 | 445 | 13,302 | ||||||||
| Payments for shares redeemed | (1,995 | ) | (53,194 | ) | (1,554 | ) | (46,892 | ) | ||||
| Net increase (decrease) | (697 | ) | (19,500 | ) | (73 | ) | (2,567 | ) | ||||
| Class R6(1) | ||||||||||||
| Proceeds from shares sold | 17 | 444 | — | — | ||||||||
| Payments for shares redeemed | (2 | ) | (75 | ) | — | — | ||||||
| Net increase (decrease) | 15 | 369 | — | — | ||||||||
| Class S | ||||||||||||
| Proceeds from shares sold | 7,389 | 197,236 | 8,794 | 265,900 | ||||||||
| Proceeds from reinvestment of distributions | 3,721 | 95,360 | 3,598 | 107,104 | ||||||||
| Payments for shares redeemed | (18,521 | ) | (493,294 | ) | (14,161 | ) | (427,728 | ) | ||||
| Net increase (decrease) | (7,411 | ) | (200,698 | ) | (1,769 | ) | (54,724 | ) | ||||
| Class Y | ||||||||||||
| Proceeds from shares sold | 397 | 10,136 | 699 | 21,210 | ||||||||
| Proceeds from reinvestment of distributions | 1,338 | 34,285 | 1,497 | 44,556 | ||||||||
| Payments for shares redeemed | (4,243 | ) | (115,339 | ) | (5,997 | ) | (184,024 | ) | ||||
| Net increase (decrease) | (2,508 | ) | (70,918 | ) | (3,801 | ) | (118,258 | ) | ||||
| Total increase (decrease) | (11,098 | ) | $ | (304,068 | ) | (5,949 | ) | $ | (184,494 | ) | ||
| (1) For the period March 1, 2016 (commencement of operations) to October 31, 2016. | ||||||||||||
See accompanying notes which are an integral part of the financial statements.
Russell U.S. Small Cap Equity Fund 159
Russell Investment Company
Russell U.S. Small Cap Equity Fund
Financial Highlights — For the Periods Ended
For a Share Outstanding Throughout Each Period.
| $ | $ | $ | $ | $ | $ | ||||||||||||
| Net Asset Value, | Net | Net Realized | Total from | Distributions | Distributions | ||||||||||||
| Beginning of | Investment | and Unrealized | Investment | from Net | from Net | ||||||||||||
| Period | Income (Loss)(a)(d) | Gain (Loss) | Operations | Investment Income | Realized Gain | ||||||||||||
| Class A | |||||||||||||||||
| October 31, 2016 | 28.33 | .10 | .88 | .98 | (.12 | ) | (1.87 | ) | |||||||||
| October 31, 2015 | 30.93 | .06 | (.50 | ) | (.44 | ) | (.02 | ) | (2.14 | ) | |||||||
| October 31, 2014 | 33.31 | .04 | 2.13 | 2.17 | (.05 | ) | (4.50 | ) | |||||||||
| October 31, 2013 | 23.77 | .16 | 9.55 | 9.71 | (.17 | ) | — | ||||||||||
| October 31, 2012 | 21.67 | .05 | 2.06 | 2.11 | (.01 | ) | — | ||||||||||
| Class C | |||||||||||||||||
| October 31, 2016 | 27.13 | (.10 | ) | .84 | .74 | — | (1.87 | ) | |||||||||
| October 31, 2015 | 29.89 | (.16 | ) | (.46 | ) | (.62 | ) | — | (2.14 | ) | |||||||
| October 31, 2014 | 32.51 | (.20 | ) | 2.08 | 1.88 | — | (4.50 | ) | |||||||||
| October 31, 2013 | 23.22 | (.04 | ) | 9.33 | 9.29 | — | — | ||||||||||
| October 31, 2012 | 21.32 | (.12 | ) | 2.02 | 1.90 | — | — | ||||||||||
| Class E | |||||||||||||||||
| October 31, 2016 | 28.45 | .10 | .88 | .98 | (.11 | ) | (1.87 | ) | |||||||||
| October 31, 2015 | 31.03 | .06 | (.49 | ) | (.43 | ) | (.01 | ) | (2.14 | ) | |||||||
| October 31, 2014 | 33.39 | .04 | 2.13 | 2.17 | (.03 | ) | (4.50 | ) | |||||||||
| October 31, 2013 | 23.84 | .17 | 9.56 | 9.73 | (.18 | ) | — | ||||||||||
| October 31, 2012 | 21.74 | .06 | 2.06 | 2.12 | (.02 | ) | — | ||||||||||
| Class I | |||||||||||||||||
| October 31, 2016 | 28.74 | .19 | .88 | 1.07 | (.22 | ) | (1.87 | ) | |||||||||
| October 31, 2015 | 31.33 | .16 | (.49 | ) | (.33 | ) | (.12 | ) | (2.14 | ) | |||||||
| October 31, 2014 | 33.66 | .14 | 2.16 | 2.30 | (.13 | ) | (4.50 | ) | |||||||||
| October 31, 2013 | 24.03 | .27 | 9.61 | 9.88 | (.25 | ) | — | ||||||||||
| October 31, 2012 | 21.91 | .12 | 2.08 | 2.20 | (.08 | ) | — | ||||||||||
| Class R6 | |||||||||||||||||
| October 31, 2016(8) | 23.87 | .13 | 3.61 | 3.74 | — | — | |||||||||||
| Class S | |||||||||||||||||
| October 31, 2016 | 28.59 | .16 | .89 | 1.05 | (.20 | ) | (1.87 | ) | |||||||||
| October 31, 2015 | 31.19 | .14 | (.51 | ) | (.37 | ) | (.09 | ) | (2.14 | ) | |||||||
| October 31, 2014 | 33.53 | .10 | 2.17 | 2.27 | (.11 | ) | (4.50 | ) | |||||||||
| October 31, 2013 | 23.94 | .23 | 9.59 | 9.82 | (.23 | ) | — | ||||||||||
| October 31, 2012 | 21.83 | .11 | 2.07 | 2.18 | (.07 | ) | — | ||||||||||
| Class Y | |||||||||||||||||
| October 31, 2016 | 28.64 | .22 | .88 | 1.10 | (.26 | ) | (1.87 | ) | |||||||||
| October 31, 2015 | 31.24 | .20 | (.51 | ) | (.31 | ) | (.15 | ) | (2.14 | ) | |||||||
| October 31, 2014 | 33.58 | .17 | 2.16 | 2.33 | (.17 | ) | (4.50 | ) | |||||||||
| October 31, 2013 | 23.97 | .32 | 9.57 | 9.89 | (.28 | ) | — | ||||||||||
| October 31, 2012 | 21.85 | .15 | 2.07 | 2.22 | (.10 | ) | — | ||||||||||
See accompanying notes which are an integral part of the financial statements.
160 Russell U.S. Small Cap Equity Fund
| % | % | % | ||||||||||||||||
| $ | $ | Ratio of Expenses | Ratio of Expenses | Ratio of Net | ||||||||||||||
| Net Asset Value, | % | Net Assets, | to Average | to Average | Investment Income | % | ||||||||||||
| $ | End of | Total | End of Period | Net Assets, | Net Assets, | to Average | Portfolio | |||||||||||
| Total Distributions | Period | Return(b)(c) | (000 | ) | Gross(e)(l) | Net(d)(e)(l) | Net Assets(d)(e) | Turnover Rate(b)(k) | ||||||||||
| (1.99 | ) | 27.32 | 3.99 | 20,554 | 1.25 | 1.25 | .37 | 98 | ||||||||||
| (2.16 | ) | 28.33 | (1.72 | ) | 23,410 | 1.25 | 1.25 | .20 | 95 | |||||||||
| (4.55 | ) | 30.93 | 6.70 | 25,406 | 1.25 | 1.25 | .09 | 86 | ||||||||||
| (.17 | ) | 33.31 | 41.08 | 23,677 | 1.25 | 1.25 | .58 | 111 | ||||||||||
| (.01 | ) | 23.77 | 9.73 | 15,232 | 1.25 | 1.25 | .21 | 129 | ||||||||||
| (1.87 | ) | 26.00 | 3.19 | 22,459 | 2.00 | 2.00 | (.38 | ) | 98 | |||||||||
| (2.14 | ) | 27.13 | (2.42 | ) | 27,794 | 2.00 | 2.00 | (.55 | ) | 95 | ||||||||
| (4.50 | ) | 29.89 | 5.91 | 33,003 | 2.00 | 2.00 | (.66 | ) | 86 | |||||||||
| — | 32.51 | 40.01 | 32,285 | 2.00 | 2.00 | (.15 | ) | 111 | ||||||||||
| — | 23.22 | 8.91 | 25,597 | 2.00 | 2.00 | (.54 | ) | 129 | ||||||||||
| (1.98 | ) | 27.45 | 3.96 | 24,161 | 1.25 | 1.25 | .36 | 98 | ||||||||||
| (2.15 | ) | 28.45 | (1.68 | ) | 32,486 | 1.25 | 1.25 | .20 | 95 | |||||||||
| (4.53 | ) | 31.03 | 6.71 | 42,588 | 1.25 | 1.25 | .09 | 86 | ||||||||||
| (.18 | ) | 33.39 | 41.10 | 32,126 | 1.24 | 1.23 | .60 | 111 | ||||||||||
| (.02 | ) | 23.84 | 9.78 | 24,995 | 1.25 | 1.20 | .26 | 129 | ||||||||||
| (2.09 | ) | 27.72 | 4.29 | 148,638 | .92 | .92 | .70 | 98 | ||||||||||
| (2.26 | ) | 28.74 | (1.35 | ) | 174,112 | .92 | .92 | .53 | 95 | |||||||||
| (4.63 | ) | 31.33 | 7.06 | 192,131 | .92 | .92 | .42 | 86 | ||||||||||
| (.25 | ) | 33.66 | 41.53 | 180,599 | .92 | .92 | .95 | 111 | ||||||||||
| (.08 | ) | 24.03 | 10.08 | 153,233 | .92 | .92 | .54 | 129 | ||||||||||
| — | 27.61 | 15.67 | 401 | .85 | .83 | .68 | 98 | |||||||||||
| (2.07 | ) | 27.57 | 4.22 | 1,083,721 | 1.00 | 1.00 | .62 | 98 | ||||||||||
| (2.23 | ) | 28.59 | (1.46 | ) | 1,335,636 | 1.00 | 1.00 | .45 | 95 | |||||||||
| (4.61 | ) | 31.19 | 7.01 | 1,512,046 | 1.00 | 1.00 | .33 | 86 | ||||||||||
| (.23 | ) | 33.53 | 41.38 | 1,034,016 | 1.00 | 1.00 | .81 | 111 | ||||||||||
| (.07 | ) | 23.94 | 10.02 | 733,436 | 1.00 | 1.00 | .46 | 129 | ||||||||||
| (2.13 | ) | 27.61 | 4.42 | 390,468 | .80 | .80 | .81 | 98 | ||||||||||
| (2.29 | ) | 28.64 | (1.26 | ) | 476,814 | .80 | .80 | .65 | 95 | |||||||||
| (4.67 | ) | 31.24 | 7.17 | 638,778 | .80 | .80 | .51 | 86 | ||||||||||
| (.28 | ) | 33.58 | 41.67 | 327,958 | .80 | .80 | 1.13 | 111 | ||||||||||
| (.10 | ) | 23.97 | 10.22 | 407,634 | .82 | .82 | .65 | 129 | ||||||||||
See accompanying notes which are an integral part of the financial statements.
Russell U.S. Small Cap Equity Fund 161
Russell Investment Company
Russell U.S. Small Cap Equity Fund
Related Party Transactions, Fees and Expenses
| Accrued fees payable to affiliates for the period ended October 31, 2016 were as follows: | ||
| Advisory fees | $ | 1,031,903 |
| Administration fees | 71,227 | |
| Distribution fees | 19,292 | |
| Shareholder servicing fees | 10,203 | |
| Transfer agent fees | 217,932 | |
| Trustee fees | 6,835 | |
| $ | 1,357,392 | |
| Transactions (amounts in thousands) during the period ended October 31, 2016 with Underlying Funds which are, or were, an | |||||||||||||||||||
| affiliated company are as follows: | |||||||||||||||||||
| Fair Value, | Change in | ||||||||||||||||||
| Beginning of | Realized Gain | Unrealized | Fair Value, End | Income | Capital Gains | ||||||||||||||
| Period | Purchases | Sales | (Loss) | Gain (Loss) | of Period | Distributions | Distributions | ||||||||||||
| Russell U.S. Cash Collateral Fund | $ | 151,976 | $ | 506,907 | $ | 573,407 | $ | — | $ | — | $ | 85,476 | $ | 531 | $ | — | |||
| Russell U.S. Cash Management Fund | 82,019 | 1,140,336 | 1,131,377 | 6 | 13 | 90,997 | 313 | — | |||||||||||
| $ | 233,995 | $ | 1,647,243 | $ | 1,704,784 | $ | 6 | $ | 13 | $ | 176,473 | $ | 844 | $ | — | ||||
Federal Income Taxes
At October 31, 2016, the cost of investments and net unrealized appreciation (depreciation), undistributed ordinary income and
undistributed long-term capital gains for income tax purposes were as follows:.
| Cost of Investments | $ | 1,659,101,354 | ||
| Unrealized Appreciation | $ | 176,926,738 | ||
| Unrealized Depreciation | (55,976,521 | ) | ||
| Net Unrealized Appreciation (Depreciation) | $ | 120,950,217 | ||
| Undistributed Ordinary Income | $ | 5,833,792 | ||
| Undistributed Long-Term Capital Gains | ||||
| (Capital Loss Carryforward) | $ | 2,230,244 | ||
| Tax Composition of Distributions | ||||
| Ordinary Income | $ | 14,492,731 | ||
| Long-Term Capital Gains | $ | 133,681,655 |
Net investment income and net realized gains (loss) in the financial statements may differ from taxable net investment income and net
realized gains (losses). Capital accounts within the financial statements are adjusted for permanent book-tax differences. Book-tax
differences are primarily due to foreign currency gains and losses, reclassifications of dividends, differences in treatment of income
from swaps, net operating losses, investments in partnerships, investments in passive foreign investment companies (PFICs), tax
straddle transaction, use of tax equalization and foreign capital gains taxes. These adjustments have no impact on the net assets.
At October 31, 2016, the Statement of Assets and Liabilities have been adjusted by the following amounts (in thousands):
| Undistributed net investment income | $ | (735 | ) |
| Accumulated net realized gain (loss) | 663 | ||
| Additional paid-in capital | 72 |
See accompanying notes which are an integral part of the financial statements.
162 Russell U.S. Small Cap Equity Fund
Russell Investment Company
Russell International Developed Markets Fund
Portfolio Management Discussion and Analysis — October 31, 2016 (Unaudited)
| Russell International Developed Markets Fund - Class A‡ | Russell International Developed Markets Fund - Class S‡‡‡ | ||||||
| Total | Total | ||||||
| Return | Return | ||||||
| 1 Year | (7.51 | )% | 1 Year | (1.61 | )% | ||
| 5 Years | 3.81 | %§ | 5 Years | 5.31 | %§ | ||
| 10 Years | 0.12 | %§ | 10 Years | 0.97 | %§ | ||
| Russell International Developed Markets Fund - Class C‡‡ | Russell International Developed Markets Fund - Class Y | ||||||
| Total | Total | ||||||
| Return | Return | ||||||
| 1 Year | (2.60 | )% | 1 Year | (1.44 | )% | ||
| 5 Years | 4.26 | %§ | 5 Years | 5.52 | %§ | ||
| 10 Years | 0.11 | %§ | 10 Years | 1.12 | %§ | ||
| Russell International Developed Markets Fund - Class E | Russell Developed ex-U.S. Large Cap® Index Net** | ||||||
| Total | Total | ||||||
| Return | Return | ||||||
| 1 Year | (1.86 | )% | 1 Year | (2.34 | )% | ||
| 5 Years | 5.07 | %§ | 5 Years | 4.75 | %§ | ||
| 10 Years | 0.76 | %§ | 10 Years | 1.56 | %§ | ||
| Russell International Developed Markets Fund - Class I | International Developed Markets Linked Benchmark*** | ||||||
| Total | Total | ||||||
| Return | Return | ||||||
| 1 Year | (1.52 | )% | 1 Year | (2.34 | )% | ||
| 5 Years | 5.40 | %§ | 5 Years | 4.75 | %§ | ||
| 10 Years | 1.04 | %§ | 10 Years | 1.10 | %§ | ||
Russell International Developed Markets Fund 163
Russell Investment Company
Russell International Developed Markets Fund
Portfolio Management Discussion and Analysis, continued — October 31, 2016
(Unaudited)
| The Russell International Developed Markets Fund (the “Fund”) | the U.K., culminating in the U.K. exiting the European Union on | ||
| employs a multi-manager approach whereby portions of the | June 23rd’s referendum result, severing a 43-year membership, | ||
| Fund are allocated to different money manager strategies. Fund | which spurred significant market volatility. Emerging markets | ||
| assets not allocated to money managers are managed by Russell | gained traction in the second half of the fiscal year with better | ||
| Investment Management, LLC (“RIM”), the Fund’s advisor. RIM | than expected economic data from China and other emerging | ||
| may change the allocation of the Fund’s assets among money | markets. The Fed lowered the expected pace of rate hikes to a one | ||
| managers at any time. An exemptive order from the Securities | hike scenario as the most likely case for the remainder of 2016. | ||
| and Exchange Commission (“SEC”) permits RIM to engage or | Asia ex-Japan and Canada were the stand out markets over the | ||
| terminate a money manager at any time, subject to approval by | period, while the U.K. and developed Europe ex-U.K. lagged the | ||
| the Fund’s Board, without a shareholder vote. Pursuant to the | most. The Fund’s overweight to emerging markets was favorable, | ||
| terms of the exemptive order, the Fund is required to notify its | while an underweight to Australia/New Zealand and overweight | ||
| shareholders within 90 days of when a money manager begins | to Japan detracted. | ||
| providing services. As of October 31, 2016, the Fund had five | |||
| money managers. | In terms of sector returns, commodity driven sectors materials | ||
| and energy outperformed the most, while some of the defensive | |||
| What is the Fund’s investment objective? | sectors, especially health care, lagged the most. The financial | ||
| The Fund seeks to provide long-term capital growth. | services sector lagged the benchmark, especially driven by | ||
| banks. The Fund’s underweight to materials detracted, offset by a | |||
| How did the Fund perform relative to its benchmark for the | favorable overweight to technology. | ||
| fiscal year ended October 31, 2016? | |||
| For the fiscal year ended October 31, 2016, the Fund’s Class A, | In terms of factor returns, quality outperformed the most, growth | ||
| Class C, Class E, Class I, Class S and Class Y Shares lost 1.87%, | underperformed and stocks with higher medium-term momentum | ||
| 2.60%, 1.86%, 1.52%, 1.61% and 1.44%, respectively. This is | underperformed. Stocks with lower volatility lagged, whereas | ||
| compared to the Fund’s benchmark, the Russell Developed ex- | stocks in the lower end of capitalization spectrum outperformed | ||
| U.S. Large Cap® Index (Net), which lost 2.34% during the same | in the developed ex-U.S. markets. The Fund’s overweights to | ||
| period. The Fund’s performance includes operating expenses, | value and volatility and underweight to capitalization size were | ||
| whereas index returns are unmanaged and do not include | favorable during the period. | ||
| expenses of any kind. | How did the investment strategies and techniques employed | ||
| For the fiscal year ended October 31, 2016, the Morningstar® | by the Fund and its money managers affect its benchmark- | ||
| Foreign Large Blend Category, a group of funds that Morningstar | relative performance? | ||
| considers to have investment strategies similar to those of the | With the exception of the Fund’s Class C Shares, the Fund | ||
| Fund, lost 2.08%. This result serves as a peer comparison and is | outperformed its benchmark for the one year period ending | ||
| expressed net of operating expenses. | October 31, 2016. The Fund’s overweight to value based on RIM’s | ||
| RIM may assign a money manager a specific style or | strategic beliefs was favorable during the period. In addition, | ||
| capitalization benchmark other than the Fund’s index. However, | stock selection was strong during the period, especially in the | ||
| the Fund’s primary index remains the benchmark for the Fund | United Kingdom and the United States. The Fund’s underweight | ||
| and is representative of the aggregate of each money manager’s | to materials detracted, offset by a favorable overweight to | ||
| benchmark index | technology. The Fund’s overweight to emerging markets was | ||
| favorable, while an underweight to Australia/New Zealand and | |||
| How did the market conditions described in the Market | overweight to Japan detracted. | ||
| Summary report affect the Fund’s performance? | The Fund employs discretionary money managers. The Fund’s | ||
| In the first half of the fiscal year ended October 31, 2016, the U.S. | discretionary money managers select the individual portfolio | ||
| Federal Reserve (“the Fed”) lifted the interest rate by 25 basis | securities for the assets assigned to them. Fund assets not | ||
| points to 0.5% in December 2015, the first time since financial | allocated to discretionary money managers include the Fund’s | ||
| crisis. The European Central Bank (“ECB”) and Bank of Japan | liquidity reserves and assets which may be managed directly by | ||
| (“BoJ”) maintained a dovish stance, as the ECB introduced new | RIM to effect the Fund’s investment strategies and/or to actively | ||
| accommodative stimulus measures in an effort to boost Eurozone | manage the Fund’s overall exposures by investing in securities or | ||
| inflation and the BoJ strengthened the stimulus program by moving | other instruments that RIM believes will achieve the desired risk/ | ||
| the deposit rate into negative territory. In the second half of the | return profile for the Fund. | ||
| fiscal year, market attention became increasingly fixated upon | |||
164 Russell International Developed Markets Fund
Russell Investment Company
Russell International Developed Markets Fund
Portfolio Management Discussion and Analysis, continued — October 31, 2016
(Unaudited)
| With respect to certain of the Fund’s money managers, Wellington | During the period, RIM equitized the Fund’s cash using index | |
| Management Company, LLP was the best performing manager | futures contracts to provide the Fund with full market exposure. | |
| for the period and outperformed the Fund’s benchmark. | This did not have a significant impact on the Fund’s performance | |
| Stock selection was one of the key drivers of the manager’s | for the period. | |
| outperformance, especially in Japan and Europe. | ||
| Describe any changes to the Fund’s structure or the money | ||
| Barrow, Hanley, Mewhinney & Strauss, LLC faced the strongest | manager line-up. | |
| headwinds for the period and underperformed the Fund’s | There were no changes to the Fund’s structure or the money | |
| benchmark. The manager’s stock selection was challenging | manager line-up during the period. | |
| for the period, especially within European banks. Moreover, | ||
| an underweight to stocks in the largest volatility decile was | Money Managers as of October 31, | |
| unfavorable. | 2016 | Styles |
| RIM manages a multi-factor positioning strategy that aims to | Barrow, Hanley, Mewhinney & Strauss, LLC Value | |
| increase the Fund’s value exposure while moderating volatility | MFS Institutional Advisors Inc. | Market Oriented |
| Numeric Investors LLC | Market Oriented | |
| exposure and expressing RIM’s total preferred positioning across | Pzena Investment Management, LLC | Value |
| multiple factors and sectors. The strategy uses the output from a | Wellington Management Company, LLP | Growth |
| quantitative model to purchase a stock portfolio expressing these | The views expressed in this report reflect those of the | |
| views. The positioning strategy’s benchmark-relative performance | portfolio managers only through the end of the period | |
| was modestly negative for the period. The strategy was modestly | covered by the report. These views do not necessarily | |
| overweight to larger capitalization stocks and this detracted as | represent the views of RIM or any other person in RIM or | |
| stocks in the lower end of capitalization spectrum outperformed | any other affiliated organization. These views are subject | |
| in the developed ex-U.S. markets. | to change at any time based upon market conditions or | |
| In addition, RIM utilized equity futures and currency forward | other events, and RIM disclaims any responsibility to | |
| contracts in order to position the portfolio to meet RIM’s overall | update the views contained herein. These views should not | |
| preferred positioning with respect to country and currency | be relied on as investment advice and, because investment | |
| exposures. This strategy detracted modestly during the fiscal year | decisions for a Russell Investment Company (“RIC”) Fund | |
| ended October 31, 2016. | are based on numerous factors, should not be relied on as | |
| an indication of investment decisions of any RIC Fund. | ||
Russell International Developed Markets Fund 165
Russell Investment Company
Russell International Developed Markets Fund
Portfolio Management Discussion and Analysis, continued — October 31, 2016
(Unaudited)
^ In prior years, the performance of the Fund’s Class I shares was used in the line graph. Class S Shares will have substantially similar annual returns as the Class
I Shares because the Shares of each Class are invested in the same portfolio of securities. Annual returns for each Class will differ only to the extent that the
Class S Shares do not have the same expenses as the Class I Shares.
* Assumes initial investment on November 1, 2006.
** Russell Developed ex-U.S. Large Cap® Index Net is an index which offers investors access to the large-cap segment of the global equity market, excluding
companies assigned to the United States. It is constructed to provide a comprehensive and unbiased barometer for the large-cap segment and is completely
reconstituted annually to accurately reflect the changes in the market over time.
*** The International Developed Markets Linked Benchmark provides a means to compare the Fund’s average annual returns to a secondary benchmark that takes
into account historical changes in the Fund’s primary benchmark. The International Developed Markets Linked Benchmark represents the returns of the
MSCI EAFE Index (net of tax on dividends from foreign holdings) through December 31, 2010 and the returns of the Russell Developed ex-U.S. Large Cap®
Index (net of tax on dividends from foreign holdings) thereafter.
‡ The Fund first issued Class A Shares on September 2, 2008. The returns shown for Class A Shares prior to that date are the returns of Class E Shares. The
performance shown has been adjusted to reflect the deduction of the maximum Class A sales charge of 5.75%. Annual returns for each Class will differ only to
the extent that the Class A Shares do not have the same expenses as Class E Shares.
‡‡ The Fund first issued Class C Shares on September 2, 2008. The returns shown for Class C Shares prior to that date are the returns of the Fund’s Class E Shares
and do not reflect deduction of Rule 12b-1 distribution fees that apply to Class C Shares. Had they done so, the returns shown for those periods would have been
lower. Annual returns for each Class will differ only to the extent that the Class C Shares do not have the same expenses as the Class E Shares.
‡‡‡ The Fund first issued Class S Shares on September 2, 2008. The returns shown for Class S Shares prior to that date are the returns of the Fund’s Class I
Shares. Class S Shares will have substantially similar annual returns as the Class I Shares because the Shares of each Class are invested in the same portfolio of
securities. Annual returns for each Class will differ only to the extent that the Class S Shares do not have the same expenses as the Class I Shares.
§ Annualized.
Performance is historical and assumes reinvestment of all dividends and capital gains. Investment return and principal value will fluctuate so that an investor’s
shares, when redeemed, may be worth more or less than when purchased. Past performance is not indicative of future results. The returns shown do not reflect the
deduction of taxes that a shareholder would pay on Fund distributions or the redemption of Fund shares. Additionally, the returns presented herein may differ from
the performance reported in the Financial Highlights as the returns herein are calculated in a manner consistent with standardized performance in accordance with
Securities and Exchange Commission rules, while the performance in the Financial Highlights has been calculated in accordance with U.S. Generally Accepted
Accounting Principles (“U.S. GAAP”).
166 Russell International Developed Markets Fund
Russell Investment Company
Russell International Developed Markets Fund
Shareholder Expense Example — October 31, 2016 (Unaudited)
| Fund Expenses | Please note that the expenses shown in the table are meant | |||||
| The following disclosure provides important information | to highlight your ongoing costs only and do not reflect any | |||||
| regarding the Fund’s Shareholder Expense Example | transactional costs. Therefore, the information under the heading | |||||
| (“Example”). | “Hypothetical Performance (5% return before expenses)” is | |||||
| useful in comparing ongoing costs only, and will not help you | ||||||
| Example | determine the relative total costs of owning different funds. In | |||||
| As a shareholder of the Fund, you incur two types of costs: (1) | addition, if these transactional costs were included, your costs | |||||
| transaction costs, including sales charges (loads) on certain | would have been higher. | |||||
| purchase or redemption payments, and (2) ongoing costs, | Hypothetical | |||||
| including distribution (12b-1) and/or service fees and other | Performance (5% | |||||
| Fund expenses. The Example is intended to help you understand | Actual | return before | ||||
| your ongoing costs (in dollars) of investing in the Fund and to | Class A | Performance | expenses) | |||
| Beginning Account Value | ||||||
| compare these costs with the ongoing costs of investing in other | May 1, 2016 | $ | 1,000.00 | $ | 1,000.00 | |
| mutual funds. The Example is based on an investment of $1,000 | Ending Account Value | |||||
| invested at the beginning of the period and held for the entire | October 31, 2016 | $ | 1,010.10 | $ | 1,019.15 | |
| period indicated, which for this Fund is from May 1, 2016 to | Expenses Paid During Period* | $ | 6.01 | $ | 6.04 | |
| October 31, 2016. | * Expenses are equal to the Fund's annualized expense ratio of 1.19% | |||||
| (representing the six month period annualized), multiplied by the average | ||||||
| Actual Expenses | account value over the period, multiplied by 184/366 (to reflect the one-half | |||||
| The information in the table under the heading “Actual | year period). | |||||
| Performance” provides information about actual account values | ||||||
| and actual expenses. You may use the information in this column, | Hypothetical | |||||
| Performance (5% | ||||||
| together with the amount you invested, to estimate the expenses | Actual | return before | ||||
| that you paid over the period. Simply divide your account value by | Class C | Performance | expenses) | |||
| $1,000 (for example, an $8,600 account value divided by $1,000 | Beginning Account Value | |||||
| = 8.6), then multiply the result by the number in the first column | May 1, 2016 | $ | 1,000.00 | $ | 1,000.00 | |
| Ending Account Value | ||||||
| in the row entitled “Expenses Paid During Period” to estimate | October 31, 2016 | $ | 1,006.50 | $ | 1,015.43 | |
| the expenses you paid on your account during this period. | Expenses Paid During Period* | $ | 9.73 | $ | 9.78 | |
| Hypothetical Example for Comparison Purposes | * Expenses are equal to the Fund's annualized expense ratio of 1.93% | |||||
| The information in the table under the heading “Hypothetical | (representing the six month period annualized), multiplied by the average | |||||
| account value over the period, multiplied by 184/366 (to reflect the one-half | ||||||
| Performance (5% return before expenses)” provides information | year period). | |||||
| about hypothetical account values and hypothetical expenses | ||||||
| based on the Fund’s actual expense ratio and an assumed rate of | Hypothetical | |||||
| return of 5% per year before expenses, which is not the Fund’s | Performance (5% | |||||
| Actual | return before | |||||
| actual return. The hypothetical account values and expenses | Class E | Performance | expenses) | |||
| may not be used to estimate the actual ending account balance or | Beginning Account Value | |||||
| expenses you paid for the period. You may use this information | May 1, 2016 | $ | 1,000.00 | $ | 1,000.00 | |
| to compare the ongoing costs of investing in the Fund and other | Ending Account Value | |||||
| October 31, 2016 | $ | 1,010.40 | $ | 1,019.15 | ||
| funds. To do so, compare this 5% hypothetical example with the | Expenses Paid During Period* | $ | 6.01 | $ | 6.04 | |
| 5% hypothetical examples that appear in the shareholder reports | ||||||
| of other funds. | * Expenses are equal to the Fund's annualized expense ratio of 1.19% | |||||
| (representing the six month period annualized), multiplied by the average | ||||||
| account value over the period, multiplied by 184/366 (to reflect the one-half | ||||||
| year period). | ||||||
Russell International Developed Markets Fund 167
Russell Investment Company
Russell International Developed Markets Fund
Shareholder Expense Example, continued — October 31, 2016 (Unaudited)
| Hypothetical | |||||
| Performance (5% | |||||
| Actual | return before | ||||
| Class I | Performance | expenses) | |||
| Beginning Account Value | |||||
| May 1, 2016 | $ | 1,000.00 | $ | 1,000.00 | |
| Ending Account Value | |||||
| October 31, 2016 | $ | 1,012.20 | $ | 1,020.81 | |
| Expenses Paid During Period* | $ | 4.35 | $ | 4.37 | |
| * Expenses are equal to the Fund's annualized expense ratio of 0.86% | |||||
| (representing the six month period annualized), multiplied by the average | |||||
| account value over the period, multiplied by 184/366 (to reflect the one-half | |||||
| year period). | |||||
| Hypothetical | |||||
| Performance (5% | |||||
| Actual | return before | ||||
| Class S | Performance | expenses) | |||
| Beginning Account Value | |||||
| May 1, 2016 | $ | 1,000.00 | $ | 1,000.00 | |
| Ending Account Value | |||||
| October 31, 2016 | $ | 1,011.60 | $ | 1,020.41 | |
| Expenses Paid During Period* | $ | 4.75 | $ | 4.77 | |
| * Expenses are equal to the Fund's annualized expense ratio of 0.94% | |||||
| (representing the six month period annualized), multiplied by the average | |||||
| account value over the period, multiplied by 184/366 (to reflect the one-half | |||||
| year period). | |||||
| Hypothetical | |||||
| Performance (5% | |||||
| Actual | return before | ||||
| Class Y | Performance | expenses) | |||
| Beginning Account Value | |||||
| May 1, 2016 | $ | 1,000.00 | $ | 1,000.00 | |
| Ending Account Value | |||||
| October 31, 2016 | $ | 1,012.50 | $ | 1,021.47 | |
| Expenses Paid During Period* | $ | 3.69 | $ | 3.71 | |
| * Expenses are equal to the Fund's annualized expense ratio of 0.73% | |||||
| (representing the six month period annualized), multiplied by the average | |||||
| account value over the period, multiplied by 184/366 (to reflect the one-half | |||||
| year period). | |||||
168 Russell International Developed Markets Fund
Russell Investment Company
Russell International Developed Markets Fund
Schedule of Investments — October 31, 2016
| Amounts in thousands (except share amounts) | Amounts in thousands (except share amounts) | |||||||||
| Principal | Fair | Principal | Fair | |||||||
| Amount ($) | Value | Amount ($) | Value | |||||||
| or Shares | $ | or Shares | $ | |||||||
| Common Stocks - 93.5% | Barco NV | 7,166 | 563 | |||||||
| Australia - 2.4% | Colruyt SA | 17,701 | 951 | |||||||
| AGL Energy, Ltd. | 62,826 | 915 | D'ieteren SA | 15,880 | 700 | |||||
| Ansell, Ltd. - GDR | 100,700 | 1,658 | Elia System Operator SA | 21,991 | 1,138 | |||||
| Astro Japan Property Group(ö) | 99,600 | 512 | Groupe Bruxelles Lambert SA | 24,995 | 2,149 | |||||
| Australia & New Zealand Banking | KBC Group NV | 122,876 | 7,479 | |||||||
| Group, Ltd. - ADR | 247,074 | 5,220 | Sofina SA | 12,980 | 1,814 | |||||
| Bendigo & Adelaide Bank, Ltd. | 36,358 | 307 | UCB SA | 79,872 | 5,400 | |||||
| BGP Holdings PLC(Æ)(Å) | 559,805 | — | 38,106 | |||||||
| BlueScope Steel, Ltd. | 337,300 | 2,002 | ||||||||
| Caltex Australia, Ltd. | 139,300 | 3,242 | Bermuda - 0.2% | |||||||
| CIMIC Group, Ltd. | 5,900 | 133 | Brookfield Business Partners, LP(Ñ) | 2,728 | 63 | |||||
| Coca-Cola Amatil, Ltd. | 210,600 | 1,528 | XL Group, Ltd. | 160,925 | 5,584 | |||||
| Commonwealth Bank of Australia - ADR | 101,645 | 5,660 | 5,647 | |||||||
| CSR, Ltd. | 130,383 | 362 | ||||||||
| Downer EDI, Ltd. | 434,970 | 1,924 | Brazil - 0.4% | |||||||
| Flight Centre, Ltd. | 23,900 | 615 | Ambev SA - ADR | 283,555 | 1,673 | |||||
| GDI Property Group(Æ)(ö) | 127,000 | 94 | Embraer SA - ADR(Æ) | 267,700 | 5,726 | |||||
| Genworth Mortgage Insurance Australia, | Itau Unibanco Holding SA - ADR | 215,920 | 2,576 | |||||||
| Ltd. | 292,665 | 680 | 9,975 | |||||||
| GWA Group, Ltd.(Æ) | 240,200 | 521 | ||||||||
| Harvey Norman Holdings, Ltd. | 85,316 | 327 | Canada - 3.7% | |||||||
| Investa Office Fund(ö) | 257,000 | 827 | Advantage Oil & Gas, Ltd.(Æ) | 19,600 | 132 | |||||
| JB Hi-Fi, Ltd. | 102,870 | 2,217 | Bank of Montreal | 130,819 | 8,325 | |||||
| Metcash, Ltd.(Æ) | 15,500 | 23 | Bank of Nova Scotia (The) | 207,066 | 11,128 | |||||
| Mineral Resources, Ltd. | 295,400 | 2,591 | Barrick Gold Corp. | 25,300 | 445 | |||||
| Mirvac Group(ö) | 572,200 | 907 | BCE, Inc. | 29,400 | 1,336 | |||||
| National Australia Bank, Ltd. - ADR | 149,568 | 3,177 | Bonavista Energy Corp. | 12,200 | 40 | |||||
| Northern Star Resources, Ltd. | 103,400 | 334 | Brookfield Asset Management, Inc. | |||||||
| Orica, Ltd. | 96,411 | 1,192 | Class A | 131,910 | 4,619 | |||||
| OZ Minerals, Ltd. | 506,012 | 2,573 | BRP, Inc.(Æ) | 30,000 | 580 | |||||
| Regis Resources, Ltd. | 321,400 | 809 | CAE, Inc. | 20,000 | 281 | |||||
| Resolute Mining, Ltd. Class A | 498,600 | 581 | Canadian Imperial Bank of Commerce | 100,377 | 7,521 | |||||
| Rio Tinto, Ltd. - ADR | 144,791 | 5,954 | Canadian National Railway Co. | 75,787 | 4,765 | |||||
| Sandfire Resources NL | 303,879 | 1,199 | Canadian Natural Resources, Ltd. | 195,600 | 6,208 | |||||
| Shopping Centres Australasia Property | Canadian Real Estate Investment | |||||||||
| Group(ö) | 334,700 | 557 | Trust(ö) | 55,700 | 1,918 | |||||
| Sims Metal Management, Ltd. | 110,600 | 842 | Capital Power Corp. | 36,400 | 560 | |||||
| South32, Ltd. | 222,400 | 433 | Cascades, Inc. | 78,300 | 738 | |||||
| Southern Cross Media Group, Ltd. Class | Celestica, Inc.(Æ) | 3,400 | 40 | |||||||
| Miscellaneous | 664,100 | 726 | Dominion Diamond Corp. | 129,400 | 1,100 | |||||
| Star Entertainment Grp, Ltd. (The) | 559,915 | 2,121 | Dorel Industries, Inc. Class B | 4,200 | 107 | |||||
| Telstra Corp., Ltd. | 165,485 | 626 | ECN Capital Corp. | 325,384 | 711 | |||||
| Wesfarmers, Ltd.(Æ) | 28,104 | 875 | Element Fleet Management Corp. | 149,263 | 1,455 | |||||
| Westfield Corp.(ö) | 13,229 | 89 | Emera, Inc. | 5,344 | 186 | |||||
| Westpac Banking Corp. | 97,723 | 2,259 | Entertainment One, Ltd. | 27,000 | 77 | |||||
| Whitehaven Coal, Ltd.(Æ) | 450,700 | 1,034 | Equitable Group, Inc.(Ñ) | 8,500 | 335 | |||||
| Woodside Petroleum, Ltd. | 19,300 | 414 | Fortis, Inc. | 14,100 | 464 | |||||
| 58,060 | George Weston, Ltd. | 51,000 | 4,156 | |||||||
| Granite Real Estate Investment Trust(ö) | 20,800 | 654 | ||||||||
| Austria - 0.4% | Great Canadian Gaming Corp.(Æ) | 35,000 | 581 | |||||||
| Buwog AG(Æ) | 1,660 | 40 | High Liner Foods, Inc. | 13,100 | 240 | |||||
| CA Immobilien Anlagen AG(Æ) | 19,937 | 362 | Hydro One, Ltd.(Þ) | 94,426 | 1,723 | |||||
| Erste Group Bank AG(Æ) | 317,231 | 9,952 | Intact Financial Corp. | 59,000 | 4,011 | |||||
| Kapsch TrafficCom AG(Å) | 12,275 | 549 | Loblaw Cos., Ltd. | 72,053 | 3,555 | |||||
| 10,903 | Magna International, Inc. Class A | 35,000 | 1,437 | |||||||
| Medical Facilities Corp. | 45,300 | 739 | ||||||||
| Belgium - 1.5% | Morguard Corp. | 4,100 | 515 | |||||||
| Ageas | 10,525 | 384 | Morguard North American Residential | |||||||
| AGFA-Gevaert NV(Æ) | 130,782 | 544 | Real Estate Investment Trust(ö) | 21,000 | 194 | |||||
| Anheuser-Busch InBev SA | 147,983 | 16,984 | ||||||||
See accompanying notes which are an integral part of the financial statements.
Russell International Developed Markets Fund 169
Russell Investment Company
Russell International Developed Markets Fund
Schedule of Investments, continued — October 31, 2016
| Amounts in thousands (except share amounts) | Amounts in thousands (except share amounts) | |||||||||
| Principal | Fair | Principal | Fair | |||||||
| Amount ($) | Value | Amount ($) | Value | |||||||
| or Shares | $ | or Shares | $ | |||||||
| Morguard Real Estate Investment | Alstom SA(Æ) | 4,800 | 129 | |||||||
| Trust(ö) | 17,200 | 195 | Altamir | 46,295 | 591 | |||||
| Mullen Group, Ltd. - ADR | 2,800 | 39 | Atos SE | 10,727 | 1,115 | |||||
| National Bank of Canada | 7,400 | 264 | AXA SA | 143,938 | 3,241 | |||||
| Parex Resources, Inc.(Æ) | 39,100 | 450 | BNP Paribas SA | 214,265 | 12,444 | |||||
| Power Corp. of Canada | 93,757 | 2,011 | Boiron SA | 2,733 | 231 | |||||
| Pure Industrial Real Estate Trust(ö) | 37,700 | 151 | Bouygues SA - ADR | 378,791 | 12,362 | |||||
| Quebecor, Inc. Class B | 39,772 | 1,116 | Bureau Veritas SA | 60,452 | 1,141 | |||||
| Raging River Exploration, Inc.(Æ) | 72,400 | 580 | Caisse Regionale de Credit Agricole | |||||||
| RioCan Real Estate Investment Trust(ö) | 82,900 | 1,612 | Mutuel Nord de France | 7,784 | 142 | |||||
| Rogers Sugar, Inc. | 71,200 | 333 | Casino Guichard Perrachon SA | 30,965 | 1,539 | |||||
| Royal Bank of Canada - GDR | 65,086 | 4,066 | Christian Dior SE | 25,263 | 4,877 | |||||
| Sun Life Financial, Inc. | 20,900 | 700 | Cie de Saint-Gobain | 209,900 | 9,328 | |||||
| Suncor Energy, Inc. | 114,543 | 3,437 | Credit Agricole SA | 846,279 | 9,109 | |||||
| TMX Group, Ltd. | 4,000 | 185 | Danone SA | 78,114 | 5,405 | |||||
| Toronto Dominion Bank | 128,650 | 5,837 | Dassault Systemes SA | 21,265 | 1,685 | |||||
| Transcontinental, Inc. Class A - ADR | 5,900 | 79 | Engie SA | 465,491 | 6,717 | |||||
| TransForce, Inc. | 16,000 | 363 | Eurazeo SA | 67,012 | 3,855 | |||||
| 92,294 | Faurecia | 246,401 | 9,045 | |||||||
| FFP | 6,547 | 481 | ||||||||
| China - 1.0% | GDF Suez(Å)(Æ) | 55,671 | — | |||||||
| Alibaba Group Holding, Ltd. - ADR(Æ) | 72,911 | 7,414 | Gecina SA(ö) | 8,913 | 1,298 | |||||
| China Shenhua Energy Co., Ltd. Class H | 1,561,000 | 3,248 | Hermes International | 6,619 | 2,683 | |||||
| Lenovo Group, Ltd. | 4,400,000 | 2,819 | Ipsen SA | 7,590 | 524 | |||||
| Tencent Holdings, Ltd. | 328,700 | 8,704 | Kaufman & Broad SA - GDR | 12,706 | 476 | |||||
| Yangzijiang Shipbuilding Holdings, Ltd. | 2,821,800 | 1,508 | Lectra | 7,567 | 137 | |||||
| 23,693 | Legrand SA - ADR | 35,418 | 2,000 | |||||||
| Linedata Services | 3,991 | 184 | ||||||||
| Colombia - 0.0% | L'Oreal SA | 58,355 | 10,452 | |||||||
| Ecopetrol SA - ADR(Æ)(Ñ) | 104,200 | 905 | LVMH Moet Hennessy Louis Vuitton | |||||||
| SE - ADR | 33,763 | 6,141 | ||||||||
| Czech Republic - 0.0% | Mersen | 1,160 | 23 | |||||||
| Komercni Banka AS | 18,900 | 692 | Natixis SA | 743,694 | 3,764 | |||||
| Neopost SA | 17,430 | 527 | ||||||||
| Denmark - 1.5% | Nexans SA(Æ) | 16,030 | 910 | |||||||
| Carlsberg A/S Class B | 16,431 | 1,481 | Orange SA - ADR | 55,852 | 880 | |||||
| Danske Bank A/S | 563,282 | 17,382 | Pernod Ricard SA | 46,278 | 5,501 | |||||
| DFDS A/S | 6,286 | 304 | Peugeot SA(Æ) | 296,599 | 4,441 | |||||
| DSV A/S | 147,089 | 7,125 | Publicis Groupe SA - ADR | 160,552 | 11,023 | |||||
| GN Store Nord A/S | 42,930 | 870 | Renault SA | 20,316 | 1,767 | |||||
| NKT Holding A/S | 36,990 | 2,491 | Safran SA | 64,335 | 4,419 | |||||
| Novo Nordisk A/S Class B | 15,016 | 536 | Sanofi - ADR | 217,902 | 16,949 | |||||
| Pandora A/S | 43,078 | 5,605 | Schneider Electric SE | 259,347 | 17,424 | |||||
| Schouw & Co. AB | 630 | 40 | SCOR SE - ADR | 66,740 | 2,163 | |||||
| 35,834 | Societe Generale SA | 103,412 | 4,025 | |||||||
| Synergie SA | 2,434 | 79 | ||||||||
| Finland - 0.3% | Technip SA | 145,204 | 9,595 | |||||||
| Cramo OYJ | 6,190 | 163 | Teleperformance - GDR | 9,210 | 974 | |||||
| Fortum OYJ | 8,602 | 143 | Thales SA | 54,120 | 5,098 | |||||
| Kone OYJ Class B | 98,702 | 4,542 | Total SA | 317,080 | 15,174 | |||||
| Sampo OYJ Class A | 46,881 | 2,148 | Vallourec SA(Æ)(Ñ) | 1,426,964 | 6,971 | |||||
| Sponda OYJ | 57,300 | 271 | Veolia Environnement SA | 54,000 | 1,179 | |||||
| Technopolis OYJ | 16,900 | 58 | Vinci SA | 67,762 | 4,899 | |||||
| UPM-Kymmene OYJ | 20,176 | 469 | Wendel SA | 1,147 | 132 | |||||
| Valmet OYJ | 17,370 | 258 | 244,107 | |||||||
| 8,052 | ||||||||||
| Germany - 6.6% | ||||||||||
| France - 9.9% | adidas AG | 53,093 | 8,707 | |||||||
| ABC arbitrage(Æ) | 9,500 | 79 | Allianz SE | 36,083 | 5,624 | |||||
| Air Liquide SA Class A(Ñ) | 87,011 | 8,843 | AURELIUS Equity Opportunities SE & | |||||||
| Airbus Group SE | 167,338 | 9,936 | Co. KGaA | 2,319 | 139 | |||||
See accompanying notes which are an integral part of the financial statements.
170 Russell International Developed Markets Fund
Russell Investment Company
Russell International Developed Markets Fund
Schedule of Investments, continued — October 31, 2016
| Amounts in thousands (except share amounts) | Amounts in thousands (except share amounts) | |||||||||
| Principal | Fair | Principal | Fair | |||||||
| Amount ($) | Value | Amount ($) | Value | |||||||
| or Shares | $ | or Shares | $ | |||||||
| Bayer AG | 252,944 | 25,071 | Li & Fung, Ltd. | 2,291,164 | 1,129 | |||||
| Bayerische Motoren Werke AG | 12,486 | 1,088 | Link REIT(ö) | 36,000 | 257 | |||||
| Beiersdorf AG | 48,840 | 4,299 | MTR Corp., Ltd. | 131,500 | 727 | |||||
| Cewe Stiftung & Co. KGAA | 520 | 50 | New World Development Co., Ltd. | 3,541,000 | 4,414 | |||||
| Continental AG | 28,430 | 5,449 | NewOcean Energy Holdings, Ltd. | 2,146,000 | 553 | |||||
| Covestro AG(Þ) | 4,450 | 263 | Sunlight Real Estate Investment Trust(ö) | 998,000 | 617 | |||||
| Daimler AG | 57,046 | 4,064 | Swire Properties, Ltd. | 492,800 | 1,415 | |||||
| Deutsche Beteiligungs AG | 22,296 | 752 | WH Group, Ltd.(Þ) | 5,460,000 | 4,428 | |||||
| Deutsche Boerse AG(Æ) | 171,752 | 13,359 | Wheelock & Co., Ltd. | 718,000 | 4,431 | |||||
| Deutsche Lufthansa AG | 275,481 | 3,521 | Xinyi Glass Holdings, Ltd.(Æ) | 2,134,000 | 1,834 | |||||
| Deutsche Telekom AG | 264,588 | 4,312 | 55,855 | |||||||
| Deutsche Wohnen AG | 116,927 | 3,814 | ||||||||
| Deutz AG | 34,900 | 172 | India - 0.3% | |||||||
| Evonik Industries AG | 37,030 | 1,157 | HDFC Bank, Ltd. - ADR | 36,500 | 2,583 | |||||
| Fresenius SE & Co. KGaA | 51,528 | 3,803 | Housing Development Finance Corp., | |||||||
| GEA Group AG | 80,684 | 3,116 | Ltd. | 136,347 | 2,818 | |||||
| Gerresheimer AG - GDR | 18,406 | 1,389 | Tata Consultancy Services, Ltd. | 74,940 | 2,682 | |||||
| HeidelbergCement AG | 54,070 | 5,113 | 8,083 | |||||||
| Henkel AG & Co. KGaA | 12,722 | 1,401 | ||||||||
| Infineon Technologies AG - ADR | 293,875 | 5,274 | Ireland - 1.3% | |||||||
| Kloeckner & Co. SE(Æ) | 159,004 | 1,982 | CRH PLC | 439,089 | 14,192 | |||||
| Linde AG | 22,689 | 3,743 | Fly Leasing, Ltd. - ADR(Æ) | 59,800 | 733 | |||||
| Merck KGaA | 25,765 | 2,649 | Irish Residential Properties REIT PLC(ö) | 519,691 | 670 | |||||
| MTU Aero Engines AG | 11,217 | 1,172 | James Hardie Industries PLC | 280,421 | 4,180 | |||||
| Muenchener Rueckversicherungs- | Jazz Pharmaceuticals PLC(Æ) | 15,100 | 1,653 | |||||||
| Gesellschaft AG in Muenchen | 44,166 | 8,560 | Ryanair Holdings PLC - ADR(Æ) | 54,045 | 4,058 | |||||
| OSRAM Licht AG | 13,431 | 762 | Willis Towers Watson PLC | 48,454 | 6,100 | |||||
| ProSiebenSat.1 Media SE | 41,030 | 1,768 | 31,586 | |||||||
| SAP SE - ADR | 80,899 | 7,126 | ||||||||
| Siemens AG | 136,212 | 15,463 | Isle of Man - 0.0% | |||||||
| Siltronic AG(Æ) | 2,940 | 106 | Playtech PLC | 61,250 | 696 | |||||
| Software AG | 82,852 | 3,011 | ||||||||
| STADA Arzneimittel AG | 8,320 | 416 | Israel - 0.8% | |||||||
| Talanx AG | 152,267 | 4,724 | Bank Hapoalim BM | 424,587 | 2,449 | |||||
| Uniper SE(Æ) | 34,150 | 455 | Bank Leumi Le-Israel BM(Æ) | 105,208 | 397 | |||||
| Vonovia SE | 23,064 | 813 | Check Point Software Technologies, Ltd. | |||||||
| Wuestenrot & Wuerttembergische AG | 32,495 | 646 | (Æ) | 34,400 | 2,909 | |||||
| Zalando SE(Æ)(Þ) | 171,332 | 7,521 | Mobileye NV(Æ) | 128,872 | 4,791 | |||||
| 162,854 | Plus500, Ltd. | 78,436 | 594 | |||||||
| Shufersal, Ltd. | 110,100 | 416 | ||||||||
| Hong Kong - 2.3% | Teva Pharmaceutical Industries, Ltd. | |||||||||
| AIA Group, Ltd. | 2,062,969 | 13,019 | - ADR | 195,300 | 8,347 | |||||
| Champion REIT(Æ)(ö) | 1,206,000 | 685 | Teva Pharmaceutical Industries, Ltd. | 7,282 | 311 | |||||
| Cheung Kong Infrastructure Holdings, | 20,214 | |||||||||
| Ltd. | 233,000 | 1,907 | ||||||||
| Cheung Kong Property Holdings, Ltd. | 256,000 | 1,896 | Italy - 2.7% | |||||||
| China Mobile, Ltd. | 466,500 | 5,344 | A2A SpA | 1,753,940 | 2,392 | |||||
| CK Hutchison Holdings, Ltd. | 70,500 | 872 | Davide Campari-Milano SpA | 654,412 | 6,581 | |||||
| CLP Holdings, Ltd. | 51,500 | 523 | El.En. SpA | 11,980 | 263 | |||||
| Emperor Entertainment Hotel, Ltd. | 210,000 | 51 | Enel SpA | 3,435,536 | 14,760 | |||||
| Global Brands Group Holding, Ltd.(Æ) | 6,155,164 | 697 | ENI SpA - ADR | 2,015,703 | 29,152 | |||||
| Great Eagle Holdings, Ltd. | 75,000 | 333 | Luxottica Group SpA | 28,954 | 1,435 | |||||
| Guangdong Investment, Ltd. | 2,931,600 | 4,426 | Parmalat SpA | 260,793 | 689 | |||||
| Guoco Group, Ltd. | 17,000 | 191 | Snam Rete Gas SpA | 551,507 | 2,910 | |||||
| Hang Seng Bank, Ltd. | 42,700 | 770 | Telecom Italia SpA (Æ) | 6,276,125 | 5,471 | |||||
| Hong Kong Aircraft Engineering Co., | Terna Rete Elettrica Nazionale SpA | 54,729 | 268 | |||||||
| Ltd. | 9,600 | 68 | UniCredit SpA | 152,400 | 377 | |||||
| Hongkong Land Holdings, Ltd. | 141,900 | 951 | Unione di Banche Italiane SpA(Ñ) | 79,200 | 218 | |||||
| Hysan Development Co., Ltd. | 275,000 | 1,267 | Unipol Gruppo Finanziario SpA | 680,500 | 2,080 | |||||
| Kerry Properties, Ltd. | 819,500 | 2,594 | 66,596 | |||||||
| Lai Sun Development Co., Ltd. | 22,275,000 | 456 | ||||||||
See accompanying notes which are an integral part of the financial statements.
Russell International Developed Markets Fund 171
Russell Investment Company
Russell International Developed Markets Fund
Schedule of Investments, continued — October 31, 2016
| Amounts in thousands (except share amounts) | Amounts in thousands (except share amounts) | ||||||||||
| Principal | Fair | Principal | Fair | ||||||||
| Amount ($) | Value | Amount ($) | Value | ||||||||
| or Shares | $ | or Shares | $ | ||||||||
| Japan - 18.4% | Kao Corp. | 81,700 | 4,210 | ||||||||
| Alps Electric Co., Ltd. | 203,600 | 4,877 | Kasai Kogyo Co., Ltd. | 10,600 | 120 | ||||||
| Aozora Bank, Ltd. | 691,000 | 2,286 | KDDI Corp. | 52,500 | 1,597 | ||||||
| Arcs Co., Ltd. | 30,200 | 760 | Keihanshin Building Co., Ltd. | 126,700 | 662 | ||||||
| Astellas Pharma, Inc. | 639,900 | 9,507 | Keyence Corp. | 6,700 | 4,918 | ||||||
| Bandai Namco Holdings, Inc. | 74,700 | 2,240 | Kitz Corp. | 19,800 | 114 | ||||||
| BML, Inc. | 29,100 | 773 | Kohnan Shoji Co., Ltd. | 13,700 | 271 | ||||||
| Broadleaf Co., Ltd. | 19,800 | 223 | Kokuyo Co., Ltd. | 53,000 | 703 | ||||||
| Canon, Inc. | 331,500 | 9,520 | Kubota Corp. | 134,400 | 2,166 | ||||||
| Cawachi, Ltd. | 1,600 | 41 | Kuraray Co., Ltd. | 29,600 | 449 | ||||||
| Central Japan Railway Co. | 23,700 | 4,032 | Kyocera Corp. | 53,500 | 2,603 | ||||||
| Chiba Bank, Ltd. (The) | 41,000 | 254 | Kyushu Electric Power Co., Inc. | 37,800 | 345 | ||||||
| Chubu Electric Power Co., Inc. | 324,700 | 4,776 | Mabuchi Motor Co., Ltd. | 12,000 | 697 | ||||||
| Coca-Cola West Co., Ltd. | 42,100 | 1,245 | Maeda Road Construction Co., Ltd. | 13,000 | 241 | ||||||
| cocokara fine, Inc. | 6,400 | 248 | Marudai Food Co., Ltd. | 18,000 | 86 | ||||||
| COLOPL, Inc.(Ñ) | 124,800 | 1,798 | Marvelous, Inc.(Ñ) | 95,500 | 680 | ||||||
| Computer Engineering & Consulting, | Miraca Holdings, Inc. | 19,800 | 954 | ||||||||
| Ltd. | 10,500 | 197 | Mitsubishi Chemical Holdings Corp. | 155,600 | 1,022 | ||||||
| Daiho Corp. | 108,000 | 594 | Mitsubishi Electric Corp. | 8,000 | 108 | ||||||
| Dai-ichi Life Holdings, Inc. | 476,625 | 6,984 | Mitsubishi Heavy Industries, Ltd. | 511,000 | 2,185 | ||||||
| Daikin Industries, Ltd. | 57,300 | 5,497 | Mitsubishi Tanabe Pharma Corp. | 84,100 | 1,639 | ||||||
| Daito Trust Construction Co., Ltd. | 22,200 | 3,718 | Mitsubishi UFJ Financial Group, Inc. | 2,705,700 | 14,016 | ||||||
| Denso Corp. | 94,200 | 4,091 | Mitsui & Co., Ltd. | 118,600 | 1,646 | ||||||
| DIC Corp. | 51,400 | 1,558 | Mitsui Chemicals, Inc. | 257,000 | 1,267 | ||||||
| Doutor Nichires Holdings Co., Ltd. | 24,100 | 483 | Mitsui Mining & Smelting Co., Ltd. | 459,000 | 1,022 | ||||||
| DTS Corp. | 27,700 | 614 | Mixi, Inc. | 48,300 | 1,779 | ||||||
| Dydo Drinco, Inc. | 9,500 | 526 | Mizuho Financial Group, Inc. | 3,063,700 | 5,165 | ||||||
| East Japan Railway Co. | 7,200 | 635 | MS&AD Insurance Group Holdings, Inc. | 49,800 | 1,479 | ||||||
| EDION Corp. | 12,600 | 112 | Nidec Corp. | 62,600 | 6,069 | ||||||
| Eisai Co., Ltd. | 136,100 | 8,681 | Nintendo Co., Ltd. | 22,400 | 5,432 | ||||||
| FANUC Corp. | 21,900 | 4,103 | Nippon Beet Sugar Manufacturing Co., | ||||||||
| Ferrotec Corp. | 3,300 | 40 | Ltd. | 1,000 | 19 | ||||||
| Fuji Electric Co., Ltd. | 2,357,000 | 11,779 | Nippon Flour Mills Co., Ltd. | 43,800 | 648 | ||||||
| Fuji Heavy Industries, Ltd. | 48,600 | 1,892 | Nippon Suisan Kaisha, Ltd. | 456,000 | 2,196 | ||||||
| Fuji Media Holdings, Inc. | 91,900 | 1,269 | Nippon Telegraph & Telephone Corp. | 227,300 | 10,110 | ||||||
| Fuji Soft, Inc. | 27,500 | 731 | Nippon Television Holdings, Inc. | 11,600 | 206 | ||||||
| FUJIFILM Holdings Corp. | 73,500 | 2,782 | Nippon Yusen KK | 843,000 | 1,728 | ||||||
| Fujitsu, Ltd. | 3,695,000 | 21,900 | Nissan Motor Co., Ltd. | 112,200 | 1,141 | ||||||
| Fukuda Corp. | 10,000 | 118 | Nissin Electric Co., Ltd. | 39,600 | 529 | ||||||
| Geo Holdings Corp. | 27,400 | 348 | Nitori Holdings Co., Ltd. | 32,800 | 3,924 | ||||||
| Goldcrest Co., Ltd. | 43,400 | 790 | Nittetsu Mining Co., Ltd. | 18,300 | 765 | ||||||
| Gunma Bank, Ltd. (The) | 52,600 | 251 | Nomura Holdings, Inc. | 542,000 | 2,720 | ||||||
| Hankyu Hanshin Holdings, Inc. | 17,100 | 567 | Noritz Corp. | 27,400 | 568 | ||||||
| Hazama Ando Corp. | 334,600 | 2,161 | NTT DOCOMO, Inc. | 396,500 | 9,983 | ||||||
| Hitachi, Ltd. | 1,479,000 | 7,868 | NuFlare Technology, Inc. | 4,500 | 241 | ||||||
| Honda Motor Co., Ltd. | 610,670 | 18,269 | Obayashi Road Corp. | 15,900 | 100 | ||||||
| Hoya Corp. | 157,800 | 6,588 | Oiles Corp. | 17,600 | 319 | ||||||
| IHI Corp. | 3,298,000 | 8,688 | Oita Bank, Ltd. (The) | 42,000 | 159 | ||||||
| Iida Group Holdings Co., Ltd. | 168,800 | 3,262 | Okamura Corp. | 40,400 | 397 | ||||||
| Ines Corp. | 51,300 | 571 | Okinawa Cellular Telephone Co.(Å) | 14,900 | 466 | ||||||
| Inpex Corp. | 635,500 | 5,911 | Olympus Corp. | 104,100 | 3,715 | ||||||
| Isuzu Motors, Ltd. | 932,900 | 11,535 | Ono Pharmaceutical Co., Ltd. | 286,900 | 7,297 | ||||||
| ITOCHU Corp. | 260,800 | 3,303 | Open House Co., Ltd. | 20,800 | 440 | ||||||
| Iyo Bank, Ltd. (The) | 130,900 | 805 | ORIX Corp. | 307,300 | 4,889 | ||||||
| Jaccs Co., Ltd. | 53,000 | 208 | Osaka Gas Co., Ltd. | 963,000 | 4,005 | ||||||
| Japan Airlines Co., Ltd. | 4,500 | 133 | Osaki Electric Co., Ltd. | 28,000 | 269 | ||||||
| Japan Post Bank Co., Ltd. | 422,100 | 4,976 | Oyo Corp. | 1,800 | 21 | ||||||
| Japan Post Holdings Co., Ltd. | 312,800 | 3,985 | Penta-Ocean Construction Co., Ltd. | 131,700 | 786 | ||||||
| Japan Tobacco, Inc. | 143,600 | 5,465 | Recruit Holdings Co., Ltd. | 7,400 | 298 | ||||||
| Kaga Electronics Co., Ltd. | 3,500 | 51 | Resona Holdings, Inc. | 302,000 | 1,339 | ||||||
| Kansai Electric Power Co., Inc. (The)(Æ) | 19,000 | 182 | |||||||||
See accompanying notes which are an integral part of the financial statements.
172 Russell International Developed Markets Fund
Russell Investment Company
Russell International Developed Markets Fund
Schedule of Investments, continued — October 31, 2016
| Amounts in thousands (except share amounts) | Amounts in thousands (except share amounts) | |||||||||
| Principal | Fair | Principal | Fair | |||||||
| Amount ($) | Value | Amount ($) | Value | |||||||
| or Shares | $ | or Shares | $ | |||||||
| Rohm Co., Ltd. | 66,700 | 3,508 | Yuasa Trading Co., Ltd. | 31,300 | 751 | |||||
| Round One Corp. | 337,400 | 2,381 | 455,320 | |||||||
| Saizeriya Co., Ltd. | 54,400 | 1,436 | ||||||||
| San-A Co., Ltd. Class A | 3,100 | 169 | Jersey - 0.2% | |||||||
| San-In Godo Bank, Ltd. (The) | 32,600 | 235 | Cape PLC | 45,300 | 115 | |||||
| SBS Holdings, Inc. | 4,600 | 41 | Centamin PLC | 1,334,634 | 2,585 | |||||
| Secom Co., Ltd. | 8,200 | 592 | Highland Gold Mining, Ltd.(Ñ) | 363,461 | 717 | |||||
| Seino Holdings Co., Ltd. | 32,300 | 358 | Shire PLC - ADR | 38,730 | 2,187 | |||||
| Shin-Etsu Chemical Co., Ltd. | 21,700 | 1,646 | 5,604 | |||||||
| Shinko Electric Industries Co., Ltd. | 17,200 | 111 | ||||||||
| Shinmaywa Industries, Ltd. | 107,000 | 828 | Liechtenstein - 0.0% | |||||||
| Shinnihon Corp. | 44,300 | 428 | VP Bank AG | 4,733 | 464 | |||||
| Shizuoka Gas Co., Ltd. | 41,200 | 324 | ||||||||
| SMC Corp. | 15,800 | 4,582 | Luxembourg - 0.2% | |||||||
| SoftBank Corp. | 5,300 | 333 | Aperam SA | 71,860 | 3,262 | |||||
| Sompo Holdings, Inc. | 82,700 | 2,678 | Millicom International Cellular SA | 3,200 | 141 | |||||
| Sony Corp. | 564,600 | 17,866 | Orion Engineered Carbons SA | 1,200 | 23 | |||||
| SRA Holdings | 1,400 | 33 | Regus PLC | 591,600 | 1,799 | |||||
| Studio Alice Co., Ltd. | 11,900 | 240 | 5,225 | |||||||
| Sumitomo Bakelite Co., Ltd. | 35,000 | 190 | ||||||||
| Sumitomo Corp. | 707,900 | 8,152 | Macao - 0.3% | |||||||
| Sumitomo Electric Industries, Ltd. | 25,600 | 379 | Sands China, Ltd. | 1,921,200 | 8,338 | |||||
| Sumitomo Forestry Co., Ltd. | 5,000 | 70 | ||||||||
| Sumitomo Mitsui Financial Group, Inc. | 504,400 | 17,533 | Mexico - 0.1% | |||||||
| Sumitomo Osaka Cement Co., Ltd. | 1,555,000 | 6,449 | Fomento Economico Mexicano SAB de | |||||||
| Sun Frontier Fudousan Co., Ltd. | 4,200 | 40 | CV - ADR | 36,510 | 3,493 | |||||
| Takuma Co., Ltd. | 53,000 | 487 | ||||||||
| Terumo Corp. | 142,700 | 5,530 | Netherlands - 4.7% | |||||||
| Tochigi Bank, Ltd. (The) | 18,700 | 90 | ABN AMRO Group NV(Þ) | 173,629 | 4,003 | |||||
| Toho Gas Co., Ltd. | 298,000 | 2,762 | Aegon NV | 1,867,205 | 8,039 | |||||
| Tohoku Electric Power Co., Inc. | 348,800 | 4,269 | AerCap Holdings NV(Æ) | 9,456 | 389 | |||||
| Tokai Rika Co., Ltd. | 12,600 | 236 | Akzo Nobel NV | 58,955 | 3,807 | |||||
| Token Corp. | 7,700 | 557 | AMG Advanced Metallurgical Group NV | 36,990 | 736 | |||||
| Tokuyama Corp.(Æ) | 528,000 | 2,256 | ASML Holding NV | 40,746 | 4,311 | |||||
| Tokyo Dome Corp. | 12,500 | 119 | Heineken NV | 48,057 | 3,956 | |||||
| Tokyo Electric Power Co. Holdings, Inc. | ING Groep NV(Æ) | 2,133,802 | 28,053 | |||||||
| (Æ) | 1,221,300 | 4,745 | Koninklijke Ahold Delhaize NV(Æ) | 242,642 | 5,536 | |||||
| Tokyo Electron, Ltd. | 29,500 | 2,668 | Koninklijke KPN NV | 2,078,404 | 6,774 | |||||
| Tokyo Gas Co., Ltd. | 155,000 | 703 | Koninklijke Philips NV | 344,594 | 10,377 | |||||
| Tokyo TY Financial Group, Inc. | 1,500 | 48 | NN Group NV | 203,198 | 6,119 | |||||
| Tokyu Construction Co., Ltd. | 14,700 | 149 | NXP Semiconductors NV(Æ) | 57,608 | 5,761 | |||||
| TOMONY Holdings, Inc. | 14,300 | 74 | Philips Lighting NV(Æ)(Þ) | 22,380 | 524 | |||||
| Toppan Forms Co., Ltd. | 49,000 | 487 | Randstad Holding NV | 79,249 | 4,076 | |||||
| Toppan Printing Co., Ltd. | 352,000 | 3,312 | Royal Dutch Shell PLC Class A | 654,140 | 16,297 | |||||
| Tosei Corp. | 20,900 | 156 | Royal Dutch Shell PLC Class B | 97,574 | 2,519 | |||||
| Toshiba Plant Systems & Services Corp. | 80,100 | 1,293 | Wolters Kluwer NV | 110,376 | 4,268 | |||||
| Tosoh Corp. | 37,000 | 242 | 115,545 | |||||||
| Toyo Engineering Corp. Class A(Æ) | 233,000 | 799 | ||||||||
| Toyo Ink SC Holdings Co., Ltd. | 65,000 | 303 | Norway - 0.3% | |||||||
| Toyota Motor Corp. | 198,200 | 11,449 | Austevoll Seafood ASA | 50,300 | 453 | |||||
| Trend Micro, Inc. | 139,000 | 4,898 | DNB ASA | 13,427 | 194 | |||||
| Ulvac, Inc. | 900 | 28 | DNO ASA(Æ)(Ñ) | 490,500 | 418 | |||||
| Unitika, Ltd.(Æ) | 1,452,000 | 981 | Norsk Hydro ASA | 530,600 | 2,372 | |||||
| Usen Corp. | 30,400 | 98 | Norway Royal Salmon ASA | 4,381 | 97 | |||||
| Valor Holdings Co., Ltd. | 3,900 | 111 | Telenor ASA | 199,686 | 3,178 | |||||
| Wakita & Co., Ltd. | 27,200 | 232 | TGS Nopec Geophysical Co. ASA - ADR | 38,420 | 776 | |||||
| Warabeya Nichiyo Holdings Co., Ltd. | 14,800 | 358 | 7,488 | |||||||
| West Japan Railway Co. | 71,900 | 4,432 | ||||||||
| Yamaguchi Financial Group, Inc. | 23,000 | 254 | Portugal - 0.5% | |||||||
| Banco BPI SA Class G(Æ) | 423,312 | 525 | ||||||||
| Yodogawa Steel Works, Ltd. | 4,300 | 117 | Energias de Portugal SA | 758,177 | 2,505 | |||||
See accompanying notes which are an integral part of the financial statements.
Russell International Developed Markets Fund 173
Russell Investment Company
Russell International Developed Markets Fund
Schedule of Investments, continued — October 31, 2016
| Amounts in thousands (except share amounts) | Amounts in thousands (except share amounts) | |||||||||
| Principal | Fair | Principal | Fair | |||||||
| Amount ($) | Value | Amount ($) | Value | |||||||
| or Shares | $ | or Shares | $ | |||||||
| Galp Energia SGPS SA Class B | 593,008 | 8,018 | Coor Service Management Holding | |||||||
| 11,048 | AB(Þ) | 43,163 | 251 | |||||||
| Dios Fastigheter AB | 55,356 | 370 | ||||||||
| Russia - 0.5% | Electrolux AB | 162,606 | 3,847 | |||||||
| Evraz PLC(Æ) | 307,067 | 770 | Fastighets AB Balder Class B(Æ) | 90,117 | 2,045 | |||||
| Gazprom PJSC - ADR | 1,858,912 | 8,026 | Granges AB | 67,600 | 656 | |||||
| Yandex NV Class A(Æ) | 207,991 | 4,095 | Hennes & Mauritz AB Class B | 101,786 | 2,863 | |||||
| 12,891 | Investor AB Class B | 33,710 | 1,197 | |||||||
| KappAhl AB | 33,498 | 175 | ||||||||
| Singapore - 1.4% | L E Lundbergforetagen AB Class B | 13,582 | 879 | |||||||
| China Aviation Oil Singapore Corp., Ltd. | 68,800 | 70 | Melker Schorling AB | 10,727 | 620 | |||||
| DBS Group Holdings, Ltd. | 443,096 | 4,765 | Nordea Bank AB | 312,076 | 3,276 | |||||
| Flex, Ltd.(Æ) | 3,204 | 45 | Resurs Holding AB(Æ)(Þ) | 91,640 | 581 | |||||
| IGG, Inc. | 849,000 | 621 | Saab AB Class B | 16,100 | 570 | |||||
| Japfa, Ltd. | 1,206,300 | 762 | Scandic Hotels Group AB(Æ)(Þ) | 83,118 | 724 | |||||
| Jardine Cycle & Carriage, Ltd. | 216,900 | 6,583 | Skandinaviska Enskilda Banken AB | |||||||
| Oversea-Chinese Banking Corp., Ltd. | 219,100 | 1,333 | Class A | 183,158 | 1,845 | |||||
| Singapore Telecommunications, Ltd. | 404,454 | 1,125 | Tethys Oil AB(Æ) | 61,355 | 446 | |||||
| United Engineers, Ltd. | 102,200 | 190 | 33,559 | |||||||
| United Overseas Bank, Ltd. | 677,200 | 9,131 | ||||||||
| Venture Corp., Ltd. | 119,300 | 814 | Switzerland - 8.1% | |||||||
| Wilmar International, Ltd. | 3,768,200 | 8,965 | ABB, Ltd.(Æ) | 844,563 | 17,379 | |||||
| Wing Tai Holdings, Ltd. | 391,500 | 477 | ABB, Ltd. - ADR(Æ) | 135,200 | 2,792 | |||||
| Yanlord Land Group, Ltd. | 761,000 | 757 | Actelion, Ltd.(Æ) | 32,639 | 4,715 | |||||
| 35,638 | ALSO Holding AG(Æ) | 8,260 | 757 | |||||||
| Bachem Holding AG | 324 | 29 | ||||||||
| South Korea - 2.1% | Banque Cantonale Vaudoise | 2,751 | 1,727 | |||||||
| Hana Financial Group, Inc. | 227,425 | 6,505 | Basellandschaftliche Kantonalbank | 264 | 240 | |||||
| Hankook Tire Co., Ltd. | 113,734 | 5,485 | Basler Kantonalbank | 1,588 | 107 | |||||
| NAVER Corp. | 6,115 | 4,579 | Berner Kantonalbank AG | 731 | 133 | |||||
| POSCO | 46,750 | 9,726 | BKW AG | 26,040 | 1,212 | |||||
| Samsung Electronics Co., Ltd. | 12,559 | 17,910 | Bobst Group SA | 12,664 | 697 | |||||
| Shinhan Financial Group Co., Ltd. | 206,537 | 7,948 | Chubb, Ltd. | 34,525 | 4,385 | |||||
| 52,153 | Cie Financiere Richemont SA | 56,771 | 3,649 | |||||||
| Coca-Cola HBC AG - ADR(Æ) | 66,930 | 1,445 | ||||||||
| Spain - 1.6% | Credit Suisse Group AG(Æ) | 1,085,261 | 15,126 | |||||||
| ACS Actividades de Construccion y | Forbo Holding AG(Æ) | 45 | 57 | |||||||
| Servicios SA | 40,638 | 1,244 | Georg Fischer AG | 3,165 | 2,804 | |||||
| Aena SA(Þ) | 18,909 | 2,775 | Glencore PLC(Æ) | 241,200 | 735 | |||||
| Amadeus IT Group SA Class A | 63,386 | 2,990 | Graubuendner Kantonalbank | 89 | 131 | |||||
| Banco de Sabadell SA - ADR | 4,405,798 | 5,883 | Gurit Holding AG(Æ) | 328 | 278 | |||||
| Banco Santander SA - ADR | 598,353 | 2,931 | Helvetia Holding AG | 8,589 | 4,471 | |||||
| Construcciones y Auxiliar de | Julius Baer Group, Ltd.(Æ) | 162,359 | 6,570 | |||||||
| Ferrocarriles SA | 1,088 | 410 | Kardex AG(Æ) | 3,390 | 290 | |||||
| Corp. Financiera Alba SA | 20,559 | 900 | Kuehne & Nagel International AG | 7,650 | 1,036 | |||||
| Endesa SA - ADR | 112,417 | 2,389 | Lonza Group AG(Æ) | 24,615 | 4,641 | |||||
| Gamesa Corp. Tecnologica SA | 70,040 | 1,619 | Luzerner Kantonalbank AG(Æ) | 638 | 248 | |||||
| Gas Natural SDG SA | 16,762 | 331 | Metall Zug AG(Å) | 220 | 707 | |||||
| Iberdrola SA | 734,171 | 5,002 | Nestle SA | 342,737 | 24,842 | |||||
| Industria de Diseno Textil SA | 221,509 | 7,742 | Novartis AG | 249,411 | 17,714 | |||||
| Mediaset Espana Comunicacion SA | 162,566 | 1,815 | OC Oerlikon Corp. AG(Æ) | 247,230 | 2,326 | |||||
| Red Electrica Corp. SA | 93,764 | 1,954 | Orior AG(Æ) | 920 | 74 | |||||
| Repsol SA - ADR | 123,430 | 1,725 | Partners Group Holding AG | 175 | 88 | |||||
| 39,710 | PSP Swiss Property AG | 1,670 | 149 | |||||||
| Rieter Holding AG(Æ) | 1,297 | 247 | ||||||||
| Sweden - 1.4% | Roche Holding AG | 132,656 | 30,441 | |||||||
| Assa Abloy AB Class B | 386,215 | 7,017 | Sonova Holding AG | 9,935 | 1,332 | |||||
| Atlas Copco AB Class A(Ñ) | 161,051 | 4,716 | St. Galler Kantonalbank AG | 1,332 | 500 | |||||
| B&B Tools AB Class B | 10,016 | 223 | STMicroelectronics NV | 1,068,427 | 10,182 | |||||
| Boliden AB | 52,940 | 1,224 | Swiss Life Holding AG(Æ) | 36,239 | 9,584 | |||||
| Capio AB(Þ) | 6,500 | 34 | Swiss Re AG | 57,337 | 5,322 | |||||
See accompanying notes which are an integral part of the financial statements.
174 Russell International Developed Markets Fund
Russell Investment Company
Russell International Developed Markets Fund
Schedule of Investments, continued — October 31, 2016
| Amounts in thousands (except share amounts) | Amounts in thousands (except share amounts) | ||||||||
| Principal | Fair | Principal | Fair | ||||||
| Amount ($) | Value | Amount ($) | Value | ||||||
| or Shares | $ | or Shares | $ | ||||||
| Tecan Group AG | 1,183 | 195 | Just Eat PLC(Æ) | 639,692 | 4,399 | ||||
| UBS Group AG(Æ) | 1,082,421 | 15,303 | Kingfisher PLC | 654,791 | 2,890 | ||||
| Zurich Insurance Group AG(Æ) | 22,439 | 5,868 | National Grid PLC | 793,283 | 10,332 | ||||
| 200,528 | Persimmon PLC Class A | 9,060 | 187 | ||||||
| Premier Oil PLC(Æ) | 1,208,388 | 972 | |||||||
| Taiwan - 0.6% | Prudential PLC | 77,974 | 1,271 | ||||||
| Hon Hai Precision Industry Co., Ltd. | 1,298,709 | 3,504 | QinetiQ Group PLC | 471,600 | 1,327 | ||||
| Taiwan Semiconductor Manufacturing | Reckitt Benckiser Group PLC | 223,338 | 19,971 | ||||||
| Co., Ltd. - ADR | 215,304 | 6,696 | Redrow PLC | 10,700 | 50 | ||||
| Teco Electric and Machinery Co., Ltd. | 4,377,900 | 3,881 | RELX PLC | 74,847 | 1,336 | ||||
| 14,081 | Rightmove PLC | 12,920 | 590 | ||||||
| Rio Tinto PLC | 133,317 | 4,622 | |||||||
| Thailand - 0.2% | Rolls-Royce Holdings PLC(Æ) | 40,223,681 | 7,652 | ||||||
| Bangkok Bank PCL | 302,200 | 1,371 | Royal Bank of Scotland Group PLC(Æ) | 3,550,267 | 8,198 | ||||
| Charoen Pokphand Foods PCL | 3,310,200 | 2,973 | RSA Insurance Group PLC | 886,056 | 5,986 | ||||
| 4,344 | Sage Group PLC (The) | 141,900 | 1,250 | ||||||
| Severn Trent PLC Class H | 11,857 | 337 | |||||||
| United Kingdom - 16.4% | Sky PLC | 779,942 | 7,791 | ||||||
| 3i Group PLC | 745,176 | 6,109 | Smith & Nephew PLC | 265,097 | 3,820 | ||||
| Amec Foster Wheeler PLC - GDR | 439,999 | 2,400 | Smiths Group PLC | 92,204 | 1,596 | ||||
| Antofagasta PLC(Ñ) | 2,147,917 | 14,217 | Soco International PLC | 128,614 | 218 | ||||
| AstraZeneca PLC | 72,118 | 4,044 | Standard Chartered PLC(Æ) | 1,017,025 | 8,847 | ||||
| Aviva PLC | 1,376,836 | 7,445 | Stolt-Nielsen, Ltd. Class A | 11,153 | 137 | ||||
| Barclays PLC | 3,353,432 | 7,778 | Subsea 7 SA(Æ) | 254,508 | 2,846 | ||||
| Berendsen PLC | 2,470 | 29 | Tesco PLC(Æ) | 5,551,150 | 14,317 | ||||
| BHP Billiton PLC | 355,895 | 5,339 | Travis Perkins PLC | 594,457 | 9,681 | ||||
| Bovis Homes Group PLC | 82,420 | 763 | Trinity Mirror PLC | 70,316 | 70 | ||||
| BP PLC | 2,124,652 | 12,547 | Unilever NV | 254,306 | 10,649 | ||||
| BP PLC - ADR | 134,100 | 4,767 | Unilever PLC | 111,122 | 4,647 | ||||
| British American Tobacco PLC | 218,741 | 12,556 | Vectura Group PLC(Æ) | 85,900 | 142 | ||||
| BT Group PLC | 190,890 | 877 | Vedanta Resources PLC | 38,200 | 332 | ||||
| Centrica PLC | 91,400 | 240 | Vertu Motors PLC | 486,881 | 254 | ||||
| Cineworld Group PLC | 102,100 | 674 | Vodafone Group PLC | 5,941,547 | 16,314 | ||||
| CMC Markets PLC(Þ) | 33,745 | 78 | Worldpay Group PLC(Þ) | 1,375,322 | 4,788 | ||||
| CNH Industrial NV(Ñ) | 1,060,803 | 8,229 | WPP PLC | 1,078,172 | 23,427 | ||||
| CNH Industrial NV | 261,200 | 2,032 | 406,046 | ||||||
| Cobham PLC | 220,600 | 386 | |||||||
| Coca-Cola European Partners PLC | 167,400 | 6,435 | United States - 1.2% | ||||||
| Compass Group PLC | 503,905 | 9,113 | Carnival PLC | 85,045 | 4,093 | ||||
| Dairy Crest Group PLC | 909,149 | 6,788 | Milestone Apartments Real Estate | ||||||
| Delphi Automotive PLC | 16,945 | 1,103 | Investment Trust(Ñ)(ö) | 43,000 | 578 | ||||
| Diageo PLC | 206,344 | 5,494 | News Corp. Class A | 848,625 | 10,285 | ||||
| Dialog Semiconductor PLC(Æ) | 28,790 | 1,131 | Philip Morris International, Inc. | 63,709 | 6,144 | ||||
| Direct Line Insurance Group PLC | 326,170 | 1,381 | Samsonite International SA | 1,263,600 | 3,975 | ||||
| Drax Group PLC | 87,100 | 338 | Yum! Brands, Inc. | 51,068 | 4,406 | ||||
| DS Smith PLC Class F | 2,683,315 | 13,072 | 29,481 | ||||||
| Experian PLC | 36,605 | 703 | |||||||
| Fiat Chrysler Automobiles NV | 1,733,700 | 12,682 | Total Common Stocks | ||||||
| GlaxoSmithKline PLC - ADR | 1,187,324 | 23,469 | |||||||
| Go-Ahead Group PLC | 1,920 | 49 | (cost $2,329,666) | 2,315,108 | |||||
| Great Portland Estates PLC(ö) | 70,290 | 510 | |||||||
| Greggs PLC | 9,120 | 107 | Preferred Stocks - 0.7% | ||||||
| Hansteen Holdings PLC(ö) | 167,500 | 220 | Germany - 0.7% | ||||||
| HSBC Holdings PLC | 2,370,902 | 17,833 | Henkel AG & Co. KGaA | 48,124 | 6,175 | ||||
| IG Group Holdings PLC | 99,870 | 1,009 | Man SE | 760 | 77 | ||||
| Imperial Tobacco Group PLC | 587,515 | 28,395 | Volkswagen AG | 67,928 | 9,335 | ||||
| Inchcape PLC | 176,622 | 1,406 | 15,587 | ||||||
| Indivior PLC | 358,598 | 1,377 | |||||||
| JD Sports Fashion PLC - ADR | 38,174 | 709 | Japan - 0.0% | ||||||
| John Laing Group PLC(Þ) | 12,000 | 40 | Shinkin Central Bank Class A | 145 | 318 | ||||
| Jupiter Fund Management PLC | 175,400 | 926 | |||||||
See accompanying notes which are an integral part of the financial statements.
Russell International Developed Markets Fund 175
Russell Investment Company
Russell International Developed Markets Fund
Schedule of Investments, continued — October 31, 2016
| Amounts in thousands (except share amounts) | |||||||||
| Principal | Fair | ||||||||
| Amount ($) | Value | ||||||||
| or Shares | $ | ||||||||
| Sweden - 0.0% | |||||||||
| Fastighets AB Balder | 6,653 | 252 | |||||||
| Total Preferred Stocks | |||||||||
| (cost $15,935) | 16,157 | ||||||||
| Warrants & Rights - 0.0% | |||||||||
| Spain- 0.0% | |||||||||
| Banco Santander SA(Æ)(Ñ) | |||||||||
| Rights 2016 | 1,033,053 | 58 | |||||||
| Total Warrants & Rights | |||||||||
| (cost $51) | 58 | ||||||||
| Short-Term Investments - 5.5% | |||||||||
| United States - 5.5% | |||||||||
| Russell U.S. Cash Management Fund | 107,570,656 | (8) | 107,592 | ||||||
| United States Treasury Bills | |||||||||
| 0.113% due 11/10/16 (~)(§) | 14,100 | 14,099 | |||||||
| 0.265% due 01/05/17 (~)(§) | 15,000 | 14,993 | |||||||
| 136,684 | |||||||||
| Total Short-Term Investments | |||||||||
| (cost $136,669) | 136,684 | ||||||||
| Other Securities - 1.0% | |||||||||
| Russell U.S. Cash Collateral Fund(×) | 23,802,929 | (8) | 23,803 | ||||||
| Total Other Securities | |||||||||
| (cost $23,803) | 23,803 | ||||||||
| Total Investments 100.7% | |||||||||
| (identified cost $2,506,124) | 2,491,810 | ||||||||
| Other Assets and Liabilities, Net | |||||||||
| -(0.7%) | (16,481 | ) | |||||||
| Net Assets - 100.0% | 2,475,329 | ||||||||
See accompanying notes which are an integral part of the financial statements.
176 Russell International Developed Markets Fund
Russell Investment Company
Russell International Developed Markets Fund
Schedule of Investments, continued — October 31, 2016
| Restricted Securities | |||||||||||||
| Amounts in thousands (except share and cost per unit amounts) | |||||||||||||
| Principal | Cost per | Cost | Fair Value | ||||||||||
| % of Net Assets | Acquisition | Amount ($) | Unit | (000 | ) | (000 | ) | ||||||
| Securities | Date | or shares | $ | $ | $ | ||||||||
| 0.1% | |||||||||||||
| BGP Holdings PLC | 08/06/09 | EUR | 559,805 | — | — | — | |||||||
| GDF Suez | 11/07/05 | EUR | 55,671 | 0.01 | 1 | — | |||||||
| Kapsch TrafficCom AG | 10/21/15 | EUR | 12,275 | 35.15 | 431 | 549 | |||||||
| Metall Zug AG | 08/22/13 | CHF | 220 | 2,833.06 | 623 | 707 | |||||||
| Okinawa Cellular Telephone Co. | 04/14/16 | JPY | 14,900 | 27.51 | 410 | 466 | |||||||
| 1,722 | |||||||||||||
| For a description of restricted securities see note 8 in the Notes to Financial Statements. | |||||||||||||
| Futures Contracts | |||||||||||||
| Amounts in thousands (except contract amounts) | |||||||||||||
| Unrealized | |||||||||||||
| Appreciation | |||||||||||||
| Number of | Notional | Expiration | (Depreciation) | ||||||||||
| Contracts | Amount | Date | $ | ||||||||||
| Long Positions | |||||||||||||
| CAC40 10 Euro Index Futures | 215 | EUR | 9,689 | 11/16 | 70 | ||||||||
| DAX Index Futures | 33 | EUR | 8,809 | 12/16 | 160 | ||||||||
| Euro STOXX 50 Index Futures | 533 | EUR | 16,272 | 12/16 | 300 | ||||||||
| FTSE 100 Index Futures | 152 | GBP | 10,532 | 12/16 | 196 | ||||||||
| Hang Seng Index Futures | 25 | HKD | 28,631 | 11/16 | (99 | ) | |||||||
| MSCI Emerging Markets Mini Index Futures | 217 | USD | 9,803 | 12/16 | (229 | ) | |||||||
| S&P/TSX 60 Index Futures | 487 | CAD | 84,397 | 12/16 | 1,631 | ||||||||
| SPI 200 Index Futures | 424 | AUD | 56,074 | 12/16 | 743 | ||||||||
| TOPIX Index Futures | 751 | JPY | 10,476,450 | 12/16 | 4,143 | ||||||||
| Short Positions | |||||||||||||
| Euro STOXX 50 Index Futures | 258 | EUR | 7,877 | 12/16 | (172 | ) | |||||||
| FTSE 100 Index Futures | 656 | GBP | 45,454 | 12/16 | (2,244 | ) | |||||||
| Hang Seng Index Futures | 206 | HKD | 235,921 | 11/16 | 675 | ||||||||
| S&P 500 E-Mini Index Futures | 813 | USD | 86,182 | 12/16 | 2,342 | ||||||||
| Total Unrealized Appreciation (Depreciation) on Open Futures Contracts (å) | 7,516 | ||||||||||||
| Foreign Currency Exchange Contracts | |||||||||
| Amounts in thousands | |||||||||
| Unrealized | |||||||||
| Appreciation | |||||||||
| Amount | Amount | (Depreciation) | |||||||
| Counterparty | Sold | Bought | Settlement Date | $ | |||||
| Bank of America | USD | 462 | AUD | 603 | 12/21/16 | (4 | ) | ||
| Bank of America | USD | 899 | AUD | 1,200 | 12/21/16 | 13 | |||
| Bank of America | USD | 1,363 | AUD | 1,800 | 12/21/16 | 5 | |||
| Bank of America | USD | 1,619 | AUD | 2,114 | 12/21/16 | (13 | ) | ||
| Bank of America | USD | 6,097 | AUD | 8,000 | 12/21/16 | (19 | ) | ||
| Bank of America | USD | 609 | CAD | 800 | 12/21/16 | (13 | ) | ||
| Bank of America | USD | 1,175 | CAD | 1,541 | 12/21/16 | (26 | ) | ||
| Bank of America | USD | 1,893 | CAD | 2,500 | 12/21/16 | (29 | ) | ||
| Bank of America | USD | 3,084 | CAD | 4,044 | 12/21/16 | (68 | ) | ||
| Bank of America | USD | 6,555 | CHF | 6,500 | 12/21/16 | 32 | |||
| Bank of America | USD | 112 | EUR | 100 | 12/21/16 | (2 | ) | ||
| Bank of America | USD | 142 | EUR | 130 | 12/21/16 | 1 | |||
| Bank of America | USD | 3,395 | EUR | 3,000 | 12/21/16 | (94 | ) | ||
| Bank of America | USD | 6,215 | EUR | 5,500 | 12/21/16 | (164 | ) | ||
| Bank of America | USD | 8,942 | EUR | 8,000 | 12/21/16 | (140 | ) | ||
| Bank of America | USD | 1,299 | GBP | 1,000 | 12/21/16 | (74 | ) | ||
| Bank of America | USD | 1,947 | GBP | 1,512 | 12/21/16 | (94 | ) | ||
| Bank of America | USD | 3,157 | GBP | 2,500 | 12/21/16 | (94 | ) | ||
See accompanying notes which are an integral part of the financial statements.
Russell International Developed Markets Fund 177
Russell Investment Company
Russell International Developed Markets Fund
Schedule of Investments, continued — October 31, 2016
| Foreign Currency Exchange Contracts | |||||||
| Amounts in thousands | |||||||
| Unrealized | |||||||
| Appreciation | |||||||
| Amount | Amount | (Depreciation) | |||||
| Counterparty | Sold | Bought | Settlement Date | $ | |||
| Bank of America | USD | 25,981 | GBP | 20,000 | 12/21/16 | (1,473 | ) |
| Bank of America | USD | 129 | HKD | 1,000 | 12/21/16 | — | |
| Bank of America | USD | 471 | HKD | 3,648 | 12/21/16 | — | |
| Bank of America | USD | 645 | HKD | 5,000 | 12/21/16 | — | |
| Bank of America | USD | 839 | HKD | 6,500 | 12/21/16 | — | |
| Bank of America | USD | 903 | HKD | 7,000 | 12/21/16 | — | |
| Bank of America | USD | 3,612 | HKD | 28,000 | 12/21/16 | (1 | ) |
| Bank of America | USD | 481 | JPY | 50,000 | 12/21/16 | (3 | ) |
| Bank of America | USD | 4,186 | JPY | 423,852 | 12/21/16 | (136 | ) |
| Bank of America | USD | 4,336 | JPY | 450,000 | 12/21/16 | (36 | ) |
| Bank of America | USD | 14,007 | JPY | 1,400,000 | 12/21/16 | (630 | ) |
| Bank of America | USD | 111 | NOK | 900 | 12/21/16 | (2 | ) |
| Bank of America | USD | 375 | NOK | 3,000 | 12/21/16 | (12 | ) |
| Bank of America | USD | 2,417 | NOK | 20,000 | 12/21/16 | 4 | |
| Bank of America | USD | 4,832 | SEK | 43,000 | 12/21/16 | (60 | ) |
| Bank of America | AUD | 500 | USD | 376 | 12/21/16 | (3 | ) |
| Bank of America | AUD | 500 | USD | 380 | 12/21/16 | — | |
| Bank of America | AUD | 800 | USD | 616 | 12/21/16 | 8 | |
| Bank of America | AUD | 800 | USD | 610 | 12/21/16 | 3 | |
| Bank of America | AUD | 1,000 | USD | 749 | 12/21/16 | (11 | ) |
| Bank of America | AUD | 9,000 | USD | 6,862 | 12/21/16 | 24 | |
| Bank of America | CAD | 100 | USD | 76 | 12/21/16 | 2 | |
| Bank of America | CAD | 600 | USD | 456 | 12/21/16 | 8 | |
| Bank of America | CAD | 1,000 | USD | 768 | 12/21/16 | 22 | |
| Bank of America | CAD | 1,400 | USD | 1,064 | 12/21/16 | 20 | |
| Bank of America | CAD | 1,500 | USD | 1,140 | 12/21/16 | 21 | |
| Bank of America | CAD | 2,000 | USD | 1,518 | 12/21/16 | 26 | |
| Bank of America | CAD | 4,300 | USD | 3,258 | 12/21/16 | 51 | |
| Bank of America | CHF | 4,800 | USD | 4,977 | 12/21/16 | 113 | |
| Bank of America | EUR | 100 | USD | 112 | 12/21/16 | 2 | |
| Bank of America | EUR | 139 | USD | 156 | 12/21/16 | 4 | |
| Bank of America | EUR | 2,200 | USD | 2,473 | 12/21/16 | 53 | |
| Bank of America | EUR | 2,397 | USD | 2,699 | 12/21/16 | 61 | |
| Bank of America | EUR | 3,000 | USD | 3,381 | 12/21/16 | 81 | |
| Bank of America | EUR | 3,000 | USD | 3,385 | 12/21/16 | 84 | |
| Bank of America | EUR | 8,000 | USD | 8,737 | 12/21/16 | (64 | ) |
| Bank of America | GBP | 100 | USD | 122 | 12/21/16 | (1 | ) |
| Bank of America | GBP | 100 | USD | 130 | 12/21/16 | 8 | |
| Bank of America | GBP | 900 | USD | 1,148 | 12/21/16 | 45 | |
| Bank of America | GBP | 1,000 | USD | 1,326 | 12/21/16 | 101 | |
| Bank of America | GBP | 1,000 | USD | 1,329 | 12/21/16 | 104 | |
| Bank of America | GBP | 7,700 | USD | 9,915 | 12/21/16 | 479 | |
| Bank of America | GBP | 19,000 | USD | 23,225 | 12/21/16 | (59 | ) |
| Bank of America | HKD | 1,000 | USD | 129 | 12/21/16 | — | |
| Bank of America | HKD | 1,500 | USD | 194 | 12/21/16 | — | |
| Bank of America | HKD | 3,000 | USD | 387 | 12/21/16 | — | |
| Bank of America | HKD | 4,000 | USD | 516 | 12/21/16 | — | |
| Bank of America | HKD | 8,000 | USD | 1,032 | 12/21/16 | — | |
| Bank of America | HKD | 29,938 | USD | 3,863 | 12/21/16 | 2 | |
| Bank of America | JPY | 10,036 | USD | 99 | 12/21/16 | 3 | |
| Bank of America | JPY | 20,000 | USD | 196 | 12/21/16 | 5 | |
| Bank of America | JPY | 40,000 | USD | 391 | 12/21/16 | 9 | |
| Bank of America | JPY | 60,000 | USD | 592 | 12/21/16 | 19 | |
| Bank of America | JPY | 90,000 | USD | 858 | 12/21/16 | (2 | ) |
| Bank of America | JPY | 100,000 | USD | 968 | 12/21/16 | 12 | |
| Bank of America | JPY | 200,000 | USD | 1,965 | 12/21/16 | 54 |
See accompanying notes which are an integral part of the financial statements.
178 Russell International Developed Markets Fund
Russell Investment Company
Russell International Developed Markets Fund
Schedule of Investments, continued — October 31, 2016
| Foreign Currency Exchange Contracts | |||||||
| Amounts in thousands | |||||||
| Unrealized | |||||||
| Appreciation | |||||||
| Amount | Amount | (Depreciation) | |||||
| Counterparty | Sold | Bought | Settlement Date | $ | |||
| Bank of America | JPY | 395,639 | USD | 3,907 | 12/21/16 | 127 | |
| Bank of America | JPY | 400,000 | USD | 3,983 | 12/21/16 | 161 | |
| Bank of New York | USD | 225 | JPY | 23,721 | 11/01/16 | 1 | |
| BNP Paribas | USD | 990 | AUD | 1,292 | 12/21/16 | (8 | ) |
| BNP Paribas | USD | 7,233 | AUD | 9,444 | 12/21/16 | (58 | ) |
| BNP Paribas | USD | 9,528 | AUD | 12,440 | 12/21/16 | (77 | ) |
| BNP Paribas | USD | 1,184 | CAD | 1,530 | 12/21/16 | (43 | ) |
| BNP Paribas | USD | 10,966 | CAD | 14,169 | 12/21/16 | (399 | ) |
| BNP Paribas | USD | 13,792 | CAD | 17,820 | 12/21/16 | (501 | ) |
| BNP Paribas | USD | 7,382 | EUR | 6,523 | 12/21/16 | (206 | ) |
| BNP Paribas | USD | 2,271 | GBP | 1,705 | 12/21/16 | (182 | ) |
| BNP Paribas | USD | 13,754 | GBP | 10,326 | 12/21/16 | (1,100 | ) |
| BNP Paribas | USD | 4,152 | JPY | 420,644 | 12/21/16 | (133 | ) |
| BNP Paribas | USD | 15,809 | JPY | 1,601,556 | 12/21/16 | (507 | ) |
| BNP Paribas | EUR | 21,934 | USD | 24,824 | 12/21/16 | 692 | |
| BNP Paribas | GBP | 11,160 | USD | 14,865 | 12/21/16 | 1,189 | |
| BNP Paribas | HKD | 44,580 | USD | 5,753 | 12/21/16 | 3 | |
| BNP Paribas | JPY | 1,199,200 | USD | 11,838 | 12/21/16 | 380 | |
| Brown Brothers Harriman | USD | 2 | CAD | 3 | 11/02/16 | — | |
| Brown Brothers Harriman | USD | 58 | CAD | 78 | 11/02/16 | — | |
| Brown Brothers Harriman | USD | 76 | DKK | 500 | 12/21/16 | (2 | ) |
| Brown Brothers Harriman | USD | 559 | EUR | 500 | 12/21/16 | (9 | ) |
| Brown Brothers Harriman | USD | 1,354 | EUR | 1,200 | 12/21/16 | (34 | ) |
| Brown Brothers Harriman | USD | 225 | GBP | 184 | 11/02/16 | — | |
| Brown Brothers Harriman | USD | 1,213 | GBP | 1,000 | 12/21/16 | 13 | |
| Brown Brothers Harriman | USD | 1,239 | GBP | 1,000 | 12/21/16 | (13 | ) |
| Brown Brothers Harriman | USD | 258 | HKD | 2,000 | 12/21/16 | — | |
| Brown Brothers Harriman | USD | 174 | JPY | 18,305 | 11/01/16 | 1 | |
| Brown Brothers Harriman | USD | 3,206 | JPY | 337,290 | 11/01/16 | 10 | |
| Brown Brothers Harriman | USD | 296 | JPY | 31,180 | 11/02/16 | 1 | |
| Brown Brothers Harriman | USD | 986 | JPY | 100,000 | 12/21/16 | (30 | ) |
| Brown Brothers Harriman | AUD | 500 | USD | 372 | 12/21/16 | (8 | ) |
| Brown Brothers Harriman | AUD | 1,000 | USD | 751 | 12/21/16 | (9 | ) |
| Brown Brothers Harriman | CAD | 3 | USD | 2 | 11/02/16 | — | |
| Brown Brothers Harriman | CAD | 100 | USD | 76 | 12/21/16 | 1 | |
| Brown Brothers Harriman | CAD | 200 | USD | 152 | 12/21/16 | 3 | |
| Brown Brothers Harriman | CAD | 200 | USD | 153 | 12/21/16 | 4 | |
| Brown Brothers Harriman | CAD | 1,500 | USD | 1,132 | 12/21/16 | 14 | |
| Brown Brothers Harriman | CHF | 945 | USD | 954 | 11/02/16 | (1 | ) |
| Brown Brothers Harriman | DKK | 10,421 | USD | 1,536 | 11/02/16 | (2 | ) |
| Brown Brothers Harriman | EUR | 1,000 | USD | 1,129 | 12/21/16 | 29 | |
| Brown Brothers Harriman | EUR | 2,000 | USD | 2,251 | 12/21/16 | 51 | |
| Brown Brothers Harriman | GBP | 93 | USD | 112 | 11/01/16 | (1 | ) |
| Brown Brothers Harriman | GBP | 109 | USD | 134 | 11/02/16 | — | |
| Brown Brothers Harriman | GBP | 300 | USD | 390 | 12/21/16 | 22 | |
| Brown Brothers Harriman | GBP | 500 | USD | 667 | 12/21/16 | 54 | |
| Brown Brothers Harriman | GBP | 500 | USD | 614 | 12/21/16 | 1 | |
| Brown Brothers Harriman | GBP | 600 | USD | 793 | 12/21/16 | 57 | |
| Brown Brothers Harriman | HKD | 1,000 | USD | 129 | 12/21/16 | — | |
| Brown Brothers Harriman | HKD | 1,000 | USD | 129 | 12/21/16 | — | |
| Brown Brothers Harriman | JPY | 9,977 | USD | 95 | 11/01/16 | — | |
| Brown Brothers Harriman | JPY | 86,399 | USD | 823 | 11/01/16 | — | |
| Brown Brothers Harriman | JPY | 11,474 | USD | 109 | 11/02/16 | — | |
| Brown Brothers Harriman | JPY | 40,000 | USD | 400 | 12/21/16 | 18 | |
| Brown Brothers Harriman | JPY | 80,000 | USD | 776 | 12/21/16 | 11 | |
| Brown Brothers Harriman | JPY | 100,000 | USD | 978 | 12/21/16 | 22 |
See accompanying notes which are an integral part of the financial statements.
Russell International Developed Markets Fund 179
Russell Investment Company
Russell International Developed Markets Fund
Schedule of Investments, continued — October 31, 2016
| Foreign Currency Exchange Contracts | |||||||
| Amounts in thousands | |||||||
| Unrealized | |||||||
| Appreciation | |||||||
| Amount | Amount | (Depreciation) | |||||
| Counterparty | Sold | Bought | Settlement Date | $ | |||
| Brown Brothers Harriman | NZD | 200 | USD | 146 | 12/21/16 | 3 | |
| Brown Brothers Harriman | SGD | 99 | USD | 71 | 11/01/16 | — | |
| Citigroup | USD | 1,523 | AUD | 2,000 | 12/21/16 | (3 | ) |
| Citigroup | USD | 2,286 | CAD | 3,000 | 12/21/16 | (49 | ) |
| Citigroup | USD | 8,826 | EUR | 8,000 | 12/21/16 | (24 | ) |
| Citigroup | USD | 42 | GBP | 35 | 11/01/16 | — | |
| Citigroup | USD | 3,660 | GBP | 3,000 | 12/21/16 | 16 | |
| Citigroup | USD | 1,161 | HKD | 9,000 | 12/21/16 | — | |
| Citigroup | USD | 4,825 | JPY | 500,000 | 12/21/16 | (48 | ) |
| Citigroup | AUD | 300 | USD | 228 | 12/21/16 | — | |
| Citigroup | AUD | 400 | USD | 304 | 12/21/16 | — | |
| Citigroup | CAD | 600 | USD | 456 | 12/21/16 | 8 | |
| Citigroup | CAD | 1,000 | USD | 746 | 12/21/16 | — | |
| Citigroup | EUR | 1,206 | USD | 1,324 | 11/01/16 | — | |
| Citigroup | EUR | 1,000 | USD | 1,100 | 12/21/16 | — | |
| Citigroup | EUR | 2,000 | USD | 2,233 | 12/21/16 | 33 | |
| Citigroup | GBP | 87 | USD | 106 | 11/01/16 | — | |
| Citigroup | GBP | 1,000 | USD | 1,237 | 12/21/16 | 12 | |
| Citigroup | GBP | 1,000 | USD | 1,225 | 12/21/16 | — | |
| Citigroup | HKD | 2,000 | USD | 258 | 12/21/16 | — | |
| Citigroup | HKD | 3,000 | USD | 387 | 12/21/16 | — | |
| Citigroup | JPY | 100,000 | USD | 967 | 12/21/16 | 12 | |
| Citigroup | JPY | 100,000 | USD | 955 | 12/21/16 | — | |
| Commonwealth Bank of Australia | USD | 989 | AUD | 1,292 | 12/21/16 | (7 | ) |
| Commonwealth Bank of Australia | USD | 7,229 | AUD | 9,444 | 12/21/16 | (54 | ) |
| Commonwealth Bank of Australia | USD | 9,522 | AUD | 12,440 | 12/21/16 | (71 | ) |
| Commonwealth Bank of Australia | USD | 1,185 | CAD | 1,530 | 12/21/16 | (43 | ) |
| Commonwealth Bank of Australia | USD | 10,969 | CAD | 14,169 | 12/21/16 | (402 | ) |
| Commonwealth Bank of Australia | USD | 13,796 | CAD | 17,820 | 12/21/16 | (505 | ) |
| Commonwealth Bank of Australia | USD | 7,378 | EUR | 6,523 | 12/21/16 | (202 | ) |
| Commonwealth Bank of Australia | USD | 2,271 | GBP | 1,705 | 12/21/16 | (181 | ) |
| Commonwealth Bank of Australia | USD | 13,750 | GBP | 10,326 | 12/21/16 | (1,096 | ) |
| Commonwealth Bank of Australia | USD | 4,155 | JPY | 420,644 | 12/21/16 | (136 | ) |
| Commonwealth Bank of Australia | USD | 15,820 | JPY | 1,601,556 | 12/21/16 | (518 | ) |
| Commonwealth Bank of Australia | EUR | 21,934 | USD | 24,810 | 12/21/16 | 678 | |
| Commonwealth Bank of Australia | GBP | 11,160 | USD | 14,861 | 12/21/16 | 1,185 | |
| Commonwealth Bank of Australia | HKD | 44,580 | USD | 5,753 | 12/21/16 | 3 | |
| Commonwealth Bank of Australia | JPY | 1,199,200 | USD | 11,846 | 12/21/16 | 388 | |
| Commonwealth Bank of Australia | NZD | 8,500 | USD | 6,166 | 12/21/16 | 99 | |
| HSBC | USD | 989 | AUD | 1,292 | 12/21/16 | (7 | ) |
| HSBC | USD | 7,226 | AUD | 9,444 | 12/21/16 | (51 | ) |
| HSBC | USD | 9,518 | AUD | 12,440 | 12/21/16 | (67 | ) |
| HSBC | USD | 1,184 | CAD | 1,530 | 12/21/16 | (43 | ) |
| HSBC | USD | 10,965 | CAD | 14,169 | 12/21/16 | (397 | ) |
| HSBC | USD | 13,790 | CAD | 17,820 | 12/21/16 | (500 | ) |
| HSBC | USD | 7,383 | EUR | 6,523 | 12/21/16 | (206 | ) |
| HSBC | USD | 2,271 | GBP | 1,705 | 12/21/16 | (181 | ) |
| HSBC | USD | 13,750 | GBP | 10,326 | 12/21/16 | (1,096 | ) |
| HSBC | USD | 4,153 | JPY | 420,644 | 12/21/16 | (133 | ) |
| HSBC | USD | 15,810 | JPY | 1,601,556 | 12/21/16 | (508 | ) |
| HSBC | EUR | 21,934 | USD | 24,826 | 12/21/16 | 694 | |
| HSBC | GBP | 11,160 | USD | 14,861 | 12/21/16 | 1,184 | |
| HSBC | HKD | 44,580 | USD | 5,753 | 12/21/16 | 3 | |
| HSBC | JPY | 1,199,200 | USD | 11,838 | 12/21/16 | 380 | |
| National Australia Bank | USD | 989 | AUD | 1,292 | 12/21/16 | (8 | ) |
| National Australia Bank | USD | 7,231 | AUD | 9,444 | 12/21/16 | (56 | ) |
See accompanying notes which are an integral part of the financial statements.
180 Russell International Developed Markets Fund
Russell Investment Company
Russell International Developed Markets Fund
Schedule of Investments, continued — October 31, 2016
| Foreign Currency Exchange Contracts | |||||||
| Amounts in thousands | |||||||
| Unrealized | |||||||
| Appreciation | |||||||
| Amount | Amount | (Depreciation) | |||||
| Counterparty | Sold | Bought | Settlement Date | $ | |||
| National Australia Bank | USD | 9,525 | AUD | 12,440 | 12/21/16 | (74 | ) |
| National Australia Bank | USD | 1,184 | CAD | 1,530 | 12/21/16 | (43 | ) |
| National Australia Bank | USD | 10,968 | CAD | 14,169 | 12/21/16 | (400 | ) |
| National Australia Bank | USD | 13,794 | CAD | 17,820 | 12/21/16 | (504 | ) |
| National Australia Bank | USD | 7,385 | EUR | 6,523 | 12/21/16 | (209 | ) |
| National Australia Bank | USD | 2,272 | GBP | 1,705 | 12/21/16 | (182 | ) |
| National Australia Bank | USD | 13,756 | GBP | 10,326 | 12/21/16 | (1,102 | ) |
| National Australia Bank | USD | 4,154 | JPY | 420,644 | 12/21/16 | (135 | ) |
| National Australia Bank | USD | 15,815 | JPY | 1,601,556 | 12/21/16 | (513 | ) |
| National Australia Bank | EUR | 21,934 | USD | 24,833 | 12/21/16 | 702 | |
| National Australia Bank | GBP | 11,160 | USD | 14,867 | 12/21/16 | 1,191 | |
| National Australia Bank | HKD | 44,580 | USD | 5,753 | 12/21/16 | 3 | |
| National Australia Bank | JPY | 1,199,200 | USD | 11,842 | 12/21/16 | 384 | |
| Royal Bank of Canada | USD | 990 | AUD | 1,292 | 12/21/16 | (9 | ) |
| Royal Bank of Canada | USD | 7,238 | AUD | 9,444 | 12/21/16 | (63 | ) |
| Royal Bank of Canada | USD | 9,535 | AUD | 12,440 | 12/21/16 | (83 | ) |
| Royal Bank of Canada | USD | 1,186 | CAD | 1,530 | 12/21/16 | (45 | ) |
| Royal Bank of Canada | USD | 10,980 | CAD | 14,169 | 12/21/16 | (412 | ) |
| Royal Bank of Canada | USD | 13,809 | CAD | 17,820 | 12/21/16 | (518 | ) |
| Royal Bank of Canada | USD | 7,379 | EUR | 6,523 | 12/21/16 | (203 | ) |
| Royal Bank of Canada | USD | 2,274 | GBP | 1,705 | 12/21/16 | (185 | ) |
| Royal Bank of Canada | USD | 13,772 | GBP | 10,326 | 12/21/16 | (1,117 | ) |
| Royal Bank of Canada | USD | 4,155 | JPY | 420,644 | 12/21/16 | (136 | ) |
| Royal Bank of Canada | USD | 15,819 | JPY | 1,601,556 | 12/21/16 | (516 | ) |
| Royal Bank of Canada | EUR | 21,934 | USD | 24,815 | 12/21/16 | 683 | |
| Royal Bank of Canada | GBP | 300 | USD | 367 | 12/21/16 | (1 | ) |
| Royal Bank of Canada | GBP | 11,160 | USD | 14,885 | 12/21/16 | 1,209 | |
| Royal Bank of Canada | HKD | 44,580 | USD | 5,753 | 12/21/16 | 3 | |
| Royal Bank of Canada | JPY | 80,000 | USD | 768 | 12/21/16 | 3 | |
| Royal Bank of Canada | JPY | 1,199,200 | USD | 11,844 | 12/21/16 | 386 | |
| State Street | USD | 382 | AUD | 500 | 12/21/16 | (3 | ) |
| State Street | USD | 743 | AUD | 1,000 | 12/21/16 | 16 | |
| State Street | USD | 763 | AUD | 1,000 | 12/21/16 | (3 | ) |
| State Street | USD | 765 | AUD | 1,000 | 12/21/16 | (6 | ) |
| State Street | USD | 4 | CAD | 6 | 11/01/16 | — | |
| State Street | USD | 52 | CAD | 70 | 11/01/16 | — | |
| State Street | USD | 3 | CAD | 4 | 11/03/16 | — | |
| State Street | USD | 50 | CAD | 67 | 11/03/16 | — | |
| State Street | USD | 760 | CAD | 1,000 | 12/21/16 | (14 | ) |
| State Street | USD | 775 | CAD | 1,000 | 12/21/16 | (29 | ) |
| State Street | USD | 1,146 | CAD | 1,500 | 12/21/16 | (27 | ) |
| State Street | USD | 2,674 | CAD | 3,500 | 12/21/16 | (63 | ) |
| State Street | USD | 1,262 | CHF | 1,253 | 11/01/16 | 3 | |
| State Street | USD | 53 | EUR | 49 | 11/01/16 | — | |
| State Street | USD | 46 | EUR | 42 | 11/02/16 | — | |
| State Street | USD | 3,373 | EUR | 3,000 | 12/21/16 | (72 | ) |
| State Street | USD | 4,513 | EUR | 4,000 | 12/21/16 | (112 | ) |
| State Street | USD | 164 | GBP | 135 | 11/01/16 | 1 | |
| State Street | USD | 380 | GBP | 300 | 12/21/16 | (12 | ) |
| State Street | USD | 398 | GBP | 300 | 12/21/16 | (31 | ) |
| State Street | USD | 1,335 | GBP | 1,000 | 12/21/16 | (110 | ) |
| State Street | USD | 92 | HKD | 713 | 11/01/16 | — | |
| State Street | USD | 516 | HKD | 4,000 | 12/21/16 | — | |
| State Street | USD | 1,032 | HKD | 8,000 | 12/21/16 | (1 | ) |
| State Street | USD | 2,943 | HKD | 22,803 | 12/21/16 | (2 | ) |
| State Street | USD | 20,958 | HKD | 162,400 | 12/21/16 | (12 | ) |
See accompanying notes which are an integral part of the financial statements.
Russell International Developed Markets Fund 181
Russell Investment Company
Russell International Developed Markets Fund
Schedule of Investments, continued — October 31, 2016
| Foreign Currency Exchange Contracts | |||||||
| Amounts in thousands | |||||||
| Unrealized | |||||||
| Appreciation | |||||||
| Amount | Amount | (Depreciation) | |||||
| Counterparty | Sold | Bought | Settlement Date | $ | |||
| State Street | USD | 663 | JPY | 69,824 | 11/01/16 | 3 | |
| State Street | USD | 71 | JPY | 7,495 | 11/02/16 | — | |
| State Street | USD | 417 | JPY | 43,903 | 11/02/16 | 2 | |
| State Street | USD | 12 | JPY | 1,270 | 11/04/16 | — | |
| State Street | USD | 107 | JPY | 11,221 | 11/04/16 | — | |
| State Street | USD | 107 | JPY | 11,258 | 11/04/16 | — | |
| State Street | USD | 520 | JPY | 54,580 | 11/04/16 | 1 | |
| State Street | USD | 493 | JPY | 50,000 | 12/21/16 | (16 | ) |
| State Street | USD | 785 | JPY | 80,000 | 12/21/16 | (20 | ) |
| State Street | USD | 987 | JPY | 100,000 | 12/21/16 | (32 | ) |
| State Street | USD | 2,000 | JPY | 200,000 | 12/21/16 | (89 | ) |
| State Street | USD | 55 | NOK | 458 | 11/01/16 | — | |
| State Street | USD | 6,430 | NZD | 8,700 | 12/21/16 | (220 | ) |
| State Street | USD | 10 | SEK | 87 | 11/01/16 | — | |
| State Street | AUD | 350 | USD | 263 | 12/21/16 | (3 | ) |
| State Street | AUD | 3,000 | USD | 2,291 | 12/21/16 | 12 | |
| State Street | CAD | 10 | USD | 7 | 11/01/16 | — | |
| State Street | CAD | 2 | USD | 2 | 11/03/16 | — | |
| State Street | CAD | 4 | USD | 3 | 11/03/16 | — | |
| State Street | CAD | 500 | USD | 378 | 12/21/16 | 5 | |
| State Street | CAD | 3,000 | USD | 2,263 | 12/21/16 | 25 | |
| State Street | CAD | 3,000 | USD | 2,263 | 12/21/16 | 25 | |
| State Street | CHF | 79 | USD | 80 | 11/01/16 | — | |
| State Street | CHF | 379 | USD | 383 | 11/01/16 | — | |
| State Street | CHF | 200 | USD | 206 | 12/21/16 | 3 | |
| State Street | CHF | 18,420 | USD | 19,104 | 12/21/16 | 438 | |
| State Street | DKK | 9,055 | USD | 1,332 | 11/01/16 | (4 | ) |
| State Street | DKK | 59,000 | USD | 8,972 | 12/21/16 | 246 | |
| State Street | EUR | 302 | USD | 331 | 11/01/16 | (1 | ) |
| State Street | EUR | 942 | USD | 1,031 | 11/01/16 | (3 | ) |
| State Street | EUR | 1,000 | USD | 1,128 | 12/21/16 | 28 | |
| State Street | EUR | 1,500 | USD | 1,663 | 12/21/16 | 13 | |
| State Street | EUR | 3,000 | USD | 3,380 | 12/21/16 | 79 | |
| State Street | EUR | 7,700 | USD | 8,714 | 12/21/16 | 243 | |
| State Street | GBP | 150 | USD | 182 | 12/21/16 | (2 | ) |
| State Street | GBP | 600 | USD | 780 | 12/21/16 | 44 | |
| State Street | HKD | 1,000 | USD | 129 | 12/21/16 | — | |
| State Street | HKD | 1,200 | USD | 155 | 12/21/16 | — | |
| State Street | JPY | 9,800 | USD | 93 | 11/04/16 | — | |
| State Street | JPY | 50,000 | USD | 484 | 12/21/16 | 7 | |
| State Street | JPY | 100,000 | USD | 969 | 12/21/16 | 14 | |
| State Street | JPY | 200,000 | USD | 1,962 | 12/21/16 | 51 | |
| State Street | NOK | 1,000 | USD | 121 | 12/21/16 | — | |
| State Street | NOK | 103,300 | USD | 12,624 | 12/21/16 | 120 | |
| State Street | THB | 5,604 | USD | 159 | 11/01/16 | (1 | ) |
| State Street | THB | 2,083 | USD | 59 | 11/02/16 | — | |
| State Street | THB | 702 | USD | 20 | 11/03/16 | — | |
| UBS | AUD | 1,000 | USD | 761 | 12/21/16 | 1 | |
| UBS | CAD | 500 | USD | 380 | 12/21/16 | 7 | |
| Total Unrealized Appreciation (Depreciation) on Open Foreign Currency Exchange Contracts | (5,587 | ) | |||||
See accompanying notes which are an integral part of the financial statements.
182 Russell International Developed Markets Fund
Russell Investment Company
Russell International Developed Markets Fund
Schedule of Investments, continued — October 31, 2016
| Presentation of Portfolio Holdings | |||||||||||||
| Amounts in thousands | |||||||||||||
| Fair Value | |||||||||||||
| Practical | |||||||||||||
| Portfolio Summary | Level 1 | Level 2 | Level 3 | Expedient (a) | Total | % of Net Assets | |||||||
| Common Stocks | |||||||||||||
| Australia | $ | 156 | $ | 57,904 | $ | — | $ | — | $ | 58,060 | 2.4 | ||
| Austria | — | 10,903 | — | — | 10,903 | 0.4 | |||||||
| Belgium | 16,984 | 21,122 | — | — | 38,106 | 1.5 | |||||||
| Bermuda | 5,647 | — | — | — | 5,647 | 0.2 | |||||||
| Brazil | 9,975 | — | — | — | 9,975 | 0.4 | |||||||
| Canada | 92,217 | 77 | — | — | 92,294 | 3.7 | |||||||
| China | 7,414 | 16,279 | — | — | 23,693 | 1.0 | |||||||
| Colombia | 905 | — | — | — | 905 | —* | |||||||
| Czech Republic | — | 692 | — | — | 692 | —* | |||||||
| Denmark | — | 35,834 | — | — | 35,834 | 1.5 | |||||||
| Finland | — | 8,052 | — | — | 8,052 | 0.3 | |||||||
| France | — | 244,107 | — | — | 244,107 | 9.9 | |||||||
| Germany | 718 | 162,136 | — | — | 162,854 | 6.6 | |||||||
| Hong Kong | — | 55,855 | — | — | 55,855 | 2.3 | |||||||
| India | 2,583 | 5,500 | — | — | 8,083 | 0.3 | |||||||
| Ireland | 12,544 | 19,042 | — | — | 31,586 | 1.3 | |||||||
| Isle of Man | — | 696 | — | — | 696 | —* | |||||||
| Israel | 16,047 | 4,167 | — | — | 20,214 | 0.8 | |||||||
| Italy | — | 66,596 | — | — | 66,596 | 2.7 | |||||||
| Japan | 184 | 455,136 | — | — | 455,320 | 18.4 | |||||||
| Jersey | — | 5,604 | — | — | 5,604 | 0.2 | |||||||
| Liechtenstein | — | 464 | — | — | 464 | —* | |||||||
| Luxembourg | 23 | 5,202 | — | — | 5,225 | 0.2 | |||||||
| Macao | — | 8,338 | — | — | 8,338 | 0.3 | |||||||
| Mexico | 3,493 | — | — | — | 3,493 | 0.1 | |||||||
| Netherlands | 6,150 | 109,395 | — | — | 115,545 | 4.7 | |||||||
| Norway | — | 7,488 | — | — | 7,488 | 0.3 | |||||||
| Portugal | — | 11,048 | — | — | 11,048 | 0.5 | |||||||
| Russia | 6,348 | 6,543 | — | — | 12,891 | 0.5 | |||||||
| Singapore | 45 | 35,593 | — | — | 35,638 | 1.4 | |||||||
| South Korea | — | 52,153 | — | — | 52,153 | 2.1 | |||||||
| Spain | — | 39,710 | — | — | 39,710 | 1.6 | |||||||
| Sweden | — | 33,559 | — | — | 33,559 | 1.4 | |||||||
| Switzerland | 7,177 | 193,351 | — | — | 200,528 | 8.1 | |||||||
| Taiwan | 6,696 | 7,385 | — | — | 14,081 | 0.6 | |||||||
| Thailand | — | 4,344 | — | — | 4,344 | 0.2 | |||||||
| United Kingdom | 14,377 | 391,621 | 48 | — | 406,046 | 16.4 | |||||||
| United States | 21,413 | 8,068 | — | — | 29,481 | 1.2 | |||||||
| Preferred Stocks | — | 16,157 | — | — | 16,157 | 0.7 | |||||||
| Warrants & Rights | 58 | — | — | — | 58 | —* | |||||||
| Short-Term Investments | — | 29,092 | — | 107,592 | 136,684 | 5.5 | |||||||
| Other Securities | — | — | — | 23,803 | 23,803 | 1.0 | |||||||
See accompanying notes which are an integral part of the financial statements.
Russell International Developed Markets Fund 183
Russell Investment Company
Russell International Developed Markets Fund
Schedule of Investments, continued — October 31, 2016
| Presentation of Portfolio Holdings | |||||||||||||||||
| Amounts in thousands | |||||||||||||||||
| Fair Value | |||||||||||||||||
| Practical | |||||||||||||||||
| Portfolio Summary | Level 1 | Level 2 | Level 3 | Expedient (a) | Total | % of Net Assets | |||||||||||
| Total Investments | 231,154 | 2,129,213 | 48 | 131,395 | 2,491,810 | 100.7 | |||||||||||
| Other Assets and Liabilities, Net | (0.7 | ) | |||||||||||||||
| 100.0 | |||||||||||||||||
| Other Financial Instruments | |||||||||||||||||
| Assets | |||||||||||||||||
| Futures Contracts | 10,260 | — | — | — | 10,260 | 0.4 | |||||||||||
| Foreign Currency Exchange Contracts | 24 | 14,969 | — | — | 14,993 | 0.6 | |||||||||||
| Liabilities | |||||||||||||||||
| Futures Contracts | (2,744 | ) | — | — | — | (2,744 | ) | (0.1 | ) | ||||||||
| Foreign Currency Exchange Contracts | (14 | ) | (20,566 | ) | — | — | (20,580 | ) | (0.8 | ) | |||||||
| Total Other Financial Instruments** | $ | 7,526 | $ | (5,597 | ) | $ | — | $ | — | $ | 1,929 | ||||||
* Less than 0.05% of net assets.
** Futures and foreign currency exchange contract values reflect the unrealized appreciation (depreciation) on the investments.
(a) Certain investments that are measured at fair value using the net asset value per share (or its equivalent) practical expedient have not been classified
in the fair value levels. The fair value amounts presented in the table are intended to permit reconciliation to the amounts presented in the Schedule of
Investments.
For a description of the Levels, see note 2 in the Notes to Financial Statements.
For a disclosure on transfers between Levels 1, 2 and 3 during the period ended October 31, 2016, see note 2 in the Notes to
Financial Statements.
Investments in which significant unobservable inputs (Level 3) were used in determining a fair value for the period ended October
31, 2016 were less than 1% of net assets.
| Amounts in thousands | |||
| Fair Value | |||
| Sector Exposure | $ | ||
| Consumer Discretionary | 332,342 | ||
| Consumer Staples | 203,610 | ||
| Energy | 147,980 | ||
| Financial Services | 579,517 | ||
| Health Care | 201,716 | ||
| Materials and Processing | 191,711 | ||
| Producer Durables | 304,160 | ||
| Technology | 231,269 | ||
| Utilities | 138,960 | ||
| Warrants and Rights | 58 | ||
| Short-Term Investments | 136,684 | ||
| Other Securities | 23,803 | ||
| Total Investments | 2,491,810 | ||
See accompanying notes which are an integral part of the financial statements.
184 Russell International Developed Markets Fund
Russell Investment Company
Russell International Developed Markets Fund
Fair Value of Derivative Instruments — October 31, 2016
Amounts in thousands
| Foreign | |||||||
| Equity | Currency | ||||||
| Derivatives not accounted for as hedging instruments | Contracts | Contracts | |||||
| Location: Statement of Assets and Liabilities - Assets | |||||||
| Unrealized appreciation on foreign currency exchange contracts | $ | — | $ | 14,993 | |||
| Variation margin on futures contracts* | 10,260 | — | |||||
| Total | $ | 10,260 | $ | 14,993 | |||
| Location: Statement of Assets and Liabilities - Liabilities | |||||||
| Variation margin on futures contracts* | $ | 2,744 | $ | — | |||
| Unrealized depreciation on foreign currency exchange contracts | — | 20,580 | |||||
| Total | $ | 2,744 | $ | 20,580 | |||
| Foreign | |||||||
| Equity | Currency | ||||||
| Derivatives not accounted for as hedging instruments | Contracts | Contracts | |||||
| Location: Statement of Operations - Net realized gain (loss) | |||||||
| Futures contracts | $ | (17,836 | ) | $ | — | ||
| Foreign currency-related transactions** | — | 21,510 | |||||
| Total | $ | (17,836 | ) | $ | 21,510 | ||
| Location: Statement of Operations - Net change in unrealized appreciation (depreciation) | |||||||
| Futures contracts | $ | 2,301 | $ | — | |||
| Foreign currency-related transactions*** | — | (7,694 | ) | ||||
| Total | $ | 2,301 | $ | (7,694 | ) | ||
* Includes cumulative appreciation/depreciation of futures contracts as reported in the Schedule of Investments. Only variation margin is reported within the
Statement of Assets and Liabilities.
** Only includes net realized gain (loss) on forward and spot contracts. May differ from the net realized gain (loss) on foreign currency-related transactions reported
within the Statement of Operations.
*** Only includes change in unrealized gain (loss) on forward and spot contracts. May differ from the net change in unrealized gain (loss) on foreign currency-related
transactions reported within the Statement of Operations.
For further disclosure on derivatives see note 2 in the Notes to Financial Statements.
See accompanying notes which are an integral part of the financial statements.
Russell International Developed Markets Fund 185
Russell Investment Company
Russell International Developed Markets Fund
Balance Sheet Offsetting of Financial and Derivative Instruments — October 31, 2016
| Amounts in thousands | |||||||||
| Offsetting of Financial Assets and Derivative Assets | |||||||||
| Gross | Net Amounts | ||||||||
| Amounts | of Assets | ||||||||
| Gross | Offset in the | Presented in | |||||||
| Amounts of | Statement of | the Statement | |||||||
| Recognized | Assets and | of Assets and | |||||||
| Description | Location: Statement of Assets and Liabilities - Assets | Assets | Liabilities | Liabilities | |||||
| Securities on Loan* | Investments, at fair value | $ | 22,446 | $ | — | $ | 22,446 | ||
| Foreign Currency Exchange Contracts | Unrealized appreciation on foreign currency exchange contracts | 14,993 | — | 14,993 | |||||
| Futures Contracts | Variation margin on futures contracts | 1,029 | — | 1,029 | |||||
| Total Financial and Derivative Assets | 38,468 | — | 38,468 | ||||||
| Financial and Derivative Assets not subject to a netting agreement | (1,030 | ) | — | (1,030 | ) | ||||
| Total Financial and Derivative Assets subject to a netting agreement | $ | 37,438 | $ | — | $ | 37,438 | |||
| Financial Assets, Derivative Assets, and Collateral Held by Counterparty | |||||||||||
| Gross Amounts Not Offset in | |||||||||||
| �� | the Statement of Assets and | ||||||||||
| Liabilities | |||||||||||
| Net Amounts | |||||||||||
| of Assets | |||||||||||
| Presented in | |||||||||||
| the Statement | Financial and | ||||||||||
| of Assets and | Derivative | Collateral | |||||||||
| Counterparty | Liabilities | Instruments | Received^ | Net Amount | |||||||
| Bank of America | $ | 1,764 | $ | 1,764 | $ | — | $ | — | |||
| Bank of New York | 1 | — | — | 1 | |||||||
| Barclays | 560 | — | 560 | — | |||||||
| BNP Paribas | 2,264 | 2,264 | — | — | |||||||
| Brown Brothers Harriman | 313 | 105 | — | 208 | |||||||
| Citigroup | 2,189 | 81 | 2,108 | — | |||||||
| Commonwealth Bank of Australia | 2,353 | 2,353 | — | — | |||||||
| Deutsche Bank | 9 | — | 9 | — | |||||||
| Fidelity | 303 | — | 303 | — | |||||||
| HSBC | 2,262 | 2,262 | — | — | |||||||
| JPMorgan Chase | 2,451 | — | 2,451 | — | |||||||
| Merrill Lynch | 707 | — | 707 | — | |||||||
| Morgan Stanley | 11,219 | — | 11,219 | — | |||||||
| National Australia Bank | 2,280 | 2,280 | — | — | |||||||
| Royal Bank of Canada | 2,288 | 2,288 | — | — | |||||||
| State Street | 1,377 | 877 | — | 500 | |||||||
| UBS | 5,098 | — | 5,089 | 9 | |||||||
| Total | $ | 37,438 | $ | 14,274 | $ | 22,446 | $ | 718 | |||
See accompanying notes which are an integral part of the financial statements.
186 Russell International Developed Markets Fund
Russell Investment Company
Russell International Developed Markets Fund
Balance Sheet Offsetting of Financial and Derivative Instruments, continued —
October 31, 2016
| Amounts in thousands | |||||||||
| Offsetting of Financial Liabilities and Derivative Liabilities | |||||||||
| Gross | Net Amounts | ||||||||
| Amounts | of Liabilities | ||||||||
| Gross | Offset in the | Presented in | |||||||
| Amounts of | Statement of | the Statement | |||||||
| Recognized | Assets and | of Assets and | |||||||
| Description | Location: Statement of Assets and Liabilities - Liabilities | Liabilities | Liabilities | Liabilities | |||||
| Futures Contracts | Variation margin on futures contracts | $ | 326 | $ | — | $ | 326 | ||
| Foreign Currency Exchange Contracts | Unrealized depreciation on foreign currency exchange contracts | 20,580 | — | 20,580 | |||||
| Total Financial and Derivative Liabilities | 20,906 | — | 20,906 | ||||||
| Financial and Derivative Liabilities not subject to a netting agreement | (326 | ) | — | (326 | ) | ||||
| Total Financial and Derivative Liabilities subject to a netting agreement | $ | 20,580 | $ | — | $ | 20,580 | |||
| Financial Liabilities, Derivative Liabilities, and Collateral Pledged by Counterparty | ||||||||||
| Gross Amounts Not Offset in | ||||||||||
| the Statement of Assets and | ||||||||||
| Liabilities | ||||||||||
| Net Amounts | ||||||||||
| of Liabilities | ||||||||||
| Presented in | ||||||||||
| the Statement | Financial and | |||||||||
| of Assets and | Derivative | Collateral | ||||||||
| Counterparty | Liabilities | Instruments | Pledged^ | Net Amount | ||||||
| Bank of America | $ | 3,327 | $ | 1,764 | $ | — | $ | 1,563 | ||
| BNP Paribas | 3,214 | 2,264 | — | 950 | ||||||
| Brown Brothers Harriman | 109 | 105 | — | 4 | ||||||
| Citigroup | 125 | 81 | — | 44 | ||||||
| Commonwealth Bank of Australia | 3,215 | 2,353 | — | 862 | ||||||
| HSBC | 3,190 | 2,262 | — | 928 | ||||||
| National Australia Bank | 3,226 | 2,280 | — | 946 | ||||||
| Royal Bank of Canada | 3,288 | 2,288 | — | 1,000 | ||||||
| State Street | 886 | 877 | — | 9 | ||||||
| Total | $ | 20,580 | $ | 14,274 | $ | — | $ | 6,306 | ||
* Fair value of securities on loan as reported in the footnotes to the Statement of Assets and Liabilities.
^ Collateral received or pledged amounts may not reconcile to those disclosed in the Statement of Assets and Liabilities due to the inclusion of off-Balance
Sheet collateral and adjustments made to exclude overcollateralization.
For further disclosure on derivatives and counterparty risk see note 2 in the Notes to Financial Statements.
See accompanying notes which are an integral part of the financial statements.
Russell International Developed Markets Fund 187
Russell Investment Company
Russell International Developed Markets Fund
Statement of Assets and Liabilities — October 31, 2016
| Amounts in thousands | ||
| Assets | ||
| Investments, at identified cost | $ | 2,506,124 |
| Investments, at fair value(*)(>) | 2,491,810 | |
| Foreign currency holdings(^) | 5,446 | |
| Unrealized appreciation on foreign currency exchange contracts | 14,993 | |
| Receivables: | ||
| Dividends and interest | 5,561 | |
| Dividends from affiliated Russell funds | 75 | |
| Investments sold | 16,239 | |
| Fund shares sold | 3,047 | |
| Foreign capital gains taxes recoverable | 2,952 | |
| Variation margin on futures contracts | 1,029 | |
| Total assets | 2,541,152 | |
| Liabilities | ||
| Payables: | ||
| Due to custodian | 8 | |
| Investments purchased | 16,916 | |
| Fund shares redeemed | 1,631 | |
| Accrued fees to affiliates | 2,019 | |
| Other accrued expenses | 504 | |
| Variation margin on futures contracts | 326 | |
| Deferred capital gains tax liability | 36 | |
| Unrealized depreciation on foreign currency exchange contracts | 20,580 | |
| Payable upon return of securities loaned | 23,803 | |
| Total liabilities | 65,823 | |
| Commitments and Contingencies (1) | ||
| Net Assets | $ | 2,475,329 |
| (1) See note 9 in the Notes to Financial Statements for a detailed description of commitments and contingencies. | ||
See accompanying notes which are an integral part of the financial statements.
188 Russell International Developed Markets Fund
Russell Investment Company
Russell International Developed Markets Fund
Statement of Assets and Liabilities, continued — October 31, 2016
| Amounts in thousands | |||
| Net Assets Consist of: | |||
| Undistributed (overdistributed) net investment income | $ | 57,726 | |
| Accumulated net realized gain (loss) | (296,630 | ) | |
| Unrealized appreciation (depreciation) on: | |||
| Investments (net of deferred tax liability for foreign capital gains taxes) | (14,350 | ) | |
| Futures contracts | 7,516 | ||
| Foreign currency-related transactions | (5,976 | ) | |
| Shares of beneficial interest | 728 | ||
| Additional paid-in capital | 2,726,315 | ||
| Net Assets | $ | 2,475,329 | |
| Net Asset Value, offering and redemption price per share: | |||
| Net asset value per share: Class A(#) | $ | 33.92 | |
| Maximum offering price per share (Net asset value plus sales charge of 5.75%): Class A | $ | 35.99 | |
| Class A — Net assets | $ | 27,053,195 | |
| Class A — Shares outstanding ($.01 par value) | 797,479 | ||
| Net asset value per share: Class C(#) | $ | 33.87 | |
| Class C — Net assets | $ | 26,697,839 | |
| Class C — Shares outstanding ($.01 par value) | 788,150 | ||
| Net asset value per share: Class E(#) | $ | 34.04 | |
| Class E — Net assets | $ | 48,642,825 | |
| Class E — Shares outstanding ($.01 par value) | 1,428,790 | ||
| Net asset value per share: Class I(#) | $ | 34.06 | |
| Class I — Net assets | $ | 480,517,833 | |
| Class I — Shares outstanding ($.01 par value) | 14,109,352 | ||
| Net asset value per share: Class S(#) | $ | 34.00 | |
| Class S — Net assets | $ | 1,879,757,137 | |
| Class S — Shares outstanding ($.01 par value) | 55,283,181 | ||
| Net asset value per share: Class Y(#) | $ | 34.05 | |
| Class Y — Net assets | $ | 12,660,356 | |
| Class Y — Shares outstanding ($.01 par value) | 371,786 | ||
| Amounts in thousands | |||
| (^) Foreign currency holdings - cost | $ | 5,534 | |
| (*) Securities on loan included in investments | $ | 22,446 | |
| (>) Investments in affiliates, Russell U.S. Cash Management Fund and Russell U.S. Cash Collateral Fund | $ | 131,395 | |
| (#) Net asset value per share equals class level net assets divided by class level shares of beneficial interest outstanding. | |||
See accompanying notes which are an integral part of the financial statements.
Russell International Developed Markets Fund 189
Russell Investment Company
Russell International Developed Markets Fund
Statement of Operations — For the Period Ended October 31, 2016
| Amounts in thousands | |||
| Investment Income | |||
| Dividends | $ | 76,824 | |
| Dividends from affiliated Russell funds | 363 | ||
| Interest | 70 | ||
| Securities lending income (net) | 1,424 | ||
| Less foreign taxes withheld | (6,810 | ) | |
| Total investment income | 71,871 | ||
| Expenses | |||
| Advisory fees | 17,585 | ||
| Administrative fees | 1,212 | ||
| Custodian fees (1) | 124 | ||
| Distribution fees - Class A | 69 | ||
| Distribution fees - Class C | 212 | ||
| Transfer agent fees - Class A | 55 | ||
| Transfer agent fees - Class C | 56 | ||
| Transfer agent fees - Class E | 95 | ||
| Transfer agent fees - Class I | 609 | ||
| Transfer agent fees - Class S | 3,776 | ||
| Transfer agent fees - Class Y | 1 | ||
| Professional fees | 179 | ||
| Registration fees | 128 | ||
| Shareholder servicing fees - Class C | 71 | ||
| Shareholder servicing fees - Class E | 119 | ||
| Trustees’ fees | 78 | ||
| Printing fees | 284 | ||
| Miscellaneous | 58 | ||
| Total expenses | 24,711 | ||
| Net investment income (loss) | 47,160 | ||
| Net Realized and Unrealized Gain (Loss) | |||
| Net realized gain (loss) on: | |||
| Investments (net of deferred tax liability for foreign capital gains taxes) | (67,887 | ) | |
| Futures contracts | (17,836 | ) | |
| Foreign currency-related transactions | 20,245 | ||
| Net realized gain (loss) | (65,478 | ) | |
| Net change in unrealized appreciation (depreciation) on: | |||
| Investments (net of deferred tax liability for foreign capital gains taxes) | (30,977 | ) | |
| Futures contracts | 2,301 | ||
| Foreign currency-related transactions | (7,986 | ) | |
| Net change in unrealized appreciation (depreciation) | (36,662 | ) | |
| Net realized and unrealized gain (loss) | (102,140 | ) | |
| Net Increase (Decrease) in Net Assets from Operations | $ | (54,980 | ) |
| (1) Includes a reimbursement for overbilling of custody out-of-pocket fees from prior years. See note 10 in the Notes to Financial Statements. | |||
See accompanying notes which are an integral part of the financial statements.
190 Russell International Developed Markets Fund
Russell Investment Company
Russell International Developed Markets Fund
Statements of Changes in Net Assets
| For the Periods Ended October 31, | ||||||
| Amounts in thousands | 2016 | 2015 | ||||
| Increase (Decrease) in Net Assets | ||||||
| Operations | ||||||
| Net investment income (loss) | $ | 47,160 | $ | 57,590 | ||
| Net realized gain (loss) | (65,478 | ) | 243,937 | |||
| Net change in unrealized appreciation (depreciation) | (36,662 | ) | (271,720 | ) | ||
| Net increase (decrease) in net assets from operations | (54,980 | ) | 29,807 | |||
| Distributions | ||||||
| From net investment income | ||||||
| Class A | (311 | ) | (461 | ) | ||
| Class C | (76 | ) | (247 | ) | ||
| Class E | (453 | ) | (1,185 | ) | ||
| Class I | (7,876 | ) | (12,149 | ) | ||
| Class S | (27,310 | ) | (42,375 | ) | ||
| Class Y | (217 | ) | (18,425 | ) | ||
| Net decrease in net assets from distributions | (36,243 | ) | (74,842 | ) | ||
| Share Transactions* | ||||||
| Net increase (decrease) in net assets from share transactions | (241,975 | ) | (1,248,949 | ) | ||
| Total Net Increase (Decrease) in Net Assets | (333,198 | ) | (1,293,984 | ) | ||
| Net Assets | ||||||
| Beginning of period | 2,808,527 | 4,102,511 | ||||
| End of period | $ | 2,475,329 | $ | 2,808,527 | ||
| Undistributed (overdistributed) net investment income included in net assets | $ | 57,726 | $ | 20,255 | ||
See accompanying notes which are an integral part of the financial statements.
Russell International Developed Markets Fund 191
Russell Investment Company
Russell International Developed Markets Fund
Statements of Changes in Net Assets, continued
* Share transaction amounts (in thousands) for the periods ended October 31, 2016 and October 31, 2015 were as follows:
| 2016 | 2015 | |||||||||||
| Shares | Dollars | Shares | Dollars | |||||||||
| Class A | ||||||||||||
| Proceeds from shares sold | 138 | $ | 4,612 | 194 | $ | 6,914 | ||||||
| Proceeds from reinvestment of distributions | 9 | 309 | 13 | 460 | ||||||||
| Payments for shares redeemed | (190 | ) | (6,344 | ) | (194 | ) | (6,958 | ) | ||||
| Net increase (decrease) | (43 | ) | (1,423 | ) | 13 | 416 | ||||||
| Class C | ||||||||||||
| Proceeds from shares sold | 58 | 1,916 | 91 | 3,266 | ||||||||
| Proceeds from reinvestment of distributions | 2 | 75 | 7 | 245 | ||||||||
| Payments for shares redeemed | (204 | ) | (6,755 | ) | (216 | ) | (7,701 | ) | ||||
| Net increase (decrease) | (144 | ) | (4,764 | ) | (118 | ) | (4,190 | ) | ||||
| Class E | ||||||||||||
| Proceeds from shares sold | 232 | 7,716 | 302 | 10,784 | ||||||||
| Proceeds from reinvestment of distributions | 13 | 440 | 33 | 1,153 | ||||||||
| Payments for shares redeemed | (300 | ) | (9,983 | ) | (1,085 | ) | (37,470 | ) | ||||
| Net increase (decrease) | (55 | ) | (1,827 | ) | (750 | ) | (25,533 | ) | ||||
| Class I | ||||||||||||
| Proceeds from shares sold | 2,311 | 75,750 | 3,345 | 119,368 | ||||||||
| Proceeds from reinvestment of distributions | 230 | 7,642 | 344 | 11,937 | ||||||||
| Payments for shares redeemed | (4,889 | ) | (161,258 | ) | (6,002 | ) | (215,933 | ) | ||||
| Net increase (decrease) | (2,348 | ) | (77,866 | ) | (2,313 | ) | (84,628 | ) | ||||
| Class S | ||||||||||||
| Proceeds from shares sold | 12,727 | 420,195 | 16,491 | 590,727 | ||||||||
| Proceeds from reinvestment of distributions | 816 | 27,064 | 1,213 | 42,041 | ||||||||
| Payments for shares redeemed | (18,267 | ) | (601,983 | ) | (23,155 | ) | (837,195 | ) | ||||
| Net increase (decrease) | (4,724 | ) | (154,724 | ) | (5,451 | ) | (204,427 | ) | ||||
| Class Y | ||||||||||||
| Proceeds from shares sold | 23 | 731 | 100 | 3,466 | ||||||||
| Proceeds from reinvestment of distributions | 6 | 217 | 532 | 18,425 | ||||||||
| Payments for shares redeemed | (69 | ) | (2,319 | ) | (26,240 | ) | (952,478 | ) | ||||
| Net increase (decrease) | (40 | ) | (1,371 | ) | (25,608 | ) | (930,587 | ) | ||||
| Total increase (decrease) | (7,354 | ) | $ | (241,975 | ) | (34,227 | ) | $ | (1,248,949 | ) | ||
See accompanying notes which are an integral part of the financial statements.
192 Russell International Developed Markets Fund
(This page intentionally left blank)
Russell Investment Company
Russell International Developed Markets Fund
Financial Highlights — For the Periods Ended
For a Share Outstanding Throughout Each Period.
| $ | $ | $ | $ | $ | |||||||||||||
| Net Asset Value, | Net | Net Realized | Total from | Distributions | |||||||||||||
| Beginning of | Investment | and Unrealized | Investment | from Net | $ | ||||||||||||
| Period | Income(Loss)(a)(d) | Gain (Loss) | Operations | Investment Income | Total Distributions | ||||||||||||
| Class A | |||||||||||||||||
| October 31, 2016 | 34.96 | .55 | (1.21 | ) | (.66 | ) | (.38 | ) | (.38 | ) | |||||||
| October 31, 2015 | 35.77 | .53 | (.79 | ) | (.26 | ) | (.55 | ) | (.55 | ) | |||||||
| October 31, 2014 | 36.30 | .64 | (.48 | ) | .16 | (.69 | ) | (.69 | ) | ||||||||
| October 31, 2013 | 29.68 | .49 | 6.67 | 7.16 | (.54 | ) | (.54 | ) | |||||||||
| October 31, 2012 | 28.67 | .52 | .89 | 1.41 | (.40 | ) | (.40 | ) | |||||||||
| Class C | |||||||||||||||||
| October 31, 2016 | 34.86 | .29 | (1.20 | ) | (.91 | ) | (.08 | ) | (.08 | ) | |||||||
| October 31, 2015 | 35.62 | .26 | (.78 | ) | (.52 | ) | (.24 | ) | (.24 | ) | |||||||
| October 31, 2014 | 36.15 | .37 | (.48 | ) | (.11 | ) | (.42 | ) | (.42 | ) | |||||||
| October 31, 2013 | 29.52 | .24 | 6.67 | 6.91 | (.28 | ) | (.28 | ) | |||||||||
| October 31, 2012 | 28.46 | .30 | .90 | 1.20 | (.14 | ) | (.14 | ) | |||||||||
| Class E | |||||||||||||||||
| October 31, 2016 | 35.01 | .55 | (1.21 | ) | (.66 | ) | (.31 | ) | (.31 | ) | |||||||
| October 31, 2015 | 35.81 | .54 | (.81 | ) | (.27 | ) | (.53 | ) | (.53 | ) | |||||||
| October 31, 2014 | 36.33 | .62 | (.45 | ) | .17 | (.69 | ) | (.69 | ) | ||||||||
| October 31, 2013 | 29.72 | .49 | 6.68 | 7.17 | (.56 | ) | (.56 | ) | |||||||||
| October 31, 2012 | 28.72 | .53 | .90 | 1.43 | (.43 | ) | (.43 | ) | |||||||||
| Class I | |||||||||||||||||
| October 31, 2016 | 35.10 | .65 | (1.20 | ) | (.55 | ) | (.49 | ) | (.49 | ) | |||||||
| October 31, 2015 | 35.91 | .66 | (.80 | ) | (.14 | ) | (.67 | ) | (.67 | ) | |||||||
| October 31, 2014 | 36.43 | .76 | (.48 | ) | .28 | (.80 | ) | (.80 | ) | ||||||||
| October 31, 2013 | 29.77 | .60 | 6.70 | 7.30 | (.64 | ) | (.64 | ) | |||||||||
| October 31, 2012 | 28.78 | .61 | .89 | 1.50 | (.51 | ) | (.51 | ) | |||||||||
| Class S | |||||||||||||||||
| October 31, 2016 | 35.04 | .62 | (1.20 | ) | (.58 | ) | (.46 | ) | (.46 | ) | |||||||
| October 31, 2015 | 35.86 | .63 | (.81 | ) | (.18 | ) | (.64 | ) | (.64 | ) | |||||||
| October 31, 2014 | 36.38 | .71 | (.45 | ) | .26 | (.78 | ) | (.78 | ) | ||||||||
| October 31, 2013 | 29.74 | .57 | 6.69 | 7.26 | (.62 | ) | (.62 | ) | |||||||||
| October 31, 2012 | 28.75 | .59 | .89 | 1.48 | (.49 | ) | (.49 | ) | |||||||||
| Class Y | |||||||||||||||||
| October 31, 2016 | 35.08 | .70 | (1.21 | ) | (.51 | ) | (.52 | ) | (.52 | ) | |||||||
| October 31, 2015 | 35.90 | .25 | (.36 | ) | (.11 | ) | (.71 | ) | (.71 | ) | |||||||
| October 31, 2014 | 36.41 | .79 | (.46 | ) | .33 | (.84 | ) | (.84 | ) | ||||||||
| October 31, 2013 | 29.76 | .63 | 6.69 | 7.32 | (.67 | ) | (.67 | ) | |||||||||
| October 31, 2012 | 28.77 | .65 | .88 | 1.53 | (.54 | ) | (.54 | ) | |||||||||
See accompanying notes which are an integral part of the financial statements.
194 Russell International Developed Markets Fund
| % | % | % | |||||||||||||
| $ | $ | Ratio of Expenses | Ratio of Expenses | Ratio of Net | |||||||||||
| Net Asset Value, | % | Net Assets, | to Average | to Average | Investment Income | % | |||||||||
| End of | Total | End of Period | Net Assets, | Net Assets, | to Average | Portfolio | |||||||||
| Period | Return(c) | (000 | ) | Gross(l) | Net(d)(l) | Net Assets(d) | Turnover Rate(k) | ||||||||
| 33.92 | (1.87 | ) | 27,053 | 1.23 | 1.23 | 1.66 | 68 | ||||||||
| 34.96 | (.71 | ) | 29,385 | 1.27 | 1.27 | 1.49 | 66 | ||||||||
| 35.77 | .43 | 29,619 | 1.25 | 1.25 | 1.74 | 74 | |||||||||
| 36.30 | 24.47 | 29,088 | 1.24 | 1.24 | 1.51 | 89 | |||||||||
| 29.68 | 5.04 | 22,905 | 1.24 | 1.24 | 1.83 | 65 | |||||||||
| 33.87 | (2.60 | ) | 26,698 | 1.98 | 1.98 | .88 | 68 | ||||||||
| 34.86 | (1.46 | ) | 32,495 | 2.02 | 2.02 | .72 | 66 | ||||||||
| 35.62 | (.33 | ) | 37,426 | 2.00 | 2.00 | 1.00 | 74 | ||||||||
| 36.15 | 23.53 | 43,136 | 1.99 | 1.99 | .75 | 89 | |||||||||
| 29.52 | 4.26 | 40,958 | 1.99 | 1.99 | 1.07 | 65 | |||||||||
| 34.04 | (1.86 | ) | 48,643 | 1.23 | 1.23 | 1.64 | 68 | ||||||||
| 35.01 | (.74 | ) | 51,939 | 1.27 | 1.27 | 1.51 | 66 | ||||||||
| 35.81 | .46 | 79,957 | 1.25 | 1.25 | 1.69 | 74 | |||||||||
| 36.33 | 24.48 | 111,467 | 1.24 | 1.23 | 1.51 | 89 | |||||||||
| 29.72 | 5.11 | 89,772 | 1.24 | 1.19 | 1.87 | 65 | |||||||||
| 34.06 | (1.52 | ) | 480,518 | .90 | .90 | 1.96 | 68 | ||||||||
| 35.10 | (.41 | ) | 577,646 | .94 | .94 | 1.84 | 66 | ||||||||
| 35.91 | .76 | 674,127 | .92 | .92 | 2.05 | 74 | |||||||||
| 36.43 | 24.87 | 753,290 | .91 | .91 | 1.84 | 89 | |||||||||
| 29.77 | 5.40 | 672,661 | .91 | .91 | 2.16 | 65 | |||||||||
| 34.00 | (1.61 | ) | 1,879,757 | .98 | .98 | 1.87 | 68 | ||||||||
| 35.04 | (.48 | ) | 2,102,634 | 1.02 | 1.02 | 1.77 | 66 | ||||||||
| 35.86 | .69 | 2,347,214 | 1.00 | 1.00 | 1.92 | 74 | |||||||||
| 36.38 | 24.76 | 2,740,707 | .99 | .99 | 1.76 | 89 | |||||||||
| 29.74 | 5.33 | 2,074,313 | .99 | .99 | 2.10 | 65 | |||||||||
| 34.05 | (1.41 | ) | 12,660 | .78 | .78 | 2.13 | 68 | ||||||||
| 35.08 | (.28 | ) | 14,428 | .81 | .81 | .72 | 66 | ||||||||
| 35.90 | .90 | 934,168 | .80 | .80 | 2.15 | 74 | |||||||||
| 36.41 | 24.99 | 1,491,711 | .79 | .79 | 1.93 | 89 | |||||||||
| 29.76 | 5.52 | 1,277,390 | .80 | .80 | 2.30 | 65 | |||||||||
See accompanying notes which are an integral part of the financial statements.
Russell International Developed Markets Fund 195
Russell Investment Company
Russell International Developed Markets Fund
Related Party Transactions, Fees and Expenses
| Accrued fees payable to affiliates for the period ended October 31, 2016 were as follows: | ||
| Advisory fees | $ | 1,481,268 |
| Administration fees | 102,242 | |
| Distribution fees | 22,891 | |
| Shareholder servicing fees | 16,039 | |
| Transfer agent fees | 387,866 | |
| Trustee fees | 8,775 | |
| $ | 2,019,081 | |
| Transactions (amounts in thousands) during the period ended October 31, 2016 with Underlying Funds which are, or were, an | ||||||||||||||||||
| affiliated company are as follows: | ||||||||||||||||||
| Fair Value, | Change in | |||||||||||||||||
| Beginning of | Realized Gain | Unrealized | Fair Value, End | Income | Capital Gains | |||||||||||||
| Period | Purchases | Sales | (Loss) | Gain (Loss) | of Period | Distributions | Distributions | |||||||||||
| Russell U.S. Cash Collateral Fund | $ | 69,123 | $ | 701,683 | $ | 747,003 | $ | — | $ | — | $ | 23,803 | $ | 229 | $ | — | ||
| Russell U.S. Cash Management Fund | 72,146 | 1,060,990 | 1,025,561 | 4 | 13 | 107,592 | 363 | — | ||||||||||
| $ | 141,269 | $ | 1,762,673 | $ | 1,772,564 | $ | 4 | $ | 13 | $ | 131,395 | $ | 592 | $ | — | |||
Federal Income Taxes
At October 31, 2016, the cost of investments and net unrealized appreciation (depreciation), undistributed ordinary income and
undistributed long-term capital gains for income tax purposes were as follows:.
| Cost of Investments | $ | 2,555,268,047 | ||
| Unrealized Appreciation | $ | 859,881,128 | ||
| Unrealized Depreciation | (923,339,135 | ) | ||
| Net Unrealized Appreciation (Depreciation) | $ | (63,458,007 | ) | |
| Undistributed Ordinary Income | $ | 56,663,189 | ||
| Undistributed Long-Term Capital Gains | ||||
| (Capital Loss Carryforward) | $ | (236,789,567 | ) | |
| Tax Composition of Distributions | ||||
| Ordinary Income | $ | 36,242,765 |
Net investment income and net realized gains (loss) in the financial statements may differ from taxable net investment income and net
realized gains (losses). Capital accounts within the financial statements are adjusted for permanent book-tax differences. Book-tax
differences are primarily due to foreign currency gains and losses, reclassifications of dividends, differences in treatment of income
from swaps, net operating losses, investments in partnerships, investments in passive foreign investment companies (PFICs), tax
straddle transactions, use of tax equalization and foreign capital gains taxes. These adjustments have no impact on the net assets.
At October 31, 2016, the Statement of Assets and Liabilities have been adjusted by the following amounts (in thousands):
| Undistributed net investment income | $ | 26,554 | |
| Accumulated net realized gain (loss) | (26,554 | ) | |
| Additional paid-in capital | — |
See accompanying notes which are an integral part of the financial statements.
196 Russell International Developed Markets Fund
Russell Investment Company
Russell Global Equity Fund
Portfolio Management Discussion and Analysis — October 31, 2016 (Unaudited)
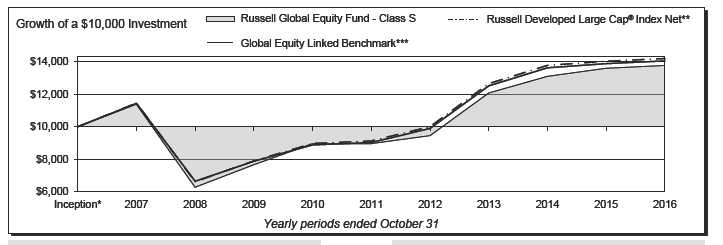
| Russell Global Equity Fund - Class A‡ | Russell Global Equity Fund - Class Y‡‡ | ||||||
| Total | Total | ||||||
| Return | Return | ||||||
| 1 Year | (4.83 | )% | 1 Year | 1.50 | % | ||
| 5 Years | 7.43 | %§ | 5 Years | 9.21 | %§ | ||
| Inception* | 2.49 | %§ | Inception* | 3.53 | %§ | ||
| Russell Global Equity Fund - Class C | Russell Developed Large Cap® Index Net** | ||||||
| Total | Total | ||||||
| Return | Return | ||||||
| 1 Year | 0.24 | % | 1 Year | 1.17 | % | ||
| 5 Years | 7.90 | %§ | 5 Years | 9.23 | %§ | ||
| Inception* | 2.33 | %§ | Inception* | 3.69 | %§ | ||
| Russell Global Equity Fund - Class E | Global Equity Linked Benchmark*** | ||||||
| Total | Total | ||||||
| Return | Return | ||||||
| 1 Year | 1.04 | % | 1 Year | 1.17 | % | ||
| 5 Years | 8.71 | %§ | 5 Years | 9.23 | %§ | ||
| Inception* | 3.10 | %§ | Inception* | 3.58 | %§ | ||
| Russell Global Equity Fund - Class S | |||||||
| Total | |||||||
| Return | |||||||
| 1 Year | 1.26 | % | |||||
| 5 Years | 8.97 | %§ | |||||
| Inception* | 3.36 | %§ | |||||
Russell Global Equity Fund 197
Russell Investment Company
Russell Global Equity Fund
Portfolio Management Discussion and Analysis, continued — October 31, 2016
(Unaudited)
| The Russell Global Equity Fund (the “Fund”) employs a multi- | the period, while the U.K. and developed Europe ex-U.K. lagged |
| manager approach whereby portions of the Fund are allocated to | the most. The Fund’s overweights to Europe ex-U.K. and Japan |
| different money manager strategies. Fund assets not allocated to | detracted, partially offset by a favorable overweight to emerging |
| money managers are managed by Russell Investment Management, | markets. |
| LLC (“RIM”), the Fund’s advisor. RIM may change the allocation | In terms of sector returns, commodity driven sectors materials |
| of the Fund’s assets among money managers at any time. An | and energy outperformed the most, while some of the defensive |
| exemptive order from the Securities and Exchange Commission | sectors, especially health care, lagged the most. The financial |
| (“SEC”) permits RIM to engage or terminate a money manager | services sector lagged the benchmark, especially driven by banks. |
| at any time, subject to approval by the Fund’s Board, without a | The Fund’s moderate overweights to health care and consumer |
| shareholder vote. Pursuant to the terms of the exemptive order, | discretionary detracted modestly. |
| the Fund is required to notify its shareholders within 90 days of | |
| when a money manager begins providing services. As of October | In terms of factor returns, value and quality outperformed the |
| 31, 2016, the Fund had five money managers. | most, growth underperformed and stocks with higher medium- |
| term momentum underperformed. Stocks with lower volatility | |
| What is the Fund’s investment objective? | outperformed broadly in global developed large cap markets. The |
| The Fund seeks to provide long-term capital growth. | Fund’s overweight to value was broadly favorable for the period. |
| How did the Fund perform relative to its benchmark for the | How did the investment strategies and techniques employed |
| fiscal year ended October 31, 2016? | by the Fund and its money managers affect its benchmark- |
| For the fiscal year ended October 31, 2016, the Fund’s Class | relative performance? |
| A, Class C, Class E, Class S and Class Y Shares gained 1.02%, | The Fund performed in line with its benchmark for the one year |
| 0.24%, 1.04%, 1.26% and 1.50%, respectively. This is compared | period ending October 31, 2016, with some of the Fund’s share |
| to the Fund’s benchmark, the Russell Developed Large Cap® | classes outperforming and some of the Fund’s share classes |
| Index (Net), which gained 1.17% during the same period. The | underperforming the Fund’s benchmark. The Fund’s overweight |
| Fund’s performance includes operating expenses, whereas index | to value based on RIM’s strategic beliefs was favorable during the |
| returns are unmanaged and do not include expenses of any kind. | period. Stock selection was strong during the period, especially in |
| For the fiscal year ended October 31, 2016, the Morningstar® | the United Kingdom and the United States. The Fund’s moderate |
| World Stock Category, a group of funds that Morningstar considers | overweights to health care and consumer discretionary detracted |
| to have investment strategies similar to those of the Fund, gained | modestly. The Fund’s overweights to Europe ex-U.K. and Japan |
| 1.00%.This result serves as a peer comparison and is expressed | detracted, partially offset by a favorable overweight to emerging |
| net of operating expenses. | markets. |
| The Fund employs discretionary money managers. The Fund’s | |
| How did the market conditions described in the Market | discretionary money managers select the individual portfolio |
| Summary report affect the Fund’s performance? | securities for the assets assigned to them. Fund assets not |
| In the first half of the fiscal year ended October 31, 2016, the U.S. | allocated to discretionary money managers include the Fund’s |
| Federal Reserve (“the Fed”) lifted the interest rate by 25 basis | liquidity reserves and assets which may be managed directly by |
| points to 0.5% in December 2015, the first time since financial | RIM to effect the Fund’s investment strategies and/or to actively |
| crisis. The European Central Bank (“ECB”) and Bank of Japan | manage the Fund’s overall exposures by investing in securities or |
| (“BoJ”) maintained a dovish stance, as the ECB introduced new | other instruments that RIM believes will achieve the desired risk/ |
| accommodative stimulus measures in an effort to boost Eurozone | return profile for the Fund. |
| inflation and the BoJ strengthened the stimulus program by moving | |
| the deposit rate into negative territory. In the second half of the | With respect to certain of the Fund’s money managers, Wellington |
| fiscal year, market attention became increasingly fixated upon | Management Company, LLP was the best performing manager |
| the U.K., culminating in the U.K. exiting the European Union on | for the period and outperformed the Fund’s benchmark. Strong |
| June 23rd’s referendum result, severing a 43-year membership, | stock selection in consumer discretionary and technology stocks |
| which spurred significant market volatility. Emerging markets | was one of the key drivers of outperformance. In addition, the |
| gained traction in the second half of the fiscal year with better | manager’s underweight to Europe ex-U.K. and overweight to |
| than expected economic data from China and other emerging | Asia ex-Japan were favorable and an overweight to quality (low |
| markets. The Fed lowered the expected pace of rate hikes to a | leverage) was beneficial. |
| one hike scenario as the most likely case for the remainder of | Sanders Capital, LLC (“Sanders”) faced the strongest headwinds |
| 2016.Asia ex-Japan and Canada were the stand out markets over | during the period and underperformed the Fund’s benchmark. |
198 Russell Global Equity Fund
Russell Investment Company
Russell Global Equity Fund
Portfolio Management Discussion and Analysis, continued — October 31, 2016
(Unaudited)
| The manager’s overweight to health care and financials detracted | Describe any changes to the Fund’s structure or the money | |
| significantly. This was partially offset by strong stock selection | manager line-up. | |
| in technology and health care and an underweight to Europe ex- | The Fund’s allocation to the multi-factor positioning strategy was | |
| U.K., which were favorable. | increased modestly during the year. | |
| RIM manages a multi-factor positioning strategy that aims to | ||
| increase the Fund’s value exposure while moderating volatility | Money Managers as of October 31, | |
| exposure and expressing RIM’s total preferred positioning across | 2016 | Styles |
| multiple factors and sectors. The strategy uses the output from a | Harris Associates L.P. | Value |
| MFS Institutional Advisors Inc. | Market Oriented | |
| quantitative model to purchase a stock portfolio expressing these | Polaris Capital Management, LLC | Value |
| views. The positioning strategy’s benchmark-relative performance | Sanders Capital, LLC | Value |
| was modestly negative for the period, as the strategy’s overweight | Wellington Management Company, LLP | Growth |
| to momentum detracted. | The views expressed in this report reflect those of the | |
| In addition, RIM utilized equity futures and currency forward | portfolio managers only through the end of the period | |
| contracts in order to position the portfolio to meet RIM’s overall | covered by the report. These views do not necessarily | |
| preferred positioning with respect to country and currency | represent the views of RIM or any other person in RIM or | |
| exposures. This strategy detracted modestly during the fiscal year | any other affiliated organization. These views are subject | |
| ended October 31, 2016. | to change at any time based upon market conditions or | |
| other events, and RIM disclaims any responsibility to | ||
| During the period, RIM equitized the Fund’s cash using index | update the views contained herein. These views should not | |
| futures contracts to provide the Fund with full market exposure. | be relied on as investment advice and, because investment | |
| This did not have a significant impact on the Fund’s performance | decisions for a Russell Investment Company (“RIC”) Fund | |
| for the period. | are based on numerous factors, should not be relied on as | |
| an indication of investment decisions of any RIC Fund. | ||
* Assumes initial investment on February 28, 2007.
** Russell Developed Large Cap® Index Net is an index which offers investors access to the large-cap segment of the developed equity universe. It is constructed
to provide a comprehensive and unbiased barometer for the large-cap segment of this market and is completely reconstituted annually to accurately reflect the
changes in the market over time.
*** The Global Equity Linked Benchmark provides a means to compare the Fund’s average annual returns to a secondary benchmark that takes into account
historical changes in the Fund’s primary benchmark. The Global Equity Linked Benchmark represents the returns of the MSCI World Index (net of tax
on dividends from foreign holdings) through December 31, 2010 and the returns of the Russell Developed Large Cap® Index (net of tax on dividends from foreign
holdings) thereafter.
‡ The performance shown has been adjusted to reflect the deduction of the maximum Class A sales charge of 5.75%.
‡‡ The Fund first issued Class Y Shares on September 29, 2008. The returns shown for Class Y Shares prior to that date are the returns of the Fund’s Class S
Shares. Class Y Shares will have substantially similar returns as the Class S Shares because the Shares of each Class are invested in the same portfolio of
securities. Annual returns for each Class will differ only to the extent that the Class Y Shares do not have the same expenses as the Class S Shares.
§ Annualized.
Performance is historical and assumes reinvestment of all dividends and capital gains. Investment return and principal value will fluctuate so that an investor’s
shares, when redeemed, may be worth more or less than when purchased. Past performance is not indicative of future results. The returns shown do not reflect the
deduction of taxes that a shareholder would pay on Fund distributions or the redemption of Fund shares. Additionally, the returns presented herein may differ from
the performance reported in the Financial Highlights as the returns herein are calculated in a manner consistent with standardized performance in accordance with
Securities and Exchange Commission rules, while the performance in the Financial Highlights has been calculated in accordance with U.S. Generally Accepted
Accounting Principles (“U.S. GAAP”).
Russell Global Equity Fund 199
Russell Investment Company
Russell Global Equity Fund
Shareholder Expense Example — October 31, 2016 (Unaudited)
| Fund Expenses | Please note that the expenses shown in the table are meant | |||||
| The following disclosure provides important information | to highlight your ongoing costs only and do not reflect any | |||||
| regarding the Fund’s Shareholder Expense Example | transactional costs. Therefore, the information under the heading | |||||
| (“Example”). | “Hypothetical Performance (5% return before expenses)” is | |||||
| useful in comparing ongoing costs only, and will not help you | ||||||
| Example | determine the relative total costs of owning different funds. In | |||||
| As a shareholder of the Fund, you incur two types of costs: (1) | addition, if these transactional costs were included, your costs | |||||
| transaction costs, including sales charges (loads) on certain | would have been higher. | |||||
| purchase or redemption payments, and (2) ongoing costs, | Hypothetical | |||||
| including distribution (12b-1) and/or service fees and other | Performance (5% | |||||
| Fund expenses. The Example is intended to help you understand | Actual | return before | ||||
| your ongoing costs (in dollars) of investing in the Fund and to | Class A | Performance | expenses) | |||
| Beginning Account Value | ||||||
| compare these costs with the ongoing costs of investing in other | May 1, 2016 | $ | 1,000.00 | $ | 1,000.00 | |
| mutual funds. The Example is based on an investment of $1,000 | Ending Account Value | |||||
| invested at the beginning of the period and held for the entire | October 31, 2016 | $ | 1,038.10 | $ | 1,017.65 | |
| period indicated, which for this Fund is from May 1, 2016 to | Expenses Paid During Period* | $ | 7.63 | $ | 7.56 | |
| October 31, 2016. | * Expenses are equal to the Fund's annualized expense ratio of 1.49% | |||||
| (representing the six month period annualized), multiplied by the average | ||||||
| Actual Expenses | account value over the period, multiplied by 184/366 (to reflect the one-half | |||||
| The information in the table under the heading “Actual | year period). | |||||
| Performance” provides information about actual account values | ||||||
| and actual expenses. You may use the information in this column, | Hypothetical | |||||
| Performance (5% | ||||||
| together with the amount you invested, to estimate the expenses | Actual | return before | ||||
| that you paid over the period. Simply divide your account value by | Class C | Performance | expenses) | |||
| $1,000 (for example, an $8,600 account value divided by $1,000 | Beginning Account Value | |||||
| = 8.6), then multiply the result by the number in the first column | May 1, 2016 | $ | 1,000.00 | $ | 1,000.00 | |
| Ending Account Value | ||||||
| in the row entitled “Expenses Paid During Period” to estimate | October 31, 2016 | $ | 1,033.40 | $ | 1,013.88 | |
| the expenses you paid on your account during this period. | Expenses Paid During Period* | $ | 11.45 | $ | 11.34 | |
| Hypothetical Example for Comparison Purposes | * Expenses are equal to the Fund's annualized expense ratio of 2.24% | |||||
| The information in the table under the heading “Hypothetical | (representing the six month period annualized), multiplied by the average | |||||
| account value over the period, multiplied by 184/366 (to reflect the one-half | ||||||
| Performance (5% return before expenses)” provides information | year period). | |||||
| about hypothetical account values and hypothetical expenses | ||||||
| based on the Fund’s actual expense ratio and an assumed rate of | Hypothetical | |||||
| return of 5% per year before expenses, which is not the Fund’s | Performance (5% | |||||
| Actual | return before | |||||
| actual return. The hypothetical account values and expenses | Class E | Performance | expenses) | |||
| may not be used to estimate the actual ending account balance or | Beginning Account Value | |||||
| expenses you paid for the period. You may use this information | May 1, 2016 | $ | 1,000.00 | $ | 1,000.00 | |
| to compare the ongoing costs of investing in the Fund and other | Ending Account Value | |||||
| October 31, 2016 | $ | 1,038.00 | $ | 1,017.65 | ||
| funds. To do so, compare this 5% hypothetical example with the | Expenses Paid During Period* | $ | 7.63 | $ | 7.56 | |
| 5% hypothetical examples that appear in the shareholder reports | ||||||
| of other funds. | * Expenses are equal to the Fund's annualized expense ratio of 1.49% | |||||
| (representing the six month period annualized), multiplied by the average | ||||||
| account value over the period, multiplied by 184/366 (to reflect the one-half | ||||||
| year period). | ||||||
200 Russell Global Equity Fund
Russell Investment Company
Russell Global Equity Fund
Shareholder Expense Example, continued — October 31, 2016 (Unaudited)
| Hypothetical | ||||
| Performance (5% | ||||
| Actual | return before | |||
| Class S | Performance | expenses) | ||
| Beginning Account Value | ||||
| May 1, 2016 | $ | 1,000.00 | $ | 1,000.00 |
| Ending Account Value | ||||
| October 31, 2016 | $ | 1,039.00 | $ | 1,018.90 |
| Expenses Paid During Period* | $ | 6.36 | $ | 6.29 |
* Expenses are equal to the Fund's annualized expense ratio of 1.24%
(representing the six month period annualized), multiplied by the average
account value over the period, multiplied by 184/366 (to reflect the one-half
year period).
| Hypothetical | ||||
| Performance (5% | ||||
| Actual | return before | |||
| Class Y | Performance | expenses) | ||
| Beginning Account Value | ||||
| May 1, 2016 | $ | 1,000.00 | $ | 1,000.00 |
| Ending Account Value | ||||
| October 31, 2016 | $ | 1,040.90 | $ | 1,019.91 |
| Expenses Paid During Period* | $ | 5.34 | $ | 5.28 |
* Expenses are equal to the Fund's annualized expense ratio of 1.04%
(representing the six month period annualized), multiplied by the average
account value over the period, multiplied by 184/366 (to reflect the one-half
year period).
Russell Global Equity Fund 201
Russell Investment Company
Russell Global Equity Fund
Schedule of Investments — October 31, 2016
| Amounts in thousands (except share amounts) | Amounts in thousands (except share amounts) | |||||||||
| Principal | Fair | Principal | Fair | |||||||
| Amount ($) | Value | Amount ($) | Value | |||||||
| or Shares | $ | or Shares | $ | |||||||
| Common Stocks - 95.8% | China - 0.7% | |||||||||
| Australia - 0.5% | Alibaba Group Holding, Ltd. - ADR(Æ) | 93,408 | 9,499 | |||||||
| AGL Energy, Ltd. | 11,493 | 167 | China Hongxing Sports, Ltd.(Å)(Æ) | 6,320,000 | — | |||||
| APA Group | 14,694 | 89 | Tencent Holdings, Ltd. | 286,600 | 7,589 | |||||
| AusNet Services(Æ) | 531,567 | 605 | 17,088 | |||||||
| Australia & New Zealand Banking | ||||||||||
| Group, Ltd. - ADR | 60,937 | 1,288 | Denmark - 0.4% | |||||||
| Caltex Australia, Ltd. | 11,262 | 262 | Pandora A/S | 64,613 | 8,407 | |||||
| CSL, Ltd. | 14,529 | 1,108 | ||||||||
| Scentre Group(ö) | 321,043 | 1,025 | Finland - 0.8% | |||||||
| Telstra Corp., Ltd. | 187,122 | 708 | Caverion Corp.(Ñ) | 189,245 | 1,361 | |||||
| Washington H Soul Pattinson & Co., Ltd. | 67,491 | 816 | Kone OYJ Class B | 131,846 | 6,066 | |||||
| Woodside Petroleum, Ltd. | 58,771 | 1,259 | Konecranes OYJ(Ñ) | 184,789 | 6,296 | |||||
| WorleyParsons, Ltd.(Æ) | 751,300 | 4,793 | Neste OYJ | 56,447 | 2,433 | |||||
| 12,120 | YIT OYJ | 321,800 | 2,680 | |||||||
| 18,836 | ||||||||||
| Austria - 0.3% | ||||||||||
| Andritz AG | 124,700 | 6,520 | France - 4.6% | |||||||
| BNP Paribas SA | 597,842 | 34,722 | ||||||||
| Belgium - 0.6% | Christian Dior SE | 30,968 | 5,979 | |||||||
| Groupe Bruxelles Lambert SA | 5,535 | 476 | Cie Generale des Etablissements | |||||||
| Solvay SA | 61,495 | 7,053 | Michelin Class B | 65,500 | 7,090 | |||||
| UCB SA | 88,938 | 6,013 | Danone SA | 204,569 | 14,155 | |||||
| 13,542 | Engie SA | 86,822 | 1,253 | |||||||
| Eurazeo SA | 10,635 | 612 | ||||||||
| Bermuda - 0.2% | Imerys SA | 88,389 | 6,151 | |||||||
| Assured Guaranty, Ltd. | 156,600 | 4,681 | Ipsos SA | 81,276 | 2,657 | |||||
| Axis Capital Holdings, Ltd. | 8,300 | 473 | Legrand SA - ADR | 102,876 | 5,809 | |||||
| Endurance Specialty Holdings, Ltd. | 3,400 | 312 | LVMH Moet Hennessy Louis Vuitton | |||||||
| Hiscox, Ltd. | 21,591 | 270 | SE - ADR | 56,150 | 10,213 | |||||
| 5,736 | PPR SA | 31,679 | 7,033 | |||||||
| Renault SA | 55,816 | 4,854 | ||||||||
| Brazil - 1.1% | Sanofi - ADR | 19,523 | 1,519 | |||||||
| BM&FBovespa SA - Bolsa de Valores | Suez Environnement Co. | 32,526 | 515 | |||||||
| Mercadorias e Futuros(Æ) | 1,166,200 | 6,869 | Total SA | 116,913 | 5,595 | |||||
| BR Malls Participacoes SA(Æ) | 1,620,500 | 6,488 | Veolia Environnement SA | 111,777 | 2,441 | |||||
| Itau Unibanco Holding SA - ADR | 569,694 | 6,796 | 110,598 | |||||||
| Kroton Educacional SA | 1,207,000 | 6,012 | ||||||||
| 26,165 | Germany - 4.7% | |||||||||
| Allianz SE | 121,055 | 18,867 | ||||||||
| Canada - 1.5% | BASF SE | 64,552 | 5,692 | |||||||
| Bank of Montreal | 83,266 | 5,299 | Bayer AG | 78,503 | 7,781 | |||||
| BCE, Inc.(Ñ) | 31,000 | 1,408 | Daimler AG | 217,400 | 15,490 | |||||
| Brookfield Canada Office Properties(ö) | 9,602 | 190 | Deutsche Lufthansa AG | 220,273 | 2,816 | |||||
| Canadian Imperial Bank of Commerce | 20,300 | 1,521 | Deutsche Telekom AG | 374,587 | 6,104 | |||||
| Canadian National Railway Co. | 146,951 | 9,239 | DMG Mori AG | 29,614 | 1,354 | |||||
| Emera, Inc. | 23,600 | 823 | Freenet AG | 162,700 | 4,663 | |||||
| Enbridge, Inc. | 13,314 | 575 | Hannover Rueck SE | 51,479 | 5,737 | |||||
| Fortis, Inc. | 4,659 | 153 | Lanxess AG | 104,992 | 6,720 | |||||
| Imperial Oil, Ltd.(Ñ) | 95,526 | 3,098 | Linde AG | 78,879 | 13,013 | |||||
| Intact Financial Corp. | 11,100 | 755 | MAN SE | 46,240 | 4,730 | |||||
| Methanex Corp. | 134,200 | 4,878 | Muenchener Rueckversicherungs- | |||||||
| Royal Bank of Canada - GDR | 12,700 | 794 | Gesellschaft AG in Muenchen | 37,958 | 7,356 | |||||
| Suncor Energy, Inc. | 49,000 | 1,470 | Rhoen Klinikum AG | 32,162 | 895 | |||||
| Toronto Dominion Bank | 68,958 | 3,129 | Symrise AG | 94,420 | 6,484 | |||||
| TransCanada Corp. | 61,147 | 2,768 | Zalando SE(Æ)(Þ) | 84,852 | 3,725 | |||||
| 36,100 | 111,427 | |||||||||
| Cayman Islands - 0.7% | Hong Kong - 0.6% | |||||||||
| Baidu, Inc. - ADR(Æ) | 95,086 | 16,817 | Cathay Pacific Airways, Ltd.(Ñ) | 1,393,100 | 1,835 | |||||
See accompanying notes which are an integral part of the financial statements.
202 Russell Global Equity Fund
Russell Investment Company
Russell Global Equity Fund
Schedule of Investments, continued — October 31, 2016
| Amounts in thousands (except share amounts) | Amounts in thousands (except share amounts) | |||||||||
| Principal | Fair | Principal | Fair | |||||||
| Amount ($) | Value | Amount ($) | Value | |||||||
| or Shares | $ | or Shares | $ | |||||||
| Cheung Kong Infrastructure Holdings, | JX Holdings, Inc. | 1,361,100 | 5,377 | |||||||
| Ltd. | 45,000 | 368 | KDDI Corp. | 216,800 | 6,593 | |||||
| China Resources Power Holdings Co., | Mitsui & Co., Ltd. | 141,900 | 1,970 | |||||||
| Ltd. | 1,399,900 | 2,374 | Mizuho Financial Group, Inc. | 1,717,100 | 2,895 | |||||
| CLP Holdings, Ltd. | 82,500 | 839 | Nagoya Railroad Co., Ltd. | 286,000 | 1,510 | |||||
| Guoco Group, Ltd. | 10,000 | 112 | Nexon Co., Ltd. | 299,000 | 5,091 | |||||
| Hang Seng Bank, Ltd. | 148,100 | 2,671 | Nikon Corp. | 185,600 | 2,805 | |||||
| New World Development Co., Ltd. | 1,760,000 | 2,194 | Nippon Prologis, Inc.(ö) | 126 | 285 | |||||
| Power Assets Holdings, Ltd. | 196,500 | 1,847 | NTT DOCOMO, Inc. | 99,300 | 2,500 | |||||
| Swire Pacific, Ltd. Class A | 34,500 | 359 | Ono Pharmaceutical Co., Ltd. | 222,300 | 5,654 | |||||
| Swire Pacific, Ltd. Class B | 37,500 | 70 | Orix JREIT, Inc.(ö) | 1,739 | 2,978 | |||||
| Wheelock & Co., Ltd. | 294,000 | 1,814 | Recruit Holdings Co., Ltd. | 44,500 | 1,790 | |||||
| 14,483 | Showa Denko KK | 477,800 | 6,317 | |||||||
| Sojitz Corp. | 33,100 | 87 | ||||||||
| India - 0.5% | Sumco Corp. | 198,600 | 2,087 | |||||||
| Bharti Infratel, Ltd. | 1,379,063 | 7,154 | Sumitomo Mitsui Financial Group, Inc. | 435,600 | 15,142 | |||||
| Infosys, Ltd. - ADR | 295,800 | 4,514 | Taisei Corp. | 101,000 | 758 | |||||
| 11,668 | Terumo Corp. | 19,200 | 744 | |||||||
| Tohoku Electric Power Co., Inc. | 251,500 | 3,078 | ||||||||
| Indonesia - 0.2% | Tokyo Electric Power Co. Holdings, Inc. | |||||||||
| Bank Central Asia Tbk PT | 3,416,500 | 4,059 | (Æ) | 564,000 | 2,191 | |||||
| TonenGeneral Sekiyu KK | 106,000 | 1,046 | ||||||||
| Ireland - 2.0% | Toppan Printing Co., Ltd. | 56,000 | 527 | |||||||
| Accenture PLC Class A | 137,820 | 16,020 | Toyota Motor Corp. | 287,200 | 16,590 | |||||
| Greencore Group PLC Class A | 1,231,145 | 4,964 | United Urban Investment Corp.(ö) | 422 | 712 | |||||
| Medtronic PLC | 317,685 | 26,057 | 148,143 | |||||||
| 47,041 | ||||||||||
| Luxembourg - 0.0% | ||||||||||
| Israel - 0.6% | Tenaris SA | 10,982 | 155 | |||||||
| Check Point Software Technologies, Ltd. | ||||||||||
| (Æ) | 42,970 | 3,634 | Mexico - 0.4% | |||||||
| Delek Energy Systems, Ltd.(Æ) | 498 | 258 | Grupo Televisa SAB - ADR | 368,400 | 9,037 | |||||
| Mobileye NV(Æ) | 186,672 | 6,940 | ||||||||
| Teva Pharmaceutical Industries, Ltd. | Netherlands - 1.3% | |||||||||
| - ADR | 90,600 | 3,872 | Akzo Nobel NV | 77,326 | 4,993 | |||||
| Teva Pharmaceutical Industries, Ltd. | 12,191 | 520 | Heineken NV | 83,729 | 6,893 | |||||
| 15,224 | Koninklijke Philips NV | 275,507 | 8,297 | |||||||
| Koninklijke Vopak NV | 27,798 | 1,403 | ||||||||
| Italy - 0.4% | NXP Semiconductors NV(Æ) | 27,506 | 2,751 | |||||||
| Enel SpA | 1,015,598 | 4,363 | Royal Dutch Shell PLC Class A | 183,388 | 4,569 | |||||
| ENI SpA - ADR | 68,802 | 995 | Royal Dutch Shell PLC Class B | 74,508 | 1,923 | |||||
| Parmalat SpA | 236,380 | 625 | 30,829 | |||||||
| Snam Rete Gas SpA | 161,453 | 852 | ||||||||
| Trevi Finanziaria Industriale SpA(Æ)(Ñ) | 1,489,405 | 2,194 | New Zealand - 0.1% | |||||||
| 9,029 | Contact Energy, Ltd. | 65,564 | 223 | |||||||
| Mercury NZ, Ltd. | 789,359 | 1,722 | ||||||||
| Japan - 6.2% | Ryman Healthcare, Ltd. | 203,485 | 1,292 | |||||||
| Aozora Bank, Ltd. | 1,445,000 | 4,780 | 3,237 | |||||||
| Asahi Group Holdings, Ltd. | 177,500 | 6,342 | ||||||||
| Canon, Inc. | 136,900 | 3,931 | Norway - 0.7% | |||||||
| Chubu Electric Power Co., Inc. | 99,800 | 1,468 | DNB ASA | 416,398 | 6,019 | |||||
| Daito Trust Construction Co., Ltd. | 19,400 | 3,249 | SpareBank 1 SR-Bank ASA | 881,252 | 5,258 | |||||
| Daiwa House Industry Co., Ltd. | 24,200 | 665 | Yara International ASA | 145,300 | 5,132 | |||||
| Daiwa Securities Group, Inc. | 1,809,000 | 10,803 | 16,409 | |||||||
| Eisai Co., Ltd. | 111,600 | 7,118 | ||||||||
| FamilyMart UNY Holdings Co., Ltd. | 58,800 | 3,689 | Portugal - 0.2% | |||||||
| Honda Motor Co., Ltd. | 324,100 | 9,696 | Banco BPI SA Class G(Æ) | 423,312 | 525 | |||||
| Idemitsu Kosan Co., Ltd. | 63,200 | 1,459 | Energias de Portugal SA | 1,079,453 | 3,566 | |||||
| Japan Post Holdings Co., Ltd. | 58,800 | 749 | 4,091 | |||||||
| Japan Retail Fund Investment Corp.(ö) | 1,581 | 3,591 | ||||||||
| Japan Tobacco, Inc. | 49,300 | 1,876 | ||||||||
See accompanying notes which are an integral part of the financial statements.
Russell Global Equity Fund 203
Russell Investment Company
Russell Global Equity Fund
Schedule of Investments, continued — October 31, 2016
| Amounts in thousands (except share amounts) | Amounts in thousands (except share amounts) | ||||||||
| Principal | Fair | Principal | Fair | ||||||
| Amount ($) | Value | Amount ($) | Value | ||||||
| or Shares | $ | or Shares | $ | ||||||
| Puerto Rico - 0.3% | Tung Thih Electronic Co., Ltd. | 288,000 | 4,217 | ||||||
| Popular, Inc. | 197,400 | 7,166 | 27,023 | ||||||
| Russia - 0.4% | Thailand - 0.5% | ||||||||
| Sberbank of Russia PJSC - ADR | 363,500 | 3,442 | Siam Commercial Bank PCL (The) | 1,631,500 | 6,676 | ||||
| Yandex NV Class A(Æ) | 274,470 | 5,404 | Thai Oil PCL | 2,933,700 | 5,866 | ||||
| 8,846 | 12,542 | ||||||||
| Singapore - 0.3% | United Kingdom - 7.2% | ||||||||
| DBS Group Holdings, Ltd. | 198,400 | 2,134 | Aon PLC | 90,317 | 10,010 | ||||
| United Overseas Bank, Ltd. | 401,400 | 5,412 | AstraZeneca PLC | 122,769 | 6,885 | ||||
| 7,546 | Barclays PLC | 6,251,799 | 14,500 | ||||||
| Barratt Developments PLC | 1,048,125 | 5,809 | |||||||
| South Korea - 2.3% | BBA Aviation PLC | 1,554,688 | 4,917 | ||||||
| BNK Financial Group, Inc. | 262,703 | 2,131 | Bellway PLC | 223,088 | 6,448 | ||||
| Kia Motors Corp. | 165,800 | 5,887 | BHP Billiton PLC - ADR | 189,400 | 5,727 | ||||
| LG Household & Health Care, Ltd. | 9,279 | 6,649 | BP PLC | 2,920,732 | 17,248 | ||||
| Samsung Biologics Co., Ltd.(Æ) | 1,180 | 140 | British American Tobacco PLC | 55,241 | 3,171 | ||||
| Samsung Electronics Co., Ltd. | 26,372 | 37,608 | Bunzl PLC | 6,005 | 161 | ||||
| Shinhan Financial Group Co., Ltd. | 69,079 | 2,658 | CNH Industrial NV(Ñ) | 2,201,000 | 17,074 | ||||
| 55,073 | Delphi Automotive PLC | 163,500 | 10,639 | ||||||
| Diageo PLC | 629,666 | 16,764 | |||||||
| Spain - 0.3% | Experian PLC | 244,000 | 4,685 | ||||||
| Endesa SA - ADR | 25,849 | 549 | GlaxoSmithKline PLC - ADR | 60,901 | 1,204 | ||||
| Iberdrola SA | 390,754 | 2,662 | HSBC Holdings PLC | 367,698 | 2,766 | ||||
| Red Electrica Corp. SA | 169,996 | 3,542 | Imperial Tobacco Group PLC | 90,351 | 4,367 | ||||
| 6,753 | Just Eat PLC(Æ) | 1,259,375 | 8,660 | ||||||
| National Grid PLC | 49,708 | 647 | |||||||
| Sweden - 1.0% | Persimmon PLC Class A | 297,534 | 6,155 | ||||||
| Atlas Copco AB Class B | 101,300 | 2,645 | Reckitt Benckiser Group PLC | 123,460 | 11,040 | ||||
| Duni AB | 260,200 | 3,463 | RELX PLC | 46,282 | 826 | ||||
| Investor AB Class B | 161,390 | 5,729 | Shaftesbury PLC(ö) | 128,793 | 1,445 | ||||
| Loomis AB Class B | 163,260 | 4,642 | Standard Chartered PLC(Æ) | 533,242 | 4,638 | ||||
| Meda AB Class A | 99,386 | 1,717 | Taylor Wimpey PLC | 3,393,992 | 5,872 | ||||
| Svenska Handelsbanken AB Class A | 436,287 | 5,943 | Unilever PLC | 4,494 | 188 | ||||
| 24,139 | Vodafone Group PLC | 386,027 | 1,060 | ||||||
| 172,906 | |||||||||
| Switzerland - 5.5% | |||||||||
| Allreal Holding AG(Æ) | 7,939 | 1,169 | United States - 47.4% | ||||||
| Basler Kantonalbank | 7,914 | 536 | 3M Co. | 61,207 | 10,118 | ||||
| Berner Kantonalbank AG | 428 | 78 | Abiomed, Inc.(Æ) | 38,500 | 4,042 | ||||
| Chubb, Ltd. | 35,150 | 4,464 | Advance Auto Parts, Inc. | 1,190 | 167 | ||||
| Cie Financiere Richemont SA | 227,776 | 14,642 | AdvanSix, Inc.(Æ) | 1,084 | 17 | ||||
| Credit Suisse Group AG(Æ) | 1,216,449 | 16,955 | Aflac, Inc. | 12,100 | 833 | ||||
| Glencore PLC(Æ) | 6,040,600 | 18,409 | Align Technology, Inc.(Æ) | 83,977 | 7,215 | ||||
| Julius Baer Group, Ltd.(Æ) | 324,132 | 13,116 | Allergan PLC(Æ) | 33,656 | 7,032 | ||||
| Kuehne & Nagel International AG | 46,895 | 6,353 | ALLETE, Inc. | 104,800 | 6,423 | ||||
| LafargeHolcim, Ltd.(Æ) | 184,375 | 9,837 | Allstate Corp. (The) | 61,995 | 4,210 | ||||
| Luzerner Kantonalbank AG(Æ) | 201 | 78 | Alphabet, Inc. Class A(Æ) | 20,224 | 16,379 | ||||
| Nestle SA | 201,381 | 14,596 | Alphabet, Inc. Class C(Æ) | 9,507 | 7,459 | ||||
| Novartis AG | 107,464 | 7,632 | Altria Group, Inc. | 48,400 | 3,200 | ||||
| Roche Holding AG | 66,193 | 15,190 | Amazon.com, Inc.(Æ) | 16,924 | 13,367 | ||||
| Sonova Holding AG | 3,986 | 534 | American Electric Power Co., Inc. | 25,300 | 1,640 | ||||
| Swiss Prime Site AG Class A(Æ) | 10,112 | 838 | American International Group, Inc. | 271,411 | 16,746 | ||||
| Swiss Re AG | 44,721 | 4,151 | American Tower Corp.(ö) | 54,314 | 6,365 | ||||
| Syngenta AG | 5,262 | 2,113 | Ameris Bancorp | 211,320 | 7,671 | ||||
| 130,691 | Annaly Capital Management, Inc.(ö) | 222,244 | 2,302 | ||||||
| Anthem, Inc. | 115,000 | 14,014 | |||||||
| Taiwan - 1.1% | Apple, Inc. | 248,954 | 28,266 | ||||||
| Taiwan Semiconductor Manufacturing | Applied Materials, Inc. | 18,100 | 526 | ||||||
| Co., Ltd. - ADR | 733,300 | 22,806 | AT&T, Inc. | 161,224 | 5,931 | ||||
See accompanying notes which are an integral part of the financial statements.
204 Russell Global Equity Fund
Russell Investment Company
Russell Global Equity Fund
Schedule of Investments, continued — October 31, 2016
| Amounts in thousands (except share amounts) | Amounts in thousands (except share amounts) | |||||||||
| Principal | Fair | Principal | Fair | |||||||
| Amount ($) | Value | Amount ($) | Value | |||||||
| or Shares | $ | or Shares | $ | |||||||
| Athenahealth, Inc.(Æ)(Ñ) | 51,977 | 5,370 | HP, Inc. | 191,800 | 2,779 | |||||
| Avnet, Inc. | 135,200 | 5,672 | Hyatt Hotels Corp. Class A(Æ)(Ñ) | 24,300 | 1,234 | |||||
| Baker Hughes, Inc. | 160,275 | 8,879 | IHS Markit, Ltd.(Æ) | 221,990 | 8,167 | |||||
| Bank of America Corp. | 1,070,000 | 17,655 | Independent Bank Corp. | 144,292 | 7,958 | |||||
| Baxter International, Inc. | 49,200 | 2,341 | Intel Corp. | 412,100 | 14,370 | |||||
| Bed Bath & Beyond, Inc. | 43,500 | 1,758 | International Bancshares Corp. | 201,918 | 6,229 | |||||
| Berkshire Hathaway, Inc. Class B(Æ) | 41,476 | 5,985 | International Business Machines Corp. | 13,000 | 1,998 | |||||
| BlackRock, Inc. Class A | 12,205 | 4,165 | International Game Technology PLC | 336,316 | 9,659 | |||||
| Bristol-Myers Squibb Co. | 213,007 | 10,844 | JM Smucker Co. (The) | 47,200 | 6,198 | |||||
| Brookline Bancorp, Inc. | 352,276 | 4,509 | Johnson & Johnson | 191,896 | 22,258 | |||||
| Cabot Oil & Gas Corp. | 453,200 | 9,463 | JPMorgan Chase & Co. | 613,534 | 42,493 | |||||
| CalAtlantic Group, Inc. | 108,384 | 3,503 | Lennar Corp. Class A | 214,400 | 8,938 | |||||
| Capital One Financial Corp. | 78,900 | 5,842 | Linear Technology Corp. | 5,117 | 307 | |||||
| Carter's, Inc. | 57,000 | 4,921 | Lockheed Martin Corp. | 20,615 | 5,079 | |||||
| Caterpillar, Inc. | 100,100 | 8,354 | Marathon Petroleum Corp. | 109,200 | 4,760 | |||||
| Charter Communications, Inc. Class | Mastercard, Inc. Class A | 17,500 | 1,873 | |||||||
| A(Æ) | 27,357 | 6,836 | McCormick & Co., Inc. | 421 | 40 | |||||
| Chevron Corp. | 63,220 | 6,622 | McDonald's Corp. | 17,800 | 2,004 | |||||
| Cigna Corp. | 105,200 | 12,501 | Merck & Co., Inc. | 259,301 | 15,226 | |||||
| Cincinnati Financial Corp. | 12,200 | 864 | Meritage Homes Corp.(Æ) | 76,200 | 2,358 | |||||
| Cisco Systems, Inc. | 35,945 | 1,103 | MetLife, Inc. | 122,600 | 5,757 | |||||
| Citigroup, Inc. | 385,100 | 18,928 | Microsoft Corp. | 574,999 | 34,454 | |||||
| Clorox Co. (The) | 36,689 | 4,403 | Middleby Corp.(Æ) | 69,108 | 7,748 | |||||
| Coca-Cola Co. (The) | 57,500 | 2,438 | Monster Beverage Corp.(Æ) | 52,152 | 7,528 | |||||
| Colgate-Palmolive Co. | 53,102 | 3,789 | MSC Industrial Direct Co., Inc. Class A | 24,794 | 1,805 | |||||
| Comcast Corp. Class A | 16,350 | 1,011 | Mylan NV(Æ) | 109,684 | 4,004 | |||||
| Corning, Inc. | 20,000 | 454 | Netflix, Inc.(Æ) | 111,417 | 13,913 | |||||
| CoStar Group, Inc.(Æ) | 32,849 | 6,147 | Newfield Exploration Co.(Æ) | 111,707 | 4,534 | |||||
| Costco Wholesale Corp. | 54,721 | 8,092 | NextEra Energy, Inc. | 52,000 | 6,656 | |||||
| Coty, Inc. Class A(Æ) | 65,573 | 1,508 | Northrop Grumman Corp. | 19,722 | 4,516 | |||||
| Cummins, Inc. | 73,300 | 9,369 | NVIDIA Corp. | 14,177 | 1,009 | |||||
| CVS Health Corp. | 32,809 | 2,759 | Occidental Petroleum Corp. | 40,780 | 2,973 | |||||
| Darden Restaurants, Inc. | 29,218 | 1,893 | Oracle Corp. | 212,016 | 8,146 | |||||
| DexCom, Inc.(Æ) | 118,526 | 9,274 | Panera Bread Co. Class A(Æ)(Ñ) | 19,511 | 3,722 | |||||
| Diamondback Energy, Inc.(Æ) | 20,632 | 1,884 | Parsley Energy, Inc. Class A(Æ) | 40,298 | 1,326 | |||||
| Dime Community Bancshares, Inc. | 246,600 | 3,995 | PepsiCo, Inc. | 51,173 | 5,486 | |||||
| Domino's Pizza, Inc. | 5,865 | 993 | Pfizer, Inc. | 443,841 | 14,074 | |||||
| DR Horton, Inc. | 553,600 | 15,960 | PG&E Corp. | 25,196 | 1,565 | |||||
| Dr Pepper Snapple Group, Inc. | 10,800 | 948 | Phillips 66 | 58,947 | 4,784 | |||||
| Duke Energy Corp. | 17,400 | 1,392 | Pioneer Natural Resources Co. | 40,141 | 7,186 | |||||
| Edwards Lifesciences Corp.(Æ) | 88,685 | 8,445 | Platform Specialty Products Corp.(Æ)(Ñ) | 637,777 | 4,649 | |||||
| Estee Lauder Cos., Inc. (The) Class A | 11,826 | 1,030 | Praxair, Inc. | 56,800 | 6,649 | |||||
| Expedia, Inc. | 81,674 | 10,555 | Priceline Group, Inc. (The)(Æ) | 6,167 | 9,092 | |||||
| Exxon Mobil Corp. | 111,827 | 9,317 | Procter & Gamble Co. (The) | 80,567 | 6,993 | |||||
| Facebook, Inc. Class A(Æ) | 179,671 | 23,535 | Progressive Corp. (The) | 47,300 | 1,490 | |||||
| FairPoint Communications, Inc.(Æ) | 130,248 | 2,032 | Pure Storage, Inc. Class A(Æ)(Ñ) | 7,786 | 96 | |||||
| Fifth Third Bancorp | 218,700 | 4,759 | Quest Diagnostics, Inc. | 80,300 | 6,540 | |||||
| Foot Locker, Inc. | 7,417 | 495 | Range Resources Corp. | 345,400 | 11,671 | |||||
| Franklin Resources, Inc. | 155,800 | 5,244 | Raytheon Co. | 14,400 | 1,967 | |||||
| Frontier Communications Corp.(Ñ) | 1,006,300 | 4,045 | Regal Entertainment Group Class A(Ñ) | 138,585 | 2,981 | |||||
| General Dynamics Corp. | 51,400 | 7,748 | Regeneron Pharmaceuticals, Inc.(Æ) | 15,403 | 5,314 | |||||
| General Electric Co. | 243,485 | 7,085 | Rite Aid Corp.(Æ) | 140,049 | 940 | |||||
| General Motors Co. | 435,300 | 13,756 | Samsonite International SA | 1,707,800 | 5,372 | |||||
| Gilead Sciences, Inc. | 18,467 | 1,360 | Schlumberger, Ltd. | 41,926 | 3,280 | |||||
| Goldman Sachs Group, Inc. (The) | 51,500 | 9,179 | ServiceNow, Inc.(Æ) | 100,268 | 8,815 | |||||
| Hartford Financial Services Group, Inc. | 18,800 | 829 | Southern Co. (The) | 38,500 | 1,985 | |||||
| HCA Holdings, Inc.(Æ) | 66,100 | 5,059 | Southwest Bancorp, Inc. | 172,800 | 3,223 | |||||
| Hewlett Packard Enterprise Co. | 191,800 | 4,310 | Spectra Energy Corp. | 27,570 | 1,153 | |||||
| Home Depot, Inc. (The) | 24,100 | 2,940 | SS&C Technologies Holdings, Inc. | 272,616 | 8,705 | |||||
| Honeywell International, Inc. | 126,646 | 13,891 | St. Jude Medical, Inc. | 18,200 | 1,417 | |||||
See accompanying notes which are an integral part of the financial statements.
Russell Global Equity Fund 205
Russell Investment Company
Russell Global Equity Fund
Schedule of Investments, continued — October 31, 2016
| Amounts in thousands (except share amounts) | Amounts in thousands (except share amounts) | |||||||||
| Principal | Fair | Principal | Fair | |||||||
| Amount ($) | Value | Amount ($) | Value | |||||||
| or Shares | $ | or Shares | $ | |||||||
| State Street Corp. | 152,464 | 10,705 | Total Other Securities | |||||||
| Symantec Corp. | 77,789 | 1,947 | (cost $34,570) | 34,570 | ||||||
| Synchrony Financial | 75,278 | 2,152 | ||||||||
| Tesoro Corp. | 22,302 | 1,895 | ||||||||
| Thermo Fisher Scientific, Inc. | 95,358 | 14,021 | Total Investments 100.8% | |||||||
| Tiffany & Co.(Ñ) | 43,739 | 3,211 | (identified cost $2,040,327) | 2,404,865 | ||||||
| Time Warner, Inc. | 127,773 | 11,371 | ||||||||
| Travelers Cos., Inc. (The) | 15,500 | 1,677 | Other Assets and Liabilities, Net | |||||||
| Tyson Foods, Inc. Class A | 1,128 | 80 | -(0.8%) | (19,548 | ) | |||||
| Ultimate Software Group, Inc.(Æ) | 2,400 | 506 | ||||||||
| United Parcel Service, Inc. Class B | 112,090 | 12,079 | Net Assets - 100.0% | 2,385,317 | ||||||
| United Technologies Corp. | 6,182 | 632 | ||||||||
| UnitedHealth Group, Inc. | 154,500 | 21,836 | ||||||||
| Valero Energy Corp. | 94,659 | 5,608 | ||||||||
| Verizon Communications, Inc. | 136,234 | 6,553 | ||||||||
| Visa, Inc. Class A | 251,874 | 20,782 | ||||||||
| Visteon Corp. | 26,603 | 1,878 | ||||||||
| VMware, Inc. Class A(Æ) | 14,950 | 1,175 | ||||||||
| Wal-Mart Stores, Inc. | 41,800 | 2,927 | ||||||||
| Walt Disney Co. (The) | 137,327 | 12,729 | ||||||||
| Waters Corp.(Æ) | 56,074 | 7,802 | ||||||||
| Wayfair, Inc. Class A(Æ)(Ñ) | 158,414 | 5,280 | ||||||||
| Web.com Group, Inc.(Æ) | 322,000 | 5,184 | ||||||||
| Webster Financial Corp. | 159,300 | 6,436 | ||||||||
| Wells Fargo & Co. | 292,148 | 13,442 | ||||||||
| WESCO International, Inc.(Æ) | 127,200 | 6,894 | ||||||||
| Western Union Co. (The) | 302,200 | 6,065 | ||||||||
| Workday, Inc. Class A(Æ) | 133,809 | 11,599 | ||||||||
| Xcel Energy, Inc. | 9,457 | 393 | ||||||||
| Xerox Corp. | 503,600 | 4,920 | ||||||||
| Zimmer Biomet Holdings, Inc. | 101,427 | 10,690 | ||||||||
| 1,131,876 | ||||||||||
| Virgin Islands, British - 0.2% | ||||||||||
| Nomad Foods, Ltd.(Æ) | 329,242 | 4,046 | ||||||||
| Total Common Stocks | ||||||||||
| (cost $1,920,831) | 2,285,368 | |||||||||
| Preferred Stocks - 0.0% | ||||||||||
| Germany - 0.0% | ||||||||||
| Man SE | 2,441 | 247 | ||||||||
| Total Preferred Stocks | ||||||||||
| (cost $257) | 247 | |||||||||
| Short-Term Investments - 3.6% | ||||||||||
| United States - 3.6% | ||||||||||
| Russell U.S. Cash Management Fund | 64,973,242 | (8) | 64,986 | |||||||
| United States Treasury Bills | ||||||||||
| 0.113% due 11/10/16 (~)(§) | 6,400 | 6,400 | ||||||||
| 0.265% due 01/05/17 (~)(§) | 13,300 | 13,294 | ||||||||
| 84,680 | ||||||||||
| Total Short-Term Investments | ||||||||||
| (cost $84,669) | 84,680 | |||||||||
| Other Securities - 1.4% | ||||||||||
| Russell U.S. Cash Collateral Fund(×) | 34,570,117 | (8) | 34,570 | |||||||
See accompanying notes which are an integral part of the financial statements.
206 Russell Global Equity Fund
Russell Investment Company
Russell Global Equity Fund
Schedule of Investments, continued — October 31, 2016
| Restricted Securities | ||||||||||||
| Amounts in thousands (except share and cost per unit amounts) | ||||||||||||
| Principal | Cost per | Cost | Fair Value | |||||||||
| % of Net Assets | Acquisition | Amount ($) | Unit | (000 | ) | (000 | ) | |||||
| Securities | Date | or shares | $ | $ | $ | |||||||
| 0.0% | ||||||||||||
| China Hongxing Sports, Ltd. | 08/27/10 | SGD | 6,320,000 | 0.12 | 764 | — | ||||||
| — | ||||||||||||
| For a description of restricted securities see note 8 in the Notes to Financial Statements. | ||||||||||||
| Futures Contracts | |||||||||
| Amounts in thousands (except contract amounts) | |||||||||
| Unrealized | |||||||||
| Appreciation | |||||||||
| Number of | Notional | Expiration | (Depreciation) | ||||||
| Contracts | Amount | Date | $ | ||||||
| Long Positions | |||||||||
| CAC40 Euro Index Futures | 16 | EUR | 721 | 11/16 | (2 | ) | |||
| DAX Index Futures | 2 | EUR | 534 | 12/16 | (1 | ) | |||
| Euro STOXX 50 Index Futures | 12 | EUR | 366 | 12/16 | (3 | ) | |||
| FTSE 100 Index Futures | 7 | GBP | 485 | 12/16 | (3 | ) | |||
| Hang Seng Index Futures | 2 | HKD | 2,291 | 11/16 | (2 | ) | |||
| OMXS30 Index Futures | 8 | SEK | 1,156 | 11/16 | (1 | ) | |||
| S&P 500 E-Mini Index Futures | 557 | USD | 59,045 | 12/16 | (569 | ) | |||
| S&P Mid 400 E-Mini Index Futures | 3 | USD | 452 | 12/16 | 4 | ||||
| S&P/TSX 60 Index Futures | 3 | CAD | 520 | 12/16 | (2 | ) | |||
| SPI 200 Index Futures | 4 | AUD | 529 | 12/16 | (1 | ) | |||
| TOPIX Index Futures | 643 | JPY | 8,969,850 | 12/16 | 3,595 | ||||
| Short Positions | |||||||||
| Euro STOXX 50 Index Futures | 891 | EUR | 27,202 | 12/16 | (657 | ) | |||
| FTSE 100 Index Futures | 677 | GBP | 46,910 | 12/16 | (2,134 | ) | |||
| Hang Seng Index Futures | 81 | HKD | 92,765 | 11/16 | 263 | ||||
| MSCI Emerging Markets Mini Index Futures | 851 | USD | 38,444 | 12/16 | 71 | ||||
| Total Unrealized Appreciation (Depreciation) on Open Futures Contracts (å) | 558 | ||||||||
| Foreign Currency Exchange Contracts | |||||||||
| Amounts in thousands | |||||||||
| Unrealized | |||||||||
| Appreciation | |||||||||
| Amount | Amount | (Depreciation) | |||||||
| Counterparty | Sold | Bought | Settlement Date | $ | |||||
| Bank of America | USD | 76 | AUD | 100 | 12/21/16 | — | |||
| Bank of America | USD | 76 | AUD | 100 | 12/21/16 | — | |||
| Bank of America | USD | 110 | AUD | 144 | 12/21/16 | (1 | ) | ||
| Bank of America | USD | 150 | AUD | 200 | 12/21/16 | 2 | |||
| Bank of America | USD | 208 | AUD | 275 | 12/21/16 | 1 | |||
| Bank of America | USD | 76 | CAD | 100 | 12/21/16 | (1 | ) | ||
| Bank of America | USD | 95 | CAD | 125 | 12/21/16 | (2 | ) | ||
| Bank of America | USD | 152 | CAD | 200 | 12/21/16 | (2 | ) | ||
| Bank of America | USD | 284 | CAD | 375 | 12/21/16 | (4 | ) | ||
| Bank of America | USD | 365 | CAD | 479 | 12/21/16 | (8 | ) | ||
| Bank of America | USD | 4,697 | CAD | 6,200 | 12/21/16 | (73 | ) | ||
| Bank of America | USD | 152 | DKK | 1,000 | 12/21/16 | (4 | ) | ||
| Bank of America | USD | 339 | EUR | 300 | 12/21/16 | (9 | ) | ||
| Bank of America | USD | 478 | EUR | 425 | 12/21/16 | (10 | ) | ||
| Bank of America | USD | 497 | EUR | 450 | 12/21/16 | (2 | ) | ||
| Bank of America | USD | 561 | EUR | 500 | 12/21/16 | (11 | ) | ||
| Bank of America | USD | 1,341 | EUR | 1,200 | 12/21/16 | (21 | ) | ||
| Bank of America | USD | 4,515 | EUR | 4,000 | 12/21/16 | (114 | ) | ||
See accompanying notes which are an integral part of the financial statements.
Russell Global Equity Fund 207
Russell Investment Company
Russell Global Equity Fund
Schedule of Investments, continued — October 31, 2016
| Foreign Currency Exchange Contracts | ||||||||
| Amounts in thousands | ||||||||
| Unrealized | ||||||||
| Appreciation | ||||||||
| Amount | Amount | (Depreciation) | ||||||
| Counterparty | Sold | Bought | Settlement Date | $ | ||||
| Bank of America | USD | 11,411 | EUR | 10,136 | 12/21/16 | (260 | ) | |
| Bank of America | USD | 14,689 | EUR | 13,000 | 12/21/16 | (386 | ) | |
| Bank of America | USD | 191 | GBP | 150 | 12/21/16 | (8 | ) | |
| Bank of America | USD | 245 | GBP | 200 | 12/21/16 | — | ||
| Bank of America | USD | 326 | GBP | 250 | 12/21/16 | (20 | ) | |
| Bank of America | USD | 467 | GBP | 363 | 12/21/16 | (23 | ) | |
| Bank of America | USD | 505 | GBP | 400 | 12/21/16 | (15 | ) | |
| Bank of America | USD | 780 | GBP | 600 | 12/21/16 | (45 | ) | |
| Bank of America | USD | 1,954 | GBP | 1,500 | 12/21/16 | (116 | ) | |
| Bank of America | USD | 2,598 | GBP | 2,000 | 12/21/16 | (147 | ) | |
| Bank of America | USD | 45 | HKD | 350 | 12/21/16 | — | ||
| Bank of America | USD | 49 | HKD | 382 | 12/21/16 | — | ||
| Bank of America | USD | 52 | HKD | 400 | 12/21/16 | — | ||
| Bank of America | USD | 65 | HKD | 500 | 12/21/16 | — | ||
| Bank of America | USD | 129 | HKD | 1,000 | 12/21/16 | — | ||
| Bank of America | USD | 387 | HKD | 3,000 | 12/21/16 | — | ||
| Bank of America | USD | 645 | HKD | 5,000 | 12/21/16 | — | ||
| Bank of America | USD | 11,616 | HKD | 90,000 | 12/21/16 | (8 | ) | |
| Bank of America | USD | 242 | JPY | 25,000 | 12/21/16 | (3 | ) | |
| Bank of America | USD | 289 | JPY | 30,000 | 12/21/16 | (2 | ) | |
| Bank of America | USD | 294 | JPY | 30,000 | 12/21/16 | (8 | ) | |
| Bank of America | USD | 296 | JPY | 30,000 | 12/21/16 | (9 | ) | |
| Bank of America | USD | 590 | JPY | 60,000 | 12/21/16 | (16 | ) | |
| Bank of America | USD | 674 | JPY | 70,000 | 12/21/16 | (6 | ) | |
| Bank of America | USD | 971 | JPY | 100,000 | 12/21/16 | (15 | ) | |
| Bank of America | USD | 2,470 | JPY | 250,000 | 12/21/16 | (81 | ) | |
| Bank of America | USD | 4,402 | JPY | 440,000 | 12/21/16 | (198 | ) | |
| Bank of America | USD | 5,752 | JPY | 600,000 | 12/21/16 | (19 | ) | |
| Bank of America | USD | 7,667 | JPY | 776,323 | 12/21/16 | (250 | ) | |
| Bank of America | USD | 3,705 | NOK | 30,000 | 12/21/16 | (74 | ) | |
| Bank of America | USD | 35 | SEK | 300 | 12/21/16 | (2 | ) | |
| Bank of America | USD | 57 | SEK | 500 | 12/21/16 | (1 | ) | |
| Bank of America | USD | 93 | SEK | 800 | 12/21/16 | (4 | ) | |
| Bank of America | USD | 1,184 | SEK | 10,000 | 12/21/16 | (74 | ) | |
| Bank of America | USD | 4,825 | SEK | 41,000 | 12/21/16 | (274 | ) | |
| Bank of America | AUD | 100 | USD | 75 | 12/21/16 | (1 | ) | |
| Bank of America | AUD | 100 | USD | 75 | 12/21/16 | (1 | ) | |
| Bank of America | AUD | 100 | USD | 76 | 12/21/16 | — | ||
| Bank of America | AUD | 200 | USD | 152 | 12/21/16 | — | ||
| Bank of America | AUD | 250 | USD | 190 | 12/21/16 | — | ||
| Bank of America | AUD | 500 | USD | 383 | 12/21/16 | 3 | ||
| Bank of America | CAD | 60 | USD | 45 | 12/21/16 | — | ||
| Bank of America | CAD | 100 | USD | 76 | 12/21/16 | 1 | ||
| Bank of America | CAD | 100 | USD | 76 | 12/21/16 | 1 | ||
| Bank of America | CAD | 200 | USD | 152 | 12/21/16 | 2 | ||
| Bank of America | CAD | 200 | USD | 154 | 12/21/16 | 4 | ||
| Bank of America | CAD | 300 | USD | 228 | 12/21/16 | 4 | ||
| Bank of America | CAD | 350 | USD | 261 | 12/21/16 | — | ||
| Bank of America | CAD | 600 | USD | 458 | 12/21/16 | 10 | ||
| Bank of America | CAD | 7,500 | USD | 5,603 | 12/21/16 | 10 | ||
| Bank of America | EUR | 200 | USD | 225 | 12/21/16 | 5 | ||
| Bank of America | EUR | 200 | USD | 218 | 12/21/16 | (2 | ) | |
| Bank of America | EUR | 300 | USD | 338 | 12/21/16 | 8 | ||
| Bank of America | EUR | 400 | USD | 451 | 12/21/16 | 11 | ||
| Bank of America | EUR | 400 | USD | 448 | 12/21/16 | 8 | ||
| Bank of America | EUR | 500 | USD | 560 | 12/21/16 | 10 | ||
See accompanying notes which are an integral part of the financial statements.
208 Russell Global Equity Fund
Russell Investment Company
Russell Global Equity Fund
Schedule of Investments, continued — October 31, 2016
| Foreign Currency Exchange Contracts | ||||||||
| Amounts in thousands | ||||||||
| Unrealized | ||||||||
| Appreciation | ||||||||
| Amount | Amount | (Depreciation) | ||||||
| Counterparty | Sold | Bought | Settlement Date | $ | ||||
| Bank of America | EUR | 600 | USD | 673 | 12/21/16 | 13 | ||
| Bank of America | EUR | 800 | USD | 902 | 12/21/16 | 21 | ||
| Bank of America | EUR | 998 | USD | 1,124 | 12/21/16 | 26 | ||
| Bank of America | EUR | 1,100 | USD | 1,211 | 12/21/16 | — | ||
| Bank of America | EUR | 1,600 | USD | 1,800 | 12/21/16 | 40 | ||
| Bank of America | EUR | 2,000 | USD | 2,184 | 12/21/16 | (16 | ) | |
| Bank of America | EUR | 11,000 | USD | 12,429 | 12/21/16 | 328 | ||
| Bank of America | GBP | 100 | USD | 133 | 12/21/16 | 10 | ||
| Bank of America | GBP | 100 | USD | 122 | 12/21/16 | — | ||
| Bank of America | GBP | 100 | USD | 130 | 12/21/16 | 7 | ||
| Bank of America | GBP | 150 | USD | 195 | 12/21/16 | 11 | ||
| Bank of America | GBP | 200 | USD | 261 | 12/21/16 | 16 | ||
| Bank of America | GBP | 300 | USD | 390 | 12/21/16 | 22 | ||
| Bank of America | GBP | 400 | USD | 488 | 12/21/16 | (2 | ) | |
| Bank of America | GBP | 500 | USD | 650 | 12/21/16 | 37 | ||
| Bank of America | GBP | 600 | USD | 772 | 12/21/16 | 37 | ||
| Bank of America | GBP | 1,000 | USD | 1,239 | 12/21/16 | 13 | ||
| Bank of America | GBP | 1,000 | USD | 1,285 | 12/21/16 | 60 | ||
| Bank of America | GBP | 2,500 | USD | 3,309 | 12/21/16 | 245 | ||
| Bank of America | GBP | 6,200 | USD | 7,579 | 12/21/16 | (19 | ) | |
| Bank of America | GBP | 7,292 | USD | 9,389 | 12/21/16 | 454 | ||
| Bank of America | HKD | 600 | USD | 77 | 12/21/16 | — | ||
| Bank of America | HKD | 800 | USD | 103 | 12/21/16 | — | ||
| Bank of America | HKD | 1,000 | USD | 129 | 12/21/16 | — | ||
| Bank of America | HKD | 3,000 | USD | 387 | 12/21/16 | — | ||
| Bank of America | HKD | 33,413 | USD | 4,311 | 12/21/16 | 2 | ||
| Bank of America | JPY | 36,208 | USD | 344 | 11/02/16 | (2 | ) | |
| Bank of America | JPY | 9,910 | USD | 98 | 12/21/16 | 3 | ||
| Bank of America | JPY | 10,000 | USD | 99 | 12/21/16 | 3 | ||
| Bank of America | JPY | 10,000 | USD | 96 | 12/21/16 | 1 | ||
| Bank of America | JPY | 20,000 | USD | 198 | 12/21/16 | 7 | ||
| Bank of America | JPY | 20,000 | USD | 196 | 12/21/16 | 5 | ||
| Bank of America | JPY | 20,000 | USD | 196 | 12/21/16 | 4 | ||
| Bank of America | JPY | 30,000 | USD | 296 | 12/21/16 | 9 | ||
| Bank of America | JPY | 40,000 | USD | 397 | 12/21/16 | 15 | ||
| Bank of America | JPY | 50,000 | USD | 481 | 12/21/16 | 3 | ||
| Bank of America | JPY | 50,000 | USD | 499 | 12/21/16 | 21 | ||
| Bank of America | JPY | 60,000 | USD | 574 | 12/21/16 | 1 | ||
| Bank of America | JPY | 100,000 | USD | 981 | 12/21/16 | 25 | ||
| Bank of America | JPY | 100,000 | USD | 987 | 12/21/16 | 32 | ||
| Bank of America | JPY | 100,000 | USD | 959 | 12/21/16 | 4 | ||
| Bank of America | JPY | 150,000 | USD | 1,495 | 12/21/16 | 62 | ||
| Bank of America | JPY | 175,000 | USD | 1,725 | 12/21/16 | 53 | ||
| Bank of America | JPY | 187,763 | USD | 1,854 | 12/21/16 | 60 | ||
| Bank of America | JPY | 200,000 | USD | 1,982 | 12/21/16 | 71 | ||
| Bank of America | JPY | 200,000 | USD | 1,972 | 12/21/16 | 61 | ||
| Bank of America | JPY | 400,000 | USD | 3,983 | 12/21/16 | 161 | ||
| Bank of America | JPY | 1,100,000 | USD | 11,005 | 12/21/16 | 495 | ||
| Bank of America | NOK | 40,000 | USD | 4,833 | 12/21/16 | (9 | ) | |
| Bank of America | SEK | 66 | USD | 8 | 12/21/16 | — | ||
| Bank of America | SEK | 500 | USD | 59 | 12/21/16 | 3 | ||
| Bank of America | SEK | 800 | USD | 89 | 12/21/16 | — | ||
| Bank of America | SEK | 1,400 | USD | 164 | 12/21/16 | 9 | ||
| Bank of America | SEK | 38,000 | USD | 4,270 | 12/21/16 | 52 | ||
| Bank of New York | AUD | 100 | USD | 77 | 12/21/16 | 1 | ||
| Bank of New York | AUD | 300 | USD | 226 | 12/21/16 | (2 | ) | |
See accompanying notes which are an integral part of the financial statements.
Russell Global Equity Fund 209
Russell Investment Company
Russell Global Equity Fund
Schedule of Investments, continued — October 31, 2016
| Foreign Currency Exchange Contracts | |||||||
| Amounts in thousands | |||||||
| Unrealized | |||||||
| Appreciation | |||||||
| Amount | Amount | (Depreciation) | |||||
| Counterparty | Sold | Bought | Settlement Date | $ | |||
| Bank of New York | CAD | 60 | USD | 45 | 12/21/16 | 1 | |
| Bank of New York | CAD | 100 | USD | 76 | 12/21/16 | 2 | |
| Bank of New York | CAD | 200 | USD | 153 | 12/21/16 | 4 | |
| Bank of New York | EUR | 200 | USD | 219 | 12/21/16 | (1 | ) |
| Bank of New York | EUR | 500 | USD | 550 | 12/21/16 | — | |
| Bank of New York | EUR | 800 | USD | 902 | 12/21/16 | 22 | |
| Bank of New York | GBP | 100 | USD | 123 | 12/21/16 | — | |
| Bank of New York | GBP | 100 | USD | 123 | 12/21/16 | — | |
| Bank of New York | GBP | 400 | USD | 534 | 12/21/16 | 43 | |
| Bank of New York | HKD | 1,000 | USD | 129 | 12/21/16 | — | |
| Bank of New York | JPY | 10,000 | USD | 96 | 12/21/16 | 1 | |
| Bank of New York | JPY | 30,000 | USD | 291 | 12/21/16 | 4 | |
| Bank of New York | JPY | 50,000 | USD | 493 | 12/21/16 | 15 | |
| Bank of New York | SEK | 800 | USD | 95 | 12/21/16 | 6 | |
| BNP Paribas | USD | 227 | AUD | 300 | 12/21/16 | 1 | |
| BNP Paribas | USD | 517 | AUD | 675 | 12/21/16 | (4 | ) |
| BNP Paribas | USD | 7,149 | AUD | 9,334 | 12/21/16 | (58 | ) |
| BNP Paribas | USD | 299 | CAD | 400 | 12/21/16 | (1 | ) |
| BNP Paribas | USD | 566 | CAD | 732 | 12/21/16 | (21 | ) |
| BNP Paribas | USD | 9,959 | CAD | 12,868 | 12/21/16 | (362 | ) |
| BNP Paribas | USD | 336 | CHF | 333 | 11/02/16 | — | |
| BNP Paribas | USD | 1,420 | EUR | 1,300 | 12/21/16 | 10 | |
| BNP Paribas | USD | 4,114 | EUR | 3,635 | 12/21/16 | (115 | ) |
| BNP Paribas | USD | 609 | GBP | 500 | 12/21/16 | 3 | |
| BNP Paribas | USD | 1,257 | GBP | 944 | 12/21/16 | (101 | ) |
| BNP Paribas | USD | 7,979 | GBP | 5,990 | 12/21/16 | (637 | ) |
| BNP Paribas | USD | 129 | HKD | 1,000 | 12/21/16 | — | |
| BNP Paribas | USD | 343 | HKD | 2,657 | 12/21/16 | — | |
| BNP Paribas | USD | 761 | JPY | 80,000 | 12/21/16 | 3 | |
| BNP Paribas | USD | 2,789 | JPY | 282,586 | 12/21/16 | (89 | ) |
| BNP Paribas | USD | 18,519 | JPY | 1,876,059 | 12/21/16 | (594 | ) |
| BNP Paribas | USD | 111 | SEK | 1,000 | 12/21/16 | — | |
| BNP Paribas | USD | 250 | SEK | 2,092 | 12/21/16 | (17 | ) |
| BNP Paribas | CHF | 10,778 | USD | 11,182 | 12/21/16 | 259 | |
| BNP Paribas | EUR | 607 | USD | 666 | 11/02/16 | (1 | ) |
| BNP Paribas | EUR | 5,301 | USD | 5,999 | 12/21/16 | 167 | |
| BNP Paribas | EUR | 10,710 | USD | 12,121 | 12/21/16 | 338 | |
| BNP Paribas | GBP | 7,473 | USD | 9,954 | 12/21/16 | 797 | |
| BNP Paribas | JPY | 1,068,400 | USD | 10,546 | 12/21/16 | 338 | |
| BNP Paribas | NOK | 35,136 | USD | 4,298 | 12/21/16 | 45 | |
| BNP Paribas | SEK | 41,400 | USD | 4,938 | 12/21/16 | 343 | |
| Brown Brothers Harriman | USD | 152 | AUD | 200 | 12/21/16 | — | |
| Brown Brothers Harriman | USD | 149 | CAD | 200 | 12/21/16 | — | |
| Brown Brothers Harriman | USD | 763 | EUR | 700 | 12/21/16 | 7 | |
| Brown Brothers Harriman | USD | 789 | EUR | 700 | 12/21/16 | (19 | ) |
| Brown Brothers Harriman | USD | 292 | GBP | 239 | 11/02/16 | — | |
| Brown Brothers Harriman | USD | 516 | GBP | 422 | 11/02/16 | 1 | |
| Brown Brothers Harriman | USD | 367 | GBP | 300 | 12/21/16 | 1 | |
| Brown Brothers Harriman | USD | 64 | HKD | 500 | 12/21/16 | — | |
| Brown Brothers Harriman | USD | 131 | JPY | 13,740 | 11/01/16 | — | |
| Brown Brothers Harriman | USD | 375 | JPY | 39,365 | 11/01/16 | — | |
| Brown Brothers Harriman | USD | 94 | JPY | 9,914 | 11/02/16 | — | |
| Brown Brothers Harriman | USD | 154 | JPY | 16,193 | 11/02/16 | 1 | |
| Brown Brothers Harriman | USD | 284 | JPY | 29,923 | 11/02/16 | 1 | |
| Brown Brothers Harriman | USD | 315 | JPY | 33,140 | 11/02/16 | 1 | |
| Brown Brothers Harriman | USD | 481 | JPY | 50,000 | 12/21/16 | (3 | ) |
See accompanying notes which are an integral part of the financial statements.
210 Russell Global Equity Fund
Russell Investment Company
Russell Global Equity Fund
Schedule of Investments, continued — October 31, 2016
| Foreign Currency Exchange Contracts | ||||||||
| Amounts in thousands | ||||||||
| Unrealized | ||||||||
| Appreciation | ||||||||
| Amount | Amount | (Depreciation) | ||||||
| Counterparty | Sold | Bought | Settlement Date | $ | ||||
| Brown Brothers Harriman | USD | 993 | JPY | 100,000 | 12/21/16 | (38 | ) | |
| Brown Brothers Harriman | USD | 1,065 | JPY | 110,000 | 12/21/16 | (14 | ) | |
| Brown Brothers Harriman | USD | 1,963 | JPY | 200,000 | 12/21/16 | (51 | ) | |
| Brown Brothers Harriman | USD | 22 | SEK | 200 | 12/21/16 | — | ||
| Brown Brothers Harriman | AUD | 100 | USD | 74 | 12/21/16 | (2 | ) | |
| Brown Brothers Harriman | AUD | 200 | USD | 152 | 12/21/16 | 1 | ||
| Brown Brothers Harriman | CAD | 100 | USD | 76 | 12/21/16 | 1 | ||
| Brown Brothers Harriman | CAD | 200 | USD | 151 | 12/21/16 | 2 | ||
| Brown Brothers Harriman | EUR | 200 | USD | 219 | 12/21/16 | (1 | ) | |
| Brown Brothers Harriman | EUR | 200 | USD | 225 | 12/21/16 | 5 | ||
| Brown Brothers Harriman | EUR | 1,000 | USD | 1,129 | 12/21/16 | 29 | ||
| Brown Brothers Harriman | GBP | 100 | USD | 122 | 12/21/16 | — | ||
| Brown Brothers Harriman | GBP | 300 | USD | 390 | 12/21/16 | 22 | ||
| Brown Brothers Harriman | GBP | 1,000 | USD | 1,227 | 12/21/16 | 2 | ||
| Brown Brothers Harriman | HKD | 192 | USD | 25 | 11/01/16 | — | ||
| Brown Brothers Harriman | HKD | 265 | USD | 34 | 11/01/16 | — | ||
| Brown Brothers Harriman | HKD | 1,000 | USD | 129 | 12/21/16 | — | ||
| Brown Brothers Harriman | HKD | 1,000 | USD | 129 | 12/21/16 | — | ||
| Brown Brothers Harriman | JPY | 10,000 | USD | 96 | 12/21/16 | — | ||
| Brown Brothers Harriman | JPY | 20,000 | USD | 196 | 12/21/16 | 4 | ||
| Brown Brothers Harriman | JPY | 60,000 | USD | 600 | 12/21/16 | 27 | ||
| Brown Brothers Harriman | SEK | 100 | USD | 12 | 12/21/16 | 1 | ||
| Citigroup | USD | 77 | AUD | 100 | 12/21/16 | (1 | ) | |
| Citigroup | USD | 76 | CAD | 100 | 12/21/16 | (2 | ) | |
| Citigroup | USD | 550 | EUR | 500 | 12/21/16 | — | ||
| Citigroup | USD | 123 | GBP | 100 | 12/21/16 | (1 | ) | |
| Citigroup | USD | 193 | JPY | 20,000 | 12/21/16 | (2 | ) | |
| Citigroup | AUD | 100 | USD | 76 | 12/21/16 | — | ||
| Citigroup | AUD | 100 | USD | 77 | 12/21/16 | 1 | ||
| Citigroup | AUD | 300 | USD | 228 | 12/21/16 | — | ||
| Citigroup | CAD | 150 | USD | 112 | 12/21/16 | — | ||
| Citigroup | CAD | 400 | USD | 305 | 12/21/16 | 6 | ||
| Citigroup | EUR | 100 | USD | 113 | 12/21/16 | 3 | ||
| Citigroup | EUR | 200 | USD | 223 | 12/21/16 | 3 | ||
| Citigroup | EUR | 500 | USD | 550 | 12/21/16 | — | ||
| Citigroup | EUR | 1,200 | USD | 1,324 | 12/21/16 | 4 | ||
| Citigroup | GBP | 100 | USD | 124 | 12/21/16 | 1 | ||
| Citigroup | GBP | 200 | USD | 245 | 12/21/16 | — | ||
| Citigroup | GBP | 200 | USD | 269 | 12/21/16 | 25 | ||
| Citigroup | GBP | 400 | USD | 488 | 12/21/16 | (2 | ) | |
| Citigroup | HKD | 400 | USD | 52 | 12/21/16 | — | ||
| Citigroup | HKD | 1,200 | USD | 155 | 12/21/16 | — | ||
| Citigroup | JPY | 10,000 | USD | 97 | 12/21/16 | 1 | ||
| Citigroup | JPY | 10,000 | USD | 98 | 12/21/16 | 3 | ||
| Citigroup | JPY | 30,000 | USD | 287 | 12/21/16 | — | ||
| Citigroup | JPY | 70,000 | USD | 675 | 12/21/16 | 7 | ||
| Citigroup | SEK | 300 | USD | 35 | 12/21/16 | 1 | ||
| Citigroup | SEK | 400 | USD | 44 | 12/21/16 | — | ||
| Citigroup | SEK | 800 | USD | 91 | 12/21/16 | 2 | ||
| Commonwealth Bank of Australia | USD | 7,144 | AUD | 9,334 | 12/21/16 | (53 | ) | |
| Commonwealth Bank of Australia | USD | 9,962 | CAD | 12,868 | 12/21/16 | (365 | ) | |
| Commonwealth Bank of Australia | USD | 7,976 | GBP | 5,990 | 12/21/16 | (635 | ) | |
| Commonwealth Bank of Australia | USD | 18,532 | JPY | 1,876,059 | 12/21/16 | (606 | ) | |
| Commonwealth Bank of Australia | CHF | 10,778 | USD | 11,191 | 12/21/16 | 268 | ||
| Commonwealth Bank of Australia | EUR | 5,301 | USD | 5,996 | 12/21/16 | 164 | ||
| Commonwealth Bank of Australia | EUR | 10,710 | USD | 12,114 | 12/21/16 | 331 | ||
See accompanying notes which are an integral part of the financial statements.
Russell Global Equity Fund 211
Russell Investment Company
Russell Global Equity Fund
Schedule of Investments, continued — October 31, 2016
| Foreign Currency Exchange Contracts | |||||||
| Amounts in thousands | |||||||
| Unrealized | |||||||
| Appreciation | |||||||
| Amount | Amount | (Depreciation) | |||||
| Counterparty | Sold | Bought | Settlement Date | $ | |||
| Commonwealth Bank of Australia | GBP | 7,473 | USD | 9,951 | 12/21/16 | 794 | |
| Commonwealth Bank of Australia | JPY | 1,068,400 | USD | 10,554 | 12/21/16 | 345 | |
| Commonwealth Bank of Australia | NOK | 35,136 | USD | 4,296 | 12/21/16 | 43 | |
| Commonwealth Bank of Australia | SEK | 41,400 | USD | 4,939 | 12/21/16 | 344 | |
| HSBC | USD | 517 | AUD | 675 | 12/21/16 | (4 | ) |
| HSBC | USD | 7,141 | AUD | 9,334 | 12/21/16 | (50 | ) |
| HSBC | USD | 566 | CAD | 732 | 12/21/16 | (21 | ) |
| HSBC | USD | 9,958 | CAD | 12,868 | 12/21/16 | (361 | ) |
| HSBC | USD | 4,114 | EUR | 3,635 | 12/21/16 | (115 | ) |
| HSBC | USD | 1,257 | GBP | 944 | 12/21/16 | (100 | ) |
| HSBC | USD | 7,976 | GBP | 5,990 | 12/21/16 | (636 | ) |
| HSBC | USD | 343 | HKD | 2,657 | 12/21/16 | — | |
| HSBC | USD | 2,790 | JPY | 282,586 | 12/21/16 | (90 | ) |
| HSBC | USD | 18,520 | JPY | 1,876,059 | 12/21/16 | (595 | ) |
| HSBC | USD | 249 | SEK | 2,092 | 12/21/16 | (17 | ) |
| HSBC | CHF | 10,778 | USD | 11,184 | 12/21/16 | 261 | |
| HSBC | EUR | 5,301 | USD | 6,000 | 12/21/16 | 168 | |
| HSBC | EUR | 10,710 | USD | 12,122 | 12/21/16 | 339 | |
| HSBC | GBP | 7,473 | USD | 9,951 | 12/21/16 | 794 | |
| HSBC | JPY | 1,068,400 | USD | 10,547 | 12/21/16 | 339 | |
| HSBC | NOK | 35,136 | USD | 4,294 | 12/21/16 | 41 | |
| HSBC | SEK | 41,400 | USD | 4,937 | 12/21/16 | 342 | |
| National Australia Bank | USD | 7,147 | AUD | 9,334 | 12/21/16 | (56 | ) |
| National Australia Bank | USD | 9,961 | CAD | 12,868 | 12/21/16 | (364 | ) |
| National Australia Bank | USD | 7,980 | GBP | 5,990 | 12/21/16 | (639 | ) |
| National Australia Bank | USD | 18,526 | JPY | 1,876,059 | 12/21/16 | (601 | ) |
| National Australia Bank | CHF | 10,778 | USD | 11,177 | 12/21/16 | 255 | |
| National Australia Bank | EUR | 5,301 | USD | 6,002 | 12/21/16 | 170 | |
| National Australia Bank | EUR | 10,710 | USD | 12,126 | 12/21/16 | 343 | |
| National Australia Bank | GBP | 7,473 | USD | 9,955 | 12/21/16 | 797 | |
| National Australia Bank | JPY | 1,068,400 | USD | 10,551 | 12/21/16 | 342 | |
| National Australia Bank | NOK | 35,136 | USD | 4,291 | 12/21/16 | 38 | |
| National Australia Bank | SEK | 41,400 | USD | 4,935 | 12/21/16 | 340 | |
| Northern Trust | EUR | 1,559 | USD | 1,706 | 11/01/16 | (6 | ) |
| Royal Bank of Canada | USD | 7,154 | AUD | 9,334 | 12/21/16 | (62 | ) |
| Royal Bank of Canada | USD | 9,972 | CAD | 12,868 | 12/21/16 | (374 | ) |
| Royal Bank of Canada | USD | 7,989 | GBP | 5,990 | 12/21/16 | (649 | ) |
| Royal Bank of Canada | USD | 18,530 | JPY | 1,876,059 | 12/21/16 | (605 | ) |
| Royal Bank of Canada | AUD | 100 | USD | 76 | 12/21/16 | — | |
| Royal Bank of Canada | CAD | 100 | USD | 77 | 12/21/16 | 3 | |
| Royal Bank of Canada | CHF | 10,778 | USD | 11,174 | 12/21/16 | 252 | |
| Royal Bank of Canada | EUR | 300 | USD | 339 | 12/21/16 | 9 | |
| Royal Bank of Canada | EUR | 5,301 | USD | 5,997 | 12/21/16 | 165 | |
| Royal Bank of Canada | EUR | 10,710 | USD | 12,117 | 12/21/16 | 334 | |
| Royal Bank of Canada | GBP | 200 | USD | 266 | 12/21/16 | 21 | |
| Royal Bank of Canada | GBP | 500 | USD | 611 | 12/21/16 | (1 | ) |
| Royal Bank of Canada | GBP | 7,473 | USD | 9,967 | 12/21/16 | 810 | |
| Royal Bank of Canada | JPY | 20,000 | USD | 196 | 12/21/16 | 5 | |
| Royal Bank of Canada | JPY | 110,000 | USD | 1,055 | 12/21/16 | 4 | |
| Royal Bank of Canada | JPY | 1,068,400 | USD | 10,553 | 12/21/16 | 344 | |
| Royal Bank of Canada | NOK | 35,136 | USD | 4,293 | 12/21/16 | 40 | |
| Royal Bank of Canada | SEK | 41,400 | USD | 4,933 | 12/21/16 | 338 | |
| Standard Chartered | USD | 75 | CAD | 100 | 12/21/16 | — | |
| Standard Chartered | USD | 436 | EUR | 400 | 12/21/16 | 3 | |
| Standard Chartered | USD | 122 | GBP | 100 | 12/21/16 | 1 | |
| Standard Chartered | USD | 96 | JPY | 10,000 | 12/21/16 | (1 | ) |
See accompanying notes which are an integral part of the financial statements.
212 Russell Global Equity Fund
Russell Investment Company
Russell Global Equity Fund
Schedule of Investments, continued — October 31, 2016
| Foreign Currency Exchange Contracts | |||||||||||||
| Amounts in thousands | |||||||||||||
| Unrealized | |||||||||||||
| Appreciation | |||||||||||||
| Amount | Amount | (Depreciation) | |||||||||||
| Counterparty | Sold | Bought | Settlement Date | $ | |||||||||
| State Street | USD | 95 | AUD | 125 | 12/21/16 | — | |||||||
| State Street | USD | 153 | AUD | 200 | 12/21/16 | (1 | ) | ||||||
| State Street | USD | 115 | CAD | 150 | 12/21/16 | (3 | ) | ||||||
| State Street | USD | 155 | CAD | 200 | 12/21/16 | (6 | ) | ||||||
| State Street | USD | 451 | EUR | 400 | 12/21/16 | (11 | ) | ||||||
| State Street | USD | 675 | EUR | 600 | 12/21/16 | (15 | ) | ||||||
| State Street | USD | 196 | GBP | 150 | 12/21/16 | (13 | ) | ||||||
| State Street | USD | 401 | GBP | 300 | 12/21/16 | (33 | ) | ||||||
| State Street | USD | 1,276 | GBP | 1,000 | 12/21/16 | (50 | ) | ||||||
| State Street | USD | 136 | JPY | 14,207 | 11/04/16 | — | |||||||
| State Street | USD | 404 | JPY | 42,422 | 11/04/16 | 1 | |||||||
| State Street | USD | 2,075 | JPY | 217,960 | 11/04/16 | 3 | |||||||
| State Street | USD | 296 | JPY | 30,000 | 12/21/16 | (9 | ) | ||||||
| State Street | USD | 299 | JPY | 30,000 | 12/21/16 | (12 | ) | ||||||
| State Street | USD | 1,000 | JPY | 100,000 | 12/21/16 | (44 | ) | ||||||
| State Street | USD | 1,480 | JPY | 150,000 | 12/21/16 | (47 | ) | ||||||
| State Street | USD | 582 | SEK | 5,000 | 12/21/16 | (27 | ) | ||||||
| State Street | CHF | 13,383 | USD | 13,817 | 12/21/16 | 253 | |||||||
| State Street | DKK | 40,000 | USD | 6,083 | 12/21/16 | 165 | |||||||
| State Street | GBP | 700 | USD | 928 | 12/21/16 | 70 | |||||||
| State Street | HKD | 44,300 | USD | 5,717 | 12/21/16 | 3 | |||||||
| State Street | HKD | 63,105 | USD | 8,144 | 12/21/16 | 5 | |||||||
| State Street | JPY | 1,616 | USD | 15 | 11/01/16 | — | |||||||
| State Street | JPY | 201,051 | USD | 1,914 | 11/04/16 | (3 | ) | ||||||
| State Street | JPY | 150,000 | USD | 1,446 | 12/21/16 | 13 | |||||||
| UBS | USD | 103 | AUD | 135 | 12/21/16 | — | |||||||
| UBS | USD | 95 | CAD | 125 | 12/21/16 | (2 | ) | ||||||
| UBS | USD | 220 | EUR | 200 | 12/21/16 | — | |||||||
| UBS | USD | 337 | EUR | 300 | 12/21/16 | (7 | ) | ||||||
| UBS | USD | 153 | GBP | 120 | 12/21/16 | (6 | ) | ||||||
| UBS | USD | 365 | GBP | 300 | 12/21/16 | 3 | |||||||
| UBS | USD | 195 | JPY | 20,000 | 12/21/16 | (4 | ) | ||||||
| UBS | USD | 607 | JPY | 63,000 | 12/21/16 | (5 | ) | ||||||
| UBS | USD | 23 | SEK | 200 | 12/21/16 | (1 | ) | ||||||
| UBS | AUD | 300 | USD | 229 | 12/21/16 | 1 | |||||||
| UBS | CAD | 300 | USD | 227 | 12/21/16 | 3 | |||||||
| UBS | EUR | 800 | USD | 901 | 12/21/16 | 21 | |||||||
| UBS | GBP | 141 | USD | 172 | 11/01/16 | (1 | ) | ||||||
| UBS | GBP | 300 | USD | 391 | 12/21/16 | 24 | |||||||
| UBS | HKD | 500 | USD | 65 | 12/21/16 | — | |||||||
| UBS | HKD | 1,550 | USD | 200 | 12/21/16 | — | |||||||
| UBS | JPY | 50,000 | USD | 500 | 12/21/16 | 22 | |||||||
| UBS | SEK | 1,100 | USD | 129 | 12/21/16 | 6 | |||||||
| Total Unrealized Appreciation (Depreciation) on Open Foreign Currency Exchange Contracts | 3,105 | ||||||||||||
| Presentation of Portfolio Holdings | |||||||||||||
| Amounts in thousands | |||||||||||||
| Fair Value | |||||||||||||
| Practical | |||||||||||||
| Portfolio Summary | Level 1 | Level 2 | Level 3 | Expedient (a) | Total | % of Net Assets | |||||||
| Common Stocks | |||||||||||||
| Australia | $ | — | $ | 12,120 | $ | — | $ | — | $ | 12,120 | 0.5 | ||
See accompanying notes which are an integral part of the financial statements.
Russell Global Equity Fund 213
Russell Investment Company
Russell Global Equity Fund
Schedule of Investments, continued — October 31, 2016
| Presentation of Portfolio Holdings | |||||||||||||
| Amounts in thousands | |||||||||||||
| Fair Value | |||||||||||||
| Practical | |||||||||||||
| Portfolio Summary | Level 1 | Level 2 | Level 3 | Expedient (a) | Total | % of Net Assets | |||||||
| Austria | — | 6,520 | — | — | 6,520 | 0.3 | |||||||
| Belgium | — | 13,542 | — | — | 13,542 | 0.6 | |||||||
| Bermuda | 5,466 | 270 | — | — | 5,736 | 0.2 | |||||||
| Brazil | 26,165 | — | — | — | 26,165 | 1.1 | |||||||
| Canada | 36,100 | — | — | — | 36,100 | 1.5 | |||||||
| Cayman Islands | 16,817 | — | — | — | 16,817 | 0.7 | |||||||
| China | 9,499 | 7,589 | — | — | 17,088 | 0.7 | |||||||
| Denmark | — | 8,407 | — | — | 8,407 | 0.4 | |||||||
| Finland | — | 18,836 | — | — | 18,836 | 0.8 | |||||||
| France | — | 110,598 | — | — | 110,598 | 4.6 | |||||||
| Germany | — | 111,427 | — | — | 111,427 | 4.7 | |||||||
| Hong Kong | — | 14,483 | — | — | 14,483 | 0.6 | |||||||
| India | 4,514 | 7,154 | — | — | 11,668 | 0.5 | |||||||
| Indonesia | — | 4,059 | — | — | 4,059 | 0.2 | |||||||
| Ireland | 42,077 | 4,964 | — | — | 47,041 | 2.0 | |||||||
| Israel | 14,966 | 258 | — | — | 15,224 | 0.6 | |||||||
| Italy | — | 9,029 | — | — | 9,029 | 0.4 | |||||||
| Japan | 2,087 | 146,056 | — | — | 148,143 | 6.2 | |||||||
| Luxembourg | — | 155 | — | — | 155 | —* | |||||||
| Mexico | 9,037 | — | — | — | 9,037 | 0.4 | |||||||
| Netherlands | 2,751 | 28,078 | — | — | 30,829 | 1.3 | |||||||
| New Zealand | — | 3,237 | — | — | 3,237 | 0.1 | |||||||
| Norway | — | 16,409 | — | — | 16,409 | 0.7 | |||||||
| Portugal | — | 4,091 | — | — | 4,091 | 0.2 | |||||||
| Puerto Rico | 7,166 | — | — | — | 7,166 | 0.3 | |||||||
| Russia | 5,404 | 3,442 | — | — | 8,846 | 0.4 | |||||||
| Singapore | — | 7,546 | — | — | 7,546 | 0.3 | |||||||
| South Korea | — | 55,073 | — | — | 55,073 | 2.3 | |||||||
| Spain | — | 6,753 | — | — | 6,753 | 0.3 | |||||||
| Sweden | — | 22,422 | 1,717 | — | 24,139 | 1.0 | |||||||
| Switzerland | 4,464 | 126,227 | — | — | 130,691 | 5.5 | |||||||
| Taiwan | 22,806 | 4,217 | — | — | 27,023 | 1.1 | |||||||
| Thailand | — | 12,542 | — | — | 12,542 | 0.5 | |||||||
| United Kingdom | 26,376 | 146,530 | — | — | 172,906 | 7.2 | |||||||
| United States | 1,126,504 | 5,372 | — | — | 1,131,876 | 47.4 | |||||||
| Virgin Islands, British | 4,046 | — | — | — | 4,046 | 0.2 | |||||||
| Preferred Stocks | — | 247 | — | — | 247 | —* | |||||||
| Short-Term Investments | — | 19,694 | — | 64,986 | 84,680 | 3.6 | |||||||
| Other Securities | — | — | — | 34,570 | 34,570 | 1.4 | |||||||
| Total Investments | 1,366,245 | 937,347 | 1,717 | 99,556 | 2,404,865 | 100.8 | |||||||
| Other Assets and Liabilities, Net | (0.8 | ) | |||||||||||
| 100.0 | |||||||||||||
See accompanying notes which are an integral part of the financial statements.
214 Russell Global Equity Fund
Russell Investment Company
Russell Global Equity Fund
Schedule of Investments, continued — October 31, 2016
| Presentation of Portfolio Holdings | |||||||||||||||||
| Amounts in thousands | |||||||||||||||||
| Fair Value | |||||||||||||||||
| Practical | |||||||||||||||||
| Portfolio Summary | Level 1 | Level 2 | Level 3 | Expedient (a) | Total | % of Net Assets | |||||||||||
| Other Financial Instruments | |||||||||||||||||
| Assets | |||||||||||||||||
| Futures Contracts | 3,933 | — | — | — | 3,933 | 0.2 | |||||||||||
| Foreign Currency Exchange Contracts | 5 | 14,923 | — | — | 14,928 | 0.6 | |||||||||||
| A | |||||||||||||||||
| Liabilities | |||||||||||||||||
| Futures Contracts | (3,375 | ) | — | — | — | (3,375 | ) | (0.1 | ) | ||||||||
| Foreign Currency Exchange Contracts | (9 | ) | (11,814 | ) | — | — | (11,823 | ) | (0.5 | ) | |||||||
| Total Other Financial Instruments** | $ | 554 | $ | 3,109 | $ | — | $ | — | $ | 3,663 | |||||||
* Less than 0.05% of net assets.
** Futures and foreign currency exchange contract values reflect the unrealized appreciation (depreciation) on the investments.
(a) Certain investments that are measured at fair value using the net asset value per share (or its equivalent) practical expedient have not been classified
in the fair value levels. The fair value amounts presented in the table are intended to permit reconciliation to the amounts presented in the Schedule of
Investments.
For a description of the Levels, see note 2 in the Notes to Financial Statements.
For a disclosure on transfers between Levels 1, 2 and 3 during the period ended October 31, 2016, see note 2 in the Notes to
Financial Statements.
Investments in which significant unobservable inputs (Level 3) were used in determining a fair value for the period ended October
31, 2016 were less than 1% of net assets.
| Amounts in thousands | |||
| Fair Value | |||
| Sector Exposure | $ | ||
| Consumer Discretionary | 391,664 | ||
| Consumer Staples | 98,653 | ||
| Energy | 159,443 | ||
| Financial Services | 546,577 | ||
| Health Care | 298,912 | ||
| Materials and Processing | 99,621 | ||
| Producer Durables | 261,393 | ||
| Technology | 333,184 | ||
| Utilities | 96,168 | ||
| Short-Term Investments | 84,680 | ||
| Other Securities | 34,570 | ||
| Total Investments | 2,404,865 | ||
See accompanying notes which are an integral part of the financial statements.
Russell Global Equity Fund 215
Russell Investment Company
Russell Global Equity Fund
Fair Value of Derivative Instruments — October 31, 2016
Amounts in thousands
| Foreign | ||||||
| Equity | Currency | |||||
| Derivatives not accounted for as hedging instruments | Contracts | Contracts | ||||
| Location: Statement of Assets and Liabilities - Assets | ||||||
| Unrealized appreciation on foreign currency exchange contracts | $ | — | $ | 14,928 | ||
| Variation margin on futures contracts* | 3,933 | — | ||||
| Total | $ | 3,933 | $ | 14,928 | ||
| Location: Statement of Assets and Liabilities - Liabilities | ||||||
| Variation margin on futures contracts* | $ | 3,375 | $ | — | ||
| Unrealized depreciation on foreign currency exchange contracts | — | 11,823 | ||||
| Total | $ | 3,375 | $ | 11,823 | ||
| Foreign | ||||||
| Equity | Currency | |||||
| Derivatives not accounted for as hedging instruments | Contracts | Contracts | ||||
| Location: Statement of Operations - Net realized gain (loss) | ||||||
| Futures contracts | $ | (15,644 | ) | $ | — | |
| Foreign currency-related transactions** | — | 13,130 | ||||
| Total | $ | (15,644 | ) | $ | 13,130 | |
| Location: Statement of Operations - Net change in unrealized appreciation (depreciation) | ||||||
| Futures contracts | $ | (9,696 | ) | $ | — | |
| Foreign currency-related transactions*** | — | 2,552 | ||||
| Total | $ | (9,696 | ) | $ | 2,552 | |
* Includes cumulative appreciation/depreciation of futures contracts as reported in the Schedule of Investments. Only variation margin is reported within the
Statement of Assets and Liabilities.
** Only includes net realized gain (loss) on forward and spot contracts. May differ from the net realized gain (loss) on foreign currency-related transactions reported
within the Statement of Operations.
*** Only includes change in unrealized gain (loss) on forward and spot contracts. May differ from the net change in unrealized gain (loss) on foreign currency-related
transactions reported within the Statement of Operations.
For further disclosure on derivatives see note 2 in the Notes to Financial Statements.
See accompanying notes which are an integral part of the financial statements.
216 Russell Global Equity Fund
Russell Investment Company
Russell Global Equity Fund
Balance Sheet Offsetting of Financial and Derivative Instruments — October 31, 2016
| Amounts in thousands | |||||||||||||
| Offsetting of Financial Assets and Derivative Assets | |||||||||||||
| Gross | Net Amounts | ||||||||||||
| Amounts | of Assets | ||||||||||||
| Gross | Offset in the | Presented in | |||||||||||
| Amounts of | Statement of | the Statement | |||||||||||
| Recognized | Assets and | of Assets and | |||||||||||
| Description | Location: Statement of Assets and Liabilities - Assets | Assets | Liabilities | Liabilities | |||||||||
| Securities on Loan* | Investments, at fair value | $ | 33,468 | $ | — | $ | 33,468 | ||||||
| Foreign Currency Exchange Contracts | Unrealized appreciation on foreign currency exchange contracts | 14,928 | — | 14,928 | |||||||||
| Futures Contracts | Variation margin on futures contracts | 636 | — | 636 | |||||||||
| Total Financial and Derivative Assets | 49,032 | — | 49,032 | ||||||||||
| Financial and Derivative Assets not subject to a netting agreement | (636 | ) | — | (636 | ) | ||||||||
| Total Financial and Derivative Assets subject to a netting agreement | $ | 48,396 | $ | — | $ | 48,396 | |||||||
| Financial Assets, Derivative Assets, and Collateral Held by Counterparty | |||||||||||||
| Gross Amounts Not Offset in | |||||||||||||
| the Statement of Assets and | |||||||||||||
| Liabilities | |||||||||||||
| Net Amounts | |||||||||||||
| of Assets | |||||||||||||
| Presented in | |||||||||||||
| the Statement | Financial and | ||||||||||||
| of Assets and | Derivative | Collateral | |||||||||||
| Counterparty | Liabilities | Instruments | Received^ | Net Amount | |||||||||
| Bank of America | $ | 2,584 | $ | 2,378 | $ | — $ | 206 | ||||||
| Bank of New York | 99 | 3 | — | 96 | |||||||||
| Barclays | 3,249 | — | 3,249 | — | |||||||||
| BNP Paribas | 2,304 | 1,999 | — | 305 | |||||||||
| Brown Brothers Harriman | 107 | — | — | 107 | |||||||||
| Citigroup | 10,016 | 7 | 9,956 | 53 | |||||||||
| Commonwealth Bank of Australia | 2,289 | 1,660 | — | 629 | |||||||||
| Credit Suisse | 2,789 | — | 2,789 | — | |||||||||
| Fidelity | 979 | — | 979 | — | |||||||||
| HSBC | 2,283 | 1,988 | — | 295 | |||||||||
| JPMorgan Chase | 8,000 | — | 8,000 | — | |||||||||
| Merrill Lynch | 3,302 | — | 3,302 | — | |||||||||
| Morgan Stanley | 3,721 | — | 3,721 | — | |||||||||
| National Australia Bank | 2,285 | 1,659 | — | 626 | |||||||||
| Royal Bank of Canada | 2,321 | 1,688 | — | 633 | |||||||||
| Standard Chartered | 4 | 1 | — | 3 | |||||||||
| State Street | 514 | 257 | — | 257 | |||||||||
| UBS | 1,550 | 25 | 1,472 | 53 | |||||||||
| Total | $ | 48,396 | $ | 11,665 | $ | 33,468 | $ | 3,263 | |||||
See accompanying notes which are an integral part of the financial statements.
Russell Global Equity Fund 217
Russell Investment Company
Russell Global Equity Fund
Balance Sheet Offsetting of Financial and Derivative Instruments, continued —
October 31, 2016
| Amounts in thousands | ||||||||||||
| Offsetting of Financial Liabilities and Derivative Liabilities | ||||||||||||
| Gross | Net Amounts | |||||||||||
| Amounts | of Liabilities | |||||||||||
| Gross | Offset in the | Presented in | ||||||||||
| Amounts of | Statement of | the Statement | ||||||||||
| Recognized | Assets and | of Assets and | ||||||||||
| Description | Location: Statement of Assets and Liabilities - Liabilities | Liabilities | Liabilities | Liabilities | ||||||||
| Futures Contracts | Variation margin on futures contracts | $ | 335 | $ | — $ | 335 | ||||||
| Foreign Currency Exchange Contracts | Unrealized depreciation on foreign currency exchange contracts | 11,823 | — | 11,823 | ||||||||
| Total Financial and Derivative Liabilities | 12,158 | — | 12,158 | |||||||||
| Financial and Derivative Liabilities not subject to a netting agreement | (335 | ) | — | (335 | ) | |||||||
| Total Financial and Derivative Liabilities subject to a netting agreement | $ | 11,823 | $ | — $ | 11,823 | |||||||
| Financial Liabilities, Derivative Liabilities, and Collateral Pledged by Counterparty | ||||||||||||
| Gross Amounts Not Offset in | ||||||||||||
| the Statement of Assets and | ||||||||||||
| Liabilities | ||||||||||||
| Net Amounts | ||||||||||||
| of Liabilities | ||||||||||||
| Presented in | ||||||||||||
| the Statement | Financial and | |||||||||||
| of Assets and | Derivative | Collateral | ||||||||||
| Counterparty | Liabilities | Instruments | Pledged^ | Net Amount | ||||||||
| Bank of America | $ | 2,381 | $ | 2,378 | $ | — $ | 3 | |||||
| Bank of New York | 3 | 3 | — | — | ||||||||
| BNP Paribas | 2,000 | 1,999 | — | 1 | ||||||||
| Brown Brothers Harriman | 129 | — | — | 129 | ||||||||
| Citigroup | 7 | 7 | — | — | ||||||||
| Commonwealth Bank of Australia | 1,660 | 1,660 | — | — | ||||||||
| HSBC | 1,988 | 1,988 | — | — | ||||||||
| National Australia Bank | 1,659 | 1,659 | — | — | ||||||||
| Northern Trust | 6 | — | — | 6 | ||||||||
| Royal Bank of Canada | 1,688 | 1,688 | — | — | ||||||||
| Standard Chartered | 1 | 1 | — | — | ||||||||
| State Street | 275 | 257 | — | 18 | ||||||||
| UBS | 26 | 25 | — | 1 | ||||||||
| Total | $ | 11,823 | $ | 11,665 | $ | — $ | 158 | |||||
* Fair value of securities on loan as reported in the footnotes to the Statement of Assets and Liabilities.
^ Collateral received or pledged amounts may not reconcile to those disclosed in the Statement of Assets and Liabilities due to the inclusion of off-Balance
Sheet collateral and adjustments made to exclude overcollateralization.
For further disclosure on derivatives and counterparty risk see note 2 in the Notes to Financial Statements.
See accompanying notes which are an integral part of the financial statements.
218 Russell Global Equity Fund
Russell Investment Company
Russell Global Equity Fund
Statement of Assets and Liabilities — October 31, 2016
| Amounts in thousands | ||
| Assets | ||
| Investments, at identified cost | $ | 2,040,327 |
| Investments, at fair value(*)(>) | 2,404,865 | |
| Cash (restricted)(a) | 2,800 | |
| Foreign currency holdings(^) | 4,314 | |
| Unrealized appreciation on foreign currency exchange contracts | 14,928 | |
| Receivables: | ||
| Dividends and interest | 2,776 | |
| Dividends from affiliated Russell funds | 34 | |
| Investments sold | 23,668 | |
| Fund shares sold | 2,108 | |
| Foreign capital gains taxes recoverable | 1,584 | |
| Variation margin on futures contracts | 636 | |
| Total assets | 2,457,713 | |
| Liabilities | ||
| Payables: | ||
| Due to custodian | 11 | |
| Investments purchased | 20,730 | |
| Fund shares redeemed | 2,059 | |
| Accrued fees to affiliates | 2,350 | |
| Other accrued expenses | 348 | |
| Variation margin on futures contracts | 335 | |
| Deferred capital gains tax liability | 170 | |
| Unrealized depreciation on foreign currency exchange contracts | 11,823 | |
| Payable upon return of securities loaned | 34,570 | |
| Total liabilities | 72,396 | |
| Commitments and Contingencies (1) | ||
| Net Assets | $ | 2,385,317 |
| (1) See note 9 in the Notes to Financial Statements for a detailed description of commitments and contingencies. | ||
See accompanying notes which are an integral part of the financial statements.
Russell Global Equity Fund 219
Russell Investment Company
Russell Global Equity Fund
Statement of Assets and Liabilities, continued — October 31, 2016
| Amounts in thousands | ||
| Net Assets Consist of: | ||
| Undistributed (overdistributed) net investment income | $ | 26,475 |
| Accumulated net realized gain (loss) | 129,350 | |
| Unrealized appreciation (depreciation) on: | ||
| Investments (net of deferred tax liability for foreign capital gains taxes) | 364,368 | |
| Futures contracts | 558 | |
| Foreign currency-related transactions | 2,657 | |
| Shares of beneficial interest | 2,292 | |
| Additional paid-in capital | 1,859,617 | |
| Net Assets | $ | 2,385,317 |
| Net Asset Value, offering and redemption price per share: | ||
| Net asset value per share: Class A(#) | $ | 10.35 |
| Maximum offering price per share (Net asset value plus sales charge of 5.75%): Class A | $ | 10.98 |
| Class A — Net assets | $ | 12,807,020 |
| Class A — Shares outstanding ($.01 par value) | 1,237,576 | |
| Net asset value per share: Class C(#) | $ | 10.21 |
| Class C — Net assets | $ | 11,059,212 |
| Class C — Shares outstanding ($.01 par value) | 1,083,268 | |
| Net asset value per share: Class E(#) | $ | 10.37 |
| Class E — Net assets | $ | 42,160,802 |
| Class E — Shares outstanding ($.01 par value) | 4,066,230 | |
| Net asset value per share: Class S(#) | $ | 10.40 |
| Class S — Net assets | $ 1,659,878,921 | |
| Class S — Shares outstanding ($.01 par value) | 159,593,390 | |
| Net asset value per share: Class Y(#) | $ | 10.42 |
| Class Y — Net assets | $ | 659,410,977 |
| Class Y — Shares outstanding ($.01 par value) | 63,254,166 | |
| Amounts in thousands | ||
| (^) Foreign currency holdings - cost | $ | 4,631 |
| (*) Securities on loan included in investments | $ | 33,468 |
| (>) Investments in affiliates, Russell U.S. Cash Management Fund and Russell U.S. Cash Collateral Fund | $ | 99,556 |
| (a) Cash Collateral for Futures | $ | 2,800 |
| (#) Net asset value per share equals class level net assets divided by class level shares of beneficial interest outstanding. | ||
See accompanying notes which are an integral part of the financial statements.
220 Russell Global Equity Fund
Russell Investment Company
Russell Global Equity Fund
Statement of Operations — For the Period Ended October 31, 2016
| Amounts in thousands | |||
| Investment Income | |||
| Dividends | $ | 56,176 | |
| Dividends from affiliated Russell funds | 315 | �� | |
| Interest | 68 | ||
| Securities lending income (net) | 1,276 | ||
| Less foreign taxes withheld | (3,393 | ) | |
| Total investment income | 54,442 | ||
| Expenses | |||
| Advisory fees | 23,585 | ||
| Administrative fees | 1,202 | ||
| Custodian fees (1) | 549 | ||
| Distribution fees - Class A | 34 | ||
| Distribution fees - Class C | 88 | ||
| Transfer agent fees - Class A | 27 | ||
| Transfer agent fees - Class C | 23 | ||
| Transfer agent fees - Class E | 85 | ||
| Transfer agent fees - Class S | 3,452 | ||
| Transfer agent fees - Class Y | 31 | ||
| Professional fees | 179 | ||
| Registration fees | 106 | ||
| Shareholder servicing fees - Class C | 29 | ||
| Shareholder servicing fees - Class E | 106 | ||
| Trustees’ fees | 83 | ||
| Printing fees | 271 | ||
| Miscellaneous | 56 | ||
| Total expenses | 29,906 | ||
| Net investment income (loss) | 24,536 | ||
| Net Realized and Unrealized Gain (Loss) | |||
| Net realized gain (loss) on: | |||
| Investments (net of deferred tax liability for foreign capital gains taxes) | 164,500 | ||
| Futures contracts | (15,644 | ) | |
| Foreign currency-related transactions | 12,805 | ||
| Net realized gain (loss) | 161,661 | ||
| Net change in unrealized appreciation (depreciation) on: | |||
| Investments (net of deferred tax liability for foreign capital gains taxes) | (163,982 | ) | |
| Futures contracts | (9,696 | ) | |
| Foreign currency-related transactions | 2,193 | ||
| Net change in unrealized appreciation (depreciation) | (171,485 | ) | |
| Net realized and unrealized gain (loss) | (9,824 | ) | |
| Net Increase (Decrease) in Net Assets from Operations | $ | 14,712 | |
| (1) Includes a reimbursement for overbilling of custody out-of-pocket fees from prior years. See note 10 in the Notes to Financial Statements. | |||
See accompanying notes which are an integral part of the financial statements.
Russell Global Equity Fund 221
Russell Investment Company
Russell Global Equity Fund
Statements of Changes in Net Assets
| For the Periods Ended October 31, | ||||||
| Amounts in thousands | 2016 | 2015 | ||||
| Increase (Decrease) in Net Assets | ||||||
| Operations | ||||||
| Net investment income (loss) | $ | 24,536 | $ | 32,592 | ||
| Net realized gain (loss) | 161,661 | 303,679 | ||||
| Net change in unrealized appreciation (depreciation) | (171,485 | ) | (196,857 | ) | ||
| Net increase (decrease) in net assets from operations | 14,712 | 139,414 | ||||
| Distributions | ||||||
| From net investment income | ||||||
| Class A | (199 | ) | (162 | ) | ||
| Class C | (76 | ) | (69 | ) | ||
| Class E | (626 | ) | (636 | ) | ||
| Class S | (31,594 | ) | (33,090 | ) | ||
| Class Y | (14,045 | ) | (15,988 | ) | ||
| From net realized gain | ||||||
| Class A | (1,154 | ) | (648 | ) | ||
| Class C | (1,095 | ) | (721 | ) | ||
| Class E | (3,782 | ) | (2,643 | ) | ||
| Class S | (159,149 | ) | (110,608 | ) | ||
| Class Y | (62,668 | ) | (47,542 | ) | ||
| Net decrease in net assets from distributions | (274,388 | ) | (212,107 | ) | ||
| Share Transactions* | ||||||
| Net increase (decrease) in net assets from share transactions | (193,436 | ) | (418,038 | ) | ||
| Total Net Increase (Decrease) in Net Assets | (453,112 | ) | (490,731 | ) | ||
| Net Assets | ||||||
| Beginning of period | 2,838,429 | 3,329,160 | ||||
| End of period | $ | 2,385,317 | $ | 2,838,429 | ||
| Undistributed (overdistributed) net investment income included in net assets | $ | 26,475 | $ | 33,906 | ||
See accompanying notes which are an integral part of the financial statements.
222 Russell Global Equity Fund
Russell Investment Company
Russell Global Equity Fund
Statements of Changes in Net Assets, continued
* Share transaction amounts (in thousands) for the periods ended October 31, 2016 and October 31, 2015 were as follows:
| 2016 | 2015 | |||||||||||
| Shares | Dollars | Shares | Dollars | |||||||||
| Class A | ||||||||||||
| Proceeds from shares sold | 299 | $ | 3,050 | 198 | $ | 2,299 | ||||||
| Proceeds from reinvestment of distributions | 134 | 1,323 | 70 | 795 | ||||||||
| Payments for shares redeemed | (387 | ) | (3,920 | ) | (170 | ) | (1,956 | ) | ||||
| Net increase (decrease) | 46 | 453 | 98 | 1,138 | ||||||||
| Class C | ||||||||||||
| Proceeds from shares sold | 129 | 1,285 | 212 | 2,422 | ||||||||
| Proceeds from reinvestment of distributions | 119 | 1,169 | 70 | 789 | ||||||||
| Payments for shares redeemed | (353 | ) | (3,523 | ) | (330 | ) | (3,779 | ) | ||||
| Net increase (decrease) | (105 | ) | (1,069 | ) | (48 | ) | (568 | ) | ||||
| Class E | ||||||||||||
| Proceeds from shares sold | 302 | 3,027 | 293 | 3,364 | ||||||||
| Proceeds from reinvestment of distributions | 422 | 4,177 | 270 | 3,056 | ||||||||
| Payments for shares redeemed | (723 | ) | (7,299 | ) | (1,041 | ) | (11,953 | ) | ||||
| Net increase (decrease) | 1 | (95 | ) | (478 | ) | (5,533 | ) | |||||
| Class S | ||||||||||||
| Proceeds from shares sold | 23,374 | 235,992 | 28,057 | 325,326 | ||||||||
| Proceeds from reinvestment of distributions | 18,937 | 187,478 | 12,460 | 141,178 | ||||||||
| Payments for shares redeemed | (55,252 | ) | (554,916 | ) | (58,451 | ) | (679,009 | ) | ||||
| Net increase (decrease) | (12,941 | ) | (131,446 | ) | (17,934 | ) | (212,505 | ) | ||||
| Class Y | ||||||||||||
| Proceeds from shares sold | 2,770 | 27,413 | 2,170 | 25,156 | ||||||||
| Proceeds from reinvestment of distributions | 7,741 | 76,713 | 5,607 | 63,530 | ||||||||
| Payments for shares redeemed | (15,977 | ) | (165,405 | ) | (24,516 | ) | (289,256 | ) | ||||
| Net increase (decrease) | (5,466 | ) | (61,279 | ) | (16,739 | ) | (200,570 | ) | ||||
| Total increase (decrease) | (18,465 | ) | $ | (193,436 | ) | (35,101 | ) | $ | (418,038 | ) | ||
See accompanying notes which are an integral part of the financial statements.
Russell Global Equity Fund 223
Russell Investment Company
Russell Global Equity Fund
Financial Highlights — For the Periods Ended
For a Share Outstanding Throughout Each Period.
| $ | $ | $ | $ | $ | $ | ||||||||||||||
| Net Asset Value, | Net | Net Realized | Total from | Distributions | Distributions | ||||||||||||||
| Beginning of | Investment | and Unrealized | Investment | from Net | from Net | ||||||||||||||
| Period | Income (Loss)(a)(d) | Gain (Loss) | Operations | Investment Income | Realized Gain | ||||||||||||||
| Class A | |||||||||||||||||||
| October 31, 2016 | 11.40 | .07 | (.01 | ) | .06 | (.16 | ) | (.95 | ) | ||||||||||
| October 31, 2015 | 11.72 | .09 | .32 | .41 | (.15 | ) | (.58 | ) | |||||||||||
| October 31, 2014 | 11.07 | .07 | .83 | .90 | (.05 | ) | (.20 | ) | |||||||||||
| October 31, 2013 | 8.76 | .07 | 2.31 | 2.38 | (.07 | ) | — | ||||||||||||
| October 31, 2012 | 8.37 | .06 | .38 | .44 | (.05 | ) | — | ||||||||||||
| Class C | |||||||||||||||||||
| October 31, 2016 | 11.24 | (.01 | ) | (.01 | ) | (.02 | ) | (.06 | ) | (.95 | ) | ||||||||
| October 31, 2015 | 11.55 | —(f) | .33 | .33 | (.06 | ) | (.58 | ) | |||||||||||
| October 31, 2014 | 10.96 | (.02 | ) | .81 | .79 | —(f) | (.20 | ) | |||||||||||
| October 31, 2013 | 8.66 | (.01 | ) | 2.31 | 2.30 | — | — | ||||||||||||
| October 31, 2012 | 8.29 | —(f) | .37 | .37 | — | — | |||||||||||||
| Class E | |||||||||||||||||||
| October 31, 2016 | 11.41 | .07 | —(f) | .07 | (.16 | ) | (.95 | ) | |||||||||||
| October 31, 2015 | 11.72 | .09 | .32 | .41 | (.14 | ) | (.58 | ) | |||||||||||
| October 31, 2014 | 11.07 | .07 | .82 | .89 | (.04 | ) | (.20 | ) | |||||||||||
| October 31, 2013 | 8.76 | .07 | 2.31 | 2.38 | (.07 | ) | — | ||||||||||||
| October 31, 2012 | 8.38 | .06 | .37 | .43 | (.05 | ) | — | ||||||||||||
| Class S | |||||||||||||||||||
| October 31, 2016 | 11.45 | .09 | —(f) | .09 | (.19 | ) | (.95 | ) | |||||||||||
| October 31, 2015 | 11.77 | .12 | .32 | .44 | (.18 | ) | (.58 | ) | |||||||||||
| October 31, 2014 | 11.11 | .09 | .84 | .93 | (.07 | ) | (.20 | ) | |||||||||||
| October 31, 2013 | 8.79 | .09 | 2.33 | 2.42 | (.10 | ) | — | ||||||||||||
| October 31, 2012 | 8.41 | .08 | .37 | .45 | (.07 | ) | — | ||||||||||||
| Class Y | |||||||||||||||||||
| October 31, 2016 | 11.48 | .12 | (.02 | ) | .10 | (.21 | ) | (.95 | ) | ||||||||||
| October 31, 2015 | 11.79 | .14 | .33 | .47 | (.20 | ) | (.58 | ) | |||||||||||
| October 31, 2014 | 11.14 | .12 | .82 | .94 | (.09 | ) | (.20 | ) | |||||||||||
| October 31, 2013 | 8.81 | .11 | 2.33 | 2.44 | (.11 | ) | — | ||||||||||||
| October 31, 2012 | 8.42 | .10 | .38 | .48 | (.09 | ) | — | ||||||||||||
See accompanying notes which are an integral part of the financial statements.
224 Russell Global Equity Fund
| % | % | % | ||||||||||||||||
| $ | $ | Ratio of Expenses | Ratio of Expenses | Ratio of Net | ||||||||||||||
| Net Asset Value, | % | Net Assets, | to Average | to Average | Investment Income | % | ||||||||||||
| $ | End of | Total | End of Period | Net Assets, | Net Assets, | to Average | Portfolio | |||||||||||
| Total Distributions | Period | Return(c) | (000 | ) | Gross | Net(d) | Net Assets(d) | Turnover Rate(k) | ||||||||||
| (1.11 | ) | 10.35 | 1.02 | 12,807 | 1.50 | 1.50 | .72 | 46 | ||||||||||
| (.73 | ) | 11.40 | 3.56 | 13,589 | 1.49 | 1.49 | .75 | 47 | ||||||||||
| (.25 | ) | 11.72 | 8.18 | 12,819 | 1.49 | 1.49 | .59 | 39 | ||||||||||
| (.07 | ) | 11.07 | 27.37 | 11,427 | 1.49 | 1.49 | .67 | 82 | ||||||||||
| (.05 | ) | 8.76 | 5.32 | 9,684 | 1.48 | 1.48 | .72 | 107 | ||||||||||
| (1.01 | ) | 10.21 | .24 | 11,059 | 2.25 | 2.25 | (.06 | ) | 46 | |||||||||
| (.64 | ) | 11.24 | 2.87 | 13,356 | 2.24 | 2.24 | —(i) | 47 | ||||||||||
| (.20 | ) | 11.55 | 7.26 | 14,286 | 2.24 | 2.24 | (.16 | ) | 39 | |||||||||
| — | 10.96 | 26.56 | 14,118 | 2.24 | 2.24 | (.08 | ) | 82 | ||||||||||
| — | 8.66 | 4.46 | 11,794 | 2.23 | 2.23 | (.02 | ) | 107 | ||||||||||
| (1.11 | ) | 10.37 | 1.04 | 42,161 | 1.50 | 1.50 | .69 | 46 | ||||||||||
| (.72 | ) | 11.41 | 3.59 | 46,407 | 1.49 | 1.49 | .75 | 47 | ||||||||||
| (.24 | ) | 11.72 | 8.15 | 53,265 | 1.49 | 1.49 | .60 | 39 | ||||||||||
| (.07 | ) | 11.07 | 27.41 | 56,210 | 1.49 | 1.49 | .67 | 82 | ||||||||||
| (.05 | ) | 8.76 | 5.25 | 47,176 | 1.48 | 1.48 | .71 | 107 | ||||||||||
| (1.14 | ) | 10.40 | 1.26 | 1,659,879 | 1.25 | 1.25 | .94 | 46 | ||||||||||
| (.76 | ) | 11.45 | 3.80 | 1,976,080 | 1.24 | 1.24 | .99 | 47 | ||||||||||
| (.27 | ) | 11.77 | 8.48 | 2,240,991 | 1.24 | 1.24 | .83 | 39 | ||||||||||
| (.10 | ) | 11.11 | 27.74 | 2,078,046 | 1.24 | 1.24 | .92 | 82 | ||||||||||
| (.07 | ) | 8.79 | 5.49 | 1,538,904 | 1.23 | 1.23 | .97 | 107 | ||||||||||
| (1.16 | ) | 10.42 | 1.40 | 659,411 | 1.05 | 1.05 | 1.14 | 46 | ||||||||||
| (.78 | ) | 11.48 | 4.09 | 788,997 | 1.04 | 1.04 | 1.20 | 47 | ||||||||||
| (.29 | ) | 11.79 | 8.56 | 1,007,799 | 1.04 | 1.04 | 1.06 | 39 | ||||||||||
| (.11 | ) | 11.14 | 28.01 | 1,067,614 | 1.04 | 1.04 | 1.13 | 82 | ||||||||||
| (.09 | ) | 8.81 | 5.79 | 1,043,120 | 1.05 | 1.05 | 1.18 | 107 | ||||||||||
See accompanying notes which are an integral part of the financial statements.
Russell Global Equity Fund 225
Russell Investment Company
Russell Global Equity Fund
Related Party Transactions, Fees and Expenses
| Accrued fees payable to affiliates for the period ended October 31, 2016 were as follows: | ||
| Advisory fees | $ | 1,923,452 |
| Administration fees | 98,529 | |
| Distribution fees | 9,873 | |
| Shareholder servicing fees | 11,366 | |
| Transfer agent fees | 297,473 | |
| Trustee fees | 8,908 | |
| $ | 2,349,601 | |
| Transactions (amounts in thousands) during the period ended October 31, 2016 with Underlying Funds which are, or were, an | |||||||||||||||||||
| affiliated company are as follows: | |||||||||||||||||||
| Fair Value, | Change in | ||||||||||||||||||
| Beginning of | Realized Gain | Unrealized | Fair Value, End | Income | Capital Gains | ||||||||||||||
| Period | Purchases | Sales | (Loss) | Gain (Loss) | of Period | Distributions | Distributions | ||||||||||||
| Russell U.S. Cash Collateral Fund $ | 58,265 | $ | 750,290 | $ | 773,985 | $ | — | $ | — | $ | 34,570 | $ | 292 | $ | — | ||||
| Russell U.S. Cash Management Fund | 166,732 | 1,096,812 | 1,198,572 | 6 | 8 | 64,986 | 315 | — | |||||||||||
| $ | 224,997 | $ | 1,847,102 | $ | 1,972,557 | $ | 6 | $ | 8 | $ | 99,556 | $ | 607 | $ | — | ||||
Federal Income Taxes
At October 31, 2016, the cost of investments and net unrealized appreciation (depreciation), undistributed ordinary income and
undistributed long-term capital gains for income tax purposes were as follows:.
| Cost of Investments | $ | 2,071,203,662 | ||
| Unrealized Appreciation | $ | 410,403,566 | ||
| Unrealized Depreciation | (76,742,231 | ) | ||
| Net Unrealized Appreciation (Depreciation) | $ | 333,661,335 | ||
| Undistributed Ordinary Income | $ | 32,623,998 | ||
| Undistributed Long-Term Capital Gains | ||||
| (Capital Loss Carryforward) | $ | 153,936,542 | ||
| Tax Composition of Distributions | ||||
| Ordinary Income | $ | 47,904,161 | ||
| Long-Term Capital Gains | $ | 226,483,588 |
Net investment income and net realized gains (loss) in the financial statements may differ from taxable net investment income and net
realized gains (losses). Capital accounts within the financial statements are adjusted for permanent book-tax differences. Book-tax
differences are primarily due to foreign currency gains and losses, reclassifications of dividends, differences in treatment of income
from swaps, net operating losses, investments in partnerships, investments in passive foreign investment companies (PFICs), tax
straddle transactions, use of tax equalization and foreign capital gains taxes. These adjustments have no impact on the net assets.
At October 31, 2016, the Statement of Assets and Liabilities have been adjusted by the following amounts (in thousands):
| Undistributed net investment income | $ | 14,573 | |
| Accumulated net realized gain (loss) | (14,573 | ) | |
| Additional paid-in capital | — |
See accompanying notes which are an integral part of the financial statements.
226 Russell Global Equity Fund
Russell Investment Company
Russell Emerging Markets Fund
Portfolio Management Discussion and Analysis — October 31, 2016 (Unaudited)
| Russell Emerging Markets Fund - Class A‡ | Russell Emerging Markets Fund - Class S | ||||||
| Total | Total | ||||||
| Return | Return | ||||||
| 1 Year | 3.06 | % | 1 Year | 9.55 | % | ||
| 5 Years | (0.47 | )%§ | 5 Years | 0.95 | %§ | ||
| 10 Years | 2.77 | %§ | 10 Years | 3.63 | %§ | ||
| Russell Emerging Markets Fund - Class C | Russell Emerging Markets Fund - Class Y‡‡‡ | ||||||
| Total | Total | ||||||
| Return | Return | ||||||
| 1 Year | 8.52 | % | 1 Year | 9.79 | % | ||
| 5 Years | (0.04 | )%§ | 5 Years | 1.16 | %§ | ||
| 10 Years | 2.61 | %§ | 10 Years | 3.79 | %§ | ||
| Russell Emerging Markets Fund - Class E | Russell Emerging Markets® Index Net** | ||||||
| Total | Total | ||||||
| Return | Return | ||||||
| 1 Year | 9.31 | % | 1 Year | 9.40 | % | ||
| 5 Years | 0.71 | %§ | 5 Years | 1.44 | %§ | ||
| 10 Years | 3.38 | %§ | 10 Years | 4.06 | %§ | ||
| Russell Emerging Markets Fund - Class R6‡‡ | Emerging Markets Linked Benchmark*** | ||||||
| Total | Total | ||||||
| Return | Return | ||||||
| 1 Year | 9.79 | % | 1 Year | 9.40 | % | ||
| 5 Years | 1.16 | %§ | 5 Years | 1.44 | %§ | ||
| 10 Years | 3.79 | %§ | 10 Years | 3.88 | %§ | ||
Russell Emerging Markets Fund 227
Russell Investment Company
Russell Emerging Markets Fund
Portfolio Management Discussion and Analysis, continued — October 31, 2016
(Unaudited)
| The Russell Emerging Markets Fund (the “Fund”) employs | U.S. Federal Reserve maintained low interest rates throughout |
| a multi-manager approach whereby portions of the Fund are | the year, which increased investor appetite for emerging markets |
| allocated to different money manager strategies. Fund assets not | holdings. |
| allocated to money managers are managed by Russell Investment | |
| Management, LLC (“RIM”), the Fund’s advisor. RIM may change | How did the investment strategies and techniques employed |
| the allocation of the Fund’s assets among money managers at | by the Fund and its money managers affect its benchmark- |
| any time. An exemptive order from the Securities and Exchange | relative performance? |
| Commission (“SEC”) permits RIM to engage or terminate a money | The Fund employs discretionary and non-discretionary money |
| manager at any time, subject to approval by the Fund’s Board, | managers. The Fund’s discretionary money managers select the |
| without a shareholder vote. Pursuant to the terms of the exemptive | individual portfolio securities for the assets assigned to them. |
| order, the Fund is required to notify its shareholders within 90 | The Fund’s non-discretionary money managers provide a model |
| days of when a money manager begins providing services. As of | portfolio to RIM representing their investment recommendations, |
| October 31, 2016, the Fund had seven money managers. | based upon which RIM purchases and sells securities for the |
| Fund. Fund assets not allocated to discretionary money managers | |
| What is the Fund’s investment objective? | include assets managed by RIM based upon model portfolios |
| The Fund seeks to provide long term capital growth. | provided by non-discretionary money managers, the Fund’s |
| How did the Fund perform relative to its benchmark for the | liquidity reserves and assets which may be managed directly by |
| fiscal year ended October 31, 2016? | RIM to effect the Fund’s investment strategies and/or to actively |
| manage the Fund’s overall exposures by investing in securities or | |
| For the fiscal year ended October 31, 2016, the Fund’s Class A, | other instruments that RIM believes will achieve the desired risk/ |
| Class C, Class E, Class R6, Class S and Class Y Shares gained | return profile for the Fund. |
| 9.34%, 8.52%, 9.31%, 9.79%, 9.55% and 9.79%, respectively. | |
| This is compared to the Fund’s benchmark, the Russell Emerging | With respect to certain of the Fund’s money managers, Numeric |
| Markets® Index (Net), which gained 9.40% during the same | Investors LLC (“Numeric”), which utilizes quantitative investment |
| period. The Fund’s performance includes operating expenses, | models, was again the best-performing money manager for the |
| whereas index returns are unmanaged and do not include | period and outperformed the Fund’s benchmark. The manager |
| expenses of any kind. | benefitted from an underweight to the health care sector and |
| an overweight to energy stocks. From a country perspective, | |
| For the fiscal year ended October 31, 2016, the Morningstar® | Numeric’s overweight to and stock selection within Brazil further |
| Diversified Emerging Markets Category, a group of funds that | drove outperformance. |
| Morningstar considers to have investment strategies similar to | |
| those of the Fund, gained 8.11%. This result serves as a peer | Consilium Investment Management, LLC (“Consilium”), a |
| comparison and is expressed net of operating expenses. | dedicated frontier markets manager, considerably outperformed |
| its frontier markets benchmark. However, its frontier markets | |
| How did the market conditions described in the Market | exposure was detrimental to the Fund’s benchmark-relative |
| Summary report affect the Fund’s performance? | performance, as frontier markets sold off over the period while |
| During much of the fiscal year, market conditions in emerging | emerging markets rallied. |
| markets were positive with the asset class experiencing inflows. | During the period, RIM managed a positioning strategy designed |
| Political conditions were improving in many emerging markets | to manage Fund-level exposures, including style, factor, currency |
| countries, particularly Brazil. Low interest rates fueled a risk-on | and country, through the direct purchase of emerging markets |
| environment, which was beneficial for emerging markets. | stocks. Using the output from a quantitative model, the strategy |
| Brazil underwent a protracted process to eventually suspend | seeks to position the portfolio to meet RIM’s overall preferred |
| President Dilma Rousseff from office. The Brazilian market was | positioning, while optimizing the portfolio to minimize tracking |
| among the strongest-performing in the world during the fiscal year | error relative to the Fund’s money manager portfolios. During the |
| as equities rallied on the back of increased investor confidence | fiscal year, the positioning strategy performed in-line with the |
| in the country pending Rousseff’s departure. This marked a | Fund’s benchmark. The strategy benefitted from an overweight to |
| recovery from a difficult 2015, a year that was wrought by political | the technology sector as well as an underweight to the healthcare |
| corruption and unsupportive economic policies. The strong | sector. However, in order to offset the Fund’s overweight to Brazil, |
| Brazilian market in 2016 was a key driver of Fund performance. | the strategy held a near zero weight to Brazilian stocks, which |
| Aside from Brazil, emerging markets experienced a broader rally | detracted. In addition to its positioning strategy, RIM tactically |
| as the asset class was perceived more favorably by the market. The | utilized index futures, swaps and currency forwards to seek to |
228 Russell Emerging Markets Fund
Russell Investment Company
Russell Emerging Markets Fund
Portfolio Management Discussion and Analysis, continued — October 31, 2016
(Unaudited)
| position the portfolio in line with RIM’s preferred positioning. | Money Managers as of October 31, | |
| These positions detracted from Fund performance. One particular | 2016 | Styles |
| detractor was the Fund’s short futures positions in Brazil, which | ||
| AllianceBernstein L.P. | Value | |
| was the strongest-performing emerging market. However, the | Consilium Investment Management, LLC | Market Oriented |
| Fund maintained an overweight to Brazil throughout the fiscal | Delaware Investments Fund Advisers, a | |
| year as these positions only mitigated the overweight. | Series of Delaware Management Business | |
| Fair value pricing adjustments on the first and last business days | Trust | Value |
| Harding Loevner LP | Market Oriented | |
| of the fiscal period were beneficial to the Fund’s benchmark- | Numeric Investors LLC | Market Oriented |
| relative performance because the Fund’s benchmark does not use | Oaktree Capital Management, L.P. | Market Oriented |
| fair value pricing adjustments. | Westwood Management Corporation | Market Oriented |
| The views expressed in this report reflect those of the | ||
| Describe any changes to the Fund’s structure or the money | portfolio managers only through the end of the period | |
| manager line-up. | covered by the report. These views do not necessarily | |
| In March 2016, RIM terminated Genesis Asset Managers, LLP as | represent the views of RIM or any other person in RIM or | |
| a money manager for the Fund. Assets were reallocated largely to | any other affiliated organization. These views are subject | |
| RIM’s positioning strategy and to Consilium. | to change at any time based upon market conditions or | |
| other events, and RIM disclaims any responsibility to | ||
| update the views contained herein. These views should not | ||
| be relied on as investment advice and, because investment | ||
| decisions for a Russell Investment Company (“RIC”) Fund | ||
| are based on numerous factors, should not be relied on as | ||
| an indication of investment decisions of any RIC Fund. | ||
* Assumes initial investment on November 1, 2006.
** The Russell Emerging Markets® Index is an index which measures the performance of the investable securities in emerging countries globally. It is constructed
to provide a comprehensive and unbiased barometer for this market segment and is completely reconstituted annually to accurately reflect the changes in the
market over time.
*** The Emerging Markets Linked Benchmark provides a means to compare the Fund’s average annual returns to a secondary benchmark that takes into account
historical changes in the Fund’s primary benchmark. The Emerging Markets Linked Benchmark represents the returns of the MSCI Emerging Markets Index
(net of tax on dividends from foreign holdings) through December 31, 2010 and the returns of the Russell Emerging Markets® Index (net of tax on dividends from
foreign holdings) thereafter.
‡ The Fund first issued Class A Shares on March 1, 2007. The returns shown for Class A Shares prior to that date are the returns of Class E Shares. The
performance shown has been adjusted to reflect the deduction of the maximum Class A sales charge of 5.75%. Annual returns for each Class will differ only to
the extent that the Class A Shares do not have the same expenses as Class E Shares.
‡‡ The Fund first issued Class R6 Shares on March 1, 2016. The returns of Class R6 prior to that date are the returns of the Fund’s Class Y Shares. Class R6 will
have substantially similar annual returns as the Class Y Shares because the Shares of each Class are invested in the same portfolio of securities. Annual returns
for each Class will differ only to the extent that the Class R6 Shares do not have the same expenses as the Class Y Shares.
‡‡‡ The Fund first issued Class Y Shares on September 26, 2008. The returns shown for Class Y Shares prior to that date are the returns of the Fund’s Class S
Shares. Class Y Shares will have substantially similar annual returns as the Class S Shares because the Shares of each Class are invested in the same portfolio of
securities. Annual returns for each Class will differ only to the extent that the Class Y Shares do not have the same expenses as the Class S Shares.
§ Annualized.
Performance is historical and assumes reinvestment of all dividends and capital gains. Investment return and principal value will fluctuate so that an investor’s
shares, when redeemed, may be worth more or less than when purchased. Past performance is not indicative of future results. The returns shown do not reflect the
deduction of taxes that a shareholder would pay on Fund distributions or the redemption of Fund shares. Additionally, the returns presented herein may differ from
the performance reported in the Financial Highlights as the returns herein are calculated in a manner consistent with standardized performance in accordance with
Securities and Exchange Commission rules, while the performance in the Financial Highlights has been calculated in accordance with U.S. Generally Accepted
Accounting Principles (“U.S. GAAP”).
Russell Emerging Markets Fund 229
Russell Investment Company
Russell Emerging Markets Fund
Shareholder Expense Example — October 31, 2016 (Unaudited)
| Fund Expenses | Please note that the expenses shown in the table are meant | |||||
| The following disclosure provides important information | to highlight your ongoing costs only and do not reflect any | |||||
| regarding the Fund’s Shareholder Expense Example | transactional costs. Therefore, the information under the heading | |||||
| (“Example”). | “Hypothetical Performance (5% return before expenses)” is | |||||
| useful in comparing ongoing costs only, and will not help you | ||||||
| Example | determine the relative total costs of owning different funds. In | |||||
| As a shareholder of the Fund, you incur two types of costs: (1) | addition, if these transactional costs were included, your costs | |||||
| transaction costs, including sales charges (loads) on certain | would have been higher. | |||||
| purchase or redemption payments, and (2) ongoing costs, | Hypothetical | |||||
| including advisory and administrative fees; distribution (12b-1) | Performance (5% | |||||
| and/or service fees; and other Fund expenses. The Example is | Actual | return before | ||||
| intended to help you understand your ongoing costs (in dollars) | Class A | Performance | expenses) | |||
| Beginning Account Value | ||||||
| of investing in the Fund and to compare these costs with the | May 1, 2016 | $ | 1,000.00 | $ | 1,000.00 | |
| ongoing costs of investing in other mutual funds. The Example | Ending Account Value | |||||
| is based on an investment of $1,000 invested at the beginning of | October 31, 2016 | $ | 1,107.40 | $ | 1,016.44 | |
| the period and held for the entire period indicated, which for this | Expenses Paid During Period* | $ | 9.16 | $ | 8.77 | |
| Fund is from May 1, 2016 to October 31, 2016. | * Expenses are equal to the Fund's annualized expense ratio of 1.73% | |||||
| (representing the six month period annualized), multiplied by the average | ||||||
| Actual Expenses | account value over the period, multiplied by 184/366 (to reflect the one-half | |||||
| The information in the table under the heading “Actual | year period). May reflect amounts waived and/or reimbursed. Without any | |||||
| Performance” provides information about actual account values | waivers and/or reimbursements, expenses would have been higher. | |||||
| and actual expenses. You may use the information in this column, | ||||||
| Hypothetical | ||||||
| together with the amount you invested, to estimate the expenses | Performance (5% | |||||
| that you paid over the period. Simply divide your account value by | Actual | return before | ||||
| $1,000 (for example, an $8,600 account value divided by $1,000 | Class C | Performance | expenses) | |||
| Beginning Account Value | ||||||
| = 8.6), then multiply the result by the number in the first column | May 1, 2016 | $ | 1,000.00 | $ | 1,000.00 | |
| in the row entitled “Expenses Paid During Period” to estimate | Ending Account Value | |||||
| the expenses you paid on your account during this period. | October 31, 2016 | $ | 1,103.20 | $ | 1,012.67 | |
| Expenses Paid During Period* | $ | 13.11 | $ | 12.55 | ||
| Hypothetical Example for Comparison Purposes | ||||||
| The information in the table under the heading “Hypothetical | * Expenses are equal to the Fund's annualized expense ratio of 2.48% | |||||
| (representing the six month period annualized), multiplied by the average | ||||||
| Performance (5% return before expenses)” provides information | account value over the period, multiplied by 184/366 (to reflect the one-half | |||||
| about hypothetical account values and hypothetical expenses | year period). May reflect amounts waived and/or reimbursed. Without any | |||||
| based on the Fund’s actual expense ratio and an assumed rate of | waivers and/or reimbursements, expenses would have been higher. | |||||
| return of 5% per year before expenses, which is not the Fund’s | ||||||
| Hypothetical | ||||||
| actual return. The hypothetical account values and expenses | Performance (5% | |||||
| may not be used to estimate the actual ending account balance or | Actual | return before | ||||
| expenses you paid for the period. You may use this information | Class E | Performance | expenses) | |||
| to compare the ongoing costs of investing in the Fund and other | Beginning Account Value | |||||
| May 1, 2016 | $ | 1,000.00 | $ | 1,000.00 | ||
| funds. To do so, compare this 5% hypothetical example with the | Ending Account Value | |||||
| 5% hypothetical examples that appear in the shareholder reports | October 31, 2016 | $ | 1,106.30 | $ | 1,016.44 | |
| of other funds. | Expenses Paid During Period* | $ | 9.16 | $ | 8.77 | |
| * Expenses are equal to the Fund's annualized expense ratio of 1.73% | ||||||
| (representing the six month period annualized), multiplied by the average | ||||||
| account value over the period, multiplied by 184/366 (to reflect the one-half | ||||||
| year period). May reflect amounts waived and/or reimbursed. Without any | ||||||
| waivers and/or reimbursements, expenses would have been higher. | ||||||
230 Russell Emerging Markets Fund
Russell Investment Company
Russell Emerging Markets Fund
Shareholder Expense Example, continued — October 31, 2016 (Unaudited)
| Hypothetical | ||||||
| Performance (5% | ||||||
| Actual | return before | |||||
| Class R6 | Performance | expenses) | ||||
| Beginning Account Value | ||||||
| May 1, 2016 | $ | 1,000.00 | $ | 1,000.00 | ||
| Ending Account Value | ||||||
| October 31, 2016 | $ | 1,109.10 | $ | 1,018.45 | ||
| Expenses Paid During Period* | $ | 7.05 | $ | 6.75 | ||
| * Expenses are equal to the Fund's annualized expense ratio of 1.33% | ||||||
| (representing the six month period annualized), multiplied by the average | ||||||
| account value over the period, multiplied by 184/366 (to reflect the one-half | ||||||
| year period). May reflect amounts waived and/or reimbursed. Without any | ||||||
| waivers and/or reimbursements, expenses would have been higher. | ||||||
| Hypothetical | ||||||
| Performance (5% | ||||||
| Actual | return before | |||||
| Class S | Performance | expenses) | ||||
| Beginning Account Value | ||||||
| May 1, 2016 | $ | 1,000.00 | $ | 1,000.00 | ||
| Ending Account Value | ||||||
| October 31, 2016 | $ | 1,107.90 | $ | 1,017.70 | ||
| Expenses Paid During Period* | $ | 7.84 | $ | 7.51 | ||
| * Expenses are equal to the Fund's annualized expense ratio of 1.48% | ||||||
| (representing the six month period annualized), multiplied by the average | ||||||
| account value over the period, multiplied by 184/366 (to reflect the one-half | ||||||
| year period). May reflect amounts waived and/or reimbursed. Without any | ||||||
| waivers and/or reimbursements, expenses would have been higher. | ||||||
| Hypothetical | ||||||
| Performance (5% | ||||||
| Actual | return before | |||||
| Class Y | Performance | expenses) | ||||
| Beginning Account Value | ||||||
| May 1, 2016 | $ | 1,000.00 | $ | 1,000.00 | ||
| Ending Account Value | ||||||
| October 31, 2016 | $ | 1,109.10 | $ | 1,018.70 | ||
| Expenses Paid During Period* | $ | 6.79 | $ | 6.50 | ||
| * Expenses are equal to the Fund's annualized expense ratio of 1.28% | ||||||
| (representing the six month period annualized), multiplied by the average | ||||||
| account value over the period, multiplied by 184/366 (to reflect the one-half | ||||||
| year period). May reflect amounts waived and/or reimbursed. Without any | ||||||
| waivers and/or reimbursements, expenses would have been higher. | ||||||
Russell Emerging Markets Fund 231
Russell Investment Company
Russell Emerging Markets Fund
Schedule of Investments — October 31, 2016
| Amounts in thousands (except share amounts) | Amounts in thousands (except share amounts) | ||||||||||
| Principal | Fair | Principal | Fair | ||||||||
| Amount ($) | Value | Amount ($) | Value | ||||||||
| or Shares | $ | or Shares | $ | ||||||||
| Common Stocks - 91.6% | Transmissora Alianca de Energia | ||||||||||
| Argentina - 1.1% | Eletrica SA | 176,427 | 1,147 | ||||||||
| Banco Macro SA - ADR | 54,897 | 4,185 | Vale SA Class B - ADR(Æ)(Ñ) | 1,611,309 | 10,575 | ||||||
| Cresud SACIF y A - ADR(Æ) | 320,784 | 5,614 | 172,453 | ||||||||
| IRSA Inversiones y Representaciones | |||||||||||
| SA - ADR(Æ)(Ñ) | 58,100 | 1,089 | Cambodia - 0.1% | ||||||||
| Pampa Energia SA - ADR(Æ) | 138,464 | 4,717 | NagaCorp, Ltd. | 4,611,624 | 2,848 | ||||||
| YPF SA - ADR | 555,200 | 9,860 | |||||||||
| 25,465 | Cayman Islands - 1.6% | ||||||||||
| 3SBio, Inc.(Æ)(Þ) | 153,500 | 153 | |||||||||
| Bangladesh - 0.4% | Baidu, Inc. - ADR(Æ) | 98,500 | 17,421 | ||||||||
| Beximco Pharmaceuticals, Ltd. | 3,075,029 | 3,023 | Changyou.com, Ltd. - ADR(Æ) | 7,500 | 198 | ||||||
| BRAC Bank, Ltd. | 6,759,554 | 5,159 | China Evergrande Group | 2,782,000 | 1,840 | ||||||
| 8,182 | China Hongqiao Group, Ltd. | 891,500 | 797 | ||||||||
| China Resources Land, Ltd. | 960,000 | 2,386 | |||||||||
| Bermuda - 0.2% | China Zhongwang Holdings, Ltd.(Ñ) | 831,200 | 384 | ||||||||
| Kunlun Energy Co., Ltd. | 492,000 | 371 | CKH Food & Health, Ltd.(Æ)(Ñ) | 213,004 | 395 | ||||||
| VimpelCom, Ltd. - ADR | 987,029 | 3,297 | Intime Retail Group Co., Ltd. | 600,500 | 471 | ||||||
| 3,668 | Momo, Inc. - ADR(Æ) | 5,700 | 137 | ||||||||
| Nexteer Automotive Group, Ltd. | 326,000 | 429 | |||||||||
| Brazil - 7.6% | Shenzhou International Group Holdings, | ||||||||||
| Ambev SA - ADR | 1,134,442 | 6,693 | Ltd. | 425,000 | 2,816 | ||||||
| B2W Cia Digital(Æ) | 1,404,933 | 6,901 | Sunny Optical Technology Group Co., | ||||||||
| Banco Bradesco SA - ADR(Æ) | 997,262 | 10,382 | Ltd. | 264,000 | 1,287 | ||||||
| Banco Bradesco SA(Æ) | 55,700 | 554 | TAL Education Group - ADR(Æ) | 19,020 | 1,549 | ||||||
| Banco do Brasil SA(Æ) | 340,042 | 3,120 | Trina Solar, Ltd. - ADR(Æ)(Ñ) | 321,386 | 3,336 | ||||||
| Banco Santander Brasil SA - ADR(Æ)(Ñ) | 170,400 | 1,394 | Yirendai, Ltd. - ADR(Æ)(Ñ) | 92,792 | 2,691 | ||||||
| BM&FBovespa SA - Bolsa de Valores | 36,290 | ||||||||||
| Mercadorias e Futuros(Æ) | 1,345,300 | 7,923 | |||||||||
| BR Malls Participacoes SA(Æ) | 968,202 | 3,877 | Chile - 0.8% | ||||||||
| Braskem SA - ADR(Ñ) | 143,538 | 2,548 | Banco de Chile | 1,880,229 | 226 | ||||||
| BRF SA - ADR(Æ)(Ñ) | 164,000 | 2,742 | Banco Santander Chile - ADR | 116,700 | 2,667 | ||||||
| BRF SA(Æ) | 100,800 | 1,686 | Cencosud SA | 30,710 | 102 | ||||||
| Centrais Eletricas Brasileiras SA(Æ) | 570,700 | 4,237 | Cia Cervecerias Unidas SA - ADR | 289,124 | 3,893 | ||||||
| Cia Brasileira de Distribuicao - ADR(Ñ) | 270,900 | 5,161 | Colbun SA | 454,717 | 100 | ||||||
| Cia de Saneamento Basico do Estado de | Empresa Nacional de Electricidad SA | 81,277 | 56 | ||||||||
| Sao Paulo(Æ) | 356,140 | 3,760 | Empresa Nacional de | ||||||||
| Cia de Saneamento Basico do Estado de | Telecomunicaciones SA(Æ) | 315,922 | 3,388 | ||||||||
| Sao Paulo - ADR(Æ) | 265,100 | 2,789 | Enersis Chile SA | 21,728,329 | 2,179 | ||||||
| Cia de Saneamento de Minas | Enersis SA(Æ) | 10,529,105 | 1,808 | ||||||||
| Gerais-COPASA(Æ) | 251,304 | 2,623 | Sociedad Quimica y Minera de Chile | ||||||||
| Cielo SA | 244,676 | 2,484 | SA - ADR | 87,600 | 2,563 | ||||||
| Cosan SA Industria e Comercio | 449,500 | 6,044 | 16,982 | ||||||||
| CVC Brasil Operadora e Agencia de | |||||||||||
| Viagens SA | 373,077 | 2,864 | China - 16.0% | ||||||||
| Gafisa SA | 879,760 | 678 | 51job, Inc. - ADR(Æ)(Ñ) | 98,988 | 3,366 | ||||||
| Gerdau SA - ADR(Ñ) | 1,247,241 | 4,278 | 58.com, Inc. - ADR(Æ)(Ñ) | 3,694 | 155 | ||||||
| Grendene SA | 499,846 | 3,072 | Agile Group Holdings, Ltd.(Æ) | 1,786,000 | 992 | ||||||
| Hypermarcas SA | 483,400 | 4,053 | Agricultural Bank of China, Ltd. Class H | 5,144,000 | 2,169 | ||||||
| Itau Unibanco Holding SA - ADR | 2,290,463 | 27,325 | Alibaba Group Holding, Ltd. - ADR(Æ) | 231,359 | 23,527 | ||||||
| JBS SA | 1,961,108 | 5,966 | Anhui Conch Cement Co., Ltd. Class H | 2,344,465 | 6,498 | ||||||
| M Dias Branco SA(Æ) | 17,376 | 742 | Anta Sports Products, Ltd. | 91,000 | 263 | ||||||
| MRV Engenharia e Participacoes SA | 519,474 | 2,012 | Autohome, Inc. - ADR(Æ)(Ñ) | 45,764 | 1,073 | ||||||
| Natura Cosmeticos SA(Æ) | 359,846 | 3,456 | BAIC Motor Corp., Ltd. Class H(Þ) | 767,500 | 804 | ||||||
| Petroleo Brasileiro SA - ADR(Æ)(Ñ) | 828,200 | 9,665 | Bank of China, Ltd. Class H | 26,094,000 | 11,676 | ||||||
| Porto Seguro SA | 307,815 | 2,919 | Bank of Communications Co., Ltd. Class | ||||||||
| Sao Martinho SA | 72,516 | 1,444 | H | 5,770,000 | 4,396 | ||||||
| Telefonica Brasil SA - ADR | 619,747 | 8,924 | BBMG Corp. Class H | 295,000 | 108 | ||||||
| TIM Participacoes SA | 766,000 | 2,126 | Beijing Capital International Airport Co., | ||||||||
| TIM Participacoes SA - ADR | 454,100 | 6,289 | Ltd. Class H | 196,000 | 205 | ||||||
See accompanying notes which are an integral part of the financial statements.
232 Russell Emerging Markets Fund
Russell Investment Company
Russell Emerging Markets Fund
Schedule of Investments, continued — October 31, 2016
| Amounts in thousands (except share amounts) | Amounts in thousands (except share amounts) | |||||||||
| Principal | Fair | Principal | Fair | |||||||
| Amount ($) | Value | Amount ($) | Value | |||||||
| or Shares | $ | or Shares | $ | |||||||
| Beijing Jingneng Clean Energy Co., Ltd. | Huadian Power International Corp., Ltd. | |||||||||
| Class H | 634,000 | 193 | Class H | 1,406,000 | 603 | |||||
| BYD Electronic International Co., Ltd. | 1,926,500 | 1,517 | Huaneng Power International, Inc. Class | |||||||
| China Cinda Asset Management Co., | H | 696,000 | 428 | |||||||
| Ltd. Class H | 3,615,000 | 1,300 | Huaneng Renewables Corp., Ltd. Class | |||||||
| China CITIC Bank Corp., Ltd. Class H | 9,849,000 | 6,362 | H | 6,878,000 | 2,310 | |||||
| China Communications Construction Co., | Industrial & Commercial Bank of China, | |||||||||
| Ltd. Class H | 1,193,000 | 1,313 | Ltd. Class H | 40,225,553 | 24,157 | |||||
| China Communications Services Corp., | JA Solar Holdings Co., Ltd. - ADR(Æ) | |||||||||
| Ltd. Class H | 536,000 | 319 | (Ñ) | 131,700 | 767 | |||||
| China Construction Bank Corp. Class H | 24,727,409 | 18,060 | JD.com, Inc. - ADR(Æ)(Ñ) | 164,100 | 4,258 | |||||
| China Forestry Holdings Co., Ltd.(Å)(Æ) | 871,100 | — | Jiangsu Expressway Co., Ltd. Class H | 1,278,000 | 1,740 | |||||
| China Galaxy Securities Co., Ltd. Class | JinkoSolar Holding Co., Ltd. - ADR(Æ) | |||||||||
| H | 3,480,000 | 3,308 | (Ñ) | 97,700 | 1,506 | |||||
| China Huishan Dairy Holdings Co., Ltd. | Kaisa Group Holdings, Ltd.(Å)(Æ)(Ñ) | 3,280,000 | 596 | |||||||
| (Ñ) | 821,000 | 305 | Kingsoft Corp., Ltd. | 74,000 | 166 | |||||
| China Life Insurance Co., Ltd. Class H | 1,822,006 | 4,524 | KWG Property Holding, Ltd.(Æ) | 1,267,000 | 734 | |||||
| China Longyuan Power Group Corp., | Lenovo Group, Ltd. | 3,679,732 | 2,358 | |||||||
| Ltd. Class H | 4,602,849 | 3,519 | Logan Property Holdings Co., Ltd. | 880,000 | 355 | |||||
| China Machinery Engineering Corp. | Longfor Properties Co., Ltd. | 221,500 | 294 | |||||||
| Class H | 702,000 | 419 | Luye Pharma Group, Ltd. | 334,500 | 225 | |||||
| China Mengniu Dairy Co., Ltd. | 2,065,000 | 3,906 | NetEase, Inc. - ADR | 29,604 | 7,608 | |||||
| China Merchants Bank Co., Ltd. Class H | 1,516,830 | 3,700 | New China Life Insurance Co., Ltd. | |||||||
| China Merchants Shekou Industrial Zone | Class H | 880,300 | 3,807 | |||||||
| Holdings Co., Ltd. Class A(Å) | 345,419 | 863 | New Oriental Education & Technology | |||||||
| China Minsheng Banking Corp., Ltd. | Group - ADR(Æ) | 105,573 | 5,292 | |||||||
| Class H | 857,500 | 977 | People's Insurance Co. Group of China, | |||||||
| China National Building Material Co., | Ltd. (The) Class H | 1,702,000 | 678 | |||||||
| Ltd. Class H | 3,280,000 | 1,500 | PetroChina Co., Ltd. Class H | 6,146,959 | 4,170 | |||||
| China Oilfield Services, Ltd. Class H | 2,001,716 | 1,920 | PetroChina Co., Ltd. - ADR | 31,700 | 2,147 | |||||
| China Pacific Insurance Group Co., Ltd. | PICC Property & Casualty Co., Ltd. | |||||||||
| Class H | 1,784,913 | 6,455 | Class H | 3,370,000 | 5,443 | |||||
| China Petroleum & Chemical Corp. | Ping An Insurance Group Co. of China, | |||||||||
| Class H | 10,654,550 | 7,708 | Ltd. Class H | 395,500 | 2,088 | |||||
| China Railway Construction Corp., Ltd. | Real Gold Mining, Ltd.(Å)(Æ) | 463,232 | — | |||||||
| Class H | 1,071,500 | 1,340 | Shandong Weigao Group Medical | |||||||
| China Shenhua Energy Co., Ltd. Class H | 2,014,826 | 4,192 | Polymer Co., Ltd. Class H | 972,000 | 634 | |||||
| China Telecom Corp., Ltd. Class H | 11,992,000 | 6,183 | Shanghai Fosun Pharmaceutical Group | |||||||
| China Vanke Co., Ltd. Class H | 592,400 | 1,553 | Co., Ltd. Class H | 105,500 | 324 | |||||
| Chongqing Changan Automobile Co., | Shanghai Pharmaceuticals Holding Co., | |||||||||
| Ltd. Class B | 327,200 | 500 | Ltd. Class H | 2,133,700 | 5,493 | |||||
| Chongqing Rural Commercial Bank Co., | Shenzhen Expressway Co., Ltd. Class H | 1,286,000 | 1,290 | |||||||
| Ltd. Class H | 4,826,000 | 2,893 | Shui On Land, Ltd. | 2,664,500 | 659 | |||||
| CIFI Holdings Group Co., Ltd. | 17,270,000 | 5,089 | SINA Corp.(Æ) | 203,500 | 14,680 | |||||
| CNOOC, Ltd. | 3,552,000 | 4,472 | Sinopec Shanghai Petrochemical Co., | |||||||
| CNOOC, Ltd. - ADR(Ñ) | 67,623 | 8,485 | Ltd. Class H | 3,054,000 | 1,556 | |||||
| Country Garden Holdings Co., Ltd. | 823,000 | 428 | Sohu.com, Inc.(Æ) | 218,600 | 8,182 | |||||
| CRRC Corp., Ltd. | 604,000 | 548 | Tencent Holdings, Ltd. | 2,121,730 | 56,183 | |||||
| Ctrip.com International, Ltd. - ADR(Æ) | 182,110 | 8,040 | Tianhe Chemicals Group, Ltd.(Å)(Æ) | 25,778,000 | 2,327 | |||||
| Datang International Power Generation | Tianneng Power International, Ltd. | 1,370,000 | 1,235 | |||||||
| Co., Ltd. Class H | 756,000 | 203 | Tingyi Cayman Islands Holding Corp. | 1,672,800 | 1,802 | |||||
| Dongfeng Motor Group Co., Ltd. Class H | 2,420,000 | 2,513 | Tsingtao Brewery Co., Ltd. Class H | 606,000 | 2,419 | |||||
| ENN Energy Holdings, Ltd. | 634,100 | 2,981 | Uni-President China Holdings, Ltd. | 4,810,200 | 3,252 | |||||
| Fantasia Holdings Group Co., Ltd.(Æ) | 1,320,000 | 172 | Vipshop Holdings, Ltd. - ADR(Æ) | 64,200 | 878 | |||||
| Future Land Development Holdings, Ltd. | 1,788,000 | 324 | Weibo Corp. - ADR(Æ)(Ñ) | 20,350 | 936 | |||||
| Geely Automobile Holdings, Ltd. | 3,495,000 | 3,596 | Weichai Power Co., Ltd. Class H | 110,000 | 166 | |||||
| Great Wall Motor Co., Ltd. Class H(Æ) | 1,078,500 | 1,049 | Weiqiao Textile Co. Class H | 291,000 | 196 | |||||
| Guangzhou Automobile Group Co., Ltd. | Yuzhou Properties Co., Ltd. | 1,468,000 | 545 | |||||||
| Class H | 3,894,000 | 4,701 | ZTE Corp. Class H | 528,000 | 726 | |||||
| Guangzhou R&F Properties Co., Ltd. | 2,766,800 | 3,904 | 364,080 | |||||||
| Hua Hong Semiconductor, Ltd.(Þ) | 1,946,000 | 2,301 | ||||||||
See accompanying notes which are an integral part of the financial statements.
Russell Emerging Markets Fund 233
Russell Investment Company
Russell Emerging Markets Fund
Schedule of Investments, continued — October 31, 2016
| Amounts in thousands (except share amounts) | Amounts in thousands (except share amounts) | |||||||||
| Principal | Fair | Principal | Fair | |||||||
| Amount ($) | Value | Amount ($) | Value | |||||||
| or Shares | $ | or Shares | $ | |||||||
| Colombia - 0.2% | Guangdong Investment, Ltd. | 238,000 | 359 | |||||||
| Almacenes Exito SA | 406,596 | 2,028 | Haier Electronics Group Co., Ltd. | 1,709,894 | 2,758 | |||||
| Bancolombia SA - ADR(Ñ) | 71,400 | 2,733 | Hanergy Thin Film Power Group, Ltd. | |||||||
| Corp. Financiera Colombiana SA | 17,284 | 214 | (Æ) | 1,630,000 | 822 | |||||
| Empresa de Energia de Bogota SA ESP | 345,858 | 219 | Hong Kong Exchanges & Clearing, Ltd. | 73,614 | 1,946 | |||||
| 5,194 | Kingboard Chemical Holdings, Ltd. | 631,500 | 1,864 | |||||||
| Kingboard Laminates Holdings, Ltd. | 1,142,000 | 1,025 | ||||||||
| Cyprus - 0.1% | Nine Dragons Paper Holdings, Ltd. | 6,042,000 | 4,914 | |||||||
| Ros Agro PLC - GDR | 108,514 | 1,416 | Shanghai Industrial Holdings, Ltd. | 168,000 | 514 | |||||
| Shenzhen International Holdings, Ltd. | 581,000 | 899 | ||||||||
| Czech Republic - 0.1% | Shenzhen Investment, Ltd. | 2,904,000 | 1,268 | |||||||
| Komercni Banka AS | 87,135 | 3,191 | Shimao Property Holdings, Ltd. | 1,829,500 | 2,443 | |||||
| Sino Biopharmaceutical, Ltd. | 2,793,885 | 1,954 | ||||||||
| Egypt - 0.5% | Sino-Ocean Group Holding, Ltd. | 834,000 | 346 | |||||||
| Commercial International Bank Egypt | Skyworth Digital Holdings, Ltd. | 6,737,344 | 4,358 | |||||||
| SAE | 940,806 | 5,476 | SmarTone Telecommunications Holdings, | |||||||
| Commercial International Bank Egypt | Ltd. | 1,348,322 | 2,037 | |||||||
| SAE - GDR | 228,000 | 1,007 | VTech Holdings, Ltd. | 157,358 | 1,930 | |||||
| Eastern Tobacco | 109,490 | 2,585 | WH Group, Ltd.(Þ) | 8,336,000 | 6,760 | |||||
| Edita Food Industries SAE - GDR | 219,639 | 1,540 | Yue Yuen Industrial Holdings, Ltd. | 778,500 | 2,966 | |||||
| 10,608 | Yuexiu Property Co., Ltd. | 6,526,000 | 958 | |||||||
| 119,695 | ||||||||||
| Greece - 0.2% | ||||||||||
| Alpha Bank AE(Æ) | 1,942,045 | 3,331 | Hungary - 0.5% | |||||||
| Sarantis SA | 140,487 | 1,548 | MOL Hungarian Oil & Gas PLC | 11,396 | 733 | |||||
| 4,879 | OTP Bank PLC | 150,190 | 4,208 | |||||||
| Richter Gedeon Nyrt | 336,488 | 7,228 | ||||||||
| Guernsey - 0.2% | 12,169 | |||||||||
| VinaCapital Vietnam Opportunity Fund, | ||||||||||
| Ltd. | 1,487,555 | 4,548 | India - 9.0% | |||||||
| Aditya Birla Nuvo, Ltd. | 48,833 | 1,015 | ||||||||
| Hong Kong - 5.3% | Ambuja Cements, Ltd. | 1,215,455 | 4,381 | |||||||
| AIA Group, Ltd. | 1,102,800 | 6,959 | Andhra Bank | 239,673 | 203 | |||||
| ASM Pacific Technology, Ltd. | 571,723 | 5,511 | Ashok Leyland, Ltd. | 597,267 | 812 | |||||
| Beijing Enterprises Holdings, Ltd. | 226,000 | 1,129 | Asian Paints, Ltd. | 97,009 | 1,563 | |||||
| Brilliance China Automotive Holdings, | Aurobindo Pharma, Ltd. | 330,811 | 4,059 | |||||||
| Ltd. | 3,879,377 | 4,600 | Axis Bank, Ltd. | 1,213,255 | 8,864 | |||||
| China Agri-Industries Holdings, Ltd.(Æ) | 2,293,000 | 896 | Bajaj Auto, Ltd. | 20,832 | 885 | |||||
| China Everbright International, Ltd. | 3,048,340 | 3,648 | Bajaj Finance, Ltd. | 71,940 | 1,164 | |||||
| China Everbright, Ltd. | 542,000 | 1,060 | Bharat Electronics, Ltd. Class A | 52,429 | 1,044 | |||||
| China High Speed Transmission | Bharat Petroleum Corp., Ltd. | 115,881 | 1,162 | |||||||
| Equipment Group Co., Ltd. | 1,757,000 | 1,824 | Bharti Airtel, Ltd. | 1,399,255 | 6,679 | |||||
| China Lumena New Materials Corp.(Æ) | 3,024,000 | 4 | Bharti Infratel, Ltd. | 576,765 | 2,992 | |||||
| China Merchants Port Holdings Co., Ltd. | 1,086,860 | 2,813 | Bosch, Ltd. | 3,023 | 990 | |||||
| China Metal Recycling Holdings, Ltd. | Britannia Industries, Ltd. | 19,056 | 949 | |||||||
| (Å)(Æ) | 335,400 | — | Cadila Healthcare, Ltd. | 90,485 | 566 | |||||
| China Mobile, Ltd. | 939,251 | 10,759 | Castrol India, Ltd. | 89,107 | 608 | |||||
| China Mobile, Ltd. - ADR(Ñ) | 299,165 | 17,181 | Chennai Petroleum Corp., Ltd. | 238,243 | 1,014 | |||||
| China Overseas Land & Investment, Ltd. | 2,633,776 | 8,114 | Cipla, Ltd. | 91,678 | 795 | |||||
| China Power International Development, | Coal India, Ltd. | 313,682 | 1,527 | |||||||
| Ltd. | 752,000 | 274 | Cummins India, Ltd. | 59,921 | 768 | |||||
| China Resources Beer Holdings Co., | Dabur India, Ltd. Class A | 775,316 | 3,391 | |||||||
| Ltd.(Æ) | 418,000 | 888 | Divi's Laboratories, Ltd. | 39,665 | 766 | |||||
| China Resources Gas Group, Ltd. | 1,035,333 | 3,248 | DLF, Ltd. | 424,459 | 956 | |||||
| China Unicom Hong Kong, Ltd. | 4,034,000 | 4,722 | Dr Reddy's Laboratories, Ltd. | 28,891 | 1,438 | |||||
| CITIC, Ltd. | 568,000 | 815 | Eicher Motors, Ltd. | 3,175 | 1,135 | |||||
| CSPC Pharmaceutical Group, Ltd. | 410,000 | 424 | Exide Industries, Ltd. | 343,481 | 1,015 | |||||
| CT Environmental Group, Ltd.(Æ) | 9,456,617 | 2,658 | Federal Bank, Ltd. | 1,989,883 | 2,453 | |||||
| Far East Horizon, Ltd. | 410,000 | 374 | GlaxoSmithKline Consumer Healthcare, | |||||||
| Fosun International, Ltd. | 163,500 | 237 | Ltd. | 3,173 | 288 | |||||
| GCL-Poly Energy Holdings, Ltd. | 10,631,971 | 1,436 | Glenmark Pharmaceuticals, Ltd. | 61,836 | 866 | |||||
See accompanying notes which are an integral part of the financial statements.
234 Russell Emerging Markets Fund
Russell Investment Company
Russell Emerging Markets Fund
Schedule of Investments, continued — October 31, 2016
| Amounts in thousands (except share amounts) | Amounts in thousands (except share amounts) | ||||||||||
| Principal | Fair | Principal | Fair | ||||||||
| Amount ($) | Value | Amount ($) | Value | ||||||||
| or Shares | $ | or Shares | $ | ||||||||
| Godrej Consumer Products, Ltd. | 34,090 | 819 | Vedanta, Ltd. | 1,830,118 | 5,554 | ||||||
| Havells India, Ltd. | 170,580 | 1,037 | Videocon d2h, Ltd. - ADR(Æ) | 143,672 | 1,346 | ||||||
| HCL Technologies, Ltd. | 115,452 | 1,325 | Wipro, Ltd. | 151,090 | 1,051 | ||||||
| Hero MotoCorp, Ltd. | 39,579 | 1,987 | Yes Bank, Ltd. | 50,068 | 944 | ||||||
| Hindalco Industries, Ltd. | 508,359 | 1,140 | Zee Entertainment Enterprises, Ltd. | 236,820 | 1,840 | ||||||
| Hindustan Petroleum Corp., Ltd. | 385,909 | 2,701 | 204,130 | ||||||||
| Hindustan Unilever, Ltd. | 96,665 | 1,215 | |||||||||
| Hindustan Zinc, Ltd. | 62,303 | 236 | Indonesia - 1.5% | ||||||||
| Housing Development Finance Corp., | Adaro Energy Tbk PT | 1,141,900 | 138 | ||||||||
| Ltd. | 322,360 | 6,663 | Astra International Tbk PT | 9,160,300 | 5,761 | ||||||
| ICICI Bank, Ltd. - ADR | 1,734,477 | 14,379 | Bank Central Asia Tbk PT | 486,500 | 578 | ||||||
| ICICI Bank, Ltd. | 241,723 | 1,003 | Bank Mandiri Persero Tbk PT | 602,300 | 529 | ||||||
| ICICI Prudential Life Insurance Co., Ltd. | Bank Negara Indonesia Persero Tbk PT | 1,217,000 | 519 | ||||||||
| (Æ)(Þ) | 419,012 | 1,963 | Bank Rakyat Indonesia Persero Tbk PT | 12,818,556 | 11,960 | ||||||
| Indiabulls Housing Finance Ltd | 98,455 | 1,250 | Gajah Tunggal Tbk PT(Æ) | 357,300 | 34 | ||||||
| Indian Oil Corp., Ltd. | 851,976 | 4,129 | Gudang Garam Tbk PT | 562,500 | 2,923 | ||||||
| Infosys, Ltd. | 178,177 | 2,674 | Media Nusantara Citra Tbk PT | 21,259,401 | 3,418 | ||||||
| ITC, Ltd. | 658,417 | 2,385 | Perusahaan Gas Negara Persero Tbk | 13,079,866 | 2,561 | ||||||
| JSW Steel, Ltd. - ADR | 49,756 | 1,236 | Steel Pipe Industry of Indonesia PT | 59,368,200 | 1,083 | ||||||
| LIC Housing Finance, Ltd. | 119,331 | 1,052 | Tambang Batubara Bukit Asam Persero | ||||||||
| Lupin, Ltd. | 61,162 | 1,393 | Tbk PT | 1,702,000 | 1,549 | ||||||
| Mahindra & Mahindra Financial | Telekomunikasi Indonesia Persero Tbk | ||||||||||
| Services, Ltd. | 197,643 | 1,073 | PT | 3,700,300 | 1,195 | ||||||
| Mahindra & Mahindra, Ltd. | 60,460 | 1,192 | Unilever Indonesia Tbk PT | 75,100 | 256 | ||||||
| Manappuram Finance, Ltd. | 1,212,117 | 1,865 | United Tractors Tbk PT | 267,757 | 442 | ||||||
| Marico, Ltd. | 83,000 | 346 | 32,946 | ||||||||
| Maruti Suzuki India, Ltd. | 49,040 | 4,331 | |||||||||
| Muthoot Finance, Ltd. | 181,248 | 980 | Jersey - 0.1% | ||||||||
| Nestle India, Ltd. | 2,638 | 275 | Randgold Resources, Ltd. | 28,104 | 2,495 | ||||||
| NHPC, Ltd. | 87,248 | 35 | |||||||||
| NTPC, Ltd. | 802,407 | 1,815 | Kazakhstan - 0.0% | ||||||||
| Oil & Natural Gas Corp., Ltd. | 214,089 | 925 | KazMunaiGas Exploration Production | ||||||||
| Oil India, Ltd. | 82,753 | 516 | JSC - GDR(Æ) | 113,257 | 855 | ||||||
| Oracle Financial Services Software, Ltd. | 12,376 | 594 | |||||||||
| Page Industries, Ltd. | 1,182 | 291 | Kenya - 0.1% | ||||||||
| Pidilite Industries, Ltd. | 100,410 | 1,085 | East African Breweries, Ltd. | 437,949 | 1,187 | ||||||
| Piramal Enterprises, Ltd. Class A | 139,127 | 3,777 | Safaricom, Ltd. | 6,722,614 | 1,314 | ||||||
| Power Finance Corp., Ltd. | 1,922,103 | 3,584 | 2,501 | ||||||||
| Prism Cement, Ltd.(Æ) | 12,128 | 19 | |||||||||
| Punjab National Bank(Æ) | 1,097,051 | 2,380 | Kuwait - 0.2% | ||||||||
| Reliance Communications, Ltd.(Æ) | 1,436,140 | 1,003 | National Bank of Kuwait SAKP | 1,479,187 | 2,879 | ||||||
| Reliance Industries, Ltd. | 1,152,804 | 18,149 | VIVA Kuwait Telecom Co.(Æ) | 662,906 | 1,880 | ||||||
| Reliance Industries, Ltd. - GDR(Þ) | 375,599 | 11,906 | 4,759 | ||||||||
| Rural Electrification Corp., Ltd. | 1,272,080 | 2,570 | |||||||||
| Shriram City Union Finance, Ltd. | 31,104 | 1,203 | Luxembourg - 0.1% | ||||||||
| Shriram Transport Finance Co., Ltd. | 61,417 | 999 | Tenaris SA - ADR(Ñ) | 115,300 | 3,252 | ||||||
| State Bank of India | 388,064 | 1,498 | |||||||||
| Sun Pharmaceutical Industries, Ltd. | 125,200 | 1,396 | Macao - 0.5% | ||||||||
| Sun TV Network, Ltd. | 351,959 | 2,896 | Sands China, Ltd. | 2,825,722 | 12,263 | ||||||
| Tata Chemicals, Ltd. | 256,764 | 2,074 | |||||||||
| Tata Consultancy Services, Ltd. | 46,225 | 1,654 | Malaysia - 0.6% | ||||||||
| Tata Motors, Ltd. Class A | 866,723 | 4,502 | AirAsia BHD | 3,618,900 | 2,389 | ||||||
| Tata Motors, Ltd. | 609,925 | 4,880 | AirAsia X BHD(Æ) | 3,998,800 | 402 | ||||||
| Tata Motors, Ltd. - ADR | 38,900 | 1,533 | AMMB Holdings BHD Class 2 | 134,000 | 134 | ||||||
| Tata Power Co., Ltd. | 756,724 | 885 | British American Tobacco Malaysia BHD | 204,253 | 2,412 | ||||||
| Tata Steel, Ltd. | 194,255 | 1,179 | CIMB Group Holdings BHD | 125,300 | 150 | ||||||
| Tech Mahindra, Ltd. | 306,932 | 2,021 | IHH Healthcare BHD | 209,400 | 319 | ||||||
| Titan Co., Ltd. | 44,535 | 255 | IJM Corp. BHD | 2,882,633 | 2,267 | ||||||
| Torrent Pharmaceuticals, Ltd. | 19,068 | 405 | Kuala Lumpur Kepong BHD | 57,800 | 330 | ||||||
| UltraTech Cement, Ltd. | 55,850 | 3,324 | Malayan Banking BHD | 234,000 | 440 | ||||||
| United Phosphorus, Ltd. | 100,552 | 1,045 | MISC Berhad | 52,900 | 95 | ||||||
See accompanying notes which are an integral part of the financial statements.
Russell Emerging Markets Fund 235
Russell Investment Company
Russell Emerging Markets Fund
Schedule of Investments, continued — October 31, 2016
| Amounts in thousands (except share amounts) | Amounts in thousands (except share amounts) | ||||||||
| Principal | Fair | Principal | Fair | ||||||
| Amount ($) | Value | Amount ($) | Value | ||||||
| or Shares | $ | or Shares | $ | ||||||
| Petronas Dagangan BHD | 288,308 | 1,605 | Netherlands - 0.4% | ||||||
| Petronas Gas BHD | 54,700 | 288 | Nostrum Oil & Gas PLC(Æ) | 259,598 | 1,113 | ||||
| Public Bank BHD | 73,000 | 346 | Steinhoff International Holdings NV | 162,112 | 875 | ||||
| Steppe Cement, Ltd.(Æ) | 1,139,180 | 258 | X5 Retail Group NV - GDR(Æ) | 265,685 | 7,928 | ||||
| Tenaga Nasional BHD | 557,200 | 1,904 | 9,916 | ||||||
| UEM Sunrise BHD | 3,169,300 | 845 | |||||||
| Westports Holdings BHD | 303,200 | 318 | Nigeria - 0.5% | ||||||
| 14,502 | Dangote Cement PLC | 5,197,285 | 2,885 | ||||||
| Guaranty Trust Bank PLC | 40,948,485 | 3,053 | |||||||
| Malta - 0.0% | Guaranty Trust Bank PLC - GDR | 101,104 | 402 | ||||||
| Brait SE(Æ) | 78,648 | 523 | Lekoil, Ltd.(Æ) | 9,627,040 | 2,410 | ||||
| Zenith Bank PLC | 53,250,714 | 2,483 | |||||||
| Mexico - 3.4% | 11,233 | ||||||||
| Alfa SAB de CV Class A | 191,013 | 290 | |||||||
| Alpek SAB de CV Class A | 390,188 | 581 | Pakistan - 0.9% | ||||||
| America Movil SAB de CV Class L | Allied Bank, Ltd. | 938,500 | 892 | ||||||
| - ADR | 464,202 | 6,100 | Engro Corp., Ltd. | 1,059,200 | 2,822 | ||||
| Arca Continental SAB de CV | 38,500 | 240 | Engro Foods, Ltd.(Æ) | 1,496,900 | 2,075 | ||||
| Cemex SAB de CV - ADR(Æ) | 1,237,383 | 10,741 | Hascol Petroleum, Ltd. | 1,565,500 | 3,742 | ||||
| Coca-Cola Femsa SAB de CV | 91,885 | 690 | Lucky Cement, Ltd. | 712,256 | 4,564 | ||||
| Fomento Economico Mexicano SAB de | Pak Elektron, Ltd. | 1,314,534 | 831 | ||||||
| CV | 79,900 | 766 | Searle Co., Ltd. (The) | 301,302 | 1,416 | ||||
| Fomento Economico Mexicano SAB de | United Bank, Ltd. | 1,978,812 | 3,803 | ||||||
| CV - ADR | 59,400 | 5,683 | 20,145 | ||||||
| Genomma Lab Internacional SAB de CV | |||||||||
| Class B(Æ) | 2,523,750 | 3,019 | Peru - 0.4% | ||||||
| Gentera SAB de CV | 1,078,396 | 2,128 | Credicorp, Ltd. | 51,205 | 7,613 | ||||
| Gruma SAB de CV Class B(Æ) | 182,090 | 2,527 | InRetail Peru Corp.(Æ)(Þ) | 59,253 | 1,067 | ||||
| Grupo Aeroportuario del Centro Norte | 8,680 | ||||||||
| SAB de CV Class B | 335,360 | 1,951 | |||||||
| Grupo Aeroportuario del Pacifico SAB de | Philippines - 0.4% | ||||||||
| CV Class B | 13,265 | 128 | Ayala Land, Inc. | 2,767,316 | 2,072 | ||||
| Grupo Aeroportuario del Sureste SAB de | Manila Electric Co. | 29,180 | 167 | ||||||
| CV Class B | 27,070 | 431 | Metro Pacific Investments Corp. | 26,487,911 | 3,939 | ||||
| Grupo Aeroportuario del Sureste SAB de | Semirara Mining & Power Corp. | 38,510 | 100 | ||||||
| CV - ADR | 22,600 | 3,593 | SM Prime Holdings, Inc. | 434,300 | 241 | ||||
| Grupo Bimbo SAB de CV | 172,600 | 465 | Universal Robina Corp. | 565,648 | 2,130 | ||||
| Grupo Fin Santander ADR B - ADR | 334,100 | 3,024 | 8,649 | ||||||
| Grupo Financiero Banorte SAB de CV | |||||||||
| Class O | 1,948,064 | 11,472 | Poland - 0.3% | ||||||
| Grupo Financiero Inbursa SAB de CV | Bank Pekao SA | 113,654 | 3,506 | ||||||
| Class O | 102,300 | 166 | mBank SA(Æ) | 1,769 | 160 | ||||
| Grupo Lala SAB de CV Class B | 142,400 | 265 | Polski Koncern Naftowy Orlen SA | 66,083 | 1,310 | ||||
| Grupo Mexico SAB de CV | 421,068 | 1,037 | Powszechna Kasa Oszczednosci Bank | ||||||
| Grupo Sanborns SAB de CV | 142,600 | 178 | Polski SA | 50,898 | 356 | ||||
| Grupo Televisa SAB - ADR | 399,200 | 9,792 | Tauron Polska Energia SA(Æ) | 960,935 | 649 | ||||
| Industrias Bachoco SAB de CV | 374,450 | 1,658 | 5,981 | ||||||
| Kimberly-Clark de Mexico SAB de CV | |||||||||
| Class A | 1,598,119 | 3,446 | Qatar - 0.2% | ||||||
| Megacable Holdings SAB de CV | 654,721 | 2,380 | Al Meera Consumer Goods Co. QSC | 46,000 | 2,357 | ||||
| Mexichem SAB de CV | 733,399 | 1,754 | Industries Qatar QSC | 84,653 | 2,369 | ||||
| Nemak SAB de CV(Þ) | 152,600 | 158 | 4,726 | ||||||
| OHL Mexico SAB de CV(Æ) | 697,332 | 821 | |||||||
| Promotora y Operadora de | Romania - 0.2% | ||||||||
| Infraestructura SAB de CV | 31,287 | 350 | Banca Transilvania SA | 2,682,787 | 1,513 | ||||
| Wal-Mart de Mexico SAB de CV | 1,295,373 | 2,741 | Fondul Proprietatea SA/Fund | 13,471,388 | 2,645 | ||||
| 78,575 | 4,158 | ||||||||
| Morocco - 0.1% | Russia - 4.5% | ||||||||
| Residences Dar Saada | 112,171 | 1,886 | Alrosa PJSC | 348,700 | 487 | ||||
| Federal Grid PJSC | 760,670,000 | 2,049 | |||||||
See accompanying notes which are an integral part of the financial statements.
236 Russell Emerging Markets Fund
Russell Investment Company
Russell Emerging Markets Fund
Schedule of Investments, continued — October 31, 2016
| Amounts in thousands (except share amounts) | Amounts in thousands (except share amounts) | |||||||||
| Principal | Fair | Principal | Fair | |||||||
| Amount ($) | Value | Amount ($) | Value | |||||||
| or Shares | $ | or Shares | $ | |||||||
| Gazprom PJSC | 961,760 | 2,104 | Reunert, Ltd. | 542,777 | 2,481 | |||||
| Gazprom PJSC - ADR | 2,363,041 | 10,203 | Sappi, Ltd. - ADR(Æ) | 162,895 | 906 | |||||
| Inter RAO UES PJSC | 24,626,000 | 1,320 | Sasol, Ltd. - ADR | 235,843 | 6,514 | |||||
| Lukoil PJSC - ADR(Ñ) | 405,762 | 19,724 | Shoprite Holdings, Ltd. - ADR | 25,941 | 383 | |||||
| Lukoil PJSC - ADR | 134,333 | 6,537 | Standard Bank Group, Ltd. | 696,439 | 7,389 | |||||
| Lukoil PJSC | 39,153 | 1,912 | Truworths International, Ltd. | 5,529 | 29 | |||||
| Magnit PJSC | 3,285 | 550 | Vodacom Group, Ltd. - ADR | 205,995 | 2,222 | |||||
| Magnitogorsk Iron & Steel OJSC | 232,800 | 114 | Woolworths Holdings, Ltd. | 411,297 | 2,382 | |||||
| MegaFon PJSC - GDR | 74,103 | 706 | 72,681 | |||||||
| MMC Norilsk Nickel PJSC - ADR | 300,719 | 4,533 | ||||||||
| MMC Norilsk Nickel PJSC | 902 | 133 | South Korea - 13.1% | |||||||
| Mobile TeleSystems PJSC - ADR | 157,600 | 1,215 | Amorepacific Corp. | 5,873 | 1,842 | |||||
| Novatek OJSC | 120,371 | 1,253 | BNK Financial Group, Inc. | 333,949 | 2,709 | |||||
| Novolipetsk Steel PJSC - GDR | 402,930 | 6,522 | Coway Co., Ltd. | 33,672 | 2,635 | |||||
| PhosAgro PJSC - GDR | 276,487 | 3,430 | Daou Technology, Inc. | 22,135 | 400 | |||||
| Rosneft PJSC - GDR | 509,444 | 2,777 | Dongbu HiTek Co., Ltd.(Æ) | 75,097 | 1,115 | |||||
| Rosneft PJSC | 152,090 | 833 | Dongbu Insurance Co., Ltd. | 80,150 | 4,979 | |||||
| Sberbank of Russia PJSC | 1,670,700 | 3,891 | E-MART, Inc. | 3,276 | 465 | |||||
| Sberbank of Russia PJSC - ADR | 1,539,822 | 14,588 | GS Engineering & Construction Corp. | |||||||
| Sberbank of Russia PJSC Class T | 774,500 | 1,797 | (Æ)(Ñ) | 55,050 | 1,285 | |||||
| Severstal PJSC - GDR | 185,830 | 2,619 | GS Holdings Corp. | 10,525 | 469 | |||||
| Surgutneftegas OJSC | 1,031,100 | 439 | Hana Financial Group, Inc. | 350,352 | 10,020 | |||||
| Surgutneftegas OJSC - ADR | 131,666 | 565 | Hankook Tire Co., Ltd. | 293,281 | 14,145 | |||||
| Tatneft PJSC | 168,080 | 939 | Hanon Systems | 313,770 | 2,927 | |||||
| Tatneft PJSC - ADR(Ñ) | 161,077 | 5,391 | Hanwha Corp. | 6,195 | 202 | |||||
| Uralkali PJSC(Æ) | 132,990 | 348 | Hanwha Life Insurance Co., Ltd. | 90,273 | 493 | |||||
| X5 Retail Group NV - GDR(Æ) | 87,321 | 2,603 | Hyosung Corp. | 11,419 | 1,333 | |||||
| Yandex NV Class A(Æ) | 125,500 | 2,471 | Hyundai Department Store Co., Ltd. | 2,062 | 212 | |||||
| 102,053 | Hyundai Engineering & Construction | |||||||||
| Co., Ltd. | 70,541 | 2,546 | ||||||||
| Singapore - 0.1% | Hyundai Marine & Fire Insurance Co., | |||||||||
| BOC Aviation, Ltd.(Þ) | 311,703 | 1,703 | Ltd. | 73,050 | 2,252 | |||||
| Golden Agri-Resources, Ltd. | 2,987,000 | 826 | Hyundai Mobis Co., Ltd. | 21,191 | 5,069 | |||||
| 2,529 | Hyundai Motor Co. | 18,756 | 2,290 | |||||||
| Industrial Bank of Korea | 30,962 | 357 | ||||||||
| South Africa - 3.2% | JB Financial Group Co., Ltd. | 77,550 | 403 | |||||||
| African Bank Investments, Ltd.(Å)(Æ) | 887,049 | — | Kakao Corp. | 2,555 | 170 | |||||
| AngloGold Ashanti, Ltd. - ADR(Æ) | 511,330 | 7,026 | Kangwon Land, Inc. | 9,538 | 316 | |||||
| Aspen Pharmacare Holdings, Ltd. | 166,458 | 3,626 | KB Financial Group, Inc. | 522,575 | 19,354 | |||||
| AVI, Ltd. | 467,666 | 3,286 | KB Financial Group, Inc. - ADR | 81,600 | 3,018 | |||||
| Barclays Africa Group, Ltd. - ADR | 51,365 | 596 | KB Insurance Co., Ltd. | 48,241 | 1,220 | |||||
| Bid Corp., Ltd. | 125,024 | 2,204 | KCC Corp. | 10,447 | 3,688 | |||||
| Bidvest Group, Ltd. (The) | 469,571 | 5,829 | KEPCO Plant Service & Engineering | |||||||
| Discovery Holdings, Ltd. | 292,652 | 2,501 | Co., Ltd. | 9,096 | 436 | |||||
| Exxaro Resources, Ltd. | 145,038 | 1,067 | Kia Motors Corp. | 135,587 | 4,814 | |||||
| FirstRand, Ltd. | 1,094,902 | 3,924 | Korea Electric Power Corp. - ADR | 155,500 | 3,391 | |||||
| Gold Fields, Ltd. - ADR | 107,200 | 445 | Korea Electric Power Corp. | 117,361 | 5,063 | |||||
| Growthpoint Properties, Ltd.(ö) | 94,100 | 175 | Korea Gas Corp. | 18,748 | 758 | |||||
| Harmony Gold Mining Co., Ltd. | Korea Investment Holdings Co., Ltd. | 5,453 | 196 | |||||||
| - ADR(Ñ) | 440,455 | 1,396 | Korea Kolmar Co., Ltd. | 36,580 | 2,605 | |||||
| Investec, Ltd. | 70,937 | 437 | Korea Petrochemical Industries Co., Ltd. | 6,487 | 1,156 | |||||
| Kumba Iron Ore, Ltd.(Æ) | 93,864 | 953 | KT Corp. - ADR(Ñ) | 190,645 | 3,048 | |||||
| Liberty Holdings, Ltd. | 16,366 | 141 | KT Corp. | 43,385 | 1,224 | |||||
| Massmart Holdings, Ltd. | 109,114 | 946 | KT&G Corp. | 22,139 | 2,182 | |||||
| Mr Price Group, Ltd. | 4,827 | 55 | LG Chem, Ltd. | 24,992 | 5,371 | |||||
| MTN Group, Ltd. | 76,175 | 657 | LG Corp. Class H | 18,783 | 1,004 | |||||
| Naspers, Ltd. Class N | 72,261 | 12,108 | LG Electronics, Inc. Class H | 18,377 | 768 | |||||
| Nedbank Group, Ltd. | 92,252 | 1,509 | LG Household & Health Care, Ltd. | 4,475 | 3,206 | |||||
| Pick n Pay Stores, Ltd.(Ñ) | 157,438 | 770 | LG International Corp. | 50,954 | 1,238 | |||||
| Remgro, Ltd. | 29,697 | 493 | LG Uplus Corp. | 335,639 | 3,458 | |||||
| Resilient Property Income(Æ) | 27,944 | 231 | Lotte Chemical Corp. | 5,983 | 1,505 | |||||
See accompanying notes which are an integral part of the financial statements.
Russell Emerging Markets Fund 237
Russell Investment Company
Russell Emerging Markets Fund
Schedule of Investments, continued — October 31, 2016
| Amounts in thousands (except share amounts) | Amounts in thousands (except share amounts) | |||||||||
| Principal | Fair | Principal | Fair | |||||||
| Amount ($) | Value | Amount ($) | Value | |||||||
| or Shares | $ | or Shares | $ | |||||||
| Lotte Chilsung Beverage Co., Ltd. | 2,199 | 2,959 | Far Eastern New Century Corp. | 1,200,000 | 928 | |||||
| Lotte Confectionery Co., Ltd. | 21,420 | 3,593 | Far EasTone Telecommunications Co., | |||||||
| Lotte Shopping Co., Ltd. | 14,962 | 2,983 | Ltd. | 447,000 | 1,056 | |||||
| NAVER Corp. | 4,668 | 3,496 | Feng TAY Enterprise Co., Ltd. | 286,160 | 1,193 | |||||
| POSCO | 31,212 | 6,493 | First Financial Holding Co., Ltd. | 2,138,070 | 1,121 | |||||
| Samsung Card Co., Ltd. | 36,460 | 1,535 | Formosa Chemicals & Fibre Corp. | 335,000 | 996 | |||||
| Samsung Electronics Co., Ltd. | 62,812 | 89,573 | Formosa Petrochemical Corp. | 483,000 | 1,614 | |||||
| Samsung Electronics Co., Ltd. - GDR(Þ) | 7,812 | 5,511 | Formosa Plastics Corp. | 447,000 | 1,210 | |||||
| Samsung Electronics Co., Ltd. - GDR | 13,098 | 8,691 | Foxconn Technology Co., Ltd. | 129,280 | 375 | |||||
| Samsung Fire & Marine Insurance Co., | Fubon Financial Holding Co., Ltd. | 3,420,000 | 4,844 | |||||||
| Ltd. | 3,572 | 910 | Giant Manufacturing Co., Ltd. | 392,951 | 2,782 | |||||
| Samsung Life Insurance Co., Ltd. | 69,107 | 6,667 | Grand Pacific Petrochemical | 1,349,000 | 753 | |||||
| Shinhan Financial Group Co., Ltd. | 195,211 | 7,512 | Hermes Microvision, Inc. | 4,000 | 177 | |||||
| Shinsegae, Inc. | 12,616 | 2,048 | Highwealth Construction Corp. | 431,000 | 638 | |||||
| SK Holdings Co., Ltd. | 1,400 | 273 | Hiwin Technologies Corp. | 208,865 | 920 | |||||
| SK Hynix, Inc. | 291,282 | 10,380 | Hon Hai Precision Industry Co., Ltd. | 4,062,617 | 10,962 | |||||
| SK Innovation Co., Ltd. | 29,188 | 3,827 | Hotai Motor Co., Ltd. | 15,000 | 175 | |||||
| SK Telecom Co., Ltd. - ADR | 460,700 | 10,066 | Hua Nan Financial Holdings Co., Ltd. | 1,828,764 | 929 | |||||
| S-Oil Corp. | 8,433 | 575 | Innolux Corp. | 5,097,000 | 1,719 | |||||
| Tongyang Life Insurance Co., Ltd. | 46,027 | 482 | Inventec Corp. | 376,000 | 294 | |||||
| Woori Bank(Æ) | 298,802 | 3,259 | King Yuan Electronics Co., Ltd.(Æ) | 1,804,000 | 1,584 | |||||
| 298,170 | Largan Precision Co., Ltd. | 137,273 | 16,187 | |||||||
| Lite-On Technology Corp. | 2,160,996 | 3,100 | ||||||||
| Spain - 0.0% | MediaTek, Inc. | 651,000 | 4,949 | |||||||
| Cemex Latam Holdings SA(Æ) | 244,566 | 909 | Mega Financial Holding Co., Ltd. | 2,304,000 | 1,575 | |||||
| Micro-Star International Co., Ltd. | 394,000 | 1,132 | ||||||||
| Sri Lanka - 0.1% | Nan Ya Plastics Corp. | 213,000 | 443 | |||||||
| Distilleries Co. of Sri Lanka PLC | 1,196,804 | 1,919 | Nanya Technology Corp. | 868,000 | 1,126 | |||||
| Nien Made Enterprise Co., Ltd. | 78,000 | 902 | ||||||||
| Switzerland - 0.2% | Novatek Microelectronics Corp. | 171,000 | 642 | |||||||
| Coca-Cola HBC AG - ADR(Æ) | 148,750 | 3,212 | OBI Pharma, Inc.(Æ) | 127,000 | 1,330 | |||||
| Dufry AG(Æ) | 19,435 | 2,363 | Pegatron Corp. | 517,000 | 1,392 | |||||
| 5,575 | Pou Chen Corp. Class B | 588,000 | 795 | |||||||
| Powertech Technology, Inc. | 835,000 | 2,383 | ||||||||
| Taiwan - 10.2% | President Chain Store Corp. | 192,000 | 1,435 | |||||||
| Advanced Semiconductor Engineering, | Quanta Computer, Inc. | 161,000 | 325 | |||||||
| Inc. | 4,991,459 | 5,857 | Realtek Semiconductor Corp. | 784,000 | 2,656 | |||||
| Advantech Co., Ltd. | 743,638 | 6,043 | Shin Kong Financial Holding Co., Ltd. | |||||||
| Airtac International Group | 154,850 | 1,234 | (Æ) | 4,289,000 | 930 | |||||
| Arcadyan Technology Corp. | 351,000 | 638 | SinoPac Financial Holdings Co., Ltd. | 3,741,150 | 1,079 | |||||
| Asia Cement Corp. | 1,163,000 | 1,014 | Taishin Financial Holding Co., Ltd. | 757,087 | 277 | |||||
| Asustek Computer, Inc. | 129,000 | 1,128 | Taiwan Cement Corp. | 487,000 | 584 | |||||
| AU Optronics Corp. | 6,146,000 | 2,336 | Taiwan Cooperative Financial Holding | |||||||
| Catcher Technology Co., Ltd. | 440,650 | 3,445 | Co., Ltd. | 2,414,990 | 1,059 | |||||
| Cathay Financial Holding Co., Ltd. | 797,000 | 1,034 | Taiwan Mobile Co., Ltd. | 288,000 | 1,007 | |||||
| Chang Hwa Commercial Bank, Ltd. | 2,319,280 | 1,185 | Taiwan Semiconductor Manufacturing | |||||||
| Cheng Shin Rubber Industry Co., Ltd. | 1,240,000 | 2,522 | Co., Ltd. | 6,834,382 | 40,793 | |||||
| China Development Financial Holding | Taiwan Semiconductor Manufacturing | |||||||||
| Corp. | 4,301,000 | 1,077 | Co., Ltd. - ADR | 1,270,109 | 39,500 | |||||
| China Life Insurance Co., Ltd. | 2,126,040 | 1,960 | Tong Yang Industry Co., Ltd. | 618,000 | 1,437 | |||||
| China Steel Corp. Class H | 1,893,000 | 1,368 | Tripod Technology Corp. | 1,818,888 | 4,297 | |||||
| Chin-Poon Industrial Co., Ltd. | 433,000 | 830 | Uni-President Enterprises Corp. | 808,000 | 1,564 | |||||
| Chipbond Technology Corp. | 2,122,000 | 2,930 | United Microelectronics Corp. | 2,153,000 | 804 | |||||
| Chunghwa Telecom Co., Ltd. | 1,398,000 | 4,789 | Win Semiconductors Corp.(Æ) | 815,094 | 2,260 | |||||
| Compal Electronics, Inc. | 582,000 | 346 | Winbond Electronics Corp. | 1,318,000 | 414 | |||||
| CTBC Financial Holding Co., Ltd. | 2,917,080 | 1,571 | Wistron Corp. | 5,390,532 | 4,064 | |||||
| Delta Electronics, Inc. | 1,131,167 | 5,965 | YFC-Boneagle Electric Co., Ltd. | 458,000 | 528 | |||||
| E Ink Holdings, Inc. | 1,878,000 | 1,589 | Yuanta Financial Holding Co., Ltd. | 3,647,000 | 1,362 | |||||
| E.Sun Financial Holding Co., Ltd. | 7,005,900 | 3,979 | 232,547 | |||||||
| Eclat Textile Co., Ltd. | 170,402 | 1,937 | ||||||||
| Elite Material Co., Ltd. | 419,000 | 1,169 | ||||||||
See accompanying notes which are an integral part of the financial statements.
238 Russell Emerging Markets Fund
Russell Investment Company
Russell Emerging Markets Fund
Schedule of Investments, continued — October 31, 2016
| Amounts in thousands (except share amounts) | Amounts in thousands (except share amounts) | ||||||||
| Principal | Fair | Principal | Fair | ||||||
| Amount ($) | Value | Amount ($) | Value | ||||||
| or Shares | $ | or Shares | $ | ||||||
| Thailand - 2.3% | MHP SA - GDR | 492,639 | 4,656 | ||||||
| Airports of Thailand PCL | 30,900 | 336 | 9,869 | ||||||
| Bangkok Bank PCL | 838,900 | 3,807 | |||||||
| Bangkok Dusit Medical Services PCL | United Arab Emirates - 0.6% | ||||||||
| Class F | 728,900 | 474 | Air Arabia PJSC | 2,388,160 | 845 | ||||
| BEC World PCL | 2,524,702 | 1,477 | Aldar Properties PJSC | 7,233,129 | 5,193 | ||||
| Central Pattana PCL | 1,800,017 | 2,876 | DAMAC Properties Dubai Co. PJSC | 1,833,974 | 1,097 | ||||
| Charoen Pokphand Foods PCL | 2,666,200 | 2,395 | DP World, Ltd. | 106,800 | 1,917 | ||||
| CP ALL PCL | 309,100 | 536 | Dubai Investments PJSC | 1,677,987 | 918 | ||||
| Intouch Holdings PCL | 141,400 | 214 | Dubai Islamic Bank PJSC | 1,121,466 | 1,600 | ||||
| Kasikornbank PCL | 1,247,087 | 6,117 | Emaar Properties PJSC | 685,100 | 1,298 | ||||
| Krung Thai Bank PCL | 1,813,300 | 890 | 12,868 | ||||||
| Pruksa Real Estate PCL | 2,991,199 | 1,972 | |||||||
| PTT Exploration & Production PCL(Ñ) | 1,550,103 | 3,663 | United Kingdom - 0.4% | ||||||
| PTT PCL | 904,000 | 8,890 | BGEO Group PLC | 231,789 | 8,372 | ||||
| Siam Cement PCL (The) | 14,100 | 203 | TBC Bank Group PLC(Æ) | 58,930 | 930 | ||||
| Siam Commercial Bank PCL (The) | 1,118,300 | 4,576 | 9,302 | ||||||
| Star Petroleum Refining PCL | 4,069,700 | 1,463 | |||||||
| Supalai PCL | 1,605,200 | 1,117 | United States - 0.3% | ||||||
| Thai Beverage PCL | 943,600 | 654 | edita food industries SAE(Æ) | 79,977 | 561 | ||||
| Thai Oil PCL | 597,600 | 1,195 | Gran Tierra Energy, Inc.(Æ) | 409,540 | 1,197 | ||||
| Thai Union Group PCL Class F | 5,529,514 | 3,425 | MercadoLibre, Inc. | 12,300 | 2,066 | ||||
| Thai Union Group PCL | 493,600 | 306 | Samsonite International SA | 848,825 | 2,670 | ||||
| Thanachart Capital PCL | 1,445,100 | 1,629 | 6,494 | ||||||
| Tisco Financial Group PCL | 2,002,640 | 2,959 | |||||||
| TMB Bank PCL | 10,515,000 | 630 | Vietnam - 0.3% | ||||||
| 51,804 | Hoa Phat Group JSC | 811,279 | 1,481 | ||||||
| Military Commercial Joint Stock | |||||||||
| Togo - 0.0% | Bank(Æ) | 2,101,459 | 1,346 | ||||||
| Ecobank Transnational, Inc. | 25,971,762 | 882 | Mobile World Investment Corp. | 566,080 | 3,678 | ||||
| PetroVietnam Drilling & Well Services | |||||||||
| Turkey - 2.0% | JSC - ADR(Æ) | 1,065,330 | 1,146 | ||||||
| Akbank TAS | 1,990,077 | 5,294 | 7,651 | ||||||
| Anadolu Efes Biracilik Ve Malt Sanayii | |||||||||
| AS | 249,754 | 1,527 | Virgin Islands, British - 0.1% | ||||||
| Arcelik AS | 207,079 | 1,366 | Arcos Dorados Holdings, Inc. Class | ||||||
| Emlak Konut Gayrimenkul Yatirim | A(Æ) | 484,793 | 2,982 | ||||||
| Ortakligi AS(ö) | 4,279,446 | 4,347 | Mail.Ru Group, Ltd. - GDR(Æ) | 1,849 | 30 | ||||
| Enka Insaat ve Sanayi AS | 1,890,150 | 2,876 | 3,012 | ||||||
| Ford Otomotiv Sanayi AS | 194,035 | 1,978 | |||||||
| GSD Holding AS | 260,524 | 81 | Total Common Stocks | ||||||
| Haci Omer Sabanci Holding AS | 1,810,118 | 5,448 | (cost $1,909,466) | 2,087,472 | |||||
| Koza Altin Isletmeleri AS(Æ) | 22,734 | 128 | |||||||
| TAV Havalimanlari Holding AS | 649,058 | 2,653 | Preferred Stocks - 1.8% | ||||||
| Tekfen Holding AS | 790,833 | 2,000 | Brazil - 1.3% | ||||||
| Torunlar Gayrimenkul Yatirim Ortakligi | Banco do Estado do Rio Grande do Sul | ||||||||
| AS(ö) | 120,316 | 190 | SA(Æ) | 303,611 | 1,293 | ||||
| Trakya Cam Sanayii AS | 209,541 | 172 | Braskem SA | 299,900 | 2,656 | ||||
| Tupras Turkiye Petrol Rafinerileri AS | 107,843 | 2,191 | Centrais Eletricas Brasileiras SA(Æ) | 96,100 | 823 | ||||
| Turkcell Iletisim Hizmetleri AS - | Cia Energetica de Minas Gerais | 356,067 | 1,088 | ||||||
| ADR(Æ)(Ñ) | 134,691 | 1,080 | Gerdau SA | 1,054,300 | 3,640 | ||||
| Turkiye Garanti Bankasi AS | 456,970 | 1,240 | Itau Unibanco Holding SA | 771,390 | 9,280 | ||||
| Turkiye Halk Bankasi AS | 2,195,783 | 6,634 | Lojas Americanas SA | 382,408 | 2,480 | ||||
| Turkiye Is Bankasi Class C | 1,441,166 | 2,328 | Metalurgica Gerdau SA(Æ) | 1,338,900 | 1,992 | ||||
| Turkiye Vakiflar Bankasi TAO Class D | 1,156,092 | 1,702 | Petroleo Brasileiro SA(Æ) | 611,800 | 3,391 | ||||
| Yapi ve Kredi Bankasi AS(Æ) | 1,789,292 | 2,129 | Vale SA(Æ) | 537,720 | 3,475 | ||||
| 45,364 | 30,118 | ||||||||
| Ukraine - 0.4% | Colombia - 0.1% | ||||||||
| Kernel Holding SA | 325,485 | 5,213 | Banco Davivienda SA | 100,774 | 1,026 | ||||
See accompanying notes which are an integral part of the financial statements.
Russell Emerging Markets Fund 239
Russell Investment Company
Russell Emerging Markets Fund
Schedule of Investments, continued — October 31, 2016
| Amounts in thousands (except share amounts) | Amounts in thousands (except share amounts) | |||||||||||||
| Principal | Fair | Principal | Fair | |||||||||||
| Amount ($) | Value | Amount ($) | Value | |||||||||||
| or Shares | $ | or Shares | $ | |||||||||||
| Bancolombia SA | 24,170 | 229 | 0.170% due 12/01/16 (~)(§) | 1,800 | 1,800 | |||||||||
| 1,255 | ||||||||||||||
| 0.238% due 12/22/16 (~)(§) | 1,000 | 1,000 | ||||||||||||
| Russia - 0.1% | 0.345% due 02/02/17 (~)(§) | 2,900 | 2,897 | |||||||||||
| Surgutneftegas OJSC | 2,442,000 | 1,106 | 99,313 | |||||||||||
| Transneft PJSC | 328 | 786 | Total Short-Term Investments | |||||||||||
| 1,892 | ||||||||||||||
| (cost $99,310) | 99,313 | |||||||||||||
| South Korea - 0.3% | ||||||||||||||
| Samsung Electronics Co., Ltd. | 5,923 | 6,789 | Other Securities - 2.1% | |||||||||||
| Samsung Fire & Marine Insurance Co., | Russell U.S. Cash Collateral Fund(×) | 48,769,437 | (8) | 48,769 | ||||||||||
| Ltd. | 1,226 | 203 | Total Other Securities | |||||||||||
| 6,992 | (cost $48,769) | 48,769 | ||||||||||||
| Total Preferred Stocks | Total Investments 100.6% | |||||||||||||
| (cost $30,627) | 40,257 | (identified cost $2,098,495) | 2,291,869 | |||||||||||
| Certificates of Participation - 0.5% | ||||||||||||||
| Netherlands - 0.4% | Other Assets and Liabilities, Net | |||||||||||||
| JPMorgan Structured Products BV | - | (0.6%) | (12,879 | ) | ||||||||||
| Zero coupon due 08/14/17 | 474,479 | 2,700 | Net Assets - 100.0% | 2,278,990 | ||||||||||
| Series 0001 | ||||||||||||||
| Zero coupon due 05/16/17 | 179,478 | 2,362 | ||||||||||||
| Zero coupon due 07/02/18 | 18,453 | 1,761 | ||||||||||||
| Series 0002 | ||||||||||||||
| Zero coupon due 07/02/18 | 176,726 | 2,245 | ||||||||||||
| 9,068 | ||||||||||||||
| United Kingdom - 0.1% | ||||||||||||||
| HSBC Bank PLC | ||||||||||||||
| Series 0008 | ||||||||||||||
| Zero coupon due 09/09/19 | 51,700 | 2,266 | ||||||||||||
| Total Certificates of Participation | ||||||||||||||
| (cost $6,419) | 11,334 | |||||||||||||
| Warrants & Rights - 0.2% | ||||||||||||||
| Australia - 0.1% | ||||||||||||||
| FPT Corp.(Æ) | ||||||||||||||
| 2018 Warrants | 890,150 | 1,733 | ||||||||||||
| Netherlands - 0.1% | ||||||||||||||
| Bharat Forge, Ltd.(Æ)(Þ) | ||||||||||||||
| 2019 Warrants | 13,707 | 181 | ||||||||||||
| Grasim Industries, Ltd.(Æ) | ||||||||||||||
| 2017 Warrants | 176,726 | 2,554 | ||||||||||||
| 2019 Warrants | 7,660 | 110 | ||||||||||||
| TTK Prestige, Ltd.(Æ)(Þ) | ||||||||||||||
| 2017 Warrants | 1,529 | 146 | ||||||||||||
| 2,991 | ||||||||||||||
| Total Warrants & Rights | ||||||||||||||
| (cost $3,904) | 4,724 | |||||||||||||
| Short-Term Investments - 4.4% | ||||||||||||||
| United States - 4.4% | ||||||||||||||
| Russell U.S. Cash Management Fund | 93,597,022 | (8) | 93,616 | |||||||||||
| United States Treasury Bills | ||||||||||||||
See accompanying notes which are an integral part of the financial statements.
240 Russell Emerging Markets Fund
Russell Investment Company
Russell Emerging Markets Fund
Schedule of Investments, continued — October 31, 2016
| Restricted Securities | |||||||||||||
| Amounts in thousands (except share and cost per unit amounts) | |||||||||||||
| Principal | Cost per | Cost | Fair Value | ||||||||||
| % of Net Assets | Acquisition | Amount ($) | Unit | (000 | ) | (000 | ) | ||||||
| Securities | Date | or shares | $ | $ | $ | ||||||||
| 0.2% | |||||||||||||
| African Bank Investments, Ltd. | 02/22/13 | ZAR | 887,049 | 1.86 | 1,651 | — | |||||||
| China Forestry Holdings Co., Ltd. | 07/26/10 | HKD | 871,100 | 0.43 | 372 | — | |||||||
| China Merchants Shekou Industrial Zone Holdings Co., Ltd. | 01/04/16 | CNY | 345,419 | 2.91 | 1,005 | 863 | |||||||
| China Metal Recycling Holdings, Ltd. | 11/16/12 | HKD | 335,400 | 1.01 | 339 | — | |||||||
| Kaisa Group Holdings, Ltd. | 09/04/14 | HKD | 3,280,000 | 0.38 | 1,261 | 596 | |||||||
| Real Gold Mining, Ltd. | 04/26/10 | HKD | 463,232 | 1.60 | 741 | — | |||||||
| Tianhe Chemicals Group, Ltd. | 06/13/14 | HKD | 25,778,000 | 0.23 | 5,886 | 2,327 | |||||||
| 3,793 | |||||||||||||
| For a description of restricted securities see note 8 in the Notes to Financial Statements. | |||||||||||||
| Futures Contracts | |||||||||||||
| Amounts in thousands (except contract amounts) | |||||||||||||
| Unrealized | |||||||||||||
| Appreciation | |||||||||||||
| Number of | Notional | Expiration | (Depreciation) | ||||||||||
| Contracts | Amount | Date | $ | ||||||||||
| Long Positions | |||||||||||||
| BIST 30 Index Futures | 810 | TRY | 7,839 | 12/16 | (29 | ) | |||||||
| BOLSA Index Futures | 200 | MXN | 95,400 | 12/16 | 93 | ||||||||
| FTSE/JSE Top 40 Futures | 260 | ZAR | 115,159 | 12/16 | (339 | ) | |||||||
| Hang Seng Index Futures | 149 | HKD | 170,642 | 11/16 | (553 | ) | |||||||
| H-Shares Index Futures | 359 | HKD | 171,871 | 11/16 | (412 | ) | |||||||
| KOSPI2 Index Futures | 268 | KRW | 34,371,000 | 12/16 | (368 | ) | |||||||
| MSCI Emerging Markets Mini Index Futures | 283 | USD | 12,785 | 12/16 | (219 | ) | |||||||
| MSCI Taiwan Index Futures | 1,136 | USD | 39,715 | 11/16 | (257 | ) | |||||||
| SGX Nifty 50 Index | 1,385 | USD | 23,833 | 11/16 | (316 | ) | |||||||
| Short Positions | |||||||||||||
| MSCI Emerging Markets Mini Index Futures | 772 | USD | 34,875 | 12/16 | 403 | ||||||||
| Total Unrealized Appreciation (Depreciation) on Open Futures Contracts (å) | (1,997 | ) | |||||||||||
| Foreign Currency Exchange Contracts | |||||||
| Amounts in thousands | |||||||
| Unrealized | |||||||
| Appreciation | |||||||
| Amount | Amount | (Depreciation) | |||||
| Counterparty | Sold | Bought | Settlement Date | $ | |||
| Bank of America | USD | 387 | HKD | 3,000 | 12/21/16 | — | |
| Bank of America | USD | 2,581 | HKD | 20,000 | 12/21/16 | (2 | ) |
| Bank of America | USD | 2,967 | HKD | 23,000 | 12/21/16 | (1 | ) |
| Bank of America | USD | 11,143 | INR | 750,400 | 12/21/16 | 30 | |
| Bank of America | USD | 11,427 | INR | 769,500 | 12/21/16 | 31 | |
| Bank of America | USD | 6,092 | KRW | 6,670,000 | 12/21/16 | (264 | ) |
| Bank of America | USD | 6,298 | KRW | 6,895,000 | 12/21/16 | (272 | ) |
| Bank of America | USD | 2,109 | TRY | 6,341 | 12/21/16 | (81 | ) |
| Bank of America | HKD | 6,000 | USD | 774 | 12/21/16 | — | |
| Bank of America | HKD | 10,000 | USD | 1,290 | 12/21/16 | — | |
| Bank of America | HKD | 10,000 | USD | 1,290 | 12/21/16 | — | |
| Bank of America | HKD | 15,000 | USD | 1,935 | 12/21/16 | — | |
| Bank of America | HKD | 20,000 | USD | 2,581 | 12/21/16 | 2 | |
| Bank of America | KRW | 3,000,000 | USD | 2,658 | 12/21/16 | 37 | |
| Bank of America | MXN | 10,000 | USD | 502 | 12/21/16 | (24 | ) |
| Bank of America | MXN | 10,000 | USD | 534 | 12/21/16 | 8 | |
| Bank of America | TRY | 600 | USD | 197 | 12/21/16 | 5 | |
| Bank of America | TRY | 1,000 | USD | 321 | 12/21/16 | 1 |
See accompanying notes which are an integral part of the financial statements.
Russell Emerging Markets Fund 241
Russell Investment Company
Russell Emerging Markets Fund
Schedule of Investments, continued — October 31, 2016
| Foreign Currency Exchange Contracts | |||||||
| Amounts in thousands | |||||||
| Unrealized | |||||||
| Appreciation | |||||||
| Amount | Amount | (Depreciation) | |||||
| Counterparty | Sold | Bought | Settlement Date | $ | |||
| Bank of America | ZAR | 10,000 | USD | 725 | 12/21/16 | (10 | ) |
| Bank of America | ZAR | 10,000 | USD | 714 | 12/21/16 | (20 | ) |
| Bank of America | ZAR | 20,000 | USD | 1,413 | 12/21/16 | (56 | ) |
| Bank of America | ZAR | 20,000 | USD | 1,436 | 12/21/16 | (33 | ) |
| Bank of New York | HKD | 10,000 | USD | 1,290 | 12/21/16 | — | |
| Barclays | USD | 2,685 | MYR | 11,136 | 12/15/16 | (35 | ) |
| Barclays | HKD | 70,087 | USD | 9,044 | 12/15/16 | 4 | |
| BNP Paribas | USD | 5,484 | HKD | 42,500 | 12/21/16 | (2 | ) |
| BNP Paribas | USD | 6,925 | HKD | 53,669 | 12/21/16 | (3 | ) |
| BNP Paribas | USD | 4,317 | IDR | 56,894,160 | 12/15/16 | 21 | |
| BNP Paribas | USD | 1,585 | KRW | 1,782,752 | 12/15/16 | (27 | ) |
| BNP Paribas | USD | 6,629 | MXN | 122,548 | 12/15/16 | (175 | ) |
| BNP Paribas | USD | 1,093 | MXN | 20,424 | 12/21/16 | (18 | ) |
| BNP Paribas | USD | 8,235 | MYR | 33,443 | 12/15/16 | (280 | ) |
| BNP Paribas | USD | 4,753 | ZAR | 66,955 | 12/15/16 | 170 | |
| BNP Paribas | USD | 2,103 | ZAR | 30,005 | 12/21/16 | 100 | |
| BNP Paribas | USD | 8,411 | ZAR | 120,000 | 12/21/16 | 401 | |
| BNP Paribas | ARS | 42,481 | USD | 2,677 | 12/15/16 | (54 | ) |
| BNP Paribas | HUF | 1,098,909 | USD | 3,972 | 12/15/16 | 63 | |
| BNP Paribas | TRY | 1,700 | USD | 566 | 12/21/16 | 23 | |
| Brown Brothers Harriman | USD | 2,337 | HKD | 18,121 | 11/01/16 | — | |
| Brown Brothers Harriman | USD | 333 | TRY | 1,000 | 12/21/16 | (13 | ) |
| Brown Brothers Harriman | USD | 1,850 | ZAR | 26,000 | 12/21/16 | 60 | |
| Brown Brothers Harriman | HKD | 128 | USD | 17 | 11/01/16 | — | |
| Brown Brothers Harriman | HKD | 1,106 | USD | 143 | 11/01/16 | — | |
| Brown Brothers Harriman | HKD | 3,000 | USD | 387 | 12/21/16 | — | |
| Brown Brothers Harriman | PLN | 473 | USD | 120 | 11/02/16 | (1 | ) |
| Brown Brothers Harriman | RON | 506 | USD | 123 | 11/02/16 | — | |
| Brown Brothers Harriman | ZAR | 40,580 | USD | 2,933 | 11/02/16 | (78 | ) |
| Citigroup | USD | 2,194 | HKD | 17,014 | 12/15/16 | — | |
| Citigroup | USD | 1,727 | HUF | 469,018 | 12/15/16 | (59 | ) |
| Citigroup | USD | 1,011 | PLN | 3,869 | 12/15/16 | (26 | ) |
| Citigroup | USD | 2,149 | PLN | 8,289 | 12/15/16 | (38 | ) |
| Citigroup | USD | 10,168 | ZAR | 144,197 | 12/15/16 | 435 | |
| Citigroup | HKD | 6,522 | USD | 842 | 12/15/16 | — | |
| Citigroup | HKD | 10,000 | USD | 1,290 | 12/21/16 | — | |
| Citigroup | MXN | 47,808 | USD | 2,521 | 11/03/16 | (8 | ) |
| Citigroup | RON | 402 | USD | 98 | 11/01/16 | — | |
| Citigroup | RUB | 443,531 | USD | 7,082 | 11/22/16 | 122 | |
| Citigroup | TRY | 600 | USD | 191 | 12/21/16 | (1 | ) |
| Citigroup | TRY | 1,000 | USD | 332 | 12/21/16 | 13 | |
| Citigroup | ZAR | 5,000 | USD | 349 | 12/21/16 | (18 | ) |
| Goldman Sachs | USD | 7,002 | BRL | 22,274 | 11/03/16 | (24 | ) |
| Goldman Sachs | USD | 240 | HKD | 1,858 | 12/21/16 | — | |
| Goldman Sachs | USD | 2,153 | HKD | 16,684 | 12/21/16 | (1 | ) |
| Goldman Sachs | USD | 840 | KRW | 954,466 | 12/15/16 | (6 | ) |
| Goldman Sachs | USD | 1,048 | KRW | 1,203,277 | 12/15/16 | 3 | |
| Goldman Sachs | USD | 4,405 | KRW | 4,901,794 | 12/15/16 | (121 | ) |
| Goldman Sachs | USD | 290 | MXN | 5,637 | 12/21/16 | 7 | |
| Goldman Sachs | BRL | 22,274 | USD | 6,962 | 11/03/16 | (16 | ) |
| Goldman Sachs | KRW | 4,988,805 | USD | 4,423 | 12/15/16 | 63 | |
| Goldman Sachs | MXN | 19,447 | USD | 1,024 | 12/15/16 | — | |
| Goldman Sachs | TRY | 316 | USD | 103 | 12/21/16 | 2 | |
| Goldman Sachs | TRY | 586 | USD | 195 | 12/21/16 | 8 | |
| Goldman Sachs | ZAR | 2,950 | USD | 214 | 12/21/16 | (3 | ) |
| HSBC | USD | 3,181 | BRL | 10,000 | 11/03/16 | (48 | ) |
See accompanying notes which are an integral part of the financial statements.
242 Russell Emerging Markets Fund
Russell Investment Company
Russell Emerging Markets Fund
Schedule of Investments, continued — October 31, 2016
| Foreign Currency Exchange Contracts | |||||||
| Amounts in thousands | |||||||
| Unrealized | |||||||
| Appreciation | |||||||
| Amount | Amount | (Depreciation) | |||||
| Counterparty | Sold | Bought | Settlement Date | $ | |||
| HSBC | USD | 5,485 | HKD | 42,500 | 12/21/16 | (3 | ) |
| HSBC | USD | 6,926 | HKD | 53,669 | 12/21/16 | (4 | ) |
| HSBC | USD | 1,151 | IDR | 15,100,394 | 12/15/16 | 1 | |
| HSBC | USD | 4,456 | INR | 300,000 | 12/21/16 | 11 | |
| HSBC | USD | 7,027 | KRW | 8,000,000 | 12/21/16 | (36 | ) |
| HSBC | USD | 1,092 | MXN | 20,424 | 12/21/16 | (18 | ) |
| HSBC | USD | 2,102 | ZAR | 30,005 | 12/21/16 | 101 | |
| HSBC | USD | 8,406 | ZAR | 120,000 | 12/21/16 | 405 | |
| HSBC | BRL | 10,000 | USD | 3,144 | 11/03/16 | 11 | |
| HSBC | HKD | 7,911 | USD | 1,020 | 12/15/16 | — | |
| HSBC | INR | 125,000 | USD | 1,860 | 12/21/16 | (1 | ) |
| HSBC | INR | 130,000 | USD | 1,931 | 12/21/16 | (5 | ) |
| HSBC | KRW | 1,000,000 | USD | 896 | 12/21/16 | 22 | |
| HSBC | KRW | 3,000,000 | USD | 2,640 | 12/21/16 | 19 | |
| Morgan Stanley | USD | 7,099 | BRL | 22,274 | 11/03/16 | (121 | ) |
| Morgan Stanley | USD | 1,614 | COP | 4,685,127 | 12/15/16 | (67 | ) |
| Morgan Stanley | USD | 2,157 | HKD | 16,721 | 12/15/16 | — | |
| Morgan Stanley | BRL | 22,274 | USD | 7,002 | 11/03/16 | 24 | |
| Morgan Stanley | BRL | 6,674 | USD | 2,116 | 12/02/16 | 43 | |
| Morgan Stanley | BRL | 22,274 | USD | 7,037 | 12/02/16 | 119 | |
| Morgan Stanley | HKD | 21,619 | USD | 2,790 | 12/15/16 | 1 | |
| Morgan Stanley | ZAR | 12,195 | USD | 840 | 12/15/16 | (56 | ) |
| Morgan Stanley | ZAR | 12,229 | USD | 872 | 12/15/16 | (27 | ) |
| National Australia Bank | USD | 6,926 | HKD | 53,669 | 12/21/16 | (4 | ) |
| National Australia Bank | USD | 1,094 | MXN | 20,424 | 12/21/16 | (19 | ) |
| National Australia Bank | USD | 2,105 | ZAR | 30,005 | 12/21/16 | 99 | |
| National Australia Bank | USD | 8,417 | ZAR | 120,000 | 12/21/16 | 395 | |
| Nomura | IDR | 10,593,939 | USD | 809 | 12/15/16 | 1 | |
| Nomura | INR | 56,680 | USD | 843 | 12/15/16 | (2 | ) |
| Nomura | MYR | 2,395 | USD | 569 | 12/15/16 | (1 | ) |
| Royal Bank of Canada | USD | 9,821 | BRL | 31,240 | 11/03/16 | (34 | ) |
| Royal Bank of Canada | USD | 22,571 | BRL | 71,800 | 11/03/16 | (77 | ) |
| Royal Bank of Canada | USD | 22,788 | BRL | 72,500 | 11/03/16 | (75 | ) |
| Royal Bank of Canada | USD | 9,735 | BRL | 31,240 | 12/02/16 | (31 | ) |
| Royal Bank of Canada | USD | 22,374 | BRL | 71,800 | 12/02/16 | (71 | ) |
| Royal Bank of Canada | USD | 6,925 | HKD | 53,669 | 12/21/16 | (3 | ) |
| Royal Bank of Canada | USD | 1,095 | MXN | 20,424 | 12/21/16 | (20 | ) |
| Royal Bank of Canada | USD | 1,000 | TRY | 3,000 | 12/21/16 | (41 | ) |
| Royal Bank of Canada | USD | 2,110 | ZAR | 30,005 | 12/21/16 | 94 | |
| Royal Bank of Canada | USD | 8,438 | ZAR | 120,000 | 12/21/16 | 375 | |
| Royal Bank of Canada | BRL | 31,240 | USD | 9,819 | 11/03/16 | 32 | |
| Royal Bank of Canada | BRL | 71,800 | USD | 22,568 | 11/03/16 | 74 | |
| Royal Bank of Canada | BRL | 72,500 | USD | 22,791 | 11/03/16 | 78 | |
| Royal Bank of Canada | BRL | 72,500 | USD | 22,592 | 12/02/16 | 71 | |
| Royal Bank of Canada | HKD | 20,000 | USD | 2,580 | 12/21/16 | 1 | |
| Royal Bank of Canada | MXN | 10,000 | USD | 530 | 12/21/16 | 4 | |
| Royal Bank of Canada | TRY | 1,000 | USD | 331 | 12/21/16 | 12 | |
| Royal Bank of Canada | ZAR | 20,000 | USD | 1,386 | 12/21/16 | (83 | ) |
| Royal Bank of Scotland | USD | 3,541 | CLP | 2,377,164 | 12/15/16 | 87 | |
| Royal Bank of Scotland | ARS | 12,931 | USD | 819 | 12/15/16 | (12 | ) |
| Royal Bank of Scotland | ARS | 26,020 | USD | 1,639 | 12/15/16 | (34 | ) |
| Royal Bank of Scotland | CLP | 2,377,164 | USD | 3,536 | 12/15/16 | (92 | ) |
| Royal Bank of Scotland | TRY | 2,600 | USD | 859 | 12/15/16 | 26 | |
| Standard Chartered | USD | 1,449 | IDR | 19,454,550 | 12/15/16 | 34 | |
| Standard Chartered | USD | 1,893 | INR | 127,220 | 12/15/16 | 3 | |
| Standard Chartered | USD | 15,125 | INR | 1,017,865 | 12/15/16 | 43 |
See accompanying notes which are an integral part of the financial statements.
Russell Emerging Markets Fund 243
Russell Investment Company
Russell Emerging Markets Fund
Schedule of Investments, continued — October 31, 2016
| Foreign Currency Exchange Contracts | |||||||
| Amounts in thousands | |||||||
| Unrealized | |||||||
| Appreciation | |||||||
| Amount | Amount | (Depreciation) | |||||
| Counterparty | Sold | Bought | Settlement Date | $ | |||
| Standard Chartered | KRW | 37,052,237 | USD | 33,816 | 12/15/16 | 1,437 | |
| Standard Chartered | MXN | 15,077 | USD | 803 | 12/15/16 | 9 | |
| State Street | USD | 47 | BRL | 149 | 11/01/16 | — | |
| State Street | USD | 51 | BRL | 163 | 11/01/16 | — | |
| State Street | USD | 110 | BRL | 349 | 11/01/16 | — | |
| State Street | USD | 299 | BRL | 947 | 11/01/16 | (2 | ) |
| State Street | USD | 33 | BRL | 106 | 11/03/16 | — | |
| State Street | USD | 63 | BRL | 200 | 11/03/16 | — | |
| State Street | USD | 6,527 | BRL | 21,240 | 11/03/16 | 127 | |
| State Street | USD | 11,002 | BRL | 35,000 | 11/03/16 | (38 | ) |
| State Street | USD | 11,202 | BRL | 35,000 | 11/03/16 | (238 | ) |
| State Street | USD | 11,370 | BRL | 37,000 | 11/03/16 | 221 | |
| State Street | USD | 13 | BRL | 41 | 11/04/16 | — | |
| State Street | USD | 546 | HKD | 4,232 | 11/02/16 | — | |
| State Street | USD | 14,187 | HKD | 110,000 | 12/21/16 | 1 | |
| State Street | USD | 189 | KRW | 215,849 | 11/01/16 | (1 | ) |
| State Street | USD | 2,126 | MXN | 40,000 | 12/21/16 | (21 | ) |
| State Street | USD | 152 | THB | 5,339 | 11/01/16 | 1 | |
| State Street | USD | 173 | TRY | 536 | 11/01/16 | — | |
| State Street | USD | 832 | TRY | 2,500 | 12/21/16 | (32 | ) |
| State Street | USD | 1,123 | TRY | 3,500 | 12/21/16 | (3 | ) |
| State Street | USD | 3,921 | ZAR | 55,000 | 12/21/16 | 118 | |
| State Street | BRL | 19 | USD | 6 | 11/03/16 | — | |
| State Street | BRL | 200 | USD | 63 | 11/03/16 | 1 | |
| State Street | BRL | 35,000 | USD | 11,202 | 11/03/16 | 236 | |
| State Street | BRL | 35,000 | USD | 11,002 | 11/03/16 | 38 | |
| State Street | BRL | 37,500 | USD | 11,524 | 11/03/16 | (225 | ) |
| State Street | CZK | 7,008 | USD | 284 | 11/02/16 | (1 | ) |
| State Street | HKD | 155 | USD | 20 | 11/01/16 | — | |
| State Street | HKD | 1,406 | USD | 181 | 11/01/16 | — | |
| State Street | HKD | 271 | USD | 35 | 11/02/16 | — | |
| State Street | HKD | 3,444 | USD | 444 | 11/02/16 | — | |
| State Street | HKD | 25,000 | USD | 3,224 | 12/21/16 | — | |
| State Street | IDR | 7,271,848 | USD | 557 | 11/02/16 | — | |
| State Street | IDR | 3,239,815 | USD | 248 | 11/03/16 | — | |
| State Street | MXN | 439 | USD | 23 | 11/01/16 | — | |
| State Street | MXN | 47,928 | USD | 2,529 | 11/03/16 | (7 | ) |
| State Street | MXN | 10,256 | USD | 543 | 11/04/16 | 1 | |
| State Street | MYR | 3,817 | USD | 907 | 11/02/16 | (3 | ) |
| State Street | PHP | 7,878 | USD | 162 | 11/02/16 | — | |
| State Street | PLN | 44 | USD | 11 | 11/02/16 | — | |
| State Street | THB | 3,861 | USD | 110 | 11/02/16 | — | |
| State Street | THB | 27,638 | USD | 789 | 11/02/16 | — | |
| State Street | ZAR | 875 | USD | 63 | 11/01/16 | (2 | ) |
| UBS | HKD | 5,000 | USD | 645 | 12/21/16 | — | |
| UBS | MXN | 5,000 | USD | 257 | 12/21/16 | (7 | ) |
| UBS | TRY | 2,000 | USD | 665 | 12/21/16 | 27 | |
| Total Unrealized Appreciation (Depreciation) on Open Foreign Currency Exchange Contracts | 2,677 | ||||||
| Total Return Swap Contracts (*) | ||||||
| Amounts in thousands | ||||||
| Notional | Termination | Fair Value | ||||
| Underlying Reference Entity | Counterparty | Amount | Date | $ | ||
| Bovespa Future Index | Goldman Sachs | BRL | 9,713 | 12/14/16 | 53 | |
| Bovespa Future Index | Goldman Sachs | BRL | 20,392 | 12/14/16 | 424 | |
| Bovespa Future Index | Goldman Sachs | BRL | 31,586 | 12/14/16 | (117 | ) |
See accompanying notes which are an integral part of the financial statements.
244 Russell Emerging Markets Fund
Russell Investment Company
Russell Emerging Markets Fund
Schedule of Investments, continued — October 31, 2016
| Total Return Swap Contracts (*) | ||||||
| Amounts in thousands | ||||||
| Notional | Termination | Fair Value | ||||
| Underlying Reference Entity | Counterparty | Amount | Date | $ | ||
| Bovespa Future Index | Goldman Sachs | BRL | 38,931 | 12/14/16 | (809 | ) |
| Total Fair Value of Open Total Return Swap Contracts Premiums Paid (Received) - $— (å) | (449 | ) | ||||
(*) Total return swaps (which includes index swaps) are agreements between counterparties to exchange cash flows, one based on a market-linked
returns of an individual asset or a basket of assets (i.e. an index), and the other on a fixed or floating rate. The floating rate fees were all based
on the total return of underlying security at termination.
| Presentation of Portfolio Holdings | ||||||||||||
| Amounts in thousands | ||||||||||||
| Fair Value | ||||||||||||
| Practical | ||||||||||||
| Portfolio Summary | Level 1 | Level 2 | Level 3 | Expedient (a) | Total | % of Net Assets | ||||||
| Common Stocks | ||||||||||||
| Argentina | $ | 25,465 | $ | — | $ | — | $ | — | $ | 25,465 | 1.1 | |
| Bangladesh | — | 8,182 | — | — | 8,182 | 0.4 | ||||||
| Bermuda | 3,297 | 371 | — | — | 3,668 | 0.2 | ||||||
| Brazil | 172,453 | — | — | — | 172,453 | 7.6 | ||||||
| Cambodia | — | 2,848 | — | — | 2,848 | 0.1 | ||||||
| Cayman Islands | 25,332 | 10,958 | — | — | 36,290 | 1.6 | ||||||
| Chile | 9,123 | 7,859 | — | — | 16,982 | 0.8 | ||||||
| China | 90,900 | 270,257 | 2,923 | — | 364,080 | 16.0 | ||||||
| Colombia | 5,194 | — | — | — | 5,194 | 0.2 | ||||||
| Cyprus | — | 1,416 | — | — | 1,416 | 0.1 | ||||||
| Czech Republic | — | 3,191 | — | — | 3,191 | 0.1 | ||||||
| Egypt | 1,540 | 9,068 | — | — | 10,608 | 0.5 | ||||||
| Greece | — | 4,879 | — | — | 4,879 | 0.2 | ||||||
| Guernsey | — | 4,548 | — | — | 4,548 | 0.2 | ||||||
| Hong Kong | 17,181 | 101,688 | 826 | — | 119,695 | 5.3 | ||||||
| Hungary | — | 12,169 | — | — | 12,169 | 0.5 | ||||||
| India | 31,127 | 173,003 | — | — | 204,130 | 9.0 | ||||||
| Indonesia | — | 32,946 | — | — | 32,946 | 1.5 | ||||||
| Jersey | — | 2,495 | — | — | 2,495 | 0.1 | ||||||
| Kazakhstan | 855 | — | — | — | 855 | —* | ||||||
| Kenya | — | 2,501 | — | — | 2,501 | 0.1 | ||||||
| Kuwait | — | 4,759 | — | — | 4,759 | 0.2 | ||||||
| Luxembourg | 3,252 | — | — | — | 3,252 | 0.1 | ||||||
| Macao | — | 12,263 | — | — | 12,263 | 0.5 | ||||||
| Malaysia | — | 14,502 | — | — | 14,502 | 0.6 | ||||||
| Malta | — | 523 | — | — | 523 | —* | ||||||
| Mexico | 78,575 | — | — | — | 78,575 | 3.4 | ||||||
| Morocco | — | 1,886 | — | — | 1,886 | 0.1 | ||||||
| Netherlands | 7,928 | 1,988 | — | — | 9,916 | 0.4 | ||||||
| Nigeria | 402 | 10,831 | — | — | 11,233 | 0.5 | ||||||
| Pakistan | — | 20,145 | — | — | 20,145 | 0.9 | ||||||
| Peru | 8,680 | — | — | — | 8,680 | 0.4 | ||||||
| Philippines | — | 8,649 | — | — | 8,649 | 0.4 | ||||||
See accompanying notes which are an integral part of the financial statements.
Russell Emerging Markets Fund 245
Russell Investment Company
Russell Emerging Markets Fund
Schedule of Investments, continued — October 31, 2016
| Presentation of Portfolio Holdings | ||||||||||||||||
| Amounts in thousands | ||||||||||||||||
| Fair Value | ||||||||||||||||
| Practical | ||||||||||||||||
| Portfolio Summary | Level 1 | Level 2 | Level 3 | Expedient (a) | Total | % of Net Assets | ||||||||||
| Poland | — | 5,981 | — | — | 5,981 | 0.3 | ||||||||||
| Qatar | — | 4,726 | — | — | 4,726 | 0.2 | ||||||||||
| Romania | — | 4,158 | — | — | 4,158 | 0.2 | ||||||||||
| Russia | 48,685 | 53,368 | — | — | 102,053 | 4.5 | ||||||||||
| Singapore | — | 2,529 | — | — | 2,529 | 0.1 | ||||||||||
| South Africa | 8,867 | 63,814 | — | — | 72,681 | 3.2 | ||||||||||
| South Korea | 25,034 | 273,136 | — | — | 298,170 | 13.1 | ||||||||||
| Spain | 909 | — | — | — | 909 | —* | ||||||||||
| Sri Lanka | — | — | 1,919 | — | 1,919 | 0.1 | ||||||||||
| Switzerland | — | 5,575 | — | — | 5,575 | 0.2 | ||||||||||
| Taiwan | 39,500 | 193,047 | — | — | 232,547 | 10.2 | ||||||||||
| Thailand | — | 51,804 | — | — | 51,804 | 2.3 | ||||||||||
| Togo | — | 882 | — | — | 882 | —* | ||||||||||
| Turkey | 1,080 | 44,284 | — | — | 45,364 | 2.0 | ||||||||||
| Ukraine | 4,656 | 5,213 | — | — | 9,869 | 0.4 | ||||||||||
| United Arab Emirates | — | 12,868 | — | — | 12,868 | 0.6 | ||||||||||
| United Kingdom | 930 | 8,372 | — | — | 9,302 | 0.4 | ||||||||||
| United States | 3,824 | 2,670 | — | — | 6,494 | 0.3 | ||||||||||
| Vietnam | — | 7,651 | — | — | 7,651 | 0.3 | ||||||||||
| Virgin Islands, British | 3,012 | — | — | — | 3,012 | 0.1 | ||||||||||
| Preferred Stocks | 31,373 | 8,884 | — | — | 40,257 | 1.8 | ||||||||||
| Certificates of Participation | — | 11,334 | — | — | 11,334 | 0.5 | ||||||||||
| Warrants & Rights | — | 4,724 | — | — | 4,724 | 0.2 | ||||||||||
| Short-Term Investments | — | 5,697 | — | 93,616 | 99,313 | 4.4 | ||||||||||
| Other Securities | — | — | — | 48,769 | 48,769 | 2.1 | ||||||||||
| Total Investments | 649,174 | 1,494,642 | 5,668 | 142,385 | 2,291,869 | 100.6 | ||||||||||
| Other Assets and Liabilities, Net | (0.6 | ) | ||||||||||||||
| 100.0 | ||||||||||||||||
| Other Financial Instruments | ||||||||||||||||
| Assets | ||||||||||||||||
| Futures Contracts | 496 | — | — | — | 496 | —* | ||||||||||
| Foreign Currency Exchange Contracts | 40 | 5,972 | — | — | 6,012 | 0.3 | ||||||||||
| Total Return Swap Contracts | — | 477 | — | — | 477 | —* | ||||||||||
| A | ||||||||||||||||
| Liabilities | ||||||||||||||||
| Futures Contracts | (2,493 | ) | — | — | — | (2,493 | ) | (0.1 | ) | |||||||
| Foreign Currency Exchange Contracts | (142 | ) | (3,193 | ) | — | — | (3,335 | ) | (0.1 | ) | ||||||
| Total Return Swap Contracts | — | (926 | ) | — | — | (926 | ) | (—)* | ||||||||
| Total Other Financial Instruments** | $ | (2,099 | ) | $ | 2,330 | $ | — | $ | — | $ | 231 | |||||
* Less than 0.05% of net assets.
** Futures and foreign currency exchange contract values reflect the unrealized appreciation (depreciation) on the investments.
See accompanying notes which are an integral part of the financial statements.
246 Russell Emerging Markets Fund
Russell Investment Company
Russell Emerging Markets Fund
Schedule of Investments, continued — October 31, 2016
(a) Certain investments that are measured at fair value using the net asset value per share (or its equivalent) practical expedient have not been classified
in the fair value levels. The fair value amounts presented in the table are intended to permit reconciliation to the amounts presented in the Schedule of
Investments.
For a description of the Levels, see note 2 in the Notes to Financial Statements.
For a disclosure on transfers between Levels 1, 2 and 3 during the period ended October 31, 2016, see note 2 in the Notes to
Financial Statements.
Investments in which significant unobservable inputs (Level 3) were used in determining a fair value for the period ended October
31, 2016 were less than 1% of net assets.
| Amounts in thousands | |||
| Fair Value | |||
| Sector Exposure | $ | ||
| Consumer Discretionary | 261,674 | ||
| Consumer Staples | 160,380 | ||
| Energy | 210,800 | ||
| Financial Services | 585,800 | ||
| Health Care | 45,104 | ||
| Materials and Processing | 174,938 | ||
| Producer Durables | 83,879 | ||
| Technology | 437,755 | ||
| Utilities | 167,399 | ||
| Certificates of Participation | 11,334 | ||
| Warrants and Rights | 4,724 | ||
| Short-Term Investments | 99,313 | ||
| Other Securities | 48,769 | ||
| Total Investments | 2,291,869 | ||
See accompanying notes which are an integral part of the financial statements.
Russell Emerging Markets Fund 247
Russell Investment Company
Russell Emerging Markets Fund
Fair Value of Derivative Instruments — October 31, 2016
Amounts in thousands
| Foreign | ||||||
| Equity | Currency | |||||
| Derivatives not accounted for as hedging instruments | Contracts | Contracts | ||||
| Location: Statement of Assets and Liabilities - Assets | ||||||
| Unrealized appreciation on foreign currency exchange contracts | $ | — | $ | 6,012 | ||
| Variation margin on futures contracts* | 496 | — | ||||
| Total return swap contracts, at fair value | 477 | — | ||||
| Total | $ | 973 | $ | 6,012 | ||
| Location: Statement of Assets and Liabilities - Liabilities | ||||||
| Variation margin on futures contracts* | $ | 2,493 | $ | — | ||
| Unrealized depreciation on foreign currency exchange contracts | — | 3,335 | ||||
| Total return swap contracts, at fair value | 926 | — | ||||
| Total | $ | 3,419 | $ | 3,335 | ||
| Foreign | ||||||
| Equity | Currency | |||||
| Derivatives not accounted for as hedging instruments | Contracts | Contracts | ||||
| Location: Statement of Operations - Net realized gain (loss) | ||||||
| Futures contracts | $ | 344 | $ | — | ||
| Total return swap contracts | (4,664 | ) | — | |||
| Foreign currency-related transactions** | — | 1,105 | ||||
| Total | $ | (4,320 | ) | $ | 1,105 | |
| Location: Statement of Operations - Net change in unrealized appreciation (depreciation) | ||||||
| Futures contracts | $ | (3,461 | ) | $ | — | |
| Total return swap contracts | 2 | — | ||||
| Foreign currency-related transactions*** | — | 2,493 | ||||
| Total | $ | (3,459 | ) | $ | 2,493 | |
* Includes cumulative appreciation/depreciation of futures contracts as reported in the Schedule of Investments. Only variation margin is reported within the
Statement of Assets and Liabilities.
** Only includes net realized gain (loss) on forward and spot contracts. May differ from the net realized gain (loss) on foreign currency-related transactions reported
within the Statement of Operations.
*** Only includes change in unrealized gain (loss) on forward and spot contracts. May differ from the net change in unrealized gain (loss) on foreign currency-related
transactions reported within the Statement of Operations.
For further disclosure on derivatives see note 2 in the Notes to Financial Statements.
See accompanying notes which are an integral part of the financial statements.
248 Russell Emerging Markets Fund
Russell Investment Company
Russell Emerging Markets Fund
Balance Sheet Offsetting of Financial and Derivative Instruments — October 31, 2016
| Amounts in thousands | |||||||||||||
| Offsetting of Financial Assets and Derivative Assets | |||||||||||||
| Gross | Net Amounts | ||||||||||||
| Amounts | of Assets | ||||||||||||
| Gross | Offset in the | Presented in | |||||||||||
| Amounts of | Statement of | the Statement | |||||||||||
| Recognized | Assets and | of Assets and | |||||||||||
| Description | Location: Statement of Assets and Liabilities - Assets | Assets | Liabilities | Liabilities | |||||||||
| Securities on Loan* | Investments, at fair value | $ | 47,387 | $ | — $ | 47,387 | |||||||
| Foreign Currency Exchange Contracts | Unrealized appreciation on foreign currency exchange contracts | 6,012 | — | 6,012 | |||||||||
| Futures Contracts | Variation margin on futures contracts | 17,378 | — | 17,378 | |||||||||
| Total Return Swap Contracts | Total return swap contracts, at fair value | 477 | — | 477 | |||||||||
| Total Financial and Derivative Assets | 71,254 | — | 71,254 | ||||||||||
| Financial and Derivative Assets not subject to a netting agreement | (17,378 | ) | — | (17,378 | ) | ||||||||
| Total Financial and Derivative Assets subject to a netting agreement | $ | 53,876 | $ | — $ | 53,876 | ||||||||
| Financial Assets, Derivative Assets, and Collateral Held by Counterparty | |||||||||||||
| Gross Amounts Not Offset in | |||||||||||||
| the Statement of Assets and | |||||||||||||
| Liabilities | |||||||||||||
| Net Amounts | |||||||||||||
| of Assets | |||||||||||||
| Presented in | |||||||||||||
| the Statement | Financial and | ||||||||||||
| of Assets and | Derivative | Collateral | |||||||||||
| Counterparty | Liabilities | Instruments | Received^ | Net Amount | |||||||||
| Bank of America | $ | 114 | $ | 114 | $ | — | $ | — | |||||
| Barclays | 22,184 | 4 | 22,180 | — | |||||||||
| BNP Paribas | 778 | 278 | — | 500 | |||||||||
| Brown Brothers Harriman | 60 | 13 | — | 47 | |||||||||
| Citigroup | 7,814 | 135 | 7,245 | 434 | |||||||||
| Credit Suisse | 6,125 | — | 6,125 | — | |||||||||
| Deutsche Bank | 1,333 | — | 1,333 | — | |||||||||
| Fidelity | 1,088 | — | 1,088 | — | |||||||||
| Goldman Sachs | 5,278 | 560 | 4,718 | — | |||||||||
| HSBC | 571 | 115 | — | 456 | |||||||||
| JPMorgan Chase | 2,022 | — | 2,022 | — | |||||||||
| Merrill Lynch | 1,027 | — | 1,027 | — | |||||||||
| Morgan Stanley | 1,601 | 187 | 1,414 | — | |||||||||
| National Australia Bank | 493 | 22 | — | 471 | |||||||||
| Nomura | 1 | — | — | 1 | |||||||||
| Royal Bank of Canada | 739 | 434 | — | 305 | |||||||||
| Royal Bank of Scotland | 113 | 113 | — | — | |||||||||
| Standard Chartered | 1,529 | — | — | 1,529 | |||||||||
| State Street | 744 | 518 | — | 226 | |||||||||
| UBS | 262 | 7 | 235 | 20 | |||||||||
| Total | $ | 53,876 | $ | 2,500 | $ | 47,387 | $ | 3,989 | |||||
See accompanying notes which are an integral part of the financial statements.
Russell Emerging Markets Fund 249
Russell Investment Company
Russell Emerging Markets Fund
Balance Sheet Offsetting of Financial and Derivative Instruments, continued —
October 31, 2016
| Amounts in thousands | |||||||||||||
| Offsetting of Financial Liabilities and Derivative Liabilities | |||||||||||||
| Gross | Net Amounts | ||||||||||||
| Amounts | of Liabilities | ||||||||||||
| Gross | Offset in the | Presented in | |||||||||||
| Amounts of | Statement of | the Statement | �� | ||||||||||
| Recognized | Assets and | of Assets and | |||||||||||
| Description | Location: Statement of Assets and Liabilities - Liabilities | Liabilities | Liabilities | Liabilities | |||||||||
| Futures Contracts | Variation margin on futures contracts | $ | 453 | $ | — | $ | 453 | ||||||
| Foreign Currency Exchange Contracts | Unrealized depreciation on foreign currency exchange contracts | 3,335 | — | 3,335 | |||||||||
| Total Return Swap Contracts | Total return swap contracts, at fair value | 926 | — | 926 | |||||||||
| Total Financial and Derivative Liabilities | 4,714 | — | 4,714 | ||||||||||
| Financial and Derivative Liabilities not subject to a netting agreement | (453 | ) | — | (453 | ) | ||||||||
| Total Financial and Derivative Liabilities subject to a netting agreement | $ | 4,261 | $ | — | $ | 4,261 | |||||||
| Financial Liabilities, Derivative Liabilities, and Collateral Pledged by Counterparty | |||||||||||||
| Gross Amounts Not Offset in | |||||||||||||
| the Statement of Assets and | |||||||||||||
| Liabilities | |||||||||||||
| Net Amounts | |||||||||||||
| of Liabilities | |||||||||||||
| Presented in | |||||||||||||
| the Statement | Financial and | ||||||||||||
| of Assets and | Derivative | Collateral | |||||||||||
| Counterparty | Liabilities | Instruments | Pledged^ | Net Amount | |||||||||
| Bank of America | $ | 764 | $ | 114 | $ | — | $ | 650 | |||||
| Barclays | 36 | 4 | — | 32 | |||||||||
| BNP Paribas | 562 | 278 | — | 284 | |||||||||
| Brown Brothers Harriman | 92 | 13 | — | 79 | |||||||||
| Citigroup | 149 | 135 | — | 14 | |||||||||
| Goldman Sachs | 1,097 | 560 | 200 | 337 | |||||||||
| HSBC | 115 | 115 | — | — | |||||||||
| Morgan Stanley | 271 | 187 | — | 84 | |||||||||
| National Australia Bank | 22 | 22 | — | — | |||||||||
| Royal Bank of Canada | 434 | 434 | — | — | |||||||||
| Royal Bank of Scotland | 138 | 113 | — | 25 | |||||||||
| State Street | 574 | 518 | — | 56 | |||||||||
| UBS | 7 | 7 | — | — | |||||||||
| Total | $ | 4,261 | $ | 2,500 | $ | 200 | $ | 1,561 | |||||
* Fair value of securities on loan as reported in the footnotes to the Statement of Assets and Liabilities.
^ Collateral received or pledged amounts may not reconcile to those disclosed in the Statement of Assets and Liabilities due to the inclusion of off-Balance
Sheet collateral and adjustments made to exclude overcollateralization.
For further disclosure on derivatives and counterparty risk see note 2 in the Notes to Financial Statements.
See accompanying notes which are an integral part of the financial statements.
250 Russell Emerging Markets Fund
Russell Investment Company
Russell Emerging Markets Fund
Statement of Assets and Liabilities — October 31, 2016
| Amounts in thousands | ||
| Assets | ||
| Investments, at identified cost | $ | 2,098,495 |
| Investments, at fair value(*)(>) | 2,291,869 | |
| Cash (restricted)(a)(b) | 4,300 | |
| Deposit with foreign regulatory agency | 7 | |
| Foreign currency holdings(^) | 15,644 | |
| Unrealized appreciation on foreign currency exchange contracts | 6,012 | |
| Receivables: | ||
| Dividends and interest | 1,652 | |
| Dividends from affiliated Russell funds | 32 | |
| Investments sold | 27,458 | |
| Fund shares sold | 1,940 | |
| Foreign capital gains taxes recoverable | 46 | |
| Variation margin on futures contracts | 17,378 | |
| Total return swap contracts, at fair value(8) | 477 | |
| Total assets | 2,366,815 | |
| Liabilities | ||
| Payables: | ||
| Due to custodian | 2,532 | |
| Due to broker (f)(g) | 2,372 | |
| Investments purchased | 21,031 | |
| Fund shares redeemed | 1,695 | |
| Accrued fees to affiliates | 2,600 | |
| Other accrued expenses | 779 | |
| Variation margin on futures contracts | 453 | |
| Deferred capital gains tax liability | 3,333 | |
| Unrealized depreciation on foreign currency exchange contracts | 3,335 | |
| Payable upon return of securities loaned | 48,769 | |
| Total return swap contracts, at fair value(8) | 926 | |
| Total liabilities | 87,825 | |
| Commitments and Contingencies (1) | ||
| Net Assets | $ | 2,278,990 |
| (1) See note 9 in the Notes to Financial Statements for a detailed description of commitments and contingencies. | ||
See accompanying notes which are an integral part of the financial statements.
Russell Emerging Markets Fund 251
Russell Investment Company
Russell Emerging Markets Fund
Statement of Assets and Liabilities, continued — October 31, 2016
| Amounts in thousands | |||
| Net Assets Consist of: | |||
| Undistributed (overdistributed) net investment income | $ | 6,624 | |
| Accumulated net realized gain (loss) | (249,167 | ) | |
| Unrealized appreciation (depreciation) on: | |||
| Investments (net of deferred tax liability for foreign capital gains taxes) | 190,041 | ||
| Futures contracts | (1,997 | ) | |
| Total return swap contracts | (449 | ) | |
| Foreign currency-related transactions | 2,367 | ||
| Shares of beneficial interest | 1,369 | ||
| Additional paid-in capital | 2,330,202 | ||
| Net Assets | $ | 2,278,990 | |
| Net Asset Value, offering and redemption price per share: | |||
| Net asset value per share: Class A(#) | $ | 16.51 | |
| Maximum offering price per share (Net asset value plus sales charge of 5.75%): Class A | $ | 17.52 | |
| Class A — Net assets | $ | 17,352,755 | |
| Class A — Shares outstanding ($.01 par value) | 1,050,947 | ||
| Net asset value per share: Class C(#) | $ | 15.30 | |
| Class C — Net assets | $ | 17,641,220 | |
| Class C — Shares outstanding ($.01 par value) | 1,153,094 | ||
| Net asset value per share: Class E(#) | $ | 16.57 | |
| Class E — Net assets | $ | 34,786,438 | |
| Class E — Shares outstanding ($.01 par value) | 2,099,556 | ||
| Net asset value per share: Class R6(#) | $ | 16.68 | |
| Class R6 — Net assets | $ | 240,019 | |
| Class R6 — Shares outstanding ($.01 par value) | 14,390 | ||
| Net asset value per share: Class S(#) | $ | 16.65 | |
| Class S — Net assets | $ 1,709,493,340 | ||
| Class S — Shares outstanding ($.01 par value) | 102,691,775 | ||
| Net asset value per share: Class Y(#) | $ | 16.68 | |
| Class Y — Net assets | $ | 499,476,232 | |
| Class Y — Shares outstanding ($.01 par value) | 29,936,931 | ||
| Amounts in thousands | |||
| (^) Foreign currency holdings - cost | $ | 15,834 | |
| (*) Securities on loan included in investments | $ | 47,387 | |
| (>) Investments in affiliates, Russell U.S. Cash Management Fund and Russell U.S. Cash Collateral Fund | $ | 142,385 | |
| (8) Total return swap contracts - premiums paid (received) | $ | — | |
| (a) Cash Collateral for Futures | $ | 4,100 | |
| (b) Cash Collateral for Swaps | $ | 200 | |
| (c) Due to Broker for Futures | $ | 372 | |
| (d) Due to Broker for Swaps | $ | 2,000 | |
| (#) Net asset value per share equals class level net assets divided by class level shares of beneficial interest outstanding. | |||
See accompanying notes which are an integral part of the financial statements.
252 Russell Emerging Markets Fund
Russell Investment Company
Russell Emerging Markets Fund
Statement of Operations — For the Period Ended October 31, 2016
| Amounts in thousands | |||
| Investment Income | |||
| Dividends | $ | 58,343 | |
| Dividends from affiliated Russell funds | 257 | ||
| Interest | 69 | ||
| Securities lending income (net) | 1,093 | ||
| Less foreign taxes withheld | (6,214 | ) | |
| Total investment income | 53,548 | ||
| Expenses | |||
| Advisory fees | 24,612 | ||
| Administrative fees | 1,034 | ||
| Custodian fees (1) | 2,018 | ||
| Distribution fees - Class A | 40 | ||
| Distribution fees - Class C | 131 | ||
| Transfer agent fees - Class A | 32 | ||
| Transfer agent fees - Class C | 35 | ||
| Transfer agent fees - Class E | 69 | ||
| Transfer agent fees - Class R6 | —** | ||
| Transfer agent fees - Class S | 3,185 | ||
| Transfer agent fees - Class Y | 21 | ||
| Professional fees | 258 | ||
| Registration fees | 125 | ||
| Shareholder servicing fees - Class C | 44 | ||
| Shareholder servicing fees - Class E | 86 | ||
| Trustees’ fees | 67 | ||
| Printing fees | 265 | ||
| Miscellaneous | 52 | ||
| Expenses before reductions | 32,074 | ||
| Expense reductions | (430 | ) | |
| Net expenses | 31,644 | ||
| Net investment income (loss) | 21,904 | ||
| Net Realized and Unrealized Gain (Loss) | |||
| Net realized gain (loss) on: | |||
| Investments (net of deferred tax liability for foreign capital gains taxes) | (141,514 | ) | |
| Futures contracts | 344 | ||
| Total return swap contracts | (4,664 | ) | |
| Foreign currency-related transactions | (1,518 | ) | |
| Net realized gain (loss) | (147,352 | ) | |
| Net change in unrealized appreciation (depreciation) on: | |||
| Investments (net of deferred tax liability for foreign capital gains taxes) | 323,982 | ||
| Futures contracts | (3,461 | ) | |
| Total return swap contracts | 2 | ||
| Foreign currency-related transactions | 1,971 | ||
| Net change in unrealized appreciation (depreciation) | 322,494 | ||
| Net realized and unrealized gain (loss) | 175,142 | ||
| Net Increase (Decrease) in Net Assets from Operations | $ | 197,046 | |
| ** Less than $500. | |||
| (1) Includes a reimbursement for overbilling of custody out-of-pocket fees from prior years. See note 10 in the Notes to Financial Statements. | |||
See accompanying notes which are an integral part of the financial statements.
Russell Emerging Markets Fund 253
Russell Investment Company
Russell Emerging Markets Fund
Statements of Changes in Net Assets
| For the Periods Ended October 31, | ||||||
| Amounts in thousands | 2016 | 2015 | ||||
| Increase (Decrease) in Net Assets | ||||||
| Operations | ||||||
| Net investment income (loss) | $ | 21,904 | $ | 24,293 | ||
| Net realized gain (loss) | (147,352 | ) | (57,539 | ) | ||
| Net change in unrealized appreciation (depreciation) | 322,494 | (422,801 | ) | |||
| Net increase (decrease) in net assets from operations | 197,046 | (456,047 | ) | |||
| Distributions | ||||||
| From net investment income | ||||||
| Class A | — | (254 | ) | |||
| Class C | — | (143 | ) | |||
| Class E | — | (575 | ) | |||
| Class S | (1,970 | ) | (31,776 | ) | ||
| Class Y | (1,811 | ) | (10,628 | ) | ||
| From net realized gain | ||||||
| Class A | — | (308 | ) | |||
| Class C | — | (426 | ) | |||
| Class E | — | (706 | ) | |||
| Class S | — | (31,455 | ) | |||
| Class Y | — | (9,279 | ) | |||
| Net decrease in net assets from distributions | (3,781 | ) | (85,550 | ) | ||
| Share Transactions* | ||||||
| Net increase (decrease) in net assets from share transactions | (262,169 | ) | (94,667 | ) | ||
| Total Net Increase (Decrease) in Net Assets | (68,904 | ) | (636,264 | ) | ||
| Net Assets | ||||||
| Beginning of period | 2,347,894 | 2,984,158 | ||||
| End of period | $ | 2,278,990 | $ | 2,347,894 | ||
| Undistributed (overdistributed) net investment income included in net assets | $ | 6,624 | $ | (29,319 | ) | |
See accompanying notes which are an integral part of the financial statements.
254 Russell Emerging Markets Fund
Russell Investment Company
Russell Emerging Markets Fund
Statements of Changes in Net Assets, continued
* Share transaction amounts (in thousands) for the periods ended October 31, 2016 and October 31, 2015 were as follows:
| 2016 | 2015 | |||||||||||
| Shares | Dollars | Shares | Dollars | |||||||||
| Class A | ||||||||||||
| Proceeds from shares sold | 223 | $ | 3,275 | 250 | $ | 4,259 | ||||||
| Proceeds from reinvestment of distributions | — | — | 33 | 555 | ||||||||
| Payments for shares redeemed | (296 | ) | (4,339 | ) | (369 | ) | (6,261 | ) | ||||
| Net increase (decrease) | (73 | ) | (1,064 | ) | (86 | ) | (1,447 | ) | ||||
| Class C | ||||||||||||
| Proceeds from shares sold | 113 | 1,567 | 196 | 3,098 | ||||||||
| Proceeds from reinvestment of distributions | — | — | 35 | 564 | ||||||||
| Payments for shares redeemed | (409 | ) | (5,576 | ) | (436 | ) | (6,825 | ) | ||||
| Net increase (decrease) | (296 | ) | (4,009 | ) | (205 | ) | (3,163 | ) | ||||
| Class E | ||||||||||||
| Proceeds from shares sold | 198 | 2,967 | 638 | 10,295 | ||||||||
| Proceeds from reinvestment of distributions | — | — | 72 | 1,213 | ||||||||
| Payments for shares redeemed | (599 | ) | (8,967 | ) | (884 | ) | (13,928 | ) | ||||
| Net increase (decrease) | (401 | ) | (6,000 | ) | (174 | ) | (2,420 | ) | ||||
| Class R6(1) | ||||||||||||
| Proceeds from shares sold | 15 | 214 | — | — | ||||||||
| Payments for shares redeemed | (1 | ) | (10 | ) | — | — | ||||||
| Net increase (decrease) | 14 | 204 | — | — | ||||||||
| Class S | ||||||||||||
| Proceeds from shares sold | 30,778 | 454,336 | 33,452 | 562,136 | ||||||||
| Proceeds from reinvestment of distributions | 137 | 1,953 | 3,687 | 62,747 | ||||||||
| Payments for shares redeemed | (44,075 | ) | (651,379 | ) | (41,075 | ) | (687,360 | ) | ||||
| Net increase (decrease) | (13,160 | ) | (195,090 | ) | (3,936 | ) | (62,477 | ) | ||||
| Class Y | ||||||||||||
| Proceeds from shares sold | 4,484 | 70,519 | 2,781 | 47,300 | ||||||||
| Proceeds from reinvestment of distributions | 126 | 1,810 | 1,168 | 19,908 | ||||||||
| Payments for shares redeemed | (8,277 | ) | (128,539 | ) | (5,229 | ) | (92,368 | ) | ||||
| Net increase (decrease) | (3,667 | ) | (56,210 | ) | (1,280 | ) | (25,160 | ) | ||||
| Total increase (decrease) | (17,583 | ) | $ | (262,169 | ) | (5,681 | ) | $ | (94,667 | ) | ||
(1) For the period March 1, 2016 (commencement of operations) to October 31, 2016.
See accompanying notes which are an integral part of the financial statements.
Russell Emerging Markets Fund 255
Russell Investment Company
Russell Emerging Markets Fund
Financial Highlights — For the Periods Ended
For a Share Outstanding Throughout Each Period.
| $ | $ | $ | $ | $ | $ | |||||||||||||
| Net Asset Value, | Net | Net Realized | Total from | Distributions | Distributions | |||||||||||||
| Beginning of | Investment | and Unrealized | Investment | from Net | from Net | |||||||||||||
| Period | Income (Loss)(a)(d) | Gain (Loss) | Operations | Investment Income | Realized Gain | |||||||||||||
| Class A | ||||||||||||||||||
| October 31, 2016 | 15.09 | .11 | 1.31 | 1.42 | — | — | ||||||||||||
| October 31, 2015 | 18.50 | .10 | (3.03 | ) | (2.93 | ) | (.22 | ) | (.26 | ) | ||||||||
| October 31, 2014 | 18.96 | .13 | .04 | .17 | (.08 | ) | (.55 | ) | ||||||||||
| October 31, 2013 | 17.79 | .13 | 1.18 | 1.31 | (.14 | ) | — | |||||||||||
| October 31, 2012 | 18.06 | .19 | .46 | .65 | (.22 | ) | (.70 | ) | ||||||||||
| Class C | ||||||||||||||||||
| October 31, 2016 | 14.09 | — | 1.21 | 1.21 | — | — | ||||||||||||
| October 31, 2015 | 17.29 | (.02 | ) | (2.83 | ) | (2.85 | ) | (.09 | ) | (.26 | ) | |||||||
| October 31, 2014 | 17.81 | (.01 | ) | .04 | .03 | — | (.55 | ) | ||||||||||
| October 31, 2013 | 16.72 | (.01 | ) | 1.10 | 1.09 | — | — | |||||||||||
| October 31, 2012 | 16.99 | .05 | .45 | .50 | (.07 | ) | (.70 | ) | ||||||||||
| Class E | ||||||||||||||||||
| October 31, 2016 | 15.14 | .11 | 1.32 | 1.43 | — | — | ||||||||||||
| October 31, 2015 | 18.56 | .11 | (3.05 | ) | (2.94 | ) | (.22 | ) | (.26 | ) | ||||||||
| October 31, 2014 | 19.01 | .15 | .03 | .18 | (.08 | ) | (.55 | ) | ||||||||||
| October 31, 2013 | 17.83 | .14 | 1.17 | 1.31 | (.13 | ) | — | |||||||||||
| October 31, 2012 | 18.10 | .18 | .47 | .65 | (.22 | ) | (.70 | ) | ||||||||||
| Class R6 | ||||||||||||||||||
| October 31, 2016(8) | 13.39 | .16 | 3.13 | 3.29 | — | — | ||||||||||||
| Class S | ||||||||||||||||||
| October 31, 2016 | 15.20 | .15 | 1.32 | 1.47 | (.02 | ) | — | |||||||||||
| October 31, 2015 | 18.63 | .15 | (3.05 | ) | (2.90 | ) | (.27 | ) | (.26 | ) | ||||||||
| October 31, 2014 | 19.09 | .19 | .03 | .22 | (.13 | ) | (.55 | ) | ||||||||||
| October 31, 2013 | 17.91 | .18 | 1.18 | 1.36 | (.18 | ) | — | |||||||||||
| October 31, 2012 | 18.19 | .23 | .46 | .69 | (.27 | ) | (.70 | ) | ||||||||||
| Class Y | ||||||||||||||||||
| October 31, 2016 | 15.24 | .18 | 1.31 | 1.49 | (.05 | ) | — | |||||||||||
| October 31, 2015 | 18.68 | .18 | (3.06 | ) | (2.88 | ) | (.30 | ) | (.26 | ) | ||||||||
| October 31, 2014 | 19.14 | .22 | .03 | .25 | (.16 | ) | (.55 | ) | ||||||||||
| October 31, 2013 | 17.96 | .23 | 1.17 | 1.40 | (.22 | ) | — | |||||||||||
| October 31, 2012 | 18.23 | .26 | .47 | .73 | (.30 | ) | (.70 | ) | ||||||||||
See accompanying notes which are an integral part of the financial statements.
256 Russell Emerging Markets Fund
| % | % | % | ||||||||||||||||
| $ | $ | Ratio of Expenses | Ratio of Expenses | Ratio of Net | ||||||||||||||
| Net Asset Value, | % | Net Assets, | to Average | to Average | Investment Income | % | ||||||||||||
| $ | End of | Total | End of Period | Net Assets, | Net Assets, | to Average | Portfolio | |||||||||||
| Total Distributions | Period | Return(b)(c) | (000 | ) | Gross(e)(l) | Net(d)(e)(l) | Net Assets(d)(e) | Turnover Rate(b)(k) | ||||||||||
| — | 16.51 | 9.41 | 17,353 | 1.78 | 1.76 | .75 | 68 | |||||||||||
| (.48 | ) | 15.09 | (16.11 | ) | 16,963 | 1.77 | 1.77 | .62 | 71 | |||||||||
| (.63 | ) | 18.50 | 1.04 | 22,378 | 1.76 | 1.76 | .72 | 67 | ||||||||||
| (.14 | ) | 18.96 | 7.36 | 21,736 | 1.75 | 1.75 | .74 | 93 | ||||||||||
| (.92 | ) | 17.79 | 4.11 | 20,585 | 1.75 | 1.75 | 1.07 | 94 | ||||||||||
| — | 15.30 | 8.59 | 17,641 | 2.53 | 2.51 | (.03 | ) | 68 | ||||||||||
| (.35 | ) | 14.09 | (16.70 | ) | 20,415 | 2.52 | 2.52 | (.15 | ) | 71 | ||||||||
| (.55 | ) | 17.29 | .26 | 28,601 | 2.51 | 2.51 | (.05 | ) | 67 | |||||||||
| — | 17.81 | 6.55 | 28,808 | 2.50 | 2.50 | (.04 | ) | 93 | ||||||||||
| (.77 | ) | 16.72 | 3.37 | 31,671 | 2.50 | 2.50 | .29 | 94 | ||||||||||
| — | 16.57 | 9.45 | 34,786 | 1.78 | 1.76 | .75 | 68 | |||||||||||
| (.48 | ) | 15.14 | (16.12 | ) | 37,874 | 1.77 | 1.77 | .64 | 71 | |||||||||
| (.63 | ) | 18.56 | 1.09 | 49,652 | 1.76 | 1.76 | .80 | 67 | ||||||||||
| (.13 | ) | 19.01 | 7.37 | 39,296 | 1.75 | 1.75 | .74 | 93 | ||||||||||
| (.92 | ) | 17.83 | 4.11 | 38,808 | 1.75 | 1.75 | 1.05 | 94 | ||||||||||
| — | 16.68 | 24.57 | 240 | 1.39 | 1.34 | 1.48 | 68 | |||||||||||
| (.02 | ) | 16.65 | 9.68 | 1,709,494 | 1.53 | 1.51 | .99 | 68 | ||||||||||
| (.53 | ) | 15.20 | (15.86 | ) | 1,760,569 | 1.52 | 1.52 | .87 | 71 | |||||||||
| (.68 | ) | 18.63 | 1.31 | 2,231,799 | 1.51 | 1.51 | 1.02 | 67 | ||||||||||
| (.18 | ) | 19.09 | 7.64 | 1,596,632 | 1.50 | 1.50 | .99 | 93 | ||||||||||
| (.97 | ) | 17.91 | 4.33 | 1,341,106 | 1.50 | 1.50 | 1.33 | 94 | ||||||||||
| (.05 | ) | 16.68 | 9.86 | 499,476 | 1.33 | 1.31 | 1.20 | 68 | ||||||||||
| (.56 | ) | 15.24 | (15.70 | ) | 512,073 | 1.32 | 1.32 | 1.04 | 71 | |||||||||
| (.71 | ) | 18.68 | 1.50 | 651,728 | 1.31 | 1.31 | 1.16 | 67 | ||||||||||
| (.22 | ) | 19.14 | 7.80 | 482,265 | 1.30 | 1.30 | 1.26 | 93 | ||||||||||
| (1.00 | ) | 17.96 | 4.58 | 387,848 | 1.32 | 1.32 | 1.50 | 94 | ||||||||||
See accompanying notes which are an integral part of the financial statements.
Russell Emerging Markets Fund 257
Russell Investment Company
Russell Emerging Markets Fund
Related Party Transactions, Fees and Expenses
| Accrued fees payable to affiliates for the period ended October 31, 2016 were as follows: | ||
| Advisory fees | $ | 2,166,591 |
| Administration fees | 94,396 | |
| Distribution fees | 15,059 | |
| Shareholder servicing fees | 11,168 | |
| Transfer agent fees | 306,506 | |
| Trustee fees | 6,382 | |
| $ | 2,600,102 | |
| Transactions (amounts in thousands) during the period ended October 31, 2016 with Underlying Funds which are, or were, an | ||||||||||||||||||
| affiliated company are as follows: | ||||||||||||||||||
| Fair Value, | Change in | |||||||||||||||||
| Beginning of | Realized Gain | Unrealized | Fair Value, End | Income | Capital Gains | |||||||||||||
| Period | Purchases | Sales | (Loss) | Gain (Loss) | of Period | Distributions | Distributions | |||||||||||
| Russell U.S. Cash Collateral Fund $ | 79,491 | $ | 397,510 | $ | 428,232 | $ | — | $ | — | $ | 48,769 | $ | 270 | $ | — | |||
| Russell U.S. Cash Management Fund | 99,452 | 1,140,171 | 1,146,016 | 7 | 2 | 93,616 | 257 | — | ||||||||||
| $ | 178,943 | $ | 1,537,681 | $ | 1,574,248 | $ | 7 | $ | 2 | $ | 142,385 | $ | 527 | $ | — | |||
Federal Income Taxes
At October 31, 2016, the cost of investments and net unrealized appreciation (depreciation), undistributed ordinary income
undistributed long-term capital gains for income tax purposes were as follows:.
| Cost of Investments | $ | 2,169,891,252 | ||
| Unrealized Appreciation | $ | 218,367,491 | ||
| Unrealized Depreciation | (96,390,305 | ) | ||
| Net Unrealized Appreciation (Depreciation) | $ | 121,977,186 | ||
| Undistributed Ordinary Income | $ | 23,507,879 | ||
| Undistributed Long-Term Capital Gains | ||||
| (Capital Loss Carryforward) | $ | (184,984,230 | ) | |
| Tax Composition of Distributions | ||||
| Ordinary Income | $ | 3,780,581 |
Net investment income and net realized gains (loss) in the financial statements may differ from taxable net investment income and net
realized gains (losses). Capital accounts within the financial statements are adjusted for permanent book-tax differences. Book-tax
differences are primarily due to foreign currency gains and losses, reclassifications of dividends, differences in treatment of income
from swaps, net operating losses, investments in partnerships, investments in passive foreign investment companies (PFICs), tax
straddle transactions, use of tax equalization and foreign capital gains taxes. These adjustments have no impact on the net assets.
At October 31, 2016, the Statement of Assets and Liabilities have been adjusted by the following amounts (in thousands):
| Undistributed net investment income | $ | 17,820 | |
| Accumulated net realized gain (loss) | (17,819 | ) | |
| Additional paid-in capital | (1 | ) |
See accompanying notes which are an integral part of the financial statements.
258 Russell Emerging Markets Fund
Russell Investment Company
Russell Tax-Managed U.S. Large Cap Fund
Portfolio Management Discussion and Analysis — October 31, 2016 (Unaudited)

| Russell Tax-Managed U.S. Large Cap Fund - Class A‡ | S&P 500® Index** | ||||||
| Total | Total | ||||||
| Return | Return | ||||||
| 1 Year | (3.88 | )% | 1 Year | 4.51 | % | ||
| 5 Years | 10.61 | %§ | 5 Years | 13.57 | %§ | ||
| 10 Years | 5.17 | %§ | 10 Years | 6.70 | %§ | ||
| Russell Tax-Managed U.S. Large Cap Fund - Class C | |||||||
| Total | |||||||
| Return | |||||||
| 1 Year | 1.23 | % | |||||
| 5 Years | 11.09 | %§ | |||||
| 10 Years | 5.01 | %§ | |||||
| Russell Tax-Managed U.S. Large Cap Fund - Class E | |||||||
| Total | |||||||
| Return | |||||||
| 1 Year | 1.98 | % | |||||
| 5 Years | 11.93 | %§ | |||||
| 10 Years | 5.80 | %§ | |||||
| Russell Tax-Managed U.S. Large Cap Fund - Class S | |||||||
| Total | |||||||
| Return | |||||||
| 1 Year | 2.25 | % | |||||
| 5 Years | 12.21 | %§ | |||||
| 10 Years | 6.07 | %§ | |||||
Russell Tax-Managed U.S. Large Cap Fund 259
Russell Investment Company
Russell Tax-Managed U.S. Large Cap Fund
Portfolio Management Discussion and Analysis, continued — October 31, 2016
(Unaudited)
| The Russell Tax-Managed U.S. Large Cap Fund (the “Fund”) | sensitive, high dividend yield, and low beta stocks (beta is a |
| employs a multi-manager approach whereby Russell Investment | measure of a stock’s sensitivity to the direction of the market) |
| Management, LLC (“RIM”) manages a portion of the Fund’s | such as utilities, real estate investment trusts, and consumer |
| assets based upon model portfolios provided by multiple non- | staples. Overall, the market conditions of the first half of the fiscal |
| discretionary money managers. The Fund’s money managers have | year had a negative effect on Fund performance as the pace of |
| non-discretionary asset management assignments pursuant to | interest rate increases was slower than the market had expected |
| which they provide a model portfolio to RIM representing their | and investors became concerned that the odds of a recession may |
| investment recommendations, based upon which RIM purchases | be increasing. However, market conditions in the second half |
| and sells securities for the Fund. RIM also manages the portion of | of the fiscal year allowed the Fund to make up a portion of the |
| the Fund's assets that RIM determines not to manage based upon | initial shortfall as expectations firmed-up regarding the economic |
| model portfolios provided by the Fund's money managers. RIM | outlook and the timing of the next interest rate increase. |
| may change the allocation of the Fund’s assets at any time. An | |
| exemptive order from the Securities and Exchange Commission | How did the investment strategies and techniques employed |
| (“SEC”) permits RIM to engage or terminate a money manager | by the Fund and its money managers affect its benchmark- |
| at any time, subject to approval by the Fund’s Board, without a | relative performance? |
| shareholder vote. Pursuant to the terms of the exemptive order, | Stock selection within the consumer discretionary sector (an |
| the Fund is required to notify its shareholders within 90 days of | overweight to Starbucks Corporation) and within the financials |
| when a money manager begins providing services. As of October | sector (an overweight to Wells Fargo & Company) detracted from |
| 31, 2016, the Fund had five money managers. | the Fund’s benchmark-relative performance for the fiscal year. |
| Underweights to the lowest beta stocks and to high dividend yield | |
| What is the Fund’s investment objective? | stocks were not beneficial. An overweight to the financials sector |
| The Fund seeks to provide long term capital growth on an after- | and underweights to the utilities and consumer staples sectors |
| tax basis. | were not rewarded. An overweight to the airlines industry held |
| How did the Fund perform relative to its benchmark for the | back benchmark-relative performance but an overweight to the |
| fiscal year ended October 31, 2016? | software industry was beneficial. |
| For the fiscal year ended October 31, 2016, the Fund’s Class | The Fund’s money managers have non-discretionary asset |
| A, Class C, Class E and Class S Shares gained 2.00%, 1.23%, | management assignments pursuant to which they provide a model |
| 1.98% and 2.25%, respectively. This is compared to the Fund’s | portfolio to RIM representing their investment recommendations, |
| benchmark, the S&P 500® Index, which gained 4.51% during | based upon which RIM purchases and sells securities for the |
| the same period. The Fund’s performance includes operating | Fund. With respect to this portion of the Fund, RIM manages |
| expenses, whereas index returns are unmanaged and do not | the Fund’s assets based upon the model portfolios provided by |
| include expenses of any kind. | the Fund’s money managers. RIM also manages the portion of |
| the Fund's assets that RIM determines not to manage based upon | |
| For the fiscal year ended October 31, 2016, the Morningstar® | model portfolios provided by the Fund's money managers. This |
| Large Growth Category, a group of funds that Morningstar | includes assets managed directly by RIM to effect the Fund's |
| considers to have investment strategies similar to those of the | investment strategies and/or to actively manage the Fund's overall |
| Fund, lost 0.07%. This result serves as a peer comparison and is | exposures to seek to achieve the desired risk/return profile for the |
| expressed net of operating expenses. | Fund. RIM also manages the Fund’s liquidity reserves. |
| RIM may assign a money manager a specific style or | With respect to certain of the Fund’s money managers, Mar Vista |
| capitalization benchmark other than the Fund’s index. However, | Investment Partners, LLC (“Mar Vista”) was the best performing |
| the Fund’s primary index remains the benchmark for the Fund | manager for the period and outperformed the Russell 1000 |
| and is representative of the aggregate of each money manager’s | Growth Index for the fiscal year. Mar Vista’s tilt away from the |
| benchmark index. | highest beta stocks was beneficial. Stock selection within the |
| How did the market conditions described in the Market | industrials sector (an overweight to TransDigm Incorporated and |
| Summary report affect the Fund’s performance? | Mettler-Toledo International) and within the health care sector |
| During the fiscal year, the U.S. large capitalization equity market | (an overweight to St. Jude Medical, an underweight to Gilead |
| produced positive returns. Fund exposures included tilts toward | Sciences) contributed positively to benchmark-relative returns. |
| moderate valuation stocks and the financials sector. The Fund | Armstrong Shaw Associates Inc. (“Armstrong”) was the worst |
| was tilted away from less economically sensitive, interest rate | performing manager for the period and underperformed the |
260 Russell Tax-Managed U.S. Large Cap Fund
Russell Investment Company
Russell Tax-Managed U.S. Large Cap Fund
Portfolio Management Discussion and Analysis, continued — October 31, 2016
(Unaudited)
| Russell 1000® Value Index for the fiscal year. Tilts away from | selection. From a benchmark-relative perspective, the strategy | |
| low beta stocks and away from high dividend yield stocks were | outperformed the S&P 500 Index for the fiscal year. Sector | |
| not beneficial. An underweight to the utilities sector and an | overweights to information technology and telecommunication | |
| overweight to the financials sector detracted. Stock selection | services contributed positively to relative performance. A tilt | |
| within the industrials sector (an overweight to Delta Airlines) and | toward the highest dividend yield stocks was rewarded. | |
| within the real estate sector (an overweight to Realogy Holdings, | During the period, RIM used index futures contracts to equitize | |
| Inc.) held back benchmark-relative performance. | the Fund’s cash. The decision to equitize the Fund’s cash was | |
| RIM manages a positioning strategy within the Fund, which is | beneficial to Fund performance for the fiscal year as the market | |
| designed with the dual mandate of improving the Fund’s after-tax | had a positive absolute return. | |
| returns as well as controlling Fund-level exposures and/or risks. | ||
| Describe any changes to the Fund’s structure or the money | ||
| The active tax management aspect of the strategy is focused on | manager line-up. | |
| improving the after-tax returns of the Fund. Because RIM controls | There were no changes to the Fund’s structure or money manager | |
| all trading for the Fund, RIM managed the tax lots of the Fund | line up during the fiscal year. | |
| and harvested losses and deferred capital gains with respect to | ||
| certain securities during the fiscal year. As a result, no realized | Money Managers as of October 31, | |
| capital gains are expected to be distributed to Fund shareholders | 2016 | Styles |
| from the fiscal year. | Armstrong Shaw Associates Inc. | Value |
| In addition, using the output from a quantitative model to guide | Barrow, Hanley, Mewhinney & Strauss, LLC Value | |
| J.P. Morgan Investment Management Inc. | Market-Oriented | |
| the purchase of a stock portfolio, RIM seeks to position the Fund | Mar Vista Investment Partners, LLC | Growth |
| to meet RIM’s overall preferred positioning with respect to Fund | Sustainable Growth Advisers, LP | Growth |
| exposures, while optimizing the portfolio to minimize tracking | The views expressed in this report reflect those of the | |
| error relative to the Fund’s money manager portfolios. Over the | portfolio managers only through the end of the period | |
| period, the Fund’s positioning strategy was designed to provide | covered by the report. These views do not necessarily | |
| exposure to Russell Top 200® Index holdings and to certain | represent the views of RIM, or any other person in RIM or | |
| sectors that tend to be underweighted by the Fund’s money | any other affiliated organization. These views are subject | |
| managers relative to the Fund’s S&P 500® benchmark (information | to change at any time based upon market conditions or | |
| technology, consumer discretionary, telecommunication services | other events, and RIM disclaims any responsibility to | |
| and utilities). The Russell Top 200® Index consists of the largest | update the views contained herein. These views should not | |
| Russell 1000® Index stocks. The positioning strategy was | be relied on as investment advice and, because investment | |
| also designed to help control the beta, volatility, and market | decisions for a Russell Investment Company (“RIC”) Fund | |
| capitalization exposures arising from the money managers’ stock | are based on numerous factors, should not be relied on as | |
| selection while preserving the potential benefits of active stock | an indication of investment decisions of any RIC Fund. | |
* Assumes initial investment on November 1, 2006.
** The Standard & Poor’s 500® Index is composed of 500 common stocks which are chosen by Standard & Poor’s Corporation to best capture the price performance
of a large cross-section of the U.S. publicly traded stock market. The index is structured to approximate the general distribution of industries in the U.S.
economy.
‡ The Fund first issued Class A Shares on June 1, 2010. The returns shown for Class A Shares prior to that date are the returns of Class E Shares. The
performance shown has been adjusted to reflect the deduction of the maximum Class A sales charge of 5.75%. Annual returns for each Class will differ only to
the extent that the Class A Shares do not have the same expenses as Class E Shares.
§ Annualized.
Performance is historical and assumes reinvestment of all dividends and capital gains. Investment return and principal value will fluctuate so that an investor’s
shares, when redeemed, may be worth more or less than when purchased. Past performance is not indicative of future results. The returns shown do not reflect the
deduction of taxes that a shareholder would pay on Fund distributions or the redemption of Fund shares. Additionally, the returns presented herein may differ from
the performance reported in the Financial Highlights as the returns herein are calculated in a manner consistent with standardized performance in accordance with
Securities and Exchange Commission rules, while the performance in the Financial Highlights has been calculated in accordance with U.S. Generally Accepted
Accounting Principles (“U.S. GAAP”).
Russell Tax-Managed U.S. Large Cap Fund 261
Russell Investment Company
Russell Tax-Managed U.S. Large Cap Fund
Shareholder Expense Example — October 31, 2016 (Unaudited)
| Fund Expenses | Please note that the expenses shown in the table are meant | |||||
| The following disclosure provides important information | to highlight your ongoing costs only and do not reflect any | |||||
| regarding the Fund’s Shareholder Expense Example | transactional costs. Therefore, the information under the heading | |||||
| (“Example”). | “Hypothetical Performance (5% return before expenses)” is | |||||
| useful in comparing ongoing costs only, and will not help you | ||||||
| Example | determine the relative total costs of owning different funds. In | |||||
| As a shareholder of the Fund, you incur two types of costs: (1) | addition, if these transactional costs were included, your costs | |||||
| transaction costs, including sales charges (loads) on certain | would have been higher. | |||||
| purchase or redemption payments, and (2) ongoing costs, | Hypothetical | |||||
| including distribution (12b-1) and/or service fees and other | Performance (5% | |||||
| Fund expenses. The Example is intended to help you understand | Actual | return before | ||||
| your ongoing costs (in dollars) of investing in the Fund and to | Class A | Performance | expenses) | |||
| Beginning Account Value | ||||||
| compare these costs with the ongoing costs of investing in other | May 1, 2016 | $ | 1,000.00 | $ | 1,000.00 | |
| mutual funds. The Example is based on an investment of $1,000 | Ending Account Value | |||||
| invested at the beginning of the period and held for the entire | October 31, 2016 | $ | 1,028.10 | $ | 1,019.00 | |
| period indicated, which for this Fund is from May 1, 2016 to | Expenses Paid During Period* | $ | 6.22 | $ | 6.19 | |
| October 31, 2016. | * Expenses are equal to the Fund's annualized expense ratio of 1.22% | |||||
| (representing the six month period annualized), multiplied by the average | ||||||
| Actual Expenses | account value over the period, multiplied by 184/366 (to reflect the one-half | |||||
| The information in the table under the heading “Actual | year period). | |||||
| Performance” provides information about actual account values | ||||||
| and actual expenses. You may use the information in this column, | Hypothetical | |||||
| Performance (5% | ||||||
| together with the amount you invested, to estimate the expenses | Actual | return before | ||||
| that you paid over the period. Simply divide your account value by | Class C | Performance | expenses) | |||
| $1,000 (for example, an $8,600 account value divided by $1,000 | Beginning Account Value | |||||
| = 8.6), then multiply the result by the number in the first column | May 1, 2016 | $ | 1,000.00 | $ | 1,000.00 | |
| Ending Account Value | ||||||
| in the row entitled “Expenses Paid During Period” to estimate | October 31, 2016 | $ | 1,024.10 | $ | 1,015.23 | |
| the expenses you paid on your account during this period. | Expenses Paid During Period* | $ | 10.02 | $ | 9.98 | |
| Hypothetical Example for Comparison Purposes | * Expenses are equal to the Fund's annualized expense ratio of 1.97% | |||||
| The information in the table under the heading “Hypothetical | (representing the six month period annualized), multiplied by the average | |||||
| account value over the period, multiplied by 184/366 (to reflect the one-half | ||||||
| Performance (5% return before expenses)” provides information | year period). | |||||
| about hypothetical account values and hypothetical expenses | ||||||
| based on the Fund’s actual expense ratio and an assumed rate of | Hypothetical | |||||
| return of 5% per year before expenses, which is not the Fund’s | Performance (5% | |||||
| Actual | return before | |||||
| actual return. The hypothetical account values and expenses | Class E | Performance | expenses) | |||
| may not be used to estimate the actual ending account balance or | Beginning Account Value | |||||
| expenses you paid for the period. You may use this information | May 1, 2016 | $ | 1,000.00 | $ | 1,000.00 | |
| to compare the ongoing costs of investing in the Fund and other | Ending Account Value | |||||
| October 31, 2016 | $ | 1,028.00 | $ | 1,019.00 | ||
| funds. To do so, compare this 5% hypothetical example with the | Expenses Paid During Period* | $ | 6.22 | $ | 6.19 | |
| 5% hypothetical examples that appear in the shareholder reports | ||||||
| of other funds. | * Expenses are equal to the Fund's annualized expense ratio of 1.22% | |||||
| (representing the six month period annualized), multiplied by the average | ||||||
| account value over the period, multiplied by 184/366 (to reflect the one-half | ||||||
| year period). | ||||||
262 Russell Tax-Managed U.S. Large Cap Fund
Russell Investment Company
Russell Tax-Managed U.S. Large Cap Fund
Shareholder Expense Example, continued — October 31, 2016 (Unaudited)
| Hypothetical | |||||
| Performance (5% | |||||
| Actual | return before | ||||
| Class S | Performance | expenses) | |||
| Beginning Account Value | |||||
| May 1, 2016 | $ | 1,000.00 | $ | 1,000.00 | |
| Ending Account Value | |||||
| October 31, 2016 | $ | 1,029.40 | $ | 1,020.26 | |
| Expenses Paid During Period* | $ | 4.95 | $ | 4.93 | |
| * Expenses are equal to the Fund's annualized expense ratio of 0.97% | |||||
| (representing the six month period annualized), multiplied by the average | |||||
| account value over the period, multiplied by 184/366 (to reflect the one-half | |||||
| year period). | |||||
Russell Tax-Managed U.S. Large Cap Fund 263
Russell Investment Company
Russell Tax-Managed U.S. Large Cap Fund
Schedule of Investments — October 31, 2016
| Amounts in thousands (except share amounts) | Amounts in thousands (except share amounts) | ||||||
| Principal | Fair | Principal | Fair | ||||
| Amount ($) or | Value | Amount ($) or | Value | ||||
| Shares | $ | Shares | $ | ||||
| Common Stocks - 93.5% | Mondelez International, Inc. Class A | 528,459 | 23,749 | ||||
| Consumer Discretionary - 11.4% | PepsiCo, Inc. | 194,765 | 20,879 | ||||
| Amazon.com, Inc.(Æ) | 31,185 | 24,631 | Philip Morris International, Inc. | 142,740 | 13,766 | ||
| AutoZone, Inc.(Æ) | 2,200 | 1,633 | Procter & Gamble Co. (The) | 70,852 | 6,150 | ||
| Carnival Corp. | 7,494 | 368 | Reynolds American, Inc. | 73,679 | 4,058 | ||
| CBS Corp. Class B | 23,776 | 1,346 | Unilever NV | 227,522 | 9,515 | ||
| Charter Communications, Inc. Class A(Æ) | 12,660 | 3,164 | Walgreens Boots Alliance, Inc. | 35,994 | 2,978 | ||
| Chipotle Mexican Grill, Inc. Class A(Æ) | 16,213 | 5,849 | Whole Foods Market, Inc. | 213,358 | 6,036 | ||
| Comcast Corp. Class A | 330,345 | 20,422 | |||||
| Costco Wholesale Corp. | 20,205 | 2,988 | 133,250 | ||||
| CST Brands, Inc. | 3,500 | 168 | |||||
| Delphi Automotive PLC | 15,697 | 1,021 | Energy - 6.6% | ||||
| Anadarko Petroleum Corp. | 10,588 | 629 | |||||
| DISH Network Corp. Class A(Æ) | 10,810 | 633 | Apache Corp. | 7,974 | 474 | ||
| Dollar General Corp. | 8,600 | 594 | Baker Hughes, Inc. | 16,422 | 910 | ||
| Dollar Tree, Inc.(Æ) | 5,970 | 451 | BP PLC - ADR | 96,815 | 3,442 | ||
| DR Horton, Inc. | 23,709 | 684 | Cabot Oil & Gas Corp. | 42,924 | 896 | ||
| eBay, Inc.(Æ) | 5,789 | 165 | Chevron Corp. | 149,973 | 15,710 | ||
| Estee Lauder Cos., Inc. (The) Class A | 9,487 | 827 | Concho Resources, Inc.(Æ) | 9,484 | 1,204 | ||
| Expedia, Inc. | 5,900 | 762 | ConocoPhillips | 116,694 | 5,070 | ||
| Ford Motor Co. | 464,313 | 5,451 | Core Laboratories NV | 114,991 | 11,151 | ||
| Gap, Inc. (The) | 148,966 | 4,110 | Devon Energy Corp. | 11,954 | 453 | ||
| General Motors Co. | 52,328 | 1,654 | Diamondback Energy, Inc.(Æ) | 8,621 | 787 | ||
| Harman International Industries, Inc. | 6,091 | 485 | EOG Resources, Inc. | 32,555 | 2,944 | ||
| Home Depot, Inc. (The) | 57,634 | 7,032 | EQT Corp. | 16,959 | 1,119 | ||
| Interpublic Group of Cos., Inc. (The) | 14,867 | 333 | Exxon Mobil Corp. | 152,616 | 12,716 | ||
| Lennar Corp. Class A | 2,800 | 117 | Halliburton Co. | 222,967 | 10,256 | ||
| Lowe's Cos., Inc. | 185,439 | 12,359 | Kinder Morgan, Inc. | 27,749 | 567 | ||
| Macy's, Inc. | 12,300 | 449 | Marathon Petroleum Corp. | 3,291 | 143 | ||
| McDonald's Corp. | 11,006 | 1,239 | Occidental Petroleum Corp. | 159,002 | 11,593 | ||
| Nike, Inc. Class B | 252,897 | 12,690 | Phillips 66 | 91,655 | 7,438 | ||
| O'Reilly Automotive, Inc.(Æ) | 22,045 | 5,830 | Pioneer Natural Resources Co. | 56,921 | 10,190 | ||
| Priceline Group, Inc. (The)(Æ) | 6,375 | 9,398 | Schlumberger, Ltd. | 277,804 | 21,733 | ||
| PulteGroup, Inc. | 44,100 | 820 | Spectra Energy Corp. | 16,266 | 680 | ||
| Ross Stores, Inc. | 18,800 | 1,176 | Valero Energy Corp. | 20,857 | 1,236 | ||
| Royal Caribbean Cruises, Ltd. | 19,702 | 1,514 | Williams Cos., Inc. (The) | 14,626 | 427 | ||
| Starbucks Corp. | 352,700 | 18,718 | |||||
| Target Corp. | 127,612 | 8,771 | 121,768 | ||||
| Time Warner, Inc. | 64,864 | 5,772 | |||||
| TJX Cos., Inc. | 169,962 | 12,535 | Financial Services - 20.4% | ||||
| Twenty-First Century Fox, Inc. Class A | 74,690 | 1,962 | Alliance Data Systems Corp. | 20,780 | 4,249 | ||
| VF Corp. | 35,920 | 1,947 | American Express Co. | 108,501 | 7,207 | ||
| Wal-Mart Stores, Inc. | 161,747 | 11,325 | American International Group, Inc. | 172,145 | 10,621 | ||
| Walt Disney Co. (The) | 73,404 | 6,804 | American Tower Corp.(ö) | 157,376 | 18,443 | ||
| Whirlpool Corp. | 18,321 | 2,745 | Ameriprise Financial, Inc. | 51,633 | 4,564 | ||
| Wyndham Worldwide Corp. | 102,189 | 6,728 | Aon PLC | 38,352 | 4,251 | ||
| Yum! Brands, Inc. | 29,534 | 2,548 | Arthur J Gallagher & Co. | 10,292 | 496 | ||
| AvalonBay Communities, Inc.(ö) | 7,200 | 1,233 | |||||
| 210,218 | Bank of America Corp. | 1,318,379 | 21,753 | ||||
| Bank of New York Mellon Corp. (The) | 16,659 | 721 | |||||
| Consumer Staples - 7.3% | BB&T Corp. | 6,074 | 238 | ||||
| Altria Group, Inc. | 142,204 | 9,402 | Berkshire Hathaway, Inc. Class B(Æ) | 151,321 | 21,836 | ||
| Archer-Daniels-Midland Co. | 26,319 | 1,147 | BlackRock, Inc. Class A | 5,485 | 1,872 | ||
| Coca-Cola Co. (The) | 84,294 | 3,574 | Boston Properties, Inc.(ö) | 4,641 | 559 | ||
| Colgate-Palmolive Co. | 109,113 | 7,786 | Capital One Financial Corp. | 169,167 | 12,525 | ||
| Constellation Brands, Inc. Class A | 18,440 | 3,082 | Charles Schwab Corp. (The) | 64,673 | 2,050 | ||
| CVS Health Corp. | 134,393 | 11,302 | Chubb, Ltd. | 119,653 | 15,196 | ||
| Dr Pepper Snapple Group, Inc. | 14,940 | 1,312 | Citigroup, Inc. | 323,640 | 15,907 | ||
| Hershey Co. (The) | 4,970 | 509 | CME Group, Inc. Class A | 2,510 | 251 | ||
| Kimberly-Clark Corp. | 22,069 | 2,525 | Comerica, Inc. | 60,506 | 3,152 | ||
| Kraft Heinz Co. (The) | 13,100 | 1,165 | Discover Financial Services | 29,578 | 1,666 | ||
| Kroger Co. (The) | 49,598 | 1,537 | Ecolab, Inc. | 141,891 | 16,200 | ||
| Molson Coors Brewing Co. Class B | 26,759 | 2,778 | |||||
See accompanying notes which are an integral part of the financial statements.
264 Russell Tax-Managed U.S. Large Cap Fund
Russell Investment Company
Russell Tax-Managed U.S. Large Cap Fund
Schedule of Investments, continued — October 31, 2016
| Amounts in thousands (except share amounts) | Amounts in thousands (except share amounts) | ||||||
| Principal | Fair | Principal | Fair | ||||
| Amount ($) or | Value | Amount ($) or | Value | ||||
| Shares | $ | Shares | $ | ||||
| Equifax, Inc. | 11,321 | 1,404 | Cigna Corp. | 94 | 11 | ||
| Equinix, Inc.(ö) | 29,524 | 10,548 | Eli Lilly & Co. | 45,153 | 3,334 | ||
| Everest Re Group, Ltd. | 900 | 183 | Express Scripts Holding Co.(Æ) | 4,938 | 333 | ||
| Extra Space Storage, Inc.(ö) | 6,120 | 448 | Gilead Sciences, Inc. | 54,378 | 4,004 | ||
| Fidelity National Information Services, Inc. | 31,196 | 2,306 | HCA Holdings, Inc.(Æ) | 4,616 | 353 | ||
| Fifth Third Bancorp | 11,520 | 251 | Humana, Inc. | 17,180 | 2,947 | ||
| First Republic Bank | 2,386 | 178 | Illumina, Inc.(Æ) | 4,189 | 570 | ||
| FleetCor Technologies, Inc.(Æ) | 41,621 | 7,296 | Intuitive Surgical, Inc.(Æ) | 104 | 70 | ||
| Goldman Sachs Group, Inc. (The) | 53,346 | 9,508 | Johnson & Johnson | 256,215 | 29,718 | ||
| Hartford Financial Services Group, Inc. | 55,496 | 2,448 | McKesson Corp. | 6,046 | 769 | ||
| Highwoods Properties, Inc.(ö) | 8,040 | 399 | Medtronic PLC | 138,574 | 11,366 | ||
| Intercontinental Exchange, Inc. | 53,228 | 14,392 | Merck & Co., Inc. | 257,486 | 15,120 | ||
| Invesco, Ltd. | 31,200 | 876 | Novo Nordisk A/S - ADR | 74,293 | 2,640 | ||
| JPMorgan Chase & Co. | 227,670 | 15,769 | PerkinElmer, Inc. | 2,100 | 107 | ||
| KeyCorp | 84,833 | 1,198 | Pfizer, Inc. | 578,373 | 18,340 | ||
| Kilroy Realty Corp.(ö) | 9,100 | 654 | Regeneron Pharmaceuticals, Inc.(Æ) | 16,716 | 5,767 | ||
| Loews Corp. | 204,585 | 8,803 | Sanofi - ADR | 40,450 | 1,573 | ||
| M&T Bank Corp. | 1,250 | 153 | St. Jude Medical, Inc. | 73,997 | 5,760 | ||
| Markel Corp.(Æ) | 14,532 | 12,751 | Stryker Corp. | 13,945 | 1,609 | ||
| Mastercard, Inc. Class A | 15,196 | 1,626 | Teva Pharmaceutical Industries, Ltd. - ADR | 12,650 | 541 | ||
| MetLife, Inc. | 118,150 | 5,548 | Thermo Fisher Scientific, Inc. | 82,339 | 12,106 | ||
| Morgan Stanley | 105,782 | 3,551 | UnitedHealth Group, Inc. | 124,574 | 17,606 | ||
| Northern Trust Corp. | 1,827 | 132 | Vertex Pharmaceuticals, Inc.(Æ) | 17,059 | 1,294 | ||
| PayPal Holdings, Inc.(Æ) | 838 | 35 | Zoetis, Inc. Class A | 13,700 | 655 | ||
| PNC Financial Services Group, Inc. (The) | 22,409 | 2,142 | 233,337 | ||||
| Prologis, Inc.(ö) | 30,162 | 1,573 | |||||
| Prudential Financial, Inc. | 7,700 | 653 | Materials and Processing - 3.0% | ||||
| Raymond James Financial, Inc. | 6,917 | 416 | AdvanSix, Inc.(Æ) | 13,686 | 218 | ||
| Realogy Holdings Corp. | 298,531 | 6,833 | Air Products & Chemicals, Inc. | 65,233 | 8,703 | ||
| Regions Financial Corp. | 20,514 | 220 | Ball Corp. | 3,000 | 231 | ||
| Simon Property Group, Inc.(ö) | 9,970 | 1,854 | Celanese Corp. Class A | 43,534 | 3,175 | ||
| SL Green Realty Corp.(ö) | 6,960 | 684 | CRH PLC - ADR | 278,001 | 8,980 | ||
| State Street Corp. | 214,059 | 15,029 | Crown Holdings, Inc.(Æ) | 24,853 | 1,348 | ||
| SunTrust Banks, Inc. | 6,350 | 287 | Dow Chemical Co. (The) | 167,787 | 9,029 | ||
| SVB Financial Group(Æ) | 2,068 | 253 | Eastman Chemical Co. | 7,126 | 512 | ||
| Synchrony Financial | 423,540 | 12,109 | EI du Pont de Nemours & Co. | 25,098 | 1,727 | ||
| TD Ameritrade Holding Corp. | 6,600 | 226 | Ingersoll-Rand PLC | 16,221 | 1,092 | ||
| Travelers Cos., Inc. (The) | 657 | 71 | Ingevity Corp.(Æ) | 4,417 | 183 | ||
| US Bancorp | 172,375 | 7,716 | International Paper Co. | 84,569 | 3,808 | ||
| Visa, Inc. Class A | 285,546 | 23,560 | Martin Marietta Materials, Inc. | 6,899 | 1,279 | ||
| Wells Fargo & Co. | 655,968 | 30,181 | Masco Corp. | 34,250 | 1,058 | ||
| XL Group, Ltd. | 155,313 | 5,389 | Monsanto Co. | 40,232 | 4,054 | ||
| 374,643 | Mosaic Co. (The) | 23,464 | 552 | ||||
| PPG Industries, Inc. | 4,260 | 397 | |||||
| Health Care - 12.7% | Praxair, Inc. | 39,607 | 4,636 | ||||
| Abbott Laboratories | 37,121 | 1,457 | Rio Tinto PLC - ADR | 37,916 | 1,321 | ||
| AbbVie, Inc. | 170,304 | 9,500 | Versum Materials, Inc.(Æ) | 32,616 | 740 | ||
| Aetna, Inc. | 25,238 | 2,709 | WestRock Co. | 26,503 | 1,224 | ||
| Alexion Pharmaceuticals, Inc.(Æ) | 13,214 | 1,724 | 54,267 | ||||
| Allergan PLC(Æ) | 118,908 | 24,845 | |||||
| Amgen, Inc. | 108,322 | 15,291 | Producer Durables - 11.2% | ||||
| Anthem, Inc. | 97,572 | 11,890 | 3M Co. | 5,520 | 913 | ||
| Baxter International, Inc. | 7,837 | 373 | Accenture PLC Class A | 43,472 | 5,053 | ||
| Becton Dickinson and Co. | 3,015 | 506 | Adient PLC(Æ) | 16,278 | 741 | ||
| Biogen, Inc.(Æ) | 11,230 | 3,146 | Allegion PLC | 18,766 | 1,198 | ||
| Boston Scientific Corp.(Æ) | 131,115 | 2,885 | Automatic Data Processing, Inc. | 80,628 | 7,020 | ||
| Bristol-Myers Squibb Co. | 81,931 | 4,171 | B/E Aerospace, Inc. | 113,697 | 6,767 | ||
| Cardinal Health, Inc. | 88,422 | 6,074 | Boeing Co. (The) | 202 | 29 | ||
| Celgene Corp.(Æ) | 44,347 | 4,531 | Canadian Pacific Railway, Ltd. | 2,520 | 360 | ||
| Cerner Corp.(Æ) | 130,458 | 7,642 | CSX Corp. | 63,100 | 1,925 | ||
See accompanying notes which are an integral part of the financial statements.
Russell Tax-Managed U.S. Large Cap Fund 265
Russell Investment Company
Russell Tax-Managed U.S. Large Cap Fund
Schedule of Investments, continued — October 31, 2016
| Amounts in thousands (except share amounts) | Amounts in thousands (except share amounts) | |||||||
| Principal | Fair | Principal | Fair | |||||
| Amount ($) or | Value | Amount ($) or | Value | |||||
| Shares | $ | Shares | $ | |||||
| Danaher Corp. | 4,171 | 328 | Microsoft Corp. | 633,468 | 37,957 | |||
| Deere & Co. | 1,500 | 132 | NXP Semiconductors NV(Æ) | 126,700 | 12,670 | |||
| Delta Air Lines, Inc. | 298,757 | 12,479 | Oracle Corp. | 493,119 | 18,946 | |||
| Eaton Corp. PLC | 35,449 | 2,261 | QUALCOMM, Inc. | 177,871 | 12,223 | |||
| Emerson Electric Co. | 13,090 | 663 | Red Hat, Inc.(Æ) | 91,858 | 7,114 | |||
| FedEx Corp. | 1,662 | 290 | Salesforce.com, Inc.(Æ) | 95,649 | 7,189 | |||
| Fluor Corp. | 3,136 | 163 | SAP SE - ADR | 67,425 | 5,923 | |||
| Fortive Corp. | 2,085 | 106 | TE Connectivity, Ltd. | 26,465 | 1,664 | |||
| General Dynamics Corp. | 47,303 | 7,130 | Texas Instruments, Inc. | 67,206 | 4,762 | |||
| General Electric Co. | 479,030 | 13,940 | Western Digital Corp. | 487 | 29 | |||
| Honeywell International, Inc. | 359,217 | 39,399 | Xilinx, Inc. | 5,800 | 295 | |||
| Illinois Tool Works, Inc. | 1,831 | 208 | Yahoo!, Inc.(Æ) | 115 | 5 | |||
| Johnson Controls International PLC | 162,789 | 6,564 | 312,887 | |||||
| Kansas City Southern | 114,970 | 10,090 | ||||||
| L-3 Communications Holdings, Inc. | 8,688 | 1,190 | Utilities - 3.9% | |||||
| Lockheed Martin Corp. | 3,081 | 759 | American Electric Power Co., Inc. | 29,948 | 1,942 | |||
| Mettler-Toledo International, Inc.(Æ) | 30,938 | 12,501 | AT&T, Inc. | 501,343 | 18,444 | |||
| Norfolk Southern Corp. | 38,039 | 3,538 | California Resources Corp.(Æ) | 1,158 | 12 | |||
| Northrop Grumman Corp. | 10,650 | 2,439 | Cheniere Energy, Inc.(Æ) | 5,800 | 219 | |||
| PACCAR, Inc. | 46,767 | 2,568 | CMS Energy Corp. | 37,178 | 1,567 | |||
| Parker-Hannifin Corp. | 800 | 98 | Dominion Resources, Inc. | 4,273 | 321 | |||
| Pentair PLC | 6,066 | 334 | Duke Energy Corp. | 16,508 | 1,321 | |||
| Raytheon Co. | 83,108 | 11,353 | Edison International | 22,508 | 1,654 | |||
| Sensata Technologies Holding NV(Æ) | 241,832 | 8,641 | Entergy Corp. | 120,802 | 8,901 | |||
| Snap-on, Inc. | 778 | 120 | Exelon Corp. | 11,196 | 381 | |||
| Southwest Airlines Co. | 180,729 | 7,238 | NextEra Energy, Inc. | 44,553 | 5,703 | |||
| Stanley Black & Decker, Inc. | 90,805 | 10,337 | NiSource, Inc. | 38,538 | 896 | |||
| TopBuild Corp.(Æ) | 3,805 | 115 | PG&E Corp. | 36,220 | 2,250 | |||
| TransDigm Group, Inc. | 44,322 | 12,076 | PPL Corp. | 24,300 | 834 | |||
| Union Pacific Corp. | 57,199 | 5,044 | Sempra Energy | 14,900 | 1,596 | |||
| United Continental Holdings, Inc.(Æ) | 23,732 | 1,334 | Southern Co. (The) | 28,934 | 1,492 | |||
| United Parcel Service, Inc. Class B | 978 | 105 | T-Mobile US, Inc.(Æ) | 27,385 | 1,362 | |||
| United Technologies Corp. | 73,893 | 7,552 | Verizon Communications, Inc. | 437,334 | 21,036 | |||
| Waste Management, Inc. | 4,229 | 278 | Xcel Energy, Inc. | 41,419 | 1,721 | |||
| WW Grainger, Inc. | 1,372 | 286 | ||||||
| 71,652 | ||||||||
| 205,665 | ||||||||
| Technology - 17.0% | Total Common Stocks | |||||||
| Adobe Systems, Inc.(Æ) | 118,355 | 12,724 | (cost $1,330,303) | 1,717,687 | ||||
| Alphabet, Inc. Class A(Æ) | 10,808 | 8,753 | ||||||
| Alphabet, Inc. Class C(Æ) | 52,710 | 41,353 | Short-Term Investments - 6.3% | |||||
| Analog Devices, Inc. | 14,338 | 919 | Russell U.S. Cash Management Fund | 110,204,336(8) | 110,226 | |||
| Apple, Inc. | 510,428 | 57,954 | United States Treasury Bills | |||||
| Applied Materials, Inc. | 23,100 | 672 | 0.170% due 12/01/16 (§)(~) | 1,800 | 1,800 | |||
| Broadcom, Ltd. | 43,243 | 7,363 | 0.238% due 12/22/16 (§)(~) | 3,200 | 3,199 | |||
| CDK Global Inc. | 996 | 54 | Total Short-Term Investments | |||||
| Cisco Systems, Inc. | 319,037 | 9,788 | (cost $115,206) | 115,225 | ||||
| Cognizant Technology Solutions Corp. Class | ||||||||
| A(Æ) | 31,157 | 1,600 | ||||||
| Dell Technologies, Inc. - VMware Inc. Class | Total Investments 99.8% | |||||||
| V(Æ) | 37,063 | 1,819 | (identified cost $1,445,509) | 1,832,912 | ||||
| Facebook, Inc. Class A(Æ) | 156,559 | 20,508 | ||||||
| Hewlett Packard Enterprise Co. | 248,993 | 5,595 | Other Assets and Liabilities, Net | |||||
| HP, Inc. | 121,079 | 1,754 | - 0.2% | 3,545 | ||||
| Intel Corp. | 195,872 | 6,830 | Net Assets - 100.0% | 1,836,457 | ||||
| International Business Machines Corp. | 55,129 | 8,473 | ||||||
| Intuit, Inc. | 79,973 | 8,696 | ||||||
| KLA-Tencor Corp. | 5,800 | 436 | ||||||
| Lam Research Corp. | 44,456 | 4,306 | ||||||
| LinkedIn Corp. Class A(Æ) | 23,801 | 4,513 | ||||||
See accompanying notes which are an integral part of the financial statements.
266 Russell Tax-Managed U.S. Large Cap Fund
Russell Investment Company
Russell Tax-Managed U.S. Large Cap Fund
Schedule of Investments, continued — October 31, 2016
| Futures Contracts | |||||||||||||||
| Amounts in thousands (except contract amounts) | |||||||||||||||
| Unrealized | |||||||||||||||
| Appreciation | |||||||||||||||
| Number of | Notional | Expiration | (Depreciation) | ||||||||||||
| Contracts | Amount | Date | $ | ||||||||||||
| Long Positions | |||||||||||||||
| S&P 500 E-Mini Index Futures | 1,029 | USD | 109,079 | 12/16 | (2,104 | ) | |||||||||
| Total Unrealized Appreciation (Depreciation) on Open Futures Contracts (å) | (2,104 | ) | |||||||||||||
| Presentation of Portfolio Holdings | |||||||||||||||
| Amounts in thousands | |||||||||||||||
| Fair Value | |||||||||||||||
| Practical | |||||||||||||||
| Portfolio Summary | Level 1 | Level 2 | Level 3 | Expedient (a) | Total | % of Net Assets | |||||||||
| Common Stocks | |||||||||||||||
| Consumer Discretionary | $ | 210,218 | $ | — | $ | — | $ | — | $ | 210,218 | 11.4 | ||||
| Consumer Staples | 133,250 | — | — | — | 133,250 | 7.3 | |||||||||
| Energy | 121,768 | — | — | — | 121,768 | 6.6 | |||||||||
| Financial Services | 374,643 | — | — | — | 374,643 | 20.4 | |||||||||
| Health Care | 233,337 | — | — | — | 233,337 | 12.7 | |||||||||
| Materials and Processing | 54,267 | — | — | — | 54,267 | 3.0 | |||||||||
| Producer Durables | 205,665 | — | — | — | 205,665 | 11.2 | |||||||||
| Technology | 312,887 | — | — | — | 312,887 | 17.0 | |||||||||
| Utilities | 71,652 | — | — | — | 71,652 | 3.9 | |||||||||
| Short-Term Investments | — | 4,999 | — | 110,226 | 115,225 | 6.3 | |||||||||
| Total Investments | 1,717,687 | 4,999 | — | 110,226 | 1,832,912 | 99.8 | |||||||||
| Other Assets and Liabilities, Net | 0.2 | ||||||||||||||
| 100.0 | |||||||||||||||
| Other Financial Instruments | |||||||||||||||
| A | |||||||||||||||
| Liabilities | |||||||||||||||
| Futures Contracts | (2,104 | ) | — | — | — | (2,104 | ) | (0.1 | ) | ||||||
| Total Other Financial Instruments* | $ | (2,104 | ) | $ | — | $ | — | $ | — | $ | (2,104 | ) | |||
* Futures and foreign currency exchange contract values reflect the unrealized appreciation (depreciation) on the investments.
(a) Certain investments that are measured at fair value using the net asset value per share (or its equivalent) practical expedient have not been classified
in the fair value levels. The fair value amounts presented in the table are intended to permit reconciliation to the amounts presented in the Schedule of
Investments.
For a description of the Levels see note 2 in the Notes to Financial Statements.
For a disclosure on transfers between Levels 1, 2 and 3 during the period ended October 31, 2016 see note 2 in the Notes to
Financial Statements.
See accompanying notes which are an integral part of the financial statements.
Russell Tax-Managed U.S. Large Cap Fund 267
Russell Investment Company
Russell Tax-Managed U.S. Large Cap Fund
Fair Value of Derivative Instruments — October 31, 2016
Amounts in thousands
| Equity | ||||
| Derivatives not accounted for as hedging instruments | Contracts | |||
| Location: Statement of Assets and Liabilities - Liabilities | ||||
| Variation margin on futures contracts* | $ | 2,104 | ||
| Equity | ||||
| Derivatives not accounted for as hedging instruments | Contracts | |||
| Location: Statement of Operations - Net realized gain (loss) | ||||
| Futures contracts | $ | 12,632 | ||
| Location: Statement of Operations - Net change in unrealized appreciation (depreciation) | ||||
| Futures contracts | $ | (7,308 | ) | |
* Includes cumulative appreciation/depreciation of futures contracts as reported in the Schedule of Investments. Only variation margin is reported within the
Statement of Assets and Liabilities.
For further disclosure on derivatives see note 2 in the Notes to Financial Statements.
See accompanying notes which are an integral part of the financial statements.
268 Russell Tax-Managed U.S. Large Cap Fund
Russell Investment Company
Russell Tax-Managed U.S. Large Cap Fund
Balance Sheet Offsetting of Financial and Derivative Instruments — October 31, 2016
| Amounts in thousands | |||||||||
| Offsetting of Financial Liabilities and Derivative Liabilities | |||||||||
| Gross | Net Amounts | ||||||||
| Amounts | of Liabilities | ||||||||
| Gross | Offset in the | Presented in | |||||||
| Amounts of | Statement of | the Statement | |||||||
| Recognized | Assets and | of Assets and | |||||||
| Description | Location: Statement of Assets and Liabilities - Liabilities | Liabilities | Liabilities | Liabilities | |||||
| Futures Contracts | Variation margin on futures contracts | $ | 190 | $ | — $ | 190 | |||
| Total Financial and Derivative Liabilities | 190 | — | 190 | ||||||
| Financial and Derivative Liabilities not subject to a netting agreement | (190 | ) | — | (190 | ) | ||||
| Total Financial and Derivative Liabilities subject to a netting agreement | $ | — | $ | — $ | — | ||||
For further disclosure on derivatives and counterparty risk see note 2 in the Notes to Financial Statements.
See accompanying notes which are an integral part of the financial statements.
Russell Tax-Managed U.S. Large Cap Fund 269
Russell Investment Company
Russell Tax-Managed U.S. Large Cap Fund
Statement of Assets and Liabilities — October 31, 2016
| Amounts in thousands | ||
| Assets | ||
| Investments, at identified cost | $ | 1,445,509 |
| Investments, at fair value(>) | 1,832,912 | |
| Receivables: | ||
| Dividends and interest | 3,343 | |
| Dividends from affiliated Russell funds | 54 | |
| Investments sold | 6,070 | |
| Fund shares sold | 4,918 | |
| Total assets | 1,847,297 | |
| Liabilities | ||
| Payables: | ||
| Investments purchased | 8,013 | |
| Fund shares redeemed | 981 | |
| Accrued fees to affiliates | 1,519 | |
| Other accrued expenses | 137 | |
| Variation margin on futures contracts | 190 | |
| Total liabilities | 10,840 | |
| Net Assets | $ | 1,836,457 |
See accompanying notes which are an integral part of the financial statements.
270 Russell Tax-Managed U.S. Large Cap Fund
Russell Investment Company
Russell Tax-Managed U.S. Large Cap Fund
Statement of Assets and Liabilities, continued — October 31, 2016
| Amounts in thousands | |||
| Net Assets Consist of: | |||
| Undistributed (overdistributed) net investment income | $ | 12,346 | |
| Accumulated net realized gain (loss) | (27,070 | ) | |
| Unrealized appreciation (depreciation) on: | |||
| Investments | 387,403 | ||
| Futures contracts | (2,104 | ) | |
| Shares of beneficial interest | 565 | ||
| Additional paid-in capital | 1,465,317 | ||
| Net Assets | $ | 1,836,457 | |
| Net Asset Value, offering and redemption price per share: | |||
| Net asset value per share: Class A(#) | $ | 32.20 | |
| Maximum offering price per share (Net asset value plus sales charge of 5.75%): Class A | $ | 34.16 | |
| Class A — Net assets | $ | 30,086,832 | |
| Class A — Shares outstanding ($.01 par value) | 934,483 | ||
| Net asset value per share: Class C(#) | $ | 30.54 | |
| Class C — Net assets | $ | 26,758,095 | |
| Class C — Shares outstanding ($.01 par value) | 876,241 | ||
| Net asset value per share: Class E(#) | $ | 32.35 | |
| Class E — Net assets | $ | 55,245,241 | |
| Class E — Shares outstanding ($.01 par value) | 1,707,586 | ||
| Net asset value per share: Class S(#) | $ | 32.55 | |
| Class S — Net assets | $ 1,724,366,890 | ||
| Class S — Shares outstanding ($.01 par value) | 52,978,938 | ||
| Amounts in thousands | |||
| (>) Investments in affiliates, Russell U.S. Cash Management Fund | $ | 110,226 | |
| (#) Net asset value per share equals class level net assets divided by class level shares of beneficial interest outstanding. | |||
See accompanying notes which are an integral part of the financial statements.
Russell Tax-Managed U.S. Large Cap Fund 271
Russell Investment Company
Russell Tax-Managed U.S. Large Cap Fund
Statement of Operations — For the Period Ended October 31, 2016
| Amounts in thousands | |||
| Investment Income | |||
| Dividends | $ | 32,327 | |
| Dividends from affiliated Russell funds | 463 | ||
| Interest | 14 | ||
| Total investment income | 32,804 | ||
| Expenses | |||
| Advisory fees | 11,883 | ||
| Administrative fees | 823 | ||
| Custodian fees (1) | 128 | ||
| Distribution fees - Class A | 70 | ||
| Distribution fees - Class C | 197 | ||
| Transfer agent fees - Class A | 56 | ||
| Transfer agent fees - Class C | 53 | ||
| Transfer agent fees - Class E | 106 | ||
| Transfer agent fees - Class S | 3,195 | ||
| Professional fees | 86 | ||
| Registration fees | 130 | ||
| Shareholder servicing fees - Class C | 66 | ||
| Shareholder servicing fees - Class E | 133 | ||
| Trustees’ fees | 60 | ||
| Printing fees | 81 | ||
| Miscellaneous | 37 | ||
| Total expenses | 17,104 | ||
| Net investment income (loss) | 15,700 | ||
| Net Realized and Unrealized Gain (Loss) | |||
| Net realized gain (loss) on: | |||
| Investments | (27,343 | ) | |
| Futures contracts | 12,632 | ||
| Net realized gain (loss) | (14,711 | ) | |
| Net change in unrealized appreciation (depreciation) on: | |||
| Investments | 49,191 | ||
| Futures contracts | (7,308 | ) | |
| Net change in unrealized appreciation (depreciation) | 41,883 | ||
| Net realized and unrealized gain (loss) | 27,172 | ||
| Net Increase (Decrease) in Net Assets from Operations | $ | 42,872 | |
| (1) Includes a reimbursement for overbilling of custody out-of-pocket fees from prior years. See note 10 in the Notes to Financial Statements. | |||
See accompanying notes which are an integral part of the financial statements.
272 Russell Tax-Managed U.S. Large Cap Fund
Russell Investment Company
Russell Tax-Managed U.S. Large Cap Fund
Statements of Changes in Net Assets
| For the Periods Ended October 31, | ||||||
| Amounts in thousands | 2016 | 2015 | ||||
| Increase (Decrease) in Net Assets | ||||||
| Operations | ||||||
| Net investment income (loss) | $ | 15,700 | $ | 10,601 | ||
| Net realized gain (loss) | (14,711 | ) | (7,695 | ) | ||
| Net change in unrealized appreciation (depreciation) | 41,883 | 62,921 | ||||
| Net increase (decrease) in net assets from operations | 42,872 | 65,827 | ||||
| Distributions | ||||||
| From net investment income | ||||||
| Class A | (167 | ) | (82 | ) | ||
| Class E | (273 | ) | (185 | ) | ||
| Class S | (11,481 | ) | (7,822 | ) | ||
| From net realized gain | ||||||
| Class A | — | (825 | ) | |||
| Class C | — | (908 | ) | |||
| Class E | — | (2,040 | ) | |||
| Class S | — | (52,960 | ) | |||
| Net decrease in net assets from distributions | (11,921 | ) | (64,822 | ) | ||
| Share Transactions* | ||||||
| Net increase (decrease) in net assets from share transactions | 216,010 | 322,913 | ||||
| Total Net Increase (Decrease) in Net Assets | 246,961 | 323,918 | ||||
| Net Assets | ||||||
| Beginning of period | 1,589,496 | 1,265,578 | ||||
| End of period | $ | 1,836,457 | $ | 1,589,496 | ||
| Undistributed (overdistributed) net investment income included in net assets | $ | 12,346 | $ | 8,567 | ||
See accompanying notes which are an integral part of the financial statements.
Russell Tax-Managed U.S. Large Cap Fund 273
Russell Investment Company
Russell Tax-Managed U.S. Large Cap Fund
Statements of Changes in Net Assets, continued
* Share transaction amounts (in thousands) for the periods ended October 31, 2016 and October 31, 2015 were as follows:
| 2016 | 2015 | |||||||||||
| Shares | Dollars | Shares | Dollars | |||||||||
| Class A | ||||||||||||
| Proceeds from shares sold | 368 | $ | 11,470 | 314 | $ | 9,824 | ||||||
| Proceeds from reinvestment of distributions | 5 | 166 | 29 | 907 | ||||||||
| Payments for shares redeemed | (207 | ) | (6,360 | ) | (162 | ) | (5,095 | ) | ||||
| Net increase (decrease) | 166 | 5,276 | 181 | 5,636 | ||||||||
| Class C | ||||||||||||
| Proceeds from shares sold | 232 | 6,883 | 253 | 7,583 | ||||||||
| Proceeds from reinvestment of distributions | — | — | 30 | 902 | ||||||||
| Payments for shares redeemed | (178 | ) | (5,289 | ) | (98 | ) | (2,892 | ) | ||||
| Net increase (decrease) | 54 | 1,594 | 185 | 5,593 | ||||||||
| Class E | ||||||||||||
| Proceeds from shares sold | 264 | 8,336 | 396 | 12,388 | ||||||||
| Proceeds from reinvestment of distributions | 9 | 271 | 70 | 2,204 | ||||||||
| Payments for shares redeemed | (245 | ) | (7,705 | ) | (215 | ) | (6,760 | ) | ||||
| Net increase (decrease) | 28 | 902 | 251 | 7,832 | ||||||||
| Class S | ||||||||||||
| Proceeds from shares sold | 17,304 | 545,046 | 15,492 | 490,821 | ||||||||
| Proceeds from reinvestment of distributions | 362 | 11,200 | 1,874 | 59,304 | ||||||||
| Payments for shares redeemed | (11,033 | ) | (348,008 | ) | (7,804 | ) | (246,273 | ) | ||||
| Net increase (decrease) | 6,633 | 208,238 | 9,562 | 303,852 | ||||||||
| Total increase (decrease) | 6,881 | $ | 216,010 | 10,179 | $ | 322,913 | ||||||
See accompanying notes which are an integral part of the financial statements.
274 Russell Tax-Managed U.S. Large Cap Fund
(This page intentionally left blank)
Russell Investment Company
Russell Tax-Managed U.S. Large Cap Fund
Financial Highlights — For the Periods Ended
For a Share Outstanding Throughout Each Period.
| $ | $ | $ | $ | $ | $ | |||||||||||
| Net Asset Value, | Net | Net Realized | Total from | Distributions | Distributions | |||||||||||
| Beginning of | Investment | and Unrealized | Investment | from Net | from Net | |||||||||||
| Period | Income (Loss)(a)(d) | Gain (Loss) | Operations | Investment Income | Realized Gain | |||||||||||
| Class A | ||||||||||||||||
| October 31, 2016 | 31.76 | .22 | .40 | .62 | (.18 | ) | — | |||||||||
| October 31, 2015 | 31.83 | .16 | 1.31 | 1.47 | (.14 | ) | (1.40 | ) | ||||||||
| October 31, 2014 | 27.84 | .13 | 3.90 | 4.03 | (.04 | ) | — | |||||||||
| October 31, 2013 | 22.11 | .06 | 5.79 | 5.85 | (.12 | ) | — | |||||||||
| October 31, 2012 | 19.49 | .06 | 2.58 | 2.64 | (.02 | ) | — | |||||||||
| Class C | ||||||||||||||||
| October 31, 2016 | 30.17 | (.02 | ) | .39 | .37 | — | — | |||||||||
| October 31, 2015 | 30.40 | (.07 | ) | 1.24 | 1.17 | — | (1.40 | ) | ||||||||
| October 31, 2014 | 26.76 | (.09 | ) | 3.73 | 3.64 | — | — | |||||||||
| October 31, 2013 | 21.29 | (.11 | ) | 5.58 | 5.47 | — | — | |||||||||
| October 31, 2012 | 18.88 | (.08 | ) | 2.49 | 2.41 | — | — | |||||||||
| Class E | ||||||||||||||||
| October 31, 2016 | 31.89 | .22 | .40 | .62 | (.16 | ) | — | |||||||||
| October 31, 2015 | 31.95 | .16 | 1.31 | 1.47 | (.13 | ) | (1.40 | ) | ||||||||
| October 31, 2014 | 27.95 | .14 | 3.90 | 4.04 | (.04 | ) | — | |||||||||
| October 31, 2013 | 22.17 | .07 | 5.81 | 5.88 | (.10 | ) | — | |||||||||
| October 31, 2012 | 19.53 | .08 | 2.57 | 2.65 | (.01 | ) | — | |||||||||
| Class S | ||||||||||||||||
| October 31, 2016 | 32.08 | .30 | .41 | .71 | (.24 | ) | — | |||||||||
| October 31, 2015 | 32.13 | .24 | 1.32 | 1.56 | (.21 | ) | (1.40 | ) | ||||||||
| October 31, 2014 | 28.10 | .21 | 3.92 | 4.13 | (.10 | ) | — | |||||||||
| October 31, 2013 | 22.28 | .13 | 5.84 | 5.97 | (.15 | ) | — | |||||||||
| October 31, 2012 | 19.63 | .13 | 2.58 | 2.71 | (.06 | ) | — | |||||||||
See accompanying notes which are an integral part of the financial statements.
276 Russell Tax-Managed U.S. Large Cap Fund
| % | % | % | |||||||||||||||
| $ | $ | Ratio of Expenses | Ratio of Expenses | Ratio of Net | |||||||||||||
| Net Asset Value, | % | Net Assets, | to Average | to Average | Investment Income | % | |||||||||||
| $ | End of | Total | End of Period | Net Assets, | Net Assets, | to Average | Portfolio | ||||||||||
| Total Distributions | Period | Return(c) | (000 | ) | Gross | Net(d) | Net Assets(d) | Turnover Rate(k) | |||||||||
| (.18 | ) | 32.20 | 2.00 | 30,087 | 1.23 | 1.23 | .70 | 23 | |||||||||
| (1.54 | ) | 31.76 | 4.68 | 24,396 | 1.24 | 1.24 | .52 | 44 | |||||||||
| (.04 | ) | 31.83 | 14.48 | 18,676 | 1.24 | 1.24 | .45 | 63 | |||||||||
| (.12 | ) | 27.84 | 26.60 | 11,631 | 1.24 | 1.24 | .25 | 35 | |||||||||
| (.02 | ) | 22.11 | 13.54 | 5,765 | 1.23 | 1.23 | .29 | 48 | |||||||||
| — | 30.54 | 1.23 | 26,758 | 1.98 | 1.98 | (.05 | ) | 23 | |||||||||
| (1.40 | ) | 30.17 | 3.88 | 24,808 | 1.99 | 1.99 | (.23 | ) | 44 | ||||||||
| ��� | 30.40 | 13.60 | 19,360 | 1.99 | 1.99 | (.30 | ) | 63 | |||||||||
| — | 26.76 | 25.69 | 14,927 | 1.99 | 1.98 | (.46 | ) | 35 | |||||||||
| — | 21.29 | 12.71 | 10,733 | 1.98 | 1.94 | (.39 | ) | 48 | |||||||||
| (.16 | ) | 32.35 | 1.98 | 55,245 | 1.23 | 1.23 | .70 | 23 | |||||||||
| (1.53 | ) | 31.89 | 4.65 | 53,565 | 1.24 | 1.24 | .52 | 44 | |||||||||
| (.04 | ) | 31.95 | 14.48 | 45,651 | 1.24 | 1.24 | .45 | 63 | |||||||||
| (.10 | ) | 27.95 | 26.61 | 36,395 | 1.24 | 1.23 | .29 | 35 | |||||||||
| (.01 | ) | 22.17 | 13.57 | 23,578 | 1.23 | 1.19 | .36 | 48 | |||||||||
| (.24 | ) | 32.55 | 2.25 | 1,724,367 | .98 | .98 | .95 | 23 | |||||||||
| (1.61 | ) | 32.08 | 4.92 | 1,486,727 | .99 | .99 | .77 | 44 | |||||||||
| (.10 | ) | 32.13 | 14.75 | 1,181,891 | .99 | .99 | .70 | 63 | |||||||||
| (.15 | ) | 28.10 | 26.94 | 758,556 | .99 | .98 | .53 | 35 | |||||||||
| (.06 | ) | 22.28 | 13.84 | 473,227 | .98 | .94 | .61 | 48 | |||||||||
See accompanying notes which are an integral part of the financial statements.
Russell Tax-Managed U.S. Large Cap Fund 277
Russell Investment Company
Russell Tax-Managed U.S. Large Cap Fund
Related Party Transactions, Fees and Expenses
| Accrued fees payable to affiliates for the period ended October 31, 2016 were as follows: | ||
| Advisory fees | $ | 1,081,803 |
| Administration fees | 75,479 | |
| Distribution fees | 23,651 | |
| Shareholder servicing fees | 17,519 | |
| Transfer agent fees | 312,423 | |
| Trustee fees | 7,800 | |
| $ | 1,518,675 | |
| Transactions (amounts in thousands) during the period ended October 31, 2016 with Underlying Funds which are, or were, an | ||||||||||||||||
| affiliated company are as follows: | ||||||||||||||||
| Fair Value, | Change in | |||||||||||||||
| Beginning of | Realized Gain | Unrealized | Fair Value, End | Income | Capital Gains | |||||||||||
| Period | Purchases | Sales | (Loss) | Gain (Loss) | of Period | Distributions | Distributions | |||||||||
| Russell U.S. Cash Management Fund $ | 88,189 | $ | 397,474 | $ | 375,457 | $ | 1 | $ | 19 | $ 110,226 | $ | 463 | $ | — | ||
| $ | 88,189 | $ | 397,474 | $ | 375,457 | $ | 1 | $ | 19 | $ 110,226 | $ | 463 | $ | — | ||
Federal Income Taxes
At October 31, 2016, the cost of investments and net unrealized appreciation (depreciation), undistributed ordinary income and
undistributed long-term capital gains for income tax purposes were as follows:.
| Cost of Investments | $ | 1,447,370,410 | ||
| Unrealized Appreciation | $ | 405,113,915 | ||
| Unrealized Depreciation | (19,572,764 | ) | ||
| Net Unrealized Appreciation (Depreciation) | $ | 385,541,151 | ||
| Undistributed Ordinary Income | $ | 11,954,394 | ||
| Undistributed Long-Term Capital Gains | ||||
| (Capital Loss Carryforward) | $ | (26,920,819 | ) | |
| Tax Composition of Distributions | ||||
| Ordinary Income | $ | 11,920,767 |
Net investment income and net realized gains (loss) in the financial statements may differ from taxable net investment income and net
realized gains (losses). Capital accounts within the financial statements are adjusted for permanent book-tax differences. Book-tax
differences are primarily due to foreign currency gains and losses, reclassifications of dividends, differences in treatment of income
from swaps, net operating losses, investments in partnerships, investments in passive foreign investment companies (PFICs), tax
straddle transaction, use of tax equalization and foreign capital gains taxes. These adjustments have no impact on the net assets. At
October 31, 2016, there were no adjustments to the Statement of Assets and Liabilities.
See accompanying notes which are an integral part of the financial statements.
278 Russell Tax-Managed U.S. Large Cap Fund
Russell Investment Company
Russell Tax-Managed U.S. Mid & Small Cap Fund
Portfolio Management Discussion and Analysis — October 31, 2016 (Unaudited)

| Russell Tax-Managed U.S. Mid & Small Cap Fund - Class | Russell 2500TM Index** | ||||||
| A‡ | Total | ||||||
| Total | Return | ||||||
| Return | 1 Year | 3.98 | % | ||||
| 1 Year | (5.77 | )% | 5 Years | 12.22 | %§ | ||
| 5 Years | 8.67 | %§ | 10 Years | 7.00 | %§ | ||
| 10 Years | 5.78 | %§ | |||||
| Russell Tax-Managed U.S. Mid & Small Cap Fund - Class C | |||||||
| Total | |||||||
| Return | |||||||
| 1 Year | (0.75 | )% | |||||
| 5 Years | 9.16 | %§ | |||||
| 10 Years | 5.63 | %§ | |||||
| Russell Tax-Managed U.S. Mid & Small Cap Fund - Class E | |||||||
| Total | |||||||
| Return | |||||||
| 1 Year | 0.04 | % | |||||
| 5 Years | 9.98 | %§ | |||||
| 10 Years | 6.43 | %§ | |||||
| Russell Tax-Managed U.S. Mid & Small Cap Fund - Class S | |||||||
| Total | |||||||
| Return | |||||||
| 1 Year | 0.28 | % | |||||
| 5 Years | 10.26 | %§ | |||||
| 10 Years | 6.69 | %§ | |||||
Russell Tax-Managed U.S. Mid & Small Cap Fund 279
Russell Investment Company
Russell Tax-Managed U.S. Mid & Small Cap Fund
Portfolio Management Discussion and Analysis, continued — October 31, 2016
(Unaudited)
| The Russell Tax-Managed U.S. Mid & Small Cap Fund (the | season, and concerns surrounding the global economy. From |
| “Fund”) employs a multi-manager approach whereby Russell | February, markets reversed and rallied in tandem with commodity |
| Investment Management, LLC (“RIM”) manages a portion of the | prices as economic data strengthened. In the back half of 2016, |
| Fund’s assets based upon model portfolios provided by multiple | although uncertainty surrounding the political landscape and |
| non-discretionary money managers. The Fund’s money managers | Brexit led to heightened market volatility, markets ended higher |
| have non-discretionary asset management assignments pursuant | for the fiscal year. |
| to which they provide a model portfolio to RIM representing their | Over the period, the Fund maintained exposure to securities |
| investment recommendations, based upon which RIM purchases | towards the bottom end of the capitalization opportunity set that |
| and sells securities for the Fund. RIM also manages the portion of | were trading at discounted valuations, as well as companies with |
| the Fund's assets that RIM determines not to manage based upon | higher quality characteristics such as lower financial leverage |
| model portfolios provided by the Fund's money managers. RIM | and higher returns-on-equity. The Fund’s quality positioning |
| may change the allocation of the Fund’s assets at any time. An | was a negative contributor as companies with lower financial |
| exemptive order from the Securities and Exchange Commission | leverage lagged. However, the value positioning was additive and |
| (“SEC”) permits RIM to engage or terminate a money manager | offset further negative performance as value stocks outperformed |
| at any time, subject to approval by the Fund’s Board, without a | growth stocks. |
| shareholder vote. Pursuant to the terms of the exemptive order, | |
| the Fund is required to notify its shareholders within 90 days of | From a sector standpoint, the expectation for a slow growth |
| when a money manager begins providing services. As of October | U.S. economic environment led to the Fund’s overweight in |
| 31, 2016, the Fund had five money managers. | several sectors such as technology and industrials, as well as |
| an avoidance of sectors that are traditionally considered to be | |
| What is the Fund’s investment objective? | interest rate sensitive such as real estate and utilities. The impact |
| The Fund seeks to provide long term capital growth on an after- | of this sector positioning on performance was negative as interest |
| tax basis. | rate sensitive pockets outperformed. Underperforming holdings |
| within the technology and industrials sectors also detracted from | |
| How did the Fund perform relative to its benchmark for the | performance. |
| fiscal year ended October 31, 2016? | |
| For the fiscal year ended October 31, 2016, the Fund’s Class A and | How did the investment strategies and techniques employed |
| Class C Shares lost 0.01% and 0.75%, respectively. The Fund’s | by the Fund and its money managers affect its benchmark- |
| Class E and Class S Shares gained 0.04% and 0.28%, respectively. | relative performance? |
| This is compared to the Fund’s benchmark, the Russell 2500™ | The Fund’s money managers have non-discretionary asset |
| Index, which gained 3.98% during the same period. The Fund’s | management assignments pursuant to which they provide a model |
| performance includes operating expenses, whereas index returns | portfolio to RIM representing their investment recommendations, |
| are unmanaged and do not include expenses of any kind. | based upon which RIM purchases and sells securities for the |
| For the fiscal year ended October 31, 2016, the Morningstar® | Fund. With respect to this portion of the Fund, RIM manages |
| Small Growth Category, a group of funds that Morningstar | the Fund’s assets based upon the model portfolios provided by |
| considers to have investment strategies similar to those of the | the Fund’s money managers. RIM also manages the portion of |
| Fund, gained 0.35%. This result serves as a peer comparison and | the Fund's assets that RIM determines not to manage based upon |
| is expressed net of operating expenses. | model portfolios provided by the Fund's money managers. This |
| includes assets managed directly by RIM to effect the Fund's | |
| RIM may assign a money manager a specific style or | investment strategies and/or to actively manage the Fund's overall |
| capitalization benchmark other than the Fund’s index. However, | exposures to seek to achieve the desired risk/return profile for the |
| the Fund’s primary index remains the benchmark for the Fund | Fund. RIM also manages the Fund’s liquidity reserves. |
| and is representative of the aggregate of each money manager’s | |
| benchmark index. | With respect to certain of the Fund’s money managers, Chartwell |
| Investment Partners, LLC was the strongest performing money | |
| How did the market conditions described in the Market | manager for the fiscal year and outperformed the Russell 2500™ |
| Summary report affect the Fund’s performance? | Value Index. Outperforming holdings within the energy and real |
| The fiscal year ended October 31, 2016 saw the Fund underperform | estate sectors were a tailwind over the period. A tilt towards |
| the Russell 2500™ Index. Through the end of 2015 into mid- | stocks exhibiting low volatility characteristics was also additive. |
| February 2016, markets sold off as recessionary fears spiked on | Netols Asset Management, Inc. faced the strongest headwinds |
| the back of weak business surveys, a lackluster U.S. earnings | over the fiscal year and underperformed the Russell 2000® Value |
280 Russell Tax-Managed U.S. Mid & Small Cap Fund
Russell Investment Company
Russell Tax-Managed U.S. Mid & Small Cap Fund
Portfolio Management Discussion and Analysis, continued — October 31, 2016
(Unaudited)
| Index. An overweight to consumer discretionary and underweight | During the period, RIM equitized the Fund’s cash using index | |
| to utilities was a headwind. Underperforming holdings within | futures contracts to provide the Fund with full market exposure. | |
| the technology, industrials, and consumer staples sectors also | This had a marginally positive impact on the Fund’s performance. | |
| negatively impacted performance. | ||
| Describe any changes to the Fund’s structure or the money | ||
| RIM manages a positioning strategy within the Fund, which is | manager line-up. | |
| designed with the dual mandate of improving the Fund’s after | In April 2016, RIM hired Snow Capital Management, LP due to | |
| tax returns as well as controlling Fund-level exposures and/or | RIM’s confidence in the excess return potential of Snow’s deep | |
| risks. The active tax management aspect of the strategy is focused | value investment strategy. | |
| on improving the after tax returns of the Fund. Because RIM | ||
| controls all trading for the Fund, RIM managed the tax lots of the | Money Managers as of October 31, | |
| Fund and harvested losses and deferred capital gains with respect | 2016 | Styles |
| to certain securities during the fiscal year. As a result, no realized | Chartwell Investment Partners, LLC | Small/Mid Cap Value |
| capital gains are expected to be distributed to Fund shareholders | Luther King Capital Management | |
| from the fiscal year. | Corporation | Small/Mid Cap Growth |
| Netols Asset Management, Inc. | Small Cap Value | |
| In addition, using the output from a quantitative model to guide | Snow Capital Management, L.P. | Small/Mid Cap Value |
| the purchase of a stock portfolio, RIM seeks to position the Fund | Summit Creek Advisors LLC | Small/Mid Cap Growth |
| to meet RIM’s overall preferred positioning with respect to Fund | The views expressed in this report reflect those of the | |
| exposures. Over the period, the Fund’s positioning strategy was | portfolio managers only through the end of the period | |
| designed to provide exposure to lower capitalization, higher | covered by the report. These views do not necessarily | |
| value, and higher quality stocks in order to manage Fund-level | represent the views of RIM or any other person in RIM or | |
| risk. From a benchmark-relative perspective, this strategy | any other affiliated organization. These views are subject | |
| underperformed the Russell 2500™ Index for the fiscal year. | to change at any time based upon market conditions or | |
| An underweight to real estate and overweight to energy was | other events, and RIM disclaims any responsibility to | |
| penalized. A preference for holdings with below average levels | update the views contained herein. These views should not | |
| of financial leverage and higher profitability characteristics also | be relied on as investment advice and, because investment | |
| detracted from performance. | decisions for a Russell Investment Company (“RIC”) Fund | |
| are based on numerous factors, should not be relied on as | ||
| an indication of investment decisions of any RIC Fund. | ||
* Assumes initial investment on November 1, 2006.
** Russell 2500TM Index is composed of the bottom 500 stocks in the Russell 1000® Index and all the stocks in the Russell 2000® Index. The Russell 2500TM Index
return reflect adjustments for income dividends and capital gains distributions reinvested as of the ex-dividend dates.
‡ The Fund first issued Class A Shares on June 1, 2010. The returns shown for Class A Shares prior to that date are the returns of Class E Shares. The
performance shown has been adjusted to reflect the deduction of the maximum Class A sales charge of 5.75%. Annual returns for each Class will differ only to
the extent that the Class A Shares do not have the same expenses as Class E Shares.
§ Annualized.
Performance is historical and assumes reinvestment of all dividends and capital gains. Investment return and principal value will fluctuate so that an investor’s
shares, when redeemed, may be worth more or less than when purchased. Past performance is not indicative of future results. The returns shown do not reflect the
deduction of taxes that a shareholder would pay on Fund distributions or the redemption of Fund shares. Additionally, the returns presented herein may differ from
the performance reported in the Financial Highlights as the returns herein are calculated in a manner consistent with standardized performance in accordance with
Securities and Exchange Commission rules, while the performance in the Financial Highlights has been calculated in accordance with U.S. Generally Accepted
Accounting Principles (“U.S. GAAP”).
Russell Tax-Managed U.S. Mid & Small Cap Fund 281
Russell Investment Company
Russell Tax-Managed U.S. Mid & Small Cap Fund
Shareholder Expense Example — October 31, 2016 (Unaudited)
| Fund Expenses | Please note that the expenses shown in the table are meant | |||||
| The following disclosure provides important information | to highlight your ongoing costs only and do not reflect any | |||||
| regarding the Fund’s Shareholder Expense Example | transactional costs. Therefore, the information under the heading | |||||
| (“Example”). | “Hypothetical Performance (5% return before expenses)” is | |||||
| useful in comparing ongoing costs only, and will not help you | ||||||
| Example | determine the relative total costs of owning different funds. In | |||||
| As a shareholder of the Fund, you incur two types of costs: (1) | addition, if these transactional costs were included, your costs | |||||
| transaction costs, including sales charges (loads) on certain | would have been higher. | |||||
| purchase or redemption payments, and (2) ongoing costs, | Hypothetical | |||||
| including distribution (12b-1) and/or service fees and other | Performance (5% | |||||
| Fund expenses. The Example is intended to help you understand | Actual | return before | ||||
| your ongoing costs (in dollars) of investing in the Fund and to | Class A | Performance | expenses) | |||
| Beginning Account Value | ||||||
| compare these costs with the ongoing costs of investing in other | May 1, 2016 | $ | 1,000.00 | $ | 1,000.00 | |
| mutual funds. The Example is based on an investment of $1,000 | Ending Account Value | |||||
| invested at the beginning of the period and held for the entire | October 31, 2016 | $ | 1,013.10 | $ | 1,017.50 | |
| period indicated, which for this Fund is from May 1, 2016 to | Expenses Paid During Period* | $ | 7.69 | $ | 7.71 | |
| October 31, 2016. | * Expenses are equal to the Fund's annualized expense ratio of 1.52% | |||||
| (representing the six month period annualized), multiplied by the average | ||||||
| Actual Expenses | account value over the period, multiplied by 184/366 (to reflect the one-half | |||||
| The information in the table under the heading “Actual | year period). May reflect amounts waived and/or reimbursed. Without any | |||||
| Performance” provides information about actual account values | waivers and/or reimbursements, expenses would have been higher. | |||||
| and actual expenses. You may use the information in this column, | ||||||
| Hypothetical | ||||||
| together with the amount you invested, to estimate the expenses | Performance (5% | |||||
| that you paid over the period. Simply divide your account value by | Actual | return before | ||||
| $1,000 (for example, an $8,600 account value divided by $1,000 | Class C | Performance | expenses) | |||
| Beginning Account Value | ||||||
| = 8.6), then multiply the result by the number in the first column | May 1, 2016 | $ | 1,000.00 | $ | 1,000.00 | |
| in the row entitled “Expenses Paid During Period” to estimate | Ending Account Value | |||||
| the expenses you paid on your account during this period. | October 31, 2016 | $ | 1,009.30 | $ | 1,013.88 | |
| Expenses Paid During Period* | $ | 11.31 | $ | 11.34 | ||
| Hypothetical Example for Comparison Purposes | ||||||
| The information in the table under the heading “Hypothetical | * Expenses are equal to the Fund's annualized expense ratio of 2.24% | |||||
| (representing the six month period annualized), multiplied by the average | ||||||
| Performance (5% return before expenses)” provides information | account value over the period, multiplied by 184/366 (to reflect the one-half | |||||
| about hypothetical account values and hypothetical expenses | year period). May reflect amounts waived and/or reimbursed. Without any | |||||
| based on the Fund’s actual expense ratio and an assumed rate of | waivers and/or reimbursements, expenses would have been higher. | |||||
| return of 5% per year before expenses, which is not the Fund’s | ||||||
| Hypothetical | ||||||
| actual return. The hypothetical account values and expenses | Performance (5% | |||||
| may not be used to estimate the actual ending account balance or | Actual | return before | ||||
| expenses you paid for the period. You may use this information | Class E | Performance | expenses) | |||
| to compare the ongoing costs of investing in the Fund and other | Beginning Account Value | |||||
| May 1, 2016 | $ | 1,000.00 | $ | 1,000.00 | ||
| funds. To do so, compare this 5% hypothetical example with the | Ending Account Value | |||||
| 5% hypothetical examples that appear in the shareholder reports | October 31, 2016 | $ | 1,013.60 | $ | 1,017.65 | |
| of other funds. | Expenses Paid During Period* | $ | 7.54 | $ | 7.56 | |
| * Expenses are equal to the Fund's annualized expense ratio of 1.49% | ||||||
| (representing the six month period annualized), multiplied by the average | ||||||
| account value over the period, multiplied by 184/366 (to reflect the one-half | ||||||
| year period). May reflect amounts waived and/or reimbursed. Without any | ||||||
| waivers and/or reimbursements, expenses would have been higher. | ||||||
282 Russell Tax-Managed U.S. Mid & Small Cap Fund
Russell Investment Company
Russell Tax-Managed U.S. Mid & Small Cap Fund
Shareholder Expense Example, continued — October 31, 2016 (Unaudited)
| Hypothetical | ||||||
| Performance (5% | ||||||
| Actual | return before | |||||
| Class S | Performance | expenses) | ||||
| Beginning Account Value | ||||||
| May 1, 2016 | $ | 1,000.00 | $ | 1,000.00 | ||
| Ending Account Value | ||||||
| October 31, 2016 | $ | 1,014.50 | $ | 1,018.90 | ||
| Expenses Paid During Period* | $ | 6.28 | $ | 6.29 | ||
| * Expenses are equal to the Fund's annualized expense ratio of 1.24% | ||||||
| (representing the six month period annualized), multiplied by the average | ||||||
| account value over the period, multiplied by 184/366 (to reflect the one-half | ||||||
| year period). May reflect amounts waived and/or reimbursed. Without any | ||||||
| waivers and/or reimbursements, expenses would have been higher. | ||||||
Russell Tax-Managed U.S. Mid & Small Cap Fund 283
Russell Investment Company
Russell Tax-Managed U.S. Mid & Small Cap Fund
Schedule of Investments — October 31, 2016
| Amounts in thousands (except share amounts) | Amounts in thousands (except share amounts) | ||||||
| Principal | Fair | Principal | Fair | ||||
| Amount ($) or | Value | Amount ($) or | Value | ||||
| Shares | $ | Shares | $ | ||||
| Common Stocks - 95.2% | Liberty TripAdvisor Holdings, Inc. Class | ||||||
| Consumer Discretionary - 13.1% | A(Æ) | 6,997 | 155 | ||||
| 1-800-Flowers.com, Inc. Class A(Æ) | 14,360 | 137 | LKQ Corp.(Æ) | 63,022 | 2,034 | ||
| Aaron's, Inc. Class A | 5,967 | 147 | Lumber Liquidators Holdings, Inc.(Æ)(Ñ) | 87,236 | 1,353 | ||
| American Axle & Manufacturing Holdings, | Macy's, Inc. | 3,580 | 131 | ||||
| Inc.(Æ) | 23,452 | 420 | Madison Square Garden Co. (The) Class A(Æ) | 606 | 100 | ||
| Aramark | 4,642 | 173 | Matthews International Corp. Class A | 26,059 | 1,561 | ||
| Arctic Cat, Inc.(Æ)(Ñ) | 60,406 | 905 | Monro Muffler Brake, Inc. | 16,360 | 900 | ||
| Barnes & Noble Education, Inc.(Æ) | 4,196 | 39 | Motorcar Parts of America, Inc.(Æ) | 81,347 | 2,135 | ||
| Beazer Homes USA, Inc.(Æ) | 85,915 | 879 | Murphy USA, Inc.(Æ) | 1,877 | 129 | ||
| Big Lots, Inc. | 9,172 | 398 | National Presto Industries, Inc. | 425 | 37 | ||
| Bloomin' Brands, Inc. | 10,325 | 179 | Noodles & Co. Class A(Æ)(Ñ) | 97,849 | 460 | ||
| Blue Nile, Inc. | 13,106 | 458 | Nutrisystem, Inc. | 7,422 | 235 | ||
| Bob Evans Farms, Inc. | 28,639 | 1,180 | NVR, Inc.(Æ) | 62 | 94 | ||
| Brinker International, Inc.(Ñ) | 5,264 | 259 | Ollie's Bargain Outlet Holdings, Inc.(Æ)(Ñ) | 24,253 | 663 | ||
| Buffalo Wild Wings, Inc.(Æ) | 5,130 | 747 | Outfront Media, Inc. (ö) | 32,988 | 710 | ||
| Burlington Stores, Inc.(Æ) | 16,125 | 1,208 | Oxford Industries, Inc. | 10,536 | 661 | ||
| Cabela's, Inc.(Æ) | 23,454 | 1,445 | Performance Sports Group, Ltd.(Æ)(Ñ) | 99,902 | 348 | ||
| Caesars Acquisition Co. Class A(Æ)(Ñ) | 28,853 | 336 | Planet Fitness, Inc. Class A(Æ)(Ñ) | 12,789 | 271 | ||
| Callaway Golf Co. | 14,281 | 146 | Polaris Industries, Inc.(Ñ) | 1,900 | 146 | ||
| Capella Education Co. | 9,579 | 700 | Pool Corp. | 25,509 | 2,362 | ||
| Carter's, Inc. | 11,919 | 1,029 | PulteGroup, Inc. | 8,808 | 164 | ||
| Cheesecake Factory, Inc. (The) | 16,428 | 874 | Red Robin Gourmet Burgers, Inc.(Æ) | 2,684 | 123 | ||
| Chico's FAS, Inc. | 10,882 | 127 | Ross Stores, Inc. | 4,846 | 303 | ||
| Cimpress NV(Æ) | 544 | 45 | Sally Beauty Holdings, Inc.(Æ) | 74,886 | 1,943 | ||
| Columbia Sportswear Co. | 10,054 | 569 | Scholastic Corp. | 35,112 | 1,343 | ||
| Cooper Tire & Rubber Co. | 4,271 | 157 | Service Corp. International | 12,050 | 308 | ||
| Coty, Inc. Class A(Æ) | 1,704 | 39 | Shoe Carnival, Inc. | 6,564 | 167 | ||
| Dana, Inc. | 9,122 | 141 | Shutterfly, Inc.(Æ) | 27,816 | 1,363 | ||
| Denny's Corp.(Æ) | 44,745 | 464 | Six Flags Entertainment Corp. | 7,880 | 439 | ||
| Domino's Pizza, Inc. | 9,020 | 1,527 | Smith & Wesson Holding Corp.(Æ)(Ñ) | 1,633 | 43 | ||
| Dorman Products, Inc.(Æ)(Ñ) | 14,563 | 936 | SodaStream International, Ltd.(Æ)(Ñ) | 11,459 | 297 | ||
| Duluth Holdings, Inc. Class B(Æ)(Ñ) | 21,663 | 588 | Star Buffet, Inc. Class A(Æ) | 12,497 | 393 | ||
| Eldorado Resorts, Inc.(Æ)(Ñ) | 6,607 | 80 | Sturm Ruger & Co., Inc.(Ñ) | 3,231 | 199 | ||
| Ethan Allen Interiors, Inc. | 45,899 | 1,409 | TEGNA, Inc. | 6,655 | 131 | ||
| FirstCash, Inc. | 32,419 | 1,530 | Tenneco, Inc.(Æ) | 20,357 | 1,121 | ||
| Five Below, Inc.(Æ) | 37,459 | 1,408 | Toll Brothers, Inc.(Æ) | 44,351 | 1,217 | ||
| Foot Locker, Inc. | 3,318 | 222 | Tupperware Brands Corp. | 6,751 | 402 | ||
| Fortune Brands Home & Security, Inc. | 20,470 | 1,118 | Vail Resorts, Inc. | 589 | 94 | ||
| FTD Cos., Inc.(Æ) | 36,188 | 728 | Vera Bradley, Inc.(Æ) | 22,851 | 306 | ||
| Gannett Co., Inc. | 3,989 | 31 | WABCO Holdings, Inc.(Æ) | 700 | 69 | ||
| Gentex Corp. | 12,980 | 219 | Wyndham Worldwide Corp. | 2,673 | 176 | ||
| Gentherm, Inc.(Æ) | 38,134 | 1,073 | |||||
| Goodyear Tire & Rubber Co. (The) | 9,881 | 287 | 52,171 | ||||
| Grand Canyon Education, Inc.(Æ) | 5,539 | 242 | |||||
| Hanesbrands, Inc. | 10,236 | 263 | Consumer Staples - 3.1% | ||||
| Andersons, Inc. (The) | 9,345 | 356 | |||||
| Horizon Global Corp.(Æ) | 36,299 | 727 | Cal-Maine Foods, Inc.(Æ)(Ñ) | 24,850 | 960 | ||
| Interpublic Group of Cos., Inc. (The) | 16,959 | 380 | Casey's General Stores, Inc. | 17,162 | 1,939 | ||
| Jamba, Inc.(Æ) | 28,589 | 302 | Diplomat Pharmacy, Inc.(Æ)(Ñ) | 34,234 | 793 | ||
| John Wiley & Sons, Inc. Class A | 3,050 | 157 | Hain Celestial Group, Inc. (The)(Æ) | 5,750 | 209 | ||
| Lamar Advertising Co. Class A(ö) | 6,641 | 421 | Herbalife, Ltd.(Æ)(Ñ) | 1,246 | 76 | ||
| Leggett & Platt, Inc. | 1,894 | 87 | Lancaster Colony Corp. | 13,801 | 1,803 | ||
| Liberty Broadband Corp. Class A(Æ) | 262 | 17 | MGP Ingredients, Inc. | 5,280 | 186 | ||
| Liberty Broadband Corp. Class C(Æ) | 633 | 42 | Omega Protein Corp.(Æ) | 7,101 | 158 | ||
| Liberty Media Corp.-Liberty Media Class | PetMed Express, Inc.(Ñ) | 15,111 | 300 | ||||
| C(Æ) | 524 | 14 | |||||
| Liberty Media Corp.-Liberty SiriusXM Class | Pinnacle Foods, Inc. | 285 | 15 | ||||
| A(Æ) | 166 | 6 | Post Holdings, Inc.(Æ) | 5,407 | 412 | ||
| Liberty Media Corp.-Liberty SiriusXM Class | Rite Aid Corp.(Æ) | 11,272 | 76 | ||||
| C(Æ) | 2,096 | 70 | Safeway, Inc.(Æ) | 9,450 | 5 | ||
| Sanderson Farms, Inc.(Ñ) | 19,716 | 1,774 | |||||
| Snyders-Lance, Inc. | 18,353 | 653 | |||||
See accompanying notes which are an integral part of the financial statements.
284 Russell Tax-Managed U.S. Mid & Small Cap Fund
Russell Investment Company
Russell Tax-Managed U.S. Mid & Small Cap Fund
Schedule of Investments, continued — October 31, 2016
| Amounts in thousands (except share amounts) | Amounts in thousands (except share amounts) | ||||||
| Principal | Fair | Principal | Fair | ||||
| Amount ($) or | Value | Amount ($) or | Value | ||||
| Shares | $ | Shares | $ | ||||
| Sprouts Farmers Market, Inc.(Æ)(Ñ) | 26,791 | 593 | Ares Capital Corp.(Ñ) | 2,664 | 41 | ||
| TreeHouse Foods, Inc.(Æ) | 12,630 | 1,105 | Argo Group International Holdings, Ltd. | 29,156 | 1,621 | ||
| WhiteWave Foods Co. (The) Class A(Æ) | 15,693 | 855 | Armada Hoffler Properties, Inc. (ö) | 23,514 | 316 | ||
| 12,268 | Artisan Partners Asset Management, Inc. | ||||||
| Class A | 6,036 | 157 | |||||
| Energy - 4.6% | Ashford Hospitality Trust, Inc. (ö) | 46,366 | 269 | ||||
| Atwood Oceanics, Inc.(Æ)(Ñ) | 68,658 | 524 | Assurant, Inc. | 5,539 | 446 | ||
| Bill Barrett Corp.(Æ)(Ñ) | 130,695 | 678 | Assured Guaranty, Ltd. | 12,463 | 373 | ||
| Chesapeake Energy Corp.(Æ) | 50,888 | 280 | Astoria Financial Corp. | 9,124 | 133 | ||
| CONSOL Energy, Inc.(Æ)(Ñ) | 11,125 | 189 | Axis Capital Holdings, Ltd. | 5,244 | 299 | ||
| Diamondback Energy, Inc.(Æ) | 7,854 | 717 | Banco Latinoamericano de Comercio Exterior | ||||
| Dril-Quip, Inc.(Æ) | 14,450 | 686 | SA Class E | 6,718 | 181 | ||
| Energen Corp.(Æ) | 5,905 | 296 | Bancorp, Inc. (The)(Æ) | 39,748 | 248 | ||
| Exterran Corp.(Æ) | 3,009 | 48 | BancorpSouth, Inc. | 55,588 | 1,306 | ||
| First Solar, Inc.(Æ) | 4,127 | 167 | Bank of Hawaii Corp. | 1,087 | 82 | ||
| FMC Technologies, Inc.(Æ) | 3,880 | 125 | Blackhawk Network Holdings, Inc. Class | ||||
| Frank's International NV(Ñ) | 40,065 | 451 | A(Æ) | 10,890 | 375 | ||
| Green Plains, Inc. | 14,705 | 382 | BofI Holding, Inc.(Æ)(Ñ) | 34,223 | 638 | ||
| Gulfport Energy Corp.(Æ) | 18,105 | 437 | Broadridge Financial Solutions, Inc. | 5,818 | 376 | ||
| Helix Energy Solutions Group, Inc.(Æ) | 67,777 | 591 | Camden Property Trust (ö) | 3,242 | 264 | ||
| Helmerich & Payne, Inc.(Ñ) | 17,796 | 1,123 | Care Capital Properties, Inc. (ö) | 715 | 19 | ||
| Matador Resources Co.(Æ) | 31,783 | 693 | CBOE Holdings, Inc. | 11,360 | 718 | ||
| McDermott International, Inc.(Æ) | 287,421 | 1,477 | Cedar Realty Trust, Inc. (ö) | 20,389 | 138 | ||
| Oceaneering International, Inc. | 3,328 | 79 | CenterState Banks, Inc. | 62,231 | 1,162 | ||
| Oil States International, Inc.(Æ) | 26,356 | 771 | Central Pacific Financial Corp. | 8,782 | 225 | ||
| Parsley Energy, Inc. Class A(Æ) | 1,221 | 40 | Chimera Investment Corp.(ö) | 2,442 | 38 | ||
| Patterson-UTI Energy, Inc. | 2,077 | 47 | City Holding Co. | 1,479 | 77 | ||
| PBF Energy, Inc. Class A | 52,721 | 1,149 | Colony Capital, Inc. Class A(ö) | 14,185 | 270 | ||
| QEP Resources, Inc.(Æ) | 8,629 | 139 | Columbia Banking System, Inc. | 37,621 | 1,242 | ||
| Range Resources Corp. | 4,001 | 135 | Community Bank System, Inc. | 28,319 | 1,334 | ||
| REX American Resources Corp.(Æ) | 13,132 | 1,037 | Corporate Office Properties Trust (ö) | 1,445 | 39 | ||
| RPC, Inc.(Ñ) | 15,704 | 271 | Corrections Corp. of America(ö) | 5,353 | 77 | ||
| RSP Permian, Inc.(Æ) | 56,112 | 2,026 | Cousins Properties, Inc. (ö) | 8,522 | 66 | ||
| SEACOR Holdings, Inc.(Æ) | 4,299 | 212 | CubeSmart (ö) | 8,887 | 232 | ||
| Seadrill, Ltd.(Æ)(Ñ) | 15,787 | 34 | CVB Financial Corp. | 10,947 | 184 | ||
| Southwestern Energy Co.(Æ) | 18,305 | 190 | DCT Industrial Trust, Inc. (ö) | 61,545 | 2,877 | ||
| SunPower Corp. Class A(Æ)(Ñ) | 7,412 | 54 | Diamond Hill Investment Group, Inc. | 1,218 | 222 | ||
| Synergy Resources Corp.(Æ)(Ñ) | 137,605 | 941 | Douglas Emmett, Inc. (ö) | 3,358 | 123 | ||
| Tesoro Corp. | 3,098 | 263 | Duke Realty Corp. (ö) | 9,864 | 258 | ||
| Willbros Group, Inc.(Æ) | 130,140 | 198 | E*Trade Financial Corp.(Æ) | 12,782 | 360 | ||
| World Fuel Services Corp. | 28,024 | 1,128 | East West Bancorp, Inc. | 9,666 | 382 | ||
| WPX Energy, Inc.(Æ) | 56,962 | 619 | EastGroup Properties, Inc. (ö) | 570 | 39 | ||
| Eaton Vance Corp. | 4,476 | 157 | |||||
| 18,197 | Education Realty Trust, Inc. (ö) | 69,748 | 2,971 | ||||
| Endurance Specialty Holdings, Ltd. | 16,365 | 1,505 | |||||
| Financial Services - 25.5% | Enova International, Inc. Class W(Æ) | 30,176 | 284 | ||||
| Alexander's, Inc. (ö) | 94 | 36 | EPR Properties (ö) | 1,198 | 87 | ||
| Alexandria Real Estate Equities, Inc. (ö) | 2,082 | 224 | Equifax, Inc. | 3,695 | 458 | ||
| Ally Financial, Inc. | 12,250 | 221 | Equinix, Inc. (ö) | 679 | 243 | ||
| Altisource Portfolio Solutions SA(Æ) | 16,217 | 418 | Equity Commonwealth (Æ)(ö) | 13,466 | 407 | ||
| Altisource Residential Corp. (ö) | 4,184 | 42 | Equity LifeStyle Properties, Inc. Class A(ö) | 1,461 | 111 | ||
| Ambac Financial Group, Inc.(Æ) | 14,068 | 260 | Erie Indemnity Co. Class A | 6,686 | 685 | ||
| American Equity Investment Life Holding | Euronet Worldwide, Inc.(Æ) | 11,467 | 912 | ||||
| Co. | 104,102 | 1,867 | Everest Re Group, Ltd. | 1,700 | 346 | ||
| American Financial Group, Inc. | 4,297 | 320 | Extra Space Storage, Inc. (ö) | 3,027 | 221 | ||
| American Homes 4 Rent Class A(ö) | 6,889 | 145 | Ezcorp, Inc. Class A(Æ) | 5,807 | 57 | ||
| American National Insurance Co. | 1,564 | 183 | FactSet Research Systems, Inc. | 3,778 | 585 | ||
| Anworth Mortgage Asset Corp. (ö) | 49,383 | 242 | Fair Isaac Corp. | 18,693 | 2,256 | ||
| Apartment Investment & Management Co. | FCB Financial Holdings, Inc. Class A(Æ) | 894 | 33 | ||||
| Class A(ö) | 902 | 40 | Federal Agricultural Mortgage Corp. Class C | 8,229 | 336 | ||
| Arch Capital Group, Ltd.(Æ) | 2,102 | 164 | Federal Realty Investment Trust (ö) | 739 | 107 | ||
See accompanying notes which are an integral part of the financial statements.
Russell Tax-Managed U.S. Mid & Small Cap Fund 285
Russell Investment Company
Russell Tax-Managed U.S. Mid & Small Cap Fund
Schedule of Investments, continued — October 31, 2016
| Amounts in thousands (except share amounts) | Amounts in thousands (except share amounts) | ||||||
| Principal | Fair | Principal | Fair | ||||
| Amount ($) or | Value | Amount ($) or | Value | ||||
| Shares | $ | Shares | $ | ||||
| FelCor Lodging Trust, Inc. (ö) | 59,322 | 379 | Pinnacle Financial Partners, Inc. | 12,713 | 656 | ||
| Fidelity & Guaranty Life | 14,310 | 316 | Popular, Inc. | 33,696 | 1,223 | ||
| First Commonwealth Financial Corp. | 27,032 | 275 | Post Properties, Inc.(ö) | 3,782 | 249 | ||
| First Financial Bancorp | 10,984 | 236 | PRA Group, Inc.(Æ)(Ñ) | 34,675 | 1,106 | ||
| First Industrial Realty Trust, Inc. (ö) | 107,283 | 2,833 | Primerica, Inc.(Ñ) | 2,921 | 160 | ||
| First Midwest Bancorp, Inc. | 7,424 | 143 | PrivateBancorp, Inc. Class A | 6,176 | 279 | ||
| First Republic Bank | 47,190 | 3,512 | PS Business Parks, Inc. (ö) | 3,323 | 365 | ||
| Fiserv, Inc.(Æ) | 15,595 | 1,536 | QTS Realty Trust, Inc. Class A(ö) | 220 | 10 | ||
| FNB Corp. | 22,890 | 299 | Radian Group, Inc. | 48,956 | 665 | ||
| FNF Group | 7,383 | 265 | Raymond James Financial, Inc. | 4,148 | 249 | ||
| FNFV Group(Æ) | 2,908 | 35 | Rayonier, Inc. (ö) | 14,986 | 402 | ||
| Forest City Realty Trust, Inc. Class A(ö) | 2,675 | 58 | RE/MAX Holdings, Inc. Class A | 6,188 | 269 | ||
| GAMCO Investors, Inc. Class A | 7,201 | 205 | Regency Centers Corp.(ö) | 516 | 37 | ||
| Genworth Financial, Inc. Class A(Æ) | 108,399 | 449 | Reinsurance Group of America, Inc. Class A | 2,529 | 273 | ||
| Glacier Bancorp, Inc. | 40,557 | 1,146 | RenaissanceRe Holdings, Ltd. | 746 | 93 | ||
| Gramercy Property Trust(ö) | 17,478 | 161 | Resource Capital Corp. (Ñ)(ö) | 8,327 | 103 | ||
| Green Dot Corp. Class A(Æ) | 20,190 | 448 | Retail Opportunity Investments Corp. (ö) | 9,870 | 198 | ||
| Hanover Insurance Group, Inc. (The) | 45,223 | 3,446 | Retail Properties of America, Inc. Class A(ö) | 145,193 | 2,261 | ||
| Hartford Financial Services Group, Inc. | 3,302 | 146 | RLJ Lodging Trust (ö) | 8,498 | 168 | ||
| Healthcare Realty Trust, Inc. (ö) | 49,784 | 1,588 | RMR Group, Inc. (The) Class A | 7,070 | 243 | ||
| Highwoods Properties, Inc. (ö) | 5,700 | 283 | Ryman Hospitality Properties, Inc. (ö) | 4,049 | 204 | ||
| Home BancShares, Inc. | 30,544 | 657 | Saul Centers, Inc. (ö) | 4,868 | 294 | ||
| Houlihan Lokey, Inc. Class A | 15,496 | 378 | Selective Insurance Group, Inc. | 86,377 | 3,192 | ||
| Huntington Bancshares, Inc. | 23,662 | 251 | ServisFirst Bancshares, Inc. | 382 | 21 | ||
| Iberiabank Corp. | 422 | 28 | Signature Bank(Æ) | 14,263 | 1,720 | ||
| Iron Mountain, Inc. (ö) | 3,977 | 134 | SLM Corp.(Æ) | 75,562 | 533 | ||
| iStar, Inc. (Æ)(ö) | 16,287 | 181 | South State Corp. | 17,665 | 1,296 | ||
| Jack Henry & Associates, Inc. | 1,611 | 131 | Starwood Property Trust, Inc.(ö) | 14,038 | 312 | ||
| KeyCorp | 29,368 | 415 | State Bank Financial Corp.(Þ) | 57,147 | 1,260 | ||
| Kilroy Realty Corp.(ö) | 3,359 | 241 | Sterling Bancorp | 84,983 | 1,530 | ||
| LaSalle Hotel Properties (ö) | 6,953 | 165 | Summit Hotel Properties, Inc. (ö) | 10,330 | 134 | ||
| Lazard, Ltd. Class A | 16,836 | 614 | Sun Communities, Inc. (ö) | 27,433 | 2,110 | ||
| LendingTree, Inc.(Æ)(Ñ) | 1,224 | 98 | SVB Financial Group(Æ) | 22,589 | 2,762 | ||
| Liberty Property Trust(ö) | 1,004 | 41 | Tanger Factory Outlet Centers, Inc. (ö) | 9,523 | 331 | ||
| Life Storage, Inc.(Æ) | 7,828 | 631 | Taubman Centers, Inc. (ö) | 5,742 | 416 | ||
| Marcus & Millichap, Inc.(Æ) | 10,002 | 234 | TCF Financial Corp. | 15,910 | 228 | ||
| MarketAxess Holdings, Inc. | 1,168 | 176 | TriState Capital Holdings, Inc.(Æ) | 3,143 | 55 | ||
| MBIA, Inc.(Æ) | 43,396 | 334 | UMB Financial Corp. | 19,681 | 1,221 | ||
| MFA Financial, Inc.(ö) | 13,738 | 100 | Union Bankshares Corp. | 39,720 | 1,109 | ||
| MGIC Investment Corp.(Æ) | 343,452 | 2,803 | United Community Banks, Inc. | 60,617 | 1,307 | ||
| Mid-America Apartment Communities, Inc. | Universal Insurance Holdings, Inc.(Ñ) | 8,695 | 185 | ||||
| (ö) | 14,562 | 1,351 | Urban Edge Properties (ö) | 3,441 | 89 | ||
| MSCI, Inc. Class A | 12,338 | 989 | Urstadt Biddle Properties, Inc. Class A(ö) | 5,742 | 123 | ||
| National Health Investors, Inc. (ö) | 13,762 | 1,043 | Ventas, Inc. (ö) | 2,256 | 153 | ||
| National Retail Properties, Inc.(ö) | 3,336 | 152 | Voya Financial, Inc. | 11,360 | 347 | ||
| Navigators Group, Inc. (The) | 2,541 | 237 | Webster Financial Corp. | 33,478 | 1,352 | ||
| Nelnet, Inc. Class A | 9,341 | 366 | Weingarten Realty Investors (ö) | 1,024 | 37 | ||
| NorthStar Realty Finance Corp. (ö) | 20,791 | 302 | WesBanco, Inc. | 17,468 | 575 | ||
| Northwest Bancshares, Inc. | 8,090 | 127 | White Mountains Insurance Group, Ltd. | 222 | 184 | ||
| OFG Bancorp(Ñ) | 84,045 | 895 | WisdomTree Investments, Inc.(Ñ) | 20,609 | 177 | ||
| Old National Bancorp | 72,361 | 1,064 | World Acceptance Corp.(Æ) | 5,306 | 252 | ||
| OM Asset Management PLC | 38,719 | 545 | WR Berkley Corp. | 3,831 | 219 | ||
| OneBeacon Insurance Group, Ltd. Class A | 25,513 | 351 | WSFS Financial Corp. | 8,031 | 281 | ||
| Oritani Financial Corp. | 8,387 | 131 | Zions Bancorporation | 8,633 | 278 | ||
| PacWest Bancorp | 26,097 | 1,132 | 101,508 | ||||
| Paramount Group, Inc.(ö) | 22,331 | 347 | |||||
| Parkway, Inc. (Æ)(ö) | 2,379 | 43 | Health Care - 10.7% | ||||
| Pebblebrook Hotel Trust (ö) | 6,610 | 160 | Acadia Healthcare Co., Inc.(Æ) | 12,649 | 455 | ||
| People's Utah Bancorp | 5,621 | 113 | Akorn, Inc.(Æ) | 105,503 | 2,527 | ||
| Piedmont Office Realty Trust, Inc. Class A(ö) | 17,744 | 363 | Albany Molecular Research, Inc.(Æ)(Ñ) | 70,933 | 1,106 | ||
See accompanying notes which are an integral part of the financial statements.
286 Russell Tax-Managed U.S. Mid & Small Cap Fund
Russell Investment Company
Russell Tax-Managed U.S. Mid & Small Cap Fund
Schedule of Investments, continued — October 31, 2016
| Amounts in thousands (except share amounts) | Amounts in thousands (except share amounts) | ||||||
| Principal | Fair | Principal | Fair | ||||
| Amount ($) or | Value | Amount ($) or | Value | ||||
| Shares | $ | Shares | $ | ||||
| Alere, Inc.(Æ) | 5,509 | 246 | Acuity Brands, Inc. | 13,016 | 2,910 | ||
| Align Technology, Inc.(Æ) | 29,954 | 2,574 | Albemarle Corp. | 5,575 | 466 | ||
| Analogic Corp. | 2,522 | 207 | Armstrong Flooring, Inc.(Æ) | 23,532 | 381 | ||
| Bio-Rad Laboratories, Inc. Class A(Æ) | 137 | 22 | Ashland Global Holdings, Inc. | 3,392 | 379 | ||
| BioSpecifics Technologies Corp.(Æ) | 3,273 | 142 | Balchem Corp. | 25,631 | 1,945 | ||
| Bio-Techne Corp. | 21,772 | 2,264 | Ball Corp. | 13,125 | 1,011 | ||
| Brookdale Senior Living, Inc. Class A(Æ) | 58,005 | 837 | Belden, Inc. | 3,675 | 238 | ||
| Cantel Medical Corp. | 10,562 | 752 | Bemis Co., Inc. | 2,414 | 118 | ||
| Celldex Therapeutics, Inc.(Æ)(Ñ) | 7,464 | 24 | Carpenter Technology Corp. | 21,149 | 668 | ||
| Charles River Laboratories International, | Century Aluminum Co.(Æ) | 71,706 | 524 | ||||
| Inc.(Æ) | 14,541 | 1,103 | Chemtura Corp.(Æ) | 19,686 | 646 | ||
| Chemed Corp. | 2,336 | 330 | Compass Minerals International, Inc.(Ñ) | 7,129 | 512 | ||
| CONMED Corp. | 28,920 | 1,157 | Crown Holdings, Inc.(Æ) | 5,723 | 310 | ||
| Cooper Cos., Inc. (The) | 2,058 | 362 | Domtar Corp. | 1,938 | 70 | ||
| DexCom, Inc.(Æ) | 7,077 | 554 | Eagle Materials, Inc. | 8,920 | 722 | ||
| DYAX Corp.(Æ) | 5,306 | 6 | Ferro Corp.(Æ) | 4,771 | 62 | ||
| Five Prime Therapeutics, Inc.(Æ) | 6,820 | 331 | FMC Corp. | 20,877 | 979 | ||
| Haemonetics Corp.(Æ) | 20,950 | 700 | GCP Applied Technologies, Inc.(Æ) | 39,690 | 1,026 | ||
| Henry Schein, Inc.(Æ) | 1,751 | 261 | Global Brass & Copper Holdings, Inc. | 16,735 | 480 | ||
| Hologic, Inc.(Æ) | 9,896 | 356 | Headwaters, Inc.(Æ) | 4,271 | 70 | ||
| Icon PLC(Æ) | 19,330 | 1,552 | Hexcel Corp. | 1,255 | 57 | ||
| ICU Medical, Inc.(Æ) | 264 | 37 | Innophos Holdings, Inc. | 12,797 | 587 | ||
| Integer Holdings Corp.(Æ) | 6,450 | 142 | Innospec, Inc. | 4,161 | 251 | ||
| Integra LifeSciences Holdings Corp.(Æ) | 23,556 | 1,873 | ITT, Inc. | 38,783 | 1,366 | ||
| Invacare Corp. | 111,429 | 1,020 | LB Foster Co. Class A | 23,129 | 287 | ||
| Ionis Pharmaceuticals, Inc.(Æ) | 7,245 | 188 | Lennox International, Inc. | 3,222 | 470 | ||
| Kindred Healthcare, Inc. | 122,035 | 1,202 | LSB Industries, Inc.(Æ)(Ñ) | 13,536 | 72 | ||
| Lannett Co., Inc.(Æ)(Ñ) | 38,118 | 835 | Martin Marietta Materials, Inc. | 6,606 | 1,225 | ||
| LifePoint Health, Inc.(Æ) | 5,147 | 308 | Minerals Technologies, Inc. | 21,553 | 1,448 | ||
| Ligand Pharmaceuticals, Inc. Class B(Æ)(Ñ) | 18,501 | 1,771 | Mosaic Co. (The) | 8,095 | 190 | ||
| MEDNAX, Inc.(Æ) | 15,511 | 950 | NewMarket Corp. | 1,978 | 793 | ||
| MiMedx Group, Inc.(Æ)(Ñ) | 88,588 | 789 | Owens Corning | 3,111 | 152 | ||
| Myriad Genetics, Inc.(Æ)(Ñ) | 15,164 | 299 | Owens-Illinois, Inc.(Æ) | 7,279 | 140 | ||
| Neurocrine Biosciences, Inc.(Æ) | 6,233 | 273 | Packaging Corp. of America | 4,726 | 390 | ||
| Omnicell, Inc.(Æ) | 8,346 | 272 | PGT, Inc.(Æ) | 87,633 | 859 | ||
| OPKO Health, Inc.(Æ)(Ñ) | 20,076 | 189 | PolyOne Corp. | 6,686 | 195 | ||
| Orthofix International NV(Æ) | 4,798 | 176 | RBC Bearings, Inc.(Æ) | 1,937 | 138 | ||
| PharmAthene, Inc.(Æ)(Ñ) | 109,442 | 301 | RPM International, Inc. | 14,379 | 684 | ||
| PRA Health Sciences, Inc.(Æ) | 20,317 | 1,081 | Schweitzer-Mauduit International, Inc. | 2,050 | 76 | ||
| Premier, Inc. Class A(Æ) | 33,387 | 1,063 | Sealed Air Corp. | 3,044 | 139 | ||
| Prestige Brands Holdings, Inc.(Æ) | 175 | 8 | Sensient Technologies Corp. | 14,260 | 1,062 | ||
| PTC Therapeutics, Inc.(Æ)(Ñ) | 15,319 | 95 | Sonoco Products Co. | 3,919 | 197 | ||
| Quality Systems, Inc.(Æ) | 2,976 | 38 | Steel Dynamics, Inc. | 7,194 | 197 | ||
| ResMed, Inc. | 645 | 39 | Trex Co., Inc.(Æ) | 925 | 50 | ||
| Retrophin, Inc.(Æ) | 11,497 | 217 | Trinseo SA | 12,619 | 662 | ||
| Sarepta Therapeutics, Inc.(Æ) | 13,002 | 510 | Unifi, Inc.(Æ) | 37,666 | 1,083 | ||
| Seattle Genetics, Inc.(Æ) | 4,553 | 235 | Universal Forest Products, Inc. | 2,625 | 226 | ||
| Spark Therapeutics, Inc.(Æ)(Ñ) | 5,664 | 266 | US Silica Holdings, Inc. | 4,390 | 203 | ||
| Teleflex, Inc. | 4,569 | 654 | Valspar Corp. | 8,128 | 810 | ||
| United Therapeutics Corp.(Æ) | 3,793 | 455 | Vulcan Materials Co. | 18,463 | 2,090 | ||
| US Physical Therapy, Inc. | 26,966 | 1,534 | Watsco, Inc. | 7,077 | 972 | ||
| VCA, Inc.(Æ) | 70,284 | 4,320 | WR Grace & Co. | 2,986 | 200 | ||
| VWR Corp.(Æ) | 33,404 | 919 | 31,423 | ||||
| WellCare Health Plans, Inc.(Æ) | 22,405 | 2,543 | |||||
| Zimmer Biomet Holdings, Inc. | 2,883 | 304 | Producer Durables - 14.8% | ||||
| 42,774 | ACCO Brands Corp.(Æ) | 33,189 | 368 | ||||
| Advisory Board Co. (The)(Æ) | 22,100 | 880 | |||||
| Materials and Processing - 7.9% | AGCO Corp. | 664 | 34 | ||||
| A Schulman, Inc. | 10,407 | 299 | Air Transport Services Group, Inc.(Æ) | 802 | 11 | ||
| AAON, Inc. | 11,226 | 336 | Aircastle, Ltd. | 8,190 | 168 | ||
See accompanying notes which are an integral part of the financial statements.
Russell Tax-Managed U.S. Mid & Small Cap Fund 287
Russell Investment Company
Russell Tax-Managed U.S. Mid & Small Cap Fund
Schedule of Investments, continued — October 31, 2016
| Amounts in thousands (except share amounts) | Amounts in thousands (except share amounts) | ||||||
| Principal | Fair | Principal | Fair | ||||
| Amount ($) or | Value | Amount ($) or | Value | ||||
| Shares | $ | Shares | $ | ||||
| Alaska Air Group, Inc. | 633 | 46 | MAXIMUS, Inc. | 41,515 | 2,161 | ||
| Allegiant Travel Co. Class A | 1,795 | 248 | Middleby Corp.(Æ) | 6,648 | 745 | ||
| Allison Transmission Holdings, Inc. Class A | 30,234 | 886 | Monster Worldwide, Inc.(Æ) | 124,377 | 424 | ||
| Altra Industrial Motion Corp. | 28,626 | 844 | MSC Industrial Direct Co., Inc. Class A | 9,223 | 671 | ||
| AO Smith Corp. | 22,536 | 1,018 | Navigant Consulting, Inc.(Æ) | 8,155 | 191 | ||
| Applied Industrial Technologies, Inc. | 4,000 | 203 | Nordson Corp. | 2,847 | 285 | ||
| Atlas Air Worldwide Holdings, Inc.(Æ) | 13,925 | 583 | NV5 Global, Inc.(Æ) | 7,442 | 213 | ||
| B/E Aerospace, Inc. | 22,681 | 1,350 | Orbital ATK, Inc. | 4,746 | 353 | ||
| Babcock & Wilcox Co. (The) Class W(Æ) | 8,957 | 351 | OSI Systems, Inc.(Æ) | 7,705 | 540 | ||
| Barnes Group, Inc. | 28,739 | 1,145 | Proto Labs, Inc.(Æ)(Ñ) | 8,132 | 364 | ||
| Booz Allen Hamilton Holding Corp. Class A | 9,028 | 275 | Robert Half International, Inc. | 4,436 | 166 | ||
| Brady Corp. Class A | 48,416 | 1,603 | Rollins, Inc. | 817 | 25 | ||
| Briggs & Stratton Corp. | 50,577 | 942 | Rush Enterprises, Inc. Class A(Æ) | 31,548 | 828 | ||
| Brink's Co. (The) | 1,241 | 49 | Saia, Inc.(Æ) | 28,441 | 1,014 | ||
| Carlisle Cos., Inc. | 3,258 | 342 | SkyWest, Inc. | 8,678 | 262 | ||
| CIRCOR International, Inc. | 19,937 | 1,072 | Snap-on, Inc. | 203 | 31 | ||
| Clarcor, Inc. | 15,000 | 933 | Stericycle, Inc.(Æ) | 12,366 | 990 | ||
| Commercial Vehicle Group, Inc.(Æ) | 77,109 | 350 | Sykes Enterprises, Inc.(Æ) | 804 | 22 | ||
| Convergys Corp. | 879 | 26 | Terex Corp. | 4,352 | 104 | ||
| CoStar Group, Inc.(Æ) | 10,684 | 1,999 | Tetra Tech, Inc. | 4,369 | 168 | ||
| Crane Co. | 6,145 | 418 | Textron, Inc. | 7,997 | 321 | ||
| Deluxe Corp. | 3,172 | 194 | Thermon Group Holdings, Inc.(Æ) | 32,431 | 594 | ||
| Echo Global Logistics, Inc.(Æ) | 67,349 | 1,428 | Tidewater, Inc.(Æ)(Ñ) | 12,052 | 21 | ||
| Electronics For Imaging, Inc.(Æ) | 4,867 | 207 | Toro Co. (The) | 7,664 | 367 | ||
| EnPro Industries, Inc. | 15,602 | 844 | TriMas Corp.(Æ) | 41,836 | 751 | ||
| ESCO Technologies, Inc. | 40,946 | 1,824 | Trimble, Inc.(Æ) | 37,548 | 1,038 | ||
| ExlService Holdings, Inc.(Æ) | 4,894 | 216 | Triumph Group, Inc. | 25,369 | 601 | ||
| Exponent, Inc. | 446 | 26 | TrueBlue, Inc.(Æ) | 47,608 | 833 | ||
| Flir Systems, Inc. | 21,187 | 698 | UniFirst Corp. | 1,948 | 239 | ||
| Flowserve Corp. | 15,683 | 664 | United Rentals, Inc.(Æ) | 12,333 | 933 | ||
| Forward Air Corp. | 3,832 | 158 | Vectrus, Inc.(Æ) | 8,310 | 139 | ||
| Franklin Electric Co., Inc. | 24,410 | 890 | Virgin America, Inc.(Æ)(Ñ) | 2,916 | 159 | ||
| FTI Consulting, Inc.(Æ) | 23,266 | 906 | Wabtec Corp. | 17,434 | 1,348 | ||
| G&K Services, Inc. Class A | 5,726 | 542 | WageWorks, Inc.(Æ) | 34,187 | 2,015 | ||
| GATX Corp.(Ñ) | 2,544 | 111 | Wesco Aircraft Holdings, Inc.(Æ) | 19,422 | 250 | ||
| Generac Holdings, Inc.(Æ) | 26,928 | 1,026 | Zebra Technologies Corp. Class A(Æ) | 7,134 | 470 | ||
| General Cable Corp. | 65,708 | 920 | 59,213 | ||||
| Genesee & Wyoming, Inc. Class A(Æ) | 21,685 | 1,473 | |||||
| Genpact, Ltd.(Æ) | 44,948 | 1,033 | Technology - 12.1% | ||||
| Graco, Inc. | 1,457 | 109 | Acacia Research Corp.(Æ) | 62,849 | 368 | ||
| Granite Construction, Inc. | 4,810 | 236 | Advanced Micro Devices, Inc.(Æ) | 8,044 | 58 | ||
| Greenbrier Cos., Inc.(Ñ) | 24,147 | 761 | Akamai Technologies, Inc.(Æ) | 14,209 | 987 | ||
| Hawaiian Holdings, Inc.(Æ) | 10,269 | 462 | Ambarella, Inc.(Æ)(Ñ) | 4,361 | 268 | ||
| Healthcare Services Group, Inc. | 72,047 | 2,664 | Anixter International, Inc.(Æ) | 5,435 | 357 | ||
| HEICO Corp. | 4,771 | 322 | Autobytel, Inc.(Æ) | 21,998 | 360 | ||
| Herc Holdings, Inc.(Æ) | 148 | 4 | Avid Technology, Inc.(Æ) | 102,590 | 674 | ||
| Herman Miller, Inc. | 35,304 | 981 | Avnet, Inc. | 5,180 | 217 | ||
| Hertz Global Holdings, Inc.(Æ) | 444 | 15 | Black Box Corp. | 10,741 | 124 | ||
| HNI Corp. | 4,654 | 189 | Bottomline Technologies de, Inc.(Æ) | 53,837 | 1,222 | ||
| Insperity, Inc. | 588 | 44 | CA, Inc. | 65,721 | 2,020 | ||
| Kansas City Southern | 1,553 | 136 | CACI International, Inc. Class A(Æ) | 14,943 | 1,462 | ||
| Keysight Technologies, Inc.(Æ) | 16,722 | 549 | Callidus Software, Inc.(Æ) | 42,987 | 785 | ||
| Kirby Corp.(Æ) | 14,520 | 856 | Cardtronics PLC Class A(Æ) | 38,257 | 1,913 | ||
| Knight Transportation, Inc. | 9,433 | 276 | Cavium, Inc.(Æ) | 32,366 | 1,827 | ||
| Knoll, Inc. | 59,276 | 1,283 | comScore, Inc.(Æ) | 12,632 | 364 | ||
| Lexmark International, Inc. Class A | 9,272 | 368 | Cypress Semiconductor Corp. | 21,153 | 211 | ||
| Littelfuse, Inc. | 2,549 | 356 | Diodes, Inc.(Æ) | 27,037 | 560 | ||
| Manitowoc Co., Inc. (The) | 7,453 | 30 | DST Systems, Inc. | 394 | 38 | ||
| Manitowoc Foodservice, Inc.(Æ) | 37,581 | 568 | Ellie Mae, Inc.(Æ) | 15,381 | 1,629 | ||
| Matson, Inc. | 1,614 | 64 | Entegris, Inc.(Æ) | 73,831 | 1,174 | ||
See accompanying notes which are an integral part of the financial statements.
288 Russell Tax-Managed U.S. Mid & Small Cap Fund
Russell Investment Company
Russell Tax-Managed U.S. Mid & Small Cap Fund
Schedule of Investments, continued — October 31, 2016
| Amounts in thousands (except share amounts) | Amounts in thousands (except share amounts) | ||||||||||
| Principal | Fair | Principal | Fair | ||||||||
| Amount ($) or | Value | Amount ($) or | Value | ||||||||
| Shares | $ | Shares | $ | ||||||||
| Envestnet, Inc.(Æ) | 39,949 | 1,412 | Southwest Gas Corp. | 4,108 | 298 | ||||||
| EPAM Systems, Inc.(Æ) | 17,260 | 1,111 | Telephone & Data Systems, Inc. | 24,403 | 630 | ||||||
| FormFactor, Inc.(Æ) | 114,373 | 1,026 | US Cellular Corp.(Æ) | 11,288 | 396 | ||||||
| Fortinet, Inc.(Æ) | 30,881 | 990 | Vectren Corp. | 31,228 | 1,571 | ||||||
| GigPeak, Inc.(Æ) | 34,814 | 82 | Westar Energy, Inc. Class A | 2,336 | 134 | ||||||
| Guidewire Software, Inc.(Æ) | 12,215 | 702 | 13,429 | ||||||||
| IPG Photonics Corp.(Æ) | 1,991 | 193 | |||||||||
| Ixia(Æ) | 5,730 | 68 | Total Common Stocks | ||||||||
| Jabil Circuit, Inc. | 6,244 | 133 | |||||||||
| Loral Space & Communications, Inc.(Æ) | 8,875 | 344 | (cost $287,653) | 379,071 | |||||||
| MACOM Technology Solutions Holdings, | |||||||||||
| Inc.(Æ) | 43,471 | 1,598 | Short | -Term Investments - 4.4% | |||||||
| Manhattan Associates, Inc.(Æ) | 6,188 | 313 | Russell U.S. Cash Management Fund | 17,615,648 | (8) | 17,619 | |||||
| ManTech International Corp. Class A | 90,712 | 3,522 | Total Short-Term Investments | ||||||||
| Match Group, Inc.(Æ)(Ñ) | 24,145 | 436 | (cost $17,617) | 17,619 | |||||||
| MeetMe, Inc.(Æ)(Ñ) | 60,159 | 294 | |||||||||
| Monolithic Power Systems, Inc. | 6,476 | 510 | Other Securities - 5.2% | ||||||||
| Oclaro, Inc.(Æ) | 7,551 | 55 | Russell U.S. Cash Collateral Fund(×) | 20,724,046 | (8) | 20,724 | |||||
| ON Semiconductor Corp.(Æ) | 9,500 | 111 | Total Other Securities | ||||||||
| Open Text Corp. | 8,431 | 523 | (cost $20,724) | 20,724 | |||||||
| Orbotech, Ltd.(Æ) | 6,913 | 189 | |||||||||
| Plexus Corp.(Æ) | 57,466 | 2,633 | |||||||||
| Progress Software Corp. | 72,732 | 1,957 | Total Investments 104.8% | ||||||||
| PTC, Inc.(Æ) | 63,500 | 3,012 | (identified cost $325,994) | 417,414 | |||||||
| Qorvo, Inc.(Æ) | 3,050 | 170 | |||||||||
| Qualys, Inc.(Æ) | 23,807 | 887 | Other Assets and Liabilities, Net | ||||||||
| Rambus, Inc.(Æ) | 18,176 | 222 | - | (4.8%) | (18,974 | ) | |||||
| RetailMeNot, Inc.(Æ) | 38,633 | 350 | Net Assets - 100.0% | 398,440 | |||||||
| Rogers Corp.(Æ) | 5,775 | 314 | |||||||||
| Sabre Corp. | 14,036 | 363 | |||||||||
| Sanmina Corp.(Æ) | 3,534 | 98 | |||||||||
| Skyworks Solutions, Inc. | 2,464 | 190 | |||||||||
| Symantec Corp. | 8,246 | 206 | |||||||||
| Synaptics, Inc.(Æ) | 15,513 | 809 | |||||||||
| Syntel, Inc. | 4,359 | 88 | |||||||||
| Take-Two Interactive Software, Inc.(Æ) | 28,421 | 1,262 | |||||||||
| TrueCar, Inc.(Æ)(Ñ) | 32,330 | 312 | |||||||||
| Tyler Technologies, Inc.(Æ) | 7,364 | 1,181 | |||||||||
| Ultimate Software Group, Inc.(Æ) | 6,243 | 1,317 | |||||||||
| VeriFone Systems, Inc.(Æ) | 107,259 | 1,660 | |||||||||
| Virtusa Corp.(Æ) | 43,646 | 827 | |||||||||
| 48,088 | |||||||||||
| Utilities - 3.4% | |||||||||||
| 8x8, Inc.(Æ) | 74,717 | 1,065 | |||||||||
| ALLETE, Inc. | 2,069 | 127 | |||||||||
| ATN International, Inc. | 2,669 | 180 | |||||||||
| CMS Energy Corp. | 60,920 | 2,568 | |||||||||
| Cogent Communications Holdings, Inc. | 20,249 | 747 | |||||||||
| Connecticut Water Service, Inc. | 4,800 | 250 | |||||||||
| El Paso Electric Co. | 26,585 | 1,228 | |||||||||
| Evolution Petroleum Corp. | 55,273 | 426 | |||||||||
| Fairmount Santrol Holdings, Inc.(Æ) | 42,623 | 366 | |||||||||
| FairPoint Communications, Inc.(Æ) | 10,893 | 170 | |||||||||
| Idacorp, Inc. | 2,424 | 190 | |||||||||
| Level 3 Communications, Inc.(Æ) | 5,357 | 301 | |||||||||
| National Fuel Gas Co. | 22,860 | 1,197 | |||||||||
| New Jersey Resources Corp. | 6,600 | 224 | |||||||||
| NorthWestern Corp. | 22,934 | 1,320 | |||||||||
| PNM Resources, Inc. | 1,238 | 41 | |||||||||
See accompanying notes which are an integral part of the financial statements.
Russell Tax-Managed U.S. Mid & Small Cap Fund 289
Russell Investment Company
Russell Tax-Managed U.S. Mid & Small Cap Fund
Schedule of Investments, continued — October 31, 2016
| Futures Contracts | |||||||||||||||
| Amounts in thousands (except contract amounts) | |||||||||||||||
| Unrealized | |||||||||||||||
| Appreciation | |||||||||||||||
| Number of | Notional | Expiration | (Depreciation) | ||||||||||||
| Contracts | Amount | Date | $ | ||||||||||||
| Long Positions | |||||||||||||||
| S&P Mid 400 E-Mini Index Futures | 118 | USD | 17,780 | 12/16 | (713 | ) | |||||||||
| Total Unrealized Appreciation (Depreciation) on Open Futures Contracts (å) | (713 | ) | |||||||||||||
| Presentation of Portfolio Holdings | |||||||||||||||
| Amounts in thousands | |||||||||||||||
| Fair Value | |||||||||||||||
| Practical | |||||||||||||||
| Portfolio Summary | Level 1 | Level 2 | Level 3 | Expedient (a) | Total | % of Net Assets | |||||||||
| Common Stocks | |||||||||||||||
| Consumer Discretionary | $ | 52,171 | $ | — | $ | — | $ | — | $ | 52,171 | 13.1 | ||||
| Consumer Staples | 12,263 | — | 5 | — | 12,268 | 3.1 | |||||||||
| Energy | 18,197 | — | — | — | 18,197 | 4.6 | |||||||||
| Financial Services | 101,508 | — | — | — | 101,508 | 25.5 | |||||||||
| Health Care | 42,768 | — | 6 | — | 42,774 | 10.7 | |||||||||
| Materials and Processing | 31,423 | — | — | — | 31,423 | 7.9 | |||||||||
| Producer Durables | 59,213 | — | — | — | 59,213 | 14.8 | |||||||||
| Technology | 48,088 | — | — | — | 48,088 | 12.1 | |||||||||
| Utilities | 13,429 | — | — | — | 13,429 | 3.4 | |||||||||
| Short-Term Investments | — | — | — | 17,619 | 17,619 | 4.4 | |||||||||
| Other Securities | — | — | — | 20,724 | 20,724 | 5.2 | |||||||||
| Total Investments | 379,060 | — | 11 | 38,343 | 417,414 | 104.8 | |||||||||
| Other Assets and Liabilities, Net | (4.8 | ) | |||||||||||||
| 100.0 | |||||||||||||||
| Other Financial Instruments | |||||||||||||||
| A | |||||||||||||||
| Liabilities | |||||||||||||||
| Futures Contracts | (713 | ) | — | — | — | (713 | ) | (0.2 | ) | ||||||
| Total Other Financial Instruments* | $ | (713 | ) | $ | — | $ | — | $ | — | $ | (713 | ) | |||
* Futures and foreign currency exchange contract values reflect the unrealized appreciation (depreciation) on the investments.
(a) Certain investments that are measured at fair value using the net asset value per share (or its equivalent) practical expedient have not been classified
in the fair value levels. The fair value amounts presented in the table are intended to permit reconciliation to the amounts presented in the Schedule of
Investments.
For a description of the Levels, see note 2 in the Notes to Financial Statements.
For a disclosure on transfers between Levels 1, 2 and 3 during the period ended October 31, 2016, see note 2 in the Notes to
Financial Statements.
Investments in which significant unobservable inputs (Level 3) were used in determining a fair value for the period ended October
31, 2016 were less than 1% of net assets.
See accompanying notes which are an integral part of the financial statements.
290 Russell Tax-Managed U.S. Mid & Small Cap Fund
Russell Investment Company
Russell Tax-Managed U.S. Mid & Small Cap Fund
Fair Value of Derivative Instruments — October 31, 2016
Amounts in thousands
| Equity | ||||
| Derivatives not accounted for as hedging instruments | Contracts | |||
| Location: Statement of Assets and Liabilities - Liabilities | ||||
| Variation margin on futures contracts* | $ | 713 | ||
| Equity | ||||
| Derivatives not accounted for as hedging instruments | Contracts | |||
| Location: Statement of Operations - Net realized gain (loss) | ||||
| Futures contracts | $ | 2,846 | ||
| Location: Statement of Operations - Net change in unrealized appreciation (depreciation) | ||||
| Futures contracts | $ | (1,228 | ) | |
* Includes cumulative appreciation/depreciation of futures contracts as reported in the Schedule of Investments. Only variation margin is reported within the
Statement of Assets and Liabilities.
For further disclosure on derivatives see note 2 in the Notes to Financial Statements.
See accompanying notes which are an integral part of the financial statements.
Russell Tax-Managed U.S. Mid & Small Cap Fund 291
Russell Investment Company
Russell Tax-Managed U.S. Mid & Small Cap Fund
Balance Sheet Offsetting of Financial and Derivative Instruments — October 31, 2016
| Amounts in thousands | |||||||||
| Offsetting of Financial Assets and Derivative Assets | |||||||||
| Gross | Net Amounts | ||||||||
| Amounts | of Assets | ||||||||
| Gross | Offset in the | Presented in | |||||||
| Amounts of | Statement of | the Statement | |||||||
| Recognized | Assets and | of Assets and | |||||||
| Description | Location: Statement of Assets and Liabilities - Assets | Assets | Liabilities | Liabilities | |||||
| Securities on Loan* | Investments, at fair value | $ | 20,086 | $ | — $ | 20,086 | |||
| Futures Contracts | Variation margin on futures contracts | 126 | — | 126 | |||||
| Total Financial and Derivative Assets | 20,212 | — | 20,212 | ||||||
| Financial and Derivative Assets not subject to a netting agreement | (126 | ) | — | (126 | ) | ||||
| Total Financial and Derivative Assets subject to a netting agreement | $ | 20,086 | $ | — $ | 20,086 | ||||
| Financial Assets, Derivative Assets, and Collateral Held by Counterparty | ||||||||||
| Gross Amounts Not Offset in | ||||||||||
| the Statement of Assets and | ||||||||||
| Liabilities | ||||||||||
| Net Amounts | ||||||||||
| of Assets | ||||||||||
| Presented in | ||||||||||
| the Statement | Financial and | |||||||||
| of Assets and | Derivative | Collateral | ||||||||
| Counterparty | Liabilities | Instruments | Received^ | Net Amount | ||||||
| Barclays | $ | 1,930 | $ | — | $ 1,930 | $ | — | |||
| Citigroup | 1,786 | — | 1,786 | — | ||||||
| Credit Suisse | 1,250 | — | 1,250 | — | ||||||
| Deutsche Bank | 288 | — | 288 | — | ||||||
| Fidelity | 1,978 | — | 1,978 | — | ||||||
| Goldman Sachs | 786 | — | 786 | — | ||||||
| JPMorgan Chase | 4,844 | — | 4,844 | — | ||||||
| Merrill Lynch | 763 | — | 763 | — | ||||||
| Morgan Stanley | 5,965 | — | 5,965 | — | ||||||
| UBS | 496 | — | 496 | — | ||||||
| Total | $ | 20,086 | $ | — | $ 20,086 | $ | — | |||
* Fair value of securities on loan as reported in the footnotes to the Statement of Assets and Liabilities.
^ Collateral received or pledged amounts may not reconcile to those disclosed in the Statement of Assets and Liabilities due to the inclusion of off-Balance
Sheet collateral and adjustments made to exclude overcollateralization.
For further disclosure on derivatives and counterparty risk see note 2 in the Notes to Financial Statements.
See accompanying notes which are an integral part of the financial statements.
292 Russell Tax-Managed U.S. Mid & Small Cap Fund
Russell Investment Company
Russell Tax-Managed U.S. Mid & Small Cap Fund
Statement of Assets and Liabilities — October 31, 2016
| Amounts in thousands | ||
| Assets | ||
| Investments, at identified cost | $ | 325,994 |
| Investments, at fair value(*)(>) | 417,414 | |
| Cash (restricted)(a) | 945 | |
| Receivables: | ||
| Dividends and interest | 88 | |
| Dividends from affiliated Russell funds | 9 | |
| Investments sold | 5,564 | |
| Fund shares sold | 897 | |
| Variation margin on futures contracts | 126 | |
| Total assets | 425,043 | |
| Liabilities | ||
| Payables: | ||
| Investments purchased | 5,261 | |
| Fund shares redeemed | 99 | |
| Accrued fees to affiliates | 410 | |
| Other accrued expenses | 109 | |
| Payable upon return of securities loaned | 20,724 | |
| Total liabilities | 26,603 | |
| Net Assets | $ | 398,440 |
See accompanying notes which are an integral part of the financial statements.
Russell Tax-Managed U.S. Mid & Small Cap Fund 293
Russell Investment Company
Russell Tax-Managed U.S. Mid & Small Cap Fund
Statement of Assets and Liabilities, continued — October 31, 2016
| Amounts in thousands | |||
| Net Assets Consist of: | |||
| Undistributed (overdistributed) net investment income | $ | (237 | ) |
| Accumulated net realized gain (loss) | (6,528 | ) | |
| Unrealized appreciation (depreciation) on: | |||
| Investments | 91,420 | ||
| Futures contracts | (713 | ) | |
| Shares of beneficial interest | 191 | ||
| Additional paid-in capital | 314,307 | ||
| Net Assets | $ | 398,440 | |
| Net Asset Value, offering and redemption price per share: | |||
| Net asset value per share: Class A(#) | $ | 20.15 | |
| Maximum offering price per share (Net asset value plus sales charge of 5.75%): Class A | $ | 21.38 | |
| Class A — Net assets | $ | 9,793,593 | |
| Class A — Shares outstanding ($.01 par value) | 486,109 | ||
| Net asset value per share: Class C(#) | $ | 17.44 | |
| Class C — Net assets | $ | 11,719,979 | |
| Class C — Shares outstanding ($.01 par value) | 671,965 | ||
| Net asset value per share: Class E(#) | $ | 20.19 | |
| Class E — Net assets | $ | 8,300,907 | |
| Class E — Shares outstanding ($.01 par value) | 411,145 | ||
| Net asset value per share: Class S(#) | $ | 20.98 | |
| Class S — Net assets | $ | 368,625,795 | |
| Class S — Shares outstanding ($.01 par value) | 17,567,687 | ||
| Amounts in thousands | |||
| (*) Securities on loan included in investments | $ | 20,086 | |
| (>) Investments in affiliates, Russell U.S. Cash Management Fund and Russell U.S. Cash Collateral Fund | $ | 38,343 | |
| (a) Cash Collateral for Futures | $ | 945 | |
| (#) Net asset value per share equals class level net assets divided by class level shares of beneficial interest outstanding. | |||
See accompanying notes which are an integral part of the financial statements.
294 Russell Tax-Managed U.S. Mid & Small Cap Fund
Russell Investment Company
Russell Tax-Managed U.S. Mid & Small Cap Fund
Statement of Operations — For the Period Ended October 31, 2016
| Amounts in thousands | |||
| Investment Income | |||
| Dividends | $ | 4,457 | |
| Dividends from affiliated Russell funds | 95 | ||
| Securities lending income (net) | 517 | ||
| Total investment income | 5,069 | ||
| Expenses | |||
| Advisory fees | 3,756 | ||
| Administrative fees | 185 | ||
| Custodian fees (1) | 117 | ||
| Distribution fees - Class A | 24 | ||
| Distribution fees - Class C | 88 | ||
| Transfer agent fees - Class A | 19 | ||
| Transfer agent fees - Class C | 24 | ||
| Transfer agent fees - Class E | 16 | ||
| Transfer agent fees - Class S | 708 | ||
| Professional fees | 57 | ||
| Registration fees | 66 | ||
| Shareholder servicing fees - Class C | 29 | ||
| Shareholder servicing fees - Class E | 20 | ||
| Trustees’ fees | 15 | ||
| Printing fees | 63 | ||
| Miscellaneous | 18 | ||
| Expenses before reductions | 5,205 | ||
| Expense reductions | (272 | ) | |
| Net expenses | 4,933 | ||
| Net investment income (loss) | 136 | ||
| Net Realized and Unrealized Gain (Loss) | |||
| Net realized gain (loss) on: | |||
| Investments | (8,169 | ) | |
| Futures contracts | 2,846 | ||
| Net realized gain (loss) | (5,323 | ) | |
| Net change in unrealized appreciation (depreciation) on: | |||
| Investments | 8,706 | ||
| Futures contracts | (1,228 | ) | |
| Net change in unrealized appreciation (depreciation) | 7,478 | ||
| Net realized and unrealized gain (loss) | 2,155 | ||
| Net Increase (Decrease) in Net Assets from Operations | $ | 2,291 | |
| (1) Includes a reimbursement for overbilling of custody out-of-pocket fees from prior years. See note 10 in the Notes to Financial Statements. | |||
See accompanying notes which are an integral part of the financial statements.
Russell Tax-Managed U.S. Mid & Small Cap Fund 295
Russell Investment Company
Russell Tax-Managed U.S. Mid & Small Cap Fund
Statements of Changes in Net Assets
| For the Periods Ended October 31, | ||||||
| Amounts in thousands | 2016 | 2015 | ||||
| Increase (Decrease) in Net Assets | ||||||
| Operations | ||||||
| Net investment income (loss) | $ | 136 | $ | (907 | ) | |
| Net realized gain (loss) | (5,323 | ) | 1,745 | |||
| Net change in unrealized appreciation (depreciation) | 7,478 | (4,229 | ) | |||
| Net increase (decrease) in net assets from operations | 2,291 | (3,391 | ) | |||
| Distributions | ||||||
| From net realized gain | ||||||
| Class A | (49 | ) | (383 | ) | ||
| Class C | (73 | ) | (747 | ) | ||
| Class E | (41 | ) | (376 | ) | ||
| Class S | (1,714 | ) | (16,931 | ) | ||
| Net decrease in net assets from distributions | (1,877 | ) | (18,437 | ) | ||
| Share Transactions* | ||||||
| Net increase (decrease) in net assets from share transactions | 28,558 | 69,370 | ||||
| Total Net Increase (Decrease) in Net Assets | 28,972 | 47,542 | ||||
| Net Assets | ||||||
| Beginning of period | 369,468 | 321,926 | ||||
| End of period | $ | 398,440 | $ | 369,468 | ||
| Undistributed (overdistributed) net investment income included in net assets | $ | (237 | ) | $ | (1,029 | ) |
See accompanying notes which are an integral part of the financial statements.
296 Russell Tax-Managed U.S. Mid & Small Cap Fund
Russell Investment Company
Russell Tax-Managed U.S. Mid & Small Cap Fund
Statements of Changes in Net Assets, continued
* Share transaction amounts (in thousands) for the periods ended October 31, 2016 and October 31, 2015 were as follows:
| 2016 | 2015 | |||||||||||
| Shares | Dollars | Shares | Dollars | |||||||||
| Class A | ||||||||||||
| Proceeds from shares sold | 175 | $ | 3,409 | 185 | $ | 3,844 | ||||||
| Proceeds from reinvestment of distributions | 2 | 49 | 18 | 380 | ||||||||
| Payments for shares redeemed | (145 | ) | (2,889 | ) | (49 | ) | (1,041 | ) | ||||
| Net increase (decrease) | 32 | 569 | 154 | 3,183 | ||||||||
| Class C | ||||||||||||
| Proceeds from shares sold | 97 | 1,666 | 170 | 3,132 | ||||||||
| Proceeds from reinvestment of distributions | 4 | 72 | 41 | 745 | ||||||||
| Payments for shares redeemed | (130 | ) | (2,206 | ) | (112 | ) | (2,055 | ) | ||||
| Net increase (decrease) | (29 | ) | (468 | ) | 99 | 1,822 | ||||||
| Class E | ||||||||||||
| Proceeds from shares sold | 74 | 1,472 | 124 | 2,534 | ||||||||
| Proceeds from reinvestment of distributions | 2 | 41 | 18 | 370 | ||||||||
| Payments for shares redeemed | (55 | ) | (1,100 | ) | (46 | ) | (955 | ) | ||||
| Net increase (decrease) | 21 | 413 | 96 | 1,949 | ||||||||
| Class S | ||||||||||||
| Proceeds from shares sold | 5,366 | 109,263 | 4,818 | 104,704 | ||||||||
| Proceeds from reinvestment of distributions | 83 | 1,673 | 767 | 16,477 | ||||||||
| Payments for shares redeemed | (4,044 | ) | (82,892 | ) | (2,717 | ) | (58,765 | ) | ||||
| Net increase (decrease) | 1,405 | 28,044 | 2,868 | 62,416 | ||||||||
| Total increase (decrease) | 1,429 | $ | 28,558 | 3,217 | $ | 69,370 | ||||||
See accompanying notes which are an integral part of the financial statements.
Russell Tax-Managed U.S. Mid & Small Cap Fund 297
Russell Investment Company
Russell Tax-Managed U.S. Mid & Small Cap Fund
Financial Highlights — For the Periods Ended
For a Share Outstanding Throughout Each Period.
| $ | $ | $ | $ | $ | $ | |||||||||||||
| Net Asset Value, | Net | Net Realized | Total from | Distributions | Distributions | |||||||||||||
| Beginning of | Investment | and Unrealized | Investment | from Net | from Net | |||||||||||||
| Period | Income (Loss)(a)(d) | Gain (Loss) | Operations | Investment Income | Realized Gain | |||||||||||||
| Class A | ||||||||||||||||||
| October 31, 2016 | 20.26 | (.04 | ) | .03 | (.01 | ) | — | (.10 | ) | |||||||||
| October 31, 2015 | 21.65 | (.10 | ) | (.04 | ) | (.14 | ) | — | (1.25 | ) | ||||||||
| October 31, 2014 | 21.99 | (.14 | ) | 1.56 | 1.42 | —(f) | (1.76 | ) | ||||||||||
| October 31, 2013 | 16.00 | (.08 | ) | 6.09 | 6.01 | —(f) | (.02 | ) | ||||||||||
| October 31, 2012 | 14.47 | (.05 | ) | 1.58 | 1.53 | — | — | |||||||||||
| Class C | ||||||||||||||||||
| October 31, 2016 | 17.68 | (.16 | ) | .02 | (.14 | ) | — | (.10 | ) | |||||||||
| October 31, 2015 | 19.18 | (.22 | ) | (.03 | ) | (.25 | ) | — | (1.25 | ) | ||||||||
| October 31, 2014 | 19.81 | (.26 | ) | 1.39 | 1.13 | —(f) | (1.76 | ) | ||||||||||
| October 31, 2013 | 14.51 | (.18 | ) | 5.50 | 5.32 | — | (.02 | ) | ||||||||||
| October 31, 2012 | 13.23 | (.15 | ) | 1.43 | 1.28 | — | — | |||||||||||
| Class E | ||||||||||||||||||
| October 31, 2016 | 20.29 | (.03 | ) | .03 | — | — | (.10 | ) | ||||||||||
| October 31, 2015 | 21.68 | (.10 | ) | (.04 | ) | (.14 | ) | — | (1.25 | ) | ||||||||
| October 31, 2014 | 22.01 | (.14 | ) | 1.57 | 1.43 | —(f) | (1.76 | ) | ||||||||||
| October 31, 2013 | 16.01 | (.06 | ) | 6.08 | 6.02 | — | (.02 | ) | ||||||||||
| October 31, 2012 | 14.48 | (.05 | ) | 1.58 | 1.53 | — | — | |||||||||||
| Class S | ||||||||||||||||||
| October 31, 2016 | 21.03 | .02 | .03 | .05 | — | (.10 | ) | |||||||||||
| October 31, 2015 | 22.38 | (.05 | ) | (.05 | ) | (.10 | ) | — | (1.25 | ) | ||||||||
| October 31, 2014 | 22.61 | (.09 | ) | 1.62 | 1.53 | —(f) | (1.76 | ) | ||||||||||
| October 31, 2013 | 16.43 | (.02 | ) | 6.25 | 6.23 | (.03 | ) | (.02 | ) | |||||||||
| October 31, 2012 | 14.83 | (.01 | ) | 1.61 | 1.60 | — | — | |||||||||||
See accompanying notes which are an integral part of the financial statements.
298 Russell Tax-Managed U.S. Mid & Small Cap Fund
| % | % | % | ||||||||||||||||
| $ | $ | Ratio of Expenses | Ratio of Expenses | Ratio of Net | ||||||||||||||
| Net Asset Value, | % | Net Assets, | to Average | to Average | Investment Income | % | ||||||||||||
| $ | End of | Total | End of Period | Net Assets, | Net Assets, | to Average | Portfolio | |||||||||||
| Total Distributions | Period | Return(c) | (000 | ) | Gross(l) | Net(d)(l) | Net Assets(d) | Turnover Rate(k) | ||||||||||
| (.10 | ) | 20.15 | (.01 | ) | 9,794 | 1.56 | 1.52 | (.20 | ) | 70 | ||||||||
| (1.25 | ) | 20.26 | (.77 | ) | 9,189 | 1.57 | 1.53 | (.49 | ) | 65 | ||||||||
| (1.76 | ) | 21.65 | 6.73 | 6,489 | 1.58 | 1.53 | (.69 | ) | 80 | |||||||||
| (.02 | ) | 21.99 | 37.62 | 3,256 | 1.56 | 1.53 | (.44 | ) | 46 | |||||||||
| — | 16.00 | 10.57 | 1,426 | 1.58 | 1.53 | (.34 | ) | 48 | ||||||||||
| (.10 | ) | 17.44 | (.75 | ) | 11,720 | 2.32 | 2.24 | (.92 | ) | 70 | ||||||||
| (1.25 | ) | 17.68 | (1.48 | ) | 12,392 | 2.32 | 2.25 | (1.21 | ) | 65 | ||||||||
| (1.76 | ) | 19.18 | 5.95 | 11,555 | 2.32 | 2.25 | (1.39 | ) | 80 | |||||||||
| (.02 | ) | 19.81 | 36.71 | 11,218 | 2.31 | 2.25 | (1.11 | ) | 46 | |||||||||
| — | 14.51 | 9.68 | 7,083 | 2.34 | 2.25 | (1.06 | ) | 48 | ||||||||||
| (.10 | ) | 20.19 | .04 | 8,301 | 1.57 | 1.49 | (.17 | ) | 70 | |||||||||
| (1.25 | ) | 20.29 | (.77 | ) | 7,918 | 1.57 | 1.50 | (.46 | ) | 65 | ||||||||
| (1.76 | ) | 21.68 | 6.77 | 6,383 | 1.57 | 1.50 | (.65 | ) | 80 | |||||||||
| (.02 | ) | 22.01 | 37.64 | 5,665 | 1.56 | 1.50 | (.36 | ) | 46 | |||||||||
| — | 16.01 | 10.57 | 3,898 | 1.59 | 1.50 | (.31 | ) | 48 | ||||||||||
| (.10 | ) | 20.98 | .28 | 368,625 | 1.32 | 1.24 | .08 | 70 | ||||||||||
| (1.25 | ) | 21.03 | (.55 | ) | 339,969 | 1.32 | 1.25 | (.21 | ) | 65 | ||||||||
| (1.76 | ) | 22.38 | 7.01 | 297,498 | 1.32 | 1.25 | (.40 | ) | 80 | |||||||||
| (.05 | ) | 22.61 | 38.02 | 233,887 | 1.31 | 1.25 | (.11 | ) | 46 | |||||||||
| — | 16.43 | 10.79 | 152,403 | 1.34 | 1.25 | (.06 | ) | 48 | ||||||||||
See accompanying notes which are an integral part of the financial statements.
Russell Tax-Managed U.S. Mid & Small Cap Fund 299
Russell Investment Company
Russell Tax-Managed U.S. Mid & Small Cap Fund
Related Party Transactions, Fees and Expenses
| Accrued fees payable to affiliates for the period ended October 31, 2016 were as follows: | ||
| Advisory fees | $ | 324,499 |
| Administration fees | 16,630 | |
| Distribution fees | 9,737 | |
| Shareholder servicing fees | 4,336 | |
| Transfer agent fees | 51,883 | |
| Trustee fees | 2,862 | |
| $ | 409,947 | |
| Transactions (amounts in thousands) during the period ended October 31, 2016 with Underlying Funds which are, or were, an | |||||||||||||||||
| affiliated company are as follows: | |||||||||||||||||
| Fair Value, | Change in | ||||||||||||||||
| Beginning of | Realized Gain | Unrealized | Fair Value, End | Income | Capital Gains | ||||||||||||
| Period | Purchases | Sales | (Loss) | Gain (Loss) | of Period | Distributions | Distributions | ||||||||||
| Russell U.S. Cash Collateral Fund $ | 21,647 | $ | 140,966 | $ | 141,889 | $ | — | $ — | $ | 20,724 | $ | 105 | $ | — | |||
| Russell U.S. Cash Management Fund | 21,776 | 102,818 | 106,977 | — | 2 | 17,619 | 95 | — | |||||||||
| $ | 43,423 | $ | 243,784 | $ | 248,866 | $ | — | $ 2 | $ | 38,343 | $ | 200 | $ | — | |||
Federal Income Taxes
At October 31, 2016, the cost of investments and net unrealized appreciation (depreciation), undistributed ordinary income and
undistributed long-term capital gains for income tax purposes were as follows:.
| Cost of Investments | $ | 326,566,564 | |||
| Unrealized Appreciation | $ | 97,696,362 | |||
| Unrealized Depreciation | (6,848,950 | ) | |||
| Net Unrealized Appreciation (Depreciation) | $ | 90,847,412 | |||
| Undistributed Long-Term Capital Gains | |||||
| (Capital Loss Carryforward) | $ | (6,842,223 | ) | ||
| Tax Composition of Distributions | |||||
| Long-Term Capital Gains | $ | 1,876,698 | |||
Net investment income and net realized gains (loss) in the financial statements may differ from taxable net investment income and net
realized gains (losses). Capital accounts within the financial statements are adjusted for permanent book-tax differences. Book-tax
differences are primarily due to foreign currency gains and losses, reclassifications of dividends, differences in treatment of income
from swaps, net operating losses, investments in partnerships, investments in passive foreign investment companies (PFICs), tax
straddle transactions, use of tax equalization and foreign capital gains taxes. These adjustments have no impact on the net assets.
As permitted by tax regulations, the Fund intends to defer a late year ordinary loss of $63,634 incurred from January 1, 2016 to October
31, 2016 and treat it as arising in the fiscal year 2017.
At October 31, 2016, the Statement of Assets and Liabilities have been adjusted by the following amounts (in thousands):
| Undistributed net investment income | $ | 656 | |
| Accumulated net realized gain (loss) | — | ||
| Additional paid-in capital | (656 | ) |
See accompanying notes which are an integral part of the financial statements.
300 Russell Tax-Managed U.S. Mid & Small Cap Fund
Russell Investment Company
Russell Tax-Managed International Equity Fund
Portfolio Management Discussion and Analysis — October 31, 2016 (Unaudited)
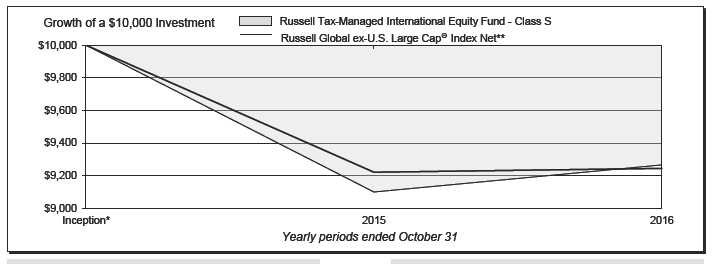
| Russell Tax-Managed International Equity Fund - Class A‡ | Russell Tax-Managed International Equity Fund - Class S | ||||||
| Total | Total | ||||||
| Return | Return | ||||||
| 1 Year | (4.10 | )% | 1 Year | 1.83 | % | ||
| Inception* | (9.26 | )%§ | Inception* | (5.24 | )%§ | ||
| Russell Tax-Managed International Equity Fund - Class C | Russell Global Large Cap® ex-U.S. Index Net** | ||||||
| Total | Total | ||||||
| Return | Return | ||||||
| 1 Year | 0.89 | % | 1 Year | 0.26 | % | ||
| Inception* | (6.15 | )%§ | Inception* | (5.39 | )%§ | ||
| Russell Tax-Managed International Equity Fund - Class E | |||||||
| Total | |||||||
| Return | |||||||
| 1 Year | 1.59 | % | |||||
| Inception* | (5.47 | )%§ | |||||
Russell Tax-Managed International Equity Fund 301
Russell Investment Company
Russell Tax-Managed International Equity Fund
Portfolio Management Discussion and Analysis, continued — October 31, 2016
(Unaudited)
| The Russell Tax-Managed International Equity Fund (the | (“BoJ”) maintained a dovish stance, as the ECB introduced new | |
| “Fund”) employs a multi-manager approach whereby Russell | accommodative stimulus measures in an effort to boost Eurozone | |
| Investment Management, LLC (“RIM”) manages a portion of the | inflation and the BoJ strengthened the stimulus program by moving | |
| Fund’s assets based upon model portfolios provided by multiple | the deposit rate into negative territory. In the second half of the | |
| non-discretionary money managers. The Fund’s money managers | fiscal year, market attention became increasingly fixated upon | |
| have non-discretionary asset management assignments pursuant | the U.K., culminating in the U.K. exiting the European Union on | |
| to which they provide a model portfolio to RIM representing their | June 23rd’s referendum result, severing a 43-year membership, | |
| investment recommendations, based upon which RIM purchases | which spurred significant market volatility. Emerging markets | |
| and sells securities for the Fund. RIM also manages the portion of | gained traction in the second half of the fiscal year with better | |
| the Fund's assets that RIM determines not to manage based upon | than expected economic data from China and other emerging | |
| model portfolios provided by the Fund's money managers. RIM | markets. The Fed lowered the expected pace of rate hikes to a one | |
| may change the allocation of the Fund’s assets at any time. An | hike scenario as the most likely case for the remainder of 2016. | |
| exemptive order from the Securities and Exchange Commission | Asia ex-Japan and Canada were the stand out markets over the | |
| (“SEC”) permits RIM to engage or terminate a money manager | period, while the U.K. and developed Europe ex-U.K. lagged the | |
| at any time, subject to approval by the Fund’s Board, without a | most. The Fund’s overweight to emerging markets was favorable, | |
| shareholder vote. Pursuant to the terms of the exemptive order, | which was partially offset by the underweight to Asia ex-Japan. | |
| the Fund is required to notify its shareholders within 90 days of | ||
| when a money manager begins providing services. As of October | In terms of sector returns, commodity driven sectors materials | |
| 31, 2016, the Fund had six money managers. | and energy outperformed the most, while some of the defensive | |
| sectors, especially health care, lagged the most. The financial | ||
| What is the Fund’s investment objective? | services sector lagged the benchmark, especially driven by | |
| The Fund seeks to provide long term capital growth on an after- | banks. The Fund’s sector positioning was broadly favorable, with | |
| tax basis. | the primary drivers being the Fund’s underweight to health care | |
| How did the Fund perform relative to its benchmark for the | and overweight to technology. | |
| fiscal year ended October 31, 2016? | In terms of factor returns, quality and value outperformed the | |
| For the fiscal year ended October 31, 2016, the Fund’s Class | most, growth factor underperformed and stocks with higher | |
| A, Class C, Class E and Class S Shares gained 1.71%, 0.89%, | medium-term momentum underperformed. Stocks with lower | |
| 1.59% and 1.83%, respectively. This is compared to the Fund’s | volatility held up well and stocks in the lower end of capitalization | |
| benchmark, the Russell Global ex-U.S. Large Cap® Index | spectrum modestly outperformed in the global ex-U.S. markets. | |
| (Net), which gained 0.26% during the same period. The Fund’s | The Fund’s overweight to value and volatility had a favorable | |
| performance includes operating expenses, whereas index returns | impact on performance for the period. | |
| are unmanaged and do not include expenses of any kind. | How did the investment strategies and techniques employed | |
| For the fiscal year ended October 31, 2016, the Morningstar® | by the Fund and its money managers affect its benchmark- | |
| Foreign Large Blend Category, a group of funds that Morningstar | relative performance? | |
| considers to have investment strategies similar to those of the | The Fund outperformed its benchmark for the one year period | |
| Fund, lost 2.08%. This result serves as a peer comparison and is | ending October 31, 2016. The Fund’s overweights to emerging | |
| expressed net of operating expenses. | markets, value and volatility were favorable during the period | |
| RIM may assign a money manager a specific style or | and the Fund was further aided by the outperformance of the | |
| capitalization benchmark other than the Fund’s index. However, | Fund’s emerging markets managers during the period. The Fund’s | |
| the Fund’s primary index remains the benchmark for the Fund | sector positioning was broadly favorable, with the primary drivers | |
| and is representative of the aggregate of each money manager’s | being the Fund’s underweight to health care and overweight to | |
| benchmark index. | technology. | |
| The Fund’s money managers have non-discretionary asset | ||
| How did the market conditions described in the Market | management assignments pursuant to which they provide a model | |
| Summary report affect the Fund’s performance? | portfolio to RIM representing their investment recommendations, | |
| In the first half of the fiscal year ended October 31, 2016, the U.S. | based upon which RIM purchases and sells securities for the | |
| Federal Reserve (“the Fed”) lifted the interest rate by 25 basis | Fund. With respect to this portion of the Fund, RIM manages | |
| points to 0.5% in December 2015, the first time since financial | the Fund’s assets based upon the model portfolios provided by | |
| crisis. The European Central Bank (“ECB”) and Bank of Japan | the Fund’s money managers. RIM also manages the portion of | |
302 Russell Tax-Managed International Equity Fund
Russell Investment Company
Russell Tax-Managed International Equity Fund
Portfolio Management Discussion and Analysis, continued — October 31, 2016
(Unaudited)
| the Fund's assets that RIM determines not to manage based upon | stocks with lower debt and higher profitability) and slightly higher | |
| model portfolios provided by the Fund's money managers. This | momentum, while preserving the potential benefits of the money | |
| includes assets managed directly by RIM to effect the Fund's | managers’ active stock selection. From a benchmark-relative | |
| investment strategies and/or to actively manage the Fund's overall | perspective, the positioning strategy was flat compared with | |
| exposures to seek to achieve the desired risk/return profile for the | the Fund’s benchmark. Overweight to value paid off, while the | |
| Fund. RIM also manages the Fund’s liquidity reserves. | underweight to volatility detracted. | |
| Emerging markets specialist manager, RWC Asset Advisors (US) | During the period, RIM equitized the Fund’s cash using index | |
| LLC (“RWC”), was the best performing money manager during | futures contracts to provide the Fund with full market exposure. | |
| the fiscal year. RWC benefited from strong stock selection as | This did not have a significant impact on Fund performance. | |
| well as from a dynamic value orientation, as value and volatility | ||
| outperformed. | Describe any changes to the Fund’s structure or the money | |
| manager line-up. | ||
| The Fund’s developed ex-U.S. value manager, Pzena Investment | During the period, RIM modestly increased the Fund’s allocation | |
| Management, LLC (“Pzena”), faced the strongest headwinds over | to emerging markets specialist managers. | |
| the period. Although the manager benefited from factor tailwinds | ||
| due to its dynamic value orientation, the manager’s overweight | Money Managers as of October 31, | |
| to capitalization size detracted. Moreover, stock selection was | 2016 | Styles |
| challenged, especially in industrials. | AllianceBernstein L.P. | Emerging - Value |
| RIM manages a positioning strategy within the Fund, which is | Delaware Investment Fund Advisers, a Series of | |
| designed with the dual mandate of improving the Fund’s after-tax | Delaware Management Business Trust | Emerging - Value |
| Fiera Capital Inc. | Developed - Growth | |
| returns as well as controlling Fund-level exposures and/or risks. | Janus Capital Management LLC and Perkins | |
| The active tax management aspect of the strategy is focused on | Investment Management, LLC | Developed - Value |
| improving the after tax returns of the Fund. Because RIM controls | Pzena Investment Management, LLC | Developed - Value |
| all trading for the Fund, RIM managed the tax lots of the Fund | RWC Asset Advisors (US) LLC | Emerging – Market |
| and harvested losses and deferred capital gains with respect to | Oriented | |
| certain securities during the fiscal year. As a result, no realized | The views expressed in this report reflect those of the | |
| capital gains are expected to be distributed to Fund shareholders | portfolio managers only through the end of the period | |
| from the fiscal year. | covered by the report. These views do not necessarily | |
| represent the views of RIM, or any other person in RIM or | ||
| In addition, using the output from a quantitative model to guide | any other affiliated organization. These views are subject | |
| the purchase of a stock portfolio, RIM seeks to position the Fund | to change at any time based upon market conditions or | |
| to meet RIM’s overall preferred positioning with respect to Fund | other events, and RIM disclaims any responsibility to | |
| exposures, while optimizing the portfolio to minimize tracking | update the views contained herein. These views should not | |
| error relative to the Fund’s money manager portfolios. Over the | be relied on as investment advice and, because investment | |
| period, the Fund’s positioning strategy was designed to provide | decisions for a Russell Investment Company (“RIC”) Fund | |
| exposure to lower capitalization (overweight the smaller stocks | are based on numerous factors, should not be relied on as | |
| in the benchmark), higher value (overweight stocks with lower | an indication of investment decisions of any RIC Fund. | |
| valuations than the benchmark), higher quality (overweight | ||
Russell Tax-Managed International Equity Fund 303
Russell Investment Company
Russell Tax-Managed International Equity Fund
Portfolio Management Discussion and Analysis, continued — October 31, 2016
(Unaudited)
* Assumes initial investment on June 1, 2015.
** The Russell Global ex-U.S. Large Cap® Index Net is an index which represents the large-cap segment of the global equity market, including both developed
and emerging market countries and excluding companies assigned to the United States. The performance for this index is calculated “Net” of the relevant
withholding tax in each country to reflect the tax implication for U.S. investors investing outside of the U.S.
‡ The performance has been adjusted to reflect the deduction of the maximum Class A sales charge of 5.75%.
Performance is historical and assumes reinvestment of all dividends and capital gains. Investment return and principal value will fluctuate so that an investor’s
shares, when redeemed, may be worth more or less than when purchased. Past performance is not indicative of future results. The returns shown do not reflect the
deduction of taxes that a shareholder would pay on Fund distributions or the redemption of Fund shares. Additionally, the returns presented herein may differ from
the performance reported in the Financial Highlights as the returns herein are calculated in a manner consistent with standardized performance in accordance with
Securities and Exchange Commission rules, while the performance in the Financial Highlights has been calculated in accordance with U.S. Generally Accepted
Accounting Principles (“U.S. GAAP”).
304 Russell Tax-Managed International Equity Fund
Russell Investment Company
Russell Tax-Managed International Equity Fund
Shareholder Expense Example — October 31, 2016 (Unaudited)
| Fund Expenses | Please note that the expenses shown in the table are meant | |||||
| The following disclosure provides important information | to highlight your ongoing costs only and do not reflect any | |||||
| regarding the Fund’s Shareholder Expense Example | transactional costs. Therefore, the information under the heading | |||||
| (“Example”). | “Hypothetical Performance (5% return before expenses)” is | |||||
| useful in comparing ongoing costs only, and will not help you | ||||||
| Example | determine the relative total costs of owning different funds. In | |||||
| As a shareholder of the Fund, you incur two types of costs: (1) | addition, if these transactional costs were included, your costs | |||||
| transaction costs, including sales charges (loads) on certain | would have been higher. | |||||
| purchase or redemption payments, and (2) ongoing costs, | Hypothetical | |||||
| including distribution (12b-1) and/or service fees and other | Performance (5% | |||||
| Fund expenses. The Example is intended to help you understand | Actual | return before | ||||
| your ongoing costs (in dollars) of investing in the Fund and to | Class A | Performance | expenses) | |||
| Beginning Account Value | ||||||
| compare these costs with the ongoing costs of investing in other | May 1, 2016 | $ | 1,000.00 | $ | 1,000.00 | |
| mutual funds. The Example is based on an investment of $1,000 | Ending Account Value | |||||
| invested at the beginning of the period and held for the entire | October 31, 2016 | $ | 1,033.70 | $ | 1,018.40 | |
| period indicated, which for this Fund is from May 1, 2016 to | Expenses Paid During Period* | $ | 6.85 | $ | 6.80 | |
| October 31, 2016. | * Expenses are equal to the Fund's annualized expense ratio of 1.34% | |||||
| (representing the six month period annualized), multiplied by the average | ||||||
| Actual Expenses | account value over the period, multiplied by 184/366 (to reflect the one-half | |||||
| The information in the table under the heading “Actual | year period). May reflect amounts waived and/or reimbursed. Without any | |||||
| Performance” provides information about actual account values | waivers and/or reimbursements, expenses would have been higher. | |||||
| and actual expenses. You may use the information in this column, | ||||||
| Hypothetical | ||||||
| together with the amount you invested, to estimate the expenses | Performance (5% | |||||
| that you paid over the period. Simply divide your account value by | Actual | return before | ||||
| $1,000 (for example, an $8,600 account value divided by $1,000 | Class C | Performance | expenses) | |||
| Beginning Account Value | ||||||
| = 8.6), then multiply the result by the number in the first column | May 1, 2016 | $ | 1,000.00 | $ | 1,000.00 | |
| in the row entitled “Expenses Paid During Period” to estimate | Ending Account Value | |||||
| the expenses you paid on your account during this period. | October 31, 2016 | $ | 1,029.40 | $ | 1,014.63 | |
| Expenses Paid During Period* | $ | 10.66 | $ | 10.58 | ||
| Hypothetical Example for Comparison Purposes | ||||||
| The information in the table under the heading “Hypothetical | * Expenses are equal to the Fund's annualized expense ratio of 2.09% | |||||
| (representing the six month period annualized), multiplied by the average | ||||||
| Performance (5% return before expenses)” provides information | account value over the period, multiplied by 184/366 (to reflect the one-half | |||||
| about hypothetical account values and hypothetical expenses | year period). May reflect amounts waived and/or reimbursed. Without any | |||||
| based on the Fund’s actual expense ratio and an assumed rate of | waivers and/or reimbursements, expenses would have been higher. | |||||
| return of 5% per year before expenses, which is not the Fund’s | ||||||
| Hypothetical | ||||||
| actual return. The hypothetical account values and expenses | Performance (5% | |||||
| may not be used to estimate the actual ending account balance or | Actual | return before | ||||
| expenses you paid for the period. You may use this information | Class E | Performance | expenses) | |||
| to compare the ongoing costs of investing in the Fund and other | Beginning Account Value | |||||
| May 1, 2016 | $ | 1,000.00 | $ | 1,000.00 | ||
| funds. To do so, compare this 5% hypothetical example with the | Ending Account Value | |||||
| 5% hypothetical examples that appear in the shareholder reports | October 31, 2016 | $ | 1,033.80 | $ | 1,018.40 | |
| of other funds. | Expenses Paid During Period* | $ | 6.85 | $ | 6.80 | |
| * Expenses are equal to the Fund's annualized expense ratio of 1.34% | ||||||
| (representing the six month period annualized), multiplied by the average | ||||||
| account value over the period, multiplied by 184/366 (to reflect the one-half | ||||||
| year period). May reflect amounts waived and/or reimbursed. Without any | ||||||
| waivers and/or reimbursements, expenses would have been higher. | ||||||
Russell Tax-Managed International Equity Fund 305
Russell Investment Company
Russell Tax-Managed International Equity Fund
Shareholder Expense Example, continued — October 31, 2016 (Unaudited)
| Hypothetical | ||||||
| Performance (5% | ||||||
| Actual | return before | |||||
| Class S | Performance | expenses) | ||||
| Beginning Account Value | ||||||
| May 1, 2016 | $ | 1,000.00 | $ | 1,000.00 | ||
| Ending Account Value | ||||||
| October 31, 2016 | $ | 1,034.80 | $ | 1,019.66 | ||
| Expenses Paid During Period* | $ | 5.58 | $ | 5.53 | ||
| * Expenses are equal to the Fund's annualized expense ratio of 1.09% | ||||||
| (representing the six month period annualized), multiplied by the average | ||||||
| account value over the period, multiplied by 184/366 (to reflect the one-half | ||||||
| year period). May reflect amounts waived and/or reimbursed. Without any | ||||||
| waivers and/or reimbursements, expenses would have been higher. | ||||||
306 Russell Tax-Managed International Equity Fund
Russell Investment Company
Russell Tax-Managed International Equity Fund
Schedule of Investments — October 31, 2016
| Amounts in thousands (except share amounts) | Amounts in thousands (except share amounts) | |||||||||
| Principal | Fair | Principal | Fair | |||||||
| Amount ($) | Value | Amount ($) | Value | |||||||
| or Shares | $ | or Shares | $ | |||||||
| Common Stocks - 91.6% | Cia de Saneamento Basico do Estado de | |||||||||
| Argentina - 0.3% | Sao Paulo - ADR(Æ) | 215,925 | 2,272 | |||||||
| Cresud SACIF y A - ADR(Æ) | 18,139 | 317 | Cia de Saneamento de Minas | |||||||
| IRSA Inversiones y Representaciones | Gerais-COPASA(Æ) | 19,464 | 203 | |||||||
| SA - ADR(Æ) | 6,750 | 126 | Cosan SA Industria e Comercio | 88,699 | 1,193 | |||||
| YPF SA - ADR | 83,435 | 1,483 | Hypermarcas SA | 92,411 | 775 | |||||
| 1,926 | Itau Unibanco Holding SA - ADR | 203,367 | 2,426 | |||||||
| JBS SA | 157,780 | 480 | ||||||||
| Australia - 1.6% | Petroleo Brasileiro SA - ADR(Æ) | 293,807 | 3,428 | |||||||
| AGL Energy, Ltd. | 14,311 | 208 | Rumo Logistica Operadora Multimodal | |||||||
| ASX, Ltd. - ADR | 4,813 | 172 | SA(Æ) | 458,657 | 1,026 | |||||
| Australia & New Zealand Banking | Telefonica Brasil SA - ADR | 69,829 | 1,006 | |||||||
| Group, Ltd. - ADR | 64,362 | 1,361 | TIM Participacoes SA - ADR | 78,641 | 1,089 | |||||
| Bendigo & Adelaide Bank, Ltd. | 30,927 | 261 | 19,022 | |||||||
| BHP Billiton, Ltd. - ADR | 12,620 | 221 | ||||||||
| Commonwealth Bank of Australia - ADR | 46,225 | 2,575 | Canada - 3.4% | |||||||
| CSL, Ltd. | 805 | 61 | Bank of Montreal | 8,445 | 537 | |||||
| Fortescue Metals Group, Ltd. | 42,690 | 178 | Bank of Nova Scotia (The) | 16,461 | 885 | |||||
| Goodman Group(ö) | 71,710 | 369 | Barrick Gold Corp. | 16,388 | 288 | |||||
| GPT Group (The)(ö) | 138,365 | 489 | BCE, Inc. | 6,228 | 283 | |||||
| Macquarie Group, Ltd. | 5,472 | 331 | Brookfield Asset Management, Inc. | |||||||
| Medibank Pvt, Ltd. | 188,483 | 370 | Class A | 4,754 | 166 | |||||
| Mirvac Group(ö) | 103,514 | 164 | Brookfield Real Estate Services, Inc. | 32,533 | 387 | |||||
| National Australia Bank, Ltd. - ADR | 9,123 | 194 | Canadian Imperial Bank of Commerce | 4,397 | 329 | |||||
| QBE Insurance Group, Ltd. | 21,631 | 164 | Canadian National Railway Co. | 27,176 | 1,709 | |||||
| Rio Tinto, Ltd. - ADR | 20,684 | 850 | Canadian Natural Resources, Ltd. | 35,419 | 1,124 | |||||
| Scentre Group(ö) | 137,481 | 439 | Canadian Pacific Railway, Ltd. | 4,758 | 680 | |||||
| Stockland(ö) | 29,894 | 100 | CCL Industries, Inc. Class B | 234 | 42 | |||||
| Suncorp Group, Ltd. | 48,123 | 437 | Cenovus Energy, Inc. | 40,360 | 582 | |||||
| Wesfarmers, Ltd.(Æ) | 12,552 | 391 | CGI Group, Inc. Class A(Æ) | 3,049 | 145 | |||||
| Westfield Corp.(ö) | 28,689 | 194 | Dollarama, Inc. | 2,149 | 161 | |||||
| Westpac Banking Corp. | 19,284 | 446 | Enbridge, Inc. | 10,289 | 444 | |||||
| 9,975 | Fairfax Financial Holdings, Ltd. | 416 | 213 | |||||||
| First Quantum Minerals, Ltd. | 160,324 | 1,523 | ||||||||
| Austria - 0.1% | Fortis, Inc. | 9,327 | 307 | |||||||
| Erste Group Bank AG(Æ) | 12,978 | 407 | Goldcorp, Inc. | 7,506 | 114 | |||||
| UNIQA Insurance Group AG | 49,228 | 318 | Husky Energy, Inc.(Æ) | 63,677 | 685 | |||||
| 725 | Industrial Alliance Insurance & | |||||||||
| Financial Services, Inc. | 8,194 | 317 | ||||||||
| Belgium - 0.5% | Intact Financial Corp. | 4,595 | 312 | |||||||
| Ageas | 8,385 | 306 | Loblaw Cos., Ltd. | 2,231 | 110 | |||||
| Anheuser-Busch InBev SA | 14,987 | 1,721 | Magna International, Inc. Class A | 35,732 | 1,467 | |||||
| Colruyt SA | 511 | 27 | Metro, Inc. Class A | 4,660 | 144 | |||||
| Elia System Operator SA | 5,531 | 286 | National Bank of Canada | 10,700 | 382 | |||||
| KBC Group NV | 15,534 | 945 | Open Text Corp. | 5,805 | 360 | |||||
| 3,285 | Potash Corp. of Saskatchewan, Inc. | 77,657 | 1,263 | |||||||
| Power Corp. of Canada | 14,238 | 305 | ||||||||
| Bermuda - 0.1% | Power Financial Corp. | 5,192 | 123 | |||||||
| Hiscox, Ltd. | 24,694 | 308 | Restaurant Brands International, Inc. | 10,135 | 451 | |||||
| Rogers Communications, Inc. Class B | 46,414 | 1,868 | ||||||||
| Brazil - 3.0% | Royal Bank of Canada - GDR | 16,949 | 1,059 | |||||||
| B2W Cia Digital(Æ) | 184,666 | 907 | SNC-Lavalin Group, Inc. | 7,651 | 311 | |||||
| Banco Bradesco SA - ADR(Æ) | 66,258 | 690 | Sun Life Financial, Inc. | 17,068 | 571 | |||||
| BM&FBovespa SA - Bolsa de Valores | Toronto Dominion Bank | 22,518 | 1,022 | |||||||
| Mercadorias e Futuros(Æ) | 152,958 | 901 | TransCanada Corp. | 18,850 | 853 | |||||
| Braskem SA - ADR | 42,926 | 762 | 21,522 | |||||||
| BRF SA - ADR(Æ) | 24,831 | 415 | ||||||||
| CCR SA | 166,353 | 904 | Cayman Islands - 0.3% | |||||||
| Centrais Eletricas Brasileiras SA | Baidu, Inc. - ADR(Æ) | 9,573 | 1,694 | |||||||
| - ADR(Æ) | 46,837 | 346 | China Resources Land, Ltd. | 138,968 | 345 | |||||
| Cia Brasileira de Distribuicao - ADR | 10,451 | 199 | ||||||||
See accompanying notes which are an integral part of the financial statements.
Russell Tax-Managed International Equity Fund 307
Russell Investment Company
Russell Tax-Managed International Equity Fund
Schedule of Investments, continued — October 31, 2016
| Amounts in thousands (except share amounts) | Amounts in thousands (except share amounts) | |||||||||
| Principal | Fair | Principal | Fair | |||||||
| Amount ($) | Value | Amount ($) | Value | |||||||
| or Shares | $ | or Shares | $ | |||||||
| Qinqin Foodstuffs Group Cayman Co., | SINA Corp.(Æ) | 29,271 | 2,112 | |||||||
| Ltd.(Æ) | 318 | — | Sinopec Shanghai Petrochemical Co., | |||||||
| Sunac China Holdings, Ltd. | 122,866 | 84 | Ltd. Class H | 2,761,136 | 1,407 | |||||
| 2,123 | Sohu.com, Inc.(Æ) | 31,439 | 1,177 | |||||||
| Tencent Holdings, Ltd. | 135,965 | 3,599 | ||||||||
| Chile - 0.1% | Tingyi Cayman Islands Holding Corp. | 298,000 | 321 | |||||||
| Banco de Credito e Inversiones | 1 | — | Tsingtao Brewery Co., Ltd. Class H | 30,000 | 120 | |||||
| Sociedad Quimica y Minera de Chile | Uni-President China Holdings, Ltd. | 311,715 | 211 | |||||||
| SA - ADR | 20,596 | 603 | Vipshop Holdings, Ltd. - ADR(Æ) | 6,559 | 90 | |||||
| 603 | Weibo Corp. - ADR(Æ) | 33,569 | 1,545 | |||||||
| Zhejiang Expressway Co., Ltd. Class H | 781 | 1 | ||||||||
| China - 6.1% | 38,403 | |||||||||
| Alibaba Group Holding, Ltd. - ADR(Æ) | 20,957 | 2,131 | ||||||||
| Angang Steel Co., Ltd. Class H(Æ) | 1,666,000 | 854 | Curacao - 0.0% | |||||||
| Bank of China, Ltd. Class H | 2,433,437 | 1,089 | HAL Trust | 320 | 63 | |||||
| China CITIC Bank Corp., Ltd. Class H | 1,157,000 | 747 | ||||||||
| China Communications Services Corp., | Denmark - 1.4% | |||||||||
| Ltd. Class H | 784,000 | 466 | Carlsberg A/S Class B | 4,284 | 386 | |||||
| China Construction Bank Corp. Class H | 1,294,000 | 945 | Chr Hansen Holding A/S | 20,898 | 1,251 | |||||
| China Mengniu Dairy Co., Ltd. | 287,000 | 543 | Danske Bank A/S | 41,336 | 1,276 | |||||
| China Minsheng Banking Corp., Ltd. | DSV A/S | 5,558 | 269 | |||||||
| Class H | 345,500 | 394 | FLSmidth & Co. A/S | 8,787 | 319 | |||||
| China Petroleum & Chemical Corp. | GN Store Nord A/S | 6,464 | 131 | |||||||
| Class H | 1,266,000 | 916 | Jyske Bank A/S | 8,525 | 387 | |||||
| China Railway Group, Ltd. Class H | 469,193 | 362 | Matas A/S | 30,494 | 592 | |||||
| China Shenhua Energy Co., Ltd. Class H | 701,500 | 1,460 | Novo Nordisk A/S Class B | 67,602 | 2,412 | |||||
| China Telecom Corp., Ltd. Class H | 311,654 | 161 | Scandinavian Tobacco Group A/S(Þ) | 57,384 | 993 | |||||
| Chongqing Changan Automobile Co., | William Demant Holding A/S(Æ) | 25,395 | 472 | |||||||
| Ltd. Class B | 185,329 | 283 | 8,488 | |||||||
| Chongqing Rural Commercial Bank Co., | ||||||||||
| Ltd. Class H | 755,059 | 453 | Egypt - 0.1% | |||||||
| CIFI Holdings Group Co., Ltd. | 2,374,000 | 700 | Commercial International Bank Egypt | |||||||
| CITIC Securities Co., Ltd. Class H | 577,000 | 1,279 | SAE - GDR | 134,962 | 596 | |||||
| CNOOC, Ltd. | 649,000 | 817 | ||||||||
| Ctrip.com International, Ltd. - ADR(Æ) | 40,084 | 1,770 | Finland - 0.4% | |||||||
| Dongfeng Motor Group Co., Ltd. Class H | 446,804 | 464 | Cargotec OYJ Class B | 5,952 | 244 | |||||
| Geely Automobile Holdings, Ltd. | 2,205,000 | 2,268 | Elisa OYJ Class A | 5,966 | 201 | |||||
| Hengan International Group Co., Ltd. | 115,092 | 916 | Fortum OYJ | 20,601 | 343 | |||||
| Hua Hong Semiconductor, Ltd.(Þ) | 254,000 | 300 | Kone OYJ Class B | 2,181 | 100 | |||||
| Huadian Power International Corp., Ltd. | Metso OYJ | 11,609 | 304 | |||||||
| Class H | 251 | — | Neste OYJ | 1,217 | 52 | |||||
| Huaneng Renewables Corp., Ltd. Class | Orion OYJ Class B | 786 | 33 | |||||||
| H | 762,000 | 256 | Tikkurila OYJ | 27,069 | 522 | |||||
| Industrial & Commercial Bank of China, | UPM-Kymmene OYJ | 22,207 | 518 | |||||||
| Ltd. Class H | 2,283,000 | 1,371 | 2,317 | |||||||
| Inner Mongolia Yili Industrial Group | ||||||||||
| Co., Ltd. Class A | 249,564 | 662 | France - 6.7% | |||||||
| JD.com, Inc. - ADR(Æ) | 11,089 | 288 | Air France-KLM(Æ) | 49,853 | 304 | |||||
| Lenovo Group, Ltd. | 592,000 | 379 | Air Liquide SA Class A | 15,303 | 1,555 | |||||
| New China Life Insurance Co., Ltd. | Arkema SA | 3,221 | 306 | |||||||
| Class H | 158,600 | 686 | AXA SA | 21,997 | 495 | |||||
| New Oriental Education & Technology | BioMerieux | 2,113 | 308 | |||||||
| Group - ADR(Æ) | 29,983 | 1,503 | Bollore SA | 104,351 | 344 | |||||
| PetroChina Co., Ltd. - ADR | 6,988 | 473 | Bouygues SA - ADR | 85,986 | 2,806 | |||||
| PICC Property & Casualty Co., Ltd. | Carrefour SA | 17,753 | 466 | |||||||
| Class H | 468,000 | 756 | Christian Dior SE | 2,234 | 431 | |||||
| Ping An Insurance Group Co. of China, | Cie de Saint-Gobain | 13,070 | 581 | |||||||
| Ltd. Class H | 70,500 | 372 | Credit Agricole SA | 152,515 | 1,642 | |||||
| Poly Real Estate Group Co., Ltd. Class A | 455,569 | 617 | Danone SA | 43,521 | 3,011 | |||||
| Shanghai Pharmaceuticals Holding Co., | Dassault Systemes SA | 348 | 28 | |||||||
| Ltd. Class H | 442,500 | 1,139 | Eiffage SA | 4,135 | 306 | |||||
See accompanying notes which are an integral part of the financial statements.
308 Russell Tax-Managed International Equity Fund
Russell Investment Company
Russell Tax-Managed International Equity Fund
Schedule of Investments, continued — October 31, 2016
| Amounts in thousands (except share amounts) | Amounts in thousands (except share amounts) | ||||||||
| Principal | Fair | Principal | Fair | ||||||
| Amount ($) | Value | Amount ($) | Value | ||||||
| or Shares | $ | or Shares | $ | ||||||
| Engie SA | 193,323 | 2,790 | Software AG | 9,114 | 331 | ||||
| Essilor International SA | 10,637 | 1,194 | ThyssenKrupp AG - ADR | 9,794 | 227 | ||||
| Euler Hermes Group | 3,989 | 346 | Uniper SE(Æ) | 1,361 | 18 | ||||
| Faurecia | 47,489 | 1,743 | Volkswagen AG | 788 | 118 | ||||
| Fonciere Des Regions(ö) | 3,174 | 277 | Vonovia SE | 5,828 | 206 | ||||
| Klepierre - GDR(ö) | 5,840 | 239 | 21,855 | ||||||
| Legrand SA - ADR | 4,894 | 276 | |||||||
| L'Oreal SA | 13,546 | 2,426 | Greece - 0.1% | ||||||
| Mercialys SA(ö) | 7,185 | 149 | Eurobank Ergasias SA(Æ) | 544,607 | 320 | ||||
| Metropole Television SA | 17,093 | 298 | National Bank of Greece SA(Æ) | 1,559,354 | 321 | ||||
| Natixis SA | 131,573 | 666 | 641 | ||||||
| Orange SA - ADR | 12,888 | 203 | |||||||
| Pernod Ricard SA | 3,723 | 443 | Hong Kong - 2.7% | ||||||
| Publicis Groupe SA - ADR | 23,347 | 1,603 | AIA Group, Ltd. | 26,200 | 165 | ||||
| Renault SA | 2,030 | 177 | Bank of East Asia, Ltd. (The) | 91,600 | 368 | ||||
| Safran SA | 21,626 | 1,485 | Brilliance China Automotive Holdings, | ||||||
| Sanofi - ADR | 73,144 | 5,688 | Ltd. | 368,000 | 436 | ||||
| Schneider Electric SE | 43,306 | 2,910 | Champion REIT(Æ)(ö) | 194,000 | 110 | ||||
| SCOR SE - ADR | 11,860 | 384 | Cheung Kong Infrastructure Holdings, | ||||||
| Societe Generale SA | 3,244 | 126 | Ltd. | 41,000 | 336 | ||||
| Technip SA | 2,003 | 132 | Cheung Kong Property Holdings, Ltd. | 102,823 | 762 | ||||
| Teleperformance - GDR | 2,067 | 219 | China Mobile, Ltd. - ADR | 52,073 | 2,992 | ||||
| Total SA | 58,591 | 2,804 | China Unicom Hong Kong, Ltd. - ADR | 55,467 | 650 | ||||
| Unibail-Rodamco SE(ö) | 729 | 174 | CK Hutchison Holdings, Ltd. | 160,529 | 1,986 | ||||
| Vallourec SA(Æ) | 180,037 | 880 | CLP Holdings, Ltd. | 35,000 | 356 | ||||
| Vicat SA | 15,196 | 955 | Goldin Financial Holdings, Ltd.(Æ) | 453 | — | ||||
| Vinci SA | 8,654 | 626 | Hang Lung Properties, Ltd. - ADR | 229,000 | 505 | ||||
| Worldline SA(Æ)(Þ) | 17,726 | 487 | Henderson Land Development Co., Ltd. | 57,000 | 338 | ||||
| 42,283 | Hongkong Land Holdings, Ltd. | 54,800 | 367 | ||||||
| Jardine Matheson Holdings, Ltd. | 4,000 | 243 | |||||||
| Germany - 3.5% | Jardine Strategic Holdings, Ltd. | 17,700 | 620 | ||||||
| adidas AG | 2,086 | 342 | Link REIT(ö) | 68,000 | 485 | ||||
| Allianz SE | 5,099 | 795 | Luk Fook Holdings International, Ltd. | 226 | 1 | ||||
| BASF SE | 6,139 | 541 | MTR Corp., Ltd. | 24,500 | 135 | ||||
| Bayer AG | 2,726 | 270 | Nine Dragons Paper Holdings, Ltd. | 1,507,000 | 1,226 | ||||
| Continental AG | 6,837 | 1,310 | Power Assets Holdings, Ltd. | 36,000 | 338 | ||||
| Daimler AG | 5,589 | 398 | Shenzhen International Holdings, Ltd. | 57,518 | 89 | ||||
| Deutsche Boerse AG(Æ) | 33,162 | 2,579 | Sino Land Co., Ltd. | 182,000 | 309 | ||||
| Deutsche Boerse AG | 1,431 | 107 | Skyworth Digital Holdings, Ltd. | 946,000 | 612 | ||||
| Deutsche Post AG | 17,994 | 557 | Swire Pacific, Ltd. Class A | 41,000 | 426 | ||||
| Deutsche Telekom AG | 14,611 | 238 | Swire Properties, Ltd. | 146,800 | 421 | ||||
| Deutsche Wohnen AG | 4,110 | 134 | WH Group, Ltd.(Þ) | 1,648,782 | 1,337 | ||||
| Fresenius Medical Care AG & Co. | 3,064 | 250 | Wharf Holdings, Ltd. (The) | 55,000 | 413 | ||||
| Fresenius SE & Co. KGaA | 12,064 | 890 | Wheelock & Co., Ltd. | 52,000 | 321 | ||||
| GEA Group AG | 5,267 | 203 | Yue Yuen Industrial Holdings, Ltd. | 113,395 | 432 | ||||
| Hamburger Hafen und Logistik AG | 40,407 | 643 | 16,779 | ||||||
| Hannover Rueck SE | 1,235 | 138 | |||||||
| HeidelbergCement AG | 16,127 | 1,525 | Hungary - 0.3% | ||||||
| Henkel AG & Co. KGaA | 560 | 62 | OTP Bank PLC | 77,163 | 2,162 | ||||
| Infineon Technologies AG - ADR | 2,021 | 36 | |||||||
| Lanxess AG | 4,782 | 306 | India - 2.6% | ||||||
| LEG Immobilien AG(Æ) | 389 | 33 | Axis Bank, Ltd. - GDR(Æ) | 30,759 | 1,113 | ||||
| Linde AG | 2,213 | 365 | Britannia Industries, Ltd. | 24,768 | 1,233 | ||||
| MAN SE | 3,249 | 332 | HDFC Bank, Ltd. - ADR | 34,599 | 2,449 | ||||
| Merck KGaA | 10,806 | 1,111 | ICICI Bank, Ltd. - ADR | 98,153 | 814 | ||||
| Muenchener Rueckversicherungs- | IRB Infrastructure Developers, Ltd. | 216,908 | 765 | ||||||
| Gesellschaft AG in Muenchen | 4,335 | 840 | Mahindra & Mahindra, Ltd. - GDR | 10,041 | 196 | ||||
| Rational AG | 1,897 | 985 | Motherson Sumi Systems, Ltd. | 169,204 | 842 | ||||
| Rhoen Klinikum AG | 10,654 | 297 | Power Finance Corp., Ltd. | 194,024 | 362 | ||||
| SAP SE - ADR | 25,858 | 2,278 | Punjab National Bank(Æ) | 248,396 | 539 | ||||
| Siemens AG | 29,850 | 3,390 | Reliance Industries, Ltd. - GDR(Þ) | 83,504 | 2,647 | ||||
See accompanying notes which are an integral part of the financial statements.
Russell Tax-Managed International Equity Fund 309
Russell Investment Company
Russell Tax-Managed International Equity Fund
Schedule of Investments, continued — October 31, 2016
| Amounts in thousands (except share amounts) | Amounts in thousands (except share amounts) | |||||||||
| Principal | Fair | Principal | Fair | |||||||
| Amount ($) | Value | Amount ($) | Value | |||||||
| or Shares | $ | or Shares | $ | |||||||
| Tata Chemicals, Ltd. | 42,685 | 345 | Dai Nippon Printing Co., Ltd. | 28,000 | 281 | |||||
| Tata Motors, Ltd. Class A | 156,506 | 813 | Dai-ichi Life Holdings, Inc. | 97,885 | 1,434 | |||||
| Tata Motors, Ltd. - ADR | 79,479 | 3,132 | Daiichi Sankyo Co., Ltd. | 7,300 | 176 | |||||
| Zee Entertainment Enterprises, Ltd. | 137,835 | 1,071 | Daikin Industries, Ltd. | 200 | 19 | |||||
| 16,321 | Daito Trust Construction Co., Ltd. | 1,800 | 301 | |||||||
| Daiwa House Industry Co., Ltd. | 13,200 | 363 | ||||||||
| Indonesia - 0.3% | Denso Corp. | 42 | 2 | |||||||
| Astra International Tbk PT | 498,100 | 313 | East Japan Railway Co. | 3,400 | 300 | |||||
| Bank Central Asia Tbk PT | 574,000 | 682 | Ebara Corp. | 42,100 | 1,250 | |||||
| Gudang Garam Tbk PT | 87,400 | 454 | FamilyMart UNY Holdings Co., Ltd. | 800 | 50 | |||||
| Tambang Batubara Bukit Asam Persero | FANUC Corp. | 8,623 | 1,616 | |||||||
| Tbk PT | 128,100 | 117 | FUJIFILM Holdings Corp. | 3,121 | 118 | |||||
| United Tractors Tbk PT | 232,000 | 383 | Fujitsu, Ltd. | 847,146 | 5,022 | |||||
| 1,949 | Honda Motor Co., Ltd. | 227,765 | 6,815 | |||||||
| Hoshizaki Corp. | 1,400 | 126 | ||||||||
| Ireland - 0.6% | Icom, Inc. | 10,400 | 191 | |||||||
| CRH PLC | 2,539 | 82 | Iida Group Holdings Co., Ltd. | 67,300 | 1,300 | |||||
| Icon PLC(Æ) | 3,032 | 243 | Inpex Corp. | 106,800 | 993 | |||||
| Kerry Group PLC Class A | 4,042 | 293 | Isuzu Motors, Ltd. | 219,200 | 2,710 | |||||
| Willis Towers Watson PLC | 12,615 | 1,589 | ITOCHU Corp. | 102,218 | 1,295 | |||||
| XL Group, Ltd. | 39,350 | 1,366 | Iyo Bank, Ltd. (The) | 46,700 | 287 | |||||
| 3,573 | Japan Post Bank Co., Ltd. | 27,688 | 326 | |||||||
| Japan Post Holdings Co., Ltd. | 21,800 | 278 | ||||||||
| Israel - 0.2% | Japan Tobacco, Inc. | 6,000 | 228 | |||||||
| Bank Hapoalim BM | 47,764 | 275 | JX Holdings, Inc. | 91,400 | 361 | |||||
| Bank Leumi Le-Israel BM(Æ) | 66,942 | 253 | Kajima Corp. | 25,000 | 169 | |||||
| Mizrahi Tefahot Bank, Ltd. | 27,841 | 363 | Kamigumi Co., Ltd. | 32,000 | 273 | |||||
| Nice, Ltd. | 600 | 40 | Kao Corp. | 3,700 | 191 | |||||
| Teva Pharmaceutical Industries, Ltd. | 1,967 | 84 | KDDI Corp. | 30,700 | 934 | |||||
| 1,015 | Keyence Corp. | 6,022 | 4,420 | |||||||
| Kikkoman Corp. | 2,000 | 64 | ||||||||
| Italy - 1.3% | Kirin Holdings Co., Ltd. | 18,600 | 321 | |||||||
| Atlantia SpA | 13,311 | 326 | Kitagawa Industries Co., Ltd. | 14,200 | 135 | |||||
| Davide Campari-Milano SpA | 11,235 | 113 | Komatsu, Ltd. | 17,300 | 386 | |||||
| Enel SpA | 709,272 | 3,048 | Kuraray Co., Ltd. | 32,400 | 492 | |||||
| ENI SpA - ADR | 176,063 | 2,546 | Kuroda Electric Co., Ltd. | 18,051 | 352 | |||||
| Intesa Sanpaolo SpA | 71,752 | 166 | Kyushu Electric Power Co., Inc. | 37,000 | 338 | |||||
| Poste Italiane SpA(Þ) | 52,075 | 347 | M3, Inc. | 1,100 | 34 | |||||
| Rizzoli Corriere Della Sera Mediagroup | Marubeni Corp. | 66,000 | 347 | |||||||
| SpA(Æ) | 6,627 | 7 | Medipal Holdings Corp. | 2,600 | 44 | |||||
| Snam Rete Gas SpA | 61,480 | 324 | MEIJI Holdings Co., Ltd. | 400 | 40 | |||||
| Telecom Italia SpA(Æ) | 1,088,532 | 949 | Mitsubishi Chemical Holdings Corp. | 43,600 | 286 | |||||
| Terna Rete Elettrica Nazionale SpA | 56,106 | 275 | Mitsubishi Corp. | 18,400 | 401 | |||||
| Unipol Gruppo Finanziario SpA | 111,971 | 342 | Mitsubishi Electric Corp. | 13,000 | 176 | |||||
| 8,443 | Mitsubishi UFJ Financial Group, Inc. | 414,816 | 2,149 | |||||||
| Mitsui & Co., Ltd. | 30,500 | 423 | ||||||||
| Japan - 11.5% | Mizuho Financial Group, Inc. | 173,500 | 293 | |||||||
| Aeon Co., Ltd. | 21,600 | 300 | MS&AD Insurance Group Holdings, Inc. | 16,000 | 475 | |||||
| Aisin Seiki Co., Ltd. | 4,100 | 180 | Murata Manufacturing Co., Ltd. | 5 | 1 | |||||
| Ajinomoto Co., Inc. | 3,000 | 67 | Nakanishi, Inc. | 7,859 | 281 | |||||
| Alfresa Holdings Corp. | 2,400 | 51 | NEC Corp. | 119,000 | 318 | |||||
| Aozora Bank, Ltd. | 33,000 | 109 | NHK Spring Co., Ltd. | 38,600 | 364 | |||||
| As One Corp. | 21,074 | 947 | Nidec Corp. | 2,800 | 271 | |||||
| Asahi Group Holdings, Ltd. | 700 | 25 | Nikon Corp. | 8,800 | 133 | |||||
| Asahi Kasei Corp. | 38,000 | 343 | Nintendo Co., Ltd. | 1,175 | 285 | |||||
| Asics Corp. | 17 | — | Nippon Fine Chemical Co., Ltd. | 45,900 | 346 | |||||
| Bridgestone Corp. | 13,000 | 484 | Nippon Telegraph & Telephone Corp. | 15,400 | 685 | |||||
| Canon, Inc. | 18,206 | 523 | Nissan Motor Co., Ltd. | 17,300 | 176 | |||||
| Central Japan Railway Co. | 2,200 | 374 | Nitori Holdings Co., Ltd. | 11,900 | 1,424 | |||||
| Chubu Electric Power Co., Inc. | 22,300 | 328 | Nitto FC Co., Ltd. | 33,852 | 273 | |||||
| Cosel Co., Ltd. | 48,777 | 583 | ||||||||
See accompanying notes which are an integral part of the financial statements.
310 Russell Tax-Managed International Equity Fund
Russell Investment Company
Russell Tax-Managed International Equity Fund
Schedule of Investments, continued — October 31, 2016
| Amounts in thousands (except share amounts) | Amounts in thousands (except share amounts) | |||||||||
| Principal | Fair | Principal | Fair | |||||||
| Amount ($) | Value | Amount ($) | Value | |||||||
| or Shares | $ | or Shares | $ | |||||||
| NTT Data Corp. | 5,300 | 274 | America Movil SAB de CV Class L | |||||||
| NTT DOCOMO, Inc. | 47,399 | 1,193 | - ADR | 11,246 | 148 | |||||
| Obayashi Corp. | 14,000 | 135 | Cemex SAB de CV - ADR(Æ) | 184,048 | 1,598 | |||||
| Obic Co., Ltd. | 300 | 16 | Coca-Cola Femsa SAB de CV | 42,352 | 318 | |||||
| ORIX Corp. | 6,735 | 107 | Fomento Economico Mexicano SAB de | |||||||
| Osaka Gas Co., Ltd. | 37,000 | 154 | CV - ADR | 5,786 | 554 | |||||
| Otsuka Holdings Co., Ltd. | 7,400 | 324 | Gentera SAB de CV | 84,244 | 166 | |||||
| Panasonic Corp. | 36,000 | 376 | Gruma SAB de CV Class B(Æ) | 19,715 | 274 | |||||
| Pola Orbis Holdings, Inc. | 9,570 | 796 | Grupo Bimbo SAB de CV | 126,173 | 340 | |||||
| Recruit Holdings Co., Ltd. | 7,300 | 294 | Grupo Fin Santander ADR B - ADR | 44,714 | 405 | |||||
| Resona Holdings, Inc. | 98,500 | 437 | Grupo Financiero Banorte SAB de CV | |||||||
| Ricoh Co., Ltd. | 31,700 | 258 | Class O | 106,441 | 627 | |||||
| Secom Co., Ltd. | 23,363 | 1,687 | Grupo Lala SAB de CV Class B | 59,042 | 110 | |||||
| Secom Joshinetsu Co., Ltd. | 8,700 | 272 | Grupo Televisa SAB - ADR | 78,451 | 1,923 | |||||
| Sekisui Chemical Co., Ltd. | 28,000 | 441 | Industrias Bachoco SAB de CV | 72,421 | 321 | |||||
| Sekisui House, Ltd. | 19,500 | 322 | Megacable Holdings SAB de CV | 73,396 | 267 | |||||
| Seven & i Holdings Co., Ltd. | 35 | 1 | Promotora y Operadora de | |||||||
| Shimadzu Corp. | 3,000 | 44 | Infraestructura SAB de CV | 5,741 | 64 | |||||
| Shimano, Inc. | 11,787 | 2,018 | Wal-Mart de Mexico SAB de CV | 54,131 | 115 | |||||
| Shinsei Bank, Ltd. | 220,000 | 356 | 9,647 | |||||||
| Shionogi & Co., Ltd. | 4,500 | 222 | ||||||||
| SoftBank Group Corp. | 22,992 | 1,446 | Netherlands - 2.3% | |||||||
| Sojitz Corp. | 110,200 | 290 | Aalberts Industries NV | 2,677 | 84 | |||||
| Sompo Holdings, Inc. | 58,501 | 1,895 | ABN AMRO Group NV(Þ) | 20,333 | 469 | |||||
| Sony Corp. | 74,900 | 2,370 | Aegon NV | 55,283 | 238 | |||||
| Sumitomo Chemical Co., Ltd. | 69,000 | 327 | AerCap Holdings NV(Æ) | 10,756 | 442 | |||||
| Sumitomo Corp. | 45,600 | 525 | ASM International NV | 5,539 | 236 | |||||
| Sumitomo Electric Industries, Ltd. | 31,000 | 458 | Delta Lloyd NV | 81,643 | 493 | |||||
| Sumitomo Mitsui Financial Group, Inc. | 72,902 | 2,534 | GrandVision NV(Þ) | 9,451 | 216 | |||||
| Takeda Pharmaceutical Co., Ltd. | 7,800 | 349 | Heineken Holding NV | 3,802 | 292 | |||||
| Terumo Corp. | 1,300 | 50 | Heineken NV | 3,822 | 315 | |||||
| Tokyo Electric Power Co. Holdings, Inc. | ING Groep NV(Æ) | 239,912 | 3,155 | |||||||
| (Æ) | 33,100 | 129 | Koninklijke Ahold Delhaize NV(Æ) | 7,277 | 166 | |||||
| Toppan Printing Co., Ltd. | 34,000 | 320 | Koninklijke DSM NV | 4,812 | 309 | |||||
| Toshiba Corp.(Æ) | 109,000 | 395 | Koninklijke KPN NV | 272,618 | 888 | |||||
| Toyota Motor Corp. | 32,400 | 1,872 | Koninklijke Philips NV | 5,156 | 155 | |||||
| Toyota Tsusho Corp. | 5,300 | 125 | NN Group NV | 11,960 | 360 | |||||
| Unicharm Corp. | 55,888 | 1,331 | Royal Dutch Shell PLC Class A | 182,152 | 4,539 | |||||
| West Japan Railway Co. | 15,500 | 955 | Royal Dutch Shell PLC Class B | 13,745 | 355 | |||||
| Yamada Denki Co., Ltd. | 25,400 | 131 | X5 Retail Group NV - GDR(Æ) | 64,279 | 1,918 | |||||
| 72,685 | 14,630 | |||||||||
| Jersey - 0.0% | New Zealand - 0.0% | |||||||||
| Henderson Group PLC | 96,375 | 272 | Fonterra Co.-operative Group, Ltd. | 35,614 | 150 | |||||
| Kazakhstan - 0.0% | Norway - 0.5% | |||||||||
| KazMunaiGas Exploration Production | DNB ASA | 35,639 | 515 | |||||||
| JSC - GDR(Æ) | 24,480 | 185 | Orkla ASA | 169,943 | 1,603 | |||||
| Telenor ASA | 47,661 | 759 | ||||||||
| Luxembourg - 0.4% | Yara International ASA | 12,028 | 425 | |||||||
| ArcelorMittal(Æ) | 234,622 | 1,573 | 3,302 | |||||||
| Tenaris SA | 45,498 | 643 | ||||||||
| Ternium SA - ADR | 9,542 | 228 | Peru - 0.2% | |||||||
| 2,444 | Cia de Minas Buenaventura SAA - ADR | 51,029 | 678 | |||||||
| Credicorp, Ltd. | 1,877 | 279 | ||||||||
| Malaysia - 0.1% | 957 | |||||||||
| SapuraKencana Petroleum BHD(Æ) | 828,200 | 318 | ||||||||
| Philippines - 0.1% | ||||||||||
| Mexico - 1.5% | BDO Unibank, Inc. | 206,370 | 481 | |||||||
| America Movil SAB de CV | 3,650,177 | 2,417 | ||||||||
See accompanying notes which are an integral part of the financial statements.
Russell Tax-Managed International Equity Fund 311
Russell Investment Company
Russell Tax-Managed International Equity Fund
Schedule of Investments, continued — October 31, 2016
| Amounts in thousands (except share amounts) | Amounts in thousands (except share amounts) | ||||||||
| Principal | Fair | Principal | Fair | ||||||
| Amount ($) | Value | Amount ($) | Value | ||||||
| or Shares | $ | or Shares | $ | ||||||
| Jollibee Foods Corp. | 22,641 | 111 | Hyundai Marine & Fire Insurance Co., | ||||||
| 592 | Ltd. | 9,766 | 301 | ||||||
| Hyundai Mobis Co., Ltd. | 1,302 | 311 | |||||||
| Portugal - 0.1% | Hyundai Motor Co. | 16,766 | 2,047 | ||||||
| Energias de Portugal SA | 81,906 | 271 | Hyundai Wia Corp. | 32 | 2 | ||||
| Sonae SGPS SA | 419,494 | 333 | KB Financial Group, Inc. | 81,724 | 3,028 | ||||
| 604 | KB Financial Group, Inc. - ADR | 9,231 | 341 | ||||||
| KCC Corp. | 1,095 | 387 | |||||||
| Romania - 0.1% | Kia Motors Corp. | 6,641 | 236 | ||||||
| New Europe Property Investments PLC | 29,805 | 366 | Korea Electric Power Corp. | 26,902 | 1,160 | ||||
| KT Corp. - ADR | 22,709 | 363 | |||||||
| Russia - 1.8% | KT&G Corp. | 9,465 | 933 | ||||||
| Gazprom PJSC - ADR | 547,141 | 2,370 | LG Chem, Ltd. | 4,078 | 876 | ||||
| Lukoil PJSC - ADR | 46,841 | 2,278 | LG Display Co., Ltd. | 5,979 | 143 | ||||
| MMC Norilsk Nickel PJSC - ADR | 58,765 | 889 | LG Uplus Corp. | 31,373 | 323 | ||||
| Novolipetsk Steel OJSC - GDR(Æ) | 103,423 | 1,675 | Lotte Chilsung Beverage Co., Ltd. | 308 | 414 | ||||
| Rosneft PJSC - GDR | 74,152 | 404 | Lotte Confectionery Co., Ltd. | 1,701 | 285 | ||||
| Sberbank of Russia PJSC - ADR | 224,631 | 2,134 | Lotte Shopping Co., Ltd. | 2,929 | 584 | ||||
| Severstal PJSC - GDR | 23,766 | 335 | NCSoft Corp. | 3,434 | 792 | ||||
| Tatneft PJSC - ADR | 19,614 | 656 | POSCO | 10,590 | 2,204 | ||||
| Yandex NV Class A(Æ) | 27,234 | 536 | Samsung Card Co., Ltd. | 10,899 | 459 | ||||
| 11,277 | Samsung Electronics Co., Ltd. | 6,259 | 8,927 | ||||||
| Samsung Fire & Marine Insurance Co., | |||||||||
| Singapore - 1.0% | Ltd. | 776 | 198 | ||||||
| CapitaLand Commercial Trust, Ltd.(Æ) | Samsung Life Insurance Co., Ltd. | 8,594 | 829 | ||||||
| (ö) | 351,300 | 397 | Shinhan Financial Group Co., Ltd. | 36,649 | 1,410 | ||||
| CapitaLand, Ltd. | 68,100 | 151 | SK Hynix, Inc. | 41,409 | 1,476 | ||||
| DBS Group Holdings, Ltd. | 34,000 | 366 | SK Telecom Co., Ltd. - ADR | 57,456 | 1,255 | ||||
| Keppel Corp., Ltd. - ADR | 72,600 | 275 | Woori Bank(Æ) | 23,620 | 258 | ||||
| Oversea-Chinese Banking Corp., Ltd. | 108,300 | 659 | 37,363 | ||||||
| Singapore Airlines, Ltd.(Æ) | 42,000 | 306 | |||||||
| Singapore Telecommunications, Ltd. | 578,678 | 1,618 | Spain - 0.8% | ||||||
| United Overseas Bank, Ltd. | 15,200 | 205 | Amadeus IT Group SA Class A | 26,235 | 1,238 | ||||
| Wilmar International, Ltd. | 914,200 | 2,174 | Banco Bilbao Vizcaya Argentaria SA | ||||||
| 6,151 | - ADR | 78,038 | 562 | ||||||
| Banco de Sabadell SA - ADR | 97,347 | 130 | |||||||
| South Africa - 0.6% | Banco Santander SA - ADR | 98,750 | 484 | ||||||
| Aspen Pharmacare Holdings, Ltd. | 37,793 | 824 | Ebro Foods SA | 14,635 | 316 | ||||
| Bid Corp., Ltd. | 6,399 | 113 | Enagas SA | 9,662 | 277 | ||||
| Bidvest Group, Ltd. (The) | 54,688 | 679 | Endesa SA - ADR | 8,418 | 179 | ||||
| Investec PLC | 60,762 | 377 | Gas Natural SDG SA | 14,938 | 295 | ||||
| Naspers, Ltd. Class N | 4,347 | 729 | Iberdrola SA | 97,488 | 664 | ||||
| Resilient Property Income(Æ) | 37,971 | 314 | Industria de Diseno Textil SA | 2,080 | 73 | ||||
| Vodacom Group, Ltd. - ADR | 27,565 | 297 | Mapfre SA | 121,880 | 362 | ||||
| Woolworths Holdings, Ltd. | 22,155 | 128 | Red Electrica Corp. SA | 11,240 | 234 | ||||
| 3,461 | Repsol SA - ADR | 8,869 | 124 | ||||||
| 4,938 | |||||||||
| South Korea - 5.9% | |||||||||
| BGF retail Co., Ltd. | 4,903 | 744 | Sweden - 1.6% | ||||||
| Daelim Industrial Co., Ltd. | 5,369 | 382 | Assa Abloy AB Class B | 4,860 | 88 | ||||
| Dongbu Insurance Co., Ltd. | 14,914 | 926 | Castellum AB | 19,425 | 264 | ||||
| GS Engineering & Construction Corp. | Fastighets AB Balder Class B(Æ) | 23,179 | 526 | ||||||
| (Æ) | 4,662 | 109 | Hufvudstaden AB Class A | 3,405 | 53 | ||||
| Hana Financial Group, Inc. | 60,747 | 1,737 | L E Lundbergforetagen AB Class B | 8,737 | 565 | ||||
| Hankook Tire Co., Ltd. | 30,812 | 1,486 | Nordea Bank AB | 50,430 | 529 | ||||
| Hanssem Co., Ltd. | 3,687 | 571 | Skandinaviska Enskilda Banken AB | ||||||
| Hyosung Corp. | 144 | 17 | Class A | 37,417 | 377 | ||||
| Hyundai Development Co.-Engineering | SKF AB Class B | 21,330 | 361 | ||||||
| & Construction | 28,536 | 1,206 | Svenska Cellulosa AB SCA Class B | 5,320 | 151 | ||||
| Hyundai Engineering & Construction | Svenska Handelsbanken AB Class A | 193,114 | 2,631 | ||||||
| Co., Ltd. | 17,823 | 643 | Swedbank AB Class A | 11,613 | 272 | ||||
See accompanying notes which are an integral part of the financial statements.
312 Russell Tax-Managed International Equity Fund
Russell Investment Company
Russell Tax-Managed International Equity Fund
Schedule of Investments, continued — October 31, 2016
| Amounts in thousands (except share amounts) | Amounts in thousands (except share amounts) | |||||||||
| Principal | Fair | Principal | Fair | |||||||
| Amount ($) | Value | Amount ($) | Value | |||||||
| or Shares | $ | or Shares | $ | |||||||
| Swedish Match AB | 95,711 | 3,328 | Hota Industrial Manufacturing Co., Ltd. | 195,934 | 816 | |||||
| Telefonaktiebolaget LM Ericsson Class B | 33,077 | 161 | Largan Precision Co., Ltd. | 10,421 | 1,229 | |||||
| Telia Co. AB | 94,818 | 378 | Lite-On Technology Corp. | 191,000 | 274 | |||||
| Trelleborg AB Class B | 17,236 | 300 | MediaTek, Inc. | 108,000 | 821 | |||||
| Volvo AB Class A - GDR | 28,347 | 303 | Realtek Semiconductor Corp. | 107,000 | 363 | |||||
| 10,287 | Taiwan Semiconductor Manufacturing | |||||||||
| Co., Ltd. - ADR | 273,188 | 8,497 | ||||||||
| Switzerland - 8.5% | United Microelectronics Corp. - ADR | 114,497 | 218 | |||||||
| ABB, Ltd.(Æ) | 155,953 | 3,209 | Win Semiconductors Corp.(Æ) | 144,536 | 401 | |||||
| Actelion, Ltd.(Æ) | 1,338 | 193 | Wistron Corp. | 555,524 | 419 | |||||
| Allreal Holding AG(Æ) | 1,934 | 285 | 18,677 | |||||||
| Aryzta AG(Æ) | 9,275 | 407 | ||||||||
| Baloise Holding AG | 3,248 | 400 | Thailand - 0.3% | |||||||
| Basellandschaftliche Kantonalbank | 221 | 201 | Bangkok Bank PCL | 66,900 | 303 | |||||
| Chocoladefabriken Lindt & Spruengli | Land & Houses PCL | 2,419,000 | 635 | |||||||
| AG | 15 | 78 | Minor International PCL | 288,500 | 317 | |||||
| Chubb, Ltd. | 9,044 | 1,149 | PTT PCL | 77,200 | 759 | |||||
| Cie Financiere Richemont SA | 45,327 | 2,914 | Siam Cement PCL (The) | 3,800 | 55 | |||||
| Credit Suisse Group AG(Æ) | 122,426 | 1,706 | 2,069 | |||||||
| Flughafen Zuerich AG | 3,710 | 681 | ||||||||
| GAM Holding AG(Æ) | 18,227 | 176 | Turkey - 0.3% | |||||||
| Geberit AG | 4,864 | 2,056 | Akbank TAS | 245,462 | 653 | |||||
| Georg Fischer AG | 393 | 348 | Anadolu Efes Biracilik Ve Malt Sanayii | |||||||
| Givaudan SA | 184 | 356 | AS | 40,066 | 245 | |||||
| Glencore PLC(Æ) | 336,163 | 1,024 | Haci Omer Sabanci Holding AS | 309,452 | 931 | |||||
| Kuehne & Nagel International AG | 897 | 122 | Turkiye Garanti Bankasi AS | 100,164 | 272 | |||||
| LafargeHolcim, Ltd.(Æ) | 28,862 | 1,540 | Turkiye Is Bankasi Class C | 22,241 | 36 | |||||
| Lonza Group AG(Æ) | 163 | 31 | 2,137 | |||||||
| Nestle SA | 101,737 | 7,374 | ||||||||
| Novartis AG | 117,931 | 8,376 | Ukraine - 0.0% | |||||||
| Panalpina Welttransport Holding AG | 5,995 | 779 | MHP SA - GDR | 1,431 | 14 | |||||
| Partners Group Holding AG | 81 | 41 | ||||||||
| Roche Holding AG | 37,330 | 8,566 | United Arab Emirates - 0.4% | |||||||
| Schindler Holding AG | 17,636 | 3,271 | Air Arabia PJSC | 739,974 | 262 | |||||
| Sika AG | 68 | 327 | Aldar Properties PJSC | 1,244,043 | 893 | |||||
| St. Galler Kantonalbank AG | 637 | 239 | Emaar Properties PJSC | 742,295 | 1,407 | |||||
| STMicroelectronics NV | 189,311 | 1,804 | 2,562 | |||||||
| Straumann Holding AG | 153 | 57 | ||||||||
| Swiss Life Holding AG(Æ) | 413 | 109 | United Kingdom - 14.0% | |||||||
| Swiss Re AG | 8,390 | 779 | Aberdeen Asset Management PLC | 79,859 | 312 | |||||
| Syngenta AG | 481 | 193 | Amec Foster Wheeler PLC - GDR | 96,784 | 528 | |||||
| TE Connectivity, Ltd. | 2,475 | 156 | Anglo American PLC(Æ) | 109,919 | 1,518 | |||||
| UBS Group AG(Æ) | 199,068 | 2,814 | Antofagasta PLC | 444,129 | 2,940 | |||||
| Wolseley PLC - ADR | 25,214 | 1,310 | Ashmore Group PLC | 31,850 | 137 | |||||
| Zurich Insurance Group AG(Æ) | 2,176 | 569 | Aviva PLC | 365,243 | 1,975 | |||||
| 53,640 | Babcock International Group PLC | 32,497 | 393 | |||||||
| BAE Systems PLC | 400,199 | 2,654 | ||||||||
| Taiwan - 3.0% | Barclays PLC | 801,723 | 1,859 | |||||||
| Advanced Semiconductor Engineering, | BBA Aviation PLC | 390,645 | 1,235 | |||||||
| Inc. - ADR | 163,428 | 956 | BGEO Group PLC | 9,468 | 342 | |||||
| Chang Hwa Commercial Bank, Ltd. | 364,640 | 186 | BHP Billiton PLC | 51,874 | 778 | |||||
| China Development Financial Holding | BP PLC | 214,116 | 1,264 | |||||||
| Corp. | 1,711,000 | 428 | BP PLC - ADR | 46,583 | 1,656 | |||||
| China Life Insurance Co., Ltd. | 270,400 | 249 | British American Tobacco PLC | 12,650 | 726 | |||||
| Chipbond Technology Corp. | 306,000 | 422 | Bunzl PLC | 35,818 | 962 | |||||
| Chunghwa Telecom Co., Ltd. - ADR | 28,357 | 968 | Close Brothers Group PLC | 18,469 | 300 | |||||
| Compal Electronics, Inc. | 480,178 | 286 | CNH Industrial NV | 29,387 | 228 | |||||
| E.Sun Financial Holding Co., Ltd. | 18,073 | 10 | Cobham PLC | 729,607 | 1,275 | |||||
| Eclat Textile Co., Ltd. | 88,000 | 1,001 | Compass Group PLC | 9,655 | 175 | |||||
| Hon Hai Precision Industry Co., Ltd. | Diageo PLC | 207,910 | 5,534 | |||||||
| - GDR | 209,501 | 1,133 | Direct Line Insurance Group PLC | 24 | — | |||||
See accompanying notes which are an integral part of the financial statements.
Russell Tax-Managed International Equity Fund 313
Russell Investment Company
Russell Tax-Managed International Equity Fund
Schedule of Investments, continued — October 31, 2016
| Amounts in thousands (except share amounts) | Amounts in thousands (except share amounts) | |||||||||
| Principal | Fair | Principal | Fair | |||||||
| Amount ($) | Value | Amount ($) | Value | |||||||
| or Shares | $ | or Shares | $ | |||||||
| Drax Group PLC | 72,938 | 283 | MercadoLibre, Inc. | 7,282 | 1,223 | |||||
| G4S PLC | 532,293 | 1,430 | News Corp. Class A | 181,499 | 2,200 | |||||
| Galiform PLC | 231,726 | 1,061 | PriceSmart, Inc. | 1,824 | 166 | |||||
| GKN PLC | 88,326 | 345 | 5,677 | |||||||
| GlaxoSmithKline PLC - ADR | 184,323 | 3,643 | ||||||||
| Greene King PLC | 37,494 | 335 | Total Common Stocks | |||||||
| Halma PLC | 7,340 | 94 | (cost $529,109) | 576,851 | ||||||
| HSBC Holdings PLC | 383,574 | 2,885 | ||||||||
| Imperial Tobacco Group PLC | 64,421 | 3,113 | ||||||||
| Inchcape PLC | 43,979 | 350 | Preferred Stocks - 0.7% | |||||||
| InterContinental Hotels Group PLC | 63,669 | 2,468 | Colombia - 0.1% | |||||||
| Intertek Group PLC | 66,727 | 2,789 | Banco Davivienda SA | 40,000 | 407 | |||||
| J Sainsbury PLC | 146,103 | 449 | Germany - 0.5% | |||||||
| Johnson Matthey PLC | 3,067 | 128 | Funchs Petrolub SE | 29,437 | 1,316 | |||||
| Jupiter Fund Management PLC | 58,513 | 309 | Porsche Automobil Holding SE | 6,006 | 324 | |||||
| Kingfisher PLC | 149,520 | 660 | Volkswagen AG | 10,286 | 1,413 | |||||
| Land Securities Group PLC(ö) | 27,245 | 333 | 3,053 | |||||||
| Legal & General Group PLC | 202,158 | 517 | ||||||||
| Lloyds Banking Group PLC | 2,863,887 | 2,003 | Japan - 0.0% | |||||||
| Man Group PLC | 210,369 | 321 | Shinkin Central Bank Class A | 123 | 270 | |||||
| Meggitt PLC | 229,909 | 1,223 | ||||||||
| National Grid PLC | 13,559 | 177 | South Korea - 0.1% | |||||||
| Old Mutual PLC | 43,102 | 106 | Samsung Electronics Co., Ltd. | 366 | 420 | |||||
| PageGroup PLC | 382,748 | 1,697 | ||||||||
| Pennon Group PLC | 30,542 | 311 | Total Preferred Stocks | |||||||
| Persimmon PLC Class A | 10,217 | 211 | ||||||||
| Petrofac, Ltd. | 33,064 | 326 | (cost $4,051) | 4,150 | ||||||
| Prudential PLC | 18,020 | 294 | ||||||||
| Reckitt Benckiser Group PLC | 2,503 | 224 | Short-Term Investments - 5.8% | |||||||
| RELX NV | 17,024 | 287 | United States - 5.8% | |||||||
| RELX PLC | 18,102 | 323 | Russell U.S. Cash Management Fund | 36,667,530 | (8) | 36,675 | ||||
| Rio Tinto PLC | 4,260 | 148 | Total Short-Term Investments | |||||||
| Rolls-Royce Holdings PLC(Æ) | 4,968,981 | 945 | (cost $36,670) | 36,675 | ||||||
| Rotork PLC | 605,687 | 1,511 | ||||||||
| Royal Bank of Scotland Group PLC(Æ) | 1,086,070 | 2,508 | ||||||||
| Royal Mail PLC | 62,622 | 376 | Total Investments 98.1% | |||||||
| RSA Insurance Group PLC | 217,134 | 1,467 | (identified cost $569,830) | 617,676 | ||||||
| Saga PLC | 145,828 | 354 | ||||||||
| Severn Trent PLC Class H | 9,550 | 272 | Other Assets and Liabilities, Net | |||||||
| Smiths Group PLC | 62,814 | 1,088 | - 1.9% | 12,070 | ||||||
| Spirax-Sarco Engineering PLC | 39,341 | 2,120 | Net Assets - 100.0% | 629,746 | ||||||
| Standard Chartered PLC(Æ) | 232,045 | 2,018 | ||||||||
| Standard Life PLC | 57,936 | 239 | ||||||||
| Stock Spirits Group PLC | 320,533 | 621 | ||||||||
| Tate & Lyle PLC | 34,713 | 331 | ||||||||
| Tesco PLC(Æ) | 1,193,399 | 3,078 | ||||||||
| Travis Perkins PLC | 131,849 | 2,147 | ||||||||
| Tullow Oil PLC(Æ) | 384,590 | 1,239 | ||||||||
| Unilever NV | 129,176 | 5,409 | ||||||||
| Unilever PLC | 5,925 | 248 | ||||||||
| Vodafone Group PLC | 1,455,990 | 3,998 | ||||||||
| William Hill PLC | 90,906 | 329 | ||||||||
| Wm Morrison Supermarkets PLC | 120,368 | 334 | ||||||||
| WPP PLC | 82,998 | 1,803 | ||||||||
| 88,069 | ||||||||||
| United States - 0.9% | ||||||||||
| Carnival PLC | 6,909 | 332 | ||||||||
| Gran Tierra Energy, Inc.(Æ) | 100,214 | 293 | ||||||||
| IHS Markit, Ltd.(Æ) | 21,997 | 809 | ||||||||
| Maginet Corp.(Æ) | 16,470 | 654 | ||||||||
See accompanying notes which are an integral part of the financial statements.
314 Russell Tax-Managed International Equity Fund
Russell Investment Company
Russell Tax-Managed International Equity Fund
Schedule of Investments, continued — October 31, 2016
| Futures Contracts | |||||||
| Amounts in thousands (except contract amounts) | |||||||
| Unrealized | |||||||
| Appreciation | |||||||
| Number of | Notional | Expiration | (Depreciation) | ||||
| Contracts | Amount | Date | $ | ||||
| Long Positions | |||||||
| Euro STOXX 50 Index Futures | 608 | EUR | 18,562 | 12/16 | 285 | ||
| MSCI EAFE Mini Index Futures | 305 | USD | 25,402 | 12/16 | (507 | ) | |
| MSCI Emerging Markets Mini Index Futures | 165 | USD | 7,454 | 12/16 | (116 | ) | |
| S&P/TSX 60 Index Futures | 48 | CAD | 8,318 | 12/16 | 134 | ||
| SPI 200 Index Futures | 61 | AUD | 8,067 | 12/16 | 61 | ||
| TOPIX Index Futures | 213 | JPY | 2,971,349 | 12/16 | 1,183 | ||
| Short Positions | |||||||
| FTSE 100 Index Futures | 222 | GBP | 15,382 | 12/16 | (489 | ) | |
| Hang Seng Index Futures | 21 | HKD | 24,050 | 11/16 | 69 | ||
| MSCI Emerging Markets Mini Index Futures | 414 | USD | 18,702 | 12/16 | 169 | ||
| S&P 500 E-Mini Index Futures | 193 | USD | 20,459 | 12/16 | 507 | ||
| Total Unrealized Appreciation (Depreciation) on Open Futures Contracts (å) | 1,296 | ||||||
| Foreign Currency Exchange Contracts | ||||||||
| Amounts in thousands | ||||||||
| Unrealized | ||||||||
| Appreciation | ||||||||
| Amount | Amount | (Depreciation) | ||||||
| Counterparty | Sold | Bought | Settlement Date | $ | ||||
| Bank of America | USD | 149 | AUD | 200 | 12/21/16 | 3 | ||
| Bank of America | USD | 534 | AUD | 700 | 12/21/16 | (2 | ) | |
| Bank of America | USD | 1,186 | AUD | 1,549 | 12/21/16 | (9 | ) | |
| Bank of America | USD | 1,595 | AUD | 2,100 | 12/21/16 | 1 | ||
| Bank of America | USD | 379 | CAD | 500 | 12/21/16 | (6 | ) | |
| Bank of America | USD | 1,365 | CAD | 1,789 | 12/21/16 | (30 | ) | |
| Bank of America | USD | 1,502 | CAD | 2,000 | 12/21/16 | (10 | ) | |
| Bank of America | USD | 1,854 | EUR | 1,700 | 12/21/16 | 16 | ||
| Bank of America | USD | 1,971 | EUR | 1,751 | 12/21/16 | (45 | ) | |
| Bank of America | USD | 4,407 | EUR | 3,900 | 12/21/16 | (115 | ) | |
| Bank of America | USD | 67 | GBP | 55 | 12/21/16 | — | ||
| Bank of America | USD | 260 | GBP | 200 | 12/21/16 | (15 | ) | |
| Bank of America | USD | 64 | HKD | 500 | 12/21/16 | — | ||
| Bank of America | USD | 129 | HKD | 1,000 | 12/21/16 | — | ||
| Bank of America | USD | 1,805 | HKD | 14,000 | 12/21/16 | — | ||
| Bank of America | USD | 245 | JPY | 25,000 | 12/21/16 | (6 | ) | |
| Bank of America | USD | 1,601 | JPY | 160,000 | 12/21/16 | (72 | ) | |
| Bank of America | USD | 3,068 | JPY | 310,639 | 12/21/16 | (99 | ) | |
| Bank of America | USD | 75 | NOK | 600 | 12/21/16 | (3 | ) | |
| Bank of America | USD | 242 | NOK | 2,000 | 12/21/16 | — | ||
| Bank of America | USD | 1,216 | NZD | 1,700 | 12/21/16 | (2 | ) | |
| Bank of America | CAD | 3,600 | USD | 2,703 | 12/21/16 | 18 | ||
| Bank of America | CHF | 100 | USD | 103 | 12/21/16 | 2 | ||
| Bank of America | CHF | 100 | USD | 101 | 12/21/16 | — | ||
| Bank of America | CHF | 120 | USD | 122 | 12/21/16 | — | ||
| Bank of America | CHF | 700 | USD | 726 | 12/21/16 | 16 | ||
| Bank of America | DKK | 700 | USD | 106 | 12/21/16 | 3 | ||
| Bank of America | DKK | 2,700 | USD | 396 | 12/21/16 | (4 | ) | |
| Bank of America | EUR | 120 | USD | 131 | 12/21/16 | (1 | ) | |
| Bank of America | EUR | 200 | USD | 224 | 12/21/16 | 4 | ||
| Bank of America | EUR | 2,500 | USD | 2,726 | 12/21/16 | (24 | ) | |
| Bank of America | GBP | 200 | USD | 264 | 12/21/16 | 19 | ||
| Bank of America | GBP | 500 | USD | 612 | 12/21/16 | (1 | ) | |
| Bank of America | GBP | 2,878 | USD | 3,706 | 12/21/16 | 180 | ||
See accompanying notes which are an integral part of the financial statements.
Russell Tax-Managed International Equity Fund 315
Russell Investment Company
Russell Tax-Managed International Equity Fund
Schedule of Investments, continued — October 31, 2016
| Foreign Currency Exchange Contracts | |||||||
| Amounts in thousands | |||||||
| Unrealized | |||||||
| Appreciation | |||||||
| Amount | Amount | (Depreciation) | |||||
| Counterparty | Sold | Bought | Settlement Date | $ | |||
| Bank of America | GBP | 4,000 | USD | 4,894 | 12/21/16 | (8 | ) |
| Bank of America | HKD | 1,000 | USD | 129 | 12/21/16 | — | |
| Bank of America | HKD | 23,000 | USD | 2,966 | 12/21/16 | (1 | ) |
| Bank of America | JPY | 6,000 | USD | 59 | 12/21/16 | 1 | |
| Bank of America | JPY | 12,000 | USD | 119 | 12/21/16 | 4 | |
| Bank of America | JPY | 100,000 | USD | 965 | 12/21/16 | 9 | |
| Bank of America | JPY | 100,000 | USD | 954 | 12/21/16 | (2 | ) |
| Bank of America | JPY | 170,000 | USD | 1,640 | 12/21/16 | 16 | |
| Bank of America | NOK | 1,000 | USD | 123 | 12/21/16 | 2 | |
| Bank of America | SEK | 300 | USD | 35 | 12/21/16 | 2 | |
| Bank of America | SEK | 9,000 | USD | 1,012 | 12/21/16 | 13 | |
| BNP Paribas | USD | 685 | AUD | 895 | 12/21/16 | (6 | ) |
| BNP Paribas | USD | 2,220 | AUD | 2,898 | 12/21/16 | (18 | ) |
| BNP Paribas | USD | 630 | CAD | 814 | 12/21/16 | (23 | ) |
| BNP Paribas | USD | 3,421 | CAD | 4,420 | 12/21/16 | (124 | ) |
| BNP Paribas | USD | 4,086 | EUR | 3,610 | 12/21/16 | (114 | ) |
| BNP Paribas | USD | 5,135 | JPY | 520,200 | 12/21/16 | (165 | ) |
| BNP Paribas | CHF | 3,078 | USD | 3,193 | 12/21/16 | 74 | |
| BNP Paribas | EUR | 1,570 | USD | 1,777 | 12/21/16 | 50 | |
| BNP Paribas | GBP | 1,546 | USD | 2,059 | 12/21/16 | 166 | |
| BNP Paribas | JPY | 165,700 | USD | 1,636 | 12/21/16 | 52 | |
| Brown Brothers Harriman | USD | 222 | EUR | 200 | 12/21/16 | (1 | ) |
| Brown Brothers Harriman | USD | 124 | GBP | 100 | 12/21/16 | (1 | ) |
| Brown Brothers Harriman | USD | 194 | JPY | 20,000 | 12/21/16 | (3 | ) |
| Brown Brothers Harriman | CHF | 200 | USD | 203 | 12/21/16 | — | |
| Brown Brothers Harriman | GBP | 500 | USD | 614 | 12/21/16 | 1 | |
| Brown Brothers Harriman | JPY | 10,000 | USD | 97 | 12/21/16 | 1 | |
| Brown Brothers Harriman | NOK | 400 | USD | 49 | 12/21/16 | 1 | |
| Commonwealth Bank of Australia | USD | 685 | AUD | 895 | 12/21/16 | (5 | ) |
| Commonwealth Bank of Australia | USD | 2,218 | AUD | 2,898 | 12/21/16 | (16 | ) |
| Commonwealth Bank of Australia | USD | 630 | CAD | 814 | 12/21/16 | (23 | ) |
| Commonwealth Bank of Australia | USD | 3,422 | CAD | 4,420 | 12/21/16 | (125 | ) |
| Commonwealth Bank of Australia | USD | 4,083 | EUR | 3,610 | 12/21/16 | (112 | ) |
| Commonwealth Bank of Australia | USD | 5,139 | JPY | 520,200 | 12/21/16 | (169 | ) |
| Commonwealth Bank of Australia | CHF | 3,078 | USD | 3,196 | 12/21/16 | 77 | |
| Commonwealth Bank of Australia | EUR | 1,570 | USD | 1,776 | 12/21/16 | 49 | |
| Commonwealth Bank of Australia | GBP | 1,546 | USD | 2,059 | 12/21/16 | 163 | |
| Commonwealth Bank of Australia | JPY | 165,700 | USD | 1,637 | 12/21/16 | 54 | |
| Commonwealth Bank of Australia | NZD | 4,400 | USD | 3,192 | 12/21/16 | 51 | |
| HSBC | USD | 685 | AUD | 895 | 12/21/16 | (5 | ) |
| HSBC | USD | 2,217 | AUD | 2,898 | 12/21/16 | (16 | ) |
| HSBC | USD | 630 | CAD | 814 | 12/21/16 | (23 | ) |
| HSBC | USD | 3,421 | CAD | 4,420 | 12/21/16 | (124 | ) |
| HSBC | USD | 4,086 | EUR | 3,610 | 12/21/16 | (114 | ) |
| HSBC | USD | 5,135 | JPY | 520,200 | 12/21/16 | (166 | ) |
| HSBC | CHF | 3,078 | USD | 3,194 | 12/21/16 | 75 | |
| HSBC | EUR | 1,570 | USD | 1,777 | 12/21/16 | 50 | |
| HSBC | GBP | 1,546 | USD | 2,059 | 12/21/16 | 164 | |
| HSBC | JPY | 165,700 | USD | 1,636 | 12/21/16 | 53 | |
| National Australia Bank | USD | 685 | AUD | 895 | 12/21/16 | (5 | ) |
| National Australia Bank | USD | 2,219 | AUD | 2,898 | 12/21/16 | (17 | ) |
| National Australia Bank | USD | 630 | CAD | 814 | 12/21/16 | (23 | ) |
| National Australia Bank | USD | 3,421 | CAD | 4,420 | 12/21/16 | (125 | ) |
| National Australia Bank | USD | 4,087 | EUR | 3,610 | 12/21/16 | (115 | ) |
| National Australia Bank | USD | 5,137 | JPY | 520,200 | 12/21/16 | (168 | ) |
| National Australia Bank | CHF | 3,078 | USD | 3,192 | 12/21/16 | 73 |
See accompanying notes which are an integral part of the financial statements.
316 Russell Tax-Managed International Equity Fund
Russell Investment Company
Russell Tax-Managed International Equity Fund
Schedule of Investments, continued — October 31, 2016
| Foreign Currency Exchange Contracts | |||||||
| Amounts in thousands | |||||||
| Unrealized | |||||||
| Appreciation | |||||||
| Amount | Amount | (Depreciation) | |||||
| Counterparty | Sold | Bought | Settlement Date | $ | |||
| National Australia Bank | EUR | 1,570 | USD | 1,778 | 12/21/16 | 50 | |
| National Australia Bank | GBP | 1,546 | USD | 2,059 | 12/21/16 | 165 | |
| National Australia Bank | JPY | 165,700 | USD | 1,636 | 12/21/16 | 53 | |
| Royal Bank of Canada | USD | 686 | AUD | 895 | 12/21/16 | (6 | ) |
| Royal Bank of Canada | USD | 2,221 | AUD | 2,898 | 12/21/16 | (19 | ) |
| Royal Bank of Canada | USD | 631 | CAD | 814 | 12/21/16 | (24 | ) |
| Royal Bank of Canada | USD | 3,425 | CAD | 4,420 | 12/21/16 | (129 | ) |
| Royal Bank of Canada | USD | 4,084 | EUR | 3,610 | 12/21/16 | (112 | ) |
| Royal Bank of Canada | USD | 5,138 | JPY | 520,200 | 12/21/16 | (167 | ) |
| Royal Bank of Canada | CHF | 3,078 | USD | 3,191 | 12/21/16 | 72 | |
| Royal Bank of Canada | EUR | 1,570 | USD | 1,776 | 12/21/16 | 49 | |
| Royal Bank of Canada | GBP | 1,546 | USD | 2,062 | 12/21/16 | 167 | |
| Royal Bank of Canada | JPY | 165,700 | USD | 1,637 | 12/21/16 | 53 | |
| State Street | USD | 76 | AUD | 100 | 12/21/16 | — | |
| State Street | USD | 227 | AUD | 300 | 12/21/16 | 1 | |
| State Street | USD | 75 | CAD | 100 | 12/21/16 | — | |
| State Street | USD | 91 | CAD | 120 | 12/21/16 | (1 | ) |
| State Street | USD | 151 | CAD | 200 | 12/21/16 | (2 | ) |
| State Street | USD | 760 | CAD | 1,000 | 12/21/16 | (14 | ) |
| State Street | USD | 676 | EUR | 600 | 12/21/16 | (16 | ) |
| State Street | USD | 133 | GBP | 100 | 12/21/16 | (10 | ) |
| State Street | USD | 3,043 | GBP | 2,285 | 12/21/16 | (243 | ) |
| State Street | USD | 2,930 | HKD | 22,700 | 12/21/16 | (2 | ) |
| State Street | USD | 200 | JPY | 20,000 | 12/21/16 | (9 | ) |
| State Street | USD | 3,252 | NZD | 4,400 | 12/21/16 | (111 | ) |
| State Street | CHF | 100 | USD | 101 | 12/21/16 | — | |
| State Street | CHF | 200 | USD | 205 | 12/21/16 | 3 | |
| State Street | DKK | 17,900 | USD | 2,722 | 12/21/16 | 74 | |
| State Street | JPY | 10,000 | USD | 95 | 12/21/16 | — | |
| State Street | JPY | 20,000 | USD | 196 | 12/21/16 | 5 | |
| State Street | NOK | 24,350 | USD | 2,976 | 12/21/16 | 28 | |
| State Street | SEK | 700 | USD | 83 | 12/21/16 | 5 | |
| State Street | SEK | 12,300 | USD | 1,467 | 12/21/16 | 102 | |
| UBS | AUD | 200 | USD | 152 | 12/21/16 | — | |
| UBS | CAD | 200 | USD | 152 | 12/21/16 | 3 | |
| Total Unrealized Appreciation (Depreciation) on Open Foreign Currency Exchange Contracts | (833 | ) | |||||
| Presentation of Portfolio Holdings | |||||||||||||
| Amounts in thousands | |||||||||||||
| Fair Value | |||||||||||||
| Practical | |||||||||||||
| Portfolio Summary | Level 1 | Level 2 | Level 3 | Expedient (a) | Total | % of Net Assets | |||||||
| Common Stocks | |||||||||||||
| Argentina | $ | 1,926 | $ | — | $ | — | $ | — | $ | 1,926 | 0.3 | ||
| Australia | — | 9,975 | — | — | 9,975 | 1.6 | |||||||
| Austria | — | 725 | — | — | 725 | 0.1 | |||||||
| Belgium | 1,721 | 1,564 | — | — | 3,285 | 0.5 | |||||||
| Bermuda | — | 308 | — | — | 308 | 0.1 | |||||||
| Brazil | 19,022 | — | — | — | 19,022 | 3.0 | |||||||
| Canada | 21,522 | — | — | — | 21,522 | 3.4 | |||||||
See accompanying notes which are an integral part of the financial statements.
Russell Tax-Managed International Equity Fund 317
Russell Investment Company
Russell Tax-Managed International Equity Fund
Schedule of Investments, continued — October 31, 2016
| Presentation of Portfolio Holdings | |||||||||||||
| Amounts in thousands | |||||||||||||
| Fair Value | |||||||||||||
| Practical | |||||||||||||
| Portfolio Summary | Level 1 | Level 2 | Level 3 | Expedient (a) | Total | % of Net Assets | |||||||
| Cayman Islands | 1,694 | 429 | — | — | 2,123 | 0.3 | |||||||
| Chile | 603 | — | — | — | 603 | 0.1 | |||||||
| China | 11,089 | 27,314 | — | — | 38,403 | 6.1 | |||||||
| Curacao | — | 63 | — | — | 63 | —* | |||||||
| Denmark | — | 8,488 | — | — | 8,488 | 1.4 | |||||||
| Egypt | — | 596 | — | — | 596 | 0.1 | |||||||
| Finland | — | 2,317 | — | — | 2,317 | 0.4 | |||||||
| France | 174 | 42,109 | — | — | 42,283 | 6.7 | |||||||
| Germany | 18 | 21,837 | — | — | 21,855 | 3.5 | |||||||
| Greece | — | 641 | — | — | 641 | 0.1 | |||||||
| Hong Kong | 3,642 | 13,137 | — | — | 16,779 | 2.7 | |||||||
| Hungary | — | 2,162 | — | — | 2,162 | 0.3 | |||||||
| India | 10,351 | 5,970 | — | — | 16,321 | 2.6 | |||||||
| Indonesia | — | 1,949 | — | — | 1,949 | 0.3 | |||||||
| Ireland | 3,198 | 375 | — | — | 3,573 | 0.6 | |||||||
| Israel | — | 1,015 | — | — | 1,015 | 0.2 | |||||||
| Italy | — | 8,443 | — | — | 8,443 | 1.3 | |||||||
| Japan | — | 72,685 | — | — | 72,685 | 11.5 | |||||||
| Jersey | — | 272 | — | — | 272 | —* | |||||||
| Kazakhstan | 185 | — | — | — | 185 | —* | |||||||
| Luxembourg | 228 | 2,216 | — | — | 2,444 | 0.4 | |||||||
| Malaysia | — | 318 | — | — | 318 | 0.1 | |||||||
| Mexico | 9,647 | — | — | — | 9,647 | 1.5 | |||||||
| Netherlands | 2,360 | 12,270 | — | — | 14,630 | 2.3 | |||||||
| New Zealand | — | 150 | — | — | 150 | —* | |||||||
| Norway | — | 3,302 | — | — | 3,302 | 0.5 | |||||||
| Peru | 957 | — | — | — | 957 | 0.2 | |||||||
| Philippines | — | 592 | — | — | 592 | 0.1 | |||||||
| Portugal | — | 604 | — | — | 604 | 0.1 | |||||||
| Romania | — | 366 | — | — | 366 | 0.1 | |||||||
| Russia | 10,621 | 656 | — | — | 11,277 | 1.8 | |||||||
| Singapore | — | 6,151 | — | — | 6,151 | 1.0 | |||||||
| South Africa | — | 3,461 | — | — | 3,461 | 0.6 | |||||||
| South Korea | 1,959 | 35,404 | — | — | 37,363 | 5.9 | |||||||
| Spain | — | 4,938 | — | — | 4,938 | 0.8 | |||||||
| Sweden | — | 10,287 | — | — | 10,287 | 1.6 | |||||||
| Switzerland | 1,305 | 52,335 | — | — | 53,640 | 8.5 | |||||||
| Taiwan | 11,772 | 6,905 | — | — | 18,677 | 3.0 | |||||||
| Thailand | — | 2,069 | — | — | 2,069 | 0.3 | |||||||
| Turkey | — | 2,137 | — | — | 2,137 | 0.3 | |||||||
| Ukraine | 14 | — | — | — | 14 | —* | |||||||
| United Arab Emirates | — | 2,562 | — | — | 2,562 | 0.4 | |||||||
| United Kingdom | 1,656 | 86,407 | 6 | — | 88,069 | 14.0 | |||||||
See accompanying notes which are an integral part of the financial statements.
318 Russell Tax-Managed International Equity Fund
Russell Investment Company
Russell Tax-Managed International Equity Fund
Schedule of Investments, continued — October 31, 2016
| Presentation of Portfolio Holdings | |||||||||||||||||
| Amounts in thousands | |||||||||||||||||
| Fair Value | |||||||||||||||||
| Practical | |||||||||||||||||
| Portfolio Summary | Level 1 | Level 2 | Level 3 | Expedient (a) | Total | % of Net Assets | |||||||||||
| United States | 5,345 | 332 | — | — | 5,677 | 0.9 | |||||||||||
| Preferred Stocks | 407 | 3,743 | — | — | 4,150 | 0.7 | |||||||||||
| Short-Term Investments | — | — | — | 36,675 | 36,675 | 5.8 | |||||||||||
| Total Investments | 121,416 | 459,579 | 6 | 36,675 | 617,676 | 98.1 | |||||||||||
| Other Assets and Liabilities, Net | 1.9 | ||||||||||||||||
| 100.0 | |||||||||||||||||
| Other Financial Instruments | |||||||||||||||||
| Assets | |||||||||||||||||
| Futures Contracts | 2,408 | — | — | — | 2,408 | 0.4 | |||||||||||
| Foreign Currency Exchange Contracts | — | 2,293 | — | — | 2,293 | 0.4 | |||||||||||
| A | |||||||||||||||||
| Liabilities | |||||||||||||||||
| Futures Contracts | (1,112 | ) | — | — | — | (1,112 | ) | (0.2 | ) | ||||||||
| Foreign Currency Exchange Contracts | — | (3,126 | ) | — | — | (3,126 | ) | (0.5 | ) | ||||||||
| Total Other Financial Instruments* | $ | 1,296 | $ | (833 | ) | $ | — | $ | — | $ | 463 | ||||||
* Less than 0.05% of net assets.
** Futures and foreign currency exchange contract values reflect the unrealized appreciation (depreciation) on the investments.
(a) Certain investments that are measured at fair value using the net asset value per share (or its equivalent) practical expedient have not been classified
in the fair value levels. The fair value amounts presented in the table are intended to permit reconciliation to the amounts presented in the Schedule of
Investments.
For a description of the Levels, see note 2 in the Notes to Financial Statements.
For a disclosure on transfers between Levels 1, 2 and 3 during the period ended October 31, 2016, see note 2 in the Notes to
Financial Statements.
Investments in which significant unobservable inputs (Level 3) were used in determining a fair value for the period ended October
31, 2016 were less than 1% of net assets.
| Amounts in thousands | |||
| Fair Value | |||
| Sector Exposure | $ | ||
| Consumer Discretionary | 84,204 | ||
| Consumer Staples | 45,051 | ||
| Energy | 42,220 | ||
| Financial Services | 132,032 | ||
| Health Care | 41,018 | ||
| Materials and Processing | 51,321 | ||
| Producer Durables | 82,078 | ||
| Technology | 64,394 | ||
| Utilities | 38,683 | ||
| Short-Term Investments | 36,675 | ||
| Total Investments | 617,676 | ||
See accompanying notes which are an integral part of the financial statements.
Russell Tax-Managed International Equity Fund 319
Russell Investment Company
Russell Tax-Managed International Equity Fund
Fair Value of Derivative Instruments — October 31, 2016
Amounts in thousands
| Foreign | |||||||
| Equity | Currency | ||||||
| Derivatives not accounted for as hedging instruments | Contracts | Contracts | |||||
| Location: Statement of Assets and Liabilities - Assets | |||||||
| Unrealized appreciation on foreign currency exchange contracts | $ | — | $ | 2,293 | |||
| Variation margin on futures contracts* | 2,408 | — | |||||
| Total | $ | 2,408 | $ | 2,293 | |||
| Location: Statement of Assets and Liabilities - Liabilities | |||||||
| Variation margin on futures contracts* | $ | 1,112 | $ | — | |||
| Unrealized depreciation on foreign currency exchange contracts | — | 3,126 | |||||
| Total | $ | 1,112 | $ | 3,126 | |||
| Foreign | |||||||
| Equity | Currency | ||||||
| Derivatives not accounted for as hedging instruments | Contracts | Contracts | |||||
| Location: Statement of Operations - Net realized gain (loss) | |||||||
| Futures contracts | $ | (1,795 | ) | $ | — | ||
| Foreign currency-related transactions** | — | 4,413 | |||||
| Total | $ | (1,795 | ) | $ | 4,413 | ||
| Location: Statement of Operations - Net change in unrealized appreciation (depreciation) | |||||||
| Futures contracts | $ | 101 | $ | — | |||
| Foreign currency-related transactions*** | — | (823 | ) | ||||
| Total | $ | 101 | $ | (823 | ) | ||
* Includes cumulative appreciation/depreciation of futures contracts as reported in the Schedule of Investments. Only variation margin is reported within the
Statement of Assets and Liabilities.
** Only includes net realized gain (loss) on forward and spot contracts. May differ from the net realized gain (loss) on foreign currency-related transactions reported
within the Statement of Operations.
*** Only includes change in unrealized gain (loss) on forward and spot contracts. May differ from the net change in unrealized gain (loss) on foreign currency-related
transactions reported within the Statement of Operations.
For further disclosure on derivatives see note 2 in the Notes to Financial Statements.
See accompanying notes which are an integral part of the financial statements.
320 Russell Tax-Managed International Equity Fund
Russell Investment Company
Russell Tax-Managed International Equity Fund
Balance Sheet Offsetting of Financial and Derivative Instruments — October 31, 2016
| Amounts in thousands | ||||||||||||
| Offsetting of Financial Assets and Derivative Assets | ||||||||||||
| Gross | Net Amounts | |||||||||||
| Amounts | of Assets | |||||||||||
| Gross | Offset in the | Presented in | ||||||||||
| Amounts of | Statement of | the Statement | ||||||||||
| Recognized | Assets and | of Assets and | ||||||||||
| Description | Location: Statement of Assets and Liabilities - Assets | Assets | Liabilities | Liabilities | ||||||||
| Foreign Currency Exchange Contracts | Unrealized appreciation on foreign currency exchange contracts | $ | 2,293 | $ | — $ | 2,293 | ||||||
| Futures Contracts | Variation margin on futures contracts | 291 | — | 291 | ||||||||
| Total Financial and Derivative Assets | 2,584 | — | 2,584 | |||||||||
| Financial and Derivative Assets not subject to a netting agreement | (291 | ) | — | (291 | ) | |||||||
| Total Financial and Derivative Assets subject to a netting agreement | $ | 2,293 | $ | — $ | 2,293 | |||||||
| Financial Assets, Derivative Assets, and Collateral Held by Counterparty | ||||||||||||
| Gross Amounts Not Offset in | ||||||||||||
| the Statement of Assets and | ||||||||||||
| Liabilities | ||||||||||||
| Net Amounts | ||||||||||||
| of Assets | ||||||||||||
| Presented in | ||||||||||||
| the Statement | Financial and | |||||||||||
| of Assets and | Derivative | Collateral | ||||||||||
| Counterparty | Liabilities | Instruments | Received^ | Net Amount | ||||||||
| Bank of America | $ | 310 | $ | 310 | $ | — $ | — | |||||
| BNP Paribas | 341 | 341 | — | — | ||||||||
| Brown Brothers Harriman | 3 | 3 | — | — | ||||||||
| Commonwealth Bank of Australia | 394 | 394 | — | — | ||||||||
| HSBC | 341 | 341 | — | — | ||||||||
| National Australia Bank | 341 | 341 | — | — | ||||||||
| Royal Bank of Canada | 342 | 342 | — | — | ||||||||
| State Street | 218 | 218 | — | — | ||||||||
| UBS | 3 | — | — | 3 | ||||||||
| Total | $ | 2,293 | $ | 2,290 | $ | — $ | 3 | |||||
See accompanying notes which are an integral part of the financial statements.
Russell Tax-Managed International Equity Fund 321
Russell Investment Company
Russell Tax-Managed International Equity Fund
Balance Sheet Offsetting of Financial and Derivative Instruments, continued —
October 31, 2016
| Amounts in thousands | |||||||||||||
| Offsetting of Financial Liabilities and Derivative Liabilities | |||||||||||||
| Gross | Net Amounts | ||||||||||||
| Amounts | of Liabilities | ||||||||||||
| Gross | Offset in the | Presented in | |||||||||||
| Amounts of | Statement of | the Statement | |||||||||||
| Recognized | Assets and | of Assets and | |||||||||||
| Description | Location: Statement of Assets and Liabilities - Liabilities | Liabilities | Liabilities | Liabilities | |||||||||
| Futures Contracts | Variation margin on futures contracts | $ | 214 | $ | — $ | 214 | |||||||
| Foreign Currency Exchange Contracts | Unrealized depreciation on foreign currency exchange contracts | 3,126 | — | 3,126 | |||||||||
| Total Financial and Derivative Liabilities | 3,340 | — | 3,340 | ||||||||||
| Financial and Derivative Liabilities not subject to a netting agreement | (214 | ) | — | (214 | ) | ||||||||
| Total Financial and Derivative Liabilities subject to a netting agreement | $ | 3,126 | $ | — $ | 3,126 | ||||||||
| Financial Liabilities, Derivative Liabilities, and Collateral Pledged by Counterparty | |||||||||||||
| Gross Amounts Not Offset in | |||||||||||||
| the Statement of Assets and | |||||||||||||
| Liabilities | |||||||||||||
| Net Amounts | |||||||||||||
| of Liabilities | |||||||||||||
| Presented in | |||||||||||||
| the Statement | Financial and | ||||||||||||
| of Assets and | Derivative | Collateral | |||||||||||
| Counterparty | Liabilities | Instruments | Pledged^ | Net Amount | |||||||||
| Bank of America | $ | 456 | $ | 310 | $ | — $ | 146 | ||||||
| BNP Paribas | 449 | 341 | — | 108 | |||||||||
| Brown Brothers Harriman | 5 | 3 | — | 2 | |||||||||
| Commonwealth Bank of Australia | 450 | 394 | — | 56 | |||||||||
| HSBC | 446 | 341 | — | 105 | |||||||||
| National Australia Bank | 453 | 341 | — | 112 | |||||||||
| Royal Bank of Canada | 458 | 342 | — | 116 | |||||||||
| State Street | 409 | 218 | — | 191 | |||||||||
| Total | $ | 3,126 | $ | 2,290 | $ | — $ | 836 | ||||||
^ Collateral received or pledged amounts may not reconcile to those disclosed in the Statement of Assets and Liabilities due to the inclusion of off-Balance
Sheet collateral and adjustments made to exclude overcollateralization.
For further disclosure on derivatives and counterparty risk see note 2 in the Notes to Financial Statements.
See accompanying notes which are an integral part of the financial statements.
322 Russell Tax-Managed International Equity Fund
Russell Investment Company
Russell Tax-Managed International Equity Fund
Statement of Assets and Liabilities — October 31, 2016
| Amounts in thousands | ||
| Assets | ||
| Investments, at identified cost | $ | 569,830 |
| Investments, at fair value(>) | 617,676 | |
| Cash (restricted)(a) | 8,700 | |
| Foreign currency holdings(^) | 1,767 | |
| Unrealized appreciation on foreign currency exchange contracts | 2,293 | |
| Receivables: | ||
| Dividends and interest | 887 | |
| Dividends from affiliated Russell funds | 23 | |
| Fund shares sold | 2,217 | |
| Foreign capital gains taxes recoverable | 325 | |
| Variation margin on futures contracts | 291 | |
| Total assets | 634,179 | |
| Liabilities | ||
| Payables: | ||
| Investments purchased | 6 | |
| Fund shares redeemed | 249 | |
| Accrued fees to affiliates | 533 | |
| Other accrued expenses | 172 | |
| Variation margin on futures contracts | 214 | |
| Deferred capital gains tax liability | 133 | |
| Unrealized depreciation on foreign currency exchange contracts | 3,126 | |
| Total liabilities | 4,433 | |
| Net Assets | $ | 629,746 |
See accompanying notes which are an integral part of the financial statements.
Russell Tax-Managed International Equity Fund 323
Russell Investment Company
Russell Tax-Managed International Equity Fund
Statement of Assets and Liabilities, continued — October 31, 2016
| Amounts in thousands | |||
| Net Assets Consist of: | |||
| Undistributed (overdistributed) net investment income | $ | 12,338 | |
| Accumulated net realized gain (loss) | (78,056 | ) | |
| Unrealized appreciation (depreciation) on: | |||
| Investments (net of deferred tax liability for foreign capital gains taxes) | 47,713 | ||
| Futures contracts | 1,296 | ||
| Foreign currency-related transactions | (863 | ) | |
| Shares of beneficial interest | 684 | ||
| Additional paid-in capital | 646,634 | ||
| Net Assets | $ | 629,746 | |
| Net Asset Value, offering and redemption price per share: | |||
| Net asset value per share: Class A(#) | $ | 9.19 | |
| Maximum offering price per share (Net asset value plus sales charge of 5.75%): Class A | $ | 9.75 | |
| Class A — Net assets | $ | 3,942,678 | |
| Class A — Shares outstanding ($.01 par value) | 429,200 | ||
| Net asset value per share: Class C(#) | $ | 9.11 | |
| Class C — Net assets | $ | 2,440,952 | |
| Class C — Shares outstanding ($.01 par value) | 267,816 | ||
| Net asset value per share: Class E(#) | $ | 9.18 | |
| Class E — Net assets | $ | 32,989,090 | |
| Class E — Shares outstanding ($.01 par value) | 3,592,989 | ||
| Net asset value per share: Class S(#) | $ | 9.21 | |
| Class S — Net assets | $ | 590,373,449 | |
| Class S — Shares outstanding ($.01 par value) | 64,074,305 | ||
| Amounts in thousands | |||
| (^) Foreign currency holdings - cost | $ | 1,772 | |
| (>) Investments in affiliates, Russell U.S. Cash Management Fund | $ | 36,675 | |
| (a) Cash Collateral for Futures | $ | 8,700 | |
| (#) Net asset value per share equals class level net assets divided by class level shares of beneficial interest outstanding. | |||
See accompanying notes which are an integral part of the financial statements.
324 Russell Tax-Managed International Equity Fund
Russell Investment Company
Russell Tax-Managed International Equity Fund
Statement of Operations — For the Period Ended October 31, 2016
| Amounts in thousands | |||
| Investment Income | |||
| Dividends | $ | 15,557 | |
| Dividends from affiliated Russell funds | 143 | ||
| Interest | 3 | ||
| Less foreign taxes withheld | (1,359 | ) | |
| Total investment income | 14,344 | ||
| Expenses | |||
| Advisory fees | 4,438 | ||
| Administrative fees | 252 | ||
| Custodian fees (1) | 361 | ||
| Distribution fees - Class A | 6 | ||
| Distribution fees - Class C | 14 | ||
| Transfer agent fees - Class A | 5 | ||
| Transfer agent fees - Class C | 4 | ||
| Transfer agent fees - Class E | 59 | ||
| Transfer agent fees - Class S | 976 | ||
| Professional fees | 78 | ||
| Registration fees | 129 | ||
| Shareholder servicing fees - Class C | 5 | ||
| Shareholder servicing fees - Class E | 75 | ||
| Trustees’ fees | 18 | ||
| Printing fees | 40 | ||
| Offering fees | 49 | ||
| Miscellaneous | 26 | ||
| Expenses before reductions | 6,535 | ||
| Expense reductions | (745 | ) | |
| Net expenses | 5,790 | ||
| Net investment income (loss) | 8,554 | ||
| Net Realized and Unrealized Gain (Loss) | |||
| Net realized gain (loss) on: | |||
| Investments (net of deferred tax liability for foreign capital gains taxes) | (37,711 | ) | |
| Futures contracts | (1,795 | ) | |
| Foreign currency-related transactions | 4,334 | ||
| Net realized gain (loss) | (35,172 | ) | |
| Net change in unrealized appreciation (depreciation) on: | |||
| Investments (net of deferred tax liability for foreign capital gains taxes) | 46,426 | ||
| Futures contracts | 101 | ||
| Foreign currency-related transactions | (861 | ) | |
| Net change in unrealized appreciation (depreciation) | 45,666 | ||
| Net realized and unrealized gain (loss) | 10,494 | ||
| Net Increase (Decrease) in Net Assets from Operations | $ | 19,048 | |
| (1) Includes a reimbursement for overbilling of custody out-of-pocket fees from prior years. See note 10 in the Notes to Financial Statements. | |||
See accompanying notes which are an integral part of the financial statements.
Russell Tax-Managed International Equity Fund 325
Russell Investment Company
Russell Tax-Managed International Equity Fund
Statements of Changes in Net Assets
| For the Periods Ended October 31, | ||||||
| Amounts in thousands | 2016 | 2015 | (1) | |||
| Increase (Decrease) in Net Assets | ||||||
| Operations | ||||||
| Net investment income (loss) | $ | 8,554 | $ | 1,528 | ||
| Net realized gain (loss) | (35,172 | ) | (38,061 | ) | ||
| Net change in unrealized appreciation (depreciation) | 45,666 | 2,480 | ||||
| Net increase (decrease) in net assets from operations | 19,048 | (34,053 | ) | |||
| Distributions | ||||||
| From net investment income | ||||||
| Class A | (11 | ) | — | |||
| Class C | (5 | ) | — | |||
| Class E | (165 | ) | — | |||
| Class S | (2,463 | ) | — | |||
| Net decrease in net assets from distributions | (2,644 | ) | — | |||
| Share Transactions* | ||||||
| Net increase (decrease) in net assets from share transactions | 167,477 | 479,918 | ||||
| Total Net Increase (Decrease) in Net Assets | 183,881 | 445,865 | ||||
| Net Assets | ||||||
| Beginning of period | 445,865 | — | ||||
| End of period | $ | 629,746 | $ | 445,865 | ||
| Undistributed (overdistributed) net investment income included in net assets | $ | 12,338 | $ | 1,877 | ||
| (1) For the period June 2, 2015 (commencement of operations) to October 31, 2015. | ||||||
See accompanying notes which are an integral part of the financial statements.
326 Russell Tax-Managed International Equity Fund
Russell Investment Company
Russell Tax-Managed International Equity Fund
Statements of Changes in Net Assets, continued
* Share transaction amounts (in thousands) for the periods ended October 31, 2016 and October 31, 2015 were as follows:
| 2016 | 2015 | (1) | |||||||||||
| Shares | Dollars | Shares | Dollars | ||||||||||
| Class A | |||||||||||||
| Proceeds from shares sold | 368 | $ | 3,301 | 112 | $ | 1,072 | |||||||
| Proceeds from reinvestment of distributions | 1 | 10 | — | — | |||||||||
| Payments for shares redeemed | (43 | ) | (384 | ) | (9 | ) | (91 | ) | |||||
| Net increase (decrease) | 326 | 2,927 | 103 | 981 | |||||||||
| Class C | |||||||||||||
| Proceeds from shares sold | 187 | 1,633 | 137 | 1,297 | |||||||||
| Proceeds from reinvestment of distributions | — | 5 | — | — | |||||||||
| Payments for shares redeemed | (56 | ) | (500 | ) | — | (3 | ) | ||||||
| Net increase (decrease) | 131 | 1,138 | 137 | 1,294 | |||||||||
| Class E | |||||||||||||
| Proceeds from shares sold | 693 | 6,054 | 3,274 | 28,813 | |||||||||
| Proceeds from reinvestment of distributions | 19 | 164 | — | — | |||||||||
| Payments for shares redeemed | (346 | ) | (3,011 | ) | (47 | ) | (408 | ) | |||||
| Net increase (decrease) | 366 | 3,207 | 3,227 | 28,405 | |||||||||
| Class S | |||||||||||||
| Proceeds from shares sold | 32,355 | 281,200 | 49,357 | 484,264 | |||||||||
| Proceeds from reinvestment of distributions | 285 | 2,451 | — | — | |||||||||
| Payments for shares redeemed | (14,098 | ) | (123,446 | ) | (3,825 | ) | (35,026 | ) | |||||
| Net increase (decrease) | 18,542 | 160,205 | 45,532 | 449,238 | |||||||||
| Total increase (decrease) | 19,365 | $ | 167,477 | 48,999 | $ | 479,918 | |||||||
| (1) For the period June 2, 2015 (commencement of operations) to October 31, 2015. | |||||||||||||
See accompanying notes which are an integral part of the financial statements.
Russell Tax-Managed International Equity Fund 327
Russell Investment Company
Russell Tax-Managed International Equity Fund
Financial Highlights — For the Period Ended
For a Share Outstanding Throughout Each Period.
| $ | |||||||||||||||||
| $ | Net | $ | $ | $ | |||||||||||||
| Net Asset Value, | Investment | Net Realized | Total from | Distributions | |||||||||||||
| Beginning of | Income (Loss) | and Unrealized | Investment | from Net | $ | ||||||||||||
| Period | (a) (d) | Gain (Loss) | Operations | Investment Income | Total Distributions | ||||||||||||
| Class A | |||||||||||||||||
| October 31, 2016 | 9.09 | .13 | .02 | .15 | (.05 | ) | (.05 | ) | |||||||||
| October 31, 2015(7) | 10.00 | .03 | (.94 | ) | (.91 | ) | — | — | |||||||||
| Class C | |||||||||||||||||
| October 31, 2016 | 9.06 | .06 | .02 | .08 | (.03 | ) | (.03 | ) | |||||||||
| October 31, 2015(7) | 10.00 | (.01 | ) | (.93 | ) | (.94 | ) | — | — | ||||||||
| Class E | |||||||||||||||||
| October 31, 2016 | 9.09 | .12 | .02 | .14 | (.05 | ) | (.05 | ) | |||||||||
| October 31, 2015(7) | 10.00 | .02 | (.93 | ) | (.91 | ) | — | — | |||||||||
| Class S | |||||||||||||||||
| October 31, 2016 | 9.10 | .15 | .01 | .16 | (.05 | ) | (.05 | ) | |||||||||
| October 31, 2015(7) | 10.00 | .04 | (.94 | ) | (.90 | ) | — | — | |||||||||
See accompanying notes which are an integral part of the financial statements.
328 Russell Tax-Managed International Equity Fund
| % | % | % | |||||||||||||
| $ | $ | Ratio of Expenses | Ratio of Expenses | Ratio of Net | |||||||||||
| Net Asset Value, | % | Net Assets, | to Average | to Average | Investment Income | % | |||||||||
| End of | Total | End of Period | Net Assets, | Net Assets, | to Average | Portfolio | |||||||||
| Period | Return(b)(c) | (000 | ) | Gross(e) | Net(d)(e) | Net Assets(d)(e) | Turnover Rate(b) | ||||||||
| 9.19 | 1.71 | 3,943 | 1.48 | 1.34 | 1.43 | 85 | |||||||||
| 9.09 | (9.10 | ) | 935 | 1.50 | 1.34 | .66 | 79 | ||||||||
| 9.11 | .89 | 2,441 | 2.23 | 2.09 | .71 | 85 | |||||||||
| 9.06 | (9.40 | ) | 1,239 | 2.25 | 2.09 | (.16 | ) | 79 | |||||||
| 9.18 | 1.59 | 32,989 | 1.48 | 1.34 | 1.38 | 85 | |||||||||
| 9.09 | (9.10 | ) | 29,334 | 1.53 | 1.34 | .59 | 79 | ||||||||
| 9.21 | 1.83 | 590,373 | 1.23 | 1.09 | 1.66 | 85 | |||||||||
| 9.10 | (9.00 | ) | 414,357 | 1.24 | 1.09 | .94 | 79 | ||||||||
See accompanying notes which are an integral part of the financial statements.
Russell Tax-Managed International Equity Fund 329
Russell Investment Company
Russell Tax-Managed International Equity Fund
Related Party Transactions, Fees and Expenses
| Accrued fees payable to affiliates for the period ended October 31, 2016 were as follows: | ||
| Advisory fees | $ | 387,775 |
| Administration fees | 25,623 | |
| Distribution fees | 2,263 | |
| Shareholder servicing fees | 7,504 | |
| Transfer agent fees | 106,067 | |
| Trustee fees | 3,883 | |
| $ | 533,115 | |
| Transactions (amounts in thousands) during the period ended October 31, 2016 with Underlying Funds which are, or were, an | ||||||||||||||||||
| affiliated company are as follows: | ||||||||||||||||||
| Fair Value, | Change in | |||||||||||||||||
| Beginning of | Realized Gain | Unrealized | Fair Value, End | Income | Capital Gains | |||||||||||||
| Period | Purchases | Sales | (Loss) | Gain (Loss) | of Period | Distributions | Distributions | |||||||||||
| Russell U.S. Cash Management Fund $ | 23,471 | $ | 330,062 | $ | 316,867 | $ | 4 | $ | 5 | $ | 36,675 | $ | 143 | $ | — | |||
| $ | 23,471 | $ | 330,062 | $ | 316,867 | $ | 4 | $ | 5 | $ | 36,675 | $ | 143 | $ | — | |||
Federal Income Taxes
At October 31, 2016, the cost of investments and net unrealized appreciation (depreciation), undistributed ordinary income and
undistributed long-term capital gains for income tax purposes were as follows:.
| Cost of Investments | $ | 571,465,402 | |||
| Unrealized Appreciation | $ | 60,541,619 | |||
| Unrealized Depreciation | (14,331,300 | ) | |||
| Net Unrealized Appreciation (Depreciation) | $ | 46,210,319 | |||
| Undistributed Ordinary Income | $ | 12,902,963 | |||
| Undistributed Long-Term Capital Gains | |||||
| (Capital Loss Carryforward) | $ | (74,158,896 | ) | ||
| Tax Composition of Distributions | |||||
| Ordinary Income | $ | 2,643,604 | |||
Net investment income and net realized gains (loss) in the financial statements may differ from taxable net investment income and net
realized gains (losses). Capital accounts within the financial statements are adjusted for permanent book-tax differences. Book-tax
differences are primarily due to foreign currency gains and losses, reclassifications of dividends, differences in treatment of income
from swaps, net operating losses, investments in partnerships, investments in passive foreign investment companies (PFICs), tax
straddle transactions, use of tax equalization and foreign capital gains taxes. These adjustments have no impact on the net assets.
At October 31, 2016, the Statement of Assets and Liabilities have been adjusted by the following amounts (in thousands):
| Undistributed net investment income | $ | 4,551 | |
| Accumulated net realized gain (loss) | (4,501 | ) | |
| Additional paid-in capital | (50 | ) |
See accompanying notes which are an integral part of the financial statements.
330 Russell Tax-Managed International Equity Fund
Russell Investment Company
Russell Global Opportunistic Credit Fund
Portfolio Management Discussion and Analysis — October 31, 2016 (Unaudited)
| Russell Global Opportunistic Credit Fund - Class A‡ | Russell Global Opportunistic Credit Fund - Class Y | ||||||
| Total | Total | ||||||
| Return | Return | ||||||
| 1 Year | 5.75 | % | 1 Year | 10.13 | % | ||
| 5 Years | 4.28 | %§ | 5 Years | 5.40 | %§ | ||
| Inception* | 4.19 | %§ | Inception* | 5.19 | %§ | ||
| Russell Global Opportunistic Credit Fund - Class C | BofA Merrill Lynch Global High Yield Index (USD | ||||||
| Total | Hedged)** | ||||||
| Return | Total | ||||||
| 1 Year | 9.03 | % | Return | ||||
| 5 Years | 4.29 | %§ | 1 Year | 10.57 | % | ||
| Inception* | 4.07 | %§ | 5 Years | 7.92 | %§ | ||
| Inception* | 7.48 | %§ | |||||
| Russell Global Opportunistic Credit Fund - Class E | Global Opportunistic Credit Blended Benchmark*** | ||||||
| Total | |||||||
| Total | Return | ||||||
| Return | |||||||
| 1 Year | 9.80 | % | 1 Year | 11.05 | % | ||
| 5 Years | 5.07 | %§ | 5 Years | 7.40 | %§ | ||
| Inception* | 4.84 | %§ | Inception* | 7.01 | %§ | ||
| Russell Global Opportunistic Credit Fund - Class S | |||||||
| Total | |||||||
| Return | |||||||
| 1 Year | 10.05 | % | |||||
| 5 Years | 5.33 | %§ | |||||
| Inception* | 5.11 | %§ | |||||
Russell Global Opportunistic Credit Fund 331
Russell Investment Company
Russell Global Opportunistic Credit Fund
Portfolio Management Discussion and Analysis, continued — October 31, 2016
(Unaudited)
| The Russell Global Opportunistic Credit Fund (the “Fund”) | High yield corporate credit was among the best-performing |
| employs a multi-manager approach whereby portions of the | segments of the market (the Bloomberg Barclays Global High |
| Fund are allocated to different money manager strategies. Fund | Yield Index returned 8.20% over equivalent-duration Treasuries), |
| assets not allocated to money managers are managed by Russell | as market sentiment flipped early in the year and defaults were |
| Investment Management, LLC (“RIM”), the Fund’s advisor. RIM | limited outside of the energy sector. Emerging market (“EM”) |
| may change the allocation of the Fund’s assets among money | debt outperformed developed markets (the Bloomberg Barclays |
| managers at any time. An exemptive order from the Securities | EM Hard Currency Aggregate Index outperformed equivalent- |
| and Exchange Commission (“SEC”) permits RIM to engage or | duration U.S. Treasuries by 6.61%) as growth and sentiment |
| terminate a money manager at any time, subject to approval by | stabilized. Local currency EM bonds (those issued in the issuing |
| the Fund’s Board, without a shareholder vote. Pursuant to the | country’s own currency) did not return quite as strongly (the |
| terms of the exemptive order, the Fund is required to notify its | Bloomberg Barclays EM Local Currency Government Index |
| shareholders within 90 days of when a money manager begins | returned 4.85%) as the drawdown in the first quarter of the year |
| providing services. As of October 31, 2016, the Fund had six | was much sharper for EM currencies than credit, though the |
| money managers. | subsequent rally was similarly fierce. |
| What is the Fund’s investment objective? | How did the investment strategies and techniques employed |
| The Fund seeks to provide total return. | by the Fund and its money managers affect its benchmark- |
| How did the Fund perform relative to its benchmark for the | relative performance? |
| fiscal year ended October 31, 2016? | The Fund employs discretionary money managers. The Fund’s |
| discretionary money managers select the individual portfolio | |
| For the fiscal year ended October 31, 2016, the Fund’s Class A, | securities for the assets assigned to them. Fund assets not |
| Class C, Class E, Class S, and Class Y Shares gained 9.81%, | allocated to discretionary money managers include the Fund’s |
| 9.03%, 9.80%, 10.05% and 10.13%, respectively. This is | liquidity reserves and assets which may be managed directly by |
| compared to the Fund’s benchmark, the BofA Merrill Lynch | RIM to effect the Fund’s investment strategies and/or to actively |
| Global High Yield Index Hedged (USD), which gained 10.57% | manage the Fund’s overall exposures by investing in securities or |
| during the same period. The Fund’s performance includes | other instruments that RIM believes will achieve the desired risk/ |
| operating expenses, whereas index returns are unmanaged and | return profile for the Fund. |
| do not include expenses of any kind. | |
| RIM’s asset allocation for the Fund detracted over the period as | |
| For the fiscal year ended October 31, 2016, Morningstar® | a result of decisions to hold ex-benchmark exposures in local |
| Multisector Bond Category, a group of funds that Morningstar | currency emerging market debt and bank loans. Both sectors |
| considers to have investment strategies similar to those of the | significantly lagged the traditional spread sectors of high yield |
| Fund, gained 5.69%. This return serves as a peer comparison and | corporate bonds and U.S. dollar emerging market debt. |
| is expressed net of operating expenses. | |
| With respect to certain of the Fund’s money managers, DuPont | |
| RIM may assign a money manager a benchmark other than the | Capital Management Corporation (“DuPont”) was the top |
| Fund’s index. However, the Fund’s primary index remains the | performing manager during the period. An overweight to lower |
| benchmark for the Fund. | rated countries and Venezuela in particular led to strong results |
| How did the market conditions described in the Market | during the period. DuPont also benefited from tactical management |
| Summary report affect the Fund’s performance? | of its exposure to Brazil and the quasi-sovereign issuer, Petrobras. |
| The fiscal year ended October 31, 2016 was characterized | Currency exposure to the Mexican peso detracted modestly. |
| by a sharply risk off market early in the period followed by a | DDJ Capital Management, LLC was the worst performing manager |
| similar sharp rebound and extended rally in risky assets (e.g., | during the period, meaningfully underperforming the Fund’s and |
| lower rated credit and emerging market currencies). Overall, this | its own benchmark. Exposure to bank loans were a significant |
| proved positive for most fixed income sectors around the globe. | drag on performance in the latter half of the year, but the portfolio |
| Yield curves on global government bonds tended to flatten over | was especially hard hit by poor security selection in the volatile |
| the period supporting longer maturity bonds and the asset class | metals and mining industry in the first half of the year. |
| in general. Corporate and emerging sovereign credit markets | During the period, RIM utilized credit and interest rate derivatives, |
| suffered from December to February, but returns turned positive | such as futures, forwards and swaps, to seek to achieve the Fund |
| as the year went on and eventually very significantly so. | benchmark’s duration and credit exposures with respect to the |
| portion of the Fund allocated to cash reserves. This performed | |
332 Russell Global Opportunistic Credit Fund
Russell Investment Company
Russell Global Opportunistic Credit Fund
Portfolio Management Discussion and Analysis, continued — October 31, 2016
(Unaudited)
| as intended but detracted relative to the Fund’s benchmark as | Money Managers as of October 31, | |
| credit derivatives meaningfully underperformed the cash bonds | 2016 | Styles |
| in the index. Derivatives were also used in connection with the | ||
| Axiom Alternative Investments SARL | Sector Specialist | |
| cash management process to manage Fund characteristics by | DDJ Capital Management, LLC | Sector Specialist |
| augmenting or reducing specific exposures associated with one | DuPont Capital Management Corporation | Sector Specialist |
| or more managers or strategies and gaining desired exposures | Lazard Asset Management, LLC | Sector Specialist |
| beyond those generated by the manager strategies. Overall, these | Oaktree Capital Management, L.P. | Sector Specialist |
| activities added value, in line with the benchmark’s positive | THL Credit Advisors, LLC | Sector Specialist |
| returns. | The views expressed in this report reflect those of the | |
| portfolio managers only through the end of the period | ||
| Describe any changes to the Fund’s structure or the money | covered by the report. These views do not necessarily | |
| manager line-up. | represent the views of RIM, or any other person in RIM or | |
| In March 2016, Axiom Alternative Investments SARL was hired | any other affiliated organization. These views are subject | |
| as a specialist in the European bank capital sector. | to change at any time based upon market conditions or | |
| other events, and RIM disclaims any responsibility to | ||
| update the views contained herein. These views should not | ||
| be relied on as investment advice and, because investment | ||
| decisions for a Russell Investment Company (“RIC”) Fund | ||
| are based on numerous factors, should not be relied on as | ||
| an indication of investment decisions of any RIC Fund. | ||
* Assumes initial investment on September 30, 2010.
** The BofA Merrill Lynch Global High Yield Index (USD Hedged) is composed of below investment grade bonds of corporate issuers domiciled in countries across
both developed and emerging markets.
*** The Global Opportunistic Credit Blended Benchmark is a composite index consisting of 60% BofA Merrill Lynch Global High Yield Index (USD Hedged) and
40% JP Morgan EMBI Global Diversified Index. The Global Opportunistic Credit Blended Benchmark provides a means to compare the Fund’s average annual
returns to a secondary benchmark that is more representative of the investment strategies pursued by the Fund.
‡ The performance shown has been adjusted to reflect the deduction of the maximum Class A sales charge of 3.75%.
§ Annualized.
Performance is historical and assumes reinvestment of all dividends and capital gains. Investment return and principal value will fluctuate so that an investor’s
shares, when redeemed, may be worth more or less than when purchased. Past performance is not indicative of future results. The returns shown do not reflect the
deduction of taxes that a shareholder would pay on Fund distributions or the redemption of Fund shares. Additionally, the returns presented herein may differ from
the performance reported in the Financial Highlights as the returns herein are calculated in a manner consistent with standardized performance in accordance with
Securities and Exchange Commission rules, while the performance in the Financial Highlights has been calculated in accordance with U.S. Generally Accepted
Accounting Principles (“U.S. GAAP”).
Russell Global Opportunistic Credit Fund 333
Russell Investment Company
Russell Global Opportunistic Credit Fund
Shareholder Expense Example — October 31, 2016 (Unaudited)
| Fund Expenses | Please note that the expenses shown in the table are meant | |||||
| The following disclosure provides important information | to highlight your ongoing costs only and do not reflect any | |||||
| regarding the Fund’s Shareholder Expense Example | transactional costs. Therefore, the information under the heading | |||||
| (“Example”). | “Hypothetical Performance (5% return before expenses)” is | |||||
| useful in comparing ongoing costs only, and will not help you | ||||||
| Example | determine the relative total costs of owning different funds. In | |||||
| As a shareholder of the Fund, you incur two types of costs: (1) | addition, if these transactional costs were included, your costs | |||||
| transaction costs, including sales charges (loads) on certain | would have been higher. | |||||
| purchase or redemption payments, and (2) ongoing costs, | Hypothetical | |||||
| including distribution (12b-1) and/or service fees and other | Performance | |||||
| Fund expenses. The Example is intended to help you understand | Actual | (5% return | ||||
| your ongoing costs (in dollars) of investing in the Fund and to | Class A | Performance | before expenses) | |||
| Beginning Account Value | ||||||
| compare these costs with the ongoing costs of investing in other | May 1, 2016 | $ | 1,000.00 | $ | 1,000.00 | |
| mutual funds. The Example is based on an investment of $1,000 | Ending Account Value | |||||
| invested at the beginning of the period and held for the entire | October 31, 2016 | $ | 1,058.00 | $ | 1,019.41 | |
| period indicated, which for this Fund is from May 1, 2016 to | Expenses Paid During Period* | $ | 5.90 | $ | 5.79 | |
| October 31, 2016. | * Expenses are equal to the Fund's annualized expense ratio of 1.14% | |||||
| (representing the six month period annualized), multiplied by the average | ||||||
| Actual Expenses | account value over the period, multiplied by 184/366 (to reflect the one-half | |||||
| The information in the table under the heading “Actual | year period). May reflect amounts waived and/or reimbursed. Without any | |||||
| Performance” provides information about actual account values | waivers and/or reimbursements, expenses would have been higher. | |||||
| and actual expenses. You may use the information in this column, | ||||||
| Hypothetical | ||||||
| together with the amount you invested, to estimate the expenses | Performance | |||||
| that you paid over the period. Simply divide your account value by | Actual | (5% return | ||||
| $1,000 (for example, an $8,600 account value divided by $1,000 | Class C | Performance | before expenses) | |||
| Beginning Account Value | ||||||
| = 8.6), then multiply the result by the number in the first column | May 1, 2016 | $ | 1,000.00 | $ | 1,000.00 | |
| in the row entitled “Expenses Paid During Period” to estimate | Ending Account Value | |||||
| the expenses you paid on your account during this period. | October 31, 2016 | $ | 1,054.30 | $ | 1,015.63 | |
| Expenses Paid During Period* | $ | 9.76 | $ | 9.58 | ||
| Hypothetical Example for Comparison Purposes | ||||||
| The information in the table under the heading “Hypothetical | * Expenses are equal to the Fund's annualized expense ratio of 1.89% | |||||
| (representing the six month period annualized), multiplied by the average | ||||||
| Performance (5% return before expenses)” provides information | account value over the period, multiplied by 184/366 (to reflect the one-half | |||||
| about hypothetical account values and hypothetical expenses | year period). May reflect amounts waived and/or reimbursed. Without any | |||||
| based on the Fund’s actual expense ratio and an assumed rate of | waivers and/or reimbursements, expenses would have been higher. | |||||
| return of 5% per year before expenses, which is not the Fund’s | ||||||
| Hypothetical | ||||||
| actual return. The hypothetical account values and expenses | Performance | |||||
| may not be used to estimate the actual ending account balance or | Actual | (5% return | ||||
| expenses you paid for the period. You may use this information | Class E | Performance | before expenses) | |||
| to compare the ongoing costs of investing in the Fund and other | Beginning Account Value | |||||
| May 1, 2016 | $ | 1,000.00 | $ | 1,000.00 | ||
| funds. To do so, compare this 5% hypothetical example with the | Ending Account Value | |||||
| 5% hypothetical examples that appear in the shareholder reports | October 31, 2016 | $ | 1,057.90 | $ | 1,019.41 | |
| of other funds. | Expenses Paid During Period* | $ | 5.90 | $ | 5.79 | |
| * Expenses are equal to the Fund's annualized expense ratio of 1.14% | ||||||
| (representing the six month period annualized), multiplied by the average | ||||||
| account value over the period, multiplied by 184/366 (to reflect the one-half | ||||||
| year period). May reflect amounts waived and/or reimbursed. Without any | ||||||
| waivers and/or reimbursements, expenses would have been higher. | ||||||
334 Russell Global Opportunistic Credit Fund
Russell Investment Company
Russell Global Opportunistic Credit Fund
Shareholder Expense Example, continued — October 31, 2016 (Unaudited)
| Hypothetical | ||||||
| Performance | ||||||
| Actual | (5% return | |||||
| Class S | Performance | before expenses) | ||||
| Beginning Account Value | ||||||
| May 1, 2016 | $ | 1,000.00 | $ | 1,000.00 | ||
| Ending Account Value | ||||||
| October 31, 2016 | $ | 1,059.10 | $ | 1,020.66 | ||
| Expenses Paid During Period* | $ | 4.61 | $ | 4.52 | ||
| * Expenses are equal to the Fund's annualized expense ratio of 0.89% | ||||||
| (representing the six month period annualized), multiplied by the average | ||||||
| account value over the period, multiplied by 184/366 (to reflect the one-half | ||||||
| year period). May reflect amounts waived and/or reimbursed. Without any | ||||||
| waivers and/or reimbursements, expenses would have been higher. | ||||||
| Hypothetical | ||||||
| Performance | ||||||
| Actual | (5% return | |||||
| Class Y | Performance | before expenses) | ||||
| Beginning Account Value | ||||||
| May 1, 2016 | $ | 1,000.00 | $ | 1,000.00 | ||
| Ending Account Value | ||||||
| October 31, 2016 | $ | 1,059.50 | $ | 1,021.06 | ||
| Expenses Paid During Period* | $ | 4.19 | $ | 4.12 | ||
| * Expenses are equal to the Fund's annualized expense ratio of 0.81% | ||||||
| (representing the six month period annualized), multiplied by the average | ||||||
| account value over the period, multiplied by 184/366 (to reflect the one-half | ||||||
| year period). May reflect amounts waived and/or reimbursed. Without any | ||||||
| waivers and/or reimbursements, expenses would have been higher. | ||||||
Russell Global Opportunistic Credit Fund 335
Russell Investment Company
Russell Global Opportunistic Credit Fund
Schedule of Investments — October 31, 2016
| Amounts in thousands (except share amounts) | Amounts in thousands (except share amounts) | ||||||||||
| Principal | Fair | Principal | Fair | ||||||||
| Amount ($) | Value | Amount ($) | Value | ||||||||
| or Shares | $ | or Shares | $ | ||||||||
| Long-Term Fixed Income Investments - 83.6% | 4.750% due 11/15/21 (Þ) | EUR | 810 | 944 | |||||||
| Argentina - 1.1% | Series REGS | ||||||||||
| Argentine Bonos del Tesoro | 4.750% due 11/15/21 | EUR | 530 | 618 | |||||||
| 16.000% due 10/17/23 | ARS | 11,000 | 735 | ||||||||
| 15.500% due 10/17/26 | ARS | 11,000 | 735 | 5,353 | |||||||
| Argentine Republic Government | Bermuda - 0.2% | ||||||||||
| International Bond | Catlin Insurance Co., Ltd. | ||||||||||
| 7.500% due 04/22/26 (Þ) | 2,386 | 2,607 | 7.249% due 12/31/49 (ƒ)(Þ) | 440 | 354 | ||||||
| 7.125% due 07/06/36 (Þ) | 1,000 | 1,031 | Weatherford International, Ltd. | ||||||||
| 7.625% due 04/22/46 (Þ) | 1,268 | 1,385 | 9.625% due 03/01/19 | 1,950 | 2,077 | ||||||
| Series dscEUR | 7.750% due 06/15/21 | 1,545 | 1,560 | ||||||||
| 7.820% due 12/31/33 | EUR | 4,679 | 5,490 | 4.500% due 04/15/22 | 95 | 86 | |||||
| Series EURGDP | 8.250% due 06/15/23 | 125 | 129 | ||||||||
| 12.608% due 12/15/35 (Ê)(~) | EUR | 60,000 | 6,791 | 6.750% due 09/15/40 | 585 | 464 | |||||
| Series L-GP | 4,670 | ||||||||||
| (2.627)% due 03/31/23 (Ø)(~) | 1,295 | 1,536 | Brazil - 2.0% | ||||||||
| YPF SA | Banco Nacional de Desenvolvimento | ||||||||||
| 8.750% due 04/04/24 (Þ) | 2,000 | 2,202 | Economico e Social | ||||||||
| 5.750% due 09/26/23 (Þ) | 950 | 983 | |||||||||
| 22,512 | |||||||||||
| Armenia - 0.0% | Brazil Letras do Tesouro Nacional | ||||||||||
| Series LTN | |||||||||||
| Republic of Armenia International Bond | 11.287% due 01/01/19 (~) | BRL | 18,740 | 4,655 | |||||||
| Series REGS | 11.363% due 01/01/20 (~) | BRL | 7,800 | 1,737 | |||||||
| 6.000% due 09/30/20 | 1,000 | 1,034 | Brazil Letras do Tesouro Nacional Bills | ||||||||
| Australia - 0.0% | Series LTN | ||||||||||
| FMG Resources Pty, Ltd. Covenant-Lite | 11.462% due 10/01/18 (~) | BRL | 2,950 | 751 | |||||||
| 1st Lien Term Loan B | Brazil Notas do Tesouro Nacional | ||||||||||
| 3.750% due 06/30/19 | 1,012 | 1,011 | Series NTNB | ||||||||
| (5.908)% due 05/15/35 (~) | BRL | 4,150 | 4,023 | ||||||||
| Austria - 0.2% | (3.300)% due 08/15/50 | BRL | 2,950 | 2,874 | |||||||
| BAWAG PSK Bank fuer Arbeit und | Series NTNF | ||||||||||
| Wirtschaft und Oesterreichische | 0.157% due 01/01/21 (~) | BRL | 12,890 | 4,012 | |||||||
| Postsparkasse AG | 0.387% due 01/01/23 (~) | BRL | 22,700 | 6,944 | |||||||
| 8.125% due 10/30/23 | EUR | 1,000 | 1,388 | 0.401% due 01/01/25 (~) | BRL | 20,770 | 6,297 | ||||
| Raiffeisen Bank International AG | 10.000% due 01/01/27 | BRL | 8,300 | 2,482 | |||||||
| 6.000% due 10/16/23 | EUR | 400 | 469 | Marfrig Overseas, Ltd. | |||||||
| RZB Finance Jersey IV, Ltd. | Series REGS | ||||||||||
| 1.651% due 05/29/49 (Ê)(ƒ) | EUR | 400 | 393 | 9.500% due 05/04/20 | 1,800 | 1,863 | |||||
| UNIQA Insurance Group AG | Vale SA | ||||||||||
| 6.875% due 07/31/43 | EUR | 800 | 992 | 5.625% due 09/11/42 | 4,800 | 4,173 | |||||
| 3,242 | 40,794 | ||||||||||
| Azerbaijan - 0.1% | Canada - 2.1% | ||||||||||
| State Oil Co. of the Azerbaijan Republic | 1011778 BC Unlimited Liability Co. 1st | ||||||||||
| 4.750% due 03/13/23 | 2,000 | 1,991 | Lien Term Loan B2 | ||||||||
| 3.750% due 12/12/21 (Ê) | 1,686 | 1,693 | |||||||||
| Bahrain - 0.1% | 1011778 BC Unlimited Liability Co. | ||||||||||
| Bahrain Government International Bond | Term Loan B2 | ||||||||||
| 7.000% due 01/26/26 (Þ) | 2,000 | 2,125 | 4.625% due 01/15/22 (Þ) | 905 | 934 | ||||||
| Bank of Nova Scotia (The) | |||||||||||
| Belgium - 0.3% | 1.315% due 06/11/18 (Ê) | 1,700 | 1,705 | ||||||||
| Argenta Spaarbank NV | Series YCD | ||||||||||
| 3.875% due 05/24/26 | EUR | 600 | 688 | 1.583% due 03/28/18 (Ê)(~) | 280 | 280 | |||||
| Belfius Bank SA | Cascades, Inc. | ||||||||||
| 6.000% due 04/04/22 | EUR | 600 | 738 | 5.750% due 07/15/23 (Þ) | 1,245 | 1,257 | |||||
| BNP Paribas Fortis SA | Cenovus Energy, Inc. | ||||||||||
| 1.736% due 12/29/49 (Ê)(ƒ) | EUR | 750 | 531 | 5.700% due 10/15/19 | 2,065 | 2,231 | |||||
| Ethias SA | 6.750% due 11/15/39 | 390 | 435 | ||||||||
| 5.000% due 01/14/26 | EUR | 1,000 | 956 | Cott Corp. | |||||||
| KBC Groep NV | 5.500% due 07/01/24 (Þ) | EUR | 800 | 925 | |||||||
| 5.625% due 03/29/49 (ƒ) | EUR | 800 | 878 | Eldorado Gold Corp. | |||||||
| Ontex Group NV | 6.125% due 12/15/20 (Þ) | 1,260 | 1,273 | ||||||||
See accompanying notes which are an integral part of the financial statements.
336 Russell Global Opportunistic Credit Fund
Russell Investment Company
Russell Global Opportunistic Credit Fund
Schedule of Investments, continued — October 31, 2016
| Amounts in thousands (except share amounts) | Amounts in thousands (except share amounts) | ||||||||||
| Principal | Fair | Principal | Fair | ||||||||
| Amount ($) | Value | Amount ($) | Value | ||||||||
| or Shares | $ | or Shares | $ | ||||||||
| First Quantum Minerals, Ltd. | Country Garden Holdings Co., Ltd. | ||||||||||
| 7.250% due 05/15/22 (Þ) | 1,695 | 1,604 | Series REGS | ||||||||
| HudBay Minerals, Inc. | 7.250% due 04/04/21 | 300 | 317 | ||||||||
| 9.500% due 10/01/20 | 1,790 | 1,835 | 5,550 | ||||||||
| Kinross Gold Corp. | Colombia - 1.2% | ||||||||||
| Series WI | Colombia Government International | ||||||||||
| 5.950% due 03/15/24 | 1,265 | 1,328 | Bond | ||||||||
| LG FinanceCo Corp. | 7.750% due 04/14/21 | COP | 4,905,000 | 1,721 | |||||||
| 5.875% due 11/01/24 (Þ) | 132 | 133 | 4.000% due 02/26/24 | 1,000 | 1,040 | ||||||
| MEG Energy Corp. | 9.850% due 06/28/27 | COP | 2,077,000 | 833 | |||||||
| 6.375% due 01/30/23 (Þ) | 720 | 594 | 10.375% due 01/28/33 | 514 | 797 | ||||||
| 7.000% due 03/31/24 (Þ) | 1,840 | 1,509 | 7.375% due 09/18/37 | 3,000 | 3,840 | ||||||
| Mercer International, Inc. | 5.000% due 06/15/45 | 500 | 508 | ||||||||
| 7.000% due 12/01/19 | 1,680 | 1,741 | Colombian Titulos de Tesoreria | ||||||||
| Series WI | Series B | ||||||||||
| 7.750% due 12/01/22 | 1,050 | 1,105 | 11.000% due 07/24/20 | COP | 4,204,000 | 1,591 | |||||
| Mood Media Corp. Term Loan | 7.000% due 05/04/22 | COP | 7,841,000 | 2,620 | |||||||
| 7.000% due 05/01/19 (Ê) | 1,711 | 1,622 | 10.000% due 07/24/24 | COP | 10,613,000 | 4,148 | |||||
| Open Text Corp. | 7.500% due 08/26/26 | COP | 6,094,000 | 2,043 | |||||||
| 5.625% due 01/15/23 (Þ) | 1,070 | 1,108 | 6.000% due 04/28/28 | COP | 18,094,000 | 5,356 | |||||
| 5.875% due 06/01/26 (Þ) | 655 | 698 | Ecopetrol SA | ||||||||
| Parq Holdings, LP Term Loan | 5.875% due 09/18/23 | 300 | 322 | ||||||||
| 8.500% due 12/17/20 (Ê) | 4,230 | 4,071 | 24,819 | ||||||||
| Precision Drilling Corp. | Costa Rica - 0.3% | ||||||||||
| 6.500% due 12/15/21 | 1,165 | 1,126 | Costa Rica Government International | ||||||||
| Bond | |||||||||||
| Province of Ontario Canada | 4.375% due 04/30/25 (Þ) | 2,044 | 1,945 | ||||||||
| 1.067% due 11/23/17 (Ê) | 750 | 751 | |||||||||
| 3.000% due 07/16/18 | 1,000 | 1,031 | 7.000% due 04/04/44 (Þ) | 3,000 | 3,105 | ||||||
| 1.650% due 09/27/19 | 600 | 603 | Series REGS | ||||||||
| 4.250% due 01/26/23 | 1,000 | 968 | |||||||||
| Province of Quebec Canada | |||||||||||
| 1.065% due 09/04/18 (Ê) | 450 | 450 | 6,018 | ||||||||
| Teck Resources, Ltd. | Croatia - 0.5% | ||||||||||
| 3.750% due 02/01/23 | 1,885 | 1,783 | Croatia Government International Bond | ||||||||
| 8.500% due 06/01/24 (Þ) | 820 | 949 | 6.000% due 01/26/24 (Þ) | 2,200 | 2,483 | ||||||
| 6.125% due 10/01/35 | 1,300 | 1,293 | Series REGS | ||||||||
| 6.000% due 08/15/40 | 455 | 439 | 6.625% due 07/14/20 | 1,200 | 1,331 | ||||||
| Teine Energy, Ltd. | 6.000% due 01/26/24 | 6,000 | 6,771 | ||||||||
| 6.875% due 09/30/22 (Þ) | 1,210 | 1,231 | 10,585 | ||||||||
| Trader Corp. Term Loan | Denmark - 0.0% | ||||||||||
| 5.000% due 08/09/23 | 1,000 | 1,005 | Sparekassen Sjaelland-Fyn AS | ||||||||
| Valeant Pharmaceuticals International, | 10.835% due 09/29/49 (Å)(ƒ) | DKK | 2,000 | 310 | |||||||
| Inc. | |||||||||||
| 5.625% due 12/01/21 (Þ) | 1,685 | 1,382 | Dominican Republic - 0.5% | ||||||||
| 5.875% due 05/15/23 (Þ) | 930 | 732 | Dominican Republic International Bond | ||||||||
| Veresen Midstream, LP Term Loan B1 | 7.450% due 04/30/44 (Þ) | 2,000 | 2,220 | ||||||||
| 5.250% due 03/31/22 (Ê) | 997 | 992 | 6.850% due 01/27/45 (Þ) | 4,000 | 4,160 | ||||||
| 41,848 | Series REGS | ||||||||||
| Chile - 0.3% | 7.500% due 05/06/21 | 4,000 | 4,401 | ||||||||
| Corp. Nacional del Cobre de Chile | 10,781 | ||||||||||
| 4.500% due 08/13/23 (Þ) | 1,000 | 1,059 | Egypt - 0.4% | ||||||||
| 4.875% due 11/04/44 (Þ) | 4,000 | 3,992 | Egypt Government International Bond | ||||||||
| Series REGS | 6.875% due 04/30/40 (Þ) | 8,000 | 7,272 | ||||||||
| 6.150% due 10/24/36 | 1,000 | 1,142 | Series REGS | ||||||||
| 6,193 | 6.875% due 04/30/40 | 1,000 | 909 | ||||||||
| China - 0.3% | 8,181 | ||||||||||
| China Evergrande Group | El Salvador - 0.4% | ||||||||||
| 12.000% due 02/17/20 | 500 | 559 | El Salvador Government International | ||||||||
| Series REGS | Bond | ||||||||||
| 8.750% due 10/30/18 | 4,500 | 4,674 | 6.375% due 01/18/27 (Þ) | 1,500 | 1,493 | ||||||
See accompanying notes which are an integral part of the financial statements.
Russell Global Opportunistic Credit Fund 337
Russell Investment Company
Russell Global Opportunistic Credit Fund
Schedule of Investments, continued — October 31, 2016
| Amounts in thousands (except share amounts) | Amounts in thousands (except share amounts) | ||||||||||
| Principal | Fair | Principal | Fair | ||||||||
| Amount ($) | Value | Amount ($) | Value | ||||||||
| or Shares | $ | or Shares | $ | ||||||||
| Series REGS | Series REGS | ||||||||||
| 7.375% due 12/01/19 | 1,000 | 1,054 | 4.250% due 08/01/19 (Ê) | EUR | 193 | 213 | |||||
| 7.750% due 01/24/23 | 2,400 | 2,622 | Rexel SA | ||||||||
| 5.875% due 01/30/25 | 2,500 | 2,475 | 5.250% due 06/15/20 (Þ) | 3,195 | 3,299 | ||||||
| 7.650% due 06/15/35 | 998 | 1,034 | Sanofi | ||||||||
| 8,678 | 1.250% due 04/10/18 | 500 | 500 | ||||||||
| Ethiopia - 0.0% | SFR Group SA | ||||||||||
| Ethiopia International Bond | Series REGS | ||||||||||
| 6.625% due 12/11/24 (Þ) | 1,000 | 946 | 5.375% due 05/15/22 | EUR | 900 | 1,030 | |||||
| 5.625% due 05/15/24 | EUR | 2,785 | 3,206 | ||||||||
| France - 2.0% | Societe Generale SA | ||||||||||
| AXA SA | 6.750% due 04/07/49 (ƒ) | EUR | 600 | 669 | |||||||
| 4.500% due 12/29/49 (ƒ) | 800 | 776 | 1.608% due 12/29/49 (Å)(Ê)(ƒ) | 800 | 784 | ||||||
| BNP Paribas SA | Series REGS | ||||||||||
| 6.500% due 06/29/49 (ƒ) | 1,500 | 1,527 | 7.375% due 12/29/49 (ƒ) | 800 | 793 | ||||||
| 6.125% due 12/29/49 (ƒ) | EUR | 600 | 689 | SPCM SA | |||||||
| Series REGS | 6.000% due 01/15/22 (Þ) | 200 | 207 | ||||||||
| 7.195% due 06/29/49 (ƒ) | 1,300 | 1,467 | 2.875% due 06/15/23 (Þ) | EUR | 1,350 | 1,477 | |||||
| BPCE SA | 41,002 | ||||||||||
| 6.750% due 01/29/49 | 500 | 509 | Gabon - 0.0% | ||||||||
| 6.750% due 01/29/49 (ƒ) | 530 | 539 | Gabon Government International Bond | ||||||||
| Coface SA | 6.375% due 12/12/24 (Þ) | 500 | 458 | ||||||||
| 4.125% due 03/27/24 | EUR | 600 | 708 | ||||||||
| Credit Agricole SA | Germany - 0.9% | ||||||||||
| 6.500% due 04/29/49 (ƒ) | EUR | 900 | 1,013 | Deutsche Bank AG | |||||||
| 7.375% due 10/29/49 (ƒ) | 1,000 | 1,027 | 4.296% due 05/24/28 | 800 | 724 | ||||||
| Series REGS | Deutsche Raststaetten Gruppe IV GmbH | ||||||||||
| 6.637% due 05/29/49 (ƒ) | 442 | 440 | Series REGS | ||||||||
| Credit Logement SA | 6.750% due 12/30/20 | EUR | 2,195 | 2,510 | |||||||
| 0.847% due 03/29/49 (Ê)(ƒ) | EUR | 1,250 | 1,094 | KfW | |||||||
| Crown European Holdings SA | 1.014% due 12/29/17 (Ê) | 710 | 710 | ||||||||
| Series REGS | Norddeutsche Landesbank Girozentrale | ||||||||||
| 4.000% due 07/15/22 | EUR | 1,130 | 1,358 | Series REGS | |||||||
| Elis SA | 6.250% due 04/10/24 | 800 | 727 | ||||||||
| Series REGS | Schaeffler Verwaltung Swei GmbH | ||||||||||
| 3.000% due 04/30/22 | EUR | 2,430 | 2,721 | 3.250% due 09/15/23 (Þ) | EUR | 1,815 | 2,023 | ||||
| Groupama SA | Techem Energy Metering Service GmbH | ||||||||||
| 6.375% due 05/29/49 (ƒ) | EUR | 1,000 | 1,017 | & Co. KG | |||||||
| Holding Medi-Partenaires SAS | 7.875% due 10/01/20 (Þ) | EUR | 560 | 641 | |||||||
| 7.000% due 05/15/20 (Þ) | EUR | 970 | 1,117 | Series REGS | |||||||
| Series REGS | 7.875% due 10/01/20 | EUR | 2,120 | 2,428 | |||||||
| 7.000% due 05/15/20 | EUR | 1,910 | 2,199 | Trionista TopCo GmbH | |||||||
| HomeVi SAS | Series REGS | ||||||||||
| Series REGS | 6.875% due 04/30/21 | EUR | 3,410 | 3,942 | |||||||
| 6.875% due 08/15/21 | EUR | 2,680 | 3,136 | Unitymedia GmbH | |||||||
| Kerneos Corporate SAS | Series REGS | ||||||||||
| 5.750% due 03/01/21 (Þ) | EUR | 1,060 | 1,209 | 3.750% due 01/15/27 | EUR | 1,815 | 1,891 | ||||
| Unitymedia Hessen GmbH & Co. KG / | |||||||||||
| Series REGS | Unitymedia NRW GmbH | ||||||||||
| 5.750% due 03/01/21 | EUR | 1,505 | 1,716 | ||||||||
| Series REGS | |||||||||||
| La Mondiale SAM | 5.750% due 01/15/23 | EUR | 275 | 321 | |||||||
| 2.391% due 10/29/49 (Å)(Ê)(ƒ) | EUR | 920 | 894 | 5.625% due 04/15/23 | EUR | 240 | 280 | ||||
| Linxens France SA 2nd Lien Term Loan | 4.000% due 01/15/25 | EUR | 1,350 | 1,530 | |||||||
| 1.000% due 07/15/23 (v) | 1,840 | 1,835 | |||||||||
| 17,727 | |||||||||||
| Novafives SAS | Ghana - 0.3% | ||||||||||
| Series REGS | |||||||||||
| 4.500% due 06/30/21 | EUR | 125 | 119 | Ghana Government International Bond | |||||||
| 7.875% due 08/07/23 (Þ) | 4,000 | 3,829 | |||||||||
| Picard Groupe SAS | 8.125% due 01/18/26 (Þ) | 700 | 670 | ||||||||
| 4.250% due 08/01/19 (Ê)(Þ) | EUR | 1,550 | 1,714 | ||||||||
See accompanying notes which are an integral part of the financial statements.
338 Russell Global Opportunistic Credit Fund
Russell Investment Company
Russell Global Opportunistic Credit Fund
Schedule of Investments, continued — October 31, 2016
| Amounts in thousands (except share amounts) | Amounts in thousands (except share amounts) | ||||||||||
| Principal | Fair | Principal | Fair | ||||||||
| Amount ($) | Value | Amount ($) | Value | ||||||||
| or Shares | $ | or Shares | $ | ||||||||
| 10.750% due 10/14/30 (Þ) | 1,250 | 1,472 | Series REGS | ||||||||
| 5,971 | 5.800% due 01/15/28 | 4,750 | 3,818 | ||||||||
| Greece - 0.2% | |||||||||||
| Hellenic Republic Government Bond | Ireland - 0.9% | ||||||||||
| 4.750% due 04/17/19 (Þ) | EUR | 1,100 | 1,111 | Allied Irish Banks PLC | |||||||
| Series PSI | 4.125% due 11/26/25 | EUR | 1,400 | 1,502 | |||||||
| 3.650% due 02/24/20 | EUR | 2,800 | 2,075 | Ardagh Packaging Finance PLC / | |||||||
| Ardagh Packaging Holdings USA, | |||||||||||
| 3,186 | Inc. | ||||||||||
| Honduras - 0.2% | 6.750% due 05/15/24 (Þ) | EUR | 1,790 | 2,093 | |||||||
| Honduras Government International | |||||||||||
| Bond | Series REGS | ||||||||||
| 6.750% due 05/15/24 | EUR | 825 | 965 | ||||||||
| Series REGS | |||||||||||
| 8.750% due 12/16/20 | 2,342 | 2,653 | Bank of Ireland | ||||||||
| 10.000% due 12/19/22 | EUR | 1,250 | 1,803 | ||||||||
| 7.500% due 03/15/24 | 500 | 558 | Governor and Company of the Bank of | ||||||||
| 3,211 | Ireland | ||||||||||
| Hungary - 0.8% | 7.375% due 12/29/49 | 800 | 852 | ||||||||
| Hungary Government International Bond | Grifols Worldwide Operations, Ltd. | ||||||||||
| 5.750% due 11/22/23 | 500 | 583 | Series WI | ||||||||
| 5.375% due 03/25/24 | 650 | 747 | 5.250% due 04/01/22 | 2,995 | 3,122 | ||||||
| 7.625% due 03/29/41 | 6,500 | 9,906 | Irish Life Assurance PLC | ||||||||
| Series 25/B | 5.250% due 12/29/49 (ƒ) | EUR | 600 | 636 | |||||||
| 5.500% due 06/24/25 | HUF | 1,259,260 | 5,386 | Permanent TSB PLC | |||||||
| 16,622 | 8.625% due 12/31/49 (ƒ) | EUR | 200 | 193 | |||||||
| Indonesia - 2.7% | Vimpel Communications Via VIP | ||||||||||
| Indonesia Government International | Finance Ireland, Ltd. OJSC | ||||||||||
| Bond | Series REGS | ||||||||||
| Series REGS | 7.748% due 02/02/21 | 2,600 | 2,872 | ||||||||
| 8.500% due 10/12/35 | 3,000 | 4,438 | Vnesheconombank Via VEB Finance | ||||||||
| 7.750% due 01/17/38 | 500 | 701 | PLC | ||||||||
| Indonesia Treasury Bond | Series REGS | ||||||||||
| 6.902% due 07/09/20 | 1,500 | 1,616 | |||||||||
| Series FR56 | 6.025% due 07/05/22 | 2,500 | 2,615 | ||||||||
| 8.375% due 09/15/26 | IDR | 140,000,000 | 11,416 | ||||||||
| Series FR58 | 18,269 | ||||||||||
| 8.250% due 06/15/32 | IDR | 7,539,000 | 605 | Israel - 0.4% | |||||||
| Series FR59 | Israel Electric Corp., Ltd. | ||||||||||
| 7.000% due 05/15/27 | IDR | 11,955,000 | 893 | 6.875% due 06/21/23 (Þ) | 3,500 | 4,130 | |||||
| Series FR64 | Series 6 | ||||||||||
| 6.125% due 05/15/28 | IDR | 7,739,000 | 526 | 5.000% due 11/12/24 (Þ) | 3,000 | 3,231 | |||||
| Series FR65 | 7,361 | ||||||||||
| 6.625% due 05/15/33 | IDR | 2,495,000 | 169 | Italy - 1.2% | |||||||
| Series FR68 | Assicurazioni Generali SpA | ||||||||||
| 8.375% due 03/15/34 | IDR | 39,322,000 | 3,157 | 5.000% due 06/08/48 | EUR | 600 | 664 | ||||
| Series FR70 | Banca Monte dei Paschi di Siena SpA | ||||||||||
| 8.375% due 03/15/24 | IDR | 95,084,000 | 7,739 | 5.600% due 09/09/20 | EUR | 1,100 | 942 | ||||
| Series FR71 | Banca Popolare di Milano Scarl | ||||||||||
| 9.000% due 03/15/29 | IDR | 69,797,000 | 5,927 | 7.125% due 03/01/21 | EUR | 750 | 901 | ||||
| Series FR73 | 9.000% due 06/29/49 (ƒ) | EUR | 1,200 | 1,362 | |||||||
| 8.750% due 05/15/31 | IDR | 63,182,000 | 5,411 | Banca Popolare di Vicenza | |||||||
| Pertamina Persero PT | 5.000% due 10/25/18 | EUR | 200 | 203 | |||||||
| Series REGS | Banco Popolare SC | ||||||||||
| 6.000% due 05/03/42 | 908 | 957 | 6.000% due 11/05/20 | EUR | 700 | 809 | |||||
| 5.625% due 05/20/43 | 2,000 | 2,006 | Enel SpA | ||||||||
| 6.450% due 05/30/44 | 6,000 | 6,608 | 6.500% due 01/10/74 | EUR | 2,725 | 3,242 | |||||
| Perusahaan Listrik Negara PT | Intesa Sanpaolo SpA | ||||||||||
| Series REGS | 5.017% due 06/26/24 (Þ) | 1,300 | 1,206 | ||||||||
| 5.250% due 10/24/42 | 4,350 | 4,326 | 5.710% due 01/15/26 (Þ) | 1,600 | 1,524 | ||||||
| 54,879 | 8.047% due 06/29/49 (ƒ) | EUR | 300 | 352 | |||||||
| Iraq - 0.2% | 7.000% due 12/29/49 (ƒ) | EUR | 800 | 851 | |||||||
| Iraq International Bond | Leonardo-Finmeccanica SpA | ||||||||||
| 8.000% due 12/16/19 | GBP | 845 | 1,217 | ||||||||
See accompanying notes which are an integral part of the financial statements.
Russell Global Opportunistic Credit Fund 339
Russell Investment Company
Russell Global Opportunistic Credit Fund
Schedule of Investments, continued — October 31, 2016
| Amounts in thousands (except share amounts) | Amounts in thousands (except share amounts) | ||||||||||
| Principal | Fair | Principal | Fair | ||||||||
| Amount ($) | Value | Amount ($) | Value | ||||||||
| or Shares | $ | or Shares | $ | ||||||||
| LKQ Italia Bondco SpA | 7.250% due 05/15/22 (Þ) | EUR | 1,550 | 1,804 | |||||||
| 3.875% due 04/01/24 (Þ) | EUR | 1,160 | 1,355 | Series REGS | |||||||
| Mediobanca SpA | 7.250% due 05/15/22 | EUR | 730 | 849 | |||||||
| 5.000% due 11/15/20 | EUR | 800 | 952 | 6.250% due 02/15/25 | EUR | 550 | 623 | ||||
| Telecom Italia SpA | ArcelorMittal | ||||||||||
| 5.303% due 05/30/24 (Þ) | 5,530 | 5,620 | 6.500% due 03/01/21 | 7,570 | 8,308 | ||||||
| UniCredit SpA | 7.250% due 02/25/22 | 750 | 851 | ||||||||
| 5.500% due 07/30/23 | SGD | 300 | 201 | 8.000% due 10/15/39 | 975 | 1,048 | |||||
| 4.375% due 01/03/27 | EUR | 400 | 438 | 7.750% due 03/01/41 | 650 | 682 | |||||
| 8.000% due 04/03/49 (ƒ) | 600 | 522 | ARD Finance SA | ||||||||
| 6.750% due 12/29/49 (ƒ) | EUR | 600 | 581 | 6.625% due 09/15/23 (Þ) | EUR | 1,660 | 1,777 | ||||
| UnipolSai SpA | Auris Luxembourg II SA | ||||||||||
| 5.750% due 12/31/49 (ƒ) | EUR | 1,000 | 1,044 | 8.000% due 01/15/23 (Þ) | EUR | 710 | 845 | ||||
| 23,986 | Series REGS | ||||||||||
| Ivory Coast - 0.1% | 8.000% due 01/15/23 | EUR | 1,515 | 1,802 | |||||||
| Ivory Coast Government International | Camelot Finance SA | ||||||||||
| Bond | 7.875% due 10/15/24 (Þ) | 1,420 | 1,452 | ||||||||
| Series REGS | Capsugel SA | ||||||||||
| 5.750% due 12/31/32 | 1,485 | 1,455 | 7.000% due 05/15/19 (Þ) | 2,426 | 2,426 | ||||||
| ConvaTec Finance International SA | |||||||||||
| Japan - 0.0% | 8.250% due 01/15/19 (Þ) | 8,015 | 8,015 | ||||||||
| SoftBank Group Corp. | ConvaTec Healthcare E SA | ||||||||||
| 4.500% due 04/15/20 (Þ) | 540 | 555 | 10.500% due 12/15/18 (Þ) | 2,590 | 2,619 | ||||||
| Delta 2 Lux Sarl 2nd Lien Term Loan | |||||||||||
| Jersey - 0.0% | 7.750% due 07/29/22 (Ê) | 1,995 | 2,009 | ||||||||
| Main Capital Funding II, LP | Delta 2 Lux Sarl Covenant-Lite Term | ||||||||||
| 5.750% due 12/29/49 (ƒ) | EUR | 800 | 898 | Loan B3 | |||||||
| 4.750% due 07/30/21 (Ê) | 3,250 | 3,255 | |||||||||
| Kazakhstan - 0.7% | Dufry Finance SCA | ||||||||||
| KazMunayGas National Co. JSC | 4.500% due 07/15/22 (Þ) | EUR | 350 | 404 | |||||||
| 6.375% due 04/09/21 (Þ) | 4,000 | 4,396 | 4.500% due 08/01/23 (Þ) | EUR | 870 | 1,020 | |||||
| 6.000% due 11/07/44 (Þ) | 3,000 | 2,685 | Evergreen Skills Lux Sarl | ||||||||
| Series REGS | 5.750% due 04/28/21 (Ê) | 2,190 | 1,947 | ||||||||
| 7.000% due 05/05/20 | 4,145 | 4,596 | 9.250% due 04/28/22 (Ê) | 3,850 | 2,580 | ||||||
| 5.750% due 04/30/43 | 2,000 | 2,005 | FAGE International SA/ FAGE USA | ||||||||
| 6.000% due 11/07/44 | 1,000 | 895 | Dairy Industry, Inc. | ||||||||
| 5.625% due 08/15/26 (Þ) | 1,180 | 1,218 | |||||||||
| 14,577 | |||||||||||
| Kenya - 0.2% | Gazprom OAO Via Gaz Capital SA | ||||||||||
| 9.250% due 04/23/19 (Þ) | 1,000 | 1,141 | |||||||||
| Kenya Government International Bond | |||||||||||
| 5.875% due 06/24/19 (Þ) | 2,000 | 2,069 | Series REGS | ||||||||
| 9.250% due 04/23/19 | 1,250 | 1,426 | |||||||||
| Series REGS | 6.510% due 03/07/22 | 2,000 | 2,192 | ||||||||
| 6.875% due 06/24/24 | 1,000 | 998 | 8.625% due 04/28/34 | 2,000 | 2,568 | ||||||
| 3,067 | 7.288% due 08/16/37 | 1,000 | 1,138 | ||||||||
| Lebanon - 0.2% | Hanesbrands Finance Luxembourg SCA | ||||||||||
| Lebanon Government International Bond | 3.500% due 06/15/24 (Þ) | EUR | 1,910 | 2,197 | |||||||
| Series REGS | Intelsat Jackson Holdings SA | ||||||||||
| 8.250% due 04/12/21 | 3,000 | 3,210 | 7.250% due 10/15/20 | 255 | 193 | ||||||
| 7.500% due 04/01/21 | 1,105 | 812 | |||||||||
| Luxembourg - 4.2% | 8.000% due 02/15/24 (Þ) | 305 | 307 | ||||||||
| Accudyne Industries Borrower / | International Automotive Components | ||||||||||
| Accudyne Industries LLC | Group SA | ||||||||||
| 7.750% due 12/15/20 (Þ) | 1,530 | 1,216 | 9.125% due 06/01/18 (Å) | 804 | 762 | ||||||
| Altice Financing SA | Mallinckrodt International Finance SA | ||||||||||
| 7.500% due 05/15/26 (Þ) | 285 | 294 | 5.750% due 08/01/22 (Þ) | 1,515 | 1,435 | ||||||
| Series REGS | 5.625% due 10/15/23 (Å) | 82 | 77 | ||||||||
| 5.250% due 02/15/23 (Þ) | EUR | 970 | 1,111 | Matterhorn Telecom SA | |||||||
| 5.250% due 02/15/23 | EUR | 250 | 286 | 3.625% due 05/01/22 (Þ) | CHF | 240 | 242 | ||||
| Altice Finco SA | 3.875% due 05/01/22 (Þ) | EUR | 1,215 | 1,339 | |||||||
| 7.625% due 02/15/25 (Þ) | 1,720 | 1,703 | Series REGS | ||||||||
| Altice Luxembourg SA | 3.875% due 05/01/22 | EUR | 1,050 | 1,157 | |||||||
See accompanying notes which are an integral part of the financial statements.
340 Russell Global Opportunistic Credit Fund
Russell Investment Company
Russell Global Opportunistic Credit Fund
Schedule of Investments, continued — October 31, 2016
| Amounts in thousands (except share amounts) | Amounts in thousands (except share amounts) | ||||||||||
| Principal | Fair | Principal | Fair | ||||||||
| Amount ($) | Value | Amount ($) | Value | ||||||||
| or Shares | $ | or Shares | $ | ||||||||
| SIG Combibloc Holdings SCA | 7.500% due 06/03/27 | MXN | 53,096 | 3,051 | |||||||
| 7.750% due 02/15/23 (Þ) | EUR | 1,845 | 2,139 | Series M 30 | |||||||
| Stena International SA Covenant-Lite | 10.000% due 11/20/36 | MXN | 61,705 | 4,429 | |||||||
| Term Loan B | Series M | ||||||||||
| 4.000% due 03/03/21 (Ê) | 1,463 | 1,240 | 5.000% due 12/11/19 | MXN | 127,536 | 6,603 | |||||
| Telecom Italia Capital SA | 5.750% due 03/05/26 | MXN | 32,510 | 1,659 | |||||||
| 6.999% due 06/04/18 | 1,419 | 1,527 | 7.750% due 05/29/31 | MXN | 43,944 | 2,568 | |||||
| 6.375% due 11/15/33 | 810 | 830 | 7.750% due 11/13/42 | MXN | 49,020 | 2,904 | |||||
| 7.200% due 07/18/36 | 780 | 842 | Mexican Udibonos | ||||||||
| 7.721% due 06/04/38 | 810 | 893 | Series S | ||||||||
| Telenet Finance VI Luxembourg SCA | 4.000% due 06/13/19 | MXN | 18,310 | 1,010 | |||||||
| Series REGS | 4.000% due 11/15/40 | MXN | 10,636 | 615 | |||||||
| 4.875% due 07/15/27 | EUR | 1,685 | 1,929 | ||||||||
| Travelport Finance Luxembourg Sarl | Mexico Government International Bond | ||||||||||
| 5.550% due 01/21/45 | 1,500 | 1,680 | |||||||||
| Term Loan B | 5.750% due 10/12/10 | 9,000 | 9,203 | ||||||||
| 5.000% due 09/02/21 (Ê) | 1,442 | 1,450 | |||||||||
| UniCredit International Bank | Petroleos Mexicanos | ||||||||||
| Luxembourg SA | 3.500% due 01/30/23 | 1,500 | 1,417 | ||||||||
| 8.125% due 12/29/49 (ƒ) | EUR | 1,650 | 2,011 | 6.625% due 06/15/38 | 4,000 | 3,970 | |||||
| Wind Acquisition Finance SA | 6.500% due 06/02/41 | 5,650 | 5,492 | ||||||||
| 7.000% due 04/23/21 (Þ) | EUR | 235 | 269 | 5.500% due 06/27/44 | 3,000 | 2,584 | |||||
| 7.375% due 04/23/21 (Þ) | 5,060 | 5,199 | 5.625% due 01/23/46 | 1,000 | 865 | ||||||
| Series REGS | 6.750% due 09/21/47 (Þ) | 600 | 595 | ||||||||
| 7.000% due 04/23/21 | EUR | 205 | 234 | Series 14-2 | |||||||
| Xefin Lux SCA | 7.470% due 11/12/26 | MXN | 5,330 | 249 | |||||||
| Series REGS | 56,703 | ||||||||||
| 3.750% due 06/01/19 (Ê) | EUR | 195 | 215 | Mongolia - 0.4% | |||||||
| 85,908 | Mongolia Government International | ||||||||||
| Malaysia - 1.0% | Bond | ||||||||||
| 10.875% due 04/06/21 (Þ) | 2,850 | 3,078 | |||||||||
| Malaysia Government Bond | 5.125% due 12/05/22 (Þ) | 300 | 265 | ||||||||
| Series 0416 | |||||||||||
| 3.620% due 11/30/21 | MYR | 4,470 | 1,081 | Series REGS | |||||||
| 5.125% due 12/05/22 | 4,805 | 4,241 | |||||||||
| Malaysia Government International Bond | |||||||||||
| Series 0111 | 7,584 | ||||||||||
| 4.160% due 07/15/21 | MYR | 15,810 | 3,902 | Morocco - 0.1% | |||||||
| Series 0114 | Morocco Government International Bond | ||||||||||
| 4.181% due 07/15/24 | MYR | 3,380 | 831 | 5.500% due 12/11/42 (Þ) | 1,250 | 1,406 | |||||
| Series 0115 | |||||||||||
| 3.955% due 09/15/25 | MYR | 10,350 | 2,504 | Mozambique - 0.0% | |||||||
| Mozambique International Bond | |||||||||||
| Series 0215 | 10.500% due 01/18/23 (Þ) | 1,033 | 584 | ||||||||
| 3.795% due 09/30/22 | MYR | 3,500 | 847 | ||||||||
| Series 0310 | Netherlands - 2.6% | ||||||||||
| 4.498% due 04/15/30 | MYR | 8,315 | 2,053 | ||||||||
| ABN AMRO Bank NV | |||||||||||
| Series 0311 | 5.750% due 12/29/49 (ƒ) | EUR | 600 | 670 | |||||||
| 4.392% due 04/15/26 | MYR | 2,900 | 723 | ||||||||
| Achmea BV | |||||||||||
| Series 0314 | 6.000% due 11/29/49 (ƒ) | EUR | 1,000 | 1,134 | |||||||
| 4.048% due 09/30/21 | MYR | 12,419 | 3,044 | ||||||||
| Alcoa Nederland Holding BV | |||||||||||
| Series 0414 | 6.750% due 09/30/24 (Þ) | 2,015 | 2,086 | ||||||||
| 3.654% due 10/31/19 | MYR | 14,740 | 3,560 | 7.000% due 09/30/26 (Þ) | 380 | 391 | |||||
| Series 0415 | AP NMT Acquisition BV 1st Lien Term | ||||||||||
| 4.254% due 05/31/35 | MYR | 8,910 | 2,106 | Loan | |||||||
| 20,651 | 6.750% due 08/13/21 (Ê) | 980 | 895 | ||||||||
| Mexico - 2.8% | Atradius Finance BV | ||||||||||
| America Movil SAB de CV | 5.250% due 09/23/44 | EUR | 500 | 494 | |||||||
| 6.000% due 06/09/19 | MXN | 5,210 | 273 | Carlson Wagonlit BV | |||||||
| Mexican Bonos | Series REGS | ||||||||||
| Series M 10 | 7.500% due 06/15/19 | EUR | 1,765 | 2,012 | |||||||
| 8.500% due 12/13/18 | MXN | 35,000 | 1,961 | Darling Global Finance BV | |||||||
| Series M 20 | 4.750% due 05/30/22 (Þ) | EUR | 2,310 | 2,656 | |||||||
| 10.000% due 12/05/24 | MXN | 84,735 | 5,575 | Delta Lloyd NV | |||||||
See accompanying notes which are an integral part of the financial statements.
Russell Global Opportunistic Credit Fund 341
Russell Investment Company
Russell Global Opportunistic Credit Fund
Schedule of Investments, continued — October 31, 2016
| Amounts in thousands (except share amounts) | Amounts in thousands (except share amounts) | ||||||||||
| Principal | Fair | Principal | Fair | ||||||||
| Amount ($) | Value | Amount ($) | Value | ||||||||
| or Shares | $ | or Shares | $ | ||||||||
| 4.375% due 06/29/49 (ƒ) | EUR | 1,000 | 1,007 | 4.250% due 01/15/27 (Þ) | EUR | 500 | 546 | ||||
| Goodyear Dunlop Tires Europe BV | 52,150 | ||||||||||
| 3.750% due 12/15/23 (Þ) | EUR | 820 | 945 | Nigeria - 0.0% | |||||||
| Series REGS | Nigeria Government International Bond | ||||||||||
| 3.750% due 12/15/23 | EUR | 700 | 807 | Series REGS | |||||||
| ING Groep NV | 6.750% due 01/28/21 | 1,000 | 994 | ||||||||
| 6.500% due 12/29/49 (ƒ) | 600 | 593 | |||||||||
| InterXion Holding NV | Norway - 0.0% | ||||||||||
| Series REGS | Storebrand Livsforsikring Group | ||||||||||
| 6.000% due 07/15/20 | EUR | 2,490 | 2,856 | 6.875% due 04/04/43 | EUR | 400 | 504 | ||||
| LGE HoldCo VI BV | |||||||||||
| Series REGS | Pakistan - 0.6% | ||||||||||
| 7.125% due 05/15/24 | EUR | 100 | 124 | Pakistan Government International Bond | |||||||
| Lincoln Finance, Ltd. | 8.250% due 04/15/24 (Þ) | 4,750 | 5,351 | ||||||||
| 6.875% due 04/15/21 (Þ) | EUR | 620 | 739 | Series REGS | |||||||
| Majapahit Holding BV | 7.875% due 03/31/36 | 6,000 | 6,080 | ||||||||
| Series REGS | 11,431 | ||||||||||
| 7.875% due 06/29/37 | 1,500 | 1,939 | Panama - 0.4% | ||||||||
| Marfrig Holdings Europe BV | Panama Government International Bond | ||||||||||
| Series REGS | 9.375% due 04/01/29 | 4,500 | 6,846 | ||||||||
| 6.875% due 06/24/19 | 2,000 | 2,065 | 6.700% due 01/26/36 | 1,500 | 1,993 | ||||||
| NIBC Bank NV | 8,839 | ||||||||||
| 7.625% due 10/29/49 (ƒ) | 1,000 | 1,012 | Paraguay - 0.2% | ||||||||
| Petrobras Global Finance BV | Paraguay Government International | ||||||||||
| 4.375% due 05/20/23 | 2,900 | 2,628 | Bond | ||||||||
| 6.250% due 12/14/26 | GBP | 1,000 | 1,163 | 6.100% due 08/11/44 (Þ) | 3,551 | 3,924 | |||||
| 5.375% due 10/01/29 | GBP | 1,000 | 1,048 | ||||||||
| 6.625% due 01/16/34 | GBP | 500 | 553 | Peru - 0.7% | |||||||
| 6.875% due 01/20/40 | 6,728 | 6,022 | Peruvian Government International Bond | ||||||||
| 6.850% due 06/05/15 | 5,600 | 4,760 | 6.350% due 08/12/28 (Þ) | PEN | 9,866 | 3,019 | |||||
| Playa Resorts Holding BV 1st Lien Term | 8.750% due 11/21/33 | 3,000 | 4,733 | ||||||||
| Loan B | Series REGS | ||||||||||
| 4.000% due 08/09/19 (Ê) | 1,977 | 1,972 | 6.950% due 08/12/31 | PEN | 9,900 | 3,199 | |||||
| PortAventura Entertainment Barcelona | 6.900% due 08/12/37 | PEN | 11,610 | 3,719 | |||||||
| BV | |||||||||||
| 5.326% due 12/01/19 (Ê)(Þ) | EUR | 370 | 407 | 14,670 | |||||||
| 7.250% due 12/01/20 (Þ) | EUR | 330 | 376 | Philippines - 0.2% | |||||||
| Philippine Government International | |||||||||||
| Series REGS | Bond | ||||||||||
| 7.250% due 12/01/20 | EUR | 1,060 | 1,209 | 4.950% due 01/15/21 | PHP | 42,000 | 891 | ||||
| Republic of Angola Via Northern Lights | |||||||||||
| III BV | 9.500% due 02/02/30 | 1,200 | 2,006 | ||||||||
| Series REGS | 6.250% due 01/14/36 | PHP | 20,000 | 476 | |||||||
| 7.000% due 08/16/19 | 563 | 562 | 3,373 | ||||||||
| SNS Bank NV | Poland - 1.2% | ||||||||||
| 3.750% due 11/05/25 | EUR | 1,000 | 1,122 | Poland Government International Bond | |||||||
| SRLEV NV | 3.000% due 03/17/23 | 2,000 | 2,058 | ||||||||
| 9.000% due 04/15/41 | EUR | 1,000 | 1,205 | 4.000% due 01/22/24 | 650 | 709 | |||||
| Telefonica Europe BV | Series 0718 | ||||||||||
| 6.500% due 12/31/49 (ƒ) | EUR | 1,500 | 1,755 | 2.500% due 07/25/18 | PLN | 1,860 | 481 | ||||
| UPC Holding BV | Series 0725 | ||||||||||
| Series REGS | 3.250% due 07/25/25 | PLN | 32,800 | 8,500 | |||||||
| 6.750% due 03/15/23 | EUR | 1,285 | 1,527 | Series 0922 | |||||||
| VimpelCom Holdings BV | 5.750% due 09/23/22 | PLN | 26,255 | 7,779 | |||||||
| 7.504% due 03/01/22 (Þ) | 299 | 330 | Series 1020 | ||||||||
| Ziggo Bond Finance BV | 5.250% due 10/25/20 | PLN | 17,910 | 5,073 | |||||||
| 4.625% due 01/15/25 (Þ) | EUR | 1,580 | 1,756 | 24,600 | |||||||
| Series REGS | Portugal - 0.0% | ||||||||||
| 4.625% due 01/15/25 | EUR | 705 | 784 | Novo Banco SA | |||||||
| Ziggo Secured Finance BV | 7.630% due 02/27/51 (~) | EUR | 1,500 | 132 | |||||||
See accompanying notes which are an integral part of the financial statements.
342 Russell Global Opportunistic Credit Fund
Russell Investment Company
Russell Global Opportunistic Credit Fund
Schedule of Investments, continued — October 31, 2016
| Amounts in thousands (except share amounts) | Amounts in thousands (except share amounts) | ||||||||||
| Principal | Fair | Principal | Fair | ||||||||
| Amount ($) | Value | Amount ($) | Value | ||||||||
| or Shares | $ | or Shares | $ | ||||||||
| Romania - 0.3% | Series 2048 | ||||||||||
| Romania Government International Bond | 8.750% due 02/28/48 | ZAR | 13,300 | 920 | |||||||
| Series 10YR | Series R186 | ||||||||||
| 5.950% due 06/11/21 | RON | 4,690 | 1,326 | 10.500% due 12/21/26 | ZAR | 130,290 | 10,702 | ||||
| Series 10Y | Transnet SOC, Ltd. | ||||||||||
| 4.750% due 02/24/25 | RON | 9,835 | 2,685 | 9.500% due 05/13/21 (Þ) | ZAR | 7,700 | 536 | ||||
| Series 5Y | 43,955 | ||||||||||
| 3.250% due 03/22/21 | RON | 7,580 | 1,925 | Spain - 0.4% | |||||||
| Series REGS | Banco Bilbao Vizcaya Argentaria SA | ||||||||||
| 6.750% due 02/07/22 | 1,000 | 1,188 | 8.875% due 12/29/49 (ƒ) | EUR | 600 | 710 | |||||
| 7,124 | Banco de Credito Social Cooperativo SA | ||||||||||
| Russia - 0.7% | (0.075)% due 11/03/26 (~) | EUR | 800 | 885 | |||||||
| Russian Federal Bond - OFZ | Banco de Sabadell SA | ||||||||||
| Series 6208 | Series EMTN | ||||||||||
| 7.500% due 02/27/19 | RUB | 64,420 | 994 | 5.625% due 05/06/26 | EUR | 800 | 931 | ||||
| Series 6211 | Banco Popular Espanol SA | ||||||||||
| 7.000% due 01/25/23 | RUB | 127,368 | 1,861 | 3.299% due 12/22/19 (Ê) | EUR | 1,200 | 1,267 | ||||
| Series 6212 | Banco Santander SA | ||||||||||
| 7.050% due 01/19/28 | RUB | 261,450 | 3,722 | 6.250% due 03/12/49 (ƒ) | EUR | 800 | 816 | ||||
| Series 6214 | Bankia SA | ||||||||||
| 6.400% due 05/27/20 | RUB | 319,230 | 4,690 | 4.000% due 05/22/24 | EUR | 800 | 881 | ||||
| Series 6215 | BBVA International Preferred SAU | ||||||||||
| 7.000% due 08/16/23 | RUB | 108,682 | 1,583 | 5.919% due 04/29/49 (ƒ) | 800 | 802 | |||||
| Russian Federal Inflation Linked Bond | Ibercaja Banco SA | ||||||||||
| Series 2001 | 5.000% due 07/28/25 | EUR | 700 | 718 | |||||||
| 2.500% due 08/16/23 | RUB | 55,534 | 858 | Popular Capital SA | |||||||
| Russian Federation International Bond | 6.000% due 10/29/49 (ƒ) | EUR | 700 | 684 | |||||||
| Series REGS | Santander Perpetual SAU | ||||||||||
| 7.500% due 03/31/30 | 803 | 970 | Series REGS | ||||||||
| 14,678 | 6.671% due 10/29/49 (Å)(ƒ) | 170 | 156 | ||||||||
| Serbia - 0.4% | 7,850 | ||||||||||
| Serbia Government International Bond | Sri Lanka - 0.5% | ||||||||||
| Series REGS | Sri Lanka Government International | ||||||||||
| 5.875% due 12/03/18 | 1,400 | 1,482 | Bond | ||||||||
| 7.250% due 09/28/21 | 5,000 | 5,743 | Series REGS | ||||||||
| 5.875% due 07/25/22 | 9,600 | 9,781 | |||||||||
| 7,225 | |||||||||||
| Singapore - 0.0% | |||||||||||
| Avago Technologies Finance, Ltd. Term | Sweden - 0.0% | ||||||||||
| Loan B3 | Skandinaviska Enskilda Banken AB | ||||||||||
| 3.535% due 02/01/23 (Ê) | 779 | 786 | 5.750% due 11/29/49 (ƒ) | 600 | 602 | ||||||
| Slovenia - 0.1% | Switzerland - 0.1% | ||||||||||
| Slovenia Government International Bond | Credit Suisse Group AG | ||||||||||
| 5.250% due 02/18/24 (Þ) | 1,500 | 1,745 | Series REGS | ||||||||
| Series REGS | 6.250% due 12/29/49 (ƒ) | 800 | 772 | ||||||||
| 5.850% due 05/10/23 | 500 | 593 | UBS Group AG | ||||||||
| 2,338 | 7.125% due 12/29/49 (ƒ) | 600 | 614 | ||||||||
| South Africa - 2.2% | 1,386 | ||||||||||
| Eskom Holdings SOC, Ltd. | Thailand - 0.8% | ||||||||||
| Series REGS | PTT Exploration & Production PCL | ||||||||||
| 5.750% due 01/26/21 | 5,800 | 5,829 | 4.875% due 12/29/49 (ƒ)(Þ) | 1,000 | 1,011 | ||||||
| 6.750% due 08/06/23 | 1,000 | 1,032 | Thailand Government International Bond | ||||||||
| 7.125% due 02/11/25 | 6,100 | 6,311 | 3.875% due 06/13/19 | THB | 41,710 | 1,258 | |||||
| Republic of South Africa Government | 3.650% due 12/17/21 | THB | 255,370 | 7,929 | |||||||
| Bond | 3.850% due 12/12/25 | THB | 157,270 | 5,117 | |||||||
| Series 2023 | 3.580% due 12/17/27 | THB | 30,830 | 990 | |||||||
| 7.750% due 02/28/23 | ZAR | 100,360 | 7,212 | 4.875% due 06/22/29 | THB | 16,100 | 585 | ||||
| Series 2032 | 16,890 | ||||||||||
| 8.250% due 03/31/32 | ZAR | 167,210 | 11,413 | Turkey - 2.0% | |||||||
See accompanying notes which are an integral part of the financial statements.
Russell Global Opportunistic Credit Fund 343
Russell Investment Company
Russell Global Opportunistic Credit Fund
Schedule of Investments, continued — October 31, 2016
| Amounts in thousands (except share amounts) | Amounts in thousands (except share amounts) | ||||||||||
| Principal | Fair | Principal | Fair | ||||||||
| Amount ($) | Value | Amount ($) | Value | ||||||||
| or Shares | $ | or Shares | $ | ||||||||
| Export Credit Bank of Turkey | HBOS Capital Funding, LP | ||||||||||
| 5.875% due 04/24/19 (Þ) | 7,500 | 7,791 | 6.850% due 03/29/49 (ƒ) | 1,100 | 1,111 | ||||||
| Turkey Government International Bond | Hyperion Insurance Group, Ltd. Term | ||||||||||
| 10.400% due 03/27/19 | TRY | 9,130 | 3,030 | Loan B | |||||||
| 7.500% due 11/07/19 | 1,000 | 1,110 | 5.500% due 04/30/22 (Ê) | 739 | 726 | ||||||
| 7.000% due 06/05/20 | 2,000 | 2,198 | Iceland Bondco PLC | ||||||||
| 10.700% due 02/17/21 | TRY | 13,110 | 4,398 | Series REGS | |||||||
| 7.100% due 03/08/23 | TRY | 16,680 | 4,720 | 6.250% due 07/15/21 | GBP | 1,255 | 1,475 | ||||
| 7.375% due 02/05/25 | 1,200 | 1,406 | Ineos Finance PLC | ||||||||
| 8.000% due 03/12/25 | TRY | 28,790 | 8,355 | 4.000% due 05/01/23 (Þ) | EUR | 2,130 | 2,383 | ||||
| 6.750% due 05/30/40 | 1,000 | 1,128 | Inmarsat Finance PLC | ||||||||
| 6.625% due 02/17/45 | 4,000 | 4,484 | 6.500% due 10/01/24 (Þ) | 1,730 | 1,752 | ||||||
| Series 5Y | Inovyn Finance PLC | ||||||||||
| 6.300% due 02/14/18 | TRY | 3,770 | 1,180 | 6.250% due 05/15/21 (Þ) | EUR | 895 | 1,028 | ||||
| 39,800 | Intermediate Capital Group PLC | ||||||||||
| Ukraine - 0.5% | 5.000% due 03/24/23 | GBP | 685 | 857 | |||||||
| Ukraine Government International Bond | International Personal Finance PLC | ||||||||||
| 7.750% due 09/01/22 (Þ) | 783 | 765 | 5.750% due 04/07/21 | EUR | 600 | 599 | |||||
| 7.750% due 09/01/23 (Þ) | 3,069 | 2,977 | Iron Mountain Europe PLC | ||||||||
| 7.750% due 09/01/24 (Þ) | 2,960 | 2,850 | 6.125% due 09/15/22 (Þ) | GBP | 1,015 | 1,289 | |||||
| 7.750% due 09/01/25 (Þ) | 1,160 | 1,110 | Series REGS | ||||||||
| Series GDP | 6.125% due 09/15/22 | GBP | 1,400 | 1,778 | |||||||
| 5.002% due 05/31/40 (Þ)(~) | 6,195 | 1,958 | Liverpool Victoria Friendly Society, Ltd. | ||||||||
| 6.500% due 05/22/43 | GBP | 500 | 588 | ||||||||
| 9,660 | |||||||||||
| United Kingdom - 4.6% | Lloyds Bank PLC | ||||||||||
| 4.385% due 05/29/49 (ƒ) | EUR | 600 | 710 | ||||||||
| AA Bond Co., Ltd. | |||||||||||
| 5.500% due 07/31/22 (Þ) | GBP | 1,795 | 2,186 | Series EMTN | |||||||
| 13.000% due 01/29/49 (ƒ) | GBP | 400 | 860 | ||||||||
| Aberdeen Asset Management PLC | |||||||||||
| 7.000% due 03/29/49 (ƒ) | 600 | 620 | Lloyds Banking Group PLC | ||||||||
| 6.413% due 01/29/49 (ƒ)(Þ) | 400 | 442 | |||||||||
| Anglo American Capital PLC | 7.625% due 12/29/49 (ƒ) | GBP | 600 | 764 | |||||||
| 1.750% due 04/03/18 | EUR | 825 | 917 | ||||||||
| 1.500% due 04/01/20 | EUR | 100 | 110 | Series REGS | |||||||
| 3.625% due 05/14/20 (Þ) | 1,950 | 1,960 | 6.657% due 01/29/49 (ƒ) | 250 | 278 | ||||||
| 3.500% due 03/28/22 | EUR | 825 | 960 | Merlin Entertainments PLC | |||||||
| 3.250% due 04/03/23 | EUR | 100 | 114 | 2.750% due 03/15/22 (Þ) | EUR | 680 | 778 | ||||
| Arqiva Broadcast Finance PLC | Series REGS | ||||||||||
| 9.500% due 03/31/20 (Þ) | GBP | 1,270 | 1,675 | 2.750% due 03/15/22 | EUR | 1,780 | 2,037 | ||||
| Series REGS | Moto Finance PLC | ||||||||||
| 9.500% due 03/31/20 | GBP | 925 | 1,220 | 6.375% due 09/01/20 (Þ) | GBP | 1,350 | 1,719 | ||||
| Barclays Bank PLC | Noble Holding International, Ltd. | ||||||||||
| 6.278% due (ƒ) | 385 | 418 | 4.900% due 08/01/20 | 1,300 | 1,153 | ||||||
| 5.330% due 03/29/49 (ƒ) | GBP | 100 | 111 | 8.200% due 04/01/45 | 775 | 522 | |||||
| 6.000% due 06/29/49 (ƒ) | GBP | 400 | 485 | Old Mutual PLC | |||||||
| 6.278% due 12/29/49 (ƒ) | 800 | 876 | 7.875% due 11/03/25 | GBP | 600 | 825 | |||||
| Barclays PLC | Oschadbank Via SSB #1 PLC | ||||||||||
| 8.000% due 12/15/49 (ƒ) | EUR | 600 | 674 | 9.375% due 03/10/23 (Þ) | 6,593 | 6,412 | |||||
| 7.875% due 12/31/49 (ƒ) | 200 | 199 | 7.869% due 01/19/24 (Å)(Ê) | 2,800 | 2,213 | ||||||
| Boparan Finance PLC | 9.625% due 03/20/25 (Þ) | 2,400 | 2,310 | ||||||||
| Series REGS | Pension Insurance Corp. PLC | ||||||||||
| 4.375% due 07/15/21 | EUR | 320 | 325 | 6.500% due 07/03/24 | GBP | 300 | 353 | ||||
| Privatbank CJSC Via UK SPV Credit | |||||||||||
| 5.500% due 07/15/21 | GBP | 815 | 910 | Finance PLC | |||||||
| Coventry Building Society | 10.250% due 01/23/18 | 1,400 | 1,176 | ||||||||
| 6.375% due 12/29/49 (ƒ) | GBP | 500 | 581 | 11.000% due 02/09/21 | 4,777 | 3,006 | |||||
| CPUK Finance, Ltd. | Royal Bank of Scotland Group PLC | ||||||||||
| 7.000% due 08/28/20 (Þ) | GBP | 1,710 | 2,210 | 6.666% due 04/29/49 (ƒ) | CAD | 600 | 470 | ||||
| CYBG PLC | 7.648% due 09/30/49 (ƒ) | 1,450 | 1,715 | ||||||||
| 5.000% due 02/09/26 | GBP | 400 | 462 | 5.500% due 11/29/49 (ƒ) | EUR | 800 | 843 | ||||
| Ensco PLC | Series REGS | ||||||||||
| 4.700% due 03/15/21 | 1,460 | 1,348 | 6.990% due 10/29/49 (ƒ) | 1,000 | 1,118 | ||||||
See accompanying notes which are an integral part of the financial statements.
344 Russell Global Opportunistic Credit Fund
Russell Investment Company
Russell Global Opportunistic Credit Fund
Schedule of Investments, continued — October 31, 2016
| Amounts in thousands (except share amounts) | Amounts in thousands (except share amounts) | ||||||||||
| Principal | Fair | Principal | Fair | ||||||||
| Amount ($) | Value | Amount ($) | Value | ||||||||
| or Shares | $ | or Shares | $ | ||||||||
| Series U | Series WI | ||||||||||
| 7.640% due 03/29/49 (ƒ) | 810 | 786 | 5.625% due 02/15/23 | 1,845 | 1,847 | ||||||
| Skipton Building Society | Accuvant, Inc. 2nd Lien Term Loan B | ||||||||||
| 6.875% due 04/29/49 (Å)(ƒ) | GBP | 262 | 301 | 10.000% due 01/28/23 (Ê) | 4,270 | 4,234 | |||||
| Standard Chartered PLC | Active Network, Inc. (The) 1st Lien Term | ||||||||||
| 7.014% due 12/30/49 (ƒ)(Þ) | 715 | 787 | Loan | ||||||||
| Synlab Bondco PLC | 5.500% due 11/15/20 (Ê) | 1,221 | 1,212 | ||||||||
| 6.250% due 07/01/22 (Þ) | EUR | 1,050 | 1,245 | ADT Corp. (The) | |||||||
| 3.500% due 07/15/22 | 810 | 767 | |||||||||
| Synlab Unsecured Bondco PLC | 4.125% due 06/15/23 | 745 | 728 | ||||||||
| 8.250% due 07/01/23 (Þ) | EUR | 460 | 544 | ||||||||
| TA MFG., Ltd. | AECOM | ||||||||||
| 3.625% due 04/15/23 (Þ) | EUR | 1,665 | 1,799 | Series WI | |||||||
| Tesco Corporate Treasury Services PLC | 5.750% due 10/15/22 | 1,325 | 1,391 | ||||||||
| 2.500% due 07/01/24 | EUR | 855 | 958 | AES Corp. | |||||||
| 6.000% due 05/15/26 | 1,485 | 1,530 | |||||||||
| Tesco PLC | Albertsons Cos. LLC / Safeway, Inc. / | ||||||||||
| 5.000% due 03/24/23 | GBP | 375 | 491 | New Albertson's Inc / Albertson's | |||||||
| 6.150% due 11/15/37 (Þ) | 975 | 972 | LLC | ||||||||
| Transocean, Inc. | 6.625% due 06/15/24 (Þ) | 1,170 | 1,214 | ||||||||
| 6.000% due 03/15/18 | 1,560 | 1,565 | 5.750% due 03/15/25 (Þ) | 1,635 | 1,614 | ||||||
| 6.500% due 11/15/20 | 1,105 | 1,069 | Albertsons LLC Term Loan B4 | ||||||||
| 6.800% due 03/15/38 | 1,040 | 684 | 4.500% due 08/22/21 (Ê) | 2,521 | 2,539 | ||||||
| TSB Banking Group PLC | Alcatel-Lucent USA, Inc. | ||||||||||
| 5.750% due 05/06/26 | GBP | 500 | 634 | 6.450% due 03/15/29 | 1,300 | 1,433 | |||||
| Tullow Oil PLC | Allegheny Technologies, Inc. | ||||||||||
| 6.000% due 11/01/20 (Þ) | 1,400 | 1,302 | 5.950% due 01/15/21 | 875 | 809 | ||||||
| Ukreximbank Via Biz Finance PLC | Alliant Holdings Intermediate LLC | ||||||||||
| 8.161% due 02/09/23 (Ê)(Þ) | 6,067 | 4,976 | 8.250% due 08/01/23 (Å) | 5,600 | 5,698 | ||||||
| 9.750% due 01/22/25 (Þ) | 2,369 | 2,280 | Alliant Holdings Intermediate LLC 1st | ||||||||
| Series REGS | Lien Term Loan B2 | ||||||||||
| 9.750% due 01/22/25 | 600 | 578 | 5.253% due 08/14/22 (Ê) | 374 | 376 | ||||||
| Virgin Media Finance PLC | Ally Financial, Inc. | ||||||||||
| 4.875% due 02/15/22 | 1,000 | 860 | 8.000% due 11/01/31 | 910 | 1,087 | ||||||
| 7.000% due 04/15/23 (Þ) | GBP | 1,200 | 1,552 | Alvogen Pharmaceutical US, Inc. Term | |||||||
| Series REGS | Loan | ||||||||||
| 7.000% due 04/15/23 | GBP | 1,740 | 2,251 | 6.000% due 04/02/22 (Ê) | 532 | 532 | |||||
| Virgin Media Investment Holdings, Ltd. | American Airlines, Inc. | ||||||||||
| Term Loan F | 3.500% due 04/28/23 (Ê) | 500 | 500 | ||||||||
| 3.649% due 06/30/23 (Ê) | 842 | 845 | American Airlines, Inc. Term Loan | ||||||||
| Virgin Media Secured Finance PLC | 3.250% due 05/21/20 (Ê) | 1,975 | 1,976 | ||||||||
| Series REGS | American Builders & Contractors Supply | ||||||||||
| 6.000% due 04/15/21 | GBP | 252 | 322 | Co., Inc. | |||||||
| 5.625% due 04/15/21 (Þ) | 1,820 | 1,879 | |||||||||
| Vue International Bidco PLC | American Express Credit Account | ||||||||||
| 7.875% due 07/15/20 (Þ) | GBP | 160 | 203 | Master Trust | |||||||
| Series REGS | Series 2008-2 Class A | ||||||||||
| 7.875% due 07/15/20 | GBP | 2,050 | 2,607 | 1.457% due 09/15/20 (Ê) | 2,205 | 2,236 | |||||
| Worldpay Finance PLC | American Tire Distributors, Inc. | ||||||||||
| 3.750% due 11/15/22 (Þ) | EUR | 2,100 | 2,484 | 10.250% due 03/01/22 (Þ) | 6,780 | 6,233 | |||||
| 93,746 | AmeriGas Finance LLC / AmeriGas | ||||||||||
| United States - 34.1% | Finance Corp. | ||||||||||
| 99 Cents Only Stores LLC | 7.000% due 05/20/22 | 1,315 | 1,384 | ||||||||
| 11.000% due 12/15/19 | 300 | 177 | AmeriGas Partners, LP / AmeriGas | ||||||||
| 99 Cents Only Stores LLC Covenant-Lite | Finance Corp. | ||||||||||
| Term Loan B2 | 5.625% due 05/20/24 | 1,535 | 1,608 | ||||||||
| 4.500% due 01/13/19 (Ê) | 1,425 | 1,107 | Amsurg Corp. | ||||||||
| ABG Intermediate Holdings 2, LLC 1st | Series WI | ||||||||||
| Lien Term Loan | 5.625% due 07/15/22 | 1,520 | 1,550 | ||||||||
| 5.500% due 05/27/21 (Ê) | 1,255 | 1,252 | Ancestry.com, Inc. 1st Lien Term Loan | ||||||||
| ABG Intermediate Holdings 2, LLC 2nd | 5.250% due 10/13/23 | 818 | 819 | ||||||||
| Lien Term Loan | |||||||||||
| 9.500% due 05/27/22 (Ê) | 493 | 481 | Ancestry.com, Inc. 2nd Lien Term Loan | ||||||||
| 1.000% due 10/11/24 (v) | 420 | 425 | |||||||||
| Acadia Healthcare Co., Inc. | |||||||||||
See accompanying notes which are an integral part of the financial statements.
Russell Global Opportunistic Credit Fund 345
Russell Investment Company
Russell Global Opportunistic Credit Fund
Schedule of Investments, continued — October 31, 2016
| Amounts in thousands (except share amounts) | Amounts in thousands (except share amounts) | ||||||||||
| Principal | Fair | Principal | Fair | ||||||||
| Amount ($) | Value | Amount ($) | Value | ||||||||
| or Shares | $ | or Shares | $ | ||||||||
| Anheuser-Busch InBev Finance, Inc. | Series REGS | ||||||||||
| 1.286% due 02/01/19 (Ê) | 1,065 | 1,064 | 5.500% due 04/15/23 | 1,475 | 1,716 | ||||||
| Antero Midstream Partners LP / Antero | BioScrip, Inc. 1st Lien Term Loan B | ||||||||||
| Midstream Finance Corp. | 6.500% due 07/31/20 (Ê) | 1,478 | 1,450 | ||||||||
| 5.375% due 09/15/24 (Þ) | 185 | 186 | BioScrip, Inc. Term Loan B | ||||||||
| Antero Resources Corp. | 6.500% due 07/31/20 (Ê) | 2,464 | 2,416 | ||||||||
| Series WI | BlueLine Rental Finance Corp. | ||||||||||
| 5.125% due 12/01/22 | 880 | 887 | 7.000% due 02/01/19 (Þ) | 1,505 | 1,313 | ||||||
| AP Gaming I LLC 1st Lien Term Loan B | BMC Software Finance, Inc. 1st Lien | ||||||||||
| 9.250% due 12/20/20 (Ê) | 492 | 479 | Term Loan B | ||||||||
| Apex Tool Group LLC | 5.000% due 09/10/20 (Ê) | 1,436 | 1,414 | ||||||||
| 7.000% due 02/01/21 (Þ) | 1,690 | 1,542 | BMW US Capital LLC | ||||||||
| Apple, Inc. | 1.500% due 04/11/19 (Þ) | 2,655 | 2,656 | ||||||||
| 1.131% due 05/03/18 (Ê) | 1,437 | 1,440 | BMW Vehicle Owner Trust | ||||||||
| Arbor Pharmaceuticals, Inc. Term Loan | Series 2014-A Class A3 | ||||||||||
| B | 0.970% due 11/26/18 | 933 | 932 | ||||||||
| 6.000% due 06/28/23 | 1,250 | 1,260 | Boyd Gaming Corp. | ||||||||
| Arconic, Inc. | 6.375% due 04/01/26 (Þ) | 545 | 583 | ||||||||
| 6.750% due 07/15/18 | 1,950 | 2,086 | Boyd Gaming Corp. 1st Lien Term Loan | ||||||||
| 5.400% due 04/15/21 | 975 | 1,039 | B2 | ||||||||
| 5.900% due 02/01/27 | 650 | 686 | 3.534% due 09/15/23 (Ê) | 1,000 | 1,007 | ||||||
| 5.950% due 02/01/37 | 650 | 638 | Brazil Loan Trust 1 | ||||||||
| Arctic Glacier USA, Inc. 1st Lien Term | 5.477% due 07/24/23 (Þ) | 1,896 | 1,910 | ||||||||
| Loan | Brickman Group, Ltd. LLC (The) 1st | ||||||||||
| 6.000% due 05/13/19 (Ê) | 1,226 | 1,207 | Lien Term Loan B | ||||||||
| AssuredPartners, Inc. | 4.000% due 12/18/20 (Ê) | 1,965 | 1,960 | ||||||||
| 5.750% due 10/21/22 (Ê) | 337 | 338 | BWAY Holding Co. 1st Lien Term Loan | ||||||||
| Asurion LLC | B | ||||||||||
| 5.000% due 08/04/22 (Ê) | 488 | 490 | 5.500% due 08/14/20 (Ê) | 465 | 467 | ||||||
| Asurion LLC Covenant-Lite Term Loan | Caesars Entertainment Corp. 1st Lien | ||||||||||
| B1 | Term Loan B | ||||||||||
| 5.000% due 05/24/19 (Ê) | 675 | 675 | 7.000% due 10/11/20 (Ê) | 3,693 | 3,711 | ||||||
| Asurion LLC Term Loan B5 | California Resources Corp. Term Loan | ||||||||||
| 1.000% due 10/27/23 (v) | 750 | 746 | 11.375% due 08/04/21 | 800 | 859 | ||||||
| AT&T, Inc. | CareCore National LLC | ||||||||||
| 5.600% due 05/15/18 | 440 | 466 | 5.500% due 03/06/21 (Ê) | 1,761 | 1,730 | ||||||
| 1.739% due 11/27/18 (Ê) | 500 | 505 | Carlson Travel Holdings, Inc. | ||||||||
| Avantor Performance Materials Holdings, | 7.500% due 08/15/19 (Þ) | 3,145 | 3,066 | ||||||||
| Inc. 1st Lien Term Loan | Cast & Crew Payroll LLC | ||||||||||
| 6.000% due 06/21/22 (Ê) | 299 | 301 | 8.750% due 08/03/23 (Ê) | 250 | 235 | ||||||
| Avaya, Inc. Term Loan B7 | Cast & Crew Payroll LLC Term Loan B | ||||||||||
| 6.250% due 05/29/20 (Ê) | 982 | 804 | 8.750% due 08/03/22 (Ê) | 748 | 745 | ||||||
| Avis Budget Car Rental LLC / Avis | CBS Radio, Inc. | ||||||||||
| Budget Finance, Inc. | 7.250% due 11/01/24 (Þ) | 590 | 613 | ||||||||
| 6.375% due 04/01/24 (Å) | 61 | 61 | |||||||||
| CBS Radio, Inc. Term Loan B | |||||||||||
| Avon Products, Inc. | 4.500% due 10/06/23 | 583 | 586 | ||||||||
| 6.500% due 03/01/19 | 910 | 960 | CCO Holdings LLC / CCO Holdings | ||||||||
| Axalta Coating Systems LLC | Capital Corp. | ||||||||||
| 4.250% due 08/15/24 (Þ) | 1,790 | 2,034 | 5.875% due 04/01/24 (Þ) | 2,000 | 2,115 | ||||||
| Bank of Montreal | Cedar Fair, LP / Canada's Wonderland | ||||||||||
| Series YCD | Co. / Magnum Management Corp. | ||||||||||
| 1.391% due 12/08/17 (Ê)(~) | 1,000 | 1,000 | Series WI | ||||||||
| 5.375% due 06/01/24 | 1,045 | 1,102 | |||||||||
| BayernLB Capital Trust I | Cengage Learning Acquisitions, Inc. | ||||||||||
| Series REGS | Term Loan B | ||||||||||
| 6.203% due 05/29/49 (ƒ) | 900 | 892 | 5.250% due 06/07/23 (Ê) | 2,074 | 2,025 | ||||||
| BBB Industries US Holdings, Inc. | Centene Corp. | ||||||||||
| 9.750% due 11/03/22 (Ê) | 250 | 229 | 4.750% due 01/15/25 | 318 | 316 | ||||||
| BCD Acquisition, Inc. | Series WI | ||||||||||
| 9.625% due 09/15/23 (Þ) | 1,430 | 1,476 | 6.125% due 02/15/24 | 450 | 479 | ||||||
| Belden, Inc. | Century Aluminum Co. | ||||||||||
| 5.500% due 04/15/23 (Þ) | 105 | 122 | 7.500% due 06/01/21 (Å) | 10,395 | 9,459 | ||||||
See accompanying notes which are an integral part of the financial statements.
346 Russell Global Opportunistic Credit Fund
Russell Investment Company
Russell Global Opportunistic Credit Fund
Schedule of Investments, continued — October 31, 2016
| Amounts in thousands (except share amounts) | Amounts in thousands (except share amounts) | ||||||||||
| Principal | Fair | Principal | Fair | ||||||||
| Amount ($) | Value | Amount ($) | Value | ||||||||
| or Shares | $ | or Shares | $ | ||||||||
| CenturyLink, Inc. | 4.875% due 04/01/21 | 975 | 821 | ||||||||
| Series G | Cloud Crane LLC | ||||||||||
| 6.875% due 01/15/28 | 650 | 611 | 10.125% due 08/01/24 (Þ) | 800 | 834 | ||||||
| Series WI | Commercial Barge Line Co. 1st Lien | ||||||||||
| 5.625% due 04/01/25 | 1,275 | 1,195 | Term Loan B | ||||||||
| 9.750% due 11/12/20 (Ê) | 868 | 839 | |||||||||
| CF Industries, Inc. | |||||||||||
| 3.450% due 06/01/23 | 1,785 | 1,667 | CommScope, Inc. | ||||||||
| 5.150% due 03/15/34 | 1,300 | 1,167 | 5.000% due 06/15/21 (Þ) | 1,410 | 1,442 | ||||||
| Charcoal Holdings LLC 1st Lien Term | 5.500% due 06/15/24 (Þ) | 720 | 754 | ||||||||
| Loan | Community Health Systems, Inc. | ||||||||||
| 1.000% due 07/03/23 (v) | 1,000 | 1,007 | 4.000% due 01/27/21 (Ê) | 499 | 470 | ||||||
| Charming Charlie LLC Term Loan B | Compuware Corp. | ||||||||||
| 9.000% due 12/24/19 (Ê) | 824 | 519 | 6.250% due 12/15/21 (Ê) | 990 | 989 | ||||||
| Chase Issuance Trust | Constellis Holdings LLC / Constellis | ||||||||||
| Series 2013-A7 Class A | Finance Corp. | ||||||||||
| 0.617% due 09/15/20 (Ê) | 1,595 | 1,603 | 9.750% due 05/15/20 (Å) | 500 | 508 | ||||||
| Series 2014-A6 Class A6 | Continental Resources, Inc. | ||||||||||
| 1.260% due 07/15/19 | 400 | 401 | 5.000% due 09/15/22 | 380 | 372 | ||||||
| Checkout Holding Corp. Covenant-Lite | 4.500% due 04/15/23 | 350 | 333 | ||||||||
| 1st Lien Term Loan B | 3.800% due 06/01/24 | 1,820 | 1,674 | ||||||||
| 4.500% due 04/09/21 (Ê) | 1,955 | 1,758 | 4.900% due 06/01/44 | 545 | 464 | ||||||
| Checkout Holding Corp. Covenant-Lite | ConvergeOne Holdings Corp. Covenant- | ||||||||||
| 2nd Lien Term Loan | Lite 1st Lien Term Loan | ||||||||||
| 7.750% due 04/09/22 (Ê) | 750 | 538 | 6.000% due 06/17/20 (Ê) | 244 | 243 | ||||||
| Cheniere Corpus Christi Holdings LLC | Corrections Corp. of America | ||||||||||
| 7.000% due 06/30/24 (Þ) | 5,320 | 5,639 | 4.625% due 05/01/23 | 1,960 | 1,720 | ||||||
| Chevron Corp. | County of Montgomery Ohio Revenue | ||||||||||
| 1.318% due 05/16/18 (Ê) | 1,500 | 1,506 | Bonds | ||||||||
| Chrysler Group LLC 1st Lien Term | 0.590% due 11/15/39 (Ê) | 3,000 | 3,000 | ||||||||
| Loan B | Covanta Holding Corp. | ||||||||||
| 3.250% due 12/31/18 (Ê) | 1,500 | 1,501 | 6.375% due 10/01/22 | 1,725 | 1,755 | ||||||
| CHS/Community Health Systems, Inc. | CPI Acquisition, Inc. Term Loan B | ||||||||||
| 6.875% due 02/01/22 | 1,355 | 1,033 | 5.500% due 08/17/22 (Ê) | 680 | 667 | ||||||
| CHS/Community Health Systems, Inc. | CPI Buyer LLC Covenant-Lite 2nd Lien | ||||||||||
| 1st Lien Term Loan F | Term Loan | ||||||||||
| 3.924% due 12/31/18 (Ê) | 878 | 856 | 8.500% due 08/18/22 (Å)(Ê) | 3,150 | 2,930 | ||||||
| CHS/Community Health Systems, Inc. | CPM Holdings, Inc. 2nd Lien Term Loan | ||||||||||
| 1st Lien Term Loan G | 10.250% due 02/12/22 (Å) | 3,070 | 3,055 | ||||||||
| 3.750% due 12/31/19 (Ê) | 1,773 | 1,675 | CSC Holdings LLC | ||||||||
| Churchill Downs, Inc. | 5.250% due 06/01/24 | 75 | 70 | ||||||||
| 5.375% due 12/15/21 (Þ) | 1,190 | 1,232 | 5.500% due 04/15/27 (Þ) | 850 | 862 | ||||||
| Ciena Corp. | 5.500% due 04/15/27 (Å) | 1,000 | 1,014 | ||||||||
| 4.250% due 04/25/21 (Ê) | 498 | 497 | CSC Holdings LLC Term Loan | ||||||||
| Cincinnati Bell, Inc. 1st Lien Term | 3.876% due 10/31/24 (Ê) | 493 | 495 | ||||||||
| Loan B | |||||||||||
| 4.000% due 09/10/20 (Ê) | 1,225 | 1,227 | CSRA, Inc. 1st Lien Term Loan B | ||||||||
| 3.750% due 10/29/22 (Ê) | 464 | 466 | |||||||||
| Cision, Inc. Term Loan B | |||||||||||
| 7.000% due 05/12/23 | 1,496 | 1,443 | CWGS Group LLC Term Loan | ||||||||
| 5.750% due 02/20/20 (Ê) | 992 | 991 | |||||||||
| CITGO Petroleum Corp. | |||||||||||
| 6.250% due 08/15/22 (Þ) | 1,195 | 1,222 | DaVita, Inc. | ||||||||
| 5.125% due 07/15/24 | 1,535 | 1,501 | |||||||||
| Citibank Credit Card Issuance Trust | |||||||||||
| DBP Holding Corp. | |||||||||||
| Series 2014-A2 Class A2 | 7.750% due 10/15/20 (Þ) | 2,160 | 1,642 | ||||||||
| 1.020% due 02/22/19 | 2,600 | 2,600 | |||||||||
| DCP Midstream LLC | |||||||||||
| Clear Channel Worldwide Holdings, Inc. | 5.350% due 03/15/20 (Þ) | 2,405 | 2,477 | ||||||||
| Series A | |||||||||||
| 7.625% due 03/15/20 | 3,690 | 3,487 | DCP Midstream Operating, LP | ||||||||
| 6.500% due 11/15/22 | 4,550 | 4,573 | 3.875% due 03/15/23 | 1,040 | 1,011 | ||||||
| 5.600% due 04/01/44 | 325 | 305 | |||||||||
| Series B | Dell International LLC 1st Lien Term | ||||||||||
| 7.625% due 03/15/20 | 4,150 | 4,015 | Loan B | ||||||||
| Cleaver-Brooks, Inc. | 4.000% due 09/07/23 (Ê) | 2,500 | 2,517 | ||||||||
| 8.750% due 12/15/19 (Þ) | 4,720 | 4,932 | Dell Software Group Term Loan B | ||||||||
| Cliffs Natural Resources, Inc. | 4.000% due 09/23/22 | 2,000 | 1,999 | ||||||||
See accompanying notes which are an integral part of the financial statements.
Russell Global Opportunistic Credit Fund 347
Russell Investment Company
Russell Global Opportunistic Credit Fund
Schedule of Investments, continued — October 31, 2016
| Amounts in thousands (except share amounts) | Amounts in thousands (except share amounts) | ||||||||||
| Principal | Fair | Principal | Fair | ||||||||
| Amount ($) | Value | Amount ($) | Value | ||||||||
| or Shares | $ | or Shares | $ | ||||||||
| Dell, Inc. | Enviva Partners, LP / Enviva Partners | ||||||||||
| 7.100% due 04/15/28 | 1,365 | 1,443 | Finance Corp. | ||||||||
| Denbury Resources, Inc. | 8.500% due 11/01/21 (Þ) | 1,600 | 1,636 | ||||||||
| 9.000% due 05/15/21 (Þ) | 60 | 62 | ESH Hospitality, Inc. | ||||||||
| 5.500% due 05/01/22 | 965 | 762 | 5.250% due 05/01/25 (Þ) | 1,200 | 1,188 | ||||||
| 4.625% due 07/15/23 | 680 | 495 | ESH Hospitality, Inc. 1st Lien Term | ||||||||
| Loan B | |||||||||||
| Deutsche Bank Capital Finance Trust I | 3.750% due 08/30/23 (Ê) | 1,500 | 1,508 | ||||||||
| Series cms | Extraction Oil & Gas Holdings LLC / | ||||||||||
| 1.750% due 06/27/35 (Ê)(ƒ) | 327 | 263 | Extraction Finance Corp. | ||||||||
| Deutsche Postbank Funding Trust IV | 7.875% due 07/15/21 (Þ) | 1,250 | 1,322 | ||||||||
| 5.983% due 06/29/49 (ƒ) | 1,000 | 1,070 | Exxon Mobil Corp. | ||||||||
| Diamond 1 Finance Corp. / Diamond 2 | 0.892% due 03/01/18 (Ê) | 2,000 | 1,998 | ||||||||
| Finance Corp | Fairmount Santrol, Inc. 1st Lien Term | ||||||||||
| 5.875% due 06/15/21 (Å) | 177 | 187 | Loan B2 | ||||||||
| 5.450% due 06/15/23 (Þ) | 1,795 | 1,922 | 1.000% due 09/05/19 (Ê)(v) | 1,200 | 1,136 | ||||||
| 7.125% due 06/15/24 (Å) | 126 | 138 | FBM Finance, Inc. | ||||||||
| Diamond Offshore Drilling, Inc. | 8.250% due 08/15/21 (Þ) | 4,010 | 4,190 | ||||||||
| 5.875% due 05/01/19 | 1,072 | 1,118 | Fieldwood Energy LLC 1st Lien Term | ||||||||
| 4.875% due 11/01/43 | 815 | 597 | Loan | ||||||||
| 8.375% due 09/30/20 (Ê) | 1,240 | 992 | |||||||||
| DISH DBS Corp. | Fieldwood Energy LLC 2nd Lien Term | ||||||||||
| Series WI | Loan | ||||||||||
| 5.875% due 11/15/24 | 915 | 921 | 8.375% due 09/30/20 (Ê) | 555 | 326 | ||||||
| 7.750% due 07/01/26 | 685 | 752 | First Data Corp. | ||||||||
| Double Eagle Acquisition Sub, Inc. | 7.000% due 12/01/23 (Þ) | 7,000 | 7,333 | ||||||||
| 7.500% due 10/01/24 (Þ) | 5,090 | 5,243 | 5.750% due 01/15/24 (Þ) | 1,020 | 1,035 | ||||||
| Dresdner Funding Trust I | First Data Corp. 1st Lien Term Loan B | ||||||||||
| 8.151% due 06/30/31 (Þ) | 625 | 743 | 4.238% due 07/10/22 (Ê) | 2,256 | 2,271 | ||||||
| Series REGS | First Quality Finance Co., Inc. | ||||||||||
| 8.151% due 06/30/31 | 400 | 475 | 4.625% due 05/15/21 (Þ) | 1,225 | 1,230 | ||||||
| EagleView Technology Corp. 2nd Lien | |||||||||||
| Term Loan | FirstEnergy Corp. | ||||||||||
| 1.000% due 09/28/23 (Ê)(v) | 375 | 372 | Series B | ||||||||
| Eastman Kodak Co. Term Loan | 4.250% due 03/15/23 | 1,300 | 1,379 | ||||||||
| 7.250% due 09/03/19 (Ê) | 984 | 981 | FirstEnergy Solutions Corp. | ||||||||
| Education Management LLC Term Loan | 6.050% due 08/15/21 | 1,300 | 1,010 | ||||||||
| B | FOCUS Brands, Inc. 1st Lien Term Loan | ||||||||||
| 8.500% due 07/02/20 (Å) | 294 | 12 | 5.000% due 10/03/23 (Ê) | 1,250 | 1,263 | ||||||
| Embarq Corp. | Ford Credit Auto Owner Trust | ||||||||||
| 7.995% due 06/01/36 | 1,300 | 1,319 | Series 2014-A Class A3 | ||||||||
| EMC Corp. | 0.790% due 05/15/18 | 208 | 208 | ||||||||
| 1.875% due 06/01/18 | 650 | 641 | Series 2015-A Class A3 | ||||||||
| 2.650% due 06/01/20 | 1,450 | 1,411 | 1.280% due 09/15/19 | 1,992 | 1,995 | ||||||
| 3.375% due 06/01/23 | 1,105 | 1,038 | Series 2015-B Class A3 | ||||||||
| Emerald 3, Ltd. 2nd Lien Term Loan | 1.160% due 11/15/19 | 1,000 | 1,000 | ||||||||
| 8.000% due 05/09/22 | 800 | 706 | Foresight Energy LLC / Foresight Energy | ||||||||
| Emerald US, Inc. Term Loan B1 | Finance Corp. | ||||||||||
| 5.000% due 05/09/21 | 1,000 | 905 | 9.000% due 08/15/21 (Å) | 8,457 | 8,013 | ||||||
| Endo Finance LLC | Forum Energy Technologies, Inc. | ||||||||||
| 5.750% due 01/15/22 (Þ) | 765 | 688 | 6.250% due 10/01/21 | 1,870 | 1,851 | ||||||
| Endo Finance LLC / Endo Finco, Inc. | FPC Holdings, Inc. 1st Lien Term Loan | ||||||||||
| 5.375% due 01/15/23 (Þ) | 65 | 55 | 5.250% due 11/27/19 (Ê) | 1,475 | 1,328 | ||||||
| Energizer Holdings, Inc. | FPC Holdings, Inc. 2nd Lien Term Loan | ||||||||||
| 5.500% due 06/15/25 (Þ) | 895 | 906 | 9.250% due 05/27/20 (Å)(Ê) | 2,000 | 1,392 | ||||||
| EnergySolutions LLC 1st Lien Term | Freeport-McMoRan, Inc. | ||||||||||
| Loan B | 3.550% due 03/01/22 | 1,300 | 1,193 | ||||||||
| 6.750% due 05/29/20 (Ê) | 1,693 | 1,693 | 3.875% due 03/15/23 | 1,300 | 1,173 | ||||||
| EnLink Midstream Partners, LP | 4.550% due 11/14/24 | 1,050 | 963 | ||||||||
| 4.150% due 06/01/25 | 975 | 950 | 5.400% due 11/14/34 | 580 | 500 | ||||||
| 5.050% due 04/01/45 | 690 | 615 | 5.450% due 03/15/43 | 1,160 | 963 | ||||||
| Envision Healthcare Corp. | Frontier Communications Corp. | ||||||||||
| 5.125% due 07/01/22 (Þ) | 1,350 | 1,350 | 7.125% due 01/15/23 | 100 | 90 | ||||||
See accompanying notes which are an integral part of the financial statements.
348 Russell Global Opportunistic Credit Fund
Russell Investment Company
Russell Global Opportunistic Credit Fund
Schedule of Investments, continued — October 31, 2016
| Amounts in thousands (except share amounts) | Amounts in thousands (except share amounts) | ||||||||||
| Principal | Fair | Principal | Fair | ||||||||
| Amount ($) | Value | Amount ($) | Value | ||||||||
| or Shares | $ | or Shares | $ | ||||||||
| 7.625% due 04/15/24 | 975 | 868 | Series 2016-4 Class A2 | ||||||||
| 9.000% due 08/15/31 | 975 | 848 | 1.040% due 04/18/19 | 1,000 | 1,000 | ||||||
| FullBeauty Brands Holding Corp. 2nd | Howard University | ||||||||||
| Lien Term Loan | 0.610% due 08/01/31 (Ê) | 1,000 | 1,000 | ||||||||
| 10.000% due 09/22/23 | 500 | 415 | |||||||||
| FullBeauty Brands Holdings Corp. 1st | HRG Group, Inc. | ||||||||||
| Lien Term Loan | 7.750% due 01/15/22 | 13,043 | 13,597 | ||||||||
| 5.750% due 10/14/22 (Ê) | 746 | 708 | HUB International, Ltd. | ||||||||
| General Mills, Inc. | 9.250% due 02/15/21 (Þ) | 4,600 | 4,761 | ||||||||
| 6.590% due 10/15/18 | 2,000 | 2,183 | 7.875% due 10/01/21 (Þ) | 1,400 | 1,431 | ||||||
| GENEX Services, Inc. 1st Lien Term | Hughes Satellite Systems Corp. | ||||||||||
| Loan B | 5.250% due 08/01/26 (Þ) | 435 | 428 | ||||||||
| 5.250% due 05/30/21 (Ê) | 481 | 476 | 6.625% due 08/01/26 (Þ) | 350 | 346 | ||||||
| GENEX Services, Inc. 2nd Lien Term | HVB Funding Trust III | ||||||||||
| Loan | 9.000% due 10/22/31 (Þ) | 630 | 794 | ||||||||
| 8.750% due 05/30/22 (Ê) | 250 | 238 | |||||||||
| Hypo Real Estate International Trust I | |||||||||||
| Genworth Holdings, Inc. | 5.864% due 06/29/49 (ƒ) | 600 | 650 | ||||||||
| 7.200% due 02/15/21 | 910 | 844 | |||||||||
| 7.625% due 09/24/21 | 1,040 | 975 | Hyundai Auto Receivables Trust | ||||||||
| Series 2014-A Class A3 | |||||||||||
| GEO Group, Inc. (The) | 0.790% due 07/16/18 | 701 | 701 | ||||||||
| 5.125% due 04/01/23 | 930 | 810 | |||||||||
| 6.000% due 04/15/26 | 795 | 686 | Series 2015-A Class A3 | ||||||||
| 1.050% due 04/15/19 | 1,256 | 1,256 | |||||||||
| Getty Images, Inc. 1st Lien Term Loan B | IASIS Healthcare LLC / IASIS Capital | ||||||||||
| 4.750% due 10/18/19 (Ê) | 1,469 | 1,245 | Corp. | ||||||||
| Goldcup Merger Sub, Inc. | 8.375% due 05/15/19 | 710 | 676 | ||||||||
| 6.000% due 05/03/23 (Ê) | 499 | 504 | Illinois Finance Authority Revenue | ||||||||
| Goldman Sachs Capital I | Bonds | ||||||||||
| 6.345% due 02/15/34 | 1,355 | 1,634 | 0.830% due 07/01/35 (Ê) | 1,000 | 1,000 | ||||||
| Gulfport Energy Corp. | IMS Health, Inc. | ||||||||||
| Series WI | 4.125% due 04/01/23 (Þ) | 2,500 | 2,854 | ||||||||
| 6.625% due 05/01/23 | 865 | 908 | Indigo Merger Sub I, Inc. 1st Lien Term | ||||||||
| Harbor Freight Tools USA, Inc. Term | Loan | ||||||||||
| Loan B | 4.750% due 07/08/21 (Ê) | 748 | 750 | ||||||||
| 4.137% due 08/16/23 (Ê) | 748 | 753 | Ingles Markets, Inc. | ||||||||
| Harland Clarke Holdings Corp. 1st Lien | 5.750% due 06/15/23 | 1,500 | 1,552 | ||||||||
| Term Loan B4 | International Business Machines Corp. | ||||||||||
| 6.993% due 08/04/19 (Ê) | 1,870 | 1,855 | 1.125% due 02/06/18 | 500 | 500 | ||||||
| Hawaiian Telcom Communications, Inc. | International Game Technology | ||||||||||
| Term Loan B | 7.500% due 06/15/19 | 455 | 505 | ||||||||
| 5.250% due 06/06/19 (Ê) | 1,228 | 1,234 | |||||||||
| International Wire Group, Inc. | |||||||||||
| HCA Holdings, Inc. | 10.750% due 08/01/21 (Þ) | 1,460 | 1,380 | ||||||||
| 6.250% due 02/15/21 | 2,045 | 2,206 | Intrawest Operations Group LLC Term | ||||||||
| HCA Inc. Term Loan B7 | Loan | ||||||||||
| 3.588% due 03/01/24 | 1,000 | 1,008 | 5.000% due 12/09/20 (Ê) | 1,842 | 1,856 | ||||||
| HCA, Inc. | Intrepid Aviation Group Holdings LLC / | ||||||||||
| 5.875% due 05/01/23 | 385 | 408 | Intrepid Finance Co. | ||||||||
| 5.250% due 06/15/26 | 775 | 810 | 6.875% due 02/15/19 (Þ) | 1,985 | 1,796 | ||||||
| HD Supply, Inc. | Iron Mountain US Holdings, Inc. | ||||||||||
| 5.750% due 04/15/24 (Þ) | 2,085 | 2,189 | 5.375% due 06/01/26 (Å) | 245 | 247 | ||||||
| HealthSouth Corp. | Iron Mountain, Inc. | ||||||||||
| 5.750% due 11/01/24 | 1,280 | 1,320 | 4.375% due 06/01/21 (Å) | 245 | 253 | ||||||
| Heartland Dental LLC 2nd Lien Term | J Crew Group, Inc. Term Loan B | ||||||||||
| Loan | 4.000% due 03/05/21 (Ê) | 492 | 375 | ||||||||
| 9.750% due 06/21/19 (Ê) | 5,120 | 5,018 | JBS USA LLC | ||||||||
| Honda Auto Receivables Owner Trust | 7.250% due 06/01/21 (Þ) | 1,090 | 1,117 | ||||||||
| Series 2013-4 Class A4 | 5.875% due 07/15/24 (Þ) | 120 | 121 | ||||||||
| 1.040% due 02/18/20 | 1,250 | 1,250 | JC Penney Corp., Inc. | ||||||||
| Series 2014-2 Class A3 | 7.400% due 04/01/37 | 975 | 892 | ||||||||
| 0.770% due 03/19/18 | 395 | 395 | JDA Escrow LLC / JDA Bond Finance, | ||||||||
| Series 2016-2 Class A2 | Inc. | ||||||||||
| 1.130% due 09/17/18 | 400 | 400 | 7.375% due 10/15/24 (Þ) | 2,720 | 2,808 | ||||||
| Johnson & Johnson | |||||||||||
See accompanying notes which are an integral part of the financial statements.
Russell Global Opportunistic Credit Fund 349
Russell Investment Company
Russell Global Opportunistic Credit Fund
Schedule of Investments, continued — October 31, 2016
| Amounts in thousands (except share amounts) | Amounts in thousands (except share amounts) | ||||||||||
| Principal | Fair | Principal | Fair | ||||||||
| Amount ($) | Value | Amount ($) | Value | ||||||||
| or Shares | $ | or Shares | $ | ||||||||
| 1.112% due 03/01/19 (Ê) | 350 | 351 | MGM Growth Properties Operating | ||||||||
| Joseph T Ryerson & Son, Inc. | Partnership, LP Term Loan B | ||||||||||
| 11.000% due 05/15/22 (Þ) | 3,710 | 4,053 | 4.000% due 04/25/23 (Ê) | 498 | 498 | ||||||
| Joy Global, Inc. | Microsoft Corp. | ||||||||||
| 5.125% due 10/15/21 | 730 | 798 | 1.300% due 11/03/18 | 1,530 | 1,536 | ||||||
| Kennedy-Wilson, Inc. | MidOcean Credit CLO III | ||||||||||
| 5.875% due 04/01/24 | 1,120 | 1,133 | Series 2014-3A Class E | ||||||||
| KFC Holding Co./Pizza Hut Holdings | 5.947% due 07/21/26 (Ê)(Þ) | 830 | 704 | ||||||||
| LLC/Taco Bell of America LLC | MPH Acquisition Holdings LLC | ||||||||||
| 5.000% due 06/01/24 (Þ) | 1,500 | 1,560 | 7.125% due 06/01/24 (Þ) | 2,100 | 2,247 | ||||||
| Kloeckner Pentaplast of America, Inc. | MPT Operating Partnership, LP / MPT | ||||||||||
| 7.125% due 11/01/20 (Þ) | 1,250 | 1,437 | Finance Corp. | ||||||||
| Kraton Polymers LLC Term Loan B | 4.000% due 08/19/22 | 1,000 | 1,179 | ||||||||
| 6.000% due 01/06/22 (Ê) | 1,190 | 1,197 | 6.375% due 03/01/24 | 1,295 | 1,395 | ||||||
| L Brands, Inc. | MSC.Software Corp. 1st Lien Term Loan | ||||||||||
| 6.950% due 03/01/33 | 650 | 671 | 5.000% due 05/29/20 (Ê) | 1,466 | 1,461 | ||||||
| Lamar Media Corp. | MultiPlan, Inc. Term Loan B | ||||||||||
| Series WI | 5.000% due 05/25/23 (Ê) | 718 | 725 | ||||||||
| 5.750% due 02/01/26 | 1,490 | 1,595 | Murphy Oil Corp. | ||||||||
| Lannett Co., Inc. Term Loan A | 4.700% due 12/01/22 | 1,170 | 1,110 | ||||||||
| 5.750% due 11/25/20 (Ê) | 740 | 722 | Nabors Industries, Inc. | ||||||||
| 5.000% due 09/15/20 | 975 | 986 | |||||||||
| Laredo Petroleum, Inc. | 4.625% due 09/15/21 | 845 | 836 | ||||||||
| 5.625% due 01/15/22 | 1,010 | 985 | |||||||||
| Lattice Semiconductor Corp. 1st Lien | Nathan's Famous, Inc. | ||||||||||
| Term Loan B | 10.000% due 03/15/20 (Þ) | 2,565 | 2,805 | ||||||||
| 5.250% due 03/10/21 (Ê) | 1,470 | 1,456 | Natural Resource Partners, LP / NRP | ||||||||
| Level 3 Financing, Inc. | Finance Corp. | ||||||||||
| 9.125% due 10/01/18 | 2,210 | 2,033 | |||||||||
| Series WI | Nautilus Merger Sub, Inc. 2nd Lien Term | ||||||||||
| 5.375% due 08/15/22 | 540 | 555 | Loan | ||||||||
| 5.375% due 01/15/24 | 925 | 943 | 6.750% due 03/13/22 (Ê) | 380 | 362 | ||||||
| Level 3 Financing, Inc. Term Loan B2 | Navient Corp. | ||||||||||
| 3.500% due 05/31/22 (Ê) | 1,000 | 1,004 | 8.450% due 06/15/18 | 1,460 | 1,579 | ||||||
| LifePoint Health, Inc. | 8.000% due 03/25/20 | 425 | 461 | ||||||||
| 5.500% due 12/01/21 | 1,210 | 1,254 | 5.625% due 08/01/33 | 975 | 773 | ||||||
| 5.375% due 05/01/24 (Þ) | 1,435 | 1,426 | Series MTN | ||||||||
| Linn Energy LLC / Linn Energy Finance | 4.875% due 06/17/19 | 1,920 | 1,937 | ||||||||
| Corp. | |||||||||||
| 12.000% due 12/15/20 (Ø)(Þ) | 1,248 | 874 | Navistar, Inc. 1st Lien Term Loan B | ||||||||
| 6.500% due 08/07/20 (Ê) | 496 | 499 | |||||||||
| LTS Buyer LLC 2nd Lien Term Loan | |||||||||||
| 8.000% due 04/01/21 (Ê) | 1,550 | 1,551 | NBTY, Inc. Term Loan B | ||||||||
| 5.000% due 05/05/23 (Ê) | 499 | 500 | |||||||||
| MacDermid, Inc. Term Loan | |||||||||||
| 5.000% due 10/06/23 | 1,764 | 1,777 | Neiman Marcus Group, Ltd. LLC | ||||||||
| 8.750% due 10/15/21 (Þ) | 1,835 | 1,444 | |||||||||
| Match Group, Inc. | New Millennium Holdco, Inc. 1st Lien | ||||||||||
| 6.375% due 06/01/24 | 369 | 399 | Term Loan | ||||||||
| Match Group, Inc. Term Loan B1 | 7.500% due 12/21/20 (Ê) | 491 | 308 | ||||||||
| 5.500% due 10/27/22 (Ê) | 396 | 398 | Newfield Exploration Co. | ||||||||
| MCC Iowa LLC Term Loan H | 5.625% due 07/01/24 | 100 | 104 | ||||||||
| 3.250% due 01/29/21 (Ê) | 1,473 | 1,485 | NGPL PipeCo LLC | ||||||||
| Meccanica Holdings USA, Inc. | 7.119% due 12/15/17 (Þ) | 1,200 | 1,254 | ||||||||
| 6.250% due 07/15/19 (Þ) | 965 | 1,057 | Nielsen Finance LLC / Nielsen Finance | ||||||||
| Media General, Inc. 1st Lien Term Loan | Co. | ||||||||||
| B | 5.000% due 04/15/22 (Þ) | 1,055 | 1,076 | ||||||||
| 4.000% due 07/31/20 (Ê) | 469 | 469 | Nissan Auto Receivables Owner Trust | ||||||||
| MEDNAX, Inc. | Series 2013-C Class A3 | ||||||||||
| 5.250% due 12/01/23 (Þ) | 1,395 | 1,458 | 0.670% due 08/15/18 | 354 | 353 | ||||||
| Merck & Co., Inc. | Series 2014-A Class A3 | ||||||||||
| 1.161% due 05/18/18 (Ê) | 2,275 | 2,286 | 0.720% due 08/15/18 | 249 | 249 | ||||||
| Mergermarket USA, Inc. 1st Lien Term | |||||||||||
| Loan | Series 2016-A Class A2A | ||||||||||
| 4.500% due 02/04/21 (Ê) | 1,872 | 1,839 | 1.060% due 02/15/19 | 469 | 469 | ||||||
| North American Lifting Holdings, Inc. | |||||||||||
| 1st Lien Term Loan | |||||||||||
See accompanying notes which are an integral part of the financial statements.
350 Russell Global Opportunistic Credit Fund
Russell Investment Company
Russell Global Opportunistic Credit Fund
Schedule of Investments, continued — October 31, 2016
| Amounts in thousands (except share amounts) | Amounts in thousands (except share amounts) | ||||||||||
| Principal | Fair | Principal | Fair | ||||||||
| Amount ($) | Value | Amount ($) | Value | ||||||||
| or Shares | $ | or Shares | $ | ||||||||
| 5.500% due 11/27/20 (Ê) | 973 | 817 | Post Holdings, Inc. | ||||||||
| North American Lifting Holdings, Inc. | 6.000% due 12/15/22 (Þ) | 1,165 | 1,229 | ||||||||
| Covenant-Lite 2nd Lien Term Loan | 7.750% due 03/15/24 (Þ) | 55 | 61 | ||||||||
| 10.000% due 11/27/21 (Ê) | 250 | 155 | 5.000% due 08/15/26 (Þ) | 1,435 | 1,392 | ||||||
| North Atlantic Trading Co., Inc. 1st Lien | Pre-Paid Legal Services, Inc. 2nd Lien | ||||||||||
| Term Loan B | Term Loan | ||||||||||
| 7.750% due 01/13/20 (Ê) | 2,355 | 2,331 | 10.250% due 07/01/20 (Ê) | 500 | 495 | ||||||
| Novelis Corp. | Prime Security Services Borrower LLC | ||||||||||
| 6.250% due 08/15/24 (Þ) | 785 | 816 | Term Loan B1 | ||||||||
| 5.875% due 09/30/26 (Þ) | 500 | 506 | 4.750% due 04/21/22 (Ê) | 125 | 126 | ||||||
| NRG Energy, Inc. | Procter & Gamble Co. (The) | ||||||||||
| 6.250% due 07/15/22 | 285 | 286 | 1.156% due 11/01/19 (Ê) | 559 | 560 | ||||||
| 6.625% due 03/15/23 | 1,140 | 1,137 | Prowler Acquisition Corp. 1St Lien Term | ||||||||
| NRG Yield Operating LLC | Loan | ||||||||||
| 5.000% due 09/15/26 (Þ) | 1,400 | 1,358 | 5.500% due 01/28/20 (Ê) | 487 | 373 | ||||||
| Nuance Communications, Inc. | PSPC Escrow Corp. | ||||||||||
| 6.000% due 07/01/24 (Þ) | 2,550 | 2,678 | 6.000% due 02/01/23 (Þ) | 810 | 858 | ||||||
| Numericable US LLC Term Loan B6 | Series REGS | ||||||||||
| 4.750% due 02/10/23 (Ê) | 496 | 496 | 6.000% due 02/01/23 | 1,495 | 1,584 | ||||||
| NVA Holdings, Inc. 2nd Lien Term Loan | PulteGroup, Inc. | ||||||||||
| 8.000% due 08/14/22 (Ê) | 910 | 910 | 6.000% due 02/15/35 | 650 | 647 | ||||||
| Puttable Floating Option Taxable Notes | |||||||||||
| Oasis Petroleum, Inc. | Revenue Bonds | ||||||||||
| 6.875% due 03/15/22 | 330 | 327 | 1.300% due 04/15/46 (Ê)(Þ) | 1,000 | 1,000 | ||||||
| 6.875% due 01/15/23 | 1,115 | 1,093 | QoL meds LLC 2nd Lien Term Loan | ||||||||
| Opal Acquisition, Inc. | 1.000% due 10/25/24 (Þ)(v) | 1,270 | 1,264 | ||||||||
| 8.875% due 12/15/21 (Þ) | 7,270 | 5,925 | |||||||||
| Optimas OE Solutions Holding LLC / | Qualitytech, LP/QTS Finance Corp. | ||||||||||
| Optimas OE Solutions, Inc. | 5.875% due 08/01/22 | 2,580 | 2,651 | ||||||||
| 8.625% due 06/01/21 (Þ) | 3,750 | 2,888 | Quincy Newspapers, Inc. Term Loan B | ||||||||
| PACCAR Financial Corp. | 5.500% due 11/02/22 (Ê) | 489 | 491 | ||||||||
| 1.435% due 12/06/18 (Ê) | 275 | 277 | Quintiles IMS, Inc. | ||||||||
| Party City Holdings, Inc. | 3.500% due 10/15/24 (Þ) | 205 | 231 | ||||||||
| 6.125% due 08/15/23 (Þ) | 1,850 | 1,963 | Radio One, Inc. | ||||||||
| Patterson Co. 2nd Lien Term Loan | 7.375% due 04/15/22 (Å) | 100 | 101 | ||||||||
| 9.500% due 08/28/23 (Å)(Ê) | 3,490 | 3,385 | Range Resources Corp. | ||||||||
| Pelican Products, Inc. 1st Lien Term | Series WI | ||||||||||
| Loan B1 | 4.875% due 05/15/25 | 845 | 807 | ||||||||
| 5.250% due 04/11/20 (Ê) | 968 | 956 | RBS Capital Trust B | ||||||||
| PET Acquisition Merger Sub LLC 1st | 6.800% due 12/31/49 (ƒ) | 1,000 | 995 | ||||||||
| Lien Term Loan B1 | RCN Telecom Services LLC / RCN | ||||||||||
| 5.750% due 01/26/23 (Ê) | 1,160 | 1,170 | Capital Corp. | ||||||||
| PetSmart, Inc. Term Loan B | 8.500% due 08/15/20 (Þ) | 6,891 | 7,343 | ||||||||
| 4.000% due 03/10/22 | 1,975 | 1,979 | Real Alloy Holding, Inc. | ||||||||
| PFS Acquisition LLC 2nd Lien Term | 10.000% due 01/15/19 (Þ) | 5,010 | 5,060 | ||||||||
| Loan | Realogy Group LLC Term Loan B | ||||||||||
| 8.250% due 01/31/22 (Ê) | 7,390 | 6,134 | 3.750% due 07/14/22 (Ê) | 374 | 377 | ||||||
| PGX Holdings, Inc. Covenant-Lite 1st | RegionalCare Hospital Partners | ||||||||||
| Lien Term Loan | Holdings, Inc. | ||||||||||
| 5.750% due 08/21/20 (Ê) | 456 | 456 | 8.250% due 05/01/23 (Þ) | 6,915 | 7,010 | ||||||
| PHI, Inc. | Renaissance Learning, Inc. 1st Lien | ||||||||||
| 5.250% due 03/15/19 | 1,610 | 1,550 | Term Loan | ||||||||
| Pilgrim's Pride Corp. | 4.500% due 04/09/21 (Ê) | 975 | 972 | ||||||||
| 5.750% due 03/15/25 (Þ) | 1,065 | 1,089 | Rent-A-Center, Inc. | ||||||||
| Pinnacle Entertainment, Inc. Term Loan | 6.625% due 11/15/20 | 1,700 | 1,538 | ||||||||
| B | 4.750% due 05/01/21 | 370 | 300 | ||||||||
| 3.250% due 04/28/23 | 1,126 | 1,132 | |||||||||
| RentPath, Inc. 1st Lien Term Loan B | |||||||||||
| Plantronics, Inc. | 6.250% due 12/17/21 (Ê) | 1,965 | 1,865 | ||||||||
| 5.500% due 05/31/23 (Þ) | 900 | 916 | |||||||||
| Revlon Consumer Products Corp. | |||||||||||
| Plastipak Holdings, Inc. | 5.750% due 02/15/21 | 3,480 | 3,515 | ||||||||
| 6.500% due 10/01/21 (Þ) | 1,180 | 1,221 | Reynolds Group Holdings, Inc. 1st Lien | ||||||||
| Platform Specialty Products Corp. | Term Loan | ||||||||||
| 6.500% due 02/01/22 (Þ) | 1,240 | 1,203 | 4.250% due 01/21/23 (Ê) | 1,000 | 1,002 | ||||||
See accompanying notes which are an integral part of the financial statements.
Russell Global Opportunistic Credit Fund 351
Russell Investment Company
Russell Global Opportunistic Credit Fund
Schedule of Investments, continued — October 31, 2016
| Amounts in thousands (except share amounts) | Amounts in thousands (except share amounts) | ||||||||||
| Principal | Fair | Principal | Fair | ||||||||
| Amount ($) | Value | Amount ($) | Value | ||||||||
| or Shares | $ | or Shares | $ | ||||||||
| Reynolds Group Issuer, Inc. / Reynolds | SolarWinds Holdings, Inc. Term Loan | ||||||||||
| Group Issuer LLC / Reynolds Group | 5.500% due 02/05/23 (Ê) | 1,087 | 1,092 | ||||||||
| Issuer Lu | Solera LLC / Solera Finance, Inc. | ||||||||||
| 5.750% due 10/15/20 | 1,355 | 1,391 | 10.500% due 03/01/24 (Å) | 480 | 537 | ||||||
| 5.125% due 07/15/23 (Þ) | 955 | 980 | |||||||||
| Solera LLC 1st Lien Term Loan B | |||||||||||
| 7.000% due 07/15/24 (Þ) | 910 | 973 | 5.750% due 03/04/23 (Ê) | 469 | 474 | ||||||
| Riverbed Technology, Inc. Term Loan | SourceHOV LLC 1st Lien Term Loan B | ||||||||||
| 5.000% due 04/27/22 (Ê) | 1,951 | 1,965 | 7.750% due 10/31/19 (Ê) | 931 | 807 | ||||||
| Rockies Express Pipeline LLC | Southwestern Energy Co. | ||||||||||
| 5.625% due 04/15/20 (Þ) | 330 | 346 | |||||||||
| Rovi Solutions Corp. 1st Lien Term | 5.800% due 01/23/20 | 325 | 323 | ||||||||
| Loan B | 4.100% due 03/15/22 | 15 | 13 | ||||||||
| 3.750% due 07/02/21 (Ê) | 978 | 979 | 6.700% due 01/23/25 | 2,475 | 2,358 | ||||||
| Rowan Cos., Inc. | Spectrum Brands, Inc. | ||||||||||
| 4.875% due 06/01/22 | 650 | 559 | 4.000% due 10/01/26 (Þ) | 1,820 | 2,052 | ||||||
| 4.750% due 01/15/24 | 765 | 643 | Sprint Capital Corp. | ||||||||
| RPI Finance Trust Term Loan B5 | 6.900% due 05/01/19 | 1,560 | 1,642 | ||||||||
| 3.035% due 10/04/22 | 805 | 812 | 6.875% due 11/15/28 | 1,560 | 1,435 | ||||||
| Sabine Pass Liquefaction LLC | 8.750% due 03/15/32 | 1,300 | 1,319 | ||||||||
| 5.625% due 02/01/21 | 1,192 | 1,255 | Sprint Communications, Inc. | ||||||||
| 5.625% due 04/15/23 | 165 | 175 | 6.000% due 11/15/22 | 2,075 | 1,934 | ||||||
| 5.625% due 03/01/25 | 5,535 | 5,857 | Sprint Corp. | ||||||||
| 5.875% due 06/30/26 (Þ) | 850 | 916 | Series WI | ||||||||
| 5.000% due 03/15/27 (Þ) | 755 | 768 | 7.250% due 09/15/21 | 2,680 | 2,744 | ||||||
| Safeway, Inc. | SS&C Technologies Holdings, Inc. | ||||||||||
| 7.250% due 02/01/31 | 910 | 908 | Series WI | ||||||||
| SBA Communications Corp. | 5.875% due 07/15/23 | 745 | 780 | ||||||||
| 4.875% due 09/01/24 (Þ) | 3,060 | 3,060 | Standard Industries, Inc. | ||||||||
| Scientific Games International, Inc. | 5.500% due 02/15/23 (Þ) | 2,605 | 2,709 | ||||||||
| 7.000% due 01/01/22 (Þ) | 1,700 | 1,808 | 5.375% due 11/15/24 (Þ) | 285 | 295 | ||||||
| Scientific Games International, Inc. Term | Steak n Shake Operations, Inc. Term | ||||||||||
| Loan B1 | Loan | ||||||||||
| 6.000% due 10/18/20 (Ê) | 2,687 | 2,701 | 4.750% due 03/19/21 (Ê) | 1,182 | 1,170 | ||||||
| Sterigenics-Nordion Holdings LLC 1st | |||||||||||
| SCS Holdings, Inc. 1st Lien Term Loan B | Lien Term Loan B | ||||||||||
| 6.000% due 10/30/22 (Ê) | 494 | 496 | 1.000% due 05/15/22 (Ê)(v) | 2,000 | 1,990 | ||||||
| Sealed Air Corp. | Sterling Midco Holdings, Inc. 2nd Lien | ||||||||||
| 6.875% due 07/15/33 (Þ) | 300 | 322 | Term Loan | ||||||||
| Series REGS | 8.750% due 06/19/23 (Ê) | 4,200 | 4,032 | ||||||||
| 4.500% due 09/15/23 | 1,670 | 2,026 | Suburban Propane Partners, LP/ | ||||||||
| SeaWorld Parks & Entertainment, Inc. | Suburban Energy Finance Corp. | ||||||||||
| Term Loan B3 | 7.375% due 08/01/21 | 1,225 | 1,274 | ||||||||
| 4.088% due 05/14/20 (Ê) | 1,939 | 1,943 | 5.750% due 03/01/25 | 565 | 576 | ||||||
| Sequa Corp. | Summit Materials LLC / Summit | ||||||||||
| 7.000% due 12/15/17 (Å) | 2,095 | 1,131 | Materials Finance Corp. | ||||||||
| Serta Simmons Bedding LLC | Series WI | ||||||||||
| 8.125% due 10/01/20 (Þ) | 3,020 | 3,137 | 6.125% due 07/15/23 | 2,175 | 2,229 | ||||||
| Summit Midstream Holdings LLC/ | |||||||||||
| SESI LLC | Summit Midstream Finance Corp. | ||||||||||
| 7.125% due 12/15/21 | 510 | 497 | 5.500% due 08/15/22 | 240 | 233 | ||||||
| Signode Industrial Group US, Inc. | |||||||||||
| Covenant-Lite 1st Lien Term Loan B | Suncoke Energy Partners LP | ||||||||||
| 3.750% due 05/01/21 (Ê) | 1,314 | 1,310 | 7.375% due 02/01/20 (Å) | 1,990 | 1,915 | ||||||
| Simmons Foods, Inc. | Surgery Center Holdings, Inc. | ||||||||||
| 7.875% due 10/01/21 (Þ) | 4,100 | 4,131 | 8.875% due 04/15/21 (Þ) | 2,440 | 2,599 | ||||||
| SIRVA Worldwide, Inc. 1st Lien Term | Targa Resources Partners, LP / Targa | ||||||||||
| Loan | Resources Partners Finance Corp. | ||||||||||
| 7.500% due 03/27/19 (Ê) | 2,131 | 2,115 | 5.125% due 02/01/25 (Þ) | 640 | 638 | ||||||
| TCH-2 Holdings LLC 1st Lien Term | |||||||||||
| Six Flags Entertainment Corp. | Loan | ||||||||||
| 4.875% due 07/31/24 (Þ) | 1,855 | 1,860 | 5.500% due 05/12/21 (Ê) | 1,374 | 1,374 | ||||||
| SM Energy Co. | TCH-2 Holdings LLC Covenant-Lite 2nd | ||||||||||
| 6.750% due 09/15/26 | 250 | 256 | Lien Term Loan | ||||||||
| Series WI | 8.750% due 11/12/21 (Ê) | 500 | 490 | ||||||||
| 6.125% due 11/15/22 | 315 | 317 | |||||||||
See accompanying notes which are an integral part of the financial statements.
352 Russell Global Opportunistic Credit Fund
Russell Investment Company
Russell Global Opportunistic Credit Fund
Schedule of Investments, continued — October 31, 2016
| Amounts in thousands (except share amounts) | Amounts in thousands (except share amounts) | ||||||||||
| Principal | Fair | Principal | Fair | ||||||||
| Amount ($) | Value | Amount ($) | Value | ||||||||
| or Shares | $ | or Shares | $ | ||||||||
| Tempur Sealy International, Inc. | UTEX Industries, Inc. Covenant-Lite 1st | ||||||||||
| Series WI | Lien Term Loan B | ||||||||||
| 5.500% due 06/15/26 | 2,135 | 2,199 | 5.000% due 05/22/21 (Ê) | 1,173 | 995 | ||||||
| Tender Option Bond Trust Receipts/ | UTEX Industries, Inc. Covenant-Lite | ||||||||||
| Certificates General Obligation | 2nd Lien Term Loan B | ||||||||||
| 8.250% due 05/22/22 (Å)(Ê) | 890 | 449 | |||||||||
| Unlimited | Valeant Pharmaceuticals International, | ||||||||||
| 0.740% due 08/01/49 (Ê)(Þ) | 1,300 | 1,300 | Inc. | ||||||||
| Tenet Healthcare Corp. | 5.375% due 03/15/20 (Þ) | 1,850 | 1,600 | ||||||||
| 4.375% due 10/01/21 | 1,490 | 1,483 | Valeant Pharmaceuticals International, | ||||||||
| 6.750% due 06/15/23 | 10,650 | 9,785 | Inc. 1st Lien Term Loan BF1 | ||||||||
| TerraForm AP Acquisition Holdings LLC | 3.750% due 04/02/22 (Ê) | 573 | 571 | ||||||||
| 1st Lien Term Loan B | Varsity Brands, Inc. 1st Lien Term Loan | ||||||||||
| 8.500% due 06/26/22 (Ê) | 1,003 | 993 | 5.000% due 12/11/21 | 1,228 | 1,235 | ||||||
| TerraForm Power Operating LLC | Verdesian Life Sciences LLC 1st Lien | ||||||||||
| 6.375% due 12/06/16 (Þ) | 1,660 | 1,664 | Term Loan B | ||||||||
| Tesoro Logistics, LP / Tesoro Logistics | 6.000% due 07/01/20 (Ê) | 1,371 | 1,207 | ||||||||
| Finance Corp. | VEREIT Operating Partnership, LP | ||||||||||
| 6.375% due 05/01/24 | 1,000 | 1,078 | 3.000% due 02/06/19 | 1,040 | 1,052 | ||||||
| TIAA CLO I, Ltd. | Veritas US, Inc. / Veritas Bermuda, Ltd. | ||||||||||
| Series 2016-1A Class E1 | 7.500% due 02/01/23 (Þ) | 5,017 | 4,791 | ||||||||
| 8.736% due 07/20/28 (Å)(Ê) | 683 | 675 | Vince LLC 1st Lien Term Loan B | ||||||||
| T-Mobile USA, Inc. | 5.750% due 11/27/19 (Ê) | 257 | 244 | ||||||||
| 6.542% due 04/28/20 | 130 | 134 | Vizient, Inc. | ||||||||
| 6.633% due 04/28/21 | 285 | 299 | 10.375% due 03/01/24 (Þ) | 4,910 | 5,475 | ||||||
| 6.000% due 03/01/23 | 2,220 | 2,337 | VWR Funding, Inc. | ||||||||
| TMS International Corp. | 4.625% due 04/15/22 (Þ) | 2,475 | 2,805 | ||||||||
| 7.625% due 10/15/21 (Å) | 2,420 | 1,997 | Series REGS | ||||||||
| TMS International Corp. Term Loan | 4.625% due 04/15/22 | 405 | 459 | ||||||||
| 1.000% due 10/16/20 (Ê)(v) | 2,000 | 1,968 | Walter Investment Management Corp. | ||||||||
| Toyota Auto Receivables Owner Trust | Series WI | ||||||||||
| Series 2015-A Class A3 | 7.875% due 12/15/21 | 1,175 | 905 | ||||||||
| 1.120% due 02/15/19 | 1,410 | 1,411 | Washington Inventory Service 2nd Lien | ||||||||
| Series 2015-B Class A2A | Term Loan | ||||||||||
| 0.770% due 11/15/17 | 145 | 145 | 10.250% due 06/20/19 (Å)(Ê) | 2,600 | 520 | ||||||
| TransDigm, Inc. | Waste Industries USA, Inc. 1st Lien | ||||||||||
| 5.500% due 10/15/20 | 3,780 | 3,884 | Term Loan B | ||||||||
| 6.000% due 07/15/22 | 710 | 740 | 3.500% due 02/27/20 (Ê) | 499 | 500 | ||||||
| TreeHouse Foods, Inc. | Watco Cos. LLC / Watco Finance Corp. | ||||||||||
| 6.000% due 02/15/24 (Þ) | 1,620 | 1,740 | 6.375% due 04/01/23 (Þ) | 1,610 | 1,634 | ||||||
| William Morris Endeavor Entertainment | |||||||||||
| Tribune Media Co. 1st Lien Term Loan B | LLC 1St Lien Term Loan B | ||||||||||
| 3.750% due 12/27/20 (Ê) | 494 | 496 | 5.250% due 05/06/21 (Ê) | 1,466 | 1,472 | ||||||
| Tronox Finance LLC | Williams Cos., Inc. (The) | ||||||||||
| 6.375% due 08/15/20 | 1,005 | 902 | 3.700% due 01/15/23 | 975 | 943 | ||||||
| 7.500% due 03/15/22 (Þ) | 1,370 | 1,226 | 4.550% due 06/24/24 | 1,170 | 1,190 | ||||||
| TruGreen, LP 1st Lien Term Loan B | 5.750% due 06/24/44 | 715 | 731 | ||||||||
| 6.500% due 04/13/23 (Ê) | 748 | 754 | WMG Acquisition Corp. | ||||||||
| UFC Holdings LLC 1st Lien Term Loan | 4.125% due 11/01/24 (Þ) | 560 | 634 | ||||||||
| 5.000% due 08/18/23 (Ê) | 2,000 | 2,015 | World Endurance Holdings 1St Lien | ||||||||
| United Airlines, Inc. 1st Lien Term | Term Loan | ||||||||||
| Loan B | 5.250% due 06/26/21 (Ê) | 1,732 | 1,715 | ||||||||
| 3.250% due 04/01/19 (Ê) | 972 | 974 | Xerium Technologies, Inc. | ||||||||
| United Rentals NA, Inc. | 9.500% due 08/15/21 (Þ) | 1,760 | 1,786 | ||||||||
| 7.625% due 04/15/22 | 1,025 | 1,090 | Yonkers Racing Corp. 1st Lien Term | ||||||||
| 5.500% due 05/15/27 | 225 | 224 | Loan | ||||||||
| Univision Communications, Inc. | 4.250% due 08/16/19 | 125 | 125 | ||||||||
| 5.125% due 05/15/23 (Þ) | 1,060 | 1,076 | Yum! Brands, Inc. | ||||||||
| UPC Financing Partnership 1st Lien | 3.875% due 11/01/23 | 1,690 | 1,677 | ||||||||
| Term Loan AN | 6.875% due 11/15/37 | 300 | 305 | ||||||||
| 4.080% due 08/31/24 (Ê) | 1,000 | 1,005 | Zais CLO 5, Ltd. | ||||||||
| USI, Inc. | Series 2016-2A Class C | ||||||||||
| 7.750% due 01/15/21 (Þ) | 3,234 | 3,266 | 5.216% due 10/15/28 (Å)(Ê) | 1,000 | 955 | ||||||
See accompanying notes which are an integral part of the financial statements.
Russell Global Opportunistic Credit Fund 353
Russell Investment Company
Russell Global Opportunistic Credit Fund
Schedule of Investments, continued — October 31, 2016
| Amounts in thousands (except share amounts) | Amounts in thousands (except share amounts) | ||||||||||
| Principal | Fair | Principal | Fair | ||||||||
| Amount ($) | Value | Amount ($) | Value | ||||||||
| or Shares | $ | or Shares | $ | ||||||||
| Zayo Group LLC / Zayo Capital, Inc. | Citigroup Capital XIII(Æ)(Ê) | 31,925 | 830 | ||||||||
| 6.000% due 04/01/23 | 8,250 | 8,683 | Deutsche Bank Contingent Capital Trust | ||||||||
| Zebra Technologies Corp. 1st Lien Term | II(Æ) | 29,792 | 687 | ||||||||
| Loan B | Deutsche Bank Contingent Capital Trust | ||||||||||
| 4.750% due 10/27/21 (Ê) | 2,180 | 2,201 | III(Æ) | 15,000 | 364 | ||||||
| ZF NA Capital, Inc. | Education Management Corp.(Å)(Æ) | 2,128 | — | ||||||||
| 4.500% due 04/29/22 (Þ) | 1,280 | 1,355 | 2,218 | ||||||||
| 692,755 | |||||||||||
| Venezuela, Bolivarian Republic of - 1.2% | Total Preferred Stocks | ||||||||||
| Petroleos de Venezuela SA | (cost $6,497) | 6,209 | |||||||||
| 5.375% due 04/12/27 | 15,000 | 5,487 | |||||||||
| Series REGS | Warrants & Rights - 0.0% | ||||||||||
| 8.500% due 11/02/17 | 2,667 | 1,940 | United States - 0.0% | ||||||||
| 9.000% due 11/17/21 | 5,000 | 2,475 | Education Management Corp.(Å),(Æ) | ||||||||
| 6.000% due 05/16/24 | 13,000 | 4,875 | 2021 Warrants | 1,564,221 | — | ||||||
| 9.750% due 05/17/35 | 2,000 | 891 | Foresight Energy LP(Å),(Æ) | ||||||||
| 5.500% due 04/12/37 | 9,000 | 3,299 | 2017 Warrants | 13,090 | 89 | ||||||
| Venezuela Government International | |||||||||||
| Bond | 89 | ||||||||||
| Series REGS | |||||||||||
| 13.625% due 08/15/18 | 1,800 | 1,224 | Total Warrants & Rights | ||||||||
| 7.000% due 12/01/18 | 3,000 | 1,755 | (cost $—) | 89 | |||||||
| 7.750% due 10/13/19 | 4,000 | 2,030 | |||||||||
| 23,976 | Short-Term Investments - 14.2% | ||||||||||
| Vietnam - 0.1% | Argentina - 0.1% | ||||||||||
| Vietnam Government International Bond | Argentina Bonar Bonds | ||||||||||
| 6.750% due 01/29/20 (Þ) | 1,500 | 1,671 | Series X | ||||||||
| 7.000% due 04/17/17 | 750 | 767 | |||||||||
| Virgin Islands, British - 0.2% | Letras del Banco Central de la Republica | ||||||||||
| 1MDB Global Investments, Ltd. | Argentina | ||||||||||
| Series REGS | Series ARS | ||||||||||
| 4.400% due 03/09/23 | 5,500 | 4,819 | 28.474% due 12/21/16 (~) | ARS | 3,100 | 197 | |||||
| Total Long-Term Fixed Income | 28.399% due 12/28/16 (~) | ARS | 2,330 | 148 | |||||||
| Investments | 1,112 | ||||||||||
| Australia - 0.1% | |||||||||||
| (cost $1,709,771) | 1,699,388 | Australia & New Zealand Banking | |||||||||
| Group, Ltd. | |||||||||||
| Common Stocks - 0.0% | 1.256% due 01/10/17 (Ê)(Þ) | 500 | 500 | ||||||||
| United States - 0.0% | |||||||||||
| Education Management Corp.(Æ)(Þ) | 4,460,190 | 2 | Westpac Banking Corp. | ||||||||
| Millennium Health LLC(Æ) | 14,862 | 26 | 1.255% due 11/25/16 (Ê) | 1,875 | 1,875 | ||||||
| 28 | 2,375 | ||||||||||
| Canada - 0.2% | |||||||||||
| Total Common Stocks | National Bank of Canada | ||||||||||
| (cost $435) | 28 | Series YCD | |||||||||
| 1.225% due 05/24/17 (Ê)(~) | 800 | 801 | |||||||||
| Preferred Stocks - 0.3% | Ontario Teachers' Finance Trust | ||||||||||
| Netherlands - 0.1% | 0.860% due 01/17/17 (Þ)(~) | 750 | 749 | ||||||||
| ING Groep NV(Æ) | 67,740 | 1,733 | Toronto-Dominion Bank (The) | ||||||||
| Spain - 0.0% | 1.124% due 05/02/17 (Ê) | 2,000 | 2,000 | ||||||||
| Santander Finance Preferred SAU(Æ) | 15,850 | 406 | 3,550 | ||||||||
| Japan - 0.2% | |||||||||||
| United Kingdom - 0.2% | Sumitomo Mitsui Banking Corp. | ||||||||||
| Barclays Bank PLC(Æ) | 35,000 | 903 | Series YCD | ||||||||
| HSBC Holdings PLC(Æ) | 36,780 | 949 | 1.064% due 04/26/17 (Ê)(~) | 3,000 | 2,999 | ||||||
| 1,852 | Malaysia - 0.3% | ||||||||||
| Malaysia Government Bond | |||||||||||
| United States - 0.0% | Series 0207 | ||||||||||
| Aareal Bank Capital Funding Trust | 11,908 | 337 | |||||||||
See accompanying notes which are an integral part of the financial statements.
354 Russell Global Opportunistic Credit Fund
Russell Investment Company
Russell Global Opportunistic Credit Fund
Schedule of Investments, continued — October 31, 2016
| Amounts in thousands (except share amounts) | Amounts in thousands (except share amounts) | ||||||||
| Principal | Fair | Principal | Fair | ||||||
| Amount ($) | Value | Amount ($) | Value | ||||||
| or Shares | $ | or Shares | $ | ||||||
| 3.814% due 02/15/17 | MYR | 16,630 | 3,980 | 0.690% due 08/21/17 | 17 | 17 | |||
| Malaysia Treasury Bill | Inter-American Development Bank | ||||||||
| Series 1016 | Series GMTN | ||||||||
| 2.632% due 03/10/17 (~) | MYR | 8,700 | 2,055 | 0.545% due 10/15/17 (Ê) | 1,500 | 1,498 | |||
| 6,035 | International Business Machines Corp. | ||||||||
| Netherlands - 0.0% | 1.251% due 08/18/17 (Ê) | 750 | 753 | ||||||
| Shell International Finance BV | Johnson & Johnson | ||||||||
| 1.027% due 11/15/16 (Ê) | 550 | 550 | 0.899% due 11/28/16 (Ê) | 710 | 710 | ||||
| Portugal - 0.0% | JPMorgan Chase & Co. | ||||||||
| BCP Finance Bank, Ltd. | Series MTN | ||||||||
| 0.499% due 12/21/16 (Å)(Ê) | EUR | 600 | 593 | 1.251% due 11/18/16 (Ê) | 1,620 | 1,621 | |||
| Sweden - 0.0% | Jupiter Securitization Co. LLC | ||||||||
| Nordea Bank AB | |||||||||
| 1.127% due 03/20/17 (Þ)(~) | 2,300 | 2,290 | |||||||
| 1.250% due 04/04/17 (Þ) | 500 | 501 | |||||||
| United Kingdom - 0.0% | Kells Funding LLC | ||||||||
| Co.-Operative Bank PLC | 0.010% due 12/02/16 (ç)(Þ)(~) | 3,000 | 2,998 | ||||||
| 5.125% due 09/20/17 | GBP | 300 | 341 | Liberty Street Funding LLC | |||||
| United States - 13.2% | 0.895% due 12/12/16 (ç)(Þ)(~) | 1,100 | 1,099 | ||||||
| American Honda Finance Corp. | LMA-Americas LLC | ||||||||
| 1.051% due 07/14/17 (Ê) | 2,000 | 2,001 | 1.046% due 12/01/16 (ç)(Þ)(~) | 400 | 400 | ||||
| Anheuser-Busch InBev Finance, Inc. | 1.002% due 12/07/16 (ç)(Þ)(~) | 2,000 | 1,998 | ||||||
| 1.076% due 01/27/17 (Ê) | 820 | 820 | Manhattan Asset Funding Co. LLC | ||||||
| Anheuser-Busch InBev Worldwide, Inc. | 0.973% due 11/28/16 (ç)(Þ)(~) | 2,500 | 2,498 | ||||||
| 1.313% due 12/09/16 (ç)(Þ)(~) | 300 | 300 | Matchpoint Finance PLC | ||||||
| 0.947% due 12/16/16 (ç)(Þ)(~) | 1,300 | 1,298 | 0.996% due 12/01/16 (ç)(Þ)(~) | 2,500 | 2,498 | ||||
| Antalis SA | Nieuw Amsterdam Receivables Corp. | ||||||||
| 1.046% due 12/14/16 (ç)(Þ)(~) | 2,300 | 2,297 | 0.921% due 12/06/16 (ç)(Þ)(~) | 2,500 | 2,498 | ||||
| ANZ New Zealand Int'l, Ltd. | Old Line Funding LLC | ||||||||
| 1.126% due 02/21/17 (Ê)(Þ)(~) | 1,000 | 1,001 | 0.919% due 12/20/16 (ç)(Þ)(~) | 2,500 | 2,497 | ||||
| Bank of America NA | Ontario Teachers' Finance Trust | ||||||||
| 1.287% due 02/14/17 (Ê) | 1,905 | 1,907 | 0.997% due 12/02/16 (ç)(Þ)(~) | 1,000 | 999 | ||||
| Barton Capital SA | Optima Specialty Steel, Inc. | ||||||||
| 0.889% due 11/10/16 (ç)(Þ)(~) | 2,400 | 2,399 | 12.500% due 12/15/16 (Å) | 2,030 | 1,857 | ||||
| CAFCO LLC | 12.000% due 12/30/16 (Å) | 3,700 | 3,469 | ||||||
| 0.895% due 12/12/16 (ç)(Þ)(~) | 2,000 | 1,998 | Pfizer, Inc. | ||||||
| Citigroup, Inc. | 0.967% due 05/15/17 (Ê) | 1,835 | 1,836 | ||||||
| 1.497% due 11/15/16 (Ê) | 2,225 | 2,226 | Russell U.S. Cash Management Fund | 171,837,055 | (8) | 171,871 | |||
| CRC Funding LLC | Thunder Bay Funding LLC | ||||||||
| 0.713% due 01/05/17 (Þ)(~) | 600 | 599 | 0.897% due 12/15/16 (ç)(Þ)(~) | 700 | 699 | ||||
| eBay, Inc. | Toyota Motor Credit Corp. | ||||||||
| 1.090% due 07/28/17 (Ê) | 2,625 | 2,624 | 1.018% due 05/16/17 (Ê) | 1,445 | 1,446 | ||||
| Foresight Energy LLC / Foresight Energy | 1.188% due 07/03/17 (~) | 500 | 500 | ||||||
| Finance Corp. | United States Treasury Bills | ||||||||
| 15.000% due 10/03/17 (Å) | 3,038 | 2,901 | 0.170% due 12/01/16 (ç)(~) | 15,000 | 14,998 | ||||
| General Electric Co. | |||||||||
| 0.987% due 02/15/17 (Ê) | 2,000 | 2,001 | 0.265% due 01/05/17 (§)(~) | 13,600 | 13,593 | ||||
| General Mills, Inc. | Victory Receivables Corp. | ||||||||
| 5.700% due 02/15/17 | 500 | 507 | 1.012% due 12/22/16 (ç)(Þ)(~) | 2,800 | 2,796 | ||||
| Gotham Funding Corp. | Vodafone Group PLC | ||||||||
| 1.010% due 12/22/16 (ç)(Þ)(~) | 500 | 499 | 1.635% due 09/05/17 (Þ)(~) | 3,000 | 2,959 | ||||
| Wells Fargo Bank NA | |||||||||
| 0.797% due 01/03/17 (Þ)(~) | 1,100 | 1,099 | Series CD | ||||||
| Honda Auto Receivables Owner Trust | 1.280% due 04/13/17 (Ê)(~) | 1,800 | 1,801 | ||||||
| Series 2015-2 Class A2 | |||||||||
See accompanying notes which are an integral part of the financial statements.
Russell Global Opportunistic Credit Fund 355
Russell Investment Company
Russell Global Opportunistic Credit Fund
Schedule of Investments, continued — October 31, 2016
| Amounts in thousands (except share amounts) | ||||
| Principal | Fair | |||
| Amount ($) | Value | |||
| or Shares | $ | |||
| 268,676 | ||||
| Venezuela, Bolivarian Republic of - 0.1% | ||||
| Petroleos de Venezuela SA | ||||
| Series REGS | ||||
| 5.250% due 04/12/17 | 1,600 | 1,288 | ||
| Total Short-Term Investments | ||||
| (cost $288,610) | 288,020 | |||
| Total Investments 98.1% | ||||
| (identified cost $2,005,313) | 1,993,734 | |||
| Other Assets and Liabilities, Net | ||||
| - 1.9% | 39,437 | |||
| Net Assets - 100.0% | 2,033,171 | |||
See accompanying notes which are an integral part of the financial statements.
356 Russell Global Opportunistic Credit Fund
Russell Investment Company
Russell Global Opportunistic Credit Fund
Schedule of Investments, continued — October 31, 2016
| Restricted Securities | |||||||||||||
| Amounts in thousands (except share and cost per unit amounts) | |||||||||||||
| Principal | Cost per | Cost | Fair Value | ||||||||||
| % of Net Assets | Acquisition | Amount ($) | Unit | (000 | ) | (000 | ) | ||||||
| Securities | Date | or shares | $ | $ | $ | ||||||||
| 2.9% | |||||||||||||
| Alliant Holdings Intermediate LLC | 07/15/16 | 5,600,000 | 99.79 | 5,588 | 5,698 | ||||||||
| Avis Budget Car Rental LLC / Avis Budget Finance, Inc. | 03/15/16 | 61,000 | 100.00 | 61 | 61 | ||||||||
| BCP Finance Bank, Ltd. | 04/01/16 | EUR | 600,000 | 110.69 | 664 | 593 | |||||||
| Century Aluminum Co. | 05/23/13 | 10,395,000 | 100.57 | 10,454 | 9,459 | ||||||||
| Constellis Holdings LLC / Constellis Finance Corp. | 05/06/15 | 500,000 | 99.63 | 498 | 508 | ||||||||
| CPI Buyer LLC Covenant-Lite 2nd Lien Term Loan | 08/18/14 | 3,150,000 | 98.11 | 3,091 | 2,930 | ||||||||
| CPM Holdings, Inc. 2nd Lien Term Loan | 04/02/15 | 3,070,000 | 97.50 | 2,993 | 3,055 | ||||||||
| CSC Holdings LLC | 09/09/16 | 1,000,000 | 100.00 | 1,000 | 1,014 | ||||||||
| Diamond 1 Finance Corp. / Diamond 2 Finance Corp | 06/08/16 | 126,000 | 100.00 | 126 | 138 | ||||||||
| Diamond 1 Finance Corp. / Diamond 2 Finance Corp | 06/08/16 | 177,000 | 100.00 | 177 | 187 | ||||||||
| Education Management Corp. | 07/07/16 | 1,564,221 | — | — | — | ||||||||
| Education Management Corp. | 10/07/16 | 2,128 | — | 297 | — | ||||||||
| Education Management LLC Term Loan B | 01/07/16 | 293,525 | 161.02 | 473 | 12 | ||||||||
| Foresight Energy LLC / Foresight Energy Finance Corp. | 08/26/16 | 8,457,000 | 79.63 | 6,734 | 8,013 | ||||||||
| Foresight Energy LLC / Foresight Energy Finance Corp. | 08/26/16 | 3,038,000 | 91.47 | 2,779 | 2,901 | ||||||||
| Foresight Energy LP | 08/26/16 | 13,090 | — | — | 89 | ||||||||
| FPC Holdings, Inc. 2nd Lien Term Loan | 05/23/13 | 2,000,000 | 98.00 | 1,960 | 1,392 | ||||||||
| International Automotive Components Group SA | 05/09/16 | 804,000 | 95.46 | 767 | 762 | ||||||||
| Iron Mountain US Holdings, Inc. | 05/24/16 | 245,000 | 100.00 | 245 | 247 | ||||||||
| Iron Mountain, Inc. | 05/24/16 | 245,000 | 100.00 | 245 | 253 | ||||||||
| La Mondiale SAM | 08/30/16 | EUR | 920,000 | 96.28 | 886 | 894 | |||||||
| Mallinckrodt International Finance SA | 09/09/15 | 82,000 | 100.00 | 82 | 77 | ||||||||
| Optima Specialty Steel, Inc. | 11/30/11 | 2,030,000 | 99.87 | 2,027 | 1,857 | ||||||||
| Optima Specialty Steel, Inc. | 01/20/15 | 3,700,000 | 100.00 | 3,700 | 3,469 | ||||||||
| Oschadbank Via SSB #1 PLC | 12/10/15 | 2,800,000 | 72.44 | 2,028 | 2,213 | ||||||||
| Patterson Co. 2nd Lien Term Loan | 08/14/15 | 3,490,000 | 99.00 | 3,455 | 3,385 | ||||||||
| Radio One, Inc. | 02/02/16 | 100,000 | 92.29 | 92 | 101 | ||||||||
| Santander Perpetual SAU | 05/09/16 | 170,000 | 98.01 | 167 | 156 | ||||||||
| Sequa Corp. | 12/18/13 | 2,095,000 | 100.08 | 2,097 | 1,131 | ||||||||
| Skipton Building Society | 05/03/16 | GBP | 262,000 | 134.15 | 351 | 301 | |||||||
| Societe Generale SA | 07/20/16 | 800,000 | 94.53 | 756 | 784 | ||||||||
| Solera LLC / Solera Finance, Inc. | 02/29/16 | 480,000 | 95.27 | 457 | 537 | ||||||||
| Sparekassen Sjaelland-Fyn AS | 04/04/16 | DKK | 2,000,000 | 15.28 | 306 | 310 | |||||||
| Suncoke Energy Partners LP | 01/13/15 | 1,990,000 | 100.64 | 2,003 | 1,915 | ||||||||
| TIAA CLO I, Ltd. | 06/03/16 | 683,000 | 92.11 | 629 | 675 | ||||||||
| TMS International Corp. | 10/08/13 | 2,420,000 | 102.22 | 2,474 | 1,997 | ||||||||
| UTEX Industries, Inc. Covenant-Lite 2nd Lien Term Loan B | 05/16/14 | 890,000 | 99.50 | 886 | 449 | ||||||||
| Washington Inventory Service 2nd Lien Term Loan | 01/10/13 | 2,600,000 | 97.50 | 2,535 | 520 | ||||||||
| Zais CLO 5, Ltd. | 09/23/16 | 1,000,000 | 95.54 | 955 | 955 | ||||||||
| 59,038 | |||||||||||||
| For a description of restricted securities see note 8 in the Notes to Financial Statements. | |||||||||||||
| Futures Contracts | |||||||||||||
| Amounts in thousands (except contract amounts) | |||||||||||||
| Unrealized | |||||||||||||
| Appreciation | |||||||||||||
| Number of | Notional | Expiration | (Depreciation) | ||||||||||
| Contracts | Amount | Date | $ | ||||||||||
| Long Positions | |||||||||||||
| Australia 10 Year Bond Futures | 1,337 | AUD | 177,316 | 12/16 | (2,859 | ) | |||||||
| Euro-Bobl Futures | 86 | EUR | 11,276 | 12/16 | (69 | ) | |||||||
| Euro-Bund Futures | 17 | EUR | 2,757 | 12/16 | (53 | ) | |||||||
| Euro-Schatz Futures | 77 | EUR | 8,622 | 12/16 | (8 | ) | |||||||
| Long Gilt Futures | 19 | GBP | 2,381 | 12/16 | (139 | ) | |||||||
| United States 2 Year Treasury Note Futures | 440 | USD | 95,982 | 12/16 | 22 | ||||||||
| United States 5 Year Treasury Note Futures | 763 | USD | 92,168 | 12/16 | (197 | ) | |||||||
| United States 10 Year Treasury Note Futures | 1,977 | USD | 256,269 | 12/16 | (2,304 | ) | |||||||
| United States Long Bond Futures | 207 | USD | 33,683 | 12/16 | (1,370 | ) | |||||||
| United States Ultra Bond Futures | 9 | USD | 1,583 | 12/16 | (84 | ) | |||||||
| Short Positions | |||||||||||||
| Euro-Bund Futures | 700 | EUR | 113,519 | 12/16 | 2,132 | ||||||||
See accompanying notes which are an integral part of the financial statements.
Russell Global Opportunistic Credit Fund 357
Russell Investment Company
Russell Global Opportunistic Credit Fund
Schedule of Investments, continued — October 31, 2016
| Futures Contracts | ||||||||
| Amounts in thousands (except contract amounts) | ||||||||
| Long Gilt Futures | 843 | GBP | 105,661 | 12/16 | 5,189 | |||
| Total Unrealized Appreciation (Depreciation) on Open Futures Contracts (å) | 260 | |||||||
| Foreign Currency Exchange Contracts | ||||||||
| Amounts in thousands | ||||||||
| Unrealized | ||||||||
| Appreciation | ||||||||
| Amount | Amount | (Depreciation) | ||||||
| Counterparty | Sold | Bought | Settlement Date | $ | ||||
| Bank of America | USD | 59 | BRL | 199 | 11/21/16 | 3 | ||
| Bank of America | USD | 82 | BRL | 266 | 11/21/16 | — | ||
| Bank of America | USD | 274 | BRL | 908 | 11/21/16 | 9 | ||
| Bank of America | USD | 1,519 | BRL | 4,944 | 11/21/16 | 21 | ||
| Bank of America | USD | 15 | COP | 43,842 | 11/21/16 | — | ||
| Bank of America | USD | 281 | COP | 832,002 | 11/21/16 | (5 | ) | |
| Bank of America | USD | 1,550 | COP | 4,595,518 | 11/21/16 | (27 | ) | |
| Bank of America | USD | 189 | CZK | 4,638 | 11/21/16 | — | ||
| Bank of America | USD | 37 | HUF | 10,307 | 11/21/16 | (1 | ) | |
| Bank of America | USD | 113 | HUF | 31,550 | 11/21/16 | (1 | ) | |
| Bank of America | USD | 949 | HUF | 261,377 | 11/21/16 | (20 | ) | |
| Bank of America | USD | 5,289 | HUF | 1,458,170 | 11/21/16 | (106 | ) | |
| Bank of America | USD | 68 | IDR | 901,280 | 11/21/16 | 1 | ||
| Bank of America | USD | 119 | PLN | 468 | 11/21/16 | 1 | ||
| Bank of America | USD | 945 | PLN | 3,606 | 11/21/16 | (26 | ) | |
| Bank of America | USD | 5,281 | PLN | 20,039 | 11/21/16 | (177 | ) | |
| Bank of America | USD | 39 | RUB | 2,558 | 11/21/16 | 1 | ||
| Bank of America | USD | 88 | RUB | 5,631 | 11/21/16 | — | ||
| Bank of America | USD | 278 | RUB | 18,280 | 11/21/16 | 9 | ||
| Bank of America | USD | 1,557 | RUB | 101,785 | 11/21/16 | 40 | ||
| Bank of America | USD | 86 | TRY | 270 | 11/21/16 | 1 | ||
| Bank of America | USD | 279 | TRY | 835 | 11/21/16 | (11 | ) | |
| Bank of America | USD | 288 | TRY | 900 | 11/21/16 | 2 | ||
| Bank of America | USD | 931 | TRY | 2,783 | 11/21/16 | (35 | ) | |
| Bank of America | USD | 1,560 | TRY | 4,659 | 11/21/16 | (60 | ) | |
| Bank of America | USD | 5,199 | TRY | 15,530 | 11/21/16 | (201 | ) | |
| Bank of America | USD | 4 | TWD | 134 | 11/21/16 | — | ||
| Bank of America | BRL | 80 | USD | 25 | 11/21/16 | — | ||
| Bank of America | BRL | 665 | USD | 196 | 11/21/16 | (11 | ) | |
| Bank of America | BRL | 3,026 | USD | 914 | 11/21/16 | (29 | ) | |
| Bank of America | BRL | 16,479 | USD | 5,063 | 11/21/16 | (71 | ) | |
| Bank of America | COP | 18,973 | USD | 6 | 11/21/16 | — | ||
| Bank of America | CZK | 1,392 | USD | 57 | 11/21/16 | — | ||
| Bank of America | HUF | 9,465 | USD | 34 | 11/21/16 | — | ||
| Bank of America | HUF | 34,357 | USD | 125 | 11/21/16 | 2 | ||
| Bank of America | HUF | 78,413 | USD | 285 | 11/21/16 | 6 | ||
| Bank of America | HUF | 437,451 | USD | 1,593 | 11/21/16 | 38 | ||
| Bank of America | IDR | 404,912 | USD | 31 | 11/21/16 | — | ||
| Bank of America | IDR | 12,441,200 | USD | 934 | 11/21/16 | (19 | ) | |
| Bank of America | IDR | 68,980,360 | USD | 5,215 | 11/21/16 | (65 | ) | |
| Bank of America | MYR | 269 | USD | 65 | 11/21/16 | 1 | ||
| Bank of America | MYR | 963 | USD | 228 | 11/21/16 | (1 | ) | |
| Bank of America | MYR | 3,786 | USD | 941 | 11/21/16 | 39 | ||
| Bank of America | MYR | 21,057 | USD | 5,249 | 11/21/16 | 238 | ||
| Bank of America | PLN | 13 | USD | 3 | 11/21/16 | — | ||
| Bank of America | RUB | 767 | USD | 12 | 11/21/16 | — | ||
| Bank of America | RUB | 1,689 | USD | 27 | 11/21/16 | — | ||
| Bank of America | RUB | 60,933 | USD | 928 | 11/21/16 | (29 | ) | |
| Bank of America | RUB | 339,282 | USD | 5,173 | 11/21/16 | (152 | ) | |
See accompanying notes which are an integral part of the financial statements.
358 Russell Global Opportunistic Credit Fund
Russell Investment Company
Russell Global Opportunistic Credit Fund
Schedule of Investments, continued — October 31, 2016
| Foreign Currency Exchange Contracts | |||||||
| Amounts in thousands | |||||||
| Unrealized | |||||||
| Appreciation | |||||||
| Amount | Amount | (Depreciation) | |||||
| Counterparty | Sold | Bought | Settlement Date | $ | |||
| Bank of America | TRY | 22 | USD | 7 | 11/21/16 | — | |
| Bank of America | TRY | 75 | USD | 25 | 11/21/16 | 1 | |
| Bank of America | TWD | 832 | USD | 26 | 11/21/16 | — | |
| Bank of America | TWD | 8,899 | USD | 284 | 11/21/16 | 2 | |
| Bank of America | TWD | 49,369 | USD | 1,596 | 11/21/16 | 31 | |
| Bank of Montreal | USD | 10,438 | CAD | 13,650 | 11/21/16 | (259 | ) |
| Bank of Montreal | USD | 10,294 | EUR | 9,350 | 11/21/16 | (23 | ) |
| Bank of Montreal | CHF | 3,057 | USD | 3,093 | 11/21/16 | 1 | |
| Bank of Montreal | CHF | 10,190 | USD | 10,311 | 11/21/16 | 3 | |
| Bank of Montreal | HKD | 2,210 | USD | 285 | 11/21/16 | — | |
| Bank of Montreal | HKD | 12,236 | USD | 1,579 | 11/21/16 | 1 | |
| Bank of New York | USD | 10,398 | GBP | 8,459 | 11/21/16 | (40 | ) |
| Bank of New York | USD | 14,374 | JPY | 1,493,290 | 11/21/16 | (126 | ) |
| Bank of New York | GBP | 11,843 | USD | 14,557 | 11/21/16 | 57 | |
| Bank of New York | ILS | 39,262 | USD | 10,276 | 11/21/16 | 37 | |
| Barclays | USD | 75 | BRL | 237 | 11/03/16 | — | |
| Barclays | USD | 205 | BRL | 641 | 11/03/16 | (4 | ) |
| Barclays | USD | 205 | BRL | 641 | 11/03/16 | (4 | ) |
| Barclays | USD | 234 | BRL | 745 | 11/03/16 | (1 | ) |
| Barclays | USD | 852 | BRL | 2,711 | 11/03/16 | (3 | ) |
| Barclays | USD | 1,030 | COP | 3,055,028 | 11/17/16 | (17 | ) |
| Barclays | USD | 684 | HUF | 190,117 | 11/17/16 | (9 | ) |
| Barclays | USD | 1,178 | HUF | 321,556 | 11/17/16 | (35 | ) |
| Barclays | USD | 51 | MXN | 945 | 11/17/16 | (1 | ) |
| Barclays | USD | 1,538 | MXN | 29,690 | 11/17/16 | 31 | |
| Barclays | USD | 1,058 | PEN | 3,622 | 11/21/16 | 16 | |
| Barclays | USD | 1,463 | PHP | 70,755 | 11/17/16 | (4 | ) |
| Barclays | USD | 1,944 | PLN | 7,466 | 11/17/16 | (41 | ) |
| Barclays | USD | 738 | RON | 2,954 | 11/17/16 | (18 | ) |
| Barclays | USD | 1,445 | RUB | 90,839 | 11/17/16 | (17 | ) |
| Barclays | USD | 710 | SGD | 988 | 11/17/16 | — | |
| Barclays | USD | 1,609 | TRY | 4,952 | 11/17/16 | (14 | ) |
| Barclays | USD | 494 | ZAR | 6,897 | 11/18/16 | 16 | |
| Barclays | USD | 2,219 | ZAR | 32,293 | 11/18/16 | 168 | |
| Barclays | BRL | 237 | USD | 72 | 11/03/16 | (2 | ) |
| Barclays | BRL | 641 | USD | 202 | 11/03/16 | 1 | |
| Barclays | BRL | 641 | USD | 202 | 11/03/16 | 1 | |
| Barclays | BRL | 745 | USD | 237 | 11/03/16 | 3 | |
| Barclays | BRL | 2,711 | USD | 832 | 11/03/16 | (17 | ) |
| Barclays | BRL | 641 | USD | 203 | 12/02/16 | 4 | |
| Barclays | BRL | 641 | USD | 203 | 12/02/16 | 4 | |
| Barclays | CLP | 1,259,796 | USD | 1,881 | 11/17/16 | (46 | ) |
| Barclays | IDR | 4,546,209 | USD | 349 | 11/17/16 | 1 | |
| Barclays | IDR | 23,495,041 | USD | 1,800 | 11/17/16 | 1 | |
| Barclays | IDR | 24,495,519 | USD | 1,876 | 11/17/16 | — | |
| Barclays | PEN | 470 | USD | 139 | 11/21/16 | — | |
| Barclays | PEN | 471 | USD | 140 | 11/21/16 | — | |
| Barclays | PEN | 630 | USD | 184 | 11/21/16 | (2 | ) |
| Barclays | PEN | 919 | USD | 273 | 11/21/16 | — | |
| Barclays | PEN | 1,051 | USD | 308 | 11/21/16 | (4 | ) |
| Barclays | PEN | 1,051 | USD | 307 | 11/21/16 | (5 | ) |
| Barclays | PEN | 1,311 | USD | 383 | 11/21/16 | (6 | ) |
| Barclays | PEN | 1,487 | USD | 435 | 11/21/16 | (6 | ) |
| Barclays | PHP | 20,000 | USD | 415 | 11/17/16 | 2 | |
| Barclays | PHP | 20,309 | USD | 420 | 11/17/16 | 1 | |
| Barclays | ZAR | 39,037 | USD | 2,672 | 11/18/16 | (215 | ) |
See accompanying notes which are an integral part of the financial statements.
Russell Global Opportunistic Credit Fund 359
Russell Investment Company
Russell Global Opportunistic Credit Fund
Schedule of Investments, continued — October 31, 2016
| Foreign Currency Exchange Contracts | |||||||
| Amounts in thousands | |||||||
| Unrealized | |||||||
| Appreciation | |||||||
| Amount | Amount | (Depreciation) | |||||
| Counterparty | Sold | Bought | Settlement Date | $ | |||
| Citigroup | USD | 450 | MYR | 1,876 | 11/17/16 | (3 | ) |
| Citigroup | USD | 3,141 | NZD | 4,374 | 11/21/16 | (15 | ) |
| Citigroup | USD | 14,656 | NZD | 20,412 | 11/21/16 | (71 | ) |
| Citigroup | USD | 1,463 | PHP | 70,755 | 11/17/16 | (4 | ) |
| Citigroup | USD | 739 | RON | 2,954 | 11/17/16 | (19 | ) |
| Citigroup | USD | 1,400 | SGD | 1,938 | 11/17/16 | (7 | ) |
| Citigroup | IDR | 23,495,041 | USD | 1,803 | 11/17/16 | 4 | |
| Citigroup | SEK | 27,276 | USD | 3,096 | 11/21/16 | 74 | |
| Citigroup | SEK | 127,290 | USD | 14,449 | 11/21/16 | 343 | |
| Citigroup | SGD | 2,279 | USD | 1,661 | 11/17/16 | 23 | |
| Citigroup | SGD | 2,279 | USD | 1,661 | 11/17/16 | 23 | |
| Credit Agricole | EUR | 12,350 | USD | 13,638 | 11/15/16 | 74 | |
| Credit Agricole | GBP | 2,206 | USD | 2,692 | 11/15/16 | (9 | ) |
| HSBC | USD | 684 | HUF | 190,117 | 11/17/16 | (8 | ) |
| HSBC | SGD | 2,279 | USD | 1,661 | 11/17/16 | 23 | |
| JPMorgan Chase | USD | 205 | BRL | 641 | 11/03/16 | (4 | ) |
| JPMorgan Chase | USD | 205 | BRL | 641 | 11/03/16 | (4 | ) |
| JPMorgan Chase | USD | 482 | BRL | 1,533 | 11/03/16 | (2 | ) |
| JPMorgan Chase | USD | 852 | BRL | 2,711 | 11/03/16 | (3 | ) |
| JPMorgan Chase | USD | 410 | CLP | 267,976 | 11/17/16 | — | |
| JPMorgan Chase | USD | 1,391 | HUF | 385,686 | 11/17/16 | (20 | ) |
| JPMorgan Chase | USD | 1,738 | HUF | 482,156 | 11/17/16 | (23 | ) |
| JPMorgan Chase | USD | 2,778 | HUF | 771,450 | 11/17/16 | (36 | ) |
| JPMorgan Chase | USD | 1,538 | MXN | 29,690 | 11/17/16 | 30 | |
| JPMorgan Chase | USD | 1,057 | PEN | 3,622 | 11/21/16 | 18 | |
| JPMorgan Chase | USD | 1,462 | PHP | 70,755 | 11/17/16 | (4 | ) |
| JPMorgan Chase | USD | 1,943 | PLN | 7,466 | 11/17/16 | (40 | ) |
| JPMorgan Chase | USD | 738 | RON | 2,954 | 11/17/16 | (18 | ) |
| JPMorgan Chase | USD | 4,911 | THB | 171,279 | 11/17/16 | (19 | ) |
| JPMorgan Chase | USD | 1,609 | TRY | 4,952 | 11/17/16 | (14 | ) |
| JPMorgan Chase | BRL | 641 | USD | 202 | 11/03/16 | 1 | |
| JPMorgan Chase | BRL | 641 | USD | 202 | 11/03/16 | 1 | |
| JPMorgan Chase | BRL | 1,533 | USD | 468 | 11/03/16 | (13 | ) |
| JPMorgan Chase | BRL | 2,711 | USD | 832 | 11/03/16 | (17 | ) |
| JPMorgan Chase | BRL | 641 | USD | 203 | 12/02/16 | 4 | |
| JPMorgan Chase | BRL | 641 | USD | 203 | 12/02/16 | 4 | |
| JPMorgan Chase | CLP | 1,259,796 | USD | 1,883 | 11/17/16 | (43 | ) |
| JPMorgan Chase | IDR | 46,990,083 | USD | 3,602 | 11/17/16 | 3 | |
| JPMorgan Chase | MYR | 2,927 | USD | 697 | 11/17/16 | — | |
| JPMorgan Chase | SGD | 2,279 | USD | 1,661 | 11/17/16 | 23 | |
| JPMorgan Chase | ZAR | 39,037 | USD | 2,674 | 11/18/16 | (211 | ) |
| Standard Chartered | USD | 310 | ARS | 5,441 | 11/23/16 | 44 | |
| Standard Chartered | USD | 204 | BRL | 649 | 11/03/16 | (1 | ) |
| Standard Chartered | USD | 205 | BRL | 641 | 11/03/16 | (4 | ) |
| Standard Chartered | USD | 205 | BRL | 641 | 11/03/16 | (4 | ) |
| Standard Chartered | USD | 223 | BRL | 711 | 11/03/16 | (1 | ) |
| Standard Chartered | USD | 750 | BRL | 2,421 | 11/03/16 | 8 | |
| Standard Chartered | USD | 852 | BRL | 2,711 | 11/03/16 | (3 | ) |
| Standard Chartered | USD | 2,540 | BRL | 8,198 | 11/03/16 | 29 | |
| Standard Chartered | USD | 413 | HUF | 114,662 | 11/17/16 | (5 | ) |
| Standard Chartered | USD | 957 | HUF | 261,147 | 11/17/16 | (28 | ) |
| Standard Chartered | USD | 1,539 | MXN | 29,690 | 11/17/16 | 30 | |
| Standard Chartered | USD | 1,058 | PEN | 3,622 | 11/21/16 | 17 | |
| Standard Chartered | USD | 1,463 | PHP | 70,755 | 11/17/16 | (4 | ) |
| Standard Chartered | USD | 883 | PLN | 3,474 | 11/03/16 | 3 | |
| Standard Chartered | USD | 1,944 | PLN | 7,466 | 11/17/16 | (41 | ) |
See accompanying notes which are an integral part of the financial statements.
360 Russell Global Opportunistic Credit Fund
Russell Investment Company
Russell Global Opportunistic Credit Fund
Schedule of Investments, continued — October 31, 2016
| Foreign Currency Exchange Contracts | |||||||
| Amounts in thousands | |||||||
| Unrealized | |||||||
| Appreciation | |||||||
| Amount | Amount | (Depreciation) | |||||
| Counterparty | Sold | Bought | Settlement Date | $ | |||
| Standard Chartered | USD | 310 | RON | 1,274 | 11/17/16 | 1 | |
| Standard Chartered | USD | 1,445 | RUB | 90,839 | 11/17/16 | (17 | ) |
| Standard Chartered | USD | 544 | TRY | 1,685 | 11/02/16 | — | |
| Standard Chartered | USD | 250 | TRY | 777 | 11/17/16 | — | |
| Standard Chartered | USD | 1,609 | TRY | 4,952 | 11/17/16 | (14 | ) |
| Standard Chartered | USD | 166 | ZAR | 2,239 | 11/02/16 | — | |
| Standard Chartered | USD | 734 | ZAR | 10,800 | 11/18/16 | 64 | |
| Standard Chartered | USD | 741 | ZAR | 10,806 | 11/18/16 | 58 | |
| Standard Chartered | USD | 1,366 | ZAR | 19,940 | 11/18/16 | 107 | |
| Standard Chartered | BRL | 641 | USD | 202 | 11/03/16 | 1 | |
| Standard Chartered | BRL | 641 | USD | 202 | 11/03/16 | 1 | |
| Standard Chartered | BRL | 649 | USD | 206 | 11/03/16 | 3 | |
| Standard Chartered | BRL | 711 | USD | 215 | 11/03/16 | (8 | ) |
| Standard Chartered | BRL | 1,548 | USD | 486 | 11/03/16 | 1 | |
| Standard Chartered | BRL | 2,421 | USD | 761 | 11/03/16 | 3 | |
| Standard Chartered | BRL | 2,711 | USD | 832 | 11/03/16 | (17 | ) |
| Standard Chartered | BRL | 8,198 | USD | 2,577 | 11/03/16 | 9 | |
| Standard Chartered | BRL | 641 | USD | 203 | 12/02/16 | 4 | |
| Standard Chartered | BRL | 641 | USD | 203 | 12/02/16 | 4 | |
| Standard Chartered | BRL | 2,460 | USD | 770 | 12/02/16 | 6 | |
| Standard Chartered | CLP | 1,259,796 | USD | 1,882 | 11/17/16 | (45 | ) |
| Standard Chartered | HUF | 185,499 | USD | 660 | 11/17/16 | — | |
| Standard Chartered | MXN | 7,288 | USD | 387 | 11/03/16 | 2 | |
| Standard Chartered | MXN | 10,927 | USD | 580 | 11/17/16 | 3 | |
| Standard Chartered | MYR | 1,331 | USD | 320 | 11/17/16 | 3 | |
| Standard Chartered | MYR | 3,204 | USD | 763 | 11/17/16 | — | |
| Standard Chartered | PHP | 20,031 | USD | 415 | 11/17/16 | 2 | |
| Standard Chartered | THB | 12,605 | USD | 360 | 11/17/16 | — | |
| Standard Chartered | ZAR | 39,037 | USD | 2,673 | 11/18/16 | (214 | ) |
| State Street | USD | 3,141 | AUD | 4,097 | 11/21/16 | (26 | ) |
| State Street | USD | 37 | CZK | 881 | 11/21/16 | (1 | ) |
| State Street | USD | 955 | CZK | 22,798 | 11/21/16 | (28 | ) |
| State Street | USD | 5,334 | CZK | 127,104 | 11/21/16 | (167 | ) |
| State Street | USD | 148 | DKK | 1,000 | 12/08/16 | — | |
| State Street | USD | 5,166 | EUR | 4,686 | 11/04/16 | (21 | ) |
| State Street | USD | 3,079 | EUR | 2,800 | 12/08/16 | (1 | ) |
| State Street | USD | 28 | HKD | 215 | 11/21/16 | — | |
| State Street | USD | 14,486 | NOK | 118,702 | 11/21/16 | (119 | ) |
| State Street | USD | 8 | SGD | 11 | 11/21/16 | — | |
| State Street | USD | 165 | SGD | 229 | 11/21/16 | — | |
| State Street | USD | 948 | SGD | 1,274 | 11/21/16 | (32 | ) |
| State Street | USD | 5,285 | SGD | 7,060 | 11/21/16 | (209 | ) |
| State Street | USD | 4 | ZAR | 60 | 11/21/16 | — | |
| State Street | USD | 123 | ZAR | 1,760 | 11/21/16 | 8 | |
| State Street | USD | 278 | ZAR | 3,801 | 11/21/16 | 3 | |
| State Street | USD | 1,548 | ZAR | 20,916 | 11/21/16 | (2 | ) |
| State Street | CAD | 660 | USD | 514 | 12/08/16 | 22 | |
| State Street | CHF | 242 | USD | 247 | 11/04/16 | 3 | |
| State Street | CHF | 14,267 | USD | 14,432 | 11/21/16 | 1 | |
| State Street | CZK | 2,936 | USD | 122 | 11/21/16 | 3 | |
| State Street | CZK | 6,839 | USD | 287 | 11/21/16 | 9 | |
| State Street | CZK | 38,131 | USD | 1,600 | 11/21/16 | 50 | |
| State Street | DKK | 20,868 | USD | 3,087 | 11/21/16 | 4 | |
| State Street | DKK | 3,300 | USD | 500 | 12/08/16 | 12 | |
| State Street | EUR | 793 | USD | 872 | 11/04/16 | 2 | |
| State Street | EUR | 118,815 | USD | 132,858 | 11/04/16 | 2,418 |
See accompanying notes which are an integral part of the financial statements.
Russell Global Opportunistic Credit Fund 361
Russell Investment Company
Russell Global Opportunistic Credit Fund
Schedule of Investments, continued — October 31, 2016
| Foreign Currency Exchange Contracts | |||||||
| Amounts in thousands | |||||||
| Unrealized | |||||||
| Appreciation | |||||||
| Amount | Amount | (Depreciation) | |||||
| Counterparty | Sold | Bought | Settlement Date | $ | |||
| State Street | EUR | 47,600 | USD | 53,670 | 12/08/16 | 1,337 | |
| State Street | GBP | 20,497 | USD | 26,149 | 11/04/16 | 1,060 | |
| State Street | GBP | 1,000 | USD | 1,226 | 12/08/16 | 1 | |
| State Street | GBP | 5,000 | USD | 6,721 | 12/08/16 | 596 | |
| State Street | HKD | 169 | USD | 22 | 11/21/16 | — | |
| State Street | NOK | 84,787 | USD | 10,407 | 11/21/16 | 145 | |
| State Street | SGD | 3 | USD | 2 | 11/21/16 | — | |
| State Street | SGD | 69 | USD | 50 | 11/21/16 | — | |
| State Street | SGD | 382 | USD | 284 | 11/21/16 | 10 | |
| State Street | SGD | 2,118 | USD | 1,585 | 11/21/16 | 63 | |
| UBS | USD | 205 | BRL | 641 | 11/03/16 | (4 | ) |
| UBS | USD | 205 | BRL | 641 | 11/03/16 | (4 | ) |
| UBS | USD | 324 | BRL | 1,032 | 11/03/16 | (1 | ) |
| UBS | USD | 852 | BRL | 2,711 | 11/03/16 | (3 | ) |
| UBS | USD | 736 | HUF | 200,739 | 11/17/16 | (23 | ) |
| UBS | USD | 1,446 | RUB | 90,839 | 11/17/16 | (18 | ) |
| UBS | USD | 260 | SGD | 361 | 11/17/16 | — | |
| UBS | BRL | 641 | USD | 202 | 11/03/16 | 1 | |
| UBS | BRL | 641 | USD | 202 | 11/03/16 | 1 | |
| UBS | BRL | 1,032 | USD | 327 | 11/03/16 | 4 | |
| UBS | BRL | 2,711 | USD | 832 | 11/03/16 | (17 | ) |
| UBS | BRL | 641 | USD | 203 | 12/02/16 | 4 | |
| UBS | BRL | 641 | USD | 203 | 12/02/16 | 4 | |
| UBS | HUF | 170,054 | USD | 600 | 11/17/16 | (5 | ) |
| Total Unrealized Appreciation (Depreciation) on Open Foreign Currency Exchange Contracts | 3,946 | ||||||
| Credit Default Swap Contracts | |||||||||
| Amounts in thousands | |||||||||
| Credit Indices | |||||||||
| Fund (Pays)/ | |||||||||
| Receives | Termination | Fair Value | |||||||
| Reference Entity | Counterparty | Notional Amount | Fixed Rate | Date | $ | ||||
| CDX Emerging Markets Index | Goldman Sachs | USD | 51,000 | 1.000 | % | 12/20/21 | (3,300 | ) | |
| CDX Emerging Markets Index | Morgan Stanley | USD | 45,000 | 1.000 | % | 12/20/21 | (2,912 | ) | |
| CDX NA High Yield Index | Morgan Stanley | USD | 44,000 | 5.000 | % | 12/20/21 | 1,737 | ||
| CDX NA High Yield Index | Goldman Sachs | USD | 51,000 | 5.000 | % | 12/20/21 | 2,014 | ||
| iTraxx Europe Index | Goldman Sachs | EUR | 22,000 | 5.000 | % | 12/20/21 | 2,006 | ||
| iTraxx Europe Index | Morgan Stanley | EUR | 21,000 | 5.000 | % | 12/20/21 | 1,916 | ||
| Total Fair Value on Open Credit Indices Premiums Paid (Received) - $636 | 1,461 | ||||||||
| Presentation of Portfolio Holdings | |||||||||||||
| Amounts in thousands | |||||||||||||
| Fair Value | |||||||||||||
| Practical | |||||||||||||
| Portfolio Summary | Level 1 | Level 2 | Level 3 | Expedient (a) | Total | % of Net Assets | |||||||
| Long-Term Fixed Income Investments | |||||||||||||
| Argentina | — | 22,512 | — | — | 22,512 | 1.1 | |||||||
| Armenia | — | 1,034 | — | — | 1,034 | —* | |||||||
| Australia | — | 1,011 | — | — | 1,011 | —* | |||||||
See accompanying notes which are an integral part of the financial statements.
362 Russell Global Opportunistic Credit Fund
Russell Investment Company
Russell Global Opportunistic Credit Fund
Schedule of Investments, continued — October 31, 2016
| Presentation of Portfolio Holdings | |||||||||||||
| Amounts in thousands | |||||||||||||
| Fair Value | |||||||||||||
| Practical | |||||||||||||
| Portfolio Summary | Level 1 | Level 2 | Level 3 | Expedient (a) | Total | % of Net Assets | |||||||
| Austria | — | 3,242 | — | — | 3,242 | 0.2 | |||||||
| Azerbaijan | — | 1,991 | — | — | 1,991 | 0.1 | |||||||
| Bahrain | — | 2,125 | — | — | 2,125 | 0.1 | |||||||
| Belgium | — | 5,353 | — | — | 5,353 | 0.3 | |||||||
| Bermuda | — | 4,670 | — | — | 4,670 | 0.2 | |||||||
| Brazil | — | 40,794 | — | — | 40,794 | 2.0 | |||||||
| Canada | — | 41,848 | — | — | 41,848 | 2.1 | |||||||
| Chile | — | 6,193 | — | — | 6,193 | 0.3 | |||||||
| China | — | 5,550 | — | — | 5,550 | 0.3 | |||||||
| Colombia | — | 24,819 | — | — | 24,819 | 1.2 | |||||||
| Costa Rica | — | 6,018 | — | — | 6,018 | 0.3 | |||||||
| Croatia | — | 10,585 | — | — | 10,585 | 0.5 | |||||||
| Denmark | — | — | 310 | — | 310 | —* | |||||||
| Dominican Republic | — | 10,781 | — | — | 10,781 | 0.5 | |||||||
| Egypt | — | 8,181 | — | — | 8,181 | 0.4 | |||||||
| El Salvador | — | 8,678 | — | — | 8,678 | 0.4 | |||||||
| Ethiopia | — | 946 | — | — | 946 | —* | |||||||
| France | — | 41,002 | — | — | 41,002 | 2.0 | |||||||
| Gabon | — | 458 | — | — | 458 | —* | |||||||
| Germany | — | 17,727 | — | — | 17,727 | 0.9 | |||||||
| Ghana | — | 5,971 | — | — | 5,971 | 0.3 | |||||||
| Greece | — | 3,186 | — | — | 3,186 | 0.2 | |||||||
| Honduras | — | 3,211 | — | — | 3,211 | 0.2 | |||||||
| Hungary | — | 16,622 | — | — | 16,622 | 0.8 | |||||||
| Indonesia | — | 54,879 | — | — | 54,879 | 2.7 | |||||||
| Iraq | — | 3,818 | — | — | 3,818 | 0.2 | |||||||
| Ireland | — | 18,269 | — | — | 18,269 | 0.9 | |||||||
| Israel | — | 7,361 | — | — | 7,361 | 0.4 | |||||||
| Italy | — | 23,986 | — | — | 23,986 | 1.2 | |||||||
| Ivory Coast | — | 1,455 | — | — | 1,455 | 0.1 | |||||||
| Japan | — | 555 | — | — | 555 | —* | |||||||
| Jersey | — | 898 | — | — | 898 | —* | |||||||
| Kazakhstan | — | 14,577 | — | — | 14,577 | 0.7 | |||||||
| Kenya | — | 3,067 | — | — | 3,067 | 0.2 | |||||||
| Lebanon | — | 3,210 | — | — | 3,210 | 0.2 | |||||||
| Luxembourg | — | 85,908 | — | — | 85,908 | 4.2 | |||||||
| Malaysia | — | 20,651 | — | — | 20,651 | 1.0 | |||||||
| Mexico | — | 56,703 | — | — | 56,703 | 2.8 | |||||||
| Mongolia | — | 7,584 | — | — | 7,584 | 0.4 | |||||||
| Morocco | — | 1,406 | — | — | 1,406 | 0.1 | |||||||
| Mozambique | — | 584 | — | — | 584 | —* | |||||||
| Netherlands | — | 52,150 | — | — | 52,150 | 2.6 | |||||||
| Nigeria | — | 994 | — | — | 994 | —* | |||||||
See accompanying notes which are an integral part of the financial statements.
Russell Global Opportunistic Credit Fund 363
Russell Investment Company
Russell Global Opportunistic Credit Fund
Schedule of Investments, continued — October 31, 2016
| Presentation of Portfolio Holdings | ||||||||||||
| Amounts in thousands | ||||||||||||
| Fair Value | ||||||||||||
| Practical | ||||||||||||
| Portfolio Summary | Level 1 | Level 2 | Level 3 | Expedient (a) | Total | % of Net Assets | ||||||
| Norway | — | 504 | — | — | 504 | —* | ||||||
| Pakistan | — | 11,431 | — | — | 11,431 | 0.6 | ||||||
| Panama | — | 8,839 | — | — | 8,839 | 0.4 | ||||||
| Paraguay | — | 3,924 | — | — | 3,924 | 0.2 | ||||||
| Peru | — | 14,670 | — | — | 14,670 | 0.7 | ||||||
| Philippines | — | 3,373 | — | — | 3,373 | 0.2 | ||||||
| Poland | — | 24,600 | — | — | 24,600 | 1.2 | ||||||
| Portugal | — | 132 | — | — | 132 | —* | ||||||
| Romania | — | 7,124 | — | — | 7,124 | 0.3 | ||||||
| Russia | — | 14,678 | — | — | 14,678 | 0.7 | ||||||
| Serbia | — | 7,225 | — | — | 7,225 | 0.4 | ||||||
| Singapore | — | 786 | — | — | 786 | —* | ||||||
| Slovenia | — | 2,338 | — | — | 2,338 | 0.1 | ||||||
| South Africa | — | 43,955 | — | — | 43,955 | 2.2 | ||||||
| Spain | — | 7,850 | — | — | 7,850 | 0.4 | ||||||
| Sri Lanka | — | 9,781 | — | — | 9,781 | 0.5 | ||||||
| Sweden | — | 602 | — | — | 602 | —* | ||||||
| Switzerland | — | 1,386 | — | — | 1,386 | 0.1 | ||||||
| Thailand | — | 16,890 | — | — | 16,890 | 0.8 | ||||||
| Turkey | — | 39,800 | — | — | 39,800 | 2.0 | ||||||
| Ukraine | — | 9,660 | — | — | 9,660 | 0.5 | ||||||
| United Kingdom | — | 93,746 | — | — | 93,746 | 4.6 | ||||||
| United States | — | 689,700 | 3,055 | — | 692,755 | 34.1 | ||||||
| Venezuela, Bolivarian Republic of | — | 23,976 | — | — | 23,976 | 1.2 | ||||||
| Vietnam | — | 1,671 | — | — | 1,671 | 0.1 | ||||||
| Virgin Islands, British | — | 4,819 | — | — | 4,819 | 0.2 | ||||||
| Common Stocks | — | 26 | 2 | — | 28 | —* | ||||||
| Preferred Stocks | 6,209 | — | — | — | 6,209 | 0.3 | ||||||
| Warrants & Rights | — | — | 89 | — | 89 | —* | ||||||
| Short-Term Investments | — | 112,680 | 3,469 | 171,871 | 288,020 | 14.2 | ||||||
| Total Investments | 6,209 | 1,808,729 | 6,925 | 171,871 | 1,993,734 | 98.1 | ||||||
| Other Assets and Liabilities, Net | 1.9 | |||||||||||
| 100.0 | ||||||||||||
See accompanying notes which are an integral part of the financial statements.
364 Russell Global Opportunistic Credit Fund
Russell Investment Company
Russell Global Opportunistic Credit Fund
Schedule of Investments, continued — October 31, 2016
| Presentation of Portfolio Holdings | |||||||||||||||||
| Amounts in thousands | |||||||||||||||||
| Fair Value | |||||||||||||||||
| Practical | |||||||||||||||||
| Portfolio Summary | Level 1 | Level 2 | Level 3 | Expedient (a) | Total | % of Net Assets | |||||||||||
| Other Financial Instruments | |||||||||||||||||
| Assets | |||||||||||||||||
| Futures Contracts | 7,343 | — | — | — | 7,343 | 0.4 | |||||||||||
| Foreign Currency Exchange Contracts | 6 | 7,600 | — | — | 7,606 | 0.4 | |||||||||||
| Credit Default Swap Contracts | — | 7,673 | — | — | 7,673 | 0.4 | |||||||||||
| Liabilities | |||||||||||||||||
| Futures Contracts | (7,083 | ) | — | — | — | (7,083 | ) | (0.3 | ) | ||||||||
| Foreign Currency Exchange Contracts | — | (3,660 | ) | — | — | (3,660 | ) | (0.2 | ) | ||||||||
| Credit Default Swap Contracts | — | (6,212 | ) | — | — | (6,212 | ) | (0.3 | ) | ||||||||
| Total Other Financial Instruments** | $ | 266 | $ | 5,401 | $ | — | $ | — | $ | 5,667 | |||||||
* Less than 0.05% of net assets.
** Futures and foreign currency exchange contract values reflect the unrealized appreciation (depreciation) on the investments.
(a) Certain investments that are measured at fair value using the net asset value per share (or its equivalent) practical expedient have not been classified
in the fair value levels. The fair value amounts presented in the table are intended to permit reconciliation to the amounts presented in the Schedule of
Investments.
For a description of the Levels see note 2, in the Notes to Financial Statements.
For a disclosure on transfers between Levels 1, 2 and 3 during the period ended October 31, 2016, see note 2 in the Notes to
Financial Statements.
Investments in which significant unobservable inputs (Level 3) were used in determining a fair value for the period ended October
31, 2016 were less than 1% of net assets.
See accompanying notes which are an integral part of the financial statements.
Russell Global Opportunistic Credit Fund 365
Russell Investment Company
Russell Global Opportunistic Credit Fund
Fair Value of Derivative Instruments — October 31, 2016
Amounts in thousands
| Foreign | |||||||||
| Credit | Currency | Interest Rate | |||||||
| Derivatives not accounted for as hedging instruments | Contracts | Contracts | Contracts | ||||||
| Location: Statement of Assets and Liabilities - Assets | |||||||||
| Unrealized appreciation on foreign currency exchange contracts | $ | — | $ | 7,606 | $ | — | |||
| Variation margin on futures contracts* | — | — | 7,343 | ||||||
| Credit default swap contracts, at fair value | 7,673 | — | — | ||||||
| Total | $ | 7,673 | $ | 7,606 | $ | 7,343 | |||
| Location: Statement of Assets and Liabilities - Liabilities | |||||||||
| Variation margin on futures contracts* | $ | — | $ | — | $ | 7,083 | |||
| Unrealized depreciation on foreign currency exchange contracts | — | 3,660 | — | ||||||
| Credit default swap contracts, at fair value | 6,212 | — | — | ||||||
| Total | $ | 6,212 | $ | 3,660 | $ | 7,083 | |||
| Foreign | |||||||||
| Credit | Currency | Interest Rate | |||||||
| Derivatives not accounted for as hedging instruments | Contracts | Contracts | Contracts | ||||||
| Location: Statement of Operations - Net realized gain (loss) | |||||||||
| Investments** | $ | — | $ | (166 | ) | $ | — | ||
| Futures contracts | — | — | 8,409 | ||||||
| Credit default swap contracts | 10,932 | — | — | ||||||
| Foreign currency-related transactions*** | — | 9,432 | — | ||||||
| Total | $ | 10,932 | $ | 9,266 | $ | 8,409 | |||
| Location: Statement of Operations - Net change in unrealized appreciation (depreciation) | |||||||||
| Futures contracts | $ | — | $ | — | $ | 433 | |||
| Credit default swap contracts | (1,004 | ) | — | — | |||||
| Foreign currency-related transactions**** | — | 670 | — | ||||||
| Total | $ | (1,004 | ) | $ | 670 | $ | 433 | ||
* Includes cumulative appreciation/depreciation of futures contracts as reported in the Schedule of Investments. Only variation margin is reported within the
Statement of Assets and Liabilities.
** Includes net realized gain (loss) on purchased options as reported in the Statement of Operations.
*** Only includes net realized gain (loss) on forward and spot contracts. May differ from the net realized gain (loss) on foreign currency-related transactions reported
within the Statement of Operations.
**** Only includes change in unrealized gain (loss) on forward and spot contracts. May differ from the net change in unrealized gain (loss) on foreign currency-related
transactions reported within the Statement of Operations.
For further disclosure on derivatives see note 2 in the Notes to Financial Statements.
See accompanying notes which are an integral part of the financial statements.
366 Russell Global Opportunistic Credit Fund
Russell Investment Company
Russell Global Opportunistic Credit Fund
Balance Sheet Offsetting of Financial and Derivative Instruments — October 31, 2016
| Amounts in thousands | ||||||||||||
| Offsetting of Financial Assets and Derivative Assets | ||||||||||||
| Gross | Net Amounts | |||||||||||
| Amounts | of Assets | |||||||||||
| Gross | Offset in the | Presented in | ||||||||||
| Amounts of | Statement of | the Statement | ||||||||||
| Recognized | Assets and | of Assets and | ||||||||||
| Description | Location: Statement of Assets and Liabilities - Assets | Assets | Liabilities | Liabilities | ||||||||
| Foreign Currency Exchange Contracts | Unrealized appreciation on foreign currency exchange contracts | $ | 7,606 | $ | — $ | 7,606 | ||||||
| Futures Contracts | Variation margin on futures contracts | 671 | — | 671 | ||||||||
| Credit Default Swap Contracts | Credit default swap contracts, at fair value | 7,673 | — | 7,673 | ||||||||
| Total Financial and Derivative Assets | 15,950 | — | 15,950 | |||||||||
| Financial and Derivative Assets not subject to a netting agreement | (8,350 | ) | — | (8,350 | ) | |||||||
| Total Financial and Derivative Assets subject to a netting agreement | $ | 7,600 | $ | — $ | 7,600 | |||||||
| Financial Assets, Derivative Assets, and Collateral Held by Counterparty | ||||||||||||
| Gross Amounts Not Offset in | ||||||||||||
| the Statement of Assets and | ||||||||||||
| Liabilities | ||||||||||||
| Net Amounts | ||||||||||||
| of Assets | ||||||||||||
| Presented in | ||||||||||||
| the Statement | Financial and | |||||||||||
| of Assets and | Derivative | Collateral | ||||||||||
| Counterparty | Liabilities | Instruments | Received^ | Net Amount | ||||||||
| Bank of America | $ | 446 | $ | 446 | $ | — | $ — | |||||
| Bank of Montreal | 6 | 6 | — | — | ||||||||
| Bank of New York | 93 | 93 | — | — | ||||||||
| Barclays | 249 | 249 | — | — | ||||||||
| Citigroup | 468 | 120 | — | 348 | ||||||||
| Credit Agricole | 74 | 9 | — | 65 | ||||||||
| HSBC | 23 | 8 | — | 15 | ||||||||
| JPMorgan Chase | 83 | 83 | — | — | ||||||||
| Standard Chartered | 396 | 396 | — | — | ||||||||
| State Street | 5,749 | 318 | — | 5,431 | ||||||||
| UBS | 13 | 13 | — | — | ||||||||
| Total | $ | 7,600 | $ | 1,741 | $ | — | $ 5,859 | |||||
See accompanying notes which are an integral part of the financial statements.
Russell Global Opportunistic Credit Fund 367
Russell Investment Company
Russell Global Opportunistic Credit Fund
Balance Sheet Offsetting of Financial and Derivative Instruments, continued —
October 31, 2016
| Amounts in thousands | ||||||||||||
| Offsetting of Financial Liabilities and Derivative Liabilities | ||||||||||||
| Gross | Net Amounts | |||||||||||
| Amounts | of Liabilities | |||||||||||
| Gross | Offset in the | Presented in | ||||||||||
| Amounts of | Statement of | the Statement | ||||||||||
| Recognized | Assets and | of Assets and | ||||||||||
| Description | Location: Statement of Assets and Liabilities - Liabilities | Liabilities | Liabilities | Liabilities | ||||||||
| Futures Contracts | Variation margin on futures contracts | $ | 317 | $ | — $ | 317 | ||||||
| Foreign Currency Exchange Contracts | Unrealized depreciation on foreign currency exchange contracts | 3,660 | — | 3,660 | ||||||||
| Credit Default Swap Contracts | Credit default swap contracts, at fair value | 6,212 | — | 6,212 | ||||||||
| Total Financial and Derivative Liabilities | 10,189 | — | 10,189 | |||||||||
| Financial and Derivative Liabilities not subject to a netting agreement | (6,529 | ) | — | (6,529 | ) | |||||||
| Total Financial and Derivative Liabilities subject to a netting agreement | $ | 3,660 | $ | — $ | 3,660 | |||||||
| Financial Liabilities, Derivative Liabilities, and Collateral Pledged by Counterparty | ||||||||||||
| Gross Amounts Not Offset in | ||||||||||||
| the Statement of Assets and | ||||||||||||
| Liabilities | ||||||||||||
| Net Amounts | ||||||||||||
| of Liabilities | ||||||||||||
| Presented in | ||||||||||||
| the Statement | Financial and | |||||||||||
| of Assets and | Derivative | Collateral | ||||||||||
| Counterparty | Liabilities | Instruments | Pledged^ | Net Amount | ||||||||
| Bank of America | $ | 1,046 | $ | 446 | $ | — | $ 600 | |||||
| Bank of Montreal | 283 | 6 | — | 277 | ||||||||
| Bank of New York | 166 | 93 | — | 73 | ||||||||
| Barclays | 471 | 249 | — | 222 | ||||||||
| Citigroup | 120 | 120 | — | — | ||||||||
| Credit Agricole | 9 | 9 | — | — | ||||||||
| HSBC | 8 | 8 | — | — | ||||||||
| JPMorgan Chase | 470 | 83 | — | 387 | ||||||||
| Standard Chartered | 405 | 396 | — | 9 | ||||||||
| State Street | 608 | 318 | — | 290 | ||||||||
| UBS | 74 | 13 | — | 61 | ||||||||
| Total | $ | 3,660 | $ | 1,741 | $ | — | $ 1,919 | |||||
* Fair value of securities on loan as reported in the footnotes to the Statement of Assets and Liabilities.
^ Collateral received or pledged amounts may not reconcile to those disclosed in the Statement of Assets and Liabilities due to the inclusion of off-Balance
Sheet collateral and adjustments made to exclude overcollateralization.
For further disclosure on derivatives and counterparty risk see note 2 in the Notes to Financial Statements.
See accompanying notes which are an integral part of the financial statements.
368 Russell Global Opportunistic Credit Fund
Russell Investment Company
Russell Global Opportunistic Credit Fund
Statement of Assets and Liabilities — October 31, 2016
| Amounts in thousands | ||
| Assets | ||
| Investments, at identified cost | $ | 2,005,313 |
| Investments, at fair value(>) | 1,993,734 | |
| Cash (restricted)(a)(b) | 24,930 | |
| Foreign currency holdings(^) | 5,637 | |
| Unrealized appreciation on foreign currency exchange contracts | 7,606 | |
| Receivables: | ||
| Dividends and interest | 25,258 | |
| Dividends from affiliated Russell funds | 110 | |
| Investments sold | 6,224 | |
| Fund shares sold | 2,513 | |
| Foreign capital gains taxes recoverable | 150 | |
| Variation margin on futures contracts | 671 | |
| Credit default swap contracts, at fair value(+) | 7,673 | |
| Total assets | 2,074,506 | |
| Liabilities | ||
| Payables: | ||
| Due to custodian | 1,593 | |
| Due to broker (c) | 2,418 | |
| Investments purchased | 23,377 | |
| Fund shares redeemed | 1,723 | |
| Accrued fees to affiliates | 1,375 | |
| Other accrued expenses | 449 | |
| Variation margin on futures contracts | 317 | |
| Deferred capital gains tax liability | 211 | |
| Unrealized depreciation on foreign currency exchange contracts | 3,660 | |
| Credit default swap contracts, at fair value(+) | 6,212 | |
| Total liabilities | 41,335 | |
| Commitments and Contingencies (1) | ||
| Net Assets | $ | 2,033,171 |
| (1) See note 9 in the Notes to Financial Statements for a detailed description of commitments and contingencies. | ||
See accompanying notes which are an integral part of the financial statements.
Russell Global Opportunistic Credit Fund 369
Russell Investment Company
Russell Global Opportunistic Credit Fund
Statement of Assets and Liabilities, continued — October 31, 2016
| Amounts in thousands | |||
| Net Assets Consist of: | |||
| Undistributed (overdistributed) net investment income | $ | 11,869 | |
| Accumulated net realized gain (loss) | (61,546 | ) | |
| Unrealized appreciation (depreciation) on: | |||
| Investments (net of deferred tax liability for foreign capital gains taxes) | (11,790 | ) | |
| Futures contracts | 260 | ||
| Credit default swap contracts | 825 | ||
| Foreign currency-related transactions | 3,717 | ||
| Shares of beneficial interest | 2,092 | ||
| Additional paid-in capital | 2,087,744 | ||
| Net Assets | $ | 2,033,171 | |
| Net Asset Value, offering and redemption price per share: | |||
| Net asset value per share: Class A(#) | $ | 9.69 | |
| Maximum offering price per share (Net asset value plus sales charge of 3.75%): Class A | $ | 10.06 | |
| Class A — Net assets | $ | 5,500,621 | |
| Class A — Shares outstanding ($.01 par value) | 567,846 | ||
| Net asset value per share: Class C(#) | $ | 9.64 | |
| Class C — Net assets | $ | 8,191,510 | |
| Class C — Shares outstanding ($.01 par value) | 849,864 | ||
| Net asset value per share: Class E(#) | $ | 9.70 | |
| Class E — Net assets | $ | 36,334,129 | |
| Class E — Shares outstanding ($.01 par value) | 3,744,509 | ||
| Net asset value per share: Class S(#) | $ | 9.72 | |
| Class S — Net assets | $ | 1,351,075,060 | |
| Class S — Shares outstanding ($.01 par value) | 138,994,121 | ||
| Net asset value per share: Class Y(#) | $ | 9.72 | |
| Class Y — Net assets | $ | 632,069,488 | |
| Class Y — Shares outstanding ($.01 par value) | 65,008,345 | ||
| Amounts in thousands | |||
| (^) Foreign currency holdings - cost | $ | 5,747 | |
| (+) Credit default swap contracts - premiums paid (received) | $ | 636 | |
| (>) Investments in affiliates, Russell U.S. Cash Management Fund | $ | 171,871 | |
| (a) Cash Collateral for Futures | $ | 12,173 | |
| (b) Cash Collateral for Swaps | $ | 12,757 | |
| (c) Due to Broker for Swaps | $ | 2,418 | |
| (#) Net asset value per share equals class level net assets divided by class level shares of beneficial interest outstanding. | |||
See accompanying notes which are an integral part of the financial statements.
370 Russell Global Opportunistic Credit Fund
Russell Investment Company
Russell Global Opportunistic Credit Fund
Statement of Operations — For the Period Ended October 31, 2016
| Amounts in thousands | |||
| Investment Income | |||
| Dividends | $ | 251 | |
| Dividends from affiliated Russell funds | 696 | ||
| Interest | 106,561 | ||
| Less foreign taxes withheld | (280 | ) | |
| Total investment income | 107,228 | ||
| Expenses | |||
| Advisory fees | 17,482 | ||
| Administrative fees | 844 | ||
| Custodian fees (1) | 738 | ||
| Distribution fees - Class A | 13 | ||
| Distribution fees - Class C | 63 | ||
| Transfer agent fees - Class A | 10 | ||
| Transfer agent fees - Class C | 17 | ||
| Transfer agent fees - Class E | 63 | ||
| Transfer agent fees - Class S | 2,222 | ||
| Transfer agent fees - Class Y | 26 | ||
| Professional fees | 232 | ||
| Registration fees | 114 | ||
| Shareholder servicing fees - Class C | 21 | ||
| Shareholder servicing fees - Class E | 78 | ||
| Trustees’ fees | 56 | ||
| Printing fees | 246 | ||
| Miscellaneous | 100 | ||
| Expenses before reductions | 22,325 | ||
| Expense reductions | (7,049 | ) | |
| Net expenses | 15,276 | ||
| Net investment income (loss) | 91,952 | ||
| Net Realized and Unrealized Gain (Loss) | |||
| Net realized gain (loss) on: | |||
| Investments (net of deferred tax liability for foreign capital gains taxes) | (76,596 | ) | |
| Futures contracts | 8,409 | ||
| Credit default swap contracts | 10,932 | ||
| Foreign currency-related transactions | 8,501 | ||
| Net realized gain (loss) | (48,754 | ) | |
| Net change in unrealized appreciation (depreciation) on: | |||
| Investments (net of deferred tax liability for foreign capital gains taxes) | 118,356 | ||
| Futures contracts | 433 | ||
| Credit default swap contracts | (1,004 | ) | |
| Foreign currency-related transactions | 672 | ||
| Net change in unrealized appreciation (depreciation) | 118,457 | ||
| Net realized and unrealized gain (loss) | 69,703 | ||
| Net Increase (Decrease) in Net Assets from Operations | $ | 161,655 | |
| (1) Includes a reimbursement for overbilling of custody out-of-pocket fees from prior years. See note 10 in the Notes to Financial Statements. | |||
See accompanying notes which are an integral part of the financial statements.
Russell Global Opportunistic Credit Fund 371
Russell Investment Company
Russell Global Opportunistic Credit Fund
Statements of Changes in Net Assets
| For the Periods Ended October 31, | ||||||
| Amounts in thousands | 2016 | 2015 | ||||
| Increase (Decrease) in Net Assets | ||||||
| Operations | ||||||
| Net investment income (loss) | $ | 91,952 | $ | 96,290 | ||
| Net realized gain (loss) | (48,754 | ) | (52,772 | ) | ||
| Net change in unrealized appreciation (depreciation) | 118,457 | (99,736 | ) | |||
| Net increase (decrease) in net assets from operations | 161,655 | (56,218 | ) | |||
| Distributions | ||||||
| From net investment income | ||||||
| Class A | (166 | ) | (271 | ) | ||
| Class C | (209 | ) | (495 | ) | ||
| Class E | (1,012 | ) | (1,626 | ) | ||
| Class S | (38,691 | ) | (58,534 | ) | ||
| Class Y | (20,917 | ) | (29,102 | ) | ||
| From net realized gain | ||||||
| Class A | — | (34 | ) | |||
| Class C | — | (78 | ) | |||
| Class E | — | (179 | ) | |||
| Class S | — | (6,598 | ) | |||
| Class Y | — | (2,809 | ) | |||
| Net decrease in net assets from distributions | (60,995 | ) | (99,726 | ) | ||
| Share Transactions* | ||||||
| Net increase (decrease) in net assets from share transactions | 183,363 | 316,226 | ||||
| Total Net Increase (Decrease) in Net Assets | 284,023 | 160,282 | ||||
| Net Assets | ||||||
| Beginning of period | 1,749,148 | 1,588,866 | ||||
| End of period | $ | 2,033,171 | $ | 1,749,148 | ||
| Undistributed (overdistributed) net investment income included in net assets | $ | 11,869 | $ | (3,525 | ) | |
See accompanying notes which are an integral part of the financial statements.
372 Russell Global Opportunistic Credit Fund
Russell Investment Company
Russell Global Opportunistic Credit Fund
Statements of Changes in Net Assets, continued
* Share transaction amounts (in thousands) for the periods ended October 31, 2016 and October 31, 2015 were as follows:
| 2016 | 2015 | |||||||||||
| Shares | Dollars | Shares | Dollars | |||||||||
| Class A | ||||||||||||
| Proceeds from shares sold | 145 | $ | 1,302 | 123 | $ | 1,161 | ||||||
| Proceeds from reinvestment of distributions | 17 | 160 | 31 | 293 | ||||||||
| Payments for shares redeemed | (126 | ) | (1,162 | ) | (198 | ) | (1,845 | ) | ||||
| Net increase (decrease) | 36 | 300 | (44 | ) | (391 | ) | ||||||
| Class C | ||||||||||||
| Proceeds from shares sold | 135 | 1,261 | 134 | 1,254 | ||||||||
| Proceeds from reinvestment of distributions | 22 | 208 | 60 | 568 | ||||||||
| Payments for shares redeemed | (379 | ) | (3,448 | ) | (455 | ) | (4,277 | ) | ||||
| Net increase (decrease) | (222 | ) | (1,979 | ) | (261 | ) | (2,455 | ) | ||||
| Class E | ||||||||||||
| Proceeds from shares sold | 942 | 9,013 | 1,621 | 15,278 | ||||||||
| Proceeds from reinvestment of distributions | 105 | 976 | 177 | 1,676 | ||||||||
| Payments for shares redeemed | (703 | ) | (6,491 | ) | (1,313 | ) | (12,138 | ) | ||||
| Net increase (decrease) | 344 | 3,498 | 485 | 4,816 | ||||||||
| Class S | ||||||||||||
| Proceeds from shares sold | 56,493 | 536,344 | 56,358 | 535,559 | ||||||||
| Proceeds from reinvestment of distributions | 4,134 | 38,476 | 6,836 | 64,781 | ||||||||
| Payments for shares redeemed | (42,189 | ) | (387,333 | ) | (50,894 | ) | (479,685 | ) | ||||
| Net increase (decrease) | 18,438 | 187,487 | 12,300 | 120,655 | ||||||||
| Class Y | ||||||||||||
| Proceeds from shares sold | 14,649 | 136,113 | 31,442 | 299,822 | ||||||||
| Proceeds from reinvestment of distributions | 2,254 | 20,914 | 3,370 | 31,911 | ||||||||
| Payments for shares redeemed | (17,741 | ) | (162,970 | ) | (14,778 | ) | (138,132 | ) | ||||
| Net increase (decrease) | (838 | ) | (5,943 | ) | 20,034 | 193,601 | ||||||
| Total increase (decrease) | 17,758 | $ | 183,363 | 32,514 | $ | 316,226 | ||||||
See accompanying notes which are an integral part of the financial statements.
Russell Global Opportunistic Credit Fund 373
Russell Investment Company
Russell Global Opportunistic Credit Fund
Financial Highlights — For the Periods Ended
For a Share Outstanding Throughout Each Period.
| $ | $ | $ | $ | $ | $ | |||||||||||
| Net Asset Value, | Net | Net Realized | Total from | Distributions | Distributions | |||||||||||
| Beginning of | Investment | and Unrealized | Investment | from Net | from Net | |||||||||||
| Period | Income (Loss) (a)(d) | Gain (Loss) | Operations | Investment Income | Realized Gain | |||||||||||
| Class A | ||||||||||||||||
| October 31, 2016 | 9.11 | .46 | .42 | .88 | (.30 | ) | — | |||||||||
| October 31, 2015 | 9.97 | .49 | (.82 | ) | (.33 | ) | (.47 | ) | (.06 | ) | ||||||
| October 31, 2014 | 10.18 | .46 | (.15 | ) | .31 | (.45 | ) | (.07 | ) | |||||||
| October 31, 2013 | 10.47 | .52 | (.17 | ) | .35 | (.57 | ) | (.07 | ) | |||||||
| October 31, 2012 | 10.32 | .58 | .67 | 1.25 | (1.10 | ) | — | |||||||||
| Class C | ||||||||||||||||
| October 31, 2016 | 9.06 | .39 | .42 | .81 | (.23 | ) | — | |||||||||
| October 31, 2015 | 9.93 | .41 | (.81 | ) | (.40 | ) | (.41 | ) | (.06 | ) | ||||||
| October 31, 2014 | 10.14 | .39 | (.15 | ) | .24 | (.38 | ) | (.07 | ) | |||||||
| October 31, 2013 | 10.44 | .42 | (.15 | ) | .27 | (.50 | ) | (.07 | ) | |||||||
| October 31, 2012 | 10.25 | .51 | .67 | 1.18 | (.99 | ) | — | |||||||||
| Class E | ||||||||||||||||
| October 31, 2016 | 9.12 | .46 | .42 | .88 | (.30 | ) | — | |||||||||
| October 31, 2015 | 9.99 | .49 | (.83 | ) | (.34 | ) | (.47 | ) | (.06 | ) | ||||||
| October 31, 2014 | 10.20 | .46 | (.15 | ) | .31 | (.45 | ) | (.07 | ) | |||||||
| October 31, 2013 | 10.49 | .52 | (.17 | ) | .35 | (.57 | ) | (.07 | ) | |||||||
| October 31, 2012 | 10.32 | .59 | .67 | 1.26 | (1.09 | ) | — | |||||||||
| Class S | ||||||||||||||||
| October 31, 2016 | 9.14 | .49 | .41 | .90 | (.32 | ) | — | |||||||||
| October 31, 2015 | 10.00 | .51 | (.81 | ) | (.30 | ) | (.50 | ) | (.06 | ) | ||||||
| October 31, 2014 | 10.21 | .49 | (.15 | ) | .34 | (.48 | ) | (.07 | ) | |||||||
| October 31, 2013 | 10.50 | .54 | (.16 | ) | .38 | (.60 | ) | (.07 | ) | |||||||
| October 31, 2012 | 10.35 | .62 | .66 | 1.28 | (1.13 | ) | — | |||||||||
| Class Y | ||||||||||||||||
| October 31, 2016 | 9.14 | .49 | .42 | .91 | (.33 | ) | — | |||||||||
| October 31, 2015 | 10.00 | .52 | (.82 | ) | (.30 | ) | (.50 | ) | (.06 | ) | ||||||
| October 31, 2014 | 10.22 | .50 | (.17 | ) | .33 | (.48 | ) | (.07 | ) | |||||||
| October 31, 2013 | 10.51 | .56 | (.17 | ) | .39 | (.61 | ) | (.07 | ) | |||||||
| October 31, 2012 | 10.36 | .63 | .66 | 1.29 | (1.14 | ) | — | |||||||||
See accompanying notes which are an integral part of the financial statements.
374 Russell Global Opportunistic Credit Fund
| % | % | % | |||||||||||||||
| $ | $ | Ratio of Expenses | Ratio of Expenses | Ratio of Net | |||||||||||||
| Net Asset Value, | % | Net Assets, | to Average | to Average | Investment Income | % | |||||||||||
| $ | End of | Total | End of Period | Net Assets, | Net Assets, | to Average | Portfolio | ||||||||||
| Total Distributions | Period | Return(c) | (000 | ) | Gross | Net(d) | Net Assets(d) | Turnover Rate(k) | |||||||||
| (.30 | ) | 9.69 | 9.81 | 5,501 | 1.58 | 1.14 | 5.02 | 68 | |||||||||
| (.53 | ) | 9.11 | (3.35 | ) | 4,849 | 1.58 | 1.15 | 5.18 | 98 | ||||||||
| (.52 | ) | 9.97 | 3.15 | 5,745 | 1.57 | 1.17 | 4.61 | 80 | |||||||||
| (.64 | ) | 10.18 | 3.48 | 8,273 | 1.59 | 1.20 | 5.12 | 85 | |||||||||
| (1.10 | ) | 10.47 | 13.09 | 8,857 | 1.57 | 1.20 | 5.67 | 109 | |||||||||
| (.23 | ) | 9.64 | 9.03 | 8,192 | 2.33 | 1.89 | 4.27 | 68 | |||||||||
| (.47 | ) | 9.06 | (4.14 | ) | 9,711 | 2.32 | 1.90 | 4.40 | 98 | ||||||||
| (.45 | ) | 9.93 | 2.41 | 13,224 | 2.32 | 1.92 | 3.86 | 80 | |||||||||
| (.57 | ) | 10.14 | 2.65 | 12,184 | 2.34 | 1.95 | 4.34 | 85 | |||||||||
| (.99 | ) | 10.44 | 12.33 | 6,918 | 2.32 | 1.95 | 4.94 | 109 | |||||||||
| (.30 | ) | 9.70 | 9.80 | 36,334 | 1.58 | 1.14 | 5.00 | 68 | |||||||||
| (.53 | ) | 9.12 | (3.44 | ) | 31,022 | 1.58 | 1.15 | 5.22 | 98 | ||||||||
| (.52 | ) | 9.99 | 3.16 | 29,115 | 1.57 | 1.17 | 4.59 | 80 | |||||||||
| (.64 | ) | 10.20 | 3.42 | 15,856 | 1.59 | 1.20 | 5.09 | 85 | |||||||||
| (1.09 | ) | 10.49 | 13.18 | 13,165 | 1.57 | 1.20 | 5.75 | 109 | |||||||||
| (.32 | ) | 9.72 | 10.05 | 1,351,075 | 1.33 | .89 | 5.23 | 68 | |||||||||
| (.56 | ) | 9.14 | (3.11 | ) | 1,101,648 | 1.33 | .90 | 5.45 | 98 | ||||||||
| (.55 | ) | 10.00 | 3.41 | 1,082,505 | 1.32 | .92 | 4.86 | 80 | |||||||||
| (.67 | ) | 10.21 | 3.72 | 590,280 | 1.34 | .95 | 5.33 | 85 | |||||||||
| (1.13 | ) | 10.50 | 13.37 | 457,523 | 1.32 | .95 | 6.00 | 109 | |||||||||
| (.33 | ) | 9.72 | 10.13 | 632,069 | 1.14 | .81 | 5.34 | 68 | |||||||||
| (.56 | ) | 9.14 | (3.04 | ) | 601,918 | 1.13 | .82 | 5.56 | 98 | ||||||||
| (.55 | ) | 10.00 | 3.39 | 458,277 | 1.12 | .84 | 4.92 | 80 | |||||||||
| (.68 | ) | 10.22 | 3.76 | 315,477 | 1.14 | .86 | 5.43 | 85 | |||||||||
| (1.14 | ) | 10.51 | 13.43 | 308,114 | 1.13 | .85 | 6.11 | 109 | |||||||||
See accompanying notes which are an integral part of the financial statements.
Russell Global Opportunistic Credit Fund 375
Russell Investment Company
Russell Global Opportunistic Credit Fund
Related Party Transactions, Fees and Expenses
| Accrued fees payable to affiliates for the period ended October 31, 2016 were as follows: | ||
| Advisory fees | $ | 1,173,915 |
| Administration fees | 83,754 | |
| Distribution fees | 6,474 | |
| Shareholder servicing fees | 9,491 | |
| Transfer agent fees | 97,550 | |
| Trustee fees | 3,838 | |
| $ | 1,375,022 | |
| Transactions (amounts in thousands) during the period ended October 31, 2016 with Underlying Funds which are, or were, an | ||||||||||||||
| affiliated company are as follows: | ||||||||||||||
| Fair Value, | Change in | |||||||||||||
| Beginning of | Realized Gain | Unrealized | Fair Value, End | Income | Capital Gains | |||||||||
| Period | Purchases | Sales | (Loss) | Gain (Loss) | of Period | Distributions | Distributions | |||||||
| Russell U.S. Cash Management Fund $ | 144,929 | $ 2,022,843 | $ 1,995,949 | $ | 27 | $ | 21 | $ 171,871 | $ | 696 | $ | — | ||
| $ | 144,929 | $ 2,022,843 | $ 1,995,949 | $ | 27 | $ | 21 | $ 171,871 | $ | 696 | $ | — | ||
Federal Income Taxes
At October 31, 2016, the cost of investments and net unrealized appreciation (depreciation), undistributed ordinary income and
undistributed long-term capital gains for income tax purposes were as follows:.
| Cost of Investments | $ | 2,010,890,631 | |||
| Unrealized Appreciation | $ | 75,257,922 | |||
| Unrealized Depreciation | (92,414,575 | ) | |||
| Net Unrealized Appreciation (Depreciation) | $ | (17,156,653 | ) | ||
| Undistributed Ordinary Income | $ | 20,456,964 | |||
| Undistributed Long-Term Capital Gains | |||||
| (Capital Loss Carryforward) | $ | (51,411,589 | ) | ||
| Tax Composition of Distributions | |||||
| Ordinary Income | $ | 60,995,383 | |||
Net investment income and net realized gains (loss) in the financial statements may differ from taxable net investment income and net
realized gains (losses). Capital accounts within the financial statements are adjusted for permanent book-tax differences. Book-tax
differences are primarily due to foreign currency gains and losses, reclassifications of dividends, differences in treatment of income
from swaps, net operating losses, investments in partnerships, investments in passive foreign investment companies (PFICs), tax
straddle transaction, use of tax equalization and foreign capital gains taxes. These adjustments have no impact on the net assets.
At October 31, 2016, the Statement of Assets and Liabilities have been adjusted by the following amounts (in thousands):
| Undistributed net investment income | $ | (15,563 | ) |
| Accumulated net realized gain (loss) | 16,029 | ||
| Additional paid-in capital | (466 | ) |
See accompanying notes which are an integral part of the financial statements.
376 Russell Global Opportunistic Credit Fund
Russell Investment Company
Unconstrained Total Return Fund
Portfolio Management Discussion and Analysis — October 31, 2016 (Unaudited)
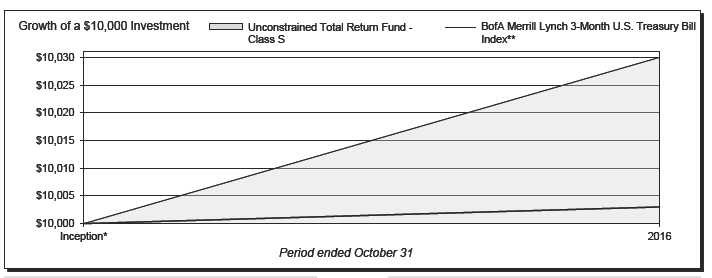
| Unconstrained Total Return Fund - Class A‡ | Unconstrained Total Return Fund - Class S | ||||||
| Total | Total | ||||||
| Return | Return | ||||||
| Inception* | (3.46 | )% | Inception* | 0.30 | % | ||
| Unconstrained Total Return Fund - Class C | Unconstrained Total Return Fund - Class Y | ||||||
| Total | Total | ||||||
| Return | Return | ||||||
| Inception* | 0.20 | % | Inception* | 0.31 | % | ||
| Unconstrained Total Return Fund - Class E | BofA Merrill Lynch 3-Month Treasury Bill Index** | ||||||
| Total | Total | ||||||
| Return | Return | ||||||
| Inception* | 0.30 | % | Inception* | 0.03 | % | ||
Unconstrained Total Return Fund 377
Russell Investment Company
Unconstrained Total Return Fund
Portfolio Management Discussion and Analysis, continued — October 31, 2016
(Unaudited)
| The Unconstrained Total Return Fund (the “Fund”) employs | Corporate credit performed relatively well compared with | |
| a multi-manager approach whereby portions of the Fund are | government bonds over the period and the Fund’s corporate bond | |
| allocated to different money manager strategies. Fund assets not | holdings added some value. | |
| allocated to money managers are managed by Russell Investment | The Fund’s exposure to loans benefited from rising LIBOR rates. | |
| Management, LLC (“RIM”), the Fund’s advisor. RIM may change | ||
| the allocation of the Fund’s assets among money managers at | How did the investment strategies and techniques employed | |
| any time. An exemptive order from the Securities and Exchange | by the Fund and its money managers affect its benchmark- | |
| Commission (“SEC”) permits RIM to engage or terminate a money | relative performance? | |
| manager at any time, subject to approval by the Fund’s Board, | The Fund employs discretionary money managers. The Fund’s | |
| without a shareholder vote. Pursuant to the terms of the exemptive | discretionary money managers select the individual portfolio | |
| order, the Fund is required to notify its shareholders within 90 | securities for the assets assigned to them. Fund assets not | |
| days of when a money manager begins providing services. As of | allocated to discretionary money managers the Fund’s liquidity | |
| October 31, 2016, the Fund had four money managers. | reserves and assets which may be managed directly by RIM to | |
| What is the Fund’s investment objective? | effect the Fund’s investment strategies and/or to actively manage | |
| The Fund seeks to provide total return. | the Fund’s overall exposures by investing in securities or other | |
| instruments that RIM believes will achieve the desired risk/ | ||
| How did the Fund perform relative to its benchmark for the | return profile for the Fund. | |
| fiscal year ended October 31, 2016? | The Fund employs a volatility strategy managed by H2O Asset | |
| For the period of September 22, 2016 (inception of the Fund) | Management LLP, which is an options-based strategy that benefits | |
| through October 31, 2016, the Fund’s Class A, Class C, Class | from rising expectations of volatility. As the market turned its | |
| E, Class S and Class Y Shares gained 0.30%, 0.20%, 0.30%, | concerns to the possibility of the U.S. Federal Reserve raising | |
| 0.30% and 0.31%, respectively. This is compared to the Fund’s | interest rates, volatility rose and the strategy was beneficial to the | |
| benchmark, the BofA Merrill Lynch 3-Month U.S. Treasury Bill | Fund’s performance. | |
| Index, which gained 0.03% during the same period. The Fund’s | The Fund also employs a mortgage strategy managed by Putnam | |
| performance includes operating expenses, whereas index returns | Investment Management, LLC. This strategy also benefited from | |
| are unmanaged and do not include expenses of any kind. | rising yields as it invests in mortgage securities that benefit when | |
| For the period of September 22, 2016 (inception of the Fund) | mortgage holders slow down their rate of refinancing, which tends | |
| through October 31, 2016, the Morningstar Nontraditional Bond | to occur when rates rise. | |
| Category, a group of funds that Morningstar considers to have | The Fund’s short duration high yield corporate bond manager, | |
| investment strategies similar to those of the Fund, gained 0.59%. | Post Advisory Group, LLC, added incremental value as corporate | |
| This result serves as a peer comparison and is expressed net of | bonds outperformed government bonds. | |
| operating expenses. | ||
| The Fund also employs a bank loan strategy managed by THL | ||
| RIM may assign a money manager a benchmark other than the | Credit Advisors, LLC. Bank loans performed well as the rate of | |
| Fund’s index. However, the Fund’s primary index remains the | interest they pay is related to LIBOR rates, which rose during the | |
| benchmark for the Fund. | period. | |
| How did the market conditions described in the Market | RIM manages a global real yield positioning strategy and a | |
| Summary report affect the Fund’s performance? | currency factor positioning strategy for the Fund. Using futures, | |
| Over the short period since the Fund’s inception, U.S. government | the global high real yield strategy took long positions in high | |
| bonds sold off as the market became more concerned about the | quality government bonds whose net-of-inflation yields are | |
| U.S. Federal Reserve raising interest rates. This caused market | expected to be relatively high and short positions where net-of- | |
| volatility to increase which was beneficial for the Fund’s exposure | inflation yield is expected to be relatively low. The currency factor | |
| to options strategies that were designed to protect the portfolio in | strategy utilized currency forward contracts to take long and | |
| these market conditions. | short positions in global foreign exchange markets. The global | |
| Furthermore, the Fund’s exposure to certain interest-only mortgage | real yield strategy added some value over the period as short | |
| securities also benefited from the rising rate environment as | positions in U.K. government rates benefited from rising inflation | |
| investors expected more interest payments to accrue. | expectations there, following the Brexit vote. The currency factor | |
| strategy suffered somewhat due to the long exposure to the U.K. | ||
378 Unconstrained Total Return Fund
Russell Investment Company
Unconstrained Total Return Fund
Portfolio Management Discussion and Analysis, continued — October 31, 2016
(Unaudited)
| pound, which after Brexit is considered cheap by a number of | The views expressed in this report reflect those of the | |
| metrics. | portfolio managers only through the end of the period | |
| covered by the report. These views do not necessarily | ||
| Describe any changes to the Fund’s structure or the money | represent the views of RIM or any other person in RIM or | |
| manager line-up. | any other affiliated organization. These views are subject | |
| There have been no changes to the manager lineup or Fund | to change at any time based upon market conditions or | |
| structure since the Fund’s inception. | other events, and RIM disclaims any responsibility to | |
| Money Managers as of October 31, | update the views contained herein. These views should not | |
| 2016 | Styles | be relied on as investment advice and, because investment |
| decisions for a Russell Investment Company (“RIC”) Fund | ||
| Post H2O Advisory Asset Management Group, LLC LLP | Sector Sector Specialist Specialist | are based on numerous factors, should not be relied on as |
| Putnam Investment Management, LLC | Sector Specialist | an indication of investment decisions of any RIC Fund. |
| THL Credit Advisors, LLC | Sector Specialist | |
* Assumes initial investment on September 22, 2016.
** The BofA Merrill Lynch 3-Month Treasury Bill Index is an unmanaged index tracking U.S. Treasury Bills maturing in 90 days.
‡ The performance shown has been adjusted to reflect the deduction of the maximum Class A sales charge of 3.75%.
Performance is historical and assumes reinvestment of all dividends and capital gains. Investment return and principal value will fluctuate so that an investor’s
shares, when redeemed, may be worth more or less than when purchased. Past performance is not indicative of future results. The returns shown do not reflect the
deduction of taxes that a shareholder would pay on Fund distributions or the redemption of Fund shares. Additionally, the returns presented herein may differ from
the performance reported in the Financial Highlights as the returns herein are calculated in a manner consistent with standardized performance in accordance with
Securities and Exchange Commission rules, while the performance in the Financial Highlights has been calculated in accordance with U.S. Generally Accepted
Accounting Principles (“U.S. GAAP”).
Unconstrained Total Return Fund 379
Russell Investment Company
Unconstrained Total Return Fund
Shareholder Expense Example — October 31, 2016 (Unaudited)
| Fund Expenses | Please note that the expenses shown in the table are meant | ||||||
| The following disclosure provides important information | to highlight your ongoing costs only and do not reflect any | ||||||
| regarding the Fund’s Shareholder Expense Example | transactional costs. Therefore, the information under the heading | ||||||
| (“Example”). | “Hypothetical Performance (5% return before expenses)” is | ||||||
| useful in comparing ongoing costs only, and will not help you | |||||||
| Example | determine the relative total costs of owning different funds. In | ||||||
| As a shareholder of the Fund, you incur two types of costs: (1) | addition, if these transactional costs were included, your costs | ||||||
| transaction costs, including sales charges (loads) on certain | would have been higher. | ||||||
| purchase or redemption payments, and (2) ongoing costs, | Hypothetical | ||||||
| including distribution (12b-1) and/or service fees and other Fund | Performance (5% | ||||||
| expenses. The Example is intended to help you understand | Actual | return before | |||||
| your ongoing costs (in dollars) of investing in the Fund and to | Class A | Performance | expenses) | ||||
| Beginning Account Value | |||||||
| compare these costs with the ongoing costs of investing in other | September 23, 2016 | $ | 1,000.00 | $ | 1,000.00 | ||
| mutual funds. The Example is based on an investment of $1,000 | Ending Account Value | ||||||
| invested at the beginning of the period and held for the entire | October 31, 2016 | $ | 1,003.00 | $ | 1,019.25 | ||
| period indicated, which for this Fund is from September 23, 2016 | Expenses Paid During Period* | $ | 1.25 | $ | 5.94 | ||
| to October 31, 2016. | * Expenses are equal to the Fund's annualized expense ratio of 1.17% | ||||||
| (representing the 39-day period annualized), multiplied by the average | |||||||
| Actual Expenses | account value over the period, multiplied by 39/366 (to reflect the period since | ||||||
| The information in the table under the heading “Actual | commencement of operations). May reflect amounts waived and/or reimbursed. | ||||||
| Performance” provides information about actual account values | Without any waivers and/or reimbursements, expenses would have been higher. | ||||||
| and actual expenses. You may use the information in this column, | Hypothetical expenses are equal to the Fund’s annualized expense ratio of | ||||||
| 1.17% (representing the six-month period annualized), multiplied by the | |||||||
| together with the amount you invested, to estimate the expenses | average account value over the period, multiplied by 184/366 (to reflect the | ||||||
| that you paid over the period. Simply divide your account value by | one-half year period). | ||||||
| $1,000 (for example, an $8,600 account value divided by $1,000 | |||||||
| = 8.6), then multiply the result by the number in the first column | Hypothetical | ||||||
| Performance (5% | |||||||
| in the row entitled “Expenses Paid During Period” to estimate | Actual | return before | |||||
| the expenses you paid on your account during this period. | Class C | Performance | expenses) | ||||
| Beginning Account Value | |||||||
| Hypothetical Example for Comparison Purposes | September 23, 2016 | $ | 1,000.00 | $ | 1,000.00 | ||
| The information in the table under the heading “Hypothetical | Ending Account Value | ||||||
| October 31, 2016 | $ | 1,002.00 | $ | 1,015.48 | |||
| Performance (5% return before expenses)” provides information | Expenses Paid During Period* | $ | 2.05 | $ | 9.73 | ||
| about hypothetical account values and hypothetical expenses | |||||||
| based on the Fund’s actual expense ratio and an assumed rate of | * Expenses are equal to the Fund's annualized expense ratio of 1.92% | ||||||
| return of 5% per year before expenses, which is not the Fund’s | (representing the 39-day period annualized), multiplied by the average | ||||||
| account value over the period, multiplied by 39/366 (to reflect the period since | |||||||
| actual return. The hypothetical account values and expenses | commencement of operations). May reflect amounts waived and/or reimbursed. | ||||||
| may not be used to estimate the actual ending account balance or | Without any waivers and/or reimbursements, expenses would have been higher. | ||||||
| expenses you paid for the period. You may use this information | Hypothetical expenses are equal to the Fund’s annualized expense ratio of | ||||||
| to compare the ongoing costs of investing in the Fund and other | 1.92% (representing the six-month period annualized), multiplied by the | ||||||
| average account value over the period, multiplied by 184/366 (to reflect the | |||||||
| funds. To do so, compare this 5% hypothetical example with the | one-half year period). | ||||||
| 5% hypothetical examples that appear in the shareholder reports | |||||||
| of other funds. | |||||||
380 Unconstrained Total Return Fund
Russell Investment Company
Unconstrained Total Return Fund
Shareholder Expense Example, continued — October 31, 2016 (Unaudited)
| Hypothetical | ||||||
| Performance (5% | ||||||
| Actual | return before | |||||
| Class E | Performance | expenses) | ||||
| Beginning Account Value | ||||||
| September 23, 2016 | $ | 1,000.00 | $ | 1,000.00 | ||
| Ending Account Value | ||||||
| October 31, 2016 | $ | 1,003.00 | $ | 1,019.25 | ||
| Expenses Paid During Period* | $ | 1.25 | $ | 5.94 | ||
| * Expenses are equal to the Fund's annualized expense ratio of 1.17% | ||||||
| (representing the 39-day period annualized), multiplied by the average | ||||||
| account value over the period, multiplied by 39/366 (to reflect the period since | ||||||
| commencement of operations). May reflect amounts waived and/or reimbursed. | ||||||
| Without any waivers and/or reimbursements, expenses would have been higher. | ||||||
| Hypothetical expenses are equal to the Fund’s annualized expense ratio of | ||||||
| 1.17% (representing the six-month period annualized), multiplied by the | ||||||
| average account value over the period, multiplied by 184/366 (to reflect the | ||||||
| one-half year period). | ||||||
| Hypothetical | ||||||
| Performance (5% | ||||||
| Actual | return before | |||||
| Class S | Performance | expenses) | ||||
| Beginning Account Value | ||||||
| September 23, 2016 | $ | 1,000.00 | $ | 1,000.00 | ||
| Ending Account Value | ||||||
| October 31, 2016 | $ | 1,003.00 | $ | 1,020.51 | ||
| Expenses Paid During Period* | $ | 0.98 | $ | 4.67 | ||
| * Expenses are equal to the Fund's annualized expense ratio of 0.92% | ||||||
| (representing the 39-day period annualized), multiplied by the average | ||||||
| account value over the period, multiplied by 39/366 (to reflect the period since | ||||||
| commencement of operations). May reflect amounts waived and/or reimbursed. | ||||||
| Without any waivers and/or reimbursements, expenses would have been higher. | ||||||
| Hypothetical expenses are equal to the Fund’s annualized expense ratio of | ||||||
| 0.92% (representing the six-month period annualized), multiplied by the | ||||||
| average account value over the period, multiplied by 184/366 (to reflect the | ||||||
| one-half year period). | ||||||
| Hypothetical | ||||||
| Performance (5% | ||||||
| Actual | return before | |||||
| Class Y | Performance | expenses) | ||||
| Beginning Account Value | ||||||
| September 23, 2016 | $ | 1,000.00 | $ | 1,000.00 | ||
| Ending Account Value | ||||||
| October 31, 2016 | $ | 1,003.10 | $ | 1,021.52 | ||
| Expenses Paid During Period* | $ | 0.77 | $ | 3.66 | ||
| * Expenses are equal to the Fund's annualized expense ratio of 0.72% | ||||||
| (representing the 39-day period annualized), multiplied by the average | ||||||
| account value over the period, multiplied by 39/366 (to reflect the period since | ||||||
| commencement of operations). May reflect amounts waived and/or reimbursed. | ||||||
| Without any waivers and/or reimbursements, expenses would have been higher. | ||||||
| Hypothetical expenses are equal to the Fund’s annualized expense ratio of | ||||||
| 0.72% (representing the six-month period annualized), multiplied by the | ||||||
| average account value over the period, multiplied by 184/366 (to reflect the | ||||||
| one-half year period). | ||||||
Unconstrained Total Return Fund 381
Russell Investment Company
Unconstrained Total Return Fund
Schedule of Investments — October 31, 2016
| Amounts in thousands (except share amounts) | Amounts in thousands (except share amounts) | ||||||
| Principal | Fair | Principal | Fair | ||||
| Amount ($) | Value | Amount ($) | Value | ||||
| or Shares | $ | or Shares | $ | ||||
| Long-Term Investments – 68.8% | Diamond 1 Finance Corp. / | ||||||
| Corporate Bonds and Notes – 21.0% | Diamond 2 Finance Corp | ||||||
| ACI Worldwide, Inc. | 3.480% due 06/01/19 (Þ) | 650 | 667 | ||||
| 6.375% due 08/15/20 (Þ) | 800 | 824 | DISH DBS Corp. | ||||
| ADT Corp. (The) | 4.250% due 04/01/18 | 750 | 768 | ||||
| 6.250% due 10/15/21 | 1,000 | 1,093 | Edgewell Personal Care Co. | ||||
| Air Lease Corp. | 4.700% due 05/19/21 | 750 | 788 | ||||
| 3.375% due 01/15/19 | 500 | 514 | Equinix, Inc. | ||||
| 2.125% due 01/15/20 | 500 | 499 | 5.375% due 01/01/22 | 650 | 689 | ||
| Alere, Inc. | Fidelity & Guaranty Life Holdings, | ||||||
| 7.250% due 07/01/18 | 1,000 | 1,018 | Inc. | ||||
| Alliance Data Systems Corp. | 6.375% due 04/01/21 (Þ) | 650 | 648 | ||||
| 5.250% due 12/01/17 (Þ) | 650 | 661 | First Data Corp. | ||||
| 6.375% due 04/01/20 (Þ) | 650 | 662 | 6.750% due 11/01/20 (Þ) | 500 | 518 | ||
| 5.875% due 11/01/21 (Þ) | 250 | 252 | Fresenius Medical Care US Finance | ||||
| Ally Financial, Inc. | II, Inc. | ||||||
| 3.250% due 11/05/18 | 650 | 650 | 4.125% due 10/15/20 (Þ) | 650 | 676 | ||
| American Equity Investment Life | Frontier Communications Corp. | ||||||
| Holding Co. | 8.125% due 10/01/18 | 650 | 707 | ||||
| 6.625% due 07/15/21 | 750 | 784 | 7.125% due 03/15/19 | 700 | 749 | ||
| Amsurg Corp. | GLP Capital, LP / GLP Financing | ||||||
| 5.625% due 11/30/20 | 600 | 615 | II, Inc. | ||||
| Anixter, Inc. | 4.875% due 11/01/20 | 700 | 746 | ||||
| 5.625% due 05/01/19 | 500 | 530 | Graphic Packaging International, | ||||
| Antero Resources Corp. | Inc. | ||||||
| 6.000% due 12/01/20 | 850 | 874 | 4.750% due 04/15/21 | 500 | 531 | ||
| Ball Corp. | HCA, Inc. | ||||||
| 4.375% due 12/15/20 | 500 | 533 | 3.750% due 03/15/19 | 700 | 716 | ||
| Cantor Commercial Real Estate Co., | Hospitality Properties Trust | ||||||
| LP / CCRE Finance Corp. | 4.250% due 02/15/21 | 650 | 688 | ||||
| 7.750% due 02/15/18 (Þ) | 650 | 650 | HRG Group, Inc. | ||||
| CCO Holdings LLC / CCO Holdings | 7.875% due 07/15/19 | 1,000 | 1,047 | ||||
| Capital Corp. | Hughes Satellite Systems Corp. | ||||||
| 5.250% due 03/15/21 | 750 | 780 | 6.500% due 06/15/19 | 750 | 818 | ||
| Cedar Fair, LP / Canada's | Huntington Ingalls Industries, Inc. | ||||||
| Wonderland Co. / Magnum | 5.000% due 12/15/21 (Þ) | 500 | 524 | ||||
| Management Corp. | Infor US, Inc. | ||||||
| 5.250% due 03/15/21 | 650 | 674 | 5.750% due 08/15/20 (Þ) | 500 | 523 | ||
| Centene Corp. | Iron Mountain, Inc. | ||||||
| 4.750% due 01/15/25 | 39 | 39 | 6.000% due 10/01/20 (Þ) | 400 | 424 | ||
| Series WI | 4.375% due 06/01/21 (Þ) | 400 | 413 | ||||
| 5.625% due 02/15/21 | 750 | 787 | Isle of Capri Casinos, Inc. | ||||
| CenturyLink, Inc. | 5.875% due 03/15/21 | 760 | 790 | ||||
| Series S | Leidos Holdings, Inc. | ||||||
| 6.450% due 06/15/21 | 250 | 267 | 4.450% due 12/01/20 | 700 | 714 | ||
| Series V | Level 3 Financing, Inc. | ||||||
| 5.625% due 04/01/20 | 750 | 801 | Series WI | ||||
| CHS/Community Health Systems, | 6.125% due 01/15/21 | 650 | 671 | ||||
| Inc. | LifePoint Health, Inc. | ||||||
| 5.125% due 08/15/18 | 800 | 793 | 5.500% due 12/01/21 | 1,000 | 1,036 | ||
| CIT Group, Inc. | MGM Resorts International | ||||||
| 5.250% due 03/15/18 | 400 | 414 | 5.250% due 03/31/20 | 650 | 691 | ||
| CNH Industrial Capital LLC | MPT Operating Partnership, LP / | ||||||
| Series WI | MPT Finance Corp. | ||||||
| 3.375% due 07/15/19 | 650 | 656 | 6.375% due 02/15/22 | 750 | 778 | ||
| CNO Financial Group, Inc. | NAI Entertainment Holdings / NAI | ||||||
| 4.500% due 05/30/20 | 850 | 872 | Entertainment Holdings Finance | ||||
| CommScope, Inc. | Corp. | ||||||
| 5.000% due 06/15/21 (Þ) | 650 | 665 | 5.000% due 08/01/18 (Þ) | 500 | 505 | ||
| CSC Holdings LLC | Netflix, Inc. | ||||||
| 7.625% due 07/15/18 | 500 | 536 | 5.375% due 02/01/21 | 300 | 325 | ||
See accompanying notes which are an integral part of the financial statements.
382 Unconstrained Total Return Fund
Russell Investment Company
Unconstrained Total Return Fund
Schedule of Investments, continued — October 31, 2016
| Amounts in thousands (except share amounts) | Amounts in thousands (except share amounts) | ||||||
| Principal | Fair | Principal | Fair | ||||
| Amount ($) | Value | Amount ($) | Value | ||||
| or Shares | $ | or Shares | $ | ||||
| Nielsen Finance LLC / Nielsen | 3.750% due 12/12/21 (Ê) | 249 | 250 | ||||
| Finance Co. | AerCap Ireland Capital, Ltd. / | ||||||
| 4.500% due 10/01/20 | 500 | 510 | AerCap Global Aviation Trust | ||||
| Nuance Communications, Inc. | 4.250% due 07/01/20 | 750 | 778 | ||||
| 5.375% due 08/15/20 (Þ) | 700 | 719 | Aircastle, Ltd. | ||||
| Orbital ATK, Inc. | 5.125% due 03/15/21 | 750 | 796 | ||||
| Series WI | Ardagh Packaging Finance PLC / | ||||||
| 5.250% due 10/01/21 | 650 | 673 | Ardagh Holdings USA, Inc. | ||||
| Oshkosh Corp. | 4.067% due 05/15/21 (Ê)(Þ) | 650 | 663 | ||||
| 5.375% due 03/01/22 | 575 | 603 | Avago Technologies Cayman | ||||
| Outfront Media Capital LLC / | Finance, Ltd. Term Loan B3 | ||||||
| Outfront Media Capital Corp. | 3.535% due 02/01/23 (Ê) | 1,000 | 1,011 | ||||
| Series WI | FMG Resources Pty, Ltd. Covenant- | ||||||
| 5.250% due 02/15/22 | 700 | 725 | Lite 1st Lien Term Loan B | ||||
| Pinnacle Foods Finance LLC / | 3.750% due 06/30/19 | 1,000 | 1,000 | ||||
| Pinnacle Foods Finance Corp. | IHO Verwaltungs GmbH | ||||||
| 4.875% due 05/01/21 | 1,000 | 1,028 | 4.125% due 09/15/21 (Þ) | 750 | 768 | ||
| Post Holdings, Inc. | International Automotive | ||||||
| 6.750% due 12/01/21 (Þ) | 300 | 321 | Components Group SA | ||||
| Regal Entertainment Group | 9.125% due 06/01/18 (Þ) | 225 | 213 | ||||
| 5.750% due 03/15/22 | 550 | 569 | International Game Technology PLC | ||||
| Reynolds Group Issuer, Inc. / | 5.625% due 02/15/20 (Þ) | 700 | 741 | ||||
| Reynolds Group Issuer LLC / | LG FinanceCo Corp. | ||||||
| Reynolds Group Issuer Lu | 5.875% due 11/01/24 (Þ) | 39 | 39 | ||||
| 5.750% due 10/15/20 | 300 | 308 | MidOcean Credit CLO III | ||||
| RHP Hotel Properties, LP / RHP | Series 2014-3A Class E | ||||||
| Finance Corp. | 5.947% due 07/21/26 (Ê)(Þ) | 275 | 233 | ||||
| 5.000% due 04/15/21 | 750 | 773 | Mondelez International Holdings | ||||
| Sabra Health Care, LP / Sabra | Netherlands BV | ||||||
| Capital Corp. | 2.000% due 10/28/21 (Þ) | 175 | 173 | ||||
| 5.500% due 02/01/21 | 500 | 521 | Playa Resorts Holding BV 1st Lien | ||||
| Service Corp. International | Term Loan B | ||||||
| 5.375% due 01/15/22 | 650 | 674 | 4.000% due 08/09/19 (Ê) | 499 | 498 | ||
| Sinclair Television Group, Inc. | Rexel SA | ||||||
| 5.375% due 04/01/21 | 750 | 775 | 5.250% due 06/15/20 (Þ) | 500 | 516 | ||
| Sirius XM Radio, Inc. | Trader Corp. Term Loan | ||||||
| 4.250% due 05/15/20 (Þ) | 750 | 767 | 5.000% due 08/09/23 | 250 | 251 | ||
| Six Flags Entertainment Corp. | UPCB Finance VI, Ltd. | ||||||
| 5.250% due 01/15/21 (Þ) | 700 | 721 | 6.875% due 01/15/22 (Þ) | 180 | 187 | ||
| Station Casinos LLC | Virgin Media Investment Holdings, | ||||||
| 7.500% due 03/01/21 | 750 | 789 | Ltd. Term Loan F | ||||
| TEGNA, Inc. | 3.500% due 06/30/23 (Ê) | 250 | 251 | ||||
| 4.875% due 09/15/21 (Þ) | 900 | 938 | Virgin Media Secured Finance PLC | ||||
| Tenet Healthcare Corp. | 5.375% due 04/15/21 (Þ) | 675 | 697 | ||||
| 6.000% due 10/01/20 | 1,000 | 1,052 | Wind Acquisition Finance SA | ||||
| TreeHouse Foods, Inc. | 4.750% due 07/15/20 (Þ) | 650 | 653 | ||||
| 4.875% due 03/15/22 | 450 | 467 | Zais CLO 5, Ltd. | ||||
| Vector Group, Ltd. | Series 2016-2A Class C | ||||||
| 7.750% due 02/15/21 | 800 | 838 | 5.216% due 10/15/28 (Å)(Ê) | 300 | 287 | ||
| ViaSat, Inc. | 10,676 | ||||||
| 6.875% due 06/15/20 | 1,000 | 1,035 | Loan Agreements - 16.7% | ||||
| WellCare Health Plans, Inc. | Albertsons LLC Term Loan B4 | ||||||
| 5.750% due 11/15/20 | 750 | 773 | 4.500% due 08/22/21 (Ê) | 998 | 1,005 | ||
| Alliant Holdings Intermediate LLC | |||||||
| 51,172 | 1st Lien Term Loan B2 | ||||||
| International Debt – 4.4% | 5.253% due 08/14/22 (Ê) | 249 | 251 | ||||
| 1011778 BC ULC / New Red | American Airlines, Inc. Term Loan | ||||||
| Finance, Inc. | B | ||||||
| 4.625% due 01/15/22 (Þ) | 650 | 671 | |||||
| 1011778 BC Unlimited Liability Co. | 3.500% due 05/21/20 (Ê) | 250 | 250 | ||||
| 1st Lien Term Loan B2 | American Airlines, Inc. Term Loan | ||||||
| 3.250% due 04/28/23 (Ê) | 250 | 250 | |||||
See accompanying notes which are an integral part of the financial statements.
Unconstrained Total Return Fund 383
Russell Investment Company
Unconstrained Total Return Fund
Schedule of Investments, continued — October 31, 2016
| Amounts in thousands (except share amounts) | Amounts in thousands (except share amounts) | ||||||
| Principal | Fair | Principal | Fair | ||||
| Amount ($) | Value | Amount ($) | Value | ||||
| or Shares | $ | or Shares | $ | ||||
| Ancestry.com, Inc. 1st Lien Term | 9.750% due 11/12/20 (Ê) | 247 | 239 | ||||
| Loan | Compuware Corp. Term Loan B2 | ||||||
| 5.250% due 10/13/23 | 245 | 246 | 6.250% due 12/15/21 (Ê) | 499 | 498 | ||
| AP Gaming I LLC 1st Lien Term | Consolidated Communications, Inc. | ||||||
| Loan B | Term Loan B | ||||||
| 9.250% due 12/20/20 (Ê) | 247 | 240 | 4.000% due 10/05/23 (Ê) | 325 | 327 | ||
| Arbor Pharmaceuticals, Inc. Term | CPI Acquisition, Inc. Term Loan B | ||||||
| Loan B | 5.500% due 08/17/22 (Ê) | 478 | 469 | ||||
| 6.000% due 06/28/23 | 250 | 252 | Creative Artists Agency LLC Term | ||||
| Arctic Glacier USA, Inc. 1st Lien | Loan B | ||||||
| Term Loan | 5.000% due 12/17/21 (Ê) | 249 | 251 | ||||
| 6.000% due 05/13/19 (Ê) | 805 | 793 | CWGS Group LLC Term Loan | ||||
| AssuredPartners, Inc. 1st Lien Term | 5.250% due 02/20/20 (Ê) | 187 | 187 | ||||
| Loan | Dell International LLC 1st Lien | ||||||
| 5.750% due 10/21/22 (Ê) | 249 | 250 | Term Loan B | ||||
| Asurion LLC Term Loan B | 4.000% due 09/07/23 (Ê) | 1,000 | 1,007 | ||||
| 5.000% due 08/04/22 (Ê) | 499 | 501 | Dell Software Group Term Loan B | ||||
| Avantor Performance Materials | 4.000% due 09/23/22 | 250 | 250 | ||||
| Holdings, Inc. 1st Lien Term | Donnelley Financial Solutions Term | ||||||
| Loan | Loan B | ||||||
| 6.000% due 06/21/22 (Ê) | 398 | 401 | 5.000% due 09/23/23 | 250 | 252 | ||
| BMC Software Finance, Inc. 1st | EagleView Technology Corp. 2nd | ||||||
| Lien Term Loan B | Lien Term Loan | ||||||
| 5.000% due 09/10/20 (Ê) | 249 | 245 | 1.000% due 09/28/23 (Ê)(v) | 250 | 248 | ||
| Brickman Group, Ltd. LLC (The) 1st | Eastman Kodak Co. Term Loan | ||||||
| Lien Term Loan B | 7.250% due 09/03/19 (Ê) | 500 | 499 | ||||
| 4.000% due 12/18/20 (Ê) | 499 | 498 | EnergySolutions LLC 1st Lien Term | ||||
| BWAY Holding Co. 1st Lien Term | Loan B | ||||||
| Loan B | 6.750% due 05/29/20 (Ê) | 552 | 552 | ||||
| 5.500% due 08/14/20 (Ê) | 247 | 248 | ESH Hospitality, Inc. 1st Lien Term | ||||
| Caesars Entertainment Corp. 1st | Loan B | ||||||
| Lien Term Loan B | 1.000% due 08/30/23 (Ê)(v) | 250 | 251 | ||||
| 7.000% due 10/11/20 (Ê) | 997 | 1,002 | First Data Corp. 1st Lien Term Loan | ||||
| Cast & Crew Payroll LLC Term | B | ||||||
| Loan B | 1.000% due 07/10/22 (Ê)(v) | 1,000 | 1,006 | ||||
| 8.750% due 08/03/22 (Ê) | 249 | 248 | FOCUS Brands, Inc. 1st Lien Term | ||||
| CBS Radio, Inc. Term Loan B | Loan | ||||||
| 4.500% due 10/06/23 | 942 | 946 | 5.000% due 10/03/23 (Ê) | 250 | 253 | ||
| Cengage Learning Acquisitions, Inc. | FPC Holdings, Inc. 1st Lien Term | ||||||
| Term Loan B | Loan | ||||||
| 5.250% due 06/07/23 (Ê) | 748 | 731 | 5.250% due 11/27/19 (Ê) | 624 | 562 | ||
| Charcoal Holdings LLC 1st Lien | Getty Images, Inc. 1st Lien Term | ||||||
| Term Loan | Loan B | ||||||
| 1.000% due 07/03/23 (v) | 500 | 503 | 4.750% due 10/18/19 (Ê) | 499 | 422 | ||
| Charter Communications Operating | Harbor Freight Tools USA, Inc. | ||||||
| LLC Term Loan H | Term Loan B | ||||||
| 3.250% due 08/24/21 (Ê) | 997 | 1,001 | 4.137% due 08/16/23 (Ê) | 499 | 502 | ||
| Checkout Holding Corp. Covenant- | Harland Clarke Holdings Corp. 1st | ||||||
| Lite 1st Lien Term Loan B | Lien Term Loan B4 | ||||||
| 4.500% due 04/09/21 (Ê) | 249 | 224 | 6.993% due 08/04/19 (Ê) | 497 | 493 | ||
| Chrysler Group LLC 1st Lien Term | HCA Inc. Term Loan B7 | ||||||
| Loan B | 3.588% due 03/01/24 | 500 | 504 | ||||
| 3.250% due 12/31/18 (Ê) | 750 | 750 | Intrawest Operations Group LLC | ||||
| CHS/Community Health Systems, | Term Loan | ||||||
| Inc. 1st Lien Term Loan G | 4.500% due 12/09/20 (Ê) | 250 | 252 | ||||
| 3.750% due 12/31/19 (Ê) | 747 | 706 | Kraton Polymers LLC Term Loan B | ||||
| Ciena Corp. Term Loan | 6.000% due 01/06/22 (Ê) | 500 | 503 | ||||
| 4.250% due 04/25/21 (Ê) | 250 | 250 | La Quinta Intermediate Holdings | ||||
| Cision, Inc. Term Loan B | LLC Covenant-Lite Term Loan B | ||||||
| 7.000% due 05/12/23 | 748 | 722 | 3.750% due 04/14/21 (Ê) | 499 | 497 | ||
| Commercial Barge Line Co. 1st Lien | Lannett Co., Inc. Term Loan A | ||||||
| Term Loan | 5.750% due 11/25/20 (Ê) | 247 | 241 | ||||
See accompanying notes which are an integral part of the financial statements.
384 Unconstrained Total Return Fund
Russell Investment Company
Unconstrained Total Return Fund
Schedule of Investments, continued — October 31, 2016
| Amounts in thousands (except share amounts) | Amounts in thousands (except share amounts) | |||||||
| Principal | Fair | Principal | Fair | |||||
| Amount ($) | Value | Amount ($) | Value | |||||
| or Shares | $ | or Shares | $ | |||||
| Level 3 Financing, Inc. Term Loan | SeaWorld Parks & Entertainment, | |||||||
| B2 | Inc. Term Loan B3 | |||||||
| 3.500% due 05/31/22 (Ê) | 750 | 753 | 4.088% due 05/14/20 (Ê) | 750 | 752 | |||
| Mediware Information Systems, Inc. | Signode Industrial Group US, Inc. | |||||||
| 2016 1st Lien Term Loan | Covenant-Lite 1st Lien Term | |||||||
| 5.750% due 09/28/23 | 250 | 251 | Loan B | |||||
| Mergermarket USA, Inc. 1st Lien | 3.750% due 05/01/21 (Ê) | 242 | 241 | |||||
| Term Loan | SIRVA Worldwide, Inc. 1st Lien | |||||||
| 4.500% due 02/04/21 (Ê) | 249 | 246 | Term Loan | |||||
| MGM Growth Properties Operating | 7.500% due 03/27/19 (Ê) | 250 | 248 | |||||
| Partnership, LP Term Loan B | SolarWinds Holdings, Inc. Term | |||||||
| 4.000% due 04/25/23 (Ê) | 499 | 500 | Loan | |||||
| Michaels Stores, Inc. Term Loan B1 | 5.500% due 02/05/23 (Ê) | 998 | 1,002 | |||||
| 3.750% due 01/28/23 (Ê) | 250 | 219 | Solera LLC 1st Lien Term Loan B | |||||
| MRI Software LLC Term Loan | 5.750% due 03/04/23 (Ê) | 249 | 252 | |||||
| 5.250% due 06/18/21 | 364 | 362 | Steak n Shake Operations, Inc. Term | |||||
| MSC.Software Corp. 1st Lien Term | Loan | |||||||
| Loan | 4.750% due 03/19/21 (Ê) | 500 | 495 | |||||
| 5.000% due 05/29/20 (Ê) | 249 | 248 | Sterigenics-Nordion Holdings LLC | |||||
| NBTY, Inc. Term Loan B | 1st Lien Term Loan B | |||||||
| 5.000% due 05/05/23 (Ê) | 249 | 250 | 4.250% due 05/15/22 (Ê) | 249 | 248 | |||
| Nielsen Finance LLC Term Loan B3 | TCH-2 Holdings LLC 1st Lien Term | |||||||
| 3.031% due 10/04/23 (Ê) | 256 | 257 | Loan | |||||
| ON Semiconductor Corp. | 5.500% due 05/12/21 (Ê) | 249 | 249 | |||||
| Incremental Term Loan | TCH-2 Holdings LLC Covenant-Lite | |||||||
| 3.777% due 03/31/23 (Ê) | 250 | 251 | 2nd Lien Term Loan | |||||
| PET Acquisition Merger Sub LLC | 8.750% due 11/12/21 (Ê) | 250 | 245 | |||||
| 1st Lien Term Loan B1 | TerraForm AP Acquisition Holdings | |||||||
| 5.000% due 01/26/23 (Ê) | 250 | 251 | LLC 1st Lien Term Loan B | |||||
| PetSmart, Inc. Term Loan B | 6.500% due 06/26/22 (Ê) | 750 | 743 | |||||
| 1.000% due 03/10/22 (v) | 500 | 501 | TMS International Corp. Term Loan | |||||
| Pinnacle Entertainment, Inc. Term | 4.500% due 10/16/20 (Ê) | 249 | 245 | |||||
| Loan B | Travelport Finance Luxembourg Sarl | |||||||
| 3.250% due 04/28/23 | 454 | 456 | Term Loan B | |||||
| Prime Security Services Borrower | 5.000% due 09/02/21 (Ê) | 250 | 251 | |||||
| LLC Term Loan B1 | Tribune Media Co. 1st Lien Term | |||||||
| 4.750% due 04/21/22 (Ê) | 499 | 502 | Loan B | |||||
| Prospect Medical Holdings, Inc. | 3.750% due 12/27/20 (Ê) | 249 | 251 | |||||
| Term Loan | TruGreen, LP 1st Lien Term Loan B | |||||||
| 7.000% due 06/30/22 | 648 | 646 | 6.500% due 04/13/23 (Ê) | 249 | 251 | |||
| Quincy Newspapers, Inc. Term | UFC Holdings LLC 1st Lien Term | |||||||
| Loan B | Loan | |||||||
| 5.500% due 11/02/22 (Ê) | 250 | 250 | 5.000% due 08/18/23 (Ê) | 250 | 252 | |||
| Realogy Group LLC Term Loan B | UFC Holdings, LLC 2nd Lien Term | |||||||
| 3.750% due 07/14/22 (Ê) | 249 | 251 | Loan | |||||
| Renaissance Learning, Inc. 1st Lien | 8.500% due 08/18/24 | 215 | 218 | |||||
| Term Loan | United Airlines, Inc. 1st Lien Term | |||||||
| 4.500% due 04/09/21 (Ê) | 250 | 249 | Loan B | |||||
| RentPath, Inc. 1st Lien Term Loan B | 3.250% due 04/01/19 (Ê) | 249 | 250 | |||||
| 6.250% due 12/17/21 (Ê) | 250 | 237 | UPC Financing Partnership 1st Lien | |||||
| Reynolds Group Holdings, Inc. 1st | Term Loan AN | |||||||
| Lien Term Loan | 4.080% due 08/31/24 (Ê) | 250 | 251 | |||||
| 4.250% due 01/21/23 (Ê) | 500 | 501 | Valeant Pharmaceuticals | |||||
| Riverbed Technology, Inc. Term | International, Inc. 1st Lien Term | |||||||
| Loan | Loan BF1 | |||||||
| 5.000% due 04/27/22 (Ê) | 500 | 504 | 3.750% due 04/02/22 (Ê) | 499 | 497 | |||
| Rovi Solutions Corp. 1st Lien Term | Varsity Brands, Inc. 1st Lien Term | |||||||
| Loan B | Loan | |||||||
| 3.750% due 07/02/21 (Ê) | 249 | 250 | 5.000% due 12/11/21 | 249 | 251 | |||
| Scientific Games International, Inc. | Veresen Midstream, LP Term Loan | |||||||
| Term Loan B2 | B1 | |||||||
| 6.000% due 10/01/21 (Ê) | 499 | 501 | 5.250% due 03/31/22 (Ê) | 249 | 248 | |||
See accompanying notes which are an integral part of the financial statements.
Unconstrained Total Return Fund 385
Russell Investment Company
Unconstrained Total Return Fund
Schedule of Investments, continued — October 31, 2016
| Amounts in thousands (except share amounts) | Amounts in thousands (except share amounts) | ||||||
| Principal | Fair | Principal | Fair | ||||
| Amount ($) | Value | Amount ($) | Value | ||||
| or Shares | $ | or Shares | $ | ||||
| Wall Street Systems Term Loan B | Freddie Mac Structured Agency | ||||||
| 1.000% due 08/23/23 (v) | 250 | 250 | Credit Risk Debt Notes | ||||
| Wastequip LLC Term Loan | Series 2015-DNA3 Class B | ||||||
| 5.500% due 08/09/19 (Ê) | 249 | 249 | 9.875% due 04/25/28 (Ê) | 355 | 378 | ||
| William Morris Endeavor | Series 2015-DNA3 Class M3 | ||||||
| Entertainment LLC 1St Lien Term | 5.133% due 04/25/28 (Ê) | 583 | 611 | ||||
| Loan B | Series 2015-HQ1 Class B | ||||||
| 5.250% due 05/06/21 (Ê) | 499 | 501 | 11.274% due 03/25/25 (Ê) | 614 | 693 | ||
| World Endurance Holdings 1St Lien | Series 2016-DNA1 Class M3 | ||||||
| Term Loan | 5.986% due 07/25/28 (Ê) | 500 | 544 | ||||
| 5.250% due 06/26/21 (Ê) | 500 | 495 | Series 2016-DNA4 Class M3 | ||||
| Yonkers Racing Corp. 1st Lien Term | 4.324% due 03/25/29 (Ê) | 625 | 619 | ||||
| Loan | Series 2016-HQA1 Class M3 | ||||||
| 4.250% due 08/16/19 | 125 | 125 | 6.792% due 09/25/28 (Ê) | 250 | 278 | ||
| Zebra Technologies Corp. 1st Lien | Series 2016-HQA2 Class M3 | ||||||
| Term Loan B | 5.674% due 11/25/28 (Ê) | 583 | 615 | ||||
| 4.750% due 10/27/21 (Ê) | 496 | 500 | |||||
| Series 2016-HQA4 Class M3 | |||||||
| 40,774 | 4.427% due 04/25/29 (Ê) | 625 | 617 | ||||
| Mortgage-Backed Securities – 26.7% | Ginnie Mae II | ||||||
| Alternative Loan Trust | 4.500% due 2046 | 1,000 | 1,076 | ||||
| Series 2005-27 Class 1A1 | Ginnie Mae REMICS | ||||||
| 1.424% due 08/25/35 (Ê) | 594 | 447 | Series 2013-H24 Class AI | ||||
| Series 2005-38 Class A3 | Interest Only STRIP | ||||||
| 1.224% due 09/25/35 (Ê) | 655 | 563 | 1.472% due 09/20/63 | 3,160 | 185 | ||
| Series 2005-59 Class 1A1 | Series 2015-60 Class IP | ||||||
| 0.862% due 11/20/35 (Ê) | 493 | 414 | |||||
| Banc of America Commercial | Interest Only STRIP | ||||||
| 4.000% due 04/20/45 | 1,859 | 307 | |||||
| Mortgage Trust | Series 2015-H03 Class DI | ||||||
| Series 2006-4 Class AJ | |||||||
| 5.695% due 07/10/46 | 295 | 293 | Interest Only STRIP | ||||
| 1.884% due 01/20/65 | 2,960 | 326 | |||||
| CSAIL Commercial Mortgage Trust | Series 2016-H12 Class AI | ||||||
| Series 2015-C1 Class D | |||||||
| 3.944% due 04/15/50 (Þ) | 500 | 411 | Interest Only STRIP | ||||
| 1.643% due 07/20/65 | 3,929 | 440 | |||||
| Fannie Mae | Government National Mortgage | ||||||
| 2.500% due 2046 | 3,143 | 3,145 | Association | ||||
| 30 Year TBA (Ï) | Series 2010-9 Class UI | ||||||
| 2.500% | 11,000 | 19,939 | Interest Only STRIP | ||||
| 3.000% | 15,000 | 21,616 | 5.000% due 01/20/40 | 4,552 | 829 | ||
| Series 2015-C03 Class 1M2 | Series 2010-35 Class DI | ||||||
| 5.436% due 07/25/25 (Ê) | 580 | 618 | Interest Only STRIP | ||||
| Series 2016-C03 Class 1M2 | 4.500% due 03/20/40 | 2,251 | 375 | ||||
| 5.739% due 10/25/28 (Ê) | 581 | 621 | Series 2010-50 Class QS | ||||
| Fannie Mae Connecticut Avenue | Interest Only STRIP | ||||||
| Securities | 6.018% due 12/20/38 (Ê) | 4,420 | 357 | ||||
| Series 2016-C01 Class 1B | Series 2014-60 Class SE | ||||||
| 12.274% due 08/25/28 (Ê) | 628 | 763 | Interest Only STRIP | ||||
| Series 2016-C02 Class 1B | 5.574% due 04/20/44 (Ê) | 842 | 139 | ||||
| 12.688% due 09/25/28 (Ê) | 610 | 761 | Series 2014-H11 Class GI | ||||
| Series 2016-C03 Class 2B | Interest Only STRIP | ||||||
| 12.939% due 10/25/28 (Ê) | 575 | 727 | 1.480% due 06/20/64 | 3,352 | 270 | ||
| Series 2016-C05 Class 2M2 | Series 2015-80 Class IA | ||||||
| 4.944% due 01/25/29 (Ê) | 345 | 353 | Interest Only STRIP | ||||
| Fannie Mae REMICS | 4.500% due 06/20/45 | 687 | 116 | ||||
| Series 2016-70 Class QI | Series 2015-89 Class IP | ||||||
| Interest Only STRIP | Interest Only STRIP | ||||||
| 3.500% due 10/25/46 | 6,366 | 866 | 4.000% due 02/20/45 | 1,261 | 169 | ||
| Freddie Mac REMICS | Series 2015-149 Class KI | ||||||
| Series 2016-4621 Class QI | Interest Only STRIP | ||||||
| Interest Only STRIP | 4.000% due 10/20/45 | 944 | 137 | ||||
| 3.500% due 10/15/46 | 1,589 | 215 | |||||
See accompanying notes which are an integral part of the financial statements.
386 Unconstrained Total Return Fund
Russell Investment Company
Unconstrained Total Return Fund
Schedule of Investments, continued — October 31, 2016
| Amounts in thousands (except share amounts) | Amounts in thousands (except share amounts) | ||||||||
| Principal | Fair | Principal | Fair | ||||||
| Amount ($) | Value | Amount ($) | Value | ||||||
| or Shares | $ | or Shares | $ | ||||||
| Series 2016-27 Class IB | Cross Currency Options | ||||||||
| Interest Only STRIP | (USD/JPY) | ||||||||
| 4.000% due 11/20/45 | 2,437 | 335 | Dec 2016 104.00 Call (1) | USD | 8,000 | (ÿ) | 130 | ||
| Dec 2016 108.00 Call (1) | USD | 8,000 | (ÿ) | 18 | |||||
| Series 2016-37 Class IW | Cross Curreny Options | ||||||||
| Interest Only STRIP | (AUD/USD) | ||||||||
| 4.500% due 02/20/46 | 2,428 | 486 | Dec 2016 0.75 Put (1) | AUD | 4,534 | (ÿ) | 57 | ||
| Series 2016-77 Class SC | Fannie Mae Bonds | ||||||||
| Interest Only STRIP | Nov 2016 100.28 Call (1) | USD | 10,000 | (ÿ) | 10 | ||||
| 5.574% due 10/20/45 (Ê) | 843 | 181 | Dec 2016 103.02 Call (1) | USD | 24,000 | (ÿ) | 83 | ||
| Series 2016-104 Class GI | Dec 2016 103.17 Call (1) | USD | 14,000 | (ÿ) | 39 | ||||
| Interest Only STRIP | United States 5 Year | ||||||||
| 4.500% due 01/20/46 | 2,198 | 183 | Treasury Note Futures | ||||||
| Series 2016-H15 Class AI | Nov 2016 120.00 Put (48) | USD | 5,760 | (ÿ) | 5 | ||||
| Interest Only STRIP | Total Options Purchased | ||||||||
| 2.634% due 07/20/66 | 2,667 | 347 | (cost $479) | 581 | |||||
| Series 2016-H20 Class BI | |||||||||
| Interest Only STRIP | Short-Term Investments – 51.9% | ||||||||
| 1.562% due 09/20/66 | 3,267 | 266 | ABN AMRO Bank | ||||||
| Series 2016-H23 Class NI | 1.051% due 01/31/17 (~) | 1,500 | 1,496 | ||||||
| Interest Only STRIP | Allianz SE | ||||||||
| 2.830% due 10/20/66 | 3,314 | 492 | 0.836% due 12/16/16 (ç)(~) | 1,500 | 1,498 | ||||
| JPMBB Commercial Mortgage | Cablevision Systems Corp. | ||||||||
| Securities Trust | 8.625% due 09/15/17 | 750 | 784 | ||||||
| Series 2013-C15 Class D | Caterpillar International | ||||||||
| 5.214% due 11/15/45 (Þ) | 345 | 334 | 0.851% due 12/08/16 (ç)(~) | 1,000 | 999 | ||||
| JPMorgan Chase Commercial | |||||||||
| CIT Group, Inc. | |||||||||
| Mortgage Securities Trust | 4.250% due 08/15/17 | 400 | 405 | ||||||
| Series 2012-C6 Class E | Credit Agricole Corporate and | ||||||||
| 5.365% due 05/15/45 (Þ) | 500 | 478 | Investment Bank | ||||||
| Series 2013-C13 Class D | 1.028% due 02/21/17 (~) | 1,500 | 1,495 | ||||||
| 4.189% due 01/15/46 (Þ) | 500 | 473 | Credit Suisse AG | ||||||
| Merrill Lynch Mortgage Trust | 1.272% due 03/27/17 (~) | 1,000 | 995 | ||||||
| Series 2008-C1 Class D | DNB NOR Bank ASA | ||||||||
| 6.475% due 02/12/51 (Þ) | 175 | 176 | 0.747% due 01/13/17 (~) | 1,500 | 1,498 | ||||
| Morgan Stanley Capital I Trust | DZ Bank AG Deutsche | ||||||||
| Series 2007-HQ11 Class AJ | 1.010% due 02/28/17 (~) | 1,500 | 1,495 | ||||||
| 5.508% due 02/12/44 | 251 | 250 | Icahn Enterprises, LP / Icahn | ||||||
| Series 2011-C3 Class E | Enterprises Finance Corp. | ||||||||
| 5.324% due 07/15/49 (Þ) | 93 | 96 | Series WI | ||||||
| UBS-Barclays Commercial Mortgage | 3.500% due 03/15/17 | 650 | 650 | ||||||
| Trust | KBC Bank NV | ||||||||
| Series 2012-C2 Class E | 1.016% due 01/05/17 (~) | 1,500 | 1,497 | ||||||
| 4.886% due 05/10/63 (Å) | 155 | 150 | Kiwibank Limited | ||||||
| Wells Fargo Commercial Mortgage | 0.954% due 02/01/17 (~) | 1,500 | 1,496 | ||||||
| Trust | Land Securities Group PLC | ||||||||
| Series 2013-LC12 Class D | 1.576% due 01/09/17 (~) | 1,500 | 1,496 | ||||||
| 4.434% due 07/15/46 (Þ) | 207 | 187 | Landesbank Hessen-Thuringen | ||||||
| 65,267 | Girozentrale | ||||||||
| 0.911% due 01/11/17 (~) | 1,500 | 1,497 | |||||||
| Total Long-Term Investments | LVMH Financia Belgique SA | ||||||||
| (cost $168,535) | 167,889 | 0.938% due 01/23/17 (~) | 1,500 | 1,497 | |||||
| Macquarie Bank, Ltd. | |||||||||
| Options Purchased - 0.2% | 0.955% due 01/09/17 (~) | 1,500 | 1,497 | ||||||
| (Number of Contracts) | Merck Financial Services | ||||||||
| Cross Currency Options | 0.761% due 01/06/17 (~) | 1,500 | 1,498 | ||||||
| (EUR/USD) | Mitsubishi UFJ Trust and Banking | ||||||||
| Sep 2017 1.25 Call (1) | EUR | 21,955 | (ÿ) | 66 | 1.165% due 03/31/17 (~) | 1,500 | 1,493 | ||
| Cross Currency Options | |||||||||
| (USD/CAD) | Mizuho Bank, Ltd. | ||||||||
| Jan 2017 1.27 Put (1) | USD | 445 | (ÿ) | 173 | 0.975% due 01/19/17 (~) | 1,500 | 1,497 | ||
| Nationwide Building | |||||||||
See accompanying notes which are an integral part of the financial statements.
Unconstrained Total Return Fund 387
Russell Investment Company
Unconstrained Total Return Fund
Schedule of Investments, continued — October 31, 2016
Amounts in thousands (except share amounts)
| Principal | Fair | ||||
| Amount ($) | Value | ||||
| or Shares | $ | ||||
| 0.572% due 01/09/17 (~) | 1,500 | 1,498 | |||
| Russell U.S. Cash Management Fund | 87,553,770 | (8) | 87,573 | ||
| SBAB Statens Bostadsfinansier | |||||
| 0.936% due 02/01/17 (~) | 1,500 | 1,496 | |||
| Schlumberger Finance BV | |||||
| 0.867% due 12/20/16 (ç)(~) | 1,500 | 1,498 | |||
| 0.787% due 01/09/17 (~) | 1,500 | 1,498 | |||
| Standard Chartered Bank | |||||
| (0.207)% due 04/05/17 (~) | 1,500 | 1,648 | |||
| Sumitomo Mitsui Banking Corp. | |||||
| 1.019% due 02/06/17 (~) | 1,500 | 1,496 | |||
| Swedbank AB | |||||
| 0.855% due 12/14/16 (ç)(~) | 1,500 | 1,498 | |||
| Toyota Finance Australia, Ltd. | |||||
| 0.791% due 11/22/16 (ç)(~) | 1,500 | 1,498 | |||
| United States Treasury Bills | |||||
| 0.163% due 11/03/16 (ç)(~)(§) | 350 | 350 | |||
| 0.117% due 11/10/16 (ç)(~)(§) | 181 | 181 | |||
| 0.277% due 11/17/16 (ç)(~)(§) | 1,650 | 1,650 | |||
| Total Short-Term Investments | |||||
| (cost $126,685) | 126,668 | ||||
| Total Investments 120.9% | |||||
| (identified cost $295,699) | 295,138 | ||||
| Other Assets and Liabilities, | |||||
| Net – (20.9%) | (51,141 | ) | |||
| Net Assets - 100.0% | 243,997 | ||||
See accompanying notes which are an integral part of the financial statements.
388 Unconstrained Total Return Fund
Russell Investment Company
Unconstrained Total Return Fund
Schedule of Investments, continued — October 31, 2016
| Restricted Securities | |||||||||||||
| Amounts in thousands (except share and cost per unit amounts) | |||||||||||||
| Principal | Cost per | Cost | Fair Value | ||||||||||
| Acquisition | Amount ($) | Unit | (000 | ) | (000 | ) | |||||||
| % of Net Assets Securities | Date | or shares | $ | $ | $ | ||||||||
| 0.2% | |||||||||||||
| UBS-Barclays Commercial Mortgage Trust | 09/23/16 | 155,000 | 94.26 | 146 | 150 | ||||||||
| Zais CLO 5, Ltd. | 09/23/16 | 300,000 | 95.54 | 287 | 287 | ||||||||
| 437 | |||||||||||||
| For a description of restricted securities see note 8 in the Notes to Financial Statements. | |||||||||||||
| Futures Contracts | |||||||||||||
| Amounts in thousands (except contract amounts) | |||||||||||||
| Unrealized | |||||||||||||
| Appreciation | |||||||||||||
| Number of | Notional | Expiration | (Depreciation) | ||||||||||
| Contracts | Amount | Date | $ | ||||||||||
| Long Positions | |||||||||||||
| Australia 10 Year Bond Futures | 223 | AUD | 29,575 | 12/16 | (582 | ) | |||||||
| CBOE Volatility Index Futures | 15 | USD | 258 | 11/16 | (11 | ) | |||||||
| Euro-Bund Options Futures | 134 | EUR | 53 | 11/16 | 35 | ||||||||
| United States 10 Year Treasury Note Futures | 221 | USD | 28,648 | 12/16 | (302 | ) | |||||||
| Short Positions | |||||||||||||
| Euro-Bund Options Futures | 117 | EUR | 18,974 | 12/16 | 382 | ||||||||
| Euro-Bund Options Futures | 60 | EUR | 49 | 11/16 | (13 | ) | |||||||
| FTSE 100 Index Futures | 10 | GBP | 693 | 12/16 | — | ||||||||
| Long Gilt Futures | 141 | GBP | 17,673 | 12/16 | 854 | ||||||||
| Total Unrealized Appreciation (Depreciation) on Open Futures Contracts (å) | 363 | ||||||||||||
| Options Written | ||||||||||
| Amounts in thousands (except contract amounts) | ||||||||||
| Number of | Strike | Notional | Expiration | Fair Value | ||||||
| Call/Put | Contracts | Price | Amount | Date | $ | |||||
| Cross Currency Options (AUD/USD) | Put | 1 | 0.73 | AUD | 4,412 | 12/30/16 | (25 | ) | ||
| Cross Currency Options (USD/JPY) | Call | 1 | 106.00 | USD | 16,000 | 12/01/16 | (111 | ) | ||
| Fannie Mae Bonds | Put | 1 | 100.28 | USD | 10,000 | 11/07/16 | (55 | ) | ||
| Fannie Mae Bonds | Put | 1 | 103.02 | USD | 24,000 | 12/06/16 | (142 | ) | ||
| Fannie Mae Bonds | Put | 1 | 103.17 | USD | 14,000 | 12/06/16 | (96 | ) | ||
| United States 5 Year Treasury Note Futures | Call | 38 | 121.00 | USD | 4,598 | 11/25/16 | (10 | ) | ||
| United States 5 Year Treasury Note Futures | Call | 38 | 121.75 | USD | 4,627 | 11/25/16 | (2 | ) | ||
| United States 5 Year Treasury Note Futures | Put | 16 | 120.75 | USD | 1,932 | 11/25/16 | (5 | ) | ||
| Total Liability for Options Written (premiums received $276) | (446 | ) | ||||||||
| Transactions in options written contracts for the period ended October 31, 2016 were as follows: | ||||||||||
| Number of | Premiums | |||||||||
| Contracts | Received | |||||||||
| Outstanding September 23, 2016 | — | $ | — | |||||||
| Opened | 97 | 276 | ||||||||
| Closed | — | — | ||||||||
| Expired | — | — | ||||||||
| Outstanding October 31, 2016 | 97 | $ | 276 | |||||||
| Foreign Currency Exchange Contracts | ||||||||
| Amounts in thousands | ||||||||
| Unrealized | ||||||||
| Appreciation | ||||||||
| Amount | Amount | (Depreciation) | ||||||
| Counterparty | Sold | Bought | Settlement Date | $ | ||||
| BNP Paribas | CAD | 2,000 | USD | 1,517 | 11/22/16 | 25 | ||
See accompanying notes which are an integral part of the financial statements.
Unconstrained Total Return Fund 389
Russell Investment Company
Unconstrained Total Return Fund
Schedule of Investments, continued — October 31, 2016
| Foreign Currency Exchange Contracts | |||||||
| Amounts in thousands | |||||||
| Unrealized | |||||||
| Appreciation | |||||||
| Amount | Amount | (Depreciation) | |||||
| Counterparty | Sold | Bought | Settlement Date | $ | |||
| BNP Paribas | EUR | 4,200 | USD | 4,645 | 11/22/16 | 31 | |
| Commonwealth Bank of Australia | USD | 4,383 | GBP | 3,343 | 11/08/16 | (290 | ) |
| Commonwealth Bank of Australia | USD | 2,603 | JPY | 261,833 | 11/08/16 | (106 | ) |
| Commonwealth Bank of Australia | GBP | 2,006 | USD | 2,630 | 11/08/16 | 174 | |
| Commonwealth Bank of Australia | NOK | 36,036 | USD | 4,448 | 11/08/16 | 87 | |
| Goldman Sachs | AUD | 46 | USD | 35 | 11/22/16 | — | |
| Royal Bank of Canada | USD | 1,749 | AUD | 2,289 | 11/08/16 | (8 | ) |
| Royal Bank of Canada | USD | 2,623 | AUD | 3,433 | 11/08/16 | (12 | ) |
| Royal Bank of Canada | USD | 1,732 | NZD | 2,371 | 11/08/16 | (37 | ) |
| Royal Bank of Canada | USD | 2,598 | NZD | 3,556 | 11/08/16 | (56 | ) |
| Royal Bank of Canada | AUD | 5,722 | USD | 4,372 | 11/08/16 | 20 | |
| Royal Bank of Canada | SEK | 14,913 | USD | 1,752 | 11/08/16 | 101 | |
| Royal Bank of Canada | SEK | 22,370 | USD | 2,628 | 11/08/16 | 151 | |
| State Street | USD | 12 | AUD | 16 | 11/08/16 | — | |
| State Street | USD | 45 | AUD | 58 | 11/08/16 | — | |
| State Street | USD | 16 | CAD | 22 | 11/08/16 | — | |
| State Street | USD | 42 | CAD | 56 | 11/08/16 | — | |
| State Street | USD | 7 | CHF | 6 | 11/08/16 | — | |
| State Street | USD | 17 | CHF | 16 | 11/08/16 | — | |
| State Street | USD | 106 | EUR | 97 | 11/08/16 | — | |
| State Street | USD | 1,752 | EUR | 1,556 | 11/08/16 | (43 | ) |
| State Street | USD | 5 | GBP | 4 | 11/08/16 | — | |
| State Street | USD | 272 | GBP | 223 | 11/08/16 | 1 | |
| State Street | USD | 107 | JPY | 11,258 | 11/08/16 | — | |
| State Street | USD | 1,662 | JPY | 174,573 | 11/08/16 | 3 | |
| State Street | USD | 117 | NOK | 938 | 11/08/16 | (4 | ) |
| State Street | USD | 2,600 | NOK | 21,453 | 11/08/16 | (4 | ) |
| State Street | USD | 16 | NZD | 22 | 11/08/16 | — | |
| State Street | USD | 24 | NZD | 34 | 11/08/16 | — | |
| State Street | USD | 29 | NZD | 40 | 11/08/16 | — | |
| State Street | USD | 43 | NZD | 60 | 11/08/16 | — | |
| State Street | AUD | 23 | USD | 18 | 11/08/16 | — | |
| State Street | AUD | 35 | USD | 27 | 11/08/16 | — | |
| State Street | AUD | 40 | USD | 31 | 11/08/16 | — | |
| State Street | AUD | 3,398 | USD | 2,585 | 11/08/16 | 1 | |
| State Street | CHF | 35 | USD | 35 | 11/08/16 | — | |
| State Street | CHF | 87 | USD | 88 | 11/08/16 | — | |
| State Street | EUR | 18 | USD | 20 | 11/08/16 | — | |
| State Street | EUR | 1,588 | USD | 1,741 | 11/08/16 | (3 | ) |
| State Street | GBP | 7 | USD | 9 | 11/08/16 | 1 | |
| State Street | GBP | 134 | USD | 163 | 11/08/16 | — | |
| State Street | JPY | 174,573 | USD | 1,726 | 11/08/16 | 60 | |
| State Street | NOK | 657 | USD | 80 | 11/08/16 | — | |
| State Street | SEK | 764 | USD | 85 | 11/08/16 | — | |
| State Street | SEK | 1,147 | USD | 127 | 11/08/16 | — | |
| UBS | USD | 4,396 | CAD | 5,724 | 11/08/16 | (130 | ) |
| UBS | USD | 4,381 | EUR | 3,890 | 11/08/16 | (110 | ) |
| UBS | CHF | 1,693 | USD | 1,755 | 11/08/16 | 44 | |
| UBS | CHF | 4,233 | USD | 4,388 | 11/08/16 | 109 | |
| UBS | EUR | 1,556 | USD | 1,752 | 11/08/16 | 44 | |
| Total Unrealized Appreciation (Depreciation) on Open Foreign Currency Exchange Contracts | 49 | ||||||
See accompanying notes which are an integral part of the financial statements.
390 Unconstrained Total Return Fund
Russell Investment Company
Unconstrained Total Return Fund
Schedule of Investments, continued — October 31, 2016
| Total Return Swap Contracts (*) | |||||
| Amounts in thousands | |||||
| Notional | Termination | Fair Value | |||
| Underlying Reference Entity | Counterparty | Amount | Date | $ | |
| Markit IOS Index | Goldman Sachs | USD | 10,773 | 01/12/41 | 62 |
| Markit IOS Index | Goldman Sachs | USD | 16,257 | 01/12/45 | 95 |
| Markit IOS Index | Goldman Sachs | USD | 29,483 | 01/12/45 | 176 |
| Total Fair Value of Open Total Return Swap Contracts Premiums Paid (Received) - $— (å) | 333 | ||||
(*) Total return swaps (which includes index swaps) are agreements between counterparties to exchange cash flows, one based on a market-linked
returns of an individual asset or a basket of assets (i.e. an index), and the other on a fixed or floating rate. The floating rate fees were based on 1
Month LIBOR rate plus a fee ranging from 3.500 to 4.500%.
| Interest Rate Swap Contracts | ||||||||||||||
| Amounts in thousands | ||||||||||||||
| Termination | Fair Value | |||||||||||||
| Counterparty | Notional Amount | Fund Receives | Fund Pays | Date | $ | |||||||||
| Barclays | USD | 32,972 | Three Month LIBOR | 1.029% | 09/26/18 | 25 | ||||||||
| Barclays | USD | 11,061 | Three Month LIBOR | 0.990% | 09/30/18 | 16 | ||||||||
| Barclays | USD | 2,751 | 1.194 | % | Three Month LIBOR | 09/26/21 | (16 | ) | ||||||
| Barclays | USD | 7,160 | 1.459 | % | Three Month LIBOR | 09/26/26 | (146 | ) | ||||||
| Barclays | USD | 585 | 1.452 | % | Three Month LIBOR | 09/27/26 | (13 | ) | ||||||
| Barclays | USD | 722 | Three Month LIBOR | 1.463% | 09/27/26 | 15 | ||||||||
| Barclays | USD | 1,003 | 1.412 | % | Three Month LIBOR | 09/29/26 | (26 | ) | ||||||
| Barclays | USD | 8,204 | Three Month LIBOR | 1.411% | 09/30/26 | 206 | ||||||||
| Barclays | USD | 1,217 | 1.410 | % | Three Month LIBOR | 10/03/26 | (31 | ) | ||||||
| Barclays | USD | 814 | 1.596 | % | Three Month LIBOR | 10/19/26 | (7 | ) | ||||||
| Barclays | USD | 1,296 | 1.592 | % | Three Month LIBOR | 10/19/26 | (12 | ) | ||||||
| Barclays | USD | 737 | 1.582 | % | Three Month LIBOR | 10/20/26 | (7 | ) | ||||||
| Barclays | USD | 658 | 1.590 | % | Three Month LIBOR | 10/24/26 | (6 | ) | ||||||
| Barclays | USD | 644 | 1.576 | % | Three Month LIBOR | 10/25/26 | (7 | ) | ||||||
| Barclays | USD | 4,357 | Three Month LIBOR | 1.585% | 10/25/26 | 42 | ||||||||
| Barclays | USD | 2,725 | Three Month LIBOR | 1.601% | 10/27/26 | 22 | ||||||||
| Barclays | USD | 1,194 | Three Month LIBOR | 1.640% | 10/28/26 | 5 | ||||||||
| Barclays | USD | 844 | Three Month LIBOR | 1.704% | 11/01/26 | — | ||||||||
| Barclays | USD | 1,505 | Three Month LIBOR | 1.690% | 11/02/26 | — | ||||||||
| Barclays | USD | 3,931 | 1.788 | % | Three Month LIBOR | 09/26/46 | (234 | ) | ||||||
| Total Fair Value on Open Interest Rate Swap Contracts Premiums Paid (Received) – ($1) (å) | (174 | ) | ||||||||||||
| Credit Default Swap Contracts | ||||||||||||||
| Amounts in thousands | ||||||||||||||
| Credit Indices | ||||||||||||||
| Fund (Pays)/ | ||||||||||||||
| Receives | Termination | Fair Value | ||||||||||||
| Reference Entity | Counterparty | Notional Amount | Fixed Rate | Date | $ | |||||||||
| CMBX NA Index | Goldman Sachs | USD | 15,000 | 3.000 | % | 01/17/47 | (1,266 | ) | ||||||
| CMBX NA Index | Goldman Sachs | USD | 3,159 | 3.000 | % | 05/11/63 | (257 | ) | ||||||
| CMBX NA Index | Goldman Sachs | USD | 424 | 3.000 | % | 01/17/47 | (36 | ) | ||||||
| CMBX NA Index | Goldman Sachs | USD | 734 | 3.000 | % | 01/17/47 | (62 | ) | ||||||
| CMBX NA Index | Goldman Sachs | USD | 430 | (5.000 | %) | 01/17/47 | 66 | |||||||
| Total Fair Value on Open Credit Default Swap Contracts Premiums Paid (Received) - ($1,435) (å) | (1,555 | ) | ||||||||||||
See accompanying notes which are an integral part of the financial statements.
Unconstrained Total Return Fund 391
Russell Investment Company
Unconstrained Total Return Fund
Schedule of Investments, continued — October 31, 2016
| Presentation of Portfolio Holdings | |||||||||||||||||
| Amounts in thousands | |||||||||||||||||
| Fair Value | |||||||||||||||||
| Practical | |||||||||||||||||
| Portfolio Summary | Level 1 | Level 2 | Level 3 | Expedient (a) | Total | % of Net Assets | |||||||||||
| Long-Term Investments | |||||||||||||||||
| Corporate Bonds and Notes | $ | — | $ | 51,172 | $ | — | $ | — | $ | 51,172 | 21.0 | ||||||
| International Debt | — | 10,676 | — | — | 10,676 | 4.4 | |||||||||||
| Loan Agreements | — | 40,774 | — | — | 40,774 | 16.7 | |||||||||||
| Mortgage-Backed Securities | — | 64,997 | 270 | — | 65,267 | 26.7 | |||||||||||
| Options Purchased | 5 | 576 | — | — | 581 | 0.2 | |||||||||||
| Short-Term Investments | — | 39,095 | — | 87,573 | 126,668 | 51.9 | |||||||||||
| Total Investments | 5 | 207,290 | 270 | 87,573 | 295,138 | 120.9 | |||||||||||
| Other Assets and Liabilities, Net | (20.9 | ) | |||||||||||||||
| 100.0 | |||||||||||||||||
| Other Financial Instruments | |||||||||||||||||
| Assets | |||||||||||||||||
| Futures Contracts | 1,271 | — | — | — | 1,271 | 0.5 | |||||||||||
| Foreign Currency Exchange Contracts | — | 852 | — | — | 852 | 0.3 | |||||||||||
| Total Return Swap Contracts | — | 333 | — | — | 333 | 0.1 | |||||||||||
| Interest Rate Swap Contracts | — | 331 | — | — | 331 | 0.1 | |||||||||||
| Credit Default Swap Contracts | — | 66 | — | — | 66 | —* | |||||||||||
| A | |||||||||||||||||
| Liabilities | |||||||||||||||||
| Futures Contracts | (908 | ) | — | — | — | (908 | ) | (0.4 | ) | ||||||||
| Options Written | (17 | ) | (429 | ) | — | — | (446 | ) | (0.2 | ) | |||||||
| Foreign Currency Exchange Contracts | — | (803 | ) | — | — | (803 | ) | (0.3 | ) | ||||||||
| Interest Rate Swap Contracts | — | (505 | ) | — | — | (505 | ) | (0.2 | ) | ||||||||
| Credit Default Swap Contracts | — | (1,621 | ) | — | — | (1,621 | ) | (0.7 | ) | ||||||||
| Total Other Financial Instruments** | $ | 346 | $ | (1,776 | ) | $ | — | $ | — | $ | (1,430 | ) | |||||
* Less than 0.05% of net assets.
** Futures and foreign currency exchange contract values reflect the unrealized appreciation (depreciation) on the investments.
*** Refer to Schedule of Investments for detailed sector breakout.
(a) Certain investments that are measured at fair value using the net asset value per share (or its equivalent) practical expedient have not been classified
in the fair value levels. The fair value amounts presented in the table are intended to permit reconciliation to the amounts presented in the Schedule of
Investments.
For a description of the Levels see note 2 in the Notes to Financial Statements.
For a disclosure on transfers between Levels 1, 2 and 3 during the period ended October 31, 2016 see note 2 in the Notes to
Financial Statements.
Investments in which significant unobservable inputs (Level 3) were used in determining a fair value for the period ended October
31, 2016 were less than 1% of net assets.
See accompanying notes which are an integral part of the financial statements.
392 Unconstrained Total Return Fund
Russell Investment Company
Unconstrained Total Return Fund
Fair Value of Derivative Instruments — October 31, 2016
Amounts in thousands
| Foreign | |||||||||||||
| Equity | Credit | Currency | Interest Rate | ||||||||||
| Derivatives not accounted for as hedging instruments | Contracts | Contracts | Contracts | Contracts | |||||||||
| Location: Statement of Assets and Liabilities - Assets | |||||||||||||
| Investments, at fair value* | $ | — | $ | — | $ | 444 | $ | 137 | |||||
| Unrealized appreciation on foreign currency exchange contracts | — | — | 852 | — | |||||||||
| Variation margin on futures contracts** | — | — | — | 1,271 | |||||||||
| Total return swap contracts, at fair value | — | — | — | 333 | |||||||||
| Interest rate swap contracts, at fair value | — | — | — | 331 | |||||||||
| Credit default swap contracts, at fair value | — | 66 | — | — | |||||||||
| Total | $ | — | $ | 66 | $ | 1,296 | $ | 2,072 | |||||
| Location: Statement of Assets and Liabilities - Liabilities | |||||||||||||
| Variation margin on futures contracts** | $ | 11 | $ | — | $ | — | $ | 897 | |||||
| Unrealized depreciation on foreign currency exchange contracts | — | — | 803 | — | |||||||||
| Options written, at fair value | — | — | 136 | 310 | |||||||||
| Interest rate swap contracts, at fair value | — | — | — | 505 | |||||||||
| Credit default swap contracts, at fair value | — | 1,621 | — | — | |||||||||
| Total | $ | 11 | $ | 1,621 | $ | 939 | $ | 1,712 | |||||
| Foreign | |||||||||||||
| Equity | Credit | Currency | Interest Rate | ||||||||||
| Derivatives not accounted for as hedging instruments | Contracts | Contracts | Contracts | Contracts | |||||||||
| Location: Statement of Operations - Net realized gain (loss) | |||||||||||||
| Futures contracts | $ | — | $ | — | $ | — | $ | 2 | |||||
| Total return swap contracts | — | — | — | 529 | |||||||||
| Credit default swap contracts | — | 4 | — | — | |||||||||
| Foreign currency-related transactions*** | — | — | 67 | — | |||||||||
| Total | $ | — | $ | 4 | $ | 67 | $ | 531 | |||||
| Location: Statement of Operations - Net change in unrealized appreciation | |||||||||||||
| (depreciation) | |||||||||||||
| Investments**** | $ | — | $ | — | $ | 131 | $ | (30 | ) | ||||
| Futures contracts | (11 | ) | — | �� | 374 | ||||||||
| Options written | — | — | (39 | ) | (131 | ) | |||||||
| Total return swap contracts | — | — | — | 333 | |||||||||
| Interest rate swap contracts | — | — | — | (173 | ) | ||||||||
| Credit default swap contracts | — | (120 | ) | — | — | ||||||||
| Foreign currency-related transactions***** | — | — | 48 | — | |||||||||
| Total | $ | (11 | ) | $ | (120 | ) | $ | 140 | $ | 373 | |||
* Fair value of purchased options.
** Includes cumulative appreciation/depreciation of futures contracts as reported in the Schedule of Investments. Only variation margin is reported within the
Statement of Assets and Liabilities.
*** Only includes net realized gain (loss) on forward and spot contracts. May differ from the net realized gain (loss) on foreign currency-related transactions reported
within the Statement of Operations.
**** Includes net unrealized gain (loss) on purchased options as reported in the Schedule of Investments.
***** Only includes change in unrealized gain (loss) on forward and spot contracts. May differ from the net change in unrealized gain (loss) on foreign currency-related
transactions reported within the Statement of Operations.
For further disclosure on derivatives see note 2 in the Notes to Financial Statements.
See accompanying notes which are an integral part of the financial statements.
Unconstrained Total Return Fund 393
Russell Investment Company
Unconstrained Total Return Fund
Balance Sheet Offsetting Financial and Derivative Instruments — October 31, 2016
| Amounts in thousands | |||||||||
| Offsetting of Financial Assets and Derivative Assets | |||||||||
| Gross | Net Amounts | ||||||||
| Amounts | of Assets | ||||||||
| Gross | Offset in the | Presented in | |||||||
| Amounts of | Statement of | the Statement | |||||||
| Recognized | Assets and | of Assets and | |||||||
| Description | Location: Statement of Assets and Liabilities - Assets | Assets | Liabilities | Liabilities | |||||
| Options Purchased Contracts | Investments, at fair value | $ | 581 | $ | — $ | 581 | |||
| Foreign Currency Exchange Contracts | Unrealized appreciation on foreign currency exchange contracts | 852 | — | 852 | |||||
| Futures Contracts | Variation margin on futures contracts | 642 | — | 642 | |||||
| Total Return Swap Contracts | Total return swap contracts, at fair value | 333 | — | 333 | |||||
| Interest Rate Swap Contracts | Interest rate swap contracts, at fair value | 331 | — | 331 | |||||
| Credit Default Swap Contracts | Credit default swap contracts, at fair value | 66 | — | 66 | |||||
| Total Financial and Derivative Assets | 2,805 | — | 2,805 | ||||||
| Financial and Derivative Assets not subject to a netting agreement | (977 | ) | — | (977 | ) | ||||
| Total Financial and Derivative Assets subject to a netting agreement | $ | 1,828 | $ | — $ | 1,828 | ||||
| Financial Assets, Derivative Assets, and Collateral Held by Counterparty | |||||||||
| Gross Amounts Not Offset in | |||||||||
| the Statement of Assets and | |||||||||
| Liabilities | |||||||||
| Net Amounts | |||||||||
| of Assets | |||||||||
| Presented in | |||||||||
| the Statement | Financial and | ||||||||
| of Assets and | Derivative | Collateral | |||||||
| Counterparty | Liabilities | Instruments | Received^ | Net Amount | |||||
| BNP Paribas | $ | 228 | $ | — | $ | — | $ 228 | ||
| Commonwealth Bank of Australia | 261 | 261 | — | — | |||||
| Goldman Sachs | 671 | 536 | — | 135 | |||||
| JPMorgan Chase | 132 | 132 | — | — | |||||
| Royal Bank of Canada | 272 | 113 | — | 159 | |||||
| State Street | 68 | 56 | — | 12 | |||||
| UBS | 196 | 196 | — | — | |||||
| Total | $ | 1,828 | $ | 1,294 | $ | — | $ 534 | ||
See accompanying notes which are an integral part of the financial statements.
394 Unconstrained Total Return Fund
Russell Investment Company
Unconstrained Total Return Fund
Balance Sheet Offsetting Financial and Derivative Instruments, continued — October
31, 2016
| Amounts in thousands | |||||||||
| Offsetting of Financial Liabilities and Derivative Liabilities | |||||||||
| Gross | Net Amounts | ||||||||
| Amounts | of Liabilities | ||||||||
| Gross | Offset in the | Presented in | |||||||
| Amounts of | Statement of | the Statement | |||||||
| Recognized | Assets and | of Assets and | |||||||
| Description | Location: Statement of Assets and Liabilities - Liabilities | Liabilities | Liabilities | Liabilities | |||||
| Futures Contracts | Variation margin on futures contracts | $ | 53 | $ | — $ | 53 | |||
| Foreign Currency Exchange Contracts | Unrealized depreciation on foreign currency exchange contracts | 803 | — | 803 | |||||
| Options Written Contracts | Options written, at fair value | 446 | — | 446 | |||||
| Interest Rate Swap Contracts | Interest rate swap contracts, at fair value | 505 | — | 505 | |||||
| Credit Default Swap Contracts | Credit default swap contracts, at fair value | 1,621 | — | 1,621 | |||||
| Total Financial and Derivative Liabilities | 3,428 | — | 3,428 | ||||||
| Financial and Derivative Liabilities not subject to a netting agreement | (562 | ) | — | (562 | ) | ||||
| Total Financial and Derivative Liabilities subject to a netting agreement | $ | 2,866 | $ | — $ | 2,866 | ||||
| Financial Liabilities, Derivative Liabilities, and Collateral Pledged by Counterparty | |||||||||
| Gross Amounts Not Offset in | |||||||||
| the Statement of Assets and | |||||||||
| Liabilities | |||||||||
| Net Amounts | |||||||||
| of Liabilities | |||||||||
| Presented in | |||||||||
| the Statement | Financial and | ||||||||
| of Assets and | Derivative | Collateral | |||||||
| Counterparty | Liabilities | Instruments | Pledged^ | Net Amount | |||||
| Commonwealth Bank of Australia | $ | 397 | $ | 261 | $ | — | $ 136 | ||
| Goldman Sachs | 1,768 | 536 | — | 1,232 | |||||
| JPMorgan Chase | 293 | 132 | — | 161 | |||||
| Royal Bank of Canada | 113 | 113 | — | — | |||||
| State Street | 56 | 56 | — | — | |||||
| UBS | 239 | 196 | — | 43 | |||||
| Total | $ | 2,866 | $ | 1,294 | $ | — | $ 1,572 | ||
* Fair value of securities on loan as reported in the footnotes to the Statement of Assets and Liabilities.
^ Collateral received or pledged amounts may not reconcile to those disclosed in the Statement of Assets and Liabilities due to the inclusion of off-Balance
Sheet collateral and adjustments made to exclude overcollateralization.
For further disclosure on derivatives and counterparty risk see note 2 in the Notes to Financial Statements.
See accompanying notes which are an integral part of the financial statements.
Unconstrained Total Return Fund 395
Russell Investment Company
Unconstrained Total Return Fund
Statement of Assets and Liabilities — October 31, 2016
| Amounts in thousands | ||
| Assets | ||
| Investments, at identified cost | $ | 295,699 |
| Investments, at fair value(>) | 295,138 | |
| Cash | 2,662 | |
| Cash (restricted)(a)(b) | 1,803 | |
| Foreign currency holdings(^) | 72 | |
| Unrealized appreciation on foreign currency exchange contracts | 852 | |
| Receivables: | ||
| Dividends and interest | 973 | |
| Dividends from affiliated Russell funds | 55 | |
| Investments sold | 52,534 | |
| From broker | 642 | |
| Variation margin on futures contracts | 642 | |
| Prepaid expenses | 77 | |
| Total return swap contracts, at fair value(8) | 333 | |
| Interest rate swap contracts, at fair value(•) | 331 | |
| Credit default swap contracts, at fair value(+) | 66 | |
| Total assets | 356,180 | |
| Liabilities | ||
| Payables: | ||
| Investments purchased | 108,048 | |
| Fund shares redeemed | 541 | |
| Accrued fees to affiliates | 53 | |
| Other accrued expenses | 113 | |
| Variation margin on futures contracts | 53 | |
| Unrealized depreciation on foreign currency exchange contracts | 803 | |
| Options written, at fair value(x) | 446 | |
| Interest rate swap contracts, at fair value(•) | 505 | |
| Credit default swap contracts, at fair value(+) | 1,621 | |
| Total liabilities | 112,183 | |
| Commitments and Contingencies (1) | ||
| Net Assets | $ | 243,997 |
| (1) See note 9 in the Notes to Financial Statements for a detailed description of commitments and contingencies. | ||
See accompanying notes which are an integral part of the financial statements.
396 Unconstrained Total Return Fund
Russell Investment Company
Unconstrained Total Return Fund
Statement of Assets and Liabilities, continued — October 31, 2016
| Amounts in thousands | |||
| Net Assets Consist of: | |||
| Undistributed (overdistributed) net investment income | $ | 976 | |
| Accumulated net realized gain (loss) | 207 | ||
| Unrealized appreciation (depreciation) on: | |||
| Investments | (561 | ) | |
| Futures contracts | 363 | ||
| Options written | (170 | ) | |
| Total return swap contracts | 333 | ||
| Interest rate swap contracts | (173 | ) | |
| Credit default swap contracts | (120 | ) | |
| Foreign currency-related transactions | 48 | ||
| Shares of beneficial interest | 243 | ||
| Additional paid-in capital | 242,851 | ||
| Net Assets | $ | 243,997 | |
| Net Asset Value, offering and redemption price per share: | |||
| Net asset value per share: Class A(#) | $ | 10.04 | |
| Maximum offering price per share (Net asset value plus sales charge of 3.75%): Class A | $ | 10.43 | |
| Class A — Net assets | $ | 101,495 | |
| Class A — Shares outstanding ($.01 par value) | 10,107 | ||
| Net asset value per share: Class C(#) | $ | 10.03 | |
| Class C — Net assets | $ | 102,716 | |
| Class C — Shares outstanding ($.01 par value) | 10,237 | ||
| Net asset value per share: Class E(#) | $ | 10.04 | |
| Class E — Net assets | $ | 100,418 | |
| Class E — Shares outstanding ($.01 par value) | 10,000 | ||
| Net asset value per share: Class S(#) | $ | 10.05 | |
| Class S — Net assets | $ | 208,024 | |
| Class S — Shares outstanding ($.01 par value) | 20,709 | ||
| Net asset value per share: Class Y(#) | $ | 10.04 | |
| Class Y — Net assets | $ | 243,484,773 | |
| Class Y — Shares outstanding ($.01 par value) | 24,260,123 | ||
| Amounts in thousands | |||
| (^) Foreign currency holdings - cost | $ | 72 | |
| (x) Premiums received on options written | $ | 276 | |
| (8) Total return swap contracts - premiums paid (received) | $ | — | |
| (+) Credit default swap contracts - premiums paid (received) | $ | (1,435 | ) |
| (•) Interest rate swap contracts - premiums paid (received) | $ | (1 | ) |
| (>) Investments in affiliates, Russell U.S. Cash Management Fund | $ | 87,573 | |
| (a) Cash Collateral for Futures | $ | 1,611 | |
| (b) Cash Collateral for Swaps | $ | 192 | |
| (#) Net asset value per share equals class level net assets divided by class level shares of beneficial interest outstanding. | |||
See accompanying notes which are an integral part of the financial statements.
Unconstrained Total Return Fund 397
Russell Investment Company
Unconstrained Total Return Fund
Statement of Operations — For the Period Ended October 31, 2016(1)
| Amounts in thousands | |||
| Investment Income | |||
| Dividends from affiliated Russell funds | $ | 84 | |
| Interest | 752 | ||
| Total investment income | 836 | ||
| Expenses | |||
| Advisory fees | 263 | ||
| Administrative fees | 13 | ||
| Custodian fees (1) | 25 | ||
| Distribution fees - Class A | —** | ||
| Distribution fees - Class C | —** | ||
| Transfer agent fees - Class A | —** | ||
| Transfer agent fees - Class C | —** | ||
| Transfer agent fees - Class E | —** | ||
| Transfer agent fees - Class S | —** | ||
| Transfer agent fees - Class Y | 1 | ||
| Professional fees | 79 | ||
| Registration fees | 6 | ||
| Shareholder servicing fees - Class C | —** | ||
| Shareholder servicing fees - Class E | —** | ||
| Trustees’ fees | 1 | ||
| Printing fees | 3 | ||
| Offering fees | 10 | ||
| Miscellaneous | 1 | ||
| Expenses before reductions | 402 | ||
| Expense reductions | (211 | ) | |
| Net expenses | 191 | ||
| Net investment income (loss) | 645 | ||
| Net Realized and Unrealized Gain (Loss) | |||
| Net realized gain (loss) on: | |||
| Investments | (69 | ) | |
| Futures contracts | 2 | ||
| Total return swap contracts | 529 | ||
| Credit default swap contracts | 4 | ||
| Foreign currency-related transactions | 77 | ||
| Net realized gain (loss) | 543 | ||
| Net change in unrealized appreciation (depreciation) on: | |||
| Investments | (561 | ) | |
| Futures contracts | 363 | ||
| Options written | (170 | ) | |
| Total return swap contracts | 333 | ||
| Interest rate swap contracts | (173 | ) | |
| Credit default swap contracts | (120 | ) | |
| Foreign currency-related transactions | 48 | ||
| Net change in unrealized appreciation (depreciation) | (280 | ) | |
| Net realized and unrealized gain (loss) | 263 | ||
| Net Increase (Decrease) in Net Assets from Operations | $ | 908 | |
** Less than $500.
(1) For the period September 23, 2016 (commencement of operations) to October 31, 2016.
See accompanying notes which are an integral part of the financial statements.
398 Unconstrained Total Return Fund
Russell Investment Company
Unconstrained Total Return Fund
Statement of Changes in Net Assets
| For the Periods Ended (1) | ||||
| Amounts in thousands | 2016 | |||
| Increase (Decrease) in Net Assets | ||||
| Operations | ||||
| Net investment income (loss) | $ | 645 | ||
| Net realized gain (loss) | 543 | |||
| Net change in unrealized appreciation (depreciation) | (280 | ) | ||
| Net increase (decrease) in net assets from operations | 908 | |||
| Distributions | ||||
| From net investment income | ||||
| Class S | (—)** | |||
| Class Y | (15 | ) | ||
| Net decrease in net assets from distributions | (15 | ) | ||
| Share Transactions* | ||||
| Net increase (decrease) in net assets from share transactions | 243,104 | |||
| Total Net Increase (Decrease) in Net Assets | 243,997 | |||
| Net Assets | ||||
| Beginning of period | — | |||
| End of period | $ | 243,997 | ||
| Undistributed (overdistributed) net investment income included in net assets | $ | 976 | ||
| ** Less than $500. | ||||
| (1) For the period September 23, 2016 (commencement of operations) to October 31, 2016. | ||||
See accompanying notes which are an integral part of the financial statements.
Unconstrained Total Return Fund 399
Russell Investment Company
Unconstrained Total Return Fund
Statement of Changes in Net Assets, continued
| * Share transaction amounts (in thousands) for the period ended October 31, 2016 were as follows: | |||||||
| 2016 | (1) | ||||||
| Shares | Dollars | ||||||
| Class A | |||||||
| Proceeds from shares sold | 10 | $ | 101 | ||||
| Net increase (decrease) | 10 | 101 | |||||
| Class C | |||||||
| Proceeds from shares sold | 10 | 102 | |||||
| Net increase (decrease) | 10 | 102 | |||||
| Class E | |||||||
| Proceeds from shares sold | 10 | 100 | |||||
| Net increase (decrease) | 10 | 100 | |||||
| Class S | |||||||
| Proceeds from shares sold | 21 | 207 | |||||
| Net increase (decrease) | 21 | 207 | |||||
| Class Y | |||||||
| Proceeds from shares sold | 24,773 | 247,725 | |||||
| Proceeds from reinvestment of distributions | 1 | 15 | |||||
| Payments for shares redeemed | (514 | ) | (5,146 | ) | |||
| Net increase (decrease) | 24,260 | 242,594 | |||||
| Total increase (decrease) | 24,311 | $ | 243,104 | ||||
| (1) For the period September 23, 2016 (commencement of operations) to October 31, 2016. | |||||||
See accompanying notes which are an integral part of the financial statements.
400 Unconstrained Total Return Fund
(This page intentionally left blank)
Russell Investment Company
Unconstrained Total Return Fund
Financial Highlights — For the Period Ended
For a Share Outstanding Throughout the Period.
| $ | $ | $ | $ | $ | ||||||
| Net Asset Value, | Net | Net Realized | Total from | Distributions | ||||||
| Beginning of | Investment | and Unrealized | Investment | from Net | $ | |||||
| Period | Income (Loss)(a)(d) | Gain (Loss) | Operations | Investment Income | Total Distributions | |||||
| Class A | ||||||||||
| October 31, 2016(9) | 10.00 | .02 | .02 | .04 | — | — | ||||
| Class C | ||||||||||
| October 31, 2016(9) | 10.00 | .01 | .02 | .03 | — | — | ||||
| Class E | ||||||||||
| October 31, 2016(9) | 10.00 | .02 | .02 | .04 | — | — | ||||
| Class S | ||||||||||
| October 31, 2016(9) | 10.00 | .03 | .02 | .05 | —(f) | —(f) | ||||
| Class Y | ||||||||||
| October 31, 2016(9) | 10.00 | .03 | .01 | .04 | —(f) | —(f) | ||||
See accompanying notes which are an integral part of the financial statements.
402 Unconstrained Total Return Fund
| % | % | % | |||||||||||
| $ | $ | Ratio of Expenses | Ratio of Expenses | Ratio of Net | |||||||||
| Net Asset Value, | % | Net Assets, | to Average | to Average | Investment Income | % | |||||||
| End of | Total | End of Period | Net Assets, | Net Assets, | to Average | Portfolio | |||||||
| Period | Return(b)(c) | (000 | ) | Gross(e) | Net(d)(e) | Net Assets(d)(e) | Turnover Rate(b) | ||||||
| 10.04 | .40 | 101 | 1.70 | .90 | 2.28 | 43 | |||||||
| 10.03 | .30 | 103 | 2.46 | 1.65 | 1.54 | 43 | |||||||
| 10.04 | .40 | 100 | 1.70 | .90 | 2.28 | 43 | |||||||
| 10.05 | .50 | 208 | 1.47 | .65 | 2.81 | 43 | |||||||
| 10.04 | .41 | 243,485 | 1.26 | .45 | 2.72 | 43 | |||||||
See accompanying notes which are an integral part of the financial statements.
Unconstrained Total Return Fund 403
Russell Investment Company
Unconstrained Total Return Fund
Related Party Transactions, Fees and Expenses
| Accrued fees payable to affiliates for the period ended October 31, 2016 were as follows: | ||
| Advisory fees | $ | 41,398 |
| Administration fees | 10,099 | |
| Distribution fees | 85 | |
| Shareholder servicing fees | 42 | |
| Transfer agent fees | 997 | |
| Trustee fees | 790 | |
| $ | 53,411 | |
| Transactions (amounts in thousands) during the period ended October 31, 2016 with Underlying Funds which are, or were, an | |||||||||||||||||
| affiliated company are as follows: | |||||||||||||||||
| Fair Value, | Change in | ||||||||||||||||
| Beginning of | Realized Gain | Unrealized | Fair Value, End | Income | Capital Gains | ||||||||||||
| Period | Purchases | Sales | (Loss) | Gain (Loss) | of Period | Distributions | Distributions | ||||||||||
| Russell U.S. Cash Management Fund $ | — $ | 447,668 | $ | 360,123 | $ | 15 | $ | 13 | $ | 87,573 | $ | 84 | $ | — | |||
| $ | — $ | 447,668 | $ | 360,123 | $ | 15 | $ | 13 | $ | 87,573 | $ | 84 | $ | — | |||
Federal Income Taxes
At October 31, 2016, the cost of investments and net unrealized appreciation (depreciation), undistributed ordinary income
undistributed long-term capital gains for income tax purposes were as follows:.
| Cost of Investments | $ | 295,614,980 | ||
| Unrealized Appreciation | $ | 129,081 | ||
| Unrealized Depreciation | (606,263 | ) | ||
| Net Unrealized Appreciation (Depreciation) | $ | (477,182 | ) | |
| Undistributed Ordinary Income | $ | 1,838,328 | ||
| Undistributed Long-Term Capital Gains | ||||
| (Capital Loss Carryforward) | $ | 582,187 | ||
| Tax Composition of Distributions | ||||
| Ordinary Income | $ | 14,857 |
Net investment income and net realized gains (loss) in the financial statements may differ from taxable net investment income and net
realized gains (losses). Capital accounts within the financial statements are adjusted for permanent book-tax differences. Book-tax
differences are primarily due to foreign currency gains and losses, reclassifications of dividends, differences in treatment of income
from swaps, net operating losses, investments in partnerships, investments in passive foreign investment companies (PFICs), tax
straddle transactions, use of tax equalization and foreign capital gains taxes. These adjustments have no impact on the net assets.
At October 31, 2016, the Statement of Assets and Liabilities have been adjusted by the following amounts (in thousands):
| Undistributed net investment income | $ | 346 | |
| Accumulated net realized gain (loss) | (336 | ) | |
| Additional paid-in capital | (10 | ) |
See accompanying notes which are an integral part of the financial statements.
404 Unconstrained Total Return Fund
Russell Investment Company
Russell Strategic Bond Fund
Portfolio Management Discussion and Analysis — October 31, 2016 (Unaudited)
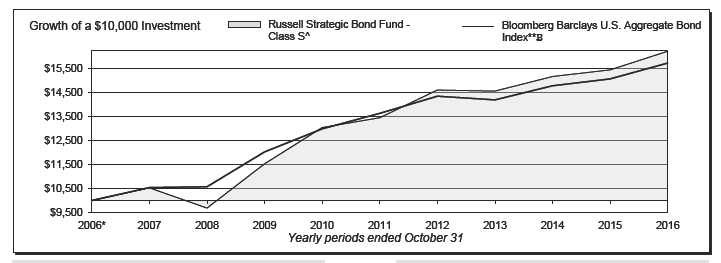
| Russell Strategic Bond Fund - Class A‡ | Russell Strategic Bond Fund - Class R6‡‡‡ | ||||||
| Total | Total | ||||||
| Return | Return | ||||||
| 1 Year | 0.78 | % | 1 Year | 5.26 | % | ||
| 5 Years | 2.76 | %§ | 5 Years | 4.00 | %§ | ||
| 10 Years | 4.26 | %§ | 10 Years | 5.09 | %§ | ||
| Russell Strategic Bond Fund - Class C‡‡ | Russell Strategic Bond Fund - Class S‡‡‡‡ | ||||||
| Total | Total | ||||||
| Return | Return | ||||||
| 1 Year | 4.01 | % | 1 Year | 5.04 | % | ||
| 5 Years | 2.79 | %§ | 5 Years | 3.82 | %§ | ||
| 10 Years | 4.03 | %§ | 10 Years | 4.97 | %§ | ||
| Russell Strategic Bond Fund - Class E | Russell Strategic Bond Fund - Class Y | ||||||
| Total | Total | ||||||
| Return | Return | ||||||
| 1 Year | 4.84 | % | 1 Year | 5.18 | % | ||
| 5 Years | 3.57 | %§ | 5 Years | 3.98 | %§ | ||
| 10 Years | 4.71 | %§ | 10 Years | 5.08 | %§ | ||
| Russell Strategic Bond Fund - Class I | Bloomberg Barclays U.S. Aggregate Bond Index**C | ||||||
| Total | Total | ||||||
| Return | Return | ||||||
| 1 Year | 5.06 | % | 1 Year | 4.37 | % | ||
| 5 Years | 3.87 | %§ | 5 Years | 2.90 | %§ | ||
| 10 Years | 4.99 | %§ | 10 Years | 4.64 | %§ | ||
Russell Strategic Bond Fund 405
Russell Investment Company
Russell Strategic Bond Fund
Portfolio Management Discussion and Analysis, continued — October 31, 2016
(Unaudited)
| The Russell Strategic Bond Fund (the “Fund”) employs a multi- | environment, the Fund’s strategic overweight to credit provided a |
| manager approach whereby portions of the Fund are allocated to | tailwind to benchmark relative performance. |
| different money manager strategies. Fund assets not allocated to | The Fund’s global strategies also added value over the period. In |
| money managers are managed by Russell Investment Management, | particular, the convergence of bond yields globally was a boost |
| LLC (“RIM”), the Fund’s advisor. RIM may change the allocation | to the performance of the Fund’s bias toward higher real yield |
| of the Fund’s assets among money managers at any time. An | government bonds. |
| exemptive order from the Securities and Exchange Commission | |
| (“SEC”) permits RIM to engage or terminate a money manager | How did the investment strategies and techniques employed |
| at any time, subject to approval by the Fund’s Board, without a | by the Fund and its money managers affect its benchmark- |
| shareholder vote. Pursuant to the terms of the exemptive order, | relative performance? |
| the Fund is required to notify its shareholders within 90 days of | The Fund employs discretionary money managers. The Fund’s |
| when a money manager begins providing services. As of October | discretionary money managers select the individual portfolio |
| 31, 2016, the Fund had six money managers. | securities for the assets assigned to them. Fund assets not |
| What is the Fund’s investment objective? | allocated to discretionary money managers include the Fund’s |
| The Fund seeks to provide current income, and as a secondary | liquidity reserves and assets which may be managed directly by |
| objective, capital appreciation. | RIM to effect the Fund’s investment strategies and/or to actively |
| manage the Fund’s overall exposures by investing in securities or | |
| How did the Fund perform relative to its benchmark for the | other instruments that RIM believes will achieve the desired risk/ |
| fiscal year ended October 31, 2016? | return profile for the Fund. |
| For the fiscal year ended October 31, 2016, the Fund’s Class A, | With respect to certain of the Fund’s money managers, Schroder |
| Class C, Class E, Class I, Class R6, Class S and Class Y Shares | Investment Management North America Inc. (“Schroder”), the |
| gained 4.70%, 4.01%, 4.84%, 5.06%, 5.26%, 5.04% and 5.18%, | Fund’s securitized assets specialist, was the best performing |
| respectively. This is compared to the Fund’s benchmark, the | manager for the period and outperformed the Fund’s benchmark. |
| Bloomberg Barclays U.S. Aggregate Bond Index, which gained | Credit risk was generally rewarded across all sectors, but |
| 4.37% during the same period. The Fund’s performance includes | securitized credit held up better during the sell-off early in the |
| operating expenses, whereas index returns are unmanaged and do | period than corporate credit, which was more hurt by energy |
| not include expenses of any kind. | exposure and earnings declines. Fundamentally, further strength |
| For the fiscal year ended October 31, 2016, the Morningstar® | in U.S. home prices supported Schroder’s holding of residential |
| Intermediate-Term Bond Category, a group of funds that | mortgage-backed securities. |
| Morningstar considers to have investment strategies similar to | Scout Investments, LLC (“Scout”) was the worst performing |
| those of the Fund, gained 4.33%. This return serves as a peer | manager over the period, but still meaningfully outperformed the |
| comparison and is expressed net of operating expenses. | benchmark during the year. Scout took an underweight position to |
| RIM may assign a money manager a benchmark other than the | corporate credit midway through the year, but markets continued |
| Fund’s index. However, the Fund’s primary index remains the | to rally, which was a drag on performance. Still, tactical rotation |
| benchmark for the Fund. | into energy credits during December and January more than made |
| up for those losses later in the period. | |
| How did the market conditions described in the Market | During the period, RIM utilized futures and swaps to seek to |
| Summary report affect the Fund’s performance? | achieve the Fund benchmark’s duration exposures with respect to |
| The fiscal year ended October 31, 2016 was characterized | the portion of the Fund allocated to cash reserves. This performed |
| by a sharply risk off market early in the period followed by a | as intended and was a positive in terms of absolute return |
| similar sharp rebound and extended rally in risky assets (e.g., | contribution, but lagged the benchmark as credit derivatives |
| lower rated credit and emerging market currencies). Overall, this | underperformed the cash bonds in the index. |
| proved positive for most fixed income sectors around the globe. | |
| Yield curves on global government bonds tended to flatten over | RIM also managed a three-pronged strategy to seek to generate |
| the period supporting longer maturity bonds and the asset class | active returns through currency positioning by supplementing the |
| in general. Corporate and emerging sovereign credit markets | Fund’s existing active currency mandate with a more mechanistic |
| suffered from December to February, but returns turned positive | strategy and to further reduce the Fund’s reliance on traditional |
| as the year went on and eventually very significantly so. In this | fixed income market risks. This approach incorporates a currency |
| overlay, an index replication and an enhanced cash strategy. | |
| The currency overlay utilizes currency forward contracts to take |
406 Russell Strategic Bond Fund
Russell Investment Company
Russell Strategic Bond Fund
Portfolio Management Discussion and Analysis, continued — October 31, 2016
(Unaudited)
| long and short positions in global foreign exchange markets. | Management Limited was hired in June 2016 to replace Principal, | |
| Because the currency overlay is an out-of-benchmark position, | which RIM considers to be an upgrade in long term return | |
| RIM managed an index replication strategy in connection with | potential. At the end of the period, Logan Circle Partners, L.P. and | |
| the currency overlay to provide benchmark-like exposure to | Schroder were given new manager-level benchmarks and roles as | |
| its overall strategy. The enhanced cash strategy is designed to | sector specialists covering the corporate and securitized portions | |
| provide for modest returns on the cash held in connection with the | of the Fund benchmark, respectively, while RIM instituted a | |
| currency overlay and index replication strategies. Over the fiscal | new positioning strategy to match the government portion of the | |
| year, the currency overlay strategy was positive for the Fund’s | benchmark. This positioning strategy purchases a physical bond | |
| benchmark-relative performance, but the benchmark replication | portfolio that seeks to replicate the Bloomberg Barclays U.S. | |
| strategy underperformed due to its reliance on derivatives rather | Government Index and replaced the derivatives-based enhanced | |
| than cash bonds. | cash strategy discussed above. Schroder was added to the Fund in | |
| RIM also implemented a global real yield strategy using global | September 2016 when Brookfield Investment Management Inc.’s | |
| government bond futures to take long positions in high quality | securities product team (formerly a money manager to the Fund) | |
| government bonds whose net-of-inflation yields are expected to | was purchased by Schroder. | |
| be relatively high and short positions where net-of-inflation yield | Money Managers as of October 31, | |
| is expected to be relatively low. This strategy had a considerably | 2016 | Styles |
| positive impact on performance over the summer as Brexit | Colchester Global Investors Limited | Fully Discretionary |
| accelerated the convergence of real interest rates globally. | Logan Circle Partners, L.P. | Sector Specialist |
| Throughout the period, RIM also implemented tactical ‘tilts’ based | Pareto Investment Management Limited | Fully Discretionary |
| on its judgments regarding shorter-term opportunities to seek to | Schroder Investment Management North | |
| America Inc. | Sector Specialist | |
| generate returns and/or mitigate risk by purchasing and shorting | Scout Investments, LLC | Fully Discretionary |
| U.S. Treasury futures, credit derivatives and currency forward | Western Asset Management Company | |
| contracts. These tilts had a modestly positive benchmark-relative | and Western Asset Management Company | |
| contribution during the period due to RIM’s tactical addition of | Limited | Fully Discretionary |
| credit risk via derivatives in the first half of the period. | The views expressed in this report reflect those of the | |
| portfolio managers only through the end of the period | ||
| Describe any changes to the Fund’s structure or the money | covered by the report. These views do not necessarily | |
| manager line-up. | represent the views of RIM, or any other person in RIM or | |
| A number of changes were effected over the period. Wellington | any other affiliated organization. These views are subject | |
| Management Company, LLP (“Wellington”), Principal Global | to change at any time based upon market conditions or | |
| Investors LLC (“Principal”), and Metropolitan West Asset | other events, and RIM disclaims any responsibility to | |
| Management LLC were all terminated during the year. In June | update the views contained herein. These views should not | |
| 2016, Western Asset Management Company (with its affiliate | be relied on as investment advice and, because investment | |
| Western Asset Management Company Limited) was hired largely | decisions for a Russell Investment Company (“RIC”) Fund | |
| to replace Wellington with a multi-strategy core plus manager, | are based on numerous factors, should not be relied on as | |
| but one with a heavy emphasis on credit in light of the significant | an indication of investment decisions of any RIC Fund. | |
| credit opportunities available in the market. Pareto Investment | ||
Russell Strategic Bond Fund 407
Russell Investment Company
Russell Strategic Bond Fund
Portfolio Management Discussion and Analysis, continued — October 31, 2016
(Unaudited)
^ In prior years, the performance of the Fund’s Class I shares was used in the line graph. Class S Shares will have substantially similar annual returns as the Class
I Shares because the Shares of each Class are invested in the same portfolio of securities. Annual returns for each Class will differ only to the extent that the
Class S Shares do not have the same expenses as the Class I Shares.
* Assumes initial investment on November 1, 2006.
** The Bloomberg Barclays U.S. Aggregate Bond Index is an index, with income reinvested, generally representative of intermediate-term government bonds,
investment-grade corporate debt securities and mortgage-backed securities.
Effective August 24, 2016 the Barclays fixed income benchmark indices, including the Barclays Aggregate family of indices, were renamed the Bloomberg
C
Barclays family of indices.
‡ The Fund first issued Class A Shares on September 2, 2008. The returns shown for Class A Shares prior to that date are the returns of Class E Shares. The
performance shown has been adjusted to reflect the deduction of the maximum Class A sales charge of 3.75%. Annual returns for each Class will differ only to
the extent that the Class A Shares do not have the same expenses as Class E Shares.
‡‡ The Fund first issued Class C Shares on September 2, 2008. The returns shown for Class C Shares prior to that date are the returns of the Fund’s Class E Shares
and do not reflect deduction of Rule 12b-1 distribution fees that apply to Class C Shares. Had they done so, the returns shown for those periods would have been
lower. Annual returns for each Class will differ only to the extent that the Class C Shares do not have the same expenses as the Class E Shares.
‡‡‡ The Fund first issued Class R6 Shares on March 1, 2016. The returns shown for Class R6 Shares prior to that date are the returns of the Fund’s Class Y
Shares. Class R6 Shares will have substantially similar annual returns as the Class Y Shares because the Shares of each Class are invested in the same portfolio
of securities. Annual returns for each Class will differ only to the extent that the Class R6 Shares do not have the same expenses as the Class Y Shares.
‡‡‡‡ The Fund first issued Class S Shares on September 2, 2008. The returns shown for Class S Shares prior to that date are the returns of the Fund’s Class I
Shares. Class S Shares will have substantially similar annual returns as the Class I Shares because the Shares of each Class are invested in the same portfolio of
securities. Annual returns for each Class will differ only to the extent that the Class S Shares do not have the same expenses as the Class I Shares.
§ Annualized.
Performance is historical and assumes reinvestment of all dividends and capital gains. Investment return and principal value will fluctuate so that an investor’s
shares, when redeemed, may be worth more or less than when purchased. Past performance is not indicative of future results. The returns shown do not reflect the
deduction of taxes that a shareholder would pay on Fund distributions or the redemption of Fund shares. Additionally, the returns presented herein may differ from
the performance reported in the Financial Highlights as the returns herein are calculated in a manner consistent with standardized performance in accordance with
Securities and Exchange Commission rules, while the performance in the Financial Highlights has been calculated in accordance with U.S. Generally Accepted
Accounting Principles (“U.S. GAAP”).
408 Russell Strategic Bond Fund
Russell Investment Company
Russell Strategic Bond Fund
Shareholder Expense Example — October 31, 2016 (Unaudited)
| Fund Expenses | Please note that the expenses shown in the table are meant | |||||
| The following disclosure provides important information | to highlight your ongoing costs only and do not reflect any | |||||
| regarding the Fund’s Shareholder Expense Example | transactional costs. Therefore, the information under the heading | |||||
| (“Example”). | “Hypothetical Performance (5% return before expenses)” is | |||||
| useful in comparing ongoing costs only, and will not help you | ||||||
| Example | determine the relative total costs of owning different funds. In | |||||
| As a shareholder of the Fund, you incur two types of costs: (1) | addition, if these transactional costs were included, your costs | |||||
| transaction costs, including sales charges (loads) on certain | would have been higher. | |||||
| purchase or redemption payments, and (2) ongoing costs, | Hypothetical | |||||
| including distribution (12b-1) and/or service fees and other | Performance (5% | |||||
| Fund expenses. The Example is intended to help you understand | Actual | return before | ||||
| your ongoing costs (in dollars) of investing in the Fund and to | Class A | Performance | expenses) | |||
| Beginning Account Value | ||||||
| compare these costs with the ongoing costs of investing in other | May 1, 2016 | $ | 1,000.00 | $ | 1,000.00 | |
| mutual funds. The Example is based on an investment of $1,000 | Ending Account Value | |||||
| invested at the beginning of the period and held for the entire | October 31, 2016 | $ | 1,020.20 | $ | 1,020.31 | |
| period indicated, which for this Fund is from May 1, 2016 to | Expenses Paid During Period* | $ | 4.87 | $ | 4.88 | |
| October 31, 2016. | * Expenses are equal to the Fund's annualized expense ratio of 0.96% | |||||
| (representing the six month period annualized), multiplied by the average | ||||||
| Actual Expenses | account value over the period, multiplied by 184/366 (to reflect the one-half | |||||
| The information in the table under the heading “Actual | year period). May reflect amounts waived and/or reimbursed. Without any | |||||
| Performance” provides information about actual account values | waivers and/or reimbursements, expenses would have been higher. | |||||
| and actual expenses. You may use the information in this column, | ||||||
| Hypothetical | ||||||
| together with the amount you invested, to estimate the expenses | Performance (5% | |||||
| that you paid over the period. Simply divide your account value by | Actual | return before | ||||
| $1,000 (for example, an $8,600 account value divided by $1,000 | Class C | Performance | expenses) | |||
| Beginning Account Value | ||||||
| = 8.6), then multiply the result by the number in the first column | May 1, 2016 | $ | 1,000.00 | $ | 1,000.00 | |
| in the row entitled “Expenses Paid During Period” to estimate | Ending Account Value | |||||
| the expenses you paid on your account during this period. | October 31, 2016 | $ | 1,017.30 | $ | 1,016.54 | |
| Expenses Paid During Period* | $ | 8.67 | $ | 8.67 | ||
| Hypothetical Example for Comparison Purposes | ||||||
| The information in the table under the heading “Hypothetical | * Expenses are equal to the Fund's annualized expense ratio of 1.71% | |||||
| (representing the six month period annualized), multiplied by the average | ||||||
| Performance (5% return before expenses)” provides information | account value over the period, multiplied by 184/366 (to reflect the one-half | |||||
| about hypothetical account values and hypothetical expenses | year period). May reflect amounts waived and/or reimbursed. Without any | |||||
| based on the Fund’s actual expense ratio and an assumed rate of | waivers and/or reimbursements, expenses would have been higher. | |||||
| return of 5% per year before expenses, which is not the Fund’s | ||||||
| Hypothetical | ||||||
| actual return. The hypothetical account values and expenses | Performance (5% | |||||
| may not be used to estimate the actual ending account balance or | Actual | return before | ||||
| expenses you paid for the period. You may use this information | Class E | Performance | expenses) | |||
| to compare the ongoing costs of investing in the Fund and other | Beginning Account Value | |||||
| May 1, 2016 | $ | 1,000.00 | $ | 1,000.00 | ||
| funds. To do so, compare this 5% hypothetical example with the | Ending Account Value | |||||
| 5% hypothetical examples that appear in the shareholder reports | October 31, 2016 | $ | 1,021.30 | $ | 1,020.31 | |
| of other funds. | Expenses Paid During Period* | $ | 4.88 | $ | 4.88 | |
| * Expenses are equal to the Fund's annualized expense ratio of 0.96% | ||||||
| (representing the six month period annualized), multiplied by the average | ||||||
| account value over the period, multiplied by 184/366 (to reflect the one-half | ||||||
| year period). May reflect amounts waived and/or reimbursed. Without any | ||||||
| waivers and/or reimbursements, expenses would have been higher. | ||||||
Russell Strategic Bond Fund 409
Russell Investment Company
Russell Strategic Bond Fund
Shareholder Expense Example, continued — October 31, 2016 (Unaudited)
| Hypothetical | ||||||
| Performance (5% | ||||||
| Actual | return before | |||||
| Class I | Performance | expenses) | ||||
| Beginning Account Value | ||||||
| May 1, 2016 | $ | 1,000.00 | $ | 1,000.00 | ||
| Ending Account Value | ||||||
| October 31, 2016 | $ | 1,022.90 | $ | 1,021.77 | ||
| Expenses Paid During Period* | $ | 3.41 | $ | 3.40 | ||
| * Expenses are equal to the Fund's annualized expense ratio of 0.67% | ||||||
| (representing the six month period annualized), multiplied by the average | ||||||
| account value over the period, multiplied by 184/366 (to reflect the one-half | ||||||
| year period). May reflect amounts waived and/or reimbursed. Without any | ||||||
| waivers and/or reimbursements, expenses would have been higher. | ||||||
| Hypothetical | ||||||
| Performance (5% | ||||||
| Actual | return before | |||||
| Class R6 | Performance | expenses) | ||||
| Beginning Account Value | ||||||
| May 1, 2016 | $ | 1,000.00 | $ | 1,000.00 | ||
| Ending Account Value | ||||||
| October 31, 2016 | $ | 1,023.30 | $ | 1,022.22 | ||
| Expenses Paid During Period* | $ | 2.95 | $ | 2.95 | ||
| * Expenses are equal to the Fund's annualized expense ratio of 0.58% | ||||||
| (representing the six month period annualized), multiplied by the average | ||||||
| account value over the period, multiplied by 184/246 (to reflect the one-half | ||||||
| year period). May reflect amounts waived and/or reimbursed. Without any | ||||||
| waivers and/or reimbursements, expenses would have been higher. | ||||||
| Hypothetical | ||||||
| Performance (5% | ||||||
| Actual | return before | |||||
| Class S | Performance | expenses) | ||||
| Beginning Account Value | ||||||
| May 1, 2016 | $ | 1,000.00 | $ | 1,000.00 | ||
| Ending Account Value | ||||||
| October 31, 2016 | $ | 1,022.30 | $ | 1,021.57 | ||
| Expenses Paid During Period* | $ | 3.61 | $ | 3.61 | ||
| * Expenses are equal to the Fund's annualized expense ratio of 0.71% | ||||||
| (representing the six month period annualized), multiplied by the average | ||||||
| account value over the period, multiplied by 184/366 (to reflect the one-half | ||||||
| year period). May reflect amounts waived and/or reimbursed. Without any | ||||||
| waivers and/or reimbursements, expenses would have been higher. | ||||||
| Hypothetical | ||||||
| Performance (5% | ||||||
| Actual | return before | |||||
| Class Y | Performance | expenses) | ||||
| Beginning Account Value | ||||||
| May 1, 2016 | $ | 1,000.00 | $ | 1,000.00 | ||
| Ending Account Value | ||||||
| October 31, 2016 | $ | 1,022.50 | $ | 1,022.37 | ||
| Expenses Paid During Period* | $ | 2.80 | $ | 2.80 | ||
| * Expenses are equal to the Fund's annualized expense ratio of 0.55% | ||||||
| (representing the six month period annualized), multiplied by the average | ||||||
| account value over the period, multiplied by 184/366 (to reflect the one-half | ||||||
| year period). May reflect amounts waived and/or reimbursed. Without any | ||||||
| waivers and/or reimbursements, expenses would have been higher. | ||||||
410 Russell Strategic Bond Fund
Russell Investment Company
Russell Strategic Bond Fund
Schedule of Investments — October 31, 2016
| Amounts in thousands (except share amounts) | Amounts in thousands (except share amounts) | ||||||
| Principal | Fair | Principal | Fair | ||||
| Amount ($) | Value | Amount ($) | Value | ||||
| or Shares | $ | or Shares | $ | ||||
| Long-Term Investments - 90.9% | 1.020% due 02/22/19 | 18,180 | 18,182 | ||||
| Asset-Backed Securities - 6.0% | Citigroup Mortgage Loan Trust, Inc. | ||||||
| Access Group, Inc. | Series 2007-WFH1 Class A3 | ||||||
| Series 2003-A Class A2 | 0.734% due 01/25/37 (Ê) | 939 | 931 | ||||
| 1.515% due 07/01/38 (Ê) | 1,149 | 1,147 | Series 2007-WFH1 Class A4 | ||||
| Accredited Mortgage Loan Trust | 0.784% due 01/25/37 (Ê) | 7,880 | 7,569 | ||||
| Series 2006-1 Class A4 | Conseco Finance Securitizations Corp. | ||||||
| 0.814% due 04/25/36 (Ê) | 3,510 | 3,171 | Series 2001-4 Class A4 | ||||
| Series 2006-2 Class A4 | 7.360% due 08/01/32 | 1,196 | 1,270 | ||||
| 0.852% due 09/25/36 (Ê) | 9,855 | 8,668 | Conseco Financial Corp. | ||||
| American Express Credit Account | Series 1997-7 Class A6 | ||||||
| Master Trust | 6.760% due 07/15/28 | 61 | 61 | ||||
| Series 2014-2 Class A | CWABS, Inc. Asset-Backed Certificates | ||||||
| 1.260% due 01/15/20 | 5,485 | 5,493 | Trust | ||||
| AmeriCredit Automobile Receivables | Series 2006-S8 Class A3 | ||||||
| Trust | 5.555% due 04/25/36 | 2,069 | 2,057 | ||||
| Series 2013-1 Class C | Dryden Senior Loan Fund | ||||||
| 1.570% due 01/08/19 | 3,777 | 3,780 | Series 2015-37A Class A | ||||
| Series 2013-3 Class C | 2.380% due 04/15/27 (Ê)(Þ) | 7,150 | 7,156 | ||||
| 2.380% due 06/10/19 | 8,235 | 8,287 | Federal Home Loan Mortgage Corp. | ||||
| Series 2013-5 Class B | Structured Pass-Through Securities | ||||||
| 1.520% due 01/08/19 | 1,180 | 1,181 | Series 2000-30 Class A5 | ||||
| 6.669% due 12/25/30 | 3 | 3 | |||||
| Series 2015-2 Class A3 | Fieldstone Mortgage Investment Trust | ||||||
| 1.270% due 01/08/20 | 5,546 | 5,549 | Series | ||||
| Applebees/IHOP Funding LLC | Series 2004-4 Class M3 | ||||||
| Series 2014-1 Class A2 | 2.484% due 10/25/35 (Ê) | 2,191 | 2,092 | ||||
| 4.277% due 09/05/44 (Þ) | 1,650 | 1,666 | |||||
| Argent Securities, Inc. Asset-Backed | Ford Credit Auto Owner Trust | ||||||
| Pass-Through Certificates | Series 2015-A Class A3 | ||||||
| Series 2005-W4 Class A2D | 1.280% due 09/15/19 | 1,295 | 1,297 | ||||
| 0.567% due 02/25/36 (Ê) | 2,662 | 1,890 | GMACM Home Equity Loan Trust | ||||
| Bank of The West Auto Trust | Series 2007-HE2 Class A2 | ||||||
| Series 2014-1 Class A3 | 6.054% due 12/25/37 | 2,480 | 2,429 | ||||
| 1.090% due 03/15/19 (Þ) | 4,951 | 4,951 | Series 2007-HE2 Class A3 | ||||
| Bear Stearns Second Lien Trust | 6.193% due 12/25/37 | 635 | 624 | ||||
| Series 2007-SV1A Class A2 | Greenpoint Manufactured Housing | ||||||
| 1.232% due 12/25/36 (Å)(Ê) | 1,058 | 1,036 | Series 1999-1 Class A5 | ||||
| BMW Vehicle Owner Trust | 6.770% due 08/15/29 | 2,554 | 2,504 | ||||
| Series 2013-A Class A3 | Series 1999-3 Class 1A7 | ||||||
| 0.670% due 11/27/17 | 149 | 148 | 7.270% due 06/15/29 | 3,769 | 3,748 | ||
| BNC Mortgage Loan Trust | GSAA Trust | ||||||
| Series 2007-2 Class A5 | Series 2006-S1 Class 2M2 | ||||||
| 0.756% due 05/25/37 (Ê) | 3,575 | 2,831 | 5.850% due 08/25/34 (Å) | 3,469 | 3,032 | ||
| Capital One Multi-Asset Execution Trust | GSAMP Trust | ||||||
| Series 2014-A1 Class A1 | Series 2006-HE5 Class A2C | ||||||
| 1.080% due 11/15/19 (Ê) | 11,975 | 11,980 | 0.742% due 08/25/36 (Ê) | 5,046 | 4,415 | ||
| Centex Home Equity Loan Trust | Hertz Vehicle Financing LLC | ||||||
| Series 2006-A Class AV4 | Series 2015-2A Class A | ||||||
| 0.842% due 06/25/36 (Ê) | 4,230 | 4,114 | 2.020% due 09/25/19 (Þ) | 5,305 | 5,277 | ||
| Chase Issuance Trust | Home Equity Asset Trust | ||||||
| Series 2007-A2 Class A2 | Series 2005-9 Class M1 | ||||||
| 0.588% due 04/15/19 (Ê) | 2,925 | 2,924 | 1.002% due 04/25/36 (Ê) | 2,977 | 2,737 | ||
| Series 2014-A6 Class A6 | Series 2006-3 Class M1 | ||||||
| 1.260% due 07/15/19 | 5,365 | 5,375 | 0.982% due 07/25/36 (Ê) | 3,950 | 3,339 | ||
| Series 2016-A7 Class A7 | Series 2006-4 Class 2A4 | ||||||
| 1.060% due 09/16/19 | 9,775 | 9,773 | 0.872% due 08/25/36 (Ê) | 3,729 | 3,278 | ||
| Citibank Credit Card Issuance Trust | Honda Auto Receivables Owner Trust | ||||||
| Series 2013-A12 Class A12 | Series 2015-2 Class A3 | ||||||
| 1.018% due 11/07/18 (Ê) | 4,985 | 4,985 | 1.040% due 02/21/19 | 6,805 | 6,804 | ||
| Series 2014-A2 Class A2 | HSI Asset Securitization Corp. Trust | ||||||
See accompanying notes which are an integral part of the financial statements.
Russell Strategic Bond Fund 411
Russell Investment Company
Russell Strategic Bond Fund
Schedule of Investments, continued — October 31, 2016
| Amounts in thousands (except share amounts) | Amounts in thousands (except share amounts) | ||||||
| Principal | Fair | Principal | Fair | ||||
| Amount ($) | Value | Amount ($) | Value | ||||
| or Shares | $ | or Shares | $ | ||||
| Series 2007-WF1 Class 2A4 | 922.000% due 09/25/36 (Ê) | 5,340 | 4,537 | ||||
| 0.842% due 05/25/37 (Ê) | 9,069 | 7,886 | Series 2007-A Class AV4 | ||||
| Hyundai Auto Receivables Trust | 0.822% due 03/25/37 (Ê) | 4,290 | 3,744 | ||||
| Series 2013-C Class A3 | Newcastle Mortgage Securities Trust | ||||||
| 1.010% due 02/15/18 | 496 | 496 | Series 2006-1 Class M3 | ||||
| Series 2015-A Class A3 | 0.982% due 03/25/36 (Ê) | 5,600 | 4,534 | ||||
| 1.050% due 04/15/19 | 1,675 | 1,675 | Nissan Auto Receivables Owner Trust | ||||
| Series 2015-C Class A2B | Series 2013-B Class A4 | ||||||
| 0.908% due 11/15/18 (Ê) | 904 | 905 | 1.310% due 10/15/19 | 3,415 | 3,420 | ||
| Series 2015-C Class A3 | Park Place Securities, Inc. | ||||||
| 1.460% due 02/18/20 | 1,730 | 1,737 | Series 2004-WHQ2 Class M2 | ||||
| Irwin Home Equity Loan Trust | 1.470% due 02/25/35 (Ê) | 5,816 | 5,829 | ||||
| Series 2006-1 Class 2A3 | Popular ABS Mortgage Pass-Through | ||||||
| 5.770% due 09/25/35 (Å) | 3,204 | 3,248 | Trust | ||||
| Series 2007-1 Class 2A2 | Series 2006-D Class A3 | ||||||
| 5.960% due 08/25/37 (Å) | 1,388 | 1,416 | 0.852% due 11/25/46 (Ê) | 5,455 | 4,876 | ||
| IXIS Real Estate Capital Trust | Purchasing Power Funding LLC | ||||||
| Series 2006-HE1 Class A3 | Series 2015-A Class A2 | ||||||
| 0.992% due 03/25/36 (Ê) | 1,749 | 1,099 | 4.750% due 12/15/19 (Þ) | 2,320 | 2,323 | ||
| Series 2006-HE1 Class A4 | RAMP Trust | ||||||
| 1.192% due 03/25/36 (Ê) | 4,751 | 3,045 | Series 2006-RZ1 Class M4 | ||||
| Series 2006-HE2 Class A3 | 1.162% due 03/25/36 (Ê) | 5,000 | 3,842 | ||||
| 0.752% due 08/25/36 (Ê) | 642 | 255 | Renaissance Home Equity Loan Trust | ||||
| Series 2006-HE2 Class A4 | Series 2006-1 Class AF6 | ||||||
| 0.852% due 08/25/36 (Ê) | 5,308 | 2,176 | 5.746% due 05/25/36 | 1,467 | 985 | ||
| Series 2007-HE1 Class A3 | Santander Drive Auto Receivables Trust | ||||||
| 0.752% due 05/25/37 (Ê) | 6,937 | 2,450 | Series 2012-4 Class D | ||||
| Lehman ABS Manufactured Housing | 3.500% due 06/15/18 | 5,188 | 5,210 | ||||
| Contract Trust | Series 2016-1 Class A2A | ||||||
| Series 2001-B Class A6 | 1.410% due 07/15/19 | 2,861 | 2,864 | ||||
| 6.467% due 04/15/40 | 375 | 390 | Saxon Asset Securities Trust | ||||
| Series 2001-B Class M1 | Series 2007-2 Class A2C | ||||||
| 6.630% due 04/15/40 | 1,615 | 1,714 | 0.832% due 05/25/47 (Ê) | 6,388 | 4,589 | ||
| Mastr Asset Backed Securities Trust | SBA Small Business Investment Cos. | ||||||
| Series 2005-NC2 Class A3 | Series 2016-10B Class 1 | ||||||
| 1.092% due 11/25/35 (Ê) | 5,079 | 3,419 | 2.051% due 09/10/26 | 270 | 271 | ||
| Series 2006-HE5 Class A3 | Securitized Asset Backed Receivables | ||||||
| 0.752% due 11/25/36 (Ê) | 3,559 | 2,327 | LLC Trust | ||||
| Series 2006-NC2 Class A4 | Series 2007-BR4 Class A2B | ||||||
| 0.742% due 08/25/36 (Ê) | 10,675 | 5,539 | 0.792% due 05/25/37 (Ê) | 6,044 | 3,775 | ||
| Series 2006-NC3 Class A5 | Series 2007-BR5 Class A2A | ||||||
| 0.802% due 10/25/36 (Ê) | 6,202 | 3,888 | 0.722% due 05/25/37 (Ê) | 3,367 | 2,605 | ||
| Mercedes-Benz Auto Receivables Trust | Series 2007-NC1 Class A2C | ||||||
| Series 2016-1 Class A2A | 0.802% due 12/25/36 (Ê) | 1,660 | 932 | ||||
| 1.110% due 03/15/19 | 8,630 | 8,632 | SLM Private Credit Student Loan Trust | ||||
| Merrill Lynch Mortgage Investors Trust | Series 2005-B Class A2 | ||||||
| Series 2006-FF1 Class M4 | 1.030% due 03/15/23 (Ê) | 579 | 578 | ||||
| 0.962% due 08/25/36 (Ê) | 5,348 | 5,158 | Series 2005-B Class A4 | ||||
| Mid-State Capital Corp. Trust | 1.180% due 06/15/39 (Ê) | 1,880 | 1,686 | ||||
| Series 2005-1 Class A | SLM Student Loan Trust | ||||||
| 5.745% due 01/15/40 | 1,762 | 1,886 | Series 2006-1 Class A5 | ||||
| MSCC Heloc Trust | 0.992% due 07/26/21 (Ê) | 1,100 | 1,049 | ||||
| Series 2007-1 Class A | Series 2008-9 Class A | ||||||
| 0.625% due 12/25/31 (Ê) | 791 | 787 | 2.382% due 04/25/23 (Ê) | 4,440 | 4,445 | ||
| National Collegiate Student Loan Trust | Series 2008-9 Class B | ||||||
| Series 2006-4 Class A3 | 3.132% due 10/25/83 (Ê) | 1,300 | 1,253 | ||||
| 0.852% due 02/26/29 (Ê) | 700 | 677 | SoFi Professional Loan Program LLC | ||||
| Nationstar Home Equity Loan Trust | Series 2014-B Class A2 | ||||||
| Series 2006-B Class M1 | 2.550% due 08/27/29 (Þ) | 3,269 | 3,308 | ||||
| Soundview Home Loan Trust | |||||||
See accompanying notes which are an integral part of the financial statements.
412 Russell Strategic Bond Fund
Russell Investment Company
Russell Strategic Bond Fund
Schedule of Investments, continued — October 31, 2016
| Amounts in thousands (except share amounts) | Amounts in thousands (except share amounts) | ||||||
| Principal | Fair | Principal | Fair | ||||
| Amount ($) | Value | Amount ($) | Value | ||||
| or Shares | $ | or Shares | $ | ||||
| Series 2005-4 Class M2 | 10.200% due 02/06/39 | 2,685 | 4,946 | ||||
| 1.062% due 03/25/36 (Ê) | 3,870 | 3,455 | 5.375% due 01/31/44 | 390 | 476 | ||
| Structured Asset Investment Loan Trust | Amazon.com, Inc. | ||||||
| Series 2006-2 Class A3 | 4.950% due 12/05/44 | 400 | 467 | ||||
| 0.626% due 04/25/36 (Ê) | 2,395 | 2,167 | American Airlines Pass-Through Trust | ||||
| Structured Asset Securities Corp. | Series 2011-1 Class A | ||||||
| Mortgage Loan Trust | 5.250% due 01/31/21 | 1,404 | 1,520 | ||||
| Series 2006-BC2 Class A3 | Series 2013-2 Class A | ||||||
| 0.742% due 09/25/36 (Ê) | 3,581 | 3,135 | 4.950% due 01/15/23 | 3,196 | 3,488 | ||
| Series 2006-BC5 Class A4 | Series 2014-1 Class B | ||||||
| 0.762% due 12/25/36 (Ê) | 2,553 | 2,336 | 4.375% due 10/01/22 | 1,963 | 1,975 | ||
| Series 2006-BC6 Class A4 | Series B | ||||||
| 0.762% due 01/25/37 (Ê) | 4,749 | 4,355 | 5.250% due 01/15/24 | 2,048 | 2,146 | ||
| Series 2006-WF3 Class A4 | American Axle & Manufacturing, Inc. | ||||||
| 0.902% due 09/25/36 (Ê) | 5,740 | 5,458 | 6.625% due 10/15/22 | 360 | 380 | ||
| Series 2007-BC1 Class A4 | American Builders & Contractors Supply | ||||||
| 0.722% due 02/25/37 (Ê) | 9,294 | 8,475 | Co., Inc. | ||||
| United States Small Business | 5.750% due 12/15/23 (Þ) | 360 | 375 | ||||
| Administration | American Express Credit Corp. | ||||||
| Series 2016-20G Class 1 | 1.700% due 10/30/19 | 3,960 | 3,962 | ||||
| 2.040% due 07/01/36 | 1,170 | 1,165 | Series F | ||||
| USAA Auto Owner Trust | 2.600% due 09/14/20 | 5,515 | 5,642 | ||||
| Series 2016-1 Class A2 | American Honda Finance Corp. | ||||||
| 1.070% due 03/15/19 | 5,555 | 5,554 | 1.155% due 12/11/17 (Ê) | 570 | 571 | ||
| 331,314 | American International Group, Inc. | ||||||
| Corporate Bonds and Notes - 18.9% | 6.400% due 12/15/20 | 6,480 | 7,545 | ||||
| 21st Century Fox America, Inc. | 4.875% due 06/01/22 | 2,325 | 2,596 | ||||
| 6.900% due 08/15/39 | 3,050 | 4,012 | 3.750% due 07/10/25 | 1,000 | 1,044 | ||
| AbbVie, Inc. | Amgen, Inc. | ||||||
| 1.750% due 11/06/17 | 2,915 | 2,925 | 3.625% due 05/22/24 | 100 | 105 | ||
| 2.500% due 05/14/20 | 6,474 | 6,555 | 4.400% due 05/01/45 | 500 | 509 | ||
| 3.600% due 05/14/25 | 1,400 | 1,428 | 4.663% due 06/15/51 (Þ) | 100 | 102 | ||
| ADT Corp. (The) | Anadarko Petroleum Corp. | ||||||
| 3.500% due 07/15/22 | 440 | 417 | 4.850% due 03/15/21 | 650 | 706 | ||
| 4.125% due 06/15/23 | 405 | 396 | 5.550% due 03/15/26 | 300 | 341 | ||
| AES Corp. | 6.450% due 09/15/36 | 7,657 | 9,086 | ||||
| 5.500% due 03/15/24 | 370 | 376 | 4.500% due 07/15/44 | 750 | 706 | ||
| Aetna, Inc. | 6.600% due 03/15/46 | 470 | 581 | ||||
| 1.700% due 06/07/18 | 1,625 | 1,630 | Anheuser-Busch InBev Finance, Inc. | ||||
| 1.900% due 06/07/19 | 2,285 | 2,303 | 2.650% due 02/01/21 | 3,230 | 3,303 | ||
| 2.400% due 06/15/21 | 300 | 303 | 3.300% due 02/01/23 | 4,200 | 4,384 | ||
| 2.800% due 06/15/23 | 3,420 | 3,466 | 3.650% due 02/01/26 | 5,915 | 6,224 | ||
| 3.200% due 06/15/26 | 600 | 602 | 4.700% due 02/01/36 | 3,880 | 4,301 | ||
| Albemarle Corp. | 4.900% due 02/01/46 | 4,120 | 4,711 | ||||
| 4.150% due 12/01/24 | 1,633 | 1,735 | Anthem, Inc. | ||||
| Series 30YR | 1.875% due 01/15/18 | 4,505 | 4,521 | ||||
| 5.450% due 12/01/44 | 3,885 | 4,352 | 3.700% due 08/15/21 | 250 | 266 | ||
| Alcatel-Lucent USA, Inc. | 3.125% due 05/15/22 | 3,665 | 3,785 | ||||
| 6.450% due 03/15/29 | 700 | 772 | Apache Corp. | ||||
| Allegheny Technologies, Inc. | 3.250% due 04/15/22 | 100 | 103 | ||||
| 5.950% due 01/15/21 | 475 | 439 | 5.100% due 09/01/40 | 900 | 951 | ||
| Allison Transmission, Inc. | 4.750% due 04/15/43 | 180 | 188 | ||||
| 5.000% due 10/01/24 (Þ) | 570 | 581 | 4.250% due 01/15/44 | 120 | 118 | ||
| Ally Financial, Inc. | Apollo Management Holdings, LP | ||||||
| 3.600% due 05/21/18 | 6,095 | 6,149 | 4.400% due 05/27/26 (Þ) | 2,560 | 2,643 | ||
| 3.250% due 11/05/18 | 3,385 | 3,385 | Apple, Inc. | ||||
| 8.000% due 11/01/31 | 1,140 | 1,362 | 1.637% due 02/22/19 (Ê) | 3,380 | 3,436 | ||
| Altria Group, Inc. | 1.176% due 05/06/19 (Ê) | 2,725 | 2,732 | ||||
| 2.850% due 08/09/22 | 1,500 | 1,543 | 2.450% due 08/04/26 | 1,750 | 1,715 | ||
| 9.950% due 11/10/38 | 515 | 928 | Arconic, Inc. | ||||
See accompanying notes which are an integral part of the financial statements.
Russell Strategic Bond Fund 413
Russell Investment Company
Russell Strategic Bond Fund
Schedule of Investments, continued — October 31, 2016
| Amounts in thousands (except share amounts) | Amounts in thousands (except share amounts) | ||||||
| Principal | Fair | Principal | Fair | ||||
| Amount ($) | Value | Amount ($) | Value | ||||
| or Shares | $ | or Shares | $ | ||||
| 6.750% due 07/15/18 | 1,050 | 1,123 | 1.500% due 04/11/19 (Þ) | 5,640 | 5,643 | ||
| 5.400% due 04/15/21 | 525 | 559 | Boeing Co. (The) | ||||
| 5.900% due 02/01/27 | 350 | 369 | 4.875% due 02/15/20 | 700 | 775 | ||
| 5.950% due 02/01/37 | 350 | 344 | Boston Properties, LP | ||||
| Assurant, Inc. | 2.750% due 10/01/26 | 2,810 | 2,715 | ||||
| 2.500% due 03/15/18 | 3,723 | 3,760 | Burlington Northern Santa Fe LLC | ||||
| AT&T, Inc. | 4.150% due 04/01/45 | 305 | 323 | ||||
| 3.000% due 02/15/22 | 250 | 254 | Capital One Bank NA | ||||
| 3.400% due 05/15/25 | 2,070 | 2,063 | Series BKNT | ||||
| 4.800% due 06/15/44 | 1,000 | 985 | 2.250% due 02/13/19 | 4,335 | 4,385 | ||
| 4.350% due 06/15/45 | 650 | 596 | Capital One NA | ||||
| 4.550% due 03/09/49 (Þ) | 6,287 | 5,921 | 2.350% due 08/17/18 | 3,705 | 3,744 | ||
| AutoNation, Inc. | Series BKNT | ||||||
| 4.500% due 10/01/25 | 3,455 | 3,615 | 1.650% due 02/05/18 | 4,560 | 4,564 | ||
| Avon Products, Inc. | Cardinal Health, Inc. | ||||||
| 6.500% due 03/01/19 | 490 | 517 | 1.700% due 03/15/18 | 4,453 | 4,467 | ||
| BAC Capital Trust XIV | CCO Holdings LLC / CCO Holdings | ||||||
| Series G | Capital Corp. | ||||||
| 4.000% due 09/29/49 (Ê)(ƒ) | 500 | 410 | 5.375% due 05/01/25 (Þ) | 760 | 781 | ||
| Ball Corp. | Celgene Corp. | ||||||
| 5.250% due 07/01/25 | 720 | 766 | 3.550% due 08/15/22 | 200 | 210 | ||
| Bank of America Corp. | 3.875% due 08/15/25 | 500 | 524 | ||||
| 5.750% due 12/01/17 | 1,000 | 1,045 | 5.000% due 08/15/45 | 1,300 | 1,395 | ||
| 5.000% due 05/13/21 | 1,600 | 1,774 | CenturyLink, Inc. | ||||
| 2.503% due 10/21/22 | 3,020 | 3,013 | Series G | ||||
| 4.250% due 10/22/26 | 1,150 | 1,208 | 6.875% due 01/15/28 | 350 | 329 | ||
| 6.110% due 01/29/37 | 2,855 | 3,466 | CF Industries, Inc. | ||||
| 5.000% due 01/21/44 | 1,000 | 1,145 | 3.450% due 06/01/23 | 965 | 901 | ||
| 4.875% due 04/01/44 | 2,000 | 2,258 | 5.150% due 03/15/34 | 700 | 629 | ||
| Series GMTN | Charter Communications Operating LLC | ||||||
| 3.300% due 01/11/23 | 2,100 | 2,160 | / Charter Communications Operating | ||||
| 3.500% due 04/19/26 | 12,515 | 12,846 | Capital | ||||
| 4.464% due 07/23/22 (Þ) | 5,185 | 5,523 | |||||
| Series L | 4.908% due 07/23/25 (Þ) | 200 | 216 | ||||
| 2.600% due 01/15/19 | 310 | 315 | 6.384% due 10/23/35 (Þ) | 1,890 | 2,178 | ||
| Series X | |||||||
| 6.250% due 09/29/49 (ƒ) | 420 | 440 | Chesapeake Energy Corp. | ||||
| 6.125% due 02/15/21 | 310 | 284 | |||||
| Bank of America NA | 5.750% due 03/15/23 | 50 | 43 | ||||
| Series BKNT | |||||||
| 1.750% due 06/05/18 | 6,965 | 7,001 | Chevron Corp. | ||||
| 1.076% due 11/15/17 (Ê) | 1,595 | 1,597 | |||||
| 2.050% due 12/07/18 | 1,815 | 1,835 | 1.411% due 05/16/18 (Ê) | 875 | 879 | ||
| Bank of Montreal | 1.790% due 11/16/18 | 750 | 756 | ||||
| Series YCD | 2.954% due 05/16/26 | 2,760 | 2,816 | ||||
| 1.395% due 12/11/17 (Ê)(~) | 7,590 | 7,599 | Chubb INA Holdings, Inc. | ||||
| Bank of New York Mellon Corp. (The) | 2.300% due 11/03/20 | 150 | 153 | ||||
| 2.600% due 08/17/20 | 6,805 | 6,983 | 2.875% due 11/03/22 | 2,020 | 2,105 | ||
| 2.200% due 08/16/23 | 3,970 | 3,913 | 3.350% due 05/03/26 | 1,200 | 1,261 | ||
| Barrick NA Finance LLC | Cisco Systems, Inc. | ||||||
| 5.700% due 05/30/41 | 200 | 229 | 1.850% due 09/20/21 | 3,065 | 3,060 | ||
| 5.750% due 05/01/43 | 2,000 | 2,334 | CIT Group, Inc. | ||||
| BB&T Corp. | 5.000% due 08/01/23 | 630 | 671 | ||||
| 2.050% due 06/19/18 | 4,590 | 4,636 | Citigroup Capital III | ||||
| Becton Dickinson and Co. | 7.625% due 12/01/36 | 2,825 | 3,471 | ||||
| 3.734% due 12/15/24 | 300 | 320 | |||||
| 4.685% due 12/15/44 | 100 | 109 | Citigroup, Inc. | ||||
| 1.630% due 11/24/17 (Ê) | 7,300 | 7,320 | |||||
| Berkshire Hathaway Energy Co. | 1.800% due 02/05/18 | 8,815 | 8,832 | ||||
| 6.500% due 09/15/37 | 350 | 476 | 2.150% due 07/30/18 | 3,715 | 3,741 | ||
| Blue Cube Spinco, Inc. | 3.200% due 10/21/26 | 2,465 | 2,459 | ||||
| Series WI | 4.450% due 09/29/27 | 8,920 | 9,398 | ||||
| 10.000% due 10/15/25 | 6,255 | 7,506 | 8.125% due 07/15/39 | 590 | 900 | ||
| BMW US Capital LLC | |||||||
See accompanying notes which are an integral part of the financial statements.
414 Russell Strategic Bond Fund
Russell Investment Company
Russell Strategic Bond Fund
Schedule of Investments, continued — October 31, 2016
| Amounts in thousands (except share amounts) | Amounts in thousands (except share amounts) | ||||||
| Principal | Fair | Principal | Fair | ||||
| Amount ($) | Value | Amount ($) | Value | ||||
| or Shares | $ | or Shares | $ | ||||
| 5.300% due 05/06/44 | 800 | 882 | Delta Air Lines Pass-Through Trust | ||||
| 4.650% due 07/30/45 | 3,910 | 4,278 | Series 2002-1 Class G-1 | ||||
| Series P | 6.718% due 01/02/23 | 352 | 405 | ||||
| 5.950% due 12/31/49 (ƒ) | 1,900 | 1,943 | Series 2007-1 Class A | ||||
| Clear Channel Worldwide Holdings, Inc. | 6.821% due 08/10/22 | 2,927 | 3,486 | ||||
| Series B | Devon Energy Corp. | ||||||
| 6.500% due 11/15/22 | 3,650 | 3,718 | 5.850% due 12/15/25 | 7,168 | 8,217 | ||
| Cliffs Natural Resources, Inc. | 5.000% due 06/15/45 | 550 | 532 | ||||
| 4.875% due 04/01/21 | 525 | 442 | Devon Financing Co. LLC | ||||
| CME Group, Inc. | 7.875% due 09/30/31 | 3,835 | 4,882 | ||||
| 5.300% due 09/15/43 | 200 | 248 | Diageo Investment Corp. | ||||
| CNOOC Finance USA LLC | 2.875% due 05/11/22 | 600 | 625 | ||||
| 3.500% due 05/05/25 | 1,300 | 1,320 | Diamond 1 Finance Corp. / Diamond 2 | ||||
| Comcast Cable Communications | Finance Corp | ||||||
| Holdings, Inc. | 3.480% due 06/01/19 (Þ) | 1,000 | 1,026 | ||||
| 9.455% due 11/15/22 | 400 | 558 | 4.420% due 06/15/21 (Þ) | 1,840 | 1,924 | ||
| Comcast Corp. | 5.450% due 06/15/23 (Þ) | 7,795 | 8,347 | ||||
| 1.625% due 01/15/22 | 2,870 | 2,812 | 7.125% due 06/15/24 (Þ) | 630 | 690 | ||
| 3.375% due 08/15/25 | 200 | 210 | 8.350% due 07/15/46 (Þ) | 4,250 | 5,150 | ||
| 3.200% due 07/15/36 | 420 | 400 | Diamond Offshore Drilling, Inc. | ||||
| 6.400% due 03/01/40 | 700 | 956 | 5.875% due 05/01/19 | 590 | 616 | ||
| Commonwealth Edison Co. | 4.875% due 11/01/43 | 445 | 326 | ||||
| 5.800% due 03/15/18 | 1,745 | 1,850 | Discovery Communications LLC | ||||
| Concho Resources, Inc. | 4.900% due 03/11/26 | 2,761 | 3,001 | ||||
| 5.500% due 04/01/23 | 570 | 583 | 6.350% due 06/01/40 | 2,445 | 2,671 | ||
| ConocoPhillips Co. | DISH DBS Corp. | ||||||
| 1.050% due 12/15/17 | 357 | 355 | 6.750% due 06/01/21 | 235 | 252 | ||
| Constellation Brands, Inc. | 5.875% due 07/15/22 | 150 | 155 | ||||
| 4.750% due 11/15/24 | 370 | 405 | Series WI | ||||
| Continental Resources, Inc. | 5.875% due 11/15/24 | 650 | 655 | ||||
| 3.800% due 06/01/24 | 1,040 | 957 | Dollar Tree, Inc. | ||||
| 4.900% due 06/01/44 | 305 | 259 | Series WI | ||||
| Cox Communications, Inc. | 5.750% due 03/01/23 | 490 | 522 | ||||
| 3.350% due 09/15/26 (Þ) | 2,640 | 2,603 | Dollar Tree, Inc. Term Loan B3 | ||||
| Credit Suisse | 3.000% due 07/06/22 (Ê) | 222 | 224 | ||||
| 1.750% due 01/29/18 | 5,245 | 5,248 | Dominion Resources, Inc. | ||||
| Crestwood Midstream Partners, LP / | 7.000% due 06/15/38 | 150 | 198 | ||||
| Crestwood Midstream Finance Corp. | Dresdner Funding Trust I | ||||||
| 6.125% due 03/01/22 | 400 | 409 | 8.151% due 06/30/31 (Þ) | 350 | 416 | ||
| Crown Castle Towers LLC | Duke Energy Carolinas LLC | ||||||
| 3.222% due 05/15/22 (Þ) | 3,610 | 3,730 | 5.300% due 02/15/40 | 200 | 247 | ||
| CVS Health Corp. | 4.250% due 12/15/41 | 100 | 108 | ||||
| 2.750% due 12/01/22 | 600 | 610 | Duke Energy Progress LLC | ||||
| 2.875% due 06/01/26 | 5,585 | 5,544 | 4.100% due 03/15/43 | 1,545 | 1,628 | ||
| 5.125% due 07/20/45 | 7,422 | 8,658 | Eaton Corp. | ||||
| Daimler Finance NA LLC | 2.750% due 11/02/22 | 1,000 | 1,019 | ||||
| 2.000% due 08/03/18 (Þ) | 6,630 | 6,674 | 4.150% due 11/02/42 | 250 | 257 | ||
| 1.750% due 10/30/19 (Þ) | 3,850 | 3,849 | Ecolab, Inc. | ||||
| Darden Restaurants, Inc. | 4.350% due 12/08/21 | 100 | 111 | ||||
| 6.800% due 10/15/37 | 3,610 | 4,209 | Embarq Corp. | ||||
| DaVita, Inc. | 7.995% due 06/01/36 | 700 | 710 | ||||
| 5.000% due 05/01/25 | 770 | 743 | EMC Corp. | ||||
| DCP Midstream LLC | 1.875% due 06/01/18 | 350 | 345 | ||||
| 5.350% due 03/15/20 (Þ) | 1,295 | 1,334 | 2.650% due 06/01/20 | 800 | 778 | ||
| DCP Midstream Operating, LP | 3.375% due 06/01/23 | 595 | 559 | ||||
| 2.500% due 12/01/17 | 685 | 680 | Emera US Finance, LP | ||||
| 3.875% due 03/15/23 | 560 | 545 | 3.550% due 06/15/26 (Þ) | 2,575 | 2,630 | ||
| 5.600% due 04/01/44 | 175 | 164 | 4.750% due 06/15/46 (Þ) | 1,755 | 1,865 | ||
| Dell, Inc. | Energy Transfer Partners, LP | ||||||
| 7.100% due 04/15/28 | 735 | 777 | 4.050% due 03/15/25 | 5,120 | 5,057 | ||
See accompanying notes which are an integral part of the financial statements.
Russell Strategic Bond Fund 415
Russell Investment Company
Russell Strategic Bond Fund
Schedule of Investments, continued — October 31, 2016
| Amounts in thousands (except share amounts) | Amounts in thousands (except share amounts) | ||||||
| Principal | Fair | Principal | Fair | ||||
| Amount ($) | Value | Amount ($) | Value | ||||
| or Shares | $ | or Shares | $ | ||||
| 6.050% due 06/01/41 | 2,678 | 2,726 | 3.550% due 03/01/22 | 1,300 | 1,193 | ||
| 5.150% due 03/15/45 | 1,385 | 1,290 | 3.875% due 03/15/23 | 700 | 632 | ||
| EnLink Midstream Partners, LP | 4.550% due 11/14/24 | 700 | 642 | ||||
| 2.700% due 04/01/19 | 3,100 | 3,098 | 5.400% due 11/14/34 | 320 | 276 | ||
| 4.150% due 06/01/25 | 525 | 512 | 5.450% due 03/15/43 | 640 | 531 | ||
| 5.050% due 04/01/45 | 370 | 330 | Fresenius Medical Care US Finance II, | ||||
| Enterprise Products Operating LLC | Inc. | ||||||
| 4.750% due 10/15/24 (Þ) | 740 | 771 | |||||
| Series B | |||||||
| 7.034% due 01/15/68 | 2,890 | 3,051 | Frontier Communications Corp. | ||||
| 9.000% due 08/15/31 | 525 | 457 | |||||
| EOG Resources, Inc. | |||||||
| 4.150% due 01/15/26 | 200 | 217 | General Electric Co. | ||||
| EP Energy LLC / Everest Acquisition | 5.250% due 12/06/17 | 3,805 | 3,973 | ||||
| Finance, Inc. | 5.300% due 02/11/21 | 900 | 1,022 | ||||
| Series WI | 5.875% due 01/14/38 | 1,835 | 2,397 | ||||
| 6.375% due 06/15/23 | 640 | 435 | 4.500% due 03/11/44 | 2,400 | 2,699 | ||
| Exelon Corp. | Series GMTN | ||||||
| 2.850% due 06/15/20 | 2,590 | 2,666 | 3.100% due 01/09/23 | 679 | 715 | ||
| Express Scripts Holding Co. | 6.150% due 08/07/37 | 583 | 779 | ||||
| 3.000% due 07/15/23 | 3,130 | 3,113 | 6.875% due 01/10/39 | 5,855 | 8,575 | ||
| Exxon Mobil Corp. | Series NOTZ | ||||||
| 1.000% due 03/15/19 (Ê) | 4,555 | 4,552 | 1.680% due 04/15/20 (Ê) | 1,140 | 1,150 | ||
| 3.043% due 03/01/26 | 500 | 517 | General Motors Co. | ||||
| 4.114% due 03/01/46 | 250 | 270 | 3.500% due 10/02/18 | 380 | 390 | ||
| Farmers Exchange Capital III | 4.875% due 10/02/23 | 6,470 | 6,966 | ||||
| 5.454% due 10/15/54 (Þ) | 3,275 | 3,265 | 6.250% due 10/02/43 | 650 | 744 | ||
| Fidelity National Information Services, | 5.200% due 04/01/45 | 2,375 | 2,422 | ||||
| Inc. | General Motors Financial Co., Inc. | ||||||
| 2.850% due 10/15/18 | 3,345 | 3,421 | 4.375% due 09/25/21 | 150 | 159 | ||
| Fifth Third Bank | 4.250% due 05/15/23 | 100 | 104 | ||||
| Series BKNT | 5.250% due 03/01/26 | 3,440 | 3,746 | ||||
| 2.875% due 10/01/21 | 2,900 | 3,008 | Genworth Holdings, Inc. | ||||
| First Data Corp. | 7.200% due 02/15/21 | 490 | 454 | ||||
| 5.375% due 08/15/23 (Þ) | 1,810 | 1,873 | 7.625% due 09/24/21 | 560 | 525 | ||
| First Union Capital II | Georgia-Pacific LLC | ||||||
| Series A | 8.875% due 05/15/31 | 2,360 | 3,694 | ||||
| 7.950% due 11/15/29 | 1,575 | 2,082 | Gilead Sciences, Inc. | ||||
| FirstEnergy Corp. | 2.550% due 09/01/20 | 5,100 | 5,227 | ||||
| Series A | 3.650% due 03/01/26 | 1,300 | 1,363 | ||||
| 2.750% due 03/15/18 | 200 | 202 | 4.000% due 09/01/36 | 2,580 | 2,584 | ||
| Series B | 4.750% due 03/01/46 | 1,125 | 1,215 | ||||
| 4.250% due 03/15/23 | 1,400 | 1,485 | Glencore Funding LLC | ||||
| Series C | 2.875% due 04/16/20 (Þ) | 2,340 | 2,352 | ||||
| 7.375% due 11/15/31 | 1,900 | 2,471 | GLP Capital, LP / GLP Financing II, Inc. | ||||
| FirstEnergy Solutions Corp. | 5.375% due 11/01/23 | 550 | 590 | ||||
| 6.050% due 08/15/21 | 700 | 544 | Goldman Sachs Capital I | ||||
| Florida East Coast Holdings Corp. | 6.345% due 02/15/34 | 7,265 | 8,762 | ||||
| 6.750% due 05/01/19 (Þ) | 320 | 322 | Goldman Sachs Capital II | ||||
| Ford Motor Co. | 4.000% due 06/01/43 (Ê)(ƒ) | 17 | 14 | ||||
| 4.750% due 01/15/43 | 10 | 10 | Goldman Sachs Group, Inc. (The) | ||||
| Ford Motor Credit Co. LLC | 5.250% due 07/27/21 | 1,900 | 2,135 | ||||
| 1.724% due 12/06/17 | 1,000 | 1,000 | 2.350% due 11/15/21 | 5,300 | 5,268 | ||
| 2.551% due 10/05/18 | 6,880 | 6,963 | 3.850% due 07/08/24 | 1,445 | 1,525 | ||
| 3.157% due 08/04/20 | 1,750 | 1,794 | 4.250% due 10/21/25 | 1,200 | 1,255 | ||
| 5.875% due 08/02/21 | 650 | 738 | 6.750% due 10/01/37 | 5,507 | 6,946 | ||
| Series FXD | 6.250% due 02/01/41 | 1,100 | 1,409 | ||||
| 2.145% due 01/09/18 | 6,395 | 6,419 | 4.750% due 10/21/45 | 1,000 | 1,100 | ||
| Freeport-McMoran Oil & Gas LLC / FCX | Series D | ||||||
| Oil & Gas, Inc. | 6.000% due 06/15/20 | 1,875 | 2,118 | ||||
| 6.875% due 02/15/23 | 100 | 104 | Series GMTN | ||||
| Freeport-McMoRan, Inc. | 2.640% due 10/28/27 (Ê) | 5,140 | 5,150 | ||||
See accompanying notes which are an integral part of the financial statements.
416 Russell Strategic Bond Fund
Russell Investment Company
Russell Strategic Bond Fund
Schedule of Investments, continued — October 31, 2016
| Amounts in thousands (except share amounts) | Amounts in thousands (except share amounts) | ||||||
| Principal | Fair | Principal | Fair | ||||
| Amount ($) | Value | Amount ($) | Value | ||||
| or Shares | $ | or Shares | $ | ||||
| Series O | 6.400% due 05/15/38 | 3,135 | 4,225 | ||||
| 5.300% due 12/29/49 (ƒ) | 2,400 | 2,445 | 4.950% due 06/01/45 | 2,260 | 2,484 | ||
| Goodyear Tire & Rubber Co. (The) | Series H | ||||||
| 5.125% due 11/15/23 | 330 | 341 | 1.700% due 03/01/18 | 990 | 993 | ||
| Great Plains Energy, Inc. | JPMorgan Chase Capital XXIII | ||||||
| 5.292% due 06/15/22 | 3,785 | 4,195 | 1.906% due 05/15/47 (Ê) | 3,955 | 3,174 | ||
| Halliburton Co. | Keurig Green Mountain, Inc. Term Loan | ||||||
| 3.800% due 11/15/25 | 500 | 520 | B | ||||
| 4.850% due 11/15/35 | 200 | 216 | 5.250% due 03/03/23 (Ê) | 862 | 873 | ||
| Harris Corp. | Kinder Morgan, Inc. | ||||||
| 1.999% due 04/27/18 | 2,426 | 2,438 | 5.550% due 06/01/45 | 2,900 | 3,010 | ||
| 5.054% due 04/27/45 | 200 | 220 | Kindred Healthcare, Inc. | ||||
| HCA, Inc. | Series WI | ||||||
| 5.375% due 02/01/25 | 830 | 847 | 8.750% due 01/15/23 | 380 | 369 | ||
| Hewlett Packard Enterprise Co. | KKR Group Finance Co. II LLC | ||||||
| 3.100% due 10/05/18 (Þ) | 1,595 | 1,631 | 5.500% due 02/01/43 (Þ) | 50 | 52 | ||
| 6.450% due 10/15/35 (Þ) | 5,413 | 5,597 | KKR Group Finance Co. III LLC | ||||
| HSBC Bank USA | 5.125% due 06/01/44 (Þ) | 4,605 | 4,576 | ||||
| Series BKNT | KLA-Tencor Corp. | ||||||
| 5.875% due 11/01/34 | 2,665 | 3,185 | 4.650% due 11/01/24 | 200 | 219 | ||
| HSBC Finance Corp. | Kohl's Corp. | ||||||
| 6.676% due 01/15/21 | 700 | 799 | 5.550% due 07/17/45 | 3,115 | 3,021 | ||
| Humana, Inc. | Kraft Foods Group, Inc. | ||||||
| 3.150% due 12/01/22 | 100 | 103 | 3.500% due 06/06/22 | 700 | 739 | ||
| 4.625% due 12/01/42 | 150 | 153 | Kraft Heinz Foods Co. | ||||
| Huntington National Bank (The) | 4.875% due 02/15/25 (Þ) | 7,609 | 8,360 | ||||
| 2.200% due 11/06/18 | 3,696 | 3,731 | 5.200% due 07/15/45 | 150 | 168 | ||
| Hyundai Capital America | Series WI | ||||||
| 2.000% due 07/01/19 (Þ) | 2,085 | 2,086 | 5.000% due 07/15/35 | 250 | 281 | ||
| Intel Corp. | Kroger Co. (The) | ||||||
| 3.700% due 07/29/25 | 150 | 164 | 5.150% due 08/01/43 | 150 | 172 | ||
| 4.900% due 07/29/45 | 100 | 115 | L Brands, Inc. | ||||
| International Business Machines Corp. | 5.625% due 10/15/23 | 180 | 198 | ||||
| 1.272% due 02/12/19 (Ê) | 1,270 | 1,276 | 6.950% due 03/01/33 | 350 | 361 | ||
| International Game Technology | Land O' Lakes, Inc. | ||||||
| 7.500% due 06/15/19 | 245 | 272 | 6.000% due 11/15/22 (Þ) | 4,290 | 4,730 | ||
| International Lease Finance Corp. | Landry's, Inc. Term Loan B | ||||||
| 7.125% due 09/01/18 (Þ) | 1,000 | 1,089 | 4.000% due 09/22/23 (Ê) | 960 | 965 | ||
| 5.875% due 08/15/22 | 1,370 | 1,509 | Legg Mason, Inc. | ||||
| International Paper Co. | 4.750% due 03/15/26 | 4,399 | 4,695 | ||||
| 8.700% due 06/15/38 | 1,735 | 2,556 | Lockheed Martin Corp. | ||||
| IPALCO Enterprises, Inc. | 3.350% due 09/15/21 | 1,775 | 1,884 | ||||
| 5.000% due 05/01/18 | 3,800 | 3,971 | 4.500% due 05/15/36 | 100 | 112 | ||
| Jackson National Life Global Funding | Series 10YR | ||||||
| Series 144a | 3.550% due 01/15/26 | 600 | 638 | ||||
| 2.600% due 12/09/20 (Þ) | 1,670 | 1,706 | Lowe's Cos., Inc. | ||||
| Janus Capital Group, Inc. | 4.375% due 09/15/45 | 5,060 | 5,527 | ||||
| 4.875% due 08/01/25 | 3,410 | 3,647 | LyondellBasell Industries NV | ||||
| JC Penney Corp., Inc. | 4.625% due 02/26/55 | 3,285 | 3,113 | ||||
| 7.400% due 04/01/37 | 525 | 480 | M&T Bank Corp. | ||||
| Joy Global, Inc. | 6.875% due 12/29/49 (ƒ) | 1,000 | 1,006 | ||||
| 5.125% due 10/15/21 | 400 | 437 | McDonald's Corp. | ||||
| 2.100% due 12/07/18 | 2,975 | 3,012 | |||||
| JPMorgan Chase & Co. | 3.700% due 01/30/26 | 400 | 423 | ||||
| 2.750% due 06/23/20 | 2,755 | 2,821 | |||||
| 2.550% due 03/01/21 | 3,340 | 3,390 | Medtronic, Inc. | ||||
| 2.295% due 08/15/21 | 6,295 | 6,300 | 3.150% due 03/15/22 | 4,965 | 5,234 | ||
| 4.350% due 08/15/21 | 900 | 983 | 3.500% due 03/15/25 | 1,000 | 1,061 | ||
| 3.875% due 09/10/24 | 1,000 | 1,044 | Merck & Co., Inc. | ||||
| 4.125% due 12/15/26 | 1,600 | 1,688 | 0.986% due 05/18/18 (Ê) | 8,385 | 8,426 | ||
| 2.750% due 02/10/25 | 300 | 306 | |||||
See accompanying notes which are an integral part of the financial statements.
Russell Strategic Bond Fund 417
Russell Investment Company
Russell Strategic Bond Fund
Schedule of Investments, continued — October 31, 2016
| Amounts in thousands (except share amounts) | Amounts in thousands (except share amounts) | ||||||
| Principal | Fair | Principal | Fair | ||||
| Amount ($) | Value | Amount ($) | Value | ||||
| or Shares | $ | or Shares | $ | ||||
| MetLife, Inc. | 8.250% due 03/01/19 | 600 | 683 | ||||
| 6.400% due 12/15/36 | 670 | 751 | 3.900% due 11/15/24 | 1,000 | 1,028 | ||
| 10.750% due 08/01/39 | 3,910 | 6,393 | 5.250% due 11/15/43 | 100 | 105 | ||
| 4.050% due 03/01/45 | 2,220 | 2,204 | NVR, Inc. | ||||
| Metropolitan Life Global Funding I | 3.950% due 09/15/22 | 3,200 | 3,372 | ||||
| 1.350% due 09/14/18 (Þ) | 9,700 | 9,647 | Occidental Petroleum Corp. | ||||
| 2.500% due 12/03/20 (Þ) | 2,000 | 2,040 | 3.125% due 02/15/22 | 200 | 209 | ||
| MGM Resorts International | 3.400% due 04/15/26 | 350 | 365 | ||||
| 6.000% due 03/15/23 | 550 | 595 | 4.625% due 06/15/45 | 200 | 219 | ||
| Microsoft Corp. | Oracle Corp. | ||||||
| 2.400% due 08/08/26 | 1,350 | 1,324 | 1.900% due 09/15/21 | 4,385 | 4,368 | ||
| 3.450% due 08/08/36 | 20 | 20 | 2.650% due 07/15/26 | 2,215 | 2,185 | ||
| 3.750% due 02/12/45 | 1,000 | 996 | PACCAR Financial Corp. | ||||
| MidAmerican Energy Co. | 1.650% due 02/25/19 | 1,400 | 1,409 | ||||
| 3.500% due 10/15/24 | 1,500 | 1,614 | 1.200% due 08/12/19 | 1,236 | 1,229 | ||
| Mondelez International, Inc. | Pacific Gas & Electric Co. | ||||||
| 4.000% due 02/01/24 | 600 | 666 | 6.050% due 03/01/34 | 1,700 | 2,232 | ||
| Monongahela Power Co. | 5.800% due 03/01/37 | 400 | 512 | ||||
| 4.100% due 04/15/24 (Þ) | 1,815 | 1,974 | Pfizer, Inc. | ||||
| Morgan Stanley | 1.150% due 06/15/18 (Ê) | 7,545 | 7,574 | ||||
| 5.950% due 12/28/17 | 1,000 | 1,051 | Pharmacia LLC | ||||
| 2.282% due 10/24/23 (Ê) | 7,970 | 7,960 | 6.500% due 12/01/18 | 2,065 | 2,280 | ||
| Series GMTN | Philip Morris International, Inc. | ||||||
| 7.300% due 05/13/19 | 1,000 | 1,131 | 2.500% due 08/22/22 | 600 | 610 | ||
| 3.875% due 01/27/26 | 4,925 | 5,193 | 4.500% due 03/20/42 | 250 | 270 | ||
| MPLX LP | Pricoa Global Funding I | ||||||
| 4.875% due 12/01/24 | 4,305 | 4,503 | 2.550% due 11/24/20 (Þ) | 2,210 | 2,260 | ||
| 4.875% due 06/01/25 | 700 | 730 | Prime Security Services Borrower LLC / | ||||
| Murphy Oil Corp. | Prime Finance, Inc. | ||||||
| 4.700% due 12/01/22 | 630 | 598 | 9.250% due 05/15/23 (Þ) | 660 | 701 | ||
| Mutual of Omaha Insurance Co. | Procter & Gamble Co. (The) | ||||||
| 4.297% due 07/15/54 (Þ) | 3,140 | 3,150 | 1.156% due 11/01/19 (Ê) | 1,580 | 1,584 | ||
| Mylan NV | Progress Energy, Inc. | ||||||
| 3.950% due 06/15/26 (Þ) | 8,555 | 8,533 | 4.400% due 01/15/21 | 200 | 218 | ||
| 5.250% due 06/15/46 (Þ) | 2,480 | 2,511 | Protective Life Global Funding | ||||
| Nabors Industries, Inc. | 2.700% due 11/25/20 (Þ) | 1,100 | 1,125 | ||||
| 5.000% due 09/15/20 | 525 | 531 | PulteGroup, Inc. | ||||
| 4.625% due 09/15/21 | 455 | 450 | 6.000% due 02/15/35 | 350 | 348 | ||
| Navient Corp. | Quebecor World Capital Corp. | ||||||
| 8.450% due 06/15/18 | 790 | 854 | 4.875% due 01/02/49 (Ø)(Þ) | 625 | — | ||
| 8.000% due 03/25/20 | 725 | 787 | 6.125% due 11/15/49 (Ø) | 1,955 | — | ||
| 5.625% due 08/01/33 | 525 | 416 | Quicken Loans, Inc. | ||||
| NBCUniversal Media LLC | 5.750% due 05/01/25 (Þ) | 230 | 227 | ||||
| 4.375% due 04/01/21 | 1,000 | 1,100 | QVC, Inc. | ||||
| NCL Corp., Ltd. | 4.375% due 03/15/23 | 845 | 848 | ||||
| 4.625% due 11/15/20 (Þ) | 280 | 283 | Rayonier AM Products, Inc. | ||||
| 5.500% due 06/01/24 (Þ) | 3,360 | 3,083 | |||||
| Neiman Marcus Group, Ltd. LLC | Regency Energy Partners, LP / Regency | ||||||
| 8.750% due 10/15/21 (Þ) | 530 | 417 | Energy Finance Corp. | ||||
| Netflix, Inc. | 5.875% due 03/01/22 | 400 | 448 | ||||
| 5.875% due 02/15/25 | 380 | 421 | Reliance Standard Life Global Funding | ||||
| New York Life Global Funding | II | ||||||
| 1.450% due 12/15/17 (Þ) | 4,880 | 4,895 | 2.500% due 01/15/20 (Þ) | 3,380 | 3,407 | ||
| Newell Brands, Inc. | Reynolds American, Inc. | ||||||
| 3.150% due 04/01/21 | 150 | 156 | 6.875% due 05/01/20 | 5,400 | 6,277 | ||
| 3.850% due 04/01/23 | 4,225 | 4,484 | 3.250% due 06/12/20 | 250 | 261 | ||
| 5.000% due 11/15/23 | 819 | 875 | 5.850% due 08/15/45 | 1,600 | 1,989 | ||
| 4.200% due 04/01/26 | 250 | 270 | Reynolds Group Issuer, Inc. / Reynolds | ||||
| NGPL PipeCo LLC | Group Issuer LLC / Reynolds Group | ||||||
| 7.119% due 12/15/17 (Þ) | 650 | 679 | Issuer Lu | ||||
| Noble Energy, Inc. | 5.750% due 10/15/20 | 500 | 513 | ||||
See accompanying notes which are an integral part of the financial statements.
418 Russell Strategic Bond Fund
Russell Investment Company
Russell Strategic Bond Fund
Schedule of Investments, continued — October 31, 2016
| Amounts in thousands (except share amounts) | Amounts in thousands (except share amounts) | ||||||
| Principal | Fair | Principal | Fair | ||||
| Amount ($) | Value | Amount ($) | Value | ||||
| or Shares | $ | or Shares | $ | ||||
| 6.875% due 02/15/21 | 370 | 383 | 2.800% due 07/13/22 | 2,085 | 2,171 | ||
| Rockies Express Pipeline LLC | Transcontinental Gas Pipe Line Co. LLC | ||||||
| 5.625% due 04/15/20 (Þ) | 182 | 191 | 7.850% due 02/01/26 (Þ) | 800 | 1,015 | ||
| Rowan Cos., Inc. | Tyson Foods, Inc. | ||||||
| 4.875% due 06/01/22 | 350 | 301 | 5.150% due 08/15/44 | 100 | 113 | ||
| 4.750% due 01/15/24 | 420 | 353 | Union Pacific Railroad Co. Pass-Through | ||||
| Sabine Pass Liquefaction LLC | Trust | ||||||
| 5.000% due 03/15/27 (Þ) | 2,030 | 2,065 | Series 06-1 | ||||
| Series WI | 5.866% due 07/02/30 | 875 | 1,014 | ||||
| 5.750% due 05/15/24 | 380 | 402 | United Rentals NA, Inc. | ||||
| Safeway, Inc. | 5.750% due 11/15/24 | 380 | 394 | ||||
| 7.250% due 02/01/31 | 490 | 489 | United Technologies Corp. | ||||
| Schlumberger Holdings Corp. | 4.500% due 06/01/42 | 200 | 219 | ||||
| 4.000% due 12/21/25 (Þ) | 3,520 | 3,780 | UnitedHealth Group, Inc. | ||||
| Sealed Air Corp. | 1.900% due 07/16/18 | 3,765 | 3,798 | ||||
| 6.875% due 07/15/33 (Þ) | 700 | 752 | 3.875% due 10/15/20 | 100 | 108 | ||
| South Carolina Electric & Gas Co. | 5.700% due 10/15/40 | 400 | 508 | ||||
| 6.050% due 01/15/38 | 1,817 | 2,322 | Univision Communications, Inc. | ||||
| 5.125% due 05/15/23 (Þ) | 550 | 558 | |||||
| Southwest Airlines Co. | 5.125% due 02/15/25 (Þ) | 380 | 381 | ||||
| 2.650% due 11/05/20 | 3,130 | 3,201 | |||||
| Southwestern Energy Co. | US Airways Pass-Through Trust | ||||||
| 5.800% due 01/23/20 | 175 | 174 | Series 2012-1 Class A | ||||
| 6.700% due 01/23/25 | 875 | 834 | 5.900% due 10/01/24 | 2,432 | 2,787 | ||
| Sprint Capital Corp. | Series A Class A | ||||||
| 6.900% due 05/01/19 | 840 | 884 | 7.125% due 10/22/23 | 2,377 | 2,808 | ||
| 6.875% due 11/15/28 | 840 | 773 | USF&G Capital III | ||||
| 8.750% due 03/15/32 | 6,715 | 6,816 | 8.312% due 07/01/46 (Þ) | 5,426 | 7,309 | ||
| Sprint Spectrum Co. LLC / Sprint | Valeant Pharmaceuticals International, | ||||||
| Spectrum Co II LLC / Sprint Spectrum | Inc. | ||||||
| Co III LLC | 5.875% due 05/15/23 (Þ) | 940 | 740 | ||||
| Series A-1 | VEREIT Operating Partnership, LP | ||||||
| 3.360% due 09/20/21 (Þ) | 2,590 | 2,596 | 3.000% due 02/06/19 | 560 | 566 | ||
| State Street Corp. | Verizon Communications, Inc. | ||||||
| 4.956% due 03/15/18 | 1,000 | 1,042 | 2.606% due 09/14/18 (Ê) | 600 | 616 | ||
| Structured Adjustable Rate Mortgage | 3.650% due 09/14/18 | 1,970 | 2,044 | ||||
| Loan Trust | 1.375% due 08/15/19 | 5,665 | 5,617 | ||||
| 2.600% due 10/28/31 | 1,680 | 1,675 | 5.150% due 09/15/23 | 5,885 | 6,732 | ||
| Taylor Morrison Communities, Inc. / | 6.400% due 09/15/33 | 550 | 686 | ||||
| Monarch Communities Inc | 6.550% due 09/15/43 | 1,690 | 2,214 | ||||
| 5.625% due 03/01/24 (Þ) | 700 | 726 | 4.672% due 03/15/55 | 7,965 | 7,765 | ||
| Teachers Insurance & Annuity | |||||||
| Association of America | Series WI | ||||||
| 4.900% due 09/15/44 (Þ) | 400 | 445 | 4.862% due 08/21/46 | 1,190 | 1,260 | ||
| 4.375% due 09/15/54 (Þ) | 200 | 203 | Viacom, Inc. | ||||
| Tenet Healthcare Corp. | 3.875% due 04/01/24 | 150 | 155 | ||||
| 4.350% due 06/15/20 (Ê) | 500 | 504 | 5.850% due 09/01/43 | 1,540 | 1,727 | ||
| 8.125% due 04/01/22 | 6,010 | 5,875 | Visa, Inc. | ||||
| Thermo Fisher Scientific, Inc. | 3.150% due 12/14/25 | 1,000 | 1,043 | ||||
| 2.950% due 09/19/26 | 1,400 | 1,379 | 4.300% due 12/14/45 | 1,650 | 1,841 | ||
| Time Warner Cable LLC | Voya Financial, Inc. | ||||||
| 4.125% due 02/15/21 | 1,000 | 1,062 | 2.900% due 02/15/18 | 2,585 | 2,628 | ||
| 7.300% due 07/01/38 | 400 | 505 | Wachovia Capital Trust II | ||||
| 5.875% due 11/15/40 | 1,200 | 1,314 | 1.380% due 01/15/27 (Ê) | 2,520 | 2,205 | ||
| Time Warner, Inc. | Walgreens Boots Alliance, Inc. | ||||||
| 4.750% due 03/29/21 | 6,070 | 6,682 | 3.450% due 06/01/26 | 1,500 | 1,529 | ||
| 7.700% due 05/01/32 | 1,000 | 1,382 | Wal-Mart Stores, Inc. | ||||
| TJX Companies, Inc. (The) | 6.200% due 04/15/38 | 100 | 139 | ||||
| 2.250% due 09/15/26 | 140 | 135 | Waste Management, Inc. | ||||
| 3.500% due 05/15/24 | 800 | 848 | |||||
| Toyota Motor Credit Corp. | WEA Finance LLC / Westfield UK & | ||||||
| Series GMTN | Europe Finance PLC | ||||||
| 1.338% due 07/13/18 (Ê) | 525 | 527 | 3.250% due 10/05/20 (Þ) | 1,025 | 1,061 | ||
See accompanying notes which are an integral part of the financial statements.
Russell Strategic Bond Fund 419
Russell Investment Company
Russell Strategic Bond Fund
Schedule of Investments, continued — October 31, 2016
| Amounts in thousands (except share amounts) | Amounts in thousands (except share amounts) | ||||||
| Principal | Fair | Principal | Fair | ||||
| Amount ($) | Value | Amount ($) | Value | ||||
| or Shares | $ | or Shares | $ | ||||
| Wells Fargo & Co. | 5.000% due 03/30/20 | 2,961 | 3,243 | ||||
| 2.500% due 03/04/21 | 2,895 | 2,927 | Anglo American Capital PLC | ||||
| 4.600% due 04/01/21 | 1,500 | 1,647 | 3.625% due 05/14/20 (Þ) | 1,050 | 1,055 | ||
| 2.117% due 10/31/23 (Ê) | 9,430 | 9,406 | ArcelorMittal | ||||
| 3.000% due 04/22/26 | 2,000 | 1,991 | 6.500% due 03/01/21 | 525 | 576 | ||
| 3.000% due 10/23/26 | 8,255 | 8,198 | 7.250% due 02/25/22 | 1,120 | 1,271 | ||
| 4.650% due 11/04/44 | 1,200 | 1,240 | 6.125% due 06/01/25 | 2,525 | 2,765 | ||
| 4.400% due 06/14/46 | 3,350 | 3,360 | 8.000% due 10/15/39 | 525 | 564 | ||
| Series GMTN | 7.750% due 03/01/41 | 350 | 368 | ||||
| 2.600% due 07/22/20 | 5,385 | 5,487 | Ardagh Packaging Finance PLC / | ||||
| 4.300% due 07/22/27 | 2,000 | 2,126 | Ardagh Holdings USA, Inc. | ||||
| 4.900% due 11/17/45 | 1,700 | 1,827 | 3.850% due 12/15/19 (Ê)(Þ) | 730 | 742 | ||
| Argentine Republic Government | |||||||
| West Corp. | International Bond | ||||||
| 5.375% due 07/15/22 (Þ) | 350 | 337 | 6.875% due 04/22/21 (Þ) | 490 | 530 | ||
| Western Gas Partners, LP | 7.500% due 04/22/26 (Þ) | 360 | 394 | ||||
| 4.650% due 07/01/26 | 240 | 251 | 7.625% due 04/22/46 (Þ) | 240 | 262 | ||
| Westlake Chemical Corp. | Aristocrat International Pty, Ltd. Term | ||||||
| 4.875% due 05/15/23 (Þ) | 2,055 | 2,137 | Loan B | ||||
| Williams Cos., Inc. (The) | 3.630% due 10/20/21 (Ê) | 1,026 | 1,030 | ||||
| 3.700% due 01/15/23 | 525 | 508 | AstraZeneca PLC | ||||
| 4.550% due 06/24/24 | 630 | 641 | 2.375% due 11/16/20 | 2,110 | 2,148 | ||
| 5.750% due 06/24/44 | 385 | 393 | Avago Technologies Cayman Finance, | ||||
| Williams Partners, LP | Ltd. Term Loan B3 | ||||||
| 3.600% due 03/15/22 | 7,505 | 7,639 | 3.535% due 02/01/23 (Ê) | 2,034 | 2,054 | ||
| Yum! Brands, Inc. | Bank of Montreal | ||||||
| 3.875% due 11/01/23 | 910 | 903 | 1.900% due 08/27/21 | 2,525 | 2,497 | ||
| 6.875% due 11/15/37 | 165 | 168 | Bank of Nova Scotia (The) | ||||
| ZF NA Capital, Inc. | 1.516% due 06/14/19 (Ê) | 7,500 | 7,524 | ||||
| 4.750% due 04/29/25 (Þ) | 620 | 654 | Barclays Bank PLC | ||||
| ZFS Finance USA Trust | 6.278% due (ƒ) | 215 | 233 | ||||
| 6.500% due 05/09/37 (Þ) | 5,977 | 6,020 | 6.050% due 12/04/17 (Þ) | 200 | 209 | ||
| Barrick Gold Corp. | |||||||
| 1,042,078 | 4.100% due 05/01/23 | 3,960 | 4,257 | ||||
| International Debt - 5.9% | 5.250% due 04/01/42 | 1,540 | 1,686 | ||||
| 1011778 BC ULC / New Red Finance, | |||||||
| Inc. | Bharti Airtel, Ltd. | ||||||
| 6.000% due 04/01/22 (Þ) | 740 | 773 | 4.375% due 06/10/25 (Þ) | 3,240 | 3,334 | ||
| 1011778 BC Unlimited Liability Co. 1st | BHP Billiton Finance USA, Ltd. | ||||||
| Lien Term Loan B2 | 3.250% due 11/21/21 | 800 | 845 | ||||
| 3.750% due 12/12/21 (Ê) | 1,018 | 1,023 | 2.875% due 02/24/22 | 100 | 104 | ||
| ABN AMRO Bank NV | 5.000% due 09/30/43 | 300 | 342 | ||||
| 4.750% due 07/28/25 (Þ) | 400 | 420 | 6.750% due 10/19/75 (Þ) | 1,800 | 2,038 | ||
| Actavis Funding SCS | BP Capital Markets PLC | ||||||
| 3.450% due 03/15/22 | 250 | 259 | 3.245% due 05/06/22 | 100 | 104 | ||
| 3.800% due 03/15/25 | 1,400 | 1,453 | 3.119% due 05/04/26 | 800 | 810 | ||
| 4.750% due 03/15/45 | 300 | 315 | Braskem Finance, Ltd. | ||||
| AerCap Global Aviation Trust | 6.450% due 02/03/24 | 2,375 | 2,512 | ||||
| 6.500% due 06/15/45 (Þ) | 2,900 | 2,987 | Brazilian Government International Bond | ||||
| AerCap Ireland Capital, Ltd. / AerCap | 5.625% due 01/07/41 | 2,700 | 2,605 | ||||
| Global Aviation Trust | 5.000% due 01/27/45 | 460 | 406 | ||||
| 4.625% due 07/01/22 | 3,670 | 3,831 | |||||
| British Telecommunications PLC | |||||||
| Series WI | 9.375% due 12/15/30 | 200 | 321 | ||||
| 3.750% due 05/15/19 | 400 | 410 | |||||
| Canadian Oil Sands, Ltd. | |||||||
| Alcoa Nederland Holding BV | 7.750% due 05/15/19 (Þ) | 2,590 | 2,882 | ||||
| 7.000% due 09/30/26 (Þ) | 600 | 618 | 4.500% due 04/01/22 (Þ) | 3,740 | 3,846 | ||
| Altice Financing SA | |||||||
| 6.625% due 02/15/23 (Þ) | 260 | 268 | CDP Financial, Inc. | ||||
| 5.600% due 11/25/39 (Þ) | 2,480 | 3,258 | |||||
| Altice Luxembourg SA | |||||||
| 7.750% due 05/15/22 (Þ) | 4,175 | 4,360 | Celulosa Arauco y Constitucion SA | ||||
| Series WI | |||||||
| America Movil SAB de CV | 4.750% due 01/11/22 | 300 | 320 | ||||
| 5.625% due 11/15/17 | 250 | 261 | |||||
| Cenovus Energy, Inc. | |||||||
See accompanying notes which are an integral part of the financial statements.
420 Russell Strategic Bond Fund
Russell Investment Company
Russell Strategic Bond Fund
Schedule of Investments, continued — October 31, 2016
| Amounts in thousands (except share amounts) | Amounts in thousands (except share amounts) | ||||||
| Principal | Fair | Principal | Fair | ||||
| Amount ($) | Value | Amount ($) | Value | ||||
| or Shares | $ | or Shares | $ | ||||
| 5.700% due 10/15/19 | 1,135 | 1,227 | ING Bank NV | ||||
| 6.750% due 11/15/39 | 210 | 234 | 5.800% due 09/25/23 (Þ) | 600 | 675 | ||
| Colombia Government International | Intelsat Jackson Holdings SA | ||||||
| Bond | 7.250% due 04/01/19 | 4,290 | 3,459 | ||||
| 5.625% due 02/26/44 | 1,720 | 1,879 | |||||
| Intesa Sanpaolo SpA | |||||||
| Commonwealth Bank of Australia | 5.017% due 06/26/24 (Þ) | 1,800 | 1,670 | ||||
| 5.000% due 10/15/19 (Þ) | 200 | 219 | |||||
| Kinross Gold Corp. | |||||||
| Cooperatieve Rabobank UA | Series WI | ||||||
| 4.625% due 12/01/23 | 900 | 970 | 5.950% due 03/15/24 | 685 | 719 | ||
| 4.375% due 08/04/25 | 2,600 | 2,738 | |||||
| 5.250% due 08/04/45 | 2,450 | 2,761 | Lloyds Banking Group PLC | ||||
| 11.000% due 06/29/49 (ƒ)(Þ) | 2,257 | 2,719 | 4.500% due 11/04/24 | 600 | 620 | ||
| Majapahit Holding BV | |||||||
| Credit Agricole SA | Series REGS | ||||||
| 8.375% due 10/29/49 (ƒ)(Þ) | 600 | 675 | |||||
| Credit Suisse Group Funding Guernsey, | 7.750% due 01/20/20 | 580 | 664 | ||||
| Ltd. | Mallinckrodt International Finance SA | ||||||
| 4.550% due 04/17/26 (Þ) | 5,930 | 6,220 | 4.750% due 04/15/23 | 470 | 410 | ||
| 4.875% due 05/15/45 | 1,000 | 1,050 | Mexico Government International Bond | ||||
| Danone SA | 4.750% due 03/08/44 | 300 | 299 | ||||
| 2.077% due 11/02/21 (Þ) | 1,120 | 1,120 | 5.550% due 01/21/45 | 4,000 | 4,480 | ||
| 2.589% due 11/02/23 (Þ) | 1,390 | 1,389 | Mondelez International Holdings | ||||
| 2.947% due 11/02/26 (Þ) | 1,460 | 1,457 | Netherlands BV | ||||
| 1.625% due 10/28/19 (Þ) | 4,620 | 4,604 | |||||
| Ecopetrol SA | |||||||
| 5.375% due 06/26/26 | 770 | 777 | Nationwide Building Society | ||||
| 5.875% due 05/28/45 | 1,510 | 1,333 | 4.000% due 09/14/26 (Þ) | 6,280 | 6,195 | ||
| Noble Holding International, Ltd. | |||||||
| Emera, Inc. | 4.900% due 08/01/20 | 700 | 621 | ||||
| Series 16-A | 3.950% due 03/15/22 | 1,420 | 1,090 | ||||
| 6.750% due 06/15/76 | 4,200 | 4,641 | 7.200% due 04/01/25 | 1,350 | 1,100 | ||
| Ensco PLC | 8.200% due 04/01/45 | 425 | 286 | ||||
| 4.700% due 03/15/21 | 1,210 | 1,117 | |||||
| 5.750% due 10/01/44 | 3,610 | 2,410 | Nokia OYJ | ||||
| 6.625% due 05/15/39 | 3,520 | 3,802 | |||||
| Equate Petrochemical BV | |||||||
| 4.250% due 11/03/26 (Þ) | 660 | 654 | Nordea Bank AB | ||||
| 4.875% due 05/13/21 (Þ) | 600 | 661 | |||||
| Fiat Chrysler Automobiles NV | OCP SA | ||||||
| Series WI | 4.500% due 10/22/25 (Þ) | 330 | 333 | ||||
| 5.250% due 04/15/23 | 580 | 592 | |||||
| Pernod Ricard SA | |||||||
| Fortis, Inc. | 4.450% due 01/15/22 (Þ) | 580 | 635 | ||||
| 3.055% due 10/04/26 (Þ) | 3,350 | 3,297 | |||||
| GE Capital International Funding Co. | 5.500% due 01/15/42 (Þ) | 150 | 177 | ||||
| Unlimited Co | Perrigo Co. PLC | ||||||
| 4.418% due 11/15/35 | 1,000 | 1,091 | 2.300% due 11/08/18 | 3,255 | 3,271 | ||
| GlaxoSmithKline Capital PLC | 4.000% due 11/15/23 | 3,816 | 3,914 | ||||
| 2.850% due 05/08/22 | 400 | 416 | Perrigo Finance Unlimited Co. | ||||
| HBOS PLC | 3.500% due 03/15/21 | 2,235 | 2,309 | ||||
| Series GMTN | 4.375% due 03/15/26 | 2,120 | 2,225 | ||||
| 6.750% due 05/21/18 (Þ) | 1,000 | 1,063 | Peruvian Government International Bond | ||||
| HSBC Bank PLC | 6.550% due 03/14/37 | 90 | 123 | ||||
| 7.650% due 05/01/25 | 2,055 | 2,567 | 5.625% due 11/18/50 | 770 | 978 | ||
| HSBC Holdings PLC | Petrobras Global Finance BV | ||||||
| 3.400% due 03/08/21 | 2,000 | 2,062 | 5.750% due 01/20/20 | 200 | 206 | ||
| 2.650% due 01/05/22 | 4,615 | 4,592 | 5.375% due 01/27/21 | 5,750 | 5,694 | ||
| 4.250% due 08/18/25 | 1,000 | 1,026 | 6.250% due 03/17/24 | 580 | 573 | ||
| 3.900% due 05/25/26 | 1,500 | 1,552 | Petroleos Mexicanos | ||||
| Series . | 3.500% due 01/30/23 | 570 | 539 | ||||
| 6.375% due 12/31/49 (ƒ) | 400 | 399 | 4.625% due 09/21/23 (Þ) | 2,330 | 2,324 | ||
| Indonesia Government International | 4.875% due 01/18/24 | 290 | 291 | ||||
| Bond | 6.875% due 08/04/26 (Þ) | 1,010 | 1,129 | ||||
| Series REGS | 5.500% due 06/27/44 | 150 | 129 | ||||
| 3.750% due 04/25/22 | 1,380 | 1,434 | 6.375% due 01/23/45 | 1,390 | 1,321 | ||
| 5.375% due 10/17/23 | 290 | 328 | Series REGS | ||||
| 5.125% due 01/15/45 | 400 | 435 | 6.875% due 08/04/26 | 240 | 268 | ||
See accompanying notes which are an integral part of the financial statements.
Russell Strategic Bond Fund 421
Russell Investment Company
Russell Strategic Bond Fund
Schedule of Investments, continued — October 31, 2016
| Amounts in thousands (except share amounts) | Amounts in thousands (except share amounts) | ||||||
| Principal | Fair | Principal | Fair | ||||
| Amount ($) | Value | Amount ($) | Value | ||||
| or Shares | $ | or Shares | $ | ||||
| Poland Government International Bond | 6.000% due 08/15/40 | 250 | 241 | ||||
| 4.000% due 01/22/24 | 180 | 196 | Telecom Italia Capital SA | ||||
| Province of Quebec Canada | 6.999% due 06/04/18 | 781 | 840 | ||||
| 1.161% due 09/04/18 (Ê) | 1,895 | 1,896 | 6.375% due 11/15/33 | 440 | 451 | ||
| 1.161% due 07/21/19 (Ê) | 3,380 | 3,383 | 7.200% due 07/18/36 | 420 | 454 | ||
| Qatar Government International Bond | 7.721% due 06/04/38 | 440 | 485 | ||||
| 4.625% due 06/02/46 (Þ) | 3,675 | 3,869 | Telefonica Emisiones SAU | ||||
| Republic of Poland Government | 5.134% due 04/27/20 | 250 | 274 | ||||
| International Bond | Tengizchevroil Finance Co. International, | ||||||
| 5.125% due 04/21/21 | 2,540 | 2,868 | Ltd. | ||||
| Rio Tinto Finance USA, Ltd. | 4.000% due 08/15/26 (Þ) | 1,355 | 1,306 | ||||
| 3.750% due 09/20/21 | 500 | 538 | Tesco PLC | ||||
| Royal Bank of Scotland Group PLC | 6.150% due 11/15/37 (Þ) | 525 | 524 | ||||
| 6.400% due 10/21/19 | 1,000 | 1,106 | Teva Pharmaceutical Finance | ||||
| 6.125% due 12/15/22 | 500 | 528 | Netherlands III BV | ||||
| 3.875% due 09/12/23 | 5,325 | 5,213 | 2.200% due 07/21/21 | 5,550 | 5,483 | ||
| 5.125% due 05/28/24 | 1,500 | 1,485 | 2.800% due 07/21/23 | 4,470 | 4,399 | ||
| 7.648% due 09/30/49 (ƒ) | 350 | 414 | Toronto-Dominion Bank (The) | ||||
| 2.125% due 04/07/21 | 3,200 | 3,222 | |||||
| Series U | 3.625% due 09/15/31 | 3,035 | 3,032 | ||||
| 7.640% due 03/29/49 (ƒ) | 440 | 427 | |||||
| Royal Bank of Scotland NV | Trade MAPS 1, Ltd. | ||||||
| 4.650% due 06/04/18 | 200 | 205 | Series 2013-1A Class A | ||||
| Saudi Government International Bond | 1.237% due 12/10/18 (Ê)(Þ) | 6,410 | 6,404 | ||||
| 4.500% due 10/26/46 (Þ) | 1,470 | 1,446 | Transcanada Trust | ||||
| Schlumberger Norge AS | Series 16-A | ||||||
| Series 144a | 5.875% due 08/15/76 | 6,225 | 6,661 | ||||
| 4.200% due 01/15/21 (Þ) | 500 | 541 | Transocean, Inc. | ||||
| 6.000% due 03/15/18 | 840 | 842 | |||||
| Seagate HDD Cayman | 6.500% due 11/15/20 | 595 | 576 | ||||
| 4.750% due 06/01/23 | 3,615 | 3,597 | |||||
| 6.800% due 03/15/38 | 2,275 | 1,496 | |||||
| SFR Group SA | |||||||
| 6.250% due 05/15/24 (Þ) | 780 | 779 | Tyco International Finance SA | ||||
| 7.375% due 05/01/26 (Þ) | 2,370 | 2,394 | 5.125% due 09/14/45 | 850 | 975 | ||
| Shell International Finance BV | UBS AG | ||||||
| 1.462% due 11/10/18 (Ê) | 5,690 | 5,730 | Series BKNT | ||||
| 4.375% due 03/25/20 | 100 | 108 | 1.800% due 03/26/18 | 7,750 | 7,768 | ||
| 2.875% due 05/10/26 | 4,525 | 4,533 | UBS Group Funding Jersey, Ltd. | ||||
| 4.375% due 05/11/45 | 1,000 | 1,043 | 4.125% due 09/24/25 (Þ) | 500 | 521 | ||
| 4.000% due 05/10/46 | 3,035 | 3,008 | 4.125% due 04/15/26 (Þ) | 3,315 | 3,461 | ||
| Shire Acquisitions Investments Ireland | Vale Overseas, Ltd. | ||||||
| DAC | 6.875% due 11/21/36 | 2,300 | 2,319 | ||||
| 1.900% due 09/23/19 | 5,855 | 5,844 | Validus Holdings, Ltd. | ||||
| Sinopec Group Overseas Development | 8.875% due 01/26/40 | 2,213 | 3,016 | ||||
| 2014, Ltd. | Virgin Media Finance PLC | ||||||
| 4.375% due 04/10/24 (Þ) | 730 | 795 | 6.375% due 04/15/23 (Þ) | 370 | 377 | ||
| Sirius International Group, Ltd. | Virgin Media Investment Holdings, Ltd. | ||||||
| 7.506% due 05/29/49 (ƒ)(Þ) | 4,170 | 4,196 | Term Loan F | ||||
| Sky PLC | 3.500% due 06/30/23 (Ê) | 670 | 673 | ||||
| 6.100% due 02/15/18 (Þ) | 4,670 | 4,909 | Vodafone Group PLC | ||||
| SoftBank Group Corp. | 7.875% due 02/15/30 | 3,770 | 5,177 | ||||
| 4.500% due 04/15/20 (Þ) | 285 | 293 | Weatherford International, Ltd. | ||||
| Southern Copper Corp. | 9.625% due 03/01/19 | 1,050 | 1,118 | ||||
| 6.750% due 04/16/40 | 60 | 65 | 6.750% due 09/15/40 | 315 | 250 | ||
| 5.250% due 11/08/42 | 2,470 | 2,337 | Yara International ASA | ||||
| Standard Chartered PLC | 3.800% due 06/06/26 (Þ) | 3,815 | 3,901 | ||||
| 5.700% due 03/26/44 (Þ) | 1,400 | 1,456 | 325,072 | ||||
| 7.014% due 12/30/49 (ƒ)(Þ) | 385 | 424 | Loan Agreements - 0.6% | ||||
| Suncor Energy, Inc. | Air Medical Group Holdings, Inc. Term | ||||||
| 5.950% due 12/01/34 | 2,690 | 3,192 | Loan B | ||||
| Teck Resources, Ltd. | 4.250% due 04/28/22 (Ê) | 668 | 662 | ||||
| 3.750% due 02/01/23 | 1,015 | 960 | Albertsons LLC Term Loan B4 | ||||
| 6.125% due 10/01/35 | 700 | 697 | 4.500% due 08/22/21 (Ê) | 501 | 505 | ||
See accompanying notes which are an integral part of the financial statements.
422 Russell Strategic Bond Fund
Russell Investment Company
Russell Strategic Bond Fund
Schedule of Investments, continued — October 31, 2016
| Amounts in thousands (except share amounts) | Amounts in thousands (except share amounts) | ||||||
| Principal | Fair | Principal | Fair | ||||
| Amount ($) | Value | Amount ($) | Value | ||||
| or Shares | $ | or Shares | $ | ||||
| Albertsons LLC Term Loan B6 | ServiceMaster Co. LLC (The) Tem Loan | ||||||
| 4.750% due 06/22/23 (Ê) | 468 | 472 | B | ||||
| 4.250% due 07/01/21 (Ê) | 784 | 784 | |||||
| Allison Transmission, Inc. Term Loan B3 | Sungard Availability Services Capital, | ||||||
| 3.250% due 08/23/19 (Ê) | 381 | 384 | Inc. Term Loan B | ||||
| American Airlines, Inc. Term Loan | 6.000% due 03/31/19 (Ê) | 2,841 | 2,685 | ||||
| 3.250% due 05/21/20 (Ê) | 490 | 490 | |||||
| American Builders & Contractors Supply | T-Mobile USA, Inc. Term Loan B | ||||||
| 3.500% due 11/09/22 (Ê) | 943 | 950 | |||||
| Co., Inc. Term Loan | Univision Communications, Inc. Term | ||||||
| 3.500% due 04/16/20 (Ê) | 290 | 291 | Loan C4 | ||||
| B/E Aerospace, Inc. Term Loan B | 4.000% due 03/01/20 (Ê) | 698 | 699 | ||||
| 3.850% due 12/16/21 (Ê) | 1,070 | 1,076 | UPC Financing Partnership 1st Lien | ||||
| Berry Plastics Group, Inc. Term Loan H | Term Loan | ||||||
| 3.750% due 10/01/22 (Ê) | 826 | 829 | 4.080% due 08/31/24 (Ê) | 670 | 673 | ||
| Boyd Gaming Corp. 1st Lien Term Loan | XPO Logistics, Inc. Term Loan B2 | ||||||
| B2 | 4.250% due 10/30/21 (Ê) | 1,018 | 1,023 | ||||
| 3.530% due 09/15/23 (Ê) | 670 | 675 | Zebra Technologies Corp. 1st Lien Term | ||||
| Catalent Pharma Solutions, Inc. Term | Loan B | ||||||
| Loan B | 4.750% due 10/27/21 (Ê) | 420 | 424 | ||||
| 4.250% due 05/20/21 (Ê) | 1,391 | 1,397 | |||||
| Charter Communications Operating LLC | 31,645 | ||||||
| Term Loan I | Mortgage-Backed Securities - 24.2% | ||||||
| 3.500% due 01/24/23 (Ê) | 668 | 672 | 225 Liberty Street Trust | ||||
| CSC Holdings LLC Term Loan | Series 2016-225L Class A | ||||||
| 3.876% due 10/31/24 (Ê) | 600 | 602 | 3.597% due 02/10/36 (Þ) | 975 | 1,039 | ||
| CWGS Group LLC Term Loan | A10 Securitization LLC | ||||||
| 5.250% due 02/20/20 (Ê) | 502 | 501 | Series 2016-1 Class C | ||||
| HCA Inc. Term Loan B7 | 5.750% due 03/15/35 (Å) | 4,391 | 4,391 | ||||
| 3.588% due 03/01/24 | 538 | 543 | Alternative Loan Trust | ||||
| Hilton Worldwide Finance LLC Term | Series 2005-J13 Class 2A7 | ||||||
| Loan B2 | 5.500% due 11/25/35 | 455 | 414 | ||||
| 3.034% due 10/25/23 (Ê) | 708 | 711 | Series 2006-13T1 Class A3 | ||||
| Kronos, Inc. Initial Term Loan | 6.000% due 05/25/36 | 2,907 | 2,281 | ||||
| 4.500% due 10/30/19 (Ê) | 100 | 100 | Series 2007-8CB Class A1 | ||||
| Level 3 Financing, Inc. Term Loan B2 | 5.500% due 05/25/37 | 39 | 35 | ||||
| 3.500% due 05/31/22 (Ê) | 1,170 | 1,174 | Series 2007-15CB Class A5 | ||||
| MacDermid, Inc. 1st Lien Term Loan | 5.750% due 07/25/37 | 397 | 346 | ||||
| 5.500% due 06/07/20 (Ê) | 5,211 | 5,214 | Series 2007-15CB Class A7 | �� | |||
| MGM Growth Properties Operating | 6.000% due 07/25/37 | 1,125 | 1,000 | ||||
| Partnership, LP Term Loan B | BAMLL Commercial Mortgage Securities | ||||||
| 4.000% due 04/25/23 (Ê) | 668 | 670 | Trust | ||||
| Michaels Stores, Inc. Term Loan B1 | Series 2014-520M Class A | ||||||
| 3.750% due 01/28/23 (Ê) | 1,117 | 1,125 | 4.325% due 08/15/46 (Þ) | 660 | 739 | ||
| MultiPlan, Inc. Term Loan B | Banc of America Commercial Mortgage | ||||||
| 5.000% due 05/25/23 (Ê) | 1,041 | 1,052 | Trust | ||||
| Neptune Finco Corp. Term Loan B | Series 2006-6 Class AJ | ||||||
| Zero coupon due 10/09/22 (Ê) | 442 | 443 | 5.421% due 10/10/45 | 3,840 | 3,835 | ||
| Party City Holdings, Inc. Term Loan B | Series 2007-2 Class AJ | ||||||
| 4.490% due 08/19/22 (Ê) | 618 | 620 | 5.810% due 04/10/49 | 880 | 821 | ||
| PET Acquisition Merger Sub LLC 1st | Series 2007-3 Class AJ | ||||||
| Lien Term Loan B1 | 5.732% due 06/10/49 | 2,530 | 2,568 | ||||
| 5.000% due 01/26/23 (Ê) | 923 | 930 | Series 2008-1 Class A4 | ||||
| PetSmart, Inc. Term Loan B2 | 6.436% due 02/10/51 | 1,144 | 1,184 | ||||
| 4.000% due 03/10/22 | 350 | 351 | |||||
| Pharmaceutical Product Development | Banc of America Funding Corp. | ||||||
| LLC Term Loan B | Series 2015-R3 Class 1A2 | ||||||
| 4.250% due 08/18/22 (Ê) | 688 | 687 | 0.724% due 03/27/36 (Ê)(Þ) | 5,745 | 3,369 | ||
| Prime Security Services Borrower LLC | Series 2015-R3 Class 5A2 | ||||||
| Term Loan B1 | 0.787% due 06/29/37 (Ê)(Þ) | 8,984 | 4,480 | ||||
| 4.750% due 04/21/22 (Ê) | 1,280 | 1,289 | Banc of America Mortgage Securities, | ||||
| Reynolds Group Holdings, Inc. 1st Lien | Inc. | ||||||
| Term Loan | Series 2004-11 Class 2A1 | ||||||
| 4.250% due 01/21/23 (Ê) | 940 | 942 | 5.750% due 01/25/35 | 312 | 316 | ||
| Banc of America Mortgage Trust | |||||||
See accompanying notes which are an integral part of the financial statements.
Russell Strategic Bond Fund 423
Russell Investment Company
Russell Strategic Bond Fund
Schedule of Investments, continued — October 31, 2016
| Amounts in thousands (except share amounts) | Amounts in thousands (except share amounts) | ||||||
| Principal | Fair | Principal | Fair | ||||
| Amount ($) | Value | Amount ($) | Value | ||||
| or Shares | $ | or Shares | $ | ||||
| Series 2005-D Class 2A7 | Commercial Mortgage Trust | ||||||
| 3.195% due 05/25/35 (Ê) | 1,037 | 989 | Series 2007-C9 Class AJ | ||||
| Banc of America Re-REMIC Trust | 5.650% due 12/10/49 | 987 | 1,011 | ||||
| Series 2010-UB5 Class A4A | Series 2007-GG11 Class AJ | ||||||
| 5.701% due 02/17/51 (Þ) | 1,742 | 1,754 | 6.236% due 12/10/49 | 2,642 | 2,641 | ||
| Bayview Commercial Asset Trust | Series 2010-RR1 Class GEA | ||||||
| Series 2006-2A Class A2 | 5.543% due 12/11/49 (Þ) | 5,949 | 5,978 | ||||
| 0.872% due 07/25/36 (Ê)(Þ) | 1,967 | 1,722 | Series 2013-300P Class A1 | ||||
| BCAP LLC Trust | 4.353% due 08/10/30 (Þ) | 1,900 | 2,113 | ||||
| Series 2009-RR11 Class 7A1 | Series 2014-277P Class A | ||||||
| 2.893% due 02/26/36 (Ê)(Þ) | 496 | 495 | 3.732% due 08/10/49 (Þ) | 2,140 | 2,294 | ||
| Series 2010-RR7 Class 3A1 | Series 2015-3BP Class A | ||||||
| 2.941% due 08/26/35 (Ê)(Þ) | 1,103 | 1,097 | 3.178% due 02/10/35 (Þ) | 2,060 | 2,137 | ||
| Series 2010-RR7 Class 3A12 | Series 2015-CR24 Class D | ||||||
| 2.941% due 08/26/35 (Ê)(Þ) | 6,930 | 5,018 | 3.463% due 08/10/55 | 180 | 132 | ||
| Series 2011-R11 Class 15A1 | Series 2015-LC19 Class A4 | ||||||
| 3.070% due 10/26/33 (Ê)(Þ) | 2,504 | 2,522 | 3.183% due 02/10/48 | 1,232 | 1,284 | ||
| Series 2011-R11 Class 20A5 | Series 2016-787S Class A | ||||||
| 3.094% due 03/26/35 (Ê)(Þ) | 903 | 902 | 3.545% due 02/10/36 (Þ) | 975 | 1,035 | ||
| Bear Stearns Adjustable Rate Mortgage | Series 2016-GCT Class A | ||||||
| Trust | 2.681% due 08/10/29 (Þ) | 971 | 995 | ||||
| Series 2004-5 Class 2A | Credit Suisse Commercial Mortgage | ||||||
| 3.465% due 07/25/34 (Ê) | 556 | 553 | Trust Series | ||||
| Bear Stearns Commercial Mortgage | Series 2007-C1 Class A3 | ||||||
| Securities Trust | 5.383% due 02/15/40 | 1,645 | 1,643 | ||||
| Series 2007-PW15 Class A4 | Series 2007-C4 Class A4 | ||||||
| 5.331% due 02/11/44 | 2,315 | 2,327 | 6.134% due 09/15/39 | 4,075 | 4,155 | ||
| CFCRE Commercial Mortgage Trust | Credit Suisse Mortgage Trust | ||||||
| Series 2016-C3 Class A3 | Series 2014-11R Class 9A2 | ||||||
| 3.865% due 01/10/48 | 6,630 | 7,198 | 0.674% due 10/27/36 (Ê)(Þ) | 2,920 | 1,628 | ||
| CGBAM Commercial Mortgage Trust | CSAIL Commercial Mortgage Trust | ||||||
| Series 2016-IMC Class E | Series 2015-C3 Class A3 | ||||||
| 7.920% due 11/15/21 (Ê)(Þ) | 3,560 | 3,560 | 3.447% due 08/15/48 | 270 | 286 | ||
| CHL Mortgage Pass-Through Trust | Series 2015-C4 Class E | ||||||
| Series 2004-11 Class 2A1 | 3.738% due 11/15/48 | 3,350 | 2,266 | ||||
| 2.650% due 07/25/34 (Ê) | 1,438 | 1,434 | CSMC Trust | ||||
| Series 2006-14 Class A4 | Series 2015-12R Class 2A2 | ||||||
| 6.250% due 09/25/36 | 2,279 | 2,046 | 1.025% due 11/30/37 (Ê)(Þ) | 5,450 | 3,386 | ||
| Series 2007-4 Class 1A10 | DBJPM Mortgage Trust | ||||||
| 6.000% due 05/25/37 | 4,082 | 3,462 | Series 2016-C3 Class A5 | ||||
| Series 2007-9 Class A11 | 2.890% due 09/10/49 | 1,630 | 1,651 | ||||
| 5.750% due 07/25/37 | 1,036 | 964 | DBUBS Mortgage Trust | ||||
| Citigroup Commercial Mortgage Trust | Series 2011-LC3A Class C | ||||||
| Series 2013-375P Class A | 5.510% due 08/10/44 (Þ) | 720 | 800 | ||||
| 3.251% due 05/10/35 (Þ) | 800 | 839 | DSLA Mortgage Loan Trust | ||||
| Series 2013-375P Class D | Series 2007-AR1 Class 2A1A | ||||||
| 3.635% due 05/10/35 (Þ) | 3,810 | 3,795 | 0.579% due 04/19/47 (Ê) | 6,025 | 4,817 | ||
| Series 2015-GC29 Class C | EQTY Mortgage Trust | ||||||
| 4.293% due 04/10/48 | 650 | 642 | Series 2014-INNS Class E | ||||
| Series 2015-GC29 Class D | 3.954% due 05/08/31 (Ê)(Þ) | 3,460 | 3,373 | ||||
| 3.110% due 04/10/48 (Þ) | 520 | 356 | Fannie Mae | ||||
| Series 2015-GC29 Class XA | 3.170% due 2018 | 6,866 | 7,024 | ||||
| 1.306% due 04/10/48 | — | — | 3.766% due 2020 | 5,679 | 6,095 | ||
| Citigroup Mortgage Loan Trust, Inc. | 3.400% due 2021 | 4,790 | 5,122 | ||||
| Series 2005-11 Class A2A | 3.500% due 2021 | 185 | 195 | ||||
| 2.930% due 10/25/35 (Ê) | 78 | 77 | 3.840% due 2021 | 3,699 | 4,017 | ||
| Series 2007-AR8 Class 2A1A | 3.890% due 2021 | 1,827 | 1,985 | ||||
| 3.165% due 07/25/37 (Ê) | 1,172 | 1,108 | 4.363% due 2021 | 5,686 | 6,215 | ||
| Series 2012-7 Class 10A2 | 5.500% due 2021 | 68 | 73 | ||||
| 3.206% due 09/25/36 (Ê)(Þ) | 2,170 | 1,989 | 2.820% due 2022 | 2,494 | 2,615 | ||
See accompanying notes which are an integral part of the financial statements.
424 Russell Strategic Bond Fund
Russell Investment Company
Russell Strategic Bond Fund
Schedule of Investments, continued — October 31, 2016
| Amounts in thousands (except share amounts) | Amounts in thousands (except share amounts) | ||||||
| Principal | Fair | Principal | Fair | ||||
| Amount ($) | Value | Amount ($) | Value | ||||
| or Shares | $ | or Shares | $ | ||||
| 2.830% due 2022 | 2,292 | 2,404 | 3.500% | 1,000 | 1,054 | ||
| 2.860% due 2022 | 1,311 | 1,371 | 30 Year TBA(Ï) | ||||
| 5.500% due 2022 | 288 | 311 | 3.000% | 185,460 | 190,637 | ||
| 2.000% due 2023 | 9,789 | 9,883 | 4.000% | 12,000 | 12,849 | ||
| 4.500% due 2023 | 46 | 50 | Series 1997-281 Class 2 | ||||
| 5.500% due 2023 | 178 | 192 | Interest Only STRIP | ||||
| 2.500% due 2024 | 5,754 | 5,925 | 9.000% due 11/25/26 (Å) | 15 | 3 | ||
| 4.000% due 2024 | 49 | 53 | Series 2000-306 Class IO | ||||
| 5.500% due 2024 | 417 | 453 | Interest Only STRIP | ||||
| 4.000% due 2025 | 1,921 | 2,044 | 8.000% due 05/25/30 (Å) | 15 | 4 | ||
| 4.500% due 2025 | 37 | 40 | Series 2001-317 Class 2 | ||||
| 5.500% due 2025 | 676 | 710 | Interest Only STRIP | ||||
| 2.550% due 2026 | 1,454 | 1,476 | 8.000% due 12/25/31 (Å) | 23 | 7 | ||
| 3.100% due 2026 | 1,605 | 1,697 | Series 2002-320 Class 2 | ||||
| 3.500% due 2026 | 1,611 | 1,698 | Interest Only STRIP | ||||
| 4.000% due 2026 | 687 | 730 | 7.000% due 04/25/32 (Å) | 7 | 2 | ||
| 4.500% due 2026 | 120 | 137 | |||||
| 5.500% due 2026 | 123 | 138 | Series 2003-343 Class 6 | ||||
| 2.964% due 2027 | 3,934 | 4,095 | Interest Only STRIP | ||||
| 5.000% due 10/25/33 | 408 | 76 | |||||
| 3.000% due 2027 | 1,806 | 1,891 | |||||
| 4.500% due 2027 | 463 | 530 | Series 2003-345 Class 18 | ||||
| 4.500% due 2027 | 2,686 | 2,762 | Interest Only STRIP | ||||
| 5.500% due 2027 | 48 | 54 | 4.500% due 12/25/18 | 309 | 9 | ||
| 3.500% due 2028 | 1,659 | 1,765 | Series 2003-345 Class 19 | ||||
| 3.500% due 2030 | 1,605 | 1,696 | Interest Only STRIP | ||||
| 5.000% due 2031 | 3,858 | 4,282 | 4.500% due 01/25/19 | 328 | 9 | ||
| 8.500% due 2031 | 2 | 2 | Series 2005-365 Class 12 | ||||
| 3.500% due 2032 | 2,231 | 2,366 | Interest Only STRIP | ||||
| 3.000% due 2033 | 4,809 | 5,008 | 5.500% due 12/25/35 | 1,236 | 210 | ||
| 3.500% due 2033 | 4,018 | 4,252 | Series 2006-369 Class 8 | ||||
| 5.500% due 2034 | 826 | 939 | Interest Only STRIP | ||||
| 4.500% due 2035 | 3,996 | 4,409 | 5.500% due 04/25/36 | 175 | 40 | ||
| 5.500% due 2035 | 539 | 614 | Fannie Mae Connecticut Avenue | ||||
| 6.000% due 2035 | 524 | 609 | Securities | ||||
| 4.000% due 2036 | 51 | 55 | Series 2016-C04 Class 1M1 | ||||
| 5.500% due 2036 | 1,130 | 1,282 | 2.042% due 01/25/29 (Ê) | 4,909 | 4,933 | ||
| 4.000% due 2037 | 57 | 62 | Series 2016-C04 Class 1M2 | ||||
| 5.500% due 2037 | 347 | 393 | 4.842% due 01/25/29 (Ê) | 4,980 | 5,034 | ||
| 5.500% due 2038 | 63 | 72 | Series 2016-C05 Class 2M1 | ||||
| 4.500% due 2039 | 528 | 578 | 1.942% due 01/25/29 (Ê) | 1,642 | 1,648 | ||
| 6.000% due 2039 | 562 | 661 | Fannie Mae Grantor Trust | ||||
| 6.000% due 2039 | 467 | 536 | Series 2001-T4 Class A1 | ||||
| 4.500% due 2040 | 175 | 191 | 7.500% due 07/25/41 | 2,004 | 2,396 | ||
| 5.500% due 2040 | 6,036 | 6,881 | Fannie Mae REMICS | ||||
| 4.000% due 2041 | 934 | 1,003 | Series 1997-68 Class SC | ||||
| 4.500% due 2041 | 1,200 | 1,376 | 7.945% due 05/18/27 (Å)(Ê) | 22 | 4 | ||
| 4.500% due 2041 | 5,434 | 5,954 | Series 2001-4 Class SA | ||||
| 5.000% due 2041 | 8,449 | 9,407 | 6.999% due 02/17/31 (Å)(Ê) | 2 | — | ||
| 3.000% due 2042 | 4,685 | 4,848 | Series 2003-25 Class IK | ||||
| 4.500% due 2042 | 435 | 476 | 7.000% due 04/25/33 (Å) | 60 | 11 | ||
| 3.500% due 2043 | 4,328 | 4,597 | Series 2003-32 Class UI | ||||
| 3.000% due 2044 | 8,065 | 8,321 | 6.000% due 05/25/33 (Å) | 50 | 12 | ||
| 3.500% due 2045 | 32,631 | 34,302 | Series 2003-33 Class IA | ||||
| 4.000% due 2045 | 8,382 | 9,037 | 6.500% due 05/25/33 (Å) | 288 | 53 | ||
| 3.500% due 2046 | 14,820 | 15,559 | Series 2003-35 Class FY | ||||
| 4.000% due 2046 | 14,422 | 15,623 | 0.984% due 05/25/18 (Ê) | 156 | 156 | ||
| 4.500% due 2046 | 4,298 | 4,799 | Series 2003-35 Class IU | ||||
| 15 Year TBA(Ï) | 6.000% due 05/25/33 (Å) | 52 | 11 | ||||
| 2.500% | 95,080 | 97,682 | Series 2003-35 Class UI | ||||
| 3.000% | 3,300 | 3,453 | 6.500% due 05/25/33 (Å) | 64 | 12 | ||
See accompanying notes which are an integral part of the financial statements.
Russell Strategic Bond Fund 425
Russell Investment Company
Russell Strategic Bond Fund
Schedule of Investments, continued — October 31, 2016
| Amounts in thousands (except share amounts) | Amounts in thousands (except share amounts) | ||||||
| Principal | Fair | Principal | Fair | ||||
| Amount ($) | Value | Amount ($) | Value | ||||
| or Shares | $ | or Shares | $ | ||||
| Series 2003-64 Class JI | 2.395% due 05/25/26 | 4,800 | 4,737 | ||||
| 6.000% due 07/25/33 (Å) | 30 | 6 | Series 2016-M7 Class AV2 | ||||
| Series 2005-117 Class LC | 2.157% due 10/25/23 | 11,995 | 12,053 | ||||
| 5.500% due 11/25/35 | 1,725 | 1,862 | FDIC Trust | ||||
| Series 2006-118 Class A1 | Series 2010-R1 Class A | ||||||
| 0.644% due 12/25/36 (Å)(Ê) | 54 | 53 | 2.184% due 05/25/50 (Þ) | 1 | 1 | ||
| Series 2007-73 Class A1 | Federal Home Loan Mortgage Corp. | ||||||
| 0.644% due 07/25/37 (Å)(Ê) | 551 | 540 | Multifamily Structured Pass Through | ||||
| Series 2009-39 Class LB | Certificates | ||||||
| 4.500% due 06/25/29 | — | — | Series 2016-K058 Class X1 | ||||
| Series 2009-70 Class PS | Interest Only STRIP | ||||||
| Interest Only STRIP | 0.931% due 08/25/26 | 13,238 | 970 | ||||
| 6.166% due 01/25/37 (Ê) | 9,519 | 1,963 | Series 2016-KJ08 Class A2 | ||||
| 2.356% due 01/25/35 | 940 | 955 | |||||
| Series 2009-96 Class DB | Federal Home Loan Mortgage Corp. | ||||||
| 4.000% due 11/25/29 | 3,188 | 3,414 | Multifamily Structured Pass-Through | ||||
| Series 2010-95 Class S | Certificates | ||||||
| Interest Only STRIP | Series 2011-K702 Class X1 | ||||||
| 6.016% due 09/25/40 (Ê) | 9,089 | 1,957 | Interest Only STRIP | ||||
| Series 2013-111 Class PL | 1.617% due 02/25/18 | 52,704 | 784 | ||||
| 2.000% due 12/25/42 | 3,641 | 3,462 | Series 2015-K044 Class A2 | ||||
| Series 2013-119 Class NT | 2.811% due 01/25/25 | 3,050 | 3,192 | ||||
| 4.000% due 12/25/43 | 3,600 | 3,955 | Series 2015-K048 Class A2 | ||||
| Series 2015-43 Class PA | 3.284% due 06/25/25 | 8,750 | 9,441 | ||||
| 3.500% due 01/25/43 | 2,463 | 2,528 | Series 2015-K050 Class A2 | ||||
| Series 2016-23 Class ST | 3.334% due 08/25/25 | 8,590 | 9,301 | ||||
| Interest Only STRIP | Series 2015-K151 Class A3 | ||||||
| 5.416% due 11/25/45 (Ê) | 3,952 | 938 | 3.511% due 04/25/30 | 2,405 | 2,572 | ||
| Series 2016-60 Class QS | Series 2016-K053 Class A2 | ||||||
| Interest Only STRIP | 2.995% due 12/25/25 | 9,655 | 10,193 | ||||
| 5.516% due 09/25/46 (Ê) | 1,477 | 295 | Series 2016-K058 Class A2 | ||||
| Series 2016-61 Class BS | 2.653% due 08/25/26 | 7,500 | 7,725 | ||||
| Interest Only STRIP | Series 2016-KF15 Class A | ||||||
| 5.516% due 09/25/46 (Ê) | 4,119 | 785 | 1.262% due 02/25/23 (Ê) | 13,906 | 13,924 | ||
| Fannie Mae-Aces | Series 2016-KF17 Class A | ||||||
| Series 2011-M2 Class A3 | 1.142% due 03/25/23 (Ê) | 8,514 | 8,509 | ||||
| 3.764% due 04/25/21 | 4,250 | 4,591 | First Horizon Mortgage Pass-Through | ||||
| Series 2012-M8 Class ASQ2 | Trust | ||||||
| 1.520% due 12/25/19 | 7,367 | 7,386 | Series 2005-AR4 Class 2A1 | ||||
| Series 2013-M4 Class ASQ2 | 2.902% due 10/25/35 (Ê) | 1,197 | 990 | ||||
| 1.451% due 02/25/18 | 3,067 | 3,073 | First Union National Bank-Bank of | ||||
| Series 2014-M13 Class AB2 | America NA Commercial Mortgage | ||||||
| 2.951% due 08/25/24 | 3,645 | 3,773 | Trust | ||||
| Series 2014-M13 Class ASQ2 | Series 2001-C1 Class IO1 | ||||||
| 1.637% due 11/25/17 | 12,766 | 12,795 | Interest Only STRIP | ||||
| 2.200% due 03/15/33 (Þ) | 2,321 | — | |||||
| Series 2015-M1 Class ASQ2 | |||||||
| 1.626% due 02/25/18 | 8,520 | 8,546 | Freddie Mac | ||||
| 4.500% due 2018 | 7,957 | 8,172 | |||||
| Series 2015-M7 Class ASQ1 | 4.500% due 2020 | 22,018 | 22,643 | ||||
| 0.882% due 04/25/18 | 2,756 | 2,751 | 8.500% due 2025 | 6 | 7 | ||
| Series 2015-M7 Class ASQ2 | 3.500% due 2027 | 2,431 | 2,570 | ||||
| 1.550% due 04/25/18 | 3,325 | 3,335 | 8.500% due 2027 | 39 | 46 | ||
| Series 2015-M11 Class A1 | 3.500% due 2030 | 1,323 | 1,407 | ||||
| 2.097% due 04/25/25 | 4,400 | 4,449 | 3.000% due 2031 | 2,565 | 2,685 | ||
| Series 2015-M15 Class ASQ1 | 3.000% due 2035 | 420 | 437 | ||||
| 0.849% due 01/25/19 | 5,640 | 5,632 | 3.500% due 2035 | 2,237 | 2,371 | ||
| Series 2016-M2 Class ABV2 | 5.000% due 2035 | 41 | 45 | ||||
| 2.131% due 01/25/23 | 3,810 | 3,775 | 3.000% due 2036 | 1,934 | 2,015 | ||
| Series 2016-M3 Class ASQ2 | 4.000% due 2036 | 111 | 119 | ||||
| 2.263% due 02/25/23 | 5,170 | 5,235 | 6.000% due 2038 | 1,757 | 2,040 | ||
| Series 2016-M6 Class AB2 | 4.500% due 2039 | 6,425 | 7,193 | ||||
See accompanying notes which are an integral part of the financial statements.
426 Russell Strategic Bond Fund
Russell Investment Company
Russell Strategic Bond Fund
Schedule of Investments, continued — October 31, 2016
| Amounts in thousands (except share amounts) | Amounts in thousands (except share amounts) | ||||||||
| Principal | Fair | Principal | Fair | ||||||
| Amount ($) | Value | Amount ($) | Value | ||||||
| or Shares | $ | or Shares | $ | ||||||
| 5.500% due 2039 | 1,081 | 1,214 | Series 2014-334 Class S7 | ||||||
| 4.000% due 2040 | 8,189 | 9,009 | Interest Only STRIP | ||||||
| 5.500% due 2040 | 1,525 | 1,727 | 5.562% due 08/15/44 (Ê) | 1,508 | 367 | ||||
| 4.000% due 2041 | 8,044 | 8,740 | Freddie Mac Whole Loan Securities | ||||||
| 5.500% due 2041 | 2,131 | 2,431 | Trust | ||||||
| 3.000% due 2042 | 2,621 | 2,700 | Series 2016-SC01 Class M1 | ||||||
| 3.500% due 2043 | 3,340 | 3,533 | 3.883% due 07/25/46 | 1,638 | 1,637 | ||||
| 4.000% due 2044 | 5,769 | 6,243 | FREMF Mortgage Trust | ||||||
| 3.500% due 2045 | 23,348 | 24,759 | Series 2016-K57 Class C | ||||||
| 4.000% due 2045 | 2,889 | 3,089 | 4.053% due 08/25/49 (Þ) | 823 | 676 | ||||
| 3.000% due 2046 | 8,215 | 8,465 | Ginnie Mae | ||||||
| 3.500% due 2046 | 26,271 | 27,632 | Series 1999-27 Class SE | ||||||
| 4.000% due 2046 | 17,013 | 18,289 | 8.058% due 08/16/29 (Å)(Ê) | 54 | 12 | ||||
| 4.500% due 2046 | 777 | 857 | Series 2014-190 Class PL | ||||||
| 30 Year TBA(Ï) | 3.500% due 12/20/44 | 4,959 | 5,343 | ||||||
| 3.000% | 41,070 | 42,280 | Ginnie Mae I | ||||||
| 3.500% | 800 | 840 | 2.140% due 2023 | 3,200 | 3,203 | ||||
| Freddie Mac REMICS | 4.500% due 2039 | 10,819 | 12,138 | ||||||
| Series 1999-2129 Class SG | 5.000% due 2039 | 4,451 | 4,987 | ||||||
| 6.450% due 06/17/27 (Å)(Ê) | 415 | 69 | 4.500% due 2040 | 1,425 | 1,576 | ||||
| Series 2000-2247 Class SC | 4.500% due 2041 | 2,470 | 2,725 | ||||||
| 6.962% due 08/15/30 (Å)(Ê) | 14 | 3 | 4.500% due 2042 | 236 | 261 | ||||
| Series 2002-2463 Class SJ | 3.000% due 2043 | 1,185 | 1,237 | ||||||
| 7.462% due 03/15/32 (Å)(Ê) | 35 | 10 | Ginnie Mae II | ||||||
| Series 2003-2610 Class UI | 3.000% due 2046 | 3,116 | 3,251 | ||||||
| 6.500% due 05/15/33 (Å) | 9 | 2 | 3.500% due 2046 | 4,061 | 4,303 | ||||
| Series 2003-2624 Class QH | 4.000% due 2046 | 306 | 327 | ||||||
| 5.000% due 06/15/33 | 561 | 627 | 30 Year TBA(Ï) | ||||||
| Series 2003-2649 Class IM | 3.000% | 15,000 | 15,626 | ||||||
| 7.000% due 07/15/33 (Å) | 78 | 20 | 3.500% | 500 | 529 | ||||
| Government National Mortgage | |||||||||
| Series 2003-2725 Class TA | Association | ||||||||
| 4.500% due 12/15/33 | 1,300 | 1,503 | |||||||
| Series 2006-R007 Class ZA | Series 2012-135 Class IO | ||||||||
| 6.000% due 05/15/36 | 2,002 | 2,288 | Interest Only STRIP | ||||||
| 0.611% due 01/16/53 | 14,598 | 632 | |||||||
| Series 2011-3963 Class JB | |||||||||
| 4.500% due 11/15/41 | 3,500 | 3,992 | Series 2016-21 Class ST | ||||||
| Interest Only STRIP | |||||||||
| Series 2012-3997 Class PB | 5.588% due 02/20/46 (Ê) | 2,894 | 661 | ||||||
| 4.000% due 02/15/42 | 4,000 | 4,381 | |||||||
| Series 2016-47 Class CB | |||||||||
| Series 2012-4045 Class HD | 4.000% due 04/20/46 | 2,461 | 2,739 | ||||||
| 4.500% due 07/15/41 | 2,525 | 2,699 | |||||||
| Series 2016-82 Class PC | |||||||||
| Series 2013-4233 Class MD | 3.500% due 06/20/46 | 3,355 | 3,476 | ||||||
| 1.750% due 03/15/25 | 2,027 | 2,034 | |||||||
| Series 2014-4423 Class VB | Series 2016-84 Class IG | ||||||||
| 3.500% due 06/15/33 | 1,090 | 1,151 | Interest Only STRIP | ||||||
| 4.500% due 11/16/45 | 2,842 | 547 | |||||||
| Freddie Mac Strips | |||||||||
| Series 1998-191 Class IO | Series 2016-135 Class SB | ||||||||
| Interest Only STRIP | |||||||||
| Interest Only STRIP | 5.558% due 10/16/46 (Ê) | 400 | 99 | ||||||
| 8.000% due 01/01/28 (Å) | 14 | 4 | |||||||
| Series 1998-194 Class IO | GS Mortgage Securities Trust | ||||||||
| Interest Only STRIP | Series 2011-GC5 Class XA | ||||||||
| 6.500% due 04/01/28 (Å) | 33 | 7 | Interest Only STRIP | ||||||
| 1.540% due 08/10/44 (Þ) | 20 | 1 | |||||||
| Series 2001-212 Class IO | |||||||||
| Series 2013-GC12 Class A1 | |||||||||
| Interest Only STRIP | 0.742% due 06/10/46 | 657 | 655 | ||||||
| 6.000% due 05/01/31 (Å) | 34 | 7 | |||||||
| Series 2001-215 Class IO | Series 2013-GC13 Class XA | ||||||||
| Interest Only STRIP | |||||||||
| Interest Only STRIP | 0.260% due 07/10/46 | 17 | — | ||||||
| 8.000% due 06/15/31 (Å) | 35 | 10 | |||||||
| Series 2013-GC14 Class AS | |||||||||
| Series 2012-271 Class 30 | 4.507% due 08/10/46 (Þ) | 1,630 | 1,811 | ||||||
| 3.000% due 08/15/42 | 7,050 | 7,245 | |||||||
| Series 2013-GC16 Class A1 | |||||||||
See accompanying notes which are an integral part of the financial statements.
Russell Strategic Bond Fund 427
Russell Investment Company
Russell Strategic Bond Fund
Schedule of Investments, continued — October 31, 2016
| Amounts in thousands (except share amounts) | Amounts in thousands (except share amounts) | |||||||
| Principal | Fair | Principal | Fair | |||||
| Amount ($) | Value | Amount ($) | Value | |||||
| or Shares | $ | or Shares | $ | |||||
| 1.264% due 11/10/46 | 201 | 202 | Morgan Stanley Bank of America Merrill | |||||
| Series 2015-GS1 Class C | Lynch Trust | |||||||
| 4.570% due 11/10/48 | 780 | 813 | Series 2015-C24 Class A4 | |||||
| Hilton USA Trust | 3.732% due 05/15/48 | 1,000 | 1,077 | |||||
| Series 2013-HLT Class EFX | Series 2015-C26 Class A3 | |||||||
| 4.602% due 11/05/30 (Þ) | 5,000 | 5,000 | 3.211% due 11/15/48 | 5,055 | 5,181 | |||
| Hudsons Bay Simon JV Trust | Series 2016-C31 | |||||||
| Series 2015-HB7 Class A7 | 1.511% due | 2,810 | 2,810 | |||||
| 3.914% due 08/05/34 (Þ) | 3,403 | 3,574 | Morgan Stanley Capital I Trust | |||||
| IndyMac INDA Mortgage Loan Trust | Series 2006-HQ8 Class C | |||||||
| Series 2007-AR1 Class 1A1 | 5.589% due 03/12/44 | 1,405 | 1,276 | |||||
| 3.186% due 03/25/37 (Ê) | 1,895 | 1,817 | Series 2007-IQ15 Class A4 | |||||
| JPMBB Commercial Mortgage Securities | 6.098% due 06/11/49 | 1,818 | 1,860 | |||||
| Trust | Series 2007-IQ16 Class AM | |||||||
| Series 2013-C14 Class AS | 6.256% due 12/12/49 | 6,907 | 7,160 | |||||
| 4.409% due 08/15/46 | 1,780 | 1,948 | Series 2007-T25 Class AJ | |||||
| Series 2014-C23 Class XA | 5.574% due 11/12/49 | 2,962 | 2,944 | |||||
| 0.996% due 09/15/47 | 3 | — | Series 2008-T29 Class AM | |||||
| JPMorgan Chase Commercial Mortgage | 6.477% due 01/11/43 | 4,950 | 5,155 | |||||
| Securities Trust | Series 2011-C2 Class A2 | |||||||
| Series 2004-LN2 Class B | 3.476% due 06/15/44 (Þ) | 18 | 19 | |||||
| 5.446% due 07/15/41 | 1,550 | 1,541 | Series 2015-MS1 Class A4 | |||||
| Series 2007-CB18 Class A4 | 3.779% due 05/15/48 | 1,360 | 1,474 | |||||
| 5.440% due 06/12/47 | 975 | 978 | Series 2016-UBS9 Class A4 | |||||
| Series 2007-LDPX Class A3 | 3.594% due 03/15/49 | 1,425 | 1,524 | |||||
| 5.420% due 01/15/49 | 82 | 83 | Morgan Stanley Capital I, Inc. | |||||
| Series 2015-MAR7 Class E | Series 2007-IQ14 Class A4 | |||||||
| 5.962% due 06/05/32 (Þ) | 3,000 | 2,890 | 5.692% due 04/15/49 | 1,480 | 1,490 | |||
| JPMorgan Mortgage Trust | Morgan Stanley Re-REMIC Trust | |||||||
| Series 2005-A4 Class 1A1 | Series 2009-GG10 Class A4A | |||||||
| 2.991% due 07/25/35 (Ê) | 338 | 335 | 5.988% due 08/12/45 (Þ) | 324 | 325 | |||
| Series 2013-1 Class 2A2 | MSCG Trust | |||||||
| 2.500% due 03/25/43 (Þ) | 4,613 | 4,649 | Series 2015-ALDR Class A2 | |||||
| JPMorgan Resecuritization Trust Series | 3.577% due 06/07/35 (Þ) | 1,435 | 1,485 | |||||
| Series 2009-5 Class 2A2 | New Residential Mortgage Loan Trust | |||||||
| 2.064% due 01/26/37 (Ê)(Þ) | 5,654 | 4,726 | Series 2016-3A Class A1B | |||||
| Series 2010-6 Class 2A1 | 3.250% due 09/25/56 (Þ) | 1,578 | 1,619 | |||||
| 3.041% due 08/26/35 (Ê)(Þ) | 1,641 | 1,649 | Nomura Resecuritization Trust | |||||
| LB-Commercial Mortgage Trust | Series 2013-1R Class 3A12 | |||||||
| Series 2007-C3 Class AJ | 0.694% due 10/26/36 (Ê)(Þ) | 2,482 | 2,215 | |||||
| 6.116% due 07/15/44 | 2,440 | 2,425 | Series 2014-1R Class 5A3 | |||||
| Series 2007-C3 Class AM | 0.684% due 10/26/36 (Ê)(Þ) | 4,173 | 3,486 | |||||
| 6.116% due 07/15/44 | 4,780 | 4,872 | Series 2015-4R Class 1A14 | |||||
| LB-UBS Commercial Mortgage Trust | 0.739% due 03/26/47 (Ê)(Þ) | 5,270 | 2,934 | |||||
| Series 2007-C1 Class AJ | Series 2015-8R Class 2A2 | |||||||
| 5.484% due 02/15/40 | 3,840 | 3,845 | 0.674% due 10/26/36 (Ê)(Þ) | 3,213 | 1,674 | |||
| Series 2007-C1 Class AM | Series 2015-8R Class 4A4 | |||||||
| 5.455% due 02/15/40 | 2,570 | 2,584 | 1.369% due 11/25/47 (Þ) | 7,732 | 3,602 | |||
| Series 2007-C2 Class A3 | Series 2015-11R Class 3A2 | |||||||
| 5.430% due 02/15/40 | 2,067 | 2,079 | 2.747% due 05/25/36 (Þ) | 1,272 | 1,217 | |||
| Series 2007-C7 Class AJ | RBS Commercial Funding, Inc. Trust | |||||||
| 6.449% due 09/15/45 | 4,830 | 4,888 | Series 2013-GSP Class A | |||||
| Merrill Lynch Mortgage Investors Trust | 3.961% due 01/13/32 (Þ) | 1,055 | 1,141 | |||||
| Series 2005-A9 Class 2A1C | RBSSP Resecuritization Trust | |||||||
| 3.053% due 12/25/35 (Ê) | 3,555 | 3,391 | Series 2010-3 Class 9A1 | |||||
| ML-CFC Commercial Mortgage Trust | 5.500% due 02/26/35 (Þ) | 219 | 220 | |||||
| Series 2007-5 Class AJ | Series 2010-12 Class 7A3 | |||||||
| 5.450% due 08/12/48 | 2,666 | 2,167 | 4.000% due 12/27/35 (Þ) | 2,133 | 2,139 | |||
| Series 2007-5 Class AJFL | Sequoia Mortgage Trust | |||||||
| 5.450% due 08/12/48 (Þ) | 2,410 | 1,960 | ||||||
See accompanying notes which are an integral part of the financial statements.
428 Russell Strategic Bond Fund
Russell Investment Company
Russell Strategic Bond Fund
Schedule of Investments, continued — October 31, 2016
| Amounts in thousands (except share amounts) | Amounts in thousands (except share amounts) | |||||||
| Principal | Fair | Principal | Fair | |||||
| Amount ($) | Value | Amount ($) | Value | |||||
| or Shares | $ | or Shares | $ | |||||
| 1.874% due 02/25/43 | 3,570 | 3,500 | 2.888% due 01/25/35 (Ê) | 498 | 502 | |||
| 2.500% due 05/25/43 (Þ) | 1,782 | 1,789 | Series 2005-AR7 Class 2A1 | |||||
| Series 2013-4 Class A1 | 3.078% due 05/25/35 (Ê) | 1,024 | 1,012 | |||||
| 2.325% due 04/25/43 | 6,968 | 6,843 | Series 2005-AR8 Class 1A1 | |||||
| Series 2015-1 Class A1 | 2.947% due 06/25/35 (Ê) | 3,454 | 3,496 | |||||
| 3.500% due 01/25/45 (Þ) | 5,971 | 6,160 | Series 2006-6 Class 1A8 | |||||
| SG Commercial Mortgage Securities | 5.750% due 05/25/36 | 738 | 739 | |||||
| Trust | Series 2006-8 Class A15 | |||||||
| Series 2016-C5 Class A4 | 6.000% due 07/25/36 | 1,426 | 1,438 | |||||
| 3.055% due 10/10/48 | 2,870 | 2,905 | ||||||
| Structured Adjustable Rate Mortgage | Series 2006-11 Class A9 | |||||||
| Loan Trust | 6.500% due 09/25/36 | 643 | 631 | |||||
| Series 2004-12 Class 2A | Series 2006-13 Class A5 | |||||||
| 2.735% due 09/25/34 (Ê) | 4,573 | 4,499 | 6.000% due 10/25/36 | 3,036 | 3,054 | |||
| Structured Asset Mortgage Investments | Series 2007-11 Class A81 | |||||||
| II Trust | 6.000% due 08/25/37 | 1,594 | 1,584 | |||||
| Series 2004-AR7 Class A1B | Series 2007-13 Class A7 | |||||||
| 0.962% due 04/19/35 (Ê) | 566 | 530 | 6.000% due 09/25/37 | 320 | 322 | |||
| Series 2004-AR8 Class A1 | WFRBS Commercial Mortgage Trust | |||||||
| 1.242% due 05/19/35 (Ê) | 1,889 | 1,845 | Series 2012-C9 Class A1 | |||||
| Towd Point Mortgage Trust | 0.673% due 11/15/45 | 119 | 119 | |||||
| Series 2015-2 Class 2A1 | Series 2013-C14 Class A1 | |||||||
| 3.750% due 11/25/57 (Þ) | 2,279 | 2,354 | 0.836% due 06/15/46 | 833 | 830 | |||
| Series 2016-3 Class A1 | Series 2014-C19 Class A3 | |||||||
| 2.250% due 08/25/55 (Þ) | 3,549 | 3,554 | 3.660% due 03/15/47 | 1,780 | 1,891 | |||
| Wachovia Bank Commercial Mortgage | Series 2014-C24 Class D | |||||||
| Trust | 3.692% due 11/15/47 (Þ) | 930 | 578 | |||||
| 5.413% due 12/15/43 | 1,500 | 1,500 | ||||||
| Series 2007-C30 Class A5 | 1,337,459 | |||||||
| 5.342% due 12/15/43 | 1,211 | 1,215 | Municipal Bonds - 0.5% | |||||
| City of Valdez Alaska Revenue Bonds | ||||||||
| Series 2007-C30 Class AM | 0.620% due 05/01/31 (Ê) | 2,000 | 2,000 | |||||
| 5.383% due 12/15/43 | 1,562 | 1,571 | County of Montgomery Ohio Revenue | |||||
| Series 2007-C33 Class AJ | Bonds | |||||||
| 6.170% due 02/15/51 | 5,100 | 5,105 | 0.570% due 11/15/39 (Ê) | 7,300 | 7,300 | |||
| Waldorf Astoria Boca Raton Trust | Mississippi Business Finance Corp. | |||||||
| Series 2016-BOCA Class E | Revenue Bonds | |||||||
| 4.888% due 06/15/29 (Å)(Ê) | 4,000 | 3,999 | 0.600% due 12/01/30 (Ê) | 5,000 | 5,000 | |||
| Washington Mutual Mortgage Pass- | Municipal Electric Authority of Georgia | |||||||
| Through Certificates Trust | Revenue Bonds | |||||||
| Series 2004-AR1 Class A | 6.637% due 04/01/57 | 4,755 | 6,231 | |||||
| 2.783% due 03/25/34 (Ê) | 344 | 345 | 7.055% due 04/01/57 | 4,445 | 5,351 | |||
| Tender Option Bond Trust Receipts/ | ||||||||
| Series 2004-AR13 Class A1A | Certificates General Obligation | |||||||
| 1.304% due 11/25/34 (Ê) | 2,173 | 2,062 | ||||||
| Unlimited | ||||||||
| Series 2005-AR6 Class 2A1A | 0.740% due 08/01/49 (Ê)(Þ) | 3,000 | 3,000 | |||||
| 0.822% due 04/25/45 (Ê) | 4,917 | 4,614 | ||||||
| Series 2006-AR7 Class 2A | 28,882 | |||||||
| 1.522% due 07/25/46 (Ê) | 1,411 | 1,140 | Non-US Bonds - 5.2% | |||||
| Series 2006-AR10 Class 1A1 | Australia Government Bond | |||||||
| 2.821% due 09/25/36 (Ê) | 3,768 | 3,403 | Series 126 | |||||
| 4.500% due 04/15/20 | AUD | 21,940 | 18,236 | |||||
| Series 2007-HY5 Class 3A1 | ||||||||
| 4.322% due 05/25/37 (Ê) | 3,357 | 2,928 | Series 133 | |||||
| 5.500% due 04/21/23 | AUD | 4,910 | 4,509 | |||||
| Series 2007-OA2 Class 1A | ||||||||
| 1.242% due 03/25/47 (Ê) | 4,371 | 3,305 | Series 140 | |||||
| 4.500% due 04/21/33 | AUD | 9,730 | 9,140 | |||||
| Wells Fargo Commercial Mortgage Trust | ||||||||
| Series 2015-NXS1 Class D | Brazil Notas do Tesouro Nacional | |||||||
| 4.241% due 05/15/48 | 40 | 32 | Series NTNB | |||||
| (3.901)% due 05/15/45 (~) | BRL | 1,591 | 1,553 | |||||
| Series 2016-BNK1 Class A3 | ||||||||
| 2.652% due 08/15/49 | 3,220 | 3,210 | Series NTNF | |||||
| Wells Fargo Mortgage Backed Securities | 0.157% due 01/01/21 | BRL | 16,000 | 4,980 | ||||
| Trust | 0.157% due 01/01/21 (~) | BRL | 5,850 | 1,821 | ||||
| Series 2004-CC Class A1 | 0.387% due 01/01/23 (~) | BRL | 39,911 | 12,208 | ||||
See accompanying notes which are an integral part of the financial statements.
Russell Strategic Bond Fund 429
Russell Investment Company
Russell Strategic Bond Fund
Schedule of Investments, continued — October 31, 2016
| Amounts in thousands (except share amounts) | Amounts in thousands (except share amounts) | |||||||||
| Principal | Fair | Principal | Fair | |||||||
| Amount ($) | Value | Amount ($) | Value | |||||||
| or Shares | $ | or Shares | $ | |||||||
| 0.401% due 01/01/25 (~) | BRL | 25,360 | 7,689 | Republic of Poland Government Bond | ||||||
| Colombian Titulos de Tesoreria | Series 0420 | |||||||||
| Series B | 1.500% due 04/25/20 | PLN | 9,470 | 2,358 | ||||||
| 10.000% due 07/24/24 | COP | 56,370,800 | 22,032 | Series 0421 | ||||||
| Housing Financing Fund | 2.000% due 04/25/21 | PLN | 10,720 | 2,688 | ||||||
| Series 2 | Series 0726 | |||||||||
| 3.750% due 04/15/34 | ISK | 354,657 | 1,910 | 2.500% due 07/25/26 | PLN | 22,670 | 5,483 | |||
| Series 3 | Republic of South Africa Government | |||||||||
| 3.750% due 06/15/44 | ISK | 778,831 | 4,372 | Bond | ||||||
| Ireland Government Bond | Series R186 | |||||||||
| 5.400% due 03/13/25 | EUR | 10,010 | 15,377 | 10.500% due 12/21/26 | ZAR | 36,970 | 3,037 | |||
| Malaysia Government Bond | Series R207 | |||||||||
| Series 0111 | 7.250% due 01/15/20 | ZAR | 54,590 | 3,967 | ||||||
| 4.160% due 07/15/21 | MYR | 1,680 | 415 | Series R209 | ||||||
| Series 0114 | 6.250% due 03/31/36 | ZAR | 38,350 | 2,067 | ||||||
| 4.181% due 07/15/24 | MYR | 15,330 | 3,768 | Series R214 | ||||||
| Series 0115 | 6.500% due 02/28/41 | ZAR | 153,920 | 8,284 | ||||||
| 3.955% due 09/15/25 | MYR | 5,480 | 1,326 | Russian Federal Bond - OFZ | ||||||
| Series 0116 | Series 6207 | |||||||||
| 3.800% due 08/17/23 | MYR | 35,800 | 8,666 | 8.150% due 02/03/27 | RUB | 249,850 | 3,873 | |||
| Series 0215 | Series 6219 | |||||||||
| 3.795% due 09/30/22 | MYR | 4,170 | 1,008 | 7.750% due 09/16/26 | RUB | 293,970 | 4,425 | |||
| Series 0314 | Singapore Government Bond | |||||||||
| 4.048% due 09/30/21 | MYR | 6,770 | 1,659 | 0.500% due 04/01/18 | SGD | 3,230 | 2,310 | |||
| 2.000% due 07/01/20 | SGD | 1,420 | 1,052 | |||||||
| Series 0315 | 2.250% due 06/01/21 | SGD | 3,080 | 2,307 | ||||||
| 3.659% due 10/15/20 | MYR | 50 | 12 | |||||||
| 3.125% due 09/01/22 | SGD | 2,780 | 2,177 | |||||||
| Series 0414 | ||||||||||
| 3.654% due 10/31/19 | MYR | 11,660 | 2,816 | 2.750% due 07/01/23 | SGD | 2,980 | 2,291 | |||
| 3.000% due 09/01/24 | SGD | 4,150 | 3,250 | |||||||
| Series 0515 | 2.375% due 06/01/25 | SGD | 1,700 | 1,273 | ||||||
| 3.759% due 03/15/19 | MYR | 5,300 | 1,285 | 3.500% due 03/01/27 | SGD | 2,790 | 2,290 | |||
| Mexican Bonos | ||||||||||
| Series M 20 | Titulos De Tesoreria B Bonds | |||||||||
| 10.000% due 12/05/24 | MXN | 35,060 | 2,307 | Series B | ||||||
| 7.500% due 06/03/27 | MXN | 52,333 | 3,007 | 6.000% due 04/28/28 | COP | 7,644,500 | 2,263 | |||
| Series M 30 | 288,107 | |||||||||
| 10.000% due 11/20/36 | MXN | 102,130 | 7,330 | United States Government Agencies - 0.9% | ||||||
| 8.500% due 11/18/38 | MXN | 21,960 | 1,390 | United States Treasury Inflation Indexed | ||||||
| Bonds | ||||||||||
| Series M | 0.375% due 07/15/25 | 5,383 | 5,525 | |||||||
| 8.000% due 06/11/20 | MXN | 17,550 | 994 | 0.625% due 01/15/26 | 10,035 | 10,475 | ||||
| 6.500% due 06/09/22 | MXN | 68,370 | 3,701 | 0.250% due 07/15/26 | 6,121 | 6,203 | ||||
| 7.750% due 05/29/31 | MXN | 20,610 | 1,204 | 1.375% due 02/15/44 | 6,495 | 7,523 | ||||
| 7.750% due 11/13/42 | MXN | 328,700 | 19,472 | 0.750% due 02/15/45 | 6,817 | 6,848 | ||||
| New Zealand Government Bond | 1.000% due 02/15/46 | 10,836 | 11,673 | |||||||
| Series 0423 | ||||||||||
| 5.500% due 04/15/23 | NZD | 3,290 | 2,785 | 48,247 | ||||||
| Series 0427 | United States Government Treasuries - 28.7% | |||||||||
| 4.500% due 04/15/27 | NZD | 4,050 | 3,361 | United States Treasury Notes | ||||||
| 0.625% due 11/30/17 | 1,000 | 999 | ||||||||
| Series 0521 | 0.875% due 03/31/18 | 37,015 | 37,060 | |||||||
| 6.000% due 05/15/21 | NZD | 37,015 | 30,783 | 0.750% due 04/15/18 | 23,263 | 23,249 | ||||
| Series 0925 | 0.750% due 04/30/18 | 29,706 | 29,684 | |||||||
| 2.000% due 09/20/25 | NZD | 5,270 | 4,049 | 1.000% due 05/15/18 | 28,090 | 28,171 | ||||
| Norway Government International Bond | 1.000% due 05/31/18 | 28,208 | 28,286 | |||||||
| Series 473 | 2.375% due 05/31/18 | 26,933 | 27,586 | |||||||
| 4.500% due 05/22/19 (Þ) | NOK | 61,070 | 8,092 | 1.125% due 06/15/18 | 32,196 | 32,353 | ||||
| Series 477 | 1.250% due 12/15/18 | 29,922 | 30,132 | |||||||
| 1.750% due 03/13/25 (Þ) | NOK | 23,030 | 2,885 | 1.500% due 01/31/19 | 16,405 | 16,614 | ||||
| Peru Government International Bond | 1.500% due 02/28/19 | 18,346 | 18,585 | |||||||
| 5.700% due 08/12/24 | PEN | 27,270 | 8,306 | 1.000% due 03/15/19 | 3,126 | 3,131 | ||||
| 6.900% due 08/12/37 | PEN | 25,800 | 8,264 | 1.625% due 03/31/19 | 9,103 | 9,251 | ||||
See accompanying notes which are an integral part of the financial statements.
430 Russell Strategic Bond Fund
Russell Investment Company
Russell Strategic Bond Fund
Schedule of Investments, continued — October 31, 2016
| Amounts in thousands (except share amounts) | Amounts in thousands (except share amounts) | |||||||
| Principal | Fair | Principal | Fair | |||||
| Amount ($) | Value | Amount ($) | Value | |||||
| or Shares | $ | or Shares | $ | |||||
| 0.875% due 04/15/19 | 48,715 | 48,637 | ||||||
| 1.500% due 11/30/19 | 8,817 | 8,943 | ||||||
| 1.625% due 12/31/19 | 10,601 | 10,790 | Preferred Stocks - 0.1% | |||||
| 1.375% due 01/31/20 | 10,179 | 10,280 | Financial Services - 0.1% | |||||
| 3.625% due 02/15/20 | 11,420 | 12,359 | XLIT, Ltd. | 3,685 | 2,911 | |||
| 1.375% due 02/29/20 | 9,713 | 9,804 | ||||||
| 3.500% due 05/15/20 | 20,794 | 22,497 | Total Preferred Stocks | |||||
| 1.375% due 05/31/20 | 14,096 | 14,218 | (cost $3,075) | 2,911 | ||||
| 1.500% due 05/31/20 | 14,177 | 14,358 | ||||||
| 2.625% due 08/15/20 | 30,283 | 31,901 | ||||||
| 2.125% due 08/31/20 | 29,287 | 30,314 | ||||||
| 1.375% due 09/30/20 | 84,465 | 85,033 | Options Purchased - 0.0% | |||||
| 1.750% due 12/31/20 | 38,025 | 38,806 | (Number of Contracts) | |||||
| 1.375% due 04/30/21 | 380 | 381 | Cross Currency Options | |||||
| 1.375% due 05/31/21 | 59,220 | 59,444 | (USD/GBP) CALL (1) | |||||
| Nov 2016 1.21 Call (11,600,000) | USD | 14,036 | (ÿ) | 73 | ||||
| 1.125% due 06/30/21 | 630 | 625 | United States 10 Year | |||||
| 1.125% due 08/31/21 | 1,315 | 1,303 | Treasury Note Futures | |||||
| 1.125% due 09/30/21 | 750 | 743 | Nov 2016 130.25 Call (34) | USD | 4,429 | (ÿ) | 12 | |
| 1.125% due 10/31/21 | 114,805 | 113,774 | Nov 2016 130.50 Call (68) | USD | 8,874 | (ÿ) | 19 | |
| 1.250% due 10/31/21 | 8,045 | 8,020 | Nov 2016 131.00 Call (68) | USD | 8,908 | (ÿ) | 12 | |
| 2.000% due 11/15/21 | 51,030 | 52,591 | Nov 2016 129.00 Put (67) | USD | 8,643 | (ÿ) | 8 | |
| 1.625% due 04/30/23 | 13,575 | 13,615 | United States 5 Year | |||||
| 1.250% due 07/31/23 | 9,308 | 9,100 | Treasury Note Futures | |||||
| 2.500% due 08/15/23 | 11,585 | 12,253 | Nov 2016 121.00 Call (68) | USD | 8,228 | (ÿ) | 18 | |
| 6.250% due 08/15/23 | 9,795 | 12,748 | Nov 2016 121.25 Call (170) | USD | 20,613 | (ÿ) | 28 | |
| 1.375% due 08/31/23 | 9,461 | 9,321 | United States Treasury | |||||
| 1.375% due 09/30/23 | 4,395 | 4,326 | Bond Futures | |||||
| 1.625% due 10/31/23 | 15,250 | 15,249 | Nov 2016 163.50 Call (40) | USD | 6,540 | (ÿ) | 57 | |
| 1.750% due 10/31/23 | 52,835 | 53,564 | Nov 2016 165.50 Call (40) | USD | 6,620 | (ÿ) | 28 | |
| 2.750% due 11/15/23 | 11,389 | 12,246 | Nov 2016 166.00 Call (51) | USD | 8,466 | (ÿ) | 30 | |
| 2.750% due 02/15/24 | 12,444 | 13,392 | Total Options Purchased | |||||
| 2.500% due 05/15/24 | 16,169 | 17,127 | (cost $449) | 285 | ||||
| 2.000% due 02/15/25 | 41,903 | 42,705 | ||||||
| 1.625% due 02/15/26 | 28,000 | 27,536 | Short-Term Investments - 14.1% | |||||
| 1.625% due 05/15/26 | 29,172 | 28,652 | ||||||
| 1.500% due 08/15/26(§) | 150,945 | 146,440 | American Express Credit Corp. | |||||
| 3.500% due 02/15/39 | 9,276 | 11,033 | 1.125% due 06/05/17 | 4,215 | 4,217 | |||
| 4.500% due 08/15/39 | 8,850 | 12,057 | American Honda Finance Corp. | |||||
| 4.625% due 02/15/40 | 10,154 | 14,076 | 1.051% due 07/14/17 (Ê) | 8,375 | 8,379 | |||
| 4.375% due 05/15/40 | 9,965 | 13,372 | Anheuser-Busch InBev Worldwide, Inc. | |||||
| 3.125% due 02/15/43 | 13,704 | 15,240 | ||||||
| 3.625% due 08/15/43 | 13,827 | 16,810 | 1.053% due 12/30/16 (Þ)(~) | 722 | 721 | |||
| 3.000% due 11/15/44 | 16,275 | 17,678 | 0.922% due 04/21/17 (Þ)(~) | 2,605 | 2,594 | |||
| 3.000% due 05/15/45 | 18,560 | 20,149 | 1.105% due 06/08/17 (Þ)(~) | 800 | 794 | |||
| 2.500% due 02/15/46 | 1,390 | 1,364 | AT&T, Inc. | |||||
| 2.500% due 05/15/46 | 77,800 | 76,375 | ||||||
| 2.250% due 08/15/46 | 117,030 | 108,843 | 1.600% due 02/15/17 | 1,895 | 1,898 | |||
| 1,585,193 | 1.700% due 06/01/17 | 4,815 | 4,832 | |||||
| Total Long-Term Investments | Bank of America Corp. | |||||||
| (cost $4,993,120) | 5,017,997 | 5.700% due 05/02/17 | 550 | 562 | ||||
| Bank of America NA | ||||||||
| Series BKNT | ||||||||
| Common Stocks - 0.0% | 1.381% due 06/05/17 (Ê) | 3,935 | 3,940 | |||||
| Financial Services - 0.0% | Bear Stearns Cos. LLC (The) | |||||||
| Escrow GM Corp.(Å) | 420,000 | — | ||||||
| Producer Durables - 0.0% | 5.550% due 01/22/17 | 3,681 | 3,718 | |||||
| Quad/Graphics, Inc. | 75 | 2 | BNP Paribas SA | |||||
| Total Common Stocks | 2.375% due 09/14/17 | 300 | 303 | |||||
| (cost $—) | 2 | Brazil Notas do Tesouro Nacional | ||||||
| Series NTNF | ||||||||
See accompanying notes which are an integral part of the financial statements.
Russell Strategic Bond Fund 431
Russell Investment Company
Russell Strategic Bond Fund
Schedule of Investments, continued — October 31, 2016
| Amounts in thousands (except share amounts) | Amounts in thousands (except share amounts) | ||||||||
| Principal | Fair | Principal | Fair | ||||||
| Amount ($) | Value | Amount ($) | Value | ||||||
| or Shares | $ | or Shares | $ | ||||||
| 10.000% due 01/01/17 | BRL | 5,000 | 1,608 | 0.938% due 02/10/17 (Þ)(~) | 3,600 | 3,591 | |||
| Canadian Imperial Bank of Commerce | Province of British Columbia Canada | ||||||||
| 0.986% due 02/21/17 (Ê) | 5,485 | 5,485 | 1.200% due 04/25/17 | 1,895 | 1,897 | ||||
| Chariot Funding LLC | Royal Bank of Canada | ||||||||
| 1.160% due 03/31/17 (Þ)(~) | 3,000 | 2,986 | Series YCD | ||||||
| Commonwealth Bank of Australia | 0.935% due 01/09/17 (Ê)(~) | 4,000 | 4,002 | ||||||
| 1.114% due 03/09/17 (Ê)(Þ)(~) | 8,350 | 8,359 | Russell U.S. Cash Management Fund | 405,794,740 | (8) | 405,876 | |||
| Compass Bank | Samsung Electronics America, Inc. | ||||||||
| Series BKNT | 1.750% due 04/10/17 (Þ) | 1,910 | 1,912 | ||||||
| Sinopec Group Overseas Development | |||||||||
| 6.400% due 10/01/17 | 6,880 | 7,144 | 2012, Ltd. | ||||||
| Cooperatieve Rabobank UA | 2.750% due 05/17/17 (Þ) | 260 | 262 | ||||||
| 0.945% due 03/09/17 (Ê)(~) | 7,590 | 7,592 | Small Business Administration | ||||||
| Credit Suisse | Series 97-D Class 1 | ||||||||
| Series GMTN | 7.500% due 04/01/17 | 15 | 15 | ||||||
| 1.427% due 05/26/17 (Ê) | 2,050 | 2,050 | |||||||
| Deutsche Telekom International Finance | Statoil ASA | ||||||||
| BV | 3.125% due 08/17/17 | 150 | 152 | ||||||
| 2.250% due 03/06/17 (Þ) | 6,780 | 6,804 | Sumitomo Mitsui Banking Corp. | ||||||
| DNB Bank ASA | Series YCD | ||||||||
| Series YCD | 1.133% due 04/26/17 (Ê)(~) | 3,000 | 2,999 | ||||||
| 1.174% due 06/09/17 (Ê)(~) | 7,590 | 7,595 | Thomson Reuters Corp. | ||||||
| eBay, Inc. | 1.650% due 09/29/17 | 4,000 | 4,010 | ||||||
| 1.350% due 07/15/17 | 4,085 | 4,087 | Total Capital International SA | ||||||
| FCA US LLC Term Loan B | 1.550% due 06/28/17 | 5,110 | 5,122 | ||||||
| 3.500% due 05/24/17 (Ê) | 2,316 | 2,317 | Toyota Motor Credit Corp. | ||||||
| Freddie Mac | 1.125% due 05/16/17 | 8,055 | 8,062 | ||||||
| 8.500% due 02/01/17 | — | — | Transocean, Inc. | ||||||
| General Electric Co. | 4.250% due 10/15/17 | 3,349 | 3,332 | ||||||
| 1.086% due 12/29/16 (Ê) | 2,470 | 2,471 | Tyco Electronics Group SA | ||||||
| Glencore Finance Canada, Ltd. | 6.550% due 10/01/17 | 2,425 | 2,541 | ||||||
| 2.700% due 10/25/17 (Þ) | 900 | 903 | United States Treasury Bills | ||||||
| Hewlett Packard Enterprise Co. | 0.113% due 11/10/16 (~)(§) | 6,000 | 6,000 | ||||||
| 2.700% due 10/05/17 (Þ) | 5,330 | 5,398 | 0.010% due 12/22/16 (~)(§) | 500 | 500 | ||||
| Intesa Sanpaolo SpA | 0.265% due 01/05/17 (~)(§) | 35,950 | 35,933 | ||||||
| 2.375% due 01/13/17 | 2,570 | 2,572 | 0.262% due 01/12/17 (~) | 13,830 | 13,823 | ||||
| JPMorgan Chase Bank NA | 0.331% due 02/23/17 (~) | 5,460 | 5,454 | ||||||
| Series BKNT | |||||||||
| 6.000% due 10/01/17 | 7,800 | 8,124 | 0.468% due 04/20/17 (~) | 33,140 | 33,067 | ||||
| LMA-Americas LLC | United States Treasury Notes | ||||||||
| 1.158% due 03/01/17 (Þ)(~) | 2,000 | 1,992 | 0.500% due 11/30/16 | 14,730 | 14,734 | ||||
| Manufacturers & Traders Trust Co. | 0.500% due 04/30/17 | 35,690 | 35,682 | ||||||
| Series BKNT | 0.875% due 10/15/17 | 16,500 | 16,525 | ||||||
| 1.400% due 07/25/17 | 5,600 | 5,607 | 0.750% due 10/31/17 | 2,500 | 2,500 | ||||
| Matchpoint Finance PLC | Verizon Communications, Inc. | ||||||||
| 1.021% due 12/14/16 (ç)(Þ)(~) | 5,900 | 5,893 | 1.234% due 06/09/17 (Ê) | 2,380 | 2,384 | ||||
| National Australia Bank, Ltd. | 1.350% due 06/09/17 | 5,785 | 5,791 | ||||||
| 2.750% due 03/09/17 | 2,105 | 2,117 | Vodafone Group PLC | ||||||
| 1.118% due 06/30/17 (Ê)(Þ) | 2,965 | 2,966 | 1.625% due 03/20/17 | 5,915 | 5,923 | ||||
| Nordea Bank Finland PLC | 1.644% due 09/13/17 (Þ)(~) | 1,500 | 1,479 | ||||||
| Series YCD | Wells Fargo & Co. | ||||||||
| 1.252% due 06/13/17 (Ê)(~) | 5,485 | 5,491 | 1.234% due 06/02/17 (Ê) | 10,930 | 10,936 | ||||
| Ontario Teachers' Finance Trust | Wells Fargo Bank NA | ||||||||
See accompanying notes which are an integral part of the financial statements.
432 Russell Strategic Bond Fund
Russell Investment Company
Russell Strategic Bond Fund
Schedule of Investments, continued — October 31, 2016
Amounts in thousands (except share amounts)
| Principal | Fair | |||
| Amount ($) | Value | |||
| or Shares | $ | |||
| Series CD | ||||
| 1.245% due 06/12/17 (Ê)(~) | 5,485 | 5,492 | ||
| Westpac Banking Corp. | ||||
| Series YCD | ||||
| 1.301% due 03/01/17 (Ê)(~) | 5,295 | 5,302 | ||
| Williams Partners, LP / Williams | ||||
| Partners Finance Corp. | ||||
| 7.250% due 02/01/17 | 1,480 | 1,500 | ||
| Total Short-Term Investments | ||||
| (cost $777,526) | 778,317 | |||
| Total Investments 105.1% | ||||
| (identified cost $5,774,170) | 5,799,512 | |||
| Other Assets and Liabilities, | ||||
| Net - (5.1%) | (280,058 | ) | ||
| Net Assets - 100.0% | 5,519,454 | |||
See accompanying notes which are an integral part of the financial statements.
Russell Strategic Bond Fund 433
Russell Investment Company
Russell Strategic Bond Fund
Schedule of Investments, continued — October 31, 2016
| Restricted Securities | |||||||||||
| Amounts in thousands (except share and cost per unit amounts) | |||||||||||
| Principal | Cost per | Cost | Fair Value | ||||||||
| % of Net Assets | Acquisition | Amount ($) | Unit | (000 | ) | (000 | ) | ||||
| Securities | Date | or shares | $ | $ | $ | ||||||
| 0.3% | |||||||||||
| A10 Securitization LLC | 05/19/16 | 4,391,000 | 99.97 | 4,390 | 4,391 | ||||||
| Bear Stearns Second Lien Trust | 10/22/15 | 1,057,788 | 96.54 | 1,021 | 1,036 | ||||||
| Escrow GM Corp. | 04/21/11 | 420,000 | — | — | — | ||||||
| Fannie Mae | 10/27/00 | 14,885 | 22.36 | 3 | 3 | ||||||
| Fannie Mae | 02/12/01 | 15,068 | 27.26 | 4 | 4 | ||||||
| Fannie Mae | 08/14/02 | 6,784 | 27.33 | 2 | 2 | ||||||
| Fannie Mae | 04/27/10 | 22,955 | 32.51 | 7 | 7 | ||||||
| Fannie Mae REMICS | 09/15/00 | 22,185 | 19.25 | 4 | 4 | ||||||
| Fannie Mae REMICS | 06/12/01 | 1,687 | 1.60 | — | — | ||||||
| Fannie Mae REMICS | 05/28/03 | 60,013 | 18.93 | 11 | 11 | ||||||
| Fannie Mae REMICS | 01/07/04 | 49,646 | 24.77 | 12 | 12 | ||||||
| Fannie Mae REMICS | 04/25/05 | 63,762 | 18.13 | 12 | 12 | ||||||
| Fannie Mae REMICS | 04/25/05 | 30,204 | 20.11 | 6 | 6 | ||||||
| Fannie Mae REMICS | 02/28/07 | 54,448 | 99.93 | 54 | 53 | ||||||
| Fannie Mae REMICS | 08/17/07 | 551,102 | 99.18 | 547 | 540 | ||||||
| Fannie Mae REMICS | 09/19/08 | 287,828 | 18.44 | 53 | 53 | ||||||
| Fannie Mae REMICS | 09/19/08 | 52,072 | 21.42 | 11 | 11 | ||||||
| Freddie Mac REMICS | 04/14/03 | 34,916 | 27.76 | 10 | 10 | ||||||
| Freddie Mac REMICS | 06/11/03 | 9,190 | 16.89 | 2 | 2 | ||||||
| Freddie Mac REMICS | 03/05/04 | 77,714 | 26.42 | 20 | 20 | ||||||
| Freddie Mac REMICS | 03/15/04 | 14,222 | 20.69 | 3 | 3 | ||||||
| Freddie Mac REMICS | 09/19/08 | 414,511 | 16.56 | 69 | 69 | ||||||
| Freddie Mac Strips | 12/12/00 | 14,064 | 26.08 | 4 | 4 | ||||||
| Freddie Mac Strips | 05/29/03 | 32,771 | 23.10 | 8 | 7 | ||||||
| Freddie Mac Strips | 08/19/03 | 33,985 | 21.29 | 7 | 7 | ||||||
| Freddie Mac Strips | 02/13/04 | 34,764 | 28.62 | 10 | 10 | ||||||
| Ginnie Mae | 01/20/10 | 54,191 | 23.47 | 13 | 12 | ||||||
| GSAA Trust | 10/21/15 | 3,469,032 | 85.55 | 2,968 | 3,032 | ||||||
| Irwin Home Equity Loan Trust | 02/03/16 | 3,204,302 | 102.38 | 3,280 | 3,248 | ||||||
| Irwin Home Equity Loan Trust | 05/04/16 | 1,388,398 | 102.20 | 1,419 | 1,416 | ||||||
| Waldorf Astoria Boca Raton Trust | 07/12/16 | 4,000,000 | 100.00 | 4,000 | 3,999 | ||||||
| 17,984 | |||||||||||
| For a description of restricted securities see note 8 in the Notes to Financial Statements. | |||||||||||
| Futures Contracts | |||||||||
| Amounts in thousands (except contract amounts) | |||||||||
| Unrealized | |||||||||
| Appreciation | |||||||||
| Number of | Notional | Expiration | (Depreciation) | ||||||
| Contracts | Amount | Date | $ | ||||||
| Long Positions | |||||||||
| Australia 10 Year Bond Futures | 2,529 | AUD | 335,402 | 12/16 | (1,725 | ) | |||
| Euro-BTP Futures | 99 | EUR | 13,717 | 12/16 | (139 | ) | |||
| Eurodollar Futures | 393 | USD | 97,322 | 12/16 | (1 | ) | |||
| Eurodollar Futures | 21 | USD | 2,844 | 12/16 | (9 | ) | |||
| Eurodollar Futures | 341 | USD | 84,278 | 12/17 | (48 | ) | |||
| United States 2 Year Treasury Note Futures | 937 | USD | 204,398 | 12/16 | 45 | ||||
| United States 5 Year Treasury Note Futures | 4,261 | USD | 514,715 | 12/16 | (980 | ) | |||
| United States 10 Year Treasury Note Futures | 3,225 | USD | 418,041 | 12/16 | (1,074 | ) | |||
| United States Long Bond Futures | 583 | USD | 94,865 | 12/16 | (2,561 | ) | |||
| United States Ultra Bond Futures | 18 | USD | 3,167 | 12/16 | (23 | ) | |||
| Short Positions | |||||||||
| Cross Currency (AUD/USD) | 77 | USD | 5,846 | 12/16 | 8 | ||||
| Euro-Bobl Futures | 288 | EUR | 37,760 | 12/16 | 170 | ||||
| Euro-Bund Futures | 1,399 | EUR | 226,876 | 12/16 | 1,905 | ||||
| Eurodollar Futures | 341 | USD | 83,958 | 12/19 | 140 | ||||
| Euro-OAT Futures | 141 | EUR | 22,038 | 12/16 | 467 | ||||
| British Pound Currency Futures | 75 | USD | 5,744 | 12/16 | 234 | ||||
| Japan Government 10 Year Bond Futures | 33 | JPY | 5,006,430 | 12/16 | (104 | ) | |||
| Japanese Yen Currency Futures | 23 | USD | 2,744 | 12/16 | — | ||||
See accompanying notes which are an integral part of the financial statements.
434 Russell Strategic Bond Fund
Russell Investment Company
Russell Strategic Bond Fund
Schedule of Investments, continued — October 31, 2016
| Futures Contracts | ||||||||||||||
| Amounts in thousands (except contract amounts) | ||||||||||||||
| Long Gilt Futures | 1,809 | GBP | 226,740 | 12/16 | 3,923 | |||||||||
| United States 10 Year Treasury Note Futures | 588 | USD | 76,220 | 12/16 | 586 | |||||||||
| United States 10 Year Ultra Bond Futures | 263 | USD | 37,219 | 12/16 | 303 | |||||||||
| United States Long Bond Futures | 200 | USD | 32,544 | 12/16 | 694 | |||||||||
| United States Ultra Bond Futures | 57 | USD | 10,028 | 12/16 | 632 | |||||||||
| Total Unrealized Appreciation (Depreciation) on Open Futures Contracts (å) | 2,443 | |||||||||||||
| Options Written | ||||||||||||||
| Amounts in thousands (except contract amounts) | ||||||||||||||
| Number of | Strike | Notional | Expiration | Fair Value | ||||||||||
| Call/Put | Contracts | Price | Amount | Date | $ | |||||||||
| Cross Currency Options (USD/GBP) | Call | 1 | 1.18 | USD | 13,688 | 11/23/16 | (20 | ) | ||||||
| United States 10 Year Treasury Note Futures | Call | 37 | 131.50 | USD | 4,866 | 11/25/16 | (4 | ) | ||||||
| United States 10 Year Treasury Note Futures | Call | 266 | 133.00 | USD | 35,378 | 11/25/16 | (8 | ) | ||||||
| United States 10 Year Treasury Note Futures | Call | 107 | 170.00 | USD | 18,190 | 11/25/16 | (13 | ) | ||||||
| United States 10 Year Treasury Note Futures | Call | 136 | 132.50 | USD | 18,020 | 12/23/16 | (13 | ) | ||||||
| United States 10 Year Treasury Note Futures | Put | 67 | 127.75 | USD | 8,559 | 11/25/16 | (8 | ) | ||||||
| United States 5 Year Treasury Note Futures | Call | 57 | 121.75 | USD | 6,940 | 11/25/16 | (3 | ) | ||||||
| United States Treasury Bond Futures | Call | 47 | 178.00 | USD | 8,366 | 11/25/16 | — | |||||||
| United States Treasury Bond Futures | Call | 40 | 165.00 | USD | 6,600 | 12/23/16 | (44 | ) | ||||||
| United States Treasury Bond Futures | Call | 40 | 166.00 | USD | 6,640 | 12/23/16 | (35 | ) | ||||||
| United States Treasury Bond Futures | Call | 40 | 167.00 | USD | 6,680 | 12/23/16 | (26 | ) | ||||||
| United States Treasury Bond Futures | Call | 40 | 168.00 | USD | 6,720 | 12/23/16 | (20 | ) | ||||||
| United States Treasury Bond Futures | Put | 34 | 158.50 | USD | 5,389 | 11/25/16 | (17 | ) | ||||||
| Total Liability for Options Written (premiums received $469) | (211 | ) | ||||||||||||
| Transactions in options written contracts for the period ended October 31, 2016 were as follows: | ||||||||||||||
| Number of | Premiums | |||||||||||||
| Contracts | Received | |||||||||||||
| Outstanding October 31, 2015 | 1 | $ | 769 | |||||||||||
| Opened | 2,321 | 1,330 | ||||||||||||
| Closed | (1,208 | ) | (1,262 | ) | ||||||||||
| Expired | (202 | ) | (368 | ) | ||||||||||
| Outstanding October 31, 2016 | 912 | $ | 469 | |||||||||||
| Foreign Currency Exchange Contracts | ||||||||
| Amounts in thousands | ||||||||
| Unrealized | ||||||||
| Appreciation | ||||||||
| Amount | Amount | (Depreciation) | ||||||
| Counterparty | Sold | Bought | Settlement Date | $ | ||||
| Bank of America | USD | 91 | BRL | 293 | 11/21/16 | 1 | ||
| Bank of America | USD | 374 | BRL | 1,269 | 11/21/16 | 21 | ||
| Bank of America | USD | 9,425 | BRL | 30,675 | 11/21/16 | 133 | ||
| Bank of America | USD | 125 | COP | 369,417 | 11/21/16 | (2 | ) | |
| Bank of America | USD | 188 | COP | 551,815 | 11/21/16 | (5 | ) | |
| Bank of America | USD | 9,620 | COP | 28,514,907 | 11/21/16 | (167 | ) | |
| Bank of America | USD | 1,172 | CZK | 28,766 | 11/21/16 | (3 | ) | |
| Bank of America | USD | 3,297 | GBP | 2,640 | 01/20/17 | (60 | ) | |
| Bank of America | USD | 165 | HUF | 45,430 | 11/21/16 | (3 | ) | |
| Bank of America | USD | 898 | HUF | 250,992 | 11/21/16 | (6 | ) | |
| Bank of America | USD | 22,154 | HUF | 6,107,300 | 11/21/16 | (439 | ) | |
| Bank of America | USD | 150 | IDR | 1,982,863 | 11/21/16 | 2 | ||
| Bank of America | USD | 73 | PLN | 280 | 11/21/16 | (1 | ) | |
| Bank of America | USD | 917 | PLN | 3,615 | 11/21/16 | 4 | ||
| Bank of America | USD | 22,120 | PLN | 83,930 | 11/21/16 | (737 | ) | |
| Bank of America | USD | 61 | RUB | 3,996 | 11/21/16 | 2 | ||
See accompanying notes which are an integral part of the financial statements.
Russell Strategic Bond Fund 435
Russell Investment Company
Russell Strategic Bond Fund
Schedule of Investments, continued — October 31, 2016
| Foreign Currency Exchange Contracts | |||||||
| Amounts in thousands | |||||||
| Unrealized | |||||||
| Appreciation | |||||||
| Amount | Amount | (Depreciation) | |||||
| Counterparty | Sold | Bought | Settlement Date | $ | |||
| Bank of America | USD | 81 | RUB | 5,145 | 11/21/16 | — | |
| Bank of America | USD | 9,662 | RUB | 631,567 | 11/21/16 | 251 | |
| Bank of America | USD | 675 | TRY | 2,112 | 11/21/16 | 4 | |
| Bank of America | USD | 1,519 | TRY | 4,751 | 11/21/16 | 10 | |
| Bank of America | USD | 9,677 | TRY | 28,908 | 11/21/16 | (374 | ) |
| Bank of America | USD | 21,773 | TRY | 65,044 | 11/21/16 | (842 | ) |
| Bank of America | BRL | 660 | USD | 205 | 11/21/16 | (1 | ) |
| Bank of America | BRL | 2,855 | USD | 842 | 11/21/16 | (48 | ) |
| Bank of America | BRL | 69,018 | USD | 21,207 | 11/21/16 | (299 | ) |
| Bank of America | CNY | 130,030 | USD | 19,122 | 01/20/17 | 70 | |
| Bank of America | CZK | 12,785 | USD | 521 | 11/21/16 | 1 | |
| Bank of America | HUF | 102,217 | USD | 371 | 11/21/16 | 7 | |
| Bank of America | HUF | 111,552 | USD | 399 | 11/21/16 | 3 | |
| Bank of America | HUF | 2,714,356 | USD | 9,887 | 11/21/16 | 236 | |
| Bank of America | IDR | 7,974,700 | USD | 606 | 11/21/16 | (4 | ) |
| Bank of America | IDR | 288,912,756 | USD | 21,841 | 11/21/16 | (271 | ) |
| Bank of America | MYR | 1,293 | USD | 311 | 11/21/16 | 4 | |
| Bank of America | MYR | 5,536 | USD | 1,309 | 11/21/16 | (8 | ) |
| Bank of America | MYR | 88,196 | USD | 21,986 | 11/21/16 | 990 | |
| Bank of America | RUB | 1,776 | USD | 27 | 11/21/16 | (1 | ) |
| Bank of America | RUB | 11,577 | USD | 182 | 11/21/16 | — | |
| Bank of America | RUB | 1,421,025 | USD | 21,667 | 11/21/16 | (639 | ) |
| Bank of America | TRY | 24 | USD | 8 | 11/21/16 | — | |
| Bank of America | TRY | 54 | USD | 18 | 11/21/16 | 1 | |
| Bank of America | TWD | 565 | USD | 18 | 11/21/16 | — | |
| Bank of America | TWD | 11,445 | USD | 359 | 11/21/16 | (3 | ) |
| Bank of America | TWD | 306,331 | USD | 9,902 | 11/21/16 | 192 | |
| Bank of Montreal | USD | 38,038 | CAD | 49,745 | 11/21/16 | (946 | ) |
| Bank of Montreal | USD | 37,515 | EUR | 34,072 | 11/21/16 | (84 | ) |
| Bank of Montreal | CHF | 16,505 | USD | 16,700 | 11/21/16 | 5 | |
| Bank of Montreal | CHF | 37,136 | USD | 37,575 | 11/21/16 | 12 | |
| Bank of Montreal | HKD | 75,922 | USD | 9,799 | 11/21/16 | 9 | |
| Bank of New York | USD | 37,892 | GBP | 30,827 | 11/21/16 | (146 | ) |
| Bank of New York | USD | 58,202 | JPY | 6,046,438 | 11/21/16 | (509 | ) |
| Bank of New York | GBP | 47,953 | USD | 58,943 | 11/21/16 | 227 | |
| Bank of New York | ILS | 143,078 | USD | 37,446 | 11/21/16 | 135 | |
| Barclays | USD | 5,800 | NZD | 8,220 | 11/17/16 | 74 | |
| Barclays | MXN | 55,243 | USD | 2,900 | 11/17/16 | (24 | ) |
| Barclays | ZAR | 41,592 | USD | 2,900 | 11/17/16 | (172 | ) |
| Citigroup | USD | 16,956 | NZD | 23,614 | 11/21/16 | (82 | ) |
| Citigroup | USD | 59,344 | NZD | 82,649 | 11/21/16 | (288 | ) |
| Citigroup | MXN | 54,826 | USD | 2,900 | 11/17/16 | (2 | ) |
| Citigroup | SEK | 147,258 | USD | 16,716 | 11/21/16 | 398 | |
| Citigroup | SEK | 515,404 | USD | 58,505 | 11/21/16 | 1,393 | |
| Goldman Sachs | CNY | 97,342 | USD | 14,351 | 12/14/16 | 38 | |
| JPMorgan Chase | USD | 13,197 | CAD | 17,420 | 12/14/16 | (205 | ) |
| JPMorgan Chase | USD | 10,624 | CLP | 7,094,649 | 11/17/16 | 226 | |
| JPMorgan Chase | USD | 5,952 | COP | 17,458,210 | 11/17/16 | (161 | ) |
| JPMorgan Chase | USD | 4,179 | GBP | 3,404 | 12/14/16 | (8 | ) |
| JPMorgan Chase | USD | 6,708 | GBP | 5,480 | 12/14/16 | 6 | |
| JPMorgan Chase | USD | 1,599 | GBP | 1,310 | 01/20/17 | 7 | |
| JPMorgan Chase | USD | 7,146 | INR | 483,660 | 01/20/17 | 27 | |
| JPMorgan Chase | USD | 2,373 | MXN | 45,457 | 01/20/17 | 12 | |
| JPMorgan Chase | USD | 30,990 | NOK | 251,715 | 12/14/16 | (522 | ) |
| JPMorgan Chase | USD | 1,335 | NZD | 1,890 | 11/17/16 | 16 | |
| JPMorgan Chase | USD | 4,323 | PLN | 16,638 | 12/14/16 | (86 | ) |
See accompanying notes which are an integral part of the financial statements.
436 Russell Strategic Bond Fund
Russell Investment Company
Russell Strategic Bond Fund
Schedule of Investments, continued — October 31, 2016
| Foreign Currency Exchange Contracts | |||||||
| Amounts in thousands | |||||||
| Unrealized | |||||||
| Appreciation | |||||||
| Amount | Amount | (Depreciation) | |||||
| Counterparty | Sold | Bought | Settlement Date | $ | |||
| JPMorgan Chase | USD | 4,943 | PLN | 19,664 | 12/14/16 | 65 | |
| JPMorgan Chase | USD | 7,057 | SEK | 62,739 | 11/21/16 | (105 | ) |
| JPMorgan Chase | USD | 7,040 | SGD | 9,704 | 12/14/16 | (63 | ) |
| JPMorgan Chase | USD | 18,362 | SGD | 25,576 | 12/14/16 | 26 | |
| JPMorgan Chase | USD | 11,067 | TRY | 34,544 | 12/14/16 | (4 | ) |
| JPMorgan Chase | USD | 9,122 | ZAR | 128,465 | 12/14/16 | 325 | |
| JPMorgan Chase | AUD | 75,019 | USD | 56,604 | 12/14/16 | (401 | ) |
| JPMorgan Chase | BRL | 12,363 | USD | 3,887 | 11/17/16 | 30 | |
| JPMorgan Chase | BRL | 39,899 | USD | 12,269 | 11/17/16 | (178 | ) |
| JPMorgan Chase | CHF | 25,400 | USD | 25,850 | 12/14/16 | 122 | |
| JPMorgan Chase | CNY | 19,700 | USD | 2,907 | 12/14/16 | 10 | |
| JPMorgan Chase | COP | 56,976,306 | USD | 19,281 | 11/16/16 | 376 | |
| JPMorgan Chase | CZK | 21,038 | USD | 867 | 12/14/16 | 11 | |
| JPMorgan Chase | DKK | 2,113 | USD | 316 | 12/14/16 | 4 | |
| JPMorgan Chase | EUR | 2,619 | USD | 2,856 | 12/14/16 | (25 | ) |
| JPMorgan Chase | EUR | 13,284 | USD | 14,793 | 12/14/16 | 184 | |
| JPMorgan Chase | EUR | 6,050 | USD | 6,694 | 01/20/17 | 28 | |
| JPMorgan Chase | GBP | 2,441 | USD | 3,004 | 12/14/16 | 13 | |
| JPMorgan Chase | HKD | 5,312 | USD | 685 | 12/14/16 | — | |
| JPMorgan Chase | HUF | 2,976,981 | USD | 10,522 | 11/21/16 | (63 | ) |
| JPMorgan Chase | IDR | 91,785,820 | USD | 6,991 | 11/17/16 | (38 | ) |
| JPMorgan Chase | IDR | 115,307,290 | USD | 8,795 | 11/17/16 | (35 | ) |
| JPMorgan Chase | JPY | 1,832,379 | USD | 17,662 | 12/14/16 | 160 | |
| JPMorgan Chase | JPY | 483,590 | USD | 4,673 | 01/20/17 | 46 | |
| JPMorgan Chase | JPY | 1,021,700 | USD | 9,923 | 01/20/17 | 148 | |
| JPMorgan Chase | MXN | 29,374 | USD | 1,546 | 12/14/16 | (1 | ) |
| JPMorgan Chase | MYR | 17,517 | USD | 4,233 | 11/16/16 | 62 | |
| JPMorgan Chase | NZD | 18,321 | USD | 13,049 | 11/17/16 | (43 | ) |
| JPMorgan Chase | NZD | 105,148 | USD | 74,257 | 12/14/16 | (813 | ) |
| JPMorgan Chase | PEN | 37,042 | USD | 10,963 | 11/16/16 | (33 | ) |
| JPMorgan Chase | PEN | 61,687 | USD | 18,007 | 11/16/16 | (306 | ) |
| JPMorgan Chase | PHP | 549,477 | USD | 11,350 | 11/16/16 | 21 | |
| JPMorgan Chase | SGD | 58,940 | USD | 42,732 | 12/14/16 | 355 | |
| JPMorgan Chase | THB | 123,715 | USD | 3,518 | 11/16/16 | (16 | ) |
| JPMorgan Chase | THB | 424,034 | USD | 12,164 | 11/16/16 | 52 | |
| JPMorgan Chase | TRY | 12,947 | USD | 4,140 | 12/14/16 | (6 | ) |
| JPMorgan Chase | ZAR | 46,251 | USD | 3,259 | 12/14/16 | (143 | ) |
| State Street | USD | 16,957 | AUD | 22,121 | 11/21/16 | (138 | ) |
| State Street | USD | 160 | CZK | 3,843 | 11/21/16 | (4 | ) |
| State Street | USD | 22,339 | CZK | 532,354 | 11/21/16 | (700 | ) |
| State Street | USD | 102 | HKD | 794 | 11/21/16 | — | |
| State Street | USD | 58,655 | NOK | 480,634 | 11/21/16 | (482 | ) |
| State Street | USD | 122 | SGD | 167 | 11/21/16 | (2 | ) |
| State Street | USD | 1,086 | SGD | 1,509 | 11/21/16 | (1 | ) |
| State Street | USD | 22,134 | SGD | 29,571 | 11/21/16 | (875 | ) |
| State Street | USD | 245 | ZAR | 3,492 | 11/21/16 | 13 | |
| State Street | USD | 696 | ZAR | 9,999 | 11/21/16 | 43 | |
| State Street | USD | 9,604 | ZAR | 129,781 | 11/21/16 | (15 | ) |
| State Street | CHF | 57,766 | USD | 58,437 | 11/21/16 | 5 | |
| State Street | CZK | 8,647 | USD | 361 | 11/21/16 | 9 | |
| State Street | CZK | 236,602 | USD | 9,928 | 11/21/16 | 311 | |
| State Street | DKK | 112,659 | USD | 16,663 | 11/21/16 | 23 | |
| State Street | HKD | 2,612 | USD | 337 | 11/21/16 | — | |
| State Street | NOK | 308,979 | USD | 37,925 | 11/21/16 | 528 | |
| State Street | SGD | 74 | USD | 54 | 11/21/16 | 1 | |
| State Street | SGD | 671 | USD | 483 | 11/21/16 | — |
See accompanying notes which are an integral part of the financial statements.
Russell Strategic Bond Fund 437
Russell Investment Company
Russell Strategic Bond Fund
Schedule of Investments, continued — October 31, 2016
| Foreign Currency Exchange Contracts | |||||||
| Amounts in thousands | |||||||
| Unrealized | |||||||
| Appreciation | |||||||
| Amount | Amount | (Depreciation) | |||||
| Counterparty | Sold | Bought | Settlement Date | $ | |||
| State Street | SGD | 13,143 | USD | 9,837 | 11/21/16 | 389 | |
| Toronto Dominion Bank | USD | 2,900 | ZAR | 40,717 | 11/17/16 | 107 | |
| UBS | USD | 2,900 | MXN | 54,475 | 11/17/16 | (16 | ) |
| UBS | USD | 2,860 | RUB | 180,000 | 11/17/16 | (31 | ) |
| UBS | BRL | 9,280 | USD | 2,891 | 11/17/16 | (11 | ) |
| Total Unrealized Appreciation (Depreciation) on Open Foreign Currency Exchange Contracts | (3,712 | ) | |||||
| Total Return Swap Contracts (*) | ||||||
| Amounts in thousands | ||||||
| Notional | Termination | Fair Value | ||||
| Underlying Reference Entity | Counterparty | Amount | Date | $ | ||
| Barclays U.S. Aggregate Total Return Value Unhedged | ||||||
| USD Index | Barclays | USD | 57,859 | 04/28/17 | (30 | ) |
| Barclays U.S. Aggregate Total Return Value Unhedged | ||||||
| USD Index | Barclays | USD | 20,301 | 04/28/17 | (9 | ) |
| Barclays U.S. Aggregate Total Return Value Unhedged | ||||||
| USD Index | Barclays | USD | 5,075 | 04/28/17 | (3 | ) |
| Barclays U.S. Aggregate Total Return Value Unhedged | ||||||
| USD Index | Barclays | USD | 62,805 | 06/30/17 | (33 | ) |
| Barclays U.S. Aggregate Total Return Value Unhedged | ||||||
| USD Index | Barclays | USD | 27,913 | 06/30/17 | (15 | ) |
| Total Fair Value of Open Total Return Swap Contracts Premiums Paid (Received) - $— (å) | (90 | ) | ||||
(*) Total return swaps (which includes index swaps) are agreements between counterparties to exchange cash flows, one based on a market-linked
returns of an individual asset or a basket of assets (i.e. an index), and the other on a fixed or floating rate. The floating rate fees were all based
on 1 Month LIBOR rate plus a fee ranging from 0.00% to 0.10%.
| Interest Rate Swap Contracts | |||||||||||||
| Amounts in thousands | |||||||||||||
| Termination | Fair Value | ||||||||||||
| Counterparty | Notional Amount | Fund Receives | Fund Pays | Date | $ | ||||||||
| JPMorgan Chase | DKK | 940 | Six Month CIBOR | 0.943 | % | 05/05/25 | (4 | ) | |||||
| JPMorgan Chase | DKK | 36,000 | Six Month CIBOR | 0.510 | % | 05/05/25 | 43 | ||||||
| JPMorgan Chase | DKK | 14,500 | Six Month LIBOR | Six Month LIBOR | 05/06/25 | — | |||||||
| JPMorgan Chase | DKK | 14,500 | Six Month CIBOR | 0.640 | % | 05/06/25 | (9 | ) | |||||
| JPMorgan Chase | HKD | 1,477 | Three Month MIBOR | 2.160 | % | 05/14/25 | (10 | ) | |||||
| JPMorgan Chase | HKD | 17,100 | Three Month HIBOR | 1.462 | % | 05/14/25 | 16 | ||||||
| JPMorgan Chase | HKD | 42,200 | Three Month HIBOR | 1.420 | % | 05/14/25 | 53 | ||||||
| JPMorgan Chase | CZK | 54,500 | Six Month PRIBOR | 0.490 | % | 06/19/25 | 40 | ||||||
| JPMorgan Chase | CZK | 133,000 | Six Month PRIBOR | 0.495 | % | 06/19/25 | 90 | ||||||
| JPMorgan Chase | CZK | 255,000 | Six Month PRIBOR | 1.280 | % | 06/19/25 | (543 | ) | |||||
| Merrill Lynch | USD | 76,416 | Three Month LIBOR | 1.267 | % | 05/15/23 | 1,061 | ||||||
| Total Fair Value on Open Interest Rate Swap Contracts Premiums Paid (Received) – ($14) (å) | 737 | ||||||||||||
| Credit Default Swap Contracts | |||||||||||||
| Amounts in thousands | |||||||||||||
| Credit Indices | |||||||||||||
| Fund (Pays)/ | |||||||||||||
| Receives | Termination | Fair Value | |||||||||||
| Reference Entity | Counterparty | Notional Amount | Fixed Rate | Date | $ | ||||||||
| CDX NA High Yield Index | Goldman Sachs | USD | 20,760 | 5.000 | % | 06/20/21 | 998 | ||||||
| Total Fair Value on Open Credit Indices Premiums Paid (Received) - $881 | 998 | ||||||||||||
See accompanying notes which are an integral part of the financial statements.
438 Russell Strategic Bond Fund
Russell Investment Company
Russell Strategic Bond Fund
Schedule of Investments, continued — October 31, 2016
| Presentation of Portfolio Holdings | ||||||||||||||||
| Amounts in thousands | ||||||||||||||||
| Fair Value | ||||||||||||||||
| Practical | ||||||||||||||||
| Portfolio Summary | Level 1 | Level 2 | Level 3 | Expedient (a) | Total | % of Net Assets | ||||||||||
| Long-Term Investments | ||||||||||||||||
| Asset-Backed Securities | $ | — | $ | 331,314 | $ | — | $ | — | $ | 331,314 | 6.0 | |||||
| Corporate Bonds and Notes | — | 1,040,403 | 1,675 | — | 1,042,078 | 18.9 | ||||||||||
| International Debt | — | 325,072 | — | — | 325,072 | 5.9 | ||||||||||
| Loan Agreements | — | 31,645 | — | — | 31,645 | 0.6 | ||||||||||
| Mortgage-Backed Securities | — | 1,332,657 | 4,802 | — | 1,337,459 | 24.2 | ||||||||||
| Municipal Bonds | — | 28,882 | — | — | 28,882 | 0.5 | ||||||||||
| Non-US Bonds | — | 288,107 | — | — | 288,107 | 5.2 | ||||||||||
| United States Government Agencies | — | 48,247 | — | — | 48,247 | 0.9 | ||||||||||
| United States Government Treasuries | — | 1,585,193 | — | — | 1,585,193 | 28.7 | ||||||||||
| Common Stocks | ||||||||||||||||
| Financial Services | — | — | — | — | — | |||||||||||
| Producer Durables | 2 | — | — | 2 | —* | |||||||||||
| Preferred Stocks | 2,911 | — | — | — | 2,911 | 0.1 | ||||||||||
| Options Purchased | 212 | 73 | — | — | 285 | —* | ||||||||||
| Short-Term Investments | — | 372,441 | — | 405,876 | 778,317 | 14.1 | ||||||||||
| Total Investments | 3,125 | 5,384,034 | 6,477 | 405,876 | 5,799,512 | 105.1 | ||||||||||
| Other Assets and Liabilities, Net | (5.1 | ) | ||||||||||||||
| 100.0 | ||||||||||||||||
| Other Financial Instruments | ||||||||||||||||
| Assets | ||||||||||||||||
| Futures Contracts | 9,107 | — | — | — | 9,107 | 0.2 | ||||||||||
| Foreign Currency Exchange Contracts | — | 7,984 | — | — | 7,984 | 0.1 | ||||||||||
| Interest Rate Swap Contracts | — | 1,303 | — | — | 1,303 | —* | ||||||||||
| Credit Default Swap Contracts | — | 998 | — | — | 998 | —* | ||||||||||
| Liabilities | ||||||||||||||||
| Futures Contracts | (6,664 | ) | — | — | — | (6,664 | ) | (0.1 | ) | |||||||
| Options Written | (191 | ) | (20 | ) | — | — | (211 | ) | (—)* | |||||||
| Foreign Currency Exchange Contracts | — | (11,696 | ) | — | — | (11,696 | ) | (0.2 | ) | |||||||
| Interest Rate Swap Contracts | — | (566 | ) | — | — | (566 | ) | (—)* | ||||||||
| Total Return Swap Contracts | — | (90 | ) | — | — | (90 | ) | (—)* | ||||||||
| Total Other Financial Instruments** | $ | 2,252 | $ | (2,087 | ) | $ | — | $ | — | $ | 165 | |||||
* Less than 0.05% of net assets.
** Futures and foreign currency exchange contract values reflect the unrealized appreciation (depreciation) on the investments.
(a) Certain investments that are measured at fair value using the net asset value per share (or its equivalent) practical expedient have not been classified
in the fair value levels. The fair value amounts presented in the table are intended to permit reconciliation to the amounts presented in the Schedule of
Investments.
For a description of the Levels see note 2 in the Notes to Financial Statements.
For a disclosure on transfers between Levels 1, 2 and 3 during the period ended October 31, 2016 see note 2 in the Notes to
Financial Statements.
See accompanying notes which are an integral part of the financial statements.
Russell Strategic Bond Fund 439
Russell Investment Company
Russell Strategic Bond Fund
Schedule of Investments, continued — October 31, 2016
Investments in which significant unobservable inputs (Level 3) were used in determining a fair value for the period ended October
31, 2016 were less than 1% of net assets.
See accompanying notes which are an integral part of the financial statements.
440 Russell Strategic Bond Fund
Russell Investment Company
Russell Strategic Bond Fund
Fair Value of Derivative Instruments — October 31, 2016
Amounts in thousands
| Foreign | ||||||||
| Credit | Currency | Interest Rate | ||||||
| Derivatives not accounted for as hedging instruments | Contracts | Contracts | Contracts | |||||
| Location: Statement of Assets and Liabilities - Assets | ||||||||
| Investments, at fair value* | $ | — | $ | 73 | $ | 212 | ||
| Unrealized appreciation on foreign currency exchange contracts | — | 7,984 | — | |||||
| Variation margin on futures contracts** | — | 8 | 9,099 | |||||
| Interest rate swap contracts, at fair value | — | — | 1,303 | |||||
| Credit default swap contracts, at fair value | 998 | — | — | |||||
| Total | $ | 998 | $ | 8,065 | $ | 10,614 | ||
| Location: Statement of Assets and Liabilities - Liabilities | ||||||||
| Variation margin on futures contracts** | $ | — | $ | — | $ | 6,664 | ||
| Unrealized depreciation on foreign currency exchange contracts | — | 11,696 | — | |||||
| Options written, at fair value | — | 20 | 191 | |||||
| Total return swap contracts, at fair value | — | — | 90 | |||||
| Interest rate swap contracts, at fair value | — | — | 566 | |||||
| Total | $ | — | $ | 11,716 | $ | 7,511 | ||
| Foreign | ||||||||
| Credit | Currency | Interest Rate | ||||||
| Derivatives not accounted for as hedging instruments | Contracts | Contracts | Contracts | |||||
| Location: Statement of Operations - Net realized gain (loss) | ||||||||
| Investments*** | $ | — | $ | (1,418 | ) | $ | (1,432 | ) |
| Futures contracts | — | (516 | ) | 31,631 | ||||
| Options written | — | 306 | 1,041 | |||||
| Total return swap contracts | — | — | 19,217 | |||||
| Interest rate swap contracts | — | — | (7,279 | ) | ||||
| Credit default swap contracts | 6,416 | — | — | |||||
| Foreign currency-related transactions**** | — | 9,478 | — | |||||
| Total | $ | 6,416 | $ | 7,850 | $ | 43,178 | ||
| Location: Statement of Operations - Net change in unrealized appreciation (depreciation) | ||||||||
| Investments***** | $ | — | $ | (49 | ) | $ | 214 | |
| Futures contracts | — | 8 | 4,591 | |||||
| Options written | — | 27 | (309 | ) | ||||
| Total return swap contracts | — | — | 47 | |||||
| Interest rate swap contracts | — | — | 3,774 | |||||
| Credit default swap contracts | 143 | — | — | |||||
| Foreign currency-related transactions****** | — | (3,942 | ) | — | ||||
| Total | $ | 143 | $ | (3,956 | ) | $ | 8,317 | |
* Fair value of purchased options.
** Includes cumulative appreciation/depreciation of futures contracts as reported in the Schedule of Investments. Only variation margin is reported within the
Statement of Assets and Liabilities.
*** Includes net realized gain (loss) on purchased options as reported in the Statement of Operations.
**** Only includes net realized gain (loss) on forward and spot contracts. May differ from the net realized gain (loss) on foreign currency-related transactions reported
within the Statement of Operations.
***** Includes net unrealized gain (loss) on purchased options as reported in the Schedule of Investments.
****** Only includes change in unrealized gain (loss) on forward and spot contracts. May differ from the net change in unrealized gain (loss) on foreign currency-related
transactions reported within the Statement of Operations.
For further disclosure on derivatives see note 2 in the Notes to Financial Statements.
See accompanying notes which are an integral part of the financial statements.
Russell Strategic Bond Fund 441
Russell Investment Company
Russell Strategic Bond Fund
Consolidated Balance Sheet Offsetting of Financial and Derivative Instruments —
October 31, 2016
| Amounts in thousands | |||||||||
| Offsetting of Financial Assets and Derivative Assets | |||||||||
| Gross | Net Amounts | ||||||||
| Amounts | of Assets | ||||||||
| Gross | Offset in the | Presented in | |||||||
| Amounts of | Statement of | the Statement | |||||||
| Recognized | Assets and | of Assets and | |||||||
| Description | Location: Statement of Assets and Liabilities - Assets | Assets | Liabilities | Liabilities | |||||
| Options Purchased Contracts | Investments, at fair value | $ | 285 | $ | — | $ | 285 | ||
| Foreign Currency Exchange Contracts | Unrealized appreciation on foreign currency exchange contracts | 7,984 | — | 7,984 | |||||
| Futures Contracts | Variation margin on futures contracts | 6,862 | — | 6,862 | |||||
| Interest Rate Swap Contracts | Interest rate swap contracts, at fair value | 1,303 | — | 1,303 | |||||
| Credit Default Swap Contracts | Credit default swap contracts, at fair value | 998 | — | 998 | |||||
| Total Financial and Derivative Assets | 17,432 | — | 17,432 | ||||||
| Financial and Derivative Assets not subject to a netting agreement | (9,133) | — | (9,133 | ) | |||||
| Total Financial and Derivative Assets subject to a netting agreement | $ | 8,299 | $ | — | $ | 8,299 | |||
| Financial Assets, Derivative Assets, and Collateral Held by Counterparty | ||||||||||
| Gross Amounts Not Offset in | ||||||||||
| the Statement of Assets and | ||||||||||
| Liabilities | ||||||||||
| Net Amounts | ||||||||||
| of Assets | ||||||||||
| Presented in | ||||||||||
| the Statement | Financial and | |||||||||
| of Assets and | Derivative | Collateral | ||||||||
| Counterparty | Liabilities | Instruments | Received^ | Net Amount | ||||||
| Bank of America | $ | 1,932 | $ | 1,922 | $ | — | $ | 10 | ||
| Bank of Montreal | 26 | 26 | — | — | ||||||
| Bank of New York | 362 | 362 | — | — | ||||||
| Barclays | 74 | 74 | — | — | ||||||
| Citigroup | 1,791 | 370 | — | 1,421 | ||||||
| Goldman Sachs | 111 | 20 | 91 | — | ||||||
| JPMorgan Chase | 2,572 | 2,304 | — | 268 | ||||||
| State Street | 1,324 | 1,324 | — | — | ||||||
| Toronto Dominion Bank | 107 | — | — | 107 | ||||||
| Total | $ | 8,299 | $ | 6,402 | $ | 91 | $ | 1,806 | ||
See accompanying notes which are an integral part of the financial statements.
442 Russell Strategic Bond Fund
Russell Investment Company
Russell Strategic Bond Fund
Consolidated Balance Sheet Offsetting of Financial and Derivative Instruments,
continued — October 31, 2016
| Amounts in thousands | |||||||||
| Offsetting of Financial Liabilities and Derivative Liabilities | |||||||||
| Gross | Net Amounts | ||||||||
| Amounts | of Liabilities | ||||||||
| Gross | Offset in the | Presented in | |||||||
| Amounts of | Statement of | the Statement | |||||||
| Recognized | Assets and | of Assets and | |||||||
| Description | Location: Statement of Assets and Liabilities - Liabilities | Liabilities | Liabilities | Liabilities | |||||
| Futures Contracts | Variation margin on futures contracts | $ | 643 | $ | — | $ | 643 | ||
| Foreign Currency Exchange Contracts | Unrealized depreciation on foreign currency exchange contracts | 11,696 | — | 11,696 | |||||
| Options Written Contracts | Options written, at fair value | 211 | — | 211 | |||||
| Total Return Swap Contracts | Total return swap contracts, at fair value | 90 | — | 90 | |||||
| Interest Rate Swap Contracts | Interest rate swap contracts, at fair value | 566 | — | 566 | |||||
| Total Financial and Derivative Liabilities | 13,206 | — | 13,206 | ||||||
| Financial and Derivative Liabilities not subject to a netting agreement | (834) | — | (834 | ) | |||||
| Total Financial and Derivative Liabilities subject to a netting agreement | $ | 12,372 | $ | — | $ | 12,372 | |||
| Financial Liabilities, Derivative Liabilities, and Collateral Pledged by Counterparty | |||||||||||
| Gross Amounts Not Offset in | |||||||||||
| the Statement of Assets and | |||||||||||
| Liabilities | |||||||||||
| Net Amounts | |||||||||||
| of Liabilities | |||||||||||
| Presented in | |||||||||||
| the Statement | Financial and | ||||||||||
| of Assets and | Derivative | Collateral | |||||||||
| Counterparty | Liabilities | Instruments | Pledged^ | Net Amount | |||||||
| Bank of America | $ | 3,912 | $ | 1,922 | $ | — | $ | 1,990 | |||
| Bank of Montreal | 1,031 | 26 | — | 1,005 | |||||||
| Bank of New York | 655 | 362 | — | 293 | |||||||
| Barclays | 286 | 74 | 212 | — | |||||||
| Citigroup | 372 | 370 | — | 2 | |||||||
| Goldman Sachs | 20 | 20 | — | — | |||||||
| JPMorgan Chase | 3,819 | 2,304 | 1,515 | — | |||||||
| State Street | 2,219 | 1,324 | — | 895 | |||||||
| UBS | 58 | — | — | 58 | |||||||
| Total | $ | 12,372 | $ | 6,402 | $ | 1,727 | $ | 4,243 | |||
* Fair value of securities on loan as reported in the footnotes to the Statement of Assets and Liabilities.
^ Collateral received or pledged amounts may not reconcile to those disclosed in the Statement of Assets and Liabilities due to the inclusion of off-Balance
Sheet collateral and adjustments made to exclude overcollateralization.
For further disclosure on derivatives and counterparty risk see note 2 in the Notes to Financial Statements.
See accompanying notes which are an integral part of the financial statements.
Russell Strategic Bond Fund 443
Russell Investment Company
Russell Strategic Bond Fund
Statement of Assets and Liabilities — October 31, 2016
| Amounts in thousands | ||
| Assets | ||
| Investments, at identified cost | $ | 5,774,170 |
| Investments, at fair value(>) | 5,799,512 | |
| Cash | 53,494 | |
| Cash (restricted)(a)(b)(c) | 31,259 | |
| Foreign currency holdings(^) | 8,484 | |
| Unrealized appreciation on foreign currency exchange contracts | 7,984 | |
| Receivables: | ||
| Dividends and interest | 31,462 | |
| Dividends from affiliated Russell funds | 227 | |
| Investments sold | 261,614 | |
| Fund shares sold | 6,988 | |
| Investments matured(<) | 1,589 | |
| Variation margin on futures contracts | 6,862 | |
| Other receivable | 124 | |
| Interest rate swap contracts, at fair value(•) | 1,303 | |
| Credit default swap contracts, at fair value(+) | 998 | |
| Total assets | 6,211,900 | |
| Liabilities | ||
| Payables: | ||
| Due to broker (d)(e)(f) | 3,280 | |
| Investments purchased | 667,701 | |
| Fund shares redeemed | 4,345 | |
| Accrued fees to affiliates | 3,111 | |
| Other accrued expenses | 632 | |
| Variation margin on futures contracts | 643 | |
| Other payable | 171 | |
| Unrealized depreciation on foreign currency exchange contracts | 11,696 | |
| Options written, at fair value(x) | 211 | |
| Total return swap contracts, at fair value(8) | 90 | |
| Interest rate swap contracts, at fair value(•) | 566 | |
| Total liabilities | 692,446 | |
| Commitments and Contingencies (1) | ||
| Net Assets | $ | 5,519,454 |
| (1) See note 9 in the Notes to Financial Statements for a detailed description of commitments and contingencies. | ||
See accompanying notes which are an integral part of the financial statements.
444 Russell Strategic Bond Fund
Russell Investment Company
Russell Strategic Bond Fund
Statement of Assets and Liabilities, continued — October 31, 2016
| Amounts in thousands | |||
| Net Assets Consist of: | |||
| Undistributed (overdistributed) net investment income | $ | 15,061 | |
| Accumulated net realized gain (loss) | 128,423 | ||
| Unrealized appreciation (depreciation) on: | |||
| Investments | 25,342 | ||
| Futures contracts | 2,443 | ||
| Options written | 258 | ||
| Total return swap contracts | (90 | ) | |
| Interest rate swap contracts | 751 | ||
| Credit default swap contracts | 117 | ||
| Investments matured | (189 | ) | |
| Foreign currency-related transactions | (3,901 | ) | |
| Other investments | (1,723 | ) | |
| Shares of beneficial interest | 4,952 | ||
| Additional paid-in capital | 5,348,010 | ||
| Net Assets | $ | 5,519,454 | |
| Net Asset Value, offering and redemption price per share: | |||
| Net asset value per share: Class A(#) | $ | 11.18 | |
| Maximum offering price per share (Net asset value plus sales charge of 3.75%): Class A | $ | 11.62 | |
| Class A — Net assets | $ | 56,662,911 | |
| Class A — Shares outstanding ($.01 par value) | 5,069,653 | ||
| Net asset value per share: Class C(#) | $ | 11.16 | |
| Class C — Net assets | $ | 57,161,309 | |
| Class C — Shares outstanding ($.01 par value) | 5,120,483 | ||
| Net asset value per share: Class E(#) | $ | 11.09 | |
| Class E — Net assets | $ | 133,208,697 | |
| Class E — Shares outstanding ($.01 par value) | 12,012,294 | ||
| Net asset value per share: Class I(#) | $ | 11.05 | |
| Class I — Net assets | $ | 1,142,324,523 | |
| Class I — Shares outstanding ($.01 par value) | 103,361,888 | ||
| Net asset value per share: Class R6(#) | $ | 11.09 | |
| Class R6 — Net assets | $ | 674,231 | |
| Class R6 — Shares outstanding ($.01 par value) | 60,811 | ||
| Net asset value per share: Class S(#) | $ | 11.21 | |
| Class S — Net assets | $ | 3,123,603,602 | |
| Class S — Shares outstanding ($.01 par value) | 278,636,201 | ||
| Net asset value per share: Class Y(#) | $ | 11.07 | |
| Class Y — Net assets | $ | 1,005,818,285 | |
| Class Y — Shares outstanding ($.01 par value) | 90,890,447 | ||
| Amounts in thousands | |||
| (^) Foreign currency holdings - cost | $ | 8,640 | |
| (x) Premiums received on options written | $ | 469 | |
| (+) Credit default swap contracts - premiums paid (received) | $ | 881 | |
| (•) Interest rate swap contracts - premiums paid (received) | $ | (14 | ) |
| (<) Investments matured - cost | $ | 1,777 | |
| (>) Investments in affiliates, Russell U.S. Cash Management Fund | $ | 405,876 | |
| (a) Cash Collateral for Futures | $ | 24,417 | |
| (b) Cash Collateral for Swaps | $ | 6,756 | |
| (c) Cash Collateral for TBAs | $ | 86 | |
| (d) Due to Broker for Futures | $ | 64 | |
| (e) Due to Broker for Swaps | $ | 2,991 | |
| (f) Due to Broker for TBAs | $ | 225 | |
| (#) Net asset value per share equals class level net assets divided by class level shares of beneficial interest outstanding. | |||
See accompanying notes which are an integral part of the financial statements.
Russell Strategic Bond Fund 445
Russell Investment Company
Russell Strategic Bond Fund
Statement of Operations — For the Period Ended October 31, 2016
| Amounts in thousands | |||
| Investment Income | |||
| Dividends | $ | 435 | |
| Dividends from affiliated Russell funds | 2,901 | ||
| Interest | 147,811 | ||
| Total investment income | 151,147 | ||
| Expenses | |||
| Advisory fees | 28,137 | ||
| Administrative fees | 2,784 | ||
| Custodian fees (1) | 998 | ||
| Distribution fees - Class A | 145 | ||
| Distribution fees - Class C | 447 | ||
| Transfer agent fees - Class A | 116 | ||
| Transfer agent fees - Class C | 119 | ||
| Transfer agent fees - Class E | 243 | ||
| Transfer agent fees - Class I | 1,344 | ||
| Transfer agent fees - Class R6 | —** | ||
| Transfer agent fees - Class S | 6,242 | ||
| Transfer agent fees - Class Y | 57 | ||
| Professional fees | 339 | ||
| Registration fees | 181 | ||
| Shareholder servicing fees - Class C | 149 | ||
| Shareholder servicing fees - Class E | 303 | ||
| Trustees’ fees | 191 | ||
| Printing fees | 403 | ||
| Miscellaneous | 130 | ||
| Expenses before reductions | 42,328 | ||
| Expense reductions | (2,598 | ) | |
| Net expenses | 39,730 | ||
| Net investment income (loss) | 111,417 | ||
| Net Realized and Unrealized Gain (Loss) | |||
| Net realized gain (loss) on: | |||
| Investments | 69,857 | ||
| Futures contracts | 31,115 | ||
| Options written | 1,347 | ||
| Total return swap contracts | 19,217 | ||
| Interest rate swap contracts | (7,279 | ) | |
| Credit default swap contracts | 6,416 | ||
| Foreign currency-related transactions | 9,041 | ||
| Net realized gain (loss) | 129,714 | ||
| Net change in unrealized appreciation (depreciation) on: | |||
| Investments | 33,022 | ||
| Futures contracts | 4,599 | ||
| Options written | (282 | ) | |
| Total return swap contracts | 47 | ||
| Interest rate swap contracts | 3,774 | ||
| Credit default swap contracts | 143 | ||
| Investment matured | (189 | ) | |
| Foreign currency-related transactions | (3,755 | ) | |
| Other investments | 59 | ||
| Net change in unrealized appreciation (depreciation) | 37,418 | ||
| Net realized and unrealized gain (loss) | 167,132 | ||
See accompanying notes which are an integral part of the financial statements.
446 Russell Strategic Bond Fund
Russell Investment Company
Russell Strategic Bond Fund
Statement of Operations — For the Period Ended October 31, 2016
| Amounts in thousands | ||
| Net Increase (Decrease) in Net Assets from Operations | $ | 278,549 |
| ** Less than $500. | ||
| (1) Includes a reimbursement for overbilling of custody out-of-pocket fees from prior years. See note 10 in the Notes to Financial Statements. | ||
See accompanying notes which are an integral part of the financial statements.
Russell Strategic Bond Fund 447
Russell Investment Company
Russell Strategic Bond Fund
Statements of Changes in Net Assets
| For the Periods Ended October 31, | ||||||
| Amounts in thousands | 2016 | 2015 | ||||
| Increase (Decrease) in Net Assets | ||||||
| Operations | ||||||
| Net investment income (loss) | $ | 111,417 | $ | 107,354 | ||
| Net realized gain (loss) | 129,714 | 131,446 | ||||
| Net change in unrealized appreciation (depreciation) | 37,418 | (108,357 | ) | |||
| Net increase (decrease) in net assets from operations | 278,549 | 130,443 | ||||
| Distributions | ||||||
| From net investment income | ||||||
| Class A | (1,012 | ) | (893 | ) | ||
| Class C | (629 | ) | (572 | ) | ||
| Class E | (2,179 | ) | (2,136 | ) | ||
| Class I | (23,706 | ) | (22,492 | ) | ||
| Class R6 | (3 | ) | — | |||
| Class S | (64,492 | ) | (65,820 | ) | ||
| Class Y | (29,383 | ) | (33,141 | ) | ||
| From net realized gain | ||||||
| Class A | (852 | ) | (1,283 | ) | ||
| Class C | (966 | ) | (1,354 | ) | ||
| Class E | (1,887 | ) | (2,908 | ) | ||
| Class I | (17,991 | ) | (24,276 | ) | ||
| Class S | (51,248 | ) | (80,024 | ) | ||
| Class Y | (22,781 | ) | (34,970 | ) | ||
| Net decrease in net assets from distributions | (217,129 | ) | (269,869 | ) | ||
| Share Transactions* | ||||||
| Net increase (decrease) in net assets from share transactions | (740,336 | ) | (987,593 | ) | ||
| Total Net Increase (Decrease) in Net Assets | (678,916 | ) | (1,127,019 | ) | ||
| Net Assets | ||||||
| Beginning of period | 6,198,370 | 7,325,389 | ||||
| End of period | $ | 5,519,454 | $ | 6,198,370 | ||
| Undistributed (overdistributed) net investment income included in net assets | $ | 15,061 | $ | 33,571 | ||
See accompanying notes which are an integral part of the financial statements.
448 Russell Strategic Bond Fund
Russell Investment Company
Russell Strategic Bond Fund
Statements of Changes in Net Assets, continued
* Share transaction amounts (in thousands) for the periods ended October 31, 2016 and October 31, 2015 were as follows:
| 2016 | 2015 | |||||||||||
| Shares | Dollars | Shares | Dollars | |||||||||
| Class A | ||||||||||||
| Proceeds from shares sold | 1,464 | $ | 15,992 | 1,460 | $ | 16,262 | ||||||
| Proceeds from reinvestment of distributions | 168 | 1,820 | 195 | 2,160 | ||||||||
| Payments for shares redeemed | (1,467 | ) | (16,206 | ) | (2,508 | ) | (27,827 | ) | ||||
| Net increase (decrease) | 165 | 1,606 | (853 | ) | (9,405 | ) | ||||||
| Class C | ||||||||||||
| Proceeds from shares sold | 563 | 6,198 | 812 | 9,052 | ||||||||
| Proceeds from reinvestment of distributions | 147 | 1,575 | 173 | 1,913 | ||||||||
| Payments for shares redeemed | (1,252 | ) | (13,764 | ) | (1,493 | ) | (16,575 | ) | ||||
| Net increase (decrease) | (542 | ) | (5,991 | ) | (508 | ) | (5,610 | ) | ||||
| Class E | ||||||||||||
| Proceeds from shares sold | 2,842 | 31,560 | 927 | 10,243 | ||||||||
| Proceeds from reinvestment of distributions | 354 | 3,794 | 422 | 4,633 | ||||||||
| Payments for shares redeemed | (2,165 | ) | (23,668 | ) | (3,445 | ) | (37,876 | ) | ||||
| Net increase (decrease) | 1,031 | 11,686 | (2,096 | ) | (23,000 | ) | ||||||
| Class I | ||||||||||||
| Proceeds from shares sold | 22,335 | 244,249 | 18,967 | 208,936 | ||||||||
| Proceeds from reinvestment of distributions | 3,858 | 41,237 | 4,225 | 46,261 | ||||||||
| Payments for shares redeemed | (29,972 | ) | (324,761 | ) | (25,013 | ) | (274,838 | ) | ||||
| Net increase (decrease) | (3,779 | ) | (39,275 | ) | (1,821 | ) | (19,641 | ) | ||||
| Class R6(1) | ||||||||||||
| Proceeds from shares sold | 61 | 676 | — | — | ||||||||
| Proceeds from reinvestment of distributions | —** | 3 | — | — | ||||||||
| Payments for shares redeemed | —** | (3 | ) | — | — | |||||||
| Net increase (decrease) | 61 | 676 | — | — | ||||||||
| Class S | ||||||||||||
| Proceeds from shares sold | 70,965 | 789,298 | 68,318 | 761,817 | ||||||||
| Proceeds from reinvestment of distributions | 10,554 | 114,325 | 13,031 | 144,624 | ||||||||
| Payments for shares redeemed | (103,329 | ) | (1,138,615 | ) | (139,848 | ) | (1,558,632 | ) | ||||
| Net increase (decrease) | (21,810 | ) | (234,992 | ) | (58,499 | ) | (652,191 | ) | ||||
| Class Y | ||||||||||||
| Proceeds from shares sold | 6,591 | 71,207 | 10,527 | 116,057 | ||||||||
| Proceeds from reinvestment of distributions | 4,879 | 52,164 | 6,210 | 68,112 | ||||||||
| Payments for shares redeemed | (54,713 | ) | (597,417 | ) | (42,052 | ) | (461,915 | ) | ||||
| Net increase (decrease) | (43,243 | ) | (474,046 | ) | (25,315 | ) | (277,746 | ) | ||||
| Total increase (decrease) | (68,117 | ) | $ | (740,336 | ) | (89,092 | ) | $ | (987,593 | ) | ||
** Less than 500 shares.
(1) For the period March 1, 2016 (commencement of operations) to October 31, 2016.
See accompanying notes which are an integral part of the financial statements.
Russell Strategic Bond Fund 449
Russell Investment Company
Russell Strategic Bond Fund
Financial Highlights — For the Periods Ended
For a Share Outstanding Throughout Each Period.
| $ | $ | $ | $ | $ | $ | |||||||||||
| Net Asset Value, | Net | Net Realized | Total from | Distributions | Distributions | |||||||||||
| Beginning of | Investment | and Unrealized | Investment | from Net | from Net | |||||||||||
| Period | Income (Loss)(a)(d) | Gain (Loss) | Operations | Investment Income | Realized Gain | |||||||||||
| Class A | ||||||||||||||||
| October 31, 2016 | 11.04 | .18 | .33 | .51 | (.20 | ) | (.17 | ) | ||||||||
| October 31, 2015 | 11.26 | .14 | .03 | .17 | (.17 | ) | (.22 | ) | ||||||||
| October 31, 2014 | 11.01 | .15 | .29 | .44 | (.14 | ) | (.05 | ) | ||||||||
| October 31, 2013 | 11.50 | .17 | (.24 | ) | (.07 | ) | (.18 | ) | (.24 | ) | ||||||
| October 31, 2012 | 10.95 | .26 | .64 | .90 | (.25 | ) | (.10 | ) | ||||||||
| Class C | ||||||||||||||||
| October 31, 2016 | 11.02 | .10 | .33 | .43 | (.12 | ) | (.17 | ) | ||||||||
| October 31, 2015 | 11.25 | .06 | .03 | .09 | (.10 | ) | (.22 | ) | ||||||||
| October 31, 2014 | 11.01 | .07 | .27 | .34 | (.05 | ) | (.05 | ) | ||||||||
| October 31, 2013 | 11.49 | .08 | (.23 | ) | (.15 | ) | (.09 | ) | (.24 | ) | ||||||
| October 31, 2012 | 10.95 | .17 | .64 | .81 | (.17 | ) | (.10 | ) | ||||||||
| Class E | ||||||||||||||||
| October 31, 2016 | 10.95 | .18 | .33 | .51 | (.20 | ) | (.17 | ) | ||||||||
| October 31, 2015 | 11.18 | .14 | .02 | .16 | (.17 | ) | (.22 | ) | ||||||||
| October 31, 2014 | 10.94 | .15 | .28 | .43 | (.14 | ) | (.05 | ) | ||||||||
| October 31, 2013 | 11.42 | .16 | (.22 | ) | (.06 | ) | (.18 | ) | (.24 | ) | ||||||
| October 31, 2012 | 10.88 | .26 | .64 | .90 | (.26 | ) | (.10 | ) | ||||||||
| Class I | ||||||||||||||||
| October 31, 2016 | 10.92 | .21 | .32 | .53 | (.23 | ) | (.17 | ) | ||||||||
| October 31, 2015 | 11.14 | .17 | .04 | .21 | (.21 | ) | (.22 | ) | ||||||||
| October 31, 2014 | 10.91 | .18 | .28 | .46 | (.18 | ) | (.05 | ) | ||||||||
| October 31, 2013 | 11.39 | .20 | (.23 | ) | (.03 | ) | (.21 | ) | (.24 | ) | ||||||
| October 31, 2012 | 10.85 | .29 | .64 | .93 | (.29 | ) | (.10 | ) | ||||||||
| Class R6 | ||||||||||||||||
| October 31, 2016(8) | 10.71 | .14 | .34 | .48 | (.10 | ) | — | |||||||||
| Class S | ||||||||||||||||
| October 31, 2016 | 11.07 | .21 | .33 | .54 | (.23 | ) | (.17 | ) | ||||||||
| October 31, 2015 | 11.29 | .17 | .03 | .20 | (.20 | ) | (.22 | ) | ||||||||
| October 31, 2014 | 11.05 | .18 | .28 | .46 | (.17 | ) | (.05 | ) | ||||||||
| October 31, 2013 | 11.53 | .19 | (.22 | ) | (.03 | ) | (.21 | ) | (.24 | ) | ||||||
| October 31, 2012 | 10.98 | .28 | .65 | .93 | (.28 | ) | (.10 | ) | ||||||||
| Class Y | ||||||||||||||||
| October 31, 2016 | 10.93 | .23 | .33 | .56 | (.25 | ) | (.17 | ) | ||||||||
| October 31, 2015 | 11.15 | .19 | .03 | .22 | (.22 | ) | (.22 | ) | ||||||||
| October 31, 2014 | 10.92 | .19 | .27 | .46 | (.18 | ) | (.05 | ) | ||||||||
| October 31, 2013 | 11.40 | .21 | (.22 | ) | (.01 | ) | (.23 | ) | (.24 | ) | ||||||
| October 31, 2012 | 10.86 | .30 | .64 | .94 | (.30 | ) | (.10 | ) | ||||||||
See accompanying notes which are an integral part of the financial statements.
450 Russell Strategic Bond Fund
| % | % | % | |||||||||||||||
| $ | $ | Ratio of Expenses | Ratio of Expenses | Ratio of Net | |||||||||||||
| Net Asset Value, | % | Net Assets, | to Average | to Average | Investment Income | % | |||||||||||
| $ | End of | Total | End of Period | Net Assets, | Net Assets, | to Average | Portfolio | ||||||||||
| Total Distributions | Period | Return(c) | (000 | ) | Gross(d) | Net(d) | Net Assets(d) | Turnover Rate(k) | |||||||||
| (.37 | ) | 11.18 | 4.79 | 56,663 | 1.02 | .96 | 1.66 | 203 | |||||||||
| (.39 | ) | 11.04 | 1.57 | 54,123 | 1.04 | .98 | 1.29 | 152 | |||||||||
| (.19 | ) | 11.26 | 4.03 | 64,810 | 1.03 | 1.00 | 1.35 | 133 | |||||||||
| (.42 | ) | 11.01 | (.62 | ) | 64,310 | 1.03 | 1.01 | 1.50 | 104 | ||||||||
| (.35 | ) | 11.50 | 8.44 | 101,799 | 1.02 | 1.00 | 2.32 | 186 | |||||||||
| (.29 | ) | 11.16 | 3.92 | 57,161 | 1.77 | 1.71 | .91 | 203 | |||||||||
| (.32 | ) | 11.02 | .78 | 62,412 | 1.79 | 1.73 | .54 | 152 | |||||||||
| (.10 | ) | 11.25 | 3.15 | 69,413 | 1.78 | 1.75 | .60 | 133 | |||||||||
| (.33 | ) | 11.01 | (1.34 | ) | 81,015 | 1.78 | 1.76 | .74 | 104 | ||||||||
| (.27 | ) | 11.49 | 7.56 | 107,160 | 1.77 | 1.75 | 1.56 | 186 | |||||||||
| (.37 | ) | 11.09 | 4.84 | 133,209 | 1.02 | .96 | 1.65 | 203 | |||||||||
| (.39 | ) | 10.95 | 1.50 | 120,286 | 1.04 | .98 | 1.29 | 152 | |||||||||
| (.19 | ) | 11.18 | 3.96 | 146,158 | 1.03 | 1.00 | 1.34 | 133 | |||||||||
| (.42 | ) | 10.94 | (.59 | ) | 182,211 | 1.03 | 1.02 | 1.46 | 104 | ||||||||
| (.36 | ) | 11.42 | 8.46 | 164,834 | 1.02 | .97 | 2.33 | 186 | |||||||||
| (.40 | ) | 11.05 | 5.06 | 1,142,325 | .69 | .67 | 1.94 | 203 | |||||||||
| (.43 | ) | 10.92 | 1.89 | 1,169,757 | .71 | .69 | 1.58 | 152 | |||||||||
| (.23 | ) | 11.14 | 4.20 | 1,214,059 | .70 | .70 | 1.64 | 133 | |||||||||
| (.45 | ) | 10.91 | (.24 | ) | 1,272,388 | .70 | .70 | 1.79 | 104 | ||||||||
| (.39 | ) | 11.39 | 8.78 | 1,312,829 | .69 | .69 | 2.63 | 186 | |||||||||
| (.10 | ) | 11.09 | 4.48 | 674 | .61 | .58 | 1.93 | 203 | |||||||||
| (.40 | ) | 11.21 | 5.04 | 3,123,604 | .78 | .71 | 1.91 | 203 | |||||||||
| (.42 | ) | 11.07 | 1.82 | 3,325,522 | .79 | .73 | 1.54 | 152 | |||||||||
| (.22 | ) | 11.29 | 4.19 | 4,052,322 | .78 | .75 | 1.60 | 133 | |||||||||
| (.45 | ) | 11.05 | (.34 | ) | 4,152,586 | .78 | .76 | 1.72 | 104 | ||||||||
| (.38 | ) | 11.53 | 8.71 | 3,773,716 | .77 | .75 | 2.55 | 186 | |||||||||
| (.42 | ) | 11.07 | 5.27 | 1,005,818 | .58 | .55 | 2.07 | 203 | |||||||||
| (.44 | ) | 10.93 | 2.00 | 1,466,270 | .59 | .57 | 1.70 | 152 | |||||||||
| (.23 | ) | 11.15 | 4.31 | 1,778,627 | .59 | .59 | 1.75 | 133 | |||||||||
| (.47 | ) | 10.92 | (.15 | ) | 2,522,793 | .58 | .58 | 1.90 | 104 | ||||||||
| (.40 | ) | 11.40 | 8.89 | 2,585,753 | .59 | .59 | 2.73 | 186 | |||||||||
See accompanying notes which are an integral part of the financial statements.
Russell Strategic Bond Fund 451
Russell Investment Company
Russell Strategic Bond Fund
Related Party Transactions, Fees and Expenses
| Accrued fees payable to affiliates for the period ended October 31, 2016 were as follows: | ||
| Advisory fees | $ | 2,195,487 |
| Administration fees | 227,647 | |
| Distribution fees | 49,012 | |
| Shareholder servicing fees | 40,477 | |
| Transfer agent fees | 579,446 | |
| Trustee fees | 18,844 | |
| $ | 3,110,913 | |
| Transactions (amounts in thousands) during the period ended October 31, 2016 with Underlying Funds which are, or were, an | ||||||||||||||||
| affiliated company are as follows: | ||||||||||||||||
| Fair Value, | Change in | |||||||||||||||
| Beginning of | Realized Gain | Unrealized | Fair Value, End | Income | Capital Gains | |||||||||||
| Period | Purchases | Sales | (Loss) | Gain (Loss) | of Period | Distributions | Distributions | |||||||||
| Russell U.S. Cash Management Fund $ | 792,929 | $ | 7,667,335 | $ | 8,054,416 | $ | — | $ | 28 | $ | 405,876 | $ | 2,901 | $ | — | |
| $ | 792,929 | $ | 7,667,335 | $ | 8,054,416 | $ | — | $ | 28 | $ | 405,876 | $ | 2,901 | $ | — | |
Federal Income Taxes
At October 31, 2016, the cost of investments and net unrealized appreciation (depreciation), undistributed ordinary income and
undistributed long-term capital gains for income tax purposes were as follows:.
| Cost of Investments | $ | 5,785,058,969 | |||
| Unrealized Appreciation | $ | 47,467,493 | |||
| Unrealized Depreciation | (33,014,718 | ) | |||
| Net Unrealized Appreciation (Depreciation) | $ | 14,452,775 | |||
| Undistributed Ordinary Income | $ | 132,514,282 | |||
| Undistributed Long-Term Capital Gains | |||||
| (Capital Loss Carryforward) | $ | 30,866,145 | |||
| Tax Composition of Distributions | |||||
| Ordinary Income | $ | 182,988,962 | |||
| Long-Term Capital Gains | $ | 34,140,530 | |||
Net investment income and net realized gains (loss) in the financial statements may differ from taxable net investment income and net
realized gains (losses). Capital accounts within the financial statements are adjusted for permanent book-tax differences. Book-tax
differences are primarily due to foreign currency gains and losses, reclassifications of dividends, differences in treatment of income
from swaps, net operating losses, investments in partnerships, investments in passive foreign investment companies (PFICs), tax
straddle transaction, use of tax equalization and foreign capital gains taxes. These adjustments have no impact on the net assets.
At October 31, 2016, the Statement of Assets and Liabilities have been adjusted by the following amounts (in thousands):
| Undistributed net investment income | $ | (8,523 | ) |
| Accumulated net realized gain (loss) | 8,522 | ||
| Additional paid-in capital | 1 |
See accompanying notes which are an integral part of the financial statements.
452 Russell Strategic Bond Fund
Russell Investment Company
Russell Investment Grade Bond Fund
Portfolio Management Discussion and Analysis — October 31, 2016 (Unaudited)

| Russell Investment Grade Bond Fund - Class A‡ | Russell Investment Grade Bond Fund - Class R6‡‡‡ | ||||||
| Total | Total | ||||||
| Return | Return | ||||||
| 1 Year | 0.53 | % | 1 Year | 4.93 | % | ||
| 5 Years | 2.20 | %§ | 5 Years | 3.44 | %§ | ||
| 10 Years | 4.13 | %§ | 10 Years | 4.93 | %§ | ||
| Russell Investment Grade Bond Fund - Class C‡‡ | Russell Investment Grade Bond Fund - Class S‡‡‡‡ | ||||||
| Total | Total | ||||||
| Return | Return | ||||||
| 1 Year | 3.68 | % | 1 Year | 4.68 | % | ||
| 5 Years | 2.22 | %§ | 5 Years | 3.24 | %§ | ||
| 10 Years | 3.77 | %§ | 10 Years | 4.74 | %§ | ||
| Russell Investment Grade Bond Fund - Class E | Russell Investment Grade Bond Fund - Class Y | ||||||
| Total | Total | ||||||
| Return | Return | ||||||
| 1 Year | 4.45 | % | 1 Year | 4.93 | % | ||
| 5 Years | 3.00 | %§ | 5 Years | 3.44 | %§ | ||
| 10 Years | 4.54 | %§ | 10 Years | 4.93 | %§ | ||
| Russell Investment Grade Bond Fund - Class I | Bloomberg Barclays U.S. Aggregate Bond Index**C | ||||||
| Total | Total | ||||||
| Return | Return | ||||||
| 1 Year | 4.76 | % | 1 Year | 4.37 | % | ||
| 5 Years | 3.33 | %§ | 5 Years | 2.90 | %§ | ||
| 10 Years | 4.83 | %§ | 10 Years | 4.64 | %§ | ||
Russell Investment Grade Bond Fund 453
Russell Investment Company
Russell Investment Grade Bond Fund
Portfolio Management Discussion and Analysis, continued — October 31, 2016
(Unaudited)
| The Russell Investment Grade Bond Fund (the “Fund”) employs | environment, the Fund’s strategic overweight to credit provided a |
| a multi-manager approach whereby portions of the Fund are | tailwind to benchmark relative performance. |
| allocated to different money manager strategies. Fund assets not | The Fund’s global strategies also added value over the period. In |
| allocated to money managers are managed by Russell Investment | particular, the convergence of bond yields globally was a boost |
| Management, LLC (“RIM”), the Fund’s advisor. RIM may change | to the performance of the Fund’s bias toward higher real yield |
| the allocation of the Fund’s assets among money managers at | government bonds. |
| any time. An exemptive order from the Securities and Exchange | |
| Commission (“SEC”) permits RIM to engage or terminate a money | How did the investment strategies and techniques employed |
| manager at any time, subject to approval by the Fund’s Board, | by the Fund and its money managers affect its benchmark- |
| without a shareholder vote. Pursuant to the terms of the exemptive | relative performance? |
| order, the Fund is required to notify its shareholders within 90 | The Fund employs discretionary money managers. The Fund’s |
| days of when a money manager begins providing services. As of | discretionary money managers select the individual portfolio |
| October 31, 2016, the Fund had four money managers. | securities for the assets assigned to them. Fund assets not |
| What is the Fund’s investment objective? | allocated to discretionary money managers include the Fund’s |
| The Fund seeks to provide current income and the preservation | liquidity reserves and assets which may be managed directly by |
| of capital. | RIM to effect the Fund’s investment strategies and/or to actively |
| manage the Fund’s overall exposures by investing in securities or | |
| How did the Fund perform relative to its benchmark for the | other instruments that RIM believes will achieve the desired risk/ |
| fiscal year ended October 31, 2016? | return profile for the Fund. |
| For the fiscal year ended October 31, 2016, the Fund’s Class A, | With respect to certain of the Fund’s money managers, Loomis |
| Class C, Class E, Class I, Class R6, Class S, and Class Y Shares | Sayles & Company, L.P. (“Loomis”) was the best performing |
| gained 4.47%, 3.68%, 4.45%, 4.76%, 4.93%, 4.68% and 4.93%, | manager over the period. Loomis benefitted from relatively |
| respectively. This is compared to the Fund’s benchmark, the | conservative credit positioning coming into the period. They then |
| Bloomberg Barclays U.S. Aggregate Bond Index, which gained | increased credit risk as prices fell and generated particularly |
| 4.37% during the same period. The Fund’s performance includes | strong performance from purchases of energy and emerging |
| operating expenses, whereas index returns are unmanaged and do | market issuers such as Petrobras, which rallied strong off the |
| not include expenses of any kind. | bottoms. |
| For the fiscal year ended October 31, 2016, the Morningstar® | Neuberger Berman Investment Advisers LLC (“Neuberger”) was |
| Intermediate-Term Bond Category, a group of funds that | the worst performing manager over the period but still modestly |
| Morningstar considers to have investment strategies similar to | outperformed the benchmark. Neuberger’s enhanced index style |
| those of the Fund, gained 4.33%. This return serves as a peer | is naturally more conservative than other fully active managers |
| comparison and is expressed net of operating expenses. | within the Fund. As a result, they lagged behind other managers |
| RIM may assign a money manager a benchmark other than the | during a year in which aggressive risk taking was rewarded. |
| Fund’s index. However, the Fund’s primary index remains the | During the period, RIM utilized futures and swaps to seek to |
| benchmark for the Fund. | achieve the Fund benchmark’s duration exposures with respect to |
| the portion of the Fund allocated to cash reserves. This performed | |
| How did the market conditions described in the Market | as intended and was a positive in terms of absolute return |
| Summary report affect the Fund’s performance? | contribution, but lagged the benchmark as credit derivatives |
| The fiscal year ended October 31, 2016 was characterized | underperformed the cash bonds in the index. |
| by a sharply risk off market early in the period followed by a | |
| similar sharp rebound and extended rally in risky assets (e.g., | RIM also managed a three-pronged strategy to seek to generate |
| lower rated credit and emerging market currencies). Overall, this | active returns through currency positioning by supplementing the |
| proved positive for most fixed income sectors around the globe. | Fund’s existing active currency mandate with a more mechanistic |
| Yield curves on global government bonds tended to flatten over | strategy and to further reduce the Fund’s reliance on traditional |
| the period supporting longer maturity bonds and the asset class | fixed income market risks. This approach incorporates a currency |
| in general. Corporate and emerging sovereign credit markets | overlay, an index replication and an enhanced cash strategy. |
| suffered from December to February, but returns turned positive | The currency overlay utilizes currency forward contracts to take |
| as the year went on and eventually very significantly so. In this | long and short positions in global foreign exchange markets. |
| Because the currency overlay is an out-of-benchmark position, | |
| RIM managed an index replication strategy in connection with |
454 Russell Investment Grade Bond Fund
Russell Investment Company
Russell Investment Grade Bond Fund
Portfolio Management Discussion and Analysis, continued — October 31, 2016
(Unaudited)
| the currency overlay to provide benchmark-like exposure to | manager. In September 2016, Schroder Investment Management | |
| its overall strategy. The enhanced cash strategy is designed to | North America Inc. was a hired as a securitized credit specialist. | |
| provide for modest returns on the cash held in connection with the | In September 2016, Logan Circle Partners, L.P.’s manager-level | |
| currency overlay and index replication strategies. Over the fiscal | benchmark was changed from the Fund benchmark to a corporate- | |
| year, the currency overlay strategy was positive for the Fund’s | only index making them the Fund’s corporate specialist. | |
| benchmark-relative performance, but the benchmark replication | ||
| strategy underperformed due to its reliance on derivatives rather | Money Managers as of October 31, | |
| than cash bonds. | 2016 | Styles |
| Logan Circle Partners, L.P. | Sector Specialist | |
| RIM also implemented a strategy using global government | Loomis, Sayles & Company, L.P. | Fully Discretionary |
| bond futures to capture the performance of higher real yield | Neuberger Berman Investment Advisers | |
| government bonds versus lower yielding ones. This strategy had a | LLC | Enhanced Core |
| considerably positive impact on performance over the summer as | Schroder Investment Management North | |
| Brexit accelerated the convergence of real rates globally. RIM also | America Inc. | Sector Specialist |
| implemented a global real yield strategy using global government | ||
| bond futures to take long positions in high quality government | The views expressed in this report reflect those of the | |
| bonds whose net-of-inflation yields are expected to be relatively | portfolio managers only through the end of the period | |
| high and short positions where net-of-inflation yield is expected | covered by the report. These views do not necessarily | |
| to be relatively low. This strategy had a considerably positive | represent the views of RIM or any other person in RIM or | |
| impact on performance over the summer as Brexit accelerated the | any other affiliated organization. These views are subject | |
| convergence of real interest rates globally. | to change at any time based upon market conditions or | |
| Additionally, RIM purchased long corporate credit to take | other events, and RIM disclaims any responsibility to | |
| advantage of wide corporate bond spreads. This added value as | update the views contained herein. These views should not | |
| spreads continued to tighten throughout the year. | be relied on as investment advice and, because investment | |
| decisions for a Russell Investment Company (“RIC”) Fund | ||
| Describe any changes to the Fund’s structure or the money | are based on numerous factors, should not be relied on as | |
| manager line-up. | an indication of investment decisions of any RIC Fund. | |
| A number of changes were affected over the period. In June 2016, | ||
| Principal Global Investors LLC was terminated as a currency | ||
Russell Investment Grade Bond Fund 455
Russell Investment Company
Russell Investment Grade Bond Fund
Portfolio Management Discussion and Analysis, continued — October 31, 2016
(Unaudited)
^ In prior years, the performance of the Fund’s Class I shares was used in the line graph. Class S Shares will have substantially similar annual returns as the Class
I Shares because the Shares of each Class are invested in the same portfolio of securities. Annual returns for each Class will differ only to the extent that the
Class S Shares do not have the same expenses as the Class I Shares.
* Assumes initial investment on November 1, 2006.
** The Bloomberg Barclays U.S. Aggregate Bond Index is an index, with income reinvested, generally representative of intermediate-term government bonds,
investment-grade corporate debt securities and mortgage-backed securities.
Effective August 24, 2016 the Barclays fixed income benchmark indices, including the Barclays Aggregate family of indices, were renamed the Bloomberg
Barclays family of indices.
‡ The Fund first issued Class A Shares on June 1, 2010. The returns shown for Class A Shares prior to that date are the returns of Class E Shares. The
performance shown has been adjusted to reflect the deduction of the maximum Class A sales charge of 3.75%. Annual returns for each Class will differ only to
the extent that the Class A Shares do not have the same expenses as Class E Shares.
‡‡ The Fund first issued Class C Shares on October 22, 2007. The returns shown for Class C Shares prior to that date are the returns of the Fund’s Class E Shares
and do not reflect deduction of Rule 12b-1 distribution fees that apply to Class C Shares. Had they done so, the returns shown for those periods would have
been lower. However, the returns for Class C Shares would be substantially similar to those of Class E Shares because they are invested in the same portfolio of
securities. Annual returns for each Class will differ only to the extent that the Class C Shares do not have the same expenses as the Class E Shares.
‡‡‡ The Fund first issued Class R6 Shares on March 1, 2016. The returns shown for Class R6 Shares prior to that date are the returns of the Fund’s Class Y
Shares. Class R6 Shares will have substantially similar annual returns as the Class Y Shares because the Shares of each Class are invested in the same portfolio
of securities. Annual returns for each Class will differ only to the extent that the Class R6 Shares do not have the same expenses as the Class Y Shares.
‡‡‡‡ The Fund first issued Class S Shares on October 22, 2007. The returns shown for Class S Shares prior to that date are the returns of the Fund’s Class I
Shares. However, the returns for Class S Shares would be substantially similar to those of Class I Shares because they are invested in the same portfolio of
securities. Annual returns for each Class will differ only to the extent that the Class S Shares do not have the same expenses as the Class I Shares.
§ Annualized.
Performance is historical and assumes reinvestment of all dividends and capital gains. Investment return and principal value will fluctuate so that an investor’s
shares, when redeemed, may be worth more or less than when purchased. Past performance is not indicative of future results. The returns shown do not reflect the
deduction of taxes that a shareholder would pay on Fund distributions or the redemption of Fund shares. Additionally, the returns presented herein may differ from
the performance reported in the Financial Highlights as the returns herein are calculated in a manner consistent with standardized performance in accordance with
Securities and Exchange Commission rules, while the performance in the Financial Highlights has been calculated in accordance with U.S. Generally Accepted
Accounting Principles (“U.S. GAAP”).
456 Russell Investment Grade Bond Fund
Russell Investment Company
Russell Investment Grade Bond Fund
Shareholder Expense Example — October 31, 2016 (Unaudited)
| Fund Expenses | Please note that the expenses shown in the table are meant | |||||
| The following disclosure provides important information | to highlight your ongoing costs only and do not reflect any | |||||
| regarding the Fund’s Shareholder Expense Example | transactional costs. Therefore, the information under the heading | |||||
| (“Example”). | “Hypothetical Performance (5% return before expenses)” is | |||||
| useful in comparing ongoing costs only, and will not help you | ||||||
| Example | determine the relative total costs of owning different funds. In | |||||
| As a shareholder of the Fund, you incur two types of costs: (1) | addition, if these transactional costs were included, your costs | |||||
| transaction costs, including sales charges (loads) on certain | would have been higher. | |||||
| purchase or redemption payments, and (2) ongoing costs, | Hypothetical | |||||
| including distribution (12b-1) and/or service fees and other | Performance (5% | |||||
| Fund expenses. The Example is intended to help you understand | Actual | return before | ||||
| your ongoing costs (in dollars) of investing in the Fund and to | Class A | Performance | expenses) | |||
| Beginning Account Value | ||||||
| compare these costs with the ongoing costs of investing in other | May 1, 2016 | $ | 1,000.00 | $ | 1,000.00 | |
| mutual funds. The Example is based on an investment of $1,000 | Ending Account Value | |||||
| invested at the beginning of the period and held for the entire | October 31, 2016 | $ | 1,017.90 | $ | 1,021.17 | |
| period indicated, which for this Fund is from May 1, 2016 to | Expenses Paid During Period* | $ | 4.01 | $ | 4.01 | |
| October 31, 2016. | * Expenses are equal to the Fund's annualized expense ratio of 0.79% | |||||
| (representing the six month period annualized), multiplied by the average | ||||||
| Actual Expenses | account value over the period, multiplied by 184/366 (to reflect the one-half | |||||
| The information in the table under the heading “Actual | year period). | |||||
| Performance” provides information about actual account values | ||||||
| and actual expenses. You may use the information in this column, | Hypothetical | |||||
| Performance (5% | ||||||
| together with the amount you invested, to estimate the expenses | Actual | return before | ||||
| that you paid over the period. Simply divide your account value by | Class C | Performance | expenses) | |||
| $1,000 (for example, an $8,600 account value divided by $1,000 | Beginning Account Value | |||||
| = 8.6), then multiply the result by the number in the first column | May 1, 2016 | $ | 1,000.00 | $ | 1,000.00 | |
| Ending Account Value | ||||||
| in the row entitled “Expenses Paid During Period” to estimate | October 31, 2016 | $ | 1,014.20 | $ | 1,017.39 | |
| the expenses you paid on your account during this period. | Expenses Paid During Period* | $ | 7.80 | $ | 7.81 | |
| Hypothetical Example for Comparison Purposes | * Expenses are equal to the Fund's annualized expense ratio of 1.54% | |||||
| The information in the table under the heading “Hypothetical | (representing the six month period annualized), multiplied by the average | |||||
| account value over the period, multiplied by 184/366 (to reflect the one-half | ||||||
| Performance (5% return before expenses)” provides information | year period). | |||||
| about hypothetical account values and hypothetical expenses | ||||||
| based on the Fund’s actual expense ratio and an assumed rate of | Hypothetical | |||||
| return of 5% per year before expenses, which is not the Fund’s | Performance (5% | |||||
| Actual | return before | |||||
| actual return. The hypothetical account values and expenses | Class E | Performance | expenses) | |||
| may not be used to estimate the actual ending account balance or | Beginning Account Value | |||||
| expenses you paid for the period. You may use this information | May 1, 2016 | $ | 1,000.00 | $ | 1,000.00 | |
| to compare the ongoing costs of investing in the Fund and other | Ending Account Value | |||||
| funds. To do so, compare this 5% hypothetical example with the | October 31, 2016 | $ | 1,018.20 | $ | 1,021.17 | |
| 5% hypothetical examples that appear in the shareholder reports | Expenses Paid During Period* | $ | 4.01 | $ | 4.01 | |
| of other funds. | ||||||
| * Expenses are equal to the Fund's annualized expense ratio of 0.79% | ||||||
| (representing the six month period annualized), multiplied by the average | ||||||
| account value over the period, multiplied by 184/366 (to reflect the one-half | ||||||
| year period). | ||||||
Russell Investment Grade Bond Fund 457
Russell Investment Company
Russell Investment Grade Bond Fund
Shareholder Expense Example, continued — October 31, 2016 (Unaudited)
| Hypothetical | ||||||
| Performance (5% | ||||||
| Actual | return before | |||||
| Class I | Performance | expenses) | ||||
| Beginning Account Value | ||||||
| May 1, 2016 | $ | 1,000.00 | $ | 1,000.00 | ||
| Ending Account Value | ||||||
| October 31, 2016 | $ | 1,019.60 | $ | 1,022.82 | ||
| Expenses Paid During Period* | $ | 2.34 | $ | 2.34 | ||
| * Expenses are equal to the Fund's annualized expense ratio of 0.46% | ||||||
| (representing the six month period annualized), multiplied by the average | ||||||
| account value over the period, multiplied by 184/366 (to reflect the one-half | ||||||
| year period). | ||||||
| Hypothetical | ||||||
| Performance (5% | ||||||
| Actual | return before | |||||
| Class R6 | Performance | expenses) | ||||
| Beginning Account Value | ||||||
| May 1, 2016 | $ | 1,000.00 | $ | 1,000.00 | ||
| Ending Account Value | ||||||
| October 31, 2016 | $ | 1,020.00 | $ | 1,023.23 | ||
| Expenses Paid During Period* | $ | 1.93 | $ | 1.93 | ||
| * Expenses are equal to the Fund's annualized expense ratio of 0.38% | ||||||
| (representing the six month period annualized), multiplied by the average | ||||||
| account value over the period, multiplied by 184/366 (to reflect the one-half | ||||||
| year period). May reflect amounts waived and/or reimbursed. Without any | ||||||
| waivers and/or reimbursements, expenses would have been higher. | ||||||
| Hypothetical | ||||||
| Performance (5% | ||||||
| Actual | return before | |||||
| Class S | Performance | expenses) | ||||
| Beginning Account Value | ||||||
| May 1, 2016 | $ | 1,000.00 | $ | 1,000.00 | ||
| Ending Account Value | ||||||
| October 31, 2016 | $ | 1,019.10 | $ | 1,022.42 | ||
| Expenses Paid During Period* | $ | 2.74 | $ | 2.75 | ||
| * Expenses are equal to the Fund's annualized expense ratio of 0.54% | ||||||
| (representing the six month period annualized), multiplied by the average | ||||||
| account value over the period, multiplied by 184/366 (to reflect the one-half | ||||||
| year period). | ||||||
| Hypothetical | ||||||
| Performance (5% | ||||||
| Actual | return before | |||||
| Class Y | Performance | expenses) | ||||
| Beginning Account Value | ||||||
| May 1, 2016 | $ | 1,000.00 | $ | 1,000.00 | ||
| Ending Account Value | ||||||
| October 31, 2016 | $ | 1,020.10 | $ | 1,023.43 | ||
| Expenses Paid During Period* | $ | 1.73 | $ | 1.73 | ||
| * Expenses are equal to the Fund's annualized expense ratio of 0.34% | ||||||
| (representing the six month period annualized), multiplied by the average | ||||||
| account value over the period, multiplied by 184/366 (to reflect the one-half | ||||||
| year period). | ||||||
458 Russell Investment Grade Bond Fund
Russell Investment Company
Russell Investment Grade Bond Fund
Schedule of Investments — October 31, 2016
| Amounts in thousands (except share amounts) | Amounts in thousands (except share amounts) | |||||||
| Principal | Fair | Principal | Fair | |||||
| Amount ($) | Value | Amount ($) | Value | |||||
| or Shares | $ | or Shares | $ | |||||
| Long-Term Investments - 93.9% | Chase Issuance Trust | |||||||
| Asset-Backed Securities - 4.3% | Series 2016-A3 Class A3 | |||||||
| Ajax Mortgage Loan Trust | 0.550% due 06/15/23 (Ê) | 874 | 878 | |||||
| Series 2016-C Class A | Chrysler Capital Auto Receivables Trust | |||||||
| 4.000% due 10/25/57 (Þ) | 315 | 315 | Series 2016-BA Class A3 | |||||
| AmeriCredit Automobile Receivables | 1.640% due 07/15/21 (Þ) | 663 | 663 | |||||
| Trust | CountryPlace Manufactured Housing | |||||||
| Series 2013-3 Class C | Contract Trust | |||||||
| 2.380% due 06/10/19 | 1,480 | 1,489 | Series 2005-1 Class A4 | |||||
| Series 2014-4 Class A3 | 5.200% due 12/15/35 (Þ) | 675 | 700 | |||||
| 1.270% due 07/08/19 | 793 | 793 | CPS Auto Receivables Trust | |||||
| Series 2015-4 Class A2B | Series 2013-D Class A | |||||||
| 1.250% due 04/08/19 (Ê) | 405 | 406 | 1.540% due 07/16/18 (Þ) | 17 | 17 | |||
| Series 2016-1 Class A2B | Series 2014-A Class A | |||||||
| 1.175% due 06/10/19 (Ê) | 530 | 532 | 1.210% due 08/15/18 (Þ) | 17 | 17 | |||
| Series 2016-2 Class A2A | Series 2014-D Class A | |||||||
| 1.420% due 10/08/19 | 771 | 772 | 1.490% due 04/15/19 (Þ) | 27 | 27 | |||
| Series 2016-3 Class C | Series 2015-A Class A | |||||||
| 2.240% due 04/08/22 | 417 | 419 | 1.530% due 07/15/19 (Þ) | 7 | 7 | |||
| Series 2016-3 Class D | Series 2015-B Class A | |||||||
| 2.710% due 09/08/22 | 138 | 138 | 1.650% due 11/15/19 (Þ) | 25 | 25 | |||
| Series 2016-4 Class C | Series 2015-C Class A | |||||||
| 2.410% due 07/08/22 | 314 | 314 | 1.770% due 06/17/19 (Þ) | 303 | 304 | |||
| Ameriquest Mortgage Securities, Inc. | Series 2016-B Class A | |||||||
| Series 2005-R5 Class M1 | 2.070% due 11/15/19 (Þ) | 518 | 521 | |||||
| 0.955% due 07/25/35 (Ê) | 157 | 157 | Series 2016-C Class A | |||||
| Bayview Financial Acquisition Trust | 1.620% due 01/15/20 (Þ) | 855 | 855 | |||||
| Series 2006-A Class 1A3 | CPS Auto Trust | |||||||
| 5.865% due 02/28/41 | 82 | 84 | Series 2016-D Class A | |||||
| 1.500% due 06/15/20 (Þ) | 770 | 770 | ||||||
| Bayview Opportunity Master Fund Trust | Credit-Based Asset Servicing & | |||||||
| Series 2016-RN3 Class A1 | Securitization LLC | |||||||
| 3.598% due 09/28/31 (Þ) | 189 | 189 | Series 2004-CB7 Class AF5 | |||||
| Series 2016-RPL3 Class A1 | 4.745% due 10/25/34 | 212 | 218 | |||||
| 3.475% due 07/28/31 (Þ) | 113 | 113 | Discover Card Execution Note Trust | |||||
| BMW Vehicle Owner Trust | Series 2016-A4 Class A4 | |||||||
| Series 2013-A Class A3 | 1.390% due 03/15/22 | 986 | 986 | |||||
| 0.670% due 11/27/17 | 57 | 57 | Drive Auto Receivables Trust | |||||
| Capital Auto Receivables Asset Trust | Series 2016-BA Class A2 | |||||||
| Series 2016-1 Class A2A | 1.380% due 08/15/18 (Þ) | 855 | 856 | |||||
| 1.500% due 11/20/18 | 442 | 443 | DT Auto Owner Trust | |||||
| Series 2016-3 Class A2A | Series 2015-3A Class A | |||||||
| 1.360% due 04/20/19 | 320 | 320 | 1.660% due 03/15/19 (Þ) | 215 | 216 | |||
| Capital One Multi-Asset Execution Trust | Series 2016-3A Class A | |||||||
| Series 2016-A1 Class A1 | 1.750% due 11/15/19 (Þ) | 563 | 564 | |||||
| 0.931% due 02/15/22 (Ê) | 851 | 855 | Series 2016-4A Class A | |||||
| CarFinance Capital Auto Trust | 1.440% due 11/15/19 (Þ) | 862 | 862 | |||||
| Series 2014-1A Class A | Exeter Automobile Receivables Trust | |||||||
| 1.460% due 12/17/18 (Þ) | 1 | 1 | Series 2014-3A Class A | |||||
| Series 2015-1A Class A | 1.320% due 01/15/19 (Þ) | 93 | 93 | |||||
| 1.750% due 06/15/21 (Þ) | 313 | 313 | Series 2015-1A Class A | |||||
| CarMax Auto Owner Trust | 1.600% due 06/17/19 (Þ) | 4 | 4 | |||||
| Series 2016-3 Class A2 | Series 2015-2A Class A | |||||||
| 1.170% due 08/15/19 | 1,891 | 1,892 | 1.540% due 11/15/19 (Þ) | 4 | 4 | |||
| Series 2016-4 Class A3 | Series 2016-1A Class A | |||||||
| 1.400% due 08/15/21 | 568 | 567 | 2.350% due 07/15/20 (Þ) | 164 | 164 | |||
| Centex Home Equity Loan Trust | Series 2016-3A Class A | |||||||
| Series 2003-B Class AF4 | 1.840% due 11/16/20 (Þ) | 873 | 873 | |||||
| 3.735% due 02/25/32 | 2,224 | 2,231 | Fannie Mae Grantor Trust | |||||
| Series 2005-D Class M1 | Series 2003-T4 Class 1A | |||||||
| 0.955% due 10/25/35 (Ê) | 303 | 303 | ||||||
See accompanying notes which are an integral part of the financial statements.
Russell Investment Grade Bond Fund 459
Russell Investment Company
Russell Investment Grade Bond Fund
Schedule of Investments, continued — October 31, 2016
| Amounts in thousands (except share amounts) | Amounts in thousands (except share amounts) | |||||||
| Principal | Fair | Principal | Fair | |||||
| Amount ($) | Value | Amount ($) | Value | |||||
| or Shares | $ | or Shares | $ | |||||
| 0.390% due 09/26/33 (Ê) | 105 | 104 | NYMT Residential | |||||
| Fannie Mae REMICS | Series 2016-RP1A Class A | |||||||
| Series 1999-56 Class Z | 4.000% due 03/25/21 (Þ) | 123 | 123 | |||||
| 7.000% due 12/18/29 | 64 | 73 | Oak Hill Advisors Residential Loan | |||||
| Fannie Mae Whole Loan | Trust | |||||||
| Series 2003-W5 Class A | Series 2015-NPL2 Class A1 | |||||||
| 0.390% due 04/25/33 (Ê) | 32 | 30 | 3.721% due 07/25/55 (Þ) | 269 | 270 | |||
| Series 2003-W9 Class A | Option One Mortgage Loan Trust | |||||||
| 0.423% due 06/25/33 (Ê) | 43 | 43 | Series 2004-3 Class M1 | |||||
| First Investors Auto Owner Trust | 1.314% due 11/25/34 (Ê) | 1,338 | 1,309 | |||||
| Series 2013-3A Class A3 | Park Place Securities, Inc. | |||||||
| 1.440% due 10/15/19 (Þ) | 14 | 14 | Series 2004-WHQ2 Class M2 | |||||
| Series 2016-2A Class A1 | 1.470% due 02/25/35 (Ê) | 1,046 | 1,048 | |||||
| 1.530% due 11/16/20 (Þ) | 494 | 494 | Series 2005-WCH1 Class M2 | |||||
| Flagship Credit Auto Trust | 1.305% due 01/25/36 (Ê) | 333 | 332 | |||||
| Series 2014-1 Class A | Prestige Auto Receivables Trust | |||||||
| 1.210% due 04/15/19 (Þ) | 41 | 41 | Series 2014-1A Class A3 | |||||
| Series 2014-2 Class A | 1.520% due 04/15/20 (Þ) | 603 | 603 | |||||
| 1.430% due 12/16/19 (Þ) | 19 | 19 | Series 2016-2A Class C | |||||
| Series 2015-1 Class A | 2.880% due 11/15/22 (Þ) | 87 | 87 | |||||
| 1.630% due 06/15/20 (Þ) | 4 | 4 | RAMP Trust | |||||
| Series 2015-3 Class A | Series 2003-RS2 Class AII | |||||||
| 2.380% due 10/15/20 (Þ) | 145 | 145 | 0.850% due 03/25/33 (Ê) | 38 | 34 | |||
| Series 2016-2 Class A1 | Santander Drive Auto Receivables Trust | |||||||
| 2.280% due 05/15/20 | 218 | 219 | Series 2014-1 Class B | |||||
| Series 2016-3 Class A1 | 1.590% due 10/15/18 | 52 | 51 | |||||
| 1.610% due 12/15/19 (Þ) | 739 | 740 | Series 2014-4 Class B | |||||
| Series 2016-4 Class A1 | 1.820% due 05/15/19 | 628 | 629 | |||||
| 1.470% due 03/15/20 (Þ) | 480 | 480 | Series 2015-2 Class B | |||||
| Ford Credit Auto Owner Trust | 1.830% due 01/15/20 | 368 | 369 | |||||
| Series 2016-2 Class A | Series 2015-4 Class A2A | |||||||
| 2.030% due 12/15/27 (Þ) | 661 | 664 | 1.200% due 12/17/18 | 157 | 157 | |||
| Series 2016-C Class A3 | Series 2015-4 Class A3 | |||||||
| 1.220% due 03/15/21 | 767 | 766 | 1.580% due 09/16/19 | 585 | 586 | |||
| Series 2016-C Class A4 | Series 2015-5 Class A2B | |||||||
| 1.400% due 02/15/22 | 574 | 572 | 0.947% due 11/15/18 (Ê) | 33 | 33 | |||
| Freddie Mac REMICS | Series 2016-3 Class C | |||||||
| Series 2006-R007 Class ZA | 2.460% due 03/15/22 | 427 | 427 | |||||
| 6.000% due 05/15/36 | 579 | 662 | Saxon Asset Securities Trust | |||||
| Home Equity Asset Trust | Series 2004-1 Class A | |||||||
| 0.695% due 03/25/35 (Ê) | 57 | 53 | ||||||
| Series 2005-9 Class M1 | Specialty Underwriting & Residential | |||||||
| 0.580% due 04/25/36 (Ê) | 470 | 432 | Finance Trust | |||||
| Honda Auto Receivables Trust | Series 2003-BC1 Class A | |||||||
| Series 2015-4 Class A2 | 0.850% due 01/25/34 (Ê) | 25 | 24 | |||||
| 0.820% due 07/23/18 | 430 | 430 | Toyota Auto Receivables Owner Trust | |||||
| Series 2016-3 Class A4 | Series 2014-A Class A3 | |||||||
| 1.330% due 11/18/22 | 809 | 807 | 0.670% due 12/15/17 | 132 | 132 | |||
| Series 2016-4 Class A3 | Series 2016-D Class A3 | |||||||
| 1.210% due 12/18/20 | 653 | 653 | 1.230% due 10/15/20 | 1,704 | 1,703 | |||
| Series 2016-4 Class A4 | United Auto Credit Securitization Trust | |||||||
| 1.360% due 01/18/23 | 503 | 502 | Series 2016-2 Class A | |||||
| Hyundai Auto Receivables Trust | 1.670% due 09/10/18 (Þ) | 835 | 836 | |||||
| Series 2013-C Class A3 | Vericrest Opportunity Loan Trust | |||||||
| 1.010% due 02/15/18 | 49 | 49 | Series 2015-NP12 Class A1 | |||||
| Morgan Stanley ABS Capital I, Inc. Trust | 3.875% due 09/25/45 (Þ) | 139 | 140 | |||||
| Series 2003-NC6 Class M1 | Series 2015-NPL2 Class A1 | |||||||
| 1.725% due 06/25/33 (Ê) | 193 | 189 | 3.500% due 02/25/55 (Þ) | 322 | 323 | |||
| Series 2003-NC7 Class M1 | Series 2015-NPL4 Class A1 | |||||||
| 1.575% due 06/25/33 (Ê) | 166 | 161 | 3.500% due 02/25/55 (Þ) | 95 | 95 | |||
See accompanying notes which are an integral part of the financial statements.
460 Russell Investment Grade Bond Fund
Russell Investment Company
Russell Investment Grade Bond Fund
Schedule of Investments, continued — October 31, 2016
| Amounts in thousands (except share amounts) | Amounts in thousands (except share amounts) | ||||||
| Principal | Fair | Principal | Fair | ||||
| Amount ($) | Value | Amount ($) | Value | ||||
| or Shares | $ | or Shares | $ | ||||
| Verizon Owner Trust | 5.250% due 01/15/24 | 369 | 386 | ||||
| Series 2016-1A Class A | American Honda Finance Corp. | ||||||
| 1.420% due 01/20/21 (Þ) | 199 | 199 | 2.250% due 08/15/19 | 485 | 496 | ||
| VOLT XLV LLC | Series GMTN | ||||||
| Series 2016-NPL5 Class A1 | 1.700% due 09/09/21 | 748 | 740 | ||||
| 4.000% due 05/25/46 (Þ) | 308 | 311 | American International Group, Inc. | ||||
| VOLT XLVIII LLC | 4.875% due 06/01/22 | 420 | 469 | ||||
| Series 2016-NPL8 Class A1 | 4.500% due 07/16/44 | 113 | 115 | ||||
| 3.500% due 07/25/46 (Þ) | 98 | 98 | 4.800% due 07/10/45 | 152 | 162 | ||
| VOLT XXVI LLC | 8.175% due 05/15/58 | 160 | 214 | ||||
| Series 2014-NPL6 Class A1 | Amgen, Inc. | ||||||
| 3.125% due 09/25/43 (Þ) | 429 | 428 | 4.663% due 06/15/51 (Þ) | 335 | 343 | ||
| VOLT XXX LLC | Anadarko Petroleum Corp. | ||||||
| Series 2015-NPL1 Class A1 | 6.950% due 06/15/19 | 115 | 128 | ||||
| 3.625% due 10/25/57 (Þ) | 23 | 23 | 6.450% due 09/15/36 | 1,242 | 1,474 | ||
| VOLT XXXIV LLC | 4.500% due 07/15/44 | 178 | 168 | ||||
| Series 2015-NPL7 Class A1 | 6.600% due 03/15/46 | 144 | 178 | ||||
| 3.250% due 02/25/55 (Þ) | 96 | 96 | Anheuser-Busch InBev Finance, Inc. | ||||
| VOLT XXXV | 2.650% due 02/01/21 | 385 | 394 | ||||
| Series 2016-NPL9 Class A1 | 3.650% due 02/01/26 | 2,040 | 2,146 | ||||
| 3.500% due 09/25/46 (Þ) | 230 | 230 | 4.700% due 02/01/36 | 910 | 1,009 | ||
| VOLT XXXVI LLC | 4.900% due 02/01/46 | 1,349 | 1,543 | ||||
| Series 2015-NP10 Class A1 | Anheuser-Busch InBev Worldwide, Inc. | ||||||
| 3.625% due 07/25/45 (Þ) | 33 | 33 | 8.200% due 01/15/39 | 193 | 305 | ||
| World Financial Network Credit Card | Anthem, Inc. | ||||||
| Master Trust | 1.875% due 01/15/18 | 810 | 813 | ||||
| Series 2016-B Class A | 3.125% due 05/15/22 | 725 | 749 | ||||
| 1.440% due 06/15/22 | 919 | 919 | Apache Corp. | ||||
| 42,321 | 5.100% due 09/01/40 | 192 | 203 | ||||
| Corporate Bonds and Notes - 23.1% | Apollo Management Holdings, LP | ||||||
| 21st Century Fox America, Inc. | 4.400% due 05/27/26 (Þ) | 495 | 511 | ||||
| 6.900% due 08/15/39 | 560 | 737 | Apple, Inc. | ||||
| 6.150% due 02/15/41 | 810 | 1,005 | 4.375% due 05/13/45 | 878 | 933 | ||
| 3M Co. | 4.650% due 02/23/46 | 530 | 584 | ||||
| 3.875% due 06/15/44 | 200 | 215 | 3.850% due 08/04/46 | 556 | 541 | ||
| AbbVie, Inc. | Assurant, Inc. | ||||||
| 1.750% due 11/06/17 | 470 | 472 | 2.500% due 03/15/18 | 780 | 788 | ||
| 1.800% due 05/14/18 | 604 | 606 | AT&T, Inc. | ||||
| 2.500% due 05/14/20 | 1,160 | 1,174 | 3.000% due 06/30/22 | 1,215 | 1,232 | ||
| 3.200% due 05/14/26 | 960 | 944 | 3.600% due 02/17/23 | 1,316 | 1,355 | ||
| 4.500% due 05/14/35 | 312 | 318 | 4.500% due 05/15/35 | 1,575 | 1,563 | ||
| Aetna, Inc. | 5.150% due 03/15/42 | 49 | 50 | ||||
| 1.700% due 06/07/18 | 125 | 125 | 4.300% due 12/15/42 | 169 | 156 | ||
| 1.900% due 06/07/19 | 580 | 585 | 4.750% due 05/15/46 | 333 | 326 | ||
| 2.800% due 06/15/23 | 445 | 451 | 4.500% due 03/09/48 (Þ) | 522 | 490 | ||
| 4.375% due 06/15/46 | 183 | 186 | 4.550% due 03/09/49 (Þ) | 1,132 | 1,066 | ||
| Albemarle Corp. | AutoNation, Inc. | ||||||
| 4.150% due 12/01/24 | 290 | 308 | 4.500% due 10/01/25 | 700 | 732 | ||
| Series 30YR | Bank of America Corp. | ||||||
| 5.450% due 12/01/44 | 815 | 913 | 2.000% due 01/11/18 | 1,170 | 1,175 | ||
| Allstate Corp. (The) | 2.503% due 10/21/22 | 540 | 539 | ||||
| 5.750% due 08/15/53 | 560 | 601 | 4.125% due 01/22/24 | 774 | 831 | ||
| Altria Group, Inc. | 4.200% due 08/26/24 | 95 | 99 | ||||
| 10.200% due 02/06/39 | 579 | 1,066 | 3.875% due 08/01/25 | 575 | 605 | ||
| 5.375% due 01/31/44 | 253 | 309 | 3.248% due 10/21/27 | 657 | 657 | ||
| American Airlines Pass-Through Trust | 6.110% due 01/29/37 | 515 | 625 | ||||
| Series AA Class AA | 4.875% due 04/01/44 | 254 | 287 | ||||
| 3.200% due 06/15/28 | 710 | 723 | Series GMTN | ||||
| 2.625% due 04/19/21 | 735 | 744 | |||||
| Series B | 4.450% due 03/03/26 | 210 | 224 | ||||
See accompanying notes which are an integral part of the financial statements.
Russell Investment Grade Bond Fund 461
Russell Investment Company
Russell Investment Grade Bond Fund
Schedule of Investments, continued — October 31, 2016
| Amounts in thousands (except share amounts) | Amounts in thousands (except share amounts) | ||||||
| Principal | Fair | Principal | Fair | ||||
| Amount ($) | Value | Amount ($) | Value | ||||
| or Shares | $ | or Shares | $ | ||||
| 3.500% due 04/19/26 | 1,200 | 1,232 | 3.875% due 03/26/25 | 415 | 425 | ||
| Bank of America NA | 4.600% due 03/09/26 | 435 | 464 | ||||
| Series BKNT | 3.200% due 10/21/26 | 765 | 763 | ||||
| 2.050% due 12/07/18 | 112 | 113 | 4.450% due 09/29/27 | 1,070 | 1,127 | ||
| 6.000% due 10/15/36 | 560 | 705 | 4.125% due 07/25/28 | 653 | 669 | ||
| Bank of New York Mellon Corp. (The) | 5.875% due 01/30/42 | 304 | 382 | ||||
| 2.600% due 08/17/20 | 1,225 | 1,257 | 4.650% due 07/30/45 | 585 | 640 | ||
| 2.200% due 08/16/23 | 715 | 705 | 4.750% due 05/18/46 | 370 | 381 | ||
| BB&T Corp. | Cleveland Clinic Foundation (The) | ||||||
| 2.050% due 06/19/18 | 825 | 833 | 4.858% due 01/01/14 | 129 | 137 | ||
| Berkshire Hathaway Energy Co. | Columbia Property Trust Operating | ||||||
| 5.150% due 11/15/43 | 278 | 331 | Partnership, LP | ||||
| 4.150% due 04/01/25 | 230 | 237 | |||||
| Berkshire Hathaway Finance Corp. | |||||||
| 1.450% due 03/07/18 | 485 | 487 | Comcast Corp. | ||||
| 1.300% due 08/15/19 | 474 | 473 | 1.625% due 01/15/22 | 545 | 534 | ||
| 4.250% due 01/15/33 | 533 | 573 | |||||
| BMW US Capital LLC | 4.500% due 01/15/43 | 237 | 259 | ||||
| 1.850% due 09/15/21 (Þ) | 1,199 | 1,187 | |||||
| Commonwealth Edison Co. | |||||||
| Boston Properties, LP | 5.800% due 03/15/18 | 315 | 334 | ||||
| 2.750% due 10/01/26 | 1,263 | 1,220 | Consolidated Edison Co. of New York, | ||||
| Brixmor Operating Partnership, LP | Inc. | ||||||
| 4.125% due 06/15/26 | 311 | 319 | Series 06-E | ||||
| Burlington Northern Santa Fe LLC | 5.700% due 12/01/36 | 202 | 250 | ||||
| 4.900% due 04/01/44 | 125 | 145 | Corporate Office Properties, LP | ||||
| 3.900% due 08/01/46 | 250 | 255 | 3.700% due 06/15/21 | 815 | 851 | ||
| Capital One Bank NA | Cox Communications, Inc. | ||||||
| Series BKNT | 3.350% due 09/15/26 (Þ) | 475 | 468 | ||||
| 1.650% due 02/05/18 | 682 | 683 | Credit Suisse AG | ||||
| 2.250% due 02/13/19 | 780 | 789 | 1.750% due 01/29/18 | 910 | 910 | ||
| Capital One Financial Corp. | Crown Castle Towers LLC | ||||||
| 2.450% due 04/24/19 | 350 | 356 | 3.222% due 05/15/22 (Þ) | 760 | 785 | ||
| Cardinal Health, Inc. | CSX Corp. | ||||||
| 1.950% due 06/15/18 | 1,070 | 1,078 | 2.600% due 11/01/26 | 1,500 | 1,470 | ||
| Caterpillar Financial Services Corp. | 3.800% due 11/01/46 | 393 | 380 | ||||
| 1.700% due 08/09/21 | 1,213 | 1,191 | CVS Health Corp. | ||||
| CBS Corp. | 2.875% due 06/01/26 | 1,005 | 998 | ||||
| 7.875% due 07/30/30 | 151 | 212 | 4.875% due 07/20/35 | 234 | 263 | ||
| 4.600% due 01/15/45 | 460 | 467 | 5.125% due 07/20/45 | 2,054 | 2,396 | ||
| Celgene Corp. | CVS Pass-Through Trust | ||||||
| 2.875% due 08/15/20 | 745 | 769 | 4.704% due 01/10/36 (Þ) | 249 | 266 | ||
| 5.000% due 08/15/45 | 224 | 240 | Darden Restaurants, Inc. | ||||
| Charter Communications Operating LLC | 6.800% due 10/15/37 | 650 | 758 | ||||
| / Charter Communications Operating | |||||||
| Capital | Devon Energy Corp. | ||||||
| 3.579% due 07/23/20 (Þ) | 471 | 488 | 5.850% due 12/15/25 | 880 | 1,009 | ||
| 4.464% due 07/23/22 (Þ) | 780 | 831 | Devon Financing Co. LLC | ||||
| 4.908% due 07/23/25 (Þ) | 540 | 582 | 7.875% due 09/30/31 | 690 | 878 | ||
| Diamond 1 Finance Corp. / Diamond 2 | |||||||
| 6.384% due 10/23/35 (Þ) | 560 | 646 | Finance Corp | ||||
| 6.484% due 10/23/45 (Þ) | 71 | 83 | 5.450% due 06/15/23 (Þ) | 3,335 | 3,571 | ||
| Chevron Corp. | 6.020% due 06/15/26 (Þ) | 106 | 116 | ||||
| 2.411% due 03/03/22 | 555 | 563 | 8.100% due 07/15/36 (Þ) | 106 | 127 | ||
| 2.954% due 05/16/26 | 355 | 362 | 8.350% due 07/15/46 (Þ) | 970 | 1,175 | ||
| Chubb INA Holdings, Inc. | Discovery Communications LLC | ||||||
| 2.875% due 11/03/22 | 410 | 427 | 4.900% due 03/11/26 | 505 | 549 | ||
| Cigna Corp. | 6.350% due 06/01/40 | 450 | 491 | ||||
| 5.375% due 02/15/42 | 218 | 254 | Dominion Gas Holdings LLC | ||||
| Cisco Systems, Inc. | 2.500% due 12/15/19 | 135 | 138 | ||||
| 1.850% due 09/20/21 | 555 | 554 | 4.600% due 12/15/44 | 39 | 41 | ||
| Citigroup, Inc. | Dominion Resources, Inc. | ||||||
| 2.500% due 09/26/18 | 940 | 953 | 2.962% due 07/01/19 | 498 | 509 | ||
| 2.700% due 03/30/21 | 671 | 683 | Dow Chemical Co. (The) | ||||
See accompanying notes which are an integral part of the financial statements.
462 Russell Investment Grade Bond Fund
Russell Investment Company
Russell Investment Grade Bond Fund
Schedule of Investments, continued — October 31, 2016
| Amounts in thousands (except share amounts) | Amounts in thousands (except share amounts) | ||||||
| Principal | Fair | Principal | Fair | ||||
| Amount ($) | Value | Amount ($) | Value | ||||
| or Shares | $ | or Shares | $ | ||||
| 4.375% due 11/15/42 | 230 | 231 | 3.100% due 01/09/23 | 685 | 722 | ||
| Duke Energy Corp. | 6.875% due 01/10/39 | 904 | 1,324 | ||||
| 4.800% due 12/15/45 | 202 | 226 | General Mills, Inc. | ||||
| 3.750% due 09/01/46 | 880 | 833 | 5.650% due 02/15/19 | 195 | 213 | ||
| Duke Energy Progress LLC | General Motors Co. | ||||||
| 3.000% due 09/15/21 | 690 | 725 | 4.875% due 10/02/23 | 1,075 | 1,158 | ||
| 4.200% due 08/15/45 | 270 | 292 | 6.250% due 10/02/43 | 534 | 611 | ||
| Eastman Chemical Co. | 5.200% due 04/01/45 | 375 | 382 | ||||
| 4.650% due 10/15/44 | 177 | 179 | General Motors Financial Co., Inc. | ||||
| EI du Pont de Nemours & Co. | 2.400% due 05/09/19 | 835 | 836 | ||||
| 4.150% due 02/15/43 | 206 | 204 | 3.200% due 07/13/20 | 1,200 | 1,221 | ||
| Emera US Finance, LP | 3.200% due 07/06/21 | 955 | 964 | ||||
| 3.550% due 06/15/26 (Þ) | 445 | 455 | 5.250% due 03/01/26 | 575 | 626 | ||
| 4.750% due 06/15/46 (Þ) | 325 | 345 | Georgia Power Co. | ||||
| Energy Transfer Partners, LP | 5.950% due 02/01/39 | 230 | 293 | ||||
| 4.050% due 03/15/25 | 395 | 390 | Georgia-Pacific LLC | ||||
| 6.625% due 10/15/36 | 252 | 278 | 2.539% due 11/15/19 (Þ) | 975 | 995 | ||
| 6.050% due 06/01/41 | 755 | 769 | 8.875% due 05/15/31 | 395 | 618 | ||
| 5.150% due 03/15/45 | 345 | 321 | Gilead Sciences, Inc. | ||||
| EnLink Midstream Partners, LP | 2.550% due 09/01/20 | 1,015 | 1,040 | ||||
| 2.700% due 04/01/19 | 864 | 863 | 2.950% due 03/01/27 | 1,075 | 1,063 | ||
| 5.600% due 04/01/44 | 186 | 178 | 4.000% due 09/01/36 | 465 | 466 | ||
| 5.050% due 04/01/45 | 58 | 52 | 4.750% due 03/01/46 | 658 | 710 | ||
| Enterprise Products Operating LLC | GlaxoSmithKline Capital, Inc. | ||||||
| 5.250% due 01/31/20 | 760 | 835 | 6.375% due 05/15/38 | 152 | 211 | ||
| 4.450% due 02/15/43 | 186 | 179 | Goldman Sachs Capital I | ||||
| 5.100% due 02/15/45 | 543 | 576 | 6.345% due 02/15/34 | 1,190 | 1,435 | ||
| ERAC Finance LLC | Goldman Sachs Group, Inc. (The) | ||||||
| 2.350% due 10/15/19 (Þ) | 675 | 684 | 2.900% due 07/19/18 | 640 | 653 | ||
| Exelon Corp. | 2.625% due 01/31/19 | 255 | 260 | ||||
| 2.850% due 06/15/20 | 1,370 | 1,410 | 2.550% due 10/23/19 | 785 | 799 | ||
| 5.625% due 06/15/35 | 112 | 131 | 2.350% due 11/15/21 | 950 | 944 | ||
| Express Scripts Holding Co. | 3.625% due 01/22/23 | 223 | 235 | ||||
| 3.000% due 07/15/23 | 1,250 | 1,243 | 4.250% due 10/21/25 | 610 | 638 | ||
| 4.800% due 07/15/46 | 132 | 132 | 3.750% due 02/25/26 | 420 | 439 | ||
| Exxon Mobil Corp. | 6.750% due 10/01/37 | 905 | 1,141 | ||||
| 4.114% due 03/01/46 | 123 | 133 | 6.250% due 02/01/41 | 331 | 424 | ||
| Farmers Exchange Capital III | 4.800% due 07/08/44 | 320 | 349 | ||||
| 5.454% due 10/15/54 (Þ) | 710 | 708 | 4.750% due 10/21/45 | 461 | 507 | ||
| FedEx Corp. | Series GMTN | ||||||
| 4.750% due 11/15/45 | 175 | 190 | 2.640% due 10/28/27 (Ê) | 560 | 561 | ||
| Fidelity National Information Services, | Great Plains Energy, Inc. | ||||||
| Inc. | 5.292% due 06/15/22 | 560 | 621 | ||||
| 2.850% due 10/15/18 | 600 | 614 | Halliburton Co. | ||||
| Fifth Third Bank | 5.000% due 11/15/45 | 200 | 218 | ||||
| Series BKNT | Hewlett Packard Enterprise Co. | ||||||
| 2.375% due 04/25/19 | 605 | 615 | 4.650% due 10/15/22 (Þ) | 1,021 | 1,099 | ||
| FirstEnergy Transmission LLC | 6.450% due 10/15/35 (Þ) | 925 | 957 | ||||
| 5.450% due 07/15/44 (Þ) | 256 | 282 | 6.600% due 10/15/45 (Þ) | 141 | 146 | ||
| Florida Power & Light Co. | Home Depot, Inc. (The) | ||||||
| 5.950% due 02/01/38 | 175 | 233 | 4.250% due 04/01/46 | 265 | 291 | ||
| Ford Motor Credit Co. LLC | Honeywell International, Inc. | ||||||
| 2.551% due 10/05/18 | 770 | 779 | 2.500% due 11/01/26 | 1,068 | 1,053 | ||
| 3.336% due 03/18/21 | 410 | 422 | HP, Inc. | ||||
| 3.096% due 05/04/23 | 610 | 610 | 3.750% due 12/01/20 | 141 | 148 | ||
| General Electric Co. | HSBC Bank USA | ||||||
| 5.250% due 12/06/17 | 310 | 324 | Series BKNT | ||||
| 5.875% due 01/14/38 | 105 | 137 | 5.875% due 11/01/34 | 575 | 687 | ||
| 4.500% due 03/11/44 | 1,015 | 1,141 | Huntington National Bank (The) | ||||
| Series GMTN | 2.200% due 11/06/18 | 770 | 777 | ||||
See accompanying notes which are an integral part of the financial statements.
Russell Investment Grade Bond Fund 463
Russell Investment Company
Russell Investment Grade Bond Fund
Schedule of Investments, continued — October 31, 2016
| Amounts in thousands (except share amounts) | Amounts in thousands (except share amounts) | ||||||
| Principal | Fair | Principal | Fair | ||||
| Amount ($) | Value | Amount ($) | Value | ||||
| or Shares | $ | or Shares | $ | ||||
| Intel Corp. | 5.857% due 11/29/49 (ƒ)(Ø) | 1,450 | — | ||||
| 4.800% due 10/01/41 | 245 | 279 | Lehman Brothers Holdings, Inc. | ||||
| International Business Machines Corp. | 6.750% due 12/28/17 (Ø) | 990 | — | ||||
| 2.875% due 11/09/22 | 1,035 | 1,076 | Lockheed Martin Corp. | ||||
| International Paper Co. | 3.350% due 09/15/21 | 325 | 345 | ||||
| 8.700% due 06/15/38 | 310 | 457 | 3.800% due 03/01/45 | 405 | 401 | ||
| ITC Holdings Corp. | 4.700% due 05/15/46 | 360 | 408 | ||||
| 5.300% due 07/01/43 | 265 | 299 | Lowe's Cos., Inc. | ||||
| Janus Capital Group, Inc. | 5.125% due 11/15/41 | 300 | 359 | ||||
| 4.875% due 08/01/25 | 735 | 786 | 4.375% due 09/15/45 | 910 | 994 | ||
| Jersey Central Power & Light Co. | LyondellBasell Industries NV | ||||||
| 4.300% due 01/15/26 (Þ) | 389 | 407 | 4.625% due 02/26/55 | 590 | 559 | ||
| John Deere Capital Corp. | Marathon Petroleum Corp. | ||||||
| 2.800% due 03/06/23 | 335 | 345 | 6.500% due 03/01/41 | 157 | 169 | ||
| Johnson & Johnson | McDonald's Corp. | ||||||
| 3.700% due 03/01/46 | 336 | 358 | 4.875% due 12/09/45 | 235 | 263 | ||
| JPMorgan Chase & Co. | McKesson Corp. | ||||||
| 2.250% due 01/23/20 | 1,536 | 1,547 | 2.284% due 03/15/19 | 720 | 730 | ||
| 2.400% due 06/07/21 | 342 | 345 | Medtronic, Inc. | ||||
| 2.295% due 08/15/21 | 720 | 721 | 3.150% due 03/15/22 | 895 | 944 | ||
| 3.875% due 09/10/24 | 905 | 945 | 4.375% due 03/15/35 | 278 | 305 | ||
| 3.300% due 04/01/26 | 560 | 571 | 4.625% due 03/15/45 | 338 | 382 | ||
| 2.950% due 10/01/26 | 566 | 560 | MetLife, Inc. | ||||
| 4.125% due 12/15/26 | 205 | 216 | 10.750% due 08/01/39 | 820 | 1,341 | ||
| 4.250% due 10/01/27 | 275 | 292 | 4.875% due 11/13/43 | 348 | 383 | ||
| 6.400% due 05/15/38 | 565 | 761 | 4.050% due 03/01/45 | 400 | 397 | ||
| 4.950% due 06/01/45 | 280 | 308 | Microsoft Corp. | ||||
| JPMorgan Chase Capital XXIII | 1.550% due 08/08/21 | 895 | 886 | ||||
| 1.817% due 05/15/47 (Ê) | 730 | 586 | 3.500% due 02/12/35 | 414 | 414 | ||
| Kimco Realty Corp. | 3.700% due 08/08/46 | 440 | 430 | ||||
| 4.250% due 04/01/45 | 232 | 232 | Morgan Stanley | ||||
| Kinder Morgan Energy Partners, LP | 2.125% due 04/25/18 | 705 | 710 | ||||
| 6.950% due 01/15/38 | 187 | 214 | 2.282% due 10/24/23 (Ê) | 490 | 489 | ||
| 5.500% due 03/01/44 | 170 | 172 | 3.125% due 07/27/26 | 1,032 | 1,027 | ||
| Kinder Morgan, Inc. | 6.375% due 07/24/42 | 238 | 318 | ||||
| 3.050% due 12/01/19 | 275 | 282 | Series F | ||||
| 5.300% due 12/01/34 | 536 | 543 | 3.875% due 04/29/24 | 450 | 476 | ||
| 5.550% due 06/01/45 | 1,060 | 1,100 | Series GMTN | ||||
| 5.050% due 02/15/46 | 205 | 199 | 5.500% due 07/24/20 | 535 | 596 | ||
| Series GMTN | 3.875% due 01/27/26 | 885 | 933 | ||||
| 7.800% due 08/01/31 | 201 | 249 | MPLX LP | ||||
| KKR Group Finance Co. III LLC | 4.500% due 07/15/23 | 193 | 199 | ||||
| 5.125% due 06/01/44 (Þ) | 1,160 | 1,153 | 4.875% due 12/01/24 | 770 | 805 | ||
| Kohl's Corp. | 4.875% due 06/01/25 | 124 | 129 | ||||
| 5.550% due 07/17/45 | 505 | 490 | Mutual of Omaha Insurance Co. | ||||
| Kraft Heinz Foods Co. | 4.297% due 07/15/54 (Þ) | 650 | 652 | ||||
| 2.000% due 07/02/18 | 288 | 290 | Mylan NV | ||||
| 2.800% due 07/02/20 | 555 | 571 | 3.950% due 06/15/26 (Þ) | 2,260 | 2,254 | ||
| 4.875% due 02/15/25 (Þ) | 1,090 | 1,198 | 5.250% due 06/15/46 (Þ) | 445 | 451 | ||
| 6.875% due 01/26/39 | 195 | 261 | New York and Presbyterian Hospital | ||||
| 5.200% due 07/15/45 | 236 | 265 | (The) | ||||
| 4.375% due 06/01/46 | 222 | 225 | 4.763% due 08/01/16 | 200 | 206 | ||
| Kroger Co. (The) | Newell Brands, Inc. | ||||||
| 2.300% due 01/15/19 | 375 | 381 | 3.850% due 04/01/23 | 915 | 971 | ||
| 5.000% due 11/15/23 | 145 | 155 | |||||
| Land O' Lakes, Inc. | 5.500% due 04/01/46 | 336 | 396 | ||||
| 6.000% due 11/15/22 (Þ) | 770 | 849 | |||||
| Legg Mason, Inc. | Newmont Mining Corp. | ||||||
| 4.750% due 03/15/26 | 790 | 843 | 6.250% due 10/01/39 | 150 | 176 | ||
| Lehman Brothers Holdings Capital Trust | NextEra Energy Capital Holdings, Inc. | ||||||
| VII | 2.700% due 09/15/19 | 352 | 361 | ||||
See accompanying notes which are an integral part of the financial statements.
464 Russell Investment Grade Bond Fund
Russell Investment Company
Russell Investment Grade Bond Fund
Schedule of Investments, continued — October 31, 2016
| Amounts in thousands (except share amounts) | Amounts in thousands (except share amounts) | ||||||
| Principal | Fair | Principal | Fair | ||||
| Amount ($) | Value | Amount ($) | Value | ||||
| or Shares | $ | or Shares | $ | ||||
| Noble Energy, Inc. | Series C | ||||||
| 8.250% due 03/01/19 | 481 | 547 | 3.600% due 02/01/45 | 395 | 399 | ||
| Norfolk Southern Corp. | Southern Co. (The) | ||||||
| 4.650% due 01/15/46 | 345 | 385 | 2.150% due 09/01/19 | 980 | 992 | ||
| Occidental Petroleum Corp. | 2.350% due 07/01/21 | 455 | 459 | ||||
| 3.500% due 06/15/25 | 315 | 332 | 3.250% due 07/01/26 | 850 | 871 | ||
| Oracle Corp. | 4.400% due 07/01/46 | 217 | 229 | ||||
| 1.900% due 09/15/21 | 1,957 | 1,950 | Southern Power Co. | ||||
| 2.650% due 07/15/26 | 500 | 493 | 4.150% due 12/01/25 | 165 | 177 | ||
| 3.850% due 07/15/36 | 361 | 364 | Southwest Airlines Co. | ||||
| 6.500% due 04/15/38 | 250 | 336 | 2.650% due 11/05/20 | 550 | 563 | ||
| 4.000% due 07/15/46 | 160 | 158 | Sprint Spectrum Co. LLC / Sprint | ||||
| PACCAR Financial Corp. | Spectrum Co II LLC / Sprint Spectrum | ||||||
| 1.435% due 12/06/18 (Ê) | 510 | 514 | Co III LLC | ||||
| Pacific Gas & Electric Co. | Series A-1 | ||||||
| 4.750% due 02/15/44 | 140 | 162 | 3.360% due 09/20/21 (Þ) | 450 | 451 | ||
| Structured Adjustable Rate Mortgage | |||||||
| PacifiCorp | Loan Trust | ||||||
| 2.950% due 02/01/22 | 465 | 486 | 2.600% due 10/28/31 | 330 | 329 | ||
| PECO Energy Co. | Sunoco Logistics Partners Operations, | �� | |||||
| 1.700% due 09/15/21 | 615 | 612 | LP | ||||
| PepsiCo, Inc. | 5.350% due 05/15/45 | 186 | 188 | ||||
| 4.250% due 10/22/44 | 325 | 353 | Thermo Fisher Scientific, Inc. | ||||
| Philip Morris International, Inc. | 2.400% due 02/01/19 | 280 | 285 | ||||
| 6.375% due 05/16/38 | 196 | 263 | 2.950% due 09/19/26 | 250 | 246 | ||
| Phillips 66 Partners, LP | Thomson Reuters Corp. | ||||||
| 3.550% due 10/01/26 | 355 | 354 | 5.650% due 11/23/43 | 385 | 437 | ||
| Plains All American Pipeline, LP / PAA | Time Warner Cable LLC | ||||||
| Finance Corp. | 6.550% due 05/01/37 | 350 | 411 | ||||
| 6.650% due 01/15/37 | 156 | 172 | 7.300% due 07/01/38 | 52 | 65 | ||
| Praxair, Inc. | Time Warner Cos., Inc. | ||||||
| 3.200% due 01/30/26 | 910 | 958 | 7.570% due 02/01/24 | 537 | 682 | ||
| Precision Castparts Corp. | Time Warner, Inc. | ||||||
| 2.500% due 01/15/23 | 435 | 441 | 4.750% due 03/29/21 | 1,040 | 1,145 | ||
| President and Fellows of Harvard | 7.700% due 05/01/32 | 63 | 87 | ||||
| College | |||||||
| 3.150% due 07/15/46 | 181 | 177 | 6.250% due 03/29/41 | 205 | 251 | ||
| Progress Energy, Inc. | Toyota Motor Credit Corp. | ||||||
| 7.750% due 03/01/31 | 442 | 609 | 1.550% due 10/18/19 | 714 | 714 | ||
| Qwest Corp. | Series GMTN | ||||||
| 6.750% due 12/01/21 | 315 | 349 | 2.800% due 07/13/22 | 375 | 390 | ||
| Regency Energy Partners, LP / Regency | TTX Co. | ||||||
| Energy Finance Corp. | 2.250% due 02/01/19 (Þ) | 323 | 326 | ||||
| 4.500% due 11/01/23 | 351 | 358 | UDR, Inc. | ||||
| Reynolds American, Inc. | 4.625% due 01/10/22 | 359 | 395 | ||||
| 2.300% due 06/12/18 | 594 | 602 | Union Pacific Corp. | ||||
| 6.875% due 05/01/20 | 1,035 | 1,203 | 4.050% due 11/15/45 | 395 | 415 | ||
| 4.450% due 06/12/25 | 294 | 323 | United Parcel Service, Inc. | ||||
| 6.150% due 09/15/43 | 375 | 479 | 6.200% due 01/15/38 | 142 | 197 | ||
| 5.850% due 08/15/45 | 212 | 263 | United Technologies Corp. | ||||
| Sabine Pass Liquefaction LLC | 1.778% due 05/04/18 | 1,333 | 1,338 | ||||
| 5.000% due 03/15/27 (Þ) | 490 | 499 | 4.500% due 06/01/42 | 280 | 307 | ||
| SABMiller Holdings, Inc. | UnitedHealth Group, Inc. | ||||||
| 3.750% due 01/15/22 (Þ) | 800 | 862 | 3.875% due 10/15/20 | 100 | 108 | ||
| Sempra Energy | 3.750% due 07/15/25 | 320 | 346 | ||||
| 9.800% due 02/15/19 | 1,227 | 1,446 | 4.625% due 07/15/35 | 283 | 323 | ||
| 3.550% due 06/15/24 | 315 | 331 | US Bancorp | ||||
| South Carolina Electric & Gas Co. | 2.200% due 04/25/19 | 1,185 | 1,208 | ||||
| 6.050% due 01/15/38 | 330 | 422 | 2.950% due 07/15/22 | 570 | 591 | ||
| 5.100% due 06/01/65 | 225 | 255 | US Bank NA | ||||
| Southern California Edison Co. | 1.450% due 01/29/18 | 530 | 532 | ||||
| 5.625% due 02/01/36 | 320 | 404 | USF&G Capital III | ||||
See accompanying notes which are an integral part of the financial statements.
Russell Investment Grade Bond Fund 465
Russell Investment Company
Russell Investment Grade Bond Fund
Schedule of Investments, continued — October 31, 2016
| Amounts in thousands (except share amounts) | Amounts in thousands (except share amounts) | ||||||
| Principal | Fair | Principal | Fair | ||||
| Amount ($) | Value | Amount ($) | Value | ||||
| or Shares | $ | or Shares | $ | ||||
| 8.312% due 07/01/46 (Þ) | 445 | 600 | AIA Group, Ltd. | ||||
| Valero Energy Corp. | 2.250% due 03/11/19 (Þ) | 207 | 209 | ||||
| 6.625% due 06/15/37 | 175 | 205 | America Movil SAB de CV | ||||
| Verizon Communications, Inc. | 5.000% due 03/30/20 | 445 | 487 | ||||
| 1.375% due 08/15/19 | 1,015 | 1,006 | 6.125% due 03/30/40 | 169 | 203 | ||
| 3.000% due 11/01/21 | 180 | 185 | AstraZeneca PLC | ||||
| 5.150% due 09/15/23 | 1,533 | 1,754 | 2.375% due 11/16/20 | 425 | 433 | ||
| 4.400% due 11/01/34 | 355 | 360 | Bank of Montreal | ||||
| 4.272% due 01/15/36 | 2,257 | 2,266 | 1.900% due 08/27/21 | 455 | 450 | ||
| 5.012% due 08/21/54 | 387 | 399 | Barrick Australia Finance Pty, Ltd. | ||||
| 4.672% due 03/15/55 | 1,215 | 1,185 | 5.950% due 10/15/39 | 143 | 164 | ||
| Viacom, Inc. | Barrick Gold Corp. | ||||||
| 3.450% due 10/04/26 | 186 | 185 | 4.100% due 05/01/23 | 281 | 302 | ||
| 5.850% due 09/01/43 | 275 | 308 | 5.250% due 04/01/42 | 325 | 356 | ||
| Virginia Electric & Power Co. | BHP Billiton Finance USA, Ltd. | ||||||
| Series A | 5.000% due 09/30/43 | 220 | 251 | ||||
| 6.000% due 05/15/37 | 263 | 345 | BP Capital Markets PLC | ||||
| Voya Financial, Inc. | 3.062% due 03/17/22 | 720 | 750 | ||||
| 2.900% due 02/15/18 | 465 | 473 | 3.245% due 05/06/22 | 817 | 852 | ||
| Wachovia Capital Trust II | 3.994% due 09/26/23 | 630 | 685 | ||||
| 1.380% due 01/15/27 (Ê) | 455 | 398 | Braskem Finance, Ltd. | ||||
| Walgreens Boots Alliance, Inc. | 6.450% due 02/03/24 | 430 | 455 | ||||
| 4.800% due 11/18/44 | 538 | 576 | British Telecommunications PLC | ||||
| Wal-Mart Stores, Inc. | 9.375% due 12/15/30 | 124 | 199 | ||||
| 6.500% due 08/15/37 | 710 | 1,014 | Canadian Natural Resources, Ltd. | ||||
| 6.200% due 04/15/38 | 280 | 388 | 1.750% due 01/15/18 | 740 | 739 | ||
| Walt Disney Co. (The) | 5.900% due 02/01/18 | 240 | 252 | ||||
| 1.850% due 07/30/26 | 580 | 543 | 6.250% due 03/15/38 | 192 | 219 | ||
| WEA Finance LLC / Westfield UK & | Canadian Pacific Railway Co. | ||||||
| Europe Finance PLC | 4.800% due 09/15/35 | 260 | 292 | ||||
| 2.700% due 09/17/19 (Þ) | 460 | 470 | |||||
| CDP Financial, Inc. | |||||||
| 4.750% due 09/17/44 (Þ) | 237 | 251 | 5.600% due 11/25/39 (Þ) | 545 | 716 | ||
| WEC Energy Group, Inc. | Cooperatieve Rabobank UA | ||||||
| 1.650% due 06/15/18 | 440 | 442 | 3.750% due 07/21/26 | 445 | 447 | ||
| Wells Fargo & Co. | 5.250% due 08/04/45 | 550 | 620 | ||||
| 2.125% due 04/22/19 | 1,165 | 1,178 | 11.000% due 06/29/49 (ƒ)(Þ) | 422 | 508 | ||
| 3.000% due 10/23/26 | 1,961 | 1,947 | |||||
| Corp. Nacional del Cobre de Chile | |||||||
| 4.650% due 11/04/44 | 583 | 603 | 3.875% due 11/03/21 (Þ) | 499 | 518 | ||
| 4.400% due 06/14/46 | 605 | 607 | 4.875% due 11/04/44 (Þ) | 34 | 34 | ||
| Series GMTN | Credit Suisse Group Funding Guernsey, | ||||||
| 4.900% due 11/17/45 | 173 | 186 | Ltd. | ||||
| Welltower, Inc. | 4.550% due 04/17/26 (Þ) | 1,070 | 1,122 | ||||
| 6.500% due 03/15/41 | 250 | 312 | 4.875% due 05/15/45 | 255 | 268 | ||
| Wesleyan University | DANONE SA | ||||||
| 4.781% due 07/01/16 | 213 | 219 | 2.947% due 11/02/26 (Þ) | 715 | 714 | ||
| Westlake Chemical Corp. | Deutsche Telekom International Finance | ||||||
| 5.000% due 08/15/46 (Þ) | 260 | 257 | BV | ||||
| Williams Partners, LP | 8.750% due 06/15/30 | 160 | 244 | ||||
| 5.250% due 03/15/20 | 592 | 640 | DP World, Ltd. | ||||
| 3.600% due 03/15/22 | 865 | 880 | 6.850% due 07/02/37 (Þ) | 190 | 216 | ||
| 6.300% due 04/15/40 | 216 | 232 | Dryden Senior Loan Fund | ||||
| ZFS Finance USA Trust | Series 2015-37A Class A | ||||||
| 6.500% due 05/09/37 (Þ) | 1,260 | 1,269 | 2.180% due 04/15/27 (Ê)(Þ) | 1,300 | 1,301 | ||
| 227,229 | Emera, Inc. | ||||||
| International Debt - 6.2% | Series 16-A | ||||||
| 6.750% due 06/15/76 | 775 | 856 | |||||
| Actavis Funding SCS | |||||||
| 3.450% due 03/15/22 | 1,073 | 1,114 | Encana Corp. | ||||
| 3.800% due 03/15/25 | 369 | 383 | 6.500% due 05/15/19 | 80 | 87 | ||
| 4.550% due 03/15/35 | 64 | 66 | 3.900% due 11/15/21 | 251 | 254 | ||
| 4.850% due 06/15/44 | 255 | 270 | 6.500% due 02/01/38 | 291 | 312 | ||
See accompanying notes which are an integral part of the financial statements.
466 Russell Investment Grade Bond Fund
Russell Investment Company
Russell Investment Grade Bond Fund
Schedule of Investments, continued — October 31, 2016
| Amounts in thousands (except share amounts) | Amounts in thousands (except share amounts) | ||||||
| Principal | Fair | Principal | Fair | ||||
| Amount ($) | Value | Amount ($) | Value | ||||
| or Shares | $ | or Shares | $ | ||||
| European Investment Bank | 2.875% due 05/10/26 | 775 | 777 | ||||
| 1.250% due 05/15/18 | 830 | 832 | 6.375% due 12/15/38 | 253 | 333 | ||
| Fortis, Inc. | 4.000% due 05/10/46 | 1,798 | 1,782 | ||||
| 2.100% due 10/04/21 (Þ) | 223 | 221 | Shire Acquisitions Investments Ireland | ||||
| 3.055% due 10/04/26 (Þ) | 1,212 | 1,193 | DAC | ||||
| GE Capital International Funding Co. | 1.900% due 09/23/19 | 1,055 | 1,053 | ||||
| Unlimited Co | 2.400% due 09/23/21 | 1,070 | 1,062 | ||||
| 4.418% due 11/15/35 | 1,020 | 1,113 | 2.875% due 09/23/23 | 363 | 357 | ||
| Grupo Bimbo SAB de CV | Sky PLC | ||||||
| 4.875% due 06/27/44 (Þ) | 565 | 550 | 6.100% due 02/15/18 (Þ) | 945 | 993 | ||
| HSBC Bank PLC | Suncor Energy, Inc. | ||||||
| 7.650% due 05/01/25 | 385 | 481 | 6.100% due 06/01/18 | 366 | 391 | ||
| HSBC Holdings PLC | 5.950% due 12/01/34 | 545 | 647 | ||||
| 3.400% due 03/08/21 | 729 | 751 | Tengizchevroil Finance Co. International, | ||||
| 2.650% due 01/05/22 | 1,214 | 1,208 | Ltd. | ||||
| 3.900% due 05/25/26 | 1,468 | 1,519 | 4.000% due 08/15/26 (Þ) | 245 | 236 | ||
| Teva Pharmaceutical Finance | |||||||
| 5.250% due 03/14/44 | 282 | 310 | Netherlands III BV | ||||
| Hungary Government International Bond | 2.200% due 07/21/21 | 1,595 | 1,576 | ||||
| 6.375% due 03/29/21 | 636 | 734 | 2.800% due 07/21/23 | 805 | 792 | ||
| ING Bank NV | Toronto-Dominion Bank (The) | ||||||
| 2.000% due 11/26/18 (Þ) | 724 | 727 | 1.950% due 04/02/20 (Þ) | 317 | 319 | ||
| Kaupthing Bank HF | 2.125% due 04/07/21 | 605 | 609 | ||||
| 7.625% due 02/28/20 (Å) | 1,210 | — | 3.625% due 09/15/31 | 590 | 590 | ||
| 5.750% due 10/04/20 (Å) | 100 | — | TransCanada PipeLines, Ltd. | ||||
| Mondelez International Holdings | 1.625% due 11/09/17 | 341 | 342 | ||||
| Netherlands BV | 7.250% due 08/15/38 | 250 | 353 | ||||
| 1.625% due 10/28/19 (Þ) | 1,301 | 1,296 | |||||
| 2.000% due 10/28/21 (Þ) | 660 | 654 | Transcanada Trust | ||||
| Nationwide Building Society | Series 16-A | ||||||
| 4.000% due 09/14/26 (Þ) | 1,435 | 1,416 | 5.875% due 08/15/76 | 1,120 | 1,198 | ||
| Perrigo Co. PLC | Tyco International Finance SA | ||||||
| 2.300% due 11/08/18 | 762 | 766 | 5.125% due 09/14/45 | 155 | 178 | ||
| 4.000% due 11/15/23 | 680 | 697 | UBS Group Funding Jersey, Ltd. | ||||
| 2.950% due 09/24/20 (Þ) | 740 | 755 | |||||
| Perrigo Finance Unlimited Co. | |||||||
| 3.500% due 03/15/21 | 400 | 413 | 4.125% due 04/15/26 (Þ) | 500 | 522 | ||
| 4.375% due 03/15/26 | 400 | 420 | Vale Overseas, Ltd. | ||||
| 6.250% due 08/10/26 | 154 | 165 | |||||
| Petroleos Mexicanos | |||||||
| 4.625% due 09/21/23 (Þ) | 500 | 499 | 6.875% due 11/21/36 | 193 | 195 | ||
| 5.625% due 01/23/46 | 309 | 267 | 6.875% due 11/10/39 | 168 | 166 | ||
| 6.750% due 09/21/47 (Þ) | 350 | 347 | Validus Holdings, Ltd. | ||||
| 8.875% due 01/26/40 | 590 | 804 | |||||
| Province of Ontario Canada | |||||||
| 2.500% due 04/27/26 | 525 | 531 | Vodafone Group PLC | ||||
| 7.875% due 02/15/30 | 550 | 755 | |||||
| Province of Quebec Canada | |||||||
| 2.500% due 04/20/26 | 565 | 570 | Westpac Banking Corp. | ||||
| 2.000% due 08/19/21 | 1,086 | 1,082 | |||||
| Qatar Government International Bond | |||||||
| 2.375% due 06/02/21 (Þ) | 607 | 609 | Yara International ASA | ||||
| 4.625% due 06/02/46 (Þ) | 1,808 | 1,904 | 3.800% due 06/06/26 (Þ) | 845 | 864 | ||
| Royal Bank of Canada | 60,630 | ||||||
| 1.500% due 07/29/19 | 506 | 504 | Mortgage-Backed Securities - 28.2% | ||||
| Royal Bank of Scotland Group PLC | 225 Liberty Street Trust | ||||||
| 3.875% due 09/12/23 | 960 | 940 | Series 2016-225L Class A | ||||
| Saudi Government International Bond | 3.597% due 02/10/36 (Þ) | 235 | 250 | ||||
| 2.375% due 10/26/21 (Þ) | 470 | 469 | 7 WTC Depositor LLC Trust | ||||
| 4.500% due 10/26/46 (Þ) | 667 | 656 | Series 2012-7WTC Class A | ||||
| Schlumberger Investment SA | 4.082% due 03/13/31 (Þ) | 82 | 83 | ||||
| 3.650% due 12/01/23 | 510 | 546 | Alternative Loan Trust | ||||
| Seagate HDD Cayman | Series 2003-20CB Class 2A1 | ||||||
| 4.750% due 06/01/23 | 905 | 900 | 5.750% due 10/25/33 | 60 | 62 | ||
| Shell International Finance BV | Banc of America Commercial Mortgage | ||||||
| 2.125% due 05/11/20 | 340 | 343 | Trust | ||||
| Series 2007-3 Class AJ | |||||||
See accompanying notes which are an integral part of the financial statements.
Russell Investment Grade Bond Fund 467
Russell Investment Company
Russell Investment Grade Bond Fund
Schedule of Investments, continued — October 31, 2016
| Amounts in thousands (except share amounts) | Amounts in thousands (except share amounts) | ||||||
| Principal | Fair | Principal | Fair | ||||
| Amount ($) | Value | Amount ($) | Value | ||||
| or Shares | $ | or Shares | $ | ||||
| 5.730% due 06/10/49 | 1,390 | 1,411 | Credit Suisse Commercial Mortgage | ||||
| Series 2008-1 Class A4 | Trust | ||||||
| 6.436% due 02/10/51 | 488 | 505 | Series 2007-C5 Class A4 | ||||
| Banc of America Merrill Lynch | 5.695% due 09/15/40 | 816 | 835 | ||||
| Commercial Mortgage Securities Trust | Credit Suisse First Boston Mortgage | ||||||
| Series 2012-PARK Class A | Securities Corp. | ||||||
| 2.959% due 12/10/30 (Þ) | 324 | 336 | Series 2003-27 Class 4A4 | ||||
| Series 2014-520M Class A | 5.750% due 11/25/33 | 39 | 41 | ||||
| 4.325% due 08/15/46 (Þ) | 230 | 257 | CSAIL Commercial Mortgage Trust | ||||
| Banc of America Merrill Lynch | Series 2015-C2 Class XA | ||||||
| Commercial Mortgage, Inc. | 1.020% due 06/15/57 | 9,841 | 518 | ||||
| Series 2006-3 Class A4 | Series 2015-C4 Class A4 | ||||||
| 5.889% due 07/10/44 | 19 | 19 | 3.808% due 11/15/48 | 123 | 133 | ||
| Series 2007-1 Class A4 | CSMC Trust | ||||||
| 5.451% due 01/15/49 | 567 | 568 | Series 2014 Class A2 | ||||
| Banc of America Mortgage Securities, | 3.953% due 09/15/37 (Þ) | 121 | 129 | ||||
| Inc. | CW Capital Cobalt, Ltd. | ||||||
| Series 2006-B Class 1A1 | Series 2007-C3 Class A4 | ||||||
| 2.747% due 10/20/46 (Ê) | 63 | 38 | 5.959% due 05/15/46 | 1,281 | 1,304 | ||
| BBCMS-ETC Mortgage Trust | DBJPM Mortgage Trust | ||||||
| Series 2016-ETC Class A | Series 2016-C1 Class A4 | ||||||
| 2.937% due 08/14/36 (Þ) | 193 | 196 | 3.276% due 05/10/49 | 284 | 297 | ||
| BCAP LLC Trust | Fannie Mae | ||||||
| Series 2011-R11 Class 15A1 | 5.000% due 2017 | 10 | 10 | ||||
| 3.037% due 10/26/33 (Ê)(Þ) | 977 | 984 | 6.500% due 2017 | 4 | 4 | ||
| Bear Stearns Adjustable Rate Mortgage | |||||||
| Trust | 5.000% due 2018 | 20 | 20 | ||||
| 5.500% due 2018 | 63 | 64 | |||||
| Series 2005-2 Class A1 | 6.500% due 2018 | 11 | 12 | ||||
| 2.920% due 03/25/35 (Ê) | 512 | 514 | |||||
| 5.000% due 2019 | 30 | 30 | |||||
| Citigroup Commercial Mortgage Trust | 6.500% due 2019 | 8 | 10 | ||||
| Series 2014-GC19 Class A4 | 3.540% due 2020 | 414 | 442 | ||||
| 4.023% due 03/10/47 | 825 | 905 | |||||
| 5.000% due 2020 | 43 | 44 | |||||
| Series 2014-GC25 Class AAB | 5.500% due 2020 | 299 | 309 | ||||
| 3.371% due 10/10/47 | 1,015 | 1,068 | 6.500% due 2020 | 5 | 6 | ||
| Citigroup Mortgage Loan Trust, Inc. | 3.881% due 2021 | 1,259 | 1,370 | ||||
| Series 2010-8 Class 3A1 | 4.000% due 2021 | 24 | 24 | ||||
| 3.078% due 04/25/35 (Ê)(Þ) | 570 | 570 | 4.640% due 2021 | 1,282 | 1,419 | ||
| Series 2015-2 Class 1A1 | 5.500% due 2021 | 12 | 13 | ||||
| 0.371% due 06/25/47 (Ê)(Þ) | 344 | 297 | 5.000% due 2022 | 56 | 59 | ||
| Commercial Mortgage Trust | 5.500% due 2022 | 48 | 51 | ||||
| Series 2012-9W57 Class A | 4.500% due 2023 | 48 | 51 | ||||
| 2.365% due 02/10/29 (Þ) | 1,185 | 1,186 | 5.000% due 2023 | 90 | 96 | ||
| Series 2013-CR9 Class A4 | 4.500% due 2024 | 99 | 106 | ||||
| 4.233% due 07/10/45 | 26 | 29 | 5.000% due 2024 | 15 | 16 | ||
| Series 2013-CR11 Class A3 | 8.500% due 2024 | 3 | 3 | ||||
| 3.983% due 10/10/46 | 353 | 386 | 9.000% due 2024 | 1 | 1 | ||
| Series 2013-CR12 Class A4 | 3.500% due 2025 | 95 | 100 | ||||
| 4.046% due 10/10/46 | 965 | 1,060 | 4.000% due 2025 | 194 | 207 | ||
| Series 2013-LC6 Class A4 | 4.500% due 2025 | 16 | 18 | ||||
| 2.941% due 01/10/46 | 61 | 63 | 7.000% due 2025 | 4 | 4 | ||
| Series 2015-3BP Class A | 8.500% due 2025 | 8 | 8 | ||||
| 3.178% due 02/10/35 (Þ) | 5 | 5 | 2.320% due 2026 | 474 | 473 | ||
| Series 2015-CR25 Class A4 | 3.000% due 2026 | 164 | 171 | ||||
| 3.759% due 08/10/48 | 237 | 256 | 3.100% due 2026 | 315 | 333 | ||
| Series 2015-LC21 Class A4 | 3.400% due 2026 | 437 | 472 | ||||
| 3.708% due 07/10/48 | 145 | 156 | 3.500% due 2026 | 576 | 607 | ||
| Series 2015-PC1 Class A5 | 7.000% due 2026 | 8 | 9 | ||||
| 3.902% due 07/10/50 | 9 | 10 | 9.000% due 2026 | 1 | 1 | ||
| Series 2016-787S Class A | 2.500% due 2027 | 30 | 31 | ||||
| 3.545% due 02/10/36 (Þ) | 235 | 249 | 3.000% due 2027 | 747 | 783 | ||
| 3.500% due 2027 | 303 | 319 | |||||
See accompanying notes which are an integral part of the financial statements.
468 Russell Investment Grade Bond Fund
Russell Investment Company
Russell Investment Grade Bond Fund
Schedule of Investments, continued — October 31, 2016
| Amounts in thousands (except share amounts) | Amounts in thousands (except share amounts) | |||||||
| Principal | Fair | Principal | Fair | |||||
| Amount ($) | Value | Amount ($) | Value | |||||
| or Shares | $ | or Shares | $ | |||||
| 5.500% due 2027 | 113 | 127 | 4.500% due 2043 | 24 | 26 | |||
| 7.000% due 2027 | 1 | 1 | 3.000% due 2045 | 366 | 378 | |||
| 2.500% due 2028 | 2,123 | 2,187 | 3.500% due 2045 | 10,646 | 11,200 | |||
| 2.820% due 2028 | 462 | 476 | 4.000% due 2045 | 2,153 | 2,319 | |||
| 2.910% due 2028 | 460 | 476 | 4.500% due 2045 | 55 | 60 | |||
| 3.000% due 2028 | 277 | 290 | 3.500% due 2046 | 4,128 | 4,358 | |||
| 3.010% due 2028 | 472 | 493 | 4.000% due 2046 | 6,528 | 7,062 | |||
| 3.380% due 2028 | 397 | 421 | 4.500% due 2046 | 1,466 | 1,625 | |||
| 3.000% due 2029 | 587 | 616 | 15 Year TBA(Ï) | |||||
| 5.000% due 2029 | 189 | 209 | 2.500% | 3,645 | 3,751 | |||
| 2.500% due 2030 | 333 | 343 | 3.000% | 2,940 | 3,077 | |||
| 3.000% due 2030 | 274 | 287 | 3.500% | 1,225 | 1,290 | |||
| 3.320% due 2030 | 443 | 470 | 30 Year TBA(Ï) | |||||
| 3.500% due 2030 | 359 | 379 | 3.000% | 27,485 | 28,269 | |||
| 4.500% due 2030 | 51 | 56 | 3.500% | 3,080 | 3,234 | |||
| 8.000% due 2030 | 20 | 24 | 4.000% | 2,110 | 2,259 | |||
| 2.500% due 2031 | 49 | 50 | 4.500% | 3,610 | 3,946 | |||
| 3.000% due 2031 | 219 | 229 | Fannie Mae Grantor Trust | |||||
| 8.000% due 2031 | 15 | 19 | Series 2002-T5 Class A1 | |||||
| 4.000% due 2032 | 58 | 62 | 0.410% due 05/25/32 (Ê) | 195 | 191 | |||
| 3.000% due 2033 | 539 | 562 | Fannie Mae REMIC Trust | |||||
| 4.500% due 2033 | 39 | 43 | Series 2004-W12 Class 1A1 | |||||
| 5.000% due 2033 | 300 | 333 | 6.000% due 07/25/44 | 375 | 433 | |||
| 5.500% due 2033 | 329 | 376 | Series 2004-W12 Class 1A3 | |||||
| 6.150% due 2033(Ê) | 240 | 268 | 7.000% due 07/25/44 | 882 | 1,045 | |||
| 3.500% due 2034 | 503 | 533 | Fannie Mae REMICS | |||||
| 4.500% due 2034 | 22 | 24 | Series 2005-117 Class LC | |||||
| 5.000% due 2034 | 121 | 135 | 5.500% due 11/25/35 | 392 | 423 | |||
| 5.500% due 2034 | 657 | 747 | ||||||
| 6.000% due 2034 | 94 | 109 | Series 2009-96 Class DB | |||||
| 4.000% due 11/25/29 | 619 | 662 | ||||||
| 4.500% due 2035 | 1,342 | 1,477 | ||||||
| 5.000% due 2035 | 148 | 165 | Series 2010-114 Class BA | |||||
| 4.000% due 07/25/39 | 102 | 103 | ||||||
| 5.500% due 2035 | 27 | 31 | Federal Home Loan Mortgage Corp. | |||||
| 6.000% due 2035 | 305 | 352 | Multifamily Structured Pass-Through | |||||
| 5.500% due 2036 | 708 | 804 | Certificates | |||||
| 6.500% due 2036 | 6 | 7 | Series 2014-K040 Class A2 | |||||
| 5.000% due 2037 | 105 | 117 | 3.241% due 09/25/24 | 301 | 324 | |||
| 5.500% due 2037 | 1,351 | 1,539 | Series 2014-K041 Class A2 | |||||
| 6.000% due 2037 | 163 | 187 | 3.171% due 10/25/24 | 282 | 303 | |||
| 6.500% due 2037 | 40 | 46 | Series 2015-K046 Class A2 | |||||
| 5.000% due 2038 | 5 | 6 | 3.205% due 03/25/25 | 480 | 516 | |||
| 5.500% due 2038 | 1,393 | 1,585 | Series 2015-K048 Class A2 | |||||
| 4.500% due 2039 | 536 | 586 | 3.284% due 06/25/25 | 2,067 | 2,230 | |||
| 5.000% due 2039 | 2 | 2 | Series 2015-K049 Class A2 | |||||
| 6.000% due 2039 | 94 | 108 | 3.010% due 08/25/25 | 164 | 174 | |||
| 4.000% due 2040 | 315 | 341 | ||||||
| 4.500% due 2040 | 499 | 545 | Series 2015-K050 Class A2 | |||||
| 3.334% due 08/25/25 | 1,550 | 1,678 | ||||||
| 5.000% due 2040 | 526 | 589 | ||||||
| 5.500% due 2040 | 1,187 | 1,353 | Series 2016-K058 Class A2 | |||||
| 2.653% due 08/25/26 | 1,350 | 1,390 | ||||||
| 3.500% due 2041 | 1,986 | 2,105 | ||||||
| 4.000% due 2041 | 720 | 781 | Federal Housing Authority Trust | |||||
| 7.430% due 06/27/21 | 19 | 19 | ||||||
| 4.500% due 2041 | 583 | 638 | ||||||
| 5.000% due 2041 | 904 | 1,007 | Freddie Mac | |||||
| 4.500% due 2018 | 30 | 31 | ||||||
| 5.500% due 2041 | 127 | 144 | 5.000% due 2018 | 6 | 6 | |||
| 3.000% due 2042 | 1,457 | 1,507 | 4.500% due 2019 | 13 | 13 | |||
| 3.500% due 2042 | 1,187 | 1,251 | 5.000% due 2019 | 32 | 33 | |||
| 4.000% due 2042 | 1,009 | 1,085 | 6.000% due 2022 | 3 | 3 | |||
| 3.000% due 2043 | 3,283 | 3,390 | 4.000% due 2024 | 77 | 82 | |||
| 3.500% due 2043 | 4,622 | 4,921 | 5.500% due 2024 | 46 | 49 | |||
| 4.000% due 2043 | 1,604 | 1,730 | 9.000% due 2024 | 3 | 3 | |||
See accompanying notes which are an integral part of the financial statements.
Russell Investment Grade Bond Fund 469
Russell Investment Company
Russell Investment Grade Bond Fund
Schedule of Investments, continued — October 31, 2016
| Amounts in thousands (except share amounts) | Amounts in thousands (except share amounts) | ||||||
| Principal | Fair | Principal | Fair | ||||
| Amount ($) | Value | Amount ($) | Value | ||||
| or Shares | $ | or Shares | $ | ||||
| 6.500% due 2025 | 3 | 3 | 2.995% due 12/25/25 | 688 | 726 | ||
| 8.000% due 2025 | 3 | 3 | Freddie Mac REMICS | ||||
| 9.000% due 2025 | 3 | 3 | Series 2002-2533 Class Z | ||||
| 3.000% due 2026 | 104 | 109 | 5.500% due 12/15/32 | 1,220 | 1,394 | ||
| 5.000% due 2027 | 1 | 2 | Series 2006-3123 Class HT | ||||
| 6.500% due 2027 | — | — | 5.000% due 03/15/26 | 399 | 435 | ||
| 5.000% due 2028 | 101 | 111 | Series 2006-R006 Class ZA | ||||
| 6.000% due 2028 | 124 | 141 | 6.000% due 04/15/36 | 970 | 1,122 | ||
| 6.500% due 2028 | 8 | 9 | Series 2010-3632 Class PK | ||||
| 6.500% due 2029 | 6 | 7 | 5.000% due 02/15/40 | 353 | 390 | ||
| 3.500% due 2030 | 291 | 309 | Series 2010-3653 Class B | ||||
| 5.500% due 2032 | 126 | 145 | 4.500% due 04/15/30 | 873 | 955 | ||
| 6.000% due 2032 | 16 | 18 | Series 2011-3954 Class HU | ||||
| 7.000% due 2032 | 93 | 104 | 4.000% due 05/15/29 | 69 | 72 | ||
| 7.500% due 2032 | 11 | 12 | Series 2012-3989 Class BW | ||||
| 5.500% due 2033 | 52 | 60 | 3.500% due 01/15/27 | 3,180 | 3,468 | ||
| 5.000% due 2034 | 346 | 388 | Series 2012-4019 Class JD | ||||
| 5.500% due 2034 | 52 | 59 | 3.000% due 05/15/41 | 407 | 422 | ||
| 5.500% due 2035 | 86 | 98 | |||||
| 5.500% due 2036 | 84 | 95 | Series 2013-4281 Class LG | ||||
| 4.000% due 01/15/43 | 346 | 367 | |||||
| 6.000% due 2036 | 29 | 33 | |||||
| 5.000% due 2037 | 5 | 6 | Freddie Mac Strips | ||||
| 5.500% due 2037 | 12 | 13 | Series 2012-271 Class 30 | ||||
| 6.000% due 2037 | 63 | 72 | 3.000% due 08/15/42 | 1,396 | 1,435 | ||
| 5.000% due 2038 | 2 | 3 | Ginnie Mae | ||||
| 5.500% due 2038 | 56 | 63 | Series 2004-93 Class PC | ||||
| 6.000% due 2038 | 66 | 76 | 5.000% due 04/16/34 | 720 | 744 | ||
| 4.500% due 2039 | 183 | 200 | Ginnie Mae I | ||||
| 5.500% due 2039 | 15 | 17 | 9.000% due 2025 | 6 | 6 | ||
| 4.000% due 2040 | 1,547 | 1,691 | 7.000% due 2031 | 22 | 25 | ||
| 4.500% due 2040 | 1,056 | 1,163 | 7.000% due 2033 | 1 | 1 | ||
| 5.000% due 2040 | 17 | 19 | 3.000% due 2042 | 368 | 383 | ||
| 5.500% due 2040 | 9 | 11 | 3.000% due 2043 | 565 | 590 | ||
| 4.000% due 2041 | 477 | 512 | 3.500% due 2043 | 156 | 166 | ||
| 4.500% due 2041 | 976 | 1,069 | Ginnie Mae II | ||||
| 5.000% due 2041 | 201 | 223 | 7.500% due 2032 | 2 | 2 | ||
| 5.500% due 2041 | 450 | 514 | 5.500% due 2039 | 109 | 121 | ||
| 3.000% due 2042 | 1,058 | 1,091 | 4.000% due 2040 | 40 | 43 | ||
| 3.500% due 2042 | 938 | 989 | 4.000% due 2041 | 253 | 272 | ||
| 4.000% due 2042 | 678 | 733 | 4.500% due 2041 | 1,175 | 1,290 | ||
| 4.500% due 2042 | 727 | 801 | 5.500% due 2041 | 14 | 15 | ||
| 3.000% due 2043 | 2,030 | 2,094 | 3.000% due 2042 | 178 | 187 | ||
| 3.500% due 2043 | 3,454 | 3,668 | 3.500% due 2042 | 671 | 713 | ||
| 4.000% due 2043 | 94 | 101 | 4.000% due 2042 | 919 | 989 | ||
| 3.500% due 2044 | 224 | 239 | 4.500% due 2042 | 376 | 414 | ||
| 4.000% due 2044 | 1,424 | 1,542 | 3.000% due 2043 | 717 | 750 | ||
| 4.500% due 2044 | 6 | 6 | 3.500% due 2043 | 1,377 | 1,467 | ||
| 3.000% due 2045 | 68 | 70 | 4.000% due 2043 | 290 | 311 | ||
| 3.500% due 2045 | 1,891 | 1,998 | 3.500% due 2044 | 480 | 509 | ||
| 4.000% due 2045 | 2,845 | 3,073 | 4.000% due 2044 | 422 | 453 | ||
| 3.000% due 2046 | 2,433 | 2,507 | 3.000% due 2045 | 687 | 716 | ||
| 3.500% due 2046 | 10,359 | 10,899 | 3.500% due 2045 | 1,634 | 1,731 | ||
| 4.000% due 2046 | 7,361 | 7,947 | 4.000% due 2045 | 683 | 732 | ||
| 3.000% due 2046 | 145 | 151 | |||||
| 30 Year TBA(Ï) | 3.500% due 2046 | 886 | 940 | ||||
| 2.500% | 1,035 | 1,065 | |||||
| 3.000% | 26,725 | 27,513 | 4.000% due 2046 | 1,382 | 1,483 | ||
| 3.500% | 1,905 | 1,999 | 30 Year TBA(Ï) | ||||
| 4.000% | 1,025 | 1,096 | 3.000% | 5,740 | 5,980 | ||
| Freddie Mac Multifamily Structured Pass | 3.500% | 6,235 | 6,603 | ||||
| Through Certificates | 4.000% | 1,505 | 1,612 | ||||
| Series 2016-K053 Class A2 | GS Mortgage Securities Corp. II | ||||||
See accompanying notes which are an integral part of the financial statements.
470 Russell Investment Grade Bond Fund
Russell Investment Company
Russell Investment Grade Bond Fund
Schedule of Investments, continued — October 31, 2016
| Amounts in thousands (except share amounts) | Amounts in thousands (except share amounts) | ||||||
| Principal | Fair | Principal | Fair | ||||
| Amount ($) | Value | Amount ($) | Value | ||||
| or Shares | $ | or Shares | $ | ||||
| Series 2012-BWTR Class A | OBP Depositor LLC Trust | ||||||
| 2.954% due 11/05/34 (Þ) | 204 | 210 | Series 2010-OBP Class A | ||||
| Series 2015-GC30 Class A4 | 4.646% due 07/15/45 (Þ) | 230 | 250 | ||||
| 3.382% due 05/10/50 | 27 | 28 | RBS Commercial Funding, Inc. Trust | ||||
| GS Mortgage Securities Trust | Series 2013-GSP Class A | ||||||
| Series 2012-SHOP Class A | 3.961% due 01/13/32 (Þ) | 235 | 254 | ||||
| 2.933% due 06/05/31 (Þ) | 647 | 663 | RBSSP Resecuritization Trust | ||||
| Series 2014-GC18 Class A4 | Series 2010-3 Class 9A1 | ||||||
| 4.074% due 01/10/47 | 625 | 688 | 5.500% due 02/26/35 (Þ) | 333 | 335 | ||
| HarborView Mortgage Loan Trust | Sequoia Mortgage Trust | ||||||
| Series 2004-4 Class 3A | 1.874% due 02/25/43 | 298 | 292 | ||||
| 1.281% due 06/19/34 (Ê) | 53 | 51 | Series 2013-6 Class A1 | ||||
| JPMorgan Chase Commercial Mortgage | 2.500% due 05/25/43 | 518 | 515 | ||||
| Securities Trust | Structured Adjustable Rate Mortgage | ||||||
| Series 2004-LN2 Class B | Loan Trust | ||||||
| 5.466% due 07/15/41 | 500 | 497 | Series 2004-6 Class 1A | ||||
| Series 2007-CB20 Class ASB | 2.358% due 06/25/34 (Ê) | 246 | 243 | ||||
| 5.688% due 02/12/51 | 23 | 23 | Series 2004-12 Class 7A3 | ||||
| JPMorgan Mortgage Trust | 2.694% due 09/25/34 (Ê) | 98 | 97 | ||||
| Series 2003-A2 Class 3A1 | Structured Asset Securities Corp. | ||||||
| 2.503% due 11/25/33 (Ê) | 158 | 150 | Mortgage Pass-Through Certificates | ||||
| Series 2005-A1 Class 6T1 | Series 2003-34A Class 5A4 | ||||||
| 3.089% due 02/25/35 (Ê) | 273 | 269 | 2.956% due 11/25/33 (Ê) | 745 | 750 | ||
| Wachovia Bank Commercial Mortgage | |||||||
| Series 2005-A3 Class 4A1 | Trust | ||||||
| 2.658% due 06/25/35 (Ê) | 121 | 121 | Series 2007-C33 Class A4 | ||||
| LB Commercial Mortgage Trust | 6.158% due 02/15/51 | 234 | 236 | ||||
| Series 2007-C3 Class AM | Washington Mutual Mortgage Pass- | ||||||
| 6.114% due 07/15/44 | 790 | 805 | Through Certificates Trust | ||||
| LB-UBS Commercial Mortgage Trust | Series 2003-AR10 Class A7 | ||||||
| Series 2007-C6 Class A4 | 2.669% due 10/25/33 (Ê) | 291 | 296 | ||||
| 5.858% due 07/15/40 | 560 | 566 | Series 2004-AR1 Class A | ||||
| ML-CFC Commercial Mortgage Trust | 2.771% due 03/25/34 (Ê) | 1,319 | 1,320 | ||||
| Series 2007-5 Class A4 | Series 2005-AR13 Class A1A1 | ||||||
| 5.378% due 08/12/48 | 149 | 149 | 0.815% due 10/25/45 (Ê) | 1,178 | 1,114 | ||
| Morgan Stanley Bank of America Merrill | Wedgewood Real Estate Trust | ||||||
| Lynch Trust | Series 2016-1 Class A1 | ||||||
| Series 2013-C10 Class A4 | 3.450% due 07/15/46 (Þ) | 75 | 75 | ||||
| 4.218% due 07/15/46 | 88 | 97 | Wells Fargo Commercial Mortgage Trust | ||||
| Series 2013-C12 Class A4 | Series 2015-NXS3 Class A4 | ||||||
| 4.259% due 10/15/46 | 153 | 170 | 3.617% due 09/15/57 | 19 | 20 | ||
| Series 2014-C14 Class A4 | Series 2015-SG1 Class A4 | ||||||
| 3.787% due 02/15/47 | 165 | 178 | 3.789% due 12/15/47 | 181 | 196 | ||
| Series 2014-C14 Class A5 | Wells Fargo Mortgage Backed Securities | ||||||
| 4.064% due 02/15/47 | 45 | 50 | Trust | ||||
| Series 2015-C20 Class A4 | Series 2003-J Class 1A9 | ||||||
| 3.249% due 02/15/48 | 181 | 188 | 2.612% due 10/25/33 (Ê) | 769 | 769 | ||
| Series 2015-C24 Class A4 | Series 2005-AR10 Class 2A4 | ||||||
| 3.732% due 05/15/48 | 945 | 1,018 | 2.652% due 06/25/35 (Ê) | 37 | 38 | ||
| Series 2016-C31 | Series 2006-AR8 Class 1A3 | ||||||
| 1.511% due 11/15/21 | 510 | 510 | 3.024% due 04/25/36 (Ê) | 589 | 581 | ||
| Series 2016-C31 Class A5 | WFRBS Commercial Mortgage Trust | ||||||
| 3.102% due 10/15/26 | 158 | 161 | Interest Only STRIP | ||||
| Morgan Stanley Capital I Trust | Series 2014-C21 Class XA | ||||||
| Series 2007-IQ16 Class AM | 1.316% due 08/15/47 | 7,816 | 483 | ||||
| 6.277% due 12/12/49 | 1,055 | 1,094 | 277,054 | ||||
| Series 2014-CPT Class A | Municipal Bonds - 0.5% | ||||||
| 3.350% due 07/13/29 (Þ) | 456 | 481 | Commonwealth Financing Authority | ||||
| MSCG Trust ALDR | Revenue Bonds | ||||||
| Series 2015-ALDR Class A2 | 4.144% due 06/01/38 | 125 | 126 | ||||
| 3.577% due 06/07/35 (Þ) | 310 | 321 | |||||
See accompanying notes which are an integral part of the financial statements.
Russell Investment Grade Bond Fund 471
Russell Investment Company
Russell Investment Grade Bond Fund
Schedule of Investments, continued — October 31, 2016
| Amounts in thousands (except share amounts) | Amounts in thousands (except share amounts) | ||||||
| Principal | Fair | Principal | Fair | ||||
| Amount ($) | Value | Amount ($) | Value | ||||
| or Shares | $ | or Shares | $ | ||||
| Municipal Electric Authority of Georgia | 0.875% due 05/31/18 | 1,931 | 1,933 | ||||
| Revenue Bonds | 0.625% due 06/30/18 | 14,644 | 14,598 | ||||
| 6.637% due 04/01/57 | 990 | 1,297 | 0.750% due 07/31/18 | 6,230 | 6,221 | ||
| 7.055% due 04/01/57 | 1,410 | 1,698 | 1.250% due 10/31/18 | 200 | 201 | ||
| New Jersey Transportation Trust Fund | 1.750% due 10/31/18 | 1,000 | 1,017 | ||||
| Authority Revenue Bonds | |||||||
| 5.754% due 12/15/28 | 455 | 505 | 1.250% due 12/15/18 | 237 | 239 | ||
| San Diego Tobacco Settlement Revenue | 1.375% due 12/31/18 | 1,074 | 1,084 | ||||
| Funding Corp. Revenue Bonds | 2.625% due 08/15/20 | 7,182 | 7,566 | ||||
| 7.125% due 06/01/32 | 210 | 240 | 1.375% due 08/31/20 | 5,767 | 5,808 | ||
| State of California General Obligation | 2.125% due 08/31/20 | 7,849 | 8,124 | ||||
| Unlimited | 1.625% due 11/30/20 | 4,882 | 4,959 | ||||
| 7.300% due 10/01/39 | 300 | 442 | 1.375% due 01/31/21 | 4,282 | 4,303 | ||
| 7.350% due 11/01/39 | 77 | 114 | 1.250% due 03/31/21 | 250 | 250 | ||
| State of Illinois General Obligation | 1.375% due 04/30/21 | 1,250 | 1,254 | ||||
| Unlimited | 1.125% due 06/30/21 | 2,490 | 2,469 | ||||
| 5.877% due 03/01/19 | 335 | 361 | 1.125% due 08/31/21 | 1,131 | 1,121 | ||
| University of California Revenue Bonds | 1.250% due 10/31/21 | 5,010 | 4,995 | ||||
| 4.767% due 05/15/15 | 255 | 262 | 2.000% due 11/15/21 | 2,210 | 2,277 | ||
| 5,045 | 1.750% due 04/30/22 | 1,150 | 1,168 | ||||
| United States Government Agencies - 12.6% | 2.125% due 12/31/22 | 3,460 | 3,579 | ||||
| Fannie Mae | 1.750% due 01/31/23 | 2,862 | 2,896 | ||||
| 1.125% due 12/14/18 | 335 | 336 | 2.000% due 02/15/23 | 3,136 | 3,220 | ||
| 1.000% due 02/26/19 | 165 | 165 | 1.500% due 02/28/23 | 2,650 | 2,640 | ||
| 1.625% due 01/21/20 | 100 | 102 | 1.500% due 03/31/23 | 2,515 | 2,505 | ||
| 1.600% due 12/24/20 | 1,205 | 1,201 | 1.375% due 06/30/23 | 6,472 | 6,384 | ||
| 1.875% due 12/28/20 | 125 | 128 | 1.375% due 08/31/23 | 4,663 | 4,594 | ||
| 2.625% due 09/06/24 | 449 | 473 | 1.625% due 02/15/26 | 1,895 | 1,864 | ||
| 7.125% due 01/15/30 | 100 | 153 | 1.625% due 05/15/26 | 1,331 | 1,307 | ||
| 7.250% due 05/15/30 | 230 | 355 | 2.500% due 02/15/46 | 1,741 | 1,708 | ||
| 6.625% due 11/15/30 | 100 | 149 | 2.500% due 05/15/46 | 4,385 | 4,305 | ||
| Federal Home Loan Banks | 123,525 | ||||||
| 0.875% due 06/29/18 | 250 | 250 | United States Government Treasuries - 19.0% | ||||
| 0.875% due 10/01/18 | 175 | 175 | |||||
| 0.875% due 08/05/19 | 200 | 199 | United States Treasury Notes | ||||
| 0.750% due 12/31/17 | 2,000 | 2,000 | |||||
| 2.875% due 09/11/20 | 250 | 265 | 0.875% due 01/31/18 | 1,100 | 1,102 | ||
| 1.375% due 02/18/21 | 120 | 120 | 0.750% due 02/28/18 | 675 | 675 | ||
| Federal Home Loan Mortgage Corp. | 0.750% due 03/31/18 | 4,375 | 4,373 | ||||
| Series GMTN | 0.625% due 04/30/18 | 3,798 | 3,788 | ||||
| 0.750% due 04/09/18 | 200 | 200 | 2.625% due 04/30/18 | 1,200 | 1,232 | ||
| Federal National Mortgage Association | 1.000% due 05/15/18 | 1,695 | 1,700 | ||||
| 0.875% due 08/02/19 | 250 | 249 | 1.000% due 05/31/18 | 1,359 | 1,363 | ||
| 2.125% due 04/24/26 | 20 | 20 | 1.375% due 06/30/18 | 1,726 | 1,741 | ||
| 1.875% due 09/24/26 | 100 | 97 | 0.750% due 08/31/18 (§) | 2,175 | 2,171 | ||
| Freddie Mac | 1.500% due 08/31/18 | 450 | 455 | ||||
| 2.375% due 01/13/22 | 837 | 874 | 1.000% due 09/15/18 | 500 | 501 | ||
| 6.250% due 07/15/32 | 424 | 626 | 0.750% due 09/30/18 | 916 | 914 | ||
| Tennessee Valley Authority | 1.125% due 01/15/19 | 1,425 | 1,431 | ||||
| 6.150% due 01/15/38 | 345 | 505 | 2.750% due 02/15/19 | 250 | 260 | ||
| 3.500% due 12/15/42 | 343 | 362 | 1.375% due 02/28/19 | 2,180 | 2,202 | ||
| 4.250% due 09/15/65 | 387 | 437 | 1.500% due 02/28/19 | 2,500 | 2,533 | ||
| United States Treasury Inflation Indexed | 1.500% due 03/31/19 | 250 | 253 | ||||
| Bonds | 0.875% due 04/15/19 | 3,455 | 3,449 | ||||
| 0.375% due 07/15/25 | 868 | 891 | 0.875% due 06/15/19 | 1,350 | 1,347 | ||
| 0.250% due 07/15/26 | 1,439 | 1,458 | 1.000% due 06/30/19 | 700 | 701 | ||
| 0.625% due 02/15/43 | 943 | 922 | 1.625% due 06/30/19 | 500 | 509 | ||
| 1.375% due 02/15/44 | 1,374 | 1,592 | 3.625% due 08/15/19 | 365 | 391 | ||
| 0.750% due 02/15/45 | 1,447 | 1,454 | 8.125% due 08/15/19 | 4,760 | 5,692 | ||
| United States Treasury Notes | 1.000% due 10/15/19 | 2,782 | 2,782 | ||||
| 1.000% due 12/31/17 | 260 | 261 | 1.500% due 10/31/19 | 2,100 | 2,130 | ||
| 0.875% due 03/31/18 | 4,312 | 4,317 | 1.375% due 02/29/20 | 2,932 | 2,959 | ||
| 0.750% due 04/15/18 | 600 | 600 | |||||
See accompanying notes which are an integral part of the financial statements.
472 Russell Investment Grade Bond Fund
Russell Investment Company
Russell Investment Grade Bond Fund
Schedule of Investments, continued — October 31, 2016
| Amounts in thousands (except share amounts) | Amounts in thousands (except share amounts) | ||||||||
| Principal | Fair | Principal | Fair | ||||||
| Amount ($) | Value | Amount ($) | Value | ||||||
| or Shares | $ | or Shares | $ | ||||||
| 1.125% due 03/31/20 | 2,000 | 2,002 | Short-Term Investments - 14.7% | ||||||
| 1.125% due 04/30/20 | 2,525 | 2,525 | |||||||
| 1.375% due 04/30/20 | 3,694 | 3,727 | Bear Stearns Cos. LLC (The) | ||||||
| 8.750% due 05/15/20 | 2,500 | 3,159 | 5.550% due 01/22/17 | 470 | 475 | ||||
| 1.625% due 07/31/20 | 7,462 | 7,586 | Exelon Corp. | ||||||
| 1.375% due 09/30/20 | 9,239 | 9,301 | 1.550% due 06/09/17 | 476 | 476 | ||||
| 2.000% due 09/30/20 | 200 | 206 | Fannie Mae | ||||||
| 1.375% due 10/31/20 | 8,870 | 8,925 | |||||||
| 1.750% due 10/31/20 | 6,638 | 6,777 | 5.500% due 01/01/17 | 1 | 1 | ||||
| 3.625% due 02/15/21 | 1,000 | 1,099 | Freddie Mac | ||||||
| 2.250% due 03/31/21 | 500 | 521 | 6.000% due 07/01/17 | 7 | 7 | ||||
| 8.125% due 05/15/21 | 300 | 390 | 6.000% due 08/01/17 | 2 | 2 | ||||
| 2.125% due 06/30/21 | 750 | 777 | |||||||
| 2.125% due 08/15/21 | 5,995 | 6,213 | 6.000% due 09/01/17 | 3 | 3 | ||||
| 1.125% due 09/30/21 | 4,745 | 4,700 | Hewlett Packard Enterprise Co. | ||||||
| 1.125% due 10/31/21 | 5,502 | 5,453 | 2.700% due 10/05/17 (Þ) | 1,260 | 1,276 | ||||
| 2.000% due 10/31/21 | 435 | 448 | Intesa Sanpaolo SpA | ||||||
| 8.000% due 11/15/21 | 1,250 | 1,654 | 2.375% due 01/13/17 | 826 | 827 | ||||
| 1.500% due 01/31/22 | 430 | 432 | Lehman Brothers Holdings, Inc. | ||||||
| 1.750% due 02/28/22 | 1,185 | 1,205 | |||||||
| 1.875% due 05/31/22 | 1,315 | 1,345 | 6.500% due 07/19/17 (Ø) | 390 | — | ||||
| 1.625% due 11/15/22 | 1,200 | 1,207 | Metropolitan Life Global Funding I | ||||||
| 1.750% due 05/15/23 | 1,000 | 1,011 | 1.300% due 04/10/17 (Þ) | 337 | 337 | ||||
| 6.250% due 08/15/23 | 810 | 1,054 | NextEra Energy Capital Holdings, Inc. | ||||||
| 1.375% due 09/30/23 | 907 | 893 | 2.056% due 09/01/17 | 846 | 851 | ||||
| 2.750% due 02/15/24 | 335 | 361 | Russell U.S. Cash Management Fund | 128,147,334 | (8) | 128,173 | |||
| 2.500% due 05/15/24 | 600 | 636 | |||||||
| 2.375% due 08/15/24 | 3,909 | 4,103 | Samsung Electronics America, Inc. | ||||||
| 2.250% due 11/15/24 | 850 | 884 | 1.750% due 04/10/17 (Þ) | 765 | 766 | ||||
| 2.000% due 02/15/25 | 4,322 | 4,405 | Thomson Reuters Corp. | ||||||
| 2.125% due 05/15/25 | 403 | 414 | 1.650% due 09/29/17 | 720 | 722 | ||||
| 1.500% due 08/15/26 | 7,165 | 6,951 | Tyco Electronics Group SA | ||||||
| 6.125% due 11/15/27 | 35 | 50 | 6.550% due 10/01/17 | 705 | 739 | ||||
| 5.250% due 02/15/29 | 2,367 | 3,214 | |||||||
| 6.125% due 08/15/29 | 2,476 | 3,637 | UBS AG | ||||||
| 6.250% due 05/15/30 | 1,498 | 2,255 | 1.375% due 06/01/17 | 802 | 802 | ||||
| 5.375% due 02/15/31 | 1,050 | 1,491 | United Auto Credit Securitization Trust | ||||||
| 4.500% due 02/15/36 | 300 | 408 | Series 2016-1 Class A | ||||||
| 4.750% due 02/15/37 | 3,994 | 5,598 | 2.000% due 10/16/17 (Þ) | 56 | 56 | ||||
| 4.375% due 05/15/40 | 500 | 671 | United States Treasury Bills | ||||||
| 3.875% due 08/15/40 | 1,270 | 1,589 | |||||||
| 3.750% due 08/15/41 | 400 | 492 | 0.167% due 12/08/16 (~) | 85 | 85 | ||||
| 3.125% due 11/15/41 | 1,627 | 1,809 | United States Treasury Notes | ||||||
| 3.125% due 02/15/42 | 1,670 | 1,859 | 0.875% due 08/15/17 | 3,000 | 3,005 | ||||
| 3.000% due 05/15/42 | 1,575 | 1,715 | 1.875% due 08/31/17 | 2,000 | 2,020 | ||||
| 2.750% due 08/15/42 | 3,266 | 3,394 | |||||||
| 2.750% due 11/15/42 | 1,870 | 1,941 | 1.000% due 09/15/17 | 2,000 | 2,005 | ||||
| 3.125% due 02/15/43 | 4,588 | 5,102 | 0.875% due 10/15/17 | 1,750 | 1,753 | ||||
| 2.875% due 05/15/43 | 1,000 | 1,061 | Xcel Energy, Inc. | ||||||
| 3.750% due 11/15/43 | 5,022 | 6,242 | 1.200% due 06/01/17 | 611 | 611 | ||||
| 2.500% due 02/15/45 | 1,880 | 1,847 | Total Short-Term Investments | ||||||
| 3.000% due 05/15/45 | 1,141 | 1,239 | |||||||
| 2.875% due 08/15/45 | 2,424 | 2,569 | (cost $145,317) | 144,992 | |||||
| 3.000% due 11/15/45 | 100 | 109 | |||||||
| 187,310 | Total Investments 108.6% | ||||||||
| Total Long-Term Investments | (identified cost $1,060,777) | 1,068,106 | |||||||
| (cost $915,460) | 923,114 | ||||||||
| Other Assets and Liabilities, | |||||||||
| Net - (8.6%) | (84,693 | ) | |||||||
See accompanying notes which are an integral part of the financial statements.
Russell Investment Grade Bond Fund 473
Russell Investment Company
Russell Investment Grade Bond Fund
Schedule of Investments, continued — October 31, 2016
| Amounts in thousands (except share amounts) | |
| Principal | Fair |
| Amount ($) | Value |
| or Shares | $ |
| Net Assets - 100.0% | 983,413 |
See accompanying notes which are an integral part of the financial statements.
474 Russell Investment Grade Bond Fund
Russell Investment Company
Russell Investment Grade Bond Fund
Schedule of Investments, continued — October 31, 2016
| Restricted Securities | |||||||||||||||
| Amounts in thousands (except share and cost per unit amounts) | |||||||||||||||
| Principal | Cost per | Cost | Fair Value | ||||||||||||
| % of Net Assets | Acquisition | Amount ($) | Unit | (000 | ) | (000 | ) | ||||||||
| Securities | Date | or shares | $ | $ | $ | ||||||||||
| 0.0% | |||||||||||||||
| Kaupthing Bank HF | 02/17/16 | 1,210,000 | — | — | — | ||||||||||
| Kaupthing Bank HF | 02/17/16 | 100,000 | — | — | — | ||||||||||
| — | |||||||||||||||
| For a description of restricted securities see note 8 in the Notes to Financial Statements. | |||||||||||||||
| Futures Contracts | |||||||||||||||
| Amounts in thousands (except contract amounts) | |||||||||||||||
| Unrealized | |||||||||||||||
| Appreciation | |||||||||||||||
| Number of | Notional | Expiration | (Depreciation) | ||||||||||||
| Contracts | Amount | Date | $ | ||||||||||||
| Long Positions | |||||||||||||||
| Australia 10 Year Bond Futures | 406 | AUD | 53,845 | 12/16 | (277 | ) | |||||||||
| United States 2 Year Treasury Note Futures | 88 | USD | 19,196 | 12/16 | 2 | ||||||||||
| United States 5 Year Treasury Note Futures | 192 | USD | 23,193 | 12/16 | (41 | ) | |||||||||
| United States 10 Year Treasury Note Futures | 523 | USD | 67,794 | 12/16 | (169 | ) | |||||||||
| United States Treasury Long Bond Futures | 43 | USD | 6,997 | 12/16 | (296 | ) | |||||||||
| Short Positions | |||||||||||||||
| Euro-Bund Futures | 213 | EUR | 34,542 | 12/16 | 302 | ||||||||||
| Long Gilt Futures | 257 | GBP | 32,213 | 12/16 | 379 | ||||||||||
| United States 10 Year Treasury Note Futures | 37 | USD | 4,796 | 12/16 | 22 | ||||||||||
| United States 10 Year Ultra Bond Futures | 77 | USD | 10,897 | 12/16 | 39 | ||||||||||
| United States Treasury Long Bond Futures | 3 | USD | 488 | 12/16 | 23 | ||||||||||
| United States Treasury Ultra Bond Futures | 76 | USD | 13,371 | 12/16 | 741 | ||||||||||
| Total Unrealized Appreciation (Depreciation) on Open Futures Contracts (å) | 725 | ||||||||||||||
| Transactions in options written contracts for the period ended October 31, 2016 were as follows: | |||||||||||||||
| Number of | Premiums | ||||||||||||||
| Contracts | Received | ||||||||||||||
| Outstanding October 31, 2015 | 1 | $ | 159 | ||||||||||||
| Opened | — | — | |||||||||||||
| Closed | (1 | ) | (159 | ) | |||||||||||
| Expired | — | — | |||||||||||||
| Outstanding October 31, 2016 | — | $ | — | ||||||||||||
| Foreign Currency Exchange Contracts | ||||||||
| Amounts in thousands | ||||||||
| Unrealized | ||||||||
| Appreciation | ||||||||
| Amount | Amount | (Depreciation) | ||||||
| Counterparty | Sold | Bought | Settlement Date | $ | ||||
| Bank of America | USD | 45 | BRL | 152 | 11/21/16 | 3 | ||
| Bank of America | USD | 79 | BRL | 253 | 11/21/16 | — | ||
| Bank of America | USD | 159 | BRL | 519 | 11/21/16 | 3 | ||
| Bank of America | USD | 1,128 | BRL | 3,671 | 11/21/16 | 16 | ||
| Bank of America | USD | 15 | COP | 44,351 | 11/21/16 | — | ||
| Bank of America | USD | 70 | COP | 204,532 | 11/21/16 | (2 | ) | |
| Bank of America | USD | 1,151 | COP | 3,412,769 | 11/21/16 | (20 | ) | |
| Bank of America | USD | 188 | CZK | 4,619 | 11/21/16 | — | ||
| Bank of America | USD | 20 | HUF | 5,425 | 11/21/16 | — | ||
| Bank of America | USD | 57 | HUF | 15,479 | 11/21/16 | (2 | ) | |
| Bank of America | USD | 181 | HUF | 50,523 | 11/21/16 | (1 | ) | |
| Bank of America | USD | 2,357 | HUF | 649,728 | 11/21/16 | (47 | ) | |
See accompanying notes which are an integral part of the financial statements.
Russell Investment Grade Bond Fund 475
Russell Investment Company
Russell Investment Grade Bond Fund
Schedule of Investments, continued — October 31, 2016
| Foreign Currency Exchange Contracts | |||||||
| Amounts in thousands | |||||||
| Unrealized | |||||||
| Appreciation | |||||||
| Amount | Amount | (Depreciation) | |||||
| Counterparty | Sold | Bought | Settlement Date | $ | |||
| Bank of America | USD | 16 | IDR | 209,735 | 11/21/16 | — | |
| Bank of America | USD | 139 | IDR | 1,830,934 | 11/21/16 | 1 | |
| Bank of America | USD | 95 | MYR | 397 | 11/21/16 | (1 | ) |
| Bank of America | USD | 8 | PLN | 30 | 11/21/16 | — | |
| Bank of America | USD | 189 | PLN | 744 | 11/21/16 | 1 | |
| Bank of America | USD | 2,353 | PLN | 8,929 | 11/21/16 | (78 | ) |
| Bank of America | USD | 6 | RUB | 419 | 11/21/16 | — | |
| Bank of America | USD | 97 | RUB | 6,154 | 11/21/16 | — | |
| Bank of America | USD | 202 | RUB | 12,707 | 11/21/16 | (2 | ) |
| Bank of America | USD | 1,156 | RUB | 75,588 | 11/21/16 | 30 | |
| Bank of America | USD | 97 | TRY | 303 | 11/21/16 | 1 | |
| Bank of America | USD | 194 | TRY | 607 | 11/21/16 | 1 | |
| Bank of America | USD | 1,158 | TRY | 3,460 | 11/21/16 | (45 | ) |
| Bank of America | USD | 2,316 | TRY | 6,920 | 11/21/16 | (90 | ) |
| Bank of America | USD | 66 | TWD | 2,087 | 11/21/16 | — | |
| Bank of America | BRL | 260 | USD | 79 | 11/21/16 | (2 | ) |
| Bank of America | BRL | 304 | USD | 90 | 11/21/16 | (5 | ) |
| Bank of America | BRL | 507 | USD | 157 | 11/21/16 | (1 | ) |
| Bank of America | BRL | 7,343 | USD | 2,256 | 11/21/16 | (32 | ) |
| Bank of America | COP | 176,273 | USD | 60 | 11/21/16 | 1 | |
| Bank of America | CZK | 2,310 | USD | 94 | 11/21/16 | — | |
| Bank of America | HUF | 10,849 | USD | 39 | 11/21/16 | 1 | |
| Bank of America | HUF | 25,262 | USD | 90 | 11/21/16 | 1 | |
| Bank of America | HUF | 30,959 | USD | 113 | 11/21/16 | 3 | |
| Bank of America | HUF | 324,864 | USD | 1,183 | 11/21/16 | 28 | |
| Bank of America | IDR | 2,342,857 | USD | 178 | 11/21/16 | (1 | ) |
| Bank of America | IDR | 30,736,130 | USD | 2,324 | 11/21/16 | (29 | ) |
| Bank of America | MYR | 138 | USD | 33 | 11/21/16 | — | |
| Bank of America | MYR | 878 | USD | 208 | 11/21/16 | (1 | ) |
| Bank of America | MYR | 9,383 | USD | 2,339 | 11/21/16 | 106 | |
| Bank of America | PLN | 460 | USD | 120 | 11/21/16 | 3 | |
| Bank of America | RUB | 210 | USD | 3 | 11/21/16 | — | |
| Bank of America | RUB | 6,353 | USD | 101 | 11/21/16 | 1 | |
| Bank of America | RUB | 12,308 | USD | 193 | 11/21/16 | — | |
| Bank of America | RUB | 151,177 | USD | 2,305 | 11/21/16 | (68 | ) |
| Bank of America | TRY | 3 | USD | 1 | 11/21/16 | — | |
| Bank of America | TRY | 6 | USD | 2 | 11/21/16 | — | |
| Bank of America | TRY | 90 | USD | 29 | 11/21/16 | — | |
| Bank of America | TRY | 181 | USD | 59 | 11/21/16 | 1 | |
| Bank of America | TWD | 69 | USD | 2 | 11/21/16 | — | |
| Bank of America | TWD | 3,048 | USD | 96 | 11/21/16 | (1 | ) |
| Bank of America | TWD | 36,663 | USD | 1,185 | 11/21/16 | 23 | |
| Bank of Montreal | USD | 4,003 | CAD | 5,236 | 11/21/16 | (100 | ) |
| Bank of Montreal | USD | 3,948 | EUR | 3,586 | 11/21/16 | (9 | ) |
| Bank of Montreal | CHF | 1,954 | USD | 1,977 | 11/21/16 | 1 | |
| Bank of Montreal | CHF | 3,908 | USD | 3,955 | 11/21/16 | 1 | |
| Bank of Montreal | HKD | 9,087 | USD | 1,173 | 11/21/16 | 1 | |
| Bank of New York | USD | 3,988 | GBP | 3,245 | 11/21/16 | (15 | ) |
| Bank of New York | USD | 7,876 | JPY | 818,202 | 11/21/16 | (69 | ) |
| Bank of New York | GBP | 6,489 | USD | 7,976 | 11/21/16 | 31 | |
| Bank of New York | ILS | 15,059 | USD | 3,941 | 11/21/16 | 14 | |
| Citigroup | USD | 2,008 | NZD | 2,796 | 11/21/16 | (10 | ) |
| Citigroup | USD | 8,030 | NZD | 11,184 | 11/21/16 | (39 | ) |
| Citigroup | SEK | 17,436 | USD | 1,979 | 11/21/16 | 47 | |
| Citigroup | SEK | 69,744 | USD | 7,917 | 11/21/16 | 189 | |
| State Street | USD | 2,008 | AUD | 2,619 | 11/21/16 | (16 | ) |
See accompanying notes which are an integral part of the financial statements.
476 Russell Investment Grade Bond Fund
Russell Investment Company
Russell Investment Grade Bond Fund
Schedule of Investments, continued — October 31, 2016
| Foreign Currency Exchange Contracts | ||||||||
| Amounts in thousands | ||||||||
| Unrealized | ||||||||
| Appreciation | ||||||||
| Amount | Amount | (Depreciation) | ||||||
| Counterparty | Sold | Bought | Settlement Date | $ | ||||
| State Street | USD | 19 | CZK | 459 | 11/21/16 | — | ||
| State Street | USD | 45 | CZK | 1,095 | 11/21/16 | (1 | ) | |
| State Street | USD | 2,377 | CZK | 56,635 | 11/21/16 | (75 | ) | |
| State Street | USD | 12 | HKD | 95 | 11/21/16 | — | ||
| State Street | USD | 54 | HKD | 420 | 11/21/16 | — | ||
| State Street | USD | 7,937 | NOK | 65,039 | 11/21/16 | (65 | ) | |
| State Street | USD | 13 | SGD | 18 | 11/21/16 | — | ||
| State Street | USD | 49 | SGD | 68 | 11/21/16 | (1 | ) | |
| State Street | USD | 188 | SGD | 261 | 11/21/16 | — | ||
| State Street | USD | 2,355 | SGD | 3,146 | 11/21/16 | (94 | ) | |
| State Street | USD | 83 | ZAR | 1,197 | 11/21/16 | 5 | ||
| State Street | USD | 130 | ZAR | 1,853 | 11/21/16 | 7 | ||
| State Street | USD | 1,149 | ZAR | 15,533 | 11/21/16 | (2 | ) | |
| State Street | CHF | 7,817 | USD | 7,908 | 11/21/16 | 1 | ||
| State Street | CZK | 918 | USD | 38 | 11/21/16 | 1 | ||
| State Street | CZK | 2,189 | USD | 91 | 11/21/16 | 2 | ||
| State Street | CZK | 28,317 | USD | 1,188 | 11/21/16 | 37 | ||
| State Street | DKK | 13,339 | USD | 1,973 | 11/21/16 | 3 | ||
| State Street | HKD | 633 | USD | 82 | 11/21/16 | — | ||
| State Street | NOK | 32,520 | USD | 3,992 | 11/21/16 | 56 | ||
| State Street | SGD | 9 | USD | 7 | 11/21/16 | — | ||
| State Street | SGD | 130 | USD | 94 | 11/21/16 | — | ||
| State Street | SGD | 136 | USD | 99 | 11/21/16 | 1 | ||
| State Street | SGD | 1,573 | USD | 1,177 | 11/21/16 | 47 | ||
| State Street | ZAR | 1,619 | USD | 116 | 11/21/16 | (4 | ) | |
| Total Unrealized Appreciation (Depreciation) on Open Foreign Currency Exchange Contracts | (260 | ) | ||||||
| Presentation of Portfolio Holdings | |||||||||||||
| Amounts in thousands | |||||||||||||
| Fair Value | |||||||||||||
| Practical | |||||||||||||
| Portfolio Summary | Level 1 | Level 2 | Level 3 | Expedient (a) | Total | % of Net Assets | |||||||
| Long-Term Investments | |||||||||||||
| Asset-Backed Securities | $ | — | $ | 41,133 | $ | 1,188 | $ | — | $ | 42,321 | 4.3 | ||
| Corporate Bonds and Notes | — | 226,900 | 329 | — | 227,229 | 23.1 | |||||||
| International Debt | — | 60,630 | — | — | 60,630 | 6.2 | |||||||
| Mortgage-Backed Securities | — | 277,035 | 19 | — | 277,054 | 28.2 | |||||||
| Municipal Bonds | — | 5,045 | — | — | 5,045 | 0.5 | |||||||
| United States Government Agencies | — | 123,525 | — | — | 123,525 | 12.6 | |||||||
| United States Government Treasuries | — | 187,310 | — | — | 187,310 | 19.0 | |||||||
| Short-Term Investments | — | 16,819 | — | 128,173 | 144,992 | 14.7 | |||||||
| Total Investments | — | 938,397 | 1,536 | 128,173 | 1,068,106 | 108.6 | |||||||
| Other Assets and Liabilities, Net | (8.6 | ) | |||||||||||
| 100.0 | |||||||||||||
See accompanying notes which are an integral part of the financial statements.
Russell Investment Grade Bond Fund 477
Russell Investment Company
Russell Investment Grade Bond Fund
Schedule of Investments, continued — October 31, 2016
| Presentation of Portfolio Holdings | ||||||||||||||||
| Amounts in thousands | ||||||||||||||||
| Fair Value | ||||||||||||||||
| Practical | ||||||||||||||||
| Portfolio Summary | Level 1 | Level 2 | Level 3 | Expedient (a) | Total | % of Net Assets | ||||||||||
| Other Financial Instruments | ||||||||||||||||
| Assets | ||||||||||||||||
| Futures Contracts | 1,508 | — | — | — | 1,508 | 0.2 | ||||||||||
| Foreign Currency Exchange Contracts | — | 668 | — | — | 668 | 0.1 | ||||||||||
| A | ||||||||||||||||
| Liabilities | ||||||||||||||||
| Futures Contracts | (783 | ) | — | — | — | (783 | ) | (0.1 | ) | |||||||
| Foreign Currency Exchange Contracts | — | (928 | ) | — | — | (928 | ) | (0.1 | ) | |||||||
| Total Other Financial Instruments* | $ | 725 | $ | (260 | ) | $ | — | $ | — | $ | 465 | |||||
* Futures and foreign currency exchange contract values reflect the unrealized appreciation (depreciation) on the investments.
(a) Certain investments that are measured at fair value using the net asset value per share (or its equivalent) practical expedient have not been classified
in the fair value levels. The fair value amounts presented in the table are intended to permit reconciliation to the amounts presented in the Schedule of
Investments.
For a description of the Levels, see note 2 in the Notes to Financial Statements.
For a disclosure on transfers between Levels 1, 2 and 3 during the period ended October 31, 2016, see note 2 in the Notes to
Financial Statements.
Investments in which significant unobservable inputs (Level 3) were used in determining a fair value for the period ended October
31, 2016 were less than 1% of net assets.
See accompanying notes which are an integral part of the financial statements.
478 Russell Investment Grade Bond Fund
Russell Investment Company
Russell Investment Grade Bond Fund
Fair Value of Derivative Instruments — October 31, 2016
Amounts in thousands
| Foreign | |||||||||
| Currency | Interest Rate | ||||||||
| Derivatives not accounted for as hedging instruments | Contracts | Contracts | |||||||
| Location: Statement of Assets and Liabilities - Assets | |||||||||
| Unrealized appreciation on foreign currency exchange contracts | $ | 668 | $ | — | |||||
| Variation margin on futures contracts* | — | 1,508 | |||||||
| Total | $ | 668 | $ | 1,508 | |||||
| Location: Statement of Assets and Liabilities - Liabilities | |||||||||
| Variation margin on futures contracts* | $ | — | $ | 783 | |||||
| Unrealized depreciation on foreign currency exchange contracts | 928 | — | |||||||
| Total | $ | 928 | $ | 783 | |||||
| Foreign | |||||||||
| Credit | Currency | Interest Rate | |||||||
| Derivatives not accounted for as hedging instruments | Contracts | Contracts | Contracts | ||||||
| Location: Statement of Operations - Net realized gain (loss) | |||||||||
| Futures contracts | $ | — | $ | — | $ | 2,406 | |||
| Options written | — | — | 48 | ||||||
| Total return swap contracts | — | — | 2,278 | ||||||
| Interest rate swap contracts | — | — | (1,019 | ) | |||||
| Credit default swap contracts | 62 | — | — | ||||||
| Foreign currency-related transactions** | — | 3,482 | — | ||||||
| Total | $ | 62 | $ | 3,482 | $ | 3,713 | |||
| Location: Statement of Operations - Net change in unrealized appreciation (depreciation) | |||||||||
| Futures contracts | $ | — | $ | — | $ | 708 | |||
| Options written | — | — | (112 | ) | |||||
| Total return swap contracts | — | — | 26 | ||||||
| Interest rate swap contracts | — | — | 447 | ||||||
| Foreign currency-related transactions*** | — | (1,260 | ) | — | |||||
| Total | $ | — | $ | (1,260 | ) | $ | 1,069 | ||
* Includes cumulative appreciation/depreciation of futures contracts as reported in the Schedule of Investments. Only variation margin is reported within the
Statement of Assets and Liabilities.
** Only includes net realized gain (loss) on forward and spot contracts. May differ from the net realized gain (loss) on foreign currency-related transactions reported
within the Statement of Operations.
*** Only includes change in unrealized gain (loss) on forward and spot contracts. May differ from the net change in unrealized gain (loss) on foreign currency-related
transactions reported within the Statement of Operations.
For further disclosure on derivatives see note 2 in the Notes to Financial Statements.
See accompanying notes which are an integral part of the financial statements.
Russell Investment Grade Bond Fund 479
Russell Investment Company
Russell Investment Grade Bond Fund
Balance Sheet Offsetting of Financial and Derivative Instruments — October 31, 2016
| Amounts in thousands | ||||||||||
| Offsetting of Financial Assets and Derivative Assets | ||||||||||
| Gross | Net Amounts | |||||||||
| Amounts | of Assets | |||||||||
| Gross | Offset in the | Presented in | ||||||||
| Amounts of | Statement of | the Statement | ||||||||
| Recognized | Assets and | of Assets and | ||||||||
| Description | Location: Statement of Assets and Liabilities - Assets | Assets | Liabilities | Liabilities | ||||||
| Foreign Currency Exchange Contracts | Unrealized appreciation on foreign currency exchange contracts | $ | 668 | $ | — | $ | 668 | |||
| Futures Contracts | Variation margin on futures contracts | 177 | — | 177 | ||||||
| Total Financial and Derivative Assets | 845 | — | 845 | |||||||
| Financial and Derivative Assets not subject to a netting agreement | (177) | — | (177 | ) | ||||||
| Total Financial and Derivative Assets subject to a netting agreement | $ | 668 | $ | — | $ | 668 | ||||
| Financial Assets, Derivative Assets, and Collateral Held by Counterparty | ||||||||||
| Gross Amounts Not Offset in | ||||||||||
| the Statement of Assets and | ||||||||||
| Liabilities | ||||||||||
| Net Amounts | ||||||||||
| of Assets | ||||||||||
| Presented in | ||||||||||
| the Statement | Financial and | |||||||||
| of Assets and | Derivative | Collateral | ||||||||
| Counterparty | Liabilities | Instruments | Received^ | Net Amount | ||||||
| Bank of America | $ | 225 | $ | 225 | $ | — | $ | — | ||
| Bank of Montreal | 3 | 3 | — | — | ||||||
| Bank of New York | 45 | 45 | — | — | ||||||
| Citigroup | 236 | 49 | — | 187 | ||||||
| State Street | 159 | 159 | — | — | ||||||
| Total | $ | 668 | $ | 481 | $ | — | $ | 187 | ||
See accompanying notes which are an integral part of the financial statements.
480 Russell Investment Grade Bond Fund
Russell Investment Company
Russell Investment Grade Bond Fund
Balance Sheet Offsetting of Financial and Derivative Instruments, continued —
October 31, 2016
| Amounts in thousands | |||||||||
| Offsetting of Financial Liabilities and Derivative Liabilities | |||||||||
| Gross | Net Amounts | ||||||||
| Amounts | of Liabilities | ||||||||
| Gross | Offset in the | Presented in | |||||||
| Amounts of | Statement of | the Statement | |||||||
| Recognized | Assets and | of Assets and | |||||||
| Description | Location: Statement of Assets and Liabilities - Liabilities | Liabilities | Liabilities | Liabilities | |||||
| Futures Contracts | Variation margin on futures contracts | $ | 180 | $ | — | $ | 180 | ||
| Foreign Currency Exchange Contracts | Unrealized depreciation on foreign currency exchange contracts | 928 | — | 928 | |||||
| Total Financial and Derivative Liabilities | 1,108 | — | 1,108 | ||||||
| Financial and Derivative Liabilities not subject to a netting agreement | (180) | — | (180 | ) | |||||
| Total Financial and Derivative Liabilities subject to a netting agreement | $ | 928 | $ | — | $ | 928 | |||
| Financial Liabilities, Derivative Liabilities, and Collateral Pledged by Counterparty | ||||||||||
| Gross Amounts Not Offset in | ||||||||||
| the Statement of Assets and | ||||||||||
| Liabilities | ||||||||||
| Net Amounts | ||||||||||
| of Liabilities | ||||||||||
| Presented in | ||||||||||
| the Statement | Financial and | |||||||||
| of Assets and | Derivative | Collateral | ||||||||
| Counterparty | Liabilities | Instruments | Pledged^ | Net Amount | ||||||
| Bank of America | $ | 429 | $ | 225 | $ | — | $ | 204 | ||
| Bank of Montreal | 108 | 3 | — | 105 | ||||||
| Bank of New York | 84 | 45 | — | 39 | ||||||
| Citigroup | 49 | 49 | — | — | ||||||
| State Street | 258 | 159 | — | 99 | ||||||
| Total | $ | 928 | $ | 481 | $ | — | $ | 447 | ||
* Fair value of securities on loan as reported in the footnotes to the Statement of Assets and Liabilities.
^ Collateral received or pledged amounts may not reconcile to those disclosed in the Statement of Assets and Liabilities due to the inclusion of off-Balance
Sheet collateral and adjustments made to exclude overcollateralization.
For further disclosure on derivatives and counterparty risk see note 2 in the Notes to Financial Statements.
See accompanying notes which are an integral part of the financial statements.
Russell Investment Grade Bond Fund 481
Russell Investment Company
Russell Investment Grade Bond Fund
Statement of Assets and Liabilities — October 31, 2016
| Amounts in thousands | ||
| Assets | ||
| Investments, at identified cost | $ | 1,060,777 |
| Investments, at fair value(>) | 1,068,106 | |
| Cash | 5,776 | |
| Cash (restricted)(a) | 3,840 | |
| Unrealized appreciation on foreign currency exchange contracts | 668 | |
| Receivables: | ||
| Dividends and interest | 5,137 | |
| Dividends from affiliated Russell funds | 58 | |
| Investments sold | 15,935 | |
| Fund shares sold | 821 | |
| Investments matured(<) | 239 | |
| Variation margin on futures contracts | 177 | |
| Total assets | 1,100,757 | |
| Liabilities | ||
| Payables: | ||
| Investments purchased | 114,513 | |
| Fund shares redeemed | 1,049 | |
| Accrued fees to affiliates | 398 | |
| Other accrued expenses | 276 | |
| Variation margin on futures contracts | 180 | |
| Unrealized depreciation on foreign currency exchange contracts | 928 | |
| Total liabilities | 117,344 | |
| Net Assets | $ | 983,413 |
See accompanying notes which are an integral part of the financial statements.
482 Russell Investment Grade Bond Fund
Russell Investment Company
Russell Investment Grade Bond Fund
Statement of Assets and Liabilities, continued — October 31, 2016
| Amounts in thousands | |||
| Net Assets Consist of: | |||
| Undistributed (overdistributed) net investment income | $ | 5,522 | |
| Accumulated net realized gain (loss) | 23,399 | ||
| Unrealized appreciation (depreciation) on: | |||
| Investments | 7,329 | ||
| Futures contracts | 725 | ||
| Investments matured | (1,264 | ) | |
| Foreign currency-related transactions | (261 | ) | |
| Shares of beneficial interest | 441 | ||
| Additional paid-in capital | 947,522 | ||
| Net Assets | $ | 983,413 | |
| Net Asset Value, offering and redemption price per share: | |||
| Net asset value per share: Class A(#) | $ | 22.32 | |
| Maximum offering price per share (Net asset value plus sales charge of 3.75%): Class A | $ | 23.19 | |
| Class A — Net assets | $ | 10,903,708 | |
| Class A — Shares outstanding ($.01 par value) | 488,560 | ||
| Net asset value per share: Class C(#) | $ | 22.13 | |
| Class C — Net assets | $ | 17,203,569 | |
| Class C — Shares outstanding ($.01 par value) | 777,478 | ||
| Net asset value per share: Class E(#) | $ | 22.31 | |
| Class E — Net assets | $ | 14,785,234 | |
| Class E — Shares outstanding ($.01 par value) | 662,802 | ||
| Net asset value per share: Class I(#) | $ | 22.31 | |
| Class I — Net assets | $ | 258,359,260 | |
| Class I — Shares outstanding ($.01 par value) | 11,580,122 | ||
| Net asset value per share: Class R6(#) | $ | 22.37 | |
| Class R6 — Net assets | $ | 450,135 | |
| Class R6 — Shares outstanding ($.01 par value) | 20,123 | ||
| Net asset value per share: Class S(#) | $ | 22.29 | |
| Class S — Net assets | $ | 517,173,112 | |
| Class S — Shares outstanding ($.01 par value) | 23,202,400 | ||
| Net asset value per share: Class Y(#) | $ | 22.33 | |
| Class Y — Net assets | $ | 164,538,044 | |
| Class Y — Shares outstanding ($.01 par value) | 7,368,034 | ||
| Amounts in thousands | |||
| (<) Investments matured - cost | $ | 1,503 | |
| (>) Investments in affiliates, Russell U.S. Cash Management Fund | $ | 128,173 | |
| (a) Cash Collateral for Futures | $ | 3,840 | |
| (#) Net asset value per share equals class level net assets divided by class level shares of beneficial interest outstanding. | |||
See accompanying notes which are an integral part of the financial statements.
Russell Investment Grade Bond Fund 483
Russell Investment Company
Russell Investment Grade Bond Fund
Statement of Operations — For the Period Ended October 31, 2016
| Amounts in thousands | |||
| Investment Income | |||
| Dividends | $ | 74 | |
| Dividends from affiliated Russell funds | 467 | ||
| Interest | 26,309 | ||
| Total investment income | 26,850 | ||
| Expenses | |||
| Advisory fees | 2,824 | ||
| Administrative fees | 545 | ||
| Custodian fees (1) | 170 | ||
| Distribution fees - Class A | 26 | ||
| Distribution fees - Class C | 134 | ||
| Transfer agent fees - Class A | 21 | ||
| Transfer agent fees - Class C | 36 | ||
| Transfer agent fees - Class E | 42 | ||
| Transfer agent fees - Class I | 329 | ||
| Transfer agent fees - Class R6 | —** | ||
| Transfer agent fees - Class S | 1,270 | ||
| Transfer agent fees - Class Y | 7 | ||
| Professional fees | 136 | ||
| Registration fees | 117 | ||
| Shareholder servicing fees - Class C | 45 | ||
| Shareholder servicing fees - Class E | 52 | ||
| Trustees’ fees | 38 | ||
| Printing fees | 101 | ||
| Miscellaneous | 48 | ||
| Expenses before reductions | 5,941 | ||
| Expense reductions | (—)** | ||
| Net expenses | 5,941 | ||
| Net investment income (loss) | 20,909 | ||
| Net Realized and Unrealized Gain (Loss) | |||
| Net realized gain (loss) on: | |||
| Investments | 21,136 | ||
| Futures contracts | 2,406 | ||
| Options written | 48 | ||
| Total return swap contracts | 2,278 | ||
| Interest rate swap contracts | (1,019 | ) | |
| Credit default swap contracts | 62 | ||
| Foreign currency-related transactions | 3,499 | ||
| Net realized gain (loss) | 28,410 | ||
| Net change in unrealized appreciation (depreciation) on: | |||
| Investments | 5,391 | ||
| Futures contracts | 708 | ||
| Options written | (112 | ) | |
| Total return swap contracts | 26 | ||
| Interest rate swap contracts | 447 | ||
| Investment matured | 16 | ||
| Foreign currency-related transactions | (1,261 | ) | |
| Net change in unrealized appreciation (depreciation) | 5,215 | ||
| Net realized and unrealized gain (loss) | 33,625 | ||
| Net Increase (Decrease) in Net Assets from Operations | $ | 54,534 | |
See accompanying notes which are an integral part of the financial statements.
484 Russell Investment Grade Bond Fund
Russell Investment Company
Russell Investment Grade Bond Fund
Statement of Operations — For the Period Ended October 31, 2016
Amounts in thousands
** Less than $500.
(1) Includes a reimbursement for overbilling of custody out-of-pocket fees from prior years. See note 10 in the Notes to Financial Statements
See accompanying notes which are an integral part of the financial statements.
Russell Investment Grade Bond Fund 485
Russell Investment Company
Russell Investment Grade Bond Fund
Statements of Changes in Net Assets
| For the Periods Ended October 31, | ||||||
| Amounts in thousands | 2016 | 2015 | ||||
| Increase (Decrease) in Net Assets | ||||||
| Operations | ||||||
| Net investment income (loss) | $ | 20,909 | $ | 21,591 | ||
| Net realized gain (loss) | 28,410 | 27,089 | ||||
| Net change in unrealized appreciation (depreciation) | 5,215 | (17,099 | ) | |||
| Net increase (decrease) in net assets from operations | 54,534 | 31,581 | ||||
| Distributions | ||||||
| From net investment income | ||||||
| Class A | (186 | ) | (91 | ) | ||
| Class C | (191 | ) | (84 | ) | ||
| Class E | (383 | ) | (306 | ) | ||
| Class I | (5,879 | ) | (3,949 | ) | ||
| Class R6 | (3 | ) | — | |||
| Class S | (13,280 | ) | (10,020 | ) | ||
| Class Y | (3,954 | ) | (4,203 | ) | ||
| From net realized gain | ||||||
| Class A | (181 | ) | (149 | ) | ||
| Class C | (355 | ) | (392 | ) | ||
| Class E | (486 | ) | (648 | ) | ||
| Class I | (5,624 | ) | (5,533 | ) | ||
| Class S | (14,125 | ) | (15,849 | ) | ||
| Class Y | (4,105 | ) | (6,747 | ) | ||
| Net decrease in net assets from distributions | (48,752 | ) | (47,971 | ) | ||
| Share Transactions* | ||||||
| Net increase (decrease) in net assets from share transactions | (283,091 | ) | (296,345 | ) | ||
| Total Net Increase (Decrease) in Net Assets | (277,309 | ) | (312,735 | ) | ||
| Net Assets | ||||||
| Beginning of period | 1,260,722 | 1,573,457 | ||||
| End of period | $ | 983,413 | $ | 1,260,722 | ||
| Undistributed (overdistributed) net investment income included in net assets | $ | 5,522 | $ | 4,927 | ||
See accompanying notes which are an integral part of the financial statements.
486 Russell Investment Grade Bond Fund
Russell Investment Company
Russell Investment Grade Bond Fund
Statements of Changes in Net Assets, continued
* Share transaction amounts (in thousands) for the periods ended October 31, 2016 and October 31, 2015 were as follows:
| 2016 | 2015 | |||||||||||
| Shares | Dollars | Shares | Dollars | |||||||||
| Class A | ||||||||||||
| Proceeds from shares sold | 156 | $ | 3,440 | 115 | $ | 2,576 | ||||||
| Proceeds from reinvestment of distributions | 16 | 349 | 11 | 233 | ||||||||
| Payments for shares redeemed | (98 | ) | (2,173 | ) | (69 | ) | (1,531 | ) | ||||
| Net increase (decrease) | 74 | 1,616 | 57 | 1,278 | ||||||||
| Class C | ||||||||||||
| Proceeds from shares sold | 145 | 3,157 | 86 | 1,902 | ||||||||
| Proceeds from reinvestment of distributions | 25 | 537 | 21 | 472 | ||||||||
| Payments for shares redeemed | (203 | ) | (4,466 | ) | (235 | ) | (5,216 | ) | ||||
| Net increase (decrease) | (33 | ) | (772 | ) | (128 | ) | (2,842 | ) | ||||
| Class E | ||||||||||||
| Proceeds from shares sold | 105 | 2,327 | 126 | 2,816 | ||||||||
| Proceeds from reinvestment of distributions | 38 | 825 | 40 | 877 | ||||||||
| Payments for shares redeemed | (581 | ) | (12,950 | ) | (596 | ) | (13,251 | ) | ||||
| Net increase (decrease) | (438 | ) | (9,798 | ) | (430 | ) | (9,558 | ) | ||||
| Class I | ||||||||||||
| Proceeds from shares sold | 2,080 | 46,077 | 2,254 | 50,450 | ||||||||
| Proceeds from reinvestment of distributions | 516 | 11,237 | 418 | 9,276 | ||||||||
| Payments for shares redeemed | (3,617 | ) | (80,127 | ) | (3,328 | ) | (74,386 | ) | ||||
| Net increase (decrease) | (1,021 | ) | (22,813 | ) | (656 | ) | (14,660 | ) | ||||
| Class R6(1) | ||||||||||||
| Proceeds from shares sold | 20 | 452 | — | — | ||||||||
| Proceeds from reinvestment of distributions | —** | 3 | — | — | ||||||||
| Payments for shares redeemed | —** | (3 | ) | — | — | |||||||
| Net increase (decrease) | 20 | 452 | — | — | ||||||||
| Class S | ||||||||||||
| Proceeds from shares sold | 6,766 | 149,844 | 6,501 | 144,894 | ||||||||
| Proceeds from reinvestment of distributions | 1,252 | 27,220 | 1,159 | 25,712 | ||||||||
| Payments for shares redeemed | (17,183 | ) | (382,127 | ) | (13,033 | ) | (290,280 | ) | ||||
| Net increase (decrease) | (9,165 | ) | (205,063 | ) | (5,373 | ) | (119,674 | ) | ||||
| Class Y | ||||||||||||
| Proceeds from shares sold | 953 | 21,033 | 1,019 | 22,828 | ||||||||
| Proceeds from reinvestment of distributions | 370 | 8,059 | 493 | 10,950 | ||||||||
| Payments for shares redeemed | (3,463 | ) | (75,805 | ) | (8,230 | ) | (184,667 | ) | ||||
| Net increase (decrease) | (2,140 | ) | (46,713 | ) | (6,718 | ) | (150,889 | ) | ||||
| Total increase (decrease) | (12,703 | ) | $ | (283,091 | ) | (13,248 | ) | $ | (296,345 | ) | ||
(1) For the period March 1, 2016 (commencement of operations) to October 31, 2016.
** Less than 500 shares.
See accompanying notes which are an integral part of the financial statements.
Russell Investment Grade Bond Fund 487
Russell Investment Company
Russell Investment Grade Bond Fund
Financial Highlights — For the Periods Ended
For a Share Outstanding Throughout Each Period.
| $ | $ | $ | $ | $ | $ | ||||||||||||
| Net Asset Value, | Net | Net Realized | Total from | Distributions | Distributions | ||||||||||||
| Beginning of | Investment | and Unrealized | Investment | from Net | from Net | ||||||||||||
| Period | Income (Loss)(a)(d) | Gain (Loss) | Operations | Investment Income | Realized Gain | ||||||||||||
| Class A | |||||||||||||||||
| October 31, 2016 | 22.21 | .35 | .61 | .96 | (.40 | ) | (.45 | ) | |||||||||
| October 31, 2015 | 22.48 | .28 | .10 | .38 | (.23 | ) | (.42 | ) | |||||||||
| October 31, 2014 | 21.91 | .28 | .53 | .81 | (.24 | ) | — | ||||||||||
| October 31, 2013 | 23.15 | .25 | (.58 | ) | (.33 | ) | (.21 | ) | (.70 | ) | |||||||
| October 31, 2012 | 22.31 | .36 | 1.10 | 1.46 | (.38 | ) | (.24 | ) | |||||||||
| Class C | |||||||||||||||||
| October 31, 2016 | 22.03 | .18 | .61 | .79 | (.24 | ) | (.45 | ) | |||||||||
| October 31, 2015 | 22.33 | .11 | .11 | .22 | (.10 | ) | (.42 | ) | |||||||||
| October 31, 2014 | 21.77 | .12 | .52 | .64 | (.08 | ) | — | ||||||||||
| October 31, 2013 | 23.03 | .09 | (.59 | ) | (.50 | ) | (.06 | ) | (.70 | ) | |||||||
| October 31, 2012 | 22.20 | .21 | 1.08 | 1.29 | (.22 | ) | (.24 | ) | |||||||||
| Class E | |||||||||||||||||
| October 31, 2016 | 22.20 | .35 | .61 | .96 | (.40 | ) | (.45 | ) | |||||||||
| October 31, 2015 | 22.46 | .27 | .12 | .39 | (.23 | ) | (.42 | ) | |||||||||
| October 31, 2014 | 21.89 | .28 | .53 | .81 | (.24 | ) | — | ||||||||||
| October 31, 2013 | 23.13 | .25 | (.58 | ) | (.33 | ) | (.21 | ) | (.70 | ) | |||||||
| October 31, 2012 | 22.28 | .39 | 1.09 | 1.48 | (.39 | ) | (.24 | ) | |||||||||
| Class I | |||||||||||||||||
| October 31, 2016 | 22.21 | .42 | .60 | 1.02 | (.47 | ) | (.45 | ) | |||||||||
| October 31, 2015 | 22.47 | .35 | .12 | .47 | (.31 | ) | (.42 | ) | |||||||||
| October 31, 2014 | 21.90 | .36 | .52 | .88 | (.31 | ) | — | ||||||||||
| October 31, 2013 | 23.14 | .33 | (.59 | ) | (.26 | ) | (.28 | ) | (.70 | ) | |||||||
| October 31, 2012 | 22.29 | .45 | 1.09 | 1.54 | (.45 | ) | (.24 | ) | |||||||||
| Class R6 | |||||||||||||||||
| October 31, 2016(8) | 21.86 | .29 | .47 | .76 | (.25 | ) | — | ||||||||||
| Class S | |||||||||||||||||
| October 31, 2016 | 22.19 | .40 | .60 | 1.00 | (.45 | ) | (.45 | ) | |||||||||
| October 31, 2015 | 22.45 | .33 | .12 | .45 | (.29 | ) | (.42 | ) | |||||||||
| October 31, 2014 | 21.88 | .34 | .52 | .86 | (.29 | ) | — | ||||||||||
| October 31, 2013 | 23.12 | .31 | (.58 | ) | (.27 | ) | (.27 | ) | (.70 | ) | |||||||
| October 31, 2012 | 22.27 | .43 | 1.09 | 1.52 | (.43 | ) | (.24 | ) | |||||||||
| Class Y | |||||||||||||||||
| October 31, 2016 | 22.22 | .45 | .61 | 1.06 | (.50 | ) | (.45 | ) | |||||||||
| October 31, 2015 | 22.49 | .37 | .11 | .48 | (.33 | ) | (.42 | ) | |||||||||
| October 31, 2014 | 21.91 | .38 | .54 | .92 | (.34 | ) | — | ||||||||||
| October 31, 2013 | 23.15 | .35 | (.58 | ) | (.23 | ) | (.31 | ) | (.70 | ) | |||||||
| October 31, 2012 | 22.30 | .48 | 1.08 | 1.56 | (.47 | ) | (.24 | ) | |||||||||
See accompanying notes which are an integral part of the financial statements.
488 Russell Investment Grade Bond Fund
| % | % | % | |||||||||||||||
| $ | $ | Ratio of Expenses | Ratio of Expenses | Ratio of Net | |||||||||||||
| Net Asset Value, | % | Net Assets, | to Average | to Average | Investment Income | % | |||||||||||
| $ | End of | Total | End of Period | Net Assets, | Net Assets, | to Average | Portfolio | ||||||||||
| Total Distributions | Period | Return(b)(c) | (000 | ) | Gross(e)(l) | Net(d)(e)(l) | Net Assets(d)(e) | Turnover Rate(b) | |||||||||
| (.85 | ) | 22.32 | 4.47 | 10,904 | .80 | .80 | 1.58 | 207 | |||||||||
| (.65 | ) | 22.21 | 1.73 | 9,210 | .80 | .80 | 1.25 | 187 | |||||||||
| (.24 | ) | 22.48 | 3.70 | 8,036 | .81 | .81 | 1.27 | 178 | |||||||||
| (.91 | ) | 21.91 | (1.48 | ) | 10,114 | .79 | .79 | 1.15 | 136 | ||||||||
| (.62 | ) | 23.15 | 6.68 | 11,983 | .79 | .79 | 1.59 | 159 | |||||||||
| (.69 | ) | 22.13 | 3.68 | 17,204 | 1.55 | 1.55 | .82 | 207 | |||||||||
| (.52 | ) | 22.03 | .99 | 17,869 | 1.55 | 1.55 | .49 | 187 | |||||||||
| (.08 | ) | 22.33 | 2.94 | 20,978 | 1.56 | 1.56 | .54 | 178 | |||||||||
| (.76 | ) | 21.77 | (2.23 | ) | 25,285 | 1.54 | 1.54 | .39 | 136 | ||||||||
| (.46 | ) | 23.03 | 5.92 | 36,340 | 1.54 | 1.54 | .92 | 159 | |||||||||
| (.85 | ) | 22.31 | 4.45 | 14,785 | .80 | .80 | 1.58 | 207 | |||||||||
| (.65 | ) | 22.20 | 1.77 | 24,430 | .80 | .80 | 1.23 | 187 | |||||||||
| (.24 | ) | 22.46 | 3.71 | 34,378 | .81 | .81 | 1.28 | 178 | |||||||||
| (.91 | ) | 21.89 | (1.46 | ) | 41,621 | .79 | .78 | 1.15 | 136 | ||||||||
| (.63 | ) | 23.13 | 6.76 | 43,762 | .79 | .74 | 1.74 | 159 | |||||||||
| (.92 | ) | 22.31 | 4.76 | 258,359 | .47 | .47 | 1.90 | 207 | |||||||||
| (.73 | ) | 22.21 | 2.11 | 279,818 | .47 | .47 | 1.57 | 187 | |||||||||
| (.31 | ) | 22.47 | 4.05 | 297,900 | .48 | .48 | 1.62 | 178 | |||||||||
| (.98 | ) | 21.90 | (1.15 | ) | 339,903 | .46 | .46 | 1.47 | 136 | ||||||||
| (.69 | ) | 23.14 | 7.05 | 410,807 | .46 | .46 | 2.01 | 159 | |||||||||
| (.25 | ) | 22.37 | 3.49 | 450 | .40 | .38 | 1.95 | 207 | |||||||||
| (.90 | ) | 22.29 | 4.68 | 517,173 | .55 | .55 | 1.82 | 207 | |||||||||
| (.71 | ) | 22.19 | 2.03 | 718,081 | .55 | .55 | 1.49 | 187 | |||||||||
| (.29 | ) | 22.45 | 3.97 | 847,289 | .56 | .56 | 1.54 | 178 | |||||||||
| (.97 | ) | 21.88 | (1.23 | ) | 817,400 | .54 | .54 | 1.38 | 136 | ||||||||
| (.67 | ) | 23.12 | 6.93 | 805,089 | .54 | .54 | 1.92 | 159 | |||||||||
| (.95 | ) | 22.33 | 4.93 | 164,538 | .35 | .35 | 2.03 | 207 | |||||||||
| (.75 | ) | 22.22 | 2.18 | 211,314 | .35 | .35 | 1.67 | 187 | |||||||||
| (.34 | ) | 22.49 | 4.21 | 364,876 | .36 | .36 | 1.71 | 178 | |||||||||
| (1.01 | ) | 21.91 | (.99 | ) | 608,499 | .34 | .34 | 1.59 | 136 | ||||||||
| (.71 | ) | 23.15 | 7.15 | 609,301 | .36 | .36 | 2.11 | 159 | |||||||||
See accompanying notes which are an integral part of the financial statements.
Russell Investment Grade Bond Fund 489
Russell Investment Company
Russell Investment Grade Bond Fund
Related Party Transactions, Fees and Expenses
| Accrued fees payable to affiliates for the period ended October 31, 2016 were as follows: | ||
| Advisory fees | $ | 209,450 |
| Administration fees | 40,481 | |
| Distribution fees | 13,446 | |
| Shareholder servicing fees | 6,862 | |
| Transfer agent fees | 123,482 | |
| Trustee fees | 4,422 | |
| $ | 398,143 | |
| Transactions (amounts in thousands) during the period ended October 31, 2016 with Underlying Funds which are, or were, an | |||||||||||||||||
| affiliated company are as follows: | |||||||||||||||||
| Fair Value, | Change in | ||||||||||||||||
| Beginning of | Realized Gain | Unrealized | Fair Value, End | Income | Capital Gains | ||||||||||||
| Period | Purchases | Sales | (Loss) | Gain (Loss) | of Period | Distributions | Distributions | ||||||||||
| Russell U.S. Cash Management Fund $ | 186,707 | $ | 1,165,065 | $ | 1,223,611 | $ | — | $ | 12 | $ | 128,173 | $ | 467 | $ | — | ||
| $ | 186,707 | $ | 1,165,065 | $ | 1,223,611 | $ | — | $ | 12 | $ | 128,173 | $ | 467 | $ | — | ||
Federal Income Taxes
At October 31, 2016, the cost of investments and net unrealized appreciation (depreciation), undistributed ordinary income and
undistributed long-term capital gains for income tax purposes were as follows:.
| Cost of Investments | $ | 1,063,405,532 | |||
| Unrealized Appreciation | $ | 11,237,811 | |||
| Unrealized Depreciation | (6,537,730 | ) | |||
| Net Unrealized Appreciation (Depreciation) | $ | 4,700,081 | |||
| Undistributed Ordinary Income | $ | 29,366,250 | |||
| Undistributed Long-Term Capital Gains | |||||
| (Capital Loss Carryforward) | $ | 2,849,035 | |||
| Tax Composition of Distributions | |||||
| Ordinary Income | $ | 46,848,276 | |||
| Long-Term Capital Gains | $ | 1,902,828 | |||
Net investment income and net realized gains (loss) in the financial statements may differ from taxable net investment income and net
realized gains (losses). Capital accounts within the financial statements are adjusted for permanent book-tax differences. Book-tax
differences are primarily due to foreign currency gains and losses, reclassifications of dividends, differences in treatment of income
from swaps, net operating losses, investments in partnerships, investments in passive foreign investment companies (PFICs), tax
straddle transactions, use of tax equalization and foreign capital gains taxes. These adjustments have no impact on the net assets.
At October 31, 2016, the Statement of Assets and Liabilities have been adjusted by the following amounts (in thousands):
| Undistributed net investment income | $ | 3,562 | |
| Accumulated net realized gain (loss) | (3,562 | ) | |
| Additional paid-in capital | — |
See accompanying notes which are an integral part of the financial statements.
490 Russell Investment Grade Bond Fund
Russell Investment Company
Russell Short Duration Bond Fund
Portfolio Management Discussion and Analysis — October 31, 2016 (Unaudited)

| Russell Short Duration Bond Fund - Class A‡ | Russell Short Duration Bond Fund - Class S | ||||||
| Total | Total | ||||||
| Return | Return | ||||||
| 1 Year | (1.60 | )% | 1 Year | 2.47 | % | ||
| 5 Years | 0.91 | %§ | 5 Years | 1.94 | %§ | ||
| 10 Years | 2.36 | %§ | 10 Years | 3.02 | %§ | ||
| Russell Short Duration Bond Fund - Class C | Russell Short Duration Bond Fund - Class Y‡‡‡ | ||||||
| Total | Total | ||||||
| Return | Return | ||||||
| 1 Year | 1.44 | % | 1 Year | 2.54 | % | ||
| 5 Years | 0.93 | %§ | 5 Years | 2.04 | %§ | ||
| 10 Years | 2.00 | %§ | 10 Years | 3.10 | %§ | ||
| Russell Short Duration Bond Fund - Class E | BofA Merrill Lynch1-3 Yr U.S. Treasuries Index** | ||||||
| Total | Total | ||||||
| Return | Return | ||||||
| 1 Year | 2.20 | % | 1 Year | 0.91 | % | ||
| 5 Years | 1.69 | %§ | 5 Years | 0.66 | %§ | ||
| 10 Years | 2.76 | %§ | 10 Years | 2.21 | %§ | ||
| Russell Short Duration Bond Fund - Class R6‡‡ | |||||||
| Total | |||||||
| Return | |||||||
| 1 Year | 2.49 | % | |||||
| 5 Years | 2.03 | %§ | |||||
| 10 Years | 3.09 | %§ | |||||
Russell Short Duration Bond Fund 491
Russell Investment Company
Russell Short Duration Bond Fund
Portfolio Management Discussion and Analysis, continued — October 31, 2016
(Unaudited)
| The Russell Short Duration Bond Fund (the “Fund”) employs | U.S. fixed income performance, the Bloomberg Barclays 1-3 | |
| a multi-manager approach whereby portions of the Fund are | Year U.S. Aggregate Index, returned 1.33% for the fiscal year, | |
| allocated to different money manager strategies. Fund assets not | as yields fell modestly and spreads tightened during a fiscal year | |
| allocated to money managers are managed by Russell Investment | where monetary policy remained generally accommodative and | |
| Management, LLC (“RIM”), the Fund’s advisor. RIM may change | recession fears early in the period were never realized. | |
| the allocation of the Fund’s assets among money managers at | ||
| any time. An exemptive order from the Securities and Exchange | How did the investment strategies and techniques employed | |
| Commission (“SEC”) permits RIM to engage or terminate a money | by the Fund and its money managers affect its benchmark- | |
| manager at any time, subject to approval by the Fund’s Board, | relative performance? | |
| without a shareholder vote. Pursuant to the terms of the exemptive | The Fund employs discretionary money managers. The Fund’s | |
| order, the Fund is required to notify its shareholders within 90 | discretionary money managers select the individual portfolio | |
| days of when a money manager begins providing services. As of | securities for the assets assigned to them. Fund assets not | |
| October 31, 2016, the Fund had three money managers. | allocated to discretionary money managers include the Fund’s | |
| liquidity reserves and assets which may be managed directly by | ||
| What is the Fund’s investment objective? | RIM to effect the Fund’s investment strategies and/or to actively | |
| The Fund seeks to provide current income and preservation of | manage the Fund’s overall exposures by investing in securities or | |
| capital with a focus on short duration securities. | other instruments that RIM believes will achieve the desired risk/ | |
| How did the Fund perform relative to its benchmark for the | return profile for the Fund. | |
| fiscal year ended October 31, 2016? | With respect to certain of the Fund’s money managers, Scout | |
| For the fiscal year ended October 31, 2016, the Fund’s Class A, | Investments, Inc. was the worst performing manager for the | |
| Class C, Class E, Class R6, Class S and Class Y Shares gained | period though outperformed the Fund’s benchmark. Ex- | |
| 2.21%, 1.44%, 2.20%, 2.49%, 2.47% and 2.54%, respectively. | benchmark exposures to corporate credit risk via allocations to | |
| This is compared to the Fund’s benchmark, the BofA Merrill | investment grade and high yield corporate bonds were the largest | |
| Lynch 1-3 Year U.S. Treasuries Index, which gained 0.91% | contributor to outperformance while allocations to securitized | |
| during the same period. The Fund’s performance includes | bonds, including commercial and agency residential mortgages, | |
| operating expenses, whereas index returns are unmanaged and | and asset-backed securities, also contributed materially. Tactical | |
| do not include expenses of any kind. | duration management modestly detracted. | |
| For the fiscal year ended October 31, 2016, the Morningstar® | THL Credit Advisors LLC (“THL”), the Fund’s bank loan | |
| Short-Term Bond Category, a group of funds that Morningstar | specialist, was the best performing manager for the period and | |
| considers to have investment strategies similar to those of the | outperformed the Fund’s benchmark amid a favorable market | |
| Fund, gained 1.91%. This return serves as a peer comparison and | environment for bank loans driven by technical demand from | |
| is expressed net of operating expenses. | collateralized loan obligation formations and general demand for | |
| high yielding assets in a low yield market environment. | ||
| RIM may assign a money manager a benchmark other than the | ||
| Fund’s index. However, the Fund’s primary index remains the | During the period, the aggregate of RIM’s investment activities | |
| benchmark for the Fund | contributed positively to the Fund’s benchmark-relative | |
| performance. Outperformance was primarily driven by currency | ||
| How did the market conditions described in the Market | factor and global real yield positioning strategies as well as | |
| Summary report affect the Fund’s performance? | RIM’s asset allocation decision to overweight THL relative to | |
| The fiscal year ended October 31, 2016 was characterized by a | strategic weights. The currency factor strategy utilized currency | |
| sharply risk off market early in the period followed by a similar | forward contracts to take long and short positions in global | |
| sharp rebound and extended rally in risky assets (e.g., lower rated | foreign exchange markets. Using futures, the global high real | |
| credit and emerging market currencies). Overall, this proved | yield strategy took long positions in high quality government | |
| positive for most fixed income sectors around the globe, including | bonds whose net-of-inflation yields are expected to be relatively | |
| those invested in by the Fund. Yield curves on global government | high and short positions where net-of-inflation yield is expected | |
| bonds tended to flatten over the period supporting longer maturity | to be relatively low. RIM also implemented tactical ‘tilts’ based | |
| bonds and the asset class in general. Corporate and emerging | on its judgments regarding shorter-term opportunities to seek | |
| sovereign credit markets suffered from December to February, | to generate returns and/or mitigate risk during the period by | |
| but returns turned positive as the year went on and eventually | investing in derivative instruments. Tactical tilts to the Fund’s | |
| very significantly so. A representative indicator of short duration | overall credit risk exposure, using investment grade credit default | |
492 Russell Short Duration Bond Fund
Russell Investment Company
Russell Short Duration Bond Fund
Portfolio Management Discussion and Analysis, continued — October 31, 2016
(Unaudited)
| swap index contracts, marginally contributed to excess returns. | The views expressed in this report reflect those of the | |
| RIM’s management of the Fund’s liquidity reserves and a U.S. | portfolio managers only through the end of the period | |
| treasuries based positioning strategy had a neutral impact to | covered by the report. These views do not necessarily | |
| excess returns, which was in line with the design and expectations | represent the views of RIM, or any other person in RIM or | |
| of those allocations. | any other affiliated organization. These views are subject | |
| to change at any time based upon market conditions or | ||
| Describe any changes to the Fund’s structure or the money | other events, and RIM disclaims any responsibility to | |
| manager line-up. | update the views contained herein. These views should not | |
| In June 2016, RIM’s increased its direct investing allocation | be relied on as investment advice and, because investment | |
| in the Fund through the addition of the global high real yield | decisions for a Russell Investment Company (“RIC”) Fund | |
| strategy discussed above. | are based on numerous factors, should not be relied on as | |
| Money Managers as of October 31, | an indication of investment decisions of any RIC Fund. | |
| 2016 | Styles | |
| Logan Circle Partners, L.P. | Fully Discretionary | |
| Scout Investments, Inc. | Fully Discretionary | |
| THL Credit Advisors, LLC | Specialist | |
* Assumes initial investment on November 1, 2006.
** The BofA Merrill Lynch 1-3 Yr U.S. Treasuries Index tracks the performance of U.S. dollar denominated sovereign debt publicly issued by the U.S. government
in its domestic market. Qualifying securities must have at least one year and less than three years remaining term to final maturity, a fixed coupon schedule and
a minimum amount outstanding of $1 billion.
‡ The Fund first issued Class A Shares on March 1, 2007. The returns shown for Class A Shares prior to that date are the returns of Class E Shares. The
performance shown has been adjusted to reflect the deduction of the maximum Class A sales charge of 3.75%. Annual returns for each Class will differ only to
the extent that the Class A Shares do not have the same expenses as Class E Shares.
‡‡ The Fund first issued Class R6 Shares on March 1, 2016. The returns shown for Class R6 Shares prior to that date are the returns of the Fund’s Class Y
Shares. Class R6 Shares will have substantially similar annual returns as the Class Y Shares because the Shares of each Class are invested in the same portfolio
of securities. Annual returns for each Class will differ only to the extent that the Class R6 Shares do not have the same expenses as the Class Y Shares.
‡‡‡ The Fund first issued Class Y Shares on September 29, 2008. The returns shown for Class Y Shares prior to that date are the returns of the Fund’s Class S
Shares. Class Y Shares will have substantially similar annual returns as the Class S Shares because the Shares of each Class are invested in the same portfolio of
securities. Annual returns for each Class will differ only to the extent that the Class Y Shares do not have the same expenses as the Class S Shares.
§ Annualized.
Performance is historical and assumes reinvestment of all dividends and capital gains. Investment return and principal value will fluctuate so that an investor’s
shares, when redeemed, may be worth more or less than when purchased. Past performance is not indicative of future results. The returns shown do not reflect the
deduction of taxes that a shareholder would pay on Fund distributions or the redemption of Fund shares. Additionally, the returns presented herein may differ from
the performance reported in the Financial Highlights as the returns herein are calculated in a manner consistent with standardized performance in accordance with
Securities and Exchange Commission rules, while the performance in the Financial Highlights has been calculated in accordance with U.S. Generally Accepted
Accounting Principles (“U.S. GAAP”).
Russell Short Duration Bond Fund 493
Russell Investment Company
Russell Short Duration Bond Fund
Shareholder Expense Example — October 31, 2016 (Unaudited)
| Fund Expenses | Please note that the expenses shown in the table are meant | |||||
| The following disclosure provides important information | to highlight your ongoing costs only and do not reflect any | |||||
| regarding the Fund’s Shareholder Expense Example | transactional costs. Therefore, the information under the heading | |||||
| (“Example”). | “Hypothetical Performance (5% return before expenses)” is | |||||
| useful in comparing ongoing costs only, and will not help you | ||||||
| Example | determine the relative total costs of owning different funds. In | |||||
| As a shareholder of the Fund, you incur two types of costs: (1) | addition, if these transactional costs were included, your costs | |||||
| transaction costs, including sales charges (loads) on certain | would have been higher. | |||||
| purchase or redemption payments, and (2) ongoing costs, | Hypothetical | |||||
| including distribution (12b-1) and/or service fees and other Fund | Performance (5% | |||||
| expenses. The Example is intended to help you understand | Actual | return before | ||||
| your ongoing costs (in dollars) of investing in the Fund and to | Class A | Performance | expenses) | |||
| Beginning Account Value | ||||||
| compare these costs with the ongoing costs of investing in other | May 1, 2016 | $ | 1,000.00 | $ | 1,000.00 | |
| mutual funds. The Example is based on an investment of $1,000 | Ending Account Value | |||||
| invested at the beginning of the period and held for the entire | October 31, 2016 | $ | 1,012.50 | $ | 1,021.06 | |
| period indicated, which for this Fund is from May 1, 2016 to | Expenses Paid During Period* | $ | 4.10 | $ | 4.12 | |
| October 31, 2016. | * Expenses are equal to the Fund's annualized expense ratio of 0.81% | |||||
| (representing the six month period annualized), multiplied by the average | ||||||
| Actual Expenses | account value over the period, multiplied by 184/366 (to reflect the one-half | |||||
| The information in the table under the heading “Actual | year period). May reflect amounts waived and/or reimbursed. Without any | |||||
| Performance” provides information about actual account values | waivers and/or reimbursements, expenses would have been higher. | |||||
| and actual expenses. You may use the information in this column, | ||||||
| Hypothetical | ||||||
| together with the amount you invested, to estimate the expenses | Performance (5% | |||||
| that you paid over the period. Simply divide your account value by | Actual | return before | ||||
| $1,000 (for example, an $8,600 account value divided by $1,000 | Class C | Performance | expenses) | |||
| Beginning Account Value | ||||||
| = 8.6), then multiply the result by the number in the first column | May 1, 2016 | $ | 1,000.00 | $ | 1,000.00 | |
| in the row entitled “Expenses Paid During Period” to estimate | Ending Account Value | |||||
| the expenses you paid on your account during this period. | October 31, 2016 | $ | 1,008.80 | $ | 1,017.34 | |
| Expenses Paid During Period* | $ | 7.83 | $ | 7.86 | ||
| Hypothetical Example for Comparison Purposes | ||||||
| The information in the table under the heading “Hypothetical | * Expenses are equal to the Fund's annualized expense ratio of 1.55% | |||||
| (representing the six month period annualized), multiplied by the average | ||||||
| Performance (5% return before expenses)” provides information | account value over the period, multiplied by 184/366 (to reflect the one-half | |||||
| about hypothetical account values and hypothetical expenses | year period). May reflect amounts waived and/or reimbursed. Without any | |||||
| based on the Fund’s actual expense ratio and an assumed rate of | waivers and/or reimbursements, expenses would have been higher. | |||||
| return of 5% per year before expenses, which is not the Fund’s | ||||||
| Hypothetical | ||||||
| actual return. The hypothetical account values and expenses | Performance (5% | |||||
| may not be used to estimate the actual ending account balance or | Actual | return before | ||||
| expenses you paid for the period. You may use this information | Class E | Performance | expenses) | |||
| to compare the ongoing costs of investing in the Fund and other | Beginning Account Value | |||||
| May 1, 2016 | $ | 1,000.00 | $ | 1,000.00 | ||
| funds. To do so, compare this 5% hypothetical example with the | Ending Account Value | |||||
| 5% hypothetical examples that appear in the shareholder reports | October 31, 2016 | $ | 1,012.90 | $ | 1,021.11 | |
| of other funds. | Expenses Paid During Period* | $ | 4.05 | $ | 4.06 | |
| * Expenses are equal to the Fund's annualized expense ratio of 0.80% | ||||||
| (representing the six month period annualized), multiplied by the average | ||||||
| account value over the period, multiplied by 184/366 (to reflect the one-half | ||||||
| year period). May reflect amounts waived and/or reimbursed. Without any | ||||||
| waivers and/or reimbursements, expenses would have been higher. | ||||||
494 Russell Short Duration Bond Fund
Russell Investment Company
Russell Short Duration Bond Fund
Shareholder Expense Example, continued — October 31, 2016 (Unaudited)
| Hypothetical | ||||||
| Performance (5% | ||||||
| Actual | return before | |||||
| Class R6 | Performance | expenses) | ||||
| Beginning Account Value | ||||||
| May 1, 2016 | $ | 1,000.00 | $ | 1,000.00 | ||
| Ending Account Value | ||||||
| October 31, 2016 | $ | 1,014.00 | $ | 1,022.62 | ||
| Expenses Paid During Period* | $ | 2.53 | $ | 2.54 | ||
| * Expenses are equal to the Fund's annualized expense ratio of 0.50% | ||||||
| (representing the six month period annualized), multiplied by the average | ||||||
| account value over the period, multiplied by 184/366 (to reflect the one-half | ||||||
| year period). May reflect amounts waived and/or reimbursed. Without any | ||||||
| waivers and/or reimbursements, expenses would have been higher. | ||||||
| Hypothetical | ||||||
| Performance (5% | ||||||
| Actual | return before | |||||
| Class S | Performance | expenses) | ||||
| Beginning Account Value | ||||||
| May 1, 2016 | $ | 1,000.00 | $ | 1,000.00 | ||
| Ending Account Value | ||||||
| October 31, 2016 | $ | 1,013.80 | $ | 1,022.32 | ||
| Expenses Paid During Period* | $ | 2.83 | $ | 2.85 | ||
| * Expenses are equal to the Fund's annualized expense ratio of 0.56% | ||||||
| (representing the six month period annualized), multiplied by the average | ||||||
| account value over the period, multiplied by 184/366 (to reflect the one-half | ||||||
| year period). May reflect amounts waived and/or reimbursed. Without any | ||||||
| waivers and/or reimbursements, expenses would have been higher. | ||||||
| Hypothetical | ||||||
| Performance (5% | ||||||
| Actual | return before | |||||
| Class Y | Performance | expenses) | ||||
| Beginning Account Value | ||||||
| May 1, 2016 | $ | 1,000.00 | $ | 1,000.00 | ||
| Ending Account Value | ||||||
| October 31, 2016 | $ | 1,014.20 | $ | 1,022.77 | ||
| Expenses Paid During Period* | $ | 2.38 | $ | 2.39 | ||
| * Expenses are equal to the Fund's annualized expense ratio of 0.47% | ||||||
| (representing the six month period annualized), multiplied by the average | ||||||
| account value over the period, multiplied by 184/366 (to reflect the one-half | ||||||
| year period). May reflect amounts waived and/or reimbursed. Without any | ||||||
| waivers and/or reimbursements, expenses would have been higher. | ||||||
Russell Short Duration Bond Fund 495
Russell Investment Company
Russell Short Duration Bond Fund
Schedule of Investments — October 31, 2016
| Amounts in thousands (except share amounts) | Amounts in thousands (except share amounts) | ||||||
| Principal | Fair | Principal | Fair | ||||
| Amount ($) | Value | Amount ($) | Value | ||||
| or Shares | $ | or Shares | $ | ||||
| Long-Term Investments - 88.0% | Series 2014-3A Class A | ||||||
| Asset-Backed Securities - 6.9% | 1.320% due 01/15/19 (Þ) | 320 | 319 | ||||
| Federal Home Loan Mortgage Corp. | |||||||
| Ally Auto Receivables Trust | Structured Pass Through Securities | ||||||
| Series 2016-2 Class A2 | Series 2000-30 Class A5 | ||||||
| 1.170% due 10/15/18 | 1,173 | 1,173 | 6.644% due 12/25/30 | 1,775 | 1,881 | ||
| Americredit Automobile Receivables | |||||||
| Trust | Flagship Credit Auto Trust | ||||||
| Series 2016-4 Class A2A | Series 2016-4 Class A1 | ||||||
| 1.340% due 04/08/20 | 545 | 545 | 1.470% due 03/15/20 (Þ) | 1,525 | 1,525 | ||
| AmeriCredit Automobile Receivables | Ford Credit Auto Owner Trust | ||||||
| Trust | Series 2015-A Class A3 | ||||||
| Series 2014-1 Class A3 | 1.280% due 09/15/19 | 1,130 | 1,132 | ||||
| 0.900% due 02/08/19 | 175 | 175 | GM Financial Automobile Leasing Trust | ||||
| Series 2015-1 Class A3 | Series 2015-1 Class A2 | ||||||
| 1.260% due 11/08/19 | 778 | 778 | 1.100% due 12/20/17 | 485 | 485 | ||
| Series 2015-2 Class A2A | Series 2015-3 Class A3 | ||||||
| 0.830% due 09/10/18 | 347 | 347 | 1.690% due 03/20/19 | 1,950 | 1,960 | ||
| Bank of The West Auto Trust | Hertz Fleet Lease Funding, LP | ||||||
| Series 2014-1 Class A3 | Series 2013-3 Class C | ||||||
| 1.090% due 03/15/19 (Þ) | 1,224 | 1,224 | 1.616% due 12/10/27 (Ê)(Þ) | 2,240 | 2,242 | ||
| Series 2015-1 Class A3 | Series 2014-1 Class C | ||||||
| 1.310% due 10/15/19 (Þ) | 3,065 | 3,068 | 1.316% due 04/10/28 (Ê)(Þ) | 1,475 | 1,471 | ||
| Capital Auto Receivables Asset Trust | Honda Auto Receivables Owner Trust | ||||||
| Series 2016-1 Class A2A | Series 2014-4 Class A3 | ||||||
| 1.500% due 11/20/18 | 477 | 478 | 0.990% due 09/17/18 | 1,856 | 1,856 | ||
| Series 2016-3 Class A2A | Series 2016-3 Class A2 | ||||||
| 1.360% due 04/20/19 | 955 | 955 | 1.010% due 10/18/18 | 2,590 | 2,590 | ||
| CarFinance Capital Auto Trust | Huntington Auto Trust | ||||||
| Series 2014-1A Class A | Series 2015-1 Class A3 | ||||||
| 1.460% due 12/17/18 (Þ) | 33 | 33 | 1.240% due 09/16/19 | 1,822 | 1,824 | ||
| CarMax Auto Owner Trust | Hyundai Auto Receivables Trust | ||||||
| Series 2016-2 Class A3 | Series 2016-A Class A2A | ||||||
| 1.520% due 02/16/21 | 855 | 858 | 1.210% due 06/17/19 | 815 | 816 | ||
| Series 2016-3 Class A2 | JCP&L Transition Funding LLC | ||||||
| 1.170% due 08/15/19 | 1,946 | 1,947 | Series 2002-A Class A4 | ||||
| CCG Receivables Trust | 6.160% due 06/05/19 | 39 | 40 | ||||
| Series 2014-1 Class A2 | John Deere Owner Trust | ||||||
| 1.060% due 11/15/21 (Þ) | 332 | 332 | Series 2015-B Class A3 | ||||
| Chase Issuance Trust | 1.440% due 10/15/19 | 1,440 | 1,444 | ||||
| Series 2014-A1 Class A1 | MMAF Equipment Finance LLC | ||||||
| 1.150% due 01/15/19 | 2,050 | 2,051 | Series 2016-AA Class A2 | ||||
| Series 2016-A7 Class A7 | 1.770% due 12/17/18 (Þ) | 1,030 | 1,031 | ||||
| 1.060% due 09/16/19 | 1,905 | 1,904 | MSCC Heloc Trust | ||||
| CPS Auto Receivables Trust | Series 2007-1 Class A | ||||||
| Series 2014-D Class A | 0.539% due 12/25/31 (Ê) | 278 | 277 | ||||
| 1.490% due 04/15/19 (Þ) | 923 | 923 | Nissan Auto Receivables Owner Trust | ||||
| Credit-Based Asset Servicing and | Series 2014-A Class A3 | ||||||
| Securitization LLC | 0.720% due 08/15/18 | 633 | 632 | ||||
| Series 2006-SC1 Class A | |||||||
| 0.455% due 05/25/36 (Ê)(Þ) | 136 | 135 | Prestige Auto Receivables Trust | ||||
| Series 2014-1A Class A3 | |||||||
| Drive Auto Receivables Trust | 1.520% due 04/15/20 (Þ) | 1,129 | 1,130 | ||||
| Series 2016-BA Class A2 | |||||||
| 1.380% due 08/15/18 (Þ) | 1,251 | 1,252 | Series 2016-1A Class A2 | ||||
| 1.780% due 08/15/19 (Þ) | 1,161 | 1,164 | |||||
| Education Loan Asset-Backed Trust | Renaissance Home Equity Loan Trust | ||||||
| Series 2013-1 Class B1 | |||||||
| 1.525% due 11/25/33 (Ê)(Þ) | 2,390 | 2,119 | Series 2005-4 Class A3 | ||||
| 5.565% due 02/25/36 | 49 | 49 | |||||
| Equity One Mortgage Pass-Through Trust | Santander Drive Auto Receivables Trust | ||||||
| Series 2003-4 Class M1 | |||||||
| 5.243% due 10/25/34 | 199 | 192 | Series 2012-5 Class C | ||||
| 2.700% due 08/15/18 | 502 | 502 | |||||
| Exeter Automobile Receivables Trust | Series 2012-6 Class D | ||||||
See accompanying notes which are an integral part of the financial statements.
496 Russell Short Duration Bond Fund
Russell Investment Company
Russell Short Duration Bond Fund
Schedule of Investments, continued — October 31, 2016
| Amounts in thousands (except share amounts) | Amounts in thousands (except share amounts) | ||||||
| Principal | Fair | Principal | Fair | ||||
| Amount ($) | Value | Amount ($) | Value | ||||
| or Shares | $ | or Shares | $ | ||||
| 2.520% due 09/17/18 | 385 | 387 | Series 2013-13 Class 1A | ||||
| Series 2014-4 Class B | 1.551% due 03/15/18 (Þ) | 1,165 | 1,165 | ||||
| 1.820% due 05/15/19 | 907 | 908 | Anheuser-Busch InBev Finance, Inc. | ||||
| Series 2015-1 Class A3 | 1.900% due 02/01/19 | 2,650 | 2,671 | ||||
| 1.270% due 02/15/19 | 316 | 316 | 2.150% due 02/01/19 | 1,085 | 1,101 | ||
| Series 2016-3 Class A2 | Apple, Inc. | ||||||
| 1.340% due 11/15/19 | 1,100 | 1,100 | 2.100% due 05/06/19 | 1,085 | 1,106 | ||
| SLM Private Education Loan Trust | Assurant, Inc. | ||||||
| Series 2010-A Class 2A | 2.500% due 03/15/18 | 1,025 | 1,035 | ||||
| 3.774% due 05/16/44 (Ê)(Þ) | 1,650 | 1,715 | AT&T, Inc. | ||||
| SoFi Professional Loan Program LLC | 1.400% due 12/01/17 | 965 | 965 | ||||
| Series 2014-B Class A2 | 5.500% due 02/01/18 | 3,737 | 3,916 | ||||
| 2.550% due 08/27/29 (Þ) | 1,069 | 1,082 | Bank of America Corp. | ||||
| Series 2016-B Class A2A | 2.000% due 01/11/18 | 800 | 804 | ||||
| 1.680% due 03/25/31 (Þ) | 1,534 | 1,536 | Bank of New York Mellon Corp. (The) | ||||
| Series 2016-C Class A2B | Series G | ||||||
| 2.360% due 12/25/32 (Þ) | 1,150 | 1,155 | 2.200% due 05/15/19 | 575 | 584 | ||
| SunTrust Auto Receivables Trust | Barrick NA Finance LLC | ||||||
| Series 2015-1A Class A2 | 4.400% due 05/30/21 | 1,520 | 1,660 | ||||
| 0.990% due 06/15/18 (Þ) | 482 | 482 | BB&T Corp. | ||||
| Tidewater Auto Receivables Trust | 2.250% due 02/01/19 | 1,760 | 1,785 | ||||
| Series 2016-AA Class A2 | Berkshire Hathaway Finance Corp. | ||||||
| 2.300% due 09/15/19 (Þ) | 2,270 | 2,271 | 1.450% due 03/07/18 | 935 | 940 | ||
| World Financial Network Credit Card | BMW US Capital LLC | ||||||
| Master Trust | 1.500% due 04/11/19 (Þ) | 1,570 | 1,571 | ||||
| Series 2016-C Class A | Capital One Financial Corp. | ||||||
| 1.720% due 08/15/23 | 460 | 460 | 2.450% due 04/24/19 | 1,060 | 1,078 | ||
| 56,271 | Capital One NA | ||||||
| Corporate Bonds and Notes - 16.9% | Series BKNT | ||||||
| AbbVie, Inc. | 1.850% due 09/13/19 | 1,025 | 1,024 | ||||
| 1.750% due 11/06/17 | 1,878 | 1,885 | Cardinal Health, Inc. | ||||
| 2.500% due 05/14/20 | 480 | 486 | 1.950% due 06/15/18 | 525 | 529 | ||
| Aetna, Inc. | Caterpillar Financial Services Corp. | ||||||
| 1.900% due 06/07/19 | 1,300 | 1,310 | Series GMTN | ||||
| AIG Global Funding | 1.700% due 06/16/18 | 1,300 | 1,307 | ||||
| 1.900% due 10/06/21 (Þ) | 490 | 484 | Charter Communications Operating LLC | ||||
| Air Lease Corp. | / Charter Communications Operating | ||||||
| 2.125% due 01/15/18 | 805 | 808 | Capital | ||||
| Albemarle Corp. | 4.464% due 07/23/22 (Þ) | 620 | 660 | ||||
| Series 5YR | Chevron Corp. | ||||||
| 3.000% due 12/01/19 | 845 | 870 | 1.718% due 06/24/18 | 615 | 619 | ||
| Altria Group, Inc. | 1.790% due 11/16/18 | 955 | 963 | ||||
| 4.750% due 05/05/21 | 794 | 886 | 1.561% due 05/16/19 | 1,070 | 1,075 | ||
| Amazon.com, Inc. | 1.961% due 03/03/20 | 440 | 445 | ||||
| 2.600% due 12/05/19 | 745 | 770 | 2.100% due 05/16/21 | 350 | 352 | ||
| American Express Credit Corp. | Cisco Systems, Inc. | ||||||
| 2.125% due 03/18/19 | 240 | 243 | 1.850% due 09/20/21 | 990 | 988 | ||
| Series F | Citigroup, Inc. | ||||||
| 2.600% due 09/14/20 | 1,650 | 1,688 | 1.850% due 11/24/17 | 2,570 | 2,579 | ||
| 1.800% due 02/05/18 | 900 | 901 | |||||
| American Honda Finance Corp. | 2.050% due 12/07/18 | 505 | 508 | ||||
| 1.500% due 03/13/18 | 725 | 728 | |||||
| 1.600% due 07/13/18 | 1,700 | 1,710 | ConocoPhillips Co. | ||||
| 1.200% due 07/12/19 | 1,015 | 1,008 | 1.050% due 12/15/17 | 1,424 | 1,417 | ||
| Series GMTN | 1.500% due 05/15/18 | 1,395 | 1,396 | ||||
| 1.700% due 09/09/21 | 815 | 806 | Crown Castle Towers LLC | ||||
| American International Group, Inc. | 6.113% due 01/15/20 (Þ) | 1,410 | 1,556 | ||||
| 5.850% due 01/16/18 | 825 | 868 | CVS Health Corp. | ||||
| 6.400% due 12/15/20 | 160 | 186 | 2.750% due 12/01/22 | 660 | 671 | ||
| American Tower Trust I | Daimler Finance NA LLC | ||||||
| 1.500% due 07/05/19 (Þ) | 735 | 730 | |||||
See accompanying notes which are an integral part of the financial statements.
Russell Short Duration Bond Fund 497
Russell Investment Company
Russell Short Duration Bond Fund
Schedule of Investments, continued — October 31, 2016
| Amounts in thousands (except share amounts) | Amounts in thousands (except share amounts) | ||||||
| Principal | Fair | Principal | Fair | ||||
| Amount ($) | Value | Amount ($) | Value | ||||
| or Shares | $ | or Shares | $ | ||||
| 1.750% due 10/30/19 (Þ) | 400 | 400 | Kinder Morgan Energy Partners, LP | ||||
| DCP Midstream Operating, LP | 3.500% due 03/01/21 | 450 | 463 | ||||
| 2.500% due 12/01/17 | 1,680 | 1,667 | Kraft Heinz Foods Co. | ||||
| Dell International LLC | 2.800% due 07/02/20 | 1,610 | 1,656 | ||||
| 1.000% due 09/07/23 (Ê) | 1,000 | 1,007 | 4.875% due 02/15/25 (Þ) | 605 | 665 | ||
| Diamond 1 Finance Corp. / Diamond 2 | Lehman Brothers Holdings Capital Trust | ||||||
| Finance Corp | VII | ||||||
| 5.450% due 06/15/23 (Þ) | 970 | 1,039 | 5.857% due 11/29/49 (ƒ)(Ø) | 270 | — | ||
| Ecolab, Inc. | Lockheed Martin Corp. | ||||||
| 4.350% due 12/08/21 | 560 | 624 | 3.350% due 09/15/21 | 590 | 626 | ||
| EnLink Midstream Partners, LP | Marathon Oil Corp. | ||||||
| 2.700% due 04/01/19 | 310 | 310 | 2.700% due 06/01/20 | 495 | 488 | ||
| ERAC USA Finance LLC | MassMutual Global Funding II | ||||||
| 2.800% due 11/01/18 (Þ) | 2,075 | 2,115 | 1.550% due 10/11/19 (Þ) | 980 | 980 | ||
| Exelon Corp. | Medtronic, Inc. | ||||||
| 2.850% due 06/15/20 | 650 | 669 | Series WI | ||||
| Ford Motor Credit Co. LLC | 2.500% due 03/15/20 | 1,525 | 1,565 | ||||
| 1.724% due 12/06/17 | 400 | 400 | MetLife, Inc. | ||||
| 2.551% due 10/05/18 | 925 | 936 | 1.756% due 12/15/17 | 1,130 | 1,136 | ||
| 2.012% due 05/03/19 | 1,110 | 1,110 | Metropolitan Life Global Funding I | ||||
| 1.897% due 08/12/19 | 2,550 | 2,542 | 1.950% due 12/03/18 (Þ) | 755 | 763 | ||
| General Electric Capital Corp. | 1.550% due 09/13/19 (Þ) | 720 | 717 | ||||
| 1.625% due 04/02/18 | 995 | 999 | Microsoft Corp. | ||||
| General Electric Co. | 1.300% due 11/03/18 | 925 | 929 | ||||
| 5.250% due 12/06/17 | 1,385 | 1,446 | Morgan Stanley | ||||
| General Mills, Inc. | 2.200% due 12/07/18 | 1,865 | 1,882 | ||||
| 5.650% due 02/15/19 | 985 | 1,075 | 2.800% due 06/16/20 | 1,075 | 1,101 | ||
| General Motors Financial Co., Inc. | Mylan NV | ||||||
| 2.400% due 04/10/18 | 530 | 533 | 3.150% due 06/15/21 (Þ) | 1,450 | 1,473 | ||
| 2.400% due 05/09/19 | 2,035 | 2,037 | New York Life Global Funding | ||||
| Gilead Sciences, Inc. | 1.700% due 09/14/21 (Þ) | 1,540 | 1,525 | ||||
| 2.550% due 09/01/20 | 825 | 846 | NextEra Energy Capital Holdings, Inc. | ||||
| Goldman Sachs Group, Inc. (The) | 1.649% due 09/01/18 | 720 | 722 | ||||
| 2.625% due 01/31/19 | 2,545 | 2,593 | Nissan Motor Acceptance Corp. | ||||
| 2.000% due 04/25/19 | 425 | 428 | 1.550% due 09/13/19 (Þ) | 820 | 817 | ||
| 2.750% due 09/15/20 | 1,055 | 1,076 | Oracle Corp. | ||||
| Harbor Freight Tools USA, Inc. Term | 1.900% due 09/15/21 | 620 | 618 | ||||
| Loan B | |||||||
| 4.137% due 08/16/23 (Ê) | 998 | 1,004 | PACCAR Financial Corp. | ||||
| 1.200% due 08/12/19 | 905 | 900 | |||||
| Harris Corp. | |||||||
| 1.999% due 04/27/18 | 675 | 678 | PepsiCo, Inc. | ||||
| 5.000% due 06/01/18 | 570 | 604 | |||||
| Home Depot, Inc. (The) | |||||||
| 2.000% due 04/01/21 | 620 | 628 | Pfizer, Inc. | ||||
| 6.200% due 03/15/19 | 600 | 664 | |||||
| Huntington National Bank (The) | |||||||
| 2.200% due 11/06/18 | 865 | 873 | Pharmacia LLC | ||||
| 6.500% due 12/01/18 | 1,085 | 1,198 | |||||
| Hyundai Capital America | |||||||
| 2.000% due 07/01/19 (Þ) | 430 | 430 | PNC Bank NA | ||||
| Series BKNT | |||||||
| International Business Machines Corp. | 1.850% due 07/20/18 | 1,360 | 1,369 | ||||
| 1.800% due 05/17/19 | 530 | 536 | |||||
| Pricoa Global Funding I | |||||||
| International Lease Finance Corp. | 1.450% due 09/13/19 (Þ) | 510 | 508 | ||||
| 3.875% due 04/15/18 | 800 | 818 | |||||
| Protective Life Global Funding | |||||||
| IPALCO Enterprises, Inc. | 1.555% due 09/13/19 (Þ) | 2,055 | 2,039 | ||||
| 5.000% due 05/01/18 | 300 | 314 | |||||
| PSEG Power LLC | |||||||
| JPMorgan Chase & Co. | 2.450% due 11/15/18 | 1,150 | 1,167 | ||||
| 1.800% due 01/25/18 | 560 | 562 | |||||
| 1.625% due 05/15/18 | 700 | 701 | Quebecor World Capital Corp. | ||||
| 4.875% due 01/02/49 (Ø)(Þ) | 205 | — | |||||
| 2.350% due 01/28/19 | 2,190 | 2,226 | 6.125% due 11/15/49 (Ø) | 70 | — | ||
| 2.295% due 08/15/21 | 855 | 855 | |||||
| QVC, Inc. | |||||||
| Series H | 3.125% due 04/01/19 | 785 | 802 | ||||
| 1.700% due 03/01/18 | 1,055 | 1,058 | |||||
| Reynolds American, Inc. | |||||||
See accompanying notes which are an integral part of the financial statements.
498 Russell Short Duration Bond Fund
Russell Investment Company
Russell Short Duration Bond Fund
Schedule of Investments, continued — October 31, 2016
| Amounts in thousands (except share amounts) | Amounts in thousands (except share amounts) | ||||||
| Principal | Fair | Principal | Fair | ||||
| Amount ($) | Value | Amount ($) | Value | ||||
| or Shares | $ | or Shares | $ | ||||
| 6.875% due 05/01/20 | 695 | 808 | Avago Technologies Cayman Finance, | ||||
| SBA Tower Trust | Ltd. Term Loan B3 | ||||||
| Series 2014-1A | 3.535% due 02/01/23 (Ê) | 1,101 | 1,112 | ||||
| 2.898% due 10/15/19 (Þ) | 1,415 | 1,439 | Bank of Montreal | ||||
| Solera LLC 1st Lien Term Loan B | 1.900% due 08/27/21 | 565 | 559 | ||||
| 5.750% due 03/04/23 (Ê) | 469 | 474 | BP Capital Markets PLC | ||||
| Southern Co. (The) | 1.375% due 05/10/18 | 505 | 504 | ||||
| 2.150% due 09/01/19 | 520 | 526 | Braskem Finance, Ltd. | ||||
| Southern Power Co. | 7.000% due 05/07/20 (Þ) | 780 | 858 | ||||
| Series 15A | British Telecommunications PLC | ||||||
| 1.500% due 06/01/18 | 1,075 | 1,076 | 5.950% due 01/15/18 | 545 | 574 | ||
| Sprint Spectrum Co. LLC / Sprint | Canadian Imperial Bank of Commerce | ||||||
| Spectrum Co II LLC / Sprint Spectrum | 1.550% due 01/23/18 | 1,499 | 1,501 | ||||
| Co III LLC | Canadian Oil Sands, Ltd. | ||||||
| Series A-1 | 4.500% due 04/01/22 (Þ) | 500 | 514 | ||||
| 3.360% due 09/20/21 (Þ) | 795 | 797 | Danone SA | ||||
| Starbucks Corp. | 1.691% due 10/30/19 (Þ) | 1,150 | 1,151 | ||||
| 2.100% due 02/04/21 | 460 | 467 | Delta 2 Lux Sarl 2nd Lien Term Loan | ||||
| Thomson Reuters Corp. | 7.750% due 07/29/22 (Ê) | 250 | 252 | ||||
| 6.500% due 07/15/18 | 685 | 740 | Delta 2 Lux Sarl Covenant-Lite Term | ||||
| Time Warner, Inc. | Loan B3 | ||||||
| 4.750% due 03/29/21 | 527 | 580 | 4.750% due 07/30/21 (Ê) | 2,250 | 2,253 | ||
| Toyota Motor Credit Corp. | Ensco PLC | ||||||
| 1.200% due 04/06/18 | 1,010 | 1,009 | 4.700% due 03/15/21 | 585 | 540 | ||
| 1.700% due 02/19/19 | 950 | 954 | European Investment Bank | ||||
| Series GMTN | Series DIP | ||||||
| 1.338% due 07/13/18 (Ê) | 785 | 788 | 1.125% due 08/15/19 | 1,085 | 1,081 | ||
| US Bancorp | Evergreen Skills Lux Sarl | ||||||
| 2.200% due 04/25/19 | 965 | 984 | 5.750% due 04/28/21 (Ê) | 735 | 654 | ||
| Expro Financial Services SARL Term | |||||||
| Verizon Communications, Inc. | Loan B | ||||||
| 6.100% due 04/15/18 | 810 | 862 | 5.750% due 09/02/21 (Ê) | 784 | 680 | ||
| 2.606% due 09/14/18 (Ê) | 100 | 103 | FMG Resources Pty, Ltd. Covenant-Lite | ||||
| 3.650% due 09/14/18 | 1,715 | 1,779 | 1st Lien Term Loan B | ||||
| 1.375% due 08/15/19 | 1,025 | 1,016 | 3.750% due 06/30/19 | 405 | 404 | ||
| 4.500% due 09/15/20 | 1,455 | 1,582 | HSBC Holdings PLC | ||||
| Walgreens Boots Alliance, Inc. | 2.950% due 05/25/21 | 505 | 513 | ||||
| 1.750% due 05/30/18 | 895 | 899 | ING Bank NV | ||||
| Wal-Mart Stores, Inc. | 1.650% due 08/15/19 (Þ) | 1,730 | 1,724 | ||||
| 1.950% due 12/15/18 | 920 | 936 | Mondelez International Holdings | ||||
| Wells Fargo & Co. | Netherlands BV | ||||||
| 2.125% due 04/22/19 | 2,000 | 2,022 | 1.625% due 10/28/19 (Þ) | 1,440 | 1,435 | ||
| Series GMTN | Mood Media Corp. Term Loan | ||||||
| 1.500% due 01/16/18 | 1,120 | 1,120 | 7.000% due 05/01/19 (Ê) | 975 | 924 | ||
| Williams Partners, LP | Noble Holding International, Ltd. | ||||||
| 4.125% due 11/15/20 | 502 | 524 | 5.250% due 03/16/18 | 595 | 592 | ||
| ZFS Finance USA Trust | Perrigo Co. PLC | ||||||
| 6.500% due 05/09/37 (Þ) | 325 | 327 | 2.300% due 11/08/18 | 745 | 749 | ||
| 136,561 | Perrigo Finance Unlimited Co. | ||||||
| 3.500% due 03/15/21 | 1,465 | 1,514 | |||||
| International Debt - 5.3% | Playa Resorts Holding BV 1st Lien Term | ||||||
| 1011778 BC Unlimited Liability Co. 1st | |||||||
| Lien Term Loan B2 | Loan B | ||||||
| 3.750% due 12/12/21 (Ê) | 1,311 | 1,317 | 4.000% due 08/09/19 (Ê) | 248 | 247 | ||
| AP NMT Acquisition BV 1st Lien Term | Royal Bank of Canada | ||||||
| Loan | Series GMTN | ||||||
| 6.750% due 08/13/21 (Ê) | 490 | 447 | 1.800% due 07/30/18 | 1,310 | 1,317 | ||
| AstraZeneca PLC | Royal Bank of Scotland Group PLC | ||||||
| 2.375% due 11/16/20 | 920 | 936 | 4.700% due 07/03/18 | 1,025 | 1,049 | ||
| Australia & New Zealand Banking | Shell International Finance BV | ||||||
| Group, Ltd. | 1.625% due 11/10/18 | 1,880 | 1,884 | ||||
| Series GMTN | 1.875% due 05/10/21 | 315 | 313 | ||||
| 1.500% due 01/16/18 | 1,085 | 1,086 | |||||
See accompanying notes which are an integral part of the financial statements.
Russell Short Duration Bond Fund 499
Russell Investment Company
Russell Short Duration Bond Fund
Schedule of Investments, continued — October 31, 2016
| Amounts in thousands (except share amounts) | Amounts in thousands (except share amounts) | ||||||
| Principal | Fair | Principal | Fair | ||||
| Amount ($) | Value | Amount ($) | Value | ||||
| or Shares | $ | or Shares | $ | ||||
| Shire Acquisitions Investments Ireland | Arctic Glacier USA, Inc. 1st Lien Term | ||||||
| DAC | Loan | ||||||
| 1.900% due 09/23/19 | 1,175 | 1,173 | 6.000% due 05/13/19 (Ê) | 492 | 485 | ||
| Sky PLC | AssuredPartners, Inc. 1st Lien Term | ||||||
| 6.100% due 02/15/18 (Þ) | 865 | 909 | Loan | ||||
| SMART ABS Series Trust | 5.750% due 10/21/22 (Ê) | 292 | 293 | ||||
| Series 2015-3US Class A3A | Asurion LLC Term Loan B4 | ||||||
| 1.660% due 08/14/19 | 865 | 865 | 5.000% due 08/04/22 (Ê) | 488 | 490 | ||
| Stena International SA Covenant-Lite | Asurion LLC Term Loan B5 | ||||||
| Term Loan B | 4.750% due 10/27/23 | 500 | 498 | ||||
| 4.240% due 03/03/21 (Ê) | 975 | 827 | Avantor Performance Materials Holdings, | ||||
| Teva Pharmaceutical Finance | Inc. 1st Lien Term Loan | ||||||
| Netherlands III BV | 6.000% due 06/21/22 (Ê) | 100 | 100 | ||||
| 1.700% due 07/19/19 | 755 | 749 | Avaya, Inc. Term Loan B7 | ||||
| 2.200% due 07/21/21 | 920 | 909 | 6.250% due 05/29/20 (Ê) | 982 | 804 | ||
| Toronto-Dominion Bank (The) | B&G Foods, Inc. Term Loan B | ||||||
| 1.400% due 04/30/18 | 970 | 970 | 3.839% due 10/05/22 (Ê) | 853 | 861 | ||
| 2.125% due 04/07/21 | 830 | 836 | BioScrip, Inc. 1st Lien Term Loan B | ||||
| Series GMTN | 6.500% due 07/31/20 (Ê) | 45 | 44 | ||||
| 1.750% due 07/23/18 | 845 | 849 | BioScrip, Inc. Term Loan B | ||||
| Total Capital Canada, Ltd. | 6.500% due 07/31/20 (Ê) | 75 | 73 | ||||
| 1.450% due 01/15/18 | 975 | 977 | BMC Software Finance, Inc. 1st Lien | ||||
| Trade MAPS 1, Ltd. | Term Loan B | ||||||
| 5.000% due 09/10/20 (Ê) | 989 | 974 | |||||
| Series 2013-1A Class A | BWAY Holding Co. 1st Lien Term Loan | ||||||
| 1.229% due 12/10/18 (Ê)(Þ) | 2,190 | 2,188 | |||||
| Travelport Finance Luxembourg Sarl | B | ||||||
| 5.500% due 08/14/20 (Ê) | 1,413 | 1,422 | |||||
| Term Loan B | Caesars Entertainment Corp. 1st Lien | ||||||
| 5.000% due 09/02/21 (Ê) | 961 | 967 | Term Loan B | ||||
| UBS AG | 7.000% due 10/11/20 (Ê) | 1,244 | 1,250 | ||||
| Series BKNT | Cast & Crew Payroll LLC Term Loan B | ||||||
| 5.875% due 12/20/17 | 820 | 860 | 5.000% due 08/03/22 (Ê) | 499 | 496 | ||
| Veresen Midstream, LP Term Loan B1 | CBS Radio, Inc. Term Loan B | ||||||
| 5.250% due 03/31/22 (Ê) | 374 | 372 | 4.500% due 10/06/23 | 292 | 293 | ||
| Virgin Media Investment Holdings, Ltd. | Cengage Learning Acquisitions, Inc. | ||||||
| Term Loan F | Term Loan B | ||||||
| 3.500% due 06/30/23 (Ê) | 505 | 507 | 5.250% due 06/07/23 (Ê) | 577 | 563 | ||
| 42,642 | Charter Communications Operating LLC | ||||||
| Loan Agreements - 12.4% | Term Loan H | ||||||
| Abacus Innovations Corp. Term Loan B | 3.250% due 08/24/21 (Ê) | 2,220 | 2,228 | ||||
| 3.284% due 08/16/23 (Ê) | 1,250 | 1,258 | Checkout Holding Corp. Covenant-Lite | ||||
| ABG Intermediate Holdings 2, LLC 1st | 1st Lien Term Loan B | ||||||
| Lien Term Loan | 4.500% due 04/09/21 (Ê) | 978 | 879 | ||||
| 5.500% due 05/27/21 (Ê) | 461 | 460 | Chrysler Group LLC 1st Lien Term | ||||
| ABG Intermediate Holdings 2, LLC 2nd | Loan B | ||||||
| Lien Term Loan | 3.250% due 12/31/18 (Ê) | 1,403 | 1,404 | ||||
| 9.500% due 05/27/22 (Ê) | 500 | 487 | CHS/Community Health Systems, Inc. | ||||
| Active Network, Inc. (The) 1st Lien Term | 1st Lien Term Loan G | ||||||
| Loan | 3.750% due 12/31/19 (Ê) | 602 | 569 | ||||
| 5.500% due 11/15/20 (Ê) | 975 | 968 | Cincinnati Bell, Inc. 1st Lien Term | ||||
| Loan B | |||||||
| Albertsons LLC Term Loan B4 | 4.000% due 09/10/20 (Ê) | 236 | 237 | ||||
| 4.500% due 08/22/21 (Ê) | 1,490 | 1,500 | |||||
| Alvogen Pharmaceutical US, Inc. Term | Cinemark USA, Inc. Term Loan B | ||||||
| Loan | 3.290% due 05/08/22 (Ê) | 1,000 | 1,011 | ||||
| 6.000% due 04/02/22 (Ê) | 824 | 824 | Cision, Inc. Term Loan B | ||||
| American Airlines, Inc. Term Loan | 7.000% due 05/12/23 | 998 | 962 | ||||
| 3.250% due 05/21/20 (Ê) | 1,471 | 1,472 | Commercial Barge Line Co. Term Loan | ||||
| Ancestry.com, Inc. 1st Lien Term Loan | 9.750% due 11/12/20 (Ê) | 868 | 839 | ||||
| 5.250% due 10/13/23 | 818 | 819 | Community Health Systems, Inc. Term | ||||
| Loan H | |||||||
| AP Gaming I LLC 1st Lien Term Loan B | 4.000% due 01/27/21 (Ê) | 1,108 | 1,045 | ||||
| 9.250% due 12/20/20 (Ê) | 492 | 479 | |||||
| Arbor Pharmaceuticals, Inc. Term Loan | Compuware Corp. 1st Lien Term Loan B1 | ||||||
| B | 6.250% due 12/15/19 (Ê) | 912 | 914 | ||||
| 6.000% due 06/28/23 | 1,000 | 1,008 | |||||
See accompanying notes which are an integral part of the financial statements.
500 Russell Short Duration Bond Fund
Russell Investment Company
Russell Short Duration Bond Fund
Schedule of Investments, continued — October 31, 2016
| Amounts in thousands (except share amounts) | Amounts in thousands (except share amounts) | ||||||
| Principal | Fair | Principal | Fair | ||||
| Amount ($) | Value | Amount ($) | Value | ||||
| or Shares | $ | or Shares | $ | ||||
| ConvergeOne Holdings Corp. Covenant- | 4.000% due 03/05/21 (Ê) | 492 | 375 | ||||
| Lite 1st Lien Term Loan | Jaguar Holding Company II Term Loan B | ||||||
| 6.375% due 06/17/20 (Ê) | 978 | 970 | 4.250% due 08/18/22 (Ê) | 1,120 | 1,118 | ||
| CPI Acquisition, Inc. Term Loan B | Kraton Polymers LLC Term Loan B | ||||||
| 5.500% due 08/17/22 (Ê) | 718 | 705 | 6.000% due 01/06/22 (Ê) | 197 | 198 | ||
| Creative Artists Agency LLC Term Loan | |||||||
| B | Lannett Co., Inc. Term Loan A | ||||||
| 5.000% due 12/17/21 (Ê) | 984 | 990 | 5.750% due 11/25/20 (Ê) | 577 | 562 | ||
| Las Vegas Sands LLC 1st Lien Term | |||||||
| CSC Holdings LLC Term Loan | Loan B | ||||||
| 3.876% due 10/31/24 (Ê) | 888 | 891 | 3.250% due 12/19/20 (Ê) | 1,237 | 1,244 | ||
| CSRA, Inc. Term Loan B | Level 3 Financing, Inc. Term Loan B2 | ||||||
| 3.750% due 10/29/22 (Ê) | 928 | 932 | 3.500% due 05/31/22 (Ê) | 750 | 753 | ||
| CWGS Group LLC Term Loan | LTS Buyer LLC Term Loan | ||||||
| 5.750% due 02/20/20 (Ê) | 1,038 | 1,037 | 4.088% due 04/13/20 (Ê) | 987 | 988 | ||
| Eastman Kodak Co. Term Loan | M/A-COM Technology Solutions | ||||||
| 7.250% due 09/03/19 (Ê) | 964 | 962 | Holdings, Inc. Term Loan | ||||
| Emerald US, Inc. Term Loan B1 | 4.628% due 05/08/21 (Ê) | 499 | 502 | ||||
| 5.000% due 05/09/21 | 1,000 | 905 | MacDermid, Inc. Term Loan | ||||
| EnergySolutions LLC 1st Lien Term | 5.000% due 10/06/23 | 712 | 717 | ||||
| Loan B | Match Group, Inc. Term Loan V1 | ||||||
| 6.750% due 05/29/20 (Ê) | 795 | 795 | 5.500% due 10/27/22 (Ê) | 396 | 398 | ||
| First Data Corp. 1st Lien Term Loan B | MCC Iowa LLC Term Loan H | ||||||
| 4.274% due 07/10/22 (Ê) | 1,375 | 1,384 | 3.250% due 01/29/21 (Ê) | 985 | 993 | ||
| FPC Holdings, Inc. 1st Lien Term Loan | Media General, Inc. 1st Lien Term Loan | ||||||
| 5.250% due 11/27/19 (Ê) | 492 | 443 | B | ||||
| FullBeauty Brands Holdings Corp. 1st | 4.000% due 07/31/20 (Ê) | 859 | 859 | ||||
| Lien Term Loan | Mergermarket USA, Inc. 1st Lien Term | ||||||
| 5.750% due 10/14/22 (Ê) | 746 | 708 | Loan | ||||
| GCI Holdings, Inc. Term B Loan | 4.500% due 02/04/21 (Ê) | 872 | 856 | ||||
| 4.000% due 02/02/22 (Ê) | 985 | 981 | MGM Growth Properties Operating | ||||
| GENEX Holdings, Inc. 2nd Lien Term | Partnership, LP Term Loan B | ||||||
| Loan | 4.000% due 04/25/23 (Ê) | 995 | 997 | ||||
| 8.750% due 05/30/22 (Ê) | 250 | 238 | Minerals Technologies, Inc. Term Loan B | ||||
| GENEX Services, Inc. 1st Lien Term | 3.750% due 05/09/21 (Ê) | 549 | 554 | ||||
| Loan B | MRI Software LLC Term Loan | ||||||
| 5.250% due 05/30/21 (Ê) | 980 | 969 | 5.250% due 06/18/21 | 494 | 491 | ||
| Getty Images, Inc. 1st Lien Term Loan B | MSC.Software Corp. 1st Lien Term Loan | ||||||
| 4.750% due 10/18/19 (Ê) | 980 | 830 | 5.000% due 05/29/20 (Ê) | 978 | 974 | ||
| Global Healthcare Exchange LLC Term | |||||||
| Loan B | MultiPlan, Inc. Term Loan B | ||||||
| 5.250% due 08/13/22 (Ê) | 990 | 995 | 5.000% due 05/25/23 (Ê) | 718 | 725 | ||
| Go Daddy Operating Co. LLC Term Loan | Navistar, Inc. 1st Lien Term Loan B | ||||||
| 4.250% due 05/13/21 (Ê) | 978 | 983 | 6.500% due 08/07/20 (Ê) | 496 | 499 | ||
| Harland Clarke Holdings Corp. 1st Lien | NBTY, Inc. Term Loan B | ||||||
| Term Loan B4 | 5.000% due 05/05/23 (Ê) | 499 | 500 | ||||
| 6.993% due 08/04/19 (Ê) | 1,406 | 1,394 | New Millennium Holdco, Inc. Term Loan | ||||
| Hawaiian Telcom Communications, Inc. | 7.500% due 12/21/20 (Ê) | 490 | 308 | ||||
| Term Loan B | Numericable US LLC Term Loan B7 | ||||||
| 5.250% due 06/06/19 (Ê) | 1,228 | 1,234 | 5.137% due 01/31/24 (Ê) | 746 | 752 | ||
| HCA Inc. Term Loan B7 | PET Acquisition Merger Sub LLC Term | ||||||
| 3.588% due 03/01/24 | 500 | 504 | Loan | ||||
| Hilton Worldwide Finance LLC Term | 5.750% due 01/26/23 (Ê) | 390 | 393 | ||||
| Loan B2 | PetSmart, Inc. Term Loan B | ||||||
| 3.034% due 10/25/23 (Ê) | 1,228 | 1,233 | 4.000% due 03/10/22 | 988 | 989 | ||
| Indigo Merger Sub I, Inc. 1st Lien Term | PGX Holdings, Inc. Covenant-Lite 1st | ||||||
| Loan | Lien Term Loan | ||||||
| 4.750% due 07/08/21 (Ê) | 978 | 980 | 5.750% due 08/21/20 (Ê) | 456 | 456 | ||
| Informatica Corp. Term Loan | Pinnacle Entertainment, Inc. Term Loan | ||||||
| 4.500% due 06/03/22 (Ê) | 990 | 971 | B | ||||
| Intrawest Operations Group LLC Term | 3.750% due 04/28/23 | 218 | 219 | ||||
| Loan | Pinnacle Foods Finance LLC Term Loan | ||||||
| 4.500% due 12/09/20 (Ê) | 692 | 698 | H | ||||
| J Crew Group, Inc. Term Loan B | 3.250% due 04/29/20 (Ê) | 1,237 | 1,243 | ||||
See accompanying notes which are an integral part of the financial statements.
Russell Short Duration Bond Fund 501
Russell Investment Company
Russell Short Duration Bond Fund
Schedule of Investments, continued — October 31, 2016
| Amounts in thousands (except share amounts) | Amounts in thousands (except share amounts) | ||||||
| Principal | Fair | Principal | Fair | ||||
| Amount ($) | Value | Amount ($) | Value | ||||
| or Shares | $ | or Shares | $ | ||||
| Power Buyer LLC 2nd Lien Term Loan | 3.500% due 11/09/22 (Ê) | 1,244 | 1,253 | ||||
| 8.250% due 11/06/20 (Ê) | 500 | 498 | TMS International Corp. Term Loan | ||||
| Pre-Paid Legal Services, Inc. 2nd Lien | 4.500% due 10/16/20 (Ê) | 500 | 492 | ||||
| Term Loan | Tribune Media Co. 1st Lien Term Loan B | ||||||
| 10.250% due 07/01/20 (Ê) | 500 | 495 | 3.750% due 12/27/20 (Ê) | 831 | 835 | ||
| Prime Security Services Borrower LLC | |||||||
| Term Loan B1 | TruGreen, LP 1st Lien Term Loan B | ||||||
| 4.750% due 04/21/22 (Ê) | 125 | 126 | 6.500% due 04/13/23 (Ê) | 748 | 754 | ||
| Prolampac Intermediate, Inc. 1st Lien | United Airlines, Inc. Term Loan B1 | ||||||
| Term Loan | 3.500% due 09/15/21 (Ê) | 385 | 386 | ||||
| 5.750% due 06/30/22 (Ê) | 990 | 990 | UPC Financing Partnership 1st Lien | ||||
| Quincy Newspapers, Inc. Term Loan B | Term Loan AN | ||||||
| 7.000% due 11/02/22 (Ê) | 978 | 982 | 4.080% due 08/31/24 (Ê) | 1,000 | 1,005 | ||
| Valeant Pharmaceuticals International, | |||||||
| Realogy Group LLC Term Loan B | Inc. 1st Lien Term Loan BF1 | ||||||
| 3.750% due 07/14/22 (Ê) | 499 | 503 | 5.500% due 04/02/22 (Ê) | 573 | 571 | ||
| Renaissance Learning, Inc. 1st Lien | |||||||
| Term Loan | Varsity Brands, Inc. 1st Lien Term Loan | ||||||
| 4.500% due 04/09/21 (Ê) | 975 | 972 | 5.000% due 12/11/21 | 123 | 123 | ||
| Verdesian Life Sciences LLC 1st Lien | |||||||
| RentPath, Inc. 1st Lien Term Loan B | Term Loan B | ||||||
| 6.250% due 12/17/21 (Ê) | 1,965 | 1,865 | 6.000% due 07/01/20 (Ê) | 910 | 801 | ||
| RHP Hotel Properties LP Term Loan B | William Morris Endeavor Entertainment | ||||||
| 3.590% due 01/15/21 (Ê) | 978 | 982 | LLC 1St Lien Term Loan B | ||||
| Rovi Solutions Corp. 1st Lien Term | 5.250% due 05/06/21 (Ê) | 978 | 982 | ||||
| Loan B | WMG Acquisition Corp. Term Loan B | ||||||
| 3.750% due 07/02/21 (Ê) | 978 | 979 | 3.750% due 07/01/20 (Ê) | 751 | 749 | ||
| RPI Finance Trust Term Loan B5 | World Endurance Holdings 1St Lien | ||||||
| 3.495% due 10/04/22 | 807 | 814 | Term Loan | ||||
| Scientific Games International, Inc. Term | 5.250% due 06/26/21 (Ê) | 982 | 973 | ||||
| Loan B1 | Yonkers Racing Corp. 1st Lien Term | ||||||
| 6.000% due 10/18/20 (Ê) | 1,712 | 1,721 | Loan | ||||
| Scientific Games International, Inc. Term | 4.250% due 08/16/19 | 890 | 888 | ||||
| Loan B2 | Zebra Technologies Corp. 1st Lien Term | ||||||
| 6.000% due 10/01/21 (Ê) | 688 | 690 | Loan B | ||||
| SCS Holdings, Inc. 1st Lien Term Loan | 4.089% due 10/27/21 (Ê) | 878 | 886 | ||||
| 6.000% due 10/30/22 (Ê) | 989 | 992 | 100,292 | ||||
| SeaWorld Parks & Entertainment, Inc. | Mortgage-Backed Securities - 19.9% | ||||||
| Term Loan B3 | Banc of America Commercial Mortgage | ||||||
| 4.088% due 05/14/20 (Ê) | 1,246 | 1,249 | Trust | ||||
| Signode Industrial Group US, Inc. | |||||||
| Covenant-Lite 1st Lien Term Loan B | Series 2007-2 Class AM | ||||||
| 3.750% due 05/01/21 (Ê) | 563 | 562 | 5.801% due 04/10/49 | 1,010 | 1,021 | ||
| SIRVA Worldwide, Inc. 1st Lien Term | Series 2007-4 Class AM | ||||||
| Loan | 6.005% due 02/10/51 | 178 | 183 | ||||
| 7.500% due 03/27/19 (Ê) | 477 | 473 | Banc of America Funding Trust | ||||
| SolarWinds Holdings, Inc. Term Loan | Series 2006-A Class 1A1 | ||||||
| 5.500% due 02/05/23 (Ê) | 1,087 | 1,092 | 2.816% due 02/20/36 (Ê) | 338 | 334 | ||
| SourceHOV LLC 1st Lien Term Loan B | Series 2006-F Class 1A2 | ||||||
| 7.750% due 10/31/19 (Ê) | 466 | 403 | 3.098% due 07/20/36 (Ê) | 24 | 19 | ||
| Steak n Shake Operations, Inc. Term | Banc of America Merrill Lynch | ||||||
| Loan | Commercial Mortgage, Inc. | ||||||
| 4.750% due 03/19/21 (Ê) | 976 | 966 | Series 2003-2 Class H | ||||
| Sterigenics-Nordion Holdings LLC 1st | 5.765% due 03/11/41 (Þ) | 1,758 | 1,859 | ||||
| Lien Term Loan B | Series 2005-3 Class AM | ||||||
| 4.250% due 05/15/22 (Ê) | 500 | 498 | 4.727% due 07/10/43 | 256 | 256 | ||
| Sungard Availability Services Capital, | |||||||
| Inc. Covenant-Lite 1st Lien Term | Series 2007-2 Class A4 | ||||||
| Loan B | 5.791% due 04/10/49 | 311 | 312 | ||||
| 6.000% due 03/31/19 (Ê) | 467 | 441 | Banc of America Re-REMIC Trust | ||||
| TCH-2 Holdings LLC 1st Lien Term | Series 2010-UB5 Class A4A | ||||||
| Loan | 5.649% due 02/17/51 (Þ) | 1,400 | 1,409 | ||||
| 5.500% due 05/12/21 (Ê) | 983 | 983 | BCAP LLC Trust | ||||
| TerraForm AP Acquisition Holdings LLC | Series 2009-RR5 Class 6A1 | ||||||
| 1st Lien Term Loan B | 2.895% due 02/26/37 (Ê)(Þ) | 558 | 555 | ||||
| 8.500% due 06/26/22 (Ê) | 923 | 914 | Series 2011-R11 Class 15A1 | ||||
| T-Mobile USA, Inc. Term Loan B | |||||||
See accompanying notes which are an integral part of the financial statements.
502 Russell Short Duration Bond Fund
Russell Investment Company
Russell Short Duration Bond Fund
Schedule of Investments, continued — October 31, 2016
| Amounts in thousands (except share amounts) | Amounts in thousands (except share amounts) | ||||||
| Principal | Fair | Principal | Fair | ||||
| Amount ($) | Value | Amount ($) | Value | ||||
| or Shares | $ | or Shares | $ | ||||
| 3.037% due 10/26/33 (Ê)(Þ) | 759 | 765 | Deutsche Mortgage Securities, Inc. Re- | ||||
| Series 2011-R11 Class 20A5 | REMIC Trust | ||||||
| 3.069% due 03/26/35 (Ê)(Þ) | 326 | 326 | Series 2007-WM1 Class A1 | ||||
| Bear Stearns ARM Trust | 4.078% due 06/27/37 (Ê)(Þ) | 696 | 686 | ||||
| Series 2004-5 Class 2A | Fannie Mae | ||||||
| 3.489% due 07/25/34 (Ê) | 404 | 402 | 3.530% due 2018 | 2,829 | 2,876 | ||
| Bear Stearns Commercial Mortgage | 3.739% due 2018 | 1,399 | 1,432 | ||||
| Securities Trust | 3.860% due 2018 | 1,159 | 1,185 | ||||
| Series 2004-PWR5 Class L | 5.000% due 2018 | 2,104 | 2,158 | ||||
| 4.693% due 07/11/42 (Þ) | 416 | 404 | 4.500% due 2019 | 22 | 23 | ||
| Series 2007-PW18 Class A1A | 4.506% due 2019 | 2,280 | 2,351 | ||||
| 5.602% due 06/11/50 | 275 | 284 | 5.700% due 2019 | 877 | 955 | ||
| Capmark Mortgage Securities, Inc. | 4.399% due 2020 | 890 | 965 | ||||
| Series 1997-C2 Class G | 4.500% due 2020 | 577 | 598 | ||||
| 6.750% due 04/15/29 | 594 | 617 | 4.500% due 2021 | 30 | 31 | ||
| CCRESG Commercial Mortgage Trust | 2.400% due 2022 | 879 | 905 | ||||
| Series 2016-HEAT Class C | 7.000% due 2022 | 26 | 27 | ||||
| 4.919% due 04/10/29 (Þ) | 775 | 796 | 2.000% due 2023 | 2,297 | 2,319 | ||
| Citigroup Commercial Mortgage Trust | 2.500% due 2024 | 5,775 | 5,948 | ||||
| Series 2014-GC19 Class A1 | 4.500% due 2025 | 419 | 453 | ||||
| 1.199% due 03/10/47 | 275 | 275 | 3.500% due 2030 | 1,590 | 1,680 | ||
| 5.000% due 2031 | 1,948 | 2,163 | |||||
| Citigroup Mortgage Loan Trust | 2.229% due 2033(Ê) | 26 | 28 | ||||
| Series 2010-8 Class 6A6 | |||||||
| 4.500% due 12/25/36 (Þ) | 574 | 575 | Fannie Mae Grantor Trust | ||||
| Commercial Mortgage Loan Trust | Series 2001-T4 Class A1 | ||||||
| 7.500% due 07/25/41 | 503 | 602 | |||||
| Series 2008-LS1 Class A4B | |||||||
| 6.296% due 12/10/49 | 930 | 954 | Series 2004-T2 Class 1A3 | ||||
| 7.000% due 11/25/43 | 474 | 544 | |||||
| Commercial Mortgage Trust | |||||||
| Series 2005-GG3 Class E | Fannie Mae REMIC Trust | ||||||
| 5.087% due 08/10/42 | 732 | 731 | Series 2004-W12 Class 1A1 | ||||
| 6.000% due 07/25/44 | 2,055 | 2,374 | |||||
| Series 2007-GG9 Class A4 | |||||||
| 5.444% due 03/10/39 | 215 | 216 | Series 2005-W1 Class 1A2 | ||||
| 6.500% due 10/25/44 | 82 | 97 | |||||
| Series 2012-9W57 Class A | |||||||
| 2.365% due 02/10/29 (Þ) | 765 | 765 | Fannie Mae REMICS | ||||
| Series 2013-LC13 Class A1 | Series 2004-70 Class EB | ||||||
| 1.309% due 08/10/46 | 292 | 292 | 5.000% due 10/25/24 | 69 | 74 | ||
| Series 2014-CR15 Class A1 | Series 2007-73 Class A1 | ||||||
| 1.218% due 02/10/47 | 350 | 350 | 0.584% due 07/25/37 (Å)(Ê) | 54 | 53 | ||
| Series 2014-CR16 Class A1 | Series 2009-96 Class DB | ||||||
| 1.445% due 04/10/47 | 312 | 312 | 4.000% due 11/25/29 | 128 | 136 | ||
| Credit Suisse Commercial Mortgage | Series 2011-21 Class VJ | ||||||
| Trust | 5.000% due 03/25/22 | 1,026 | 1,032 | ||||
| Series 2006-C1 Class G | Series 2011-88 Class AB | ||||||
| 5.862% due 02/15/39 (Þ) | 425 | 423 | 2.500% due 09/25/26 | 422 | 426 | ||
| Series 2007-C1 Class A3 | Series 2011-141 Class EA | ||||||
| 5.383% due 02/15/40 | 29 | 29 | 1.750% due 07/25/21 | 540 | 543 | ||
| Series 2007-C2 Class A3 | Series 2013-21 Class BA | ||||||
| 5.542% due 01/15/49 | 4 | 4 | 1.000% due 03/25/23 | 2,222 | 2,210 | ||
| Credit Suisse First Boston Mortgage | Series 2013-136 Class KA | ||||||
| Securities Corp. | 2.000% due 05/25/25 | 969 | 974 | ||||
| Series 1998-C1 Class F | Fannie Mae Whole Loan | ||||||
| 6.000% due 05/17/40 (Þ) | 171 | 175 | Series 2004-W9 Class 2A1 | ||||
| Series 2004-C4 Class E | 6.500% due 02/25/44 | 22 | 25 | ||||
| 5.135% due 10/15/39 (Þ) | 1,580 | 1,672 | Fannie Mae-Aces | ||||
| Series 2005-C3 Class AJ | Series 2012-M2 Class A1 | ||||||
| 4.771% due 07/15/37 | 5 | 5 | 1.824% due 02/25/22 | 260 | 262 | ||
| CSMC Series | Series 2012-M8 Class ASQ2 | ||||||
| Series 2010-RR4 Class 1BA | 1.520% due 12/25/19 | 1,998 | 2,003 | ||||
| 5.383% due 02/15/40 (Þ) | 2,092 | 2,090 | Series 2012-M9 Class ASQ2 | ||||
| 1.513% due 12/25/17 | 3,735 | 3,744 | |||||
See accompanying notes which are an integral part of the financial statements.
Russell Short Duration Bond Fund 503
Russell Investment Company
Russell Short Duration Bond Fund
Schedule of Investments, continued — October 31, 2016
| Amounts in thousands (except share amounts) | Amounts in thousands (except share amounts) | ||||||
| Principal | Fair | Principal | Fair | ||||
| Amount ($) | Value | Amount ($) | Value | ||||
| or Shares | $ | or Shares | $ | ||||
| Series 2013-M5 Class ASQ4 | Freddie Mac Multifamily Structured Pass | ||||||
| 1.919% due 01/25/22 | 1,235 | 1,250 | Through Certificates | ||||
| Series 2013-M7 Class ASQ2 | Series 2011-K702 Class X1 | ||||||
| 1.233% due 03/26/18 | 250 | 250 | Interest Only STRIP | ||||
| Series 2013-M9 Class ASQ2 | 1.617% due 02/25/18 | 26,977 | 402 | ||||
| 1.825% due 06/25/18 | 537 | 540 | Series 2015-KF12 Class A | ||||
| Series 2014-M1 Class A1 | 1.224% due 09/25/22 (Ê) | 2,456 | 2,459 | ||||
| 2.325% due 07/25/23 | 315 | 321 | Series 2016-KF15 Class A | ||||
| Series 2015-M1 Class ASQ2 | 1.070% due 02/25/23 (Ê) | 2,489 | 2,492 | ||||
| 1.626% due 02/25/18 | 2,763 | 2,771 | Freddie Mac REMICS | ||||
| Series 2015-M7 Class ASQ1 | Series 2003-2559 Class PB | ||||||
| 0.882% due 04/25/18 | 715 | 713 | 5.500% due 08/15/30 | — | — | ||
| Series 2015-M7 Class ASQ2 | Series 2003-2632 Class AB | ||||||
| 1.550% due 04/25/18 | 835 | 837 | 4.500% due 06/15/18 | 350 | 358 | ||
| Series 2015-M13 Class ASQ1 | Series 2003-2657 Class WT | ||||||
| 0.856% due 09/25/19 | 293 | 293 | 4.500% due 08/15/18 | 88 | 90 | ||
| Series 2015-M15 Class ASQ1 | Series 2005-2922 Class JN | ||||||
| 0.849% due 01/25/19 | 1,134 | 1,132 | 4.500% due 02/15/20 | 563 | 576 | ||
| Series 2016-M1 Class ASQ1 | Series 2010-3704 Class DC | ||||||
| 1.374% due 07/25/19 | 531 | 532 | 4.000% due 11/15/36 | 267 | 282 | ||
| Series 2016-M3 Class ASQ1 | Series 2011-3803 Class PG | ||||||
| 1.468% due 03/25/21 | 1,642 | 1,639 | 4.000% due 01/15/41 | 523 | 549 | ||
| Series 2016-M6 Class ASQ2 | Series 2011-3816 Class D | ||||||
| 1.785% due 06/25/19 | 4,050 | 4,075 | 3.500% due 08/15/28 | 559 | 572 | ||
| Series 2016-M7 Class AV1 | Series 2012-4060 Class QA | ||||||
| 1.557% due 10/25/23 | 1,172 | 1,170 | 1.500% due 09/15/26 | 2,456 | 2,436 | ||
| FDIC Trust | Series 2014-4315 Class CA | ||||||
| Series 2010-R1 Class A | 2.000% due 01/15/23 | 1,584 | 1,600 | ||||
| 2.184% due 05/25/50 (Þ) | 1,358 | 1,359 | Series 2014-4350 Class CA | ||||
| Series 2011-R1 Class A | 2.000% due 10/15/19 | 492 | 496 | ||||
| 2.672% due 07/25/26 (Þ) | 539 | 548 | Series 2014-4351 Class GA | ||||
| Federal Home Loan Mortgage Corp. | 2.000% due 11/15/19 | 1,065 | 1,070 | ||||
| Multifamily Structured Pass Through | Series 2014-4383 Class JC | ||||||
| Certificates | 2.000% due 05/15/23 | 909 | 915 | ||||
| Series 2010-K007 Class A1 | Series 2014-4399 Class A | ||||||
| 3.342% due 12/25/19 | 1,277 | 1,287 | 2.500% due 07/15/24 | 3,278 | 3,308 | ||
| Series 2010-K009 Class A1 | FREMF Mortgage Trust | ||||||
| 2.757% due 05/25/20 | 767 | 776 | Series 2012-K707 Class B | ||||
| Series 2012-K019 Class A1 | 4.019% due 01/25/47 (Þ) | 890 | 923 | ||||
| 1.459% due 09/25/21 | 2,262 | 2,259 | Ginnie Mae | ||||
| Series 2012-K706 Class A1 | Series 2010-14 Class A | ||||||
| 1.691% due 06/25/18 | 289 | 289 | 4.500% due 06/16/39 | 147 | 157 | ||
| Series 2012-K706 Class X1 | Series 2010-H12 Class PT | ||||||
| Interest Only STRIP | 5.470% due 11/20/59 | 401 | 409 | ||||
| 1.689% due 10/25/18 | 10,552 | 270 | Series 2010-H22 Class JI | ||||
| Series 2016-K504 Class A1 | Interest Only STRIP | ||||||
| 1.680% due 10/25/19 | 755 | 760 | 2.507% due 11/20/60 | 3,326 | 210 | ||
| Series 2016-KP03 Class A2 | Series 2012-H11 Class CI | ||||||
| 1.780% due 07/25/19 | 7,090 | 7,138 | Interest Only STRIP | ||||
| Federal Home Loan Mortgage Corp. | 2.908% due 04/20/62 | 4,952 | 285 | ||||
| Structured Pass Through Securities | Series 2013-H03 Class HI | ||||||
| Series 2003-58 Class 2A | |||||||
| 6.500% due 09/25/43 | 29 | 34 | Interest Only STRIP | ||||
| 2.631% due 12/20/62 | 4,997 | 411 | |||||
| Freddie Mac | |||||||
| 6.000% due 2018 | 3 | 3 | Series 2014-137 Class JD | ||||
| 5.500% due 2019 | 248 | 259 | 5.459% due 09/20/44 | 901 | 1,018 | ||
| 5.500% due 2022 | 183 | 195 | Ginnie Mae II | ||||
| 4.500% due 2026 | 3,016 | 3,232 | 2.000% due 2040(Ê) | 644 | 668 | ||
| 5.500% due 2029 | 103 | 117 | 2.500% due 2040(Ê) | 2,144 | 2,216 | ||
| 3.500% due 2030 | 1,308 | 1,391 | 3.500% due 2040(Ê) | 45 | 47 | ||
| 5.390% due 2059 | 1,151 | 1,180 | |||||
See accompanying notes which are an integral part of the financial statements.
504 Russell Short Duration Bond Fund
Russell Investment Company
Russell Short Duration Bond Fund
Schedule of Investments, continued — October 31, 2016
| Amounts in thousands (except share amounts) | Amounts in thousands (except share amounts) | ||||||
| Principal | Fair | Principal | Fair | ||||
| Amount ($) | Value | Amount ($) | Value | ||||
| or Shares | $ | or Shares | $ | ||||
| 5.508% due 2059 | 829 | 843 | 2.991% due 05/25/34 (Ê) | 87 | 87 | ||
| 4.816% due 2062 | 1,352 | 1,423 | Series 2005-A4 Class 1A1 | ||||
| 4.856% due 2062 | 1,840 | 1,921 | 2.920% due 07/25/35 (Ê) | 34 | 33 | ||
| GS Mortgage Securities Trust | Series 2006-A6 Class 1A2 | ||||||
| Series 2013-GC12 Class A1 | 3.069% due 10/25/36 (Ê) | 19 | 17 | ||||
| 0.742% due 06/10/46 | 176 | 175 | LB Commercial Mortgage Trust | ||||
| Series 2014-GC18 Class A1 | Series 2007-C3 Class AM | ||||||
| 1.298% due 01/10/47 | 20 | 20 | 6.114% due 07/15/44 | 887 | 904 | ||
| GSMPS Mortgage Loan Trust | LB-UBS Commercial Mortgage Trust | ||||||
| Series 1998-1 Class A | Series 2004-C1 Class A4 | ||||||
| 8.000% due 09/19/27 (Þ) | 29 | 29 | 4.568% due 01/15/31 | 346 | 346 | ||
| Series 1998-2 Class A | Series 2004-C7 Class K | ||||||
| 7.587% due 05/19/27 (Þ) | 119 | 123 | 5.161% due 10/15/36 (Þ) | 1,357 | 1,371 | ||
| Series 1998-3 Class A | Series 2005-C3 Class D | ||||||
| 7.750% due 09/19/27 (Þ) | 5 | 5 | 4.954% due 07/15/40 | 447 | 467 | ||
| Series 1999-3 Class A | Series 2005-C7 Class F | ||||||
| 8.000% due 08/19/29 (Þ) | 13 | 12 | 5.350% due 11/15/40 | 510 | 512 | ||
| Series 2005-RP1 Class 1A4 | Mastr Adjustable Rate Mortgages Trust | ||||||
| 8.500% due 01/25/35 (Þ) | 130 | 148 | Series 2005-1 Class B1 | ||||
| Series 2006-RP1 Class 1A2 | 2.855% due 03/25/35 (Ê) | 158 | 50 | ||||
| 7.500% due 01/25/36 (Þ) | 312 | 333 | MASTR Reperforming Loan Trust | ||||
| Series 2006-RP1 Class 1A3 | Series 2005-1 Class 1A3 | ||||||
| 8.000% due 01/25/36 (Þ) | 73 | 79 | 7.000% due 08/25/34 (Þ) | 372 | 375 | ||
| Hilton USA Trust | Series 2005-2 Class 1A4 | ||||||
| Series 2013-HLT Class CFX | 8.000% due 05/25/35 (Þ) | 274 | 288 | ||||
| 3.714% due 11/05/30 (Þ) | 1,520 | 1,521 | Merrill Lynch Mortgage Investors Trust | ||||
| JPMorgan Chase Commercial Mortgage | Series 1998-C1 Class B | ||||||
| Securities Trust | 6.750% due 11/15/26 | 826 | 837 | ||||
| Series 2004-LN2 Class A2 | Series 1998-C3 Class IO | ||||||
| 5.115% due 07/15/41 | 45 | 45 | |||||
| Interest Only STRIP | |||||||
| Series 2004-LN2 Class B | 0.898% due 12/15/30 | 766 | 5 | ||||
| 5.466% due 07/15/41 | 150 | 149 | |||||
| Series 2005-A10 Class A | |||||||
| Series 2005-CB12 Class AJ | 0.735% due 02/25/36 (Ê) | 28 | 26 | ||||
| 4.987% due 09/12/37 | 534 | 537 | |||||
| Merrill Lynch Mortgage Trust | |||||||
| Series 2005-LDP2 Class C | |||||||
| 4.911% due 07/15/42 | 216 | 216 | Series 2005-CKI1 Class D | ||||
| 5.525% due 11/12/37 | 574 | 560 | |||||
| Series 2006-LDP9 Class A1A | |||||||
| 5.257% due 05/15/47 | 297 | 296 | Series 2007-C1 Class A4 | ||||
| 5.838% due 06/12/50 | 957 | 971 | |||||
| Series 2007-CB20 Class AM | Morgan Stanley Bank of America Merrill | ||||||
| 6.088% due 02/12/51 | 160 | 165 | Lynch Trust | ||||
| Series 2007-LD11 Class A4 | Series 2015-C26 Class A1 | ||||||
| 5.927% due 06/15/49 | 524 | 529 | 1.591% due 10/15/48 | 937 | 933 | ||
| Series 2007-LDPX Class A1A | Morgan Stanley Capital I Trust | ||||||
| 5.439% due 01/15/49 | 1,079 | 1,087 | Series 2006-HQ8 Class AJ | ||||
| Series 2007-LDPX Class AM | 5.495% due 03/12/44 | 212 | 213 | ||||
| 5.464% due 01/15/49 | 995 | 976 | Series 2006-IQ12 Class AM | ||||
| Series 2014-CBM Class A | 5.370% due 12/15/43 | 930 | 929 | ||||
| 1.067% due 10/15/29 (Ê)(Þ) | 2,580 | 2,555 | Series 2006-T21 Class B | ||||
| Series 2015-CSMO Class A | 5.312% due 10/12/52 (Þ) | 796 | 794 | ||||
| 1.774% due 01/15/32 (Ê)(Þ) | 465 | 465 | Morgan Stanley Re-REMIC Trust | ||||
| Series 2015-FL7 Class A | Series 2010-GG10 Class A4A | ||||||
| 1.774% due 05/15/28 (Ê)(Þ) | 262 | 260 | 5.988% due 08/15/45 (Þ) | 3,641 | 3,660 | ||
| Series 2016-C1 Class A1 | NCUA Guaranteed Notes Trust | ||||||
| 1.695% due 03/15/49 | 1,317 | 1,323 | Series 2010-R3 Class 3A | ||||
| JPMorgan Commercial Mortgage Finance | 2.400% due 12/08/20 | 302 | 303 | ||||
| Corp. | |||||||
| Series 2000-C10 Class F | ORES LLC | ||||||
| 8.559% due 08/15/32 | 494 | 516 | Series 2014-LV3 Class A | ||||
| 3.000% due 03/27/24 (Þ) | 9 | 9 | |||||
| JPMorgan Mortgage Trust | |||||||
| Series 2004-A2 Class 1A1 | RBSCF Trust | ||||||
See accompanying notes which are an integral part of the financial statements.
Russell Short Duration Bond Fund 505
Russell Investment Company
Russell Short Duration Bond Fund
Schedule of Investments, continued — October 31, 2016
| Amounts in thousands (except share amounts) | Amounts in thousands (except share amounts) | ||||||
| Principal | Fair | Principal | Fair | ||||
| Amount ($) | Value | Amount ($) | Value | ||||
| or Shares | $ | or Shares | $ | ||||
| Series 2010-RR3 Class MSCA | United States Government Agencies - 0.9% | ||||||
| 6.103% due 06/16/49 (Þ) | 211 | 212 | Fannie Mae | ||||
| Series 2010-RR4 Class CMLA | 1.125% due 07/20/18 | 4,684 | 4,703 | ||||
| 6.296% due 12/16/49 (Þ) | 292 | 297 | Federal Home Loan Banks | ||||
| Series 2010-RR4 Class WBCA | 1.750% due 12/14/18 | 2,415 | 2,454 | ||||
| 5.509% due 04/16/47 (Þ) | 1,752 | 1,748 | 0.875% due 08/05/19 | 25 | 25 | ||
| RBSSP Resecuritization Trust | 7,182 | ||||||
| Series 2010-3 Class 9A1 | United States Government Treasuries - 25.7% | ||||||
| 5.500% due 02/26/35 (Þ) | 256 | 257 | United States Treasury Notes | ||||
| Series 2010-12 Class 7A3 | 0.875% due 11/15/17 | 5,265 | 5,272 | ||||
| 4.000% due 12/27/35 (Þ) | 801 | 804 | 2.250% due 11/30/17 | 3,658 | 3,716 | ||
| Reperforming Loan REMIC Trust | 0.750% due 01/31/18 | 3 | 3 | ||||
| Series 2005-R2 Class 2A4 | 1.014% due 02/15/18 | 488 | 489 | ||||
| 8.500% due 06/25/35 (Þ) | 51 | 53 | 3.500% due 02/15/18 | 4,653 | 4,814 | ||
| Rialto Capital Management LLC | 0.750% due 02/28/18 | 4,919 | 4,918 | ||||
| Series 2014-LT5 Class A | 2.750% due 02/28/18 | 4,900 | 5,026 | ||||
| 2.850% due 05/15/24 (Þ) | 76 | 76 | 0.750% due 03/31/18 | 1,300 | 1,299 | ||
| Structured Asset Securities Corp. | 0.625% due 04/30/18 | 8,009 | 7,988 | ||||
| Mortgage Pass Through Certificates | 1.000% due 05/31/18 | 7,485 | 7,506 | ||||
| Series 2003-34A Class 6A | 0.750% due 08/31/18 | 8,485 | 8,470 | ||||
| 2.595% due 11/25/33 (Ê) | 166 | 163 | 1.500% due 08/31/18 | 8,938 | 9,041 | ||
| Wachovia Bank Commercial Mortgage | 0.750% due 09/30/18 | 555 | 554 | ||||
| Trust | 1.375% due 09/30/18 | 8,653 | 8,733 | ||||
| Series 2004-C12 Class F | 0.875% due 10/15/18 (§) | 22,240 | 22,238 | ||||
| 5.611% due 07/15/41 (Þ) | 121 | 121 | 3.750% due 11/15/18 | 7,220 | 7,635 | ||
| Series 2006-C26 Class AM | 1.250% due 11/30/18 | 11,085 | 11,164 | ||||
| 6.285% due 06/15/45 | 1,000 | 1,002 | 1.125% due 01/15/19 | 6,210 | 6,237 | ||
| Series 2006-C27 Class AM | 1.250% due 01/31/19 | 7,600 | 7,655 | ||||
| 5.795% due 07/15/45 | 80 | 80 | 0.750% due 02/15/19 | 2,628 | 2,618 | ||
| Series 2007-C31 Class A4 | 2.750% due 02/15/19 | 6,689 | 6,966 | ||||
| 5.509% due 04/15/47 | 1,084 | 1,091 | 1.500% due 02/28/19 | 10,505 | 10,642 | ||
| Series 2007-C31 Class A5FL | 0.875% due 04/15/19 | 2,570 | 2,566 | ||||
| 0.640% due 04/15/47 (Ê)(Þ) | 1,020 | 1,012 | 1.625% due 04/30/19 | 4,270 | 4,341 | ||
| Series 2007-C31 Class AM | 0.875% due 05/15/19 | 5,547 | 5,537 | ||||
| 5.591% due 04/15/47 | 1,090 | 1,102 | 0.875% due 06/15/19 | 5,790 | 5,777 | ||
| Series 2007-C32 Class A2 | 1.000% due 06/30/19 | 760 | 761 | ||||
| 5.711% due 06/15/49 | 34 | 34 | 1.625% due 06/30/19 | 3,980 | 4,048 | ||
| Series 2007-C33 Class A4 | 0.750% due 08/15/19 | 8,240 | 8,188 | ||||
| 6.158% due 02/15/51 | 381 | 385 | 0.875% due 09/15/19 | 3,650 | 3,637 | ||
| Washington Mutual Mortgage Pass- | 1.000% due 10/15/19 | 13,030 | 13,031 | ||||
| Through Certificates Trust | 1.125% due 09/30/21 | 5,620 | 5,567 | ||||
| Series 2003-AR7 Class A7 | 1.125% due 10/31/21 | 11,250 | 11,149 | ||||
| 2.676% due 08/25/33 (Ê) | 60 | 60 | 1.375% due 09/30/23 | 615 | 605 | ||
| Wells Fargo Commercial Mortgage Trust | 1.500% due 08/15/26 | 310 | 301 | ||||
| Series 2015-C31 Class A1 | 208,492 | ||||||
| 1.679% due 11/15/48 | 1,002 | 1,005 | |||||
| Wells Fargo Mortgage Backed Securities | Total Long-Term Investments | ||||||
| Trust | (cost $714,511) | 712,690 | |||||
| Series 2005-AR2 Class 2A1 | |||||||
| 2.615% due 03/25/35 (Ê) | 114 | 114 | |||||
| WF-RBS Commercial Mortgage Trust | Common Stocks - 0.0% | ||||||
| Series 2012-C9 Class A1 | Health Care - 0.0% | ||||||
| 0.673% due 11/15/45 | 431 | 431 | Millennium Health LLC(Æ) | 14,856 | 26 | ||
| Series 2012-C10 Class A1 | Producer Durables - 0.0% | ||||||
| 0.734% due 12/15/45 | 80 | 80 | Quad/Graphics, Inc. | 8 | — | ||
| Series 2013-C14 Class A1 | Total Common Stocks | ||||||
| 0.836% due 06/15/46 | 461 | 460 | (cost $108) | 26 | |||
| Series 2014-C19 Class A3 | |||||||
| 3.660% due 03/15/47 | 340 | 361 | Short-Term Investments - 11.7% | ||||
| 161,250 | |||||||
| Ally Financial, Inc. | |||||||
See accompanying notes which are an integral part of the financial statements.
506 Russell Short Duration Bond Fund
Russell Investment Company
Russell Short Duration Bond Fund
Schedule of Investments, continued — October 31, 2016
| Amounts in thousands (except share amounts) | Amounts in thousands (except share amounts) | |||||||
| Principal | Fair | Principal | Fair | |||||
| Amount ($) | Value | Amount ($) | Value | |||||
| or Shares | $ | or Shares | $ | |||||
| 5.500% due 02/15/17 | 2,595 | 2,618 | 3.500% due 01/13/17 (Þ) | 940 | 944 | |||
| American Express Centurion Bank | International Business Machines Corp. | |||||||
| Series BKN1 | 5.700% due 09/14/17 | 560 | 583 | |||||
| 6.000% due 09/13/17 | 870 | 905 | Intesa Sanpaolo SpA | |||||
| AmeriCredit Automobile Receivables | 2.375% due 01/13/17 | 1,460 | 1,461 | |||||
| Trust | ||||||||
| Series 2016-3 Class A1 | Mercedes-Benz Auto Receivables Trust | |||||||
| 0.750% due 08/08/17 | 3,807 | 3,805 | Series 2016-1 Class A1 | |||||
| Bank of America Corp. | 0.750% due 09/15/17 | 3,714 | 3,714 | |||||
| 1.700% due 08/25/17 | 1,775 | 1,779 | Noble Holding International, Ltd. | |||||
| Bear Stearns Cos. LLC (The) | 2.500% due 03/15/17 | 610 | 608 | |||||
| 5.550% due 01/22/17 | 1,650 | 1,666 | Pricoa Global Funding I | |||||
| BMW Vehicle Owner Trust | 1.350% due 08/18/17 (Þ) | 940 | 941 | |||||
| Series 2016-A Class A1 | Principal Life Global Funding II | |||||||
| 0.620% due 07/25/17 | 283 | 283 | 1.500% due 09/11/17 (Þ) | 1,175 | 1,177 | |||
| Russell U.S. Cash Management Fund | 36,211,273 | (8) | 36,219 | |||||
| Compass Bank | ||||||||
| Series BKNT | Samsung Electronics America, Inc. | |||||||
| 6.400% due 10/01/17 | 1,270 | 1,319 | 1.750% due 04/10/17 (Þ) | 895 | 896 | |||
| Coventry Health Care, Inc. | United States Treasury Bills | |||||||
| 5.950% due 03/15/17 | 775 | 788 | 0.073% due 11/03/16 (~) | 1,660 | 1,660 | |||
| Credit Suisse AG | United States Treasury Notes | |||||||
| Series GMTN | 0.875% due 12/31/16 | 1,025 | 1,026 | |||||
| 1.375% due 05/26/17 | 905 | 905 | 0.701% due 09/15/17 | 5,637 | 5,652 | |||
| Daimler Finance NA LLC | 0.750% due 10/31/17 | 10,120 | 10,122 | |||||
| 1.375% due 08/01/17 (Þ) | 1,165 | 1,165 | Westlake Automobile Receivables Trust | |||||
| Deutsche Telekom International Finance | Series 2016-3A Class A1 | |||||||
| BV | 0.950% due 10/16/17 (Þ) | 1,905 | 1,905 | |||||
| 2.250% due 03/06/17 (Þ) | 2,295 | 2,303 | XTO Energy, Inc. | |||||
| Enterprise Fleet Financing LLC | 6.250% due 08/01/17 | 900 | 934 | |||||
| Series 2016-2 Class A1 | Total Short-Term Investments | |||||||
| 0.850% due 07/20/17 (Þ) | 2,318 | 2,318 | (cost $94,322) | 94,396 | ||||
| Fannie Mae | ||||||||
| 7.000% due 06/01/17 | 2 | 2 | Total Investments 99.7% | |||||
| Fannie Mae REMICS | ||||||||
| Series 2002-57 Class PG | (identified cost $808,941) | 807,112 | ||||||
| 5.500% due 09/25/17 | 24 | 24 | Other Assets and Liabilities, | |||||
| Fannie Mae-Aces | Net - 0.3% | 2,377 | ||||||
| Series 2012-M13 Class ASQ2 | Net Assets - 100.0% | 809,489 | ||||||
| 1.246% due 08/25/17 | 1,969 | 1,969 | ||||||
| Series 2012-M14 Class ASQ2 | ||||||||
| 1.114% due 02/25/17 | 60 | 60 | ||||||
| Series 2014-M9 Class ASQ2 | ||||||||
| 1.462% due 04/25/17 | 224 | 224 | ||||||
| Federal Home Loan Mortgage Corp. | ||||||||
| Multifamily Structured Pass Through | ||||||||
| Certificates | ||||||||
| Series 2013-K502 Class A2 | ||||||||
| 1.426% due 08/25/17 | 400 | 401 | ||||||
| General Mills, Inc. | ||||||||
| 1.400% due 10/20/17 | 2,670 | 2,678 | ||||||
| Hewlett Packard Enterprise Co. | ||||||||
| 2.700% due 10/05/17 (Þ) | 1,325 | 1,342 | ||||||
| Hutchison Whampoa International 11, | ||||||||
| Ltd. | ||||||||
See accompanying notes which are an integral part of the financial statements.
Russell Short Duration Bond Fund 507
Russell Investment Company
Russell Short Duration Bond Fund
Schedule of Investments, continued — October 31, 2016
| Restricted Securities | |||||||||||||
| Amounts in thousands (except share and cost per unit amounts) | |||||||||||||
| Principal | Cost per | Cost | Fair Value | ||||||||||
| % of Net Assets | Acquisition | Amount ($) | Unit | (000 | ) | (000 | ) | ||||||
| Securities | Date | or shares | $ | $ | $ | ||||||||
| 0.0% | |||||||||||||
| Fannie Mae REMICS | 08/17/07 | 54,030 | 99.15 | 53 | 53 | ||||||||
| 53 | |||||||||||||
| For a description of restricted securities see note 8 in the Notes to Financial Statements. | |||||||||||||
| Futures Contracts | |||||||||||||
| Amounts in thousands (except contract amounts) | |||||||||||||
| Unrealized | |||||||||||||
| Appreciation | |||||||||||||
| Number of | Notional | Expiration | (Depreciation) | ||||||||||
| Contracts | Amount | Date | $ | ||||||||||
| Long Positions | |||||||||||||
| Australia 10 Year Bond Futures | 241 | AUD | 31,962 | 12/16 | (516 | ) | |||||||
| United States 2 Year Treasury Note Futures | 516 | USD | 112,560 | 12/16 | (19 | ) | |||||||
| United States 10 Year Treasury Note Futures | 240 | USD | 31,110 | 12/16 | (289 | ) | |||||||
| Short Positions | �� | ||||||||||||
| Euro-Bund Futures | 127 | EUR | 20,595 | 12/16 | 387 | ||||||||
| Long Gilt Futures | 152 | GBP | 19,052 | 12/16 | 935 | ||||||||
| United States 5 Year Treasury Note Futures | 258 | USD | 31,166 | 12/16 | 66 | ||||||||
| United States 10 Year Treasury Note Futures | 42 | USD | 5,444 | 12/16 | 50 | ||||||||
| Total Unrealized Appreciation (Depreciation) on Open Futures Contracts (å) | 614 | ||||||||||||
| Foreign Currency Exchange Contracts | |||||||||
| Amounts in thousands | |||||||||
| Unrealized | |||||||||
| Appreciation | |||||||||
| Amount | Amount | (Depreciation) | |||||||
| Counterparty | Sold | Bought | Settlement Date | $ | |||||
| Northern Trust | USD | 3,618 | AUD | 4,721 | 11/08/16 | (28 | ) | ||
| Northern Trust | USD | 3,659 | CAD | 4,788 | 11/08/16 | (89 | ) | ||
| Northern Trust | CHF | 7,029 | USD | 7,244 | 11/08/16 | 139 | |||
| State Street | USD | 63 | CAD | 84 | 11/08/16 | — | |||
| State Street | USD | 3,638 | JPY | 382,248 | 11/08/16 | 7 | |||
| State Street | USD | 3,545 | NOK | 29,251 | 11/08/16 | (5 | ) | ||
| State Street | USD | 175 | NZD | 245 | 11/08/16 | — | |||
| State Street | USD | 7,240 | NZD | 9,972 | 11/08/16 | (110 | ) | ||
| State Street | AUD | 4,721 | USD | 3,591 | 11/08/16 | 1 | |||
| State Street | CHF | 200 | USD | 203 | 11/08/16 | — | |||
| State Street | EUR | 3,227 | USD | 3,538 | 11/08/16 | (5 | ) | ||
| State Street | SEK | 3,665 | USD | 406 | 11/08/16 | — | |||
| State Street | SEK | 62,167 | USD | 7,296 | 11/08/16 | 412 | |||
| Wespac | USD | 3,631 | EUR | 3,227 | 11/08/16 | (88 | ) | ||
| Wespac | NOK | 29,251 | USD | 3,666 | 11/08/16 | 126 | |||
| Total Unrealized Appreciation (Depreciation) on Open Foreign Currency Exchange Contracts | 360 | ||||||||
| Credit Default Swap Contracts | |||||||||
| Amounts in thousands | |||||||||
| Credit Indices | |||||||||
| Fund (Pays)/ | |||||||||
| Receives | Termination | Fair Value | |||||||
| Reference Entity | Counterparty | Notional Amount | Fixed Rate | Date | $ | ||||
| CDX NA High Yield Index | Goldman Sachs | USD | 3,880 | 5.000% | 06/20/21 | 187 | |||
| Total Fair Value on Open Credit Indices Premiums Paid (Received) - $141 | 187 | ||||||||
See accompanying notes which are an integral part of the financial statements.
508 Russell Short Duration Bond Fund
Russell Investment Company
Russell Short Duration Bond Fund
Schedule of Investments, continued — October 31, 2016
| Presentation of Portfolio Holdings | |||||||||||||||||
| Amounts in thousands | |||||||||||||||||
| Fair Value | |||||||||||||||||
| Practical | |||||||||||||||||
| Portfolio Summary | Level 1 | Level 2 | Level 3 | Expedient (a) | Total | % of Net Assets | |||||||||||
| Long-Term Investments | |||||||||||||||||
| Asset-Backed Securities | $ | — | $ | 56,271 | $ | — | $ | — | $ | 56,271 | 6.9 | ||||||
| Corporate Bonds and Notes | — | 136,561 | — | — | 136,561 | 16.9 | |||||||||||
| International Debt | — | 42,642 | — | — | 42,642 | 5.3 | |||||||||||
| Loan Agreements | — | 100,292 | — | — | 100,292 | 12.4 | |||||||||||
| Mortgage-Backed Securities | — | 161,250 | — | — | 161,250 | 19.9 | |||||||||||
| United States Government Agencies | — | 7,182 | — | — | 7,182 | 0.9 | |||||||||||
| United States Government Treasuries | — | 208,492 | — | — | 208,492 | 25.7 | |||||||||||
| Common Stocks | |||||||||||||||||
| Health Care | — | 26 | — | — | 26 | —* | |||||||||||
| Producer Durables | — | — | — | — | — | —* | |||||||||||
| Short-Term Investments | — | 58,177 | — | 36,219 | 94,396 | 11.7 | |||||||||||
| Total Investments | — | 770,893 | — | 36,219 | 807,112 | 99.7 | |||||||||||
| Other Assets and Liabilities, Net | 0.3 | ||||||||||||||||
| 100.0 | |||||||||||||||||
| Other Financial Instruments | |||||||||||||||||
| Assets | |||||||||||||||||
| Futures Contracts | 1,438 | — | — | — | 1,438 | 0.2 | |||||||||||
| Foreign Currency Exchange Contracts | — | 685 | — | — | 685 | 0.1 | |||||||||||
| Credit Default Swap Contracts | — | 187 | — | — | 187 | —* | |||||||||||
| A | |||||||||||||||||
| Liabilities | |||||||||||||||||
| Futures Contracts | (824 | ) | — | — | — | (824 | ) | (0.1 | ) | ||||||||
| Foreign Currency Exchange Contracts | — | (325 | ) | — | — | (325 | ) | (—)* | |||||||||
| Total Other Financial Instruments** | $ | 614 | $ | 547 | $ | — | $ | — | $ | 1,161 | |||||||
* Less than 0.05% of net assets.
** Futures and foreign currency exchange contract values reflect the unrealized appreciation (depreciation) on the investments.
(a) Certain investments that are measured at fair value using the net asset value per share (or its equivalent) practical expedient have not been classified
in the fair value levels. The fair value amounts presented in the table are intended to permit reconciliation to the amounts presented in the Schedule of
Investments.
For a description of the Levels see note 2 in the Notes to Financial Statements.
For a disclosure on transfers between Levels 1, 2 and 3 during the period ended October 31, 2016 see note 2 in the Notes to
Financial Statements.
See accompanying notes which are an integral part of the financial statements.
Russell Short Duration Bond Fund 509
Russell Investment Company
Russell Short Duration Bond Fund
Fair Value of Derivative Instruments — October 31, 2016
Amounts in thousands
| Foreign | ||||||||
| Credit | Currency | Interest Rate | ||||||
| Derivatives not accounted for as hedging instruments | Contracts | Contracts | Contracts | |||||
| Location: Statement of Assets and Liabilities - Assets | ||||||||
| Unrealized appreciation on foreign currency exchange contracts | $ | — | $ | 685 | $ | — | ||
| Variation margin on futures contracts* | — | — | 1,438 | |||||
| Credit default swap contracts, at fair value | 187 | — | — | |||||
| Total | $ | 187 | $ | 685 | $ | 1,438 | ||
| Location: Statement of Assets and Liabilities - Liabilities | ||||||||
| Variation margin on futures contracts* | $ | — | $ | — | $ | 824 | ||
| Unrealized depreciation on foreign currency exchange contracts | — | 325 | — | |||||
| Total | $ | — | $ | 325 | $ | 824 | ||
| Foreign | ||||||||
| Credit | Currency | Interest Rate | ||||||
| Derivatives not accounted for as hedging instruments | Contracts | Contracts | Contracts | |||||
| Location: Statement of Operations - Net realized gain (loss) | ||||||||
| Futures contracts | $ | — | $ | — | $ | (753 | ) | |
| Credit default swap contracts | 284 | — | — | |||||
| Foreign currency-related transactions** | — | 1,300 | — | |||||
| Total | $ | 284 | $ | 1,300 | $ | (753 | ) | |
| Location: Statement of Operations - Net change in unrealized appreciation (depreciation) | ||||||||
| Futures contracts | $ | — | $ | — | $ | 798 | ||
| Credit default swap contracts | 46 | — | — | |||||
| Foreign currency-related transactions*** | — | 171 | — | |||||
| Total | $ | 46 | $ | 171 | $ | 798 | ||
* Includes cumulative appreciation/depreciation of futures contracts as reported in the Schedule of Investments. Only variation margin is reported within the
Statement of Assets and Liabilities.
** Only includes net realized gain (loss) on forward and spot contracts. May differ from the net realized gain (loss) on foreign currency-related transactions reported
within the Statement of Operations.
*** Only includes change in unrealized gain (loss) on forward and spot contracts. May differ from the net change in unrealized gain (loss) on foreign currency-related
transactions reported within the Statement of Operations.
For further disclosure on derivatives see note 2 in the Notes to Financial Statements.
See accompanying notes which are an integral part of the financial statements.
510 Russell Short Duration Bond Fund
Russell Investment Company
Russell Short Duration Bond Fund
Balance Sheet Offsetting of Financial and Derivative Instruments — October 31, 2016
| Amounts in thousands | ||||||||||
| Offsetting of Financial Assets and Derivative Assets | ||||||||||
| Gross | Net Amounts | |||||||||
| Amounts | of Assets | |||||||||
| Gross | Offset in the | Presented in | ||||||||
| Amounts of | Statement of | the Statement | ||||||||
| Recognized | Assets and | of Assets and | ||||||||
| Description | Location: Statement of Assets and Liabilities - Assets | Assets | Liabilities | Liabilities | ||||||
| Foreign Currency Exchange Contracts | Unrealized appreciation on foreign currency exchange contracts | $ | 685 | $ | — | $ | 685 | |||
| Futures Contracts | Variation margin on futures contracts | 103 | — | 103 | ||||||
| Credit Default Swap Contracts | Credit default swap contracts, at fair value | 187 | — | 187 | ||||||
| Total Financial and Derivative Assets | 975 | — | 975 | |||||||
| Financial and Derivative Assets not subject to a netting agreement | (290) | — | (290 | ) | ||||||
| Total Financial and Derivative Assets subject to a netting agreement | $ | 685 | $ | — | $ | 685 | ||||
| Financial Assets, Derivative Assets, and Collateral Held by Counterparty | ||||||||||
| Gross Amounts Not Offset in | ||||||||||
| the Statement of Assets and | ||||||||||
| Liabilities | ||||||||||
| Net Amounts | ||||||||||
| of Assets | ||||||||||
| Presented in | ||||||||||
| the Statement | Financial and | |||||||||
| of Assets and | Derivative | Collateral | ||||||||
| Counterparty | Liabilities | Instruments | Received^ | Net Amount | ||||||
| Northern Trust | 139 | $ | 117 | $ | — | $ | 22 | |||
| State Street | 420 | 120 | — | 300 | ||||||
| Westpac | 126 | 88 | — | 38 | ||||||
| Total | $ | 685 | $ | 325 | $ | — | $ | 360 | ||
See accompanying notes which are an integral part of the financial statements.
Russell Short Duration Bond Fund 511
Russell Investment Company
Russell Short Duration Bond Fund
Balance Sheet Offsetting of Financial and Derivative Instruments, continued —
October 31, 2016
| Amounts in thousands | |||||||||
| Offsetting of Financial Liabilities and Derivative Liabilities | |||||||||
| Gross | Net Amounts | ||||||||
| Amounts | of Liabilities | ||||||||
| Gross | Offset in the | Presented in | |||||||
| Amounts of | Statement of | the Statement | |||||||
| Recognized | Assets and | of Assets and | |||||||
| Description | Location: Statement of Assets and Liabilities - Liabilities | Liabilities | Liabilities | Liabilities | |||||
| Futures Contracts | Variation margin on futures contracts | $ | 77 | $ | — | $ | 77 | ||
| Foreign Currency Exchange Contracts | Unrealized depreciation on foreign currency exchange contracts | 325 | — | 325 | |||||
| Total Financial and Derivative Liabilities | 402 | — | 402 | ||||||
| Financial and Derivative Liabilities not subject to a netting agreement | (77) | — | (77 | ) | |||||
| Total Financial and Derivative Liabilities subject to a netting agreement | $ | 325 | $ | — | $ | 325 | |||
| Financial Liabilities, Derivative Liabilities, and Collateral Pledged by Counterparty | ||||||||||
| Gross Amounts Not Offset in | ||||||||||
| the Statement of Assets and | ||||||||||
| Liabilities | ||||||||||
| Net Amounts | ||||||||||
| of Liabilities | ||||||||||
| Presented in | ||||||||||
| the Statement | Financial and | |||||||||
| of Assets and | Derivative | Collateral | ||||||||
| Counterparty | Liabilities | Instruments | Pledged^ | Net Amount | ||||||
| Northern Trust | 117 | $ | 117 | $ | — | $ | — | |||
| State Street | 120 | 120 | — | — | ||||||
| Westpac | 88 | 88 | — | — | ||||||
| Total | $ | 325 | $ | 325 | $ | — | $ | — | ||
* Fair value of securities on loan as reported in the footnotes to the Statement of Assets and Liabilities.
^ Collateral received or pledged amounts may not reconcile to those disclosed in the Statement of Assets and Liabilities due to the inclusion of off-Balance
Sheet collateral and adjustments made to exclude overcollateralization.
For further disclosure on derivatives and counterparty risk see note 2 in the Notes to Financial Statements.
See accompanying notes which are an integral part of the financial statements.
512 Russell Short Duration Bond Fund
Russell Investment Company
Russell Short Duration Bond Fund
Statement of Assets and Liabilities — October 31, 2016
| Amounts in thousands | ||
| Assets | ||
| Investments, at identified cost | $ | 808,941 |
| Investments, at fair value(>) | 807,112 | |
| Cash | 7,411 | |
| Cash (restricted)(a)(b) | 2,262 | |
| Unrealized appreciation on foreign currency exchange contracts | 685 | |
| Receivables: | ||
| Dividends and interest | 3,101 | |
| Dividends from affiliated Russell funds | 18 | |
| Investments sold | 18,953 | |
| Fund shares sold | 1,993 | |
| Variation margin on futures contracts | 103 | |
| Credit default swap contracts, at fair value(+) | 187 | |
| Total assets | 841,825 | |
| Liabilities | ||
| Payables: | ||
| Due to custodian | 7,279 | |
| Due to broker (c) | 191 | |
| Investments purchased | 22,961 | |
| Fund shares redeemed | 885 | |
| Accrued fees to affiliates | 384 | |
| Other accrued expenses | 234 | |
| Variation margin on futures contracts | 77 | |
| Unrealized depreciation on foreign currency exchange contracts | 325 | |
| Total liabilities | 32,336 | |
| Commitments and Contingencies (1) | ||
| Net Assets | $ | 809,489 |
| (1) See note 9 in the Notes to Financial Statements for a detailed description of commitments and contingencies. | ||
See accompanying notes which are an integral part of the financial statements.
Russell Short Duration Bond Fund 513
Russell Investment Company
Russell Short Duration Bond Fund
Statement of Assets and Liabilities, continued — October 31, 2016
| Amounts in thousands | |||
| Net Assets Consist of: | |||
| Undistributed (overdistributed) net investment income | $ | 2,581 | |
| Accumulated net realized gain (loss) | (2,063 | ) | |
| Unrealized appreciation (depreciation) on: | |||
| Investments | (1,829 | ) | |
| Futures contracts | 614 | ||
| Credit default swap contracts | 46 | ||
| Foreign currency-related transactions | 360 | ||
| Shares of beneficial interest | 420 | ||
| Additional paid-in capital | 809,360 | ||
| Net Assets | $ | 809,489 | |
| Net Asset Value, offering and redemption price per share: | |||
| Net asset value per share: Class A(#) | $ | 19.26 | |
| Maximum offering price per share (Net asset value plus sales charge of 3.75%): Class A | $ | 20.01 | |
| Class A — Net assets | $ | 21,102,209 | |
| Class A — Shares outstanding ($.01 par value) | 1,095,847 | ||
| Net asset value per share: Class C(#) | $ | 19.10 | |
| Class C — Net assets | $ | 48,970,138 | |
| Class C — Shares outstanding ($.01 par value) | 2,563,990 | ||
| Net asset value per share: Class E(#) | $ | 19.30 | |
| Class E — Net assets | $ | 15,785,664 | |
| Class E — Shares outstanding ($.01 par value) | 817,989 | ||
| Net asset value per share: Class R6(#) | $ | 19.30 | |
| Class R6 — Net assets | $ | 105,547 | |
| Class R6 — Shares outstanding ($.01 par value) | 5,468 | ||
| Net asset value per share: Class S(#) | $ | 19.27 | |
| Class S — Net assets | $ | 583,387,681 | |
| Class S — Shares outstanding ($.01 par value) | 30,274,604 | ||
| Net asset value per share: Class Y(#) | $ | 19.28 | |
| Class Y — Net assets | $ | 140,137,908 | |
| Class Y — Shares outstanding ($.01 par value) | 7,269,383 | ||
| Amounts in thousands | |||
| (+) Credit default swap contracts - premiums paid (received) | $ | 141 | |
| (>) Investments in affiliates, Russell U.S. Cash Management Fund | $ | 36,219 | |
| (a) Cash Collateral for Futures | $ | 2,049 | |
| (b) Cash Collateral for Swaps | $ | 213 | |
| (c) Due to Broker for Swaps | $ | 191 | |
| (#) Net asset value per share equals class level net assets divided by class level shares of beneficial interest outstanding. | |||
See accompanying notes which are an integral part of the financial statements.
514 Russell Short Duration Bond Fund
Russell Investment Company
Russell Short Duration Bond Fund
Statement of Operations — For the Period Ended October 31, 2016
| Amounts in thousands | |||
| Investment Income | |||
| Dividends from affiliated Russell funds | $ | 143 | |
| Interest | 17,762 | ||
| Total investment income | 17,905 | ||
| Expenses | |||
| Advisory fees | 3,666 | ||
| Administrative fees | 393 | ||
| Custodian fees (1) | 202 | ||
| Distribution fees - Class A | 63 | ||
| Distribution fees - Class C | 386 | ||
| Transfer agent fees - Class A | 50 | ||
| Transfer agent fees - Class C | 103 | ||
| Transfer agent fees - Class E | 45 | ||
| Transfer agent fees - Class R6 | —** | ||
| Transfer agent fees - Class S | 1,133 | ||
| Transfer agent fees - Class Y | 7 | ||
| Professional fees | 132 | ||
| Registration fees | 95 | ||
| Shareholder servicing fees - Class C | 128 | ||
| Shareholder servicing fees - Class E | 57 | ||
| Trustees’ fees | 26 | ||
| Printing fees | 66 | ||
| Miscellaneous | 25 | ||
| Expenses before reductions | 6,577 | ||
| Expense reductions | (1,467 | ) | |
| Net expenses | 5,110 | ||
| Net investment income (loss) | 12,795 | ||
| Net Realized and Unrealized Gain (Loss) | |||
| Net realized gain (loss) on: | |||
| Investments | (1,772 | ) | |
| Futures contracts | (753 | ) | |
| Credit default swap contracts | 284 | ||
| Foreign currency-related transactions | 1,295 | ||
| Net realized gain (loss) | (946 | ) | |
| Net change in unrealized appreciation (depreciation) on: | |||
| Investments | 5,678 | ||
| Futures contracts | 798 | ||
| Credit default swap contracts | 46 | ||
| Foreign currency-related transactions | 171 | ||
| Net change in unrealized appreciation (depreciation) | 6,693 | ||
| Net realized and unrealized gain (loss) | 5,747 | ||
| Net Increase (Decrease) in Net Assets from Operations | $ | 18,542 | |
| ** Less than $500. | |||
| (1) Includes a reimbursement for overbilling of custody out-of-pocket fees from prior years. See note 10 in the Notes to Financial Statements. | |||
See accompanying notes which are an integral part of the financial statements.
Russell Short Duration Bond Fund 515
Russell Investment Company
Russell Short Duration Bond Fund
Statements of Changes in Net Assets
| For the Periods Ended October 31, | ||||||
| Amounts in thousands | 2016 | 2015 | ||||
| Increase (Decrease) in Net Assets | ||||||
| Operations | ||||||
| Net investment income (loss) | $ | 12,795 | $ | 14,089 | ||
| Net realized gain (loss) | (946 | ) | (1,438 | ) | ||
| Net change in unrealized appreciation (depreciation) | 6,693 | (5,313 | ) | |||
| Net increase (decrease) in net assets from operations | 18,542 | 7,338 | ||||
| Distributions | ||||||
| From net investment income | ||||||
| Class A | (315 | ) | (338 | ) | ||
| Class C | (273 | ) | (306 | ) | ||
| Class E | (283 | ) | (376 | ) | ||
| Class R6 | (1 | ) | — | |||
| Class S | (8,455 | ) | (10,139 | ) | ||
| Class Y | (2,335 | ) | (3,263 | ) | ||
| From net realized gain | ||||||
| Class A | (15 | ) | (185 | ) | ||
| Class C | (32 | ) | (489 | ) | ||
| Class E | (15 | ) | (223 | ) | ||
| Class S | (339 | ) | (4,718 | ) | ||
| Class Y | (91 | ) | (1,635 | ) | ||
| Net decrease in net assets from distributions | (12,154 | ) | (21,672 | ) | ||
| Share Transactions* | ||||||
| Net increase (decrease) in net assets from share transactions | (76,694 | ) | (289,403 | ) | ||
| Total Net Increase (Decrease) in Net Assets | (70,306 | ) | (303,737 | ) | ||
| Net Assets | ||||||
| Beginning of period | 879,795 | 1,183,532 | ||||
| End of period | $ | 809,489 | $ | 879,795 | ||
| Undistributed (overdistributed) net investment income included in net assets | $ | 2,581 | $ | 460 | ||
See accompanying notes which are an integral part of the financial statements.
516 Russell Short Duration Bond Fund
Russell Investment Company
Russell Short Duration Bond Fund
Statements of Changes in Net Assets, continued
* Share transaction amounts (in thousands) for the periods ended October 31, 2016 and October 31, 2015 were as follows:
| 2016 | 2015 | |||||||||||
| Shares | Dollars | Shares | Dollars | |||||||||
| Class A | ||||||||||||
| Proceeds from shares sold | 359 | $ | 6,831 | 310 | $ | 5,939 | ||||||
| Proceeds from reinvestment of distributions | 16 | 305 | 23 | 447 | ||||||||
| Payments for shares redeemed | (584 | ) | (11,194 | ) | (560 | ) | (10,713 | ) | ||||
| Net increase (decrease) | (209 | ) | (4,058 | ) | (227 | ) | (4,327 | ) | ||||
| Class C | ||||||||||||
| Proceeds from shares sold | 560 | 10,629 | 461 | 8,780 | ||||||||
| Proceeds from reinvestment of distributions | 16 | 298 | 41 | 779 | ||||||||
| Payments for shares redeemed | (997 | ) | (18,887 | ) | (1,822 | ) | (34,708 | ) | ||||
| Net increase (decrease) | (421 | ) | (7,960 | ) | (1,320 | ) | (25,149 | ) | ||||
| Class E | ||||||||||||
| Proceeds from shares sold | 460 | 8,855 | 66 | 1,259 | ||||||||
| Proceeds from reinvestment of distributions | 15 | 282 | 27 | 518 | ||||||||
| Payments for shares redeemed | (1,049 | ) | (20,186 | ) | (562 | ) | (10,772 | ) | ||||
| Net increase (decrease) | (574 | ) | (11,049 | ) | (469 | ) | (8,995 | ) | ||||
| Class R6(1) | ||||||||||||
| Proceeds from shares sold | 5 | 103 | — | — | ||||||||
| Proceeds from reinvestment of distributions | —** | 1 | — | — | ||||||||
| Payments for shares redeemed | — | — | — | — | ||||||||
| Net increase (decrease) | 5 | 104 | — | — | ||||||||
| Class S | ||||||||||||
| Proceeds from shares sold | 11,727 | 224,721 | 14,434 | 276,916 | ||||||||
| Proceeds from reinvestment of distributions | 455 | 8,699 | 769 | 14,738 | ||||||||
| Payments for shares redeemed | (13,880 | ) | (265,132 | ) | (23,067 | ) | (442,522 | ) | ||||
| Net increase (decrease) | (1,698 | ) | (31,712 | ) | (7,864 | ) | (150,868 | ) | ||||
| Class Y | ||||||||||||
| Proceeds from shares sold | 519 | 9,865 | 864 | 16,598 | ||||||||
| Proceeds from reinvestment of distributions | 127 | 2,427 | 255 | 4,898 | ||||||||
| Payments for shares redeemed | (1,798 | ) | (34,311 | ) | (6,327 | ) | (121,560 | ) | ||||
| Net increase (decrease) | (1,152 | ) | (22,019 | ) | (5,208 | ) | (100,064 | ) | ||||
| Total increase (decrease) | (4,049 | ) | $ | (76,694 | ) | (15,088 | ) | $ | (289,403 | ) | ||
** Less than 500 shares.
(1) For the period March 1, 2016 (commencement of operations) to October 31, 2016.
See accompanying notes which are an integral part of the financial statements.
Russell Short Duration Bond Fund 517
Russell Investment Company
Russell Short Duration Bond Fund
Financial Highlights — For the Periods Ended
For a Share Outstanding Throughout Each Period.
| $ | $ | $ | $ | $ | $ | |||||||||||
| Net Asset Value, | Net | Net Realized | Total from | Distributions | Distributions | |||||||||||
| Beginning of | Investment | and Unrealized | Investment | from Net | from Net | |||||||||||
| Period | Income (Loss)(a)(d) | Gain (Loss) | Operations | Investment Income | Realized Gain | |||||||||||
| Class A | ||||||||||||||||
| October 31, 2016 | 19.09 | .26 | .16 | .42 | (.24 | ) | (.01 | ) | ||||||||
| October 31, 2015 | 19.35 | .22 | (.14 | ) | .08 | (.22 | ) | (.12 | ) | |||||||
| October 31, 2014 | 19.35 | .22 | (.01 | ) | .21 | (.18 | ) | (.03 | ) | |||||||
| October 31, 2013 | 19.70 | .19 | (.11 | ) | .08 | (.23 | ) | (.20 | ) | |||||||
| October 31, 2012 | 19.15 | .26 | .57 | .83 | (.28 | ) | — | |||||||||
| Class C | ||||||||||||||||
| October 31, 2016 | 18.94 | .12 | .15 | .27 | (.10 | ) | (.01 | ) | ||||||||
| October 31, 2015 | 19.21 | .08 | (.15 | ) | (.07 | ) | (.08 | ) | (.12 | ) | ||||||
| October 31, 2014 | 19.23 | .08 | (.02 | ) | .06 | (.05 | ) | (.03 | ) | |||||||
| October 31, 2013 | 19.59 | .05 | (.11 | ) | (.06 | ) | (.10 | ) | (.20 | ) | ||||||
| October 31, 2012 | 19.06 | .11 | .57 | .68 | (.15 | ) | — | |||||||||
| Class E | ||||||||||||||||
| October 31, 2016 | 19.13 | .27 | .15 | .42 | (.24 | ) | (.01 | ) | ||||||||
| October 31, 2015 | 19.38 | .22 | (.13 | ) | .09 | (.22 | ) | (.12 | ) | |||||||
| October 31, 2014 | 19.38 | .22 | (.01 | ) | .21 | (.18 | ) | (.03 | ) | |||||||
| October 31, 2013 | 19.73 | .17 | (.08 | ) | .09 | (.24 | ) | (.20 | ) | |||||||
| October 31, 2012 | 19.18 | .26 | .57 | .83 | (.28 | ) | — | |||||||||
| Class R6 | ||||||||||||||||
| October 31, 2016(8) | 18.97 | .21 | .30 | .51 | (.18 | ) | — | |||||||||
| Class S | ||||||||||||||||
| October 31, 2016 | 19.10 | .31 | .16 | .47 | (.29 | ) | (.01 | ) | ||||||||
| October 31, 2015 | 19.36 | .27 | (.14 | ) | .13 | (.27 | ) | (.12 | ) | |||||||
| October 31, 2014 | 19.36 | .27 | (.01 | ) | .26 | (.23 | ) | (.03 | ) | |||||||
| October 31, 2013 | 19.71 | .24 | (.11 | ) | .13 | (.28 | ) | (.20 | ) | |||||||
| October 31, 2012 | 19.15 | .30 | .58 | .88 | (.32 | ) | — | |||||||||
| Class Y | ||||||||||||||||
| October 31, 2016 | 19.11 | .33 | .15 | .48 | (.30 | ) | (.01 | ) | ||||||||
| October 31, 2015 | 19.37 | .28 | (.14 | ) | .14 | (.28 | ) | (.12 | ) | |||||||
| October 31, 2014 | 19.36 | .29 | (.01 | ) | .28 | (.24 | ) | (.03 | ) | |||||||
| October 31, 2013 | 19.71 | .26 | (.11 | ) | .15 | (.30 | ) | (.20 | ) | |||||||
| October 31, 2012 | 19.15 | .33 | .57 | .90 | (.34 | ) | — | |||||||||
See accompanying notes which are an integral part of the financial statements.
518 Russell Short Duration Bond Fund
| % | % | % | |||||||||||||||
| $ | $ | Ratio of Expenses | Ratio of Expenses | Ratio of Net | |||||||||||||
| Net Asset Value, | % | Net Assets, | to Average | to Average | Investment Income | % | |||||||||||
| $ | End of | Total | End of Period | Net Assets, | Net Assets, | to Average | Portfolio | ||||||||||
| Total Distributions | Period | Return(b)(c) | (000 | ) | Gross(e)(l) | Net(d)(e)(l) | Net Assets(d)(e) | Turnover Rate(b) | |||||||||
| (.25 | ) | 19.26 | 2.21 | 21,102 | 1.02 | .81 | 1.39 | 113 | |||||||||
| (.34 | ) | 19.09 | .42 | 24,914 | 1.01 | .82 | 1.15 | 183 | |||||||||
| (.21 | ) | 19.35 | 1.04 | 29,639 | 1.01 | .85 | 1.14 | 220 | |||||||||
| (.43 | ) | 19.35 | .42 | 36,961 | 1.00 | .87 | .99 | 180 | |||||||||
| (.28 | ) | 19.70 | 4.37 | 37,994 | 1.00 | .86 | 1.33 | 245 | |||||||||
| (.11 | ) | 19.10 | 1.44 | 48,970 | 1.77 | 1.56 | .63 | 113 | |||||||||
| (.20 | ) | 18.94 | (.34 | ) | 56,538 | 1.76 | 1.57 | .40 | 183 | ||||||||
| (.08 | ) | 19.21 | .28 | 82,676 | 1.76 | 1.60 | .39 | 220 | |||||||||
| (.30 | ) | 19.23 | (.32 | ) | 120,088 | 1.75 | 1.62 | .24 | 180 | ||||||||
| (.15 | ) | 19.59 | 3.59 | 132,292 | 1.75 | 1.61 | .56 | 245 | |||||||||
| (.25 | ) | 19.30 | 2.20 | 15,786 | 1.02 | .81 | 1.39 | 113 | |||||||||
| (.34 | ) | 19.13 | .47 | 26,633 | 1.01 | .82 | 1.15 | 183 | |||||||||
| (.21 | ) | 19.38 | 1.08 | 36,083 | 1.01 | .85 | 1.15 | 220 | |||||||||
| (.44 | ) | 19.38 | .42 | 41,281 | 1.00 | .87 | .93 | 180 | |||||||||
| (.28 | ) | 19.73 | 4.36 | 20,230 | 1.00 | .86 | 1.33 | 245 | |||||||||
| (.18 | ) | 19.30 | 2.70 | 106 | .61 | .51 | 1.66 | 113 | |||||||||
| (.30 | ) | 19.27 | 2.47 | 583,387 | .77 | .56 | 1.63 | 113 | |||||||||
| (.39 | ) | 19.10 | .67 | 610,784 | .76 | .57 | 1.40 | 183 | |||||||||
| (.26 | ) | 19.36 | 1.30 | 771,202 | .76 | .60 | 1.40 | 220 | |||||||||
| (.48 | ) | 19.36 | .67 | 865,268 | .75 | .62 | 1.23 | 180 | |||||||||
| (.32 | ) | 19.71 | 4.66 | 801,758 | .75 | .62 | 1.56 | 245 | |||||||||
| (.31 | ) | 19.28 | 2.54 | 140,138 | .57 | .48 | 1.71 | 113 | |||||||||
| (.40 | ) | 19.11 | .75 | 160,926 | .56 | .49 | 1.46 | 183 | |||||||||
| (.27 | ) | 19.37 | 1.41 | 263,932 | .56 | .51 | 1.49 | 220 | |||||||||
| (.50 | ) | 19.36 | .78 | 256,684 | .56 | .51 | 1.36 | 180 | |||||||||
| (.34 | ) | 19.71 | 4.75 | 266,289 | .56 | .51 | 1.70 | 245 | |||||||||
See accompanying notes which are an integral part of the financial statements.
Russell Short Duration Bond Fund 519
Russell Investment Company
Russell Short Duration Bond Fund
Related Party Transactions, Fees and Expenses
| Accrued fees payable to affiliates for the period ended October 31, 2016 were as follows: | ||
| Advisory fees | $ | 252,514 |
| Administration fees | 33,155 | |
| Distribution fees | 35,905 | |
| Shareholder servicing fees | 13,782 | |
| Transfer agent fees | 45,855 | |
| Trustee fees | 2,706 | |
| $ | 383,917 | |
| Transactions (amounts in thousands) during the period ended October 31, 2016 with Underlying Funds which are, or were, an | ||||||||||||||||||
| affiliated company are as follows: | ||||||||||||||||||
| Fair Value, | Change in | |||||||||||||||||
| Beginning of | Realized Gain | Unrealized | Fair Value, End | Income | Capital Gains | |||||||||||||
| Period | Purchases | Sales | (Loss) | Gain (Loss) | of Period | Distributions | Distributions | |||||||||||
| Russell U.S. Cash Management Fund $ | 33,027 | $ | 711,749 | $ | 708,560 | $ | — | $ | 3 | $ | 36,219 | $ | 143 | $ | — | |||
| $ | 33,027 | $ | 711,749 | $ | 708,560 | $ | — | $ | 3 | $ | 36,219 | $ | 143 | $ | — | |||
Federal Income Taxes
At October 31, 2016, the cost of investments and net unrealized appreciation (depreciation), undistributed ordinary income and
undistributed long-term capital gains for income tax purposes were as follows:.
| Cost of Investments | $ | 809,147,997 | |||
| Unrealized Appreciation | $ | 3,538,344 | |||
| Unrealized Depreciation | (5,574,533 | ) | |||
| Net Unrealized Appreciation (Depreciation) | $ | (2,036,189 | ) | ||
| Undistributed Ordinary Income | $ | 2,909,573 | |||
| Tax Composition of Distributions | |||||
| Ordinary Income | $ | 11,709,709 | |||
| Long-Term Capital Gains | $ | 443,542 |
Net investment income and net realized gains (loss) in the financial statements may differ from taxable net investment income and net
realized gains (losses). Capital accounts within the financial statements are adjusted for permanent book-tax differences. Book-tax
differences are primarily due to foreign currency gains and losses, reclassifications of dividends, differences in treatment of income
from swaps, net operating losses, investments in partnerships, investments in passive foreign investment companies (PFICs), tax
straddle transactions, use of tax equalization and foreign capital gains taxes. These adjustments have no impact on the net assets.
At October 31, 2016, the Statement of Assets and Liabilities have been adjusted by the following amounts (in thousands):
| Undistributed net investment income | $ | 988 | |
| Accumulated net realized gain (loss) | (967 | ) | |
| Additional paid-in capital | (21 | ) |
See accompanying notes which are an integral part of the financial statements.
520 Russell Short Duration Bond Fund
Russell Investment Company
Russell Tax Exempt High Yield Bond Fund
Portfolio Management Discussion and Analysis — October 31, 2016 (Unaudited)

| Russell Tax Exempt High Yield Bond Fund - Class A‡ | Russell Tax Exempt High Yield Bond Fund - Class S | ||||||
| Total | Total | ||||||
| Return | Return | ||||||
| 1 Year | 4.55 | % | 1 Year | 8.95 | % | ||
| Inception* | 4.69 | %§ | Inception* | 7.88 | %§ | ||
| Russell Tax Exempt High Yield Bond Fund - Class C | Bloomberg BarclaysC 60% Muni HY Tax-Ex/40% Muni Bond | ||||||
| Total | Index (USD)** | ||||||
| Return | Total | ||||||
| 1 Year | 7.79 | % | Return | ||||
| Inception* | 6.79 | %§ | 1 Year | 6.78 | % | ||
| Inception* | 5.08 | %§ | |||||
| Russell Tax Exempt High Yield Bond Fund - Class E | |||||||
| Total | |||||||
| Return | |||||||
| 1 Year | 8.68 | % | |||||
| Inception* | 7.64 | %§ | |||||
Russell Tax Exempt High Yield Bond Fund 521
Russell Investment Company
Russell Tax Exempt High Yield Bond Fund
Portfolio Management Discussion and Analysis, continued — October 31, 2016
(Unaudited)
| The Russell Tax Exempt High Yield Bond Fund (the “Fund”) | environment where the economy is stable and a higher coupon | |
| employs a multi-manager approach whereby portions of the | can be clipped or an environment where municipal tax receipts | |
| Fund are allocated to different money manager strategies. Fund | are stable or increasing, providing a better ability for issuers to | |
| assets not allocated to money managers are managed by Russell | service their debt. This may also be generalized as a “risk on” | |
| Investment Management, LLC (“RIM”), the Fund’s advisor. RIM | market where investors are generally bullish about the economy. | |
| may change the allocation of the Fund’s assets among money | Environments that feature sharp rises in interest rates or mass | |
| managers at any time. An exemptive order from the Securities | sell offs in fixed income risk assets (e.g., the 2008 global financial | |
| and Exchange Commission (“SEC”) permits RIM to engage or | crisis) will tend to be unfavorable for Fund. | |
| terminate a money manager at any time, subject to approval by | ||
| the Fund’s Board, without a shareholder vote. Pursuant to the | How did the investment strategies and techniques employed | |
| terms of the exemptive order, the Fund is required to notify its | by the Fund and its money managers affect its benchmark- | |
| shareholders within 90 days of when a money manager begins | relative performance? | |
| providing services. As of October 31, 2016, the Fund had two | The Fund outperformed its benchmark for the period. Sector | |
| money managers. | selection within revenue and industrial development sectors, | |
| security selection within the revenue sector (hospitals, education, | ||
| What is the Fund’s investment objective? | transportation) and positions in Illinois, Puerto Rico and tobacco | |
| The Fund seeks to provide a high level of current income that | settlement revenue bonds all contributed to outperformance for | |
| is exempt from federal tax, and as a secondary objective, total | the period. | |
| return. | The Fund employs discretionary money managers. The Fund’s | |
| How did the Fund perform relative to its benchmark for the | discretionary money managers select the individual portfolio | |
| fiscal year ended October 31, 2016? | securities for the assets assigned to them. Fund assets not | |
| For the fiscal year ended October 31, 2016, the Fund’s Class | allocated to discretionary money managers include the Fund’s | |
| A, Class C, Class E and Class S Shares gained 8.59%, 7.79%, | liquidity reserves and assets which may be managed directly by | |
| 8.68% and 8.95%, respectively. This is compared to the Fund’s | RIM to effect the Fund’s investment strategies and/or to actively | |
| benchmark, the 60% Bloomberg Barclays U.S. Municipal | manage the Fund’s overall exposures by investing in securities or | |
| High Yield Index / 40% Bloomberg Barclays Municipal Bond | other instruments that RIM believes will achieve the desired risk/ | |
| Index, which gained 6.78% during the same period. The Fund’s | return profile for the Fund. | |
| performance includes operating expenses, whereas index returns | MacKay Shields LLC was the best performing manager for the | |
| are unmanaged and do not include expenses of any kind. | period and outperformed the Fund’s benchmark. Positions in | |
| For the fiscal year ended October 31, 2016, the Morningstar® | tobacco bonds and insured Puerto Rico debt were the primary | |
| High Yield Muni Category, a group of funds that Morningstar | positive contributors. Security selection across special tax, | |
| considers to have investment strategies similar to those of the | transportation, education and healthcare sectors was also | |
| Fund, gained 6.57%. This result serves as a peer comparison and | beneficial. | |
| is expressed net of operating expenses. | Goldman Sachs Asset Management, L.P. also outperformed the | |
| Fund’s benchmark, though to a lesser degree. Results were largely | ||
| How did the market conditions described in the Market | due to Puerto Rico sales tax and insured highway bonds, tobacco | |
| Summary report affect the Fund’s performance? | settlement revenue bonds, and City of Chicago and Chicago Board | |
| For the fiscal year ended October 31, 2016, high yield municipal | of Education debt. | |
| bonds significantly outperformed investment grade municipal | ||
| bonds. Specifically, high yield municipal revenue and industrial | Describe any changes to the Fund’s structure or the money | |
| development sectors performed well, as did Puerto Rico and | manager line-up. | |
| tobacco settlement revenue bonds. In addition, the municipal | There were no changes to the Fund’s structure or money manager | |
| yield curve flattened and investor demand for municipal debt | line-up during the fiscal year. | |
| was strong, which provided a favorable environment for Fund | ||
| performance. | Money Managers as of October 31, | |
| 2016 | Styles | |
| The Fund will tend to perform well in markets where revenue | ||
| Goldman Sachs Asset Management, L.P | Sector Specialist | |
| and industrial development sectors lead. This is generally an | MacKay Shields LLC | Sector Specialist |
522 Russell Tax Exempt High Yield Bond Fund
Russell Investment Company
Russell Tax Exempt High Yield Bond Fund
Portfolio Management Discussion and Analysis, continued — October 31, 2016
(Unaudited)
The views expressed in this report reflect those of the
portfolio managers only through the end of the period
covered by the report. These views do not necessarily
represent the views of RIM, or any other person in RIM or
any other affiliated organization. These views are subject
to change at any time based upon market conditions or
other events, and RIM disclaims any responsibility to
update the views contained herein. These views should not
be relied on as investment advice and, because investment
decisions for a Russell Investment Company (“RIC”) Fund
are based on numerous factors, should not be relied on as
an indication of investment decisions of any RIC Fund.
* Assumes initial investment on June 1, 2015.
** The Bloomberg Barclays 60% Muni High Yield Bond/40% Muni Bond Index (USD) is a custom blend of 60% Bloomberg Barclays Municipal High Yield Bond
Index / 40% Bloomberg Barclays Municipal Bond Index, created and maintained by Bloomberg Barclays.
Effective August 24, 2016 the Barclays fixed income benchmark indices, including the Barclays Aggregate family of indices, were renamed the Bloomberg
Barclays family of indices.
‡ The performance has been adjusted to reflect the deduction of the maximum Class A sales charge of 3.75%.
Performance is historical and assumes reinvestment of all dividends and capital gains. Investment return and principal value will fluctuate so that an investor’s
shares, when redeemed, may be worth more or less than when purchased. Past performance is not indicative of future results. The returns shown do not reflect the
deduction of taxes that a shareholder would pay on Fund distributions or the redemption of Fund shares. Additionally, the returns presented herein may differ from
the performance reported in the Financial Highlights as the returns herein are calculated in a manner consistent with standardized performance in accordance with
Securities and Exchange Commission rules, while the performance in the Financial Highlights has been calculated in accordance with U.S. Generally Accepted
Accounting Principles (“U.S. GAAP”).
Russell Tax Exempt High Yield Bond Fund 523
Russell Investment Company
Russell Tax Exempt High Yield Bond Fund
Shareholder Expense Example — October 31, 2016 (Unaudited)
| Fund Expenses | Please note that the expenses shown in the table are meant | |||||
| The following disclosure provides important information | to highlight your ongoing costs only and do not reflect any | |||||
| regarding the Fund’s Shareholder Expense Example | transactional costs. Therefore, the information under the heading | |||||
| (“Example”). | “Hypothetical Performance (5% return before expenses)” is | |||||
| useful in comparing ongoing costs only, and will not help you | ||||||
| Example | determine the relative total costs of owning different funds. In | |||||
| As a shareholder of the Fund, you incur two types of costs: (1) | addition, if these transactional costs were included, your costs | |||||
| transaction costs, including sales charges (loads) on certain | would have been higher. | |||||
| purchase or redemption payments, and (2) ongoing costs, | Hypothetical | |||||
| including distribution (12b-1) and/or service fees and other Fund | Performance (5% | |||||
| expenses. The Example is intended to help you understand | Actual | return before | ||||
| your ongoing costs (in dollars) of investing in the Fund and to | Class A | Performance | expenses) | |||
| Beginning Account Value | ||||||
| compare these costs with the ongoing costs of investing in other | May 1, 2016 | $ | 1,000.00 | $ | 1,000.00 | |
| mutual funds. The Example is based on an investment of $1,000 | Ending Account Value | |||||
| invested at the beginning of the period and held for the entire | October 31, 2016 | $ | 1,027.00 | $ | 1,020.66 | |
| period indicated, which for this Fund is from May 1, 2016 to | Expenses Paid During Period* | $ | 4.53 | $ | 4.52 | |
| October 31, 2016. | * Expenses are equal to the Fund's annualized expense ratio of 0.89% | |||||
| (representing the six month period annualized), multiplied by the average | ||||||
| Actual Expenses | account value over the period, multiplied by 184/366 (to reflect the one-half | |||||
| The information in the table under the heading “Actual | year period). May reflect amounts waived and/or reimbursed. Without any | |||||
| Performance” provides information about actual account values | waivers and/or reimbursements, expenses would have been higher. | |||||
| and actual expenses. You may use the information in this column, | ||||||
| Hypothetical | ||||||
| together with the amount you invested, to estimate the expenses | Performance (5% | |||||
| that you paid over the period. Simply divide your account value by | Actual | return before | ||||
| $1,000 (for example, an $8,600 account value divided by $1,000 | Class C | Performance | expenses) | |||
| Beginning Account Value | ||||||
| = 8.6), then multiply the result by the number in the first column | May 1, 2016 | $ | 1,000.00 | $ | 1,000.00 | |
| in the row entitled “Expenses Paid During Period” to estimate | Ending Account Value | |||||
| the expenses you paid on your account during this period. | October 31, 2016 | $ | 1,023.50 | $ | 1,016.89 | |
| Expenses Paid During Period* | $ | 8.34 | $ | 8.31 | ||
| Hypothetical Example for Comparison Purposes | ||||||
| The information in the table under the heading “Hypothetical | * Expenses are equal to the Fund's annualized expense ratio of 1.64% | |||||
| (representing the six month period annualized), multiplied by the average | ||||||
| Performance (5% return before expenses)” provides information | account value over the period, multiplied by 184/366 (to reflect the one-half | |||||
| about hypothetical account values and hypothetical expenses | year period). May reflect amounts waived and/or reimbursed. Without any | |||||
| based on the Fund’s actual expense ratio and an assumed rate of | waivers and/or reimbursements, expenses would have been higher. | |||||
| return of 5% per year before expenses, which is not the Fund’s | ||||||
| Hypothetical | ||||||
| actual return. The hypothetical account values and expenses | Performance (5% | |||||
| may not be used to estimate the actual ending account balance or | Actual | return before | ||||
| expenses you paid for the period. You may use this information | Class E | Performance | expenses) | |||
| to compare the ongoing costs of investing in the Fund and other | Beginning Account Value | |||||
| May 1, 2016 | $ | 1,000.00 | $ | 1,000.00 | ||
| funds. To do so, compare this 5% hypothetical example with the | Ending Account Value | |||||
| 5% hypothetical examples that appear in the shareholder reports | October 31, 2016 | $ | 1,027.90 | $ | 1,020.66 | |
| of other funds. | Expenses Paid During Period* | $ | 4.54 | $ | 4.52 | |
| * Expenses are equal to the Fund's annualized expense ratio of 0.89% | ||||||
| (representing the six month period annualized), multiplied by the average | ||||||
| account value over the period, multiplied by 184/366 (to reflect the one-half | ||||||
| year period). May reflect amounts waived and/or reimbursed. Without any | ||||||
| waivers and/or reimbursements, expenses would have been higher. | ||||||
524 Russell Tax Exempt High Yield Bond Fund
Russell Investment Company
Russell Tax Exempt High Yield Bond Fund
Shareholder Expense Example, continued — October 31, 2016 (Unaudited)
| Hypothetical | ||||
| Performance (5% | ||||
| Actual | return before | |||
| Class S | Performance | expenses) | ||
| Beginning Account Value | ||||
| May 1, 2016 | $ | 1,000.00 | $ | 1,000.00 |
| Ending Account Value | ||||
| October 31, 2016 | $ | 1,029.20 | $ | 1,021.92 |
| Expenses Paid During Period* | $ | 3.26 | $ | 3.25 |
* Expenses are equal to the Fund's annualized expense ratio of 0.64%
(representing the six month period annualized), multiplied by the average
account value over the period, multiplied by 184/366 (to reflect the one-half
year period). May reflect amounts waived and/or reimbursed. Without any
waivers and/or reimbursements, expenses would have been higher.
Russell Tax Exempt High Yield Bond Fund 525
Russell Investment Company
Russell Tax Exempt High Yield Bond Fund
Schedule of Investments — October 31, 2016
| Amounts in thousands (except share amounts) | ||||||||
| Principal | Fair | |||||||
| Amount ($) | Rate | Date of | Value | |||||
| or Shares | % | Maturity | $ | |||||
| Municipal Bonds - 94.6% | ||||||||
| Alabama - 2.0% | ||||||||
| Alabama Industrial Development Authority Revenue Bonds | 500 | 6.450 | 12/01/23 | 501 | ||||
| County of Jefferson Alabama General Obligation Limited(µ) | 425 | 5.000 | 04/01/23 | 433 | ||||
| County of Jefferson Alabama General Obligation Unlimited(µ) | 1,590 | 5.000 | 04/01/20 | 1,619 | ||||
| County of Jefferson Alabama Revenue Bonds | 150 | 4.750 | 01/01/25 | 151 | ||||
| County of Jefferson Alabama Sewer Revenue Bonds | 1,220 | 7.000 | 10/01/51 | 1,544 | ||||
| County of Jefferson Alabama Sewer Revenue Bonds | 1,000 | 6.500 | 10/01/53 | 1,230 | ||||
| Houston County Health Care Authority Revenue Bonds | 150 | 5.000 | 10/01/30 | 170 | ||||
| Montgomery County Educational Authority Revenue Bonds | 820 | 5.000 | 10/01/36 | 904 | ||||
| 6,552 | ||||||||
| Alaska - 0.8% | ||||||||
| Northern Tobacco Securitization Corp. Revenue Bonds | 2,990 | 5.000 | 06/01/46 | 2,765 | ||||
| Arizona - 1.0% | ||||||||
| Arizona Health Facilities Authority Revenue Bonds(Ê) | 1,000 | 1.220 | 01/01/37 | 934 | ||||
| Industrial Development Authority of the City of Phoenix (The) Revenue Bonds | 1,000 | 5.000 | 07/01/35 | 1,077 | ||||
| Industrial Development Authority of the City of Phoenix (The) Revenue Bonds | 800 | 5.125 | 12/01/40 | 860 | ||||
| Industrial Development Authority of the County of Pima (The) Revenue Bonds | 250 | 4.500 | 06/01/30 | 276 | ||||
| 3,147 | ||||||||
| California - 11.9% | ||||||||
| Alameda Corridor Transportation Authority Revenue Bonds | 150 | 5.000 | 10/01/37 | 173 | ||||
| Alhambra Unified School District General Obligation Unlimited(µ) | 1,150 | 3.517 | 08/01/37 | 561 | ||||
| Anaheim Community Facilities District Special Tax | 125 | 4.000 | 09/01/46 | 128 | ||||
| California County Tobacco Securitization Agency Revenue Bonds | 300 | 5.700 | 06/01/46 | 304 | ||||
| California Municipal Finance Authority Revenue Bonds | 1,000 | 4.250 | 02/01/40 | 1,039 | ||||
| California Municipal Finance Authority Revenue Bonds | 1,000 | 5.375 | 11/01/40 | 1,083 | ||||
| California Municipal Finance Authority Revenue Bonds | 3,700 | 5.000 | 06/01/50 | 4,137 | ||||
| California Pollution Control Financing Authority Revenue Bonds | 1,000 | 3.375 | 07/01/25 | 1,075 | ||||
| California Pollution Control Financing Authority Revenue Bonds | 2,720 | 5.000 | 11/21/45 | 3,023 | ||||
| California School Finance Authority Revenue Bonds | 500 | 5.000 | 08/01/45 | 555 | ||||
| California Statewide Communities Development Authority Revenue Bonds | 460 | 5.000 | 05/15/32 | 516 | ||||
| California Statewide Communities Development Authority Revenue Bonds | 1,500 | 5.000 | 12/01/41 | 1,660 | ||||
| California Statewide Communities Development Authority Revenue Bonds | 1,000 | 5.000 | 10/01/43 | 1,096 | ||||
| California Statewide Communities Development Authority Revenue Bonds(Å) | 250 | 5.250 | 12/01/56 | 278 | ||||
| California Statewide Communities Development Authority Special Tax | 500 | 4.000 | 09/01/19 | 525 | ||||
| California Statewide Communities Development Authority Special Tax | 1,085 | 4.000 | 09/01/20 | 1,152 | ||||
| California Statewide Communities Development Authority Special Tax | 500 | 4.250 | 09/01/22 | 545 | ||||
| City of Long Beach California Marina System Revenue Bonds | 225 | 5.000 | 05/15/40 | 258 | ||||
| City of Long Beach California Marina System Revenue Bonds | 1,185 | 5.000 | 05/15/45 | 1,356 | ||||
| Foothill-Eastern Transportation Corridor Agency Revenue Bonds | 100 | 6.000 | 01/15/49 | 119 | ||||
| Fremont Community Facilities District No. 1 Special Tax | 1,255 | 5.000 | 09/01/26 | 1,437 | ||||
| Golden State Tobacco Securitization Corp. Revenue Bonds | 1,995 | 5.300 | 06/01/37 | 2,009 | ||||
| Golden State Tobacco Securitization Corp. Revenue Bonds | 500 | 5.000 | 06/01/45 | 576 | ||||
| Golden State Tobacco Securitization Corp. Revenue Bonds | 700 | 5.125 | 06/01/47 | 671 | ||||
| Golden State Tobacco Securitization Corp. Revenue Bonds | 885 | 5.750 | 06/01/47 | 871 | ||||
| Golden State Tobacco Securitization Corp. Revenue Bonds | 200 | 7.831 | 06/01/47 | 20 | ||||
| Golden State Tobacco Securitization Corp. Revenue Bonds | 10,000 | 10.017 | 06/01/47 | 539 | ||||
| Jurupa Public Financing Authority Special Tax | 1,000 | 5.000 | 09/01/43 | 1,137 | ||||
| M-S-R Energy Authority Revenue Bonds | 1,000 | 6.500 | 11/01/39 | 1,381 | ||||
| Palomar Health Certificate Of Participation | 450 | 6.750 | 11/01/39 | 526 | ||||
| Palomar Health Certificate Of Participation | 500 | 6.000 | 11/01/41 | 556 | ||||
| Poway Unified School District General Obligation Unlimited | 1,300 | 3.700 | 08/01/40 | 548 | ||||
See accompanying notes which are an integral part of the financial statements.
526 Russell Tax Exempt High Yield Bond Fund
Russell Investment Company
Russell Tax Exempt High Yield Bond Fund
Schedule of Investments, continued — October 31, 2016
| Amounts in thousands (except share amounts) | ||||||||
| Principal | Fair | |||||||
| Amount ($) | Rate | Date of | Value | |||||
| or Shares | % | Maturity | $ | |||||
| Rancho Cordova Community Facilities District Special Tax | 125 | 3.000 | 09/01/34 | 118 | ||||
| Regents of the University of California Medical Center Pooled Revenue Bonds(µ)(Ê) | 1,000 | 0.924 | 05/15/43 | 871 | ||||
| River Islands Public Financing Authority Special Tax | 940 | 5.500 | 09/01/45 | 1,026 | ||||
| Sacramento County Sanitation Districts Financing Authority Revenue Bonds(µ)(Ê) | 1,515 | 0.719 | 12/01/35 | 1,426 | ||||
| San Jacinto Community Facilities District Special Tax | 280 | 5.000 | 09/01/33 | 312 | ||||
| San Jacinto Community Facilities District Special Tax | 335 | 5.000 | 09/01/34 | 371 | ||||
| San Joaquin Hills Transportation Corridor Agency Revenue Bonds | 1,000 | 5.000 | 01/15/29 | 1,175 | ||||
| San Joaquin Hills Transportation Corridor Agency Revenue Bonds | 180 | 5.250 | 01/15/49 | 206 | ||||
| San Joaquin Hills Transportation Corridor Agency Revenue Bonds | 2,000 | 5.000 | 01/15/50 | 2,264 | ||||
| Tobacco Securitization Authority of Northern California Revenue Bonds | 800 | 5.500 | 06/01/45 | 788 | ||||
| 38,411 | ||||||||
| Colorado - 2.0% | ||||||||
| City & County of Denver Colorado Certificate of Participation(Ê) | 100 | 0.700 | 12/01/29 | 100 | ||||
| City & County of Denver Colorado Certificate Of Participation(Ê) | 250 | 0.630 | 12/01/29 | 250 | ||||
| Denver Health & Hospital Authority Revenue Bonds(Ê) | 1,000 | 1.289 | 12/01/33 | 939 | ||||
| Denver Health & Hospital Authority Revenue Bonds | 1,500 | 5.250 | 12/01/45 | 1,666 | ||||
| Eaton Area Park & Recreation District General Obligation Limited | 725 | 5.250 | 12/01/34 | 765 | ||||
| Eaton Area Park & Recreation District General Obligation Limited | 525 | 5.500 | 12/01/38 | 559 | ||||
| Foothills Metropolitan District Special Assessment | 500 | 6.000 | 12/01/38 | 544 | ||||
| Palisade County General Obligation Unlimited | 500 | 5.000 | 12/01/46 | 506 | ||||
| Park 70 County General Obligation Bonds Unlimited | 1,000 | 5.000 | 12/01/36 | 1,114 | ||||
| 6,443 | ||||||||
| Connecticut - 0.1% | ||||||||
| Mohegan Tribal Finance Authority Revenue Bonds(Å) | 350 | 7.000 | 02/01/45 | 366 | ||||
| Delaware - 0.3% | ||||||||
| County of Sussex Delaware Revenue Bonds | 1,000 | 5.000 | 01/01/36 | 1,097 | ||||
| District of Columbia - 1.1% | ||||||||
| District of Columbia Revenue Bonds | 145 | 6.250 | 10/01/23 | 161 | ||||
| District of Columbia Tobacco Settlement Financing Corp. Revenue Bonds | 4,000 | 7.282 | 06/15/46 | 498 | ||||
| Metropolitan Washington Airports Authority Dulles Toll Road Revenue Bonds | 2,475 | 5.000 | 10/01/53 | 2,752 | ||||
| 3,411 | ||||||||
| Florida - 8.0% | ||||||||
| Anthem Park Community Development District Special Assessment | 100 | 3.750 | 05/01/36 | 96 | ||||
| Anthem Park Community Development District Special Assessment | 135 | 4.750 | 05/01/36 | 130 | ||||
| Avelar Creek Community Development District Revenue Bonds | 100 | 4.000 | 05/01/36 | 101 | ||||
| Bannon Lakes Community Development District Special Assessment | 100 | 5.000 | 11/01/48 | 98 | ||||
| Bartram Park Community Development District Special Assessment | 770 | 4.500 | 05/01/25 | 787 | ||||
| Bartram Park Community Development District Special Assessment | 500 | 4.250 | 05/01/29 | 517 | ||||
| Bartram Park Community Development District Special Assessment | 500 | 4.500 | 05/01/35 | 522 | ||||
| Century Gardens Community Development District Special Assessment | 100 | 4.250 | 05/01/37 | 102 | ||||
| Charlotte County Industrial Development Authority Revenue Bonds(Å) | 250 | 5.500 | 10/01/36 | 254 | ||||
| City of Atlantic Beach Florida Revenue Bonds | 1,000 | 5.000 | 11/15/37 | 1,091 | ||||
| City of Cape Coral Florida Water & Sewer Revenue Bonds | 1,000 | 4.000 | 10/01/36 | 1,070 | ||||
| City of Tampa Florida Revenue Bonds | 960 | 5.000 | 04/01/45 | 1,093 | ||||
| Concord Station Community Development District Special Assessment | 125 | 3.625 | 05/01/35 | 119 | ||||
| Concord Station Community Development District Special Assessment | 100 | 4.750 | 05/01/46 | 93 | ||||
| County of Osceola Florida Revenue Bonds | 3,700 | 1.285 | 10/01/24 | 2,868 | ||||
| Escambia County Health Facilities Authority Revenue Bonds | 1,000 | 6.000 | 08/15/36 | 1,138 | ||||
| Fountainbleau Community Development District Special Assessment | 45 | 4.000 | 05/01/31 | 46 | ||||
| Grand Bay at Doral Community Development District Special Assessment | 75 | 4.750 | 05/01/36 | 74 | ||||
See accompanying notes which are an integral part of the financial statements.
Russell Tax Exempt High Yield Bond Fund 527
Russell Investment Company
Russell Tax Exempt High Yield Bond Fund
Schedule of Investments, continued — October 31, 2016
| Amounts in thousands (except share amounts) | |||||||
| Principal | Fair | ||||||
| Amount ($) | Rate | Date of | Value | ||||
| or Shares | % | Maturity | $ | ||||
| Grand Bay at Doral Community Development District Special Assessment | 75 | 5.000 | 05/01/46 | 74 | |||
| Greater Orlando Aviation Authority Revenue Bonds | 750 | 5.000 | 11/15/36 | 786 | |||
| Hacienda Lakes Community Development District Special Assessment | 100 | 4.625 | 05/01/46 | 94 | |||
| Highlands Community Development District Revenue Bonds | 200 | 4.250 | 05/01/36 | 206 | |||
| Lakewood Ranch Stewardship District Special Assessment | 100 | 4.000 | 05/01/21 | 103 | |||
| Lakewood Ranch Stewardship District Special Assessment | 100 | 4.250 | 05/01/26 | 103 | |||
| Lakewood Ranch Stewardship District Special Assessment | 1,000 | 4.875 | 05/01/35 | 1,028 | |||
| Lakewood Ranch Stewardship District Special Assessment | 100 | 5.000 | 05/01/36 | 104 | |||
| Lakewood Ranch Stewardship District Special Assessment | 215 | 5.125 | 05/01/46 | 221 | |||
| Lee County Industrial Development Authority Revenue Bonds | 750 | 5.000 | 11/15/29 | 761 | |||
| Miami Beach Health Facilities Authority Revenue Bonds | 2,250 | 5.000 | 11/15/39 | 2,530 | |||
| Mid-Bay Bridge Authority Revenue Bonds | 1,000 | 5.000 | 10/01/40 | 1,155 | |||
| Orchid Grove Community Development District Special Assessment | 970 | 3.625 | 05/01/21 | 972 | |||
| Orchid Grove Community Development District Special Assessment | 1,245 | 5.000 | 05/01/36 | 1,261 | |||
| Palm Glades Community Development District Special Assessment | 100 | 3.750 | 05/01/31 | 101 | |||
| Reunion East Community Development District Special Assessment | 750 | 5.000 | 05/01/25 | 820 | |||
| Reunion East Community Development District Special Assessment | 750 | 5.000 | 05/01/33 | 809 | |||
| Reunion East Community Development District Special Assessment | 100 | 6.600 | 05/01/33 | 104 | |||
| South Kendall Community Development District Special Assessment | 100 | 4.125 | 11/01/40 | 101 | |||
| South-Dade Venture Community Development District Special Assessment | 1,000 | 5.125 | 05/01/33 | 1,069 | |||
| Stonebrier Community Development District Special Assessment | 100 | 4.000 | 05/01/37 | 100 | |||
| Talis Park Community Development District Special Assessment | 140 | 4.000 | 05/01/33 | 138 | |||
| Tapestry Community Development District Special Assessment | 100 | 5.000 | 05/01/46 | 99 | |||
| Tisons Landing Community Development District Special Assessment | 230 | 3.375 | 05/01/32 | 217 | |||
| TSR Community Development District Special Assessment | 200 | 4.750 | 11/01/47 | 197 | |||
| Two Creeks Community Development District Revenue Bonds | 355 | 4.200 | 05/01/26 | 346 | |||
| Two Creeks Community Development District Revenue Bonds | 100 | 3.500 | 05/01/32 | 95 | |||
| Two Creeks Community Development District Revenue Bonds | 100 | 3.625 | 05/01/37 | 93 | |||
| Venetian Community Development District Special Assessment | 480 | 5.000 | 05/01/23 | 507 | |||
| Verandah East Community Development District Special Assessment | 200 | 4.000 | 05/01/31 | 197 | |||
| Verano 1 Community Development Distrtict Special Assessment | 250 | 4.750 | 11/01/25 | 252 | |||
| Verano 1 Community Development Distrtict Special Assessment | 250 | 5.125 | 11/01/35 | 254 | |||
| Verano 1 Community Development Distrtict Special Assessment | 250 | 5.250 | 11/01/46 | 255 | |||
| Vizcaya in Kendall Community Development District Special Assessment | 100 | 4.125 | 11/01/46 | 99 | |||
| Volusia County Educational Facility Authority Revenue Bonds | 240 | 5.000 | 06/01/45 | 273 | |||
| Winding Cypress Community Development District Special Assessment | 100 | 5.000 | 11/01/45 | 100 | |||
| 25,823 | |||||||
| Georgia - 1.0% | |||||||
| Milledgeville & Baldwin County Development Authority Revenue Bonds(µ)(Ê) | 995 | 0.784 | 10/01/24 | 970 | |||
| Milledgeville & Baldwin County Development Authority Revenue Bonds(µ)(Ê) | 1,225 | 0.834 | 10/01/33 | 1,092 | |||
| Private Colleges & Universities Authority Revenue Bonds | 1,000 | 5.000 | 10/01/40 | 1,107 | |||
| 3,169 | |||||||
| Guam - 1.4% | |||||||
| Guam Government Waterworks Authority Revenue Bonds | 1,000 | 5.500 | 07/01/43 | 1,151 | |||
| Guam Government Waterworks Authority Revenue Bonds | 65 | 5.000 | 01/01/46 | 74 | |||
| Territory of Guam Revenue Bonds | 900 | 5.000 | 11/15/19 | 989 | |||
| Territory of Guam Revenue Bonds | 500 | 5.000 | 11/15/29 | 583 | |||
| Territory of Guam Revenue Bonds | 1,500 | 5.000 | 11/15/35 | 1,708 | |||
| Territory of Guam Revenue Bonds | 500 | 5.000 | 12/01/46 | 114 | |||
| 4,619 | |||||||
| Hawaii - 0.7% |
See accompanying notes which are an integral part of the financial statements.
528 Russell Tax Exempt High Yield Bond Fund
Russell Investment Company
Russell Tax Exempt High Yield Bond Fund
Schedule of Investments, continued — October 31, 2016
| Amounts in thousands (except share amounts) | ||||||||
| Principal | Fair | |||||||
| Amount ($) | Rate | Date of | Value | |||||
| or Shares | % | Maturity | $ | |||||
| State of Hawaii Department of Budget & Finance Revenue Bonds | 2,210 | 5.000 | 01/01/30 | 2,339 | ||||
| Illinois - 9.5% | ||||||||
| Chicago Board of Education General Obligation Unlimited | 145 | 4.250 | 12/01/18 | 141 | ||||
| Chicago Board of Education General Obligation Unlimited(Ê) | 1,000 | 7.500 | 03/01/26 | 1,007 | ||||
| Chicago Board of Education General Obligation Unlimited(µ) | 1,000 | 5.000 | 12/01/27 | 1,037 | ||||
| Chicago Board of Education General Obligation Unlimited | 795 | 5.000 | 12/01/28 | 727 | ||||
| Chicago Board of Education General Obligation Unlimited(µ) | 230 | 4.709 | 12/01/29 | 126 | ||||
| Chicago Board of Education General Obligation Unlimited | 150 | 5.125 | 12/01/32 | 138 | ||||
| Chicago Board of Education General Obligation Unlimited(Ê) | 1,000 | 1.220 | 03/01/36 | 944 | ||||
| Chicago Board of Education General Obligation Unlimited | 75 | 5.250 | 12/01/39 | 68 | ||||
| Chicago Board of Education General Obligation Unlimited | 325 | 5.000 | 12/01/41 | 286 | ||||
| Chicago Board of Education General Obligation Unlimited | 2,400 | 7.000 | 12/01/44 | 2,512 | ||||
| Chicago Board of Education General Obligation Unlimited | 460 | 6.500 | 12/01/46 | 468 | ||||
| Chicago O'Hare International Airport Revenue Bonds | 1,000 | 5.000 | 01/01/46 | 1,110 | ||||
| City of Chicago Illinois General Obligation Unlimited(µ) | 2,445 | 5.000 | 01/01/29 | 2,521 | ||||
| City of Chicago Illinois General Obligation Unlimited | 2,100 | 5.500 | 01/01/42 | 2,181 | ||||
| City of Chicago Illinois Revenue Bonds | 900 | 5.000 | 01/01/34 | 955 | ||||
| City of Chicago Illinois Revenue Bonds | 3,000 | 5.250 | 01/01/38 | 3,181 | ||||
| City of Chicago Illinois Waterworks Revenue Bonds | 100 | 5.000 | 11/01/29 | 117 | ||||
| City of Springfield Illinois Electric Revenue Bonds(µ) | 775 | 4.000 | 03/01/40 | 812 | ||||
| City oif Chicago Illinois General Obligation Bonds Unlimited | 250 | 5.500 | 01/01/31 | 265 | ||||
| Illinois Finance Authority Revenue Bonds(ae) | 560 | 6.000 | 05/15/20 | 634 | ||||
| Illinois Finance Authority Revenue Bonds | 500 | 5.000 | 04/01/31 | 501 | ||||
| Illinois Finance Authority Revenue Bonds | 1,375 | 5.000 | 05/15/31 | 1,539 | ||||
| Illinois Finance Authority Revenue Bonds | 200 | 5.000 | 04/01/36 | 200 | ||||
| Illinois Finance Authority Revenue Bonds | 400 | 5.000 | 12/01/36 | 400 | ||||
| Illinois Finance Authority Revenue Bonds | 630 | 5.000 | 12/01/37 | 684 | ||||
| Illinois Finance Authority Revenue Bonds | 315 | 6.000 | 05/15/39 | 356 | ||||
| Illinois Finance Authority Revenue Bonds | 350 | 6.500 | 10/15/40 | 366 | ||||
| Illinois Finance Authority Revenue Bonds | 100 | 5.000 | 09/01/46 | 112 | ||||
| Metropolitan Pier & Exposition Authority Revenue Bonds | 1,000 | 5.000 | 12/15/28 | 1,090 | ||||
| Metropolitan Pier & Exposition Authority Revenue Bonds(µ) | 220 | 4.209 | 06/15/30 | 125 | ||||
| Metropolitan Pier & Exposition Authority Revenue Bonds | 1,000 | 5.000 | 06/15/52 | 1,060 | ||||
| Springfield Metropolitan Sanitation District General Obligation Limited | 1,000 | 5.750 | 01/01/53 | 1,178 | ||||
| State of Illinois General Obligation Unlimited | 1,000 | 5.000 | 05/01/29 | 1,077 | ||||
| State of Illinois General Obligation Unlimited(µ) | 875 | 4.000 | 02/01/30 | 877 | ||||
| State of Illinois General Obligation Unlimited(µ) | 265 | 4.000 | 02/01/31 | 265 | ||||
| State of Illinois General Obligation Unlimited(µ) | 400 | 5.000 | 03/01/34 | 401 | ||||
| Town of Cortland Illinois Special Service Areas No. 9 & 10 Special Tax | 100 | 5.800 | 03/01/37 | 98 | ||||
| Village of Bourbonnais Illinois Revenue Bonds | 1,000 | 5.000 | 11/01/44 | 1,058 | ||||
| 30,617 | ||||||||
| Indiana - 1.1% | ||||||||
| Indiana Finance Authority Revenue Bonds | 600 | 5.500 | 08/15/40 | 658 | ||||
| Indiana Finance Authority Revenue Bonds | 2,000 | 5.000 | 10/01/44 | 2,196 | ||||
| Indiana Finance Authority Revenue Bonds | 270 | 5.500 | 08/15/45 | 296 | ||||
| Indiana Municipal Power Agency Revenue Bonds | 250 | 5.000 | 01/01/42 | 290 | ||||
| 3,440 | ||||||||
| Iowa - 0.2% | ||||||||
| Iowa Higher Education Loan Authority Revenue Bonds | 100 | 5.000 | 09/01/33 | 123 | ||||
| Iowa Tobacco Settlement Authority Revenue Bonds | 160 | 5.375 | 06/01/38 | 156 | ||||
| Xenia Rural Water District Revenue Bonds | 250 | 5.000 | 12/01/36 | 283 | ||||
See accompanying notes which are an integral part of the financial statements.
Russell Tax Exempt High Yield Bond Fund 529
Russell Investment Company
Russell Tax Exempt High Yield Bond Fund
Schedule of Investments, continued — October 31, 2016
| Amounts in thousands (except share amounts) | |||||||
| Principal | Fair | ||||||
| Amount ($) | Rate | Date of | Value | ||||
| or Shares | % | Maturity | $ | ||||
| 562 | |||||||
| Kentucky - 1.0% | |||||||
| County of Ohio Kentucky Revenue Bonds | 1,735 | 6.000 | 07/15/31 | 1,830 | |||
| Kentucky Economic Development Finance Authority Revenue Bonds | 750 | 6.500 | 03/01/45 | 852 | |||
| Louisville & Jefferson County Health System Revenue Bonds | 425 | 4.000 | 10/01/34 | 456 | |||
| Louisville & Jefferson County Health System Revenue Bonds | 250 | 4.000 | 10/01/36 | 267 | |||
| 3,405 | |||||||
| Louisiana - 2.3% | |||||||
| Louisiana Local Government Environmental Facilities & Community Development | |||||||
| Authority Revenue Bonds | 750 | 6.000 | 10/01/44 | 868 | |||
| Louisiana Public Facilities Authority Revenue Bonds | 250 | 4.000 | 05/15/19 | 265 | |||
| Louisiana Public Facilities Authority Revenue Bonds | 300 | 4.000 | 05/15/20 | 326 | |||
| Louisiana Public Facilities Authority Revenue Bonds | 400 | 3.375 | 09/01/28 | 408 | |||
| Louisiana Public Facilities Authority Revenue Bonds | 375 | 3.500 | 06/01/30 | 383 | |||
| Louisiana Public Facilities Authority Revenue Bonds(Ê) | 3,100 | 0.650 | 07/01/47 | 3,100 | |||
| New Orleans Aviation Board Revenue Bonds | 1,755 | 5.000 | 01/01/45 | 1,972 | |||
| 7,322 | |||||||
| Maryland - 0.9% | |||||||
| City of Baltimore Maryland Revenue Bonds(µ) | 175 | 5.250 | 09/01/39 | 175 | |||
| Maryland Health & Higher Educational Facilities Authority Revenue Bonds | 730 | 4.000 | 07/01/20 | 801 | |||
| Maryland Health & Higher Educational Facilities Authority Revenue Bonds | 600 | 5.250 | 01/01/37 | 687 | |||
| Maryland Health & Higher Educational Facilities Authority Revenue Bonds | 1,000 | 5.000 | 07/01/45 | 1,113 | |||
| 2,776 | |||||||
| Massachusetts - 2.3% | |||||||
| Massachusetts Development Finance Agency Revenue Bonds | 1,415 | 5.000 | 09/01/35 | 1,549 | |||
| Massachusetts Development Finance Agency Revenue Bonds | 1,580 | 5.000 | 10/01/35 | 1,768 | |||
| Massachusetts Development Finance Agency Revenue Bonds | 1,545 | 5.000 | 07/01/44 | 1,699 | |||
| Massachusetts Development Finance Agency Revenue Bonds | 335 | 5.000 | 07/01/46 | 377 | |||
| Massachusetts Port Authority Revenue Bonds(µ) | 2,000 | 5.000 | 01/01/27 | 2,005 | |||
| 7,398 | |||||||
| Michigan - 4.1% | |||||||
| City of Detroit Michigan Sewage Disposal System Revenue Bonds(µ) | 120 | 5.000 | 07/01/33 | 120 | |||
| City of Detroit Michigan Sewage Disposal System Revenue Bonds(µ) | 500 | 5.000 | 07/01/39 | 559 | |||
| City of Detroit Michigan Sewage Disposal System Revenue Bonds | 2,010 | 5.250 | 07/01/39 | 2,254 | |||
| City of Detroit Michigan Water Supply System Revenue Bonds(µ) | 40 | 5.000 | 07/01/28 | 40 | |||
| City of Detroit Michigan Water Supply System Revenue Bonds | 200 | 5.000 | 07/01/36 | 219 | |||
| City of Detroit Michigan Water Supply System Revenue Bonds | 1,370 | 5.000 | 07/01/41 | 1,485 | |||
| City of Detroit Michigan Water Supply System Revenue Bonds(µ) | 20 | 5.250 | 07/01/19 | 20 | |||
| City of Detroit Michigan Water Supply System Revenue Bonds(µ) | 25 | 5.000 | 07/01/29 | 25 | |||
| Flint Hospital Building Authority Revenue Bonds | 100 | 5.250 | 07/01/39 | 104 | |||
| Michigan Finance Authority Revenue Bonds | 1,000 | 3.875 | 10/01/23 | 1,083 | |||
| Michigan Finance Authority Revenue Bonds | 300 | 5.000 | 07/01/33 | 341 | |||
| Michigan Finance Authority Revenue Bonds(µ) | 1,000 | 5.000 | 07/01/36 | 1,130 | |||
| Michigan Finance Authority Revenue Bonds | 1,815 | 5.500 | 11/15/45 | 1,982 | |||
| Michigan Tobacco Settlement Finance Authority Revenue Bonds | 175 | 5.125 | 06/01/22 | 173 | |||
| Michigan Tobacco Settlement Finance Authority Revenue Bonds | 2,500 | 6.000 | 06/01/34 | 2,467 | |||
| Michigan Tobacco Settlement Finance Authority Revenue Bonds | 100 | 6.000 | 06/01/48 | 98 | |||
| Michigan Tobacco Settlement Finance Authority Revenue Bonds | 25,000 | 9.696 | 06/01/52 | 927 | |||
| Ypsilanti School District General Obligation Unlimited | 300 | 5.000 | 05/01/22 | 348 | |||
| 13,375 | |||||||
| Minnesota - 1.3% | |||||||
| City of Blaine Minnesota Revenue Bonds | 2,000 | 6.125 | 07/01/45 | 2,123 |
See accompanying notes which are an integral part of the financial statements.
530 Russell Tax Exempt High Yield Bond Fund
Russell Investment Company
Russell Tax Exempt High Yield Bond Fund
Schedule of Investments, continued — October 31, 2016
| Amounts in thousands (except share amounts) | ||||||||
| Principal | Fair | |||||||
| Amount ($) | Rate | Date of | Value | |||||
| or Shares | % | Maturity | $ | |||||
| State Paul Housing & Redevelopment Authority Revenue Bonds | 2,000 | 5.250 | 11/15/35 | 2,182 | ||||
| 4,305 | ||||||||
| Missouri - 1.2% | ||||||||
| Branson Industrial Development Authority Tax Allocation | 110 | 5.500 | 06/01/29 | 110 | ||||
| Health & Educational Facilities Authority of the State of Missouri Revenue Bonds(Ê) | 300 | 0.050 | 03/01/40 | 300 | ||||
| Health & Educational Facilities Authority of the State of Missouri Revenue Bonds | 1,410 | 5.000 | 05/01/40 | 1,540 | ||||
| Missouri Health & Educational Facilities Authority Revenue Bonds | 1,250 | 4.000 | 02/01/37 | 1,262 | ||||
| State Louis County Industrial Development Authority Revenue Bonds | 650 | 5.000 | 08/15/30 | 680 | ||||
| 3,892 | ||||||||
| Nevada - 0.2% | ||||||||
| Henderson County Improvement Districts Special Assessment | 50 | 4.000 | 09/01/35 | 49 | ||||
| Las Vegas Redevelopment Agency Tax Allocation | 250 | 5.000 | 06/15/45 | 284 | ||||
| Las Vegas Special Improvement District 607 Special Assessment | 260 | 5.000 | 06/01/24 | 292 | ||||
| 625 | ||||||||
| New Hampshire - 0.2% | ||||||||
| New Hampshire Health and Education Facilities Authority Act Revenue Bonds | 500 | 5.000 | 10/01/36 | 560 | ||||
| New Jersey - 5.0% | ||||||||
| New Jersey Economic Development Authority Revenue Bonds | 1,900 | 5.000 | 07/01/38 | 2,054 | ||||
| New Jersey Economic Development Authority Revenue Bonds | 1,500 | 5.375 | 01/01/43 | 1,715 | ||||
| New Jersey Educational Facilities Authority Revenue Bonds | 1,000 | 5.000 | 07/01/46 | 1,043 | ||||
| New Jersey Health Care Facilities Financing Authority Revenue Bonds | 100 | 5.000 | 07/01/30 | 113 | ||||
| New Jersey Health Care Facilities Financing Authority Revenue Bonds(µ) | 300 | 4.125 | 07/01/38 | 320 | ||||
| New Jersey Health Care Facilities Financing Authority Revenue Bonds | 500 | 6.625 | 07/01/38 | 547 | ||||
| New Jersey Health Care Facilities Financing Authority Revenue Bonds(µ) | 150 | 5.000 | 07/01/46 | 170 | ||||
| New Jersey Transportation Trust Fund Authority Revenue Bods(µ) | 675 | 3.689 | 12/15/27 | 451 | ||||
| New Jersey Transportation Trust Fund Authority Revenue Bonds | 165 | 5.000 | 06/15/30 | 183 | ||||
| New Jersey Transportation Trust Fund Authority Revenue Bonds(µ) | 2,650 | 4.424 | 12/15/35 | 1,158 | ||||
| New Jersey Transportation Trust Fund Authority Revenue Bonds | 550 | 4.475 | 12/15/35 | 238 | ||||
| New Jersey Transportation Trust Fund Authority Revenue Bonds | 125 | 4.669 | 12/15/36 | 50 | ||||
| New Jersey Transportation Trust Fund Authority Revenue Bonds | 945 | 5.000 | 06/15/42 | 1,016 | ||||
| South Jersey Transportation Authority LLC Revenue Bonds | 315 | 5.000 | 11/01/26 | 368 | ||||
| South Jersey Transportation Authority LLC Revenue Bonds | 1,945 | 5.000 | 11/01/39 | 2,167 | ||||
| Tobacco Settlement Financing Corp. Revenue Bonds | 380 | 5.000 | 06/01/29 | 377 | ||||
| Tobacco Settlement Financing Corp. Revenue Bonds | 1,430 | 4.750 | 06/01/34 | 1,366 | ||||
| Tobacco Settlement Financing Corp. Revenue Bonds | 3,000 | 5.000 | 06/01/41 | 2,795 | ||||
| 16,131 | ||||||||
| New York - 5.4% | ||||||||
| Brooklyn Area Development Corp. Revenue Bonds | 150 | 5.000 | 07/15/42 | 171 | ||||
| Brooklyn Area Development Corp. Revenue Bonds(µ) | 30 | 3.000 | 07/15/43 | 28 | ||||
| City of New York New York General Obligation Unlimited(Ê) | 250 | 0.440 | 01/01/36 | 250 | ||||
| City of New York New York General Obligation Unlimited(Ê) | 250 | 0.570 | 03/01/40 | 250 | ||||
| County of Chautauqua Industrial Development Agency Revenue Bonds | 650 | 5.875 | 04/01/42 | 695 | ||||
| Dutchess County Industrial Development Agency Revenue Bonds | 1,200 | 4.500 | 08/01/36 | 1,036 | ||||
| New York City Transitional Finance Authority Future Tax Secured Revenue Bonds(Ê) | 300 | 0.700 | 11/01/36 | 300 | ||||
| New York City Transitional Finance Authority Future Tax Secured Revenue Bonds(Ê) | 250 | 0.700 | 02/01/45 | 250 | ||||
| New York City Water & Sewer Financing Authority Revenue Bonds(Ê) | 250 | 0.730 | 06/15/50 | 250 | ||||
| New York Development Corp. Revenue Bonds | 300 | 5.375 | 11/15/40 | 346 | ||||
| New York Liberty Development Corp. Revenue Bonds | 2,150 | 5.000 | 11/15/44 | 2,420 | ||||
| New York Liberty Development Corp. Revenue Bonds | 1,500 | 7.250 | 11/15/44 | 1,946 | ||||
| New York State Dormitory Authority Revenue Bonds | 400 | 5.000 | 12/01/35 | 447 | ||||
| New York Transportation Development Corp. Revenue Bonds | 500 | 5.000 | 08/01/31 | 535 | ||||
See accompanying notes which are an integral part of the financial statements.
Russell Tax Exempt High Yield Bond Fund 531
Russell Investment Company
Russell Tax Exempt High Yield Bond Fund
Schedule of Investments, continued — October 31, 2016
| Amounts in thousands (except share amounts) | ||||||||
| Principal | Fair | |||||||
| Amount ($) | Rate | Date of | Value | |||||
| or Shares | % | Maturity | $ | |||||
| New York Transportation Development Corp. Revenue Bonds | 1,340 | 5.000 | 07/01/41 | 1,466 | ||||
| New York Transportation Development Corp. Revenue Bonds | 2,100 | 5.000 | 07/01/46 | 2,291 | ||||
| New York Transportation Development Corp. Revenue Bonds | 250 | 5.250 | 01/01/50 | 277 | ||||
| New York Transportation Development Corp. Revenue Bonds(µ) | 300 | 4.000 | 01/01/51 | 307 | ||||
| Onondaga Civic Development Corp. Revenue Bonds | 910 | 5.000 | 07/01/42 | 1,095 | ||||
| Suffolk Tobacco Asset Securitization Corp. Revenue Bonds | 250 | 6.000 | 06/01/48 | 252 | ||||
| Syracuse Industrial Development Agency Revenue Bonds | 2,350 | 5.000 | 01/01/31 | 2,684 | ||||
| Westchester County Local Development Corp. Revenue Bonds | 125 | 5.000 | 11/01/46 | 140 | ||||
| 17,436 | ||||||||
| North Carolina - 1.0% | ||||||||
| North Carolina Medical Care Commission Revenue Bonds | 1,000 | 5.000 | 10/01/35 | 1,149 | ||||
| North Carolina Medical Care Commission Revenue Bonds | 1,750 | 5.000 | 11/01/37 | 2,000 | ||||
| 3,149 | ||||||||
| North Dakota - 0.3% | ||||||||
| Burleigh County Educational Facilities Revenue Bonds | 1,000 | 5.200 | 04/15/46 | 961 | ||||
| Ohio - 2.1% | ||||||||
| Buckeye Tobacco Settlement Financing Authority Revenue Bonds | 1,765 | 5.125 | 06/01/24 | 1,668 | ||||
| Buckeye Tobacco Settlement Financing Authority Revenue Bonds | 1,100 | 5.375 | 06/01/24 | 1,060 | ||||
| Buckeye Tobacco Settlement Financing Authority Revenue Bonds | 1,325 | 5.875 | 06/01/30 | 1,249 | ||||
| Buckeye Tobacco Settlement Financing Authority Revenue Bonds | 1,095 | 5.750 | 06/01/34 | 1,016 | ||||
| County of Hamilton Ohio Revenue Bonds | 750 | 5.000 | 01/01/37 | 755 | ||||
| Lorain County Port Authority Revenue Bonds | 510 | 6.750 | 12/01/40 | 502 | ||||
| Ohio State Water Development Authority Revenue Bonds(Ê) | 550 | 4.375 | 06/01/33 | 542 | ||||
| 6,792 | ||||||||
| Oklahoma - 0.4% | ||||||||
| Tulsa Airports Improvement Trust Revenue Bonds(Ê) | 1,000 | 5.000 | 06/01/35 | 1,156 | ||||
| Oregon - 1.9% | ||||||||
| Astoria Hospital Facilities Authority Revenue Bonds | 1,000 | 5.000 | 08/01/41 | 1,119 | ||||
| Oregon State Facilities Authority Revenue Bonds | 1,000 | 5.000 | 10/01/36 | 1,115 | ||||
| Oregon State Facilities Authority Revenue Bonds | 2,500 | 5.000 | 04/01/45 | 2,878 | ||||
| Oregon State Facilities Authority Revenue Bonds | 500 | 5.000 | 10/01/46 | 559 | ||||
| Yamhill County Hospital Authority Revenue Bonds | 300 | 5.000 | 11/15/36 | 328 | ||||
| 5,999 | ||||||||
| Pennsylvania - 3.9% | ||||||||
| Allentown Neighborhood Improvement Zone Development Authority Revenue Bonds | 1,000 | 5.000 | 05/01/42 | 1,066 | ||||
| City of Harrisburg Pennsylvania General Obligation Unlimited(µ) | 285 | 4.379 | 09/15/22 | 222 | ||||
| Clairton Municipal Authority Revenue Bonds | 240 | 5.000 | 12/01/42 | 267 | ||||
| East Hempfield Township Industrial Development Authority Revenue Bonds | 600 | 5.000 | 07/01/45 | 641 | ||||
| Geisinger Authority Revenue Bonds(Ê) | 100 | 0.956 | 05/01/37 | 91 | ||||
| Huntingdon County General Authority Revenue Bonds | 1,000 | 5.000 | 05/01/46 | 1,102 | ||||
| Latrobe Industrial Development Authority Revenue Bonds | 1,375 | 5.000 | 05/01/43 | 1,517 | ||||
| Montgomery County Industrial Development Authority Revenue Bonds | 1,700 | 5.250 | 01/15/46 | 1,913 | ||||
| Northampton County General Purpose Authority Revenue Bonds | 1,000 | 5.000 | 10/01/36 | 1,145 | ||||
| Pennsylvania Economic Development Financing Authority Revenue Bonds | 1,000 | 5.000 | 06/30/42 | 1,103 | ||||
| Pennsylvania Higher Educational Facilities Authority Revenue Bonds | 365 | 5.000 | 07/01/31 | 421 | ||||
| Pennsylvania Higher Educational Facilities Authority Revenue Bonds | 355 | 6.250 | 09/01/33 | 405 | ||||
| Pennsylvania Higher Educational Facilities Authority Revenue Bonds | 950 | 5.500 | 07/15/43 | 1,077 | ||||
| Pennsylvania Turnpike Commission Revenue Bonds | 1,250 | 5.000 | 12/01/40 | 1,427 | ||||
| Scranton County General Obligation Unlimited | 100 | 5.000 | 11/15/32 | 107 | ||||
| Scranton Redevelopment Authority Revenue Bonds | 100 | 5.000 | 11/15/28 | 106 | ||||
See accompanying notes which are an integral part of the financial statements.
532 Russell Tax Exempt High Yield Bond Fund
Russell Investment Company
Russell Tax Exempt High Yield Bond Fund
Schedule of Investments, continued — October 31, 2016
| Amounts in thousands (except share amounts) | ||||||||
| Principal | Fair | |||||||
| Amount ($) | Rate | Date of | Value | |||||
| or Shares | % | Maturity | $ | |||||
| 12,610 | ||||||||
| Puerto Rico - 7.4% | ||||||||
| Commonwealth of Puerto Rico General Obligation Unlimited(µ) | 540 | 5.500 | 07/01/19 | 567 | ||||
| Commonwealth of Puerto Rico General Obligation Unlimited(Å) | 110 | 5.000 | 07/01/21 | 70 | ||||
| Commonwealth of Puerto Rico General Obligation Unlimited(µ) | 320 | 5.250 | 07/01/24 | 345 | ||||
| Commonwealth of Puerto Rico General Obligation Unlimited(µ) | 100 | 5.000 | 07/01/31 | 106 | ||||
| Commonwealth of Puerto Rico General Obligation Unlimited(Å) | 130 | 5.125 | 07/01/31 | 83 | ||||
| Commonwealth of Puerto Rico General Obligation Unlimited(µ) | 1,000 | 5.000 | 07/01/35 | 1,076 | ||||
| Commonwealth of Puerto Rico General Obligation Unlimited(Å) | 235 | 5.000 | 07/01/35 | 150 | ||||
| Commonwealth of Puerto Rico General Obligation Unlimited | 1,250 | 8.000 | 07/01/35 | 813 | ||||
| Commonwealth of Puerto Rico General Obligation Unlimited(Å) | 720 | 6.000 | 07/01/39 | 459 | ||||
| Commonwealth of Puerto Rico General Obligation Unlimited(Å) | 180 | 6.000 | 07/01/40 | 113 | ||||
| Puerto Rico Commonwealth Aqueduct & Sewer Authority Revenue Bonds(µ) | 265 | 5.000 | 07/01/28 | 276 | ||||
| Puerto Rico Commonwealth Aqueduct & Sewer Authority Revenue Bonds | 20 | 5.000 | 07/01/30 | 15 | ||||
| Puerto Rico Commonwealth Aqueduct & Sewer Authority Revenue Bonds | 50 | 5.000 | 07/01/33 | 37 | ||||
| Puerto Rico Commonwealth Aqueduct & Sewer Authority Revenue Bonds | 2,920 | 5.250 | 07/01/42 | 2,191 | ||||
| Puerto Rico Commonwealth Aqueduct & Sewer Authority Revenue Bonds | 75 | 6.000 | 07/01/44 | 58 | ||||
| Puerto Rico Commonwealth Aqueduct & Sewer Authority Revenue Bonds | 140 | 6.000 | 07/01/47 | 107 | ||||
| Puerto Rico Convention Center District Authority Revenue Bonds(µ) | 100 | 5.000 | 07/01/17 | 100 | ||||
| Puerto Rico Convention Center District Authority Revenue Bonds(µ) | 2,050 | 5.000 | 07/01/31 | 2,056 | ||||
| Puerto Rico Convention Center District Authority Revenue Bonds(µ) | 125 | 4.500 | 07/01/36 | 125 | ||||
| Puerto Rico Electric Power Authority Revenue Bonds(µ) | 270 | 5.000 | 07/01/22 | 274 | ||||
| Puerto Rico Electric Power Authority Revenue Bonds(µ)(Ê) | 915 | 0.738 | 07/01/29 | 686 | ||||
| Puerto Rico Highways & Transportation Authority Revenue Bonds | 60 | 5.000 | 07/01/28 | 16 | ||||
| Puerto Rico Highways & Transportation Authority Revenue Bonds(µ) | 360 | 5.000 | 07/01/28 | 364 | ||||
| Puerto Rico Highways & Transportation Authority Revenue Bonds | 205 | 5.000 | 07/01/32 | 54 | ||||
| Puerto Rico Highways & Transportation Authority Revenue Bonds(µ) | 160 | 4.750 | 07/01/38 | 162 | ||||
| Puerto Rico Highways & Transportation Authority Revenue Bonds(µ) | 3,700 | 5.250 | 07/01/38 | 3,942 | ||||
| Puerto Rico Highways & Transportation Authority Revenue Bonds | 180 | 5.000 | 07/01/42 | 47 | ||||
| Puerto Rico Infrastructure Financing Authority Revenue Bonds(µ) | 230 | 5.500 | 07/01/17 | 236 | ||||
| Puerto Rico Infrastructure Financing Authority Revenue Bonds(µ) | 2,230 | 5.500 | 07/01/23 | 2,356 | ||||
| Puerto Rico Public Buildings Authority Revenue Bonds(µ) | 1,500 | 5.250 | 07/01/21 | 1,582 | ||||
| Puerto Rico Public Buildings Authority Revenue Bonds(µ) | 425 | 6.000 | 07/01/24 | 445 | ||||
| Puerto Rico Sales Tax Financing Corp. Revenue Bonds | 115 | 6.750 | 08/01/32 | 64 | ||||
| Puerto Rico Sales Tax Financing Corp. Revenue Bonds | 155 | 6.250 | 08/01/33 | 54 | ||||
| Puerto Rico Sales Tax Financing Corp. Revenue Bonds | 900 | 12.308 | 08/01/34 | 115 | ||||
| Puerto Rico Sales Tax Financing Corp. Revenue Bonds | 900 | 11.643 | 08/01/35 | 114 | ||||
| Puerto Rico Sales Tax Financing Corp. Revenue Bonds | 200 | 11.026 | 08/01/37 | 23 | ||||
| Puerto Rico Sales Tax Financing Corp. Revenue Bonds | 360 | 5.375 | 08/01/39 | 189 | ||||
| Puerto Rico Sales Tax Financing Corp. Revenue Bonds | 1,425 | 5.250 | 08/01/41 | 748 | ||||
| Puerto Rico Sales Tax Financing Corp. Revenue Bonds(µ) | 14,125 | 5.726 | 08/01/45 | 2,845 | ||||
| Puerto Rico Sales Tax Financing Corp. Sales Tax Revenue Bonds | 235 | 6.125 | 08/01/19 | 82 | ||||
| Puerto Rico Sales Tax Financing Corp. Sales Tax Revenue Bonds | 780 | 6.000 | 08/01/42 | 410 | ||||
| Puerto Rico Sales Tax Financing Corp. Sales Tax Revenue Bonds | 610 | 6.500 | 08/01/44 | 334 | ||||
| 23,889 | ||||||||
| Rhode Island - 0.4% | ||||||||
| Rhode Island Health & Educational Building Revenue Bonds | 500 | 5.000 | 05/15/39 | 561 | ||||
| Tobacco Settlement Financing Corp. Revenue Bonds | 12,000 | 8.548 | 06/01/52 | 647 | ||||
| 1,208 | ||||||||
| South Carolina - 0.1% | ||||||||
| South Carolina Ports Authority Revenue Bonds | 125 | 5.250 | 07/01/55 | 141 |
See accompanying notes which are an integral part of the financial statements.
Russell Tax Exempt High Yield Bond Fund 533
Russell Investment Company
Russell Tax Exempt High Yield Bond Fund
Schedule of Investments, continued — October 31, 2016
| Amounts in thousands (except share amounts) | ||||||||
| Principal | Fair | |||||||
| Amount ($) | Rate | Date of | Value | |||||
| or Shares | % | Maturity | $ | |||||
| South Carolina State Public Service Authority Revenue Bonds | 250 | 5.250 | 12/01/55 | 293 | ||||
| 434 | ||||||||
| Tennessee - 1.7% | ||||||||
| Chattanooga Health Educational & Housing Facility Board Revenue Bonds | 650 | 5.000 | 10/01/35 | 750 | ||||
| Chattanooga-Hamilton County Hospital Authority Revenue Bonds | 2,000 | 5.000 | 10/01/44 | 2,231 | ||||
| Johnson City Health & Educational Facilities Board Revenue Bonds | 1,000 | 5.000 | 08/15/42 | 1,094 | ||||
| Metropolitan Government Nashville & Davidson County Health & Educational | ||||||||
| Facilities Board Revenue Bonds | 100 | 5.000 | 07/01/40 | 116 | ||||
| Metropolitan Government Nashville & Davidson County Health & Educational | ||||||||
| Facilities Board Revenue Bonds | 1,000 | 5.000 | 10/01/41 | 1,157 | ||||
| Metropolitan Government Nashville & Davidson County Health & Educational | ||||||||
| Facilities Board Revenue Bonds | 100 | 5.000 | 07/01/46 | 115 | ||||
| 5,463 | ||||||||
| Texas - 6.0% | ||||||||
| Austin Convention Enterprises, Inc. Revenue Bonds(µ) | 1,690 | 4.300 | 01/01/33 | 1,692 | ||||
| Austin Convention Enterprises, Inc. Revenue Bonds(µ) | 785 | 5.000 | 01/01/34 | 789 | ||||
| Board of Managers Joint Guadalupe County-City of Seguin Hospital Revenue Bonds | 50 | 5.250 | 12/01/35 | 55 | ||||
| Board of Managers Joint Guadalupe County-City of Seguin Hospital Revenue Bonds | 65 | 5.000 | 12/01/40 | 69 | ||||
| Board of Managers Joint Guadalupe County-City of Seguin Hospital Revenue Bonds | 50 | 5.000 | 12/01/45 | 53 | ||||
| Central Texas Regional Mobility Authority Revenue Bonds | 100 | 5.000 | 01/01/45 | 113 | ||||
| Central Texas Regional Mobility Authority Revenue Bonds | 100 | 5.000 | 01/01/46 | 113 | ||||
| Central Texas Turnpike System Revenue Bonds | 3,000 | 5.000 | 08/15/42 | 3,341 | ||||
| City of Aubrey Texas Revenue Bonds | 700 | 7.250 | 09/01/45 | 713 | ||||
| City of Celina Texas Special Assessment | 50 | 6.250 | 09/01/45 | 53 | ||||
| City of Celina Texas Special Assessment | 100 | 7.500 | 09/01/45 | 113 | ||||
| City of Houston Texas Airport System Revenue Bonds | 500 | 5.000 | 07/01/29 | 555 | ||||
| City of Houston Texas Airport System Revenue Bonds | 1,000 | 5.000 | 07/15/30 | 1,130 | ||||
| City of Houston Texas Airport System Revenue Bonds | 1,000 | 5.000 | 07/15/35 | 1,099 | ||||
| Clifton Higher Education Finance Corp. Revenue Bonds | 500 | 5.000 | 12/01/45 | 560 | ||||
| Decatur Hospital Authority Revenue Bonds | 200 | 5.250 | 09/01/44 | 216 | ||||
| Grand Parkway Transportation Corp. Revenue Bonds | 2,500 | 5.500 | 04/01/53 | 2,878 | ||||
| Kaufman County Fresh Water Supply District No. 1-C(µ) | 185 | 4.000 | 09/01/35 | 192 | ||||
| New Hope Cultural Education Facilities Corp. Revenue Bonds | 55 | 5.000 | 04/01/36 | 60 | ||||
| New Hope Cultural Education Facilities Corp. Revenue Bonds | 1,500 | 4.750 | 04/01/46 | 1,632 | ||||
| New Hope Cultural Education Facilities Finance Corp. Revenue Bonds | 500 | 5.375 | 11/15/36 | 501 | ||||
| North East Texas Regional Mobility Authority Revenue Bonds | 385 | 5.000 | 01/01/41 | 434 | ||||
| Tarrant County Educational Facilities Financing Revenue Bonds | 200 | 5.000 | 05/15/45 | 217 | ||||
| Texas City Industrial Development Corp. Revenue Bonds | 1,000 | 4.125 | 12/01/45 | 1,004 | ||||
| Texas Municipal Gas Acquisition & Supply Corp. I Revenue Bonds | 750 | 6.250 | 12/15/26 | 908 | ||||
| Texas State Transportation Revenue Bonds | 100 | 5.000 | 12/31/50 | 110 | ||||
| Texas State Transportation Revenue Bonds | 100 | 5.000 | 12/31/55 | 109 | ||||
| Tyler Health Facilities Development Corp. Revenue Bonds | 500 | 5.250 | 11/01/27 | 511 | ||||
| Viridian Municipal Management District Special Assessment | 100 | 4.000 | 12/01/21 | 106 | ||||
| Viridian Municipal Management District Special Assessment | 100 | 4.750 | 12/01/43 | 102 | ||||
| 19,428 | ||||||||
| Vermont - 0.4% | ||||||||
| Vermont Educational & Health Buildings Financing Agency Revenue Bonds | 1,050 | 5.000 | 10/01/42 | 1,178 | ||||
| Virgin Islands - 1.7% | ||||||||
| Virgin Islands Public Finance Authority Revenue Bonds(µ) | 2,000 | 4.000 | 10/01/22 | 2,125 | ||||
| Virgin Islands Public Finance Authority Revenue Bonds | 2,000 | 5.000 | 10/01/32 | 1,944 | ||||
| Virgin Islands Public Finance Authority Revenue Bonds | 1,000 | 6.750 | 10/01/37 | 1,026 | ||||
| Virgin Islands Public Finance Authority Revenue Bonds | 200 | 5.000 | 10/01/39 | 192 | ||||
See accompanying notes which are an integral part of the financial statements.
534 Russell Tax Exempt High Yield Bond Fund
Russell Investment Company
Russell Tax Exempt High Yield Bond Fund
Schedule of Investments, continued — October 31, 2016
| Amounts in thousands (except share amounts) | ||||||||
| Principal | Fair | |||||||
| Amount ($) | Rate | Date of | Value | |||||
| or Shares | % | Maturity | $ | |||||
| Virgin Islands Water & Power Authority – Electric System Revenue Bonds | 250 | 5.000 | 07/01/31 | 233 | ||||
| 5,520 | ||||||||
| Virginia - 0.4% | ||||||||
| Tobacco Settlement Financing Corp. Revenue Bonds | 1,000 | 5.200 | 06/01/46 | 940 | ||||
| Tobacco Settlement Financing Corp. Revenue Bonds | 125 | 5.000 | 06/01/47 | 115 | ||||
| Tobacco Settlement Financing Corp. Revenue Bonds | 625 | 12.837 | 06/01/47 | 16 | ||||
| Virginia Small Business Financing Authority Revenue Bonds | 180 | 5.000 | 01/01/40 | 192 | ||||
| 1,263 | ||||||||
| Washington - 1.3% | ||||||||
| Washington Health Care Facilities Authority Revenue Bonds | 2,315 | 5.000 | 07/01/39 | 2,544 | ||||
| Whidbey Island Public Hospital District General Obligation Unlimited | 1,500 | 5.500 | 12/01/33 | 1,653 | ||||
| 4,197 | ||||||||
| Wisconsin - 0.6% | ||||||||
| Public Finance Authority Revenue Bonds | 100 | 4.300 | 11/01/30 | 106 | ||||
| Public Finance Authority Revenue Bonds | 500 | 5.000 | 07/01/42 | 533 | ||||
| Public Finance Authority Revenue Bonds | 1,000 | 5.875 | 04/01/45 | 1,066 | ||||
| Public Finance Authority Revenue Bonds | 340 | 5.250 | 07/01/47 | 372 | ||||
| 2,077 | ||||||||
| Total Municipal Bonds (cost $291,739) | 305,310 | |||||||
| Short-Term Investments - 4.9% | ||||||||
| Russell U.S. Cash Management Fund | 15,908,906 | (8) | 15,912 | |||||
| Total Short-Term Investments (cost $15,910) | 15,912 | |||||||
| Total Investments 99.5% (identified cost $307,649) | 321,222 | |||||||
| Other Assets and Liabilities, Net - 0.5% | 1,496 | |||||||
| Net Assets - 100.0% | 322,718 | |||||||
See accompanying notes which are an integral part of the financial statements.
Russell Tax Exempt High Yield Bond Fund 535
Russell Investment Company
Russell Tax Exempt High Yield Bond Fund
Schedule of Investments, continued — October 31, 2016
| Restricted Securities | ||||||||||||||||
| Amounts in thousands (except share and cost per unit amounts) | ||||||||||||||||
| Principal | Cost per | Cost | Fair Value | |||||||||||||
| % of Net Assets | Acquisition | Amount ($) | Unit | (000 | ) | (000 | ) | |||||||||
| Securities | Date | or shares | $ | $ | $ | |||||||||||
| 0.5% | ||||||||||||||||
| California Statewide Communities Development Authority Revenue Bonds | 04/28/16 | 250,000 | 104.35 | 261 | 278 | |||||||||||
| Charlotte County Industrial Development Authority Revenue Bonds | 12/09/15 | 250,000 | 98.80 | 247 | 254 | |||||||||||
| Commonwealth of Puerto Rico General Obligation Unlimited | 06/02/15 | 130,000 | 70.84 | 92 | 83 | |||||||||||
| Commonwealth of Puerto Rico General Obligation Unlimited | 06/03/15 | 235,000 | 69.19 | 163 | 150 | |||||||||||
| Commonwealth of Puerto Rico General Obligation Unlimited | 06/03/15 | 110,000 | 78.83 | 87 | 70 | |||||||||||
| Commonwealth of Puerto Rico General Obligation Unlimited | 06/04/15 | 180,000 | 70.77 | 127 | 113 | |||||||||||
| Commonwealth of Puerto Rico General Obligation Unlimited | 08/31/16 | 720,000 | 65.53 | 472 | 459 | |||||||||||
| Mohegan Tribal Finance Authority Revenue Bonds | 10/06/15 | 350,000 | 95.43 | 334 | 366 | |||||||||||
| 1,773 | ||||||||||||||||
| For a description of restricted securities see note 8 in the Notes to Financial Statements. | ||||||||||||||||
| Interest Rate Swap Contracts | ||||||||||||||||
| Amounts in thousands | ||||||||||||||||
| Termination | Fair Value | |||||||||||||||
| Counterparty | Notional Amount | Fund Receives | Fund Pays | Date | $ | |||||||||||
| Morgan Stanley | USD | 4,400 | Three Month LIBOR | 2.250 | % | 12/21/41 | (201 | ) | ||||||||
| Total Fair Value on Open Interest Rate Swap Contracts Premiums Paid (Received) – ($291) (å) | (201 | ) | ||||||||||||||
| Presentation of Portfolio Holdings | |||||||||||||
| Amount in thousands | |||||||||||||
| Fair Value | |||||||||||||
| Practical | |||||||||||||
| Portfolio Summary | Level 1 | Level 2 | Level 3 | Expedient (a) | Total | % of Net Assets | |||||||
| Municipal Bonds | |||||||||||||
| Alabama | $ | — | $ | 6,552 | $ | — | $ | — | $ | 6,552 | 2.0 | ||
| Alaska | — | 2,765 | — | — | 2,765 | 0.8 | |||||||
| Arizona | — | 3,147 | — | — | 3,147 | 1.0 | |||||||
| California | — | 38,411 | — | — | 38,411 | 11.9 | |||||||
| Colorado | — | 6,443 | — | — | 6,443 | 2.0 | |||||||
| Connecticut | — | 366 | — | — | 366 | 0.1 | |||||||
| Delaware | — | 1,097 | — | — | 1,097 | 0.3 | |||||||
| District of Columbia | — | 3,411 | — | — | 3,411 | 1.1 | |||||||
| Florida | — | 25,823 | — | — | 25,823 | 8.0 | |||||||
| Georgia | — | 3,169 | — | — | 3,169 | 1.0 | |||||||
| Guam | — | 4,619 | — | — | 4,619 | 1.4 | |||||||
| Hawaii | — | 2,339 | — | — | 2,339 | 0.7 | |||||||
| Illinois | — | 30,617 | — | — | 30,617 | 9.5 | |||||||
| Indiana | — | 3,440 | — | — | 3,440 | 1.1 | |||||||
| Iowa | — | 562 | — | — | 562 | 0.2 | |||||||
| Kentucky | — | 3,405 | — | — | 3,405 | 1.0 | |||||||
| Louisiana | — | 7,322 | — | — | 7,322 | 2.3 | |||||||
| Maryland | — | 2,776 | — | — | 2,776 | 0.9 | |||||||
| Massachusetts | — | 7,398 | — | — | 7,398 | 2.3 | |||||||
| Michigan | — | 13,375 | — | — | 13,375 | 4.1 | |||||||
| Minnesota | — | 4,305 | — | — | 4,305 | 1.3 | |||||||
| Missouri | — | 3,892 | — | — | 3,892 | 1.2 | |||||||
See accompanying notes which are an integral part of the financial statements.
536 Russell Tax Exempt High Yield Bond Fund
Russell Investment Company
Russell Tax Exempt High Yield Bond Fund
Schedule of Investments, continued — October 31, 2016
| Presentation of Portfolio Holdings | ||||||||||||||||
| Amount in thousands | ||||||||||||||||
| Fair Value | ||||||||||||||||
| Practical | ||||||||||||||||
| Portfolio Summary | Level 1 | Level 2 | Level 3 | Expedient (a) | Total | % of Net Assets | ||||||||||
| Nevada | — | 625 | — | — | 625 | 0.2 | ||||||||||
| New Hampshire | — | 560 | — | — | 560 | 0.2 | ||||||||||
| New Jersey | — | 16,131 | — | — | 16,131 | 5.0 | ||||||||||
| New York | — | 17,436 | — | — | 17,436 | 5.4 | ||||||||||
| North Carolina | — | 3,149 | — | — | 3,149 | 1.0 | ||||||||||
| North Dakota | — | 961 | — | — | 961 | 0.3 | ||||||||||
| Ohio | — | 6,792 | — | — | 6,792 | 2.1 | ||||||||||
| Oklahoma | — | 1,156 | — | — | 1,156 | 0.4 | ||||||||||
| Oregon | — | 5,999 | — | — | 5,999 | 1.9 | ||||||||||
| Pennsylvania | — | 12,610 | — | — | 12,610 | 3.9 | ||||||||||
| Puerto Rico | — | 23,889 | — | — | 23,889 | 7.4 | ||||||||||
| Rhode Island | — | 1,208 | — | — | 1,208 | 0.4 | ||||||||||
| South Carolina | — | 434 | — | — | 434 | 0.1 | ||||||||||
| Tennessee | — | 5,463 | — | — | 5,463 | 1.7 | ||||||||||
| Texas | — | 19,428 | — | — | 19,428 | 6.0 | ||||||||||
| Vermont | — | 1,178 | — | — | 1,178 | 0.4 | ||||||||||
| Virgin Islands | — | 5,520 | — | — | 5,520 | 1.7 | ||||||||||
| Virginia | — | 1,263 | — | — | 1,263 | 0.4 | ||||||||||
| Washington | — | 4,197 | — | — | 4,197 | 1.3 | ||||||||||
| Wisconsin | — | 2,077 | — | — | 2,077 | 0.6 | ||||||||||
| Short-Term Investments | — | — | — | 15,912 | 15,912 | 4.9 | ||||||||||
| Total Investments | $ | — | $ | 305,310 | $ | — | $ | 15,912 | $ | 321,222 | 99.5 | |||||
| Other Assets and Liabilities, Net | 0.5 | |||||||||||||||
| 100.0 | ||||||||||||||||
| Other Financial Instruments | ||||||||||||||||
| Liabilities | ||||||||||||||||
| Interest Rate Swap Contracts | — | (201 | ) | — | — | (201 | ) | (0.1 | ) | |||||||
| Total Other Financial Instruments* | $ | — | $ | (201 | ) | $ | — | $ | — | $ | (201 | ) | ||||
* Futures and foreign currency exchange contract values reflect the unrealized appreciation (depreciation) on the investments.
(a) Certain investments that are measured at fair value using the net asset value per share (or its equivalent) practical expedient have not been classified
in the fair value levels. The fair value amounts presented in the table are intended to permit reconciliation to the amounts presented in the Schedule of
Investments.
For a description of the Levels, see note 2 in the Notes to Financial Statements.
For a disclosure on transfers between Levels 1, 2 and 3 during the period ended October 31, 2016, see note 2 in the Notes to
Financial Statements.
See accompanying notes which are an integral part of the financial statements.
Russell Tax Exempt High Yield Bond Fund 537
Russell Investment Company
Russell Tax Exempt High Yield Bond Fund
Fair Value of Derivative Instruments — October 31, 2016
| Amounts in thousands | ||||
| Interest Rate | ||||
| Derivatives not accounted for as hedging instruments | Contracts | |||
| Location: Statement of Assets and Liabilities - Liabilities | ||||
| Interest rate swap contracts, at fair value | $ | 201 | ||
| Interest Rate | ||||
| Derivatives not accounted for as hedging instruments | Contracts | |||
| Location: Statement of Operations - Net realized gain (loss) | ||||
| Interest rate swap contracts | $ | (696 | ) | |
| Location: Statement of Operations - Net change in unrealized appreciation (depreciation) | ||||
| Interest rate swap contracts | $ | 151 | ||
| For further disclosure on derivatives see note 2 in the Notes to Financial Statements. | ||||
See accompanying notes which are an integral part of the financial statements.
538 Russell Tax Exempt High Yield Bond Fund
Russell Investment Company
Russell Tax Exempt High Yield Bond Fund
Balance Sheet Offsetting of Financial and Derivative Instruments — October 31, 2016
| Amounts in thousands | |||||||||
| Offsetting of Financial Liabilities and Derivative Liabilities | |||||||||
| Gross | Net Amounts | ||||||||
| Amounts | of Liabilities | ||||||||
| Gross | Offset in the | Presented in | |||||||
| Amounts of | Statement of | the Statement | |||||||
| Recognized | Assets and | of Assets and | |||||||
| Description | Location: Statement of Assets and Liabilities - Liabilities | Liabilities | Liabilities | Liabilities | |||||
| Interest Rate Swap Contracts | Interest rate swap contracts, at fair value | $ | 201 | $ | — | $ | 201 | ||
| Total Financial and Derivative Liabilities | 201 | — | 201 | ||||||
| Financial and Derivative Liabilities not subject to a netting agreement | (201) | — | (201 | ) | |||||
| Total Financial and Derivative Liabilities subject to a netting agreement | $ | — | $ | — | $ | — | |||
For further disclosure on derivatives and counterparty risk see note 2 in the Notes to Financial Statements.
See accompanying notes which are an integral part of the financial statements.
Russell Tax Exempt High Yield Bond Fund 539
Russell Investment Company
Russell Tax Exempt High Yield Bond Fund
Statement of Assets and Liabilities — October 31, 2016
| Amounts in thousands | ||
| Assets | ||
| Investments, at identified cost | $ | 307,649 |
| Investments, at fair value(>) | 321,222 | |
| Cash (restricted)(a) | 787 | |
| Receivables: | ||
| Dividends and interest | 4,118 | |
| Dividends from affiliated Russell funds | 7 | |
| Investments sold | 2,886 | |
| Fund shares sold | 1,349 | |
| Total assets | 330,369 | |
| Liabilities | ||
| Payables: | ||
| Investments purchased | 6,999 | |
| Fund shares redeemed | 176 | |
| Accrued fees to affiliates | 152 | |
| Other accrued expenses | 123 | |
| Interest rate swap contracts, at fair value(•) | 201 | |
| Total liabilities | 7,651 | |
| Net Assets | $ | 322,718 |
See accompanying notes which are an integral part of the financial statements.
540 Russell Tax Exempt High Yield Bond Fund
Russell Investment Company
Russell Tax Exempt High Yield Bond Fund
Statement of Assets and Liabilities, continued — October 31, 2016
| Amounts in thousands | |||
| Net Assets Consist of: | |||
| Undistributed (overdistributed) net investment income | $ | 1,186 | |
| Accumulated net realized gain (loss) | 501 | ||
| Unrealized appreciation (depreciation) on: | |||
| Investments | 13,573 | ||
| Interest rate swap contracts | 90 | ||
| Shares of beneficial interest | 305 | ||
| Additional paid-in capital | 307,063 | ||
| Net Assets | $ | 322,718 | |
| Net Asset Value, offering and redemption price per share: | |||
| Net asset value per share: Class A(#) | $ | 10.58 | |
| Maximum offering price per share (Net asset value plus sales charge of 3.75%): Class A | $ | 10.99 | |
| Class A — Net assets | $ | 1,980,247 | |
| Class A — Shares outstanding ($.01 par value) | 187,118 | ||
| Net asset value per share: Class C(#) | $ | 10.56 | |
| Class C — Net assets | $ | 2,095,319 | |
| Class C — Shares outstanding ($.01 par value) | 198,386 | ||
| Net asset value per share: Class E(#) | $ | 10.59 | |
| Class E — Net assets | $ | 18,321,306 | |
| Class E — Shares outstanding ($.01 par value) | 1,730,708 | ||
| Net asset value per share: Class S(#) | $ | 10.59 | |
| Class S — Net assets | $ | 300,321,148 | |
| Class S — Shares outstanding ($.01 par value) | 28,368,256 | ||
| Amounts in thousands | |||
| (•) Interest rate swap contracts - premiums paid (received) | $ | (291 | ) |
| (>) Investments in affiliates, Russell U.S. Cash Management Fund | $ | 15,912 | |
| (a) Cash Collateral for Swaps | $ | 787 | |
| (#) Net asset value per share equals class level net assets divided by class level shares of beneficial interest outstanding. | |||
See accompanying notes which are an integral part of the financial statements.
Russell Tax Exempt High Yield Bond Fund 541
Russell Investment Company
Russell Tax Exempt High Yield Bond Fund
Statement of Operations — For the Period Ended October 31, 2016
| Amounts in thousands | |||
| Investment Income | |||
| Dividends from affiliated Russell funds | $ | 54 | |
| Interest | 12,906 | ||
| Total investment income | 12,960 | ||
| Expenses | |||
| Advisory fees | 1,432 | ||
| Administrative fees | 138 | ||
| Custodian fees (1) | 106 | ||
| Distribution fees - Class A | 4 | ||
| Distribution fees - Class C | 10 | ||
| Transfer agent fees - Class A | 3 | ||
| Transfer agent fees - Class C | 3 | ||
| Transfer agent fees - Class E | 35 | ||
| Transfer agent fees - Class S | 532 | ||
| Professional fees | 46 | ||
| Registration fees | 116 | ||
| Shareholder servicing fees - Class C | 3 | ||
| Shareholder servicing fees - Class E | 44 | ||
| Trustees’ fees | 11 | ||
| Printing fees | 29 | ||
| Offering fees | 57 | ||
| Miscellaneous | 24 | ||
| Expenses before reductions | 2,593 | ||
| Expense reductions | (699 | ) | |
| Net expenses | 1,894 | ||
| Net investment income (loss) | 11,066 | ||
| Net Realized and Unrealized Gain (Loss) | |||
| Net realized gain (loss) on: | |||
| Investments | 1,199 | ||
| Interest rate swap contracts | (696 | ) | |
| Net realized gain (loss) | 503 | ||
| Net change in unrealized appreciation (depreciation) on: | |||
| Investments | 11,588 | ||
| Interest rate swap contracts | 151 | ||
| Net change in unrealized appreciation (depreciation) | 11,739 | ||
| Net realized and unrealized gain (loss) | 12,242 | ||
| Net Increase (Decrease) in Net Assets from Operations | $ | 23,308 | |
| (1) Includes a reimbursement for overbilling of custody out-of-pocket fees from prior years. See note 10 in the Notes to Financial Statements. | |||
See accompanying notes which are an integral part of the financial statements.
542 Russell Tax Exempt High Yield Bond Fund
Russell Investment Company
Russell Tax Exempt High Yield Bond Fund
Statements of Changes in Net Assets
| For the Periods Ended October 31, | ||||||
| Amounts in thousands | 2016 | 2015 | (1) | |||
| Increase (Decrease) in Net Assets | ||||||
| Operations | ||||||
| Net investment income (loss) | $ | 11,066 | $ | 3,218 | ||
| Net realized gain (loss) | 503 | 204 | ||||
| Net change in unrealized appreciation (depreciation) | 11,739 | 1,924 | ||||
| Net increase (decrease) in net assets from operations | 23,308 | 5,346 | ||||
| Distributions | ||||||
| From net investment income | ||||||
| Class A | (60 | ) | (10 | ) | ||
| Class C | (38 | ) | (2 | ) | ||
| Class E | (629 | ) | (49 | ) | ||
| Class S | (10,093 | ) | (2,306 | ) | ||
| From net realized gain | ||||||
| Class A | (1 | ) | — | |||
| Class C | (1 | ) | — | |||
| Class E | (13 | ) | — | |||
| Class S | (190 | ) | — | |||
| Net decrease in net assets from distributions | (11,025 | ) | (2,367 | ) | ||
| Share Transactions* | ||||||
| Net increase (decrease) in net assets from share transactions | 61,150 | 246,306 | ||||
| Total Net Increase (Decrease) in Net Assets | 73,433 | 249,285 | ||||
| Net Assets | ||||||
| Beginning of period | 249,285 | — | ||||
| End of period | $ | 322,718 | $ | 249,285 | ||
| Undistributed (overdistributed) net investment income included in net assets | $ | 1,186 | $ | 879 | ||
| (1) For the period June 2, 2015 (commencement of operations) to October 31, 2015. | ||||||
See accompanying notes which are an integral part of the financial statements.
Russell Tax Exempt High Yield Bond Fund 543
Russell Investment Company
Russell Tax Exempt High Yield Bond Fund
Statements of Changes in Net Assets, continued
* Share transaction amounts (in thousands) for the periods ended October 31, 2016 and October 31, 2015 were as follows:
| 2016 | 2015 | (1) | |||||||||||
| Shares | Dollars | Shares | Dollars | ||||||||||
| Class A | |||||||||||||
| Proceeds from shares sold | 86 | $ | 895 | 140 | $ | 1,402 | |||||||
| Proceeds from reinvestment of distributions | 6 | 58 | 1 | 10 | |||||||||
| Payments for shares redeemed | (19 | ) | (199 | ) | (27 | ) | (265 | ) | |||||
| Net increase (decrease) | 73 | 754 | 114 | 1,147 | |||||||||
| Class C | |||||||||||||
| Proceeds from shares sold | 290 | 3,042 | 52 | 524 | |||||||||
| Proceeds from reinvestment of distributions | 4 | 38 | —** | 2 | |||||||||
| Payments for shares redeemed | (145 | ) | (1,517 | ) | (3 | ) | (34 | ) | |||||
| Net increase (decrease) | 149 | 1,563 | 49 | 492 | |||||||||
| Class E | |||||||||||||
| Proceeds from shares sold | 290 | 3,038 | 1,657 | 16,479 | |||||||||
| Proceeds from reinvestment of distributions | 61 | 639 | 5 | 49 | |||||||||
| Payments for shares redeemed | (256 | ) | (2,676 | ) | (26 | ) | (270 | ) | |||||
| Net increase (decrease) | 95 | 1,001 | 1,636 | 16,258 | |||||||||
| Class S | |||||||||||||
| Proceeds from shares sold | 11,243 | 117,796 | 24,486 | 244,766 | |||||||||
| Proceeds from reinvestment of distributions | 981 | 10,233 | 231 | 2,297 | |||||||||
| Payments for shares redeemed | (6,705 | ) | (70,197 | ) | (1,868 | ) | (18,654 | ) | |||||
| Net increase (decrease) | 5,519 | 57,832 | 22,849 | 228,409 | |||||||||
| Total increase (decrease) | 5,836 | $ | 61,150 | 24,648 | $ | 246,306 | |||||||
| ** Less than 500 shares. | |||||||||||||
| (1) For the period June 2, 2015 (commencement of operations) to October 31, 2015. | |||||||||||||
See accompanying notes which are an integral part of the financial statements.
544 Russell Tax Exempt High Yield Bond Fund
(This page intentionally left blank)
Russell Investment Company
Russell Tax Exempt High Yield Bond Fund
Financial Highlights — For the Period Ended
For a Share Outstanding Throughout Each Period.
| $ | $ | $ | $ | $ | $ | |||||||||
| Net Asset Value, | Net | Net Realized | Total from | Distributions | Distributions | |||||||||
| Beginning of | Investment | and Unrealized | Investment | from Net | from Net | |||||||||
| Period | Income (Loss)(a)(d) | Gain (Loss) | Operations | Investment Income | Realized Gain | |||||||||
| Class A | ||||||||||||||
| October 31, 2016 | 10.11 | .38 | .48 | .86 | (.38 | ) | (.01 | ) | ||||||
| October 31, 2015(7) | 10.00 | .13 | .08 | .21 | (.10 | ) | — | |||||||
| Class C | ||||||||||||||
| October 31, 2016 | 10.10 | .30 | .48 | .78 | (.31 | ) | (.01 | ) | ||||||
| October 31, 2015(7) | 10.00 | .12 | .06 | .18 | (.08 | ) | — | |||||||
| Class E | ||||||||||||||
| October 31, 2016 | 10.11 | .38 | .48 | .86 | (.37 | ) | (.01 | ) | ||||||
| October 31, 2015(7) | 10.00 | .16 | .05 | .21 | (.10 | ) | — | |||||||
| Class S | ||||||||||||||
| October 31, 2016 | 10.11 | .41 | .48 | .89 | (.40 | ) | (.01 | ) | ||||||
| October 31, 2015(7) | 10.00 | .15 | .07 | .22 | (.11 | ) | — | |||||||
See accompanying notes which are an integral part of the financial statements.
546 Russell Tax Exempt High Yield Bond Fund
| % | % | % | ||||||||||||||
| $ | $ | Ratio of Expenses | Ratio of Expenses | Ratio of Net | ||||||||||||
| Net Asset Value, | % | Net Assets, | to Average | to Average | Investment Income | % | ||||||||||
| $ | End of | Total | End of Period | Net Assets, | Net Assets, | to Average | Portfolio | |||||||||
| Total Distributions | Period | Return(b)(c) | (000 | ) | Gross(e) | Net(d)(e) | Net Assets(d)(e) | Turnover Rate(b) | ||||||||
| (.39 | ) | 10.58 | 8.59 | 1,980 | 1.13 | .89 | 3.63 | 22 | ||||||||
| (.10 | ) | 10.11 | 2.11 | 1,155 | 1.12 | .89 | 3.16 | 23 | ||||||||
| (.32 | ) | 10.56 | 7.79 | 2,096 | 1.88 | 1.64 | 2.86 | 22 | ||||||||
| (.08 | ) | 10.10 | 1.82 | 498 | 1.88 | 1.64 | 2.82 | 23 | ||||||||
| (.38 | ) | 10.59 | 8.68 | 18,321 | 1.13 | .89 | 3.64 | 22 | ||||||||
| (.10 | ) | 10.11 | 2.13 | 16,539 | 1.15 | .89 | 3.81 | 23 | ||||||||
| (.41 | ) | 10.59 | 8.95 | 300,321 | .88 | .64 | 3.89 | 22 | ||||||||
| (.11 | ) | 10.11 | 2.20 | 231,093 | .88 | .64 | 3.57 | 23 | ||||||||
See accompanying notes which are an integral part of the financial statements.
Russell Tax Exempt High Yield Bond Fund 547
Russell Investment Company
Russell Tax Exempt High Yield Bond Fund
Related Party Transactions, Fees and Expenses
| Accrued fees payable to affiliates for the period ended October 31, 2016 were as follows: | ||
| Advisory fees | $ | 75,546 |
| Administration fees | 13,096 | |
| Distribution fees | 1,665 | |
| Shareholder servicing fees | 4,324 | |
| Transfer agent fees | 54,207 | |
| Trustee fees | 3,016 | |
| $ | 151,854 | |
| Transactions (amounts in thousands) during the period ended October 31, 2016 with Underlying Funds which are, or were, an | ||||||||||||||||||
| affiliated company are as follows: | ||||||||||||||||||
| Fair Value, | Change in | |||||||||||||||||
| Beginning of | Realized Gain | Unrealized | Fair Value, End | Income | Capital Gains | |||||||||||||
| Period | Purchases | Sales | (Loss) | Gain (Loss) | of Period | Distributions | Distributions | |||||||||||
| Russell U.S. Cash Management Fund $ | 8,960 | $ | 145,899 | $ | 138,948 | $ | — | $ | 1 | $ | 15,912 | $ | 54 | $ | — | |||
| $ | 8,960 | $ | 145,899 | $ | 138,948 | $ | — | $ | 1 | $ | 15,912 | $ | 54 | $ | — | |||
Federal Income Taxes
At October 31, 2016, the cost of investments and net unrealized appreciation (depreciation), undistributed ordinary income and
undistributed long-term capital gains for income tax purposes were as follows:.
| Cost of Investments | $ | 307,604,978 | |||
| Unrealized Appreciation | $ | 15,166,718 | |||
| Unrealized Depreciation | (1,549,481 | ) | |||
| Net Unrealized Appreciation (Depreciation) | $ | 13,617,237 | |||
| Undistributed Ordinary Income | $ | 1,643,447 | |||
| Tax Composition of Distributions | |||||
| Ordinary Income | $ | 559,634 | |||
| Tax-Exempt Income | $ | 10,464,197 |
Net investment income and net realized gains (loss) in the financial statements may differ from taxable net investment income and net
realized gains (losses). Capital accounts within the financial statements are adjusted for permanent book-tax differences. Book-tax
differences are primarily due to foreign currency gains and losses, reclassifications of dividends, differences in treatment of income
from swaps, net operating losses, investments in partnerships, investments in passive foreign investment companies (PFICs), tax
straddle transactions, use of tax equalization and foreign capital gains taxes. These adjustments have no impact on the net assets.
At October 31, 2016, the Statement of Assets and Liabilities have been adjusted by the following amounts (in thousands):
| Undistributed net investment income | $ | 61 | |
| Accumulated net realized gain (loss) | — | ||
| Additional paid-in capital | (61 | ) |
See accompanying notes which are an integral part of the financial statements.
548 Russell Tax Exempt High Yield Bond Fund
Russell Investment Company
Russell Tax Exempt Bond Fund
Portfolio Management Discussion and Analysis — October 31, 2016 (Unaudited)
| Russell Tax Exempt Bond Fund - Class A‡ | BloombergC Barclays Municipal 1-15 Year Blend (1-17 | ||||||
| Total | Index)** | ||||||
| Return | Total | ||||||
| 1 Year | (0.52 | )% | Return | ||||
| 5 Years | 2.33 | %§ | 1 Year | 3.10 | % | ||
| 10 Years | 3.13 | %§ | 5 Years | 3.51 | %§ | ||
| 10 Years | 4.28 | %§ | |||||
| Russell Tax Exempt Bond Fund - Class C | Tax Exempt Bond Linked Benchmark*** | ||||||
| Total | |||||||
| Total | Return | ||||||
| Return | |||||||
| 1 Year | 2.67 | % | 1 Year | 3.10 | % | ||
| 5 Years | 2.40 | %§ | 5 Years | 3.37 | %§ | ||
| 10 Years | 2.78 | %§ | 10 Years | 4.16 | %§ | ||
| Russell Tax Exempt Bond Fund - Class E | |||||||
| Total | |||||||
| Return | |||||||
| 1 Year | 3.42 | % | |||||
| 5 Years | 3.17 | %§ | |||||
| 10 Years | 3.55 | %§ | |||||
| Russell Tax Exempt Bond Fund - Class S | |||||||
| Total | |||||||
| Return | |||||||
| 1 Year | 3.68 | % | |||||
| 5 Years | 3.42 | %§ | |||||
| 10 Years | 3.82 | %§ | |||||
Russell Tax Exempt Bond Fund 549
Russell Investment Company
Russell Tax Exempt Bond Fund
Portfolio Management Discussion and Analysis, continued — October 31, 2016
(Unaudited)
| The Russell Tax Exempt Bond Fund (the “Fund”) employs | The Fund will tend to perform well in markets where revenue |
| a multi-manager approach whereby portions of the Fund are | and industrial development sectors lead. This is generally an |
| allocated to different money manager strategies. Fund assets not | environment where the economy is stable and a higher coupon |
| allocated to money managers are managed by Russell Investment | can be clipped or an environment where municipal tax receipts |
| Management, LLC (“RIM”), the Fund’s advisor. RIM may change | are stable or increasing, providing a better ability for issuers to |
| the allocation of the Fund’s assets among money managers at | service their debt. This may also be generalized as a “risk on” |
| any time. An exemptive order from the Securities and Exchange | market where investors are generally bullish about the economy. |
| Commission (“SEC”) permits RIM to engage or terminate a money | Environments that feature sharp rises in interest rates or mass |
| manager at any time, subject to approval by the Fund’s Board, | sell offs in fixed income risk assets (e.g., the 2008 financial crisis) |
| without a shareholder vote. Pursuant to the terms of the exemptive | will tend to be unfavorable for the Fund. |
| order, the Fund is required to notify its shareholders within 90 | For the fiscal year ended October 31, 2016, strong investor |
| days of when a money manager begins providing services. As of | demand, good performance in investment grade municipal |
| October 31, 2016, the Fund had two money managers. | revenue and industrial development sectors, and the flattening of |
| What is the Fund’s investment objective? | the intermediate and long end of the yield curve all combined to |
| The Fund seeks to provide federal tax-exempt current income | create a favorable environment for Fund performance. |
| consistent with the preservation of capital. The Fund will invest, | How did the investment strategies and techniques employed |
| under normal circumstances, at least 80% of the value of its | by the Fund and its money managers affect its benchmark- |
| assets in investments the income from which is exempt from | relative performance? |
| federal income tax. | With the exception of Class C Shares, the Fund outperformed its |
| How did the Fund perform relative to its benchmark for the | benchmark for the fiscal year. An overweight to revenue bonds was |
| fiscal year ended October 31, 2016? | beneficial, as was security selection within the state and regional |
| For the fiscal year ended October 31, 2016, the Fund’s Class | general obligation bond sector (e.g., Illinois, Puerto Rico). |
| A, Class C, Class E and Class S Shares gained 3.37%, 2.67%, | The Fund employs discretionary money managers. The Fund’s |
| 3.42% and 3.68%, respectively. This is compared to the Fund’s | discretionary money managers select the individual portfolio |
| benchmark, the Bloomberg Barclays Municipal 1-15 Year Blend | securities for the assets assigned to them. Fund assets not |
| (1-17) Index, which gained 3.10% during the same period. The | allocated to discretionary money managers include the Fund’s |
| Fund’s performance includes operating expenses, whereas index | liquidity reserves and assets which may be managed directly by |
| returns are unmanaged and do not include expenses of any kind. | RIM to effect the Fund’s investment strategies and/or to actively |
| For the fiscal year ended October 31, 2016, the Morningstar® | manage the Fund’s overall exposures by investing in securities or |
| Muni National Intermediate Category, a group of funds that | other instruments that RIM believes will achieve the desired risk/ |
| Morningstar considers to have investment strategies similar to | return profile for the Fund. |
| those of the Fund, gained 3.49%. This result serves as a peer | AllianceBernstein, L.P. (“AllianceBernstein”) moderately |
| comparison and is expressed net of operating expenses. | outperformed the Fund’s benchmark over the one-year period. An |
| overweight to the intermediate part of the municipal yield curve, a | |
| How did the market conditions described in the Market | concentration in A- and BBB-rated issues and security selection |
| Summary report affect the Fund’s performance? | within special tax and hospital sectors helped drive positive |
| For the fiscal year ended October 31, 2016, the U.S. municipal | results. |
| yield curve twisted and flattened significantly around 5-year | |
| maturities, with shorter term yields rising over 50 basis points | MacKay Shields LLC (“MacKay Shields”) outperformed the |
| (with the price of these bonds declining) and longer term yields | Fund’s benchmark for the one-year period primarily due to an |
| declining 30-50 basis (with the prices of these bonds increasing). | overweight to maturities beyond 10-years, and sector and quality |
| This was driven in large part by a similar flattening in the U.S. | selection. Insured Puerto Rico bonds, which rallied strongly in the |
| treasury yield curve and investors rushing into the municipal bond | latter part of the year, were key to outperformance. Revenue bonds |
| market, creating strong demand for this class of bonds. Revenue | also contributed to positive results, particularly transportation, |
| bonds led performance among municipal sectors, as did A- and | industrial development and hospital bonds. |
| BBB-rated cohorts among quality. Among states, New Jersey and | RIM’s decision to tactically overweight the Fund’s allocation |
| Illinois did well, as did the U.S. territory of Puerto Rico despite | to MacKay Shields versus AllianceBernstein was positive for |
| its fiscal difficulties. The relatively more defensive pre-refunded | performance, given the former manager’s relatively stronger |
| sector fared worst among municipal sectors. | results. |
550 Russell Tax Exempt Bond Fund
Russell Investment Company
Russell Tax Exempt Bond Fund
Portfolio Management Discussion and Analysis, continued — October 31, 2016
(Unaudited)
| During the period, the Fund did not use derivatives. | The views expressed in this report reflect those of the | |
| portfolio managers only through the end of the period | ||
| Describe any changes to the Fund’s structure or the money | covered by the report. These views do not necessarily | |
| manager line-up. | represent the views of RIM or any other person in RIM or | |
| There were no changes to the Fund’s structure or money manager | any other affiliated organization. These views are subject | |
| line-up during the fiscal year. | to change at any time based upon market conditions or | |
| Money Managers as of October 31, | other events, and RIM disclaims any responsibility to | |
| 2016 | Styles | update the views contained herein. These views should not |
| AllianceBernstein, L.P. | be relied on as investment advice and, because investment | |
| MacKay Shields LLC | Sector Sector Specialist Specialist | decisions for a Russell Investment Company (“RIC”) Fund |
| are based on numerous factors, should not be relied on as | ||
| an indication of investment decisions of any RIC Fund. | ||
* Assumes initial investment on November 1, 2006.
** The Bloomberg Barclays Municipal 1-15 Yr Blend (1-17) Index is an index, with income reinvested, representative of municipal bonds with maturities ranging
from 1-17 years.
Effective August 24, 2016 the Barclays fixed income benchmark indices, including the Barclays Aggregate family of indices, were renamed the Bloomberg
Barclays family of indices.
*** The Tax Exempt Bond Linked Benchmark provides a means to compare the Fund’s average annual returns to a secondary benchmark that takes into account
historical changes in the Fund’s primary benchmark. The Tax Exempt Bond Linked Benchmark represents the returns of the Bloomberg Barclays Municipal
1-10 Yr Blend (1-12) Index through June 30, 2013 and the returns of the Bloomberg Barclays Municipal 1-15 Yr Blend (1-17) Index thereafter.
‡ The Fund first issued Class A Shares on June 1, 2010. The returns shown for Class A Shares prior to that date are the returns of Class E Shares. The
performance shown has been adjusted to reflect the deduction of the maximum Class A sales charge of 3.75%. Annual returns for each Class will differ only to
the extent that the Class A Shares do not have the same expenses as Class E Shares.
§ Annualized.
Performance is historical and assumes reinvestment of all dividends and capital gains. Investment return and principal value will fluctuate so that an investor’s
shares, when redeemed, may be worth more or less than when purchased. Past performance is not indicative of future results. The returns shown do not reflect the
deduction of taxes that a shareholder would pay on Fund distributions or the redemption of Fund shares. Additionally, the returns presented herein may differ from
the performance reported in the Financial Highlights as the returns herein are calculated in a manner consistent with standardized performance in accordance with
Securities and Exchange Commission rules, while the performance in the Financial Highlights has been calculated in accordance with U.S. Generally Accepted
Accounting Principles (“U.S. GAAP”).
Russell Tax Exempt Bond Fund 551
Russell Investment Company
Russell Tax Exempt Bond Fund
Shareholder Expense Example — October 31, 2016 (Unaudited)
| Fund Expenses | Please note that the expenses shown in the table are meant | |||||
| The following disclosure provides important information | to highlight your ongoing costs only and do not reflect any | |||||
| regarding the Fund’s Shareholder Expense Example | transactional costs. Therefore, the information under the heading | |||||
| (“Example”). | “Hypothetical Performance (5% return before expenses)” is | |||||
| useful in comparing ongoing costs only, and will not help you | ||||||
| Example | determine the relative total costs of owning different funds. In | |||||
| As a shareholder of the Fund, you incur two types of costs: (1) | addition, if these transactional costs were included, your costs | |||||
| transaction costs, including sales charges (loads) on certain | would have been higher. | |||||
| purchase or redemption payments, and (2) ongoing costs, | Hypothetical | |||||
| including distribution (12b-1) and/or service fees and other | Performance (5% | |||||
| Fund expenses. The Example is intended to help you understand | Actual | return before | ||||
| your ongoing costs (in dollars) of investing in the Fund and to | Class A | Performance | expenses) | |||
| Beginning Account Value | ||||||
| compare these costs with the ongoing costs of investing in other | May 1, 2016 | $ | 1,000.00 | $ | 1,000.00 | |
| mutual funds. The Example is based on an investment of $1,000 | Ending Account Value | |||||
| invested at the beginning of the period and held for the entire | October 31, 2016 | $ | 1,004.20 | $ | 1,021.01 | |
| period indicated, which for this Fund is from May 1, 2016 to | Expenses Paid During Period* | $ | 4.13 | $ | 4.17 | |
| October 31, 2016. | * Expenses are equal to the Fund's annualized expense ratio of 0.82% | |||||
| (representing the six month period annualized), multiplied by the average | ||||||
| Actual Expenses | account value over the period, multiplied by 184/366 (to reflect the one-half | |||||
| The information in the table under the heading “Actual | year period). May reflect amounts waived and/or reimbursed. Without any | |||||
| Performance” provides information about actual account values | waivers and/or reimbursements, expenses would have been higher. | |||||
| and actual expenses. You may use the information in this column, | ||||||
| Hypothetical | ||||||
| together with the amount you invested, to estimate the expenses | Performance (5% | |||||
| that you paid over the period. Simply divide your account value by | Actual | return before | ||||
| $1,000 (for example, an $8,600 account value divided by $1,000 | Class C | Performance | expenses) | |||
| Beginning Account Value | ||||||
| = 8.6), then multiply the result by the number in the first column | May 1, 2016 | $ | 1,000.00 | $ | 1,000.00 | |
| in the row entitled “Expenses Paid During Period” to estimate | Ending Account Value | |||||
| the expenses you paid on your account during this period. | October 31, 2016 | $ | 1,000.70 | $ | 1,017.44 | |
| Expenses Paid During Period* | $ | 7.69 | $ | 7.76 | ||
| Hypothetical Example for Comparison Purposes | ||||||
| The information in the table under the heading “Hypothetical | * Expenses are equal to the Fund's annualized expense ratio of 1.53% | |||||
| (representing the six month period annualized), multiplied by the average | ||||||
| Performance (5% return before expenses)” provides information | account value over the period, multiplied by 184/366 (to reflect the one-half | |||||
| about hypothetical account values and hypothetical expenses | year period). May reflect amounts waived and/or reimbursed. Without any | |||||
| based on the Fund’s actual expense ratio and an assumed rate of | waivers and/or reimbursements, expenses would have been higher. | |||||
| return of 5% per year before expenses, which is not the Fund’s | ||||||
| Hypothetical | ||||||
| actual return. The hypothetical account values and expenses | Performance (5% | |||||
| may not be used to estimate the actual ending account balance or | Actual | return before | ||||
| expenses you paid for the period. You may use this information | Class E | Performance | expenses) | |||
| to compare the ongoing costs of investing in the Fund and other | Beginning Account Value | |||||
| May 1, 2016 | $ | 1,000.00 | $ | 1,000.00 | ||
| funds. To do so, compare this 5% hypothetical example with the | Ending Account Value | |||||
| 5% hypothetical examples that appear in the shareholder reports | October 31, 2016 | $ | 1,004.40 | $ | 1,021.22 | |
| of other funds. | Expenses Paid During Period* | $ | 3.93 | $ | 3.96 | |
| * Expenses are equal to the Fund's annualized expense ratio of 0.78% | ||||||
| (representing the six month period annualized), multiplied by the average | ||||||
| account value over the period, multiplied by 184/366 (to reflect the one-half | ||||||
| year period). May reflect amounts waived and/or reimbursed. Without any | ||||||
| waivers and/or reimbursements, expenses would have been higher. | ||||||
552 Russell Tax Exempt Bond Fund
Russell Investment Company
Russell Tax Exempt Bond Fund
Shareholder Expense Example, continued — October 31, 2016 (Unaudited)
| Hypothetical | ||||
| Performance (5% | ||||
| Actual | return before | |||
| Class S | Performance | expenses) | ||
| Beginning Account Value | ||||
| May 1, 2016 | $ | 1,000.00 | $ | 1,000.00 |
| Ending Account Value | ||||
| October 31, 2016 | $ | 1,005.70 | $ | 1,022.47 |
| Expenses Paid During Period* | $ | 2.67 | $ | 2.69 |
* Expenses are equal to the Fund's annualized expense ratio of 0.53%
(representing the six month period annualized), multiplied by the average
account value over the period, multiplied by 184/366 (to reflect the one-half
year period). May reflect amounts waived and/or reimbursed. Without any
waivers and/or reimbursements, expenses would have been higher.
Russell Tax Exempt Bond Fund 553
Russell Investment Company
Russell Tax Exempt Bond Fund
Schedule of Investments — October 31, 2016
| Amounts in thousands (except share amounts) | ||||||||
| Principal | Fair | |||||||
| Amount ($) | Rate | Date of | Value | |||||
| or Shares | % | Maturity | $ | |||||
| Municipal Bonds - 94.1% | ||||||||
| Alabama - 1.6% | ||||||||
| Alabama 21st Century Authority Revenue Bonds | 1,120 | 5.000 | 06/01/18 | 1,185 | ||||
| Alabama 21st Century Authority Revenue Bonds | 545 | 5.000 | 06/01/20 | 610 | ||||
| Alabama Public School & College Authority Revenue Bonds | 3,385 | 5.000 | 05/01/23 | 4,111 | ||||
| Alabama Special Care Facilities Financing Authority-Birmingham Alabama Revenue | ||||||||
| Bonds | 850 | 5.250 | 06/01/25 | 954 | ||||
| Birmingham Water Works Board Revenue Bonds(µ) | 1,275 | 5.000 | 01/01/17 | 1,284 | ||||
| County of Jefferson Alabama General Obligation Limited(µ) | 4,100 | 5.000 | 04/01/22 | 4,175 | ||||
| County of Jefferson Alabama Sewer Revenue Bonds | 2,230 | 5.000 | 10/01/22 | 2,531 | ||||
| Homewood Educational Building Authority Revenue Bonds(µ) | 485 | 5.000 | 12/01/26 | 564 | ||||
| Limestone County Board of Education Special Tax(µ) | 1,000 | 5.000 | 11/01/30 | 1,168 | ||||
| Limestone County Board of Education Special Tax(µ) | 1,000 | 5.000 | 11/01/31 | 1,166 | ||||
| Mobile County Board of School Commissioners Revenue Bonds | 1,445 | 5.000 | 03/01/32 | 1,665 | ||||
| University of South Alabama Revenue Bonds(µ) | 1,530 | 5.000 | 11/01/24 | 1,865 | ||||
| University of South Alabama Revenue Bonds(µ) | 1,695 | 5.000 | 11/01/25 | 2,085 | ||||
| 23,363 | ||||||||
| Alaska - 0.1% | ||||||||
| Alaska Railroad Corp. Revenue Bonds | 500 | 5.000 | 08/01/18 | 532 | ||||
| City of Valdez Alaska Revenue Bonds | 750 | 5.000 | 01/01/21 | 853 | ||||
| Northern Tobacco Securitization Corp. Revenue Bonds | 350 | 5.000 | 06/01/32 | 345 | ||||
| 1,730 | ||||||||
| Arizona - 2.3% | ||||||||
| Apache County Industrial Development Authority Revenue Bonds | 3,000 | 4.500 | 03/01/30 | 3,294 | ||||
| Arizona Health Facilities Authority Revenue Bonds | 2,000 | 5.250 | 01/01/18 | 2,100 | ||||
| Arizona Health Facilities Authority Revenue Bonds | 2,000 | 5.000 | 02/01/18 | 2,096 | ||||
| Arizona Health Facilities Authority Revenue Bonds | 2,000 | 5.250 | 01/01/22 | 2,096 | ||||
| Arizona Health Facilities Authority Revenue Bonds | 2,255 | 5.000 | 02/01/34 | 2,505 | ||||
| Arizona Transportation Board Revenue Bonds | 2,685 | 5.000 | 07/01/25 | 3,312 | ||||
| Arizona Water Infrastructure Finance Authority Revenue Bonds | 1,000 | 5.000 | 10/01/18 | 1,078 | ||||
| County of Pinal Arizona Revenue Bonds | 2,455 | 5.000 | 08/01/21 | 2,858 | ||||
| County of Pinal Arizona Revenue Bonds | 1,775 | 5.000 | 08/01/25 | 2,161 | ||||
| Maricopa County Pollution Control Corp. Revenue Bonds(Ê) | 2,310 | 5.200 | 06/01/43 | 2,579 | ||||
| Salt River Project Agricultural Improvement & Power District Revenue Bonds | 1,635 | 5.000 | 01/01/25 | 1,774 | ||||
| Salt Verde Financial Corp. Revenue Bonds | 1,045 | 5.250 | 12/01/24 | 1,260 | ||||
| Student & Academic Services LLC Revenue Bonds(µ) | 200 | 5.000 | 06/01/26 | 240 | ||||
| Student & Academic Services LLC Revenue Bonds(µ) | 425 | 5.000 | 06/01/27 | 506 | ||||
| Student & Academic Services LLC Revenue Bonds(µ) | 390 | 5.000 | 06/01/28 | 461 | ||||
| Town of Marana Arizona Revenue Bonds | 2,240 | 5.000 | 07/01/26 | 2,704 | ||||
| Town of Marana Arizona Revenue Bonds | 800 | 5.000 | 07/01/27 | 960 | ||||
| Town of Marana Arizona Revenue Bonds | 1,735 | 5.000 | 07/01/28 | 2,073 | ||||
| 34,057 | ||||||||
| Arkansas - 0.2% | ||||||||
| County of Pulaski Arkansas Revenue Bonds | 1,000 | 5.000 | 03/01/29 | 1,212 | ||||
| Henderson State University Revenue Bonds(µ) | 850 | 2.000 | 11/01/16 | 850 | ||||
| Henderson State University Revenue Bonds(µ) | 220 | 3.000 | 11/01/18 | 228 | ||||
| Pulaski County Public Facilities Board Revenue Bonds | 440 | 5.000 | 12/01/22 | 524 | ||||
| 2,814 | ||||||||
| California - 8.0% | ||||||||
| Abag Finance Authority for Nonprofit Corps. Revenue Bonds | 1,340 | 6.000 | 08/01/30 | 1,601 | ||||
| Alum Rock Union Elementary School District General Obligation Unlimited(µ) | 400 | 5.000 | 08/01/20 | 456 | ||||
| Alum Rock Union Elementary School District General Obligation Unlimited(µ) | 600 | 5.000 | 08/01/21 | 702 | ||||
| Alum Rock Union Elementary School District General Obligation Unlimited(µ) | 2,855 | 5.000 | 08/01/32 | 3,397 |
See accompanying notes which are an integral part of the financial statements.
554 Russell Tax Exempt Bond Fund
Russell Investment Company
Russell Tax Exempt Bond Fund
Schedule of Investments, continued — October 31, 2016
| Amounts in thousands (except share amounts) | |||||||
| Principal | Fair | ||||||
| Amount ($) | Rate | Date of | Value | ||||
| or Shares | % | Maturity | $ | ||||
| Anaheim Housing & Public Improvements Authority Revenue Bonds | 2,450 | 5.000 | 10/01/31 | 2,823 | |||
| Anaheim Housing & Public Improvements Authority Revenue Bonds | 2,000 | 5.000 | 10/01/32 | 2,300 | |||
| Brentwood Infrastructure Financing Authority Special Assessment(µ) | 1,000 | 5.000 | 09/02/29 | 1,190 | |||
| California Health Facilities Financing Authority Revenue Bonds | 1,000 | 5.000 | 11/15/29 | 1,138 | |||
| California State Public Works Board Revenue Bonds | 1,100 | 5.000 | 12/01/16 | 1,104 | |||
| California State Public Works Board Revenue Bonds | 825 | 4.000 | 12/01/34 | 897 | |||
| California Statewide Communities Development Authority Revenue Bonds | 640 | 3.500 | 11/01/18 | 651 | |||
| California Statewide Communities Development Authority Revenue Bonds | 2,260 | 5.000 | 04/01/19 | 2,476 | |||
| California Statewide Communities Development Authority Revenue Bonds | 1,405 | 6.000 | 05/15/23 | 1,516 | |||
| California Statewide Communities Development Authority Revenue Bonds | 1,015 | 5.000 | 05/15/30 | 1,211 | |||
| California Statewide Communities Development Authority Revenue Bonds | 1,565 | 6.125 | 11/01/33 | 1,801 | |||
| California Statewide Communities Development Authority Revenue Bonds | 1,000 | 5.000 | 08/01/34 | 1,167 | |||
| California Statewide Communities Development Authority Revenue Bonds | 1,000 | 5.000 | 12/01/36 | 1,123 | |||
| Centinela Valley Union High School District General Obligation Unlimited | 500 | 5.750 | 08/01/27 | 640 | |||
| Centinela Valley Union High School District General Obligation Unlimited | 1,000 | 5.750 | 08/01/28 | 1,281 | |||
| Centinela Valley Union High School District General Obligation Unlimited | 650 | 5.750 | 08/01/29 | 832 | |||
| City of Fresno California Airport Revenue Bonds(µ) | 225 | 5.000 | 07/01/22 | 262 | |||
| City of Los Angeles Department of Airports Revenue Bonds | 1,655 | 5.000 | 05/15/29 | 1,872 | |||
| City of Vallejo California Water Revenue Bonds | 2,755 | 5.250 | 05/01/27 | 3,318 | |||
| City of Vallejo California Water Revenue Bonds | 3,105 | 5.250 | 05/01/29 | 3,727 | |||
| County of Los Angeles California Certificate Of Participation | 200 | 5.000 | 09/01/20 | 228 | |||
| County of Los Angeles California Certificate Of Participation | 500 | 5.000 | 03/01/21 | 579 | |||
| County of Los Angeles California Certificate Of Participation | 125 | 5.000 | 09/01/21 | 147 | |||
| County of Los Angeles California Certificate Of Participation | 430 | 5.000 | 09/01/22 | 515 | |||
| County of Sacramento California Airport System Revenue Bonds | 2,000 | 5.000 | 07/01/22 | 2,133 | |||
| Dinuba Redevelopment Agency Tax Allocation(µ) | 590 | 5.000 | 09/01/33 | 690 | |||
| Emeryville Redevelopment Agency Successor Agency Tax Allocation | 1,980 | 5.000 | 09/01/20 | 2,265 | |||
| Florin Resource Conservation District Revenue Bonds(µ) | 300 | 4.000 | 09/01/17 | 308 | |||
| Florin Resource Conservation District Revenue Bonds(µ) | 455 | 4.000 | 09/01/18 | 481 | |||
| Florin Resource Conservation District Revenue Bonds(µ) | 450 | 5.000 | 09/01/24 | 553 | |||
| Golden State Tobacco Securitization Corp. Revenue Bonds(µ) | 750 | 4.600 | 06/01/23 | 790 | |||
| Jurupa California Public Authority Special Tax Revenue Bonds | 425 | 3.500 | 09/01/17 | 435 | |||
| Modesto Irrigation District Revenue Bonds | 1,425 | 5.000 | 07/01/17 | 1,465 | |||
| Oxnard Financing Authority Revenue Bonds(µ) | 740 | 5.000 | 06/01/21 | 852 | |||
| Oxnard Financing Authority Revenue Bonds(µ) | 775 | 5.000 | 06/01/34 | 907 | |||
| Oxnard School District General Obligation Unlimited(µ) | 810 | 5.250 | 08/01/28 | 1,012 | |||
| Oxnard School District General Obligation Unlimited(µ) | 325 | 5.250 | 08/01/29 | 403 | |||
| Pajaro Valley Water Management Agency Revenue Bonds(µ) | 775 | 4.000 | 03/01/18 | 808 | |||
| Riverside County Public Financing Authority Tax Allocation(µ) | 2,270 | 5.000 | 10/01/27 | 2,765 | |||
| Sacramento Unified School District General Obligation Unlimited(µ) | 4,000 | 5.000 | 07/01/31 | 4,672 | |||
| San Diego Public Facilities Financing Authority Water Revenue Bonds | 8,415 | 5.000 | 08/01/26 | 10,838 | |||
| San Francisco City & County Public Utilities Commission Water Revenue Bonds | 2,685 | 5.000 | 11/01/27 | 3,160 | |||
| San Joaquin Hills Transportation Corridor Agency Revenue Bonds | 5,000 | 5.000 | 01/15/29 | 5,877 | |||
| San Ysidro School District Certificate Of Participation(µ) | 1,175 | 5.000 | 09/01/28 | 1,393 | |||
| Shasta Lake Public Finance Authority Tax Allocation(µ) | 385 | 5.000 | 12/01/25 | 482 | |||
| South Orange County Public Financing Authority Special Tax | 900 | 5.000 | 08/15/29 | 1,012 | |||
| Southern California Public Power Authority Revenue Bonds | 1,500 | 5.000 | 07/01/18 | 1,603 | |||
| Southern California Public Power Authority Revenue Bonds | 1,000 | 5.000 | 07/01/23 | 1,140 | |||
| State of California Department of Water Resources Power Supply Revenue Bonds | 1,000 | 5.000 | 05/01/17 | 1,021 | |||
| State of California Department of Water Resources Revenue Bonds(ae) | 860 | 5.000 | 06/01/18 | 917 | |||
| State of California Department of Water Resources Revenue Bonds | 140 | 5.000 | 12/01/21 | 149 |
See accompanying notes which are an integral part of the financial statements.
Russell Tax Exempt Bond Fund 555
Russell Investment Company
Russell Tax Exempt Bond Fund
Schedule of Investments, continued — October 31, 2016
| Amounts in thousands (except share amounts) | ||||||||
| Principal | Fair | |||||||
| Amount ($) | Rate | Date of | Value | |||||
| or Shares | % | Maturity | $ | |||||
| State of California General Obligation Unlimited(µ) | 1,000 | 6.000 | 02/01/17 | 1,013 | ||||
| State of California General Obligation Unlimited(ae) | 635 | 5.250 | 07/01/19 | 708 | ||||
| State of California General Obligation Unlimited | 2,000 | 5.000 | 02/01/20 | 2,252 | ||||
| State of California General Obligation Unlimited | 2,500 | 5.500 | 04/01/21 | 2,776 | ||||
| State of California General Obligation Unlimited | 365 | 5.250 | 07/01/21 | 407 | ||||
| State of California General Obligation Unlimited | 1,000 | 5.250 | 03/01/22 | 1,139 | ||||
| State of California General Obligation Unlimited | 7,095 | 5.000 | 11/01/25 | 8,727 | ||||
| State of California General Obligation Unlimited | 5,760 | 5.000 | 03/01/26 | 7,144 | ||||
| State of California General Obligation Unlimited | 2,500 | 5.250 | 09/01/28 | 2,974 | ||||
| State of California General Obligation Unlimited | 2,685 | 5.000 | 10/01/29 | 2,834 | ||||
| State of California General Obligation Unlimited | 450 | 5.000 | 02/01/31 | 528 | ||||
| Tuolumne Wind Project Authority Revenue Bonds | 1,500 | 5.000 | 01/01/18 | 1,570 | ||||
| Watereuse Finance Authority Revenue Bonds | 1,230 | 5.500 | 05/01/36 | 1,509 | ||||
| 120,666 | ||||||||
| Colorado - 2.1% | ||||||||
| City & County of Denver Colorado Airport System Revenue Bonds | 1,965 | 5.000 | 11/15/25 | 2,323 | ||||
| City of Colorado Springs Colorado Utilities System Revenue Bonds | 4,000 | 5.000 | 11/15/18 | 4,331 | ||||
| Colorado Educational & Cultural Facilities Authority Revenue Bonds | 2,000 | 5.000 | 04/01/18 | 2,110 | ||||
| Colorado Educational & Cultural Facilities Authority Revenue Bonds | 1,220 | 5.000 | 10/01/20 | 1,377 | ||||
| Colorado Educational & Cultural Facilities Authority Revenue Bonds | 1,000 | 5.000 | 08/15/30 | 1,140 | ||||
| Colorado Health Facilities Authority Revenue Bonds | 255 | 5.250 | 06/01/23 | 256 | ||||
| Colorado Health Facilities Authority Revenue Bonds | 1,500 | 5.000 | 09/01/30 | 1,773 | ||||
| Colorado Health Facilities Authority Revenue Bonds | 685 | 5.250 | 02/01/31 | 761 | ||||
| Denver Convention Center Hotel Authority Revenue Bonds(µ) | 1,265 | 5.000 | 12/01/35 | 1,266 | ||||
| Denver Health & Hospital Authority Revenue Bonds | 525 | 4.250 | 12/01/33 | 565 | ||||
| Denver Urban Renewal Authority Tax Allocation | 1,575 | 5.000 | 12/01/21 | 1,862 | ||||
| E-470 Public Highway Authority Revenue Bonds | 2,250 | 5.375 | 09/01/26 | 2,500 | ||||
| Eaton Area Park & Recreation District General Obligation Limited | 470 | 5.500 | 12/01/30 | 514 | ||||
| Park 70 Metropolitan District General Obligation Unlimited | 150 | 5.000 | 12/01/16 | 151 | ||||
| Park 70 Metropolitan District General Obligation Unlimited | 165 | 5.000 | 12/01/19 | 180 | ||||
| Park 70 Metropolitan District General Obligation Unlimited | 195 | 5.000 | 12/01/20 | 217 | ||||
| Park Creek Metropolitan District Revenue Bonds | 1,860 | 4.000 | 12/01/20 | 2,001 | ||||
| Regional Transportation District Certificate Of Participation | 6,725 | 5.000 | 06/01/27 | 7,926 | ||||
| 31,253 | ||||||||
| Connecticut - 1.9% | ||||||||
| City of Bridgeport Connecticut General Obligation Unlimited(µ) | 965 | 5.000 | 07/01/29 | 1,127 | ||||
| City of Hartford Connecticut General Obligation Unlimited(µ) | 155 | 5.000 | 08/15/22 | 178 | ||||
| City of New Haven Connecticut General Obligation Unlimited(µ) | 2,000 | 5.000 | 08/01/21 | 2,295 | ||||
| City of New Haven Connecticut General Obligation Unlimited(µ) | 1,915 | 5.000 | 09/01/30 | 2,250 | ||||
| Connecticut State Health & Educational Facility Authority Revenue Bonds | 2,500 | 5.000 | 07/01/25 | 2,668 | ||||
| State of Connecticut General Obligation Unlimited | 6,500 | 5.000 | 11/15/21 | 7,578 | ||||
| State of Connecticut General Obligation Unlimited | 5,685 | 5.000 | 11/15/22 | 6,742 | ||||
| State of Connecticut Special Tax Revenue Bonds | 4,470 | 5.000 | 10/01/25 | 5,425 | ||||
| 28,263 | ||||||||
| District of Columbia - 0.2% | ||||||||
| District of Columbia Revenue Bonds | 2,000 | 5.000 | 06/01/36 | 2,306 | ||||
| Metropolitan Washington Airports Authority Revenue Bonds | 1,205 | 5.000 | 10/01/35 | 1,362 | ||||
| 3,668 | ||||||||
| Florida - 8.6% | ||||||||
| Capital Projects Finance Authority Revenue Bonds(µ) | 220 | 5.125 | 10/01/21 | 224 | ||||
| Central Florida Expressway Authority Revenue Bonds | 500 | 4.000 | 07/01/31 | 546 | ||||
| Central Florida Expressway Authority Revenue Bonds | 3,250 | 5.000 | 07/01/33 | 3,867 |
See accompanying notes which are an integral part of the financial statements.
556 Russell Tax Exempt Bond Fund
Russell Investment Company
Russell Tax Exempt Bond Fund
Schedule of Investments, continued — October 31, 2016
| Amounts in thousands (except share amounts) | ||||||||
| Principal | Fair | |||||||
| Amount ($) | Rate | Date of | Value | |||||
| or Shares | % | Maturity | $ | |||||
| Citizens Property Insurance Corp. Revenue Bonds | 2,500 | 5.000 | 06/01/18 | 2,655 | ||||
| Citizens Property Insurance Corp. Revenue Bonds | 2,495 | 5.000 | 06/01/19 | 2,734 | ||||
| Citizens Property Insurance Corp. Revenue Bonds | 2,500 | 5.000 | 06/01/20 | 2,819 | ||||
| Citizens Property Insurance Corp. Revenue Bonds | 7,385 | 5.000 | 06/01/22 | 8,737 | ||||
| City of Lakeland Florida Department of Electric Utilities Revenue Bonds(µ) | 2,000 | 5.000 | 10/01/17 | 2,077 | ||||
| City of Miami Beach Florida Parking Revenue Bonds(µ) | 395 | 5.000 | 09/01/32 | 466 | ||||
| City of Miami Beach Florida Parking Revenue Bonds(µ) | 1,755 | 5.000 | 09/01/33 | 2,063 | ||||
| City of North Port Florida Special Assessment(µ) | 715 | 5.000 | 07/01/25 | 853 | ||||
| City of North Port Florida Special Assessment(µ) | 1,135 | 5.000 | 07/01/26 | 1,350 | ||||
| City of Tallahassee Florida Revenue Bonds | 500 | 5.000 | 12/01/27 | 604 | ||||
| City of Tallahassee Florida Revenue Bonds | 650 | 5.000 | 12/01/28 | 781 | ||||
| Collier County Industrial Development Authority Revenue Bonds | 1,695 | 5.500 | 10/01/26 | 1,957 | ||||
| County of Miami-Dade Florida Aviation Revenue Bonds(ae) | 300 | 5.250 | 10/01/20 | 347 | ||||
| County of Miami-Dade Florida Aviation Revenue Bonds | 935 | 5.250 | 10/01/30 | 1,069 | ||||
| County of Miami-Dade Florida Revenue Bonds | 3,000 | 5.000 | 10/01/28 | 3,435 | ||||
| County of Miami-Dade Florida Revenue Bonds | 3,600 | 5.000 | 10/01/29 | 4,119 | ||||
| County of Miami-Dade Florida Revenue Bonds(µ) | 4,310 | Zero coupon | 10/01/35 | 2,004 | ||||
| County of Orange Florida Sales Tax Revenue Bonds | 8,885 | 5.000 | 01/01/20 | 9,947 | ||||
| Escambia County Health Facilities Authority Revenue Bonds | 2,345 | 6.000 | 08/15/36 | 2,669 | ||||
| Florida Municipal Power Agency Revenue Bonds | 4,660 | 5.000 | 10/01/28 | 5,751 | ||||
| JEA Electric System Revenue Bonds | 1,000 | 5.000 | 10/01/17 | 1,038 | ||||
| JEA Electric System Revenue Bonds | 645 | 5.000 | 10/01/20 | 737 | ||||
| Kissimmee Utility Authority Revenue Bonds(µ) | 1,000 | 5.000 | 10/01/17 | 1,037 | ||||
| Miami Beach Health Facilities Authority Revenue Bonds | 5,930 | 5.000 | 11/15/29 | 6,671 | ||||
| Miami-Dade County Expressway Authority Revenue Bonds | 350 | 5.000 | 07/01/18 | 373 | ||||
| Miami-Dade County Expressway Authority Revenue Bonds | 1,400 | 5.000 | 07/01/31 | 1,694 | ||||
| Mid-Bay Bridge Authority Revenue Bonds | 455 | 5.000 | 10/01/23 | 541 | ||||
| Mid-Bay Bridge Authority Revenue Bonds | 2,500 | 7.250 | 10/01/34 | 3,211 | ||||
| Orange County Health Facilities Authority Revenue Bonds | 3,000 | 5.000 | 10/01/39 | 3,464 | ||||
| Orlando Utilities Commission Revenue Bonds | 3,000 | 5.000 | 10/01/19 | 3,336 | ||||
| Orlando-Orange County Expressway Authority Revenue Bonds | 4,145 | 5.000 | 07/01/20 | 4,685 | ||||
| Palm Beach County Health Facilities Authority Revenue Bonds | 1,000 | 3.000 | 12/01/17 | 1,019 | ||||
| Reedy Creek Improvement District General Obligation Limited | 850 | 5.000 | 06/01/20 | 961 | ||||
| Reedy Creek Improvement District General Obligation Limited | 5,000 | 5.000 | 06/01/25 | 6,057 | ||||
| Reedy Creek Improvement District General Obligation Limited | 4,870 | 5.000 | 06/01/26 | 5,870 | ||||
| South Miami Health Facilities Authority Revenue Bonds | 750 | 5.000 | 08/15/18 | 775 | ||||
| State of Florida General Obligation Unlimited | 11,000 | 5.000 | 06/01/21 | 12,862 | ||||
| State of Florida General Obligation Unlimited | 2,990 | 5.000 | 06/01/22 | 3,572 | ||||
| Tampa Sports Authority Revenue Bonds | 6,790 | 5.000 | 01/01/22 | 7,984 | ||||
| Volusia County School Board Certificate Of Participation(µ) | 1,730 | 5.000 | 08/01/32 | 2,047 | ||||
| 129,008 | ||||||||
| Georgia - 1.4% | ||||||||
| City of Atlanta Department of Aviation Revenue Bonds | 2,500 | 5.000 | 01/01/20 | 2,798 | ||||
| City of Atlanta Department of Aviation Revenue Bonds | 825 | 5.250 | 01/01/30 | 946 | ||||
| City of Atlanta Georgia General Obligation Limited | 3,415 | 5.000 | 12/01/21 | 4,041 | ||||
| City of Atlanta Georgia Water & Wastewater Revenue Bonds | 1,000 | 6.000 | 11/01/20 | 1,147 | ||||
| City of Atlanta Georgia Water & Wastewater Revenue Bonds(µ) | 2,000 | 5.500 | 11/01/23 | 2,256 | ||||
| City of Atlanta Georgia Water & Wastewater Revenue Bonds | 1,300 | 6.000 | 11/01/25 | 1,491 | ||||
| Glynn-Brunswick Memorial Hospital Authority Revenue Bonds | 1,000 | 5.000 | 08/01/21 | 1,151 | ||||
| Glynn-Brunswick Memorial Hospital Authority Revenue Bonds | 1,220 | 5.000 | 08/01/22 | 1,434 | ||||
| Municipal Electric Authority of Georgia Revenue Bonds(µ) | 850 | 6.250 | 01/01/17 | 858 | ||||
| Private Colleges & Universities Authority Revenue Bonds | 565 | 5.000 | 04/01/17 | 574 |
See accompanying notes which are an integral part of the financial statements.
Russell Tax Exempt Bond Fund 557
Russell Investment Company
Russell Tax Exempt Bond Fund
Schedule of Investments, continued — October 31, 2016
| Amounts in thousands (except share amounts) | ||||||||
| Principal | Fair | |||||||
| Amount ($) | Rate | Date of | Value | |||||
| or Shares | % | Maturity | $ | |||||
| Private Colleges & Universities Authority Revenue Bonds | 1,190 | 5.000 | 04/01/27 | 1,391 | ||||
| Savannah Hospital Authority Revenue Bonds | 1,000 | 5.500 | 07/01/28 | 1,205 | ||||
| State of Georgia General Obligation Unlimited | 1,240 | 5.000 | 07/01/17 | 1,275 | ||||
| 20,567 | ||||||||
| Guam - 1.3% | ||||||||
| Guam Government Waterworks Authority Revenue Bonds | 1,240 | 5.000 | 07/01/28 | 1,413 | ||||
| Guam Government Waterworks Authority Revenue Bonds | 5,200 | 5.000 | 07/01/29 | 5,940 | ||||
| Guam Power Authority Revenue Bonds | 2,500 | 5.500 | 10/01/30 | 2,754 | ||||
| Guam Power Authority Revenue Bonds | 1,000 | 5.000 | 10/01/34 | 1,100 | ||||
| Territory of Guam Revenue Bonds | 250 | 5.000 | 12/01/19 | 274 | ||||
| Territory of Guam Revenue Bonds | 400 | 5.000 | 12/01/21 | 457 | ||||
| Territory of Guam Revenue Bonds | 500 | 5.000 | 12/01/23 | 590 | ||||
| Territory of Guam Revenue Bonds | 500 | 5.375 | 12/01/24 | 566 | ||||
| Territory of Guam Revenue Bonds | 4,675 | 5.000 | 12/01/29 | 5,552 | ||||
| Territory of Guam Revenue Bonds | 785 | 5.000 | 01/01/32 | 861 | ||||
| 19,507 | ||||||||
| Idaho - 0.7% | ||||||||
| Idaho Health Facilities Authority Revenue Bonds | 1,000 | 5.000 | 09/01/28 | 1,151 | ||||
| Idaho Health Facilities Authority Revenue Bonds | 710 | 5.000 | 09/01/29 | 811 | ||||
| Idaho Health Facilities Authority Revenue Bonds | 1,500 | 5.000 | 12/01/30 | 1,736 | ||||
| Idaho Housing & Finance Association Revenue Bonds(µ) | 1,330 | 5.250 | 07/15/21 | 1,428 | ||||
| Idaho Housing & Finance Association Revenue Bonds(µ) | 1,665 | 5.250 | 07/15/26 | 1,788 | ||||
| Idaho Housing & Finance Association Revenue Bonds | 1,670 | 5.000 | 07/15/31 | 1,955 | ||||
| Idaho State Building Authority Revenue Bonds | 940 | 5.000 | 09/01/23 | 1,090 | ||||
| 9,959 | ||||||||
| Illinois - 8.1% | ||||||||
| Chicago Board of Education General Obligation Unlimited(µ) | 1,405 | 5.000 | 12/01/19 | 1,444 | ||||
| Chicago Board of Education General Obligation Unlimited | 5,000 | 7.000 | 12/01/26 | 5,239 | ||||
| Chicago Board of Education General Obligation Unlimited(µ) | 2,120 | 5.000 | 12/01/27 | 2,200 | ||||
| Chicago Board of Education General Obligation Unlimited(µ) | 1,750 | Zero coupon | 12/01/30 | 902 | ||||
| Chicago Midway International Airport Revenue Bonds | 4,435 | 5.000 | 01/01/34 | 5,061 | ||||
| Chicago Public Building Commission Revenue Bonds(µ) | 1,580 | 5.250 | 12/01/18 | 1,650 | ||||
| City of Chicago Illinois General Obligation Unlimited | 715 | 5.000 | 01/01/17 | 718 | ||||
| City of Chicago Illinois General Obligation Unlimited | 1,115 | 5.000 | 01/01/19 | 1,150 | ||||
| City of Chicago Illinois General Obligation Unlimited(µ) | 575 | 5.000 | 12/01/19 | 577 | ||||
| City of Chicago Illinois General Obligation Unlimited(µ) | 380 | 5.000 | 01/01/20 | 382 | ||||
| City of Chicago Illinois General Obligation Unlimited(µ) | 250 | 4.250 | 01/01/21 | 251 | ||||
| City of Chicago Illinois General Obligation Unlimited(µ) | 2,535 | 4.250 | 12/01/21 | 2,540 | ||||
| City of Chicago Illinois General Obligation Unlimited | 1,500 | 5.000 | 01/01/24 | 1,547 | ||||
| City of Chicago Illinois General Obligation Unlimited(µ) | 2,825 | 5.250 | 01/01/24 | 2,926 | ||||
| City of Chicago Illinois Midway Airport Revenue Bonds | 940 | 5.000 | 01/01/30 | 1,088 | ||||
| City of Chicago Illinois Motor Fuel Tax Revenue Bonds | 1,560 | 5.000 | 01/01/28 | 1,648 | ||||
| City of Chicago Illinois Motor Fuel Tax Revenue Bonds | 725 | 5.000 | 01/01/29 | 763 | ||||
| City of Chicago Illinois Wastewater Transmission Revenue Bonds | 625 | 5.000 | 01/01/18 | 649 | ||||
| City of Chicago Illinois Wastewater Transmission Revenue Bonds | 505 | 5.000 | 01/01/29 | 566 | ||||
| City of Chicago Illinois Wastewater Transmission Revenue Bonds | 1,630 | 5.000 | 01/01/35 | 1,804 | ||||
| City of Chicago Illinois Waterworks Revenue Bonds | 1,000 | 5.000 | 11/01/34 | 1,130 | ||||
| City of Chicago Illinois Waterworks Revenue Bonds(µ) | 100 | 5.000 | 11/01/24 | 100 | ||||
| City of Freeport Illinois General Obligation Unlimited(µ) | 435 | 2.000 | 12/01/17 | 440 | ||||
| City of Freeport Illinois General Obligation Unlimited(µ) | 650 | 2.000 | 12/01/18 | 659 | ||||
| City of Peoria Illinois General Obligation Unlimited | 625 | 5.000 | 01/01/22 | 655 | ||||
| City of Springfield Illinois Electric Revenue Bonds | 1,280 | 5.000 | 03/01/32 | 1,479 |
See accompanying notes which are an integral part of the financial statements.
558 Russell Tax Exempt Bond Fund
Russell Investment Company
Russell Tax Exempt Bond Fund
Schedule of Investments, continued — October 31, 2016
| Amounts in thousands (except share amounts) | ||||||||
| Principal | Fair | |||||||
| Amount ($) | Rate | Date of | Value | |||||
| or Shares | % | Maturity | $ | |||||
| Cook County Community College District No. 508 General Obligation Unlimited | 1,500 | 5.250 | 12/01/28 | 1,704 | ||||
| County of Cook Illinois General Obligation Unlimited | 350 | 5.000 | 11/15/21 | 399 | ||||
| County of Du Page Illinois General Obligation Limited | 600 | 5.000 | 01/01/28 | 737 | ||||
| Illinois Finance Authority Revenue Bonds | 1,000 | 5.000 | 11/15/18 | 1,078 | ||||
| Illinois Finance Authority Revenue Bonds | 1,000 | 5.375 | 10/01/23 | 1,115 | ||||
| Illinois Finance Authority Revenue Bonds | 1,000 | 5.375 | 10/01/24 | 1,112 | ||||
| Illinois Finance Authority Revenue Bonds | 1,000 | 6.000 | 10/01/28 | 1,078 | ||||
| Illinois Finance Authority Revenue Bonds | 2,500 | 5.750 | 08/15/29 | 2,765 | ||||
| Illinois Sports Facilities Authority Revenue Bonds(µ) | 1,000 | 5.250 | 06/15/31 | 1,135 | ||||
| Illinois State Toll Highway Authority Revenue Bonds | 5,000 | 5.000 | 12/01/32 | 5,905 | ||||
| McHenry County Community Unit School District No. 12 Johnsburg General Obligation | ||||||||
| Unlimited(µ) | 850 | 5.000 | 01/01/33 | 951 | ||||
| Metropolitan Pier & Exposition Authority Revenue Bonds | 1,500 | 5.000 | 12/15/22 | 1,528 | ||||
| Metropolitan Pier & Exposition Authority Revenue Bonds | 5,565 | 5.000 | 12/15/28 | 6,064 | ||||
| Northern Illinois Municipal Power Agency Revenue Bonds(µ) | 4,025 | 5.000 | 01/01/23 | 4,216 | ||||
| Northern Illinois Municipal Power Agency Revenue Bonds | 345 | 5.000 | 12/01/26 | 426 | ||||
| Railsplitter Tobacco Settlement Authority Revenue Bonds | 1,000 | 5.000 | 06/01/18 | 1,056 | ||||
| Railsplitter Tobacco Settlement Authority Revenue Bonds | 1,000 | 5.000 | 06/01/19 | 1,088 | ||||
| Southern Illinois University Revenue Bonds(µ) | 1,470 | 5.000 | 04/01/27 | 1,712 | ||||
| Southern Illinois University Revenue Bonds(µ) | 850 | 5.000 | 04/01/28 | 986 | ||||
| Southwestern Illinois Development Authority Revenue Bonds(µ) | 1,005 | 5.000 | 10/15/33 | 1,145 | ||||
| State of Illinois General Obligation Unlimited | 2,000 | 5.000 | 04/01/21 | 2,169 | ||||
| State of Illinois General Obligation Unlimited | 3,000 | 5.000 | 07/01/21 | 3,265 | ||||
| State of Illinois General Obligation Unlimited | 1,000 | 5.000 | 08/01/22 | 1,097 | ||||
| State of Illinois General Obligation Unlimited | 2,500 | 5.000 | 02/01/24 | 2,755 | ||||
| State of Illinois General Obligation Unlimited | 2,290 | 5.000 | 08/01/25 | 2,490 | ||||
| State of Illinois General Obligation Unlimited(µ) | 4,500 | 4.000 | 02/01/30 | 4,511 | ||||
| State of Illinois General Obligation Unlimited | 2,175 | 5.000 | 05/01/30 | 2,336 | ||||
| State of Illinois Revenue Bonds | 12,500 | 5.000 | 06/15/21 | 14,432 | ||||
| State of Illinois Sports Facilities Authority Revenue Bonds | 1,125 | 5.000 | 06/15/18 | 1,182 | ||||
| State of Illinois Sports Facilities Authority Revenue Bonds | 500 | 5.000 | 06/15/19 | 539 | ||||
| University of Illinois Revenue Bonds | 1,115 | 5.000 | 04/01/20 | 1,242 | ||||
| University of Illinois Revenue Bonds | 1,470 | 5.500 | 04/01/31 | 1,662 | ||||
| Village of Bellwood Illinois General Obligation Unlimited | 1,000 | 5.875 | 12/01/27 | 1,177 | ||||
| Village of Bellwood Illinois General Obligation Unlimited(µ) | 2,075 | 5.000 | 12/01/32 | 2,362 | ||||
| Village of East Dundee Illinois General Obligation Unlimited(µ) | 600 | 4.000 | 12/01/23 | 675 | ||||
| Village of Franklin Park Illinois General Obligation Unlimited(µ) | 295 | 5.000 | 07/01/18 | 314 | ||||
| Village of Melrose Park Illinois General Obligation Unlimited(µ) | 530 | 2.000 | 12/15/17 | 537 | ||||
| Volo Village Special Service Area No. 3 & 6 Special Tax(µ) | 1,095 | 5.000 | 03/01/34 | 1,255 | ||||
| West Chicago Park District General Obligation Unlimited(µ) | 795 | 5.250 | 12/01/29 | 856 | ||||
| Western Illinois Economic Development Authority Revenue Bonds(µ) | 1,140 | 5.000 | 01/01/27 | 1,326 | ||||
| Western Illinois Economic Development Authority Revenue Bonds(µ) | 725 | 5.000 | 01/01/28 | 841 | ||||
| Western Illinois University Revenue Bonds(µ) | 485 | 5.000 | 04/01/21 | 542 | ||||
| Western Illinois University Revenue Bonds(µ) | 560 | 5.000 | 04/01/24 | 652 | ||||
| 121,985 | ||||||||
| Indiana - 0.1% | ||||||||
| City of Indianapolis Indiana Gas Utility Revenue Bonds(µ) | 1,000 | 5.000 | 08/15/23 | 1,127 | ||||
| Indianapolis Local Public Improvement Bond Bank Revenue Bonds | 1,000 | 5.000 | 02/01/18 | 1,052 | ||||
| 2,179 | ||||||||
| Iowa - 0.8% | ||||||||
| City of Ames Iowa Revenue Bonds | 2,000 | 5.000 | 06/15/31 | 2,363 | ||||
| Iowa Finance Authority Revenue Bonds | 4,000 | 5.000 | 07/01/28 | 4,602 |
See accompanying notes which are an integral part of the financial statements.
Russell Tax Exempt Bond Fund 559
Russell Investment Company
Russell Tax Exempt Bond Fund
Schedule of Investments, continued — October 31, 2016
| Amounts in thousands (except share amounts) | ||||||||
| Principal | Fair | |||||||
| Amount ($) | Rate | Date of | Value | |||||
| or Shares | % | Maturity | $ | |||||
| Iowa Higher Education Loan Authority Revenue Bonds | 1,625 | 5.000 | 12/01/18 | 1,758 | ||||
| Xenia Rural Water District Revenue Bonds | 3,000 | 5.000 | 12/01/28 | 3,516 | ||||
| 12,239 | ||||||||
| Kansas - 0.3% | ||||||||
| Seward County Unified School District No. 480 Liberal General Obligation Unlimited | 4,000 | 5.000 | 09/01/30 | 4,672 | ||||
| Kentucky - 0.7% | ||||||||
| City of Murray Kentucky Revenue Bonds | 275 | 2.000 | 08/01/17 | 276 | ||||
| City of Murray Kentucky Revenue Bonds | 420 | 2.000 | 08/01/18 | 421 | ||||
| Commonwealth of Kentucky Certificate Of Participation | 275 | 2.000 | 06/15/17 | 277 | ||||
| County of Harrison Kentucky Revenue Notes | 1,000 | 1.500 | 05/01/17 | 1,000 | ||||
| Kentucky Economic Development Finance Authority Revenue Bonds | 1,500 | 3.000 | 05/15/22 | 1,498 | ||||
| Kentucky Economic Development Finance Authority Revenue Bonds | 2,035 | 4.000 | 07/01/31 | 2,131 | ||||
| Kentucky Municipal Power Agency Revenue Bonds(µ) | 1,500 | 5.000 | 09/01/19 | 1,645 | ||||
| Louisville/Jefferson County Metropolitan Government Revenue Bonds | 2,100 | 5.000 | 10/01/30 | 2,503 | ||||
| 9,751 | ||||||||
| Louisiana - 1.8% | ||||||||
| City of New Orleans Louisiana Sewerage Service Revenue Bonds | 250 | 5.000 | 06/01/27 | 296 | ||||
| City of New Orleans Louisiana Sewerage Service Revenue Bonds | 1,000 | 5.000 | 06/01/35 | 1,137 | ||||
| City of Shreveport Louisiana Water & Sewer Revenue Bonds(µ) | 2,955 | 5.000 | 12/01/32 | 3,462 | ||||
| City of Shreveport Louisiana Water & Sewer Revenue Bonds(µ) | 1,000 | 5.000 | 12/01/33 | 1,167 | ||||
| Lafayette Consolidated Government Revenue Bonds(µ) | 805 | 5.000 | 11/01/20 | 911 | ||||
| Lafayette Consolidated Government Revenue Bonds(µ) | 700 | 5.000 | 11/01/29 | 823 | ||||
| Louisiana Local Government Environmental Facilities & Community Development | ||||||||
| Authority Revenue Bonds | 300 | 5.000 | 11/01/19 | 333 | ||||
| Louisiana Local Government Environmental Facilities & Community Development | ||||||||
| Authority Revenue Bonds(µ) | 1,160 | 5.000 | 08/01/22 | 1,348 | ||||
| Louisiana Public Facilities Authority Revenue Bonds | 1,000 | 5.000 | 07/01/19 | 1,095 | ||||
| Louisiana Public Facilities Authority Revenue Bonds(µ) | 1,615 | 5.000 | 09/01/29 | 1,872 | ||||
| Louisiana Public Facilities Authority Revenue Bonds | 50 | 5.000 | 05/15/30 | 59 | ||||
| Louisiana Public Facilities Authority Revenue Bonds | 595 | 5.000 | 11/01/33 | 693 | ||||
| Louisiana State Citizens Property Insurance Corp. Revenue Bonds(µ) | 2,460 | 6.750 | 06/01/26 | 2,686 | ||||
| State of Louisiana Gasoline & Fuels Tax Revenue Bonds | 7,000 | 5.000 | 05/01/21 | 8,151 | ||||
| State of Louisiana General Obligation Unlimited | 850 | 5.000 | 08/01/24 | 1,037 | ||||
| State of Louisiana Revenue Bonds | 1,300 | 5.000 | 06/15/28 | 1,570 | ||||
| 26,640 | ||||||||
| Maryland - 0.3% | ||||||||
| County of Montgomery Maryland General Obligation Unlimited | 1,350 | 5.000 | 07/01/19 | 1,493 | ||||
| Maryland Economic Development Corp. Revenue Bonds | 1,155 | 5.125 | 06/01/20 | 1,295 | ||||
| Maryland Economic Development Corp. Revenue Bonds | 885 | 6.200 | 09/01/22 | 984 | ||||
| 3,772 | ||||||||
| Massachusetts - 1.2% | ||||||||
| Commonwealth of Massachusetts General Obligation Limited(µ)(Ê) | 3,000 | 0.480 | 12/01/30 | 2,722 | ||||
| Commonwealth of Massachusetts Revenue Bonds | 4,000 | 5.000 | 06/15/20 | 4,554 | ||||
| Massachusetts Clean Water Trust (The) Revenue Bonds(Ê) | 5,000 | 2.012 | 08/01/23 | 5,209 | ||||
| Massachusetts Development Finance Agency Revenue Bonds | 1,675 | 5.000 | 07/01/31 | 1,935 | ||||
| Massachusetts Development Finance Agency Revenue Bonds | 3,665 | 5.000 | 07/01/34 | 4,309 | ||||
| 18,729 | ||||||||
| Michigan - 3.9% | ||||||||
| Brighton Area School District General Obligation Unlimited | 1,525 | 5.000 | 05/01/26 | 1,780 | ||||
| City of Detroit Michigan Sewage Disposal System Revenue Bonds | 3,500 | 5.000 | 07/01/32 | 3,883 | ||||
| City of Detroit Michigan Water Supply System Revenue Bonds(µ) | 1,015 | 5.000 | 07/01/18 | 1,017 | ||||
| City of Detroit Michigan Water Supply System Revenue Bonds(µ) | 170 | 4.500 | 07/01/25 | 170 | ||||
| County of Wayne Michigan General Obligation Limited(µ) | 3,000 | 5.000 | 02/01/34 | 3,051 | ||||
See accompanying notes which are an integral part of the financial statements.
560 Russell Tax Exempt Bond Fund
Russell Investment Company
Russell Tax Exempt Bond Fund
Schedule of Investments, continued — October 31, 2016
| Amounts in thousands (except share amounts) | ||||||||
| Principal | Fair | |||||||
| Amount ($) | Rate | Date of | Value | |||||
| or Shares | % | Maturity | $ | |||||
| Detroit City School District General Obligation Unlimited(µ) | 1,000 | 6.000 | 05/01/19 | 1,108 | ||||
| Grand Rapids Public Schools General Obligation Unlimited(µ) | 2,430 | 5.000 | 05/01/34 | 2,873 | ||||
| Grand Rapids Public Schools General Obligation Unlimited(µ) | 1,000 | 5.000 | 05/01/35 | 1,179 | ||||
| Kalamazoo Hospital Finance Authority Revenue Bonds | 1,500 | 4.000 | 05/15/31 | 1,604 | ||||
| Kent Hospital Finance Authority Revenue Bonds | 1,505 | 5.000 | 11/15/19 | 1,667 | ||||
| Michigan Finance Authority Revenue Bonds | 450 | 5.000 | 07/01/19 | 491 | ||||
| Michigan Finance Authority Revenue Bonds | 600 | 5.000 | 12/01/20 | 671 | ||||
| Michigan Finance Authority Revenue Bonds | 730 | 5.000 | 12/01/21 | 828 | ||||
| Michigan Finance Authority Revenue Bonds | 770 | 5.000 | 12/01/22 | 889 | ||||
| Michigan Finance Authority Revenue Bonds | 655 | 5.000 | 12/01/23 | 767 | ||||
| Michigan Finance Authority Revenue Bonds | 2,000 | 5.000 | 04/01/25 | 2,377 | ||||
| Michigan Finance Authority Revenue Bonds | 1,000 | 5.000 | 11/01/27 | 1,150 | ||||
| Michigan Finance Authority Revenue Bonds | 4,655 | 5.000 | 07/01/28 | 5,377 | ||||
| Michigan Finance Authority Revenue Bonds | 1,375 | 5.000 | 07/01/29 | 1,580 | ||||
| Michigan Finance Authority Revenue Bonds | 3,000 | 5.000 | 11/15/29 | 3,535 | ||||
| Michigan Finance Authority Revenue Bonds | 1,000 | 5.000 | 07/01/30 | 1,146 | ||||
| Michigan Finance Authority Revenue Bonds | 5,000 | 5.000 | 11/15/31 | 5,866 | ||||
| Michigan Finance Authority Revenue Bonds | 500 | 5.000 | 07/01/35 | 568 | ||||
| Michigan Finance Authority Revenue Bonds | 1,500 | 4.000 | 11/15/36 | 1,548 | ||||
| Michigan Finance Authority Revenue Bonds | 585 | 5.000 | 12/01/36 | 666 | ||||
| Michigan State Building Authority Revenue Bonds | 125 | 5.000 | 04/15/22 | 148 | ||||
| Michigan Strategic Fund Revenue Bonds | 1,015 | 5.250 | 06/01/32 | 1,104 | ||||
| Michigan Strategic Fund Tax Allocation(Ê) | 5,000 | 4.125 | 07/01/45 | 5,086 | ||||
| Michigan Tobacco Settlement Finance Authority Revenue Bonds | 3,170 | 5.125 | 06/01/22 | 3,137 | ||||
| Saline Economic Development Corp. Revenue Bonds | 485 | 5.250 | 06/01/32 | 527 | ||||
| Wayne County Airport Authority Revenue Bonds | 2,000 | 5.000 | 12/01/17 | 2,084 | ||||
| Wayne County Airport Authority Revenue Bonds | 435 | 5.000 | 12/01/29 | 514 | ||||
| 58,391 | ||||||||
| Minnesota - 0.8% | ||||||||
| City of Minneapolis Minnesota Revenue Bonds | 1,250 | 5.000 | 08/01/17 | 1,289 | ||||
| City of Minneapolis Minnesota Revenue Bonds | 1,855 | 6.375 | 11/15/23 | 2,057 | ||||
| City of Rochester Minnesota Revenue Bonds(Ê) | 1,125 | 4.000 | 11/15/30 | 1,192 | ||||
| City of Saint Louis Park Minnesota Revenue Bonds | 1,165 | 5.500 | 07/01/17 | 1,201 | ||||
| City of Saint Louis Park Minnesota Revenue Bonds | 725 | 5.500 | 07/01/18 | 780 | ||||
| State Paul Housing & Redevelopment Authority Revenue Bonds | 2,145 | 5.000 | 11/15/25 | 2,392 | ||||
| State Paul Housing & Redevelopment Authority Revenue Bonds | 2,250 | 5.000 | 11/15/26 | 2,496 | ||||
| 11,407 | ||||||||
| Mississippi - 0.4% | ||||||||
| Mississippi Development Bank Revenue Bonds(µ) | 1,000 | 5.000 | 04/01/28 | 1,169 | ||||
| Mississippi Development Bank Revenue Bonds(µ) | 1,000 | 5.000 | 03/01/34 | 1,151 | ||||
| Mississippi Hospital Equipment & Facilities Authority Revenue Bonds | 1,555 | 5.000 | 10/01/17 | 1,614 | ||||
| Mississippi Hospital Equipment & Facilities Authority Revenue Bonds | 2,000 | 5.000 | 09/01/36 | 2,269 | ||||
| 6,203 | ||||||||
| Missouri - 1.2% | ||||||||
| Bi-State Development Agency of the Missouri-Illinois Metropolitan District Revenue | ||||||||
| Bonds | 810 | 5.000 | 10/01/28 | 868 | ||||
| Bi-State Development Agency of the Missouri-Illinois Metropolitan District Revenue | ||||||||
| Bonds | 1,775 | 5.000 | 10/01/33 | 2,075 | ||||
| City of Kansas City Missouri Revenue Bonds | 1,185 | 5.000 | 09/01/26 | 1,309 | ||||
| City of Kansas City Missouri Revenue Bonds | 500 | 5.000 | 09/01/27 | 551 | ||||
| City of Kansas City Missouri Revenue Bonds | 1,000 | 5.000 | 09/01/28 | 1,102 | ||||
| City of Kansas City Missouri Revenue Bonds | 1,000 | 5.000 | 09/01/29 | 1,100 | ||||
| City of Saint Louis Missouri Airport Revenue Bonds | 1,680 | 6.125 | 07/01/24 | 1,892 |
See accompanying notes which are an integral part of the financial statements.
Russell Tax Exempt Bond Fund 561
Russell Investment Company
Russell Tax Exempt Bond Fund
Schedule of Investments, continued — October 31, 2016
| Amounts in thousands (except share amounts) | �� | |||||||
| Principal | Fair | |||||||
| Amount ($) | Rate | Date of | Value | |||||
| or Shares | % | Maturity | $ | |||||
| County of Boone Missouri Revenue Bonds | 2,760 | 5.000 | 08/01/30 | 3,238 | ||||
| County of Boone Missouri Revenue Bonds | 1,700 | 4.000 | 08/01/33 | 1,770 | ||||
| Health & Educational Facilities Authority of the State of Missouri Revenue Bonds | 1,540 | 5.000 | 11/15/31 | 1,839 | ||||
| Lees Summit Industrial Development Authority Revenue Bonds | 1,550 | 5.000 | 08/15/36 | 1,621 | ||||
| Nixa Public Schools General Obligation Unlimited | 500 | 5.000 | 03/01/33 | 557 | ||||
| 17,922 | ||||||||
| Nebraska - 0.6% | ||||||||
| Central Plains Energy Project Revenue Bonds | 1,565 | 5.000 | 09/01/32 | 1,753 | ||||
| Central Plains Energy Project Revenue Bonds | 3,505 | 5.250 | 09/01/37 | 3,958 | ||||
| Nebraska Public Power District Revenue Bonds | 2,000 | 4.000 | 01/01/21 | 2,218 | ||||
| Nebraska Public Power District Revenue Bonds | 1,000 | 5.000 | 01/01/29 | 1,167 | ||||
| 9,096 | ||||||||
| Nevada - 1.5% | ||||||||
| City of Reno Nevada General Obligation Limited | 1,100 | 5.000 | 06/01/18 | 1,168 | ||||
| City of Reno Nevada General Obligation Limited | 1,000 | 5.000 | 06/01/22 | 1,173 | ||||
| Clark County Department of Aviation Revenue Bonds(µ) | 2,500 | 5.000 | 07/01/22 | 2,776 | ||||
| Clark County Water Reclamation District General Obligation Limited | 3,640 | 5.000 | 07/01/22 | 4,355 | ||||
| Clark County Water Reclamation District General Obligation Limited | 4,915 | 5.000 | 07/01/23 | 5,995 | ||||
| County of Clark Nevada Revenue Bonds | 2,965 | 5.000 | 07/01/29 | 3,520 | ||||
| State of Nevada General Obligation Limited | 2,590 | 5.000 | 04/01/21 | 3,003 | ||||
| 21,990 | ||||||||
| New Jersey - 5.4% | ||||||||
| Camden County Improvement Authority Revenue Bonds | 1,000 | 5.000 | 02/15/18 | 1,049 | ||||
| Camden County Improvement Authority Revenue Bonds | 1,000 | 5.000 | 02/15/19 | 1,082 | ||||
| Camden County Improvement Authority Revenue Bonds | 2,000 | 5.000 | 02/15/28 | 2,315 | ||||
| Camden County Improvement Authority Revenue Bonds | 2,000 | 5.000 | 02/15/30 | 2,287 | ||||
| Camden County Improvement Authority Revenue Bonds | 2,000 | 5.000 | 02/15/31 | 2,274 | ||||
| Camden County Improvement Authority Revenue Bonds | 300 | 5.000 | 02/15/32 | 340 | ||||
| Casino Reinvestment Development Authority Revenue Bonds | 600 | 5.000 | 11/01/18 | 631 | ||||
| Casino Reinvestment Development Authority Revenue Bonds | 1,000 | 4.000 | 11/01/19 | 1,043 | ||||
| City of Bayonne New Jersey General Obligation Unlimited(µ) | 1,500 | 5.000 | 07/01/33 | 1,744 | ||||
| City of Bayonne New Jersey General Obligation Unlimited(µ) | 1,865 | 5.000 | 07/01/34 | 2,161 | ||||
| City of Jersey City New Jersey General Obligation Unlimited | 990 | 5.000 | 01/15/23 | 1,169 | ||||
| City of Paterson New Jersey General Obligation Unlimited(µ) | 1,180 | 5.000 | 01/15/23 | 1,355 | ||||
| City of Trenton New Jersey General Obligation Unlimited(µ) | 1,680 | 5.000 | 07/15/23 | 1,950 | ||||
| New Jersey Economic Development Authority Revenue Bonds | 2,500 | 5.000 | 09/01/18 | 2,672 | ||||
| New Jersey Economic Development Authority Revenue Bonds | 6,435 | 5.000 | 06/15/19 | 6,925 | ||||
| New Jersey Economic Development Authority Revenue Bonds | 2,765 | 5.000 | 06/15/20 | 3,009 | ||||
| New Jersey Economic Development Authority Revenue Bonds | 75 | 5.000 | 06/15/21 | 83 | ||||
| New Jersey Economic Development Authority Revenue Bonds | 2,000 | 5.000 | 06/15/22 | 2,240 | ||||
| New Jersey Economic Development Authority Revenue Bonds | 2,045 | 5.000 | 06/15/23 | 2,286 | ||||
| New Jersey Economic Development Authority Revenue Bonds(µ) | 700 | 5.500 | 09/01/24 | 821 | ||||
| New Jersey Economic Development Authority Revenue Bonds | 750 | 5.000 | 07/01/29 | 851 | ||||
| New Jersey Educational Facilities Authority Revenue Bonds(µ) | 2,000 | 5.000 | 07/01/23 | 2,417 | ||||
| New Jersey Educational Facilities Authority Revenue Bonds(µ) | 500 | 5.000 | 07/01/32 | 578 | ||||
| New Jersey Educational Facilities Authority Revenue Bonds(µ) | 925 | 5.000 | 07/01/33 | 1,065 | ||||
| New Jersey Health Care Facilities Financing Authority Revenue Bonds(µ) | 1,000 | 5.000 | 09/15/17 | 1,037 | ||||
| New Jersey Health Care Facilities Financing Authority Revenue Bonds | 490 | 4.250 | 07/01/18 | 515 | ||||
| New Jersey Health Care Facilities Financing Authority Revenue Bonds | 1,355 | 3.600 | 07/01/19 | 1,400 | ||||
| New Jersey Health Care Facilities Financing Authority Revenue Bonds | 900 | 3.850 | 07/01/20 | 941 | ||||
| New Jersey Health Care Facilities Financing Authority Revenue Bonds(µ) | 1,000 | 5.000 | 07/01/27 | 1,191 | ||||
| New Jersey Health Care Facilities Financing Authority Revenue Bonds | 1,000 | 5.000 | 07/01/28 | 1,218 |
See accompanying notes which are an integral part of the financial statements.
562 Russell Tax Exempt Bond Fund
Russell Investment Company
Russell Tax Exempt Bond Fund
Schedule of Investments, continued — October 31, 2016
| Amounts in thousands (except share amounts) | ||||||||
| Principal | Fair | |||||||
| Amount ($) | Rate | Date of | Value | |||||
| or Shares | % | Maturity | $ | |||||
| New Jersey Health Care Facilities Financing Authority Revenue Bonds | 480 | 5.000 | 07/01/29 | 562 | ||||
| New Jersey Health Care Facilities Financing Authority Revenue Bonds | 300 | 5.000 | 07/01/30 | 350 | ||||
| New Jersey Health Care Facilities Financing Authority Revenue Bonds | 1,000 | 5.000 | 07/01/31 | 1,194 | ||||
| New Jersey State Turnpike Authority Revenue Bonds | 5,540 | 5.000 | 01/01/22 | 6,523 | ||||
| New Jersey State Turnpike Authority Revenue Bonds | 3,485 | 5.000 | 01/01/23 | 4,184 | ||||
| New Jersey State Turnpike Authority Revenue Bonds | 3,080 | 5.000 | 01/01/24 | 3,712 | ||||
| New Jersey State Turnpike Authority Revenue Bonds | 2,500 | 5.000 | 01/01/27 | 2,975 | ||||
| New Jersey Transportation Trust Fund Authority Revenue Bonds | 1,000 | 5.000 | 12/15/18 | 1,063 | ||||
| New Jersey Transportation Trust Fund Authority Revenue Bonds(µ) | 830 | 5.500 | 12/15/18 | 898 | ||||
| New Jersey Transportation Trust Fund Authority Revenue Bonds | 1,000 | 5.000 | 06/15/29 | 1,116 | ||||
| New Jersey Transportation Trust Fund Authority Revenue Bonds | 3,000 | 5.000 | 06/15/31 | 3,122 | ||||
| Newark Housing Authority Revenue Bonds(µ) | 350 | 5.000 | 12/01/20 | 394 | ||||
| Passaic County Improvement Authority Revenue Bonds | 250 | 5.000 | 08/01/19 | 274 | ||||
| State of New Jersey General Obligation Unlimited(µ) | 2,080 | 5.500 | 07/15/18 | 2,229 | ||||
| Tobacco Settlement Financing Corp. Revenue Bonds | 55 | 4.500 | 06/01/23 | 56 | ||||
| Tobacco Settlement Financing Corp. Revenue Bonds | 1,245 | 5.000 | 06/01/29 | 1,236 | ||||
| Tobacco Settlement Financing Corp. Revenue Bonds | 3,250 | 4.750 | 06/01/34 | 3,104 | ||||
| 81,641 | ||||||||
| New Mexico - 0.1% | ||||||||
| County of Taos New Mexico Revenue Bonds(µ) | 750 | 3.000 | 04/01/17 | 755 | ||||
| New Mexico Hospital Equipment Loan Council Revenue Bonds | 555 | 5.000 | 08/01/25 | 688 | ||||
| 1,443 | ||||||||
| New York - 7.6% | ||||||||
| Buffalo & Erie County Industrial Land Development Corp. Revenue Bonds | 385 | 5.000 | 07/01/20 | 431 | ||||
| Buffalo & Erie County Industrial Land Development Corp. Revenue Bonds | 1,350 | 5.750 | 10/01/26 | 1,597 | ||||
| Build NYC Resource Corp. Revenue Bonds(µ) | 930 | 5.000 | 12/15/18 | 1,007 | ||||
| Build NYC Resource Corp. Revenue Bonds | 1,445 | 5.000 | 08/01/19 | 1,581 | ||||
| City of New York New York General Obligation Unlimited | 1,500 | 5.000 | 08/01/19 | 1,659 | ||||
| City of New York New York General Obligation Unlimited | 2,105 | 5.000 | 08/01/20 | 2,396 | ||||
| City of New York New York General Obligation Unlimited | 2,550 | 5.000 | 08/01/21 | 2,978 | ||||
| City of New York New York General Obligation Unlimited | 2,445 | 5.000 | 08/01/22 | 2,920 | ||||
| City of New York New York General Obligation Unlimited | 6,420 | 5.000 | 08/01/23 | 7,801 | ||||
| City of Yonkers New York General Obligation Limited(µ) | 615 | 5.000 | 03/15/25 | 696 | ||||
| County of Nassau New York General Obligation Limited(µ) | 1,000 | 5.000 | 04/01/39 | 1,169 | ||||
| JPMorgan Chase Putters/Drivers Trust Revenue Bonds(Ê) | 2,200 | 0.540 | 08/01/18 | 2,200 | ||||
| Metropolitan Transportation Authority Revenue Bonds | 1,000 | 5.000 | 11/15/17 | 1,043 | ||||
| Metropolitan Transportation Authority Revenue Bonds(ae) | 1,065 | 6.500 | 11/15/18 | 1,186 | ||||
| Metropolitan Transportation Authority Revenue Bonds | 1,410 | 5.000 | 11/15/24 | 1,695 | ||||
| Metropolitan Transportation Authority Revenue Bonds | 8,320 | 5.000 | 11/15/25 | 9,972 | ||||
| Metropolitan Transportation Authority Revenue Bonds | 2,075 | 5.000 | 11/15/27 | 2,479 | ||||
| Metropolitan Transportation Authority Revenue Bonds | 4,015 | 5.000 | 11/15/28 | 4,878 | ||||
| Metropolitan Transportation Authority Revenue Bonds | 365 | 6.500 | 11/15/28 | 406 | ||||
| Metropolitan Transportation Authority Revenue Bonds | 1,000 | 5.000 | 11/15/35 | 1,174 | ||||
| New York City Health & Hospital Corp. Revenue Bonds | 1,775 | 5.000 | 02/15/17 | 1,797 | ||||
| New York City Industrial Development Agency Revenue Bonds(µ) | 1,535 | 5.000 | 01/01/31 | 1,544 | ||||
| New York City Transitional Finance Authority Future Tax Secured Revenue Bonds | 890 | 5.000 | 11/01/20 | 1,023 | ||||
| New York City Transitional Finance Authority Future Tax Secured Revenue Bonds | 2,175 | 5.000 | 05/01/21 | 2,531 | ||||
| New York City Transitional Finance Authority Future Tax Secured Revenue Bonds | 2,180 | 5.000 | 11/01/21 | 2,571 | ||||
| New York City Trust for Cultural Resources Revenue Bonds | 940 | 5.000 | 07/01/21 | 1,084 | ||||
| New York State Dormitory Authority Revenue Bonds | 1,000 | 5.000 | 12/01/16 | 1,003 | ||||
| New York State Dormitory Authority Revenue Bonds | 1,755 | 5.000 | 07/01/17 | 1,804 | ||||
| New York State Dormitory Authority Revenue Bonds(ae) | 5 | 5.250 | 02/15/19 | 6 |
See accompanying notes which are an integral part of the financial statements.
Russell Tax Exempt Bond Fund 563
Russell Investment Company
Russell Tax Exempt Bond Fund
Schedule of Investments, continued — October 31, 2016
| Amounts in thousands (except share amounts) | ||||||||
| Principal | Fair | |||||||
| Amount ($) | Rate | Date of | Value | |||||
| or Shares | % | Maturity | $ | |||||
| New York State Dormitory Authority Revenue Bonds | 1,000 | 5.000 | 10/01/19 | 1,117 | ||||
| New York State Dormitory Authority Revenue Bonds | 995 | 5.250 | 02/15/21 | 1,091 | ||||
| New York State Dormitory Authority Revenue Bonds | 180 | 5.000 | 07/01/21 | 211 | ||||
| New York State Dormitory Authority Revenue Bonds | 2,400 | 5.000 | 05/01/22 | 2,777 | ||||
| New York State Dormitory Authority Revenue Bonds | 725 | 5.000 | 05/15/23 | 864 | ||||
| New York State Dormitory Authority Revenue Bonds | 6,700 | 5.000 | 12/15/23 | 8,096 | ||||
| New York State Dormitory Authority Revenue Bonds | 700 | 5.000 | 07/01/24 | 820 | ||||
| New York State Dormitory Authority Revenue Bonds | 6,790 | 5.000 | 07/01/26 | 8,134 | ||||
| New York State Dormitory Authority Revenue Bonds | 1,710 | 5.000 | 12/15/28 | 2,041 | ||||
| New York State Dormitory Authority Revenue Bonds | 2,500 | 5.250 | 07/01/29 | 2,771 | ||||
| New York State Energy Research & Development Authority Revenue Bonds(µ)(Ê) | 3,190 | 0.433 | 03/01/27 | 3,078 | ||||
| New York State Environmental Facilities Corp. Revenue Bonds | 770 | 5.000 | 06/15/22 | 821 | ||||
| New York State Environmental Facilities Corp. Revenue Bonds | 1,640 | 5.000 | 09/15/23 | 1,701 | ||||
| New York State Thruway Authority Revenue Bonds | 12,485 | 5.000 | 05/01/19 | 13,673 | ||||
| Triborough Bridge & Tunnel Authority Revenue Bonds | 950 | 5.000 | 11/15/17 | 992 | ||||
| Triborough Bridge & Tunnel Authority Revenue Bonds(µ) | 1,000 | 5.500 | 11/15/20 | 1,170 | ||||
| Troy Capital Resource Corp. Revenue Bonds | 1,000 | 5.000 | 09/01/20 | 1,132 | ||||
| Westchester County Local Development Corp. Revenue Bonds | 1,350 | 5.000 | 05/01/34 | 1,480 | ||||
| 114,600 | ||||||||
| North Carolina - 0.6% | ||||||||
| North Carolina Capital Facilities Finance Agency Revenue Bonds | 750 | 5.000 | 04/01/19 | 815 | ||||
| North Carolina Medical Care Commission Revenue Bonds | 700 | 5.000 | 10/01/30 | 819 | ||||
| North Carolina Medical Care Commission Revenue Bonds | 2,105 | 5.000 | 11/01/31 | 2,452 | ||||
| State of North Carolina General Obligation Unlimited | 2,500 | 5.000 | 05/01/20 | 2,842 | ||||
| State of North Carolina Revenue Bonds | 1,000 | 5.000 | 05/01/19 | 1,098 | ||||
| University of North Carolina at Chapel Hill Revenue Bonds | 1,205 | 5.000 | 12/01/31 | 1,260 | ||||
| 9,286 | ||||||||
| North Dakota - 0.2% | ||||||||
| City of Bowman North Dakota Revenue Notes | 1,000 | 2.500 | 02/15/17 | 1,000 | ||||
| City of Williston North Dakota Revenue Bonds(µ) | 1,425 | 4.000 | 11/01/20 | 1,443 | ||||
| County of Burleigh North Dakota Revenue Bonds | 460 | 5.000 | 07/01/29 | 537 | ||||
| County of Burleigh North Dakota Revenue Bonds | 500 | 5.000 | 07/01/31 | 583 | ||||
| 3,563 | ||||||||
| Ohio - 4.5% | ||||||||
| American Municipal Power, Inc. Revenue Bonds | 1,790 | 5.000 | 02/15/34 | 2,093 | ||||
| American Municipal Power, Inc. Revenue Bonds | 1,605 | 5.000 | 02/15/36 | 1,866 | ||||
| Buckeye Tobacco Settlement Financing Authority Revenue Bonds | 5,700 | 5.125 | 06/01/24 | 5,386 | ||||
| Buckeye Tobacco Settlement Financing Authority Revenue Bonds | 475 | 5.375 | 06/01/24 | 458 | ||||
| Buckeye Tobacco Settlement Financing Authority Revenue Bonds | 2,650 | 5.875 | 06/01/30 | 2,497 | ||||
| City of Akron Ohio Revenue Bonds | 1,000 | 5.000 | 12/01/24 | 1,186 | ||||
| City of Cincinnati Ohio General Obligation Unlimited | 1,815 | 5.000 | 12/01/30 | 2,127 | ||||
| City of Cleveland Ohio Airport System Revenue Bonds(µ) | 3,000 | 5.000 | 01/01/30 | 3,403 | ||||
| City of Cleveland Ohio Revenue Bonds | 1,500 | 5.000 | 10/01/37 | 1,728 | ||||
| Clermont County Port Authority Revenue Bonds(µ) | 200 | 5.000 | 12/01/23 | 241 | ||||
| Cleveland Municipal School District General Obligation Unlimited | 1,100 | 5.000 | 12/01/27 | 1,306 | ||||
| County of Cuyahoga Ohio Certificate Of Participation | 14,065 | 5.000 | 12/01/27 | 16,735 | ||||
| County of Cuyahoga Ohio Certificate Of Participation | 1,990 | 5.000 | 12/01/28 | 2,351 | ||||
| County of Hamilton Ohio Revenue Bonds | 1,350 | 5.000 | 01/01/31 | 1,511 | ||||
| County of Hamilton Ohio Revenue Bonds | 1,890 | 5.250 | 06/01/32 | 2,188 | ||||
| County of Hamilton Ohio Sales Tax Revenue Bonds | 225 | 5.000 | 12/01/21 | 264 | ||||
| County of Montgomery Ohio Revenue Bonds | 1,100 | 5.750 | 11/15/22 | 1,278 | ||||
| Lakewood City School District General Obligation Unlimited | 260 | 5.000 | 11/01/29 | 312 |
See accompanying notes which are an integral part of the financial statements.
564 Russell Tax Exempt Bond Fund
Russell Investment Company
Russell Tax Exempt Bond Fund
Schedule of Investments, continued — October 31, 2016
| Amounts in thousands (except share amounts) | ||||||||
| Principal | Fair | |||||||
| Amount ($) | Rate | Date of | Value | |||||
| or Shares | % | Maturity | $ | |||||
| Lakewood City School District General Obligation Unlimited | 875 | 5.000 | 11/01/30 | 1,050 | ||||
| Middletown City School District General Obligation Unlimited | 1,435 | 5.250 | 12/01/34 | 1,742 | ||||
| North Olmsted City School District General Obligation Unlimited | 420 | 1.750 | 12/01/19 | 427 | ||||
| Ohio Air Quality Development Authority Revenue Bonds(Ê) | 255 | 4.250 | 08/01/29 | 251 | ||||
| Ohio State Water Development Authority Revenue Bonds | 6,085 | 5.000 | 06/01/21 | 7,106 | ||||
| Ohio Water Development Authority Water Pollution Control Loan Fund Revenue | ||||||||
| Bonds(Ê) | 600 | 4.375 | 06/01/33 | 591 | ||||
| State of Ohio Revenue Bonds | 3,500 | 5.000 | 12/15/22 | 4,164 | ||||
| State of Ohio Revenue Bonds | 2,815 | 5.000 | 12/15/23 | 3,352 | ||||
| Toledo-Lucas County Port Authority Revenue Bonds | 1,965 | 5.000 | 07/01/29 | 2,206 | ||||
| 67,819 | ||||||||
| Oklahoma - 0.3% | ||||||||
| Cleveland County Educational Facilities Authority Revenue Bonds | 500 | 5.000 | 06/01/23 | 603 | ||||
| Oklahoma County Finance Authority Revenue Bonds | 1,000 | 5.000 | 09/01/21 | 1,162 | ||||
| Oklahoma Development Finance Authority Revenue Bonds | 2,000 | 5.000 | 08/15/28 | 2,415 | ||||
| 4,180 | ||||||||
| Oregon - 0.3% | ||||||||
| City of Portland Oregon Sewer System Revenue Bonds | 2,000 | 5.000 | 06/15/18 | 2,132 | ||||
| Hospital Facilities Authority of Multnomah County Oregon Revenue Bonds | 410 | 5.000 | 10/01/19 | 435 | ||||
| Morrow County School District No. 1 General Obligation Unlimited(µ) | 1,955 | 5.500 | 06/15/21 | 2,329 | ||||
| 4,896 | ||||||||
| Pennsylvania - 4.2% | ||||||||
| Allegheny County Higher Education Building Authority Revenue Bonds | 410 | 5.000 | 10/15/19 | 447 | ||||
| Allegheny County Higher Education Building Authority Revenue Bonds | 590 | 5.000 | 10/15/20 | 657 | ||||
| Allegheny County Higher Education Building Authority Revenue Bonds | 615 | 5.000 | 10/15/21 | 698 | ||||
| Allegheny County Higher Education Building Authority Revenue Bonds | 650 | 5.000 | 10/15/22 | 748 | ||||
| Allegheny County Higher Education Building Authority Revenue Bonds | 790 | 5.000 | 10/15/26 | 930 | ||||
| Allegheny County Higher Education Building Authority Revenue Bonds | 835 | 5.000 | 10/15/27 | 975 | ||||
| Allegheny County Higher Education Building Authority Revenue Bonds | 870 | 5.000 | 10/15/28 | 1,008 | ||||
| Allegheny County Higher Education Building Authority Revenue Bonds | 660 | 3.000 | 10/15/29 | 632 | ||||
| Berks County Municipal Authority Revenue Bonds | 1,960 | 5.250 | 11/01/24 | 2,173 | ||||
| Bethlehem Authority Revenue Bonds(µ) | 1,000 | 4.000 | 11/15/16 | 1,001 | ||||
| Bethlehem Authority Revenue Bonds(µ) | 1,000 | 5.000 | 11/15/17 | 1,041 | ||||
| City of Philadelphia Pennsylvania General Obligation Unlimited(µ) | 1,000 | 5.000 | 08/01/24 | 1,097 | ||||
| City of Philadelphia Pennsylvania General Obligation Unlimited | 3,210 | 5.250 | 07/15/27 | 3,718 | ||||
| Commonwealth of Pennsylvania General Obligation Unlimited(µ) | 1,300 | 5.375 | 07/01/17 | 1,340 | ||||
| Dallas Area Municipal Authority Revenue Bonds | 430 | 4.000 | 05/01/18 | 442 | ||||
| Delaware County Vocational & Technical School Authority Revenue Bonds(µ) | 665 | 5.000 | 11/01/25 | 784 | ||||
| Delaware County Vocational & Technical School Authority Revenue Bonds(µ) | 970 | 5.000 | 11/01/26 | 1,140 | ||||
| Delaware County Vocational & Technical School Authority Revenue Bonds(µ) | 1,120 | 5.000 | 11/01/27 | 1,310 | ||||
| Delaware County Vocational & Technical School Authority Revenue Bonds(µ) | 1,140 | 5.000 | 11/01/28 | 1,329 | ||||
| Delaware County Vocational & Technical School Authority Revenue Bonds(µ) | 1,500 | 5.250 | 11/01/33 | 1,773 | ||||
| East Allegheny School District General Obligation Unlimited(µ) | 350 | 3.000 | 04/01/19 | 360 | ||||
| General Authority of Southcentral Pennsylvania Revenue Bonds | 360 | 5.000 | 12/01/28 | 424 | ||||
| Montgomery County Industrial Development Authority Revenue Bonds | 1,000 | 5.000 | 11/15/17 | 1,001 | ||||
| North Penn Water Authority Revenue Bonds | 1,190 | 5.000 | 11/01/30 | 1,375 | ||||
| Northampton County General Purpose Authority Revenue Bonds | 285 | 5.000 | 10/01/30 | 334 | ||||
| Northampton County General Purpose Authority Revenue Bonds | 150 | 5.000 | 10/01/31 | 174 | ||||
| Pennsylvania Economic Development Financing Authority Revenue Bonds | 2,270 | 5.000 | 01/01/22 | 2,337 | ||||
| Pennsylvania Economic Development Financing Authority Revenue Bonds | 1,460 | 5.000 | 07/01/22 | 1,480 | ||||
| Pennsylvania Higher Educational Facilities Authority Revenue Bonds | 1,940 | 5.250 | 05/01/24 | 2,227 | ||||
| Pennsylvania Higher Educational Facilities Authority Revenue Bonds | 700 | 5.000 | 07/01/31 | 807 | ||||
| Pennsylvania Turnpike Commission Revenue Bonds | 1,000 | 5.000 | 12/01/22 | 1,201 |
See accompanying notes which are an integral part of the financial statements.
Russell Tax Exempt Bond Fund 565
Russell Investment Company
Russell Tax Exempt Bond Fund
Schedule of Investments, continued — October 31, 2016
| Amounts in thousands (except share amounts) | ||||||||
| Principal | Fair | |||||||
| Amount ($) | Rate | Date of | Value | |||||
| or Shares | % | Maturity | $ | |||||
| Philadelphia Authority for Industrial Development Revenue Bonds | 1,000 | 5.875 | 06/15/22 | 1,080 | ||||
| Philadelphia Authority for Industrial Development Revenue Bonds | 2,000 | 8.000 | 01/01/33 | 2,320 | ||||
| School District of Philadelphia (The) General Obligation Limited(µ) | 4,605 | 5.000 | 09/01/27 | 5,386 | ||||
| State Public School Building Authority Revenue Bonds | 2,000 | 5.000 | 04/01/20 | 2,186 | ||||
| State Public School Building Authority Revenue Bonds | 3,030 | 5.000 | 04/01/25 | 3,358 | ||||
| State Public School Building Authority Revenue Bonds(µ) | 1,000 | 5.000 | 06/15/28 | 1,168 | ||||
| State Public School Building Authority Revenue Bonds(µ) | 1,000 | 5.000 | 06/15/29 | 1,169 | ||||
| State Public School Building Authority Revenue Bonds | 3,000 | 5.000 | 04/01/32 | 3,229 | ||||
| Township of Bensalem Pennsylvania General Obligation Unlimited | 1,380 | 5.250 | 06/01/29 | 1,674 | ||||
| University of Pittsburgh-of the Commonwealth System of Higher Education Revenue | ||||||||
| Bonds | 1,000 | 5.500 | 09/15/21 | 1,107 | ||||
| West Mifflin Sanitary Sewer Municipal Authority Revenue Bonds(µ) | 250 | 3.000 | 08/01/17 | 254 | ||||
| West Mifflin Sanitary Sewer Municipal Authority Revenue Bonds(µ) | 225 | 4.000 | 08/01/18 | 237 | ||||
| West Mifflin School District General Obligation Limited(µ) | 1,000 | 5.000 | 04/01/28 | 1,169 | ||||
| West Mifflin School District General Obligation Limited(µ) | 3,045 | 4.000 | 04/01/30 | 3,269 | ||||
| Western Wayne School District General Obligation Unlimited(µ) | 565 | 5.000 | 04/01/21 | 643 | ||||
| 63,212 | ||||||||
| Puerto Rico - 2.2% | ||||||||
| Commonwealth of Puerto Rico General Obligation Unlimited(µ) | 875 | 5.000 | 07/01/17 | 896 | ||||
| Commonwealth of Puerto Rico General Obligation Unlimited(µ) | 285 | 5.500 | 07/01/18 | 300 | ||||
| Commonwealth of Puerto Rico General Obligation Unlimited(µ) | 640 | 5.500 | 07/01/19 | 686 | ||||
| Commonwealth of Puerto Rico General Obligation Unlimited(µ) | 1,000 | 5.250 | 07/01/21 | 1,015 | ||||
| Commonwealth of Puerto Rico General Obligation Unlimited(µ) | 75 | 5.375 | 07/01/25 | 81 | ||||
| Commonwealth of Puerto Rico General Obligation Unlimited(µ) | 170 | 5.250 | 07/01/26 | 183 | ||||
| Commonwealth of Puerto Rico General Obligation Unlimited(µ) | 1,000 | 5.250 | 07/01/27 | 1,020 | ||||
| Commonwealth of Puerto Rico General Obligation Unlimited(µ) | 3,250 | 5.000 | 07/01/35 | 3,498 | ||||
| Puerto Rico Commonwealth Aqueduct and Sewer Authority Revenue Bonds(µ) | 3,050 | 5.000 | 07/01/28 | 3,178 | ||||
| Puerto Rico Convention Center District Authority Revenue Bonds(µ) | 1,400 | 5.000 | 07/01/18 | 1,405 | ||||
| Puerto Rico Convention Center District Authority Revenue Bonds(µ) | 100 | 5.000 | 07/01/20 | 100 | ||||
| Puerto Rico Convention Center District Authority Revenue Bonds(µ) | 305 | 5.000 | 07/01/31 | 306 | ||||
| Puerto Rico Convention Center District Authority Revenue Bonds(µ) | 500 | 4.500 | 07/01/36 | 501 | ||||
| Puerto Rico Electric Power Authority Revenue Bonds(µ) | 1,000 | 5.000 | 07/01/19 | 1,017 | ||||
| Puerto Rico Electric Power Authority Revenue Bonds(µ) | 1,815 | 5.000 | 07/01/21 | 1,843 | ||||
| Puerto Rico Electric Power Authority Revenue Bonds(µ) | 215 | 4.000 | 07/01/23 | 217 | ||||
| Puerto Rico Electric Power Authority Revenue Bonds(µ) | 1,940 | 5.000 | 07/01/26 | 1,980 | ||||
| Puerto Rico Electric Power Authority Revenue Bonds(µ) | 205 | 4.375 | 07/01/30 | 205 | ||||
| Puerto Rico Highways & Transportation Authority Revenue Bonds(µ) | 300 | 4.125 | 07/01/18 | 302 | ||||
| Puerto Rico Highways & Transportation Authority Revenue Bonds(µ) | 715 | 5.500 | 07/01/26 | 814 | ||||
| Puerto Rico Highways & Transportation Authority Revenue Bonds(µ) | 950 | 5.000 | 07/01/27 | 976 | ||||
| Puerto Rico Highways & Transportation Authority Revenue Bonds(µ) | 700 | 5.500 | 07/01/28 | 775 | ||||
| Puerto Rico Housing Finance Authority Revenue Bonds | 615 | 5.500 | 12/01/16 | 617 | ||||
| Puerto Rico Infrastructure Financing Authority Revenue Bonds(µ) | 1,185 | 5.500 | 07/01/17 | 1,212 | ||||
| Puerto Rico Infrastructure Financing Authority Revenue Bonds(µ) | 1,735 | 5.500 | 07/01/23 | 1,834 | ||||
| Puerto Rico Infrastructure Financing Authority Revenue Bonds(µ) | 680 | 5.500 | 07/01/24 | 721 | ||||
| Puerto Rico Infrastructure Financing Authority Revenue Bonds(µ) | 590 | 5.500 | 07/01/25 | 628 | ||||
| Puerto Rico Infrastructure Financing Authority Revenue Bonds(µ) | 1,500 | 5.500 | 07/01/26 | 1,601 | ||||
| Puerto Rico Infrastructure Financing Authority Revenue Bonds(µ) | 60 | 5.500 | 07/01/27 | 64 | ||||
| Puerto Rico Municipal Finance Agency General Obligation Unlimited(µ) | 3,090 | 5.000 | 08/01/27 | 3,176 | ||||
| Puerto Rico Municipal Finance Agency Revenue Bonds(µ) | 115 | 5.250 | 08/01/22 | 124 | ||||
| Puerto Rico Public Buildings Authority Revenue Bonds(µ) | 2,480 | 5.500 | 07/01/17 | 2,533 | ||||
| 33,808 |
See accompanying notes which are an integral part of the financial statements.
566 Russell Tax Exempt Bond Fund
Russell Investment Company
Russell Tax Exempt Bond Fund
Schedule of Investments, continued — October 31, 2016
| Amounts in thousands (except share amounts) | ||||||||
| Principal | Fair | |||||||
| Amount ($) | Rate | Date of | Value | |||||
| or Shares | % | Maturity | $ | |||||
| Rhode Island - 0.5% | ||||||||
| Providence Public Buildings Authority Revenue Bonds(µ) | 500 | 5.875 | 06/15/26 | 574 | ||||
| Rhode Island Commerce Corp. Revenue Bonds | 1,000 | 5.000 | 06/15/26 | 1,244 | ||||
| Rhode Island Commerce Corp. Revenue Bonds | 2,610 | 5.000 | 06/15/27 | 3,215 | ||||
| Rhode Island Health & Educational Building Corp. Revenue Bonds | 1,000 | 5.000 | 05/15/28 | 1,178 | ||||
| Rhode Island Health & Educational Building Corp. Revenue Bonds | 1,250 | 5.000 | 05/15/29 | 1,460 | ||||
| 7,671 | ||||||||
| South Carolina - 1.1% | ||||||||
| County of Greenwood South Carolina Revenue Bonds(µ)(Ê) | 150 | 0.396 | 10/01/34 | 140 | ||||
| Lee County School Facilities Revenue Bonds(µ) | 1,050 | 4.000 | 12/01/27 | 1,150 | ||||
| Lee County School Facilities, Inc. Revenue Bonds(µ) | 1,500 | 4.000 | 12/01/28 | 1,625 | ||||
| Piedmont Municipal Power Agency Revenue Bonds | 1,000 | 5.000 | 01/01/20 | 1,116 | ||||
| South Carolina State Public Service Authority Revenue Bonds | 1,000 | 5.000 | 12/01/16 | 1,003 | ||||
| South Carolina State Public Service Authority Revenue Bonds | 3,310 | 5.000 | 12/01/36 | 3,798 | ||||
| Spartanburg Regional Health Services District Revenue Bonds | 5,560 | 5.000 | 04/15/32 | 6,174 | ||||
| Sumter Two School Facilities, Inc. Revenue Bonds(µ) | 250 | 4.000 | 12/01/18 | 265 | ||||
| Sumter Two School Facilities, Inc. Revenue Bonds(µ) | 1,360 | 5.000 | 12/01/26 | 1,642 | ||||
| 16,913 | ||||||||
| South Dakota - 0.1% | ||||||||
| South Dakota Health & Educational Facilities Authority Revenue Bonds | 1,000 | 5.000 | 11/01/35 | 1,145 | ||||
| Tennessee - 0.4% | ||||||||
| Chattanooga Health Educational & Housing Facility Board Revenue Bonds | 600 | 5.000 | 10/01/26 | 726 | ||||
| Chattanooga Industrial Development Board Revenue Bonds(µ) | 2,000 | 5.000 | 10/01/30 | 2,071 | ||||
| Chattanooga-Hamilton County Hospital Authority Revenue Bonds | 630 | 5.000 | 10/01/23 | 751 | ||||
| Metropolitan Government Nashville & Davidson County Health & Educational Facs Bd | ||||||||
| Revenue Bonds | 340 | 5.000 | 10/01/28 | 412 | ||||
| Metropolitan Government Nashville & Davidson County Health & Educational Facs Bd | ||||||||
| Revenue Bonds | 2,200 | 5.000 | 07/01/35 | 2,586 | ||||
| 6,546 | ||||||||
| Texas - 9.4% | ||||||||
| Arlington Higher Education Finance Corp. Revenue Bonds | 1,000 | 5.000 | 08/15/26 | 1,204 | ||||
| Austin Community College District Public Facility Corp. Revenue Bonds | 1,000 | 5.000 | 08/01/23 | 1,205 | ||||
| Austin Community College District Public Facility Corp. Revenue Bonds | 1,000 | 5.000 | 08/01/24 | 1,218 | ||||
| Bexar County Health Facilities Development Corp. Revenue Bonds | 1,765 | 4.000 | 07/15/31 | 1,805 | ||||
| Central Texas Regional Mobility Authority Revenue Bonds | 1,200 | 5.000 | 01/01/35 | 1,356 | ||||
| Central Texas Turnpike System Revenue Bonds | 500 | 5.000 | 08/15/23 | 590 | ||||
| City of Beaumont Texas Waterworks & Sewer System Revenue Bonds(µ) | 425 | 4.000 | 09/01/18 | 448 | ||||
| City of Corpus Christi Texas Utility System Revenue Bonds | 1,660 | 5.000 | 07/15/22 | 1,969 | ||||
| City of Donna Texas Revenue Bonds(µ) | 1,090 | 5.000 | 02/15/31 | 1,254 | ||||
| City of Donna Texas Revenue Bonds(µ) | 1,265 | 5.000 | 02/15/34 | 1,444 | ||||
| City of El Paso Texas Water & Sewer Revenue Bonds | 2,890 | 5.000 | 03/01/25 | 3,529 | ||||
| City of Fort Worth Texas Water & Sewer System Revenue Bonds | 1,340 | 5.000 | 02/15/17 | 1,357 | ||||
| City of Houston Texas Airport System Revenue Bonds | 1,500 | 5.000 | 07/01/17 | 1,541 | ||||
| City of Houston Texas Airport System Revenue Bonds | 560 | 5.000 | 07/01/25 | 656 | ||||
| City of Houston Texas Airport System Revenue Bonds | 900 | 5.000 | 07/01/29 | 1,046 | ||||
| City of Houston Texas Revenue Bonds | 1,890 | 5.000 | 09/01/20 | 2,139 | ||||
| City of Lubbock Texas General Obligation Limited | 5,000 | 5.000 | 02/15/19 | 5,446 | ||||
| City of San Antonio Texas Water System Revenue Bonds | 2,250 | 5.000 | 05/15/24 | 2,542 | ||||
| City Public Service Board of San Antonio Texas Revenue Bonds | 1,000 | 5.000 | 02/01/18 | 1,051 | ||||
| Clifton Higher Education Finance Corp. Revenue Bonds | 175 | 3.000 | 08/15/17 | 178 | ||||
| Clifton Higher Education Finance Corp. Revenue Bonds | 400 | 4.000 | 08/15/18 | 420 | ||||
| Conroe Independent School District General Obligation Unlimited | 1,085 | 5.000 | 02/15/25 | 1,220 | ||||
See accompanying notes which are an integral part of the financial statements.
Russell Tax Exempt Bond Fund 567
Russell Investment Company
Russell Tax Exempt Bond Fund
Schedule of Investments, continued — October 31, 2016
| Amounts in thousands (except share amounts) | |||||||
| Principal | Fair | ||||||
| Amount ($) | Rate | Date of | Value | ||||
| or Shares | % | Maturity | $ | ||||
| County of Fort Bend Texas General Obligation Limited | 3,740 | 5.000 | 03/01/23 | 4,525 | |||
| Dallas/Fort Worth International Airport Revenue Bonds | 280 | 5.000 | 11/01/22 | 280 | |||
| Dallas/Fort Worth International Airport Revenue Bonds | 200 | 5.000 | 11/01/23 | 200 | |||
| Dallas/Fort Worth International Airport Revenue Bonds | 250 | 5.000 | 11/01/24 | 250 | |||
| Dallas/Fort Worth International Airport Revenue Bonds | 3,395 | 5.000 | 11/01/27 | 4,027 | |||
| Dallas/Fort Worth International Airport Revenue Bonds | 1,000 | 5.250 | 11/01/28 | 1,210 | |||
| Dallas/Fort Worth International Airport Revenue Bonds | 1,340 | 5.000 | 11/01/29 | 1,525 | |||
| Dallas/Fort Worth International Airport Revenue Bonds | 2,000 | 5.250 | 11/01/29 | 2,402 | |||
| Dallas/Fort Worth International Airport Revenue Bonds | 1,825 | 5.000 | 11/01/30 | 2,075 | |||
| Dallas/Fort Worth International Airport Revenue Bonds | 1,500 | 5.250 | 11/01/30 | 1,791 | |||
| Decatur Hospital Authority Revenue Bonds | 1,250 | 5.250 | 09/01/29 | 1,393 | |||
| Dickinson Independent School District General Obligation Unlimited | 1,000 | 4.000 | 02/15/28 | 1,139 | |||
| Dickinson Independent School District General Obligation Unlimited | 2,050 | 4.000 | 02/15/29 | 2,312 | |||
| Goose Creek Consolidated Independent School District General Obligation Unlimited | 915 | 5.000 | 02/15/24 | 1,061 | |||
| Grand Prairie Independent School District General Obligation Unlimited | 750 | 5.000 | 02/15/19 | 759 | |||
| Harris County Cultural Education Facilities Finance Corp. Revenue Bonds | 1,385 | 6.375 | 01/01/33 | 1,788 | |||
| Harris County-Houston Sports Authority Revenue Bonds | 1,000 | 5.000 | 11/15/26 | 1,175 | |||
| Harris County-Houston Sports Authority Revenue Bonds | 750 | 5.000 | 11/15/27 | 876 | |||
| Harris County-Houston Sports Authority Revenue Bonds | 2,265 | 5.000 | 11/15/29 | 2,613 | |||
| Harris County-Houston Sports Authority Revenue Bonds | 1,215 | 5.000 | 11/15/31 | 1,389 | |||
| Houston Higher Education Finance Corp. Revenue Bonds(ae) | 650 | 6.500 | 05/15/31 | 800 | |||
| Houston Higher Education Finance Corp. Revenue Bonds | 1,600 | 5.000 | 08/15/28 | 1,929 | |||
| Karnes County Hospital District Revenue Bonds | 840 | 4.000 | 02/01/19 | 866 | |||
| Karnes County Hospital District Revenue Bonds | 2,020 | 5.000 | 02/01/29 | 2,262 | |||
| Kerrville Health Facilities Development Corp. Revenue Bonds | 1,100 | 4.000 | 08/15/19 | 1,171 | |||
| Lower Colorado River Authority Revenue Bonds | 3,585 | 5.500 | 05/15/31 | 4,328 | |||
| New Hope Cultural Education Facilities Corp. Revenue Bonds | 565 | 5.000 | 04/01/21 | 634 | |||
| New Hope Cultural Education Facilities Corp. Revenue Bonds | 650 | 5.000 | 04/01/22 | 742 | |||
| New Hope Cultural Education Facilities Corp. Revenue Bonds | 180 | 4.625 | 04/01/23 | 204 | |||
| New Hope Cultural Education Facilities Corp. Revenue Bonds | 500 | 5.000 | 04/01/29 | 581 | |||
| New Hope Cultural Education Facilities Corp. Revenue Bonds | 1,160 | 5.000 | 04/01/35 | 1,373 | |||
| New Hope Cultural Education Facilities Corp. Revenue Bonds | 1,545 | 5.000 | 04/01/36 | 1,824 | |||
| North East Texas Regional Mobility Authority Revenue Bonds | 1,935 | 5.000 | 01/01/31 | 2,253 | |||
| North Texas Tollway Authority Revenue Bonds(ae) | 840 | 6.000 | 01/01/18 | 889 | |||
| North Texas Tollway Authority Revenue Bonds | 120 | 6.000 | 01/01/24 | 127 | |||
| North Texas Tollway Authority Revenue Bonds | 3,840 | 5.000 | 01/01/29 | 4,611 | |||
| Reagan Hospital District of Reagan County General Obligation Limited | 860 | 2.500 | 02/01/19 | 861 | |||
| Reagan Hospital District of Reagan County General Obligation Limited | 910 | 3.250 | 02/01/21 | 926 | |||
| Reagan Hospital District of Reagan County General Obligation Limited | 500 | 5.000 | 02/01/29 | 540 | |||
| Reagan Hospital District of Reagan County General Obligation Limited | 3,000 | 5.000 | 02/01/34 | 3,193 | |||
| State of Texas General Obligation Unlimited | 2,910 | 5.000 | 04/01/22 | 3,462 | |||
| Tarrant County Cultural Education Facilities Finance Corp. Revenue Bonds | 1,500 | 5.000 | 11/15/16 | 1,502 | |||
| Tarrant County Cultural Education Facilities Finance Corp. Revenue Bonds | 2,500 | 2.500 | 12/01/18 | 2,515 | |||
| Tarrant County Cultural Education Facilities Finance Corp. Revenue Bonds | 2,000 | 4.000 | 05/15/27 | 2,047 | |||
| Tarrant Regional Water District Revenue Bonds | 6,000 | 5.000 | 03/01/21 | 6,948 | |||
| Tarrant Regional Water District Revenue Bonds | 1,150 | 5.000 | 03/01/22 | 1,365 | |||
| Texas Municipal Gas Acquisition & Supply Corp. I Revenue Bonds | 3,775 | 6.250 | 12/15/26 | 4,570 | |||
| Texas Municipal Gas Acquisition & Supply Corp. III Revenue Bonds | 900 | 5.000 | 12/15/24 | 1,037 | |||
| Texas Municipal Gas Acquisition & Supply Corp. III Revenue Bonds | 3,515 | 5.000 | 12/15/27 | 3,976 | |||
| Texas Private Activity Bond Surface Transportation Corp. Revenue Bonds | 1,445 | 7.500 | 12/31/31 | 1,722 | |||
| Texas Private Activity Bond Surface Transportation Corp. Revenue Bonds | 1,250 | 7.500 | 06/30/33 | 1,509 |
See accompanying notes which are an integral part of the financial statements.
568 Russell Tax Exempt Bond Fund
Russell Investment Company
Russell Tax Exempt Bond Fund
Schedule of Investments, continued — October 31, 2016
| Amounts in thousands (except share amounts) | ||||||||
| Principal | Fair | |||||||
| Amount ($) | Rate | Date of | Value | |||||
| or Shares | % | Maturity | $ | |||||
| Texas Public Finance Authority Revenue Bonds | 10,985 | 4.000 | 07/01/17 | 11,100 | ||||
| Texas State Public Finance Authority Charter School Finance Corp. Revenue Bonds | 95 | 4.000 | 08/15/17 | 98 | ||||
| Texas State Public Finance Authority Charter School Finance Corp. Revenue Bonds | 300 | 4.000 | 08/15/18 | 316 | ||||
| Viridian Municipal Management District General Obligation Unlimited(µ) | 1,000 | 6.000 | 12/01/27 | 1,290 | ||||
| Viridian Municipal Management District General Obligation Unlimited(µ) | 500 | 6.000 | 12/01/32 | 639 | ||||
| Viridian Municipal Management District General Obligation Unlimited(µ) | 995 | 6.000 | 12/01/33 | 1,271 | ||||
| 141,889 | ||||||||
| Utah - 0.3% | ||||||||
| County of Salt Lake Utah Revenue Bonds(Ê) | 2,000 | 5.000 | 12/01/33 | 2,091 | ||||
| Utah State Charter School Finance Authority Revenue Bonds | 465 | 5.250 | 10/15/28 | 548 | ||||
| Utah State Charter School Finance Authority Revenue Bonds | 1,215 | 5.000 | 10/15/33 | 1,364 | ||||
| 4,003 | ||||||||
| Vermont - 0.0% | ||||||||
| City of Burlington Vermont Airport Revenue Bonds(µ) | 540 | 5.000 | 07/01/24 | 620 | ||||
| Virgin Islands - 1.2% | ||||||||
| Virgin Islands Public Finance Authority Revenue Bonds | 3,885 | 5.000 | 10/01/18 | 3,937 | ||||
| Virgin Islands Public Finance Authority Revenue Bonds | 1,000 | 4.000 | 10/01/22 | 961 | ||||
| Virgin Islands Public Finance Authority Revenue Bonds | 10,050 | 5.000 | 10/01/29 | 10,884 | ||||
| Virgin Islands Public Finance Authority Revenue Bonds | 670 | 5.250 | 10/01/29 | 656 | ||||
| Virgin Islands Public Finance Authority Revenue Bonds | 2,110 | 6.750 | 10/01/37 | 2,164 | ||||
| 18,602 | ||||||||
| Virginia - 0.9% | ||||||||
| Chesterfield County Economic Development Authority Revenue Bonds | 650 | 5.000 | 05/01/23 | 708 | ||||
| Commonwealth of Virginia General Obligation Unlimited | 1,000 | 5.000 | 06/01/23 | 1,064 | ||||
| County of Fairfax Virginia General Obligation Unlimited | 1,000 | 5.000 | 04/01/18 | 1,058 | ||||
| Henrico County Economic Development Authority Revenue Bonds | 1,490 | 5.000 | 11/01/30 | 1,700 | ||||
| Virginia College Building Authority Revenue Bonds | 530 | 5.000 | 07/01/19 | 567 | ||||
| Virginia College Building Authority Revenue Bonds | 585 | 5.000 | 07/01/20 | 636 | ||||
| Virginia College Building Authority Revenue Bonds | 710 | 5.250 | 07/01/30 | 806 | ||||
| Virginia Commonwealth Transportation Board Revenue Bonds | 1,950 | 5.000 | 03/15/18 | 2,060 | ||||
| Virginia Public School Authority Revenue Bonds | 1,000 | 5.000 | 08/01/17 | 1,032 | ||||
| Virginia Resources Authority Revenue Bonds | 3,795 | 5.000 | 11/01/21 | 4,486 | ||||
| 14,117 | ||||||||
| Washington - 3.0% | ||||||||
| City of Seattle Washington Municipal Light & Power Revenue Bonds | 5,760 | 5.000 | 05/01/20 | 6,530 | ||||
| City of Seattle Washington Municipal Light & Power Revenue Bonds | 5,545 | 5.000 | 05/01/21 | 6,464 | ||||
| City of Seattle Washington Municipal Light & Power Revenue Bonds | 2,820 | 5.000 | 05/01/22 | 3,370 | ||||
| County of King Washington Sewer Revenue Bonds | 3,085 | 5.000 | 01/01/28 | 3,696 | ||||
| Energy Northwest Revenue Bonds | 2,000 | 5.000 | 07/01/19 | 2,211 | ||||
| Greater Wenatchee Regional Events Center Public Facilities Dist Revenue Bonds | 1,060 | 3.750 | 09/01/19 | 1,084 | ||||
| Greater Wenatchee Regional Events Center Public Facilities Dist Revenue Bonds | 1,000 | 4.500 | 09/01/22 | 1,055 | ||||
| Mason County School District No. 309 Shelton General Obligation Unlimited(µ) | 1,115 | 5.000 | 12/01/18 | 1,206 | ||||
| Port of Seattle Washington Revenue Bonds | 1,000 | 5.000 | 06/01/22 | 1,128 | ||||
| Port of Seattle Washington Revenue Bonds | 1,285 | 5.000 | 03/01/23 | 1,554 | ||||
| State of Washington General Obligation Unlimited | 1,000 | 5.000 | 07/01/17 | 1,029 | ||||
| State of Washington General Obligation Unlimited | 3,825 | 5.000 | 02/01/25 | 4,765 | ||||
| State of Washington Revenue Bonds | 8,000 | 5.000 | 09/01/20 | 9,105 | ||||
| Washington Health Care Facilities Authority Revenue Bonds | 270 | 5.000 | 03/01/18 | 284 | ||||
| Washington Health Care Facilities Authority Revenue Bonds | 700 | 5.000 | 07/01/30 | 826 | ||||
| Washington State Housing Finance Commission Revenue Bonds | 1,400 | 4.375 | 01/01/21 | 1,419 | ||||
| 45,726 | ||||||||
| West Virginia - 0.2% | ||||||||
See accompanying notes which are an integral part of the financial statements.
Russell Tax Exempt Bond Fund 569
Russell Investment Company
Russell Tax Exempt Bond Fund
Schedule of Investments, continued — October 31, 2016
| Amounts in thousands (except share amounts) | |||||||||
| Principal | Fair | ||||||||
| Amount ($) | Rate | Date of | Value | ||||||
| or Shares | % | Maturity | $ | ||||||
| County of Mason West Virginia Revenue Bonds(Ê) | 1,000 | 1.625 | 10/01/22 | 1,000 | |||||
| West Virginia Hospital Finance Authority Revenue Bonds(µ)(Ê) | 450 | 0.595 | 02/15/34 | 399 | |||||
| West Virginia University Revenue Bonds | 1,350 | 5.000 | 10/01/21 | 1,572 | |||||
| 2,971 | |||||||||
| Wisconsin - 1.3% | |||||||||
| City of Marshfield Wisconsin Electric System Revenue Bonds | 4,000 | 5.500 | 12/01/30 | 4,696 | |||||
| Public Finance Authority Revenue Bonds | 1,250 | 5.125 | 11/15/29 | 1,341 | |||||
| State of Wisconsin General Obligation Unlimited | 4,250 | 5.000 | 11/01/20 | 4,891 | |||||
| Wisconsin Department of Transportation Revenue Bonds(µ) | 1,500 | 5.000 | 07/01/19 | 1,657 | |||||
| Wisconsin Department of Transportation Revenue Bonds | 5,950 | 5.000 | 07/01/22 | 7,137 | |||||
| 19,722 | |||||||||
| Wyoming - 0.2% | |||||||||
| County of Laramie Wyoming Revenue Bonds | 1,000 | 4.000 | 05/01/22 | 1,090 | |||||
| County of Sweetwater Wyoming Revenue Bonds | 1,000 | 5.000 | 12/15/16 | 1,005 | |||||
| County of Sweetwater Wyoming Revenue Bonds | 1,000 | 5.000 | 12/15/18 | 1,043 | |||||
| 3,138 | |||||||||
| Total Municipal Bonds (cost $1,363,184) | 1,417,342 | ||||||||
| Short-Term Investments - 6.0% | |||||||||
| Russell U.S. Cash Management Fund | 90,019,688 | (8) | 90,038 | ||||||
| Total Short-Term Investments (cost $90,027) | 90,038 | ||||||||
| Total Investments 100.1% (identified cost $1,453,211) | 1,507,380 | ||||||||
| Other Assets and Liabilities, Net - (0.1%) | (1,384 | ) | |||||||
| Net Assets - 100.0% | 1,505,996 | ||||||||
See accompanying notes which are an integral part of the financial statements.
570 Russell Tax Exempt Bond Fund
Russell Investment Company
Russell Tax Exempt Bond Fund
Schedule of Investments, continued — October 31, 2016
| Presentation of Portfolio Holdings | |||||||||||||
| Amount in thousands | |||||||||||||
| Fair Value | |||||||||||||
| Practical | |||||||||||||
| Portfolio Summary | Level 1 | Level 2 | Level 3 | Expedient (a) | Total | % of Net Assets | |||||||
| Municipal Bonds | |||||||||||||
| Alabama | $ | — | $ | 23,363 | $ | — | $ | — | $ | 23,363 | 1.6 | ||
| Alaska | — | 1,730 | — | — | 1,730 | 0.1 | |||||||
| Arizona | — | 34,057 | — | — | 34,057 | 2.3 | |||||||
| Arkansas | — | 2,814 | — | — | 2,814 | 0.2 | |||||||
| California | — | 120,666 | — | — | 120,666 | 8.0 | |||||||
| Colorado | — | 31,253 | — | — | 31,253 | 2.1 | |||||||
| Connecticut | — | 28,263 | — | — | 28,263 | 1.9 | |||||||
| District of Columbia | — | 3,668 | — | — | 3,668 | 0.2 | |||||||
| Florida | — | 129,008 | — | — | 129,008 | 8.6 | |||||||
| Georgia | — | 20,567 | — | — | 20,567 | 1.4 | |||||||
| Guam | — | 19,507 | — | — | 19,507 | 1.3 | |||||||
| Idaho | — | 9,959 | — | — | 9,959 | 0.7 | |||||||
| Illinois | — | 121,985 | — | — | 121,985 | 8.1 | |||||||
| Indiana | — | 2,179 | — | — | 2,179 | 0.1 | |||||||
| Iowa | — | 12,239 | — | — | 12,239 | 0.8 | |||||||
| Kansas | — | 4,672 | — | — | 4,672 | 0.3 | |||||||
| Kentucky | — | 9,751 | — | — | 9,751 | 0.7 | |||||||
| Louisiana | — | 26,640 | — | — | 26,640 | 1.8 | |||||||
| Maryland | — | 3,772 | — | — | 3,772 | 0.3 | |||||||
| Massachusetts | — | 18,729 | — | — | 18,729 | 1.2 | |||||||
| Michigan | — | 58,391 | — | — | 58,391 | 3.9 | |||||||
| Minnesota | — | 11,407 | — | — | 11,407 | 0.8 | |||||||
| Mississippi | — | 6,203 | — | — | 6,203 | 0.4 | |||||||
| Missouri | — | 17,922 | — | — | 17,922 | 1.2 | |||||||
| Nebraska | — | 9,096 | — | — | 9,096 | 0.6 | |||||||
| Nevada | — | 21,990 | — | — | 21,990 | 1.5 | |||||||
| New Jersey | — | 81,641 | — | — | 81,641 | 5.4 | |||||||
| New Mexico | — | 1,443 | — | — | 1,443 | 0.1 | |||||||
| New York | — | 114,600 | — | — | 114,600 | 7.6 | |||||||
| North Carolina | — | 9,286 | — | — | 9,286 | 0.6 | |||||||
| North Dakota | — | 3,563 | — | — | 3,563 | 0.2 | |||||||
| Ohio | — | 67,819 | — | — | 67,819 | 4.5 | |||||||
| Oklahoma | — | 4,180 | — | — | 4,180 | 0.3 | |||||||
| Oregon | — | 4,896 | — | — | 4,896 | 0.3 | |||||||
| Pennsylvania | — | 63,212 | — | — | 63,212 | 4.2 | |||||||
| Puerto Rico | — | 33,808 | — | — | 33,808 | 2.2 | |||||||
| Rhode Island | — | 7,671 | — | — | 7,671 | 0.5 | |||||||
| South Carolina | — | 16,913 | — | — | 16,913 | 1.1 | |||||||
| South Dakota | — | 1,145 | — | — | 1,145 | 0.1 | |||||||
| Tennessee | — | 6,546 | — | — | 6,546 | 0.4 | |||||||
| Texas | — | 141,889 | — | — | 141,889 | 9.4 | |||||||
| Utah | — | 4,003 | — | — | 4,003 | 0.3 | |||||||
| Vermont | — | 620 | — | — | 620 | —* | |||||||
See accompanying notes which are an integral part of the financial statements.
Russell Tax Exempt Bond Fund 571
Russell Investment Company
Russell Tax Exempt Bond Fund
Schedule of Investments, continued — October 31, 2016
| Presentation of Portfolio Holdings | ||||||||||||||
| Amount in thousands | ||||||||||||||
| Fair Value | ||||||||||||||
| Practical | ||||||||||||||
| Portfolio Summary | Level 1 | Level 2 | Level 3 | Expedient (a) | Total | % of Net Assets | ||||||||
| Virgin Islands | — | 18,602 | — | — | 18,602 | 1.2 | ||||||||
| Virginia | — | 14,117 | — | — | 14,117 | 0.9 | ||||||||
| Washington | — | 45,726 | — | — | 45,726 | 3.0 | ||||||||
| West Virginia | — | 2,971 | — | — | 2,971 | 0.2 | ||||||||
| Wisconsin | — | 19,722 | — | — | 19,722 | 1.3 | ||||||||
| Wyoming | — | 3,138 | — | — | 3,138 | 0.2 | ||||||||
| Short-Term Investments | — | — | — | 90,038 | 90,038 | 6.0 | ||||||||
| Total Investments | $ | — | $ | 1,417,342 | $ | — | $ | 90,038 | $ | 1,507,380 | 100.1 | |||
| Other Assets and Liabilities, Net | (0.1 | ) | ||||||||||||
| 100.0 | ||||||||||||||
* Less than 0.05% of net assets.
(a) Certain investments that are measured at fair value using the net asset value per share (or its equivalent) practical expedient have not been classified
in the fair value levels. The fair value amounts presented in the table are intended to permit reconciliation to the amounts presented in the Schedule of
Investments.
For a description of the Levels, see note 2 in the Notes to Financial Statements.
For a disclosure on transfers between Levels 1, 2 and 3 during the period ended October 31, 2016, see note 2 in the Notes to
Financial Statements.
See accompanying notes which are an integral part of the financial statements.
572 Russell Tax Exempt Bond Fund
Russell Investment Company
Russell Tax Exempt Bond Fund
Statement of Assets and Liabilities — October 31, 2016
| Amounts in thousands | ||
| Assets | ||
| Investments, at identified cost | $ | 1,453,211 |
| Investments, at fair value(>) | 1,507,380 | |
| Receivables: | ||
| Dividends and interest | 18,793 | |
| Dividends from affiliated Russell funds | 42 | |
| Investments sold | 12,029 | |
| Fund shares sold | 4,412 | |
| Total assets | 1,542,656 | |
| Liabilities | ||
| Payables: | ||
| Investments purchased | 34,783 | |
| Fund shares redeemed | 1,056 | |
| Accrued fees to affiliates | 670 | |
| Other accrued expenses | 151 | |
| Total liabilities | 36,660 | |
| Net Assets | $ | 1,505,996 |
See accompanying notes which are an integral part of the financial statements.
Russell Tax Exempt Bond Fund 573
Russell Investment Company
Russell Tax Exempt Bond Fund
Statement of Assets and Liabilities, continued — October 31, 2016
| Amounts in thousands | |||
| Net Assets Consist of: | |||
| Undistributed (overdistributed) net investment income | $ | 3,371 | |
| Accumulated net realized gain (loss) | (224 | ) | |
| Unrealized appreciation (depreciation) on investments | 54,169 | ||
| Shares of beneficial interest | 644 | ||
| Additional paid-in capital | 1,448,036 | ||
| Net Assets | $ | 1,505,996 | |
| Net Asset Value, offering and redemption price per share: | |||
| Net asset value per share: Class A(#) | $ | 23.45 | |
| Maximum offering price per share (Net asset value plus sales charge of 3.75%): Class A | $ | 24.36 | |
| Class A — Net assets | $ | 23,916,990 | |
| Class A — Shares outstanding ($.01 par value) | 1,020,046 | ||
| Net asset value per share: Class C(#) | $ | 23.32 | |
| Class C — Net assets | $ | 32,015,730 | |
| Class C — Shares outstanding ($.01 par value) | 1,373,177 | ||
| Net asset value per share: Class E(#) | $ | 23.41 | |
| Class E — Net assets | $ | 55,714,322 | |
| Class E — Shares outstanding ($.01 par value) | 2,380,424 | ||
| Net asset value per share: Class S(#) | $ | 23.37 | |
| Class S — Net assets | $ | 1,394,348,984 | |
| Class S — Shares outstanding ($.01 par value) | 59,676,243 | ||
| Amounts in thousands | |||
| (>) Investments in affiliates, Russell U.S. Cash Management Fund | $ | 90,038 | |
| (#) Net asset value per share equals class level net assets divided by class level shares of beneficial interest outstanding. | |||
See accompanying notes which are an integral part of the financial statements.
574 Russell Tax Exempt Bond Fund
Russell Investment Company
Russell Tax Exempt Bond Fund
Statement of Operations — For the Period Ended October 31, 2016
| Amounts in thousands | |||
| Investment Income | |||
| Dividends from affiliated Russell funds | $ | 251 | |
| Interest | 44,867 | ||
| Total investment income | 45,118 | ||
| Expenses | |||
| Advisory fees | 4,226 | ||
| Administrative fees | 680 | ||
| Custodian fees (1) | 135 | ||
| Distribution fees - Class A | 53 | ||
| Distribution fees - Class C | 224 | ||
| Transfer agent fees - Class A | 43 | ||
| Transfer agent fees - Class C | 60 | ||
| Transfer agent fees - Class E | 106 | ||
| Transfer agent fees - Class S | 2,608 | ||
| Professional fees | 96 | ||
| Registration fees | 115 | ||
| Shareholder servicing fees - Class C | 75 | ||
| Shareholder servicing fees - Class E | 133 | ||
| Trustees’ fees | 50 | ||
| Printing fees | 69 | ||
| Miscellaneous | 45 | ||
| Expenses before reductions | 8,718 | ||
| Expense reductions | (837 | ) | |
| Net expenses | 7,881 | ||
| Net investment income (loss) | 37,237 | ||
| Net Realized and Unrealized Gain (Loss) | |||
| Net realized gain (loss) on investments | 493 | ||
| Net change in unrealized appreciation (depreciation) on investments | 10,903 | ||
| Net realized and unrealized gain (loss) | 11,396 | ||
| Net Increase (Decrease) in Net Assets from Operations | $ | 48,633 | |
| (1) Includes a reimbursement for overbilling of custody out-of-pocket fees from prior years. See note 10 in the Notes to Financial Statements. | |||
See accompanying notes which are an integral part of the financial statements.
Russell Tax Exempt Bond Fund 575
Russell Investment Company
Russell Tax Exempt Bond Fund
Statements of Changes in Net Assets
| For the Periods Ended October 31, | ||||||
| Amounts in thousands | 2016 | 2015 | ||||
| Increase (Decrease) in Net Assets | ||||||
| Operations | ||||||
| Net investment income (loss) | $ | 37,237 | $ | 34,808 | ||
| Net realized gain (loss) | 493 | 2,000 | ||||
| Net change in unrealized appreciation (depreciation) | 10,903 | (6,291 | ) | |||
| Net increase (decrease) in net assets from operations | 48,633 | 30,517 | ||||
| Distributions | ||||||
| From net investment income | ||||||
| Class A | (501 | ) | (423 | ) | ||
| Class C | (498 | ) | (445 | ) | ||
| Class E | (1,279 | ) | (1,494 | ) | ||
| Class S | (34,581 | ) | (31,925 | ) | ||
| Net decrease in net assets from distributions | (36,859 | ) | (34,287 | ) | ||
| Share Transactions* | ||||||
| Net increase (decrease) in net assets from share transactions | 185,664 | 53,719 | ||||
| Total Net Increase (Decrease) in Net Assets | 197,438 | 49,949 | ||||
| Net Assets | ||||||
| Beginning of period | 1,308,558 | 1,258,609 | ||||
| End of period | $ | 1,505,996 | $ | 1,308,558 | ||
| Undistributed (overdistributed) net investment income included in net assets | $ | 3,371 | $ | 2,983 | ||
See accompanying notes which are an integral part of the financial statements.
576 Russell Tax Exempt Bond Fund
Russell Investment Company
Russell Tax Exempt Bond Fund
Statements of Changes in Net Assets, continued
* Share transaction amounts (in thousands) for the periods ended October 31, 2016 and October 31, 2015 were as follows:
| 2016 | 2015 | |||||||||||
| Shares | Dollars | Shares | Dollars | |||||||||
| Class A | ||||||||||||
| Proceeds from shares sold | 397 | $ | 9,358 | 398 | $ | 9,221 | ||||||
| Proceeds from reinvestment of distributions | 21 | 486 | 18 | 418 | ||||||||
| Payments for shares redeemed | (236 | ) | (5,551 | ) | (326 | ) | (7,550 | ) | ||||
| Net increase (decrease) | 182 | 4,293 | 90 | 2,089 | ||||||||
| Class C | ||||||||||||
| Proceeds from shares sold | 618 | 14,453 | 381 | 8,803 | ||||||||
| Proceeds from reinvestment of distributions | 21 | 483 | 19 | 432 | ||||||||
| Payments for shares redeemed | (400 | ) | (9,372 | ) | (430 | ) | (9,916 | ) | ||||
| Net increase (decrease) | 239 | 5,564 | (30 | ) | (681 | ) | ||||||
| Class E | ||||||||||||
| Proceeds from shares sold | 427 | 10,045 | 604 | 13,992 | ||||||||
| Proceeds from reinvestment of distributions | 54 | 1,257 | 64 | 1,470 | ||||||||
| Payments for shares redeemed | (283 | ) | (6,634 | ) | (1,088 | ) | (25,010 | ) | ||||
| Net increase (decrease) | 198 | 4,668 | (420 | ) | (9,548 | ) | ||||||
| Class S | ||||||||||||
| Proceeds from shares sold | 20,582 | 482,402 | 21,136 | 488,569 | ||||||||
| Proceeds from reinvestment of distributions | 1,450 | 33,948 | 1,360 | 31,388 | ||||||||
| Payments for shares redeemed | (14,726 | ) | (345,211 | ) | (19,881 | ) | (458,098 | ) | ||||
| Net increase (decrease) | 7,306 | 171,139 | 2,615 | 61,859 | ||||||||
| Total increase (decrease) | 7,925 | $ | 185,664 | 2,255 | $ | 53,719 | ||||||
See accompanying notes which are an integral part of the financial statements.
Russell Tax Exempt Bond Fund 577
Russell Investment Company
Russell Tax Exempt Bond Fund
Financial Highlights — For the Periods Ended
| $ | $ | $ | $ | $ | ||||||||||||
| Net Asset Value, | Net | Net Realized | Total from | Distributions | ||||||||||||
| Beginning of | Investment | and Unrealized | Investment | from Net | $ | |||||||||||
| Period | Income (Loss)(a)(d) | Gain (Loss) | Operations | Investment Income | Total Distributions | |||||||||||
| Class A | ||||||||||||||||
| October 31, 2016 | 23.23 | .56 | .22 | .78 | (.56 | ) | (.56 | ) | ||||||||
| October 31, 2015 | 23.27 | .54 | (.04 | ) | .50 | (.54 | ) | (.54 | ) | |||||||
| October 31, 2014 | 22.62 | .50 | .64 | 1.14 | (.49 | ) | (.49 | ) | ||||||||
| October 31, 2013 | 23.24 | .45 | (.63 | ) | (.18 | ) | (.44 | ) | (.44 | ) | ||||||
| October 31, 2012 | 22.48 | .52 | .79 | 1.31 | (.55 | ) | (.55 | ) | ||||||||
| Class C | ||||||||||||||||
| October 31, 2016 | 23.10 | .39 | .22 | .61 | (.39 | ) | (.39 | ) | ||||||||
| October 31, 2015 | 23.14 | .38 | (.05 | ) | .33 | (.37 | ) | (.37 | ) | |||||||
| October 31, 2014 | 22.50 | .34 | .62 | .96 | (.32 | ) | (.32 | ) | ||||||||
| October 31, 2013 | 23.11 | .28 | (.61 | ) | (.33 | ) | (.28 | ) | (.28 | ) | ||||||
| October 31, 2012 | 22.36 | .37 | .77 | 1.14 | (.39 | ) | (.39 | ) | ||||||||
| Class E | ||||||||||||||||
| October 31, 2016 | 23.19 | .57 | .22 | .79 | (.57 | ) | (.57 | ) | ||||||||
| October 31, 2015 | 23.23 | .55 | (.05 | ) | .50 | (.54 | ) | (.54 | ) | |||||||
| October 31, 2014 | 22.58 | .51 | .64 | 1.15 | (.50 | ) | (.50 | ) | ||||||||
| October 31, 2013 | 23.19 | .45 | (.61 | ) | (.16 | ) | (.45 | ) | (.45 | ) | ||||||
| October 31, 2012 | 22.44 | .54 | .76 | 1.30 | (.55 | ) | (.55 | ) | ||||||||
| Class S | ||||||||||||||||
| October 31, 2016 | 23.15 | .63 | .22 | .85 | (.63 | ) | (.63 | ) | ||||||||
| October 31, 2015 | 23.19 | .61 | (.05 | ) | .56 | (.60 | ) | (.60 | ) | |||||||
| October 31, 2014 | 22.55 | .56 | .63 | 1.19 | (.55 | ) | (.55 | ) | ||||||||
| October 31, 2013 | 23.16 | .51 | (.61 | ) | (.10 | ) | (.51 | ) | (.51 | ) | ||||||
| October 31, 2012 | 22.41 | .60 | .76 | 1.36 | (.61 | ) | (.61 | ) | ||||||||
See accompanying notes which are an integral part of the financial statements.
578 Russell Tax Exempt Bond Fund
| % | % | % | ||||||||||||
| $ | $ | Ratio of Expenses | Ratio of Expenses | Ratio of Net | ||||||||||
| Net Asset Value, | % | Net Assets, | to Average | to Average | Investment Income | % | ||||||||
| End of | Total | End of Period | Net Assets, | Net Assets, | to Average | Portfolio | ||||||||
| Period | Return(c) | (000 | ) | Gross | Net(d) | Net Assets(d) | Turnover Rate | |||||||
| 23.45 | 3.37 | 23,917 | .83 | .81 | 2.39 | 14 | ||||||||
| 23.23 | 2.17 | 19,472 | .83 | .82 | 2.35 | 28 | ||||||||
| 23.27 | 5.09 | 17,406 | .84 | .82 | 2.18 | 15 | ||||||||
| 22.62 | (.77 | ) | 16,851 | .84 | .82 | 1.95 | 23 | |||||||
| 23.24 | 5.89 | 14,649 | .84 | .83 | 2.28 | 29 | ||||||||
| 23.32 | 2.67 | 32,016 | 1.58 | 1.52 | 1.68 | 14 | ||||||||
| 23.10 | 1.45 | 26,215 | 1.58 | 1.53 | 1.64 | 28 | ||||||||
| 23.14 | 4.32 | 26,956 | 1.59 | 1.53 | 1.47 | 15 | ||||||||
| 22.50 | (1.44 | ) | 28,147 | 1.59 | 1.53 | 1.24 | 23 | |||||||
| 23.11 | 5.12 | 31,628 | 1.58 | 1.54 | 1.62 | 29 | ||||||||
| 23.41 | 3.42 | 55,714 | .83 | .77 | 2.43 | 14 | ||||||||
| 23.19 | 2.21 | 50,598 | .83 | .78 | 2.38 | 28 | ||||||||
| 23.23 | 5.14 | 60,440 | .84 | .78 | 2.22 | 15 | ||||||||
| 22.58 | (.68 | ) | 51,073 | .84 | .78 | 1.99 | 23 | |||||||
| 23.19 | 5.87 | 39,034 | .83 | .79 | 2.37 | 29 | ||||||||
| 23.37 | 3.68 | 1,394,349 | .58 | .52 | 2.68 | 14 | ||||||||
| 23.15 | 2.47 | 1,212,273 | .58 | .53 | 2.64 | 28 | ||||||||
| 23.19 | 5.37 | 1,153,807 | .59 | .53 | 2.47 | 15 | ||||||||
| 22.55 | (.44 | ) | 782,853 | .59 | .53 | 2.24 | 23 | |||||||
| 23.16 | 6.14 | 613,006 | .58 | .54 | 2.63 | 29 | ||||||||
See accompanying notes which are an integral part of the financial statements.
Russell Tax Exempt Bond Fund 579
Russell Investment Company
Russell Tax Exempt Bond Fund
Related Party Transactions, Fees and Expenses
| Accrued fees payable to affiliates for the period ended October 31, 2016 were as follows: | ||
| Advisory fees | $ | 379,766 |
| Administration fees | 61,163 | |
| Distribution fees | 25,249 | |
| Shareholder servicing fees | 18,483 | |
| Transfer agent fees | 178,046 | |
| Trustee fees | 7,051 | |
| $ | 669,758 | |
| Transactions (amounts in thousands) during the period ended October 31, 2016 with Underlying Funds which are, or were, an | ||||||||||||||||||
| affiliated company are as follows: | ||||||||||||||||||
| Fair Value, | Change in | |||||||||||||||||
| Beginning of | Realized Gain | Unrealized | Fair Value, End | Income | Capital Gains | |||||||||||||
| Period | Purchases | Sales | (Loss) | Gain (Loss) | of Period | Distributions | Distributions | |||||||||||
| Russell U.S. Cash Management Fund $ | 40,825 | $ | 508,332 | $ | 459,133 | $ | 3 | $ | 11 | $ | 90,038 | $ | 251 | $ | — | |||
| $ | 40,825 | $ | 508,332 | $ | 459,133 | $ | 3 | $ | 11 | $ | 90,038 | $ | 251 | $ | — | |||
Federal Income Taxes
At October 31, 2016, the cost of investments and net unrealized appreciation (depreciation), undistributed ordinary income
undistributed long-term capital gains for income tax purposes were as follows:.
| Cost of Investments | $ | 1,453,113,317 | |||
| Unrealized Appreciation | $ | 58,573,372 | |||
| Unrealized Depreciation | (4,307,011 | ) | |||
| Net Unrealized Appreciation (Depreciation) | $ | 54,266,361 | |||
| Undistributed Ordinary Income | $ | 3,270,023 | |||
| Undistributed Long-Term Capital Gains | |||||
| (Capital Loss Carryforward) | $ | (221,229 | ) | ||
| Tax Composition of Distributions | |||||
| Ordinary Income | $ | 457,877 | |||
| Tax-Exempt Income | $ | 36,401,739 | |||
Net investment income and net realized gains (loss) in the financial statements may differ from taxable net investment income and net
realized gains (losses). Capital accounts within the financial statements are adjusted for permanent book-tax differences. Book-tax
differences are primarily due to foreign currency gains and losses, reclassifications of dividends, differences in treatment of income
from swaps, net operating losses, investments in partnerships, investments in passive foreign investment companies (PFICs), tax
straddle transactions, use of tax equalization and foreign capital gains taxes. These adjustments have no impact on the net assets.
At October 31, 2016, the Statement of Assets and Liabilities have been adjusted by the following amounts (in thousands):
| Undistributed net investment income | $ | 10 | |
| Accumulated net realized gain (loss) | — | ||
| Additional paid-in capital | (10 | ) |
See accompanying notes which are an integral part of the financial statements.
580 Russell Tax Exempt Bond Fund
Russell Investment Company
Russell Commodity Strategies Fund
Portfolio Management Discussion and Analysis — October 31, 2016 (Unaudited)
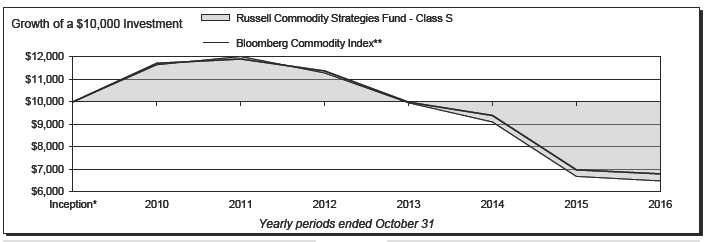
| Russell Commodity Strategies Fund - Class A‡ | Russell Commodity Strategies Fund - Class Y | ||||||
| Total | Total | ||||||
| Return | Return | ||||||
| 1 Year | (8.78 | )% | 1 Year | (2.99 | )% | ||
| 5 Years | (12.87 | )%§ | 5 Years | (11.47 | )%§ | ||
| Inception* | (7.70 | )%§ | Inception* | (6.47 | )%§ | ||
| Russell Commodity Strategies Fund - Class C | Bloomberg Commodity Index** | ||||||
| Total | Total | ||||||
| Return | Return | ||||||
| 1 Year | (4.07 | )% | 1 Year | (2.62 | )% | ||
| 5 Years | (12.50 | )%§ | 5 Years | (10.61 | )%§ | ||
| Inception* | (7.55 | )%§ | Inception* | (5.92 | )%§ | ||
| Russell Commodity Strategies Fund - Class E | |||||||
| Total | |||||||
| Return | |||||||
| 1 Year | (3.23 | )% | |||||
| 5 Years | (11.82 | )%§ | |||||
| Inception* | (6.85 | )%§ | |||||
| Russell Commodity Strategies Fund - Class S | |||||||
| Total | |||||||
| Return | |||||||
| 1 Year | (3.01 | )% | |||||
| 5 Years | (11.61 | )%§ | |||||
| Inception* | (6.61 | )%§ | |||||
Russell Commodity Strategies Fund 581
Russell Investment Company
Russell Commodity Strategies Fund
Portfolio Management Discussion and Analysis, continued — October 31, 2016
(Unaudited)
| The Russell Commodity Strategies Fund (the “Fund”) employs | Results for active management were mixed during the period. | |
| a multi-manager approach whereby portions of the Fund are | The continuing theme of oversupply was supportive of active | |
| allocated to different money manager strategies. Fund assets not | strategies that focus on buying deferred maturity contracts | |
| allocated to money managers are managed by Russell Investment | relative to the benchmark. Fundamentally-oriented trading | |
| Management, LLC (“RIM”), the Fund’s advisor. RIM may change | strategies were mixed, however, as technical factors were often | |
| the allocation of the Fund’s assets among money managers at | dominant in driving prices for some commodities. As such, the | |
| any time. An exemptive order from the Securities and Exchange | Fund’s contract selection strategies were beneficial, adding value | |
| Commission (“SEC”) permits RIM to engage or terminate a money | in the agriculture and metals sectors while directional strategies | |
| manager at any time, subject to approval by the Fund’s Board, | were mixed, with some Fund managers underperforming the | |
| without a shareholder vote. Pursuant to the terms of the exemptive | benchmark due to over and underweight trades in the energy and | |
| order, the Fund is required to notify its shareholders within 90 | agriculture sectors. | |
| days of when a money manager begins providing services. As of | ||
| October 31, 2016, the Fund had three money managers. | How did the investment strategies and techniques employed | |
| by the Fund and its money managers affect its benchmark- | ||
| What is the Fund’s investment objective? | relative performance? | |
| The Fund seeks to provide long term total return. | The Fund employs discretionary money managers. The Fund’s | |
| How did the Fund perform relative to its benchmark for the | discretionary money managers select the individual portfolio | |
| fiscal year ended October 31, 2016? | securities for the assets assigned to them. Fund assets not | |
| allocated to discretionary money managers include the Fund’s | ||
| For the fiscal year ended October 31, 2016, the Fund’s Class A, | liquidity reserves and assets which may be managed directly by | |
| Class C, Class E, Class S and Class Y Shares lost 3.23%, 4.07%, | RIM to effect the Fund’s investment strategies and/or to actively | |
| 3.23%, 3.01% and 2.99%, respectively. This is compared to | manage the Fund’s overall exposures by investing in securities or | |
| the Fund’s benchmark, the Bloomberg Commodity Index Total | other instruments that RIM believes will achieve the desired risk/ | |
| Return, which lost 2.62% during the same period. The Fund’s | return profile for the Fund. | |
| performance includes operating expenses, whereas index returns | ||
| are unmanaged and do not include expenses of any kind. | The Fund generally pursues its investment objective by investing | |
| through a wholly-owned subsidiary in commodity-linked derivative | ||
| For the fiscal year ended October 31, 2016, the Morningstar® | instruments (including swap agreements, futures and options | |
| Commodities Broad Basket Category, a group of funds that | contracts with respect to indexes or individual commodities | |
| Morningstar considers to have investment strategies similar | and options on futures contracts) that provide exposure to the | |
| to those of the Fund, lost 1.18%. This result serves as a peer | performance of the collateralized commodity futures market. | |
| comparison and is expressed net of operating expenses. | ||
| With respect to certain of the Fund’s money managers, | ||
| How did the market conditions described in the Market | CoreCommodity Management, LLC (“CoreCommodity”) | |
| Summary report affect the Fund’s performance? | outperformed the Fund’s benchmark for the fiscal year. | |
| Commodity markets declined during the one year period ending | CoreCommodity generated excess returns relative to the | |
| October 31, 2016. Within the Bloomberg Commodity Index | benchmark through its quantitative and qualitative approach to | |
| Total Return, the agriculture, industrial metals and precious | building commodity portfolios. The manager added value over | |
| metals sectors posted gains, while the energy and livestock | the period through commodity and contract selection in the | |
| sectors declined. The dispersion in sector returns underscored | agriculture, industrial metals and livestock sectors. | |
| the diverse market forces that were at play over the period. The | Goldman Sachs Asset Management, L.P. underperformed the | |
| energy sector fell sharply, with crude oil and natural gas prices | Fund’s benchmark for the fiscal year. The manager trailed the | |
| declining in the face of ample global inventories and strong | benchmark over the period due to active positioning across | |
| production. Livestock was another sector that posted losses due | sectors, but losses were primarily concentrated in the agriculture | |
| to the forces of oversupply, as cheap grains prices supported an | and energy sectors. Over and underweight trades in grains | |
| increase in the supply of lean hogs and live cattle. The industrial | commodities as well as gold and palladium contributed to losses. | |
| metals sector rose, on the other hand, as some metals markets | ||
| showed that years of supply curtailments were beginning to have | Strategies employed by RIM in the Fund include an allocation to | |
| an impact on prices. Precious metals also rose during the period | a RIM-developed backwardation strategy and the implementation | |
| thanks to continued expectations for macroeconomic uncertainty | of a total return swap with Cargill, Inc. (“Cargill”). RIM’s | |
| and loose monetary policy around the world. | backwardation strategy seeks to achieve excess return through the | |
| use of a quantitative model that selects and weights exposure to | ||
582 Russell Commodity Strategies Fund
Russell Investment Company
Russell Commodity Strategies Fund
Portfolio Management Discussion and Analysis, continued — October 31, 2016
(Unaudited)
| individual commodities based upon their relative attractiveness. | Money Managers as of October 31, | |
| The backwardation strategy outperformed the Fund’s benchmark | 2016 | Styles |
| over the period due to active positions across sectors. Overweight | ||
| CoreCommodity Management, LLC | Fully Active Commodity | |
| positions in precious metals were beneficial, as were periodic | Credit Suisse Asset Management, LLC | Enhanced Index |
| underweight positions in grains and energy commodities. | Goldman Sachs Asset Management, L.P. | Fully Active Commodity |
| The Cargill total return swap strategy seeks to benefit from the | The views expressed in this report reflect those of the | |
| trading expertise of global food giant Cargill. The total return swap | portfolio managers only through the end of the period | |
| strategy outperformed the Fund’s benchmark during the period | covered by the report. These views do not necessarily | |
| due to active positions in agricultural and energy commodities. | represent the views of RIM or any other person in RIM or | |
| any other affiliated organization. These views are subject | ||
| Describe any changes to the Fund’s structure or the money | to change at any time based upon market conditions or | |
| manager line-up. | other events, and RIM disclaims any responsibility to | |
| There were no changes to the Fund’s structure or money manager | update the views contained herein. These views should not | |
| line up during the fiscal year. | be relied on as investment advice and, because investment | |
| decisions for a Russell Investment Company (“RIC”) Fund | ||
| are based on numerous factors, should not be relied on as | ||
| an indication of investment decisions of any RIC Fund. | ||
* Assumes initial investment on June 30, 2010.
** The Bloomberg Commodity Index is made up of 22 exchange-traded futures on physical commodities. The index currently represents 20 commodities, which are
weighted to account for economic significance and market liquidity.
‡ The performance shown has been adjusted to reflect the deduction of the maximum Class A sales charge of 5.75%.
§ Annualized.
Performance is historical and assumes reinvestment of all dividends and capital gains. Investment return and principal value will fluctuate so that an investor’s
shares, when redeemed, may be worth more or less than when purchased. Past performance is not indicative of future results. The returns shown do not reflect the
deduction of taxes that a shareholder would pay on Fund distributions or the redemption of Fund shares. Additionally, the returns presented herein may differ from
the performance reported in the Financial Highlights as the returns herein are calculated in a manner consistent with standardized performance in accordance with
Securities and Exchange Commission rules, while the performance in the Financial Highlights has been calculated in accordance with U.S. Generally Accepted
Accounting Principles (“U.S. GAAP”).
Russell Commodity Strategies Fund 583
Russell Investment Company
Russell Commodity Strategies Fund
Shareholder Expense Example — October 31, 2016
| Fund Expenses | Please note that the expenses shown in the table are meant | |||||
| The following disclosure provides important information | to highlight your ongoing costs only and do not reflect any | |||||
| regarding the Fund’s Shareholder Expense Example | transactional costs. Therefore, the information under the heading | |||||
| (“Example”). | “Hypothetical Performance (5% return before expenses)” is | |||||
| useful in comparing ongoing costs only, and will not help you | ||||||
| Example | determine the relative total costs of owning different funds. In | |||||
| As a shareholder of the Fund, you incur two types of costs: (1) | addition, if these transactional costs were included, your costs | |||||
| transaction costs, including sales charges (loads) on certain | would have been higher. | |||||
| purchase or redemption payments, and (2) ongoing costs, | Hypothetical | |||||
| including distribution (12b-1) and/or service fees and other | Performance (5% | |||||
| Fund expenses. The Example is intended to help you understand | Actual | return before | ||||
| your ongoing costs (in dollars) of investing in the Fund and to | Class A | Performance | expenses) | |||
| Beginning Account Value | ||||||
| compare these costs with the ongoing costs of investing in other | May 1, 2016 | $ | 1,000.00 | $ | 1,000.00 | |
| mutual funds. The Example is based on an investment of $1,000 | Ending Account Value | |||||
| invested at the beginning of the period and held for the entire | October 31, 2016 | $ | 990.80 | $ | 1,017.90 | |
| period indicated, which for this Fund is from May 1, 2016 to | Expenses Paid During Period* | $ | 7.21 | $ | 7.30 | |
| October 31, 2016. | * Expenses are equal to the Fund's annualized expense ratio of 1.44% | |||||
| (representing the six month period annualized), multiplied by the average | ||||||
| Actual Expenses | account value over the period, multiplied by 184/366 (to reflect the one-half | |||||
| The information in the table under the heading “Actual | year period). May reflect amounts waived and/or reimbursed. Without any | |||||
| Performance” provides information about actual account values | waivers and/or reimbursements, expenses would have been higher. | |||||
| and actual expenses. You may use the information in this column, | ||||||
| Hypothetical | ||||||
| together with the amount you invested, to estimate the expenses | Performance (5% | |||||
| that you paid over the period. Simply divide your account value by | Actual | return before | ||||
| $1,000 (for example, an $8,600 account value divided by $1,000 | Class C | Performance | expenses) | |||
| Beginning Account Value | ||||||
| = 8.6), then multiply the result by the number in the first column | May 1, 2016 | $ | 1,000.00 | $ | 1,000.00 | |
| in the row entitled “Expenses Paid During Period” to estimate | Ending Account Value | |||||
| the expenses you paid on your account during this period. | October 31, 2016 | $ | 986.70 | $ | 1,014.13 | |
| Expenses Paid During Period* | $ | 10.94 | $ | 11.09 | ||
| Hypothetical Example for Comparison Purposes | ||||||
| The information in the table under the heading “Hypothetical | * Expenses are equal to the Fund's annualized expense ratio of 2.19% | |||||
| (representing the six month period annualized), multiplied by the average | ||||||
| Performance (5% return before expenses)” provides information | account value over the period, multiplied by 184/366 (to reflect the one-half | |||||
| about hypothetical account values and hypothetical expenses | year period). May reflect amounts waived and/or reimbursed. Without any | |||||
| based on the Fund’s actual expense ratio and an assumed rate of | waivers and/or reimbursements, expenses would have been higher. | |||||
| return of 5% per year before expenses, which is not the Fund’s | ||||||
| Hypothetical | ||||||
| actual return. The hypothetical account values and expenses | Performance (5% | |||||
| may not be used to estimate the actual ending account balance or | Actual | return before | ||||
| expenses you paid for the period. You may use this information | Class E | Performance | expenses) | |||
| to compare the ongoing costs of investing in the Fund and other | Beginning Account Value | |||||
| May 1, 2016 | $ | 1,000.00 | $ | 1,000.00 | ||
| funds. To do so, compare this 5% hypothetical example with the | Ending Account Value | |||||
| 5% hypothetical examples that appear in the shareholder reports | October 31, 2016 | $ | 990.80 | $ | 1,017.95 | |
| of other funds. | Expenses Paid During Period* | $ | 7.16 | $ | 7.25 | |
| * Expenses are equal to the Fund's annualized expense ratio of 1.43% | ||||||
| (representing the six month period annualized), multiplied by the average | ||||||
| account value over the period, multiplied by 184/366 (to reflect the one-half | ||||||
| year period). May reflect amounts waived and/or reimbursed. Without any | ||||||
| waivers and/or reimbursements, expenses would have been higher. | ||||||
584 Russell Commodity Strategies Fund
Russell Investment Company
Russell Commodity Strategies Fund
Shareholder Expense Example, continued — October 31, 2016
| Hypothetical | ||||
| Performance (5% | ||||
| Actual | return before | |||
| Class S | Performance | expenses) | ||
| Beginning Account Value | ||||
| May 1, 2016 | $ | 1,000.00 | $ | 1,000.00 |
| Ending Account Value | ||||
| October 31, 2016 | $ | 992.70 | $ | 1,019.15 |
| Expenses Paid During Period* | $ | 5.96 | $ | 6.04 |
* Expenses are equal to the Fund's annualized expense ratio of 1.19%
(representing the six month period annualized), multiplied by the average
account value over the period, multiplied by 184/366 (to reflect the one-half
year period). May reflect amounts waived and/or reimbursed. Without any
waivers and/or reimbursements, expenses would have been higher.
| Hypothetical | ||||
| Performance (5% | ||||
| Actual | return before | |||
| Class Y | Performance | expenses) | ||
| Beginning Account Value | ||||
| May 1, 2016 | $ | 1,000.00 | $ | 1,000.00 |
| Ending Account Value | ||||
| October 31, 2016 | $ | 992.80 | $ | 1,020.11 |
| Expenses Paid During Period* | $ | 5.01 | $ | 5.08 |
* Expenses are equal to the Fund's annualized expense ratio of 1.00%
(representing the six month period annualized), multiplied by the average
account value over the period, multiplied by 184/366 (to reflect the one-half
year period). May reflect amounts waived and/or reimbursed. Without any
waivers and/or reimbursements, expenses would have been higher.
Russell Commodity Strategies Fund 585
Russell Investment Company
Russell Commodity Strategies Fund
Consolidated Schedule of Investments — October 31, 2016
| Amounts in thousands (except share amounts) | Amounts in thousands (except share amounts) | |||||
| Principal | Fair | Principal | Fair | |||
| Amount ($) | Value | Amount ($) | Value | |||
| or Shares | $ | or Shares | $ | |||
| Short-Term Investments - 96.4% | ||||||
| Russell U.S. Cash Management Fund(a) | 653,642,105 | (8) | 653,773 | Total Investments 96.4% | ||
| United States Treasury Bills | (identified cost $685,139) | 685,267 | ||||
| 0.277% due 11/17/16 (§)(ç)(~) | 19,500 | 19,498 | ||||
| 0.305% due 12/15/16 (§)(ç)(~) | 7,200 | 7,197 | Other Assets and Liabilities, | |||
| 0.262% due 01/12/17 (§)(~) | 3,800 | 3,798 | Net - 3.6% | 25,248 | ||
| United States Treasury Notes | Net Assets - 100.0% | 710,515 | ||||
| 0.875% due 01/31/17 (§) | 1,000 | 1,001 | ||||
| Total Short-Term Investments | ||||||
| (cost $685,139) | 685,267 | |||||
(a) Russell U.S. Cash Management Fund is an investment fund which is valued daily and allows redemptions on a daily basis. The fund exists
primarily for the investment and reinvestment of cash balances held by Russell Investment Company and Russell Investment Funds. Russell
Commodity Strategies Fund’s ownership in the Russell U.S. Cash Management Fund includes proportional ownership in short term United States
Treasury Bills and Notes with an approximate aggregate value of $68,482,868 which represents 9.64% of Russell Commodity Strategies Fund’s net
assets.
See accompanying notes which are an integral part of the financial statements.
586 Russell Commodity Strategies Fund
Russell Investment Company
Russell Commodity Strategies Fund
Consolidated Schedule of Investments, continued — October 31, 2016
| Futures Contracts | |||||||
| Amounts in thousands (except contract amounts) | |||||||
| Unrealized | |||||||
| Appreciation | |||||||
| Number of | Notional | Expiration | (Depreciation) | ||||
| Contracts | Amount | Date | $ | ||||
| Long Positions | |||||||
| Natural Gas Futures | 25 | USD | 768 | 03/17 | 16 | ||
| Natural Gas Futures | 25 | USD | 782 | 09/17 | (5 | ) | |
| WTI Crude Oil Futures | 73 | USD | 3,550 | 02/17 | (112 | ) | |
| WTI Crude Oil Futures | 73 | USD | 3,642 | 05/17 | (164 | ) | |
| Total Unrealized Appreciation (Depreciation) on Open Futures Contracts (å) | (265 | ) | |||||
| Total Return Swap Contracts (*) | |||||||
| Amounts in thousands | |||||||
| Notional | Termination | Fair Value | |||||
| Underlying Reference Entity | Counterparty | Amount | Date | $ | |||
| Bloomberg Brent Crude Subindex | Merrill Lynch | USD | 1,187 | 01/13/17 | — | ||
| Bloomberg Brent Crude Subindex | UBS | USD | 6,724 | 06/08/17 | (1 | ) | |
| Bloomberg Brent Crude Subindex | UBS | USD | 1,545 | 11/28/16 | — | ||
| Bloomberg Brent Crude Subindex | UBS | USD | 2,020 | 06/08/17 | — | ||
| Bloomberg Coffee Subindex | BNP Paribas | USD | 639 | 11/28/16 | — | ||
| Bloomberg Coffee Subindex | Merrill Lynch | USD | 2,373 | 04/04/17 | — | ||
| Bloomberg Commodity Index | UBS | USD | 85,359 | 04/20/17 | (11 | ) | |
| Bloomberg Commodity Index | Merrill Lynch | USD | 33,648 | 04/04/17 | (4 | ) | |
| Bloomberg Commodity Index 2 Month Forward Total | |||||||
| Return | BNP Paribas | USD | 24,664 | 11/28/16 | (305 | ) | |
| Bloomberg Commodity Index 2 Month Forward Total | |||||||
| Return | Morgan Stanley | USD | 10,832 | 11/28/16 | (134 | ) | |
| Bloomberg Commodity Index 2 Month Forward Total | |||||||
| Return | Societe Generale | USD | 6,614 | 11/28/16 | (82 | ) | |
| Bloomberg Commodity Index 2 Month Forward Total | |||||||
| Return | UBS | USD | 13,335 | 11/28/16 | (165 | ) | |
| Bloomberg Commodity Index Total Return | Societe Generale | USD | 8,250 | 11/28/16 | (108 | ) | |
| Bloomberg Commodity Index Total Return | UBS | USD | 15,460 | 11/28/16 | (202 | ) | |
| Bloomberg Copper Index | Merrill Lynch | USD | 2,890 | 04/04/17 | — | ||
| Bloomberg Corn Subindex | Merrill Lynch | USD | 1,228 | 04/04/17 | — | ||
| Bloomberg Cotton Subindex | Merrill Lynch | USD | 2,118 | 04/04/17 | — | ||
| Bloomberg Gold Subindex | UBS | USD | 12,633 | 06/08/17 | (2 | ) | |
| Bloomberg Heating Oil Subindex | Merrill Lynch | USD | 464 | 01/13/17 | — | ||
| Bloomberg Heating Oil Subindex | Merrill Lynch | USD | 4,249 | 01/13/17 | (1 | ) | |
| Bloomberg Kansas Wheat Subindex | UBS | USD | 974 | 08/16/17 | — | ||
| Bloomberg Lean Hogs Subindex | Merrill Lynch | USD | 1,182 | 04/04/17 | — | ||
| Bloomberg Lean Hogs Subindex | Societe Generale | USD | 713 | 11/28/16 | — | ||
| Bloomberg Live Cattle Subindex | Merrill Lynch | USD | 2,595 | 04/04/17 | — | ||
| Bloomberg Natural Gas Subindex | Merrill Lynch | USD | 2,076 | 04/04/17 | — | ||
| Bloomberg Natural Gas Subindex | Merrill Lynch | USD | 580 | 04/04/17 | — | ||
| Bloomberg Natural Gas Subindex | Morgan Stanley | USD | 2,232 | 11/28/16 | — | ||
| Bloomberg Natural Gas Subindex 3 Month Forward | UBS | USD | 5,726 | 06/08/17 | (1 | ) | |
| Bloomberg Nickel Index | Merrill Lynch | USD | 1,065 | 01/13/17 | — | ||
| Bloomberg Nickel Index | UBS | USD | 1,683 | 06/08/17 | — | ||
| Bloomberg Silver Subindex | Merrill Lynch | USD | 4,965 | 01/13/17 | (1 | ) | |
| Bloomberg Soy Meal Subindex | UBS | USD | 3,292 | 11/28/16 | — | ||
| Bloomberg Soybean Oil Subindex | UBS | USD | 3,238 | 08/16/17 | — | ||
| Bloomberg Soybeans Subindex | Merrill Lynch | USD | 6,411 | 04/04/17 | (1 | ) | |
| Bloomberg Soybeans Subindex | Societe Generale | USD | 2,451 | 11/28/16 | — | ||
| Bloomberg Sugar Subindex | Merrill Lynch | USD | 4,730 | 04/04/17 | (1 | ) | |
| Bloomberg Sugar Subindex | UBS | USD | 302 | 04/04/17 | — | ||
| Bloomberg Unleaded Gasonline Subindex | Merrill Lynch | USD | 3,424 | 01/13/17 | — | ||
| Bloomberg Unleaded Gasonline Subindex | UBS | USD | 1,149 | 06/08/17 | — | ||
| Bloomberg WTI Crude Oil Subindex 3 Month Forward | Merrill Lynch | USD | 4,327 | 06/08/17 | (1 | ) | |
| Bloomberg WTI Crude Oil Subindex 3 Month Forward | Merrill Lynch | USD | 2,053 | 04/04/17 | — | ||
| Bloomberg Zinc Subindex | Merrill Lynch | USD | 11,466 | 04/04/17 | (2 | ) | |
| Cargill Custom Index(#) | UBS | USD | 143,617 | 08/16/17 | — | ||
| Macquarie Commodity Customized Product(##) | Macquarie | USD | 27,394 | 11/28/16 | (384 | ) | |
| Merrill Lynch Commodity Index eXtra BIN1 Index(###) | Merrill Lynch | USD | 35,557 | 06/08/17 | — | ||
| Merrill Lynch Commodity Index eXtra CS2T Index(####) | Merrill Lynch | USD | 31,866 | 11/28/16 | (374 | ) | |
| Russell Core Commodity Diversified Index(#####) | Merrill Lynch | USD | 141,699 | 11/28/16 | (2,354 | ) | |
| Societe Generale Commodity P04T Index(######) | Societe Generale | USD | 17,619 | 11/28/16 | (189 | ) | |
See accompanying notes which are an integral part of the financial statements.
Russell Commodity Strategies Fund 587
Russell Investment Company
Russell Commodity Strategies Fund
Consolidated Schedule of Investments, continued — October 31, 2016
| Total Return Swap Contracts (*) | |||||
| Amounts in thousands | |||||
| Notional | Termination | Fair Value | |||
| Underlying Reference Entity | Counterparty | Amount | Date | $ | |
| Total Fair Value of Open Total Return Swap Contracts Premiums Paid (Received) - $— (å) | (4,323 | ) | |||
(*) Total return swaps (which includes index swaps) are agreements between counterparties to exchange cash flows, one based on a market-linked
returns of an individual asset or a basket of assets (i.e. an index), and the other on a fixed or floating rate. The fixed fees embedded in the total
return swaps held as of October 31, 2016 ranged from 0.00% to 0.45%. The floating rate fees were all based on the 3-month Treasury Bill rate
plus a fee ranging from 0.096% to 0.35%. Some total return swaps may also have performance-based fees embedded in the value of the swap.
For the period ended October 31, 2016, the performance based fees were $1,648,619.
(#) The following table represents the individual commodity positions underlying the Cargill Custom Index swap contract:
| Description | % Weights | |
| Gold | 13.4 | |
| Brent Crude Oil | 11.5 | |
| Natural Gas | 11.3 | |
| WTI Crude Oil | 10.8 | |
| Copper | 8.1 | |
| Soybeans | 6.8 | |
| Aluminum | 5.5 | |
| Silver | 5.4 | |
| Heating Oil | 5.3 | |
| Sugar | 5.2 | |
| Wheat | 5.1 | |
| Unleaded Gasoline | 4.4 | |
| Zinc | 4.1 | |
| Corn | 3.7 | |
| Soybean Meal | 3.4 | |
| Soybean Oil | 3.4 | |
| Coffee | 3.3 | |
| Nickel | 2.9 | |
| Live Cattle | 2.7 | |
| Kansas Wheat | 1.1 | |
| Lean Hogs | (2.2 | ) |
| Cocoa | (2.8 | ) |
| London Cocoa | (4.4 | ) |
| Cotton | (8.0 | ) |
| Total | 100.0 |
(##) The following table represents the individual commodity positions underlying the Macquarie Commodity Customized Product swap contract:
| Description | % Weights |
| Gold | 11.0 |
| Natural Gas | 9.9 |
| Brent Crude Oil | 8.8 |
| WTI Crude Oil | 8.4 |
| Copper | 6.7 |
| Corn | 6.0 |
| Soybeans | 5.5 |
| Sugar | 4.6 |
See accompanying notes which are an integral part of the financial statements.
588 Russell Commodity Strategies Fund
Russell Investment Company
Russell Commodity Strategies Fund
Consolidated Schedule of Investments, continued — October 31, 2016
| Aluminum | 4.5 |
| Silver | 4.5 |
| Heating Oil | 4.4 |
| Unleaded Gasoline | 3.7 |
| Zinc | 3.3 |
| Soybean Meal | 2.8 |
| Soybean Oil | 2.7 |
| Coffee | 2.6 |
| Wheat | 2.4 |
| Nickel | 2.4 |
| Live Cattle | 2.2 |
| Cotton | 1.4 |
| Lean Hogs | 1.4 |
| Kansas Wheat | 0.8 |
| Total | 100.0 |
(###) The following table represents the individual commodity positions underlying the Merrill Lynch Commodity Index eXtra BIN1 Index swap
contract:
| Description | % Weights |
| Gold | 16.2 |
| Natural Gas | 14.6 |
| Copper | 9.7 |
| Soybeans | 8.3 |
| Sugar | 7.0 |
| Aluminum | 6.5 |
| Silver | 6.5 |
| Unleaded Gasoline | 5.7 |
| Zinc | 4.7 |
| Soybean Meal | 4.3 |
| Soybean Oil | 4.1 |
| Heating Oil | 3.5 |
| Nickel | 3.5 |
| Live Cattle | 3.4 |
| Cotton | 2.0 |
| Total | 100.0 |
(####) The following table represents the individual commodity positions underlying the Merrill Lynch Commodity Index eXtra CS2T Index swap
contract:
| Description | % Weights |
| Gold | 11.0 |
| Natural Gas | 9.8 |
| Brent Crude Oil | 8.9 |
| WTI Crude Oil | 8.5 |
| Copper | 6.7 |
| Corn | 6.0 |
| Soybeans | 5.5 |
| Aluminum | 4.5 |
| Sugar | 4.5 |
| Silver | 4.4 |
See accompanying notes which are an integral part of the financial statements.
Russell Commodity Strategies Fund 589
Russell Investment Company
Russell Commodity Strategies Fund
Consolidated Schedule of Investments, continued — October 31, 2016
| Heating Oil | 4.4 |
| Unleaded Gasoline | 3.7 |
| Zinc | 3.3 |
| Soybean Meal | 2.8 |
| Soybean Oil | 2.7 |
| Coffee | 2.6 |
| Wheat | 2.4 |
| Nickel | 2.4 |
| Live Cattle | 2.2 |
| Lean Hogs | 1.4 |
| Cotton | 1.4 |
| Kansas Wheat | 0.9 |
| Total | 100.0 |
(#####) The following table represents the individual commodity positions underlying the Russell Core Commodity Diversified Index swap contract:
| Description | % Weights |
| Gold | 13.6 |
| Brent Crude Oil | 13.3 |
| Natural Gas | 13.1 |
| WTI Crude Oil | 10.2 |
| Silver | 7.6 |
| Copper | 6.8 |
| Corn | 5.6 |
| Heating Oil | 4.0 |
| Gasoline RBOB | 3.9 |
| Nickel | 3.3 |
| Coffee | 2.6 |
| Soybeans | 2.5 |
| Wheat | 2.4 |
| Zinc | 2.4 |
| Aluminum | 2.2 |
| Soybean Meal | 1.6 |
| Kansas Wheat | 1.1 |
| Lean Hogs | 1.1 |
| Sugar | 1.0 |
| Soybean Oil | 1.0 |
| Live Cattle | 0.5 |
| Cotton | 0.2 |
| Total | 100.0 |
(######) The following table represents the individual commodity positions underlying the Societe Generale Commodity PO4T Index swap contract:
| Description | % Weights |
| Gold | 11.0 |
| Natural Gas | 10.3 |
| Brent Crude Oil | 8.7 |
| WTI Crude Oil | 8.3 |
| Copper | 6.7 |
| Corn | 6.0 |
See accompanying notes which are an integral part of the financial statements.
590 Russell Commodity Strategies Fund
Russell Investment Company
Russell Commodity Strategies Fund
Consolidated Schedule of Investments, continued — October 31, 2016
| Soybeans | 5.5 | |||||||||||||||
| Sugar | 4.5 | |||||||||||||||
| Aluminum | 4.5 | |||||||||||||||
| Silver | 4.4 | |||||||||||||||
| Heating Oil | 4.4 | |||||||||||||||
| Unleaded Gasoline | 3.7 | |||||||||||||||
| Zinc | 3.3 | |||||||||||||||
| Soybean Meal | 2.8 | |||||||||||||||
| Soybean Oil | 2.7 | |||||||||||||||
| Coffee | 2.5 | |||||||||||||||
| Nickel | 2.4 | |||||||||||||||
| Wheat | 2.4 | |||||||||||||||
| Live Cattle | 2.2 | |||||||||||||||
| Lean Hogs | 1.4 | |||||||||||||||
| Cotton | 1.4 | |||||||||||||||
| Kansas Wheat | 0.9 | |||||||||||||||
| Total | 100.0 | |||||||||||||||
| Presentation of Portfolio Holdings | ||||||||||||||||
| Amounts in thousands | ||||||||||||||||
| Fair Value | ||||||||||||||||
| Practical | ||||||||||||||||
| Portfolio Summary | Level 1 | Level 2 | Level 3 | Expedient (a) | Total | % of Net Assets | ||||||||||
| Short-Term Investments | $ | — | $ | 31,494 | $ | — | $ | 653,773 | $ | 685,267 | 96.4 | |||||
| Total Investments | — | 31,494 | — | 653,773 | 685,267 | 96.4 | ||||||||||
| Other Assets and Liabilities, Net | 3.6 | |||||||||||||||
| 100.0 | ||||||||||||||||
| Other Financial Instruments | ||||||||||||||||
| Assets | ||||||||||||||||
| Futures Contracts | 16 | — | — | — | 16 | —* | ||||||||||
| Liabilities | ||||||||||||||||
| Futures Contracts | (281 | ) | — | — | — | (281 | ) | (—)* | ||||||||
| Total Return Swap Contracts | — | (4,323 | ) | — | — | (4,323 | ) | (0.6 | ) | |||||||
| Total Other Financial Instruments** | $ | (265 | ) | $ | (4,323 | ) | $ | — | $ | — | $ | (4,588 | ) | |||
* Less than 0.05% of net assets.
** Futures and foreign currency exchange contract values reflect the unrealized appreciation (depreciation) on the investments.
(a) Certain investments that are measured at fair value using the net asset value per share (or its equivalent) practical expedient have not been classified
in the fair value levels. The fair value amounts presented in the table are intended to permit reconciliation to the amounts presented in the Schedule of
Investments.
For a description of the Levels, see note 2 in the Notes to Financial Statements.
For a disclosure on transfers between Levels 1, 2 and 3 during the period ended October 31, 2016, see note 2 in the Notes to
Financial Statements.
See accompanying notes which are an integral part of the financial statements.
Russell Commodity Strategies Fund 591
Russell Investment Company
Russell Commodity Strategies Fund
Consolidated Fair Value of Derivative Instruments — October 31, 2016
Amounts in thousands
| Commodity | ||||
| Derivatives not accounted for as hedging instruments | Contracts | |||
| Location: Statement of Assets and Liabilities - Assets | ||||
| Variation margin on futures contracts* | $ | 16 | ||
| Location: Statement of Assets and Liabilities - Liabilities | ||||
| Variation margin on futures contracts* | 281 | |||
| Total return swap contracts, at fair value | 4,323 | |||
| Total | $ | 4,604 | ||
| Commodity | ||||
| Derivatives not accounted for as hedging instruments | Contracts | |||
| Location: Statement of Operations - Net realized gain (loss) | ||||
| Futures contracts | $ | 756 | ||
| Total return swap contracts | (16,514 | ) | ||
| Total | $ | (15,758 | ) | |
| Location: Statement of Operations - Net change in unrealized appreciation (depreciation) | ||||
| Futures contracts | $ | (308 | ) | |
| Total return swap contracts | (4,611 | ) | ||
| Total | $ | (4,919 | ) | |
* Includes cumulative appreciation/depreciation of futures contracts as reported in the Schedule of Investments. Only variation margin is reported within the
Statement of Assets and Liabilities.
For further disclosure on derivatives see note 2 in the Notes to Financial Statements.
See accompanying notes which are an integral part of the financial statements.
592 Russell Commodity Strategies Fund
Russell Investment Company
Russell Commodity Strategies Fund
Balance Sheet Offsetting of Financial and Derivative Instruments — October 31, 2016
| Amounts in thousands | ||||||||||
| Offsetting of Financial Assets and Derivative Assets | ||||||||||
| Gross | Net Amounts | |||||||||
| Amounts | of Assets | |||||||||
| Gross | Offset in the | Presented in | ||||||||
| Amounts of | Statement of | the Statement | ||||||||
| Recognized | Assets and | of Assets and | ||||||||
| Description | Location: Statement of Assets and Liabilities - Assets | Assets | Liabilities | Liabilities | ||||||
| Futures Contracts | Variation margin on futures contracts | $ | 146 | $ | — | $ | 146 | |||
| Total Financial and Derivative Assets | 146 | — | 146 | |||||||
| Financial and Derivative Assets not subject to a netting agreement | (146) | — | (146 | ) | ||||||
| Total Financial and Derivative Assets subject to a netting agreement | $ | — | $ | — | $ | — | ||||
See accompanying notes which are an integral part of the financial statements.
Russell Commodity Strategies Fund 593
Russell Investment Company
Russell Commodity Strategies Fund
Balance Sheet Offsetting of Financial and Derivative Instruments, continued —
October 31, 2016
| Amounts in thousands | |||||||||
| Offsetting of Financial Liabilities and Derivative Liabilities | |||||||||
| Gross | Net Amounts | ||||||||
| Amounts | of Liabilities | ||||||||
| Gross | Offset in the | Presented in | |||||||
| Amounts of | Statement of | the Statement | |||||||
| Recognized | Assets and | of Assets and | |||||||
| Description | Location: Statement of Assets and Liabilities - Liabilities | Liabilities | Liabilities | Liabilities | |||||
| Futures Contracts | Variation margin on futures contracts | $ | 138 | $ | — | $ | 138 | ||
| Total Return Swap Contracts | Total return swap contracts, at fair value | 4,323 | — | 4,323 | |||||
| Total Financial and Derivative Liabilities | 4,461 | — | 4,461 | ||||||
| Financial and Derivative Liabilities not subject to a netting agreement | (140) | — | (140 | ) | |||||
| Total Financial and Derivative Liabilities subject to a netting agreement | $ | 4,321 | $ | — | $ | 4,321 | |||
| Financial Liabilities, Derivative Liabilities, and Collateral Pledged by Counterparty | ||||||||||
| Gross Amounts Not Offset in | ||||||||||
| the Statement of Assets and | ||||||||||
| Liabilities | ||||||||||
| Net Amounts | ||||||||||
| of Liabilities | ||||||||||
| Presented in | ||||||||||
| the Statement | Financial and | |||||||||
| of Assets and | Derivative | Collateral | ||||||||
| Counterparty | Liabilities | Instruments | Pledged^ | Net Amount | ||||||
| Bank of America | $ | 374 | $ | — | $ | — | $ | 374 | ||
| BNP Paribas | 305 | — | 305 | — | ||||||
| Macquarie | 384 | — | 384 | — | ||||||
| Merrill Lynch | 12 | — | 12 | — | ||||||
| Morgan Stanley | 134 | — | 134 | — | ||||||
| Societe Generale | 379 | — | 379 | — | ||||||
| Newedge | 2,352 | — | — | 2,352 | ||||||
| UBS | 381 | — | 381 | — | ||||||
| Total | $ | 4,321 | $ | — | $ | 1,595 | $ | 2,726 | ||
* Fair value of securities on loan as reported in the footnotes to the Statement of Assets and Liabilities.
^ Collateral received or pledged amounts may not reconcile to those disclosed in the Statement of Assets and Liabilities due to the inclusion of off-Balance
Sheet collateral and adjustments made to exclude overcollateralization.
For further disclosure on derivatives and counterparty risk see note 2 in the Notes to Financial Statements.
See accompanying notes which are an integral part of the financial statements.
594 Russell Commodity Strategies Fund
Russell Investment Company
Russell Commodity Strategies Fund
Consolidated Statement of Assets and Liabilities(†) — October 31, 2016
| Amounts in thousands | ||
| Assets | ||
| Investments, at identified cost | $ | 685,139 |
| Investments, at fair value(>) | 685,267 | |
| Cash (restricted)(a) | 30,777 | |
| Receivables: | ||
| Dividends and interest | 36 | |
| Dividends from affiliated Russell funds | 301 | |
| Investments sold | 3,749 | |
| Fund shares sold | 4,755 | |
| Variation margin on futures contracts | 146 | |
| Total assets | 725,031 | |
| Liabilities | ||
| Payables: | ||
| Due to broker (b) | 770 | |
| Investments purchased | 8,006 | |
| Fund shares redeemed | 303 | |
| Accrued fees to affiliates | 617 | |
| Other accrued expenses | 359 | |
| Variation margin on futures contracts | 138 | |
| Total return swap contracts, at fair value(8) | 4,323 | |
| Total liabilities | 14,516 | |
| Commitments and Contingencies (1) | ||
| Net Assets | $ | 710,515 |
(1) See note 9 in the Notes to Financial Statements for a detailed description of commitments and contingencies.
(†) The Statement of Assets and Liabilities is consolidated and includes the balances of Russell Cayman Commodity Strategies Fund Ltd. (wholly owned
subsidiary). Accordingly, all interfund balances and transactions have been eliminated. Refer to note 3 in the Notes to Financial Statements.
See accompanying notes which are an integral part of the financial statements.
Russell Commodity Strategies Fund 595
Russell Investment Company
Russell Commodity Strategies Fund
Consolidated Statement of Assets and Liabilities(†) , continued — October 31, 2016
| Amounts in thousands | |||
| Net Assets Consist of: | |||
| Undistributed (overdistributed) net investment income | $ | (2,768 | ) |
| Accumulated net realized gain (loss) | (51 | ) | |
| Unrealized appreciation (depreciation) on: | |||
| Investments | 128 | ||
| Futures contracts | (265 | ) | |
| Total return swap contracts | (4,323 | ) | |
| Shares of beneficial interest | 1,297 | ||
| Additional paid-in capital | 716,497 | ||
| Net Assets | $ | 710,515 | |
| Net Asset Value, offering and redemption price per share: | |||
| Net asset value per share: Class A(#) | $ | 5.40 | |
| Maximum offering price per share (Net asset value plus sales charge of 5.75%): Class A | $ | 5.73 | |
| Class A — Net assets | $ | 7,027,292 | |
| Class A — Shares outstanding ($.01 par value) | 1,301,673 | ||
| Net asset value per share: Class C(#) | $ | 5.18 | |
| Class C — Net assets | $ | 4,209,903 | |
| Class C — Shares outstanding ($.01 par value) | 812,460 | ||
| Net asset value per share: Class E(#) | $ | 5.40 | |
| Class E — Net assets | $ | 9,775,178 | |
| Class E — Shares outstanding ($.01 par value) | 1,810,941 | ||
| Net asset value per share: Class S(#) | $ | 5.47 | |
| Class S — Net assets | $ | 500,003,656 | |
| Class S — Shares outstanding ($.01 par value) | 91,452,139 | ||
| Net asset value per share: Class Y(#) | $ | 5.52 | |
| Class Y — Net assets | $ | 189,499,375 | |
| Class Y — Shares outstanding ($.01 par value) | 34,358,974 | ||
| Amounts in thousands | |||
| (>) Investments in affiliates, Russell U.S. Cash Management Fund | $ | 653,773 | |
| (8) Total return swap contracts – premium paid (received) | $ | — | |
| (a) Cash Collateral for Swaps | $ | 30,777 | |
| (b) Due to Broker for Swaps | $ | 770 | |
| (#) Net asset value per share equals class level net assets divided by class level shares of beneficial interest outstanding. | |||
| (†) The Statement of Assets and Liabilities is consolidated and includes the balances of Russell Cayman Commodity Strategies Fund Ltd. (wholly owned | |||
| subsidiary). Accordingly, all interfund balances and transactions have been eliminated. Refer to note 3 in the Notes to Financial Statements. | |||
See accompanying notes which are an integral part of the financial statements.
596 Russell Commodity Strategies Fund
Russell Investment Company
Russell Commodity Strategies Fund
Consolidated Statement of Operations(†) — For the Period Ended October 31, 2016
| Amounts in thousands | |||
| Investment Income | |||
| Dividends | $ | 272 | |
| Dividends from affiliated Russell funds | 2,394 | ||
| Interest | 65 | ||
| Total investment income | 2,731 | ||
| Expenses | |||
| Advisory fees | 10,361 | ||
| Administrative fees | 402 | ||
| Custodian fees (1) | 414 | ||
| Distribution fees - Class A | 17 | ||
| Distribution fees - Class C | 33 | ||
| Transfer agent fees - Class A | 14 | ||
| Transfer agent fees - Class C | 9 | ||
| Transfer agent fees - Class E | 22 | ||
| Transfer agent fees - Class S | 1,020 | ||
| Transfer agent fees - Class Y | 7 | ||
| Professional fees | 162 | ||
| Registration fees | 82 | ||
| Shareholder servicing fees - Class C | 11 | ||
| Shareholder servicing fees - Class E | 27 | ||
| Trustees’ fees | 22 | ||
| Printing fees | 195 | ||
| Miscellaneous | 94 | ||
| Expenses before reductions | 12,892 | ||
| Expense reductions | (4,671 | ) | |
| Net expenses | 8,221 | ||
| Net investment income (loss) | (5,490 | ) | |
| Net Realized and Unrealized Gain (Loss) | |||
| Net realized gain (loss) on: | |||
| Investments | 4 | ||
| Futures contracts | 756 | ||
| Total return swap contracts | (16,514 | ) | |
| Net realized gain (loss) | (15,754 | ) | |
| Net change in unrealized appreciation (depreciation) on: | |||
| Investments | 128 | ||
| Futures contracts | (308 | ) | |
| Total return swap contracts | (4,611 | ) | |
| Net change in unrealized appreciation (depreciation) | (4,791 | ) | |
| Net realized and unrealized gain (loss) | (20,545 | ) | |
| Net Increase (Decrease) in Net Assets from Operations | $ | (26,035 | ) |
(1) Includes a reimbursement for overbilling of custody out-of-pocket fees from prior years. See note 11 in the Notes to Financial Statements.
(†) The Statement of Operations is consolidated and includes the balances of Russell Cayman Commodity Strategies Fund Ltd. (wholly owned
subsidiary). Accordingly, all interfund balances and transactions have been eliminated. Refer to note 3 in the Notes to Financial Statements.
See accompanying notes which are an integral part of the financial statements.
Russell Commodity Strategies Fund 597
Russell Investment Company
Russell Commodity Strategies Fund
Consolidated Statements of Changes in Net Assets(†)
| For the Periods Ended October 31, | ||||||
| Amounts in thousands | 2016 | 2015 | ||||
| Increase (Decrease) in Net Assets | ||||||
| Operations | ||||||
| Net investment income (loss) | $ | (5,490 | ) | $ | (10,503 | ) |
| Net realized gain (loss) | (15,754 | ) | (285,192 | ) | ||
| Net change in unrealized appreciation (depreciation) | (4,791 | ) | 3,795 | |||
| Net increase (decrease) in net assets from operations | (26,035 | ) | (291,900 | ) | ||
| Share Transactions* | ||||||
| Net increase (decrease) in net assets from share transactions | (43,155 | ) | 20,927 | |||
| Total Net Increase (Decrease) in Net Assets | (69,190 | ) | (270,973 | ) | ||
| Net Assets | ||||||
| Beginning of period | 779,705 | 1,050,678 | ||||
| End of period | $ | 710,515 | $ | 779,705 | ||
| Undistributed (overdistributed) net investment income included in net assets | $ | (2,768 | ) | $ | (6,713 | ) |
(†) The Statements of Changes in Net Assets is consolidated and includes the balances of Russell Cayman Commodity Strategies Fund
Ltd. (wholly owned subsidiary). Accordingly, all interfund balances and transactions have been eliminated.
Refer to note 3 in the Notes to Financial Statements.
* Share transaction amounts (in thousands) for the periods ended October 31, 2016 and October 31, 2015 were as follows:
| 2016 | 2015 | |||||||||||
| Shares | Dollars | Shares | Dollars | |||||||||
| Class A | ||||||||||||
| Proceeds from shares sold | 323 | $ | 1,685 | 492 | $ | 3,224 | ||||||
| Payments for shares redeemed | (423 | ) | (2,206 | ) | (559 | ) | (3,669 | ) | ||||
| Net increase (decrease) | (100 | ) | (521 | ) | (67 | ) | (445 | ) | ||||
| Class C | ||||||||||||
| Proceeds from shares sold | 116 | 586 | 171 | 1,076 | ||||||||
| Payments for shares redeemed | (235 | ) | (1,188 | ) | (376 | ) | (2,393 | ) | ||||
| Net increase (decrease) | (119 | ) | (602 | ) | (205 | ) | (1,317 | ) | ||||
| Class E | ||||||||||||
| Proceeds from shares sold | 476 | 2,522 | 646 | 4,107 | ||||||||
| Payments for shares redeemed | (925 | ) | (4,971 | ) | (670 | ) | (4,243 | ) | ||||
| Net increase (decrease) | (449 | ) | (2,449 | ) | (24 | ) | (136 | ) | ||||
| Class S | ||||||||||||
| Proceeds from shares sold | 31,464 | 167,349 | 42,126 | 277,127 | ||||||||
| Payments for shares redeemed | (42,678 | ) | (226,048 | ) | (42,692 | ) | (278,855 | ) | ||||
| Net increase (decrease) | (11,214 | ) | (58,699 | ) | (566 | ) | (1,728 | ) | ||||
| Class Y | ||||||||||||
| Proceeds from shares sold | 9,215 | 50,350 | 16,705 | 111,513 | ||||||||
| Payments for shares redeemed | (5,717 | ) | (31,234 | ) | (14,243 | ) | (86,960 | ) | ||||
| Net increase (decrease) | 3,498 | 19,116 | 2,462 | 24,553 | ||||||||
| Total increase (decrease) | (8,384 | ) | $ | (43,155 | ) | 1,600 | $ | 20,927 | ||||
(†) The Statements of Changes in Net Assets is consolidated and includes the balances of Russell Cayman Commodity Strategies Fund
Ltd. (wholly owned subsidiary). Accordingly, all interfund balances and transactions have been eliminated.
Refer to note 3 in the Notes to Financial Statements.
See accompanying notes which are an integral part of the financial statements.
598 Russell Commodity Strategies Fund
(This page intentionally left blank)
Russell Investment Company
Russell Commodity Strategies Fund
Consolidated Financial Highlights — For the Periods Ended(†)
For a Share Outstanding Throughout Each Period.
| $ | ||||||||||||||||||||
| $ | Net | $ | $ | $ | $ | |||||||||||||||
| Net Asset Value, | Investment | Net Realized | Total from | Distributions | Distributions | $ | ||||||||||||||
| Beginning of | Income (Loss) | and Unrealized | Investment | from Net | from Net | Return of | ||||||||||||||
| Period | (a)(d) | Gain (Loss) | Operations | Investment Income | Realized Gain | Capital | ||||||||||||||
| Class A | ||||||||||||||||||||
| October 31, 2016 | 5.58 | (.06 | ) | (.12 | ) | (.18 | ) | — | — | — | ||||||||||
| October 31, 2015 | 7.64 | (.09 | ) | (1.97 | ) | (2.06 | ) | — | — | — | ||||||||||
| October 31, 2014 | 8.35 | (.12 | ) | (.59 | ) | (.71 | ) | —(f) | —(f) | — | ||||||||||
| October 31, 2013 | 9.50 | (.12 | ) | (1.03 | ) | (1.15 | ) | — | — | — | ||||||||||
| October 31, 2012 | 10.55 | (.13 | ) | (.53 | ) | (.66 | ) | (.15 | ) | (.02 | ) | (.22 | ) | |||||||
| Class C | ||||||||||||||||||||
| October 31, 2016 | 5.40 | (.09 | ) | (.13 | ) | (.22 | ) | — | — | — | ||||||||||
| October 31, 2015 | 7.44 | (.13 | ) | (1.91 | ) | (2.04 | ) | — | — | — | ||||||||||
| October 31, 2014 | 8.20 | (.18 | ) | (.58 | ) | (.76 | ) | —(f) | —(f) | — | ||||||||||
| October 31, 2013 | 9.39 | (.19 | ) | (1.00 | ) | (1.19 | ) | — | — | — | ||||||||||
| October 31, 2012 | 10.45 | (.20 | ) | (.53 | ) | (.73 | ) | (.09 | ) | (.02 | ) | (.22 | ) | |||||||
| Class E | ||||||||||||||||||||
| October 31, 2016 | 5.58 | (.06 | ) | (.12 | ) | (.18 | ) | — | — | — | ||||||||||
| October 31, 2015 | 7.63 | (.09 | ) | (1.96 | ) | (2.05 | ) | — | — | — | ||||||||||
| October 31, 2014 | 8.35 | (.12 | ) | (.60 | ) | (.72 | ) | —(f) | —(f) | — | ||||||||||
| October 31, 2013 | 9.50 | (.12 | ) | (1.03 | ) | (1.15 | ) | — | — | — | ||||||||||
| October 31, 2012 | 10.54 | (.13 | ) | (.52 | ) | (.65 | ) | (.15 | ) | (.02 | ) | (.22 | ) | |||||||
| Class S | ||||||||||||||||||||
| October 31, 2016 | 5.64 | (.04 | ) | (.13 | ) | (.17 | ) | — | — | — | ||||||||||
| October 31, 2015 | 7.69 | (.07 | ) | (1.98 | ) | (2.05 | ) | — | — | — | ||||||||||
| October 31, 2014 | 8.40 | (.10 | ) | (.61 | ) | (.71 | ) | —(f) | —(f) | — | ||||||||||
| October 31, 2013 | 9.52 | (.10 | ) | (1.02 | ) | (1.12 | ) | — | — | — | ||||||||||
| October 31, 2012 | 10.58 | (.11 | ) | (.53 | ) | (.64 | ) | (.18 | ) | (.02 | ) | (.22 | ) | |||||||
| Class Y | ||||||||||||||||||||
| October 31, 2016 | 5.68 | (.03 | ) | (.13 | ) | (.16 | ) | — | — | — | ||||||||||
| October 31, 2015 | 7.73 | (.06 | ) | (1.99 | ) | (2.05 | ) | — | — | — | ||||||||||
| October 31, 2014 | 8.42 | (.08 | ) | (.61 | ) | (.69 | ) | —(f) | —(f) | — | ||||||||||
| October 31, 2013 | 9.54 | (.08 | ) | (1.04 | ) | (1.12 | ) | — | — | — | ||||||||||
| October 31, 2012 | 10.59 | (.09 | ) | (.53 | ) | (.62 | ) | (.19 | ) | (.02 | ) | (.22 | ) | |||||||
See accompanying notes which are an integral part of the financial statements.
600 Russell Commodity Strategies Fund
| % | % | % | ||||||||||||||||
| $ | $ | Ratio of Expenses | Ratio of Expenses | Ratio of Net | ||||||||||||||
| Net Asset Value, | % | Net Assets, | to Average | to Average | Investment Income | % | ||||||||||||
| $ | End of | Total | End of Period | Net Assets, | Net Assets, | to Average | Portfolio | |||||||||||
| Total Distributions | Period | Return(c) | (000 | ) | Gross | Net(d) | Net Assets(d) | Turnover Rate | ||||||||||
| — | 5.40 | (3.23 | ) | 7,027 | 2.13 | 1.46 | (1.07 | ) | — | |||||||||
| — | 5.58 | (26.96 | ) | 7,826 | 2.09 | 1.48 | (1.39 | ) | — | |||||||||
| —(f) | 7.64 | (8.50 | ) | 11,212 | 2.08 | 1.52 | (1.41 | ) | 302 | |||||||||
| — | 8.35 | (12.11 | ) | 20,224 | 2.04 | 1.52 | (1.37 | ) | 145 | |||||||||
| (.39 | ) | 9.50 | (6.28 | ) | 21,301 | 2.08 | 1.55 | (1.39 | ) | 60 | ||||||||
| — | 5.18 | (4.07 | ) | 4,210 | 2.87 | 2.21 | (1.82 | ) | — | |||||||||
| — | 5.40 | (27.42 | ) | 5,029 | 2.83 | 2.23 | (2.14 | ) | — | |||||||||
| —(f) | 7.44 | (9.26 | ) | 8,454 | 2.83 | 2.27 | (2.16 | ) | 302 | |||||||||
| — | 8.20 | (12.67 | ) | 11,436 | 2.79 | 2.27 | (2.12 | ) | 145 | |||||||||
| (.33 | ) | 9.39 | (7.01 | ) | 14,104 | 2.83 | 2.30 | (2.15 | ) | 60 | ||||||||
| — | 5.40 | (3.23 | ) | 9,775 | 2.12 | 1.46 | (1.07 | ) | — | |||||||||
| — | 5.58 | (26.87 | ) | 12,615 | 2.09 | 1.48 | (1.39 | ) | — | |||||||||
| —(f) | 7.63 | (8.62 | ) | 17,427 | 2.08 | 1.52 | (1.41 | ) | 302 | |||||||||
| — | 8.35 | (12.11 | ) | 20,652 | 2.04 | 1.52 | (1.36 | ) | 145 | |||||||||
| (.39 | ) | 9.50 | (6.23 | ) | 17,078 | 2.08 | 1.54 | (1.38 | ) | 60 | ||||||||
| — | 5.47 | (3.01 | ) | 500,004 | 1.87 | 1.21 | (.82 | ) | — | |||||||||
| — | 5.64 | (26.66 | ) | 579,005 | 1.84 | 1.23 | (1.14 | ) | — | |||||||||
| —(f) | 7.69 | (8.45 | ) | 793,989 | 1.83 | 1.27 | (1.16 | ) | 302 | |||||||||
| — | 8.40 | (11.76 | ) | 830,645 | 1.79 | 1.27 | (1.12 | ) | 145 | |||||||||
| (.42 | ) | 9.52 | (6.10 | ) | 762,582 | 1.83 | 1.30 | (1.14 | ) | 60 | ||||||||
| — | 5.52 | (2.82 | ) | 189,499 | 1.68 | 1.02 | (.62 | ) | — | |||||||||
| — | 5.68 | (26.52 | ) | 175,230 | 1.64 | 1.04 | (.95 | ) | — | |||||||||
| —(f) | 7.73 | (8.19 | ) | 219,596 | 1.63 | 1.08 | (.97 | ) | 302 | |||||||||
| — | 8.42 | (11.74 | ) | 351,831 | 1.60 | 1.08 | (.93 | ) | 145 | |||||||||
| (.43 | ) | 9.54 | (5.82 | ) | 445,434 | 1.65 | 1.11 | (.95 | ) | 60 | ||||||||
See accompanying notes which are an integral part of the financial statements.
Russell Commodity Strategies Fund 601
Russell Investment Company
Russell Commodity Strategies Fund
Related Party Transactions, Fees and Expenses
| Accrued fees payable to affiliates for the period ended October 31, 2016 were as follows: | ||
| Advisory fees | $ | 491,606 |
| Administration fees | 29,567 | |
| Distribution fees | 4,208 | |
| Shareholder servicing fees | 3,008 | |
| Transfer agent fees | 85,938 | |
| Trustee fees | 2,719 | |
| $ | 617,046 | |
| Transactions (amounts in thousands) during the period ended October 31, 2016 with Underlying Funds which are, or were, an | |||||||||||||||||
| affiliated company are as follows: | |||||||||||||||||
| Fair Value, | Change in | ||||||||||||||||
| Beginning of | Realized Gain | Unrealized | Fair Value, End | Income | Capital Gains | ||||||||||||
| Period | Purchases | Sales | (Loss) | Gain (Loss) | of Period | Distributions | Distributions | ||||||||||
| Russell U.S. Cash Management Fund $ | 705,735 | $ | 1,624,516 | $ | 1,676,612 | $ | 4 | $ | 130 | $ | 653,773 | $ | 2,394 | $ | — | ||
| $ | 705,735 | $ | 1,624,516 | $ | 1,676,612 | $ | 4 | $ | 130 | $ | 653,773 | $ | ,394 | $ | — | ||
Federal Income Taxes
At October 31, 2016, the cost of investments and net unrealized appreciation (depreciation), undistributed ordinary income and
undistributed long-term capital gains for income tax purposes were as follows:.
| Cost of Investments | $ | 684,124,221 | ||
| Unrealized Appreciation | $ | 1,142,851 | ||
| Unrealized Depreciation | — | |||
| Net Unrealized Appreciation (Depreciation) | $ | 1,142,851 | ||
| Undistributed Long-Term Capital Gains | ||||
| (Capital Loss Carryforward) | $ | (81,606 | ) |
Net investment income and net realized gains (loss) in the financial statements may differ from taxable net investment income and net
realized gains (losses). Capital accounts within the financial statements are adjusted for permanent book-tax differences. Book-tax
differences are primarily due to foreign currency gains and losses, reclassifications of dividends, differences in treatment of income
from swaps, net operating losses, investments in partnerships, investments in passive foreign investment companies (PFICs), tax
straddle transactions, use of tax equalization and foreign capital gains taxes. These adjustments have no impact on the net assets.
At October 31, 2016, the Statement of Assets and Liabilities have been adjusted by the following amounts (in thousands):
| Undistributed net investment income | $ | 9,435 | |
| Accumulated net realized gain (loss) | 15,738 | ||
| Additional paid-in capital | (25,173 | ) |
See accompanying notes which are an integral part of the financial statements.
602 Russell Commodity Strategies Fund
Russell Investment Company
Russell Global Infrastructure Fund
Portfolio Management Discussion and Analysis — October 31, 2016 (Unaudited)
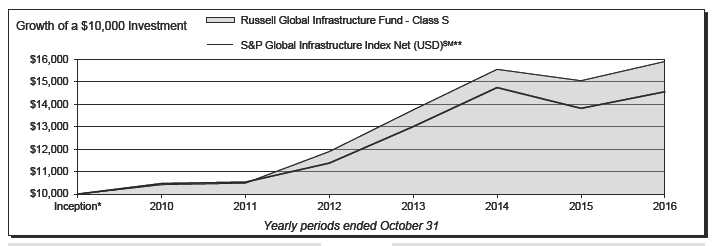
| Russell Global Infrastructure Fund - Class A‡ | Russell Global Infrastructure Fund - Class Y | ||||||
| Total | Total | ||||||
| Return | Return | ||||||
| 1 Year | (0.65 | )% | 1 Year | 5.87 | % | ||
| 5 Years | 7.13 | %§ | 5 Years | 8.87 | %§ | ||
| Inception* | 6.61 | %§ | Inception* | 8.10 | %§ | ||
| Russell Global Infrastructure Fund - Class C | S&P Global Infrastructure Index Net (USD)SM** | ||||||
| Total | Total | ||||||
| Return | Return | ||||||
| 1 Year | 4.65 | % | 1 Year | 5.34 | % | ||
| 5 Years | 7.60 | %§ | 5 Years | 6.68 | %§ | ||
| Inception* | 6.84 | %§ | Inception* | 6.36 | %§ | ||
| Russell Global Infrastructure Fund - Class E | |||||||
| Total | |||||||
| Return | |||||||
| 1 Year | 5.42 | % | |||||
| 5 Years | 8.40 | %§ | |||||
| Inception* | 7.64 | %§ | |||||
| Russell Global Infrastructure Fund - Class S | |||||||
| Total | |||||||
| Return | |||||||
| 1 Year | 5.69 | % | |||||
| 5 Years | 8.68 | %§ | |||||
| Inception* | 7.92 | %§ | |||||
Russell Global Infrastructure Fund 603
Russell Investment Company
Russell Global Infrastructure Fund
Portfolio Management Discussion and Analysis, continued — October 31, 2016
(Unaudited)
| The Russell Global Infrastructure Fund (the “Fund”) employs | was a detractor while the underweight to the marine ports sector |
| a multi-manager approach whereby portions of the Fund are | was beneficial. From a regional perspective, North America and |
| allocated to different money manager strategies. Fund assets not | Asia ex-Japan delivered positive returns, outperforming relative |
| allocated to money managers are managed by Russell Investment | to emerging markets and Europe, while Japan posted significant |
| Management, LLC (“RIM”), the Fund’s advisor. RIM may change | declines during the fiscal year. Stock selection within North |
| the allocation of the Fund’s assets among money managers at | America, emerging markets and Japan contributed positively |
| any time. An exemptive order from the Securities and Exchange | to performance, though selection within Europe had a negative |
| Commission (“SEC”) permits RIM to engage or terminate a money | impact. |
| manager at any time, subject to approval by the Fund’s Board, | |
| without a shareholder vote. Pursuant to the terms of the exemptive | How did the investment strategies and techniques employed |
| order, the Fund is required to notify its shareholders within 90 | by the Fund and its money managers affect its benchmark- |
| days of when a money manager begins providing services. As of | relative performance? |
| October 31, 2016, the Fund had four money managers. | The Fund employs discretionary money managers. The Fund’s |
| discretionary money managers select the individual portfolio | |
| What is the Fund’s investment objective? | securities for the assets assigned to them. Fund assets not |
| The Fund seeks to provide long term growth of capital and current | allocated to discretionary money managers include the Fund’s |
| income. | liquidity reserves and assets which may be managed directly by |
| How did the Fund perform relative to its benchmark for the | RIM to effect the Fund’s investment strategies and/or to actively |
| fiscal year ended October 31, 2016? | manage the Fund’s overall exposures by investing in securities or |
| other instruments that RIM believes will achieve the desired risk/ | |
| For the fiscal year ended October 31, 2016, the Fund’s Class | return profile for the Fund. |
| A, Class C, Class E, Class S and Class Y Shares gained 5.43%, | |
| 4.65%, 5.42%, 5.69% and 5.87%, respectively. This is compared | With respect to certain of the Fund’s money managers, Cohen |
| to the Fund’s benchmark, the S&P Global Infrastructure Index | & Steers Capital Management, Inc., Cohen & Steers UK |
| (Net), which gained 5.34% during the same period. The Fund’s | Limited and Cohen & Steers Asia Limited (together, “Cohen”) |
| performance includes operating expenses, whereas index returns | underperformed the Fund’s benchmark by a wide margin for the |
| are unmanaged and do not include expenses of any kind. | fiscal year. Cohen implements a “growth at a reasonable price” |
| strategy incorporating both top-down and bottom-up components. | |
| For the fiscal year ended October 31, 2016, the Morningstar® | An overweight to European tollroads and North American energy |
| Infrastructure Category, a group of funds that Morningstar | pipelines companies resulted in Cohen’s underperformance. Out- |
| considers to have investment strategies similar to those of the | of-index exposure to the satellites, construction & engineering |
| Fund, gained 4.49%. This return serves as a peer comparison and | and gas utilities sectors further detracted from performance. On a |
| is expressed net of operating expenses. | positive note, effective stock selection within multi-utilities and |
| How did the market conditions described in the Market | airports sectors benefitted. From a regional perspective, stock |
| Summary report affect the Fund’s performance? | picking within Japan and emerging markets was also beneficial. |
| For the fiscal year ended October 31, 2016, the global infrastructure | Colonial First State Asset Management (Australia) Limited |
| market, as measured by the S&P Global Infrastructure Index (Net), | (“Colonial”) outperformed the Fund’s benchmark by a wide margin |
| delivered a positive 5.34% return. Within the global infrastructure | for the fiscal year. Colonial utilizes a fundamental relative value |
| sector, there was a wide dispersion in company performance. | strategy that features significant ex-benchmark exposure. Stock |
| Utilities sector performance was strong during the period, driven | selection in the energy pipelines sector drove outperformance. |
| by a large fall in the U.S. Treasury 10-year yields of more than 30 | Within the utilities space, an underweight to multi-utilities and |
| basis points, while the alternative energy sector saw significant | out-of-index exposure to gas utilities and water utilities also |
| negative returns primarily within China. Stock selection within | contributed to performance. An underweight to the airports sector |
| the utilities sector and an underweight to the energy pipelines | was the most notable detractor from performance. |
| sector were key positive contributors to the Fund��s performance. | Nuveen Asset Management, Inc. (“Nuveen”) slightly outperformed |
| Companies with energy-related businesses posted positive returns | the Fund’s benchmark for the fiscal year. Nuveen utilizes a |
| in response to energy commodity price volatility during the | bottom-up relative value strategy that features a high degree |
| period. The owners of transportation infrastructure showed mixed | of turnover. An underweight to marine ports, power producers |
| results with airports benefitting from stronger passenger volume | and electric utilities, in addition to out-of-index exposure to the |
| growth, while marine ports suffered from weaker volumes within | gas utilities sector, contributed to performance. Out-of-index |
| Asia. The Fund’s underweight position within the airports sector | |
604 Russell Global Infrastructure Fund
Russell Investment Company
Russell Global Infrastructure Fund
Portfolio Management Discussion and Analysis, continued — October 31, 2016
(Unaudited)
| exposure to construction & engineering, railroads, wireless towers | Money Managers as of October 31, | |
| and satellites sectors detracted from performance. Negative stock | 2016 | Styles |
| selection within airports and an underweight to the sector had a | ||
| negative impact. | Cohen & Steers Capital Management, Inc., | |
| Cohen & Steers UK Limited and Cohen and | ||
| RIM utilized a strategy during the period to implement sector | Cohen & Steers Asia Limited | Public Market Equity |
| tilting through the use/purchase of infrastructure stocks. The | Colonial First State Asset Management | |
| strategy seeks to position the portfolio to meet RIM’s overall | (Australia) Limited | Public Market Equity |
| Maple-Brown Abbott Limited | Public Market Equity | |
| preferred positioning objectives, while optimizing the portfolio | Nuveen Asset Management, LLC | Public Market Equity |
| to minimize tracking error relative to the Fund’s money manager | The views expressed in this report reflect those of the | |
| portfolios. The strategy outperformed relative to the Fund’s | portfolio managers only through the end of the period | |
| benchmark as a result of exposure to the oil & gas pipelines, | covered by the report. These views do not necessarily | |
| electric utilities and multi-utilities sectors. | represent the views of RIM or any other person in RIM or | |
| During the fiscal year, the Fund used index futures contracts | any other affiliated organization. These views are subject | |
| to equitize the Fund’s cash. The use of these derivatives had a | to change at any time based upon market conditions or | |
| modestly positive impact on performance, as equity markets | other events, and RIM disclaims any responsibility to | |
| delivered positive returns ahead of cash. | update the views contained herein. These views should not | |
| be relied on as investment advice and, because investment | ||
| Describe any changes to the Fund’s structure or the money | decisions for a Russell Investment Company (“RIC”) Fund | |
| manager line-up. | are based on numerous factors, should not be relied on as | |
| In order to introduce a higher conviction manager, in September | an indication of investment decisions of any RIC Fund. | |
| 2016, Lazard Asset Management LLC was replaced with Maple- | ||
| Brown Abbott Limited, which pursues a more diversified strategy. | ||
* Assumes initial investment on September 30, 2010.
** The S&P Global Infrastructure Index Net (USD)SM provides liquid and tradable exposure to 75 companies around the world that represent the listed
infrastructure universe. The index has balanced weights across three distinct infrastructure classes: utilities, transportation and energy.
‡ The performance shown has been adjusted to reflect the deduction of the maximum Class A sales charge of 5.75%.
§ Annualized.
Performance is historical and assumes reinvestment of all dividends and capital gains. Investment return and principal value will fluctuate so that an investor’s
shares, when redeemed, may be worth more or less than when purchased. Past performance is not indicative of future results. The returns shown do not reflect the
deduction of taxes that a shareholder would pay on Fund distributions or the redemption of Fund shares. Additionally, the returns presented herein may differ from
the performance reported in the Financial Highlights as the returns herein are calculated in a manner consistent with standardized performance in accordance with
Securities and Exchange Commission rules, while the performance in the Financial Highlights has been calculated in accordance with U.S. Generally Accepted
Accounting Principles (“U.S. GAAP”).
Russell Global Infrastructure Fund 605
Russell Investment Company
Russell Global Infrastructure Fund
Shareholder Expense Example — October 31, 2016 (Unaudited)
| Fund Expenses | Please note that the expenses shown in the table are meant | |||||
| The following disclosure provides important information | to highlight your ongoing costs only and do not reflect any | |||||
| regarding the Fund’s Shareholder Expense Example | transactional costs. Therefore, the information under the heading | |||||
| (“Example”). | “Hypothetical Performance (5% return before expenses)” is | |||||
| useful in comparing ongoing costs only, and will not help you | ||||||
| Example | determine the relative total costs of owning different funds. In | |||||
| As a shareholder of the Fund, you incur two types of costs: (1) | addition, if these transactional costs were included, your costs | |||||
| transaction costs, including sales charges (loads) on certain | would have been higher. | |||||
| purchase or redemption payments, and (2) ongoing costs, | Hypothetical | |||||
| including distribution (12b-1) and/or service fees and other | Performance (5% | |||||
| Fund expenses. The Example is intended to help you understand | Actual | return before | ||||
| your ongoing costs (in dollars) of investing in the Fund and to | Class A | Performance | expenses) | |||
| Beginning Account Value | ||||||
| compare these costs with the ongoing costs of investing in other | May 1, 2016 | $ | 1,000.00 | $ | 1,000.00 | |
| mutual funds. The Example is based on an investment of $1,000 | Ending Account Value | |||||
| invested at the beginning of the period and held for the entire | October 31, 2016 | $ | 1,008.70 | $ | 1,017.80 | |
| period indicated, which for this Fund is from May 1, 2016 to | Expenses Paid During Period* | $ | 7.37 | $ | 7.41 | |
| October 31, 2016. | * Expenses are equal to the Fund's annualized expense ratio of 1.46% | |||||
| (representing the six month period annualized), multiplied by the average | ||||||
| Actual Expenses | account value over the period, multiplied by 184/366 (to reflect the one-half | |||||
| The information in the table under the heading “Actual | year period). May reflect amounts waived and/or reimbursed. Without any | |||||
| Performance” provides information about actual account values | waivers and/or reimbursements, expenses would have been higher. | |||||
| and actual expenses. You may use the information in this column, | ||||||
| Hypothetical | ||||||
| together with the amount you invested, to estimate the expenses | Performance (5% | |||||
| that you paid over the period. Simply divide your account value by | Actual | return before | ||||
| $1,000 (for example, an $8,600 account value divided by $1,000 | Class C | Performance | expenses) | |||
| Beginning Account Value | ||||||
| = 8.6), then multiply the result by the number in the first column | May 1, 2016 | $ | 1,000.00 | $ | 1,000.00 | |
| in the row entitled “Expenses Paid During Period” to estimate | Ending Account Value | |||||
| the expenses you paid on your account during this period. | October 31, 2016 | $ | 1,003.90 | $ | 1,013.93 | |
| Expenses Paid During Period* | $ | 11.23 | $ | 11.29 | ||
| Hypothetical Example for Comparison Purposes | ||||||
| The information in the table under the heading “Hypothetical | * Expenses are equal to the Fund's annualized expense ratio of 2.23% | |||||
| (representing the six month period annualized), multiplied by the average | ||||||
| Performance (5% return before expenses)�� provides information | account value over the period, multiplied by 184/366 (to reflect the one-half | |||||
| about hypothetical account values and hypothetical expenses | year period). May reflect amounts waived and/or reimbursed. Without any | |||||
| based on the Fund’s actual expense ratio and an assumed rate of | waivers and/or reimbursements, expenses would have been higher. | |||||
| return of 5% per year before expenses, which is not the Fund’s | ||||||
| Hypothetical | ||||||
| actual return. The hypothetical account values and expenses | Performance (5% | |||||
| may not be used to estimate the actual ending account balance or | Actual | return before | ||||
| expenses you paid for the period. You may use this information | Class E | Performance | expenses) | |||
| to compare the ongoing costs of investing in the Fund and other | Beginning Account Value | |||||
| May 1, 2016 | $ | 1,000.00 | $ | 1,000.00 | ||
| funds. To do so, compare this 5% hypothetical example with the | Ending Account Value | |||||
| 5% hypothetical examples that appear in the shareholder reports | October 31, 2016 | $ | 1,007.70 | $ | 1,017.70 | |
| of other funds. | Expenses Paid During Period* | $ | 7.47 | $ | 7.51 | |
| * Expenses are equal to the Fund's annualized expense ratio of 1.48% | ||||||
| (representing the six month period annualized), multiplied by the average | ||||||
| account value over the period, multiplied by 184/366 (to reflect the one-half | ||||||
| year period). May reflect amounts waived and/or reimbursed. Without any | ||||||
| waivers and/or reimbursements, expenses would have been higher. | ||||||
606 Russell Global Infrastructure Fund
Russell Investment Company
Russell Global Infrastructure Fund
Shareholder Expense Example, continued — October 31, 2016 (Unaudited)
| Hypothetical | ||||
| Performance (5% | ||||
| Actual | return before | |||
| Class S | Performance | expenses) | ||
| Beginning Account Value | ||||
| May 1, 2016 | $ | 1,000.00 | $ | 1,000.00 |
| Ending Account Value | ||||
| October 31, 2016 | $ | 1,009.00 | $ | 1,018.95 |
| Expenses Paid During Period* | $ | 6.21 | $ | 6.24 |
* Expenses are equal to the Fund's annualized expense ratio of 1.23%
(representing the six month period annualized), multiplied by the average
account value over the period, multiplied by 184/366 (to reflect the one-half
year period). May reflect amounts waived and/or reimbursed. Without any
waivers and/or reimbursements, expenses would have been higher.
| Hypothetical | ||||
| Performance (5% | ||||
| Actual | return before | |||
| Class Y | Performance | expenses) | ||
| Beginning Account Value | ||||
| May 1, 2016 | $ | 1,000.00 | $ | 1,000.00 |
| Ending Account Value | ||||
| October 31, 2016 | $ | 1,009.90 | $ | 1,019.86 |
| Expenses Paid During Period* | $ | 5.30 | $ | 5.33 |
* Expenses are equal to the Fund's annualized expense ratio of 1.05%
(representing the six month period annualized), multiplied by the average
account value over the period, multiplied by 184/366 (to reflect the one-half
year period). May reflect amounts waived and/or reimbursed. Without any
waivers and/or reimbursements, expenses would have been higher.
Russell Global Infrastructure Fund 607
Russell Investment Company
Russell Global Infrastructure Fund
Schedule of Investments — October 31, 2016
| Amounts in thousands (except share amounts) | Amounts in thousands (except share amounts) | ||||||||||
| Principal | Fair | ||||||||||
| Principal | Fair | Amount ($) | Value | ||||||||
| Amount ($) | Value | or Shares | $ | ||||||||
| or Shares | $ | ||||||||||
| Common Stocks - 96.0% | China - 2.0% | ||||||||||
| Australia - 8.9% | Beijing Capital International Airport Co., | ||||||||||
| APA Group | 634,897 | 3,837 | Ltd. Class H | 1,354,000 | 1,419 | ||||||
| Aurizon Holdings, Ltd. | 470,338 | 1,743 | China Resources Gas Group, Ltd. | 906,094 | 2,842 | ||||||
| AusNet Services(Æ) | 6,103,146 | 6,951 | COSCO SHIPPING Ports, Ltd. | 8,859,023 | 8,784 | ||||||
| DUET Group | 367,102 | 663 | ENN Energy Holdings, Ltd. | 108,240 | 509 | ||||||
| Macquarie Atlas Roads Group | 938,696 | 3,364 | Hopewell Highway Infrastructure, Ltd. | 345,806 | 185 | ||||||
| Spark Infrastructure Group | 6,721,274 | 11,328 | Jiangsu Expressway Co., Ltd. Class H | 5,345,413 | 7,278 | ||||||
| Sydney Airport | 1,443,346 | 6,856 | Towngas China Co., Ltd.(Æ) | 234,899 | 132 | ||||||
| Transurban Group - ADR(Æ) | 7,251,004 | 57,191 | 21,149 | ||||||||
| 91,933 | |||||||||||
| France - 5.0% | |||||||||||
| Austria - 0.2% | Aeroports de Paris | 26,856 | 2,713 | ||||||||
| Flughafen Wien AG | 82,959 | 2,010 | Engie SA | 249,476 | 3,600 | ||||||
| Oesterreichische Post AG(Æ) | 4,958 | 171 | Groupe Eurotunnel SE | 3,043,335 | 28,459 | ||||||
| 2,181 | Rubis SCA | 44,570 | 4,063 | ||||||||
| Suez Environnement Co. | 131,754 | 2,088 | |||||||||
| Belgium - 0.2% | Veolia Environnement SA | 69,670 | 1,521 | ||||||||
| bpost SA | 52,423 | 1,394 | Vinci SA | 133,504 | 9,652 | ||||||
| Elia System Operator SA | 9,672 | 500 | 52,096 | ||||||||
| 1,894 | |||||||||||
| Germany - 2.2% | |||||||||||
| Bermuda - 0.2% | Fraport AG Frankfurt Airport Services | ||||||||||
| Brookfield Renewable Partners, LP(Ñ) | 40,923 | 1,249 | Worldwide | 348,511 | 20,656 | ||||||
| China Everbright Water, Ltd. | 1,118,857 | 458 | Innogy SE(Æ)(Þ) | 60,873 | 2,418 | ||||||
| 1,707 | 23,074 | ||||||||||
| Brazil - 0.8% | Hong Kong - 2.7% | ||||||||||
| CCR SA | 353,284 | 1,920 | Cheung Kong Infrastructure Holdings, | ||||||||
| Cia de Saneamento Basico do Estado de | Ltd. | 136,790 | 1,119 | ||||||||
| Sao Paulo(Æ) | 84,459 | 892 | China Everbright International, Ltd. | 1,801,966 | 2,157 | ||||||
| CPFL Energias Renovaveis SA(Æ) | 55,424 | 196 | China Merchants Port Holdings Co., Ltd. | 5,846,508 | 15,133 | ||||||
| Energisa SA | 25,773 | 181 | CLP Holdings, Ltd. | 56,614 | 575 | ||||||
| Transmissora Alianca de Energia | Hong Kong & China Gas Co., Ltd. | 67,352 | 132 | ||||||||
| Eletrica SA | 830,306 | 5,397 | MTR Corp., Ltd. | 63,631 | 352 | ||||||
| 8,586 | Power Assets Holdings, Ltd. | 919,624 | 8,645 | ||||||||
| 28,113 | |||||||||||
| Canada - 8.4% | |||||||||||
| AltaGas, Ltd. - ADR | 12,214 | 302 | India - 0.3% | ||||||||
| Brookfield Infrastructure Partners, LP(Ñ) | 19,829 | 671 | Power Grid Corp. of India, Ltd. | 1,116,622 | 2,927 | ||||||
| Canadian Pacific Railway, Ltd. | 5,189 | 742 | |||||||||
| Emera, Inc. | 54,929 | 1,916 | Indonesia - 0.1% | ||||||||
| Enbridge, Inc. | 889,338 | 38,401 | Tower Bersama Infrastructure Tbk PT | 1,299,285 | 595 | ||||||
| Inter Pipeline, Ltd. | 80,187 | 1,662 | |||||||||
| Keyera Corp. | 103,503 | 3,107 | Italy - 4.6% | ||||||||
| Pembina Pipeline Corp. | 23,549 | 723 | Atlantia SpA | 1,496,825 | 36,702 | ||||||
| TransCanada Corp. | 627,461 | 28,407 | Ei Towers SpA(Æ) | 25,731 | 1,216 | ||||||
| Veresen, Inc. | 90,196 | 817 | Hera SpA | 465,409 | 1,191 | ||||||
| Waste Connections, Inc. | 127,261 | 9,571 | Infrastrutture Wireless Italiane SpA(Þ) | 804,812 | 3,806 | ||||||
| 86,319 | Snam Rete Gas SpA | 906,559 | 4,784 | ||||||||
| Terna Rete Elettrica Nazionale SpA | 51,016 | 250 | |||||||||
| Chile - 0.6% | 47,949 | ||||||||||
| AES Gener SA | 558,110 | 190 | |||||||||
| Aguas Andinas SA Class A | 6,927,940 | 4,568 | Japan - 3.7% | ||||||||
| Empresa Nacional de Electricidad SA | East Japan Railway Co. | 109,975 | 9,696 | ||||||||
| - ADR | 12,196 | 253 | Japan Airport Terminal Co., Ltd.(Ñ) | 164,293 | 6,318 | ||||||
| Endesa Americas SA - ADR | 68,674 | 658 | Kamigumi Co., Ltd. | 1,289,524 | 11,017 | ||||||
| Enersis Chile SA - ADR | 128,016 | 636 | Tokyo Gas Co., Ltd. | 2,202,000 | 9,983 | ||||||
| 6,305 | West Japan Railway Co. | 22,000 | 1,356 | ||||||||
| 38,370 | |||||||||||
See accompanying notes which are an integral part of the financial statements.
608 Russell Global Infrastructure Fund
Russell Investment Company
Russell Global Infrastructure Fund
Schedule of Investments, continued — October 31, 2016
| Amounts in thousands (except share amounts) | Amounts in thousands (except share amounts) | |||||||||
| Principal | Fair | Principal | Fair | |||||||
| Amount ($) | Value | Amount ($) | Value | |||||||
| or Shares | $ | or Shares | $ | |||||||
| Luxembourg - 0.0% | Red Electrica Corp. SA | 304,240 | 6,339 | |||||||
| SES SA | 12,923 | 297 | Saeta Yield SA - ADR | 33,333 | 322 | |||||
| 76,974 | ||||||||||
| Malaysia - 0.1% | ||||||||||
| Petronas Gas BHD | 78,424 | 413 | Switzerland - 1.9% | |||||||
| Westports Holdings BHD | 101,416 | 106 | Flughafen Zuerich AG | 105,957 | 19,463 | |||||
| 519 | ||||||||||
| United Kingdom - 4.7% | ||||||||||
| Mexico - 2.1% | Centrica PLC | 239,701 | 629 | |||||||
| Grupo Aeroportuario del Centro Norte | Inmarsat PLC | 17,667 | 151 | |||||||
| SAB de CV - ADR | 49,492 | 2,311 | National Grid PLC | 1,358,248 | 17,691 | |||||
| Grupo Aeroportuario del Pacifico SAB de | National Grid PLC - ADR | 66,368 | 4,342 | |||||||
| CV - ADR | 43,570 | 4,210 | Scottish & Southern Energy PLC | 740,788 | 14,430 | |||||
| Grupo Aeroportuario del Pacifico SAB de | Severn Trent PLC Class H | 138,686 | 3,947 | |||||||
| CV Class B | 730,977 | 7,065 | Stagecoach Group PLC | 71,656 | 173 | |||||
| Infraestructura Energetica Nova SAB | United Utilities Group PLC | 621,803 | 7,144 | |||||||
| de CV | 489,103 | 2,165 | 48,507 | |||||||
| OHL Mexico SAB de CV(Æ) | 3,582,705 | 4,220 | ||||||||
| Promotora y Operadora de | United States - 36.8% | |||||||||
| Infraestructura SAB de CV | 59,701 | 668 | 8Point3 Energy Partners, LP Class A(Ñ) | 28,401 | 435 | |||||
| Promotora y Operadora de | Alliant Energy Corp. | 134,631 | 5,123 | |||||||
| Infraestructura SAB de CV Class L | 155,677 | 1,466 | Ameren Corp. | 85,061 | 4,249 | |||||
| 22,105 | American Tower Corp.(ö) | 15,218 | 1,783 | |||||||
| American Water Works Co., Inc. | 39,235 | 2,905 | ||||||||
| Netherlands - 0.7% | Atmos Energy Corp. | 89,903 | 6,688 | |||||||
| Koninklijke Vopak NV | 152,651 | 7,703 | Avangrid, Inc. | 10,170 | 401 | |||||
| Boardwalk Pipeline Partners, LP(Ñ) | 418,200 | 7,197 | ||||||||
| New Zealand - 1.3% | Buckeye Partners, LP | 18,953 | 1,223 | |||||||
| Auckland International Airport, Ltd. | 1,803,087 | 8,496 | CenterPoint Energy, Inc. | 72,250 | 1,647 | |||||
| Infratil, Ltd. | 1,194,009 | 2,544 | Cheniere Energy, Inc.(Æ) | 136,161 | 5,133 | |||||
| Port of Tauranga, Ltd.(Ñ) | 699,600 | 1,950 | CMS Energy Corp. | 206,130 | 8,688 | |||||
| Vector, Ltd. | 3,352 | 8 | Connecticut Water Service, Inc. | 11,068 | 576 | |||||
| 12,998 | Covanta Holding Corp. | 22,264 | 334 | |||||||
| Crown Castle International Corp.(ö) | 212,229 | 19,311 | ||||||||
| Norway - 0.0% | CSX Corp. | 87,838 | 2,680 | |||||||
| Hafslund ASA Class B | 37,463 | 389 | Digital Realty Trust, Inc. (ö) | 30,865 | 2,884 | |||||
| Dominion Resources, Inc. | 232,690 | 17,498 | ||||||||
| Philippines - 0.0% | DTE Energy Co. | 2,558 | 246 | |||||||
| International Container Terminal | Duke Energy Corp. | 38,138 | 3,052 | |||||||
| Services, Inc. | 177,270 | 285 | Edison International | 90,374 | 6,641 | |||||
| El Paso Electric Co. | 87,306 | 4,034 | ||||||||
| Portugal - 0.0% | Enbridge Energy Management LLC(Æ) | 235,286 | 5,746 | |||||||
| REN - Redes Energeticas Nacionais | Enterprise Products Partners, LP(Ñ) | 382,727 | 9,660 | |||||||
| SGPS SA | 44,632 | 130 | Equinix, Inc.(ö) | 79 | 28 | |||||
| Eversource Energy | 153,037 | 8,426 | ||||||||
| Singapore - 1.0% | Great Plains Energy, Inc. | 54,114 | 1,539 | |||||||
| CitySpring Infrastructure Trust(Æ) | 5,482,470 | 1,990 | Kansas City Southern | 24,311 | 2,134 | |||||
| ComfortDelGro Corp., Ltd. | 1,317,608 | 2,406 | Kinder Morgan, Inc. | 2,184,317 | 44,626 | |||||
| Hutchison Port Holdings Trust Class U | 6,135,326 | 2,725 | Macquarie Infrastructure Corp. | 67,534 | 5,525 | |||||
| Parkway Life Real Estate Investment | Magellan Midstream Partners, LP | 91,085 | 6,124 | |||||||
| Trust (Æ)(ö) | 910,651 | 1,675 | New Jersey Resources Corp. | 7,418 | 252 | |||||
| SATS, Ltd. | 379,423 | 1,319 | ||||||||
| 10,115 | NextEra Energy, Inc. | 375,575 | 37,073 | |||||||
| NiSource, Inc. | 155,446 | 3,616 | ||||||||
| Spain - 7.5% | Noble Midstream Partners LP(Æ) | 25,445 | 763 | |||||||
| Abertis Infraestructuras SA(Ñ) | 1,500,260 | 22,265 | ONE Gas, Inc. | 9,039 | 554 | |||||
| Aena SA(Þ) | 142,371 | 20,894 | ONEOK, Inc. | 33,401 | 1,618 | |||||
| Cellnex Telecom SA(Þ) | 150,663 | 2,473 | Pattern Energy Group, Inc. Class A | 76,673 | 1,714 | |||||
| Enagas SA | 151,742 | 4,357 | PG&E Corp. | 568,689 | 35,327 | |||||
| Ferrovial SA | 194,756 | 3,786 | Plains All American Pipeline, LP | 17,897 | 543 | |||||
| Iberdrola SA | 2,427,514 | 16,538 | Plains GP Holdings, LP Class A(Æ)(Ñ) | 132,116 | 1,659 | |||||
| PPL Corp. | 67,216 | 2,308 | ||||||||
See accompanying notes which are an integral part of the financial statements.
Russell Global Infrastructure Fund 609
Russell Investment Company
Russell Global Infrastructure Fund
Schedule of Investments, continued — October 31, 2016
| Amounts in thousands (except share amounts) | ||||||||
| Principal | Fair | |||||||
| Amount ($) | Value | |||||||
| or Shares | $ | |||||||
| Rice Midstream Partners, LP | 36,800 | 797 | ||||||
| SBA Communications Corp. Class A(Æ) | 94,238 | 10,675 | ||||||
| SemGroup Corp. Class A | 20,606 | 665 | ||||||
| Sempra Energy | 103,117 | 11,044 | ||||||
| Shell Midstream Partners, LP | 51,050 | 1,385 | ||||||
| SJW Corp. | 60,268 | 3,057 | ||||||
| Spectra Energy Corp. | 601,176 | 25,135 | ||||||
| Spire, Inc. | 5,251 | 330 | ||||||
| Targa Resources Corp. | 102,563 | 4,502 | ||||||
| UGI Corp. | 141,204 | 6,536 | ||||||
| Union Pacific Corp. | 68,455 | 6,036 | ||||||
| Unitil Corp. | 18,852 | 765 | ||||||
| WEC Energy Group, Inc. | 175,281 | 10,468 | ||||||
| Williams Cos., Inc. (The) | 361,104 | 10,544 | ||||||
| Xcel Energy, Inc. | 393,483 | 16,349 | ||||||
| 380,251 | ||||||||
| Total Common Stocks | ||||||||
| (cost $887,893) | 992,934 | |||||||
| Investments in Other Funds - 0.1% | ||||||||
| 3i Infrastructure PLC | 254,590 | 597 | ||||||
| John Laing Infrastructure Fund, Ltd. | 396,931 | 615 | ||||||
| Total Investments in Other Funds | ||||||||
| (cost $1,244) | 1,212 | |||||||
| Warrants & Rights - 0.0% | ||||||||
| Spain- 0.0% | ||||||||
| Ferrovial SA(Æ) | ||||||||
| 2017 Rights | 194,756 | 83 | ||||||
| Total Warrants & Rights | ||||||||
| (cost $87) | 83 | |||||||
| Short-Term Investments - 3.2% | ||||||||
| United States - 3.2% | ||||||||
| Russell U.S. Cash Management Fund | 32,922,518 | (8) | 32,929 | |||||
| Total Short-Term Investments | ||||||||
| (cost $32,928) | 32,929 | |||||||
| Other Securities - 3.6% | ||||||||
| Russell U.S. Cash Collateral Fund(×) | 37,088,837 | (8) | 37,089 | |||||
| Total Other Securities | ||||||||
| (cost $37,089) | 37,089 | |||||||
| Total Investments 102.9% | ||||||||
| (identified cost $959,241) | 1,064,247 | |||||||
| Other Assets and Liabilities, Net | ||||||||
| - | (2.9%) | (30,093 | ) | |||||
| Net Assets - 100.0% | 1,034,154 | |||||||
See accompanying notes which are an integral part of the financial statements.
610 Russell Global Infrastructure Fund
Russell Investment Company
Russell Global Infrastructure Fund
Schedule of Investments, continued — October 31, 2016
| Futures Contracts | |||||||
| Amounts in thousands (except contract amounts) | |||||||
| Unrealized | |||||||
| Appreciation | |||||||
| Number of | Notional | Expiration | (Depreciation) | ||||
| Contracts | Amount | Date | $ | ||||
| Long Positions | |||||||
| CAC40 Euro Index Futures | 37 | EUR | 1,667 | 11/16 | 3 | ||
| DAX Index Futures | 2 | EUR | 534 | 12/16 | — | ||
| Euro STOXX 50 Index Futures | 39 | EUR | 1,191 | 12/16 | 20 | ||
| FTSE 100 Index Futures | 21 | GBP | 1,455 | 12/16 | 9 | ||
| Hang Seng Index Futures | 11 | HKD | 12,598 | 11/16 | (43 | ) | |
| IBEX 35 Index Futures | 42 | EUR | 3,833 | 11/16 | 132 | ||
| S&P E-Mini Utilities Select Sector Index Futures | 298 | USD | 14,802 | 12/16 | 427 | ||
| S&P/TSX 60 Index Futures | 27 | CAD | 4,679 | 12/16 | 58 | ||
| SPI 200 Index Futures | 31 | AUD | 4,100 | 12/16 | (54 | ) | |
| TOPIX Index Futures | 7 | JPY | 97,650 | 12/16 | 27 | ||
| Total Unrealized Appreciation (Depreciation) on Open Futures Contracts (å) | 579 | ||||||
| Foreign Currency Exchange Contracts | |||||||||
| Amounts in thousands | |||||||||
| Unrealized | |||||||||
| Appreciation | |||||||||
| Amount | Amount | (Depreciation) | |||||||
| Counterparty | Sold | Bought | Settlement Date | $ | |||||
| Australia and New Zealand Banking Group | EUR | 273 | USD | 300 | 11/01/16 | — | |||
| Bank of America | USD | 671 | AUD | 900 | 12/21/16 | 13 | |||
| Bank of America | USD | 682 | AUD | 910 | 12/21/16 | 10 | |||
| Bank of America | USD | 1,440 | AUD | 1,910 | 12/21/16 | 11 | |||
| Bank of America | USD | 1,095 | EUR | 970 | 12/21/16 | (28 | ) | ||
| Bank of America | USD | 1,467 | EUR | 1,300 | 12/21/16 | (37 | ) | ||
| Bank of America | USD | 344 | GBP | 260 | 12/21/16 | (25 | ) | ||
| Bank of America | USD | 448 | HKD | 3,470 | 12/21/16 | — | |||
| Bank of America | USD | 451 | HKD | 3,500 | 12/21/16 | — | |||
| Bank of America | USD | 757 | HKD | 5,870 | 12/21/16 | — | |||
| Bank of America | USD | 253 | JPY | 25,780 | 12/21/16 | (7 | ) | ||
| Bank of America | USD | 255 | JPY | 26,040 | 12/21/16 | (7 | ) | ||
| Bank of America | USD | 525 | JPY | 54,240 | 12/21/16 | (7 | ) | ||
| Bank of America | AUD | 410 | USD | 311 | 12/21/16 | — | |||
| Bank of America | AUD | 820 | USD | 628 | 12/21/16 | 5 | |||
| Bank of America | CAD | 170 | USD | 129 | 12/21/16 | 2 | |||
| Bank of America | CAD | 530 | USD | 404 | 12/21/16 | 9 | |||
| Bank of America | CAD | 680 | USD | 519 | 12/21/16 | 12 | |||
| Bank of America | CAD | 1,000 | USD | 762 | 12/21/16 | 16 | |||
| Bank of America | EUR | 620 | USD | 697 | 12/21/16 | 15 | |||
| Bank of America | EUR | 1,200 | USD | 1,324 | 12/21/16 | 3 | |||
| Bank of America | GBP | 140 | USD | 179 | 12/21/16 | 7 | |||
| Bank of America | GBP | 200 | USD | 244 | 12/21/16 | (1 | ) | ||
| Bank of America | GBP | 210 | USD | 271 | 12/21/16 | 13 | |||
| Bank of America | GBP | 210 | USD | 270 | 12/21/16 | 13 | |||
| Bank of America | HKD | 1,180 | USD | 152 | 12/21/16 | — | |||
| Bank of America | JPY | 27,470 | USD | 265 | 12/21/16 | 3 | |||
| Bank of America | JPY | 39,990 | USD | 395 | 12/21/16 | 13 | |||
| BNP Paribas | USD | 1,409 | AUD | 1,839 | 12/21/16 | (11 | ) | ||
| BNP Paribas | USD | 389 | CAD | 510 | 12/21/16 | (9 | ) | ||
| BNP Paribas | USD | 1,329 | CAD | 1,717 | 12/21/16 | (48 | ) | ||
| BNP Paribas | USD | 451 | EUR | 410 | 12/21/16 | — | |||
| BNP Paribas | USD | 2,783 | EUR | 2,459 | 12/21/16 | (79 | ) | ||
| BNP Paribas | USD | 259 | GBP | 210 | 12/21/16 | (1 | ) | ||
| BNP Paribas | USD | 684 | GBP | 514 | 12/21/16 | (56 | ) | ||
| BNP Paribas | USD | 743 | HKD | 5,758 | 12/21/16 | — | |||
See accompanying notes which are an integral part of the financial statements.
Russell Global Infrastructure Fund 611
Russell Investment Company
Russell Global Infrastructure Fund
Schedule of Investments, continued — October 31, 2016
| Foreign Currency Exchange Contracts | |||||||||
| Amounts in thousands | |||||||||
| Unrealized | |||||||||
| Appreciation | |||||||||
| Amount | Amount | (Depreciation) | |||||||
| Counterparty | Sold | Bought | Settlement Date | $ | |||||
| BNP Paribas | USD | 448 | JPY | 45,398 | 12/21/16 | (14 | ) | ||
| BNP Paribas | AUD | 800 | USD | 612 | 12/21/16 | 5 | |||
| BNP Paribas | HKD | 2,310 | USD | 298 | 12/21/16 | — | |||
| BNP Paribas | JPY | 26,990 | USD | 260 | 12/21/16 | 2 | |||
| Brown Brothers Harriman | USD | 358 | AUD | 471 | 11/02/16 | 1 | |||
| Brown Brothers Harriman | AUD | 260 | USD | 197 | 12/21/16 | — | |||
| Brown Brothers Harriman | AUD | 680 | USD | 518 | 12/21/16 | 1 | |||
| Brown Brothers Harriman | EUR | 1,660 | USD | 1,864 | 12/21/16 | 37 | |||
| Brown Brothers Harriman | HKD | 2,340 | USD | 302 | 12/21/16 | — | |||
| Brown Brothers Harriman | HKD | 2,360 | USD | 305 | 12/21/16 | — | |||
| Brown Brothers Harriman | JPY | 13,320 | USD | 130 | 12/21/16 | 3 | |||
| Citigroup | USD | 388 | CAD | 520 | 12/21/16 | — | |||
| Citigroup | USD | 1,398 | CAD | 1,850 | 12/21/16 | (18 | ) | ||
| Citigroup | USD | 770 | EUR | 700 | 12/21/16 | — | |||
| Citigroup | USD | 3,526 | EUR | 3,180 | 12/21/16 | (27 | ) | ||
| Citigroup | USD | 171 | GBP | 140 | 12/21/16 | — | |||
| Citigroup | USD | 765 | GBP | 630 | 12/21/16 | 7 | |||
| Commonwealth Bank of Australia | USD | 396 | CAD | 520 | 12/21/16 | (9 | ) | ||
| Commonwealth Bank of Australia | USD | 172 | GBP | 140 | 12/21/16 | — | |||
| Credit Suisse | USD | 852 | AUD | 1,124 | 11/02/16 | 3 | |||
| Credit Suisse | USD | 12 | CHF | 12 | 11/01/16 | — | |||
| Credit Suisse | USD | 482 | EUR | 439 | 11/02/16 | 1 | |||
| Credit Suisse | USD | 409 | HKD | 3,167 | 11/01/16 | — | |||
| Credit Suisse | GBP | 34 | USD | 41 | 11/01/16 | — | |||
| Deutsche Bank | USD | 140 | CAD | 187 | 11/01/16 | — | |||
| Deutsche Bank | USD | 107 | HKD | 828 | 11/02/16 | — | |||
| Deutsche Bank | CAD | 20 | USD | 15 | 11/03/16 | — | |||
| Goldman Sachs | USD | 416 | AUD | 540 | 12/21/16 | (6 | ) | ||
| Goldman Sachs | USD | 301 | HKD | 2,330 | 12/21/16 | — | |||
| Goldman Sachs | USD | 263 | JPY | 27,080 | 12/21/16 | (4 | ) | ||
| HSBC | USD | 1,407 | AUD | 1,839 | 12/21/16 | (10 | ) | ||
| HSBC | USD | 1,329 | CAD | 1,717 | 12/21/16 | (48 | ) | ||
| HSBC | USD | 2,783 | EUR | 2,459 | 12/21/16 | (79 | ) | ||
| HSBC | USD | 684 | GBP | 514 | 12/21/16 | (55 | ) | ||
| HSBC | USD | 743 | HKD | 5,758 | 12/21/16 | — | |||
| HSBC | USD | 448 | JPY | 45,398 | 12/21/16 | (14 | ) | ||
| HSBC | EUR | 570 | USD | 623 | 12/21/16 | (5 | ) | ||
| HSBC | GBP | 140 | USD | 171 | 12/21/16 | (1 | ) | ||
| JPMorgan Chase | USD | 70 | CHF | 70 | 11/02/16 | — | |||
| JPMorgan Chase | USD | 24 | NZD | 34 | 11/02/16 | — | |||
| Morgan Stanley | USD | 412 | AUD | 540 | 12/21/16 | (2 | ) | ||
| Morgan Stanley | USD | 151 | HKD | 1,170 | 12/21/16 | — | |||
| Morgan Stanley | USD | 131 | JPY | 13,570 | 12/21/16 | (1 | ) | ||
| Morgan Stanley | CAD | 350 | USD | 265 | 12/21/16 | 5 | |||
| Morgan Stanley | GBP | 140 | USD | 172 | 12/21/16 | — | |||
| Royal Bank of Canada | AUD | 270 | USD | 206 | 12/21/16 | 1 | |||
| Royal Bank of Canada | CAD | 340 | USD | 254 | 12/21/16 | 1 | |||
| Royal Bank of Canada | HKD | 2,370 | USD | 306 | 12/21/16 | — | |||
| Royal Bank of Canada | JPY | 14,080 | USD | 138 | 12/21/16 | 3 | |||
| State Street | USD | 17 | AUD | 23 | 11/03/16 | — | |||
| State Street | USD | 58 | CAD | 78 | 11/02/16 | — | |||
| State Street | USD | 635 | CAD | 840 | 12/21/16 | (9 | ) | ||
| State Street | USD | 745 | CAD | 980 | 12/21/16 | (14 | ) | ||
| State Street | USD | 338 | EUR | 300 | 12/21/16 | (8 | ) | ||
| State Street | USD | 251 | GBP | 190 | 12/21/16 | (18 | ) | ||
| State Street | USD | 68 | MXN | 1,274 | 11/04/16 | — | |||
See accompanying notes which are an integral part of the financial statements.
612 Russell Global Infrastructure Fund
Russell Investment Company
Russell Global Infrastructure Fund
Schedule of Investments, continued — October 31, 2016
| Foreign Currency Exchange Contracts | ||||||||
| Amounts in thousands | ||||||||
| Unrealized | ||||||||
| Appreciation | ||||||||
| Amount | Amount | (Depreciation) | ||||||
| Counterparty | Sold | Bought | Settlement Date | $ | ||||
| State Street | USD | 133 | SGD | 185 | 11/03/16 | — | ||
| State Street | AUD | 410 | USD | 310 | 12/21/16 | (1 | ) | |
| State Street | AUD | 530 | USD | 404 | 12/21/16 | 1 | ||
| State Street | CAD | 22 | USD | 16 | 11/01/16 | — | ||
| State Street | CAD | 500 | USD | 383 | 12/21/16 | 10 | ||
| State Street | CAD | 510 | USD | 395 | 12/21/16 | 15 | ||
| State Street | EUR | 131 | USD | 143 | 11/01/16 | — | ||
| State Street | EUR | 800 | USD | 877 | 11/01/16 | (1 | ) | |
| State Street | EUR | 820 | USD | 922 | 12/21/16 | 21 | ||
| State Street | GBP | 130 | USD | 170 | 12/21/16 | 11 | ||
| State Street | HKD | 1,150 | USD | 148 | 12/21/16 | — | ||
| State Street | HKD | 1,190 | USD | 153 | 12/21/16 | — | ||
| State Street | HKD | 2,380 | USD | 307 | 12/21/16 | — | ||
| State Street | JPY | 13,560 | USD | 131 | 12/21/16 | 1 | ||
| State Street | JPY | 13,900 | USD | 132 | 12/21/16 | (1 | ) | |
| Total Unrealized Appreciation (Depreciation) on Open Foreign Currency Exchange Contracts | (387 | ) | ||||||
| Presentation of Portfolio Holdings | |||||||||||||
| Amounts in thousands | |||||||||||||
| Fair Value | |||||||||||||
| Practical | |||||||||||||
| Portfolio Summary | Level 1 | Level 2 | Level 3 | Expedient (a) | Total | % of Net Assets | |||||||
| Common Stocks | |||||||||||||
| Australia | $ | — | $ | 91,933 | $ | — | $ | — | $ | 91,933 | 8.9 | ||
| Austria | — | 2,181 | — | — | 2,181 | 0.2 | |||||||
| Belgium | — | 1,894 | — | — | 1,894 | 0.2 | |||||||
| Bermuda | 1,249 | 458 | — | — | 1,707 | 0.2 | |||||||
| Brazil | 8,586 | — | — | — | 8,586 | 0.8 | |||||||
| Canada | 86,319 | — | — | — | 86,319 | 8.4 | |||||||
| Chile | 1,547 | 4,758 | — | — | 6,305 | 0.6 | |||||||
| China | — | 21,149 | — | — | 21,149 | 2.0 | |||||||
| France | — | 52,096 | — | — | 52,096 | 5.0 | |||||||
| Germany | 2,418 | 20,656 | — | — | 23,074 | 2.2 | |||||||
| Hong Kong | — | 28,113 | — | — | 28,113 | 2.7 | |||||||
| India | — | 2,927 | — | — | 2,927 | 0.3 | |||||||
| Indonesia | — | 595 | — | — | 595 | 0.1 | |||||||
| Italy | — | 47,949 | — | — | 47,949 | 4.6 | |||||||
| Japan | — | 38,370 | — | — | 38,370 | 3.7 | |||||||
| Luxembourg | — | 297 | — | — | 297 | —* | |||||||
| Malaysia | — | 519 | — | — | 519 | 0.1 | |||||||
| Mexico | 22,105 | — | — | — | 22,105 | 2.1 | |||||||
| Netherlands | — | 7,703 | — | — | 7,703 | 0.7 | |||||||
| New Zealand | — | 12,998 | — | — | 12,998 | 1.3 | |||||||
| Norway | — | 389 | — | — | 389 | —* | |||||||
| Philippines | — | 285 | — | — | 285 | —* | |||||||
| Portugal | — | 130 | — | — | 130 | —* | |||||||
See accompanying notes which are an integral part of the financial statements.
Russell Global Infrastructure Fund 613
Russell Investment Company
Russell Global Infrastructure Fund
Schedule of Investments, continued — October 31, 2016
| Presentation of Portfolio Holdings | |||||||||||||||||
| Amounts in thousands | |||||||||||||||||
| Fair Value | |||||||||||||||||
| Practical | |||||||||||||||||
| Portfolio Summary | Level 1 | Level 2 | Level 3 | Expedient (a) | Total | % of Net Assets | |||||||||||
| Singapore | — | 10,115 | — | — | 10,115 | 1.0 | |||||||||||
| Spain | — | 76,974 | — | — | 76,974 | 7.5 | |||||||||||
| Switzerland | — | 19,463 | — | — | 19,463 | 1.9 | |||||||||||
| United Kingdom | 4,342 | 44,165 | — | — | 48,507 | 4.7 | |||||||||||
| United States | 380,251 | — | — | — | 380,251 | 36.8 | |||||||||||
| Investments in Other Funds | — | 1,212 | — | — | 1,212 | 0.1 | |||||||||||
| Warrants & Rights | 83 | — | — | — | 83 | —* | |||||||||||
| Short-Term Investments | — | — | — | 32,929 | 32,929 | 3.2 | |||||||||||
| Other Securities | — | — | — | 37,089 | 37,089 | 3.6 | |||||||||||
| Total Investments | 506,900 | 487,329 | — | 70,018 | 1,064,247 | 102.9 | |||||||||||
| Other Assets and Liabilities, Net | (2.9 | ) | |||||||||||||||
| 100.0 | |||||||||||||||||
| Other Financial Instruments | |||||||||||||||||
| Assets | |||||||||||||||||
| Futures Contracts | 676 | — | — | — | 676 | 0.1 | |||||||||||
| Foreign Currency Exchange Contracts | 5 | 269 | — | — | 274 | —* | |||||||||||
| Liabilities | |||||||||||||||||
| Futures Contracts | (97 | ) | — | — | — | (97 | ) | (—)* | |||||||||
| Foreign Currency Exchange Contracts | (3 | ) | (658 | ) | — | — | (661 | ) | (0.1 | ) | |||||||
| Total Other Financial Instruments** | $ | 581 | $ | (389 | ) | $ | — | $ | — | $ | 192 | ||||||
* Less than 0.05% of net assets.
** Futures and foreign currency exchange contract values reflect the unrealized appreciation (depreciation) on the investments.
(a) Certain investments that are measured at fair value using the net asset value per share (or its equivalent) practical expedient have not been classified
in the fair value levels. The fair value amounts presented in the table are intended to permit reconciliation to the amounts presented in the Schedule of
Investments.
For a description of the Levels, see note 2 in the Notes to Financial Statements.
For a disclosure on transfers between Levels 1, 2 and 3 during the period ended October 31, 2016, see note 2 in the Notes to
Financial Statements.
See accompanying notes which are an integral part of the financial statements.
614 Russell Global Infrastructure Fund
Russell Investment Company
Russell Global Infrastructure Fund
Schedule of Investments, continued — October 31, 2016
| Amounts in thousands | |||
| Fair Value | |||
| Infrastructure Subindustry Exposure | $ | ||
| Air Freight & Logistics | 1,565 | ||
| Airport Services | 109,255 | ||
| Alternative Carriers | 151 | ||
| Cable & Satellite | 297 | ||
| Construction & Engineering | 13,521 | ||
| Diversified | 39,110 | ||
| Electric Utilities | 199,279 | ||
| Environmental & Facilities Services | 12,062 | ||
| Gas Utilities | 47,577 | ||
| Healthcare REITs | 1,675 | ||
| Highways & Railtracks | 163,717 | ||
| Independent Power Producers & Energy Traders | 443 | ||
| Integrated Telecommunication Services | 18,170 | ||
| Marine Ports & Services | 24,867 | ||
| Multi-Utilities | 94,492 | ||
| Oil & Gas Refining & Marketing | 3,107 | ||
| Oil & Gas Storage & Transportation | 205,337 | ||
| Railroads | 24,739 | ||
| Renewable Electricity | 6,904 | ||
| Specialized REITs | 28 | ||
| Trucking | 2,579 | ||
| Water Utilities | 23,547 | ||
| Wireless Telecommunication Services | 595 | ||
| Investment in Other Funds | 1,212 | ||
| Short-Term Investments | 32,929 | ||
| Other Securities | 37,089 | ||
| Total Investments | 1,064,247 | ||
See accompanying notes which are an integral part of the financial statements.
Russell Global Infrastructure Fund 615
Russell Investment Company
Russell Global Infrastructure Fund
Fair Value of Derivative Instruments — October 31, 2016
Amounts in thousands
| Foreign | |||||||
| Equity | Currency | ||||||
| Derivatives not accounted for as hedging instruments | Contracts | Contracts | |||||
| Location: Statement of Assets and Liabilities - Assets | |||||||
| Unrealized appreciation on foreign currency exchange contracts | $ | — | $ | 274 | |||
| Variation margin on futures contracts* | 676 | — | |||||
| Total | $ | 676 | $ | 274 | |||
| Location: Statement of Assets and Liabilities - Liabilities | |||||||
| Variation margin on futures contracts* | $ | 97 | $ | — | |||
| Unrealized depreciation on foreign currency exchange contracts | — | 661 | |||||
| Total | $ | 97 | $ | 661 | |||
| Foreign | |||||||
| Equity | Currency | ||||||
| Derivatives not accounted for as hedging instruments | Contracts | Contracts | |||||
| Location: Statement of Operations - Net realized gain (loss) | |||||||
| Futures contracts | $ | 1,431 | $ | — | |||
| Foreign currency-related transactions** | — | 329 | |||||
| Total | $ | 1,431 | $ | 329 | |||
| Location: Statement of Operations - Net change in unrealized appreciation (depreciation) | |||||||
| Futures contracts | $ | (159 | ) | $ | — | ||
| Foreign currency-related transactions*** | — | (310 | ) | ||||
| Total | $ | (159 | ) | $ | (310 | ) | |
* Includes cumulative appreciation/depreciation of futures contracts as reported in the Schedule of Investments. Only variation margin is reported within the
Statement of Assets and Liabilities.
** Only includes net realized gain (loss) on forward and spot contracts. May differ from the net realized gain (loss) on foreign currency-related transactions reported
within the Statement of Operations.
*** Only includes change in unrealized gain (loss) on forward and spot contracts. May differ from the net change in unrealized gain (loss) on foreign currency-related
transactions reported within the Statement of Operations.
For further disclosure on derivatives see note 2 in the Notes to Financial Statements.
See accompanying notes which are an integral part of the financial statements.
616 Russell Global Infrastructure Fund
Russell Investment Company
Russell Global Infrastructure Fund
Balance Sheet Offsetting of Financial and Derivative Instruments — October 31, 2016
| Amounts in thousands | |||||||||||||
| Offsetting of Financial Assets and Derivative Assets | |||||||||||||
| Gross | Net Amounts | ||||||||||||
| Amounts | of Assets | ||||||||||||
| Gross | Offset in the | Presented in | |||||||||||
| Amounts of | Statement of | the Statement | |||||||||||
| Recognized | Assets and | of Assets and | |||||||||||
| Description | Location: Statement of Assets and Liabilities - Assets | Assets | Liabilities | Liabilities | |||||||||
| Securities on Loan* | Investments, at fair value | $ | 35,276 | $ | — | $ | 35,276 | ||||||
| Foreign Currency Exchange Contracts | Unrealized appreciation on foreign currency exchange contracts | 274 | — | 274 | |||||||||
| Futures Contracts | Variation margin on futures contracts | 296 | — | 296 | |||||||||
| Total Financial and Derivative Assets | 35,846 | — | 35,846 | ||||||||||
| Financial and Derivative Assets not subject to a netting agreement | (296) | — | (296 | ) | |||||||||
| Total Financial and Derivative Assets subject to a netting agreement | $ | 35,550 | $ | — | $ | 35,550 | |||||||
| Financial Assets, Derivative Assets, and Collateral Held by Counterparty | |||||||||||||
| Gross Amounts Not Offset in | |||||||||||||
| the Statement of Assets and | |||||||||||||
| Liabilities | |||||||||||||
| Net Amounts | |||||||||||||
| of Assets | |||||||||||||
| Presented in | |||||||||||||
| the Statement | Financial and | ||||||||||||
| of Assets and | Derivative | Collateral | |||||||||||
| Counterparty | Liabilities | Instruments | Received^ | Net Amount | |||||||||
| Bank of America | $ | 144 | $ | 112 | $ | — | $ | 32 | |||||
| Barclays | 3,105 | — | 3,105 | — | |||||||||
| BNP Paribas | 7 | 7 | — | — | |||||||||
| Brown Brothers Harriman | 42 | — | — | 42 | |||||||||
| Citigroup | 5,914 | 7 | 5,906 | 1 | |||||||||
| Credit Suisse | 1,398 | — | 1,394 | 4 | |||||||||
| Deutsche Bank | 1,521 | — | 1,521 | — | |||||||||
| Goldman Sachs | 4,459 | — | 4,459 | — | |||||||||
| ING | 3,612 | — | 3,612 | — | |||||||||
| JPMorgan Chase | 295 | — | 295 | — | |||||||||
| Merrill Lynch | 12,242 | — | 12,242 | — | |||||||||
| Morgan Stanley | 18 | 3 | 13 | 2 | |||||||||
| Royal Bank of Canada | 5 | — | — | 5 | |||||||||
| State Street | 59 | 50 | — | 9 | |||||||||
| UBS | 2,729 | — | 2,729 | — | |||||||||
| Total | $ | 35,550 | $ | 179 | $ | 35,276 | $ | 95 | |||||
See accompanying notes which are an integral part of the financial statements.
Russell Global Infrastructure Fund 617
Russell Investment Company
Russell Global Infrastructure Fund
Balance Sheet Offsetting of Financial and Derivative Instruments, continued —
October 31, 2016
| Amounts in thousands | |||||||||
| Offsetting of Financial Liabilities and Derivative Liabilities | |||||||||
| Gross | Net Amounts | ||||||||
| Amounts | of Liabilities | ||||||||
| Gross | Offset in the | Presented in | |||||||
| Amounts of | Statement of | the Statement | |||||||
| Recognized | Assets and | of Assets and | |||||||
| Description | Location: Statement of Assets and Liabilities - Liabilities | Liabilities | Liabilities | Liabilities | |||||
| Futures Contracts | Variation margin on futures contracts | $ | 45 | $ | — | $ | 45 | ||
| Foreign Currency Exchange Contracts | Unrealized depreciation on foreign currency exchange contracts | 661 | — | 661 | |||||
| Total Financial and Derivative Liabilities | 706 | — | 706 | ||||||
| Financial and Derivative Liabilities not subject to a netting agreement | (45) | — | (45 | ) | |||||
| Total Financial and Derivative Liabilities subject to a netting agreement | $ | 661 | $ | — | $ | 661 | |||
| Financial Liabilities, Derivative Liabilities, and Collateral Pledged by Counterparty | ||||||||||
| Gross Amounts Not Offset in | ||||||||||
| the Statement of Assets and | ||||||||||
| Liabilities | ||||||||||
| Net Amounts | ||||||||||
| of Liabilities | ||||||||||
| Presented in | ||||||||||
| the Statement | Financial and | |||||||||
| of Assets and | Derivative | Collateral | ||||||||
| Counterparty | Liabilities | Instruments | Pledged^ | Net Amount | ||||||
| Bank of America | $ | 112 | $ | 112 | $ | — | $ | — | ||
| BNP Paribas | 218 | 7 | — | 211 | ||||||
| Citigroup | 46 | 7 | — | 39 | ||||||
| Commonwealth Bank of Australia | 9 | — | — | 9 | ||||||
| Goldman Sachs | 10 | — | — | 10 | ||||||
| HSBC | 211 | — | — | 211 | ||||||
| Morgan Stanley | 3 | 3 | — | — | ||||||
| State Street | 52 | 50 | — | 2 | ||||||
| Total | $ | 661 | $ | 179 | $ | — | $ | 482 | ||
* Fair value of securities on loan as reported in the footnotes to the Statement of Assets and Liabilities.
^ Collateral received or pledged amounts may not reconcile to those disclosed in the Statement of Assets and Liabilities due to the inclusion of off-Balance
Sheet collateral and adjustments made to exclude overcollateralization.
For further disclosure on derivatives and counterparty risk see note 2 in the Notes to Financial Statements.
See accompanying notes which are an integral part of the financial statements.
618 Russell Global Infrastructure Fund
Russell Investment Company
Russell Global Infrastructure Fund
Statement of Assets and Liabilities — October 31, 2016
| Amounts in thousands | ||
| Assets | ||
| Investments, at identified cost | $ | 959,241 |
| Investments, at fair value(*)(>) | 1,064,247 | |
| Cash (restricted)(a) | 1,991 | |
| Foreign currency holdings(^) | 2,952 | |
| Unrealized appreciation on foreign currency exchange contracts | 274 | |
| Receivables: | ||
| Dividends and interest | 1,972 | |
| Dividends from affiliated Russell funds | 12 | |
| Investments sold | 6,275 | |
| Fund shares sold | 1,153 | |
| Foreign capital gains taxes recoverable | 432 | |
| Variation margin on futures contracts | 296 | |
| Total assets | 1,079,604 | |
| Liabilities | ||
| Payables: | ||
| Due to custodian | 1 | |
| Investments purchased | 5,878 | |
| Fund shares redeemed | 438 | |
| Accrued fees to affiliates | 978 | |
| Other accrued expenses | 321 | |
| Variation margin on futures contracts | 45 | |
| Deferred capital gains tax liability | 39 | |
| Unrealized depreciation on foreign currency exchange contracts | 661 | |
| Payable upon return of securities loaned | 37,089 | |
| Total liabilities | 45,450 | |
| Commitments and Contingencies (1) | ||
| Net Assets | $ | 1,034,154 |
| (1) See note 9 in the Notes to Financial Statements for a detailed description of commitments and contingencies. | ||
See accompanying notes which are an integral part of the financial statements.
Russell Global Infrastructure Fund 619
Russell Investment Company
Russell Global Infrastructure Fund
Statement of Assets and Liabilities, continued — October 31, 2016
| Amounts in thousands | |||
| Net Assets Consist of: | |||
| Undistributed (overdistributed) net investment income | $ | 1,585 | |
| Accumulated net realized gain (loss) | (10,384 | ) | |
| Unrealized appreciation (depreciation) on: | |||
| Investments (net of deferred tax liability for foreign capital gains taxes) | 104,967 | ||
| Futures contracts | 579 | ||
| Foreign currency-related transactions | (421 | ) | |
| Shares of beneficial interest | 905 | ||
| Additional paid-in capital | 936,923 | ||
| Net Assets | $ | 1,034,154 | |
| Net Asset Value, offering and redemption price per share: | |||
| Net asset value per share: Class A(#) | $ | 11.42 | |
| Maximum offering price per share (Net asset value plus sales charge of 5.75%): Class A | $ | 12.11 | |
| Class A — Net assets | $ | 7,595,359 | |
| Class A — Shares outstanding ($.01 par value) | 665,297 | ||
| Net asset value per share: Class C(#) | $ | 11.36 | |
| Class C — Net assets | $ | 6,342,843 | |
| Class C — Shares outstanding ($.01 par value) | 558,275 | ||
| Net asset value per share: Class E(#) | $ | 11.42 | |
| Class E — Net assets | $ | 17,600,680 | |
| Class E — Shares outstanding ($.01 par value) | 1,541,466 | ||
| Net asset value per share: Class S(#) | $ | 11.43 | |
| Class S — Net assets | $ | 783,412,111 | |
| Class S — Shares outstanding ($.01 par value) | 68,525,213 | ||
| Net asset value per share: Class Y(#) | $ | 11.43 | |
| Class Y — Net assets | $ | 219,203,246 | |
| Class Y — Shares outstanding ($.01 par value) | 19,169,780 | ||
| Amounts in thousands | |||
| (^) Foreign currency holdings - cost | $ | 2,939 | |
| (*) Securities on loan included in investments | $ | 35,276 | |
| (>) Investments in affiliates, Russell U.S. Cash Management Fund and Russell U.S. Cash Collateral Fund | $ | 70,018 | |
| (a) Cash Collateral for Futures | $ | 1,991 | |
| (#) Net asset value per share equals class level net assets divided by class level shares of beneficial interest outstanding. | |||
See accompanying notes which are an integral part of the financial statements.
620 Russell Global Infrastructure Fund
Russell Investment Company
Russell Global Infrastructure Fund
Statement of Operations — For the Period Ended October 31, 2016
| Amounts in thousands | |||
| Investment Income | |||
| Dividends | $ | 46,388 | |
| Dividends from affiliated Russell funds | 120 | ||
| Securities lending income (net) | 704 | ||
| Less foreign taxes withheld | (2,787 | ) | |
| Total investment income | 44,425 | ||
| Expenses | |||
| Advisory fees | 15,308 | ||
| Administrative fees | 591 | ||
| Custodian fees (1) | 497 | ||
| Distribution fees - Class A | 19 | ||
| Distribution fees - Class C | 52 | ||
| Transfer agent fees - Class A | 15 | ||
| Transfer agent fees - Class C | 14 | ||
| Transfer agent fees - Class E | 43 | ||
| Transfer agent fees - Class S | 1,791 | ||
| Transfer agent fees - Class Y | 13 | ||
| Professional fees | 129 | ||
| Registration fees | 102 | ||
| Shareholder servicing fees - Class C | 17 | ||
| Shareholder servicing fees - Class E | 54 | ||
| Trustees’ fees | 41 | ||
| Printing fees | 278 | ||
| Miscellaneous | 37 | ||
| Expenses before reductions | 19,001 | ||
| Expense reductions | (4,388 | ) | |
| Net expenses | 14,613 | ||
| Net investment income (loss) | 29,812 | ||
| Net Realized and Unrealized Gain (Loss) | |||
| Net realized gain (loss) on: | |||
| Investments (net of deferred tax liability for foreign capital gains taxes) | 19,053 | ||
| Futures contracts | 1,431 | ||
| Foreign currency-related transactions | 335 | ||
| Net realized gain (loss) | 20,819 | ||
| Net change in unrealized appreciation (depreciation) on: | |||
| Investments (net of deferred tax liability for foreign capital gains taxes) | 20,378 | ||
| Futures contracts | (159 | ) | |
| Foreign currency-related transactions | (164 | ) | |
| Net change in unrealized appreciation (depreciation) | 20,055 | ||
| Net realized and unrealized gain (loss) | 40,874 | ||
| Net Increase (Decrease) in Net Assets from Operations | $ | 70,686 | |
| (1) Includes a reimbursement for overbilling of custody out-of-pocket fees from prior years. See note 10 in the Notes to Financial Statements. | |||
See accompanying notes which are an integral part of the financial statements.
Russell Global Infrastructure Fund 621
Russell Investment Company
Russell Global Infrastructure Fund
Statements of Changes in Net Assets
| For the Periods Ended October 31, | ||||||
| Amounts in thousands | 2016 | 2015 | ||||
| Increase (Decrease) in Net Assets | ||||||
| Operations | ||||||
| Net investment income (loss) | $ | 29,812 | $ | 31,193 | ||
| Net realized gain (loss) | 20,819 | 28,483 | ||||
| Net change in unrealized appreciation (depreciation) | 20,055 | (110,385 | ) | |||
| Net increase (decrease) in net assets from operations | 70,686 | (50,709 | ) | |||
| Distributions | ||||||
| From net investment income | ||||||
| Class A | (162 | ) | (155 | ) | ||
| Class C | (101 | ) | (93 | ) | ||
| Class E | (466 | ) | (413 | ) | ||
| Class S | (21,288 | ) | (21,486 | ) | ||
| Class Y | (7,243 | ) | (8,564 | ) | ||
| From net realized gain | ||||||
| Class A | (230 | ) | (673 | ) | ||
| Class C | (220 | ) | (636 | ) | ||
| Class E | (719 | ) | (1,948 | ) | ||
| Class S | (28,742 | ) | (83,712 | ) | ||
| Class Y | (10,311 | ) | (31,985 | ) | ||
| Net decrease in net assets from distributions | (69,482 | ) | (149,665 | ) | ||
| Share Transactions* | ||||||
| Net increase (decrease) in net assets from share transactions | (376,259 | ) | (162,926 | ) | ||
| Total Net Increase (Decrease) in Net Assets | (375,055 | ) | (363,300 | ) | ||
| Net Assets | ||||||
| Beginning of period | 1,409,209 | 1,772,509 | ||||
| End of period | $ | 1,034,154 | $ | 1,409,209 | ||
| Undistributed (overdistributed) net investment income included in net assets | $ | 1,585 | $ | 67 | ||
See accompanying notes which are an integral part of the financial statements.
622 Russell Global Infrastructure Fund
Russell Investment Company
Russell Global Infrastructure Fund
Statements of Changes in Net Assets, continued
* Share transaction amounts (in thousands) for the periods ended October 31, 2016 and October 31, 2015 were as follows:
| 2016 | 2015 | |||||||||||
| Shares | Dollars | Shares | Dollars | |||||||||
| Class A | ||||||||||||
| Proceeds from shares sold | 150 | $ | 1,671 | 95 | $ | 1,140 | ||||||
| Proceeds from reinvestment of distributions | 36 | 385 | 68 | 810 | ||||||||
| Payments for shares redeemed | (266 | ) | (2,942 | ) | (183 | ) | (2,165 | ) | ||||
| Net increase (decrease) | (80 | ) | (886 | ) | (20 | ) | (215 | ) | ||||
| Class C | ||||||||||||
| Proceeds from shares sold | 69 | 768 | 140 | 1,679 | ||||||||
| Proceeds from reinvestment of distributions | 30 | 319 | 61 | 727 | ||||||||
| Payments for shares redeemed | (219 | ) | (2,427 | ) | (233 | ) | (2,703 | ) | ||||
| Net increase (decrease) | (120 | ) | (1,340 | ) | (32 | ) | (297 | ) | ||||
| Class E | ||||||||||||
| Proceeds from shares sold | 142 | 1,587 | 458 | 5,168 | ||||||||
| Proceeds from reinvestment of distributions | 105 | 1,116 | 186 | 2,205 | ||||||||
| Payments for shares redeemed | (865 | ) | (9,946 | ) | (718 | ) | (8,442 | ) | ||||
| Net increase (decrease) | (618 | ) | (7,243 | ) | (74 | ) | (1,069 | ) | ||||
| Class S | ||||||||||||
| Proceeds from shares sold | 14,026 | 155,438 | 20,377 | 244,604 | ||||||||
| Proceeds from reinvestment of distributions | 4,640 | 49,380 | 8,728 | 103,764 | ||||||||
| Payments for shares redeemed | (39,231 | ) | (441,729 | ) | (36,114 | ) | (430,506 | ) | ||||
| Net increase (decrease) | (20,565 | ) | (236,911 | ) | (7,009 | ) | (82,138 | ) | ||||
| Class Y | ||||||||||||
| Proceeds from shares sold | 1,726 | 18,969 | 1,169 | 13,909 | ||||||||
| Proceeds from reinvestment of distributions | 1,655 | 17,553 | 3,410 | 40,549 | ||||||||
| Payments for shares redeemed | (14,690 | ) | (166,401 | ) | (11,231 | ) | (133,665 | ) | ||||
| Net increase (decrease) | (11,309 | ) | (129,879 | ) | (6,652 | ) | (79,207 | ) | ||||
| Total increase (decrease) | (32,692 | ) | $ | (376,259 | ) | (13,787 | ) | $ | (162,926 | ) | ||
See accompanying notes which are an integral part of the financial statements.
Russell Global Infrastructure Fund 623
Russell Investment Company
Russell Global Infrastructure Fund
Financial Highlights — For the Periods Ended
For a Share Outstanding Throughout Each Period.
| $ | $ | $ | $ | $ | $ | ||||||||||||
| Net Asset Value, | Net | Net Realized | Total from | Distributions | Distributions | ||||||||||||
| Beginning of | Investment | and Unrealized | Investment | from Net | from Net | ||||||||||||
| Period | Income (Loss)(a)(d) | Gain (Loss) | Operations | Investment Income | Realized Gain | ||||||||||||
| Class A | |||||||||||||||||
| October 31, 2016 | 11.43 | .24 | .33 | .57 | (.24 | ) | (.34 | ) | |||||||||
| October 31, 2015 | 12.93 | .20 | (.62 | ) | (.42 | ) | (.21 | ) | (.87 | ) | |||||||
| October 31, 2014 | 12.32 | .23 | 1.27 | 1.50 | (.25 | ) | (.64 | ) | |||||||||
| October 31, 2013 | 11.18 | .23 | 1.41 | 1.64 | (.24 | ) | (.26 | ) | |||||||||
| October 31, 2012 | 10.11 | .25 | 1.07 | 1.32 | (.25 | ) | —(f) | ||||||||||
| Class C | |||||||||||||||||
| October 31, 2016 | 11.38 | .15 | .33 | .48 | (.16 | ) | (.34 | ) | |||||||||
| October 31, 2015 | 12.89 | .11 | (.62 | ) | (.51 | ) | (.13 | ) | (.87 | ) | |||||||
| October 31, 2014 | 12.30 | .13 | 1.26 | 1.39 | (.16 | ) | (.64 | ) | |||||||||
| October 31, 2013 | 11.16 | .15 | 1.41 | 1.56 | (.16 | ) | (.26 | ) | |||||||||
| October 31, 2012 | 10.09 | .17 | 1.06 | 1.23 | (.16 | ) | —(f) | ||||||||||
| Class E | |||||||||||||||||
| October 31, 2016 | 11.43 | .24 | .33 | .57 | (.24 | ) | (.34 | ) | |||||||||
| October 31, 2015 | 12.93 | .20 | (.62 | ) | (.42 | ) | (.21 | ) | (.87 | ) | |||||||
| October 31, 2014 | 12.32 | .23 | 1.27 | 1.50 | (.25 | ) | (.64 | ) | |||||||||
| October 31, 2013 | 11.18 | .23 | 1.41 | 1.64 | (.24 | ) | (.26 | ) | |||||||||
| October 31, 2012 | 10.12 | .24 | 1.07 | 1.31 | (.25 | ) | —(f) | ||||||||||
| Class S | |||||||||||||||||
| October 31, 2016 | 11.44 | .27 | .33 | .60 | (.27 | ) | (.34 | ) | |||||||||
| October 31, 2015 | 12.94 | .23 | (.62 | ) | (.39 | ) | (.24 | ) | (.87 | ) | |||||||
| October 31, 2014 | 12.33 | .26 | 1.27 | 1.53 | (.28 | ) | (.64 | ) | |||||||||
| October 31, 2013 | 11.19 | .26 | 1.41 | 1.67 | (.27 | ) | (.26 | ) | |||||||||
| October 31, 2012 | 10.13 | .27 | 1.07 | 1.34 | (.28 | ) | —(f) | ||||||||||
| Class Y | |||||||||||||||||
| October 31, 2016 | 11.45 | .29 | .32 | .61 | (.29 | ) | (.34 | ) | |||||||||
| October 31, 2015 | 12.95 | .25 | (.62 | ) | (.37 | ) | (.26 | ) | (.87 | ) | |||||||
| October 31, 2014 | 12.34 | .28 | 1.28 | 1.56 | (.31 | ) | (.64 | ) | |||||||||
| October 31, 2013 | 11.19 | .27 | 1.43 | 1.70 | (.29 | ) | (.26 | ) | |||||||||
| October 31, 2012 | 10.13 | .29 | 1.07 | 1.36 | (.30 | ) | —(f) | ||||||||||
See accompanying notes which are an integral part of the financial statements.
624 Russell Global Infrastructure Fund
| % | % | % | |||||||||||||||
| $ | $ | Ratio of Expenses | Ratio of Expenses | Ratio of Net | |||||||||||||
| Net Asset Value, | % | Net Assets, | to Average | to Average | Investment Income | % | |||||||||||
| $ | End of | Total | End of Period | Net Assets, | Net Assets, | to Average | Portfolio | ||||||||||
| Total Distributions | Period | Return(c) | (000 | ) | Gross | Net(d) | Net Assets(d) | Turnover Rate(k) | |||||||||
| (.58 | ) | 11.42 | 5.43 | 7,595 | 1.83 | 1.47 | 2.14 | 102 | |||||||||
| (1.08 | ) | 11.43 | (3.49 | ) | 8,522 | 1.82 | 1.47 | 1.70 | 86 | ||||||||
| (.89 | ) | 12.93 | 12.95 | 9,903 | 1.81 | 1.47 | 1.83 | 119 | |||||||||
| (.50 | ) | 12.32 | 15.24 | 7,556 | 1.82 | 1.49 | 2.02 | 127 | |||||||||
| (.25 | ) | 11.18 | 13.07 | 4,819 | 1.83 | 1.47 | 2.35 | 125 | |||||||||
| (.50 | ) | 11.36 | 4.65 | 6,343 | 2.59 | 2.22 | 1.38 | 102 | |||||||||
| (1.00 | ) | 11.38 | (4.23 | ) | 7,718 | 2.57 | 2.22 | .96 | 86 | ||||||||
| (.80 | ) | 12.89 | 12.00 | 9,145 | 2.56 | 2.22 | 1.07 | 119 | |||||||||
| (.42 | ) | 12.30 | 14.41 | 5,900 | 2.58 | 2.24 | 1.26 | 127 | |||||||||
| (.16 | ) | 11.16 | 12.32 | 4,514 | 2.58 | 2.22 | 1.62 | 125 | |||||||||
| (.58 | ) | 11.42 | 5.42 | 17,601 | 1.84 | 1.47 | 2.16 | 102 | |||||||||
| (1.08 | ) | 11.43 | (3.50 | ) | 24,683 | 1.82 | 1.47 | 1.67 | 86 | ||||||||
| (.89 | ) | 12.93 | 12.92 | 28,885 | 1.81 | 1.47 | 1.87 | 119 | |||||||||
| (.50 | ) | 12.32 | 15.23 | 21,848 | 1.83 | 1.49 | 1.99 | 127 | |||||||||
| (.25 | ) | 11.18 | 13.08 | 18,444 | 1.83 | 1.47 | 2.32 | 125 | |||||||||
| (.61 | ) | 11.43 | 5.69 | 783,412 | 1.59 | 1.22 | 2.41 | 102 | |||||||||
| (1.11 | ) | 11.44 | (3.25 | ) | 1,019,451 | 1.57 | 1.22 | 1.95 | 86 | ||||||||
| (.92 | ) | 12.94 | 13.21 | 1,243,852 | 1.56 | 1.22 | 2.06 | 119 | |||||||||
| (.53 | ) | 12.33 | 15.59 | 755,311 | 1.57 | 1.24 | 2.24 | 127 | |||||||||
| (.28 | ) | 11.19 | 13.38 | 551,759 | 1.58 | 1.22 | 2.60 | 125 | |||||||||
| (.63 | ) | 11.43 | 5.78 | 219,203 | 1.39 | 1.04 | 2.57 | 102 | |||||||||
| (1.13 | ) | 11.45 | (3.07 | ) | 348,835 | 1.37 | 1.04 | 2.13 | 86 | ||||||||
| (.95 | ) | 12.95 | 13.39 | 480,724 | 1.36 | 1.04 | 2.28 | 119 | |||||||||
| (.55 | ) | 12.34 | 15.79 | 427,919 | 1.37 | 1.06 | 2.33 | 127 | |||||||||
| (.30 | ) | 11.19 | 13.58 | 308,901 | 1.39 | 1.06 | 2.79 | 125 | |||||||||
See accompanying notes which are an integral part of the financial statements.
Russell Global Infrastructure Fund 625
Russell Investment Company
Russell Global Infrastructure Fund
Related Party Transactions, Fees and Expenses
| Accrued fees payable to affiliates for the period ended October 31, 2016 were as follows: | ||
| Advisory fees | $ | 793,417 |
| Administration fees | 42,594 | |
| Distribution fees | 5,770 | |
| Shareholder servicing fees | 5,137 | |
| Transfer agent fees | 125,906 | |
| Trustee fees | 4,904 | |
| $ | 977,728 | |
| Transactions (amounts in thousands) during the period ended October 31, 2016 with Underlying Funds which are, or were, an | |||||||||||||||||||
| affiliated company are as follows: | |||||||||||||||||||
| Fair Value, | Change in | ||||||||||||||||||
| Beginning of | Realized Gain | Unrealized | Fair Value, End | Income | Capital Gains | ||||||||||||||
| Period | Purchases | Sales | (Loss) | Gain (Loss) | of Period | Distributions | Distributions | ||||||||||||
| Russell U.S. Cash Collateral Fund | $ | 44,280 | $ | 564,385 | $ | 571,576 | $ | — | $ | — | $ | 37,089 | $ | 150 | $ | — | |||
| Russell U.S. Cash Management Fund | 27,950 | 802,609 | 797,633 | 2 | 1 | 32,929 | 120 | — | |||||||||||
| $ | 72,230 | $ | 1,366,994 | $ | 1,369,209 | $ | 2 | $ | 1 | $ | 70,018 | $ | 270 | $ | — | ||||
Federal Income Taxes
At October 31, 2016, the cost of investments and net unrealized appreciation (depreciation), undistributed ordinary income and
undistributed long-term capital gains for income tax purposes were as follows:.
| Cost of Investments | $ | 1,007,037,090 | |||
| Unrealized Appreciation | $ | 66,746,677 | |||
| Unrealized Depreciation | (9,536,964 | ) | |||
| Net Unrealized Appreciation (Depreciation) | $ | 57,209,713 | |||
| Undistributed Ordinary Income | $ | 9,609,683 | |||
| Undistributed Long-Term Capital Gains | |||||
| (Capital Loss Carryforward) | $ | 28,867,730 | |||
| Tax Composition of Distributions | |||||
| Ordinary Income | $ | 34,794,304 | |||
| Long-Term Capital Gains | $ | 34,687,634 | |||
Net investment income and net realized gains (loss) in the financial statements may differ from taxable net investment income and net
realized gains (losses). Capital accounts within the financial statements are adjusted for permanent book-tax differences. Book-tax
differences are primarily due to foreign currency gains and losses, reclassifications of dividends, differences in treatment of income
from swaps, net operating losses, investments in partnerships, investments in passive foreign investment companies (PFICs), tax
straddle transactions, use of tax equalization and foreign capital gains taxes. These adjustments have no impact on the net assets.
At October 31, 2016, the Statement of Assets and Liabilities have been adjusted by the following amounts (in thousands):
| Undistributed net investment income | $ | 966 | |
| Accumulated net realized gain (loss) | (1,583 | ) | |
| Additional paid-in capital | 617 |
See accompanying notes which are an integral part of the financial statements.
626 Russell Global Infrastructure Fund
Russell Investment Company
Russell Global Real Estate Securities Fund
Portfolio Management Discussion and Analysis — October 31, 2016 (Unaudited)
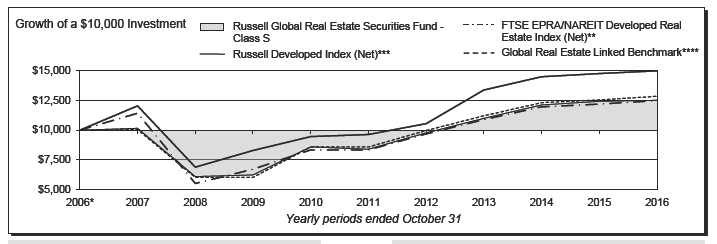
| Russell Global Real Estate Securities Fund - Class A‡ | Russell Global Real Estate Securities Fund - Class Y‡‡‡ | ||||||
| Total | Total | ||||||
| Return | Return | ||||||
| 1 Year | (5.36 | )% | 1 Year | 0.88 | % | ||
| 5 Years | 6.73 | %§ | 5 Years | 8.48 | %§ | ||
| 10 Years | 1.41 | %§ | 10 Years | 2.41 | %§ | ||
| Russell Global Real Estate Securities Fund - Class C | FTSE EPRA/NAREIT Developed Real Estate Index (Net)** | ||||||
| Total | Total | ||||||
| Return | Return | ||||||
| 1 Year | (0.31 | )% | 1 Year | 2.48 | % | ||
| 5 Years | 7.20 | %§ | 5 Years | 8.38 | %§ | ||
| 10 Years | 1.24 | %§ | 10 Years | 2.24 | %§ | ||
| Russell Global Real Estate Securities Fund - Class E | Russell Developed Index (Net)*** | ||||||
| Total | |||||||
| Total | Return | ||||||
| Return | |||||||
| 1 Year | 0.44 | % | 1 Year | 1.49 | % | ||
| 5 Years | 8.00 | %§ | 5 Years | 9.21 | %§ | ||
| 10 Years | 2.00 | %§ | 10 Years | 4.12 | %§ | ||
| Global Real Estate Linked Benchmark**** | |||||||
| Russell Global Real Estate Securities Fund - Class R6‡‡ | Total | ||||||
| Total | Return | ||||||
| Return | 1 Year | 2.48 | % | ||||
| 1 Year | 0.89 | % | 5 Years | 8.38 | %§ | ||
| 5 Years | 8.49 | %§ | 10 Years | 2.53 | %§ | ||
| 10 Years | 2.41 | %§ | |||||
| Russell Global Real Estate Securities Fund - Class S | |||||||
| Total | |||||||
| Return | |||||||
| 1 Year | 0.68 | % | |||||
| 5 Years | 8.28 | %§ | |||||
| 10 Years | 2.26 | %§ | |||||
Russell Global Real Estate Securities Fund 627
Russell Investment Company
Russell Global Real Estate Securities Fund
Portfolio Management Discussion and Analysis, continued — October 31, 2016
(Unaudited)
| The Russell Global Real Estate Securities Fund (the “Fund”) | Within the global property securities market, Asia and North | ||||
| employs a multi-manager approach whereby portions of the | America delivered positive returns, outpacing Europe, which | ||||
| Fund are allocated to different money manager strategies. Fund | registered declines. The United Kingdom was the weakest major | ||||
| assets not allocated to money managers are managed by Russell | market, posting declines both in anticipation of and immediately | ||||
| Investment Management, LLC (“RIM”), the Fund’s advisor. RIM | subsequent to the U.K. referendum on EU membership. The | ||||
| may change the allocation of the Fund’s assets among money | Fund was positioned with an underweight to North America and | ||||
| managers at any time. An exemptive order from the Securities | overweight positions in Asia and the United Kingdom, resulting | ||||
| and Exchange Commission (“SEC”) permits RIM to engage or | in a net negative contribution from regional allocation. | ||||
| terminate a money manager at any time, subject to approval by | With respect to property sectors, the more bond-like, yield- | ||||
| the Fund’s Board, without a shareholder vote. Pursuant to the | oriented health care and net lease sectors delivered the strongest | ||||
| terms of the exemptive order, the Fund is required to notify its | performance, supported by a net decline in interest rates through | ||||
| shareholders within 90 days of when a money manager begins | the fiscal year. Property types with shorter lease terms, including | ||||
| providing services. As of October 31, 2016, the Fund had three | self-storage and residential, were among the weakest-performing | ||||
| money managers. | property types. These trends in property sector performance | ||||
| What is the Fund’s investment objective? | posed a headwind for Fund performance, as the portfolio was | ||||
| The Fund seeks to provide current income and long term capital | positioned to favor sectors characterized by strong fundamental | ||||
| growth. | growth rather than higher yields. | ||||
| How did the Fund perform relative to its benchmark for the | How did the investment strategies and techniques employed | ||||
| fiscal year ended October 31, 2016? | by the Fund and its money managers affect its benchmark- | ||||
| For the fiscal year ended October 31, 2016, the Fund’s Class A, | relative performance? | ||||
| Class E, Class R6, Class S and Class Y Shares gained 0.42%, | The Fund employs discretionary money managers. The Fund’s | ||||
| 0.44%, 0.89%, 0.68% and 0.88%, respectively. The Fund’s Class | discretionary money managers select the individual portfolio | ||||
| C Shares lost 0.31%. This is compared to the Fund’s benchmark, | securities for the assets assigned to them. Fund assets not | ||||
| the FTSE EPRA/NAREIT Developed Real Estate Index (Net), | allocated to discretionary money managers include the Fund’s | ||||
| which gained 2.48% during the same period. The Fund’s | liquidity reserves and assets which may be managed directly by | ||||
| performance includes operating expenses, whereas index returns | RIM to effect the Fund’s investment strategies and/or to actively | ||||
| are unmanaged and do not include expenses of any kind. | manage the Fund’s overall exposures by investing in securities or | ||||
| other instruments that RIM believes will achieve the desired risk/ | |||||
| For the fiscal year ended October 31, 2016, the Morningstar® | return profile for the Fund. | ||||
| Global Real Estate Category, a group of funds that Morningstar | |||||
| considers to have investment strategies similar to those of the | With respect to certain of the Fund’s money managers, Cohen & | ||||
| Fund, gained 0.38%. This result serves as a peer comparison and | Steers Capital Management, Inc., Cohen & Steers UK Limited and | ||||
| is expressed net of operating expenses. | Cohen & Steers Asia Limited (together, “Cohen”) outperformed | ||||
| the Fund’s benchmark for the fiscal year. Cohen seeks to generate | |||||
| How did the market conditions described in the Market | excess returns through a combination of fundamental bottom- | ||||
| Summary report affect the Fund’s performance? | up stock selection and top-down regional and property type | ||||
| For the fiscal year ended October 31, 2016, the global listed | allocation decisions. The key driver of performance was property | ||||
| property market, as measured by the FTSE EPRA/NAREIT | sector allocation within the U.S. Underweight positions in the | ||||
| Developed Real Estate Index (Net), delivered a 2.48% return. | self-storage and retail sectors were beneficial. Outside of the | ||||
| The sector began the fiscal year with negative performance | U.S., an overweight to Hong Kong, along with stock selection in | ||||
| through February amid ongoing concern over fundamental | that region, contributed positively to performance. Negative stock | ||||
| sensitivity to China and anticipation of the U.K.’s approaching | selection within Continental Europe and an overweight position to | ||||
| referendum on EU membership. This weakness was followed | the U.K. had a negative impact during the period. | ||||
| by a period of positive performance between March and July, as | Morgan Stanley Investment Management, Inc., Morgan | ||||
| long-term government bond yields reached record lows in several | Stanley Investment Management Limited and Morgan Stanley | ||||
| major markets, driving continued investor demand for higher- | Investment Management Company (together, “Morgan Stanley”) | ||||
| yielding equity sectors. The listed property sector underwent a | underperformed the Fund’s benchmark by a wide margin during | ||||
| moderate correction to end the fiscal period, as expectations of | the fiscal year. Morgan Stanley’s process focuses on identifying | ||||
| higher interest rates overwhelmed generally positive real estate | listed property companies that trade at discounts relative to | ||||
| fundamental growth. | |||||
628 Russell Global Real Estate Securities Fund
Russell Investment Company
Russell Global Real Estate Securities Fund
Portfolio Management Discussion and Analysis, continued — October 31, 2016
(Unaudited)
| underlying asset values. Property sector allocation detracted | and Deutsche Alternatives Asset Management (Global) Limited | |
| from fiscal year performance, as underweight positions in the | (operating under the brand name Deutsche Asset Management) | |
| U.S. industrial, data center and net lease sectors detracted from | which manages a more concentrated strategy. | |
| performance. Overweight positioning in the Japanese developer | ||
| sector and a corresponding underweight to Japanese real estate | Money Managers as of October 31, | |
| investment trusts (“REITs”) also had a negative effect. On a | 2016 | Styles |
| positive note, effective stock selection within Continental Europe | Cohen & Steers Capital Management, Inc., | |
| and an underweight to the U.S. self-storage sector were beneficial. | Cohen & Steers UK Limited and Cohen & | |
| Steers Asia Limited | Market-Oriented | |
| During the period, RIM continued to utilize a strategy to | Morgan Stanley Investment Management, | |
| implement regional and property sector tilting through the direct | Inc., Morgan Stanley Investment | |
| purchase of real estate stocks. Using the output from a quantitative | Management Limited and Morgan Stanley | |
| model, the strategy seeks to position the portfolio to meet RIM’s | Investment Management Company | Value |
| overall preferred positioning with respect to regional and property | RREEF America L.L.C., Deutsche | |
| Investments Australia Limited and Deutsche | ||
| type exposures. The strategy underperformed relative to the | Alternatives Asset Management (Global) | |
| Fund’s benchmark as a result of a zero weight in Japan REITs | Limited operating under the brand name | |
| and overweight positions in Japanese developers and the U.S. | Deutsche Asset Management | Market-Oriented |
| lodging sector. An overweight to Hong Kong and an underweight | The views expressed in this report reflect those of the | |
| to Canada were modestly beneficial during the period. | portfolio managers only through the end of the period | |
| During the period, the Fund used index futures and swap | covered by the report. These views do not necessarily | |
| contracts to equitize the Fund’s cash. The use of these derivatives | represent the views of RIM or any other person in RIM or | |
| had a modestly positive impact on performance, as equity markets | any other affiliated organization. These views are subject | |
| delivered positive returns ahead of cash. | to change at any time based upon market conditions or | |
| other events, and RIM disclaims any responsibility to | ||
| Describe any changes to the Fund’s structure or the money | update the views contained herein. These views should not | |
| manager line-up. | be relied on as investment advice and, because investment | |
| In order to seek to improve the excess return potential of the Fund, | decisions for a Russell Investment Company (“RIC”) Fund | |
| in September 2016, INVESCO Advisers, Inc. was replaced with | are based on numerous factors, should not be relied on as | |
| RREEF America L.L.C., Deutsche Investments Australia Limited | an indication of investment decisions of any RIC Fund. | |
Russell Global Real Estate Securities Fund 629
Russell Investment Company
Russell Global Real Estate Securities Fund
Portfolio Management Discussion and Analysis, continued — October 31, 2016
(Unaudited)
* Assumes initial investment on November 1, 2006.
** FTSE EPRA/NAREIT Developed Real Estate Index (Net) is an unmanaged market-weighted total return index, which consists of publicly traded equity REITs
and listed property companies from developed markets whose floats are larger than $100 million and derive more than half of their revenue from property-related
activities and is net of dividend withholding taxes.
*** The Russell Developed Index (Net) measures the performance of the investable securities in developed countries globally (net of tax on dividends from foreign
holdings).
**** The Global Real Estate Linked Benchmark provides a means to compare the Fund’s average annual returns to a secondary benchmark that takes into account
historical changes in the Fund’s primary benchmark. The Global Real Estate Linked Benchmark represents the returns of the FTSE NAREIT Equity REIT
Index through September 30, 2010 and the returns of the FTSE EPRA/NAREIT Developed Real Estate Index (net) thereafter. The FTSE NAREIT Equity REIT
Index is an unmanaged, market-capitalization-weighted index of all publicly traded U.S. REITs that invest predominantly in the equity ownership of real estate,
excluding timber and infrastructure. The index is designed to reflect the performance of all U.S. publicly traded equity REITs as a whole.
‡ The Fund first issued Class A Shares on March 1, 2007. The returns shown for Class A Shares prior to that date are the returns of Class E Shares. The
performance shown has been adjusted to reflect the deduction of the maximum Class A sales charge of 5.75%. Annual returns for each Class will differ only to
the extent that the Class A Shares do not have the same expenses as Class E Shares.
‡‡ The Fund first issued Class R6 Shares on March 1, 2016. The returns shown for Class R6 Shares prior to that date are the returns of the Fund’s Class Y
Shares. Class R6 Shares will have substantially similar annual returns as the Class Y Shares because the Shares of each Class are invested in the same portfolio
of securities. Annual returns for each Class will differ only to the extent that the Class R6 Shares do not have the same expenses as the Class Y Shares.
‡‡‡ The Fund first issued Class Y Shares on September 29, 2008. The returns shown for Class Y Shares prior to that date are the returns of the Fund’s Class S
Shares. Class Y Shares will have substantially similar annual returns as the Class S Shares because the Shares of each Class are invested in the same portfolio
of securities. Annual returns for each Class will differ only to the extent that the Class Y Shares do not have the same expenses as the Class S Shares.
§ Annualized.
Performance is historical and assumes reinvestment of all dividends and capital gains. Investment return and principal value will fluctuate so that an investor’s
shares, when redeemed, may be worth more or less than when purchased. Past performance is not indicative of future results. The returns shown do not reflect the
deduction of taxes that a shareholder would pay on Fund distributions or the redemption of Fund shares. Additionally, the returns presented herein may differ from
the performance reported in the Financial Highlights as the returns herein are calculated in a manner consistent with standardized performance in accordance with
Securities and Exchange Commission rules, while the performance in the Financial Highlights has been calculated in accordance with U.S. Generally Accepted
Accounting Principles (“U.S. GAAP”).
630 Russell Global Real Estate Securities Fund
Russell Investment Company
Russell Global Real Estate Securities Fund
Shareholder Expense Example — October 31, 2016 (Unaudited)
| Fund Expenses | Please note that the expenses shown in the table are meant | |||||
| The following disclosure provides important information | to highlight your ongoing costs only and do not reflect any | |||||
| regarding the Fund’s Shareholder Expense Example | transactional costs. Therefore, the information under the heading | |||||
| (“Example”). | “Hypothetical Performance (5% return before expenses)” is | |||||
| useful in comparing ongoing costs only, and will not help you | ||||||
| Example | determine the relative total costs of owning different funds. In | |||||
| As a shareholder of the Fund, you incur two types of costs: (1) | addition, if these transactional costs were included, your costs | |||||
| transaction costs, including sales charges (loads) on certain | would have been higher. | |||||
| purchase or redemption payments, and (2) ongoing costs, | Hypothetical | |||||
| including distribution (12b-1) and/or service fees and other | Performance (5% | |||||
| Fund expenses. The Example is intended to help you understand | Actual | return before | ||||
| your ongoing costs (in dollars) of investing in the Fund and to | Class A | Performance | expenses) | |||
| Beginning Account Value | ||||||
| compare these costs with the ongoing costs of investing in other | May 1, 2016 | $ | 1,000.00 | $ | 1,000.00 | |
| mutual funds. The Example is based on an investment of $1,000 | Ending Account Value | |||||
| invested at the beginning of the period and held for the entire | October 31, 2016 | $ | 986.70 | $ | 1,018.20 | |
| period indicated, which for this Fund is from May 1, 2016 to | Expenses Paid During Period* | $ | 6.89 | $ | 7.00 | |
| October 31, 2016. | * Expenses are equal to the Fund's annualized expense ratio of 1.38% | |||||
| (representing the six month period annualized), multiplied by the average | ||||||
| Actual Expenses | account value over the period, multiplied by 184/366 (to reflect the one-half | |||||
| The information in the table under the heading “Actual | year period). | |||||
| Performance” provides information about actual account values | ||||||
| and actual expenses. You may use the information in this column, | Hypothetical | |||||
| Performance (5% | ||||||
| together with the amount you invested, to estimate the expenses | Actual | return before | ||||
| that you paid over the period. Simply divide your account value by | Class C | Performance | expenses) | |||
| $1,000 (for example, an $8,600 account value divided by $1,000 | Beginning Account Value | |||||
| = 8.6), then multiply the result by the number in the first column | May 1, 2016 | $ | 1,000.00 | $ | 1,000.00 | |
| Ending Account Value | ||||||
| in the row entitled “Expenses Paid During Period” to estimate | October 31, 2016 | $ | 983.10 | $ | 1,014.43 | |
| the expenses you paid on your account during this period. | Expenses Paid During Period* | $ | 10.62 | $ | 10.79 | |
| Hypothetical Example for Comparison Purposes | * Expenses are equal to the Fund's annualized expense ratio of 2.13% | |||||
| The information in the table under the heading “Hypothetical | (representing the six month period annualized), multiplied by the average | |||||
| account value over the period, multiplied by 184/366 (to reflect the one-half | ||||||
| Performance (5% return before expenses)” provides information | year period). | |||||
| about hypothetical account values and hypothetical expenses | ||||||
| based on the Fund’s actual expense ratio and an assumed rate of | Hypothetical | |||||
| return of 5% per year before expenses, which is not the Fund’s | Performance (5% | |||||
| Actual | return before | |||||
| actual return. The hypothetical account values and expenses | Class E | Performance | expenses) | |||
| may not be used to estimate the actual ending account balance or | Beginning Account Value | |||||
| expenses you paid for the period. You may use this information | May 1, 2016 | $ | 1,000.00 | $ | 1,000.00 | |
| to compare the ongoing costs of investing in the Fund and other | Ending Account Value | |||||
| October 31, 2016 | $ | 986.90 | $ | 1,018.20 | ||
| funds. To do so, compare this 5% hypothetical example with the | Expenses Paid During Period* | $ | 6.89 | $ | 7.00 | |
| 5% hypothetical examples that appear in the shareholder reports | ||||||
| of other funds. | * Expenses are equal to the Fund's annualized expense ratio of 1.38% | |||||
| (representing the six month period annualized), multiplied by the average | ||||||
| account value over the period, multiplied by 184/366 (to reflect the one-half | ||||||
| year period). | ||||||
Russell Global Real Estate Securities Fund 631
Russell Investment Company
Russell Global Real Estate Securities Fund
Shareholder Expense Example, continued — October 31, 2016 (Unaudited)
| Hypothetical | ||||
| Performance (5% | ||||
| Actual | return before | |||
| Class R6 | Performance | expenses) | ||
| Beginning Account Value | ||||
| May 1, 2016 | $ | 1,000.00 | $ | 1,000.00 |
| Ending Account Value | ||||
| October 31, 2016 | $ | 989.10 | $ | 1,020.31 |
| Expenses Paid During Period* | $ | 4.80 | $ | 4.88 |
* Expenses are equal to the Fund's annualized expense ratio of 0.96%
(representing the six month period annualized), multiplied by the average
account value over the period, multiplied by 184/366 (to reflect the one-half
year period). May Reflect amounts waived and/or reimbursed. Without any
waivers and/or reimbursements, expenses would have been higher.
| Hypothetical | ||||
| Performance (5% | ||||
| Actual | return before | |||
| Class S | Performance | expenses) | ||
| Beginning Account Value | ||||
| May 1, 2016 | $ | 1,000.00 | $ | 1,000.00 |
| Ending Account Value | ||||
| October 31, 2016 | $ | 988.20 | $ | 1,019.46 |
| Expenses Paid During Period* | $ | 5.65 | $ | 5.74 |
* Expenses are equal to the Fund's annualized expense ratio of 1.13%
(representing the six month period annualized), multiplied by the average
account value over the period, multiplied by 184/366 (to reflect the one-half
year period).
| Hypothetical | ||||
| Performance (5% | ||||
| Actual | return before | |||
| Class Y | Performance | expenses) | ||
| Beginning Account Value | ||||
| May 1, 2016 | $ | 1,000.00 | $ | 1,000.00 |
| Ending Account Value | ||||
| October 31, 2016 | $ | 988.90 | $ | 1,020.46 |
| Expenses Paid During Period* | $ | 4.65 | $ | 4.72 |
* Expenses are equal to the Fund's annualized expense ratio of 0.93%
(representing the six month period annualized), multiplied by the average
account value over the period, multiplied by 184/366 (to reflect the one-half
year period).
632 Russell Global Real Estate Securities Fund
Russell Investment Company
Russell Global Real Estate Securities Fund
Schedule of Investments — October 31, 2016
| Amounts in thousands (except share amounts) | Amounts in thousands (except share amounts) | ||||||||||
| Principal | Fair | Principal | Fair | ||||||||
| Amount ($) | Value | Amount ($) | Value | ||||||||
| or Shares | $ | or Shares | $ | ||||||||
| Common Stocks - 97.3% | Vonovia SE | 253,285 | 8,934 | ||||||||
| Australia - 5.6% | 34,969 | ||||||||||
| BGP Holdings PLC(Å)(Æ) | 4,619,419 | — | |||||||||
| Dexus Property Group(Æ)(ö) | 1,398,694 | 9,494 | Hong Kong - 9.0% | ||||||||
| Goodman Group(ö) | 646,508 | 3,331 | Cheung Kong Property Holdings, Ltd. | 3,256,500 | 24,119 | ||||||
| GPT Group (The)(ö) | 978,463 | 3,461 | China Overseas Land & Investment, Ltd. | 178,000 | 548 | ||||||
| Investa Office Fund(ö) | 199,583 | 643 | Hang Lung Properties, Ltd. - ADR | 1,855,000 | 4,094 | ||||||
| Mirvac Group(ö) | 4,113,995 | 6,523 | Henderson Land Development Co., Ltd. | 376,943 | 2,233 | ||||||
| Scentre Group(ö) | 6,069,553 | 19,383 | Hongkong Land Holdings, Ltd. | 1,425,403 | 9,551 | ||||||
| Shopping Centres Australasia Property | Hysan Development Co., Ltd. | 822,000 | 3,789 | ||||||||
| Group(ö) | 156,682 | 261 | Kerry Properties, Ltd. | 512,500 | 1,622 | ||||||
| Stockland(ö) | 640,776 | 2,150 | Link REIT(ö) | 1,858,755 | 13,252 | ||||||
| Vicinity Centres(ö) | 4,644,019 | 10,116 | New World Development Co., Ltd. | 1,564,551 | 1,950 | ||||||
| Viva Energy REIT(Æ)(ö) | 1,473,484 | 2,529 | Sino Land Co., Ltd. | 402,000 | 683 | ||||||
| Westfield Corp.(ö) | 1,653,048 | 11,163 | Sun Hung Kai Properties, Ltd. | 1,739,982 | 25,920 | ||||||
| 69,054 | Swire Properties, Ltd. | 2,966,800 | 8,517 | ||||||||
| Wharf Holdings, Ltd. (The) | 1,765,000 | 13,266 | |||||||||
| Austria - 0.7% | 109,544 | ||||||||||
| Atrium European Real Estate, Ltd.(Æ) | 84,919 | 364 | |||||||||
| Buwog AG(Æ) | 330,805 | 8,000 | Ireland - 0.4% | ||||||||
| 8,364 | Green REIT PLC(ö) | 734,802 | 1,097 | ||||||||
| Hibernia REIT PLC(ö) | 2,298,001 | 3,242 | |||||||||
| Brazil - 0.0% | 4,339 | ||||||||||
| BR Properties SA | 18,495 | 50 | |||||||||
| Italy - 0.0% | |||||||||||
| Canada - 2.1% | Beni Stabili SpA SIIQ(Æ)(ö) | 472,110 | 275 | ||||||||
| Allied Properties Real Estate Investment | |||||||||||
| Trust(ö) | 271,201 | 7,291 | Japan - 11.8% | ||||||||
| Boardwalk Real Estate Investment | Activia Properties, Inc.(ö) | 738 | 3,589 | ||||||||
| Trust(Ñ)(ö) | 32,210 | 1,182 | Advance Residence Investment Corp.(ö) | 1,454 | 4,073 | ||||||
| Brookfield Canada Office Properties(ö) | 48,106 | 952 | Daiwa Office Investment Corp.(ö) | 120 | 677 | ||||||
| Chartwell Retirement Residences | 374,806 | 4,175 | Frontier Real Estate Investment Corp.(ö) | 680 | 3,202 | ||||||
| Crombie Real Estate Investment Trust(ö) | 56,410 | 569 | Global One Real Estate Investment | ||||||||
| Dream Office Real Estate Investment | Corp.(ö) | 662 | 2,499 | ||||||||
| Trust(ö) | 45,824 | 571 | GLP J-Reit(ö) | 734 | 920 | ||||||
| First Capital Realty, Inc. Class A | 236,340 | 3,769 | Hulic Co., Ltd. | 96,635 | 921 | ||||||
| RioCan Real Estate Investment Trust(ö) | 148,707 | 2,891 | Hulic Reit, Inc.(ö) | 2,324 | 4,072 | ||||||
| Smart Real Estate Investment Trust(ö) | 194,973 | 4,862 | Industrial & Infrastructure Fund | ||||||||
| 26,262 | Investment Corp.(ö) | 12 | 63 | ||||||||
| Invincible Investment Corp.(ö) | 2,216 | 1,075 | |||||||||
| China - 0.0% | Japan Hotel REIT Investment Corp.(ö) | 600 | 405 | ||||||||
| China Resources Land, Ltd. | 20,000 | 50 | Japan Logistics Fund, Inc.(ö) | 1,310 | 2,849 | ||||||
| Japan Real Estate Investment Corp.(ö) | 1,256 | 7,268 | |||||||||
| Finland - 0.1% | Japan Rental Housing Investments, Inc. | ||||||||||
| Citycon OYJ(Æ) | 640,886 | 1,503 | (ö) | 210 | 162 | ||||||
| Japan Retail Fund Investment Corp.(ö) | 2,473 | 5,617 | |||||||||
| France - 3.7% | Kenedix Office Investment Corp. Class | ||||||||||
| Fonciere Des Regions(ö) | 8,140 | 711 | A(ö) | 62 | 349 | ||||||
| Gecina SA(ö) | 62,268 | 9,065 | Mitsubishi Estate Co., Ltd. | 1,367,000 | 27,095 | ||||||
| Icad, Inc.(ö) | 31,517 | 2,265 | Mitsui Fudosan Co., Ltd. | 1,417,350 | 32,242 | ||||||
| Klepierre - GDR(ö) | 595,723 | 24,383 | Mori Hills REIT Investment Corp. Class | ||||||||
| Unibail-Rodamco SE(ö) | 39,118 | 9,315 | A(ö) | 2,487 | 3,505 | ||||||
| 45,739 | Mori Trust Sogo Reit, Inc.(ö) | 2,422 | 3,899 | ||||||||
| Nippon Building Fund, Inc.(ö) | 1,389 | 8,262 | |||||||||
| Germany - 2.9% | Nippon Prologis REIT, Inc.(ö) | 319 | 721 | ||||||||
| alstria office REIT-AG(Æ)(ö) | 639,004 | 8,249 | Nomura Real Estate Master Fund, Inc. | ||||||||
| Deutsche EuroShop AG | 9,045 | 391 | (Æ)(ö) | 3,307 | 5,360 | ||||||
| Deutsche Wohnen AG | 416,609 | 13,589 | NTT Urban Development Corp. | 368,600 | 3,384 | ||||||
| LEG Immobilien AG(Æ) | 6,070 | 513 | Orix JREIT, Inc.(ö) | 2,618 | 4,484 | ||||||
| TLG Immobilien AG | 157,143 | 3,293 | Sekisui House Reit, Inc.(ö) | 506 | 684 | ||||||
See accompanying notes which are an integral part of the financial statements.
Russell Global Real Estate Securities Fund 633
Russell Investment Company
Russell Global Real Estate Securities Fund
Schedule of Investments, continued — October 31, 2016
| Amounts in thousands (except share amounts) | Amounts in thousands (except share amounts) | ||||||||
| Principal | Fair | Principal | Fair | ||||||
| Amount ($) | Value | Amount ($) | Value | ||||||
| or Shares | $ | or Shares | $ | ||||||
| Sumitomo Realty & Development Co., | Wihlborgs Fastigheter AB | 9,196 | 178 | ||||||
| Ltd. | 222,000 | 5,837 | 7,942 | ||||||
| Tokyo Tatemono Co., Ltd. | 700,500 | 8,908 | |||||||
| Tokyu REIT, Inc.(ö) | 42 | 55 | Switzerland - 0.4% | ||||||
| United Urban Investment Corp.(ö) | 963 | 1,624 | PSP Swiss Property AG | 46,642 | 4,172 | ||||
| 143,801 | Swiss Prime Site AG Class A(Æ) | 7,426 | 616 | ||||||
| 4,788 | |||||||||
| Jersey - 0.0% | |||||||||
| Kennedy Wilson Europe Real Estate | United Kingdom - 5.3% | ||||||||
| PLC | 46,709 | 580 | Assura PLC(ö) | 3,405,139 | 2,455 | ||||
| Big Yellow Group PLC(ö) | 549,374 | 4,650 | |||||||
| Luxembourg - 0.2% | British Land Co. PLC (The)(ö) | 1,457,388 | 10,438 | ||||||
| ADO Properties SA(Þ) | 76,779 | 2,795 | Capital & Regional PLC(ö) | 435,258 | 301 | ||||
| Derwent London PLC(ö) | 96,283 | 2,849 | |||||||
| Netherlands - 0.5% | Great Portland Estates PLC(ö) | 707,176 | 5,135 | ||||||
| Eurocommercial Properties NV | 31,904 | 1,357 | Hammerson PLC(ö) | 652,440 | 4,393 | ||||
| InterXion Holding NV(Æ) | 51,424 | 1,914 | Helical PLC | 7,302 | 24 | ||||
| NSI NV(ö) | 223,820 | 877 | Intu Properties PLC Class H(ö) | 317,030 | 1,069 | ||||
| Vastned Retail NV(ö) | 8,920 | 343 | Land Securities Group PLC(ö) | 522,724 | 6,381 | ||||
| Wereldhave NV(Ñ)(ö) | 22,937 | 1,026 | LondonMetric Property PLC(ö) | 2,969,064 | 5,414 | ||||
| 5,517 | LXB Retail Properties PLC(Æ) | 571,895 | 337 | ||||||
| Segro PLC(ö) | 2,248,685 | 12,068 | |||||||
| Norway - 0.1% | St. Modwen Properties PLC | 516,225 | 1,722 | ||||||
| Entra ASA(Þ) | 135,016 | 1,446 | UNITE Group PLC (The) | 902,434 | 6,121 | ||||
| Norwegian Property ASA | 122,128 | 160 | Urban & Civic PLC | 311,300 | 752 | ||||
| 1,606 | Workspace Group PLC(ö) | 57,389 | 442 | ||||||
| 64,551 | |||||||||
| Singapore - 1.5% | |||||||||
| Ascendas Real Estate Investment | United States - 51.6% | ||||||||
| Trust(ö) | 574,200 | 978 | Acadia Realty Trust(ö) | 21,011 | 708 | ||||
| CapitaLand Commercial Trust, Ltd.(Æ) | Agree Realty Corp.(ö) | 69,964 | 3,383 | ||||||
| (ö) | 605,700 | 684 | Alexandria Real Estate Equities, Inc.(ö) | 140,893 | 15,190 | ||||
| CapitaLand Mall Trust Class A(Æ)(ö) | 3,671,700 | 5,450 | American Homes 4 Rent Class A(ö) | 301,849 | 6,372 | ||||
| CapitaLand, Ltd. | 478,000 | 1,059 | Apartment Investment & Management | ||||||
| CDL Hospitality Trusts(Æ)(ö) | 6,900 | 7 | Co. Class A(ö) | 158,678 | 6,993 | ||||
| City Developments, Ltd. | 711,000 | 4,340 | AvalonBay Communities, Inc.(ö) | 114,757 | 19,644 | ||||
| EC World Real Estate Investment Trust | Boston Properties, Inc.(ö) | 106,653 | 12,849 | ||||||
| Unit(Æ)(ö) | 154,400 | 82 | Brixmor Property Group, Inc.(ö) | 567,958 | 14,438 | ||||
| Frasers Logistics & Industrial Trust(Æ) | Camden Property Trust(ö) | 111,839 | 9,108 | ||||||
| (ö) | 2,768,300 | 1,918 | CBL & Associates Properties, Inc.(ö) | 21,678 | 232 | ||||
| Global Logistic Properties, Ltd. | 679,300 | 867 | Chesapeake Lodging Trust(ö) | 72,370 | 1,571 | ||||
| Keppel REIT(Æ)(ö) | 1,264,500 | 991 | Columbia Property Trust, Inc.(ö) | 33,016 | 696 | ||||
| Mapletree Commercial Trust(Æ)(ö) | 254,000 | 279 | CoreSite Realty Corp. Class A(ö) | 57,584 | 4,246 | ||||
| Mapletree Logistics Trust(Æ)(ö) | 290,808 | 216 | Corporate Office Properties Trust(ö) | 39,499 | 1,054 | ||||
| Suntec Real Estate Investment Trust(Æ) | Cousins Properties, Inc.(ö) | 628,243 | 4,881 | ||||||
| (ö) | 317,400 | 383 | Crown Castle International Corp.(ö) | 49,575 | 4,511 | ||||
| UOL Group, Ltd. | 171,280 | 698 | CubeSmart(ö) | 305,749 | 7,971 | ||||
| 17,952 | DDR Corp.(ö) | 95,598 | 1,462 | ||||||
| DiamondRock Hospitality Co.(ö) | 344,392 | 3,151 | |||||||
| Spain - 0.8% | Digital Realty Trust, Inc.(ö) | 97,255 | 9,086 | ||||||
| Hispania Activos Inmobiliarios Socimi | Douglas Emmett, Inc.(ö) | 316,178 | 11,540 | ||||||
| SA(ö) | 219,224 | 2,697 | Duke Realty Corp.(ö) | 95,172 | 2,489 | ||||
| Inmobiliaria Colonial SA | 128,742 | 909 | DuPont Fabros Technology, Inc.(ö) | 210,760 | 8,601 | ||||
| Merlin Properties Socimi SA(ö) | 537,633 | 6,039 | Education Realty Trust, Inc.(ö) | 193,057 | 8,222 | ||||
| 9,645 | Empire State Realty Trust, Inc. Class | ||||||||
| A(ö) | 349,515 | 6,840 | |||||||
| Sweden - 0.6% | Equity LifeStyle Properties, Inc. Class | ||||||||
| Atrium Ljungberg AB Class B | 27,928 | 435 | A(ö) | 153,134 | 11,614 | ||||
| Castellum AB | 73,447 | 997 | Equity One, Inc.(ö) | 204,061 | 5,816 | ||||
| Fabege AB | 156,779 | 2,646 | Equity Residential(ö) | 547,183 | 33,789 | ||||
| Hufvudstaden AB Class A | 237,961 | 3,686 | Essex Property Trust, Inc.(ö) | 72,374 | 15,495 | ||||
See accompanying notes which are an integral part of the financial statements.
634 Russell Global Real Estate Securities Fund
Russell Investment Company
Russell Global Real Estate Securities Fund
Schedule of Investments, continued — October 31, 2016
| Amounts in thousands (except share amounts) | Amounts in thousands (except share amounts) | |||||||||
| Principal | Fair | Principal | Fair | |||||||
| Amount ($) | Value | Amount ($) | Value | |||||||
| or Shares | $ | or Shares | $ | |||||||
| Federal Realty Investment Trust(ö) | 7,627 | 1,108 | Total Common Stocks | |||||||
| Four Corners Property Trust, Inc.(ö) | 120,833 | 2,426 | (cost $1,038,429) | 1,190,304 | ||||||
| Gaming and Leisure Properties, Inc.(ö) | 242,582 | 7,964 | ||||||||
| General Growth Properties, Inc.(ö) | 529,496 | 13,211 | ||||||||
| HCP, Inc.(ö) | 585,306 | 20,047 | Short-Term Investments - 2.3% | |||||||
| Healthcare Realty Trust, Inc.(ö) | 58,941 | 1,880 | United States - 2.3% | |||||||
| Russell U.S. Cash Management Fund | 28,323,123 | (8) | 28,329 | |||||||
| Healthcare A(ö) Trust of America, Inc. Class | 96,453 | 2,951 | Total Short-Term Investments | |||||||
| Hilton Worldwide Holdings, Inc. | 401,562 | 9,075 | (cost $28,325) | 28,329 | ||||||
| Host Hotels & Resorts, Inc.(ö) | 507,426 | 7,855 | ||||||||
| Hudson Pacific Properties, Inc.(ö) | 287,339 | 9,660 | Other Securities - 0.3% | |||||||
| Kilroy Realty Corp.(ö) | 116,114 | 8,340 | Russell U.S. Cash Collateral Fund(×) | 3,103,680 | (8) | 3,104 | ||||
| Kimco Realty Corp.(ö) | 128,015 | 3,406 | Total Other Securities | |||||||
| LaSalle Hotel Properties(ö) | 317,277 | 7,536 | (cost $3,104) | 3,104 | ||||||
| Liberty Property Trust(ö) | 28,461 | 1,151 | ||||||||
| Life Storage, Inc.(Æ) | 35,514 | 2,864 | ||||||||
| Macerich Co. (The)(ö) | 16,387 | 1,160 | Total Investments 99.9% | |||||||
| Mack-Cali Realty Corp.(ö) | 19,695 | 506 | (identified cost $1,069,858) | 1,221,737 | ||||||
| MedEquities Realty Trust, Inc.(ö) | 23,899 | 277 | ||||||||
| Medical Properties Trust, Inc.(ö) | 269,316 | 3,754 | Other Assets and Liabilities, Net | |||||||
| Mid-America Apartment Communities, | - 0.1% | 1,378 | ||||||||
| Inc.(ö) | 53,248 | 4,939 | Net Assets - 100.0% | 1,223,115 | ||||||
| National Retail Properties, Inc.(ö) | 77,764 | 3,548 | ||||||||
| Omega Healthcare Investors, Inc.(Ñ)(ö) | 103,517 | 3,295 | ||||||||
| Paramount Group, Inc.(ö) | 143,912 | 2,238 | ||||||||
| Parkway, Inc.(Æ)(ö) | 14,492 | 261 | ||||||||
| Pebblebrook Hotel Trust(ö) | 110,913 | 2,693 | ||||||||
| Pennsylvania Real Estate Investment | ||||||||||
| Trust(ö) | 120,604 | 2,353 | ||||||||
| Piedmont Office Realty Trust, Inc. Class | ||||||||||
| A(ö) | 170,934 | 3,501 | ||||||||
| Post Properties, Inc.(ö) | 81,471 | 5,360 | ||||||||
| Prologis, Inc.(ö) | 568,477 | 29,652 | ||||||||
| Public Storage(ö) | 87,940 | 18,794 | ||||||||
| QTS Realty Trust, Inc. Class A(ö) | 93,410 | 4,293 | ||||||||
| Ramco-Gershenson Properties Trust(ö) | 46,824 | 812 | ||||||||
| Regency Centers Corp.(ö) | 97,989 | 7,062 | ||||||||
| Retail Properties of America, Inc. Class | ||||||||||
| A(ö) | 304,397 | 4,739 | ||||||||
| Rexford Industrial Realty, Inc.(ö) | 291,629 | 6,142 | ||||||||
| Senior Housing Properties Trust(ö) | 254,870 | 5,421 | ||||||||
| Simon Property Group, Inc.(ö) | 376,689 | 70,049 | ||||||||
| SL Green Realty Corp.(ö) | 48,165 | 4,731 | ||||||||
| Spirit Realty Capital, Inc.(ö) | 1,129,840 | 13,456 | ||||||||
| STORE Capital Corp.(ö) | 53,366 | 1,456 | ||||||||
| Sun Communities, Inc.(ö) | 123,404 | 9,493 | ||||||||
| Sunstone Hotel Investors, Inc.(ö) | 567,538 | 7,128 | ||||||||
| Tanger Factory Outlet Centers, Inc.(ö) | 214,199 | 7,454 | ||||||||
| Taubman Centers, Inc.(ö) | 19,286 | 1,397 | ||||||||
| UDR, Inc.(ö) | 284,510 | 9,949 | ||||||||
| Urban Edge Properties(ö) | 171,523 | 4,427 | ||||||||
| Ventas, Inc.(ö) | 238,209 | 16,139 | ||||||||
| VEREIT, Inc.(ö) | 665,491 | 6,256 | ||||||||
| Vornado Realty Trust(ö) | 317,480 | 29,456 | ||||||||
| Washington Prime Group, Inc.(ö) | 15,045 | 158 | ||||||||
| Welltower, Inc.(ö) | 93,116 | 6,381 | ||||||||
| Xenia Hotels & Resorts, Inc.(ö) | 52,660 | 822 | ||||||||
| 630,978 | ||||||||||
See accompanying notes which are an integral part of the financial statements.
Russell Global Real Estate Securities Fund 635
Russell Investment Company
Russell Global Real Estate Securities Fund
Schedule of Investments, continued — October 31, 2016
| Restricted Securities | ||||||||||||
| Amounts in thousands (except share and cost per unit amounts) | ||||||||||||
| Principal | Cost per | Cost | Fair Value | |||||||||
| % of Net Assets | Acquisition | Amount ($) | Unit | (000 | ) | (000 | ) | |||||
| Securities | Date | or shares | $ | $ | $ | |||||||
| 0.0% | ||||||||||||
| BGP Holdings PLC | 08/06/09 | AUD | 4,619,419 | — | — | — | ||||||
| — | ||||||||||||
| For a description of restricted securities see note 8 in the Notes to Financial Statements. | ||||||||||||
| Futures Contracts | ||||||||||||
| Amounts in thousands (except contract amounts) | ||||||||||||
| Unrealized | ||||||||||||
| Appreciation | ||||||||||||
| Number of | Notional | Expiration | (Depreciation) | |||||||||
| Contracts | Amount | Date | $ | |||||||||
| Long Positions | ||||||||||||
| Dow Jones U.S. Real Estate Index Futures | 432 | USD | 13,008 | 12/16 | (322 | ) | ||||||
| FTSE/EPRA Europe Index Futures | 482 | EUR | 9,510 | 12/16 | (356 | ) | ||||||
| Hang Seng Index Futures | 14 | HKD | 16,033 | 11/16 | (55 | ) | ||||||
| MSCI Singapore Index Futures | 28 | SGD | 863 | 11/16 | (8 | ) | ||||||
| S&P/TSX 60 Index Futures | 5 | CAD | 866 | 12/16 | 17 | |||||||
| SPI 200 Index Futures | 16 | AUD | 2,116 | 12/16 | (41 | ) | ||||||
| TOPIX Index Futures | 21 | JPY | 292,950 | 12/16 | 126 | |||||||
| Total Unrealized Appreciation (Depreciation) on Open Futures Contracts (å) | (639 | ) | ||||||||||
| Foreign Currency Exchange Contracts | ||||||||
| Amounts in thousands | ||||||||
| Unrealized | ||||||||
| Appreciation | ||||||||
| Amount | Amount | (Depreciation) | ||||||
| Counterparty | Sold | Bought | Settlement Date | $ | ||||
| Bank of America | USD | 149 | AUD | 200 | 12/21/16 | 3 | ||
| Bank of America | USD | 757 | AUD | 1,000 | 12/21/16 | 3 | ||
| Bank of America | USD | 76 | CAD | 100 | 12/21/16 | (1 | ) | |
| Bank of America | USD | 377 | CAD | 500 | 12/21/16 | (4 | ) | |
| Bank of America | USD | 1,129 | EUR | 1,000 | 12/21/16 | (29 | ) | |
| Bank of America | USD | 6,169 | EUR | 5,500 | 12/21/16 | (119 | ) | |
| Bank of America | USD | 258 | HKD | 2,000 | 12/21/16 | — | ||
| Bank of America | USD | 968 | HKD | 7,500 | 12/21/16 | — | ||
| Bank of America | USD | 392 | JPY | 40,000 | 12/21/16 | (10 | ) | |
| Bank of America | USD | 1,459 | JPY | 150,000 | 12/21/16 | (26 | ) | |
| Bank of America | USD | 255 | SGD | 350 | 12/21/16 | (3 | ) | |
| Bank of America | AUD | 100 | USD | 76 | 12/21/16 | — | ||
| Bank of America | AUD | 100 | USD | 76 | 12/21/16 | — | ||
| Bank of America | AUD | 100 | USD | 77 | 12/21/16 | 1 | ||
| Bank of America | AUD | 300 | USD | 224 | 12/21/16 | (4 | ) | |
| Bank of America | AUD | 500 | USD | 383 | 12/21/16 | 3 | ||
| Bank of America | CAD | 100 | USD | 76 | 12/21/16 | 1 | ||
| Bank of America | CAD | 100 | USD | 75 | 12/21/16 | — | ||
| Bank of America | CAD | 100 | USD | 76 | 12/21/16 | 1 | ||
| Bank of America | CAD | 100 | USD | 76 | 12/21/16 | 2 | ||
| Bank of America | CAD | 100 | USD | 76 | 12/21/16 | 2 | ||
| Bank of America | EUR | 100 | USD | 113 | 12/21/16 | 3 | ||
| Bank of America | EUR | 100 | USD | 113 | 12/21/16 | 3 | ||
| Bank of America | EUR | 500 | USD | 545 | 12/21/16 | (5 | ) | |
| Bank of America | EUR | 600 | USD | 676 | 12/21/16 | 16 | ||
| Bank of America | EUR | 800 | USD | 899 | 12/21/16 | 19 | ||
| Bank of America | EUR | 1,000 | USD | 1,120 | 12/21/16 | 20 | ||
| Bank of America | EUR | 1,500 | USD | 1,687 | 12/21/16 | 37 | ||
See accompanying notes which are an integral part of the financial statements.
636 Russell Global Real Estate Securities Fund
Russell Investment Company
Russell Global Real Estate Securities Fund
Schedule of Investments, continued — October 31, 2016
| Foreign Currency Exchange Contracts | ||||||||
| Amounts in thousands | ||||||||
| Unrealized | ||||||||
| Appreciation | ||||||||
| Amount | Amount | (Depreciation) | ||||||
| Counterparty | Sold | Bought | Settlement Date | $ | ||||
| Bank of America | HKD | 1,000 | USD | 129 | 12/21/16 | — | ||
| Bank of America | HKD | 1,000 | USD | 129 | 12/21/16 | — | ||
| Bank of America | HKD | 1,000 | USD | 129 | 12/21/16 | — | ||
| Bank of America | HKD | 2,000 | USD | 258 | 12/21/16 | — | ||
| Bank of America | HKD | 3,000 | USD | 387 | 12/21/16 | — | ||
| Bank of America | JPY | 10,000 | USD | 98 | 12/21/16 | 2 | ||
| Bank of America | JPY | 10,000 | USD | 96 | 12/21/16 | 1 | ||
| Bank of America | JPY | 20,000 | USD | 199 | 12/21/16 | 8 | ||
| Bank of America | JPY | 20,000 | USD | 194 | 12/21/16 | 2 | ||
| Bank of America | JPY | 20,000 | USD | 198 | 12/21/16 | 7 | ||
| Bank of America | JPY | 40,000 | USD | 395 | 12/21/16 | 13 | ||
| Bank of America | JPY | 50,000 | USD | 490 | 12/21/16 | 13 | ||
| Bank of America | SGD | 100 | USD | 74 | 12/21/16 | 2 | ||
| Bank of America | SGD | 100 | USD | 74 | 12/21/16 | 2 | ||
| Bank of America | SGD | 100 | USD | 73 | 12/21/16 | 1 | ||
| Bank of America | SGD | 100 | USD | 72 | 12/21/16 | — | ||
| Bank of America | SGD | 100 | USD | 73 | 12/21/16 | 1 | ||
| Bank of New York | AUD | 100 | USD | 75 | 12/21/16 | (1 | ) | |
| Bank of New York | AUD | 400 | USD | 304 | 12/21/16 | 1 | ||
| Bank of New York | CAD | 100 | USD | 76 | 12/21/16 | 1 | ||
| Bank of New York | CAD | 100 | USD | 77 | 12/21/16 | 2 | ||
| Bank of New York | EUR | 400 | USD | 451 | 12/21/16 | 11 | ||
| Bank of New York | EUR | 1,000 | USD | 1,095 | 12/21/16 | (5 | ) | |
| Bank of New York | HKD | 2,000 | USD | 258 | 12/21/16 | — | ||
| Bank of New York | HKD | 3,000 | USD | 387 | 12/21/16 | — | ||
| Bank of New York | JPY | 20,000 | USD | 197 | 12/21/16 | 6 | ||
| Bank of New York | JPY | 30,000 | USD | 289 | 12/21/16 | 2 | ||
| Bank of New York | SGD | 100 | USD | 72 | 12/21/16 | — | ||
| BNP Paribas | USD | 714 | AUD | 933 | 12/21/16 | (6 | ) | |
| BNP Paribas | USD | 271 | CAD | 350 | 12/21/16 | (10 | ) | |
| BNP Paribas | USD | 4,783 | EUR | 4,226 | 12/21/16 | (133 | ) | |
| BNP Paribas | USD | 807 | HKD | 6,256 | 12/21/16 | — | ||
| BNP Paribas | USD | 1,365 | JPY | 138,280 | 12/21/16 | (44 | ) | |
| BNP Paribas | USD | 271 | SGD | 365 | 12/21/16 | (9 | ) | |
| BNP Paribas | AUD | 400 | USD | 303 | 12/21/16 | (1 | ) | |
| BNP Paribas | CAD | 100 | USD | 76 | 12/21/16 | 2 | ||
| BNP Paribas | CAD | 200 | USD | 149 | 12/21/16 | — | ||
| BNP Paribas | EUR | 800 | USD | 881 | 12/21/16 | 1 | ||
| BNP Paribas | EUR | 2,000 | USD | 2,185 | 12/21/16 | (15 | ) | |
| BNP Paribas | HKD | 3,000 | USD | 387 | 12/21/16 | — | ||
| BNP Paribas | JPY | 20,000 | USD | 192 | 12/21/16 | 1 | ||
| BNP Paribas | JPY | 70,000 | USD | 666 | 12/21/16 | (3 | ) | |
| BNP Paribas | SGD | 200 | USD | 143 | 12/21/16 | — | ||
| Brown Brothers Harriman | USD | 38 | AUD | 50 | 11/02/16 | — | ||
| Brown Brothers Harriman | USD | 53 | AUD | 69 | 11/03/16 | — | ||
| Brown Brothers Harriman | USD | 53 | AUD | 69 | 11/03/16 | — | ||
| Brown Brothers Harriman | USD | 53 | AUD | 69 | 11/03/16 | — | ||
| Brown Brothers Harriman | USD | 53 | AUD | 69 | 11/03/16 | — | ||
| Brown Brothers Harriman | USD | 53 | AUD | 69 | 11/03/16 | — | ||
| Brown Brothers Harriman | USD | 53 | AUD | 69 | 11/03/16 | — | ||
| Brown Brothers Harriman | USD | 534 | AUD | 700 | 12/21/16 | (2 | ) | |
| Brown Brothers Harriman | USD | 227 | CAD | 300 | 12/21/16 | (3 | ) | |
| Brown Brothers Harriman | USD | 2 | EUR | 2 | 11/02/16 | — | ||
| Brown Brothers Harriman | USD | 244 | EUR | 223 | 11/02/16 | — | ||
| Brown Brothers Harriman | USD | 35 | EUR | 31 | 11/03/16 | — | ||
| Brown Brothers Harriman | USD | 3,388 | EUR | 3,000 | 12/21/16 | (88 | ) | |
See accompanying notes which are an integral part of the financial statements.
Russell Global Real Estate Securities Fund 637
Russell Investment Company
Russell Global Real Estate Securities Fund
Schedule of Investments, continued — October 31, 2016
| Foreign Currency Exchange Contracts | ||||||||
| Amounts in thousands | ||||||||
| Unrealized | ||||||||
| Appreciation | ||||||||
| Amount | Amount | (Depreciation) | ||||||
| Counterparty | Sold | Bought | Settlement Date | $ | ||||
| Brown Brothers Harriman | USD | — | GBP | — | 11/01/16 | — | ||
| Brown Brothers Harriman | USD | 23 | GBP | 19 | 11/01/16 | — | ||
| Brown Brothers Harriman | USD | 27 | GBP | 22 | 11/01/16 | — | ||
| Brown Brothers Harriman | USD | 774 | HKD | 6,000 | 12/21/16 | — | ||
| Brown Brothers Harriman | USD | 11 | JPY | 1,171 | 11/02/16 | — | ||
| Brown Brothers Harriman | USD | 38 | JPY | 4,042 | 11/02/16 | — | ||
| Brown Brothers Harriman | USD | 47 | JPY | 4,931 | 11/02/16 | — | ||
| Brown Brothers Harriman | USD | 1,001 | JPY | 100,000 | 12/21/16 | (46 | ) | |
| Brown Brothers Harriman | USD | 221 | SGD | 300 | 12/21/16 | (5 | ) | |
| Brown Brothers Harriman | AUD | 7 | USD | 6 | 11/03/16 | — | ||
| Brown Brothers Harriman | AUD | 100 | USD | 76 | 12/21/16 | — | ||
| Brown Brothers Harriman | AUD | 200 | USD | 149 | 12/21/16 | (3 | ) | |
| Brown Brothers Harriman | CAD | 100 | USD | 76 | 12/21/16 | 1 | ||
| Brown Brothers Harriman | EUR | 18 | USD | 20 | 11/01/16 | — | ||
| Brown Brothers Harriman | EUR | 100 | USD | 109 | 12/21/16 | (1 | ) | |
| Brown Brothers Harriman | EUR | 1,400 | USD | 1,576 | 12/21/16 | 36 | ||
| Brown Brothers Harriman | GBP | 36 | USD | 43 | 11/01/16 | — | ||
| Brown Brothers Harriman | GBP | 39 | USD | 47 | 11/01/16 | — | ||
| Brown Brothers Harriman | HKD | 1,000 | USD | 129 | 12/21/16 | — | ||
| Brown Brothers Harriman | HKD | 1,000 | USD | 129 | 12/21/16 | — | ||
| Brown Brothers Harriman | JPY | 2,395 | USD | 23 | 11/02/16 | — | ||
| Brown Brothers Harriman | JPY | 4,073 | USD | 39 | 11/02/16 | — | ||
| Brown Brothers Harriman | JPY | 5,495 | USD | 52 | 11/02/16 | — | ||
| Brown Brothers Harriman | JPY | 10,000 | USD | 96 | 12/21/16 | 1 | ||
| Brown Brothers Harriman | JPY | 30,000 | USD | 293 | 12/21/16 | 7 | ||
| Brown Brothers Harriman | NOK | 2 | USD | — | 11/02/16 | — | ||
| Brown Brothers Harriman | SGD | 7 | USD | 5 | 11/01/16 | — | ||
| Citigroup | AUD | 100 | USD | 76 | 12/21/16 | — | ||
| Citigroup | CAD | 100 | USD | 75 | 12/21/16 | — | ||
| Citigroup | EUR | 1,000 | USD | 1,100 | 12/21/16 | — | ||
| Citigroup | HKD | 1,000 | USD | 129 | 12/21/16 | — | ||
| Citigroup | JPY | 30,000 | USD | 287 | 12/21/16 | — | ||
| Credit Suisse | USD | 82 | EUR | 75 | 11/01/16 | — | ||
| Credit Suisse | USD | 251 | SGD | 350 | 11/01/16 | 1 | ||
| HSBC | USD | 714 | AUD | 933 | 12/21/16 | (5 | ) | |
| HSBC | USD | 271 | CAD | 350 | 12/21/16 | (10 | ) | |
| HSBC | USD | 4,783 | EUR | 4,226 | 12/21/16 | (134 | ) | |
| HSBC | USD | 807 | HKD | 6,256 | 12/21/16 | — | ||
| HSBC | USD | 1,365 | JPY | 138,280 | 12/21/16 | (44 | ) | |
| HSBC | USD | 271 | SGD | 365 | 12/21/16 | (8 | ) | |
| National Australia Bank | USD | 714 | AUD | 933 | 12/21/16 | (6 | ) | |
| National Australia Bank | USD | 271 | CAD | 350 | 12/21/16 | (10 | ) | |
| National Australia Bank | USD | 4,785 | EUR | 4,226 | 12/21/16 | (135 | ) | |
| National Australia Bank | USD | 807 | HKD | 6,256 | 12/21/16 | — | ||
| National Australia Bank | USD | 1,366 | JPY | 138,280 | 12/21/16 | (44 | ) | |
| National Australia Bank | USD | 271 | SGD | 365 | 12/21/16 | (9 | ) | |
| Royal Bank of Canada | AUD | 200 | USD | 152 | 12/21/16 | — | ||
| Royal Bank of Canada | EUR | 300 | USD | 339 | 12/21/16 | 10 | ||
| Royal Bank of Canada | HKD | 1,000 | USD | 129 | 12/21/16 | — | ||
| Royal Bank of Canada | JPY | 10,000 | USD | 98 | 12/21/16 | 2 | ||
| State Street | USD | 180 | AUD | 236 | 11/03/16 | — | ||
| State Street | USD | — | EUR | — | 11/01/16 | — | ||
| State Street | USD | 13 | EUR | 12 | 11/01/16 | — | ||
| State Street | USD | 50 | EUR | 45 | 11/01/16 | — | ||
| State Street | USD | 32 | EUR | 29 | 11/02/16 | — | ||
| State Street | USD | 6 | GBP | 5 | 11/01/16 | — | ||
See accompanying notes which are an integral part of the financial statements.
638 Russell Global Real Estate Securities Fund
Russell Investment Company
Russell Global Real Estate Securities Fund
Schedule of Investments, continued — October 31, 2016
| Foreign Currency Exchange Contracts | ||||||||
| Amounts in thousands | ||||||||
| Unrealized | ||||||||
| Appreciation | ||||||||
| Amount | Amount | (Depreciation) | ||||||
| Counterparty | Sold | Bought | Settlement Date | $ | ||||
| State Street | USD | 24 | GBP | 20 | 11/01/16 | — | ||
| State Street | USD | 49 | GBP | 40 | 11/01/16 | — | ||
| State Street | USD | 52 | GBP | 43 | 11/01/16 | — | ||
| State Street | USD | 52 | GBP | 43 | 11/01/16 | — | ||
| State Street | USD | 82 | GBP | 68 | 11/01/16 | 1 | ||
| State Street | USD | 17 | JPY | 1,754 | 11/04/16 | — | ||
| State Street | USD | 88 | JPY | 9,269 | 11/04/16 | — | ||
| State Street | USD | 7 | SGD | 9 | 11/03/16 | — | ||
| State Street | AUD | 200 | USD | 151 | 12/21/16 | (1 | ) | |
| State Street | CAD | 100 | USD | 76 | 12/21/16 | 1 | ||
| State Street | EUR | 21 | USD | 24 | 11/01/16 | — | ||
| State Street | EUR | 500 | USD | 554 | 12/21/16 | 5 | ||
| State Street | HKD | 1,200 | USD | 155 | 12/21/16 | — | ||
| State Street | JPY | 1,317 | USD | 13 | 11/04/16 | — | ||
| State Street | JPY | 3,066 | USD | 29 | 11/04/16 | — | ||
| State Street | JPY | 9,705 | USD | 92 | 11/04/16 | — | ||
| State Street | JPY | 30,000 | USD | 290 | 12/21/16 | 4 | ||
| State Street | NOK | 190 | USD | 23 | 11/01/16 | — | ||
| State Street | SGD | 100 | USD | 72 | 12/21/16 | — | ||
| UBS | USD | 109 | AUD | 142 | 12/21/16 | (1 | ) | |
| UBS | USD | 108 | CAD | 141 | 12/21/16 | (2 | ) | |
| UBS | USD | 269 | HKD | 2,082 | 12/21/16 | — | ||
| UBS | USD | 5 | SGD | 7 | 12/21/16 | — | ||
| UBS | EUR | 108 | USD | 122 | 12/21/16 | 3 | ||
| UBS | JPY | 24,810 | USD | 245 | 12/21/16 | 7 | ||
| Total Unrealized Appreciation (Depreciation) on Open Foreign Currency Exchange Contracts | (713 | ) | ||||||
| Presentation of Portfolio Holdings | |||||||||||||
| Amounts in thousands | |||||||||||||
| Fair Value | |||||||||||||
| Practical | |||||||||||||
| Portfolio Summary | Level 1 | Level 2 | Level 3 | Expedient (a) | Total | % of Net Assets | |||||||
| Common Stocks | |||||||||||||
| Australia | $ | — | $ | 69,054 | $ | — | $ | — | $ | 69,054 | 5.6 | ||
| Austria | — | 8,364 | — | — | 8,364 | 0.7 | |||||||
| Brazil | 50 | — | — | — | 50 | —* | |||||||
| Canada | 26,262 | — | — | — | 26,262 | 2.1 | |||||||
| China | — | 50 | — | — | 50 | —* | |||||||
| Finland | — | 1,503 | — | — | 1,503 | 0.1 | |||||||
| France | 6,037 | 39,702 | — | — | 45,739 | 3.7 | |||||||
| Germany | — | 34,969 | — | — | 34,969 | 2.9 | |||||||
| Hong Kong | — | 109,544 | — | — | 109,544 | 9.0 | |||||||
| Ireland | — | 4,339 | — | — | 4,339 | 0.4 | |||||||
| Italy | — | 275 | — | — | 275 | —* | |||||||
| Japan | — | 143,801 | — | — | 143,801 | 11.8 | |||||||
| Jersey | — | 580 | — | — | 580 | —* | |||||||
| Luxembourg | — | 2,795 | — | — | 2,795 | 0.2 | |||||||
| Netherlands | 1,914 | 3,603 | — | — | 5,517 | 0.5 | |||||||
See accompanying notes which are an integral part of the financial statements.
Russell Global Real Estate Securities Fund 639
Russell Investment Company
Russell Global Real Estate Securities Fund
Schedule of Investments, continued — October 31, 2016
| Presentation of Portfolio Holdings | |||||||||||||||||
| Amounts in thousands | |||||||||||||||||
| Fair Value | |||||||||||||||||
| Practical | |||||||||||||||||
| Portfolio Summary | Level 1 | Level 2 | Level 3 | Expedient (a) | Total | % of Net Assets | |||||||||||
| Norway | — | 1,606 | — | — | 1,606 | 0.1 | |||||||||||
| Singapore | 89 | 17,863 | — | — | 17,952 | 1.5 | |||||||||||
| Spain | — | 9,645 | — | — | 9,645 | 0.8 | |||||||||||
| Sweden | — | 7,942 | — | — | 7,942 | 0.6 | |||||||||||
| Switzerland | — | 4,788 | — | — | 4,788 | 0.4 | |||||||||||
| United Kingdom | — | 64,551 | — | — | 64,551 | 5.3 | |||||||||||
| United States | 630,978 | — | — | — | 630,978 | 51.6 | |||||||||||
| Short-Term Investments | — | — | — | 28,329 | 28,329 | 2.3 | |||||||||||
| Other Securities | — | — | — | 3,104 | 3,104 | 0.3 | |||||||||||
| Total Investments | 665,330 | 524,974 | — | 31,433 | 1,221,737 | 99.9 | |||||||||||
| Other Assets and Liabilities, Net | 0.1 | ||||||||||||||||
| 100.0 | |||||||||||||||||
| Other Financial Instruments | |||||||||||||||||
| Assets | |||||||||||||||||
| Futures Contracts | 143 | — | — | — | 143 | —* | |||||||||||
| Foreign Currency Exchange Contracts | 5 | 267 | — | — | 272 | —* | |||||||||||
| Liabilities | |||||||||||||||||
| Futures Contracts | (782 | ) | — | — | — | (782 | ) | (0.1 | ) | ||||||||
| Foreign Currency Exchange Contracts | (2 | ) | (983 | ) | — | — | (985 | ) | (0.1 | ) | |||||||
| Total Other Financial Instruments** | $ | (636 | ) | $ | (716 | ) | $ | — | $ | — | $ | (1,352 | ) | ||||
* Less than 0.05% of net assets.
** Futures and foreign currency exchange contract values reflect the unrealized appreciation (depreciation) on the investments.
(a) Certain investments that are measured at fair value using the net asset value per share (or its equivalent) practical expedient have not been classified
in the fair value levels. The fair value amounts presented in the table are intended to permit reconciliation to the amounts presented in the Schedule of
Investments.
For a description of the Levels, see note 2 in the Notes to Financial Statements.
For a disclosure on transfers between Levels 1, 2 and 3 during the period ended October 31, 2016, see note 2 in the Notes to
Financial Statements.
| Amounts in thousands | |||
| Fair Value | |||
| Property Sector Exposure | $ | ||
| Diversified | 358,580 | ||
| Healthcare | 66,775 | ||
| Industrial | 63,365 | ||
| Lodging/Resorts | 41,318 | ||
| Office | 172,444 | ||
| Residential | 180,824 | ||
| Retail | 272,719 | ||
| Self Storage | 34,279 | ||
| Short-Term Investments | 28,329 | ||
| Other Securities | 3,104 | ||
See accompanying notes which are an integral part of the financial statements.
640 Russell Global Real Estate Securities Fund
Russell Investment Company
Russell Global Real Estate Securities Fund
Schedule of Investments, continued — October 31, 2016
| Total Investments | 1,221,737 |
See accompanying notes which are an integral part of the financial statements.
Russell Global Real Estate Securities Fund 641
Russell Investment Company
Russell Global Real Estate Securities Fund
Fair Value of Derivative Instruments — October 31, 2016
Amounts in thousands
| Foreign | |||||||
| Equity | Currency | ||||||
| Derivatives not accounted for as hedging instruments | Contracts | Contracts | |||||
| Location: Statement of Assets and Liabilities - Assets | |||||||
| Unrealized appreciation on foreign currency exchange contracts | $ | — | $ | 272 | |||
| Variation margin on futures contracts* | 143 | — | |||||
| Total | $ | 143 | $ | 272 | |||
| Location: Statement of Assets and Liabilities - Liabilities | |||||||
| Variation margin on futures contracts* | $ | 782 | $ | — | |||
| Unrealized depreciation on foreign currency exchange contracts | — | 985 | |||||
| Total | $ | 782 | $ | 985 | |||
| Foreign | |||||||
| Equity | Currency | ||||||
| Derivatives not accounted for as hedging instruments | Contracts | Contracts | |||||
| Location: Statement of Operations - Net realized gain (loss) | |||||||
| Futures contracts | $ | 2,239 | $ | — | |||
| Foreign currency-related transactions** | — | 498 | |||||
| Total | $ | 2,239 | $ | 498 | |||
| Location: Statement of Operations - Net change in unrealized appreciation (depreciation) | |||||||
| Futures contracts | $ | (2,499 | ) | $ | — | ||
| Foreign currency-related transactions*** | — | (429 | ) | ||||
| Total | $ | (2,499 | ) | $ | (429 | ) | |
* Includes cumulative appreciation/depreciation of futures contracts as reported in the Schedule of Investments. Only variation margin is reported within the
Statement of Assets and Liabilities.
** Only includes net realized gain (loss) on forward and spot contracts. May differ from the net realized gain (loss) on foreign currency-related transactions reported
within the Statement of Operations.
*** Only includes change in unrealized gain (loss) on forward and spot contracts. May differ from the net change in unrealized gain (loss) on foreign currency-related
transactions reported within the Statement of Operations.
For further disclosure on derivatives see note 2 in the Notes to Financial Statements.
See accompanying notes which are an integral part of the financial statements.
642 Russell Global Real Estate Securities Fund
Russell Investment Company
Russell Global Real Estate Securities Fund
Balance Sheet Offsetting of Financial and Derivative Instruments — October 31, 2016
| Amounts in thousands | |||||||||
| Offsetting of Financial Assets and Derivative Assets | |||||||||
| Gross | Net Amounts | ||||||||
| Amounts | of Assets | ||||||||
| Gross | Offset in the | Presented in | |||||||
| Amounts of | Statement of | the Statement | |||||||
| Recognized | Assets and | of Assets and | |||||||
| Description | Location: Statement of Assets and Liabilities - Assets | Assets | Liabilities | Liabilities | |||||
| Securities on Loan* | Investments, at fair value | $ | 2,999 | $ | — | $ | 2,999 | ||
| Foreign Currency Exchange Contracts | Unrealized appreciation on foreign currency exchange contracts | 272 | — | 272 | |||||
| Futures Contracts | Variation margin on futures contracts | 256 | — | 256 | |||||
| Total Financial and Derivative Assets | 3,527 | — | 3,527 | ||||||
| Financial and Derivative Assets not subject to a netting agreement | (256 | ) | — | (256 | ) | ||||
| Total Financial and Derivative Assets subject to a netting agreement | $ | 3,271 | $ | — | $ | 3,271 | |||
| Financial Assets, Derivative Assets, and Collateral Held by Counterparty | |||||||||||
| Gross Amounts Not Offset in | |||||||||||
| the Statement of Assets and | |||||||||||
| Liabilities | |||||||||||
| Net Amounts | |||||||||||
| of Assets | |||||||||||
| Presented in | |||||||||||
| the Statement | Financial and | ||||||||||
| of Assets and | Derivative | Collateral | |||||||||
| Counterparty | Liabilities | Instruments | Received^ | Net Amount | |||||||
| Bank of America | $ | 166 | $ | 166 | $ | — | $ | — | |||
| Bank of New York | 23 | 6 | — | 17 | |||||||
| Barclays | 939 | — | 939 | — | |||||||
| BNP Paribas | 4 | 4 | — | — | |||||||
| Brown Brothers Harriman | 45 | 44 | — | 1 | |||||||
| Citigroup | 730 | — | 730 | — | |||||||
| Credit Suisse | 1 | — | — | 1 | |||||||
| Fidelity | 70 | — | 70 | — | |||||||
| JPMorgan Chase | 980 | — | 980 | — | |||||||
| Royal Bank of Canada | 12 | — | — | 12 | |||||||
| State Street | 12 | 1 | — | 11 | |||||||
| UBS | 289 | 3 | 280 | 6 | |||||||
| Total | $ | 3,271 | $ | 224 | $ | 2,999 | $ | 48 | |||
See accompanying notes which are an integral part of the financial statements.
Russell Global Real Estate Securities Fund 643
Russell Investment Company
Russell Global Real Estate Securities Fund
Balance Sheet Offsetting of Financial and Derivative Instruments, continued —
October 31, 2016
| Amounts in thousands | |||||||||
| Offsetting of Financial Liabilities and Derivative Liabilities | |||||||||
| Gross | Net Amounts | ||||||||
| Amounts | of Liabilities | ||||||||
| Gross | Offset in the | Presented in | |||||||
| Amounts of | Statement of | the Statement | |||||||
| Recognized | Assets and | of Assets and | |||||||
| Description | Location: Statement of Assets and Liabilities - Liabilities | Liabilities | Liabilities | Liabilities | |||||
| Futures Contracts | Variation margin on futures contracts | $ | 1 | $ | — | $ | 1 | ||
| Foreign Currency Exchange Contracts | Unrealized depreciation on foreign currency exchange contracts | 985 | — | 985 | |||||
| Total Financial and Derivative Liabilities | 986 | — | 986 | ||||||
| Financial and Derivative Liabilities not subject to a netting agreement | (1 | ) | — | (1 | ) | ||||
| Total Financial and Derivative Liabilities subject to a netting agreement | $ | 985 | $ | — | $ | 985 | |||
| Financial Liabilities, Derivative Liabilities, and Collateral Pledged by Counterparty | |||||||||
| Gross Amounts Not Offset in | |||||||||
| the Statement of Assets and | |||||||||
| Liabilities | |||||||||
| Net Amounts | |||||||||
| of Liabilities | |||||||||
| Presented in | |||||||||
| the Statement | Financial and | ||||||||
| of Assets and | Derivative | Collateral | |||||||
| Counterparty | Liabilities | Instruments | Pledged^ | Net Amount | |||||
| Bank of America | $ | 201 | $ | 166 | $ | — | $ | 35 | |
| Bank of New York | 6 | 6 | — | — | |||||
| BNP Paribas | 221 | 4 | — | 217 | |||||
| Brown Brothers Harriman | 148 | 44 | — | 104 | |||||
| HSBC | 201 | — | — | 201 | |||||
| National Australia Bank | 204 | — | — | 204 | |||||
| State Street | 1 | 1 | — | — | |||||
| UBS | 3 | 3 | — | — | |||||
| Total | $ | 985 | $ | 224 | $ | — | $ | 761 | |
* Fair value of securities on loan as reported in the footnotes to the Statement of Assets and Liabilities.
^ Collateral received or pledged amounts may not reconcile to those disclosed in the Statement of Assets and Liabilities due to the inclusion of off-Balance
Sheet collateral and adjustments made to exclude overcollateralization.
For further disclosure on derivatives and counterparty risk see note 2 in the Notes to Financial Statements.
See accompanying notes which are an integral part of the financial statements.
644 Russell Global Real Estate Securities Fund
Russell Investment Company
Russell Global Real Estate Securities Fund
Statement of Assets and Liabilities — October 31, 2016
| Amounts in thousands | |||
| Assets | |||
| Investments, at identified cost | $ | 1,069,858 | |
| Investments, at fair value(*)(>) | 1,221,737 | ||
| Cash | 197 | ||
| Cash (restricted)(a) | 2,600 | ||
| Foreign currency holdings(^) | 2,582 | ||
| Unrealized appreciation on foreign currency exchange contracts | 272 | ||
| Receivables: | |||
| Dividends and interest | 1,835 | ||
| Dividends from affiliated Russell funds | 19 | ||
| Investments sold | 5,205 | ||
| Fund shares sold | 1,187 | ||
| Foreign capital gains taxes recoverable | 423 | ||
| Variation margin on futures contracts | 256 | ||
| Total assets | 1,236,313 | ||
| Liabilities | |||
| Payables: | |||
| Investments purchased | 6,608 | ||
| Fund shares redeemed | 1,019 | ||
| Accrued fees to affiliates | 1,132 | ||
| Other accrued expenses | 349 | ||
| Variation margin on futures contracts | 1 | ||
| Unrealized depreciation on foreign currency exchange contracts | 985 | ||
| Payable upon return of securities loaned | 3,104 | ||
| Total liabilities | 13,198 | ||
| Commitments and Contingencies (1) | |||
| Net Assets | $ | 1,223,115 | |
| (1) See note 9 in the Notes to Financial Statements for a detailed description of commitments and contingencies. | |||
See accompanying notes which are an integral part of the financial statements.
Russell Global Real Estate Securities Fund 645
Russell Investment Company
Russell Global Real Estate Securities Fund
Statement of Assets and Liabilities, continued — October 31, 2016
| Amounts in thousands | |||
| Net Assets Consist of: | |||
| Undistributed (overdistributed) net investment income | $ | 1,691 | |
| Accumulated net realized gain (loss) | 28,857 | ||
| Unrealized appreciation (depreciation) on: | |||
| Investments | 151,879 | ||
| Futures contracts | (639 | ) | |
| Foreign currency-related transactions | (832 | ) | |
| Shares of beneficial interest | 343 | ||
| Additional paid-in capital | 1,041,816 | ||
| Net Assets | $ | 1,223,115 | |
| Net Asset Value, offering and redemption price per share: | |||
| Net asset value per share: Class A(#) | $ | 34.94 | |
| Maximum offering price per share (Net asset value plus sales charge of 5.75%): Class A | $ | 37.07 | |
| Class A — Net assets | $ | 25,717,920 | |
| Class A — Shares outstanding ($.01 par value) | 735,968 | ||
| Net asset value per share: Class C(#) | $ | 33.82 | |
| Class C — Net assets | $ | 31,202,091 | |
| Class C — Shares outstanding ($.01 par value) | 922,634 | ||
| Net asset value per share: Class E(#) | $ | 35.00 | |
| Class E — Net assets | $ | 18,764,055 | |
| Class E — Shares outstanding ($.01 par value) | 536,148 | ||
| Net asset value per share: Class R6(#) | $ | 35.74 | |
| Class R6 — Net assets | $ | 298,448 | |
| Class R6 — Shares outstanding ($.01 par value) | 8,351 | ||
| Net asset value per share: Class S(#) | $ | 35.74 | |
| Class S — Net assets | $ | 1,030,470,786 | |
| Class S — Shares outstanding ($.01 par value) | 28,835,624 | ||
| Net asset value per share: Class Y(#) | $ | 35.73 | |
| Class Y — Net assets | $ | 116,661,795 | |
| Class Y — Shares outstanding ($.01 par value) | 3,264,827 | ||
| Amounts in thousands | |||
| (^) Foreign currency holdings - cost | $ | 2,589 | |
| (*) Securities on loan included in investments | $ | 2,999 | |
| (>) Investments in affiliates, Russell U.S. Cash Management Fund and Russell U.S. Cash Collateral Fund | $ | 31,433 | |
| (a) Cash Collateral for Futures | $ | 2,600 | |
| (#) Net asset value per share equals class level net assets divided by class level shares of beneficial interest outstanding. | |||
See accompanying notes which are an integral part of the financial statements.
646 Russell Global Real Estate Securities Fund
Russell Investment Company
Russell Global Real Estate Securities Fund
Statement of Operations — For the Period Ended October 31, 2016
| Amounts in thousands | |||
| Investment Income | |||
| Dividends | $ | 49,070 | |
| Dividends from affiliated Russell funds | 138 | ||
| Securities lending income (net) | 146 | ||
| Less foreign taxes withheld | (1,807 | ) | |
| Total investment income | 47,547 | ||
| Expenses | |||
| Advisory fees | 11,151 | ||
| Administrative fees | 673 | ||
| Custodian fees (1) | 459 | ||
| Distribution fees - Class A | 69 | ||
| Distribution fees - Class C | 258 | ||
| Transfer agent fees - Class A | 56 | ||
| Transfer agent fees - Class C | 69 | ||
| Transfer agent fees - Class E | 47 | ||
| Transfer agent fees - Class R6 | —** | ||
| Transfer agent fees - Class S | 2,349 | ||
| Transfer agent fees - Class Y | 6 | ||
| Professional fees | 127 | ||
| Registration fees | 102 | ||
| Shareholder servicing fees - Class C | 86 | ||
| Shareholder servicing fees - Class E | 59 | ||
| Trustees’ fees | 47 | ||
| Printing fees | 343 | ||
| Miscellaneous | 39 | ||
| Expenses before reductions | 15,940 | ||
| Expense reductions | (—)** | ||
| Net expenses | 15,940 | ||
| Net investment income (loss) | 31,607 | ||
| Net Realized and Unrealized Gain (Loss) | |||
| Net realized gain (loss) on: | |||
| Investments | 100,231 | ||
| Futures contracts | 2,239 | ||
| Foreign currency-related transactions | 516 | ||
| Net realized gain (loss) | 102,986 | ||
| Net change in unrealized appreciation (depreciation) on: | |||
| Investments | (118,129 | ) | |
| Futures contracts | (2,499 | ) | |
| Foreign currency-related transactions | (481 | ) | |
| Net change in unrealized appreciation (depreciation) | (121,109 | ) | |
| Net realized and unrealized gain (loss) | (18,123 | ) | |
| Net Increase (Decrease) in Net Assets from Operations | $ | 13,484 | |
** Less than $500.
(1) Includes a reimbursement for overbilling of custody out-of-pocket fees from prior years. See note 10 in the Notes to Financial Statements.
See accompanying notes which are an integral part of the financial statements.
Russell Global Real Estate Securities Fund 647
Russell Investment Company
Russell Global Real Estate Securities Fund
Statements of Changes in Net Assets
| For the Periods Ended October 31, | ||||||
| Amounts in thousands | 2016 | 2015 | ||||
| Increase (Decrease) in Net Assets | ||||||
| Operations | ||||||
| Net investment income (loss) | $ | 31,607 | $ | 26,477 | ||
| Net realized gain (loss) | 102,986 | 121,451 | ||||
| Net change in unrealized appreciation (depreciation) | (121,109 | ) | (100,147 | ) | ||
| Net increase (decrease) in net assets from operations | 13,484 | 47,781 | ||||
| Distributions | ||||||
| From net investment income | ||||||
| Class A | (614 | ) | (767 | ) | ||
| Class C | (600 | ) | (755 | ) | ||
| Class E | (532 | ) | (798 | ) | ||
| Class R6 | (4 | ) | — | |||
| Class S | (27,436 | ) | (39,352 | ) | ||
| Class Y | (3,215 | ) | (4,706 | ) | ||
| From net realized gain | ||||||
| Class A | (1,563 | ) | (1,697 | ) | ||
| Class C | (2,013 | ) | (2,370 | ) | ||
| Class E | (1,388 | ) | (1,998 | ) | ||
| Class S | (66,390 | ) | (84,879 | ) | ||
| Class Y | (7,783 | ) | (8,992 | ) | ||
| Net decrease in net assets from distributions | (111,538 | ) | (146,314 | ) | ||
| Share Transactions* | ||||||
| Net increase (decrease) in net assets from share transactions | (248,685 | ) | (165,258 | ) | ||
| Total Net Increase (Decrease) in Net Assets | (346,739 | ) | (263,791 | ) | ||
| Net Assets | ||||||
| Beginning of period | 1,569,854 | 1,833,645 | ||||
| End of period | $ | 1,223,115 | $ | 1,569,854 | ||
| Undistributed (overdistributed) net investment income included in net assets | $ | 1,691 | $ | (27,899 | ) | |
See accompanying notes which are an integral part of the financial statements.
648 Russell Global Real Estate Securities Fund
Russell Investment Company
Russell Global Real Estate Securities Fund
Statements of Changes in Net Assets, continued
* Share transaction amounts (in thousands) for the periods ended October 31, 2016 and October 31, 2015 were as follows:
| 2016 | 2015 | |||||||||||
| Shares | Dollars | Shares | Dollars | |||||||||
| Class A | ||||||||||||
| Proceeds from shares sold | 76 | $ | 2,732 | 85 | $ | 3,237 | ||||||
| Proceeds from reinvestment of distributions | 62 | 2,166 | 65 | 2,454 | ||||||||
| Payments for shares redeemed | (186 | ) | (6,647 | ) | (124 | ) | (4,706 | ) | ||||
| Net increase (decrease) | (48 | ) | (1,749 | ) | 26 | 985 | ||||||
| Class C | ||||||||||||
| Proceeds from shares sold | 50 | 1,731 | 61 | 2,270 | ||||||||
| Proceeds from reinvestment of distributions | 75 | 2,550 | 82 | 3,062 | ||||||||
| Payments for shares redeemed | (226 | ) | (7,888 | ) | (196 | ) | (7,273 | ) | ||||
| Net increase (decrease) | (101 | ) | (3,607 | ) | (53 | ) | (1,941 | ) | ||||
| Class E | ||||||||||||
| Proceeds from shares sold | 90 | 3,251 | 139 | 5,319 | ||||||||
| Proceeds from reinvestment of distributions | 53 | 1,872 | 72 | 2,728 | ||||||||
| Payments for shares redeemed | (307 | ) | (11,245 | ) | (402 | ) | (15,164 | ) | ||||
| Net increase (decrease) | (164 | ) | (6,122 | ) | (191 | ) | (7,117 | ) | ||||
| Class R6(1) | ||||||||||||
| Proceeds from shares sold | 9 | 322 | — | — | ||||||||
| Proceeds from reinvestment of distributions | —** | 4 | — | — | ||||||||
| Payments for shares redeemed | (1 | ) | (23 | ) | — | — | ||||||
| Net increase (decrease) | 8 | 303 | — | — | ||||||||
| Class S | ||||||||||||
| Proceeds from shares sold | 4,835 | 174,901 | 6,453 | 251,972 | ||||||||
| Proceeds from reinvestment of distributions | 2,589 | 92,685 | 3,171 | 122,953 | ||||||||
| Payments for shares redeemed | (13,084 | ) | (480,200 | ) | (13,344 | ) | (523,777 | ) | ||||
| Net increase (decrease) | (5,660 | ) | (212,614 | ) | (3,720 | ) | (148,852 | ) | ||||
| Class Y | ||||||||||||
| Proceeds from shares sold | 339 | 12,264 | 1,279 | 50,846 | ||||||||
| Proceeds from reinvestment of distributions | 307 | 10,998 | 354 | 13,698 | ||||||||
| Payments for shares redeemed | (1,322 | ) | (48,158 | ) | (1,849 | ) | (72,877 | ) | ||||
| Net increase (decrease) | (676 | ) | (24,896 | ) | (216 | ) | (8,333 | ) | ||||
| Total increase (decrease) | (6,641 | ) | $ | (248,685 | ) | (4,154 | ) | $ | (165,258 | ) | ||
(1) For the period March 1, 2016 (commencement of operations) to October 31, 2016.
** Less than 500 shares.
See accompanying notes which are an integral part of the financial statements.
Russell Global Real Estate Securities Fund 649
Russell Investment Company
Russell Global Real Estate Securities Fund
Financial Highlights — For the Periods Ended
For a Share Outstanding Throughout Each Period.
| $ | $ | $ | $ | $ | $ | ||||||||||||
| Net Asset Value, | Net | Net Realized | Total from | Distributions | Distributions | ||||||||||||
| Beginning of | Investment | and Unrealized | Investment | from Net | from Net | ||||||||||||
| Period | Income (Loss)(a)(d) | Gain (Loss) | Operations | Investment Income | Realized Gain | ||||||||||||
| Class A | |||||||||||||||||
| October 31, 2016 | 37.65 | .73 | (.62 | ) | .11 | (.80 | ) | (2.02 | ) | ||||||||
| October 31, 2015 | 39.99 | .51 | .37 | .88 | (.98 | ) | (2.24 | ) | |||||||||
| October 31, 2014 | 40.49 | .54 | 2.97 | 3.51 | (1.07 | ) | (2.94 | ) | |||||||||
| October 31, 2013 | 38.18 | .58 | 3.94 | 4.52 | (2.08 | ) | (.13 | ) | |||||||||
| October 31, 2012 | 33.52 | .63 | 4.72 | 5.35 | (.69 | ) | — | ||||||||||
| Class C | |||||||||||||||||
| October 31, 2016 | 36.60 | .44 | (.59 | ) | (.15 | ) | (.61 | ) | (2.02 | ) | |||||||
| October 31, 2015 | 38.96 | .22 | .36 | .58 | (.70 | ) | (2.24 | ) | |||||||||
| October 31, 2014 | 39.55 | .24 | 2.90 | 3.14 | (.79 | ) | (2.94 | ) | |||||||||
| October 31, 2013 | 37.34 | .28 | 3.85 | 4.13 | (1.79 | ) | (.13 | ) | |||||||||
| October 31, 2012 | 32.83 | .36 | 4.60 | 4.96 | (.45 | ) | — | ||||||||||
| Class E | |||||||||||||||||
| October 31, 2016 | 37.70 | .73 | (.61 | ) | .12 | (.80 | ) | (2.02 | ) | ||||||||
| October 31, 2015 | 40.02 | .50 | .39 | .89 | (.97 | ) | (2.24 | ) | |||||||||
| October 31, 2014 | 40.52 | .54 | 2.97 | 3.51 | (1.07 | ) | (2.94 | ) | |||||||||
| October 31, 2013 | 38.20 | .58 | 3.95 | 4.53 | (2.08 | ) | (.13 | ) | |||||||||
| October 31, 2012 | 33.54 | .63 | 4.72 | 5.35 | (.69 | ) | — | ||||||||||
| Class R6 | |||||||||||||||||
| October 31, 2016(8) | 33.90 | .55 | 2.21 | 2.76 | (.92 | ) | — | ||||||||||
| Class S | |||||||||||||||||
| October 31, 2016 | 38.42 | .84 | (.63 | ) | .21 | (.87 | ) | (2.02 | ) | ||||||||
| October 31, 2015 | 40.73 | .61 | .39 | 1.00 | (1.07 | ) | (2.24 | ) | |||||||||
| October 31, 2014 | 41.16 | .64 | 3.04 | 3.68 | (1.17 | ) | (2.94 | ) | |||||||||
| October 31, 2013 | 38.78 | .67 | 4.02 | 4.69 | (2.18 | ) | (.13 | ) | |||||||||
| October 31, 2012 | 34.03 | .73 | 4.79 | 5.52 | (.77 | ) | — | ||||||||||
| Class Y | |||||||||||||||||
| October 31, 2016 | 38.39 | .90 | (.61 | ) | .29 | (.93 | ) | (2.02 | ) | ||||||||
| October 31, 2015 | 40.71 | .69 | .38 | 1.07 | (1.15 | ) | (2.24 | ) | |||||||||
| October 31, 2014 | 41.15 | .73 | 3.01 | 3.74 | (1.24 | ) | (2.94 | ) | |||||||||
| October 31, 2013 | 38.76 | .84 | 3.94 | 4.78 | (2.25 | ) | (.13 | ) | |||||||||
| October 31, 2012 | 34.03 | .81 | 4.77 | 5.58 | (.85 | ) | — | ||||||||||
See accompanying notes which are an integral part of the financial statements.
650 Russell Global Real Estate Securities Fund
| % | % | % | |||||||||||||||
| $ | $ | Ratio of Expenses | Ratio of Expenses | Ratio of Net | |||||||||||||
| Net Asset Value, | % | Net Assets, | to Average | to Average | Investment Income | % | |||||||||||
| $ | End of | Total | End of Period | Net Assets, | Net Assets, | to Average | Portfolio | ||||||||||
| Total Distributions | Period | Return(b)(c) | (000 | ) | Gross(e) | Net(d)(e) | Net Assets(d)(e) | Turnover Rate(b) | |||||||||
| (2.82 | ) | 34.94 | .42 | 25,718 | 1.38 | 1.38 | 2.03 | 79 | |||||||||
| (3.22 | ) | 37.65 | 2.22 | 29,511 | 1.37 | 1.37 | 1.33 | 61 | |||||||||
| (4.01 | ) | 39.99 | 9.98 | 30,324 | 1.36 | 1.36 | 1.41 | 69 | |||||||||
| (2.21 | ) | 40.49 | 12.17 | 29,098 | 1.35 | 1.35 | 1.47 | 78 | |||||||||
| (.69 | ) | 38.18 | 16.03 | 27,867 | 1.35 | 1.35 | 1.79 | 64 | |||||||||
| (2.63 | ) | 33.82 | (.31 | ) | 31,202 | 2.13 | 2.13 | 1.28 | 79 | ||||||||
| (2.94 | ) | 36.60 | 1.46 | 37,474 | 2.12 | 2.12 | .58 | 61 | |||||||||
| (3.73 | ) | 38.96 | 9.14 | 41,936 | 2.11 | 2.11 | .66 | 69 | |||||||||
| (1.92 | ) | 39.55 | 11.34 | 44,084 | 2.10 | 2.10 | .73 | 78 | |||||||||
| (.45 | ) | 37.34 | 15.17 | 42,262 | 2.10 | 2.10 | 1.05 | 64 | |||||||||
| (2.82 | ) | 35.00 | .44 | 18,764 | 1.38 | 1.38 | 2.03 | 79 | |||||||||
| (3.21 | ) | 37.70 | 2.25 | 26,394 | 1.37 | 1.37 | 1.30 | 61 | |||||||||
| (4.01 | ) | 40.02 | 9.95 | 35,655 | 1.36 | 1.36 | 1.42 | 69 | |||||||||
| (2.21 | ) | 40.52 | 12.18 | 38,596 | 1.35 | 1.35 | 1.46 | 78 | |||||||||
| (.69 | ) | 38.20 | 16.01 | 36,250 | 1.35 | 1.35 | 1.79 | 64 | |||||||||
| (.92 | ) | 35.74 | 8.07 | 298 | .98 | .96 | 2.20 | 79 | |||||||||
| (2.89 | ) | 35.74 | .68 | 1,030,471 | 1.13 | 1.13 | 2.28 | 79 | |||||||||
| (3.31 | ) | 38.42 | 2.51 | 1,325,152 | 1.12 | 1.12 | 1.57 | 61 | |||||||||
| (4.11 | ) | 40.73 | 10.23 | 1,556,497 | 1.11 | 1.11 | 1.65 | 69 | |||||||||
| (2.31 | ) | 41.16 | 12.46 | 1,373,266 | 1.10 | 1.10 | 1.68 | 78 | |||||||||
| (.77 | ) | 38.78 | 16.32 | 1,174,848 | 1.10 | 1.10 | 2.05 | 64 | |||||||||
| (2.95 | ) | 35.73 | .88 | 116,662 | .93 | .93 | 2.47 | 79 | |||||||||
| (3.39 | ) | 38.39 | 2.69 | 151,323 | .92 | .92 | 1.78 | 61 | |||||||||
| (4.18 | ) | 40.71 | 10.45 | 169,233 | .91 | .91 | 1.88 | 69 | |||||||||
| (2.38 | ) | 41.15 | 12.69 | 235,303 | .90 | .90 | 2.03 | 78 | |||||||||
| (.85 | ) | 38.76 | 16.53 | 354,260 | .92 | .92 | 2.26 | 64 | |||||||||
See accompanying notes which are an integral part of the financial statements.
Russell Global Real Estate Securities Fund 651
Russell Investment Company
Russell Global Real Estate Securities Fund
Related Party Transactions, Fees and Expenses
| Accrued fees payable to affiliates for the period ended October 31, 2016 were as follows: | ||
| Advisory fees | $ | 847,653 |
| Administration fees | 51,195 | |
| Distribution fees | 25,897 | |
| Shareholder servicing fees | 10,829 | |
| Transfer agent fees | 191,770 | |
| Trustee fees | 4,826 | |
| $ | 1,132,170 | |
| Transactions (amounts in thousands) during the period ended October 31, 2016 with Underlying Funds which are, or were, an | |||||||||||||||||||
| affiliated company are as follows: | |||||||||||||||||||
| Fair Value, | Change in | ||||||||||||||||||
| Beginning of | Realized Gain | Unrealized | Fair Value, End | Income | Capital Gains | ||||||||||||||
| Period | Purchases | Sales | (Loss) | Gain (Loss) | of Period | Distributions | Distributions | ||||||||||||
| Russell U.S. Cash Collateral Fund | $ | 31,896 | $ | 183,043 | $ | 211,835 | $ | — | $ | — | $ | 3,104 | $ | 70 | $ | — | |||
| Russell U.S. Cash Management Fund | 34,932 | 627,637 | 634,249 | 5 | 4 | 28,329 | 138 | — | |||||||||||
| $ | 66,828 | $ | 810,680 | $ | 846,084 | $ | 5 | $ | 4 | $ | 31,433 | $ | 208 | $ | — | ||||
Federal Income Taxes
At October 31, 2016, the cost of investments and net unrealized appreciation (depreciation), undistributed ordinary income and
undistributed long-term capital gains for income tax purposes were as follows:.
| Cost of Investments | $ | 1,134,590,331 | |||
| Unrealized Appreciation | $ | 109,264,644 | |||
| Unrealized Depreciation | (22,118,212 | ) | |||
| Net Unrealized Appreciation (Depreciation) | $ | 87,146,432 | |||
| Undistributed Ordinary Income | $ | 28,711,978 | |||
| Undistributed Long-Term Capital Gains | |||||
| (Capital Loss Carryforward) | $ | 65,559,838 | |||
| Tax Composition of Distributions | |||||
| Ordinary Income | $ | 39,401,935 | |||
| Long-Term Capital Gains | $ | 72,135,628 | |||
Net investment income and net realized gains (loss) in the financial statements may differ from taxable net investment income and net
realized gains (losses). Capital accounts within the financial statements are adjusted for permanent book-tax differences. Book-tax
differences are primarily due to foreign currency gains and losses, reclassifications of dividends, differences in treatment of income
from swaps, net operating losses, investments in partnerships, investments in passive foreign investment companies (PFICs), tax
straddle transaction, use of tax equalization and foreign capital gains taxes. These adjustments have no impact on the net assets.
At October 31, 2016, the Statement of Assets and Liabilities have been adjusted by the following amounts (in thousands):
| Undistributed net investment income | $ | 30,384 | |
| Accumulated net realized gain (loss) | (30,383 | ) | |
| Additional paid-in capital | (1 | ) |
See accompanying notes which are an integral part of the financial statements.
652 Russell Global Real Estate Securities Fund
Russell Investment Company
Russell Multi-Strategy Income Fund
Portfolio Management Discussion and Analysis — October 31, 2016 (Unaudited)
| Russell Multi-Strategy Income Fund - Class A‡ | Russell Multi-Strategy Income Fund - Class Y | ||||||
| Total | Total | ||||||
| Return | Return | ||||||
| 1 Year | (0.95 | )% | 1 Year | 5.51 | % | ||
| Inception* | (2.91 | )%§ | Inception* | 1.49 | %§ | ||
| Russell Multi-Strategy Income Fund - Class C | BofA Merrill Lynch Global High Yield 2% Constrained | ||||||
| Total | Index (USD Hedged)** | ||||||
| Return | Total | ||||||
| 1 Year | 4.34 | % | Return | ||||
| Inception* | 0.32 | %§ | 1 Year | 10.57 | % | ||
| Inception* | 5.07 | %§ | |||||
| Russell Multi-Strategy Income Fund - Class E | |||||||
| Total | |||||||
| Return | |||||||
| 1 Year | 5.06 | % | |||||
| Inception* | 1.10 | %§ | |||||
| Russell Multi-Strategy Income Fund - Class S | |||||||
| Total | |||||||
| Return | |||||||
| 1 Year | 5.43 | % | |||||
| Inception* | 1.31 | %§ | |||||
Russell Multi-Strategy Income Fund 653
Russell Investment Company
Russell Multi-Strategy Income Fund
Portfolio Management Discussion and Analysis, continued — October 31, 2016
(Unaudited)
| The Russell Multi-Strategy Income Fund (the “Fund”) employs | assets in the Fund rally, as well as more interest rate sensitive |
| a multi-manager approach whereby portions of the Fund are | real assets like global real estate investment trusts and global |
| allocated to different money manager strategies. Fund assets not | infrastructure. With interest rates falling, income opportunities |
| allocated to money managers are managed by Russell Investment | around the globe continued to shrink and income available from |
| Management, LLC (“RIM”), the Fund’s advisor. RIM may change | most assets fell. |
| the allocation of the Fund’s assets among money managers at | The U.S. equity market, as measured by the S&P 500® Index, |
| any time. An exemptive order from the Securities and Exchange | was up 4.51% over the period but also experienced multiple |
| Commission (“SEC”) permits RIM to engage or terminate a money | draw downs. The Fund’s strategic exposure to global equities |
| manager at any time, subject to approval by the Fund’s Board, | proved beneficial over the period as emerging markets rallied |
| without a shareholder vote. Pursuant to the terms of the exemptive | and outperformed U.S. equities. By contrast, non-U.S. developed |
| order, the Fund is required to notify its shareholders within 90 | equity was the lowest performing portion of the Fund as falling |
| days of when a money manager begins providing services. As of | commodity prices and currencies weighed on returns. |
| October 31, 2016, the Fund had eight money managers. | |
| What is the Fund’s investment objective? | How did the investment strategies and techniques employed |
| by the Fund and its money managers affect its benchmark- | |
| The Fund seeks to provide a high level of current income and, as | relative performance? |
| a secondary objective, long-term capital growth. | The Fund employs discretionary and non-discretionary money |
| How did the Fund perform relative to its benchmark for the | managers. The Fund’s discretionary money managers select the |
| fiscal year ended October 31, 2016? | individual portfolio securities for the assets assigned to them. |
| For the fiscal year ended October 31, 2016, the Fund’s Class | The Fund’s non-discretionary money managers provide a model |
| A, Class C, Class E, Class S and Class Y Shares gained 5.08%, | portfolio to RIM representing their investment recommendations, |
| 4.34%, 5.06%, 5.43% and 5.51%, respectively. This is compared | based upon which RIM purchases and sells securities for the |
| to the Fund’s benchmark, the BofAML Global High Yield 2% | Fund. Fund assets not allocated to discretionary money managers |
| Constrained Index (USD Hedged), which gained 10.57% during | include assets managed by RIM based upon model portfolios |
| the same period. The Fund’s performance includes operating | provided by non-discretionary money managers, the Fund’s |
| expenses, whereas index returns are unmanaged and do not | liquidity reserves and assets which may be managed directly by |
| include expenses of any kind. As of October 31, 2016, the | RIM to effect the Fund’s investment strategies and/or to actively |
| 12-month distribution yield of the Fund’s Class A, Class C, Class | manage the Fund’s overall exposures by investing in securities or |
| E, Class S and Class Y Shares was 3.41%, 2.82%, 3.39%, 3.63% | other instruments that RIM believes will achieve the desired risk/ |
| and 3.81%, respectively. | return profile for the Fund. |
| For the fiscal year ended October 31, 2016, the Morningstar® | In order to seek to achieve the Fund’s objective during the period, |
| Allocation 30% to 50% Equity Category, a group of funds that | RIM’s strategic asset allocation included global equity, high |
| Morningstar considers to have investment strategies similar to | yield debt, bank loans, preferred securities, global real estate |
| those of the Fund, gained 3.53%. This result serves as a peer | investment trusts, global infrastructure, investment grade credit |
| comparison and is expressed net of operating expenses. | and emerging market debt. |
| RIM may assign a money manager a specific asset class, style or | RIM adapted the Fund’s asset allocation over the period as market |
| capitalization benchmark other than the Fund’s index. However, | opportunities and risks evolved. The Fund was defensively |
| the Fund’s primary index remains the benchmark for the Fund. | positioned in the fourth quarter of 2015, favoring fixed income |
| over equity securities. During the first quarter of 2016, equity | |
| How did the market conditions described in the Market | markets declined substantially, and RIM added further risk to the |
| Summary report affect the Fund’s performance? | portfolio by overweighting high yield credit and emerging markets |
| The Fund seeks to achieve its objective by investing in a range of | equity compared with core bonds and cash. Markets subsequently |
| income-producing investments, and all major asset classes in the | rebounded from the February lows and RIM reduced risk exposure |
| portfolio produced positive absolute returns during the period. | to a more defensive stance with the Fund’s equity allocation |
| Markets during the fiscal year were characterized by higher | below strategic weights. RIM’s modifications to the Fund’s asset |
| levels of volatility and dispersion across return sources. Within | allocation were additive during the period. |
| the Fund’s fixed income portfolio, exposure to high yield debt | Manager security selection during the period was generally |
| was beneficial as it was one of the best performing asset classes | additive to returns as equity managers were able to find strong |
| globally. Falling interest rates also helped other fixed income | outperforming stocks in the materials sector. With respect to certain |
654 Russell Multi-Strategy Income Fund
Russell Investment Company
Russell Multi-Strategy Income Fund
Portfolio Management Discussion and Analysis, continued — October 31, 2016
(Unaudited)
| of the Fund’s money managers, Kopernik Global Investors, LLC | Money Managers as of October 31, | ||
| (“Kopernik”) was a standout in this regard, and outperformed the | 2016 | Styles | |
| Russell Global Equity Index by over 25% following their addition | |||
| to the Fund in March 2016. By contrast, certain fixed income | Janus Capital Management LLC and Perkins | Global Equities | |
| Investment Management, LLC | |||
| strategies struggled to keep pace with the rapid appreciation of | Kopernik Global Investors, LLC | Global Equities | |
| fixed income markets. Managers like DDJ Capital Management, | Lazard Asset Management, LLC | Emerging Markets | |
| LLC, which have less interest rate sensitivity and are higher in | Debt | ||
| credit quality than their BofA Merrill Lynch Global High Yield | Loomis, Sayles & Company, L.P. | Global Investment | |
| Index, lagged as interest rates fell quickly and the lowest quality | Grade Credit | ||
| THL Credit Advisors, LLC | Bank Loans | ||
| credit rallied. | The views expressed in this report reflect those of the | ||
| Describe any changes to the Fund’s structure or the money | portfolio managers only through the end of the period | ||
| manager line-up. | covered by the report. These views do not necessarily | ||
| In March 2016, RIM added Kopernik to the Fund’s manager line | represent the views of RIM, or any other person in RIM or | ||
| up in order to help diversify the Fund’s active risk and increase | any other affiliated organization. These views are subject | ||
| the Fund’s exposure to cyclical sectors. | to change at any time based upon market conditions or | ||
| other events, and RIM disclaims any responsibility to | |||
| Money Managers as of October 31, | update the views contained herein. These views should not | ||
| 2016 | Styles | be relied on as investment advice and, because investment | |
| Cohen & Steers Capital Management, Inc. | Global Listed Real | decisions for a Russell Investment Company (“RIC”) Fund | |
| Cohen & Steers UK Limited and Cohen & | Estate Securities, | are based on numerous factors, should not be relied on as | |
| Steers Asia Limited | Global Listed | an indication of investment decisions of any RIC Fund. | |
| Infrastructure, | |||
| Preferred Securities | |||
| DDJ Capital Management, LLC | Global High Yield | ||
| Debt | |||
| Epoch Investment Partners, Inc. | Global Equities | ||
* Assumes initial investment on May 1, 2015.
** The BofA Merrill Lynch Global High Yield 2% Constrained Index (USD Hedged) contains all securities in the BofA Merrill Lynch Global High Yield Index
but caps issuer exposure at 2%. Index constituents are capitalization-weighted, based on their current amount outstanding, provided the total allocation to an
individual issuer does not exceed 2%. Issuers that exceed the limit are reduced to 2% and the face value of each of their bonds is adjusted on a pro-rata basis.
Similarly, the face values of bonds of all other issuers that fall below the 2% cap are increased on a pro-rata basis. In the event there are fewer than 50 issuers in
the Index, each is equally weighted and the face values of their respective bonds are increased or decreased on a pro-rata basis.
‡ The performance shown has been adjusted to reflect the deduction of the maximum Class A sales charge of 5.75%.
Performance is historical and assumes reinvestment of all dividends and capital gains. Investment return and principal value will fluctuate so that an investor’s
shares, when redeemed, may be worth more or less than when purchased. Past performance is not indicative of future results. The returns shown do not reflect the
deduction of taxes that a shareholder would pay on Fund distributions or the redemption of Fund shares. Additionally, the returns presented herein may differ from
the performance reported in the Financial Highlights as the returns herein are calculated in a manner consistent with standardized performance in accordance with
Securities and Exchange Commission rules, while the performance in the Financial Highlights has been calculated in accordance with U.S. Generally Accepted
Accounting Principles (“U.S. GAAP”).
Russell Multi-Strategy Income Fund 655
Russell Investment Company
Russell Multi-Strategy Income Fund
Shareholder Expense Example — October 31, 2016 (Unaudited)
| Fund Expenses | Please note that the expenses shown in the table are meant | |||||
| The following disclosure provides important information | to highlight your ongoing costs only and do not reflect any | |||||
| regarding the Fund’s Shareholder Expense Example | transactional costs. Therefore, the information under the heading | |||||
| (“Example”). | “Hypothetical Performance (5% return before expenses)” is | |||||
| useful in comparing ongoing costs only, and will not help you | ||||||
| Example | determine the relative total costs of owning different funds. In | |||||
| As a shareholder of the Fund, you incur two types of costs: (1) | addition, if these transactional costs were included, your costs | |||||
| transaction costs, including sales charges (loads) on certain | would have been higher. | |||||
| purchase or redemption payments, and (2) ongoing costs, | Hypothetical | |||||
| including distribution (12b-1) and/or service fees and other | Performance (5% | |||||
| Fund expenses. The Example is intended to help you understand | Actual | return before | ||||
| your ongoing costs (in dollars) of investing in the Fund and to | Class A | Performance | expenses) | |||
| Beginning Account Value | ||||||
| compare these costs with the ongoing costs of investing in other | May 1, 2016 | $ | 1,000.00 | $ | 1,000.00 | |
| mutual funds. The Example is based on an investment of $1,000 | Ending Account Value | |||||
| invested at the beginning of the period and held for the entire | October 31, 2016 | $ | 1,034.70 | $ | 1,019.61 | |
| period indicated, which for this Fund is from May 1, 2016 to | Expenses Paid During Period* | $ | 5.63 | $ | 5.58 | |
| October 31, 2016. | * Expenses are equal to the Fund's annualized expense ratio of 1.10% | |||||
| (representing the six month period annualized), multiplied by the average | ||||||
| Actual Expenses | account value over the period, multiplied by 184/366 (to reflect the one-half | |||||
| The information in the table under the heading “Actual | year period). May reflect amounts waived and/or reimbursed. Without any | |||||
| Performance” provides information about actual account values | waivers and/or reimbursements, expenses would have been higher. | |||||
| and actual expenses. You may use the information in this column, | ||||||
| Hypothetical | ||||||
| together with the amount you invested, to estimate the expenses | Performance (5% | |||||
| that you paid over the period. Simply divide your account value by | Actual | return before | ||||
| $1,000 (for example, an $8,600 account value divided by $1,000 | Class C | Performance | expenses) | |||
| Beginning Account Value | ||||||
| = 8.6), then multiply the result by the number in the first column | May 1, 2016 | $ | 1,000.00 | $ | 1,000.00 | |
| in the row entitled “Expenses Paid During Period” to estimate | Ending Account Value | |||||
| the expenses you paid on your account during this period. | October 31, 2016 | $ | 1,031.30 | $ | 1,015.84 | |
| Expenses Paid During Period* | $ | 9.45 | $ | 9.37 | ||
| Hypothetical Example for Comparison Purposes | ||||||
| The information in the table under the heading “Hypothetical | * Expenses are equal to the Fund's annualized expense ratio of 1.85% | |||||
| (representing the six month period annualized), multiplied by the average | ||||||
| Performance (5% return before expenses)” provides information | account value over the period, multiplied by 184/366 (to reflect the one-half | |||||
| about hypothetical account values and hypothetical expenses | year period). May reflect amounts waived and/or reimbursed. Without any | |||||
| based on the Fund’s actual expense ratio and an assumed rate of | waivers and/or reimbursements, expenses would have been higher. | |||||
| return of 5% per year before expenses, which is not the Fund’s | ||||||
| Hypothetical | ||||||
| actual return. The hypothetical account values and expenses | Performance (5% | |||||
| may not be used to estimate the actual ending account balance or | Actual | return before | ||||
| expenses you paid for the period. You may use this information | Class E | Performance | expenses) | |||
| to compare the ongoing costs of investing in the Fund and other | Beginning Account Value | |||||
| May 1, 2016 | $ | 1,000.00 | $ | 1,000.00 | ||
| funds. To do so, compare this 5% hypothetical example with the | Ending Account Value | |||||
| 5% hypothetical examples that appear in the shareholder reports | October 31, 2016 | $ | 1,034.60 | $ | 1,019.61 | |
| of other funds. | Expenses Paid During Period* | $ | 5.63 | $ | 5.58 | |
| * Expenses are equal to the Fund's annualized expense ratio of 1.10% | ||||||
| (representing the six month period annualized), multiplied by the average | ||||||
| account value over the period, multiplied by 184/366 (to reflect the one-half | ||||||
| year period). May reflect amounts waived and/or reimbursed. Without any | ||||||
| waivers and/or reimbursements, expenses would have been higher. | ||||||
656 Russell Multi-Strategy Income Fund
Russell Investment Company
Russell Multi-Strategy Income Fund
Shareholder Expense Example, continued — October 31, 2016 (Unaudited)
| Hypothetical | ||||
| Performance (5% | ||||
| Actual | return before | |||
| Class S | Performance | expenses) | ||
| Beginning Account Value | ||||
| May 1, 2016 | $ | 1,000.00 | $ | 1,000.00 |
| Ending Account Value | ||||
| October 31, 2016 | $ | 1,035.80 | $ | 1,020.86 |
| Expenses Paid During Period* | $ | 4.35 | $ | 4.32 |
* Expenses are equal to the Fund's annualized expense ratio of 0.85%
(representing the six month period annualized), multiplied by the average
account value over the period, multiplied by 184/366 (to reflect the one-half
year period). May reflect amounts waived and/or reimbursed. Without any
waivers and/or reimbursements, expenses would have been higher.
| Hypothetical | ||||
| Performance (5% | ||||
| Actual | return before | |||
| Class Y | Performance | expenses) | ||
| Beginning Account Value | ||||
| May 1, 2016 | $ | 1,000.00 | $ | 1,000.00 |
| Ending Account Value | ||||
| October 31, 2016 | $ | 1,036.60 | $ | 1,021.87 |
| Expenses Paid During Period* | $ | 3.33 | $ | 3.30 |
* Expenses are equal to the Fund's annualized expense ratio of 0.65%
(representing the six month period annualized), multiplied by the average
account value over the period, multiplied by 184/366 (to reflect the one-half
year period). May reflect amounts waived and/or reimbursed. Without any
waivers and/or reimbursements, expenses would have been higher.
Russell Multi-Strategy Income Fund 657
Russell Investment Company
Russell Multi-Strategy Income Fund
Schedule of Investments — October 31, 2016
| Amounts in thousands (except share amounts) | Amounts in thousands (except share amounts) | ||||||
| Principal | Fair | Principal | Fair | ||||
| Amount ($) | Value | Amount ($) | Value | ||||
| or Shares | $ | or Shares | $ | ||||
| Long-Term Investments - 62.6% | 3.500% due 04/01/22 | 75 | 77 | ||||
| Asset-Backed Securities - 0.2% | AT&T, Inc. | ||||||
| CLI Funding V LLC | 4.450% due 04/01/24 | 55 | 59 | ||||
| Series 2014-2A Class A | 4.125% due 02/17/26 | 235 | 246 | ||||
| 3.380% due 10/18/29 (Þ) | 112 | 109 | 5.150% due 03/15/42 | 15 | 16 | ||
| Credit Acceptance Auto Loan Trust | 4.300% due 12/15/42 | 150 | 138 | ||||
| Series 2015-1A Class A | 4.800% due 06/15/44 | 5 | 5 | ||||
| 2.000% due 07/15/22 (Þ) | 250 | 251 | 4.350% due 06/15/45 | 235 | 216 | ||
| Zais CLO 5, Ltd. | Aviation Capital Group Corp. | ||||||
| Series 2016-2A Class C | 4.875% due 10/01/25 (Þ) | 114 | 126 | ||||
| 5.216% due 10/15/28 (Å)(Ê) | 1,000 | 955 | Avis Budget Car Rental LLC / Avis | ||||
| 1,315 | Budget Finance, Inc. | ||||||
| Corporate Bonds and Notes - 19.4% | 6.375% due 04/01/24 (Å) | 22 | 22 | ||||
| 99 Cents Only Stores LLC | Avnet, Inc. | ||||||
| 11.000% due 12/15/19 | 220 | 130 | 4.625% due 04/15/26 | 175 | 179 | ||
| Activision Blizzard, Inc. | BAE Systems Holdings, Inc. | ||||||
| 2.300% due 09/15/21 (Þ) | 410 | 409 | 3.850% due 12/15/25 (Þ) | 380 | 403 | ||
| Aetna, Inc. | Baltimore Gas & Electric Co. | ||||||
| 2.400% due 06/15/21 | 110 | 111 | 3.350% due 07/01/23 | 75 | 79 | ||
| 3.200% due 06/15/26 | 145 | 146 | Bank of America Corp. | ||||
| 4.375% due 06/15/46 | 30 | 30 | Series DD | ||||
| Air Lease Corp. | 6.300% due 12/29/49 (ƒ) | 600 | 655 | ||||
| 3.375% due 06/01/21 | 60 | 62 | Series L | ||||
| 4.250% due 09/15/24 | 20 | 21 | 3.950% due 04/21/25 | 380 | 390 | ||
| Albertsons Cos. LLC / Safeway, Inc. / | Series Z | ||||||
| New Albertson's Inc / Albertson's | 6.500% due 12/31/49 (ƒ) | 1,025 | 1,112 | ||||
| LLC | BCD Acquisition, Inc. | ||||||
| 6.625% due 06/15/24 (Þ) | 25 | 26 | 9.625% due 09/15/23 (Þ) | 1,200 | 1,239 | ||
| 5.750% due 03/15/25 (Þ) | 110 | 109 | Becton Dickinson and Co. | ||||
| Aleris International, Inc. | 2.675% due 12/15/19 | 40 | 41 | ||||
| 7.875% due 11/01/20 | 1,400 | 1,400 | 3.734% due 12/15/24 | 75 | 80 | ||
| Alliant Holdings Intermediate LLC | Brixmor Operating Partnership, LP | ||||||
| 8.250% due 08/01/23 (Þ) | 4,060 | 4,131 | 3.875% due 08/15/22 | 60 | 63 | ||
| Ally Financial, Inc. | Burlington Northern Santa Fe LLC | ||||||
| 3.750% due 11/18/19 | 225 | 226 | 3.650% due 09/01/25 | 260 | 281 | ||
| 4.125% due 03/30/20 | 5 | 5 | CBS Radio, Inc. | ||||
| 4.250% due 04/15/21 | 15 | 15 | 7.250% due 11/01/24 (Þ) | 330 | 343 | ||
| 4.125% due 02/13/22 | 235 | 235 | Celgene Corp. | ||||
| Altria Group, Inc. | 5.000% due 08/15/45 | 65 | 70 | ||||
| 2.850% due 08/09/22 | 250 | 257 | Centene Corp. | ||||
| American Airlines Pass-Through Trust | 4.750% due 01/15/25 | 136 | 135 | ||||
| Series B | Century Aluminum Co. | ||||||
| 5.250% due 01/15/24 | 100 | 104 | 7.500% due 06/01/21 (Å) | 5,450 | 4,959 | ||
| American International Group, Inc. | Cheniere Corpus Christi Holdings LLC | ||||||
| 4.875% due 06/01/22 | 55 | 61 | 7.000% due 06/30/24 (Þ) | 3,100 | 3,286 | ||
| 4.800% due 07/10/45 | 110 | 117 | Cigna Corp. | ||||
| American Tire Distributors, Inc. | 3.250% due 04/15/25 | 55 | 56 | ||||
| 10.250% due 03/01/22 (Þ) | 4,320 | 3,972 | Citigroup, Inc. | ||||
| Anadarko Petroleum Corp. | 4.000% due 08/05/24 | 150 | 155 | ||||
| 5.550% due 03/15/26 | 290 | 330 | Series R | ||||
| Anheuser-Busch InBev Finance, Inc. | 6.125% due 12/31/49 (ƒ) | 399 | 417 | ||||
| 2.650% due 02/01/21 | 115 | 118 | Series T | ||||
| 3.300% due 02/01/23 | 365 | 381 | 6.250% due 12/29/49 (ƒ) | 900 | 969 | ||
| 3.650% due 02/01/26 | 225 | 237 | Clear Channel Worldwide Holdings, Inc. | ||||
| 4.700% due 02/01/36 | 30 | 33 | Series A | ||||
| 4.900% due 02/01/46 | 140 | 160 | 6.500% due 11/15/22 | 2,720 | 2,733 | ||
| Anthem, Inc. | Series B | ||||||
| 4.650% due 08/15/44 | 45 | 48 | 7.625% due 03/15/20 | 4,280 | 4,141 | ||
| Arrow Electronics, Inc. | Cleaver-Brooks, Inc. | ||||||
See accompanying notes which are an integral part of the financial statements.
658 Russell Multi-Strategy Income Fund
Russell Investment Company
Russell Multi-Strategy Income Fund
Schedule of Investments, continued — October 31, 2016
| Amounts in thousands (except share amounts) | Amounts in thousands (except share amounts) | ||||||
| Principal | Fair | Principal | Fair | ||||
| Amount ($) | Value | Amount ($) | Value | ||||
| or Shares | $ | or Shares | $ | ||||
| 8.750% due 12/15/19 (Þ) | 1,130 | 1,181 | Duke Energy Corp. | ||||
| Cloud Crane LLC | 3.050% due 08/15/22 | 240 | 250 | ||||
| 10.125% due 08/01/24 (Þ) | 630 | 657 | 2.650% due 09/01/26 | 290 | 282 | ||
| CoBank ACB | Eaton Corp. | ||||||
| Series I | 4.000% due 11/02/32 | 75 | 78 | ||||
| 6.250% due 12/29/49 (ƒ) | 1,080 | 1,168 | Embarq Corp. | ||||
| Comcast Corp. | 7.995% due 06/01/36 | 250 | 254 | ||||
| 4.200% due 08/15/34 | 90 | 96 | Energy Transfer Partners, LP | ||||
| Constellation Brands, Inc. | 4.900% due 02/01/24 | 230 | 241 | ||||
| 3.875% due 11/15/19 | 40 | 42 | 5.150% due 03/15/45 | 75 | 70 | ||
| Constellis Holdings LLC / Constellis | 6.125% due 12/15/45 | 65 | 68 | ||||
| Finance Corp. | Enterprise Products Operating LLC | ||||||
| 9.750% due 05/15/20 (Å) | 500 | 507 | 1.650% due 05/07/18 | 115 | 115 | ||
| Continental Resources, Inc. | Enviva Partners, LP / Enviva Partners | ||||||
| 5.000% due 09/15/22 | 290 | 284 | Finance Corp. | ||||
| 4.500% due 04/15/23 | 460 | 438 | 8.500% due 11/01/21 (Þ) | 930 | 951 | ||
| 3.800% due 06/01/24 | 1,075 | 989 | ERAC USA Finance LLC | ||||
| CRH America, Inc. | 2.800% due 11/01/18 (Þ) | 115 | 117 | ||||
| 3.875% due 05/18/25 (Þ) | 400 | 425 | 3.800% due 11/01/25 (Þ) | 350 | 371 | ||
| Crown Castle International Corp. | 4.500% due 02/15/45 (Þ) | 75 | 77 | ||||
| 3.400% due 02/15/21 | 65 | 67 | Essex Portfolio, LP | ||||
| 3.700% due 06/15/26 | 80 | 82 | 3.250% due 05/01/23 | 150 | 153 | ||
| CSC Holdings LLC | Express Scripts Holding Co. | ||||||
| 5.500% due 04/15/27 (Å) | 1,000 | 1,014 | 3.400% due 03/01/27 | 35 | 34 | ||
| CVS Health Corp. | Series 10YR | ||||||
| 4.125% due 05/15/21 | 115 | 125 | 4.500% due 02/25/26 | 335 | 359 | ||
| 2.125% due 06/01/21 | 225 | 225 | Extraction Oil & Gas Holdings LLC / | ||||
| 2.875% due 06/01/26 | 175 | 174 | Extraction Finance Corp. | ||||
| 5.125% due 07/20/45 | 140 | 163 | 7.875% due 07/15/21 (Þ) | 1,610 | 1,703 | ||
| Daimler Finance NA LLC | FBM Finance, Inc. | ||||||
| 2.700% due 08/03/20 (Þ) | 300 | 308 | 8.250% due 08/15/21 (Þ) | 1,460 | 1,526 | ||
| 2.200% due 10/30/21 (Þ) | 340 | 340 | FedEx Corp. | ||||
| DDR Corp. | 4.550% due 04/01/46 | 110 | 118 | ||||
| 3.375% due 05/15/23 | 30 | 30 | First Data Corp. | ||||
| 3.625% due 02/01/25 | 230 | 231 | 7.000% due 12/01/23 (Þ) | 3,920 | 4,106 | ||
| Delphi Corp. | FirstCash, Inc. | ||||||
| 4.150% due 03/15/24 | 50 | 54 | 6.750% due 04/01/21 | 500 | 522 | ||
| Delta Air Lines Pass-Through Trust | Ford Motor Credit Co. LLC | ||||||
| Series 15-1 Class B | 3.096% due 05/04/23 | 400 | 400 | ||||
| 4.250% due 07/30/23 | 84 | 87 | 4.134% due 08/04/25 | 620 | 644 | ||
| Foresight Energy LLC / Foresight Energy | |||||||
| Devon Energy Corp. | Finance Corp. | ||||||
| 3.250% due 05/15/22 | 305 | 306 | 9.000% due 08/15/21 (Å) | 1,621 | 1,536 | ||
| 5.850% due 12/15/25 | 75 | 86 | Forum Energy Technologies, Inc. | ||||
| Diamond 1 Finance Corp. / Diamond 2 | 6.250% due 10/01/21 | 2,360 | 2,336 | ||||
| Finance Corp | |||||||
| 5.875% due 06/15/21 (Å) | 72 | 76 | Freeport-McMoRan, Inc. | ||||
| 7.125% due 06/15/24 (Å) | 51 | 56 | 5.400% due 11/14/34 | 5 | 4 | ||
| Diamond Offshore Drilling, Inc. | 5.450% due 03/15/43 | 55 | 46 | ||||
| 4.875% due 11/01/43 | 25 | 18 | Frontier Communications Corp. | ||||
| Diebold, Inc. | 6.875% due 01/15/25 | 300 | 251 | ||||
| 8.500% due 04/15/24 (Þ) | 640 | 678 | GATX Corp. | ||||
| Discovery Communications LLC | 3.250% due 03/30/25 | 90 | 89 | ||||
| 4.875% due 04/01/43 | 40 | 38 | General Electric Co. | ||||
| Double Eagle Acquisition Sub, Inc. | 5.875% due 01/14/38 | 185 | 242 | ||||
| 7.500% due 10/01/24 (Þ) | 2,930 | 3,018 | 4.125% due 10/09/42 | 210 | 223 | ||
| Dresdner Funding Trust I | Series D | ||||||
| 8.151% due 06/30/31 (Þ) | 300 | 357 | 5.000% due 12/29/49 (ƒ) | 1,606 | 1,701 | ||
| Duke Energy Carolinas LLC | General Motors Co. | ||||||
| 4.000% due 09/30/42 | 40 | 42 | 5.200% due 04/01/45 | 75 | 76 | ||
See accompanying notes which are an integral part of the financial statements.
Russell Multi-Strategy Income Fund 659
Russell Investment Company
Russell Multi-Strategy Income Fund
Schedule of Investments, continued — October 31, 2016
| Amounts in thousands (except share amounts) | Amounts in thousands (except share amounts) | ||||||
| Principal | Fair | Principal | Fair | ||||
| Amount ($) | Value | Amount ($) | Value | ||||
| or Shares | $ | or Shares | $ | ||||
| General Motors Financial Co., Inc. | 3.200% due 05/01/21 | 275 | 284 | ||||
| 4.000% due 01/15/25 | 285 | 286 | 2.800% due 10/01/26 | 95 | 93 | ||
| Gilead Sciences, Inc. | 4.250% due 04/01/45 | 95 | 95 | ||||
| 4.500% due 02/01/45 | 50 | 52 | Kinder Morgan, Inc. | ||||
| 4.750% due 03/01/46 | 5 | 5 | 5.050% due 02/15/46 | 210 | 203 | ||
| 4.150% due 03/01/47 | 60 | 60 | Kraft Heinz Foods Co. | ||||
| Goldman Sachs Group, Inc. (The) | 3.000% due 06/01/26 | 285 | 282 | ||||
| 3.850% due 07/08/24 | 165 | 174 | 4.375% due 06/01/46 | 65 | 66 | ||
| Series GMTN | LafargeHolcim Finance US LLC | ||||||
| 5.375% due 03/15/20 | 210 | 232 | 4.750% due 09/22/46 (Þ) | 200 | 202 | ||
| Series L | LG FinanceCo Corp. | ||||||
| 5.700% due 12/31/49 (ƒ) | 75 | 76 | 5.875% due 11/01/24 (Þ) | 137 | 138 | ||
| Halyard Health, Inc. | Liberty Mutual Group, Inc. | ||||||
| 6.250% due 10/15/22 | 1,340 | 1,372 | 4.250% due 06/15/23 (Þ) | 140 | 151 | ||
| HCA, Inc. | 7.800% due 03/15/37 (Þ) | 986 | 1,159 | ||||
| 4.750% due 05/01/23 | 5 | 5 | 4.850% due 08/01/44 (Þ) | 90 | 93 | ||
| 5.375% due 02/01/25 | 225 | 230 | Lockheed Martin Corp. | ||||
| Home Depot, Inc. (The) | 3.800% due 03/01/45 | 50 | 50 | ||||
| 2.625% due 06/01/22 | 275 | 284 | 4.700% due 05/15/46 | 70 | 79 | ||
| Host Hotels & Resorts, LP | Marriott International, Inc. | ||||||
| Series D | 2.300% due 01/15/22 | 285 | 285 | ||||
| 3.750% due 10/15/23 | 55 | 55 | Match Group, Inc. | ||||
| HRG Group, Inc. | 6.375% due 06/01/24 | 152 | 164 | ||||
| 7.750% due 01/15/22 | 7,290 | 7,600 | McKesson Corp. | ||||
| HSBC Bank USA | 4.883% due 03/15/44 | 55 | 60 | ||||
| Series BKNT | Medtronic, Inc. | ||||||
| 5.875% due 11/01/34 | 500 | 598 | 3.500% due 03/15/25 | 295 | 313 | ||
| HSBC USA, Inc. | Merck & Co., Inc. | ||||||
| 2.750% due 08/07/20 | 230 | 234 | 2.350% due 02/10/22 | 380 | 387 | ||
| HUB International, Ltd. | MetLife Capital Trust IV | ||||||
| 9.250% due 02/15/21 (Þ) | 1,470 | 1,521 | 7.875% due 12/15/37 (Þ) | 1,275 | 1,632 | ||
| Hyundai Capital America | MetLife Capital Trust X | ||||||
| 3.000% due 10/30/20 (Þ) | 90 | 92 | 9.250% due 04/08/38 (Þ) | 500 | 728 | ||
| 2.750% due 09/27/26 (Þ) | 430 | 415 | MetLife, Inc. | ||||
| Series REGS | 10.750% due 08/01/39 | 50 | 82 | ||||
| 2.600% due 03/19/20 | 190 | 193 | 4.125% due 08/13/42 | 50 | 50 | ||
| IASIS Healthcare LLC / IASIS Capital | Series C | ||||||
| Corp. | 5.250% due 12/29/49 (ƒ) | 451 | 460 | ||||
| 8.375% due 05/15/19 | 400 | 381 | Morgan Stanley | ||||
| International Wire Group, Inc. | 3.950% due 04/23/27 | 50 | 51 | ||||
| 10.750% due 08/01/21 (Þ) | 1,300 | 1,228 | Series GMTN | ||||
| INVISTA Finance LLC | 5.500% due 07/28/21 | 250 | 284 | ||||
| 4.250% due 10/15/19 (Þ) | 100 | 100 | MPH Acquisition Holdings LLC | ||||
| Iron Mountain US Holdings, Inc. | 7.125% due 06/01/24 (Þ) | 2,890 | 3,092 | ||||
| 5.375% due 06/01/26 (Å) | 101 | 102 | MPLX LP | ||||
| Iron Mountain, Inc. | 4.500% due 07/15/23 | 20 | 21 | ||||
| 4.375% due 06/01/21 (Å) | 101 | 104 | 4.875% due 12/01/24 | 10 | 10 | ||
| JDA Escrow LLC / JDA Bond Finance, | |||||||
| Inc. | 4.875% due 06/01/25 | 30 | 31 | ||||
| 7.375% due 10/15/24 (Þ) | 1,490 | 1,538 | Nathan's Famous, Inc. | ||||
| Joseph T Ryerson & Son, Inc. | 10.000% due 03/15/20 (Þ) | 540 | 591 | ||||
| 11.000% due 05/15/22 (Þ) | 680 | 743 | National Rural Utilities Cooperative | ||||
| Finance Corp. | |||||||
| JPMorgan Chase & Co. | 5.250% due 04/20/46 | 286 | 306 | ||||
| 3.200% due 01/25/23 | 80 | 83 | Nationwide Financial Services, Inc. | ||||
| Series 1 | 5.375% due 03/25/21 (Þ) | 172 | 191 | ||||
| 7.900% due 04/29/49 (ƒ) | 1,600 | 1,649 | Newfield Exploration Co. | ||||
| Series S | 5.625% due 07/01/24 | 25 | 26 | ||||
| 6.750% due 01/29/49 (ƒ) | 1,200 | 1,332 | NextEra Energy Capital Holdings, Inc. | ||||
| Kimco Realty Corp. | |||||||
See accompanying notes which are an integral part of the financial statements.
660 Russell Multi-Strategy Income Fund
Russell Investment Company
Russell Multi-Strategy Income Fund
Schedule of Investments, continued — October 31, 2016
| Amounts in thousands (except share amounts) | Amounts in thousands (except share amounts) | ||||||
| Principal | Fair | Principal | Fair | ||||
| Amount ($) | Value | Amount ($) | Value | ||||
| or Shares | $ | or Shares | $ | ||||
| 2.400% due 09/15/19 | 175 | 178 | Series 2015-1 Class B | ||||
| Noble Energy, Inc. | 4.450% due 04/01/24 | 94 | 96 | ||||
| 5.250% due 11/15/43 | 95 | 100 | State Street Corp. | ||||
| Northrop Grumman Corp. | Series F | ||||||
| 3.850% due 04/15/45 | 75 | 76 | 5.250% due 12/29/49 (ƒ) | 200 | 210 | ||
| Oasis Petroleum, Inc. | Summit Midstream Holdings LLC/ | ||||||
| 6.875% due 03/15/22 | 410 | 406 | Summit Midstream Finance Corp. | ||||
| Omega Healthcare Investors, Inc. | 5.500% due 08/15/22 | 2,230 | 2,163 | ||||
| 4.375% due 08/01/23 | 50 | 51 | Surgery Center Holdings, Inc. | ||||
| Opal Acquisition, Inc. | 8.875% due 04/15/21 (Þ) | 3,290 | 3,504 | ||||
| 8.875% due 12/15/21 (Þ) | 5,110 | 4,165 | Tenet Healthcare Corp. | ||||
| Optimas OE Solutions Holding LLC / | 4.500% due 04/01/21 | 260 | 260 | ||||
| Optimas OE Solutions, Inc. | 4.375% due 10/01/21 | 30 | 30 | ||||
| 8.625% due 06/01/21 (Þ) | 3,020 | 2,325 | 6.750% due 06/15/23 | 5,390 | 4,952 | ||
| Owens Corning | Time Warner Cable LLC | ||||||
| 3.400% due 08/15/26 | 50 | 49 | 4.500% due 09/15/42 | 275 | 259 | ||
| Pioneer Natural Resources Co. | Time Warner, Inc. | ||||||
| 4.450% due 01/15/26 | 5 | 5 | 4.875% due 03/15/20 | 65 | 71 | ||
| Platform Specialty Products Corp. | 4.850% due 07/15/45 | 180 | 191 | ||||
| 6.500% due 02/01/22 (Þ) | 710 | 689 | Trans-Allegheny Interstate Line Co. | ||||
| PNC Financial Services Group, Inc. | 3.850% due 06/01/25 (Þ) | 65 | 69 | ||||
| (The) | TransDigm, Inc. | ||||||
| 6.750% due 12/31/49 (ƒ) | 500 | 555 | 5.500% due 10/15/20 | 1,400 | 1,439 | ||
| Principal Financial Group, Inc. | 6.000% due 07/15/22 | 2,260 | 2,356 | ||||
| 3.400% due 05/15/25 | 75 | 77 | Travelers Cos., Inc. (The) | ||||
| Prudential Financial, Inc. | 4.600% due 08/01/43 | 30 | 35 | ||||
| 5.625% due 06/15/43 | 1,794 | 1,929 | United Airlines Pass-Through Trust | ||||
| QCP SNF West/Central/East REIT LLC | |||||||
| 8.125% due 11/01/23 (Þ) | 200 | 202 | 5.375% Series B due 08/15/21 | 74 | 76 | ||
| Qualitytech, LP/QTS Finance Corp. | 4.625% due 09/03/22 | 72 | 74 | ||||
| 5.875% due 08/01/22 | 630 | 647 | United Continental Holdings, Inc. | ||||
| Quicken Loans, Inc. | 6.375% due 06/01/18 | 65 | 68 | ||||
| 5.750% due 05/01/25 (Þ) | 75 | 74 | United Technologies Corp. | ||||
| Radio One, Inc. | 2.650% due 11/01/26 | 90 | 90 | ||||
| 7.375% due 04/15/22 (Å) | 25 | 25 | 3.750% due 11/01/46 | 280 | 278 | ||
| Real Alloy Holding, Inc. | UnitedHealth Group, Inc. | ||||||
| 10.000% due 01/15/19 (Þ) | 3,460 | 3,495 | 2.700% due 07/15/20 | 165 | 170 | ||
| RegionalCare Hospital Partners | |||||||
| Holdings, Inc. | 4.625% due 07/15/35 | 100 | 114 | ||||
| 8.250% due 05/01/23 (Þ) | 4,880 | 4,947 | USI, Inc. | ||||
| Revlon Consumer Products Corp. | 7.750% due 01/15/21 (Þ) | 1,630 | 1,646 | ||||
| 5.750% due 02/15/21 | 1,890 | 1,909 | Veritas US, Inc. / Veritas Bermuda, Ltd. | ||||
| Sabine Pass Liquefaction LLC | 7.500% due 02/01/23 (Þ) | 2,910 | 2,779 | ||||
| 5.625% due 03/01/25 | 2,320 | 2,455 | Verizon Communications, Inc. | ||||
| Santander Holdings USA, Inc. | 2.625% due 02/21/20 | 165 | 168 | ||||
| 4.500% due 07/17/25 | 135 | 138 | 5.150% due 09/15/23 | 90 | 103 | ||
| Sempra Energy | 2.625% due 08/15/26 | 335 | 321 | ||||
| 3.750% due 11/15/25 | 75 | 79 | 5.050% due 03/15/34 | 115 | 125 | ||
| Serta Simmons Bedding LLC | 4.272% due 01/15/36 | 55 | 55 | ||||
| 8.125% due 10/01/20 (Þ) | 1,840 | 1,911 | 4.750% due 11/01/41 | 20 | 21 | ||
| SESI LLC | Virginia Electric & Power Co. | ||||||
| 7.125% due 12/15/21 | 200 | 195 | 4.450% due 02/15/44 | 65 | 73 | ||
| Simmons Foods, Inc. | Vizient, Inc. | ||||||
| 7.875% due 10/01/21 (Þ) | 2,380 | 2,398 | 10.375% due 03/01/24 (Þ) | 3,890 | 4,337 | ||
| Solera LLC / Solera Finance, Inc. | Voya Financial, Inc. | ||||||
| 10.500% due 03/01/24 (Å) | 200 | 224 | 5.650% due 05/15/53 | 500 | 498 | ||
| Southwestern Electric Power Co. | Wells Fargo & Co. | ||||||
| 3.550% due 02/15/22 | 150 | 159 | Series K | ||||
| Spirit Airlines Pass-Through Trust | 7.980% due 03/29/49 (ƒ) | 1,160 | 1,209 | ||||
See accompanying notes which are an integral part of the financial statements.
Russell Multi-Strategy Income Fund 661
Russell Investment Company
Russell Multi-Strategy Income Fund
Schedule of Investments, continued — October 31, 2016
| Amounts in thousands (except share amounts) | Amounts in thousands (except share amounts) | ||||||
| Principal | Fair | Principal | Fair | ||||
| Amount ($) | Value | Amount ($) | Value | ||||
| or Shares | $ | or Shares | $ | ||||
| Series U | 9.000% due 05/29/49 (ƒ) | 400 | 415 | ||||
| 5.875% due 12/31/49 (ƒ) | 750 | 806 | Banco Nacional de Comercio Exterior | ||||
| Westlake Chemical Corp. | SNC | ||||||
| 3.600% due 08/15/26 (Þ) | 25 | 25 | 3.800% due 08/11/26 (Þ) | 140 | 139 | ||
| 5.000% due 08/15/46 (Þ) | 25 | 25 | Banco Nacional de Costa Rica | ||||
| Whiting Petroleum Corp. | 5.875% due 04/25/21 (Þ) | 50 | 52 | ||||
| 5.750% due 03/15/21 | 175 | 162 | Bank of America Corp. | ||||
| Williams Partners, LP | 4.625% due 09/14/18 | 225 | 267 | ||||
| 4.000% due 09/15/25 | 205 | 205 | Barclays PLC | ||||
| Wisconsin Power & Light Co. | 4.375% due 09/11/24 | 395 | 397 | ||||
| 4.100% due 10/15/44 | 175 | 183 | 7.875% due 12/31/49 (ƒ) | 400 | 398 | ||
| Worthington Industries, Inc. | 8.250% due 12/31/49 (ƒ) | 600 | 607 | ||||
| 4.550% due 04/15/26 | 40 | 41 | BGEO Group JSC | ||||
| Xerium Technologies, Inc. | 6.000% due 07/26/23 (Þ) | 125 | 128 | ||||
| 9.500% due 08/15/21 (Þ) | 810 | 822 | Series REGS | ||||
| XPO Logistics, Inc. | 6.000% due 07/26/23 | 200 | 205 | ||||
| 6.500% due 06/15/22 (Þ) | 1,350 | 1,404 | BHP Billiton Finance USA, Ltd. | ||||
| Zayo Group LLC / Zayo Capital, Inc. | 6.250% due 10/19/75 (Þ) | 400 | 433 | ||||
| 6.000% due 04/01/23 | 3,740 | 3,936 | 6.750% due 10/19/75 (Þ) | 1,400 | 1,586 | ||
| Zimmer Biomet Holdings, Inc. | BNP Paribas SA | ||||||
| 3.550% due 04/01/25 | 500 | 509 | 7.625% due 12/29/49 (ƒ)(Þ) | 800 | 836 | ||
| 7.195% due 12/31/49 (ƒ)(Þ) | 200 | 226 | |||||
| 165,694 | BorgWarner, Inc. | ||||||
| International Debt - 13.3% | 1.800% due 11/07/22 | 215 | 250 | ||||
| 1011778 BC Unlimited Liability Co. 1st | |||||||
| Lien Term Loan B2 | Brazilian Government International Bond | ||||||
| 3.750% due 12/12/21 (Ê) | 1,951 | 1,959 | 6.000% due 04/07/26 | 220 | 243 | ||
| Accudyne Industries Borrower / | Camelot Finance SA | ||||||
| Accudyne Industries LLC | 7.875% due 10/15/24 (Þ) | 710 | 726 | ||||
| 7.750% due 12/15/20 (Þ) | 770 | 612 | Canadian Pacific Railway Co. | ||||
| Air Liquide Finance SA | 2.900% due 02/01/25 | 445 | 453 | ||||
| 1.375% due 09/27/19 (Þ) | 295 | 294 | Cemex SAB de CV | ||||
| 1.750% due 09/27/21 (Þ) | 295 | 291 | Series REGS | ||||
| Albemarle Corp. | 7.750% due 04/16/26 | 200 | 224 | ||||
| 1.875% due 12/08/21 | 300 | 347 | Citigroup, Inc. | ||||
| Angolan Government International Bond | 1.375% due 10/27/21 | 330 | 378 | ||||
| 9.500% due 11/12/25 (Þ) | 73 | 71 | Series MPLE | ||||
| Series REGS | 4.090% due 06/09/25 (Þ) | 100 | 77 | ||||
| 9.500% due 11/12/25 | 200 | 196 | CK Hutchison International, Ltd. | ||||
| Aquarius & Investments PLC for Swiss | 1.875% due 10/03/21 (Þ) | 490 | 483 | ||||
| Reinsurance Co., Ltd. | Colombia Government International | ||||||
| 8.250% due 09/29/49 (ƒ) | 650 | 697 | Bond | ||||
| Argentine Republic Government | 4.375% due 07/12/21 | 70 | 75 | ||||
| International Bond | |||||||
| 7.500% due 04/22/26 (Þ) | 140 | 153 | 2.625% due 03/15/23 | 600 | 580 | ||
| 6.625% due 07/06/28 (Þ) | 150 | 154 | 4.000% due 02/26/24 | 50 | 52 | ||
| 8.280% due 12/31/33 | 878 | 985 | 4.500% due 01/28/26 | 730 | 781 | ||
| Series REGS | 7.375% due 09/18/37 | 270 | 346 | ||||
| 7.500% due 04/22/26 | 2,380 | 2,600 | Comision Federal de Electricidad | ||||
| Australia & New Zealand Banking | 4.750% due 02/23/27 (Þ) | 160 | 163 | ||||
| Group, Ltd. - ADR | ConvaTec Finance International SA | ||||||
| 6.750% due 12/31/49 (ƒ)(Þ) | 600 | 659 | 8.250% due 01/15/19 (Þ) | 3,330 | 3,330 | ||
| Avago Technologies Cayman Finance, | ConvaTec Healthcare E SA | ||||||
| Ltd. Term Loan B3 | 10.500% due 12/15/18 (Þ) | 490 | 496 | ||||
| 3.535% due 02/01/23 (Ê) | 1,586 | 1,601 | Cooperatieve Rabobank UA | ||||
| AXA SA | 11.000% due 06/29/49 (ƒ)(Þ) | 1,275 | 1,536 | ||||
| 6.463% due 12/14/18 (ƒ)(Þ) | 350 | 365 | Costa Rica Government International | ||||
| 8.600% due 12/15/30 | 475 | 667 | Bond | ||||
| Baidu, Inc. | Series REGS | ||||||
| 3.250% due 08/06/18 | 600 | 613 | 4.375% due 04/30/25 | 380 | 362 | ||
| Banco Bilbao Vizcaya Argentaria SA | Credit Agricole SA | ||||||
See accompanying notes which are an integral part of the financial statements.
662 Russell Multi-Strategy Income Fund
Russell Investment Company
Russell Multi-Strategy Income Fund
Schedule of Investments, continued — October 31, 2016
| Amounts in thousands (except share amounts) | Amounts in thousands (except share amounts) | ||||||
| Principal | Fair | Principal | Fair | ||||
| Amount ($) | Value | Amount ($) | Value | ||||
| or Shares | $ | or Shares | $ | ||||
| 4.375% due 03/17/25 (Þ) | 200 | 204 | Emirates Telecommunications Group | ||||
| 8.125% due 12/31/49 (ƒ)(Þ) | 800 | 859 | Co. PJSC | ||||
| Series REGS | Series GMTN | ||||||
| 4.375% due 03/17/25 | 400 | 408 | 2.375% due 06/18/19 | 600 | 605 | ||
| Credit Suisse Group AG | Enel SpA | ||||||
| 7.500% due 12/31/49 (ƒ)(Þ) | 400 | 414 | 8.750% due 09/24/73 (Þ) | 1,050 | 1,225 | ||
| Croatia Government International Bond | Eskom Holdings SOC, Ltd. | ||||||
| Series REGS | Series REGS | ||||||
| 5.500% due 04/04/23 | 450 | 490 | 6.750% due 08/06/23 | 100 | 103 | ||
| Dai-ichi Life Insurance Co., Ltd. (The) | Evergreen Skills Lux Sarl | ||||||
| 7.250% due 12/29/49 (ƒ)(Þ) | 600 | 708 | 5.750% due 04/28/21 (Ê) | 4,203 | 3,737 | ||
| 4.000% due 12/31/49 (ƒ)(Þ) | 600 | 601 | 9.250% due 04/28/22 (Ê) | 2,070 | 1,387 | ||
| Danone SA | FedEx Corp. | ||||||
| 2.947% due 11/02/26 (Þ) | 540 | 539 | 1.625% due 01/11/27 | 450 | 509 | ||
| FMG Resources Pty, Ltd. Covenant-Lite | |||||||
| Delphi Automotive PLC | 1st Lien Term Loan B | ||||||
| 3.150% due 11/19/20 | 25 | 26 | 3.750% due 06/30/19 | 2,024 | 2,022 | ||
| 4.250% due 01/15/26 | 140 | 151 | Gabon Government International Bond | ||||
| Delta 2 Lux Sarl 2nd Lien Term Loan | Series REGS | ||||||
| 7.750% due 07/29/22 (Ê) | 1,500 | 1,510 | 6.950% due 06/16/25 | 200 | 184 | ||
| Delta 2 Lux Sarl Term Loan B3 | Ghana Government International Bond | ||||||
| 4.750% due 07/30/21 (Ê) | 2,500 | 2,503 | Series REGS | ||||
| Demeter Investments BV for Swiss Re, | 7.875% due 08/07/23 | 30 | 29 | ||||
| Ltd. | |||||||
| 5.625% due 08/15/52 | 550 | 566 | 8.125% due 01/18/26 | 1,125 | 1,077 | ||
| Dominican Republic International Bond | Global SC Finance II SRL | ||||||
| 6.875% due 01/29/26 (Þ) | 540 | 598 | Series 2014-1A Class A1 | ||||
| Series REGS | 3.190% due 07/17/29 (Þ) | 194 | 186 | ||||
| 7.500% due 05/06/21 | 45 | 50 | GTH Finance BV | ||||
| 6.875% due 01/29/26 | 635 | 703 | Series REGS | ||||
| 7.450% due 04/30/44 | 165 | 183 | 7.250% due 04/26/23 | 200 | 213 | ||
| 6.850% due 01/27/45 | 525 | 546 | HSBC Capital Funding, LP | ||||
| Dubai Electricity & Water Authority | 10.176% due 12/29/49 (ƒ)(Þ) | 600 | 906 | ||||
| Series REGS | HSBC Holdings PLC | ||||||
| 7.375% due 10/21/20 | 100 | 118 | 6.875% due 12/31/49 (ƒ) | 600 | 632 | ||
| Ecuador Government International Bond | ICICI Bank, Ltd. | ||||||
| 10.750% due 03/28/22 (Þ) | 220 | 233 | Series REGS | ||||
| 5.750% due 11/16/20 | 200 | 223 | |||||
| Series REGS | Indonesia Government International | ||||||
| 10.750% due 03/28/22 | 260 | 275 | Bond | ||||
| 7.950% due 06/20/24 | 705 | 664 | Series REGS | ||||
| EDP Finance BV | 5.875% due 01/15/24 | 250 | 290 | ||||
| 4.900% due 10/01/19 (Þ) | 300 | 318 | 4.125% due 01/15/25 | 390 | 409 | ||
| Egypt Government International Bond | 4.750% due 01/08/26 | 1,130 | 1,232 | ||||
| Series REGS | 6.625% due 02/17/37 | 275 | 345 | ||||
| 5.750% due 04/29/20 | 140 | 143 | 7.750% due 01/17/38 | 90 | 126 | ||
| 5.875% due 06/11/25 | 435 | 403 | 5.125% due 01/15/45 | 635 | 691 | ||
| El Salvador Government International | International Automotive Components | ||||||
| Bond | Group SA | ||||||
| Series REGS | 9.125% due 06/01/18 (Å) | 837 | 793 | ||||
| 7.375% due 12/01/19 | 365 | 385 | Iraq International Bond | ||||
| 7.750% due 01/24/23 | 95 | 104 | Series REGS | ||||
| 5.875% due 01/30/25 | 414 | 410 | 5.800% due 01/15/28 | 300 | 241 | ||
| 6.375% due 01/18/27 | 20 | 20 | Itau Unibanco Holding SA | ||||
| 7.650% due 06/15/35 | 30 | 31 | 2.850% due 05/26/18 (Þ) | 200 | 199 | ||
| 7.625% due 02/01/41 | 172 | 176 | Ivory Coast Government International | ||||
| Embraer Netherlands Finance BV | Bond | ||||||
| 5.050% due 06/15/25 | 155 | 155 | Series REGS | ||||
| Emera, Inc. | 5.750% due 12/31/32 | 1,772 | 1,736 | ||||
| Series 16-A | Jamaica Government International Bond | ||||||
| 6.750% due 06/15/76 | 1,507 | 1,665 | 6.750% due 04/28/28 | 205 | 232 | ||
See accompanying notes which are an integral part of the financial statements.
Russell Multi-Strategy Income Fund 663
Russell Investment Company
Russell Multi-Strategy Income Fund
Schedule of Investments, continued — October 31, 2016
| Amounts in thousands (except share amounts) | Amounts in thousands (except share amounts) | |||||||
| Principal | Fair | Principal | Fair | |||||
| Amount ($) | Value | Amount ($) | Value | |||||
| or Shares | $ | or Shares | $ | |||||
| 8.500% due 02/28/36 | 100 | 118 | 7.000% due 05/01/19 (Ê) | 124 | 117 | |||
| 8.000% due 03/15/39 | 151 | 176 | Moody's Corp. | |||||
| Jordan Government International Bond | 1.750% due 03/09/27 | 300 | 344 | |||||
| 6.125% due 01/29/26 (Þ) | 15 | 16 | Morgan Stanley | |||||
| 5.750% due 01/31/27 (Þ) | 180 | 179 | 1.875% due 03/30/23 | 300 | 348 | |||
| JPMorgan Chase & Co. | Morocco Government International Bond | |||||||
| 1.500% due 01/27/25 | 275 | 315 | Series REGS | |||||
| Kazakhstan Government International | 5.500% due 12/11/42 | 200 | 225 | |||||
| Bond | Myriad International Holdings BV | |||||||
| Series REGS | Series REGS | |||||||
| 3.875% due 10/14/24 | 140 | 145 | 5.500% due 07/21/25 | 200 | 212 | |||
| 5.125% due 07/21/25 | 485 | 537 | Namibia International Bonds | |||||
| 6.500% due 07/21/45 | 200 | 239 | 5.250% due 10/29/25 (Þ) | 30 | 31 | |||
| KazMunayGas National Co. JSC | Nippon Life Insurance Co. | |||||||
| Series REGS | 4.700% due 01/20/46 (Þ) | 700 | 751 | |||||
| 9.125% due 07/02/18 | 200 | 219 | Noble Holding International, Ltd. | |||||
| Kenya Government International Bond | 6.200% due 08/01/40 | 5 | 3 | |||||
| Series REGS | 6.050% due 03/01/41 | 5 | 3 | |||||
| 6.875% due 06/24/24 | 250 | 249 | 5.250% due 03/15/42 | 5 | 3 | |||
| Koninklijke Ahold Delhaize NV | OCP SA | |||||||
| 5.700% due 10/01/40 | 100 | 119 | Series REGS | |||||
| Lamar Funding, Ltd. | 5.625% due 04/25/24 | 400 | 430 | |||||
| Series REGS | Oman Government International Bond | |||||||
| 3.958% due 05/07/25 | 255 | 244 | 3.625% due 06/15/21 (Þ) | 60 | 61 | |||
| Linxens France SA 2nd Lien Term Loan | Series REGS | |||||||
| 9.500% due 07/15/23 | 310 | 309 | 4.750% due 06/15/26 | 310 | 312 | |||
| Lloyds Bank PLC | Ooredoo International Finance, Ltd. | |||||||
| 2.350% due 09/05/19 | 400 | 407 | 3.750% due 06/22/26 (Þ) | 50 | 51 | |||
| Lloyds Banking Group PLC | Series REGS | |||||||
| 4.500% due 11/04/24 | 600 | 620 | 5.000% due 10/19/25 | 400 | 450 | |||
| 7.500% due 12/31/49 (ƒ) | 400 | 412 | Pakistan Government International Bond | |||||
| Mallinckrodt International Finance SA / | ||||||||
| Mallinckrodt CB LLC | Series REGS | |||||||
| 5.625% due 10/15/23 (Å) | 28 | 26 | 8.250% due 04/15/24 | 220 | 248 | |||
| MEG Energy Corp. | Panama Government International Bond | |||||||
| 6.375% due 01/30/23 (Þ) | 410 | 338 | 4.000% due 09/22/24 | 150 | 161 | |||
| 7.000% due 03/31/24 (Þ) | 1,580 | 1,296 | 7.125% due 01/29/26 | 107 | 142 | |||
| Mercer International, Inc. | 8.875% due 09/30/27 | 253 | 373 | |||||
| 7.000% due 12/01/19 | 760 | 788 | 9.375% due 04/01/29 | 390 | 593 | |||
| Methanex Corp. | Paraguay Government International | |||||||
| Bond | ||||||||
| 3.250% due 12/15/19 | 40 | 40 | 5.000% due 04/15/26 (Þ) | 70 | 74 | |||
| Mexico City Airport Trust | Series REGS | |||||||
| 4.250% due 10/31/26 (Þ) | 100 | 102 | 4.625% due 01/25/23 | 510 | 532 | |||
| Mexico Government International Bond | 5.000% due 04/15/26 | 100 | 106 | |||||
| 4.000% due 10/02/23 | 590 | 620 | 6.100% due 08/11/44 | 490 | 542 | |||
| 8.300% due 08/15/31 | 170 | 270 | Parq Holdings, LP Term Loan | |||||
| 6.050% due 01/11/40 | 232 | 276 | 8.500% due 12/17/20 (Ê) | 820 | 789 | |||
| 4.750% due 03/08/44 | 276 | 275 | Pernod Ricard SA | |||||
| MidOcean Credit CLO III | 5.500% due 01/15/42 (Þ) | 450 | 532 | |||||
| Series 2014-3A Class E | Pertamina Persero PT | |||||||
| 5.947% due 07/21/26 (Ê)(Þ) | 825 | 700 | Series REGS | |||||
| Mohawk Industries, Inc. | 4.875% due 05/03/22 | 108 | 115 | |||||
| 2.000% due 01/14/22 | 335 | 388 | 4.300% due 05/20/23 | 345 | 358 | |||
| Mongolia Government International | ||||||||
| Bond | 6.000% due 05/03/42 | 140 | 148 | |||||
| Series REGS | 5.625% due 05/20/43 | 150 | 150 | |||||
| 10.875% due 04/06/21 | 10 | 11 | Perusahaan Penerbit SBSN Indonesia III | |||||
| 5.125% due 12/05/22 | 220 | 194 | 4.550% due 03/29/26 (Þ) | 80 | 84 | |||
| Mood Media Corp. Term Loan | Peruvian Government International Bond | |||||||
See accompanying notes which are an integral part of the financial statements.
664 Russell Multi-Strategy Income Fund
Russell Investment Company
Russell Multi-Strategy Income Fund
Schedule of Investments, continued — October 31, 2016
| Amounts in thousands (except share amounts) | Amounts in thousands (except share amounts) | ||||||
| Principal | Fair | Principal | Fair | ||||
| Amount ($) | Value | Amount ($) | Value | ||||
| or Shares | $ | or Shares | $ | ||||
| 4.125% due 08/25/27 | 270 | 301 | Simon Property Group, LP | ||||
| 8.750% due 11/21/33 | 270 | 426 | 2.375% due 10/02/20 | 300 | 356 | ||
| Petrobras Global Finance BV | Sky PLC | ||||||
| 3.737% due 03/17/20 (Ê) | 95 | 93 | Series REGS | ||||
| 8.375% due 05/23/21 | 790 | 874 | 3.750% due 09/16/24 | 600 | 616 | ||
| Petroleos de Venezuela SA | Slovenia Government International Bond | ||||||
| 5.375% due 04/12/27 | 81 | 30 | Series REGS | ||||
| Series REGS | 4.125% due 02/18/19 | 870 | 913 | ||||
| 8.500% due 11/02/17 | 97 | 71 | 5.500% due 10/26/22 | 505 | 584 | ||
| 9.000% due 11/17/21 | 37 | 18 | Societe Generale SA | ||||
| 12.750% due 02/17/22 | 235 | 139 | 7.375% due 12/29/49 (ƒ)(Þ) | 200 | 198 | ||
| 9.750% due 05/17/35 | 135 | 60 | South Africa Government International | ||||
| Petroleos Mexicanos | Bond | ||||||
| 5.625% due 01/23/46 | 279 | 241 | 4.300% due 10/12/28 | 380 | 368 | ||
| Sri Lanka Government International | |||||||
| Series REGS | Bond | ||||||
| 6.375% due 02/04/21 | 190 | 208 | 5.750% due 01/18/22 (Þ) | 360 | 365 | ||
| 6.875% due 08/04/26 | 290 | 324 | 6.850% due 11/03/25 (Þ) | 130 | 137 | ||
| Philip Morris International, Inc. | Series REGS | ||||||
| 1.750% due 03/19/20 | 240 | 278 | 5.875% due 07/25/22 | 60 | 61 | ||
| Playa Resorts Holding BV 1st Lien Term | 6.125% due 06/03/25 | 315 | 316 | ||||
| Loan B | |||||||
| 4.000% due 08/09/19 (Ê) | 1,989 | 1,984 | Standard Chartered PLC | ||||
| PPG Industries, Inc. | 3.950% due 01/11/23 (Þ) | 200 | 199 | ||||
| 0.875% due 11/03/25 | 100 | 109 | Sumitomo Life Insurance Co. | ||||
| Prologis, LP | 6.500% due 09/20/73 (Þ) | 200 | 237 | ||||
| 3.000% due 06/02/26 | 305 | 387 | Teine Energy, Ltd. | ||||
| QBE Insurance Group, Ltd. | 6.875% due 09/30/22 (Þ) | 580 | 590 | ||||
| 6.750% due 12/02/44 | 1,100 | 1,201 | Telecom Italia Capital SA | ||||
| 5.875% due 06/17/46 | 606 | 627 | 6.000% due 09/30/34 | 65 | 65 | ||
| Republic of Azerbaijan International | Telefonica Emisiones SAU | ||||||
| Bond | 5.462% due 02/16/21 | 135 | 152 | ||||
| Series REGS | 7.045% due 06/20/36 | 15 | 19 | ||||
| 4.750% due 03/18/24 | 450 | 465 | Telstra Corp., Ltd. | ||||
| Republic of South Africa Government | 3.125% due 04/07/25 (Þ) | 15 | 15 | ||||
| International Bond | Teva Pharmaceutical Finance | ||||||
| 5.875% due 05/30/22 | 40 | 45 | Netherlands III BV | ||||
| 5.875% due 09/16/25 | 605 | 679 | 2.800% due 07/21/23 | 120 | 118 | ||
| 5.375% due 07/24/44 | 5 | 5 | TIAA CLO I, Ltd. | ||||
| Republic of Suriname | Series 2016-1A Class E1 | ||||||
| 9.250% due 10/26/26 (Þ) | 380 | 397 | 8.736% due 07/20/28 (Å)(Ê) | 279 | 276 | ||
| Royal Bank of Scotland Group PLC | Trader Corp. Term Loan | ||||||
| 6.100% due 06/10/23 | 50 | 52 | 5.000% due 08/09/23 | 1,000 | 1,005 | ||
| 5.125% due 05/28/24 | 335 | 331 | Transcanada Trust | ||||
| 7.648% due 09/30/49 (ƒ) | 240 | 284 | 5.625% due 05/20/75 | 175 | 177 | ||
| Russia Government International Bond | Series 16-A | ||||||
| 4.750% due 05/27/26 (Þ) | 200 | 212 | 5.875% due 08/15/76 | 1,638 | 1,753 | ||
| Series REGS | Travelport Finance Luxembourg Sarl | ||||||
| 4.875% due 09/16/23 | 400 | 430 | Term Loan B | ||||
| Russian Foreign Bond - Eurobond | 5.000% due 09/02/21 (Ê) | 1,220 | 1,227 | ||||
| Turkey Government International Bond | |||||||
| 4.500% Series REGS due 04/04/22 | 600 | 633 | 4.250% due 04/14/26 | 50 | 48 | ||
| 7.500% due 03/31/30 | 60 | 72 | 4.875% due 10/09/26 | 615 | 613 | ||
| 5.625% due 04/04/42 | 200 | 221 | 6.625% due 02/17/45 | 775 | 869 | ||
| Senegal Government International Bond | UBS Group AG | ||||||
| Series REGS | 7.125% due 12/29/49 (ƒ) | 1,000 | 1,023 | ||||
| 6.250% due 07/30/24 | 380 | 391 | Ukraine Government International Bond | ||||
| Serbia Government International Bond | Series REGS | ||||||
| Series REGS | 7.750% due 09/01/22 | 405 | 396 | ||||
| 7.250% due 09/28/21 | 435 | 500 | 7.750% due 09/01/27 | 375 | 356 | ||
| Ukreximbank Via Biz Finance PLC | |||||||
See accompanying notes which are an integral part of the financial statements.
Russell Multi-Strategy Income Fund 665
Russell Investment Company
Russell Multi-Strategy Income Fund
Schedule of Investments, continued — October 31, 2016
| Amounts in thousands (except share amounts) | Amounts in thousands (except share amounts) | ||||||
| Principal | Fair | Principal | Fair | ||||
| Amount ($) | Value | Amount ($) | Value | ||||
| or Shares | $ | or Shares | $ | ||||
| Series REGS | 5.250% due 10/11/24 | 320 | 324 | ||||
| 9.625% due 04/27/22 | 210 | 207 | AP Gaming I LLC 1st Lien Term Loan B | ||||
| 9.750% due 01/22/25 | 400 | 385 | 9.250% due 12/20/20 (Ê) | 496 | 483 | ||
| Uruguay Government International Bond | Arbor Pharmaceuticals, Inc. Term Loan | ||||||
| 4.375% due 10/27/27 | 795 | 840 | B | ||||
| 5.100% due 06/18/50 | 230 | 229 | 6.000% due 06/28/23 | 1,000 | 1,008 | ||
| Venezuela Government International | Arctic Glacier USA, Inc. 1st Lien Term | ||||||
| Bond | Loan | ||||||
| 6.000% due 05/13/19 (Ê) | 2,127 | 2,095 | |||||
| Series REGS | AssuredPartners, Inc. 1st Lien Term | ||||||
| 7.000% due 12/01/18 | 20 | 12 | Loan | ||||
| 7.750% due 10/13/19 | 60 | 31 | 5.750% due 10/21/22 (Ê) | 499 | 501 | ||
| 6.000% due 12/09/20 | 100 | 44 | Asurion LLC Term Loan 2 | ||||
| 9.000% due 05/07/23 | 57 | 26 | 8.500% due 03/03/21 (Ê) | 3,130 | 3,152 | ||
| 8.250% due 10/13/24 | 75 | 33 | Asurion LLC Term Loan B4 | ||||
| 7.650% due 04/21/25 | 170 | 73 | 5.000% due 08/04/22 (Ê) | 2,223 | 2,233 | ||
| Veresen Midstream, LP Term Loan B1 | Avantor Performance Materials Holdings, | ||||||
| 5.250% due 03/31/22 (Ê) | 1,995 | 1,984 | Inc. 1st Lien Term Loan | ||||
| Vietnam Government International Bond | 6.000% due 06/21/22 (Ê) | 1,095 | 1,102 | ||||
| Series REGS | Avaya, Inc. Term Loan B7 | ||||||
| 4.800% due 11/19/24 | 160 | 169 | 6.250% due 05/29/20 (Ê) | 1,964 | 1,607 | ||
| Virgin Media Investment Holdings, Ltd. | BBB Industries US Holdings, Inc. Term | ||||||
| Term Loan F | Loan B | ||||||
| 3.500% due 06/30/23 (Ê) | 1,400 | 1,405 | 9.750% due 11/03/22 (Ê) | 250 | 229 | ||
| WPP Finance | Berlin Packaging LLC 2nd Lien Term | ||||||
| 5.625% due 11/15/43 | 170 | 197 | Loan | ||||
| Ziggo Bond Finance BV | 7.750% due 10/01/22 (Ê) | 1,000 | 1,007 | ||||
| 6.000% due 01/15/27 (Þ) | 150 | 147 | BioScrip, Inc. 1st Lien Term Loan B | ||||
| 6.500% due 07/31/20 (Ê) | 1,017 | 997 | |||||
| 112,837 | BioScrip, Inc. Term Loan B | ||||||
| Loan Agreements - 19.6% | 6.500% due 07/31/20 (Ê) | 1,695 | 1,662 | ||||
| 99 Cents Only Stores LLC New Term | BMC Software Finance, Inc. 1st Lien | ||||||
| Loan | |||||||
| 4.500% due 01/13/19 (Ê) | 228 | 177 | Term Loan B | ||||
| ABG Intermediate Holdings 2, LLC 1st | 5.000% due 09/10/20 (Ê) | 1,489 | 1,466 | ||||
| Lien Term Loan | Boyd Gaming Corp. 1st Lien Term Loan | ||||||
| 5.500% due 05/27/21 (Ê) | 115 | 115 | B2 | ||||
| ABG Intermediate Holdings 2, LLC 2nd | 3.524% due 09/15/23 (Ê) | 1,000 | 1,007 | ||||
| Lien Term Loan | Brickman Group, Ltd. LLC (The) 1st | ||||||
| 9.000% due 05/27/22 (Ê) | 250 | 244 | Lien Term Loan B | ||||
| 4.000% due 12/18/20 (Ê) | 2,058 | 2,054 | |||||
| Accuvant, Inc. 2nd Lien Term Loan | BWAY Holding Co. 1st Lien Term Loan | ||||||
| 10.000% due 01/28/23 (Ê) | 900 | 892 | B | ||||
| Active Network, Inc. (The) 1st Lien Term | 5.500% due 08/14/20 (Ê) | 969 | 975 | ||||
| Loan | Caesars Entertainment Corp. 1st Lien | ||||||
| 5.500% due 11/15/20 (Ê) | 492 | 489 | Term Loan B | ||||
| Albertsons LLC Term Loan B4 | 7.000% due 10/11/20 (Ê) | 3,499 | 3,516 | ||||
| 4.500% due 08/22/21 (Ê) | 2,601 | 2,620 | CareCore National LLC Term Loan 1 | ||||
| Alliant Holdings Intermediate LLC 1st | 5.500% due 03/06/21 (Ê) | 368 | 344 | ||||
| Lien Term Loan B2 | Cast & Crew Payroll LLC 2nd Lien Term | ||||||
| 5.252% due 08/14/22 (Ê) | 374 | 376 | Loan | ||||
| Alvogen Pharmaceutical US, Inc. Term | 8.750% due 08/03/23 (Ê) | 250 | 235 | ||||
| Loan | Cast & Crew Payroll LLC Term Loan B | ||||||
| 6.000% due 04/02/22 (Ê) | 1,446 | 1,446 | 8.750% due 08/03/22 (Ê) | 748 | 745 | ||
| American Airlines, Inc. Term Loan B | CBS Radio, Inc. Term Loan B | ||||||
| 3.250% due 04/28/23 (Ê) | 250 | 250 | 4.500% due 10/06/23 (Ê) | 583 | 586 | ||
| American Airlines, Inc. Term Loan B1 | Cengage Learning Acquisitions, Inc. | ||||||
| 3.250% due 05/21/20 (Ê) | 1,994 | 1,995 | Term Loan B | ||||
| American Builders & Contractors Supply | 5.250% due 06/07/23 (Ê) | 2,287 | 2,233 | ||||
| Co., Inc. Term Loan B1 | Charcoal Holdings LLC 1st Lien Term | ||||||
| 1.000% due 09/23/23 (Ê)(v) | 250 | 251 | Loan | ||||
| Ancestry.com, Inc. 1st Lien Term Loan | 1.000% due 07/03/23 (v) | 1,654 | 1,665 | ||||
| 5.250% due 10/13/23 | 818 | 819 | Charming Charlie LLC Term Loan B | ||||
| Ancestry.com, Inc. 2nd Lien Term Loan | 9.000% due 12/24/19 (Ê) | 239 | 150 | ||||
See accompanying notes which are an integral part of the financial statements.
666 Russell Multi-Strategy Income Fund
Russell Investment Company
Russell Multi-Strategy Income Fund
Schedule of Investments, continued — October 31, 2016
| Amounts in thousands (except share amounts) | Amounts in thousands (except share amounts) | ||||||
| Principal | Fair | Principal | Fair | ||||
| Amount ($) | Value | Amount ($) | Value | ||||
| or Shares | $ | or Shares | $ | ||||
| Charter Communications Operating LLC | 5.000% due 10/03/23 (Ê) | 1,250 | 1,263 | ||||
| Term Loan H | FPC Holdings, Inc. 1st Lien Term Loan | ||||||
| 3.250% due 08/24/21 (Ê) | 2,742 | 2,752 | 5.250% due 11/27/19 (Ê) | 1,116 | 1,004 | ||
| Checkout Holding Corp. Covenant-Lite | FullBeauty Brands Holding Corp. 2nd | ||||||
| 1st Lien Term Loan B | Lien Term Loan | ||||||
| 4.500% due 04/09/21 (Ê) | 1,247 | 1,121 | 10.000% due 09/22/23 | 250 | 207 | ||
| Chrysler Group LLC 1st Lien Term | FullBeauty Brands Holdings Corp. 1st | ||||||
| Loan B | Lien Term Loan | ||||||
| 3.250% due 12/31/18 (Ê) | 2,581 | 2,583 | 5.750% due 10/14/22 (Ê) | 622 | 590 | ||
| Ciena Corp. Term Loan 1 | GENEX Services, Inc. 1st Lien Term | ||||||
| 4.250% due 04/25/21 (Ê) | 498 | 497 | Loan B | ||||
| Cincinnati Bell, Inc. 1st Lien Term | 5.250% due 05/30/21 (Ê) | 997 | 986 | ||||
| Loan B | GENEX Services, Inc. 2nd Lien Term | ||||||
| 4.000% due 09/10/20 (Ê) | 492 | 493 | Loan | ||||
| Cision, Inc. Term Loan B | 8.750% due 05/30/22 (Ê) | 250 | 237 | ||||
| 7.000% due 05/12/23 | 1,247 | 1,203 | Getty Images, Inc. 1st Lien Term Loan B | ||||
| Commercial Barge Line Co. Term Loan | 4.750% due 10/18/19 (Ê) | 985 | 834 | ||||
| B1 | Global Healthcare Exchange LLC Term | ||||||
| 9.750% due 11/12/20 (Ê) | 711 | 687 | Loan B | ||||
| Community Health Systems, Inc. Term | 5.250% due 08/13/22 (Ê) | 339 | 341 | ||||
| Loan B2 | Harbor Freight Tools USA, Inc. Term | ||||||
| 4.000% due 01/27/21 (Ê) | 2,982 | 2,813 | Loan B | ||||
| Compuware Corp. Term Loan B2 | 4.137% due 08/16/23 (Ê) | 1,995 | 2,008 | ||||
| 6.250% due 12/15/21 (Ê) | 1,234 | 1,234 | Harland Clarke Holdings Corp. 1st Lien | ||||
| Consolidated Communications, Inc. Term | Term Loan B4 | ||||||
| Loan B1 | 6.993% due 08/04/19 (Ê) | 1,987 | 1,971 | ||||
| 4.000% due 10/05/23 (Ê) | 650 | 654 | Hawaiian Telcom Communications, Inc. | ||||
| CPI Acquisition, Inc. Term Loan B | Term Loan B | ||||||
| 5.500% due 08/17/22 (Ê) | 407 | 399 | 5.250% due 06/06/19 (Ê) | 166 | 167 | ||
| Creative Artists Agency LLC Term Loan | HCA Inc. Term Loan B7 | ||||||
| B | 3.588% due 03/01/24 | 2,000 | 2,017 | ||||
| 5.000% due 12/17/21 (Ê) | 497 | 500 | Heartland Dental LLC 2nd Lien Term | ||||
| CSC Holdings LLC Term Loan | Loan | ||||||
| 3.876% due 10/31/24 (Ê) | 493 | 495 | 9.750% due 06/21/19 (Ê) | 780 | 764 | ||
| Houghton Mifflin Harcourt Publishers, | |||||||
| CSRA, Inc. Term Loan B1 | Inc. Term Loan B | ||||||
| 1.000% due 10/29/22 (Ê)(v) | 947 | 951 | 4.000% due 05/29/21 (Ê) | 494 | 488 | ||
| CWGS Group LLC Term Loan B1 | Indigo Merger Sub I, Inc. 1st Lien Term | ||||||
| 5.250% due 02/20/20 (Ê) | 1,466 | 1,465 | Loan | ||||
| Dell International LLC 1st Lien Term | 5.000% due 07/08/21 (Ê) | 249 | 250 | ||||
| Loan B | Informatica Corp. 1st Lien Term Loan | ||||||
| 4.000% due 09/07/23 (Ê) | 2,500 | 2,517 | 4.000% due 06/03/22 (Ê) | 1,246 | 1,222 | ||
| Dell Software Group Term Loan B | Intrawest Operations Group LLC Term | ||||||
| 4.000% due 09/23/22 | 1,250 | 1,249 | Loan B1 | ||||
| Donnelley Financial Solutions Term | 4.500% due 12/09/20 (Ê) | 1,000 | 1,007 | ||||
| Loan B | J Crew Group, Inc. Term Loan B | ||||||
| 5.000% due 09/23/23 | 250 | 252 | 4.000% due 03/05/21 (Ê) | 98 | 75 | ||
| EagleView Technology Corp. 2nd Lien | Jill Acquisition LLC Term Loan B1 | ||||||
| Term Loan | |||||||
| 1.000% due 09/28/23 (Ê)(v) | 500 | 496 | 6.000% due 05/23/22 (Ê) | 518 | 505 | ||
| Eastman Kodak Co. Exit Term Loan | Koosharem LLC Exit Term Loan | ||||||
| 7.250% due 09/03/19 (Ê) | 1,743 | 1,739 | 7.500% due 05/16/20 (Ê) | 492 | 437 | ||
| EnergySolutions LLC 1st Lien Term | Kraton Polymers LLC Term Loan B | ||||||
| Loan B | 6.000% due 01/06/22 (Ê) | 1,824 | 1,834 | ||||
| 6.750% due 05/29/20 (Ê) | 2,158 | 2,158 | La Quinta Intermediate Holdings LLC | ||||
| ESH Hospitality, Inc. 1st Lien Term | Covenant-Lite Term Loan B | ||||||
| Loan B | 3.750% due 04/14/21 (Ê) | 997 | 995 | ||||
| 3.750% due 08/30/23 (Ê) | 1,500 | 1,508 | Lannett Co., Inc. Term Loan A | ||||
| Fairmount Santrol, Inc. 1st Lien Term | 5.750% due 11/25/20 (Ê) | 1,234 | 1,203 | ||||
| Loan B2 | Level 3 Financing, Inc. Term Loan B2 | ||||||
| 4.500% due 09/05/19 (Ê) | 1,047 | 992 | 3.500% due 05/31/22 (Ê) | 1,500 | 1,506 | ||
| First Data Corp. Term Loan B | LTS Buyer LLC 2nd Lien Term Loan | ||||||
| 4.425% due 07/10/22 (Ê) | 2,250 | 2,265 | 8.000% due 04/01/21 (Ê) | 470 | 470 | ||
| FOCUS Brands, Inc. 1st Lien Term Loan | Match Group, Inc. Term Loan B1 | ||||||
See accompanying notes which are an integral part of the financial statements.
Russell Multi-Strategy Income Fund 667
Russell Investment Company
Russell Multi-Strategy Income Fund
Schedule of Investments, continued — October 31, 2016
| Amounts in thousands (except share amounts) | Amounts in thousands (except share amounts) | ||||||
| Principal | Fair | Principal | Fair | ||||
| Amount ($) | Value | Amount ($) | Value | ||||
| or Shares | $ | or Shares | $ | ||||
| 5.500% due 10/27/22 (Ê) | 599 | 602 | Power Buyer LLC 2nd Lien Term Loan | ||||
| MCC Iowa LLC Term Loan H | 8.250% due 11/06/20 (Ê) | 250 | 249 | ||||
| 3.250% due 01/29/21 (Ê) | 492 | 496 | Pre-Paid Legal Services, Inc. 2nd Lien | ||||
| Media General, Inc. 1st Lien Term Loan | Term Loan | ||||||
| B | 10.250% due 07/01/20 (Ê) | 250 | 247 | ||||
| 4.000% due 07/31/20 (Ê) | 434 | 434 | Prime Security Services Borrower LLC | ||||
| Mediware Information Systems, Inc. | Term Loan B1 | ||||||
| 2016 1st Lien Term Loan | 4.750% due 04/21/22 (Ê) | 873 | 879 | ||||
| 5.750% due 09/28/23 | 250 | 251 | QoL meds LLC 2nd Lien Term Loan | ||||
| Mergermarket USA, Inc. 1st Lien Term | 1.000% due 10/25/24 (Å)(v) | 2,040 | 2,030 | ||||
| Loan | Quincy Newspapers, Inc. Term Loan B | ||||||
| 4.500% due 02/04/21 (Ê) | 880 | 865 | 5.500% due 11/02/22 (Ê) | 993 | 997 | ||
| MGM Growth Properties, LLC 1st Lien | |||||||
| Term Loan B | Realogy Group LLC Term Loan B | ||||||
| 4.000% due 04/25/23 (Ê) | 997 | 999 | 3.750% due 07/14/22 (Ê) | 998 | 1,005 | ||
| Michaels Stores, Inc. Term Loan B1 | Renaissance Learning, Inc. 1st Lien | ||||||
| Term Loan | |||||||
| 3.750% due 01/28/23 (Ê) | 217 | 219 | 4.500% due 04/09/21 (Ê) | 500 | 498 | ||
| MRI Software LLC Term Loan | RentPath, Inc. 1st Lien Term Loan B | ||||||
| 5.250% due 06/18/21 | 364 | 362 | 6.250% due 12/17/21 (Ê) | 985 | 935 | ||
| MSC.Software Corp. 1st Lien Term Loan | Reynolds Group Holdings, Inc. 1st Lien | ||||||
| 5.000% due 05/29/20 (Ê) | 742 | 739 | Term Loan | ||||
| Nautilus Merger Sub, Inc. 2nd Lien Term | 4.250% due 01/21/23 (Ê) | 500 | 501 | ||||
| Loan | Riverbed Technology, Inc. Term Loan | ||||||
| 6.750% due 03/13/22 (Ê) | 1,280 | 1,221 | 5.000% due 04/27/22 (Ê) | 2,000 | 2,015 | ||
| Navistar, Inc. 1st Lien Term Loan B | ROC Finance LLC Term Loan B1 | ||||||
| 6.500% due 08/07/20 (Ê) | 248 | 249 | 5.000% due 06/20/19 (Ê) | 1,637 | 1,635 | ||
| NBTY, Inc. Term Loan B | Rovi Solutions Corp. 1st Lien Term | ||||||
| 5.000% due 05/05/23 (Ê) | 1,247 | 1,250 | Loan B | ||||
| New Asurion Corp. Term Loan B | 3.750% due 07/02/21 (Ê) | 622 | 623 | ||||
| 1.000% due 08/10/21 (v) | 1,960 | 1,973 | Royal Holdings, Inc. Term Loan | ||||
| New Millennium Holding Co., Inc. Exit | 8.500% due 06/19/23 (Ê) | 390 | 382 | ||||
| Term Loan | RPI Finance Trust Term Loan B5 | ||||||
| 7.500% due 12/21/20 (Ê) | 82 | 52 | 3.035% due 10/04/22 | 200 | 201 | ||
| Nielsen Finance LLC Term Loan B3 | Scientific Games International, Inc. Term | ||||||
| 3.031% due 10/04/23 (Ê) | 500 | 502 | Loan B2 | ||||
| Numericable US LLC Term Loan B6 | 6.000% due 10/01/21 (Ê) | 2,974 | 2,985 | ||||
| 4.750% due 02/10/23 (Ê) | 248 | 248 | SCS Holdings, Inc. 1st Lien Term Loan | ||||
| Numericable US LLC Term Loan B7 | 6.000% due 10/30/22 (Ê) | 494 | 496 | ||||
| 5.000% due 01/31/24 (Ê) | 2,239 | 2,257 | SeaWorld Parks & Entertainment, Inc. | ||||
| NVA Holdings, Inc. 2nd Lien Term Loan | Incremental Term Loan B3 | ||||||
| 8.000% due 08/14/22 (Ê) | 170 | 170 | 4.000% due 05/14/20 (Ê) | 1,935 | 1,939 | ||
| Signode Industrial Group US, Inc. 1st | |||||||
| ON Semiconductor Corp. Term Loan B1 | Lien Term Loan B | ||||||
| 3.777% due 03/31/23 (Ê) | 250 | 251 | 3.750% due 05/01/21 (Ê) | 1,484 | 1,481 | ||
| Opal Acquisition, Inc. 1st Lien Term | SIRVA Worldwide, Inc. 1st Lien Term | ||||||
| Loan B | Loan | ||||||
| 5.000% due 11/27/20 (Ê) | 1,532 | 1,408 | 7.500% due 03/27/19 (Ê) | 2,645 | 2,625 | ||
| Patterson Co. 2nd Lien Term Loan | SolarWinds Holdings, Inc. Term Loan | ||||||
| 8.750% due 08/28/23 (Å)(Ê) | 590 | 572 | 5.500% due 02/05/23 (Ê) | 2,096 | 2,105 | ||
| PET Acquisition Merger Sub LLC 1st | Solera LLC Term Loan B | ||||||
| Lien Term Loan B1 | |||||||
| 8.250% due 01/26/23 (Ê) | 1,246 | 1,256 | 5.750% due 03/04/23 (Ê) | 1,232 | 1,245 | ||
| PetSmart, Inc. Term Loan B | SourceHOV LLC 1st Lien Term Loan B | ||||||
| 4.000% due 03/10/22 | 1,798 | 1,801 | 7.750% due 10/31/19 (Ê) | 493 | 427 | ||
| PFS Acquisition LLC 2nd Lien Term | Spectrum Brands, Inc. Term Loan B1 | ||||||
| Loan | 3.250% due 06/23/22 (Ê) | 801 | 808 | ||||
| 1.000% due 01/31/22 (Ê)(v) | 1,890 | 1,569 | 5.000% due 06/23/22 (Ê) | 2 | 1 | ||
| Pinnacle Entertainment, Inc. Term Loan | Steak n Shake Operations, Inc. Term | ||||||
| B | Loan B1 | ||||||
| 3.250% due 04/28/23 | 653 | 657 | 4.750% due 03/19/21 (Ê) | 541 | 536 | ||
| Pinnacle Foods Finance LLC Term | Sterigenics-Nordion Holdings LLC 1st | ||||||
| Loan 1 | Lien Term Loan B | ||||||
| 3.284% due 01/13/23 (Ê) | 499 | 503 | 4.250% due 05/15/22 (Ê) | 994 | 989 | ||
See accompanying notes which are an integral part of the financial statements.
668 Russell Multi-Strategy Income Fund
Russell Investment Company
Russell Multi-Strategy Income Fund
Schedule of Investments, continued — October 31, 2016
| Amounts in thousands (except share amounts) | Amounts in thousands (except share amounts) | |||||||
| Principal | Fair | Principal | Fair | |||||
| Amount ($) | Value | Amount ($) | Value | |||||
| or Shares | $ | or Shares | $ | |||||
| Sterling Midco Holdings, Inc. 2nd Lien | 165 | |||||||
| Term Loan | Non-US Bonds - 9.6% | |||||||
| 8.750% due 06/19/23 (Ê) | 710 | 682 | ||||||
| TCH-2 Holdings LLC 1st Lien Term | Alimentation Couche-Tard, Inc. | |||||||
| Loan | Series 2 | |||||||
| 5.500% due 05/12/21 (Ê) | 998 | 998 | 3.319% due 11/01/19 | CAD | 170 | 132 | ||
| TCH-2 Holdings LLC Covenant-Lite 2nd | Allianz Finance II BV | |||||||
| Lien Term Loan | 5.750% due 07/08/41 | EUR | 300 | 383 | ||||
| 8.750% due 11/12/21 (Ê) | 500 | 490 | America Movil SAB de CV | |||||
| TerraForm AP Acquisition Holdings LLC | 1.500% due 03/10/24 | EUR | 170 | 192 | ||||
| 1st Lien Term Loan B | Aquarius & Investments PLC for Zurich | |||||||
| 8.500% due 06/26/22 (Ê) | 1,093 | 1,082 | Insurance Co., Ltd. | |||||
| TMS International Corp. Term Loan B1 | 4.250% due 10/02/43 | EUR | 235 | 285 | ||||
| 4.500% due 10/16/20 (Ê) | 748 | 736 | Aviva PLC | |||||
| Tribune Media Co. 1st Lien Term Loan B | 6.625% due 06/03/41 | GBP | 200 | 268 | ||||
| 3.750% due 12/27/20 (Ê) | 494 | 496 | 3.875% due 07/03/44 | EUR | 200 | 226 | ||
| TruGreen, LP 1st Lien Term Loan B | AXA SA | |||||||
| 6.500% due 04/13/23 (Ê) | 748 | 754 | 3.375% due 07/06/47 | EUR | 150 | 167 | ||
| UFC Holdings LLC 1st Lien Term Loan | BMW Finance NV | |||||||
| 5.000% due 08/18/23 (Ê) | 2,000 | 2,015 | 3.625% due 01/29/18 | EUR | 115 | 132 | ||
| United Airlines, Inc. 1st Lien Term | BNP Paribas SA | |||||||
| Loan B | 5.750% due 01/24/22 | GBP | 75 | 106 | ||||
| 3.250% due 04/01/19 (Ê) | 1,995 | 1,999 | ||||||
| UPC Financing Partnership 1st Lien | 2.375% due 02/17/25 | EUR | 300 | 339 | ||||
| Term Loan AN | Brazil Letras do Tesouro Nacional | |||||||
| 4.080% due 08/31/24 (Ê) | 2,000 | 2,009 | Series LTN | |||||
| US Renal Care, Inc. 2nd Lien Term Loan | 12.092% due 01/01/18 (~) | BRL | 2,550 | 699 | ||||
| 9.000% due 11/16/23 (Ê) | 2,850 | 2,722 | 11.287% due 01/01/19 (~) | BRL | 2,110 | 524 | ||
| Valeant Pharmaceuticals International, | 11.299% due 07/01/19 (~) | BRL | 300 | 71 | ||||
| Inc. 1st Lien Term Loan BF1 | 11.363% due 01/01/20 (~) | BRL | 950 | 211 | ||||
| 5.000% due 04/02/22 (Ê) | 946 | 942 | Brazil Notas do Tesouro Nacional Serie B | |||||
| Vantiv LLC Term Loan B1 | Series NTNB | |||||||
| 3.250% due 06/13/21 (Ê) | 500 | 503 | (5.908)% due 05/15/35 (~) | BRL | 270 | 262 | ||
| Varsity Brands, Inc. 1st Lien Term Loan | (3.300)% due 08/15/50 (~) | BRL | 1,200 | 1,169 | ||||
| 5.000% due 12/11/21 | 997 | 1,003 | Brazil Notas do Tesouro Nacional Serie F | |||||
| Wall Street Systems Term Loan B | Series NTNF | |||||||
| 1.000% due 08/23/23 (v) | 250 | 250 | 0.387% due 01/01/23 (~) | BRL | 2,990 | 915 | ||
| Waste Industries USA, Inc. 1st Lien | 0.401% due 01/01/25 (~) | BRL | 9,970 | 3,023 | ||||
| Term Loan B | ||||||||
| 3.500% due 02/27/20 (Ê) | 499 | 499 | 10.000% due 01/01/27 | BRL | 9,250 | 2,766 | ||
| Wastequip LLC Term Loan B1 | Bundesrepublik Deutschland | |||||||
| 5.500% due 08/09/19 (Ê) | 748 | 747 | 1.500% due 05/15/24 | EUR | 90 | 111 | ||
| William Morris Endeavor Entertainment | 0.500% due 02/15/26 | EUR | 255 | 291 | ||||
| LLC 1St Lien Term Loan B | Series 2007 | |||||||
| 5.250% due 05/06/21 (Ê) | 2,487 | 2,498 | 4.250% due 07/04/39 | EUR | 185 | 357 | ||
| World Endurance Holdings 1St Lien | Buzzi Unicem SpA | |||||||
| Term Loan | 2.125% due 04/28/23 | EUR | 125 | 140 | ||||
| 5.250% due 06/26/21 (Ê) | 872 | 864 | Carrefour SA | |||||
| Yonkers Racing Corp. 1st Lien Term | ||||||||
| Loan | 1.750% due 07/15/22 | EUR | 300 | 353 | ||||
| 4.250% due 08/16/19 | 375 | 375 | Claris ABS | |||||
| Zebra Technologies Corp. 1st Lien Term | Series 2012-1 Class A | |||||||
| Loan B | 0.208% due 10/31/60 (Ê) | EUR | 46 | 50 | ||||
| 4.750% due 10/27/21 (Ê) | 1,986 | 2,004 | Colombian Titulos de Tesoreria | |||||
| 166,862 | Series B | |||||||
| Mortgage-Backed Securities - 0.0% | 7.000% due 05/04/22 | COP | 1,133,000 | 378 | ||||
| JPMorgan Chase Commercial Mortgage | 10.000% due 07/24/24 | COP | 7,615,000 | 2,976 | ||||
| Securities Trust | 7.500% due 08/26/26 | COP | 4,823,000 | 1,617 | ||||
| Series 2006-LDP9 Class A3 | 6.000% due 04/28/28 | COP | 2,476,000 | 733 | ||||
| 5.336% due 05/15/47 | 14 | 14 | Commerzbank AG | |||||
| Morgan Stanley Re-REMIC Trust | 4.000% due 03/23/26 | EUR | 100 | 111 | ||||
| Series 2010-GG10 Class A4B | Enel Finance International NV | |||||||
| 5.989% due 08/15/45 (Þ) | 150 | 151 | ||||||
See accompanying notes which are an integral part of the financial statements.
Russell Multi-Strategy Income Fund 669
Russell Investment Company
Russell Multi-Strategy Income Fund
Schedule of Investments, continued — October 31, 2016
| Amounts in thousands (except share amounts) | Amounts in thousands (except share amounts) | ||||||||
| Principal | Fair | Principal | Fair | ||||||
| Amount ($) | Value | Amount ($) | Value | ||||||
| or Shares | $ | or Shares | $ | ||||||
| 5.625% due 08/14/24 | GBP | 185 | 277 | Series S | |||||
| 5.750% due 09/14/40 | GBP | 150 | 244 | 4.000% due 06/13/19 | MXN | 8,131 | 449 | ||
| Eurosail-UK 2007-1nc PLC | 4.000% due 11/15/40 | MXN | 5,274 | 305 | |||||
| Series 2007-1X Class A3C | Muenchener Rueckversicherungs- | ||||||||
| 0.734% due 03/13/45 (Ê) | GBP | 27 | 32 | Gesellschaft AG in Muenchen | |||||
| Fonterra Co.-operative Group, Ltd. | 6.000% due 05/26/41 | EUR | 100 | 130 | |||||
| 4.500% due 06/30/21 | AUD | 200 | 159 | NWEN Finance PLC | |||||
| Hungary Government Bond | 5.875% due 06/21/21 | GBP | 200 | 268 | |||||
| Series 23/A | Peruvian Government International Bond | ||||||||
| 6.000% due 11/24/23 | HUF | 119,700 | 525 | 6.350% due 08/12/28 (Þ) | PEN | 3,154 | 965 | ||
| Series 25/B | Series REGS | ||||||||
| 5.500% due 06/24/25 | HUF | 285,150 | 1,220 | 6.950% due 08/12/31 | PEN | 1,750 | 566 | ||
| Indonesia Treasury Bond | 6.900% due 08/12/37 | PEN | 6,020 | 1,928 | |||||
| Series FR56 | Philippine Government Bond | ||||||||
| 8.375% due 09/15/26 | IDR | 36,974,000 | 3,015 | Series 1060 | |||||
| Series FR68 | 3.625% due 09/09/25 | PHP | 15,800 | 312 | |||||
| 8.375% due 03/15/34 | IDR | 5,550,000 | 1,248 | Poland Government International Bond | |||||
| Series FR69 | Series 0725 | ||||||||
| 7.875% due 04/15/19 | IDR | 1,364,000 | 107 | 3.250% due 07/25/25 | PLN | 7,660 | 1,985 | ||
| Series FR70 | Province of Manitoba Canada | ||||||||
| 8.375% due 03/15/24 | IDR | 2,760,000 | 225 | 4.400% due 09/05/25 | CAD | 520 | 458 | ||
| Series FR71 | Province of Ontario Canada | ||||||||
| 9.000% due 03/15/29 | IDR | 17,672,000 | 1,501 | 1.950% due 01/27/23 | CAD | 320 | 244 | ||
| Series FR72 | 4.650% due 06/02/41 | CAD | 135 | 133 | |||||
| 8.250% due 05/15/36 | IDR | 704,000 | 56 | Prudential PLC | |||||
| Series FR73 | 5.000% due 07/20/55 | GBP | 100 | 118 | |||||
| 8.750% due 05/15/31 | IDR | 47,006,000 | 4,026 | Queensland Treasury Corp. | |||||
| ING Bank NV | Series 23 | ||||||||
| Series EMTM | 4.250% due 07/21/23 (Þ) | AUD | 250 | 212 | |||||
| 3.625% due 02/25/26 | EUR | 300 | 359 | Republic of Poland Government Bond | |||||
| Kelda Finance No. 3 PLC | Series 0420 | ||||||||
| Series REGS | 1.500% due 04/25/20 | PLN | 2,600 | 647 | |||||
| 5.750% due 02/17/20 | GBP | 100 | 134 | Series 0922 | |||||
| KfW | 5.750% due 09/23/22 | PLN | 7,290 | 2,160 | |||||
| 1.625% due 01/15/21 | EUR | 40 | 48 | Series 1020 | |||||
| Malaysia Government International Bond | 5.250% due 10/25/20 | PLN | 3,470 | 983 | |||||
| Republic of South Africa Government | |||||||||
| Series 0114 | Bond | ||||||||
| 4.181% due 07/15/24 | MYR | 7,500 | 1,843 | Series 2023 | |||||
| Series 0115 | 7.750% due 02/28/23 | ZAR | 26,136 | 1,878 | |||||
| 3.955% due 09/15/25 | MYR | 210 | 51 | Series 2032 | |||||
| Series 0310 | 8.250% due 03/31/32 | ZAR | 11,700 | 799 | |||||
| 4.498% due 04/15/30 | MYR | 1,800 | 444 | Series 2048 | |||||
| Series 0311 | 8.750% due 02/28/48 | ZAR | 9,210 | 637 | |||||
| 4.392% due 04/15/26 | MYR | 2,890 | 721 | Series R214 | |||||
| Series 0314 | 6.500% due 02/28/41 | ZAR | 44,250 | 2,382 | |||||
| 4.048% due 09/30/21 | MYR | 4,140 | 1,015 | Residential Mortgage Securities 22 PLC | |||||
| Series 0414 | Series 2006-22X Class A3A | ||||||||
| 3.654% due 10/31/19 | MYR | 4,005 | 967 | 0.944% due 11/14/39 (Ê) | GBP | 15 | 18 | ||
| Series 0415 | Romania Government Bond | ||||||||
| 4.254% due 05/31/35 | MYR | 1,430 | 338 | Series 10Y | |||||
| Mexican Bonos | 4.750% due 02/24/25 | RON | 4,255 | 1,162 | |||||
| Series M 20 | Romanian Government International | ||||||||
| 10.000% due 12/05/24 | MXN | 37,282 | 2,453 | Bond | |||||
| Series M 30 | Series EMTN | ||||||||
| 10.000% due 11/20/36 | MXN | 18,652 | 1,339 | 2.875% due 10/28/24 | EUR | 80 | 96 | ||
| Series M | 2.875% due 05/26/28 (Þ) | EUR | 50 | 58 | |||||
| 5.000% due 12/11/19 | MXN | 58,547 | 3,031 | RTE Reseau de Transport d'Electricite | |||||
| Mexican Udibonos | SA | ||||||||
| 1.625% due 10/08/24 | EUR | 200 | 237 | ||||||
See accompanying notes which are an integral part of the financial statements.
670 Russell Multi-Strategy Income Fund
Russell Investment Company
Russell Multi-Strategy Income Fund
Schedule of Investments, continued — October 31, 2016
| Amounts in thousands (except share amounts) | Amounts in thousands (except share amounts) | ||||||||
| Principal | Fair | Principal | Fair | ||||||
| Amount ($) | Value | Amount ($) | Value | ||||||
| or Shares | $ | or Shares | $ | ||||||
| 2.750% due 06/20/29 | EUR | 200 | 260 | 6.375% due 10/15/24 (Þ) | GBP | 100 | 126 | ||
| Russian Federal Bond - OFZ | Virgin Media Secured Finance PLC | ||||||||
| Series 6205 | Series REGS | ||||||||
| 7.600% due 04/14/21 | RUB | 45,640 | 694 | 4.875% due 01/15/27 | GBP | 200 | 239 | ||
| Series 6208 | Vonovia Finance BV | ||||||||
| 7.500% due 02/27/19 | RUB | 70,100 | 1,082 | 1.500% due 06/10/26 | EUR | 100 | 113 | ||
| Series 6209 | WPP Finance Deutschland GmbH | ||||||||
| 7.600% due 07/20/22 | RUB | 6,540 | 99 | 1.625% due 03/23/30 | EUR | 300 | 332 | ||
| Series 6211 | 82,129 | ||||||||
| 7.000% due 01/25/23 | RUB | 13,100 | 191 | United States Government Agencies - 0.1% | |||||
| Series 6212 | United States Treasury Inflation Indexed | ||||||||
| 7.050% due 01/19/28 | RUB | 24,810 | 353 | Bonds | |||||
| Series 6215 | 0.125% due 07/15/26 | 573 | 574 | ||||||
| 7.000% due 08/16/23 | RUB | 118,230 | 1,722 | United States Treasury Notes | |||||
| Santander Issuances SAU | 2.500% due 02/15/46 | 35 | 34 | ||||||
| 2.500% due 03/18/25 | EUR | 100 | 108 | 2.500% due 05/15/46 | 340 | 334 | |||
| Santander UK PLC | 942 | ||||||||
| 0.875% due 01/13/20 | EUR | 285 | 318 | United States Government Treasuries - 0.4% | |||||
| SGSP Australia Assets Pty, Ltd. | United States Treasury Notes | ||||||||
| Series EMTN | 1.500% due 12/31/18 | 3,275 | 3,316 | ||||||
| 2.000% due 06/30/22 | EUR | 300 | 353 | 2.875% due 05/15/43 | 220 | 234 | |||
| Siviglia SPV SRL | 2.500% due 02/15/45 | 30 | 29 | ||||||
| Series 2012-1 Class A | 3,579 | ||||||||
| 0.203% due 10/25/55 (Ê) | EUR | 53 | 58 | Total Long-Term Investments | |||||
| SNS Bank NV | (cost $534,111) | 533,523 | |||||||
| 3.750% due 11/05/25 | EUR | 155 | 174 | Common Stocks - 25.6% | |||||
| South Africa Government International | Consumer Discretionary - 1.8% | ||||||||
| Bond | Brinker International, Inc. | 612 | 30 | ||||||
| Series R186 | Cie Financiere Richemont SA | 14,631 | 940 | ||||||
| 10.500% due 12/21/26 | ZAR | 23,850 | 1,959 | Cie Generale des Etablissements | |||||
| Standard Chartered PLC | Michelin Class B | 2,666 | 289 | ||||||
| 4.000% due 10/21/25 | EUR | 300 | 340 | Coach, Inc. | 15,043 | 540 | |||
| Telefonica Emisiones SAU | Daimler AG | 6,113 | 435 | ||||||
| 5.375% due 02/02/26 | GBP | 150 | 223 | Diageo PLC | 37,718 | 1,004 | |||
| Telstra Corp., Ltd. | Flight Centre, Ltd. | 9,403 | 242 | ||||||
| 4.500% due 11/13/18 | AUD | 280 | 221 | GameStop Corp. Class A | 588 | 14 | |||
| Tesco PLC | Garmin, Ltd. | 11,405 | 551 | ||||||
| 5.000% due 03/24/23 | GBP | 170 | 223 | Genuine Parts Co. | 5,404 | 490 | |||
| Thailand Government Bond | Grupo Televisa SAB - ADR | 33,464 | 821 | ||||||
| 3.625% due 06/16/23 | THB | 12,930 | 407 | Harvey Norman Holdings, Ltd. | 131,496 | 504 | |||
| 3.580% due 12/17/27 | THB | 7,920 | 254 | Hilton Worldwide Holdings, Inc. | 7,207 | 163 | |||
| Thailand Government International Bond | Home Depot, Inc. (The) | 3,277 | 400 | ||||||
| 3.850% due 12/12/25 | THB | 54,290 | 1,766 | Honda Motor Co., Ltd. | 38,600 | 1,155 | |||
| 4.875% due 06/22/29 | THB | 10,300 | 374 | Hyundai Motor Co. | 14,725 | 1,798 | |||
| Turkey Government Bond | Las Vegas Sands Corp. | 2,421 | 140 | ||||||
| 7.100% due 03/08/23 | TRY | 4,700 | 1,330 | M.Video PJSC | 4,071 | 22 | |||
| 8.000% due 03/12/25 | TRY | 8,460 | 2,455 | Matas A/S | 32,606 | 633 | |||
| Turkey Government International Bond | Mattel, Inc. | 18,563 | 585 | ||||||
| Series 5Y | McDonald's Corp. | 6,678 | 752 | ||||||
| 6.300% due 02/14/18 | TRY | 6,220 | 1,947 | Pacific Textiles Holdings, Ltd. | 30,000 | 38 | |||
| United Kingdom Gilt | Pandora Media, Inc.(Æ) | 28,565 | 324 | ||||||
| 4.000% due 03/07/22 | GBP | 50 | 72 | Pandox AB | 30,530 | 484 | |||
| 2.000% due 09/07/25 | GBP | 180 | 236 | Pearson PLC | 7,342 | 68 | |||
| 3.250% due 01/22/44 | GBP | 185 | 293 | Persimmon PLC Class A | 12,864 | 266 | |||
| Unitymedia GmbH | Regal Entertainment Group Class A(Ñ) | 17,054 | 367 | ||||||
| Series REGS | Sankyo Co., Ltd. | 5,400 | 190 | ||||||
| 3.750% due 01/15/27 | EUR | 300 | 312 | SATS, Ltd. | 111,900 | 389 | |||
| Virgin Media Finance PLC | Secom Co., Ltd. | 6,161 | 445 | ||||||
See accompanying notes which are an integral part of the financial statements.
Russell Multi-Strategy Income Fund 671
Russell Investment Company
Russell Multi-Strategy Income Fund
Schedule of Investments, continued — October 31, 2016
| Amounts in thousands (except share amounts) | Amounts in thousands (except share amounts) | ||||||||
| Principal | Fair | Principal | Fair | ||||||
| Amount ($) | Value | Amount ($) | Value | ||||||
| or Shares | $ | or Shares | $ | ||||||
| Shingakukai Co., Ltd. | 24,684 | 116 | Hanergy Thin Film Power Group, Ltd. | 205,123 | 103 | ||||
| Singapore Press Holdings, Ltd. | 110,200 | 294 | (Æ) | ||||||
| Sky PLC | 22,455 | 224 | Helmerich & Payne, Inc. | 5,252 | 331 | ||||
| Tatts Group, Ltd. | 88,428 | 273 | Innogy SE(Æ)(Þ) | 4,812 | 191 | ||||
| Thomson Reuters Corp. | 10,547 | 416 | Kinder Morgan, Inc. | 51,368 | 1,049 | ||||
| Tupperware Brands Corp. | 460 | 27 | Lukoil PJSC - ADR | 3,919 | 191 | ||||
| Wal-Mart Stores, Inc. | 4,789 | 335 | NextEra Energy Partners, LP | 4,315 | 118 | ||||
| Occidental Petroleum Corp. | 10,638 | 776 | |||||||
| 15,764 | OMV AG | 2,888 | 90 | ||||||
| Rice Midstream Partners, LP | 5,508 | 119 | |||||||
| Consumer Staples - 2.3% | Royal Dutch Shell PLC Class A - ADR | 9,426 | 470 | ||||||
| Altria Group, Inc. | 9,722 | 643 | |||||||
| Astarta Holding NV(Æ) | 8,461 | 114 | Royal Dutch Shell PLC Class A | 17,932 | 446 | ||||
| BrasilAgro - Co. Brasileira de | SemGroup Corp. Class A | 5,079 | 164 | ||||||
| Propriedades Agricolas | 9,559 | 31 | Spectra Energy Corp. | 6,277 | 262 | ||||
| British American Tobacco PLC | 14,311 | 821 | Statoil ASA Class N | 22,309 | 364 | ||||
| China Yurun Food Group, Ltd.(Æ) | 706,000 | 113 | Targa Resources Corp. | 7,820 | 343 | ||||
| CK Hutchison Holdings, Ltd. | 41,719 | 516 | Total SA | 12,269 | 587 | ||||
| Coca-Cola Co. (The) | 67,171 | 2,848 | Vermilion Energy, Inc. | 9,923 | 389 | ||||
| Dr Pepper Snapple Group, Inc. | 1,870 | 164 | Washington H Soul Pattinson & Co., Ltd. | 46,800 | 566 | ||||
| Golden Agri-Resources, Ltd. | 2,201,300 | 609 | Williams Cos., Inc. (The) | 23,043 | 673 | ||||
| Imperial Tobacco Group PLC | 10,794 | 522 | Woodside Petroleum, Ltd. | 10,301 | 221 | ||||
| JM Smucker Co. (The) | 350 | 46 | 15,309 | ||||||
| Kernel Holding SA | 4,025 | 64 | |||||||
| Kimberly-Clark Corp. | 2,940 | 336 | Financial Services - 5.4% | ||||||
| KT&G Corp. | 2,635 | 260 | Activia Properties, Inc.(ö) | 16 | 78 | ||||
| MHP SA - GDR | 47,830 | 452 | ADO Properties SA(Þ) | 2,146 | 78 | ||||
| PepsiCo, Inc. | 22,359 | 2,397 | Aflac, Inc. | 4,239 | 292 | ||||
| Philip Morris International, Inc. | 6,543 | 631 | AGNC Investment Corp.(ö) | 19,112 | 383 | ||||
| Procter & Gamble Co. (The) | 42,149 | 3,658 | Alexandria Real Estate Equities, Inc.(ö) | 2,028 | 219 | ||||
| Reynolds American, Inc. | 14,035 | 773 | Allianz SE | 1,797 | 280 | ||||
| Scandinavian Tobacco Group A/S(Þ) | 24,160 | 418 | Allied Properties Real Estate Investment | 8,367 | 225 | ||||
| SLC Agricola SA | 50,367 | 249 | Trust(ö) | ||||||
| Allied World Assurance Co. Holdings | |||||||||
| Stock Spirits Group PLC | 247,684 | 480 | 5,376 | 231 | |||||
| AG | |||||||||
| Swedish Match AB | 43,683 | 1,519 | Ally Financial, Inc. | 54,692 | 988 | ||||
| Sysco Corp. | 11,954 | 575 | alstria office REIT-AG(Æ)(ö) | 12,229 | 158 | ||||
| Unilever NV | 19,302 | 808 | American Financial Group, Inc. | 1,999 | 149 | ||||
| Unilever PLC | 7,523 | 315 | American Homes 4 Rent Class A(ö) | 8,495 | 179 | ||||
| Woolworths, Ltd. | 3,221 | 58 | American Tower Corp.(ö) | 981 | 115 | ||||
| 19,420 | AmTrust Financial Services, Inc. | 3,940 | 104 | ||||||
| Apartment Investment & Management | 2,760 | 122 | |||||||
| Energy - 1.8% | Co. Class A(ö) | ||||||||
| 8Point3 Energy Partners, LP Class A(Ñ) | 3,600 | 55 | Arthur J Gallagher & Co. | 14,896 | 718 | ||||
| APA Group | 40,982 | 248 | ASR Nederland NV(Æ) | 15,962 | 354 | ||||
| ARC Resources, Ltd. | 28,256 | 480 | Assura PLC(ö) | 109,992 | 79 | ||||
| Areva SA(Æ) | 25,098 | 132 | ASX, Ltd. - ADR | 16,469 | 589 | ||||
| BP PLC - ADR | 28,677 | 1,020 | Australia & New Zealand Banking | 22,380 | 473 | ||||
| BP PLC | 104,964 | 620 | Group, Ltd. - ADR | ||||||
| AvalonBay Communities, Inc.(ö) | 1,233 | 211 | |||||||
| Cenovus Energy, Inc. | 19,069 | 275 | AXA SA | 14,685 | 331 | ||||
| Chevron Corp. | 9,174 | 961 | Axis Capital Holdings, Ltd. | 4,823 | 275 | ||||
| Cloud Peak Energy, Inc.(Æ) | 32,485 | 200 | Bank Leumi Le-Israel BM(Æ) | 152,113 | 574 | ||||
| CONSOL Energy, Inc.(Æ) | 9,024 | 153 | Big Yellow Group PLC(ö) | 16,703 | 141 | ||||
| Denison Mines Corp.(Æ) | 107,383 | 43 | BlackRock, Inc. Class A | 649 | 221 | ||||
| Enterprise Products Partners, LP(Ñ) | 13,432 | 339 | Brixmor Property Group, Inc.(ö) | 9,044 | 230 | ||||
| ERG SpA | 16,471 | 183 | Buwog AG(Æ) | 5,161 | 125 | ||||
| Exxon Mobil Corp. | 25,370 | 2,114 | Canadian Imperial Bank of Commerce | 4,698 | 352 | ||||
| Fission Uranium Corp.(Æ) | 114,859 | 47 | CapitaLand Mall Trust Class A(Æ)(ö) | 61,200 | 91 | ||||
| Gazprom PJSC - ADR | 162,179 | 702 | Cheung Kong Property Holdings, Ltd. | 80,000 | 593 | ||||
| Gazprom PJSC | 129,858 | 284 | China Construction Bank Corp. Class H | 118,000 | 86 | ||||
See accompanying notes which are an integral part of the financial statements.
672 Russell Multi-Strategy Income Fund
Russell Investment Company
Russell Multi-Strategy Income Fund
Schedule of Investments, continued — October 31, 2016
| Amounts in thousands (except share amounts) | Amounts in thousands (except share amounts) | ||||||||
| Principal | Fair | Principal | Fair | ||||||
| Amount ($) | Value | Amount ($) | Value | ||||||
| or Shares | $ | or Shares | $ | ||||||
| Chubb, Ltd. | 2,545 | 323 | Mitsubishi Estate Co., Ltd. | 13,000 | 258 | ||||
| CI Financial Corp. | 12,250 | 225 | Mitsui Fudosan Co., Ltd. | 15,000 | 341 | ||||
| Cincinnati Financial Corp. | 8,478 | 600 | Moscow Exchange MICEX-RTS PJSC | 106,609 | 196 | ||||
| CIT Group, Inc. | 33,271 | 1,209 | Muenchener Rueckversicherungs- | 3,300 | 640 | ||||
| Citizens Financial Group, Inc. | 14,703 | 387 | Gesellschaft AG in Muenchen | ||||||
| CME Group, Inc. Class A | 8,656 | 866 | National Australia Bank, Ltd. - ADR | 1,551 | 33 | ||||
| CNA Financial Corp. | 19,441 | 711 | Navient Corp. | 27,168 | 347 | ||||
| Commonwealth Bank of Australia - ADR | 5,015 | 279 | Nippon Building Fund, Inc.(ö) | 28 | 167 | ||||
| Nomura Real Estate Master Fund, Inc. | |||||||||
| Cousins Properties, Inc.(ö) | 15,177 | 118 | 57 | 92 | |||||
| (Æ)(ö) | |||||||||
| Crown Castle International Corp.(ö) | 1,795 | 163 | Nordea Bank AB | 10,105 | 106 | ||||
| Deutsche Wohnen AG | 7,192 | 235 | NSI NV(ö) | 2,354 | 9 | ||||
| Dexus Property Group(Æ)(ö) | 36,916 | 251 | Old Republic International Corp. | 32,988 | 556 | ||||
| Digital Realty Trust, Inc.(ö) | 2,343 | 219 | Omega Healthcare Investors, Inc.(ö) | 699 | 22 | ||||
| Douglas Emmett, Inc.(ö) | 5,129 | 187 | Orix JREIT, Inc.(ö) | 66 | 113 | ||||
| Dundee Corp. Class A(Æ) | 40,442 | 191 | PacWest Bancorp | 12,354 | 536 | ||||
| DuPont Fabros Technology, Inc.(ö) | 3,373 | 138 | PAX Global Technology, Ltd. | 210,000 | 131 | ||||
| Education Realty Trust, Inc.(ö) | 5,953 | 254 | Pebblebrook Hotel Trust(ö) | 3,338 | 81 | ||||
| Empire State Realty Trust, Inc. Class | 7,553 | 148 | People's United Financial, Inc. | 16,114 | 262 | ||||
| A(ö) | |||||||||
| Endurance Specialty Holdings, Ltd. | 5,920 | 544 | ProAssurance Corp. | 9,924 | 529 | ||||
| Equity Commonwealth(Æ) | 12,558 | 339 | Progressive Corp. (The) | 7,596 | 239 | ||||
| Equity LifeStyle Properties, Inc. Class | Prologis, Inc.(ö) | 6,588 | 344 | ||||||
| A(ö) | 2,047 | 155 | Public Storage(Æ)(ƒ) | 15,000 | 364 | ||||
| Equity Residential(ö) | 1,471 | 91 | QTS Realty Trust, Inc. Class A(ö) | 1,598 | 73 | ||||
| Erie Indemnity Co. Class A | 6,416 | 657 | Ramco-Gershenson Properties Trust(ö) | 924 | 16 | ||||
| Essex Property Trust, Inc.(ö) | 1,398 | 299 | Royal Bank of Canada - GDR | 3,270 | 204 | ||||
| Etalon Group, Ltd. - GDR(Æ) | 65,038 | 185 | Royal Bank of Scotland Group PLC(Æ) | 124,162 | 287 | ||||
| Everest Re Group, Ltd. | 2,445 | 498 | Sberbank of Russia PJSC Class T | 48,360 | 112 | ||||
| Fifth Third Bancorp | 18,117 | 394 | Sberbank of Russia PJSC - ADR | 72,900 | 693 | ||||
| Gaming and Leisure Properties, Inc.(ö) | 5,784 | 190 | Scentre Group(ö) | 62,594 | 200 | ||||
| Gecina SA(ö) | 824 | 120 | SCOR SE - ADR | 7,322 | 237 | ||||
| Genworth MI Canada, Inc. | 19,558 | 425 | Segro PLC(ö) | 42,966 | 231 | ||||
| Great-West Lifeco, Inc. | 10,343 | 260 | Simon Property Group, Inc.(ö) | 3,593 | 668 | ||||
| Guoco Group, Ltd. | 9,000 | 101 | Singapore Exchange, Ltd. | 55,500 | 283 | ||||
| Hang Lung Properties, Ltd. - ADR | 50,000 | 110 | Skandinaviska Enskilda Banken AB | 58,256 | 587 | ||||
| Hang Seng Bank, Ltd. | 33,700 | 608 | Class A | ||||||
| HCP, Inc.(ö) | 12,994 | 445 | SL Green Realty Corp.(ö) | 926 | 91 | ||||
| Hiscox, Ltd. | 11,581 | 145 | Smart Real Estate Investment Trust(ö) | 5,373 | 134 | ||||
| Hispania Activos Inmobiliarios SA(ö) | 6,709 | 83 | Societe Generale SA | 13,040 | 508 | ||||
| Hongkong Land Holdings, Ltd. | 9,536 | 64 | Sompo Holdings, Inc. | 20,594 | 667 | ||||
| Hopewell Holdings, Ltd. | 15,000 | 53 | Spirit Realty Capital, Inc.(ö) | 23,840 | 284 | ||||
| HSBC Holdings PLC | 36,081 | 271 | Sprott, Inc. | 262,546 | 436 | ||||
| Hudson Pacific Properties, Inc.(ö) | 4,073 | 137 | Sun Communities, Inc.(ö) | 3,724 | 286 | ||||
| Hulic Reit, Inc.(ö) | 71 | 124 | Sun Hung Kai Properties, Ltd. | 17,000 | 253 | ||||
| IGM Financial, Inc. | 5,049 | 135 | Sunstone Hotel Investors, Inc.(ö) | 4,987 | 63 | ||||
| Immofinanz AG(Æ) | 43,164 | 93 | Svenska Handelsbanken AB Class A | 24,299 | 331 | ||||
| Insurance Australia Group, Ltd. | 91,833 | 384 | Tanger Factory Outlet Centers, Inc.(ö) | 3,136 | 109 | ||||
| Intact Financial Corp. | 2,291 | 156 | Tokyo Tatemono Co., Ltd. | 20,800 | 265 | ||||
| Interactive Brokers Group, Inc. Class A | 14,704 | 488 | Travelers Cos., Inc. (The) | 2,625 | 284 | ||||
| Iron Mountain, Inc.(ö) | 11,097 | 374 | Two Harbors Investment Corp.(ö) | 95,348 | 794 | ||||
| Japan Retail Fund Investment Corp.(ö) | 60 | 136 | UDR, Inc.(ö) | 8,429 | 295 | ||||
| Kilroy Realty Corp.(ö) | 3,279 | 236 | Unibail-Rodamco SE(ö) | 1,773 | 423 | ||||
| Klepierre - GDR(ö) | 11,070 | 453 | UNITE Group PLC (The) | 14,979 | 102 | ||||
| Link REIT(ö) | 17,500 | 125 | Uranium Participation Corp.(Æ) | 142,452 | 395 | ||||
| Lloyds Banking Group PLC | 1,103,157 | 771 | Validus Holdings, Ltd. | 4,358 | 223 | ||||
| LondonMetric Property PLC(ö) | 57,828 | 105 | Vicinity Centres(ö) | 123,490 | 269 | ||||
| LSL Property Services PLC | 70,097 | 167 | Wells Fargo & Co. | 65,033 | 2,992 | ||||
| Mercury General Corp. | 12,007 | 654 | Welltower, Inc.(ö) | 9,483 | 650 | ||||
| Merlin Properties Socimi SA(ö) | 8,342 | 94 | Westpac Banking Corp. | 15,787 | 365 | ||||
See accompanying notes which are an integral part of the financial statements.
Russell Multi-Strategy Income Fund 673
Russell Investment Company
Russell Multi-Strategy Income Fund
Schedule of Investments, continued — October 31, 2016
| Amounts in thousands (except share amounts) | Amounts in thousands (except share amounts) | |||||||
| Principal | Fair | Principal | Fair | |||||
| Amount ($) | Value | Amount ($) | Value | |||||
| or Shares | $ | or Shares | $ | |||||
| XL Group, Ltd. | 9,203 | 319 | Yuexiu Transport Infrastructure, Ltd. | 302,000 | 207 | |||
| 45,712 | 11,259 | |||||||
| Health Care - 2.1% | Producer Durables - 3.9% | |||||||
| AbbVie, Inc. | 6,211 | 346 | 3M Co. | 2,863 | 473 | |||
| As One Corp. | 7,981 | 359 | Abertis Infraestructuras SA(Ñ) | 34,276 | 509 | |||
| AstraZeneca PLC | 5,996 | 336 | Accenture PLC Class A | 4,877 | 567 | |||
| AstraZeneca PLC - ADR | 15,104 | 428 | Aena SA(Þ) | 3,826 | 562 | |||
| GlaxoSmithKline PLC - ADR | 113,770 | 2,249 | Atlantia SpA | 46,333 | 1,136 | |||
| Johnson & Johnson | 33,636 | 3,901 | Auckland International Airport, Ltd. | 183,732 | 866 | |||
| Medikit Co., Ltd. | 1,021 | 44 | Automatic Data Processing, Inc. | 5,618 | 489 | |||
| Merck & Co., Inc. | 14,041 | 825 | Babcock & Wilcox Co. (The) Class W(Æ) | 10,247 | 402 | |||
| Millennium Health LLC(Æ) | 2,491 | 4 | BAE Systems PLC | 107,399 | 712 | |||
| Nakanishi, Inc. | 4,220 | 151 | BBA Aviation PLC | 86,945 | 275 | |||
| Novartis AG | 25,215 | 1,791 | Beijing Capital International Airport Co., | 234,000 | 245 | |||
| Pfizer, Inc. | 98,822 | 3,134 | Ltd. Class H | |||||
| Protek PJSC | 42,289 | 66 | Boeing Co. (The) | 4,227 | 602 | |||
| Roche Holding AG | 4,777 | 1,096 | Boskalis Westminster | 15,423 | 497 | |||
| Sanofi - ADR | 23,915 | 1,860 | Canadian Pacific Railway, Ltd. | 895 | 128 | |||
| Sonic Healthcare, Ltd. | 13,302 | 207 | Canon, Inc. | 21,529 | 618 | |||
| Stryker Corp. | 4,993 | 576 | Cobham PLC | 367,081 | 642 | |||
| Takeda Pharmaceutical Co., Ltd. | 5,900 | 264 | COSCO Shipping Ports, Ltd. | 128,000 | 127 | |||
| Veeva Systems, Inc. Class A(Æ) | 2,788 | 108 | Covanta Holding Corp. | 42,081 | 631 | |||
| CSX Corp. | 4,788 | 146 | ||||||
| 17,745 | Cummins, Inc. | 4,354 | 557 | |||||
| Danone SA | 19,416 | 1,343 | ||||||
| Materials and Processing - 1.3% | Deutsche Post AG | 11,759 | 364 | |||||
| AdvanSix, Inc.(Æ) | 9 | — | ||||||
| Agrium, Inc. | 2,320 | 213 | Diana Shipping, Inc.(Æ) | 37,234 | 93 | |||
| Albemarle Corp. | 7,753 | 648 | Eaton Corp. PLC | 4,537 | 289 | |||
| Barrick Gold Corp. | 19,102 | 336 | Ebara Corp. | 12,400 | 368 | |||
| BASF SE | 4,471 | 394 | Emerson Electric Co. | 11,787 | 597 | |||
| Cameco Corp. Class A | 79,176 | 610 | Flughafen Zuerich AG | 4,800 | 882 | |||
| Centerra Gold, Inc. | 36,429 | 184 | G4S PLC | 140,817 | 378 | |||
| Dongyue Group(Æ) | 122,000 | 21 | Golden Ocean Group, Ltd.(Æ) | 36,086 | 131 | |||
| Dow Chemical Co. (The) | 10,473 | 564 | Graco, Inc. | 647 | 48 | |||
| Groupe Eurotunnel SE | 71,067 | 665 | ||||||
| Dundee Precious Metals, Inc.(Æ) | 100,244 | 205 | Grupo Aeroportuario del Pacifico SAB de | |||||
| Gabriel Resources, Ltd.(Æ) | 2,350,925 | 1,052 | CV - ADR | 4,860 | 470 | |||
| Impala Platinum Holdings, Ltd.(Æ) | 79,629 | 320 | Guangshen Railway Co., Ltd. Class H | 630,000 | 348 | |||
| Ivanhoe Mines, Ltd. Class A(Æ) | 248,793 | 388 | Hamburger Hafen und Logistik AG | 20,345 | 324 | |||
| Kingboard Laminates Holdings, Ltd. | 157,000 | 141 | Hopewell Highway Infrastructure, Ltd. | 44,000 | 24 | |||
| Kinross Gold Corp.(Æ) | 134,951 | 521 | Hubbell, Inc. Class B | 5,214 | 545 | |||
| Lundin Gold, Inc.(Æ)(Ñ) | 84,866 | 390 | Hutchison Port Holdings Trust Class U | 630,300 | 280 | |||
| Mosaic Co. (The) | 14,092 | 332 | Japan Steel Works, Ltd. (The) | 34,400 | 739 | |||
| New Gold, Inc.(Æ) | 25,357 | 100 | Jiangsu Expressway Co., Ltd. Class H | 260,000 | 354 | |||
| Newcrest Mining, Ltd. | 59,622 | 1,040 | Kamigumi Co., Ltd. | 26,000 | 222 | |||
| Nippon Fine Chemical Co., Ltd. | 28,141 | 212 | KBR, Inc. | 10,408 | 154 | |||
| Nitto FC Co., Ltd. | 29,185 | 236 | Kitagawa Industries Co., Ltd. | 14,831 | 141 | |||
| Northern Dynasty Minerals, Ltd.(Æ) | 232,016 | 194 | Kurita Water Industries, Ltd. | 10,800 | 256 | |||
| Novagold Resources, Inc.(Æ) | 22,878 | 114 | Lockheed Martin Corp. | 4,088 | 1,007 | |||
| Packaging Corp. of America | 1,858 | 153 | LSC Communications, Inc. | 4,823 | 117 | |||
| Royal Gold, Inc. | 7,168 | 493 | Luks Group Vietnam Holdings Co., Ltd. | 112,000 | 40 | |||
| Seabridge Gold, Inc.(Æ) | 5,127 | 56 | Macquarie Infrastructure Corp. | 16,516 | 1,351 | |||
| Siemens AG | 4,057 | 461 | Meggitt PLC | 132,935 | 707 | |||
| Silver Wheaton Corp. | 16,338 | 394 | Mitsubishi Corp. | 36,600 | 798 | |||
| Sonoco Products Co. | 12,192 | 613 | Mitsui & Co., Ltd. | 63,000 | 875 | |||
| Tikkurila Oyj | 13,263 | 255 | MSC Industrial Direct Co., Inc. Class A | 7,114 | 518 | |||
| Turquoise Hill Resources, Ltd.(Æ) | 102,598 | 318 | MTR Corp., Ltd. | 49,500 | 274 | |||
| Xinyi Glass Holdings, Ltd.(Æ) | 110,000 | 94 | Nestle SA | 17,055 | 1,236 | |||
See accompanying notes which are an integral part of the financial statements.
674 Russell Multi-Strategy Income Fund
Russell Investment Company
Russell Multi-Strategy Income Fund
Schedule of Investments, continued — October 31, 2016
| Amounts in thousands (except share amounts) | Amounts in thousands (except share amounts) | ||||||||
| Principal | Fair | Principal | Fair | ||||||
| Amount ($) | Value | Amount ($) | Value | ||||||
| or Shares | $ | or Shares | $ | ||||||
| OHL Mexico SAB de CV(Æ) | 180,437 | 213 | SBA Communications Corp. Class A(Æ) | 1,150 | 130 | ||||
| Organo Corp. | 52,000 | 225 | Spark New Zealand, Ltd. | 229,973 | 602 | ||||
| Orkla ASA | 72,949 | 689 | StarHub, Ltd. | 145,400 | 353 | ||||
| Park24 Co., Ltd. | 5,200 | 161 | Symantec Corp. | 21,912 | 548 | ||||
| Promotora y Operadora de | Taiwan Semiconductor Manufacturing | ||||||||
| 9,712 | 109 | 12,596 | 392 | ||||||
| Infraestructura SAB de CV | Co., Ltd. - ADR | ||||||||
| Raytheon Co. | 2,640 | 361 | Telesites SAB de CV(Æ) | 68,454 | 40 | ||||
| Safe Bulkers, Inc.(Æ) | 54,562 | 69 | Texas Instruments, Inc. | 11,452 | 811 | ||||
| Secom Joshinetsu Co., Ltd. | 9,102 | 285 | TLG Immobilien AG | 2,219 | 47 | ||||
| SIA Engineering Co., Ltd. | 105,200 | 279 | Tokyo Electron, Ltd. | 6,900 | 624 | ||||
| Singapore Airlines, Ltd.(Æ) | 29,100 | 212 | Vodafone Group PLC | 579,764 | 1,592 | ||||
| SkyWest, Inc. | 2,864 | 86 | Yandex NV Class A(Æ) | 10,483 | 206 | ||||
| TopBuild Corp.(Æ) | 499 | 15 | 26,594 | ||||||
| Transurban Group - ADR(Æ) | 179,509 | 1,416 | |||||||
| Tsakos Energy Navigation, Ltd. | 35,368 | 159 | Utilities - 3.9% | ||||||
| Turk Traktor ve Ziraat Makineleri AS | 927 | 24 | Alliant Energy Corp. | 5,499 | 209 | ||||
| UniFirst Corp. | 4,734 | 580 | Ameren Corp. | 8,878 | 443 | ||||
| Union Pacific Corp. | 1,993 | 176 | America Movil SAB de CV | 2,014,852 | 1,335 | ||||
| United Parcel Service, Inc. Class B | 7,915 | 853 | American Water Works Co., Inc. | 4,515 | 334 | ||||
| United Technologies Corp. | 3,273 | 334 | AT&T, Inc. | 31,117 | 1,145 | ||||
| Vinci SA | 3,439 | 249 | Atmos Energy Corp. | 1,785 | 133 | ||||
| Waste Management, Inc. | 4,295 | 282 | Buckeye Partners, LP | 3,190 | 206 | ||||
| West Japan Railway Co. | 7,600 | 468 | Canadian Natural Resources, Ltd. | 9,855 | 313 | ||||
| Wharf Holdings, Ltd. (The) | 30,000 | 225 | Centrais Eletricas Brasileiras SA(Æ) | 120,128 | 892 | ||||
| 33,592 | CenturyLink, Inc. | 12,108 | 322 | ||||||
| Cheniere Energy, Inc.(Æ) | 13,170 | 497 | |||||||
| Technology - 3.1% | Cia de Saneamento Basico do Estado de | 14,088 | 149 | ||||||
| Alphabet, Inc. Class A(Æ) | 2,904 | 2,352 | Sao Paulo(Æ) | ||||||
| Analog Devices, Inc. | 4,436 | 284 | CMS Energy Corp. | 189,723 | 589 | ||||
| Apple, Inc. | 3,699 | 420 | Deutsche Telekom AG | 20,863 | 340 | ||||
| AVX Corp. | 18,814 | 264 | Dominion Resources, Inc. | 3,603 | 271 | ||||
| BCE, Inc. | 27,065 | 1,230 | Duke Energy Corp. | 7,710 | 617 | ||||
| CA, Inc. | 16,645 | 512 | Edison International | 8,064 | 593 | ||||
| Cellnex Telecom SA(Þ) | 12,587 | 207 | Electricite de France SA | 65,779 | 738 | ||||
| Cisco Systems, Inc. | 27,613 | 847 | Enagas SA | 23,599 | 678 | ||||
| Corning, Inc. | 10,561 | 240 | Enbridge, Inc. | 14,348 | 620 | ||||
| Cosel Co., Ltd. | 44,039 | 526 | Engie SA | 64,837 | 936 | ||||
| Cypress Semiconductor Corp. | 47,427 | 473 | Entergy Corp. | 6,701 | 494 | ||||
| Dolby Laboratories, Inc. Class A | 7,140 | 340 | Exelon Corp. | 35,356 | 1,205 | ||||
| Donnelley Financial Solutions, Inc.(Æ) | 6,971 | 150 | Federal Grid PJSC | 258,488,350 | 696 | ||||
| Ei Towers SpA(Æ) | 4,035 | 191 | Gas Natural SDG SA | 12,164 | 240 | ||||
| Hua Hong Semiconductor, Ltd.(Þ) | 109,000 | 129 | Great Plains Energy, Inc. | 9,330 | 265 | ||||
| Infraestructura Energetica Nova SAB | |||||||||
| Icom, Inc. | 12,543 | 230 | 19,875 | 88 | |||||
| de CV | |||||||||
| Intel Corp. | 17,012 | 593 | Inter Pipeline, Ltd. | 744 | 15 | ||||
| International Business Machines Corp. | 4,494 | 691 | Keyera Corp. | 8,312 | 249 | ||||
| Japan Digital Laboratory Co., Ltd. | 12,600 | 196 | KT Corp. | 18,118 | 511 | ||||
| Mail.Ru Group, Ltd. - GDR(Æ) | 6,806 | 111 | MEG Energy Corp. Class A(Æ) | 80,575 | 329 | ||||
| Microchip Technology, Inc. | 14,615 | 885 | Mobile TeleSystems PJSC | 29,056 | 102 | ||||
| Microsoft Corp. | 47,333 | 2,836 | National Grid PLC | 105,458 | 1,374 | ||||
| Nam Tai Property, Inc. | 2,041 | 17 | NextEra Energy, Inc. | 10,436 | 1,336 | ||||
| NTT DOCOMO, Inc. | 25,939 | 653 | NiSource, Inc. | 7,741 | 180 | ||||
| NVC Lighting Holdings, Ltd.(Æ) | 691,000 | 95 | Noble Midstream Partners LP(Æ) | 4,664 | 140 | ||||
| NVIDIA Corp. | 10,109 | 719 | Pattern Energy Group, Inc. Class A | 10,580 | 236 | ||||
| O2 Czech Republic AS | 63,047 | 578 | PCCW, Ltd. | 778,000 | 463 | ||||
| Oracle Corp. | 74,154 | 2,849 | Pembina Pipeline Corp. | 14,115 | 434 | ||||
| QUALCOMM, Inc. | 17,438 | 1,198 | PG&E Corp. | 13,806 | 858 | ||||
| Rogers Communications, Inc. Class B | 33,201 | 1,336 | Power Assets Holdings, Ltd. | 37,000 | 348 | ||||
| Sanshin Electronics Co., Ltd. | 11,000 | 97 | PPL Corp. | 50,327 | 1,728 | ||||
See accompanying notes which are an integral part of the financial statements.
Russell Multi-Strategy Income Fund 675
Russell Investment Company
Russell Multi-Strategy Income Fund
Schedule of Investments, continued — October 31, 2016
| Amounts in thousands (except share amounts) | Amounts in thousands (except share amounts) | ||||||||
| Principal | Fair | Principal | Fair | ||||||
| Amount ($) | Value | Amount ($) | Value | ||||||
| or Shares | $ | or Shares | $ | ||||||
| RusHydro PJSC - ADR | 400,857 | 503 | KKR & Co., LP | 28,200 | 752 | ||||
| RusHydro PJSC | 20,405,826 | 256 | Legg Mason, Inc. | 35,820 | 892 | ||||
| Scottish & Southern Energy PLC | 16,732 | 326 | Morgan Stanley | 38,834 | 1,091 | ||||
| Sempra Energy | 5,345 | 572 | National Retail Properties, Inc. | 15,700 | 386 | ||||
| Singapore Telecommunications, Ltd. | 216,466 | 605 | National Westminster Bank PLC | 11,824 | 305 | ||||
| Snam Rete Gas SpA | 132,067 | 697 | NorthStar Realty Finance Corp. | 14,900 | 399 | ||||
| Southern Co. (The) | 5,938 | 306 | PartnerRe, Ltd. | 8,590 | 236 | ||||
| Spark Infrastructure Group | 137,356 | 231 | Pennsylvania Real Estate Investment | 1,939 | 50 | ||||
| Swisscom AG | 966 | 441 | Trust(ö) | ||||||
| Telenor ASA | 22,893 | 364 | People's United Financial, Inc. | 22,400 | 585 | ||||
| Telstra Corp., Ltd. | 262,978 | 995 | PS Business Parks, Inc. | 8,465 | 219 | ||||
| TELUS Corp. | 17,473 | 566 | Public Storage | 2,331 | 57 | ||||
| Terna Rete Elettrica Nazionale SpA | 107,931 | 529 | Regions Financial Corp. | 8,723 | 251 | ||||
| Tokyo Gas Co., Ltd. | 23,000 | 104 | Reinsurance Group of America, Inc. | 13,300 | 382 | ||||
| TransCanada Corp. | 27,905 | 1,263 | Rexford Industrial Realty, Inc. | 19,500 | 490 | ||||
| United Utilities Group PLC | 20,949 | 241 | STAG Industrial, Inc. | 7,037 | 187 | ||||
| Verizon Communications, Inc. | 13,539 | 651 | State Street Corp. | 13,675 | 366 | ||||
| WEC Energy Group, Inc. | 22,987 | 1,373 | Stifel Financial Corp. | 9,700 | 261 | ||||
| Xcel Energy, Inc. | 9,155 | 380 | Summit Hotel Properties, Inc. | 14,653 | 378 | ||||
| Sunstone Hotel Investors, Inc. | 22,391 | 590 | |||||||
| 33,054 | Taubman Centers, Inc. | 7,313 | 189 | ||||||
| Urstadt Biddle Properties, Inc. | 2,125 | 55 | |||||||
| Total Common Stocks | Validus Holdings, Ltd. | 24,750 | 627 | ||||||
| (cost $221,201) | 218,449 | VEREIT, Inc. | 27,419 | 735 | |||||
| Preferred Stocks - 3.4% | Wells Fargo & Co. | 53,197 | 1,390 | ||||||
| Consumer Discretionary - 0.3% | WR Berkley Corp. | 37,973 | 978 | ||||||
| CHS, Inc. | 43,393 | 1,269 | |||||||
| eBay, Inc. | 27,900 | 741 | 23,352 | ||||||
| GMAC Capital Trust I | 14,799 | 378 | Technology - 0.1% | ||||||
| Qwest Corp. | 19,872 | 506 | |||||||
| 2,388 | |||||||||
| Consumer Staples - 0.0% | Utilities - 0.2% | ||||||||
| Dairy Farmers of America, Inc. | 2,500 | 262 | Dominion Resources, Inc. | 13,200 | 329 | ||||
| DTE Energy Co. | 17,903 | 454 | |||||||
| Energy - 0.1% | Integrys Holding, Inc. | 34,500 | 938 | ||||||
| Southern Co. (The) | 16,900 | 451 | NextEra Energy Capital Holdings, Inc. | 14,096 | 354 | ||||
| Financial Services - 2.7% | 2,075 | ||||||||
| Aegon NV | 14,400 | 373 | Total Preferred Stocks | ||||||
| American Financial Group, Inc. | 1,556 | 42 | (cost $28,967) | 29,034 | |||||
| American Homes 4 Rent | 37,100 | 986 | |||||||
| Arch Capital Group, Ltd. | 23,050 | 562 | Options Purchased - 0.3% | ||||||
| Ares Management, LP | 28,931 | 750 | (Number of Contracts) | ||||||
| Aspen Insurance Holdings, Ltd. | 8,375 | 214 | S&P 500 Index | ||||||
| Bank of America Corp. | 32,325 | 841 | Nov 2016 2,137.68 Put (12,967) | USD | 27,719 | (ÿ) | 546 | ||
| Barclays Bank PLC | 14,649 | 378 | Nov 2016 2,147.45 Put (10,004) | USD | 21,483 | (ÿ) | 468 | ||
| Jan 2017 2,137.94 Put (19,912) | USD | 42,571 | (ÿ) | 1,211 | |||||
| Capital One Financial Corp. | 7,000 | 187 | Total Options Purchased | ||||||
| Charles Schwab Corp. (The) | 27,900 | 755 | |||||||
| Chesapeake Lodging Trust | 7,200 | 186 | (cost $2,331) | 2,225 | |||||
| Citigroup, Inc. | 27,018 | 742 | |||||||
| CoBank ACB | 2,200 | 232 | Warrants & Rights - 0.0% | ||||||
| DDR Corp. | 19,783 | 508 | Foresight Energy LP(Þ)(Æ) | ||||||
| DuPont Fabros Technology, Inc. | 13,391 | 368 | 2017 Warrant | 2,510 | 17 | ||||
| Endurance Specialty Holdings, Ltd. | 8,000 | 213 | |||||||
| Farm Credit Bank of Texas | 20,696 | 2,347 | Total Warrants & Rights | ||||||
| First Republic Bank | 7,759 | 203 | (cost $—) | 17 | |||||
| Goldman Sachs Group, Inc. (The) | 13,847 | 369 | Short-Term Investments - 7.4% | ||||||
| Hanover Insurance Group, Inc. (The) | 18,900 | 486 | Belize Government International Bond | ||||||
| Huntington Bancshares, Inc. | 13,425 | 359 | Series REGS | ||||||
| JPMorgan Chase & Co. | 15,000 | 400 | 6.767% due 08/20/17 | 75 | 41 | ||||
See accompanying notes which are an integral part of the financial statements.
676 Russell Multi-Strategy Income Fund
Russell Investment Company
Russell Multi-Strategy Income Fund
Schedule of Investments, continued — October 31, 2016
| Amounts in thousands (except share amounts) | |||||
| Principal | Fair | ||||
| Amount ($) | Value | ||||
| or Shares | $ | ||||
| BNZ International Funding, Ltd. | |||||
| Series GMTN | |||||
| 4.000% due 03/08/17 | EUR | 120 | 134 | ||
| Brazil Letras do Tesouro Nacional | |||||
| Series LTN | |||||
| 13.848% due 01/01/17 (~) | BRL | 2,530 | 775 | ||
| Foresight Energy LLC / Foresight Energy | |||||
| Finance Corp. | |||||
| 15.000% due 10/03/17 (Å) | 582 | 556 | |||
| Hungary Treasury Bills | |||||
| Series 12 M | |||||
| 0.548% due 09/13/17 (~) | HUF | 293,760 | 1,039 | ||
| Malaysia Government International Bond | |||||
| Series 0210 | |||||
| 4.012% due 09/15/17 | MYR | 240 | 58 | ||
| Malaysia Treasury Bill | |||||
| Series 1016 | |||||
| 2.632% due 03/10/17 (~) | MYR | 710 | 168 | ||
| Optima Specialty Steel, Inc. | |||||
| 12.500% due 12/15/16 (Å) | 1,000 | 915 | |||
| Queensland Treasury Corp. | |||||
| 7.125% due 09/18/17 (Þ) | NZD | 125 | 93 | ||
| Russell U.S. Cash Management Fund | 57,669,712 | (8) | 57,681 | ||
| Russian Federal Bond - OFZ | |||||
| Series 6206 | |||||
| 7.400% due 06/14/17 | RUB | 6,201 | 97 | ||
| Sprint Communications, Inc. | |||||
| 9.125% due 03/01/17 | 320 | 326 | |||
| 8.375% due 08/15/17 | 1,500 | 1,562 | |||
| Turkey Government Bond | |||||
| 8.177% due 12/14/16 (~) | TRY | 300 | 96 | ||
| Total Short-Term Investments | |||||
| (cost $63,568) | 63,541 | ||||
| Other Securities - 0.2% | |||||
| Russell U.S. Cash Collateral Fund(×) | 1,655,227 | (8) | 1,655 | ||
| Total Other Securities | |||||
| (cost $1,655) | 1,655 | ||||
| Total Investments 99.5% | |||||
| (identified cost $851,833) | 848,444 | ||||
| Other Assets and Liabilities, | |||||
| Net - 0.5% | 4,120 | ||||
| Net Assets - 100.0% | 852,564 | ||||
See accompanying notes which are an integral part of the financial statements.
Russell Multi-Strategy Income Fund 677
Russell Investment Company
Russell Multi-Strategy Income Fund
Schedule of Investments, continued — October 31, 2016
| Restricted Securities | |||||||||||
| Amounts in thousands (except share and cost per unit amounts) | |||||||||||
| Principal | Cost per | Cost | Fair Value | ||||||||
| % of Net Assets | Acquisition | Amount ($) | Unit | (000 | ) | (000 | ) | ||||
| Securities | Date | or shares | $ | $ | $ | ||||||
| 1.7% | |||||||||||
| Avis Budget Car Rental LLC / Avis Budget Finance, Inc. | 03/14/16 | 22,000 | 100.00 | 22 | 22 | ||||||
| Century Aluminum Co. | 05/01/15 | 5,450,000 | 95.40 | 5,199 | 4,959 | ||||||
| Constellis Holdings LLC / Constellis Finance Corp. | 05/06/15 | 500,000 | 99.63 | 498 | 507 | ||||||
| CSC Holdings LLC | 09/09/16 | 1,000,000 | 100.00 | 1,000 | 1,014 | ||||||
| Diamond 1 Finance Corp. / Diamond 2 Finance Corp | 06/08/16 | 72,000 | 100.00 | 72 | 76 | ||||||
| Diamond 1 Finance Corp. / Diamond 2 Finance Corp | 06/08/16 | 51,000 | 100.00 | 51 | 56 | ||||||
| Foresight Energy LLC / Foresight Energy Finance Corp. | 08/26/16 | 1,621,000 | 79.63 | 1,291 | 1,536 | ||||||
| Foresight Energy LLC / Foresight Energy Finance Corp. | 08/26/16 | 582,000 | 91.47 | 532 | 556 | ||||||
| International Automotive Components Group SA | 05/09/16 | 837,000 | 95.51 | 799 | 793 | ||||||
| Iron Mountain US Holdings, Inc. | 05/24/16 | 101,000 | 100.00 | 101 | 102 | ||||||
| Iron Mountain, Inc. | 05/24/16 | 101,000 | 100.00 | 101 | 104 | ||||||
| Mallinckrodt International Finance SA / Mallinckrodt CB LLC | 09/09/15 | 28,000 | 100.00 | 28 | 26 | ||||||
| Optima Specialty Steel, Inc. | 09/22/15 | 1,000,000 | 99.51 | 995 | 915 | ||||||
| Patterson Co. 2nd Lien Term Loan | 08/14/15 | 590,000 | 99.00 | 584 | 572 | ||||||
| QoL meds LLC 2nd Lien Term Loan | 10/27/16 | 2,040,000 | 98.50 | 2,009 | 2,030 | ||||||
| Radio One, Inc. | 01/02/16 | 25,000 | 92.29 | 23 | 25 | ||||||
| Solera LLC / Solera Finance, Inc. | 02/29/16 | 200,000 | 95.27 | 191 | 224 | ||||||
| TIAA CLO I, Ltd. | 06/03/16 | 279,000 | 92.11 | 257 | 276 | ||||||
| Zais CLO 5, Ltd. | 09/23/16 | 1,000,000 | 95.54 | 955 | 955 | ||||||
| 14,748 | |||||||||||
| For a description of restricted securities see note 8 in the Notes to Financial Statements. | |||||||||||
| Futures Contracts | |||||||
| Amounts in thousands (except contract amounts) | |||||||
| Unrealized | |||||||
| Appreciation | |||||||
| Number of | Notional | Expiration | (Depreciation) | ||||
| Contracts | Amount | Date | $ | ||||
| Long Positions | |||||||
| Amsterdam Index Futures | 8 | EUR | 722 | 11/16 | 1 | ||
| CAC40 Euro Index Futures | 47 | EUR | 2,118 | 11/16 | 7 | ||
| DAX Index Futures | 8 | EUR | 2,136 | 12/16 | 44 | ||
| Euro STOXX 50 Index Futures | 54 | EUR | 1,649 | 12/16 | 35 | ||
| Euro-Bund Index Futures | 2 | EUR | 324 | 12/16 | (7 | ) | |
| FTSE/MIB Index Futures | 6 | EUR | 513 | 12/16 | 17 | ||
| IBEX 35 Index Futures | 8 | EUR | 730 | 11/16 | 29 | ||
| MSCI EAFE Mini Index Futures | 74 | USD | 6,163 | 12/16 | (223 | ) | |
| MSCI Emerging Markets Mini Index Futures | 14 | USD | 633 | 12/16 | (16 | ) | |
| OMXS30 Index Futures | 34 | SEK | 4,912 | 11/16 | (2 | ) | |
| Russell 1000 Mini Index Futures | 6 | USD | 704 | 12/16 | (19 | ) | |
| S&P 500 E-Mini Index Futures | 67 | USD | 7,102 | 12/16 | (156 | ) | |
| S&P Consumer Discretionary Select Sector Index Futures | 68 | USD | 5,333 | 12/16 | (150 | ) | |
| S&P Financial Select Sector Index Futures | 385 | USD | 23,350 | 12/16 | (111 | ) | |
| S&P Mid 400 E-Mini Index Futures | 6 | USD | 904 | 12/16 | (35 | ) | |
| TOPIX Index Futures | 22 | JPY | 306,900 | 12/16 | 124 | ||
| United States 2 Year Treasury Note Futures | 38 | USD | 8,289 | 12/16 | 1 | ||
| United States 5 Year Treasury Note Futures | 101 | USD | 12,201 | 12/16 | (27 | ) | |
| United States 10 Year Treasury Note Futures | 62 | USD | 8,037 | 12/16 | (66 | ) | |
| United States Long Bond Futures | 6 | USD | 976 | 12/16 | (39 | ) | |
| Short Positions | |||||||
| Dow Jones U.S. Real Estate Index Futures | 551 | USD | 16,591 | 12/16 | 1,480 | ||
| FTSE 100 Index Futures | 47 | GBP | 3,257 | 12/16 | (161 | ) | |
| Hang Seng Index Futures | 4 | HKD | 4,581 | 11/16 | 12 | ||
| MSCI Emerging Markets Mini Index Futures | 29 | USD | 1,310 | 12/16 | 25 | ||
| MSCI Singapore Index Futures | 69 | SGD | 2,126 | 11/16 | 24 | ||
| S&P Energy Select Sector Index Futures | 45 | USD | 3,082 | 12/16 | 72 | ||
| S&P Utilities Select Sector Index Futures | 185 | USD | 9,189 | 12/16 | 72 | ||
| S&P/TSX 60 Index Futures | 61 | CAD | 10,571 | 12/16 | (247 | ) | |
See accompanying notes which are an integral part of the financial statements.
678 Russell Multi-Strategy Income Fund
Russell Investment Company
Russell Multi-Strategy Income Fund
Schedule of Investments, continued — October 31, 2016
| Futures Contracts | |||||||||||||
| Amounts in thousands (except contract amounts) | |||||||||||||
| SPI 200 Index Futures | 34 | AUD | 4,496 | 12/16 | (74 | ) | |||||||
| United States 10 Year Treasury Note Futures | 73 | USD | 9,463 | 12/16 | 75 | ||||||||
| Total Unrealized Appreciation (Depreciation) on Open Futures Contracts (å) | 685 | ||||||||||||
| Options Written | |||||||||||||
| Amounts in thousands (except contract amounts) | |||||||||||||
| Number of | Strike | Notional | Expiration | Fair Value | |||||||||
| Call/Put | Contracts | Price | Amount | Date | $ | ||||||||
| S&P 500 Index | Put | 25,934 | 1,900.16 | USD | 49,279 | 11/30/16 | (85 | ) | |||||
| S&P 500 Index | Put | 20,008 | 1,908.84 | USD | 38,192 | 11/30/16 | (72 | ) | |||||
| S&P 500 Index | Put | 39,824 | 1,900.39 | USD | 75,681 | 01/06/17 | (477 | ) | |||||
| Total Liability for Options Written (premiums received $1,154) | (634 | ) | |||||||||||
| Transactions in options written contracts for the period ended October 31, 2016 were as follows: | |||||||||||||
| Number of | Premiums | ||||||||||||
| Contracts | Received | ||||||||||||
| Outstanding October 31, 2015 | — | $ | — | ||||||||||
| Opened | 719,683 | 3,415 | |||||||||||
| Closed | (612,710 | ) | (1,128 | ) | |||||||||
| Expired | (21,207 | ) | (1,133 | ) | |||||||||
| Outstanding October 31, 2016 | 85,766 | $ | 1,154 | ||||||||||
| Foreign Currency Exchange Contracts | |||||||
| Amounts in thousands | |||||||
| Unrealized | |||||||
| Appreciation | |||||||
| Amount | Amount | (Depreciation) | |||||
| Counterparty | Sold | Bought | Settlement Date | $ | |||
| Bank of America | USD | 1,985 | INR | 133,680 | 12/21/16 | 5 | |
| Bank of America | AUD | 230 | USD | 176 | 12/21/16 | 1 | |
| Barclays | USD | 15 | BRL | 48 | 11/03/16 | — | |
| Barclays | USD | 103 | BRL | 329 | 11/03/16 | — | |
| Barclays | USD | 176 | BRL | 559 | 11/03/16 | (1 | ) |
| Barclays | USD | 265 | BRL | 831 | 11/03/16 | (5 | ) |
| Barclays | USD | 266 | BRL | 831 | 11/03/16 | (5 | ) |
| Barclays | USD | 487 | BRL | 1,548 | 11/03/16 | (2 | ) |
| Barclays | USD | 85 | HUF | 23,622 | 11/17/16 | (1 | ) |
| Barclays | USD | 398 | HUF | 108,559 | 11/17/16 | (12 | ) |
| Barclays | USD | 195 | MYR | 819 | 11/17/16 | 1 | |
| Barclays | USD | 302 | PHP | 14,607 | 11/17/16 | (1 | ) |
| Barclays | USD | 436 | PLN | 1,674 | 11/17/16 | (9 | ) |
| Barclays | USD | 373 | RON | 1,493 | 11/17/16 | (9 | ) |
| Barclays | USD | 4 | RUB | 246 | 11/17/16 | — | |
| Barclays | USD | 478 | TRY | 1,471 | 11/17/16 | (4 | ) |
| Barclays | USD | 19 | ZAR | 259 | 11/18/16 | 1 | |
| Barclays | USD | 387 | ZAR | 5,256 | 11/18/16 | 2 | |
| Barclays | USD | 465 | ZAR | 6,764 | 11/18/16 | 34 | |
| Barclays | BRL | 48 | USD | 15 | 11/03/16 | — | |
| Barclays | BRL | 329 | USD | 104 | 11/03/16 | 1 | |
| Barclays | BRL | 559 | USD | 172 | 11/03/16 | (3 | ) |
| Barclays | BRL | 831 | USD | 261 | 11/03/16 | 1 | |
| Barclays | BRL | 831 | USD | 261 | 11/03/16 | 1 | |
| Barclays | BRL | 1,548 | USD | 473 | 11/03/16 | (13 | ) |
| Barclays | BRL | 831 | USD | 263 | 12/02/16 | 5 | |
| Barclays | BRL | 831 | USD | 263 | 12/02/16 | 5 | |
| Barclays | CLP | 319,502 | USD | 477 | 11/17/16 | (12 | ) |
| Barclays | COP | 683,948 | USD | 231 | 11/17/16 | 4 |
See accompanying notes which are an integral part of the financial statements.
Russell Multi-Strategy Income Fund 679
Russell Investment Company
Russell Multi-Strategy Income Fund
Schedule of Investments, continued — October 31, 2016
| Foreign Currency Exchange Contracts | ||||||||
| Amounts in thousands | ||||||||
| Unrealized | ||||||||
| Appreciation | ||||||||
| Amount | Amount | (Depreciation) | ||||||
| Counterparty | Sold | Bought | Settlement Date | $ | ||||
| Barclays | IDR | 1,916,558 | USD | 147 | 11/17/16 | — | ||
| Barclays | IDR | 1,918,114 | USD | 147 | 11/17/16 | — | ||
| Barclays | IDR | 2,025,764 | USD | 155 | 11/17/16 | — | ||
| Barclays | IDR | 4,005,613 | USD | 307 | 11/17/16 | — | ||
| Barclays | IDR | 7,369,268 | USD | 563 | 11/17/16 | (1 | ) | |
| Barclays | MXN | 126 | USD | 7 | 11/17/16 | — | ||
| Barclays | PEN | 225 | USD | 66 | 11/21/16 | (1 | ) | |
| Barclays | PEN | 371 | USD | 108 | 11/21/16 | (2 | ) | |
| Barclays | PEN | 376 | USD | 110 | 11/21/16 | (1 | ) | |
| Barclays | PEN | 465 | USD | 136 | 11/21/16 | (2 | ) | |
| Barclays | PEN | 532 | USD | 156 | 11/21/16 | (2 | ) | |
| Barclays | PEN | 555 | USD | 162 | 11/21/16 | (2 | ) | |
| Barclays | PHP | 20,642 | USD | 424 | 11/17/16 | (1 | ) | |
| Barclays | ZAR | 7 | USD | 1 | 11/18/16 | — | ||
| Barclays | ZAR | 3,062 | USD | 210 | 11/18/16 | (18 | ) | |
| Barclays | ZAR | 3,247 | USD | 232 | 11/18/16 | (8 | ) | |
| BNP Paribas | USD | 602 | JPY | 61,010 | 12/21/16 | (19 | ) | |
| BNP Paribas | USD | 483 | ZAR | 6,897 | 12/21/16 | 23 | ||
| BNP Paribas | AUD | 2,823 | USD | 2,162 | 12/21/16 | 17 | ||
| BNP Paribas | CAD | 3,163 | USD | 2,448 | 12/21/16 | 90 | ||
| BNP Paribas | CHF | 57 | USD | 59 | 12/21/16 | 1 | ||
| BNP Paribas | EUR | 17 | USD | 19 | 12/21/16 | 1 | ||
| BNP Paribas | GBP | 1,183 | USD | 1,576 | 12/21/16 | 127 | ||
| BNP Paribas | NOK | 2,690 | USD | 329 | 12/21/16 | 3 | ||
| BNP Paribas | SEK | 437 | USD | 52 | 12/21/16 | 4 | ||
| BNP Paribas | SGD | 450 | USD | 334 | 12/21/16 | 10 | ||
| Brown Brothers Harriman | USD | 8 | EUR | 7 | 11/02/16 | — | ||
| Brown Brothers Harriman | USD | 3 | EUR | 3 | 11/03/16 | — | ||
| Brown Brothers Harriman | USD | 2 | JPY | 235 | 11/02/16 | — | ||
| Brown Brothers Harriman | JPY | 184 | USD | 2 | 11/02/16 | — | ||
| Brown Brothers Harriman | JPY | 366 | USD | 3 | 11/02/16 | — | ||
| Citigroup | USD | 667 | BRL | 2,122 | 11/03/16 | (2 | ) | |
| Citigroup | USD | 559 | MYR | 2,328 | 11/17/16 | (4 | ) | |
| Citigroup | USD | 302 | PHP | 14,607 | 11/17/16 | (1 | ) | |
| Citigroup | USD | 373 | RON | 1,493 | 11/17/16 | (10 | ) | |
| Citigroup | BRL | 2,122 | USD | 650 | 11/03/16 | (14 | ) | |
| Citigroup | IDR | 4,005,613 | USD | 307 | 11/17/16 | 1 | ||
| Citigroup | PHP | 23,171 | USD | 476 | 11/17/16 | (2 | ) | |
| Citigroup | SGD | 326 | USD | 237 | 11/17/16 | 3 | ||
| Citigroup | SGD | 326 | USD | 237 | 11/17/16 | 3 | ||
| Credit Suisse | USD | 343 | EUR | 305 | 12/21/16 | (8 | ) | |
| Credit Suisse | USD | 1,606 | EUR | 1,425 | 12/21/16 | (38 | ) | |
| HSBC | USD | 85 | HUF | 23,622 | 11/17/16 | (1 | ) | |
| HSBC | USD | 602 | JPY | 61,010 | 12/21/16 | (19 | ) | |
| HSBC | USD | 527 | PLN | 2,076 | 11/17/16 | 2 | ||
| HSBC | USD | 960 | THB | 33,862 | 11/17/16 | 7 | ||
| HSBC | USD | 483 | ZAR | 6,897 | 12/21/16 | 23 | ||
| HSBC | AUD | 2,823 | USD | 2,160 | 12/21/16 | 15 | ||
| HSBC | CAD | 3,163 | USD | 2,448 | 12/21/16 | 89 | ||
| HSBC | CHF | 57 | USD | 59 | 12/21/16 | 1 | ||
| HSBC | EUR | 17 | USD | 19 | 12/21/16 | 1 | ||
| HSBC | GBP | 1,183 | USD | 1,576 | 12/21/16 | 127 | ||
| HSBC | NOK | 2,690 | USD | 329 | 12/21/16 | 3 | ||
| HSBC | SEK | 437 | USD | 52 | 12/21/16 | 4 | ||
| HSBC | SGD | 326 | USD | 237 | 11/17/16 | 3 | ||
| HSBC | SGD | 450 | USD | 334 | 12/21/16 | 10 | ||
See accompanying notes which are an integral part of the financial statements.
680 Russell Multi-Strategy Income Fund
Russell Investment Company
Russell Multi-Strategy Income Fund
Schedule of Investments, continued — October 31, 2016
| Foreign Currency Exchange Contracts | |||||||
| Amounts in thousands | |||||||
| Unrealized | |||||||
| Appreciation | |||||||
| Amount | Amount | (Depreciation) | |||||
| Counterparty | Sold | Bought | Settlement Date | $ | |||
| JPMorgan Chase | USD | 98 | BRL | 312 | 11/03/16 | — | |
| JPMorgan Chase | USD | 176 | BRL | 559 | 11/03/16 | (1 | ) |
| JPMorgan Chase | USD | 265 | BRL | 831 | 11/03/16 | (5 | ) |
| JPMorgan Chase | USD | 266 | BRL | 831 | 11/03/16 | (5 | ) |
| JPMorgan Chase | USD | 270 | MXN | 5,068 | 11/17/16 | (2 | ) |
| JPMorgan Chase | USD | 597 | MYR | 2,516 | 11/17/16 | 2 | |
| JPMorgan Chase | USD | 302 | PHP | 14,607 | 11/17/16 | (1 | ) |
| JPMorgan Chase | USD | 436 | PLN | 1,674 | 11/17/16 | (9 | ) |
| JPMorgan Chase | USD | 373 | RON | 1,493 | 11/17/16 | (9 | ) |
| JPMorgan Chase | USD | 1,155 | THB | 40,290 | 11/17/16 | (4 | ) |
| JPMorgan Chase | USD | 478 | TRY | 1,471 | 11/17/16 | (4 | ) |
| JPMorgan Chase | BRL | 312 | USD | 95 | 11/03/16 | (3 | ) |
| JPMorgan Chase | BRL | 559 | USD | 172 | 11/03/16 | (4 | ) |
| JPMorgan Chase | BRL | 831 | USD | 261 | 11/03/16 | 1 | |
| JPMorgan Chase | BRL | 831 | USD | 261 | 11/03/16 | 1 | |
| JPMorgan Chase | BRL | 831 | USD | 263 | 12/02/16 | 5 | |
| JPMorgan Chase | BRL | 831 | USD | 263 | 12/02/16 | 5 | |
| JPMorgan Chase | CLP | 319,502 | USD | 478 | 11/17/16 | (11 | ) |
| JPMorgan Chase | HUF | 569 | USD | 2 | 11/17/16 | — | |
| JPMorgan Chase | IDR | 4,005,613 | USD | 307 | 11/17/16 | — | |
| JPMorgan Chase | MXN | 126 | USD | 7 | 11/17/16 | — | |
| JPMorgan Chase | PEN | 555 | USD | 162 | 11/21/16 | (3 | ) |
| JPMorgan Chase | SGD | 326 | USD | 237 | 11/17/16 | 3 | |
| JPMorgan Chase | ZAR | 3,062 | USD | 210 | 11/18/16 | (17 | ) |
| National Australia Bank | USD | 602 | JPY | 61,010 | 12/21/16 | (20 | ) |
| National Australia Bank | USD | 484 | ZAR | 6,897 | 12/21/16 | 23 | |
| National Australia Bank | AUD | 2,823 | USD | 2,162 | 12/21/16 | 17 | |
| National Australia Bank | CAD | 3,163 | USD | 2,449 | 12/21/16 | 89 | |
| National Australia Bank | CHF | 57 | USD | 59 | 12/21/16 | 1 | |
| National Australia Bank | EUR | 17 | USD | 19 | 12/21/16 | 1 | |
| National Australia Bank | GBP | 1,183 | USD | 1,576 | 12/21/16 | 126 | |
| National Australia Bank | NOK | 2,690 | USD | 329 | 12/21/16 | 3 | |
| National Australia Bank | SEK | 437 | USD | 52 | 12/21/16 | 4 | |
| National Australia Bank | SGD | 450 | USD | 334 | 12/21/16 | 10 | |
| Standard Chartered | USD | 48 | BRL | 153 | 11/03/16 | — | |
| Standard Chartered | USD | 90 | BRL | 286 | 11/03/16 | — | |
| Standard Chartered | USD | 176 | BRL | 559 | 11/03/16 | (1 | ) |
| Standard Chartered | USD | 260 | BRL | 839 | 11/03/16 | 3 | |
| Standard Chartered | USD | 265 | BRL | 831 | 11/03/16 | (5 | ) |
| Standard Chartered | USD | 266 | BRL | 831 | 11/03/16 | (5 | ) |
| Standard Chartered | USD | 169 | HUF | 46,989 | 11/17/16 | (2 | ) |
| Standard Chartered | USD | 398 | HUF | 108,559 | 11/17/16 | (12 | ) |
| Standard Chartered | USD | 430 | IDR | 5,611,500 | 11/17/16 | — | |
| Standard Chartered | USD | 188 | MYR | 794 | 11/17/16 | 1 | |
| Standard Chartered | USD | 302 | PHP | 14,607 | 11/17/16 | (1 | ) |
| Standard Chartered | USD | 210 | PLN | 827 | 11/17/16 | 1 | |
| Standard Chartered | USD | 436 | PLN | 1,674 | 11/17/16 | (9 | ) |
| Standard Chartered | USD | 110 | RON | 452 | 11/17/16 | — | |
| Standard Chartered | USD | 4 | RUB | 246 | 11/17/16 | — | |
| Standard Chartered | USD | 650 | THB | 22,944 | 11/17/16 | 5 | |
| Standard Chartered | USD | 280 | TRY | 870 | 11/17/16 | — | |
| Standard Chartered | USD | 478 | TRY | 1,471 | 11/17/16 | (4 | ) |
| Standard Chartered | USD | 109 | ZAR | 1,468 | 11/02/16 | — | |
| Standard Chartered | BRL | 153 | USD | 46 | 11/03/16 | (2 | ) |
| Standard Chartered | BRL | 286 | USD | 91 | 11/03/16 | 1 | |
| Standard Chartered | BRL | 559 | USD | 172 | 11/03/16 | (4 | ) |
See accompanying notes which are an integral part of the financial statements.
Russell Multi-Strategy Income Fund 681
Russell Investment Company
Russell Multi-Strategy Income Fund
Schedule of Investments, continued — October 31, 2016
| Foreign Currency Exchange Contracts | |||||||
| Amounts in thousands | |||||||
| Unrealized | |||||||
| Appreciation | |||||||
| Amount | Amount | (Depreciation) | |||||
| Counterparty | Sold | Bought | Settlement Date | $ | |||
| Standard Chartered | BRL | 831 | USD | 261 | 11/03/16 | 1 | |
| Standard Chartered | BRL | 831 | USD | 261 | 11/03/16 | 1 | |
| Standard Chartered | BRL | 839 | USD | 264 | 11/03/16 | 1 | |
| Standard Chartered | BRL | 831 | USD | 263 | 12/02/16 | 5 | |
| Standard Chartered | BRL | 831 | USD | 263 | 12/02/16 | 5 | |
| Standard Chartered | BRL | 1,342 | USD | 420 | 12/02/16 | 3 | |
| Standard Chartered | CLP | 319,502 | USD | 477 | 11/17/16 | (11 | ) |
| Standard Chartered | CNY | 87,690 | USD | 12,911 | 12/21/16 | 27 | |
| Standard Chartered | IDR | 4,005,613 | USD | 307 | 11/17/16 | — | |
| Standard Chartered | IDR | 7,363,167 | USD | 562 | 11/17/16 | (2 | ) |
| Standard Chartered | MXN | 5,251 | USD | 279 | 11/03/16 | 1 | |
| Standard Chartered | MXN | 126 | USD | 7 | 11/17/16 | — | |
| Standard Chartered | PEN | 555 | USD | 162 | 11/21/16 | (3 | ) |
| Standard Chartered | THB | 4,202 | USD | 120 | 11/17/16 | — | |
| Standard Chartered | ZAR | 3,062 | USD | 210 | 11/18/16 | (17 | ) |
| State Street | USD | 5 | AUD | 7 | 11/03/16 | — | |
| State Street | USD | 1,200 | CAD | 1,550 | 12/21/16 | (43 | ) |
| State Street | USD | 5 | JPY | 475 | 11/04/16 | — | |
| State Street | EUR | 1,070 | USD | 1,209 | 12/21/16 | 32 | |
| State Street | HKD | 4,650 | USD | 600 | 12/21/16 | — | |
| State Street | JPY | 366 | USD | 3 | 11/04/16 | — | |
| State Street | JPY | 123,030 | USD | 1,205 | 12/21/16 | 29 | |
| State Street | SGD | 810 | USD | 599 | 12/21/16 | 17 | |
| UBS | USD | 143 | BRL | 456 | 11/03/16 | — | |
| UBS | USD | 176 | BRL | 559 | 11/03/16 | (1 | ) |
| UBS | USD | 265 | BRL | 831 | 11/03/16 | (5 | ) |
| UBS | USD | 266 | BRL | 831 | 11/03/16 | (5 | ) |
| UBS | USD | 31 | CHF | 30 | 12/21/16 | (1 | ) |
| UBS | USD | 442 | CHF | 425 | 12/21/16 | (11 | ) |
| UBS | USD | 398 | HUF | 108,559 | 11/17/16 | (12 | ) |
| UBS | USD | 41 | JPY | 4,080 | 12/21/16 | (2 | ) |
| UBS | USD | 882 | JPY | 90,000 | 12/21/16 | (22 | ) |
| UBS | USD | 4 | RUB | 246 | 11/17/16 | — | |
| UBS | BRL | 456 | USD | 145 | 11/03/16 | 2 | |
| UBS | BRL | 559 | USD | 172 | 11/03/16 | (4 | ) |
| UBS | BRL | 831 | USD | 261 | 11/03/16 | 1 | |
| UBS | BRL | 831 | USD | 261 | 11/03/16 | 1 | |
| UBS | BRL | 831 | USD | 263 | 12/02/16 | 5 | |
| UBS | BRL | 831 | USD | 263 | 12/02/16 | 5 | |
| Total Unrealized Appreciation (Depreciation) on Open Foreign Currency Exchange Contracts | 552 | ||||||
| Credit Default Swap Contracts | |||||||||
| Amounts in thousands | |||||||||
| Credit Indices | |||||||||
| Fund (Pays)/ | |||||||||
| Receives | Termination | Fair Value | |||||||
| Reference Entity | Counterparty | Notional Amount | Fixed Rate | Date | $ | ||||
| CDX Emerging Markets Index | Barclays | USD | 19,600 | (1.000 | %) | 12/20/21 | 1,268 | ||
| CDX NA High Yield Index | Morgan Stanley | USD | 41,000 | 5.000 | % | 12/20/21 | 1,620 | ||
| Total Fair Value on Open Credit Default Swap Contracts Premiums Paid (Received) - $2,782 (å) | 2,888 | ||||||||
See accompanying notes which are an integral part of the financial statements.
682 Russell Multi-Strategy Income Fund
Russell Investment Company
Russell Multi-Strategy Income Fund
Schedule of Investments, continued — October 31, 2016
| Presentation of Portfolio Holdings | |||||||||||||||||
| Amounts in thousands | |||||||||||||||||
| Fair Value | |||||||||||||||||
| Practical | |||||||||||||||||
| Portfolio Summary | Level 1 | Level 2 | Level 3 | Expedient (a) | Total | % of Net Assets | |||||||||||
| Long-Term Investments | |||||||||||||||||
| Asset-Backed Securities | $ | — | $ | 1,315 | $ | — | $ | — | $ | 1,315 | 0.2 | ||||||
| Corporate Bonds and Notes | — | 165,694 | — | — | 165,694 | 19.4 | |||||||||||
| International Debt | — | 112,837 | — | — | 112,837 | 13.3 | |||||||||||
| Loan Agreements | — | 166,862 | — | — | 166,862 | 19.6 | |||||||||||
| Mortgage-Backed Securities | — | 165 | — | — | 165 | —* | |||||||||||
| Non-US Bonds | — | 82,129 | — | — | 82,129 | 9.6 | |||||||||||
| United States Government Agencies | — | 942 | — | — | 942 | 0.1 | |||||||||||
| United States Government Treasuries | — | 3,579 | — | — | 3,579 | 0.4 | |||||||||||
| Common Stocks | |||||||||||||||||
| Consumer Discretionary | 6,243 | 9,521 | — | — | 15,764 | 1.8 | |||||||||||
| Consumer Staples | 12,803 | 6,617 | — | — | 19,420 | 2.3 | |||||||||||
| Energy | 11,749 | 3,457 | 103 | — | 15,309 | 1.8 | |||||||||||
| Financial Services | 31,663 | 14,049 | — | — | 45,712 | 5.4 | |||||||||||
| Health Care | 9,318 | 8,427 | — | — | 17,745 | 2.1 | |||||||||||
| Materials and Processing | 7,878 | 3,360 | 21 | — | 11,259 | 1.3 | |||||||||||
| Producer Durables | 12,552 | 21,040 | — | — | 33,592 | 3.9 | |||||||||||
| Technology | 20,474 | 6,120 | — | — | 26,594 | 3.1 | |||||||||||
| Utilities | 21,660 | 11,394 | — | — | 33,054 | 3.9 | |||||||||||
| Preferred Stocks | 29,034 | — | — | — | 29,034 | 3.4 | |||||||||||
| Options Purchased | — | 2,225 | — | — | 2,225 | 0.3 | |||||||||||
| Warrants & Rights | — | — | 17 | — | 17 | —* | |||||||||||
| Short-Term Investments | — | 5,860 | — | 57,681 | 63,541 | 7.4 | |||||||||||
| Other Securities | — | — | — | 1,655 | 1,655 | 0.2 | |||||||||||
| Total Investments | 163,374 | 625,593 | 141 | 59,336 | 848,444 | 99.5 | |||||||||||
| Other Assets and Liabilities, Net | 0.5 | ||||||||||||||||
| 100.0 | |||||||||||||||||
| Other Financial Instruments | |||||||||||||||||
| Assets | |||||||||||||||||
| Futures Contracts | 2,018 | — | — | — | 2,018 | 0.2 | |||||||||||
| Foreign Currency Exchange Contracts | 1 | 1,066 | — | — | 1,067 | 0.1 | |||||||||||
| Credit Default Swap Contracts | — | 2,888 | — | — | 2,888 | 0.3 | |||||||||||
| Liabilities | |||||||||||||||||
| Futures Contracts | (1,333 | ) | — | — | — | (1,333 | ) | (0.2 | ) | ||||||||
| Options Written | — | (634 | ) | — | — | (634 | ) | (0.1 | ) | ||||||||
| Foreign Currency Exchange Contracts | — | (515 | ) | — | — | (515 | ) | (0.1 | ) | ||||||||
| Total Other Financial Instruments** | $ | 686 | $ | 2,805 | $ | — | $ | — | $ | 3,491 | |||||||
* Less than 0.05% of net assets.
** Futures and foreign currency exchange contract values reflect the unrealized appreciation (depreciation) on the investments.
See accompanying notes which are an integral part of the financial statements.
Russell Multi-Strategy Income Fund 683
Russell Investment Company
Russell Multi-Strategy Income Fund
Schedule of Investments, continued — October 31, 2016
(a) Certain investments that are measured at fair value using the net asset value per share (or its equivalent) practical expedient have not been classified
in the fair value levels. The fair value amounts presented in the table are intended to permit reconciliation to the amounts presented in the Schedule of
Investments.
For a description of the Levels, see note 2 in the Notes to Financial Statements.
For a disclosure on transfers between Levels 1, 2 and 3 during the period ended October 31, 2016, see note 2 in the Notes to
Financial Statements.
Investments in which significant unobservable inputs (Level 3) were used in determining a fair value for the period ended October
31, 2016 were less than 1% of net assets.
See accompanying notes which are an integral part of the financial statements.
684 Russell Multi-Strategy Income Fund
Russell Investment Company
Russell Multi-Strategy Income Fund
Fair Value of Derivative Instruments — October 31, 2016
Amounts in thousands
| Foreign | ||||||||||||
| Equity | Credit | Currency | Interest Rate | |||||||||
| Derivatives not accounted for as hedging instruments | Contracts | Contracts | Contracts | Contracts | ||||||||
| Location: Statement of Assets and Liabilities - Assets | ||||||||||||
| Investments, at fair value* | $ | 2,225 | $ | — | $ | — | $ | — | ||||
| Unrealized appreciation on foreign currency exchange contracts | — | — | 1,067 | — | ||||||||
| Variation margin on futures contracts** | 1,942 | — | — | 76 | ||||||||
| Credit default swap contracts, at fair value | — | 2,888 | — | — | ||||||||
| Total | $ | 4,167 | $ | 2,888 | $ | 1,067 | $ | 76 | ||||
| Location: Statement of Assets and Liabilities - Liabilities | ||||||||||||
| Variation margin on futures contracts** | $ | 1,194 | $ | — | $ | — | $ | 139 | ||||
| Unrealized depreciation on foreign currency exchange contracts | — | — | 515 | — | ||||||||
| Options written, at fair value | 634 | — | — | — | ||||||||
| Total | $ | 1,828 | $ | — | $ | 515 | $ | 139 | ||||
| Foreign | ||||||||||||
| Equity | Credit | Currency | Interest Rate | |||||||||
| Derivatives not accounted for as hedging instruments | Contracts | Contracts | Contracts | Contracts | ||||||||
| Location: Statement of Operations - Net realized gain (loss) | ||||||||||||
| Investments*** | $ | (57 | ) | $ | — | $ | — | $ | — | |||
| Futures contracts | 798 | — | — | (137 | ) | |||||||
| Options written | 834 | — | — | — | ||||||||
| Credit default swap contracts | — | 910 | — | — | ||||||||
| Foreign currency-related transactions**** | — | — | (26 | ) | — | |||||||
| Total | $ | 1,575 | $ | 910 | $ | (26 | ) | $ | (137 | ) | ||
| Location: Statement of Operations - Net change in unrealized appreciation | ||||||||||||
| (depreciation) | ||||||||||||
| Investments***** | $ | (106 | ) | $ | — | $ | — | $ | — | |||
| Futures contracts | 63 | — | — | (92 | ) | |||||||
| Options written | 520 | — | — | — | ||||||||
| Credit default swap contracts | — | (314 | ) | — | — | |||||||
| Foreign currency-related transactions****** | — | — | 531 | — | ||||||||
| Total | $ | 477 | $ | (314 | ) | $ | 531 | $ | (92 | ) | ||
* Fair value of purchased options.
** Includes cumulative appreciation/depreciation of futures contracts as reported in the Schedule of Investments. Only variation margin is reported within the
Statement of Assets and Liabilities.
*** Includes net realized gain (loss) on purchased options as reported in the Statement of Operations.
**** Only includes net realized gain (loss) on forward and spot contracts. May differ from the net realized gain (loss) on foreign currency-related transactions reported
within the Statement of Operations.
***** Includes net unrealized gain (loss) on purchased options as reported in the Schedule of Investments.
****** Only includes change in unrealized gain (loss) on forward and spot contracts. May differ from the net change in unrealized gain (loss) on foreign currency-related
transactions reported within the Statement of Operations.
For further disclosure on derivatives see note 2 in the Notes to Financial Statements.
See accompanying notes which are an integral part of the financial statements.
Russell Multi-Strategy Income Fund 685
Russell Investment Company
Russell Multi-Strategy Income Fund
Balance Sheet Offsetting Financial and Derivative Instruments — October 31, 2016
| Amounts in thousands | |||||||||
| Offsetting of Financial Assets and Derivative Assets | |||||||||
| Gross | Net Amounts | ||||||||
| Amounts | of Assets | ||||||||
| Gross | Offset in the | Presented in | |||||||
| Amounts of | Statement of | the Statement | |||||||
| Recognized | Assets and | of Assets and | |||||||
| Description | Location: Statement of Assets and Liabilities - Assets | Assets | Liabilities | Liabilities | |||||
| Options Purchased Contracts | Investments, at fair value | $ | 2,225 | $ | — | $ | 2,225 | ||
| Securities on Loan* | Investments, at fair value | 1,587 | — | 1,587 | |||||
| Foreign Currency Exchange Contracts | Unrealized appreciation on foreign currency exchange contracts | 1,067 | — | 1,067 | |||||
| Futures Contracts | Variation margin on futures contracts | 99 | — | 99 | |||||
| Credit Default Swap Contracts | Credit default swap contracts, at fair value | 2,888 | — | 2,888 | |||||
| Total Financial and Derivative Assets | 7,866 | — | 7,866 | ||||||
| Financial and Derivative Assets not subject to a netting agreement | (2,987 | ) | — | (2,987 | ) | ||||
| Total Financial and Derivative Assets subject to a netting agreement | $ | 4,879 | $ | — | $ | 4,879 | |||
| Financial Assets, Derivative Assets, and Collateral Held by Counterparty | |||||||||||
| Gross Amounts Not Offset in | |||||||||||
| the Statement of Assets and | |||||||||||
| Liabilities | |||||||||||
| Net Amounts | |||||||||||
| of Assets | |||||||||||
| Presented in | |||||||||||
| the Statement | Financial and | ||||||||||
| of Assets and | Derivative | Collateral | |||||||||
| Counterparty | Liabilities | Instruments | Received^ | Net Amount | |||||||
| Bank of America | $ | 1,683 | $ | 549 | $ | — | $ | 1,134 | |||
| Barclays | 56 | 56 | — | — | |||||||
| BNP Paribas | 275 | 19 | — | 256 | |||||||
| Citigroup | 46 | 7 | 38 | 1 | |||||||
| Credit Suisse | 359 | — | 359 | — | |||||||
| Fidelity | 391 | — | 391 | — | |||||||
| HSBC | 285 | 20 | — | 265 | |||||||
| ING | 331 | — | 331 | — | |||||||
| JPMorgan Chase | 563 | 101 | — | 462 | |||||||
| National Australia Bank | 274 | 20 | — | 254 | |||||||
| Standard Chartered | 55 | 27 | — | 28 | |||||||
| State Street | 79 | 44 | — | 35 | |||||||
| UBS | 482 | 14 | 468 | — | |||||||
| Total | $ | 4,879 | $ | 857 | $ | 1,587 | $ | 2,435 | |||
See accompanying notes which are an integral part of the financial statements.
686 Russell Multi-Strategy Income Fund
Russell Investment Company
Russell Multi-Strategy Income Fund
Balance Sheet Offsetting Financial and Derivative Instruments, continued — October
31, 2016
| Amounts in thousands | |||||||||
| Offsetting of Financial Liabilities and Derivative Liabilities | |||||||||
| Gross | Net Amounts | ||||||||
| Amounts | of Liabilities | ||||||||
| Gross | Offset in the | Presented in | |||||||
| Amounts of | Statement of | the Statement | |||||||
| Recognized | Assets and | of Assets and | |||||||
| Description | Location: Statement of Assets and Liabilities - Liabilities | Liabilities | Liabilities | Liabilities | |||||
| Futures Contracts | Variation margin on futures contracts | $ | 542 | $ | — | $ | 542 | ||
| Foreign Currency Exchange Contracts | Unrealized depreciation on foreign currency exchange contracts | 515 | — | 515 | |||||
| Options Written Contracts | Options written, at fair value | 634 | — | 634 | |||||
| Total Financial and Derivative Liabilities | 1,691 | — | 1,691 | ||||||
| Financial and Derivative Liabilities not subject to a netting agreement | (542 | ) | — | (542 | ) | ||||
| Total Financial and Derivative Liabilities subject to a netting agreement | $ | 1,149 | $ | — | $ | 1,149 | |||
| Financial Liabilities, Derivative Liabilities, and Collateral Pledged by Counterparty | |||||||||
| Gross Amounts Not Offset in | |||||||||
| the Statement of Assets and | |||||||||
| Liabilities | |||||||||
| Net Amounts | |||||||||
| of Liabilities | |||||||||
| Presented in | |||||||||
| the Statement | Financial and | ||||||||
| of Assets and | Derivative | Collateral | |||||||
| Counterparty | Liabilities | Instruments | Pledged^ | Net Amount | |||||
| Bank of America | $ | 549 | $ | 549 | $ | — | $ | — | |
| Barclays | 116 | 56 | — | 60 | |||||
| BNP Paribas | 19 | 19 | — | — | |||||
| Citigroup | 34 | 7 | — | 27 | |||||
| Credit Suisse | 46 | — | — | 46 | |||||
| HSBC | 20 | 20 | — | — | |||||
| JPMorgan Chase | 162 | 101 | — | 61 | |||||
| National Australia Bank | 20 | 20 | — | — | |||||
| Standard Chartered | 77 | 27 | — | 50 | |||||
| State Street | 44 | 44 | — | — | |||||
| UBS | 62 | 14 | — | 48 | |||||
| Total | $ | 1,149 | $ | 857 | $ | — | $ | 292 | |
* Fair value of securities on loan as reported in the footnotes to the Statement of Assets and Liabilities.
^ Collateral received or pledged amounts may not reconcile to those disclosed in the Statement of Assets and Liabilities due to the inclusion of off-Balance
Sheet collateral and adjustments made to exclude overcollateralization.
For further disclosure on derivatives and counterparty risk see note 2 in the Notes to Financial Statements.
See accompanying notes which are an integral part of the financial statements.
Russell Multi-Strategy Income Fund 687
Russell Investment Company
Russell Multi-Strategy Income Fund
Statement of Assets and Liabilities — October 31, 2016
| Amounts in thousands | ||
| Assets | ||
| Investments, at identified cost | $ | 851,833 |
| Investments, at fair value(*)(>) | 848,444 | |
| Cash | 493 | |
| Cash (restricted)(a)(b) | 8,400 | |
| Foreign currency holdings(^) | 1,909 | |
| Unrealized appreciation on foreign currency exchange contracts | 1,067 | |
| Receivables: | ||
| Dividends and interest | 6,913 | |
| Dividends from affiliated Russell funds | 36 | |
| Investments sold | 3,218 | |
| Fund shares sold | 1,067 | |
| Variation margin on futures contracts | 99 | |
| Credit default swap contracts, at fair value(+) | 2,888 | |
| Total assets | 874,534 | |
| Liabilities | ||
| Payables: | ||
| Due to broker (c) | 4,056 | |
| Investments purchased | 13,021 | |
| Fund shares redeemed | 807 | |
| Accrued fees to affiliates | 441 | |
| Other accrued expenses | 287 | |
| Variation margin on futures contracts | 542 | |
| Deferred capital gains tax liability | 12 | |
| Unrealized depreciation on foreign currency exchange contracts | 515 | |
| Options written, at fair value(x) | 634 | |
| Payable upon return of securities loaned | 1,655 | |
| Total liabilities | 21,970 | |
| Commitments and Contingencies (1) | ||
| Net Assets | $ | 852,564 |
| (1) See note 9 in the Notes to Financial Statements for a detailed description of commitments and contingencies. | ||
See accompanying notes which are an integral part of the financial statements.
688 Russell Multi-Strategy Income Fund
Russell Investment Company
Russell Multi-Strategy Income Fund
Statement of Assets and Liabilities, continued — October 31, 2016
| Amounts in thousands | |||
| Net Assets Consist of: | |||
| Undistributed (overdistributed) net investment income | $ | 2,183 | |
| Accumulated net realized gain (loss) | (9,268 | ) | |
| Unrealized appreciation (depreciation) on: | |||
| Investments (net of deferred tax liability for foreign capital gains taxes) | (3,401 | ) | |
| Futures contracts | 685 | ||
| Options written | 520 | ||
| Credit default swap contracts | 106 | ||
| Foreign currency-related transactions | 522 | ||
| Shares of beneficial interest | 881 | ||
| Additional paid-in capital | 860,336 | ||
| Net Assets | $ | 852,564 | |
| Net Asset Value, offering and redemption price per share: | |||
| Net asset value per share: Class A(#) | $ | 9.66 | |
| Maximum offering price per share (Net asset value plus sales charge of 3.75%): Class A | $ | 10.04 | |
| Class A — Net assets | $ | 10,052,322 | |
| Class A — Shares outstanding ($.01 par value) | 1,040,146 | ||
| Net asset value per share: Class C(#) | $ | 9.64 | |
| Class C — Net assets | $ | 7,232,665 | |
| Class C — Shares outstanding ($.01 par value) | 750,592 | ||
| Net asset value per share: Class E (#) | $ | 9.67 | |
| Class E — Net assets | $ | 23,602,355 | |
| Class E — Shares outstanding ($.01 par value) | 2,440,507 | ||
| Net asset value per share: Class S (#) | $ | 9.68 | |
| Class S — Net assets | $ | 552,190,370 | |
| Class S — Shares outstanding ($.01 par value) | 57,046,386 | ||
| Net asset value per share: Class Y(#) | $ | 9.68 | |
| Class Y — Net assets | $ | 259,485,888 | |
| Class Y — Shares outstanding ($.01 par value) | 26,792,604 | ||
| Amounts in thousands | |||
| (^) Foreign currency holdings - cost | $ | 1,925 | |
| (x) Premiums received on options written | $ | 1,154 | |
| (*) Securities on loan included in investments | $ | 1,587 | |
| (+) Credit default swap contracts - premiums paid (received) | $ | 2,782 | |
| (>) Investments in affiliates, Russell U.S. Cash Management Fund and Russell U.S. Cash Collateral Fund | $ | 59,336 | |
| (a) Cash Collateral for Futures | $ | 5,300 | |
| (b) Cash Collateral for Swaps | $ | 3,100 | |
| (c) Due to Broker for Swaps | $ | 4,056 | |
| (#) Net asset value per share equals class level net assets divided by class level shares of beneficial interest outstanding. | |||
See accompanying notes which are an integral part of the financial statements.
Russell Multi-Strategy Income Fund 689
Russell Investment Company
Russell Multi-Strategy Income Fund
Statement of Operations — For the Period Ended October 31, 2016
| Amounts in thousands | |||
| Investment Income | |||
| Dividends | $ | 4,719 | |
| Dividends from affiliated Russell funds | 222 | ||
| Interest | 14,326 | ||
| Securities lending income(net) | 1 | ||
| Less foreign taxes withheld | (303 | ) | |
| Total investment income | 18,965 | ||
| Expenses | |||
| Advisory fees | 3,023 | ||
| Administrative fees | 195 | ||
| Custodian fees | 427 | ||
| Distribution fees - Class A | 16 | ||
| Distribution fees - Class C | 36 | ||
| Transfer agent fees - Class A | 13 | ||
| Transfer agent fees - Class C | 10 | ||
| Transfer agent fees - Class E | 23 | ||
| Transfer agent fees - Class S . | 549 | ||
| Transfer agent fees - Class Y | 5 | ||
| Professional fees | 95 | ||
| Registration fees | 100 | ||
| Shareholder servicing fees - Class C | 12 | ||
| Shareholder servicing fees - Class E | 29 | ||
| Trustees’ fees | 12 | ||
| Printing fees | 32 | ||
| Offering fees | 58 | ||
| Miscellaneous | 49 | ||
| Expenses before reductions | 4,684 | ||
| Expense reductions | (1,371 | ) | |
| Net expenses | 3,313 | ||
| Net investment income (loss) | 15,652 | ||
| Net Realized and Unrealized Gain (Loss) | |||
| Net realized gain (loss) on: | |||
| Investments (net of deferred tax liability for foreign capital gains taxes) | (9,789 | ) | |
| Futures contracts | 661 | ||
| Options written | 834 | ||
| Credit default swap contracts | 910 | ||
| Foreign currency-related transactions | 265 | ||
| Net realized gain (loss) | (7,119 | ) | |
| Net change in unrealized appreciation (depreciation) on: | |||
| Investments (net of deferred tax liability for foreign capital gains taxes) | 8,663 | ||
| Futures contracts | (29 | ) | |
| Options written | 520 | ||
| Credit default swap contracts | (314 | ) | |
| Foreign currency-related transactions | 508 | ||
| Net change in unrealized appreciation (depreciation) | 9,348 | ||
| Net realized and unrealized gain (loss) | 2,229 | ||
| Net Increase (Decrease) in Net Assets from Operations | $ | 17,881 | |
See accompanying notes which are an integral part of the financial statements.
690 Russell Multi-Strategy Income Fund
Russell Investment Company
Russell Multi-Strategy Income Fund
Statements of Changes in Net Assets
| For the Periods Ended October 31, | ||||||
| Amounts in thousands | 2016 | 2015 | (1) | |||
| Increase (Decrease) in Net Assets | ||||||
| Operations | ||||||
| Net investment income (loss) | $ | 15,652 | $ | 4,828 | ||
| Net realized gain (loss) | (7,119 | ) | (2,287 | ) | ||
| Net change in unrealized appreciation (depreciation) | 9,348 | (10,916 | ) | |||
| Net increase (decrease) in net assets from operations | 17,881 | (8,375 | ) | |||
| Distributions | ||||||
| From net investment income | ||||||
| Class A | (219 | ) | (31 | ) | ||
| Class C | (139 | ) | (22 | ) | ||
| Class E . | (345 | ) | (69 | ) | ||
| Class S | (8,900 | ) | (2,412 | ) | ||
| Class Y | (4,719 | ) | (1,619 | ) | ||
| Net decrease in net assets from distributions | (14,322 | ) | (4,153 | ) | ||
| Share Transactions* | ||||||
| Net increase (decrease) in net assets from share transactions | 573,338 | 288,195 | ||||
| Total Net Increase (Decrease) in Net Assets | 576,897 | 275,667 | ||||
| Net Assets | ||||||
| Beginning of period | 275,667 | — | ||||
| End of period | $ | 852,564 | $ | 275,667 | ||
| Undistributed (overdistributed) net investment income included in net assets | $ | 2,183 | $ | 285 | ||
| (1) For the period May 4, 2015 (commencement of operations) to October 31, 2015. | ||||||
See accompanying notes which are an integral part of the financial statements.
Russell Multi-Strategy Income Fund 691
Russell Investment Company
Russell Multi-Strategy Income Fund
Statements of Changes in Net Assets, continued
* Share transaction amounts (in thousands) for the periods ended October 31, 2016 and October 31, 2015 were as follows:
| 2016 | 2015 | (1) | |||||||||||
| Shares | Dollars | Shares | Dollars | ||||||||||
| Class A | |||||||||||||
| Proceeds from shares sold | 826 | $ | 7,810 | 349 | $ | 3,391 | |||||||
| Proceeds from reinvestment of distributions | 21 | 199 | 3 | 27 | |||||||||
| Payments for shares redeemed | (110 | ) | (1,039 | ) | (49 | ) | (466 | ) | |||||
| Net increase (decrease) | 737 | 6,970 | 303 | 2,952 | |||||||||
| Class C | |||||||||||||
| Proceeds from shares sold | 540 | 5,100 | 295 | 2,871 | |||||||||
| Proceeds from reinvestment of distributions | 14 | 136 | 2 | 21 | |||||||||
| Payments for shares redeemed | (62 | ) | (589 | ) | (39 | ) | (379 | ) | |||||
| Net increase (decrease) | 492 | 4,647 | 258 | 2,513 | |||||||||
| Class E | |||||||||||||
| Proceeds from shares sold | 1,980 | 19,092 | 785 | 7,422 | |||||||||
| Proceeds from reinvestment of distributions | 36 | 345 | 7 | 69 | |||||||||
| Payments for shares redeemed | (330 | ) | (3,155 | ) | (38 | ) | (361 | ) | |||||
| Net increase (decrease) | 1,686 | 16,282 | 754 | 7,130 | |||||||||
| Class S | |||||||||||||
| Proceeds from shares sold | 48,360 | 464,565 | 19,539 | 193,959 | |||||||||
| Proceeds from reinvestment of distributions | 936 | 8,874 | 255 | 2,407 | |||||||||
| Payments for shares redeemed | (9,363 | ) | (89,008 | ) | (2,680 | ) | (25,926 | ) | |||||
| Net increase (decrease) | 39,933 | 384,431 | 17,114 | 170,440 | |||||||||
| Class Y | |||||||||||||
| Proceeds from shares sold | 18,832 | 184,667 | 11,736 | 117,289 | |||||||||
| Proceeds from reinvestment of distributions | 499 | 4,719 | 172 | 1,620 | |||||||||
| Payments for shares redeemed | (3,022 | ) | (28,378 | ) | (1,424 | ) | (13,749 | ) | |||||
| Net increase (decrease) | 16,309 | 161,008 | 10,484 | 105,160 | |||||||||
| Total increase (decrease) | 59,157 | $ | 573,338 | 28,913 | $ | 288,195 | |||||||
(1) For the period May 4, 2015 (commencement of operations) to October 31, 2015.
See accompanying notes which are an integral part of the financial statements.
692 Russell Multi-Strategy Income Fund
Russell Investment Company
Russell Multi-Strategy Income Fund
Financial Highlights — For the Period Ended
For a Share Outstanding Throughout Each Period.
| $ | $ | $ | $ | $ | ||||||||||||
| Net Asset Value, | Net | Net Realized | Total from | Distributions | ||||||||||||
| Beginning of | Investment | and Unrealized | Investment | from Net | $ | |||||||||||
| Period | Income (Loss)(a)(d) | Gain (Loss) | Operations | Investment Income | Total Distributions | |||||||||||
| Class A | ||||||||||||||||
| October 31, 2016 | 9.52 | .35 | .12 | .47 | (.33 | ) | (.33 | ) | ||||||||
| October 31, 2015(6) | 10.00 | .16 | (.50 | ) | (.34 | ) | (.14 | ) | (.14 | ) | ||||||
| Class C | ||||||||||||||||
| October 31, 2016 | 9.51 | .27 | .13 | .40 | (.27 | ) | (.27 | ) | ||||||||
| October 31, 2015(6) | 10.00 | .12 | (.49 | ) | (.37 | ) | (.12 | ) | (.12 | ) | ||||||
| Class E | ||||||||||||||||
| October 31, 2016 | 9.53 | .34 | .13 | .47 | (.33 | ) | (.33 | ) | ||||||||
| October 31, 2015(6) | 10.00 | .15 | (.48 | ) | (.33 | ) | (.14 | ) | (.14 | ) | ||||||
| Class S | ||||||||||||||||
| October 31, 2016 | 9.53 | .36 | .14 | .50 | (.35 | ) | (.35 | ) | ||||||||
| October 31, 2015(6) | 10.00 | .17 | (.50 | ) | (.33 | ) | (.14 | ) | (.14 | ) | ||||||
| Class Y | ||||||||||||||||
| October 31, 2016 | 9.54 | .39 | .12 | .51 | (.37 | ) | (.37 | ) | ||||||||
| October 31, 2015(6) | 10.00 | .18 | (.49 | ) | (.31 | ) | (.15 | ) | (.15 | ) | ||||||
See accompanying notes which are an integral part of the financial statements.
693 Russell Multi-Strategy Income Fund
| % | % | % | ||||||||||||
| $ | $ | Ratio of Expenses | Ratio of Expenses | Ratio of Net | ||||||||||
| Net Asset Value, | % | Net Assets, | to Average | to Average | Investment Income | % | ||||||||
| End of | Total | End of Period | Net Assets, | Net Assets, | to Average | Portfolio | ||||||||
| Period | Return(b)(c) | (000 | ) | Gross(e) | Net(d)(e) | Net Assets(d)(e) | Turnover Rate(b) | |||||||
| 9.66 | 5.08 | 10,052 | 1.44 | 1.10 | 3.70 | 67 | ||||||||
| 9.52 | (3.40 | ) | 2,887 | 1.44 | 1.10 | 3.35 | 38 | |||||||
| 9.64 | 4.34 | 7,233 | 2.19 | 1.85 | 2.92 | 67 | ||||||||
| 9.51 | (3.71 | ) | 2,456 | 2.19 | 1.85 | 2.59 | 38 | |||||||
| 9.67 | 5.06 | 23,603 | 1.44 | 1.10 | 3.57 | 67 | ||||||||
| 9.53 | (3.25 | ) | 7,187 | 1.43 | 1.10 | 3.31 | 38 | |||||||
| 9.68 | 5.43 | 552,190 | 1.19 | .85 | 3.81 | 67 | ||||||||
| 9.53 | (3.27 | ) | 163,159 | 1.18 | .85 | 3.50 | 38 | |||||||
| 9.68 | 5.51 | 259,486 | 1.00 | .65 | 4.16 | 67 | ||||||||
| 9.54 | (3.09 | ) | 99,978 | .98 | .65 | 3.56 | 38 | |||||||
See accompanying notes which are an integral part of the financial statements.
Russell Multi-Strategy Income Fund 694
Russell Investment Company
Russell Multi-Strategy Income Fund
Related Party Transactions, Fees and Expenses
| Accrued fees payable to affiliates for the period ended October 31, 2016 were as follows: | ||
| Advisory fees | $ | 288,832 |
| Administration fees | 34,962 | |
| Distribution fees | 6,747 | |
| Shareholder servicing fees | 6,534 | |
| Transfer agent fees | 101,284 | |
| Trustee fees | 2,412 | |
| $ | 440,771 | |
| Transactions (amounts in thousands) during the period ended October 31, 2016 with Underlying Funds which are, or were, an | |||||||||||||||||||
| affiliated company are as follows: | |||||||||||||||||||
| Fair Value, | Change in | ||||||||||||||||||
| Beginning of | Realized Gain | Unrealized | Fair Value, End | Income | Capital Gains | ||||||||||||||
| Period | Purchases | Sales | (Loss) | Gain (Loss) | of Period | Distributions | Distributions | ||||||||||||
| Russell U.S. Cash Collateral Fund | $ | — | $ | 5,078 | $ | 3,423 | $ | — | $ | — | $ | 1,655 | $ | 1 | $ | — | |||
| Russell U.S. Cash Management Fund | 22,662 | 1,005,936 | 970,933 | 8 | 8 | 57,681 | 222 | — | |||||||||||
| $ | 22,662 | $ | 1,011,014 | $ | 974,356 | $ | 8 | $ | 8 | $ | 59,336 | $ | 223 | $ | — | ||||
Federal Income Taxes
At October 31, 2016, the cost of investments and net unrealized appreciation (depreciation), undistributed ordinary income and
undistributed long-term capital gains for income tax purposes were as follows:.
| Cost of Investments | $ | 853,020,568 | |||
| Unrealized Appreciation | $ | 19,499,260 | |||
| Unrealized Depreciation | (24,075,526 | ) | |||
| Net Unrealized Appreciation (Depreciation) | $ | (4,576,266 | ) | ||
| Undistributed Ordinary Income | $ | 2,675,830 | |||
| Undistributed Long-Term Capital Gains | |||||
| (Capital Loss Carryforward) | $ | (6,588,266 | ) | ||
| Tax Composition of Distributions | |||||
| Ordinary Income | $ | 14,322,047 | |||
Net investment income and net realized gains (loss) in the financial statements may differ from taxable net investment income and net
realized gains (losses). Capital accounts within the financial statements are adjusted for permanent book-tax differences. Book-tax
differences are primarily due to foreign currency gains and losses, reclassifications of dividends, differences in treatment of income
from swaps, net operating losses, investments in partnerships, investments in passive foreign investment companies (PFICs), tax
straddle transactions, use of tax equalization and foreign capital gains taxes. These adjustments have no impact on the net assets.
At October 31, 2016, the Statement of Assets and Liabilities have been adjusted by the following amounts (in thousands):
| Undistributed net investment income | $ | 568 | |
| Accumulated net realized gain (loss) | (302 | ) | |
| Additional paid-in capital | (266 | ) |
See accompanying notes which are an integral part of the financial statements.
Russell Multi-Strategy Income Fund 695
Russell Investment Company
Russell Strategic Call Overwriting Fund
Portfolio Management Discussion and Analysis — October 31, 2016 (Unaudited)
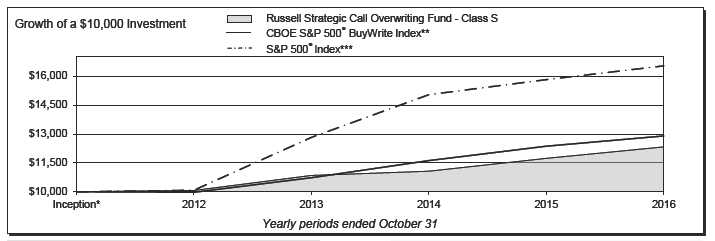
| Russell Strategic Call Overwriting Fund - Class S | CBOE S&P 500® BuyWrite Index** | ||||||
| Total | Total | ||||||
| Return | Return | ||||||
| 1 Year | 5.07 | % | 1 Year | 4.27 | % | ||
| Inception* | 5.10 | %§ | Inception* | 6.23 | %§ | ||
| S&P 500® Index*** | |||||||
| Total | |||||||
| Return | |||||||
| 1 Year | 4.51 | % | |||||
| Inception* | 12.69 | %§ | |||||
696 Russell Strategic Call Overwriting Fund
Russell Investment Company
Russell Strategic Call Overwriting Fund
Portfolio Management Discussion and Analysis, continued — October 31, 2016
(Unaudited)
| What is the Fund’s investment objective? | to the benchmark and is designed to adapt to market and volatility |
| The Russell Strategic Call Overwriting Fund (the “Fund”) seeks to | moves relative to a static, monthly option buy write approach. |
| provide total return with lower volatility than U.S. equity markets. | Because of this, the Fund takes directional views based on |
| momentum and statistically overbought or oversold conditions. | |
| How did the Fund perform relative to its benchmark for the | The Fund does so by utilizing weekly, bi-weekly and monthly |
| fiscal year ended October 31, 2016? | options that are slightly in-the-money to slightly out-of-the- |
| For the fiscal year ended October 31, 2016, the Fund’s Class S | money. |
| Shares gained 5.07%. This is compared to the Fund’s benchmark, | During the fiscal year, the Fund took option positions which |
| the CBOE S&P 500® BuyWrite Index, which gained 4.27% | often allowed for more upside than the benchmark due to their |
| during the same period. The Fund’s performance includes | higher strike prices. Occasional defensive positions (which |
| operating expenses, whereas index returns are unmanaged and | were characterized as options with lower strike prices than the |
| do not include expenses of any kind. | benchmark) indicated by the Fund’s quantitative model were |
| For the fiscal year ended October 31, 2016, the Morningstar® | short lived. Market rallies were swift during the period, which is |
| Option Writing Category, a group of funds that Morningstar | historically out of the ordinary. These factors contributed to the |
| considers to have investment strategies similar to those of the | Fund outperforming its benchmark during the fiscal year. |
| Fund, gained 1.42%. This result serves as a peer comparison and | |
| is expressed net of operating expenses. | Describe any changes to the Fund’s structure. |
| There were no changes to the Fund’s structure during the fiscal | |
| How did the market conditions described in the Market | year. |
| Summary report affect the Fund’s performance? | |
| Fund performance was positively impacted by the increased | The views expressed in this report reflect those of the |
| level of market volatility experienced in 2016, as the Fund’s call | portfolio managers only through the end of the period |
| overwriting program seeks to benefit from mispricings based upon | covered by the report. These views do not necessarily |
| market anticipated volatility and realized volatility. | represent the views of RIM, or any other person in RIM or |
| any other affiliated organization. These views are subject | |
| How did the investment strategies and techniques employed | to change at any time based upon market conditions or |
| by the Fund and its money managers affect its benchmark- | other events, and RIM disclaims any responsibility to |
| relative performance? | update the views contained herein. These views should not |
| The Fund seeks to be less time and path dependent relative to the | be relied on as investment advice and, because investment |
| buy write approach of the Fund’s benchmark, which only trades | decisions for a Russell Investment Company (“RIC”) Fund |
| options once per month. The Fund seeks a smoother overwriting | are based on numerous factors, should not be relied on as |
| profile through a more diversified option tenor selection relative | an indication of investment decisions of any RIC Fund. |
* Assumes initial investment on August 15, 2012.
** CBOE S&P 500® BuyWrite Index is a passive total return index based on (1) buying an S&P® stock index portfolio, and (2) “writing” (or selling) the near-term
S&P 500 Index “covered” call option, generally on the third Friday of each month. The SPX call written will have about one month remaining to expiration, with
an exercise price just above the prevailing index level (i.e., slightly out of the money). The SPX call is held until expiration and cash settled, at which time a new
one-month, near-the-money call is written.
*** The Standard & Poor’s 500® Index is composed of 500 common stocks which are chosen by Standard & Poor’s Corporation to best capture the price performance
of a large cross-section of the U.S. publicly traded stock market. The index is structured to approximate the general distribution of industries in the U.S.
economy.
§ Annualized.
Performance is historical and assumes reinvestment of all dividends and capital gains. Investment return and principal value will fluctuate so that an investor’s
shares, when redeemed, may be worth more or less than when purchased. Past performance is not indicative of future results. The returns shown do not reflect the
deduction of taxes that a shareholder would pay on Fund distributions or the redemption of Fund shares. Additionally, the returns presented herein may differ from
the performance reported in the Financial Highlights as the returns herein are calculated in a manner consistent with standardized performance in accordance with
Securities and Exchange Commission rules, while the performance in the Financial Highlights has been calculated in accordance with U.S. Generally Accepted
Accounting Principles (“U.S. GAAP”).
Russell Strategic Call Overwriting Fund 697
Russell Investment Company
Russell Strategic Call Overwriting Fund
Shareholder Expense Example — October 31, 2016 (Unaudited)
| Fund Expenses | Please note that the expenses shown in the table are meant | |||||
| The following disclosure provides important information | to highlight your ongoing costs only and do not reflect any | |||||
| regarding the Fund’s Shareholder Expense Example | transactional costs. Therefore, the information under the heading | |||||
| (“Example”). | “Hypothetical Performance (5% return before expenses)” is | |||||
| useful in comparing ongoing costs only, and will not help you | ||||||
| Example | determine the relative total costs of owning different funds. In | |||||
| As a shareholder of the Fund, you incur two types of costs: (1) | addition, if these transactional costs were included, your costs | |||||
| transaction costs, and (2) ongoing costs, including advisory and | would have been higher. | |||||
| administrative fees; and other Fund expenses. The Example is | Hypothetical | |||||
| intended to help you understand your ongoing costs (in dollars) | Performance (5% | |||||
| of investing in the Fund and to compare these costs with the | Actual | return before | ||||
| ongoing costs of investing in other mutual funds. The Example | Class S | Performance | expenses) | |||
| Beginning Account Value | ||||||
| is based on an investment of $1,000 invested at the beginning of | May 1, 2016 | $ | 1,000.00 | $ | 1,000.00 | |
| the period and held for the entire period indicated, which for this | Ending Account Value | |||||
| Fund is from May 1, 2016 to October 31, 2016. | October 31, 2016 | $ | 1,051.30 | $ | 1,020.26 | |
| Expenses Paid During Period* | $ | 5.00 | $ | 4.93 | ||
| Actual Expenses | ||||||
| The information in the table under the heading “Actual | * Expenses are equal to the Fund's annualized expense ratio of 0.97% | |||||
| (representing the six month period annualized), multiplied by the average | ||||||
| Performance” provides information about actual account values | account value over the period, multiplied by 184/366 (to reflect the one-half | |||||
| and actual expenses. You may use the information in this column, | year period). May reflect amounts waived and/or reimbursed. Without any | |||||
| together with the amount you invested, to estimate the expenses | waivers and/or reimbursements, expenses would have been higher. | |||||
| that you paid over the period. Simply divide your account value by | ||||||
| $1,000 (for example, an $8,600 account value divided by $1,000 | ||||||
| = 8.6), then multiply the result by the number in the first column | ||||||
| in the row entitled “Expenses Paid During Period” to estimate | ||||||
| the expenses you paid on your account during this period. | ||||||
| Hypothetical Example for Comparison Purposes | ||||||
| The information in the table under the heading “Hypothetical | ||||||
| Performance (5% return before expenses)” provides information | ||||||
| about hypothetical account values and hypothetical expenses | ||||||
| based on the Fund’s actual expense ratio and an assumed rate of | ||||||
| return of 5% per year before expenses, which is not the Fund’s | ||||||
| actual return. The hypothetical account values and expenses | ||||||
| may not be used to estimate the actual ending account balance or | ||||||
| expenses you paid for the period. You may use this information | ||||||
| to compare the ongoing costs of investing in the Fund and other | ||||||
| funds. To do so, compare this 5% hypothetical example with the | ||||||
| 5% hypothetical examples that appear in the shareholder reports | ||||||
| of other funds. | ||||||
698 Russell Strategic Call Overwriting Fund
Russell Investment Company
Russell Strategic Call Overwriting Fund
Schedule of Investments — October 31, 2016
| Amounts in thousands (except share amounts) | Amounts in thousands (except share amounts) | ||||||
| Principal | Fair | ||||||
| Principal | Fair | Amount ($) or | Value | ||||
| Amount ($) or | Value | Shares | $ | ||||
| Shares | $ | ||||||
| Common Stocks - 94.5% | Starbucks Corp. | 7,452 | 396 | ||||
| Consumer Discretionary - 13.5% | TEGNA, Inc. | 1,865 | 37 | ||||
| Aaron's, Inc. Class A | 815 | 20 | Tempur Sealy International, Inc.(Æ) | 219 | 12 | ||
| Advance Auto Parts, Inc. | 343 | 48 | Tiffany & Co. | 1,156 | 85 | ||
| Amazon.com, Inc.(ì)(Æ) | 1,685 | 1,331 | Time Warner, Inc. | 4,934 | 439 | ||
| AMC Networks, Inc. Class A(Æ) | 208 | 10 | TJX Cos., Inc. | 4,732 | 349 | ||
| AutoNation, Inc.(Æ) | 793 | 35 | TripAdvisor, Inc.(Æ) | 769 | 50 | ||
| Best Buy Co., Inc. | 2,196 | 85 | Twenty-First Century Fox, Inc. Class A | 10,120 | 266 | ||
| CarMax, Inc.(Æ) | 2,143 | 107 | Urban Outfitters, Inc.(Æ) | 1,573 | 53 | ||
| Charter Communications, Inc. Class A(Æ) | 215 | 54 | Visteon Corp. | 226 | 16 | ||
| Comcast Corp. Class A(ì) | 14,568 | 901 | Wal-Mart Stores, Inc.(ì) | 8,670 | 607 | ||
| Costco Wholesale Corp. | 2,784 | 412 | Walt Disney Co. (The)(ì) | 9,323 | 864 | ||
| Dick's Sporting Goods, Inc. | 336 | 19 | Whirlpool Corp. | 556 | 83 | ||
| Dillard's, Inc. Class A | 692 | 42 | Williams-Sonoma, Inc. | 266 | 12 | ||
| Dollar General Corp. | 2,083 | 144 | Wyndham Worldwide Corp. | 1,531 | 101 | ||
| DR Horton, Inc. | 2,712 | 78 | Wynn Resorts, Ltd. | 346 | 33 | ||
| DSW, Inc. Class A | 1,598 | 33 | 11,201 | ||||
| eBay, Inc.(Æ) | 5,552 | 158 | |||||
| Expedia, Inc. | 692 | 89 | Consumer Staples - 8.4% | ||||
| Fitbit, Inc. Class A(Æ) | 1,100 | 15 | Altria Group, Inc.(ì) | 9,809 | 649 | ||
| Ford Motor Co. | 21,357 | 251 | Bunge, Ltd. | 647 | 40 | ||
| Fortune Brands Home & Security, Inc. | 621 | 34 | Campbell Soup Co. | 2,795 | 152 | ||
| Fossil Group, Inc.(Æ) | 1,030 | 28 | Coca-Cola Co. (The)(ì) | 16,565 | 702 | ||
| GameStop Corp. Class A | 1,714 | 41 | Colgate-Palmolive Co. | 5,464 | 390 | ||
| Gannett Co., Inc. | 932 | 7 | Constellation Brands, Inc. Class A | 748 | 125 | ||
| Gap, Inc. (The) | 962 | 27 | CVS Health Corp. | 6,712 | 564 | ||
| Gentex Corp. | 3,254 | 55 | GNC Holdings, Inc. Class A | 545 | 7 | ||
| Goodyear Tire & Rubber Co. (The) | 2,724 | 79 | Herbalife, Ltd.(Æ) | 359 | 22 | ||
| GoPro, Inc. Class A(Æ) | 2,433 | 31 | Hormel Foods Corp. | 4,652 | 179 | ||
| Graham Holdings Co. Class B | 55 | 26 | Kimberly-Clark Corp. | 2,584 | 296 | ||
| H&R Block, Inc. | 2,631 | 60 | Kraft Heinz Co. (The) | 3,305 | 294 | ||
| Harman International Industries, Inc. | 482 | 38 | Molson Coors Brewing Co. Class B | 1,487 | 154 | ||
| Hasbro, Inc. | 1,340 | 112 | Mondelez International, Inc. Class A | 9,898 | 445 | ||
| Home Depot, Inc. (The)(ì) | 8,950 | 1,092 | Nu Skin Enterprises, Inc. Class A | 284 | 18 | ||
| Interpublic Group of Cos., Inc. (The) | 1,780 | 40 | PepsiCo, Inc.(ì) | 9,278 | 995 | ||
| J Alexander's Holdings, Inc.(Æ) | 1 | — | Philip Morris International, Inc.(ì) | 6,587 | 635 | ||
| JC Penney Co., Inc.(Æ) | 10,549 | 91 | Procter & Gamble Co. (The)(ì) | 13,237 | 1,149 | ||
| Kohl's Corp. | 1,153 | 50 | Safeway, Inc.(Æ) | 4,648 | 2 | ||
| Lamar Advertising Co. Class A(ö) | 451 | 29 | Tyson Foods, Inc. Class A | 2,568 | 182 | ||
| Lear Corp. | 1,030 | 126 | 7,000 | ||||
| Leggett & Platt, Inc. | 680 | 31 | |||||
| Lennar Corp. Class A | 954 | 40 | Energy - 6.3% | ||||
| Liberty Interactive Corp. Class A(Æ) | 1,594 | 30 | Anadarko Petroleum Corp. | 3,508 | 209 | ||
| Liberty Ventures Class A(Æ) | 226 | 9 | Apache Corp. | 2,959 | 176 | ||
| Macy's, Inc. | 1,319 | 48 | Chesapeake Energy Corp.(Æ) | 4,080 | 23 | ||
| Madison Square Garden Co. (The) Class A(Æ) | 107 | 18 | Chevron Corp.(ì) | 9,365 | 981 | ||
| McDonald's Corp. | 5,682 | 640 | ConocoPhillips | 8,741 | 380 | ||
| Michael Kors Holdings, Ltd.(Æ) | 852 | 43 | Denbury Resources, Inc.(Æ) | 5,120 | 12 | ||
| MSG Networks, Inc.(Æ) | 323 | 6 | EQT Corp. | 2,257 | 149 | ||
| Netflix, Inc.(Æ) | 2,569 | 321 | Exxon Mobil Corp.(ì) | 19,040 | 1,586 | ||
| Newell Brands, Inc. | 1,942 | 93 | First Solar, Inc.(Æ) | 501 | 20 | ||
| News Corp. Class A | 2,507 | 30 | Halliburton Co. | 7,112 | 327 | ||
| Nike, Inc. Class B | 8,514 | 427 | Helmerich & Payne, Inc. | 1,227 | 77 | ||
| Penske Automotive Group, Inc. | 414 | 19 | HollyFrontier Corp. | 948 | 24 | ||
| PulteGroup, Inc. | 2,943 | 55 | Noble Corp. PLC | 1,228 | 6 | ||
| PVH Corp. | 797 | 85 | NOW, Inc.(Æ) | 904 | 20 | ||
| Sally Beauty Holdings, Inc.(Æ) | 375 | 10 | Occidental Petroleum Corp. | 4,488 | 327 | ||
| Scripps Networks Interactive, Inc. Class A | 597 | 38 | Rowan Cos. PLC Class A(Æ) | 1,570 | 21 | ||
| Signet Jewelers, Ltd. | 338 | 27 | Schlumberger, Ltd.(ì) | 8,132 | 636 | ||
| Skechers U.S.A., Inc. Class A(Æ) | 475 | 10 | SM Energy Co. | 785 | 26 | ||
| Staples, Inc. | 2,745 | 20 | |||||
See accompanying notes which are an integral part of the financial statements.
Russell Strategic Call Overwriting Fund 699
Russell Investment Company
Russell Strategic Call Overwriting Fund
Schedule of Investments, continued — October 31, 2016
| Amounts in thousands (except share amounts) | Amounts in thousands (except share amounts) | ||||||
| Principal | Fair | Principal | Fair | ||||
| Amount ($) or | Value | Amount ($) or | Value | ||||
| Shares | $ | Shares | $ | ||||
| Southwestern Energy Co.(Æ) | 2,804 | 29 | SL Green Realty Corp.(ö) | 803 | 79 | ||
| Superior Energy Services, Inc.(Æ) | 1,913 | 27 | Synovus Financial Corp. | 1,170 | 39 | ||
| Tesoro Corp. | 1,113 | 95 | TD Ameritrade Holding Corp. | 4,432 | 152 | ||
| Williams Cos., Inc. (The) | 2,901 | 85 | Torchmark Corp. | 2,397 | 152 | ||
| 5,236 | Total System Services, Inc. | 2,598 | 130 | ||||
| Unum Group | 5,074 | 180 | |||||
| Financial Services - 17.7% | US Bancorp | 9,816 | 439 | ||||
| Affiliated Managers Group, Inc.(Æ) | 867 | 115 | Visa, Inc. Class A(ì) | 12,100 | 998 | ||
| Alliance Data Systems Corp. | 375 | 77 | Waddell & Reed Financial, Inc. Class A | 2,936 | 46 | ||
| American Express Co.(ì) | 6,880 | 457 | Weingarten Realty Investors(ö) | 1,406 | 51 | ||
| American International Group, Inc. | 8,619 | 532 | Wells Fargo & Co.(ì) | 25,452 | 1,171 | ||
| American Tower Corp.(ö) | 1,802 | 211 | Weyerhaeuser Co.(ö) | 3,853 | 115 | ||
| Apartment Investment & Management Co. | WR Berkley Corp. | 1,829 | 105 | ||||
| Class A(ö) | 2,311 | 102 | XL Group, Ltd. | 3,586 | 125 | ||
| Assurant, Inc. | 1,255 | 101 | Zions Bancorporation | 4,152 | 134 | ||
| Bank of America Corp.(ì) | 47,474 | 783 | 14,664 | ||||
| Berkshire Hathaway, Inc. Class B(ì)(Æ) | 9,794 | 1,413 | |||||
| CBL & Associates Properties, Inc.(ö) | 1,254 | 13 | Health Care - 11.9% | ||||
| CBRE Group, Inc. Class A(Æ) | 2,909 | 75 | Abbott Laboratories(ì) | 7,702 | 302 | ||
| Chimera Investment Corp.(ö) | 445 | 7 | AbbVie, Inc.(ì) | 6,870 | 383 | ||
| Cincinnati Financial Corp. | 3,142 | 222 | Aetna, Inc. | 2,474 | 266 | ||
| Citigroup, Inc.(ì) | 12,560 | 617 | Allscripts Healthcare Solutions, Inc.(Æ) | 993 | 12 | ||
| Comerica, Inc. | 912 | 48 | Amgen, Inc.(ì) | 3,207 | 453 | ||
| Credit Acceptance Corp.(Æ) | 83 | 15 | Baxter International, Inc. | 3,771 | 179 | ||
| Crown Castle International Corp.(ö) | 1,419 | 129 | Biogen, Inc.(Æ) | 1,233 | 345 | ||
| DDR Corp.(ö) | 3,346 | 51 | Bluebird Bio, Inc.(Æ) | 618 | 30 | ||
| Duke Realty Corp.(ö) | 4,212 | 110 | Bristol-Myers Squibb Co. | 8,156 | 415 | ||
| E*Trade Financial Corp.(Æ) | 4,055 | 114 | Bruker Corp. | 746 | 15 | ||
| Eaton Vance Corp. | 3,867 | 136 | Centene Corp.(Æ) | 723 | 45 | ||
| Equifax, Inc. | 652 | 81 | Community Health Systems, Inc.(Æ) | 3,303 | 17 | ||
| Federal Realty Investment Trust(ö) | 676 | 98 | Dentsply Sirona, Inc. | 2,613 | 150 | ||
| Federated Investors, Inc. Class B | 2,001 | 54 | Eli Lilly & Co. | 5,710 | 422 | ||
| Fidelity National Information Services, Inc. | 1,695 | 125 | Envision Healthcare Holdings, Inc.(Æ) | 1,050 | 21 | ||
| FNF Group | 4,299 | 154 | Express Scripts Holding Co.(Æ) | 4,536 | 306 | ||
| Genworth Financial, Inc. Class A(Æ) | 4,514 | 19 | Gilead Sciences, Inc.(ì) | 5,828 | 429 | ||
| Goldman Sachs Group, Inc. (The) | 2,470 | 440 | HCA Holdings, Inc.(Æ) | 1,896 | 145 | ||
| Huntington Bancshares, Inc. | 11,657 | 124 | Henry Schein, Inc.(Æ) | 1,290 | 192 | ||
| Intercontinental Exchange, Inc. | 514 | 139 | Hill-Rom Holdings, Inc. | 428 | 24 | ||
| JPMorgan Chase & Co.(ì) | 17,526 | 1,214 | IDEXX Laboratories, Inc.(Æ) | 1,224 | 131 | ||
| Kilroy Realty Corp.(ö) | 1,430 | 103 | Incyte Corp.(Æ) | 500 | 44 | ||
| Legg Mason, Inc. | 2,165 | 62 | Johnson & Johnson(ì) | 11,765 | 1,365 | ||
| LendingClub Corp.(Æ) | 5,146 | 25 | Medtronic PLC | 7,884 | 647 | ||
| Leucadia National Corp. | 2,584 | 48 | Merck & Co., Inc.(ì) | 15,711 | 923 | ||
| Lincoln National Corp. | 2,048 | 101 | Patterson Cos., Inc. | 1,312 | 56 | ||
| Macerich Co. (The)(ö) | 665 | 47 | PerkinElmer, Inc. | 2,078 | 106 | ||
| Mastercard, Inc. Class A | 6,458 | 691 | Pfizer, Inc.(ì) | 33,045 | 1,048 | ||
| MetLife, Inc. | 6,203 | 291 | Puma Biotechnology, Inc.(Æ) | 966 | 37 | ||
| Nasdaq, Inc. | 2,333 | 149 | Quorum Health Corp.(Æ) | 1,532 | 6 | ||
| Navient Corp. | 1,457 | 19 | Regeneron Pharmaceuticals, Inc.(Æ) | 412 | 142 | ||
| NorthStar Realty Europe Corp.(ö) | 2,721 | 27 | ResMed, Inc. | 905 | 54 | ||
| Old Republic International Corp. | 1,160 | 20 | Shire PLC - ADR | 558 | 94 | ||
| PayPal Holdings, Inc.(Æ) | 5,552 | 231 | United Therapeutics Corp.(Æ) | 369 | 44 | ||
| People's United Financial, Inc. | 6,598 | 107 | UnitedHealth Group, Inc.(ì) | 6,346 | 897 | ||
| Public Storage(ö) | 857 | 183 | Varian Medical Systems, Inc.(Æ) | 1,286 | 117 | ||
| Raymond James Financial, Inc. | 1,908 | 115 | 9,862 | ||||
| Realty Income Corp.(ö) | 1,064 | 63 | |||||
| RenaissanceRe Holdings, Ltd. | 1,137 | 141 | Materials and Processing - 3.0% | ||||
| Santander Consumer USA Holdings, Inc.(Æ) | 1,220 | 15 | AdvanSix, Inc.(Æ) | 205 | 3 | ||
| SEI Investments Co. | 2,715 | 120 | Albemarle Corp. | 1,165 | 97 | ||
| Simon Property Group, Inc.(ö) | 2,224 | 414 | Ball Corp. | 1,447 | 112 | ||
See accompanying notes which are an integral part of the financial statements.
700 Russell Strategic Call Overwriting Fund
Russell Investment Company
Russell Strategic Call Overwriting Fund
Schedule of Investments, continued — October 31, 2016
| Amounts in thousands (except share amounts) | Amounts in thousands (except share amounts) | ||||||
| Principal | Fair | Principal | Fair | ||||
| Amount ($) or | Value | Amount ($) or | Value | ||||
| Shares | $ | Shares | $ | ||||
| Bemis Co., Inc. | 1,486 | 72 | Southwest Airlines Co. | 2,791 | 112 | ||
| Cabot Corp. | 555 | 29 | Spirit Airlines, Inc.(Æ) | 374 | 18 | ||
| Domtar Corp. | 658 | 24 | SPX Corp.(Æ) | 1,176 | 22 | ||
| Dow Chemical Co. (The) | 6,661 | 358 | SPX FLOW, Inc.(Æ) | 525 | 13 | ||
| EI du Pont de Nemours & Co. | 5,336 | 367 | Square, Inc. Class A(Æ) | 1,552 | 17 | ||
| FMC Corp. | 1,114 | 52 | Textron, Inc. | 2,068 | 83 | ||
| Freeport-McMoRan, Inc.(Æ) | 6,395 | 72 | TopBuild Corp.(Æ) | 334 | 10 | ||
| Huntsman Corp. | 1,323 | 22 | TransDigm Group, Inc. | 332 | 90 | ||
| Ingevity Corp.(Æ) | 251 | 10 | Trimble, Inc.(Æ) | 1,732 | 48 | ||
| International Flavors & Fragrances, Inc. | 520 | 68 | Triumph Group, Inc. | 473 | 11 | ||
| Masco Corp. | 3,011 | 93 | Union Pacific Corp.(ì) | 6,272 | 553 | ||
| Monsanto Co. | 3,444 | 347 | United Parcel Service, Inc. Class B | 5,059 | 545 | ||
| Newmont Mining Corp. | 2,293 | 85 | United Technologies Corp. | 5,341 | 546 | ||
| Owens-Illinois, Inc.(Æ) | 1,379 | 27 | Waters Corp.(Æ) | 1,344 | 187 | ||
| Packaging Corp. of America | 995 | 82 | WESCO International, Inc.(Æ) | 875 | 47 | ||
| Platform Specialty Products Corp.(Æ) | 1,793 | 13 | Xylem, Inc. | 2,411 | 117 | ||
| Praxair, Inc. | 1,988 | 233 | 8,837 | ||||
| Reliance Steel & Aluminum Co. | 589 | 41 | |||||
| Sealed Air Corp. | 2,145 | 98 | Technology - 18.2% | ||||
| Steel Dynamics, Inc. | 1,639 | 45 | Akamai Technologies, Inc.(Æ) | 1,200 | 83 | ||
| Vulcan Materials Co. | 817 | 92 | Alphabet, Inc. Class A(ì)(Æ) | 1,249 | 1,012 | ||
| WestRock Co. | 1,507 | 70 | Alphabet, Inc. Class C(ì)(Æ) | 1,305 | 1,024 | ||
| 2,512 | Ansys, Inc.(Æ) | 309 | 28 | ||||
| Apple, Inc.(ì) | 25,098 | 2,850 | |||||
| Producer Durables - 10.6% | Avnet, Inc. | 1,478 | 62 | ||||
| 3M Co.(ì) | 4,400 | 727 | Broadcom, Ltd. | 1,576 | 268 | ||
| Accenture PLC Class A | 3,500 | 407 | Cadence Design Systems, Inc.(Æ) | 4,432 | 113 | ||
| AECOM(Æ) | 197 | 6 | Cisco Systems, Inc.(ì) | 26,614 | 816 | ||
| AGCO Corp. | 898 | 46 | CommerceHub, Inc.(Æ) | 67 | 1 | ||
| Allison Transmission Holdings, Inc. Class A | 500 | 15 | Computer Sciences Corp. | 949 | 52 | ||
| Ametek, Inc. | 1,190 | 53 | CSRA, Inc. | 949 | 24 | ||
| Avery Dennison Corp. | 1,187 | 83 | Electronic Arts, Inc.(Æ) | 3,031 | 238 | ||
| Boeing Co. (The) | 4,507 | 642 | Facebook, Inc. Class A(Æ) | 9,756 | 1,278 | ||
| Booz Allen Hamilton Holding Corp. Class A | 1,211 | 37 | Fortinet, Inc.(Æ) | 757 | 24 | ||
| Caterpillar, Inc. | 4,132 | 345 | Harris Corp. | 882 | 79 | ||
| Chicago Bridge & Iron Co. | 461 | 15 | Hewlett Packard Enterprise Co. | 9,771 | 220 | ||
| Cintas Corp. | 713 | 76 | HP, Inc. | 9,771 | 142 | ||
| Copa Holdings, SA Class A | 503 | 46 | IAC/InterActiveCorp(Æ) | 410 | 26 | ||
| Delta Air Lines, Inc. | 3,588 | 150 | Intel Corp.(ì) | 20,083 | 700 | ||
| Emerson Electric Co. | 5,760 | 292 | International Business Machines Corp.(ì) | 3,758 | 578 | ||
| Flir Systems, Inc. | 1,971 | 65 | Lam Research Corp. | 1,621 | 157 | ||
| Flowserve Corp. | 2,221 | 94 | Leidos Holdings, Inc. | 900 | 37 | ||
| GATX Corp. | 511 | 22 | Linear Technology Corp. | 4,274 | 257 | ||
| General Electric Co.(ì) | 52,287 | 1,522 | LinkedIn Corp. Class A(Æ) | 183 | 35 | ||
| Honeywell International, Inc. | 5,132 | 563 | Lumentum Holdings, Inc.(Æ) | 793 | 27 | ||
| IDEX Corp. | 1,808 | 156 | Marvell Technology Group, Ltd. | 1,954 | 25 | ||
| IHS Markit, Ltd.(Æ) | 1,205 | 44 | Maxim Integrated Products, Inc. | 1,820 | 72 | ||
| Jacobs Engineering Group, Inc.(Æ) | 2,018 | 104 | Microchip Technology, Inc. | 2,564 | 155 | ||
| JetBlue Airways Corp.(Æ) | 786 | 14 | Micron Technology, Inc.(Æ) | 7,807 | 134 | ||
| Joy Global, Inc. | 2,203 | 61 | Microsoft Corp.(ì) | 37,691 | 2,258 | ||
| Kennametal, Inc. | 1,039 | 29 | Oracle Corp.(ì) | 20,062 | 771 | ||
| L-3 Communications Holdings, Inc. | 1,344 | 184 | QUALCOMM, Inc.(ì) | 9,016 | 620 | ||
| Mettler-Toledo International, Inc.(Æ) | 372 | 150 | SBA Communications Corp. Class A(Æ) | 1,097 | 124 | ||
| Oshkosh Corp. | 638 | 34 | Skyworks Solutions, Inc. | 909 | 70 | ||
| Pitney Bowes, Inc. | 2,023 | 36 | Tableau Software, Inc. Class A(Æ) | 330 | 16 | ||
| Quanta Services, Inc.(Æ) | 1,940 | 56 | Teradyne, Inc. | 2,531 | 59 | ||
| Robert Half International, Inc. | 1,651 | 62 | Texas Instruments, Inc. | 6,986 | 495 | ||
| Rockwell Collins, Inc. | 1,531 | 129 | VeriSign, Inc.(Æ) | 1,322 | 111 | ||
| Ryder System, Inc. | 494 | 34 | VMware, Inc. Class A(Æ) | 362 | 28 | ||
| Snap-on, Inc. | 769 | 119 | Yelp, Inc. Class A(Æ) | 592 | 19 | ||
See accompanying notes which are an integral part of the financial statements.
Russell Strategic Call Overwriting Fund 701
Russell Investment Company
Russell Strategic Call Overwriting Fund
Schedule of Investments, continued — October 31, 2016
| Amounts in thousands (except share amounts) | Amounts in thousands (except share amounts) | |||||||
| Principal | Fair | Principal | Fair | |||||
| Amount ($) or | Value | Amount ($) or | Value | |||||
| Shares | $ | Shares | $ | |||||
| Zynga, Inc. Class A(Æ) | 1,760 | 5 | Other Assets and Liabilities, Net | |||||
| 15,093 | - 2.2% | 1,808 | ||||||
| Net Assets - 100.0% | 83,048 | |||||||
| Utilities - 4.9% | ||||||||
| Ameren Corp. | 3,981 | 199 | ||||||
| American Electric Power Co., Inc. | 4,308 | 279 | ||||||
| AT&T, Inc.(ì) | 26,151 | 962 | ||||||
| Calpine Corp.(Æ) | 2,233 | 26 | ||||||
| CMS Energy Corp. | 5,891 | 248 | ||||||
| Duke Energy Corp. | 5,607 | 449 | ||||||
| Exelon Corp. | 6,807 | 232 | ||||||
| FirstEnergy Corp. | 1,801 | 62 | ||||||
| Frontier Communications Corp. | 7,878 | 32 | ||||||
| Hawaiian Electric Industries, Inc. | 454 | 13 | ||||||
| MDU Resources Group, Inc. | 734 | 19 | ||||||
| NiSource, Inc. | 4,424 | 103 | ||||||
| NRG Energy, Inc. | 5,010 | 53 | ||||||
| OGE Energy Corp. | 508 | 16 | ||||||
| Pinnacle West Capital Corp. | 2,359 | 179 | ||||||
| SCANA Corp. | 2,626 | 193 | ||||||
| Verizon Communications, Inc.(ì) | 18,621 | 896 | ||||||
| Westar Energy, Inc. Class A | 1,532 | 88 | ||||||
| 4,049 | ||||||||
| Total Common Stocks | ||||||||
| (cost $52,782) | 78,454 | |||||||
| Options Purchased - 0.6% | ||||||||
| (Number of Contracts) | ||||||||
| SPX Volatility Index | ||||||||
| Nov 2016 19.00 Call (220) | USD | 418 | (ÿ) | 30 | ||||
| Dec 2016 21.00 Call (380) | USD | 798 | (ÿ) | 53 | ||||
| Dec 2016 25.00 Call (175) | USD | 438 | (ÿ) | 15 | ||||
| Dec 2016 30.00 Call (225) | USD | 675 | (ÿ) | 11 | ||||
| Jan 2017 25.00 Call (105) | USD | 263 | (ÿ) | 13 | ||||
| Jan 2017 30.00 Call (170) | USD | 510 | (ÿ) | 13 | ||||
| Feb 2017 25.00 Call (140) | USD | 350 | (ÿ) | 21 | ||||
| Feb 2017 30.00 Call (225) | USD | 675 | (ÿ) | 20 | ||||
| Nov 2016 12.00 Put (375) | USD | 450 | (ÿ) | 1 | ||||
| Nov 2016 15.00 Put (380) | USD | 570 | (ÿ) | 24 | ||||
| Nov 2016 17.00 Put (275) | USD | 468 | (ÿ) | 48 | ||||
| Nov 2016 20.00 Put (210) | USD | 420 | (ÿ) | 82 | ||||
| Dec 2016 12.00 Put (280) | USD | 336 | (ÿ) | 1 | ||||
| Dec 2016 16.00 Put (105) | USD | 168 | (ÿ) | 14 | ||||
| Dec 2016 19.00 Put (145) | USD | 276 | (ÿ) | 50 | ||||
| Dec 2016 20.00 Put (210) | USD | 420 | (ÿ) | 87 | ||||
| Jan 2017 12.00 Put (280) | USD | 336 | (ÿ) | 1 | ||||
| Jan 2017 13.00 Put (375) | USD | 488 | (ÿ) | 5 | ||||
| Jan 2017 16.00 Put (140) | USD | 224 | (ÿ) | 15 | ||||
| Total Options Purchased | ||||||||
| (cost $619) | 504 | |||||||
| Short-Term Investments - 2.7% | ||||||||
| Russell U.S. Cash Management Fund | 2,282,137 | (8) | 2,282 | |||||
| Total Short-Term Investments | ||||||||
| (cost $2,282) | 2,282 | |||||||
| Total Investments 97.8% | ||||||||
| (identified cost $55,683) | 81,240 | |||||||
See accompanying notes which are an integral part of the financial statements.
702 Russell Strategic Call Overwriting Fund
Russell Investment Company
Russell Strategic Call Overwriting Fund
Schedule of Investments, continued — October 31, 2016
| Futures Contracts | |||||||||||||
| Amounts in thousands (except contract amounts) | |||||||||||||
| Unrealized | |||||||||||||
| Appreciation | |||||||||||||
| Number of | Notional | Expiration | (Depreciation) | ||||||||||
| Contracts | Amount | Date | $ | ||||||||||
| Long Positions | |||||||||||||
| S&P 500 E-Mini Index Futures | 41 | USD | 4,346 | 12/16 | (18 | ) | |||||||
| Total Unrealized Appreciation (Depreciation) on Open Futures Contracts (å) | (18 | ) | |||||||||||
| Options Written | |||||||||||||
| Amounts in thousands (except contract amounts) | |||||||||||||
| Number of | Strike | Notional | Expiration | Fair Value | |||||||||
| Call/Put | Contracts | Price | Amount | Date | $ | ||||||||
| S&P 500 Index | Call | 70 | 2,120.00 | USD | 14,840 | 11/04/16 | (113 | ) | |||||
| S&P 500 Index | Call | 70 | 2,140.00 | USD | 14,980 | 11/04/16 | (38 | ) | |||||
| S&P 500 Index | Call | 40 | 2,125.00 | USD | 8,500 | 11/11/16 | (111 | ) | |||||
| S&P 500 Index | Call | 30 | 2,130.00 | USD | 6,390 | 11/11/16 | (74 | ) | |||||
| S&P 500 Index | Call | 120 | 2,130.00 | USD | 25,560 | 11/18/16 | (322 | ) | |||||
| S&P 500 Index | Call | 40 | 2,120.00 | USD | 8,480 | 11/25/16 | (140 | ) | |||||
| SPX Volatility Index | Call | 220 | 16.00 | USD | 352 | 11/16/16 | (51 | ) | |||||
| SPX Volatility Index | Call | 380 | 18.00 | USD | 684 | 12/21/16 | (78 | ) | |||||
| SPX Volatility Index | Call | 400 | 40.00 | USD | 1,600 | 12/21/16 | (7 | ) | |||||
| SPX Volatility Index | Call | 275 | 40.00 | USD | 1,100 | 01/18/17 | (8 | ) | |||||
| SPX Volatility Index | Call | 365 | 40.00 | USD | 1,460 | 02/15/17 | (15 | ) | |||||
| SPX Volatility Index | Put | 485 | 14.00 | USD | 679 | 11/16/16 | (12 | ) | |||||
| SPX Volatility Index | Put | 355 | 14.00 | USD | 497 | 12/21/16 | (14 | ) | |||||
| Total Liability for Options Written (premiums received $1,329) | (983 | ) | |||||||||||
| Transactions in options written contracts for the period ended October 31, 2016 were as follows: | |||||||||||||
| Number of | Premiums | ||||||||||||
| Contracts | Received | ||||||||||||
| Outstanding October 31, 2015 | 2,965 | $ | 1,561 | ||||||||||
| Opened | 111,501 | 40,800 | |||||||||||
| Closed | (111,546 | ) | (41,020 | ) | |||||||||
| Expired | (70 | ) | (12 | ) | |||||||||
| Outstanding October 31, 2016 | 2,850 | $ | 1,329 | ||||||||||
| Presentation of Portfolio Holdings | |||||||||||||
| Amounts in thousands | |||||||||||||
| Fair Value | |||||||||||||
| Practical | |||||||||||||
| Portfolio Summary | Level 1 | Level 2 | Level 3 | Expedient (a) | Total | % of Net Assets | |||||||
| Common Stocks | |||||||||||||
| Consumer Discretionary | $ | 11,201 | $ | — | $ | — | $ | — | $ | 11,201 | 13.5 | ||
| Consumer Staples | 6,998 | — | 2 | — | 7,000 | 8.4 | |||||||
| Energy | 5,236 | — | — | — | 5,236 | 6.3 | |||||||
| Financial Services | 14,664 | — | — | — | 14,664 | 17.7 | |||||||
| Health Care | 9,862 | — | — | — | 9,862 | 11.9 | |||||||
| Materials and Processing | 2,512 | — | — | — | 2,512 | 3.0 | |||||||
| Producer Durables | 8,837 | — | — | — | 8,837 | 10.6 | |||||||
| Technology | 15,093 | — | — | — | 15,093 | 18.2 | |||||||
| Utilities | 4,049 | — | — | — | 4,049 | 4.9 | |||||||
See accompanying notes which are an integral part of the financial statements.
Russell Strategic Call Overwriting Fund 703
Russell Investment Company
Russell Strategic Call Overwriting Fund
Schedule of Investments, continued — October 31, 2016
| Presentation of Portfolio Holdings | ||||||||||||||||
| Amounts in thousands | ||||||||||||||||
| Fair Value | ||||||||||||||||
| Practical | ||||||||||||||||
| Portfolio Summary | Level 1 | Level 2 | Level 3 | Expedient (a) | Total | % of Net Assets | ||||||||||
| Options Purchased | 504 | — | — | — | 504 | 0.6 | ||||||||||
| Short-Term Investments | — | — | — | 2,282 | 2,282 | 2.7 | ||||||||||
| Total Investments | 78,956 | — | 2 | 2,282 | 81,240 | 97.8 | ||||||||||
| Other Assets and Liabilities, Net | 2.2 | |||||||||||||||
| 100.0 | ||||||||||||||||
| Other Financial Instruments | ||||||||||||||||
| Liabilities | ||||||||||||||||
| Futures Contracts | (18 | ) | — | — | — | (18 | ) | (—)* | ||||||||
| Options Written | (983 | ) | — | — | — | (983 | ) | (1.2 | ) | |||||||
| Total Other Financial Instruments** | $ | (1,001 | ) | $ | — | $ | — | $ | — | $ | (1,001 | ) | ||||
* Less than 0.05% of net assets.
** Futures and foreign currency exchange contract values reflect the unrealized appreciation (depreciation) on the investments.
(a) Certain investments that are measured at fair value using the net asset value per share (or its equivalent) practical expedient have not been classified
in the fair value levels. The fair value amounts presented in the table are intended to permit reconciliation to the amounts presented in the Schedule of
Investments.
For a description of the Levels, see note 2 in the Notes to Financial Statements.
For a disclosure on transfers between Levels 1, 2 and 3 during the period ended October 31, 2016, see note 2 in the Notes to
Financial Statements.
Investments in which significant unobservable inputs (Level 3) were used in determining a fair value for the period ended October
31, 2016 were less than 1% of net assets.
See accompanying notes which are an integral part of the financial statements.
704 Russell Strategic Call Overwriting Fund
Russell Investment Company
Russell Strategic Call Overwriting Fund
Fair Value of Derivative Instruments — October 31, 2016
Amounts in thousands
| Equity | ||||
| Derivatives not accounted for as hedging instruments | Contracts | |||
| Location: Statement of Assets and Liabilities - Assets | ||||
| Investments, at fair value* | $ | 504 | ||
| Total | $ | 504 | ||
| Location: Statement of Assets and Liabilities - Liabilities | ||||
| Variation margin on futures contracts** | $ | 18 | ||
| Options written, at fair value | 983 | |||
| Total | $ | 1,001 | ||
| Equity | ||||
| Derivatives not accounted for as hedging instruments | Contracts | |||
| Location: Statement of Operations - Net realized gain (loss) | ||||
| Investments*** | $ | (838 | ) | |
| Futures contracts | 939 | |||
| Options written | 1,079 | |||
| Total | $ | 1,180 | ||
| Location: Statement of Operations - Net change in unrealized appreciation (depreciation) | ||||
| Investments**** | $ | 28 | ||
| Futures contracts | (595 | ) | ||
| Options written | 655 | |||
| Total | $ | 88 | ||
* Fair value of purchased options.
** Includes cumulative appreciation/depreciation of futures contracts as reported in the Schedule of Investments. Only variation margin is reported within the
Statement of Assets and Liabilities.
*** Includes net realized gain (loss) on purchased options as reported in the Statement of Operations.
**** Includes net unrealized gain (loss) on purchased options as reported in the Schedule of Investments.
For further disclosure on derivatives see note 2 in the Notes to Financial Statements.
See accompanying notes which are an integral part of the financial statements.
Russell Strategic Call Overwriting Fund 705
Russell Investment Company
Russell Strategic Call Overwriting Fund
Balance Sheet Offsetting of Financial and Derivative Instruments — October 31, 2016
| Amounts in thousands | ||||||||||
| Offsetting of Financial Assets and Derivative Assets | ||||||||||
| Gross | Net Amounts | |||||||||
| Amounts | of Assets | |||||||||
| Gross | Offset in the | Presented in | ||||||||
| Amounts of | Statement of | the Statement | ||||||||
| Recognized | Assets and | of Assets and | ||||||||
| Description | Location: Statement of Assets and Liabilities - Assets | Assets | Liabilities | Liabilities | ||||||
| Options Purchased Contracts | Investments, at fair value | $ | 504 | $ | — | $ | 504 | |||
| Total Financial and Derivative Assets | 504 | — | 504 | |||||||
| Financial and Derivative Assets not subject to a netting agreement | (504 | ) | — | (504 | ) | |||||
| Total Financial and Derivative Assets subject to a netting agreement | $ | — | $ | — | $ | — | ||||
| Offsetting of Financial Liabilities and Derivative Liabilities | ||||||||||
| Gross | Net Amounts | |||||||||
| Amounts | of Liabilities | |||||||||
| Gross | Offset in the | Presented in | ||||||||
Amounts of | Statement of | the Statement | ||||||||
| Recognized | Assets and | of Assets and | ||||||||
| Description | Location: Statement of Assets and Liabilities - Liabilities | Liabilities | Liabilities | Liabilities | ||||||
| Futures Contracts | Variation margin on futures contracts | $ | 8 | $ | — | $ | 8 | |||
| Options Written Contracts | Options written, at fair value | 983 | — | 983 | ||||||
| Total Financial and Derivative Liabilities | 991 | — | 991 | |||||||
| Financial and Derivative Liabilities not subject to a netting agreement | (991 | ) | — | (991 | ) | |||||
| Total Financial and Derivative Liabilities subject to a netting agreement | $ | — | $ | — | $ | — | ||||
For further disclosure on derivatives and counterparty risk see note 2 in the Notes to Financial Statements.
See accompanying notes which are an integral part of the financial statements.
706 Russell Strategic Call Overwriting Fund
Russell Investment Company
Russell Strategic Call Overwriting Fund
Statement of Assets and Liabilities — October 31, 2016
| Amounts in thousands | ||
| Assets | ||
| Investments, at identified cost | $ | 55,683 |
| Investments, at fair value(>) | 81,240 | |
| Cash (restricted)(a)(b) | 3,702 | |
| Receivables: | ||
| Dividends and interest | 83 | |
| Dividends from affiliated Russell funds | 1 | |
| Investments sold | 148 | |
| Fund shares sold | 12 | |
| Total assets | 85,186 | |
| Liabilities | ||
| Payables: | ||
| Due to broker (c) | 989 | |
| Fund shares redeemed | 19 | |
| Accrued fees to affiliates | 44 | |
| Other accrued expenses | 95 | |
| Variation margin on futures contracts | 8 | |
| Options written, at fair value(x) | 983 | |
| Total liabilities | 2,138 | |
| Net Assets | $ | 83,048 |
See accompanying notes which are an integral part of the financial statements.
Russell Strategic Call Overwriting Fund 707
Russell Investment Company
Russell Strategic Call Overwriting Fund
Statement of Assets and Liabilities, continued — October 31, 2016
| Amounts in thousands | |||
| Net Assets Consist of: | |||
| Undistributed (overdistributed) net investment income | $ | 29 | |
| Accumulated net realized gain (loss) | (12,989 | ) | |
| Unrealized appreciation (depreciation) on: | |||
| Investments | 25,557 | ||
| Futures contracts | (18 | ) | |
| Options written | 346 | ||
| Shares of beneficial interest | 71 | ||
| Additional paid-in capital | 70,052 | ||
| Net Assets | $ | 83,048 | |
| Net Asset Value, offering and redemption price per share: | |||
| Net asset value per share: Class S(#) | $ | 11.75 | |
| Class S — Net assets | $ | 83,048,028 | |
| Class S — Shares outstanding ($.01 par value) | 7,066,662 | ||
| Amounts in thousands | |||
| (x) Premiums received on options written | $ | 1,329 | |
| (>) Investments in affiliates, Russell U.S. Cash Management Fund | $ | 2,282 | |
| (a) Cash Collateral for Futures | $ | 250 | |
| (b) Cash Collateral for Options | $ | 3,452 | |
| (c) Due to Broker for Options | $ | 989 | |
| (#) Net asset value per share equals class level net assets divided by class level shares of beneficial interest outstanding. | |||
See accompanying notes which are an integral part of the financial statements.
708 Russell Strategic Call Overwriting Fund
Russell Investment Company
Russell Strategic Call Overwriting Fund
Statement of Operations — For the Period Ended October 31, 2016
| Amounts in thousands | |||
| Investment Income | |||
| Dividends | $ | 1,732 | |
| Dividends from affiliated Russell funds | 16 | ||
| Total investment income | 1,748 | ||
| Expenses | |||
| Advisory fees | 663 | ||
| Administrative fees | 40 | ||
| Custodian fees (1) | 104 | ||
| Transfer agent fees - Class S | 166 | ||
| Professional fees | 62 | ||
| Registration fees | 31 | ||
| Trustees’ fees | 3 | ||
| Printing fees | 6 | ||
| Miscellaneous | 15 | ||
| Expenses before reductions | 1,090 | ||
| Expense reductions | (286 | ) | |
| Net expenses | 804 | ||
| Net investment income (loss) | 944 | ||
| Net Realized and Unrealized Gain (Loss) | |||
| Net realized gain (loss) on: | |||
| Investments | 216 | ||
| Futures contracts | 939 | ||
| Options written | 1,079 | ||
| Net realized gain (loss) | 2,234 | ||
| Net change in unrealized appreciation (depreciation) on: | |||
| Investments | 918 | ||
| Futures contracts | (595 | ) | |
| Options written | 655 | ||
| Net change in unrealized appreciation (depreciation) | 978 | ||
| Net realized and unrealized gain (loss) | 3,212 | ||
| Net Increase (Decrease) in Net Assets from Operations | $ | 4,156 | |
| (1) Includes a reimbursement for overbilling of custody out-of-pocket fees from prior years. See note 10 in the Notes to Financial Statements. | |||
See accompanying notes which are an integral part of the financial statements.
Russell Strategic Call Overwriting Fund 709
Russell Investment Company
Russell Strategic Call Overwriting Fund
Statements of Changes in Net Assets
| For the Periods Ended October 31, | ||||||
| Amounts in thousands | 2016 | 2015 | ||||
| Increase (Decrease) in Net Assets | ||||||
| Operations | ||||||
| Net investment income (loss) | $ | 944 | $ | 762 | ||
| Net realized gain (loss) | 2,234 | 2,281 | ||||
| Net change in unrealized appreciation (depreciation) | 978 | 2,024 | ||||
| Net increase (decrease) in net assets from operations | 4,156 | 5,067 | ||||
| Distributions | ||||||
| From net investment income | ||||||
| Class S | (938 | ) | (761 | ) | ||
| Net decrease in net assets from distributions | (938 | ) | (761 | ) | ||
| Share Transactions* | ||||||
| Net increase (decrease) in net assets from share transactions | (7,572 | ) | (3,677 | ) | ||
| Total Net Increase (Decrease) in Net Assets | (4,354 | ) | 629 | |||
| Net Assets | ||||||
| Beginning of period | 87,402 | 86,773 | ||||
| End of period | $ | 83,048 | $ | 87,402 | ||
| Undistributed (overdistributed) net investment income included in net assets | $ | 29 | $ | 23 | ||
See accompanying notes which are an integral part of the financial statements.
710 Russell Strategic Call Overwriting Fund
Russell Investment Company
Russell Strategic Call Overwriting Fund
Statements of Changes in Net Assets, continued
* Share transaction amounts (in thousands) for the periods ended October 31, 2016 and October 31, 2015 were as follows:
| 2016 | 2015 | |||||||||||
| Shares | Dollars | Shares | Dollars | |||||||||
| Class S | ||||||||||||
| Proceeds from shares sold | 732 | $ | 8,127 | 1,130 | $ | 12,343 | ||||||
| Proceeds from reinvestment of distributions | 83 | 938 | 69 | 758 | ||||||||
| Payments for shares redeemed | (1,482 | ) | (16,637 | ) | (1,526 | ) | (16,778 | ) | ||||
| Total increase (decrease) | (667 | ) | $ | (7,572 | ) | (327 | ) | $ | (3,677 | ) | ||
See accompanying notes which are an integral part of the financial statements.
Russell Strategic Call Overwriting Fund 711
Russell Investment Company
Russell Strategic Call Overwriting Fund
Financial Highlights �� For the Periods Ended
For a Share Outstanding Throughout Each Period.
| $ | $ | $ | $ | $ | $ | |||||||||
| Net Asset Value, | Net | Net Realized | Total from | Distributions | Distributions | |||||||||
| Beginning of | Investment | and Unrealized | Investment | from Net | from Net | |||||||||
| Period | Income (Loss)(a)(d) | Gain (Loss) | Operations | Investment Income | Realized Gain | |||||||||
| Class S | ||||||||||||||
| October 31, 2016 | 11.30 | .13 | .45 | .58 | (.13 | ) | — | |||||||
| October 31, 2015 | 10.77 | .10 | .53 | .63 | (.10 | ) | — | |||||||
| October 31, 2014 | 10.64 | .10 | .13 | .23 | (.10 | ) | — | |||||||
| October 31, 2013 | 10.06 | .12 | .65 | .77 | (.13 | ) | (.06 | ) | ||||||
| October 31, 2012(3) | 10.00 | .02 | .05 | .07 | (.01 | ) | — | |||||||
See accompanying notes which are an integral part of the financial statements.
712 Russell Strategic Call Overwriting Fund
| % | % | % | ||||||||||||||
| $ | $ | Ratio of Expenses | Ratio of Expenses | Ratio of Net | ||||||||||||
| Net Asset Value, | % | Net Assets, | to Average | to Average | Investment Income | % | ||||||||||
| $ | End of | Total | End of Period | Net Assets, | Net Assets, | to Average | Portfolio | |||||||||
| Total Distributions | Period | Return(b)(c) | (000 | ) | Gross(e) | Net(d)(e) | Net Assets(d)(e) | Turnover Rate(b) | ||||||||
| (.13 | ) | 11.75 | 5.16 | 83,048 | 1.32 | .97 | 1.14 | 4 | ||||||||
| (.10 | ) | 11.30 | 5.84 | 87,402 | 1.19 | .97 | .87 | 1 | ||||||||
| (.10 | ) | 10.77 | 2.13 | 86,773 | 1.19 | .97 | .88 | 5 | ||||||||
| (.19 | ) | 10.64 | 7.78 | 83,541 | 1.45 | .97 | 1.11 | 3 | ||||||||
| (.01 | ) | 10.06 | .68 | 59,941 | 1.88 | .97 | .73 | — | ||||||||
See accompanying notes which are an integral part of the financial statements.
Russell Strategic Call Overwriting Fund 713
Russell Investment Company
Russell Strategic Call Overwriting Fund
Related Party Transactions, Fees and Expenses
| Accrued fees payable to affiliates for the period ended October 31, 2016 were as follows: | ||
| Advisory fees | $ | 25,851 |
| Administration fees | 3,407 | |
| Transfer agent fees | 14,095 | |
| Trustee fees | 468 | |
| $ | 43,821 | |
| Transactions (amounts in thousands) during the period ended October 31, 2016 with Underlying Funds which are, or were, an | ||||||||||||||||||
| affiliated company are as follows: | ||||||||||||||||||
| Fair Value, | Change in | |||||||||||||||||
| Beginning of | Realized Gain | Unrealized | Fair Value, End | Income | Capital Gains | |||||||||||||
| Period | Purchases | Sales | (Loss) | Gain (Loss) | of Period | Distributions | Distributions | |||||||||||
| Russell U.S. Cash Management Fund | $ | 7,126 | $ | 17,024 | $ | 21,868 | $ | — | $ | — | $ | 2,282 | $ | 16 | $ | — | ||
| $ | 7,126 | $ | 17,024 | $ | 21,868 | $ | — | $ | — | $ | 2,282 | $ | 16 | $ | — | |||
Federal Income Taxes
At October 31, 2016, the cost of investments and net unrealized appreciation (depreciation), undistributed ordinary income and
undistributed long-term capital gains for income tax purposes were as follows:.
| Cost of Investments | $ | 55,678,664 | |||
| Unrealized Appreciation | $ | 26,809,236 | |||
| Unrealized Depreciation | (1,247,725 | ) | |||
| Net Unrealized Appreciation (Depreciation) | $ | 25,561,511 | |||
| Undistributed Ordinary Income | $ | 12,785 | |||
| Undistributed Long-Term Capital Gains | |||||
| (Capital Loss Carryforward) | $ | (12,659,049 | ) | ||
| Tax Composition of Distributions | |||||
| Ordinary Income | $ | 938,532 | |||
Net investment income and net realized gains (loss) in the financial statements may differ from taxable net investment income and net
realized gains (losses). Capital accounts within the financial statements are adjusted for permanent book-tax differences. Book-tax
differences are primarily due to foreign currency gains and losses, reclassifications of dividends, differences in treatment of income
from swaps, net operating losses, investments in partnerships, investments in passive foreign investment companies (PFICs), tax
straddle transaction, use of tax equalization and foreign capital gains taxes. These adjustments have no impact on the net assets. At
October 31, 2016, there were no adjustments to the Statement of Assets and Liabilities.
See accompanying notes which are an integral part of the financial statements.
714 Russell Strategic Call Overwriting Fund
Russell Investment Company
Select U.S. Equity Fund
Portfolio Management Discussion and Analysis — October 31, 2016 (Unaudited)
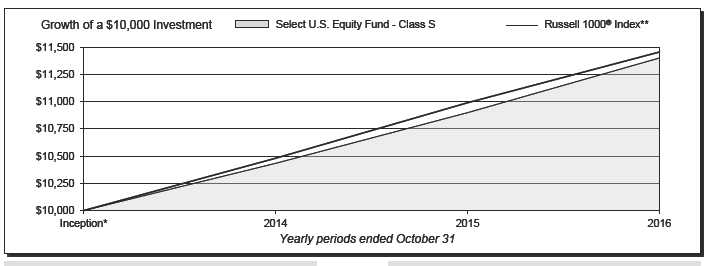
| Select U.S. Equity Fund - Class R6‡ | Select U.S. Equity Fund - Class Y | ||||||
| Total | Total | ||||||
| Return | Return | ||||||
| 1 Year | 4.78 | % | 1 Year | 4.70 | % | ||
| Inception* | 6.17 | %§ | Inception* | 6.14 | %§ | ||
| Select U.S. Equity Fund - Class S‡‡ | Russell 1000® Index** | ||||||
| Total | Total | ||||||
| Return | Return | ||||||
| 1 Year | 4.61 | % | 1 Year | 4.26 | % | ||
| Inception* | 6.00 | %§ | Inception* | 6.23 | %§ | ||
| Select U.S. Equity Fund - Class T‡‡ | |||||||
| Total | |||||||
| Return | |||||||
| 1 Year | 4.75 | % | |||||
| Inception* | 6.15 | %§ | |||||
Select U.S. Equity Fund 715
Russell Investment Company
Select U.S. Equity Fund
Portfolio Management Discussion and Analysis, continued — October 31, 2016
(Unaudited)
| What is the Fund’s investment objective? | of the fiscal year were rewarded and RIM tactically neutralized |
| The Select U.S. Equity Fund (the “Fund”) seeks to provide long | the overweight positions to both energy and low beta stocks in the |
| term capital growth. | second half of the fiscal year as the valuations of other parts of the |
| market had become significantly more attractive. | |
| How did the Fund perform relative to its benchmark for the | |
| fiscal year ended October 31, 2016? | How did the investment strategies and techniques employed |
| For the fiscal year ended October 31, 2016, the Fund’s Class | by the Fund and its money managers affect its benchmark- |
| R6, Class S, Class T and Class Y Shares gained 4.78%, 4.61%, | relative performance? |
| 4.75% and 4.70%, respectively. This is compared to the Fund’s | Tilts away from the highest price-to-book stocks and the highest beta |
| benchmark, the Russell 1000® Index, which gained 4.26% during | stocks were rewarded for the year. Additionally, an underweight |
| the same period. The Fund’s performance includes operating | to stocks with zero dividend yield and an underweight to stocks |
| expenses, whereas index returns are unmanaged and do not | with the highest amounts of financial leverage (highest debt-to- |
| include expenses of any kind. | capital ratios) contributed positively to relative performance. |
| Industry positioning was rewarded, specifically underweights to | |
| For the fiscal year ended October 31, 2016, the Morningstar® | biotech and airlines and an overweight to insurance. However, |
| Large Blend Category, a group of funds that Morningstar considers | an underweight to the internet software & services industry |
| to have investment strategies similar to those of the Fund, gained | detracted. |
| 2.12%. This result serves as a peer comparison and is expressed | |
| net of operating expenses. | During the period, RIM used index futures contracts to equitize |
| the Fund’s cash. The decision to equitize cash was beneficial to | |
| How did the market conditions described in the Market | Fund performance for the fiscal year as the market produced a |
| Summary report affect the Fund’s performance? | positive absolute return. |
| During the fiscal year, the U.S. large capitalization equity market | |
| produced positive returns. Fund exposures included tilts toward | Describe any changes to the Fund’s structure. |
| value stocks with low price-to-earnings ratios and the financials | There were no significant changes to the Fund’s structure during |
| sector. The Fund began the fiscal year tilted toward lower beta | the fiscal year. |
| stocks (beta is a measure of a stock’s sensitivity to the direction | The views expressed in this report reflect those of the |
| of the market), financial services stocks, and energy stocks, but | portfolio managers only through the end of the period |
| was underweight to the real estate investment trust industry. | covered by the report. These views do not necessarily |
| Overall, the market conditions of the first half of the fiscal year | represent the views of RIM, or any other person in RIM or |
| had a positive effect on Fund performance considering the Fund’s | any other affiliated organization. These views are subject |
| slight defensive tilt as investors became concerned that the odds | to change at any time based upon market conditions or |
| of a recession may be increasing. However, RIM decreased the | other events, and RIM disclaims any responsibility to |
| Fund’s tilt toward defensive stocks as the year progressed and | update the views contained herein. These views should not |
| market conditions in the second half of the fiscal year became | be relied on as investment advice and, because investment |
| more favorable for higher beta stocks as expectations firmed-up | decisions for a Russell Investment Company (“RIC”) Fund |
| regarding the economic outlook and the timing of next interest rate | are based on numerous factors, should not be relied on as |
| increase. RIM’s factor and sector rotation was beneficial as tilts | an indication of investment decisions of any RIC Fund. |
| toward outperforming energy and low beta stocks in the first half |
716 Select U.S. Equity Fund
Russell Investment Company
Select U.S. Equity Fund
Portfolio Management Discussion and Analysis, continued — October 31, 2016
(Unaudited)
^ In prior years, the performance of the Fund’s Class Y shares was used in the line graph. Class S Shares will have substantially similar annual returns as the
Class Y Shares because the Shares of each Class are invested in the same portfolio of securities. Annual returns for each Class will differ only to the extent that
the Class S Shares do not have the same expenses as the Class Y Shares.
* Assumes initial investment on July 31, 2014.
** Russell 1000® Index includes the 1,000 largest companies in the Russell 3000® Index. The Russell 1000® Index represents the universe of stocks from which
most active money managers typically select. The Russell 1000® Index return reflects adjustments from income dividends and capital gain distributions
reinvested as of the ex-dividend dates.
‡ The Fund first issued Class R6 Shares on March 1, 2016. The returns shown for Class R6 Shares prior to that date are the returns of the Fund’s Class Y
Shares. Class R6 Shares will have substantially similar annual returns as the Class Y Shares because the Shares of each Class are invested in the same portfolio
of securities. Annual returns for each Class will differ only to the extent that the Class R6 Shares do not have the same expenses as the Class Y Shares.
‡‡ The Fund first issued Class S and Class T Shares on January 2, 2015. The returns shown for Class S and Class T Shares prior to that date are the returns of the
Fund’s Class Y Shares. Class S and Class T Shares will have substantially similar annual returns as the Class Y Shares because the Shares of each Class are
invested in the same portfolio of securities. Annual returns for each Class will differ only to the extent that the Class S and Class T Shares do not have the same
expenses as the Class Y Shares.
§ Annualized.
Performance is historical and assumes reinvestment of all dividends and capital gains. Investment return and principal value will fluctuate so that an investor’s
shares, when redeemed, may be worth more or less than when purchased. Past performance is not indicative of future results. The returns shown do not reflect the
deduction of taxes that a shareholder would pay on Fund distributions or the redemption of Fund shares. Additionally, the returns presented herein may differ from
the performance reported in the Financial Highlights as the returns herein are calculated in a manner consistent with standardized performance in accordance with
Securities and Exchange Commission rules, while the performance in the Financial Highlights has been calculated in accordance with U.S. Generally Accepted
Accounting Principles (“U.S. GAAP”).
Select U.S. Equity Fund 717
Russell Investment Company
Select U.S. Equity Fund
Shareholder Expense Example — October 31, 2016 (Unaudited)
| Fund Expenses | Please note that the expenses shown in the table are meant | |||||
| The following disclosure provides important information | to highlight your ongoing costs only and do not reflect any | |||||
| regarding the Fund’s Shareholder Expense Example | transactional costs. Therefore, the information under the heading | |||||
| (“Example”). | “Hypothetical Performance (5% return before expenses)” is | |||||
| useful in comparing ongoing costs only, and will not help you | ||||||
| Example | determine the relative total costs of owning different funds. In | |||||
| As a shareholder of the Fund, you incur two types of costs: (1) | addition, if these transactional costs were included, your costs | |||||
| transaction costs, and (2) ongoing costs, including advisory and | would have been higher. | |||||
| administrative fees; distribution (12b-1) and/or service fees; | Hypothetical | |||||
| and other Fund expenses. The Example is intended to help | Performance (5% | |||||
| you understand your ongoing costs (in dollars) of investing in | Actual | return before | ||||
| the Fund and to compare these costs with the ongoing costs of | Class R6 | Performance | expenses) | |||
| Beginning Account Value | ||||||
| investing in other mutual funds. The Example is based on an | May 1, 2016 | $ | 1,000.00 | $ | 1,000.00 | |
| investment of $1,000 invested at the beginning of the period and | Ending Account Value | |||||
| held for the entire period indicated, which for this Fund is from | October 31, 2016 | $ | 1,042.50 | $ | 1,023.23 | |
| May 1, 2016 to October 31, 2016. | Expenses Paid During Period* | $ | 1.95 | $ | 1.93 | |
| Actual Expenses | * Expenses are equal to the Fund's annualized expense ratio of 0.38% | |||||
| (representing the six month period annualized), multiplied by the average | ||||||
| The information in the table under the heading “Actual | account value over the period, multiplied by 184/366 (to reflect the one-half | |||||
| Performance” provides information about actual account values | year period). May reflect amounts waived and/or reimbursed. Without any | |||||
| and actual expenses. You may use the information in this column, | waivers and/or reimbursements, expenses would have been higher. | |||||
| together with the amount you invested, to estimate the expenses | ||||||
| Hypothetical | ||||||
| that you paid over the period. Simply divide your account value by | Performance (5% | |||||
| $1,000 (for example, an $8,600 account value divided by $1,000 | Actual | return before | ||||
| = 8.6), then multiply the result by the number in the first column | Class S | Performance | expenses) | |||
| Beginning Account Value | ||||||
| in the row entitled “Expenses Paid During Period” to estimate | May 1, 2016 | $ | 1,000.00 | $ | 1,000.00 | |
| the expenses you paid on your account during this period. | Ending Account Value | |||||
| October 31, 2016 | $ | 1,042.70 | $ | 1,022.37 | ||
| Hypothetical Example for Comparison Purposes | Expenses Paid During Period* | $ | 2.82 | $ | 2.80 | |
| The information in the table under the heading “Hypothetical | ||||||
| Performance (5% return before expenses)” provides information | * Expenses are equal to the Fund's annualized expense ratio of 0.55% | |||||
| (representing the six month period annualized), multiplied by the average | ||||||
| about hypothetical account values and hypothetical expenses | account value over the period, multiplied by 184/366 (to reflect the one-half | |||||
| based on the Fund’s actual expense ratio and an assumed rate of | year period). May reflect amounts waived and/or reimbursed. Without any | |||||
| return of 5% per year before expenses, which is not the Fund’s | waivers and/or reimbursements, expenses would have been higher. | |||||
| actual return. The hypothetical account values and expenses | ||||||
| Hypothetical | ||||||
| may not be used to estimate the actual ending account balance or | Performance (5% | |||||
| expenses you paid for the period. You may use this information | Actual | return before | ||||
| to compare the ongoing costs of investing in the Fund and other | Class T | Performance | expenses) | |||
| funds. To do so, compare this 5% hypothetical example with the | Beginning Account Value | |||||
| May 1, 2016 | $ | 1,000.00 | $ | 1,000.00 | ||
| 5% hypothetical examples that appear in the shareholder reports | Ending Account Value | |||||
| of other funds. | October 31, 2016 | $ | 1,042.40 | $ | 1,023.13 | |
| Expenses Paid During Period* | $ | 2.05 | $ | 2.03 | ||
| * Expenses are equal to the Fund's annualized expense ratio of 0.40% | ||||||
| (representing the six month period annualized), multiplied by the average | ||||||
| account value over the period, multiplied by 184/366 (to reflect the one-half | ||||||
| year period). May reflect amounts waived and/or reimbursed. Without any | ||||||
| waivers and/or reimbursements, expenses would have been higher. | ||||||
718 Select U.S. Equity Fund
Russell Investment Company
Select U.S. Equity Fund
Shareholder Expense Example, continued — October 31, 2016 (Unaudited)
| Hypothetical | ||||
| Performance (5% | ||||
| Actual | return before | |||
| Class Y | Performance | expenses) | ||
| Beginning Account Value | ||||
| May 1, 2016 | $ | 1,000.00 | $ | 1,000.00 |
| Ending Account Value | ||||
| October 31, 2016 | $ | 1,042.60 | $ | 1,023.38 |
| Expenses Paid During Period* | $ | 1.80 | $ | 1.78 |
* Expenses are equal to the Fund's annualized expense ratio of 0.35%
(representing the six month period annualized), multiplied by the average
account value over the period, multiplied by 184/366 (to reflect the one-half
year period). May reflect amounts waived and/or reimbursed. Without any
waivers and/or reimbursements, expenses would have been higher.
Select U.S. Equity Fund 719
Russell Investment Company
Select U.S. Equity Fund
Schedule of Investments — October 31, 2016
| Amounts in thousands (except share amounts) | Amounts in thousands (except share amounts) | ||||||
| Principal | Fair | Principal | Fair | ||||
| Amount ($) or | Value | Amount ($) or | Value | ||||
| Shares | $ | Shares | $ | ||||
| Common Stocks - 94.6% | Fortune Brands Home & Security, Inc. | 2,332 | 127 | ||||
| Consumer Discretionary - 13.1% | Fossil Group, Inc.(Æ) | 1,320 | 36 | ||||
| Aaron's, Inc. Class A | 3,391 | 84 | GameStop Corp. Class A | 5,313 | 128 | ||
| Advance Auto Parts, Inc. | 3,162 | 443 | Gannett Co., Inc. | 5,905 | 46 | ||
| Amazon.com, Inc.(Æ) | 7,195 | 5,683 | Gap, Inc. (The) | 3,221 | 89 | ||
| AMC Networks, Inc. Class A(Æ) | 1,847 | 90 | Garmin, Ltd. | 9,803 | 474 | ||
| Amerco, Inc. | 388 | 125 | General Motors Co. | 74,278 | 2,347 | ||
| American Eagle Outfitters, Inc. | 2,033 | 35 | Genesco, Inc.(Æ) | 296 | 16 | ||
| Aramark | 2,052 | 76 | Gentex Corp. | 8,319 | 141 | ||
| AutoNation, Inc.(Æ) | 2,837 | 124 | Genuine Parts Co. | 7,922 | 718 | ||
| AutoZone, Inc.(Æ) | 1,606 | 1,192 | Goodyear Tire & Rubber Co. (The) | 19,937 | 579 | ||
| Avis Budget Group, Inc.(Æ) | 1,244 | 40 | Graham Holdings Co. Class B | 297 | 141 | ||
| Bed Bath & Beyond, Inc. | 6,644 | 269 | Group 1 Automotive, Inc. | 261 | 16 | ||
| Belmond, Ltd. Class A(Æ) | 1,328 | 17 | Guess?, Inc. | 986 | 13 | ||
| Best Buy Co., Inc. | 13,942 | 542 | H&R Block, Inc. | 1,859 | 43 | ||
| BJ's Restaurants, Inc.(Æ) | 309 | 11 | Hanesbrands, Inc. | 10,694 | 275 | ||
| Bob Evans Farms, Inc. | 333 | 14 | Harley-Davidson, Inc. | 2,955 | 169 | ||
| BorgWarner, Inc. | 1,178 | 42 | Harman International Industries, Inc. | 2,168 | 173 | ||
| Brinker International, Inc. | 3,937 | 194 | Hasbro, Inc. | 2,985 | 249 | ||
| Brunswick Corp. | 461 | 20 | Helen of Troy, Ltd.(Æ) | 276 | 23 | ||
| Cabela's, Inc.(Æ) | 2,424 | 149 | Hilton Worldwide Holdings, Inc. | 4,621 | 104 | ||
| Cable One, Inc. | 439 | 253 | Home Depot, Inc. (The) | 39,181 | 4,780 | ||
| CalAtlantic Group, Inc. | 865 | 28 | Hyatt Hotels Corp. Class A(Æ) | 2,172 | 110 | ||
| CarMax, Inc.(Æ) | 4,329 | 216 | International Game Technology PLC | 631 | 18 | ||
| Carnival Corp. | 23,715 | 1,164 | International Speedway Corp. Class A | 540 | 18 | ||
| Carter's, Inc. | 1,660 | 143 | Interpublic Group of Cos., Inc. (The) | 2,064 | 46 | ||
| Cato Corp. (The) Class A | 396 | 12 | JC Penney Co., Inc.(Æ) | 13,152 | 113 | ||
| CBS Corp. Class B | 7,581 | 429 | John Wiley & Sons, Inc. Class A | 3,769 | 194 | ||
| Charter Communications, Inc. Class A(Æ) | 3,912 | 978 | KAR Auction Services, Inc. | 5,384 | 229 | ||
| Children's Place, Inc. (The) | 331 | 25 | Kate Spade & Co.(Æ) | 1,777 | 30 | ||
| Chipotle Mexican Grill, Inc. Class A(Æ) | 279 | 101 | Kohl's Corp. | 3,677 | 161 | ||
| Choice Hotels International, Inc. | 1,766 | 86 | L Brands, Inc. | 3,866 | 279 | ||
| Cinemark Holdings, Inc. | 3,591 | 143 | Lamar Advertising Co. Class A(ö) | 1,086 | 69 | ||
| Coach, Inc. | 6,749 | 242 | Las Vegas Sands Corp. | 4,719 | 273 | ||
| Comcast Corp. Class A | 71,092 | 4,395 | Lear Corp. | 5,573 | 684 | ||
| Cooper Tire & Rubber Co. | 548 | 20 | Leggett & Platt, Inc. | 3,594 | 165 | ||
| Costco Wholesale Corp. | 13,779 | 2,038 | Lennar Corp. Class A | 8,823 | 368 | ||
| Coty, Inc. Class A(Æ) | 3,112 | 72 | Liberty Broadband Corp. Class A(Æ) | 197 | 13 | ||
| Cracker Barrel Old Country Store, Inc. | 112 | 15 | Liberty Broadband Corp. Class C(Æ) | 3,824 | 255 | ||
| Dana, Inc. | 917 | 14 | Liberty Interactive Corp. Class A(Æ) | 7,779 | 144 | ||
| Darden Restaurants, Inc. | 5,408 | 350 | Liberty Media Corp.-Liberty Braves Class | ||||
| Delphi Automotive PLC | 5,231 | 340 | A(Æ) | 1,094 | 19 | ||
| Dick's Sporting Goods, Inc. | 2,971 | 165 | Liberty Media Corp.-Liberty Braves Class | ||||
| Dillard's, Inc. Class A | 1,276 | 78 | C(Æ) | 491 | 8 | ||
| DineEquity, Inc. | 149 | 12 | Liberty Media Corp.-Liberty SiriusXM Class | ||||
| Discovery Communications, Inc. Class A(Æ) | 3,071 | 80 | C(Æ) | 4,917 | 163 | ||
| Discovery Communications, Inc. Class C(Æ) | 5,114 | 128 | Liberty Ventures Class A(Æ) | 3,814 | 152 | ||
| DISH Network Corp. Class A(Æ) | 5,674 | 332 | Lions Gate Entertainment Corp.(Æ) | 1,131 | 23 | ||
| Dollar General Corp. | 11,244 | 777 | Live Nation Entertainment, Inc.(Æ) | 4,942 | 137 | ||
| Dollar Tree, Inc.(Æ) | 12,871 | 972 | LKQ Corp.(Æ) | 12,758 | 412 | ||
| Domino's Pizza, Inc. | 2,001 | 339 | Lowe's Cos., Inc. | 28,583 | 1,905 | ||
| DR Horton, Inc. | 13,152 | 379 | lululemon athletica, Inc.(Æ) | 2,488 | 142 | ||
| DSW, Inc. Class A | 3,658 | 76 | Macy's, Inc. | 3,809 | 139 | ||
| Dunkin' Brands Group, Inc. | 2,779 | 134 | Madison Square Garden Co. (The) Class A(Æ) | 1,453 | 240 | ||
| eBay, Inc.(Æ) | 39,898 | 1,138 | Marriott International, Inc. Class A | 3,579 | 246 | ||
| Estee Lauder Cos., Inc. (The) Class A | 11,906 | 1,037 | Marriott Vacations Worldwide Corp. | 314 | 20 | ||
| Expedia, Inc. | 3,547 | 458 | Mattel, Inc. | 15,111 | 476 | ||
| Express, Inc.(Æ) | 1,226 | 15 | Matthews International Corp. Class A | 415 | 25 | ||
| Finish Line, Inc. (The) Class A | 682 | 13 | McDonald's Corp. | 27,024 | 3,042 | ||
| Foot Locker, Inc. | 7,600 | 507 | Media General, Inc.(Æ) | 1,092 | 18 | ||
| Ford Motor Co. | 173,725 | 2,040 | Meredith Corp. | 445 | 20 | ||
See accompanying notes which are an integral part of the financial statements.
720 Select U.S. Equity Fund
Russell Investment Company
Select U.S. Equity Fund
Schedule of Investments, continued — October 31, 2016
| Amounts in thousands (except share amounts) | Amounts in thousands (except share amounts) | ||||||
| Principal | Fair | Principal | Fair | ||||
| Amount ($) or | Value | Amount ($) or | Value | ||||
| Shares | $ | Shares | $ | ||||
| Meritage Homes Corp.(Æ) | 448 | 14 | Ulta Salon Cosmetics & Fragrance, Inc.(Æ) | 2,117 | 515 | ||
| MGM Resorts International(Æ) | 16,560 | 433 | Under Armour, Inc. Class A(Æ) | 4,105 | 128 | ||
| Michael Kors Holdings, Ltd.(Æ) | 2,179 | 111 | Under Armour, Inc. Class C(Æ) | 4,134 | 107 | ||
| Michaels Cos., Inc. (The)(Æ) | 2,792 | 65 | Urban Outfitters, Inc.(Æ) | 2,993 | 100 | ||
| Mohawk Industries, Inc.(Æ) | 2,764 | 509 | VF Corp. | 15,880 | 861 | ||
| Murphy USA, Inc.(Æ) | 2,220 | 153 | Viacom, Inc. Class B | 12,475 | 469 | ||
| Netflix, Inc.(Æ) | 10,805 | 1,349 | Vista Outdoor, Inc.(Æ) | 1,515 | 59 | ||
| New York Times Co. (The) Class A | 1,463 | 16 | WABCO Holdings, Inc.(Æ) | 1,600 | 158 | ||
| Newell Brands, Inc. | 16,129 | 775 | Wal-Mart Stores, Inc. | 64,614 | 4,524 | ||
| News Corp. Class A | 24,001 | 291 | Walt Disney Co. (The) | 45,235 | 4,193 | ||
| Nielsen Holdings PLC | 3,956 | 178 | Wendy's Co. (The) | 5,007 | 54 | ||
| Nike, Inc. Class B | 45,270 | 2,272 | Whirlpool Corp. | 4,216 | 632 | ||
| Nordstrom, Inc. | 5,642 | 293 | Williams-Sonoma, Inc. | 674 | 31 | ||
| Norwegian Cruise Line Holdings, Ltd.(Æ) | 3,091 | 120 | Wyndham Worldwide Corp. | 713 | 47 | ||
| NVR, Inc.(Æ) | 135 | 206 | Wynn Resorts, Ltd. | 1,138 | 108 | ||
| Office Depot, Inc. | 19,687 | 62 | Yum! Brands, Inc. | 17,818 | 1,537 | ||
| Omnicom Group, Inc. | 10,446 | 834 | Zillow Group, Inc.(Æ) | 992 | 33 | ||
| O'Reilly Automotive, Inc.(Æ) | 4,973 | 1,315 | Zillow Group, Inc. Class A(Æ) | 496 | 16 | ||
| Outfront Media, Inc.(ö) | 1,765 | 38 | 91,532 | ||||
| Pandora Media, Inc.(Æ) | 2,887 | 33 | |||||
| Panera Bread Co. Class A(Æ) | 265 | 51 | Consumer Staples - 7.0% | ||||
| Penske Automotive Group, Inc. | 1,399 | 63 | Altria Group, Inc. | 49,370 | 3,264 | ||
| Polaris Industries, Inc. | 2,371 | 182 | Archer-Daniels-Midland Co. | 26,723 | 1,164 | ||
| Priceline Group, Inc. (The)(Æ) | 1,034 | 1,524 | Brown-Forman Corp. Class B - ADR | 13,898 | 642 | ||
| PulteGroup, Inc. | 17,020 | 317 | Bunge, Ltd. | 6,111 | 379 | ||
| PVH Corp. | 3,332 | 356 | Campbell Soup Co. | 9,056 | 492 | ||
| Ralph Lauren Corp. Class A | 4,130 | 405 | Church & Dwight Co., Inc. | 13,232 | 639 | ||
| Regal Entertainment Group Class A | 3,078 | 66 | Clorox Co. (The) | 6,943 | 833 | ||
| Ross Stores, Inc. | 20,973 | 1,312 | Coca-Cola Co. (The) | 92,603 | 3,926 | ||
| Royal Caribbean Cruises, Ltd. | 9,317 | 716 | Colgate-Palmolive Co. | 20,540 | 1,466 | ||
| Sally Beauty Holdings, Inc.(Æ) | 9,521 | 247 | ConAgra Foods, Inc. | 4,033 | 194 | ||
| Scholastic Corp. | 450 | 17 | Constellation Brands, Inc. Class A | 3,407 | 569 | ||
| Scripps Networks Interactive, Inc. Class A | 5,293 | 341 | Core-Mark Holding Co., Inc. | 586 | 21 | ||
| Service Corp. International | 3,933 | 101 | CVS Health Corp. | 38,753 | 3,259 | ||
| ServiceMaster Global Holdings, Inc.(Æ) | 2,525 | 90 | Dean Foods Co. | 1,121 | 20 | ||
| Signet Jewelers, Ltd. | 1,068 | 87 | Dr Pepper Snapple Group, Inc. | 9,094 | 798 | ||
| Sirius XM Holdings, Inc. | 38,242 | 159 | Energizer Holdings, Inc.(Æ) | 378 | 28 | ||
| Six Flags Entertainment Corp. | 1,024 | 57 | Flowers Foods, Inc. | 7,852 | 122 | ||
| Skechers U.S.A., Inc. Class A(Æ) | 3,372 | 71 | Fresh Del Monte Produce, Inc. | 540 | 33 | ||
| Staples, Inc. | 40,234 | 298 | General Mills, Inc. | 20,227 | 1,254 | ||
| Star Buffet, Inc. Class A(Æ) | 1,315 | 41 | Hain Celestial Group, Inc. (The)(Æ) | 2,299 | 84 | ||
| Starbucks Corp. | 43,798 | 2,324 | Herbalife, Ltd.(Æ) | 827 | 50 | ||
| Target Corp. | 29,932 | 2,057 | Hershey Co. (The) | 7,349 | 753 | ||
| TEGNA, Inc. | 17,310 | 340 | Hormel Foods Corp. | 15,673 | 603 | ||
| Tempur Sealy International, Inc.(Æ) | 114 | 6 | Ingredion, Inc. | 4,259 | 559 | ||
| Tesla Motors, Inc.(Æ) | 1,204 | 238 | JM Smucker Co. (The) | 5,697 | 748 | ||
| Thomson Reuters Corp. | 15,879 | 626 | Kellogg Co. | 1,869 | 140 | ||
| Thor Industries, Inc. | 3,307 | 262 | Kimberly-Clark Corp. | 10,064 | 1,151 | ||
| Tiffany & Co. | 1,892 | 139 | Kraft Heinz Co. (The) | 7,999 | 712 | ||
| Time Warner, Inc. | 26,678 | 2,374 | Kroger Co. (The) | 38,397 | 1,190 | ||
| TiVo Corp.(Æ) | 2,303 | 46 | McCormick & Co., Inc. | 6,639 | 636 | ||
| TJX Cos., Inc. | 28,312 | 2,088 | Mead Johnson Nutrition Co. Class A | 3,098 | 232 | ||
| Toll Brothers, Inc.(Æ) | 7,709 | 212 | Molson Coors Brewing Co. Class B | 2,203 | 229 | ||
| Tractor Supply Co. | 4,816 | 302 | Mondelez International, Inc. Class A | 57,665 | 2,591 | ||
| TRI Pointe Group, Inc.(Æ) | 1,351 | 15 | Monster Beverage Corp.(Æ) | 603 | 87 | ||
| Tribune Media Co. Class A | 2,949 | 96 | Nu Skin Enterprises, Inc. Class A | 504 | 31 | ||
| TripAdvisor, Inc.(Æ) | 1,688 | 109 | PepsiCo, Inc. | 35,221 | 3,776 | ||
| Tupperware Brands Corp. | 708 | 42 | Philip Morris International, Inc. | 38,866 | 3,748 | ||
| Twenty-First Century Fox, Inc. Class A | 34,659 | 911 | Pinnacle Foods, Inc. | 6,289 | 323 | ||
| Twenty-First Century Fox, Inc. Class B | 10,149 | 268 | Post Holdings, Inc.(Æ) | 440 | 34 | ||
See accompanying notes which are an integral part of the financial statements.
Select U.S. Equity Fund 721
Russell Investment Company
Select U.S. Equity Fund
Schedule of Investments, continued — October 31, 2016
| Amounts in thousands (except share amounts) | Amounts in thousands (except share amounts) | ||||||
| Principal | Fair | Principal | Fair | ||||
| Amount ($) or | Value | Amount ($) or | Value | ||||
| Shares | $ | Shares | $ | ||||
| Procter & Gamble Co. (The) | 79,585 | 6,908 | Tesoro Corp. | 7,267 | 618 | ||
| Reynolds American, Inc. | 31,769 | 1,750 | Valero Energy Corp. | 27,350 | 1,620 | ||
| Rite Aid Corp.(Æ) | 19,919 | 134 | Weatherford International PLC(Æ) | 16,505 | 80 | ||
| Safeway, Inc.(Æ) | 4,520 | 2 | Williams Cos., Inc. (The) | 8,902 | 260 | ||
| Seaboard Corp.(Æ) | 4 | 14 | World Fuel Services Corp. | 3,557 | 143 | ||
| Snyders-Lance, Inc. | 664 | 24 | 45,864 | ||||
| SpartanNash Co. | 641 | 18 | |||||
| SUPERVALU, Inc.(Æ) | 2,110 | 9 | Financial Services - 20.1% | ||||
| Sysco Corp. | 16,668 | 802 | Acadia Realty Trust(ö) | 782 | 26 | ||
| TreeHouse Foods, Inc.(Æ) | 303 | 27 | Affiliated Managers Group, Inc.(Æ) | 1,692 | 224 | ||
| Tyson Foods, Inc. Class A | 4,737 | 336 | Aflac, Inc. | 23,418 | 1,613 | ||
| United Natural Foods, Inc.(Æ) | 205 | 9 | AGNC Investment Corp.(ö) | 11,201 | 225 | ||
| Universal Corp. | 372 | 20 | Alexander & Baldwin, Inc. | 509 | 21 | ||
| Walgreens Boots Alliance, Inc. | 28,471 | 2,355 | Alexandria Real Estate Equities, Inc.(ö) | 901 | 97 | ||
| WhiteWave Foods Co. (The) Class A(Æ) | 321 | 17 | Alleghany Corp.(Æ) | 508 | 262 | ||
| 49,205 | Alliance Data Systems Corp. | 210 | 43 | ||||
| Allied World Assurance Co. Holdings AG | 3,085 | 133 | |||||
| Energy - 6.6% | Allstate Corp. (The) | 20,900 | 1,419 | ||||
| Anadarko Petroleum Corp. | 14,936 | 888 | Ally Financial, Inc. | 10,011 | 181 | ||
| Antero Resources Corp.(Æ) | 3,139 | 83 | American Campus Communities, Inc.(ö) | 3,907 | 204 | ||
| Apache Corp. | 14,255 | 848 | American Equity Investment Life Holding | ||||
| Baker Hughes, Inc. | 19,912 | 1,103 | Co. | 862 | 15 | ||
| Cabot Oil & Gas Corp. | 1,302 | 27 | American Express Co. | 26,995 | 1,793 | ||
| Chevron Corp. | 74,755 | 7,831 | American Financial Group, Inc. | 3,044 | 227 | ||
| Cimarex Energy Co. | 356 | 46 | American Homes 4 Rent Class A(ö) | 7,802 | 165 | ||
| Concho Resources, Inc.(Æ) | 509 | 65 | American International Group, Inc. | 42,906 | 2,647 | ||
| ConocoPhillips | 43,847 | 1,905 | American Tower Corp.(ö) | 10,108 | 1,185 | ||
| Continental Resources, Inc.(Æ) | 1,290 | 63 | Ameriprise Financial, Inc. | 2,766 | 245 | ||
| Devon Energy Corp. | 19,055 | 722 | AmTrust Financial Services, Inc. | 3,104 | 82 | ||
| Diamond Offshore Drilling, Inc.(Æ) | 2,936 | 48 | Annaly Capital Management, Inc.(ö) | 24,670 | 256 | ||
| Energen Corp.(Æ) | 2,834 | 142 | Aon PLC | 4,601 | 510 | ||
| EOG Resources, Inc. | 15,471 | 1,399 | Arch Capital Group, Ltd.(Æ) | 8,700 | 678 | ||
| EQT Corp. | 823 | 54 | Argo Group International Holdings, Ltd. | 452 | 25 | ||
| Exxon Mobil Corp. | 154,119 | 12,841 | ARMOUR Residential REIT, Inc.(ö) | 679 | 15 | ||
| First Solar, Inc.(Æ) | 2,169 | 88 | Arthur J Gallagher & Co. | 6,636 | 320 | ||
| FMC Technologies, Inc.(Æ) | 3,372 | 109 | Aspen Insurance Holdings, Ltd. | 5,583 | 269 | ||
| Gulfport Energy Corp.(Æ) | 3,498 | 84 | Associated Banc-Corp. | 6,655 | 135 | ||
| Halliburton Co. | 39,354 | 1,810 | Assurant, Inc. | 3,437 | 277 | ||
| Helmerich & Payne, Inc. | 3,950 | 249 | Assured Guaranty, Ltd. | 6,662 | 199 | ||
| Hess Corp. | 6,481 | 311 | Astoria Financial Corp. | 1,367 | 20 | ||
| HollyFrontier Corp. | 6,913 | 173 | AvalonBay Communities, Inc.(ö) | 2,678 | 458 | ||
| Kinder Morgan, Inc. | 76,818 | 1,569 | Axis Capital Holdings, Ltd. | 3,393 | 193 | ||
| Marathon Oil Corp. | 15,815 | 208 | Banco Latinoamericano de Comercio Exterior | ||||
| Marathon Petroleum Corp. | 31,704 | 1,382 | SA Class E | 555 | 15 | ||
| Murphy Oil Corp. | 4,444 | 115 | BancorpSouth, Inc. | 1,136 | 27 | ||
| National Oilwell Varco, Inc. | 8,745 | 281 | Bank of America Corp. | 373,419 | 6,161 | ||
| Newfield Exploration Co.(Æ) | 4,602 | 187 | Bank of Hawaii Corp. | 1,565 | 118 | ||
| Noble Energy, Inc. | 10,040 | 346 | Bank of New York Mellon Corp. (The) | 49,948 | 2,161 | ||
| Occidental Petroleum Corp. | 23,318 | 1,700 | BankUnited, Inc. | 3,131 | 91 | ||
| Oceaneering International, Inc. | 4,009 | 95 | BB&T Corp. | 43,743 | 1,715 | ||
| ONEOK, Inc. | 1,140 | 55 | Berkshire Hathaway, Inc. Class B(Æ) | 74,729 | 10,783 | ||
| PBF Energy, Inc. Class A | 3,046 | 66 | BlackRock, Inc. Class A | 3,999 | 1,365 | ||
| Phillips 66 | 27,397 | 2,223 | BOK Financial Corp. | 2,347 | 167 | ||
| Pioneer Natural Resources Co. | 746 | 134 | Broadridge Financial Solutions, Inc. | 8,702 | 563 | ||
| Range Resources Corp. | 2,341 | 79 | Brown & Brown, Inc. | 5,706 | 210 | ||
| RPC, Inc. | 5,838 | 101 | Camden Property Trust(ö) | 2,844 | 232 | ||
| Schlumberger, Ltd. | 36,686 | 2,870 | Capital One Financial Corp. | 22,025 | 1,631 | ||
| SolarCity Corp.(Æ) | 795 | 16 | Capitol Federal Financial, Inc. | 1,827 | 27 | ||
| Spectra Energy Corp. | 18,992 | 794 | Capstead Mortgage Corp.(ö) | 1,505 | 14 | ||
| Targa Resources Corp. | 749 | 33 | Care Capital Properties, Inc.(ö) | 1,488 | 40 | ||
See accompanying notes which are an integral part of the financial statements.
722 Select U.S. Equity Fund
Russell Investment Company
Select U.S. Equity Fund
Schedule of Investments, continued — October 31, 2016
| Amounts in thousands (except share amounts) | Amounts in thousands (except share amounts) | ||||||
| Principal | Fair | Principal | Fair | ||||
| Amount ($) or | Value | Amount ($) or | Value | ||||
| Shares | $ | Shares | $ | ||||
| Cathay General Bancorp | 936 | 28 | First Financial Bankshares, Inc. | 688 | 25 | ||
| CBOE Holdings, Inc. | 3,550 | 224 | First Horizon National Corp. | 7,257 | 112 | ||
| CBRE Group, Inc. Class A(Æ) | 8,855 | 228 | First Industrial Realty Trust, Inc.(ö) | 1,066 | 28 | ||
| Charles Schwab Corp. (The) | 32,747 | 1,038 | First Midwest Bancorp, Inc. | 1,101 | 21 | ||
| Chemical Financial Corp. | 595 | 26 | First Republic Bank | 8,275 | 616 | ||
| Chesapeake Lodging Trust(ö) | 620 | 13 | Fiserv, Inc.(Æ) | 8,523 | 839 | ||
| Chimera Investment Corp.(ö) | 2,908 | 46 | FleetCor Technologies, Inc.(Æ) | 1,314 | 230 | ||
| Chubb, Ltd. | 20,697 | 2,629 | FNB Corp. | 2,028 | 27 | ||
| Cincinnati Financial Corp. | 10,682 | 756 | FNF Group | 17,697 | 636 | ||
| CIT Group, Inc. | 6,189 | 225 | Forest City Realty Trust, Inc. Class A(ö) | 1,258 | 27 | ||
| Citigroup, Inc. | 110,330 | 5,423 | Four Corners Property Trust, Inc.(ö) | 2,462 | 49 | ||
| Citizens Financial Group, Inc. | 17,765 | 468 | Franklin Resources, Inc. | 23,511 | 791 | ||
| CME Group, Inc. Class A | 12,506 | 1,252 | Franklin Street Properties Corp.(ö) | 1,420 | 16 | ||
| CNA Financial Corp. | 1,478 | 54 | General Growth Properties, Inc.(ö) | 5,005 | 125 | ||
| CNO Financial Group, Inc. | 1,856 | 28 | Genworth Financial, Inc. Class A(Æ) | 15,346 | 64 | ||
| Colony Capital, Inc. Class A(ö) | 1,156 | 22 | GEO Group, Inc. (The)(ö) | 757 | 18 | ||
| Columbia Banking System, Inc. | 762 | 25 | Glacier Bancorp, Inc. | 943 | 27 | ||
| Comerica, Inc. | 7,161 | 373 | Global Payments, Inc. | 7,216 | 523 | ||
| Commerce Bancshares, Inc. | 5,924 | 295 | Goldman Sachs Group, Inc. (The) | 13,911 | 2,480 | ||
| Communications Sales & Leasing, Inc.(ö) | 5,405 | 154 | Gramercy Property Trust(ö) | 4,473 | 41 | ||
| Community Bank System, Inc. | 569 | 27 | Hancock Holding Co. | 934 | 31 | ||
| CoreLogic, Inc.(Æ) | 2,865 | 122 | Hanover Insurance Group, Inc. (The) | 193 | 15 | ||
| Corrections Corp. of America(ö) | 5,990 | 87 | Hartford Financial Services Group, Inc. | 8,131 | 359 | ||
| Cousins Properties, Inc.(ö) | 4,230 | 33 | HCP, Inc.(ö) | 10,636 | 364 | ||
| Credit Acceptance Corp.(Æ) | 361 | 66 | Hersha Hospitality Trust Class A(ö) | 682 | 12 | ||
| Crown Castle International Corp.(ö) | 844 | 77 | Highwoods Properties, Inc.(ö) | 867 | 43 | ||
| CubeSmart(ö) | 1,335 | 35 | Hilltop Holdings, Inc. | 990 | 24 | ||
| Cullen/Frost Bankers, Inc. | 4,929 | 375 | Horace Mann Educators Corp. | 597 | 21 | ||
| CVB Financial Corp. | 1,392 | 23 | Hudson Pacific Properties, Inc.(ö) | 674 | 23 | ||
| CYS Investments, Inc.(ö) | 2,020 | 17 | Huntington Bancshares, Inc. | 28,733 | 305 | ||
| DCT Industrial Trust, Inc.(ö) | 840 | 39 | Iberiabank Corp. | 383 | 25 | ||
| DiamondRock Hospitality Co.(ö) | 2,041 | 19 | Independent Bank Corp. | 450 | 25 | ||
| Digital Realty Trust, Inc.(ö) | 1,626 | 152 | Interactive Brokers Group, Inc. Class A | 2,147 | 71 | ||
| Discover Financial Services | 19,942 | 1,123 | Intercontinental Exchange, Inc. | 2,954 | 799 | ||
| Dun & Bradstreet Corp. (The) | 2,153 | 269 | International Bancshares Corp. | 728 | 22 | ||
| E*Trade Financial Corp.(Æ) | 8,634 | 243 | Invesco Mortgage Capital, Inc.(ö) | 1,371 | 20 | ||
| East West Bancorp, Inc. | 7,798 | 308 | Invesco, Ltd. | 2,885 | 81 | ||
| Eaton Vance Corp. | 1,852 | 65 | Investors Bancorp, Inc. | 3,202 | 39 | ||
| Ecolab, Inc. | 9,324 | 1,065 | Jack Henry & Associates, Inc. | 4,848 | 393 | ||
| Education Realty Trust, Inc.(ö) | 597 | 25 | Janus Capital Group, Inc. | 1,662 | 21 | ||
| Endurance Specialty Holdings, Ltd. | 4,910 | 451 | Jones Lang LaSalle, Inc. | 1,652 | 160 | ||
| Enstar Group, Ltd.(Æ) | 131 | 22 | JPMorgan Chase & Co. | 144,241 | 9,990 | ||
| EPR Properties(ö) | 579 | 42 | Kemper Corp. | 603 | 23 | ||
| Equifax, Inc. | 6,386 | 792 | Kennedy-Wilson Holdings, Inc. | 829 | 17 | ||
| Equinix, Inc.(ö) | 374 | 134 | KeyCorp | 43,861 | 619 | ||
| Equity LifeStyle Properties, Inc. Class A(ö) | 3,608 | 274 | LaSalle Hotel Properties(ö) | 1,054 | 25 | ||
| Equity One, Inc.(ö) | 804 | 23 | Lazard, Ltd. Class A | 3,221 | 117 | ||
| Equity Residential(ö) | 11,335 | 700 | Legg Mason, Inc. | 5,408 | 155 | ||
| Erie Indemnity Co. Class A | 2,560 | 262 | Leucadia National Corp. | 6,331 | 118 | ||
| Essex Property Trust, Inc.(ö) | 1,053 | 225 | Lexington Realty Trust(ö) | 2,197 | 22 | ||
| EverBank Financial Corp. | 1,053 | 20 | Liberty Property Trust(ö) | 2,597 | 105 | ||
| Everest Re Group, Ltd. | 2,745 | 559 | Life Storage, Inc.(Æ) | 196 | 16 | ||
| Extra Space Storage, Inc.(ö) | 7,797 | 570 | Lincoln National Corp. | 8,677 | 426 | ||
| FactSet Research Systems, Inc. | 587 | 91 | Loews Corp. | 10,662 | 459 | ||
| Federal Realty Investment Trust(ö) | 3,634 | 528 | LPL Financial Holdings, Inc. | 286 | 9 | ||
| Federated Investors, Inc. Class B | 5,832 | 157 | LTC Properties, Inc.(ö) | 471 | 24 | ||
| Fidelity National Information Services, Inc. | 7,239 | 535 | M&T Bank Corp. | 10,336 | 1,269 | ||
| Fifth Third Bancorp | 42,952 | 935 | Macerich Co. (The)(ö) | 1,826 | 129 | ||
| First American Financial Corp. | 1,062 | 41 | Markel Corp.(Æ) | 641 | 562 | ||
| First Citizens BancShares, Inc. Class A | 109 | 32 | Marsh & McLennan Cos., Inc. | 17,672 | 1,120 | ||
See accompanying notes which are an integral part of the financial statements.
Select U.S. Equity Fund 723
Russell Investment Company
Select U.S. Equity Fund
Schedule of Investments, continued — October 31, 2016
| Amounts in thousands (except share amounts) | Amounts in thousands (except share amounts) | ||||||
| Principal | Fair | Principal | Fair | ||||
| Amount ($) or | Value | Amount ($) or | Value | ||||
| Shares | $ | Shares | $ | ||||
| Mastercard, Inc. Class A | 27,817 | 2,977 | Santander Consumer USA Holdings, Inc.(Æ) | 3,537 | 43 | ||
| MB Financial, Inc. | 776 | 28 | SEI Investments Co. | 2,080 | 92 | ||
| Medical Properties Trust, Inc.(ö) | 2,166 | 30 | Selective Insurance Group, Inc. | 765 | 28 | ||
| Mercury General Corp. | 3,650 | 199 | Senior Housing Properties Trust(ö) | 7,976 | 170 | ||
| MetLife, Inc. | 32,974 | 1,548 | Signature Bank(Æ) | 2,635 | 318 | ||
| MFA Financial, Inc.(ö) | 27,903 | 204 | Simon Property Group, Inc.(ö) | 6,306 | 1,173 | ||
| MGIC Investment Corp.(Æ) | 2,152 | 18 | SLM Corp.(Æ) | 18,978 | 134 | ||
| Moody's Corp. | 6,798 | 683 | South State Corp. | 319 | 23 | ||
| Morgan Stanley | 51,841 | 1,740 | Starwood Property Trust, Inc.(ö) | 15,474 | 344 | ||
| Morningstar, Inc. | 1,951 | 138 | State Street Corp. | 17,678 | 1,241 | ||
| MSCI, Inc. Class A | 5,399 | 433 | Sterling Bancorp | 1,313 | 24 | ||
| Nasdaq, Inc. | 7,396 | 473 | Stifel Financial Corp.(Æ) | 658 | 26 | ||
| National Retail Properties, Inc.(ö) | 7,069 | 323 | Sunstone Hotel Investors, Inc.(ö) | 1,916 | 24 | ||
| Nationstar Mortgage Holdings, Inc.(Æ) | 2,378 | 36 | SunTrust Banks, Inc. | 28,800 | 1,303 | ||
| Navient Corp. | 12,390 | 158 | SVB Financial Group(Æ) | 1,630 | 199 | ||
| NBT Bancorp, Inc. | 773 | 26 | Synchrony Financial | 7,466 | 213 | ||
| New Residential Investment Corp.(ö) | 1,493 | 21 | Synovus Financial Corp. | 10,505 | 347 | ||
| New York Community Bancorp, Inc. | 14,119 | 203 | T Rowe Price Group, Inc. | 7,185 | 460 | ||
| New York REIT, Inc.(ö) | 1,827 | 17 | Taubman Centers, Inc.(ö) | 1,323 | 96 | ||
| Northern Trust Corp. | 8,006 | 580 | TCF Financial Corp. | 5,745 | 82 | ||
| NorthStar Asset Management Group, Inc. | 10,983 | 150 | TD Ameritrade Holding Corp. | 2,146 | 73 | ||
| Northwest Bancshares, Inc. | 1,613 | 25 | Texas Capital Bancshares, Inc.(Æ) | 453 | 27 | ||
| Old National Bancorp | 1,548 | 23 | Torchmark Corp. | 7,933 | 503 | ||
| Old Republic International Corp. | 5,837 | 98 | Total System Services, Inc. | 9,115 | 455 | ||
| OneMain Holdings, Inc.(Æ) | 1,626 | 46 | Travelers Cos., Inc. (The) | 20,917 | 2,263 | ||
| PacWest Bancorp | 4,606 | 200 | Trustmark Corp. | 912 | 25 | ||
| Park National Corp. | 220 | 21 | Two Harbors Investment Corp.(ö) | 5,058 | 42 | ||
| Parkway, Inc.(Æ)(ö) | 528 | 10 | UDR, Inc.(ö) | 3,169 | 111 | ||
| PayPal Holdings, Inc.(Æ) | 35,385 | 1,474 | UMB Financial Corp. | 464 | 29 | ||
| Pebblebrook Hotel Trust(ö) | 692 | 17 | Umpqua Holdings Corp. | 1,787 | 27 | ||
| PennyMac Mortgage Investment Trust(ö) | 903 | 14 | Union Bankshares Corp. | 835 | 23 | ||
| People's United Financial, Inc. | 9,668 | 157 | United Bankshares, Inc. | 765 | 29 | ||
| Pinnacle Financial Partners, Inc. | 468 | 24 | Unum Group | 3,799 | 134 | ||
| PNC Financial Services Group, Inc. (The) | 26,723 | 2,555 | US Bancorp | 72,671 | 3,253 | ||
| Popular, Inc. | 1,240 | 45 | Validus Holdings, Ltd. | 4,507 | 230 | ||
| Post Properties, Inc.(ö) | 2,886 | 190 | Valley National Bancorp | 2,670 | 26 | ||
| Primerica, Inc. | 565 | 31 | Vantiv, Inc. Class A(Æ) | 2,821 | 165 | ||
| Principal Financial Group, Inc. | 11,970 | 654 | Ventas, Inc.(ö) | 4,389 | 297 | ||
| PrivateBancorp, Inc. Class A | 676 | 31 | Visa, Inc. Class A | 56,579 | 4,668 | ||
| ProAssurance Corp. | 3,625 | 193 | Voya Financial, Inc. | 11,000 | 336 | ||
| Progressive Corp. (The) | 34,771 | 1,096 | Waddell & Reed Financial, Inc. Class A | 1,325 | 21 | ||
| Prologis, Inc.(ö) | 1,374 | 72 | Washington Federal, Inc. | 1,200 | 33 | ||
| Prosperity Bancshares, Inc. | 699 | 39 | Washington Real Estate Investment Trust(ö) | 802 | 24 | ||
| Provident Financial Services, Inc. | 1,032 | 23 | Webster Financial Corp. | 908 | 37 | ||
| Prudential Financial, Inc. | 16,753 | 1,421 | Weingarten Realty Investors(ö) | 4,799 | 174 | ||
| PS Business Parks, Inc.(ö) | 215 | 24 | Wells Fargo & Co. | 188,216 | 8,660 | ||
| Public Storage(ö) | 4,338 | 927 | Welltower, Inc.(ö) | 2,571 | 176 | ||
| Radian Group, Inc. | 1,459 | 20 | WesBanco, Inc. | 570 | 19 | ||
| Ramco-Gershenson Properties Trust(ö) | 1,033 | 18 | Westamerica Bancorporation | 444 | 22 | ||
| Raymond James Financial, Inc. | 7,736 | 465 | Western Union Co. (The) | 15,063 | 302 | ||
| Rayonier, Inc.(ö) | 3,305 | 89 | WEX, Inc.(Æ) | 159 | 17 | ||
| Realogy Holdings Corp. | 4,007 | 92 | Weyerhaeuser Co.(ö) | 8,768 | 262 | ||
| Realty Income Corp.(ö) | 13,035 | 772 | White Mountains Insurance Group, Ltd. | 286 | 237 | ||
| Redwood Trust, Inc.(ö) | 1,057 | 15 | Wintrust Financial Corp. | 546 | 29 | ||
| Regions Financial Corp. | 58,429 | 626 | WR Berkley Corp. | 6,936 | 396 | ||
| Reinsurance Group of America, Inc. Class A | 2,966 | 320 | XL Group, Ltd. | 17,232 | 598 | ||
| RenaissanceRe Holdings, Ltd. | 2,275 | 283 | Zions Bancorporation | 4,014 | 129 | ||
| Retail Opportunity Investments Corp.(ö) | 1,225 | 25 | 140,468 | ||||
| RLI Corp. | 515 | 29 | |||||
| RLJ Lodging Trust(ö) | 1,123 | 22 | |||||
See accompanying notes which are an integral part of the financial statements.
724 Select U.S. Equity Fund
Russell Investment Company
Select U.S. Equity Fund
Schedule of Investments, continued — October 31, 2016
| Amounts in thousands (except share amounts) | Amounts in thousands (except share amounts) | ||||||
| Principal | Fair | Principal | Fair | ||||
| Amount ($) or | Value | Amount ($) or | Value | ||||
| Shares | $ | Shares | $ | ||||
| Health Care - 12.4% | Intuitive Surgical, Inc.(Æ) | 678 | 456 | ||||
| Abbott Laboratories | 45,531 | 1,787 | Ionis Pharmaceuticals, Inc.(Æ) | 5,272 | 137 | ||
| AbbVie, Inc. | 30,256 | 1,688 | Johnson & Johnson | 100,886 | 11,702 | ||
| Acadia Healthcare Co., Inc.(Æ) | 652 | 23 | Juno Therapeutics, Inc.(Æ) | 1,815 | 44 | ||
| Aetna, Inc. | 19,761 | 2,121 | Kindred Healthcare, Inc. | 845 | 8 | ||
| Agilent Technologies, Inc. | 6,561 | 286 | Laboratory Corp. of America Holdings(Æ) | 7,972 | 999 | ||
| Agios Pharmaceuticals, Inc.(Æ) | 810 | 39 | LifePoint Health, Inc.(Æ) | 3,362 | 201 | ||
| Akorn, Inc.(Æ) | 1,963 | 47 | Magellan Health, Inc.(Æ) | 353 | 18 | ||
| Alere, Inc.(Æ) | 2,355 | 105 | Mallinckrodt PLC(Æ) | 2,586 | 153 | ||
| Alexion Pharmaceuticals, Inc.(Æ) | 4,040 | 527 | McKesson Corp. | 7,412 | 943 | ||
| Align Technology, Inc.(Æ) | 1,450 | 125 | MEDNAX, Inc.(Æ) | 1,719 | 105 | ||
| Alkermes PLC(Æ) | 4,069 | 205 | Medtronic PLC | 46,721 | 3,832 | ||
| Allergan PLC(Æ) | 10,001 | 2,090 | Merck & Co., Inc. | 91,876 | 5,395 | ||
| Allscripts Healthcare Solutions, Inc.(Æ) | 7,622 | 92 | Mylan NV(Æ) | 13,779 | 503 | ||
| Alnylam Pharmaceuticals, Inc.(Æ) | 2,423 | 86 | OPKO Health, Inc.(Æ) | 7,233 | 68 | ||
| AmerisourceBergen Corp. Class A | 3,657 | 257 | Owens & Minor, Inc. | 736 | 24 | ||
| Amgen, Inc. | 24,047 | 3,395 | PAREXEL International Corp.(Æ) | 261 | 15 | ||
| Amsurg Corp. Class A(Æ) | 422 | 25 | Patterson Cos., Inc. | 792 | 34 | ||
| Analogic Corp. | 203 | 17 | PerkinElmer, Inc. | 2,634 | 134 | ||
| Anthem, Inc. | 15,160 | 1,847 | Perrigo Co. PLC | 2,357 | 196 | ||
| Baxter International, Inc. | 23,187 | 1,103 | Pfizer, Inc. | 220,678 | 6,998 | ||
| Becton Dickinson and Co. | 8,484 | 1,425 | Premier, Inc. Class A(Æ) | 2,013 | 64 | ||
| Biogen, Inc.(Æ) | 4,654 | 1,304 | Qiagen NV(Æ) | 9,335 | 228 | ||
| BioMarin Pharmaceutical, Inc.(Æ) | 4,138 | 333 | Quest Diagnostics, Inc. | 10,533 | 858 | ||
| Boston Scientific Corp.(Æ) | 23,519 | 517 | Quintiles IMS Holdings, Inc.(Æ) | 3,238 | 232 | ||
| Bristol-Myers Squibb Co. | 45,562 | 2,320 | Quorum Health Corp.(Æ) | 1,047 | 4 | ||
| Brookdale Senior Living, Inc. Class A(Æ) | 1,153 | 17 | Regeneron Pharmaceuticals, Inc.(Æ) | 2,310 | 797 | ||
| Bruker Corp. | 1,963 | 40 | ResMed, Inc. | 7,778 | 465 | ||
| Cardinal Health, Inc. | 13,266 | 911 | Seattle Genetics, Inc.(Æ) | 549 | 28 | ||
| Celgene Corp.(Æ) | 13,748 | 1,405 | St. Jude Medical, Inc. | 6,944 | 541 | ||
| Centene Corp.(Æ) | 5,314 | 332 | Stryker Corp. | 14,357 | 1,656 | ||
| Cerner Corp.(Æ) | 12,687 | 743 | Teleflex, Inc. | 2,302 | 330 | ||
| Charles River Laboratories International, | Tenet Healthcare Corp.(Æ) | 527 | 10 | ||||
| Inc.(Æ) | 1,349 | 102 | Thermo Fisher Scientific, Inc. | 14,553 | 2,140 | ||
| Cigna Corp. | 12,039 | 1,431 | United Therapeutics Corp.(Æ) | 2,260 | 271 | ||
| Community Health Systems, Inc.(Æ) | 4,191 | 22 | UnitedHealth Group, Inc. | 31,886 | 4,506 | ||
| CONMED Corp. | 388 | 16 | Universal Health Services, Inc. Class B | 2,739 | 331 | ||
| Cooper Cos., Inc. (The) | 2,645 | 466 | Varian Medical Systems, Inc.(Æ) | 5,253 | 477 | ||
| CR Bard, Inc. | 4,167 | 903 | VCA, Inc.(Æ) | 2,084 | 128 | ||
| DaVita, Inc.(Æ) | 1,048 | 61 | Veeva Systems, Inc. Class A(Æ) | 1,263 | 49 | ||
| Dentsply Sirona, Inc. | 15,459 | 890 | Vertex Pharmaceuticals, Inc.(Æ) | 4,930 | 374 | ||
| DexCom, Inc.(Æ) | 2,246 | 176 | VWR Corp.(Æ) | 2,823 | 78 | ||
| Edwards Lifesciences Corp.(Æ) | 5,516 | 525 | West Pharmaceutical Services, Inc. | 302 | 23 | ||
| Eli Lilly & Co. | 25,341 | 1,871 | Zimmer Biomet Holdings, Inc. | 4,875 | 514 | ||
| Endo International PLC(Æ) | 4,204 | 79 | Zoetis, Inc. Class A | 7,034 | 336 | ||
| Envision Healthcare Holdings, Inc.(Æ) | 1,438 | 28 | 86,557 | ||||
| Express Scripts Holding Co.(Æ) | 21,234 | 1,431 | |||||
| Gilead Sciences, Inc. | 29,308 | 2,158 | Materials and Processing - 2.7% | ||||
| HCA Holdings, Inc.(Æ) | 17,316 | 1,325 | Acuity Brands, Inc. | 1,302 | 291 | ||
| HealthSouth Corp. | 482 | 19 | AdvanSix, Inc.(Æ) | 923 | 15 | ||
| Henry Schein, Inc.(Æ) | 6,277 | 937 | Air Products & Chemicals, Inc. | 9,620 | 1,283 | ||
| Hill-Rom Holdings, Inc. | 2,022 | 112 | Albemarle Corp. | 3,187 | 266 | ||
| Hologic, Inc.(Æ) | 6,607 | 238 | AptarGroup, Inc. | 2,086 | 149 | ||
| Humana, Inc. | 5,628 | 965 | Arconic, Inc. | 7,649 | 220 | ||
| ICU Medical, Inc.(Æ) | 207 | 29 | Ashland Global Holdings, Inc. | 2,354 | 263 | ||
| IDEXX Laboratories, Inc.(Æ) | 770 | 83 | Axalta Coating Systems, Ltd.(Æ) | 2,668 | 67 | ||
| Illumina, Inc.(Æ) | 4,327 | 589 | Ball Corp. | 3,539 | 273 | ||
| Incyte Corp.(Æ) | 4,786 | 416 | Beacon Roofing Supply, Inc.(Æ) | 625 | 26 | ||
| Integer Holdings Corp.(Æ) | 364 | 8 | Bemis Co., Inc. | 4,776 | 233 | ||
| Intercept Pharmaceuticals, Inc.(Æ) | 146 | 18 | Berry Plastics Group, Inc.(Æ) | 499 | 22 | ||
| Intrexon Corp.(Æ) | 1,625 | 42 | |||||
See accompanying notes which are an integral part of the financial statements.
Select U.S. Equity Fund 725
Russell Investment Company
Select U.S. Equity Fund
Schedule of Investments, continued — October 31, 2016
| Amounts in thousands (except share amounts) | Amounts in thousands (except share amounts) | ||||||
| Principal | Fair | Principal | Fair | ||||
| Amount ($) or | Value | Amount ($) or | Value | ||||
| Shares | $ | Shares | $ | ||||
| Cabot Corp. | 1,250 | 65 | WestRock Co. | 6,094 | 281 | ||
| CF Industries Holdings, Inc. | 5,795 | 139 | WR Grace & Co. | 518 | 35 | ||
| Commercial Metals Co. | 1,400 | 22 | 19,141 | ||||
| Compass Minerals International, Inc. | 1,934 | 139 | |||||
| Crown Holdings, Inc.(Æ) | 518 | 28 | Producer Durables - 10.8% | ||||
| Domtar Corp. | 3,581 | 129 | 3M Co. | 17,942 | 2,966 | ||
| Dow Chemical Co. (The) | 34,203 | 1,840 | AAR Corp. | 570 | 18 | ||
| Eagle Materials, Inc. | 816 | 66 | ABM Industries, Inc. | 722 | 28 | ||
| Eastman Chemical Co. | 2,204 | 158 | Accenture PLC Class A | 20,444 | 2,376 | ||
| EI du Pont de Nemours & Co. | 16,504 | 1,135 | Adient PLC(Æ) | 3,608 | 164 | ||
| Fastenal Co. | 13,384 | 522 | AECOM(Æ) | 3,042 | 85 | ||
| FMC Corp. | 1,069 | 50 | AGCO Corp. | 1,114 | 57 | ||
| Freeport-McMoRan, Inc.(Æ) | 16,087 | 180 | Air Lease Corp. Class A | 3,433 | 104 | ||
| Graphic Packaging Holding Co. | 8,087 | 101 | Aircastle, Ltd. | 708 | 15 | ||
| Hecla Mining Co. | 4,958 | 30 | Alaska Air Group, Inc. | 7,948 | 574 | ||
| Hexcel Corp. | 8,716 | 396 | Albany International Corp. Class A | 427 | 17 | ||
| Huntsman Corp. | 3,469 | 59 | Allegion PLC | 1,017 | 65 | ||
| International Flavors & Fragrances, Inc. | 3,794 | 496 | Allison Transmission Holdings, Inc. Class A | 1,526 | 45 | ||
| International Paper Co. | 2,993 | 135 | American Airlines Group, Inc. | 11,448 | 465 | ||
| ITT, Inc. | 3,653 | 129 | Ametek, Inc. | 10,901 | 481 | ||
| Lennox International, Inc. | 1,125 | 164 | AO Smith Corp. | 3,204 | 145 | ||
| LyondellBasell Industries Class A | 11,536 | 918 | Applied Industrial Technologies, Inc. | 443 | 23 | ||
| Martin Marietta Materials, Inc. | 1,827 | 339 | Atlas Air Worldwide Holdings, Inc.(Æ) | 353 | 15 | ||
| Masco Corp. | 8,737 | 270 | Automatic Data Processing, Inc. | 13,235 | 1,152 | ||
| Minerals Technologies, Inc. | 332 | 22 | Avery Dennison Corp. | 3,600 | 251 | ||
| Monsanto Co. | 8,057 | 812 | Babcock & Wilcox Co. (The) Class W(Æ) | 3,631 | 142 | ||
| Mosaic Co. (The) | 8,368 | 197 | Babcock & Wilcox Enterprises, Inc.(Æ) | 4,164 | 66 | ||
| Mueller Industries, Inc. | 488 | 15 | Barnes Group, Inc. | 641 | 26 | ||
| NewMarket Corp. | 661 | 265 | Boeing Co. (The) | 14,944 | 2,128 | ||
| Newmont Mining Corp. | 9,212 | 341 | Brady Corp. Class A | 703 | 23 | ||
| Nucor Corp. | 5,958 | 291 | Briggs & Stratton Corp. | 795 | 15 | ||
| Olin Corp. | 927 | 20 | Carlisle Cos., Inc. | 3,407 | 357 | ||
| Owens Corning | 4,065 | 198 | Caterpillar, Inc. | 17,266 | 1,441 | ||
| Owens-Illinois, Inc.(Æ) | 2,544 | 49 | CH Robinson Worldwide, Inc. | 4,891 | 333 | ||
| Packaging Corp. of America | 1,845 | 152 | Chicago Bridge & Iron Co. | 3,489 | 112 | ||
| PPG Industries, Inc. | 8,406 | 783 | Cintas Corp. | 6,129 | 654 | ||
| Praxair, Inc. | 9,838 | 1,152 | Clarcor, Inc. | 252 | 16 | ||
| Reliance Steel & Aluminum Co. | 3,079 | 212 | Clean Harbors, Inc.(Æ) | 844 | 40 | ||
| Royal Gold, Inc. | 319 | 22 | Colfax Corp.(Æ) | 2,086 | 66 | ||
| RPM International, Inc. | 3,950 | 188 | Convergys Corp. | 1,180 | 34 | ||
| Schweitzer-Mauduit International, Inc. | 396 | 15 | Copa Holdings SA Class A | 932 | 86 | ||
| Sealed Air Corp. | 4,577 | 209 | Copart, Inc.(Æ) | 6,454 | 339 | ||
| Sensient Technologies Corp. | 501 | 37 | CoStar Group, Inc.(Æ) | 964 | 180 | ||
| Sherwin-Williams Co. (The) | 3,818 | 935 | Covanta Holding Corp. | 2,768 | 42 | ||
| Silgan Holdings, Inc. | 3,232 | 165 | Crane Co. | 1,929 | 131 | ||
| Simpson Manufacturing Co., Inc. | 556 | 24 | CSX Corp. | 35,333 | 1,078 | ||
| Sonoco Products Co. | 5,364 | 270 | Cubic Corp. | 329 | 14 | ||
| Southern Copper Corp. | 1,704 | 48 | Cummins, Inc. | 6,565 | 839 | ||
| Steel Dynamics, Inc. | 10,928 | 300 | Curtiss-Wright Corp. | 418 | 37 | ||
| Tahoe Resources, Inc. | 4,879 | 59 | Danaher Corp. | 21,589 | 1,696 | ||
| Timken Co. (The) | 3,435 | 113 | Darling Ingredients, Inc.(Æ) | 1,555 | 21 | ||
| United States Steel Corp. | 4,864 | 94 | Deere & Co. | 9,728 | 859 | ||
| Universal Forest Products, Inc. | 310 | 27 | Delta Air Lines, Inc. | 24,578 | 1,027 | ||
| USG Corp.(Æ) | 1,600 | 40 | Deluxe Corp. | 370 | 23 | ||
| Valmont Industries, Inc. | 1,665 | 213 | Donaldson Co., Inc. | 7,890 | 288 | ||
| Valspar Corp. | 2,236 | 223 | Dover Corp. | 7,034 | 471 | ||
| Versum Materials, Inc.(Æ) | 4,059 | 92 | Eaton Corp. PLC | 18,807 | 1,199 | ||
| Vulcan Materials Co. | 2,629 | 298 | EMCOR Group, Inc. | 715 | 43 | ||
| Watsco, Inc. | 2,102 | 288 | Emerson Electric Co. | 25,179 | 1,276 | ||
| Westlake Chemical Corp. | 739 | 38 | EnerSys | 431 | 28 | ||
See accompanying notes which are an integral part of the financial statements.
726 Select U.S. Equity Fund
Russell Investment Company
Select U.S. Equity Fund
Schedule of Investments, continued — October 31, 2016
| Amounts in thousands (except share amounts) | Amounts in thousands (except share amounts) | ||||||
| Principal | Fair | Principal | Fair | ||||
| Amount ($) or | Value | Amount ($) or | Value | ||||
| Shares | $ | Shares | $ | ||||
| ESCO Technologies, Inc. | 446 | 20 | PACCAR, Inc. | 5,465 | 300 | ||
| Essendant, Inc.(Æ) | 529 | 8 | Parker-Hannifin Corp. | 3,426 | 421 | ||
| Esterline Technologies Corp.(Æ) | 316 | 23 | Paychex, Inc. | 9,557 | 528 | ||
| Expeditors International of Washington, Inc. | 4,418 | 227 | Pentair PLC | 2,300 | 127 | ||
| Federal Signal Corp. | 972 | 12 | Pitney Bowes, Inc. | 1,481 | 26 | ||
| FedEx Corp. | 6,022 | 1,050 | Quanta Services, Inc.(Æ) | 10,511 | 302 | ||
| Flir Systems, Inc. | 9,726 | 320 | Raytheon Co. | 13,795 | 1,885 | ||
| Fluor Corp. | 2,433 | 126 | Regal Beloit Corp. | 1,589 | 94 | ||
| Fortive Corp. | 12,112 | 618 | Republic Services, Inc. Class A | 10,953 | 576 | ||
| FTI Consulting, Inc.(Æ) | 490 | 19 | Robert Half International, Inc. | 6,798 | 254 | ||
| GATX Corp. | 521 | 23 | Rockwell Automation, Inc. | 2,433 | 291 | ||
| General Dynamics Corp. | 11,755 | 1,772 | Rockwell Collins, Inc. | 6,671 | 562 | ||
| General Electric Co. | 265,494 | 7,726 | Rollins, Inc. | 7,762 | 239 | ||
| Genesee & Wyoming, Inc. Class A(Æ) | 799 | 54 | Roper Technologies, Inc. | 4,536 | 786 | ||
| Genpact, Ltd.(Æ) | 11,557 | 266 | RR Donnelley & Sons Co. | 2,061 | 37 | ||
| Graco, Inc. | 3,536 | 265 | Ryder System, Inc. | 2,331 | 162 | ||
| Granite Construction, Inc. | 562 | 28 | S&P Global, Inc. | 3,757 | 458 | ||
| HD Supply Holdings, Inc.(Æ) | 7,172 | 237 | Snap-on, Inc. | 2,679 | 413 | ||
| HEICO Corp. | 281 | 19 | Southwest Airlines Co. | 17,945 | 719 | ||
| Herc Holdings, Inc.(Æ) | 1,479 | 44 | Spirit AeroSystems Holdings, Inc. Class A | 2,897 | 146 | ||
| Hertz Global Holdings, Inc.(Æ) | 4,438 | 147 | Spirit Airlines, Inc.(Æ) | 784 | 38 | ||
| Honeywell International, Inc. | 23,077 | 2,531 | SPX FLOW, Inc.(Æ) | 1,999 | 50 | ||
| Hubbell, Inc. Class B | 914 | 96 | Stanley Black & Decker, Inc. | 4,346 | 495 | ||
| Huntington Ingalls Industries, Inc. | 1,251 | 202 | Stericycle, Inc.(Æ) | 2,341 | 187 | ||
| Huron Consulting Group, Inc.(Æ) | 301 | 17 | Sykes Enterprises, Inc.(Æ) | 720 | 19 | ||
| IDEX Corp. | 3,721 | 322 | Teledyne Technologies, Inc.(Æ) | 324 | 35 | ||
| Illinois Tool Works, Inc. | 9,284 | 1,054 | Terex Corp. | 941 | 22 | ||
| Jacobs Engineering Group, Inc.(Æ) | 3,491 | 180 | Tetra Tech, Inc. | 835 | 32 | ||
| JB Hunt Transport Services, Inc. | 5,785 | 472 | Textron, Inc. | 9,801 | 393 | ||
| JetBlue Airways Corp.(Æ) | 15,142 | 265 | TopBuild Corp.(Æ) | 270 | 8 | ||
| Johnson Controls International PLC | 36,085 | 1,455 | Toro Co. (The) | 6,632 | 318 | ||
| Kansas City Southern | 4,088 | 359 | TransDigm Group, Inc. | 2,319 | 632 | ||
| KBR, Inc. | 6,008 | 89 | Trinity Industries, Inc. | 5,316 | 113 | ||
| Keysight Technologies, Inc.(Æ) | 2,835 | 93 | UniFirst Corp. | 190 | 23 | ||
| Kirby Corp.(Æ) | 4,932 | 291 | Union Pacific Corp. | 21,820 | 1,924 | ||
| Korn/Ferry International | 541 | 11 | United Continental Holdings, Inc.(Æ) | 9,270 | 521 | ||
| L-3 Communications Holdings, Inc. Class 3 | 5,141 | 704 | United Parcel Service, Inc. Class B | 16,038 | 1,728 | ||
| Landstar System, Inc. | 1,527 | 109 | United Rentals, Inc.(Æ) | 781 | 59 | ||
| Lexmark International, Inc. Class A | 3,036 | 120 | United Technologies Corp. | 29,423 | 3,007 | ||
| Lincoln Electric Holdings, Inc. | 3,257 | 214 | Verisk Analytics, Inc. Class A(Æ) | 7,338 | 598 | ||
| Lockheed Martin Corp. | 6,959 | 1,715 | Wabtec Corp. | 4,265 | 330 | ||
| LSC Communications, Inc. | 773 | 19 | Waste Management, Inc. | 16,763 | 1,101 | ||
| Macquarie Infrastructure Corp. | 473 | 39 | Waters Corp.(Æ) | 4,241 | 590 | ||
| Manitowoc Foodservice, Inc.(Æ) | 2,169 | 33 | Werner Enterprises, Inc. | 578 | 14 | ||
| ManpowerGroup, Inc. | 1,867 | 143 | WESCO International, Inc.(Æ) | 797 | 43 | ||
| Matson, Inc. | 478 | 19 | Woodward, Inc. | 440 | 26 | ||
| MAXIMUS, Inc. | 283 | 15 | WW Grainger, Inc. | 3,595 | 748 | ||
| Mettler-Toledo International, Inc.(Æ) | 1,829 | 739 | Xerox Corp. | 32,459 | 317 | ||
| Middleby Corp.(Æ) | 640 | 72 | XPO Logistics, Inc.(Æ) | 454 | 15 | ||
| Mobile Mini, Inc. | 493 | 12 | Xylem, Inc. | 8,997 | 435 | ||
| Moog, Inc. Class A(Æ) | 416 | 24 | Zebra Technologies Corp. Class A(Æ) | 981 | 65 | ||
| MSC Industrial Direct Co., Inc. Class A | 3,218 | 234 | 75,152 | ||||
| National Instruments Corp. | 2,557 | 72 | |||||
| Nordson Corp. | 3,200 | 320 | Technology - 16.6% | ||||
| Norfolk Southern Corp. | 12,944 | 1,204 | Activision Blizzard, Inc. | 19,891 | 859 | ||
| Northrop Grumman Corp. | 8,057 | 1,845 | Adobe Systems, Inc.(Æ) | 11,414 | 1,227 | ||
| Old Dominion Freight Line, Inc.(Æ) | 4,303 | 321 | Akamai Technologies, Inc.(Æ) | 5,018 | 349 | ||
| Orbital ATK, Inc. | 3,504 | 261 | Alphabet, Inc. Class A(Æ) | 10,173 | 8,239 | ||
| Oshkosh Corp. | 1,331 | 71 | Alphabet, Inc. Class C(Æ) | 6,018 | 4,721 | ||
| OSI Systems, Inc.(Æ) | 251 | 18 | Amdocs, Ltd. | 8,311 | 486 | ||
See accompanying notes which are an integral part of the financial statements.
Select U.S. Equity Fund 727
Russell Investment Company
Select U.S. Equity Fund
Schedule of Investments, continued — October 31, 2016
| Amounts in thousands (except share amounts) | Amounts in thousands (except share amounts) | ||||||
| Principal | Fair | Principal | Fair | ||||
| Amount ($) or | Value | Amount ($) or | Value | ||||
| Shares | $ | Shares | $ | ||||
| Amphenol Corp. Class A | 16,228 | 1,070 | Jabil Circuit, Inc. | 10,228 | 218 | ||
| Analog Devices, Inc. | 12,618 | 809 | Juniper Networks, Inc. | 14,089 | 371 | ||
| Anixter International, Inc.(Æ) | 254 | 17 | KLA-Tencor Corp. | 2,940 | 221 | ||
| Ansys, Inc.(Æ) | 5,654 | 516 | Lam Research Corp. | 5,374 | 521 | ||
| Apple, Inc. | 170,304 | 19,336 | Leidos Holdings, Inc. | 3,283 | 136 | ||
| Applied Materials, Inc. | 12,071 | 351 | Linear Technology Corp. | 8,886 | 534 | ||
| ARRIS International PLC(Æ) | 2,868 | 80 | LinkedIn Corp. Class A(Æ) | 906 | 172 | ||
| Arrow Electronics, Inc.(Æ) | 3,992 | 244 | Manhattan Associates, Inc.(Æ) | 328 | 17 | ||
| Aspen Technology, Inc.(Æ) | 446 | 22 | Marvell Technology Group, Ltd. | 21,033 | 274 | ||
| Autodesk, Inc.(Æ) | 1,942 | 140 | Maxim Integrated Products, Inc. | 4,110 | 163 | ||
| Avnet, Inc. | 6,255 | 262 | Mentor Graphics Corp. | 1,127 | 33 | ||
| Benchmark Electronics, Inc.(Æ) | 808 | 20 | Microchip Technology, Inc. | 4,246 | 257 | ||
| Bio Techne Corp. | 2,205 | 229 | Micron Technology, Inc.(Æ) | 35,077 | 602 | ||
| Black Knight Financial Services, Inc. Class | Microsemi Corp.(Æ) | 761 | 32 | ||||
| A(Æ) | 2,131 | 84 | Microsoft Corp. | 252,531 | 15,132 | ||
| Broadcom, Ltd. | 7,510 | 1,279 | MKS Instruments, Inc. | 668 | 34 | ||
| Brocade Communications Systems, Inc. | 18,014 | 191 | Motorola Solutions, Inc. | 2,873 | 209 | ||
| CA, Inc. | 19,388 | 596 | NCR Corp.(Æ) | 7,718 | 271 | ||
| CACI International, Inc. Class A(Æ) | 283 | 28 | NetApp, Inc. | 10,523 | 357 | ||
| Cadence Design Systems, Inc.(Æ) | 3,992 | 102 | NETGEAR, Inc.(Æ) | 554 | 28 | ||
| CDK Global Inc. | 3,523 | 192 | NetSuite, Inc.(Æ) | 813 | 76 | ||
| CDW Corp. | 2,657 | 119 | Nuance Communications, Inc.(Æ) | 1,517 | 21 | ||
| Cirrus Logic, Inc.(Æ) | 595 | 32 | NVIDIA Corp. | 18,934 | 1,347 | ||
| Cisco Systems, Inc. | 215,742 | 6,619 | ON Semiconductor Corp.(Æ) | 14,903 | 174 | ||
| Citrix Systems, Inc.(Æ) | 2,620 | 222 | Oracle Corp. | 106,147 | 4,078 | ||
| Cognex Corp. | 2,796 | 144 | Palo Alto Networks, Inc.(Æ) | 1,538 | 237 | ||
| Cognizant Technology Solutions Corp. Class | Plexus Corp.(Æ) | 424 | 19 | ||||
| A(Æ) | 15,119 | 776 | PTC, Inc.(Æ) | 1,378 | 65 | ||
| Coherent, Inc.(Æ) | 323 | 34 | Qorvo, Inc.(Æ) | 1,416 | 79 | ||
| CommerceHub, Inc.(Æ) | 762 | 11 | QUALCOMM, Inc. | 54,561 | 3,749 | ||
| CommScope Holding Co., Inc.(Æ) | 1,833 | 56 | Rackspace Hosting, Inc.(Æ) | 1,988 | 63 | ||
| Computer Sciences Corp. | 6,402 | 349 | Red Hat, Inc.(Æ) | 4,653 | 360 | ||
| Corning, Inc. | 60,762 | 1,380 | Rogers Corp.(Æ) | 228 | 12 | ||
| Cree, Inc.(Æ) | 4,666 | 104 | Sabre Corp. | 1,873 | 48 | ||
| CSRA, Inc. | 6,402 | 161 | Salesforce.com, Inc.(Æ) | 12,980 | 976 | ||
| Cypress Semiconductor Corp. | 8,377 | 84 | Sanmina Corp.(Æ) | 885 | 24 | ||
| Dell Technologies, Inc. - VMware Inc Class | SBA Communications Corp. Class A(Æ) | 1,522 | 172 | ||||
| V(Æ) | 9,837 | 483 | ScanSource, Inc.(Æ) | 475 | 17 | ||
| Diebold, Inc. | 1,123 | 24 | ServiceNow, Inc.(Æ) | 4,463 | 392 | ||
| DigitalGlobe, Inc.(Æ) | 712 | 18 | Skyworks Solutions, Inc. | 5,728 | 441 | ||
| Dolby Laboratories, Inc. Class A | 5,101 | 243 | Splunk, Inc.(Æ) | 2,667 | 161 | ||
| Donnelley Financial Solutions, Inc.(Æ) | 773 | 17 | SS&C Technologies Holdings, Inc. | 5,198 | 166 | ||
| EchoStar Corp. Class A(Æ) | 1,406 | 66 | Symantec Corp. | 25,001 | 626 | ||
| Electronic Arts, Inc.(Æ) | 7,925 | 622 | SYNNEX Corp. | 314 | 32 | ||
| Entegris, Inc.(Æ) | 1,315 | 21 | Synopsys, Inc.(Æ) | 7,165 | 425 | ||
| F5 Networks, Inc.(Æ) | 1,078 | 149 | Tableau Software, Inc. Class A(Æ) | 658 | 32 | ||
| Facebook, Inc. Class A(Æ) | 58,966 | 7,724 | Teradata Corp.(Æ) | 4,895 | 132 | ||
| FireEye, Inc.(Æ) | 3,231 | 38 | Teradyne, Inc. | 5,489 | 128 | ||
| Fortinet, Inc.(Æ) | 3,096 | 99 | Texas Instruments, Inc. | 36,597 | 2,593 | ||
| Gartner, Inc.(Æ) | 2,372 | 204 | Twitter, Inc.(Æ) | 2,198 | 39 | ||
| Groupon, Inc. Class A(Æ) | 10,977 | 44 | Tyler Technologies, Inc.(Æ) | 140 | 22 | ||
| Harris Corp. | 2,083 | 186 | Ultimate Software Group, Inc.(Æ) | 742 | 157 | ||
| Hewlett Packard Enterprise Co. | 73,684 | 1,656 | Veeco Instruments, Inc.(Æ) | 540 | 12 | ||
| HP, Inc. | 109,349 | 1,584 | Verint Systems, Inc.(Æ) | 273 | 10 | ||
| II-VI, Inc.(Æ) | 939 | 26 | VeriSign, Inc.(Æ) | 1,938 | 163 | ||
| Ingram Micro, Inc. Class A(Æ) | 3,265 | 121 | VMware, Inc. Class A(Æ) | 1,228 | 97 | ||
| Insight Enterprises, Inc.(Æ) | 663 | 19 | Western Digital Corp. | 16,408 | 959 | ||
| Intel Corp. | 178,503 | 6,224 | Workday, Inc. Class A(Æ) | 979 | 85 | ||
| International Business Machines Corp. | 26,930 | 4,139 | Xilinx, Inc. | 6,603 | 336 | ||
| Intuit, Inc. | 10,550 | 1,147 | Yahoo!, Inc.(Æ) | 23,331 | 969 | ||
| IPG Photonics Corp.(Æ) | 834 | 81 | |||||
See accompanying notes which are an integral part of the financial statements.
728 Select U.S. Equity Fund
Russell Investment Company
Select U.S. Equity Fund
Schedule of Investments, continued — October 31, 2016
| Amounts in thousands (except share amounts) | Amounts in thousands (except share amounts) | ||||||||
| Principal | Fair | Principal | Fair | ||||||
| Amount ($) or | Value | Amount ($) or | Value | ||||||
| Shares | $ | Shares | $ | ||||||
| Yelp, Inc. Class A(Æ) | 1,086 | 35 | South Jersey Industries, Inc. | 826 | 25 | ||||
| Zynga, Inc. Class A(Æ) | 21,456 | 60 | Southern Co. (The) | 26,082 | 1,345 | ||||
| 115,646 | Southwest Gas Corp. | 512 | 37 | ||||||
| Spire, Inc. | 505 | 32 | |||||||
| Utilities - 5.3% | Sprint Corp.(Æ) | 24,933 | 154 | ||||||
| AES Corp. | 678 | 8 | Talen Energy Corp.(Æ) | 1,767 | 25 | ||||
| ALLETE, Inc. | 504 | 31 | Telephone & Data Systems, Inc. | 5,211 | 135 | ||||
| Alliant Energy Corp. | 6,968 | 265 | T-Mobile US, Inc.(Æ) | 16,022 | 797 | ||||
| Ameren Corp. | 6,135 | 306 | UGI Corp. | 3,197 | 148 | ||||
| American Electric Power Co., Inc. | 20,942 | 1,358 | US Cellular Corp.(Æ) | 2,005 | 70 | ||||
| American States Water Co. | 511 | 20 | Vectren Corp. | 6,543 | 329 | ||||
| American Water Works Co., Inc. | 9,195 | 681 | Verizon Communications, Inc. | 129,653 | 6,236 | ||||
| Aqua America, Inc. | 8,922 | 274 | WEC Energy Group, Inc. | 11,209 | 669 | ||||
| AT&T, Inc. | 231,088 | 8,502 | Westar Energy, Inc. Class A | 5,852 | 335 | ||||
| Atmos Energy Corp. | 1,565 | 116 | WGL Holdings, Inc. | 557 | 35 | ||||
| Avangrid, Inc. | 608 | 24 | Xcel Energy, Inc. | 21,309 | 885 | ||||
| Avista Corp. | 726 | 30 | 37,148 | ||||||
| Black Hills Corp. | 519 | 32 | |||||||
| California Water Service Group | 731 | 23 | Total Common Stocks | ||||||
| Calpine Corp.(Æ) | 789 | 9 | (cost $647,100) | 660,713 | |||||
| CenterPoint Energy, Inc. | 6,738 | 154 | |||||||
| CenturyLink, Inc. | 14,808 | 394 | Short-Term Investments - 5.1% | ||||||
| Cheniere Energy, Inc.(Æ) | 1,100 | 42 | Russell U.S. Cash Management Fund | 35,694,980 | (8) | 35,702 | |||
| CMS Energy Corp. | 7,994 | 337 | Total Short-Term Investments | ||||||
| Consolidated Edison, Inc. | 11,832 | 894 | |||||||
| Dominion Resources, Inc. | 7,870 | 592 | (cost $35,695) | 35,702 | |||||
| DTE Energy Co. | 6,786 | 652 | |||||||
| Duke Energy Corp. | 17,463 | 1,397 | Total Investments 99.7% | ||||||
| Dynegy, Inc. Class A(Æ) | 1,034 | 11 | (identified cost $682,795) | 696,415 | |||||
| Edison International | 5,953 | 437 | |||||||
| El Paso Electric Co. | 552 | 26 | Other Assets and Liabilities, Net | ||||||
| Empire District Electric Co. (The) | 698 | 24 | - 0.3% | 2,168 | |||||
| Entergy Corp. | 4,371 | 322 | Net Assets - 100.0% | 698,583 | |||||
| Eversource Energy | 9,612 | 529 | |||||||
| Exelon Corp. | 40,884 | 1,393 | |||||||
| FirstEnergy Corp. | 3,880 | 133 | |||||||
| Frontier Communications Corp. | 35,220 | 142 | |||||||
| Hawaiian Electric Industries, Inc. | 8,535 | 252 | |||||||
| Idacorp, Inc. | 525 | 41 | |||||||
| Level 3 Communications, Inc.(Æ) | 5,861 | 329 | |||||||
| MDU Resources Group, Inc. | 1,352 | 35 | |||||||
| MGE Energy, Inc. | 479 | 28 | |||||||
| National Fuel Gas Co. | 2,487 | 130 | |||||||
| New Jersey Resources Corp. | 930 | 32 | |||||||
| NextEra Energy, Inc. | 10,960 | 1,403 | |||||||
| NiSource, Inc. | 3,769 | 88 | |||||||
| Northwest Natural Gas Co. | 404 | 24 | |||||||
| NorthWestern Corp. | 524 | 30 | |||||||
| NRG Energy, Inc. | 3,145 | 33 | |||||||
| OGE Energy Corp. | 3,684 | 114 | |||||||
| ONE Gas, Inc. | 522 | 32 | |||||||
| Otter Tail Corp. | 564 | 20 | |||||||
| PG&E Corp. | 17,939 | 1,114 | |||||||
| Pinnacle West Capital Corp. | 2,104 | 160 | |||||||
| PNM Resources, Inc. | 918 | 30 | |||||||
| Portland General Electric Co. | 836 | 37 | |||||||
| PPL Corp. | 14,918 | 512 | |||||||
| Public Service Enterprise Group, Inc. | 14,304 | 602 | |||||||
| SCANA Corp. | 11,162 | 819 | |||||||
| Sempra Energy | 8,101 | 868 | |||||||
See accompanying notes which are an integral part of the financial statements.
Select U.S. Equity Fund 729
Russell Investment Company
Select U.S. Equity Fund
Schedule of Investments, continued — October 31, 2016
| Futures Contracts | |||||||||||||||
| Amounts in thousands (except contract amounts) | |||||||||||||||
| Unrealized | |||||||||||||||
| Appreciation | |||||||||||||||
| Number of | Notional | Expiration | (Depreciation) | ||||||||||||
| Contracts | Amount | Date | $ | ||||||||||||
| Long Positions | |||||||||||||||
| Russell 1000 Mini Index Futures | 155 | USD | 18,195 | 12/16 | (292 | ) | |||||||||
| S&P 500 E-Mini Index Futures | 172 | USD | 18,233 | 12/16 | (124 | ) | |||||||||
| Total Unrealized Appreciation (Depreciation) on Open Futures Contracts (å) | (416 | ) | |||||||||||||
| Presentation of Portfolio Holdings | |||||||||||||||
| Amounts in thousands | |||||||||||||||
| Fair Value | |||||||||||||||
| Practical | |||||||||||||||
| Portfolio Summary | Level 1 | Level 2 | Level 3 | Expedient (a) | Total | % of Net Assets | |||||||||
| Common Stocks | |||||||||||||||
| Consumer Discretionary | $ | 91,532 | $ | — | $ | — | $ | — | $ | 91,532 | 13.1 | ||||
| Consumer Staples | 49,203 | — | 2 | — | 49,205 | 7.0 | |||||||||
| Energy | 45,864 | — | — | — | 45,864 | 6.6 | |||||||||
| Financial Services | 140,468 | — | — | — | 140,468 | 20.1 | |||||||||
| Health Care | 86,557 | — | — | — | 86,557 | 12.4 | |||||||||
| Materials and Processing | 19,141 | — | — | — | 19,141 | 2.7 | |||||||||
| Producer Durables | 75,152 | — | — | — | 75,152 | 10.8 | |||||||||
| Technology | 115,646 | — | — | — | 115,646 | 16.6 | |||||||||
| Utilities | 37,148 | — | — | — | 37,148 | 5.3 | |||||||||
| Short-Term Investments | — | — | — | 35,702 | 35,702 | 5.1 | |||||||||
| Total Investments | 660,711 | — | 2 | 35,702 | 696,415 | 99.7 | |||||||||
| Other Assets and Liabilities, Net | 0.3 | ||||||||||||||
| 100.0 | |||||||||||||||
| Other Financial Instruments | |||||||||||||||
| Liabilities | |||||||||||||||
| Futures Contracts | (416 | ) | — | — | — | (416 | ) | (0.1 | ) | ||||||
| Total Other Financial Instruments* | $ | (416 | ) | $ | — | $ | — | $ | — | $ | (416 | ) | |||
* Futures and foreign currency exchange contract values reflect the unrealized appreciation (depreciation) on the investments.
(a) Certain investments that are measured at fair value using the net asset value per share (or its equivalent) practical expedient have not been classified
in the fair value levels. The fair value amounts presented in the table are intended to permit reconciliation to the amounts presented in the Schedule of
Investments.
For a description of the Levels, see note 2 in the Notes to Financial Statements.
For a disclosure on transfers between Levels 1, 2 and 3 during the period ended October 31, 2016, see note 2 in the Notes to
Financial Statements.
Investments in which significant unobservable inputs (Level 3) were used in determining a fair value for the period ended October
31, 2016 were less than 1% of net assets.
See accompanying notes which are an integral part of the financial statements.
730 Select U.S. Equity Fund
Russell Investment Company
Select U.S. Equity Fund
Fair Value of Derivative Instruments — October 31, 2016
Amounts in thousands
| Equity | ||||||
| Derivatives not accounted for as hedging instruments | Contracts | |||||
| Location: Statement of Assets and Liabilities - Liabilities | ||||||
| Variation margin on futures contracts** | $ | 416 | ||||
| Foreign | ||||||
| Equity | Currency | |||||
| Derivatives not accounted for as hedging instruments | Contracts | Contracts | ||||
| Location: Statement of Operations - Net realized gain (loss) | ||||||
| Futures contracts | $ | 3,028 | $ | — | ||
| Foreign currency-related transactions*** | — | —* | ||||
| Total | $ | 3,028 | $ | — | ||
| Location: Statement of Operations - Net change in unrealized appreciation (depreciation) | ||||||
| Futures contracts | $ | (2,049 | ) | $ | — | |
* Less than $500.
** Includes cumulative appreciation/depreciation of futures contracts as reported in the Schedule of Investments. Only variation margin is reported within the
Statement of Assets and Liabilities.
*** Only includes net realized gain (loss) on forward and spot contracts. May differ from the net realized gain (loss) on foreign currency-related transactions reported
within the Statement of Operations.
For further disclosure on derivatives see note 2 in the Notes to Financial Statements.
See accompanying notes which are an integral part of the financial statements.
Select U.S. Equity Fund 731
Russell Investment Company
Select U.S. Equity Fund
Balance Sheet Offsetting of Financial and Derivative Instruments — October 31, 2016
| Amounts in thousands | |||||||||
| Offsetting of Financial Liabilities and Derivative Liabilities | |||||||||
| Gross | Net Amounts | ||||||||
| Amounts | of Liabilities | ||||||||
| Gross | Offset in the | Presented in | |||||||
| Amounts of | Statement of | the Statement | |||||||
| Recognized | Assets and | of Assets and | |||||||
| Description | Location: Statement of Assets and Liabilities - Liabilities | Liabilities | Liabilities | Liabilities | |||||
| Futures Contracts | Variation margin on futures contracts | $ | 56 | $ | — | $ | 56 | ||
| Total Financial and Derivative Liabilities | 56 | — | 56 | ||||||
| Financial and Derivative Liabilities not subject to a netting agreement | (56) | — | (56 | ) | |||||
| Total Financial and Derivative Liabilities subject to a netting agreement | $ | — | $ | — | $ | — | |||
^ Collateral received or pledged amounts may not reconcile to those disclosed in the Statement of Assets and Liabilities due to the inclusion of off-Balance
Sheet collateral and adjustments made to exclude overcollateralization.
For further disclosure on derivatives and counterparty risk see note 2 in the Notes to Financial Statements.
See accompanying notes which are an integral part of the financial statements.
732 Select U.S. Equity Fund
Russell Investment Company
Select U.S. Equity Fund
Statement of Assets and Liabilities — October 31, 2016
| Amounts in thousands | ||
| Assets | ||
| Investments, at identified cost | $ | 682,795 |
| Investments, at fair value(>) | 696,415 | |
| Cash (restricted)(a) | 2,100 | |
| Foreign currency holdings(^) | 62 | |
| Receivables: | ||
| Dividends and interest | 809 | |
| Dividends from affiliated Russell funds | 20 | |
| Fund shares sold | 69 | |
| Prepaid expenses | 1 | |
| Total assets | 699,476 | |
| Liabilities | ||
| Payables: | ||
| Investments purchased | 169 | |
| Fund shares redeemed | 345 | |
| Accrued fees to affiliates | 184 | |
| Other accrued expenses | 139 | |
| Variation margin on futures contracts | 56 | |
| Total liabilities | 893 | |
| Net Assets | $ | 698,583 |
See accompanying notes which are an integral part of the financial statements.
Select U.S. Equity Fund 733
Russell Investment Company
Select U.S. Equity Fund
Statement of Assets and Liabilities, continued — October 31, 2016
| Amounts in thousands | |||
| Net Assets Consist of: | |||
| Undistributed (overdistributed) net investment income | $ | 759 | |
| Accumulated net realized gain (loss) | (5,199 | ) | |
| Unrealized appreciation (depreciation) on: | |||
| Investments | 13,620 | ||
| Futures contracts | (416 | ) | |
| Foreign currency-related transactions | (1 | ) | |
| Shares of beneficial interest | 639 | ||
| Additional paid-in capital | 689,181 | ||
| Net Assets | $ | 698,583 | |
| Net Asset Value, offering and redemption price per share: | |||
| Net asset value per share: Class R6(#) | $ | 10.93 | |
| Class R6 — Net assets | $ | 111,784 | |
| Class R6 — Shares outstanding ($.01 par value) | 10,229 | ||
| Net asset value per share: Class S(#) | $ | 10.92 | |
| Class S — Net assets | $ | 7,843,987 | |
| Class S — Shares outstanding ($.01 par value) | 718,632 | ||
| Net asset value per share: Class T(#) | $ | 10.93 | |
| Class T — Net assets | $ | 1,024,162 | |
| Class T — Shares outstanding ($.01 par value) | 93,702 | ||
| Net asset value per share: Class Y(#) | $ | 10.92 | |
| Class Y — Net assets | $ | 689,602,651 | |
| Class Y — Shares outstanding ($.01 par value) | 63,124,461 | ||
| Amounts in thousands | |||
| (^) Foreign currency holdings - cost | $ | 64 | |
| (>) Investments in affiliates, Russell U.S. Cash Management Fund | $ | 35,702 | |
| (a) Cash Collateral for Futures | $ | 2,100 | |
| (#) Net asset value per share equals class level net assets divided by class level shares of beneficial interest outstanding. | |||
See accompanying notes which are an integral part of the financial statements.
734 Select U.S. Equity Fund
Russell Investment Company
Select U.S. Equity Fund
Statement of Operations — For the Period Ended October 31, 2016
| Amounts in thousands | |||
| Investment Income | |||
| Dividends | $ | 16,190 | |
| Dividends from affiliated Russell funds | 112 | ||
| Total investment income | 16,302 | ||
| Expenses | |||
| Advisory fees | 2,225 | ||
| Administrative fees | 358 | ||
| Custodian fees | 165 | ||
| Transfer agent fees - Class R6 | —** | ||
| Transfer agent fees - Class S | 10 | ||
| Transfer agent fees - Class T | 2 | ||
| Transfer agent fees - Class Y | 32 | ||
| Professional fees | 66 | ||
| Registration fees | 111 | ||
| Trustees’ fees | 25 | ||
| Printing fees | 6 | ||
| Miscellaneous | 30 | ||
| Expenses before reductions | 3,030 | ||
| Expense reductions | (394 | ) | |
| Net expenses | 2,636 | ||
| Net investment income (loss) | 13,666 | ||
| Net Realized and Unrealized Gain (Loss) | |||
| Net realized gain (loss) on: | |||
| Investments | (4,730 | ) | |
| Futures contracts | 3,028 | ||
| Net realized gain (loss) | (1,702 | ) | |
| Net change in unrealized appreciation (depreciation) on: | |||
| Investments | 22,577 | ||
| Futures contracts | (2,049 | ) | |
| Foreign currency-related transactions | (1 | ) | |
| Net change in unrealized appreciation (depreciation) | 20,527 | ||
| Net realized and unrealized gain (loss) | 18,825 | ||
| Net Increase (Decrease) in Net Assets from Operations | $ | 32,491 | |
** Less than $500.
See accompanying notes which are an integral part of the financial statements.
Select U.S. Equity Fund 735
Russell Investment Company
Select U.S. Equity Fund
Statements of Changes in Net Assets
| For the Periods Ended October 31, | ||||||
| Amounts in thousands | 2016 | 2015 | ||||
| Increase (Decrease) in Net Assets | ||||||
| Operations | ||||||
| Net investment income (loss) | $ | 13,666 | $ | 9,228 | ||
| Net realized gain (loss) | (1,702 | ) | 4,680 | |||
| Net change in unrealized appreciation (depreciation) | 20,527 | (11,166 | ) | |||
| Net increase (decrease) in net assets from operations | 32,491 | 2,742 | ||||
| Distributions | ||||||
| From net investment income | ||||||
| Class R6 | (1 | ) | — | |||
| Class S | (85 | ) | (25 | ) | ||
| Class T | (18 | ) | (7 | ) | ||
| Class Y | (13,562 | ) | (8,598 | ) | ||
| From net realized gain | ||||||
| Class S | (30 | ) | — | |||
| Class T | (10 | ) | — | |||
| Class Y | (8,012 | ) | (107 | ) | ||
| Net decrease in net assets from distributions | (21,718 | ) | (8,737 | ) | ||
| Share Transactions* | ||||||
| Net increase (decrease) in net assets from share transactions | (118,744 | ) | 671,710 | |||
| Total Net Increase (Decrease) in Net Assets | (107,971 | ) | 665,715 | |||
| Net Assets | ||||||
| Beginning of period | 806,554 | 140,839 | ||||
| End of period | $ | 698,583 | $ | 806,554 | ||
| Undistributed (overdistributed) net investment income included in net assets | $ | 759 | $ | 726 | ||
See accompanying notes which are an integral part of the financial statements.
736 Select U.S. Equity Fund
Russell Investment Company
Select U.S. Equity Fund
Statements of Changes in Net Assets, continued
* Share transaction amounts (in thousands) for the periods ended October 31, 2016 and October 31, 2015 were as follows:
| 2016 | 2015 | |||||||||||
| Shares | Dollars | Shares | Dollars | |||||||||
| Class R6(2) | ||||||||||||
| Proceeds from shares sold | 10 | $ | 100 | — | $ | — | ||||||
| Proceeds from reinvestment of distributions | —** | 1 | — | — | ||||||||
| Net increase (decrease) | 10 | 101 | — | — | ||||||||
| Class S(1) | ||||||||||||
| Proceeds from shares sold | 525 | 5,598 | 322 | 3,455 | ||||||||
| Proceeds from reinvestment of distributions | 11 | 115 | 2 | 25 | ||||||||
| Payments for shares redeemed | (118 | ) | (1,265 | ) | (23 | ) | (246 | ) | ||||
| Net increase (decrease) | 418 | 4,448 | 301 | 3,234 | ||||||||
| Class T(1) | ||||||||||||
| Proceeds from shares sold | 42 | 439 | 102 | 1,099 | ||||||||
| Proceeds from reinvestment of distributions | 3 | 27 | 1 | 8 | ||||||||
| Payments for shares redeemed | (32 | ) | (326 | ) | (22 | ) | (221 | ) | ||||
| Net increase (decrease) | 13 | 140 | 81 | 886 | ||||||||
| Class Y | ||||||||||||
| Proceeds from shares sold | 10,697 | 111,801 | 87,095 | 948,364 | ||||||||
| Proceeds from reinvestment of distributions | 2,052 | 21,574 | 827 | 8,705 | ||||||||
| Payments for shares redeemed | (24,342 | ) | (256,808 | ) | (26,729 | ) | (289,479 | ) | ||||
| Net increase (decrease) | (11,593 | ) | (123,433 | ) | 61,193 | 667,590 | ||||||
| Total increase (decrease) | (11,152 | ) | $ | (118,744 | ) | 61,575 | $ | 671,710 | ||||
** Less than 500 shares.
(1) For the period January 5, 2015 (commencement of operations) to October 31, 2015.
(2) For the period March 1, 2016 (commencement of operations) to October 31, 2016.
See accompanying notes which are an integral part of the financial statements.
Select U.S. Equity Fund 737
Russell Investment Company
Select U.S. Equity Fund
Financial Highlights — For the Periods Ended
For a Share Outstanding Throughout Each Period.
| $ | $ | $ | $ | $ | $ | |||||||||
| Net Asset Value, | Net | Net Realized | Total from | Distributions | Distributions | |||||||||
| Beginning of | Investment | and Unrealized | Investment | from Net | from Net | |||||||||
| Period | Income (Loss)(a)(d) | Gain (Loss) | Operations | Investment Income | Realized Gain | |||||||||
| Class R6 | ||||||||||||||
| October 31, 2016(8) | 9.91 | .12 | 1.05 | 1.17 | (.15 | ) | — | |||||||
| Class S | ||||||||||||||
| October 31, 2016 | 10.73 | .17 | .31 | .48 | (.18 | ) | (.11 | ) | ||||||
| October 31, 2015(5) | 10.61 | .12 | .09 | .21 | (.09 | ) | — | |||||||
| Class T | ||||||||||||||
| October 31, 2016 | 10.74 | .19 | .31 | .50 | (.20 | ) | (.11 | ) | ||||||
| October 31, 2015(5) | 10.61 | .14 | .09 | .23 | (.10 | ) | — | |||||||
| Class Y | ||||||||||||||
| October 31, 2016 | 10.74 | .20 | .29 | .49 | (.20 | ) | (.11 | ) | ||||||
| October 31, 2015 | 10.41 | .17 | .31 | .48 | (.14 | ) | (.01 | ) | ||||||
| October 31, 2014(4) | 10.00 | .04 | .39 | .43 | (.02 | ) | — | |||||||
See accompanying notes which are an integral part of the financial statements.
738 Select U.S. Equity Fund
| % | % | % | ||||||||||||||
| $ | $ | Ratio of Expenses | Ratio of Expenses | Ratio of Net | ||||||||||||
| Net Asset Value, | % | Net Assets, | to Average | to Average | Investment Income | % | ||||||||||
| $ | End of | Total | End of Period | Net Assets, | Net Assets, | to Average | Portfolio | |||||||||
| Total Distributions | Period | Return(b) | (000 | ) | Gross(e) | Net(d)(e) | Net Assets(d)(e) | Turnover Rate(b) | ||||||||
| (.15 | ) | 10.93 | 9.27 | 112 | .45 | .38 | 1.67 | 9 | ||||||||
| (.29 | ) | 10.92 | 4.61 | 7,844 | .60 | .55 | 1.62 | 9 | ||||||||
| (.09 | ) | 10.73 | 2.04 | 3,227 | .62 | .40 | 1.36 | 44 | ||||||||
| (.31 | ) | 10.93 | 4.75 | 1,024 | .60 | .40 | 1.78 | 9 | ||||||||
| (.10 | ) | 10.74 | 2.23 | 873 | .62 | .40 | 1.53 | 44 | ||||||||
| (.31 | ) | 10.92 | 4.70 | 689,603 | .41 | .35 | 1.84 | 9 | ||||||||
| (.15 | ) | 10.74 | 4.71 | 802,454 | .43 | .35 | 1.56 | 44 | ||||||||
| (.02 | ) | 10.41 | 4.34 | 140,839 | .60 | .35 | 1.42 | 2 | ||||||||
See accompanying notes which are an integral part of the financial statements.
Select U.S. Equity Fund 739
Russell Investment Company
Select U.S. Equity Fund
Related Party Transactions, Fees and Expenses
| Accrued fees payable to affiliates for the period ended October 31, 2016 were as follows: | ||
| Advisory fees | $ | 146,607 |
| Administration fees | 28,989 | |
| Transfer agent fees | 3,977 | |
| Trustee fees | 4,133 | |
| $ | 183,706 | |
| Transactions (amounts in thousands) during the period ended October 31, 2016 with Underlying Funds which are, or were, an | ||||||||||||||||||
| affiliated company are as follows: | ||||||||||||||||||
| Fair Value, | Change in | |||||||||||||||||
| Beginning of | Realized Gain | Unrealized | Fair Value, End | Income | Capital Gains | |||||||||||||
| Period | Purchases | Sales | (Loss) | Gain (Loss) | of Period | Distributions | Distributions | |||||||||||
| Russell U.S. Cash Management Fund $ | 33,264 | $ | 270,888 | $ | 268,459 | $ | 1 | $ | 8 | $ | 35,702 | $ | 112 | $ | — | |||
| $ | 33,264 | $ | 270,888 | $ | 268,459 | $ | 1 | $ | 8 | $ | 35,702 | $ | 112 | $ | — | |||
Federal Income Taxes
At October 31, 2016, the cost of investments and net unrealized appreciation (depreciation), undistributed ordinary income
undistributed long-term capital gains for income tax purposes were as follows:.
| Cost of Investments | $ | 682,707,616 | ||
| Unrealized Appreciation | $ | 54,194,213 | ||
| Unrealized Depreciation | (40,487,023 | ) | ||
| Net Unrealized Appreciation (Depreciation) | $ | 13,707,190 | ||
| Undistributed Ordinary Income | $ | 669,532 | ||
| Undistributed Long-Term Capital Gains | ||||
| (Capital Loss Carryforward) | $ | (2,933,738 | ) | |
| Tax Composition of Distributions | ||||
| Ordinary Income | $ | 20,652,570 | ||
| Long-Term Capital Gains | $ | 1,065,331 |
Net investment income and net realized gains (loss) in the financial statements may differ from taxable net investment income and net
realized gains (losses). Capital accounts within the financial statements are adjusted for permanent book-tax differences. Book-tax
differences are primarily due to foreign currency gains and losses, reclassifications of dividends, differences in treatment of income
from swaps, net operating losses, investments in partnerships, investments in passive foreign investment companies (PFICs), tax
straddle transaction, use of tax equalization and foreign capital gains taxes. These adjustments have no impact on the net assets.
At October 31, 2016, the Statement of Assets and Liabilities have been adjusted by the following amounts (in thousands):
| Undistributed net investment income | $ | 33 | |
| Accumulated net realized gain (loss) | 1 | ||
| Additional paid-in capital | (34 | ) |
See accompanying notes which are an integral part of the financial statements.
740 Select U.S. Equity Fund
Russell Investment Company
Select International Equity Fund
Portfolio Management Discussion and Analysis — October 31, 2016 (Unaudited)
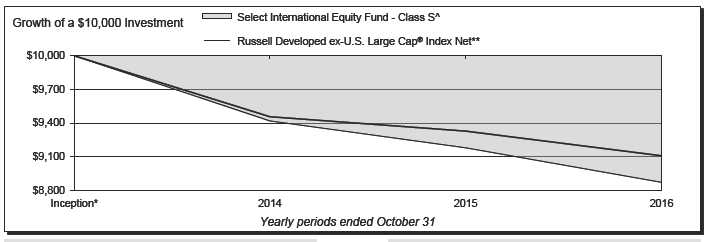
| Select International Equity Fund - Class R6‡ | Select International Equity Fund - Class Y | ||||||
| Total | Total | ||||||
| Return | Return | ||||||
| 1 Year | (3.11 | )% | 1 Year | (3.11 | )% | ||
| Inception* | (5.02 | )%§ | Inception* | (5.02 | )%§ | ||
| Select International Equity Fund - Class S‡‡ | Russell Developed ex-U.S. Large Cap® Index Net** | ||||||
| Total | Total | ||||||
| Return | Return | ||||||
| 1 Year | (3.35 | )% | 1 Year | (2.34 | )% | ||
| Inception* | (5.17 | )%§ | Inception* | (4.05 | )%§ | ||
| Select International Equity Fund - Class T‡‡ | |||||||
| Total | |||||||
| Return | |||||||
| 1 Year | (3.25 | )% | |||||
| Inception* | (5.03 | )%§ | |||||
Select International Equity Fund 741
Russell Investment Company
Select International Equity Fund
Portfolio Management Discussion and Analysis, continued — October 31, 2016
(Unaudited)
| What is the Fund’s investment objective? | The Fund’s underweight to health care was favorable, offset by an | |||
| The Select International Equity Fund (the “Fund”) seeks to | overweight to consumer discretionary. | |||
| provide long term capital growth. | In terms of factor returns, quality outperformed the most, growth | |||
| How did the Fund perform relative to its benchmark for the | underperformed and stocks with higher medium-term momentum | |||
| fiscal year ended October 31, 2016? | underperformed. Stocks with lower volatility lagged, whereas | |||
| stocks in the lower end of capitalization spectrum outperformed | ||||
| For the fiscal year ended October 31, 2016, the Fund’s Class | in the developed ex-U.S. markets. The Fund’s overweight to value | |||
| R6, Class S, Class T and Class Y Shares lost 3.11%, 3.35%, | and underweight to capitalization size was favorable during the | |||
| 3.25% and 3.11%, respectively. This is compared to the Fund’s | period. | |||
| benchmark, the Russell Developed ex-U.S. Large Cap® Index | ||||
| (Net), which lost 2.34% during the same period. The Fund’s | How did the investment strategies and techniques employed | |||
| performance includes operating expenses, whereas index returns | by the Fund and its money managers affect its benchmark- | |||
| are unmanaged and do not include expenses of any kind. | relative performance? | |||
| For the fiscal year ended October 31, 2016, the Morningstar® | The Fund underperformed the benchmark for the one year period | |||
| Foreign Large Blend Category, a group of funds that Morningstar | ending October 31, 2016. In terms of factor returns for the period, | |||
| considers to have investment strategies similar to those of the | the Fund’s underweight to capitalization size and overweight to | |||
| Fund, lost 2.08%. This result serves as a peer comparison and is | value had a favorable impact. | |||
| expressed net of operating expenses. | Benchmark-relative sector deviations in the Fund were modest | |||
| How did the market conditions described in the Market | and over the period favored financials, while underweighting | |||
| Summary report affect the Fund’s performance? | health care and technology sectors and to a lesser degree energy. | |||
| An underweight to the health care sector was favorable during the | ||||
| In the first half of the fiscal year ended October 31, 2016, the U.S. | period, however, this was offset by an overweight to financials. | |||
| Federal Reserve (“the Fed”) lifted the interest rate by 25 basis | ||||
| points to 0.5% in December 2015, the first time since financial | Over the period, the Fund was regionally positioned to favor | |||
| crisis. The European Central Bank (“ECB”) and Bank of Japan | Continental Europe, Japan and emerging markets while being | |||
| (“BoJ”) maintained a dovish stance, as the ECB introduced new | underweight to Canada, Australia and Asia ex-Japan. This | |||
| accommodative stimulus measures in an effort to boost Eurozone | positioning had a slightly negative impact on performance. | |||
| inflation and the BoJ strengthened the stimulus program by moving | Regional allocations were driven by RIM’s cycle, valuation and | |||
| the deposit rate into negative territory. In the second half of the | sentiment views. The Fund’s overweight to Japan was unfavorable, | |||
| fiscal year, market attention became increasingly fixated upon | while an overweight to emerging markets had a positive impact. | |||
| the U.K., culminating in the U.K. exiting the European Union on | Over the period, RIM hedged the Fund’s exposure to certain | |||
| June 23rd’s referendum result, severing a 43-year membership, | currencies through the use of forward currency contracts in order | |||
| which spurred significant market volatility. Emerging markets | to allow RIM to make certain country allocation decisions without | |||
| gained traction in the second half of the fiscal year with better | generating equivalent currency exposures. RIM’s currency | |||
| than expected economic data from China and other emerging | hedging strategy also incorporated RIM’s views on currency | |||
| markets. The Fed lowered the expected pace of rate hikes to a one | market factors that are expected to result in positive returns over | |||
| hike scenario as the most likely case for the remainder of 2016. | time, creating very small active currency positioning relative to | |||
| Asia ex-Japan and Canada were the stand out markets over the | the Fund’s benchmark. The Fund’s currency positions did not | |||
| period, while the U.K. and developed Europe ex-U.K. lagged the | have a material impact on the Fund’s benchmark-relative returns | |||
| most. The Fund’s overweight to Japan was unfavorable, while an | for the period. | |||
| overweight to emerging markets had a positive impact. | During the period, RIM used index futures contracts to equitize | |||
| In terms of sector returns, commodity driven sectors materials | the Fund’s cash. The decision to equitize cash did not have a | |||
| and energy outperformed the most, while some of the defensive | significant impact on the Fund performance for the fiscal year. | |||
| sectors, especially health care, lagged the most. The financial | Describe any changes to the Fund’s structure. | |||
| services sector lagged the benchmark, especially driven by banks. | There were no significant changes to the Fund’s structure during | |||
| the fiscal year. | ||||
742 Select International Equity Fund
Russell Investment Company
Select International Equity Fund
Portfolio Management Discussion and Analysis, continued — October 31, 2016
(Unaudited)
The views expressed in this report reflect those of the
portfolio managers only through the end of the period
covered by the report. These views do not necessarily
represent the views of RIM, or any other person in RIM or
any other affiliated organization. These views are subject
to change at any time based upon market conditions or
other events, and RIM disclaims any responsibility to
update the views contained herein. These views should not
be relied on as investment advice and, because investment
decisions for a Russell Investment Company (“RIC”) Fund
are based on numerous factors, should not be relied on as
an indication of investment decisions of any RIC Fund.
^ In prior years, the performance of the Fund’s Class Y shares was used in the line graph. Class S Shares will have substantially similar annual returns as the
Class Y Shares because the Shares of each Class are invested in the same portfolio of securities. Annual returns for each Class will differ only to the extent that
the Class S Shares do not have the same expenses as the Class Y Shares.
* Assumes initial investment on July 31, 2014.
** The Russell Developed ex-U.S. Large Cap® Index Net is an index which offers investors access to the large-cap segment of the global equity market, excluding
companies assigned to the United States. It is constructed to provide a comprehensive and unbiased barometer of the large-cap segment and is completely
reconstituted annually to accurately reflect the changes in the market over time.
‡ The Fund first issued Class R6 Shares on March 1, 2016. The returns shown for Class R6 Shares prior to that date are the returns of the Fund’s Class Y
Shares. Class R6 Shares will have substantially similar annual returns as the Class Y Shares because the Shares of each Class are invested in the same portfolio
of securities. Annual returns for each Class will differ only to the extent that the Class R6 Shares do not have the same expenses as the Class Y Shares.
‡‡ The Fund first issued Class S and Class T Shares on January 2, 2015. The returns shown for Class S and Class T Shares prior to that date are the returns of the
Fund’s Class Y Shares. Class S and Class T Shares will have substantially similar annual returns as the Class Y Shares because the Shares of each Class are
invested in the same portfolio of securities. Annual returns for each Class will differ only to the extent that the Class S and Class T Shares do not have the same
expenses as the Class Y Shares.
§ Annualized.
Performance is historical and assumes reinvestment of all dividends and capital gains. Investment return and principal value will fluctuate so that an investor’s
shares, when redeemed, may be worth more or less than when purchased. Past performance is not indicative of future results. The returns shown do not reflect the
deduction of taxes that a shareholder would pay on Fund distributions or the redemption of Fund shares. Additionally, the returns presented herein may differ from
the performance reported in the Financial Highlights as the returns herein are calculated in a manner consistent with standardized performance in accordance with
Securities and Exchange Commission rules, while the performance in the Financial Highlights has been calculated in accordance with U.S. Generally Accepted
Accounting Principles (“U.S. GAAP”).
Select International Equity Fund 743
Russell Investment Company
Select International Equity Fund
Shareholder Expense Example — October 31, 2016 (Unaudited)
| Fund Expenses | Please note that the expenses shown in the table are meant | |||||
| The following disclosure provides important information | to highlight your ongoing costs only and do not reflect any | |||||
| regarding the Fund’s Shareholder Expense Example | transactional costs. Therefore, the information under the heading | |||||
| (“Example”). | “Hypothetical Performance (5% return before expenses)” is | |||||
| useful in comparing ongoing costs only, and will not help you | ||||||
| Example | determine the relative total costs of owning different funds. In | |||||
| As a shareholder of the Fund, you incur two types of costs: (1) | addition, if these transactional costs were included, your costs | |||||
| transaction costs, and (2) ongoing costs, including advisory and | would have been higher. | |||||
| administrative fees; distribution (12b-1) and/or service fees; | Hypothetical | |||||
| and other Fund expenses. The Example is intended to help | Performance (5% | |||||
| you understand your ongoing costs (in dollars) of investing in | Actual | return before | ||||
| the Fund and to compare these costs with the ongoing costs of | Class R6 | Performance | expenses) | |||
| Beginning Account Value | ||||||
| investing in other mutual funds. The Example is based on an | May 1, 2016 | $ | 1,000.00 | $ | 1,000.00 | |
| investment of $1,000 invested at the beginning of the period and | Ending Account Value | |||||
| held for the entire period indicated, which for this Fund is from | October 31, 2016 | $ | 1,004.70 | $ | 1,022.77 | |
| May 1, 2016 to October 31, 2016. | Expenses Paid During Period* | $ | 2.37 | $ | 2.39 | |
| Actual Expenses | * Expenses are equal to the Fund's annualized expense ratio of 0.47% | |||||
| (representing the six month period annualized), multiplied by the average | ||||||
| The information in the table under the heading “Actual | account value over the period, multiplied by 184/366 (to reflect the one-half | |||||
| Performance” provides information about actual account values | year period). May reflect amounts waived and/or reimbursed. Without any | |||||
| and actual expenses. You may use the information in this column, | waivers and/or reimbursements, expenses would have been higher. | |||||
| together with the amount you invested, to estimate the expenses | ||||||
| Hypothetical | ||||||
| that you paid over the period. Simply divide your account value by | Performance (5% | |||||
| $1,000 (for example, an $8,600 account value divided by $1,000 | Actual | return before | ||||
| = 8.6), then multiply the result by the number in the first column | Class S | Performance | expenses) | |||
| Beginning Account Value | ||||||
| in the row entitled “Expenses Paid During Period” to estimate | May 1, 2016 | $ | 1,000.00 | $ | 1,000.00 | |
| the expenses you paid on your account during this period. | Ending Account Value | |||||
| October 31, 2016 | $ | 1,003.50 | $ | 1,021.92 | ||
| Hypothetical Example for Comparison Purposes | Expenses Paid During Period* | $ | 3.22 | $ | 3.25 | |
| The information in the table under the heading “Hypothetical | ||||||
| Performance (5% return before expenses)” provides information | * Expenses are equal to the Fund's annualized expense ratio of 0.64% | |||||
| (representing the six month period annualized), multiplied by the average | ||||||
| about hypothetical account values and hypothetical expenses | account value over the period, multiplied by 184/366 (to reflect the one-half | |||||
| based on the Fund’s actual expense ratio and an assumed rate of | year period). May reflect amounts waived and/or reimbursed. Without any | |||||
| return of 5% per year before expenses, which is not the Fund’s | waivers and/or reimbursements, expenses would have been higher. | |||||
| actual return. The hypothetical account values and expenses | ||||||
| Hypothetical | ||||||
| may not be used to estimate the actual ending account balance or | Performance (5% | |||||
| expenses you paid for the period. You may use this information | Actual | return before | ||||
| to compare the ongoing costs of investing in the Fund and other | Class T | Performance | expenses) | |||
| funds. To do so, compare this 5% hypothetical example with the | Beginning Account Value | |||||
| May 1, 2016 | $ | 1,000.00 | $ | 1,000.00 | ||
| 5% hypothetical examples that appear in the shareholder reports | Ending Account Value | |||||
| of other funds. | October 31, 2016 | $ | 1,004.70 | $ | 1,022.72 | |
| Expenses Paid During Period* | $ | 2.42 | $ | 2.44 | ||
| * Expenses are equal to the Fund's annualized expense ratio of 0.48% | ||||||
| (representing the six month period annualized), multiplied by the average | ||||||
| account value over the period, multiplied by 184/366 (to reflect the one-half | ||||||
| year period). May reflect amounts waived and/or reimbursed. Without any | ||||||
| waivers and/or reimbursements, expenses would have been higher. | ||||||
744 Select International Equity Fund
Russell Investment Company
Select International Equity Fund
Shareholder Expense Example, continued — October 31, 2016 (Unaudited)
| Hypothetical | ||||
| Performance (5% | ||||
| Actual | return before | |||
| Class Y | Performance | expenses) | ||
| Beginning Account Value | ||||
| May 1, 2016 | $ | 1,000.00 | $ | 1,000.00 |
| Ending Account Value | ||||
| October 31, 2016 | $ | 1,005.90 | $ | 1,022.92 |
| Expenses Paid During Period* | $ | 2.22 | $ | 2.24 |
* Expenses are equal to the Fund's annualized expense ratio of 0.44%
(representing the six month period annualized), multiplied by the average
account value over the period, multiplied by 184/366 (to reflect the one-half
year period). May reflect amounts waived and/or reimbursed. Without any
waivers and/or reimbursements, expenses would have been higher.
Select International Equity Fund 745
Russell Investment Company
Select International Equity Fund
Schedule of Investments — October 31, 2016
| Amounts in thousands (except share amounts) | Amounts in thousands (except share amounts) | |||||||||
| Principal | Fair | Principal | Fair | |||||||
| Amount ($) | Value | Amount ($) | Value | |||||||
| or Shares | $ | or Shares | $ | |||||||
| Common Stocks - 95.2% | Austria - 0.6% | |||||||||
| Australia - 4.9% | Erste Group Bank AG(Æ) | 39,318 | 1,234 | |||||||
| AGL Energy, Ltd. | 59,011 | 859 | EVN AG | 13,173 | 154 | |||||
| Amcor, Ltd. Class A | 47,937 | 535 | Mayr Melnhof Karton AG | 682 | 76 | |||||
| AMP, Ltd. | 46,853 | 162 | OMV AG | 35,083 | 1,095 | |||||
| APA Group | 36,205 | 219 | Raiffeisen Bank International AG(Æ) | 23,214 | 380 | |||||
| Aristocrat Leisure, Ltd. | 47,861 | 557 | Strabag SE | 21,737 | 729 | |||||
| ASX, Ltd. - ADR | 14,625 | 523 | Telekom Austria AG - ADR(Æ) | 26,681 | 153 | |||||
| Aurizon Holdings, Ltd. | 42,852 | 159 | Verbund AG Class A | 12,063 | 201 | |||||
| AusNet Services(Æ) | 95,591 | 109 | Voestalpine AG | 11,361 | 402 | |||||
| Australia & New Zealand Banking | 4,424 | |||||||||
| Group, Ltd. - ADR | 117,705 | 2,487 | ||||||||
| Bank of Queensland, Ltd. | 38,655 | 307 | Belgium - 1.2% | |||||||
| Bendigo & Adelaide Bank, Ltd. | 73,908 | 625 | Ackermans & van Haaren NV | 867 | 120 | |||||
| BHP Billiton, Ltd. - ADR | 66,420 | 1,163 | Ageas | 32,624 | 1,191 | |||||
| Brambles, Ltd. | 71,911 | 629 | Anheuser-Busch InBev SA | 24,577 | 2,821 | |||||
| Challenger, Ltd. | 26,093 | 213 | Cie d'Entreprises CFE | 809 | 89 | |||||
| CIMIC Group, Ltd. | 24,027 | 541 | Colruyt SA | 9,453 | 508 | |||||
| Coca-Cola Amatil, Ltd. | 32,508 | 236 | D'ieteren SA | 4,604 | 203 | |||||
| Cochlear, Ltd. | 4,566 | 444 | Elia System Operator SA | 6,590 | 341 | |||||
| Commonwealth Bank of Australia - ADR | 58,401 | 3,252 | Groupe Bruxelles Lambert SA | 10,930 | 940 | |||||
| CSL, Ltd. | 19,213 | 1,466 | KBC Group NV | 13,286 | 809 | |||||
| Dexus Property Group(Æ)(ö) | 64,066 | 435 | Proximus | 4,768 | 136 | |||||
| Domino's Pizza Enterprises, Ltd. | 3,610 | 176 | Sofina SA | 2,629 | 367 | |||||
| Fortescue Metals Group, Ltd. | 338,830 | 1,412 | Solvay SA | 5,120 | 587 | |||||
| Goodman Group(ö) | 68,750 | 354 | UCB SA | 10,572 | 715 | |||||
| GPT Group (The)(ö) | 75,931 | 269 | 8,827 | |||||||
| Harvey Norman Holdings, Ltd. | 71,745 | 275 | ||||||||
| Incitec Pivot, Ltd. | 126,722 | 284 | Canada - 7.3% | |||||||
| LendLease Group | 45,279 | 464 | Agnico Eagle Mines, Ltd. | 5,904 | 300 | |||||
| Macquarie Group, Ltd. | 13,717 | 830 | Agrium, Inc. | 1,701 | 156 | |||||
| Medibank Pvt, Ltd. | 202,902 | 398 | Alimentation Couche-Tard, Inc. Class B | 25,722 | 1,292 | |||||
| National Australia Bank, Ltd. - ADR | 76,720 | 1,630 | Atco, Ltd. Class I | 2,347 | 82 | |||||
| Newcrest Mining, Ltd. | 57,704 | 1,006 | Bank of Montreal | 50,163 | 3,192 | |||||
| Origin Energy, Ltd.(Æ) | 65,270 | 263 | Bank of Nova Scotia (The) | 57,995 | 3,117 | |||||
| Qantas Airways, Ltd.(Æ) | 105,118 | 245 | Barrick Gold Corp. | 38,619 | 679 | |||||
| QBE Insurance Group, Ltd. | 74,146 | 562 | BCE, Inc. | 19,233 | 874 | |||||
| Ramsay Health Care, Ltd. | 9,440 | 526 | Brookfield Asset Management, Inc. | |||||||
| REA Group, Ltd. | 5,342 | 207 | Class A | 41,800 | 1,464 | |||||
| Santos, Ltd.(Æ) | 41,442 | 111 | CAE, Inc. | 14,419 | 203 | |||||
| Scentre Group(ö) | 296,717 | 948 | Canadian Imperial Bank of Commerce | 24,871 | 1,864 | |||||
| Sonic Healthcare, Ltd. | 24,784 | 385 | Canadian National Railway Co. | 19,424 | 1,221 | |||||
| South32, Ltd. | 563,465 | 1,097 | Canadian Natural Resources, Ltd. | 57,023 | 1,810 | |||||
| Star Entertainment Grp, Ltd. (The) | 87,094 | 330 | Canadian Tire Corp., Ltd. Class A | 7,919 | 770 | |||||
| Stockland(ö) | 94,551 | 317 | CCL Industries, Inc. Class B | 2,117 | 376 | |||||
| Suncorp Group, Ltd. | 44,242 | 402 | Cenovus Energy, Inc. | 59,625 | 860 | |||||
| Sydney Airport | 101,655 | 483 | CGI Group, Inc. Class A(Æ) | 15,738 | 748 | |||||
| Telstra Corp., Ltd. | 194,967 | 737 | Constellation Software, Inc. | 344 | 161 | |||||
| TPG Telecom, Ltd. | 51,737 | 297 | Dollarama, Inc. | 7,725 | 577 | |||||
| Transurban Group - ADR(Æ) | 119,434 | 942 | Emera, Inc. | 8,399 | 293 | |||||
| Treasury Wine Estates, Ltd. | 136,050 | 1,110 | Empire Co., Ltd. Class A | 14,481 | 209 | |||||
| Vicinity Centres(ö) | 86,056 | 187 | Enbridge, Inc. | 13,362 | 577 | |||||
| Vocus Communications, Ltd. | 63,589 | 275 | Fairfax Financial Holdings, Ltd. | 2,588 | 1,325 | |||||
| Washington H Soul Pattinson & Co., Ltd. | 16,507 | 200 | First Quantum Minerals, Ltd. | 57,821 | 549 | |||||
| Wesfarmers, Ltd.(Æ) | 24,642 | 767 | Fortis, Inc. | 31,517 | 1,037 | |||||
| Westfield Corp.(ö) | 105,914 | 715 | Genworth MI Canada, Inc. | 8,548 | 186 | |||||
| Westpac Banking Corp. | 133,894 | 3,095 | George Weston, Ltd. | 4,065 | 331 | |||||
| Woolworths, Ltd. | 15,724 | 282 | Gildan Activewear, Inc. Class A | 5,791 | 149 | |||||
| 36,502 | Goldcorp, Inc. | 31,315 | 476 | |||||||
| Great-West Lifeco, Inc. | 33,878 | 851 | ||||||||
| Husky Energy, Inc.(Æ) | 24,953 | 268 | ||||||||
See accompanying notes which are an integral part of the financial statements.
746 Select International Equity Fund
Russell Investment Company
Select International Equity Fund
Schedule of Investments, continued — October 31, 2016
| Amounts in thousands (except share amounts) | Amounts in thousands (except share amounts) | |||||||||
| Principal | Fair | Principal | Fair | |||||||
| Amount ($) | Value | Amount ($) | Value | |||||||
| or Shares | $ | or Shares | $ | |||||||
| Imperial Oil, Ltd. | 41,080 | 1,332 | Nokia OYJ | 74,465 | 332 | |||||
| Industrial Alliance Insurance & | Nokian Renkaat OYJ | 4,317 | 145 | |||||||
| Financial Services, Inc. | 8,550 | 331 | Orion OYJ Class A | 4,659 | 198 | |||||
| Kinross Gold Corp.(Æ) | 185,261 | 720 | Orion OYJ Class B | 5,362 | 228 | |||||
| Loblaw Cos., Ltd. | 11,640 | 574 | Sampo OYJ Class A | 15,506 | 711 | |||||
| Lundin Mining Corp.(Æ) | 60,978 | 239 | Stora Enso OYJ Class R | 71,553 | 676 | |||||
| Magna International, Inc. Class A | 36,222 | 1,487 | UPM-Kymmene OYJ | 112,508 | 2,617 | |||||
| Manulife Financial Corp. | 119,326 | 1,729 | 9,533 | |||||||
| Metro, Inc. Class A | 24,473 | 756 | ||||||||
| National Bank of Canada | 27,458 | 980 | France - 8.5% | |||||||
| Open Text Corp. | 2,617 | 162 | Aeroports de Paris | 1,179 | 119 | |||||
| Pembina Pipeline Corp. | 6,814 | 209 | Air Liquide SA Class A | 7,849 | 798 | |||||
| Peyto Exploration & Development Corp. | 3,697 | 95 | Arkema SA | 8,995 | 854 | |||||
| Potash Corp. of Saskatchewan, Inc. | 20,254 | 329 | Atos SE | 5,434 | 565 | |||||
| Power Corp. of Canada | 59,981 | 1,287 | AXA SA | 156,349 | 3,520 | |||||
| Power Financial Corp. | 38,847 | 918 | BioMerieux | 1,156 | 169 | |||||
| Restaurant Brands International, Inc. | 8,888 | 395 | BNP Paribas SA | 72,776 | 4,227 | |||||
| Ritchie Bros Auctioneers, Inc. | 2,334 | 81 | Bollore SA | 105,122 | 346 | |||||
| Rogers Communications, Inc. Class A | 1,768 | 72 | Bouygues SA - ADR | 33,100 | 1,080 | |||||
| Rogers Communications, Inc. Class B | 17,075 | 687 | Capgemini SA | 6,184 | 513 | |||||
| Royal Bank of Canada - GDR | 62,168 | 3,885 | Carrefour SA | 47,723 | 1,253 | |||||
| Saputo, Inc. - ADR | 21,173 | 761 | Casino Guichard Perrachon SA | 4,145 | 206 | |||||
| Seven Generations Energy, Ltd. Class | Christian Dior SE | 4,284 | 827 | |||||||
| A(Æ) | 18,641 | 397 | Cie de Saint-Gobain | 45,230 | 2,010 | |||||
| Sun Life Financial, Inc. | 44,677 | 1,495 | CNP Assurances | 11,677 | 202 | |||||
| Suncor Energy, Inc. | 75,662 | 2,270 | Credit Agricole SA | 140,950 | 1,517 | |||||
| Teck Resources, Ltd. Class B | 64,541 | 1,394 | Danone SA | 22,144 | 1,532 | |||||
| TELUS Corp. | 5,062 | 164 | Dassault Systemes SA | 13,790 | 1,093 | |||||
| Toronto Dominion Bank | 87,469 | 3,970 | Eiffage SA | 13,737 | 1,018 | |||||
| TransCanada Corp. | 17,327 | 784 | Electricite de France SA | 6,179 | 69 | |||||
| Waste Connections, Inc. | 1,017 | 76 | Engie SA | 118,184 | 1,705 | |||||
| WestJet Airlines, Ltd. | 15,059 | 246 | Essilor International SA | 11,069 | 1,242 | |||||
| WSP Global, Inc. | 12,751 | 413 | Eurazeo SA | 10,552 | 607 | |||||
| Yamana Gold, Inc. | 180,021 | 643 | Financiere de L'Odet | 84 | 61 | |||||
| 54,878 | Iliad SA | 787 | 165 | |||||||
| Imerys SA | 2,719 | 189 | ||||||||
| Denmark - 1.5% | Ingenico Group SA | 3,030 | 240 | |||||||
| AP Moller - Maersk A/S Class B | 626 | 958 | Ipsen SA | 3,088 | 213 | |||||
| CHR Hansen Holding A/S | 7,684 | 460 | Kering | 1,216 | 270 | |||||
| Coloplast A/S Class B | 2,454 | 171 | Legrand SA - ADR | 7,543 | 426 | |||||
| Danske Bank A/S | 38,227 | 1,180 | L'Oreal SA | 8,237 | 1,475 | |||||
| DSV A/S | 15,607 | 756 | LVMH Moet Hennessy Louis Vuitton | |||||||
| Genmab A/S(Æ) | 6,259 | 1,032 | SE - ADR | 5,888 | 1,071 | |||||
| H Lundbeck A/S(Æ) | 7,629 | 246 | Natixis SA | 31,035 | 157 | |||||
| ISS AS | 11,840 | 465 | Orange SA - ADR | 132,966 | 2,096 | |||||
| Jyske Bank A/S | 11,174 | 507 | Orpea | 1,688 | 141 | |||||
| Novo Nordisk A/S Class B | 88,441 | 3,156 | Pernod Ricard SA | 6,556 | 779 | |||||
| Novozymes A/S Class B | 7,231 | 269 | Peugeot SA(Æ) | 27,032 | 405 | |||||
| Pandora A/S | 6,890 | 896 | Publicis Groupe SA - ADR | 10,729 | 737 | |||||
| TDC AS(Æ) | 49,563 | 273 | Renault SA | 32,940 | 2,865 | |||||
| Vestas Wind Systems A/S | 12,261 | 983 | Sanofi - ADR | 43,669 | 3,397 | |||||
| 11,352 | Sartorius Stedim Biotech | 7,446 | 502 | |||||||
| Schneider Electric SE | 28,674 | 1,926 | ||||||||
| Finland - 1.3% | SCOR SE - ADR | 30,594 | 991 | |||||||
| Amer Sports OYJ Class A | 9,438 | 257 | SEB SA | 1,845 | 272 | |||||
| Elisa OYJ Class A | 15,892 | 535 | Societe BIC SA | 2,208 | 306 | |||||
| Fortum OYJ | 57,217 | 954 | Societe Generale SA | 78,662 | 3,062 | |||||
| Huhtamaki OYJ | 9,990 | 403 | Sodexo SA | 3,802 | 442 | |||||
| Kesko OYJ Class B | 8,718 | 433 | Suez Environnement Co. | 26,793 | 425 | |||||
| Kone OYJ Class B | 16,353 | 752 | Technip SA | 17,038 | 1,126 | |||||
| Neste OYJ | 29,970 | 1,292 | Teleperformance - GDR | 5,467 | 578 | |||||
See accompanying notes which are an integral part of the financial statements.
Select International Equity Fund 747
Russell Investment Company
Select International Equity Fund
Schedule of Investments, continued — October 31, 2016
| Amounts in thousands (except share amounts) | Amounts in thousands (except share amounts) | ||||||||
| Principal | Fair | Principal | Fair | ||||||
| Amount ($) | Value | Amount ($) | Value | ||||||
| or Shares | $ | or Shares | $ | ||||||
| Thales SA | 11,786 | 1,110 | Vonovia SE | 13,730 | 484 | ||||
| Total SA | 148,876 | 7,124 | 59,213 | ||||||
| Unibail-Rodamco SE(ö) | 2,733 | 651 | |||||||
| Valeo SA | 9,990 | 576 | Hong Kong - 3.4% | ||||||
| Veolia Environnement SA | 36,139 | 789 | AIA Group, Ltd. | 255,853 | 1,615 | ||||
| Vinci SA | 33,434 | 2,417 | Bank of East Asia, Ltd. (The) | 148,600 | 598 | ||||
| Vivendi SA - ADR | 66,983 | 1,356 | BOC Hong Kong Holdings, Ltd. | 283,500 | 1,012 | ||||
| Worldline SA(Æ)(Þ) | 5,717 | 157 | Cheung Kong Infrastructure Holdings, | ||||||
| 63,969 | Ltd. | 63,000 | 516 | ||||||
| Cheung Kong Property Holdings, Ltd. | 285,487 | 2,115 | |||||||
| Germany - 7.9% | Chinese Estates Holdings, Ltd. | 19,000 | 34 | ||||||
| adidas AG | 14,634 | 2,400 | CK Hutchison Holdings, Ltd. | 99,036 | 1,225 | ||||
| Allianz SE | 33,730 | 5,256 | CLP Holdings, Ltd. | 35,500 | 361 | ||||
| BASF SE | 39,333 | 3,468 | Guoco Group, Ltd. | 37,000 | 415 | ||||
| Bayer AG | 28,932 | 2,868 | Hang Lung Properties, Ltd. - ADR | 95,000 | 210 | ||||
| Bayerische Motoren Werke AG | 28,766 | 2,506 | Hang Seng Bank, Ltd. | 47,700 | 860 | ||||
| Beiersdorf AG | 10,103 | 889 | Henderson Land Development Co., Ltd. | 180,070 | 1,067 | ||||
| Brenntag AG | 3,005 | 161 | HK Electric Investments & HK Electric | ||||||
| Commerzbank AG | 101,851 | 692 | Investments, Ltd.(Þ) | 505,000 | 501 | ||||
| Continental AG | 3,608 | 691 | Hongkong Land Holdings, Ltd. | 99,400 | 666 | ||||
| Covestro AG(Þ) | 3,911 | 231 | Hopewell Holdings, Ltd. | 114,000 | 399 | ||||
| Daimler AG | 62,158 | 4,429 | Jardine Matheson Holdings, Ltd. | 32,600 | 1,983 | ||||
| Deutsche Bank AG(Æ) | 75,422 | 1,088 | Jardine Strategic Holdings, Ltd. | 20,100 | 704 | ||||
| Deutsche Boerse AG | 4,225 | 316 | Link REIT(ö) | 245,460 | 1,750 | ||||
| Deutsche Lufthansa AG | 82,549 | 1,055 | Melco Crown Entertainment, Ltd.(Æ) | 8,400 | 47 | ||||
| Deutsche Post AG | 55,295 | 1,713 | MTR Corp., Ltd. | 132,000 | 730 | ||||
| Deutsche Telekom AG | 106,375 | 1,733 | New World Development Co., Ltd. | 742,000 | 925 | ||||
| Deutsche Wohnen AG | 35,225 | 1,149 | NWS Holdings, Ltd. | 200,000 | 354 | ||||
| E.ON SE | 65,874 | 481 | PCCW, Ltd. | 335,000 | 199 | ||||
| Evonik Industries AG | 9,626 | 301 | Power Assets Holdings, Ltd. | 29,500 | 277 | ||||
| Freenet AG | 8,999 | 258 | Sino Land Co., Ltd. | 480,000 | 815 | ||||
| Fresenius Medical Care AG & Co. | 9,096 | 741 | Sun Hung Kai Properties, Ltd. | 105,190 | 1,567 | ||||
| Fresenius SE & Co. KGaA | 23,937 | 1,767 | Swire Pacific, Ltd. Class A | 118,000 | 1,227 | ||||
| Fuchs Petrolub AG | 4,056 | 160 | Swire Properties, Ltd. | 57,200 | 164 | ||||
| Hannover Rueck SE | 8,457 | 943 | Techtronic Industries Co., Ltd. | 47,000 | 177 | ||||
| HeidelbergCement AG | 24,702 | 2,336 | Wharf Holdings, Ltd. (The) | 188,808 | 1,419 | ||||
| Henkel AG & Co. KGaA | 8,537 | 940 | Wheelock & Co., Ltd. | 188,000 | 1,160 | ||||
| Hochtief AG | 3,809 | 520 | Yue Yuen Industrial Holdings, Ltd. | 54,500 | 208 | ||||
| Infineon Technologies AG - ADR | 84,709 | 1,520 | 25,300 | ||||||
| K&S AG | 8,144 | 165 | |||||||
| Krones AG | 2,034 | 207 | Ireland - 0.9% | ||||||
| LEG Immobilien AG(Æ) | 4,233 | 358 | CRH PLC | 51,502 | 1,668 | ||||
| Linde AG | 2,416 | 399 | DCC PLC | 6,814 | 555 | ||||
| Merck KGaA | 10,259 | 1,055 | Experian PLC | 37,587 | 722 | ||||
| Metro AG | 2,315 | 69 | Glanbia PLC | 21,203 | 345 | ||||
| MTU Aero Engines AG | 3,723 | 389 | Icon PLC(Æ) | 4,432 | 356 | ||||
| Muenchener Rueckversicherungs- | James Hardie Industries PLC | 13,561 | 202 | ||||||
| Gesellschaft AG in Muenchen | 17,289 | 3,351 | Jazz Pharmaceuticals PLC(Æ) | 519 | 57 | ||||
| OSRAM Licht AG | 16,947 | 961 | Kerry Group PLC Class A | 10,082 | 732 | ||||
| ProSiebenSat.1 Media SE | 4,569 | 197 | Kingspan Group PLC | 10,690 | 261 | ||||
| Rational AG | 573 | 297 | Paddy Power Betfair PLC | 5,128 | 531 | ||||
| Rheinmetall AG | 8,822 | 611 | Smurfit Kappa Group PLC | 7,572 | 166 | ||||
| Rhoen Klinikum AG | 2,460 | 68 | Willis Towers Watson PLC | 7,093 | 893 | ||||
| RWE AG(Æ) | 31,673 | 503 | 6,488 | ||||||
| SAP SE - ADR | 29,538 | 2,602 | |||||||
| Siemens AG | 41,780 | 4,743 | Israel - 0.5% | ||||||
| Suedzucker AG | 24,191 | 620 | Bank Hapoalim BM | 153,198 | 884 | ||||
| Symrise AG | 11,023 | 757 | Bank Leumi Le-Israel BM(Æ) | 194,304 | 733 | ||||
| Talanx AG | 6,377 | 198 | Check Point Software Technologies, Ltd. | ||||||
| Uniper SE(Æ) | 6,587 | 88 | (Æ) | 4,473 | 378 | ||||
| United Internet AG | 11,650 | 479 | Delek Energy Systems, Ltd.(Æ) | 141 | 73 | ||||
See accompanying notes which are an integral part of the financial statements.
748 Select International Equity Fund
Russell Investment Company
Select International Equity Fund
Schedule of Investments, continued — October 31, 2016
| Amounts in thousands (except share amounts) | Amounts in thousands (except share amounts) | |||||||||
| Principal | Fair | Principal | Fair | |||||||
| Amount ($) | Value | Amount ($) | Value | |||||||
| or Shares | $ | or Shares | $ | |||||||
| Elbit Systems, Ltd. | 1,765 | 175 | Dai-ichi Life Holdings, Inc. | 24,400 | 358 | |||||
| Mizrahi Tefahot Bank, Ltd. | 21,430 | 279 | Daiichi Sankyo Co., Ltd. | 50,100 | 1,205 | |||||
| Mobileye NV(Æ) | 1,621 | 60 | Daikin Industries, Ltd. | 9,900 | 950 | |||||
| Taro Pharmaceutical Industries, Ltd. | Daito Trust Construction Co., Ltd. | 3,400 | 569 | |||||||
| (Æ)(Ñ) | 1,243 | 126 | Daiwa House Industry Co., Ltd. | 32,300 | 888 | |||||
| Teva Pharmaceutical Industries, Ltd. | 28,785 | 1,229 | Daiwa Securities Group, Inc. | 88,000 | 526 | |||||
| 3,937 | Denso Corp. | 28,200 | 1,225 | |||||||
| Dentsu, Inc. | 5,600 | 279 | ||||||||
| Italy - 1.9% | East Japan Railway Co. | 9,700 | 855 | |||||||
| A2A SpA | 54,670 | 75 | Eisai Co., Ltd. | 7,900 | 504 | |||||
| Assicurazioni Generali SpA | 100,483 | 1,297 | Electric Power Development Co., Ltd. | 22,100 | 515 | |||||
| Atlantia SpA | 38,742 | 950 | Ezaki Glico Co., Ltd. | 4,500 | 256 | |||||
| Banca Popolare di Milano Scarl | 254,016 | 116 | FamilyMart UNY Holdings Co., Ltd. | 6,400 | 402 | |||||
| Banco Popolare SC | 40,625 | 117 | FANUC Corp. | 1,000 | 187 | |||||
| Davide Campari-Milano SpA | 27,326 | 275 | Fuji Electric Co., Ltd. | 23,000 | 115 | |||||
| Enel SpA | 599,739 | 2,577 | Fuji Heavy Industries, Ltd. | 29,900 | 1,164 | |||||
| ENI SpA - ADR | 129,456 | 1,872 | FUJIFILM Holdings Corp. | 34,600 | 1,309 | |||||
| Hera SpA | 158,023 | 404 | Fujitsu, Ltd. | 36,000 | 213 | |||||
| Intesa Sanpaolo SpA | 782,047 | 1,806 | Fukuoka Financial Group, Inc. | 102,000 | 442 | |||||
| Leonardo-Finmeccanica SpA(Æ) | 19,126 | 233 | Gunma Bank, Ltd. (The) | 26,000 | 124 | |||||
| Luxottica Group SpA | 5,489 | 272 | Hachijuni Bank, Ltd. (The) | 62,000 | 338 | |||||
| Mediobanca SpA | 26,943 | 197 | Hankyu Hanshin Holdings, Inc. | 19,600 | 650 | |||||
| Parmalat SpA | 87,811 | 232 | Hikari Tsushin, Inc. | 2,400 | 221 | |||||
| Poste Italiane SpA(Þ) | 28,309 | 188 | Hiroshima Bank, Ltd. (The) | 40,000 | 171 | |||||
| Prysmian SpA | 6,954 | 173 | Hisamitsu Pharmaceutical Co., Inc. | 9,400 | 501 | |||||
| Recordati SpA | 15,766 | 446 | Hitachi High-Technologies Corp. | 5,500 | 230 | |||||
| Snam Rete Gas SpA | 157,159 | 829 | Hitachi Metals, Ltd. | 13,100 | 164 | |||||
| Telecom Italia SpA(Æ) | 157,897 | 138 | Hitachi, Ltd. | 237,000 | 1,261 | |||||
| Terna Rete Elettrica Nazionale SpA | 130,299 | 639 | Hokuriku Electric Power Co. | 8,500 | 97 | |||||
| UniCredit SpA | 553,205 | 1,369 | Honda Motor Co., Ltd. | 85,000 | 2,543 | |||||
| Unione di Banche Italiane SpA(Ñ) | 66,709 | 183 | Hoshizaki Corp. | 5,700 | 514 | |||||
| 14,388 | Hoya Corp. | 21,000 | 877 | |||||||
| Idemitsu Kosan Co., Ltd. | 29,500 | 681 | ||||||||
| Japan - 21.6% | Iida Group Holdings Co., Ltd. | 16,000 | 309 | |||||||
| Aeon Co., Ltd. | 65,100 | 903 | Inpex Corp. | 61,900 | 576 | |||||
| Aisin Seiki Co., Ltd. | 23,600 | 1,037 | Isuzu Motors, Ltd. | 42,100 | 521 | |||||
| Ajinomoto Co., Inc. | 31,000 | 690 | ITOCHU Corp. | 155,100 | 1,964 | |||||
| Alfresa Holdings Corp. | 24,600 | 520 | Iyo Bank, Ltd. (The) | 16,900 | 104 | |||||
| ANA Holdings, Inc. | 173,000 | 486 | Japan Post Bank Co., Ltd. | 70,100 | 826 | |||||
| Aozora Bank, Ltd. | 95,000 | 314 | Japan Post Holdings Co., Ltd. | 63,500 | 809 | |||||
| Asahi Glass Co., Ltd. | 100,000 | 700 | Japan Tobacco, Inc. | 40,200 | 1,530 | |||||
| Asahi Group Holdings, Ltd. | 7,700 | 275 | JFE Holdings, Inc. | 30,900 | 443 | |||||
| Asahi Kasei Corp. | 76,000 | 686 | JGC Corp. | 14,000 | 248 | |||||
| Astellas Pharma, Inc. | 62,400 | 927 | JSR Corp. | 16,600 | 253 | |||||
| Bandai Namco Holdings, Inc. | 8,300 | 249 | JTEKT Corp. | 6,500 | 96 | |||||
| Bridgestone Corp. | 37,600 | 1,401 | JX Holdings, Inc. | 302,600 | 1,195 | |||||
| Brother Industries, Ltd. | 28,900 | 530 | Kajima Corp. | 133,000 | 898 | |||||
| Calbee, Inc. | 3,600 | 131 | Kamigumi Co., Ltd. | 40,000 | 342 | |||||
| Canon, Inc. | 48,000 | 1,378 | Kaneka Corp. | 36,000 | 298 | |||||
| Casio Computer Co., Ltd. | 8,400 | 117 | Kansai Electric Power Co., Inc. (The)(Æ) | 67,100 | 642 | |||||
| Central Japan Railway Co. | 7,400 | 1,259 | Kao Corp. | 24,900 | 1,283 | |||||
| Chiba Bank, Ltd. (The) | 76,000 | 470 | KDDI Corp. | 68,800 | 2,092 | |||||
| Chubu Electric Power Co., Inc. | 68,300 | 1,005 | Keihan Holdings Co., Ltd. | 43,000 | 290 | |||||
| Chugai Pharmaceutical Co., Ltd. | 22,000 | 750 | Keikyu Corp. | 8,000 | 81 | |||||
| Chugoku Bank, Ltd. (The) | 20,800 | 279 | Keio Corp. | 15,000 | 124 | |||||
| Chugoku Electric Power Co., Inc. (The) | 12,900 | 151 | Keisei Electric Railway Co., Ltd. | 5,500 | 133 | |||||
| Concordia Financial Group, Ltd. | 122,000 | 565 | Kewpie Corp. | 3,100 | 88 | |||||
| Cosmos Pharmaceutical Corp. | 900 | 196 | Keyence Corp. | 1,800 | 1,321 | |||||
| CYBERDYNE, Inc.(Æ)(Ñ) | 14,100 | 212 | Kikkoman Corp. | 13,000 | 414 | |||||
| Dai Nippon Printing Co., Ltd. | 65,000 | 652 | Kintetsu Group Holdings Co., Ltd. | 134,000 | 541 | |||||
| Daicel Chemical Industries, Ltd. | 18,400 | 242 | ||||||||
See accompanying notes which are an integral part of the financial statements.
Select International Equity Fund 749
Russell Investment Company
Select International Equity Fund
Schedule of Investments, continued — October 31, 2016
| Amounts in thousands (except share amounts) | Amounts in thousands (except share amounts) | |||||||||
| Principal | Fair | Principal | Fair | |||||||
| Amount ($) | Value | Amount ($) | Value | |||||||
| or Shares | $ | or Shares | $ | |||||||
| Kirin Holdings Co., Ltd. | 20,300 | 350 | NSK, Ltd. | 15,500 | 172 | |||||
| Kobayashi Pharmaceutical Co., Ltd. | 5,800 | 303 | NTT Data Corp. | 14,000 | 723 | |||||
| Kobe Steel, Ltd.(Æ) | 26,300 | 217 | NTT DOCOMO, Inc. | 75,800 | 1,908 | |||||
| Koito Manufacturing Co., Ltd. | 6,800 | 355 | Obayashi Corp. | 91,100 | 879 | |||||
| Komatsu, Ltd. | 54,800 | 1,221 | Obic Co., Ltd. | 5,600 | 291 | |||||
| Konami Holdings Corp. | 12,700 | 501 | Odakyu Electric Railway Co., Ltd. | 17,500 | 357 | |||||
| Konica Minolta, Inc. | 66,400 | 594 | Oji Holdings Corp. | 173,000 | 733 | |||||
| Kose Corp. | 2,700 | 246 | Ono Pharmaceutical Co., Ltd. | 28,800 | 732 | |||||
| Kubota Corp. | 39,500 | 637 | Oracle Corp. Japan | 4,100 | 223 | |||||
| Kuraray Co., Ltd. | 39,400 | 598 | Oriental Land Co., Ltd. | 4,500 | 263 | |||||
| Kyocera Corp. | 10,300 | 501 | ORIX Corp. | 114,400 | 1,820 | |||||
| Kyowa Hakko Kirin Co., Ltd. | 18,200 | 277 | Osaka Gas Co., Ltd. | 260,000 | 1,081 | |||||
| Lawson, Inc. | 5,200 | 395 | Otsuka Holdings Co., Ltd. | 26,800 | 1,173 | |||||
| Lion Corp. | 9,000 | 147 | Panasonic Corp. | 97,900 | 1,022 | |||||
| LIXIL Group Corp. | 5,900 | 136 | Park24 Co., Ltd. | 13,200 | 408 | |||||
| M3, Inc. | 13,000 | 397 | Pola Orbis Holdings, Inc. | 4,400 | 366 | |||||
| Makita Corp. | 10,300 | 713 | Recruit Holdings Co., Ltd. | 12,700 | 511 | |||||
| Marubeni Corp. | 213,600 | 1,124 | Resona Holdings, Inc. | 245,800 | 1,090 | |||||
| Marui Group Co., Ltd. | 12,600 | 177 | Ricoh Co., Ltd. | 114,200 | 931 | |||||
| Mazda Motor Corp. | 19,800 | 325 | Rinnai Corp. | 3,800 | 365 | |||||
| Mebuki Financial Group, Inc. | 60,840 | 217 | Ryohin Keikaku Co., Ltd. | 1,700 | 364 | |||||
| Medipal Holdings Corp. | 33,100 | 565 | Santen Pharmaceutical Co., Ltd. | 35,200 | 514 | |||||
| MEIJI Holdings Co., Ltd. | 9,100 | 909 | Sawai Pharmaceutical Co., Ltd. | 2,300 | 148 | |||||
| Mitsubishi Chemical Holdings Corp. | 209,300 | 1,375 | SBI Holdings, Inc. | 6,500 | 77 | |||||
| Mitsubishi Corp. | 105,600 | 2,303 | Secom Co., Ltd. | 7,200 | 520 | |||||
| Mitsubishi Electric Corp. | 84,000 | 1,137 | Seiko Epson Corp. | 39,700 | 806 | |||||
| Mitsubishi Gas Chemical Co., Inc. | 45,000 | 693 | Sekisui Chemical Co., Ltd. | 55,800 | 879 | |||||
| Mitsubishi Heavy Industries, Ltd. | 182,000 | 778 | Sekisui House, Ltd. | 69,200 | 1,144 | |||||
| Mitsubishi Materials Corp. | 13,800 | 396 | Seven & i Holdings Co., Ltd. | 27,700 | 1,156 | |||||
| Mitsubishi Motors Corp. | 77,900 | 434 | Shimadzu Corp. | 9,000 | 131 | |||||
| Mitsubishi Tanabe Pharma Corp. | 33,400 | 651 | Shimamura Co., Ltd. | 2,600 | 333 | |||||
| Mitsubishi UFJ Financial Group, Inc. | 626,400 | 3,246 | Shimano, Inc. | 2,800 | 479 | |||||
| Mitsubishi UFJ Lease & Finance Co., | Shimizu Corp. | 56,000 | 498 | |||||||
| Ltd. | 54,700 | 265 | Shin-Etsu Chemical Co., Ltd. | 7,500 | 569 | |||||
| Mitsui & Co., Ltd. | 145,700 | 2,022 | Shinsei Bank, Ltd. | 243,000 | 393 | |||||
| Mitsui Chemicals, Inc. | 90,000 | 444 | Shionogi & Co., Ltd. | 21,800 | 1,074 | |||||
| Mitsui OSK Lines, Ltd. | 187,000 | 468 | Shiseido Co., Ltd. | 19,200 | 495 | |||||
| Mixi, Inc. | 3,700 | 136 | Shizuoka Bank, Ltd. (The) | 49,000 | 414 | |||||
| Mizuho Financial Group, Inc. | 1,476,100 | 2,489 | SoftBank Group Corp. | 21,800 | 1,371 | |||||
| MS&AD Insurance Group Holdings, Inc. | 42,200 | 1,253 | Sohgo Security Services Co., Ltd. | 8,200 | 374 | |||||
| Murata Manufacturing Co., Ltd. | 7,000 | 976 | Sojitz Corp. | 359,200 | 944 | |||||
| Nagoya Railroad Co., Ltd. | 29,000 | 153 | Sompo Holdings, Inc. | 7,700 | 249 | |||||
| Nankai Electric Railway Co., Ltd. | 59,000 | 268 | Sony Corp. | 17,100 | 541 | |||||
| NEC Corp. | 220,000 | 588 | Sosei Group Corp.(Æ) | 1,100 | 165 | |||||
| NHK Spring Co., Ltd. | 21,000 | 198 | Sugi Holdings Co., Ltd. - GDR | 5,900 | 316 | |||||
| Nidec Corp. | 5,300 | 514 | Sumitomo Chemical Co., Ltd. | 166,000 | 786 | |||||
| Nikon Corp. | 31,200 | 472 | Sumitomo Corp. | 137,600 | 1,585 | |||||
| Nintendo Co., Ltd. | 4,100 | 994 | Sumitomo Dainippon Pharma Co., Ltd. | 19,700 | 342 | |||||
| Nippon Express Co., Ltd. | 54,000 | 267 | Sumitomo Electric Industries, Ltd. | 73,800 | 1,091 | |||||
| Nippon Steel & Sumitomo Metal Corp. | 53,800 | 1,064 | Sumitomo Heavy Industries, Ltd. | 22,000 | 116 | |||||
| Nippon Telegraph & Telephone Corp. | 70,200 | 3,123 | Sumitomo Metal Mining Co., Ltd. | 52,000 | 674 | |||||
| Nippon Yusen | 206,000 | 422 | Sumitomo Mitsui Financial Group, Inc. | 80,400 | 2,795 | |||||
| Nissan Chemical Industries, Ltd. | 2,600 | 88 | Sumitomo Mitsui Trust Holdings, Inc. | 31,200 | 1,054 | |||||
| Nissan Motor Co., Ltd. | 260,900 | 2,654 | Sumitomo Rubber Industries, Ltd. | 27,100 | 453 | |||||
| Nisshin Seifun Group, Inc. | 28,200 | 416 | Sundrug Co., Ltd. | 4,200 | 331 | |||||
| Nissin Foods Holdings Co., Ltd. | 5,600 | 324 | Suntory Beverage & Food, Ltd. | 8,200 | 358 | |||||
| Nitori Holdings Co., Ltd. | 6,700 | 802 | Suzuken Co., Ltd. | 10,400 | 334 | |||||
| Nomura Holdings, Inc. | 137,000 | 687 | Suzuki Motor Corp. | 9,500 | 337 | |||||
| Nomura Real Estate Holdings, Inc. | 14,200 | 240 | Sysmex Corp. | 8,300 | 576 | |||||
| Nomura Real Estate Master Fund, Inc. | T&D Holdings, Inc. | 7,900 | 96 | |||||||
| (Æ)(ö) | 45 | 73 | ||||||||
See accompanying notes which are an integral part of the financial statements.
750 Select International Equity Fund
Russell Investment Company
Select International Equity Fund
Schedule of Investments, continued — October 31, 2016
| Amounts in thousands (except share amounts) | Amounts in thousands (except share amounts) | ||||||||
| Principal | Fair | Principal | Fair | ||||||
| Amount ($) | Value | Amount ($) | Value | ||||||
| or Shares | $ | or Shares | $ | ||||||
| Taiheiyo Cement Corp. | 143,000 | 410 | ABN AMRO Group NV(Þ) | 37,548 | 866 | ||||
| Taisei Corp. | 59,000 | 443 | Aegon NV | 145,697 | 627 | ||||
| Taisho Pharmaceutical Holdings Co., | AerCap Holdings NV(Æ) | 27,713 | 1,139 | ||||||
| Ltd. | 4,700 | 459 | Akzo Nobel NV | 4,925 | 318 | ||||
| Takashimaya Co., Ltd. | 41,000 | 335 | ASM International NV | 5,336 | 227 | ||||
| Takeda Pharmaceutical Co., Ltd. | 19,500 | 873 | ASML Holding NV | 11,942 | 1,263 | ||||
| TDK Corp. | 3,500 | 242 | Boskalis Westminster | 14,498 | 467 | ||||
| Teijin, Ltd. | 15,800 | 306 | Core Laboratories NV | 1,868 | 181 | ||||
| Terumo Corp. | 31,600 | 1,225 | GrandVision NV(Þ) | 8,520 | 195 | ||||
| Tobu Railway Co., Ltd. | 26,000 | 128 | HAL Trust | 787 | 155 | ||||
| Toho Co., Ltd. | 8,400 | 253 | Heineken Holding NV | 13,116 | 1,009 | ||||
| Toho Gas Co., Ltd. | 37,000 | 343 | Heineken NV | 16,122 | 1,327 | ||||
| Tohoku Electric Power Co., Inc. | 49,800 | 610 | ING Groep NV(Æ) | 252,025 | 3,313 | ||||
| Tokio Marine Holdings, Inc. | 21,200 | 837 | Koninklijke Ahold Delhaize NV(Æ) | 85,670 | 1,955 | ||||
| Tokyo Broadcasting System Holdings, | Koninklijke DSM NV | 11,689 | 751 | ||||||
| Inc. | 16,800 | 264 | Koninklijke Philips NV | 37,778 | 1,138 | ||||
| Tokyo Century Corp. | 10,500 | 370 | Koninklijke Vopak NV | 2,273 | 115 | ||||
| Tokyo Electric Power Co. Holdings, Inc. | NN Group NV | 39,588 | 1,192 | ||||||
| (Æ) | 334,100 | 1,298 | NXP Semiconductors NV(Æ) | 12,767 | 1,277 | ||||
| Tokyo Electron, Ltd. | 3,600 | 326 | Randstad Holding NV | 2,690 | 138 | ||||
| Tokyo Gas Co., Ltd. | 126,000 | 571 | Royal Dutch Shell PLC Class A | 245,074 | 6,107 | ||||
| Tokyu Corp. | 86,000 | 645 | Royal Dutch Shell PLC Class B | 68,533 | 1,769 | ||||
| TonenGeneral Sekiyu | 26,000 | 257 | SBM Offshore NV | 27,035 | 388 | ||||
| Toppan Printing Co., Ltd. | 100,000 | 941 | Wolters Kluwer NV | 20,948 | 810 | ||||
| Toray Industries, Inc. | 32,000 | 298 | 26,885 | ||||||
| Tosoh Corp. | 75,000 | 490 | |||||||
| TOTO, Ltd. | 12,900 | 516 | New Zealand - 0.2% | ||||||
| Toyo Seikan Group Holdings, Ltd. | 26,200 | 484 | Auckland International Airport, Ltd. | 85,847 | 405 | ||||
| Toyo Suisan Kaisha, Ltd. | 5,000 | 203 | Fisher & Paykel Healthcare Corp., Ltd. | 28,945 | 183 | ||||
| Toyoda Gosei Co., Ltd. | 6,300 | 144 | Meridian Energy, Ltd. | 43,100 | 79 | ||||
| Toyota Industries Corp. | 16,700 | 765 | Ryman Healthcare, Ltd. | 15,216 | 97 | ||||
| Toyota Motor Corp. | 126,400 | 7,303 | Spark New Zealand, Ltd. | 147,515 | 386 | ||||
| Toyota Tsusho Corp. | 21,900 | 518 | 1,150 | ||||||
| Tsuruha Holdings, Inc. | 3,400 | 394 | |||||||
| Unicharm Corp. | 5,600 | 133 | Norway - 0.8% | ||||||
| Welcia Holdings Co., Ltd. | 1,500 | 102 | DNB ASA | 113,424 | 1,640 | ||||
| West Japan Railway Co. | 8,300 | 512 | Marine Harvest ASA | 24,533 | 444 | ||||
| Yahoo! Japan Corp. | 51,200 | 197 | Norsk Hydro ASA | 58,483 | 261 | ||||
| Yamada Denki Co., Ltd. | 145,600 | 753 | Orkla ASA | 49,815 | 470 | ||||
| Yamaguchi Financial Group, Inc. | 25,000 | 276 | Salmar ASA Class A | 2,386 | 77 | ||||
| Yamaha Corp. | 18,800 | 672 | Statoil ASA Class N | 102,816 | 1,676 | ||||
| Yamato Holdings Co., Ltd. | 3,000 | 68 | Telenor ASA | 37,860 | 603 | ||||
| Yamazaki Baking Co., Ltd. | 4,000 | 90 | Yara International ASA | 24,082 | 851 | ||||
| Yokohama Rubber Co., Ltd. (The) | 9,800 | 170 | 6,022 | ||||||
| 162,352 | |||||||||
| Portugal - 0.3% | |||||||||
| Jersey - 0.3% | Banco BPI SA Class G(Æ) | 228,875 | 284 | ||||||
| Randgold Resources, Ltd. | 9,609 | 853 | Banco Comercial Portugues SA Class | ||||||
| Shire PLC - ADR | 26,148 | 1,477 | R(Æ) | 174,650 | 232 | ||||
| 2,330 | Banco Espirito Santo SA Class C(Æ) | 22,842 | 3 | ||||||
| Energias de Portugal SA | 355,145 | 1,173 | |||||||
| Luxembourg - 0.2% | Galp Energia SGPS SA Class B | 32,008 | 433 | ||||||
| ArcelorMittal(Æ) | 77,288 | 518 | Jeronimo Martins SGPS SA | 19,354 | 333 | ||||
| Eurofins Scientific SE | 419 | 190 | Navigator Co. SA (The) - ADR(Æ) | 45,893 | 134 | ||||
| Millicom International Cellular SA | 3,580 | 157 | 2,592 | ||||||
| Regus PLC | 75,293 | 229 | |||||||
| Tenaris SA | 53,306 | 754 | Singapore - 1.0% | ||||||
| 1,848 | CapitaLand, Ltd. | 134,200 | 297 | ||||||
| DBS Group Holdings, Ltd. | 103,800 | 1,116 | |||||||
| Netherlands - 3.6% | Flex, Ltd.(Æ) | 33,113 | 470 | ||||||
| Aalberts Industries NV | 4,999 | 158 | Jardine Cycle & Carriage, Ltd. | 3,200 | 97 | ||||
See accompanying notes which are an integral part of the financial statements.
Select International Equity Fund 751
Russell Investment Company
Select International Equity Fund
Schedule of Investments, continued — October 31, 2016
| Amounts in thousands (except share amounts) | Amounts in thousands (except share amounts) | |||||||||
| Principal | Fair | Principal | Fair | |||||||
| Amount ($) | Value | Amount ($) | Value | |||||||
| or Shares | $ | or Shares | $ | |||||||
| Keppel Corp., Ltd. - ADR | 116,100 | 439 | L E Lundbergforetagen AB Class B | 7,188 | 465 | |||||
| Oversea-Chinese Banking Corp., Ltd. | 234,438 | 1,427 | Melker Schorling AB | 5,005 | 289 | |||||
| Singapore Airlines, Ltd.(Æ) | 88,300 | 643 | NCC AB Class B(Æ) | 5,367 | 136 | |||||
| Singapore Telecommunications, Ltd. | 278,900 | 780 | NIBE Industrier AB B Shares(Æ) | 23,928 | 178 | |||||
| United Overseas Bank, Ltd. | 84,800 | 1,143 | Nordea Bank AB | 177,243 | 1,862 | |||||
| Wilmar International, Ltd. | 352,100 | 838 | Securitas AB Class B | 35,908 | 554 | |||||
| 7,250 | Skandinaviska Enskilda Banken AB | |||||||||
| Class A | 125,765 | 1,268 | ||||||||
| South Africa - 0.1% | Skanska AB Class B | 18,971 | 412 | |||||||
| Investec PLC | 40,680 | 253 | SSAB AB Class A(Æ) | 53,193 | 168 | |||||
| Mondi PLC | 28,426 | 554 | Svenska Cellulosa AB SCA Class A | 15,926 | 451 | |||||
| 807 | Svenska Cellulosa AB SCA Class B | 39,161 | 1,109 | |||||||
| Svenska Handelsbanken AB Class A | 66,075 | 900 | ||||||||
| Spain - 3.1% | Svenska Handelsbanken AB Class B | 5,656 | 76 | |||||||
| Abertis Infraestructuras SA | 15,186 | 225 | Swedbank AB Class A | 53,641 | 1,255 | |||||
| Acciona SA | 2,040 | 155 | Swedish Match AB | 6,661 | 232 | |||||
| ACS Actividades de Construccion y | Tele2 AB Class B | 8,585 | 71 | |||||||
| Servicios SA | 13,489 | 413 | Telefonaktiebolaget LM Ericsson Class B | 163,920 | 797 | |||||
| Aena SA(Þ) | 6,569 | 964 | Telia Co. AB | 246,629 | 984 | |||||
| Almirall SA | 4,770 | 69 | Trelleborg AB Class B | 24,296 | 424 | |||||
| Amadeus IT Group SA Class A | 22,597 | 1,066 | Volvo AB Class B | 109,886 | 1,179 | |||||
| Banco Bilbao Vizcaya Argentaria SA | 18,593 | |||||||||
| - ADR | 356,559 | 2,570 | ||||||||
| Banco de Sabadell SA - ADR | 486,641 | 650 | Switzerland - 7.8% | |||||||
| Banco Santander SA - ADR | 705,428 | 3,455 | ABB, Ltd.(Æ) | 68,414 | 1,408 | |||||
| Bankia SA Class A | 426,585 | 375 | Actelion, Ltd.(Æ) | 7,612 | 1,100 | |||||
| CaixaBank SA | 180,424 | 545 | Alpiq Holding AG(Æ) | 1,140 | 106 | |||||
| Corp. Financiera Alba SA | 5,491 | 241 | Aryzta AG(Æ) | 3,155 | 138 | |||||
| Ebro Foods SA | 23,266 | 502 | Baloise Holding AG | 5,910 | 727 | |||||
| Enagas SA | 2,516 | 72 | Barry Callebaut AG(Æ) | 145 | 181 | |||||
| Endesa SA - ADR | 54,495 | 1,158 | Basellandschaftliche Kantonalbank | 855 | 779 | |||||
| Ferrovial SA | 22,681 | 441 | Basler Kantonalbank | 6,802 | 460 | |||||
| Gamesa Corp. Tecnologica SA | 25,981 | 601 | Berner Kantonalbank AG | 1,072 | 195 | |||||
| Gas Natural SDG SA | 47,058 | 928 | Bucher Industries AG | 1,142 | 254 | |||||
| Iberdrola SA | 525,179 | 3,577 | Chocoladefabriken Lindt & Spruengli | |||||||
| Industria de Diseno Textil SA | 58,122 | 2,031 | AG | 85 | 953 | |||||
| Red Electrica Corp. SA | 10,350 | 216 | Cie Financiere Richemont SA | 8,062 | 518 | |||||
| Repsol SA - ADR | 128,338 | 1,794 | Coca-Cola HBC AG - ADR(Æ) | 20,936 | 452 | |||||
| Telefonica SA - ADR | 90,617 | 923 | Credit Suisse Group AG(Æ) | 65,149 | 908 | |||||
| Zardoya Otis SA | 13,699 | 116 | Emmi AG(Æ) | 119 | 70 | |||||
| 23,087 | EMS-Chemie Holding AG | 348 | 175 | |||||||
| Galenica AG | 602 | 603 | ||||||||
| Sweden - 2.5% | Geberit AG | 1,654 | 699 | |||||||
| Alfa Laval AB | 6,197 | 89 | Georg Fischer AG | 439 | 389 | |||||
| Assa Abloy AB Class B | 50,218 | 912 | Givaudan SA | 328 | 634 | |||||
| Atlas Copco AB Class A | 6,637 | 194 | Glencore PLC(Æ) | 956,764 | 2,916 | |||||
| Atlas Copco AB Class B | 3,059 | 80 | Graubuendner Kantonalbank | 215 | 316 | |||||
| Axfood AB | 18,834 | 294 | Kuehne & Nagel International AG | 4,344 | 589 | |||||
| BillerudKorsnas AB | 11,282 | 185 | LafargeHolcim, Ltd.(Æ) | 20,513 | 1,094 | |||||
| Boliden AB | 29,749 | 688 | Lonza Group AG(Æ) | 3,896 | 735 | |||||
| Castellum AB | 7,161 | 97 | Nestle SA | 147,404 | 10,683 | |||||
| Electrolux AB | 3,590 | 85 | Novartis AG | 96,660 | 6,864 | |||||
| Fastighets AB Balder Class B(Æ) | 24,470 | 555 | Partners Group Holding AG | 1,184 | 598 | |||||
| Fingerprint Cards AB Class B(Æ) | 22,255 | 214 | Roche Holding AG | 33,813 | 7,767 | |||||
| Getinge AB Class B | 6,223 | 102 | Schindler Holding AG | 6,303 | 1,169 | |||||
| Hennes & Mauritz AB Class B | 24,906 | 701 | SFS Group AG(Æ) | 2,626 | 198 | |||||
| Hexagon AB Class B | 21,047 | 735 | SGS SA | 233 | 472 | |||||
| Holmen AB Class B | 3,835 | 131 | Sika AG | 96 | 461 | |||||
| Hufvudstaden AB Class A | 20,104 | 311 | Sonova Holding AG | 2,438 | 327 | |||||
| ICA Gruppen AB | 8,459 | 262 | St. Galler Kantonalbank AG | 360 | 135 | |||||
| Investment AB Latour Class B | 4,009 | 148 | Straumann Holding AG | 479 | 180 | |||||
See accompanying notes which are an integral part of the financial statements.
752 Select International Equity Fund
Russell Investment Company
Select International Equity Fund
Schedule of Investments, continued — October 31, 2016
| Amounts in thousands (except share amounts) | Amounts in thousands (except share amounts) | ||||||||
| Principal | Fair | Principal | Fair | ||||||
| Amount ($) | Value | Amount ($) | Value | ||||||
| or Shares | $ | or Shares | $ | ||||||
| Sulzer AG | 1,642 | 162 | International Consolidated Airlines | ||||||
| Swatch Group AG (The) Class B | 2,609 | 785 | Group SA | 68,434 | 363 | ||||
| Swiss Life Holding AG(Æ) | 3,354 | 887 | Intertek Group PLC | 15,230 | 636 | ||||
| Swiss Prime Site AG Class A(Æ) | 4,652 | 386 | ITV PLC | 141,934 | 296 | ||||
| Swiss Re AG | 38,113 | 3,537 | J Sainsbury PLC | 295,912 | 908 | ||||
| Swisscom AG | 965 | 441 | John Wood Group PLC | 54,196 | 509 | ||||
| Syngenta AG | 1,058 | 425 | Johnson Matthey PLC | 22,884 | 952 | ||||
| TE Connectivity, Ltd. | 13,635 | 857 | Kingfisher PLC | 345,301 | 1,524 | ||||
| UBS Group AG(Æ) | 173,721 | 2,456 | Land Securities Group PLC(ö) | 54,985 | 671 | ||||
| Wolseley PLC - ADR | 11,733 | 610 | Legal & General Group PLC | 496,163 | 1,269 | ||||
| Zurich Insurance Group AG(Æ) | 9,410 | 2,461 | Liberty Global PLC Class A(Æ) | 8,798 | 287 | ||||
| 58,260 | Liberty Global PLC Class C(Æ) | 9,012 | 287 | ||||||
| Liberty Global PLC LiLAC(Æ) | 3,863 | 107 | |||||||
| United Kingdom - 13.4% | Lloyds Banking Group PLC | 1,809,652 | 1,266 | ||||||
| 3i Group PLC | 167,581 | 1,374 | Manchester United PLC Class A | 5,381 | 82 | ||||
| Admiral Group PLC | 12,994 | 304 | Marks & Spencer Group PLC | 112,084 | 466 | ||||
| Amec Foster Wheeler PLC - GDR | 16,698 | 91 | Meggitt PLC | 75,511 | 402 | ||||
| Anglo American PLC(Æ) | 60,915 | 841 | Micro Focus International PLC | 14,602 | 382 | ||||
| Ashtead Group PLC | 18,462 | 289 | National Grid PLC | 120,338 | 1,567 | ||||
| Associated British Foods PLC | 12,691 | 382 | Next PLC | 4,191 | 247 | ||||
| AstraZeneca PLC | 24,747 | 1,388 | Old Mutual PLC | 505,087 | 1,242 | ||||
| Auto Trader Group PLC(Þ) | 17,120 | 78 | Pearson PLC | 86,179 | 797 | ||||
| Aviva PLC | 296,796 | 1,605 | Persimmon PLC Class A | 32,674 | 676 | ||||
| Babcock International Group PLC | 34,372 | 416 | Petrofac, Ltd. | 34,300 | 338 | ||||
| BAE Systems PLC | 115,980 | 769 | Prudential PLC | 173,758 | 2,833 | ||||
| Barclays PLC | 745,380 | 1,729 | Reckitt Benckiser Group PLC | 25,291 | 2,262 | ||||
| Barratt Developments PLC | 79,237 | 439 | RELX NV | 46,570 | 785 | ||||
| BBA Aviation PLC | 50,634 | 160 | RELX PLC | 74,739 | 1,334 | ||||
| Bellway PLC | 10,089 | 292 | Rentokil Initial PLC | 165,018 | 461 | ||||
| Berkeley Group Holdings PLC | 12,177 | 351 | Rightmove PLC | 6,973 | 318 | ||||
| BHP Billiton PLC | 151,929 | 2,279 | Rio Tinto PLC | 80,175 | 2,780 | ||||
| Booker Group PLC | 37,689 | 83 | Rolls-Royce Holdings PLC(Æ) | 3,519,078 | 669 | ||||
| BP PLC | 1,000,420 | 5,907 | Royal Bank of Scotland Group PLC(Æ) | 175,825 | 406 | ||||
| British American Tobacco PLC | 74,011 | 4,248 | Royal Mail PLC | 128,032 | 769 | ||||
| British Land Co. PLC (The)(ö) | 79,238 | 567 | RSA Insurance Group PLC | 151,950 | 1,026 | ||||
| Britvic PLC | 14,249 | 97 | Sage Group PLC (The) | 83,717 | 738 | ||||
| BT Group PLC | 229,313 | 1,054 | Scottish & Southern Energy PLC | 20,945 | 408 | ||||
| BTG PLC(Æ) | 9,764 | 79 | Segro PLC(ö) | 74,854 | 402 | ||||
| Bunzl PLC | 15,968 | 429 | Severn Trent PLC Class H | 11,909 | 339 | ||||
| CNH Industrial NV | 10,980 | 85 | Shaftesbury PLC(ö) | 46,053 | 517 | ||||
| Coca-Cola European Partners PLC | 11,491 | 442 | Sky PLC | 86,075 | 860 | ||||
| Compass Group PLC | 48,326 | 874 | Smith & Nephew PLC | 63,794 | 919 | ||||
| CYBG PLC(Æ) | 95,594 | 316 | Smiths Group PLC | 32,308 | 559 | ||||
| Derwent London PLC(ö) | 6,978 | 206 | Spectris PLC | 12,092 | 303 | ||||
| Diageo PLC | 55,263 | 1,471 | Standard Chartered PLC(Æ) | 170,066 | 1,479 | ||||
| Direct Line Insurance Group PLC | 171,353 | 725 | Standard Life PLC | 59,214 | 244 | ||||
| DS Smith PLC Class F | 75,704 | 369 | Subsea 7 SA(Æ) | 96,968 | 1,084 | ||||
| Fiat Chrysler Automobiles NV | 116,286 | 851 | Tate & Lyle PLC | 42,044 | 401 | ||||
| GKN PLC | 170,998 | 667 | Taylor Wimpey PLC | 323,555 | 560 | ||||
| GlaxoSmithKline PLC - ADR | 220,520 | 4,359 | Tesco PLC(Æ) | 336,163 | 867 | ||||
| Great Portland Estates PLC(ö) | 25,896 | 188 | Travis Perkins PLC | 18,982 | 309 | ||||
| Greene King PLC | 45,653 | 408 | UBM PLC | 17,495 | 154 | ||||
| Halma PLC | 42,689 | 546 | Unilever NV | 51,792 | 2,169 | ||||
| Hammerson PLC(ö) | 61,006 | 411 | Unilever PLC | 42,551 | 1,779 | ||||
| Hiscox, Ltd. | 62,352 | 779 | United Utilities Group PLC | 16,518 | 190 | ||||
| HSBC Holdings PLC | 1,231,419 | 9,261 | Vodafone Group PLC | 1,263,120 | 3,468 | ||||
| Imperial Tobacco Group PLC | 35,061 | 1,695 | Weir Group PLC (The) | 3,715 | 77 | ||||
| Inchcape PLC | 88,585 | 705 | William Hill PLC | 26,951 | 98 | ||||
| Informa PLC | 49,616 | 408 | Wm Morrison Supermarkets PLC | 301,562 | 836 | ||||
| InterContinental Hotels Group PLC | 1,946 | 75 | |||||||
See accompanying notes which are an integral part of the financial statements.
Select International Equity Fund 753
Russell Investment Company
Select International Equity Fund
Schedule of Investments, continued — October 31, 2016
| Amounts in thousands (except share amounts) | Amounts in thousands (except share amounts) | ||||||||
| Principal | Fair | Principal | Fair | ||||||
| Amount ($) | Value | Amount ($) | Value | ||||||
| or Shares | $ | or Shares | $ | ||||||
| WPP PLC | 115,782 | 2,516 | Russell U.S. Cash Collateral Fund(×) | 701,480 | (8) | 701 | |||
| 100,285 | Total Other Securities | ||||||||
| (cost $701) | 701 | ||||||||
| United States - 0.4% | |||||||||
| Autoliv, Inc. | 5,685 | 550 | |||||||
| Ball Corp. | 2,455 | 189 | Total Investments 99.3% | ||||||
| Carnival PLC | 32,964 | 1,587 | (identified cost $766,396) | 744,235 | |||||
| Samsonite International SA | 56,100 | 176 | |||||||
| Seagate Technology PLC | 15,663 | 537 | Other Assets and Liabilities, Net | ||||||
| Sensata Technologies Holding NV(Æ) | 7,515 | 269 | - 0.7% | 5,360 | |||||
| 3,308 | Net Assets - 100.0% | 749,595 | |||||||
| Total Common Stocks | |||||||||
| (cost $734,797) | 713,580 | ||||||||
| Investments in Other Funds - 1.0% | |||||||||
| Vanguard FTSE Emerging Markets | |||||||||
| ETF | 196,138 | 7,404 | |||||||
| Total Investments in Other Funds | |||||||||
| (cost $7,192) | 7,404 | ||||||||
| Preferred Stocks - 0.9% | |||||||||
| Germany - 0.6% | |||||||||
| Fuchs Petrolub SE | 5,714 | 255 | |||||||
| Henkel AG & Co. KGaA | 8,473 | 1,087 | |||||||
| Porsche Automobil Holding SE | 24,447 | 1,318 | |||||||
| Sartorius AG | 5,852 | 460 | |||||||
| Volkswagen AG | 11,253 | 1,547 | |||||||
| 4,667 | |||||||||
| Japan - 0.2% | |||||||||
| Shinkin Central Bank Class A | 566 | 1,242 | |||||||
| Sweden - 0.1% | |||||||||
| Fastighets AB Balder | 13,305 | 504 | |||||||
| Total Preferred Stocks | |||||||||
| (cost $7,575) | 6,413 | ||||||||
| Warrants & Rights - 0.0% | |||||||||
| Spain - 0.0% | |||||||||
| Ferrovial SA(Æ) | |||||||||
| 2018 Rights | 22,681 | 10 | |||||||
| Sweden - 0.0% | |||||||||
| Tele2 AB(Æ) | |||||||||
| 2018 Rights | 8,585 | 3 | |||||||
| Total Warrants & Rights | |||||||||
| (cost $10) | 13 | ||||||||
| Short-Term Investments - 2.1% | |||||||||
| United States - 2.1% | |||||||||
| Russell U.S. Cash Management Fund | 16,121,166 | (8) | 16,124 | ||||||
| Total Short-Term Investments | |||||||||
| (cost $16,121) | 16,124 | ||||||||
| Other Securities - 0.1% | |||||||||
See accompanying notes which are an integral part of the financial statements.
754 Select International Equity Fund
Russell Investment Company
Select International Equity Fund
Schedule of Investments, continued — October 31, 2016
| Futures Contracts | |||||||||
| Amounts in thousands (except contract amounts) | |||||||||
| Unrealized | |||||||||
| Appreciation | |||||||||
| Number of | Notional | Expiration | (Depreciation) | ||||||
| Contracts | Amount | Date | $ | ||||||
| Long Positions | |||||||||
| Euro STOXX 50 Index Futures | 90 | EUR | 2,748 | 12/16 | 59 | ||||
| FTSE 100 Index Futures | 66 | GBP | 4,573 | 12/16 | 140 | ||||
| MSCI EAFE Mini Index Futures | 123 | USD | 10,244 | 12/16 | (260 | ) | |||
| S&P/TSX 60 Index Futures | 36 | CAD | 6,238 | 12/16 | 137 | ||||
| SPI 200 Index Futures | 36 | AUD | 4,761 | 12/16 | 71 | ||||
| Short Positions | |||||||||
| Hang Seng Index Futures | 25 | HKD | 28,631 | 11/16 | 82 | ||||
| S&P 500 E-Mini Index Futures | 116 | USD | 12,297 | 12/16 | 334 | ||||
| Total Unrealized Appreciation (Depreciation) on Open Futures Contracts (å) | 563 | ||||||||
| Foreign Currency Exchange Contracts | |||||||||
| Amounts in thousands | |||||||||
| Unrealized | |||||||||
| Appreciation | |||||||||
| Amount | Amount | (Depreciation) | |||||||
| Counterparty | Sold | Bought | Settlement Date | $ | |||||
| Bank of America | USD | 187 | AUD | 250 | 12/21/16 | 3 | |||
| Bank of America | USD | 221 | AUD | 288 | 12/21/16 | (2 | ) | ||
| Bank of America | USD | 686 | AUD | 900 | 12/21/16 | (2 | ) | ||
| Bank of America | USD | 3 | CAD | 4 | 12/21/16 | — | |||
| Bank of America | USD | 23 | CAD | 30 | 12/21/16 | (1 | ) | ||
| Bank of America | USD | 38 | CAD | 50 | 12/21/16 | (1 | ) | ||
| Bank of America | USD | 61 | CAD | 80 | 12/21/16 | (1 | ) | ||
| Bank of America | USD | 352 | CAD | 461 | 12/21/16 | (8 | ) | ||
| Bank of America | USD | 1,109 | CHF | 1,100 | 12/21/16 | 5 | |||
| Bank of America | USD | 57 | EUR | 51 | 12/21/16 | (1 | ) | ||
| Bank of America | USD | 679 | EUR | 600 | 12/21/16 | (19 | ) | ||
| Bank of America | USD | 107 | GBP | 83 | 12/21/16 | (5 | ) | ||
| Bank of America | USD | 129 | HKD | 1,000 | 12/21/16 | — | |||
| Bank of America | USD | 202 | SEK | 1,800 | 12/21/16 | (2 | ) | ||
| Bank of America | AUD | 300 | USD | 230 | 12/21/16 | 2 | |||
| Bank of America | CAD | 30 | USD | 23 | 12/21/16 | 1 | |||
| Bank of America | CAD | 30 | USD | 23 | 12/21/16 | — | |||
| Bank of America | CAD | 40 | USD | 30 | 12/21/16 | — | |||
| Bank of America | CAD | 50 | USD | 38 | 12/21/16 | 1 | |||
| Bank of America | CAD | 80 | USD | 60 | 12/21/16 | 1 | |||
| Bank of America | CAD | 100 | USD | 77 | 12/21/16 | 2 | |||
| Bank of America | CAD | 100 | USD | 76 | 12/21/16 | 1 | |||
| Bank of America | CAD | 100 | USD | 76 | 12/21/16 | 1 | |||
| Bank of America | CAD | 150 | USD | 114 | 12/21/16 | 3 | |||
| Bank of America | CAD | 200 | USD | 149 | 12/21/16 | — | |||
| Bank of America | CAD | 850 | USD | 635 | 12/21/16 | 1 | |||
| Bank of America | EUR | 150 | USD | 169 | 12/21/16 | 4 | |||
| Bank of America | EUR | 200 | USD | 219 | 12/21/16 | (1 | ) | ||
| Bank of America | GBP | 100 | USD | 132 | 12/21/16 | 10 | |||
| Bank of America | GBP | 1,100 | USD | 1,345 | 12/21/16 | (3 | ) | ||
| Bank of America | HKD | 1,146 | USD | 148 | 12/21/16 | — | |||
| Bank of America | JPY | 12,000 | USD | 118 | 12/21/16 | 3 | |||
| Bank of America | NZD | 500 | USD | 364 | 12/21/16 | 7 | |||
| Bank of New York | CAD | 40 | USD | 31 | 12/21/16 | 1 | |||
| Bank of New York | CAD | 100 | USD | 76 | 12/21/16 | 1 | |||
| Brown Brothers Harriman | USD | 124 | GBP | 100 | 12/21/16 | (1 | ) | ||
| Brown Brothers Harriman | CAD | 100 | USD | 76 | 12/21/16 | 1 | |||
See accompanying notes which are an integral part of the financial statements.
Select International Equity Fund 755
Russell Investment Company
Select International Equity Fund
Schedule of Investments, continued — October 31, 2016
| Foreign Currency Exchange Contracts | |||||||
| Amounts in thousands | |||||||
| Unrealized | |||||||
| Appreciation | |||||||
| Amount | Amount | (Depreciation) | |||||
| Counterparty | Sold | Bought | Settlement Date | $ | |||
| Brown Brothers Harriman | CAD | 100 | USD | 75 | 12/21/16 | — | |
| Brown Brothers Harriman | CAD | 360 | USD | 272 | 12/21/16 | 4 | |
| Citigroup | USD | 76 | CAD | 100 | 12/21/16 | (1 | ) |
| Citigroup | CAD | 100 | USD | 78 | 12/21/16 | 3 | |
| Royal Bank of Canada | USD | 3,130 | EUR | 2,800 | 12/21/16 | (49 | ) |
| Royal Bank of Canada | USD | 1,559 | GBP | 1,200 | 12/21/16 | (88 | ) |
| Royal Bank of Canada | USD | 2,448 | JPY | 250,000 | 12/21/16 | (59 | ) |
| Royal Bank of Canada | AUD | 200 | USD | 151 | 12/21/16 | (1 | ) |
| Royal Bank of Canada | CAD | 200 | USD | 155 | 12/21/16 | 6 | |
| Royal Bank of Canada | NOK | 2,000 | USD | 240 | 12/21/16 | (2 | ) |
| Royal Bank of Canada | NZD | 2,400 | USD | 1,744 | 12/21/16 | 31 | |
| Royal Bank of Canada | SEK | 16,000 | USD | 1,867 | 12/21/16 | 90 | |
| State Street | USD | 3,522 | AUD | 4,600 | 12/21/16 | (27 | ) |
| State Street | USD | 6,408 | AUD | 8,370 | 12/21/16 | (48 | ) |
| State Street | USD | 78 | CAD | 100 | 12/21/16 | (3 | ) |
| State Street | USD | 453 | CAD | 585 | 12/21/16 | (16 | ) |
| State Street | USD | 1,215 | CAD | 1,600 | 12/21/16 | (21 | ) |
| State Street | USD | 3,869 | CAD | 5,000 | 12/21/16 | (140 | ) |
| State Street | USD | 9,749 | CAD | 12,600 | 12/21/16 | (352 | ) |
| State Street | USD | 3,056 | EUR | 2,700 | 12/21/16 | (85 | ) |
| State Street | USD | 1,931 | GBP | 1,450 | 12/21/16 | (154 | ) |
| State Street | USD | 3,769 | GBP | 2,900 | 12/21/16 | (215 | ) |
| State Street | USD | 10,654 | GBP | 8,000 | 12/21/16 | (852 | ) |
| State Street | USD | 103 | HKD | 800 | 12/21/16 | — | |
| State Street | USD | 1,872 | HKD | 14,500 | 12/21/16 | (1 | ) |
| State Street | USD | 1,700 | JPY | 170,000 | 12/21/16 | (75 | ) |
| State Street | USD | 1,974 | JPY | 200,000 | 12/21/16 | (63 | ) |
| State Street | USD | 4,397 | NZD | 5,950 | 12/21/16 | (150 | ) |
| State Street | CAD | 50 | USD | 38 | 12/21/16 | 1 | |
| State Street | EUR | 18,550 | USD | 20,993 | 12/21/16 | 583 | |
| State Street | GBP | 2,600 | USD | 3,379 | 12/21/16 | 193 | |
| State Street | HKD | 14,000 | USD | 1,806 | 12/21/16 | 1 | |
| State Street | HKD | 14,800 | USD | 1,910 | 12/21/16 | 1 | |
| State Street | JPY | 188,000 | USD | 1,855 | 12/21/16 | 59 | |
| State Street | JPY | 1,268,000 | USD | 12,515 | 12/21/16 | 400 | |
| State Street | NOK | 22,400 | USD | 2,737 | 12/21/16 | 26 | |
| State Street | SEK | 16,550 | USD | 1,974 | 12/21/16 | 137 | |
| UBS | AUD | 200 | USD | 152 | 12/21/16 | — | |
| UBS | CAD | 200 | USD | 152 | 12/21/16 | 3 | |
| Total Unrealized Appreciation (Depreciation) on Open Foreign Currency Exchange Contracts | (863 | ) | |||||
| Presentation of Portfolio Holdings | |||||||||||||
| Amounts in thousands | |||||||||||||
| Fair Value | |||||||||||||
| Practical | |||||||||||||
| Portfolio Summary | Level 1 | Level 2 | Level 3 | Expedient (a) | Total | % of Net Assets | |||||||
| Common Stocks | |||||||||||||
| Australia | $ | — | $ | 36,502 | $ | — | $ | — | $ | 36,502 | 4.9 | ||
| Austria | — | 4,424 | — | — | 4,424 | 0.6 | |||||||
| Belgium | 2,821 | 6,006 | — | — | 8,827 | 1.2 | |||||||
| Canada | 54,878 | — | — | — | 54,878 | 7.3 | |||||||
See accompanying notes which are an integral part of the financial statements.
756 Select International Equity Fund
Russell Investment Company
Select International Equity Fund
Schedule of Investments, continued — October 31, 2016
| Presentation of Portfolio Holdings | |||||||||||||||||
| Amounts in thousands | |||||||||||||||||
| Fair Value | |||||||||||||||||
| Practical | |||||||||||||||||
| Portfolio Summary | Level 1 | Level 2 | Level 3 | Expedient (a) | Total | % of Net Assets | |||||||||||
| Denmark | — | 11,352 | — | — | 11,352 | 1.5 | |||||||||||
| Finland | — | 9,533 | — | — | 9,533 | 1.3 | |||||||||||
| France | 651 | 63,318 | — | — | 63,969 | 8.5 | |||||||||||
| Germany | 88 | 59,125 | — | — | 59,213 | 7.9 | |||||||||||
| Hong Kong | — | 25,253 | 47 | — | 25,300 | 3.4 | |||||||||||
| Ireland | 1,306 | 5,182 | — | — | 6,488 | 0.9 | |||||||||||
| Israel | 564 | 3,373 | — | — | 3,937 | 0.5 | |||||||||||
| Italy | — | 14,388 | — | — | 14,388 | 1.9 | |||||||||||
| Japan | — | 162,352 | — | — | 162,352 | 21.6 | |||||||||||
| Jersey | — | 2,330 | — | — | 2,330 | 0.3 | |||||||||||
| Luxembourg | — | 1,848 | — | — | 1,848 | 0.2 | |||||||||||
| Netherlands | 2,597 | 24,288 | — | — | 26,885 | 3.6 | |||||||||||
| New Zealand | — | 1,150 | — | — | 1,150 | 0.2 | |||||||||||
| Norway | — | 6,022 | — | — | 6,022 | 0.8 | |||||||||||
| Portugal | — | 2,589 | 3 | — | 2,592 | 0.3 | |||||||||||
| Singapore | 470 | 6,780 | — | — | 7,250 | 1.0 | |||||||||||
| South Africa | — | 807 | — | — | 807 | 0.1 | |||||||||||
| Spain | — | 23,087 | — | — | 23,087 | 3.1 | |||||||||||
| Sweden | — | 18,593 | — | — | 18,593 | 2.5 | |||||||||||
| Switzerland | 857 | 57,403 | — | — | 58,260 | 7.8 | |||||||||||
| United Kingdom | 1,205 | 99,076 | 4 | — | 100,285 | 13.4 | |||||||||||
| United States | 1,545 | 1,763 | — | — | 3,308 | 0.4 | |||||||||||
| Investments in Other Funds | 7,404 | — | — | — | 7,404 | 1.0 | |||||||||||
| Preferred Stocks | — | 6,413 | — | — | 6,413 | 0.9 | |||||||||||
| Warrants & Rights | 10 | 3 | — | — | 13 | —* | |||||||||||
| Short-Term Investments | — | — | — | 16,124 | 16,124 | 2.1 | |||||||||||
| Other Securities | — | — | — | 701 | 701 | 0.1 | |||||||||||
| Total Investments | 74,396 | 652,960 | 54 | 16,825 | 744,235 | 99.3 | |||||||||||
| Other Assets and Liabilities, Net | 0.7 | ||||||||||||||||
| 100.0 | |||||||||||||||||
| Other Financial Instruments | |||||||||||||||||
| Assets | |||||||||||||||||
| Futures Contracts | 823 | — | — | — | 823 | 0.1 | |||||||||||
| Foreign Currency Exchange Contracts | — | 1,586 | — | — | 1,586 | 0.2 | |||||||||||
| A | |||||||||||||||||
| Liabilities | |||||||||||||||||
| Futures Contracts | (260 | ) | — | — | — | (260 | ) | (—)* | |||||||||
| Foreign Currency Exchange Contracts | — | (2,449 | ) | — | — | (2,449 | ) | (0.3 | ) | ||||||||
| Total Other Financial Instruments** | $ | 563 | $ | (863 | ) | $ | — | $ | — | $ | (300 | ) | |||||
* Less than 0.05% of net assets.
** Futures and foreign currency exchange contract values reflect the unrealized appreciation (depreciation) on the investments.
See accompanying notes which are an integral part of the financial statements.
Select International Equity Fund 757
Russell Investment Company
Select International Equity Fund
Schedule of Investments, continued — October 31, 2016
(a) Certain investments that are measured at fair value using the net asset value per share (or its equivalent) practical expedient have not been classified
in the fair value levels. The fair value amounts presented in the table are intended to permit reconciliation to the amounts presented in the Schedule of
Investments.
For a description of the Levels, see note 2 in the Notes to Financial Statements.
For a disclosure on transfers between Levels 1, 2 and 3 during the period ended October 31, 2016, see note 2 in the Notes to
Financial Statements.
Investments in which significant unobservable inputs (Level 3) were used in determining a fair value for the period ended October
31, 2016 were less than 1% of net assets.
| Amounts in thousands | |||
| Fair Value | |||
| Sector Exposure | $ | ||
| Consumer Discretionary | 96,774 | ||
| Consumer Staples | 55,635 | ||
| Energy | 48,117 | ||
| Financial Services | 208,752 | ||
| Health Care | 65,315 | ||
| Materials and Processing | 69,027 | ||
| Producer Durables | 98,172 | ||
| Technology | 33,542 | ||
| Utilities | 52,063 | ||
| Warrants and Rights | 13 | ||
| Short-Term Investments | 16,124 | ||
| Other Securities | 701 | ||
| Total Investments | 744,235 | ||
See accompanying notes which are an integral part of the financial statements.
758 Select International Equity Fund
Russell Investment Company
Select International Equity Fund
Fair Value of Derivative Instruments — October 31, 2016
Amounts in thousands
| Foreign | |||||||
| Equity | Currency | ||||||
| Derivatives not accounted for as hedging instruments | Contracts | Contracts | |||||
| Location: Statement of Assets and Liabilities - Assets | |||||||
| Unrealized appreciation on foreign currency exchange contracts | $ | — | $ | 1,586 | |||
| Variation margin on futures contracts* | 823 | — | |||||
| Total | $ | 823 | $ | 1,586 | |||
| Location: Statement of Assets and Liabilities - Liabilities | |||||||
| Variation margin on futures contracts* | $ | 260 | $ | — | |||
| Unrealized depreciation on foreign currency exchange contracts | — | 2,449 | |||||
| Total | $ | 260 | $ | 2,449 | |||
| Foreign | |||||||
| Equity | Currency | ||||||
| Derivatives not accounted for as hedging instruments | Contracts | Contracts | |||||
| Location: Statement of Operations - Net realized gain (loss) | |||||||
| Futures contracts | $ | (270 | ) | $ | — | ||
| Foreign currency-related transactions** | — | (1,322 | ) | ||||
| Total | $ | (270 | ) | $ | (1,322 | ) | |
| Location: Statement of Operations - Net change in unrealized appreciation (depreciation) | |||||||
| Futures contracts | $ | 260 | $ | — | |||
| Foreign currency-related transactions*** | — | (1,259 | ) | ||||
| Total | $ | 260 | $ | (1,259 | ) | ||
* Includes cumulative appreciation/depreciation of futures contracts as reported in the Schedule of Investments. Only variation margin is reported within the
Statement of Assets and Liabilities.
** Only includes net realized gain (loss) on forward and spot contracts. May differ from the net realized gain (loss) on foreign currency-related transactions reported
within the Statement of Operations.
*** Only includes change in unrealized gain (loss) on forward and spot contracts. May differ from the net change in unrealized gain (loss) on foreign currency-related
transactions reported within the Statement of Operations.
For further disclosure on derivatives see note 2 in the Notes to Financial Statements.
See accompanying notes which are an integral part of the financial statements.
Select International Equity Fund 759
Russell Investment Company
Select International Equity Fund
Balance Sheet Offsetting of Financial and Derivative Instruments — October 31, 2016
| Amounts in thousands | |||||||||||||
| Offsetting of Financial Assets and Derivative Assets | |||||||||||||
| Gross | Net Amounts | ||||||||||||
| Amounts | of Assets | ||||||||||||
| Gross | Offset in the | Presented in | |||||||||||
| Amounts of | Statement of | the Statement | |||||||||||
| Recognized | Assets and | of Assets and | |||||||||||
| Description | Location: Statement of Assets and Liabilities - Assets | Assets | Liabilities | Liabilities | |||||||||
| Securities on Loan* | Investments, at fair value | $ | 671 | $ | — | $ | 671 | ||||||
| Foreign Currency Exchange Contracts | Unrealized appreciation on foreign currency exchange contracts | 1,586 | — | 1,586 | |||||||||
| Futures Contracts | Variation margin on futures contracts | 52 | — | 52 | |||||||||
| Total Financial and Derivative Assets | 2,309 | — | 2,309 | ||||||||||
| Financial and Derivative Assets not subject to a netting agreement | (52) | — | (52 | ) | |||||||||
| Total Financial and Derivative Assets subject to a netting agreement | $ | 2,257 | $ | — | $ | 2,257 | |||||||
| Financial Assets, Derivative Assets, and Collateral Held by Counterparty | |||||||||||||
| Gross Amounts Not Offset in | |||||||||||||
| the Statement of Assets and | |||||||||||||
| Liabilities | |||||||||||||
| Net Amounts | |||||||||||||
| of Assets | |||||||||||||
| Presented in | |||||||||||||
| the Statement | Financial and | ||||||||||||
| of Assets and | Derivative | Collateral | |||||||||||
| Counterparty | Liabilities | Instruments | Received^ | Net Amount | |||||||||
| Bank of America | $ | 45 | $ | 45 | $ | — | $ | — | |||||
| Bank of New York | 2 | — | — | 2 | |||||||||
| Brown Brothers Harriman | 5 | 1 | — | 4 | |||||||||
| Citigroup | 176 | 1 | 173 | 2 | |||||||||
| Credit Suisse | 200 | — | 200 | — | |||||||||
| Fidelity | 176 | — | 176 | — | |||||||||
| Goldman Sachs | 122 | — | 122 | — | |||||||||
| Royal Bank of Canada | 128 | 128 | — | — | |||||||||
| State Street | 1,400 | 1,400 | — | — | |||||||||
| UBS | 3 | — | — | 3 | |||||||||
| Total | $ | 2,257 | $ | 1,575 | $ | 671 | $ | 11 | |||||
See accompanying notes which are an integral part of the financial statements.
760 Select International Equity Fund
Russell Investment Company
Select International Equity Fund
Balance Sheet Offsetting of Financial and Derivative Instruments, continued —
October 31, 2016
| Amounts in thousands | ||||||||||||
| Offsetting of Financial Liabilities and Derivative Liabilities | ||||||||||||
| Gross | Net Amounts | |||||||||||
| Amounts | of Liabilities | |||||||||||
| Gross | Offset in the | Presented in | ||||||||||
| Amounts of | Statement of | the Statement | ||||||||||
| Recognized | Assets and | of Assets and | ||||||||||
| Description | Location: Statement of Assets and Liabilities - Liabilities | Liabilities | Liabilities | Liabilities | ||||||||
| Futures Contracts | Variation margin on futures contracts | $ | 52 | $ | — | $ | 52 | |||||
| Foreign Currency Exchange Contracts | Unrealized depreciation on foreign currency exchange contracts | 2,449 | — | 2,449 | ||||||||
| Total Financial and Derivative Liabilities | 2,501 | — | 2,501 | |||||||||
| Financial and Derivative Liabilities not subject to a netting agreement | (52) | — | (52 | ) | ||||||||
| Total Financial and Derivative Liabilities subject to a netting agreement | $ | 2,449 | $ | — | $ | 2,449 | ||||||
| Financial Liabilities, Derivative Liabilities, and Collateral Pledged by Counterparty | ||||||||||||
| Gross Amounts Not Offset in | ||||||||||||
| the Statement of Assets and | ||||||||||||
| Liabilities | ||||||||||||
| Net Amounts | ||||||||||||
| of Liabilities | ||||||||||||
| Presented in | ||||||||||||
| the Statement | Financial and | |||||||||||
| of Assets and | Derivative | Collateral | ||||||||||
| Counterparty | Liabilities | Instruments | Pledged^ | Net Amount | ||||||||
| Bank of America | $ | 46 | $ | 45 | $ | — | $ | 1 | ||||
| Brown Brothers Harriman | 1 | 1 | — | — | ||||||||
| Citigroup | 1 | 1 | — | — | ||||||||
| Royal Bank of Canada | 200 | 128 | — | 72 | ||||||||
| State Street | 2,201 | 1,400 | — | 801 | ||||||||
| Total | $ | 2,449 | $ | 1,575 | $ | — | $ | 874 | ||||
* Fair value of securities on loan as reported in the footnotes to the Statement of Assets and Liabilities.
^ Collateral received or pledged amounts may not reconcile to those disclosed in the Statement of Assets and Liabilities due to the inclusion of off-Balance
Sheet collateral and adjustments made to exclude overcollateralization.
For further disclosure on derivatives and counterparty risk see note 2 in the Notes to Financial Statements.
See accompanying notes which are an integral part of the financial statements.
Select International Equity Fund 761
Russell Investment Company
Select International Equity Fund
Statement of Assets and Liabilities — October 31, 2016
| Amounts in thousands | ||
| Assets | ||
| Investments, at identified cost | $ | 766,396 |
| Investments, at fair value(*)(>) | 744,235 | |
| Cash (restricted)(a) | 2,600 | |
| Foreign currency holdings(^) | 2,325 | |
| Unrealized appreciation on foreign currency exchange contracts | 1,586 | |
| Receivables: | ||
| Dividends and interest | 1,939 | |
| Dividends from affiliated Russell funds | 9 | |
| Fund shares sold | 34 | |
| Foreign capital gains taxes recoverable | 1,324 | |
| Variation margin on futures contracts | 52 | |
| Prepaid expenses | 1 | |
| Total assets | 754,105 | |
| Liabilities | ||
| Payables: | ||
| Investments purchased | 14 | |
| Fund shares redeemed | 851 | |
| Accrued fees to affiliates | 245 | |
| Other accrued expenses | 198 | |
| Variation margin on futures contracts | 52 | |
| Unrealized depreciation on foreign currency exchange contracts | 2,449 | |
| Payable upon return of securities loaned | 701 | |
| Total liabilities | 4,510 | |
| Net Assets | $ | 749,595 |
See accompanying notes which are an integral part of the financial statements.
762 Select International Equity Fund
Russell Investment Company
Select International Equity Fund
Statement of Assets and Liabilities, continued — October 31, 2016
| Amounts in thousands | |||
| Net Assets Consist of: | |||
| Undistributed (overdistributed) net investment income | $ | 14,336 | |
| Accumulated net realized gain (loss) | (94,224 | ) | |
| Unrealized appreciation (depreciation) on: | |||
| Investments (net of deferred tax liability for foreign capital gains taxes) | (22,161 | ) | |
| Futures contracts | 563 | ||
| Foreign currency-related transactions | (962 | ) | |
| Shares of beneficial interest | 873 | ||
| Additional paid-in capital | 851,170 | ||
| Net Assets | $ | 749,595 | |
| Net Asset Value, offering and redemption price per share: | |||
| Net asset value per share: Class R6(#) | $ | 8.59 | |
| Class R6 — Net assets | $ | 110,273 | |
| Class R6 — Shares outstanding ($.01 par value) | 12,837 | ||
| Net asset value per share: Class S(#) | $ | 8.58 | |
| Class S — Net assets | $ | 2,517,366 | |
| Class S — Shares outstanding ($.01 par value) | 293,231 | ||
| Net asset value per share: Class T(#) | $ | 8.59 | |
| Class T — Net assets | $ | 867,235 | |
| Class T — Shares outstanding ($.01 par value) | 100,910 | ||
| Net asset value per share: Class Y(#) | $ | 8.59 | |
| Class Y — Net assets | $ | 746,100,353 | |
| Class Y — Shares outstanding ($.01 par value) | 86,860,247 | ||
| Amounts in thousands | |||
| (^) Foreign currency holdings - cost | $ | 2,356 | |
| (*) Securities on loan included in investments | $ | 671 | |
| (>) Investments in affiliates, Russell U.S. Cash Management Fund and Russell U.S. Cash Collateral Fund | $ | 16,825 | |
| (a) Cash Collateral for Futures | $ | 2,600 | |
| (#) Net asset value per share equals class level net assets divided by class level shares of beneficial interest outstanding. | |||
See accompanying notes which are an integral part of the financial statements.
Select International Equity Fund 763
Russell Investment Company
Select International Equity Fund
Statement of Operations — For the Period Ended October 31, 2016
| Amounts in thousands | |||
| Investment Income | |||
| Dividends | $ | 26,503 | |
| Dividends from affiliated Russell funds | 83 | ||
| Securities lending income (net) | 5 | ||
| Less foreign taxes withheld | (2,379 | ) | |
| Total investment income | 24,212 | ||
| Expenses | |||
| Advisory fees | 3,499 | ||
| Administrative fees | 375 | ||
| Custodian fees | 455 | ||
| Transfer agent fees - Class R6 | —** | ||
| Transfer agent fees - Class S | 4 | ||
| Transfer agent fees - Class T | 3 | ||
| Transfer agent fees - Class Y | 34 | ||
| Professional fees | 75 | ||
| Registration fees | 109 | ||
| Trustees’ fees | 25 | ||
| Printing fees | 7 | ||
| Offering fees | —** | ||
| Miscellaneous | 22 | ||
| Expenses before reductions | 4,608 | ||
| Expense reductions | (1,150 | ) | |
| Net expenses | 3,458 | ||
| Net investment income (loss) | 20,754 | ||
| Net Realized and Unrealized Gain (Loss) | |||
| Net realized gain (loss) on: | |||
| Investments (net of deferred tax liability for foreign capital gains taxes) | (84,463 | ) | |
| Futures contracts | (270 | ) | |
| Foreign currency-related transactions | (2,147 | ) | |
| Net realized gain (loss) | (86,880 | ) | |
| Net change in unrealized appreciation (depreciation) on: | |||
| Investments (net of deferred tax liability for foreign capital gains taxes) | 41,832 | ||
| Futures contracts | 260 | ||
| Foreign currency-related transactions | (1,332 | ) | |
| Net change in unrealized appreciation (depreciation) | 40,760 | ||
| Net realized and unrealized gain (loss) | (46,120 | ) | |
| Net Increase (Decrease) in Net Assets from Operations | $ | (25,366 | ) |
| ** Less than $500. | |||
See accompanying notes which are an integral part of the financial statements.
764 Select International Equity Fund
Russell Investment Company
Select International Equity Fund
Statements of Changes in Net Assets
| For the Periods Ended October 31, | ||||||
| Amounts in thousands | 2016 | 2015 | ||||
| Increase (Decrease) in Net Assets | ||||||
| Operations | ||||||
| Net investment income (loss) | $ | 20,754 | $ | 20,070 | ||
| Net realized gain (loss) | (86,880 | ) | (10,135 | ) | ||
| Net change in unrealized appreciation (depreciation) | 40,760 | (56,663 | ) | |||
| Net increase (decrease) in net assets from operations | (25,366 | ) | (46,728 | ) | ||
| Distributions | ||||||
| From net investment income | ||||||
| Class S | (33 | ) | — | |||
| Class T | (76 | ) | — | |||
| Class Y | (22,981 | ) | (755 | ) | ||
| Net decrease in net assets from distributions | (23,090 | ) | (755 | ) | ||
| Share Transactions* | ||||||
| Net increase (decrease) in net assets from share transactions | (68,393 | ) | 802,026 | |||
| Total Net Increase (Decrease) in Net Assets | (116,849 | ) | 754,543 | |||
| Net Assets | ||||||
| Beginning of period | 866,444 | 111,901 | ||||
| End of period | $ | 749,595 | $ | 866,444 | ||
| Undistributed (overdistributed) net investment income included in net assets | $ | 14,336 | $ | 18,437 | ||
See accompanying notes which are an integral part of the financial statements.
Select International Equity Fund 765
Russell Investment Company
Select International Equity Fund
Statements of Changes in Net Assets, continued
* Share transaction amounts (in thousands) for the periods ended October 31, 2016 and October 31, 2015 were as follows:
| 2016 | 2015 | |||||||||||
| Shares | Dollars | Shares | Dollars | |||||||||
| Class R6(2) | ||||||||||||
| Proceeds from shares sold | 13 | $ | 100 | — | $ | — | ||||||
| Payments for shares redeemed | — | — | — | — | ||||||||
| Net increase (decrease) | 13 | 100 | — | — | ||||||||
| Class S(1) | ||||||||||||
| Proceeds from shares sold | 237 | 1,985 | 235 | 2,236 | ||||||||
| Proceeds from reinvestment of distributions | 4 | 33 | — | — | ||||||||
| Payments for shares redeemed | (132 | ) | (1,140 | ) | (51 | ) | (474 | ) | ||||
| Net increase (decrease) | 109 | 878 | 184 | 1,762 | ||||||||
| Class T(1) | ||||||||||||
| Proceeds from shares sold | 70 | 589 | 324 | 3,130 | ||||||||
| Proceeds from reinvestment of distributions | 9 | 76 | — | — | ||||||||
| Payments for shares redeemed | (276 | ) | (2,289 | ) | (26 | ) | (244 | ) | ||||
| Net increase (decrease) | (197 | ) | (1,624 | ) | 298 | 2,886 | ||||||
| Class Y | ||||||||||||
| Proceeds from shares sold | 9,715 | 79,026 | 95,343 | 920,901 | ||||||||
| Proceeds from reinvestment of distributions | 2,713 | 22,981 | 82 | 755 | ||||||||
| Payments for shares redeemed | (19,942 | ) | (169,754 | ) | (12,928 | ) | (124,278 | ) | ||||
| Net increase (decrease) | (7,514 | ) | (67,747 | ) | 82,497 | 797,378 | ||||||
| Total increase (decrease) | (7,589 | ) | $ | (68,393 | ) | 82,979 | $ | 802,026 | ||||
(1) For the period January 5, 2015 (commencement of operations) to October 31, 2015.
(2) For the period March 1, 2016 (commencement of operations) to October 31, 2016.
See accompanying notes which are an integral part of the financial statements.
766 Select International Equity Fund
(This page intentionally left blank)
Russell Investment Company
Select International Equity Fund
Financial Highlights — For the Periods Ended
For a Share Outstanding Throughout Each Period.
| $ | $ | $ | $ | $ | ||||||||||||
| Net Asset Value, | Net | Net Realized | Total from | Distributions | ||||||||||||
| Beginning of | Investment | and Unrealized | Investment | from Net | $ | |||||||||||
| Period | Income (Loss)(a)(d) | Gain (Loss) | Operations | Investment Income | Total Distributions | |||||||||||
| Class R6 | ||||||||||||||||
| October 31, 2016(8) | 7.79 | .19 | .61 | .80 | — | — | ||||||||||
| Class S | ||||||||||||||||
| October 31, 2016 | 9.12 | .21 | (.52 | ) | (.31 | ) | (.23 | ) | (.23 | ) | ||||||
| October 31, 2015(5) | 9.07 | .23 | (.18 | ) | .05 | — | — | |||||||||
| Class T | ||||||||||||||||
| October 31, 2016 | 9.14 | .22 | (.52 | ) | (.30 | ) | (.25 | ) | (.25 | ) | ||||||
| October 31, 2015(5) | 9.07 | .22 | (.15 | ) | .07 | — | — | |||||||||
| Class Y | ||||||||||||||||
| October 31, 2016 | 9.13 | .23 | (.52 | ) | (.29 | ) | (.25 | ) | (.25 | ) | ||||||
| October 31, 2015 | 9.42 | .29 | (.52 | ) | (.23 | ) | (.06 | ) | (.06 | ) | ||||||
| October 31, 2014(4) | 10.00 | .05 | (.63 | ) | (.58 | ) | — | — | ||||||||
See accompanying notes which are an integral part of the financial statements.
768 Select International Equity Fund
| % | % | % | ||||||||||||
| $ | $ | Ratio of Expenses | Ratio of Expenses | Ratio of Net | ||||||||||
| Net Asset Value, | % | Net Assets, | to Average | to Average | Investment Income | % | ||||||||
| End of | Total | End of Period | Net Assets, | Net Assets, | to Average | Portfolio | ||||||||
| Period | Return(b) | (000 | ) | Gross(e) | Net(d)(e) | Net Assets(d)(e) | Turnover Rate(b) | |||||||
| 8.59 | 10.27 | 110 | .62 | .47 | 3.32 | 57 | ||||||||
| 8.58 | (3.35 | ) | 2,518 | .78 | .64 | 2.49 | 57 | |||||||
| 9.12 | .55 | 1,679 | .84 | .64 | 2.91 | 25 | ||||||||
| 8.59 | (3.25 | ) | 867 | .79 | .49 | 2.62 | 57 | |||||||
| 9.14 | .77 | 2,724 | .84 | .49 | 2.77 | 25 | ||||||||
| 8.59 | (3.11 | ) | 746,100 | .59 | .44 | 2.67 | 57 | |||||||
| 9.13 | (2.43 | ) | 862,041 | .65 | .44 | 3.07 | 25 | |||||||
| 9.42 | (5.80 | ) | 111,901 | .87 | .44 | 1.90 | 7 | |||||||
See accompanying notes which are an integral part of the financial statements.
Select International Equity Fund 769
Russell Investment Company
Select International Equity Fund
Related Party Transactions, Fees and Expenses
| Accrued fees payable to affiliates for the period ended October 31, 2016 were as follows: | ||
| Advisory fees | $ | 207,765 |
| Administration fees | 31,019 | |
| Transfer agent fees | 3,277 | |
| Trustee fees | 2,679 | |
| $ | 244,740 | |
| Transactions (amounts in thousands) during the period ended October 31, 2016 with Underlying Funds which are, or were, an | ||||||||||||||||||
| affiliated company are as follows: | ||||||||||||||||||
| Fair Value, | Change in | |||||||||||||||||
| Beginning of | Realized Gain | Unrealized | Fair Value, End | Income | Capital Gains | |||||||||||||
| Period | Purchases | Sales | (Loss) | Gain (Loss) | of Period | Distributions | Distributions | |||||||||||
| Russell U.S. Cash Collateral Fund $ | — | $ | 12,784 | $ | 12,083 | $ | — | $ | — | $ | 701 | $ | 2 | $ | — | |||
| Russell U.S. Cash Management Fund | 2,875 | 352,389 | 339,144 | 1 | 3 | 16,124 | 83 | — | ||||||||||
| $ | 2,875 | $ | 365,173 | $ | 351,227 | $ | 1 | $ | 3 | $ | 16,825 | $ | 85 | $ | — | |||
Federal Income Taxes
At October 31, 2016, the cost of investments and net unrealized appreciation (depreciation), undistributed ordinary income
undistributed long-term capital gains for income tax purposes were as follows:.
| Cost of Investments | $ | 775,116,439 | |||
| Unrealized Appreciation | $ | 64,967,315 | |||
| Unrealized Depreciation | (95,848,930 | ) | |||
| Net Unrealized Appreciation (Depreciation) | $ | (30,881,615 | ) | ||
| Undistributed Ordinary Income | $ | 14,962,052 | |||
| Undistributed Long-Term Capital Gains | |||||
| (Capital Loss Carryforward) | $ | (86,718,553 | ) | ||
| Tax Composition of Distributions | |||||
| Ordinary Income | $ | 23,089,621 | |||
Net investment income and net realized gains (loss) in the financial statements may differ from taxable net investment income and net
realized gains (losses). Capital accounts within the financial statements are adjusted for permanent book-tax differences. Book-tax
differences are primarily due to foreign currency gains and losses, reclassifications of dividends, differences in treatment of income
from swaps, net operating losses, investments in partnerships, investments in passive foreign investment companies (PFICs), tax
straddle transactions, use of tax equalization and foreign capital gains taxes. These adjustments have no impact on the net assets.
At October 31, 2016, the Statement of Assets and Liabilities have been adjusted by the following amounts (in thousands):
| Undistributed net investment income | $ | (1,765 | ) |
| Accumulated net realized gain (loss) | 1,798 | ||
| Additional paid-in capital | (33 | ) |
See accompanying notes which are an integral part of the financial statements.
770 Select International Equity Fund
Russell Investment Company
Russell Funds
Notes to Schedules of Investments — October 31, 2016
Footnotes:
(Æ) Non-Income producing security.
(Ï) Forward commitment.
(Ê) Adjustable or floating rate security. Rate shown reflects rate in effect at period end.
(ƒ) Perpetual floating rate security. Rate shown reflects rate in effect at period end.
(ö) Real Estate Investment Trust (REIT).
(µ) Bond is insured by a guarantor.
(Ø) In default.
(ç) At amortized cost, which approximates market value.
(~ ) Rate noted is yield-to-maturity from date of acquisition.
(æ) Pre-refunded: These bonds are collateralized by U.S. Treasury securities, which are held in escrow by a trustee and used to pay
principal and interest in the tax-exempt issue and to retire the bonds in full at the earliest refunding date.
(§) All or a portion of the shares of this security are pledged as collateral in connection with futures contracts purchased (sold) or swap
contracts entered into by the Fund.
(x) The security is purchased with the cash collateral from securities loaned.
(Ñ) All or a portion of the shares of this security are on loan.
(Þ) Restricted security. Security may have contractual restrictions on resale, may have been offered in a private placement transaction,
and is not registered under the Securities Act of 1933.
(Å) Illiquid and restricted security.
(Û) All or a portion of the shares of this security are pledged as collateral in connection with securities sold short.
(ÿ) Notional Amount in thousands.
(8) Unrounded units.
(å) Currency balances were pledged in connection with futures contracts purchased (sold), options written, or swaps entered into by the
Fund. See Statement of Assets and Liabilities.
(ì ) All or a portion of the shares of this security are pledged as collateral in connection with options written contracts.
(v) Loan agreement still pending. Rate not available at period end. 1.000% Rate is used as a placeholder.
Abbreviations:
ADR - American Depositary Receipt
ADS - American Depositary Share
BBR - Bank Bill Rate
BBSW - Bank Bill Swap Reference Rate
BUBOR – Budapest Interbank Offered Rate
CIBOR - Copenhagen Interbank Offered Rate
CME - Chicago Mercantile Exchange
CMO - Collateralized Mortgage Obligation
CVO - Contingent Value Obligation
EMU - European Economic and Monetary Union
EURIBOR - Euro Interbank Offered Rate
FDIC - Federal Deposit Insurance Company
GDR - Global Depositary Receipt
GDS - Global Depositary Share
GSCI – Goldman Sachs Commodity Index
HIBOR – Hong Kong Interbank Offer Rate
JIBAR – Johannesburg Interbank Agreed Rate
KSDA – Korean Securities Dealers Association
LIBOR - London Interbank Offered Rate
MIBOR - Mumbai Interbank Offered Rate
NIBOR - Norwegian Interbank Offered Rate
PIK - Payment in Kind
REMIC - Real Estate Mortgage Investment Conduit
STIBOR – Stockholm Interbank Offered Rate
STRIP - Separate Trading of Registered Interest and Principal of Securities
SFE - Sydney Futures Exchange
TBA - To Be Announced Security
UK - United Kingdom
WTI – West Texas Intermediate
Foreign Currency Abbreviations:
Notes to Schedules of Investments 771
Russell Investment Company
Russell Funds
Notes to Schedules of Investments, continued — October 31, 2016
| ARS - Argentine peso | HKD - Hong Kong dollar | PKR - Pakistani rupee |
| AUD - Australian dollar | HUF - Hungarian forint | PLN - Polish zloty |
| BRL - Brazilian real | IDR - Indonesian rupiah | RON – Romanian New Leu |
| CAD - Canadian dollar | ILS - Israeli shekel | RUB - Russian ruble |
| CHF - Swiss franc | INR - Indian rupee | SEK - Swedish krona |
| CLP - Chilean peso | ISK - Icelandic krona | SGD - Singapore dollar |
| CNH – Chinese offshore spot | ITL - Italian lira | SKK - Slovakian koruna |
| CNY - Chinese renminbi yuan | JPY - Japanese yen | THB - Thai baht |
| COP - Colombian peso | KES - Kenyan schilling | TRY - Turkish lira |
| CRC - Costa Rican colon | KRW - South Korean won | TWD - Taiwanese dollar |
| CZK - Czech koruna | MXN - Mexican peso | USD - United States dollar |
| DKK - Danish krone | MYR - Malaysian ringgit | UYU – Uruguayan peso |
| DOP - Dominican peso | NOK - Norwegian krone | VEB - Venezuelan bolivar |
| EGP - Egyptian pound | NGN – Nigerian naira | VND - Vietnamese dong |
| EUR - Euro | NZD - New Zealand dollar | ZAR - South African rand |
| GBP - British pound sterling | PEN - Peruvian nuevo sol | |
| GHS – Ghanaian Cedi | PHP - Philippine peso |
772 Notes to Schedules of Investments
Russell Investment Company
Russell Funds
Notes to Financial Highlights — October 31, 2016
(1) For the period February 7, 2012 (commencement of operations) to October 31, 2012.
(2) For the period August 7, 2012 (commencement of operations) to October 31, 2012.
(3) For the period August 16, 2012 (commencement of operations) to October 31, 2012.
(4) For the period August 1, 2014 (commencement of operations) to October 31, 2014.
(5) For the period January 5, 2015 (commencement of operations) to October 31, 2015.
(6) For the period May 4, 2015 (commencement of operations) to October 31, 2015.
(7) For the period June 2, 2015 (commencement of operations) to October 31, 2015.
(8) For the period March 1, 2016 (commencement of operations) to October 31, 2016.
(9) For the period September 23, 2016 (commencement of operations) to October 31, 2016.
(a) Average daily shares outstanding were used for this calculation.
(b) The ratios for periods less than one year are not annualized.
(c) Total return for Class A does not reflect a front-end sales charge. If sales charges were included, the total return would be lower.
(d) May reflect amounts waived and/or reimbursed by Russell Investment Management, LLC (“RIM”) and /or Russell Investments Fund Services, LLC
(“RIFUS”).
(e) The ratios for periods less than one year are annualized.
(f) Less than $.01 per share.
(g) For the Russell U.S. Defensive Equity Fund, the respective annualized net expense ratios, not including the dividends and interest expense from
short sales, were as follows:
| For the period ended | Class A | Class C | Class E | Class I | Class S | Class Y | ||||||
| October 31, 2016 | 1.07 | % | 1.83 | % | 1.08 | % | 0.75 | % | 0.83 | % | 0.64 | % |
| October 31, 2015 | N/A | N/A | N/A | N/A | N/A | N/A | ||||||
| October 31, 2014 | N/A | N/A | N/A | N/A | N/A | N/A | ||||||
| October 31, 2013 | N/A | N/A | N/A | N/A | N/A | N/A | ||||||
| October 31, 2012 | 1.09 | % | 1.83 | % | 1.03 | % | 0.76 | % | 0.83 | % | 0.65 | % |
For the Russell U.S. Dynamic Equity Fund, the respective annualized net expense ratios, not including the dividends and interest expense from short
sales, were as follows:
| For the period ended | Class A | Class C | Class E | Class I | Class S | Class Y | ||||||
| October 31, 2016 | 1.37 | % | 2.12 | % | 1.37 | % | 1.04 | % | 1.12 | % | 0.93 | % |
| October 31, 2015 | 1.36 | % | 2.11 | % | 1.36 | % | 1.03 | % | 1.11 | % | 0.91 | % |
| October 31, 2014 | 1.34 | % | 2.10 | % | 1.35 | % | 1.00 | % | 1.10 | % | 0.90 | % |
| October 31, 2013 | 1.35 | % | 2.11 | % | 1.36 | % | 0.98 | % | 1.11 | % | 0.91 | % |
For the Russell U.S. Strategic Equity Fund, the respective annualized net expense ratios, not including the dividends and interest expense from short
sales, were as follows:
| For the period ended | Class A | Class C | Class E | Class S | ||||
| October 31, 2016 | 1.02 | % | 1.77 | % | 1.02 | % | 0.77 | % |
| October 31, 2015 | 1.02 | % | 1.77 | % | 1.02 | % | 0.77 | % |
| October 31, 2014 | 1.03 | % | 1.78 | % | 1.03 | % | 0.78 | % |
| October 31, 2013 | 1.10 | % | 1.85 | % | 1.10 | % | 0.85 | % |
| October 31, 2012 | 1.10 | % | 1.85 | % | 1.10 | % | 0.85 | % |
(h) Distributions in excess of accumulated earnings and profits but not in excess of current earnings and profits computed on a tax basis.
(i) Less than .005% of average net assets.
(j) No shares were outstanding since May 1, 2015.
(k) Subsequent to the issuance of the October 31, 2015 financial statements, Management determined that the portfolio turnover rate for this Fund was incorrectly
presented within the financial statements as a result of including the impact of securities transferred between Money Managers in the calculation of portfolio
turnover rates. Management evaluated the impact of presenting the incorrect portfolio turnover rate and concluded that the October 31, 2015 financial
statements were not materially misstated. However, Management concluded it was appropriate to present the correct rate in this and future filings and
accordingly, the portfolio turnover rate has been revised from previously presented.
Notes to Financial Highlights 773
Russell Investment Company
Russell Funds
Notes to Financial Highlights, continued — October 31, 2016
(l) Gross and Net Expense Ratios for the period ended October 31, 2016 include a reimbursement from State Street for the overbilling of custody expenses in
prior years. Without the reimbursement, each class of the Fund listed below would have been higher by the amount listed below. All other Funds with fee
reimbursements were less than 0.005%.
| Impact of the fee reimbursement on | ||
| Fund | gross and net expense ratios | |
| Russell U.S. Core Equity Fund | 0.03 | % |
| Russell U.S. Defensive Equity Fund | 0.02 | % |
| Russell U.S. Small Cap Equity Fund | 0.01 | % |
| Russell International Developed Markets Fund | 0.04 | % |
| Russell Emerging Markets Fund | 0.01 | % |
| Russell Tax-Managed U.S. Mid & Small Cap Fund | 0.01 | % |
| Russell Investment Grade Bond Fund | 0.02 | % |
| Russell Short Duration Bond Fund | 0.01 | % |
(†) For the Russell Cayman Commodity Strategies Fund, the Financial Highlights are consolidated and include the balance of the Russell Cayman Commodity
Strategies Fund Ltd. (wholly-owned subsidiary). Accordingly, all interfund balances and transactions have been eliminated. Refer to note 3 in the Notes to the
Financial Statements.
774 Notes to Financial Highlights
Russell Investment Company
Russell Funds
Notes to Financial Statements — October 31, 2016
1. Organization
Russell Investment Company (the “Investment Company” or “RIC”) is a series investment company with 41 different investment
portfolios referred to as funds (each a “Fund” and collectively the “Funds”). These financial statements report on 27 of these
Funds. The Investment Company is registered under the Investment Company Act of 1940, as amended (“Investment Company
Act”), as an open-end management investment company. It is organized and operated as a Massachusetts business trust under a
Second Amended and Restated Master Trust Agreement dated October 1, 2008, as amended (“Master Trust Agreement”), and the
provisions of Massachusetts law governing the operation of a Massachusetts business trust. The Investment Company’s Master Trust
Agreement permits the Board of Trustees (the “Board”) to issue an unlimited number of shares of beneficial interest. Each of the
Funds, except the Unconstrained Total Return Fund, is diversified. Under the Investment Company Act, a diversified company
is defined as a management company which meets the following requirements: at least 75% of the value of its total assets is
represented by cash and cash items (including receivables), government securities, securities of other investment companies, and
other securities for the purposes of this calculation limited in respect of any one issuer to an amount not greater in value than five
percent of the value of the total assets of such management company and to not more than 10% of the outstanding voting securities
of such issuer.
2. Significant Accounting Policies
The Funds’ financial statements are prepared in accordance with U.S. generally accepted accounting principles (“U.S. GAAP”)
which require the use of management estimates and assumptions at the date of the financial statements. Actual results could differ
from those estimates. The Funds are considered investment companies under U.S. GAAP and follow the accounting and reporting
guidance applicable to investment companies. The following is a summary of the significant accounting policies consistently
followed by each Fund in the preparation of its financial statements.
In October 2016, the U.S. Securities and Exchange Commission adopted new rules and amended existing rules (together, “final
rules”) intended to modernize the reporting and disclosure of information by registered investment companies. In part, the final
rules amend Regulation S-X and require standardized, enhanced disclosure about derivatives in investment company financial
statements, as well as other amendments. The compliance date for the amendments to Regulation S-X is August 1, 2017.
Management is currently evaluating the impact that the adoption of the amendments to Regulation S-X will have on the Funds’
financial statements and related disclosures.
Security Valuation
The Funds value portfolio securities according to Board-approved securities valuation procedures which include market and fair
value procedures. The Board has delegated the responsibility for administration of the securities valuation procedures to Russell
Investments Fund Services, LLC ("RIFUS").
U.S. GAAP defines fair value as the price that a Fund would receive to sell an asset or pay to transfer a liability in an orderly
transaction between market participants at the measurement date. It establishes a fair value hierarchy that prioritizes inputs to
valuation methods and requires a separate disclosure of the fair value hierarchy for each major category of assets and liabilities,
that segregates fair value measurements into levels (Level 1, 2, and 3). The inputs or methodology used for valuing securities are
not necessarily an indication of the risk associated with investing in those securities. Levels 1, 2 and 3 of the fair value hierarchy
are defined as follows:
• Level 1 — Quoted prices (unadjusted) in active markets or exchanges for identical assets and liabilities.
• Level 2 — Inputs other than quoted prices included within Level 1 that are observable, which may include, but are not
limited to, quoted prices for similar assets or liabilities in markets that are active, quoted prices for identical or similar assets
or liabilities in markets that are not active, and inputs such as interest rates, yield curves, implied volatilities, credit spreads
or other market corroborated inputs.
• Level 3 — Significant unobservable inputs based on the best information available in the circumstances, to the extent
observable inputs are not available, which may include assumptions made by RIFUS, acting at the discretion of the Board,
that are used in determining the fair value of investments.
The availability of observable inputs can vary from security to security and is affected by a wide variety of factors, including, for
example, the type of security, whether the security is new and not yet established in the marketplace, the liquidity of markets, and
other characteristics particular to the security. To the extent that valuation is based on models or inputs that are less observable or
unobservable in the market, the determination of fair value requires more judgment. Accordingly, the degree of judgment exercised
Notes to Financial Statements 775
Russell Investment Company
Russell Funds
Notes to Financial Statements, continued — October 31, 2016
in determining fair value is greatest for instruments categorized in Level 3. The inputs or methodology used for valuing securities
are not necessarily an indication of the risk associated with investing in those securities.
The inputs used to measure fair value may fall into different levels of the fair value hierarchy. In such cases, for disclosure purposes,
the level in the fair value hierarchy within which the fair value measurement falls is determined based on the lowest level input that
is significant to the fair value measurement in its entirety.
The valuation techniques and significant inputs used in determining the fair market values of financial instruments categorized as
Level 1 and Level 2 of the fair value hierarchy are as follows:
Equity securities, including common and preferred stock, short securities and restricted securities that are traded on a national
securities exchange (or reported on the NASDAQ national market), are stated at the last reported sales price on the day of valuation
or official closing price, as applicable. To the extent these securities are actively traded, and valuation adjustments are not applied,
they are categorized as Level 1 of the fair value hierarchy. Preferred stock and other equities traded on inactive markets or valued
by reference to similar instruments are categorized as Level 2 of the fair value hierarchy. Certain foreign equity securities may
be fair valued using a pricing service that considers the correlation of the trading patterns of the foreign security to the intraday
trading in the U.S. markets for investments such as American Depositary Receipts, financial futures, exchange-traded funds, and
the movement of certain indexes of securities, based on the statistical analysis of historical relationships. Foreign equity securities
prices as described above are categorized as Level 2 of the fair value hierarchy.
Fixed income securities including corporate, convertible, U.S. government agency, municipal bonds and notes, U.S. treasury
obligations, sovereign issues, bank loans, bank notes and non-U.S. bonds are normally valued by pricing service providers that use
broker dealer quotations or valuation estimates from their internal pricing models. The pricing service providers’ internal models
use inputs that are observable such as issuer details, interest rates, yield curves, prepayment speeds, credit risks/spreads and
default rates. Such fixed income securities that use pricing service internal models as described above are categorized as Level
2 of the fair value hierarchy. Such fixed income securities that use broker dealer quotations are categorized as Level 3 of the fair
value hierarchy.
Fixed income securities purchased on a delayed-delivery basis and marked-to-market daily until settlement at the forward settlement
date are categorized as Level 2 of the fair value hierarchy.
Mortgage and asset-backed securities are usually issued as separate tranches, or classes, of securities within each deal. These
securities are also normally valued by pricing service providers that use broker dealer quotations or valuation estimates from their
internal pricing models. The pricing models for these securities usually consider tranche-level attributes, including estimated cash
flows of each tranche, market-based yield spreads for each tranche, and current market data, as well as incorporate deal collateral
performance, as available. Mortgage and asset-backed securities that use these and similar valuation techniques and inputs as
described above are categorized as Level 2 of the fair value hierarchy.
Investments in privately held investment funds will be valued based upon the net asset value (“NAV”) of such investments.
The Funds have adopted the authoritative guidance under U.S. GAAP for estimating the fair value of investments in funds that
have calculated NAV per share in accordance with the specialized accounting guidance for investment companies. Accordingly,
the Funds estimate the fair value of an investment in a fund using the NAV per share without further adjustment as a practical
expedient, if the NAV per share of the investment is determined in accordance with the specialized accounting guidance for
investment companies as of the reporting entity’s measurement date.
Short-term investments having a maturity of 60 days or less are generally valued at amortized cost, which approximates fair market
value. These investments are categorized as Level 2 of the fair value hierarchy.
Derivative instruments are instruments such as foreign currency contracts, futures contracts, options contracts, or swap agreements
that derive their value from underlying asset prices, indices, reference rates, and other inputs or a combination of these factors.
Derivatives may be classified into two groups depending upon the way that they are traded: privately traded over-the-counter
(“OTC”) derivatives that do not go through an exchange or intermediary and exchange-traded derivatives that are traded through
specialized derivatives exchanges or other regulated exchanges. OTC derivatives are normally valued on the basis of broker dealer
quotations or pricing service providers. Depending on the product and the terms of the transaction, the value of the derivative
instrument can be estimated by a pricing service provider using a series of techniques, including simulation pricing models.
The pricing models use inputs that are observed from actively quoted markets such as issuer details, indices, spreads, interest
rates, yield curves, dividends and exchange rates. OTC derivatives that use these and similar valuation techniques and inputs as
described above are categorized as Level 2 of the fair value hierarchy, with the exception of foreign currency spot contracts which
776 Notes to Financial Statements
Russell Investment Company
Russell Funds
Notes to Financial Statements, continued — October 31, 2016
are categorized as Level 1 of the fair value hierarchy. OTC derivatives that use broker dealer quotations are categorized as level 3 of
the fair value hierarchy. Exchange-traded derivatives are valued based on the last reported sales price on the day of valuation and
are categorized as Level 1 of the fair value hierarchy.
Centrally cleared swaps listed or traded on a multilateral or trade facility platform, such as a registered exchange, are valued at
the daily settlement price determined by the respective exchange. For centrally cleared credit default swaps, the clearing facility
requires its members to provide actionable levels across complete term structures. These levels along with external third party
prices are used to produce daily settlement prices. These securities are categorized as Level 2 of the fair value hierarchy. Centrally
cleared interest rate swaps are valued using a pricing model that references the underlying rates including the overnight index
swap rate and London Interbank Offered Rate (“LIBOR”) forward rate to produce the daily settlement price. These securities are
categorized as Level 2 of the fair value hierarchy.
Events or circumstances affecting the values of Fund securities that occur between the closing of the principal markets on which
they trade and the time the NAV of Fund shares is determined may be reflected in the calculation of NAV for each applicable
Fund when the Fund deems that the particular event or circumstance would materially affect such Fund’s NAV. Funds that invest
primarily in frequently traded exchange-listed securities will use fair value pricing in limited circumstances since reliable market
quotations will often be readily available. Funds that invest in foreign securities use fair value pricing daily, as events may occur
between the close of foreign markets and the time of pricing. Although there are observable inputs assigned on a security level,
prices are derived from factors using proprietary models or matrix pricing. For this reason, fair value factors will cause movement
between Levels 1 and 2. Significant events that could trigger fair value pricing of one or more securities include: a company
development such as a material business development; a natural disaster or emergency situation; or an armed conflict.
The NAV of a Fund’s portfolio that includes foreign securities may change on days when shareholders will not be able to purchase
or redeem Fund shares, since foreign securities can trade on non-business days.
For movements between the levels within the fair value hierarchy, the Funds have adopted a policy of recognizing the transfers as
of year end.
The Russell U.S. Core Equity, Russell U.S. Defensive Equity, Russell U.S. Dynamic Equity, Russell U.S. Strategic Equity, Russell
U.S. Large Cap Equity, Russell U.S. Mid Cap Equity, Russell U.S. Small Cap Equity, Russell International Developed Markets,
Russell Global Equity, Russell Tax-Managed U.S. Large Cap, Russell Tax-Managed U.S. Mid & Small Cap, Russell Tax-Managed
International Equity, Unconstrained Total Return, Russell Tax Exempt High Yield Bond, Russell Tax Exempt Bond, Russell
Commodity Strategies, Russell Global Real Estate Securities, Russell Strategic Call Overwriting, Select U.S. Equity, and Select
International Equity Funds had no transfers between Levels 1, 2 and 3 for the period ended October 31, 2016, other than those
caused by application of fair value factors.
The Russell Global Opportunistic Credit, Russell Strategic Bond, Russell Investment Grade Bond, Russell Short Duration Bond
and Russell Emerging Markets Funds had transfers out of Level 2 into Level 3 representing financial instruments for which pricing
had been determined using observable inputs that became unobservable. The amounts transferred were as follows:
| Russell Global Opportunistic Credit Fund | $ | 3,054,650 |
| Russell Strategic Bond Fund | 4,703,210 | |
| Russell Investment Grade Bond Fund | 8,083 | |
| Russell Short Duration Bond Fund | 27 | |
| Russell Emerging Markets Fund | 1,918,609 |
The Russell Strategic Bond, Russell Short Duration Bond, Russell Global Infrastructure and Multi-Strategy Income Funds had
transfers out of Level 3 into Level 2 representing financial instruments for which pricing had been determined using unobservable
inputs that became observable. The amounts transferred were as follows:
| Russell Strategic Bond Fund | $ | 5,180,657 |
| Russell Short Duration Bond Fund | 2,844,643 | |
| Russell Global Infrastructure Fund | 8,783,976 | |
| Russell Multi-Strategy Income Fund | 126,916 |
Level 3 Fair Value Investments
The valuation techniques and significant inputs used in determining the fair values of financial instruments classified as Level 3 of
the fair value hierarchy are as follows:
Notes to Financial Statements 777
Russell Investment Company
Russell Funds
Notes to Financial Statements, continued — October 31, 2016
Securities and other assets for which market quotes are not readily available, or are not reliable, are valued at fair value as
determined in good faith by RIFUS and are categorized as Level 3 of the fair value hierarchy. Market quotes are considered not
readily available in circumstances where there is an absence of current or reliable market-based data (e.g., trade information or
broker quotes). When RIFUS applies fair valuation methods that use significant unobservable inputs to determine a Fund’s NAV,
securities will not be priced on the basis of quotes from the primary market in which they are traded, but instead may be priced by
another method that RIFUS believes accurately reflects fair value and will be categorized as Level 3 of the fair value hierarchy. Fair
value pricing may require subjective determinations about the value of a security. While the securities valuation procedures are
intended to result in a calculation of a Fund’s NAV that fairly reflects security values as of the time of pricing, the process cannot
guarantee that fair values determined by RIFUS would accurately reflect the price that a Fund could obtain for a security if it were
to dispose of that security as of the time of pricing (for instance, in a forced or distressed sale). The prices used by a Fund may differ
from the value that would be realized if the security was sold.
RIFUS employs third party pricing vendors to provide fair value measurements. RIFUS oversees third-party pricing service
providers in order to support the valuation process throughout the year.
The significant unobservable input used in fair value measurement of certain of the Funds’ preferred equity securities is the
redemption value calculated on a fully-diluted basis if converted to common stock. Significant increases or decreases in the
redemption value would have a direct and proportional impact to fair value.
The significant unobservable input used in the fair value measurement of certain Funds’ debt securities is the yield to worst ratio.
Significant increases (decreases) in the yield to worst ratio would result in a lower (higher) fair value measurement.
These significant unobservable inputs are further disclosed in the Presentation of Portfolio Holdings for each respective Fund as
applicable.
If third party evaluated vendor pricing is neither available nor deemed to be indicative of fair value, RIFUS may elect to obtain
indicative market quotations (“broker quotes”) directly from the broker or passed through from a third party vendor. In the event
that the source of fair value is from a single source broker quote, these securities are classified as Level 3 per the fair value
hierarchy. Broker quotes are typically received from established market participants. Although independently received on a daily
basis, RIFUS does not have the transparency to view the underlying inputs which support the broker quotes. Significant changes
in the broker quote would have direct and proportional changes in the fair value of the security. There is a third-party pricing
exception to the quantitative disclosure requirement when prices are not determined by the reporting entity. RIFUS is exercising
this exception and has made a reasonable attempt to obtain quantitative information from the third party pricing vendors regarding
the unobservable inputs used.
For fair valuations using significant unobservable inputs, U.S. GAAP requires a reconciliation of the beginning to ending balances
for reported fair values that present changes attributable to total realized and unrealized gains or losses, purchases and sales, and
transfers in/out of the Level 3 category during the period. Additionally, U.S. GAAP requires quantitative information regarding the
significant unobservable inputs used in the determination of fair value of assets categorized as Level 3 in the fair value hierarchy. In
accordance with the requirements of U.S. GAAP, a fair value hierarchy, a Level 3 reconciliation and an additional disclosure about
fair value measurements, if any, has been included in the Presentation of Portfolio Holdings for each respective Fund.
Investment Transactions
Investment transactions are reflected as of the trade date for financial reporting purposes. This may cause the NAV stated in the
financial statements to be different from the NAV at which shareholders may transact. Realized gains and losses from securities
transactions, if applicable, are recorded on the basis of specific identified cost incurred within a particular Fund.
Investment Income
Dividend income is recorded net of applicable withholding taxes on the ex-dividend date, except that certain dividends from
foreign securities are recorded as soon as the Funds are informed of the dividend, subsequent to the ex-dividend date. To the
extent the dividend represents a return of capital or capital gain for tax purposes, reclassifications are made which may be based
on management’s estimates. Interest income is recorded daily on the accrual basis. The Funds classify gains and losses realized on
prepayments received on mortgage-backed securities as an adjustment to interest income. All premiums and discounts, including
original issue discounts, are amortized/ accreted using the effective interest method. Debt obligation securities may be placed in
a non-accrual status and related interest income may be reduced by stopping current accruals and writing off interest receivable
when the collection of all or a portion of interest has become doubtful.
778 Notes to Financial Statements
Russell Investment Company
Russell Funds
Notes to Financial Statements, continued — October 31, 2016
Federal Income Taxes
Since the Investment Company is a Massachusetts business trust, each Fund is a separate corporate taxpayer and determines its
net investment income and capital gains (or losses) and the amounts to be distributed to each Fund’s shareholders without regard
to the income and capital gains (or losses) of the other Funds.
For each year, each Fund intends to qualify or continue to qualify as a regulated investment company under Subchapter M of the
Internal Revenue Code of 1986, as amended (the “Code”) and intends to distribute all of its taxable income and capital gains.
Therefore, no federal income tax provision is required for the Funds.
The Russell Commodity Strategies Fund intends to gain exposure indirectly to commodities markets by investing in a wholly-owned
subsidiary which is organized as a company under the laws of the Cayman Islands and may invest in commodity index-linked
instruments and other commodity-linked instruments and derivative instruments. In order for the Fund to qualify as a regulated
investment company under Subchapter M of the Code, the Fund must derive at least 90 percent of its gross income each taxable
year from certain qualifying sources of income. The Internal Revenue Service (“IRS”) has issued a revenue ruling which holds that
income derived from commodity-linked swaps is not qualifying income under Subchapter M of the Code. However, the IRS has also
issued private letter rulings to other taxpayers in which the IRS specifically concluded that income from certain commodity-linked
notes is qualifying income and that income derived from a wholly-owned subsidiary will also constitute qualifying income, even
if the subsidiary itself owns commodity-linked swaps and other commodity-linked derivative instruments. Although those private
letter rulings can be relied on only by the taxpayers to whom they were issued, based on the reasoning in such rulings, the Russell
Commodity Strategies Fund may seek to gain exposure to the commodity markets primarily through investments in commodity-
linked notes and, through investments in its Subsidiary (as defined in note 3), commodity-linked swaps and other commodity-
linked derivative instruments. The IRS recently issued a revenue procedure, which states that the IRS will not in the future
issue private letter rulings that would require a determination of whether an asset (such as a commodity index-linked note) is a
“security” under the 1940 Act. The IRS also recently issued proposed regulations that, if finalized, would generally treat the Funds’
income inclusions with respect to a subsidiary as qualifying income only if there is a distribution out of the earnings and profits
of a subsidiary that are attributable to such income inclusion. The proposed regulations, if adopted, would apply to taxable years
beginning on or after 90 days after the regulations are published as final. There can be no assurance that the IRS will not change its
position that income derived from commodity-linked notes and wholly-owned subsidiaries is qualifying income. The ability of the
Russell Commodity Strategies Fund to qualify for regulated investment company status under the Code could be jeopardized if it is
unable to treat its income from commodity-linked notes and a wholly-owned subsidiary as qualifying income. Furthermore, the tax
treatment of commodity-linked notes, other commodity-linked derivatives and the Russell Commodity Strategy Fund's investments
in its Subsidiary may otherwise be adversely affected by future legislation, Treasury Regulation and/or guidance issued by the IRS
that could affect the character, timing and/or amount the Fund's taxable income or any gains and distributions made by the Fund.
The Funds comply with the authoritative guidance for uncertainty in income taxes which requires management to determine whether
a tax position of the Funds is more likely than not to be sustained upon examination, including resolution of any related appeals or
litigation processes, based on the technical merits of the position. For tax positions meeting the more likely than not threshold, the
tax amount recognized in the financial statements is reduced by the largest benefit that has a greater than 50% likelihood of being
realized upon ultimate settlement with the relevant taxing authority. Management determined that no accruals need to be made in
the financial statements due to uncertain tax positions. Management continually reviews and adjusts the Funds’ liability for income
taxes based on analyses of tax laws and regulations, as well as their interpretations, and other relevant factors.
Each Fund files a U.S. tax return. At October 31, 2016, the Funds had recorded no liabilities for net unrecognized tax benefits
relating to uncertain income tax positions they have taken or expect to take in future tax returns. While the statute of limitations
remains open to examine the Funds’ U.S. tax returns filed for the fiscal years ended October 31, 2013 through October 31, 2015,
no examinations are in progress or anticipated at this time. The Funds are not aware of any tax positions for which it is reasonably
possible that the total amounts of unrecognized tax benefits will significantly change in the next twelve months.
Dividends and Distributions to Shareholders
For all Funds, income and capital gain distributions, if any, are recorded on the ex-dividend date. Income distributions are generally
declared and paid according to the following schedule:
Notes to Financial Statements 779
Russell Investment Company
Russell Funds
Notes to Financial Statements, continued — October 31, 2016
| Declared | Payable | Funds |
| Monthly | Early in the following month | Russell Global Opportunistic Credit, Unconstrained Total Return, |
| Russell Strategic Bond, Russell Investment Grade Bond, Russell | ||
| Short Duration Bond, Russell Tax Exempt High Yield Bond and | ||
| Russell Tax Exempt Bond Funds | ||
| Quarterly | April, July, October and December | Russell U.S. Core Equity, Russell U.S. Defensive Equity, Russell |
| U.S. Dynamic Equity, Russell U.S. Strategic Equity, Russell U.S. | ||
| Large Cap Equity, Russell U.S. Mid Cap Equity, Russell Global | ||
| Infrastructure, Russell Global Real Estate Securities, Russell | ||
| Multi-Strategy Income, Russell Strategic Call Overwriting and | ||
| Select U.S. Equity Funds | ||
| Annually | Mid-December | Russell U.S. Small Cap Equity, Russell International Developed |
| Markets, Russell Global Equity, Russell Emerging Markets, | ||
| Russell Tax-Managed U.S. Large Cap, Russell Tax-Managed U.S. | ||
| Mid & Small Cap, Russell Tax-Managed International Equity, | ||
| Russell Commodity Strategies and Select International Equity | ||
| Funds |
The Funds intend to distribute substantially all of the distributions they receive from real estate investment trust ("REIT")
investments, less expenses, as well as income from other investments. Such distributions may be comprised of income, return of
capital, and capital gains. The Funds may also realize capital gains on the sale of its REIT shares and other investments.
Capital gain distributions are generally declared and paid annually. An additional distribution may be paid by the Funds to avoid
imposition of federal income and excise tax on any remaining undistributed capital gains and net investment income.
The timing and characterization of certain income and capital gain distributions are determined in accordance with federal tax
regulations which may differ from U.S. GAAP. As a result, net investment income and net realized gain (or loss) on investments
and foreign currency-related transactions for a reporting period may differ significantly from distributions during such period. The
differences between tax regulations and U.S. GAAP primarily relate to investments in options, futures, forward contracts, swap
contracts, passive foreign investment companies, foreign-denominated investments, mortgage-backed securities, certain securities
sold at a loss, wash sale deferrals and capital loss carryforwards. Accordingly, the Funds may periodically make reclassifications
among certain of their capital accounts without impacting their NAVs.
Expenses
The Funds pay their own expenses other than those expressly assumed by Russell Investment Management, LLC (“RIM”), the
Funds’ adviser, or RIFUS. Most expenses can be directly attributed to the individual Funds. Expenses which cannot be directly
attributed to a specific Fund are allocated among all Funds principally based on their relative net assets.
Class Allocation
Each of the Funds presented herein may offer certain of the following classes of shares: Class A, Class C, Class E, Class I, Class R6,
Class S, Class T and Class Y. All share classes have identical voting, dividend, liquidation and other rights, preferences, powers,
restrictions, limitations, qualifications and the same terms and conditions. The separate classes of shares differ principally in the
applicable transfer agent fees, distribution fees and shareholder servicing fees. Shareholders of each class bear certain expenses
that pertain to that particular class. Realized and unrealized gains (losses), investment income and expenses, with the exception
of class level expenses, are allocated daily to each class of shares based upon the relative proportion of net assets of each class.
Foreign Currency Translations
The books and records of the Funds are maintained in U.S. dollars. Foreign currency amounts and transactions of the Funds are
translated into U.S. dollars on the following basis:
(a) Fair value of investment securities, other assets and liabilities at the closing rate of exchange on the valuation date.
(b) Purchases and sales of investment securities and income at the closing rate of exchange prevailing on the respective trade
dates of such transactions.
Net realized gains or losses from foreign currency-related transactions arise from: sales and maturities of short-term securities;
sales of foreign currencies; currency gains or losses realized between the trade and settlement dates on securities transactions; the
780 Notes to Financial Statements
Russell Investment Company
Russell Funds
Notes to Financial Statements, continued — October 31, 2016
difference between the amounts of dividends, interest, and foreign withholding taxes recorded on the Funds’ books and the U.S.
dollar equivalent of the amounts actually received or paid. Net unrealized gains or losses from foreign currency-related transactions
arise from changes in the value of assets and liabilities, other than investments in securities, as a result of changes in the exchange
rates.
The Funds do not isolate that portion of the results of operations of the Funds that arises as a result of changes in exchange rates
from that portion that arises from changes in market prices of investments during the year. Such fluctuations are included with the
net realized and unrealized gain or loss from investments. However, for federal income tax purposes, the Funds do isolate the effects
of changes in foreign exchange rates from the fluctuations arising from changes in market prices for realized gain (or loss) on debt
obligations.
Capital Gains Taxes
The Russell International Developed Markets, Russell Global Equity, Russell Emerging Markets, Russell Tax-Managed International
Equity, Russell Global Opportunistic Credit, Russell Global Infrastructure, Russell Global Real Estate Securities, Russell Multi-
Strategy Income and Select International Equity Funds may be subject to capital gains taxes and repatriation taxes imposed by
certain countries in which they invest. The Funds may record a deferred capital gains tax liability with respect to the unrealized
appreciation on foreign securities for potential capital gains and repatriation taxes as of October 31, 2016. The accrual for capital
gains and repatriation taxes is included in net unrealized appreciation (depreciation) on investments in the Statements of Assets
and Liabilities. The amounts related to capital gains and repatriation taxes are included in net realized gain (loss) on investments
in the Statements of Operations for the following Funds:
| Deferred Capital | |||||
| Gains Tax | Capital Gains | ||||
| Liability | Taxes | ||||
| Russell International Developed Markets Fund | $ | 36,011 | $ | 108,480 | |
| Russell Global Equity Fund | 170,362 | 4,918 | |||
| Russell Emerging Markets Fund | 3,332,938 | 1,702,197 | |||
| Russell Tax-Managed International Equity Fund | 133,267 | 11,044 | |||
| Russell Global Opportunistic Credit Fund | 210,396 | 93,197 | |||
| Russell Global Infrastructure Fund | 39,156 | — | |||
| Russell Global Real Estate Securities Fund | 7 | — | |||
| Russell Multi-Strategy Income Fund | 11,978 | 14,153 | |||
Derivatives
Certain Funds may invest in derivatives. Derivative securities are instruments or agreements whose value is derived from an
underlying security or index. They include options, futures, swaps and forwards. These instruments offer unique characteristics and
risks that facilitate the Funds’ investment strategies.
The Funds typically use derivatives in three ways: exposing cash to markets, hedging and return enhancement. In addition, certain
Funds may enter into foreign exchange contracts for trade settlement purposes. Certain Funds may pursue their strategy of being
fully invested by exposing cash to the performance of appropriate markets by purchasing securities and/or derivatives. This is
intended to cause the Funds to perform as though cash were actually invested in those markets.
Hedging may be used by certain Funds to limit or control risks, such as adverse movements in exchange rates and interest rates.
Return enhancement can be accomplished through the use of derivatives in a Fund, including using derivatives as a substitute for
holding physical securities, and using them to express various macro views (e.g., interest rate movements, currency movements,
and macro credit strategies). By purchasing certain instruments, the Funds may more effectively achieve the desired portfolio
characteristics that assist them in meeting their investment objectives. Depending on how the derivatives are structured and
utilized, the risks associated with them may vary widely. These risks include, but are not limited to, market risk, liquidity risk,
leveraging risk, counterparty risk, basis risk, reinvestment risk, political risk, prepayment risk, extension risk, valuation risk and
credit risk.
Futures, certain options and cleared swaps are traded or cleared on an exchange or central exchange clearing house. Exchange-
traded or exchange-cleared transactions generally present less counterparty risk to a Fund. The exchange’s clearing house stands
between the Fund and the broker to the contract and therefore, credit risk is generally limited to the failure of the clearing
house and the clearing member. Cleared swap contracts are subject to clearing house rules, including initial and variation margin
Notes to Financial Statements 781
Russell Investment Company
Russell Funds
Notes to Financial Statements, continued — October 31, 2016
requirement, daily settlement of obligations and the clearing house guarantee of payments to the broker. There is, however, still
counterparty risk due to the insolvency of the broker with respect to any margin held in the brokers’ customer accounts. While
clearing members are required to segregate customer assets from their own assets, in the event of insolvency, there may be a
shortfall in the amount of margin held by the broker for its clients. Collateral and margin requirements for exchange-traded or
exchange-cleared derivatives are established through regulation, as well as set by the broker or applicable clearing house. Margin
for exchange-traded and exchange-cleared transactions are detailed in the Statements of Assets and Liabilities as cash held at the
broker for futures contracts and cash held at the broker for swap contracts, respectively. Securities pledged by a Fund for exchange-
traded and exchange-cleared transactions are noted as collateral or margin requirements in the Schedule of Investments. Typically,
the Funds and counterparties are not permitted to sell, repledge, rehypothecate or otherwise use collateral pledged by the other
party unless explicitly permitted by each respective governing agreement.
In December 2015, the SEC proposed new regulations applicable to a mutual fund's use of derivatives. If adopted as proposed, these
regulations could potentially limit or impact a Fund's ability to invest in derivatives and negatively affect the Fund's performance
and ability to pursue its stated investment objectives
The effects of derivative instruments, categorized by risk exposure, on the Statements of Assets and Liabilities and the Statements
of Operations, for the period ended October 31, 2016, if applicable, are disclosed in the Fair Value of Derivative Instruments table
following each applicable Fund’s Schedule of Investments.
Foreign Currency Exchange Contracts
Certain Funds may enter into foreign currency exchange spot contracts and forward foreign currency exchange contracts (“FX
contracts”). From time to time, certain Funds may enter into FX contracts to hedge certain foreign currency-denominated assets.
FX contracts are recorded at fair value. Certain risks may arise upon entering into these FX contracts from the potential inability
of counterparties to meet the terms of their FX contracts and are generally limited to the amount of unrealized gain on the FX
contracts, if any, that are disclosed in the Statements of Assets and Liabilities.
For the period ended October 31, 2016, the following Funds entered into foreign currency exchange contracts primarily for the
strategies listed below:
| Funds | Strategies |
| Russell International Developed Markets Fund | Return enhancement, hedging, exposing cash to markets, and trade settlement |
| Russell Global Equity Fund | Return enhancement, hedging, exposing cash to markets, and trade settlement |
| Russell Emerging Markets Fund | Hedging, exposing cash to markets, and trade settlement |
| Russell Tax-Managed International Equity Fund | Return enhancement, hedging, exposing cash to markets and trade settlement |
| Russell Global Opportunistic Credit Fund | Return enhancement and hedging |
| Unconstrained Total Return Fund | Return enhancement and hedging |
| Russell Strategic Bond Fund | Return enhancement and hedging |
| Russell Investment Grade Bond Fund | Return enhancement and hedging |
| Russell Short Duration Bond Fund | Return enhancement and hedging |
| Russell Global Infrastructure Fund | Exposing cash to markets and trade settlement |
| Russell Global Real Estate Securities Fund | Exposing cash to markets and trade settlement |
| Russell Multi-Strategy Income Fund | Return enhancement, hedging, and exposing cash to markets |
| Select International Equity Fund | Return enhancement, hedging, exposing cash to markets, and trade settlement |
The Funds’ foreign currency contract notional dollar values outstanding fluctuate throughout the fiscal year as required to meet
strategic requirements. The following tables illustrate the quarterly volume of foreign currency contracts. For the purpose of this
disclosure, volume is measured by the amounts bought and sold in USD.
782 Notes to Financial Statements
Russell Investment Company
Russell Funds
Notes to Financial Statements, continued — October 31, 2016
| Outstanding Contract Amounts Sold | ||||||||||||
| Quarter Ended | January 31, 2016 | April 30, 2016 | July 31, 2016 | October 31, 2016 | ||||||||
| Russell International Developed Markets Fund | $ | 1,473,722,553 | $ | 960,839,549 | $ | 1,285,990,222 | $ | 1,115,146,599 | ||||
| Russell Global Equity Fund | 1,422,206,405 | 964,714,966 | 913,907,305 | 799,690,896 | ||||||||
| Russell Emerging Markets Fund | 596,135,028 | 404,279,903 | 585,725,094 | 661,096,623 | ||||||||
| Russell Tax-Managed International Equity Fund | — | 133,990,518 | 207,977,197 | 194,847,085 | ||||||||
| Russell Global Opportunistic Credit Fund | 492,167,910 | 607,209,606 | 592,630,870 | 601,906,664 | ||||||||
| Unconstrained Total Return Fund | — | — | — | 67,142,670 | ||||||||
| Russell Strategic Bond Fund | 1,449,591,361 | 1,502,384,416 | 1,559,400,072 | 1,586,508,919 | ||||||||
| Russell Investment Grade Bond Fund | 120,951,041 | 122,554,747 | 107,295,547 | 118,388,348 | ||||||||
| Russell Short Duration Bond Fund | 45,559,122 | 54,143,878 | 78,127,178 | 50,837,056 | ||||||||
| Russell Global Infrastructure Fund | 121,143,368 | 93,979,113 | 165,686,106 | 56,025,038 | ||||||||
| Russell Global Real Estate Securities Fund | 90,280,434 | 86,164,675 | 117,605,885 | 69,564,402 | ||||||||
| Russell Multi-Strategy Income Fund | 34,096,397 | 47,088,560 | 58,666,961 | 81,079,551 | ||||||||
| Select International Equity Fund | 114,581,652 | 99,159,935 | 190,379,924 | 120,581,287 | ||||||||
| Outstanding Contract Amounts Bought | ||||||||||||
| Quarter Ended | January 31, 2016 | April 30, 2016 | July 31, 2016 | October 31, 2016 | ||||||||
| Russell International Developed Markets Fund | $ | 1,468,717,742 | $ | 971,305,747 | $ | 1,290,982,251 | $ | 1,109,777,893 | ||||
| Russell Global Equity Fund | 1,422,447,518 | 965,289,300 | 920,842,764 | 803,190,535 | ||||||||
| Russell Emerging Markets Fund | 596,380,079 | 405,995,687 | 588,210,787 | 664,481,359 | ||||||||
| Russell Tax-Managed International Equity Fund | — | 134,950,721 | 210,473,396 | 194,037,242 | ||||||||
| Russell Global Opportunistic Credit Fund | 493,500,848 | 603,660,913 | 591,607,603 | 606,003,007 | ||||||||
| Unconstrained Total Return Fund | — | — | — | 67,197,894 | ||||||||
| Russell Strategic Bond Fund | 1,449,051,891 | 1,499,846,175 | 1,556,372,972 | 1,582,818,513 | ||||||||
| Russell Investment Grade Bond Fund | 120,450,965 | 122,384,792 | 107,619,887 | 118,159,671 | ||||||||
| Russell Short Duration Bond Fund | 45,432,962 | 54,190,302 | 78,320,250 | 51,201,947 | ||||||||
| Russell Global Infrastructure Fund | 120,741,945 | 94,983,322 | 165,446,337 | 55,619,339 | ||||||||
| Russell Global Real Estate Securities Fund | 90,263,811 | 86,945,395 | 117,542,709 | 68,823,255 | ||||||||
| Russell Multi-Strategy Income Fund | 34,419,522 | 46,692,718 | 59,047,478 | 81,568,831 | ||||||||
| Select International Equity Fund | 113,599,326 | 98,543,709 | 189,832,743 | 119,769,573 | ||||||||
Options
Certain Funds may purchase and sell (write) call and put options on securities and securities indices. Such options are traded on
a national securities exchange or in an OTC market. The Funds may also purchase and sell (write) call and put options on foreign
currencies.
When a Fund writes a covered call or a put option, an amount equal to the premium received by the Fund is included in the Fund’s
Statement of Assets and Liabilities as an asset and as an equivalent liability. The amount of the liability is subsequently marked-
to-market to reflect the current fair value of the option written. The Fund receives a premium on the sale of a call option but gives
up the opportunity to profit from any increase in the value of the underlying instrument above the exercise price of the option, and
when the Fund writes a put option it is exposed to a decline in the price of the underlying instrument.
When a Fund sells an uncovered call option, it does not simultaneously have a long position in the underlying security. When a
Fund sells an uncovered put option, it does not simultaneously have a short position in the underlying security. Uncovered options
are riskier than covered options because there is no underlying security held by the Fund that can act as a partial hedge.
Whether an option which the Fund has written expires on its stipulated expiration date or the Fund enters into a closing purchase
transaction, the Fund realizes a gain (or loss, if the cost of a closing purchase transaction exceeds the premium received when the
option was sold) without regard to any unrealized gain or loss on the underlying security, and the liability related to such option is
extinguished. If a call option which the Fund has written is exercised, the Fund realizes a capital gain or loss from the sale of the
Notes to Financial Statements 783
Russell Investment Company
Russell Funds
Notes to Financial Statements, continued — October 31, 2016
underlying security, and the proceeds from such sale are increased by the premium originally received. When a put option which
a Fund has written is exercised, the amount of the premium originally received will reduce the cost of the security which a Fund
purchases upon exercise of the option.
The Funds’ use of written options involves, to varying degrees, elements of market risk in excess of the amount recognized in the
Statements of Assets and Liabilities. The face or contract amounts of these instruments reflect the extent of the Funds’ exposure to
market risk. The risks may be caused by an imperfect correlation between movements in the price of the instrument and the price
of the underlying securities and interest rates.
Certain Funds may enter into a swaption (an option on a swap). In a swaption, in exchange for an option, the buyer gains the right
but not the obligation to enter into a specified swap agreement with the issuer on a specified future date. The writer of the contract
receives the premium and bears the risk of unfavorable changes in the preset rate on the underlying swap.
As of October 31, 2016, the Russell Strategic Call Overwriting Fund pledged securities valued at $36,175,577 as collateral in
connection with options.
For the period ended October 31, 2016, the Funds purchased or sold options primarily for the strategies listed below:
| Funds | Strategies |
| Russell U.S. Defensive Equity Fund | Exposing cash to markets |
| Russell Global Opportunistic Credit Fund | Return enhancement and hedging |
| Unconstrained Total Return Fund | Return enhancement |
| Russell Strategic Bond Fund | Return enhancement and hedging |
| Russell Investment Grade Bond Fund | Return enhancement and hedging |
| Russell Multi-Strategy Income Fund | Return enhancement and hedging |
| Russell Strategic Call Overwriting Fund | Return enhancement and hedging |
The Funds’ options contracts notional amounts fluctuate throughout the fiscal year as required to meet strategic requirements. The
following table illustrates the quarterly activity of options contracts measured by notional in USD.
| Notional of Options Contracts Opened or Closed | |||||||||||||
| Funds | January 31, 2016 | April 30, 2016 | July 31, 2016 | October 31, 2016 | |||||||||
| Russell U.S. Defensive Equity Fund | Opened | $ | 168,416,500 | $ | 218,154,500 | $ | 236,384,500 | $ | 197,841,500 | ||||
| Closed | 165,990,500 | 187,903,500 | 235,015,000 | 220,670,000 | |||||||||
| Russell Global Opportunistic Credit Fund | Opened | 297,000,000 | — | — | 33,689,600 | ||||||||
| Closed | — | 297,000,000 | — | 33,689,600 | |||||||||
| Unconstrained Total Return Fund | Opened | — | — | — | 181,120,389 | ||||||||
| Russell Strategic Bond Fund | Opened | 22,759,771 | 3,200,000 | 1,662,093,750 | 890,215,065 | ||||||||
| Closed | 198,896,000 | — | 1,520,952,514 | 805,226,961 | |||||||||
| Russell Investment Grade Bond Fund | Closed | 38,875,000 | — | — | — | ||||||||
| Russell Multi-Strategy Income Fund | Opened | 40,669,525 | 70,671,916 | 193,968,519 | 195,249,839 | ||||||||
| Closed | 24,402,411 | 35,517,963 | 52,108,518 | 134,180,348 | |||||||||
| Russell Strategic Call Overwriting Fund | Opened | 661,735,350 | 1,013,149,000 | 1,047,822,750 | 850,009,250 | ||||||||
| Closed | 666,922,350 | 1,034,408,000 | 1,017,306,250 | 860,069,750 | |||||||||
Futures Contracts
Certain Funds may invest in futures contracts (i.e., interest rate, foreign currency, index futures contracts) and commodity futures
contracts (Russell Commodity Strategies Fund only). The face or contract value of these instruments reflect the extent of the Funds’
exposure to off balance sheet risk. The primary risks associated with the use of futures contracts are an imperfect correlation
between the change in fair value of the securities held by the Funds and the prices of futures contracts, and the possibility of an
illiquid market. Upon entering into a futures contract, the Funds are required to deposit with a broker an amount, termed the initial
margin, which typically represents 5% to 10% of the purchase price indicated in the futures contract. Payments to and from the
broker, known as variation margin, are typically required to be made on a daily basis as the price of the futures contract fluctuates.
Changes in initial settlement value are accounted for as unrealized appreciation (depreciation) until the contracts are terminated,
at which time realized gains and losses are recognized.
For the period ended October 31, 2016, the following Funds entered into futures contracts primarily for the strategies listed below:
784 Notes to Financial Statements
Russell Investment Company
Russell Funds
Notes to Financial Statements, continued — October 31, 2016
| Funds | Strategies |
| Russell U.S. Core Equity Fund | Exposing cash to markets |
| Russell U.S. Defensive Equity Fund | Exposing cash to markets |
| Russell U.S. Dynamic Equity Fund | Exposing cash to markets |
| Russell U.S. Strategic Equity Fund | Exposing cash to markets |
| Russell U.S. Large Cap Equity Fund | Exposing cash to markets |
| Russell U.S. Mid Cap Equity Fund | Exposing cash to markets |
| Russell U.S. Small Cap Equity Fund | Exposing cash to markets |
| Russell International Developed Markets Fund | Return enhancement, hedging, and exposing cash to markets |
| Russell Global Equity Fund | Return enhancement, hedging, and exposing cash to markets |
| Russell Emerging Markets Fund | Hedging and exposing cash to markets |
| Russell Tax-Managed U.S. Large Cap Fund | Exposing cash to markets |
| Russell Tax-Managed U.S. Mid & Small Cap Fund | Exposing cash to markets |
| Russell Tax-Managed International Equity Fund | Return enhancement, hedging, and exposing cash to markets |
| Russell Global Opportunistic Credit Fund | Return enhancement, hedging, and exposing cash to markets |
| Unconstrained Total Return Fund | Return enhancement and hedging |
| Russell Strategic Bond Fund | Return enhancement, hedging, and exposing cash to markets |
| Russell Investment Grade Bond Fund | Return enhancement, hedging, and exposing cash to markets |
| Russell Short Duration Bond Fund | Return enhancement, hedging, and exposing cash to markets |
| Russell Commodity Strategies Fund | Return enhancement |
| Russell Global Infrastructure Fund | Exposing cash to markets |
| Russell Global Real Estate Securities Fund | Exposing cash to markets |
| Russell Multi-Strategy Income Fund | Return enhancement, hedging and exposing cash to markets |
| Russell Strategic Call Overwriting Fund | Hedging and exposing cash to markets |
| Select U.S. Equity Fund | Exposing cash to markets |
| Select International Equity Fund | Return enhancement, hedging and exposing cash to markets |
The Funds' futures contracts notional amounts fluctuate throughout the fiscal year as required to meet strategic requirements. The
following table illustrates the quarterly activity of futures contracts measured by notional in USD.
| Notional of Futures Contracts Opened or Closed | |||||||||||||
| Funds | January 31, 2016 | April 30, 2016 | July 31, 2016 | October 31, 2016 | |||||||||
| Russell U.S. Core Equity Fund | Opened | $ | 138,790,082 | $ | 93,692,865 | $ | 53,076,701 | $ | 63,622,677 | ||||
| Closed | 131,298,989 | 104,867,171 | 66,975,284 | 54,193,026 | |||||||||
| Russell U.S. Defensive Equity Fund | Opened | 149,518,508 | 100,233,512 | 38,941,109 | 204,178,595 | ||||||||
| Closed | 102,151,332 | 153,874,200 | 56,607,579 | 197,363,772 | |||||||||
| Russell U.S. Dynamic Equity Fund | Opened | 67,312,741 | 51,635,307 | 43,109,882 | 45,427,496 | ||||||||
| Closed | 67,669,804 | 61,123,572 | 46,111,996 | 45,290,992 | |||||||||
| Russell U.S. Strategic Equity Fund | Opened | 296,667,174 | 292,384,361 | 735,349,566 | 211,023,007 | ||||||||
| Closed | 330,054,254 | 347,845,752 | 745,208,123 | 189,981,515 | |||||||||
| Russell U.S. Large Cap Equity Fund | Opened | 56,134,059 | 37,440,827 | 31,084,789 | 36,336,097 | ||||||||
| Closed | 59,357,215 | 39,059,115 | 34,804,880 | 31,953,216 | |||||||||
| Russell U.S. Mid Cap Equity Fund | Opened | 21,924,238 | 21,260,579 | 16,834,941 | 33,731,096 | ||||||||
| Closed | 22,073,270 | 18,454,675 | 15,542,233 | 41,130,385 | |||||||||
| Russell U.S. Small Cap Equity Fund | Opened | 166,684,811 | 145,711,186 | 249,552,584 | 184,175,780 | ||||||||
| Closed | 168,489,193 | 151,749,480 | 278,529,304 | 148,692,278 | |||||||||
| Russell International Developed Markets Fund | Opened | 927,343,203 | 763,178,741 | 978,992,232 | 696,566,401 | ||||||||
| Closed | 804,171,166 | 822,697,628 | 944,232,380 | 803,419,374 | |||||||||
| Russell Global Equity Fund | Opened | 792,821,545 | 749,149,301 | 641,922,304 | 485,067,943 | ||||||||
| Closed | 894,165,890 | 805,525,973 | 748,029,318 | 493,598,817 | |||||||||
| Russell Emerging Markets Fund | Opened | 884,617,803 | 424,159,267 | 428,687,773 | 522,525,542 | ||||||||
| Closed | 665,195,523 | 575,195,520 | 406,080,322 | 514,422,700 | |||||||||
| Russell Tax-Managed U.S. Large Cap Fund | Opened | 231,891,602 | 168,737,139 | 128,661,210 | 138,375,715 | ||||||||
| Closed | 201,432,571 | 173,825,823 | 154,818,970 | 125,620,437 | |||||||||
| Russell Tax-Managed U.S. Mid & Small Cap Fund | Opened | 40,643,701 | 44,909,551 | 30,190,407 | 22,273,733 | ||||||||
| Closed | 32,611,849 | 49,169,375 | 40,739,990 | 21,674,820 | |||||||||
Notes to Financial Statements 785
Russell Investment Company
Russell Funds
Notes to Financial Statements, continued — October 31, 2016
| Notional of Futures Contracts Opened or Closed | ||||||||||
| Russell Tax-Managed International Equity Fund | Opened | 76,607,189 | 304,863,438 | 222,402,507 | 225,027,893 | |||||
| Closed | 45,590,572 | 229,252,213 | 222,871,376 | 209,749,583 | ||||||
| Russell Global Opportunistic Credit Fund | Opened | 552,381,145 | 482,225,990 | 1,495,989,646 | 1,728,954,157 | |||||
| Closed | 394,768,234 | 519,278,982 | 851,787,207 | 1,686,539,312 | ||||||
| Unconstrained Total Return Fund | Opened | — | — | — | 113,136,755 | |||||
| Closed | — | — | — | 14,578,469 | ||||||
| Russell Strategic Bond Fund | Opened | 2,451,430,181 | 2,763,472,209 | 4,816,644,194 | 7,821,068,973 | |||||
| Closed | 2,287,420,551 | 2,924,599,188 | 3,229,196,968 | 8,026,183,351 | ||||||
| Russell Investment Grade Bond Fund | Opened | 223,693,157 | 298,061,711 | 690,346,774 | 960,409,668 | |||||
| Closed | 172,181,191 | 315,544,302 | 501,766,816 | 977,685,390 | ||||||
| Russell Short Duration Bond Fund | Opened | 331,901,288 | 176,500,538 | 374,144,505 | 314,832,985 | |||||
| Closed | 343,893,520 | 171,003,337 | 243,296,890 | 321,408,751 | ||||||
| Russell Commodity Strategies Fund | Opened | 11,700,609 | 3,429,374 | 15,602,039 | 5,711,070 | |||||
| Closed | 5,399,159 | 5,317,142 | 15,831,370 | 3,595,852 | ||||||
| Russell Global Infrastructure Fund | Opened | 153,295,054 | 130,011,597 | 178,191,802 | 87,172,216 | |||||
| Closed | 144,526,149 | 130,670,131 | 185,226,408 | 88,599,288 | ||||||
| Russell Global Real Estate Securities Fund | Opened | 111,574,608 | 110,888,890 | 144,229,607 | 101,803,352 | |||||
| Closed | 122,592,250 | 91,949,547 | 155,036,308 | 106,935,168 | ||||||
| Russell Multi-Strategy Income Fund | Opened | 95,849,672 | 100,693,427 | 292,538,473 | 204,160,998 | |||||
| Closed | 85,929,336 | 90,955,495 | 162,994,062 | 270,365,724 | ||||||
| Russell Strategic Call Overwriting Fund | Opened | 9,048,437 | 13,183,447 | 8,821,566 | 8,938,286 | |||||
| Closed | 1,235,778 | 839,851 | 9,202,808 | 8,053,937 | ||||||
| Select U.S. Equity Fund | Opened | 54,640,636 | 84,379,972 | 45,527,626 | 91,951,402 | |||||
| Closed | 53,262,649 | 102,624,639 | 43,361,145 | 76,616,963 | ||||||
| Select International Equity Fund | Opened | 140,564,763 | 113,020,277 | 123,841,553 | 71,591,333 | |||||
| Closed | 78,869,660 | 141,777,166 | 117,715,763 | 74,567,866 | ||||||
Swap Agreements
Certain Funds may enter into swap agreements, on either an asset-based or liability-based basis, depending on whether they are
hedging their assets or their liabilities, and will usually enter into swaps on a net basis (i.e., the two payment streams are netted
out, with the Funds receiving or paying only the net amount of the two payments). When a Fund engages in a swap, it exchanges
its obligations to pay or rights to receive payments for the obligations to pay or rights to receive payments of another party (i.e., an
exchange of floating rate payments for fixed rate payments).
Certain Funds may enter into several different types of swap agreements including credit default, interest rate, commodity-linked
(Russell Commodity Strategies Fund only), total return (equity and/or index) and currency swaps. Credit default swaps are a
counterparty agreement which allows the transfer of third party credit risk (the possibility that an issuer will default on its obligation
by failing to pay principal or interest in a timely manner) from one party to another. The lender faces the credit risk from a third
party and the counterparty in the swap agrees to insure this risk in exchange for regular periodic payments. Interest rate swaps are a
counterparty agreement, can be customized to meet each party’s needs, and involve the exchange of a fixed or variable payment per
period for a payment that is not fixed. Equity swaps are a counterparty agreement where two parties exchange two sets of cash flows
on predetermined dates for an agreed upon amount of time. The cash flows will typically be an equity index value swapped with
a floating rate such as LIBOR plus or minus a predefined spread. Index swap agreements are a counterparty agreement intended
to expose cash to markets or to effect investment transactions consistent with those Funds’ investment objectives and strategies.
Currency swaps are a counterparty agreement where two parties exchange specified amounts of different currencies which are
followed by each paying the other a series of interest payments that are based on the principal cash flow. At maturity the principal
amounts are returned.
The Funds generally expect to enter into these transactions primarily to preserve a return or spread on a particular investment or
portion of their portfolios or to protect against any increase in the price of securities they anticipate purchasing at a later date, or for
786 Notes to Financial Statements
Russell Investment Company
Russell Funds
Notes to Financial Statements, continued — October 31, 2016
return enhancement. Under most swap agreements entered into by a Fund, the parties' obligations are determined on a "net basis".
The net amount of the excess, if any, of the Funds’ obligations over their entitlements with respect to each swap will be accrued on a
daily basis and an amount of cash or liquid assets having an aggregate NAV at least equal to the accrued excess will be segregated.
To the extent that the Funds enter into swaps on other than a net basis, the amount maintained in a segregated account will be the
full amount of the Funds’ obligations, if any, with respect to such swaps, accrued on a daily basis. If there is a default by the other
party to such a transaction, the Funds will have contractual remedies pursuant to the agreement related to the transaction.
A Fund may not receive the expected amount under a swap agreement if the other party to the agreement defaults or becomes
bankrupt.
Credit Default Swaps
Certain Funds may enter into credit default swaps. A credit default swap can refer to corporate issues, government issues, asset-
backed securities or an index of assets, each known as the reference entity or underlying asset. Funds may act as either the buyer
or the seller of a credit default swap involving one party making a stream of payments to another party in exchange for the right to
receive a specified return in the event of a default or other credit event. Depending upon the terms of the contract, the credit default
swap may be closed via physical settlement. However, due to the possible or potential instability in the market, there is a risk that
the Funds may be unable to deliver the underlying debt security to the other party to the agreement. Additionally, the Funds may
not receive the expected amount under the swap agreement if the other party to the agreement defaults or becomes bankrupt. In
an unhedged credit default swap, Funds enter into a credit default swap without owning the underlying asset or debt issued by the
reference entity. Credit default swaps allow Funds to acquire or reduce credit exposure to a particular issuer, asset or basket of
assets.
As the seller of protection in a credit default swap, a Fund would be required to pay the par or other agreed-upon value (or otherwise
perform according to the swap contract) of a reference debt obligation to the counterparty in the event of a default (or other specified
credit event) and the counterparty would be required to surrender the reference debt obligation. In return, the Fund would receive
from the counterparty a periodic stream of payments over the term of the contract provided that no credit event has occurred. If no
credit event occurs, the Fund would keep the stream of payments and would have no payment obligations. As a seller of protection,
the Fund would effectively add leverage to its portfolio because, in addition to its total net assets, that Fund would be subject to
investment exposure on the notional amount of the swap.
Certain Funds may also purchase protection via credit default swap contracts in order to offset the risk of default of debt securities
held in their portfolios or to take a short position in a debt security, in which case the Fund would function as the counterparty
referenced in the preceding paragraph.
If a credit event occurs and cash settlement is not elected, a variety of other deliverable obligations may be delivered in lieu of
the specific referenced obligation. The ability to deliver other obligations may result in a cheapest-to-deliver option (the buyer
of protection’s right to choose the deliverable obligation with the lowest value following a credit event). Certain Funds may use
credit default swaps to provide a measure of protection against defaults of the issuers (i.e., to reduce risk where Funds own or have
exposure to the referenced obligation) or to take an active long or short position with respect to the likelihood (as measured by the
credit default swap’s spread) of a particular issuer’s default.
Deliverable obligations for credit default swaps on asset-backed securities in most instances are limited to the specific referenced
obligation as performance for asset-backed securities can vary across deals. Prepayments, principal paydowns, and other writedown
or loss events on the underlying mortgage loans will reduce the outstanding principal balance of the referenced obligation. These
reductions may be temporary or permanent as defined under the terms of the swap agreement and the notional amount for the swap
agreement generally will be adjusted by corresponding amounts. Certain Funds may use credit default swaps on asset-backed
securities to provide a measure of protection against defaults (or other defined credit events) of the referenced obligation or to take
an active long or short position with respect to the likelihood of a particular referenced obligation’s default (or another defined credit
event).
Credit default swap agreements on credit indices involve one party making a stream of payments to another party in exchange for
the right to receive a specified return in the event of a write-down, principal shortfall, interest shortfall or default of all or part of
the referenced entities comprising the credit index. A credit index is a basket of credit instruments or exposures designed to be
representative of some part of the credit market as a whole. These indices are made up of reference credits that are judged by a
poll of dealers to be the most liquid entities in the credit default swap market based on the sector of the index. Components of the
indices may include, but are not limited to, investment grade securities, high yield securities, asset-backed securities, emerging
Notes to Financial Statements 787
Russell Investment Company
Russell Funds
Notes to Financial Statements, continued — October 31, 2016
markets, and/or various credit ratings within each sector. Credit indices are traded using credit default swaps with standardized
terms including a fixed spread and standard maturity dates. An index credit default swap references all the names in the index, and
if there is a default, the credit event is settled based on that name’s weight in the index. The composition of the indices changes
periodically, usually every six months, and, for most indices, each name has an equal weight in the index. Traders may use credit
default swaps on indices to speculate on changes in credit quality.
Implied credit spreads, represented in absolute terms, utilized in determining the fair value of credit default swap agreements on
corporate issues as of period-end are disclosed in the Schedules of Investments and generally serve as an indicator of the current
status of the payment/performance risk and represent the likelihood or risk of default (or other defined credit event) for the credit
derivative. The implied credit spread of a particular referenced entity reflects the cost of entering into a credit default swap and
may include upfront payments required to be made to enter into the agreement. For credit default swap agreements on asset-
backed securities and credit indices, the quoted market prices and resulting values serve as the indicator of the current status of
the payment/performance risk. Wider credit spreads and increasing fair values, in absolute terms when compared to the notional
amount of the swap, generally represent a deterioration of the referenced entity’s credit soundness and a greater likelihood or risk
of default or other credit event occurring as defined under the terms of the agreement. The maximum potential amount of future
payments (undiscounted) that Funds as a seller of protection could be required to make under a credit default swap agreement
equals the notional amount of the agreement. Notional amounts of all credit default swap agreements outstanding as of October 31,
2016, for which a Fund is the seller of protection are disclosed in the Schedules of Investments. These potential amounts would be
partially offset by any recovery values of the respective referenced obligations, upfront payments received upon entering into the
agreement, or net amounts received from the settlement of buy protection credit default swap agreements entered into by a Fund for
the same referenced entity or entities.
Credit default swaps could result in losses if the Funds do not correctly evaluate the creditworthiness of the company or companies
on which the credit default swap is based. Credit default swap agreements may involve greater risks than if the Funds had invested
in the reference obligation directly since, in addition to risks relating to the reference obligation, credit default swaps are subject
to illiquidity and counterparty risk. A Fund will generally incur a greater degree of risk when it sells a credit default swap than
when it purchases a credit default swap. As a buyer of a credit default swap, a Fund may lose its investment and recover nothing
should a credit event fail to occur and the swap is held to its termination date. As seller of a credit default swap, if a credit event
were to occur, the value of any deliverable obligation received by a Fund, coupled with the upfront or periodic payments previously
received, may be less than what it pays to the buyer, resulting in a loss of value to the Fund.
If the creditworthiness of a Fund’s swap counterparty declines, the risk that the counterparty may not perform could increase,
potentially resulting in a loss to the Fund. To limit the counterparty risk involved in swap agreements, the Funds will only enter
into swap agreements with counterparties that meet certain standards of creditworthiness. Although there can be no assurance that
the Funds will be able to do so, the Funds may be able to reduce or eliminate their exposure under a swap agreement either by
assignment or other disposition, or by entering into an offsetting swap agreement with the same party or another creditworthy party.
The Funds may have limited ability to eliminate their exposure under a credit default swap if the credit quality of the reference
entity or underlying asset has declined.
For the period ended October 31, 2016, the Funds entered into credit default swaps primarily for the strategies listed below:
| Funds | Strategies |
| Russell Global Opportunistic Credit Fund | Return enhancement and exposing cash to markets |
| Unconstrained Total Return Fund | Return enhancement |
| Russell Strategic Bond Fund | Return enhancement, hedging and exposing cash to markets |
| Russell Investment Grade Bond Fund | Return enhancement, hedging and exposing cash to markets |
| Russell Short Duration Bond Fund | Return enhancement and hedging |
| Russell Multi-Strategy Income Fund | Return enhancement and hedging |
The Funds' period end credit default swap contract notional amounts outstanding fluctuate throughout the fiscal year as required to
meet strategic requirements. The following table illustrates the quarterly volume of credit default swap contracts. For the purpose
of this disclosure, the volume is measured by notional amounts outstanding at each quarter end.
788 Notes to Financial Statements
Russell Investment Company
Russell Funds
Notes to Financial Statements, continued — October 31, 2016
| Credit Default Swap Notional Amounts Outstanding | ||||||||||||
| Quarter Ended | January 31, 2016 | April 30, 2016 | July 31, 2016 | October 31, 2016 | ||||||||
| Russell Global Opportunistic Credit Fund | $ | 149,045,810 | $ | 118,046,059 | $ | 367,788,032 | $ | 238,203,262 | ||||
| Unconstrained Total Return Fund | — | — | — | 19,747,000 | ||||||||
| Russell Strategic Bond Fund | 257,856,936 | 31,216,040 | 14,000,000 | 20,760,000 | ||||||||
| Russell Investment Grade Bond Fund | 23,916,304 | 12,000,000 | — | — | ||||||||
| Russell Short Duration Bond Fund | 5,650,000 | — | — | 3,880,000 | ||||||||
| Russell Multi-Strategy Income Fund | 9,600,000 | 17,200,000 | 98,600,000 | 60,600,000 | ||||||||
Interest Rate Swaps
The use of interest rate swaps is a highly specialized activity which involves investment techniques and risks different from those
associated with ordinary portfolio securities transactions. If RIM or a money manager using this technique is incorrect in its forecast
of fair values, interest rates and other applicable factors, the investment performance of a Fund might diminish compared to what
it would have been if this investment technique were not used.
Interest rate swaps do not involve the delivery of securities or other underlying assets or principal. Accordingly, the risk of loss
with respect to interest rate swaps is limited to the net amount of interest payments that the Funds are contractually obligated to
make. Interest rate swaps are traded on exchanges and are subject to central clearing. If the clearing house or futures commission
merchant defaults, the Funds' risk of loss consists of the net amount of interest payments that the Funds are contractually entitled
to receive. The counterparty risk for cleared derivatives is generally lower than for uncleared derivatives. However, clearing may
subject a Fund to increased costs or margin requirements.
For the period ended October 31, 2016, the Funds entered into interest rate swaps primarily for the strategies listed below:
| Funds | Strategies |
| Unconstrained Total Return Fund | Return enhancement and hedging |
| Russell Strategic Bond Fund | Return enhancement and hedging |
| Russell Investment Grade Bond Fund | Return enhancement and hedging |
| Russell Tax Exempt High Yield Bond Fund | Return enhancement and hedging |
The Funds’ interest rate swap contract notional amounts outstanding fluctuate throughout the fiscal year as required to meet
strategic requirements. The following table illustrates the quarterly volume of interest rate swap contracts. For the purpose of this
disclosure, the volume is measured by the base notional amounts outstanding at each quarter end.
| Interest Rate Swap Notional Amounts Outstanding | ||||||||||||
| Quarter Ended | January 31, 2016 | April 30, 2016 | Aprl 31, 2016 | October 31, 2016 | ||||||||
| Unconstrained Total Return Fund | $ | — | $ | — | $ | — | $ | 84,380,000 | ||||
| Russell Strategic Bond Fund | 116,182,080 | 145,934,764 | 78,018,744 | 111,962,138 | ||||||||
| Russell Investment Grade Bond Fund | 3,840,000 | 2,450,000 | 2,450,000 | — | ||||||||
| Russell Tax Exempt High Yield Bond Fund | 7,300,000 | 2,800,000 | 2,200,000 | 4,400,000 | ||||||||
Total Return Swaps
Certain Funds may enter into index swap agreements to expose cash to markets or to effect investment transactions. Index swap
agreements are two party contracts entered into primarily by institutional investors for periods ranging from a few weeks to more
than one year. In a standard index swap transaction, the two parties agree to exchange the returns (or differentials in rates of return)
earned or realized on particular investments or instruments.
The returns to be exchanged between the parties are calculated with respect to a “notional amount” (i.e., a specified dollar amount
that is hypothetically invested in a “basket” of securities representing a particular index).
For the period ended October 31, 2016, the Funds entered into total return swaps primarily for the strategies listed below:
| Funds | Strategies |
| Russell Emerging Markets Fund | Exposing cash to markets |
| Unconstrained Total Return Fund | Hedging |
| Russell Strategic Bond Fund | Exposing cash to markets |
| Russell Investment Grade Bond Fund | Exposing cash to markets |
| Russell Commodity Strategies Fund | Return enhancement |
Notes to Financial Statements 789
Russell Investment Company
Russell Funds
Notes to Financial Statements, continued — October 31, 2016
The Funds' period end total return swap contract notional amounts outstanding fluctuate throughout the fiscal year as required to
meet strategic requirements. The following table illustrates the quarterly volume of total return swap contracts. For the purpose of
this disclosure, volume is measured by base notional amounts outstanding at each quarter end.
| Total Return Swap Notional Amounts Outstanding | ||||||||||||
| Quarter Ended | January 31, 2016 | April 30, 2016 | July 31, 2016 | October 31, 2016 | ||||||||
| Russell Emerging Markets Fund | $ | 50,729,750 | $ | 29,223,320 | $ | 26,277,000 | $ | 31,523,449 | ||||
| Unconstrained Total Return Fund | — | — | — | 56,513,355 | ||||||||
| Russell Strategic Bond Fund | 508,962,316 | 461,515,940 | 417,400,410 | 173,953,443 | ||||||||
| Russell Investment Grade Bond Fund | 64,663,951 | 36,064,070 | 24,083,943 | — | ||||||||
| Russell Commodity Strategies Fund | 621,677,547 | 666,733,158 | 657,783,005 | 700,617,598 | ||||||||
Currency Swaps
Certain Funds may enter into currency swap agreements to enhance returns or for hedging purposes. Currency swap agreements are
agreements where two parties exchange specified amounts of different currencies which are followed by paying the other a series of
interest payments that are based on the principal cash flow. At maturity, the principal amounts are exchanged.
Commodity-Linked Instruments
The Russell Commodity Strategies Fund may invest in commodity-linked derivative instruments, such as swap agreements and
futures. At least part of their value is derived from the value of an underlying commodity index, commodity futures or options
contracts index, or other readily measurable economic variable. The prices of commodity-linked derivative instruments may move
in different directions than investments in traditional equity and debt securities. As an example, during periods of rising inflation,
debt securities have historically tended to decline in value due to the general increase in prevailing interest rates. Conversely,
during those same periods of rising inflation, historically the prices of certain commodities, such as oil and metals, have tended to
increase. Of course, there cannot be any guarantee that such commodity-linked derivative instruments will perform in that manner
in the future, and at certain times the price movements of commodity-linked derivative investments have been parallel to those of
debt and equity securities.
The Russell Commodity Strategies Fund may invest in commodity-linked notes. Commodity-linked notes pay a return linked to the
performance of a commodity over a defined period. On the maturity date, the note pays the initial principal amount plus return, if
any, based on the percentage change in the underlying commodity.
Master Agreements
Certain Funds are parties to International Swaps and Derivatives Association, Inc. Master Agreements (“ISDA Master Agreements”)
with counterparties that govern transactions in OTC derivative and foreign exchange contracts entered into by the Funds and
those counterparties. The ISDA Master Agreements contain provisions for general obligations, representations, agreements,
collateral and events of default or termination. Events of termination and default include conditions that may entitle either party
to elect to terminate early and cause settlement of all outstanding transactions under the applicable ISDA Master Agreement.
Any election to terminate early could be material to the financial statements. Since different types of forward and OTC financial
derivative transactions have different mechanics and are sometimes traded out of different legal entities of a particular counterparty
organization, each type of transaction may be covered by a different ISDA Master Agreement, resulting in the need for multiple
agreements with a single counterparty. As the ISDA Master Agreements are specific to unique operations of different asset types,
they allow a Fund to net its total exposure to a counterparty in the event of a default with respect to all the transactions governed
under a single agreement with a counterparty.
Master Repurchase Agreements (“Master Repo Agreements”) govern transactions between a Fund and select counterparties.
The Master Repo Agreements maintain provisions for, among other things, initiation, income payments, events of default, and
maintenance of collateral for repurchase and reverse repurchase agreements.
Master Securities Forward Transaction Agreements (“Master Forward Agreements”) govern the considerations and factors
surrounding the settlement of certain forward settling transactions, such as delayed delivery by and between a Fund and select
counterparties. The Master Forward Agreements maintain provisions for, among other things, initiation and confirmation, payment
and transfer, events of default, termination, and maintenance of collateral.
790 Notes to Financial Statements
Russell Investment Company
Russell Funds
Notes to Financial Statements, continued — October 31, 2016
Disclosure about Offsetting Assets and Liabilities
Balance sheet disclosure is based on various netting agreements between brokers and counterparties, such as ISDA Master
Agreements, Master Repo Agreements and Master Forward Agreements. Certain funds utilize multiple counterparties. The
quantitative disclosure begins with disaggregation of counterparties by legal entity and the roll up of the data to reflect a single
counterparty in the table within the Funds’ financial statements. Net exposure represents the net receivable (payable) that would be
due from/to the counterparty in the event of default. Exposure from OTC derivatives can only be netted across transactions governed
under the same Master Agreement with the same legal entity.
Loan Agreements
Certain Funds may invest in direct debt instruments, which are interests in amounts owed by corporate, governmental, or other
borrowers to lenders or lending syndicates. The Funds' investments in loans may be in the form of participations in loans or
assignments of all or a portion of loans from third parties. A loan is often administered by a bank or other financial institution (the
“agent”) that acts as agent for all holders. The agent administers the terms of the loan, as specified in the loan agreement. When
investing in a loan participation, the Funds have the right to receive payments of principal, interest and any fees to which they
are entitled only from the agent selling the loan agreement and only upon receipt by the agent of payments from the borrower. The
Funds generally have no right to enforce compliance with the terms of the loan agreement with the borrower. As a result, the Funds
may be subject to the credit risk of both the borrower and the agent that is selling the loan agreement. When the Funds purchase
assignments from agents they acquire direct rights against the borrower on the loan.
Local Access Products
Certain Funds may invest in local access products, also known as certificates of participation, participation notes or participation
interest notes. Local access products are issued by banks or broker-dealers and are designed to replicate the performance of foreign
companies or foreign securities markets and can be used by the Fund as an alternative means to access the securities market of a
frontier emerging market country. The performance results of local access products will not replicate exactly the performance of
the foreign companies or foreign securities markets that they seek to replicate due to transaction and other expenses. Investments
in local access products involve certain risks in addition to those associated with a direct investment in the underlying foreign
companies or foreign securities markets whose return they seek to replicate. There can be no assurance that there will be a trading
market or that the trading price of local access products will equal the underlying value of the foreign company or foreign securities
market that it seeks to replicate. The Funds rely on the creditworthiness of the counterparty issuing the local access products and
have no rights against the issuer of the underlying security. The Funds minimize this risk by entering into agreements only with
counterparties that RIM deems creditworthy. Due to liquidity and transfer restrictions, the secondary markets on which the local
access products are traded may be less liquid than the markets for other securities, or may be completely illiquid.
Credit Linked Notes
Certain Funds may invest in credit linked notes. Credit linked notes are obligations between two or more parties where the payment
of principal and/or interest is based on the performance of some obligation, basket of obligations, index or economic indicator (a
“reference instrument”). In addition to the credit risk associated with the reference instrument and interest rate risk, the buyer and
seller of a credit linked note or similar structured investment are subject to counterparty risk.
Short Sales
The Russell U.S. Defensive Equity, Russell U.S. Dynamic Equity and Russell U.S. Strategic Equity Funds may enter into short
sale transactions. In a short sale, the seller sells a security that it does not own, typically a security borrowed from a broker or
dealer. Because the seller remains liable to return the underlying security that it borrowed from the broker or dealer, the seller
must purchase the security prior to the date on which delivery to the broker or dealer is required. The Funds will incur a loss as a
result of the short sale if the price of the security increases between the date of the short sale and the date on which the Funds must
return the borrowed security. The Funds will realize a gain if the security declines in price between those dates. Short sales expose
the Funds to the risk of liability for the fair value of the security that is sold (the amount of which increases as the fair value of the
underlying security increases), in addition to the costs associated with establishing, maintaining and closing out the short position.
Although the Funds’ potential for gain as a result of a short sale is limited to the price at which it sold the security short less the
cost of borrowing the security, its potential for loss is theoretically unlimited because there is no limit to the cost of replacing the
borrowed security. When the Funds make a short sale, the Funds may use all or a portion of the cash proceeds of short sales to
purchase other securities or for any other permissible Fund purpose. To the extent necessary to meet collateral requirements, the
Notes to Financial Statements 791
Russell Investment Company
Russell Funds
Notes to Financial Statements, continued — October 31, 2016
Funds are required to pledge assets in a segregated account maintained by the Funds’ custodian for the benefit of the broker. The
Funds also may use securities they own to meet any such collateral obligations. Until the Funds replace a borrowed security in
connection with a short sale, the Funds will: (a) maintain daily a segregated account, containing liquid assets at such a level that
the amount deposited in the segregated account will equal the current requirement under Regulation T promulgated by the Board
of Governors of the Federal Reserve System under the authority of Sections 7 and 8 of the Securities Exchange Act of 1934, as
amended; or (b) otherwise cover its short position in accordance with positions taken by the staff of the Securities and Exchange
Commission (e.g., taking an offsetting long position in the security sold short). As of October 31, 2016, the Russell U.S. Defensive
Equity Fund held $57,755,313, the Russell U.S. Dynamic Equity Fund held $21,825,100, and the Russell U.S. Strategic Equity
Fund held $46,567,817 as collateral for short sales.
Emerging Markets Securities
Certain Funds may invest in emerging markets securities. Investing in emerging markets securities can pose some risks different
from, and greater than, risks of investing in U.S. or developed markets securities. These risks include: a risk of loss due to
exposure to economic structures that are generally less diverse and mature, and to political systems which may have less stability,
than those of more developed countries; smaller market capitalization of securities markets, which may suffer periods of relative
illiquidity; significant price volatility; restrictions on foreign investment; and possible difficulties in the repatriation of investment
income and capital. In addition, foreign investors may be required to register the proceeds of sales and future economic or political
crises could lead to price controls, forced mergers, expropriation or confiscatory taxation, seizure, nationalization, or creation of
government monopolies. The currencies of emerging market countries may experience significant declines against the U.S. dollar,
and devaluation may occur subsequent to investments in these currencies by the Funds. Emerging market securities may be
subject to currency transfer restrictions and may experience delays and disruptions in settlement procedures. Inflation and rapid
fluctuations in inflation rates have had, and may continue to have, negative effects on the economies and securities markets of
certain emerging market countries.
Emerging Markets Debt
Certain Funds may invest in emerging markets debt. A Fund's emerging markets debt securities may include obligations of
governments and corporations. As with any fixed income securities, emerging markets debt securities are subject to the risk of
being downgraded in credit rating due to the risk of default. In the event of a default on any investments in foreign debt obligations,
it may be more difficult for a Fund to obtain or to enforce a judgment against the issuers of such securities. With respect to debt
issued by emerging market governments, such issuers may be unwilling to pay interest and repay principal when due, either due
to an inability to pay or submission to political pressure not to pay, and as a result may default, declare temporary suspensions of
interest payments or require that the conditions for payment be renegotiated.
Repurchase Agreements
Certain Funds may enter into repurchase agreements. A repurchase agreement is an agreement under which a Fund acquires a
fixed income security from a commercial bank, broker or dealer and simultaneously agrees to resell such security to the seller
at an agreed upon price and date (normally within a few days or weeks). The resale price reflects an agreed upon interest rate
effective for the period the security is held by a Fund and is unrelated to the interest rate on the security. The securities acquired
by a Fund constitute collateral for the repurchase obligation. In these transactions, the securities acquired by a Fund (including
accrued interest earned thereon) must have a total value in excess of the value of the repurchase agreement and must be held by the
custodian bank until repurchased. A Fund will not invest more than 15% of its net assets (taken at current fair value) in repurchase
agreements maturing in more than seven days.
Mortgage-Related and Other Asset-Backed Securities
Certain Funds may invest in mortgage or other asset-backed securities (“ABS”). These securities may include mortgage instruments
issued by U.S. government agencies (“agency mortgages”) or those issued by private entities (“non-agency mortgages”). Specific
types of instruments may include reverse mortgages, mortgage pass-through securities, collateralized mortgage obligations
(“CMO”), commercial mortgage-backed securities, mortgage dollar rolls, CMO residuals, stripped mortgage-backed securities and
other securities that directly or indirectly represent a participation in, or are secured by a payable from, mortgage loans on real
property. The value of a Fund’s mortgage-backed securities (“MBS”) may be affected by, among other things, changes or perceived
changes in interest rates, factors concerning the interests in and structure of the issuer or the originator of the mortgage, or the
quality of the underlying assets. The mortgages underlying the securities may default or decline in quality or value. Through its
792 Notes to Financial Statements
Russell Investment Company
Russell Funds
Notes to Financial Statements, continued — October 31, 2016
investments in MBS, a Fund has exposure to subprime loans, Alt-A loans and non-conforming loans as well as to the mortgage
and credit markets generally. Underlying collateral related to subprime, Alt-A and non-conforming mortgage loans has become
increasingly susceptible to defaults and declines in quality or value, especially in a declining residential real estate market. In
addition, regulatory or tax changes may adversely affect the mortgage securities markets as a whole.
Mortgage-Backed Securities
MBS often have stated maturities of up to thirty years when they are issued, depending upon the length of the mortgages underlying
the securities. In practice, however, unscheduled or early payments of principal and interest on the underlying mortgages may make
the securities’ effective maturity shorter than this, and the prevailing interest rates may be higher or lower than the current yield of
a Fund’s portfolio at the time resulting in reinvestment risk.
Rising or high interest rates may result in slower than expected principal payments which may tend to extend the duration of MBS,
making them more volatile and more sensitive to changes in interest rates. This is known as extension risk.
MBS may have less potential for capital appreciation than comparable fixed income securities due to the likelihood of increased
prepayments of mortgages resulting from foreclosures or declining interest rates. These foreclosed or refinanced mortgages are paid
off at face value (par) or less, causing a loss, particularly for any investor who may have purchased the security at a premium or a
price above par. In such an environment, this risk limits the potential price appreciation of these securities.
Agency Mortgage-Backed Securities
Certain MBS may be issued or guaranteed by the U.S. government or a government sponsored entity, such as Fannie Mae (the Federal
National Mortgage Association) or Freddie Mac (the Federal Home Loan Mortgage Corporation). Although these instruments may
be guaranteed by the U.S. government or a government sponsored entity, many such MBS are not backed by the full faith and credit
of the United States and are still exposed to the risk of non-payment.
Privately Issued Mortgage-Backed Securities
MBS held by a Fund may be issued by private issuers including commercial banks, savings associations, mortgage companies,
investment banking firms, finance companies and special purpose finance entities (called special purpose vehicles or SPVs) and
other entities that acquire and package mortgage loans for resale as MBS. These privately issued non-agency MBS may offer higher
yields than those issued by government agencies, but also may be subject to greater price changes than governmental issues.
Subprime loans refer to loans made to borrowers with weakened credit histories or with a lower capacity to make timely payments
on their loans. Alt-A loans refer to loans extended to borrowers who have incomplete documentation of income, assets, or other
variables that are important to the credit underwriting processes. Non-conforming mortgages are loans that do not meet the standards
that allow purchase by government-sponsored enterprises. MBS with exposure to subprime loans, Alt-A loans or nonconforming
loans have had in many cases higher default rates than those loans that meet government underwriting requirements. The risk of
non-payment is greater for MBS that are backed by mortgage pools that contain subprime, Alt-A and non-conforming loans, but a
level of risk exists for all loans.
Unlike agency MBS issued or guaranteed by the U.S. government or a government-sponsored entity (e.g., Fannie Mae and Freddie
Mac), MBS issued by private issuers do not have a government or government-sponsored entity guarantee, but may have credit
enhancements provided by external entities such as banks or financial institutions or achieved through the structuring of the
transaction itself. Examples of such credit support arising out of the structure of the transaction include the issue of senior and
subordinated securities (e.g., the issuance of securities by an SPV in multiple classes or tranches, with one or more classes being
senior to other subordinated classes as to the payment of principal and interest, with the result that defaults on the underlying
mortgage loans are borne first by the holders of the subordinated class); creation of reserve funds (in which case cash or investments,
sometimes funded from a portion of the payments on the underlying mortgage loans, are held in reserve against future losses); and
overcollateralization (in which case the scheduled payments on, or the principal amount of, the underlying mortgage loans exceeds
that required to make payment on the securities and pay any servicing or other fees). However, there can be no guarantee that credit
enhancements, if any, will be sufficient to prevent losses in the event of defaults on the underlying mortgage loans. In addition, MBS
that are issued by private issuers are not subject to the underwriting requirements for the underlying mortgages that are applicable
to those MBS that have a government or government-sponsored entity guarantee. As a result, the mortgage loans underlying private
MBS may, and frequently do, have less favorable collateral, credit risk or other underwriting characteristics than government or
government-sponsored MBS and have wider variances in a number of terms including interest rate, term, size, purpose and borrower
characteristics. Privately issued pools more frequently include second mortgages, high loan-to-value mortgages and manufactured
Notes to Financial Statements 793
Russell Investment Company
Russell Funds
Notes to Financial Statements, continued — October 31, 2016
housing loans. The coupon rates and maturities of the underlying mortgage loans in a private-label MBS pool may vary to a greater
extent than those included in a government guaranteed pool, and the pool may include subprime mortgage loans.
Privately issued MBS are not traded on an exchange and there may be a limited market for the securities, especially when there is a
perceived weakness in the mortgage and real estate market sectors. Without an active trading market, MBS held in a Fund's portfolio
may be particularly difficult to value because of the complexities involved in assessing the value of the underlying mortgage loans.
Asset-Backed Securities
ABS may include MBS, loans, receivables or other assets. The value of the Funds’ ABS may be affected by, among other things,
actual or perceived changes in interest rates, factors concerning the interests in and structure of the issuer or the originator of the
receivables, the market’s assessment of the quality of underlying assets or actual or perceived changes in the credit worthiness of
the individual borrowers, the originator, the servicing agent or the financial institution providing the credit support.
Payment of principal and interest may be largely dependent upon the cash flows generated by the assets backing the securities.
Rising or high interest rates tend to extend the duration of ABS, making them more volatile and more sensitive to changes in interest
rates. The underlying assets are sometimes subject to prepayments which can shorten the security’s weighted average life and may
lower its return. Defaults on loans underlying ABS have become an increasing risk for ABS that are secured by home equity loans
related to sub-prime, Alt-A or non-conforming mortgage loans, especially in a declining residential real estate market.
ABS (other than MBS) present certain risks that are not presented by MBS. Primarily, these securities may not have the benefit
of any security interest in the related assets. Credit card receivables are generally unsecured and the debtors are entitled to the
protection of a number of state and federal consumer credit laws, many of which give such debtors the right to set off certain amounts
owed on the credit cards, thereby reducing the balance due. There is the possibility that recoveries on repossessed collateral may
not, in some cases, be available to support payments on these securities. ABS are often backed by a pool of assets representing the
obligations of a number of different parties. To lessen the effect of failures by obligors on underlying assets to make payments, the
securities may contain elements of credit support which fall into two categories: (i) liquidity protection, and (ii) protection against
losses resulting from ultimate default by an obligor on the underlying assets. Liquidity protection refers to the provision of advances,
generally by the entity administering the pool of assets, to ensure that the receipt of payments on the underlying pool occurs in a
timely fashion. Protection against losses results from payment of the insurance obligations on at least a portion of the assets in the
pool. This protection may be provided through guarantees, policies or letters of credit obtained by the issuer or sponsor from third
parties, through various means of structuring the transaction or through a combination of such approaches. The Funds will not
pay any additional or separate fees for credit support. The degree of credit support provided for each issue is generally based on
historical information respecting the level of credit risk associated with the underlying assets.
Delinquency or loss in excess of that anticipated or failure of the credit support could adversely affect the return on an investment
in such a security. The availability of ABS may be affected by legislative or regulatory developments. It is possible that such
developments may require the Funds to dispose of any then-existing holdings of such securities.
Forward Commitments
Certain Funds may contract to purchase securities for a fixed price at a future date beyond customary settlement time. The price
of the underlying securities and the date when the securities will be delivered and paid for are fixed at the time the transaction is
negotiated. The Funds may dispose of a forward commitment transaction prior to settlement if it is appropriate to do so and may
realize short-term gains (or losses) upon such sale. When effecting such transactions, cash or liquid high-grade debt obligations
of the Funds in a dollar amount sufficient to make payment for the portfolio securities to be purchased will be earmarked on the
Fund's records at the trade date and until the transaction is settled. A forward commitment transaction involves a risk of loss if the
value of the security to be purchased declines prior to the settlement date or the other party to the transaction fails to complete the
transaction.
Certain Funds may invest in to-be-announced ("TBA") mortgage-backed securities. A TBA security is a forward mortgage-backed
securities trade in which a seller agrees to issue a TBA mortgage-backed security at a future date. The securities are purchased
and sold on a forward commitment basis with an approximate principal amount and maturity date. The actual principal amount and
maturity date will be determined upon settlement when the specific mortgage pools are assigned. These securities are within the
parameters of industry “good delivery” standards.
794 Notes to Financial Statements
Russell Investment Company
Russell Funds
Notes to Financial Statements, continued — October 31, 2016
Inflation-Indexed Bonds
The fixed income funds may invest in inflation-indexed securities, which are typically bonds or notes designed to provide a return
higher than the rate of inflation (based on a designated index) if held to maturity. A common type of inflation-indexed security is a
U.S. Treasury Inflation-Protected Security (“TIPS”). The principal of a TIPS increases with inflation and decreases with deflation,
as measured by the Consumer Price Index. When a TIPS matures, the adjusted principal or original principal is paid, whichever is
greater. TIPS pay interest twice a year, at a fixed rate. The rate is applied to the adjusted principal; so, like the principal, interest
payments rise with inflation and fall with deflation.
Guarantees
In the normal course of business, the Funds enter into contracts that contain a variety of representations which provide general
indemnifications. The Funds’ maximum exposure under these arrangements is unknown as this would involve future claims that
may be made against the Funds that have not yet occurred. However, the Funds expect the risk of loss to be remote.
Market, Credit and Counterparty Risk
In the normal course of business, the Funds trade financial instruments and enter into financial transactions where risk of potential
loss exists due to changes in the market (market risk) or failure of the other party to a transaction to perform (credit risk). Similar to
credit risk, the Funds may also be exposed to counterparty risk or risk that an institution or other entity with which the Funds have
unsettled or open transactions will default. The potential loss could exceed the value of the relevant assets recorded in the financial
statements (the “Assets”). The Assets consist principally of cash due from counterparties and investments. The extent of the Funds'
exposure to market, credit and counterparty risks with respect to the Assets approximates their carrying value as recorded in the
Funds' Statements of Assets and Liabilities.
Global economies and financial markets are becoming increasingly interconnected and political and economic conditions (including
recent instability and volatility) and events (including natural disasters) in one country, region or financial market may adversely
impact issuers in a different country, region or financial market. As a result, issuers of securities held by a Fund may experience
significant declines in the value of their assets and even cease operations. Such conditions and/or events may not have the same
impact on all types of securities and may expose a Fund to greater market and liquidity risk and potential difficulty in valuing
portfolio instruments held. This could cause a Fund to underperform other types of investments.
3. Investment in Russell Cayman Commodity Strategies Fund Ltd.
The Russell Cayman Commodity Strategies Fund Ltd. (“Subsidiary”) is a Cayman Island exempted company and wholly owned
subsidiary of the Russell Commodity Strategies Fund. The Subsidiary acts as an investment vehicle for the Fund in order to effect
certain investments on behalf of the Fund. The Fund is the sole shareholder of its Subsidiary, and it is intended that the Fund
will remain the sole shareholder and, as a result, will continue to control the Subsidiary. As of October 31, 2016, net assets of the
Russell Commodity Strategies Fund were $710,515,404 of which $135,292,608 or approximately 19.0%, represents the Fund’s
ownership of the shares of the Subsidiary.
The Russell Commodity Strategies Fund may invest up to 25% of its total assets in the Subsidiary, which may invest without limitation
in commodity-linked derivative instruments, such as swaps and futures that provide exposure to the performance of commodities
markets. The Subsidiary may also invest in fixed income securities. The financial statements of the Russell Commodity Strategies
Fund have been consolidated and include the accounts of both the Fund and the Subsidiary. All inter-company transactions and
balances have been eliminated upon consolidation.
4. Investment Transactions
Securities
During the period ended October 31, 2016, purchases and sales of investment securities (excluding U.S. Government and Agency
obligations, short-term investments, options, futures and repurchase agreements) were as follows:
Notes to Financial Statements 795
Russell Investment Company
Russell Funds
Notes to Financial Statements, continued — October 31, 2016
| Purchases | Sales | |||||
| Russell U.S. Core Equity Fund | $ | 541,829,144 | $ | 802,541,030 | ||
| Russell U.S. Defensive Equity Fund | 766,508,118 | 1,163,787,264 | ||||
| Russell U.S. Dynamic Equity Fund | 601,274,724 | 724,523,434 | ||||
| Russell U.S. Strategic Equity Fund | 2,497,529,363 | 3,608,771,109 | ||||
| Russell U.S. Large Cap Equity Fund | 325,448,779 | 389,931,900 | ||||
| Russell U.S. Mid Cap Equity Fund | 210,204,803 | 266,005,583 | ||||
| Russell U.S. Small Cap Equity Fund | 1,744,396,542 | 2,179,804,087 | ||||
| Russell International Developed Markets Fund | 1,625,096,463 | 1,880,859,963 | ||||
| Russell Global Equity Fund | 1,097,056,897 | 1,449,149,007 | ||||
| Russell Emerging Markets Fund | 1,382,132,434 | 1,651,948,677 | ||||
| Russell Tax-Managed U.S. Large Cap Fund | 565,922,619 | 365,396,502 | ||||
| Russell Tax-Managed U.S. Mid & Small Cap Fund | 286,289,043 | 253,964,819 | ||||
| Russell Tax-Managed International Equity Fund | 564,082,772 | 409,865,028 | ||||
| Russell Global Opportunistic Credit Fund | 1,178,572,980 | 1,017,983,561 | ||||
| Unconstrained Total Return Fund | 112,915,752 | 667,027 | ||||
| Russell Strategic Bond Fund | 3,052,145,406 | 3,756,252,244 | ||||
| Russell Investment Grade Bond Fund | 680,849,026 | 838,337,132 | ||||
| Russell Short Duration Bond Fund | 345,250,232 | 342,265,544 | ||||
| Russell Tax Exempt High Yield Bond Fund | 116,113,426 | 60,699,679 | ||||
| Russell Tax Exempt Bond Fund | 357,549,154 | 185,584,465 | ||||
| Russell Global Infrastructure Fund | 1,211,346,209 | 1,630,992,306 | ||||
| Russell Global Real Estate Securities Fund | 1,069,691,329 | 1,387,891,194 | ||||
| Russell Multi-Strategy Income Fund | 784,915,397 | 243,636,477 | ||||
| Russell Strategic Call Overwriting Fund | 3,078,474 | 5,441,457 | ||||
| Select U.S. Equity Fund | 65,227,570 | 194,217,096 | ||||
| Select International Equity Fund | 430,421,844 | 519,747,436 | ||||
Purchases and sales of U.S. Government and Agency obligations (excluding short-term investments, options, futures and repurchase
agreements) were as follows:
| Purchases | Sales | |||||
| Russell Global Opportunistic Credit Fund | $ | 17,186,571 | $ | 18,747,381 | ||
| Unconstrained Total Return Fund | 110,703,230 | 91,322,645 | ||||
| Russell Strategic Bond Fund | 7,323,712,817 | 6,734,068,207 | ||||
| Russell Investment Grade Bond Fund | 1,535,518,017 | 1,529,154,503 | ||||
| Russell Short Duration Bond Fund | 598,247,705 | 544,711,195 | ||||
| Russell Multi-Strategy Income Fund | 11,704,321 | 7,668,743 |
Securities Lending
The Investment Company has a securities lending program whereby each Fund can loan securities with a value up to 33 1/3% of
each Fund’s total assets. The maturity associated with these securities is considered continuous. The Fund receives cash (U.S.
currency), U.S. Government or U.S. Government Agency obligations as collateral against the loaned securities. The cash collateral
cannot be resold, repledged or rehypothecated. As of October 31, 2016, to the extent that a loan was collateralized by cash, such
collateral was invested by the securities lending agent, Brown Brothers Harriman & Co. (“BBH”), in the U.S. Cash Collateral Fund,
an unregistered fund advised by RIM. The collateral received is recorded on a lending Fund’s Statement of Assets and Liabilities
along with the related obligation to return the collateral.
Income generated from the investment of cash collateral, less negotiated rebate fees paid to participating brokers, is divided
between the Fund and BBH and is recorded as securities lending income for the Fund. To the extent that a loan is secured by non-
cash collateral, brokers pay the Fund negotiated lenders’ fees, which are divided between the Fund and BBH and are recorded
796 Notes to Financial Statements
Russell Investment Company
Russell Funds
Notes to Financial Statements, continued — October 31, 2016
as securities lending income for the Fund. All collateral received will be in an amount at least equal to 102% (for loans of U.S.
securities) or 105% (for loans of non-U.S. securities) of the fair value of the loaned securities at the inception of each loan. The fair
value of the loaned securities is determined at the close of business of the Fund and any additional required collateral is delivered
to the Fund the next day. Should the borrower of the securities fail financially, there is a risk of delay in recovery of the securities
or loss of rights in the collateral.
5. Related Party Transactions, Fees and Expenses
Adviser, Administrator, Transfer and Dividend Disbursing Agent
RIM provides or oversees the provision of all investment advisory and portfolio management services for the Funds, including
developing the investment program for each Fund and managing each Fund's overall exposures. From its advisory fees received
from the Funds, RIM, as agent for RIC, pays all fees to the money managers for their investment advisory services. Each money
manager has agreed that it will look only to RIM for the payment of the money manager’s fee, after RIC has paid RIM. Fees paid
to the money managers are not affected by any voluntary or statutory expense limitations. RIFUS is the Funds' administrator and
transfer agent. RIFUS, in its capacity as the Funds' administrator, provides or oversees the provision of all administrative services
for the Funds. RIFUS, in its capacity as the Funds' transfer agent and dividend disbursing agent, is responsible for providing
transfer agency and dividend disbursing services to the Funds. RIFUS is a wholly-owned subsidiary of RIM. RIM is an indirect,
wholly-owned subsidiary of Russell Investments Group, Ltd., a Cayman company.
The Funds are permitted to invest their cash (i.e., cash awaiting investment or cash held to meet redemption requests or to pay
expenses) in the Russell U.S. Cash Management Fund, an unregistered fund advised by RIM. As of October 31, 2016, the Funds
had invested $2,510,903,016 in the Russell U.S. Cash Management Fund. In addition, all or a portion of the collateral received
from the Investment Company’s securities lending program in the amount of $262,912,700 is invested in the Russell U.S. Cash
Collateral Fund, an unregistered fund advised by RIM.
As a part of the launch of the Unconstrained Total Return Fund, RIM invested $100,000 in classes A, C, E and S.
An affiliated company is a company in which a Fund has ownership of at least 5% of the voting securities or which the Fund
controls, is controlled by or is under common control with. See each Fund’s Related Party Transactions, Fees and Expenses for
disclosure of transactions with affiliated companies.
Each of the Funds pays the following advisory fee directly to RIM, billed monthly on a pro rata basis and calculated as a specified
percentage of the average daily net assets of each of the Funds:
Notes to Financial Statements 797
Russell Investment Company
Russell Funds
Notes to Financial Statements, continued — October 31, 2016
| Funds | Asset Level | Fee | |||||
| Russell U.S. Core Equity Fund | All assets | .55 | % | ||||
| Russell U.S. Defensive Equity Fund | All assets | .55 | % | ||||
| Russell U.S. Dynamic Equity Fund | First $2 billion | .80 | % | ||||
| Next $3 billion | .76 | % | |||||
| Next $5 billion | .73 | % | |||||
| In excess of $10 billion | .71 | % | |||||
| Russell U.S. Strategic Equity Fund | First $2 billion | .75 | % | ||||
| Next $3 billion | .71 | % | |||||
| Next $5 billion | .68 | % | |||||
| In excess of $10 billion | .66 | % | |||||
| Russell U.S. Large Cap Equity Fund | First $2 billion | .70 | % | ||||
| Next $3 billion | .66 | % | |||||
| Next $5 billion | .63 | % | |||||
| In excess of $10 billion | .61 | % | |||||
| Russell U.S. Mid Cap Equity Fund | First $2 billion | .80 | % | ||||
| Next $3 billion | .76 | % | |||||
| Next $5 billion | .73 | % | |||||
| In excess of $10 billion | .71 | % | |||||
| Russell U.S. Small Cap Equity Fund | All assets | .70 | % | ||||
| Russell International Developed Markets Fund | All assets | .70 | % | ||||
| Russell Global Equity Fund | First $2 billion | .95 | % | ||||
| Next $3 billion | .91 | % | |||||
| Next $5 billion | .88 | % | |||||
| In excess of $10 billion | .86 | % | |||||
| Russell Emerging Markets Fund | First $2 billion | 1.15 | % | ||||
| Next $3 billion | 1.11 | % | |||||
| Next $5 billion | 1.08 | % | |||||
| In excess of $10 billion | 1.06 | % | |||||
| Russell Tax-Managed U.S. Large Cap Fund | First $1.5 billion | .70 | % | ||||
| Next $2.5 billion | .66 | % | |||||
| Next $4 billion | .63 | % | |||||
| In excess of $8 billion | .61 | % | |||||
| Russell Tax-Managed U.S. Mid & Small Cap Fund | First $1.5 billion | .98 | % | ||||
| Next $2.5 billion | .94 | % | |||||
| Next $4 billion | .91 | % | |||||
| In excess of $8 billion | .89 | % | |||||
| Russell Tax-Managed International Equity Fund | First $1.5 billion | .85 | % | ||||
| Next $2.5 billion | .81 | % | |||||
| Next $4 billion | .78 | % | |||||
| In excess of $8 billion | .76 | % | |||||
| Russell Global Opportunistic Credit Fund | First $2 billion | 1.00 | % | ||||
| Next $3 billion | .96 | % | |||||
| Next $5 billion | .93 | % | |||||
| In excess of $10 billion | .91 | % | |||||
| Unconstrained Total Return Fund | First $2 billion | 1.00 | % | ||||
| Next $3 billion | .96 | % | |||||
| Next $5 billion | .93 | % | |||||
| In excess of $10 billion | .91 | % | |||||
798 Notes to Financial Statements
Russell Investment Company
Russell Funds
Notes to Financial Statements, continued — October 31, 2016
| Funds | Asset Level | Fee | |||||
| Russell Strategic Bond Fund | First $2 billion | .50 | % | ||||
| Next $3 billion | .46 | % | |||||
| Next $5 billion | .43 | % | |||||
| In excess of $10 billion | .41 | % | |||||
| Russell Investment Grade Bond Fund | All assets | .25 | % | ||||
| Russell Short Duration Bond Fund | First $2 billion | .45 | % | ||||
| Next $3 billion | .41 | % | |||||
| Next $5 billion | .38 | % | |||||
| In excess of $10 billion | .36 | % | |||||
| Russell Tax Exempt High Yield Bond Fund | All assets | .50 | % | ||||
| Russell Tax Exempt Bond Fund | All assets | .30 | % | ||||
| Russell Commodity Strategies Fund | First $2 billion | 1.25 | % | ||||
| Next $3 billion | 1.21 | % | |||||
| Next $5 billion | 1.18 | % | |||||
| In excess of $10 billion | 1.16 | % | |||||
| Russell Global Infrastructure Fund | First $2 billion | 1.25 | % | ||||
| Next $3 billion | 1.21 | % | |||||
| Next $5 billion | 1.18 | % | |||||
| In excess of $10 billion | 1.16 | % | |||||
| Russell Global Real Estate Securities Fund | First $2 billion | .80 | % | ||||
| Next $3 billion | .76 | % | |||||
| Next $5 billion | .73 | % | |||||
| In excess of $10 billion | .71 | % | |||||
| Russell Multi-Strategy Income Fund | First $2 billion | .75 | % | ||||
| Next $3 billion | .71 | % | |||||
| Next $5 billion | .68 | % | |||||
| In excess of $10 billion | .66 | % | |||||
| Russell Strategic Call Overwriting Fund | All assets | .80 | % | ||||
| Select U.S. Equity Fund | All assets | .30 | % | ||||
| Select International Equity Fund | All assets | .45 | % | ||||
The administrative fee of up to 0.05% specified in the table below are based on the average daily net assets of each Fund and are
payable monthly to RIFUS.
Notes to Financial Statements 799
Russell Investment Company
Russell Funds
Notes to Financial Statements, continued — October 31, 2016
| Funds | Administrator* | ||||||
| Russell U.S. Core Equity Fund | .05 | % | |||||
| Russell U.S. Defensive Equity Fund | .05 | ||||||
| Russell U.S. Dynamic Equity Fund | .05 | ||||||
| Russell U.S. Strategic Equity Fund | .05 | ||||||
| Russell U.S. Large Cap Equity Fund | .05 | ||||||
| Russell U.S. Mid Cap Equity Fund | .05 | ||||||
| Russell U.S. Small Cap Equity Fund | .05 | ||||||
| Russell International Developed Markets Fund | .05 | ||||||
| Russell Global Equity Fund | .05 | ||||||
| Russell Emerging Markets Fund | .05 | ||||||
| Russell Tax-Managed U.S. Large Cap Fund | .05 | ||||||
| Russell Tax-Managed U.S. Mid & Small Cap Fund | .05 | ||||||
| Russell Tax-Managed International Equity Fund | .05 | ||||||
| Russell Global Opportunistic Credit Fund | .05 | ||||||
| Unconstrained Total Return Fund | .05 | ||||||
| Russell Strategic Bond Fund | .05 | ||||||
| Russell Investment Grade Bond Fund | .05 | ||||||
| Russell Short Duration Bond Fund | .05 | ||||||
| Russell Tax Exempt High Yield Bond Fund | .05 | ||||||
| Russell Tax Exempt Bond Fund | .05 | ||||||
| Russell Commodity Strategies Fund** | .05 | ||||||
| Russell Global Infrastructure Fund | .05 | ||||||
| Russell Global Real Estate Securities Fund | .05 | ||||||
| Russell Multi-Strategy Income Fund | .05 | ||||||
| Russell Strategic Call Overwriting Fund | .05 | ||||||
| Select U.S. Equity Fund | .05 | ||||||
| Select International Equity Fund | .05 |
* Administrative fees are assessed on total Fund assets based on a tiered fee schedule.
** Annual rates do not reflect the consolidated rates inclusive of fees paid by the Fund's Subsidiary.
The following shows the respective totals for advisory and administrative fees for the period ended October 31, 2016.
800 Notes to Financial Statements
Russell Investment Company
Russell Funds
Notes to Financial Statements, continued — October 31, 2016
| Advisory | Administrative | |||||
| Russell U.S. Core Equity Fund | $ | 4,208,202 | $ | 369,186 | ||
| Russell U.S. Defensive Equity Fund | 4,836,843 | 424,370 | ||||
| Russell U.S. Dynamic Equity Fund | 4,047,009 | 244,105 | ||||
| Russell U.S. Strategic Equity Fund | 25,242,078 | 1,635,565 | ||||
| Russell U.S. Large Cap Equity Fund | 2,608,556 | 179,822 | ||||
| Russell U.S. Mid Cap Equity Fund | 1,402,341 | 84,584 | ||||
| Russell U.S. Small Cap Equity Fund | 12,965,250 | 893,765 | ||||
| Russell International Developed Markets Fund | 17,585,426 | 1,212,274 | ||||
| Russell Global Equity Fund | 23,585,314 | 1,201,665 | ||||
| Russell Emerging Markets Fund | 24,612,125 | 1,034,415 | ||||
| Russell Tax-Managed U.S. Large Cap Fund | 11,882,582 | 822,851 | ||||
| Russell Tax-Managed U.S. Mid & Small Cap Fund | 3,756,396 | 184,984 | ||||
| Russell Tax-Managed International Equity Fund | 4,437,646 | 251,973 | ||||
| Russell Global Opportunistic Credit Fund | 17,481,541 | 843,843 | ||||
| Unconstrained Total Return Fund | 263,230 | 12,715 | ||||
| Russell Strategic Bond Fund | 28,137,367 | 2,784,025 | ||||
| Russell Investment Grade Bond Fund | 2,824,007 | 545,126 | ||||
| Russell Short Duration Bond Fund | 3,665,995 | 393,144 | ||||
| Russell Tax Exempt High Yield Bond Fund | 1,431,593 | 138,191 | ||||
| Russell Tax Exempt Bond Fund | 4,226,210 | 679,898 | ||||
| Russell Commodity Strategies Fund | 10,361,419 | 402,253 | ||||
| Russell Global Infrastructure Fund | 15,308,211 | 590,972 | ||||
| Russell Global Real Estate Securities Fund | 11,150,988 | 672,642 | ||||
| Russell Multi-Strategy Income Fund | 3,023,126 | 194,576 | ||||
| Russell Strategic Call Overwriting Fund | 662,763 | 39,983 | ||||
| Select U.S. Equity Fund | 2,224,610 | 357,838 | ||||
| Select International Equity Fund | 3,499,022 | 375,217 | ||||
RIM has agreed to certain waivers of its advisory and administrative fees as follows:
For the Russell U.S. Strategic Equity Fund, RIM has contractually agreed, until February 28, 2017, to waive up to the full amount
of its 0.75% advisory fee and then to reimburse the Fund for other direct Fund-level expenses, excluding dividend and interest
expenses on short sales, to the extent that direct Fund-level expenses exceed 0.59% of the average daily net assets of that Fund
on an annual basis. This waiver and reimbursement may not be terminated during the relevant period except with Board approval.
Direct Fund-level expenses for the Russell U.S. Strategic Equity Fund do not include 12b-1 fees, shareholder services fees, transfer
agency fees, extraordinary expenses or the expenses of other investment companies in which the Fund invests which are borne
indirectly by the Fund. The total amount of the waiver for the period ended October 31, 2016 was $8,198,722. There were no
reimbursements for the period ended October 31, 2016.
For the Russell U.S. Large Cap Equity Fund, RIM has contractually agreed, until February 28, 2017, to waive up to the full amount
of its 0.70% advisory fee and then to reimburse the Fund for other direct Fund-level expenses to the extent that direct Fund-level
expenses exceed 0.67% of the average daily net assets of that Fund on an annual basis. This waiver and reimbursement may not
be terminated during the relevant period except with Board approval. Direct Fund-level expenses for the Russell U.S. Large Cap
Equity Fund do not include 12b-1 fees, shareholder services fees, transfer agency fees, extraordinary expenses or the expenses of
other investment companies in which the Fund invests which are borne indirectly by the Fund. The total amount of the waiver for
the period ended October 31, 2016 was $609,075. There were no reimbursements for the period ended October 31, 2016.
For the Russell U.S. Mid Cap Equity Fund, RIM has contractually agreed, until February 28, 2017, to waive up to the full amount
of its 0.80% advisory fee and then to reimburse the Fund for other direct Fund-level expenses to the extent that direct Fund-level
expenses exceed 0.77% of the average daily net assets of that Fund on an annual basis. This waiver and reimbursement may not be
terminated during the relevant period except with Board approval. Direct Fund-level expenses for the Russell U.S. Mid Cap Equity
Fund do not include 12b-1 fees, shareholder services fees, transfer agency fees, extraordinary expenses or the expenses of other
Notes to Financial Statements 801
Russell Investment Company
Russell Funds
Notes to Financial Statements, continued — October 31, 2016
investment companies in which the Fund invests which are borne indirectly by the Fund. The total amount of the waiver for the
period ended October 31, 2016 was $437,816. There were no reimbursements for the period ended October 31, 2016.
For the Russell Emerging Markets Fund, RIM has entered into a contractual fee waiver agreement, until February 28, 2017, to
waive 0.041% of its 1.15% advisory fee. This waiver may not be terminated during the relevant period except with Board approval.
The total amount of the waiver for the period ended October 31, 2016 was $430,327.
For the Russell Tax-Managed U.S. Mid & Small Cap Fund, RIM has contractually agreed, until February 28, 2017, to waive up
to the full amount of its 0.98% advisory fee and then to reimburse the Fund for other direct Fund-level expenses to the extent
that direct Fund-level expenses exceed 1.10% of the average daily net assets of that Fund on an annual basis. This waiver and
reimbursement may not be terminated during the relevant period except with Board approval. Direct Fund-level expenses for the
Russell Tax-Managed U.S. Mid & Small Cap Fund do not include 12b-1 fees, shareholder services fees, transfer agency fees,
extraordinary expenses or the expenses of other investment companies in which the Fund invests which are borne indirectly by the
Fund. The total amount of the waiver for the period ended October 31, 2016 was $82,955. There were no reimbursements for the
period ended October 31, 2016
For the Russell Tax-Managed International Equity Fund, RIM has contractually agreed, until February 28, 2017, to waive up to the
full amount of its 0.85% advisory fee and then to reimburse the Fund for other direct Fund-level expenses to the extent that direct
Fund-level expenses exceed 0.89% of the average daily net assets of that Fund on an annual basis. This waiver and reimbursement
may not be terminated during the relevant period except with Board approval. Direct Fund-level expenses for the Russell Tax-
Managed International Equity Fund do not include 12b-1 fees, shareholder services fees, transfer agency fees, extraordinary
expenses or the expenses of other investment companies in which the Fund invests which are borne indirectly by the Fund. The
total amount of the waiver for the period ended October 31, 2016 was $745,495. There were no reimbursements for the period ended
October 31, 2016.
For the Russell Global Opportunistic Credit Fund, RIM has entered into a contractual fee waiver agreement, until February 28,
2017, that results in an effective advisory fee not to exceed 0.676%. This waiver may not be terminated during the relevant period
except with Board approval. The total amount of the waiver for the period ended October 31, 2016 was $5,661,526.
For the Unconstrained Total Return Fund, RIM has contractually agreed, until February 28, 2018, to waive up to the full amount of
its 1.00% advisory fee and then to reimburse the Fund for other direct Fund-level expenses, excluding extraordinary expenses, to
the extent that direct Fund-level expenses exceed 0.72% of the average daily net assets of that Fund on an annual basis. This waiver
and reimbursement may not be terminated during the relevant period except with Board approval. Direct Fund-level expenses for
the Unconstrained Total Return Fund do not include 12b-1 fees, shareholder services fees, transfer agency fees, extraordinary
expenses or the expenses of other investment companies in which the Fund invests which are borne indirectly by the Fund. The
total amount of the waiver for the period ended October 31, 2016 was $210,981. There were no reimbursements for the period ended
October 31, 2016.
For the Russell Strategic Bond Fund, RIM has entered into a contractual fee waiver agreement, until February 28, 2017, that results
in an effective advisory fee not to exceed 0.466%. This waiver may not be terminated during the relevant period except with Board
approval. The total amount of the waiver for the period ended October 31, 2016 was $1,253,859.
For the Russell Short Duration Bond Fund, RIM has entered into a contractual fee waiver agreement, until February 28, 2017, that
results in an effective advisory fee not to exceed 0.368%. This waiver may not be terminated during the relevant period except with
Board approval. The total amount of the waiver for the period ended October 31, 2016 was $668,026.
For the Russell Tax Exempt High Yield Bond Fund, RIM has contractually agreed, until February 28, 2017, to waive up to the full
amount of its 0.50% advisory fee and then to reimburse the Fund for other direct Fund-level expenses, including extraordinary
expenses, to the extent that direct Fund-level expenses exceed 0.44% of the average daily net assets of that Fund on an annual basis.
This waiver and reimbursement may not be terminated during the relevant period except with Board approval. Direct Fund-level
expenses for the Russell Tax Exempt High Yield Bond Fund do not include 12b-1 fees, shareholder services fees, transfer agency
fees, extraordinary expenses or the expenses of other investment companies in which the Fund invests which are borne indirectly
by the Fund. The total amount of the waiver for the period ended October 31, 2016 was $698,931. There were no reimbursements
for the period ended October 31, 2016.
For Russell Cayman Commodity Strategies Fund Ltd., a wholly-owned subsidiary of the Fund, (the “Commodity Strategies
Subsidiary”) pays RIM an advisory fee at the annual rate of 1.25% and pays RIFUS an administrative fee at the annual rate of 0.05%
of the Commodity Strategies Subsidiary’s net assets (the “Commodity Strategies Subsidiaries Fees”). Pursuant to a contractual
802 Notes to Financial Statements
Russell Investment Company
Russell Funds
Notes to Financial Statements, continued — October 31, 2016
agreement with the Russell Commodity Strategies Fund, RIM and RIFUS have contractually agreed to permanently waive all or a
portion of the advisory and administrative fees paid by the Russell Commodity Strategies Fund to RIM and RIFUS in an amount
equal to the amount of the Commodity Strategies Subsidiary Fees received by RIM and RIFUS, if any. This waiver may not be
terminated by RIM and RIFUS. The total amount of the advisory waiver for the period ended October 31, 2016 was $1,600,928.
The total amount of the administrative fee waiver for the period ended October 31, 2016 was $64,037.
For the Russell Commodity Strategies Fund, RIM has entered into a contractual fee waiver agreement, until February 28, 2017, that
results in an effective advisory fee not to exceed 0.8025%. This waiver may not be terminated during the relevant period except with
Board approval. The total amount of the waiver for the period ended October 31, 2016 was $2,953,007.
For the Russell Global Infrastructure Fund, RIM has entered into a contractual fee waiver agreement, until February 28, 2017, that
results in an effective advisory fee not to exceed 0.90%. This waiver may not be terminated during the relevant period except with
Board approval. The total amount of the waiver for the period ended October 31, 2016 was $4,201,415.
For the Russell Multi-Strategy Income Fund, RIM has contractually agreed, until February 28, 2017, to waive up to the full amount
of its 0.75% advisory fee and then to reimburse the Fund for other direct Fund-level expenses to the extent that direct Fund-level
expenses exceed 0.65% of the average daily net assets of that Fund on an annual basis. This waiver and reimbursement may not
be terminated during the relevant period except with Board approval. Direct Fund-level expenses for the Russell Multi-Strategy
Income Fund do not include 12b-1 fees, shareholder services fees, transfer agency fees, extraordinary expenses or the expenses of
other investment companies in which the Fund invests which are borne indirectly by the Fund. The total amount of the waiver for
the period ended October 31, 2016 was $1,370,507. There were no reimbursements for the period ended October 31, 2016.
For the Russell Strategic Call Overwriting Fund, RIM has contractually agreed, until February 28, 2017, to waive up to the full
amount of its 0.80% advisory fee and then to reimburse the Fund for other direct Fund-level expenses, to the extent such direct
Fund-level expenses exceed 0.77% of the average daily net assets of that Fund on an annual basis. This waiver and reimbursement
may not be terminated during the relevant period except with Board approval. Direct Fund-level expenses for the Russell Strategic
Call Overwriting Fund do not include 12b-1 fees, shareholder services fees, transfer agency fees, extraordinary expenses or the
expenses of other investment companies in which the Fund invests which are borne indirectly by the Fund. The total amount of the
waiver for the period ended October 31, 2016 was $286,135.
For the Select U.S. Equity Fund, RIM has contractually agreed, until February 28, 2017, to waive up to the full amount of its 0.30%
advisory fee and then to reimburse the Fund for other direct Fund-level expenses, excluding dividend and interest expense on short
sales, to the extent such direct Fund-level expenses exceed 0.35% of the average daily net assets of that Fund on an annual basis.
This waiver and reimbursement may not be terminated during the relevant period except with Board approval. Direct Fund-level
expenses for the Select U.S. Equity Fund do not include 12b-1 fees, shareholder services fees, transfer agency fees, extraordinary
expenses or the expenses of other investment companies in which the Fund invests which are borne indirectly by the Fund. The
total amount of the waiver for the period ended October 31, 2016 was $392,141. There were no reimbursements for the period ended
October 31, 2016.
For the Select International Equity Fund, RIM has contractually agreed, until February 28, 2017, to waive up to the full amount
of its 0.45% advisory fee and then to reimburse the Fund for other direct Fund-level expenses, excluding dividend and interest
expense on short sales, to the extent such direct Fund-level expenses exceed 0.44% of the average daily net assets of that Fund
on an annual basis. This waiver and reimbursement may not be terminated during the relevant period except with Board approval.
Direct Fund-level expenses for the Select International Equity Fund do not include 12b-1 fees, shareholder services fees, transfer
agency fees, extraordinary expenses or the expenses of other investment companies in which the Fund invests which are borne
indirectly by the Fund. The total amount of the waiver for the period ended October 31, 2016 was $1,147,511. There were no
reimbursements for the period ended October 31, 2016.
RIM does not have the ability to recover amounts waived or reimbursed from previous periods.
Transfer and Dividend Disbursing Agent
RIFUS serves as transfer agent and provides dividend disbursing services to the Funds. For this service, RIFUS is paid a fee based
upon the average daily net assets of the Funds for transfer agency and dividend disbursing services. Transfer agency fees are class-
level expenses and may differ by class. RIFUS retains a portion of this fee for services provided to the Funds and pays the balance
to unaffiliated agents who assist in providing these services. Transfer agency fees paid by the Funds presented herein for the period
ended October 31, 2016 were as follows:
Notes to Financial Statements 803
Russell Investment Company
Russell Funds
Notes to Financial Statements, continued — October 31, 2016
| Amount | |||
| Russell U.S. Core Equity Fund | $ | 1,219,596 | |
| Russell U.S. Defensive Equity Fund | 767,439 | ||
| Russell U.S. Dynamic Equity Fund | 110,445 | ||
| Russell U.S. Strategic Equity Fund | 6,778,992 | ||
| Russell U.S. Large Cap Equity Fund | 745,302 | ||
| Russell U.S. Mid Cap Equity Fund | 350,584 | ||
| Russell U.S. Small Cap Equity Fund | 2,750,319 | ||
| Russell International Developed Markets Fund | 4,592,023 | ||
| Russell Global Equity Fund | 3,618,092 | ||
| Russell Emerging Markets Fund | 3,341,753 | ||
| Russell Tax-Managed U.S. Large Cap Fund | 3,409,950 | ||
| Russell Tax-Managed U.S. Mid & Small Cap Fund | 766,611 | ||
| Russell Tax-Managed International Equity Fund | 1,044,152 | ||
| Russell Global Opportunistic Credit Fund | 2,337,730 | ||
| Unconstrained Total Return Fund | 1,253 | ||
| Russell Strategic Bond Fund | 8,121,407 | ||
| Russell Investment Grade Bond Fund | 1,705,006 | ||
| Russell Short Duration Bond Fund | 1,338,064 | ||
| Russell Tax Exempt High Yield Bond Fund | 572,637 | ||
| Russell Tax Exempt Bond Fund | 2,817,473 | ||
| Russell Commodity Strategies Fund | 1,071,748 | ||
| Russell Global Infrastructure Fund | 1,876,293 | ||
| Russell Global Real Estate Securities Fund | 2,526,884 | ||
| Russell Multi-Strategy Income Fund | 599,543 | ||
| Russell Strategic Call Overwriting Fund | 165,691 | ||
| Select U.S. Equity Fund | 44,248 | ||
| Select International Equity Fund | 41,378 | ||
RIFUS has contractually agreed to waive, through February 28, 2017, a portion of its transfer agency fees for certain classes of
certain Funds as set forth below:
| Funds/Classes | Waivers | |
| Russell U.S. Strategic Equity Fund-Class A,C,E & S | .02 | % |
| Russell U.S. Small Cap Equity Fund-Class R6 | .02 | |
| Russell Emerging Markets Fund-Class R6 | .02 | |
| Russell Tax-Managed U.S. Mid & Small Cap Fund-Class A | .02 | |
| Russell Tax-Managed U.S. Mid & Small Cap Fund-Class C,E & S | .05 | |
| Russell Global Opportunistic Credit Fund-Class A,C,E & S | .12 | |
| Russell Strategic Bond Fund-Class A, C, E & S | .04 | |
| Russell Strategic Bond Fund-Class R6 | .02 | |
| Russell Investment Grade Bond Fund-Class R6 | .02 | |
| Russell Short Duration Bond Fund-Class A,C,E & S | .12 | |
| Russell Short Duration Bond Fund-Class R6 | .02 | |
| Russell Tax Exempt Bond Fund-Class A | .02 | |
| Russell Tax Exempt Bond Fund-Class C,E & S | .06 | |
| Russell Commodity Strategies Fund-Class A,C,E & S | .01 | |
| Russell Global Infrastructure Fund-Class A,C,E & S | .02 | |
| Russell Global Real Estate Securities Fund-Class R6 | .02 | |
| Select U.S. Equity Fund-Class R6 | .02 | |
| Select U.S. Equity Fund-Class T | .15 | |
| Select International Fund-Class R6 | .02 | |
| Select International Fund-Class T | .15 |
804 Notes to Financial Statements
Russell Investment Company
Russell Funds
Notes to Financial Statements, continued — October 31, 2016
For the period ended October 31, 2016, the total transfer agent fee waivers are as follows:
| Amount | |||
| Russell U.S. Strategic Equity Fund | $ | 677,899 | |
| Russell U.S. Small Cap Equity Fund | 37 | ||
| Russell Emerging Markets Fund | 23 | ||
| Russell Tax-Managed U.S. Mid & Small Cap Fund | 188,819 | ||
| Russell Global Opportunistic Credit Fund | 1,386,991 | ||
| Russell Strategic Bond Fund | 1,344,154 | ||
| Russell Investment Grade Bond Fund | 36 | ||
| Russell Short Duration Bond Fund | 798,902 | ||
| Russell Tax Exempt Bond Fund | 836,690 | ||
| Russell Commodity Strategies Fund | 53,216 | ||
| Russell Global Infrastructure Fund | 186,341 | ||
| Russell Global Real Estate Securities Fund | 28 | ||
| Select U.S. Equity Fund | 1,454 | ||
| Select International Equity Fund | 2,569 |
Distributor and Shareholder Servicing
Russell Investments Financial Services, LLC (the “Distributor”), a wholly owned subsidiary of RIM, serves as a distributor for RIC,
pursuant to a distribution agreement with RIC.
The Investment Company has a distribution plan pursuant to Rule 12b-1 (the “Plan”) under the Investment Company Act. Under
this Plan, the Investment Company is authorized to make payments to the Distributor, or any selling agents, as defined in the Plan,
for sales support services provided and related expenses incurred which are primarily intended to result in the sale of the Class A
and Class C shares subject to the Plan. 12b-1 distribution payments are 0.25% or 0.75% of the average daily net assets of a Fund’s
Class A or Class C shares, respectively, on an annual basis.
In addition, the Investment Company has adopted a Shareholder Services Plan (the “Services Plan”) under which the Funds
may make payments to the Distributor or any servicing agent for any activities or expenses primarily intended to assist, support
or service the servicing agents’ clients who beneficially own Class C or Class E shares of the Funds. The shareholder servicing
payments shall not exceed 0.25% of the average daily net assets of a Fund’s Class C and Class E shares on an annual basis.
Pursuant to the rules of the Financial Industry Regulatory Authority (“FINRA”), these limitations are imposed at the class level of
each Fund rather than on a per shareholder basis. Therefore, long-term shareholders may pay more than the economic equivalent
of the maximum sales charges permitted by FINRA.
The aggregate initial sales charges, deferred sales charges and asset-based sales charges on Class A, Class C and Class
E Shares of the Funds may not exceed 7.25%, 6.25% and 6.25%, respectively, of total gross sales, and are subject to
certain exclusions. For the period ended October 31, 2016, the Distributor retained the following amounts in sales charges:
Notes to Financial Statements 805
Russell Investment Company
Russell Funds
Notes to Financial Statements, continued — October 31, 2016
| Contingent Deferred Sales Charges | Class A Shares | ||
| Russell U.S. Core Equity Fund | $ | 370 | |
| Russell U.S. Defensive Equity Fund | 351 | ||
| Russell U.S. Large Cap Equity Fund | 35 | ||
| Russell U.S. Mid Cap Equity Fund | 8 | ||
| Russell U.S. Small Cap Equity Fund | 142 | ||
| Russell International Developed Markets Fund | 1,656 | ||
| Russell Global Equity Fund | 278 | ||
| Russell Emerging Markets Fund | 786 | ||
| Russell Tax-Managed U.S. Large Cap Fund | 2,435 | ||
| Russell Tax-Managed U.S. Mid & Small Cap Fund | 618 | ||
| Russell Global Opportunistic Credit Fund | 588 | ||
| Russell Strategic Bond Fund | 451 | ||
| Russell Investment Grade Bond Fund | 362 | ||
| Russell Short Duration Bond Fund | 56 | ||
| Russell Tax Exempt Bond Fund | 1,913 | ||
| Russell Commodity Strategies Fund | 483 | ||
| Russell Global Infrastructure Fund | 87 | ||
| Russell Global Real Estate Securities Fund | 377 |
For the period ended October 31, 2016, the sales commissions paid to the selling agents for the sales of Class A shares were as
follows:
| Aggregate | Class A Front-End | |||||
| Front-End | Sales Charges | |||||
| Sales Charges | Retained by | |||||
| on Class A Shares | Distributor | |||||
| Russell U.S. Core Equity Fund | $ | 16,185 | $ | 2,596 | ||
| Russell U.S. Defensive Equity Fund | 102,236 | 16,088 | ||||
| Russell U.S. Dynamic Equity Fund | 15,386 | 2,217 | ||||
| Russell U.S. Strategic Equity Fund | 6,573 | 1,228 | ||||
| Russell U.S. Large Cap Equity Fund | 42,476 | 7,104 | ||||
| Russell U.S. Mid Cap Equity Fund | 14,215 | 2,527 | ||||
| Russell U.S. Small Cap Equity Fund | 11,559 | 2,048 | ||||
| Russell International Developed Markets Fund | 37,083 | 5,732 | ||||
| Russell Global Equity Fund | 26,340 | 4,519 | ||||
| Russell Emerging Markets Fund | 23,870 | 3,513 | ||||
| Russell Tax-Managed U.S. Large Cap Fund | 110,506 | 17,809 | ||||
| Russell Tax-Managed U.S. Mid & Small Cap Fund | 33,851 | 5,443 | ||||
| Russell Tax-Managed International Equity Fund | 23,412 | 4,411 | ||||
| Russell Global Opportunistic Credit Fund | 4,926 | 584 | ||||
| Unconstrained Total Return Fund | 28 | 6 | ||||
| Russell Strategic Bond Fund | 48,178 | 9,799 | ||||
| Russell Investment Grade Bond Fund | 5,963 | 1,141 | ||||
| Russell Short Duration Bond Fund | 11,181 | 2,204 | ||||
| Russell Tax Exempt High Yield Bond Fund | 5,001 | 1,007 | ||||
| Russell Tax Exempt Bond Fund | 28,750 | 4,889 | ||||
| Russell Commodity Strategies Fund | 15,009 | 1,955 | ||||
| Russell Global Infrastructure Fund | 15,981 | 2,637 | ||||
| Russell Global Real Estate Securities Fund | 37,983 | 6,173 | ||||
| Russell Multi-Strategy Income Fund | 59,101 | 10,107 | ||||
806 Notes to Financial Statements
Russell Investment Company
Russell Funds
Notes to Financial Statements, continued — October 31, 2016
Affiliated Brokerage Commissions
The Funds effect certain transactions through Russell Investments Implementation Services, LLC (“RIIS”). RIIS is a registered
broker and investment adviser and an affiliate of RIM. RIIS uses a multi-venue trade management approach whereby RIIS allocates
trades among RIIS’ network of independent brokers for execution, clearing and other services. Trades placed through RIIS and its
independent brokers are made (i) to manage trading associated with changes in money managers, rebalancing across existing money
managers, cash flows and other portfolio transitions, (ii) to execute portfolio securities transactions for the portion of each Fund’s
assets that RIM determines not to allocate to money managers, including assets RIM may manage to effect a Fund’s investment
strategies and/or to modify a Fund's overall portfolio characteristics and for each Fund’s cash reserves, (iii) to execute portfolio
securities transactions for the portion of a Fund’s assets that RIM manages based upon model portfolios provided by the Fund’s
non-discretionary managers or (iv) to execute money manager’s portfolio securities transactions for the segment of a Fund’s portfolio
assigned to the money manager. RIM has authorized RIS to effect certain futures, swaps, OTC derivative transactions, and cleared
swaps, including foreign currency spots, forwards and options trading on behalf of the Funds.
The Funds are permitted to purchase or sell securities from or to certain related affiliated funds under specified conditions outlined
in procedures adopted by the Board. The procedures have been designed to ensure that any purchase or sale of securities by the
Funds from or to another fund or portfolio that are, or could be, considered an affiliate by virtue of having a common investment
adviser (or affiliated investment advisers), common Trustees and/or common officers complies with Rule 17a -7 of the Investment
Company Act. Further, as defined under the procedures each transaction is effected at the current market value.
During the period ended October 31, 2016, the Funds engaged in purchases and sales of securities pursuant to Rule 17a -7 of the
Investment Company Act, as follows (amounts in thousands):
| Purchases | Sales | ||||||
| Russell Global Equity Fund | $ | 172 | $ | 1,567 | |||
| Russell Global Real Estate Securities Fund | 18 | — | |||||
| Russell Tax Exempt High Yield Bond Fund | — | 1,047 | |||||
| Unconstrained Total Return Fund | 51,376 | 420 | |||||
Board of Trustees
The Russell Fund Complex consists of RIC, which has 41 funds and Russell Investment Funds ("RIF"), which has 9 funds. Each of
the Trustees is a Trustee of RIC and RIF. The Russell Investments Fund Complex compensates each Trustee who is not an employee
of RIM or its affiliates. The costs of paying Trustee compensation and expenses are allocated to each Fund based on its net assets
relative to other funds in the Russell Investments Fund Complex.
For the period ended October 31, 2016 the total amount of regular and special compensation paid to the Trustees by the Funds was
$1,444,583 and $7,000, respectively.
6. Federal Income Taxes
At October 31, 2016, the following Funds had net tax basis capital loss carryforwards which may be applied against any net realized
taxable gains in each succeeding year or until their respective expiration dates, whichever occurs first. Available capital loss
carryforwards and expiration dates are as follows:
Notes to Financial Statements 807
Russell Investment Company
Russell Funds
Notes to Financial Statements, continued — October 31, 2016
| No Expiration | ||||||||||||||
| Funds | 10/31/2016 | 10/31/2017 | 10/31/2018 | 10/31/2019 | Short Term | Long-Term | Totals | |||||||
| Russell International | ||||||||||||||
| Developed Markets | $ | — | $ | 112,332,658 | $ | 51,503,855 | $ | — | $ | 38,965,195 | $ | 33,987,859 | $ | 236,789,567 |
| Fund | ||||||||||||||
| Russell Emerging | ||||||||||||||
| Markets Fund | — | — | — | — | 51,156,348 | 133,827,882 | 184,984,230 | |||||||
| Russell Tax-Managed | ||||||||||||||
| U.S. Large Cap Fund | — | — | — | — | 26,920,819 | — | 26,920,819 | |||||||
| Russell Tax-Managed | ||||||||||||||
| U.S. Mid & Small | — | — | — | — | 6,842,223 | — | 6,842,223 | |||||||
| Cap Fund | ||||||||||||||
| Russell Tax-Managed | ||||||||||||||
| International Equity | — | — | — | — | 62,425,052 | 11,733,844 | 74,158,896 | |||||||
| Fund | ||||||||||||||
| Russell Global | ||||||||||||||
| Opportunistic Credit | — | — | — | — | 20,216,628 | 31,194,961 | 51,411,589 | |||||||
| Fund | ||||||||||||||
| Russell Short Duration | ||||||||||||||
| Bond Fund | — | — | — | — | — | 648,215 | 648,215 | |||||||
| Russell Tax Exempt | ||||||||||||||
| Bond Fund | — | — | — | 221,229 | — | — | 221,229 | |||||||
| Russell Commodity | ||||||||||||||
| Strategies Fund | — | — | — | — | 81,606 | — | 81,606 | |||||||
| Russell Multi-Strategy | ||||||||||||||
| Income Fund | — | — | — | — | 6,588,266 | — | 6,588,266 | |||||||
| Russell Strategic Call | ||||||||||||||
| Overwriting Fund | — | — | — | — | 6,780,082 | 5,878,967 | 12,659,049 | |||||||
| Select U.S. Equity | ||||||||||||||
| Fund | — | — | — | — | 2,120,243 | 813,495 | 2,933,738 | |||||||
| Select International | ||||||||||||||
| Equity Fund | — | — | — | — | 56,775,810 | 29,942,743 | 86,718,553 | |||||||
Under the Regulated Investment Company Modernization Act of 2010, the Funds will be permitted to carry forward capital losses
incurred in taxable years beginning after December 22, 2010 for an unlimited period. However, any losses incurred during those
future taxable years will be required to be utilized prior to the losses incurred in pre-enactment taxable years. As a result of
this ordering rule, pre-enactment capital loss carryforwards may be more likely to expire unused. Additionally, post-enactment
capital losses that are carried forward will retain their character as either short-term or long-term capital losses rather than being
considered all short-term as under previous law.
7. Record Ownership
As of October 31, 2016, the following table includes shareholders of record with greater than 10% of the total outstanding shares
of each respective Fund:
| # of Shareholders | % | |||
| Russell U.S. Core Equity Fund | 3 | 72.1 | ||
| Russell U.S. Defensive Equity Fund | 3 | 43.4 | ||
| Russell U.S. Dynamic Equity Fund | 3 | 76.5 | ||
| Russell U.S. Strategic Equity Fund | 2 | 60.1 | ||
| Russell U.S. Large Cap Equity Fund | 1 | 98.4 | ||
| Russell U.S. Mid Cap Equity Fund | 1 | 95.8 | ||
| Russell U.S. Small Cap Equity Fund | 3 | 53.5 | ||
| Russell International Developed Markets Fund | 4 | 82.8 | ||
| Russell Global Equity Fund | 4 | 58.8 | ||
| Russell Emerging Markets Fund | 4 | 66.2 | ||
| Russell Tax-Managed U.S. Large Cap Fund | 3 | 66.7 | ||
| Russell Tax-Managed U.S. Mid & Small Cap Fund | 3 | 67.3 | ||
808 Notes to Financial Statements
Russell Investment Company
Russell Funds
Notes to Financial Statements, continued — October 31, 2016
| Russell Tax-Managed International Equity Fund | 3 | 66.4 | ||
| Russell Global Opportunistic Credit Fund | 2 | 43.1 | ||
| Unconstrained Total Return Fund | 3 | 77.9 | ||
| Russell Strategic Bond Fund | 4 | 65.8 | ||
| Russell Investment Grade Bond Fund | 3 | 62.9 | ||
| Russell Short Duration Bond Fund | 4 | 69.2 | ||
| Russell Tax Exempt High Yield Bond Fund | 3 | 70.0 | ||
| Russell Tax Exempt Bond Fund | 4 | 81.2 | ||
| Russell Commodity Strategies Fund | 3 | 59.9 | ||
| Russell Global Infrastructure Fund | 4 | 67.8 | ||
| Russell Global Real Estate Securities Fund | 3 | 68.0 | ||
| Russell Multi-Strategy Income Fund | 2 | 41.6 | ||
| Russell Strategic Call Overwriting Fund | 1 | 92.5 | ||
| Select U.S. Equity Fund | 3 | 80.5 | ||
| Select International Equity Fund | 4 | 87.5 |
8. Restricted Securities
Restricted securities are subject to contractual limitations on resale, are often issued in private placement transactions, and are not
registered under the Act. The most common types of restricted securities are those sold under Rule 144A of the Act and commercial
paper sold under Section 4(2) of the Act.
A Fund may invest a portion of its net assets not to exceed 15% in securities that are illiquid. This limitation is applied at the time
of purchase. Illiquid securities are securities that may not be readily marketable, and that cannot be sold within seven days in
the ordinary course of business at the approximate amount at which the Fund has valued the securities. Restricted securities are
generally considered to be illiquid.
See each Fund’s Schedule of Investments for a list of restricted securities held by a Fund that are illiquid.
9. Commitments and Contingencies
Certain Funds enter into certain credit agreements, all or a portion of which may be unfunded. The Funds are obligated to fund
these loan commitments at the borrowers' discretion. Unfunded loan commitments and funded portions of credit agreements are
marked to market daily and any unrealized appreciation or depreciation is included in the Statements of Assets and Liabilities and
the Statements of Operations. Funded portions of credit agreements are presented in the Schedules of Investments. For the period
ended October 31, 2016, the Funds had unfunded bank loan commitments as follows:
| Unfunded Bank Loan | |||
| Commitments | |||
| Russell Global Opportunistic Credit Fund | $ | 16,497,712 | |
| Unconstrained Total Return Fund | 6,674,989 | ||
| Russell Strategic Bond Fund | 3,184,722 | ||
| Russell Short Duration Bond Fund | 4,383,965 | ||
| Russell Multi-Strategy Income Fund | 6,905,552 | ||
Pending Legal Proceedings
On October 17, 2013, Fred McClure filed a derivative lawsuit against RIM on behalf of ten funds: the Russell Commodity
Strategies Fund, Russell Emerging Markets Fund, Russell Global Equity Fund, Russell Global Infrastructure Fund, Russell Global
Opportunistic Credit Fund, Russell International Developed Markets Fund, Russell Multi-Strategy Alternative Fund (liquidated
in 2016), Russell Strategic Bond Fund, Russell U.S. Small Cap Equity Fund and Russell Global Real Estate Securities Fund.
The lawsuit, which was filed in the United States District Court for the District of Massachusetts, seeks recovery under Section
36(b) of the Investment Company Act, as amended, for the funds’ alleged payment of excessive investment management fees to
RIM. On December 8, 2014, Fred McClure filed a second derivative lawsuit in the United States District Court for the District of
Massachusetts. This second suit involves the same ten funds, and the allegations are similar, although the second suit adds a claim
alleging that RIFUS charged the funds excessive administrative fees under Section 36(b). The plaintiff seeks on behalf of the funds
recovery of the amount of the allegedly excessive compensation or payments received from these ten funds and earnings that would
have accrued to plaintiff had that compensation not been paid or, alternatively, rescission of the contracts and restitution of all
excessive fees paid, for a period commencing one year prior to the filing of the lawsuit through the date of the trial. RIM and RIFUS
are defending the actions.
Notes to Financial Statements 809
Russell Investment Company
Russell Funds
Notes to Financial Statements, continued — October 31, 2016
The Russell Strategic Bond Fund is one of several defendants in a bankruptcy adversary avoidance claim in a Consolidated
Multidistrict Action styled In Re: Motors Liquidation Company, et al., Debtors, Motors Liquidation Company Avoidance Action
Trust, etc., v. JPMorgan Chase Bank, et al., United States District Bankruptcy Court for the Southern District of New York. The
claim relates to alleged improper payments to the Fund as a participating lender in a term loan provided to General Motors
Company due to the Fund’s security interests not being properly perfected. The Fund has filed answers denying liability and a
crossclaim against the administrative agent for the term loan lenders seeking damages arising from the agent’s failure to properly
perfect the security interests of the lenders.
10. Custodian Fee Reimbursement
During the period ended October 31, 2016, several of the Funds received a reimbursement from State Street Bank for overbilling
of custody out-of-pocket fees from prior years. The table below provides a summary of actual custodian fees for the current fiscal
year prior to the reimbursement as well as the impact of the fee reimbursement to each Fund's custodian fee as presented in the
Statements of Operations.
| Net Custodian Fees as | |||||||||
| Custodian Fees Before | disclosed in the Statement of | ||||||||
| Reimbursement | Fee Reimbursement | Operations | |||||||
| Russell U.S. Core Equity Fund (1) | $ | 188,017 | $ | 197,892 | $ | — | |||
| Russell U.S. Defensive Equity Fund | 233,524 | 218,093 | 15,431 | ||||||
| Russell U.S. Dynamic Equity Fund | 174,255 | 22,083 | 152,172 | ||||||
| Russell U.S. Strategic Equity Fund | 482,888 | 963 | 481,925 | ||||||
| Russell U.S. Large Cap Equity Fund | 150,625 | 1,875 | 148,750 | ||||||
| Russell U.S. Mid Cap Equity Fund | 141,760 | 1,875 | 139,885 | ||||||
| Russell U.S. Small Cap Equity Fund | 395,372 | 123,399 | 271,973 | ||||||
| Russell International Developed Markets Fund | 1,049,463 | 925,486 | 123,977 | ||||||
| Russell Global Equity Fund | 550,499 | 1,401 | 549,098 | ||||||
| Russell Emerging Markets Fund | 2,253,647 | 235,362 | 2,018,285 | ||||||
| Russell Tax-Managed U.S. Large Cap Fund | 169,049 | 40,777 | 128,272 | ||||||
| Russell Tax-Managed U.S. Mid & Small Cap Fund | 139,934 | 22,483 | 117,451 | ||||||
| Russell Tax-Managed International Equity Fund | 361,625 | 185 | 361,440 | ||||||
| Russell Global Opportunistic Credit Fund | 738,925 | 1,156 | 737,769 | ||||||
| Russell Strategic Bond Fund | 1,150,206 | 152,353 | 997,853 | ||||||
| Russell Investment Grade Bond Fund | 357,468 | 187,832 | 169,636 | ||||||
| Russell Short Duration Bond Fund | 281,690 | 79,463 | 202,227 | ||||||
| Russell Tax Exempt High Yield Bond Fund | 106,166 | 185 | 105,981 | ||||||
| Russell Tax Exempt Bond Fund | 168,396 | 33,569 | 134,827 | ||||||
| Russell Commodity Strategies Fund | 415,488 | 1,920 | 413,568 | ||||||
| Russell Global Infrastructure Fund | 498,552 | 1,157 | 497,395 | ||||||
| Russell Global Real Estate Securities Fund | 525,822 | 66,913 | 458,909 | ||||||
| (1) The fee reimbursement for the Russell U.S. Core Equity Fund exceeded the current year total custodian fees by $9,875. The excess reimbursement was | |||||||||
| accounted for as miscellaneous income for the period ended October 31, 2016. | |||||||||
11. Subsequent Events
Management has evaluated the events and/or transactions that have occurred through the date the financial statements were issued
and noted no items requiring adjustments of the financial statements or additional disclosures except the following:
On November 1, 2016, the Board declared dividends payable from net investment income. Dividends were paid on November 3,
2016, to shareholder of record effective with the opening of business on November 2, 2016.
On November 14, 2016, the name of the Russell Cayman Commodity Strategies Fund Ltd., a wholly-owned subsidiary of the Russell
Commodity Strategies Fund, was changed to the Cayman Commodity Strategies Fund Ltd.
On December 1, 2016, the Board declared dividends payable from net investment income. Dividends were paid on December 5,
2016, to shareholder of record effective with the opening of business on December 2, 2016.
810 Notes to Financial Statements
Russell Investment Company
Russell Funds
Notes to Financial Statements, continued — October 31, 2016
On December 16, 2016, the Board declared dividends payable from net investment income and capital gains. Dividends were paid
on December 20, 2016, to shareholder of record effective with the opening of business on December 19, 2016.
Notes to Financial Statements 811
Report of Independent Registered Public Accounting Firm
To the Board of Trustees and Shareholders
of Russell Investment Company
In our opinion, the accompanying statements of assets and liabilities, including the schedules of investments and the related statements
of operations and of changes in net assets and the financial highlights present fairly, in all material respects, the financial position
of Russell U.S. Core Equity Fund, Russell U.S. Defensive Equity Fund, Russell U.S. Dynamic Equity Fund, Russell U.S. Strategic
Equity Fund, Russell U.S. Large Cap Equity Fund, Russell U.S. Mid Cap Equity Fund, Russell U.S. Small Cap Equity Fund, Russell
International Developed Markets Fund, Russell Global Equity Fund, Russell Emerging Markets Fund, Russell Tax-Managed U.S.
Large Cap Fund, Russell Tax-Managed U.S. Mid & Small Cap Fund, Russell Tax-Managed International Equity Fund, Russell Global
Opportunistic Credit Fund, Unconstrained Total Return Fund, Russell Strategic Bond Fund, Russell Investment Grade Bond Fund,
Russell Short Duration Bond Fund, Russell Tax Exempt High Yield Bond Fund, Russell Tax Exempt Bond Fund, Russell Commodity
Strategies Fund and its subsidiary, Russell Global Infrastructure Fund, Russell Global Real Estate Securities Fund, Russell Multi-
Strategy Income Fund, Russell Strategic Call Overwriting Fund, Select U.S. Equity Fund and Select International Equity Fund, (twenty
seven of the portfolios constituting Russell Investment Company, hereafter collectively referred to as the “Funds”) as of October 31,
2016, the results of each of their operations for the period then ended, the changes in each of their net assets for each of the periods
presented and the financial highlights for each of the periods presented, in conformity with accounting principles generally accepted in
the United States of America. These financial statements and financial highlights (hereafter referred to as “financial statements”) are the
responsibility of the Funds’ management. Our responsibility is to express an opinion on these financial statements based on our audits.
We conducted our audits of these financial statements in accordance with the standards of the Public Company Accounting Oversight
Board (United States). Those standards require that we plan and perform the audit to obtain reasonable assurance about whether the
financial statements are free of material misstatement. An audit includes examining, on a test basis, evidence supporting the amounts
and disclosures in the financial statements, assessing the accounting principles used and significant estimates made by management,
and evaluating the overall financial statement presentation. We believe that our audits, which included confirmation of securities as
of October 31, 2016 by correspondence with the custodian, brokers and transfer agent, provide a reasonable basis for our opinion.

812 Report of Independent Registered Public Accounting Firm
Russell Investment Company
Russell Funds
Tax Information — October 31, 2016 (Unaudited)
For the tax year ended October 31, 2016, the Funds hereby designate 100%, or the maximum amount allowable, of its net taxable
income as qualified dividends taxed at individual net capital gain rates.
For the tax year ended October 31, 2016, the Funds hereby designate under Section 871(k)(2)(c) of the Internal Revenue Code,
the maximum amount allowable as a short-term capital gains dividend for purposes of the tax imposed under Section 871(a)(1)(A)
of the Code. This applies to nonresident alien shareholders only.
The Form 1099 you receive in January 2017 will show the tax status of all distributions paid to your account in calendar year
2016.
The Funds designate dividends distributed during the fiscal year as qualifying for the dividends received deduction for corporate
shareholders as follows:
| Russell U.S Core Equity Fund | 100.0 | % |
| Russell U.S. Defensive Equity Fund | 100.0 | % |
| Russell U.S. Dynamic Equity Fund | 100.0 | % |
| Russell U.S. Strategic Equity Fund | 100.0 | % |
| Russell U.S. Large Cap Equity Fund | 100.0 | % |
| Russell U.S. Mid Cap Equity Fund | 80.5 | % |
| Russell U.S. Small Cap Equity Fund | 100.0 | % |
| Russell International Developed Markets Fund | 0.0 | % |
| Russell Global Equity Fund | 49.9 | % |
| Russell Emerging Markets Fund | 0.0 | % |
| Russell Tax-Managed U.S. Large Cap Fund | 100.0 | % |
| Russell Tax-Managed U.S. Mid & Small Cap Fund | 0.0 | % |
| Russell Tax-Managed International Fund | 0.0 | % |
| Russell Global Opportunistic Credit Fund | 0.0 | % |
| Unconstrained Total Return Fund | 0.0 | % |
| Russell Strategic Bond Fund | 0.0 | % |
| Russell Investment Grade Bond Fund | 0.0 | % |
| Russell Short Duration Bond Fund | 0.0 | % |
| Russell Tax Exempt High Yield Bond Fund | 0.0 | % |
| Russell Tax Exempt Bond Fund | 0.0 | % |
| Russell Commodity Strategies Fund | 0.0 | % |
| Russell Global Infrastructure Fund | 33.6 | % |
| Russell Global Real Estate Securities Fund | 0.0 | % |
| Russell Multi-Strategy Income Fund | 10.2 | % |
| Russell Strategic Call Overwriting Fund | 100.0 | % |
| Select U.S. Equity Fund | 100.0 | % |
| Select International Equity Fund | 0.0 | % |
Pursuant to Section 852 of the Internal Revenue Code, the Funds designate the following amounts as long-term capital gain
dividends for their taxable year ended October 31, 2016:
| Russell U.S. Core Equity Fund | $ | 137,841,291 |
| Russell U.S. Defensive Equity Fund | 14,696,015 |
Tax Information 813
Russell Investment Company
Russell Funds
Tax Information — October 31, 2016 (Unaudited)
| Russell U.S. Dynamic Equity Fund | 53,264,453 |
| Russell U.S. Strategic Equity Fund | 177,632,651 |
| Russell U.S. Large Cap Equity Fund | 28,572,325 |
| Russell U.S. Mid Cap Equity Fund | 21,898,920 |
| Russell U.S. Small Cap Fund | 133,681,655 |
| Russell Global Equity Fund | 226,483,588 |
| Russell Tax-Managed U.S. Mid & Small Cap Fund | 1,876,698 |
| Russell Strategic Bond Fund | 34,140,530 |
| Russell Investment Grade Bond Fund | 1,902,828 |
| Russell Short Duration Bond Fund | 443,542 |
| Russell Global Infrastructure Fund | 34,687,634 |
| Russell Global Real Estate Securities Fund | 72,135,628 |
| Select U.S. Equity Fund | 1,065,331 |
Please consult a tax adviser for any questions about federal or state income tax laws.
The Funds listed below paid foreign taxes and recognized foreign source income during the taxable year ended October 31, 2016.
Pursuant to Section 853 of the Internal Revenue Code, the Funds designate the following per share amounts of foreign taxes paid
and income earned from foreign sources:
| Foreign | Foreign | |||||||
| Taxes | Source | |||||||
| Foreign | Paid | Foreign Source | Income Per | |||||
| Fund Name | Taxes Paid | Per Share | Income | Share | ||||
| Russell International Developed Markets Fund | $ | 5,065,876 | $ | 0.0696 | $ | 73,618,442 | $ | 1.0115 |
| Russell Global Equity Fund | 2,325,283 | 0.0101 | 30,822,203 | 0.1345 | ||||
| Russell Emerging Markets Fund | 7,562,112 | 0.0552 | 46,275,500 | 0.3379 | ||||
| Russell Tax Managed International Equity Fund | 1,364,645 | 0.0200 | 13,980,656 | 0.2045 | ||||
| Russell Global Infrastructure Fund | 2,017,044 | 0.0223 | 29,166,307 | 0.3224 | ||||
| Select International Equity Fund | 2,364,572 | 0.0271 | 26,147,235 | 0.2996 |
Pursuant to Section 852(b)(5)(A) of the Internal Revenue Code, the following Funds designate distributions from net investment
income as exempt interest dividends during the taxable year ended October 31, 2016:
| Russell Tax Exempt High Yield Bond Fund | 10,464,197 | |
| Russell Tax Exempt Bond Fund | $ | 36,401,739 |
814 Tax Information
Russell Investment Company
Russell Funds
Affiliated Brokerage Transactions — October 31, 2016 (Unaudited)
As discussed in the Note 5 in the Notes to Financial Statements contained in this annual report, the Funds utilize RIIS and its
independent brokers. RIIS is a registered broker dealer and investment adviser and an affiliate of RIM. RIIS uses a multi-venue
trade management approach whereby RIIS allocates trades among RIIS’ network of independent brokers for execution, clearing,
and other services. Trades placed through RIIS and its independent brokers are made (i) to manage trading associated with changes
in money manager, rebalancing across existing money managers, cash flows and other portfolio transitions, (ii) to execute portfolio
securities transactions for each Fund’s assets that RIM determines not to allocate to money managers including assets RIM may
manage to effect a Fund’s investment strategies and/or to modify a Fund’s overall portfolio characteristics and for each Fund’s cash
reserves, (iii) to execute portfolio securities transactions for the portion of a Fund’s assets that RIM manages based upon model
portfolios provided by the Funds’ non-discretionary managers or (iv) to execute money manager portfolio securities transactions for
the segment of a Fund’s portfolio assigned to the money manager. RIM has authorized RIIS to effect certain futures, swaps, OTC
derivative transactions, and cleared swaps, including foreign currency spots, forwards and options trading on behalf of the Funds.
Amounts retained by RIIS for the period ended October 31, 2016 were as follows:
| Affiliated Broker | Fund Name | 2016 | |
| RIM | |||
| Russell U.S. Core Equity Fund | $ | 34,564 | |
| Russell U.S. Defensive Equity Fund | 65,987 | ||
| Russell U.S. Dynamic Equity Fund | 50,986 | ||
| Russell U.S. Strategic Equity Fund | 327,847 | ||
| Russell U.S. Large Cap Equity Fund | 37,789 | ||
| Russell U.S. Mid Cap Equity Fund | 26,755 | ||
| Russell U.S. Small Cap Equity Fund | 821,508 | ||
| Russell International Developed Markets Fund | 449,264 | ||
| Russell Global Equity Fund | 336,688 | ||
| Russell Emerging Markets Fund | 297,110 | ||
| Russell Strategic Bond Fund | 673,156 | ||
| Russell Investment Grade Bond Fund | 68,214 | ||
| Russell Global Infrastructure Fund | 275,749 | ||
| Russell Global Real Estate Securities Fund | 265,677 |
Affiliated Brokerage Transactions 815
Russell Investment Company
Russell Funds
Basis for Approval of Investment Advisory Contracts — (Unaudited)
Initial Approval of the Investment Advisory Agreement for the Unconstrained Total Return Fund
In the case of a new Fund, the Investment Company Act of 1940, as amended (the “1940 Act”), requires that the Board of Trustees (the
“Board”), including a majority of its members who are not considered to be “interested persons” under the 1940 Act (the “Independent
Trustees”) voting separately, initially approve the advisory agreement with RIM (formerly, Russell Investment Management Company)
(the “New Fund RIM Agreement”) and the portfolio management contract with each Money Manager of the Fund (collectively, the “New
Fund Money Manager Agreements,” and together with the New Fund RIM Agreement, the “New Fund Agreements”) and, thereafter,
to approve the continuation of each New Fund Agreement on at least an annual basis, and that the terms and conditions of each New
Fund Agreement provide for its termination if continuation is not approved annually and upon its “assignment” within the meaning of
Section 2(a)(4) of the 1940 Act.
The Board, including all of the Independent Trustees, initially considered and approved the adoption of the New Fund Agreements
for the Unconstrained Total Return Fund (the “New Fund”) at a meeting held in person on May 24, 2016 (the “New Fund Agreement
Evaluation Meeting”). The Board considered RIM’s expectation that a change in ownership would occur in or around June 2016 as a
result of a transaction involving the sale of Frank Russell Company’s (“FRC”) asset management business (“Russell Investments”),
including RIM, by the London Stock Exchange Group plc (“LSEG”) to Emerald Acquisition Limited (“Emerald Acquisition”), a
newly-formed acquisition vehicle through which the limited partners of certain private equity funds (the “TA Funds”) affiliated with
TA Associates Management, L.P. ( “TA Associates”) would indirectly acquire a majority ownership interest and the limited partners of
certain private equity funds (the “Reverence Capital Funds”) affiliated with Reverence Capital Partners, L.P. (“Reverence Capital,”
and together with TA Associates, the “RIM Purchaser”) would indirectly acquire a significant minority ownership interest in Russell
Investments (the “Transaction”). The New Fund Agreements that the Board considered and approved at the New Fund Agreement
Evaluation Meeting consisted of (i) the New Fund RIM Agreement to be to effective prior to the Transaction (the “Pre-Transaction
New Fund RIM Agreement”); (ii) the New Fund Money Manager Agreements to be to effective prior to the Transaction (collectively,
the “Pre-Transaction New Fund Money Manager Agreements,” and together with the Pre-Transaction New Fund RIM Agreement, the
“Pre-Transaction New Fund Agreements”); (iii) the New Fund RIM Agreement to be effective upon the closing of the Transaction (the
“Post-Transaction New Fund RIM Agreement,” and together with the Pre-Transaction New Fund RIM Agreement, the “New Fund RIM
Agreements”); and (iv) the New Fund Money Manager Agreements to be effective upon the closing of the Transaction (collectively, the
“Post-Transaction New Fund Money Manager Agreements,” and together with the Post-Transaction New Fund RIM Agreement, the
“Post-Transaction New Fund Agreements”).
In preparation for the reviews, the Board, including the Independent Trustees, considered (1) information and reports prepared by RIM
relating to the services proposed to be provided by RIM (and its affiliates) and each Money Manager to the New Fund; (2) information
prepared by RIM, not an independent source, comparing the proposed fees and projected expenses of the New Fund with other peer
funds not managed by RIM, identified and presented by RIM as generally comparable in investment objective to the New Fund (the
“RIM Comparable Funds,” and with the New Fund, in the case of operating expense comparisons, the New Fund’s “RIM Expense
Universe”); and (3) presentations made by RIM to the Trustees at the New Fund Agreement Evaluation Meeting in connection with
its evaluation of the New Fund Agreements. The foregoing and other information received by the Board, including the Independent
Trustees, in connection with its evaluations of the New Fund Agreements are collectively called the “New Fund Agreement Evaluation
Information.” The Trustees’ evaluations also reflected the knowledge and familiarity gained as Board members of the other RIM-
managed funds (the “Other RIM-Managed Funds”) for which the Board has supervisory responsibility with respect to services provided
by RIM and RIM’s affiliates, and advice previously received from counsel to the Funds and counsel to the Independent Trustees
regarding the Trustees’ responsibilities in considering the New Fund Agreements. The Other RIM-Managed Funds and the New Fund
collectively are called the “Funds.”
At the New Fund Agreement Evaluation Meeting, the Board was advised that RIM’s goal with respect to the New Fund was initially to
include the New Fund as an underlying fund for certain target allocation funds-of-funds managed by RIM, and later to add the New
Fund to certain strategic asset allocation models provided by RIM. The Board considered RIM’s advice that the New Fund would
offer a diversified fixed-income investment option designed to maintain positive returns in different interest rate environments. The
Board was advised that the New Fund initially would have a contractual advisory fee (i.e., not giving effect to any voluntary fee waivers
proposed for the New Fund or by the managers of the other RIM Expense Universe funds) that ranked in the fifth quintile of its RIM
Expense Universe. The Board considered that the advisory fee schedule included breakpoints that would reduce advisory fees as
certain asset levels are reached. The Board further considered a contractual agreement by RIM to waive up to the full amount of its
advisory fee and reimburse the New Fund for other direct fund-level expenses, excluding extraordinary expenses, to the extent that the
816 Basis for Approval of Investment Advisory Contracts
Russell Investment Company
Russell Funds
Basis for Approval of Investment Advisory Contracts, continued — (Unaudited)
direct fund-level expenses exceed 0.75% of the New Fund’s average daily net assets, and, after taking that waiver into account, that the
New Fund would have a total expense ratio that ranked in the third quintile of its RIM Expense Universe.
Based upon the New Fund Agreement Evaluation Information, the Trustees considered various specific factors in evaluating approval
of the New Fund RIM Agreements, including the following:
1. The nature, scope, and overall quality of the investment management and other services expected to be provided to the New Fund
by RIM;
2. The advisory fee to be paid by the New Fund to RIM (the “Advisory Fee”) and the fact that it would encompass all investment
advisory fees to be paid by the New Fund, including the fees for any Money Managers of the New Fund;
3. Information provided by RIM as to other fees and benefits expected to be received by RIM or its affiliates from the New Fund,
including any administrative or transfer agent fees and any fees received for management or administration of securities lending cash
collateral, soft dollar arrangements and commissions in connection with portfolio securities transactions;
4. Information provided by RIM as to projected expenses to be incurred by the New Fund; and
5. Information provided by RIM as to the projected profits that RIM expects to derive from its operations with respect to the New Fund.
The Board noted, among other things, that as a newly organized fund, the New Fund, at the time of the New Fund Agreement Evaluation
Meeting, had no historical operating, performance, expense ratio or profitability information. Moreover, the Board noted, in considering
the structure of the Advisory Fee and whether economies of scale are reflected appropriately, the uncertainties as to the New Fund’s
ability to attract assets.
On the basis of the New Fund Agreement Evaluation Information and other information previously received by the Board from RIM
during the course of the current year or prior years, or presented at or in connection with the New Fund Agreement Evaluation Meeting
by RIM, the Board found, after giving effect to any applicable waivers and/or reimbursements, (1) the Advisory Fee rate and structure
to be charged by RIM was reasonable in light of the nature, scope and overall quality of the investment management and other services
expected to be provided to the New Fund; (2) the projected relative expense ratio of the New Fund was comparable to those of its RIM
Comparable Funds; (3) other benefits and fees expected to be received by RIM or its affiliates from the New Fund were not excessive;
and (4) RIM’s projected profitability with respect to the New Fund was not excessive in light of judicial guidance and the expected
nature, scope and overall quality of the investment management and other services to be provided by RIM.
In addition to the reviews and considerations described above, the Trustees considered the New Fund RIM Agreements in light of
certain reviews conducted in December 2015 in connection with the Trustees’ evaluation and approval of new investment advisory
agreements with RIM and then current Money Managers for the Other RIM-Managed Funds. These reviews were required as a result
of the change of RIM control caused by the Transaction (the “Other RIM-Managed Funds Agreements”). In approving the Other
RIM-Managed Funds Agreements, the Board considered a variety of factors, positive and negative, deemed relevant in their business
judgment, certain of which are noted below. The factors discussed below are not intended to be all-inclusive.
1. The Trustees’ belief that the Other RIM-Managed Funds Agreements would address the immediate need to provide for continuation
without interruption of the investment advisory and other services to be provided to the Other RIM-Managed Funds following the
completion of the Transaction.
2. RIM’s belief that the Transaction would address the uncertainty of its employees and shareholders of the Other RIM-Managed
Funds and potential shareholders regarding ultimate ownership of RIM and the continuity of services to the Other RIM-Managed
Funds, facilitating efforts to attract and retain qualified investment and other professionals, and to retain current assets of the Other
RIM-Managed Funds and attract attract new assets to such Funds. The Board noted, however, that the involvement of TA Associates
and Reverence Capital and the investments made indirectly by the limited partners of the TA Funds and the Reverence Capital
Funds would not be viewed as permanent by employees and shareholders and potential shareholders of the Other RIM-Managed
Funds; therefore, the Transaction might not resolve these uncertainties. When TA Associates and Reverence Capital determine to
end their involvement in RIM and to exit the investments made by alternative investment vehicles created by or from the TA Funds
(the “TA Alternative Investment Vehicles”) and by alternative investment vehicles (the “Reverence Capital Entities”), respectively,
subsequent to the Transaction, the manner in which such an exit would be accomplished and the consequences to RIM and the Other
RIM-Managed Funds were not and are not determinable. In the event of such a determination and exit, the Board would consider what
Basis for Approval of Investment Advisory Contracts 817
Russell Investment Company
Russell Funds
Basis for Approval of Investment Advisory Contracts, continued — (Unaudited)
actions, if any, are available, necessary, appropriate, and in the best interests of the Other RIM-Managed Funds and their shareholders
under the circumstances.
3. The reputations of TA Associates and Reverence Capital and their records of acquiring investments in investment management
companies, as well as their having advised the Board that there is no established timetable for their exits from the RIM investments
made by the TA Alternative Investment Vehicles or Reverence Capital Entities at this time. Information presented to the Board by TA
Associates and Reverence Capital in connection with its evaluation of the Other RIM-Managed Funds Agreements showed that past
investments by TA Associates in investment management companies historically have extended for three to ten years. In the case of
RIM, it was noted by TA Associates and Reverence Capital that the duration of the investments made by the TA Alternative Investment
Vehicles and the Reverence Capital Entities, respectively, could be shorter or longer than the historical duration of its investments
in investment management companies. The impact of such exit on RIM’s operations and financial condition was not determinable,
although an exit likely would result in a change of control of RIM.
4. Assurances from TA Associates and Reverence Capital that RIM would continue to be part of Russell Investments and that Russell
Investments will continue to operate as a separate organization under its own governance structure. TA Associates and Reverence
Capital advised the Board that they did not envision involvement in RIM’s day-to-day operations, but that each organization would have
representation on the board of directors of a direct or indirect corporate parent company of RIM (the “Russell Investments Board”).
Through their representatives, TA Associates and Reverence Capital would be actively involved in the governance and growth strategy
of RIM, would recruit additional members for the Russell Investments Board with meaningful leadership and managerial experience
in investment management, and intended to bring strategic relationships to bear in support of driving the growth of RIM’s business.
5. The stated intention of TA Associates and Reverence Capital to retain RIM’s existing management team and other key professionals.
See below for additional information regarding this factor.
6. The intention of TA Associates and Reverence Capital to finance a substantial portion of the Transaction purchase price by issuing debt
to certain third-party financial institutions (the “Transaction Lenders”), guaranteed by Emerald Acquisition and certain subsidiaries,
including RIM, of FRC (“Transferred Subsidiaries”) (Emerald Acquisition and certain Transferred Subsidiaries, including RIM, are
collectively, the “Guarantors”), with the possibility of a future change of control of RIM upon the occurrence of certain conditions or
events of default under the final terms and conditions of the borrowing arrangements with the Transaction Lenders (the “Transaction
Borrowing Arrangements”) financing a portion of the Transaction purchase price (which, at the time, had not been negotiated or
finalized). The Board noted that RIM, TA Associates, and Reverence Capital each anticipated, based on historical operating profits of
the Transferred Subsidiaries, that cash flows from the Transferred Subsidiaries would be adequate to service all debt with appropriate
cushions with no diminution in the nature, scope or quality of services provided to the Other RIM-Managed Funds by RIM and its
affiliates, as supported by analyses and five-year projections prepared by and provided to the Board by TA Associates and Reverence
Capital. The Board noted that TA Associates and Reverence Capital advised the Board that the capital structure of RIM, giving effect
to its debt service obligations under the Transaction Borrowing Arrangements, would be appropriately balanced and that the most
recent balance sheet and statement of income of RIM would not be changed significantly by the Transaction. The Board particularly
noted that TA Associates and Reverence Capital advised the Board that each had used leverage effectively in prior transactions with
asset managers with mutual fund complexes as part of a balanced structure and that a TA Fund and a Reverence Capital Fund (and,
indirectly, their limited partners) have guaranteed Emerald Acquisition’s obligation to pay U.S. $150 million of the purchase price to
FRC in four annual installments commencing on December 31, 2017 (the “Holdback”) and, therefore, have an additional financial
interest in the success of the Transaction until the Holdback is paid to FRC. TA Associates and Reverence Capital informed the Board
that Emerald Acquisition (which is, and it is expected that the terms of the Transaction Borrowing Arrangements will require it to
remain, a passive holding company with no operations) is prepared to support the business of RIM through reinvestment of cash flow
and additional capital investments as appropriate, but made no commitments and could be financially constrained in its ability to do so.
7. Statements from TA Associates and Reverence Capital that there should be no pressure, and there were then no plans, to make
changes with respect to current advisory fees, expense limitations, and distribution arrangements for the Other RIM-Managed Funds
or in the nature, scope or quality of services provided to the Funds by RIM and its affiliates.
8. The strong support expressed by the senior management team at RIM for the Transaction.
9. Statements from TA Associates and Reverence Capital that there was no intention to change any of the Other RIM-Managed Funds’
affiliated or third-party service providers in connection with the Transaction, thereby assuring continuation of services needed for
818 Basis for Approval of Investment Advisory Contracts
Russell Investment Company
Russell Funds
Basis for Approval of Investment Advisory Contracts, continued — (Unaudited)
the Other RIM-Managed Funds’ operations and minimizing complications in connection with the transfer of ownership of Russell
Investments from LSEG to Emerald Acquisition through one or more direct or indirect wholly-owned subsidiaries (the “Owners”).
10. The Board was informed that the Transaction would result in employees of Russell Investments owning a larger financial interest,
indirectly, in RIM than they currently own, which may align their long-term interests with the interests of RIM and should help RIM
retain key management and investment personnel, an important factor in assessing the stability of RIM following completion of the
Transaction.
11. There would be no changes to the Independent Trustees of the Board in connection with the Transaction, assuring continuity of the
Other RIM-Managed Funds’ supervision and oversight.
12. Assurances from RIM and Emerald Acquisition that no “unfair burden” has been imposed on the Other RIM-Managed Funds
within the meaning of Section 15(f) of the 1940 Act in connection with the Transaction, and that for a period of two years following the
effective date of the Transaction, they would use reasonable best efforts not to engage in activities that would impose an unfair burden
on the Funds.
13. Statements from TA Associates and Reverence Capital that they would not require or seek any changes to the manager-of-managers
structure employed by RIM in the case of manager-of-managers Other RIM-Managed Funds and employed by Funds of such Funds
through their investments in manager-of-managers Funds or changes to current Money Managers to the manager-of-managers Funds
other than in the ordinary course of business.
14. RIM is a joint and several Guarantor, and the Owners’ interests in the Transferred Subsidiaries, including RIM, would be pledged as
loan collateral (the “Loan Collateral”) under the Transaction Borrowing Arrangements. If ownership of the Loan Collateral changes as
a result of the Transaction Lenders’ exercise of their rights in connection with the Transaction Borrowing Arrangements, and the Other
RIM-Managed Funds Agreements automatically terminate upon the change of control of RIM, there may be no acceptable alternative
investment managers with special expertise to continue the manager-of-managers structure selected by shareholders of the manager-
of-managers Other RIM-Managed Funds on comparable terms and conditions. In such event, the Board will consider what actions, if
any, are available, necessary, appropriate, and in the best interests of such Other RIM-Managed Funds and their shareholders under the
circumstances, which may include approving a temporary interim advisory agreement with RIM in accordance with Rule 15a-4 under
the 1940 Act that would allow RIM to continue to serve as investment manager for a maximum period of 150 days.
In connection with its evaluation of the New Fund RIM Agreements, the Board considered changes in senior management prior to the
New Fund Agreement Evaluation Meeting and assurances from RIM that such changes would not impact significantly the services
provided to the New Fund under the New Fund RIM Agreements.
In connection with its evaluation of the New Fund RIM Agreements, the Board considered that the above factors generally would be
applicable to the New Fund, which employs a manager-of managers structure, including various risks associated with the Transaction.
Such risks include the possibility that a change of control terminating the Post-Transaction New Fund RIM Agreement may occur at any
time after the Transaction in the event of, among others things, (1) a default under the Transaction Borrowing Arrangements by direct
or indirect subsidiaries of Emerald Acquisition (the “Borrowers”) and the Guarantors, including RIM; or (2) exits from the investments
made by the TA Alternative Investment Vehicles and/or the Reverence Capital Entities. Moreover, the Board considered, although TA
Associates and Reverence Capital believe, that based on the historical operating profits of RIM and the other Transferred Subsidiaries,
that the “free” cash flows of RIM and the other Transferred Subsidiaries will be sufficient for the Borrowers and the Guarantors to meet
their debt service obligations under the Transaction Borrowing Arrangements with no diminution in the nature, scope or quality of
services provided to the New Fund, the operating profits of RIM and the other Transferred Subsidiaries may be adversely affected by
various factors, including general economic, market and business conditions and developments specific to the business activities and
operations of RIM and the other Transferred Subsidiaries. Therefore, there is no assurance that the historical operating profits of RIM
and the other Transferred Subsidiaries will be sustained in the future at levels sufficient for the Borrowers and the Guarantors to meet
their obligations in respect of the Transaction Borrowing Arrangements and to do so without diminution in the nature, scope and quality
of services provided by RIM and its affiliates to the New Fund.
After considering the foregoing and other relevant factors, the Board concluded that approval of the New Fund RIM Agreements would
be in the best interest of the New Fund and voted to approve the Agreements.
Basis for Approval of Investment Advisory Contracts 819
Russell Investment Company
Russell Funds
Basis for Approval of Investment Advisory Contracts, continued — (Unaudited)
At the New Fund Agreement Evaluation Meeting, with respect to the evaluation of the terms of the New Fund Money Manager
Agreements, the Board received and considered information from RIM reporting, among other things, for each Money Manager: RIM’s
assessment of the investment capabilities, philosophy and approach of the Money Manager; any significant business relationships
between the Money Manager and RIM or Russell Investments Financial Services, LLC (formerly, Russell Financial Services, Inc.),
the New Fund’s underwriter; and RIM’s recommendation with respect to the Money Manager’s fee rate. The Board also received
reports regarding each Money Manager’s compliance program and certification from the New Fund’s Chief Compliance Officer that its
compliance program would meet applicable legal and regulatory requirements. RIM advised the Board that it does not regard Money
Manager profitability as relevant to its evaluation of the New Fund Money Manager Agreements because the willingness of Money
Managers to serve in such capacity depends upon arm’s-length negotiations with RIM; RIM is aware of the standard fees charged by
Money Managers to other clients; and RIM believes that the fees agreed upon with Money Managers are reasonable in light of the
anticipated quality of investment advisory services to be rendered. The Board accepted RIM’s explanation in light of the Board’s
findings as to the reasonableness of the Advisory Fee to be paid by the New Fund and the fact that each Money Manager’s fee will be
paid by RIM.
Based substantially upon RIM’s recommendations, together with the New Fund Agreement Evaluation Information, the Board
concluded that the fees proposed to be paid to the Money Managers of the New Fund are reasonable in light of the expected quality
of the investment advisory services to be provided and that approval of the New Fund Money Manager Agreements with each Money
Manager of the New Fund would be in the best interests of the New Fund and its shareholders.
Approval of Money Manager Contracts
The Board received the following proposals from RIM: (i) at a meeting held on May 24, 2016, to effect Money Manager changes for the
Russell Strategic Bond Fund; and (ii) at a meeting held on August 30, 2016, to effect Money Manager changes for the Russell Strategic
Bond Fund, Russell Investment Grade Bond Fund, Russell Global Real Estate Securities Fund and Russell Global Infrastructure Fund.
In the case of each proposed change, the Trustees approved the terms of the proposed portfolio management contract based upon RIM’s
recommendation to hire the Money Manager at the proposed fee rate; information as to reason for the proposed change; information as
to the Money Manager’s role in the management of the Fund’s investment portfolio (including the amount of Fund assets to be allocated
to the Money Manager) and RIM’s evaluation of the anticipated quality of the investment advisory services to be provided by the
Money Manager; information as to any significant business relationships between the Money Manager and RIM or Russell Investments
Financial Services, LLC, the Fund’s underwriter; the CCO’s evaluation of the Money Manager’s compliance program, policies and
procedures, and certification that they were consistent with applicable legal standards; RIM’s explanation as to the lack of relevance
of Money Manager profitability to the evaluation of portfolio management contracts with Money Managers because the willingness of
Money Managers to serve in such capacity depends upon arm’s-length negotiations with RIM; RIM’s awareness of the standard fee rates
charged by the Money Manager to other clients; RIM’s belief that the proposed investment advisory fees would be reasonable in light
of the anticipated quality of investment advisory services to be rendered; the increase or decrease in aggregate Money Manager fees
to be paid by RIM from its Advisory Fee as a result of the engagement of the Money Manager; and the expected costs of transitioning
Fund assets to the Money Manager. The Trustees’ approval also reflected their findings at prior meetings, including their December
2015 meeting in connection with the their evaluation and approval of new investment advisory agreements with RIM and then current
Money Managers for the Other RIM-Managed Funds, as well as information received throughout the course of the year, regarding the
reasonableness of the aggregate investment advisory fees paid by the Funds, and the fact that the aggregate investment advisory fees
paid by the Funds would not increase as a result of the implementation of the proposed money manager changes because the money
manager’s investment advisory fees are paid by RIM.
820 Basis for Approval of Investment Advisory Contracts
Russell Investment Company
Russell Funds
Shareholder Requests for Additional Information — October 31, 2016 (Unaudited)
A complete unaudited schedule of investments is made available generally no later than 60 days after the end of the first and third
quarters of each fiscal year. These reports are available (i) free of charge, upon request, by calling the Funds at (800) 787-7354; (ii)
at https://russellinvestments.com; and (iii) at the Securities and Exchange Commission’s Office of Investor Education and Advocacy
(formerly, the Public Reference room).
The Board has delegated to RIM, as RIC’s investment adviser, the primary responsibility for monitoring, evaluating and voting proxies
solicited by or with respect to issuers of securities in which assets of the Funds may be invested. RIM has established a proxy voting
committee and has adopted written proxy voting policies and procedures (“P&P”) and proxy voting guidelines (“Guidelines”). The
Funds maintain a Portfolio Holdings Disclosure Policy that governs the timing and circumstances of disclosure to shareholders and
third parties of information regarding the portfolio investments held by the Funds. A description of the P&P, Guidelines, Portfolio
Holdings Disclosure Policy and additional information about Fund Trustees are contained in the Funds’ Statement of Additional
Information (“SAI”). The SAI and information regarding how the Funds voted proxies relating to portfolio securities during the most
recent 12-month period ended June 30, 2016 are available (i) free of charge, upon request, by calling the Funds at (800) 787-7354; (ii)
at https://russellinvestments.com; and (iii) on the Securities and Exchange Commission’s website at www. sec.gov.
To reduce expenses, we may mail only one copy of the Funds’ prospectuses and each annual and semi-annual report to those addresses
shared by two or more accounts. If you wish to receive individual copies of these documents, please contact your Financial Intermediary.
Some Financial Intermediaries may offer electronic delivery of the Funds’ prospectuses and annual and semi-annual reports. Please
contact your Financial Intermediary for further details.
Financial statements of the Funds can be obtained at no charge by calling the Funds at (800) 787-7354.
Shareholder Requests for Additional Information 821
Russell Investment Company
Russell Funds
Disclosure of Information about Fund Trustees and Officers — October 31, 2016
(Unaudited)
The following tables provide information for each officer and trustee of the Russell Fund Complex. The Russell Fund Complex
consists of Russell Investment Company (“RIC”), which has 41 funds and Russell Investment Funds (“RIF”), which has 9 funds.
Each of the trustees is a trustee of RIC and RIF. The first table provides information for the independent trustees. The second table
provides information for the Trustee Emeritus. The third table provides information for the officers. Furthermore, each Trustee
possesses the following specific attributes: Mr. Alston has business, financial and investment experience as a senior executive of
an international real estate firm and is trained as a lawyer; Ms. Blake has had experience as a certified public accountant and has
had experience as a member of boards of directors/trustees of other investment companies; Ms. Burgermeister has had experience
as a certified public accountant and as a member of boards of directors/trustees of other investment companies; Mr. Connealy has
had experience with other investment companies and their investment advisers, first as a partner in the investment management
practice of PricewaterhouseCoopers LLP and, subsequently, as the senior financial executive of two other investment organizations
sponsoring and managing investment companies, and has been determined by the Board to be an “audit committee financial
expert”; Ms. Krysty has had business, financial and investment experience as the founder and senior executive of a registered
investment adviser focusing on high net worth individuals as well as a certified public accountant and a member of the boards of
other corporations and non-profit organizations; Mr. Tennison has had business, financial and investment experience as a senior
executive of a corporation with international activities and was trained as an accountant; and Mr. Thompson has had experience in
business, governance, investment and financial reporting matters as a senior executive of an organization sponsoring and managing
other investment companies, and, subsequently, has served as a board member of other investment companies. Effective June 30,
2016, Ms. Sandra Cavanaugh retired from Russell Investments and resigned her position as an Interested Trustee of the Trust.
| Name, | Position(s) Held | Term | Principal Occupation(s) | No. of | Other |
| Age, | With Fund and | of | During the | Portfolios | Directorships |
| Address | Length of | Office * | Past 5 Years | in Russell | Held by Trustee |
| Time Served | Fund | During the | |||
| Complex | Past 5 Years | ||||
| Overseen | |||||
| by Trustee | |||||
| INDEPENDENT TRUSTEES | |||||
| Thaddas L. Alston, | Trustee since 2006 | Appointed until | Senior Vice President, Larco | 50 | Until October |
| Born April 7, 1945 | successor is | Investments, Ltd. (real estate firm) | 2015, Trustee, | ||
| 1301 Second Avenue, | duly elected and | Russell | |||
| 18th Floor, Seattle, WA | qualified | Exchange | |||
| 98101 | Traded Funds | ||||
| Trust | |||||
822 Disclosure of Information about Fund Trustees and Officers
Russell Investment Company
Russell Funds
Disclosure of Information about Fund Trustees and Officers, continued — October 31,
2016 (Unaudited)
| Name, | Position(s) Held | Term | Principal Occupation(s) | No. of | Other |
| Age, | With Fund and | of | During the | Portfolios | Directorships |
| Address | Length of | Office * | Past 5 Years | in Russell | Held by Trustee |
| Time Served | Fund | During the | |||
| Complex | Past 5 Years | ||||
| Overseen | |||||
| by Trustee | |||||
| Kristianne Blake, | Trustee since 2000 | Appointed until | • Director and Chairman of the Audit | 50 | • Director, |
| Born January 22, 1954 | Chairman since 2005 | successor is | Committee, Avista Corp (electric | Avista Corp | |
| 1301 Second Avenue, | duly elected and | utilities) | (electric | ||
| 18th Floor, Seattle, WA | qualified | • Regent, University of Washington | utilities) | ||
| 98101 | Approved | • President, Kristianne Gates Blake, | • Until June | ||
| annually | P.S. (accounting services) | 30, 2014, | |||
| • Until June 30, 2014, Director, Ecova | Director, | ||||
| (total energy and sustainability | Ecova (total | ||||
| management) | energy and | ||||
| • Until December 31, 2013, Trustee | sustainability | ||||
| and Chairman of the Operations | management) | ||||
| Committee, Principal Investors Funds | • Until | ||||
| and Principal Variable Contracts | December 31, | ||||
| Funds (investment company) | 2013, Trustee, | ||||
| • From April 2004 through December | Principal | ||||
| 2012, Director, Laird Norton Wealth | Investors | ||||
| Management and Laird Norton Tyee | Funds | ||||
| Trust (investment company) | (investment | ||||
| company) | |||||
| • Until | |||||
| December 31, | |||||
| 2013, Trustee | |||||
| Principal | |||||
| Variable | |||||
| Contracts | |||||
| Funds | |||||
| (investment | |||||
| company) | |||||
| • From April | |||||
| 2004 through | |||||
| December | |||||
| 2012, | |||||
| Director, Laird | |||||
| Norton Wealth | |||||
| Management | |||||
| and Laird | |||||
| Norton | |||||
| Tyee Trust | |||||
| (investment | |||||
| company) | |||||
| • Until October | |||||
| 2015, Trustee, | |||||
| Russell | |||||
| Exchange | |||||
| Traded Funds | |||||
| Trust |
* Each Trustee is subject to mandatory retirement at age 75.
Disclosure of Information about Fund Trustees and Officers 823
Russell Investment Company
Russell Funds
Disclosure of Information about Fund Trustees and Officers, continued — October 31,
2016 (Unaudited)
| Name, | Position(s) Held | Term | Principal Occupation(s) | No. of | Other |
| Age, | With Fund and | of | During the | Portfolios | Directorships |
| Address | Length of | Office * | Past 5 Years | in Russell | Held by Trustee |
| Time Served | Fund | During the | |||
| Complex | Past 5 Years | ||||
| Overseen | |||||
| by Trustee | |||||
| INDEPENDENT TRUSTEES (continued) | |||||
| Cheryl Burgermeister, | Trustee since 2012 | Appointed until | • Retired | 50 | • Trustee and |
| Born June 26, 1951 | successor is | • Trustee and Chairperson of Select | Chairperson of | ||
| 1301 Second Avenue, | duly elected and | Sector SPDR Funds (investment | Select Sector | ||
| 18th Floor, Seattle, WA | qualified | company) | SPDR Funds | ||
| 98101 | • Until December 31, 2014, | (investment | |||
| Chairperson of Audit Committee, | company) | ||||
| Select Sector SPDR Funds | • Until May | ||||
| (investment company) | 6, 2016, | ||||
| Trustee, ALPS | |||||
| Series Trust | |||||
| (investment | |||||
| company) | |||||
| • Until | |||||
| December | |||||
| 31, 2014, | |||||
| Chairperson | |||||
| of Audit | |||||
| Committee, | |||||
| Select Sector | |||||
| SPDR Funds | |||||
| (investment | |||||
| company) | |||||
| • Until October | |||||
| 2015, Trustee, | |||||
| Russell | |||||
| Exchange | |||||
| Traded Funds | |||||
| Trust | |||||
| Daniel P. Connealy, | Trustee since 2003 | Appointed until | • Retired | 50 | Until October |
| Born June 6, 1946 | Chairman of the | successor is | • June 2004 to June 2014, Senior Vice | 2015, Trustee, | |
| 1301 Second Avenue, | Audit Committee | duly elected and | President and Chief Financial Officer, | Russell | |
| 18th Floor, Seattle, WA | since 2015 | qualified | Waddell & Reed Financial, Inc. | Exchange | |
| 98101 | Appointed until | (investment company) | Traded Funds | ||
| successor is | Trust | ||||
| duly elected and | |||||
| qualified | |||||
| Katherine W. Krysty, | Trustee since 2014 | Appointed until | • Retired | 50 | Until October |
| Born December 3, 1951 | successor is | • January 2011 through March 2013, | 2015, Trustee, | ||
| 1301 Second Avenue | duly elected and | President Emerita, Laird Norton | Russell | ||
| 18th Floor, Seattle, WA | qualified | Wealth Management (investment | Exchange | ||
| 98101 | company) | Traded Funds | |||
| Trust | |||||
824 Disclosure of Information about Fund Trustees and Officers
Russell Investment Company
Russell Funds
Disclosure of Information about Fund Trustees and Officers, continued — October 31,
2016 (Unaudited)
| Position(s) Held | Term | Principal Occupation(s) | No. of | Other | |
| Name, | With Fund and | of | During the | Portfolios | Directorships |
| Age, | Length of | Office * | Past 5 Years | in Russell | Held by Trustee |
| Address | Time Served | Fund | During the | ||
| Complex | Past 5 Years | ||||
| Overseen | |||||
| by Trustee | |||||
| INDEPENDENT TRUSTEES (continued) | |||||
| Raymond P. Tennison, Jr., | Trustee since 2000 | Appointed until | • Retired | 50 | Until October |
| Born December 21, 1955 | Chairman of | successor is | • From January 2008 to December | 2015, Trustee, | |
| 1301 Second Avenue | the Nominating | duly elected and | 2011, Vice Chairman of the Board, | Russell | |
| 18th Floor, Seattle, WA | and Governance | qualified | Simpson Investment Company (paper | Exchange | |
| 98101 | Committee since | Appointed until | and forest products) | Traded Funds | |
| 2007 | successor is | Trust | |||
| duly elected and | |||||
| qualified | |||||
| Jack R. Thompson, | Trustee since 2005 | Appointed until | • Retired | 50 | • Until October |
| Born March 21, 1949 | Chairman of | successor is | 2015, Trustee, | ||
| 1301 Second Avenue, | the Investment | duly elected and | Russell | ||
| 18th Floor, Seattle, WA | Committee since | qualified | Exchange | ||
| 98101 | 2015 | Appointed until | Traded Funds | ||
| successor is | Trust | ||||
| duly elected and | |||||
| qualified | |||||
* Each Trustee is subject to mandatory retirement at age 75.
| Name, | Position(s) Held | Term | Principal Occupation(s) | No. of | Other |
| Age, | With Fund and | of | During the | Portfolios | Directorships |
| Address | Length of | Office * | Past 5 Years | in Russell | Held by Trustee |
| Time Served | Fund | During the | |||
| Complex | Past 5 Years | ||||
| Overseen | |||||
| by Trustee | |||||
| TRUSTEE EMERITUS | |||||
| George F. Russell, Jr., | Trustee Emeritus and | Until resignation | • Director Emeritus, RIM | 50 | None |
| Born July 3, 1932 | Chairman Emeritus | or removal | |||
| 1301 Second Avenue, | since 1999 | ||||
| 18th Floor, Seattle, WA | |||||
| 98101 | |||||
| Name, | Positions(s) Held | Term | Principal Occupation(s) | ||
| Age, | With Fund and | of | During the | ||
| Address | Length of | Office | Past 5 Years | ||
| Time Served | |||||
| OFFICERS | |||||
| Cheryl Wichers, | Chief Compliance | Until removed | • Chief Compliance Officer, RIC and RIF | ||
| Born December 16, 1966 | Officer since 2005 | by Independent | • Chief Compliance Officer, RIFUS and U.S. One Inc. | ||
| 1301 Second Avenue | Trustees | • 2005 to 2011 Chief Compliance Officer, RIM | |||
| 18th Floor, Seattle, WA | |||||
| 98101 | |||||
Disclosure of Information about Fund Trustees and Officers 825
Russell Investment Company
Russell Funds
Disclosure of Information about Fund Trustees and Officers, continued — October 31,
2016 (Unaudited)
| Name, | Positions(s) Held | Term | Principal Occupation(s) |
| Age, | With Fund and | of | During the |
| Address | Length of | Office | Past 5 Years |
| Time Served | |||
| Mark E. Swanson, | President and Chief | Until successor | • Global Head of Fund Services, Russell Investments |
| Born November 26, 1963 | Executive Officer | is chosen and | • President, CEO, Treasurer, Chief Accounting Officer and CFO, RIC |
| 1301 Second Avenue | since 2016 | qualified by | and RIF |
| 18th Floor, Seattle, WA | Treasurer and Chief | Trustees | • Director, President and CEO, RIFUS |
| 98101 | Accounting Officer | • Director, RIM, Russell Investments Trust Company (“RITC”) and | |
| since 1998 | Russell Investments Financial Services, LLC (“RIFIS”) | ||
| • October 2011 to December 2013, Head of North America Operations | |||
| Russell Investments | |||
| • May 2009 to October 2011, Global Head of Fund Operations, Russell | |||
| Investments | |||
| Jeffrey T. Hussey, | Chief Investment | Until removed by | • Global Chief Investment Officer, Russell Investments |
| Born May 2, 1969 | Officer since 2013 | Trustees | • Chief Investment Officer, RIC and RIF |
| 1301 Second Avenue, | • Chairman of the Board, President and CEO, RIM | ||
| 18th Floor, Seattle WA | • Director, RITC, Russell Investments Implementation Services, LLC | ||
| 98101 | and Russell Investments Delaware, LLC | ||
| • Board of Managers, Russell Investments Funds Management, LLC | |||
| • 2003 to 2013 Chief Investment Officer, Fixed Income, Russell | |||
| Investments | |||
| Mary Beth R. Albaneze, | Secretary since 2010 | Until successor | • Associate General Counsel, Russell Investments |
| Born April 25, 1969 | is chosen and | • Secretary, RIM, RIFUS and RIFIS | |
| 1301 Second Avenue, | qualified by | • Secretary and Chief Legal Officer, RIC and RIF | |
| 18th Floor, Seattle, WA | Trustees | • Assistant Secretary, Russell Investments Insurance Agency, LLC | |
| 98101 | (“RIIA”)(insurance agency) and U.S. One Inc. | ||
826 Disclosure of Information about Fund Trustees and Officers
Russell Investment Company
Russell Funds
Adviser, Money Manager and Service Providers — October 31, 2016
| Independent Trustees | Russell U.S. Dynamic Equity Fund |
| Thaddas L. Alston | AJO, LP, Philadelphia, PA |
| Kristianne Blake | Jacobs Levy Equity Management, Inc., Florham Park, NJ |
| Cheryl Burgermeister | Pzena Investment Management, LLC, New York, NY |
| Daniel P. Connealy | Suffolk Capital Management, LLC, New York, NY |
| Katherine W. Krysty | Russell U.S. Strategic Equity Fund |
| Raymond P. Tennison, Jr. | AJO, LP, Philadelphia, PA |
| Jack R. Thompson | Barrow, Hanley, Mewhinney & Strauss, LLC, Dallas, TX |
| Trustee Emeritus | Brandywine Global Investment Management, LLC, |
| George F. Russell, Jr. | Philadelphia, PA |
| Officers | Jacobs Levy Equity Management, Inc., Florham Park, NJ |
| Mark E. Swanson, President, CEO, Treasurer, Chief | PanAgora Asset Management Inc, Boston, MA |
| Accounting Officer & CFO | Suffolk Capital Management, LLC, New York, NY |
| Cheryl Wichers, Chief Compliance Officer | William Blair Investment Management, LLC, Chicago, IL |
| Jeffrey T. Hussey, Chief Investment Officer | Russell U.S. Large Cap Equity Fund |
| Mary Beth Rhoden Albaneze, Secretary | Ceredex Value Advisors LLC, Orlando, FL |
| Adviser | Columbus Circle Investors, Stamford, CT |
| Russell Investment Management, LLC | Jacobs Levy Equity Management Inc., Florham Park, NJ |
| 1301 Second Avenue | Sustainable Growth Advisers, LP, Stamford, CT |
| Seattle, WA 98101 | TCW Asset Management Company, Los Angeles, CA |
| Administrator and Transfer and Dividend Disbursing | Russell U.S. Mid Cap Equity Fund |
| Ceredex Value Advisors LLC, Orlando, FL | |
| Agent | Elk Creek Partners, LLC, Denver, CO |
| Russell Investments Fund Services, LLC | Jacobs Levy Equity Management Inc., Florham Park, NJ |
| 1301 Second Avenue | |
| Seattle, WA 98101 | Russell U.S. Small Cap Equity Fund |
| Ancora Advisors LLC, Mayfield Heights, OH | |
| Custodian | Cardinal Capital Management, L.L.C., Greenwich, CT |
| State Street Bank and Trust Company | Copeland Capital Management, LLC, Conshohocken, PA |
| 1 Heritage Drive | DePrince, Race & Zollo, Inc., Winter Park, FL |
| North Quincy, MA 021171 | EAM Investors, LLC, Cardiff by the Sea, CA |
| Office of Shareholder Inquiries | Falcon Point Capital, LLC, San Francisco, CA |
| 1301 Second Avenue | Jacobs Levy Equity Management Inc., Florham Park, NJ |
| Seattle, WA 98101 | PENN Capital Management Company, Inc., Philadelphia, PA |
| (800) 787-7354 | Robeco Investment Management, Inc., New York, NY |
| Legal Counsel | Timpani Capital Management LLC, Milwaukee, WI |
| Dechert LLP | Russell International Developed Markets Fund |
| One International Place, 40th Floor | Barrow, Hanley, Mewhinney & Strauss, LLC, Dallas, TX |
| 100 Oliver Street | MFS Institutional Advisors Inc., Boston, MA |
| Boston, MA 02110 | Numeric Investors LLC, Boston, MA |
| Distributor | Pzena Investment Management, LLC, New York, NY |
| Russell Investments Financial Services, LLC | Wellington Management Company, LLP, Boston, MA |
| 1301 Second Avenue | Russell Global Equity Fund |
| Seattle, WA 98101 | Harris Associates L.P., Chicago, IL |
| Independent Registered Public Accounting Firm | MFS Institutional Advisors Inc., Boston, MA |
| PricewaterhouseCoopers LLP | Polaris Capital Management, LLC, Boston, MA |
| 1420 5th Avenue, Suite 2800 | Sanders Capital, LLC, New York, NY |
| Seattle, WA 98101 | Wellington Management Company, LLP, Boston, MA |
| Money Managers | Russell Emerging Markets Fund |
| Russell U.S. Core Equity Fund | AllianceBernstein L.P., New York, NY |
| Consillium Investment Management, LLC, Fort Lauderdale, | |
| Barrow, Hanley, Mewhinney & Strauss, LLC, Dallas, TX | FL |
| Brandywine Global Investment Management, LLC, | Delaware Management Company, a Series of Delaware |
| Philadelphia, PA | Management Business Trust, Philadelphia, PA |
| Columbus Circle Investors, Stamford, CT | Harding Loevner LP, Bridgewater, NJ |
| Jacobs Levy Equity Management, Inc., Florham Park, NJ | Numeric Investors LLC, Boston, MA |
| Suffolk Capital Management, LLC, New York, NY | Oaktree Capital Management, L.P., Los Angeles, CA |
| Sustainable Growth Advisers, LP, Stamford, CT | Westwood Management Corporation, Dallas, TX |
| Russell U.S. Defensive Equity Fund | Russell Tax-Managed U.S. Large Cap Fund |
| Coho Partners, Ltd., Berwyn, PA | Armstrong Shaw Associates Inc., New Canaan, CT |
| J.P. Morgan Investment Management Inc., New York, NY | Barrow, Hanley, Mewhinney & Strauss, LLC, Dallas, TX |
| Jacobs Levy Equity Management, Inc., Florham Park, NJ | J.P. Morgan Investment Management Inc., New York, NY |
| PanAgora Asset Management Inc, Boston, MA |
Adviser, Money Manager and Service Providers 827
Russell Investment Company
Russell Funds
Adviser, Money Manager and Service Providers — October 31, 2016
| MarVista Investment Partners LLC, Los Angeles, CA | Russell Investment Grade Bond Fund |
| Sustainable Growth Advisers, LP, Stamford, CT | Logan Circle Partners, L.P., Philadelphia, PA |
| Russell Tax-Managed U.S. Mid & Small Cap Fund | Loomis, Sayles & Company, L.P., Boston, MA |
| Chartwell Investment Partners, Berwyn, PA | Neuberger Berman Fixed Income LLC, Chicago, IL |
| Luther King Capital Management Corporation, Fort Worth, | Schroder Investment Management North America Inc., New |
| TX | York, NY |
| Netols Asset Management Inc., Mequon, WI | Russell Short Duration Bond Fund |
| Snow Capital Management, L.P., Sewickley, PA | Logan Circle Partners, L.P., Philadelphia, PA |
| Summit Creek Advisors LLC, Minneapolis, MN | Scout Investments, Inc, Kansas City, MO |
| Russell Tax-Managed International Equity Fund | THL Credit Advisors, LLC, Boston, MA |
| AllianceBernstein L.P., New York, NY | Russell Tax Exempt High Yield Bond Fund |
| Delaware Investment Fund Advisers, a Series of Delaware | Goldman Sachs Asset Management, New York, NY |
| Management Business Trust, Philadelphia, PA | MacKay Shields LLC, New York, NY |
| Fiera Capital Inc., New York, NY | Russell Tax Exempt Bond Fund |
| Janus Capital Management LLC, Denver, CO | |
| Pzena Investment Management, LLC, New York, NY | AllianceBernstein L.P., New York, NY |
| RWC Asset Advisors (US) LLC, London, United Kingdom | MacKay Shields LLC, New York, NY |
| Russell Global Opportunistic Credit Fund | Russell Commodity Strategies Fund |
| Axiom Alternative Investments SARL, Paris, France | CoreCommodity Management, LLC, Stamford, CT |
| DDJ Capital Management LLC, Waltham, MA | Credit Suisse Asset Management, LLC, New York, NY |
| Dupont Capital Management Corporation, Wilmington, DE | Goldman Sachs Asset Management, New York, NY |
| Lazard Asset Management LLC, New York, NY | Russell Global Infrastructure Fund |
| Oaktree Capital Management, L.P., Los Angeles, CA | Cohen & Steers Capital Management, Inc., New York, NY |
| THL Credit Advisors, LLC, Boston, MA | Colonial First State Asset Management (Australia) Limited, |
| Unconstrained Total Return Fund | Sydney, Australia |
| H2O Asset Management LLP, London, United Kingdom | Maple-Brown Abbott Limited, Sydney, Australia |
| Post Advisory Group, LLC, Santa Monica, CA | Nuveen Asset Management, LLC, Chicago, IL |
| Putnam Investment Management, LLC, Boston, MA | Russell Global Real Estate Securities Fund |
| THL Credit Advisors, LLC, Boston, MA | Cohen & Steers Capital Management, Inc., New York, NY |
| Russell Strategic Bond Fund | Morgan Stanley Investment Management Inc., New York, NY |
| Colchester Global Investors Limited, London, United | RREEF America L.L.C., Chicago, IL |
| Kingdom | Russell Multi-Strategy Income Fund |
| Logan Circle Partners, L.P., Philadelphia, PA | Cohen & Steers Capital Management, Inc., New York, NY |
| Pareto Investment Management Limited, London, United | DDJ Capital Management LLC, Waltham, MA |
| Kingdom | Epoch Investment Partners, Inc., New York, NY |
| Schroder Investment Management North America Inc., New | Janus Capital Management LLC, Denver, CO |
| York, NY | Kopernik Global Investors, LLC, Tampa, FL |
| Scout Investments, Inc, Kansas City, MO | Lazard Asset Management LLC, New York, NY |
| Western Asset Management Company, Pasadena, CA and | Loomis, Sayles & Company, L.P., Boston, MA |
| Western Asset Management Company Limited, London, | THL Credit Advisors, LLC, Boston, MA |
| United Kingdom | |
| Note: Select U.S. Equity, Select International Equity and Russell Strategic Call | |
| Overwriting Funds are directly managed by RIM. |
This report is prepared from the books and records of the Funds and is submitted for the general information of shareholders and is not
authorized for distribution to prospective investors unless accompanied or preceded by an effective Prospectus. Nothing herein contained is
to be considered an offer of sale or a solicitation of an offer to buy shares of Russell Investment Company. Such offering is made only by
Prospectus, which includes details as to offering price and other material information.
828 Adviser, Money Manager and Service Providers

Russell Investment
Company
Russell Investment Company is a
series investment company with
41 different investment portfolios
referred to as Funds. These
financial statements report on 14
of these Funds.
Russell Investment Company
LifePoints® Funds
Annual Report
October 31, 2016
Table of Contents
| Page | |
| To Our Shareholders | 3 |
| Market Summary | 4 |
| Conservative Strategy Fund | 9 |
| Moderate Strategy Fund | 32 |
| Balanced Strategy Fund | 54 |
| Growth Strategy Fund | 78 |
| Equity Growth Strategy Fund | 102 |
| 2020 Strategy Fund | 126 |
| 2025 Strategy Fund | 140 |
| 2030 Strategy Fund | 154 |
| 2035 Strategy Fund | 168 |
| 2040 Strategy Fund | 182 |
| 2045 Strategy Fund | 196 |
| 2050 Strategy Fund | 210 |
| 2055 Strategy Fund | 224 |
| In Retirement Fund | 237 |
| Notes to Schedules of Investments | 252 |
| Notes to Financial Highlights | 253 |
| Notes to Financial Statements | 254 |
| Report of Independent Registered Public Accounting Firm | 272 |
| Tax Information | 273 |
| Shareholder Requests for Additional Information | 275 |
| Disclosure of Information about Fund Trustees and Officers | 276 |
| Adviser and Service Providers | 281 |
Russell Investment Company - LifePoints® Funds.
Copyright © Russell Investments 2016. All rights reserved.
Russell Investments’ ownership is composed of a majority stake held by funds managed by TA Associates with
minority stakes held by funds managed by Reverence Capital Partners and Russell Investments’ management.
Frank Russell Company is the owner of the Russell trademarks contained in this material and all trademark rights
related to the Russell trademarks, which the members of the Russell Investment group of companies are permitted
to use under license from Frank Russell Company. The members of the Russell Investments group of companies
are not affiliated in any manner with Frank Russell Company or any entity operating under the “FTSE RUSSELL”
brand.
Fund objectives, risks, charges and expenses should be carefully considered before in-
vesting. A prospectus containing this and other important information must precede or
accompany this material. Please read the prospectus carefully before investing.
Securities distributed through Russell Investments Financial Services, LLC, member FINRA, part of
Russell Investments.
Indices and benchmarks are unmanaged and cannot be invested in directly. Returns represent past performance,
are not a guarantee of future performance, and are not indicative of any specific investment. Index return
information is provided by vendors and although deemed reliable, is not guaranteed by Russell Investments or its
affiliates.
S&P® is a registered trademark of Standard & Poor’s Financial Services LLC.
Performance quoted represents past performance and does not guarantee future results. The investment return
and principal value of an investment will fluctuate so that shares, when redeemed, may be worth more or less
than their original cost. Current performance may be lower or higher than the performance data quoted. Current
to the most recent month-end performance data may be obtained by visiting https://russellinvestments.com/us/
funds/performance-prices.
To Our Shareholders
Fellow Shareholder,
2016 goes down as a year of great restlessness, and certainly a bruising year for forecasters. To call the political landscape
restive seems understated, but for all the referendums, coups and national elections, the markets remained orderly,
delivering returns right down the middle of the road. In fact, you might say that it was a remarkably positive result in view
of how plausible major market sell offs would have been!
With record stock market highs, why the rattled nerves? Our current climate appears increasingly unconventional, and
delivering returns moving forward could prove increasingly challenging, especially in the U.S. where corporate profits are
thinning out and interest rates are likely headed up. Our global team of market strategists continues to keep a close eye on
a potential interest rate hike from the Federal Reserve in December, as well as two possible hikes in 2017, supported by the
modest economic growth and a gradual firming in inflation we’ve seen this year. The numbers from the U.S. labor market
in 2016 remained healthy, and showed no signs of imbalances in business investment. We are, however, keeping a close
eye on warning signs stemming from the corporate sector, including a troubling rise in corporate leverage throughout 2016.
U.S. corporate earnings appear to have bottomed, while the most recent earnings growth was positive but tepid. While our
team still has an underweight U.S. equities view, their modeling shows only a modest risk of recession, and they continue
with a ‘buy-the-dips and sell-the-rallies’ investment strategy.
At the same time, change is inseparable with opportunity. Our strategists and portfolio managers work diligently to ensure
that portfolios are well positioned to take advantage of new opportunities, while seeking to avoid as much of the downside as
possible. If bond yields rise, if inflation increases in some regions while deflation occurs elsewhere, a dynamic investment
process can respond. We also are active currency investors in certain portfolios, looking to see if the U.S. dollar will
test previous highs or whether the British pound remains at risk, as investors focus on the full implications of Brexit’s
implementation.
We believe more than ever that securing your desired investment outcomes takes a dynamic process, comprehensive
asset class coverage, and the tools required to identify and manage risk. But as important as that contribution can be,
we also believe it’s never been more vital for shareholders to have solid, long-term financial plans, realistic goals, and
regular check-ins with personal financial advisors. The following pages provide additional insights on the markets and the
performance of Russell Investments mutual funds for the fiscal year ending October 31, 2016.
Thank you for your continued trust. As always, our purpose at Russell Investments is to improve the financial security of
people like you. We take that purpose very seriously.
Best regards,

Len Brennan
Chief Executive Officer, Russell Investments
To Our Shareholders 3
Russell Investment Company
Market Summary as of October 31, 2016 (Unaudited)
U.S. Equity Markets
Broadly measured by the Russell 3000® Index, U.S. stocks returned 4.24% for the one year period which is the eighth
straight fiscal year ending October 31st that the Russell 3000® Index has finished with a positive absolute return. The
Russell 3000® Index finished with a positive absolute return in eight of the fiscal year’s twelve months.
Within U.S. large capitalization stocks, factors that were rewarded during the fiscal year included moderate beta (beta is
a measure of a stock’s sensitivity to the direction of the market) and high dividend yield. Factors that trailed the market
included high historical earnings growth, high forecasted growth, positive price momentum, and low price-to-earnings
ratios. Additionally, defensive stocks outperformed dynamic stocks across all market capitalization tiers. From a sector
perspective, utilities, telecommunication services, information technology, and real estate investment trusts (“REITs”)
outperformed the Russell 1000® Index by 13.31%, 6.58%, 9.71%, and 1.27%, respectively. Sectors that failed to find
traction during the one year period were health care, consumer discretionary, energy, and financial services trailing by
8.59%, 6.16%, 2.71%, and 2.21%, respectively.
In early November 2015, non-farm payroll growth for October was reported significantly above consensus at 271,000.
This caused certain industries that may benefit from rising interest rates to react favorably, most notably banks, which
outperformed the Russell 3000® Index by over 3.60% in November. Leveraged industries that are seen as bond substitutes
due to high dividend yields, such as electric utilities and REITs, underperformed the Russell 3000® Index in November
by 2.15% and 0.75%, respectively. In mid-December the U.S. Federal Reserve (the “Fed”) raised short term interest rates
for the first time since the global financial crisis. There was not a significant market reaction in December when the Fed
raised rates because the increase was mostly priced in by the market once the positive non-farm payroll growth report was
released in November, which signaled a high probability of an interest rate increase in December. Fed Chair Yellen stated
that, despite recent international developments, domestically “the economy has been performing well, and we expect it to
continue to do so.”
In The Russell 3000® Index ended the January through March period of 2016 with a positive absolute return of 0.97%
although the quarter was defined by two very distinct periods. The first half of the quarter was characterized by slowing
growth in China coupled with an ongoing commodities rout (especially in oil), which created significant market volatility
and substantial risk-off sentiment. Interest rate sensitive sectors and traditional non-cyclical sectors such as utilities,
consumer staples, and REITs were big outperformers and traded at an unusual valuation premium to the broader market.
However, in the latter part of the quarter there was a rebound in the traditional cyclical areas of the market driven in part
by more dovish rhetoric from the Fed alongside oil price stabilization. Gross domestic product (“GDP”) growth during
the fourth quarter of 2015 was revised further upwards to 1.4% (quarter-over-quarter). Nonfarm payrolls also rose by
242,000 in February and the core inflation rate (2.3% year-over-year in February) was slightly above expectations of 2.2%.
However, at the first quarter Federal Open Market Committee (“FOMC”) meeting, Fed Chair Yellen explained that even
though domestic “economic forecasts have not changed much since December”, this was being overshadowed by “global
economic and financial developments”, posing a risk to growth. As a result, FOMC “dots” reduced to two the number of
likely interest rate hikes in 2016 down from four earlier in the year.
The Russell 3000® Index finished with a positive absolute return of 2.63% from April through June. The U.S. equity
market gained over the period despite the U.K. Brexit referendum on European Union membership. The U.K.’s decision to
potentially leave the EU threw worldwide markets into turmoil during the month of June. This caused valuations to become
even more stretched within utilities, REITs and consumer staples stocks and was a catalyst for discussion about what
some in the industry called a “low volatility bubble.” The final revision to first quarter GDP growth was upward to 1.1%,
beating consensus estimates of 1.0%. However, a weak May U.S. jobs report came out in early June with non-farm payrolls
advancing by only 38,000 versus the 164,000 expected and this reduced expectations about Fed rate hikes. Inflation also
continued to remain below target at 1.0% year-over-year, while retail sales were up 2.5% year-over-year in May. Mixed
4 Market Summary
Russell Investment Company
Market Summary as of October 31, 2016, continued — (Unaudited)
U.S. economic data, combined with global uncertainties, caused the Fed to take a more dovish stance relating to increasing
interest rates over the intermediate term.
During the third quarter, the Russell 3000® Index rose 4.4%, as the recession fears that characterized the end of the second
quarter began to dissipate. The Fed ended the latest round of deliberations on whether to raise rates, with a hawkish hold.
This, combined with moderately favorable economic data and second quarter earnings reports, caused low volatility stocks
to underperform while banks and technology stocks outperformed. The final revision for second quarter GDP growth was
increased to 1.4% quarter-over-quarter. U.S. retail sales cooled over the period, declining 0.3% month-over-month in the
latest reading for August. The non-farm payrolls numbers reported during the quarter impressed markets, increasing by a
robust 406,000 over July and August combined, which beat consensus estimates of 360,000. The FOMC left interest rates
unchanged at 0.5%, but strongly signaled that “the case for an increase in the federal funds rate has strengthened”. While
signaling that a rate hike was likely in the months ahead, Fed officials lowered their economic growth forecast and trimmed
the number of rate hikes they foresaw in 2017 from three to two.
In October, the Russell 3000® Index lost 2.16%. Investors gravitated toward larger market capitalization higher beta stocks
despite the market decline. Even though higher beta stocks outperformed, some of the lower beta parts of the market such
as electric utilities and consumer staples held-up reasonably well. Medium and small capitalization stocks fell more than
the broad market while REITs and health care stocks lagged as investors focused on the interest rate cycle and election
worries. Value stocks were unusually cheap and generally held-up better than their growth counterparts. Financials,
specifically bank stocks, rallied as the Fed moved closer toward a potential December rate hike and the yield on the 10-
year U.S. treasury hit its highest level since May of 2016. September U.S. non-farm payrolls released in October rose by
156,000 slightly trailing consensus estimates of 168,000. The market reaction was muted overall as the possibility of the
Fed raising short term rates in December seemed to still be on track.
Non-U.S. Developed Equity Markets
For the fiscal year ended October 31, 2016, the developed non-U.S. equity market, as measured by the Russell Developed
ex-U.S. Large Cap® Index (the “Index”), was down -2.34%. There were significant drivers of market volatility during
the fiscal year, key among them were the U.S. Federal Reserve (the “Fed’) rate hikes, the U.K. Brexit referendum and
uncertainty around economic data in emerging markets following an emerging market slowdown during the last fiscal year.
Amid the market volatility, quality factor outperformed the most within the Index during the fiscal year as investors flocked
to quality stocks. Compared to the last fiscal year ending October 31, 2015 when commodity driven sectors, particularly
energy and materials, were the worst hit, this fiscal year saw a reversal in sector trends with these sectors gaining traction
as commodity prices stabilized. Momentum and growth factors underperformed as the fiscal year saw some trend reversals.
In the first quarter of the fiscal year ended October 31, 2016, the Fed lifted the interest rate by 25 basis points to 0.5% in
December 2015, the first time since the financial crisis, while in the rest of the developed markets the monetary policies
broadly remained dovish. With respect to China, slightly softer economic activity, Chinese yuan depreciation, tripping of
circuit breakers and a meaningful decline in foreign exchange reserves stoked concerns about the health of the Chinese
economy and global markets more broadly. The Index was down in all the three months of the first quarter of the fiscal year.
From January 2016 through June 2016, uncertainties grew as market attention became increasingly fixated upon the
U.K., culminating in the U.K. exiting the European Union on June 23rd’s Brexit referendum result, severing a 43-year
membership. Developed non-U.S. equity markets experienced several months of volatility in the first half of 2016 in the
wake of these developments.
In the last quarter of the fiscal year ending October 31, 2016, emerging markets gained traction with better than expected
economic data from China in July 2016. As the fiscal year progressed, the Fed took a more cautious stance and lowered
Market Summary 5
Russell Investment Company
Market Summary as of October 31, 2016, continued — (Unaudited)
the expected pace of rate hikes to a one hike scenario as the most likely case for the remainder of 2016. Markets stabilized
post July after witnessing months of volatility through the end of June 2016.
Asia ex-Japan and Canada were the stand out non-U.S. developed markets over the period, while the U.K. and developed
Europe ex-U.K. lagged the most. Better than expected emerging markets data and stabilization in commodity prices helped
the commodity heavy economies over the fiscal year ending October 31, 2016.
In terms of sector returns within the Index for the fiscal year ended October 31 2016, commodity driven sectors, such as
materials and energy, had the strongest outperformance, while certain defensive sectors, especially health care, were the
biggest laggards. The financial services sector also lagged the Index, especially driven by banks.
Emerging Markets
The Russell Emerging Markets® Index, as measured in U.S. dollar terms (the “Index”), gained 9.4% over the fiscal year
ended October 31, 2016. The asset class experienced a strong reversal from a negative 2015. Political tailwinds, strong
growth and low interest rates fuelled a positive market environment.
In November and December of 2015, the Index declined 4.9%. Anticipation of a U.S. Federal Reserve rate hike was a key
negative driver over the period. This effect was most pronounced in countries with large current account deficits and dollar-
denominated debt. Currency was also a headwind for emerging markets as the U.S. dollar strengthened. Brazil declined
due to weak economic data and political uncertainty. Near the end of the year, Fitch downgraded Brazil’s credit rating from
investment grade to “junk” status (BB+). This sparked the resignation of finance minister Joaquim Levy and further loss of
trust in President Rousseff. Speculation of impeachment continued, which materialized in 2016.
The Index recorded a strong 4.8% increase in the first quarter of 2016. This was a sharp contrast to developed markets. The
market climb was driven by strong March performance, following falls in January and February. Turmoil in Chinese equity
markets and volatility in the price of oil drove a negative start to the period, in a broadly risk-off environment for equity
markets. The market rebounded from mid-February as equity market and oil price volatility stabilized. A more dovish
outlook for U.S. interest rate rises provided support to emerging markets, particularly countries with large current account
deficits. A weakening of the U.S. dollar acted as a further tailwind. Unlike most of 2015, it was a positive period for Latin
American countries. Brazil overcame a negative start to the year to climb 27.8%. Investors appeared hopeful of a change
of government and ignored weak economic data. The Brazilian Democratic Movement party withdrew from the ruling
coalition. Meanwhile, fourth quarter gross domestic product (“GDP”) growth contracted 5.9% year-over-year. Elsewhere,
Turkey enjoyed a positive start to 2016 (20.4%), aided by low interest rate prospects in the U.S. Russia climbed 16.5% as
the ruble recovered some of its 2015 depreciation. South Africa (15.1%) also benefited from speculation of accommodative
U.S. Federal Reserve policy. In Asia, China was the weakest-performing country in the first quarter. The market slipped
5.6% as economic slowdown concerns remained. After a tumultuous January, where sentiment was hampered by the
failed government-implemented market “stop” on the main stock markets, the People’s Bank of China introduced further
accommodative measures to improve market liquidity. In February, the central bank moved to daily open market operations
and cut its required reserve ratio for banks by 0.5%. Nevertheless, Standard & Poor’s cut its outlook on China to negative
due to economic outlook. India also experienced a slowdown (-3.6%). Capitalization concerns within the nation’s banking
system weighed on sentiment.
The Index recovered from a negative May to edge 1.0% higher in the second quarter of 2016. Emerging markets continued
to outperform developed markets. Fears of an impending U.S. interest rate rise weighed on sentiment, although these
concerns eased over the period. This followed U.S. Federal Reserve Chair Yellen’s more “dovish” comments in June.
Expectations of future U.S. interest rate hikes were pushed out further after the U.K. Brexit referendum to leave the
European Union. The Index echoed the developed market selloff following the Brexit vote, before a subsequent rebound
at quarter-end. It was also a turbulent but positive quarter for Brazil (14.7%). After a protracted process, President Dilma
Rousseff was eventually suspended from office. China extended its weak 2016 performance, as it underperformed to
6 Market Summary
Russell Investment Company
Market Summary as of October 31, 2016, continued — (Unaudited)
finish flat over the period (-0.2%). In addition, the yuan sold off on speculation that China may devalue its currency
following Brexit. Economic data remained healthy but weakened over the period. Elsewhere, Taiwan edged 0.2% higher.
At quarter-end, the central bank reduced its key interest rate as expected to 1.375% from 1.5% in an effort to boost
growth. Europe was the weakest-performing region within the Index. Poland was the standout laggard in the second quarter
(-15.7%), hardest hit by the U.K.’s decision to leave the European Union. Greece slid 9.6% despite surging higher in May.
Meanwhile, political developments drove market movements in Turkey (-7.9%). The market reacted negatively to Prime
Minister Ahmet Davutoglu’s resignation in May.
The Index surged 8.7% in the third quarter of 2016 in a risk-on environment. Emerging markets continued to outperform
with the strongest quarterly return in over three years. Returns were amplified after the U.S. Federal Reserve failed to
increase interest rates in September. The subsequent weakening of the U.S. dollar was a tailwind to the market. It was
a volatile period for oil. The price surged 8.5% in the week ending the quarter as OPEC members agreed in principle
to reduce output. However, the price per barrel fell 3.8% over the period. China was the strongest performing country
during the quarter (13.4%), as positive economic data increased investor confidence in the economy. Second-quarter GDP
growth was positive at 6.7% year-over-year, beating estimates of 6.6%. The modest surprise was driven by an increase in
consumption. The Caixin China services purchasing managers' index (“PMI”) climbed above 50 over the period. However,
the inflation rate fixed lower in August to 1.3% year-over-year (from 1.9% in June). Meanwhile, Brazil continued its strong
year-to-date rebound with an 11.8% climb. The impeachment process against former President Dilma Rousseff finally
concluded, with investor confidence boosted on hopes President Michel Temer would implement market-friendly reforms.
Economic data also improved from recent lows. Industrial production beat expectations at -6.0% year-over-year in June,
the strongest in close in one year, while the manufacturing PMI edged higher. South Korea (9.1%), Indonesia (9.2%) and
Taiwan (11.5%) also outperformed the broader Index return. In Korea, second quarter GDP growth beat expectations at
0.8% quarter-over-quarter. Elsewhere, Indonesia also beat second quarter GDP growth expectations at 4.0% quarter-over-
quarter. The central bank lowered its interest rate to 5.0% as inflation remained subdued. Positive sentiment towards
Taiwan was driven by strong corporate earnings, which led to large investor inflows. Mexico and Turkey were among the
worst-performing countries for the quarter, with both the peso and lira the weakest currencies against the U.S. dollar over
the period. In Mexico (-2.0%), the “Trump effect” weighed on investor confidence. Corruption scandals and the resignation
of finance minister Luis Videgaray also put pressure on President Enrique Pena Nieto. Meanwhile, in Turkey (-4.8%),
markets reacted negatively to July’s failed military coup and subsequent strengthening of power by President Erdogan.
Moody’s downgrade of the country’s credit rating to “junk” status, based on increased risks to the country’s balance of
payments and weaker expected future growth, further weighed on sentiment.
The Index was close to flat in October 2016, returning 0.03%. Rate hike speculation spurred a risk-off environment that
was detrimental to emerging markets. Oil rallied early in the month before selling off, ending flat. Energy outpace other
sectors while consumer stocks sold off on negative sentiment. From a country-perspective, Brazil rallied as Petrobras
rallied to a near two-year high. South Korea sold off with Samsung continuing to suffer from its botched Galaxy Note 7.
U.S./Global Fixed Income Markets
The fiscal year ended October 31, 2016 was characterized by a sharply risk off market early in the period followed by a
similarly sharp rebound and extended rally in risky assets (e.g. lower rated credit and emerging market currencies). Overall,
this proved positive for most fixed income sectors around the globe. Yield curves on global government bonds tended to
flatten over the period supporting longer maturity bonds and the asset class in general. Corporate and emerging sovereign
credit markets suffered from December to February, but returns turned positive as the year went on and eventually very
significantly so. A key indicator of global fixed income performance, the Bloomberg Barclays Global Aggregate Bond Index,
returned 5.17% for the fiscal year, in U.S. dollar-hedged terms, as yields fell modestly and spreads tightened during a fiscal
year where monetary policy remained generally accommodative and recession fears early in the period were never realized.
Market Summary 7
Russell Investment Company
Market Summary as of October 31, 2016, continued — (Unaudited)
Regionally, Europe outperformed the U.S. as the U.S. Federal Reserve (the “Fed”) hiked rates once in the U.S. and
greater exposure to the corporate energy sector represented headwinds to the U.S. market. The Bloomberg Barclays Pan-
European Aggregate Bond Index returned 5.81% during the period (in U.S. dollar-hedged terms), led by the corporate
sector of the market, where the European Central Bank (the “ECB”) began to buy investment grade corporate bonds as
a part of its expanded quantitative easing program. A sharp bond rally in the U.K. following the Brexit referendum also
supported European bond performance. The U.S., in comparison, returned 4.37% during the fiscal year as measured by
the Bloomberg Barclays U.S. Aggregate Bond Index. While the U.S. corporate market performed strongly as did longer
maturity U.S. bonds, Treasury yields rose at the front end of the yield curve representing a headwind to performance in the
US.
In the U.S., economic data remained broadly positive, with solid nonfarm payroll gains and a steady decline in the
unemployment rate to below 5.0%. Gross domestic product (“GDP”) growth regained steam over the period reaching as
high as 2.9% after having dipped below 1% in the first quarter of 2016. Inflation also began to tick up through the period.
The Consumer Price Index was lifted by a recovery in energy prices, but the fiscal year also witnessed modest gains in
wage and producer price inflation supporting expectations that the Fed might be on a path to raise rates again, but not until
after the fiscal year end.
In Europe, the ECB elected to further loosen monetary policy by expanding its asset purchase program to include investment
grade corporate debt. In spite of continued lackluster growth in the Eurozone, the corporate market produced over 3.0%
excess returns over equivalent duration government bonds during the period as ECB demand and support dominated any
fundamental issues. European peripheral markets were mixed during the period as idiosyncratic political events led to
more divergent performance. A series of delayed and failed bank restructurings as well as a looming referendum led Italian
bonds to lag in the market rally. Spain, on the other hand, held an election with an ambiguous result but by the end of the
period appeared on a path for the current lead party to maintain power. As a result, Spanish 10-year bond yields fell over
50 basis points.
Emerging markets suffered more than most early in the period as commodity prices fell, but ultimately rallied to produce
exceptionally strong performance for the fiscal year. China’s growth beat expectations with 6.7% reported GDP growth for
3 consecutive quarters. In Brazil, the President was impeached, which the market took very favorably. The Brazilian Real
was the strong performing major currency worldwide up over 35% against the U.S. dollar. One country that struggled in
emerging markets throughout the year was Mexico. Beaten down by market sentiment early in the year, Mexican assets
failed to rally later in the year as the possibility of a Trump presidency in the U.S. appeared to pose significant risks
to that economy. Emerging market (“EM”) debt outperformed developed markets (the Bloomberg Barclays EM Hard
Currency Aggregate Bond Index outperformed equivalent-duration U.S. Treasuries by 6.61%) as growth and sentiment
stabilized. Local currency EM bonds (those issued in the issuing country’s own currency) did not return quite as strongly
(the Bloomberg Barclays EM Local Currency Government Bond Index returned 4.85%) as the drawdown in the first quarter
of the year was much sharper for EM currencies than credit, though the subsequent rally was similarly fierce.
Strong corporate new issuance volumes continued in the fiscal year period after a brief lull in the first quarter of 2016.
Overall, corporate credit was up globally (the Bloomberg Barclays Global Aggregate Corporate Bond Index returned 3.22%
over equivalent-duration U.S. Treasuries), with particularly strong performance out of the industrial sector of the market.
Financials performed well versus government bonds, but lagged their industrial counterparts as sustained flat yield curves
weighed on banking sector profitability and organic growth outlook.
High yield corporate credit was among the best-performing segments of the market (the Bloomberg Barclays Global High
Yield Bond Index returned 8.20% over equivalent-duration Treasuries), as market sentiment flipped early in the year and
defaults were limited outside of the energy sector.
8 Market Summary
Russell Investment Company
Conservative Strategy Fund
Portfolio Management Discussion and Analysis — October 31, 2016 (Unaudited)
| Conservative Strategy Fund - Class A‡ | Conservative Strategy Fund - Class R5‡‡‡ | ||||||
| Total | Total | ||||||
| Return | Return | ||||||
| 1 Year | (2.01 | )% | 1 Year | 3.88 | % | ||
| 5 Years | 2.46 | %§ | 5 Years | 3.56 | %§ | ||
| 10 Years | 3.21 | %§ | 10 Years | 3.66 | %§ | ||
| Conservative Strategy Fund - Class C | Conservative Strategy Fund - Class S | ||||||
| Total | Total | ||||||
| Return | Return | ||||||
| 1 Year | 3.22 | % | 1 Year | 4.20 | % | ||
| 5 Years | 2.90 | %§ | 5 Years | 3.93 | %§ | ||
| 10 Years | 3.05 | %§ | 10 Years | 4.09 | %§ | ||
| Conservative Strategy Fund - Class E | Bloomberg Barclays U.S. Aggregate Bond Index**C | ||||||
| Total | Total | ||||||
| Return | Return | ||||||
| 1 Year | 3.95 | % | 1 Year | 4.37 | % | ||
| 5 Years | 3.69 | %§ | 5 Years | 2.90 | %§ | ||
| 10 Years | 3.83 | %§ | 10 Years | 4.64 | %§ | ||
| Conservative Strategy Fund - Class R1 | BofA Merrill Lynch 1-3 Yr U.S. Treasuries Index*** | ||||||
| Total | |||||||
| Total | Return | ||||||
| Return | |||||||
| 1 Year | 4.35 | % | 1 Year | 0.91 | % | ||
| 5 Years | 4.09 | %§ | 5 Years | 0.66 | %§ | ||
| 10 Years | 4.18 | %§ | 10 Years | 2.21 | %§ | ||
| Conservative Strategy Fund - Class R4‡‡ | |||||||
| Total | |||||||
| Return | |||||||
| 1 Year | 4.11 | % | |||||
| 5 Years | 3.84 | %§ | |||||
| 10 Years | 3.91 | %§ | |||||
Conservative Strategy Fund 9
Russell Investment Company
Conservative Strategy Fund
Portfolio Management Discussion and Analysis, continued — October 31, 2016
(Unaudited)
| The Conservative Strategy Fund (the “Fund”) is a fund of funds that | real assets like global real estate investment trusts and global | ||
| invests principally in other Russell Investment Company mutual | infrastructure. With interest rates falling, income opportunities | ||
| funds (the “Underlying Funds”). The Underlying Funds employ | around the globe continued to shrink and income available from | ||
| a multi-manager approach whereby portions of the Underlying | most assets fell. | ||
| Funds are allocated to different money managers. Underlying | The U.S. equity market, as measured by the S&P 500® Index, | ||
| Fund assets not allocated to money managers are managed by | was up 4.51% over the period but also experienced multiple | ||
| Russell Investment Management, LLC (“RIM”), the Fund’s | draw downs. The Fund’s strategic exposure to global equities | ||
| and Underlying Funds’ advisor. RIM, as the Underlying Funds’ | proved beneficial over the period as emerging markets rallied | ||
| advisor, may change the allocation of the Underlying Funds’ | and outperformed U.S. equities. By contrast, non-U.S. developed | ||
| assets among money managers at any time. An exemptive order | equity was one of the lowest performing portions of the Fund’s | ||
| from the Securities and Exchange Commission (“SEC”) permits | exposure as falling commodities and currencies weighed on | ||
| RIM to engage or terminate a money manager in an Underlying | returns. | ||
| Fund at any time, subject to approval by the Underlying Fund’s | |||
| Board, without a shareholder vote. Pursuant to the terms of the | How did the investment strategies and techniques employed | ||
| exemptive order, an Underlying Fund is required to notify its | by the Fund and the Underlying Funds affect the Fund’s | ||
| shareholders within 90 days of when a money manager begins | performance? | ||
| providing services. | The Fund is a fund of funds and its performance is based on RIM’s | ||
| What is the Fund’s investment objective? | strategic asset allocations, the performance of the Underlying | ||
| The Fund seeks to provide current income and capital preservation, | Funds in which the Fund invests, and tactical changes in the | ||
| and as a secondary objective, long term capital appreciation. | Fund’s asset allocation throughout the year. | ||
| In order to seek to achieve the Fund’s objective during the period, | |||
| How did the Fund perform relative to its benchmark for the | RIM’s strategic asset allocation included investments in global | ||
| fiscal year ended October 31, 2016? | equity, alternative and fixed/other income Underlying Funds. The | ||
| For the fiscal year ended October 31, 2016, the Fund’s Class A, | Fund’s diverse asset allocation partially hindered performance | ||
| Class C, Class E, Class R1, Class R4, Class R5 and Class S Shares | during the period as certain of these exposures underperformed | ||
| gained 3.97%, 3.22%, 3.95%, 4.35%, 4.11%, 3.88% and 4.20%, | the Bloomberg Barclays U.S. Aggregate Bond Index. While | ||
| respectively. This is compared to the Fund’s primary benchmark, | areas like high yield bonds, as measured by the BofA Merrill | ||
| the Bloomberg Barclays U.S. Aggregate Bond Index, which gained | Lynch Global High Yield Index Hedged USD, outperformed | ||
| 4.37% during the same period. The Fund’s performance includes | the Bloomberg Barclays U.S. Aggregate Bond, areas like | ||
| operating expenses, whereas index returns are unmanaged and do | commodities and non-U.S. developed equities delivered negative | ||
| not include expenses of any kind. | returns as measured by the Bloomberg Commodity Index Total | ||
| For the fiscal year ended October 31, 2016, the Morningstar® | Return and Russell Developed ex-U.S. Large Cap® Index Net, | ||
| Allocation-15% to 30% Equity Category, a group of funds that | respectively. In addition, the Fund’s exposure to short duration | ||
| Morningstar considers to have investment strategies similar to | credit produced positive absolute returns, but underperformed | ||
| those of the Fund, gained 3.61%. This result serves as a peer | core bond exposures as represented by the Fund’s benchmark. | ||
| comparison and is expressed net of operating expenses. | The underperformance of certain of the Fund’s exposures relative | ||
| to the Bloomberg Barclays U.S. Aggregate Bond Index was | |||
| How did the market conditions described in the Market | partially offset by strong excess returns within the fixed income | ||
| Summary report affect the Fund’s performance? | portion of the Fund’s portfolio. Underlying Fund bond issue | ||
| The Fund seeks to achieve its objective by investing in Underlying | selection during the period was generally additive to returns | ||
| Funds that provide exposure to a range of diversified investments, | as fixed income money managers were able to pick well within | ||
| and most major asset classes invested in by the Underlying Funds | credit, avoiding defaults in places like the energy sector where | ||
| produced positive absolute returns during the period. Markets | trouble occurred with falling energy prices in early 2016. As | ||
| during the fiscal year were characterized by higher levels of | such, allocations to the Russell Strategic Bond Fund and Russell | ||
| volatility and dispersion across return sources. Within the fixed/ | Investment Grade Bond Fund were positive from a benchmark- | ||
| other income Underlying Funds, exposure to high yield debt | relative perspective. Both Underlying Funds were positively | ||
| was beneficial as it was one of the best performing asset classes | impacted by their overweight to credit and additive currency | ||
| globally. Falling interest rates also helped other fixed income | positioning also helped to drive excess return. In contrast, though | ||
| assets in the Underlying Funds rally, as well as more rate sensitive | the Russell Short Duration Bond Fund outperformed its shorter- | ||
10 Conservative Strategy Fund
Russell Investment Company
Conservative Strategy Fund
Portfolio Management Discussion and Analysis, continued — October 31, 2016
(Unaudited)
| term debt index, shorter duration U.S. fixed income securities | fixed income over equity. During the first quarter of 2016, equity |
| underperformed their longer maturity counterparts. | markets declined substantially, and RIM added further risk to |
| By contrast, equity selection and positioning was more difficult, | the portfolio by overweighting exposure to high yield credit and |
| with allocations to non-U.S. equity Underlying Funds detracting | emerging markets equity compared with core bond holdings |
| from the Fund’s performance and security selection within | and cash. Markets subsequently rebounded from the February |
| those Underlying Funds struggling. In addition, overweights | lows and RIM reduced risk exposure to a more defensive stance |
| to European securities in the Select International Equity Fund | with the Fund’s equity allocation below strategic weights. RIM’s |
| caused the Underlying Fund to struggle as European equities | modifications to the Fund’s asset allocation were additive during |
| continued to lag the U.S. equity market. | the period. |
| RIM also made strategic asset allocation changes during the | |
| Describe any changes to the Fund’s structure or allocation | period. In September 2016, RIM added further diversity and |
| to the Underlying Funds. | dynamism to the Fund through the addition of the Unconstrained |
| RIM has the discretion to vary the Fund’s actual allocation | Total Return Fund as an Underlying Fund. |
| from the target strategic asset allocation by up to +/- 5% at the | |
| equity, fixed/other income or alternative category level based on | The views expressed in this report reflect those of the |
| RIM’s capital markets research. In addition to investing in the | portfolio managers only through the end of the period |
| Underlying Funds, RIM may seek to actively manage a Fund’s | covered by the report. These views do not necessarily |
| overall exposures by investing in derivatives that RIM believes | represent the views of RIM, or any other person in RIM or |
| will achieve the desired risk/return profile for the Fund. RIM’s | any other affiliated organization. These views are subject |
| asset allocation modifications, implemented through both tactical | to change at any time based upon market conditions or |
| changes to Underlying Fund allocations and derivatives-based | other events, and RIM disclaims any responsibility to |
| exposures, benefited the Fund’s performance relative to the | update the views contained herein. These views should not |
| Fund’s target strategic asset allocation. | be relied on as investment advice and, because investment |
| RIM adapted the Fund’s asset allocation over the period | decisions for a Russell Investment Company (“RIC”) Fund |
| as market opportunities and risks evolved. The Fund was | are based on numerous factors, should not be relied on as |
| defensively positioned in the fourth quarter of 2015, favoring | an indication of investment decisions of any RIC Fund. |
Conservative Strategy Fund 11
Russell Investment Company
Conservative Strategy Fund
Portfolio Management Discussion and Analysis, continued — October 31, 2016
(Unaudited)
* Assumes initial investment on November 1, 2006.
** The Bloomberg Barclays U.S. Aggregate Bond Index is an index, with income reinvested, generally representative of intermediate-term government bonds,
investment-grade corporate debt securities and mortgage-backed securities.
Effective August 24, 2016, the Barclays fixed income benchmark indices, including the Barclays Aggregate family of indices, were renamed the Bloomberg
Barclays family of indices.
*** BofA Merrill Lynch 1-3 Yr U.S. Treasuries Index is an index composed of approximately 160 issues in the form of publicly placed, coupon-bearing U.S. Treasury
debt. Issues must carry a term to maturity of at least one year and par amounts outstanding must be no less than $10 million at the start and at the close of the
performance measurement periods.
‡ The performance shown has been adjusted to reflect the deduction of the maximum Class A sales charge of 5.75%.
‡‡ The Fund first issued Class R4 Shares on October 1, 2014. The returns shown for Class R4 Shares prior to that date are the returns of the Fund’s Class R2
Shares.
‡‡‡ The Fund first issued Class R5 Shares on October 1, 2014. The returns shown for Class R5 Shares prior to that date are the returns of the Fund’s Class R3
Shares.
§ Annualized.
Performance is historical and assumes reinvestment of all dividends and capital gains. Investment return and principal value will fluctuate so that an investor’s
shares, when redeemed, may be worth more or less than when purchased. Past performance is not indicative of future results. The returns shown do not reflect the
deduction of taxes that a shareholder would pay on Fund distributions or the redemption of Fund shares. Additionally, the returns presented herein may differ from
the performance reported in the Financial Highlights as the returns herein are calculated in a manner consistent with standardized performance in accordance with
Securities and Exchange Commission rules, while the performance in the Financial Highlights has been calculated in accordance with U.S. Generally Accepted
Accounting Principles (“U.S. GAAP”).
12 Conservative Strategy Fund
Russell Investment Company
Conservative Strategy Fund
Shareholder Expense Example — October 31, 2016 (Unaudited)
| Fund Expenses | Please note that the expenses shown in the table are meant | |||||
| The following disclosure provides important information | to highlight your ongoing costs only and do not reflect any | |||||
| regarding the Fund’s Shareholder Expense Example | transactional costs. Therefore, the information under the heading | |||||
| (“Example”). | “Hypothetical Performance (5% return before expenses)” is | |||||
| useful in comparing ongoing costs only, and will not help you | ||||||
| Example | determine the relative total costs of owning different funds. In | |||||
| As a shareholder of the Fund, you incur two types of costs: (1) | addition, if these transactional costs were included, your costs | |||||
| transaction costs, including sales charges (loads) on certain | would have been higher. | |||||
| purchase or redemption payments, and (2) ongoing costs, | Hypothetical | |||||
| including advisory and administrative fees; distribution and/or | Performance (5% | |||||
| service fees; and other Fund expenses. The Example is intended | Actual | return before | ||||
| to help you understand your ongoing costs (in dollars) of investing | Class A | Performance | expenses) | |||
| Beginning Account Value | ||||||
| in the Fund and to compare these costs with the ongoing costs of | May 1, 2016 | $ | 1,000.00 | $ | 1,000.00 | |
| investing in other mutual funds. The Example is based on an | Ending Account Value | |||||
| investment of $1,000 invested at the beginning of the period and | October 31, 2016 | $ | 1,024.10 | $ | 1,022.42 | |
| held for the entire period indicated, which for this Fund is from | Expenses Paid During Period* | $ | 2.75 | $ | 2.75 | |
| May 1, 2016 to October 31, 2016. | * Expenses are equal to the Fund's annualized expense ratio of 0.54% | |||||
| (representing the six month period annualized), multiplied by the average | ||||||
| Actual Expenses | account value over the period, multiplied by 184/366 (to reflect the one-half | |||||
| The information in the table under the heading “Actual | year period). May reflect amounts waived and/or reimbursed. Without any | |||||
| Performance” provides information about actual account values | waivers and/or reimbursements, expenses would have been higher. | |||||
| and actual expenses. You may use the information in this column, | ||||||
| Hypothetical | ||||||
| together with the amount you invested, to estimate the expenses | Performance (5% | |||||
| that you paid over the period. Simply divide your account value by | Actual | return before | ||||
| $1,000 (for example, an $8,600 account value divided by $1,000 | Class C | Performance | expenses) | |||
| Beginning Account Value | ||||||
| = 8.6), then multiply the result by the number in the first column | May 1, 2016 | $ | 1,000.00 | $ | 1,000.00 | |
| in the row entitled “Expenses Paid During Period” to estimate | Ending Account Value | |||||
| the expenses you paid on your account during this period. | October 31, 2016 | $ | 1,020.50 | $ | 1,018.65 | |
| Expenses Paid During Period* | $ | 6.55 | $ | 6.55 | ||
| Hypothetical Example for Comparison Purposes | ||||||
| The information in the table under the heading “Hypothetical | * Expenses are equal to the Fund's annualized expense ratio of 1.29% | |||||
| (representing the six month period annualized), multiplied by the average | ||||||
| Performance (5% return before expenses)” provides information | account value over the period, multiplied by 184/366 (to reflect the one-half | |||||
| about hypothetical account values and hypothetical expenses | year period). May reflect amounts waived and/or reimbursed. Without any | |||||
| based on the Fund’s actual expense ratio and an assumed rate of | waivers and/or reimbursements, expenses would have been higher. | |||||
| return of 5% per year before expenses, which is not the Fund’s | ||||||
| Hypothetical | ||||||
| actual return. The hypothetical account values and expenses | Performance (5% | |||||
| may not be used to estimate the actual ending account balance or | Actual | return before | ||||
| expenses you paid for the period. You may use this information | Class E | Performance | expenses) | |||
| to compare the ongoing costs of investing in the Fund and other | Beginning Account Value | |||||
| May 1, 2016 | $ | 1,000.00 | $ | 1,000.00 | ||
| funds. To do so, compare this 5% hypothetical example with the | Ending Account Value | |||||
| 5% hypothetical examples that appear in the shareholder reports | October 31, 2016 | $ | 1,024.00 | $ | 1,022.42 | |
| of other funds. | Expenses Paid During Period* | $ | 2.75 | $ | 2.75 | |
| * Expenses are equal to the Fund's annualized expense ratio of 0.54% | ||||||
| (representing the six month period annualized), multiplied by the average | ||||||
| account value over the period, multiplied by 184/366 (to reflect the one-half | ||||||
| year period). May reflect amounts waived and/or reimbursed. Without any | ||||||
| waivers and/or reimbursements, expenses would have been higher. | ||||||
Conservative Strategy Fund 13
Russell Investment Company
Conservative Strategy Fund
Shareholder Expense Example, continued — October 31, 2016 (Unaudited)
| Hypothetical | ||||||
| Performance (5% | ||||||
| Actual | return before | |||||
| Class R1 | Performance | expenses) | ||||
| Beginning Account Value | ||||||
| May 1, 2016 | $ | 1,000.00 | $ | 1,000.00 | ||
| Ending Account Value | ||||||
| October 31, 2016 | $ | 1,025.90 | $ | 1,024.33 | ||
| Expenses Paid During Period* | $ | 0.81 | $ | 0.81 | ||
| * Expenses are equal to the Fund's annualized expense ratio of 0.16% | ||||||
| (representing the six month period annualized), multiplied by the average | ||||||
| account value over the period, multiplied by 184/366 (to reflect the one-half | ||||||
| year period). May reflect amounts waived and/or reimbursed. Without any | ||||||
| waivers and/or reimbursements, expenses would have been higher. | ||||||
| Hypothetical | ||||||
| Performance (5% | ||||||
| Actual | return before | |||||
| Class R4 | Performance | expenses) | ||||
| Beginning Account Value | ||||||
| May 1, 2016 | $ | 1,000.00 | $ | 1,000.00 | ||
| Ending Account Value | ||||||
| October 31, 2016 | $ | 1,024.70 | $ | 1,023.08 | ||
| Expenses Paid During Period* | $ | 2.09 | $ | 2.08 | ||
| * Expenses are equal to the Fund's annualized expense ratio of 0.41% | ||||||
| (representing the six month period annualized), multiplied by the average | ||||||
| account value over the period, multiplied by 184/366 (to reflect the one-half | ||||||
| year period). May reflect amounts waived and/or reimbursed. Without any | ||||||
| waivers and/or reimbursements, expenses would have been higher. | ||||||
| Hypothetical | ||||||
| Performance (5% | ||||||
| Actual | return before | |||||
| Class R5 | Performance | expenses) | ||||
| Beginning Account Value | ||||||
| May 1, 2016 | $ | 1,000.00 | $ | 1,000.00 | ||
| Ending Account Value | ||||||
| October 31, 2016 | $ | 1,024.10 | $ | 1,021.82 | ||
| Expenses Paid During Period* | $ | 3.36 | $ | 3.35 | ||
| * Expenses are equal to the Fund's annualized expense ratio of 0.66% | ||||||
| (representing the six month period annualized), multiplied by the average | ||||||
| account value over the period, multiplied by 184/366 (to reflect the one-half | ||||||
| year period). May reflect amounts waived and/or reimbursed. Without any | ||||||
| waivers and/or reimbursements, expenses would have been higher. | ||||||
| Hypothetical | ||||||
| Performance (5% | ||||||
| Actual | return before | |||||
| Class S | Performance | expenses) | ||||
| Beginning Account Value | ||||||
| May 1, 2016 | $ | 1,000.00 | $ | 1,000.00 | ||
| Ending Account Value | ||||||
| October 31, 2016 | $ | 1,025.20 | $ | 1,023.68 | ||
| Expenses Paid During Period* | $ | 1.48 | $ | 1.48 | ||
| * Expenses are equal to the Fund's annualized expense ratio of 0.29% | ||||||
| (representing the six month period annualized), multiplied by the average | ||||||
| account value over the period, multiplied by 184/366 (to reflect the one-half | ||||||
| year period). May reflect amounts waived and/or reimbursed. Without any | ||||||
| waivers and/or reimbursements, expenses would have been higher. | ||||||
14 Conservative Strategy Fund
Russell Investment Company
Conservative Strategy Fund
Schedule of Investments — October 31, 2016
| Amounts in thousands (except share amounts) | ||||
| Fair | ||||
| Value | ||||
| Shares | $ | |||
| Investments in Russell Affiliated Mutual Funds - 97.3% | ||||
| Alternative - 6.5% | ||||
| Russell Commodity Strategies Fund Class Y | 59,581 | 328 | ||
| Russell Global Infrastructure Fund Class Y | 776,197 | 8,872 | ||
| Russell Global Real Estate Securities Fund Class Y | 396,160 | 14,155 | ||
| 23,355 | ||||
| Domestic Equities - 3.4% | ||||
| Russell U.S. Defensive Equity Fund Class Y | 6,745 | 332 | ||
| Russell U.S. Dynamic Equity Fund Class Y | 466,267 | 4,630 | ||
| Select U.S. Equity Fund Class Y | 649,808 | 7,096 | ||
| 12,058 | ||||
| Fixed Income - 60.6% | ||||
| Russell Global Opportunistic Credit Fund Class Y | 2,190,773 | 21,294 | ||
| Russell Investment Grade Bond Fund Class Y | 1,589,798 | 35,500 | ||
| Russell Short Duration Bond Fund Class Y | 4,237,525 | 81,700 | ||
| Russell Strategic Bond Fund Class Y | 5,459,416 | 60,381 | ||
| Unconstrained Total Return Fund Class Y | 1,769,868 | 17,752 | ||
| 216,627 | ||||
| International Equities - 4.0% | ||||
| Russell Emerging Markets Fund Class Y | 425,217 | 7,088 | ||
| Select International Equity Fund Class Y | 826,547 | 7,100 | ||
| 14,188 | ||||
| Specialty - 22.8% | ||||
| Russell Multi-Strategy Income Fund Class Y | 8,440,819 | 81,707 | ||
| Total Investments in Russell Affiliated Mutual Funds | ||||
| (cost $335,241) | 347,935 | |||
| Short-Term Investments - 2.3% | ||||
| Russell U.S. Cash Management Fund | 8,025,498 | (8) | 8,027 | |
| Total Short-Term Investments | ||||
| (cost $8,026) | 8,027 | |||
| Total Investments 99.6% | ||||
| (identified cost $343,267) | 355,962 | |||
| Other Assets and Liabilities, Net - 0.4% | 1,542 | |||
| Net Assets - 100.0% | 357,504 | |||
See accompanying notes which are an integral part of the financial statements.
Conservative Strategy Fund 15
Russell Investment Company
Conservative Strategy Fund
Schedule of Investments, continued — October 31, 2016
| Futures Contracts | |||||||
| Amounts in thousands (except contract amounts) | |||||||
| Unrealized | |||||||
| Appreciation | |||||||
| Number of | Notional | Expiration | (Depreciation) | ||||
| Contracts | Amount | Date | $ | ||||
| Long Positions | |||||||
| Russell 1000 Mini Index Futures | 3 | USD | 352 | 12/16 | (10 | ) | |
| S&P 500 E-Mini Index Futures | 52 | USD | 5,513 | 12/16 | (101 | ) | |
| S&P Mid 400 E-Mini Index Futures | 4 | USD | 603 | 12/16 | (26 | ) | |
| Short Positions | |||||||
| Amsterdam Index Futures | 2 | EUR | 180 | 11/16 | — | ||
| CAC40 Euro Index Futures | 6 | EUR | 270 | 11/16 | — | ||
| Dow Jones Index Futures | 2 | EUR | 534 | 12/16 | (11 | ) | |
| EURO STOXX 50 Index Futures | 5 | EUR | 153 | 12/16 | (3 | ) | |
| FTSE 100 Index Futures | 7 | GBP | 485 | 12/16 | (23 | ) | |
| FTSE/MIB Index Futures | 1 | EUR | 86 | 12/16 | (3 | ) | |
| Hang Seng Index Futures | 1 | HKD | 1,145 | 11/16 | 3 | ||
| IBEX 35 Index Futures | 2 | EUR | 183 | 11/16 | (7 | ) | |
| MSCI Emerging Markets Mini Index Futures | 20 | USD | 904 | 12/16 | 1 | ||
| MSCI Singapore Index Futures | 2 | SGD | 62 | 11/16 | 1 | ||
| OMXS 30 Index Futures | 5 | SEK | 722 | 11/16 | — | ||
| Russell 1000 Mini Index Futures | 3 | USD | 352 | 12/16 | 11 | ||
| Russell 2000 Mini Index Futures | 5 | USD | 595 | 12/16 | 33 | ||
| S&P 500 E-Mini Index Futures | 50 | USD | 5,299 | 12/16 | 144 | ||
| S&P Mid 400 E-Mini Index Futures | 3 | USD | 452 | 12/16 | 19 | ||
| SPI 200 Index Futures | 3 | AUD | 397 | 12/16 | (6 | ) | |
| TOPIX Index Futures | 6 | JPY | 83,701 | 12/16 | (31 | ) | |
| Total Unrealized Appreciation (Depreciation) on Open Futures Contracts (å) | (9 | ) | |||||
| Options Written | |||||||||||
| Amounts in thousands (except contract amounts) | |||||||||||
| Transactions in options written contracts for the period ended October 31, 2016 were as follows: | |||||||||||
| Number of | Premiums | ||||||||||
| Contracts | Received | ||||||||||
| Outstanding October 31, 2015 | — | $ | — | ||||||||
| Opened | 4,850 | 312 | |||||||||
| Closed | — | — | |||||||||
| Expired | (4,850 | ) | (312 | ) | |||||||
| Outstanding October 31, 2016 | — | $ | — | ||||||||
| Foreign Currency Exchange Contracts | |||||||||||
| Amounts in thousands | |||||||||||
| Unrealized | |||||||||||
| Appreciation | |||||||||||
| Amount | Amount | (Depreciation) | |||||||||
| Counterparty | Sold | Bought | Settlement Date | $ | |||||||
| State Street | USD | 15 | AUD | 20 | 11/08/16 | — | |||||
| State Street | USD | 658 | AUD | 865 | 11/08/16 | — | |||||
| State Street | USD | 12 | CAD | 16 | 11/08/16 | — | |||||
| State Street | USD | 851 | CAD | 1,139 | 11/08/16 | (2 | ) | ||||
| State Street | USD | 21 | CHF | 20 | 11/08/16 | — | |||||
| State Street | USD | 794 | CHF | 785 | 11/08/16 | (1 | ) | ||||
| State Street | USD | 90 | EUR | 80 | 11/08/16 | (2 | ) | ||||
| State Street | USD | 2,879 | EUR | 2,629 | 11/08/16 | 7 | |||||
| State Street | USD | 40 | GBP | 31 | 11/08/16 | (2 | ) | ||||
| State Street | USD | 1,577 | GBP | 1,295 | 11/08/16 | 8 | |||||
| State Street | USD | 331 | HKD | 2,567 | 11/08/16 | — | |||||
See accompanying notes which are an integral part of the financial statements.
16 Conservative Strategy Fund
Russell Investment Company
Conservative Strategy Fund
Schedule of Investments, continued — October 31, 2016
| Foreign Currency Exchange Contracts | |||||||
| Amounts in thousands | |||||||
| Unrealized | |||||||
| Appreciation | |||||||
| Amount | Amount | (Depreciation) | |||||
| Counterparty | Sold | Bought | Settlement Date | $ | |||
| State Street | USD | 21 | JPY | 2,168 | 11/08/16 | (1 | ) |
| State Street | USD | 1,956 | JPY | 205,278 | 11/08/16 | 2 | |
| State Street | USD | 2 | SEK | 18 | 11/08/16 | — | |
| State Street | USD | 312 | SEK | 2,813 | 11/08/16 | (1 | ) |
| State Street | USD | 1 | SGD | 1 | 11/08/16 | — | |
| State Street | USD | 110 | SGD | 153 | 11/08/16 | — | |
| State Street | AUD | 885 | USD | 674 | 11/08/16 | — | |
| State Street | AUD | 865 | USD | 658 | 12/07/16 | — | |
| State Street | AUD | 390 | USD | 299 | 12/21/16 | 2 | |
| State Street | CAD | 1,155 | USD | 878 | 11/08/16 | 17 | |
| State Street | CAD | 1,139 | USD | 851 | 12/07/16 | 2 | |
| State Street | CHF | 805 | USD | 828 | 11/08/16 | 14 | |
| State Street | CHF | 785 | USD | 796 | 12/07/16 | 1 | |
| State Street | EUR | 2,709 | USD | 3,029 | 11/08/16 | 55 | |
| State Street | EUR | 2,629 | USD | 2,883 | 12/07/16 | (7 | ) |
| State Street | EUR | 1,430 | USD | 1,618 | 12/21/16 | 45 | |
| State Street | GBP | 1,326 | USD | 1,719 | 11/08/16 | 96 | |
| State Street | GBP | 1,295 | USD | 1,578 | 12/07/16 | (8 | ) |
| State Street | GBP | 490 | USD | 653 | 12/21/16 | 52 | |
| State Street | HKD | 41 | USD | 5 | 11/08/16 | — | |
| State Street | HKD | 2,526 | USD | 326 | 11/08/16 | — | |
| State Street | HKD | 2,567 | USD | 331 | 12/07/16 | — | |
| State Street | HKD | 1,160 | USD | 150 | 12/21/16 | — | |
| State Street | JPY | 207,446 | USD | 2,051 | 11/08/16 | 73 | |
| State Street | JPY | 205,278 | USD | 1,958 | 12/07/16 | (2 | ) |
| State Street | JPY | 82,010 | USD | 809 | 12/21/16 | 26 | |
| State Street | SEK | 2,831 | USD | 329 | 11/08/16 | 15 | |
| State Street | SEK | 2,813 | USD | 313 | 12/07/16 | 1 | |
| State Street | SEK | 850 | USD | 101 | 12/21/16 | 7 | |
| State Street | SGD | 154 | USD | 113 | 11/08/16 | 2 | |
| State Street | SGD | 153 | USD | 110 | 12/07/16 | — | |
| Total Unrealized Appreciation (Depreciation) on Open Foreign Currency Exchange Contracts | 399 | ||||||
| Presentation of Portfolio Holdings | ||||||||||||||
| Amounts in thousands | ||||||||||||||
| Fair Value | ||||||||||||||
| Practical | ||||||||||||||
| Portfolio Summary | Level 1 | Level 2 | Level 3 | Expedient (a) | Total | % of Net Assets | ||||||||
| Investments in Russell Affiliated Mutual | ||||||||||||||
| Funds | $ | 347,935 | $ | — | $ | — | $ | — | $ | 347,935 | 97.3 | |||
| Short-Term Investments | — | — | — | 8,027 | 8,027 | 2.3 | ||||||||
| Total Investments | 347,935 | — | — | 8,027 | 355,962 | 99.6 | ||||||||
| Other Assets and Liabilities, Net | 0.4 | |||||||||||||
| 100.0 | ||||||||||||||
| Other Financial Instruments | ||||||||||||||
| Assets | ||||||||||||||
| Futures Contracts | 212 | — | — | — | 212 | 0.1 | ||||||||
| Foreign Currency Exchange Contracts | — | 425 | — | — | 425 | 0.1 | ||||||||
| ' | ||||||||||||||
See accompanying notes which are an integral part of the financial statements.
Conservative Strategy Fund 17
Russell Investment Company
Conservative Strategy Fund
Schedule of Investments, continued — October 31, 2016
| Presentation of Portfolio Holdings | |||||||||||||||||||
| Amounts in thousands | |||||||||||||||||||
| Fair Value | |||||||||||||||||||
| Practical | |||||||||||||||||||
| Portfolio Summary | Level 1 | Level 2 | Level 3 | Expedient (a) | Total | % of Net Assets | |||||||||||||
| Liabilities | |||||||||||||||||||
| Futures Contracts | (221 | ) | — | — | — | (221 | ) | (0.1 | ) | ||||||||||
| Foreign Currency Exchange Contracts | — | (26 | ) | — | — | (26 | ) | (—)* | |||||||||||
| Total Other Financial Instruments** | $ | (9 | ) | $ | 399 | $ | — | $ | — | $ | 390 | ||||||||
* Less than 0.05% of net assets.
** Futures and foreign currency exchange contract values reflect the unrealized appreciation (depreciation) on the investments.
(a) Certain investments that are measured at fair value using the net asset value per share (or its equivalent) practical expedient have not been classified
in the fair value levels. The fair value amounts presented in the table are intended to permit reconciliation to the amounts presented in the Schedule of
Investments.
For a description of the Levels, see note 2 in the Notes to Financial Statements.
For a disclosure on transfers between Levels 1, 2 and 3 during the period ended October 31, 2016, see note 2 in the Notes to
Financial Statements.
See accompanying notes which are an integral part of the financial statements.
18 Conservative Strategy Fund
Russell Investment Company
Conservative Strategy Fund
Fair Value of Derivative Instruments — October 31, 2016
Amounts in thousands
| Foreign | |||||||
| Equity | Currency | ||||||
| Derivatives not accounted for as hedging instruments | Contracts | Contracts | |||||
| Location: Statement of Assets and Liabilities - Assets | |||||||
| Unrealized appreciation on foreign currency exchange contracts | $ | — | $ | 425 | |||
| Variation margin on futures contracts* | 212 | — | |||||
| Total | $ | 212 | $ | 425 | |||
| Location: Statement of Assets and Liabilities - Liabilities | |||||||
| Variation margin on futures contracts* | $ | 221 | $ | — | |||
| Unrealized depreciation on foreign currency exchange contracts | — | 26 | |||||
| Total | $ | 221 | $ | 26 | |||
| Foreign | |||||||
| Equity | Currency | ||||||
| Derivatives not accounted for as hedging instruments | Contracts | Contracts | |||||
| Location: Statement of Operations - Net realized gain (loss) | |||||||
| Investments** | $ | (312 | ) | $ | — | ||
| Futures contracts | (198 | ) | — | ||||
| Options written | 312 | — | |||||
| Foreign currency-related transactions*** | — | (59 | ) | ||||
| Total | $ | (198 | ) | $ | (59 | ) | |
| Location: Statement of Operations - Net change in unrealized appreciation (depreciation) | |||||||
| Futures contracts | $ | (209 | ) | $ | — | ||
| Foreign currency-related transactions**** | — | 365 | |||||
| Total | $ | (209 | ) | $ | 365 | ||
* Includes cumulative appreciation/depreciation of futures contracts as reported in the Schedule of Investments. Only variation margin is reported within the
Statement of Assets and Liabilities.
** Includes net realized gain (loss) on purchased options as reported in the Statement of Operations.
*** Only includes net realized gain (loss) on forward and spot contracts. May differ from the net realized gain (loss) on foreign currency-related transactions reported
within the Statement of Operations.
**** Only includes change in unrealized gain (loss) on forward and spot contracts. May differ from the net change in unrealized gain (loss) on foreign currency-related
transactions reported within the Statement of Operations.
For further disclosure on derivatives see note 2 in the Notes to Financial Statements.
See accompanying notes which are an integral part of the financial statements.
Conservative Strategy Fund 19
Russell Investment Company
Conservative Strategy Fund
Balance Sheet Offsetting of Financial and Derivative Instruments — October 31, 2016
| Amounts in thousands | |||||||||||
| Offsetting of Financial Assets and Derivative Assets | |||||||||||
| Gross | Net Amounts | ||||||||||
| Amounts | of Assets | ||||||||||
| Gross | Offset in the | Presented in | |||||||||
| Amounts of | Statement of | the Statement | |||||||||
| Recognized | Assets and | of Assets and | |||||||||
| Description | Location: Statement of Assets and Liabilities - Assets | Assets | Liabilities | Liabilities | |||||||
| Foreign Currency Exchange Contracts | Unrealized appreciation on foreign currency exchange contracts | $ | 425 | $ | — | $ 425 | |||||
| Futures Contracts | Variation margin on futures contracts | 25 | — | 25 | |||||||
| Total Financial and Derivative Assets | 450 | — | 450 | ||||||||
| Financial and Derivative Assets not subject to a netting agreement | (25 | ) | — | (25 | ) | ||||||
| Total Financial and Derivative Assets subject to a netting agreement | $ | 425 | $ | — | $ 425 | ||||||
| Financial Assets, Derivative Assets, and Collateral Held by Counterparty | |||||||||||
| Gross Amounts Not Offset in | |||||||||||
| the Statement of Assets and | |||||||||||
| Liabilities | |||||||||||
| Net Amounts | |||||||||||
| of Assets | |||||||||||
| Presented in | |||||||||||
| the Statement | Financial and | ||||||||||
| of Assets and | Derivative | Collateral | |||||||||
| Counterparty | Liabilities | Instruments | Received^ | Net Amount | |||||||
| State Street | $ | 425 | $ | 26 | $ | — $ | 399 | ||||
| Total | $ | 425 | $ | 26 | $ | — $ | 399 | ||||
See accompanying notes which are an integral part of the financial statements.
20 Conservative Strategy Fund
Russell Investment Company
Conservative Strategy Fund
Balance Sheet Offsetting of Financial and Derivative Instruments, continued —
October 31, 2016
| Amounts in thousands | ||||||||||
| Offsetting of Financial Liabilities and Derivative Liabilities | ||||||||||
| Gross | Net Amounts | |||||||||
| Amounts | of Liabilities | |||||||||
| Gross | Offset in the | Presented in | ||||||||
| Amounts of | Statement of | the Statement | ||||||||
| Recognized | Assets and | of Assets and | ||||||||
| Description | Location: Statement of Assets and Liabilities - Liabilities | Liabilities | Liabilities | Liabilities | ||||||
| Futures Contracts | Variation margin on futures contracts | $ | 24 | $ | — $ | 24 | ||||
| Foreign Currency Exchange Contracts | Unrealized depreciation on foreign currency exchange contracts | 26 | — | 26 | ||||||
| Total Financial and Derivative Liabilities | 50 | — | 50 | |||||||
| Financial and Derivative Liabilities not subject to a netting agreement | (24 | ) | — | (24 | ) | |||||
| Total Financial and Derivative Liabilities subject to a netting agreement | $ | 26 | $ | — $ | 26 | |||||
| Financial Liabilities, Derivative Liabilities, and Collateral Pledged by Counterparty | ||||||||||
| Gross Amounts Not Offset in | ||||||||||
| the Statement of Assets and | ||||||||||
| Liabilities | ||||||||||
| Net Amounts | ||||||||||
| of Liabilities | ||||||||||
| Presented in | ||||||||||
| the Statement | Financial and | |||||||||
| of Assets and | Derivative | Collateral | ||||||||
| Counterparty | Liabilities | Instruments | Pledged^ | Net Amount | ||||||
| State Street | $ | 26 | $ | 26 | $ | — $ | — | |||
| Total | $ | 26 | $ | 26 | $ | — $ | — | |||
^ Collateral received or pledged amounts may not reconcile to those disclosed in the Statement of Assets and Liabilities due to the inclusion of off-Balance
Sheet collateral and adjustments made to exclude overcollateralization.
For further disclosure on derivatives and counterparty risk see note 2 in the Notes to Financial Statements.
See accompanying notes which are an integral part of the financial statements.
Conservative Strategy Fund 21
Russell Investment Company
Conservative Strategy Fund
Statement of Assets and Liabilities — October 31, 2016
| Amounts in thousands | ||
| Assets | ||
| Investments, at identified cost | $ | 343,267 |
| Investments, at fair value(>) | 355,962 | |
| Cash | 270 | |
| Cash (restricted)(a) | 1,100 | |
| Unrealized appreciation on foreign currency exchange contracts | 425 | |
| Receivables: | ||
| Dividends from affiliated Russell funds | 4 | |
| Investments sold | 701 | |
| Fund shares sold | 322 | |
| Variation margin on futures contracts | 25 | |
| Total assets | 358,809 | |
| Liabilities | ||
| Payables: | ||
| Fund shares redeemed | 929 | |
| Accrued fees to affiliates | 238 | |
| Other accrued expenses | 88 | |
| Variation margin on futures contracts | 24 | |
| Unrealized depreciation on foreign currency exchange contracts | 26 | |
| Total liabilities | 1,305 | |
| Net Assets | $ | 357,504 |
See accompanying notes which are an integral part of the financial statements.
22 Conservative Strategy Fund
Russell Investment Company
Conservative Strategy Fund
Statement of Assets and Liabilities, continued — October 31, 2016
| Amounts in thousands | |||
| Net Assets Consist of: | |||
| Undistributed (overdistributed) net investment income | $ | (1 | ) |
| Accumulated net realized gain (loss) | 3,968 | ||
| Unrealized appreciation (depreciation) on: | |||
| Investments | 12,695 | ||
| Futures contracts | (9 | ) | |
| Foreign currency-related transactions | 399 | ||
| Shares of beneficial interest | 361 | ||
| Additional paid-in capital | 340,091 | ||
| Net Assets | $ | 357,504 | |
| Net Asset Value, offering and redemption price per share: | |||
| Net asset value per share: Class A(#) | $ | 9.92 | |
| Maximum offering price per share (Net asset value plus sales charge of 5.75%): Class A | $ | 10.53 | |
| Class A — Net assets | $ | 88,921,109 | |
| Class A — Shares outstanding ($.01 par value) | 8,960,626 | ||
| Net asset value per share: Class C(#) | $ | 9.82 | |
| Class C — Net assets | $ | 161,403,478 | |
| Class C — Shares outstanding ($.01 par value) | 16,433,157 | ||
| Net asset value per share: Class E(#) | $ | 9.97 | |
| Class E — Net assets | $ | 14,227,404 | |
| Class E — Shares outstanding ($.01 par value) | 1,427,040 | ||
| Net asset value per share: Class R1(#) | $ | 9.99 | |
| Class R1 — Net assets | $ | 19,545,469 | |
| Class R1 — Shares outstanding ($.01 par value) | 1,956,371 | ||
| Net asset value per share: Class R4(#) | $ | 9.94 | |
| Class R4 — Net assets | $ | 15,964,478 | |
| Class R4 — Shares outstanding ($.01 par value) | 1,606,312 | ||
| Net asset value per share: Class R5(#) | $ | 10.02 | |
| Class R5 — Net assets | $ | 14,067,083 | |
| Class R5 — Shares outstanding ($.01 par value) | 1,403,739 | ||
| Net asset value per share: Class S(#) | $ | 10.00 | |
| Class S — Net assets | $ | 43,375,177 | |
| Class S — Shares outstanding ($.01 par value) | 4,337,129 | ||
| Amounts in thousands | |||
| (>) Investments in affiliated Russell funds | $ | 355,962 | |
| (a) Cash Collateral for Futures | $ | 1,100 | |
| (#) Net asset value per share equals class level net assets divided by class level shares of beneficial interest outstanding. | |||
See accompanying notes which are an integral part of the financial statements.
Conservative Strategy Fund 23
Russell Investment Company
Conservative Strategy Fund
Statement of Operations — For the Period Ended October 31, 2016
| Amounts in thousands | |||
| Investment Income | |||
| Income distributions from affiliated Russell funds | $ | 11,488 | |
| Expenses | |||
| Advisory fees | 767 | ||
| Administrative fees | 163 | ||
| Custodian fees (1) | 30 | ||
| Distribution fees - Class A | 238 | ||
| Distribution fees - Class C | 1,284 | ||
| Distribution fees - Class R5 | 41 | ||
| Transfer agent fees - Class A | 190 | ||
| Transfer agent fees - Class C | 342 | ||
| Transfer agent fees - Class E | 30 | ||
| Transfer agent fees - Class R1 | 47 | ||
| Transfer agent fees - Class R4 | 33 | ||
| Transfer agent fees - Class R5 | 33 | ||
| Transfer agent fees - Class S | 92 | ||
| Professional fees | 41 | ||
| Registration fees | 109 | ||
| Shareholder servicing fees - Class C | 428 | ||
| Shareholder servicing fees - Class E | 38 | ||
| Shareholder servicing fees - Class R4 | 41 | ||
| Shareholder servicing fees - Class R5 | 41 | ||
| Trustees’ fees | 13 | ||
| Printing fees | 48 | ||
| Miscellaneous | 15 | ||
| Expenses before reductions | 4,064 | ||
| Expense reductions | (899 | ) | |
| Net expenses | 3,165 | ||
| Net investment income (loss) | 8,323 | ||
| Net Realized and Unrealized Gain (Loss) | |||
| Net realized gain (loss) on: | |||
| Investments | 4,166 | ||
| Futures contracts | (198 | ) | |
| Options Written | 312 | ||
| Foreign currency-related transactions | (59 | ) | |
| Capital gain distributions from Underlying Funds | 2,520 | ||
| Net realized gain (loss) | 6,741 | ||
| Net change in unrealized appreciation (depreciation) on: | |||
| Investments | (2,417 | ) | |
| Futures contracts | (209 | ) | |
| Foreign currency-related transactions | 365 | ||
| Net change in unrealized appreciation (depreciation) | (2,261 | ) | |
| Net realized and unrealized gain (loss) | 4,480 | ||
| Net Increase (Decrease) in Net Assets from Operations | $ | 12,803 | |
| (1) Includes a reimbursement for overbilling of custody out-of-pocket fees from prior years. See note 8 in the Notes to Financial Statements. | |||
See accompanying notes which are an integral part of the financial statements.
24 Conservative Strategy Fund
Russell Investment Company
Conservative Strategy Fund
Statements of Changes in Net Assets
| For the Periods Ended October 31, | ||||||
| Amounts in thousands | 2016 | 2015 | ||||
| Increase (Decrease) in Net Assets | ||||||
| Operations | ||||||
| Net investment income (loss) | $ | 8,323 | $ | 11,017 | ||
| Net realized gain (loss) | 6,741 | 34,804 | ||||
| Net change in unrealized appreciation (depreciation) | (2,261 | ) | (46,504 | ) | ||
| Net increase (decrease) in net assets from operations | 12,803 | (683 | ) | |||
| Distributions | ||||||
| From net investment income | ||||||
| Class A | (2,378 | ) | (2,910 | ) | ||
| Class C | (2,959 | ) | (3,553 | ) | ||
| Class E | (370 | ) | (523 | ) | ||
| Class R1 | (674 | ) | (908 | ) | ||
| Class R4 | (427 | ) | (540 | ) | ||
| Class R5 | (382 | ) | (584 | ) | ||
| Class S | (1,283 | ) | (2,128 | ) | ||
| From net realized gain | ||||||
| Class A | (8,444 | ) | (2,759 | ) | ||
| Class C | (14,648 | ) | (4,706 | ) | ||
| Class E | (1,288 | ) | (497 | ) | ||
| Class R1 | (2,205 | ) | (760 | ) | ||
| Class R4 | (1,394 | ) | (510 | ) | ||
| Class R5 | (1,462 | ) | (596 | ) | ||
| Class S | (4,306 | ) | (1,843 | ) | ||
| Net decrease in net assets from distributions | (42,220 | ) | (22,817 | ) | ||
| Share Transactions* | ||||||
| Net increase (decrease) in net assets from share transactions | (47,792 | ) | (71,922 | ) | ||
| Total Net Increase (Decrease) in Net Assets | (77,209 | ) | (95,422 | ) | ||
| Net Assets | ||||||
| Beginning of period | 434,713 | 530,135 | ||||
| End of period | $ | 357,504 | $ | 434,713 | ||
| Undistributed (overdistributed) net investment income included in net assets | $ | (1 | ) | $ | 208 | |
See accompanying notes which are an integral part of the financial statements.
Conservative Strategy Fund 25
Russell Investment Company
Conservative Strategy Fund
Statements of Changes in Net Assets, continued
* Share transaction amounts (in thousands) for the periods ended October 31, 2016 and October 31, 2015 were as follows:
| 2016 | 2015 | |||||||||||
| Shares | Dollars | Shares | Dollars | |||||||||
| Class A | ||||||||||||
| Proceeds from shares sold | 1,253 | $ | 12,435 | 1,145 | $ | 12,384 | ||||||
| Proceeds from reinvestment of distributions | 1,117 | 10,673 | 520 | 5,596 | ||||||||
| Payments for shares redeemed | (3,417 | ) | (33,410 | ) | (2,790 | ) | (30,202 | ) | ||||
| Net increase (decrease) | (1,047 | ) | (10,302 | ) | (1,125 | ) | (12,222 | ) | ||||
| Class C | ||||||||||||
| Proceeds from shares sold | 2,087 | 20,289 | 3,357 | 36,006 | ||||||||
| Proceeds from reinvestment of distributions | 1,855 | 17,525 | 770 | 8,214 | ||||||||
| Payments for shares redeemed | (5,325 | ) | (51,945 | ) | (5,293 | ) | (56,663 | ) | ||||
| Net increase (decrease) | (1,383 | ) | (14,131 | ) | (1,166 | ) | (12,443 | ) | ||||
| Class E | ||||||||||||
| Proceeds from shares sold | 96 | 945 | 481 | 5,294 | ||||||||
| Proceeds from reinvestment of distributions | 172 | 1,651 | 94 | 1,017 | ||||||||
| Payments for shares redeemed | (432 | ) | (4,295 | ) | (849 | ) | (9,208 | ) | ||||
| Net increase (decrease) | (164 | ) | (1,699 | ) | (274 | ) | (2,897 | ) | ||||
| Class R1 | ||||||||||||
| Proceeds from shares sold | 668 | 6,567 | 1,135 | 12,331 | ||||||||
| Proceeds from reinvestment of distributions | 299 | 2,879 | 154 | 1,668 | ||||||||
| Payments for shares redeemed | (1,696 | ) | (16,649 | ) | (1,994 | ) | (21,699 | ) | ||||
| Net increase (decrease) | (729 | ) | (7,203 | ) | (705 | ) | (7,700 | ) | ||||
| Class R4 | ||||||||||||
| Proceeds from shares sold | 600 | 6,008 | 598 | 6,517 | ||||||||
| Proceeds from reinvestment of distributions | 190 | 1,821 | 97 | 1,050 | ||||||||
| Payments for shares redeemed | (701 | ) | (6,911 | ) | (1,459 | ) | (15,909 | ) | ||||
| Net increase (decrease) | 89 | 918 | (764 | ) | (8,342 | ) | ||||||
| Class R5 | ||||||||||||
| Proceeds from shares sold | 310 | 3,078 | 347 | 3,790 | ||||||||
| Proceeds from reinvestment of distributions | 191 | 1,844 | 109 | 1,180 | ||||||||
| Payments for shares redeemed | (986 | ) | (9,862 | ) | (1,035 | ) | (11,288 | ) | ||||
| Net increase (decrease) | (485 | ) | (4,940 | ) | (579 | ) | (6,318 | ) | ||||
| Class S | ||||||||||||
| Proceeds from shares sold | 1,759 | 17,277 | 1,938 | 21,080 | ||||||||
| Proceeds from reinvestment of distributions | 575 | 5,531 | 364 | 3,941 | ||||||||
| Payments for shares redeemed | (3,388 | ) | (33,243 | ) | (4,349 | ) | (47,021 | ) | ||||
| Net increase (decrease) | (1,054 | ) | (10,435 | ) | (2,047 | ) | (22,000 | ) | ||||
| Total increase (decrease) | (4,773 | ) | $ | (47,792 | ) | (6,660 | ) | $ | (71,922 | ) | ||
See accompanying notes which are an integral part of the financial statements.
26 Conservative Strategy Fund
(This page intentionally left blank)
Russell Investment Company
Conservative Strategy Fund
Financial Highlights — For the Periods Ended
For a Share Outstanding Throughout Each Period.
| $ | |||||||||||||||
| $ | Net | $ | $ | $ | $ | ||||||||||
| Net Asset Value, | Investment | Net Realized | Total from | Distributions | Distributions | ||||||||||
| Beginning of | Income (Loss) | and Unrealized | Investment | from Net | from Net | ||||||||||
| Period | (a)(b)(e) | Gain (Loss) | Operations | Investment Income | Realized Gain | ||||||||||
| Class A | |||||||||||||||
| October 31, 2016 | 10.65 | .24 | .13 | .37 | (.25 | ) | (.85 | ) | |||||||
| October 31, 2015 | 11.16 | .27 | (.26 | ) | .01 | (.27 | ) | (.25 | ) | ||||||
| October 31, 2014 | 11.09 | .14 | .28 | .42 | (.13 | ) | (.22 | ) | |||||||
| October 31, 2013 | 11.02 | .28 | .08 | .36 | (.27 | ) | (.02 | ) | |||||||
| October 31, 2012 | 10.53 | .24 | .50 | .74 | (.25 | ) | — | ||||||||
| Class C | |||||||||||||||
| October 31, 2016 | 10.55 | .16 | .13 | .29 | (.17 | ) | (.85 | ) | |||||||
| October 31, 2015 | 11.06 | .18 | (.25 | ) | (.07) | (.19 | ) | (.25 | ) | ||||||
| October 31, 2014 | 10.99 | .05 | .30 | .35 | (.06 | ) | (.22 | ) | |||||||
| October 31, 2013 | 10.94 | .19 | .09 | .28 | (.21 | ) | (.02 | ) | |||||||
| October 31, 2012 | 10.46 | .16 | .49 | .65 | (.17 | ) | — | ||||||||
| Class E | |||||||||||||||
| October 31, 2016 | 10.70 | .24 | .13 | .37 | (.25 | ) | (.85 | ) | |||||||
| October 31, 2015 | 11.21 | .26 | (.25 | ) | .01 | (.27 | ) | (.25 | ) | ||||||
| October 31, 2014 | 11.13 | .14 | .29 | .43 | (.13 | ) | (.22 | ) | |||||||
| October 31, 2013 | 11.05 | .30 | .07 | .37 | (.27 | ) | (.02 | ) | |||||||
| October 31, 2012 | 10.56 | .25 | .49 | .74 | (.25 | ) | — | ||||||||
| Class R1 | |||||||||||||||
| October 31, 2016 | 10.72 | .29 | .12 | .41 | (.29 | ) | (.85 | ) | |||||||
| October 31, 2015 | 11.23 | .32 | (.26 | ) | .06 | (.32 | ) | (.25 | ) | ||||||
| October 31, 2014 | 11.15 | .18 | .30 | .48 | (.18 | ) | (.22 | ) | |||||||
| October 31, 2013 | 11.08 | .31 | .10 | .41 | (.32 | ) | (.02 | ) | |||||||
| October 31, 2012 | 10.59 | .28 | .51 | .79 | (.30 | ) | — | ||||||||
| Class R4(1) | |||||||||||||||
| October 31, 2016 | 10.67 | .25 | .13 | .38 | (.26 | ) | (.85 | ) | |||||||
| October 31, 2015 | 11.18 | .29 | (.26 | ) | .03 | (.29 | ) | (.25 | ) | ||||||
| October 31, 2014 | 11.10 | .15 | .30 | .45 | (.15 | ) | (.22 | ) | |||||||
| October 31, 2013 | 11.03 | .32 | .06 | .38 | (.29 | ) | (.02 | ) | |||||||
| October 31, 2012 | 10.54 | .27 | .49 | .76 | (.27 | ) | — | ||||||||
| Class R5(2) | |||||||||||||||
| October 31, 2016 | 10.74 | .23 | .13 | .36 | (.23 | ) | (.85 | ) | |||||||
| October 31, 2015 | 11.25 | .27 | (.27 | ) | — | (.26 | ) | (.25 | ) | ||||||
| October 31, 2014 | 11.17 | .13 | .29 | .42 | (.12 | ) | (.22 | ) | |||||||
| October 31, 2013 | 11.09 | .30 | .06 | .36 | (.26 | ) | (.02 | ) | |||||||
| October 31, 2012 | 10.60 | .28 | .44 | .72 | (.23 | ) | — | ||||||||
| Class S | |||||||||||||||
| October 31, 2016 | 10.73 | .28 | .11 | .39 | (.27 | ) | (.85 | ) | |||||||
| October 31, 2015 | 11.24 | .30 | (.26 | ) | .04 | (.30 | ) | (.25 | ) | ||||||
| October 31, 2014 | 11.16 | .16 | .30 | .46 | (.16 | ) | (.22 | ) | |||||||
| October 31, 2013 | 11.09 | .31 | .08 | .39 | (.30 | ) | (.02 | ) | |||||||
| October 31, 2012 | 10.60 | .28 | .49 | .77 | (.28 | ) | — | ||||||||
See accompanying notes which are an integral part of the financial statements.
28 Conservative Strategy Fund
| % | % | % | |||||||||||||||
| $ | $ | Ratio of Expenses | Ratio of Expenses | Ratio of Net | |||||||||||||
| Net Asset Value, | % | Net Assets, | to Average | to Average | Investment Income | % | |||||||||||
| $ | End of | Total | End of Period | Net Assets, | Net Assets, | to Average | Portfolio | ||||||||||
| Total Distributions | Period | Return(d) | (000 | ) | Gross(g)(i) | Net(e)(g)(i) | Net Assets(b)(e) | Turnover Rate | |||||||||
| (1.10 | ) | 9.92 | 3.97 | 88,921 | .76 | .54 | 2.47 | 18 | |||||||||
| (.52 | ) | 10.65 | .11 | 106,603 | .75 | .55 | 2.54 | 39 | |||||||||
| (.35 | ) | 11.16 | 3.92 | 124,288 | .75 | .56 | 1.22 | 26 | |||||||||
| (.29 | ) | 11.09 | 3.35 | 136,433 | .73 | .57 | 2.55 | 21 | |||||||||
| (.25 | ) | 11.02 | 7.15 | 133,172 | .72 | .56 | 2.28 | 22 | |||||||||
| (1.02 | ) | 9.82 | 3.22 | 161,404 | 1.51 | 1.29 | 1.67 | 18 | |||||||||
| (.44 | ) | 10.55 | (.64 | ) | 188,011 | 1.50 | 1.30 | 1.71 | 39 | ||||||||
| (.28 | ) | 11.06 | 3.21 | 210,015 | 1.50 | 1.31 | .47 | 26 | |||||||||
| (.23 | ) | 10.99 | 2.61 | 227,048 | 1.48 | 1.32 | 1.76 | 21 | |||||||||
| (.17 | ) | 10.94 | 6.28 | 230,038 | 1.47 | 1.31 | 1.51 | 22 | |||||||||
| (1.10 | ) | 9.97 | 3.95 | 14,227 | .76 | .54 | 2.43 | 18 | |||||||||
| (.52 | ) | 10.70 | .12 | 17,017 | .75 | .55 | 2.43 | 39 | |||||||||
| (.35 | ) | 11.21 | 3.99 | 20,901 | .75 | .56 | 1.22 | 26 | |||||||||
| (.29 | ) | 11.13 | 3.40 | 24,180 | .74 | .57 | 2.75 | 21 | |||||||||
| (.25 | ) | 11.05 | 7.11 | 39,156 | .72 | .56 | 2.32 | 22 | |||||||||
| (1.14 | ) | 9.99 | 4.35 | 19,546 | .51 | .16 | 2.88 | 18 | |||||||||
| (.57 | ) | 10.72 | .50 | 28,784 | .50 | .17 | 2.96 | 39 | |||||||||
| (.40 | ) | 11.23 | 4.40 | 38,079 | .50 | .17 | 1.63 | 26 | |||||||||
| (.34 | ) | 11.15 | 3.79 | 43,145 | .48 | .17 | 2.81 | 21 | |||||||||
| (.30 | ) | 11.08 | 7.57 | 40,536 | .47 | .14 | 2.59 | 22 | |||||||||
| (1.11 | ) | 9.94 | 4.11 | 15,964 | .76 | .41 | 2.56 | 18 | |||||||||
| (.54 | ) | 10.67 | .23 | 16,189 | .75 | .42 | 2.70 | 39 | |||||||||
| (.37 | ) | 11.18 | 4.14 | 25,502 | .75 | .42 | 1.38 | 26 | |||||||||
| (.31 | ) | 11.10 | 3.51 | 35,427 | .73 | .42 | 2.95 | 21 | |||||||||
| (.27 | ) | 11.03 | 7.32 | 44,214 | .72 | .39 | 2.51 | 22 | |||||||||
| (1.08 | ) | 10.02 | 3.88 | 14,067 | 1.01 | .66 | 2.33 | 18 | |||||||||
| (.51 | ) | 10.74 | (.03 | ) | 20,285 | 1.00 | .67 | 2.45 | 39 | ||||||||
| (.34 | ) | 11.25 | 3.83 | 27,768 | 1.00 | .67 | 1.16 | 26 | |||||||||
| (.28 | ) | 11.17 | 3.30 | 42,335 | .98 | .67 | 2.76 | 21 | |||||||||
| (.23 | ) | 11.09 | 6.91 | 63,878 | .98 | .64 | 2.60 | 22 | |||||||||
| (1.12 | ) | 10.00 | 4.20 | 43,375 | .51 | .29 | 2.77 | 18 | |||||||||
| (.55 | ) | 10.73 | .36 | 57,824 | .50 | .30 | 2.78 | 39 | |||||||||
| (.38 | ) | 11.24 | 4.25 | 83,582 | .50 | .31 | 1.46 | 26 | |||||||||
| (.32 | ) | 11.16 | 3.59 | 82,691 | .48 | .32 | 2.82 | 21 | |||||||||
| (.28 | ) | 11.09 | 7.37 | 95,523 | .47 | .31 | 2.61 | 22 | |||||||||
See accompanying notes which are an integral part of the financial statements.
Conservative Strategy Fund 29
Russell Investment Company
Conservative Strategy Fund
Related Party Transactions, Fees and Expenses
| Accrued fees payable to affiliates for the period ended October 31, 2016 were as follows: | ||
| Advisory fees | $ | 5,227 |
| Administration fees | 12,936 | |
| Distribution fees | 125,496 | |
| Shareholder servicing fees | 43,985 | |
| Transfer agent fees | 49,282 | |
| Trustee fees | 1,483 | |
| $ | 238,409 | |
Transactions (amounts in thousands) during the period ended October 31, 2016 with Underlying Funds which are, or were, an
affiliated company are as follows:
| Fair Value, | Change in | Fair Value, | ||||||||||||||||||
| Beginning of | Realized Gain | Unrealized | End | Income | Capital Gains | |||||||||||||||
| Period | Purchases | Sales | (Loss) | Gain (Loss) | of Period | Distributions | Distributions | |||||||||||||
| Russell Commodity Strategies Fund | $ | — | $ | 334 | $ | — | $ | — | $ | (6 | ) $ | 328 | $ | — | $ | — | ||||
| Russell Global Infrastructure Fund | 17,176 | 2,229 | 10,745 | 602 | (390 | ) | 8,872 | 426 | 444 | |||||||||||
| Russell Fund Global Real Estate Securities | 17,266 | 3,286 | 5,333 | (373 | ) | (691 | ) | 14,155 | 456 | 801 | ||||||||||
| Russell U.S. Defensive Equity Fund | 6,538 | 772 | 7,308 | 4,607 | (4,277 | ) | 332 | 64 | — | |||||||||||
| Russell U.S. Dynamic Equity Fund | 6,566 | 1,808 | 3,014 | (153 | ) | (577 | ) | 4,630 | 296 | 595 | ||||||||||
| Select U.S. Equity Fund | 8,731 | 956 | 2,716 | (92 | ) | 217 | 7,096 | 215 | 12 | |||||||||||
| Russell Fund Global Opportunistic Credit | 8,687 | 14,967 | 2,704 | (190 | ) | 534 | 21,294 | 332 | — | |||||||||||
| Russell Investment Grade Bond Fund | 43,326 | 2,947 | 10,881 | 152 | (44 | ) | 35,500 | 1,650 | 64 | |||||||||||
| Russell Short Duration Bond Fund | 99,896 | 4,365 | 23,236 | 234 | 441 | 81,700 | 1,383 | 56 | ||||||||||||
| Russell Strategic Bond Fund | 99,679 | 6,006 | 46,224 | 2,359 | (1,439 | ) | 60,381 | 2,958 | 548 | |||||||||||
| Unconstrained Total Return Fund | — | 18,000 | 301 | — | 53 | 17,752 | 1 | — | ||||||||||||
| Russell Emerging Markets Fund | 8,596 | 1,150 | 3,315 | (495 | ) | 1,152 | 7,088 | 30 | — | |||||||||||
| Select International Equity Fund | 8,664 | 1,351 | 2,437 | (413 | ) | (65 | ) | 7,100 | 236 | — | ||||||||||
| Russell Multi-Strategy Income Fund | 100,016 | 6,641 | 25,864 | (1,760 | ) | 2,674 | 81,707 | 3,406 | — | |||||||||||
| Russell U.S. Cash Management Fund | 8,872 | 13,072 | 13,918 | — | 1 | 8,027 | 35 | — | ||||||||||||
| $ | 434,013 | $ | 77,884 | $ | 157,996 | $ | 4,478 | $ | (2,417) | $ | 355,962 | $ | 11,488 | $ | 2,520 | |||||
Federal Income Taxes
At October 31, 2016, the cost of investments and net unrealized appreciation (depreciation), undistributed ordinary income and
undistributed long-term capital gains for income tax purposes were as follows:
| Cost of Investments | $ | 346,119,187 | ||
| Unrealized Appreciation | $ | 12,189,552 | ||
| Unrealized Depreciation | (2,346,268 | ) | ||
| Net Unrealized Appreciation (Depreciation) | $ | 9,843,284 | ||
| Undistributed Ordinary Income | $ | 365,162 | ||
| Undistributed Long-Term Capital Gains | ||||
| (Capital Loss Carryforward) | $ | 6,886,645 | ||
| Tax Composition of Distributions | ||||
| Ordinary Income | $ | 8,472,876 | ||
| Long-Term Capital Gains | $ | 33,747,215 |
See accompanying notes which are an integral part of the financial statements.
30 Conservative Strategy Fund
Russell Investment Company
Conservative Strategy Fund
Federal Income Taxes, continued
Net investment income and net realized gains (losses) in the financial statements may differ from taxable net investment income and
net realized gains (losses). Capital accounts within the financial statements are adjusted for permanent differences between book and
tax accounting. These differences may be due to foreign currency gains or losses, reclassifications of dividends and /or differences in
treatment of income from swaps. These adjustments have no impact on the net assets.
At October 31, 2016, the Statement of Assets and Liabilities have been adjusted by the following amounts (in thousands):
| Undistributed net investment income | $ | (59 | ) |
| Accumulated net realized gain (loss) | 59 | ||
| Additional paid-in capital | — |
See accompanying notes which are an integral part of the financial statements.
Conservative Strategy Fund 31
Russell Investment Company
Moderate Strategy Fund
Portfolio Management Discussion and Analysis — October 31, 2016 (Unaudited)
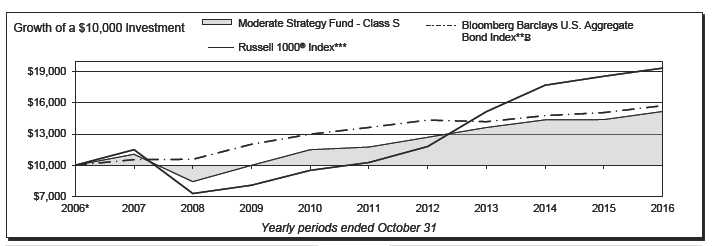
| Moderate Strategy Fund - Class A‡ | Moderate Strategy Fund - Class R5‡‡‡ | ||||||
| Total | Total | ||||||
| Return | Return | ||||||
| 1 Year | (0.80 | )% | 1 Year | 5.06 | % | ||
| 5 Years | 3.80 | %§ | 5 Years | 4.85 | %§ | ||
| 10 Years | 3.42 | %§ | 10 Years | 3.83 | %§ | ||
| Moderate Strategy Fund - Class C | Moderate Strategy Fund - Class S | ||||||
| Total | Total | ||||||
| Return | Return | ||||||
| 1 Year | 4.53 | % | 1 Year | 5.43 | % | ||
| 5 Years | 4.25 | %§ | 5 Years | 5.25 | %§ | ||
| 10 Years | 3.24 | %§ | 10 Years | 4.26 | %§ | ||
| Moderate Strategy Fund - Class E | Bloomberg Barclays U.S. Aggregate Bond Index**C | ||||||
| Total | Total | ||||||
| Return | Return | ||||||
| 1 Year | 5.26 | % | 1 Year | 4.37 | % | ||
| 5 Years | 5.01 | %§ | 5 Years | 2.90 | %§ | ||
| 10 Years | 4.01 | %§ | 10 Years | 4.64 | %§ | ||
| Moderate Strategy Fund - Class R1 | Russell 1000® Index*** | ||||||
| Total | |||||||
| Total | Return | ||||||
| Return | |||||||
| 1 Year | 5.60 | % | 1 Year | 4.26 | % | ||
| 5 Years | 5.39 | %§ | 5 Years | 13.51 | %§ | ||
| 10 Years | 4.36 | %§ | 10 Years | 6.83 | %§ | ||
| Moderate Strategy Fund - Class R4‡‡ | |||||||
| Total | |||||||
| Return | |||||||
| 1 Year | 5.26 | % | |||||
| 5 Years | 5.13 | %§ | |||||
| 10 Years | 4.09 | %§ | |||||
32 Moderate Strategy Fund
Russell Investment Company
Moderate Strategy Fund
Portfolio Management Discussion and Analysis, continued — October 31, 2016
(Unaudited)
| The Moderate Strategy Fund (the “Fund”) is a fund of funds that | infrastructure. With interest rates falling, income opportunities |
| invests principally in other Russell Investment Company mutual | around the globe continued to shrink and income available from |
| funds (the “Underlying Funds”). The Underlying Funds employ | most assets fell. |
| a multi-manager approach whereby portions of the Underlying | The U.S. equity market, as measured by the S&P 500® Index, |
| Funds are allocated to different money managers. Underlying | was up 4.51% over the period but also experienced multiple |
| Fund assets not allocated to money managers are managed by | draw downs. The Fund’s strategic exposure to global equities |
| Russell Investment Management, LLC (“RIM”), the Fund’s | proved beneficial over the period as emerging markets rallied |
| and Underlying Funds’ advisor. RIM, as the Underlying Funds’ | and outperformed U.S. equities. By contrast, non-U.S. developed |
| advisor, may change the allocation of the Underlying Funds’ | equity was one of the lowest performing portions of the Fund’s |
| assets among money managers at any time. An exemptive order | exposure as falling commodities and currencies weighed on |
| from the Securities and Exchange Commission (“SEC”) permits | returns. |
| RIM to engage or terminate a money manager in an Underlying | |
| Fund at any time, subject to approval by the Underlying Fund’s | How did the investment strategies and techniques employed |
| Board, without a shareholder vote. Pursuant to the terms of the | by the Fund and the Underlying Funds affect the Fund’s |
| exemptive order, an Underlying Fund is required to notify its | performance? |
| shareholders within 90 days of when a money manager begins | The Fund is a fund of funds and its performance is based on RIM’s |
| providing services. | strategic asset allocations, the performance of the Underlying |
| What is the Fund’s investment objective? | Funds in which the Fund invests, and tactical changes in the |
| The Fund seeks to provide current income and moderate long | Fund’s asset allocation throughout the year. |
| term capital appreciation. | In order to seek to achieve the Fund’s objective during the period, |
| RIM’s strategic asset allocation included investments in global | |
| How did the Fund perform relative to its benchmark for the | equity, alternative and fixed/other income Underlying Funds. The |
| fiscal year ended October 31, 2016? | Fund’s allocations to Underlying Funds invested in high yield |
| For the fiscal year ended October 31, 2016, the Fund’s Class A, | bonds and emerging market debt and equity helped benchmark- |
| Class C, Class E, Class R1, Class R4, Class R5 and Class S Shares | relative performance during the period as these areas outperformed |
| gained 5.29%, 4.53%, 5.26%, 5.60%, 5.26%, 5.06% and 5.43%, | the Bloomberg Barclays U.S. Aggregate Bond Index. However, |
| respectively. This is compared to the Fund’s primary benchmark, | commodities and non-U.S. developed equities delivered negative |
| the Bloomberg Barclays U.S. Aggregate Bond Index, which gained | returns as measured by the Bloomberg Commodity Index Total |
| 4.37% during the same period. The Fund’s performance includes | Return and Russell Developed ex-U.S. Large Cap® Index Net, |
| operating expenses, whereas index returns are unmanaged and do | respectively. |
| not include expenses of any kind. | The Fund’s outperformance relative to the Bloomberg Barclays |
| For the fiscal year ended October 31, 2016, the Morningstar® | U.S. Aggregate Bond Index was helped by strong active |
| Allocation-30% to 50% Equity Category, a group of funds that | management within the fixed income portion of the portfolio. |
| Morningstar considers to have investment strategies similar to | Underlying Fund bond issue selection during the period was |
| those of the Fund, gained 3.53%. This result serves as a peer | generally additive to returns as fixed income money managers |
| comparison and is expressed net of operating expenses. | were able to pick well within credit, avoiding defaults in places |
| like the energy sector where trouble occurred with falling energy | |
| How did the market conditions described in the Market | prices in early 2016. As such, allocations to the Russell Strategic |
| Summary report affect the Fund’s performance? | Bond Fund and Russell Investment Grade Bond Fund were |
| The Fund seeks to achieve its objective by investing in Underlying | positive from a benchmark-relative perspective. Both Underlying |
| Funds that provide exposure to a range of diversified investments, | Funds were positively impacted by their overweight to credit and |
| and most major asset classes invested in by the Underlying Funds | additive currency positioning also helped to drive excess return. |
| produced positive absolute returns during the period. Markets | |
| during the fiscal year were characterized by higher levels of | By contrast, equity selection and positioning was more difficult, |
| volatility and dispersion across return sources. Within the fixed/ | with allocations to non-U.S. equity Underlying Funds detracting |
| other income Underlying Funds, exposure to high yield debt | from the Fund’s performance and security selection within |
| was beneficial as it was one of the best performing asset classes | those Underlying Funds struggling. In addition, overweights |
| globally. Falling interest rates also helped other fixed income | to European securities in the Select International Equity Fund |
| assets in the Underlying Funds rally, as well as more rate sensitive | caused the Underlying Fund to struggle as European equities |
| real assets like global real estate investment trusts and global | continued to lag the U.S. equity market. |
Moderate Strategy Fund 33
Russell Investment Company
Moderate Strategy Fund
Portfolio Management Discussion and Analysis, continued — October 31, 2016
(Unaudited)
| Describe any changes to the Fund’s structure or allocation | lows and RIM reduced risk exposure to a more defensive stance |
| to the Underlying Funds. | with the Fund’s equity allocation below strategic weights. RIM’s |
| RIM has the discretion to vary the Fund’s actual allocation | modifications to the Fund’s asset allocation were additive during |
| from the target strategic asset allocation by up to +/- 5% at the | the period. |
| equity, fixed/other income or alternative category level based on | RIM also made strategic asset allocation changes during the |
| RIM’s capital markets research. In addition to investing in the | period. In September 2016, RIM added further diversity and |
| Underlying Funds, RIM may seek to actively manage a Fund’s | dynamism to the Fund through the addition of the Russell Multi- |
| overall exposures by investing in derivatives that RIM believes | Strategy Income Fund and the Unconstrained Total Return Fund |
| will achieve the desired risk/return profile for the Fund. RIM’s | as Underlying Funds. |
| asset allocation modifications, implemented through both tactical | |
| changes to Underlying Fund allocations and derivatives-based | The views expressed in this report reflect those of the |
| exposures, benefited the Fund’s performance relative to the | portfolio managers only through the end of the period |
| Fund’s target strategic asset allocation. | covered by the report. These views do not necessarily |
| represent the views of RIM, or any other person in RIM or | |
| RIM adapted the Fund’s asset allocation over the period | any other affiliated organization. These views are subject |
| as market opportunities and risks evolved. The Fund was | to change at any time based upon market conditions or |
| defensively positioned in the fourth quarter of 2015, favoring | other events, and RIM disclaims any responsibility to |
| fixed income over equity. During the first quarter of 2016, equity | update the views contained herein. These views should not |
| markets declined substantially, and RIM added further risk to | be relied on as investment advice and, because investment |
| the portfolio by overweighting exposure to high yield credit and | decisions for a Russell Investment Company (“RIC”) Fund |
| emerging markets equity compared with core bond holdings | are based on numerous factors, should not be relied on as |
| and cash. Markets subsequently rebounded from the February | an indication of investment decisions of any RIC Fund. |
* Assumes initial investment on November 1, 2006.
** The Bloomberg Barclays U.S. Aggregate Bond Index is an index, with income reinvested, generally representative of intermediate-term government bonds,
investment grade corporate debt securities and mortgage-backed securities.
Effective August 24, 2016, the Barclays fixed income benchmark indices, including the Barclays Aggregate family of indices, were renamed the Bloomberg
Barclays family of indices.
*** Russell 1000® Index includes the 1,000 largest companies in the Russell 3000® Index. The Russell 1000® Index represents the universe of stocks from which
most active money managers typically select. The Russell 1000® Index return reflects adjustments from income dividends and capital gain distributions
reinvested as of the ex-dividend dates.
‡ The performance shown has been adjusted to reflect the deduction of the maximum Class A sales charge of 5.75%.
‡‡ The Fund first issued Class R4 Shares on October 1, 2014. The returns shown for Class R4 Shares prior to that date are the returns of the Fund’s Class R2
Shares.
‡‡‡ The Fund first issued Class R5 Shares on October 1, 2014. The returns shown for Class R5 Shares prior to that date are the returns of the Fund’s Class R3
Shares.
§ Annualized.
Performance is historical and assumes reinvestment of all dividends and capital gains. Investment return and principal value will fluctuate so that an investor’s
shares, when redeemed, may be worth more or less than when purchased. Past performance is not indicative of future results. The returns shown do not reflect the
deduction of taxes that a shareholder would pay on Fund distributions or the redemption of Fund shares. Additionally, the returns presented herein may differ from
the performance reported in the Financial Highlights as the returns herein are calculated in a manner consistent with standardized performance in accordance with
Securities and Exchange Commission rules, while the performance in the Financial Highlights has been calculated in accordance with U.S. Generally Accepted
Accounting Principles (“U.S. GAAP”).
34 Moderate Strategy Fund
Russell Investment Company
Moderate Strategy Fund
Shareholder Expense Example — October 31, 2016 (Unaudited)
| Fund Expenses | Please note that the expenses shown in the table are meant | |||||
| The following disclosure provides important information | to highlight your ongoing costs only and do not reflect any | |||||
| regarding the Fund’s Shareholder Expense Example | transactional costs. Therefore, the information under the heading | |||||
| (“Example”). | “Hypothetical Performance (5% return before expenses)” is | |||||
| useful in comparing ongoing costs only, and will not help you | ||||||
| Example | determine the relative total costs of owning different funds. In | |||||
| As a shareholder of the Fund, you incur two types of costs: (1) | addition, if these transactional costs were included, your costs | |||||
| transaction costs, including sales charges (loads) on certain | would have been higher. | |||||
| purchase or redemption payments, and (2) ongoing costs, | Hypothetical | |||||
| including advisory and administrative fees; distribution and/or | Performance (5% | |||||
| service fees; and other Fund expenses. The Example is intended | Actual | return before | ||||
| to help you understand your ongoing costs (in dollars) of investing | Class A | Performance | expenses) | |||
| Beginning Account Value | ||||||
| in the Fund and to compare these costs with the ongoing costs of | May 1, 2016 | $ | 1,000.00 | $ | 1,000.00 | |
| investing in other mutual funds. The Example is based on an | Ending Account Value | |||||
| investment of $1,000 invested at the beginning of the period and | October 31, 2016 | $ | 1,036.90 | $ | 1,022.72 | |
| held for the entire period indicated, which for this Fund is from | Expenses Paid During Period* | $ | 2.46 | $ | 2.44 | |
| May 1, 2016 to October 31, 2016. | * Expenses are equal to the Fund's annualized expense ratio of 0.48% | |||||
| (representing the six month period annualized), multiplied by the average | ||||||
| Actual Expenses | account value over the period, multiplied by 184/366 (to reflect the one-half | |||||
| The information in the table under the heading “Actual | year period). May reflect amounts waived and/or reimbursed. Without any | |||||
| Performance” provides information about actual account values | waivers and/or reimbursements, expenses would have been higher. | |||||
| and actual expenses. You may use the information in this column, | ||||||
| Hypothetical | ||||||
| together with the amount you invested, to estimate the expenses | Performance (5% | |||||
| that you paid over the period. Simply divide your account value by | Actual | return before | ||||
| $1,000 (for example, an $8,600 account value divided by $1,000 | Class C | Performance | expenses) | |||
| Beginning Account Value | ||||||
| = 8.6), then multiply the result by the number in the first column | May 1, 2016 | $ | 1,000.00 | $ | 1,000.00 | |
| in the row entitled “Expenses Paid During Period” to estimate | Ending Account Value | |||||
| the expenses you paid on your account during this period. | October 31, 2016 | $ | 1,032.30 | $ | 1,018.95 | |
| Expenses Paid During Period* | $ | 6.28 | $ | 6.24 | ||
| Hypothetical Example for Comparison Purposes | ||||||
| The information in the table under the heading “Hypothetical | * Expenses are equal to the Fund's annualized expense ratio of 1.23% | |||||
| (representing the six month period annualized), multiplied by the average | ||||||
| Performance (5% return before expenses)” provides information | account value over the period, multiplied by 184/366 (to reflect the one-half | |||||
| about hypothetical account values and hypothetical expenses | year period). May reflect amounts waived and/or reimbursed. Without any | |||||
| based on the Fund’s actual expense ratio and an assumed rate of | waivers and/or reimbursements, expenses would have been higher. | |||||
| return of 5% per year before expenses, which is not the Fund’s | ||||||
| Hypothetical | ||||||
| actual return. The hypothetical account values and expenses | Performance (5% | |||||
| may not be used to estimate the actual ending account balance or | Actual | return before | ||||
| expenses you paid for the period. You may use this information | Class E | Performance | expenses) | |||
| to compare the ongoing costs of investing in the Fund and other | Beginning Account Value | |||||
| May 1, 2016 | $ | 1,000.00 | $ | 1,000.00 | ||
| funds. To do so, compare this 5% hypothetical example with the | Ending Account Value | |||||
| 5% hypothetical examples that appear in the shareholder reports | October 31, 2016 | $ | 1,036.30 | $ | 1,022.32 | |
| of other funds. | Expenses Paid During Period* | $ | 2.87 | $ | 2.85 | |
| * Expenses are equal to the Fund's annualized expense ratio of 0.56% | ||||||
| (representing the six month period annualized), multiplied by the average | ||||||
| account value over the period, multiplied by 184/366 (to reflect the one-half | ||||||
| year period). May reflect amounts waived and/or reimbursed. Without any | ||||||
| waivers and/or reimbursements, expenses would have been higher. | ||||||
Moderate Strategy Fund 35
Russell Investment Company
Moderate Strategy Fund
Shareholder Expense Example, continued — October 31, 2016 (Unaudited)
| Hypothetical | ||||||
| Performance (5% | ||||||
| Actual | return before | |||||
| Class R1 | Performance | expenses) | ||||
| Beginning Account Value | ||||||
| May 1, 2016 | $ | 1,000.00 | $ | 1,000.00 | ||
| Ending Account Value | ||||||
| October 31, 2016 | $ | 1,037.90 | $ | 1,023.98 | ||
| Expenses Paid During Period* | $ | 1.18 | $ | 1.17 | ||
| * Expenses are equal to the Fund's annualized expense ratio of 0.23% | ||||||
| (representing the six month period annualized), multiplied by the average | ||||||
| account value over the period, multiplied by 184/366 (to reflect the one-half | ||||||
| year period). May reflect amounts waived and/or reimbursed. Without any | ||||||
| waivers and/or reimbursements, expenses would have been higher. | ||||||
| Hypothetical | ||||||
| Performance (5% | ||||||
| Actual | return before | |||||
| Class R4 | Performance | expenses) | ||||
| Beginning Account Value | ||||||
| May 1, 2016 | $ | 1,000.00 | $ | 1,000.00 | ||
| Ending Account Value | ||||||
| October 31, 2016 | $ | 1,035.80 | $ | 1,022.72 | ||
| Expenses Paid During Period* | $ | 2.46 | $ | 2.44 | ||
| * Expenses are equal to the Fund's annualized expense ratio of 0.48% | ||||||
| (representing the six month period annualized), multiplied by the average | ||||||
| account value over the period, multiplied by 184/366 (to reflect the one-half | ||||||
| year period). May reflect amounts waived and/or reimbursed. Without any | ||||||
| waivers and/or reimbursements, expenses would have been higher. | ||||||
| Hypothetical | ||||||
| Performance (5% | ||||||
| Actual | return before | |||||
| Class R5 | Performance | expenses) | ||||
| Beginning Account Value | ||||||
| May 1, 2016 | $ | 1,000.00 | $ | 1,000.00 | ||
| Ending Account Value | ||||||
| October 31, 2016 | $ | 1,035.10 | $ | 1,021.47 | ||
| Expenses Paid During Period* | $ | 3.73 | $ | 3.71 | ||
| * Expenses are equal to the Fund's annualized expense ratio of 0.73% | ||||||
| (representing the six month period annualized), multiplied by the average | ||||||
| account value over the period, multiplied by 184/366 (to reflect the one-half | ||||||
| year period). May reflect amounts waived and/or reimbursed. Without any | ||||||
| waivers and/or reimbursements, expenses would have been higher. | ||||||
| Hypothetical | ||||||
| Performance (5% | ||||||
| Actual | return before | |||||
| Class S | Performance | expenses) | ||||
| Beginning Account Value | ||||||
| May 1, 2016 | $ | 1,000.00 | $ | 1,000.00 | ||
| Ending Account Value | ||||||
| October 31, 2016 | $ | 1,036.60 | $ | 1,023.58 | ||
| Expenses Paid During Period* | $ | 1.59 | $ | 1.58 | ||
| * Expenses are equal to the Fund's annualized expense ratio of 0.31% | ||||||
| (representing the six month period annualized), multiplied by the average | ||||||
| account value over the period, multiplied by 184/366 (to reflect the one-half | ||||||
| year period). May reflect amounts waived and/or reimbursed. Without any | ||||||
| waivers and/or reimbursements, expenses would have been higher. | ||||||
36 Moderate Strategy Fund
Russell Investment Company
Moderate Strategy Fund
Schedule of Investments — October 31, 2016
| Amounts in thousands (except share amounts) | ||||
| Fair | ||||
| Value | ||||
| Shares | $ | |||
| Investments in Russell Affiliated Mutual Funds - 97.0% | ||||
| Alternative - 7.7% | ||||
| Russell Commodity Strategies Fund Class Y | 3,121,146 | 17,198 | ||
| Russell Global Infrastructure Fund Class Y | 1,513,936 | 17,304 | ||
| Russell Global Real Estate Securities Fund Class Y | 292,941 | 10,467 | ||
| 44,969 | ||||
| Domestic Equities - 5.8% | ||||
| Russell U.S. Defensive Equity Fund Class Y | 6,332 | 312 | ||
| Russell U.S. Dynamic Equity Fund Class Y | 1,050,361 | 10,430 | ||
| Russell U.S. Small Cap Equity Fund Class Y | 824,218 | 22,756 | ||
| Select U.S. Equity Fund Class Y | 52,062 | 569 | ||
| 34,067 | ||||
| Fixed Income - 56.1% | ||||
| Russell Global Opportunistic Credit Fund Class Y | 9,851,654 | 95,758 | ||
| Russell Investment Grade Bond Fund Class Y | 3,254,701 | 72,677 | ||
| Russell Strategic Bond Fund Class Y | 11,820,677 | 130,738 | ||
| Unconstrained Total Return Fund Class Y | 2,897,515 | 29,062 | ||
| 328,235 | ||||
| International Equities - 17.5% | ||||
| Russell Emerging Markets Fund Class Y | 2,254,006 | 37,574 | ||
| Russell Global Equity Fund Class Y | 2,889,304 | 30,135 | ||
| Select International Equity Fund Class Y | 4,055,955 | 34,841 | ||
| 102,550 | ||||
| Specialty - 9.9% | ||||
| Russell Multi-Strategy Income Fund Class Y | 5,996,485 | 58,046 | ||
| Total Investments in Russell Affiliated Mutual Funds | ||||
| (cost $541,282) | 567,867 | |||
| Short-Term Investments - 1.8% | ||||
| Russell U.S. Cash Management Fund | 10,779,331 | (8) | 10,781 | |
| Total Short-Term Investments | ||||
| (cost $10,780) | 10,781 | |||
| Total Investments 98.8% | ||||
| (identified cost $552,062) | 578,648 | |||
| Other Assets and Liabilities, Net - 1.2% | 6,980 | |||
| Net Assets - 100.0% | 585,628 | |||
See accompanying notes which are an integral part of the financial statements.
Moderate Strategy Fund 37
Russell Investment Company
Moderate Strategy Fund
Schedule of Investments, continued — October 31, 2016
| Futures Contracts | |||||||
| Amounts in thousands (except contract amounts) | |||||||
| Unrealized | |||||||
| Appreciation | |||||||
| Number of | Notional | Expiration | (Depreciation) | ||||
| Contracts | Amount | Date | $ | ||||
| Long Positions | |||||||
| Amsterdam Index Futures | 24 | EUR | 2,166 | 11/16 | 1 | ||
| CAC40 Index Futures | 137 | EUR | 6,174 | 11/16 | 37 | ||
| DAX Index Futures | 22 | EUR | 5,872 | 12/16 | 161 | ||
| EURO STOXX 50 Index Futures | 128 | EUR | 3,908 | 12/16 | 89 | ||
| FTSE/MIB Index Futures | 15 | EUR | 1,283 | 12/16 | 43 | ||
| IBEX 35 Index Futures | 22 | EUR | 2,008 | 11/16 | 80 | ||
| OMXS30 Index Futures | 96 | SEK | 13,870 | 11/16 | (5 | ) | |
| Russell 1000 Mini Index Futures | 10 | USD | 1,174 | 12/16 | (22 | ) | |
| S&P 500 E-Mini Index Futures | 139 | USD | 14,734 | 12/16 | (282 | ) | |
| S&P Mid 400 E-Mini Index Futures | 11 | USD | 1,657 | 12/16 | (42 | ) | |
| Short Positions | |||||||
| FTSE 100 Index Futures | 12 | GBP | 831 | 12/16 | (40 | ) | |
| Hang Seng Index Futures | 2 | HKD | 2,291 | 11/16 | 7 | ||
| MSCI Emerging Markets Mini Index Futures | 98 | USD | 4,427 | 12/16 | 9 | ||
| MSCI Singapore Index Futures | 3 | SGD | 92 | 11/16 | 1 | ||
| Russell 1000 Mini Index Futures | 5 | USD | 587 | 12/16 | 4 | ||
| Russell 2000 Mini Index Futures | 7 | USD | 833 | 12/16 | 47 | ||
| S&P 500 E-Mini Index Futures | 96 | USD | 10,177 | 12/16 | 171 | ||
| S&P Mid 400 E-Mini Index Futures | 6 | USD | 904 | 12/16 | 12 | ||
| S&P/TSX 60 Index Futures | 39 | CAD | 6,759 | 12/16 | (158 | ) | |
| SPI 200 Index Futures | 43 | AUD | 5,687 | 12/16 | (93 | ) | |
| TOPIX Index Futures | 40 | JPY | 558,000 | 12/16 | (203 | ) | |
| United States 2 Year Treasury Note Futures | 31 | USD | 6,762 | 12/16 | (2 | ) | |
| United States 5 Year Treasury Note Futures | 108 | USD | 13,047 | 12/16 | 25 | ||
| United States 10 Year Treasury Note Futures | 70 | USD | 9,074 | 12/16 | 73 | ||
| United States Long Bond Futures | 4 | USD | 651 | 12/16 | 28 | ||
| Total Unrealized Appreciation (Depreciation) on Open Futures Contracts (å) | (59 | ) | |||||
| Options Written | ||||||||||||
| Amounts in thousands (except contract amounts) | ||||||||||||
| Transactions in options written contracts for the period ended October 31, 2016 were as follows: | ||||||||||||
| Number of | Premiums | |||||||||||
| Contracts | Received | |||||||||||
| Outstanding October 31, 2015 | — | $ | — | |||||||||
| Opened | 968,895 | 1,374 | ||||||||||
| Closed | (948,433 | ) | (225 | ) | ||||||||
| Expired | (20,462 | ) | (1,149 | ) | ||||||||
| Outstanding October 31, 2016 | — | $ | — | |||||||||
| Foreign Currency Exchange Contracts | ||||||||||||
| Amounts in thousands | ||||||||||||
| Unrealized | ||||||||||||
| Appreciation | ||||||||||||
| Amount | Amount | (Depreciation) | ||||||||||
| Counterparty | Sold | Bought | Settlement Date | $ | ||||||||
| Bank of America | USD | 8,014 | EUR | 7,280 | 12/21/16 | (5 | ) | |||||
| Bank of America | USD | 1,495 | MXN | 28,480 | 12/21/16 | 4 | ||||||
| Bank of America | USD | 987 | RUB | 62,970 | 12/21/16 | (6 | ) | |||||
| Bank of America | USD | 1,985 | ZAR | 28,520 | 12/21/16 | 110 | ||||||
| Bank of America | AUD | 7,220 | USD | 5,470 | 12/21/16 | (16 | ) | |||||
| Bank of America | CAD | 350 | USD | 266 | 12/21/16 | 5 | ||||||
See accompanying notes which are an integral part of the financial statements.
38 Moderate Strategy Fund
Russell Investment Company
Moderate Strategy Fund
Schedule of Investments, continued — October 31, 2016
| Foreign Currency Exchange Contracts | |||||||
| Amounts in thousands | |||||||
| Unrealized | |||||||
| Appreciation | |||||||
| Amount | Amount | (Depreciation) | |||||
| Counterparty | Sold | Bought | Settlement Date | $ | |||
| Bank of America | JPY | 416,520 | USD | 4,006 | 12/21/16 | 27 | |
| Bank of America | KRW | 4,856,000 | USD | 4,435 | 12/21/16 | 191 | |
| Bank of Montreal | USD | 589 | AUD | 774 | 11/08/16 | — | |
| Bank of Montreal | USD | 762 | CAD | 1,020 | 11/08/16 | (1 | ) |
| Bank of Montreal | USD | 711 | CHF | 703 | 11/08/16 | (1 | ) |
| Bank of Montreal | USD | 2,575 | EUR | 2,352 | 11/08/16 | 7 | |
| Bank of Montreal | USD | 1,411 | GBP | 1,159 | 11/08/16 | 8 | |
| Bank of Montreal | USD | 296 | HKD | 2,297 | 11/08/16 | — | |
| Bank of Montreal | USD | 1,749 | JPY | 183,645 | 11/08/16 | 2 | |
| Bank of Montreal | USD | 279 | SEK | 2,517 | 11/08/16 | (1 | ) |
| Bank of Montreal | USD | 98 | SGD | 137 | 11/08/16 | — | |
| Bank of Montreal | AUD | 794 | USD | 604 | 11/08/16 | — | |
| Bank of Montreal | AUD | 774 | USD | 588 | 12/07/16 | — | |
| Bank of Montreal | CAD | 1,036 | USD | 787 | 11/08/16 | 15 | |
| Bank of Montreal | CAD | 1,020 | USD | 762 | 12/07/16 | 1 | |
| Bank of Montreal | CHF | 722 | USD | 742 | 11/08/16 | 13 | |
| Bank of Montreal | CHF | 703 | USD | 712 | 12/07/16 | — | |
| Bank of Montreal | EUR | 2,430 | USD | 2,716 | 11/08/16 | 48 | |
| Bank of Montreal | EUR | 2,352 | USD | 2,578 | 12/07/16 | (7 | ) |
| Bank of Montreal | GBP | 1,189 | USD | 1,542 | 11/08/16 | 88 | |
| Bank of Montreal | GBP | 1,159 | USD | 1,412 | 12/07/16 | (8 | ) |
| Bank of Montreal | HKD | 2,266 | USD | 292 | 11/08/16 | — | |
| Bank of Montreal | HKD | 2,297 | USD | 296 | 12/07/16 | — | |
| Bank of Montreal | JPY | 186,059 | USD | 1,838 | 11/08/16 | 64 | |
| Bank of Montreal | JPY | 183,645 | USD | 1,751 | 12/07/16 | (3 | ) |
| Bank of Montreal | SEK | 2,539 | USD | 295 | 11/08/16 | 14 | |
| Bank of Montreal | SEK | 2,517 | USD | 280 | 12/07/16 | 1 | |
| Bank of Montreal | SGD | 138 | USD | 101 | 11/08/16 | 2 | |
| Bank of Montreal | SGD | 137 | USD | 98 | 12/07/16 | — | |
| BNP Paribas | USD | 746 | GBP | 560 | 12/21/16 | (60 | ) |
| BNP Paribas | USD | 1,474 | JPY | 149,365 | 12/21/16 | (47 | ) |
| BNP Paribas | AUD | 794 | USD | 604 | 11/08/16 | 1 | |
| BNP Paribas | AUD | 2,215 | USD | 1,697 | 12/21/16 | 14 | |
| BNP Paribas | CAD | 1,036 | USD | 788 | 11/08/16 | 15 | |
| BNP Paribas | CAD | 515 | USD | 399 | 12/21/16 | 14 | |
| BNP Paribas | CHF | 722 | USD | 743 | 11/08/16 | 13 | |
| BNP Paribas | EUR | 2,430 | USD | 2,719 | 11/08/16 | 51 | |
| BNP Paribas | EUR | 2,015 | USD | 2,281 | 12/21/16 | 64 | |
| BNP Paribas | GBP | 1,189 | USD | 1,542 | 11/08/16 | 87 | |
| BNP Paribas | HKD | 2,266 | USD | 292 | 11/08/16 | — | |
| BNP Paribas | HKD | 1,165 | USD | 150 | 12/21/16 | — | |
| BNP Paribas | JPY | 186,059 | USD | 1,840 | 11/08/16 | 66 | |
| BNP Paribas | SEK | 2,539 | USD | 295 | 11/08/16 | 14 | |
| BNP Paribas | SEK | 640 | USD | 76 | 12/21/16 | 5 | |
| BNP Paribas | SGD | 138 | USD | 101 | 11/08/16 | 2 | |
| Citigroup | USD | 589 | AUD | 774 | 11/08/16 | — | |
| Citigroup | USD | 762 | CAD | 1,020 | 11/08/16 | (2 | ) |
| Citigroup | USD | 711 | CHF | 703 | 11/08/16 | (1 | ) |
| Citigroup | USD | 2,575 | EUR | 2,352 | 11/08/16 | 7 | |
| Citigroup | USD | 1,411 | GBP | 1,159 | 11/08/16 | 8 | |
| Citigroup | USD | 296 | HKD | 2,297 | 11/08/16 | — | |
| Citigroup | USD | 1,749 | JPY | 183,645 | 11/08/16 | 2 | |
| Citigroup | USD | 280 | SEK | 2,517 | 11/08/16 | (1 | ) |
| Citigroup | USD | 98 | SGD | 137 | 11/08/16 | — | |
| Citigroup | AUD | 774 | USD | 588 | 12/07/16 | — | |
| Citigroup | CAD | 1,020 | USD | 762 | 12/07/16 | 2 |
See accompanying notes which are an integral part of the financial statements.
Moderate Strategy Fund 39
Russell Investment Company
Moderate Strategy Fund
Schedule of Investments, continued — October 31, 2016
| Foreign Currency Exchange Contracts | |||||||||
| Amounts in thousands | |||||||||
| Unrealized | |||||||||
| Appreciation | |||||||||
| Amount | Amount | (Depreciation) | |||||||
| Counterparty | Sold | Bought | Settlement Date | $ | |||||
| Citigroup | CHF | 703 | USD | 712 | 12/07/16 | — | |||
| Citigroup | EUR | 2,352 | USD | 2,578 | 12/07/16 | (7 | ) | ||
| Citigroup | GBP | 1,159 | USD | 1,412 | 12/07/16 | (8 | ) | ||
| Citigroup | HKD | 2,297 | USD | 296 | 12/07/16 | — | |||
| Citigroup | JPY | 183,645 | USD | 1,751 | 12/07/16 | (2 | ) | ||
| Citigroup | SEK | 2,517 | USD | 280 | 12/07/16 | 1 | |||
| Citigroup | SGD | 137 | USD | 98 | 12/07/16 | — | |||
| Standard Chartered | USD | 1,483 | INR | 100,040 | 12/21/16 | 6 | |||
| Standard Chartered | CNY | 92,410 | USD | 13,606 | 12/21/16 | 29 | |||
| Standard Chartered | TWD | 62,000 | USD | 1,992 | 12/21/16 | 26 | |||
| State Street | USD | 30 | AUD | 39 | 11/08/16 | — | |||
| State Street | USD | 25 | CAD | 33 | 11/08/16 | (1 | ) | ||
| State Street | USD | 39 | CHF | 38 | 11/08/16 | (1 | ) | ||
| State Street | USD | 175 | EUR | 156 | 11/08/16 | (4 | ) | ||
| State Street | USD | 77 | GBP | 60 | 11/08/16 | (4 | ) | ||
| State Street | USD | 48 | JPY | 4,828 | 11/08/16 | (2 | ) | ||
| State Street | USD | 5 | SEK | 44 | 11/08/16 | — | |||
| State Street | USD | 1 | SGD | 2 | 11/08/16 | — | |||
| State Street | CNY | 39,000 | USD | 5,803 | 12/21/16 | 73 | |||
| State Street | HKD | 62 | USD | 8 | 11/08/16 | — | |||
| Westpac | USD | 746 | GBP | 560 | 12/21/16 | (59 | ) | ||
| Westpac | USD | 1,474 | JPY | 149,365 | 12/21/16 | (47 | ) | ||
| Westpac | AUD | 2,215 | USD | 1,696 | 12/21/16 | 13 | |||
| Westpac | CAD | 515 | USD | 399 | 12/21/16 | 15 | |||
| Westpac | EUR | 2,015 | USD | 2,280 | 12/21/16 | 62 | |||
| Westpac | HKD | 1,165 | USD | 150 | 12/21/16 | — | |||
| Westpac | SEK | 640 | USD | 76 | 12/21/16 | 5 | |||
| Total Unrealized Appreciation (Depreciation) on Open Foreign Currency Exchange Contracts | 901 | ||||||||
| Total Return Swap Contracts (*) | |||||||||
| Amounts in thousands | |||||||||
| Notional | Termination | Fair Value | |||||||
| Underlying Reference Entity | Counterparty | Amount | Date | $ | |||||
| Dow Jones U.S. Real Estate Total Return Index | Bank of America | USD | 6,935 | 03/07/17 | 487 | ||||
| Total Fair Value of Open Total Return Swap Contracts Premiums Paid (Received) - $— (å) | 487 | ||||||||
(*) Total return swaps (which includes index swaps) are agreements between counterparties to exchange cash flows, one based on a market-linked
returns of an individual asset or a basket of assets (i.e. an index), and the other on a fixed or floating rate. The floating rate is based on the 3
Month LIBOR rate plus a fee of 0.075%
| Credit Default Swap Contracts | ||||||||
| Amounts in thousands | ||||||||
| Credit Indices | ||||||||
| Fund (Pays)/ | ||||||||
| Receives | Termination | Fair Value | ||||||
| Reference Entity | Counterparty | Notional Amount | Fixed Rate | Date | $ | |||
| CDX Emerging Markets Index | Bank of America | USD | 22,000 | (1.000 | %) | 12/20/21 | 1,424 | |
| CDX NA High Yield Index | Bank of America | USD | 17,300 | 5.000 | % | 12/20/21 | 683 | |
| Total Fair Value on Open Credit Indices Premiums Paid (Received) - $2,108 | 2,107 | |||||||
See accompanying notes which are an integral part of the financial statements.
40 Moderate Strategy Fund
Russell Investment Company
Moderate Strategy Fund
Schedule of Investments, continued — October 31, 2016
| Presentation of Portfolio Holdings | |||||||||||||||||
| Amounts in thousands | |||||||||||||||||
| Fair Value | |||||||||||||||||
| Practical | |||||||||||||||||
| Portfolio Summary | Level 1 | Level 2 | Level 3 | Expedient (a) | Total | % of Net Assets | |||||||||||
| Investments in Russell Affiliated Mutual | |||||||||||||||||
| Funds | $ | 567,867 | $ | — | $ | — | $ | — | $ | 567,867 | 97.0 | ||||||
| Short-Term Investments | — | — | — | 10,781 | 10,781 | 1.8 | |||||||||||
| Total Investments | 567,867 | — | — | 10,781 | 578,648 | 98.8 | |||||||||||
| Other Assets and Liabilities, Net | 1.2 | ||||||||||||||||
| 100.0 | |||||||||||||||||
| Other Financial Instruments | |||||||||||||||||
| Assets | |||||||||||||||||
| Futures Contracts | 788 | — | — | — | 788 | 0.1 | |||||||||||
| Foreign Currency Exchange Contracts | — | 1,195 | — | — | 1,195 | 0.2 | |||||||||||
| Total Return Swap Contracts | — | 487 | — | — | 487 | 0.1 | |||||||||||
| Credit Default Swap Contracts | — | 2,107 | — | — | 2,107 | 0.4 | |||||||||||
| ' | |||||||||||||||||
| Liabilities | |||||||||||||||||
| Futures Contracts | (847 | ) | — | — | — | (847 | ) | (0.1 | ) | ||||||||
| Foreign Currency Exchange Contracts | — | (294 | ) | — | — | (294 | ) | (0.1 | ) | ||||||||
| Total Other Financial Instruments* | $ | (59 | ) | $ | 3,495 | $ | — | $ | — | $ | 3,436 | ||||||
* Futures and foreign currency exchange contract values reflect the unrealized appreciation (depreciation) on the investments.
(a) Certain investments that are measured at fair value using the net asset value per share (or its equivalent) practical expedient have not been classified
in the fair value levels. The fair value amounts presented in the table are intended to permit reconciliation to the amounts presented in the Schedule of
Investments.
For a description of the Levels, see note 2 in the Notes to Financial Statements.
For a disclosure on transfers between Levels 1, 2 and 3 during the period ended October 31, 2016, see note 2 in the Notes to
Financial Statements.
See accompanying notes which are an integral part of the financial statements.
Moderate Strategy Fund 41
Russell Investment Company
Moderate Strategy Fund
Fair Value of Derivative Instruments — October 31, 2016
Amounts in thousands
| Foreign | ||||||||||||
| Equity | Credit | Currency | Interest Rate | |||||||||
| Derivatives not accounted for as hedging instruments | Contracts | Contracts | Contracts | Contracts | ||||||||
| Location: Statement of Assets and Liabilities - Assets | ||||||||||||
| Unrealized appreciation on foreign currency exchange contracts | $ | — | $ | — | $ | 1,195 | $ | — | ||||
| Variation margin on futures contracts* | 662 | — | — | 126 | ||||||||
| Total return swap contracts, at fair value | 487 | — | — | — | ||||||||
| Credit default swap contracts, at fair value | — | 2,107 | — | — | ||||||||
| Total | $ | 1,149 | $ | 2,107 | $ | 1,195 | $ | 126 | ||||
| Location: Statement of Assets and Liabilities - Liabilities | ||||||||||||
| Variation margin on futures contracts* | $ | 845 | $ | — | $ | — | $ | 2 | ||||
| Unrealized depreciation on foreign currency exchange contracts | — | — | 294 | — | ||||||||
| Total | $ | 845 | $ | — | $ | 294 | $ | 2 | ||||
| Foreign | ||||||||||||
| Equity | Credit | Currency | Interest Rate | |||||||||
| Derivatives not accounted for as hedging instruments | Contracts | Contracts | Contracts | Contracts | ||||||||
| Location: Statement of Operations - Net realized gain (loss) | ||||||||||||
| Futures contracts | $ | (262 | ) | $ | — | $ | — | $ | — | |||
| Options written | 1,180 | — | — | — | ||||||||
| Total return swap contracts | (1,589 | ) | — | — | — | |||||||
| Credit default swap contracts | — | 1,446 | — | — | ||||||||
| Foreign currency-related transactions** | — | — | (295 | ) | — | |||||||
| Total | $ | (671 | ) | $ | 1,446 | $ | (295 | ) | $ | — | ||
| Location: Statement of Operations - Net change in unrealized appreciation | ||||||||||||
| (depreciation) | ||||||||||||
| Futures contracts | $ | (994 | ) | $ | — | $ | — | $ | 124 | |||
| Total return swap contracts | 1,149 | — | — | — | ||||||||
| Credit default swap contracts | — | (1 | ) | — | — | |||||||
| Foreign currency-related transactions*** | — | — | 833 | — | ||||||||
| Total | $ | 155 | $ | (1 | ) | $ | 833 | $ | 124 | |||
* Includes cumulative appreciation/depreciation of futures contracts as reported in the Schedule of Investments. Only variation margin is reported within the
Statement of Assets and Liabilities.
** Only includes net realized gain (loss) on forward and spot contracts. May differ from the net realized gain (loss) on foreign currency-related transactions reported
within the Statement of Operations.
*** Only includes change in unrealized gain (loss) on forward and spot contracts. May differ from the net change in unrealized gain (loss) on foreign currency-related
transactions reported within the Statement of Operations.
For further disclosure on derivatives see note 2 in the Notes to Financial Statements.
See accompanying notes which are an integral part of the financial statements.
42 Moderate Strategy Fund
Russell Investment Company
Moderate Strategy Fund
Balance Sheet Offsetting of Financial and Derivative Instruments — October 31, 2016
| Amounts in thousands | |||||||||
| Offsetting of Financial Assets and Derivative Assets | |||||||||
| Gross | Net Amounts | ||||||||
| Amounts | of Assets | ||||||||
| Gross | Offset in the | Presented in | |||||||
| Amounts of | Statement of | the Statement | |||||||
| Recognized | Assets and | of Assets and | |||||||
| Description | Location: Statement of Assets and Liabilities - Assets | Assets | Liabilities | Liabilities | |||||
| Foreign Currency Exchange Contracts | Unrealized appreciation on foreign currency exchange contracts | $ | 1,195 | $ | — $ | 1,195 | |||
| Futures Contracts | Variation margin on futures contracts | 35 | — | 35 | |||||
| Total Return Swap Contracts | Total return swap contracts, at fair value | 487 | — | 487 | |||||
| Credit Default Swap Contracts | Credit default swap contracts, at fair value | 2,107 | — | 2,107 | |||||
| Total Financial and Derivative Assets | 3,824 | — | 3,824 | ||||||
| Financial and Derivative Assets not subject to a netting agreement | (2,142 | ) | — | (2,142 | ) | ||||
| Total Financial and Derivative Assets subject to a netting agreement | $ | 1,682 | $ | — $ | 1,682 | ||||
| Financial Assets, Derivative Assets, and Collateral Held by Counterparty | |||||||||||
| Gross Amounts Not Offset in | |||||||||||
| the Statement of Assets and | |||||||||||
| Liabilities | |||||||||||
| Net Amounts | |||||||||||
| of Assets | |||||||||||
| Presented in | |||||||||||
| the Statement | Financial and | ||||||||||
| of Assets and | Derivative | Collateral | |||||||||
| Counterparty | Liabilities | Instruments | Received^ | Net Amount | |||||||
| Bank of America | $ | 825 | $ | 27 | $ | 430 | $ | 368 | |||
| Bank of Montreal | 262 | 21 | — | 241 | |||||||
| BNP Paribas | 346 | 97 | — | 249 | |||||||
| Citigroup | 21 | 21 | — | — | |||||||
| Standard Chartered | 61 | — | — | 61 | |||||||
| State Street | 72 | — | — | 72 | |||||||
| Westpac | 95 | 95 | — | — | |||||||
| Total | $ | 1,682 | $ | 261 | $ | 430 | $ | 991 | |||
See accompanying notes which are an integral part of the financial statements.
Moderate Strategy Fund 43
Russell Investment Company
Moderate Strategy Fund
Balance Sheet Offsetting of Financial and Derivative Instruments, continued —
October 31, 2016
| Amounts in thousands | |||||||||
| Offsetting of Financial Liabilities and Derivative Liabilities | |||||||||
| Gross | Net Amounts | ||||||||
| Amounts | of Liabilities | ||||||||
| Gross | Offset in the | Presented in | |||||||
| Amounts of | Statement of | the Statement | |||||||
| Recognized | Assets and | of Assets and | |||||||
| Description | Location: Statement of Assets and Liabilities - Liabilities | Liabilities | Liabilities | Liabilities | |||||
| Futures Contracts | Variation margin on futures contracts | $ | 253 | $ | — $ | 253 | |||
| Foreign Currency Exchange Contracts | Unrealized depreciation on foreign currency exchange contracts | 294 | — | 294 | |||||
| Total Financial and Derivative Liabilities | 547 | — | 547 | ||||||
| Financial and Derivative Liabilities not subject to a netting agreement | (253 | ) | — | (253 | ) | ||||
| Total Financial and Derivative Liabilities subject to a netting agreement | $ | 294 | $ | — $ | 294 | ||||
| Financial Liabilities, Derivative Liabilities, and Collateral Pledged by Counterparty | |||||||||
| Gross Amounts Not Offset in | |||||||||
| the Statement of Assets and | |||||||||
| Liabilities | |||||||||
| Net Amounts | |||||||||
| of Liabilities | |||||||||
| Presented in | |||||||||
| the Statement | Financial and | ||||||||
| of Assets and | Derivative | Collateral | |||||||
| Counterparty | Liabilities | Instruments | Pledged^ | Net Amount | |||||
| Bank of America | $ | 27 | $ | 27 | $ | — $ | — | ||
| Bank of Montreal | 21 | 21 | — | — | |||||
| BNP Paribas | 108 | 97 | — | 11 | |||||
| Citigroup | 21 | 21 | — | — | |||||
| State Street | 11 | — | — | 11 | |||||
| Westpac | 106 | 95 | — | 11 | |||||
| Total | $ | 294 | $ | 261 | $ | — $ | 33 | ||
^ Collateral received or pledged amounts may not reconcile to those disclosed in the Statement of Assets and Liabilities due to the inclusion of off-Balance
Sheet collateral and adjustments made to exclude overcollateralization.
For further disclosure on derivatives and counterparty risk see note 2 in the Notes to Financial Statements.
See accompanying notes which are an integral part of the financial statements.
44 Moderate Strategy Fund
Russell Investment Company
Moderate Strategy Fund
Statement of Assets and Liabilities — October 31, 2016
| Amounts in thousands | ||
| Assets | ||
| Investments, at identified cost | $ | 552,062 |
| Investments, at fair value(>) | 578,648 | |
| Cash (restricted)(a)(b) | 6,600 | |
| Unrealized appreciation on foreign currency exchange contracts | 1,195 | |
| Receivables: | ||
| Dividends from affiliated Russell funds | 5 | |
| Investments sold | 477 | |
| Fund shares sold | 275 | |
| Variation margin on futures contracts | 35 | |
| Total return swap contracts, at fair value(8) | 487 | |
| Credit default swap contracts, at fair value(+) | 2,107 | |
| Total assets | 589,829 | |
| Liabilities | ||
| Payables: | ||
| Due to custodian | 1 | |
| Due to broker (c) | 2,538 | |
| Fund shares redeemed | 687 | |
| Accrued fees to affiliates | 340 | |
| Other accrued expenses | 88 | |
| Variation margin on futures contracts | 253 | |
| Unrealized depreciation on foreign currency exchange contracts | 294 | |
| Total liabilities | 4,201 | |
| Net Assets | $ | 585,628 |
See accompanying notes which are an integral part of the financial statements.
Moderate Strategy Fund 45
Russell Investment Company
Moderate Strategy Fund
Statement of Assets and Liabilities, continued — October 31, 2016
| Amounts in thousands | |||
| Net Assets Consist of: | |||
| Undistributed (overdistributed) net investment income | $ | 770 | |
| Accumulated net realized gain (loss) | 17,885 | ||
| Unrealized appreciation (depreciation) on: | |||
| Investments | 26,586 | ||
| Futures contracts | (59 | ) | |
| Total return swap contracts | 487 | ||
| Credit default swap contracts | (1 | ) | |
| Foreign currency-related transactions | 901 | ||
| Shares of beneficial interest | 553 | ||
| Additional paid-in capital | 538,506 | ||
| Net Assets | $ | 585,628 | |
| Net Asset Value, offering and redemption price per share: | |||
| Net asset value per share: Class A(#) | $ | 10.63 | |
| Maximum offering price per share (Net asset value plus sales charge of 5.75%): Class A | $ | 11.28 | |
| Class A — Net assets | $ | 182,048,580 | |
| Class A — Shares outstanding ($.01 par value) | 17,133,284 | ||
| Net asset value per share: Class C(#) | $ | 10.51 | |
| Class C — Net assets | $ | 225,203,850 | |
| Class C — Shares outstanding ($.01 par value) | 21,430,387 | ||
| Net asset value per share: Class E(#) | $ | 10.66 | |
| Class E — Net assets | $ | 9,421,046 | |
| Class E — Shares outstanding ($.01 par value) | 884,080 | ||
| Net asset value per share: Class R1(#) | $ | 10.68 | |
| Class R1 — Net assets | $ | 20,069,380 | |
| Class R1 — Shares outstanding ($.01 par value) | 1,879,630 | ||
| Net asset value per share: Class R4(#) | $ | 10.64 | |
| Class R4 — Net assets | $ | 27,183,442 | |
| Class R4 — Shares outstanding ($.01 par value) | 2,554,217 | ||
| Net asset value per share: Class R5(#) | $ | 10.70 | |
| Class R5 — Net assets | $ | 17,667,728 | |
| Class R5 — Shares outstanding ($.01 par value) | 1,651,496 | ||
| Net asset value per share: Class S(#) | $ | 10.67 | |
| Class S — Net assets | $ | 104,034,440 | |
| Class S — Shares outstanding ($.01 par value) | 9,747,655 | ||
| Amounts in thousands | |||
| (8) Total return swap contracts - premiums paid (received) | $ | — | |
| (+) Credit default swap contracts - premiums paid (received) | $ | 2,108 | |
| (>) Investments in affiliated Russell funds | $ | 578,648 | |
| (a) Cash Collateral for Futures | $ | 4,900 | |
| (b) Cash Collateral for Swaps | $ | 1,700 | |
| (c) Due to Broker for Swaps | $ | 2,538 | |
| (#) Net asset value per share equals class level net assets divided by class level shares of beneficial interest outstanding. | |||
See accompanying notes which are an integral part of the financial statements.
46 Moderate Strategy Fund
Russell Investment Company
Moderate Strategy Fund
Statement of Operations — For the Period Ended October 31, 2016
| Amounts in thousands | |||
| Investment Income | |||
| Income distributions from affiliated Russell funds | $ | 19,276 | |
| Expenses | |||
| Advisory fees | 1,247 | ||
| Administrative fees | 265 | ||
| Custodian fees (1) | 45 | ||
| Distribution fees - Class A | 472 | ||
| Distribution fees - Class C | 1,807 | ||
| Distribution fees - Class R5 | 51 | ||
| Transfer agent fees - Class A | 377 | ||
| Transfer agent fees - Class C | 482 | ||
| Transfer agent fees - Class E | 21 | ||
| Transfer agent fees - Class R1 | 48 | ||
| Transfer agent fees - Class R4 | 59 | ||
| Transfer agent fees - Class R5 | 41 | ||
| Transfer agent fees - Class S | 219 | ||
| Professional fees | 46 | ||
| Registration fees | 110 | ||
| Shareholder servicing fees - Class C | 602 | ||
| Shareholder servicing fees - Class E | 27 | ||
| Shareholder servicing fees - Class R4 | 74 | ||
| Shareholder servicing fees - Class R5 | 51 | ||
| Trustees’ fees | 21 | ||
| Printing fees | 66 | ||
| Miscellaneous | 17 | ||
| Expenses before reductions | 6,148 | ||
| Expense reductions | (1,497 | ) | |
| Net expenses | 4,651 | ||
| Net investment income (loss) | 14,625 | ||
| Net Realized and Unrealized Gain (Loss) | |||
| Net realized gain (loss) on: | |||
| Investments | 15,426 | ||
| Futures contracts | (262 | ) | |
| Options written | 1,180 | ||
| Total return swap contracts | (1,589 | ) | |
| Credit default swap contracts | 1,446 | ||
| Foreign currency-related transactions | (295 | ) | |
| Capital gain distributions from Underlying Funds | 9,279 | ||
| Net realized gain (loss) | 25,185 | ||
| Net change in unrealized appreciation (depreciation) on: | |||
| Investments | (12,722 | ) | |
| Futures contracts | (870 | ) | |
| Total return swap contracts | 1,149 | ||
| Credit default swap contracts | (1 | ) | |
| Foreign currency-related transactions | 833 | ||
| Net change in unrealized appreciation (depreciation) | (11,611 | ) | |
| Net realized and unrealized gain (loss) | 13,574 | ||
| Net Increase (Decrease) in Net Assets from Operations | $ | 28,199 | |
(1) Includes a reimbursement for overbilling of custody out-of-pocket fees from prior years. See note 8 in the Notes to Financial Statements.
See accompanying notes which are an integral part of the financial statements.
Moderate Strategy Fund 47
Russell Investment Company
Moderate Strategy Fund
Statements of Changes in Net Assets
| For the Periods Ended October 31, | ||||||
| Amounts in thousands | 2016 | 2015 | ||||
| Increase (Decrease) in Net Assets | ||||||
| Operations | ||||||
| Net investment income (loss) | $ | 14,625 | $ | 19,067 | ||
| Net realized gain (loss) | 25,185 | 70,578 | ||||
| Net change in unrealized appreciation (depreciation) | (11,611 | ) | (90,491 | ) | ||
| Net increase (decrease) in net assets from operations | 28,199 | (846 | ) | |||
| Distributions | ||||||
| From net investment income | ||||||
| Class A | (5,081 | ) | (5,692 | ) | ||
| Class C | (4,766 | ) | (5,593 | ) | ||
| Class E | (289 | ) | (798 | ) | ||
| Class R1 | (785 | ) | (1,261 | ) | ||
| Class R4 | (812 | ) | (1,101 | ) | ||
| Class R5 | (500 | ) | (791 | ) | ||
| Class S | (3,100 | ) | (3,968 | ) | ||
| From net realized gain | ||||||
| Class A | (20,300 | ) | (2,315 | ) | ||
| Class C | (26,556 | ) | (3,181 | ) | ||
| Class E | (1,258 | ) | (353 | ) | ||
| Class R1 | (3,336 | ) | (478 | ) | ||
| Class R4 | (3,331 | ) | (460 | ) | ||
| Class R5 | (2,271 | ) | (368 | ) | ||
| Class S | (11,655 | ) | (1,527 | ) | ||
| Net decrease in net assets from distributions | (84,040 | ) | (27,886 | ) | ||
| Share Transactions* | ||||||
| Net increase (decrease) in net assets from share transactions | (57,990 | ) | (116,926 | ) | ||
| Total Net Increase (Decrease) in Net Assets | (113,831 | ) | (145,658 | ) | ||
| Net Assets | ||||||
| Beginning of period | 699,459 | 845,117 | ||||
| End of period | $ | 585,628 | $ | 699,459 | ||
| Undistributed (overdistributed) net investment income included in net assets | $ | 770 | $ | 598 | ||
See accompanying notes which are an integral part of the financial statements.
48 Moderate Strategy Fund
Russell Investment Company
Moderate Strategy Fund
Statements of Changes in Net Assets, continued
* Share transaction amounts (in thousands) for the periods ended October 31, 2016 and October 31, 2015 were as follows:
| 2016 | 2015 | |||||||||||
| Shares | Dollars | Shares | Dollars | |||||||||
| Class A | ||||||||||||
| Proceeds from shares sold | 1,669 | $ | 17,171 | 1,839 | $ | 21,674 | ||||||
| Proceeds from reinvestment of distributions | 2,490 | 25,066 | 674 | 7,906 | ||||||||
| Payments for shares redeemed | (4,483 | ) | (46,328 | ) | (3,603 | ) | (42,415 | ) | ||||
| Net increase (decrease) | (324 | ) | (4,091 | ) | (1,090 | ) | (12,835 | ) | ||||
| Class C | ||||||||||||
| Proceeds from shares sold | 1,992 | 20,630 | 3,204 | 37,484 | ||||||||
| Proceeds from reinvestment of distributions | 3,127 | 31,122 | 750 | 8,714 | ||||||||
| Payments for shares redeemed | (6,866 | ) | (70,802 | ) | (6,104 | ) | (71,131 | ) | ||||
| Net increase (decrease) | (1,747 | ) | (19,050 | ) | (2,150 | ) | (24,933 | ) | ||||
| Class E | ||||||||||||
| Proceeds from shares sold | 116 | 1,210 | 424 | 5,024 | ||||||||
| Proceeds from reinvestment of distributions | 150 | 1,516 | 98 | 1,146 | ||||||||
| Payments for shares redeemed | (551 | ) | (5,783 | ) | (2,467 | ) | (29,119 | ) | ||||
| Net increase (decrease) | (285 | ) | (3,057 | ) | (1,945 | ) | (22,949 | ) | ||||
| Class R1 | ||||||||||||
| Proceeds from shares sold | 694 | 7,209 | 616 | 7,300 | ||||||||
| Proceeds from reinvestment of distributions | 407 | 4,118 | 148 | 1,739 | ||||||||
| Payments for shares redeemed | (2,319 | ) | (23,897 | ) | (2,060 | ) | (24,514 | ) | ||||
| Net increase (decrease) | (1,218 | ) | (12,570 | ) | (1,296 | ) | (15,475 | ) | ||||
| Class R4 | ||||||||||||
| Proceeds from shares sold | 321 | 3,363 | 478 | 5,656 | ||||||||
| Proceeds from reinvestment of distributions | 411 | 4,143 | 133 | 1,561 | ||||||||
| Payments for shares redeemed | (1,015 | ) | (10,459 | ) | (1,582 | ) | (18,747 | ) | ||||
| Net increase (decrease) | (283 | ) | (2,953 | ) | (971 | ) | (11,530 | ) | ||||
| Class R5 | ||||||||||||
| Proceeds from shares sold | 332 | 3,432 | 250 | 2,962 | ||||||||
| Proceeds from reinvestment of distributions | 273 | 2,771 | 99 | 1,159 | ||||||||
| Payments for shares redeemed | (1,007 | ) | (10,598 | ) | (1,324 | ) | (15,667 | ) | ||||
| Net increase (decrease) | (402 | ) | (4,395 | ) | (975 | ) | (11,546 | ) | ||||
| Class S | ||||||||||||
| Proceeds from shares sold | 2,640 | 27,292 | 2,655 | 31,197 | ||||||||
| Proceeds from reinvestment of distributions | 1,440 | 14,572 | 459 | 5,404 | ||||||||
| Payments for shares redeemed | (5,112 | ) | (53,738 | ) | (4,594 | ) | (54,259 | ) | ||||
| Net increase (decrease) | (1,032 | ) | (11,874 | ) | (1,480 | ) | (17,658 | ) | ||||
| Total increase (decrease) | (5,291 | ) | $ | (57,990 | ) | (9,907 | ) | $ | (116,926 | ) | ||
See accompanying notes which are an integral part of the financial statements.
Moderate Strategy Fund 49
Russell Investment Company
Moderate Strategy Fund
Financial Highlights — For the Periods Ended
For a Share Outstanding Throughout Each Period.
| $ | |||||||||||||||
| $ | Net | $ | $ | $ | $ | ||||||||||
| Net Asset Value, | Investment | Net Realized | Total from | Distributions | Distributions | ||||||||||
| Beginning of | Income (Loss) | and Unrealized | Investment | from Net | from Net | ||||||||||
| Period | (a)(b)(e) | Gain (Loss) | Operations | Investment Income | Realized Gain | ||||||||||
| Class A | |||||||||||||||
| October 31, 2016 | 11.58 | .27 | .25 | .52 | (.30 | ) | (1.17 | ) | |||||||
| October 31, 2015 | 12.02 | .31 | (.31 | ) | — | (.31 | ) | (.13 | ) | ||||||
| October 31, 2014 | 11.59 | .17 | .43 | .60 | (.17 | ) | — | ||||||||
| October 31, 2013 | 11.06 | .26 | .53 | .79 | (.26 | ) | — | ||||||||
| October 31, 2012 | 10.51 | .24 | .55 | .79 | (.24 | ) | — | ||||||||
| Class C | |||||||||||||||
| October 31, 2016 | 11.46 | .19 | .25 | .44 | (.22 | ) | (1.17 | ) | |||||||
| October 31, 2015 | 11.90 | .22 | (.31 | ) | (.09) | (.22 | ) | (.13 | ) | ||||||
| October 31, 2014 | 11.49 | .08 | .42 | .50 | (.09 | ) | — | ||||||||
| October 31, 2013 | 10.99 | .18 | .52 | .70 | (.20 | ) | — | ||||||||
| October 31, 2012 | 10.44 | .16 | .55 | .71 | (.16 | ) | — | ||||||||
| Class E | |||||||||||||||
| October 31, 2016 | 11.60 | .27 | .25 | .52 | (.29 | ) | (1.17 | ) | |||||||
| October 31, 2015 | 12.04 | .36 | (.37 | ) | (.01) | (.30 | ) | (.13 | ) | ||||||
| October 31, 2014 | 11.61 | .18 | .42 | .60 | (.17 | ) | — | ||||||||
| October 31, 2013 | 11.08 | .29 | .50 | .79 | (.26 | ) | — | ||||||||
| October 31, 2012 | 10.52 | .23 | .57 | .80 | (.24 | ) | — | ||||||||
| Class R1 | |||||||||||||||
| October 31, 2016 | 11.62 | .34 | .21 | .55 | (.32 | ) | (1.17 | ) | |||||||
| October 31, 2015 | 12.07 | .36 | (.34 | ) | .02 | (.34 | ) | (.13 | ) | ||||||
| October 31, 2014 | 11.63 | .23 | .42 | .65 | (.21 | ) | — | ||||||||
| October 31, 2013 | 11.11 | .31 | .51 | .82 | (.30 | ) | — | ||||||||
| October 31, 2012 | 10.56 | .27 | .57 | .84 | (.29 | ) | — | ||||||||
| Class R4(1) | |||||||||||||||
| October 31, 2016 | 11.59 | .28 | .24 | .52 | (.30 | ) | (1.17 | ) | |||||||
| October 31, 2015 | 12.03 | .33 | (.33 | ) | — | (.31 | ) | (.13 | ) | ||||||
| October 31, 2014 | 11.60 | .20 | .41 | .61 | (.18 | ) | — | ||||||||
| October 31, 2013 | 11.08 | .29 | .51 | .80 | (.28 | ) | — | ||||||||
| October 31, 2012 | 10.52 | .26 | .56 | .82 | (.26 | ) | — | ||||||||
| Class R5(2) | |||||||||||||||
| October 31, 2016 | 11.64 | .25 | .25 | .50 | (.27 | ) | (1.17 | ) | |||||||
| October 31, 2015 | 12.08 | .32 | (.35 | ) | (.03) | (.28 | ) | (.13 | ) | ||||||
| October 31, 2014 | 11.64 | .17 | .42 | .59 | (.15 | ) | — | ||||||||
| October 31, 2013 | 11.12 | .30 | .47 | .77 | (.25 | ) | — | ||||||||
| October 31, 2012 | 10.56 | .27 | .51 | .78 | (.22 | ) | — | ||||||||
| Class S | |||||||||||||||
| October 31, 2016 | 11.62 | .29 | .24 | .53 | (.31 | ) | (1.17 | ) | |||||||
| October 31, 2015 | 12.06 | .34 | (.32 | ) | .02 | (.33 | ) | (.13 | ) | ||||||
| October 31, 2014 | 11.63 | .20 | .43 | .63 | (.20 | ) | — | ||||||||
| October 31, 2013 | 11.11 | .30 | .51 | .81 | (.29 | ) | — | ||||||||
| October 31, 2012 | 10.55 | .27 | .56 | .83 | (.27 | ) | — | ||||||||
See accompanying notes which are an integral part of the financial statements.
50 Moderate Strategy Fund
| % | % | % | |||||||||||||||
| $ | $ | Ratio of Expenses | Ratio of Expenses | Ratio of Net | |||||||||||||
| Net Asset Value, | % | Net Assets, | to Average | to Average | Investment Income | % | |||||||||||
| $ | End of | Total | End of Period | Net Assets, | Net Assets, | to Average | Portfolio | ||||||||||
| Total Distributions | Period | Return(d) | (000 | ) | Gross(g) | Net(e)(g) | Net Assets(b)(e) | Turnover Rate | |||||||||
| (1.47 | ) | 10.63 | 5.29 | 182,049 | .74 | .49 | 2.58 | 34 | |||||||||
| (.44 | ) | 11.58 | (.04 | ) | 202,107 | .74 | .51 | 2.61 | 32 | ||||||||
| (.17 | ) | 12.02 | 5.19 | 222,875 | .73 | .56 | 1.45 | 14 | |||||||||
| (.26 | ) | 11.59 | 7.22 | 235,684 | .72 | .57 | 2.35 | 13 | |||||||||
| (.24 | ) | 11.06 | 7.67 | 232,467 | .71 | .56 | 2.21 | 23 | |||||||||
| (1.39 | ) | 10.51 | 4.53 | 225,204 | 1.49 | 1.24 | 1.83 | 34 | |||||||||
| (.35 | ) | 11.46 | (.80 | ) | 265,698 | 1.49 | 1.26 | 1.88 | 32 | ||||||||
| (.09 | ) | 11.90 | 4.39 | 301,445 | 1.48 | 1.31 | .70 | 14 | |||||||||
| (.20 | ) | 11.49 | 6.42 | 318,120 | 1.47 | 1.32 | 1.60 | 13 | |||||||||
| (.16 | ) | 10.99 | 6.91 | 314,391 | 1.46 | 1.31 | 1.48 | 23 | |||||||||
| (1.46 | ) | 10.66 | 5.26 | 9,421 | .74 | .57 | 2.62 | 34 | |||||||||
| (.43 | ) | 11.60 | (.14 | ) | 13,559 | .73 | .56 | 3.07 | 32 | ||||||||
| (.17 | ) | 12.04 | 5.18 | 37,485 | .73 | .56 | 1.51 | 14 | |||||||||
| (.26 | ) | 11.61 | 7.17 | 47,129 | .72 | .57 | 2.56 | 13 | |||||||||
| (.24 | ) | 11.08 | 7.75 | 74,240 | .71 | .56 | 2.14 | 23 | |||||||||
| (1.49 | ) | 10.68 | 5.60 | 20,069 | .49 | .24 | 3.23 | 34 | |||||||||
| (.47 | ) | 11.62 | .18 | 36,011 | .49 | .21 | 3.07 | 32 | |||||||||
| (.21 | ) | 12.07 | 5.67 | 53,016 | .48 | .17 | 1.92 | 14 | |||||||||
| (.30 | ) | 11.63 | 7.57 | 69,274 | .47 | .17 | 2.71 | 13 | |||||||||
| (.29 | ) | 11.11 | 8.10 | 66,823 | .46 | .14 | 2.48 | 23 | |||||||||
| (1.47 | ) | 10.64 | 5.26 | 27,183 | .74 | .49 | 2.64 | 34 | |||||||||
| (.44 | ) | 11.59 | (.01 | ) | 32,895 | .74 | .46 | 2.80 | 32 | ||||||||
| (.18 | ) | 12.03 | 5.31 | 45,828 | .73 | .42 | 1.68 | 14 | |||||||||
| (.28 | ) | 11.60 | 7.31 | 67,330 | .72 | .42 | 2.56 | 13 | |||||||||
| (.26 | ) | 11.08 | 7.95 | 73,019 | .71 | .39 | 2.38 | 23 | |||||||||
| (1.44 | ) | 10.70 | 5.06 | 17,668 | .99 | .74 | 2.39 | 34 | |||||||||
| (.41 | ) | 11.64 | (.27 | ) | 23,915 | .99 | .71 | 2.70 | 32 | ||||||||
| (.15 | ) | 12.08 | 5.10 | 36,598 | .98 | .67 | 1.46 | 14 | |||||||||
| (.25 | ) | 11.64 | 7.01 | 57,788 | .97 | .67 | 2.63 | 13 | |||||||||
| (.22 | ) | 11.12 | 7.55 | 86,756 | .97 | .64 | 2.56 | 23 | |||||||||
| (1.48 | ) | 10.67 | 5.43 | 104,034 | .49 | .32 | 2.77 | 34 | |||||||||
| (.46 | ) | 11.62 | .16 | 125,274 | .49 | .31 | 2.89 | 32 | |||||||||
| (.20 | ) | 12.06 | 5.44 | 147,870 | .48 | .31 | 1.71 | 14 | |||||||||
| (.29 | ) | 11.63 | 7.41 | 154,841 | .47 | .32 | 2.63 | 13 | |||||||||
| (.27 | ) | 11.11 | 8.02 | 155,433 | .46 | .31 | 2.52 | 23 | |||||||||
See accompanying notes which are an integral part of the financial statements.
Moderate Strategy Fund 51
Russell Investment Company
Moderate Strategy Fund
Related Party Transactions, Fees and Expenses
| Accrued fees payable to affiliates for the period ended October 31, 2016 were as follows: | ||
| Advisory fees | $ | 157 |
| Administration fees | 21,326 | |
| Distribution fees | 188,162 | |
| Shareholder servicing fees | 60,135 | |
| Transfer agent fees | 67,987 | |
| Trustee fees | 2,238 | |
| $ | 340,005 | |
Transactions (amounts in thousands) during the period ended October 31, 2016 with Underlying Funds which are, or were, an
affiliated company are as follows:
| Fair Value, | Change in | |||||||||||||||||||
| Beginning of | Realized Gain | Unrealized | Fair Value, End | Income | Capital Gains | |||||||||||||||
| Period | Purchases | Sales | (Loss) | Gain (Loss) | of Period | Distributions | Distributions | |||||||||||||
| Russell Commodity Strategies Fund | $ | 9,919 | $ | 10,564 | $ | 3,201 | $ | (2,121) | $ | 2,037 | $ | 17,198 | $ | — | $ | — | ||||
| Russell Global Infrastructure Fund | 20,886 | 5,308 | 8,424 | 453 | (919 | ) | 17,304 | 512 | 531 | |||||||||||
| Russell Fund Global Real Estate Securities | 7,000 | 5,836 | 1,909 | 496 | (956 | ) | 10,467 | 186 | 321 | |||||||||||
| Russell U.S. Defensive Equity Fund | 28,304 | 1,882 | 31,316 | 16,625 | (15,183 | ) | 312 | 278 | — | |||||||||||
| Russell U.S. Dynamic Equity Fund | 21,241 | 4,422 | 12,924 | (169 | ) | (2,140 | ) | 10,430 | 944 | 1,916 | ||||||||||
| Russell U.S. Small Cap Equity Fund | 27,652 | 4,278 | 8,324 | (981 | ) | 131 | 22,756 | 241 | 1,746 | |||||||||||
| Select U.S. Equity Fund | 31,839 | 2,426 | 34,796 | 696 | 404 | 569 | 668 | 42 | ||||||||||||
| Russell Fund Global Opportunistic Credit | 90,947 | 27,396 | 29,452 | (1,766 | ) | 8,633 | 95,758 | 3,401 | — | |||||||||||
| Russell Investment Grade Bond Fund | 111,597 | 6,771 | 45,421 | 443 | (713 | ) | 72,677 | 3,963 | 166 | |||||||||||
| Russell Strategic Bond Fund | 222,767 | 13,296 | 107,561 | 2,293 | (57) | 130,738 | 6,610 | 1,227 | ||||||||||||
| Unconstrained Total Return Fund | — | 29,514 | 540 | 1 | 87 | 29,062 | 2 | — | ||||||||||||
| Russell Emerging Markets Fund | 27,217 | 17,300 | 9,188 | (2,149 | ) | 4,394 | 37,574 | 96 | — | |||||||||||
| Russell Global Equity Fund | 42,233 | 6,777 | 15,249 | 2,602 | (6,228 | ) | 30,135 | 771 | 3,330 | |||||||||||
| Select International Equity Fund | 41,652 | 3,554 | 7,997 | (990 | ) | (1,378 | ) | 34,841 | 1,137 | — | ||||||||||
| Russell Multi-Strategy Income Fund | — | 59,434 | 546 | (7 | ) | (835 | ) | 58,046 | 427 | — | ||||||||||
| Russell U.S. Cash Management Fund | 13,188 | 60,194 | 62,602 | — | 1 | 10,781 | 40 | — | ||||||||||||
| $ | 696,442 | $ | 258,952 | $ | 379,450 | $ | 15,426 | $ | (12,722) | $ | 578,648 | $ | 19,276 | $ | 9,279 | |||||
Federal Income Taxes
At October 31, 2016, the cost of investments and net unrealized appreciation (depreciation), undistributed ordinary income and
undistributed long-term capital gains for income tax purposes were as follows:
| Cost of Investments | $ | 560,529,684 | ||
| Unrealized Appreciation | $ | 24,877,618 | ||
| Unrealized Depreciation | (6,759,628 | ) | ||
| Net Unrealized Appreciation (Depreciation) | $ | 18,117,990 | ||
| Undistributed Ordinary Income | $ | 2,085,900 | ||
| Undistributed Long-Term Capital Gains | ||||
| (Capital Loss Carryforward) | $ | 26,698,313 | ||
| Tax Composition of Distributions | ||||
| Ordinary Income | $ | 15,332,768 | ||
| Long-Term Capital Gains | $ | 68,706,955 |
See accompanying notes which are an integral part of the financial statements.
52 Moderate Strategy Fund
Russell Investment Company
Moderate Strategy Fund
Federal Income Taxes, continued
Net investment income and net realized gains (losses) in the financial statements may differ from taxable net investment income and
net realized gains (losses). Capital accounts within the financial statements are adjusted for permanent differences between book and
tax accounting. These differences may be due to foreign currency gains or losses, reclassifications of dividends and /or differences in
treatment of income from swaps. These adjustments have no impact on the net assets.
At October 31, 2016, the Statement of Assets and Liabilities have been adjusted by the following amounts (in thousands):
| Undistributed net investment income | $ | 880 | |
| Accumulated net realized gain (loss) | (880 | ) | |
| Additional paid-in capital | — |
See accompanying notes which are an integral part of the financial statements.
Moderate Strategy Fund 53
Russell Investment Company
Balanced Strategy Fund
Portfolio Management Discussion and Analysis — October 31, 2016 (Unaudited)
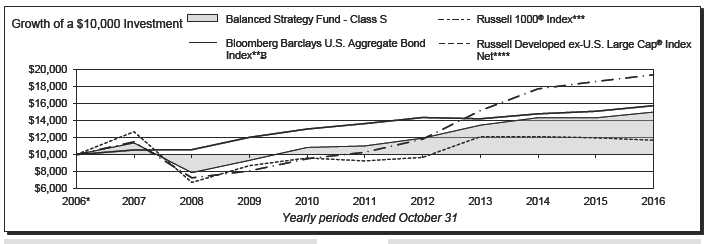
| Balanced Strategy Fund - Class A‡ | Balanced Strategy Fund - Class R5‡‡‡ | ||||||
| Total | Total | ||||||
| Return | Return | ||||||
| 1 Year | (1.48 | )% | 1 Year | 4.18 | % | ||
| 5 Years | 4.86 | %§ | 5 Years | 5.94 | %§ | ||
| 10 Years | 3.28 | %§ | 10 Years | 3.70 | %§ | ||
| Balanced Strategy Fund - Class C | Balanced Strategy Fund - Class S | ||||||
| Total | Total | ||||||
| Return | Return | ||||||
| 1 Year | 3.80 | % | 1 Year | 4.73 | % | ||
| 5 Years | 5.33 | %§ | 5 Years | 6.34 | %§ | ||
| 10 Years | 3.11 | %§ | 10 Years | 4.13 | %§ | ||
| Balanced Strategy Fund - Class E | Bloomberg Barclays U.S. Aggregate Bond Index**C | ||||||
| Total | Total | ||||||
| Return | Return | ||||||
| 1 Year | 4.38 | % | 1 Year | 4.37 | % | ||
| 5 Years | 6.08 | %§ | 5 Years | 2.90 | %§ | ||
| 10 Years | 3.87 | %§ | 10 Years | 4.64 | %§ | ||
| Balanced Strategy Fund - Class R1 | Russell 1000® Index*** | ||||||
| Total | |||||||
| Total | Return | ||||||
| Return | |||||||
| 1 Year | 4.70 | % | 1 Year | 4.26 | % | ||
| 5 Years | 6.46 | %§ | 5 Years | 13.51 | %§ | ||
| 10 Years | 4.21 | %§ | 10 Years | 6.83 | %§ | ||
| Russell Developed ex-U.S. Large Cap® Index Net**** | |||||||
| Balanced Strategy Fund - Class R4‡‡ | Total | ||||||
| Total | Return | ||||||
| Return | 1 Year | (2.34 | )% | ||||
| 1 Year | 4.46 | % | 5 Years | 4.75 | %§ | ||
| 5 Years | 6.20 | %§ | 10 Years | 1.56 | %§ | ||
| 10 Years | 3.94 | %§ | |||||
54 Balanced Strategy Fund
Russell Investment Company
Balanced Strategy Fund
Portfolio Management Discussion and Analysis, continued — October 31, 2016
(Unaudited)
| The Balanced Strategy Fund (the “Fund”) is a fund of funds that | real assets like global real estate investment trusts and global |
| invests principally in other Russell Investment Company mutual | infrastructure. With interest rates falling, income opportunities |
| funds (the “Underlying Funds”). The Underlying Funds employ | around the globe continued to shrink and income available from |
| a multi-manager approach whereby portions of the Underlying | most assets fell. |
| Funds are allocated to different money managers. Underlying | The U.S. equity market, as measured by the S&P 500® Index, |
| Fund assets not allocated to money managers are managed by | was up 4.51% over the period but also experienced multiple |
| Russell Investment Management, LLC (“RIM”), the Fund’s | draw downs. The Fund’s strategic exposure to global equities |
| and Underlying Funds’ advisor. RIM, as the Underlying Funds’ | proved beneficial over the period as emerging markets rallied |
| advisor, may change the allocation of the Underlying Funds’ | and outperformed U.S. equities. By contrast, non-U.S. developed |
| assets among money managers at any time. An exemptive order | equity was one of the lowest performing portions of the Fund’s |
| from the Securities and Exchange Commission (“SEC”) permits | exposure as falling commodities and currencies weighed on |
| RIM to engage or terminate a money manager in an Underlying | returns. |
| Fund at any time, subject to approval by the Underlying Fund’s | |
| Board, without a shareholder vote. Pursuant to the terms of the | How did the investment strategies and techniques employed |
| exemptive order, an Underlying Fund is required to notify its | by the Fund and the Underlying Funds affect the Fund’s |
| shareholders within 90 days of when a money manager begins | performance? |
| providing services. | The Fund is a fund of funds and its performance is based on RIM’s |
| What is the Fund’s investment objective? | strategic asset allocations, the performance of the Underlying |
| The Fund seeks to provide above average long term capital | Funds in which the Fund invests, and tactical changes in the |
| appreciation and a moderate level of current income. | Fund’s asset allocation throughout the year. |
| In order to seek to achieve the Fund’s objective during the | |
| How did the Fund perform relative to its benchmark for the | period, RIM’s strategic asset allocation included investments in |
| fiscal year ended October 31, 2016? | global equity, alternatives and fixed/other income Underlying |
| For the fiscal year ended October 31, 2016, the Fund’s Class A, | Funds. The Fund’s allocations to Underlying Funds invested in |
| Class C, Class E, Class R1, Class R4, Class R5 and Class S Shares | high yield bonds and emerging market debt and equity helped |
| gained 4.56%, 3.80%, 4.38%, 4.70%, 4.46%, 4.18% and 4.73%, | benchmark-relative performance during the period as these areas |
| respectively. This is compared to the Fund’s primary benchmark, | outperformed the Bloomberg Barclays U.S. Aggregate Bond Index. |
| the Bloomberg Barclays U.S. Aggregate Bond Index, which gained | However, commodities and non-U.S. developed equities delivered |
| 4.37% during the same period. The Fund’s performance includes | negative returns as measured by the Bloomberg Commodity Index |
| operating expenses, whereas index returns are unmanaged and do | Total Return and Russell Developed ex-U.S. Large Cap® Index |
| not include expenses of any kind. | Net, respectively. |
| For the fiscal year ended October 31, 2016, the Morningstar® | The Fund’s performance relative to the Bloomberg Barclays U.S. |
| Allocation-50% to 70% Equity Category, a group of funds that | Aggregate Bond Index was helped by strong active management |
| Morningstar considers to have investment strategies similar to | within the fixed income portion of the portfolio. Underlying Fund |
| those of the Fund, gained 2.75%. This result serves as a peer | bond issue selection during the period was generally additive to |
| comparison and is expressed net of operating expenses. | returns as fixed income money managers were able to pick well |
| within credit, avoiding defaults in places like the energy sector | |
| How did the market conditions described in the Market | where trouble occurred with falling energy prices in early 2016. |
| Summary report affect the Fund’s performance? | As such, an allocation to the Russell Strategic Bond Fund was |
| The Fund seeks to achieve its objective by investing in Underlying | positive from a benchmark-relative perspective. The Underlying |
| Funds that provide exposure to a range of diversified investments, | Fund was positively impacted by its overweight to credit and |
| and most major asset classes invested in by the Underlying Funds | additive currency positioning also helped to drive excess return. |
| produced positive absolute returns during the period. Markets | |
| during the fiscal year were characterized by higher levels of | By contrast, equity selection and positioning was more difficult, |
| volatility and dispersion across return sources. Within the fixed/ | with allocations to non-U.S. equity Underlying Funds detracting |
| other income Underlying Funds, exposure to high yield debt | from the Fund’s performance and security selection within |
| was beneficial as it was one of the best performing asset classes | those Underlying Funds struggling. In addition, overweights |
| globally. Falling interest rates also helped other fixed income | to European securities in the Select International Equity Fund |
| assets in the Underlying Funds rally, as well as more rate sensitive | caused the Underlying Fund to struggle as European equities |
| continued to lag the U.S. equity market. |
Balanced Strategy Fund 55
Russell Investment Company
Balanced Strategy Fund
Portfolio Management Discussion and Analysis, continued — October 31, 2016
(Unaudited)
| Describe any changes to the Fund’s structure or allocation | lows and RIM reduced risk exposure to a more defensive stance |
| to the Underlying Funds. | with the Fund’s equity allocation below strategic weights. RIM’s |
| RIM has the discretion to vary the Fund’s actual allocation | modifications to the Fund’s asset allocation were additive during |
| from the target strategic asset allocation by up to +/- 5% at the | the period. |
| equity, fixed/other income or alternative category level based on | RIM also made strategic asset allocation changes during the |
| RIM’s capital markets research. In addition to investing in the | period. In September 2016, RIM added further diversity and |
| Underlying Funds, RIM may seek to actively manage a Fund’s | dynamism to the Fund through the addition of the Russell Multi- |
| overall exposures by investing in derivatives that RIM believes | Strategy Income Fund and the Unconstrained Total Return Fund |
| will achieve the desired risk/return profile for the Fund. RIM’s | as Underlying Funds. |
| asset allocation modifications, implemented through both tactical | |
| changes to Underlying Fund allocations and derivatives-based | The views expressed in this report reflect those of the |
| exposures, benefited the Fund’s performance relative to the | portfolio managers only through the end of the period |
| Fund’s target strategic asset allocation. | covered by the report. These views do not necessarily |
| represent the views of RIM, or any other person in RIM or | |
| RIM adapted the Fund’s asset allocation over the period | any other affiliated organization. These views are subject |
| as market opportunities and risks evolved. The Fund was | to change at any time based upon market conditions or |
| defensively positioned in the fourth quarter of 2015, favoring | other events, and RIM disclaims any responsibility to |
| fixed income over equity. During the first quarter of 2016, equity | update the views contained herein. These views should not |
| markets declined substantially, and RIM added further risk to | be relied on as investment advice and, because investment |
| the portfolio by overweighting exposure to high yield credit and | decisions for a Russell Investment Company (“RIC”) Fund |
| emerging markets equity compared with core bond holdings | are based on numerous factors, should not be relied on as |
| and cash. Markets subsequently rebounded from the February | an indication of investment decisions of any RIC Fund. |
56 Balanced Strategy Fund
Russell Investment Company
Balanced Strategy Fund
Portfolio Management Discussion and Analysis, continued — October 31, 2016
(Unaudited)
* Assumes initial investment on November 1, 2006.
** The Bloomberg Barclays U.S. Aggregate Bond Index is an index, with income reinvested, generally representative of intermediate-term government bonds,
investment-grade corporate debt securities and mortgage-backed securities.
Effective August 24, 2016, the Barclays fixed income benchmark indices, including the Barclays Aggregate family of indices, were renamed the Bloomberg
Barclays family of indices.
*** Russell 1000® Index includes the 1,000 largest companies in the Russell 3000® Index. The Russell 1000® Index represents the universe of stocks from which
most active money managers typically select. The Russell 1000® Index return reflects adjustments from income dividends and capital gain distributions
reinvested as of the ex-dividend dates.
**** Russell Developed ex-U.S. Large Cap® Index (net of tax on dividends from foreign holdings) is an index which offers investors access to the large-cap segment
of the global equity market, excluding companies assigned to the United States. It is constructed to provide a comprehensive and unbiased barometer for the
large-cap segment and is completely reconstituted annually to accurately reflect the changes in the market over time.
‡ The performance shown has been adjusted to reflect the deduction of the maximum Class A sales charge of 5.75%.
‡‡ The Fund first issued Class R4 Shares on October 1, 2014. The returns shown for Class R4 Shares prior to that date are the returns of the Fund’s Class R2
Shares.
‡‡‡ The Fund first issued Class R5 Shares on October 1, 2014. The returns shown for Class R5 Shares prior to that date are the returns of the Fund’s Class R3
Shares.
§ Annualized.
Performance is historical and assumes reinvestment of all dividends and capital gains. Investment return and principal value will fluctuate so that an investor’s
shares, when redeemed, may be worth more or less than when purchased. Past performance is not indicative of future results. The returns shown do not reflect the
deduction of taxes that a shareholder would pay on Fund distributions or the redemption of Fund shares. Additionally, the returns presented herein may differ from
the performance reported in the Financial Highlights as the returns herein are calculated in a manner consistent with standardized performance in accordance with
Securities and Exchange Commission rules, while the performance in the Financial Highlights has been calculated in accordance with U.S. Generally Accepted
Accounting Principles (“U.S. GAAP”).
Balanced Strategy Fund 57
Russell Investment Company
Balanced Strategy Fund
Shareholder Expense Example — October 31, 2016 (Unaudited)
| Fund Expenses | Please note that the expenses shown in the table are meant | |||||
| The following disclosure provides important information | to highlight your ongoing costs only and do not reflect any | |||||
| regarding the Fund’s Shareholder Expense Example | transactional costs. Therefore, the information under the heading | |||||
| (“Example”). | “Hypothetical Performance (5% return before expenses)” is | |||||
| useful in comparing ongoing costs only, and will not help you | ||||||
| Example | determine the relative total costs of owning different funds. In | |||||
| As a shareholder of the Fund, you incur two types of costs: (1) | addition, if these transactional costs were included, your costs | |||||
| transaction costs, including sales charges (loads) on certain | would have been higher. | |||||
| purchase or redemption payments, and (2) ongoing costs, | Hypothetical | |||||
| including advisory and administrative fees; distribution and/or | Performance (5% | |||||
| service fees; and other Fund expenses. The Example is intended | Actual | return before | ||||
| to help you understand your ongoing costs (in dollars) of investing | Class A | Performance | expenses) | |||
| Beginning Account Value | ||||||
| in the Fund and to compare these costs with the ongoing costs of | May 1, 2016 | $ | 1,000.00 | $ | 1,000.00 | |
| investing in other mutual funds. The Example is based on an | Ending Account Value | |||||
| investment of $1,000 invested at the beginning of the period and | October 31, 2016 | $ | 1,040.20 | $ | 1,022.92 | |
| held for the entire period indicated, which for this Fund is from | Expenses Paid During Period* | $ | 2.26 | $ | 2.24 | |
| May 1, 2016 to October 31, 2016. | * Expenses are equal to the Fund's annualized expense ratio of 0.44% | |||||
| (representing the six month period annualized), multiplied by the average | ||||||
| Actual Expenses | account value over the period, multiplied by 184/366 (to reflect the one-half | |||||
| The information in the table under the heading “Actual | year period). May reflect amounts waived and/or reimbursed. Without any | |||||
| Performance” provides information about actual account values | waivers and/or reimbursements, expenses would have been higher. | |||||
| and actual expenses. You may use the information in this column, | ||||||
| Hypothetical | ||||||
| together with the amount you invested, to estimate the expenses | Performance (5% | |||||
| that you paid over the period. Simply divide your account value by | Actual | return before | ||||
| $1,000 (for example, an $8,600 account value divided by $1,000 | Class C | Performance | expenses) | |||
| Beginning Account Value | ||||||
| = 8.6), then multiply the result by the number in the first column | May 1, 2016 | $ | 1,000.00 | $ | 1,000.00 | |
| in the row entitled “Expenses Paid During Period” to estimate | Ending Account Value | |||||
| the expenses you paid on your account during this period. | October 31, 2016 | $ | 1,036.00 | $ | 1,019.15 | |
| Expenses Paid During Period* | $ | 6.09 | $ | 6.04 | ||
| Hypothetical Example for Comparison Purposes | ||||||
| The information in the table under the heading “Hypothetical | * Expenses are equal to the Fund's annualized expense ratio of 1.19% | |||||
| (representing the six month period annualized), multiplied by the average | ||||||
| Performance (5% return before expenses)” provides information | account value over the period, multiplied by 184/366 (to reflect the one-half | |||||
| about hypothetical account values and hypothetical expenses | year period). May reflect amounts waived and/or reimbursed. Without any | |||||
| based on the Fund’s actual expense ratio and an assumed rate of | waivers and/or reimbursements, expenses would have been higher. | |||||
| return of 5% per year before expenses, which is not the Fund’s | ||||||
| Hypothetical | ||||||
| actual return. The hypothetical account values and expenses | Performance (5% | |||||
| may not be used to estimate the actual ending account balance or | Actual | return before | ||||
| expenses you paid for the period. You may use this information | Class E | Performance | expenses) | |||
| to compare the ongoing costs of investing in the Fund and other | Beginning Account Value | |||||
| May 1, 2016 | $ | 1,000.00 | $ | 1,000.00 | ||
| funds. To do so, compare this 5% hypothetical example with the | Ending Account Value | |||||
| 5% hypothetical examples that appear in the shareholder reports | October 31, 2016 | $ | 1,039.30 | $ | 1,022.27 | |
| of other funds. | Expenses Paid During Period* | $ | 2.92 | $ | 2.90 | |
| * Expenses are equal to the Fund's annualized expense ratio of 0.57% | ||||||
| (representing the six month period annualized), multiplied by the average | ||||||
| account value over the period, multiplied by 184/366 (to reflect the one-half | ||||||
| year period). May reflect amounts waived and/or reimbursed. Without any | ||||||
| waivers and/or reimbursements, expenses would have been higher. | ||||||
58 Balanced Strategy Fund
Russell Investment Company
Balanced Strategy Fund
Shareholder Expense Example, continued — October 31, 2016 (Unaudited)
| Hypothetical | ||||||
| Performance (5% | ||||||
| Actual | return before | |||||
| Class R1 | Performance | expenses) | ||||
| Beginning Account Value | ||||||
| May 1, 2016 | $ | 1,000.00 | $ | 1,000.00 | ||
| Ending Account Value | ||||||
| October 31, 2016 | $ | 1,040.70 | $ | 1,023.83 | ||
| Expenses Paid During Period* | $ | 1.33 | $ | 1.32 | ||
| * Expenses are equal to the Fund's annualized expense ratio of 0.26% | ||||||
| (representing the six month period annualized), multiplied by the average | ||||||
| account value over the period, multiplied by 184/366 (to reflect the one-half | ||||||
| year period). May reflect amounts waived and/or reimbursed. Without any | ||||||
| waivers and/or reimbursements, expenses would have been higher. | ||||||
| Hypothetical | ||||||
| Performance (5% | ||||||
| Actual | return before | |||||
| Class R4 | Performance | expenses) | ||||
| Beginning Account Value | ||||||
| May 1, 2016 | $ | 1,000.00 | $ | 1,000.00 | ||
| Ending Account Value | ||||||
| October 31, 2016 | $ | 1,039.70 | $ | 1,022.57 | ||
| Expenses Paid During Period* | $ | 2.61 | $ | 2.59 | ||
| * Expenses are equal to the Fund's annualized expense ratio of 0.51% | ||||||
| (representing the six month period annualized), multiplied by the average | ||||||
| account value over the period, multiplied by 184/366 (to reflect the one-half | ||||||
| year period). May reflect amounts waived and/or reimbursed. Without any | ||||||
| waivers and/or reimbursements, expenses would have been higher. | ||||||
| Hypothetical | ||||||
| Performance (5% | ||||||
| Actual | return before | |||||
| Class R5 | Performance | expenses) | ||||
| Beginning Account Value | ||||||
| May 1, 2016 | $ | 1,000.00 | $ | 1,000.00 | ||
| Ending Account Value | ||||||
| October 31, 2016 | $ | 1,038.30 | $ | 1,021.32 | ||
| Expenses Paid During Period* | $ | 3.89 | $ | 3.86 | ||
| * Expenses are equal to the Fund's annualized expense ratio of 0.76% | ||||||
| (representing the six month period annualized), multiplied by the average | ||||||
| account value over the period, multiplied by 184/366 (to reflect the one-half | ||||||
| year period). May reflect amounts waived and/or reimbursed. Without any | ||||||
| waivers and/or reimbursements, expenses would have been higher. | ||||||
| Hypothetical | ||||||
| Performance (5% | ||||||
| Actual | return before | |||||
| Class S | Performance | expenses) | ||||
| Beginning Account Value | ||||||
| May 1, 2016 | $ | 1,000.00 | $ | 1,000.00 | ||
| Ending Account Value | ||||||
| October 31, 2016 | $ | 1,041.30 | $ | 1,023.53 | ||
| Expenses Paid During Period* | $ | 1.64 | $ | 1.63 | ||
| * Expenses are equal to the Fund's annualized expense ratio of 0.32% | ||||||
| (representing the six month period annualized), multiplied by the average | ||||||
| account value over the period, multiplied by 184/366 (to reflect the one-half | ||||||
| year period). May reflect amounts waived and/or reimbursed. Without any | ||||||
| waivers and/or reimbursements, expenses would have been higher. | ||||||
Balanced Strategy Fund 59
Russell Investment Company
Balanced Strategy Fund
Schedule of Investments — October 31, 2016
| Amounts in thousands (except share amounts) | ||||
| Fair | ||||
| Value | ||||
| Shares | $ | |||
| Investments in Russell Affiliated Mutual Funds - 96.6% | ||||
| Alternative - 7.1% | ||||
| Russell Commodity Strategies Fund Class Y | 14,185,463 | 78,162 | ||
| Russell Global Infrastructure Fund Class Y | 6,345,138 | 72,525 | ||
| Russell Global Real Estate Securities Fund Class Y | 656,238 | 23,447 | ||
| 174,134 | ||||
| Domestic Equities - 22.3% | ||||
| Russell U.S. Defensive Equity Fund Class Y | 987,182 | 48,589 | ||
| Russell U.S. Dynamic Equity Fund Class Y | 17,089,026 | 169,694 | ||
| Russell U.S. Small Cap Equity Fund Class Y | 5,167,184 | 142,666 | ||
| Select U.S. Equity Fund Class Y | 17,248,069 | 188,349 | ||
| 549,298 | ||||
| Fixed Income - 36.6% | ||||
| Russell Global Opportunistic Credit Fund Class Y | 24,991,260 | 242,915 | ||
| Russell Strategic Bond Fund Class Y | 50,609,604 | 559,742 | ||
| Unconstrained Total Return Fund Class Y | 9,704,835 | 97,339 | ||
| 899,996 | ||||
| International Equities - 26.7% | ||||
| Russell Emerging Markets Fund Class Y | 10,171,787 | 169,564 | ||
| Russell Global Equity Fund Class Y | 23,302,038 | 243,040 | ||
| Select International Equity Fund Class Y | 28,342,132 | 243,459 | ||
| 656,063 | ||||
| Specialty - 3.9% | ||||
| Russell Multi-Strategy Income Fund Class Y | 10,043,440 | 97,221 | ||
| Total Investments in Russell Affiliated Mutual Funds | ||||
| (cost $2,278,149) | 2,376,712 | |||
| Options Purchased - 0.2% | ||||
| (Number of Contracts) | ||||
| S&P 500 Index | ||||
| Nov 2016 2,137.68 Put (19,451) | USD | 41,580 (ÿ) | 820 | |
| Nov 2016 2,147.45 Put (21,990) | USD | 47,222 (ÿ) | 1,027 | |
| Jan 2017 2,137.94 Put (41,675) | USD | 89,099 (ÿ) | 2,534 | |
| Total Options Purchased | ||||
| (cost $4,648) | 4,381 | |||
| Short-Term Investments - 1.7% | ||||
| Russell U.S. Cash Management Fund | 41,657,171 | (8) | 41,666 | |
| Total Short-Term Investments | ||||
| (cost $41,659) | 41,666 | |||
| Total Investments 98.5% | ||||
| (identified cost $2,324,456) | 2,422,759 | |||
| Other Assets and Liabilities, Net - 1.5% | 36,880 | |||
| Net Assets - 100.0% | 2,459,639 | |||
See accompanying notes which are an integral part of the financial statements.
60 Balanced Strategy Fund
Russell Investment Company
Balanced Strategy Fund
Schedule of Investments, continued — October 31, 2016
| Futures Contracts | |||||||
| Amounts in thousands (except contract amounts) | |||||||
| Unrealized | |||||||
| Appreciation | |||||||
| Number of | Notional | Expiration | (Depreciation) | ||||
| Contracts | Amount | Date | $ | ||||
| Long Positions | |||||||
| Amsterdam Index Futures | 129 | EUR | 11,641 | 11/16 | 7 | ||
| CAC40 Euro Index Futures | 735 | EUR | 33,123 | 11/16 | 199 | ||
| DAX Index Futures | 117 | EUR | 31,230 | 12/16 | 861 | ||
| Euro STOXX 50 Index Futures | 681 | EUR | 20,791 | 12/16 | 212 | ||
| FTSE/MIB Index Futures | 80 | EUR | 6,843 | 12/16 | 200 | ||
| IBEX 35 Index Futures | 119 | EUR | 10,861 | 11/16 | 434 | ||
| OMXS 30 Index Futures | 515 | SEK | 74,405 | 11/16 | 3 | ||
| Russell 1000 Mini Index Futures | 31 | USD | 3,639 | 12/16 | (81 | ) | |
| S&P 500 E-Mini Index Futures | 541 | USD | 57,349 | 12/16 | (1,102 | ) | |
| S&P Mid 400 E-Mini Index Futures | 32 | USD | 4,822 | 12/16 | (169 | ) | |
| Short Positions | |||||||
| FTSE 100 Index Futures | 111 | GBP | 7,691 | 12/16 | (358 | ) | |
| Hang Seng Index Futures | 8 | HKD | 9,162 | 11/16 | 26 | ||
| MSCI Emerging Markets Mini Index Futures | 204 | USD | 9,216 | 12/16 | 86 | ||
| MSCI Singapore Index Futures | 20 | SGD | 616 | 11/16 | 7 | ||
| Russell 1000 Mini Index Futures | 59 | USD | 6,926 | 12/16 | 135 | ||
| Russell 2000 Mini Index Futures | 14 | USD | 1,665 | 12/16 | 93 | ||
| S&P 500 E-Mini Index Futures | 1,137 | USD | 120,527 | 12/16 | 2,368 | ||
| S&P Mid 400 E-Mini Index Futures | 65 | USD | 9,794 | 12/16 | 309 | ||
| S&P/TSX 60 Index Futures | 254 | CAD | 44,018 | 12/16 | (1,029 | ) | |
| SPI 200 Index Futures | 217 | AUD | 28,698 | 12/16 | (472 | ) | |
| TOPIX Index Futures | 262 | JPY | 3,654,901 | 12/16 | (1,441 | ) | |
| Total Unrealized Appreciation (Depreciation) on Open Futures Contracts (å) | 288 | ||||||
| Options Written | ||||||||||||
| Amounts in thousands (except contract amounts) | ||||||||||||
| Number of | Strike | Notional | Expiration | Fair Value | ||||||||
| Call/Put | Contracts | Price | Amount | Date | $ | |||||||
| S&P 500 Index | Put | 38,902 | 1,900.16 | USD | 73,920 | 11/30/16 | (127 | ) | ||||
| S&P 500 Index | Put | 43,981 | 1,908.84 | USD | 83,953 | 11/30/16 | (158 | ) | ||||
| S&P 500 Index | Put | 83,350 | 1,900.39 | USD | 158,398 | 01/06/17 | (999 | ) | ||||
| Total Liability for Options Written (premiums received $2,373) | (1,284 | ) | ||||||||||
| Transactions in options written contracts for the period ended October 31, 2016 were as follows: | ||||||||||||
| Number of | Premiums | |||||||||||
| Contracts | Received | |||||||||||
| Outstanding October 31, 2015 | — | $ | — | |||||||||
| Opened | 9,742,147 | 16,421 | ||||||||||
| Closed | (9,449,522 | ) | (7,149 | ) | ||||||||
| Expired | (126,392 | ) | (6,899 | ) | ||||||||
| Outstanding October 31, 2016 | 166,233 | $ | 2,373 | |||||||||
| Foreign Currency Exchange Contracts | |||||||||
| Amounts in thousands | |||||||||
| Unrealized | |||||||||
| Appreciation | |||||||||
| Amount | Amount | (Depreciation) | |||||||
| Counterparty | Sold | Bought | Settlement Date | $ | |||||
| Bank of America | USD | 10,040 | CHF | 9,900 | 12/21/16 | (7 | ) | ||
| Bank of America | USD | 32,112 | EUR | 29,170 | 12/21/16 | (19 | ) | ||
See accompanying notes which are an integral part of the financial statements.
Balanced Strategy Fund 61
Russell Investment Company
Balanced Strategy Fund
Schedule of Investments, continued — October 31, 2016
| Foreign Currency Exchange Contracts | |||||||
| Amounts in thousands | |||||||
| Unrealized | |||||||
| Appreciation | |||||||
| Amount | Amount | (Depreciation) | |||||
| Counterparty | Sold | Bought | Settlement Date | $ | |||
| Bank of America | USD | 6,486 | MXN | 123,570 | 12/21/16 | 17 | |
| Bank of America | USD | 5,923 | RUB | 377,700 | 12/21/16 | (39 | ) |
| Bank of America | USD | 464 | SEK | 3,960 | 12/21/16 | (24 | ) |
| Bank of America | USD | 8,968 | ZAR | 128,870 | 12/21/16 | 495 | |
| Bank of America | AUD | 32,830 | USD | 24,870 | 12/21/16 | (72 | ) |
| Bank of America | CAD | 2,310 | USD | 1,759 | 12/21/16 | 36 | |
| Bank of America | KRW | 30,401,000 | USD | 27,767 | 12/21/16 | 1,200 | |
| Bank of Montreal | USD | 2,179 | AUD | 2,865 | 11/08/16 | — | |
| Bank of Montreal | USD | 2,819 | CAD | 3,774 | 11/08/16 | (5 | ) |
| Bank of Montreal | USD | 2,630 | CHF | 2,600 | 11/08/16 | (2 | ) |
| Bank of Montreal | USD | 9,535 | EUR | 8,708 | 11/08/16 | 26 | |
| Bank of Montreal | USD | 5,222 | GBP | 4,291 | 11/08/16 | 30 | |
| Bank of Montreal | USD | 6,476 | JPY | 679,956 | 11/08/16 | 9 | |
| Bank of Montreal | AUD | 2,937 | USD | 2,234 | 11/08/16 | 1 | |
| Bank of Montreal | AUD | 2,865 | USD | 2,177 | 12/07/16 | — | |
| Bank of Montreal | CAD | 3,834 | USD | 2,913 | 11/08/16 | 55 | |
| Bank of Montreal | CAD | 3,774 | USD | 2,820 | 12/07/16 | 5 | |
| Bank of Montreal | CHF | 2,672 | USD | 2,747 | 11/08/16 | 46 | |
| Bank of Montreal | CHF | 2,600 | USD | 2,634 | 12/07/16 | 2 | |
| Bank of Montreal | EUR | 8,993 | USD | 10,051 | 11/08/16 | 178 | |
| Bank of Montreal | EUR | 8,708 | USD | 9,546 | 12/07/16 | (26 | ) |
| Bank of Montreal | GBP | 4,400 | USD | 5,708 | 11/08/16 | 320 | |
| Bank of Montreal | GBP | 4,291 | USD | 5,226 | 12/07/16 | (30 | ) |
| Bank of Montreal | JPY | 688,661 | USD | 6,805 | 11/08/16 | 236 | |
| Bank of Montreal | JPY | 679,956 | USD | 6,482 | 12/07/16 | (10 | ) |
| BNP Paribas | AUD | 2,937 | USD | 2,236 | 11/08/16 | 3 | |
| BNP Paribas | AUD | 5,494 | USD | 4,208 | 12/21/16 | 34 | |
| BNP Paribas | CAD | 3,834 | USD | 2,914 | 11/08/16 | 56 | |
| BNP Paribas | CAD | 1,784 | USD | 1,381 | 12/21/16 | 50 | |
| BNP Paribas | CHF | 2,672 | USD | 2,749 | 11/08/16 | 49 | |
| BNP Paribas | CHF | 1,024 | USD | 1,062 | 12/21/16 | 25 | |
| BNP Paribas | EUR | 8,993 | USD | 10,064 | 11/08/16 | 190 | |
| BNP Paribas | EUR | 3,968 | USD | 4,491 | 12/21/16 | 125 | |
| BNP Paribas | GBP | 4,400 | USD | 5,705 | 11/08/16 | 319 | |
| BNP Paribas | GBP | 566 | USD | 754 | 12/21/16 | 60 | |
| BNP Paribas | JPY | 688,661 | USD | 6,812 | 11/08/16 | 244 | |
| Citigroup | USD | 2,179 | AUD | 2,865 | 11/08/16 | — | |
| Citigroup | USD | 2,821 | CAD | 3,774 | 11/08/16 | (7 | ) |
| Citigroup | USD | 2,630 | CHF | 2,600 | 11/08/16 | (2 | ) |
| Citigroup | USD | 9,534 | EUR | 8,708 | 11/08/16 | 27 | |
| Citigroup | USD | 5,223 | GBP | 4,291 | 11/08/16 | 30 | |
| Citigroup | USD | 6,477 | JPY | 679,956 | 11/08/16 | 8 | |
| Citigroup | AUD | 2,865 | USD | 2,178 | 12/07/16 | — | |
| Citigroup | CAD | 3,774 | USD | 2,822 | 12/07/16 | 7 | |
| Citigroup | CHF | 2,600 | USD | 2,634 | 12/07/16 | 2 | |
| Citigroup | EUR | 8,708 | USD | 9,546 | 12/07/16 | (27 | ) |
| Citigroup | GBP | 4,291 | USD | 5,226 | 12/07/16 | (31 | ) |
| Citigroup | JPY | 679,956 | USD | 6,483 | 12/07/16 | (9 | ) |
| Commonwealth Bank of Australia | USD | 2,179 | AUD | 2,865 | 11/08/16 | — | |
| Commonwealth Bank of Australia | USD | 2,820 | CAD | 3,774 | 11/08/16 | (6 | ) |
| Commonwealth Bank of Australia | USD | 2,630 | CHF | 2,600 | 11/08/16 | (2 | ) |
| Commonwealth Bank of Australia | USD | 9,535 | EUR | 8,708 | 11/08/16 | 26 | |
| Commonwealth Bank of Australia | USD | 5,223 | GBP | 4,291 | 11/08/16 | 29 | |
| Commonwealth Bank of Australia | USD | 6,478 | JPY | 679,956 | 11/08/16 | 7 | |
| Commonwealth Bank of Australia | AUD | 2,937 | USD | 2,236 | 11/08/16 | 3 | |
| Commonwealth Bank of Australia | AUD | 2,865 | USD | 2,178 | 12/07/16 | — |
See accompanying notes which are an integral part of the financial statements.
62 Balanced Strategy Fund
Russell Investment Company
Balanced Strategy Fund
Schedule of Investments, continued — October 31, 2016
| Foreign Currency Exchange Contracts | |||||||
| Amounts in thousands | |||||||
| Unrealized | |||||||
| Appreciation | |||||||
| Amount | Amount | (Depreciation) | |||||
| Counterparty | Sold | Bought | Settlement Date | $ | |||
| Commonwealth Bank of Australia | AUD | 5,494 | USD | 4,205 | 12/21/16 | 31 | |
| Commonwealth Bank of Australia | CAD | 3,834 | USD | 2,915 | 11/08/16 | 56 | |
| Commonwealth Bank of Australia | CAD | 3,774 | USD | 2,821 | 12/07/16 | 7 | |
| Commonwealth Bank of Australia | CAD | 1,784 | USD | 1,381 | 12/21/16 | 51 | |
| Commonwealth Bank of Australia | CHF | 2,672 | USD | 2,749 | 11/08/16 | 49 | |
| Commonwealth Bank of Australia | CHF | 2,600 | USD | 2,634 | 12/07/16 | 2 | |
| Commonwealth Bank of Australia | CHF | 1,024 | USD | 1,063 | 12/21/16 | 25 | |
| Commonwealth Bank of Australia | EUR | 8,993 | USD | 10,058 | 11/08/16 | 184 | |
| Commonwealth Bank of Australia | EUR | 8,708 | USD | 9,546 | 12/07/16 | (26 | ) |
| Commonwealth Bank of Australia | EUR | 3,968 | USD | 4,488 | 12/21/16 | 123 | |
| Commonwealth Bank of Australia | GBP | 4,400 | USD | 5,702 | 11/08/16 | 315 | |
| Commonwealth Bank of Australia | GBP | 4,291 | USD | 5,226 | 12/07/16 | (29 | ) |
| Commonwealth Bank of Australia | GBP | 566 | USD | 754 | 12/21/16 | 60 | |
| Commonwealth Bank of Australia | JPY | 688,661 | USD | 6,810 | 11/08/16 | 241 | |
| Commonwealth Bank of Australia | JPY | 679,956 | USD | 6,484 | 12/07/16 | (8 | ) |
| HSBC | USD | 2,179 | AUD | 2,865 | 11/08/16 | — | |
| HSBC | USD | 2,820 | CAD | 3,774 | 11/08/16 | (6 | ) |
| HSBC | USD | 2,630 | CHF | 2,600 | 11/08/16 | (2 | ) |
| HSBC | USD | 9,535 | EUR | 8,708 | 11/08/16 | 26 | |
| HSBC | USD | 5,223 | GBP | 4,291 | 11/08/16 | 29 | |
| HSBC | USD | 6,477 | JPY | 679,956 | 11/08/16 | 8 | |
| HSBC | AUD | 2,865 | USD | 2,178 | 12/07/16 | — | |
| HSBC | CAD | 3,774 | USD | 2,821 | 12/07/16 | 6 | |
| HSBC | CHF | 2,600 | USD | 2,634 | 12/07/16 | 2 | |
| HSBC | EUR | 8,708 | USD | 9,547 | 12/07/16 | (26 | ) |
| HSBC | GBP | 4,291 | USD | 5,226 | 12/07/16 | (29 | ) |
| HSBC | JPY | 679,956 | USD | 6,483 | 12/07/16 | (9 | ) |
| National Australia Bank | AUD | 5,494 | USD | 4,207 | 12/21/16 | 33 | |
| National Australia Bank | CAD | 1,784 | USD | 1,381 | 12/21/16 | 50 | |
| National Australia Bank | CHF | 1,024 | USD | 1,062 | 12/21/16 | 24 | |
| National Australia Bank | EUR | 3,968 | USD | 4,493 | 12/21/16 | 128 | |
| National Australia Bank | GBP | 566 | USD | 754 | 12/21/16 | 60 | |
| Royal Bank of Canada | AUD | 5,494 | USD | 4,211 | 12/21/16 | 37 | |
| Royal Bank of Canada | CAD | 1,784 | USD | 1,382 | 12/21/16 | 52 | |
| Royal Bank of Canada | CHF | 1,024 | USD | 1,062 | 12/21/16 | 24 | |
| Royal Bank of Canada | EUR | 3,968 | USD | 4,489 | 12/21/16 | 123 | |
| Royal Bank of Canada | GBP | 566 | USD | 755 | 12/21/16 | 61 | |
| Standard Chartered | USD | 6,991 | GBP | 5,740 | 12/21/16 | 43 | |
| Standard Chartered | USD | 2,967 | INR | 200,150 | 12/21/16 | 13 | |
| Standard Chartered | CNY | 80,940 | USD | 11,917 | 12/21/16 | 24 | |
| Standard Chartered | TWD | 358,000 | USD | 11,500 | 12/21/16 | 152 | |
| State Street | USD | 218 | AUD | 285 | 11/08/16 | (1 | ) |
| State Street | USD | 181 | CAD | 238 | 11/08/16 | (4 | ) |
| State Street | USD | 294 | CHF | 285 | 11/08/16 | (6 | ) |
| State Street | USD | 1,281 | EUR | 1,140 | 11/08/16 | (29 | ) |
| State Street | USD | 564 | GBP | 439 | 11/08/16 | (27 | ) |
| State Street | USD | 4,386 | HKD | 34,014 | 11/08/16 | — | |
| State Street | USD | 343 | JPY | 34,820 | 11/08/16 | (11 | ) |
| State Street | USD | 36 | SEK | 310 | 11/08/16 | (2 | ) |
| State Street | USD | 4,139 | SEK | 37,277 | 11/08/16 | (11 | ) |
| State Street | USD | 7 | SGD | 10 | 11/08/16 | — | |
| State Street | USD | 1,458 | SGD | 2,030 | 11/08/16 | 1 | |
| State Street | CNY | 229,000 | USD | 34,072 | 12/21/16 | 423 | |
| State Street | HKD | 475 | USD | 61 | 11/08/16 | — | |
| State Street | HKD | 33,539 | USD | 4,327 | 11/08/16 | 2 | |
| State Street | HKD | 34,014 | USD | 4,387 | 12/07/16 | — |
See accompanying notes which are an integral part of the financial statements.
Balanced Strategy Fund 63
Russell Investment Company
Balanced Strategy Fund
Schedule of Investments, continued — October 31, 2016
| Foreign Currency Exchange Contracts | ||||||||
| Amounts in thousands | ||||||||
| Unrealized | ||||||||
| Appreciation | ||||||||
| Amount | Amount | (Depreciation) | ||||||
| Counterparty | Sold | Bought | Settlement Date | $ | ||||
| State Street | HKD | 9,310 | USD | 1,201 | 12/21/16 | 1 | ||
| State Street | JPY | 163,480 | USD | 1,614 | 12/21/16 | 52 | ||
| State Street | SEK | 37,587 | USD | 4,368 | 11/08/16 | 206 | ||
| State Street | SEK | 37,277 | USD | 4,145 | 12/07/16 | 11 | ||
| State Street | SEK | 9,980 | USD | 1,190 | 12/21/16 | 83 | ||
| State Street | SGD | 2,040 | USD | 1,496 | 11/08/16 | 29 | ||
| State Street | SGD | 2,030 | USD | 1,458 | 12/07/16 | (1 | ) | |
| State Street | SGD | 610 | USD | 453 | 12/21/16 | 14 | ||
| UBS | AUD | 2,937 | USD | 2,236 | 11/08/16 | 3 | ||
| UBS | CAD | 3,834 | USD | 2,914 | 11/08/16 | 56 | ||
| UBS | CHF | 2,672 | USD | 2,745 | 11/08/16 | 45 | ||
| UBS | EUR | 8,993 | USD | 10,049 | 11/08/16 | 176 | ||
| UBS | GBP | 4,400 | USD | 5,704 | 11/08/16 | 316 | ||
| UBS | JPY | 688,661 | USD | 6,806 | 11/08/16 | 238 | ||
| Westpac | AUD | 5,494 | USD | 4,206 | 12/21/16 | 32 | ||
| Westpac | CAD | 1,784 | USD | 1,381 | 12/21/16 | 50 | ||
| Westpac | CHF | 1,024 | USD | 1,062 | 12/21/16 | 24 | ||
| Westpac | EUR | 3,968 | USD | 4,489 | 12/21/16 | 124 | ||
| Westpac | GBP | 566 | USD | 754 | 12/21/16 | 60 | ||
| Total Unrealized Appreciation (Depreciation) on Open Foreign Currency Exchange Contracts | 7,390 | |||||||
| Total Return Swap Contracts (*) | ||||||||
| Amounts in thousands | ||||||||
| Notional | Termination | Fair Value | ||||||
| Underlying Reference Entity | Counterparty | Amount | Date | $ | ||||
| Dow Jones U.S. Real Estate Total Return Index | Bank of America | USD | 14,019 | 03/07/17 | 984 | |||
| Total Fair Value of Open Total Return Swap Contracts Premiums Paid (Received) - $— (å) | 984 | |||||||
(*) Total return swaps (which includes index swaps) are agreements between counterparties to exchange cash flows, one based on a market-linked
returns of an individual asset or a basket of assets (i.e. an index), and the other on a fixed or floating rate. The floating rate is based on the 3
Month LIBOR rate plus a fee of 0.075%.
| Credit Default Swap Contracts | |||||||
| Amounts in thousands | |||||||
| Credit Indices | |||||||
| Fund (Pays)/ | |||||||
| Receives | Termination | Fair Value | |||||
| Reference Entity | Counterparty | Notional Amount | Fixed Rate | Date | $ | ||
| CDX Emerging Markets Index | Bank of America | USD | 62,700 | (1.000 | %) | 12/20/21 | 4,057 |
| CDX NA High Yield Index | Bank of America | USD | 154,600 | 5.000 | % | 12/20/21 | 6,107 |
| Total Fair Value on Open Credit Indices Premiums Paid (Received) - $9,729 | 10,164 | ||||||
See accompanying notes which are an integral part of the financial statements.
64 Balanced Strategy Fund
Russell Investment Company
Balanced Strategy Fund
Schedule of Investments, continued — October 31, 2016
| Presentation of Portfolio Holdings | |||||||||||||||||
| Amounts in thousands | |||||||||||||||||
| Fair Value | |||||||||||||||||
| Practical | |||||||||||||||||
| Portfolio Summary | Level 1 | Level 2 | Level 3 | Expedient (a) | Total | % of Net Assets | |||||||||||
| Investments in Russell Affiliated Mutual | |||||||||||||||||
| Funds | $ | 2,376,712 | $ | — | $ | — | $ | — | $ | 2,376,712 | 96.6 | ||||||
| Options Purchased | — | 4,381 | — | — | 4,381 | 0.2 | |||||||||||
| Short-Term Investments | — | — | — | 41,666 | 41,666 | 1.7 | |||||||||||
| Total Investments | 2,376,712 | 4,381 | — | 41,666 | 2,422,759 | 98.5 | |||||||||||
| Other Assets and Liabilities, Net | 1.5 | ||||||||||||||||
| 100.0 | |||||||||||||||||
| Other Financial Instruments | |||||||||||||||||
| Assets | |||||||||||||||||
| Futures Contracts | 4,940 | — | — | — | 4,940 | 0.2 | |||||||||||
| Foreign Currency Exchange Contracts | — | 7,935 | — | — | 7,935 | 0.3 | |||||||||||
| Total Return Swap Contracts | — | 984 | — | — | 984 | —* | |||||||||||
| Credit Default Swap Contracts | — | 10,164 | — | — | 10,164 | 0.4 | |||||||||||
| ' | |||||||||||||||||
| Liabilities | |||||||||||||||||
| Futures Contracts | (4,652 | ) | — | — | — | (4,652 | ) | (0.2 | ) | ||||||||
| Options Written | — | (1,284 | ) | — | — | (1,284 | ) | (0.1 | ) | ||||||||
| Foreign Currency Exchange Contracts | — | (545 | ) | — | — | (545 | ) | (—)* | |||||||||
| Total Other Financial Instruments** | $ | 288 | $ | 17,254 | $ | — | $ | — | $ | 17,542 | |||||||
* Less than 0.05% of net assets.
** Futures and foreign currency exchange contract values reflect the unrealized appreciation (depreciation) on the investments.
(a) Certain investments that are measured at fair value using the net asset value per share (or its equivalent) practical expedient have not been classified
in the fair value levels. The fair value amounts presented in the table are intended to permit reconciliation to the amounts presented in the Schedule of
Investments.
For a description of the Levels, see note 2 in the Notes to Financial Statements.
For a disclosure on transfers between Levels 1, 2 and 3 during the period ended October 31, 2016, see note 2 in the Notes to
Financial Statements.
See accompanying notes which are an integral part of the financial statements.
Balanced Strategy Fund 65
Russell Investment Company
Balanced Strategy Fund
Fair Value of Derivative Instruments — October 31, 2016
Amounts in thousands
| Foreign | ||||||||
| Equity | Credit | Currency | ||||||
| Derivatives not accounted for as hedging instruments | Contracts | Contracts | Contracts | |||||
| Location: Statement of Assets and Liabilities - Assets | ||||||||
| Investments, at fair value* | $ | 4,381 | $ | — | $ | — | ||
| Unrealized appreciation on foreign currency exchange contracts | — | — | 7,935 | |||||
| Variation margin on futures contracts** | 4,940 | — | — | |||||
| Total return swap contracts, at fair value | 984 | — | — | |||||
| Credit default swap contracts, at fair value | — | 10,164 | — | |||||
| Total | $ | 10,305 | $ | 10,164 | $ | 7,935 | ||
| Location: Statement of Assets and Liabilities - Liabilities | ||||||||
| Variation margin on futures contracts** | $ | 4,652 | $ | — | $ | — | ||
| Unrealized depreciation on foreign currency exchange contracts | — | — | 545 | |||||
| Options written, at fair value | 1,284 | — | — | |||||
| Total | $ | 5,936 | $ | — | $ | 545 | ||
| Foreign | ||||||||
| Equity | Credit | Currency | ||||||
| Derivatives not accounted for as hedging instruments | Contracts | Contracts | Contracts | |||||
| Location: Statement of Operations - Net realized gain (loss) | ||||||||
| Investments*** | $ | 7,775 | $ | — | $ | — | ||
| Futures contracts | (5,187 | ) | — | — | ||||
| Options written | 937 | — | — | |||||
| Total return swap contracts | (5,746 | ) | — | — | ||||
| Credit default swap contracts | — | 5,180 | — | |||||
| Foreign currency-related transactions**** | — | — | (1,894 | ) | ||||
| Total | $ | (2,221 | ) | $ | 5,180 | $ | (1,894 | ) |
| Location: Statement of Operations - Net change in unrealized appreciation (depreciation) | ||||||||
| Investments***** | $ | (267 | ) | $ | — | $ | — | |
| Futures contracts | (1,609 | ) | — | — | ||||
| Options written | 1,089 | — | — | |||||
| Total return swap contracts | 3,905 | — | — | |||||
| Credit default swap contracts | — | 435 | — | |||||
| Foreign currency-related transactions****** | — | — | 6,801 | |||||
| Total | $ | 3,118 | $ | 435 | $ | 6,801 | ||
* Fair value of purchased options.
** Includes cumulative appreciation/depreciation of futures contracts as reported in the Schedule of Investments. Only variation margin is reported within the
Statement of Assets and Liabilities.
*** Includes net realized gain (loss) on purchased options as reported in the Statement of Operations.
**** Only includes net realized gain (loss) on forward and spot contracts. May differ from the net realized gain (loss) on foreign currency-related transactions reported
within the Statement of Operations.
***** Includes net unrealized gain (loss) on purchased options as reported in the Schedule of Investments.
****** Only includes change in unrealized gain (loss) on forward and spot contracts. May differ from the net change in unrealized gain (loss) on foreign currency-related
transactions reported within the Statement of Operations.
For further disclosure on derivatives see note 2 in the Notes to Financial Statements.
See accompanying notes which are an integral part of the financial statements.
66 Balanced Strategy Fund
Russell Investment Company
Balanced Strategy Fund
Balance Sheet Offsetting of Financial and Derivative Instruments — October 31, 2016
| Amounts in thousands | |||||||||
| Offsetting of Financial Assets and Derivative Assets | |||||||||
| Gross | Net Amounts | ||||||||
| Amounts | of Assets | ||||||||
| Gross | Offset in the | Presented in | |||||||
| Amounts of | Statement of | the Statement | |||||||
| Recognized | Assets and | of Assets and | |||||||
| Description | Location: Statement of Assets and Liabilities - Assets | Assets | Liabilities | Liabilities | |||||
| Options Purchased Contracts | Investments, at fair value | $ | 4,381 | $ | — $ | 4,381 | |||
| Foreign Currency Exchange Contracts | Unrealized appreciation on foreign currency exchange contracts | 7,935 | — | 7,935 | |||||
| Futures Contracts | Variation margin on futures contracts | 313 | — | 313 | |||||
| Total Return Swap Contracts | Total return swap contracts, at fair value | 984 | — | 984 | |||||
| Credit Default Swap Contracts | Credit default swap contracts, at fair value | 10,164 | — | 10,164 | |||||
| Total Financial and Derivative Assets | 23,777 | — | 23,777 | ||||||
| Financial and Derivative Assets not subject to a netting agreement | (10,476 | ) | — | (10,476 | ) | ||||
| Total Financial and Derivative Assets subject to a netting agreement | $ | 13,301 | $ | — $ | 13,301 | ||||
| Financial Assets, Derivative Assets, and Collateral Held by Counterparty | |||||||||||
| Gross Amounts Not Offset in | |||||||||||
| the Statement of Assets and | |||||||||||
| Liabilities | |||||||||||
| Net Amounts | |||||||||||
| of Assets | |||||||||||
| Presented in | |||||||||||
| the Statement | Financial and | ||||||||||
| of Assets and | Derivative | Collateral | |||||||||
| Counterparty | Liabilities | Instruments | Received^ | Net Amount | |||||||
| Bank of America | $ | 6,292 | $ | 1,316 | $ | 3,490 | $ | 1,486 | |||
| Bank of Montreal | 909 | 74 | — | 835 | |||||||
| BNP Paribas | 1,155 | — | — | 1,155 | |||||||
| Citigroup | 73 | 73 | — | — | |||||||
| Commonwealth Bank of Australia | 1,209 | 72 | — | 1,137 | |||||||
| HSBC | 72 | 72 | — | — | |||||||
| JPMorgan Chase | 820 | 127 | — | 693 | |||||||
| National Australia Bank | 295 | — | — | 295 | |||||||
| Royal Bank of Canada | 297 | — | — | 297 | |||||||
| Standard Chartered | 232 | — | — | 232 | |||||||
| State Street | 823 | 92 | — | 731 | |||||||
| UBS | 834 | — | — | 834 | |||||||
| Westpac | 290 | — | — | 290 | |||||||
| Total | $ | 13,301 | $ | 1,826 | $ | 3,490 | $ | 7,985 | |||
See accompanying notes which are an integral part of the financial statements.
Balanced Strategy Fund 67
Russell Investment Company
Balanced Strategy Fund
Balance Sheet Offsetting of Financial and Derivative Instruments, continued —
October 31, 2016
| Amounts in thousands | |||||||||
| Offsetting of Financial Liabilities and Derivative Liabilities | |||||||||
| Gross | Net Amounts | ||||||||
| Amounts | of Liabilities | ||||||||
| Gross | Offset in the | Presented in | |||||||
| Amounts of | Statement of | the Statement | |||||||
| Recognized | Assets and | of Assets and | |||||||
| Description | Location: Statement of Assets and Liabilities - Liabilities | Liabilities | Liabilities | Liabilities | |||||
| Futures Contracts | Variation margin on futures contracts | $ | 1,184 | $ | — $ | 1,184 | |||
| Foreign Currency Exchange Contracts | Unrealized depreciation on foreign currency exchange contracts | 545 | — | 545 | |||||
| Options Written Contracts | Options written, at fair value | 1,284 | — | 1,284 | |||||
| Total Financial and Derivative Liabilities | 3,013 | — | 3,013 | ||||||
| Financial and Derivative Liabilities not subject to a netting agreement | (1,184 | ) | — | (1,184 | ) | ||||
| Total Financial and Derivative Liabilities subject to a netting agreement | $ | 1,829 | $ | — $ | 1,829 | ||||
| Financial Liabilities, Derivative Liabilities, and Collateral Pledged by Counterparty | |||||||||
| Gross Amounts Not Offset in | |||||||||
| the Statement of Assets and | |||||||||
| Liabilities | |||||||||
| Net Amounts | |||||||||
| of Liabilities | |||||||||
| Presented in | |||||||||
| the Statement | Financial and | ||||||||
| of Assets and | Derivative | Collateral | |||||||
| Counterparty | Liabilities | Instruments | Pledged^ Net Amount | ||||||
| Bank of America | $ | 1,316 | $ | 1,316 | $ | — $ | — | ||
| Bank of Montreal | 74 | 74 | — | — | |||||
| Citigroup | 75 | 73 | — | 2 | |||||
| Commonwealth Bank of Australia | 72 | 72 | — | — | |||||
| HSBC | 73 | 72 | — | 1 | |||||
| JPMorgan Chase | 127 | 127 | — | — | |||||
| State Street | 92 | 92 | — | — | |||||
| Total | $ | 1,829 | $ | 1,826 | $ | — $ | 3 | ||
^ Collateral received or pledged amounts may not reconcile to those disclosed in the Statement of Assets and Liabilities due to the inclusion of off-Balance
Sheet collateral and adjustments made to exclude overcollateralization.
For further disclosure on derivatives and counterparty risk see note 2 in the Notes to Financial Statements.
See accompanying notes which are an integral part of the financial statements.
68 Balanced Strategy Fund
Russell Investment Company
Balanced Strategy Fund
Statement of Assets and Liabilities — October 31, 2016
| Amounts in thousands | ||
| Assets | ||
| Investments, at identified cost | $ | 2,324,456 |
| Investments, at fair value(>) | 2,422,759 | |
| Cash (restricted)(a)(b) | 36,450 | |
| Unrealized appreciation on foreign currency exchange contracts | 7,935 | |
| Receivables: | ||
| Dividends from affiliated Russell funds | 20 | |
| Investments sold | 7,211 | |
| Fund shares sold | 1,099 | |
| Variation margin on futures contracts | 313 | |
| Total return swap contracts, at fair value(8) | 984 | |
| Credit default swap contracts, at fair value(+) | 10,164 | |
| Total assets | 2,486,935 | |
| Liabilities | ||
| Payables: | ||
| Due to custodian | 1,087 | |
| Due to broker (c) | 13,769 | |
| Investments purchased | 3,660 | |
| Fund shares redeemed | 4,202 | |
| Accrued fees to affiliates | 1,401 | |
| Other accrued expenses | 164 | |
| Variation margin on futures contracts | 1,184 | |
| Unrealized depreciation on foreign currency exchange contracts | 545 | |
| Options written, at fair value(x) | 1,284 | |
| Total liabilities | 27,296 | |
| Net Assets | $ | 2,459,639 |
See accompanying notes which are an integral part of the financial statements.
Balanced Strategy Fund 69
Russell Investment Company
Balanced Strategy Fund
Statement of Assets and Liabilities, continued — October 31, 2016
| Amounts in thousands | ||
| Net Assets Consist of: | ||
| Undistributed (overdistributed) net investment income | $ | 3,454 |
| Accumulated net realized gain (loss) | 96,597 | |
| Unrealized appreciation (depreciation) on: | ||
| Investments | 98,303 | |
| Futures contracts | 288 | |
| Options written | 1,089 | |
| Total return swap contracts | 984 | |
| Credit default swap contracts | 435 | |
| Foreign currency-related transactions | 7,390 | |
| Shares of beneficial interest | 2,164 | |
| Additional paid-in capital | 2,248,935 | |
| Net Assets | $ | 2,459,639 |
| Net Asset Value, offering and redemption price per share: | ||
| Net asset value per share: Class A(#) | $ | 11.41 |
| Maximum offering price per share (Net asset value plus sales charge of 5.75%): Class A | $ | 12.11 |
| Class A — Net assets | $ | 808,160,493 |
| Class A — Shares outstanding ($.01 par value) | 70,826,770 | |
| Net asset value per share: Class C(#) | $ | 11.22 |
| Class C — Net assets | $ | 910,761,729 |
| Class C — Shares outstanding ($.01 par value) | 81,188,699 | |
| Net asset value per share: Class E(#) | $ | 11.47 |
| Class E — Net assets | $ | 23,707,863 |
| Class E — Shares outstanding ($.01 par value) | 2,067,497 | |
| Net asset value per share: Class R1(#) | $ | 11.54 |
| Class R1 — Net assets | $ | 124,090,636 |
| Class R1 — Shares outstanding ($.01 par value) | 10,754,204 | |
| Net asset value per share: Class R4(#) | $ | 11.44 |
| Class R4 — Net assets | $ | 115,400,233 |
| Class R4 — Shares outstanding ($.01 par value) | 10,085,434 | |
| Net asset value per share: Class R5(#) | $ | 11.47 |
| Class R5 — Net assets | $ | 73,055,098 |
| Class R5 — Shares outstanding ($.01 par value) | 6,371,505 | |
| Net asset value per share: Class S(#) | $ | 11.54 |
| Class S — Net assets | $ | 404,463,441 |
| Class S — Shares outstanding ($.01 par value) | 35,062,256 | |
| Amounts in thousands | ||
| (>) Investments in affiliated Russell funds | $ | 2,418,378 |
| (8) Total return swap contracts – premiums paid (received) | $ | — |
| (+) Credit default swap contracts - premiums paid (received) | $ | 9,729 |
| (x) Premiums received on options written | $ | 2,373 |
| (a) Cash Collateral for Futures | $ | 25,600 |
| (b) Cash Collateral for Swaps | $ | 10,850 |
| (c) Due to Broker for Swaps | $ | 13,769 |
| (#) Net asset value per share equals class level net assets divided by class level shares of beneficial interest outstanding. | ||
See accompanying notes which are an integral part of the financial statements.
70 Balanced Strategy Fund
Russell Investment Company
Balanced Strategy Fund
Statement of Operations — For the Period Ended October 31, 2016
| Amounts in thousands | |||
| Investment Income | |||
| Income distributions from affiliated Russell funds | $ | 71,351 | |
| Expenses | |||
| Advisory fees | 5,271 | ||
| Administrative fees | 1,120 | ||
| Custodian fees (1) | 20 | ||
| Distribution fees - Class A | 2,097 | ||
| Distribution fees - Class C | 7,375 | ||
| Distribution fees - Class R5 | 204 | ||
| Transfer agent fees - Class A | 1,677 | ||
| Transfer agent fees - Class C | 1,967 | ||
| Transfer agent fees - Class E | 55 | ||
| Transfer agent fees - Class R1 | 302 | ||
| Transfer agent fees - Class R4 | 264 | ||
| Transfer agent fees - Class R5 | 163 | ||
| Transfer agent fees - Class S | 843 | ||
| Professional fees | 97 | ||
| Registration fees | 144 | ||
| Shareholder servicing fees - Class C | 2,458 | ||
| Shareholder servicing fees - Class E | 68 | ||
| Shareholder servicing fees - Class R4 | 330 | ||
| Shareholder servicing fees - Class R5 | 204 | ||
| Trustees’ fees | 88 | ||
| Printing fees | 283 | ||
| Miscellaneous | 49 | ||
| Expenses before reductions | 25,079 | ||
| Expense reductions | (6,560 | ) | |
| Net expenses | 18,519 | ||
| Net investment income (loss) | 52,832 | ||
| Net Realized and Unrealized Gain (Loss) | |||
| Net realized gain (loss) on: | |||
| Investments | 57,968 | ||
| Futures contracts | (5,187 | ) | |
| Options written | 937 | ||
| Total return swap contracts | (5,746 | ) | |
| Credit default swap contracts | 5,180 | ||
| Foreign currency-related transactions | (1,897 | ) | |
| Capital gain distributions from Underlying Funds | 63,313 | ||
| Net realized gain (loss) | 114,568 | ||
| Net change in unrealized appreciation (depreciation) on: | |||
| Investments | (81,001 | ) | |
| Futures contracts | (1,609 | ) | |
| Options written | 1,089 | ||
| Total return swap contracts | 3,905 | ||
| Credit default swap contracts | 435 | ||
| Foreign currency-related transactions | 6,801 | ||
| Net change in unrealized appreciation (depreciation) | (70,380 | ) | |
| Net realized and unrealized gain (loss) | 44,188 | ||
| Net Increase (Decrease) in Net Assets from Operations | $ | 97,020 | |
| (1) Includes a reimbursement for overbilling of custody out-of-pocket fees from prior years. See note 8 in the Notes to Financial Statements. | |||
See accompanying notes which are an integral part of the financial statements.
Balanced Strategy Fund 71
Russell Investment Company
Balanced Strategy Fund
Statements of Changes in Net Assets
| For the Periods Ended October 31, | ||||||
| Amounts in thousands | 2016 | 2015 | ||||
| Increase (Decrease) in Net Assets | ||||||
| Operations | ||||||
| Net investment income (loss) | $ | 52,832 | $ | 83,674 | ||
| Net realized gain (loss) | 114,568 | 214,460 | ||||
| Net change in unrealized appreciation (depreciation) | (70,380 | ) | (310,897 | ) | ||
| Net increase (decrease) in net assets from operations | 97,020 | (12,763 | ) | |||
| Distributions | ||||||
| From net investment income | ||||||
| Class A | (19,536 | ) | (27,056 | ) | ||
| Class C | (16,534 | ) | (24,672 | ) | ||
| Class E | (654 | ) | (1,511 | ) | ||
| Class R1 | (4,092 | ) | (7,007 | ) | ||
| Class R4 | (3,065 | ) | (5,009 | ) | ||
| Class R5 | (1,657 | ) | (3,183 | ) | ||
| Class S | (10,331 | ) | (15,364 | ) | ||
| From net realized gain | ||||||
| Class A | (64,986 | ) | — | |||
| Class C | (78,692 | ) | — | |||
| Class E | (2,454 | ) | — | |||
| Class R1 | (13,573 | ) | — | |||
| Class R4 | (10,810 | ) | — | |||
| Class R5 | (6,598 | ) | — | |||
| Class S | (33,009 | ) | — | |||
| Net decrease in net assets from distributions | (265,991 | ) | (83,802 | ) | ||
| Share Transactions* | ||||||
| Net increase (decrease) in net assets from share transactions | (343,648 | ) | (489,691 | ) | ||
| Total Net Increase (Decrease) in Net Assets | (512,619 | ) | (586,256 | ) | ||
| Net Assets | ||||||
| Beginning of period | 2,972,258 | 3,558,514 | ||||
| End of period | $ | 2,459,639 | $ | 2,972,258 | ||
| Undistributed (overdistributed) net investment income included in net assets | $ | 3,454 | $ | 3,290 | ||
See accompanying notes which are an integral part of the financial statements.
72 Balanced Strategy Fund
Russell Investment Company
Balanced Strategy Fund
Statements of Changes in Net Assets, continued
* Share transaction amounts (in thousands) for the periods ended October 31, 2016 and October 31, 2015 were as follows:
| 2016 | 2015 | |||||||||||
| Shares | Dollars | Shares | Dollars | |||||||||
| Class A | ||||||||||||
| Proceeds from shares sold | 4,512 | $ | 50,186 | 5,840 | $ | 71,827 | ||||||
| Proceeds from reinvestment of distributions | 7,696 | 83,491 | 2,181 | 26,745 | ||||||||
| Payments for shares redeemed | (16,733 | ) | (185,377 | ) | (17,883 | ) | (218,947 | ) | ||||
| Net increase (decrease) | (4,525 | ) | (51,700 | ) | (9,862 | ) | (120,375 | ) | ||||
| Class C | ||||||||||||
| Proceeds from shares sold | 5,536 | 60,370 | 9,415 | 114,123 | ||||||||
| Proceeds from reinvestment of distributions | 8,878 | 94,675 | 2,023 | 24,485 | ||||||||
| Payments for shares redeemed | (24,801 | ) | (270,937 | ) | (22,027 | ) | (266,650 | ) | ||||
| Net increase (decrease) | (10,387 | ) | (115,892 | ) | (10,589 | ) | (128,042 | ) | ||||
| Class E | ||||||||||||
| Proceeds from shares sold | 225 | 2,508 | 443 | 5,481 | ||||||||
| Proceeds from reinvestment of distributions | 281 | 3,061 | 121 | 1,497 | ||||||||
| Payments for shares redeemed | (1,505 | ) | (16,702 | ) | (2,644 | ) | (32,647 | ) | ||||
| Net increase (decrease) | (999 | ) | (11,133 | ) | (2,080 | ) | (25,669 | ) | ||||
| Class R1 | ||||||||||||
| Proceeds from shares sold | 2,239 | 25,025 | 3,580 | 44,545 | ||||||||
| Proceeds from reinvestment of distributions | 1,612 | 17,662 | 566 | 7,007 | ||||||||
| Payments for shares redeemed | (9,577 | ) | (106,218 | ) | (8,831 | ) | (108,883 | ) | ||||
| Net increase (decrease) | (5,726 | ) | (63,531 | ) | (4,685 | ) | (57,331 | ) | ||||
| Class R4 | ||||||||||||
| Proceeds from shares sold | 936 | 10,414 | 1,336 | 16,501 | ||||||||
| Proceeds from reinvestment of distributions | 1,276 | 13,875 | 407 | 5,004 | ||||||||
| Payments for shares redeemed | (4,844 | ) | (53,911 | ) | (5,610 | ) | (69,422 | ) | ||||
| Net increase (decrease) | (2,632 | ) | (29,622 | ) | (3,867 | ) | (47,917 | ) | ||||
| Class R5 | ||||||||||||
| Proceeds from shares sold | 927 | 10,234 | 1,069 | 13,204 | ||||||||
| Proceeds from reinvestment of distributions | 758 | 8,255 | 258 | 3,183 | ||||||||
| Payments for shares redeemed | (3,689 | ) | (41,337 | ) | (4,527 | ) | (55,905 | ) | ||||
| Net increase (decrease) | (2,004 | ) | (22,848 | ) | (3,200 | ) | (39,518 | ) | ||||
| Class S | ||||||||||||
| Proceeds from shares sold | 6,405 | 71,543 | 7,550 | 93,912 | ||||||||
| Proceeds from reinvestment of distributions | 3,911 | 42,872 | 1,218 | 15,086 | ||||||||
| Payments for shares redeemed | (14,582 | ) | (163,337 | ) | (14,575 | ) | (179,837 | ) | ||||
| Net increase (decrease) | (4,266 | ) | (48,922 | ) | (5,807 | ) | (70,839 | ) | ||||
| Total increase (decrease) | (30,539 | ) | $ | (343,648 | ) | (40,090 | ) | $ | (489,691 | ) | ||
See accompanying notes which are an integral part of the financial statements.
Balanced Strategy Fund 73
Russell Investment Company
Balanced Strategy Fund
Financial Highlights — For the Periods Ended
For a Share Outstanding Throughout Each Period.
| $ | ||||||||||||||||
| $ | Net | $ | $ | $ | $ | |||||||||||
| Net Asset Value, | Investment | Net Realized | Total from | Distributions | Distributions | |||||||||||
| Beginning of | Income (Loss) | and Unrealized | Investment | from Net | from Net | |||||||||||
| Period | (a)(b)(e) | Gain (Loss) | Operations | Investment Income | Realized Gain | |||||||||||
| Class A | ||||||||||||||||
| October 31, 2016 | 12.07 | .25 | .23 | .48 | (.26 | ) | (.88 | ) | ||||||||
| October 31, 2015 | 12.43 | .34 | (.37 | ) | (.03 | ) | (.33 | ) | — | |||||||
| October 31, 2014 | 11.89 | .21 | .53 | .74 | (.20 | ) | — | |||||||||
| October 31, 2013 | 10.78 | .22 | 1.10 | 1.32 | (.21 | ) | — | |||||||||
| October 31, 2012 | 10.20 | .22 | .57 | .79 | (.21 | ) | — | |||||||||
| Class C | ||||||||||||||||
| October 31, 2016 | 11.89 | .16 | .23 | .39 | (.18 | ) | (.88 | ) | ||||||||
| October 31, 2015 | 12.26 | .24 | (.36 | ) | (.12 | ) | (.25 | ) | — | |||||||
| October 31, 2014 | 11.76 | .12 | .52 | .64 | (.14 | ) | — | |||||||||
| October 31, 2013 | 10.69 | .14 | 1.09 | 1.23 | (.16 | ) | — | |||||||||
| October 31, 2012 | 10.11 | .14 | .58 | .72 | (.14 | ) | — | |||||||||
| Class E | ||||||||||||||||
| October 31, 2016 | 12.13 | .26 | .21 | .47 | (.25 | ) | (.88 | ) | ||||||||
| October 31, 2015 | 12.48 | .36 | (.40 | ) | (.04 | ) | (.31 | ) | — | |||||||
| October 31, 2014 | 11.94 | .22 | .52 | .74 | (.20 | ) | — | |||||||||
| October 31, 2013 | 10.82 | .25 | 1.08 | 1.33 | (.21 | ) | — | |||||||||
| October 31, 2012 | 10.23 | .22 | .58 | .80 | (.21 | ) | — | |||||||||
| Class R1 | ||||||||||||||||
| October 31, 2016 | 12.20 | .30 | .20 | .50 | (.28 | ) | (.88 | ) | ||||||||
| October 31, 2015 | 12.55 | .38 | (.37 | ) | .01 | (.36 | ) | — | ||||||||
| October 31, 2014 | 12.00 | .27 | .52 | .79 | (.24 | ) | — | |||||||||
| October 31, 2013 | 10.86 | .27 | 1.12 | 1.39 | (.25 | ) | — | |||||||||
| October 31, 2012 | 10.28 | .25 | .59 | .84 | (.26 | ) | — | |||||||||
| Class R4(1) | ||||||||||||||||
| October 31, 2016 | 12.10 | .25 | .22 | .47 | (.25 | ) | (.88 | ) | ||||||||
| October 31, 2015 | 12.46 | .35 | (.38 | ) | (.03 | ) | (.33 | ) | — | |||||||
| October 31, 2014 | 11.92 | .24 | .51 | .75 | (.21 | ) | — | |||||||||
| October 31, 2013 | 10.80 | .24 | 1.11 | 1.35 | (.23 | ) | — | |||||||||
| October 31, 2012 | 10.21 | .23 | .59 | .82 | (.23 | ) | — | |||||||||
| Class R5(2) | ||||||||||||||||
| October 31, 2016 | 12.13 | .22 | .22 | .44 | (.22 | ) | (.88 | ) | ||||||||
| October 31, 2015 | 12.48 | .33 | (.39 | ) | (.06 | ) | (.29 | ) | — | |||||||
| October 31, 2014 | 11.94 | .22 | .51 | .73 | (.19 | ) | — | |||||||||
| October 31, 2013 | 10.83 | .23 | 1.08 | 1.31 | (.20 | ) | — | |||||||||
| October 31, 2012 | 10.23 | .24 | .56 | .80 | (.20 | ) | — | |||||||||
| Class S | ||||||||||||||||
| October 31, 2016 | 12.19 | .27 | .24 | .51 | (.28 | ) | (.88 | ) | ||||||||
| October 31, 2015 | 12.55 | .36 | (.37 | ) | (.01 | ) | (.35 | ) | — | |||||||
| October 31, 2014 | 12.00 | .25 | .52 | .77 | (.22 | ) | — | |||||||||
| October 31, 2013 | 10.87 | .25 | 1.12 | 1.37 | (.24 | ) | — | |||||||||
| October 31, 2012 | 10.28 | .24 | .59 | .83 | (.24 | ) | — | |||||||||
See accompanying notes which are an integral part of the financial statements.
74 Balanced Strategy Fund
| % | % | % | |||||||||||||||
| $ | $ | Ratio of Expenses | Ratio of Expenses | Ratio of Net | |||||||||||||
| Net Asset Value, | % | Net Assets, | to Average | to Average | Investment Income | % | |||||||||||
| $ | End of | Total | End of Period | Net Assets, | Net Assets, | to Average | Portfolio | ||||||||||
| Total Distributions | Period | Return(d) | (000 | ) | Gross(g) | Net(e)(g) | Net Assets(b)(e) | Turnover Rate | |||||||||
| (1.14 | ) | 11.41 | 4.56 | 808,160 | .72 | .44 | 2.24 | 16 | |||||||||
| (.33 | ) | 12.07 | (.31 | ) | 909,827 | .72 | .48 | 2.75 | 35 | ||||||||
| (.20 | ) | 12.43 | 6.30 | 1,058,976 | .72 | .56 | 1.74 | 19 | |||||||||
| (.21 | ) | 11.89 | 12.47 | 1,093,788 | .71 | .57 | 1.99 | 11 | |||||||||
| (.21 | ) | 10.78 | 7.94 | 1,068,990 | .70 | .56 | 2.07 | 20 | |||||||||
| (1.06 | ) | 11.22 | 3.80 | 910,762 | 1.47 | 1.19 | 1.47 | 16 | |||||||||
| (.25 | ) | 11.89 | (1.05 | ) | 1,089,189 | 1.47 | 1.23 | 1.95 | 35 | ||||||||
| (.14 | ) | 12.26 | 5.51 | 1,252,253 | 1.47 | 1.31 | .98 | 19 | |||||||||
| (.16 | ) | 11.76 | 11.60 | 1,300,173 | 1.46 | 1.32 | 1.22 | 11 | |||||||||
| (.14 | ) | 10.69 | 7.22 | 1,283,125 | 1.45 | 1.31 | 1.32 | 20 | |||||||||
| (1.13 | ) | 11.47 | 4.38 | 23,708 | .72 | .57 | 2.35 | 16 | |||||||||
| (.31 | ) | 12.13 | (.32 | ) | 37,184 | .72 | .56 | 2.93 | 35 | ||||||||
| (.20 | ) | 12.48 | 6.26 | 64,210 | .72 | .56 | 1.81 | 19 | |||||||||
| (.21 | ) | 11.94 | 12.50 | 88,974 | .71 | .57 | 2.22 | 11 | |||||||||
| (.21 | ) | 10.82 | 7.98 | 129,301 | .70 | .56 | 2.16 | 20 | |||||||||
| (1.16 | ) | 11.54 | 4.70 | 124,091 | .47 | .26 | 2.68 | 16 | |||||||||
| (.36 | ) | 12.20 | .04 | 200,991 | .47 | .23 | 3.03 | 35 | |||||||||
| (.24 | ) | 12.55 | 6.63 | 265,650 | .47 | .17 | 2.24 | 19 | |||||||||
| (.25 | ) | 12.00 | 13.00 | 306,020 | .46 | .17 | 2.36 | 11 | |||||||||
| (.26 | ) | 10.86 | 8.36 | 279,572 | .45 | .14 | 2.34 | 20 | |||||||||
| (1.13 | ) | 11.44 | 4.46 | 115,400 | .72 | .51 | 2.25 | 16 | |||||||||
| (.33 | ) | 12.10 | (.31 | ) | 153,931 | .72 | .48 | 2.86 | 35 | ||||||||
| (.21 | ) | 12.46 | 6.39 | 206,600 | .72 | .42 | 1.99 | 19 | |||||||||
| (.23 | ) | 11.92 | 12.67 | 276,656 | .71 | .42 | 2.15 | 11 | |||||||||
| (.23 | ) | 10.80 | 8.23 | 267,734 | .70 | .39 | 2.24 | 20 | |||||||||
| (1.10 | ) | 11.47 | 4.18 | 73,055 | .97 | .76 | 2.00 | 16 | |||||||||
| (.29 | ) | 12.13 | (.48 | ) | 101,555 | .97 | .73 | 2.71 | 35 | ||||||||
| (.19 | ) | 12.48 | 6.17 | 144,430 | .97 | .67 | 1.82 | 19 | |||||||||
| (.20 | ) | 11.94 | 12.32 | 212,516 | .96 | .67 | 2.01 | 11 | |||||||||
| (.20 | ) | 10.83 | 7.95 | 261,491 | .95 | .64 | 2.34 | 20 | |||||||||
| (1.16 | ) | 11.54 | 4.73 | 404,463 | .47 | .32 | 2.43 | 16 | |||||||||
| (.35 | ) | 12.19 | (.13 | ) | 479,581 | .47 | .31 | 2.93 | 35 | ||||||||
| (.22 | ) | 12.55 | 6.52 | 566,395 | .47 | .31 | 2.03 | 19 | |||||||||
| (.24 | ) | 12.00 | 12.77 | 614,376 | .46 | .32 | 2.20 | 11 | |||||||||
| (.24 | ) | 10.87 | 8.26 | 548,418 | .45 | .31 | 2.30 | 20 | |||||||||
See accompanying notes which are an integral part of the financial statements.
Balanced Strategy Fund 75
Russell Investment Company
Balanced Strategy Fund
Related Party Transactions, Fees and Expenses
| Accrued fees payable to affiliates for the period ended October 31, 2016 were as follows: | ||
| Advisory fees | $ | 63,707 |
| Administration fees | 90,000 | |
| Distribution fees | 780,278 | |
| Shareholder servicing fees | 242,623 | |
| Transfer agent fees | 214,766 | |
| Trustee fees | 9,787 | |
| $ | 1,401,161 | |
Transactions (amounts in thousands) during the period ended October 31, 2016 with Underlying Funds which are, or were, an
affiliated company are as follows:
| Fair Value, | Change in | ||||||||||||||||||||
| Beginning of | Realized Gain | Unrealized | Fair Value, End | Income | Capital Gains | ||||||||||||||||
| Period | Purchases | Sales | (Loss) | Gain (Loss) | of Period | Distributions | Distributions | ||||||||||||||
| Russell Commodity Strategies Fund | $ | 63,902 | $ | 26,132 | $ | 9,769 | $ | (1,962 | ) $ | (141) | $ 78,162 | $ | — | $ | — | ||||||
| Russell Global Infrastructure Fund | 118,176 | 6,011 | 52,053 | 5,328 | (4,937) | 72,525 | 2,986 | 3,007 | |||||||||||||
| Russell Global Real Estate Securities | |||||||||||||||||||||
| Fund | 29,788 | 2,169 | 6,610 | 2,682 | (4,582) | 23,447 | 788 | 1,371 | |||||||||||||
| Russell U.S. Defensive Equity Fund | 211,423 | 2,304 | 174,103 | 65,343 | (56,378) | 48,589 | 2,280 | — | |||||||||||||
| Russell U.S. Dynamic Equity Fund | 212,054 | 28,820 | 46,707 | (4,402 | ) | (20,071) | 169,694 | 9,523 | 19,112 | ||||||||||||
| Russell U.S. Small Cap Equity Fund | 177,488 | 12,915 | 41,878 | (4,348 | ) | (1,511) | 142,666 | 1,549 | 11,206 | ||||||||||||
| Select U.S. Equity Fund | 234,357 | 6,150 | 54,957 | (1,641 | ) | 4,440 | 188,349 | 5,743 | 307 | ||||||||||||
| Russell Global Opportunistic Credit | |||||||||||||||||||||
| Fund | 266,655 | 28,340 | 68,282 | (3,467 | ) | 19,669 | 242,915 | 8,902 | — | ||||||||||||
| Russell Strategic Bond Fund | 820,265 | 29,745 | 296,539 | 4,130 | 2,141 | 559,742 | 24,510 | 4,561 | |||||||||||||
| Unconstrained Total Return Fund | — | 99,626 | 2,582 | 4 | 291 | 97,339 | 6 | — | |||||||||||||
| Russell Emerging Markets Fund | 168,590 | 27,051 | 39,940 | (8,349 | ) | 22,212 | 169,564 | 595 | — | ||||||||||||
| Russell Global Equity Fund | 301,305 | 29,443 | 61,404 | 2,348 | (28,652) | 243,040 | 5,500 | 23,749 | |||||||||||||
| Select International Equity Fund | 296,878 | 8,250 | 44,394 | (5,452 | ) | (11,823) | 243,459 | 8,073 | — | ||||||||||||
| Russell Multi-Strategy Income Fund | — | 100,341 | 1,699 | (22 | ) | (1,399) | 97,221 | 721 | — | ||||||||||||
| Russell U.S. Cash Management Fund | 50,457 | 322,352 | 331,151 | 1 | 7 | 41,666 | 175 | — | |||||||||||||
| $ | 2,951,338 | $ | 729,649 | $ | 1,232,068 | $ | 50,193 | $ | (80,734) | $ | 2,418,378 | $ | 71,351 | $ | 63,313 | ||||||
Federal Income Taxes
At October 31, 2016, the cost of investments and net unrealized appreciation (depreciation), undistributed ordinary income and
undistributed long-term capital gains for income tax purposes were as follows:
| Cost of Investments | $ | 2,342,654,179 | |||
| Unrealized Appreciation | $ | 135,961,939 | |||
| Unrealized Depreciation | (55,856,897 | ) | |||
| Net Unrealized Appreciation (Depreciation) | $ | 80,105,042 | |||
| Undistributed Ordinary Income | $ | 11,468,244 | |||
| Undistributed Long-Term Capital Gains | |||||
| (Capital Loss Carryforward) | $ | 118,132,636 | |||
| Tax Composition of Distributions | |||||
| Ordinary Income | $ | 55,869,465 | |||
| Long-Term Capital Gains | $ | 210,121,787 | |||
See accompanying notes which are an integral part of the financial statements.
76 Balanced Strategy Fund
Russell Investment Company
Balanced Strategy Fund
Federal Income Taxes, continued
Net investment income and net realized gains (losses) in the financial statements may differ from taxable net investment income and
net realized gains (losses). Capital accounts within the financial statements are adjusted for permanent differences between book and
tax accounting. These differences may be due to foreign currency gains or losses, reclassifications of dividends and /or differences in
treatment of income from swaps. These adjustments have no impact on the net assets.
At October 31, 2016, the Statement of Assets and Liabilities have been adjusted by the following amounts (in thousands):
| Undistributed net investment income | $ | 3,201 | |
| Accumulated net realized gain (loss) | (3,201 | ) | |
| Additional paid-in capital | — |
See accompanying notes which are an integral part of the financial statements.
Balanced Strategy Fund 77
Russell Investment Company
Growth Strategy Fund
Portfolio Management Discussion and Analysis — October 31, 2016 (Unaudited)
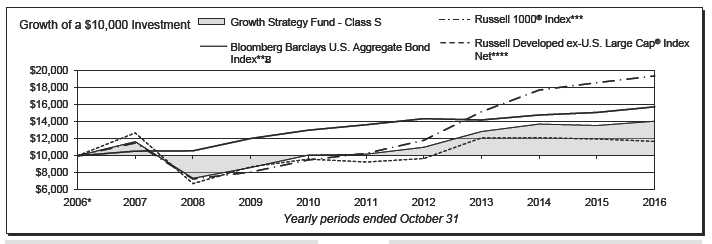
| Growth Strategy Fund - Class A‡ | Growth Strategy Fund - Class R5‡‡‡ | ||||||
| Total | Total | ||||||
| Return | Return | ||||||
| 1 Year | (2.43 | )% | 1 Year | 3.37 | % | ||
| 5 Years | 5.14 | %§ | 5 Years | 6.24 | %§ | ||
| 10 Years | 2.60 | %§ | 10 Years | 3.02 | %§ | ||
| Growth Strategy Fund - Class C | Growth Strategy Fund - Class S | ||||||
| Total | Total | ||||||
| Return | Return | ||||||
| 1 Year | 2.78 | % | 1 Year | 3.72 | % | ||
| 5 Years | 5.58 | %§ | 5 Years | 6.65 | %§ | ||
| 10 Years | 3.46 | %§ | |||||
| 10 Years | 2.43 | %§ | |||||
| Bloomberg Barclays U.S. Aggregate Bond Index**C | |||||||
| Growth Strategy Fund - Class E | |||||||
| Total | |||||||
| Total | Return | ||||||
| Return | 1 Year | 4.37 | % | ||||
| 1 Year | 3.48 | % | 5 Years | 2.90 | %§ | ||
| 5 Years | 6.38 | %§ | 10 Years | 4.64 | %§ | ||
| 10 Years | 3.21 | %§ | |||||
| Russell 1000® Index*** | |||||||
| Growth Strategy Fund - Class R1 | Total | ||||||
| Total | Return | ||||||
| Return | 1 Year | 4.26 | % | ||||
| 1 Year | 3.77 | % | 5 Years | 13.51 | %§ | ||
| 5 Years | 6.77 | %§ | 10 Years | 6.83 | %§ | ||
| 10 Years | 3.53 | %§ | |||||
| Russell Developed ex-U.S. Large Cap® Index Net**** | |||||||
| Growth Strategy Fund - Class R4‡‡ | Total | ||||||
| Return | |||||||
| Total | 1 Year | (2.34 | )% | ||||
| Return | |||||||
| 1 Year | 3.53 | % | 5 Years | 4.75 | %§ | ||
| 5 Years | 6.49 | %§ | 10 Years | 1.56 | %§ | ||
| 10 Years | 3.28 | %§ | |||||
78 Growth Strategy Fund
Russell Investment Company
Growth Strategy Fund
Portfolio Management Discussion and Analysis, continued — October 31, 2016
(Unaudited)
| The Growth Strategy Fund (the “Fund”) is a fund of funds that | infrastructure. With interest rates falling, income opportunities |
| invests principally in other Russell Investment Company mutual | around the globe continued to shrink and income available from |
| funds (the “Underlying Funds”). The Underlying Funds employ | most assets fell. |
| a multi-manager approach whereby portions of the Underlying | The U.S. equity market, as measured by the S&P 500® Index, |
| Funds are allocated to different money managers. Underlying | was up 4.51% over the period but also experienced multiple |
| Fund assets not allocated to money managers are managed by | draw downs. The Fund’s strategic exposure to global equities |
| Russell Investment Management, LLC (“RIM”), the Fund’s | proved beneficial over the period as emerging markets rallied |
| and Underlying Funds’ advisor. RIM, as the Underlying Funds’ | and outperformed U.S. equities. By contrast, non-U.S. developed |
| advisor, may change the allocation of the Underlying Funds’ | equity was one of the lowest performing portions of the Fund’s |
| assets among money managers at any time. An exemptive order | exposure as falling commodities and currencies weighed on |
| from the Securities and Exchange Commission (“SEC”) permits | returns. |
| RIM to engage or terminate a money manager in an Underlying | |
| Fund at any time, subject to approval by the Underlying Fund’s | How did the investment strategies and techniques employed |
| Board, without a shareholder vote. Pursuant to the terms of the | by the Fund and the Underlying Funds affect the Fund’s |
| exemptive order, an Underlying Fund is required to notify its | performance? |
| shareholders within 90 days of when a money manager begins | The Fund is a fund of funds and its performance is based on RIM’s |
| providing services. | strategic asset allocations, the performance of the Underlying |
| What is the Fund’s investment objective? | Funds in which the Fund invests, and tactical changes in the |
| The Fund seeks to provide high long term capital appreciation, | Fund’s asset allocation throughout the year. |
| and as a secondary objective, current income. | In order to seek to achieve the Fund’s objective during the period, |
| RIM’s strategic asset allocation included investments in global | |
| How did the Fund perform relative to its benchmark for the | equity, alternative and fixed/other income Underlying Funds. The |
| fiscal year ended October 31, 2016? | Fund’s diverse asset allocation partially hindered performance |
| For the fiscal year ended October 31, 2016, the Fund’s Class A, | during the period as certain of these exposures underperformed |
| Class C, Class E, Class R1, Class R4, Class R5 and Class S Shares | the Russell 1000® Index. While areas like high yield bonds, as |
| gained 3.50%, 2.78%, 3.48%, 3.77%, 3.53%, 3.37% and 3.72%, | measured by the BofA Merrill Lynch Global High Yield Index |
| respectively. This is compared to the Fund’s primary benchmark, | Hedged USD, outperformed the Russell 1000® Index, areas like |
| the Russell 1000® Index, which gained 4.26% during the same | commodities and non-U.S. developed equities delivered negative |
| period. The Fund’s performance includes operating expenses, | returns as measured by the Bloomberg Commodity Index Total |
| whereas index returns are unmanaged and do not include | Return and Russell Developed ex-U.S. Large Cap® Index Net, |
| expenses of any kind. | respectively. |
| For the fiscal year ended October 31, 2016, the Morningstar® | The Fund’s underperformance relative to the Russell 1000® |
| Allocation-70% to 85% Equity Category, a group of funds that | Index was partially offset by strong active management within |
| Morningstar considers to have investment strategies similar to | the fixed income portion of the Fund’s portfolio. Underlying Fund |
| those of the Fund, gained 2.43%. This result serves as a peer | bond issue selection during the period was generally additive to |
| comparison and is expressed net of operating expenses. | returns as fixed income money managers were able to pick well |
| within credit, avoiding defaults in places like the energy sector | |
| How did the market conditions described in the Market | where trouble occurred with falling energy prices in early 2016. |
| Summary report affect the Fund’s performance? | As such, an allocation to the Russell Strategic Bond Fund was |
| The Fund seeks to achieve its objective by investing in Underlying | positive from a benchmark-relative perspective. The Underlying |
| Funds that provide exposure to a range of diversified investments, | Fund was positively impacted by its overweight to credit and |
| and most major asset classes invested in by the Underlying Funds | additive currency positioning also helped to drive excess return. |
| produced positive absolute returns during the period. Markets | |
| during the fiscal year were characterized by higher levels of | By contrast, equity selection and positioning was more difficult, |
| volatility and dispersion across return sources. Within the fixed/ | with allocations to non-U.S. equity Underlying Funds detracting |
| other income Underlying Funds, exposure to high yield debt | from the Fund’s performance and security selection within |
| was beneficial as it was one of the best performing asset classes | those Underlying Funds struggling. In addition, overweights |
| globally. Falling interest rates also helped other fixed income | to European securities in the Select International Equity Fund |
| assets in the Underlying Funds rally, as well as more rate sensitive | caused the Underlying Fund to struggle as European equities |
| real assets like global real estate investment trusts and global | continued to lag the U.S. equity market. |
Growth Strategy Fund 79
Russell Investment Company
Growth Strategy Fund
Portfolio Management Discussion and Analysis, continued — October 31, 2016
(Unaudited)
| Describe any changes to the Fund’s structure or allocation | lows and RIM reduced risk exposure to a more defensive stance |
| to the Underlying Funds. | with the Fund’s equity allocation below strategic weights. RIM’s |
| RIM has the discretion to vary the Fund’s actual allocation | modifications to the Fund’s asset allocation were additive during |
| from the target strategic asset allocation by up to +/- 5% at the | the period. |
| equity, fixed/other income or alternative category level based on | RIM also made strategic asset allocation changes during the |
| RIM’s capital markets research. In addition to investing in the | period. In September 2016, RIM added further diversity and |
| Underlying Funds, RIM may seek to actively manage a Fund’s | dynamism to the Fund through the addition of the Unconstrained |
| overall exposures by investing in derivatives that RIM believes | Total Return Fund as an Underlying Fund. |
| will achieve the desired risk/return profile for the Fund. RIM’s | |
| asset allocation modifications, implemented through both tactical | The views expressed in this report reflect those of the |
| changes to Underlying Fund allocations and derivatives-based | portfolio managers only through the end of the period |
| exposures, benefited the Fund’s performance relative to the | covered by the report. These views do not necessarily |
| Fund’s target strategic asset allocation. | represent the views of RIM, or any other person in RIM or |
| any other affiliated organization. These views are subject | |
| RIM adapted the Fund’s asset allocation over the period | to change at any time based upon market conditions or |
| as market opportunities and risks evolved. The Fund was | other events, and RIM disclaims any responsibility to |
| defensively positioned in the fourth quarter of 2015, favoring | update the views contained herein. These views should not |
| fixed income over equity. During the first quarter of 2016, equity | be relied on as investment advice and, because investment |
| markets declined substantially, and RIM added further risk to | decisions for a Russell Investment Company (“RIC”) Fund |
| the portfolio by overweighting exposure to high yield credit and | are based on numerous factors, should not be relied on as |
| emerging markets equity compared with core bond holdings | an indication of investment decisions of any RIC Fund. |
| and cash. Markets subsequently rebounded from the February |
80 Growth Strategy Fund
Russell Investment Company
Growth Strategy Fund
Portfolio Management Discussion and Analysis, continued — October 31, 2016
(Unaudited)
* Assumes initial investment on November 1, 2006.
** The Bloomberg Barclays U.S. Aggregate Bond Index is an index, with income reinvested, generally representative of intermediate-term government bonds,
investment grade corporate debt securities and mortgage-backed securities.
Effective August 24, 2016, the Barclays fixed income benchmark indices, including the Barclays Aggregate family of indices, were renamed the Bloomberg
Barclays family of indices.
*** Russell 1000® Index includes the 1,000 largest companies in the Russell 3000® Index. The Russell 1000® Index represents the universe of stocks from which
most active money managers typically select. The Russell 1000® Index return reflects adjustments from income dividends and capital gain distributions
reinvested as of the ex-dividend dates.
**** Russell Developed ex-U.S. Large Cap® Index (net of tax on dividends from foreign holdings) is an index which offers investors access to the large-cap segment
of the global equity market, excluding companies assigned to the United States. It is constructed to provide a comprehensive and unbiased barometer for the
large-cap segment and is completely reconstituted annually to accurately reflect the changes in the market over time.
‡ The performance shown has been adjusted to reflect the deduction of the maximum Class A sales charge of 5.75%.
‡‡ The Fund first issued Class R4 Shares on October 1, 2014. The returns shown for Class R4 Shares prior to that date are the returns of the Fund’s Class R2
Shares.
‡‡‡ The Fund first issued Class R5 Shares on October 1, 2014. The returns shown for Class R5 Shares prior to that date are the returns of the Fund’s Class R3
Shares.
§ Annualized.
Performance is historical and assumes reinvestment of all dividends and capital gains. Investment return and principal value will fluctuate so that an investor’s
shares, when redeemed, may be worth more or less than when purchased. Past performance is not indicative of future results. The returns shown do not reflect the
deduction of taxes that a shareholder would pay on Fund distributions or the redemption of Fund shares. Additionally, the returns presented herein may differ from
the performance reported in the Financial Highlights as the returns herein are calculated in a manner consistent with standardized performance in accordance with
Securities and Exchange Commission rules, while the performance in the Financial Highlights has been calculated in accordance with U.S. Generally Accepted
Accounting Principles (“U.S. GAAP”).
Growth Strategy Fund 81
Russell Investment Company
Growth Strategy Fund
Shareholder Expense Example — October 31, 2016 (Unaudited)
| Fund Expenses | Please note that the expenses shown in the table are meant | |||||
| The following disclosure provides important information | to highlight your ongoing costs only and do not reflect any | |||||
| regarding the Fund’s Shareholder Expense Example | transactional costs. Therefore, the information under the heading | |||||
| (“Example”). | “Hypothetical Performance (5% return before expenses)” is | |||||
| useful in comparing ongoing costs only, and will not help you | ||||||
| Example | determine the relative total costs of owning different funds. In | |||||
| As a shareholder of the Fund, you incur two types of costs: (1) | addition, if these transactional costs were included, your costs | |||||
| transaction costs, including sales charges (loads) on certain | would have been higher. | |||||
| purchase or redemption payments, and (2) ongoing costs, | Hypothetical | |||||
| including advisory and administrative fees; distribution and/or | Performance (5% | |||||
| service fees; and other Fund expenses. The Example is intended | Actual | return before | ||||
| to help you understand your ongoing costs (in dollars) of investing | Class A | Performance | expenses) | |||
| Beginning Account Value | ||||||
| in the Fund and to compare these costs with the ongoing costs of | May 1, 2016 | $ | 1,000.00 | $ | 1,000.00 | |
| investing in other mutual funds. The Example is based on an | Ending Account Value | |||||
| investment of $1,000 invested at the beginning of the period and | October 31, 2016 | $ | 1,039.30 | $ | 1,022.27 | |
| held for the entire period indicated, which for this Fund is from | Expenses Paid During Period* | $ | 2.92 | $ | 2.90 | |
| May 1, 2016 to October 31, 2016. | * Expenses are equal to the Fund's annualized expense ratio of 0.57% | |||||
| (representing the six month period annualized), multiplied by the average | ||||||
| Actual Expenses | account value over the period, multiplied by 184/366 (to reflect the one-half | |||||
| The information in the table under the heading “Actual | year period). May reflect amounts waived and/or reimbursed. Without any | |||||
| Performance” provides information about actual account values | waivers and/or reimbursements, expenses would have been higher. | |||||
| and actual expenses. You may use the information in this column, | ||||||
| Hypothetical | ||||||
| together with the amount you invested, to estimate the expenses | Performance (5% | |||||
| that you paid over the period. Simply divide your account value by | Actual | return before | ||||
| $1,000 (for example, an $8,600 account value divided by $1,000 | Class C | Performance | expenses) | |||
| Beginning Account Value | ||||||
| = 8.6), then multiply the result by the number in the first column | May 1, 2016 | $ | 1,000.00 | $ | 1,000.00 | |
| in the row entitled “Expenses Paid During Period” to estimate | Ending Account Value | |||||
| the expenses you paid on your account during this period. | October 31, 2016 | $ | 1,036.00 | $ | 1,018.50 | |
| Expenses Paid During Period* | $ | 6.76 | $ | 6.70 | ||
| Hypothetical Example for Comparison Purposes | ||||||
| The information in the table under the heading “Hypothetical | * Expenses are equal to the Fund's annualized expense ratio of 1.32% | |||||
| (representing the six month period annualized), multiplied by the average | ||||||
| Performance (5% return before expenses)” provides information | account value over the period, multiplied by 184/366 (to reflect the one-half | |||||
| about hypothetical account values and hypothetical expenses | year period). May reflect amounts waived and/or reimbursed. Without any | |||||
| based on the Fund’s actual expense ratio and an assumed rate of | waivers and/or reimbursements, expenses would have been higher. | |||||
| return of 5% per year before expenses, which is not the Fund’s | ||||||
| Hypothetical | ||||||
| actual return. The hypothetical account values and expenses | Performance (5% | |||||
| may not be used to estimate the actual ending account balance or | Actual | return before | ||||
| expenses you paid for the period. You may use this information | Class E | Performance | expenses) | |||
| to compare the ongoing costs of investing in the Fund and other | Beginning Account Value | |||||
| May 1, 2016 | $ | 1,000.00 | $ | 1,000.00 | ||
| funds. To do so, compare this 5% hypothetical example with the | Ending Account Value | |||||
| 5% hypothetical examples that appear in the shareholder reports | October 31, 2016 | $ | 1,040.10 | $ | 1,022.27 | |
| of other funds. | Expenses Paid During Period* | $ | 2.92 | $ | 2.90 | |
| * Expenses are equal to the Fund's annualized expense ratio of 0.57% | ||||||
| (representing the six month period annualized), multiplied by the average | ||||||
| account value over the period, multiplied by 184/366 (to reflect the one-half | ||||||
| year period). May reflect amounts waived and/or reimbursed. Without any | ||||||
| waivers and/or reimbursements, expenses would have been higher. | ||||||
82 Growth Strategy Fund
Russell Investment Company
Growth Strategy Fund
Shareholder Expense Example, continued — October 31, 2016 (Unaudited)
| Hypothetical | ||||
| Performance (5% | ||||
| Actual | return before | |||
| Class R1 | Performance | expenses) | ||
| Beginning Account Value | ||||
| May 1, 2016 | $ | 1,000.00 | $ | 1,000.00 |
| Ending Account Value | ||||
| October 31, 2016 | $ | 1,041.30 | $ | 1,023.78 |
| Expenses Paid During Period* | $ | 1.39 | $ | 1.37 |
* Expenses are equal to the Fund's annualized expense ratio of 0.27%
(representing the six month period annualized), multiplied by the average
account value over the period, multiplied by 184/366 (to reflect the one-half
year period). May reflect amounts waived and/or reimbursed. Without any
waivers and/or reimbursements, expenses would have been higher.
| Hypothetical | ||||
| Performance (5% | ||||
| Actual | return before | |||
| Class R4 | Performance | expenses) | ||
| Beginning Account Value | ||||
| May 1, 2016 | $ | 1,000.00 | $ | 1,000.00 |
| Ending Account Value | ||||
| October 31, 2016 | $ | 1,040.30 | $ | 1,022.52 |
| Expenses Paid During Period* | $ | 2.67 | $ | 2.64 |
* Expenses are equal to the Fund's annualized expense ratio of 0.52%
(representing the six month period annualized), multiplied by the average
account value over the period, multiplied by 184/366 (to reflect the one-half
year period). May reflect amounts waived and/or reimbursed. Without any
waivers and/or reimbursements, expenses would have been higher.
| Hypothetical | ||||
| Performance (5% | ||||
| Actual | return before | |||
| Class R5 | Performance | expenses) | ||
| Beginning Account Value | ||||
| May 1, 2016 | $ | 1,000.00 | $ | 1,000.00 |
| Ending Account Value | ||||
| October 31, 2016 | $ | 1,039.00 | $ | 1,021.27 |
| Expenses Paid During Period* | $ | 3.95 | $ | 3.91 |
* Expenses are equal to the Fund's annualized expense ratio of 0.77%
(representing the six month period annualized), multiplied by the average
account value over the period, multiplied by 184/366 (to reflect the one-half
year period). May reflect amounts waived and/or reimbursed. Without any
waivers and/or reimbursements, expenses would have been higher.
| Hypothetical | ||||
| Performance (5% | ||||
| Actual | return before | |||
| Class S | Performance | expenses) | ||
| Beginning Account Value | ||||
| May 1, 2016 | $ | 1,000.00 | $ | 1,000.00 |
| Ending Account Value | ||||
| October 31, 2016 | $ | 1,041.10 | $ | 1,023.53 |
| Expenses Paid During Period* | $ | 1.64 | $ | 1.63 |
* Expenses are equal to the Fund's annualized expense ratio of 0.32%
(representing the six month period annualized), multiplied by the average
account value over the period, multiplied by 184/366 (to reflect the one-half
year period). May reflect amounts waived and/or reimbursed. Without any
waivers and/or reimbursements, expenses would have been higher.
Growth Strategy Fund 83
Russell Investment Company
Growth Strategy Fund
Schedule of Investments — October 31, 2016
| Amounts in thousands (except share amounts) | ||||
| Fair | ||||
| Value | ||||
| Shares | $ | |||
| Investments in Russell Affiliated Mutual Funds - 96.9% | ||||
| Alternative - 8.8% | ||||
| Russell Commodity Strategies Fund Class Y | 8,489,779 | 46,779 | ||
| Russell Global Infrastructure Fund Class Y | 4,125,574 | 47,155 | ||
| Russell Global Real Estate Securities Fund Class Y | 1,284,827 | 45,907 | ||
| 139,841 | ||||
| Domestic Equities - 32.5% | ||||
| Russell U.S. Defensive Equity Fund Class Y | 1,604,676 | 78,982 | ||
| Russell U.S. Dynamic Equity Fund Class Y | 12,692,896 | 126,040 | ||
| Russell U.S. Small Cap Equity Fund Class Y | 5,054,365 | 139,551 | ||
| Select U.S. Equity Fund Class Y | 15,924,832 | 173,900 | ||
| 518,473 | ||||
| Fixed Income - 21.8% | ||||
| Russell Global Opportunistic Credit Fund Class Y | 13,003,070 | 126,390 | ||
| Russell Strategic Bond Fund Class Y | 14,306,762 | 158,232 | ||
| Unconstrained Total Return Fund Class Y | 6,326,806 | 63,458 | ||
| 348,080 | ||||
| International Equities - 33.8% | ||||
| Russell Emerging Markets Fund Class Y | 8,503,121 | 141,747 | ||
| Russell Global Equity Fund Class Y | 18,211,244 | 189,943 | ||
| Select International Equity Fund Class Y | 24,008,947 | 206,237 | ||
| 537,927 | ||||
| Total Investments in Russell Affiliated Mutual Funds | ||||
| (cost $1,502,244) | 1,544,321 | |||
| Options Purchased - 0.2% | ||||
| (Number of Contracts) | ||||
| S&P 500 Index | ||||
| Nov 2016 2,137.68 Put (17,135) | USD | 36,629 (ÿ) | 722 | |
| Nov 2016 2,143.18 Put (19,078) | USD | 40,888 (ÿ) | 852 | |
| Jan 2017 2,137.94 Put (34,730) | USD | 74,251 (ÿ) | 2,112 | |
| Total Options Purchased | ||||
| (cost $3,965) | 3,686 | |||
| Short-Term Investments - 1.4% | ||||
| Russell U.S. Cash Management Fund | 21,941,254 | (8) | 21,946 | |
| Total Short-Term Investments | ||||
| (cost $21,944) | 21,946 | |||
| Total Investments 98.5% | ||||
| (identified cost $1,528,153) | 1,569,953 | |||
| Other Assets and Liabilities, Net - 1.5% | 23,982 | |||
| Net Assets - 100.0% | 1,593,935 | |||
See accompanying notes which are an integral part of the financial statements.
84 Growth Strategy Fund
Russell Investment Company
Growth Strategy Fund
Schedule of Investments, continued — October 31, 2016
| Futures Contracts | |||||||
| Amounts in thousands (except contract amounts) | |||||||
| Unrealized | |||||||
| Appreciation | |||||||
| Number of | Notional | Expiration | (Depreciation) | ||||
| Contracts | Amount | Date | $ | ||||
| Long Positions | |||||||
| Amsterdam Index Futures | 114 | EUR | 10,287 | 11/16 | 6 | ||
| CAC40 Euro Index Futures | 650 | EUR | 29,292 | 11/16 | 176 | ||
| DAX Index Futures | 103 | EUR | 27,493 | 12/16 | 758 | ||
| Euro STOXX 50 Index Futures | 523 | EUR | 15,967 | 12/16 | 253 | ||
| FTSE/MIB Index Futures | 71 | EUR | 6,073 | 12/16 | 178 | ||
| IBEX 35 Index Futures | 105 | EUR | 9,583 | 11/16 | 383 | ||
| OMXS30 Index Futures | 454 | SEK | 65,592 | 11/16 | 2 | ||
| Russell 1000 Mini Index Futures | 22 | USD | 2,583 | 12/16 | (51 | ) | |
| Russell 2000 Mini Index Futures | 11 | USD | 1,308 | 12/16 | (68 | ) | |
| S&P 500 E-Mini Index Futures | 379 | USD | 40,176 | 12/16 | (750 | ) | |
| S&P Mid 400 E-Mini Index Futures | 24 | USD | 3,616 | 12/16 | (106 | ) | |
| Short Positions | |||||||
| FTSE 100 Index Futures | 64 | GBP | 4,435 | 12/16 | (204 | ) | |
| Hang Seng Index Futures | 4 | HKD | 4,581 | 11/16 | 12 | ||
| MSCI Emerging Markets Mini Index Futures | 115 | USD | 5,195 | 12/16 | (38 | ) | |
| MSCI Singapore Index Futures | 7 | SGD | 216 | 11/16 | 3 | ||
| Russell 1000 Mini Index Futures | 54 | USD | 6,339 | 12/16 | 124 | ||
| S&P 500 E-Mini Index Futures | 1,037 | USD | 109,927 | 12/16 | 2,114 | ||
| S&P Mid 400 E-Mini Index Futures | 59 | USD | 8,890 | 12/16 | 268 | ||
| S&P/TSX 60 Index Futures | 173 | CAD | 29,981 | 12/16 | (701 | ) | |
| SPI 200 Index Futures | 197 | AUD | 26,053 | 12/16 | (428 | ) | |
| TOPIX Index Futures | 132 | JPY | 1,841,400 | 12/16 | (733 | ) | |
| Total Unrealized Appreciation (Depreciation) on Open Futures Contracts (å) | 1,198 | ||||||
| Options Written | ||||||||||||
| Amounts in thousands (except contract amounts) | ||||||||||||
| Number of | Strike | Notional | Expiration | Fair Value | ||||||||
| Call/Put | Contracts | Price | Amount | Date | $ | |||||||
| S&P 500 Index | Put | 34,270 | 1,900.16 | USD | 65,118 | 11/30/16 | (111 | ) | ||||
| S&P 500 Index | Put | 38,156 | 1,905.05 | USD | 72,689 | 11/30/16 | (131 | ) | ||||
| S&P 500 Index | Put | 69,460 | 1,900.39 | USD | 132,001 | 01/06/17 | (833 | ) | ||||
| Total Liability for Options Written (premiums received $2,016) | (1,075 | ) | ||||||||||
| Transactions in options written contracts for the period ended October 31, 2016 were as follows: | ||||||||||||
| Number of | Premiums | |||||||||||
| Contracts | Received | |||||||||||
| Outstanding October 31, 2015 | — | $ | — | |||||||||
| Opened | 8,192,695 | 13,780 | ||||||||||
| Closed | (7,948,251 | ) | (6,260 | ) | ||||||||
| Expired | (102,558 | ) | (5,504 | ) | ||||||||
| Outstanding October 31, 2016 | 141,886 | $ | 2,016 | |||||||||
| Foreign Currency Exchange Contracts | |||||||||
| Amounts in thousands | |||||||||
| Unrealized | |||||||||
| Appreciation | |||||||||
| Amount | Amount | (Depreciation) | |||||||
| Counterparty | Sold | Bought | Settlement Date | $ | |||||
| Bank of America | USD | 7,028 | CHF | 6,930 | 12/21/16 | (5 | ) | ||
| Bank of America | USD | 13,552 | EUR | 12,310 | 12/21/16 | (8 | ) | ||
See accompanying notes which are an integral part of the financial statements.
Growth Strategy Fund 85
Russell Investment Company
Growth Strategy Fund
Schedule of Investments, continued — October 31, 2016
| Foreign Currency Exchange Contracts | |||||||
| Amounts in thousands | |||||||
| Unrealized | |||||||
| Appreciation | |||||||
| Amount | Amount | (Depreciation) | |||||
| Counterparty | Sold | Bought | Settlement Date | $ | |||
| Bank of America | USD | 20,044 | JPY | 2,083,900 | 12/21/16 | (133 | ) |
| Bank of America | USD | 2,993 | MXN | 57,030 | 12/21/16 | 8 | |
| Bank of America | USD | 2,961 | RUB | 188,850 | 12/21/16 | (19 | ) |
| Bank of America | USD | 4,484 | ZAR | 64,440 | 12/21/16 | 248 | |
| Bank of America | AUD | 48,550 | USD | 36,779 | 12/21/16 | (107 | ) |
| Bank of America | CAD | 1,540 | USD | 1,172 | 12/21/16 | 24 | |
| Bank of America | GBP | 840 | USD | 1,093 | 12/21/16 | 63 | |
| Bank of America | KRW | 25,987,000 | USD | 23,735 | 12/21/16 | 1,027 | |
| Bank of Montreal | USD | 1,345 | AUD | 1,769 | 11/08/16 | — | |
| Bank of Montreal | USD | 1,741 | CAD | 2,331 | 11/08/16 | (3 | ) |
| Bank of Montreal | USD | 1,624 | CHF | 1,606 | 11/08/16 | (1 | ) |
| Bank of Montreal | USD | 5,888 | EUR | 5,377 | 11/08/16 | 16 | |
| Bank of Montreal | USD | 3,225 | GBP | 2,650 | 11/08/16 | 19 | |
| Bank of Montreal | USD | 3,999 | JPY | 419,879 | 11/08/16 | 6 | |
| Bank of Montreal | AUD | 1,788 | USD | 1,360 | 11/08/16 | 1 | |
| Bank of Montreal | AUD | 1,769 | USD | 1,344 | 12/07/16 | — | |
| Bank of Montreal | CAD | 2,334 | USD | 1,774 | 11/08/16 | 33 | |
| Bank of Montreal | CAD | 2,331 | USD | 1,741 | 12/07/16 | 3 | |
| Bank of Montreal | CHF | 1,627 | USD | 1,672 | 11/08/16 | 28 | |
| Bank of Montreal | CHF | 1,606 | USD | 1,627 | 12/07/16 | 1 | |
| Bank of Montreal | EUR | 5,475 | USD | 6,120 | 11/08/16 | 108 | |
| Bank of Montreal | EUR | 5,377 | USD | 5,895 | 12/07/16 | (16 | ) |
| Bank of Montreal | GBP | 2,679 | USD | 3,475 | 11/08/16 | 195 | |
| Bank of Montreal | GBP | 2,650 | USD | 3,227 | 12/07/16 | (18 | ) |
| Bank of Montreal | JPY | 419,277 | USD | 4,143 | 11/08/16 | 143 | |
| Bank of Montreal | JPY | 419,879 | USD | 4,003 | 12/07/16 | (6 | ) |
| BNP Paribas | USD | 74 | CAD | 95 | 12/21/16 | (3 | ) |
| BNP Paribas | AUD | 1,788 | USD | 1,362 | 11/08/16 | 2 | |
| BNP Paribas | AUD | 5,075 | USD | 3,887 | 12/21/16 | 31 | |
| BNP Paribas | CAD | 2,334 | USD | 1,774 | 11/08/16 | 34 | |
| BNP Paribas | CHF | 1,627 | USD | 1,674 | 11/08/16 | 30 | |
| BNP Paribas | EUR | 5,475 | USD | 6,127 | 11/08/16 | 116 | |
| BNP Paribas | EUR | 1,543 | USD | 1,746 | 12/21/16 | 49 | |
| BNP Paribas | GBP | 2,679 | USD | 3,474 | 11/08/16 | 193 | |
| BNP Paribas | GBP | 1,300 | USD | 1,732 | 12/21/16 | 139 | |
| BNP Paribas | HKD | 583 | USD | 75 | 12/21/16 | — | |
| BNP Paribas | JPY | 419,277 | USD | 4,147 | 11/08/16 | 149 | |
| BNP Paribas | JPY | 320,158 | USD | 3,160 | 12/21/16 | 101 | |
| BNP Paribas | SEK | 1,193 | USD | 142 | 12/21/16 | 10 | |
| BNP Paribas | SGD | 50 | USD | 37 | 12/21/16 | 1 | |
| Citigroup | USD | 1,346 | AUD | 1,769 | 11/08/16 | — | |
| Citigroup | USD | 1,742 | CAD | 2,331 | 11/08/16 | (4 | ) |
| Citigroup | USD | 1,624 | CHF | 1,606 | 11/08/16 | (1 | ) |
| Citigroup | USD | 5,888 | EUR | 5,377 | 11/08/16 | 16 | |
| Citigroup | USD | 3,225 | GBP | 2,650 | 11/08/16 | 18 | |
| Citigroup | USD | 4,000 | JPY | 419,879 | 11/08/16 | 5 | |
| Citigroup | AUD | 1,769 | USD | 1,345 | 12/07/16 | — | |
| Citigroup | CAD | 2,331 | USD | 1,742 | 12/07/16 | 4 | |
| Citigroup | CHF | 1,606 | USD | 1,627 | 12/07/16 | 1 | |
| Citigroup | EUR | 5,377 | USD | 5,895 | 12/07/16 | (17 | ) |
| Citigroup | GBP | 2,650 | USD | 3,227 | 12/07/16 | (18 | ) |
| Citigroup | JPY | 419,879 | USD | 4,003 | 12/07/16 | (5 | ) |
| Commonwealth Bank of Australia | USD | 1,346 | AUD | 1,769 | 11/08/16 | — | |
| Commonwealth Bank of Australia | USD | 1,742 | CAD | 2,331 | 11/08/16 | (4 | ) |
| Commonwealth Bank of Australia | USD | 1,624 | CHF | 1,606 | 11/08/16 | (1 | ) |
| Commonwealth Bank of Australia | USD | 5,888 | EUR | 5,377 | 11/08/16 | 16 |
See accompanying notes which are an integral part of the financial statements.
86 Growth Strategy Fund
Russell Investment Company
Growth Strategy Fund
Schedule of Investments, continued — October 31, 2016
| Foreign Currency Exchange Contracts | |||||||
| Amounts in thousands | |||||||
| Unrealized | |||||||
| Appreciation | |||||||
| Amount | Amount | (Depreciation) | |||||
| Counterparty | Sold | Bought | Settlement Date | $ | |||
| Commonwealth Bank of Australia | USD | 3,226 | GBP | 2,650 | 11/08/16 | 18 | |
| Commonwealth Bank of Australia | USD | 4,000 | JPY | 419,879 | 11/08/16 | 4 | |
| Commonwealth Bank of Australia | AUD | 1,788 | USD | 1,361 | 11/08/16 | 2 | |
| Commonwealth Bank of Australia | AUD | 1,769 | USD | 1,345 | 12/07/16 | — | |
| Commonwealth Bank of Australia | CAD | 2,334 | USD | 1,775 | 11/08/16 | 34 | |
| Commonwealth Bank of Australia | CAD | 2,331 | USD | 1,742 | 12/07/16 | 4 | |
| Commonwealth Bank of Australia | CHF | 1,627 | USD | 1,674 | 11/08/16 | 30 | |
| Commonwealth Bank of Australia | CHF | 1,606 | USD | 1,627 | 12/07/16 | 1 | |
| Commonwealth Bank of Australia | EUR | 5,475 | USD | 6,124 | 11/08/16 | 112 | |
| Commonwealth Bank of Australia | EUR | 5,377 | USD | 5,895 | 12/07/16 | (16 | ) |
| Commonwealth Bank of Australia | GBP | 2,679 | USD | 3,472 | 11/08/16 | 192 | |
| Commonwealth Bank of Australia | GBP | 2,650 | USD | 3,227 | 12/07/16 | (18 | ) |
| Commonwealth Bank of Australia | JPY | 419,277 | USD | 4,146 | 11/08/16 | 147 | |
| Commonwealth Bank of Australia | JPY | 419,879 | USD | 4,004 | 12/07/16 | (5 | ) |
| HSBC | USD | 1,346 | AUD | 1,769 | 11/08/16 | — | |
| HSBC | USD | 1,741 | CAD | 2,331 | 11/08/16 | (4 | ) |
| HSBC | USD | 1,624 | CHF | 1,606 | 11/08/16 | (1 | ) |
| HSBC | USD | 5,888 | EUR | 5,377 | 11/08/16 | 16 | |
| HSBC | USD | 3,225 | GBP | 2,650 | 11/08/16 | 18 | |
| HSBC | USD | 3,999 | JPY | 419,879 | 11/08/16 | 5 | |
| HSBC | AUD | 1,769 | USD | 1,345 | 12/07/16 | — | |
| HSBC | CAD | 2,331 | USD | 1,742 | 12/07/16 | 4 | |
| HSBC | CHF | 1,606 | USD | 1,627 | 12/07/16 | 1 | |
| HSBC | EUR | 5,377 | USD | 5,895 | 12/07/16 | (16 | ) |
| HSBC | GBP | 2,650 | USD | 3,227 | 12/07/16 | (18 | ) |
| HSBC | JPY | 419,879 | USD | 4,003 | 12/07/16 | (6 | ) |
| National Australia Bank | USD | 74 | CAD | 95 | 12/21/16 | (3 | ) |
| National Australia Bank | AUD | 5,075 | USD | 3,886 | 12/21/16 | 30 | |
| National Australia Bank | EUR | 1,543 | USD | 1,746 | 12/21/16 | 49 | |
| National Australia Bank | GBP | 1,300 | USD | 1,732 | 12/21/16 | 139 | |
| National Australia Bank | HKD | 583 | USD | 75 | 12/21/16 | — | |
| National Australia Bank | JPY | 320,158 | USD | 3,162 | 12/21/16 | 103 | |
| National Australia Bank | SEK | 1,193 | USD | 142 | 12/21/16 | 10 | |
| National Australia Bank | SGD | 50 | USD | 37 | 12/21/16 | 1 | |
| Royal Bank of Canada | USD | 74 | CAD | 95 | 12/21/16 | (3 | ) |
| Royal Bank of Canada | AUD | 5,075 | USD | 3,890 | 12/21/16 | 34 | |
| Royal Bank of Canada | EUR | 1,543 | USD | 1,745 | 12/21/16 | 48 | |
| Royal Bank of Canada | GBP | 1,300 | USD | 1,734 | 12/21/16 | 141 | |
| Royal Bank of Canada | HKD | 583 | USD | 75 | 12/21/16 | — | |
| Royal Bank of Canada | JPY | 320,158 | USD | 3,162 | 12/21/16 | 103 | |
| Royal Bank of Canada | SEK | 1,193 | USD | 142 | 12/21/16 | 10 | |
| Royal Bank of Canada | SGD | 50 | USD | 37 | 12/21/16 | 1 | |
| Standard Chartered | USD | 10,999 | GBP | 9,030 | 12/21/16 | 67 | |
| Standard Chartered | CNY | 37,100 | USD | 5,462 | 12/21/16 | 11 | |
| Standard Chartered | TWD | 264,000 | USD | 8,481 | 12/21/16 | 112 | |
| State Street | USD | 57 | AUD | 74 | 11/08/16 | — | |
| State Street | USD | 11 | CAD | 15 | 11/08/16 | — | |
| State Street | USD | 86 | CHF | 83 | 11/08/16 | (2 | ) |
| State Street | USD | 440 | EUR | 392 | 11/08/16 | (10 | ) |
| State Street | USD | 152 | GBP | 118 | 11/08/16 | (7 | ) |
| State Street | USD | 2,709 | HKD | 21,004 | 11/08/16 | — | |
| State Street | USD | 2,556 | SEK | 23,019 | 11/08/16 | (7 | ) |
| State Street | USD | 900 | SGD | 1,253 | 11/08/16 | 1 | |
| State Street | CNY | 177,000 | USD | 26,335 | 12/21/16 | 327 | |
| State Street | HKD | 584 | USD | 75 | 11/08/16 | — | |
| State Street | HKD | 20,420 | USD | 2,634 | 11/08/16 | 1 |
See accompanying notes which are an integral part of the financial statements.
Growth Strategy Fund 87
Russell Investment Company
Growth Strategy Fund
Schedule of Investments, continued — October 31, 2016
| Foreign Currency Exchange Contracts | ||||||||
| Amounts in thousands | ||||||||
| Unrealized | ||||||||
| Appreciation | ||||||||
| Amount | Amount | (Depreciation) | ||||||
| Counterparty | Sold | Bought | Settlement Date | $ | ||||
| State Street | HKD | 21,004 | USD | 2,709 | 12/07/16 | — | ||
| State Street | JPY | 2,405 | USD | 24 | 11/08/16 | 1 | ||
| State Street | SEK | 135 | USD | 16 | 11/08/16 | 1 | ||
| State Street | SEK | 22,884 | USD | 2,660 | 11/08/16 | 125 | ||
| State Street | SEK | 23,019 | USD | 2,559 | 12/07/16 | 7 | ||
| State Street | SGD | 11 | USD | 8 | 11/08/16 | — | ||
| State Street | SGD | 1,242 | USD | 911 | 11/08/16 | 18 | ||
| State Street | SGD | 1,253 | USD | 900 | 12/07/16 | (1 | ) | |
| UBS | AUD | 1,788 | USD | 1,361 | 11/08/16 | 2 | ||
| UBS | CAD | 2,334 | USD | 1,774 | 11/08/16 | 34 | ||
| UBS | CHF | 1,627 | USD | 1,671 | 11/08/16 | 27 | ||
| UBS | EUR | 5,475 | USD | 6,118 | 11/08/16 | 107 | ||
| UBS | GBP | 2,679 | USD | 3,473 | 11/08/16 | 193 | ||
| UBS | JPY | 419,277 | USD | 4,144 | 11/08/16 | 145 | ||
| Westpac | USD | 74 | CAD | 95 | 12/21/16 | (3 | ) | |
| Westpac | AUD | 5,075 | USD | 3,885 | 12/21/16 | 29 | ||
| Westpac | EUR | 1,543 | USD | 1,745 | 12/21/16 | 48 | ||
| Westpac | GBP | 1,300 | USD | 1,731 | 12/21/16 | 138 | ||
| Westpac | HKD | 583 | USD | 75 | 12/21/16 | — | ||
| Westpac | JPY | 320,158 | USD | 3,160 | 12/21/16 | 101 | ||
| Westpac | SEK | 1,193 | USD | 142 | 12/21/16 | 10 | ||
| Westpac | SGD | 50 | USD | 37 | 12/21/16 | 1 | ||
| Total Unrealized Appreciation (Depreciation) on Open Foreign Currency Exchange Contracts | 5,112 | |||||||
| Total Return Swap Contracts (*) | |||||
| Amounts in thousands | |||||
| Notional | Termination | Fair Value | |||
| Underlying Reference Entity | Counterparty | Amount | Date | $ | |
| Dow Jones U.S. Real Estate Total Return Index | Bank of America | USD | 35,753 | 03/07/17 | 2,510 |
| Total Fair Value of Open Total Return Swap Contracts Premiums Paid (Received) - $— (å) | 2,510 | ||||
(*) Total return swaps (which includes index swaps) are agreements between counterparties to exchange cash flows, one based on a market-linked
returns of an individual asset or a basket of assets (i.e. an index), and the other on a fixed or floating rate. The floating rate fees were based on 3
Month LIBOR rate plus a fee of 0.075%.
| Credit Default Swap Contracts | ||||||||
| Amounts in thousands | ||||||||
| Credit Indices | ||||||||
| Fund (Pays)/ | ||||||||
| Receives | Termination | Fair Value | ||||||
| Reference Entity | Counterparty | Notional Amount | Fixed Rate | Date | $ | |||
| CDX NA High Yield Index | Bank of America | USD | 67,500 | 5.000 | % | 12/20/21 | 2,666 | |
| Total Fair Value on Open Credit Indices Premiums Paid (Received) - $2,386 | 2,666 | |||||||
See accompanying notes which are an integral part of the financial statements.
88 Growth Strategy Fund
Russell Investment Company
Growth Strategy Fund
Schedule of Investments, continued — October 31, 2016
| Presentation of Portfolio Holdings | |||||||||||||||||
| Amounts in thousands | |||||||||||||||||
| Fair Value | |||||||||||||||||
| Practical | |||||||||||||||||
| Portfolio Summary | Level 1 | Level 2 | Level 3 | Expedient (a) | Total | % of Net Assets | |||||||||||
| Investments in Russell Affiliated Mutual | |||||||||||||||||
| Funds | $ | 1,544,321 | $ | — | $ | — | $ | — | $ | 1,544,321 | 96.9 | ||||||
| Options Purchased | — | 3,686 | — | — | 3,686 | 0.2 | |||||||||||
| Short-Term Investments | — | — | — | 21,946 | 21,946 | 1.4 | |||||||||||
| Total Investments | 1,544,321 | 3,686 | — | 21,946 | 1,569,953 | 98.5 | |||||||||||
| Other Assets and Liabilities, Net | 1.5 | ||||||||||||||||
| 100.0 | |||||||||||||||||
| Other Financial Instruments | |||||||||||||||||
| Assets | |||||||||||||||||
| Futures Contracts | 4,277 | — | — | — | 4,277 | 0.3 | |||||||||||
| Foreign Currency Exchange Contracts | — | 5,601 | — | — | 5,601 | 0.4 | |||||||||||
| Total Return Swap Contracts | — | 2,510 | — | — | 2,510 | 0.2 | |||||||||||
| Credit Default Swap Contracts | — | 2,666 | — | — | 2,666 | 0.2 | |||||||||||
| ' | |||||||||||||||||
| Liabilities | |||||||||||||||||
| Futures Contracts | (3,079 | ) | — | — | — | (3,079 | ) | (0.2 | ) | ||||||||
| Options Written | — | (1,075 | ) | — | — | (1,075 | ) | (0.1 | ) | ||||||||
| Foreign Currency Exchange Contracts | — | (489 | ) | — | — | (489 | ) | (—)* | |||||||||
| Total Other Financial Instruments** | $ | 1,198 | $ | 9,213 | $ | — | $ | — | $ | 10,411 | |||||||
* Less than 0.05% of net assets.
** Futures and foreign currency exchange contract values reflect the unrealized appreciation (depreciation) on the investments.
(a) Certain investments that are measured at fair value using the net asset value per share (or its equivalent) practical expedient have not been classified
in the fair value levels. The fair value amounts presented in the table are intended to permit reconciliation to the amounts presented in the Schedule of
Investments.
For a description of the Levels, see note 2 in the Notes to Financial Statements.
For a disclosure on transfers between Levels 1, 2 and 3 during the period ended October 31, 2016, see note 2 in the Notes to
Financial Statements.
See accompanying notes which are an integral part of the financial statements.
Growth Strategy Fund 89
Russell Investment Company
Growth Strategy Fund
Fair Value of Derivative Instruments — October 31, 2016
Amounts in thousands
| Foreign | |||||||||
| Equity | Credit | Currency | |||||||
| Derivatives not accounted for as hedging instruments | Contracts | Contracts | Contracts | ||||||
| Location: Statement of Assets and Liabilities - Assets | |||||||||
| Investments, at fair value* | $ | 3,686 | $ | — | $ | — | |||
| Unrealized appreciation on foreign currency exchange contracts | — | — | 5,601 | ||||||
| Variation margin on futures contracts** | 4,277 | — | — | ||||||
| Total return swap contracts, at fair value | 2,510 | — | — | ||||||
| Credit default swap contracts, at fair value | — | 2,666 | — | ||||||
| Total | $ | 10,473 | $ | 2,666 | $ | 5,601 | |||
| Location: Statement of Assets and Liabilities - Liabilities | |||||||||
| Variation margin on futures contracts** | $ | 3,079 | $ | — | $ | — | |||
| Unrealized depreciation on foreign currency exchange contracts | — | — | 489 | ||||||
| Options written, at fair value | 1,075 | — | — | ||||||
| Total | $ | 4,154 | $ | — | $ | 489 | |||
| Foreign | |||||||||
| Equity | Credit | Currency | |||||||
| Derivatives not accounted for as hedging instruments | Contracts | Contracts | Contracts | ||||||
| Location: Statement of Operations - Net realized gain (loss) | |||||||||
| Investments*** | $ | 6,764 | $ | — | $ | — | |||
| Futures contracts | 1,156 | — | — | ||||||
| Options written | 389 | — | — | ||||||
| Total return swap contracts | (12,588 | ) | — | — | |||||
| Credit default swap contracts | — | (97 | ) | — | |||||
| Foreign currency-related transactions**** | — | — | (1,303 | ) | |||||
| Total | $ | (4,279 | ) | $ | (97 | ) | $ | (1,303 | ) |
| Location: Statement of Operations - Net change in unrealized appreciation (depreciation) | |||||||||
| Investments***** | $ | (279 | ) | $ | — | $ | — | ||
| Futures contracts | (3,685 | ) | — | — | |||||
| Options written | 941 | — | — | ||||||
| Total return swap contracts | 8,002 | — | — | ||||||
| Credit default swap contracts | — | 280 | — | ||||||
| Foreign currency-related transactions****** | — | — | 4,750 | ||||||
| Total | $ | 4,979 | $ | 280 | $ | 4,750 | |||
* Fair value of purchased options.
** Includes cumulative appreciation/depreciation of futures contracts as reported in the Schedule of Investments. Only variation margin is reported within the
Statement of Assets and Liabilities.
*** Includes net realized gain (loss) on purchased options as reported in the Statement of Operations.
**** Only includes net realized gain (loss) on forward and spot contracts. May differ from the net realized gain (loss) on foreign currency-related transactions reported
within the Statement of Operations.
***** Includes net unrealized gain (loss) on purchased options as reported in the Schedule of Investments.
****** Only includes change in unrealized gain (loss) on forward and spot contracts. May differ from the net change in unrealized gain (loss) on foreign currency-related
transactions reported within the Statement of Operations.
For further disclosure on derivatives see note 2 in the Notes to Financial Statements.
See accompanying notes which are an integral part of the financial statements.
90 Growth Strategy Fund
Russell Investment Company
Growth Strategy Fund
Balance Sheet Offsetting of Financial and Derivative Instruments — October 31, 2016
| Amounts in thousands | |||||||||||||
| Offsetting of Financial Assets and Derivative Assets | |||||||||||||
| Gross | Net Amounts | ||||||||||||
| Amounts | of Assets | ||||||||||||
| Gross | Offset in the | Presented in | |||||||||||
| Amounts of | Statement of | the Statement | |||||||||||
| Recognized | Assets and | of Assets and | |||||||||||
| Description | Location: Statement of Assets and Liabilities - Assets | Assets | Liabilities | Liabilities | |||||||||
| Options Purchased Contracts | Investments, at fair value | $ | 3,686 | $ | — | $ | 3,686 | ||||||
| Foreign Currency Exchange Contracts | Unrealized appreciation on foreign currency exchange contracts | 5,601 | — | 5,601 | |||||||||
| Futures Contracts | Variation margin on futures contracts | 266 | — | 266 | |||||||||
| Total Return Swap Contracts | Total return swap contracts, at fair value | 2,510 | — | 2,510 | |||||||||
| Credit Default Swap Contracts | Credit default swap contracts, at fair value | 2,666 | — | 2,666 | |||||||||
| Total Financial and Derivative Assets | 14,729 | — | 14,729 | ||||||||||
| Financial and Derivative Assets not subject to a netting agreement | (2,932 | ) | — | (2,932 | ) | ||||||||
| Total Financial and Derivative Assets subject to a netting agreement | $ | 11,797 | $ | — | $ | 11,797 | |||||||
| Financial Assets, Derivative Assets, and Collateral Held by Counterparty | |||||||||||||
| Gross Amounts Not Offset in | |||||||||||||
| the Statement of Assets and | |||||||||||||
| Liabilities | |||||||||||||
| Net Amounts | |||||||||||||
| of Assets | |||||||||||||
| Presented in | |||||||||||||
| the Statement | Financial and | ||||||||||||
| of Assets and | Derivative | Collateral | |||||||||||
| Counterparty | Liabilities | Instruments | Received^ | Net Amount | |||||||||
| Bank of America | $ | 6,841 | $ | 1,233 | $ | 4,980 | $ | 628 | |||||
| Bank of Montreal | 554 | 46 | — | 508 | |||||||||
| BNP Paribas | 855 | 3 | — | 852 | |||||||||
| Citigroup | 45 | 45 | — | — | |||||||||
| Commonwealth Bank of Australia | 560 | 44 | — | 516 | |||||||||
| HSBC | 44 | 44 | — | — | |||||||||
| JPMorgan Chase | 722 | 111 | — | 611 | |||||||||
| National Australia Bank | 332 | 3 | — | 329 | |||||||||
| Royal Bank of Canada | 337 | 3 | — | 334 | |||||||||
| Standard Chartered | 190 | — | — | 190 | |||||||||
| State Street | 482 | 27 | — | 455 | |||||||||
| UBS | 508 | — | — | 508 | |||||||||
| Westpac | 327 | 3 | — | 324 | |||||||||
| Total | $ | 11,797 | $ | 1,562 | $ | 4,980 | $ | 5,255 | |||||
See accompanying notes which are an integral part of the financial statements.
Growth Strategy Fund 91
Russell Investment Company
Growth Strategy Fund
Balance Sheet Offsetting of Financial and Derivative Instruments, continued —
October 31, 2016
| Amounts in thousands | ||||||||||||
| Offsetting of Financial Liabilities and Derivative Liabilities | ||||||||||||
| Gross | Net Amounts | |||||||||||
| Amounts | of Liabilities | |||||||||||
| Gross | Offset in the | Presented in | ||||||||||
| Amounts of | Statement of | the Statement | ||||||||||
| Recognized | Assets and | of Assets and | ||||||||||
| Description | Location: Statement of Assets and Liabilities - Liabilities | Liabilities | Liabilities | Liabilities | ||||||||
| Futures Contracts | Variation margin on futures contracts | $ | 975 | $ | — $ | 975 | ||||||
| Foreign Currency Exchange Contracts | Unrealized depreciation on foreign currency exchange contracts | 489 | — | 489 | ||||||||
| Options Written Contracts | Options written, at fair value | 1,075 | — | 1,075 | ||||||||
| Total Financial and Derivative Liabilities | 2,539 | — | 2,539 | |||||||||
| Financial and Derivative Liabilities not subject to a netting agreement | (975 | ) | — | (975 | ) | |||||||
| Total Financial and Derivative Liabilities subject to a netting agreement | $ | 1,564 | $ | — $ | 1,564 | |||||||
| Financial Liabilities, Derivative Liabilities, and Collateral Pledged by Counterparty | ||||||||||||
| Gross Amounts Not Offset in | ||||||||||||
| the Statement of Assets and | ||||||||||||
| Liabilities | ||||||||||||
| Net Amounts | ||||||||||||
| of Liabilities | ||||||||||||
| Presented in | ||||||||||||
| the Statement | Financial and | |||||||||||
| of Assets and | Derivative | Collateral | ||||||||||
| Counterparty | Liabilities | Instruments | Pledged^ | Net Amount | ||||||||
| Bank of America | $ | 1,233 | $ | 1,233 | $ | — $ | — | |||||
| Bank of Montreal | 46 | 46 | — | — | ||||||||
| BNP Paribas | 3 | 3 | — | — | ||||||||
| Citigroup | 46 | 45 | — | 1 | ||||||||
| Commonwealth Bank of Australia | 44 | 44 | — | — | ||||||||
| HSBC | 45 | 44 | — | 1 | ||||||||
| JPMorgan Chase | 111 | 111 | — | — | ||||||||
| National Australia Bank | 3 | 3 | — | — | ||||||||
| Royal Bank of Canada | 3 | 3 | — | — | ||||||||
| State Street | 27 | 27 | — | — | ||||||||
| Westpac | 3 | 3 | — | — | ||||||||
| Total | $ | 1,564 | $ | 1,562 | $ | — $ | 2 | |||||
^ Collateral received or pledged amounts may not reconcile to those disclosed in the Statement of Assets and Liabilities due to the inclusion of off-Balance
Sheet collateral and adjustments made to exclude overcollateralization.
For further disclosure on derivatives and counterparty risk see note 2 in the Notes to Financial Statements.
See accompanying notes which are an integral part of the financial statements.
92 Growth Strategy Fund
Russell Investment Company
Growth Strategy Fund
Statement of Assets and Liabilities — October 31, 2016
| Amounts in thousands | |||
| Assets | |||
| Investments, at identified cost | $ | 1,528,153 | |
| Investments, at fair value(>) | 1,569,953 | ||
| Cash (restricted)(a)(b) | 25,000 | ||
| Unrealized appreciation on foreign currency exchange contracts | 5,601 | ||
| Receivables: | |||
| Dividends from affiliated Russell funds | 9 | ||
| Investments sold | 3,379 | ||
| Fund shares sold | 899 | ||
| Variation margin on futures contracts | 266 | ||
| Total return swap contracts, at fair value(8) | 2,510 | ||
| Credit default swap contracts, at fair value(+) | 2,666 | ||
| Total assets | 1,610,283 | ||
| Liabilities | |||
| Payables: | |||
| Due to custodian | 959 | ||
| Due to broker(c) | 7,719 | ||
| Investments purchased | 3,050 | ||
| Fund shares redeemed | 947 | ||
| Accrued fees to affiliates | 1,012 | ||
| Other accrued expenses | 122 | ||
| Variation margin on futures contracts | 975 | ||
| Unrealized depreciation on foreign currency exchange contracts | 489 | ||
| Options written, at fair value(x) | 1,075 | ||
| Total liabilities | 16,348 | ||
| Net Assets | $ | 1,593,935 | |
See accompanying notes which are an integral part of the financial statements.
Growth Strategy Fund 93
Russell Investment Company
Growth Strategy Fund
Statement of Assets and Liabilities, continued — October 31, 2016
| Amounts in thousands | |||
| Net Assets Consist of: | |||
| Undistributed (overdistributed) net investment income | $ | 5,678 | |
| Accumulated net realized gain (loss) | 33,717 | ||
| Unrealized appreciation (depreciation) on: | |||
| Investments | 41,800 | ||
| Futures contracts | 1,198 | ||
| Options written | 941 | ||
| Total return swap contracts | 2,510 | ||
| Credit default swap contracts | 280 | ||
| Foreign currency-related transactions | 5,112 | ||
| Shares of beneficial interest | 1,352 | ||
| Additional paid-in capital | 1,501,347 | ||
| Net Assets | $ | 1,593,935 | |
| Net Asset Value, offering and redemption price per share: | |||
| Net asset value per share: Class A(#) | $ | 11.88 | |
| Maximum offering price per share (Net asset value plus sales charge of 5.75%): Class A | $ | 12.60 | |
| Class A — Net assets | $ | 583,887,786 | |
| Class A — Shares outstanding ($.01 par value) | 49,130,789 | ||
| Net asset value per share: Class C(#) | $ | 11.54 | |
| Class C — Net assets | $ | 554,254,726 | |
| Class C — Shares outstanding ($.01 par value) | 48,013,499 | ||
| Net asset value per share: Class E(#) | $ | 11.93 | |
| Class E — Net assets | $ | 21,217,116 | |
| Class E — Shares outstanding ($.01 par value) | 1,778,038 | ||
| Net asset value per share: Class R1(#) | $ | 12.02 | |
| Class R1 — Net assets | $ | 76,969,280 | |
| Class R1 — Shares outstanding ($.01 par value) | 6,406,012 | ||
| Net asset value per share: Class R4(#) | $ | 11.92 | |
| Class R4 — Net assets | $ | 84,535,309 | |
| Class R4 — Shares outstanding ($.01 par value) | 7,089,221 | ||
| Net asset value per share: Class R5(#) | $ | 11.93 | |
| Class R5 — Net assets | $ | 54,899,335 | |
| Class R5 — Shares outstanding ($.01 par value) | 4,601,322 | ||
| Net asset value per share: Class S(#) | $ | 12.02 | |
| Class S — Net assets | $ | 218,171,778 | |
| Class S — Shares outstanding ($.01 par value) | 18,157,968 | ||
| Amounts in thousands | |||
| (x) Premiums received on options written | $ | 2,016 | |
| (+) Credit default swap contracts - premiums paid (received) | $ | 2,386 | |
| (>) Investments in affiliated Russell funds | $ | 1,566,267 | |
| (8) Total return swap contracts - premiums paid (received) | $ | — | |
| (a) Cash Collateral for Futures | $ | 20,700 | |
| (b) Cash Collateral for Swaps | $ | 4,300 | |
| (c) Due to Broker for Swaps | $ | 7,719 | |
| (#) Net asset value per share equals class level net assets divided by class level shares of beneficial interest outstanding. | |||
See accompanying notes which are an integral part of the financial statements.
94 Growth Strategy Fund
Russell Investment Company
Growth Strategy Fund
Statement of Operations — For the Period Ended October 31, 2016
| Amounts in thousands | |||
| Investment Income | |||
| Income distributions from affiliated Russell funds | $ | 40,968 | |
| Expenses | |||
| Advisory fees | 3,383 | ||
| Administrative fees | 719 | ||
| Custodian fees (1) | 37 | ||
| Distribution fees - Class A | 1,522 | ||
| Distribution fees - Class C | 4,436 | ||
| Distribution fees - Class R5 | 144 | ||
| Transfer agent fees - Class A | 1,218 | ||
| Transfer agent fees - Class C | 1,183 | ||
| Transfer agent fees - Class E | 44 | ||
| Transfer agent fees - Class R1 | 168 | ||
| Transfer agent fees - Class R4 | 188 | ||
| Transfer agent fees - Class R5 | 115 | ||
| Transfer agent fees - Class S | 467 | ||
| Professional fees | 73 | ||
| Registration fees | 121 | ||
| Shareholder servicing fees - Class C | 1,479 | ||
| Shareholder servicing fees - Class E | 55 | ||
| Shareholder servicing fees - Class R4 | 235 | ||
| Shareholder servicing fees - Class R5 | 144 | ||
| Trustees’ fees | 56 | ||
| Printing fees | 196 | ||
| Miscellaneous | 32 | ||
| Expenses before reductions | 16,015 | ||
| Expense reductions | (2,745 | ) | |
| Net expenses | 13,270 | ||
| Net investment income (loss) | 27,698 | ||
| Net Realized and Unrealized Gain (Loss) | |||
| Net realized gain (loss) on: | |||
| Investments | 12,669 | ||
| Futures contracts | 1,156 | ||
| Options written | 389 | ||
| Total return swap contracts | (12,588 | ) | |
| Credit default swap contracts | (97 | ) | |
| Foreign currency-related transactions | (1,305 | ) | |
| Capital gain distributions from Underlying Funds | 49,154 | ||
| Net realized gain (loss) | 49,378 | ||
| Net change in unrealized appreciation (depreciation) on: | |||
| Investments | (40,158 | ) | |
| Futures contracts | (3,685 | ) | |
| Options written | 941 | ||
| Total return swap contracts | 8,002 | ||
| Credit default swap contracts | 280 | ||
| Foreign currency-related transactions | 4,750 | ||
| Net change in unrealized appreciation (depreciation) | (29,870 | ) | |
| Net realized and unrealized gain (loss) | 19,508 | ||
| Net Increase (Decrease) in Net Assets from Operations | $ | 47,206 | |
| (1) Includes a reimbursement for overbilling of custody out-of-pocket fees from prior years. See note 8 in the Notes to Financial Statements. | |||
See accompanying notes which are an integral part of the financial statements.
Growth Strategy Fund 95
Russell Investment Company
Growth Strategy Fund
Statements of Changes in Net Assets
| For the Periods Ended October 31, | ||||||
| Amounts in thousands | 2016 | 2015 | ||||
| Increase (Decrease) in Net Assets | ||||||
| Operations | ||||||
| Net investment income (loss) | $ | 27,698 | $ | 48,823 | ||
| Net realized gain (loss) | 49,378 | 165,194 | ||||
| Net change in unrealized appreciation (depreciation) | (29,870 | ) | (246,185 | ) | ||
| Net increase (decrease) in net assets from operations | 47,206 | (32,168 | ) | |||
| Distributions | ||||||
| From net investment income | ||||||
| Class A | (10,831 | ) | (15,921 | ) | ||
| Class C | (6,672 | ) | (13,333 | ) | ||
| Class E | (402 | ) | (1,026 | ) | ||
| Class R1 | (1,744 | ) | (3,046 | ) | ||
| Class R4 | (1,737 | ) | (3,089 | ) | ||
| Class R5 | (913 | ) | (1,791 | ) | ||
| Class S | (4,740 | ) | (7,269 | ) | ||
| In excess | ||||||
| Class A | — | (1,608 | ) | |||
| Class C | — | (1,347 | ) | |||
| Class E | — | (104 | ) | |||
| Class R1 | — | (307 | ) | |||
| Class R4 | — | (312 | ) | |||
| Class R5 | — | (181 | ) | |||
| Class S | — | (734 | ) | |||
| Net decrease in net assets from distributions | (27,039 | ) | (50,068 | ) | ||
| Share Transactions* | ||||||
| Net increase (decrease) in net assets from share transactions | (314,636 | ) | (311,093 | ) | ||
| Total Net Increase (Decrease) in Net Assets | (294,469 | ) | (393,329 | ) | ||
| Net Assets | ||||||
| Beginning of period | 1,888,404 | 2,281,733 | ||||
| End of period | $ | 1,593,935 | $ | 1,888,404 | ||
| Undistributed (overdistributed) net investment income included in net assets | $ | 5,678 | $ | 5,132 | ||
See accompanying notes which are an integral part of the financial statements.
96 Growth Strategy Fund
Russell Investment Company
Growth Strategy Fund
Statements of Changes in Net Assets, continued
* Share transaction amounts (in thousands) for the periods ended October 31, 2016 and October 31, 2015 were as follows:
| 2016 | 2015 | |||||||||||
| Shares | Dollars | Shares | Dollars | |||||||||
| Class A | ||||||||||||
| Proceeds from shares sold | 2,440 | $ | 27,663 | 4,192 | $ | 50,206 | ||||||
| Proceeds from reinvestment of distributions | 946 | 10,783 | 1,456 | 17,454 | ||||||||
| Payments for shares redeemed | (11,157 | ) | (127,604 | ) | (11,284 | ) | (134,983 | ) | ||||
| Net increase (decrease) | (7,771 | ) | (89,158 | ) | (5,636 | ) | (67,323 | ) | ||||
| Class C | ||||||||||||
| Proceeds from shares sold | 3,280 | 36,157 | 5,813 | 67,853 | ||||||||
| Proceeds from reinvestment of distributions | 599 | 6,614 | 1,246 | 14,566 | ||||||||
| Payments for shares redeemed | (13,306 | ) | (147,933 | ) | (13,887 | ) | (161,705 | ) | ||||
| Net increase (decrease) | (9,427 | ) | (105,162 | ) | (6,828 | ) | (79,286 | ) | ||||
| Class E | ||||||||||||
| Proceeds from shares sold | 208 | 2,362 | 461 | 5,566 | ||||||||
| Proceeds from reinvestment of distributions | 35 | 398 | 93 | 1,124 | ||||||||
| Payments for shares redeemed | (670 | ) | (7,487 | ) | (2,524 | ) | (30,334 | ) | ||||
| Net increase (decrease) | (427 | ) | (4,727 | ) | (1,970 | ) | (23,644 | ) | ||||
| Class R1 | ||||||||||||
| Proceeds from shares sold | 1,224 | 14,117 | 1,497 | 18,136 | ||||||||
| Proceeds from reinvestment of distributions | 151 | 1,742 | 277 | 3,353 | ||||||||
| Payments for shares redeemed | (3,405 | ) | (39,322 | ) | (5,558 | ) | (67,070 | ) | ||||
| Net increase (decrease) | (2,030 | ) | (23,463 | ) | (3,784 | ) | (45,581 | ) | ||||
| Class R4 | ||||||||||||
| Proceeds from shares sold | 626 | 7,132 | 813 | 9,759 | ||||||||
| Proceeds from reinvestment of distributions | 152 | 1,736 | 283 | 3,401 | ||||||||
| Payments for shares redeemed | (3,151 | ) | (36,290 | ) | (3,837 | ) | (46,192 | ) | ||||
| Net increase (decrease) | (2,373 | ) | (27,422 | ) | (2,741 | ) | (33,032 | ) | ||||
| Class R5 | ||||||||||||
| Proceeds from shares sold | 622 | 7,074 | 593 | 7,106 | ||||||||
| Proceeds from reinvestment of distributions | 80 | 913 | 164 | 1,972 | ||||||||
| Payments for shares redeemed | (1,535 | ) | (17,463 | ) | (3,044 | ) | (36,588 | ) | ||||
| Net increase (decrease) | (833 | ) | (9,476 | ) | (2,287 | ) | (27,510 | ) | ||||
| Class S | ||||||||||||
| Proceeds from shares sold | 3,097 | 35,740 | 4,632 | 56,042 | ||||||||
| Proceeds from reinvestment of distributions | 407 | 4,689 | 654 | 7,914 | ||||||||
| Payments for shares redeemed | (8,295 | ) | (95,657 | ) | (8,195 | ) | (98,673 | ) | ||||
| Net increase (decrease) | (4,791 | ) | (55,228 | ) | (2,909 | ) | (34,717 | ) | ||||
| Total increase (decrease) | (27,652 | ) | $ | (314,636 | ) | (26,155 | ) | $ | (311,093 | ) | ||
See accompanying notes which are an integral part of the financial statements.
Growth Strategy Fund 97
Russell Investment Company
Growth Strategy Fund
Financial Highlights — For the Periods Ended
For a Share Outstanding Throughout Each Period.
| $ | ||||||||||||||||
| $ | Net | $ | $ | $ | ||||||||||||
| Net Asset Value, | Investment | Net Realized | Total from | Distributions | $ | |||||||||||
| Beginning of | Income (Loss) | and Unrealized | Investment | from Net | Distributions in | |||||||||||
| Period | (a)(b)(e) | Gain (Loss) | Operations | Investment Income | Excess | |||||||||||
| Class A | ||||||||||||||||
| October 31, 2016 | 11.68 | .21 | .19 | .40 | (.20 | ) | — | |||||||||
| October 31, 2015 | 12.14 | .30 | (.48 | ) | (.18 | ) | (.25 | ) | (.03 | ) | ||||||
| October 31, 2014 | 11.60 | .23 | .52 | .75 | (.21 | ) | — | |||||||||
| October 31, 2013 | 10.11 | .17 | 1.48 | 1.65 | (.16 | ) | — | |||||||||
| October 31, 2012 | 9.56 | .17 | .55 | .72 | (.17 | ) | — | |||||||||
| Class C | ||||||||||||||||
| October 31, 2016 | 11.36 | .11 | .19 | .30 | (.12 | ) | — | |||||||||
| October 31, 2015 | 11.85 | .20 | (.46 | ) | (.26 | ) | (.21 | ) | (.02 | ) | ||||||
| October 31, 2014 | 11.36 | .13 | .52 | .65 | (.16 | ) | — | |||||||||
| October 31, 2013 | 9.93 | .08 | 1.46 | 1.54 | (.11 | ) | — | |||||||||
| October 31, 2012 | 9.41 | .10 | .53 | .63 | (.11 | ) | — | |||||||||
| Class E | ||||||||||||||||
| October 31, 2016 | 11.73 | .23 | .17 | .40 | (.20 | ) | — | |||||||||
| October 31, 2015 | 12.19 | .35 | (.53 | ) | (.18 | ) | (.25 | ) | (.03 | ) | ||||||
| October 31, 2014 | 11.64 | .24 | .52 | .76 | (.21 | ) | — | |||||||||
| October 31, 2013 | 10.15 | .18 | 1.47 | 1.65 | (.16 | ) | — | |||||||||
| October 31, 2012 | 9.59 | .18 | .54 | .72 | (.16 | ) | — | |||||||||
| Class R1 | ||||||||||||||||
| October 31, 2016 | 11.81 | .26 | .18 | .44 | (.23 | ) | — | |||||||||
| October 31, 2015 | 12.27 | .36 | (.50 | ) | (.14 | ) | (.29 | ) | (.03 | ) | ||||||
| October 31, 2014 | 11.72 | .29 | .52 | .81 | (.26 | ) | — | |||||||||
| October 31, 2013 | 10.21 | .20 | 1.50 | 1.70 | (.19 | ) | — | |||||||||
| October 31, 2012 | 9.65 | .21 | .56 | .77 | (.21 | ) | — | |||||||||
| Class R4(1) | ||||||||||||||||
| October 31, 2016 | 11.72 | .23 | .17 | .40 | (.20 | ) | — | |||||||||
| October 31, 2015 | 12.18 | .33 | (.50 | ) | (.17 | ) | (.26 | ) | (.03 | ) | ||||||
| October 31, 2014 | 11.64 | .26 | .50 | .76 | (.22 | ) | — | |||||||||
| October 31, 2013 | 10.14 | .19 | 1.48 | 1.67 | (.17 | ) | — | |||||||||
| October 31, 2012 | 9.59 | .19 | .54 | .73 | (.18 | ) | — | |||||||||
| Class R5(2) | ||||||||||||||||
| October 31, 2016 | 11.73 | .19 | .19 | .38 | (.18 | ) | — | |||||||||
| October 31, 2015 | 12.19 | .31 | (.50 | ) | (.19 | ) | (.25 | ) | (.02 | ) | ||||||
| October 31, 2014 | 11.65 | .24 | .49 | .73 | (.19 | ) | — | |||||||||
| October 31, 2013 | 10.16 | .17 | 1.47 | 1.64 | (.15 | ) | — | |||||||||
| October 31, 2012 | 9.59 | .20 | .52 | .72 | (.15 | ) | — | |||||||||
| Class S | ||||||||||||||||
| October 31, 2016 | 11.81 | .25 | .19 | .44 | (.23 | ) | — | |||||||||
| October 31, 2015 | 12.27 | .34 | (.49 | ) | (.15 | ) | (.28 | ) | (.03 | ) | ||||||
| October 31, 2014 | 11.72 | .26 | .53 | .79 | (.24 | ) | — | |||||||||
| October 31, 2013 | 10.21 | .19 | 1.50 | 1.69 | (.18 | ) | — | |||||||||
| October 31, 2012 | 9.65 | .20 | .55 | .75 | (.19 | ) | — | |||||||||
See accompanying notes which are an integral part of the financial statements.
98 Growth Strategy Fund
| % | % | % | |||||||||||||||
| $ | $ | Ratio of Expenses | Ratio of Expenses | Ratio of Net | |||||||||||||
| Net Asset Value, | % | Net Assets, | to Average | to Average | Investment Income | % | |||||||||||
| $ | End of | Total | End of Period | Net Assets, | Net Assets, | to Average | Portfolio | ||||||||||
| Total Distributions | Period | Return(d) | (000 | ) | Gross(g) | Net(e)(g) | Net Assets(b)(e) | Turnover Rate | |||||||||
| (.20 | ) | 11.88 | 3.50 | 583,888 | .72 | .57 | 1.85 | 14 | |||||||||
| (.28 | ) | 11.68 | (1.50 | ) | 664,817 | .72 | .56 | 2.51 | 39 | ||||||||
| (.21 | ) | 12.14 | 6.52 | 759,361 | .72 | .56 | 1.91 | 22 | |||||||||
| (.16 | ) | 11.60 | 16.55 | 768,352 | .71 | .57 | 1.53 | 11 | |||||||||
| (.17 | ) | 10.11 | 7.64 | 713,412 | .70 | .56 | 1.79 | 23 | |||||||||
| (.12 | ) | 11.54 | 2.69 | 554,255 | 1.47 | 1.32 | 1.04 | 14 | |||||||||
| (.23 | ) | 11.36 | (2.31 | ) | 652,242 | 1.47 | 1.31 | 1.68 | 39 | ||||||||
| (.16 | ) | 11.85 | 5.77 | 761,495 | 1.47 | 1.31 | 1.12 | 22 | |||||||||
| (.11 | ) | 11.36 | 15.62 | 763,893 | 1.46 | 1.32 | .76 | 11 | |||||||||
| (.11 | ) | 9.93 | 6.84 | 704,704 | 1.45 | 1.31 | 1.05 | 23 | |||||||||
| (.20 | ) | 11.93 | 3.48 | 21,217 | .72 | .57 | 1.96 | 14 | |||||||||
| (.28 | ) | 11.73 | (1.51 | ) | 25,868 | .72 | .56 | 2.89 | 39 | ||||||||
| (.21 | ) | 12.19 | 6.57 | 50,878 | .72 | .56 | 2.04 | 22 | |||||||||
| (.16 | ) | 11.64 | 16.47 | 69,531 | .71 | .57 | 1.67 | 11 | |||||||||
| (.16 | ) | 10.15 | 7.69 | 95,667 | .70 | .56 | 1.87 | 23 | |||||||||
| (.23 | ) | 12.02 | 3.86 | 76,969 | .47 | .27 | 2.24 | 14 | |||||||||
| (.32 | ) | 11.81 | (1.15 | ) | 99,618 | .47 | .23 | 2.96 | 39 | ||||||||
| (.26 | ) | 12.27 | 6.95 | 149,940 | .47 | .17 | 2.43 | 22 | |||||||||
| (.19 | ) | 11.72 | 16.93 | 166,211 | .46 | .17 | 1.87 | 11 | |||||||||
| (.21 | ) | 10.21 | 8.15 | 143,252 | .45 | .14 | 2.08 | 23 | |||||||||
| (.20 | ) | 11.92 | 3.53 | 84,535 | .72 | .52 | 1.97 | 14 | |||||||||
| (.29 | ) | 11.72 | (1.42 | ) | 110,916 | .72 | .48 | 2.72 | 39 | ||||||||
| (.22 | ) | 12.18 | 6.63 | 148,650 | .72 | .42 | 2.19 | 22 | |||||||||
| (.17 | ) | 11.64 | 16.73 | 199,046 | .71 | .42 | 1.74 | 11 | |||||||||
| (.18 | ) | 10.14 | 7.81 | 200,007 | .70 | .39 | 1.97 | 23 | |||||||||
| (.18 | ) | 11.93 | 3.28 | 54,899 | .97 | .77 | 1.69 | 14 | |||||||||
| (.27 | ) | 11.73 | (1.71 | ) | 63,731 | .97 | .73 | 2.60 | 39 | ||||||||
| (.19 | ) | 12.19 | 6.37 | 94,141 | .97 | .67 | 2.01 | 22 | |||||||||
| (.15 | ) | 11.65 | 16.37 | 135,920 | .96 | .67 | 1.57 | 11 | |||||||||
| (.15 | ) | 10.16 | 7.65 | 171,237 | .95 | .64 | 2.03 | 23 | |||||||||
| (.23 | ) | 12.02 | 3.81 | 218,172 | .47 | .32 | 2.20 | 14 | |||||||||
| (.31 | ) | 11.81 | (1.23 | ) | 271,012 | .47 | .31 | 2.81 | 39 | ||||||||
| (.24 | ) | 12.27 | 6.81 | 317,268 | .47 | .31 | 2.16 | 22 | |||||||||
| (.18 | ) | 11.72 | 16.80 | 304,251 | .46 | .32 | 1.71 | 11 | |||||||||
| (.19 | ) | 10.21 | 7.96 | 258,600 | .45 | .31 | 2.01 | 23 | |||||||||
See accompanying notes which are an integral part of the financial statements.
Growth Strategy Fund 99
Russell Investment Company
Growth Strategy Fund
Related Party Transactions, Fees and Expenses
Accrued fees payable to affiliates for the period ended October 31, 2016 were as follows:
| Advisory fees | $ | 34,134 |
| Administration fees | 58,200 | |
| Distribution fees | 495,108 | |
| Shareholder servicing fees | 153,800 | |
| Transfer agent fees | 264,556 | |
| Trustee fees | 5,991 | |
| $ | 1,011,789 |
Transactions (amounts in thousands) during the period ended October 31, 2016 with Underlying Funds which are, or were, an
affiliated company are as follows:
| Fair Value, | Change in | ||||||||||||||||||||
| Beginning of | Realized Gain | Unrealized | Fair Value, End | Income | Capital Gains | ||||||||||||||||
| Period | Purchases | Sales | (Loss) | Gain (Loss) | of Period | Distributions | Distributions | ||||||||||||||
| Russell Commodity Strategies Fund | $ | 54,010 | $ | 360 | $ | 6,084 | $ | (4,750 | ) $ | 3,243 | $ | 46,779 | $ | — | $ | — | |||||
| Russell Global Infrastructure Fund | 93,545 | 4,594 | 51,029 | 5,373 | (5,328) | 47,155 | 2,146 | 2,381 | |||||||||||||
| Russell Global Real Estate Securities | |||||||||||||||||||||
| Fund | 56,730 | 4,326 | 11,479 | (1,026 | ) | (2,644) | 45,907 | 1,528 | 2,618 | ||||||||||||
| Russell U.S. Defensive Equity Fund | 153,146 | 1,914 | 81,367 | 27,775 | (22,486) | 78,982 | 1,863 | — | |||||||||||||
| Russell U.S. Dynamic Equity Fund | 153,412 | 20,991 | 30,713 | (4,654 | ) | (12,996) | 126,040 | 6,930 | 13,872 | ||||||||||||
| Russell U.S. Small Cap Equity Fund | 168,431 | 12,274 | 35,708 | (4,573 | ) | (873) | 139,551 | 1,476 | 10,678 | ||||||||||||
| Select U.S. Equity Fund | 210,585 | 5,505 | 44,727 | (1,423 | ) | 3,960 | 173,900 | 5,225 | 277 | ||||||||||||
| Russell Global Opportunistic Credit | |||||||||||||||||||||
| Fund | 94,007 | 53,323 | 25,419 | (1,697 | ) | 6,176 | 126,390 | 3,411 | — | ||||||||||||
| Russell Strategic Bond Fund | 223,346 | 25,297 | 92,882 | 1,538 | 933 | 158,232 | 6,857 | 1,243 | |||||||||||||
| Unconstrained Total Return Fund | — | 64,547 | 1,280 | 1 | 190 | 63,458 | 4 | — | |||||||||||||
| Russell Emerging Markets Fund | 161,755 | 779 | 34,155 | (8,583 | ) | 21,951 | 141,747 | 571 | — | ||||||||||||
| Russell Global Equity Fund | 228,866 | 22,274 | 41,353 | 1,694 | (21,538) | 189,943 | 4,189 | 18,085 | |||||||||||||
| Select International Equity Fund | 244,750 | 6,694 | 30,967 | (3,771 | ) | (10,469) | 206,237 | 6,663 | — | ||||||||||||
| Russell U.S. Cash Management Fund | 33,266 | 247,187 | 258,510 | 1 | 2 | 21,946 | 105 | — | |||||||||||||
| $ | 1,875,849 | $ | 470,065 | $ | 745,673 | $ | 5,905 | $ | (39,879) | $ | 1,566,267 | $ | 40,968 | $ | 49,154 | ||||||
Federal Income Taxes
At October 31, 2016, the cost of investments and net unrealized appreciation (depreciation), undistributed ordinary income and
undistributed long-term capital gains for income tax purposes were as follows:
| Cost of Investments | $ | 1,532,431,188 | |||
| Unrealized Appreciation | $ | 97,258,736 | |||
| Unrealized Depreciation | (59,737,302 | ) | |||
| Net Unrealized Appreciation (Depreciation) | $ | 37,521,434 | |||
| Undistributed Ordinary Income | $ | 13,032,876 | |||
| Undistributed Long-Term Capital Gains | |||||
| (Capital Loss Carryforward) | $ | 40,817,946 | |||
| Tax Composition of Distributions | |||||
| Ordinary Income | $ | 27,039,134 | |||
See accompanying notes which are an integral part of the financial statements.
100 Growth Strategy Fund
Russell Investment Company
Growth Strategy Fund
Federal Income Taxes, continued
Net investment income and net realized gains (losses) in the financial statements may differ from taxable net investment income and
net realized gains (losses). Capital accounts within the financial statements are adjusted for permanent differences between book and
tax accounting. These differences may be due to foreign currency gains or losses, reclassifications of dividends and /or differences in
treatment of income from swaps. These adjustments have no impact on the net assets.
At October 31, 2016, the Statement of Assets and Liabilities have been adjusted by the following amounts (in thousands):
| Undistributed net investment income | $ | (113 | ) |
| Accumulated net realized gain (loss) | 108 | ||
| Additional paid-in capital | 5 |
See accompanying notes which are an integral part of the financial statements.
Growth Strategy Fund 101
Russell Investment Company
Equity Growth Strategy Fund
Portfolio Management Discussion and Analysis — October 31, 2016 (Unaudited)

| Equity Growth Strategy Fund - Class A‡ | Equity Growth Strategy Fund - Class R5‡‡‡ | ||||||
| Total | Total | ||||||
| Return | Return | ||||||
| 1 Year | (2.42 | )% | 1 Year | 3.40 | % | ||
| 5 Years | 5.76 | %§ | 5 Years | 6.88 | %§ | ||
| 10 Years | 2.00 | %§ | 10 Years | 2.44 | %§ | ||
| Equity Growth Strategy Fund - Class C | Equity Growth Strategy Fund - Class S | ||||||
| Total | Total | ||||||
| Return | Return | ||||||
| 1 Year | 2.72 | % | 1 Year | 3.81 | % | ||
| 5 Years | 6.20 | %§ | 5 Years | 7.27 | %§ | ||
| 10 Years | 1.83 | %§ | 10 Years | 2.86 | %§ | ||
| Equity Growth Strategy Fund - Class E | Russell 1000® Index** | ||||||
| Total | Total | ||||||
| Return | Return | ||||||
| 1 Year | 3.52 | % | 1 Year | 4.26 | % | ||
| 5 Years | 6.99 | %§ | 5 Years | 13.51 | %§ | ||
| 10 Years | 2.60 | %§ | 10 Years | 6.83 | %§ | ||
| Equity Growth Strategy Fund - Class R1 | Russell Developed ex-U.S. Large Cap® Index Net*** | ||||||
| Total | |||||||
| Total | Return | ||||||
| Return | |||||||
| 1 Year | 3.88 | % | 1 Year | (2.34 | )% | ||
| 5 Years | 7.42 | %§ | 5 Years | 4.75 | %§ | ||
| 10 Years | 2.94 | %§ | 10 Years | 1.56 | %§ | ||
| Equity Growth Strategy Fund - Class R4‡‡ | |||||||
| Total | |||||||
| Return | |||||||
| 1 Year | 3.63 | % | |||||
| 5 Years | 7.13 | %§ | |||||
| 10 Years | 2.69 | %§ | |||||
102 Equity Growth Strategy Fund
Russell Investment Company
Equity Growth Strategy Fund
Portfolio Management Discussion and Analysis, continued — October 31, 2016
(Unaudited)
| The Equity Growth Strategy Fund (the “Fund”) is a fund of funds | infrastructure. With interest rates falling, income opportunities |
| that invests principally in other Russell Investment Company | around the globe continued to shrink and income available from |
| mutual funds (the “Underlying Funds”). The Underlying Funds | most assets fell. |
| employ a multi-manager approach whereby portions of the | The U.S. equity market, as measured by the S&P 500® Index, |
| Underlying Funds are allocated to different money managers. | was up 4.51% over the period but also experienced multiple |
| Underlying Fund assets not allocated to money managers are | draw downs. The Fund’s strategic exposure to global equities |
| managed by Russell Investment Management, LLC (“RIM”), the | proved beneficial over the period as emerging markets rallied |
| Fund’s and Underlying Funds’ advisor. RIM, as the Underlying | and outperformed U.S. equities. By contrast, non-U.S. developed |
| Funds’ advisor, may change the allocation of the Underlying Funds’ | equity was one of the lowest performing portions of the Fund’s |
| assets among money managers at any time. An exemptive order | exposure as falling commodities and currencies weighed on |
| from the Securities and Exchange Commission (“SEC”) permits | returns. |
| RIM to engage or terminate a money manager in an Underlying | |
| Fund at any time, subject to approval by the Underlying Fund’s | How did the investment strategies and techniques employed |
| Board, without a shareholder vote. Pursuant to the terms of the | by the Fund and the Underlying Funds affect the Fund’s |
| exemptive order, an Underlying Fund is required to notify its | performance? |
| shareholders within 90 days of when a money manager begins | The Fund is a fund of funds and its performance is based on RIM’s |
| providing services. | strategic asset allocations, the performance of the Underlying |
| What is the Fund’s investment objective? | Funds in which the Fund invests, and tactical changes in the |
| The Fund seeks to provide high long term capital appreciation. | Fund’s asset allocation throughout the year. |
| In order to seek to achieve the Fund’s objective during the period, | |
| How did the Fund perform relative to its benchmark for the | RIM’s strategic asset allocation included investments in global |
| fiscal year ended October 31, 2016? | equity, alternative and fixed/other income Underlying Funds. The |
| For the fiscal year ended October 31, 2016, the Fund’s Class A, | Fund’s diverse asset allocation partially hindered performance |
| Class C, Class E, Class R1, Class R4, Class R5 and Class S Shares | during the period as certain of these exposures underperformed |
| gained 3.56%, 2.72%, 3.52%, 3.88%, 3.63%, 3.40% and 3.81%, | the Russell 1000® Index. While areas like high yield bonds, as |
| respectively. This is compared to the Fund’s primary benchmark, | measured by the BofA Merrill Lynch Global High Yield Index |
| the Russell 1000® Index, which gained 4.26% during the same | Hedged USD, outperformed the Russell 1000® Index, areas like |
| period. The Fund’s performance includes operating expenses, | commodities and non-U.S. developed equities delivered negative |
| whereas index returns are unmanaged and do not include | returns as measured by the Bloomberg Commodity Index Total |
| expenses of any kind. | Return and Russell Developed ex-U.S. Large Cap® Index Net, |
| For the fiscal year ended October 31, 2016, the Morningstar® | respectively. |
| Allocation-70% to 85% Equity Category, a group of funds that | The Fund’s underperformance relative to the Russell 1000® |
| Morningstar considers to have investment strategies similar to | Index was partially offset by strong active management within |
| those of the Fund, gained 2.43%. This result serves as a peer | the fixed income portion of the Fund’s portfolio. Underlying Fund |
| comparison and is expressed net of operating expenses. | bond issue selection during the period was generally additive to |
| returns as fixed income money managers were able to pick well | |
| How did the market conditions described in the Market | within high yield credit, avoiding defaults in places like the |
| Summary report affect the Fund’s performance? | energy sector where trouble occurred with falling energy prices |
| The Fund seeks to achieve its objective by investing in Underlying | in early 2016, and through solid emerging market debt selection. |
| Funds that provide exposure to a range of diversified investments, | As such, an allocation to the Russell Global Opportunistic Credit |
| and most major asset classes invested in by the Underlying Funds | was positive from a benchmark-relative perspective. |
| produced positive absolute returns during the period. Markets | |
| during the fiscal year were characterized by higher levels of | By contrast, equity selection and positioning was more difficult, |
| volatility and dispersion across return sources. Within the fixed/ | with allocations to non-U.S. equity Underlying Funds detracting |
| other income Underlying Funds, exposure to high yield debt | from the Fund’s performance and security selection within |
| was beneficial as it was one of the best performing asset classes | those Underlying Funds struggling. In addition, overweights |
| globally. Falling interest rates also helped other fixed income | to European securities in the Select International Equity Fund |
| assets in the Underlying Funds rally, as well as more rate sensitive | caused the Underlying Fund to struggle as European equities |
| real assets like global real estate investment trusts and global | continued to lag the U.S. equity market. |
Equity Growth Strategy Fund 103
Russell Investment Company
Equity Growth Strategy Fund
Portfolio Management Discussion and Analysis, continued — October 31, 2016
(Unaudited)
| Describe any changes to the Fund’s structure or allocation | subsequently rebounded from the February lows and RIM |
| to the Underlying Funds. | reduced risk exposure to a more defensive stance with the Fund’s |
| RIM has the discretion to vary the Fund’s actual allocation | equity allocation below strategic weights. RIM’s modifications to |
| from the target strategic asset allocation by up to +/- 5% at the | the Fund’s asset allocation were additive during the period. |
| equity, fixed/other income or alternative category level based on | RIM also made strategic asset allocation changes during the period. |
| RIM’s capital markets research. In addition to investing in the | In September 2016, RIM added further diversity and dynamism |
| Underlying Funds, RIM may seek to actively manage a Fund’s | to the portfolio through the addition of the Unconstrained Total |
| overall exposures by investing in derivatives that RIM believes | Return Fund as an Underlying Fund. |
| will achieve the desired risk/return profile for the Fund. RIM’s | |
| asset allocation modifications, implemented through both tactical | The views expressed in this report reflect those of the |
| changes to Underlying Fund allocations and derivatives-based | portfolio managers only through the end of the period |
| exposures, benefited the Fund’s performance relative to the | covered by the report. These views do not necessarily |
| Fund’s target strategic asset allocation. | represent the views of RIM, or any other person in RIM or |
| any other affiliated organization. These views are subject | |
| RIM adapted the Fund’s asset allocation over the period as market | to change at any time based upon market conditions or |
| opportunities and risks evolved. The Fund was defensively | other events, and RIM disclaims any responsibility to |
| positioned in the fourth quarter of 2015, favoring fixed income | update the views contained herein. These views should not |
| over equity. During the first quarter of 2016, equity markets | be relied on as investment advice and, because investment |
| declined substantially, and RIM added further risk to the portfolio | decisions for a Russell Investment Company (“RIC”) Fund |
| by overweighting exposure to high yield credit and emerging | are based on numerous factors, should not be relied on as |
| markets equity compared with U.S. equity and cash. Markets | an indication of investment decisions of any RIC Fund. |
* Assumes initial investment on November 1, 2006.
** Russell 1000® Index includes the 1,000 largest companies in the Russell 3000® Index. The Russell 1000® Index represents the universe of stocks from which
most active money managers typically select. The Russell 1000® Index return reflects adjustments from income dividends and capital gain distributions
reinvested as of the ex-dividend dates.
*** Russell Developed ex-U.S. Large Cap Index® (net of tax on dividends from foreign holdings) is an index which offers investors access to the large-cap segment
of the global equity market, excluding companies assigned to the United States. It is constructed to provide a comprehensive and unbiased barometer for the
large-cap segment and is completely reconstituted annually to accurately reflect the changes in the market over time.
‡ The performance shown has been adjusted to reflect the deduction of the maximum Class A sales charge of 5.75%.
‡‡ The Fund first issued Class R4 Shares on October 1, 2014. The returns shown for Class R4 Shares prior to that date are the returns of the Fund’s Class R2
Shares.
‡‡‡ The Fund first issued Class R5 Shares on October 1, 2014. The returns shown for Class R5 Shares prior to that date are the returns of the Fund’s Class R3
Shares.
§ Annualized.
Performance is historical and assumes reinvestment of all dividends and capital gains. Investment return and principal value will fluctuate so that an investor’s
shares, when redeemed, may be worth more or less than when purchased. Past performance is not indicative of future results. The returns shown do not reflect the
deduction of taxes that a shareholder would pay on Fund distributions or the redemption of Fund shares. Additionally, the returns presented herein may differ from
the performance reported in the Financial Highlights as the returns herein are calculated in a manner consistent with standardized performance in accordance with
Securities and Exchange Commission rules, while the performance in the Financial Highlights has been calculated in accordance with U.S. Generally Accepted
Accounting Principles (“U.S. GAAP”).
104 Equity Growth Strategy Fund
Russell Investment Company
Equity Growth Strategy Fund
Shareholder Expense Example — October 31, 2016 (Unaudited)
| Fund Expenses | Please note that the expenses shown in the table are meant | |||||
| The following disclosure provides important information | to highlight your ongoing costs only and do not reflect any | |||||
| regarding the Fund’s Shareholder Expense Example | transactional costs. Therefore, the information under the heading | |||||
| (“Example”). | “Hypothetical Performance (5% return before expenses)” is | |||||
| useful in comparing ongoing costs only, and will not help you | ||||||
| Example | determine the relative total costs of owning different funds. In | |||||
| As a shareholder of the Fund, you incur two types of costs: (1) | addition, if these transactional costs were included, your costs | |||||
| transaction costs, including sales charges (loads) on certain | would have been higher. | |||||
| purchase or redemption payments, and (2) ongoing costs, | Hypothetical | |||||
| including advisory and administrative fees; distribution and/or | Performance (5% | |||||
| service fees; and other Fund expenses. The Example is intended | Actual | return before | ||||
| to help you understand your ongoing costs (in dollars) of investing | Class A | Performance | expenses) | |||
| Beginning Account Value | ||||||
| in the Fund and to compare these costs with the ongoing costs of | May 1, 2016 | $ | 1,000.00 | $ | 1,000.00 | |
| investing in other mutual funds. The Example is based on an | Ending Account Value | |||||
| investment of $1,000 invested at the beginning of the period and | October 31, 2016 | $ | 1,044.40 | $ | 1,022.32 | |
| held for the entire period indicated, which for this Fund is from | Expenses Paid During Period* | $ | 2.88 | $ | 2.85 | |
| May 1, 2016 to October 31, 2016. | * Expenses are equal to the Fund's annualized expense ratio of 0.56% | |||||
| (representing the six month period annualized), multiplied by the average | ||||||
| Actual Expenses | account value over the period, multiplied by 184/366 (to reflect the one-half | |||||
| The information in the table under the heading “Actual | year period). May reflect amounts waived and/or reimbursed. Without any | |||||
| Performance” provides information about actual account values | waivers and/or reimbursements, expenses would have been higher. | |||||
| and actual expenses. You may use the information in this column, | ||||||
| Hypothetical | ||||||
| together with the amount you invested, to estimate the expenses | Performance (5% | |||||
| that you paid over the period. Simply divide your account value by | Actual | return before | ||||
| $1,000 (for example, an $8,600 account value divided by $1,000 | Class C | Performance | expenses) | |||
| Beginning Account Value | ||||||
| = 8.6), then multiply the result by the number in the first column | May 1, 2016 | $ | 1,000.00 | $ | 1,000.00 | |
| in the row entitled “Expenses Paid During Period” to estimate | Ending Account Value | |||||
| the expenses you paid on your account during this period. | October 31, 2016 | $ | 1,039.40 | $ | 1,018.55 | |
| Expenses Paid During Period* | $ | 6.72 | $ | 6.65 | ||
| Hypothetical Example for Comparison Purposes | ||||||
| The information in the table under the heading “Hypothetical | * Expenses are equal to the Fund's annualized expense ratio of 1.31% | |||||
| (representing the six month period annualized), multiplied by the average | ||||||
| Performance (5% return before expenses)” provides information | account value over the period, multiplied by 184/366 (to reflect the one-half | |||||
| about hypothetical account values and hypothetical expenses | year period). May reflect amounts waived and/or reimbursed. Without any | |||||
| based on the Fund’s actual expense ratio and an assumed rate of | waivers and/or reimbursements, expenses would have been higher. | |||||
| return of 5% per year before expenses, which is not the Fund’s | ||||||
| Hypothetical | ||||||
| actual return. The hypothetical account values and expenses | Performance (5% | |||||
| may not be used to estimate the actual ending account balance or | Actual | return before | ||||
| expenses you paid for the period. You may use this information | Class E | Performance | expenses) | |||
| to compare the ongoing costs of investing in the Fund and other | Beginning Account Value | |||||
| May 1, 2016 | $ | 1,000.00 | $ | 1,000.00 | ||
| funds. To do so, compare this 5% hypothetical example with the | Ending Account Value | |||||
| 5% hypothetical examples that appear in the shareholder reports | October 31, 2016 | $ | 1,043.40 | $ | 1,022.32 | |
| of other funds. | Expenses Paid During Period* | $ | 2.88 | $ | 2.85 | |
| * Expenses are equal to the Fund's annualized expense ratio of 0.56% | ||||||
| (representing the six month period annualized), multiplied by the average | ||||||
| account value over the period, multiplied by 184/366 (to reflect the one-half | ||||||
| year period). May reflect amounts waived and/or reimbursed. Without any | ||||||
| waivers and/or reimbursements, expenses would have been higher. | ||||||
Equity Growth Strategy Fund 105
Russell Investment Company
Equity Growth Strategy Fund
Shareholder Expense Example, continued — October 31, 2016 (Unaudited)
| Performance (5% | ||||
| Actual | return before | |||
| Class R1 | Performance | expenses) | ||
| Beginning Account Value | ||||
| May 1, 2016 | $ | 1,000.00 | $ | 1,000.00 |
| Ending Account Value | ||||
| October 31, 2016 | $ | 1,045.90 | $ | 1,023.98 |
| Expenses Paid During Period* | $ | 1.18 | $ | 1.17 |
* Expenses are equal to the Fund's annualized expense ratio of 0.23%
(representing the six month period annualized), multiplied by the average
account value over the period, multiplied by 184/366 (to reflect the one-half
year period). May reflect amounts waived and/or reimbursed. Without any
waivers and/or reimbursements, expenses would have been higher.
| Hypothetical | ||||
| Performance (5% | ||||
| Actual | return before | |||
| Class R4 | Performance | expenses) | ||
| Beginning Account Value | ||||
| May 1, 2016 | $ | 1,000.00 | $ | 1,000.00 |
| Ending Account Value | ||||
| October 31, 2016 | $ | 1,044.70 | $ | 1,022.72 |
| Expenses Paid During Period* | $ | 2.47 | $ | 2.44 |
* Expenses are equal to the Fund's annualized expense ratio of 0.48%
(representing the six month period annualized), multiplied by the average
account value over the period, multiplied by 184/366 (to reflect the one-half
year period). May reflect amounts waived and/or reimbursed. Without any
waivers and/or reimbursements, expenses would have been higher.
| Hypothetical | ||||
| Performance (5% | ||||
| Actual | return before | |||
| Class R5 | Performance | expenses) | ||
| Beginning Account Value | ||||
| May 1, 2016 | $ | 1,000.00 | $ | 1,000.00 |
| Ending Account Value | ||||
| October 31, 2016 | $ | 1,043.00 | $ | 1,021.47 |
| Expenses Paid During Period* | $ | 3.75 | $ | 3.71 |
* Expenses are equal to the Fund's annualized expense ratio of 0.73%
(representing the six month period annualized), multiplied by the average
account value over the period, multiplied by 184/366 (to reflect the one-half
year period). May reflect amounts waived and/or reimbursed. Without any
waivers and/or reimbursements, expenses would have been higher.
| Hypothetical | ||||
| Performance (5% | ||||
| Actual | return before | |||
| Class S | Performance | expenses) | ||
| Beginning Account Value | ||||
| May 1, 2016 | $ | 1,000.00 | $ | 1,000.00 |
| Ending Account Value | ||||
| October 31, 2016 | $ | 1,045.50 | $ | 1,023.58 |
| Expenses Paid During Period* | $ | 1.59 | $ | 1.58 |
* Expenses are equal to the Fund's annualized expense ratio of 0.31%
(representing the six month period annualized), multiplied by the average
account value over the period, multiplied by 184/366 (to reflect the one-half
year period). May reflect amounts waived and/or reimbursed. Without any
waivers and/or reimbursements, expenses would have been higher.
106 Equity Growth Strategy Fund
Russell Investment Company
Equity Growth Strategy Fund
Schedule of Investments — October 31, 2016
| Amounts in thousands (except share amounts) | ||||
| Fair | ||||
| Value | ||||
| Shares | $ | |||
| Investments in Russell Affiliated Mutual Funds - 97.0% | ||||
| Alternative - 7.7% | ||||
| Russell Commodity Strategies Fund Class Y | 3,556,090 | 19,594 | ||
| Russell Global Infrastructure Fund Class Y | 1,724,644 | 19,713 | ||
| Russell Global Real Estate Securities Fund Class Y | 345,742 | 12,353 | ||
| 51,660 | ||||
| Domestic Equities - 37.0% | ||||
| Russell U.S. Defensive Equity Fund Class Y | 1,012,411 | 49,831 | ||
| Russell U.S. Dynamic Equity Fund Class Y | 6,010,954 | 59,689 | ||
| Russell U.S. Small Cap Equity Fund Class Y | 2,586,768 | 71,421 | ||
| Select U.S. Equity Fund Class Y | 6,085,281 | 66,451 | ||
| 247,392 | ||||
| Fixed Income - 11.5% | ||||
| Russell Global Opportunistic Credit Fund Class Y | 6,850,159 | 66,584 | ||
| Unconstrained Total Return Fund Class Y | 1,000,196 | 10,032 | ||
| 76,616 | ||||
| International Equities - 40.8% | ||||
| Russell Emerging Markets Fund Class Y | 4,776,819 | 79,630 | ||
| Russell Global Equity Fund Class Y | 10,235,368 | 106,754 | ||
| Select International Equity Fund Class Y | 10,105,315 | 86,804 | ||
| 273,188 | ||||
| Total Investments in Russell Affiliated Mutual Funds | ||||
| (cost $641,517) | 648,856 | |||
| Options Purchased - 0.1% | ||||
| (Number of Contracts) | ||||
| S&P 500 Index | ||||
| Nov 2016 2,137.68 Put (4,168) | USD | 8,910 (ÿ) | 176 | |
| Jan 2017 2,137.94 Put (8,335) | USD | 17,820 (ÿ) | 507 | |
| Total Options Purchased | ||||
| (cost $646) | 683 | |||
| Short-Term Investments - 1.6% | ||||
| Russell U.S. Cash Management Fund | 10,495,648 | (8) | 10,498 | |
| Total Short-Term Investments | ||||
| (cost $10,496) | 10,498 | |||
| Total Investments 98.7% | ||||
| (identified cost $652,659) | 660,037 | |||
| Other Assets and Liabilities, Net - 1.3% | 8,719 | |||
| Net Assets - 100.0% | 668,756 | |||
See accompanying notes which are an integral part of the financial statements.
Equity Growth Strategy Fund 107
Russell Investment Company
Equity Growth Strategy Fund
Schedule of Investments, continued — October 31, 2016
| Futures Contracts | |||||||
| Amounts in thousands (except contract amounts) | |||||||
| Unrealized | |||||||
| Appreciation | |||||||
| Number of | Notional | Expiration | (Depreciation) | ||||
| Contracts | Amount | Date | $ | ||||
| Long Positions | |||||||
| Amsterdam Index Futures | 59 | EUR | 5,324 | 11/16 | 3 | ||
| CAC40 Euro Index Futures | 338 | EUR | 15,232 | 11/16 | 90 | ||
| DAX Index Futures | 53 | EUR | 14,147 | 12/16 | 381 | ||
| Dow Jones U.S. Real Estate Index Futures | 221 | USD | 6,654 | 12/16 | (36 | ) | |
| Euro STOXX 50 Index Futures | 311 | EUR | 9,495 | 12/16 | 214 | ||
| FTSE/MIB Index Futures | 39 | EUR | 3,336 | 12/16 | 100 | ||
| IBEX 35 Index Futures | 55 | EUR | 5,020 | 11/16 | 201 | ||
| OMXS30 Index Futures | 233 | SEK | 33,663 | 11/16 | 1 | ||
| Russell 1000 Mini Index Futures | 5 | USD | 587 | 12/16 | (5 | ) | |
| Russell 2000 Mini Index Futures | 4 | USD | 476 | 12/16 | (25 | ) | |
| S&P 500 E-Mini Index Futures | 21 | USD | 2,226 | 12/16 | (29 | ) | |
| S&P Mid 400 E-Mini Index Futures | 5 | USD | 753 | 12/16 | (11 | ) | |
| TOPIX Index Futures | 1 | JPY | 13,950 | 12/16 | 4 | ||
| Short Positions | |||||||
| FTSE 100 Index Futures | 12 | GBP | 831 | 12/16 | (38 | ) | |
| Hang Seng Index Futures | 2 | HKD | 2,291 | 11/16 | 7 | ||
| MSCI Emerging Markets Mini Index Futures | 111 | USD | 5,014 | 12/16 | 20 | ||
| MSCI Singapore Index Futures | 4 | SGD | 123 | 11/16 | 1 | ||
| Russell 1000 Mini Index Futures | 18 | USD | 2,113 | 12/16 | 6 | ||
| S&P 500 E-Mini Index Futures | 331 | USD | 35,088 | 12/16 | 91 | ||
| S&P Mid 400 E-Mini Index Futures | 19 | USD | 2,863 | 12/16 | 20 | ||
| S&P/TSX 60 Index Futures | 72 | CAD | 12,478 | 12/16 | (291 | ) | |
| SPI 200 Index Futures | 79 | AUD | 10,448 | 12/16 | (172 | ) | |
| Total Unrealized Appreciation (Depreciation) on Open Futures Contracts (å) | 532 | ||||||
| Options Written | ||||||||||||
| Amounts in thousands (except contract amounts) | ||||||||||||
| Number of | Strike | Notional | Expiration | Fair Value | ||||||||
| Call/Put | Contracts | Price | Amount | Date | $ | |||||||
| S&P 500 Index | Put | 8,336 | 1,900.16 | USD | 15,840 | 11/30/16 | (27 | ) | ||||
| S&P 500 Index | Put | 16,670 | 1,900.39 | USD | 31,680 | 01/06/17 | (200 | ) | ||||
| Total Liability for Options Written (premiums received $296) | (227 | ) | ||||||||||
| Transactions in options written contracts for the period ended October 31, 2016 were as follows: | ||||||||||||
| Number of | Premiums | |||||||||||
| Contracts | Received | |||||||||||
| Outstanding October 31, 2015 | — | $ | — | |||||||||
| Opened | 2,497,942 | 3,562 | ||||||||||
| Closed | (2,427,169 | ) | (820 | ) | ||||||||
| Expired | (45,767 | ) | (2,446 | ) | ||||||||
| Outstanding October 31, 2016 | 25,006 | $ | 296 | |||||||||
| Foreign Currency Exchange Contracts | ||||||||
| Amounts in thousands | ||||||||
| Unrealized | ||||||||
| Appreciation | ||||||||
| Amount | Amount | (Depreciation) | ||||||
| Counterparty | Sold | Bought | Settlement Date | $ | ||||
| Bank of America | USD | 5,000 | CAD | 6,610 | 12/21/16 | (70 | ) | |
| Bank of America | AUD | 20,980 | USD | 15,985 | 12/21/16 | 45 | ||
| Bank of America | CAD | 650 | USD | 495 | 12/21/16 | 10 | ||
| Bank of America | KRW | 13,730,000 | USD | 12,540 | 12/21/16 | 543 | ||
See accompanying notes which are an integral part of the financial statements.
108 Equity Growth Strategy Fund
Russell Investment Company
Equity Growth Strategy Fund
Schedule of Investments, continued — October 31, 2016
| Foreign Currency Exchange Contracts | |||||||
| Amounts in thousands | |||||||
| Unrealized | |||||||
| Appreciation | |||||||
| Amount | Amount | (Depreciation) | |||||
| Counterparty | Sold | Bought | Settlement Date | $ | |||
| Bank of Montreal | USD | 619 | AUD | 814 | 11/08/16 | — | |
| Bank of Montreal | USD | 801 | CAD | 1,073 | 11/08/16 | (1 | ) |
| Bank of Montreal | USD | 748 | CHF | 739 | 11/08/16 | (1 | ) |
| Bank of Montreal | USD | 2,710 | EUR | 2,475 | 11/08/16 | 7 | |
| Bank of Montreal | USD | 1,484 | GBP | 1,219 | 11/08/16 | 9 | |
| Bank of Montreal | USD | 1,840 | JPY | 193,246 | 11/08/16 | 3 | |
| Bank of Montreal | AUD | 821 | USD | 624 | 11/08/16 | — | |
| Bank of Montreal | AUD | 814 | USD | 619 | 12/07/16 | — | |
| Bank of Montreal | CAD | 1,071 | USD | 814 | 11/08/16 | 15 | |
| Bank of Montreal | CAD | 1,073 | USD | 802 | 12/07/16 | 2 | |
| Bank of Montreal | CHF | 747 | USD | 768 | 11/08/16 | 13 | |
| Bank of Montreal | CHF | 739 | USD | 749 | 12/07/16 | — | |
| Bank of Montreal | EUR | 2,513 | USD | 2,809 | 11/08/16 | 50 | |
| Bank of Montreal | EUR | 2,475 | USD | 2,713 | 12/07/16 | (8 | ) |
| Bank of Montreal | GBP | 1,230 | USD | 1,595 | 11/08/16 | 90 | |
| Bank of Montreal | GBP | 1,219 | USD | 1,485 | 12/07/16 | (9 | ) |
| Bank of Montreal | JPY | 192,442 | USD | 1,901 | 11/08/16 | 66 | |
| Bank of Montreal | JPY | 193,246 | USD | 1,842 | 12/07/16 | (3 | ) |
| BNP Paribas | USD | 1,558 | GBP | 1,170 | 12/21/16 | (125 | ) |
| BNP Paribas | USD | 740 | JPY | 74,930 | 12/21/16 | (24 | ) |
| BNP Paribas | AUD | 821 | USD | 625 | 11/08/16 | 1 | |
| BNP Paribas | AUD | 4,075 | USD | 3,121 | 12/21/16 | 25 | |
| BNP Paribas | CAD | 1,071 | USD | 814 | 11/08/16 | 16 | |
| BNP Paribas | CAD | 355 | USD | 275 | 12/21/16 | 10 | |
| BNP Paribas | CHF | 747 | USD | 768 | 11/08/16 | 14 | |
| BNP Paribas | EUR | 2,513 | USD | 2,812 | 11/08/16 | 53 | |
| BNP Paribas | EUR | 420 | USD | 475 | 12/21/16 | 13 | |
| BNP Paribas | GBP | 1,230 | USD | 1,595 | 11/08/16 | 89 | |
| BNP Paribas | HKD | 1,165 | USD | 150 | 12/21/16 | — | |
| BNP Paribas | JPY | 192,442 | USD | 1,904 | 11/08/16 | 68 | |
| BNP Paribas | SEK | 990 | USD | 118 | 12/21/16 | 8 | |
| BNP Paribas | SGD | 70 | USD | 52 | 12/21/16 | 2 | |
| Citigroup | USD | 619 | AUD | 814 | 11/08/16 | — | |
| Citigroup | USD | 802 | CAD | 1,073 | 11/08/16 | (2 | ) |
| Citigroup | USD | 748 | CHF | 739 | 11/08/16 | (1 | ) |
| Citigroup | USD | 2,710 | EUR | 2,475 | 11/08/16 | 8 | |
| Citigroup | USD | 1,484 | GBP | 1,219 | 11/08/16 | 8 | |
| Citigroup | USD | 1,841 | JPY | 193,246 | 11/08/16 | 2 | |
| Citigroup | AUD | 814 | USD | 619 | 12/07/16 | — | |
| Citigroup | CAD | 1,073 | USD | 802 | 12/07/16 | 2 | |
| Citigroup | CHF | 739 | USD | 749 | 12/07/16 | — | |
| Citigroup | EUR | 2,475 | USD | 2,713 | 12/07/16 | (8 | ) |
| Citigroup | GBP | 1,219 | USD | 1,485 | 12/07/16 | (8 | ) |
| Citigroup | JPY | 193,246 | USD | 1,843 | 12/07/16 | (2 | ) |
| Commonwealth Bank of Australia | USD | 619 | AUD | 814 | 11/08/16 | — | |
| Commonwealth Bank of Australia | USD | 802 | CAD | 1,073 | 11/08/16 | (2 | ) |
| Commonwealth Bank of Australia | USD | 748 | CHF | 739 | 11/08/16 | (1 | ) |
| Commonwealth Bank of Australia | USD | 2,710 | EUR | 2,475 | 11/08/16 | 7 | |
| Commonwealth Bank of Australia | USD | 1,484 | GBP | 1,219 | 11/08/16 | 8 | |
| Commonwealth Bank of Australia | USD | 1,841 | JPY | 193,246 | 11/08/16 | 2 | |
| Commonwealth Bank of Australia | AUD | 821 | USD | 625 | 11/08/16 | 1 | |
| Commonwealth Bank of Australia | AUD | 814 | USD | 619 | 12/07/16 | — | |
| Commonwealth Bank of Australia | CAD | 1,071 | USD | 814 | 11/08/16 | 16 | |
| Commonwealth Bank of Australia | CAD | 1,073 | USD | 802 | 12/07/16 | 2 | |
| Commonwealth Bank of Australia | CHF | 747 | USD | 768 | 11/08/16 | 14 | |
| Commonwealth Bank of Australia | CHF | 739 | USD | 749 | 12/07/16 | 1 |
See accompanying notes which are an integral part of the financial statements.
Equity Growth Strategy Fund 109
Russell Investment Company
Equity Growth Strategy Fund
Schedule of Investments, continued — October 31, 2016
| Foreign Currency Exchange Contracts | |||||||
| Amounts in thousands | |||||||
| Unrealized | |||||||
| Appreciation | |||||||
| Amount | Amount | (Depreciation) | |||||
| Counterparty | Sold | Bought | Settlement Date | $ | |||
| Commonwealth Bank of Australia | EUR | 2,513 | USD | 2,811 | 11/08/16 | 51 | |
| Commonwealth Bank of Australia | EUR | 2,475 | USD | 2,713 | 12/07/16 | (7 | ) |
| Commonwealth Bank of Australia | GBP | 1,230 | USD | 1,594 | 11/08/16 | 87 | |
| Commonwealth Bank of Australia | GBP | 1,219 | USD | 1,485 | 12/07/16 | (8 | ) |
| Commonwealth Bank of Australia | JPY | 192,442 | USD | 1,903 | 11/08/16 | 68 | |
| Commonwealth Bank of Australia | JPY | 193,246 | USD | 1,843 | 12/07/16 | (2 | ) |
| HSBC | USD | 619 | AUD | 814 | 11/08/16 | — | |
| HSBC | USD | 802 | CAD | 1,073 | 11/08/16 | (2 | ) |
| HSBC | USD | 748 | CHF | 739 | 11/08/16 | (1 | ) |
| HSBC | USD | 2,710 | EUR | 2,475 | 11/08/16 | 7 | |
| HSBC | USD | 1,484 | GBP | 1,219 | 11/08/16 | 9 | |
| HSBC | USD | 1,841 | JPY | 193,246 | 11/08/16 | 2 | |
| HSBC | AUD | 814 | USD | 619 | 12/07/16 | — | |
| HSBC | CAD | 1,073 | USD | 802 | 12/07/16 | 2 | |
| HSBC | CHF | 739 | USD | 749 | 12/07/16 | — | |
| HSBC | EUR | 2,475 | USD | 2,713 | 12/07/16 | (7 | ) |
| HSBC | GBP | 1,219 | USD | 1,485 | 12/07/16 | (7 | ) |
| HSBC | JPY | 193,246 | USD | 1,842 | 12/07/16 | (3 | ) |
| Standard Chartered | USD | 992 | INR | 66,840 | 12/21/16 | 3 | |
| Standard Chartered | USD | 2,387 | MXN | 44,670 | 12/21/16 | (37 | ) |
| Standard Chartered | USD | 4,258 | ZAR | 59,990 | 12/21/16 | 148 | |
| Standard Chartered | CNY | 58,680 | USD | 8,640 | 12/21/16 | 18 | |
| Standard Chartered | TWD | 153,000 | USD | 4,915 | 12/21/16 | 65 | |
| State Street | USD | 19 | AUD | 25 | 11/08/16 | — | |
| State Street | USD | 31 | CHF | 30 | 11/08/16 | (1 | ) |
| State Street | USD | 172 | EUR | 153 | 11/08/16 | (4 | ) |
| State Street | USD | 54 | GBP | 42 | 11/08/16 | (3 | ) |
| State Street | USD | 1,247 | HKD | 9,667 | 11/08/16 | — | |
| State Street | USD | 1,676 | RUB | 106,170 | 12/21/16 | (23 | ) |
| State Street | USD | 1,176 | SEK | 10,594 | 11/08/16 | (3 | ) |
| State Street | USD | 414 | SGD | 577 | 11/08/16 | — | |
| State Street | CAD | 6 | USD | 5 | 11/08/16 | — | |
| State Street | CNY | 95,000 | USD | 14,135 | 12/21/16 | 177 | |
| State Street | HKD | 295 | USD | 38 | 11/08/16 | — | |
| State Street | HKD | 9,372 | USD | 1,209 | 11/08/16 | 1 | |
| State Street | HKD | 9,667 | USD | 1,247 | 12/07/16 | — | |
| State Street | JPY | 3,217 | USD | 32 | 11/08/16 | 1 | |
| State Street | SEK | 91 | USD | 11 | 11/08/16 | 1 | |
| State Street | SEK | 10,503 | USD | 1,221 | 11/08/16 | 57 | |
| State Street | SEK | 10,594 | USD | 1,178 | 12/07/16 | 3 | |
| State Street | SGD | 7 | USD | 5 | 11/08/16 | — | |
| State Street | SGD | 570 | USD | 418 | 11/08/16 | 8 | |
| State Street | SGD | 577 | USD | 415 | 12/07/16 | — | |
| UBS | AUD | 821 | USD | 625 | 11/08/16 | 1 | |
| UBS | CAD | 1,071 | USD | 814 | 11/08/16 | 16 | |
| UBS | CHF | 747 | USD | 767 | 11/08/16 | 12 | |
| UBS | EUR | 2,513 | USD | 2,808 | 11/08/16 | 49 | |
| UBS | GBP | 1,230 | USD | 1,594 | 11/08/16 | 89 | |
| UBS | JPY | 192,442 | USD | 1,902 | 11/08/16 | 66 | |
| Westpac | USD | 1,558 | GBP | 1,170 | 12/21/16 | (124 | ) |
| Westpac | USD | 740 | JPY | 74,930 | 12/21/16 | (24 | ) |
| Westpac | AUD | 4,075 | USD | 3,120 | 12/21/16 | 24 | |
| Westpac | CAD | 355 | USD | 275 | 12/21/16 | 10 | |
| Westpac | EUR | 420 | USD | 475 | 12/21/16 | 13 | |
| Westpac | HKD | 1,165 | USD | 150 | 12/21/16 | — | |
| Westpac | SEK | 990 | USD | 118 | 12/21/16 | 8 |
See accompanying notes which are an integral part of the financial statements.
110 Equity Growth Strategy Fund
Russell Investment Company
Equity Growth Strategy Fund
Schedule of Investments, continued — October 31, 2016
| Foreign Currency Exchange Contracts | ||||||||
| Amounts in thousands | ||||||||
| Unrealized | ||||||||
| Appreciation | ||||||||
| Amount | Amount | (Depreciation) | ||||||
| Counterparty | Sold | Bought | Settlement Date | $ | ||||
| Westpac | SGD | 70 | USD | 52 | 12/21/16 | 2 | ||
| Total Unrealized Appreciation (Depreciation) on Open Foreign Currency Exchange Contracts | 1,700 | |||||||
| Total Return Swap Contracts (*) | ||||||||
| Amounts in thousands | ||||||||
| Notional | Termination | Fair Value | ||||||
| Underlying Reference Entity | Counterparty | Amount | Date | $ | ||||
| Dow Jones U.S. Real Estate Total Return Index | Bank of America | USD | 17,997 | 03/07/17 | 1,264 | |||
| Total Fair Value of Open Total Return Swap Contracts Premiums Paid (Received) - $— (å) | 1,264 | |||||||
| (*) Total return swaps (which includes index swaps) are agreements between counterparties to exchange cash flows, one based on a market-linked | ||||||||
| returns of an individual asset or a basket of assets (i.e. an index), and the other on a fixed or floating rate. The floating rate fee was based on the | ||||||||
| 3 Month LIBOR rate minus 0.075%. | ||||||||
| Credit Default Swap Contracts | ||||||||
| Amounts in thousands | ||||||||
| Credit Indices | ||||||||
| Fund (Pays)/ | ||||||||
| Receives | Termination | Fair Value | ||||||
| Reference Entity | Counterparty | Notional Amount | Fixed Rate | Date | $ | |||
| CDX NA High Yield Index | Bank of America | USD | 1,000 | 5.000 | % | 12/20/21 | 40 | |
| Total Fair Value on Open Credit Indices Premiums Paid (Received) - $35 | 40 | |||||||
| Presentation of Portfolio Holdings | |||||||||||||||||
| Amounts in thousands | |||||||||||||||||
| Fair Value | |||||||||||||||||
| Practical | |||||||||||||||||
| Portfolio Summary | Level 1 | Level 2 | Level 3 | Expedient (a) | Total | % of Net Assets | |||||||||||
| Investments in Russell Affiliated Mutual | |||||||||||||||||
| Funds | $ | 648,856 | $ | — | $ | — | $ | — | $ | 648,856 | 97.0 | ||||||
| Options Purchased | — | 683 | — | — | 683 | 0.1 | |||||||||||
| Short-Term Investments | — | — | — | 10,498 | 10,498 | 1.6 | |||||||||||
| Total Investments | 648,856 | 683 | — | 10,498 | 660,037 | 98.7 | |||||||||||
| Other Assets and Liabilities, Net | 1.3 | ||||||||||||||||
| 100.0 | |||||||||||||||||
| Other Financial Instruments | |||||||||||||||||
| Assets | |||||||||||||||||
| Futures Contracts | 1,139 | — | — | — | 1,139 | 0.2 | |||||||||||
| Foreign Currency Exchange Contracts | — | 2,221 | — | — | 2,221 | 0.3 | |||||||||||
| Total Return Swap Contracts | — | 1,264 | — | — | 1,264 | 0.2 | |||||||||||
| Credit Default Swap Contracts | — | 40 | — | — | 40 | —* | |||||||||||
| ' | |||||||||||||||||
| Liabilities | |||||||||||||||||
| Futures Contracts | (607 | ) | — | — | — | (607 | ) | (0.1 | ) | ||||||||
| Options Written | — | (227 | ) | — | — | (227 | ) | (—)* | |||||||||
| Foreign Currency Exchange Contracts | — | (521 | ) | — | — | (521 | ) | (0.1 | ) | ||||||||
| Total Other Financial Instruments** | $ | 532 | $ | 2,777 | $ | — | $ | — | $ | 3,309 | |||||||
See accompanying notes which are an integral part of the financial statements.
Equity Growth Strategy Fund 111
Russell Investment Company
Equity Growth Strategy Fund
Schedule of Investments, continued — October 31, 2016
| Presentation of Portfolio Holdings | |||||||
| Amounts in thousands | |||||||
| Fair Value | |||||||
| Practical | |||||||
| Portfolio Summary | Level 1 | Level 2 | Level 3 | Expedient (a) | Total | % of Net Assets | |
* Less than 0.05% of net assets.
** Futures and foreign currency exchange contract values reflect the unrealized appreciation (depreciation) on the investments.
(a) Certain investments that are measured at fair value using the net asset value per share (or its equivalent) practical expedient have not been classified
in the fair value levels. The fair value amounts presented in the table are intended to permit reconciliation to the amounts presented in the Schedule of
Investments.
For a description of the Levels, see note 2, in the Notes to Financial Statements.
For a disclosure on transfers between Levels 1, 2 and 3 during the period ended October 31, 2016, see note 2 in the Notes to
Financial Statements.
See accompanying notes which are an integral part of the financial statements.
112 Equity Growth Strategy Fund
Russell Investment Company
Equity Growth Strategy Fund
Fair Value of Derivative Instruments — October 31, 2016
Amounts in thousands
| Foreign | ||||||||
| Equity | Credit | Currency | ||||||
| Derivatives not accounted for as hedging instruments | Contracts | Contracts | Contracts | |||||
| Location: Statement of Assets and Liabilities - Assets | ||||||||
| Investments, at fair value* | $ | 683 | $ | — | $ | — | ||
| Unrealized appreciation on foreign currency exchange contracts | — | — | 2,221 | |||||
| Variation margin on futures contracts** | 1,139 | — | — | |||||
| Total return swap contracts, at fair value | 1,264 | — | — | |||||
| Credit default swap contracts, at fair value | — | 40 | — | |||||
| Total | $ | 3,086 | $ | 40 | $ | 2,221 | ||
| Location: Statement of Assets and Liabilities - Liabilities | ||||||||
| Variation margin on futures contracts** | $ | 607 | $ | — | $ | — | ||
| Unrealized depreciation on foreign currency exchange contracts | — | — | 521 | |||||
| Options written, at fair value | 227 | — | — | |||||
| Total | $ | 834 | $ | — | $ | 521 | ||
| Foreign | ||||||||
| Equity | Credit | Currency | ||||||
| Derivatives not accounted for as hedging instruments | Contracts | Contracts | Contracts | |||||
| Location: Statement of Operations - Net realized gain (loss) | ||||||||
| Investments*** | $ | 2,230 | $ | — | $ | — | ||
| Futures contracts | (355 | ) | — | — | ||||
| Options written | 834 | — | — | |||||
| Total return swap contracts | (5,042 | ) | — | — | ||||
| Credit default swap contracts | — | 92 | — | |||||
| Foreign currency-related transactions**** | — | — | (393 | ) | ||||
| Total | $ | (2,333 | ) | $ | 92 | $ | (393 | ) |
| Location: Statement of Operations - Net change in unrealized appreciation (depreciation) | ||||||||
| Investments***** | $ | 37 | $ | — | $ | — | ||
| Futures contracts | (1,488 | ) | — | — | ||||
| Options written | 69 | — | — | |||||
| Total return swap contracts | 3,513 | — | — | |||||
| Credit default swap contracts | — | 5 | — | |||||
| Foreign currency-related transactions****** | — | — | 1,596 | |||||
| Total | $ | 2,131 | $ | 5 | $ | 1,596 | ||
* Fair value of purchased options.
** Includes cumulative appreciation/depreciation of futures contracts as reported in the Schedule of Investments. Only variation margin is reported within the
Statement of Assets and Liabilities.
*** Includes net realized gain (loss) on purchased options as reported in the Statement of Operations.
**** Only includes net realized gain (loss) on forward and spot contracts. May differ from the net realized gain (loss) on foreign currency-related transactions reported
within the Statement of Operations.
***** Includes net unrealized gain (loss) on purchased options as reported in the Schedule of Investments.
****** Only includes change in unrealized gain (loss) on forward and spot contracts. May differ from the net change in unrealized gain (loss) on foreign currency-related
transactions reported within the Statement of Operations.
For further disclosure on derivatives see note 2 in the Notes to Financial Statements.
See accompanying notes which are an integral part of the financial statements.
Equity Growth Strategy Fund 113
Russell Investment Company
Equity Growth Strategy Fund
Balance Sheet Offsetting of Financial and Derivative Instruments — October 31, 2016
| Amounts in thousands | |||||||||
| Offsetting of Financial Assets and Derivative Assets | |||||||||
| Gross | Net Amounts | ||||||||
| Amounts | of Assets | ||||||||
| Gross | Offset in the | Presented in | |||||||
| Amounts of | Statement of | the Statement | |||||||
| Recognized | Assets and | of Assets and | |||||||
| Description | Location: Statement of Assets and Liabilities - Assets | Assets | Liabilities | Liabilities | |||||
| Options Purchased Contracts | Investments, at fair value | $ | 683 | $ | — | $ | 683 | ||
| Foreign Currency Exchange Contracts | Unrealized appreciation on foreign currency exchange contracts | 2,221 | — | 2,221 | |||||
| Futures Contracts | Variation margin on futures contracts | 177 | — | 177 | |||||
| Total Return Swap Contracts | Total return swap contracts, at fair value | 1,264 | — | 1,264 | |||||
| Credit Default Swap Contracts | Credit default swap contracts, at fair value | 40 | — | 40 | |||||
| Total Financial and Derivative Assets | 4,385 | — | 4,385 | ||||||
| Financial and Derivative Assets not subject to a netting agreement | (216) | — | (216 | ) | |||||
| Total Financial and Derivative Assets subject to a netting agreement | $ | 4,169 | $ | — | $ | 4,169 | |||
| Financial Assets, Derivative Assets, and Collateral Held by Counterparty | |||||||||||
| Gross Amounts Not Offset in | |||||||||||
| the Statement of Assets and | |||||||||||
| Liabilities | |||||||||||
| Net Amounts | |||||||||||
| of Assets | |||||||||||
| Presented in | |||||||||||
| the Statement | Financial and | ||||||||||
| of Assets and | Derivative | Collateral | |||||||||
| Counterparty | Liabilities | Instruments | Received^ | Net Amount | |||||||
| Bank of America | $ | 2,372 | $ | 270 | $ | 1,850 | $ | 252 | |||
| Bank of Montreal | 254 | 21 | — | 233 | |||||||
| BNP Paribas | 299 | 58 | — | 241 | |||||||
| Citigroup | 21 | 21 | — | — | |||||||
| Commonwealth Bank of Australia | 257 | 20 | — | 237 | |||||||
| HSBC | 20 | 20 | — | — | |||||||
| JPMorgan Chase | 176 | 27 | — | 149 | |||||||
| Standard Chartered | 233 | 37 | — | 196 | |||||||
| State Street | 248 | 33 | — | 215 | |||||||
| UBS | 233 | — | — | 233 | |||||||
| Westpac | 56 | 56 | — | — | |||||||
| Total | $ | 4,169 | $ | 563 | $ | 1,850 | $ | 1,756 | |||
See accompanying notes which are an integral part of the financial statements.
114 Equity Growth Strategy Fund
Russell Investment Company
Equity Growth Strategy Fund
Balance Sheet Offsetting of Financial and Derivative Instruments, continued —
October 31, 2016
| Amounts in thousands | |||||||||
| Offsetting of Financial Liabilities and Derivative Liabilities | |||||||||
| Gross | Net Amounts | ||||||||
| Amounts | of Liabilities | ||||||||
| Gross | Offset in the | Presented in | |||||||
| Amounts of | Statement of | the Statement | |||||||
| Recognized | Assets and | of Assets and | |||||||
| Description | Location: Statement of Assets and Liabilities - Liabilities | Liabilities | Liabilities | Liabilities | |||||
| Futures Contracts | Variation margin on futures contracts | $ | 449 | $ | — | $ | 449 | ||
| Foreign Currency Exchange Contracts | Unrealized depreciation on foreign currency exchange contracts | 521 | — | 521 | |||||
| Options Written Contracts | Options written, at fair value | 227 | — | 227 | |||||
| Total Financial and Derivative Liabilities | 1,197 | — | 1,197 | ||||||
| Financial and Derivative Liabilities not subject to a netting agreement | (449) | — | (449 | ) | |||||
| Total Financial and Derivative Liabilities subject to a netting agreement | $ | 748 | $ | — | $ | 748 | |||
| Financial Liabilities, Derivative Liabilities, and Collateral Pledged by Counterparty | ||||||||||
| Gross Amounts Not Offset in | ||||||||||
| the Statement of Assets and | ||||||||||
| Liabilities | ||||||||||
| Net Amounts | ||||||||||
| of Liabilities | ||||||||||
| Presented in | ||||||||||
| the Statement | Financial and | |||||||||
| of Assets and | Derivative | Collateral | ||||||||
| Counterparty | Liabilities | Instruments | Pledged^ | Net Amount | ||||||
| Bank of America | $ | 270 | $ | 270 | $ | — | $ | — | ||
| Bank of Montreal | 21 | 21 | — | — | ||||||
| BNP Paribas | 150 | 58 | — | 92 | ||||||
| Citigroup | 21 | 21 | — | — | ||||||
| Commonwealth Bank of Australia | 20 | 20 | — | — | ||||||
| HSBC | 21 | 20 | — | 1 | ||||||
| JPMorgan Chase | 27 | 27 | — | — | ||||||
| Standard Chartered | 37 | 37 | — | — | ||||||
| State Street | 33 | 33 | — | — | ||||||
| Westpac | 148 | 56 | — | 92 | ||||||
| Total | $ | 748 | $ | 563 | $ | — | $ | 185 | ||
^ Collateral received or pledged amounts may not reconcile to those disclosed in the Statement of Assets and Liabilities due to the inclusion of off-Balance
Sheet collateral and adjustments made to exclude overcollateralization.
For further disclosure on derivatives and counterparty risk see note 2 in the Notes to Financial Statements.
See accompanying notes which are an integral part of the financial statements.
Equity Growth Strategy Fund 115
Russell Investment Company
Equity Growth Strategy Fund
Statement of Assets and Liabilities — October 31, 2016
| Amounts in thousands | ||
| Assets | ||
| Investments, at identified cost | $ | 652,659 |
| Investments, at fair value(>) | 660,037 | |
| Cash (restricted)(a)(b) | 8,710 | |
| Unrealized appreciation on foreign currency exchange contracts | 2,221 | |
| Receivables: | ||
| Dividends from affiliated Russell funds | 5 | |
| Investments sold | 969 | |
| Fund shares sold | 416 | |
| From affiliates | 1 | |
| Variation margin on futures contracts | 177 | |
| Total return swap contracts, at fair value(8) | 1,264 | |
| Credit default swap contracts, at fair value(+) | 40 | |
| Total assets | 673,840 | |
| Liabilities | ||
| Payables: | ||
| Due to custodian | 234 | |
| Due to broker (c) | 1,891 | |
| Investments purchased | 732 | |
| Fund shares redeemed | 542 | |
| Accrued fees to affiliates | 401 | |
| Other accrued expenses | 87 | |
| Variation margin on futures contracts | 449 | |
| Unrealized depreciation on foreign currency exchange contracts | 521 | |
| Options written, at fair value(x) | 227 | |
| Total liabilities | 5,084 | |
| Net Assets | $ | 668,756 |
See accompanying notes which are an integral part of the financial statements.
116 Equity Growth Strategy Fund
Russell Investment Company
Equity Growth Strategy Fund
Statement of Assets and Liabilities, continued — October 31, 2016
| Amounts in thousands | |||
| Net Assets Consist of: | |||
| Undistributed (overdistributed) net investment income | $ | 2,318 | |
| Accumulated net realized gain (loss) | (92,721 | ) | |
| Unrealized appreciation (depreciation) on: | |||
| Investments | 7,378 | ||
| Futures contracts | 532 | ||
| Options written | 69 | ||
| Total return swap contracts | 1,264 | ||
| Credit default swap contracts | 5 | ||
| Foreign currency-related transactions | 1,700 | ||
| Shares of beneficial interest | 606 | ||
| Additional paid-in capital | 747,605 | ||
| Net Assets | $ | 668,756 | |
| Net Asset Value, offering and redemption price per share: | |||
| Net asset value per share: Class A(#) | $ | 11.48 | |
| Maximum offering price per share (Net asset value plus sales charge of 5.75%): Class A | $ | 12.18 | |
| Class A — Net assets | $ | 182,585,615 | |
| Class A — Shares outstanding ($.01 par value) | 15,908,089 | ||
| Net asset value per share: Class C(#) | $ | 10.34 | |
| Class C — Net assets | $ | 242,008,323 | |
| Class C — Shares outstanding ($.01 par value) | 23,394,240 | ||
| Net asset value per share: Class E(#) | $ | 11.22 | |
| Class E — Net assets | $ | 5,872,928 | |
| Class E — Shares outstanding ($.01 par value) | 523,349 | ||
| Net asset value per share: Class R1(#) | $ | 11.54 | |
| Class R1 — Net assets | $ | 24,917,552 | |
| Class R1 — Shares outstanding ($.01 par value) | 2,159,614 | ||
| Net asset value per share: Class R4(#) | $ | 11.26 | |
| Class R4 — Net assets | $ | 31,005,556 | |
| Class R4 — Shares outstanding ($.01 par value) | 2,754,123 | ||
| Net asset value per share: Class R5(#) | $ | 11.13 | |
| Class R5 — Net assets | $ | 22,282,574 | |
| Class R5 — Shares outstanding ($.01 par value) | 2,002,373 | ||
| Net asset value per share: Class S(#) | $ | 11.52 | |
| Class S — Net assets | $ | 160,082,969 | |
| Class S — Shares outstanding ($.01 par value) | 13,900,443 | ||
| Amounts in thousands | |||
| (x) Premiums received on options written | $ | 296 | |
| (+) Credit default swap contracts - premiums paid (received) | $ | 35 | |
| (>) Investments in affiliated Russell funds | $ | 659,354 | |
| (8) Total return swap contracts - premiums paid (received) | $ | — | |
| (a) Cash Collateral for Futures | $ | 8,510 | |
| (b) Cash Collateral for Swaps | $ | 200 | |
| (c) Due to Broker for Swaps | $ | 1,891 | |
| (#) Net asset value per share equals class level net assets divided by class level shares of beneficial interest outstanding. | |||
See accompanying notes which are an integral part of the financial statements.
Equity Growth Strategy Fund 117
Russell Investment Company
Equity Growth Strategy Fund
Statement of Operations — For the Period Ended October 31, 2016
| Amounts in thousands | |||
| Investment Income | |||
| Income distributions from affiliated Russell funds | $ | 15,818 | |
| Expenses | |||
| Advisory fees | 1,395 | ||
| Administrative fees | 296 | ||
| Custodian fees (1) | 43 | ||
| Distribution fees - Class A | 470 | ||
| Distribution fees - Class C | 1,922 | ||
| Distribution fees - Class R5 | 62 | ||
| Transfer agent fees - Class A | 376 | ||
| Transfer agent fees - Class C | 512 | ||
| Transfer agent fees - Class E | 15 | ||
| Transfer agent fees - Class R1 | 55 | ||
| Transfer agent fees - Class R4 | 66 | ||
| Transfer agent fees - Class R5 | 50 | ||
| Transfer agent fees - Class S | 321 | ||
| Professional fees | 48 | ||
| Registration fees | 102 | ||
| Shareholder servicing fees - Class C | 641 | ||
| Shareholder servicing fees - Class E | 19 | ||
| Shareholder servicing fees - Class R4 | 83 | ||
| Shareholder servicing fees - Class R5 | 62 | ||
| Trustees’ fees | 23 | ||
| Printing fees | 91 | ||
| Miscellaneous | 20 | ||
| Expenses before reductions | 6,672 | ||
| Expense reductions | (1,277 | ) | |
| Net expenses | 5,395 | ||
| Net investment income (loss) | 10,423 | ||
| Net Realized and Unrealized Gain (Loss) | |||
| Net realized gain (loss) on: | |||
| Investments | 12,937 | ||
| Futures contracts | (355 | ) | |
| Options written | 834 | ||
| Total return swap contracts | (5,042 | ) | |
| Credit default swap contracts | 92 | ||
| Foreign currency-related transactions | (394 | ) | |
| Capital gain distributions from Underlying Funds | 23,210 | ||
| Net realized gain (loss) | 31,282 | ||
| Net change in unrealized appreciation (depreciation) on: | |||
| Investments | (26,016 | ) | |
| Futures contracts | (1,488 | ) | |
| Options written | 69 | ||
| Total return swap contracts | 3,513 | ||
| Credit default swap contracts | 5 | ||
| Foreign currency-related transactions | 1,596 | ||
| Net change in unrealized appreciation (depreciation) | (22,321 | ) | |
| Net realized and unrealized gain (loss) | 8,961 | ||
| Net Increase (Decrease) in Net Assets from Operations | $ | 19,384 | |
| (1) Includes a reimbursement for overbilling of custody out-of-pocket fees from prior years. See note 8 in the Notes to Financial Statements. | |||
See accompanying notes which are an integral part of the financial statements.
118 Equity Growth Strategy Fund
Russell Investment Company
Equity Growth Strategy Fund
Statements of Changes in Net Assets
| For the Periods Ended October 31, | ||||||
| Amounts in thousands | 2016 | 2015 | ||||
| Increase (Decrease) in Net Assets | ||||||
| Operations | ||||||
| Net investment income (loss) | $ | 10,423 | $ | 21,047 | ||
| Net realized gain (loss) | 31,282 | 59,995 | ||||
| Net change in unrealized appreciation (depreciation) | (22,321 | ) | (97,318 | ) | ||
| Net increase (decrease) in net assets from operations | 19,384 | (16,276 | ) | |||
| Distributions | ||||||
| From net investment income | ||||||
| Class A | (2,992 | ) | (5,196 | ) | ||
| Class C | (2,683 | ) | (5,914 | ) | ||
| Class E | (120 | ) | (481 | ) | ||
| Class R1 | (523 | ) | (1,335 | ) | ||
| Class R4 | (569 | ) | (1,251 | ) | ||
| Class R5 | (362 | ) | (1,037 | ) | ||
| Class S | (2,926 | ) | (4,597 | ) | ||
| In excess | ||||||
| Class A | — | (333 | ) | |||
| Class C | — | (379 | ) | |||
| Class E | — | (31 | ) | |||
| Class R1 | — | (86 | ) | |||
| Class R4 | — | (80 | ) | |||
| Class R5 | — | (66 | ) | |||
| Class S | — | (294 | ) | |||
| Net decrease in net assets from distributions | (10,175 | ) | (21,080 | ) | ||
| Share Transactions* | ||||||
| Net increase (decrease) in net assets from share transactions | (119,442 | ) | (123,235 | ) | ||
| Total Net Increase (Decrease) in Net Assets | (110,233 | ) | (160,591 | ) | ||
| Net Assets | ||||||
| Beginning of period | 778,989 | 939,580 | ||||
| End of period | $ | 668,756 | $ | 778,989 | ||
| Undistributed (overdistributed) net investment income included in net assets | $ | 2,318 | $ | 2,136 | ||
See accompanying notes which are an integral part of the financial statements.
Equity Growth Strategy Fund 119
Russell Investment Company
Equity Growth Strategy Fund
Statements of Changes in Net Assets, continued
* Share transaction amounts (in thousands) for the periods ended October 31, 2016 and October 31, 2015 were as follows:
| 2016 | 2015 | |||||||||||
| Shares | Dollars | Shares | Dollars | |||||||||
| Class A | ||||||||||||
| Proceeds from shares sold | 873 | $ | 9,528 | 1,439 | $ | 16,759 | ||||||
| Proceeds from reinvestment of distributions | 270 | 2,974 | 476 | 5,510 | ||||||||
| Payments for shares redeemed | (3,566 | ) | (39,181 | ) | (3,435 | ) | (39,824 | ) | ||||
| Net increase (decrease) | (2,423 | ) | (26,679 | ) | (1,520 | ) | (17,555 | ) | ||||
| Class C | ||||||||||||
| Proceeds from shares sold | 1,693 | 16,640 | 2,861 | 29,995 | ||||||||
| Proceeds from reinvestment of distributions | 269 | 2,655 | 593 | 6,228 | ||||||||
| Payments for shares redeemed | (6,182 | ) | (61,434 | ) | (6,578 | ) | (69,011 | ) | ||||
| Net increase (decrease) | (4,220 | ) | (42,139 | ) | (3,124 | ) | (32,788 | ) | ||||
| Class E | ||||||||||||
| Proceeds from shares sold | 117 | 1,206 | 232 | 2,644 | ||||||||
| Proceeds from reinvestment of distributions | 11 | 118 | 45 | 510 | ||||||||
| Payments for shares redeemed | (573 | ) | (6,106 | ) | (1,315 | ) | (15,020 | ) | ||||
| Net increase (decrease) | (445 | ) | (4,782 | ) | (1,038 | ) | (11,866 | ) | ||||
| Class R1 | ||||||||||||
| Proceeds from shares sold | 431 | 4,720 | 616 | 7,173 | ||||||||
| Proceeds from reinvestment of distributions | 47 | 520 | 122 | 1,421 | ||||||||
| Payments for shares redeemed | (1,390 | ) | (15,255 | ) | (3,268 | ) | (37,665 | ) | ||||
| Net increase (decrease) | (912 | ) | (10,015 | ) | (2,530 | ) | (29,071 | ) | ||||
| Class R4 | ||||||||||||
| Proceeds from shares sold | 353 | 3,795 | 601 | 6,877 | ||||||||
| Proceeds from reinvestment of distributions | 53 | 569 | 117 | 1,331 | ||||||||
| Payments for shares redeemed | (1,113 | ) | (12,030 | ) | (2,229 | ) | (25,526 | ) | ||||
| Net increase (decrease) | (707 | ) | (7,666 | ) | (1,511 | ) | (17,318 | ) | ||||
| Class R5 | ||||||||||||
| Proceeds from shares sold | 224 | 2,366 | 302 | 3,406 | ||||||||
| Proceeds from reinvestment of distributions | 34 | 362 | 98 | 1,103 | ||||||||
| Payments for shares redeemed | (1,059 | ) | (11,256 | ) | (2,268 | ) | (25,618 | ) | ||||
| Net increase (decrease) | (801 | ) | (8,528 | ) | (1,868 | ) | (21,109 | ) | ||||
| Class S | ||||||||||||
| Proceeds from shares sold | 2,398 | 26,428 | 5,110 | 60,171 | ||||||||
| Proceeds from reinvestment of distributions | 210 | 2,318 | 385 | 4,470 | ||||||||
| Payments for shares redeemed | (4,406 | ) | (48,379 | ) | (5,018 | ) | (58,169 | ) | ||||
| Net increase (decrease) | (1,798 | ) | (19,633 | ) | 477 | 6,472 | ||||||
| Total increase (decrease) | (11,306 | ) | $ | (119,442 | ) | (11,114 | ) | $ | (123,235 | ) | ||
See accompanying notes which are an integral part of the financial statements.
120 Equity Growth Strategy Fund
(This page intentionally left blank)
Russell Investment Company
Equity Growth Strategy Fund
Financial Highlights — For the Periods Ended
| For a Share Outstanding Throughout Each Period. | ||||||||||||||||
| $ | ||||||||||||||||
| $ | Net | $ | $ | $ | ||||||||||||
| Net Asset Value, | Investment | Net Realized | Total from | Distributions | $ | |||||||||||
| Beginning of | Income (Loss) | and Unrealized | Investment | from Net | Distributions | |||||||||||
| Period | (a)(b)(e) | Gain (Loss) | Operations | Investment Income | in Excess | |||||||||||
| Class A | ||||||||||||||||
| October 31, 2016 | 11.26 | .20 | .19 | .39 | (.17 | ) | — | |||||||||
| October 31, 2015 | 11.75 | .32 | (.53 | ) | (.21 | ) | (.26 | ) | (.02 | ) | ||||||
| October 31, 2014 | 11.24 | .26 | .49 | .75 | (.24 | ) | — | |||||||||
| October 31, 2013 | 9.50 | .12 | 1.75 | 1.87 | (.13 | ) | — | |||||||||
| October 31, 2012 | 8.93 | .15 | .54 | .69 | (.12 | ) | — | |||||||||
| Class C | ||||||||||||||||
| October 31, 2016 | 10.17 | .07 | .20 | .27 | (.10 | ) | — | |||||||||
| October 31, 2015 | 10.64 | .17 | (.43 | ) | (.26 | ) | (.20 | ) | (.01 | ) | ||||||
| October 31, 2014 | 10.23 | .14 | .46 | .60 | (.19 | ) | — | |||||||||
| October 31, 2013 | 8.69 | .04 | 1.59 | 1.63 | (.09 | ) | — | |||||||||
| October 31, 2012 | 8.21 | .07 | .51 | .58 | (.10 | ) | — | |||||||||
| Class E | ||||||||||||||||
| October 31, 2016 | 11.01 | .21 | .17 | .38 | (.17 | ) | — | |||||||||
| October 31, 2015 | 11.49 | .34 | (.54 | ) | (.20 | ) | (.26 | ) | (.02 | ) | ||||||
| October 31, 2014 | 10.99 | .26 | .48 | .74 | (.24 | ) | — | |||||||||
| October 31, 2013 | 9.30 | .13 | 1.69 | 1.82 | (.13 | ) | — | |||||||||
| October 31, 2012 | 8.75 | .14 | .53 | .67 | (.12 | ) | — | |||||||||
| Class R1 | ||||||||||||||||
| October 31, 2016 | 11.32 | .25 | .18 | .43 | (.21 | ) | — | |||||||||
| October 31, 2015 | 11.81 | .44 | (.60 | ) | (.16 | ) | (.31 | ) | (.02 | ) | ||||||
| October 31, 2014 | 11.29 | .34 | .46 | .80 | (.28 | ) | — | |||||||||
| October 31, 2013 | 9.53 | .15 | 1.77 | 1.92 | (.16 | ) | — | |||||||||
| October 31, 2012 | 8.95 | .18 | .55 | .73 | (.15 | ) | — | |||||||||
| Class R4(1) | ||||||||||||||||
| October 31, 2016 | 11.05 | .20 | .19 | .39 | (.18 | ) | — | |||||||||
| October 31, 2015 | 11.53 | .34 | (.52 | ) | (.18 | ) | (.28 | ) | (.02 | ) | ||||||
| October 31, 2014 | 11.03 | .30 | .45 | .75 | (.25 | ) | — | |||||||||
| October 31, 2013 | 9.32 | .14 | 1.71 | 1.85 | (.14 | ) | — | |||||||||
| October 31, 2012 | 8.77 | .16 | .52 | .68 | (.13 | ) | — | |||||||||
| Class R5(2) | ||||||||||||||||
| October 31, 2016 | 10.92 | .17 | .19 | .36 | (.15 | ) | — | |||||||||
| October 31, 2015 | 11.40 | .32 | (.53 | ) | (.21 | ) | (.25 | ) | (.02 | ) | ||||||
| October 31, 2014 | 10.91 | .26 | .45 | .71 | (.22 | ) | — | |||||||||
| October 31, 2013 | 9.23 | .11 | 1.69 | 1.80 | (.12 | ) | — | |||||||||
| October 31, 2012 | 8.68 | .16 | .51 | .67 | (.12 | ) | — | |||||||||
| Class S | ||||||||||||||||
| October 31, 2016 | 11.30 | .23 | .19 | .42 | (.20 | ) | — | |||||||||
| October 31, 2015 | 11.79 | .33 | (.51 | ) | (.18 | ) | (.29 | ) | (.02 | ) | ||||||
| October 31, 2014 | 11.27 | .30 | .48 | .78 | (.26 | ) | — | |||||||||
| October 31, 2013 | 9.52 | .15 | 1.75 | 1.90 | (.15 | ) | — | |||||||||
| October 31, 2012 | 8.95 | .17 | .54 | .71 | (.14 | ) | — | |||||||||
See accompanying notes which are an integral part of the financial statements.
122 Equity Growth Strategy Fund
| % | % | % | |||||||||||||||
| $ | $ | Ratio of Expenses | Ratio of Expenses | Ratio of Net | |||||||||||||
| Net Asset Value, | % | Net Assets, | to Average | to Average | Investment Income | % | |||||||||||
| $ | End of | Total | End of Period | Net Assets, | Net Assets, | to Average | Portfolio | ||||||||||
| Total Distributions | Period | Return(d) | (000 | ) | Gross(g) | Net(e)(g) | Net Assets(b)(e) | Turnover Rate | |||||||||
| (.17 | ) | 11.48 | 3.56 | 182,586 | .74 | .57 | 1.82 | 16 | |||||||||
| (.28 | ) | 11.26 | (1.80 | ) | 206,436 | .73 | .56 | 2.72 | 47 | ||||||||
| (.24 | ) | 11.75 | 6.70 | 233,233 | .72 | .56 | 2.28 | 23 | |||||||||
| (.13 | ) | 11.24 | 19.86 | 241,814 | .71 | .57 | 1.17 | 14 | |||||||||
| (.12 | ) | 9.50 | 7.90 | 218,585 | .71 | .56 | 1.61 | 24 | |||||||||
| (.10 | ) | 10.34 | 2.72 | 242,007 | 1.49 | 1.32 | .73 | 16 | |||||||||
| (.21 | ) | 10.17 | (2.51 | ) | 280,881 | 1.48 | 1.31 | 1.60 | 47 | ||||||||
| (.19 | ) | 10.64 | 5.87 | 327,125 | 1.47 | 1.31 | 1.37 | 23 | |||||||||
| (.09 | ) | 10.23 | 18.95 | 331,940 | 1.46 | 1.32 | .42 | 14 | |||||||||
| (.10 | ) | 8.69 | 7.12 | 311,910 | 1.46 | 1.31 | .86 | 24 | |||||||||
| (.17 | ) | 11.22 | 3.52 | 5,873 | .74 | .57 | 1.91 | 16 | |||||||||
| (.28 | ) | 11.01 | (1.78 | ) | 10,665 | .73 | .56 | 3.01 | 47 | ||||||||
| (.24 | ) | 11.49 | 6.76 | 23,055 | .72 | .56 | 2.35 | 23 | |||||||||
| (.13 | ) | 10.99 | 19.74 | 29,977 | .72 | .57 | 1.29 | 14 | |||||||||
| (.12 | ) | 9.30 | 7.84 | 42,548 | .71 | .56 | 1.60 | 24 | |||||||||
| (.21 | ) | 11.54 | 3.88 | 24,918 | .49 | .24 | 2.26 | 16 | |||||||||
| (.33 | ) | 11.32 | (1.45 | ) | 34,770 | .48 | .21 | 3.81 | 47 | ||||||||
| (.28 | ) | 11.81 | 7.17 | 66,147 | .47 | .17 | 2.97 | 23 | |||||||||
| (.16 | ) | 11.29 | 20.37 | 87,682 | .46 | .17 | 1.40 | 14 | |||||||||
| (.15 | ) | 9.53 | 8.29 | 64,614 | .46 | .14 | 1.95 | 24 | |||||||||
| (.18 | ) | 11.26 | 3.63 | 31,006 | .74 | .49 | 1.87 | 16 | |||||||||
| (.30 | ) | 11.05 | (1.66 | ) | 38,243 | .73 | .46 | 3.02 | 47 | ||||||||
| (.25 | ) | 11.53 | 6.87 | 57,343 | .72 | .42 | 2.61 | 23 | |||||||||
| (.14 | ) | 11.03 | 20.07 | 92,890 | .71 | .42 | 1.34 | 14 | |||||||||
| (.13 | ) | 9.32 | 7.94 | 88,307 | .71 | .39 | 1.83 | 24 | |||||||||
| (.15 | ) | 11.13 | 3.40 | 22,283 | .99 | .74 | 1.60 | 16 | |||||||||
| (.27 | ) | 10.92 | (1.94 | ) | 30,620 | .98 | .71 | 2.87 | 47 | ||||||||
| (.22 | ) | 11.40 | 6.61 | 53,253 | .97 | .67 | 2.34 | 23 | |||||||||
| (.12 | ) | 10.91 | 19.71 | 70,233 | .97 | .67 | 1.14 | 14 | |||||||||
| (.12 | ) | 9.23 | 7.81 | 78,384 | .96 | .64 | 1.78 | 24 | |||||||||
| (.20 | ) | 11.52 | 3.81 | 160,083 | .49 | .32 | 2.08 | 16 | |||||||||
| (.31 | ) | 11.30 | (1.54 | ) | 177,374 | .48 | .31 | 2.84 | 47 | ||||||||
| (.26 | ) | 11.79 | 7.04 | 179,424 | .47 | .31 | 2.56 | 23 | |||||||||
| (.15 | ) | 11.27 | 20.15 | 190,902 | .46 | .32 | 1.46 | 14 | |||||||||
| (.14 | ) | 9.52 | 8.06 | 192,200 | .47 | .31 | 1.82 | 24 | |||||||||
See accompanying notes which are an integral part of the financial statements.
Equity Growth Strategy Fund 123
Russell Investment Company
Equity Growth Strategy Fund
Related Party Transactions, Fees and Expenses
| Accrued fees payable to affiliates for the period ended October 31, 2016 were as follows: | ||
| Administration fees | $ | 24,358 |
| Distribution fees | 199,915 | |
| Shareholder servicing fees | 64,685 | |
| Transfer agent fees | 109,261 | |
| Trustee fees | 2,434 | |
| $ | 400,653 | |
| Transactions (amounts in thousands) during the period ended October 31, 2016 with Underlying Funds which are, or were, an | ||||||||||||||||||||
| affiliated company are as follows: | ||||||||||||||||||||
| Fair Value, | Change in | |||||||||||||||||||
| Beginning of | Realized Gain | Unrealized | Fair Value, End | Income | Capital Gains | |||||||||||||||
| Period | Purchases | Sales | (Loss) | Gain (Loss) | of Period | Distributions | Distributions | |||||||||||||
| Russell Commodity Strategies Fund | $ | 22,224 | $ | 2,935 | $ | 4,896 | $ | (874) | $ | 205 | $ | 19,594 | $ | — | $ | — | ||||
| Russell Global Infrastructure Fund | 38,384 | 4,041 | 22,656 | 2,049 | (2,105 | ) | 19,713 | 887 | 982 | |||||||||||
| Russell Global Real Estate Securities | ||||||||||||||||||||
| Fund | 23,316 | 2,553 | 12,031 | 1,814 | (3,299 | ) | 12,353 | 629 | 1,067 | |||||||||||
| Russell U.S. Defensive Equity Fund | 70,935 | 3,660 | 26,706 | 3,611 | (1,669 | ) | 49,831 | 917 | — | |||||||||||
| Russell U.S. Dynamic Equity Fund | 71,117 | 13,172 | 16,471 | 246 | (8,375 | ) | 59,689 | 3,202 | 6,407 | |||||||||||
| Russell U.S. Small Cap Equity Fund | 84,328 | 10,092 | 20,215 | 286 | (3,070 | ) | 71,421 | 742 | 5,367 | |||||||||||
| Select U.S. Equity Fund | 78,843 | 5,202 | 18,463 | (51 | ) | 920 | 66,451 | 1,955 | 103 | |||||||||||
| Russell Global Opportunistic Credit | ||||||||||||||||||||
| Fund | 69,276 | 12,314 | 18,449 | (899 | ) | 4,342 | 66,584 | 2,264 | — | |||||||||||
| Unconstrained Total Return Fund | — | 10,110 | 109 | — | 31 | 10,032 | 1 | — | ||||||||||||
| Russell Emerging Markets Fund | 83,306 | 12,116 | 23,389 | 2,637 | 4,960 | 79,630 | 297 | — | ||||||||||||
| Russell Global Equity Fund | 117,891 | 23,143 | 24,057 | 2,820 | (13,043) | 106,754 | 2,150 | 9,284 | ||||||||||||
| Select International Equity Fund | 100,646 | 7,316 | 15,274 | (932 | ) | (4,952 | ) | 86,804 | 2,731 | — | ||||||||||
| Russell U.S. Cash Management Fund | 13,143 | 90,923 | 93,570 | — | 2 | 10,498 | 43 | — | ||||||||||||
| $ | 773,409 | $ | 197,577 | $ | 296,286 | $ | 10,707 | $ | (26,053) | $ | 659,354 | $ | 15,818 | $ | 23,210 | |||||
Federal Income Taxes
At October 31, 2016, the cost of investments and net unrealized appreciation (depreciation), undistributed ordinary income and
undistributed long-term capital gains for income tax purposes were as follows:
| Cost of Investments | $ | 653,594,203 | ||
| Unrealized Appreciation | $ | 32,071,238 | ||
| Unrealized Depreciation | (25,628,884 | ) | ||
| Net Unrealized Appreciation (Depreciation) | $ | 6,442,354 | ||
| Undistributed Ordinary Income | $ | 5,146,320 | ||
| Undistributed Long-Term Capital Gains | ||||
| (Capital Loss Carryforward) | $ | (91,132,775 | ) | |
| Tax Composition of Distributions | ||||
| Ordinary Income | $ | 10,174,592 |
Net investment income and net realized gains (losses) in the financial statements may differ from taxable net investment income and
net realized gains (losses). Capital accounts within the financial statements are adjusted for permanent differences between book and
tax accounting. These differences may be due to foreign currency gains or losses, reclassifications of dividends and /or differences in
treatment of income from swaps. These adjustments have no impact on the net assets.
At October 31, 2016, the Statement of Assets and Liabilities have been adjusted by the following amounts (in thousands):
See accompanying notes which are an integral part of the financial statements.
124 Equity Growth Strategy Fund
Russell Investment Company
Equity Growth Strategy Fund
Federal Income Taxes, continued
| Undistributed net investment income | $ | (66 | ) |
| Accumulated net realized gain (loss) | 66 | ||
| Additional paid-in capital | — |
See accompanying notes which are an integral part of the financial statements.
Equity Growth Strategy Fund 125
Russell Investment Company
2020 Strategy Fund
Portfolio Management Discussion and Analysis — October 31, 2016 (Unaudited)

| 2020 Strategy Fund - Class A‡ | 2020 Strategy Fund - Class R5‡‡‡ | ||||||
| Total | Total | ||||||
| Return | Return | ||||||
| 1 Year | (1.99 | )% | 1 Year | 3.74 | % | ||
| 5 Years | 4.30 | %§ | 5 Years | 5.29 | %§ | ||
| 10 Years | 3.31 | %§ | 10 Years | 3.67 | %§ | ||
| 2020 Strategy Fund - Class E | 2020 Strategy Fund - Class S | ||||||
| Total | Total | ||||||
| Return | Return | ||||||
| 1 Year | 4.00 | % | 1 Year | 4.28 | % | ||
| 5 Years | 5.53 | %§ | 5 Years | 5.79 | %§ | ||
| 10 Years | 3.94 | %§ | 10 Years | 4.20 | %§ | ||
| 2020 Strategy Fund - Class R1 | Bloomberg Barclays U.S. Aggregate Bond Index**C | ||||||
| Total | Total | ||||||
| Return | Return | ||||||
| 1 Year | 4.28 | % | 1 Year | 4.37 | % | ||
| 5 Years | 5.79 | %§ | 5 Years | 2.90 | %§ | ||
| 10 Years | 4.19 | %§ | 10 Years | 4.64 | %§ | ||
| 2020 Strategy Fund - Class R4‡‡ | |||||||
| Total | |||||||
| Return | |||||||
| 1 Year | 4.02 | % | |||||
| 5 Years | 5.55 | %§ | |||||
| 10 Years | 3.93 | %§ | |||||
126 2020 Strategy Fund
Russell Investment Company
2020 Strategy Fund
Portfolio Management Discussion and Analysis, continued — October 31, 2016
(Unaudited)
| The 2020 Strategy Fund (the “Fund”) is a fund of funds that | the fixed income Underlying Funds, exposure to high yield debt |
| invests in other Russell Investment Company mutual funds (the | was beneficial as it was one of the best performing asset classes |
| “Underlying Funds”). The Underlying Funds employ a multi- | globally. Falling interest rates also helped other fixed income |
| manager approach whereby portions of the Underlying Funds are | assets in the Underlying Funds rally, as well as more rate sensitive |
| allocated to different money managers. Underlying Fund assets not | real assets like global real estate investment trusts and global |
| allocated to money managers are managed by Russell Investment | infrastructure. With interest rates falling, income opportunities |
| Management, LLC (“RIM”), the Fund’s and Underlying Funds’ | around the globe continued to shrink and income available from |
| advisor. RIM, as the Underlying Funds’ advisor, may change | most assets fell. |
| the allocation of the Underlying Funds’ assets among money | The U.S. equity market, as measured by the S&P 500® Index, |
| managers at any time. An exemptive order from the Securities | was up 4.51% over the period but also experienced multiple |
| and Exchange Commission (“SEC”) permits RIM to engage or | draw downs. The Fund’s strategic exposure to global equities |
| terminate a money manager in an Underlying Fund at any time, | proved beneficial over the period as emerging markets rallied |
| subject to approval by the Underlying Fund’s Board, without a | and outperformed U.S. equities. By contrast, non-U.S. developed |
| shareholder vote. Pursuant to the terms of the exemptive order, an | equity was one of the lowest performing portions of the Fund’s |
| Underlying Fund is required to notify its shareholders within 90 | exposure as falling commodities and currencies weighed on |
| days of when a money manager begins providing services. | returns. |
| What is the Fund’s investment objective? | How did the investment strategies and techniques employed |
| The Fund seeks to provide capital growth and income consistent | by the Fund and the Underlying Funds affect the Fund’s |
| with its current asset allocation which will change over time, with | performance? |
| an increasing allocation to fixed income funds. | The Fund is a fund of funds and its performance is based on RIM’s |
| The Fund pursues this objective by investing in a diversified | strategic asset allocations, the performance of the Underlying |
| portfolio that, as of October 31, 2016, consisted of approximately | Funds in which the Fund invests, and tactical changes in the |
| 35.0% equity Underlying Funds, 58.2% fixed income Underlying | Fund’s asset allocation throughout the year. |
| Funds and 6.8% alternative Underlying Funds. The Fund’s | In order to seek to achieve the Fund’s objective during the period, |
| allocation to fixed income Underlying Funds will be fixed at | RIM’s strategic asset allocation included investments in global |
| 66.3% in approximately the year 2020. | equity, alternative and fixed income Underlying Funds. The |
| How did the Fund perform relative to its benchmark for the | Fund’s diverse asset allocation partially hindered performance |
| fiscal year ended October 31, 2016? | during the period as certain of these exposures underperformed |
| For the fiscal year ended October 31, 2016, the Fund’s Class A, | the Bloomberg Barclays U.S. Aggregate Bond Index. While |
| Class E, Class R1, Class R4, Class R5 and Class S gained 4.00%, | areas like high yield bonds, as measured by the BofA Merrill |
| 4.00%, 4.28%, 4.02%, 3.74% and 4.28%, respectively. This | Lynch Global High Yield Index Hedged USD, outperformed the |
| is compared to the Fund’s primary benchmark, the Bloomberg | Bloomberg Barclays U.S. Aggregate Bond, areas like commodities |
| Barclays U.S. Aggregate Bond Index, which gained 4.37% during | and non-U.S. developed equities delivered negative returns as |
| the same period. The Fund’s performance includes operating | measured by the Bloomberg Commodity Index Total Return and |
| expenses, whereas index returns are unmanaged and do not | Russell Developed ex-U.S. Large Cap® Index Net, respectively. |
| include expenses of any kind. | The underperformance of certain of the Fund’s exposures relative |
| For the fiscal year ended October 31, 2016, the Morningstar® | to the Bloomberg Barclays U.S. Aggregate Bond Index was |
| Target-Date 2020 Category gained 3.30%. This result serves as | partially offset by strong excess returns within the fixed income |
| a peer comparison and is expressed net of operating expenses. | portion of the Fund’s portfolio. Underlying Fund bond issue |
| selection during the period was generally additive to returns | |
| How did the market conditions described in the Market | as fixed income money managers were able to pick well within |
| Summary report affect the Fund’s performance? | credit, avoiding defaults in places like the energy sector where |
| The Fund seeks to achieve its objective by investing in Underlying | trouble occurred with falling energy prices in early 2016. As |
| Funds that provide exposure to a range of diversified investments, | such, allocations to the Russell Strategic Bond Fund and Russell |
| and most major asset classes invested in by the Underlying | Investment Grade Bond Fund were positive from a benchmark- |
| Funds produced positive absolute returns during the period. | relative perspective. Both Funds were positively impacted by |
| Markets during the fiscal year were characterized by higher | their overweight to credit and additive currency positioning also |
| levels of volatility and dispersion across return sources. Within | helped to drive excess return. |
2020 Strategy Fund 127
Russell Investment Company
2020 Strategy Fund
Portfolio Management Discussion and Analysis, continued — October 31, 2016
(Unaudited)
| By contrast, equity selection and positioning was more difficult, | equity markets declined substantially, and RIM added further risk | |
| with allocations to non-U.S. equity Underlying Funds detracting | to the portfolio by overweighting Underlying Funds that invest | |
| from the Fund’s performance and security selection within | in high yield credit and emerging markets equity compared with | |
| those Underlying Funds struggling. In addition, overweights | core bond holdings and cash. Markets subsequently rebounded | |
| to European securities in the Select International Equity Fund | from the February lows and RIM reduced risk exposure to a more | |
| caused the Underlying Fund to struggle as European equities | defensive stance with the Fund’s equity allocation below strategic | |
| continued to lag the U.S. equity market. | weights. RIM’s modifications to the Fund’s asset allocation were | |
| additive during the period. | ||
| Describe any changes to the Fund’s structure or allocation | ||
| to the Underlying Funds. | The views expressed in this report reflect those of the | |
| RIM has the discretion to vary the Fund’s actual allocation from | portfolio managers only through the end of the period | |
| the target strategic asset allocation by up to +/- 5% at the equity, | covered by the report. These views do not necessarily | |
| fixed income or alternative category level based on RIM’s capital | represent the views of RIM, or any other person in RIM or | |
| markets research. RIM’s asset allocation modifications benefited | any other affiliated organization. These views are subject | |
| the Fund’s performance relative to the Fund’s target strategic | to change at any time based upon market conditions or | |
| asset allocation. | other events, and RIM disclaims any responsibility to | |
| RIM adapted the Fund’s asset allocation over the period as market | update the views contained herein. These views should not | |
| opportunities and risks evolved. The Fund was defensively | be relied on as investment advice and, because investment | |
| positioned in the fourth quarter of 2015, favoring fixed income | decisions for a Russell Investment Company (“RIC”) Fund | |
| over equity Underlying Funds. During the first quarter of 2016, | are based on numerous factors, should not be relied on as | |
| an indication of investment decisions of any RIC Fund. | ||
^ In prior years, the performance of the Fund’s Class E shares was used in the line graph. Class S Shares will have substantially similar annual returns as the Class
E Shares because the Shares of each Class are invested in the same portfolio of securities. Annual returns for each Class will differ only to the extent that the
Class S Shares do not have the same expenses as the Class E Shares.
* Assumes initial investment on November 1, 2006.
** The Bloomberg Barclays U.S. Aggregate Bond Index is an index, with income reinvested, generally representative of intermediate-term government bonds,
investment grade corporate debt securities and mortgage-backed securities.
Effective August 24, 2016, the Barclays fixed income benchmark indices, including the Barclays Aggregate family of indices, were renamed the Bloomberg
Barclays family of indices.
‡ The performance shown has been adjusted to reflect the deduction of the maximum Class A sales charge of 5.75%.
‡‡ The Fund first issued Class R4 Shares on October 1, 2014. The returns shown for Class R4 Shares prior to that date are the returns of the Fund's Class R2
Shares.
‡‡‡ The Fund first issued Class R5 Shares on October 1, 2014. The returns shown for Class R5 Shares prior to that date are the returns of the Fund’s Class R3
Shares.
§ Annualized.
Performance is historical and assumes reinvestment of all dividends and capital gains. Investment return and principal value will fluctuate so that an investor’s
shares, when redeemed, may be worth more or less than when purchased. Past performance is not indicative of future results. The returns shown do not reflect the
deduction of taxes that a shareholder would pay on Fund distributions or the redemption of Fund shares. Additionally, the returns presented herein may differ from
the performance reported in the Financial Highlights as the returns herein are calculated in a manner consistent with standardized performance in accordance with
Securities and Exchange Commission rules, while the performance in the Financial Highlights has been calculated in accordance with U.S. Generally Accepted
Accounting Principles (“U.S. GAAP”).
128 2020 Strategy Fund
Russell Investment Company
2020 Strategy Fund
Shareholder Expense Example — October 31, 2016 (Unaudited)
| Fund Expenses | Hypothetical | |||||
| The following disclosure provides important information | Performance (5% | |||||
| Actual | return before | |||||
| regarding the Fund’s Shareholder Expense Example | Class A | Performance | expenses) | |||
| (“Example”). | Beginning Account Value | |||||
| May 1, 2016 | $ | 1,000.00 | $ | 1,000.00 | ||
| Example | Ending Account Value | |||||
| As a shareholder of the Fund, you incur two types of costs: (1) | October 31, 2016 | $ | 1,025.90 | $ | 1,023.88 | |
| transaction costs, including sales charges (loads) on certain | Expenses Paid During Period* | $ | 1.27 | $ | 1.27 | |
| purchase or redemption payments, and (2) ongoing costs, | * Expenses are equal to the Fund's annualized expense ratio of 0.25% | |||||
| including advisory and administrative fees; distribution and/or | (representing the six month period annualized), multiplied by the average | |||||
| service fees; and other Fund expenses. The Example is intended | account value over the period, multiplied by 184/366 (to reflect the one-half | |||||
| year period). | ||||||
| to help you understand your ongoing costs (in dollars) of investing | ||||||
| in the Fund and to compare these costs with the ongoing costs of | Hypothetical | |||||
| investing in other mutual funds. The Example is based on an | Performance (5% | |||||
| Actual | return before | |||||
| investment of $1,000 invested at the beginning of the period and | Class E | Performance | expenses) | |||
| held for the entire period indicated, which for this Fund is from | Beginning Account Value | |||||
| May 1, 2016 to October 31, 2016. | May 1, 2016 | $ | 1,000.00 | $ | 1,000.00 | |
| Ending Account Value | ||||||
| Actual Expenses | October 31, 2016 | $ | 1,025.80 | $ | 1,023.88 | |
| The information in the table under the heading “Actual | Expenses Paid During Period* | $ | 1.27 | $ | 1.27 | |
| Performance” provides information about actual account values | * Expenses are equal to the Fund's annualized expense ratio of 0.25% | |||||
| and actual expenses. You may use the information in this column, | (representing the six month period annualized), multiplied by the average | |||||
| together with the amount you invested, to estimate the expenses | account value over the period, multiplied by 184/366 (to reflect the one-half | |||||
| that you paid over the period. Simply divide your account value by | year period). | |||||
| $1,000 (for example, an $8,600 account value divided by $1,000 | Hypothetical | |||||
| = 8.6), then multiply the result by the number in the first column | Performance (5% | |||||
| in the row entitled “Expenses Paid During Period” to estimate | Actual | return before | ||||
| the expenses you paid on your account during this period. | Class R1 | Performance | expenses) | |||
| Beginning Account Value | ||||||
| Hypothetical Example for Comparison Purposes | May 1, 2016 | $ | 1,000.00 | $ | 1,000.00 | |
| Ending Account Value | ||||||
| The information in the table under the heading “Hypothetical | October 31, 2016 | $ | 1,027.20 | $ | 1,025.14 | |
| Performance (5% return before expenses)” provides information | Expenses Paid During Period* | $ | — | $ | — | |
| about hypothetical account values and hypothetical expenses | ||||||
| based on the Fund’s actual expense ratio and an assumed rate of | * There were no expenses charged to the Class. | |||||
| return of 5% per year before expenses, which is not the Fund’s | Hypothetical | |||||
| actual return. The hypothetical account values and expenses | Performance (5% | |||||
| may not be used to estimate the actual ending account balance or | Actual | return before | ||||
| Class R4 | Performance | expenses) | ||||
| expenses you paid for the period. You may use this information | Beginning Account Value | |||||
| to compare the ongoing costs of investing in the Fund and other | May 1, 2016 | $ | 1,000.00 | $ | 1,000.00 | |
| funds. To do so, compare this 5% hypothetical example with the | Ending Account Value | |||||
| 5% hypothetical examples that appear in the shareholder reports | October 31, 2016 | $ | 1,025.90 | $ | 1,023.88 | |
| of other funds. | Expenses Paid During Period* | $ | 1.27 | $ | 1.27 | |
| Please note that the expenses shown in the table are meant | * Expenses are equal to the Fund's annualized expense ratio of 0.25% | |||||
| to highlight your ongoing costs only and do not reflect any | (representing the six month period annualized), multiplied by the average | |||||
| account value over the period, multiplied by 184/366 (to reflect the one-half | ||||||
| transactional costs. Therefore, the information under the heading | year period). | |||||
| “Hypothetical Performance (5% return before expenses)” is | ||||||
| useful in comparing ongoing costs only, and will not help you | ||||||
| determine the relative total costs of owning different funds. In | ||||||
| addition, if these transactional costs were included, your costs | ||||||
| would have been higher. | ||||||
2020 Strategy Fund 129
Russell Investment Company
2020 Strategy Fund
Shareholder Expense Example, continued — October 31, 2016 (Unaudited)
| Hypothetical | ||||
| Performance (5% | ||||
| Actual | return before | |||
| Class R5 | Performance | expenses) | ||
| Beginning Account Value | ||||
| May 1, 2016 | $ | 1,000.00 | $ | 1,000.00 |
| Ending Account Value | ||||
| October 31, 2016 | $ | 1,024.50 | $ | 1,022.62 |
| Expenses Paid During Period* | $ | 2.54 | $ | 2.54 |
* Expenses are equal to the Fund's annualized expense ratio of 0.50%
(representing the six month period annualized), multiplied by the average
account value over the period, multiplied by 184/366 (to reflect the one-half
year period).
| Hypothetical | |||||
| Performance (5% | |||||
| Actual | return before | ||||
| Class S | Performance | expenses) | |||
| Beginning Account Value | |||||
| May 1, 2016 | $ | 1,000.00 | $ | 1,000.00 | |
| Ending Account Value | |||||
| October 31, 2016 | $ | 1,027.20 | $ | 1,025.14 | |
| Expenses Paid During Period* | $ | — | $ | — | |
| * There were no expenses charged to the Class. | |||||
130 2020 Strategy Fund
Russell Investment Company
2020 Strategy Fund
Schedule of Investments — October 31, 2016
Amounts in thousands (except share amounts)
| Fair | |||
| Value | |||
| Shares | $ | ||
| Investments in Russell Affiliated Mutual Funds - 100.0% | |||
| Alternative - 5.8% | |||
| Russell Commodity Strategies Fund Class Y | 239,241 | 1,318 | |
| Russell Global Infrastructure Fund Class Y | 103,503 | 1,183 | |
| Russell Global Real Estate Securities Fund Class Y | 24,906 | 890 | |
| 3,391 | |||
| Domestic Equities - 19.0% | |||
| Russell U.S. Defensive Equity Fund Class Y | 30,336 | 1,493 | |
| Russell U.S. Dynamic Equity Fund Class Y | 95,851 | 952 | |
| Russell U.S. Small Cap Equity Fund Class Y | 54,701 | 1,510 | |
| Select U.S. Equity Fund Class Y | 656,823 | 7,173 | |
| 11,128 | |||
| Fixed Income - 58.3% | |||
| Russell Global Opportunistic Credit Fund Class Y | 194,571 | 1,891 | |
| Russell Investment Grade Bond Fund Class Y | 305,618 | 6,825 | |
| Russell Short Duration Bond Fund Class Y | 306,945 | 5,918 | |
| Russell Strategic Bond Fund Class Y | 1,760,845 | 19,475 | |
| 34,109 | |||
| International Equities - 16.9% | |||
| Russell Emerging Markets Fund Class Y | 79,021 | 1,317 | |
| Russell Global Equity Fund Class Y | 313,374 | 3,269 | |
| Select International Equity Fund Class Y | 620,645 | 5,331 | |
| 9,917 | |||
| Total Investments in Russell Affiliated Mutual Funds | |||
| (cost $50,811) | 58,545 | ||
| Total Investments 100.0% | |||
| (identified cost $50,811) | 58,545 | ||
| Other Assets and Liabilities, Net - 0.0% | 19 | ||
| Net Assets - 100.0% | 58,564 | ||
| Presentation of Portfolio Holdings | ||||||||||||||
| Amounts in thousands | ||||||||||||||
| Fair Value | ||||||||||||||
| Practical | ||||||||||||||
| Portfolio Summary | Level 1 | Level 2 | Level 3 | Expedient | Total | % of Net Assets | ||||||||
| Investments in Russell Affiliated Mutual | ||||||||||||||
| Funds | $ | 58,545 | $ | — | $ | — | $ | — | $ | 58,545 | 100.0 | |||
| Total Investments | 58,545 | — | — | — | 58,545 | 100.0 | ||||||||
| Other Assets and Liabilities, Net | —* | |||||||||||||
| 100.0 | ||||||||||||||
| * Less than 0.05% of net assets. | ||||||||||||||
For a description of the Levels, see note 2 in the Notes to Financial Statements.
For a disclosure on transfers between Levels 1, 2 and 3 during the period ended October 31, 2016, see note 2 in the Notes to
Financial Statements.
See accompanying notes which are an integral part of the financial statements.
2020 Strategy Fund 131
Russell Investment Company
2020 Strategy Fund
Statement of Assets and Liabilities — October 31, 2016
| Amounts in thousands | ||
| Assets | ||
| Investments, at identified cost | $ | 50,811 |
| Investments, at fair value(>) | 58,545 | |
| Receivables: | ||
| Investments sold | 104 | |
| Fund shares sold | 42 | |
| Total assets | 58,691 | |
| Liabilities | ||
| Payables: | ||
| Fund shares redeemed | 120 | |
| Accrued fees to affiliates | 7 | |
| Total liabilities | 127 | |
| Net Assets | $ | 58,564 |
| Net Assets Consist of: | ||
| Accumulated net realized gain (loss) | $ | 1,470 |
| Unrealized appreciation (depreciation) on investments | 7,734 | |
| Shares of beneficial interest | 75 | |
| Additional paid-in capital | 49,285 | |
| Net Assets | $ | 58,564 |
| Net Asset Value, offering and redemption price per share: | ||
| Net asset value per share: Class A(#) | $ | 7.80 |
| Maximum offering price per share (Net asset value plus sales charge of 5.75%): Class A | $ | 8.28 |
| Class A — Net assets | $ | 200,207 |
| Class A — Shares outstanding ($.01 par value) | 25,672 | |
| Net asset value per share: Class E(#) | $ | 7.81 |
| Class E — Net assets | $ | 1,874,953 |
| Class E — Shares outstanding ($.01 par value) | 240,114 | |
| Net asset value per share: Class R1(#) | $ | 7.79 |
| Class R1 — Net assets | $ | 30,034,105 |
| Class R1 — Shares outstanding ($.01 par value) | 3,855,850 | |
| Net asset value per share: Class R4(#) | $ | 7.79 |
| Class R4 — Net assets | $ | 9,818,648 |
| Class R4 — Shares outstanding ($.01 par value) | 1,260,822 | |
| Net asset value per share: Class R5(#) | $ | 7.78 |
| Class R5 — Net assets | $ | 11,544,241 |
| Class R5 — Shares outstanding ($.01 par value) | 1,484,337 | |
| Net asset value per share: Class S(#) | $ | 7.79 |
| Class S — Net assets | $ | 5,091,809 |
| Class S — Shares outstanding ($.01 par value) | 653,644 | |
| Amounts in thousands | ||
| (>) Investments in affiliated Russell funds | $ | 58,545 |
| (#) Net asset value per share equals class level net assets divided by class level shares of beneficial interest outstanding. | ||
See accompanying notes which are an integral part of the financial statements.
132 2020 Strategy Fund
Russell Investment Company
2020 Strategy Fund
Statement of Operations — For the Period Ended October 31, 2016
| Amounts in thousands | |||
| Investment Income | |||
| Income distributions from affiliated Russell funds | $ | 1,865 | |
| Expenses | |||
| Distribution fees - Class A | 1 | ||
| Distribution fees - Class R5 | 33 | ||
| Shareholder servicing fees - Class E | 5 | ||
| Shareholder servicing fees - Class R4 | 24 | ||
| Shareholder servicing fees - Class R5 | 33 | ||
| Total expenses | 96 | ||
| Net investment income (loss) | 1,769 | ||
| Net Realized and Unrealized Gain (Loss) | |||
| Net realized gain (loss) on: | |||
| Investments | 1,302 | ||
| Capital gain distributions from Underlying Funds | 775 | ||
| Net realized gain (loss) | 2,077 | ||
| Net change in unrealized appreciation (depreciation) on investments | (1,468 | ) | |
| Net realized and unrealized gain (loss) | 609 | ||
| Net Increase (Decrease) in Net Assets from Operations | $ | 2,378 | |
See accompanying notes which are an integral part of the financial statements.
2020 Strategy Fund 133
Russell Investment Company
2020 Strategy Fund
Statements of Changes in Net Assets
| For the Periods Ended October 31, | ||||||
| Amounts in thousands | 2016 | 2015 | ||||
| Increase (Decrease) in Net Assets | ||||||
| Operations | ||||||
| Net investment income (loss) | $ | 1,769 | $ | 2,315 | ||
| Net realized gain (loss) | 2,077 | 6,344 | ||||
| Net change in unrealized appreciation (depreciation) | (1,468 | ) | (7,746 | ) | ||
| Net increase (decrease) in net assets from operations | 2,378 | 913 | ||||
| Distributions | ||||||
| From net investment income | ||||||
| Class A | (5 | ) | (10 | ) | ||
| Class E | (50 | ) | (47 | ) | ||
| Class R1 | (995 | ) | (1,192 | ) | ||
| Class R4 | (244 | ) | (280 | ) | ||
| Class R5 | (331 | ) | (561 | ) | ||
| Class S | (156 | ) | (226 | ) | ||
| From net realized gain | ||||||
| Class A | (19 | ) | (152 | ) | ||
| Class E | (179 | ) | (577 | ) | ||
| Class R1 | (3,345 | ) | (12,846 | ) | ||
| Class R4 | (841 | ) | (3,500 | ) | ||
| Class R5 | (1,340 | ) | (8,665 | ) | ||
| Class S | (517 | ) | (2,714 | ) | ||
| Net decrease in net assets from distributions | (8,022 | ) | (30,770 | ) | ||
| Share Transactions* | ||||||
| Net increase (decrease) in net assets from share transactions | (8,279 | ) | (12,169 | ) | ||
| Total Net Increase (Decrease) in Net Assets | (13,923 | ) | (42,026 | ) | ||
| Net Assets | ||||||
| Beginning of period | 72,487 | 114,513 | ||||
| End of period | $ | 58,564 | $ | 72,487 | ||
| Undistributed (overdistributed) net investment income included in net assets | $ | — | $ | 1 | ||
See accompanying notes which are an integral part of the financial statements.
134 2020 Strategy Fund
Russell Investment Company
2020 Strategy Fund
Statements of Changes in Net Assets, continued
* Share transaction amounts (in thousands) for the periods ended October 31, 2016 and October 31, 2015 were as follows:
| 2016 | 2015 | |||||||||||
| Shares | Dollars | Shares | Dollars | |||||||||
| Class A | ||||||||||||
| Proceeds from shares sold | — | $ | — | — | $ | — | ||||||
| Proceeds from reinvestment of distributions | 3 | 24 | 19 | 160 | ||||||||
| Payments for shares redeemed | (7 | ) | (60 | ) | (34 | ) | (290 | ) | ||||
| Net increase (decrease) | (4 | ) | (36 | ) | (15 | ) | (130 | ) | ||||
| Class E | ||||||||||||
| Proceeds from shares sold | 8 | 58 | 31 | 268 | ||||||||
| Proceeds from reinvestment of distributions | 31 | 229 | 73 | 624 | ||||||||
| Payments for shares redeemed | (27 | ) | (200 | ) | (66 | ) | (654 | ) | ||||
| Net increase (decrease) | 12 | 87 | 38 | 238 | ||||||||
| Class R1 | ||||||||||||
| Proceeds from shares sold | 775 | 6,095 | 2,175 | 19,668 | ||||||||
| Proceeds from reinvestment of distributions | 579 | 4,329 | 1,634 | 14,022 | ||||||||
| Payments for shares redeemed | (2,023 | ) | (15,764 | ) | (3,517 | ) | (33,000 | ) | ||||
| Net increase (decrease) | (669 | ) | (5,340 | ) | 292 | 690 | ||||||
| Class R4 | ||||||||||||
| Proceeds from shares sold | 185 | 1,426 | 182 | 1,623 | ||||||||
| Proceeds from reinvestment of distributions | 145 | 1,086 | 440 | 3,780 | ||||||||
| Payments for shares redeemed | (168 | ) | (1,325 | ) | (584 | ) | (5,210 | ) | ||||
| Net increase (decrease) | 162 | 1,187 | 38 | 193 | ||||||||
| Class R5 | ||||||||||||
| Proceeds from shares sold | 379 | 2,899 | 637 | 5,959 | ||||||||
| Proceeds from reinvestment of distributions | 224 | 1,671 | 1,076 | 9,226 | ||||||||
| Payments for shares redeemed | (1,036 | ) | (8,086 | ) | (2,889 | ) | (27,154 | ) | ||||
| Net increase (decrease) | (433 | ) | (3,516 | ) | (1,176 | ) | (11,969 | ) | ||||
| Class S | ||||||||||||
| Proceeds from shares sold | 154 | 1,187 | 161 | 1,447 | ||||||||
| Proceeds from reinvestment of distributions | 90 | 672 | 342 | 2,935 | ||||||||
| Payments for shares redeemed | (323 | ) | (2,520 | ) | (612 | ) | (5,573 | ) | ||||
| Net increase (decrease) | (79 | ) | (661 | ) | (109 | ) | (1,191 | ) | ||||
| Total increase (decrease) | (1,011 | ) | $ | (8,279 | ) | (932 | ) | $ | (12,169 | ) | ||
See accompanying notes which are an integral part of the financial statements.
2020 Strategy Fund 135
Russell Investment Company
2020 Strategy Fund
Financial Highlights — For the Periods Ended
For a Share Outstanding Throughout Each Period.
| $ | |||||||||||||||
| $ | Net | $ | $ | $ | $ | ||||||||||
| Net Asset Value, | Investment | Net Realized | Total from | Distributions | Distributions | ||||||||||
| Beginning of | Income (Loss) | and Unrealized | Investment | from Net | from Net | ||||||||||
| Period | (a)(b)(e) | Gain (Loss) | Operations | Investment Income | Realized Gain | ||||||||||
| Class A | |||||||||||||||
| October 31, 2016 | 8.51 | .20 | .09 | .29 | (.22 | ) | (.78 | ) | |||||||
| October 31, 2015 | 12.11 | .28 | (.21 | ) | .07 | (.25 | ) | (3.42 | ) | ||||||
| October 31, 2014 | 11.92 | .27 | .37 | .64 | (.22 | ) | (.23 | ) | |||||||
| October 31, 2013 | 11.17 | .24 | .80 | 1.04 | (.29 | ) | — | ||||||||
| October 31, 2012 | 10.55 | .32 | .54 | .86 | (.24 | ) | — | ||||||||
| Class E | |||||||||||||||
| October 31, 2016 | 8.52 | .21 | .08 | .29 | (.22 | ) | (.78 | ) | |||||||
| October 31, 2015 | 12.13 | .21 | (.14 | ) | .07 | (.26 | ) | (3.42 | ) | ||||||
| October 31, 2014 | 11.94 | .22 | .42 | .64 | (.22 | ) | (.23 | ) | |||||||
| October 31, 2013 | 11.19 | .30 | .74 | 1.04 | (.29 | ) | — | ||||||||
| October 31, 2012 | 10.57 | .25 | .62 | .87 | (.25 | ) | — | ||||||||
| Class R1 | |||||||||||||||
| October 31, 2016 | 8.50 | .23 | .08 | .31 | (.24 | ) | (.78 | ) | |||||||
| October 31, 2015 | 12.11 | .23 | (.14 | ) | .09 | (.28 | ) | (3.42 | ) | ||||||
| October 31, 2014 | 11.93 | .27 | .39 | .66 | (.25 | ) | (.23 | ) | |||||||
| October 31, 2013 | 11.18 | .34 | .73 | 1.07 | (.32 | ) | — | ||||||||
| October 31, 2012 | 10.56 | .27 | .63 | .90 | (.28 | ) | — | ||||||||
| Class R4(1) | |||||||||||||||
| October 31, 2016 | 8.50 | .20 | .09 | .29 | (.22 | ) | (.78 | ) | |||||||
| October 31, 2015 | 12.11 | .22 | (.15 | ) | .07 | (.26 | ) | (3.42 | ) | ||||||
| October 31, 2014 | 11.92 | .22 | .42 | .64 | (.22 | ) | (.23 | ) | |||||||
| October 31, 2013 | 11.17 | .30 | .74 | 1.04 | (.29 | ) | — | ||||||||
| October 31, 2012 | 10.54 | .27 | .60 | .87 | (.24 | ) | — | ||||||||
| Class R5(2) | |||||||||||||||
| October 31, 2016 | 8.49 | .19 | .08 | .27 | (.20 | ) | (.78 | ) | |||||||
| October 31, 2015 | 12.08 | .22 | (.16 | ) | .06 | (.23 | ) | (3.42 | ) | ||||||
| October 31, 2014 | 11.90 | .21 | .39 | .60 | (.19 | ) | (.23 | ) | |||||||
| October 31, 2013 | 11.15 | .27 | .74 | 1.01 | (.26 | ) | — | ||||||||
| October 31, 2012 | 10.52 | .23 | .62 | .85 | (.22 | ) | — | ||||||||
| Class S | |||||||||||||||
| October 31, 2016 | 8.50 | .23 | .08 | .31 | (.24 | ) | (.78 | ) | |||||||
| October 31, 2015 | 12.11 | .25 | (.16 | ) | .09 | (.28 | ) | (3.42 | ) | ||||||
| October 31, 2014 | 11.93 | .28 | .38 | .66 | (.25 | ) | (.23 | ) | |||||||
| October 31, 2013 | 11.18 | .32 | .75 | 1.07 | (.32 | ) | — | ||||||||
| October 31, 2012 | 10.56 | .27 | .63 | .90 | (.28 | ) | — | ||||||||
See accompanying notes which are an integral part of the financial statements.
136 2020 Strategy Fund
| % | % | % | ||||||||||||||
| $ | $ | Ratio of Expenses | Ratio of Expenses | Ratio of Net | ||||||||||||
| Net Asset Value, | % | Net Assets, | to Average | to Average | Investment Income | % | ||||||||||
| $ | End of | Total | End of Period | Net Assets, | Net Assets, | to Average | Portfolio | |||||||||
| Total Distributions | Period | Return(d) | (000 | ) | Gross(g) | Net(e)(g) | Net Assets(b)(e) | Turnover Rate | ||||||||
| (1.00 | ) | 7.80 | 4.00 | 200 | .25 | .25 | 2.58 | 28 | ||||||||
| (3.67 | ) | 8.51 | .59 | 253 | .25 | .25 | 3.03 | 28 | ||||||||
| (.45 | ) | 12.11 | 5.48 | 540 | .25 | .25 | 2.24 | 42 | ||||||||
| (.29 | ) | 11.92 | 9.52 | 1,460 | .25 | .25 | 2.11 | 15 | ||||||||
| (.24 | ) | 11.17 | 8.33 | 902 | .25 | .25 | 3.02 | 21 | ||||||||
| (1.00 | ) | 7.81 | 4.00 | 1,875 | .25 | .25 | 2.66 | 28 | ||||||||
| (3.68 | ) | 8.52 | .52 | 1,947 | .25 | .25 | 2.37 | 28 | ||||||||
| (.45 | ) | 12.13 | 5.52 | 2,312 | .25 | .25 | 1.80 | 42 | ||||||||
| (.29 | ) | 11.94 | 9.48 | 2,240 | .25 | .25 | 2.62 | 15 | ||||||||
| (.25 | ) | 11.19 | 8.39 | 2,380 | .25 | .25 | 2.30 | 21 | ||||||||
| (1.02 | ) | 7.79 | 4.28 | 30,034 | — | — | 2.97 | 28 | ||||||||
| (3.70 | ) | 8.50 | .78 | 38,455 | — | — | 2.56 | 28 | ||||||||
| (.48 | ) | 12.11 | 5.70 | 51,257 | — | — | 2.24 | 42 | ||||||||
| (.32 | ) | 11.93 | 9.77 | 92,947 | — | — | 2.95 | 15 | ||||||||
| (.28 | ) | 11.18 | 8.68 | 121,239 | — | — | 2.51 | 21 | ||||||||
| (1.00 | ) | 7.79 | 4.02 | 9,819 | .25 | .25 | 2.56 | 28 | ||||||||
| (3.68 | ) | 8.50 | .52 | 9,340 | .25 | .25 | 2.41 | 28 | ||||||||
| (.45 | ) | 12.11 | 5.51 | 12,844 | .25 | .25 | 1.82 | 42 | ||||||||
| (.29 | ) | 11.92 | 9.48 | 17,172 | .25 | .25 | 2.65 | 15 | ||||||||
| (.24 | ) | 11.17 | 8.46 | 24,126 | .25 | .25 | 2.55 | 21 | ||||||||
| (.98 | ) | 7.78 | 3.74 | 11,544 | .50 | .50 | 2.48 | 28 | ||||||||
| (3.65 | ) | 8.49 | .38 | 16,269 | .50 | .50 | 2.37 | 28 | ||||||||
| (.42 | ) | 12.08 | 5.15 | 37,373 | .50 | .50 | 1.73 | 42 | ||||||||
| (.26 | ) | 11.90 | 9.23 | 59,271 | .50 | .50 | 2.38 | 15 | ||||||||
| (.22 | ) | 11.15 | 8.19 | 67,605 | .50 | .50 | 2.17 | 21 | ||||||||
| (1.02 | ) | 7.79 | 4.28 | 5,092 | — | — | 2.96 | 28 | ||||||||
| (3.70 | ) | 8.50 | .78 | 6,223 | — | — | 2.78 | 28 | ||||||||
| (.48 | ) | 12.11 | 5.70 | 10,187 | — | — | 2.32 | 42 | ||||||||
| (.32 | ) | 11.93 | 9.77 | 20,550 | — | — | 2.80 | 15 | ||||||||
| (.28 | ) | 11.18 | 8.68 | 22,285 | — | — | 2.53 | 21 | ||||||||
See accompanying notes which are an integral part of the financial statements.
2020 Strategy Fund 137
Russell Investment Company
2020 Strategy Fund
Related Party Transactions, Fees and Expenses
| Accrued fees payable to affiliates for the period ended October 31, 2016 were as follows: | ||
| Distribution fees | $ | 2,509 |
| Shareholder servicing fees | 4,947 | |
| $ | 7,456 | |
| Transactions (amounts in thousands) during the period ended October 31, 2016 with Underlying Funds which are, or were, an | ||||||||||||||||||||
| affiliated company are as follows: | ||||||||||||||||||||
| Fair Value, | Change in | |||||||||||||||||||
| Beginning of | Realized Gain | Unrealized | Fair Value, End | Income | Capital Gains | |||||||||||||||
| Period | Purchases | Sales | (Loss) | Gain (Loss) | of Period | Distributions | Distributions | |||||||||||||
| Russell Commodity Strategies Fund | $ | 1,677 | $ | 343 | $ | 645 | $ | (166) | $ | 109 | $ | 1,318 | $ | — | $ | — | ||||
| Russell Global Infrastructure Fund | 1,442 | 287 | 542 | (86 | ) | 82 | 1,183 | 38 | 36 | |||||||||||
| Russell Global Real Estate Securities | ||||||||||||||||||||
| Fund | 1,442 | 289 | 728 | 270 | (383 | ) | 890 | 31 | 64 | |||||||||||
| Russell U.S. Defensive Equity Fund | 1,871 | 206 | 635 | 286 | (235 | ) | 1,493 | 25 | — | |||||||||||
| Russell U.S. Dynamic Equity Fund | 1,288 | 406 | 606 | 12 | (148 | ) | 952 | 57 | 115 | |||||||||||
| Russell U.S. Small Cap Equity Fund | 2,072 | 513 | 1,015 | 301 | (361 | ) | 1,510 | 17 | 126 | |||||||||||
| Select U.S. Equity Fund | 9,107 | 1,539 | 3,637 | 155 | 9 | 7,173 | 219 | 12 | ||||||||||||
| Russell Global Opportunistic Credit | ||||||||||||||||||||
| Fund | 3,044 | 301 | 1,575 | (158 | ) | 279 | 1,891 | 84 | — | |||||||||||
| Russell Investment Grade Bond Fund | 10,104 | 1,774 | 5,053 | 57 | (57 | ) | 6,825 | 358 | 14 | |||||||||||
| Russell Short Duration Bond Fund | 4,720 | 3,224 | 2,098 | (33 | ) | 105 | 5,918 | 90 | 3 | |||||||||||
| Russell Strategic Bond Fund | 23,584 | 4,929 | 9,242 | 645 | (441 | ) | 19,475 | 696 | 125 | |||||||||||
| Russell Emerging Markets Fund | 1,766 | 258 | 820 | 158 | (45 | ) | 1,317 | 6 | — | |||||||||||
| Russell Global Equity Fund | 3,630 | 1,494 | 1,658 | 304 | (501 | ) | 3,269 | 65 | 280 | |||||||||||
| Select International Equity Fund | 6,747 | 1,655 | 2,747 | (443 | ) | 119 | 5,331 | 179 | — | |||||||||||
| $ | 72,494 | $ | 17,218 | $ | 31,001 | $ | 1,302 | $ | (1,468) | $ | 58,545 | $ | 1,865 | $ | 775 | |||||
Federal Income Taxes
At October 31, 2016, the cost of investments and net unrealized appreciation (depreciation), undistributed ordinary income and
undistributed long-term capital gains for income tax purposes were as follows:
| Cost of Investments | $ | 51,559,104 | ||
| Unrealized Appreciation | $ | 8,057,843 | ||
| Unrealized Depreciation | (1,072,425 | ) | ||
| Net Unrealized Appreciation (Depreciation) | $ | 6,985,418 | ||
| Undistributed Ordinary Income | $ | 85,888 | ||
| Undistributed Long-Term Capital Gains | ||||
| (Capital Loss Carryforward) | $ | 2,132,456 | ||
| Tax Composition of Distributions | ||||
| Ordinary Income | $ | 1,900,115 | ||
| Long-Term Capital Gains | $ | 6,122,044 |
Net investment income and net realized gains (losses) in the financial statements may differ from taxable net investment income and
net realized gains (losses). Capital accounts within the financial statements are adjusted for permanent differences between book and
tax accounting. These differences may be due to foreign currency gains or losses, reclassifications of dividends and /or differences in
treatment of income from swaps. These adjustments have no impact on the net assets.
At October 31, 2016, the Statement of Assets and Liabilities have been adjusted by the following amounts (in thousands):
See accompanying notes which are an integral part of the financial statements.
138 2020 Strategy Fund
Russell Investment Company
2020 Strategy Fund
Federal Income Taxes, continued
| Undistributed net investment income | $ | 11 | |
| Accumulated net realized gain (loss) | (10 | ) | |
| Additional paid-in capital | (1 | ) |
See accompanying notes which are an integral part of the financial statements.
2020 Strategy Fund 139
Russell Investment Company
2025 Strategy Fund
Portfolio Management Discussion and Analysis — October 31, 2016 (Unaudited)
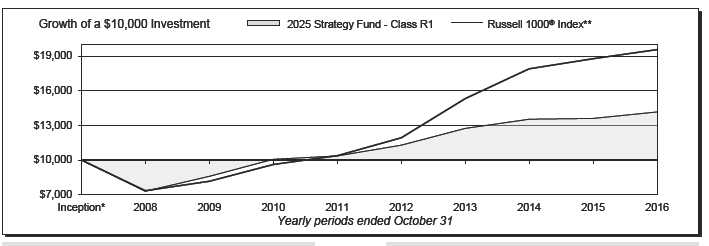
| 2025 Strategy Fund - Class R1 | 2025 Strategy Fund - Class R5‡ | ||||||
| Total | Total | ||||||
| Return | Return | ||||||
| 1 Year | 4.12 | % | 1 Year | 3.60 | % | ||
| 5 Years | 6.46 | %§ | 5 Years | 5.94 | %§ | ||
| Inception* | 4.13 | %§ | Inception* | 3.60 | %§ | ||
| 2025 Strategy Fund - Class R4‡ | Russell 1000® Index** | ||||||
| Total | Total | ||||||
| Return | Return | ||||||
| 1 Year | 3.86 | % | 1 Year | 4.26 | % | ||
| 5 Years | 6.21 | %§ | 5 Years | 13.51 | %§ | ||
| Inception* | 3.88 | %§ | Inception* | 8.12 | %§ | ||
140 2025 Strategy Fund
Russell Investment Company
2025 Strategy Fund
Portfolio Management Discussion and Analysis, continued — October 31, 2016
(Unaudited)
| The 2025 Strategy Fund (the “Fund”) is a fund of funds that | was beneficial as it was one of the best performing asset classes |
| invests in other Russell Investment Company mutual funds (the | globally. Falling interest rates also helped other fixed income |
| “Underlying Funds”). The Underlying Funds employ a multi- | assets in the Underlying Funds rally, as well as more rate sensitive |
| manager approach whereby portions of the Underlying Funds are | real assets like global real estate investment trusts and global |
| allocated to different money managers. Underlying Fund assets not | infrastructure. With interest rates falling, income opportunities |
| allocated to money managers are managed by Russell Investment | around the globe continued to shrink and income available from |
| Management, LLC (“RIM”), the Fund’s and Underlying Funds’ | most assets fell. |
| advisor. RIM, as the Underlying Funds’ advisor, may change | The U.S. equity market, as measured by the S&P 500® Index, |
| the allocation of the Underlying Funds’ assets among money | was up 4.51% over the period but also experienced multiple |
| managers at any time. An exemptive order from the Securities | draw downs. The Fund’s strategic exposure to global equities |
| and Exchange Commission (“SEC”) permits RIM to engage or | proved beneficial over the period as emerging markets rallied |
| terminate a money manager in an Underlying Fund at any time, | and outperformed U.S. equities. By contrast, non-U.S. developed |
| subject to approval by the Underlying Fund’s Board, without a | equity was one of the lowest performing portions of the Fund’s |
| shareholder vote. Pursuant to the terms of the exemptive order, an | exposure as falling commodities and currencies weighed on |
| Underlying Fund is required to notify its shareholders within 90 | returns. |
| days of when a money manager begins providing services. | |
| What is the Fund’s investment objective? | How did the investment strategies and techniques employed |
| by the Fund and the Underlying Funds affect the Fund’s | |
| The Fund seeks to provide capital growth and income consistent | performance? |
| with its current asset allocation which will change over time, with | The Fund is a fund of funds and its performance is based on RIM’s |
| an increasing allocation to fixed income funds. | strategic asset allocations, the performance of the Underlying |
| The Fund pursues this objective by investing in a diversified | Funds in which the Fund invests, and tactical changes in the |
| portfolio that, as of October 31, 2016, consisted of approximately | Fund’s asset allocation throughout the year. |
| 44.9% equity Underlying Funds, 47.8% fixed income Underlying | In order to seek to achieve the Fund’s objective during the period, |
| Funds and 7.3% alternative Underlying Funds. The Fund’s | RIM’s strategic asset allocation included investments in global |
| allocation to fixed income Underlying Funds will be fixed at | equity, alternative and fixed income Underlying Funds. The |
| 66.3% in approximately the year 2025. | Fund’s diverse asset allocation partially hindered performance |
| How did the Fund perform relative to its benchmark for the | during the period as certain of these exposures underperformed |
| fiscal year ended October 31, 2016? | the Russell 1000® Index. While areas like high yield bonds, as |
| For the fiscal year ended October 31, 2016, the Fund’s Class R1, | measured by the BofA Merrill Lynch Global High Yield Index |
| Class R4 and Class R5 Shares gained 4.12%, 3.86% and 3.60%, | Hedged USD, outperformed the Russell 1000® Index, areas like |
| respectively. This is compared to the Fund’s primary benchmark, | commodities and non-U.S. developed equities delivered negative |
| the Russell 1000® Index, which gained 4.26% during the same | returns as measured by the Bloomberg Commodity Index Total |
| period. The Fund’s performance includes operating expenses, | Return and Russell Developed ex-U.S. Large Cap® Index Net, |
| whereas index returns are unmanaged and do not include | respectively. |
| expenses of any kind. | The Fund’s underperformance relative to the Russell 1000® |
| For the fiscal year ended October 31, 2016, the Morningstar® | Index was partially offset by strong active management within |
| Target-Date 2025 Category gained 3.08%. This result serves as | the fixed income portion of the Fund’s portfolio. Underlying Fund |
| a peer comparison and is expressed net of operating expenses. | bond issue selection during the period was generally additive to |
| returns as fixed income money managers were able to pick well | |
| How did the market conditions described in the Market | within credit, avoiding defaults in places like the energy sector |
| Summary report affect the Fund’s performance? | where trouble occurred with falling energy prices in early 2016. |
| The Fund seeks to achieve its objective by investing in Underlying | As such, an allocation to the Russell Strategic Bond Fund was |
| Funds that provide exposure to a range of diversified investments, | positive from a benchmark-relative perspective. The Underlying |
| and most major asset classes invested in by the Underlying | Fund was positively impacted by its overweight to credit and |
| Funds produced positive absolute returns during the period. | additive currency positioning also helped to drive excess return. |
| Markets during the fiscal year were characterized by higher | By contrast, equity selection and positioning was more difficult, |
| levels of volatility and dispersion across return sources. Within | with allocations to non-U.S. equity Underlying Funds detracting |
| the fixed income Underlying Funds, exposure to high yield debt | from the Fund’s performance and security selection within |
2025 Strategy Fund 141
Russell Investment Company
2025 Strategy Fund
Portfolio Management Discussion and Analysis, continued — October 31, 2016
(Unaudited)
| those Underlying Funds struggling. In addition, overweights | in high yield credit and emerging markets equity compared with | |
| to European securities in the Select International Equity Fund | core bond holdings and cash. Markets subsequently rebounded | |
| caused the Underlying Fund to struggle as European equities | from the February lows and RIM reduced risk exposure to a more | |
| continued to lag the U.S. equity market. | defensive stance with the Fund’s equity allocation below strategic | |
| weights. RIM’s modifications to the Fund’s asset allocation were | ||
| Describe any changes to the Fund’s structure or allocation | additive during the period. | |
| to the Underlying Funds. | ||
| RIM has the discretion to vary the Fund’s actual allocation from | The views expressed in this report reflect those of the | |
| the target strategic asset allocation by up to +/- 5% at the equity, | portfolio managers only through the end of the period | |
| fixed income or alternative category level based on RIM’s capital | covered by the report. These views do not necessarily | |
| markets research. RIM’s asset allocation modifications benefited | represent the views of RIM, or any other person in RIM or | |
| the Fund’s performance relative to the Fund’s target strategic | any other affiliated organization. These views are subject | |
| asset allocation. | to change at any time based upon market conditions or | |
| RIM adapted the Fund’s asset allocation over the period as market | other events, and RIM disclaims any responsibility to | |
| opportunities and risks evolved. The Fund was defensively | update the views contained herein. These views should not | |
| positioned in the fourth quarter of 2015, favoring fixed income | be relied on as investment advice and, because investment | |
| over equity Underlying Funds. During the first quarter of 2016, | decisions for a Russell Investment Company (“RIC”) Fund | |
| equity markets declined substantially, and RIM added further risk | are based on numerous factors, should not be relied on as | |
| to the portfolio by overweighting Underlying Funds that invest | an indication of investment decisions of any RIC Fund. | |
* Assumes initial investment on March 31, 2008.
** Russell 1000® Index includes the 1,000 largest companies in the Russell 3000® Index. The Russell 1000® Index represents the universe of stocks from which
most active money managers typically select. The Russell 1000® Index return reflects adjustments from income dividends and capital gain distributions
reinvested as of the ex-dividend dates.
‡ The Fund first issued Class R4 and Class R5 Shares on October 1, 2014. The returns shown for Class R4 and Class R5 Shares prior to that date are the returns
of the Fund’s Class R2 and Class R3 Shares, respectively.
§ Annualized.
Performance is historical and assumes reinvestment of all dividends and capital gains. Investment return and principal value will fluctuate so that an investor’s
shares, when redeemed, may be worth more or less than when purchased. Past performance is not indicative of future results. The returns shown do not reflect the
deduction of taxes that a shareholder would pay on Fund distributions or the redemption of Fund shares. Additionally, the returns presented herein may differ from
the performance reported in the Financial Highlights as the returns herein are calculated in a manner consistent with standardized performance in accordance with
Securities and Exchange Commission rules, while the performance in the Financial Highlights has been calculated in accordance with U.S. Generally Accepted
Accounting Principles (“U.S. GAAP”).
142 2025 Strategy Fund
Russell Investment Company
2025 Strategy Fund
Shareholder Expense Example — October 31, 2016 (Unaudited)
| Fund Expenses | Hypothetical | |||||
| The following disclosure provides important information | Performance (5% | |||||
| Actual | return before | |||||
| regarding the Fund’s Shareholder Expense Example | Class R1 | Performance | expenses) | |||
| (“Example”). | Beginning Account Value | |||||
| May 1, 2016 | $ | 1,000.00 | $ | 1,000.00 | ||
| Example | Ending Account Value | |||||
| As a shareholder of the Fund, you incur ongoing costs, including | October 31, 2016 | $ | 1,029.10 | $ | 1,025.14 | |
| distribution (12b-1) and/or service fees and other Fund expenses. | Expenses Paid During Period* | $ | — | $ | — | |
| The Example is intended to help you understand your ongoing | * There were no expenses charged to the Class. | |||||
| costs (in dollars) of investing in the Fund and to compare these | ||||||
| costs with the ongoing costs of investing in other mutual funds. | Hypothetical | |||||
| Performance (5% | ||||||
| The Example is based on an investment of $1,000 invested at the | Actual | return before | ||||
| beginning of the period and held for the entire period indicated, | Class R4 | Performance | expenses) | |||
| which for this Fund is from May 1, 2016 to October 31, 2016. | Beginning Account Value | |||||
| May 1, 2016 | $ | 1,000.00 | $ | 1,000.00 | ||
| Actual Expenses | Ending Account Value | |||||
| The information in the table under the heading “Actual | October 31, 2016 | $ | 1,027.80 | $ | 1,023.88 | |
| Expenses Paid During Period* | $ | 1.27 | $ | 1.27 | ||
| Performance” provides information about actual account values | ||||||
| and actual expenses. You may use the information in this column, | * Expenses are equal to the Fund's annualized expense ratio of 0.25% | |||||
| together with the amount you invested, to estimate the expenses | (representing the six month period annualized), multiplied by the average | |||||
| account value over the period, multiplied by 184/366 (to reflect the one-half | ||||||
| that you paid over the period. Simply divide your account value by | year period). | |||||
| $1,000 (for example, an $8,600 account value divided by $1,000 | ||||||
| = 8.6), then multiply the result by the number in the first column | Hypothetical | |||||
| in the row entitled “Expenses Paid During Period” to estimate | Performance (5% | |||||
| Actual | return before | |||||
| the expenses you paid on your account during this period. | Class R5 | Performance | expenses) | |||
| Beginning Account Value | ||||||
| Hypothetical Example for Comparison Purposes | May 1, 2016 | $ | 1,000.00 | $ | 1,000.00 | |
| The information in the table under the heading “Hypothetical | Ending Account Value | |||||
| Performance (5% return before expenses)” provides information | October 31, 2016 | $ | 1,026.50 | $ | 1,022.62 | |
| about hypothetical account values and hypothetical expenses | Expenses Paid During Period* | $ | 2.55 | $ | 2.54 | |
| based on the Fund’s actual expense ratio and an assumed rate of | * Expenses are equal to the Fund's annualized expense ratio of 0.50% | |||||
| return of 5% per year before expenses, which is not the Fund’s | (representing the six month period annualized), multiplied by the average | |||||
| actual return. The hypothetical account values and expenses | account value over the period, multiplied by 184/366 (to reflect the one-half | |||||
| may not be used to estimate the actual ending account balance or | year period). | |||||
| expenses you paid for the period. You may use this information | ||||||
| to compare the ongoing costs of investing in the Fund and other | ||||||
| funds. To do so, compare this 5% hypothetical example with the | ||||||
| 5% hypothetical examples that appear in the shareholder reports | ||||||
| of other funds. | ||||||
| Please note that the expenses shown in the table are meant | ||||||
| to highlight your ongoing costs only and do not reflect any | ||||||
| transactional costs. Therefore, the information under the heading | ||||||
| “Hypothetical Performance (5% return before expenses)” is | ||||||
| useful in comparing ongoing costs only, and will not help you | ||||||
| determine the relative total costs of owning different funds. In | ||||||
| addition, if these transactional costs were included, your costs | ||||||
| would have been higher. | ||||||
2025 Strategy Fund 143
Russell Investment Company
2025 Strategy Fund
Schedule of Investments — October 31, 2016
| Amounts in thousands (except share amounts) | ||||
| Fair | ||||
| Value | ||||
| Shares | $ | |||
| Investments in Russell Affiliated Mutual Funds - 100.0% | ||||
| Alternative - 6.3% | ||||
| Russell Commodity Strategies Fund Class Y | 121,743 | 671 | ||
| Russell Global Infrastructure Fund Class Y | 53,064 | 606 | ||
| Russell Global Real Estate Securities Fund Class Y | 13,148 | 470 | ||
| 1,747 | ||||
| Domestic Equities - 23.8% | ||||
| Russell U.S. Defensive Equity Fund Class Y | 14,956 | 736 | ||
| Russell U.S. Dynamic Equity Fund Class Y | 63,934 | 635 | ||
| Russell U.S. Small Cap Equity Fund Class Y | 38,566 | 1,065 | ||
| Select U.S. Equity Fund Class Y | 382,189 | 4,173 | ||
| 6,609 | ||||
| Fixed Income - 47.8% | ||||
| Russell Global Opportunistic Credit Fund Class Y | 87,729 | 853 | ||
| Russell Investment Grade Bond Fund Class Y | 133,429 | 2,980 | ||
| Russell Short Duration Bond Fund Class Y | 62,934 | 1,213 | ||
| Russell Strategic Bond Fund Class Y | 745,217 | 8,242 | ||
| 13,288 | ||||
| International Equities - 22.1% | ||||
| Russell Emerging Markets Fund Class Y | 54,663 | 911 | ||
| Russell Global Equity Fund Class Y | 193,714 | 2,021 | ||
| Select International Equity Fund Class Y | 375,082 | 3,222 | ||
| 6,154 | ||||
| Total Investments in Russell Affiliated Mutual Funds | ||||
| (cost $24,986) | 27,798 | |||
| Total Investments 100.0% | ||||
| (identified cost $24,986) | 27,798 | |||
| Other Assets and Liabilities, Net - (0.0%) | (4 | ) | ||
| Net Assets - 100.0% | 27,794 | |||
| Presentation of Portfolio Holdings | ||||||||||||||
| Amounts in thousands | ||||||||||||||
| Fair Value | ||||||||||||||
| Practical | ||||||||||||||
| Portfolio Summary | Level 1 | Level 2 | Level 3 | Expedient | Total | % of Net Assets | ||||||||
| Investments in Russell Affiliated Mutual | ||||||||||||||
| Funds | $ | 27,798 | $ | — | $ | — | $ | — | $ | 27,798 | 100.0 | |||
| Total Investments | 27,798 | — | — | — | 27,798 | 100.0 | ||||||||
| Other Assets and Liabilities, Net | (—)* | |||||||||||||
| 100.0 | ||||||||||||||
| * Less than 0.05% of net assets. | ||||||||||||||
For a description of the Levels, see note 2 in the Notes to Financial Statements.
For a disclosure on transfers between Levels 1, 2 and 3 during the period ended October 31, 2016, see note 2 in the Notes to
Financial Statements.
See accompanying notes which are an integral part of the financial statements.
144 2025 Strategy Fund
Russell Investment Company
2025 Strategy Fund
Statement of Assets and Liabilities — October 31, 2016
| Amounts in thousands | |||
| Assets | |||
| Investments, at identified cost | $ | 24,986 | |
| Investments, at fair value(>) | 27,798 | ||
| Receivables: | |||
| Fund shares sold | 11 | ||
| Total assets | 27,809 | ||
| Liabilities | |||
| Payables: | |||
| Investments purchased | 8 | ||
| Fund shares redeemed | 3 | ||
| Accrued fees to affiliates | 4 | ||
| Total liabilities | 15 | ||
| Net Assets | $ | 27,794 | |
| Net Assets Consist of: | |||
| Undistributed (overdistributed) net investment income | $ | — | |
| Accumulated net realized gain (loss) | (105 | ) | |
| Unrealized appreciation (depreciation) on investments | 2,812 | ||
| Shares of beneficial interest | 34 | ||
| Additional paid-in capital | 25,053 | ||
| Net Assets | $ | 27,794 | |
| Net Asset Value, offering and redemption price per share: | |||
| Net asset value per share: Class R1(#) | $ | 8.23 | |
| Class R1 — Net assets | $ | 14,977,970 | |
| Class R1 — Shares outstanding ($.01 par value) | 1,819,316 | ||
| Net asset value per share: Class R4(#) | $ | 8.24 | |
| Class R4 — Net assets | $ | 7,206,337 | |
| Class R4 — Shares outstanding ($.01 par value) | 874,787 | ||
| Net asset value per share: Class R5(#) | $ | 8.21 | |
| Class R5 — Net assets | $ | 5,609,493 | |
| Class R5 — Shares outstanding ($.01 par value) | 683,201 | ||
| Amounts in thousands | |||
| (>) Investments in affiliated Russell funds | $ | 27,798 | |
| (#) Net asset value per share equals class level net assets divided by class level shares of beneficial interest outstanding. | |||
See accompanying notes which are an integral part of the financial statements.
2025 Strategy Fund 145
Russell Investment Company
2025 Strategy Fund
Statement of Operations — For the Period Ended October 31, 2016
| Amounts in thousands | |||
| Investment Income | |||
| Income distributions from affiliated Russell funds | $ | 798 | |
| Expenses | |||
| Distribution fees - Class R5 | 16 | ||
| Shareholder servicing fees - Class R4 | 18 | ||
| Shareholder servicing fees - Class R5 | 16 | ||
| Total expenses | 50 | ||
| Net investment income (loss) | 748 | ||
| Net Realized and Unrealized Gain (Loss) | |||
| Net realized gain (loss) on: | |||
| Investments | 9 | ||
| Capital gain distributions from Underlying Funds | 402 | ||
| Net realized gain (loss) | 411 | ||
| Net change in unrealized appreciation (depreciation) on investments | (143 | ) | |
| Net realized and unrealized gain (loss) | 268 | ||
| Net Increase (Decrease) in Net Assets from Operations | $ | 1,016 | |
See accompanying notes which are an integral part of the financial statements.
146 2025 Strategy Fund
Russell Investment Company
2025 Strategy Fund
Statements of Changes in Net Assets
| For the Periods Ended October 31, | |||||||
| Amounts in thousands | 2016 | 2015 | |||||
| Increase (Decrease) in Net Assets | |||||||
| Operations | |||||||
| Net investment income (loss) | $ | 748 | $ | 798 | |||
| Net realized gain (loss) | 411 | 522 | |||||
| Net change in unrealized appreciation (depreciation) | (143 | ) | (1,110 | ) | |||
| Net increase (decrease) in net assets from operations | 1,016 | 210 | |||||
| Distributions | |||||||
| From net investment income | |||||||
| Class R1 | (401 | ) | (424 | ) | |||
| Class R4 | (194 | ) | (176 | ) | |||
| Class R5 | (154 | ) | (199 | ) | |||
| From net realized gain | |||||||
| Class R1 | (414 | ) | (3,163 | ) | |||
| Class R4 | (226 | ) | (1,537 | ) | |||
| Class R5 | (201 | ) | (2,105 | ) | |||
| Net decrease in net assets from distributions | (1,590 | ) | (7,604 | ) | |||
| Share Transactions* | |||||||
| Net increase (decrease) in net assets from share transactions | (3,401 | ) | 4,967 | ||||
| Total Net Increase (Decrease) in Net Assets | (3,975 | ) | (2,427 | ) | |||
| Net Assets | |||||||
| Beginning of period | 31,769 | 34,196 | |||||
| End of period | $ | 27,794 | $ | 31,769 | |||
See accompanying notes which are an integral part of the financial statements.
2025 Strategy Fund 147
Russell Investment Company
2025 Strategy Fund
Statements of Changes in Net Assets, continued
* Share transaction amounts (in thousands) for the periods ended October 31, 2016 and October 31, 2015 were as follows:
| 2016 | 2015 | |||||||||||
| Shares | Dollars | Shares | Dollars | |||||||||
| Class R1 | ||||||||||||
| Proceeds from shares sold | 368 | $ | 2,999 | 1,597 | $ | 13,886 | ||||||
| Proceeds from reinvestment of distributions | 103 | 815 | 423 | 3,588 | ||||||||
| Payments for shares redeemed | (658 | ) | (5,375 | ) | (1,380 | ) | (11,770 | ) | ||||
| Net increase (decrease) | (187 | ) | (1,561 | ) | 640 | 5,704 | ||||||
| Class R4 | ||||||||||||
| Proceeds from shares sold | 158 | 1,272 | 182 | 1,576 | ||||||||
| Proceeds from reinvestment of distributions | 53 | 420 | 201 | 1,712 | ||||||||
| Payments for shares redeemed | (234 | ) | (1,888 | ) | (211 | ) | (1,804 | ) | ||||
| Net increase (decrease) | (23 | ) | (196 | ) | 172 | 1,484 | ||||||
| Class R5 | ||||||||||||
| Proceeds from shares sold | 151 | 1,209 | 298 | 2,611 | ||||||||
| Proceeds from reinvestment of distributions | 45 | 355 | 272 | 2,304 | ||||||||
| Payments for shares redeemed | (396 | ) | (3,208 | ) | (803 | ) | (7,136 | ) | ||||
| Net increase (decrease) | (200 | ) | (1,644 | ) | (233 | ) | (2,221 | ) | ||||
| Total increase (decrease) | (410 | ) | $ | (3,401 | ) | 579 | $ | 4,967 | ||||
See accompanying notes which are an integral part of the financial statements.
148 2025 Strategy Fund
(This page intentionally left blank)
Russell Investment Company
2025 Strategy Fund
Financial Highlights — For the Periods Ended
For a Share Outstanding Throughout Each Period.
| $ | Net | $ | $ | $ | $ | ||||||||||
| Net Asset Value, | Investment | Net Realized | Total from | Distributions | Distributions | ||||||||||
| Beginning of | Income (Loss) | and Unrealized | Investment | from Net | from Net | ||||||||||
| Period | (a)(b)(e) | Gain (Loss) | Operations | Investment Income | Realized Gain | ||||||||||
| Class R1 | |||||||||||||||
| October 31, 2016 | 8.39 | .22 | .10 | .32 | (.23 | ) | (.25 | ) | |||||||
| October 31, 2015 | 10.67 | .21 | (.15 | ) | .06 | (.25 | ) | (2.09 | ) | ||||||
| October 31, 2014 | 10.80 | .25 | .39 | .64 | (.24 | ) | (.53 | ) | |||||||
| October 31, 2013 | 10.01 | .28 | .96 | 1.24 | (.26 | ) | (.19 | ) | |||||||
| October 31, 2012 | 9.44 | .22 | .61 | .83 | (.23 | ) | (.03 | ) | |||||||
| Class R4(1) | |||||||||||||||
| October 31, 2016 | 8.40 | .21 | .09 | .30 | (.21 | ) | (.25 | ) | |||||||
| October 31, 2015 | 10.67 | .20 | (.15 | ) | .05 | (.23 | ) | (2.09 | ) | ||||||
| October 31, 2014 | 10.81 | .19 | .42 | .61 | (.22 | ) | (.53 | ) | |||||||
| October 31, 2013 | 10.01 | .23 | 1.00 | 1.23 | (.24 | ) | (.19 | ) | |||||||
| October 31, 2012 | 9.44 | .22 | .58 | .80 | (.20 | ) | (.03 | ) | |||||||
| Class R5(2) | |||||||||||||||
| October 31, 2016 | 8.37 | .19 | .09 | .28 | (.19 | ) | (.25 | ) | |||||||
| October 31, 2015 | 10.64 | .19 | (.17 | ) | .02 | (.20 | ) | (2.09 | ) | ||||||
| October 31, 2014 | 10.77 | .19 | .40 | .59 | (.19 | ) | (.53 | ) | |||||||
| October 31, 2013 | 9.98 | .20 | .99 | 1.19 | (.21 | ) | (.19 | ) | |||||||
| October 31, 2012 | 9.41 | .19 | .58 | .77 | (.17 | ) | (.03 | ) | |||||||
See accompanying notes which are an integral part of the financial statements.
150 2025 Strategy Fund
| % | % | % | ||||||||||||||
| $ | $ | Ratio of Expenses | Ratio of Expenses | Ratio of Net | ||||||||||||
| Net Asset Value, | % | Net Assets, | to Average | to Average | Investment Income | % | ||||||||||
| $ | End of | Total | End of Period | Net Assets, | Net Assets, | to Average | Portfolio | |||||||||
| Total Distributions | Period | Return | (000 | ) | Gross(g) | Net(e)(g) | Net Assets(b)(e) | Turnover Rate | ||||||||
| (.48 | ) | 8.23 | 4.12 | 14,978 | — | — | 2.75 | 27 | ||||||||
| (2.34 | ) | 8.39 | .52 | 16,836 | — | — | 2.35 | 53 | ||||||||
| (.77 | ) | 10.67 | 6.23 | 14,573 | — | — | 2.41 | 67 | ||||||||
| (.45 | ) | 10.80 | 12.93 | 22,717 | — | — | 2.75 | 28 | ||||||||
| (.26 | ) | 10.01 | 9.00 | 34,875 | — | — | 2.32 | 37 | ||||||||
| (.46 | ) | 8.24 | 3.86 | 7,206 | .25 | .25 | 2.61 | 27 | ||||||||
| (2.32 | ) | 8.40 | .37 | 7,540 | .25 | .25 | 2.27 | 53 | ||||||||
| (.75 | ) | 10.67 | 5.87 | 7,743 | .25 | .25 | 1.83 | 67 | ||||||||
| (.43 | ) | 10.81 | 12.68 | 6,736 | .25 | .25 | 2.20 | 28 | ||||||||
| (.23 | ) | 10.01 | 8.67 | 6,235 | .25 | .25 | 2.28 | 37 | ||||||||
| (.44 | ) | 8.21 | 3.60 | 5,610 | .50 | .50 | 2.39 | 27 | ||||||||
| (2.29 | ) | 8.37 | .07 | 7,393 | .50 | .50 | 2.14 | 53 | ||||||||
| (.72 | ) | 10.64 | 5.70 | 11,880 | .50 | .50 | 1.84 | 67 | ||||||||
| (.40 | ) | 10.77 | 12.41 | 16,585 | .50 | .50 | 1.99 | 28 | ||||||||
| (.20 | ) | 9.98 | 8.40 | 14,350 | .50 | .50 | 2.00 | 37 | ||||||||
See accompanying notes which are an integral part of the financial statements.
2025 Strategy Fund 151
Russell Investment Company
2025 Strategy Fund
Related Party Transactions, Fees and Expenses
| Accrued fees payable to affiliates for the period ended October 31, 2016 were as follows: | ||
| Distribution fees | $ | 1,203 |
| Shareholder servicing fees | 2,729 | |
| $ | 3,932 | |
| Transactions (amounts in thousands) during the period ended October 31, 2016 with Underlying Funds which are, or were, an | ||||||||||||||||||||
| affiliated company are as follows: | ||||||||||||||||||||
| Fair Value, | Change in | |||||||||||||||||||
| Beginning of | Realized Gain | Unrealized | Fair Value, End | Income | Capital Gains | |||||||||||||||
| Period | Purchases | Sales | (Loss) | Gain (Loss) | of Period | Distributions | Distributions | |||||||||||||
| Russell Commodity Strategies Fund | $ | 780 | $ | 173 | $ | 255 | $ | (87) | $ | 60 | $ | 671 | $ | — | $ | — | ||||
| Russell Global Infrastructure Fund | 685 | 139 | 213 | (36 | ) | 31 | 606 | 18 | 16 | |||||||||||
| Russell Global Real Estate Securities | ||||||||||||||||||||
| Fund | 683 | 158 | 319 | 61 | (113 | ) | 470 | 15 | 29 | |||||||||||
| Russell U.S. Defensive Equity Fund | 854 | 107 | 248 | 95 | (72 | ) | 736 | 11 | — | |||||||||||
| Russell U.S. Dynamic Equity Fund | 781 | 246 | 313 | 11 | (90 | ) | 635 | 33 | 67 | |||||||||||
| Russell U.S. Small Cap Equity Fund | 1,302 | 313 | 519 | 87 | (118 | ) | 1,065 | 11 | 76 | |||||||||||
| Select U.S. Equity Fund | 4,922 | 760 | 1,596 | 67 | 20 | 4,173 | 118 | 6 | ||||||||||||
| Russell Global Opportunistic Credit | ||||||||||||||||||||
| Fund | 1,284 | 152 | 635 | (60 | ) | 112 | 853 | 36 | — | |||||||||||
| Russell Investment Grade Bond Fund | 3,932 | 704 | 1,662 | (22 | ) | 28 | 2,980 | 138 | 6 | |||||||||||
| Russell Short Duration Bond Fund | 398 | 1,066 | 269 | (2 | ) | 20 | 1,213 | 16 | — | |||||||||||
| Russell Strategic Bond Fund | 9,170 | 1,958 | 2,975 | 36 | 53 | 8,242 | 267 | 46 | ||||||||||||
| Russell Emerging Markets Fund | 1,113 | 205 | 488 | (49 | ) | 130 | 911 | 4 | — | |||||||||||
| Russell Global Equity Fund | 2,106 | 765 | 738 | 93 | (205 | ) | 2,021 | 36 | 156 | |||||||||||
| Select International Equity Fund | 3,763 | 830 | 1,187 | (185 | ) | 1 | 3,222 | 95 | — | |||||||||||
| $ | 31,773 | $ | 7,576 | $ | 11,417 | $ | 9 | $ | (143) | $ | 27,798 | $ | 798 | $ | 402 | |||||
Federal Income Taxes
At October 31, 2016, the cost of investments and net unrealized appreciation (depreciation), undistributed ordinary income and
undistributed long-term capital gains for income tax purposes were as follows:
| Cost of Investments | $ | 25,649,986 | ||
| Unrealized Appreciation | $ | 2,459,575 | ||
| Unrealized Depreciation | (311,829 | ) | ||
| Net Unrealized Appreciation (Depreciation) | $ | 2,147,746 | ||
| Undistributed Ordinary Income | $ | 21,025 | ||
| Undistributed Long-Term Capital Gains | ||||
| (Capital Loss Carryforward) | $ | 538,506 | ||
| Tax Composition of Distributions | ||||
| Ordinary Income | $ | 816,591 | ||
| Long-Term Capital Gains | $ | 773,227 |
See accompanying notes which are an integral part of the financial statements.
152 2025 Strategy Fund
Russell Investment Company
2025 Strategy Fund
Federal Income Taxes, continued
Net investment income and net realized gains (losses) in the financial statements may differ from taxable net investment income and
net realized gains (losses). Capital accounts within the financial statements are adjusted for permanent differences between book and
tax accounting. These differences may be due to foreign currency gains or losses, reclassifications of dividends and /or differences in
treatment of income from swaps. These adjustments have no impact on the net assets.
At October 31, 2016, the Statement of Assets and Liabilities have been adjusted by the following amounts (in thousands):
| Undistributed net investment income | $ | 1 | |
| Accumulated net realized gain (loss) | (1 | ) | |
| Additional paid-in capital | — |
See accompanying notes which are an integral part of the financial statements.
2025 Strategy Fund 153
Russell Investment Company
2030 Strategy Fund
Portfolio Management Discussion and Analysis — October 31, 2016 (Unaudited)
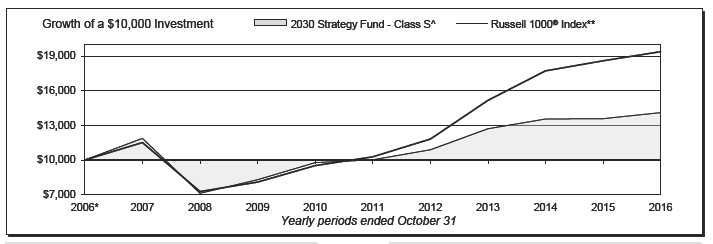
| 2030 Strategy Fund - Class A‡ | 2030 Strategy Fund - Class R5‡‡‡ | ||||||
| Total | Total | ||||||
| Return | Return | ||||||
| 1 Year | (2.31 | )% | 1 Year | 3.34 | % | ||
| 5 Years | 5.55 | %§ | 5 Years | 6.55 | %§ | ||
| 10 Years | 2.71 | %§ | 10 Years | 2.98 | %§ | ||
| 2030 Strategy Fund - Class E | 2030 Strategy Fund - Class S | ||||||
| Total | Total | ||||||
| Return | Return | ||||||
| 1 Year | 3.63 | % | 1 Year | 3.87 | % | ||
| 5 Years | 6.82 | %§ | 5 Years | 7.08 | %§ | ||
| 10 Years | 3.23 | %§ | 10 Years | 3.49 | %§ | ||
| 2030 Strategy Fund - Class R1 | Russell 1000® Index** | ||||||
| Total | Total | ||||||
| Return | Return | ||||||
| 1 Year | 3.88 | % | 1 Year | 4.26 | % | ||
| 5 Years | 7.09 | %§ | 5 Years | 13.51 | %§ | ||
| 10 Years | 3.51 | %§ | 10 Years | 6.83 | %§ | ||
| 2030 Strategy Fund - Class R4‡‡ | |||||||
| Total | |||||||
| Return | |||||||
| 1 Year | 3.62 | % | |||||
| 5 Years | 6.82 | %§ | |||||
| 10 Years | 3.24 | %§ | |||||
154 2030 Strategy Fund
Russell Investment Company
2030 Strategy Fund
Portfolio Management Discussion and Analysis, continued — October 31, 2016
(Unaudited)
| The 2030 Strategy Fund (the “Fund”) is a fund of funds that | was beneficial as it was one of the best performing asset classes |
| invests in other Russell Investment Company mutual funds (the | globally. Falling interest rates also helped other fixed income |
| “Underlying Funds”). The Underlying Funds employ a multi- | assets in the Underlying Funds rally, as well as more rate sensitive |
| manager approach whereby portions of the Underlying Funds are | real assets like global real estate investment trusts and global |
| allocated to different money managers. Underlying Fund assets not | infrastructure. With interest rates falling, income opportunities |
| allocated to money managers are managed by Russell Investment | around the globe continued to shrink and income available from |
| Management, LLC (“RIM”), the Fund’s and Underlying Funds’ | most assets fell. |
| advisor. RIM, as the Underlying Funds’ advisor, may change | The U.S. equity market, as measured by the S&P 500® Index, |
| the allocation of the Underlying Funds’ assets among money | was up 4.51% over the period but also experienced multiple |
| managers at any time. An exemptive order from the Securities | draw downs. The Fund’s strategic exposure to global equities |
| and Exchange Commission (“SEC”) permits RIM to engage or | proved beneficial over the period as emerging markets rallied |
| terminate a money manager in an Underlying Fund at any time, | and outperformed U.S. equities. By contrast, non-U.S. developed |
| subject to approval by the Underlying Fund’s Board, without a | equity was one of the lowest performing portions of the Fund’s |
| shareholder vote. Pursuant to the terms of the exemptive order, an | exposure as falling commodities and currencies weighed on |
| Underlying Fund is required to notify its shareholders within 90 | returns. |
| days of when a money manager begins providing services. | |
| What is the Fund’s investment objective? | How did the investment strategies and techniques employed |
| by the Fund and the Underlying Funds affect the Fund’s | |
| The Fund seeks to provide capital growth and income consistent | performance? |
| with its current asset allocation which will change over time, with | The Fund is a fund of funds and its performance is based on RIM’s |
| an increasing allocation to fixed income funds. | strategic asset allocations, the performance of the Underlying |
| The Fund pursues this objective by investing in a diversified | Funds in which the Fund invests, and tactical changes in the |
| portfolio that, as of October 31, 2016, consisted of approximately | Fund’s asset allocation throughout the year. |
| 56.8% equity Underlying Funds, 35.1% fixed income Underlying | In order to seek to achieve the Fund’s objective during the period, |
| Funds and 8.1% alternative Underlying Funds. The Fund’s | RIM’s strategic asset allocation included investments in global |
| allocation to fixed income Underlying Funds will be fixed at | equity, alternative and fixed income Underlying Funds. The |
| 66.3% in approximately the year 2030. | Fund’s diverse asset allocation partially hindered performance |
| How did the Fund perform relative to its benchmark for the | during the period as certain of these exposures underperformed |
| fiscal year ended October 31, 2016? | the Russell 1000® Index. While areas like high yield bonds, as |
| For the fiscal year ended October 31, 2016, the Fund’s Class A, | measured by the BofA Merrill Lynch Global High Yield Index |
| Class E, Class R1, Class R4, Class R5 and Class S Shares gained | Hedged USD, outperformed the Russell 1000® Index, areas like |
| 3.70%, 3.63%, 3.88%, 3.62%, 3.34% and 3.87%, respectively. | commodities and non-U.S. developed equities delivered negative |
| This is compared to the Fund’s primary benchmark, the Russell | returns as measured by the Bloomberg Commodity Index Total |
| 1000® Index, which gained 4.26% during the same period. The | Return and Russell Developed ex-U.S. Large Cap® Index Net, |
| Fund’s performance includes operating expenses, whereas index | respectively. |
| returns are unmanaged and do not include expenses of any kind. | The Fund’s underperformance relative to the Russell 1000® |
| For the fiscal year ended October 31, 2016, the Morningstar® | Index was partially offset by strong active management within |
| Target-Date 2030 Category gained 3.04%. This result serves as | the fixed income portion of the Fund’s portfolio. Underlying Fund |
| a peer comparison and is expressed net of operating expenses. | bond issue selection during the period was generally additive to |
| returns as fixed income money managers were able to pick well | |
| How did the market conditions described in the Market | within credit, avoiding defaults in places like the energy sector |
| Summary report affect the Fund’s performance? | where trouble occurred with falling energy prices in early 2016. |
| The Fund seeks to achieve its objective by investing in Underlying | As such, an allocation to the Russell Strategic Bond Fund was |
| Funds that provide exposure to a range of diversified investments, | positive from a benchmark-relative perspective. The Underlying |
| and most major asset classes invested in by the Underlying | Fund was positively impacted by its overweight to credit and |
| Funds produced positive absolute returns during the period. | additive currency positioning also helped to drive excess return. |
| Markets during the fiscal year were characterized by higher | By contrast, equity selection and positioning was more difficult, |
| levels of volatility and dispersion across return sources. Within | with allocations to non-U.S. equity Underlying Funds detracting |
| the fixed income Underlying Funds, exposure to high yield debt | from the Fund’s performance and security selection within |
2030 Strategy Fund 155
Russell Investment Company
2030 Strategy Fund
Portfolio Management Discussion and Analysis, continued — October 31, 2016
(Unaudited)
| those Underlying Funds struggling. In addition, overweights | in high yield credit and emerging markets equity compared with | |
| to European securities in the Select International Equity Fund | core bond holdings and cash. Markets subsequently rebounded | |
| caused the Underlying Fund to struggle as European equities | from the February lows and RIM reduced risk exposure to a more | |
| continued to lag the U.S. equity market. | defensive stance with the Fund’s equity allocation below strategic | |
| weights. RIM’s modifications to the Fund’s asset allocation were | ||
| Describe any changes to the Fund’s structure or allocation | additive during the period. | |
| to the Underlying Funds. | ||
| RIM has the discretion to vary the Fund’s actual allocation from | The views expressed in this report reflect those of the | |
| the target strategic asset allocation by up to +/- 5% at the equity, | portfolio managers only through the end of the period | |
| fixed income or alternative category level based on RIM’s capital | covered by the report. These views do not necessarily | |
| markets research. RIM’s asset allocation modifications benefited | represent the views of RIM, or any other person in RIM or | |
| the Fund’s performance relative to the Fund’s target strategic | any other affiliated organization. These views are subject | |
| asset allocation. | to change at any time based upon market conditions or | |
| RIM adapted the Fund’s asset allocation over the period as market | other events, and RIM disclaims any responsibility to | |
| opportunities and risks evolved. The Fund was defensively | update the views contained herein. These views should not | |
| positioned in the fourth quarter of 2015, favoring fixed income | be relied on as investment advice and, because investment | |
| over equity Underlying Funds. During the first quarter of 2016, | decisions for a Russell Investment Company (“RIC”) Fund | |
| equity markets declined substantially, and RIM added further risk | are based on numerous factors, should not be relied on as | |
| to the portfolio by overweighting Underlying Funds that invest | an indication of investment decisions of any RIC Fund. | |
^ In prior years, the performance of the Fund’s Class E shares was used in the line graph. Class S Shares will have substantially similar annual returns as the Class
E Shares because the Shares of each Class are invested in the same portfolio of securities. Annual returns for each Class will differ only to the extent that the
Class S Shares do not have the same expenses as the Class E Shares.
* Assumes initial investment on November 1, 2006.
** Russell 1000® Index includes the 1,000 largest companies in the Russell 3000® Index. The Russell 1000® Index represents the universe of stocks from which
most active money managers typically select. The Russell 1000® Index return reflects adjustments from income dividends and capital gain distributions
reinvested as of the ex-dividend dates.
‡ The performance shown has been adjusted to reflect the deduction of the maximum Class A sales charge of 5.75%.
‡‡ The Fund first issued Class R4 Shares on October 1, 2014. The returns shown for Class R4 Shares prior to that date are the returns of the Fund’s Class R2
Shares.
‡‡‡ The Fund first issued Class R5 Shares on October 1, 2014. The returns shown for Class R4 and Class R5 Shares prior to that date are the returns of the Fund’s
Class R3 Shares.
§ Annualized.
Performance is historical and assumes reinvestment of all dividends and capital gains. Investment return and principal value will fluctuate so that an investor’s
shares, when redeemed, may be worth more or less than when purchased. Past performance is not indicative of future results. The returns shown do not reflect the
deduction of taxes that a shareholder would pay on Fund distributions or the redemption of Fund shares. Additionally, the returns presented herein may differ from
the performance reported in the Financial Highlights as the returns herein are calculated in a manner consistent with standardized performance in accordance with
Securities and Exchange Commission rules, while the performance in the Financial Highlights has been calculated in accordance with U.S. Generally Accepted
Accounting Principles (“U.S. GAAP”).
156 2030 Strategy Fund
Russell Investment Company
2030 Strategy Fund
Shareholder Expense Example — October 31, 2016 (Unaudited)
| Fund Expenses | Hypothetical | |||||
| The following disclosure provides important information | Performance (5% | |||||
| Actual | return before | |||||
| regarding the Fund’s Shareholder Expense Example | Class A | Performance | expenses) | |||
| (“Example”). | Beginning Account Value | |||||
| May 1, 2016 | $ | 1,000.00 | $ | 1,000.00 | ||
| Example | Ending Account Value | |||||
| As a shareholder of the Fund, you incur two types of costs: (1) | October 31, 2016 | $ | 1,031.30 | $ | 1,023.88 | |
| transaction costs, including sales charges (loads) on certain | Expenses Paid During Period* | $ | 1.28 | $ | 1.27 | |
| purchase or redemption payments, and (2) ongoing costs, | * Expenses are equal to the Fund's annualized expense ratio of 0.25% | |||||
| including advisory and administrative fees; distribution and/or | (representing the six month period annualized), multiplied by the average | |||||
| service fees; and other Fund expenses. The Example is intended | account value over the period, multiplied by 184/366 (to reflect the one-half | |||||
| year period). | ||||||
| to help you understand your ongoing costs (in dollars) of investing | ||||||
| in the Fund and to compare these costs with the ongoing costs of | Hypothetical | |||||
| investing in other mutual funds. The Example is based on an | Performance (5% | |||||
| Actual | return before | |||||
| investment of $1,000 invested at the beginning of the period and | Class E | Performance | expenses) | |||
| held for the entire period indicated, which for this Fund is from | Beginning Account Value | |||||
| May 1, 2016 to October 31, 2016. | May 1, 2016 | $ | 1,000.00 | $ | 1,000.00 | |
| Ending Account Value | ||||||
| Actual Expenses | October 31, 2016 | $ | 1,030.50 | $ | 1,023.88 | |
| The information in the table under the heading “Actual | Expenses Paid During Period* | $ | 1.28 | $ | 1.27 | |
| Performance” provides information about actual account values | * Expenses are equal to the Fund's annualized expense ratio of 0.25% | |||||
| and actual expenses. You may use the information in this column, | (representing the six month period annualized), multiplied by the average | |||||
| together with the amount you invested, to estimate the expenses | account value over the period, multiplied by 184/366 (to reflect the one-half | |||||
| that you paid over the period. Simply divide your account value by | year period). | |||||
| $1,000 (for example, an $8,600 account value divided by $1,000 | Hypothetical | |||||
| = 8.6), then multiply the result by the number in the first column | Performance (5% | |||||
| in the row entitled “Expenses Paid During Period” to estimate | Actual | return before | ||||
| the expenses you paid on your account during this period. | Class R1 | Performance | expenses) | |||
| Beginning Account Value | ||||||
| Hypothetical Example for Comparison Purposes | May 1, 2016 | $ | 1,000.00 | $ | 1,000.00 | |
| Ending Account Value | ||||||
| The information in the table under the heading “Hypothetical | October 31, 2016 | $ | 1,031.70 | $ | 1,025.14 | |
| Performance (5% return before expenses)” provides information | Expenses Paid During Period* | $ | — | $ | — | |
| about hypothetical account values and hypothetical expenses | ||||||
| based on the Fund’s actual expense ratio and an assumed rate of | * There were no expenses charged to the Class. | |||||
| return of 5% per year before expenses, which is not the Fund’s | Hypothetical | |||||
| actual return. The hypothetical account values and expenses | Performance (5% | |||||
| may not be used to estimate the actual ending account balance or | Actual | return before | ||||
| Class R4 | Performance | expenses) | ||||
| expenses you paid for the period. You may use this information | Beginning Account Value | |||||
| to compare the ongoing costs of investing in the Fund and other | May 1, 2016 | $ | 1,000.00 | $ | 1,000.00 | |
| funds. To do so, compare this 5% hypothetical example with the | Ending Account Value | |||||
| 5% hypothetical examples that appear in the shareholder reports | October 31, 2016 | $ | 1,030.40 | $ | 1,023.88 | |
| of other funds. | Expenses Paid During Period* | $ | 1.28 | $ | 1.27 | |
| Please note that the expenses shown in the table are meant | * Expenses are equal to the Fund's annualized expense ratio of 0.25% | |||||
| to highlight your ongoing costs only and do not reflect any | (representing the six month period annualized), multiplied by the average | |||||
| account value over the period, multiplied by 184/366 (to reflect the one-half | ||||||
| transactional costs. Therefore, the information under the heading | year period). | |||||
| “Hypothetical Performance (5% return before expenses)” is | ||||||
| useful in comparing ongoing costs only, and will not help you | ||||||
| determine the relative total costs of owning different funds. In | ||||||
| addition, if these transactional costs were included, your costs | ||||||
| would have been higher. | ||||||
2030 Strategy Fund 157
Russell Investment Company
2030 Strategy Fund
Shareholder Expense Example, continued — October 31, 2016 (Unaudited)
| Hypothetical | ||||
| Performance (5% | ||||
| Actual | return before | |||
| Class R5 | Performance | expenses) | ||
| Beginning Account Value | ||||
| May 1, 2016 | $ | 1,000.00 | $ | 1,000.00 |
| Ending Account Value | ||||
| October 31, 2016 | $ | 1,029.00 | $ | 1,022.62 |
| Expenses Paid During Period* | $ | 2.55 | $ | 2.54 |
* Expenses are equal to the Fund's annualized expense ratio of 0.50%
(representing the six month period annualized), multiplied by the average
account value over the period, multiplied by 184/366 (to reflect the one-half
year period).
| Hypothetical | |||||
| Performance (5% | |||||
| Actual | return before | ||||
| Class S | Performance | expenses) | |||
| Beginning Account Value | |||||
| May 1, 2016 | $ | 1,000.00 | $ | 1,000.00 | |
| Ending Account Value | |||||
| October 31, 2016 | $ | 1,031.70 | $ | 1,025.14 | |
| Expenses Paid During Period* | $ | — | $ | — | |
| * There were no expenses charged to the Class. | |||||
158 2030 Strategy Fund
Russell Investment Company
2030 Strategy Fund
Schedule of Investments — October 31, 2016
| Amounts in thousands (except share amounts) | ||||
| Fair | ||||
| Value | ||||
| Shares | $ | |||
| Investments in Russell Affiliated Mutual Funds - 100.0% | ||||
| Alternative - 6.5% | ||||
| Russell Commodity Strategies Fund Class Y | 338,791 | 1,867 | ||
| Russell Global Infrastructure Fund Class Y | 134,641 | 1,539 | ||
| Russell Global Real Estate Securities Fund Class Y | 33,261 | 1,188 | ||
| 4,594 | ||||
| Domestic Equities - 29.9% | ||||
| Russell U.S. Defensive Equity Fund Class Y | 40,279 | 1,983 | ||
| Russell U.S. Dynamic Equity Fund Class Y | 222,056 | 2,205 | ||
| Russell U.S. Small Cap Equity Fund Class Y | 137,541 | 3,797 | ||
| Select U.S. Equity Fund Class Y | 1,200,116 | 13,105 | ||
| 21,090 | ||||
| Fixed Income - 35.2% | ||||
| Russell Global Opportunistic Credit Fund Class Y | 190,847 | 1,855 | ||
| Russell Investment Grade Bond Fund Class Y | 236,970 | 5,292 | ||
| Russell Strategic Bond Fund Class Y | 1,594,609 | 17,636 | ||
| 24,783 | ||||
| International Equities - 28.4% | ||||
| Russell Emerging Markets Fund Class Y | 198,950 | 3,316 | ||
| Russell Global Equity Fund Class Y | 617,528 | 6,441 | ||
| Select International Equity Fund Class Y | 1,199,033 | 10,300 | ||
| 20,057 | ||||
| Total Investments in Russell Affiliated Mutual Funds | ||||
| (cost $61,413) | 70,524 | |||
| Total Investments 100.0% | ||||
| (identified cost $61,413) | 70,524 | |||
| Other Assets and Liabilities, Net - (0.0%) | (8 | ) | ||
| Net Assets - 100.0% | 70,516 | |||
| Presentation of Portfolio Holdings | ||||||||||||||
| Amounts in thousands | ||||||||||||||
| Fair Value | ||||||||||||||
| Practical | ||||||||||||||
| Portfolio Summary | Level 1 | Level 2 | Level 3 | Expedient (a) | Total | % of Net Assets | ||||||||
| Investments in Russell Affiliated Mutual | ||||||||||||||
| Funds | $ | 70,524 | $ | — | $ | — | $ | — | $ | 70,524 | 100.0 | |||
| Total Investments | 70,524 | — | — | — | 70,524 | 100.0 | ||||||||
| Other Assets and Liabilities, Net | (—)* | |||||||||||||
| 100.0 | ||||||||||||||
| * Less than 0.05% of net assets. | ||||||||||||||
For a description of the Levels, see note 2 in the Notes to Financial Statements.
For a disclosure on transfers between Levels 1, 2 and 3 during the period ended October 31, 2016, see note 2 in the Notes to
Financial Statements.
See accompanying notes which are an integral part of the financial statements.
2030 Strategy Fund 159
Russell Investment Company
2030 Strategy Fund
Statement of Assets and Liabilities — October 31, 2016
| Amounts in thousands | ||
| Assets | ||
| Investments, at identified cost | $ | 61,413 |
| Investments, at fair value(>) | 70,524 | |
| Receivables: | ||
| Investments sold | 72 | |
| Fund shares sold | 21 | |
| Total assets | 70,617 | |
| Liabilities | ||
| Payables: | ||
| Fund shares redeemed | 92 | |
| Accrued fees to affiliates | 9 | |
| Total liabilities | 101 | |
| Net Assets | $ | 70,516 |
| Net Assets Consist of: | ||
| Accumulated net realized gain (loss) | $ | 631 |
| Unrealized appreciation (depreciation) on investments | 9,111 | |
| Shares of beneficial interest | 88 | |
| Additional paid-in capital | 60,686 | |
| Net Assets | $ | 70,516 |
| Net Asset Value, offering and redemption price per share: | ||
| Net asset value per share: Class A(#) | $ | 8.13 |
| Maximum offering price per share (Net asset value plus sales charge of 5.75%): Class A | $ | 8.63 |
| Class A — Net assets | $ | 812,830 |
| Class A — Shares outstanding ($.01 par value) | 99,986 | |
| Net asset value per share: Class E(#) | $ | 8.03 |
| Class E — Net assets | $ | 277,681 |
| Class E — Shares outstanding ($.01 par value) | 34,565 | |
| Net asset value per share: Class R1(#) | $ | 8.05 |
| Class R1 — Net assets | $ | 35,654,849 |
| Class R1 — Shares outstanding ($.01 par value) | 4,429,755 | |
| Net asset value per share: Class R4(#) | $ | 8.03 |
| Class R4 — Net assets | $ | 10,460,624 |
| Class R4 — Shares outstanding ($.01 par value) | 1,302,495 | |
| Net asset value per share: Class R5(#) | $ | 8.04 |
| Class R5 — Net assets | $ | 14,110,803 |
| Class R5 — Shares outstanding ($.01 par value) | 1,754,157 | |
| Net asset value per share: Class S(#) | $ | 8.04 |
| Class S — Net assets | $ | 9,198,852 |
| Class S — Shares outstanding ($.01 par value) | 1,143,612 | |
| Amounts in thousands | ||
| (>) Investments in affiliated Russell funds | $ | 70,524 |
| (#) Net asset value per share equals class level net assets divided by class level shares of beneficial interest outstanding. | ||
See accompanying notes which are an integral part of the financial statements.
160 2030 Strategy Fund
Russell Investment Company
2030 Strategy Fund
Statement of Operations — For the Period Ended October 31, 2016
| Amounts in thousands | |||
| Investment Income | |||
| Income distributions from affiliated Russell funds | $ | 2,088 | |
| Expenses | |||
| Distribution fees - Class A | 2 | ||
| Distribution fees - Class R5 | 41 | ||
| Shareholder servicing fees - Class E | 1 | ||
| Shareholder servicing fees - Class R4 | 26 | ||
| Shareholder servicing fees - Class R5 | 42 | ||
| Total expenses | 112 | ||
| Net investment income (loss) | 1,976 | ||
| Net Realized and Unrealized Gain (Loss) | |||
| Net realized gain (loss) on: | |||
| Investments | 549 | ||
| Capital gain distributions from Underlying Funds | 1,415 | ||
| Net realized gain (loss) | 1,964 | ||
| Net change in unrealized appreciation (depreciation) on investments | (1,423 | ) | |
| Net realized and unrealized gain (loss) | 541 | ||
| Net Increase (Decrease) in Net Assets from Operations | $ | 2,517 | |
See accompanying notes which are an integral part of the financial statements.
2030 Strategy Fund 161
Russell Investment Company
2030 Strategy Fund
Statements of Changes in Net Assets
| For the Periods Ended October 31, | ||||||
| Amounts in thousands | 2016 | 2015 | ||||
| Increase (Decrease) in Net Assets | ||||||
| Operations | ||||||
| Net investment income (loss) | $ | 1,976 | $ | 2,384 | ||
| Net realized gain (loss) | 1,964 | 4,869 | ||||
| Net change in unrealized appreciation (depreciation) | (1,423 | ) | (7,054 | ) | ||
| Net increase (decrease) in net assets from operations | 2,517 | 199 | ||||
| Distributions | ||||||
| From net investment income | ||||||
| Class A | (18 | ) | (35 | ) | ||
| Class E | (7 | ) | (6 | ) | ||
| Class R1 | (1,085 | ) | (1,205 | ) | ||
| Class R4 | (261 | ) | (333 | ) | ||
| Class R5 | (385 | ) | (527 | ) | ||
| Class S | (230 | ) | (281 | ) | ||
| From net realized gain | ||||||
| Class A | (49 | ) | (599 | ) | ||
| Class E | (20 | ) | (76 | ) | ||
| Class R1 | (2,744 | ) | (14,989 | ) | ||
| Class R4 | (707 | ) | (4,908 | ) | ||
| Class R5 | (1,206 | ) | (9,219 | ) | ||
| Class S | (562 | ) | (3,747 | ) | ||
| Net decrease in net assets from distributions | (7,274 | ) | (35,925 | ) | ||
| Share Transactions* | ||||||
| Net increase (decrease) in net assets from share transactions | (11,057 | ) | (1,386 | ) | ||
| Total Net Increase (Decrease) in Net Assets | (15,814 | ) | (37,112 | ) | ||
| Net Assets | ||||||
| Beginning of period | 86,330 | 123,442 | ||||
| End of period | $ | 70,516 | $ | 86,330 | ||
See accompanying notes which are an integral part of the financial statements.
162 2030 Strategy Fund
Russell Investment Company
2030 Strategy Fund
Statements of Changes in Net Assets, continued
* Share transaction amounts (in thousands) for the periods ended October 31, 2016 and October 31, 2015 were as follows:
| 2016 | 2015 | |||||||||||
| Shares | Dollars | Shares | Dollars | |||||||||
| Class A | ||||||||||||
| Proceeds from shares sold | 8 | $ | 63 | 3 | $ | 29 | ||||||
| Proceeds from reinvestment of distributions | 9 | 68 | 72 | 630 | ||||||||
| Payments for shares redeemed | (5 | ) | (38 | ) | (147 | ) | (1,294 | ) | ||||
| Net increase (decrease) | 12 | 93 | (72 | ) | (635 | ) | ||||||
| Class E | ||||||||||||
| Proceeds from shares sold | 11 | 86 | 10 | 94 | ||||||||
| Proceeds from reinvestment of distributions | 3 | 27 | 9 | 81 | ||||||||
| Payments for shares redeemed | (11 | ) | (85 | ) | (17 | ) | (185 | ) | ||||
| Net increase (decrease) | 3 | 28 | 2 | (10 | ) | |||||||
| Class R1 | ||||||||||||
| Proceeds from shares sold | 1,083 | 8,582 | 2,654 | 24,599 | ||||||||
| Proceeds from reinvestment of distributions | 493 | 3,800 | 1,868 | 16,192 | ||||||||
| Payments for shares redeemed | (2,470 | ) | (19,697 | ) | (3,254 | ) | (29,966 | ) | ||||
| Net increase (decrease) | (894 | ) | (7,315 | ) | 1,268 | 10,825 | ||||||
| Class R4 | ||||||||||||
| Proceeds from shares sold | 193 | 1,528 | 207 | 1,866 | ||||||||
| Proceeds from reinvestment of distributions | 126 | 968 | 606 | 5,241 | ||||||||
| Payments for shares redeemed | (254 | ) | (2,007 | ) | (926 | ) | (8,193 | ) | ||||
| Net increase (decrease) | 65 | 489 | (113 | ) | (1,086 | ) | ||||||
| Class R5 | ||||||||||||
| Proceeds from shares sold | 330 | 2,585 | 563 | 5,170 | ||||||||
| Proceeds from reinvestment of distributions | 206 | 1,590 | 1,125 | 9,747 | ||||||||
| Payments for shares redeemed | (1,141 | ) | (9,017 | ) | (2,496 | ) | (24,345 | ) | ||||
| Net increase (decrease) | (605 | ) | (4,842 | ) | (808 | ) | (9,428 | ) | ||||
| Class S | ||||||||||||
| Proceeds from shares sold | 219 | 1,734 | 277 | 2,531 | ||||||||
| Proceeds from reinvestment of distributions | 103 | 792 | 465 | 4,028 | ||||||||
| Payments for shares redeemed | (256 | ) | (2,036 | ) | (800 | ) | (7,611 | ) | ||||
| Net increase (decrease) | 66 | 490 | (58 | ) | (1,052 | ) | ||||||
| Total increase (decrease) | (1,353 | ) | $ | (11,057 | ) | 219 | $ | (1,386 | ) | |||
See accompanying notes which are an integral part of the financial statements.
2030 Strategy Fund 163
Russell Investment Company
2030 Strategy Fund
Financial Highlights — For the Periods Ended
For a Share Outstanding Throughout Each Period.
| $ | ||||||||||||||||
| $ | Net | $ | $ | $ | $ | |||||||||||
| Net Asset Value, | Investment | Net Realized | Total from | Distributions | Distributions | |||||||||||
| Beginning of | Income (Loss) | and Unrealized | Investment | from Net | from Net | |||||||||||
| Period | (a)(b)(e) | Gain (Loss) | Operations | Investment Income | Realized Gain | |||||||||||
| Class A | ||||||||||||||||
| October 31, 2016 | 8.61 | .19 | .09 | .28 | (.20 | ) | (.56 | ) | ||||||||
| October 31, 2015 | 12.55 | .31 | (.28 | ) | .03 | (.24 | ) | (3.73 | ) | |||||||
| October 31, 2014 | 12.05 | .26 | .50 | .76 | (.26 | ) | — | |||||||||
| October 31, 2013 | 10.55 | .21 | 1.50 | 1.71 | (.21 | ) | — | |||||||||
| October 31, 2012 | 9.92 | .17 | .64 | .81 | (.18 | ) | — | |||||||||
| Class E | ||||||||||||||||
| October 31, 2016 | 8.52 | .21 | .06 | .27 | (.20 | ) | (.56 | ) | ||||||||
| October 31, 2015 | 12.46 | .18 | (.15 | ) | .03 | (.24 | ) | (3.73 | ) | |||||||
| October 31, 2014 | 11.96 | .28 | .48 | .76 | (.26 | ) | — | |||||||||
| October 31, 2013 | 10.48 | .21 | 1.48 | 1.69 | (.21 | ) | — | |||||||||
| October 31, 2012 | 9.84 | .19 | .63 | .82 | (.18 | ) | — | |||||||||
| Class R1 | ||||||||||||||||
| October 31, 2016 | 8.54 | .22 | .07 | .29 | (.22 | ) | (.56 | ) | ||||||||
| October 31, 2015 | 12.48 | .21 | (.16 | ) | .05 | (.26 | ) | (3.73 | ) | |||||||
| October 31, 2014 | 11.98 | .33 | .47 | .80 | (.30 | ) | — | |||||||||
| October 31, 2013 | 10.49 | .24 | 1.49 | 1.73 | (.24 | ) | — | |||||||||
| October 31, 2012 | 9.86 | .20 | .64 | .84 | (.21 | ) | — | |||||||||
| Class R4(1) | ||||||||||||||||
| October 31, 2016 | 8.52 | .19 | .08 | .27 | (.20 | ) | (.56 | ) | ||||||||
| October 31, 2015 | 12.46 | .20 | (.17 | ) | .03 | (.24 | ) | (3.73 | ) | |||||||
| October 31, 2014 | 11.96 | .27 | .49 | .76 | (.26 | ) | — | |||||||||
| October 31, 2013 | 10.48 | .21 | 1.48 | 1.69 | (.21 | ) | — | |||||||||
| October 31, 2012 | 9.84 | .20 | .61 | .81 | (.17 | ) | — | |||||||||
| Class R5(2) | ||||||||||||||||
| October 31, 2016 | 8.53 | .18 | .07 | .25 | (.18 | ) | (.56 | ) | ||||||||
| October 31, 2015 | 12.47 | .19 | (.19 | ) | — | (.21 | ) | (3.73 | ) | |||||||
| October 31, 2014 | 11.97 | .26 | .47 | .73 | (.23 | ) | — | |||||||||
| October 31, 2013 | 10.48 | .19 | 1.48 | 1.67 | (.18 | ) | — | |||||||||
| October 31, 2012 | 9.84 | .16 | .63 | .79 | (.15 | ) | — | |||||||||
| Class S | ||||||||||||||||
| October 31, 2016 | 8.53 | .21 | .08 | .29 | (.22 | ) | (.56 | ) | ||||||||
| October 31, 2015 | 12.47 | .23 | (.18 | ) | .05 | (.26 | ) | (3.73 | ) | |||||||
| October 31, 2014 | 11.98 | .33 | .46 | .79 | (.30 | ) | — | |||||||||
| October 31, 2013 | 10.49 | .24 | 1.49 | 1.73 | (.24 | ) | — | |||||||||
| October 31, 2012 | 9.86 | .20 | .64 | .84 | (.21 | ) | — | |||||||||
See accompanying notes which are an integral part of the financial statements.
164 2030 Strategy Fund
| % | % | % | |||||||||||||||
| $ | $ | Ratio of Expenses | Ratio of Expenses | Ratio of Net | |||||||||||||
| Net Asset Value, | % | Net Assets, | to Average | to Average | Investment Income | % | |||||||||||
| $ | End of | Total | End of Period | Net Assets, | Net Assets, | to Average | Portfolio | ||||||||||
| Total Distributions | Period | Return(d) | (000 | ) | Gross(g) | Net(e)(g) | Net Assets(b)(e) | Turnover Rate | |||||||||
| (.76 | ) | 8.13 | 3.70 | 813 | .25 | .25 | 2.37 | 24 | |||||||||
| (3.97 | ) | 8.61 | (.07 | ) | 757 | .25 | .25 | 3.23 | 32 | ||||||||
| (.26 | ) | 12.55 | 6.40 | 2,011 | .25 | .25 | 2.14 | 60 | |||||||||
| (.21 | ) | 12.05 | 16.42 | 2,321 | .25 | .25 | 1.85 | 16 | |||||||||
| (.18 | ) | 10.55 | 8.32 | 2,033 | .25 | .25 | 1.70 | 26 | |||||||||
| (.76 | ) | 8.03 | 3.63 | 278 | .25 | .25 | 2.69 | 24 | |||||||||
| (3.97 | ) | 8.52 | (.08 | ) | 270 | .25 | .25 | 2.01 | 32 | ||||||||
| (.26 | ) | 12.46 | 6.43 | 362 | .25 | .25 | 2.25 | 60 | |||||||||
| (.21 | ) | 11.96 | 16.34 | 527 | .25 | .25 | 1.84 | 16 | |||||||||
| (.18 | ) | 10.48 | 8.46 | 589 | .25 | .25 | 1.90 | 26 | |||||||||
| (.78 | ) | 8.05 | 3.88 | 35,655 | — | — | 2.75 | 24 | |||||||||
| (3.99 | ) | 8.54 | .22 | 45,445 | — | — | 2.29 | 32 | |||||||||
| (.30 | ) | 12.48 | 6.72 | 50,599 | — | — | 2.66 | 60 | |||||||||
| (.24 | ) | 11.98 | 16.71 | 83,569 | — | — | 2.18 | 16 | |||||||||
| (.21 | ) | 10.49 | 8.65 | 87,265 | — | — | 1.99 | 26 | |||||||||
| (.76 | ) | 8.03 | 3.62 | 10,460 | .25 | .25 | 2.43 | 24 | |||||||||
| (3.97 | ) | 8.52 | (.05 | ) | 10,545 | .25 | .25 | 2.22 | 32 | ||||||||
| (.26 | ) | 12.46 | 6.45 | 16,830 | .25 | .25 | 2.21 | 60 | |||||||||
| (.21 | ) | 11.96 | 16.33 | 20,147 | .25 | .25 | 1.86 | 16 | |||||||||
| (.17 | ) | 10.48 | 8.43 | 21,520 | .25 | .25 | 1.96 | 26 | |||||||||
| (.74 | ) | 8.04 | 3.34 | 14,111 | .50 | .50 | 2.31 | 24 | |||||||||
| (3.94 | ) | 8.53 | (.35 | ) | 20,120 | .50 | .50 | 2.02 | 32 | ||||||||
| (.23 | ) | 12.47 | 6.17 | 39,472 | .50 | .50 | 2.12 | 60 | |||||||||
| (.18 | ) | 11.97 | 16.13 | 51,507 | .50 | .50 | 1.66 | 16 | |||||||||
| (.15 | ) | 10.48 | 8.15 | 50,961 | .50 | .50 | 1.64 | 26 | |||||||||
| (.78 | ) | 8.04 | 3.87 | 9,199 | — | — | 2.64 | 24 | |||||||||
| (3.99 | ) | 8.53 | .22 | 9,193 | — | — | 2.46 | 32 | |||||||||
| (.30 | ) | 12.47 | 6.63 | 14,168 | — | — | 2.68 | 60 | |||||||||
| (.24 | ) | 11.98 | 16.71 | 20,905 | — | — | 2.15 | 16 | |||||||||
| (.21 | ) | 10.49 | 8.65 | 24,300 | — | — | 1.98 | 26 | |||||||||
See accompanying notes which are an integral part of the financial statements.
2030 Strategy Fund 165
Russell Investment Company
2030 Strategy Fund
Related Party Transactions, Fees and Expenses
| Accrued fees payable to affiliates for the period ended October 31, 2016 were as follows: | ||
| Distribution fees | $ | 3,293 |
| Shareholder servicing fees | 5,398 | |
| $ | 8,691 | |
| Transactions (amounts in thousands) during the period ended October 31, 2016 with Underlying Funds which are, or were, an | ||||||||||||||||||||
| affiliated company are as follows: | ||||||||||||||||||||
| Fair Value, | Change in | |||||||||||||||||||
| Beginning of | Realized Gain | Unrealized | Fair Value, End | Income | Capital Gains | |||||||||||||||
| Period | Purchases | Sales | (Loss) | Gain (Loss) | of Period | Distributions | Distributions | |||||||||||||
| Russell Commodity Strategies Fund | $ | 2,387 | $ | 474 | $ | 915 | $ | (23) | $ | 204 | $ | 1,867 | $ | — | $ | — | ||||
| Russell Global Infrastructure Fund | 1,943 | 307 | 698 | (117) | 104 | 1,539 | 50 | 49 | ||||||||||||
| Russell Global Real Estate Securities | ||||||||||||||||||||
| Fund | 1,926 | 339 | 919 | 335 | (493 | ) | 1,188 | 41 | 86 | |||||||||||
| Russell U.S. Defensive Equity Fund | 2,463 | 183 | 728 | 371 | (306 | ) | 1,983 | 33 | — | |||||||||||
| Russell U.S. Dynamic Equity Fund | 2,872 | 801 | 1,153 | 22 | (337 | ) | 2,205 | 127 | 256 | |||||||||||
| Russell U.S. Small Cap Equity Fund | 4,983 | 1,233 | 2,280 | 599 | (738 | ) | 3,797 | 42 | 303 | |||||||||||
| Select U.S. Equity Fund | 16,392 | 1,968 | 5,513 | 263 | (5 | ) | 13,105 | 399 | 21 | |||||||||||
| Russell Global Opportunistic Credit | ||||||||||||||||||||
| Fund | 3,020 | 381 | 1,668 | (150 | ) | 272 | 1,855 | 84 | — | |||||||||||
| Russell Investment Grade Bond Fund | 5,164 | 2,474 | 2,414 | (26 | ) | 94 | 5,292 | 207 | 8 | |||||||||||
| Russell Strategic Bond Fund | 20,659 | 5,174 | 8,414 | 55 | 162 | 17,636 | 618 | 109 | ||||||||||||
| Russell Emerging Markets Fund | 4,305 | 579 | 1,854 | (148 | ) | 434 | 3,316 | 15 | — | |||||||||||
| Russell Global Equity Fund | 7,535 | 2,081 | 2,642 | 284 | (817 | ) | 6,441 | 135 | 583 | |||||||||||
| Select International Equity Fund | 12,691 | 2,250 | 3,988 | (656 | ) | 3 | 10,300 | 337 | — | |||||||||||
| $ | 86,340 | $ | 18,244 | $ | 33,186 | $ | 549 | $ | (1,423) | $ | 70,524 | $ | 2,088 | $ | 1,415 | |||||
Federal Income Taxes
At October 31, 2016, the cost of investments and net unrealized appreciation (depreciation), undistributed ordinary income and
undistributed long-term capital gains for income tax purposes were as follows:
| Cost of Investments | $ | 62,989,373 | ||
| Unrealized Appreciation | $ | 9,044,077 | ||
| Unrealized Depreciation | (1,509,098 | ) | ||
| Net Unrealized Appreciation (Depreciation) | $ | 7,534,979 | ||
| Undistributed Ordinary Income | $ | 139,795 | ||
| Undistributed Long-Term Capital Gains | ||||
| (Capital Loss Carryforward) | $ | 2,067,226 | ||
| Tax Composition of Distributions | ||||
| Ordinary Income | $ | 2,063,435 | ||
| Long-Term Capital Gains | $ | 5,211,353 |
See accompanying notes which are an integral part of the financial statements.
166 2030 Strategy Fund
Russell Investment Company
2030 Strategy Fund
Federal Income Taxes, continued
Net investment income and net realized gains (losses) in the financial statements may differ from taxable net investment income and
net realized gains (losses). Capital accounts within the financial statements are adjusted for permanent differences between book and
tax accounting. These differences may be due to foreign currency gains or losses, reclassifications of dividends and /or differences in
treatment of income from swaps. These adjustments have no impact on the net assets.
At October 31, 2016, the Statement of Assets and Liabilities have been adjusted by the following amounts (in thousands):
| Undistributed net investment income | $ | 10 | |
| Accumulated net realized gain (loss) | (10 | ) | |
| Additional paid-in capital | — |
See accompanying notes which are an integral part of the financial statements.
2030 Strategy Fund 167
Russell Investment Company
2035 Strategy Fund
Portfolio Management Discussion and Analysis — October 31, 2016 (Unaudited)

| 2035 Strategy Fund - Class R1 | 2035 Strategy Fund - Class R5‡ | ||||||
| Total | Total | ||||||
| Return | Return | ||||||
| 1 Year | 3.41 | % | 1 Year | 2.99 | % | ||
| 5 Years | 7.74 | %§ | 5 Years | 7.23 | %§ | ||
| Inception* | 4.11 | %§ | Inception* | 3.60 | %§ | ||
| 2035 Strategy Fund - Class R4‡ | Russell 1000® Index** | ||||||
| Total | Total | ||||||
| Return | Return | ||||||
| 1 Year | 3.15 | % | 1 Year | 4.26 | % | ||
| 5 Years | 7.47 | %§ | 5 Years | 13.51 | %§ | ||
| Inception* | 3.84 | %§ | Inception* | 8.12 | %§ | ||
168 2035 Strategy Fund
Russell Investment Company
2035 Strategy Fund
Portfolio Management Discussion and Analysis, continued — October 31, 2016
(Unaudited)
| The 2035 Strategy Fund (the “Fund”) is a fund of funds that | was beneficial as it was one of the best performing asset classes |
| invests in other Russell Investment Company mutual funds (the | globally. Falling interest rates also helped other fixed income |
| “Underlying Funds”). The Underlying Funds employ a multi- | assets in the Underlying Funds rally, as well as more rate sensitive |
| manager approach whereby portions of the Underlying Funds are | real assets like global real estate investment trusts and global |
| allocated to different money managers. Underlying Fund assets not | infrastructure. With interest rates falling, income opportunities |
| allocated to money managers are managed by Russell Investment | around the globe continued to shrink and income available from |
| Management, LLC (“RIM”), the Fund’s and Underlying Funds’ | most assets fell. |
| advisor. RIM, as the Underlying Funds’ advisor, may change | The U.S. equity market, as measured by the S&P 500® Index, |
| the allocation of the Underlying Funds’ assets among money | was up 4.51% over the period but also experienced multiple |
| managers at any time. An exemptive order from the Securities | draw downs. The Fund’s strategic exposure to global equities |
| and Exchange Commission (“SEC”) permits RIM to engage or | proved beneficial over the period as emerging markets rallied |
| terminate a money manager in an Underlying Fund at any time, | and outperformed U.S. equities. By contrast, non-U.S. developed |
| subject to approval by the Underlying Fund’s Board, without a | equity was one of the lowest performing portions of the Fund’s |
| shareholder vote. Pursuant to the terms of the exemptive order, an | exposure as falling commodities and currencies weighed on |
| Underlying Fund is required to notify its shareholders within 90 | returns. |
| days of when a money manager begins providing services. | |
| What is the Fund’s investment objective? | How did the investment strategies and techniques employed |
| by the Fund and the Underlying Funds affect the Fund’s | |
| The Fund seeks to provide capital growth and income consistent | performance? |
| with its current asset allocation which will change over time, with | The Fund is a fund of funds and its performance is based on RIM’s |
| an increasing allocation to fixed income funds. | strategic asset allocations, the performance of the Underlying |
| The Fund pursues this objective by investing in a diversified | Funds in which the Fund invests, and tactical changes in the |
| portfolio that, as of October 31, 2016, consisted of approximately | Fund’s asset allocation throughout the year. |
| 70.0% equity Underlying Funds, 20.9% fixed income Underlying | In order to seek to achieve the Fund’s objective during the period, |
| Funds and 9.1% alternative Underlying Funds. The Fund’s | RIM’s strategic asset allocation included investments in global |
| allocation to fixed income Underlying Funds will be fixed at | equity, alternative and fixed income Underlying Funds. The |
| 66.3% in approximately the year 2035. | Fund’s diverse asset allocation partially hindered performance |
| How did the Fund perform relative to its benchmark for the | during the period as certain of these exposures underperformed |
| fiscal year ended October 31, 2016? | the Russell 1000® Index. While areas like high yield bonds, as |
| For the fiscal year ended October 31, 2016, the Fund’s Class R1, | measured by the BofA Merrill Lynch Global High Yield Index |
| Class R4 and Class R5 Shares gained 3.41%, 3.15% and 2.99%, | Hedged USD, outperformed the Russell 1000® Index, areas like |
| respectively. This is compared to the Fund’s primary benchmark, | commodities and non-U.S. developed equities delivered negative |
| the Russell 1000® Index, which gained 4.26% during the same | returns as measured by the Bloomberg Commodity Index Total |
| period. The Fund’s performance includes operating expenses, | Return and Russell Developed ex-U.S. Large Cap® Index Net, |
| whereas index returns are unmanaged and do not include | respectively. |
| expenses of any kind. | The Fund’s underperformance relative to the Russell 1000® |
| For the fiscal year ended October 31, 2016, the Morningstar® | Index was partially offset by strong active management within |
| Target-Date 2035 Category gained 2.65%. This result serves as | the fixed income portion of the Fund’s portfolio. Underlying Fund |
| a peer comparison and is expressed net of operating expenses. | bond issue selection during the period was generally additive to |
| returns as fixed income money managers were able to pick well | |
| How did the market conditions described in the Market | within credit, avoiding defaults in places like the energy sector |
| Summary report affect the Fund’s performance? | where trouble occurred with falling energy prices in early 2016. |
| The Fund seeks to achieve its objective by investing in Underlying | As such, an allocation to the Russell Strategic Bond Fund was |
| Funds that provide exposure to a range of diversified investments, | positive from a benchmark-relative perspective. The Underlying |
| and most major asset classes invested in by the Underlying | Fund was positively impacted by its overweight to credit and |
| Funds produced positive absolute returns during the period. | additive currency positioning also helped to drive excess return. |
| Markets during the fiscal year were characterized by higher | By contrast, equity selection and positioning was more difficult, |
| levels of volatility and dispersion across return sources. Within | with allocations to non-U.S. equity Underlying Funds detracting |
| the fixed income Underlying Funds, exposure to high yield debt | from the Fund’s performance and security selection within |
2035 Strategy Fund 169
Russell Investment Company
2035 Strategy Fund
Portfolio Management Discussion and Analysis, continued — October 31, 2016
(Unaudited)
| those Underlying Funds struggling. In addition, overweights | in high yield credit and emerging markets equity compared with | |
| to European securities in the Select International Equity Fund | core bond holdings and cash. Markets subsequently rebounded | |
| caused the Underlying Fund to struggle as European equities | from the February lows and RIM reduced risk exposure to a more | |
| continued to lag the U.S. equity market. | defensive stance with the Fund’s equity allocation below strategic | |
| weights. RIM’s modifications to the Fund’s asset allocation were | ||
| Describe any changes to the Fund’s structure or allocation | additive during the period. | |
| to the Underlying Funds. | ||
| RIM has the discretion to vary the Fund’s actual allocation from | The views expressed in this report reflect those of the | |
| the target strategic asset allocation by up to +/- 5% at the equity, | portfolio managers only through the end of the period | |
| fixed income or alternative category level based on RIM’s capital | covered by the report. These views do not necessarily | |
| markets research. RIM’s asset allocation modifications benefited | represent the views of RIM, or any other person in RIM or | |
| the Fund’s performance relative to the Fund’s target strategic | any other affiliated organization. These views are subject | |
| asset allocation. | to change at any time based upon market conditions or | |
| RIM adapted the Fund’s asset allocation over the period as market | other events, and RIM disclaims any responsibility to | |
| opportunities and risks evolved. The Fund was defensively | update the views contained herein. These views should not | |
| positioned in the fourth quarter of 2015, favoring fixed income | be relied on as investment advice and, because investment | |
| over equity Underlying Funds. During the first quarter of 2016, | decisions for a Russell Investment Company (“RIC”) Fund | |
| equity markets declined substantially, and RIM added further risk | are based on numerous factors, should not be relied on as | |
| to the portfolio by overweighting Underlying Funds that invest | an indication of investment decisions of any RIC Fund. | |
* Assumes initial investment on March 31, 2008.
** Russell 1000® Index includes the 1,000 largest companies in the Russell 3000® Index. The Russell 1000® Index represents the universe of stocks from which
most active money managers typically select. The Russell 1000® Index return reflects adjustments from income dividends and capital gain distributions
reinvested as of the ex-dividend dates.
‡ The Fund first issued Class R4 and Class R5 Shares on October 1, 2014. The returns shown for Class R4 and Class R5 Shares prior to that date are the returns
of the Fund’s Class R2 Shares and Class R3 Shares, respectively.
§ Annualized.
Performance is historical and assumes reinvestment of all dividends and capital gains. Investment return and principal value will fluctuate so that an investor’s
shares, when redeemed, may be worth more or less than when purchased. Past performance is not indicative of future results. The returns shown do not reflect the
deduction of taxes that a shareholder would pay on Fund distributions or the redemption of Fund shares. Additionally, the returns presented herein may differ from
the performance reported in the Financial Highlights as the returns herein are calculated in a manner consistent with standardized performance in accordance with
Securities and Exchange Commission rules, while the performance in the Financial Highlights has been calculated in accordance with U.S. Generally Accepted
Accounting Principles (“U.S. GAAP”).
170 2035 Strategy Fund
Russell Investment Company
2035 Strategy Fund
Shareholder Expense Example — October 31, 2016 (Unaudited)
| Fund Expenses | Hypothetical | |||||
| The following disclosure provides important information | Performance (5% | |||||
| Actual | return before | |||||
| regarding the Fund’s Shareholder Expense Example | Class R1 | Performance | expenses) | |||
| (“Example”). | Beginning Account Value | |||||
| May 1, 2016 | $ | 1,000.00 | $ | 1,000.00 | ||
| Example | Ending Account Value | |||||
| As a shareholder of the Fund, you incur ongoing costs, including | October 31, 2016 | $ | 1,034.00 | $ | 1,025.14 | |
| distribution (12b-1) and/or service fees and other Fund expenses. | Expenses Paid During Period* | $ | — | $ | — | |
| The Example is intended to help you understand your ongoing | * There were no expenses charged to the Class. | |||||
| costs (in dollars) of investing in the Fund and to compare these | ||||||
| costs with the ongoing costs of investing in other mutual funds. | Hypothetical | |||||
| Performance (5% | ||||||
| The Example is based on an investment of $1,000 invested at the | Actual | return before | ||||
| beginning of the period and held for the entire period indicated, | Class R4 | Performance | expenses) | |||
| which for this Fund is from May 1, 2016 to October 31, 2016. | Beginning Account Value | |||||
| May 1, 2016 | $ | 1,000.00 | $ | 1,000.00 | ||
| Actual Expenses | Ending Account Value | |||||
| The information in the table under the heading “Actual | October 31, 2016 | $ | 1,032.80 | $ | 1,023.88 | |
| Expenses Paid During Period* | $ | 1.28 | $ | 1.27 | ||
| Performance” provides information about actual account values | ||||||
| and actual expenses. You may use the information in this column, | * Expenses are equal to the Fund's annualized expense ratio of 0.25% | |||||
| together with the amount you invested, to estimate the expenses | (representing the six month period annualized), multiplied by the average | |||||
| account value over the period, multiplied by 184/366 (to reflect the one-half | ||||||
| that you paid over the period. Simply divide your account value by | year period). | |||||
| $1,000 (for example, an $8,600 account value divided by $1,000 | ||||||
| = 8.6), then multiply the result by the number in the first column | Hypothetical | |||||
| in the row entitled “Expenses Paid During Period” to estimate | Performance (5% | |||||
| Actual | return before | |||||
| the expenses you paid on your account during this period. | Class R5 | Performance | expenses) | |||
| Beginning Account Value | ||||||
| Hypothetical Example for Comparison Purposes | May 1, 2016 | $ | 1,000.00 | $ | 1,000.00 | |
| The information in the table under the heading “Hypothetical | Ending Account Value | |||||
| Performance (5% return before expenses)” provides information | October 31, 2016 | $ | 1,032.60 | $ | 1,022.62 | |
| about hypothetical account values and hypothetical expenses | Expenses Paid During Period* | $ | 2.55 | $ | 2.54 | |
| based on the Fund’s actual expense ratio and an assumed rate of | * Expenses are equal to the Fund's annualized expense ratio of 0.50% | |||||
| return of 5% per year before expenses, which is not the Fund’s | (representing the six month period annualized), multiplied by the average | |||||
| actual return. The hypothetical account values and expenses | account value over the period, multiplied by 184/366 (to reflect the one-half | |||||
| may not be used to estimate the actual ending account balance or | year period). | |||||
| expenses you paid for the period. You may use this information | ||||||
| to compare the ongoing costs of investing in the Fund and other | ||||||
| funds. To do so, compare this 5% hypothetical example with the | ||||||
| 5% hypothetical examples that appear in the shareholder reports | ||||||
| of other funds. | ||||||
| Please note that the expenses shown in the table are meant | ||||||
| to highlight your ongoing costs only and do not reflect any | ||||||
| transactional costs. Therefore, the information under the heading | ||||||
| “Hypothetical Performance (5% return before expenses)” is | ||||||
| useful in comparing ongoing costs only, and will not help you | ||||||
| determine the relative total costs of owning different funds. In | ||||||
| addition, if these transactional costs were included, your costs | ||||||
| would have been higher. | ||||||
2035 Strategy Fund 171
Russell Investment Company
2035 Strategy Fund
Schedule of Investments — October 31, 2016
| Amounts in thousands (except share amounts) | ||||
| Fair | ||||
| Value | ||||
| Shares | $ | |||
| Investments in Russell Affiliated Mutual Funds - 100.0% | ||||
| Alternative - 7.1% | ||||
| Russell Commodity Strategies Fund Class Y | 110,495 | 609 | ||
| Russell Global Infrastructure Fund Class Y | 44,892 | 513 | ||
| Russell Global Real Estate Securities Fund Class Y | 8,754 | 313 | ||
| 1,435 | ||||
| Domestic Equities - 36.8% | ||||
| Russell U.S. Defensive Equity Fund Class Y | 12,293 | 605 | ||
| Russell U.S. Dynamic Equity Fund Class Y | 82,775 | 822 | ||
| Russell U.S. Small Cap Equity Fund Class Y | 51,889 | 1,433 | ||
| Select U.S. Equity Fund Class Y | 418,866 | 4,574 | ||
| 7,434 | ||||
| Fixed Income - 20.9% | ||||
| Russell Global Opportunistic Credit Fund Class Y | 38,384 | 373 | ||
| Russell Strategic Bond Fund Class Y | 346,875 | 3,836 | ||
| 4,209 | ||||
| International Equities - 35.2% | ||||
| Russell Emerging Markets Fund Class Y | 76,706 | 1,279 | ||
| Russell Global Equity Fund Class Y | 215,555 | 2,248 | ||
| Select International Equity Fund Class Y | 415,269 | 3,567 | ||
| 7,094 | ||||
| Total Investments in Russell Affiliated Mutual Funds | ||||
| (cost $17,967) | 20,172 | |||
| Total Investments 100.0% | ||||
| (identified cost $17,967) | 20,172 | |||
| Other Assets and Liabilities, Net - (0.0%) | (2 | ) | ||
| Net Assets - 100.0% | 20,170 | |||
| Presentation of Portfolio Holdings | ||||||||||||||
| Amounts in thousands | ||||||||||||||
| Fair Value | ||||||||||||||
| Practical | ||||||||||||||
| Portfolio Summary | Level 1 | Level 2 | Level 3 | Expedient | Total | % of Net Assets | ||||||||
| Investments in Russell Affiliated Mutual | ||||||||||||||
| Funds | $ | 20,172 | $ | — | $ | — | $ | — | $ | 20,172 | 100.0 | |||
| Total Investments | 20,172 | — | — | — | 20,172 | 100.0 | ||||||||
| Other Assets and Liabilities, Net | (—)* | |||||||||||||
| 100.0 | ||||||||||||||
* Less than 0.05% of net assets.
For a description of the Levels, see note 2 in the Notes to Financial Statements.
For a disclosure on transfers between Levels 1, 2 and 3 during the period ended October 31, 2016, see note 2 in the Notes to
Financial Statements.
See accompanying notes which are an integral part of the financial statements.
172 2035 Strategy Fund
Russell Investment Company
2035 Strategy Fund
Statement of Assets and Liabilities — October 31, 2016
| Amounts in thousands | |||
| Assets | |||
| Investments, at identified cost | $ | 17,967 | |
| Investments, at fair value(>) | 20,172 | ||
| Receivables: | |||
| Fund shares sold | 10 | ||
| Total assets | 20,182 | ||
| Liabilities | |||
| Payables: | |||
| Investments purchased | 7 | ||
| Fund shares redeemed | 1 | ||
| Accrued fees to affiliates | 4 | ||
| Total liabilities | 12 | ||
| Net Assets | $ | 20,170 | |
| Net Assets Consist of: | |||
| Accumulated net realized gain (loss) | $ | (189 | ) |
| Unrealized appreciation (depreciation) on investments | 2,205 | ||
| Shares of beneficial interest | 24 | ||
| Additional paid-in capital | 18,130 | ||
| Net Assets | $ | 20,170 | |
| Net Asset Value, offering and redemption price per share: | |||
| Net asset value per share: Class R1(#) | $ | 8.51 | |
| Class R1 — Net assets | $ | 8,086,676 | |
| Class R1 — Shares outstanding ($.01 par value) | 949,818 | ||
| Net asset value per share: Class R4(#) | $ | 8.50 | |
| Class R4 — Net assets | $ | 7,224,430 | |
| Class R4 — Shares outstanding ($.01 par value) | 849,585 | ||
| Net asset value per share: Class R5(#) | $ | 8.51 | |
| Class R5 — Net assets | $ | 4,859,350 | |
| Class R5 — Shares outstanding ($.01 par value) | 571,347 | ||
| Amounts in thousands | |||
| (>) Investments in affiliated Russell funds | $ | 20,172 | |
| (#) Net asset value per share equals class level net assets divided by class level shares of beneficial interest outstanding. | |||
See accompanying notes which are an integral part of the financial statements.
2035 Strategy Fund 173
Russell Investment Company
2035 Strategy Fund
Statement of Operations — For the Period Ended October 31, 2016
| Amounts in thousands | |||
| Investment Income | |||
| Income distributions from affiliated Russell funds | $ | 511 | |
| Expenses | |||
| Distribution fees - Class R5 | 13 | ||
| Shareholder servicing fees - Class R4 | 19 | ||
| Shareholder servicing fees - Class R5 | 13 | ||
| Total expenses | 45 | ||
| Net investment income (loss) | 466 | ||
| Net Realized and Unrealized Gain (Loss) | |||
| Net realized gain (loss) on: | |||
| Investments | (124 | ) | |
| Capital gain distributions from Underlying Funds | 440 | ||
| Net realized gain (loss) | 316 | ||
| Net change in unrealized appreciation (depreciation) on investments | (195 | ) | |
| Net realized and unrealized gain (loss) | 121 | ||
| Net Increase (Decrease) in Net Assets from Operations | $ | 587 | |
See accompanying notes which are an integral part of the financial statements.
174 2035 Strategy Fund
Russell Investment Company
2035 Strategy Fund
Statements of Changes in Net Assets
| For the Periods Ended October 31, | |||||||
| Amounts in thousands | 2016 | 2015 | |||||
| Increase (Decrease) in Net Assets | |||||||
| Operations | |||||||
| Net investment income (loss) | $ | 466 | $ | 518 | |||
| Net realized gain (loss) | 316 | 383 | |||||
| Net change in unrealized appreciation (depreciation) | (195 | ) | (977 | ) | |||
| Net increase (decrease) in net assets from operations | 587 | (76 | ) | ||||
| Distributions | |||||||
| From net investment income | |||||||
| Class R1 | (197 | ) | (218 | ) | |||
| Class R4 | (162 | ) | (153 | ) | |||
| Class R5 | (108 | ) | (148 | ) | |||
| From net realized gain | |||||||
| Class R1 | (269 | ) | (1,980 | ) | |||
| Class R4 | (248 | ) | (1,702 | ) | |||
| Class R5 | (192 | ) | (2,029 | ) | |||
| Net decrease in net assets from distributions | (1,176 | ) | (6,230 | ) | |||
| Share Transactions* | |||||||
| Net increase (decrease) in net assets from share transactions | (4,271 | ) | 4,486 | ||||
| Total Net Increase (Decrease) in Net Assets | (4,860 | ) | (1,820 | ) | |||
| Net Assets | |||||||
| Beginning of period | 25,030 | 26,850 | |||||
| End of period | $ | 20,170 | $ | 25,030 | |||
See accompanying notes which are an integral part of the financial statements.
2035 Strategy Fund 175
Russell Investment Company
2035 Strategy Fund
Statements of Changes in Net Assets, continued
* Share transaction amounts (in thousands) for the periods ended October 31, 2016 and October 31, 2015 were as follows:
| 2016 | 2015 | |||||||||||
| Shares | Dollars | Shares | Dollars | |||||||||
| Class R1 | ||||||||||||
| Proceeds from shares sold | 265 | $ | 2,146 | 918 | $ | 8,457 | ||||||
| Proceeds from reinvestment of distributions | 55 | 450 | 246 | 2,197 | ||||||||
| Payments for shares redeemed | (613 | ) | (5,147 | ) | (609 | ) | (5,439 | ) | ||||
| Net increase (decrease) | (293 | ) | (2,551 | ) | 555 | 5,215 | ||||||
| Class R4 | ||||||||||||
| Proceeds from shares sold | 132 | 1,090 | 170 | 1,588 | ||||||||
| Proceeds from reinvestment of distributions | 50 | 410 | 208 | 1,854 | ||||||||
| Payments for shares redeemed | (207 | ) | (1,745 | ) | (180 | ) | (1,610 | ) | ||||
| Net increase (decrease) | (25 | ) | (245 | ) | 198 | 1,832 | ||||||
| Class R5 | ||||||||||||
| Proceeds from shares sold | 176 | 1,449 | 253 | 2,336 | ||||||||
| Proceeds from reinvestment of distributions | 37 | 301 | 245 | 2,177 | ||||||||
| Payments for shares redeemed | (390 | ) | (3,225 | ) | (744 | ) | (7,074 | ) | ||||
| Net increase (decrease) | (177 | ) | (1,475 | ) | (246 | ) | (2,561 | ) | ||||
| Total increase (decrease) | (495 | ) | $ | (4,271 | ) | 507 | $ | 4,486 | ||||
See accompanying notes which are an integral part of the financial statements.
176 2035 Strategy Fund
(This page intentionally left blank)
Russell Investment Company
2035 Strategy Fund
Financial Highlights — For the Periods Ended
For a Share Outstanding Throughout Each Period.
| $ | ||||||||||||||||
| $ | Net | $ | $ | $ | $ | |||||||||||
| Net Asset Value, | Investment | Net Realized | Total from | Distributions | Distributions | |||||||||||
| Beginning of | Income (Loss) | and Unrealized | Investment | from Net | from Net | |||||||||||
| Period | (a)(b)(e) | Gain (Loss) | Operations | Investment Income | Realized Gain | |||||||||||
| Class R1 | ||||||||||||||||
| October 31, 2016 | 8.74 | .20 | .07 | .27 | (.21 | ) | (.29 | ) | ||||||||
| October 31, 2015 | 11.39 | .18 | (.18 | ) | — | (.23 | ) | (2.42 | ) | |||||||
| October 31, 2014 | 11.16 | .33 | .45 | .78 | (.30 | ) | (.25 | ) | ||||||||
| October 31, 2013 | 9.68 | .17 | 1.75 | 1.92 | (.18 | ) | (.26 | ) | ||||||||
| October 31, 2012 | 9.10 | .17 | .63 | .80 | (.17 | ) | (.05 | ) | ||||||||
| Class R4(1) | ||||||||||||||||
| October 31, 2016 | 8.73 | .18 | .07 | .25 | (.19 | ) | (.29 | ) | ||||||||
| October 31, 2015 | 11.38 | .18 | (.21 | ) | (.03 | ) | (.20 | ) | (2.42 | ) | ||||||
| October 31, 2014 | 11.15 | .24 | .51 | .75 | (.27 | ) | (.25 | ) | ||||||||
| October 31, 2013 | 9.67 | .16 | 1.74 | 1.90 | (.16 | ) | (.26 | ) | ||||||||
| October 31, 2012 | 9.09 | .14 | .63 | .77 | (.14 | ) | (.05 | ) | ||||||||
| Class R5(2) | ||||||||||||||||
| October 31, 2016 | 8.73 | .17 | .07 | .24 | (.17 | ) | (.29 | ) | ||||||||
| October 31, 2015 | 11.38 | .17 | (.22 | ) | (.05 | ) | (.18 | ) | (2.42 | ) | ||||||
| October 31, 2014 | 11.15 | .24 | .48 | .72 | (.24 | ) | (.25 | ) | ||||||||
| October 31, 2013 | 9.67 | .12 | 1.75 | 1.87 | (.13 | ) | (.26 | ) | ||||||||
| October 31, 2012 | 9.08 | .13 | .62 | .75 | (.11 | ) | (.05 | ) | ||||||||
See accompanying notes which are an integral part of the financial statements.
178 2035 Strategy Fund
| % | % | % | |||||||||||||||
| $ | $ | Ratio of Expenses | Ratio of Expenses | Ratio of Net | |||||||||||||
| Net Asset Value, | % | Net Assets, | to Average | to Average | Investment Income | % | |||||||||||
| $ | End of | Total | End of Period | Net Assets, | Net Assets, | to Average | Portfolio | ||||||||||
| Total Distributions | Period | Return | (000 | ) | Gross(g) | Net(e)(g) | Net Assets(b)(e) | Turnover Rate | |||||||||
| (.50 | ) | 8.51 | 3.41 | 8,087 | — | — | 2.35 | 29 | |||||||||
| (2.65 | ) | 8.74 | (.34 | ) | 10,865 | — | — | 1.94 | 46 | ||||||||
| (.55 | ) | 11.39 | 7.12 | 7,843 | — | — | 2.91 | 80 | |||||||||
| (.44 | ) | 11.16 | 20.63 | 11,299 | — | — | 1.68 | 44 | |||||||||
| (.22 | ) | 9.68 | 8.99 | 11,495 | — | — | 1.78 | 47 | |||||||||
| (.48 | ) | 8.50 | 3.15 | 7,224 | .25 | .25 | 2.20 | 29 | |||||||||
| (2.62 | ) | 8.73 | (.59 | ) | 7,634 | .25 | .25 | 1.90 | 46 | ||||||||
| (.52 | ) | 11.38 | 6.86 | 7,695 | .25 | .25 | 2.14 | 80 | |||||||||
| (.42 | ) | 11.15 | 20.36 | 6,258 | .25 | .25 | 1.52 | 44 | |||||||||
| (.19 | ) | 9.67 | 8.72 | 5,457 | .25 | .25 | 1.49 | 47 | |||||||||
| (.46 | ) | 8.51 | 2.99 | 4,859 | .50 | .50 | 2.02 | 29 | |||||||||
| (2.60 | ) | 8.73 | (.89 | ) | 6,531 | .50 | .50 | 1.84 | 46 | ||||||||
| (.49 | ) | 11.38 | 6.60 | 11,312 | .50 | .50 | 2.18 | 80 | |||||||||
| (.39 | ) | 11.15 | 20.06 | �� | 12,381 | .50 | .50 | 1.21 | 44 | ||||||||
| (.16 | ) | 9.67 | 8.50 | 9,014 | .50 | .50 | 1.36 | 47 | |||||||||
See accompanying notes which are an integral part of the financial statements.
2035 Strategy Fund 179
Russell Investment Company
2035 Strategy Fund
Related Party Transactions, Fees and Expenses
| Accrued fees payable to affiliates for the period ended October 31, 2016 were as follows: | ||
| Distribution fees | $ | 1,033 |
| Shareholder servicing fees | 2,572 | |
| $ | 3,605 | |
| Transactions (amounts in thousands) during the period ended October 31, 2016 with Underlying Funds which are, or were, an | ||||||||||||||||||||
| affiliated company are as follows: | ||||||||||||||||||||
| Fair Value, | Change in | |||||||||||||||||||
| Beginning of | Realized Gain | Unrealized | Fair Value, End | Income | Capital Gains | |||||||||||||||
| Period | Purchases | Sales | (Loss) | Gain (Loss) | of Period | Distributions | Distributions | |||||||||||||
| 2035 Strategy Fund | ||||||||||||||||||||
| Russell Commodity Strategies Fund | $ | 793 | $ | 183 | $ | 333 | $ | (140) | $ | 106 | $ | 609 | $ | — | $ | — | ||||
| Russell Global Infrastructure Fund | 665 | 142 | 285 | (55 | ) | 46 | 513 | 16 | 15 | |||||||||||
| Russell Global Real Estate Securities | ||||||||||||||||||||
| Fund | 662 | 131 | 421 | 72 | (131 | ) | 313 | 11 | 26 | |||||||||||
| Russell U.S. Defensive Equity Fund | 750 | 85 | 248 | 103 | (85 | ) | 605 | 10 | — | |||||||||||
| Russell U.S. Dynamic Equity Fund | 1,081 | 273 | 428 | 24 | (128 | ) | 822 | 43 | 87 | |||||||||||
| Russell U.S. Small Cap Equity Fund | 1,868 | 396 | 790 | 55 | (96 | ) | 1,433 | 14 | 102 | |||||||||||
| Select U.S. Equity Fund | 5,808 | 743 | 2,065 | 93 | (5 | ) | 4,574 | 131 | 7 | |||||||||||
| Russell Global Opportunistic Credit | ||||||||||||||||||||
| Fund | 596 | 195 | 443 | (29 | ) | 54 | 373 | 17 | — | |||||||||||
| Russell Strategic Bond Fund | 4,008 | 1,887 | 2,119 | (22 | ) | 82 | 3,836 | 116 | 19 | |||||||||||
| Russell Emerging Markets Fund | 1,690 | 261 | 779 | (130 | ) | 237 | 1,279 | 5 | — | |||||||||||
| Russell Global Equity Fund | 2,657 | 713 | 961 | 148 | (309 | ) | 2,248 | 43 | 184 | |||||||||||
| Select International Equity Fund | 4,455 | 879 | 1,558 | (243 | ) | 34 | 3,567 | 105 | — | |||||||||||
| $ | 25,033 | $ | 5,888 | $ | 10,430 | $ | (124) | $ | (195) | $ | 20,172 | $ | 511 | $ | 440 | |||||
Federal Income Taxes
At October 31, 2016, the cost of investments and net unrealized appreciation (depreciation), undistributed ordinary income and
undistributed long-term capital gains for income tax purposes were as follows:
| Cost of Investments | $ | 18,683,940 | ||
| Unrealized Appreciation | $ | 1,739,852 | ||
| Unrealized Depreciation | (251,715 | ) | ||
| Net Unrealized Appreciation (Depreciation) | $ | 1,488,137 | ||
| Undistributed Ordinary Income | $ | 17,762 | ||
| Undistributed Long-Term Capital Gains | ||||
| (Capital Loss Carryforward) | $ | 510,578 | ||
| Tax Composition of Distributions | ||||
| Ordinary Income | $ | 539,619 | ||
| Long-Term Capital Gains | $ | 636,109 |
Net investment income and net realized gains (losses) in the financial statements may differ from taxable net investment income and
net realized gains (losses). Capital accounts within the financial statements are adjusted for permanent differences between book and
tax accounting. These differences may be due to foreign currency gains or losses, reclassifications of dividends and /or differences in
treatment of income from swaps. These adjustments have no impact on the net assets.
At October 31, 2016, the Statement of Assets and Liabilities have been adjusted by the following amounts (in thousands):
See accompanying notes which are an integral part of the financial statements.
180 2035 Strategy Fund
Russell Investment Company
2035 Strategy Fund
Federal Income Taxes, continued
| Undistributed net investment income | $ | 1 | |
| Accumulated net realized gain (loss) | (2 | ) | |
| Additional paid-in capital | 1 |
See accompanying notes which are an integral part of the financial statements.
2035 Strategy Fund 181
Russell Investment Company
2040 Strategy Fund
Portfolio Management Discussion and Analysis — October 31, 2016 (Unaudited)
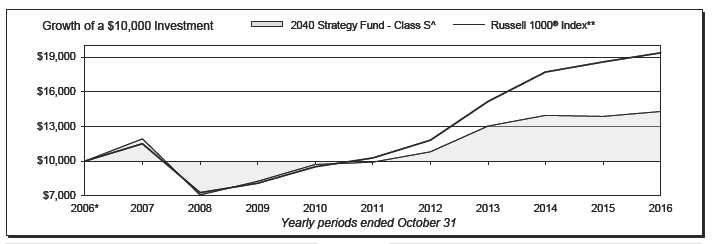
| 2040 Strategy Fund - Class A‡ | 2040 Strategy Fund - Class R5‡‡‡ | ||||||
| Total | Total | ||||||
| Return | Return | ||||||
| 1 Year | (3.08 | )% | 1 Year | 2.56 | % | ||
| 5 Years | 6.06 | %§ | 5 Years | 7.07 | %§ | ||
| 10 Years | 2.78 | %§ | 10 Years | 3.13 | %§ | ||
| 2040 Strategy Fund - Class E | 2040 Strategy Fund - Class S | ||||||
| Total | Total | ||||||
| Return | Return | ||||||
| 1 Year | 2.80 | % | 1 Year | 3.08 | % | ||
| 5 Years | 7.30 | %§ | 5 Years | 7.59 | %§ | ||
| 10 Years | 3.36 | %§ | 10 Years | 3.64 | %§ | ||
| 2040 Strategy Fund - Class R1 | Russell 1000® Index** | ||||||
| Total | Total | ||||||
| Return | Return | ||||||
| 1 Year | 3.08 | % | 1 Year | 4.26 | % | ||
| 5 Years | 7.60 | %§ | 5 Years | 13.51 | %§ | ||
| 10 Years | 3.64 | %§ | 10 Years | 6.83 | %§ | ||
| 2040 Strategy Fund - Class R4‡‡ | |||||||
| Total | |||||||
| Return | |||||||
| 1 Year | 2.81 | % | |||||
| 5 Years | 7.32 | %§ | |||||
| 10 Years | 3.38 | %§ | |||||
182 2040 Strategy Fund
Russell Investment Company
2040 Strategy Fund
Portfolio Management Discussion and Analysis, continued — October 31, 2016
(Unaudited)
| The 2040 Strategy Fund (the “Fund”) is a fund of funds that | was beneficial as it was one of the best performing asset classes |
| invests in other Russell Investment Company mutual funds (the | globally. Falling interest rates also helped other fixed income |
| “Underlying Funds”). The Underlying Funds employ a multi- | assets in the Underlying Funds rally, as well as more rate sensitive |
| manager approach whereby portions of the Underlying Funds are | real assets like global real estate investment trusts and global |
| allocated to different money managers. Underlying Fund assets not | infrastructure. With interest rates falling, income opportunities |
| allocated to money managers are managed by Russell Investment | around the globe continued to shrink and income available from |
| Management, LLC (“RIM”), the Fund’s and Underlying Funds’ | most assets fell. |
| advisor. RIM, as the Underlying Funds’ advisor, may change | The U.S. equity market, as measured by the S&P 500® Index, |
| the allocation of the Underlying Funds’ assets among money | was up 4.51% over the period but also experienced multiple |
| managers at any time. An exemptive order from the Securities | draw downs. The Fund’s strategic exposure to global equities |
| and Exchange Commission (“SEC”) permits RIM to engage or | proved beneficial over the period as emerging markets rallied |
| terminate a money manager in an Underlying Fund at any time, | and outperformed U.S. equities. By contrast, non-U.S. developed |
| subject to approval by the Underlying Fund’s Board, without a | equity was one of the lowest performing portions of the Fund’s |
| shareholder vote. Pursuant to the terms of the exemptive order, an | exposure as falling commodities and currencies weighed on |
| Underlying Fund is required to notify its shareholders within 90 | returns. |
| days of when a money manager begins providing services. | |
| What is the Fund’s investment objective? | How did the investment strategies and techniques employed |
| by the Fund and the Underlying Funds affect the Fund’s | |
| The Fund seeks to provide capital growth and income consistent | performance? |
| with its current asset allocation which will change over time, with | The Fund is a fund of funds and its performance is based on RIM’s |
| an increasing allocation to fixed income funds. | strategic asset allocations, the performance of the Underlying |
| The Fund pursues this objective by investing in a diversified | Funds in which the Fund invests, and tactical changes in the |
| portfolio that, as of October 31, 2016, consisted of approximately | Fund’s asset allocation throughout the year. |
| 82.5% equity Underlying Funds, 7% fixed income Underlying | In order to seek to achieve the Fund’s objective during the period, |
| Funds and 10.5% alternative Underlying Funds. The Fund’s | RIM’s strategic asset allocation included investments in global |
| allocation to fixed income Underlying Funds will be fixed at | equity, alternative and fixed income Underlying Funds. The |
| 66.3% in approximately the year 2040. | Fund’s diverse asset allocation partially hindered performance |
| How did the Fund perform relative to its benchmark for the | during the period as certain of these exposures underperformed |
| fiscal year ended October 31, 2016? | the Russell 1000® Index. While areas like high yield bonds, as |
| For the fiscal year ended October 31, 2016, the Fund’s Class A, | measured by the BofA Merrill Lynch Global High Yield Index |
| Class E, Class R1, Class R4, Class R5 and Class S Shares gained | Hedged USD, outperformed the Russell 1000® Index, areas like |
| 2.82%, 2.80%, 3.08%, 2.81%, 2.56% and 3.08% respectively. | commodities and non-U.S. developed equities delivered negative |
| This is compared to the Fund’s primary benchmark, the Russell | returns as measured by the Bloomberg Commodity Index Total |
| 1000® Index, which gained 4.26% during the same period. The | Return and Russell Developed ex-U.S. Large Cap® Index Net, |
| Fund’s performance includes operating expenses, whereas index | respectively. |
| returns are unmanaged and do not include expenses of any kind. | The Fund’s underperformance relative to the Russell 1000® |
| For the fiscal year ended October 31, 2016, the Morningstar® | Index was partially offset by strong active management within |
| Target-Date 2040 Category gained 2.73%. This result serves as | the fixed income portion of the Fund’s portfolio. Underlying Fund |
| a peer comparison and is expressed net of operating expenses. | bond issue selection during the period was generally additive to |
| returns as fixed income money managers were able to pick well | |
| How did the market conditions described in the Market | within credit, avoiding defaults in places like the energy sector |
| Summary report affect the Fund’s performance? | where trouble occurred with falling energy prices in early 2016. |
| The Fund seeks to achieve its objective by investing in Underlying | As such, an allocation to the Russell Strategic Bond Fund was |
| Funds that provide exposure to a range of diversified investments, | positive from a benchmark-relative perspective. The Underlying |
| and most major asset classes invested in by the Underlying | Fund was positively impacted by its overweight to credit and |
| Funds produced positive absolute returns during the period. | additive currency positioning also helped to drive excess return. |
| Markets during the fiscal year were characterized by higher | By contrast, equity selection and positioning was more difficult, |
| levels of volatility and dispersion across return sources. Within | with allocations to non-U.S. equity Underlying Funds detracting |
| the fixed income Underlying Funds, exposure to high yield debt | from the Fund’s performance and security selection within |
2040 Strategy Fund 183
Russell Investment Company
2040 Strategy Fund
Portfolio Management Discussion and Analysis, continued — October 31, 2016
(Unaudited)
| those Underlying Funds struggling. In addition, overweights | in high yield credit and emerging markets equity compared with | |
| to European securities in the Select International Equity Fund | core bond holdings and cash. Markets subsequently rebounded | |
| caused the Underlying Fund to struggle as European equities | from the February lows and RIM reduced risk exposure to a more | |
| continued to lag the U.S. equity market. | defensive stance with the Fund’s equity allocation below strategic | |
| weights. RIM’s modifications to the Fund’s asset allocation were | ||
| Describe any changes to the Fund’s structure or allocation | additive during the period. | |
| to the Underlying Funds. | ||
| RIM has the discretion to vary the Fund’s actual allocation from | The views expressed in this report reflect those of the | |
| the target strategic asset allocation by up to +/- 5% at the equity, | portfolio managers only through the end of the period | |
| fixed income or alternative category level based on RIM’s capital | covered by the report. These views do not necessarily | |
| markets research. RIM’s asset allocation modifications benefited | represent the views of RIM, or any other person in RIM or | |
| the Fund’s performance relative to the Fund’s target strategic | any other affiliated organization. These views are subject | |
| asset allocation. | to change at any time based upon market conditions or | |
| RIM adapted the Fund’s asset allocation over the period as market | other events, and RIM disclaims any responsibility to | |
| opportunities and risks evolved. The Fund was defensively | update the views contained herein. These views should not | |
| positioned in the fourth quarter of 2015, favoring fixed income | be relied on as investment advice and, because investment | |
| over equity Underlying Funds. During the first quarter of 2016, | decisions for a Russell Investment Company (“RIC”) Fund | |
| equity markets declined substantially, and RIM added further risk | are based on numerous factors, should not be relied on as | |
| to the portfolio by overweighting Underlying Funds that invest | an indication of investment decisions of any RIC Fund. | |
^ In prior years, the performance of the Fund’s Class E shares was used in the line graph. Class S Shares will have substantially similar annual returns as the Class
E Shares because the Shares of each Class are invested in the same portfolio of securities. Annual returns for each Class will differ only to the extent that the
Class S Shares do not have the same expenses as the Class E Shares.
* Assumes initial investment on November 1, 2006.
** Russell 1000® Index includes the 1,000 largest companies in the Russell 3000® Index. The Russell 1000® Index represents the universe of stocks from which
most active money managers typically select. The Russell 1000® Index return reflects adjustments from income dividends and capital gain distributions
reinvested as of the ex-dividend dates.
‡ The performance shown has been adjusted to reflect the deduction of the maximum Class A sales charge of 5.75%.
‡‡ The Fund first issued Class R4 Shares on October 1, 2014. The returns shown for Class R4 Shares prior to that date are the returns of the Fund’s Class R2
Shares.
‡‡‡ The Fund first issued Class R5 Shares on October 1, 2014. The returns shown for Class R5 Shares prior to that date are the returns of the Fund’s Class R3
Shares.
§ Annualized.
Performance is historical and assumes reinvestment of all dividends and capital gains. Investment return and principal value will fluctuate so that an investor’s
shares, when redeemed, may be worth more or less than when purchased. Past performance is not indicative of future results. The returns shown do not reflect the
deduction of taxes that a shareholder would pay on Fund distributions or the redemption of Fund shares. Additionally, the returns presented herein may differ from
the performance reported in the Financial Highlights as the returns herein are calculated in a manner consistent with standardized performance in accordance with
Securities and Exchange Commission rules, while the performance in the Financial Highlights has been calculated in accordance with U.S. Generally Accepted
Accounting Principles (“U.S. GAAP”).
184 2040 Strategy Fund
Russell Investment Company
2040 Strategy Fund
Shareholder Expense Example — October 31, 2016 (Unaudited)
| Fund Expenses | Hypothetical | |||||
| The following disclosure provides important information | Performance (5% | |||||
| Actual | return before | |||||
| regarding the Fund’s Shareholder Expense Example | Class A | Performance | expenses) | |||
| (“Example”). | Beginning Account Value | |||||
| May 1, 2016 | $ | 1,000.00 | $ | 1,000.00 | ||
| Example | Ending Account Value | |||||
| As a shareholder of the Fund, you incur two types of costs: (1) | October 31, 2016 | $ | 1,035.80 | $ | 1,023.88 | |
| transaction costs, including sales charges (loads) on certain | Expenses Paid During Period* | $ | 1.28 | $ | 1.27 | |
| purchase or redemption payments, and (2) ongoing costs, | * Expenses are equal to the Fund's annualized expense ratio of 0.25% | |||||
| including advisory and administrative fees; distribution and/or | (representing the six month period annualized), multiplied by the average | |||||
| service fees; and other Fund expenses. The Example is intended | account value over the period, multiplied by 184/366 (to reflect the one-half | |||||
| year period). | ||||||
| to help you understand your ongoing costs (in dollars) of investing | ||||||
| in the Fund and to compare these costs with the ongoing costs of | Hypothetical | |||||
| investing in other mutual funds. The Example is based on an | Performance (5% | |||||
| Actual | return before | |||||
| investment of $1,000 invested at the beginning of the period and | Class E | Performance | expenses) | |||
| held for the entire period indicated, which for this Fund is from | Beginning Account Value | |||||
| May 1, 2016 to October 31, 2016. | May 1, 2016 | $ | 1,000.00 | $ | 1,000.00 | |
| Ending Account Value | ||||||
| Actual Expenses | October 31, 2016 | $ | 1,035.60 | $ | 1,023.88 | |
| The information in the table under the heading “Actual | Expenses Paid During Period* | $ | 1.28 | $ | 1.27 | |
| Performance” provides information about actual account values | * Expenses are equal to the Fund's annualized expense ratio of 0.25% | |||||
| and actual expenses. You may use the information in this column, | (representing the six month period annualized), multiplied by the average | |||||
| together with the amount you invested, to estimate the expenses | account value over the period, multiplied by 184/366 (to reflect the one-half | |||||
| that you paid over the period. Simply divide your account value by | year period). | |||||
| $1,000 (for example, an $8,600 account value divided by $1,000 | Hypothetical | |||||
| = 8.6), then multiply the result by the number in the first column | Performance (5% | |||||
| in the row entitled “Expenses Paid During Period” to estimate | Actual | return before | ||||
| the expenses you paid on your account during this period. | Class R1 | Performance | expenses) | |||
| Beginning Account Value | ||||||
| Hypothetical Example for Comparison Purposes | May 1, 2016 | $ | 1,000.00 | $ | 1,000.00 | |
| Ending Account Value | ||||||
| The information in the table under the heading “Hypothetical | October 31, 2016 | $ | 1,037.00 | $ | 1,025.14 | |
| Performance (5% return before expenses)” provides information | Expenses Paid During Period* | $ | — | $ | — | |
| about hypothetical account values and hypothetical expenses | ||||||
| based on the Fund’s actual expense ratio and an assumed rate of | * There were no expenses charged to the Class. | |||||
| return of 5% per year before expenses, which is not the Fund’s | Hypothetical | |||||
| actual return. The hypothetical account values and expenses | Performance (5% | |||||
| may not be used to estimate the actual ending account balance or | Actual | return before | ||||
| Class R4 | Performance | expenses) | ||||
| expenses you paid for the period. You may use this information | Beginning Account Value | |||||
| to compare the ongoing costs of investing in the Fund and other | May 1, 2016 | $ | 1,000.00 | $ | 1,000.00 | |
| funds. To do so, compare this 5% hypothetical example with the | Ending Account Value | |||||
| 5% hypothetical examples that appear in the shareholder reports | October 31, 2016 | $ | 1,035.70 | $ | 1,023.88 | |
| of other funds. | Expenses Paid During Period* | $ | 1.28 | $ | 1.27 | |
| Please note that the expenses shown in the table are meant | * Expenses are equal to the Fund's annualized expense ratio of 0.25% | |||||
| to highlight your ongoing costs only and do not reflect any | (representing the six month period annualized), multiplied by the average | |||||
| account value over the period, multiplied by 184/366 (to reflect the one-half | ||||||
| transactional costs. Therefore, the information under the heading | year period). | |||||
| “Hypothetical Performance (5% return before expenses)” is | ||||||
| useful in comparing ongoing costs only, and will not help you | ||||||
| determine the relative total costs of owning different funds. In | ||||||
| addition, if these transactional costs were included, your costs | ||||||
| would have been higher. | ||||||
2040 Strategy Fund 185
Russell Investment Company
2040 Strategy Fund
Shareholder Expense Example, continued — October 31, 2016 (Unaudited)
| Hypothetical | ||||
| Performance (5% | ||||
| Actual | return before | |||
| Class R5 | Performance | expenses) | ||
| Beginning Account Value | ||||
| May 1, 2016 | $ | 1,000.00 | $ | 1,000.00 |
| Ending Account Value | ||||
| October 31, 2016 | $ | 1,035.80 | $ | 1,022.62 |
| Expenses Paid During Period* | $ | 2.56 | $ | 2.54 |
* Expenses are equal to the Fund's annualized expense ratio of 0.50%
(representing the six month period annualized), multiplied by the average
account value over the period, multiplied by 184/366 (to reflect the one-half
year period).
| Hypothetical | |||||
| Performance (5% | |||||
| Actual | return before | ||||
| Class S | Performance | expenses) | |||
| Beginning Account Value | |||||
| May 1, 2016 | $ | 1,000.00 | $ | 1,000.00 | |
| Ending Account Value | |||||
| October 31, 2016 | $ | 1,037.00 | $ | 1,025.14 | |
| Expenses Paid During Period* | $ | — | $ | — | |
| * There were no expenses charged to the Class. | |||||
186 2040 Strategy Fund
Russell Investment Company
2040 Strategy Fund
Schedule of Investments — October 31, 2016
| Amounts in thousands (except share amounts) | ||||
| Fair | ||||
| Value | ||||
| Shares | $ | |||
| Investments in Russell Affiliated Mutual Funds - 100.0% | ||||
| Alternative - 8.5% | ||||
| Russell Commodity Strategies Fund Class Y | 249,423 | 1,375 | ||
| Russell Global Infrastructure Fund Class Y | 104,560 | 1,195 | ||
| Russell Global Real Estate Securities Fund Class Y | 22,393 | 800 | ||
| 3,370 | ||||
| Domestic Equities - 43.3% | ||||
| Russell U.S. Defensive Equity Fund Class Y | 24,251 | 1,194 | ||
| Russell U.S. Dynamic Equity Fund Class Y | 200,026 | 1,986 | ||
| Russell U.S. Small Cap Equity Fund Class Y | 122,579 | 3,385 | ||
| Select U.S. Equity Fund Class Y | 974,027 | 10,636 | ||
| 17,201 | ||||
| Fixed Income - 7.0% | ||||
| Russell Strategic Bond Fund Class Y | 251,659 | 2,783 | ||
| International Equities - 41.2% | ||||
| Russell Emerging Markets Fund Class Y | 191,006 | 3,184 | ||
| Russell Global Equity Fund Class Y | 495,597 | 5,169 | ||
| Select International Equity Fund Class Y | 937,350 | 8,052 | ||
| 16,405 | ||||
| Total Investments in Russell Affiliated Mutual Funds | ||||
| (cost $33,031) | 39,759 | |||
| Total Investments 100.0% | ||||
| (identified cost $33,031) | 39,759 | |||
| Other Assets and Liabilities, Net - (0.0%) | (6 | ) | ||
| Net Assets - 100.0% | 39,753 | |||
| Presentation of Portfolio Holdings | ||||||||||||||
| Amounts in thousands | ||||||||||||||
| Fair Value | ||||||||||||||
| Practical | ||||||||||||||
| Portfolio Summary | Level 1 | Level 2 | Level 3 | Expedient | Total | % of Net Assets | ||||||||
| Investments in Russell Affiliated Mutual | ||||||||||||||
| Funds | $ | 39,759 | $ | — | $ | — | $ | — | $ | 39,759 | 100.0 | |||
| Total Investments | 39,759 | — | — | — | 39,759 | 100.0 | ||||||||
| Other Assets and Liabilities, Net | (—)* | |||||||||||||
| 100.0 | ||||||||||||||
* Less than 0.05% of net assets.
For a description of the Levels, see note 2 in the Notes to Financial Statements.
For a disclosure on transfers between Levels 1, 2 and 3 during the period ended October 31, 2016, see note 2 in the Notes to
Financial Statements.
See accompanying notes which are an integral part of the financial statements.
2040 Strategy Fund 187
Russell Investment Company
2040 Strategy Fund
Statement of Assets and Liabilities — October 31, 2016
| Amounts in thousands | ||
| Assets | ||
| Investments, at identified cost | $ | 33,031 |
| Investments, at fair value(>) | 39,759 | |
| Receivables: | ||
| Investments sold | 16 | |
| Fund shares sold | 20 | |
| Total assets | 39,795 | |
| Liabilities | ||
| Payables: | ||
| Fund shares redeemed | 37 | |
| Accrued fees to affiliates | 5 | |
| Total liabilities | 42 | |
| Net Assets | $ | 39,753 |
| Net Assets Consist of: | ||
| Undistributed (overdistributed) net investment income | $ | — |
| Accumulated net realized gain (loss) | 903 | |
| Unrealized appreciation (depreciation) on investments | 6,728 | |
| Shares of beneficial interest | 52 | |
| Additional paid-in capital | 32,070 | |
| Net Assets | $ | 39,753 |
| Net Asset Value, offering and redemption price per share: | ||
| Net asset value per share: Class A(#) | $ | 7.63 |
| Maximum offering price per share (Net asset value plus sales charge of 5.75%): Class A | $ | 8.10 |
| Class A — Net assets | $ | 582,230 |
| Class A — Shares outstanding ($.01 par value) | 76,294 | |
| Net asset value per share: Class E(#) | $ | 7.63 |
| Class E — Net assets | $ | 84,402 |
| Class E — Shares outstanding ($.01 par value) | 11,062 | |
| Net asset value per share: Class R1(#) | $ | 7.64 |
| Class R1 — Net assets | $ | 20,162,937 |
| Class R1 — Shares outstanding ($.01 par value) | 2,639,762 | |
| Net asset value per share: Class R4(#) | $ | 7.64 |
| Class R4 — Net assets | $ | 6,354,075 |
| Class R4 — Shares outstanding ($.01 par value) | 831,625 | |
| Net asset value per share: Class R5(#) | $ | 7.62 |
| Class R5 — Net assets | $ | 8,071,806 |
| Class R5 — Shares outstanding ($.01 par value) | 1,059,940 | |
| Net asset value per share: Class S(#) | $ | 7.64 |
| Class S — Net assets | $ | 4,497,782 |
| Class S — Shares outstanding ($.01 par value) | 588,718 | |
| Amounts in thousands | ||
| (>) Investments in affiliated Russell funds | $ | 39,759 |
| (#) Net asset value per share equals class level net assets divided by class level shares of beneficial interest outstanding. | ||
See accompanying notes which are an integral part of the financial statements.
188 2040 Strategy Fund
Russell Investment Company
2040 Strategy Fund
Statement of Operations — For the Period Ended October 31, 2016
| Amounts in thousands | |||
| Investment Income | |||
| Income distributions from affiliated Russell funds | $ | 1,278 | |
| Expenses | |||
| Distribution fees - Class A | 2 | ||
| Distribution fees - Class R5 | 26 | ||
| Shareholder servicing fees - Class E | 1 | ||
| Shareholder servicing fees - Class R4 | 16 | ||
| Shareholder servicing fees - Class R5 | 26 | ||
| Total expenses | 71 | ||
| Net investment income (loss) | 1,207 | ||
| Net Realized and Unrealized Gain (Loss) | |||
| Net realized gain (loss) on: | |||
| Investments | 838 | ||
| Capital gain distributions from Underlying Funds | 1,417 | ||
| Net realized gain (loss) | 2,255 | ||
| Net change in unrealized appreciation (depreciation) on investments | (2,827 | ) | |
| Net realized and unrealized gain (loss) | (572 | ) | |
| Net Increase (Decrease) in Net Assets from Operations | $ | 635 | |
See accompanying notes which are an integral part of the financial statements.
2040 Strategy Fund 189
Russell Investment Company
2040 Strategy Fund
Statements of Changes in Net Assets
| For the Periods Ended October 31, | ||||||
| Amounts in thousands | 2016 | 2015 | ||||
| Increase (Decrease) in Net Assets | ||||||
| Operations | ||||||
| Net investment income (loss) | $ | 1,207 | $ | 1,680 | ||
| Net realized gain (loss) | 2,255 | 4,808 | ||||
| Net change in unrealized appreciation (depreciation) | (2,827 | ) | (6,447 | ) | ||
| Net increase (decrease) in net assets from operations | 635 | 41 | ||||
| Distributions | ||||||
| From net investment income | ||||||
| Class A | (15 | ) | (19 | ) | ||
| Class E | (2 | ) | (6 | ) | ||
| Class R1 | (749 | ) | (899 | ) | ||
| Class R4 | (133 | ) | (182 | ) | ||
| Class R5 | (215 | ) | (333 | ) | ||
| Class S | (105 | ) | (241 | ) | ||
| From net realized gain | ||||||
| Class A | (67 | ) | (380 | ) | ||
| Class E | (10 | ) | (137 | ) | ||
| Class R1 | (3,237 | ) | (15,255 | ) | ||
| Class R4 | (588 | ) | (3,650 | ) | ||
| Class R5 | (1,118 | ) | (7,836 | ) | ||
| Class S | (421 | ) | (4,503 | ) | ||
| Net decrease in net assets from distributions | (6,660 | ) | (33,441 | ) | ||
| Share Transactions* | ||||||
| Net increase (decrease) in net assets from share transactions | (18,921 | ) | (3,967 | ) | ||
| Total Net Increase (Decrease) in Net Assets | (24,946 | ) | (37,367 | ) | ||
| Net Assets | ||||||
| Beginning of period | 64,699 | 102,066 | ||||
| End of period | $ | 39,753 | $ | 64,699 | ||
| Undistributed (overdistributed) net investment income included in net assets | $ | — | $ | 2 | ||
See accompanying notes which are an integral part of the financial statements.
190 2040 Strategy Fund
Russell Investment Company
2040 Strategy Fund
Statements of Changes in Net Assets, continued
* Share transaction amounts (in thousands) for the periods ended October 31, 2016 and October 31, 2015 were as follows:
| 2016 | 2015 | |||||||||||
| Shares | Dollars | Shares | Dollars | |||||||||
| Class A | ||||||||||||
| Proceeds from shares sold | 3 | $ | 18 | —** | $ | 2 | ||||||
| Proceeds from reinvestment of distributions | 11 | 82 | 47 | 398 | ||||||||
| Payments for shares redeemed | (25 | ) | (184 | ) | (44 | ) | (384 | ) | ||||
| Net increase (decrease) | (11 | ) | (84 | ) | 3 | 16 | ||||||
| Class E | ||||||||||||
| Proceeds from shares sold | 6 | 48 | 8 | 73 | ||||||||
| Proceeds from reinvestment of distributions | 2 | 12 | 16 | 143 | ||||||||
| Payments for shares redeemed | (11 | ) | (83 | ) | (57 | ) | (568 | ) | ||||
| Net increase (decrease) | (3 | ) | (23 | ) | (33 | ) | (352 | ) | ||||
| Class R1 | ||||||||||||
| Proceeds from shares sold | 1,598 | 11,876 | 2,026 | 18,574 | ||||||||
| Proceeds from reinvestment of distributions | 536 | 3,932 | 1,885 | 16,153 | ||||||||
| Payments for shares redeemed | (4,107 | ) | (30,592 | ) | (2,840 | ) | (26,110 | ) | ||||
| Net increase (decrease) | (1,973 | ) | (14,784 | ) | 1,071 | 8,617 | ||||||
| Class R4 | ||||||||||||
| Proceeds from shares sold | 187 | 1,415 | 157 | 1,417 | ||||||||
| Proceeds from reinvestment of distributions | 98 | 720 | 447 | 3,833 | ||||||||
| Payments for shares redeemed | (245 | ) | (1,910 | ) | (655 | ) | (5,779 | ) | ||||
| Net increase (decrease) | 40 | 225 | (51 | ) | (529 | ) | ||||||
| Class R5 | ||||||||||||
| Proceeds from shares sold | 349 | 2,568 | 426 | 3,913 | ||||||||
| Proceeds from reinvestment of distributions | 183 | 1,333 | 955 | 8,169 | ||||||||
| Payments for shares redeemed | (955 | ) | (7,088 | ) | (1,833 | ) | (16,641 | ) | ||||
| Net increase (decrease) | (423 | ) | (3,187 | ) | (452 | ) | (4,559 | ) | ||||
| Class S | ||||||||||||
| Proceeds from shares sold | 422 | 3,123 | 462 | 4,238 | ||||||||
| Proceeds from reinvestment of distributions | 71 | 525 | 552 | 4,738 | ||||||||
| Payments for shares redeemed | (630 | ) | (4,716 | ) | (1,641 | ) | (16,136 | ) | ||||
| Net increase (decrease) | (137 | ) | (1,068 | ) | (627 | ) | (7,160 | ) | ||||
| Total increase (decrease) | (2,507 | ) | $ | (18,921 | ) | (89 | ) | $ | (3,967 | ) | ||
** Less than 500 shares.
See accompanying notes which are an integral part of the financial statements.
2040 Strategy Fund 191
Russell Investment Company
2040 Strategy Fund
Financial Highlights — For the Periods Ended
For a Share Outstanding Throughout Each Period.
| $ | |||||||||||||||||
| $ | Net | $ | $ | $ | $ | ||||||||||||
| Net Asset Value, | Investment | Net Realized | Total from | Distributions | Distributions | ||||||||||||
| Beginning of | Income (Loss) | and Unrealized | Investment | from Net | from Net | ||||||||||||
| Period | (a)(b)(e) | Gain (Loss) | Operations | Investment Income | Realized Gain | ||||||||||||
| Class A | |||||||||||||||||
| October 31, 2016 | 8.38 | .17 | .02 | .19 | (.17 | ) | (.77 | ) | |||||||||
| October 31, 2015 | 13.08 | .17 | (.20 | ) | (.03 | ) | (.22 | ) | (4.45 | ) | |||||||
| October 31, 2014 | 12.53 | .30 | .55 | .85 | (.30 | ) | — | ||||||||||
| October 31, 2013 | 10.58 | .17 | 1.95 | 2.12 | (.17 | ) | — | ||||||||||
| October 31, 2012 | 9.89 | .17 | .67 | .84 | (.15 | ) | — | ||||||||||
| Class E | |||||||||||||||||
| October 31, 2016 | 8.38 | .15 | .04 | .19 | (.17 | ) | (.77 | ) | |||||||||
| October 31, 2015 | 13.08 | .23 | (.27 | ) | (.04 | ) | (.21 | ) | (4.45 | ) | |||||||
| October 31, 2014 | 12.53 | .32 | .52 | .84 | (.29 | ) | — | ||||||||||
| October 31, 2013 | 10.57 | .17 | 1.96 | 2.13 | (.17 | ) | — | ||||||||||
| October 31, 2012 | 9.89 | .16 | .68 | .84 | (.16 | ) | — | ||||||||||
| Class R1 | |||||||||||||||||
| October 31, 2016 | 8.39 | .19 | .02 | .21 | (.19 | ) | (.77 | ) | |||||||||
| October 31, 2015 | 13.09 | .18 | (.18 | ) | — | (.25 | ) | (4.45 | ) | ||||||||
| October 31, 2014 | 12.54 | .36 | .52 | .88 | (.33 | ) | — | ||||||||||
| October 31, 2013 | 10.59 | .21 | 1.94 | 2.15 | (.20 | ) | — | ||||||||||
| October 31, 2012 | 9.90 | .18 | .69 | .87 | (.18 | ) | — | ||||||||||
| Class R4(1) | |||||||||||||||||
| October 31, 2016 | 8.39 | .15 | .04 | .19 | (.17 | ) | (.77 | ) | |||||||||
| October 31, 2015 | 13.09 | .18 | (.21 | ) | (.03 | ) | (.22 | ) | (4.45 | ) | |||||||
| October 31, 2014 | 12.54 | .31 | .54 | .85 | (.30 | ) | — | ||||||||||
| October 31, 2013 | 10.58 | .18 | 1.95 | 2.13 | (.17 | ) | — | ||||||||||
| October 31, 2012 | 9.89 | .18 | .66 | .84 | (.15 | ) | — | ||||||||||
| Class R5(2) | |||||||||||||||||
| October 31, 2016 | 8.37 | .15 | .02 | .17 | (.15 | ) | (.77 | ) | |||||||||
| October 31, 2015 | 13.06 | .17 | (.22 | ) | (.05 | ) | (.19 | ) | (4.45 | ) | |||||||
| October 31, 2014 | 12.52 | .32 | .49 | .81 | (.27 | ) | — | ||||||||||
| October 31, 2013 | 10.56 | .15 | 1.95 | 2.10 | (.14 | ) | — | ||||||||||
| October 31, 2012 | 9.87 | .14 | .67 | .81 | (.12 | ) | — | ||||||||||
| Class S | |||||||||||||||||
| October 31, 2016 | 8.39 | .17 | .04 | .21 | (.19 | ) | (.77 | ) | |||||||||
| October 31, 2015 | 13.09 | .24 | (.24 | ) | — | (.25 | ) | (4.45 | ) | ||||||||
| October 31, 2014 | 12.54 | .36 | .52 | .88 | (.33 | ) | — | ||||||||||
| October 31, 2013 | 10.59 | .21 | 1.94 | 2.15 | (.20 | ) | — | ||||||||||
| October 31, 2012 | 9.90 | .18 | .69 | .87 | (.18 | ) | — | ||||||||||
See accompanying notes which are an integral part of the financial statements.
192 2040 Strategy Fund
| % | % | % | |||||||||||||||
| $ | $ | Ratio of Expenses | Ratio of Expenses | Ratio of Net | |||||||||||||
| Net Asset Value, | % | Net Assets, | to Average | to Average | Investment Income | % | |||||||||||
| $ | End of | Total | End of Period | Net Assets, | Net Assets, | to Average | Portfolio | ||||||||||
| Total Distributions | Period | Return(d) | (000 | ) | Gross(g) | Net(e)(g) | Net Assets(b)(e) | Turnover Rate | |||||||||
| (.94 | ) | 7.63 | 2.82 | 582 | .25 | .25 | 2.29 | 31 | |||||||||
| (4.67 | ) | 8.38 | (.92 | ) | 736 | .25 | .25 | 1.89 | 25 | ||||||||
| (.30 | ) | 13.08 | 6.85 | 1,114 | .25 | .25 | 2.29 | 64 | |||||||||
| (.17 | ) | 12.53 | 20.33 | 1,048 | .25 | .25 | 1.52 | 14 | |||||||||
| (.15 | ) | 10.58 | 8.69 | 902 | .25 | .25 | 1.71 | 26 | |||||||||
| (.94 | ) | 7.63 | 2.80 | 84 | .25 | .25 | 2.01 | 31 | |||||||||
| (4.66 | ) | 8.38 | (.97 | ) | 116 | .25 | .25 | 2.43 | 25 | ||||||||
| (.29 | ) | 13.08 | 6.80 | 605 | .25 | .25 | 2.49 | 64 | |||||||||
| (.17 | ) | 12.53 | 20.45 | 1,100 | .25 | .25 | 1.49 | 14 | |||||||||
| (.16 | ) | 10.57 | 8.59 | 979 | .25 | .25 | 1.55 | 26 | |||||||||
| (.96 | ) | 7.64 | 3.08 | 20,163 | — | — | 2.57 | 31 | |||||||||
| (4.70 | ) | 8.39 | (.61 | ) | 38,704 | — | — | 2.01 | 25 | ||||||||
| (.33 | ) | 13.09 | 7.11 | 46,351 | — | — | 2.83 | 64 | |||||||||
| (.20 | ) | 12.54 | 20.61 | 66,546 | — | — | 1.79 | 14 | |||||||||
| (.18 | ) | 10.59 | 8.99 | 59,225 | — | — | 1.76 | 26 | |||||||||
| (.94 | ) | 7.64 | 2.81 | 6,354 | .25 | .25 | 2.04 | 31 | |||||||||
| (4.67 | ) | 8.39 | (.91 | ) | 6,640 | .25 | .25 | 1.92 | 25 | ||||||||
| (.30 | ) | 13.09 | 6.84 | 11,027 | .25 | .25 | 2.39 | 64 | |||||||||
| (.17 | ) | 12.54 | 20.41 | 12,257 | .25 | .25 | 1.58 | 14 | |||||||||
| (.15 | ) | 10.58 | 8.64 | 13,393 | .25 | .25 | 1.81 | 26 | |||||||||
| (.92 | ) | 7.62 | 2.56 | 8,072 | .50 | .50 | 1.99 | 31 | |||||||||
| (4.64 | ) | 8.37 | (1.07 | ) | 12,410 | .50 | .50 | 1.83 | 25 | ||||||||
| (.27 | ) | 13.06 | 6.51 | 25,262 | .50 | .50 | 2.47 | 64 | |||||||||
| (.14 | ) | 12.52 | 20.14 | 36,644 | .50 | .50 | 1.34 | 14 | |||||||||
| (.12 | ) | 10.56 | 8.39 | 38,165 | .50 | .50 | 1.38 | 26 | |||||||||
| (.96 | ) | 7.64 | 3.08 | 4,498 | — | — | 2.25 | 31 | |||||||||
| (4.70 | ) | 8.39 | (.65 | ) | 6,093 | — | — | 2.49 | 25 | ||||||||
| (.33 | ) | 13.09 | 7.11 | 17,707 | — | — | 2.79 | 64 | |||||||||
| (.20 | ) | 12.54 | 20.61 | 22,214 | — | — | 1.87 | 14 | |||||||||
| (.18 | ) | 10.59 | 8.99 | 24,994 | — | — | 1.75 | 26 | |||||||||
See accompanying notes which are an integral part of the financial statements.
2040 Strategy Fund 193
Russell Investment Company
2040 Strategy Fund
Related Party Transactions, Fees and Expenses
| Accrued fees payable to affiliates for the period ended October 31, 2016 were as follows: | ||
| Distribution fees | $ | 2,049 |
| Shareholder servicing fees | 3,293 | |
| $ | 5,342 | |
| Transactions (amounts in thousands) during the period ended October 31, 2016 with Underlying Funds which are, or were, an | ||||||||||||||||||||
| affiliated company are as follows: | ||||||||||||||||||||
| Fair Value, | Change in | |||||||||||||||||||
| Beginning of | Realized Gain | Unrealized | Fair Value, End | Income | Capital Gains | |||||||||||||||
| Period | Purchases | Sales | (Loss) | Gain (Loss) | of Period | Distributions | Distributions | |||||||||||||
| Russell Commodity Strategies Fund | $ | 2,268 | $ | 754 | $ | 1,580 | $ | (631) | $ | 564 | $ | 1,375 | $ | — | $ | — | ||||
| Russell Global Infrastructure Fund | 1,943 | 512 | 1,245 | (201 | ) | 186 | 1,195 | 43 | 47 | |||||||||||
| Russell Global Real Estate Securities | ||||||||||||||||||||
| Fund | 1,933 | 432 | 1,394 | 461 | (632 | ) | 800 | 32 | 84 | |||||||||||
| Russell U.S. Defensive Equity Fund | 1,942 | 321 | 1,110 | 509 | (468 | ) | 1,194 | 23 | — | |||||||||||
| Russell U.S. Dynamic Equity Fund | 3,241 | 932 | 1,787 | 18 | (418 | ) | 1,986 | 139 | 282 | |||||||||||
| Russell U.S. Small Cap Equity Fund | 5,518 | 1,209 | 3,126 | 934 | (1,150 | ) | 3,385 | 45 | 328 | |||||||||||
| Select U.S. Equity Fund | 16,999 | 2,820 | 9,295 | 374 | (262 | ) | 10,636 | 381 | 21 | |||||||||||
| Russell Strategic Bond Fund | 4,532 | 2,036 | 3,815 | 219 | (189 | ) | 2,783 | 124 | 23 | |||||||||||
| Russell Emerging Markets Fund | 5,143 | 890 | 3,073 | (317 | ) | 541 | 3,184 | 17 | — | |||||||||||
| Russell Global Equity Fund | 8,418 | 2,419 | 4,923 | 721 | (1,466 | ) | 5,169 | 147 | 632 | |||||||||||
| Select International Equity Fund | 12,767 | 2,921 | 6,854 | (1,249 | ) | 467 | 8,052 | 327 | — | |||||||||||
| $ | 64,704 | $ | 15,246 | $ | 38,202 | $ | 838 | $ | (2,827) | $ | 39,759 | $ | 1,278 | $ | 1,417 | |||||
Federal Income Taxes
At October 31, 2016, the cost of investments and net unrealized appreciation (depreciation), undistributed ordinary income and
undistributed long-term capital gains for income tax purposes were as follows:
| Cost of Investments | $ | 34,640,317 | ||
| Unrealized Appreciation | $ | 5,863,554 | ||
| Unrealized Depreciation | (745,289 | ) | ||
| Net Unrealized Appreciation (Depreciation) | $ | 5,118,265 | ||
| Undistributed Ordinary Income | $ | 10,225 | ||
| Undistributed Long-Term Capital Gains | ||||
| (Capital Loss Carryforward) | $ | 2,501,824 | ||
| Tax Composition of Distributions | ||||
| Ordinary Income | $ | 1,442,504 | ||
| Long-Term Capital Gains | $ | 5,217,612 |
Net investment income and net realized gains (losses) in the financial statements may differ from taxable net investment income and
net realized gains (losses). Capital accounts within the financial statements are adjusted for permanent differences between book and
tax accounting. These differences may be due to foreign currency gains or losses, reclassifications of dividends and /or differences in
treatment of income from swaps. These adjustments have no impact on the net assets.
At October 31, 2016, the Statement of Assets and Liabilities have been adjusted by the following amounts (in thousands):
| Undistributed net investment income | $ | 10 | |
| Accumulated net realized gain (loss) | (10 | ) |
See accompanying notes which are an integral part of the financial statements.
194 2040 Strategy Fund
Russell Investment Company
2040 Strategy Fund
Federal Income Taxes, continued
| Additional paid-in capital | — |
See accompanying notes which are an integral part of the financial statements.
2040 Strategy Fund 195
Russell Investment Company
2045 Strategy Fund
Portfolio Management Discussion and Analysis — October 31, 2016 (Unaudited)
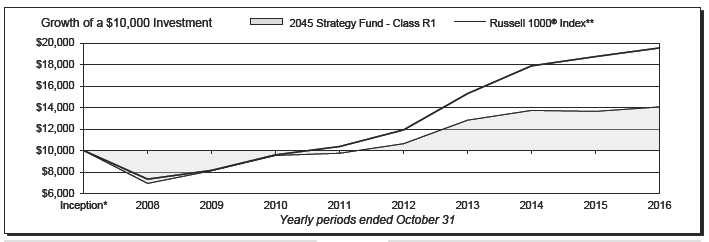
| 2045 Strategy Fund - Class R1 | 2045 Strategy Fund - Class R5‡ | ||||||
| Total | Total | ||||||
| Return | Return | ||||||
| 1 Year | 3.05 | % | 1 Year | 2.42 | % | ||
| 5 Years | 7.61 | %§ | 5 Years | 7.06 | %§ | ||
| Inception* | 4.05 | %§ | Inception* | 3.52 | %§ | ||
| 2045 Strategy Fund - Class R4‡ | Russell 1000® Index** | ||||||
| Total | Total | ||||||
| Return | Return | ||||||
| 1 Year | 2.79 | % | 1 Year | 4.26 | % | ||
| 5 Years | 7.34 | %§ | 5 Years | 13.51 | %§ | ||
| Inception* | 3.81 | %§ | Inception* | 8.12 | %§ | ||
196 2045 Strategy Fund
Russell Investment Company
2045 Strategy Fund
Portfolio Management Discussion and Analysis, continued — October 31, 2016
(Unaudited)
| The 2045 Strategy Fund (the “Fund”) is a fund of funds that | was beneficial as it was one of the best performing asset classes |
| invests in other Russell Investment Company mutual funds (the | globally. Falling interest rates also helped other fixed income |
| “Underlying Funds”). The Underlying Funds employ a multi- | assets in the Underlying Funds rally, as well as more rate sensitive |
| manager approach whereby portions of the Underlying Funds are | real assets like global real estate investment trusts and global |
| allocated to different money managers. Underlying Fund assets not | infrastructure. With interest rates falling, income opportunities |
| allocated to money managers are managed by Russell Investment | around the globe continued to shrink and income available from |
| Management, LLC (“RIM”), the Fund’s and Underlying Funds’ | most assets fell. |
| advisor. RIM, as the Underlying Funds’ advisor, may change | The U.S. equity market, as measured by the S&P 500® Index, |
| the allocation of the Underlying Funds’ assets among money | was up 4.51% over the period but also experienced multiple |
| managers at any time. An exemptive order from the Securities | draw downs. The Fund’s strategic exposure to global equities |
| and Exchange Commission (“SEC”) permits RIM to engage or | proved beneficial over the period as emerging markets rallied |
| terminate a money manager in an Underlying Fund at any time, | and outperformed U.S. equities. By contrast, non-U.S. developed |
| subject to approval by the Underlying Fund’s Board, without a | equity was one of the lowest performing portions of the Fund’s |
| shareholder vote. Pursuant to the terms of the exemptive order, an | exposure as falling commodities and currencies weighed on |
| Underlying Fund is required to notify its shareholders within 90 | returns. |
| days of when a money manager begins providing services. | |
| What is the Fund’s investment objective? | How did the investment strategies and techniques employed |
| by the Fund and the Underlying Funds affect the Fund’s | |
| The Fund seeks to provide capital growth and income consistent | performance? |
| with its current asset allocation which will change over time, with | The Fund is a fund of funds and its performance is based on RIM’s |
| an increasing allocation to fixed income funds. | strategic asset allocations, the performance of the Underlying |
| The Fund pursues this objective by investing in a diversified | Funds in which the Fund invests, and tactical changes in the |
| portfolio that, as of October 31, 2016, consisted of approximately | Fund’s asset allocation throughout the year. |
| 82.5% equity Underlying Funds, 7% fixed income Underlying | In order to seek to achieve the Fund’s objective during the period, |
| Funds and 10.5% alternative Underlying Funds. The Fund’s | RIM’s strategic asset allocation included investments in global |
| allocation to fixed income Underlying Funds will be fixed at | equity, alternative and fixed income Underlying Funds. The |
| 66.3% in approximately the year 2045. | Fund’s diverse asset allocation partially hindered performance |
| How did the Fund perform relative to its benchmark for the | during the period as certain of these exposures underperformed |
| fiscal year ended October 31, 2016? | the Russell 1000® Index. While areas like high yield bonds, as |
| For the fiscal year ended October 31, 2016, the Fund’s Class R1, | measured by the BofA Merrill Lynch Global High Yield Index |
| Class R4 and Class R5 Shares gained 3.05%, 2.79% and 2.42%, | Hedged USD, outperformed the Russell 1000® Index, areas like |
| respectively. This is compared to the Fund’s primary benchmark, | commodities and non-U.S. developed equities delivered negative |
| the Russell 1000® Index, which gained 4.26% during the same | returns as measured by the Bloomberg Commodity Index Total |
| period. The Fund’s performance includes operating expenses, | Return and Russell Developed ex-U.S. Large Cap® Index Net, |
| whereas index returns are unmanaged and do not include | respectively. |
| expenses of any kind. | The Fund’s underperformance relative to the Russell 1000® |
| For the fiscal year ended October 31, 2016, the Morningstar® | Index was partially offset by strong active management within |
| Target-Date 2045 Category gained 2.44%. This result serves as | the fixed income portion of the Fund’s portfolio. Underlying Fund |
| a peer comparison and is expressed net of operating expenses. | bond issue selection during the period was generally additive to |
| returns as fixed income money managers were able to pick well | |
| How did the market conditions described in the Market | within credit, avoiding defaults in places like the energy sector |
| Summary report affect the Fund’s performance? | where trouble occurred with falling energy prices in early 2016. |
| The Fund seeks to achieve its objective by investing in Underlying | As such, an allocation to the Russell Strategic Bond Fund was |
| Funds that provide exposure to a range of diversified investments, | positive from a benchmark-relative perspective. The Underlying |
| and most major asset classes invested in by the Underlying | Fund was positively impacted by its overweight to credit and |
| Funds produced positive absolute returns during the period. | additive currency positioning also helped to drive excess return. |
| Markets during the fiscal year were characterized by higher | By contrast, equity selection and positioning was more difficult, |
| levels of volatility and dispersion across return sources. Within | with allocations to non-U.S. equity Underlying Funds detracting |
| the fixed income Underlying Funds, exposure to high yield debt | from the Fund’s performance and security selection within |
2045 Strategy Fund 197
Russell Investment Company
2045 Strategy Fund
Portfolio Management Discussion and Analysis, continued — October 31, 2016
(Unaudited)
| those Underlying Funds struggling. In addition, overweights | in high yield credit and emerging markets equity compared with | |
| to European securities in the Select International Equity Fund | core bond holdings and cash. Markets subsequently rebounded | |
| caused the Underlying Fund to struggle as European equities | from the February lows and RIM reduced risk exposure to a more | |
| continued to lag the U.S. equity market. | defensive stance with the Fund’s equity allocation below strategic | |
| weights. RIM’s modifications to the Fund’s asset allocation were | ||
| Describe any changes to the Fund’s structure or allocation | additive during the period. | |
| to the Underlying Funds. | ||
| RIM has the discretion to vary the Fund’s actual allocation from | The views expressed in this report reflect those of the | |
| the target strategic asset allocation by up to +/- 5% at the equity, | portfolio managers only through the end of the period | |
| fixed income or alternative category level based on RIM’s capital | covered by the report. These views do not necessarily | |
| markets research. RIM’s asset allocation modifications benefited | represent the views of RIM, or any other person in RIM or | |
| the Fund’s performance relative to the Fund’s target strategic | any other affiliated organization. These views are subject | |
| asset allocation. | to change at any time based upon market conditions or | |
| RIM adapted the Fund’s asset allocation over the period as market | other events, and RIM disclaims any responsibility to | |
| opportunities and risks evolved. The Fund was defensively | update the views contained herein. These views should not | |
| positioned in the fourth quarter of 2015, favoring fixed income | be relied on as investment advice and, because investment | |
| over equity Underlying Funds. During the first quarter of 2016, | decisions for a Russell Investment Company (“RIC”) Fund | |
| equity markets declined substantially, and RIM added further risk | are based on numerous factors, should not be relied on as | |
| to the portfolio by overweighting Underlying Funds that invest | an indication of investment decisions of any RIC Fund. | |
* Assumes initial investment on March 31, 2008.
** Russell 1000® Index includes the 1,000 largest companies in the Russell 3000® Index. The Russell 1000® Index represents the universe of stocks from which
most active money managers typically select. The Russell 1000® Index return reflects adjustments from income dividends and capital gain distributions
reinvested as of the ex-dividend dates.
‡ The Fund first issued Class R4 and Class R5 Shares on October 1, 2014. The returns shown for Class R4 and Class R5 Shares prior to that date are the returns
of the Fund’s Class R2 and Class R3 Shares, respectively.
§ Annualized.
Performance is historical and assumes reinvestment of all dividends and capital gains. Investment return and principal value will fluctuate so that an investor’s
shares, when redeemed, may be worth more or less than when purchased. Past performance is not indicative of future results. The returns shown do not reflect the
deduction of taxes that a shareholder would pay on Fund distributions or the redemption of Fund shares. Additionally, the returns presented herein may differ from
the performance reported in the Financial Highlights as the returns herein are calculated in a manner consistent with standardized performance in accordance with
Securities and Exchange Commission rules, while the performance in the Financial Highlights has been calculated in accordance with U.S. Generally Accepted
Accounting Principles (“U.S. GAAP”).
198 2045 Strategy Fund
Russell Investment Company
2045 Strategy Fund
Shareholder Expense Example — October 31, 2016 (Unaudited)
| Fund Expenses | Hypothetical | |||||
| The following disclosure provides important information | Performance (5% | |||||
| Actual | return before | |||||
| regarding the Fund’s Shareholder Expense Example | Class R1 | Performance | expenses) | |||
| (“Example”). | Beginning Account Value | |||||
| May 1, 2016 | $ | 1,000.00 | $ | 1,000.00 | ||
| Example | Ending Account Value | |||||
| As a shareholder of the Fund, you incur ongoing costs, including | October 31, 2016 | $ | 1,036.40 | $ | 1,025.14 | |
| distribution (12b-1) and/or service fees and other Fund expenses. | Expenses Paid During Period* | $ | — | $ | — | |
| The Example is intended to help you understand your ongoing | * There were no expenses charged to the Class. | |||||
| costs (in dollars) of investing in the Fund and to compare these | ||||||
| costs with the ongoing costs of investing in other mutual funds. | Hypothetical | |||||
| Performance (5% | ||||||
| The Example is based on an investment of $1,000 invested at the | Actual | return before | ||||
| beginning of the period and held for the entire period indicated, | Class R4 | Performance | expenses) | |||
| which for this Fund is from May 1, 2016 to October 31, 2016. | Beginning Account Value | |||||
| May 1, 2016 | $ | 1,000.00 | $ | 1,000.00 | ||
| Actual Expenses | Ending Account Value | |||||
| The information in the table under the heading “Actual | October 31, 2016 | $ | 1,035.00 | $ | 1,023.88 | |
| Expenses Paid During Period* | $ | 1.28 | $ | 1.27 | ||
| Performance” provides information about actual account values | ||||||
| and actual expenses. You may use the information in this column, | * Expenses are equal to the Fund's annualized expense ratio of 0.25% | |||||
| together with the amount you invested, to estimate the expenses | (representing the six month period annualized), multiplied by the average | |||||
| account value over the period, multiplied by 184/366 (to reflect the one-half | ||||||
| that you paid over the period. Simply divide your account value by | year period). | |||||
| $1,000 (for example, an $8,600 account value divided by $1,000 | ||||||
| = 8.6), then multiply the result by the number in the first column | Hypothetical | |||||
| in the row entitled “Expenses Paid During Period” to estimate | Performance (5% | |||||
| Actual | return before | |||||
| the expenses you paid on your account during this period. | Class R5 | Performance | expenses) | |||
| Beginning Account Value | ||||||
| Hypothetical Example for Comparison Purposes | May 1, 2016 | $ | 1,000.00 | $ | 1,000.00 | |
| The information in the table under the heading “Hypothetical | Ending Account Value | |||||
| Performance (5% return before expenses)” provides information | October 31, 2016 | $ | 1,033.90 | $ | 1,022.62 | |
| about hypothetical account values and hypothetical expenses | Expenses Paid During Period* | $ | 2.56 | $ | 2.54 | |
| based on the Fund’s actual expense ratio and an assumed rate of | * Expenses are equal to the Fund's annualized expense ratio of 0.50% | |||||
| return of 5% per year before expenses, which is not the Fund’s | (representing the six month period annualized), multiplied by the average | |||||
| actual return. The hypothetical account values and expenses | account value over the period, multiplied by 184/366 (to reflect the one-half | |||||
| may not be used to estimate the actual ending account balance or | year period). | |||||
| expenses you paid for the period. You may use this information | ||||||
| to compare the ongoing costs of investing in the Fund and other | ||||||
| funds. To do so, compare this 5% hypothetical example with the | ||||||
| 5% hypothetical examples that appear in the shareholder reports | ||||||
| of other funds. | ||||||
| Please note that the expenses shown in the table are meant | ||||||
| to highlight your ongoing costs only and do not reflect any | ||||||
| transactional costs. Therefore, the information under the heading | ||||||
| “Hypothetical Performance (5% return before expenses)” is | ||||||
| useful in comparing ongoing costs only, and will not help you | ||||||
| determine the relative total costs of owning different funds. In | ||||||
| addition, if these transactional costs were included, your costs | ||||||
| would have been higher. | ||||||
2045 Strategy Fund 199
Russell Investment Company
2045 Strategy Fund
Schedule of Investments — October 31, 2016
| Amounts in thousands (except share amounts) | ||||
| Fair | ||||
| Value | ||||
| Shares | $ | |||
| Investments in Russell Affiliated Mutual Funds - 100.0% | ||||
| Alternative - 8.5% | ||||
| Russell Commodity Strategies Fund Class Y | 72,981 | 402 | ||
| Russell Global Infrastructure Fund Class Y | 30,453 | 348 | ||
| Russell Global Real Estate Securities Fund Class Y | 6,505 | 233 | ||
| 983 | ||||
| Domestic Equities - 43.2% | ||||
| Russell U.S. Defensive Equity Fund Class Y | 7,067 | 348 | ||
| Russell U.S. Dynamic Equity Fund Class Y | 58,292 | 579 | ||
| Russell U.S. Small Cap Equity Fund Class Y | 35,654 | 984 | ||
| Select U.S. Equity Fund Class Y | 283,935 | 3,101 | ||
| 5,012 | ||||
| Fixed Income - 7.0% | ||||
| Russell Strategic Bond Fund Class Y | 73,417 | 812 | ||
| International Equities - 41.3% | ||||
| Russell Emerging Markets Fund Class Y | 55,658 | 928 | ||
| Russell Global Equity Fund Class Y | 144,484 | 1,507 | ||
| Select International Equity Fund Class Y | 273,532 | 2,349 | ||
| 4,784 | ||||
| Total Investments in Russell Affiliated Mutual Funds | ||||
| (cost $10,310) | 11,591 | |||
| Total Investments 100.0% | ||||
| (identified cost $10,310) | 11,591 | |||
| Other Assets and Liabilities, Net - (0.0%) | (2 | ) | ||
| Net Assets - 100.0% | 11,589 | |||
| Presentation of Portfolio Holdings | ||||||||||||||
| Amounts in thousands | ||||||||||||||
| Fair Value | ||||||||||||||
| Practical | ||||||||||||||
| Portfolio Summary | Level 1 | Level 2 | Level 3 | Expedient | Total | % of Net Assets | ||||||||
| Investments in Russell Affiliated Mutual | ||||||||||||||
| Funds | $ | 11,591 | $ | — | $ | — | $ | — | $ | 11,591 | 100.0 | |||
| Total Investments | 11,591 | — | — | — | 11,591 | 100.0 | ||||||||
| Other Assets and Liabilities, Net | (—)* | |||||||||||||
| 100.0 | ||||||||||||||
* Less than 0.05% of net assets.
For a description of the Levels, see note 2 in the Notes to Financial Statements.
For a disclosure on transfers between Levels 1, 2 and 3 during the period ended October 31, 2016, see note 2 in the Notes to
Financial Statements.
See accompanying notes which are an integral part of the financial statements.
200 2045 Strategy Fund
Russell Investment Company
2045 Strategy Fund
Statement of Assets and Liabilities — October 31, 2016
| Amounts in thousands | |||
| Assets | |||
| Investments, at identified cost | $ | 10,310 | |
| Investments, at fair value(>) | 11,591 | ||
| Receivables: | |||
| Investments sold | 10 | ||
| Fund shares sold | 8 | ||
| Total assets | 11,609 | ||
| Liabilities | |||
| Payables: | |||
| Fund shares redeemed | 18 | ||
| Accrued fees to affiliates | 2 | ||
| Total liabilities | 20 | ||
| Net Assets | $ | 11,589 | |
| Net Assets Consist of: | |||
| Accumulated net realized gain (loss) | $ | (177 | ) |
| Unrealized appreciation (depreciation) on investments | 1,281 | ||
| Shares of beneficial interest | 14 | ||
| Additional paid-in capital | 10,471 | ||
| Net Assets | $ | 11,589 | |
| Net Asset Value, offering and redemption price per share: | |||
| Net asset value per share: Class R1(#) | $ | 8.36 | |
| Class R1 — Net assets | $ | 4,301,998 | |
| Class R1 — Shares outstanding ($.01 par value) | 514,805 | ||
| Net asset value per share: Class R4(#) | $ | 8.38 | |
| Class R4 — Net assets | $ | 4,125,999 | |
| Class R4 — Shares outstanding ($.01 par value) | 492,555 | ||
| Net asset value per share: Class R5(#) | $ | 8.33 | |
| Class R5 — Net assets | $ | 3,160,509 | |
| Class R5 — Shares outstanding ($.01 par value) | 379,284 | ||
| Amounts in thousands | |||
| (>) Investments in affiliated Russell funds | $ | 11,591 | |
| (#) Net asset value per share equals class level net assets divided by class level shares of beneficial interest outstanding. | |||
See accompanying notes which are an integral part of the financial statements.
2045 Strategy Fund 201
Russell Investment Company
2045 Strategy Fund
Statement of Operations — For the Period Ended October 31, 2016
| Amounts in thousands | |||
| Investment Income | |||
| Income distributions from affiliated Russell funds | $ | 264 | |
| Expenses | |||
| Distribution fees - Class R5 | 8 | ||
| Shareholder servicing fees - Class R4 | 10 | ||
| Shareholder servicing fees - Class R5 | 8 | ||
| Total expenses | 26 | ||
| Net investment income (loss) | 238 | ||
| Net Realized and Unrealized Gain (Loss) | |||
| Net realized gain (loss) on: | |||
| Investments | (145 | ) | |
| Capital gain distributions from Underlying Funds | 275 | ||
| Net realized gain (loss) | 130 | ||
| Net change in unrealized appreciation (depreciation) on investments | (78 | ) | |
| Net realized and unrealized gain (loss) | 52 | ||
| Net Increase (Decrease) in Net Assets from Operations | $ | 290 | |
See accompanying notes which are an integral part of the financial statements.
202 2045 Strategy Fund
Russell Investment Company
2045 Strategy Fund
Statements of Changes in Net Assets
| For the Periods Ended October 31, | |||||||
| Amounts in thousands | 2016 | 2015 | |||||
| Increase (Decrease) in Net Assets | |||||||
| Operations | |||||||
| Net investment income (loss) | $ | 238 | $ | 251 | |||
| Net realized gain (loss) | 130 | 77 | |||||
| Net change in unrealized appreciation (depreciation) | (78 | ) | (400 | ) | |||
| Net increase (decrease) in net assets from operations | 290 | (72 | ) | ||||
| Distributions | |||||||
| From net investment income | |||||||
| Class R1 | (96 | ) | (123 | ) | |||
| Class R4 | (83 | ) | (71 | ) | |||
| Class R5 | (60 | ) | (57 | ) | |||
| From net realized gain | |||||||
| Class R1 | (98 | ) | (1,274 | ) | |||
| Class R4 | (93 | ) | (880 | ) | |||
| Class R5 | (78 | ) | (847 | ) | |||
| Net decrease in net assets from distributions | (508 | ) | (3,252 | ) | |||
| Share Transactions* | |||||||
| Net increase (decrease) in net assets from share transactions | (1,049 | ) | 2,520 | ||||
| Total Net Increase (Decrease) in Net Assets | (1,267 | ) | (804 | ) | |||
| Net Assets | |||||||
| Beginning of period | 12,856 | 13,660 | |||||
| End of period | $ | 11,589 | $ | 12,856 | |||
See accompanying notes which are an integral part of the financial statements.
2045 Strategy Fund 203
Russell Investment Company
2045 Strategy Fund
Statements of Changes in Net Assets, continued
* Share transaction amounts (in thousands) for the periods ended October 31, 2016 and October 31, 2015 were as follows:
| 2016 | 2015 | |||||||||||
| Shares | Dollars | Shares | Dollars | |||||||||
| Class R1 | ||||||||||||
| Proceeds from shares sold | 175 | $ | 1,431 | 524 | $ | 4,667 | ||||||
| Proceeds from reinvestment of distributions | 23 | 184 | 161 | 1,397 | ||||||||
| Payments for shares redeemed | (317 | ) | (2,594 | ) | (525 | ) | (4,550 | ) | ||||
| Net increase (decrease) | (119 | ) | (979 | ) | 160 | 1,514 | ||||||
| Class R4 | ||||||||||||
| Proceeds from shares sold | 126 | 1,027 | 111 | 1,001 | ||||||||
| Proceeds from reinvestment of distributions | 22 | 176 | 109 | 950 | ||||||||
| Payments for shares redeemed | (130 | ) | (1,073 | ) | (114 | ) | (1,038 | ) | ||||
| Net increase (decrease) | 18 | 130 | 106 | 913 | ||||||||
| Class R5 | ||||||||||||
| Proceeds from shares sold | 146 | 1,178 | 141 | 1,263 | ||||||||
| Proceeds from reinvestment of distributions | 17 | 137 | 104 | 905 | ||||||||
| Payments for shares redeemed | (186 | ) | (1,515 | ) | (225 | ) | (2,075 | ) | ||||
| Net increase (decrease) | (23 | ) | (200 | ) | 20 | 93 | ||||||
| Total increase (decrease) | (124 | ) | $ | (1,049 | ) | 286 | $ | 2,520 | ||||
See accompanying notes which are an integral part of the financial statements.
204 2045 Strategy Fund
(This page intentionally left blank)
Russell Investment Company
2045 Strategy Fund
Financial Highlights — For the Periods Ended
For a Share Outstanding Throughout Each Period.
| $ | ||||||||||||||||
| $ | Net | $ | $ | $ | $ | |||||||||||
| Net Asset Value, | Investment | Net Realized | Total from | Distributions | Distributions | |||||||||||
| Beginning of | Income (Loss) | and Unrealized | Investment | from Net | from Net | |||||||||||
| Period | (a)(b)(e) | Gain (Loss) | Operations | Investment Income | Realized Gain | |||||||||||
| Class R1 | ||||||||||||||||
| October 31, 2016 | 8.51 | .18 | .06 | .24 | (.19 | ) | (.20 | ) | ||||||||
| October 31, 2015 | 11.16 | .16 | (.19 | ) | (.03 | ) | (.21 | ) | (2.41 | ) | ||||||
| October 31, 2014 | 10.78 | .30 | .45 | .75 | (.28 | ) | (.09 | ) | ||||||||
| October 31, 2013 | 9.29 | .18 | 1.67 | 1.85 | (.17 | ) | (.19 | ) | ||||||||
| October 31, 2012 | 9.10 | .14 | .62 | .76 | (.16 | ) | (.41 | ) | ||||||||
| Class R4(1) | ||||||||||||||||
| October 31, 2016 | 8.53 | .16 | .06 | .22 | (.17 | ) | (.20 | ) | ||||||||
| October 31, 2015 | 11.18 | .16 | (.21 | ) | (.05 | ) | (.19 | ) | (2.41 | ) | ||||||
| October 31, 2014 | 10.80 | .24 | .49 | .73 | (.26 | ) | (.09 | ) | ||||||||
| October 31, 2013 | 9.30 | .15 | 1.69 | 1.84 | (.15 | ) | (.19 | ) | ||||||||
| October 31, 2012 | 9.11 | .14 | .60 | .74 | (.14 | ) | (.41 | ) | ||||||||
| Class R5(2) | ||||||||||||||||
| October 31, 2016 | 8.49 | .15 | .04 | .19 | (.15 | ) | (.20 | ) | ||||||||
| October 31, 2015 | 11.13 | .14 | (.21 | ) | (.07 | ) | (.16 | ) | (2.41 | ) | ||||||
| October 31, 2014 | 10.76 | .25 | .44 | .69 | (.23 | ) | (.09 | ) | ||||||||
| October 31, 2013 | 9.27 | .12 | 1.69 | 1.81 | (.13 | ) | (.19 | ) | ||||||||
| October 31, 2012 | 9.08 | .12 | .60 | .72 | (.12 | ) | (.41 | ) | ||||||||
See accompanying notes which are an integral part of the financial statements.
206 2045 Strategy Fund
| % | % | % | |||||||||||||||
| $ | $ | Ratio of Expenses | Ratio of Expenses | Ratio of Net | |||||||||||||
| Net Asset Value, | % | Net Assets, | to Average | to Average | Investment Income | % | |||||||||||
| $ | End of | Total | End of Period | Net Assets, | Net Assets, | to Average | Portfolio | ||||||||||
| Total Distributions | Period | Return | (000 | ) | Gross(g) | Net(e)(g) | Net Assets(b)(e) | Turnover Rate | |||||||||
| (.39 | ) | 8.36 | 3.05 | 4,302 | — | — | 2.27 | 28 | |||||||||
| (2.62 | ) | 8.51 | (.65 | ) | 5,398 | — | — | 1.82 | 39 | ||||||||
| (.37 | ) | 11.16 | 7.08 | 5,297 | — | — | 2.78 | 84 | |||||||||
| (.36 | ) | 10.78 | 20.59 | 6,750 | — | — | 1.77 | 28 | |||||||||
| (.57 | ) | 9.29 | 9.13 | 5,391 | — | — | 1.59 | 57 | |||||||||
| (.37 | ) | 8.38 | 2.79 | 4,126 | .25 | .25 | 2.02 | 28 | |||||||||
| (2.60 | ) | 8.53 | (.89 | ) | 4,043 | .25 | .25 | 1.74 | 39 | ||||||||
| (.35 | ) | 11.18 | 6.80 | 4,111 | .25 | .25 | 2.16 | 84 | |||||||||
| (.34 | ) | 10.80 | 20.37 | 3,404 | .25 | .25 | 1.48 | 28 | |||||||||
| (.55 | ) | 9.30 | 8.82 | 2,796 | .25 | .25 | 1.58 | 57 | |||||||||
| (.35 | ) | 8.33 | 2.42 | 3,161 | .50 | .50 | 1.81 | 28 | |||||||||
| (2.57 | ) | 8.49 | (1.06 | ) | 3,415 | .50 | .50 | 1.54 | 39 | ||||||||
| (.32 | ) | 11.13 | 6.48 | 4,252 | .50 | .50 | 2.24 | 84 | |||||||||
| (.32 | ) | 10.76 | 20.07 | 6,123 | .50 | .50 | 1.26 | 28 | |||||||||
| (.53 | ) | 9.27 | 8.56 | 3,603 | .50 | .50 | 1.30 | 57 | |||||||||
See accompanying notes which are an integral part of the financial statements.
2045 Strategy Fund 207
Russell Investment Company
2045 Strategy Fund
Related Party Transactions, Fees and Expenses
| Accrued fees payable to affiliates for the period ended October 31, 2016 were as follows: | ||
| Distribution fees | $ | 673 |
| Shareholder servicing fees | 1,545 | |
| $ | 2,218 | |
| Transactions (amounts in thousands) during the period ended October 31, 2016 with Underlying Funds which are, or were, an | ||||||||||||||||||||
| affiliated company are as follows: | ||||||||||||||||||||
| Fair Value, | Change in | |||||||||||||||||||
| Beginning of | Realized Gain | Unrealized | Fair Value, End | Income | Capital Gains | |||||||||||||||
| Period | Purchases | Sales | (Loss) | Gain (Loss) | of Period | Distributions | Distributions | |||||||||||||
| Russell Commodity Strategies Fund | $ | 452 | $ | 155 | $ | 188 | $ | (74) | $ | 57 | $ | 402 | $ | — | $ | — | ||||
| Russell Global Infrastructure Fund | 384 | 109 | 141 | (26 | ) | 22 | 348 | 10 | 9 | |||||||||||
| Russell Global Real Estate Securities | ||||||||||||||||||||
| Fund | 384 | 96 | 212 | 29 | (64 | ) | 233 | 8 | 16 | |||||||||||
| Russell U.S. Defensive Equity Fund | 386 | 66 | 114 | 35 | (25 | ) | 348 | 5 | — | |||||||||||
| Russell U.S. Dynamic Equity Fund | 648 | 186 | 190 | 6 | (71 | ) | 579 | 28 | 55 | |||||||||||
| Russell U.S. Small Cap Equity Fund | 1,101 | 279 | 372 | (12 | ) | (12 | ) | 984 | 9 | 64 | ||||||||||
| Select U.S. Equity Fund | 3,386 | 587 | 930 | 30 | 28 | 3,101 | 83 | 4 | ||||||||||||
| Russell Strategic Bond Fund | 898 | 418 | 513 | 4 | 5 | 812 | 26 | 4 | ||||||||||||
| Russell Emerging Markets Fund | 1,020 | 226 | 400 | (69 | ) | 151 | 928 | 3 | — | |||||||||||
| Russell Global Equity Fund | 1,672 | 480 | 530 | 35 | (150 | ) | 1,507 | 29 | 123 | |||||||||||
| Select International Equity Fund | 2,526 | 627 | 682 | (103 | ) | (19 | ) | 2,349 | 63 | — | ||||||||||
| $ | 12,857 | $ | 3,229 | $ | 4,272 | $ | (145) | $ | (78) | $ | 11,591 | $ | 264 | $ | 275 | |||||
Federal Income Taxes
At October 31, 2016, the cost of investments and net unrealized appreciation (depreciation), undistributed ordinary income and
undistributed long-term capital gains for income tax purposes were as follows:
| Cost of Investments | $ | 10,759,521 | ||
| Unrealized Appreciation | $ | 992,021 | ||
| Unrealized Depreciation | (160,818 | ) | ||
| Net Unrealized Appreciation (Depreciation) | $ | 831,203 | ||
| Undistributed Ordinary Income | $ | 2,603 | ||
| Undistributed Long-Term Capital Gains | ||||
| (Capital Loss Carryforward) | $ | 270,106 | ||
| Tax Composition of Distributions | ||||
| Ordinary Income | $ | 257,874 | ||
| Long-Term Capital Gains | $ | 249,446 |
Net investment income and net realized gains (losses) in the financial statements may differ from taxable net investment income and
net realized gains (losses). Capital accounts within the financial statements are adjusted for permanent differences between book and
tax accounting. These differences may be due to foreign currency gains or losses, reclassifications of dividends and /or differences in
treatment of income from swaps. These adjustments have no impact on the net assets.
At October 31, 2016, the Statement of Assets and Liabilities have been adjusted by the following amounts (in thousands):
| Undistributed net investment income | $ | 1 | |
| Accumulated net realized gain (loss) | (1 | ) |
See accompanying notes which are an integral part of the financial statements.
208 2045 Strategy Fund
Russell Investment Company
2045 Strategy Fund
Federal Income Taxes, continued
| Additional paid-in capital | — |
See accompanying notes which are an integral part of the financial statements.
2045 Strategy Fund 209
Russell Investment Company
2050 Strategy Fund
Portfolio Management Discussion and Analysis — October 31, 2016 (Unaudited)

| 2050 Strategy Fund - Class R1 | 2050 Strategy Fund - Class R5‡ | ||||||
| Total | Total | ||||||
| Return | Return | ||||||
| 1 Year | 3.07 | % | 1 Year | 2.57 | % | ||
| 5 Years | 7.59 | %§ | 5 Years | 7.07 | %§ | ||
| Inception* | 4.27 | %§ | Inception* | 3.76 | %§ | ||
| 2050 Strategy Fund - Class R4‡ | Russell 1000® Index** | ||||||
| Total | Total | ||||||
| Return | Return | ||||||
| 1 Year | 2.82 | % | 1 Year | 4.26 | % | ||
| 5 Years | 7.36 | %§ | 5 Years | 13.51 | %§ | ||
| Inception* | 4.02 | %§ | Inception* | 8.12 | %§ | ||
210 2050 Strategy Fund
Russell Investment Company
2050 Strategy Fund
Portfolio Management Discussion and Analysis, continued — October 31, 2016
(Unaudited)
| The 2050 Strategy Fund (the “Fund”) is a fund of funds that | was beneficial as it was one of the best performing asset classes |
| invests in other Russell Investment Company mutual funds (the | globally. Falling interest rates also helped other fixed income |
| “Underlying Funds”). The Underlying Funds employ a multi- | assets in the Underlying Funds rally, as well as more rate sensitive |
| manager approach whereby portions of the Underlying Funds are | real assets like global real estate investment trusts and global |
| allocated to different money managers. Underlying Fund assets not | infrastructure. With interest rates falling, income opportunities |
| allocated to money managers are managed by Russell Investment | around the globe continued to shrink and income available from |
| Management, LLC (“RIM”), the Fund’s and Underlying Funds’ | most assets fell. |
| advisor. RIM, as the Underlying Funds’ advisor, may change | The U.S. equity market, as measured by the S&P 500® Index, |
| the allocation of the Underlying Funds’ assets among money | was up 4.51% over the period but also experienced multiple |
| managers at any time. An exemptive order from the Securities | draw downs. The Fund’s strategic exposure to global equities |
| and Exchange Commission (“SEC”) permits RIM to engage or | proved beneficial over the period as emerging markets rallied |
| terminate a money manager in an Underlying Fund at any time, | and outperformed U.S. equities. By contrast, non-U.S. developed |
| subject to approval by the Underlying Fund’s Board, without a | equity was one of the lowest performing portions of the Fund’s |
| shareholder vote. Pursuant to the terms of the exemptive order, an | exposure as falling commodities and currencies weighed on |
| Underlying Fund is required to notify its shareholders within 90 | returns. |
| days of when a money manager begins providing services. | |
| What is the Fund’s investment objective? | How did the investment strategies and techniques employed |
| by the Fund and the Underlying Funds affect the Fund’s | |
| The Fund seeks to provide capital growth and income consistent | performance? |
| with its current asset allocation which will change over time, with | The Fund is a fund of funds and its performance is based on RIM’s |
| an increasing allocation to fixed income funds. | strategic asset allocations, the performance of the Underlying |
| The Fund pursues this objective by investing in a diversified | Funds in which the Fund invests, and tactical changes in the |
| portfolio that, as of October 31, 2016, consisted of approximately | Fund’s asset allocation throughout the year. |
| 82.5% equity Underlying Funds, 7% fixed income Underlying | In order to seek to achieve the Fund’s objective during the period, |
| Funds and 10.5% alternative Underlying Funds. The Fund’s | RIM’s strategic asset allocation included investments in global |
| allocation to fixed income Underlying Funds will be fixed at | equity, alternative and fixed income Underlying Funds. The |
| 66.3% in approximately the year 2050. | Fund’s diverse asset allocation partially hindered performance |
| How did the Fund perform relative to its benchmark for the | during the period as certain of these exposures underperformed |
| fiscal year ended October 31, 2016? | the Russell 1000® Index. While areas like high yield bonds, as |
| For the fiscal year ended October 31, 2016, the Fund’s Class R1, | measured by the BofA Merrill Lynch Global High Yield Index |
| Class R4 and Class R5 Shares gained 3.07%, 2.82% and 2.57%, | Hedged USD, outperformed the Russell 1000® Index, areas like |
| respectively. This is compared to the Fund’s primary benchmark, | commodities and non-U.S. developed equities delivered negative |
| the Russell 1000® Index, which gained 4.26% during the same | returns as measured by the Bloomberg Commodity Index Total |
| period. The Fund’s performance includes operating expenses, | Return and Russell Developed ex-U.S. Large Cap® Index Net, |
| whereas index returns are unmanaged and do not include | respectively. |
| expenses of any kind. | The Fund’s underperformance relative to the Russell 1000® |
| For the fiscal year ended October 31, 2016, the Morningstar® | Index was partially offset by strong active management within |
| Target-Date 2050 Category gained 2.74%. This result serves as | the fixed income portion of the Fund’s portfolio. Underlying Fund |
| a peer comparison and is expressed net of operating expenses. | bond issue selection during the period was generally additive to |
| returns as fixed income money managers were able to pick well | |
| How did the market conditions described in the Market | within credit, avoiding defaults in places like the energy sector |
| Summary report affect the Fund’s performance? | where trouble occurred with falling energy prices in early 2016. |
| The Fund seeks to achieve its objective by investing in Underlying | As such, an allocation to the Russell Strategic Bond Fund was |
| Funds that provide exposure to a range of diversified investments, | positive from a benchmark-relative perspective. The Underlying |
| and most major asset classes invested in by the Underlying | Fund was positively impacted by its overweight to credit and |
| Funds produced positive absolute returns during the period. | additive currency positioning also helped to drive excess return. |
| Markets during the fiscal year were characterized by higher | By contrast, equity selection and positioning was more difficult, |
| levels of volatility and dispersion across return sources. Within | with allocations to non-U.S. equity Underlying Funds detracting |
| the fixed income Underlying Funds, exposure to high yield debt | from the Fund’s performance and security selection within |
2050 Strategy Fund 211
Russell Investment Company
2050 Strategy Fund
Portfolio Management Discussion and Analysis, continued — October 31, 2016
(Unaudited)
| those Underlying Funds struggling. In addition, overweights | in high yield credit and emerging markets equity compared with | |
| to European securities in the Select International Equity Fund | core bond holdings and cash. Markets subsequently rebounded | |
| caused the Underlying Fund to struggle as European equities | from the February lows and RIM reduced risk exposure to a more | |
| continued to lag the U.S. equity market. | defensive stance with the Fund’s equity allocation below strategic | |
| weights. RIM’s modifications to the Fund’s asset allocation were | ||
| Describe any changes to the Fund’s structure or allocation | additive during the period. | |
| to the Underlying Funds. | ||
| RIM has the discretion to vary the Fund’s actual allocation from | The views expressed in this report reflect those of the | |
| the target strategic asset allocation by up to +/- 5% at the equity, | portfolio managers only through the end of the period | |
| fixed income or alternative category level based on RIM’s capital | covered by the report. These views do not necessarily | |
| markets research. RIM’s asset allocation modifications benefited | represent the views of RIM, or any other person in RIM or | |
| the Fund’s performance relative to the Fund’s target strategic | any other affiliated organization. These views are subject | |
| asset allocation. | to change at any time based upon market conditions or | |
| RIM adapted the Fund’s asset allocation over the period as market | other events, and RIM disclaims any responsibility to | |
| opportunities and risks evolved. The Fund was defensively | update the views contained herein. These views should not | |
| positioned in the fourth quarter of 2015, favoring fixed income | be relied on as investment advice and, because investment | |
| over equity Underlying Funds. During the first quarter of 2016, | decisions for a Russell Investment Company (“RIC”) Fund | |
| equity markets declined substantially, and RIM added further risk | are based on numerous factors, should not be relied on as | |
| to the portfolio by overweighting Underlying Funds that invest | an indication of investment decisions of any RIC Fund. | |
* Assumes initial investment on March 31, 2008.
** Russell 1000® Index includes the 1,000 largest companies in the Russell 3000® Index. The Russell 1000® Index represents the universe of stocks from which
most active money managers typically select. The Russell 1000® Index return reflects adjustments from income dividends and capital gain distributions
reinvested as of the ex-dividend dates.
‡ The Fund first issued Class R4 and Class R5 Shares on October 1, 2014. The returns shown for Class R4 and Class R5 Shares prior to that date are the returns
of the Fund’s Class R2 and Class R3 Shares, respectively.
§ Annualized.
Performance is historical and assumes reinvestment of all dividends and capital gains. Investment return and principal value will fluctuate so that an investor’s
shares, when redeemed, may be worth more or less than when purchased. Past performance is not indicative of future results. The returns shown do not reflect the
deduction of taxes that a shareholder would pay on Fund distributions or the redemption of Fund shares. Additionally, the returns presented herein may differ from
the performance reported in the Financial Highlights as the returns herein are calculated in a manner consistent with standardized performance in accordance with
Securities and Exchange Commission rules, while the performance in the Financial Highlights has been calculated in accordance with U.S. Generally Accepted
Accounting Principles (“U.S. GAAP”).
212 2050 Strategy Fund
Russell Investment Company
2050 Strategy Fund
Shareholder Expense Example — October 31, 2016 (Unaudited)
| Fund Expenses | Hypothetical | |||||
| The following disclosure provides important information | Performance (5% | |||||
| Actual | return before | |||||
| regarding the Fund’s Shareholder Expense Example | Class R1 | Performance | expenses) | |||
| (“Example”). | Beginning Account Value | |||||
| May 1, 2016 | $ | 1,000.00 | $ | 1,000.00 | ||
| Example | Ending Account Value | |||||
| As a shareholder of the Fund, you incur ongoing costs, including | October 31, 2016 | $ | 1,036.40 | $ | 1,025.14 | |
| distribution (12b-1) and/or service fees and other Fund expenses. | Expenses Paid During Period* | $ | — | $ | — | |
| The Example is intended to help you understand your ongoing | * There were no expenses charged to the Class. | |||||
| costs (in dollars) of investing in the Fund and to compare these | ||||||
| costs with the ongoing costs of investing in other mutual funds. | Hypothetical | |||||
| Performance (5% | ||||||
| The Example is based on an investment of $1,000 invested at the | Actual | return before | ||||
| beginning of the period and held for the entire period indicated, | Class R4 | Performance | expenses) | |||
| which for this Fund is from May 1, 2016 to October 31, 2016. | Beginning Account Value | |||||
| May 1, 2016 | $ | 1,000.00 | $ | 1,000.00 | ||
| Actual Expenses | Ending Account Value | |||||
| The information in the table under the heading “Actual | October 31, 2016 | $ | 1,036.80 | $ | 1,023.88 | |
| Expenses Paid During Period* | $ | 1.28 | $ | 1.27 | ||
| Performance” provides information about actual account values | ||||||
| and actual expenses. You may use the information in this column, | * Expenses are equal to the Fund's annualized expense ratio of 0.25% | |||||
| together with the amount you invested, to estimate the expenses | (representing the six month period annualized), multiplied by the average | |||||
| account value over the period, multiplied by 184/366 (to reflect the one-half | ||||||
| that you paid over the period. Simply divide your account value by | year period). | |||||
| $1,000 (for example, an $8,600 account value divided by $1,000 | ||||||
| = 8.6), then multiply the result by the number in the first column | Hypothetical | |||||
| in the row entitled “Expenses Paid During Period” to estimate | Performance (5% | |||||
| Actual | return before | |||||
| the expenses you paid on your account during this period. | Class R5 | Performance | expenses) | |||
| Beginning Account Value | ||||||
| Hypothetical Example for Comparison Purposes | May 1, 2016 | $ | 1,000.00 | $ | 1,000.00 | |
| The information in the table under the heading “Hypothetical | Ending Account Value | |||||
| Performance (5% return before expenses)” provides information | October 31, 2016 | $ | 1,033.90 | $ | 1,022.62 | |
| about hypothetical account values and hypothetical expenses | Expenses Paid During Period* | $ | 2.56 | $ | 2.54 | |
| based on the Fund’s actual expense ratio and an assumed rate of | * Expenses are equal to the Fund's annualized expense ratio of 0.50% | |||||
| return of 5% per year before expenses, which is not the Fund’s | (representing the six month period annualized), multiplied by the average | |||||
| actual return. The hypothetical account values and expenses | account value over the period, multiplied by 184/366 (to reflect the one-half | |||||
| may not be used to estimate the actual ending account balance or | year period). | |||||
| expenses you paid for the period. You may use this information | ||||||
| to compare the ongoing costs of investing in the Fund and other | ||||||
| funds. To do so, compare this 5% hypothetical example with the | ||||||
| 5% hypothetical examples that appear in the shareholder reports | ||||||
| of other funds. | ||||||
| Please note that the expenses shown in the table are meant | ||||||
| to highlight your ongoing costs only and do not reflect any | ||||||
| transactional costs. Therefore, the information under the heading | ||||||
| “Hypothetical Performance (5% return before expenses)” is | ||||||
| useful in comparing ongoing costs only, and will not help you | ||||||
| determine the relative total costs of owning different funds. In | ||||||
| addition, if these transactional costs were included, your costs | ||||||
| would have been higher. | ||||||
2050 Strategy Fund 213
Russell Investment Company
2050 Strategy Fund
Schedule of Investments — October 31, 2016
| Amounts in thousands (except share amounts) | ||||
| Fair | ||||
| Value | ||||
| Shares | $ | |||
| Investments in Russell Affiliated Mutual Funds - 100.0% | ||||
| Alternative - 8.5% | ||||
| Russell Commodity Strategies Fund Class Y | 74,903 | 413 | ||
| Russell Global Infrastructure Fund Class Y | 31,328 | 358 | ||
| Russell Global Real Estate Securities Fund Class Y | 6,733 | 240 | ||
| 1,011 | ||||
| Domestic Equities - 43.3% | ||||
| Russell U.S. Defensive Equity Fund Class Y | 7,259 | 357 | ||
| Russell U.S. Dynamic Equity Fund Class Y | 59,858 | 594 | ||
| Russell U.S. Small Cap Equity Fund Class Y | 36,711 | 1,014 | ||
| Select U.S. Equity Fund Class Y | 291,413 | 3,182 | ||
| 5,147 | ||||
| Fixed Income - 7.0% | ||||
| Russell Strategic Bond Fund Class Y | 75,292 | 833 | ||
| International Equities - 41.2% | ||||
| Russell Emerging Markets Fund Class Y | 57,184 | 953 | ||
| Russell Global Equity Fund Class Y | 148,274 | 1,547 | ||
| Select International Equity Fund Class Y | 280,439 | 2,409 | ||
| 4,909 | ||||
| Total Investments in Russell Affiliated Mutual Funds | ||||
| (cost $10,122) | 11,900 | |||
| Total Investments 100.0% | ||||
| (identified cost $10,122) | 11,900 | |||
| Other Assets and Liabilities, Net - (0.0%) | (1 | ) | ||
| Net Assets - 100.0% | 11,899 | |||
| Presentation of Portfolio Holdings | ||||||||||||||
| Amounts in thousands | ||||||||||||||
| Fair Value | ||||||||||||||
| Practical | ||||||||||||||
| Portfolio Summary | Level 1 | Level 2 | Level 3 | Expedient | Total | % of Net Assets | ||||||||
| Investments in Russell Affiliated Mutual | ||||||||||||||
| Funds | $ | 11,900 | $ | — | $ | — | $ | — | $ | 11,900 | 100.0 | |||
| Total Investments | 11,900 | — | — | — | 11,900 | 100.0 | ||||||||
| Other Assets and Liabilities, Net | (—)* | |||||||||||||
| 100.0 | ||||||||||||||
* Less than 0.05% of net assets.
For a description of the Levels, see note 2 in the Notes to Financial Statements.
For a disclosure on transfers between Levels 1, 2 and 3 during the period ended October 31, 2016, see note 2 in the Notes to
Financial Statements.
See accompanying notes which are an integral part of the financial statements.
214 2050 Strategy Fund
Russell Investment Company
2050 Strategy Fund
Statement of Assets and Liabilities — October 31, 2016
| Amounts in thousands | |||
| Assets | |||
| Investments, at identified cost | $ | 10,122 | |
| Investments, at fair value(>) | 11,900 | ||
| Receivables: | |||
| Fund shares sold | 10 | ||
| Total assets | 11,910 | ||
| Liabilities | |||
| Payables: | |||
| Investments purchased | 3 | ||
| Fund shares redeemed | 6 | ||
| Accrued fees to affiliates | 2 | ||
| Total liabilities | 11 | ||
| Net Assets | $ | 11,899 | |
| Net Assets Consist of: | |||
| Accumulated net realized gain (loss) | $ | (157 | ) |
| Unrealized appreciation (depreciation) on investments | 1,778 | ||
| Shares of beneficial interest | 20 | ||
| Additional paid-in capital | 10,258 | ||
| Net Assets | $ | 11,899 | |
| Net Asset Value, offering and redemption price per share: | |||
| Net asset value per share: Class R1(#) | $ | 6.08 | |
| Class R1 — Net assets | $ | 5,748,809 | |
| Class R1 — Shares outstanding ($.01 par value) | 945,837 | ||
| Net asset value per share: Class R4(#) | $ | 6.10 | |
| Class R4 — Net assets | $ | 2,697,107 | |
| Class R4 — Shares outstanding ($.01 par value) | 442,511 | ||
| Net asset value per share: Class R5(#) | $ | 6.08 | |
| Class R5 — Net assets | $ | 3,452,637 | |
| Class R5 — Shares outstanding ($.01 par value) | 568,265 | ||
| Amounts in thousands | |||
| (>) Investments in affiliated Russell funds | $ | 11,900 | |
| (#) Net asset value per share equals class level net assets divided by class level shares of beneficial interest outstanding. | |||
See accompanying notes which are an integral part of the financial statements.
2050 Strategy Fund 215
Russell Investment Company
2050 Strategy Fund
Statement of Operations — For the Period Ended October 31, 2016
| Amounts in thousands | |||
| Investment Income | |||
| Income distributions from affiliated Russell funds | $ | 261 | |
| Expenses | |||
| Distribution fees - Class R5 | 8 | ||
| Shareholder servicing fees - Class R4 | 7 | ||
| Shareholder servicing fees - Class R5 | 8 | ||
| Total expenses | 23 | ||
| Net investment income (loss) | 238 | ||
| Net Realized and Unrealized Gain (Loss) | |||
| Net realized gain (loss) on: | |||
| Investments | (105 | ) | |
| Capital gain distributions from Underlying Funds | 272 | ||
| Net realized gain (loss) | 167 | ||
| Net change in unrealized appreciation (depreciation) on investments | (97 | ) | |
| Net realized and unrealized gain (loss) | 70 | ||
| Net Increase (Decrease) in Net Assets from Operations | $ | 308 | |
See accompanying notes which are an integral part of the financial statements.
216 2050 Strategy Fund
Russell Investment Company
2050 Strategy Fund
Statements of Changes in Net Assets
| For the Periods Ended October 31, | |||||||
| Amounts in thousands | 2016 | 2015 | |||||
| Increase (Decrease) in Net Assets | |||||||
| Operations | |||||||
| Net investment income (loss) | $ | 238 | $ | 251 | |||
| Net realized gain (loss) | 167 | 283 | |||||
| Net change in unrealized appreciation (depreciation) | (97 | ) | (643 | ) | |||
| Net increase (decrease) in net assets from operations | 308 | (109 | ) | ||||
| Distributions | |||||||
| From net investment income | |||||||
| Class R1 | (130 | ) | (143 | ) | |||
| Class R4 | (50 | ) | (39 | ) | |||
| Class R5 | (59 | ) | (69 | ) | |||
| From net realized gain | |||||||
| Class R1 | (248 | ) | (2,251 | ) | |||
| Class R4 | (104 | ) | (693 | ) | |||
| Class R5 | (141 | ) | (1,524 | ) | |||
| Net decrease in net assets from distributions | (732 | ) | (4,719 | ) | |||
| Share Transactions* | |||||||
| Net increase (decrease) in net assets from share transactions | (45 | ) | 1,961 | ||||
| Total Net Increase (Decrease) in Net Assets | (469 | ) | (2,867 | ) | |||
| Net Assets | |||||||
| Beginning of period | 12,368 | 15,235 | |||||
| End of period | $ | 11,899 | $ | 12,368 | |||
See accompanying notes which are an integral part of the financial statements.
2050 Strategy Fund 217
Russell Investment Company
2050 Strategy Fund
Statements of Changes in Net Assets, continued
* Share transaction amounts (in thousands) for the periods ended October 31, 2016 and October 31, 2015 were as follows:
| 2016 | 2015 | |||||||||||
| Shares | Dollars | Shares | Dollars | |||||||||
| Class R1 | ||||||||||||
| Proceeds from shares sold | 800 | $ | 4,777 | 746 | $ | 4,986 | ||||||
| Proceeds from reinvestment of distributions | 65 | 378 | 371 | 2,395 | ||||||||
| Payments for shares redeemed | (967 | ) | (5,787 | ) | (861 | ) | (5,949 | ) | ||||
| Net increase (decrease) | (102 | ) | (632 | ) | 256 | 1,432 | ||||||
| Class R4 | ||||||||||||
| Proceeds from shares sold | 161 | 950 | 134 | 907 | ||||||||
| Proceeds from reinvestment of distributions | 26 | 153 | 113 | 732 | ||||||||
| Payments for shares redeemed | (126 | ) | (762 | ) | (93 | ) | (628 | ) | ||||
| Net increase (decrease) | 61 | 341 | 154 | 1,011 | ||||||||
| Class R5 | ||||||||||||
| Proceeds from shares sold | 190 | 1,114 | 290 | 2,006 | ||||||||
| Proceeds from reinvestment of distributions | 35 | 200 | 247 | 1,593 | ||||||||
| Payments for shares redeemed | (182 | ) | (1,068 | ) | (592 | ) | (4,081 | ) | ||||
| Net increase (decrease) | 43 | 246 | (55 | ) | (482 | ) | ||||||
| Total increase (decrease) | 2 | $ | (45 | ) | 355 | $ | 1,961 | |||||
See accompanying notes which are an integral part of the financial statements.
218 2050 Strategy Fund
(This page intentionally left blank)
Russell Investment Company
2050 Strategy Fund
Financial Highlights — For the Periods Ended
For a Share Outstanding Throughout Each Period.
| $ | ||||||||||||||||
| $ | Net | $ | $ | $ | $ | |||||||||||
| Net Asset Value, | Investment | Net Realized | Total from | Distributions | Distributions | |||||||||||
| Beginning of | Income (Loss) | and Unrealized | Investment | from Net | from Net | |||||||||||
| Period | (a)(b)(e) | Gain (Loss) | Operations | Investment Income | Realized Gain | |||||||||||
| Class R1 | ||||||||||||||||
| October 31, 2016 | 6.32 | .14 | .04 | .18 | (.15 | ) | (.27 | ) | ||||||||
| October 31, 2015 | 9.52 | .13 | (.14 | ) | (.01 | ) | (.17 | ) | (3.02 | ) | ||||||
| October 31, 2014 | 9.20 | .27 | .37 | .64 | (.24 | ) | (.08 | ) | ||||||||
| October 31, 2013 | 7.84 | .15 | 1.43 | 1.58 | (.15 | ) | (.07 | ) | ||||||||
| October 31, 2012 | 9.19 | .11 | .48 | .59 | (.16 | ) | (1.78 | ) | ||||||||
| Class R4(1) | ||||||||||||||||
| October 31, 2016 | 6.34 | .12 | .04 | .16 | (.13 | ) | (.27 | ) | ||||||||
| October 31, 2015 | 9.54 | .11 | (.14 | ) | (.03 | ) | (.15 | ) | (3.02 | ) | ||||||
| October 31, 2014 | 9.22 | .23 | .39 | .62 | (.22 | ) | (.08 | ) | ||||||||
| October 31, 2013 | 7.85 | .12 | 1.45 | 1.57 | (.13 | ) | (.07 | ) | ||||||||
| October 31, 2012 | 9.19 | .12 | .46 | .58 | (.14 | ) | (1.78 | ) | ||||||||
| Class R5(2) | ||||||||||||||||
| October 31, 2016 | 6.32 | .11 | .04 | .15 | (.12 | ) | (.27 | ) | ||||||||
| October 31, 2015 | 9.51 | .11 | (.15 | ) | (.04 | ) | (.13 | ) | (3.02 | ) | ||||||
| October 31, 2014 | 9.20 | .21 | .38 | .59 | (.20 | ) | (.08 | ) | ||||||||
| October 31, 2013 | 7.84 | .10 | 1.44 | 1.54 | (.11 | ) | (.07 | ) | ||||||||
| October 31, 2012 | 9.18 | .11 | .44 | .55 | (.11 | ) | (1.78 | ) | ||||||||
See accompanying notes which are an integral part of the financial statements.
220 2050 Strategy Fund
| % | % | % | |||||||||||||||
| $ | $ | Ratio of Expenses | Ratio of Expenses | Ratio of Net | |||||||||||||
| Net Asset Value, | % | Net Assets, | to Average | to Average | Investment Income | % | |||||||||||
| $ | End of | Total | End of Period | Net Assets, | Net Assets, | to Average | Portfolio | ||||||||||
| Total Distributions | Period | Return | (000 | ) | Gross(g) | Net(e)(g) | Net Assets(b)(e) | Turnover Rate | |||||||||
| (.42 | ) | 6.08 | 3.07 | 5,749 | — | — | 2.36 | 53 | |||||||||
| (3.19 | ) | 6.32 | (.66 | ) | 6,625 | — | — | 1.91 | 44 | ||||||||
| (.32 | ) | 9.52 | 7.12 | 7,542 | — | — | 2.89 | 84 | |||||||||
| (.22 | ) | 9.20 | 20.61 | 10,729 | — | — | 1.75 | 27 | |||||||||
| (1.94 | ) | 7.84 | 9.00 | 8,731 | — | — | 1.44 | 78 | |||||||||
| (.40 | ) | 6.10 | 2.82 | 2,697 | .25 | .25 | 1.97 | 53 | |||||||||
| (3.17 | ) | 6.34 | (.90 | ) | 2,421 | .25 | .25 | 1.66 | 44 | ||||||||
| (.30 | ) | 9.54 | 6.81 | 2,170 | .25 | .25 | 2.45 | 84 | |||||||||
| (.20 | ) | 9.22 | 20.42 | 3,515 | .25 | .25 | 1.44 | 27 | |||||||||
| (1.92 | ) | 7.85 | 8.82 | 2,658 | .25 | .25 | 1.52 | 78 | |||||||||
| (.39 | ) | 6.08 | 2.57 | 3,453 | .50 | .50 | 1.79 | 53 | |||||||||
| (3.15 | ) | 6.32 | (1.10 | ) | 3,322 | .50 | .50 | 1.61 | 44 | ||||||||
| (.28 | ) | 9.51 | 6.51 | 5,523 | .50 | .50 | 2.20 | 84 | |||||||||
| (.18 | ) | 9.20 | 20.03 | 5,649 | .50 | .50 | 1.17 | 27 | |||||||||
| (1.89 | ) | 7.84 | 8.50 | 3,482 | .50 | .50 | 1.43 | 78 | |||||||||
See accompanying notes which are an integral part of the financial statements.
2050 Strategy Fund 221
Russell Investment Company
2050 Strategy Fund
Related Party Transactions, Fees and Expenses
| Accrued fees payable to affiliates for the period ended October 31, 2016 were as follows: | ||
| Distribution fees | $ | 728 |
| Shareholder servicing fees | 1,297 | |
| $ | 2,025 | |
| Transactions (amounts in thousands) during the period ended October 31, 2016 with Underlying Funds which are, or were, an | ||||||||||||||||||||
| affiliated company are as follows: | ||||||||||||||||||||
| Fair Value, | Change in | |||||||||||||||||||
| Beginning of | Realized Gain | Unrealized | Fair Value, End | Income | Capital Gains | |||||||||||||||
| Period | Purchases | Sales | (Loss) | Gain (Loss) | of Period | Distributions | Distributions | |||||||||||||
| Russell Commodity Strategies Fund | $ | 435 | $ | 234 | $ | 239 | $ | (65) | $ | 48 | $ | 413 | $ | — | $ | — | ||||
| Russell Global Infrastructure Fund | 370 | 193 | 202 | (31 | ) | 28 | 358 | 10 | 9 | |||||||||||
| Russell Global Real Estate Securities | ||||||||||||||||||||
| Fund | 369 | 153 | 248 | 50 | (84 | ) | 240 | 8 | 16 | |||||||||||
| Russell U.S. Defensive Equity Fund | 371 | 158 | 182 | 32 | (22 | ) | 357 | 5 | — | |||||||||||
| Russell U.S. Dynamic Equity Fund | 623 | 334 | 301 | 7 | (69 | ) | 594 | 28 | 54 | |||||||||||
| Russell U.S. Small Cap Equity Fund | 1,060 | 509 | 532 | 29 | (52 | ) | 1,014 | 9 | 63 | |||||||||||
| Select U.S. Equity Fund | 3,256 | 1,405 | 1,539 | 33 | 27 | 3,182 | 82 | 4 | ||||||||||||
| Russell Strategic Bond Fund | 864 | 593 | 632 | 33 | (25 | ) | 833 | 25 | 4 | |||||||||||
| Russell Emerging Markets Fund | 981 | 411 | 523 | (64 | ) | 148 | 953 | 3 | — | |||||||||||
| Russell Global Equity Fund | 1,608 | 853 | 803 | 47 | (158 | ) | 1,547 | 28 | 122 | |||||||||||
| Select International Equity Fund | 2,431 | 1,143 | 1,051 | (176 | ) | 62 | 2,409 | 63 | — | |||||||||||
| $ | 12,368 | $ | 5,986 | $ | 6,252 | $ | (105) | $ | (97) | $ | 11,900 | $ | 261 | $ | 272 | |||||
Federal Income Taxes
At October 31, 2016, the cost of investments and net unrealized appreciation (depreciation), undistributed ordinary income and
undistributed long-term capital gains for income tax purposes were as follows:
| Cost of Investments | $ | 10,699,685 | ||
| Unrealized Appreciation | $ | 1,311,912 | ||
| Unrealized Depreciation | (111,269 | ) | ||
| Net Unrealized Appreciation (Depreciation) | $ | 1,200,643 | ||
| Undistributed Ordinary Income | $ | 4,356 | ||
| Undistributed Long-Term Capital Gains | ||||
| (Capital Loss Carryforward) | $ | 416,073 | ||
| Tax Composition of Distributions | ||||
| Ordinary Income | $ | 287,629 | ||
| Long-Term Capital Gains | $ | 444,875 |
Net investment income and net realized gains (losses) in the financial statements may differ from taxable net investment income and
net realized gains (losses). Capital accounts within the financial statements are adjusted for permanent differences between book and
tax accounting. These differences may be due to foreign currency gains or losses, reclassifications of dividends and /or differences in
treatment of income from swaps. These adjustments have no impact on the net assets.
At October 31, 2016, the Statement of Assets and Liabilities have been adjusted by the following amounts (in thousands):
Undistributed net investment income $ 1
See accompanying notes which are an integral part of the financial statements.
222 2050 Strategy Fund
Russell Investment Company
2050 Strategy Fund
Federal Income Taxes, continued
| Accumulated net realized gain (loss) | (1 | ) | |
| Additional paid-in capital | — |
See accompanying notes which are an integral part of the financial statements.
2050 Strategy Fund 223
Russell Investment Company
2055 Strategy Fund
Portfolio Management Discussion and Analysis — October 31, 2016 (Unaudited)

| 2055 Strategy Fund - Class R1 | 2055 Strategy Fund - Class R5‡ | ||||||
| Total | Total | ||||||
| Return | Return | ||||||
| 1 Year | 3.02 | % | 1 Year | 2.53 | % | ||
| 5 Years | 7.60 | %§ | 5 Years | 7.09 | %§ | ||
| Inception* | 5.91 | %§ | Inception* | 5.40 | %§ | ||
| 2055 Strategy Fund - Class R4‡ | Russell 1000® Index** | ||||||
| Total | Total | ||||||
| Return | Return | ||||||
| 1 Year | 2.80 | % | 1 Year | 4.26 | % | ||
| 5 Years | 7.34 | %§ | 5 Years | 13.51 | %§ | ||
| Inception* | 5.65 | %§ | Inception* | 11.65 | %§ | ||
224 2055 Strategy Fund
Russell Investment Company
2055 Strategy Fund
Portfolio Management Discussion and Analysis, continued — October 31, 2016
(Unaudited)
| The 2055 Strategy Fund (the “Fund”) is a fund of funds that | was beneficial as it was one of the best performing asset classes |
| invests in other Russell Investment Company mutual funds (the | globally. Falling interest rates also helped other fixed income |
| “Underlying Funds”). The Underlying Funds employ a multi- | assets in the Underlying Funds rally, as well as more rate sensitive |
| manager approach whereby portions of the Underlying Funds are | real assets like global real estate investment trusts and global |
| allocated to different money managers. Underlying Fund assets not | infrastructure. With interest rates falling, income opportunities |
| allocated to money managers are managed by Russell Investment | around the globe continued to shrink and income available from |
| Management, LLC (“RIM”), the Fund’s and Underlying Funds’ | most assets fell. |
| advisor. RIM, as the Underlying Funds’ advisor, may change | The U.S. equity market, as measured by the S&P 500® Index, |
| the allocation of the Underlying Funds’ assets among money | was up 4.51% over the period but also experienced multiple |
| managers at any time. An exemptive order from the Securities | draw downs. The Fund’s strategic exposure to global equities |
| and Exchange Commission (“SEC”) permits RIM to engage or | proved beneficial over the period as emerging markets rallied |
| terminate a money manager in an Underlying Fund at any time, | and outperformed U.S. equities. By contrast, non-U.S. developed |
| subject to approval by the Underlying Fund’s Board, without a | equity was one of the lowest performing portions of the Fund’s |
| shareholder vote. Pursuant to the terms of the exemptive order, an | exposure as falling commodities and currencies weighed on |
| Underlying Fund is required to notify its shareholders within 90 | returns. |
| days of when a money manager begins providing services. | |
| What is the Fund’s investment objective? | How did the investment strategies and techniques employed |
| by the Fund and the Underlying Funds affect the Fund’s | |
| The Fund seeks to provide capital growth and income consistent | performance? |
| with its current asset allocation which will change over time, with | The Fund is a fund of funds and its performance is based on RIM’s |
| an increasing allocation to fixed income funds. | strategic asset allocations, the performance of the Underlying |
| The Fund pursues this objective by investing in a diversified | Funds in which the Fund invests, and tactical changes in the |
| portfolio that, as of October 31, 2016, consisted of approximately | Fund’s asset allocation throughout the year. |
| 82.5% equity Underlying Funds, 7% fixed income Underlying | In order to seek to achieve the Fund’s objective during the period, |
| Funds and 10.5% alternative Underlying Funds. The Fund’s | RIM’s strategic asset allocation included investments in global |
| allocation to fixed income Underlying Funds will be fixed at | equity, alternative and fixed income Underlying Funds. The |
| 66.3% in approximately the year 2055. | Fund’s diverse asset allocation partially hindered performance |
| How did the Fund perform relative to its benchmark for the | during the period as certain of these exposures underperformed |
| fiscal year ended October 31, 2016? | the Russell 1000® Index. While areas like high yield bonds, as |
| For the fiscal year ended October 31, 2016, the Fund’s Class R1, | measured by the BofA Merrill Lynch Global High Yield Index |
| Class R4 and Class R5 Shares gained 3.02%, 2.80% and 2.53%, | Hedged USD, outperformed the Russell 1000® Index, areas like |
| respectively. This is compared to the Fund’s primary benchmark, | commodities and non-U.S. developed equities delivered negative |
| the Russell 1000® Index, which gained 4.26% during the same | returns as measured by the Bloomberg Commodity Index Total |
| period. The Fund’s performance includes operating expenses, | Return and Russell Developed ex-U.S. Large Cap® Index Net, |
| whereas index returns are unmanaged and do not include | respectively. |
| expenses of any kind. | The Fund’s underperformance relative to the Russell 1000® |
| For the fiscal year ended October 31, 2016, the Morningstar® | Index was partially offset by strong active management within |
| Target-Date 2055 Category gained 2.39%. This result serves as | the fixed income portion of the Fund’s portfolio. Underlying Fund |
| a peer comparison and is expressed net of operating expenses. | bond issue selection during the period was generally additive to |
| returns as fixed income money managers were able to pick well | |
| How did the market conditions described in the Market | within credit, avoiding defaults in places like the energy sector |
| Summary report affect the Fund’s performance? | where trouble occurred with falling energy prices in early 2016. |
| The Fund seeks to achieve its objective by investing in Underlying | As such, an allocation to the Russell Strategic Bond Fund was |
| Funds that provide exposure to a range of diversified investments, | positive from a benchmark-relative perspective. The Underlying |
| and most major asset classes invested in by the Underlying | Fund was positively impacted by its overweight to credit and |
| Funds produced positive absolute returns during the period. | additive currency positioning also helped to drive excess return. |
| Markets during the fiscal year were characterized by higher | By contrast, equity selection and positioning was more difficult, |
| levels of volatility and dispersion across return sources. Within | with allocations to non-U.S. equity Underlying Funds detracting |
| the fixed income Underlying Funds, exposure to high yield debt | from the Fund’s performance and security selection within |
2055 Strategy Fund 225
Russell Investment Company
2055 Strategy Fund
Portfolio Management Discussion and Analysis, continued — October 31, 2016
(Unaudited)
| those Underlying Funds struggling. In addition, overweights | in high yield credit and emerging markets equity compared with | |
| to European securities in the Select International Equity Fund | core bond holdings and cash. Markets subsequently rebounded | |
| caused the Underlying Fund to struggle as European equities | from the February lows and RIM reduced risk exposure to a more | |
| continued to lag the U.S. equity market. | defensive stance with the Fund’s equity allocation below strategic | |
| weights. RIM’s modifications to the Fund’s asset allocation were | ||
| Describe any changes to the Fund’s structure or allocation | additive during the period. | |
| to the Underlying Funds. | ||
| RIM has the discretion to vary the Fund’s actual allocation from | The views expressed in this report reflect those of the | |
| the target strategic asset allocation by up to +/- 5% at the equity, | portfolio managers only through the end of the period | |
| fixed income or alternative category level based on RIM’s capital | covered by the report. These views do not necessarily | |
| markets research. RIM’s asset allocation modifications benefited | represent the views of RIM, or any other person in RIM or | |
| the Fund’s performance relative to the Fund’s target strategic | any other affiliated organization. These views are subject | |
| asset allocation. | to change at any time based upon market conditions or | |
| RIM adapted the Fund’s asset allocation over the period as market | other events, and RIM disclaims any responsibility to | |
| opportunities and risks evolved. The Fund was defensively | update the views contained herein. These views should not | |
| positioned in the fourth quarter of 2015, favoring fixed income | be relied on as investment advice and, because investment | |
| over equity Underlying Funds. During the first quarter of 2016, | decisions for a Russell Investment Company (“RIC”) Fund | |
| equity markets declined substantially, and RIM added further risk | are based on numerous factors, should not be relied on as | |
| to the portfolio by overweighting Underlying Funds that invest | an indication of investment decisions of any RIC Fund. | |
* Assumes initial investment on December 31, 2010.
** Russell 1000® Index includes the 1,000 largest companies in the Russell 3000® Index. The Russell 1000® Index represents the universe of stocks from which
most active money managers typically select. The Russell 1000® Index return reflects adjustments from income dividends and capital gain distributions
reinvested as of the ex-dividend dates.
‡ The Fund first issued Class R4 and Class R5 Shares on October 1, 2014. The returns shown for Class R4 and Class R5 Shares prior to that date are the returns
of the Fund’s Class R2 and Class R3 Shares, respectively.
§ Annualized.
Performance is historical and assumes reinvestment of all dividends and capital gains. Investment return and principal value will fluctuate so that an investor’s
shares, when redeemed, may be worth more or less than when purchased. Past performance is not indicative of future results. The returns shown do not reflect the
deduction of taxes that a shareholder would pay on Fund distributions or the redemption of Fund shares. Additionally, the returns presented herein may differ from
the performance reported in the Financial Highlights as the returns herein are calculated in a manner consistent with standardized performance in accordance with
Securities and Exchange Commission rules, while the performance in the Financial Highlights has been calculated in accordance with U.S. Generally Accepted
Accounting Principles (“U.S. GAAP”).
226 2055 Strategy Fund
Russell Investment Company
2055 Strategy Fund
Shareholder Expense Example — October 31, 2016 (Unaudited)
| Fund Expenses | Hypothetical | |||||
| The following disclosure provides important information | Performance (5% | |||||
| Actual | return before | |||||
| regarding the Fund’s Shareholder Expense Example | Class R1 | Performance | expenses) | |||
| (“Example”). | Beginning Account Value | |||||
| May 1, 2016 | $ | 1,000.00 | $ | 1,000.00 | ||
| Example | Ending Account Value | |||||
| As a shareholder of the Fund, you incur ongoing costs, including | October 31, 2016 | $ | 1,036.50 | $ | 1,025.14 | |
| distribution (12b-1) and/or service fees and other Fund expenses. | Expenses Paid During Period* | $ | — | $ | — | |
| The Example is intended to help you understand your ongoing | * There were no expenses charged to the Class. | |||||
| costs (in dollars) of investing in the Fund and to compare these | ||||||
| costs with the ongoing costs of investing in other mutual funds. | Hypothetical | |||||
| Performance (5% | ||||||
| The Example is based on an investment of $1,000 invested at the | Actual | return before | ||||
| beginning of the period and held for the entire period indicated, | Class R4 | Performance | expenses) | |||
| which for this Fund is from May 1, 2016 to October 31, 2016. | Beginning Account Value | |||||
| May 1, 2016 | $ | 1,000.00 | $ | 1,000.00 | ||
| Actual Expenses | Ending Account Value | |||||
| The information in the table under the heading “Actual | October 31, 2016 | $ | 1,035.10 | $ | 1,023.88 | |
| Expenses Paid During Period* | $ | 1.28 | $ | 1.27 | ||
| Performance” provides information about actual account values | ||||||
| and actual expenses. You may use the information in this column, | * Expenses are equal to the Fund's annualized expense ratio of 0.25% | |||||
| together with the amount you invested, to estimate the expenses | (representing the six month period annualized), multiplied by the average | |||||
| account value over the period, multiplied by 184/366 (to reflect the one-half | ||||||
| that you paid over the period. Simply divide your account value by | year period). | |||||
| $1,000 (for example, an $8,600 account value divided by $1,000 | ||||||
| = 8.6), then multiply the result by the number in the first column | Hypothetical | |||||
| in the row entitled “Expenses Paid During Period” to estimate | Performance (5% | |||||
| Actual | return before | |||||
| the expenses you paid on your account during this period. | Class R5 | Performance | expenses) | |||
| Beginning Account Value | ||||||
| Hypothetical Example for Comparison Purposes | May 1, 2016 | $ | 1,000.00 | $ | 1,000.00 | |
| The information in the table under the heading “Hypothetical | Ending Account Value | |||||
| Performance (5% return before expenses)” provides information | October 31, 2016 | $ | 1,034.10 | $ | 1,022.62 | |
| about hypothetical account values and hypothetical expenses | Expenses Paid During Period* | $ | 2.56 | $ | 2.54 | |
| based on the Fund’s actual expense ratio and an assumed rate of | * Expenses are equal to the Fund's annualized expense ratio of 0.50% | |||||
| return of 5% per year before expenses, which is not the Fund’s | (representing the six month period annualized), multiplied by the average | |||||
| actual return. The hypothetical account values and expenses | account value over the period, multiplied by 184/366 (to reflect the one-half | |||||
| may not be used to estimate the actual ending account balance or | year period). | |||||
| expenses you paid for the period. You may use this information | ||||||
| to compare the ongoing costs of investing in the Fund and other | ||||||
| funds. To do so, compare this 5% hypothetical example with the | ||||||
| 5% hypothetical examples that appear in the shareholder reports | ||||||
| of other funds. | ||||||
| Please note that the expenses shown in the table are meant | ||||||
| to highlight your ongoing costs only and do not reflect any | ||||||
| transactional costs. Therefore, the information under the heading | ||||||
| “Hypothetical Performance (5% return before expenses)” is | ||||||
| useful in comparing ongoing costs only, and will not help you | ||||||
| determine the relative total costs of owning different funds. In | ||||||
| addition, if these transactional costs were included, your costs | ||||||
| would have been higher. | ||||||
2055 Strategy Fund 227
Russell Investment Company
2055 Strategy Fund
Schedule of Investments — October 31, 2016
| Amounts in thousands (except share amounts) | ||||
| Fair | ||||
| Value | ||||
| Shares | $ | |||
| Investments in Russell Affiliated Mutual Funds - 100.0% | ||||
| Alternative - 8.5% | ||||
| Russell Commodity Strategies Fund Class Y | 26,153 | 144 | ||
| Russell Global Infrastructure Fund Class Y | 10,806 | 124 | ||
| Russell Global Real Estate Securities Fund Class Y | 2,305 | 82 | ||
| 350 | ||||
| Domestic Equities - 43.3% | ||||
| Russell U.S. Defensive Equity Fund Class Y | 2,509 | 124 | ||
| Russell U.S. Dynamic Equity Fund Class Y | 20,731 | 206 | ||
| Russell U.S. Small Cap Equity Fund Class Y | 12,675 | 350 | ||
| Select U.S. Equity Fund Class Y | 100,855 | 1,101 | ||
| 1,781 | ||||
| Fixed Income - 7.0% | ||||
| Russell Strategic Bond Fund Class Y | 26,058 | 288 | ||
| International Equities - 41.2% | ||||
| Russell Emerging Markets Fund Class Y | 19,758 | 329 | ||
| Russell Global Equity Fund Class Y | 51,316 | 535 | ||
| Select International Equity Fund Class Y | 97,058 | 834 | ||
| 1,698 | ||||
| Total Investments in Russell Affiliated Mutual Funds | ||||
| (cost $3,924) | 4,117 | |||
| Total Investments 100.0% | ||||
| (identified cost $3,924) | 4,117 | |||
| Other Assets and Liabilities, Net - (0.0%) | (1 | ) | ||
| Net Assets - 100.0% | 4,116 | |||
| Presentation of Portfolio Holdings | ||||||||||||||
| Amounts in thousands | ||||||||||||||
| Fair Value | ||||||||||||||
| Practical | ||||||||||||||
| Portfolio Summary | Level 1 | Level 2 | Level 3 | Expedient | Total | % of Net Assets | ||||||||
| Investments in Russell Affiliated Mutual | ||||||||||||||
| Funds | $ | 4,117 | $ | — | $ | — | $ | — | $ | 4,117 | 100.0 | |||
| Total Investments | 4,117 | — | — | — | 4,117 | 100.0 | ||||||||
| Other Assets and Liabilities, Net | (—)* | |||||||||||||
| 100.0 | ||||||||||||||
* Less than 0.05% of net assets.
For a description of the Levels, see note 2 in the Notes to Financial Statements.
For a disclosure on transfers between Levels 1, 2 and 3 during the period ended October 31, 2016, see note 2 in the Notes to
Financial Statements.
See accompanying notes which are an integral part of the financial statements.
228 2055 Strategy Fund
Russell Investment Company
2055 Strategy Fund
Statement of Assets and Liabilities — October 31, 2016
| Amounts in thousands | ||
| Assets | ||
| Investments, at identified cost | $ | 3,924 |
| Investments, at fair value(>) | 4,117 | |
| Receivables: | ||
| Fund shares sold | 82 | |
| Total assets | 4,199 | |
| Liabilities | ||
| Payables: | ||
| Investments purchased | 62 | |
| Fund shares redeemed | 20 | |
| Accrued fees to affiliates | 1 | |
| Total liabilities | 83 | |
| Net Assets | $ | 4,116 |
| Net Assets Consist of: | |||
| Accumulated net realized gain (loss) | $ | (87 | ) |
| Unrealized appreciation (depreciation) on investments | 193 | ||
| Shares of beneficial interest | 4 | ||
| Additional paid-in capital | 4,006 | ||
| Net Assets | $ | 4,116 | |
| Net Asset Value, offering and redemption price per share: | |||
| Net asset value per share: Class R1(#) | $ | 10.96 | |
| Class R1 — Net assets | $ | 1,887,618 | |
| Class R1 — Shares outstanding ($.01 par value) | 172,281 | ||
| Net asset value per share: Class R4(#) | $ | 10.97 | |
| Class R4 — Net assets | $ | 1,148,079 | |
| Class R4 — Shares outstanding ($.01 par value) | 104,657 | ||
| Net asset value per share: Class R5(#) | $ | 10.94 | |
| Class R5 — Net assets | $ | 1,080,785 | |
| Class R5 — Shares outstanding ($.01 par value) | 98,831 | ||
| Amounts in thousands | |||
| (>) Investments in affiliated Russell funds | $ | 4,117 | |
| (#) Net asset value per share equals class level net assets divided by class level shares of beneficial interest outstanding. | |||
See accompanying notes which are an integral part of the financial statements.
2055 Strategy Fund 229
Russell Investment Company
2055 Strategy Fund
Statement of Operations — For the Period Ended October 31, 2016
| Amounts in thousands | |||
| Investment Income | |||
| Income distributions from affiliated Russell funds | $ | 94 | |
| Expenses | |||
| Distribution fees - Class R5 | 2 | ||
| Shareholder servicing fees - Class R4 | 4 | ||
| Shareholder servicing fees - Class R5 | 2 | ||
| Total expenses | 8 | ||
| Net investment income (loss) | 86 | ||
| Net Realized and Unrealized Gain (Loss) | |||
| Net realized gain (loss) on: | |||
| Investments | (138 | ) | |
| Capital gain distributions from Underlying Funds | 97 | ||
| Net realized gain (loss) | (41 | ) | |
| Net change in unrealized appreciation (depreciation) on investments | 93 | ||
| Net realized and unrealized gain (loss) | 52 | ||
| Net Increase (Decrease) in Net Assets from Operations | $ | 138 | |
See accompanying notes which are an integral part of the financial statements.
230 2055 Strategy Fund
Russell Investment Company
2055 Strategy Fund
Statements of Changes in Net Assets
| For the Periods Ended October 31, | |||||||
| Amounts in thousands | 2016 | 2015 | |||||
| Increase (Decrease) in Net Assets | |||||||
| Operations | |||||||
| Net investment income (loss) | $ | 86 | $ | 53 | |||
| Net realized gain (loss) | (41 | ) | 25 | ||||
| Net change in unrealized appreciation (depreciation) | 93 | (98 | ) | ||||
| Net increase (decrease) in net assets from operations | 138 | (20 | ) | ||||
| Distributions | |||||||
| From net investment income | |||||||
| Class R1 | (34 | ) | (16 | ) | |||
| Class R4 | (36 | ) | (28 | ) | |||
| Class R5 | (16 | ) | (10 | ) | |||
| From net realized gain | |||||||
| Class R1 | (20 | ) | (65 | ) | |||
| Class R4 | (26 | ) | (153 | ) | |||
| Class R5 | (11 | ) | (67 | ) | |||
| Net decrease in net assets from distributions | (143 | ) | (339 | ) | |||
| Share Transactions* | |||||||
| Net increase (decrease) in net assets from share transactions | (26 | ) | 1,661 | ||||
| Total Net Increase (Decrease) in Net Assets | (31 | ) | 1,302 | ||||
| Net Assets | |||||||
| Beginning of period | 4,147 | 2,845 | |||||
| End of period | $ | 4,116 | $ | 4,147 | |||
See accompanying notes which are an integral part of the financial statements.
2055 Strategy Fund 231
Russell Investment Company
2055 Strategy Fund
Statements of Changes in Net Assets, continued
| * Share transaction amounts (in thousands) for the periods ended October 31, 2016 and October 31, 2015 were as follows: | |||||||||||||
| 2016 | 2015 | ||||||||||||
| Shares | Dollars | Shares | Dollars | ||||||||||
| Class R1 | |||||||||||||
| Proceeds from shares sold | 176 | $ | 1,898 | 136 | $ | 1,515 | |||||||
| Proceeds from reinvestment of distributions | 5 | 54 | 7 | 81 | |||||||||
| Payments for shares redeemed | (134 | ) | (1,464 | ) | (64 | ) | (727 | ) | |||||
| Net increase (decrease) | 47 | 488 | 79 | 869 | |||||||||
| Class R4 | |||||||||||||
| Proceeds from shares sold | 65 | 702 | 45 | 516 | |||||||||
| Proceeds from reinvestment of distributions | 6 | 61 | 16 | 180 | |||||||||
| Payments for shares redeemed | (141 | ) | (1,521 | ) | (11 | ) | (119 | ) | |||||
| Net increase (decrease) | (70 | ) | (758 | ) | 50 | 577 | |||||||
| Class R5 | |||||||||||||
| Proceeds from shares sold | 66 | 697 | 58 | 675 | |||||||||
| Proceeds from reinvestment of distributions | 3 | 27 | 7 | 78 | |||||||||
| Payments for shares redeemed | (46 | ) | (480 | ) | (46 | ) | (538 | ) | |||||
| Net increase (decrease) | 23 | 244 | 19 | 215 | |||||||||
| Total increase (decrease) | (—)** | $ | (26 | ) | 148 | $ | 1,661 | ||||||
| ** Less than 500 shares. | |||||||||||||
See accompanying notes which are an integral part of the financial statements.
232 2055 Strategy Fund
(This page intentionally left blank)
Russell Investment Company
2055 Strategy Fund
Financial Highlights — For the Periods Ended
For a Share Outstanding Throughout Each Period.
| $ | ||||||||||||||||
| $ | Net | $ | $ | $ | $ | |||||||||||
| Net Asset Value, | Investment | Net Realized | Total from | Distributions | Distributions | |||||||||||
| Beginning of | Income (Loss) | and Unrealized | Investment | from Net | from Net | |||||||||||
| Period | (a)(b)(e) | Gain (Loss) | Operations | Investment Income | Realized Gain | |||||||||||
| Class R1 | ||||||||||||||||
| October 31, 2016 | 11.05 | .23 | .08 | .31 | (.25 | ) | (.15 | ) | ||||||||
| October 31, 2015 | 12.51 | .17 | (.21 | ) | (.04 | ) | (.24 | ) | (1.18 | ) | ||||||
| October 31, 2014 | 12.04 | .34 | .49 | .83 | (.32 | ) | (.04 | ) | ||||||||
| October 31, 2013 | 10.27 | .15 | 1.93 | 2.08 | (.19 | ) | (.12 | ) | ||||||||
| October 31, 2012 | 9.63 | .16 | .68 | .84 | (.18 | ) | (.02 | ) | ||||||||
| Class R4(1) | ||||||||||||||||
| October 31, 2016 | 11.05 | .25 | .04 | .29 | (.22 | ) | (.15 | ) | ||||||||
| October 31, 2015 | 12.52 | .19 | (.27 | ) | (.08 | ) | (.21 | ) | (1.18 | ) | ||||||
| October 31, 2014 | 12.03 | .28 | .54 | .82 | (.29 | ) | (.04 | ) | ||||||||
| October 31, 2013 | 10.27 | .16 | 1.88 | 2.04 | (.16 | ) | (.12 | ) | ||||||||
| October 31, 2012 | 9.63 | .15 | .66 | .81 | (.15 | ) | (.02 | ) | ||||||||
| Class R5(2) | ||||||||||||||||
| October 31, 2016 | 11.04 | .17 | .09 | .26 | (.21 | ) | (.15 | ) | ||||||||
| October 31, 2015 | 12.50 | .14 | (.24 | ) | (.10 | ) | (.18 | ) | (1.18 | ) | ||||||
| October 31, 2014 | 12.03 | .22 | .56 | .78 | (.27 | ) | (.04 | ) | ||||||||
| October 31, 2013 | 10.27 | .12 | 1.90 | 2.02 | (.14 | ) | (.12 | ) | ||||||||
| October 31, 2012 | 9.63 | .11 | .68 | .79 | (.13 | ) | (.02 | ) | ||||||||
See accompanying notes which are an integral part of the financial statements.
234 2055 Strategy Fund
| % | % | % | |||||||||||||||
| $ | $ | Ratio of Expenses | Ratio of Expenses | Ratio of Net | |||||||||||||
| Net Asset Value, | % | Net Assets, | to Average | to Average | Investment Income | % | |||||||||||
| $ | End of | Total | End of Period | Net Assets, | Net Assets, | to Average | Portfolio | ||||||||||
| Total Distributions | Period | Return | (000 | ) | Gross(g) | Net(e)(g) | Net Assets(b)(e) | Turnover Rate | |||||||||
| (.40 | ) | 10.96 | 3.02 | 1,887 | — | — | 2.17 | 76 | |||||||||
| (1.42 | ) | 11.05 | (.52 | ) | 1,381 | — | — | 1.54 | 28 | ||||||||
| (.36 | ) | 12.51 | 7.01 | 579 | — | — | 2.81 | 132 | |||||||||
| (.31 | ) | 12.04 | 20.74 | 648 | — | — | 1.31 | 27 | |||||||||
| (.20 | ) | 10.27 | 8.92 | 171 | — | — | 1.66 | 23 | |||||||||
| (.37 | ) | 10.97 | 2.80 | 1,148 | .25 | .25 | 2.33 | 76 | |||||||||
| (1.39 | ) | 11.05 | (.85 | ) | 1,932 | .25 | .25 | 1.63 | 28 | ||||||||
| (.33 | ) | 12.52 | 6.93 | 1,554 | .25 | .25 | 2.26 | 132 | |||||||||
| (.28 | ) | 12.03 | 20.35 | 1,290 | .25 | .25 | 1.43 | 27 | |||||||||
| (.17 | ) | 10.27 | 8.64 | 957 | .25 | .25 | 1.48 | 23 | |||||||||
| (.36 | ) | 10.94 | 2.53 | 1,081 | .50 | .50 | 1.62 | 76 | |||||||||
| (1.36 | ) | 11.04 | (1.00 | ) | 834 | .50 | .50 | 1.25 | 28 | ||||||||
| (.31 | ) | 12.50 | 6.55 | 712 | .50 | .50 | 1.80 | 132 | |||||||||
| (.26 | ) | 12.03 | 20.09 | 407 | .50 | .50 | 1.04 | 27 | |||||||||
| (.15 | ) | 10.27 | 8.41 | 233 | .50 | .50 | 1.08 | 23 | |||||||||
See accompanying notes which are an integral part of the financial statements.
2055 Strategy Fund 235
Russell Investment Company
2055 Strategy Fund
Related Party Transactions, Fees and Expenses
| Accrued fees payable to affiliates for the period ended October 31, 2016 were as follows: | ||
| Distribution fees | $ | 224 |
| Shareholder servicing fees | 454 | |
| $ | 678 | |
| Transactions (amounts in thousands) during the period ended October 31, 2016 with Underlying Funds which are, or were, an | ||||||||||||||||||||
| affiliated company are as follows: | ||||||||||||||||||||
| Fair Value, | Change in | |||||||||||||||||||
| Beginning of | Realized Gain | Unrealized | Fair Value, End | Income | Capital Gains | |||||||||||||||
| Period | Purchases | Sales | (Loss) | Gain (Loss) | of Period | Distributions | Distributions | |||||||||||||
| Russell Commodity Strategies Fund | $ | 145 | $ | 117 | $ | 114 | $ | (20) | $ | 16 | $ | 144 | $ | — | $ | — | ||||
| Russell Global Infrastructure Fund | 124 | 92 | 92 | (9 | ) | 9 | 124 | 4 | 3 | |||||||||||
| Russell Global Real Estate Securities | ||||||||||||||||||||
| Fund | 124 | 72 | 103 | (5 | ) | (6 | ) | 82 | 3 | 6 | ||||||||||
| Russell U.S. Defensive Equity Fund | 125 | 84 | 89 | 2 | 2 | 124 | 2 | — | ||||||||||||
| Russell U.S. Dynamic Equity Fund | 209 | 163 | 145 | (6 | ) | (15 | ) | 206 | 10 | 19 | ||||||||||
| Russell U.S. Small Cap Equity Fund | 354 | 248 | 247 | (9 | ) | 4 | 350 | 3 | 22 | |||||||||||
| Select U.S. Equity Fund | 1,092 | 756 | 777 | 11 | 19 | 1,101 | 30 | 2 | ||||||||||||
| Russell Strategic Bond Fund | 289 | 281 | 286 | (1 | ) | 5 | 288 | 9 | 2 | |||||||||||
| Russell Emerging Markets Fund | 329 | 204 | 237 | (30 | ) | 63 | 329 | 1 | — | |||||||||||
| Russell Global Equity Fund | 539 | 439 | 406 | (19 | ) | (18 | ) | 535 | 10 | 43 | ||||||||||
| Select International Equity Fund | 815 | 640 | 583 | (52 | ) | 14 | 834 | 22 | — | |||||||||||
| $ | 4,145 | $ | 3,096 | $ | 3,079 | $ | (138) | $ | 93 | $ | 4,117 | $ | 94 | $ | 97 | |||||
Federal Income Taxes
At October 31, 2016, the cost of investments and net unrealized appreciation (depreciation), undistributed ordinary income and
undistributed long-term capital gains for income tax purposes were as follows:
| Cost of Investments | $ | 4,061,037 | ||
| Unrealized Appreciation | $ | 69,548 | ||
| Unrealized Depreciation | (13,424 | ) | ||
| Net Unrealized Appreciation (Depreciation) | $ | 56,124 | ||
| Undistributed Long-Term Capital Gains | ||||
| (Capital Loss Carryforward) | $ | 49,395 | ||
| Tax Composition of Distributions | ||||
| Ordinary Income | $ | 90,041 | ||
| Long-Term Capital Gains | $ | 52,902 |
Net investment income and net realized gains (losses) in the financial statements may differ from taxable net investment income and
net realized gains (losses). Capital accounts within the financial statements are adjusted for permanent differences between book and
tax accounting. These differences may be due to foreign currency gains or losses, reclassifications of dividends and /or differences in
treatment of income from swaps. These adjustments have no impact on the net assets. At October 31, 2016, there were no adjustments
to the Statement of Assets and Liabilities.
See accompanying notes which are an integral part of the financial statements.
236 2055 Strategy Fund
Russell Investment Company
In Retirement Fund
Portfolio Management Discussion and Analysis — October 31, 2016 (Unaudited)
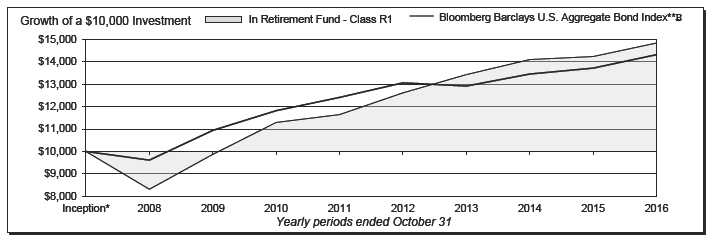
| In Retirement Fund - Class A‡ | In Retirement Fund - Class R5‡‡ | ||||||
| Total | Total | ||||||
| Return | Return | ||||||
| 1 Year | (1.92 | )% | 1 Year | 3.81 | % | ||
| 5 Years | 3.46 | %§ | 5 Years | 4.43 | %§ | ||
| Inception* | 3.73 | %§ | Inception* | 4.17 | %§ | ||
| In Retirement Fund - Class R1 | Barclays U.S. Aggregate Bond Index**C | ||||||
| Total | Total | ||||||
| Return | Return | ||||||
| 1 Year | 4.24 | % | 1 Year | 4.37 | % | ||
| 5 Years | 4.96 | %§ | 5 Years | 2.90 | %§ | ||
| Inception* | 4.70 | %§ | Inception* | 4.27 | %§ | ||
| In Retirement Fund - Class R4‡‡ | |||||||
| Total | |||||||
| Return | |||||||
| 1 Year | 4.12 | % | |||||
| 5 Years | 4.72 | %§ | |||||
| Inception* | 4.45 | %§ | |||||
In Retirement Fund 237
Russell Investment Company
In Retirement Fund
Portfolio Management Discussion and Analysis, continued — October 31, 2016
(Unaudited)
| The In Retirement Fund (the “Fund”) is a fund of funds that | real assets like global real estate investment trusts and global | |
| invests in other Russell Investment Company mutual funds (the | infrastructure. With interest rates falling, income opportunities | |
| “Underlying Funds”). The Underlying Funds employ a multi- | around the globe continued to shrink and income available from | |
| manager approach whereby portions of the Underlying Funds are | most assets fell. | |
| allocated to different money managers. Underlying Fund assets not | The U.S. equity market, as measured by the S&P 500® Index, | |
| allocated to money managers are managed by Russell Investment | was up 4.51% over the period but also experienced multiple | |
| Management, LLC (“RIM”), the Fund’s and Underlying Funds’ | draw downs. The Fund’s strategic exposure to global equities | |
| advisor. RIM, as the Underlying Funds’ advisor, may change | proved beneficial over the period as emerging markets rallied | |
| the allocation of the Underlying Funds’ assets among money | and outperformed U.S. equities. By contrast, non-U.S. developed | |
| managers at any time. An exemptive order from the Securities | equity was one of the lowest performing portions of the Fund’s | |
| and Exchange Commission (“SEC”) permits RIM to engage or | exposure as falling commodities and currencies weighed on | |
| terminate a money manager in an Underlying Fund at any time, | returns. | |
| subject to approval by the Underlying Fund’s Board, without a | ||
| shareholder vote. Pursuant to the terms of the exemptive order, an | How did the investment strategies and techniques employed | |
| Underlying Fund is required to notify its shareholders within 90 | by the Fund and the Underlying Funds affect the Fund’s | |
| days of when a money manager begins providing services. | performance? | |
| What is the Fund’s investment objective? | The Fund is a fund of funds and its performance is based on RIM’s | |
| The Fund seeks to provide income and capital growth. | strategic asset allocations, the performance of the Underlying | |
| Funds in which the Fund invests, and tactical changes in the | ||
| The Fund pursues this objective by investing in a diversified | Fund’s asset allocation throughout the year. | |
| portfolio that, as of October 31, 2016, consisted of 27.1% equity | In order to seek to achieve the Fund’s objective during the period, | |
| Underlying Funds, 66.3% fixed income Underlying Funds and | RIM’s strategic asset allocation included investments in global | |
| 6.6% alternative Underlying Funds. | equity, alternative and fixed income Underlying Funds. The | |
| How did the Fund perform relative to its benchmark for the | Fund’s diverse asset allocation partially hindered performance | |
| fiscal year ended October 31, 2016? | during the period as certain of these exposures underperformed | |
| For the fiscal year ended October 31, 2016, the Fund’s Class A, | the Bloomberg Barclays U.S. Aggregate Bond Index. While | |
| Class R1, Class R4 and Class R5 Shares gained 4.02%, 4.24%, | areas like high yield bonds, as measured by the BofA Merrill | |
| 4.12% and 3.81%, respectively. This is compared to the Fund’s | Lynch Global High Yield Index Hedged USD, outperformed the | |
| primary benchmark, the Bloomberg Barclays U.S. Aggregate | Bloomberg Barclays U.S. Aggregate Bond, areas like commodities | |
| Bond Index, which gained 4.37% during the same period. The | and non-U.S. developed equities delivered negative returns as | |
| Fund’s performance includes operating expenses, whereas index | measured by the Bloomberg Commodity Index Total Return and | |
| returns are unmanaged and do not include expenses of any kind. | Russell Developed ex-U.S. Large Cap® Index Net, respectively. | |
| For the fiscal year ended October 31, 2016, the Morningstar® | The underperformance of certain of the Fund’s exposures relative | |
| Target-Date Retirement Category gained 3.47%. This result | to the Bloomberg Barclays U.S. Aggregate Bond Index was | |
| serves as a peer comparison and is expressed net of operating | partially offset by strong excess returns within the fixed income | |
| expenses. | portion of the Fund’s portfolio. Underlying Fund bond issue | |
| selection during the period was generally additive to returns | ||
| How did the market conditions described in the Market | as fixed income money managers were able to pick well within | |
| Summary report affect the Fund’s performance? | credit, avoiding defaults in places like the energy sector where | |
| The Fund seeks to achieve its objective by investing in Underlying | trouble occurred with falling energy prices in early 2016. As | |
| Funds that provide exposure to a range of diversified investments, | such, allocations to the Russell Strategic Bond Fund and Russell | |
| and most major asset classes invested in by the Underlying | Investment Grade Bond Fund were positive from a benchmark- | |
| Funds produced positive absolute returns during the period. | relative perspective. Both Funds were positively impacted by | |
| Markets during the fiscal year were characterized by higher | their overweight to credit and additive currency positioning also | |
| levels of volatility and dispersion across return sources. Within | helped to drive excess return. | |
| the fixed income Underlying Funds, exposure to high yield debt | By contrast, equity selection and positioning was more difficult, | |
| was beneficial as it was one of the best performing asset classes | with allocations to non-U.S. equity Underlying Funds detracting | |
| globally. Falling interest rates also helped other fixed income | from the Fund’s performance and security selection within | |
| assets in the Underlying Funds rally, as well as more rate sensitive | those Underlying Funds struggling. In addition, overweights | |
238 In Retirement Fund
Russell Investment Company
In Retirement Fund
Portfolio Management Discussion and Analysis, continued — October 31, 2016
(Unaudited)
| to European securities in the Select International Equity Fund | in high yield credit and emerging markets equity compared with | |
| caused the Underlying Fund to struggle as European equities | core bond holdings and cash. Markets subsequently rebounded | |
| continued to lag the U.S. equity market. | from the February lows and RIM reduced risk exposure to a more | |
| defensive stance with the Fund’s equity allocation below strategic | ||
| Describe any changes to the Fund’s structure or allocation | weights. RIM’s modifications to the Fund’s asset allocation were | |
| to the Underlying Funds. | additive during the period. | |
| RIM has the discretion to vary the Fund’s actual allocation from | ||
| the target strategic asset allocation by up to +/- 5% at the equity, | The views expressed in this report reflect those of the | |
| fixed income or alternative category level based on RIM’s capital | portfolio managers only through the end of the period | |
| markets research. RIM’s asset allocation modifications benefited | covered by the report. These views do not necessarily | |
| the Fund’s performance relative to the Fund’s target strategic | represent the views of RIM, or any other person in RIM or | |
| asset allocation. | any other affiliated organization. These views are subject | |
| RIM adapted the Fund’s asset allocation over the period as market | to change at any time based upon market conditions or | |
| opportunities and risks evolved. The Fund was defensively | other events, and RIM disclaims any responsibility to | |
| positioned in the fourth quarter of 2015, favoring fixed income | update the views contained herein. These views should not | |
| over equity Underlying Funds. During the first quarter of 2016, | be relied on as investment advice and, because investment | |
| equity markets declined substantially, and RIM added further risk | decisions for a Russell Investment Company (“RIC”) Fund | |
| to the portfolio by overweighting Underlying Funds that invest | are based on numerous factors, should not be relied on as | |
| an indication of investment decisions of any RIC Fund. | ||
* Assumes initial investment on March 31, 2008.
** The Bloomberg Barclays U.S. Aggregate Bond Index is an index, with income reinvested, generally representative of intermediate-term government bonds,
investment grade corporate debt securities and mortgage-backed securities.
Effective August 24, 2016, the Barclays fixed income benchmark indices, including the Barclays Aggregate family of indices, were renamed the Bloomberg
Barclays family of indices.
‡ The Fund first issued Class A Shares on February 25, 2011. The returns shown for Class A Shares prior to that date are the returns of Class R2 Shares. The
performance shown has been adjusted to reflect the deduction of the maximum Class A sales charge of 5.75%.
‡‡ The Fund first issued Class R4 and Class R5 Shares on October 1, 2014. The returns shown for Class R4 and Class R5 Shares prior to that date are the returns
of the Fund’s Class R2 and Class R3 Shares, respectively.
§ Annualized.
Performance is historical and assumes reinvestment of all dividends and capital gains. Investment return and principal value will fluctuate so that an investor’s
shares, when redeemed, may be worth more or less than when purchased. Past performance is not indicative of future results. The returns shown do not reflect the
deduction of taxes that a shareholder would pay on Fund distributions or the redemption of Fund shares. Additionally, the returns presented herein may differ from
the performance reported in the Financial Highlights as the returns herein are calculated in a manner consistent with standardized performance in accordance with
Securities and Exchange Commission rules, while the performance in the Financial Highlights has been calculated in accordance with U.S. Generally Accepted
Accounting Principles (“U.S. GAAP”).
In Retirement Fund 239
Russell Investment Company
In Retirement Fund
Shareholder Expense Example — October 31, 2016 (Unaudited)
| Fund Expenses | Please note that the expenses shown in the table are meant | |||||
| The following disclosure provides important information | to highlight your ongoing costs only and do not reflect any | |||||
| regarding the Fund’s Shareholder Expense Example | transactional costs. Therefore, the information under the heading | |||||
| (“Example”). | “Hypothetical Performance (5% return before expenses)” is | |||||
| useful in comparing ongoing costs only, and will not help you | ||||||
| Example | determine the relative total costs of owning different funds. In | |||||
| As a shareholder of the Fund, you incur two types of costs: (1) | addition, if these transactional costs were included, your costs | |||||
| transaction costs, including sales charges (loads) on certain | would have been higher. | |||||
| purchase or redemption payments, and (2) ongoing costs, | Hypothetical | |||||
| including advisory and administrative fees; distribution and/or | Performance (5% | |||||
| service fees; and other Fund expenses. The Example is intended | Actual | return before | ||||
| to help you understand your ongoing costs (in dollars) of investing | Class A | Performance | expenses) | |||
| Beginning Account Value | ||||||
| in the Fund and to compare these costs with the ongoing costs of | May 1, 2016 | $ | 1,000.00 | $ | 1,000.00 | |
| investing in other mutual funds. The Example is based on an | Ending Account Value | |||||
| investment of $1,000 invested at the beginning of the period and | October 31, 2016 | $ | 1,024.00 | $ | 1,023.88 | |
| held for the entire period indicated, which for this Fund is from | Expenses Paid During Period* | $ | 1.27 | $ | 1.27 | |
| May 1, 2016 to October 31, 2016. | * Expenses are equal to the Fund's annualized expense ratio of 0.25% | |||||
| (representing the six month period annualized), multiplied by the average | ||||||
| Actual Expenses | account value over the period, multiplied by 184/366 (to reflect the one-half | |||||
| The information in the table under the heading “Actual | year period). | |||||
| Performance” provides information about actual account values | ||||||
| and actual expenses. You may use the information in this column, | Hypothetical | |||||
| Performance (5% | ||||||
| together with the amount you invested, to estimate the expenses | Actual | return before | ||||
| that you paid over the period. Simply divide your account value by | Class R1 | Performance | expenses) | |||
| $1,000 (for example, an $8,600 account value divided by $1,000 | Beginning Account Value | |||||
| = 8.6), then multiply the result by the number in the first column | May 1, 2016 | $ | 1,000.00 | $ | 1,000.00 | |
| Ending Account Value | ||||||
| in the row entitled “Expenses Paid During Period” to estimate | October 31, 2016 | $ | 1,024.40 | $ | 1,025.14 | |
| the expenses you paid on your account during this period. | Expenses Paid During Period* | $ | — | $ | — | |
| Hypothetical Example for Comparison Purposes | * There were no expenses charged to the Class. | |||||
| The information in the table under the heading “Hypothetical | ||||||
| Hypothetical | ||||||
| Performance (5% return before expenses)” provides information | Performance (5% | |||||
| about hypothetical account values and hypothetical expenses | Actual | return before | ||||
| based on the Fund’s actual expense ratio and an assumed rate of | Class R4 | Performance | expenses) | |||
| return of 5% per year before expenses, which is not the Fund’s | Beginning Account Value | |||||
| May 1, 2016 | $ | 1,000.00 | $ | 1,000.00 | ||
| actual return. The hypothetical account values and expenses | Ending Account Value | |||||
| may not be used to estimate the actual ending account balance or | October 31, 2016 | $ | 1,024.50 | $ | 1,023.88 | |
| expenses you paid for the period. You may use this information | Expenses Paid During Period* | $ | 1.27 | $ | 1.27 | |
| to compare the ongoing costs of investing in the Fund and other | ||||||
| * Expenses are equal to the Fund's annualized expense ratio of 0.25% | ||||||
| funds. To do so, compare this 5% hypothetical example with the | (representing the six month period annualized), multiplied by the average | |||||
| 5% hypothetical examples that appear in the shareholder reports | account value over the period, multiplied by 184/366 (to reflect the one-half | |||||
| of other funds. | year period). | |||||
240 In Retirement Fund
Russell Investment Company
In Retirement Fund
Shareholder Expense Example, continued — October 31, 2016 (Unaudited)
| Hypothetical | ||||
| Performance (5% | ||||
| Actual | return before | |||
| Class R5 | Performance | expenses) | ||
| Beginning Account Value | ||||
| May 1, 2016 | $ | 1,000.00 | $ | 1,000.00 |
| Ending Account Value | ||||
| October 31, 2016 | $ | 1,021.70 | $ | 1,022.62 |
| Expenses Paid During Period* | $ | 2.54 | $ | 2.54 |
* Expenses are equal to the Fund's annualized expense ratio of 0.50%
(representing the six month period annualized), multiplied by the average
account value over the period, multiplied by 184/366 (to reflect the one-half
year period).
In Retirement Fund 241
Russell Investment Company
In Retirement Fund
Schedule of Investments — October 31, 2016
| Amounts in thousands (except share amounts) | ||||
| Fair | ||||
| Value | ||||
| Shares | $ | |||
| Investments in Russell Affiliated Mutual Funds - 100.0% | ||||
| Alternative - 5.8% | ||||
| Russell Commodity Strategies Fund Class Y | 110,587 | 609 | ||
| Russell Global Infrastructure Fund Class Y | 49,174 | 562 | ||
| Russell Global Real Estate Securities Fund Class Y | 13,422 | 480 | ||
| 1,651 | ||||
| Domestic Equities - 15.0% | ||||
| Russell U.S. Defensive Equity Fund Class Y | 14,234 | 700 | ||
| Russell U.S. Dynamic Equity Fund Class Y | 33,716 | 335 | ||
| Russell U.S. Small Cap Equity Fund Class Y | 18,389 | 508 | ||
| Select U.S. Equity Fund Class Y | 250,095 | 2,731 | ||
| 4,274 | ||||
| Fixed Income - 66.4% | ||||
| Russell Global Opportunistic Credit Fund Class Y | 97,545 | 948 | ||
| Russell Investment Grade Bond Fund Class Y | 172,487 | 3,852 | ||
| Russell Short Duration Bond Fund Class Y | 214,586 | 4,137 | ||
| Russell Strategic Bond Fund Class Y | 902,563 | 9,982 | ||
| 18,919 | ||||
| International Equities - 12.8% | ||||
| Russell Emerging Markets Fund Class Y | 26,500 | 442 | ||
| Russell Global Equity Fund Class Y | 116,215 | 1,212 | ||
| Select International Equity Fund Class Y | 234,078 | 2,011 | ||
| 3,665 | ||||
| Total Investments in Russell Affiliated Mutual Funds | ||||
| (cost $24,710) | 28,509 | |||
| Total Investments 100.0% | ||||
| (identified cost $24,710) | 28,509 | |||
| Other Assets and Liabilities, Net - (0.0%) | (4 | ) | ||
| Net Assets - 100.0% | 28,505 | |||
| Presentation of Portfolio Holdings | ||||||||||||||
| Amounts in thousands | ||||||||||||||
| Fair Value | ||||||||||||||
| Practical | ||||||||||||||
| Portfolio Summary | Level 1 | Level 2 | Level 3 | Expedient | Total | % of Net Assets | ||||||||
| Investments in Russell Affiliated Mutual | ||||||||||||||
| Funds | $ | 28,509 | $ | — | $ | — | $ | — | $ | 28,509 | 100.0 | |||
| Total Investments | 28,509 | — | — | — | 28,509 | 100.0 | ||||||||
| Other Assets and Liabilities, Net | (—)* | |||||||||||||
| 100.0 | ||||||||||||||
| * Less than 0.05% of net assets. | ||||||||||||||
For a description of the Levels, see note 2 in the Notes to Financial Statements.
For a disclosure on transfers between Levels 1, 2 and 3 during the period ended October 31, 2016, see note 2 in the Notes to
Financial Statements.
See accompanying notes which are an integral part of the financial statements.
242 In Retirement Fund
Russell Investment Company
In Retirement Fund
Statement of Assets and Liabilities — October 31, 2016
| Amounts in thousands | ||
| Assets | ||
| Investments, at identified cost | $ | 24,710 |
| Investments, at fair value(>) | 28,509 | |
| Receivables: | ||
| Investments sold | 5 | |
| Fund shares sold | 2 | |
| Total assets | 28,516 | |
| Liabilities | ||
| Payables: | ||
| Fund shares redeemed | 7 | |
| Accrued fees to affiliates | 4 | |
| Total liabilities | 11 | |
| Net Assets | $ | 28,505 |
| Net Assets Consist of: | ||
| Accumulated net realized gain (loss) | $ | 445 |
| Unrealized appreciation (depreciation) on investments | 3,799 | |
| Shares of beneficial interest | 39 | |
| Additional paid-in capital | 24,222 | |
| Net Assets | $ | 28,505 |
| Net Asset Value, offering and redemption price per share: | ||
| Net asset value per share: Class A(#) | $ | 7.52 |
| Maximum offering price per share (Net asset value plus sales charge of 5.75%): Class A | $ | 7.98 |
| Class A — Net assets | $ | 446,964 |
| Class A — Shares outstanding ($.01 par value) | 59,424 | |
| Net asset value per share: Class R1(#) | $ | 7.35 |
| Class R1 — Net assets | $ | 16,242,128 |
| Class R1 — Shares outstanding ($.01 par value) | 2,208,999 | |
| Net asset value per share: Class R4(#) | $ | 7.36 |
| Class R4 — Net assets | $ | 8,274,539 |
| Class R4 — Shares outstanding ($.01 par value) | 1,124,493 | |
| Net asset value per share: Class R5(#) | $ | 7.34 |
| Class R5 — Net assets | $ | 3,541,778 |
| Class R5 — Shares outstanding ($.01 par value) | 482,241 | |
| Amounts in thousands | ||
| (>) Investments in affiliated Russell funds | $ | 28,509 |
| (#) Net asset value per share equals class level net assets divided by class level shares of beneficial interest outstanding. | ||
See accompanying notes which are an integral part of the financial statements.
In Retirement Fund 243
Russell Investment Company
In Retirement Fund
Statement of Operations — For the Period Ended October 31, 2016
| Amounts in thousands | |||
| Investment Income | |||
| Income distributions from affiliated Russell funds | $ | 942 | |
| Expenses | |||
| Distribution fees - Class A | 1 | ||
| Distribution fees - Class R5 | 13 | ||
| Shareholder servicing fees - Class R4 | 22 | ||
| Shareholder servicing fees - Class R5 | 13 | ||
| Total expenses | 49 | ||
| Net investment income (loss) | 893 | ||
| Net Realized and Unrealized Gain (Loss) | |||
| Net realized gain (loss) on: | |||
| Investments | 788 | ||
| Capital gain distributions from Underlying Funds | 299 | ||
| Net realized gain (loss) | 1,087 | ||
| Net change in unrealized appreciation (depreciation) on investments | (762 | ) | |
| Net realized and unrealized gain (loss) | 325 | ||
| Net Increase (Decrease) in Net Assets from Operations | $ | 1,218 | |
See accompanying notes which are an integral part of the financial statements.
244 In Retirement Fund
Russell Investment Company
In Retirement Fund
Statements of Changes in Net Assets
| For the Periods Ended October 31, | ||||||
| Amounts in thousands | 2016 | 2015 | ||||
| Increase (Decrease) in Net Assets | ||||||
| Operations | ||||||
| Net investment income (loss) | $ | 893 | $ | 816 | ||
| Net realized gain (loss) | 1,087 | 1,294 | ||||
| Net change in unrealized appreciation (depreciation) | (762 | ) | (2,064 | ) | ||
| Net increase (decrease) in net assets from operations | 1,218 | 46 | ||||
| Distributions | ||||||
| From net investment income | ||||||
| Class A | (12 | ) | (11 | ) | ||
| Class R1 | (505 | ) | (463 | ) | ||
| Class R4 | (245 | ) | (171 | ) | ||
| Class R5 | (131 | ) | (172 | ) | ||
| From net realized gain | ||||||
| Class A | (19 | ) | (132 | ) | ||
| Class R1 | (745 | ) | (3,510 | ) | ||
| Class R4 | (394 | ) | (1,475 | ) | ||
| Class R5 | (248 | ) | (2,175 | ) | ||
| Net decrease in net assets from distributions | (2,299 | ) | (8,109 | ) | ||
| Share Transactions* | ||||||
| Net increase (decrease) in net assets from share transactions | (9,259 | ) | 15,767 | |||
| Total Net Increase (Decrease) in Net Assets | (10,340 | ) | 7,704 | |||
| Net Assets | ||||||
| Beginning of period | 38,845 | 31,141 | ||||
| End of period | $ | 28,505 | $ | 38,845 | ||
See accompanying notes which are an integral part of the financial statements.
In Retirement Fund 245
Russell Investment Company
In Retirement Fund
Statements of Changes in Net Assets, continued
* Share transaction amounts (in thousands) for the periods ended October 31, 2016 and October 31, 2015 were as follows:
| 2016 | 2015 | |||||||||||
| Shares | Dollars | Shares | Dollars | |||||||||
| Class A | ||||||||||||
| Proceeds from shares sold | — | $ | — | — | $ | — | ||||||
| Proceeds from reinvestment of distributions | 4 | 30 | 18 | 142 | ||||||||
| Payments for shares redeemed | (4 | ) | (30 | ) | (3 | ) | (30 | ) | ||||
| Net increase (decrease) | — | — | 15 | 112 | ||||||||
| Class R1 | ||||||||||||
| Proceeds from shares sold | 326 | 2,364 | 1,186 | 9,149 | ||||||||
| Shares issued in connection with acquisition | — | — | 1,111 | 8,590 | ||||||||
| Proceeds from reinvestment of distributions | 176 | 1,244 | 516 | 3,943 | ||||||||
| Payments for shares redeemed | (1,236 | ) | (9,085 | ) | (1,259 | ) | (10,350 | ) | ||||
| Net increase (decrease) | (734 | ) | (5,477 | ) | 1,554 | 11,332 | ||||||
| Class R4 | ||||||||||||
| Proceeds from shares sold | 243 | 1,765 | 114 | 884 | ||||||||
| Shares issued in connection with acquisition | — | — | 793 | 6,137 | ||||||||
| Proceeds from reinvestment of distributions | 90 | 638 | 215 | 1,645 | ||||||||
| Payments for shares redeemed | (366 | ) | (2,660 | ) | (505 | ) | (4,029 | ) | ||||
| Net increase (decrease) | (33 | ) | (257 | ) | 617 | 4,637 | ||||||
| Class R5 | ||||||||||||
| Proceeds from shares sold | 150 | 1,093 | 488 | 3,802 | ||||||||
| Shares issued in connection with acquisition | — | — | 455 | 3,512 | ||||||||
| Proceeds from reinvestment of distributions | 54 | 380 | 308 | 2,347 | ||||||||
| Payments for shares redeemed | (682 | ) | (4,998 | ) | (1,221 | ) | (9,975 | ) | ||||
| Net increase (decrease) | (478 | ) | (3,525 | ) | 30 | (314 | ) | |||||
| Total increase (decrease) | (1,245 | ) | $ | (9,259 | ) | 2,216 | $ | 15,767 | ||||
See accompanying notes which are an integral part of the financial statements.
246 In Retirement Fund
(This page intentionally left blank)
Russell Investment Company
In Retirement Fund
Financial Highlights — For the Periods Ended
For a Share Outstanding Throughout Each Period.
| $ | |||||||||||||||
| $ | Net | $ | $ | $ | $ | ||||||||||
| Net Asset Value, | Investment | Net Realized | Total from | Distributions | Distributions | ||||||||||
| Beginning of | Income (Loss) | and Unrealized | Investment | from Net | from Net | ||||||||||
| Period | (a)(b)(e) | Gain (Loss) | Operations | Investment Income | Realized Gain | ||||||||||
| Class A | |||||||||||||||
| October 31, 2016 | 7.75 | .20 | .09 | .29 | (.20 | ) | (.32 | ) | |||||||
| October 31, 2015 | 10.88 | .20 | (.13 | ) | .07 | (.23 | ) | (2.97 | ) | ||||||
| October 31, 2014 | 11.05 | .17 | .33 | .50 | (.19 | ) | (.48 | ) | |||||||
| October 31, 2013 | 10.74 | .36 | .29 | .65 | (.29 | ) | (.05 | ) | |||||||
| October 31, 2012 | 10.10 | .25 | .55 | .80 | (.12 | ) | (.04 | ) | |||||||
| Class R1 | |||||||||||||||
| October 31, 2016 | 7.59 | .21 | .09 | .30 | (.22 | ) | (.32 | ) | |||||||
| October 31, 2015 | 10.72 | .17 | (.08 | ) | .09 | (.25 | ) | (2.97 | ) | ||||||
| October 31, 2014 | 10.90 | .21 | .31 | .52 | (.22 | ) | (.48 | ) | |||||||
| October 31, 2013 | 10.60 | .33 | .34 | .67 | (.32 | ) | (.05 | ) | |||||||
| October 31, 2012 | 10.10 | .27 | .55 | .82 | (.28 | ) | (.04 | ) | |||||||
| Class R4(1) | |||||||||||||||
| October 31, 2016 | 7.59 | .19 | .10 | .29 | (.20 | ) | (.32 | ) | |||||||
| October 31, 2015 | 10.73 | .15 | (.09 | ) | .06 | (.23 | ) | (2.97 | ) | ||||||
| October 31, 2014 | 10.90 | .17 | .33 | .50 | (.19 | ) | (.48 | ) | |||||||
| October 31, 2013 | 10.60 | .32 | .32 | .64 | (.29 | ) | (.05 | ) | |||||||
| October 31, 2012 | 10.10 | .27 | .52 | .79 | (.25 | ) | (.04 | ) | |||||||
| Class R5(2) | |||||||||||||||
| October 31, 2016 | 7.57 | .18 | .09 | .27 | (.18 | ) | (.32 | ) | |||||||
| October 31, 2015 | 10.70 | .16 | (.12 | ) | .04 | (.20 | ) | (2.97 | ) | ||||||
| October 31, 2014 | 10.88 | .16 | .30 | .46 | (.16 | ) | (.48 | ) | |||||||
| October 31, 2013 | 10.58 | .27 | .34 | .61 | (.26 | ) | (.05 | ) | |||||||
| October 31, 2012 | 10.08 | .24 | .53 | .77 | (.23 | ) | (.04 | ) | |||||||
See accompanying notes which are an integral part of the financial statements.
248 In Retirement Fund
| % | % | % | ||||||||||||||
| $ | $ | Ratio of Expenses | Ratio of Expenses | Ratio of Net | ||||||||||||
| Net Asset Value, | % | Net Assets, | to Average | to Average | Investment Income | % | ||||||||||
| $ | End of | Total | End of Period | Net Assets, | Net Assets, | to Average | Portfolio | |||||||||
| Total Distributions | Period | Return(d) | (000 | ) | Gross(g) | Net(e)(g) | Net Assets(b)(e) | Turnover Rate | ||||||||
| (.52 | ) | 7.52 | 4.02 | 447 | .25 | .25 | 2.65 | 21 | ||||||||
| (3.20 | ) | 7.75 | .69 | 459 | .25 | .25 | 2.39 | 56 | ||||||||
| (.67 | ) | 10.88 | 4.75 | 486 | .25 | .25 | 1.60 | 34 | ||||||||
| (.34 | ) | 11.05 | 6.15 | 493 | .25 | .25 | 3.30 | 19 | ||||||||
| (.16 | ) | 10.74 | 8.01 | 1,035 | .25 | .25 | 2.43 | 20 | ||||||||
| (.54 | ) | 7.35 | 4.24 | 16,242 | — | — | 2.90 | 21 | ||||||||
| (3.22 | ) | 7.59 | .96 | 22,325 | — | — | 2.15 | 56 | ||||||||
| (.70 | ) | 10.72 | 5.00 | 14,897 | — | — | 1.95 | 34 | ||||||||
| (.37 | ) | 10.90 | 6.48 | 29,451 | — | — | 3.10 | 19 | ||||||||
| (.32 | ) | 10.60 | 8.32 | 36,665 | — | — | 2.66 | 20 | ||||||||
| (.52 | ) | 7.36 | 4.12 | 8,274 | .25 | .25 | 2.67 | 21 | ||||||||
| (3.20 | ) | 7.59 | .59 | 8,789 | .25 | .25 | 1.95 | 56 | ||||||||
| (.67 | ) | 10.73 | 4.81 | 5,804 | .25 | .25 | 1.56 | 34 | ||||||||
| (.34 | ) | 10.90 | 6.16 | 7,818 | .25 | .25 | 2.95 | 19 | ||||||||
| (.29 | ) | 10.60 | 8.05 | 10,996 | .25 | .25 | 2.59 | 20 | ||||||||
| (.50 | ) | 7.34 | 3.81 | 3,542 | .50 | .50 | 2.54 | 21 | ||||||||
| (3.17 | ) | 7.57 | .38 | 7,272 | .50 | .50 | 1.97 | 56 | ||||||||
| (.64 | ) | 10.70 | 4.43 | 9,954 | .50 | .50 | 1.47 | 34 | ||||||||
| (.31 | ) | 10.88 | 5.90 | 18,939 | .50 | .50 | 2.57 | 19 | ||||||||
| (.27 | ) | 10.58 | 7.78 | 23,337 | .50 | .50 | 2.35 | 20 | ||||||||
See accompanying notes which are an integral lpart of the financial statements.
In Retirement Fund 249
Russell Investment Company
In Retirement Fund
Related Party Transactions, Fees and Expenses
| Accrued fees payable to affiliates for the period ended October 31, 2016 were as follows: | ||
| Distribution fees | $ | 980 |
| Shareholder servicing fees | 2,644 | |
| $ | 3,624 | |
| Transactions (amounts in thousands) during the period ended October 31, 2016 with Underlying Funds which are, or were, an | ||||||||||||||||||||
| affiliated company are as follows: | ||||||||||||||||||||
| Fair Value, | Change in | |||||||||||||||||||
| Beginning of | Realized Gain | Unrealized | Fair Value, End | Income | Capital Gains | |||||||||||||||
| Period | Purchases | Sales | (Loss) | Gain (Loss) | of Period | Distributions | Distributions | |||||||||||||
| Russell Commodity Strategies Fund | $ | 843 | $ | 125 | $ | 330 | $ | (82) | $ | 53 | $ | 609 | $ | — | $ | — | ||||
| Russell Global Infrastructure Fund | 766 | 128 | 329 | (53 | ) | 50 | 562 | 19 | 18 | |||||||||||
| Russell Global Real Estate Securities | ||||||||||||||||||||
| Fund | 765 | 160 | 393 | 127 | (179 | ) | 480 | 16 | 31 | |||||||||||
| Russell U.S. Defensive Equity Fund | 956 | 97 | 379 | 171 | (145 | ) | 700 | 12 | — | |||||||||||
| Russell U.S. Dynamic Equity Fund | 458 | 137 | 214 | 7 | (53 | ) | 335 | 19 | 38 | |||||||||||
| Russell U.S. Small Cap Equity Fund | 691 | 164 | 333 | 98 | (112 | ) | 508 | 5 | 40 | |||||||||||
| Select U.S. Equity Fund | 3,667 | 535 | 1,536 | 75 | (10 | ) | 2,731 | 84 | 4 | |||||||||||
| Russell Global Opportunistic Credit | ||||||||||||||||||||
| Fund | 1,682 | 115 | 910 | (81 | ) | 142 | 948 | 44 | — | |||||||||||
| Russell Investment Grade Bond Fund | 6,410 | 666 | 3,223 | 56 | (57 | ) | 3,852 | 211 | 8 | |||||||||||
| Russell Short Duration Bond Fund | 4,469 | 1,413 | 1,789 | (4 | ) | 48 | 4,137 | 69 | 2 | |||||||||||
| Russell Strategic Bond Fund | 13,597 | 1,718 | 5,436 | 531 | (428 | ) | 9,982 | 374 | 67 | |||||||||||
| Russell Emerging Markets Fund | 602 | 89 | 291 | 30 | 12 | 442 | 2 | — | ||||||||||||
| Russell Global Equity Fund | 1,263 | 606 | 616 | 86 | (127 | ) | 1,212 | 21 | 91 | |||||||||||
| Select International Equity Fund | 2,680 | 545 | 1,085 | (173 | ) | 44 | 2,011 | 66 | — | |||||||||||
| $ | 38,849 | $ | 6,498 | $ | 16,864 | $ | 788 | $ | (762) | $ | 28,509 | $ | 942 | $ | 299 | |||||
Federal Income Taxes
At October 31, 2016, the cost of investments and net unrealized appreciation (depreciation), undistributed ordinary income and
undistributed long-term capital gains for income tax purposes were as follows:.
| Cost of Investments | $ | 25,323,342 | ||
| Unrealized Appreciation | $ | 3,605,006 | ||
| Unrealized Depreciation | (419,315 | ) | ||
| Net Unrealized Appreciation (Depreciation) | $ | 3,185,691 | ||
| Undistributed Ordinary Income | $ | 36,393 | ||
| Undistributed Long-Term Capital Gains | ||||
| (Capital Loss Carryforward) | $ | 1,021,965 | ||
| Tax Composition of Distributions | ||||
| Ordinary Income | $ | 933,046 | ||
| Long-Term Capital Gains | $ | 1,365,699 |
See accompanying notes which are an integral part of the financial statements.
250 In Retirement Fund
Russell Investment Company
In Retirement Fund
Federal Income Taxes, continued
Net investment income and net realized gains (losses) in the financial statements may differ from taxable net investment income and
net realized gains (losses). Capital accounts within the financial statements are adjusted for permanent differences between book and
tax accounting. These differences may be due to foreign currency gains or losses, reclassifications of dividends and /or differences in
treatment of income from swaps. These adjustments have no impact on the net assets. At October 31, 2016, there were no adjustments
to the Statement of Assets and Liabilities.
See accompanying notes which are an integral part of the financial statements.
In Retirement Fund 251
Russell Investment Company
LifePoints® Funds
Notes to Schedules of Investments — October 31, 2016
Footnotes:
(å) Currency balances were pledged in connection with futures contracts purchased (sold), options written, or swaps entered into by the
Fund. See Statement of Assets and Liabilities.
(ÿ) Notional Amount in thousands.
(8) Unrounded units.
252 Notes to Schedules of Investments
Russell Investment Company
LifePoints® Funds
Notes to Financial Highlights — October 31, 2016
(1) As of October 1, 2014, Class R2 shares were reclassified as Class R4 shares and all shareholders were issued shares of Class R4. Class R2 shares are
no longer offered. The financial highlights for period ended October 31, 2014 reflect a consolidation of the financial activity of Class R2 shares for
the period November 1, 2013 through October 1, 2014 and the financial activity of Class R4 shares for the period October 2, 2014 through October
31, 2014. All prior periods reflect the financial activity of Class R2 shares.
(2) As of October 1, 2014, Class R3 shares were reclassified as Class R5 shares and all shareholders were issued shares of Class R5. Class R3 shares are
no longer offered. The financial highlights for period ended October 31, 2014 reflect a consolidation of the financial activity of Class R3 shares for
the period November 1, 2013 through October 1, 2014 and the financial activity of Class R4 shares for the period October 2, 2014 through October
31, 2014. All prior periods reflect the financial activity of Class R3 shares.
(a) Average daily shares outstanding were used for this calculation.
(b) Recognition of net investment income by the Fund is affected by the timing of the declaration of dividends by the Underlying Funds in which the
Fund invests.
(c) The ratios for periods less than one year are not annualized.
(d) Total return for Class A does not reflect a front-end sales charge. If sales charges were included, the total return would be lower.
(e) May reflect amounts waived and/or reimbursed by Russell Investment Management, LLC (“RIM”) and/or Russell Investments Fund Services, LLC
(“RIFUS”).
(f) The ratios for periods less than one year are annualized.
(g) The calculation includes only those expenses charged directly to the Fund and does not include expenses charged to the Underlying Funds in which
the Fund invests.
(h) Less than $.01 per share.
(i) Gross and Net Expense Ratios for the period ended October 31, 2016, include a reimbursement from State Street for the overbilling of custody
expenses in prior years. Without the reimbursement, each class of Conservative Strategy Fund would have been 0.01% higher.
Notes to Financial Highlights 253
Russell Investment Company
LifePoints® Funds
Notes to Financial Statements — October 31, 2016
1. Organization
Russell Investment Company (the “Investment Company” or “RIC”) is a series investment company with 41 different investment
portfolios referred to as funds (each a “Fund” and collectively the “Funds”). These financial statements report on 14 of these
Funds. The Investment Company is registered under the Investment Company Act of 1940, (as amended (“Investment Company
Act”), as an open-end management investment company. It is organized and operated as a Massachusetts business trust under
a Second Amended and Restated Master Trust Agreement dated October 1, 2008, as amended (“Master Trust Agreement”), and
the provisions of Massachusetts law governing the operation of a Massachusetts business trust. The Investment Company’s Master
Trust Agreement permits the Board of Trustees (the “Board”) to issue an unlimited number of shares of beneficial interest. Each
of the Funds is diversified. Under the Investment Company Act a diversified company is defined as a management company
which meets the following requirements: at least 75% of the value of their total assets is represented by cash and cash items
(including receivables), government securities, securities of other investment companies, and other securities for the purposes of
this calculation limited in respect of any one issuer to an amount not greater in value than five percent of the value of the total assets
of such management company and to not more than 10% of the outstanding voting securities of such issuer.
Target Portfolio Funds
Each of the Target Portfolio Funds listed in the table below is a “fund of funds” and diversifies its assets by investing principally,
at present, in shares of several other RIC Funds (the “Underlying Funds”). Each Fund seeks to achieve its specific investment
objective by investing in different combinations of Underlying Funds. In addition to investing in the Underlying Funds, Russell
Investment Management, LLC ("RIM"), the Funds' investment adviser, may seek to actively manage the Funds' overall exposure
by investing in derivatives, including futures, options, forwards and swaps, that RIM believes will achieve the desired risk/return
profile for the Funds. The Funds may hold cash in connection with these investments. The Funds usually, but not always, pursue
a strategy of being fully invested by exposing their cash to the performance of segments of the global equity market by purchasing
index futures contracts (also known as "equitization"). The following table shows each Fund's target strategic asset allocation to
equity, fixed/other income and alternative asset classes effective on or about September 22, 2016. As of October 31, 2016, the equity
Underlying Funds in which the Funds may invest include the Russell U.S. Defensive Equity, Russell U.S. Dynamic Equity, Russell
U.S. Small Cap Equity, Select U.S. Equity, Russell Global Equity, Russell Emerging Markets and Select International Equity
Funds. The fixed/other income Underlying Funds in which the Funds may invest include the Russell Global Opportunistic Credit,
Unconstrained Total Return, Russell Strategic Bond, Russell Investment Grade Bond, Russell Short Duration Bond and Russell
Multi-Strategy Income Funds. The alternative Underlying Funds in which the Funds may invest include the Russell Commodity
Strategies, Russell Global Infrastructure and Russell Global Real Estate Securities Funds. Each Fund intends its strategy of
investing in combinations of equity, fixed/other income and alternative Underlying Funds to result in investment diversification that
an investor could otherwise achieve only by holding numerous individual investments. A Fund’s actual allocation may vary from
the target strategic asset allocation at any point in time (1) due to market movements, (2) by up to +/- 5% at the equity, fixed/other
income or alternative category level based on RIM’s capital markets research, and/or (3) due to the implementation over a period of
time of a change to the target strategic asset allocation including the addition of a new Underlying Fund. There may be no changes
in the asset allocation or to the Underlying Funds in a given year or such changes may be made one or more times in a year.
The following table shows the Target Portfolio Funds’ approximate expected target strategic asset allocations to equity, fixed/other
income and alternative asset classes effective on or about September 22, 2016.
| Conservative | Moderate | Balanced | Growth | Equity Growth | |||||||
| Asset Allocation* | Strategy Fund | Strategy Fund | Strategy Fund | Strategy Fund | Strategy Fund | ||||||
| Alternative# | 6 | % | 7.5 | % | 7 | % | 8 | % | 8 | % | |
| Equity | 8 | % | 29.5 | % | 51 | % | 70 | % | 85 | % | |
| Fixed/Other Income | 86 | % | 63 | % | 42 | % | 22 | % | 7 | % | |
* As described above, actual asset allocation may vary.
# Alternative Underlying Funds pursue investment strategies that differ from those of traditional broad market equity or fixed income funds or seek returns
with a low correlation to global equity markets.
Target Date Funds
Each of the Target Date Funds listed in the table below is a “fund of funds” and seeks to achieve its objective by investing in
shares of several of the Underlying Funds which represent various asset classes. Each Fund currently intends to invest only in the
254 Notes to Financial Statements
Russell Investment Company
LifePoints® Funds
Notes to Financial Statements, continued — October 31, 2016
Underlying Funds. The following table shows each Fund’s target strategic asset allocation to equity Underlying Funds, fixed income
Underlying Funds and alternative Underlying Funds. As of October 31, 2016, the equity Underlying Funds in which the Funds
may invest include the Russell U.S. Defensive Equity, Russell U.S. Dynamic Equity, Select U.S. Equity, Russell U.S. Small Cap
Equity, Russell Global Equity, Select International Equity and Russell Emerging Markets Funds. The fixed income Underlying
Funds in which the Funds may invest include the Russell Global Opportunistic Credit, Russell Strategic Bond, Russell Investment
Grade Bond and Russell Short Duration Bond Funds. The alternative Underlying Funds in which the Funds may invest include the
Russell Commodity Strategies, Russell Global Infrastructure and Russell Global Real Estate Securities Funds. The 2020 Strategy,
2025 Strategy, 2030 Strategy, 2035 Strategy, 2040 Strategy, 2045 Strategy, 2050 Strategy and 2055 Strategy Funds are referred
to herein as the “Strategy Funds.” The allocation of each Strategy Fund’s assets to the Underlying Funds in which it invests will
become more conservative over time until approximately the year indicated in the Fund name, the “target year,” at which time the
allocation will remain fixed. The Strategy Funds are designed for investors who plan to retire close to the target year indicated in
the Fund name. The allocation of the In Retirement Fund’s assets to the Underlying Funds in which it invests does not shift over
time. The In Retirement Fund is intended for investors who have reached retirement age and are no longer contributing to their
retirement savings. A Fund’s actual allocation may vary from the target strategic asset allocation at any point in time (1) due to
market movements, (2) by up to +/- 5% at the equity, fixed income or alternative category level based on RIM’s capital markets
research, and/or (3) due to the implementation over a period of time of a change to the target strategic asset allocation including the
addition of a new Underlying Fund. There may be no changes in the asset allocation or to the Underlying Funds in a given year or
such changes may be made one or more times in a year.
The following table shows the Target Date Funds’ approximate expected allocations to equity Underlying Funds, fixed income
Underlying Funds and alternative Underlying Funds effective on or about March 1, 2016.
| 2020 | 2025 | 2030 | 2035 | ||||||||
| Asset Allocation | Strategy Fund | Strategy Fund | Strategy Fund | Strategy Fund | |||||||
| Alternative Underlying Funds* | 6.8 | % | 7.3 | % | 8.1 | % | 9.1 | % | |||
| Equity Underlying Funds | 35 | % | 44.9 | % | 56.8 | % | 70 | % | |||
| Fixed Income Underlying Funds | 58.2 | % | 47.8 | % | 35.1 | % | 20.9 | % | |||
| Asset Allocation Targets* | |||||||||||
| 2040 | 2045 | 2050 | 2055 | In Retirement | |||||||
| Asset Allocation | Strategy Fund | Strategy Fund | Strategy Fund | Strategy Fund | Fund | ||||||
| Alternative Underlying Funds* | 10.5 | % | 10.5 | % | 10.5 | % | 10.5 | % | 6.6 | % | |
| Equity Underlying Funds | 82.5 | % | 82.5 | % | 82.5 | % | 82.5 | % | 27.1 | % | |
| Fixed Income Underlying Funds | 7 | % | 7 | % | 7 | % | 7 | % | 66.3 | % | |
| * | Alternative Underlying Funds pursue investment strategies that differ from those of traditional broad market equity or fixed income funds or seek returns | ||||||||||
| with a low correlation to global equity markets. | |||||||||||
2. Significant Accounting Policies
The Funds’ financial statements are prepared in accordance with U.S. generally accepted accounting principles (“U.S. GAAP”)
which require the use of management estimates and assumptions at the date of the financial statements. Actual results could differ
from those estimates. The Funds are considered investment companies under U.S. GAAP and follow the accounting and reporting
guidance applicable to investment companies. The following is a summary of the significant accounting policies consistently
followed by each Fund in the preparation of its financial statements.
In October 2016, the U.S. Securities and Exchange Commission adopted new rules and amended existing rules (together, “final
rules”) intended to modernize the reporting and disclosure of information by registered investment companies. In part, the final
rules amend Regulation S-X and require standardized, enhanced disclosure about derivatives in investment company financial
statements, as well as other amendments. The compliance date for the amendments to Regulation S-X is August 1, 2017.
Management is currently evaluating the impact that the adoption of the amendments to Regulation S-X will have on the Funds’
financial statements and related disclosures.
Notes to Financial Statements 255
Russell Investment Company
LifePoints® Funds
Notes to Financial Statements, continued — October 31, 2016
Security Valuation
The Funds value portfolio securities according to Board-approved securities valuation procedures which include market and fair
value procedures. The Board has delegated the responsibility for administration of the securities valuation procedures to Russell
Investments Fund Services, LLC (“RIFUS”). The Funds value the shares of the Underlying Funds at the current net asset value
("NAV") per share of each Underlying Fund. The Funds have adopted the authoritative guidance under U.S. GAAP for estimating
the fair value of investments in funds that have calculated NAV per share in accordance with the specialized accounting guidance
for investment companies. Accordingly, the Funds estimate the fair value of an investment in a fund using the NAV per share
without further adjustment as a practical expedient, if the NAV per share of the investment is determined in accordance with the
specialized accounting guidance for investment companies as of the reporting entity’s measurement date.
U.S. GAAP defines fair value as the price that a Fund would receive to sell an asset or pay to transfer a liability in an orderly
transaction between market participants at the measurement date. It establishes a fair value hierarchy that prioritizes inputs to
valuation methods and requires a separate disclosure of the fair value hierarchy for each major category of assets and liabilities,
that segregates fair value measurements into levels (Level 1, 2, and 3). The inputs or methodology used for valuing securities are
not necessarily an indication of the risk associated with investing in those securities. Levels 1, 2 and 3 of the fair value hierarchy
are defined as follows:
• Level 1 — Quoted prices (unadjusted) in active markets or exchanges for identical assets and liabilities.
• Level 2 — Inputs other than quoted prices included within Level 1 that are observable, which may include, but are not
limited to, quoted prices for similar assets or liabilities in markets that are active, quoted prices for identical or similar assets
or liabilities in markets that are not active, and inputs such as interest rates, yield curves, implied volatilities, credit spreads
or other market corroborated inputs.
• Level 3 — Significant unobservable inputs based on the best information available in the circumstances, to the extent
observable inputs are not available, which may include assumptions made by RIFUS, acting at the discretion of the Board,
that are used in determining the fair value of investments.
All the Funds’ investments for the period ended October 31, 2016, were valued using Level 1 inputs.
The availability of observable inputs can vary from security to security and is affected by a wide variety of factors, including, for
example, the type of security, whether the security is new and not yet established in the marketplace, the liquidity of markets, and
other characteristics particular to the security. To the extent that valuation is based on models or inputs that are less observable or
unobservable in the market, the determination of fair value requires more judgment. Accordingly, the degree of judgment exercised
in determining fair value is greatest for instruments categorized in Level 3. The inputs or methodology used for valuing securities
are not necessarily an indication of the risk associated with investing in those securities.
The inputs used to measure fair value may fall into different levels of the fair value hierarchy. In such cases, for disclosure purposes,
the level in the fair value hierarchy within which the fair value measurement falls is determined based on the lowest level input that
is significant to the fair value measurement in its entirety
The valuation techniques and significant inputs used in determining the fair market values of financial instruments categorized as
Level 1 and Level 2 of the fair value hierarchy are as follows:
Derivative instruments are instruments such as foreign currency contracts, futures contracts, options contracts, or swap agreements
that derive their value from underlying asset prices, indices, reference rates, and other inputs or a combination of these factors.
Derivatives may be classified into two groups depending upon the way that they are traded: privately traded over-the-counter
(“OTC”) derivatives that do not go through an exchange or intermediary and exchange-traded derivatives that are traded through
specialized derivatives exchanges or other regulated exchanges. OTC derivatives are normally valued on the basis of broker dealer
quotations or pricing service providers. Depending on the product and the terms of the transaction, the value of the derivative
instrument can be estimated by a pricing service provider using a series of techniques, including simulation pricing models.
The pricing models use inputs that are observed from actively quoted markets such as issuer details, indices, spreads, interest
rates, yield curves, dividends and exchange rates. OTC derivatives that use these and similar valuation techniques and inputs as
described above are categorized as Level 2 of the fair value hierarchy, with the exception of foreign currency spot contracts which
are categorized as Level 1 of the fair value hierarchy. OTC derivatives that use broker dealer quotations are categorized as level 3 of
the fair value hierarchy. Exchange-traded derivatives are valued based on the last reported sales price on the day of valuation and
are categorized as Level 1 of the fair value hierarchy.
256 Notes to Financial Statements
Russell Investment Company
LifePoints® Funds
Notes to Financial Statements, continued — October 31, 2016
Centrally cleared swaps listed or traded on a multilateral or trade facility platform, such as a registered exchange, are valued at
the daily settlement price determined by the respective exchange. For centrally cleared credit default swaps, the clearing facility
requires its members to provide actionable levels across complete term structures. These levels along with external third party
prices are used to produce daily settlement prices. These securities are categorized as Level 2 of the fair value hierarchy. Centrally
cleared interest rate swaps are valued using a pricing model that references the underlying rates including the overnight index
swap rate and London Interbank Offered Rate (“LIBOR”) forward rate to produce the daily settlement price. These securities are
categorized as Level 2 of the fair value hierarchy.
Level 3 Fair Value Investments
The valuation techniques and significant inputs used in determining the fair values of financial instruments classified as Level 3 of
the fair value hierarchy are as follows:
Securities and other assets for which market quotes are not readily available, or are not reliable, are valued at fair value as
determined in good faith by RIFUS and are categorized as Level 3 of the fair value hierarchy. Market quotes are considered not
readily available in circumstances where there is an absence of current or reliable market-based data (e.g., trade information or
broker quotes). When RIFUS applies fair valuation methods that use significant unobservable inputs to determine a Fund’s NAV,
securities will not be priced on the basis of quotes from the primary market in which they are traded, but instead may be priced by
another method that RIFUS believes accurately reflects fair value and will be categorized as Level 3 of the fair value hierarchy. Fair
value pricing may require subjective determinations about the value of a security. While the securities valuation procedures are
intended to result in a calculation of a Fund’s NAV that fairly reflects security values as of the time of pricing, the process cannot
guarantee that fair values determined by RIFUS would accurately reflect the price that a Fund could obtain for a security if it were
to dispose of that security as of the time of pricing (for instance, in a forced or distressed sale). The prices used by a Fund may differ
from the value that would be realized if the security was sold.
RIFUS employs third party pricing vendors to provide fair value measurements. RIFUS oversees third-party pricing service
providers in order to support the valuation process throughout the year.
If third party evaluated vendor pricing is neither available nor deemed to be indicative of fair value, RIFUS may elect to obtain
indicative market quotations (“broker quotes”) directly from the broker or passed through from a third party vendor. In the event
that the source of fair value is from a single source broker quote, these securities are classified as Level 3 per the fair value
hierarchy. Broker quotes are typically received from established market participants. Although independently received on a daily
basis, RIFUS does not have the transparency to view the underlying inputs which support the broker quotes. Significant changes
in the broker quote would have direct and proportional changes in the fair value of the security. There is a third-party pricing
exception to the quantitative disclosure requirement when prices are not determined by the reporting entity. RIFUS is exercising
this exception and has made a reasonable attempt to obtain quantitative information from the third party pricing vendors regarding
the unobservable inputs used.
For fair valuations using significant unobservable inputs, U.S. GAAP requires a reconciliation of the beginning to ending balances
for reported fair values that present changes attributable to total realized and unrealized gains or losses, purchases and sales, and
transfers in/out of the Level 3 category during the period. Additionally, U.S. GAAP requires quantitative information regarding the
significant unobservable inputs used in the determination of fair value of assets categorized as Level 3 in the fair value hierarchy. In
accordance with the requirements of U.S. GAAP, a fair value hierarchy, a Level 3 reconciliation and an additional disclosure about
fair value measurements, if any, has been included in the Presentation of Portfolio Holdings for each respective Fund.
These significant unobservable inputs are further disclosed in the Presentation of Portfolio Holdings for each respective Fund as
applicable.
Investment Transactions
Investment transactions are reflected as of the trade date for financial reporting purposes. This may cause the NAV stated in the
financial statements to be different from the NAV at which shareholders may transact. Realized gains and losses from securities
transactions, if applicable, are recorded on the basis of specific identified cost incurred within a particular Fund or Underlying
Fund.
Notes to Financial Statements 257
Russell Investment Company
LifePoints® Funds
Notes to Financial Statements, continued — October 31, 2016
Investment Income
Distributions of income and capital gains from the Target Portfolio Funds or Underlying Funds are recorded on the ex-dividend
date.
Federal Income Taxes
Since the Investment Company is a Massachusetts business trust, each Fund is a separate corporate taxpayer and determines its
net investment income and capital gains (or losses) and the amounts to be distributed to each Fund’s shareholders without regard
to the income and capital gains (or losses) of the other Funds.
For each year, each Fund intends to qualify or continue to qualify as a regulated investment company under Subchapter M of the
Internal Revenue Code of 1986, as amended (the “Code”) and intends to distribute all of its taxable income and capital gains.
Therefore, no federal income tax provision is required for the Funds.
Each Fund files a U.S. tax return. At October 31, 2016, the Funds had recorded no liabilities for net unrecognized tax benefits
relating to uncertain income tax positions they have taken or expect to take in future tax returns. While the statute of limitations
remains open to examine the Funds’ U.S. tax returns filed for the fiscal years ended October 31, 2013 through October 31, 2015,
no examinations are in progress or anticipated at this time. The Funds are not aware of any tax positions for which it is reasonably
possible that the total amounts of unrecognized tax benefits will significantly change in the next twelve months.
The Funds comply with the authoritative guidance for uncertainty in income taxes which requires management to determine whether
a tax position of the Funds is more likely than not to be sustained upon examination, including resolution of any related appeals or
litigation processes, based on the technical merits of the position. For tax positions meeting the more likely than not threshold, the
tax amount recognized in the financial statements is reduced by the largest benefit that has a greater than 50% likelihood of being
realized upon ultimate settlement with the relevant taxing authority. Management determined that no accruals need to be made in
the financial statements due to uncertain tax positions. Management continually reviews and adjusts the Funds’ liability for income
taxes based on analyses of tax laws and regulations, as well as their interpretations, and other relevant factors.
Dividends and Distributions to Shareholders
Income dividends, capital gain distributions and return of capital, if any, are recorded on the ex-dividend date. Income dividends
are generally declared and paid quarterly. Capital gain distributions are generally declared and paid annually. An additional
distribution may be paid by the Funds to avoid imposition of federal income and excise tax on any remaining undistributed capital
gains and net investment income.
The timing and characterization of certain income and capital gain distributions are determined in accordance with federal tax
regulations which may differ from U.S. GAAP. As a result, net investment income and net realized gain (or loss) from investment
transactions for a reporting period may differ significantly from distributions during such period. The differences between tax
regulations and U.S. GAAP primarily relate to investments in options, futures, forward contracts, swap contracts, the Underlying
Funds sold at a loss, wash sale deferrals and capital loss carryforwards. Accordingly, the Funds may periodically make reclassifications
among certain of their capital accounts without impacting their NAVs.
Expenses
Expenses included in the accompanying financial statements reflect the expenses of each Fund and do not include those expenses
incurred by the Underlying Funds. Because the Underlying Funds have varied expense and fee levels and the Funds may own
different proportions of the Underlying Funds at different times, the amount of the Underlying Funds’ fees and expenses incurred
indirectly by the Funds will vary.
The Funds pay their own expenses other than those expressly assumed by RIM, the Funds’ adviser, or RIFUS. Most expenses can
be directly attributed to the individual Funds. Expenses which cannot be directly attributed to a specific Fund are allocated among
all Funds principally based on their relative net assets.
Derivatives
The Target Portfolio Funds may invest in derivatives. Derivatives are instruments or agreements whose value is derived from an
underlying security or index. They include options, futures, swaps and forwards. These instruments offer unique characteristics and
risks that facilitate the Funds’ investment strategies.
258 Notes to Financial Statements
Russell Investment Company
LifePoints® Funds
Notes to Financial Statements, continued — October 31, 2016
The Target Portfolio Funds typically use derivatives in three ways: exposing cash to markets, hedging and return enhancement. In
addition, the Target Portfolio Funds may enter into foreign exchange contracts for trade settlement purposes. The Target Portfolio
Funds may pursue their strategy of being fully invested by exposing cash to the performance of segments of the global equity market
by purchasing index futures contracts. This is intended to cause the Funds to perform as though cash were actually invested in the
global equity market.
Hedging may be used by the Funds to limit or control risks, such as adverse movements in exchange rates and interest rates. Return
enhancement can be accomplished through the use of derivatives in a Fund, including using derivatives as a substitute for holding
physical securities, and using them to express various macro views (e.g., interest rate movements, currency movements, and macro
credit strategies). By purchasing certain instruments, the Funds may more effectively achieve the desired portfolio characteristics
that assist them in meeting their investment objectives. Depending on how the derivatives are structured and utilized, the risks
associated with them may vary widely. These risks include, but are not limited to, market risk, liquidity risk, leveraging risk,
counterparty risk, basis risk, reinvestment risk, political risk, prepayment risk, extension risk, valuation risk and credit risk.
Futures, certain options and cleared swaps are traded or cleared on an exchange or central exchange clearing house. Exchange-
traded or exchange-cleared transactions generally present less counterparty risk to a Fund. The exchange’s clearing house stands
between the Fund and the broker to the contract and therefore, credit risk is generally limited to the failure of the clearing
house and the clearing member. Cleared swap contracts are subject to clearing house rules, including initial and variation margin
requirement, daily settlement of obligations and the clearing house guarantee of payments to the broker. There is, however, still
counterparty risk due to the insolvency of the broker with respect to any margin held in the brokers’ customer accounts. While
clearing members are required to segregate customer assets from their own assets, in the event of insolvency, there may be a
shortfall in the amount of margin held by the broker for its clients. Collateral and margin requirements for exchange-traded or
exchange-cleared derivatives are established through regulation, as well as set by the broker or applicable clearing house. Margin
for exchange-traded and exchange-cleared transactions are detailed in the Statements of Assets and Liabilities as cash held at the
broker for futures contracts and cash held at the broker for swap contracts, respectively. Securities pledged by a Fund for exchange-
traded and exchange-cleared transactions are noted as collateral or margin requirements in the Schedule of Investments. Typically,
the Funds and counterparties are not permitted to sell, repledge, rehypotecate or otherwise use collateral pledged by the other party
unless explicitly permitted by each respective governing agreement.
In December 2015, the SEC proposed new regulations applicable to a mutual fund's use of derivatives. If adopted as proposed, these
regulations could potentially limit or impact a Fund's ability to invest in derivatives and negatively affect the Fund's performance
and ability to pursue its stated investment objectives.
The effects of derivative instruments, categorized by risk exposure, on the Statements of Assets and Liabilities and the Statements
of Operations, for the period ended October 31, 2016, if applicable, are disclosed in the Fair Value of Derivative Instruments table
following each applicable Fund’s Schedule of Investments.
Foreign Currency Exchange Contracts
The Target Portfolio Funds may enter into foreign currency exchange spot contracts and forward foreign currency exchange contracts
(“FX contracts”). From time to time, the Target Portfolio Funds may enter into FX contracts to hedge certain foreign currency-
denominated assets. FX contracts are recorded at fair value. Certain risks may arise upon entering into these FX contracts from the
potential inability of counterparties to meet the terms of their FX contracts and are generally limited to the amount of unrealized
gain on the FX contracts, if any, that are disclosed in the Statements of Assets and Liabilities.
For the period ended October 31, 2016, the following Funds entered into foreign currency exchange contracts primarily for the
strategies listed below:
| Funds | Strategies |
| Conservative Strategy Fund | Return enhancement and hedging |
| Moderate Strategy Fund | Return enhancement and hedging |
| Balanced Strategy Fund | Return enhancement and hedging |
| Growth Strategy Fund | Return enhancement and hedging |
| Equity Growth Strategy Fund | Return enhancement and hedging |
The Target Portfolio Funds’ foreign currency contract notional dollar values outstanding fluctuate throughout the fiscal year as
required to meet strategic requirements. The following tables illustrate the quarterly volume of foreign currency contracts. For the
purpose of this disclosure, volume is measured by the amounts bought and sold in USD.
Notes to Financial Statements 259
Russell Investment Company
LifePoints® Funds
Notes to Financial Statements, continued — October 31, 2016
| Outstanding Contract Amounts Sold | ||||||||||||
| Quarter Ended | January 31, 2016 | April 30, 2016 | July 31, 2016 | October 31, 2016 | ||||||||
| Conservative Strategy Fund | $ | 33,834,755 | $ | 32,412,751 | $ | 30,678,936 | $ | 32,322,853 | ||||
| Moderate Strategy Fund | 81,912,492 | 80,408,693 | 72,998,467 | 114,413,494 | ||||||||
| Balanced Strategy Fund | 664,693,791 | 740,636,178 | 532,101,445 | 629,079,606 | ||||||||
| Growth Strategy Fund | 374,166,288 | 357,568,805 | 340,070,126 | 440,017,180 | ||||||||
| Equity Growth Strategy Fund | 179,013,420 | 169,767,159 | 162,987,895 | 190,774,974 | ||||||||
| Outstanding Contract Amounts Bought | ||||||||||||
| Quarter Ended | January 31, 2016 | April 30, 2016 | July 31, 2016 | October 31, 2016 | ||||||||
| Conservative Strategy Fund | $ | 34,036,814 | $ | 32,241,011 | $ | 30,680,677 | $ | 32,736,631 | ||||
| Moderate Strategy Fund | 82,709,236 | 79,608,596 | 72,933,396 | 115,263,815 | ||||||||
| Balanced Strategy Fund | 671,104,671 | 734,588,888 | 531,410,198 | 636,491,837 | ||||||||
| Growth Strategy Fund | 377,512,405 | 354,710,594 | 339,041,946 | 445,027,182 | ||||||||
| Equity Growth Strategy Fund | 180,574,906 | 168,545,292 | 162,410,104 | 192,444,756 | ||||||||
Options
The Target Portfolio Funds may purchase and sell (write) call and put options on securities and securities indices. Such options are
traded on a national securities exchange or in an OTC market. The Funds may also purchase and sell (write) call and put options
on foreign currencies.
When a Fund writes a covered call or a put option, an amount equal to the premium received by the Fund is included in the Fund’s
Statement of Assets and Liabilities as an asset and as an equivalent liability. The amount of the liability is subsequently marked-
to-market to reflect the current fair value of the option written. The Fund receives a premium on the sale of a call option but gives
up the opportunity to profit from any increase in the value of the underlying instrument above the exercise price of the option, and
when the Fund writes a put option it is exposed to a decline in the price of the underlying instrument.
When a Fund sells an uncovered call option, it does not simultaneously have a long position in the underlying security. When a
Fund sells an uncovered put option, it does not simultaneously have a short position in the underlying security. Uncovered options
are riskier than covered options because there is no underlying security held by the Fund that can act as a partial hedge.
Whether an option which the Fund has written expires on its stipulated expiration date or the Fund enters into a closing purchase
transaction, the Fund realizes a gain (or loss, if the cost of a closing purchase transaction exceeds the premium received when the
option was sold) without regard to any unrealized gain or loss on the underlying security, and the liability related to such option is
extinguished. If a call option which the Fund has written is exercised, the Fund realizes a capital gain or loss from the sale of the
underlying security, and the proceeds from such sale are increased by the premium originally received. When a put option which
a Fund has written is exercised, the amount of the premium originally received will reduce the cost of the security which a Fund
purchases upon exercise of the option.
The Funds’ use of written options involves, to varying degrees, elements of market risk in excess of the amount recognized in the
Statements of Assets and Liabilities. The face or contract amounts of these instruments reflect the extent of the Funds’ exposure to
market risk. The risks may be caused by an imperfect correlation between movements in the price of the instrument and the price
of the underlying securities and interest rates.
The Target Portfolio Funds may enter into a swaption (an option on a swap). In a swaption, in exchange for an option, the buyer gains
the right but not the obligation to enter into a specified swap agreement with the issuer on a specified future date. The writer of the
contract receives the premium and bears the risk of unfavorable changes in the preset rate on the underlying swap.
For the period ended October 31, 2016, the Target Portfolio Funds purchased or sold options primarily for the strategies listed
below:
260 Notes to Financial Statements
Russell Investment Company
LifePoints® Funds
Notes to Financial Statements, continued — October 31, 2016
| Funds | Strategies |
| Conservative Strategy Fund | Return enhancement and hedging |
| Moderate Strategy Fund | Return enhancement and hedging |
| Balanced Strategy Fund | Return enhancement and hedging |
| Growth Strategy Fund | Return enhancement and hedging |
| Equity Growth Strategy Fund | Return enhancement and hedging |
The Target Portfolio Funds’ options contracts notional amounts fluctuate throughout the fiscal year as required to meet strategic
requirements. The following table illustrates the quarterly activity of options contracts measured by notional in USD.
| Notional of Options Contracts Opened or Closed | |||||||||||||
| Funds | January 31, 2016 | April 30, 2016 | July 31, 2016 | October 31, 2016 | |||||||||
| Conservative Strategy Fund | Opened | $ | 25,030,298 | $ | — | $ | — | $ | — | ||||
| Closed | — | 26,146,533 | — | — | |||||||||
| Moderate Strategy Fund | Opened | 102,444,974 | 36,671,344 | 10,147,840 | — | ||||||||
| Closed | 61,766,868 | 42,492,160 | 36,671,344 | 10,071,094 | |||||||||
| Balanced Strategy Fund | Opened | 547,199,969 | 451,555,021 | 468,795,303 | 610,492,350 | ||||||||
| Closed | 374,155,452 | 362,117,637 | 270,198,881 | 584,547,096 | |||||||||
| Growth Strategy Fund | Opened | 400,630,620 | 408,750,857 | 406,403,014 | 513,481,463 | ||||||||
| Closed | 291,106,292 | 285,768,603 | 237,390,859 | 497,813,828 | |||||||||
| Equity Growth Strategy Fund | Opened | 202,076,926 | 108,080,358 | 29,792,680 | 123,748,046 | ||||||||
| Closed | 157,022,389 | 47,063,760 | 108,080,358 | 79,066,597 | |||||||||
Futures Contracts
The Target Portfolio Funds may invest in futures contracts. The face or contract value of these instruments reflect the extent of the
Funds’ exposure to off balance sheet risk. The primary risks associated with the use of futures contracts are an imperfect correlation
between the change in fair value of the securities held by the Funds and the prices of futures contracts, and the possibility of an
illiquid market. Upon entering into a futures contract, the Funds are required to deposit with a broker an amount, termed the initial
margin, which typically represents 5% to 10% of the purchase price indicated in the futures contract. Payments to and from the
broker, known as variation margin, are typically required to be made on a daily basis as the price of the futures contract fluctuates.
Changes in initial settlement value are accounted for as unrealized appreciation (depreciation) until the contracts are terminated,
at which time realized gains and losses are recognized.
For the period ended October 31, 2016, the following Funds entered into futures contracts primarily for the strategies listed below:
| Funds | Strategies |
| Conservative Strategy Fund | Return enhancement, hedging, and exposing cash to markets |
| Moderate Strategy Fund | Return enhancement, hedging, and exposing cash to markets |
| Balanced Strategy Fund | Return enhancement, hedging, and exposing cash to markets |
| Growth Strategy Fund | Return enhancement, hedging, and exposing cash to markets |
| Equity Growth Strategy Fund | Return enhancement, hedging, and exposing cash to markets |
The Target Portfolio Funds’ futures contracts notional amounts fluctuate throughout the fiscal year as required to meet strategic
requirements. The following table illustrates the quarterly activity of futures contracts measured by notional in USD.
| Notional of Futures Contracts Opened or Closed | |||||||||||||
| Funds | January 31, 2016 | April 30, 2016 | July 31, 2016 | October 31, 2016 | |||||||||
| Conservative Strategy Fund | Opened | $ | 9,002,516 | $ | 15,923,875 | $ | 17,685,433 | $ | 22,338,324 | ||||
| Closed | 7,611,001 | 8,519,761 | 16,714,846 | 21,796,435 | |||||||||
| Moderate Strategy Fund | Opened | 79,840,052 | 79,525,167 | 80,517,604 | 255,911,439 | ||||||||
| Closed | 69,444,002 | 67,805,610 | 78,088,317 | 216,572,605 | |||||||||
Notes to Financial Statements 261
Russell Investment Company
LifePoints® Funds
Notes to Financial Statements, continued — October 31, 2016
| Notional of Futures Contracts Opened or Closed | ||||||||||
| Balanced Strategy Fund | Opened | 460,138,827 | 437,945,615 | 438,014,318 | 810,641,813 | |||||
| Closed | 419,153,434 | 422,611,583 | 433,539,598 | 705,032,301 | ||||||
| Growth Strategy Fund | Opened | 335,817,508 | 270,494,227 | 258,077,801 | 739,749,704 | |||||
| Closed | 289,998,378 | 319,216,522 | 253,845,691 | 575,014,098 | ||||||
| Equity Growth Strategy Fund | Opened | 136,023,614 | 105,936,312 | 116,082,895 | 303,746,761 | |||||
| Closed | 118,407,168 | 128,824,518 | 107,598,648 | 251,636,655 | ||||||
Swap Agreements
The Target Portfolio Funds may enter into swap agreements, on either an asset-based or liability-based basis, depending on whether
they are hedging their assets or their liabilities, and will usually enter into swaps on a net basis (i.e., the two payment streams
are netted out, with the Funds receiving or paying only the net amount of the two payments). When a Fund engages in a swap, it
exchanges its obligations to pay or rights to receive payments for the obligations to pay or rights to receive payments of another party
(i.e., an exchange of floating rate payments for fixed rate payments).
The Target Portfolio Funds may enter into several different types of swap agreements including credit default, interest rate, total
return swaps and currency swaps. Credit default swaps are a counterparty agreement which allows the transfer of third party
credit risk (the possibility that an issuer will default on its obligation by failing to pay principal or interest in a timely manner)
from one party to another. The lender faces the credit risk from a third party and the counterparty in the swap agrees to insure this
risk in exchange for regular periodic payments. Interest rate swaps are a counterparty agreement, can be customized to meet each
party’s needs, and involve the exchange of a fixed or variable payment per period for a payment that is not fixed. Equity swaps are
a counterparty agreement where two parties exchange two sets of cash flows on predetermined dates for an agreed upon amount of
time. The cash flows will typically be an equity index value swapped with a floating rate such as LIBOR plus or minus a predefined
spread. Index swap agreements are a counterparty agreement intended to expose cash to markets or to effect investment transactions
consistent with those Funds’ investment objectives and strategies. Currency swaps are a counterparty agreement where two parties
exchange specified amounts of different currencies which are followed by each paying the other a series of interest payments that
are based on the principal cash flow. At maturity the principal amounts are returned.
The Funds generally expect to enter into these transactions primarily to preserve a return or spread on a particular investment or
portion of their portfolios or to protect against any increase in the price of securities they anticipate purchasing at a later date, or for
return enhancement. Under most swap agreements entered into by a Fund, the parties' obligations are determined on a "net basis".
The net amount of the excess, if any, of the Funds’ obligations over their entitlements with respect to each swap will be accrued on a
daily basis and an amount of cash or liquid assets having an aggregate NAV at least equal to the accrued excess will be segregated.
To the extent that the Funds enter into swaps on other than a net basis, the amount maintained in a segregated account will be the
full amount of the Funds’ obligations, if any, with respect to such swaps, accrued on a daily basis. If there is a default by the other
party to such a transaction, the Funds will have contractual remedies pursuant to the agreement related to the transaction.
A Fund may not receive the expected amount under a swap agreement if the other party to the agreement defaults or becomes
bankrupt.
Credit Default Swaps
The Target Portfolio Funds may enter into credit default swaps. A credit default swap can refer to corporate issues, government
issues, asset-backed securities or an index of assets, each known as the reference entity or underlying asset. Funds may act as
either the buyer or the seller of a credit default swap involving one party making a stream of payments to another party in exchange
for the right to receive a specified return in the event of a default or other credit event. Depending upon the terms of the contract,
the credit default swap may be closed via physical settlement. However, due to the possible or potential instability in the market,
there is a risk that the Funds may be unable to deliver the underlying debt security to the other party to the agreement. Additionally,
the Funds may not receive the expected amount under the swap agreement if the other party to the agreement defaults or becomes
bankrupt. In an unhedged credit default swap, Funds enter into a credit default swap without owning the underlying asset or debt
issued by the reference entity. Credit default swaps allow Funds to acquire or reduce credit exposure to a particular issuer, asset
or basket of instruments.
262 Notes to Financial Statements
Russell Investment Company
LifePoints® Funds
Notes to Financial Statements, continued — October 31, 2016
As the seller of protection in a credit default swap, a Fund would be required to pay the par or other agreed-upon value (or otherwise
perform according to the swap contract) of a reference debt obligation to the counterparty in the event of a default (or other specified
credit event) and the counterparty would be required to surrender the reference debt obligation. In return, the Fund would receive
from the counterparty a periodic stream of payments over the term of the contract provided that no credit event has occurred. If no
credit event occurs, the Fund would keep the stream of payments and would have no payment obligations. As a seller of protection,
the Fund would effectively add leverage to its portfolio because, in addition to its total net assets, that Fund would be subject to
investment exposure on the notional amount of the swap.
The Target Portfolio Funds may also purchase protection via credit default swap contracts in order to offset the risk of default of
debt securities held their portfolios or to take a short position in a debt security, in which case the Fund would function as the
counterparty referenced in the preceding paragraph.
If a credit event occurs and cash settlement is not elected, a variety of other deliverable obligations may be delivered in lieu of
the specific referenced obligation. The ability to deliver other obligations may result in a cheapest-to-deliver option (the buyer of
protection’s right to choose the deliverable obligation with the lowest value following a credit event). The Target Portfolio Funds may
use credit default swaps to provide a measure of protection against defaults of the issuers (i.e., to reduce risk where Funds own or
have exposure to the referenced obligation) or to take an active long or short position with respect to the likelihood (as measured by
the credit default swap’s spread) of a particular issuer’s default.
Deliverable obligations for credit default swaps on asset-backed securities in most instances are limited to the specific referenced
obligation as performance for asset-backed securities can vary across deals. Prepayments, principal paydowns, and other writedown
or loss events on the underlying mortgage loans will reduce the outstanding principal balance of the referenced obligation. These
reductions may be temporary or permanent as defined under the terms of the swap agreement and the notional amount for the swap
agreement generally will be adjusted by corresponding amounts. The Target Portfolio Funds may use credit default swaps on asset-
backed securities to provide a measure of protection against defaults (or other defined credit events) of the referenced obligation
or to take an active long or short position with respect to the likelihood of a particular referenced obligation’s default (or another
defined credit event).
Credit default swap agreements on credit indices involve one party making a stream of payments to another party in exchange for
the right to receive a specified return in the event of a write-down, principal shortfall, interest shortfall or default of all or part of
the referenced entities comprising the credit index. A credit index is a basket of credit instruments or exposures designed to be
representative of some part of the credit market as a whole. These indices are made up of reference credits that are judged by a
poll of dealers to be the most liquid entities in the credit default swap market based on the sector of the index. Components of the
indices may include, but are not limited to, investment grade securities, high yield securities, asset-backed securities, emerging
markets, and/or various credit ratings within each sector. Credit indices are traded using credit default swaps with standardized
terms including a fixed spread and standard maturity dates. An index credit default swap references all the names in the index, and
if there is a default, the credit event is settled based on that name’s weight in the index. The composition of the indices changes
periodically, usually every six months, and, for most indices, each name has an equal weight in the index. Traders may use credit
default swaps on indices to speculate on changes in credit quality.
Implied credit spreads, represented in absolute terms, utilized in determining the fair value of credit default swap agreements on
corporate issues as of period-end are disclosed in the Schedules of Investments and generally serve as an indicator of the current
status of the payment/performance risk and represent the likelihood or risk of default (or other defined credit event) for the credit
derivative. The implied credit spread of a particular referenced entity reflects the cost of entering into a credit default swap and
may include upfront payments required to be made to enter into the agreement. For credit default swap agreements on asset-
backed securities and credit indices, the quoted market prices and resulting values serve as the indicator of the current status of
the payment/performance risk. Wider credit spreads and increasing fair values, in absolute terms when compared to the notional
amount of the swap, generally represent a deterioration of the referenced entity’s credit soundness and a greater likelihood or risk
of default or other credit event occurring as defined under the terms of the agreement. The maximum potential amount of future
payments (undiscounted) that Funds as a seller of protection could be required to make under a credit default swap agreement
equals the notional amount of the agreement. Notional amounts of all credit default swap agreements outstanding as of October 31,
2016, for which a Fund is the seller of protection are disclosed in the Schedules of Investments. These potential amounts would be
partially offset by any recovery values of the respective referenced obligations, upfront payments received upon entering into the
agreement, or net amounts received from the settlement of buy protection credit default swap agreements entered into by a Fund for
the same referenced entity or entities.
Notes to Financial Statements 263
Russell Investment Company
LifePoints® Funds
Notes to Financial Statements, continued — October 31, 2016
Client default swaps could result in losses if the Funds do not correctly evaluate the creditworthiness of the company or companies
on which the credit default swap is based. Credit default swap agreements may involve greater risks than if the Funds had invested
in the reference obligation directly since, in addition to risks relating to the reference obligation, credit default swaps are subject
to illiquidity and counterparty risk. A Fund will generally incur a greater degree of risk when it sells a credit default swap than
when it purchases a credit default swap. As a buyer of a credit default swap, a Fund may lose its investment and recover nothing
should a credit event fail to occur and the swap is held to its termination date. As seller of a credit default swap, if a credit event
were to occur, the value of any deliverable obligation received by a Fund, coupled with the upfront or periodic payments previously
received, may be less than what it pays to the buyer, resulting in a loss of value to the Fund.
If the creditworthiness of a Fund’s swap counterparty declines, the risk that the counterparty may not perform could increase,
potentially resulting in a loss to the Fund. To limit the counterparty risk involved in swap agreements, the Funds will only enter
into swap agreements with counterparties that meet certain standards of creditworthiness. Although there can be no assurance that
the Funds will be able to do so, the Funds may be able to reduce or eliminate their exposure under a swap agreement either by
assignment or other disposition, or by entering into an offsetting swap agreement with the same party or another creditworthy party.
The Funds may have limited ability to eliminate their exposure under a credit default swap if the credit quality of the reference
entity or underlying asset has declined.
For the period ended October 31, 2016, the Funds entered into credit default swaps primarily for the strategies listed below:
| Funds | Strategies |
| Moderate Strategy Fund | Return enhancement, hedging, and exposing cash markets |
| Balanced Strategy Fund | Return enhancement, hedging, and exposing cash markets |
| Growth Strategy Fund | Return enhancement, hedging, and exposing cash markets |
| Equity Growth Strategy Fund | Return enhancement, hedging, and exposing cash markets |
The Target Portfolio Funds’ period end credit default swap contract notional amounts outstanding fluctuate throughout the fiscal
year as required to meet strategic requirements. The following table illustrates the quarterly activity of credit default swap contracts.
For the purpose of this disclosure, the volume is measured by notional amounts outstanding at each quarter end.
| Credit Default Swap Notional Amounts Outstanding | ||||||||||||
| Quarter Ended | January 31, 2016 | April 30, 2016 | July 31, 2016 | October 31, 2016 | ||||||||
| Moderate Strategy Fund | $ | 10,300,000 | $ | 54,300,000 | $ | 54,300,000 | $ | 39,300,000 | ||||
| Balanced Strategy Fund | 50,900,000 | 176,300,000 | 176,300,000 | 217,300,000 | ||||||||
| Growth Strategy Fund | — | — | — | 67,500,000 | ||||||||
| Equity Growth Strategy Fund | — | — | — | 1,000,000 | ||||||||
Total Return Swaps
The Target Portfolio Funds may enter into index swap agreements to expose cash to markets or to effect investment transactions.
Index swap agreements are two party contracts entered into primarily by institutional investors for periods ranging from a few weeks
to more than one year. In a standard index swap transaction, the two parties agree to exchange the returns (or differentials in rates
of return) earned or realized on particular investments or instruments.
The returns to be exchanged between the parties are calculated with respect to a “notional amount” (i.e., a specified dollar amount
that is hypothetically invested in a “basket” of securities representing a particular index).
For the period ended October 31, 2016, the Funds entered into total return swaps primarily for the strategies listed below:
| Funds | Strategies |
| Moderate Strategy Fund | Return enhancement and hedging |
| Balanced Strategy Fund | Return enhancement and hedging |
| Growth Strategy Fund | Return enhancement and hedging |
| Equity Growth Strategy Fund | Return enhancement and hedging |
The Target Portfolio Funds’ period end total return swap contract notional amounts outstanding fluctuate throughout the fiscal year
as required to meet strategic requirements. The following table illustrates the quarterly volume of total return swap contracts. For
the purpose of this disclosure, the volume is measured by notional amounts outstanding at each quarter end.
264 Notes to Financial Statements
Russell Investment Company
LifePoints® Funds
Notes to Financial Statements, continued — October 31, 2016
| Total Return Swap Notional Amounts Outstanding | ||||||||||||
| Quarter Ended | January 31, 2016 | April 30, 2016 | July 31, 2016 | October 31, 2016 | ||||||||
| Moderate Strategy Fund | $ | 7,344,390 | $ | 7,365,648 | $ | 7,952,437 | $ | 6,935,488 | ||||
| Balanced Strategy Fund | 32,402,483 | 32,496,267 | 35,085,105 | 14,019,151 | ||||||||
| Growth Strategy Fund | 60,917,344 | 61,093,660 | 65,960,730 | 35,752,569 | ||||||||
| Equity Growth Strategy Fund | 24,949,633 | 25,021,846 | 27,015,229 | 17,996,892 | ||||||||
Master Agreements
Certain Target Portfolio Funds are parties to International Swaps and Derivatives Association, Inc. Master Agreements (“ISDA
Master Agreements”) with counterparties that govern transactions in OTC derivative and foreign exchange contracts entered into
by the Funds and those counterparties. The ISDA Master Agreements contain provisions for general obligations, representations,
agreements, collateral and events of default or termination. Events of termination and default include conditions that may entitle
either party to elect to terminate early and cause settlement of all outstanding transactions under the applicable ISDA Master
Agreement. Any election to terminate early could be material to the financial statements. Since different types of forward and OTC
financial derivative transactions have different mechanics and are sometimes traded out of different legal entities of a particular
counterparty organization, each type of transaction may be covered by a different ISDA Master Agreement, resulting in the need
for multiple agreements with a single counterparty. As the ISDA Master Agreements are specific to unique operations of different
asset types, they allow a Fund to net its total exposure to a counterparty in the event of a default with respect to all the transactions
governed under a single agreement with a counterparty.
Master Repurchase Agreements (“Master Repo Agreements”) govern transactions between a Fund and select counterparties.
The Master Repo Agreements maintain provisions for, among other things, initiation, income payments, events of default, and
maintenance of collateral for repurchase and reverse repurchase agreements.
Master Securities Forward Transaction Agreements (“Master Forward Agreements”) govern the considerations and factors
surrounding the settlement of certain forward settling transactions, such as delayed delivery by and between a Fund and select
counterparties. The Master Forward Agreements maintain provisions for, among other things, initiation and confirmation, payment
and transfer, events of default, termination, and maintenance of collateral.
Disclosure about Offsetting Assets and Liabilities
Balance sheet disclosure is based on various netting agreements between brokers and counterparties, such as ISDA Master
Agreements, Master Repo Agreements and Master Forward Agreements. Certain Target Portfolio Funds utilized multiple
counterparties. The quantitative disclosure begins with disaggregation of counterparties by legal entity and the roll up of the data
to reflect a single counterparty in the table within the Funds’ financial statements. Net exposure represents the net receivable
(payable) that would be due from/to the counterparty in the event of default. Exposure from OTC derivatives can only be netted
across transactions governed under the same Master Agreement with the same legal entity.
Class Allocation
Each of the Funds presented herein may offer certain of the following classes of shares: Class A, Class C, Class E, Class R1, Class
R4, Class R5 and Class S. All share classes have identical voting, dividend, liquidation and other rights, preferences, powers,
restrictions, limitations, qualifications and the same terms and conditions. The separate classes of shares differ principally in the
applicable sales charges, distribution fees and shareholder servicing fees. Shareholders of each class bear certain expenses that
pertain to that particular class. Realized and unrealized gains (losses), investment income, and expenses with the exception of class
level expenses, are allocated daily to each class of shares based upon the relative proportion of net assets of each class.
Guarantees
In the normal course of business, the Funds enter into contracts that contain a variety of representations which provide general
indemnifications. The Funds’ maximum exposure under these arrangements is unknown as this would involve future claims that
may be made against the Funds that have not yet occurred. However, the Funds expect the risk of loss to be remote.
Notes to Financial Statements 265
Russell Investment Company
LifePoints® Funds
Notes to Financial Statements, continued — October 31, 2016
Market, Credit and Counterparty Risk
In the normal course of business, the Funds and Underlying Funds trade financial instruments and enter into financial transactions
where risk of potential loss exists due to changes in the market (market risk) or failure of the other party to a transaction to perform
(credit risk). Similar to credit risk, the Funds and Underlying Funds may also be exposed to counterparty risk or risk that an
institution or other entity with which the Funds or Underlying Funds have unsettled or open transactions will default. The potential
loss could exceed the value of the relevant assets recorded in the Funds' and Underlying Funds' financial statements (the “Assets”).
The Assets consist principally of cash due from counterparties and investments. The extent of the Funds' and Underlying Funds'
exposure to market, credit and counterparty risks with respect to the Assets approximates their carrying value as recorded in the
Funds' and Underlying Funds' Statements of Assets and Liabilities.
Global economies and financial markets are becoming increasingly interconnected and political and economic conditions (including
recent instability and volatility) and events (including natural disasters) in one country, region or financial market may adversely
impact issuers in a different country, region or financial market. As a result, issuers of securities held by a Fund or Underlying
Fund may experience significant declines in the value of their assets and even cease operations. Such conditions and/or events may
not have the same impact on all types of securities and may expose a Fund or an Underlying Fund to greater market and liquidity
risk and potential difficulty in valuing portfolio instruments held. This could cause a Fund or an Underlying Fund to underperform
other types of Liabilities.
3. Investment Transactions
Securities
During the period ended October 31, 2016, purchases and sales of investment securities (excluding short-term investments, options
and futures) were as follows:
| Purchases | Sales | |||||
| Conservative Strategy Fund | $ | 64,812,422 | $ | 144,077,740 | ||
| Moderate Strategy Fund | 198,757,748 | 316,847,931 | ||||
| Balanced Strategy Fund | 407,297,346 | 900,917,069 | ||||
| Growth Strategy Fund | 222,878,372 | 487,162,934 | ||||
| Equity Growth Strategy Fund | 106,653,942 | 202,715,536 | ||||
| 2020 Strategy Fund | 17,217,646 | 31,001,195 | ||||
| 2025 Strategy Fund | 7,576,106 | 11,417,056 | ||||
| 2030 Strategy Fund | 18,243,952 | 33,185,833 | ||||
| 2035 Strategy Fund | 5,888,393 | 10,430,425 | ||||
| 2040 Strategy Fund | 15,246,328 | 38,202,170 | ||||
| 2045 Strategy Fund | 3,229,149 | 4,271,655 | ||||
| 2050 Strategy Fund | 5,986,454 | 6,251,763 | ||||
| 2055 Strategy Fund | 3,095,973 | 3,079,409 | ||||
| In Retirement Fund | 6,498,183 | 16,863,902 |
4. Related Party Transactions, Fees and Expenses
Adviser, Administrator, Transfer and Dividend Disbursing Agent
RIM provides or oversees the provision of all investment advisory and portfolio management services for the Funds, including
developing the investment program for each Fund and managing each Fund's overall exposures. RIFUS is the Funds' administrator
and transfer agent. RIFUS, in its capacity as the Funds' administrator, provides or oversees the provision of all administrative
services for the Funds. RIFUS, in its capacity as the Funds' transfer agent and dividend disbursing agent, is responsible for
providing transfer agency and dividend disbursing services to the Funds. RIM is an indirect, wholly-owned subsidiary of Russell
Investments Group, Ltd., a Cayman company.
The Target Portfolio Funds are permitted to invest their cash (i.e., cash awaiting investment or cash held to meet redemption
requests or to pay expenses) in the Russell U.S. Cash Management Fund, an unregistered fund advised by RIM. As of October 31,
2016, the Target Portfolio Funds had invested $92,898,902 in the Russell U.S. Cash Management Fund.
266 Notes to Financial Statements
Russell Investment Company
LifePoints® Funds
Notes to Financial Statements, continued — October 31, 2016
An affiliated company is a company in which a Fund has ownership of at least 5% of the voting securities or which the Fund
controls, is controlled by or is under common control with. See each Fund’s Related Party Transactions, Fees and Expenses for
disclosure of transactions with affiliated companies.
Target Portfolio Funds
With respect to the Target Portfolio Funds, the advisory fee of 0.20% and administrative fee of up to 0.0425% are based upon the
average daily net assets of the Funds and are payable monthly. The following shows the total amount of each of these fees paid by
the Funds for the period ended October 31, 2016:
| Advisory | Administrative | |||||
| Conservative Strategy Fund | $ | 767,347 | $ | 163,061 | ||
| Moderate Strategy Fund | 1,246,926 | 264,972 | ||||
| Balanced Strategy Fund | 5,270,622 | 1,120,007 | ||||
| Growth Strategy Fund | 3,382,753 | 718,836 | ||||
| Equity Growth Strategy Fund | 1,395,264 | 296,495 |
RIFUS is paid a fee based upon the average daily net assets of the Funds for transfer agency and dividend disbursing services.
RIFUS retains a portion of this fee for its services provided to the Funds and pays the balance to unaffiliated agents who assist in
providing these services. The following shows the total amount of this fee paid by the Funds for the period ended October 31, 2016:
| Amount | |||
| Conservative Strategy Fund | $ | 767,347 | |
| Moderate Strategy Fund | 1,246,926 | ||
| Balanced Strategy Fund | 5,270,622 | ||
| Growth Strategy Fund | 3,382,753 | ||
| Equity Growth Strategy Fund | 1,395,264 |
Target Date Funds
For the 2020 Strategy, 2025 Strategy, 2030 Strategy, 2035 Strategy, 2040 Strategy, 2045 Strategy, 2050 Strategy, 2055 Strategy
and In Retirement Funds, RIM agreed to assume the responsibility of payment for all operating expenses other than Rule 12b-1
distribution fees, shareholder services fees, extraordinary expenses or the expenses of other investment companies in which the
Funds invest which are borne directly by the Funds.
Waivers and Reimbursements
Target Portfolio Funds
Until February 28, 2017, RIM has contractually agreed to waive up to the full amount of its 0.20% advisory fee and then reimburse
each Fund for other direct Fund-level expenses to the extent that direct Fund-level expenses exceed 0.12% of the average daily
net assets of the Fund on an annual basis. Direct Fund-level operating expenses do not include transfer agency fees, Rule 12b-
1 distribution fees, shareholder servicing fees, extraordinary expenses or the expenses of other investment companies in which
the Funds invest which are borne indirectly by the Funds. These waivers and reimbursements may not be terminated during the
relevant period except with Board approval.
For the Conservative Strategy Fund, RIFUS has contractually agreed, until February 28, 2017, to waive 0.15% of its transfer agency
fees for Class R1, R4 and R5 Shares and 0.02% of its transfer agency fees for Class A, C, E and S Shares. These waivers may not
be terminated during the relevant period except with Board approval.
For the Moderate Strategy Fund, RIFUS has contractually agreed, until February 28, 2017, to waive 0.08% of its transfer agency
fees for Class A, C, R1, R4 and R5 Shares. This waiver may not be terminated during the relevant period except with Board
approval.
Notes to Financial Statements 267
Russell Investment Company
LifePoints® Funds
Notes to Financial Statements, continued — October 31, 2016
For the Balanced Strategy Fund, RIFUS has contractually agreed, until February 28, 2017, to waive 0.06% of its transfer agency
fees for Class R1, R4 and R5 Shares and 0.13% of its transfer agency fees for Class A and C Shares. These waivers may not be
terminated during the relevant period except with Board approval.
For the Growth Strategy Fund, RIFUS has contractually agreed, until February 28, 2017, to waive 0.05% of its transfer agency fees
for Class R1, R4 and R5 Shares. This waiver may not be terminated during the relevant period except with Board approval.
For the Equity Growth Strategy Fund, RIFUS has contractually agreed, until February 28, 2017, to waive 0.08% of its transfer
agency fees for Class R1, R4 and R5 Shares. This waiver may not be terminated during the relevant period except with Board
approval.
As of October 31, 2016, RIM and RIFUS waived the following expenses:
| RIM Waiver | RIFUS Waiver | Total | |||||||
| Conservative Strategy Fund | $ | 749,438 | $ | 149,812 | $ | 899,250 | |||
| Moderate Strategy Fund | 1,093,757 | 402,752 | 1,496,509 | ||||||
| Balanced Strategy Fund | 3,972,666 | 2,587,155 | 6,559,821 | ||||||
| Growth Strategy Fund | 2,627,118 | 117,639 | 2,744,757 | ||||||
| Equity Growth Strategy Fund | 1,207,950 | 68,564 | 1,276,514 | ||||||
Distributor and Shareholder Servicing
Russell Investments Financial Services, LLC (the “Distributor”), a wholly owned subsidiary of RIM, is the distributor for the
Investment Company, pursuant to a distribution agreement with the Investment Company.
The Investment Company has distribution plans pursuant to Rule 12b-1 (the “Plans”) under the Investment Company Act. Under
the Plans, the Investment Company is authorized to make payments to the Distributor or any selling agents, as defined in the Plans,
for sales support services provided, and related expenses incurred which are primarily intended to result in the sale of the Class A,
Class C and Class R5 Shares subject to the Plans. The 12b-1 distribution payments shall not exceed 0.25% of the average daily net
assets of a Fund’s Class A or Class R5 Shares or 0.75% of the average daily net assets of a Fund’s Class C Shares on an annual basis.
Under the Plan for Class R4 and Class R5 Shares, the Funds may make payments to the Distributor or any servicing agent for any
activities or expenses primarily intended to assist, support or service the servicing agents’ clients who beneficially own Class R4
and Class R5 Shares of the Funds. The shareholder servicing payments shall not exceed 0.25% of the average daily net assets of a
Fund’s Class R4 and Class R5 Shares on an annual basis.
In addition, the Investment Company has adopted a Shareholder Services Plan under which the Funds may make payments to the
Distributor or any servicing agent for any activities or expenses primarily intended to assist, support or service the servicing agents’
clients who beneficially own Class C and Class E Shares of the Funds. The shareholder servicing payments shall not exceed 0.25%
of the average daily net assets of a Fund’s Class C and Class E Shares on an annual basis.
Pursuant to the rules of the Financial Industry Regulatory Authority (“FINRA”), the aggregate initial sales charges, deferred
sales charges and asset-based sales charges on Class A, Class C, Class E, Class R4 and Class R5 Shares of the Funds may not
exceed 7.25%, 6.25%, 6.25%, 6.25% and 6.25%, respectively, of total gross sales, subject to certain exclusions. These limitations
are imposed at the class level on each class of shares of each Fund rather than on a per shareholder basis. Therefore, long-term
shareholders of the Class A, Class C, Class E, Class R4 or Class R5 Shares may pay more than the economic equivalent of the
maximum sales charges permitted by FINRA.
For the period ended October 31, 2016, the Distributor retained the following amounts in sales charges:
| Contingent Deferred Sales Charges | Class A Shares | ||
| Conservative Strategy Fund | $ | 14,268 | |
| Moderate Strategy Fund | 3,170 | ||
| Balanced Strategy Fund | 8,075 | ||
| Growth Strategy Fund | 5,763 | ||
| Equity Growth Strategy Fund | 625 |
For the period ended October 31, 2016, the sales commissions paid to the selling agents for the sale of Class A Shares were as follows:
268 Notes to Financial Statements
Russell Investment Company
LifePoints® Funds
Notes to Financial Statements, continued — October 31, 2016
| Aggregate | Class A Front-End | |||||
| Front-End | Sales Charges | |||||
| Sales Charges | Retained by | |||||
| on Class A Shares | Distributor | |||||
| Conservative Strategy Fund | $ | 115,000 | $ | 20,350 | ||
| Moderate Strategy Fund | 217,616 | 36,392 | ||||
| Balanced Strategy Fund | 1,085,733 | 187,713 | ||||
| Growth Strategy Fund | 947,837 | 146,864 | ||||
| Equity Growth Strategy Fund | 314,135 | 50,333 | ||||
| 2030 Strategy Fund | 1,790 | 287 | ||||
Board of Trustees
The Russell Investments Fund Complex consists of RIC, which has 41 funds and Russell Investment Funds ("RIF"), which has 9
funds. Each of the Trustees is a Trustee of RIC and RIF. The Russell Investments Fund Complex compensates each Trustee who is
not an employee of RIM or its affiliates. The costs of paying Trustee compensation and expenses are allocated to each Fund based
on its net assets relative to other funds in the Russell Investments Fund Complex (see note 8).
For the period ended October 31, 2016, the total amount of regular and special compensation paid to the Trustees by the Funds was
$1,444,583 and $7,000, respectively.
5. Federal Income Taxes
At October 31, 2016, the following Funds had net tax basis capital loss carryforwards which may be applied against any net realized
taxable gains in each succeeding year or until their respective expiration dates, whichever occurs first. Available capital loss
carryforwards and expiration dates are as follows:
| No Expiration | ||||||||||
| 10/31/2018 | 10/31/2019 | Short Term | Long-Term | Totals | ||||||
| Equity Growth Strategy Fund | $ | 71,779,811 | $ | 19,352,964 | $ | — | $ | — | $ | 91,132,775 |
Under the Regulated Investment Company Modernization Act of 2010, the Funds will be permitted to carry forward capital losses
incurred in taxable years beginning after December 22, 2010 for an unlimited period. However, any losses incurred during those
future taxable years will be required to be utilized prior to the losses incurred in pre-enactment taxable years. As a result of
this ordering rule, pre-enactment capital loss carryforwards may be more likely to expire unused. Additionally, post-enactment
capital losses that are carried forward will retain their character as either short-term or long-term capital losses rather than being
considered all short-term as under previous law.
6. Record Ownership
As of October 31, 2016, the following table includes shareholders of record with greater than 10% of the total outstanding shares
of each respective Fund:
| # of Shareholders | % | |||||
| Conservative Strategy Fund | 3 | 58.8 | ||||
| Moderate Strategy Fund | 2 | 54.9 | ||||
| Balanced Strategy Fund | 3 | 62.4 | ||||
| Growth Strategy Fund | 3 | 63.5 | ||||
| Equity Growth Strategy Fund | 3 | 54.3 | ||||
| 2020 Strategy Fund | 4 | 63.0 | ||||
| 2025 Strategy Fund | 4 | 72.7 | ||||
| 2030 Strategy Fund | 3 | 56.0 | ||||
| 2035 Strategy Fund | 2 | 53.1 | ||||
Notes to Financial Statements 269
Russell Investment Company
LifePoints® Funds
Notes to Financial Statements, continued — October 31, 2016
| 2040 Strategy Fund | 3 | 57.1 | ||||
| 2045 Strategy Fund | 3 | 55.7 | ||||
| 2050 Strategy Fund | 4 | 64.9 | ||||
| 2055 Strategy Fund | 5 | 74.6 | ||||
| In Retirement Fund | 3 | 53.9 |
7. Pending Legal Proceedings
On October 17, 2013, Fred McClure filed a derivative lawsuit against RIM on behalf of ten RIC funds, some of which are Underlying
Funds in which the Funds invest: the Russell Commodity Strategies Fund, Russell Emerging Markets Fund, Russell Global
Equity Fund, Russell Global Infrastructure Fund, Russell Global Opportunistic Credit Fund, Russell International Developed
Markets Fund, Russell Multi-Strategy Alternative Fund (liquidated in 2016), Russell Strategic Bond Fund, Russell U.S. Small
Cap Equity Fund and Russell Global Real Estate Securities Fund. The lawsuit, which was filed in the United States District Court
for the District of Massachusetts, seeks recovery under Section 36(b) of the Investment Company Act, as amended, for the funds’
alleged payment of excessive investment management fees to RIM. On December 8, 2014, Fred McClure filed a second derivative
lawsuit in the United States District Court for the District of Massachusetts. This second suit involves the same ten funds, and the
allegations are similar, although the second suit adds a claim alleging that RIFUS charged the funds excessive administrative fees
under Section 36(b). The plaintiff seeks on behalf of the funds recovery of the amount of the allegedly excessive compensation or
payments received from these ten funds and earnings that would have accrued to plaintiff had that compensation not been paid or,
alternatively, rescission of the contracts and restitution of all excessive fees paid, for a period commencing one year prior to the
filing of the lawsuit through the date of the trial. RIM and RIFUS are defending the actions.
The Russell Strategic Bond Fund is one of several defendants in a bankruptcy adversary avoidance claim in a Consolidated
Multidistrict Action styled In Re: Motors Liquidation Company, et al., Debtors, Motors Liquidation Company Avoidance Action
Trust, etc., v. JPMorgan Chase Bank, et al., United States District Bankruptcy Court for the Southern District of New York. The
claim relates to alleged improper payments to the Fund as a participating lender in a term loan provided to General Motors
Company due to the Fund’s security interests not being properly perfected. The Fund has filed answers denying liability and a
crossclaim against the administrative agent for the term loan lenders seeking damages arising from the agent’s failure to properly
perfect the security interests of the lenders.
8. Custodian Fee Reimbursement
During the period ended October 31, 2016, several of the Funds and Underlying Funds received a reimbursement from State Street
Bank for overbilling of custody out-of-pocket fees from prior years. The table below provides a summary of actual custodian fees
for the current fiscal year prior to the reimbursement as well as the impact of the fee reimbursement to each Fund or Underlying
Funds’ custodian fee as presented in the Statement of Operations.
| Net Custodian Fees as | |||||||||
| Custodian Fees Before | disclosed in the Statement of | ||||||||
| Reimbursement | Fee Reimbursement | Operations | |||||||
| Conservative Strategy Fund | $ | 53,773 | $ | 23,429 | $ | 30,344 | |||
| Moderate Strategy Fund | 69,249 | 23,984 | 45,265 | ||||||
| Balanced Strategy Fund | 80,693 | 60,714 | 19,979 | ||||||
| Growth Strategy Fund | 76,787 | 39,840 | 36,947 | ||||||
| Equity Growth Strategy Fund | 69,770 | 26,312 | 43,458 | ||||||
9. Subsequent Events
Management has evaluated the events and/or transactions that have occurred through the date the financial statements were issued
and noted no items requiring adjustments of the financial statements or additional disclosure except the following:
270 Notes to Financial Statements
Russell Investment Company
LifePoints® Funds
Notes to Financial Statements, continued — October 31, 2016
On November 1, 2016, the Board declared dividends payable from net investment income. Dividends were paid on November 3,
2016, to shareholders of record on November 2, 2016.
On December 1, 2016, the Board declared dividends payable from net investment income. Dividends were paid on December 5,
2016, to shareholders of record on December 2, 2016.
Notes to Financial Statements 271
Report of Independent Registered Public Accounting Firm
To the Board of Trustees and Shareholders
of Russell Investment Company
In our opinion, the accompanying statements of assets and liabilities, including the schedules of investments, and the related statements
of operations and of changes in net assets and the financial highlights present fairly, in all material respects, the financial position of
Conservative Strategy Fund, Moderate Strategy Fund, Balanced Strategy Fund, Growth Strategy Fund, Equity Growth Strategy Fund,
2020 Strategy Fund, 2025 Strategy Fund, 2030 Strategy Fund, 2035 Strategy Fund, 2040 Strategy Fund, 2045 Strategy Fund, 2050
Strategy Fund, 2055 Strategy Fund and In Retirement Fund (fourteen of the portfolios constituting Russell Investment Company
LifePoints Funds, hereafter collectively referred to as the “Funds”) as of October 31, 2016, the results of each of their operations
for the year then ended, the changes in each of their net assets for each of the two years in the period then ended and the financial
highlights for each of the periods presented, in conformity with accounting principles generally accepted in the United States of
America. These financial statements and financial highlights (hereafter referred to as “financial statements”) are the responsibility
of the Funds’ management. Our responsibility is to express an opinion on these financial statements based on our audits. We
conducted our audits of these financial statements in accordance with the standards of the Public Company Accounting Oversight
Board (United States). Those standards require that we plan and perform the audit to obtain reasonable assurance about whether
the financial statements are free of material misstatement. An audit includes examining, on a test basis, evidence supporting the
amounts and disclosures in the financial statements, assessing the accounting principles used and significant estimates made by
management, and evaluating the overall financial statement presentation. We believe that our audits, which included confirmation
of securities as of October 31, 2016 by correspondence with brokers and transfer agents, provide a reasonable basis for our opinion.

Seattle, Washington
December 22, 2016
272 Report of Independent Registered Public Accounting Firm
Russell Investment Company
LifePoints® Funds
Tax Information— October 31, 2016 (Unaudited)
For the tax year ended October 31, 2016, the Funds hereby designate 100%, or the maximum amount allowable, of its net taxable income as
qualified dividends taxed at individual net capital gain rates.
For the tax year ended October 31, 2016, the Funds hereby designate under Section 871(k)(2)(c) of the Code, the maximum amount allowable
as a short term capital gain dividend for purposes of the tax imposed under Section 871(a)(1)(A) of the Code. This applies to nonresident alien
shareholders only.
The Form 1099 you receive in January 2017 will show the tax status of all distributions paid to your account in calendar year 2016.
The Funds designate dividends distributed during the fiscal year as qualifying for the dividends received deduction for corporate shareholders as
follows:
| Conservative Strategy Fund | 12.4 | % |
| Moderate Strategy Fund | 15.7 | % |
| Balanced Strategy Fund | 34.5 | % |
| Growth Strategy Fund | 40.5 | % |
| Equity Growth Strategy Fund | 53.4 | % |
| 2020 Strategy Fund | 19.4 | % |
| 2025 Strategy Fund | 25.6 | % |
| 2030 Strategy Fund | 32.2 | % |
| 2035 Strategy Fund | 46.3 | % |
| 2040 Strategy Fund | 55.0 | % |
| 2045 Strategy Fund | 59.2 | % |
| 2050 Strategy Fund | 58.0 | % |
| 2055 Strategy Fund | 59.7 | % |
| In Retirement Fund | 14.8 | % |
Pursuant to Section 852 of the Internal Revenue Code, the Funds designate the following amounts as long-term capital gain dividends for their
taxable year ended October 31, 2016:
| Conservative Strategy Fund | $ | 33,747,215 |
| Moderate Strategy Fund | 68,706,955 | |
| Balanced Strategy Fund | 210,121,787 | |
| 2020 Strategy Fund | 6,122,044 | |
| 2025 Strategy Fund | 773,227 | |
| 2030 Strategy Fund | 5,211,353 | |
| 2035 Strategy Fund | 636,109 | |
| 2040 Strategy Fund | 5,217,612 | |
| 2045 Strategy Fund | 249,446 | |
| 2050 Strategy Fund | 444,875 | |
| 2055 Strategy Fund | 52,902 | |
| In Retirement Fund | 1,365,699 | |
| Please consult a tax adviser for any questions about federal or state income tax laws. | ||
Tax Information 273
Russell Investment Company
LifePoints® Funds
Tax Information, continued — October 31, 2016 (Unaudited)
The Funds listed below paid foreign taxes and recognized foreign source income during the taxable year ended October 31, 2016. Pursuant to
Section 853 of the Internal Revenue Code, the Funds designate the following per share amounts of foreign taxes paid and income earned from
foreign sources:
| Foreign Taxes | Foreign Source Income | Foreign Source | ||||||
| Fund Name | Foreign Taxes Paid | Paid Per Share | Income Per Share | |||||
| Conservative Strategy Fund | $ | 63,181 | $ | 0.0017 | $ | 641,560 | $ | 0.0178 |
| Moderate Strategy Fund | 297,280 | 0.0054 | 2,853,497 | 0.0516 | ||||
| Balanced Strategy Fund | 1,705,402 | 0.0079 | 17,108,146 | 0.0791 | ||||
| Growth Strategy Fund | 1,395,949 | 0.0103 | 13,845,782 | 0.1024 | ||||
| Equity Growth Strategy Fund | 679,371 | 0.0112 | 6,574,322 | 0.1084 | ||||
| 2020 Strategy Fund | 26,655 | 0.0035 | 288,165 | 0.0383 | ||||
| 2025 Strategy Fund | 16,322 | 0.0048 | 174,008 | 0.0515 | ||||
| 2030 Strategy Fund | 52,715 | 0.0060 | 552,921 | 0.0631 | ||||
| 2035 Strategy Fund | 18,666 | 0.0079 | 193,799 | 0.0817 | ||||
| 2040 Strategy Fund | 43,283 | 0.0083 | 445,739 | 0.0856 | ||||
| 2045 Strategy Fund | 12,623 | 0.0091 | 130,008 | 0.0938 | ||||
| 2050 Strategy Fund | 12,953 | 0.0066 | 133,385 | 0.0682 | ||||
| 2055 Strategy Fund | 4,480 | 0.0119 | 46,141 | 0.1228 | ||||
| In Retirement Fund | 10,077 | 0.0026 | 110,569 | 0.0285 |
274 Tax Information
Russell Investment Company
LifePoints® Funds
Shareholder Requests for Additional Information — October 31, 2016 (Unaudited)
A complete unaudited schedule of investments is made available generally no later than 60 days after the end of the first and third
quarters of each fiscal year. These reports are available (i) free of charge, upon request, by calling the Funds at (800) 787-7354; (ii)
at https://russellinvestments.com; and (iii) at the Securities and Exchange Commission’s Office of Investor Education and Advocacy
(formerly, the Public Reference room).
The Board has delegated to RIM, as RIC’s investment adviser, the primary responsibility for monitoring, evaluating and voting proxies
solicited by or with respect to issuers of securities in which assets of the Underlying Funds may be invested. RIM has established a proxy
voting committee and has adopted written proxy voting policies and procedures (“P&P”) and proxy voting guidelines (“Guidelines”).
The Funds maintain a Portfolio Holdings Disclosure Policy that governs the timing and circumstances of disclosure to shareholders
and third parties of information regarding the portfolio investments held by the Funds. A description of the P&P, Guidelines, Portfolio
Holdings Disclosure Policy and additional information about Fund Trustees are contained in the Funds’ Statement of Additional
Information (“SAI”). The SAI and information regarding how the Underlying Funds voted proxies relating to portfolio securities during
the most recent 12-month period ended June 30, 2016 are available (i) free of charge, upon request, by calling the Funds at (800) 787-
7354; (ii) at https://russellinvestments.com; and (iii) on the Securities and Exchange Commission’s website at www. sec.gov.
To reduce expenses, we may mail only one copy of the Funds’ prospectuses and each annual and semi-annual report to those addresses
shared by two or more accounts. If you wish to receive individual copies of these documents, please contact your Financial Intermediary.
Some Financial Intermediaries may offer electronic delivery of the Funds’ prospectuses and annual and semi-annual reports. Please
contact your Financial Intermediary for further details.
Financial statements of the Underlying Funds can be obtained at no charge by calling the Funds at (800) 787-7354.
Shareholder Requests for Additional Information 275
Russell Investment Company
LifePoints® Funds
Disclosure of Information about Fund Trustees and Officers — October 31, 2016
(Unaudited)
The following tables provide information for each officer and trustee of the Russell Fund Complex. The Russell Fund Complex
consists of Russell Investment Company (“RIC”), which has 41 funds and Russell Investment Funds (“RIF”), which has 9 funds.
Each of the trustees is a trustee of RIC and RIF. The first table provides information for the independent trustees. The second table
provides information for the Trustee Emeritus. The third table provides information for the officers. Furthermore, each Trustee
possesses the following specific attributes: Mr. Alston has business, financial and investment experience as a senior executive of
an international real estate firm and is trained as a lawyer; Ms. Blake has had experience as a certified public accountant and has
had experience as a member of boards of directors/trustees of other investment companies; Ms. Burgermeister has had experience
as a certified public accountant and as a member of boards of directors/trustees of other investment companies; Mr. Connealy has
had experience with other investment companies and their investment advisers, first as a partner in the investment management
practice of PricewaterhouseCoopers LLP and, subsequently, as the senior financial executive of two other investment organizations
sponsoring and managing investment companies, and has been determined by the Board to be an “audit committee financial
expert”; Ms. Krysty has had business, financial and investment experience as the founder and senior executive of a registered
investment adviser focusing on high net worth individuals as well as a certified public accountant and a member of the boards of
other corporations and non-profit organizations; Mr. Tennison has had business, financial and investment experience as a senior
executive of a corporation with international activities and was trained as an accountant; and Mr. Thompson has had experience in
business, governance, investment and financial reporting matters as a senior executive of an organization sponsoring and managing
other investment companies, and, subsequently, has served as a board member of other investment companies. Effective June 30,
2016, Ms. Sandra Cavanaugh retired from Russell Investments and resigned her position as an Interested Trustee of the Trust.
| Name, | Position(s) Held | Term | Principal Occupation(s) | No. of | Other |
| Age, | With Fund and | of | During the | Portfolios | Directorships |
| Address | Length of | Office * | Past 5 Years | in Russell | Held by Trustee |
| Time Served | Fund | During the | |||
| Complex | Past 5 Years | ||||
| Overseen | |||||
| by Trustee | |||||
| INDEPENDENT TRUSTEES | |||||
| Thaddas L. Alston, | Trustee since 2006 | Appointed until | Senior Vice President, Larco | 50 | Until October |
| Born April 7, 1945 | successor is | Investments, Ltd. (real estate firm) | 2015, Trustee, | ||
| 1301 Second Avenue, | duly elected and | Russell | |||
| 18th Floor, Seattle, WA | qualified | Exchange | |||
| 98101 | Traded Funds | ||||
| Trust | |||||
276 Disclosure of Information about Fund Trustees and Officers
Russell Investment Company
LifePoints® Funds
Disclosure of Information about Fund Trustees and Officers, continued — October 31,
2016 (Unaudited)
| Name, | Position(s) Held | Term | Principal Occupation(s) | No. of | Other |
| Age, | With Fund and | of | During the | Portfolios | Directorships |
| Address | Length of | Office * | Past 5 Years | in Russell | Held by Trustee |
| Time Served | Fund | During the | |||
| Complex | Past 5 Years | ||||
| Overseen | |||||
| by Trustee | |||||
| Kristianne Blake, | Trustee since 2000 | Appointed until | • Director and Chairman of the Audit | 50 | • Director, |
| Born January 22, 1954 | Chairman since 2005 | successor is | Committee, Avista Corp (electric | Avista Corp | |
| 1301 Second Avenue, | duly elected and | utilities) | (electric | ||
| 18th Floor, Seattle, WA | qualified | • Regent, University of Washington | utilities) | ||
| 98101 | Approved | • President, Kristianne Gates Blake, | • Until June | ||
| annually | P.S. (accounting services) | 30, 2014, | |||
| • Until June 30, 2014, Director, Ecova | Director, | ||||
| (total energy and sustainability | Ecova (total | ||||
| management) | energy and | ||||
| • Until December 31, 2013, Trustee | sustainability | ||||
| and Chairman of the Operations | management) | ||||
| Committee, Principal Investors Funds | • Until | ||||
| and Principal Variable Contracts | December 31, | ||||
| Funds (investment company) | 2013, Trustee, | ||||
| • From April 2004 through December | Principal | ||||
| 2012, Director, Laird Norton Wealth | Investors | ||||
| Management and Laird Norton Tyee | Funds | ||||
| Trust (investment company) | (investment | ||||
| company) | |||||
| • Until | |||||
| December 31, | |||||
| 2013, Trustee | |||||
| Principal | |||||
| Variable | |||||
| Contracts | |||||
| Funds | |||||
| (investment | |||||
| company) | |||||
| • From April | |||||
| 2004 through | |||||
| December | |||||
| 2012, | |||||
| Director, Laird | |||||
| Norton Wealth | |||||
| Management | |||||
| and Laird | |||||
| Norton | |||||
| Tyee Trust | |||||
| (investment | |||||
| company) | |||||
| • Until October | |||||
| 2015, Trustee, | |||||
| Russell | |||||
| Exchange | |||||
| Traded Funds | |||||
| Trust |
* Each Trustee is subject to mandatory retirement at age 75.
Disclosure of Information about Fund Trustees and Officers 277
Russell Investment Company
LifePoints® Funds
Disclosure of Information about Fund Trustees and Officers, continued — October 31,
2016 (Unaudited)
| Name, | Position(s) Held | Term | Principal Occupation(s) | No. of | Other |
| Age, | With Fund and | of | During the | Portfolios | Directorships |
| Address | Length of | Office * | Past 5 Years | in Russell | Held by Trustee |
| Time Served | Fund | During the | |||
| Complex | Past 5 Years | ||||
| Overseen | |||||
| by Trustee | |||||
| INDEPENDENT TRUSTEES (continued) | |||||
| Cheryl Burgermeister, | Trustee since 2012 | Appointed until | • Retired | 50 | • Trustee and |
| Born June 26, 1951 | successor is | • Trustee and Chairperson of Select | Chairperson of | ||
| 1301 Second Avenue, | duly elected and | Sector SPDR Funds (investment | Select Sector | ||
| 18th Floor, Seattle, WA | qualified | company) | SPDR Funds | ||
| 98101 | • Until December 31, 2014, | (investment | |||
| Chairperson of Audit Committee, | company) | ||||
| Select Sector SPDR Funds | • Until May | ||||
| (investment company) | 6, 2016, | ||||
| Trustee, ALPS | |||||
| Series Trust | |||||
| (investment | |||||
| company) | |||||
| • Until | |||||
| December | |||||
| 31, 2014, | |||||
| Chairperson | |||||
| of Audit | |||||
| Committee, | |||||
| Select Sector | |||||
| SPDR Funds | |||||
| (investment | |||||
| company) | |||||
| • Until October | |||||
| 2015, Trustee, | |||||
| Russell | |||||
| Exchange | |||||
| Traded Funds | |||||
| Trust | |||||
| Daniel P. Connealy, | Trustee since 2003 | Appointed until | • Retired | 50 | Until October |
| Born June 6, 1946 | Chairman of the | successor is | • June 2004 to June 2014, Senior Vice | 2015, Trustee, | |
| 1301 Second Avenue, | Audit Committee | duly elected and | President and Chief Financial Officer, | Russell | |
| 18th Floor, Seattle, WA | since 2015 | qualified | Waddell & Reed Financial, Inc. | Exchange | |
| 98101 | Appointed until | (investment company) | Traded Funds | ||
| successor is | Trust | ||||
| duly elected and | |||||
| qualified | |||||
| Katherine W. Krysty, | Trustee since 2014 | Appointed until | • Retired | 50 | Until October |
| Born December 3, 1951 | successor is | • January 2011 through March 2013, | 2015, Trustee, | ||
| 1301 Second Avenue | duly elected and | President Emerita, Laird Norton | Russell | ||
| 18th Floor, Seattle, WA | qualified | Wealth Management (investment | Exchange | ||
| 98101 | company) | Traded Funds | |||
| Trust | |||||
278 Disclosure of Information about Fund Trustees and Officers
Russell Investment Company
LifePoints® Funds
Disclosure of Information about Fund Trustees and Officers, continued — October 31,
2016 (Unaudited)
| Position(s) Held | Term | Principal Occupation(s) | No. of | Other | |
| Name, | With Fund and | of | During the | Portfolios | Directorships |
| Age, | Length of | Office * | Past 5 Years | in Russell | Held by Trustee |
| Address | Time Served | Fund | During the | ||
| Complex | Past 5 Years | ||||
| Overseen | |||||
| by Trustee | |||||
| INDEPENDENT TRUSTEES (continued) | |||||
| Raymond P. Tennison, Jr., | Trustee since 2000 | Appointed until | • Retired | 50 | Until October |
| Born December 21, 1955 | Chairman of | successor is | • From January 2008 to December | 2015, Trustee, | |
| 1301 Second Avenue | the Nominating | duly elected and | 2011, Vice Chairman of the Board, | Russell | |
| 18th Floor, Seattle, WA | and Governance | qualified | Simpson Investment Company (paper | Exchange | |
| 98101 | Committee since | Appointed until | and forest products) | Traded Funds | |
| 2007 | successor is | Trust | |||
| duly elected and | |||||
| qualified | |||||
| Jack R. Thompson, | Trustee since 2005 | Appointed until | • Retired | 50 | • Until October |
| Born March 21, 1949 | Chairman of | successor is | 2015, Trustee, | ||
| 1301 Second Avenue, | the Investment | duly elected and | Russell | ||
| 18th Floor, Seattle, WA | Committee since | qualified | Exchange | ||
| 98101 | 2015 | Appointed until | Traded Funds | ||
| successor is | Trust | ||||
| duly elected and | |||||
| qualified | |||||
* Each Trustee is subject to mandatory retirement at age 75.
| Name, | Position(s) Held | Term | Principal Occupation(s) | No. of | Other |
| Age, | With Fund and | of | During the | Portfolios | Directorships |
| Address | Length of | Office * | Past 5 Years | in Russell | Held by Trustee |
| Time Served | Fund | During the | |||
| Complex | Past 5 Years | ||||
| Overseen | |||||
| by Trustee | |||||
| TRUSTEE EMERITUS | |||||
| George F. Russell, Jr., | Trustee Emeritus and | Until resignation | • Director Emeritus, RIM | 50 | None |
| Born July 3, 1932 | Chairman Emeritus | or removal | |||
| 1301 Second Avenue, | since 1999 | ||||
| 18th Floor, Seattle, WA | |||||
| 98101 | |||||
| Name, | Positions(s) Held | Term | Principal Occupation(s) | ||
| Age, | With Fund and | of | During the | ||
| Address | Length of | Office | Past 5 Years | ||
| Time Served | |||||
| OFFICERS | |||||
| Cheryl Wichers, | Chief Compliance | Until removed | • Chief Compliance Officer, RIC and RIF | ||
| Born December 16, 1966 | Officer since 2005 | by Independent | • Chief Compliance Officer, RIFUS and U.S. One Inc. | ||
| 1301 Second Avenue | Trustees | • 2005 to 2011 Chief Compliance Officer, RIM | |||
| 18th Floor, Seattle, WA | |||||
| 98101 | |||||
Disclosure of Information about Fund Trustees and Officers 279
Russell Investment Company
LifePoints® Funds
Disclosure of Information about Fund Trustees and Officers, continued — October 31,
2016 (Unaudited)
| Name, | Positions(s) Held | Term | Principal Occupation(s) |
| Age, | With Fund and | of | During the |
| Address | Length of | Office | Past 5 Years |
| Time Served | |||
| Mark E. Swanson, | President and Chief | Until successor | • Global Head of Fund Services, Russell Investments |
| Born November 26, 1963 | Executive Officer | is chosen and | • President, CEO, Treasurer, Chief Accounting Officer and CFO, RIC |
| 1301 Second Avenue | since 2016 | qualified by | and RIF |
| 18th Floor, Seattle, WA | Treasurer and Chief | Trustees | • Director, President and CEO, RIFUS |
| 98101 | Accounting Officer | • Director, RIM, Russell Investments Trust Company (“RITC”) and | |
| since 1998 | Russell Investments Financial Services, LLC (“RIFIS”) | ||
| • October 2011 to December 2013, Head of North America Operations | |||
| Russell Investments | |||
| • May 2009 to October 2011, Global Head of Fund Operations, Russell | |||
| Investments | |||
| Jeffrey T. Hussey, | Chief Investment | Until removed by | • Global Chief Investment Officer, Russell Investments |
| Born May 2, 1969 | Officer since 2013 | Trustees | • Chief Investment Officer, RIC and RIF |
| 1301 Second Avenue, | • Chairman of the Board, President and CEO, RIM | ||
| 18th Floor, Seattle WA | • Director, RITC, Russell Investments Implementation Services, LLC | ||
| 98101 | and Russell Investments Delaware, LLC | ||
| • Board of Managers, Russell Investments Funds Management, LLC | |||
| • 2003 to 2013 Chief Investment Officer, Fixed Income, Russell | |||
| Investments | |||
| Mary Beth R. Albaneze, | Secretary since 2010 | Until successor | • Associate General Counsel, Russell Investments |
| Born April 25, 1969 | is chosen and | • Secretary, RIM, RIFUS and RIFIS | |
| 1301 Second Avenue, | qualified by | • Secretary and Chief Legal Officer, RIC and RIF | |
| 18th Floor, Seattle, WA | Trustees | • Assistant Secretary, Russell Investments Insurance Agency, LLC | |
| 98101 | (“RIIA”)(insurance agency) and U.S. One Inc. | ||
280 Disclosure of Information about Fund Trustees and Officers
Russell Investment Company
LifePoints® Funds
Adviser and Service Providers — October 31, 2016
| Independent Trustees | Administrator and Transfer and Dividend Disbursing |
| Thaddas L. Alston | Agent |
| Kristianne Blake | Russell Investments Fund Services, LLC |
| Cheryl Burgermeister | 1301 Second Avenue |
| Daniel P. Connealy | Seattle, WA 98101 |
| Katherine W. Krysty | |
| Raymond P. Tennison, Jr. | Custodian |
| Jack R. Thompson | State Street Bank and Trust Company |
| 1 Heritage Drive | |
| Trustee Emeritus | North Quincy, MA 02171 |
| George F. Russell, Jr. | Office of Shareholder Inquiries |
| Officers | 1301 Second Avenue |
| Mark E. Swanson, President, CEO, Treasurer, Chief | Seattle, WA 98101 |
| Accounting Officer and CFO | (800) 787-7354 |
| Cheryl Wichers, Chief Compliance Officer | |
| Jeffrey T. Hussey, Chief Investment Officer | Legal Counsel |
| Mary Beth R. Albaneze, Secretary | Dechert LLP |
| One International Place, 40th Floor | |
| Adviser | 100 Oliver Street |
| Russell Investment Management, LLC | Boston, MA 02110 |
| 1301 Second Avenue | |
| Seattle, WA 98101 | Distributor |
| Russell Investments Financial Services, LLC. | |
| 1301 Second Avenue | |
| Seattle, WA 98101 | |
| Independent Registered Public Accounting Firm | |
| PricewaterhouseCoopers LLP | |
| 1420 5th Avenue, Suite 2800 | |
| Seattle, WA 98101 |
This report is prepared from the books and records of the Funds and is submitted for the general information of shareholders and is not
authorized for distribution to prospective investors unless accompanied or preceded by an effective Prospectus. Nothing herein contained
is to be considered an offer of sale or a solicitation of an offer to buy shares of Russell Investment Company. Such offering is made only
by Prospectus, which includes details as to offering price and other material information.
Adviser and Service Providers 281

Item 2. Code of Ethics. [Annual Report Only]
(a) As of the end of the period covered by the report, the registrant has adopted a code of ethics
that applies to the registrant's principal executive officer and principal financial officer
(“Code”).
(b) That Code comprises written standards that are reasonably designed to deter wrongdoing and
to promote:
1) honest and ethical conduct, including the ethical handling of actual or apparent
conflicts of interest between personal and professional relationships;
2) full, fair, accurate, timely and understandable disclosure in reports and documents
that a registrant files with, or submits to, the Securities and Exchange Commission
(“SEC”) and in other public communications made by each Mutual Fund;
3) compliance with applicable laws and governmental rules and regulations;
4) the prompt internal reporting to an appropriate person or persons identified in the
Code of violations of the Code; and
5) accountability for adherence to the Code.
(c) The Code was restated as of August 2015; the restatement did not involve any material
change.
(d) As of the end of the period covered by the report, there have been no waivers granted from a
provision of the Code that applies to the registrant’s principal executive officer and principal
financial officer.
(e) Not applicable.
(f) The registrant has filed with the SEC, pursuant to Item 12(a)(1), a copy of the Code that
applies to the registrant’s principal executive officer, principal financial officer, principal
accounting officer or controller, or persons performing similar functions, as an exhibit to its
annual report on this Form N-CSR.
Item 3. Audit Committee Financial Expert. [Annual Report Only]
Registrant's board of trustees has determined that the Registrant has at least one audit committee
financial expert serving on its audit committee. Daniel P. Connealy has been determined to be
the Audit Committee Financial Expert and is also determined to be “independent” for purposes
of Item 3, paragraph (a)(2)(i) and (ii) of Form N-CSR.
Item 4. Principal Accountant Fees and Services. [Annual Report Only]
Audit Fees
(a) The aggregate fees billed for each of the last two fiscal years for professional services
rendered by the principal accountant for the audit of the registrant’s annual financial statements
or services that are normally provided by the accountant in connection with statutory and
regulatory filings or engagements for those fiscal years were as follows:
| 2015 | $ | 1,447,780 |
| 2016 | $ | 1,426,364 |
Audit-Related Fees
(b) The aggregate fees billed in each of the last two fiscal years for assurance and related
services by the principal accountant that are reasonably related to the performance of the audit of
the registrant’s financial statements and are not reported under paragraph (a) of this Item and the
nature of the services comprising those fees were as follows:
| Fees | Nature of Services | ||||||
| 2015 | $ | 539,150 | Performance of agreed-upon procedures with respect to | ||||
| 04/30/15 semi-annual reports | |||||||
| to | |||||||
| 2016 | $ | 575,251 | Performance of agreed-upon procedures with respect to | ||||
| 04/30/16 semi-annual reports | |||||||
Tax Fees
(c) The aggregate fees billed in each of the last two fiscal years for professional services
rendered by the principal accountant for tax compliance, tax advice, and tax planning and the
nature of the services comprising the fees were as follows:
| Fees | Nature of Services | ||
| 2015 | $ | 450,116 | Tax services |
| 2016 | $ | 470,991 | Tax services |
All Other Fees
(d) The aggregate fees billed in each of the last two fiscal years for products and services
provided by the principal accountant, other than the services reported in paragraphs (a) through
(c) of this Item and the nature of the services comprising those fees were as follows:
| Fees | Nature of Services | |||||||
| 2015 | $ | 0 | Review excise reconciliations, transfer agent internal | |||||
| controls analysis, overhead/travel | ||||||||
| 2016 | $ | 0 | Review excise reconciliations, transfer agent internal | |||||
| controls analysis, overhead/travel | ||||||||
(e) (1) Registrant’s audit committee has adopted the following pre-approval policies and
procedures for certain services provided by Registrant’s accountants:
Russell Investment Company
Russell Investment Funds
Audit and Non-Audit Services Pre-Approval Policy
Effective Date: August 25, 2015
I. Statement of Purpose.
This Policy has been adopted by the joint Audit Committee (the “Audit Committee”) of Russell
Investment Company (“RIC”) and Russell Investment Funds (“RIF”) to apply to any and all
engagements of the independent auditor to RIC and RIF, respectively, for audit, non-audit, tax or
other services. The term “Fund” shall collectively refer to each series of RIC and RIF. The
term “Investment Adviser” shall refer to the Funds’ advisor, Russell Investment Management
Company (“RIMCo”). This Policy does not delegate to management the responsibilities set forth
herein for the pre-approval of services performed by the Funds’ independent auditor.
II. Statement of Principles.
Under the Sarbanes-Oxley Act of 2002 (the “Act”), the Audit Committee of the Funds’ Board of
Trustees (the “Audit Committee”) is charged with responsibility for the appointment,
compensation and oversight of the work of the independent auditor for the Funds. As part of
these responsibilities, the Audit Committee is required to pre-approve the audit services and
permissible non-audit services such as audit-related, tax and other services (“non-audit services”)
performed by the independent auditor for the Funds to assure that the independence of the
auditor is not in any way compromised or impaired. In determining whether an auditor is
independent in light of the services it provides to a Fund, there are three guiding principles under
the Act that must be considered. In general, the independence of the auditor to the Funds would
be deemed impaired if the auditor provides a service whereby it:
· Functions in the role of management of the Funds, the adviser of the Funds or any
other affiliate* of the Funds;
· Is in the position of auditing its own work; or
· Serves in an advocacy role for the Funds, the adviser of the Funds or any other
affiliate of the Funds.
Accordingly, it is the Funds’ policy that the independent auditor for the Funds must not be
engaged to perform any service that contravenes any of the three guidelines set forth above, or
which in any way could be deemed to impair or compromise the independence of the auditor for
the Funds. This Policy is designed to accomplish those requirements and will henceforth be
applied to all engagements by the Funds of their independent auditor, whether for audit, audit-
related, tax, or other non-audit services.
* For purposes of this Policy, an affiliate of the Funds is defined as the Funds’ investment adviser (but not a sub-
adviser whose role is primarily portfolio management and whose activities are overseen by the principal investment
adviser), and any entity controlling, controlled by, or under common control with the investment adviser that
provides ongoing services to the Fund.
Rules adopted by the United States Securities and Exchange Commission (the “SEC”) establish
two distinct approaches to the pre-approval of services by the Audit Committee. The proposed
services either may receive general pre-approval through adoption by the Audit Committee of a
list of authorized services for the fund, together with a budget of expected costs for those
services (“general pre-approval”), or specific pre-approval by the Audit Committee of all
services provided to the fund on a case-by-case basis (“specific pre-approval”).
The Funds’ Audit Committee believes that the combination of these two approaches reflected in
this Policy will result in an effective and efficient procedure for the pre-approval of permissible
services performed by the Funds’ independent auditor. The Funds’ Audit and Non-Audit Pre-
Approved Services Schedule lists the audit, audit-related, tax and other services that have the
general pre-approval of the Audit Committee. As set forth in this Policy, unless a particular
service has received general pre-approval, those services will require specific pre-approval by
the Audit Committee before any such services can be provided by the independent auditor. Any
proposed service to the Funds that exceeds the pre-approved budget for those services will also
require specific pre-approval by the appropriate Audit Committee.
In assessing whether a particular audit or non-audit service should be approved, the Audit
Committee will take into account the ratio between the total amounts paid for audit, audit-
related, tax and other services, based on historical patterns, with a view toward assuring that the
level of fees paid for non-audit services as they relate to the fees paid for audit services does not
compromise or impair the independence of the auditor. The Audit Committee will review the list
of general pre-approved services, including the pre-approved budget for those services, at least
annually and more frequently if deemed appropriate by the Audit Committee, and may
implement changes thereto from time to time.
III. Delegation.
As provided in the Act and in the SEC’s rules, the Audit Committee from time to time may
delegate either general or specific pre-approval authority to one or more of its members. Any
member to whom such authority is delegated must report any pre-approval decisions to the Audit
Committee at its next scheduled meeting.
IV. Audit Services.
The annual audit services engagement terms and fees for the independent auditor for the Funds
require specific pre-approval of the Audit Committee. Audit services include the annual
financial statement audit and other procedures required to be performed by the independent
auditor in order to be able to form an opinion on the financial statements for the Funds for that
year. These other procedures include reviews of information systems, procedural reviews and
testing performed in order to understand and rely on the Funds’ systems of internal control, and
consultations relating to the audit. Audit services also include the attestation engagement for the
independent auditor’s report on the report from management on financial reporting internal
controls. The Audit Committee will review the audit services engagement as necessary or
appropriate in the sole judgment of the Audit Committee.
In addition to the pre-approval by the Audit Committee of the annual engagement of the
independent auditor to perform audit services, the Audit Committee may grant general pre-
approval to other audit services, which are those services that only the independent auditor
reasonably can provide. These services are generally related to the issuance of an audit opinion,
and may include statutory audits and services associated with the Funds’ SEC registration
statement on Form N-1A, periodic reports and documents filed with or information requested by
the SEC or other regulatory or self-regulatory organizations, or other documents issued in
connection with the Funds’ securities offerings.
The Audit Committee has pre-approved the audit services set forth in Schedule A of the Audit
and Non-Audit Pre-Approved Services Schedule. All other audit services not listed in Schedule
A of the Audit and Non-Audit Pre-Approved Services Schedule must be specifically pre-
approved by the Audit Committee or its delegate.
V. Audit-Related Services.
Audit-related services are assurance and related services that are reasonably related to the
performance of the audit or review of the financial statements for the Funds, or the separate
financial statements for a series of the Funds that are traditionally performed by the independent
auditor. Because the Audit Committee believes that the provision of audit-related services does
not compromise or impair the independence of the auditor and is consistent with the SEC’s rules
on auditor independence, the Audit Committee may grant pre-approval to audit related services.
“Audit related services” include, among others, accounting consultations related to accounting,
financial reporting or disclosure matters not classified as “audit services;” assistance with
understanding and implementing new accounting and financial reporting or disclosure matters
not classified as “audit services;” assistance with understanding and implementing new
accounting and financial reporting guidance from rulemaking authorities; agreed upon or
expanded audit procedures related to accounting and/or billing records required to respond to or
comply with financial, accounting or regulatory reporting matters; and assistance with internal
reporting requirements, including those under Form N-SAR and Form N-CSR.
The Audit Committee has pre-approved the audit-related services set forth in Schedule B of the
Audit and Non-Audit Pre-Approved Services Schedule. All other audit-related services not
listed in Schedule B of the Audit and Non-Audit Pre-Approved Services Schedule must be
specifically pre-approved by the Audit Committee or its delegate.
VI. Tax Services.
The Audit Committee believes that the independent auditor can provide tax services to the
Funds, such as tax compliance, tax planning and tax advice, without impairing the auditor’s
independence and the SEC has stated that the independent auditor may provide such services.
Consequently, the Audit Committee believes that it may grant general pre-approval to those tax
services that have historically been provided by the auditor, that the Audit Committee has
reviewed and believes would not impair the independence of the auditor, and that are consistent
with the SEC’s rules on auditor independence. However, the Audit Committee will not permit
the retention of the independent auditor to provide tax advice in connection with any transaction
recommended by the independent auditor, the sole business purpose of which may be tax
avoidance and the tax treatment of which may not be supported by the United States Internal
Revenue Code and related regulations or the applicable tax statutes and regulations that apply to
the Funds’ investments outside the United States. The Audit Committee will consult with the
Treasurer of the Funds or outside counsel to determine that the Funds’ tax planning and reporting
positions are consistent with this policy.
The Audit Committee has pre-approved the tax services set forth in Schedule C of the Audit and
Non-Audit Pre-Approved Services Schedule. All other tax services not listed in Schedule C of
the Audit and Non-Audit Pre-Approved Services Schedule must be specifically pre-approved by
the Audit Committee or its delegate.
VII. All Other Services.
The Audit Committee believes, based on the SEC’s rules prohibiting the independent auditor
from providing specific non-audit services, that other types of non-audit services are permitted.
Accordingly, the Audit Committee believes that it may grant general pre-approval to those
permissible non-audit services classified as “all other” services that the Audit Committee
believes are routine and recurring services, would not impair or compromise the independence of
the auditor and are consistent with the SEC’s rules on auditor independence.
The Audit Committee has pre-approved the permissible “all other services” set forth in Schedule
D of the Audit and Non-Audit Pre-Approved Services Schedule. Permissible “all other services”
not listed in Schedule D of the Audit and Non-Audit Pre-Approved Services Schedule must be
specifically pre-approved by the Audit Committee or its delegate.
A list of the SEC’s prohibited non-audit services are as follows:
· Bookkeeping or other services relating to the accounting records or financial statements
of the Funds
· Financial information system design and implementation
· Appraisal or valuation services, fairness opinions or contribution-in-kind reports
· Actuarial services
· Internal audit outsourcing services
· Management functions
· Human resources services
· Broker-dealer, investment adviser or investment banking services
· Legal services unrelated to the audit
· Expert services unrelated to the audit
The SEC’s rules and relevant official interpretations and guidance should be consulted to
determine the scope of these prohibited services and the applicability of any exceptions to certain
of the prohibitions. Under no circumstance may an executive, manager or associate of the
Funds, or the Investment Adviser, authorize the independent auditor for the Funds to provide
prohibited non-audit services.
VIII. De Minimis Waiver.
In accordance with the Act and SEC regulations, notwithstanding anything in this Policy to the
contrary, the pre-approval requirements of this Policy are waived with respect to the provision of
non-audit services that are permissible for an independent auditor to perform, provided:
(a) The aggregate amount of all such services provided constitutes no more than five
percent of the total amount of fees paid by RIC or RIF, as applicable, to the
independent auditor during the fiscal year in which the services were provided;
(b) Such services were not recognized by the Funds at the time of the engagement to
be non-audit services requiring pre-approval by the Audit Committee or its
delegate; and
(c) Such services are promptly brought to the attention of the Audit Committee and
approved by the Audit Committee or its delegate prior to the completion of the
audit, pursuant to the pre-approval provisions of this Policy.
In connection with the approval of any non-audit service pursuant to this de minimis exception, a
record shall be made indicating that each of the conditions for this exception has been satisfied.
IX. Pre-Approval Fee Levels or Budgeted Amounts.
Pre-approved fee levels or budgeted amounts for all services to be provided by the independent
auditor will be established annually by the Audit Committee and shall be subject to periodic
subsequent review during the year if deemed appropriate by the Audit Committee (separate
amounts may be specified for the Funds and for other affiliates in the investment company
complex subject to pre-approval). Any proposed services exceeding these levels or amounts will
require specific pre-approval by the Audit Committee. The Audit Committee will be mindful of
the overall relationship of fees for audit and non-audit services in determining whether to pre-
approve any such services. For each fiscal year, the Audit Committee may determine the
appropriateness of the ratio between the total amount of fees for audit, audit-related, and tax
services for the Funds (including any audit-related or tax services fees for affiliates subject to
pre-approval), and the total amount of fees for certain permissible non-audit services classified as
“all other services” for the Funds (including any such services for affiliates subject to pre-
approval by the Audit Committee or its delegate).
X. Procedures.
All requests or applications for services to be provided by the independent auditor that do not
require specific pre-approval by the Audit Committee will be submitted to the “RIC/RIF
Clearance Committee” (the “Clearance Committee”) (which shall be comprised of not less than
three members, including the Treasurer of the Funds who shall serve as its Chairperson) and
must include a detailed description of the services to be rendered and the estimated costs of those
services. The Clearance Committee will determine whether such services are included within the
list of services that have received general pre-approval by the Audit Committee. The Audit
Committee will be informed not less frequently than quarterly by the Chairperson of the
Clearance Committee of any such services rendered by the independent auditor for the Funds and
the fees paid to the independent auditors for such services.
Requests or applications to provide services that require specific pre-approval by the Audit
Committee will be submitted to the Audit Committee by both the independent auditor and the
Clearance Committee and must include a joint certification by the engagement partner of the
independent auditor and the Chairperson of the Clearing Committee that, in their view, the
request or application does not involve a prohibited non-audit service and is consistent with the
SEC’s rules governing auditor independence.
The Internal Audit Department of Frank Russell Company, the parent company of RIMCo, and
the officers of RIC and RIF will report to the Chairman of the Audit Committee any breach of
this Policy that comes to the attention of the Internal Audit Department of Frank Russell
Company or an officer of RIC or RIF.
XI. Additional Requirements.
The Audit Committee has determined to take additional measures on an annual basis to meet its
responsibility to oversee the work performed by the independent auditor and to assure the
independent auditor’s continuing independence from the Funds and their affiliates, including
Frank Russell Company. Such efforts will include, but not be limited to, reviewing a written
annual statement from the independent auditor delineating all relationships between the
independent auditor and RIC, RIF and Frank Russell Company and their subsidiaries and
affiliates, consistent with the Public Company Accounting Oversight Board’s Independence
Standards Board Standard No. 1, and discussing with the independent auditor its methods and
procedures for ensuring its independence.
(e) (2) The percentage of services described in each of paragraphs (b) through (d) of this Item
that were approved by the audit committee pursuant to paragraph (c)(7)(i)(C) of Rule 2-01 of
Regulation S-X is as follows:
| Audit Fees | 0 | % |
| Audit-Related Fees | 0 | % |
| Tax Fees | 0 | % |
| All Other Fees | 0 | % |
(f) For services, 50 percent or more of which were pre-approved, the percentage of hours
expended on the principal accountant’s engagement to audit the registrant’s financial statements
for the most recent fiscal year that were attributed to work performed by persons other than the
principal accountant’s full-time, permanent employees was 0%.
(g) The aggregate non-audit fees billed by registrant’s accountant for services rendered to the
registrant, and rendered to the registrant’s investment adviser (not including any sub-adviser
whose role is primarily portfolio management and is subcontracted with or overseen by another
investment adviser), and any entity controlling, controlled by, or under common control with the
adviser that provides ongoing services to the registrant for each of the last two fiscal years of the
registrant were as follows:
| 2015 | $ | 0 |
| 2016 | $ | 0 |
(h) The registrant’s audit committee of the board of trustees has considered whether the
provision of nonaudit services that were rendered to the registrant’s investment adviser (not
including any subadviser whose role is primarily portfolio management and is subcontracted
with or overseen by another investment adviser), and any entity controlling, controlled by, or
under common control with the investment adviser that provides ongoing services to the
registrant that were not pre-approved pursuant to paragraph (c)(7)(ii) of Rule 2-01 of Regulation
S-X is compatible with maintaining the principal accountant’s independence.
Item 5. Audit Committee of Listed Registrants. [Not Applicable]
Item 6. [Schedules of Investments are included as part of the Report to Shareholders filed
under Item 1 of this form]
Items 7-9. [Not Applicable]
Item 10. Submission of Matters to a Vote of Security Holders
There have been no changes to the procedures by which shareholders may recommend
nominees to the Registrant’s Board of Trustees that would require disclosure herein.
Item 11. Controls and Procedures
(a) Registrant's principal executive officer and principal financial officer have concluded
that Registrant's disclosure controls and procedures (as defined in Rule 30a-2(c) under
the Investment Company Act of 1940 (the “Act”)) are effective, based on their evaluation
of these controls and procedures as of a date within 90 days of the date this report is filed
with the Securities and Exchange Commission.
(b) There were no significant changes in Registrant's internal control over financial
reporting that occurred during the period covered by this report that has materially
affected or is likely to materially affect Registrant's internal control over financial
reporting.
Item 12. Exhibit List
(a) Registrant’s code of ethics described in Item 2
(b) Certification for principal executive officer of Registrant as required by Rule 30a-2(a)
under the Act and certification for principal financial officer of Registrant as required by
Rule 30a-2(a) under the Act.
SIGNATURES
Pursuant to the requirements of the Securities Exchange Act of 1934 and the Investment
Company Act of 1940, the Registrant has duly caused this report to be signed on its behalf by the
undersigned, thereunto duly authorized.
Russell Investment Company
By: /s/ Mark E. Swanson
Mark E. Swanson
President, Chief Executive Officer, Treasurer, Chief Accounting Officer and Chief
Financial Officer, Russell Investment Company
Date: January 4, 2017
Pursuant to the requirements of the Securities Exchange Act of 1934 and the Investment
Company Act of 1940, this report has been signed below by the following persons on behalf of
the Registrant and in the capacities and on the dates indicated.
By: /s/ Mark E. Swanson
Mark E. Swanson
President, Chief Executive Officer, Treasurer, Chief Accounting Officer and Chief
Financial Officer, Russell Investment Company
Date: January 4, 2017