UNITED STATES
SECURITES AND EXCHANGE COMMISSION
Washington, DC 20549
FORM N-CSRS
CERTIFIED SHAREHOLDER REPORT OF
REGISTERED MANAGEMENT INVESTMENT COMPANIES
Investment Company Act file number: 811-3150
BMC FUND, INC.
(Exact name of registrant as specified in charter)
800 GOLFVIEW PARK (P. O. BOX 500)
LENOIR, NC 28645
(Address of principal executive offices) (Zip code)
CAROL FRYE
BMC FUND, INC.
P. O. BOX 500
LENOIR, NC 28645
(Name and address of agent for service)
Registrant's telephone number including area code: 828-758-6100
Date of fiscal year end: October 31, 2007
Date of reporting period: April 30, 2007
Item 1. Report to Stockholders.
BMC FUND, INC.
FINANCIAL STATEMENTS AND
SUPPLEMENTARY INFORMATION
Six Months Ended April 30, 2007
BMC FUND, INC.
TABLE OF CONTENTS
| | Page No. |
| | |
| | |
| Directors and Officers | 1 |
| | |
| Letter to Shareholders | 2 |
| | |
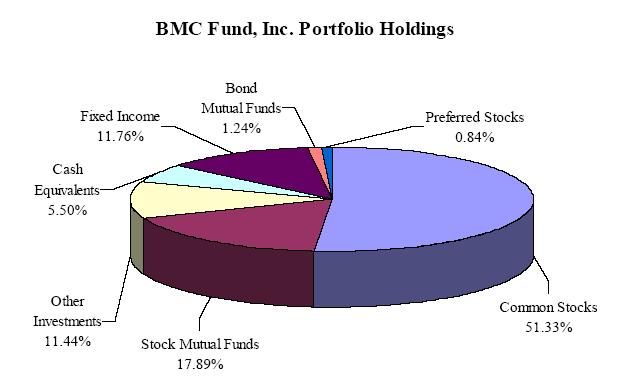
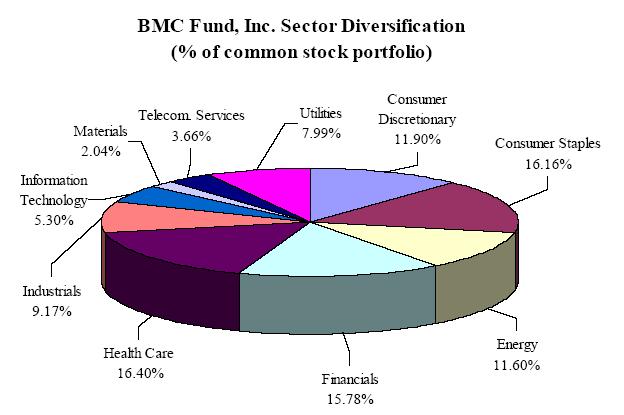
| Graphic Presentation of Portfolio Holdings and Sector Diversification | 3 |
| | |
| Statement of Assets and Liabilities | 4 |
| | |
| Statement of Operations | 5 |
| | |
| Statements of Changes In Net Assets | 6 |
| | |
| Notes to Financial Statements | 7 |
| | |
| Financial Highlights | 11 |
| | |
| Schedules of Investments: | |
| I. - Investments in Securities of Unaffiliated Issuers | 12 |
| II. - Investments in Affiliates | 25 |
BMC FUND, INC.
DIRECTORS AND OFFICERS
DIRECTORS |
| James T. Broyhill | Winston-Salem, North Carolina |
| Paul H. Broyhill | Lenoir, North Carolina |
| William E. Cooper | Dallas, Texas |
| Jan E. Gordon | Palm Harbor, Florida |
| Allene B. Heilman | Clearwater, Florida |
| Gene A. Hoots | Charlotte, North Carolina |
| Brent B. Kincaid | Lenoir, North Carolina |
| Michael G. Landry | Fort Lauderdale, Florida |
| John S. Little | Naples, Florida |
| L. Glenn Orr, Jr. | Winston-Salem, North Carolina |
| | |
| | |
OFFICERS |
| | |
| Paul H. Broyhill | Chairman and Chief Executive Officer |
| M. Hunt Broyhill | President |
| Michael G. Landry | Vice President and Chief Investment Officer |
| Boyd C. Wilson, Jr. | Vice President and Chief Financial Officer |
| Gene Hendricks | Vice President and Chief Compliance Officer |
| Carol Frye | Secretary and Treasurer |
TO OUR SHAREHOLDERS:
We are happy to present to you our semi-annual report (unaudited) for the six months ended April 30, 2007, which we believe contains complete and pertinent financial information.
BMC Fund, Inc. became a Regulated Investment Company (“RIC”) on April 1, 1981. During the six months ended April 30, 2007, the Fund paid the following dividends per share:
| December 10, 2006 to shareholders of record November 25, 2006 | | $ | 1.55 | |
| March 10, 2007 to shareholders of record February 25, 2007 | | | .25 | |
| | | | | |
| Total | | $ | 1.80 | |
Schedule I is a listing of the entire Fund’s diversified securities at April 30, 2007, with a total market value of $155,653,875.
Paul H. Broyhill, Chief Executive Officer
M. Hunt Broyhill, President
Michael G. Landry, Vice President
BMC FUND, INC. | | | | |
STATEMENT OF ASSETS AND LIABILITIES (Unaudited) | | |
April 30, 2007 | | | | | |
| ASSETS AT MARKET VALUE: | | | |
| Investment securities (cost - $119,370,075) | | $ | 155,653,875 | |
| Investments in affiliates - wholly owned subsidiaries (equity value $15,034,243) | | | 13,383,164 | |
| Cash and short-term investments | | | 31,788 | |
| Receivables, accrued interest and dividends | | | 150,471 | |
| Receivable from broker | | | 1,840,428 | |
| Receivable from hedge fund liquidation | | | 9,515 | |
| Other assets | | | 57,595 | |
| | | | | |
| Total assets | | | 171,126,836 | |
| | | | | |
| LIABILITIES: | | | | |
| Accounts payable and accrued expenses | | | 112,797 | |
| | | | | |
| Total liabilities | | | 112,797 | |
| | | | | |
| NET ASSETS AT APRIL 30, 2007 - EQUIVALENT TO $34.67 PER | | | | |
| SHARE ON 4,933,281 SHARES OF COMMON STOCK OUTSTANDING | | $ | 171,014,039 | |
| | | | | |
| SUMMARY OF SHAREHOLDERS' EQUITY: | | | | |
| Common stock, par value $5.00 per share - authorized 70,000,000 shares; | | | | |
| outstanding, 4,933,281 shares | | $ | 24,666,405 | |
| Retained earnings prior to becoming investment company | | | 92,939,370 | |
| Undistributed net investment income | | | 10,098,091 | |
| Realized gain on investments | | | 3,482,738 | |
| Undistributed nontaxable gain | | | 5,194,714 | |
| Unrealized appreciation of investments | | | 34,632,721 | |
| | | | | |
| NET ASSETS APPLICABLE TO COMMON STOCK OUTSTANDING | | $ | 171,014,039 | |
| | | | | |
| | | | | |
See accompanying notes to financial statements. | | | | |
BMC FUND, INC. | | | | | |
STATEMENT OF OPERATIONS (Unaudited) | | | |
Six Months Ended April 30, 2007 | | | | |
| INVESTMENT INCOME: | | | | |
| Income: | | | | |
| Interest - fixed income | | $ | 116,823 | |
| Other interest and dividends | | | 2,297,027 | |
| Equity in earnings of wholly-owned subsidiaries | | | 279,732 | |
| | | | | |
| Total income | | | 2,693,582 | |
| | | | | |
| Expenses: | | | | |
| Legal and professional fees | | | 60,185 | |
| Directors' fees (Note 3) | | | 23,000 | |
| Interest expense | | | 46,680 | |
| Investment expense | | | 41,203 | |
| Salaries | | | 336,466 | |
| Property and liability insurance | | | 32,658 | |
| Depreciation expense | | | 1,373 | |
| Taxes and licenses | | | 49,942 | |
| Rent | | | 9,600 | |
| Office supplies and expense | | | 26,412 | |
| Dues and subscriptions | | | 24,695 | |
| Travel and entertainment | | | 44,334 | |
| | | | | |
| Total expenses | | | 696,548 | |
| | | | | |
| Investment income, net | | | 1,997,034 | |
| | | | | |
| REALIZED AND UNREALIZED GAIN ON INVESTMENTS: | | | | |
| Realized gain from investment securities sold | | | 3,482,738 | |
| Change in unrealized appreciation of investments for the period | | | 8,914,235 | |
| | | | | |
| Net gain on investments | | | 12,396,973 | |
| | | | | |
| NET INCREASE IN NET ASSETS RESULTING | | | | |
| FROM OPERATIONS | | $ | 14,394,007 | |
See accompanying notes to financial statements. | | | | |
BMC FUND, INC. | | | | | | | |
STATEMENTS OF CHANGES IN NET ASSETS (Unaudited) | | |
Six Months Ended April 30, 2007 and 2006 | |
| | | 2007 | | 2006 | |
| | | | | | |
| INCREASE IN NET ASSETS FROM OPERATIONS: | | | | | |
| Net investment income | | $ | 1,997,034 | | $ | 3,505,860 | |
| Net realized gain on investments | | | 3,482,738 | | | 6,605,516 | |
| Change in unrealized appreciation | | | 8,914,235 | | | 5,668,181 | |
| | | | | | | | |
| Net increase in net assets resulting from operations | | | 14,394,007 | | | 15,779,557 | |
| | | | | | | | |
| Distributions to shareholders from: | | | | | | | |
| Net realized gain on investment securities | | | - | | | (7,519,823 | ) |
| Net investment income | | | (8,879,906 | ) | | (3,728,058 | ) |
| | | | | | | | |
| TOTAL INCREASE IN NET ASSETS | | | 5,514,101 | | | 4,531,676 | |
| | | | | | | | |
| NET ASSETS AT BEGINNING OF PERIOD | | | 165,499,938 | | | 162,027,098 | |
| | | | | | | | |
| NET ASSETS AT END OF PERIOD (Including | | | | | | | |
| undistributed net investment income: | | | | | | | |
| 2007 - $10,098,091; 2006 - $13,575,052) | | $ | 171,014,039 | | $ | 166,558,774 | |
See accompanying notes to financial statements. | | | | | | | |
BMC FUND, INC.
NOTES TO FINANCIAL STATEMENTS (Unaudited)
Six Months Ended April 30, 2007
1. | SIGNIFICANT ACCOUNTING POLICIES |
BMC Fund, Inc. (the “Company”) is a closed-end, diversified investment company registered under the Investment Company Act of 1940, as amended. Prior to becoming a regulated investment company on April 1, 1981, BMC Fund, Inc. operated as a regular corporation. The following is a summary of significant accounting policies followed by the Company in the preparation of its financial statements. The policies are in conformity with generally accepted accounting principles for investment companies.
| | A. | Investment Valuations - The investment securities are stated at market value as determined by closing prices on national securities exchanges. Investment securities include corporate bonds, mutual funds, and common and preferred stocks. |
The investments in limited partnerships, other investments and venture capital are stated at estimated fair value as determined by the management of these investments and are approved by the Company’s Valuation Committee after giving consideration to historical and projected financial results, economic conditions, financial condition of investee and other factors and events subject to change. Because of the inherent uncertainty of those valuations, the estimated values may differ significantly from the values that would have been used had a ready market value for the securities existed, and these differences could be material.
The carrying value of the investments in wholly owned subsidiaries is based on an independent appraisal of the fair market value of the subsidiaries. Equity in earnings of the wholly owned subsidiaries in the statement of operations represents the current year earnings of the subsidiaries accounted for using the equity method.
The carrying value of the investment in real estate is based on an independent appraisal of the fair market value of the real estate.
| | B. | Investment Transactions - Investment transactions are accounted for on the date the order to buy or sell is executed. Realized gains and losses on investments are determined on the basis of specific identification of issues sold or matured. The aggregate dollar amount of purchases and sales of investment securities, other than government securities and short-term debt securities having maturities of one year or less, for the six months ended April 30, 2007 was $58,731,470. |
| | C. | Income Taxes - No federal tax provision is required as it is the Company’s policy to comply with the provisions of Subchapter M of the Internal Revenue Code of 1954, as amended, including the distribution to its shareholders of substantially all of its income and any capital gains not offset by capital losses. Also, no state income tax provision has been provided because the states in which the Company has income recognize the tax exempt status of a regulated investment company. |
BMC FUND, INC.
NOTES TO FINANCIAL STATEMENTS (Unaudited)
Six Months Ended April 30, 2007
1. | SIGNIFICANT ACCOUNTING POLICIES (Continued) |
| | D. | Dividend Policy - It is the Company’s policy to pay dividends during the year in sufficient amounts to meet the requirements to maintain its status as a regulated investment company. |
| | E. | Cash and Short-Term Investments - For purposes of financial reporting, the Company considers all investments at financial institutions with original maturities of three months or less to be equivalent to cash. Short-term money market investments managed by third party investors are included in investment securities. |
| | F. | Use of Estimates - The preparation of financial statements in conformity with accounting principles generally accepted in the United States of America requires management to make estimates and assumptions that affect the reported amounts of assets and liabilities and disclosure of contingent assets and liabilities at the date of the financial statements and the reported amounts of revenues and expenses during the reporting period. Actual results could differ from those estimates. |
On September 25, 2000 (modified on October 20, 2000 and renewed July 21, 2005), the Company entered into an agreement with a bank for an unsecured line of credit in the amount of $10,000,000 to provide the Company more flexibility in its payment of dividends and management of its investments. The interest rate on any borrowings will be at the LIBOR market index rate plus 125 basis points. No commitment fee is charged on any unused balance. As of April 30, 2007, the Company had no borrowings from this line of credit, which expires on July 31, 2007.
3. | ADVISORY BOARD AND REMUNERATION OF DIRECTORS |
The Company does not have an advisory board. The independent directors are paid an annual fee of $3,000 plus $1,000 for each meeting attended in person or $500 cash for each meeting attended by telephone. Each such independent director is paid an additional $1,000 for each day attending a committee meeting in person or $500 by telephone other than on the date of a board meeting. In addition, all directors are reimbursed for their reasonable expenses incurred in attending meetings.
The Company owns two wholly-owned subsidiaries, P. B. Realty, Inc. and Broyhill Industries, Inc. As of April 30, 2007, the Company had borrowings of $3,500,000 from P. B. Realty, Inc. The interest rate is the LIBOR three month rate plus 125 basis points.
BMC FUND, INC.
NOTES TO FINANCIAL STATEMENTS (Unaudited)
Six Months Ended April 30, 2007
4. | RELATED PARTIES (Continued) |
The Company leases office space from Broyhill Investments, Inc. which is controlled by Paul H. Broyhill and M. Hunt Broyhill, both officers of BMC Fund, Inc. The expense associated with this related party lease amounted to $9,600 for the six months ended April 30, 2007 and $7,050 for the six months ended April 30, 2006. Broyhill Investments, Inc. also acts as a common paymaster for payroll and other shared services. This service is provided at no cost to the Company. All amounts paid by Broyhill Investments, Inc. on behalf of the Company are reimbursed by the Company. The outstanding payable related to these transactions at April 30, 2007 was $77,491.
5. | SUPPLEMENTAL PROXY INFORMATION AND 2007 ANNUAL MEETING OF SHAREHOLDERS |
The Annual Meeting of Shareholders of BMC Fund, Inc. was held on February 24, 2007 at The Hyatt, Sarasota, Florida. The meeting was held for the following purposes:
1. To elect the following 10 directors to serve as follows:
Director | Term | Expiring |
| | | |
| James T. Broyhill | 1 year | 2008 |
| Paul H. Broyhill | 1 year | 2008 |
| William E. Cooper | 1 year | 2008 |
| Jan E. Gordon | 1 year | 2008 |
| Allene B. Heilman | 1 year | 2008 |
| Gene A. Hoots | 1 year | 2008 |
| Brent B. Kincaid | 1 year | 2008 |
| Michael G. Landry | 1 year | 2008 |
| John S. Little | 1 year | 2008 |
| L. Glenn Orr, Jr. | 1 year | 2008 |
2. To vote upon such other business as may come before the meeting.
BMC FUND, INC.
NOTES TO FINANCIAL STATEMENTS (Unaudited)
Six Months Ended April 30, 2007
5. | SUPPLEMENTAL PROXY INFORMATION AND 2007 ANNUAL MEETING OF SHAREHOLDERS (Continued) |
The results of the proxy solicitation on the above matters were as follows:
Director | | Votes For | | Votes Against | | Votes Withheld | | Abstentions | |
| | | | | | | | | | |
| James T. Broyhill | | | 4,895,439 | | | 0 | | | 37,842 | | | 0 | |
| Paul H. Broyhill | | | 4,895,439 | | | 0 | | | 37,842 | | | 0 | |
| William E. Cooper | | | 4,895,439 | | | 0 | | | 37,842 | | | 0 | |
| Jan E. Gordon | | | 4,726,380 | | | 169,059 | | | 37,842 | | | 0 | |
| Allene B. Heilman | | | 4,895,439 | | | 0 | | | 37,842 | | | 0 | |
| Gene A. Hoots | | | 4,895,439 | | | 0 | | | 37,842 | | | 0 | |
| Brent B. Kincaid | | | 4,895,439 | | | 0 | | | 37,842 | | | 0 | |
| Michael G. Landry | | | 4,895,439 | | | 0 | | | 37,842 | | | 0 | |
| John S. Little | | | 4,895,439 | | | 0 | | | 37,842 | | | 0 | |
| L. Glenn Orr, Jr. | | | 4,895,439 | | | 0 | | | 37,842 | | | 0 | |
There was no other business voted upon at the Annual Meeting of Shareholders.
SUPPLEMENTAL INFORMATION
Paul H. Broyhill, Chairman and Chief Executive Officer, Michael G. Landry, Vice President and Chief Investment Officer, M. Hunt Broyhill, President, Christopher R. Pavese, CFA, Managing Director, and Dan J. Wakin, Managing Director - Alternative Investments, are primarily responsible for the day-to-day management of the Company’s portfolio. Mr. Paul Broyhill has had such responsibility since the inception of the Fund. Messrs. Landry and Hunt Broyhill have had such responsibility since 2001. Messrs. Landry and Hunt Broyhill have been engaged in asset management for various institutions and high net worth individuals for more than five years. Prior to joining the Company on March 1, 2005, Mr. Pavese was a Vice President and Portfolio Manager at JP Morgan Private Bank from January 1999 until February 2005. At JP Morgan, Mr. Pavese was engaged in asset management, portfolio strategy, and asset allocation for high net worth individuals, personal trusts, endowments and foundations. Mr. Wakin has had such responsibility since February 2006, and has served the Fund in other capacities since 1995.
BMC FUND, INC.
FINANCIAL HIGHLIGHTS
Six Months April 30, 2007 (Unaudited), Years Ended October 31, 2006, 2005, 2004, and 2003, Seven Month Period Ended October 31, 2002, and Each of the Five Years in the Period Ended March 31, 2002
The following table presents financial information divided into three parts: per share operating performance, total investment return and ratios and supplemental data for the six months ended April 30, 2007 (Unaudited), the years ended October 31, 2006, 2005, 2004, and 2003, the seven month period ended October 31, 2002, and each of the five years in the period ended March 31, 2002. The first part, per share operating performance, details the changes on a per share basis of the Company's beginning net asset value to its ending net asset value. The second part, total investment return, is based on the market price of the Company's shares of stock. Part three, ratios and supplemental data, provides additional financial information related to the Company's performance.
PER SHARE OPERATING PERFORMANCE | | Six Months Ended April 30, 2007 (Unaudited) | | 2006 | | 2005 | | 2004 | | 2003 | | Seven Months Ended October 31, 2002 | | 2002 | | 2001 | | 2000 | | 1999 | | 1998 | |
| | | | | | | | | | | | | | | | | | | | | | | | |
| Net asset value, beginning of period | | $ | 33.55 | | $ | 32.84 | | $ | 30.94 | | $ | 29.17 | | $ | 25.46 | | $ | 28.95 | | $ | 29.44 | | $ | 31.84 | | $ | 29.01 | | $ | 30.55 | | $ | 29.33 | |
| Net investment income | | | 0.41 | | | 1.06 | | | 0.88 | | | 0.82 | | | 0.95 | | | 0.59 | | | 1.13 | | | 1.31 | | | 2.11 | | | 1.04 | | | 1.26 | |
| Net gains (losses) on investments | | | 2.51 | | | 2.43 | | | 2.48 | | | 2.08 | | | 3.76 | | | (3.45 | ) | | (0.30 | ) | | (2.13 | ) | | 2.11 | | | (0.16 | ) | | 1.95 | |
| Total from investment operations | | | 2.92 | | | 3.49 | | | 3.36 | | | 2.90 | | | 4.71 | | | (2.86 | ) | | 0.83 | | | (0.82 | ) | | 4.22 | | | 0.88 | | | 3.21 | |
| Less distributions: | | | | | | | | | | | | | | | | | | | | | | | | | | | | | | | | | | |
| Dividends from net investment income | | | 0.10 | | | 2.37 | | | - | | | 0.65 | | | 0.45 | | | 0.56 | | | 0.84 | | | 1.58 | | | 1.10 | | | 1.49 | | | 1.14 | |
| Distributions from capital gains | | | 1.70 | | | 0.41 | | | 1.46 | | | 0.48 | | | 0.55 | | | 0.07 | | | 0.48 | | | - | | | 0.29 | | | 0.93 | | | 0.85 | |
| Total distributions | | | 1.80 | | | 2.78 | | | 1.46 | | | 1.13 | | | 1.00 | | | 0.63 | | | 1.32 | | | 1.58 | | | 1.39 | | | 2.42 | | | 1.99 | |
| Net asset value, end of period | | $ | 34.67 | | $ | 33.55 | | $ | 32.84 | | $ | 30.94 | | $ | 29.17 | | $ | 25.46 | | $ | 28.95 | | $ | 29.44 | | $ | 31.84 | | $ | 29.01 | | $ | 30.55 | |
| | | | | | | | | | | | | | | | | | | | | | | | | | | | | | | | | | | |
Per share market value, end of period1 | | $ | 26.00 | | $ | 26.00 | | $ | 26.00 | | $ | 26.00 | | $ | 26.00 | | $ | 26.00 | | $ | 26.00 | | $ | 26.00 | | $ | 26.00 | | $ | 26.00 | | $ | 26.00 | |
| | | | | | | | | | | | | | | | | | | | | | | | | | | | | | | | | | | |
TOTAL INVESTMENT RETURN2 | | | 22.44 | % | | 13.40 | % | | 12.95 | % | | 11.14 | % | | 18.12 | % | | (18.85 | )% | | *3.20 | % | | (3.15 | )% | | 16.23 | % | | 3.38 | % | | 12.33 | % |
| | | | | | | | | | | | | | | | | | | | | | | | | | | | | | | | | | | |
RATIOS/SUPPLEMENTAL DATA | | | | | | | | | | | | | | | | | | | | | | | | | | | | | | | | | | |
| | | | | | | | | | | | | | | | | | | | | | | | | | | | | | | | | | | |
| Net assets, end of period (in thousands) | | $ | 171,014 | | $ | 165,500 | | $ | 162,027 | | $ | 152,623 | | $ | 143,910 | | $ | 125,596 | | $ | 142,811 | | $ | 145,221 | | $ | 157,057 | | $ | 143,092 | | $ | 150,705 | |
Ratio of expenses to average net assets3 | | | 0.83 | % | | 0.73 | % | | 0.60 | % | | 0.73 | % | | 0.73 | % | | 0.71 | % | | *0.62 | % | | 0.49 | % | | 0.40 | % | | 0.32 | % | | 0.27 | % |
| Ratio of net investment income to | | | | | | | | | | | | | | | | | | | | | | | | | | | | | | | | | | |
average net assets3 | | | 6.56 | % | | 3.20 | % | | 2.77 | % | | 2.70 | % | | 3.52 | % | | 3.78 | % | | *3.91 | % | | 4.23 | % | | 6.99 | % | | 3.50 | % | | 4.18 | % |
| Portfolio turnover rate | | | 18.93 | % | | 48.22 | % | | 57.54 | % | | 40.10 | % | | 52.51 | % | | 31.95 | % | | 67.18 | % | | 33.65 | % | | 94.21 | % | | 80.17 | % | | 26.98 | % |
| | | | | | | | | | | | | | | | | | | | | | | | | | | | | | | | | | | |
1Unaudited - Based on stock trades, which are very limited, during that year.
2Unaudited - Computed as follows: income from investment operations divided by per share market value.
3Average is computed on a quarterly basis.
*Annualized
BMC FUND, INC. | | SCHEDULE I |
INVESTMENTS IN SECURITIES OF UNAFFILIATED ISSUERS (Unaudited) | | | |
April 30, 2007 | | | | | |
| | | Coupon | | | | | | | | Percent | |
| | | Interest | | Maturity | | Face | | Market | | of Net | |
Debt Issuer | | Rate | | Date | | Amount | | Value | | Assets | |
| | | | | | | | | | | | |
| | | | | | | | | | | | |
FIXED INCOME: | | | | | | | | | | | |
| OAKWOOD HOMES CORP | | | 7.875 | % | | 3/1/2004 | | $ | 1,000,000 | | $ | 480,000 | | | | |
ENRON CORP1 | | | 6.750 | % | | 7/1/2005 | | | 300,000 | | | - | | | | |
| GENERAL MOTORS ACCEPTANCE CORP | | | 6.125 | % | | 1/22/2008 | | | 250,000 | | | 249,637 | | | | |
| JP MORGAN CHASE & CO NIKKEI INDEX | | | 0.000 | % | | 1/31/2008 | | | 3,000,000 | | | 3,519,693 | | | | |
| UK TREASURY BOND | | | 5.000 | % | | 3/7/2008 | | | 3,925,377 | | | 3,983,278 | | | | |
| LEHMAN BROTHERS HLDGS EAFE INDEX | | | 0.000 | % | | 9/29/2008 | | | 1,000,000 | | | 1,288,100 | | | | |
| LEHMAN BROTHERS HLDGS NIKKEI INDEX | | | 0.000 | % | | 11/15/2008 | | | 3,000,000 | | | 4,278,600 | | | | |
| LEHMAN BROTHERS HLDGS MEDIUM TERM NOTE | | | 0.000 | % | | 3/11/2011 | | | 3,000,000 | | | 3,260,700 | | | | |
| GENERAL MOTORS CORP | | | 9.400 | % | | 7/15/2021 | | | 250,000 | | | 245,000 | | | | |
| POTOMAC TRUST CAPITAL MM S | | | 3.350 | % | | 2/4/2025 | | | 1,000,000 | | | 1,000,000 | | | | |
| | | | | | | | | | | | | | | | | |
| TOTAL INVESTMENTS IN FIXED INCOME | | | | | | | | $ | 16,725,377 | | | 18,305,008 | | | 10.70 | % |
BMC FUND, INC. | SCHEDULE I |
INVESTMENTS IN SECURITIES OF UNAFFILIATED ISSUERS (Continued) (Unaudited) |
April 30, 2007 | | | | |
| | | | | | | | | Percent | |
| | | Shares | | | | Market | | of Net | |
Company Name | | Held | | Cost | | Value | | Assets | |
| | | | | | | | | | |
MUTUAL FUNDS: | | | | | | | | | |
BOND MUTUAL FUNDS: | | | | | | | | | |
| ABERDEEN GLOBAL INC FD COM | | | 38,500.00 | | $ | 500,945 | | $ | 511,280 | | | | |
| VAN KAMPEN SR INCM TR COM | | | 50,000.00 | | | 409,877 | | | 445,500 | | | | |
| VANGUARD LONG-TERM INV GRADE ADMIRAL SH | | | 105,820.11 | | | 1,000,000 | | | 976,720 | | | | |
| TOTAL BOND MUTUAL FUNDS | | | | | | 1,910,822 | | | 1,933,500 | | | 1.13 | % |
BMC FUND, INC. | | | SCHEDULE I |
INVESTMENTS IN SECURITIES OF UNAFFILIATED ISSUERS (Continued) (Unaudited) | |
April 30, 2007 | | | | |
| | | | | | | | | Percent | |
| | | Shares | | | | Market | | of Net | |
Company Name | | Held | | Cost | | Value | | Assets | |
MUTUAL FUNDS: | | | | | | | | | |
STOCK MUTUAL FUNDS: | | | | | | | | | |
| U.S. LARGE CAP EQUITIES | | | | | | | | | | | | | |
| Large Cap Blend | | | | | | | | | | | | | |
| SELECTED AMERN SHS INC COM | | | 5,108.99 | | $ | 150,000 | | $ | 245,896 | | | | |
| SPDR TR UNIT SER 1 | | | 5,000.00 | | | 548,765 | | | 741,450 | | | | |
| Total Large Cap Blend | | | | | | 698,765 | | | 987,346 | | | 0.58 | % |
| | | | | | | | | | | | | | |
| Large Cap Value | | | | | | | | | | | | | |
| DODGE & COX STK FD COM | | | 4,146.57 | | | 489,147 | | | 661,585 | | | | |
| EATON VANCE TAX ADVT COM | | | 13,100.00 | | | 292,238 | | | 385,926 | | | | |
| GABELLI DIVIDEND & INCOME TR | | | 12,000.00 | | | 229,293 | | | 266,280 | | | | |
| GMO TR VALUE III | | | 33,419.15 | | | 254,197 | | | 374,294 | | | | |
| Total Large Cap Value | | | | | | 1,264,875 | | | 1,688,085 | | | 0.98 | % |
| | | | | | | | | | | | | | |
| TOTAL U. S. LARGE CAP EQUITIES | | | | | | 1,963,640 | | | 2,675,431 | | | 1.56 | % |
| | | | | | | | | | | | | | |
| U.S. SMALL/MID CAP EQUITIES | | | | | | | | | | | | | |
| Mid Cap Blend | | | | | | | | | | | | | |
| VANGUARD MID CAP VIPER | | | 3,000.00 | | | 235,305 | | | 235,830 | | | | |
| VANGUARD STRATEGIC EQUITY | | | 16,920.62 | | | 306,714 | | | 433,676 | | | | |
| Total Mid Cap Blend | | | | | | 542,019 | | | 669,506 | | | 0.39 | % |
| | | | | | | | | | | | | | |
| Mid Cap Growth | | | | | | | | | | | | | |
| BRANDYWINE FD INC COM | | | 10,053.62 | | | 225,000 | | | 365,550 | | | | |
| VANGUARD CAPITAL OPPOR FUN | | | 4,472.38 | | | 100,058 | | | 168,698 | | | | |
| Total Mid Cap Growth | | | | | | 325,058 | | | 534,248 | | | 0.31 | % |
| | | | | | | | | | | | | | |
| Mid Cap Value | | | | | | | | | | | | | |
| HANCOCK J PATRIOT SLCT COM | | | 10,000.00 | | | 152,050 | | | 139,600 | | | | |
| VANGUARD SELECTED VALUE FU | | | 30,467.10 | | | 522,314 | | | 681,244 | | | | |
| Total Mid Cap Value | | | | | | 674,364 | | | 820,844 | | | 0.48 | % |
| | | | | | | | | | | | | | |
| Small Cap Value | | | | | | | | | | | | | |
| CORNERCAP SMALL CAP VALUE | | | 9,354.54 | | | 100,000 | | | 116,277 | | | | |
| VANGUARD SMALL CAP VALUE I | | | 10,224.95 | | | 100,000 | | | 180,982 | | | | |
| Total Small Cap Value | | | | | | 200,000 | | | 297,259 | | | 0.18 | % |
| | | | | | | | | | | | | | |
| TOTAL U.S. SMALL/MID CAP EQUITIES | | | | | | 1,741,441 | | | 2,321,857 | | | 1.36 | % |
| | | | | | | | | | | | | | |
| INTERNATIONAL EQUITIES | | | | | | | | | | | | | |
| World Stock | | | | | | | | | | | | | |
| POLARIS GLOBAL VALUE FUND | | | 4,938.85 | | | 105,000 | | | 104,704 | | | 0.06 | % |
| | | | | | | | | | | | | | |
BMC FUND, INC. | | | SCHEDULE I |
INVESTMENTS IN SECURITIES OF UNAFFILIATED ISSUERS (Continued) (Unaudited) | |
April 30, 2007 | | | | |
| | | | | | | | | Percent | |
| | | Shares | | | | Market | | of Net | |
Company Name | | Held | | Cost | | Value | | Assets | |
| Foreign Large Blend | | | | | | | | | | | | | |
| ISHARES TR MSCI EAFE IDX | | | 12,600.00 | | $ | 520,186 | | $ | 997,416 | | | | |
| UMB SCOUT INTERNATIONAL FUND | | | 5,625.88 | | | 200,000 | | | 200,619 | | | | |
| VANGUARD INTL GROWTH FUND | | | 10,944.15 | | | 553,811 | | | 894,903 | | | | |
| Total Foreign Large Blend | | | | | | 1,273,997 | | | 2,092,938 | | | 1.22 | % |
| | | | | | | | | | | | | | |
| Foreign Large Value | | | | | | | | | | | | | |
| GMO TR FOREIGN II | | | 63,902.32 | | | 661,348 | | | 1,255,681 | | | | |
| GMO TR INTL INTRINSIC VL I | | | 19,384.40 | | | 362,936 | | | 718,192 | | | | |
| ISHARES INC MSCI CDA INDEX | | | 25,500.00 | | | 466,086 | | | 703,035 | | | | |
| Total Foreign Large Value | | | | | | 1,490,370 | | | 2,676,908 | | | 1.57 | % |
| | | | | | | | | | | | | | |
| Foreign Small/Mid Value | | | | | | | | | | | | | |
| TWEEDY BROWNE FD INC GLOBAL | | | 19,958.23 | | | 453,541 | | | 677,781 | | | 0.40 | % |
| | | | | | | | | | | | | | |
| Diversified Emerging Markets | | | | | | | | | | | | | |
| ISHARES TR MSCI EMERG MKT | | | 9,000.00 | | | 393,810 | | | 1,087,560 | | | 0.64 | % |
| | | | | | | | | | | | | | |
| Diversified Asia Pacific | | | | | | | | | | | | | |
| MORGAN S D WITTR ASIA COM | | | 56,000.00 | | | 582,115 | | | 1,087,520 | | | 0.64 | % |
| | | | | | | | | | | | | | |
| European Stock | | | | | | | | | | | | | |
| ISHARES INC MSCI UTD KINGDOM | | | 13,700.00 | | | 248,982 | | | 340,445 | | | | |
| NEW IRELAND FUND INC | | | 16,379.00 | | | 188,388 | | | 589,153 | | | | |
| SPAIN FD COM | | | 25,200.00 | | | 214,302 | | | 444,024 | | | | |
| SWISS HELVETIA FD INC COM | | | 25,479.00 | | | 292,159 | | | 532,511 | | | | |
| Total European Stock | | | | | | 943,831 | | | 1,906,133 | | | 1.11 | % |
| | | | | | | | | | | | | | |
| Japan Stock | | | | | | | | | | | | | |
| ISHARES INC MSCI JAPAN | | | 47,000.00 | | | 467,930 | | | 671,160 | | | | |
| SPDR RUSSELL/NOMURA SMALL | | | 2,000.00 | | | 107,348 | | | 103,500 | | | | |
| VANGUARD PACIFIC STOCK IND | | | 8,303.96 | | | 520,000 | | | 702,847 | | | | |
| VANGUARD PACIFIC VIPERS | | | 10,100.00 | | | 506,327 | | | 692,052 | | | | |
| Total Japan Stock | | | | | | 1,601,605 | | | 2,169,559 | | | 1.27 | % |
| | | | | | | | | | | | | | |
| Asia Ex-Japan Stock | | | | | | | | | | | | | |
| ISHARES INC MSCI AUSTRALIA | | | 41,500.00 | | | 663,914 | | | 1,124,235 | | | | |
| ISHARES INC MSCI SINGAPORE | | | 151,500.00 | | | 1,063,650 | | | 1,928,595 | | | | |
| MATTHEWS INTL FDS ASIAN GR | | | 75,615.05 | | | 1,125,000 | | | 1,491,885 | | | | |
| TAIWAN FD INC COM | | | 26,200.00 | | | 282,381 | | | 471,600 | | | | |
| Total Asia Ex-Japan Stock | | | | | | 3,134,945 | | | 5,016,315 | | | 2.93 | % |
| | | | | | | | | | | | | | |
BMC FUND, INC. | | | SCHEDULE I |
INVESTMENTS IN SECURITIES OF UNAFFILIATED ISSUERS (Continued) (Unaudited) | |
April 30, 2007 | | | | |
| | | | | | | | | Percent | |
| | | Shares | | | | Market | | of Net | |
Company Name | | Held | | Cost | | Value | | Assets | |
| Latin American Stock | | | | | | | | | | | | | |
| ISHARES INC MSCI MEXICO | | | 4,000.00 | | $ | 157,040 | | $ | 221,360 | | | 0.13 | % |
| | | | | | | | | | | | | | |
| TOTAL INTERNATIONAL EQUITIES | | | | | | 10,136,254 | | | 17,040,778 | | | 9.97 | % |
| | | | | | | | | | | | | | |
| SPECIALTY FUNDS | | | | | | | | | | | | | |
| Real Estate | | | | | | | | | | | | | |
| FIDELITY INTERNATIONAL REAL ESTATE | | | 11,514.57 | | | 200,000 | | | 199,432 | | | 0.12 | % |
| | | | | | | | | | | | | | |
| Natural Resources | | | | | | | | | | | | | |
| ENERPLUS RES FD UNIT TR G | | | 10,000.00 | | | 481,407 | | | 435,000 | | | | |
| OIL SVC HOLDRS TR | | | 4,000.00 | | | 535,334 | | | 626,200 | | | | |
| PENGROWTH ENERGY TRUST | | | 30,000.00 | | | 546,953 | | | 518,100 | | | | |
| POWERSHARES ETF TRUST WATER | | | 15,000.00 | | | 268,469 | | | 291,900 | | | | |
| PROVIDENT ENERGY TRUST UNITS | | | 20,000.00 | | | 228,130 | | | 235,600 | | | | |
| Total Natural Resources | | | | | | 2,060,293 | | | 2,106,800 | | | 1.23 | % |
| | | | | | | | | | | | | | |
| Precious Metals | | | | | | | | | | | | | |
| ISHARES COMEX GOLD TR ISHA | | | 30,000.00 | | | 1,762,368 | | | 2,016,000 | | | | |
| MARKET VECTORS ETF TR GOLD | | | 30,000.00 | | | 1,064,646 | | | 1,186,719 | | | | |
| Total Precious Metals | | | | | | 2,827,014 | | | 3,202,719 | | | 1.87 | % |
| | | | | | | | | | | | | | |
| Moderate Allocation | | | | | | | | | | | | | |
| FPA FUNDS TR FPA CRESCENT | | | 10,957.16 | | | 194,065 | | | 304,609 | | | 0.18 | % |
| | | | | | | | | | | | | | |
| TOTAL SPECIALTY FUNDS | | | | | | 5,281,372 | | | 5,813,560 | | | 3.40 | % |
| | | | | | | | | | | | | | |
| TOTAL STOCK MUTUAL FUNDS | | | | | | 19,122,707 | | | 27,851,626 | | | 16.29 | % |
| | | | | | | | | | | | | | |
| TOTAL INVESTMENT IN MUTUAL FUNDS | | | | | $ | 21,033,529 | | | 29,785,126 | | | 17.42 | % |
BMC FUND, INC. | SCHEDULE I |
INVESTMENTS IN SECURITIES OF UNAFFILIATED ISSUERS (Continued) (Unaudited) | | |
April 30, 2007 | | | |
| | | | | Market | | Percent of | |
Company Name | | Cost | | Value | | Net Assets | |
| | | | | | | | |
OTHER INVESTMENTS: | | | | | | | |
| | | | | | | | |
LIMITED PARTNERSHIPS: | | | | | | | |
| INSTITUTIONAL BENCHMARKS SERIES LLC: | | | | | | | | | | |
| - CONVERTIBLE HEDGE SERIES | | $ | 1,475,886 | | $ | 1,838,592 | | | | |
| - EVENT DRIVEN MULTI-STRATEGY SERIES | | | 2,298,592 | | | 3,360,522 | | | | |
| - MERGER ARBITRAGE SERIES | | | 1,600,000 | | | 2,120,591 | | | | |
| JMG CAPITAL PARTNERS LP | | | 609,767 | | | 1,780,758 | | | | |
| LMC COMPASS FUND LP | | | 1,500,000 | | | 1,865,067 | | | | |
| MARINER PARTNERS LP | | | 750,000 | | | 1,612,008 | | | | |
| RYE SELECT BROAD MARKET FUND LP | | | 1,000,000 | | | 1,030,875 | | | | |
| STARK INVESTMENTS LP | | | 1,000,000 | | | 2,818,252 | | | | |
| STARK STRUCTURED FINANCE ONSHORE FUND | | | 1,000,000 | | | 1,172,125 | | | | |
| WALNUT INVESTMENT PARTNERS | | | 235,567 | | | 208,965 | | | | |
| TOTAL LIMITED PARTNERSHIPS | | | 11,469,812 | | | 17,807,755 | | | 10.41 | % |
| | | | | | | | | | | |
PUT OPTIONS: | | | | | | | | | | |
| BANKRATE PUT OPTION $50 EXP 11/17/2007 | | | 52,438 | | | 32,100 | | | | |
| ISHARES RUSSELL 2000 PUT OPTION $95 EXP 08/18/2007 | | | 190,125 | | | 140,500 | | | | |
| ISHARES TR FTSE PUT OPTION $110 EXP 05/19/2007 | | | 135,125 | | | 50,000 | | | | |
| MCGRAW-HILL PUT OPTION $70 EXP 01/19/2008 | | | 16,625 | | | 11,800 | | | | |
| MOODYS CORP PUT OPTION $80 EXP 01/19/2008 | | | 36,425 | | | 28,200 | | | | |
| TOTAL PUT OPTIONS | | | 430,738 | | | 262,600 | | | 0.15 | % |
| | | | | | | | | | | |
| TOTAL OTHER INVESTMENTS | | $ | 11,900,550 | | | 18,070,355 | | | 10.56 | % |
BMC FUND, INC. | SCHEDULE I |
INVESTMENTS IN SECURITIES OF UNAFFILIATED ISSUERS (Continued) (Unaudited) | |
April 30, 2007 | |
Sectors and Industries | | Shares Held | | Company Name | | Cost | | Market Value | | Percent of Net Assets | |
| | | | | | | | | | | | | | | | | |
COMMON STOCKS: | | | | | | | | | | | |
| CONSUMER DISCRETIONARY | | | | | | | | | | | | | | | | |
| Consumer Durables & Apparel | | | 2,000.00 | | | GARMIN LTD ORD | | $ | 98,643 | | $ | 116,380 | | | | |
| | | | 170,600.00 | | | HEAD N V NY REGISTRY SH | | | 387,678 | | | 791,584 | | | | |
| | | | 2,500.00 | | | UNDER ARMOUR, INC | | | 106,262 | | | 126,250 | | | | |
| | | | | | | | | | 592,583 | | | 1,034,214 | | | 0.61 | % |
| | | | | | | | | | | | | | | | | |
| Consumer Services | | | 48,000.00 | | | APPLEBEES INTL INC COM | | | 1,053,979 | | | 1,304,640 | | | | |
| | | | 28,000.00 | | | CARNIVAL CORP COM | | | 1,116,019 | | | 1,368,920 | | | | |
| | | | 21,300.00 | | | MCDONALDS CORP COM | | | 439,383 | | | 1,028,364 | | | | |
| | | | | | | | | | 2,609,381 | | | 3,701,924 | | | 2.16 | % |
| | | | | | | | | | | | | | | | | |
| Media | | | 30,000.00 | | | DISNEY WALT CO COM | | | 701,268 | | | 1,049,400 | | | | |
| | | | 5,000.00 | | | GANNETT INC COM | | | 284,075 | | | 285,300 | | | | |
| | | | 500.00 | | | GRUPO TELEVISA SA DE SP AD | | | 14,363 | | | 13,950 | | | | |
| | | | 55,000.00 | | | NEWS CORP CL B | | | 958,567 | | | 1,320,000 | | | | |
| | | | | | | | | | 1,958,273 | | | 2,668,650 | | | 1.56 | % |
| | | | | | | | | | | | | | | | | |
| Retailing | | | 5,000.00 | | | AARON RENTS INC COM | | | 102,044 | | | 141,850 | | | | |
| | | | 3,000.00 | | | AMERN EAGLE OUTFIT NEW COM | | | 88,763 | | | 86,610 | | | | |
| | | | 30,000.00 | | | HOME DEPOT INC COM | | | 1,027,660 | | | 1,136,100 | | | | |
| | | | 1,500.00 | | | MEN'S WEARHOUSE | | | 67,242 | | | 63,630 | | | | |
| | | | 2,000.00 | | | TARGET CORP COM | | | 119,780 | | | 117,880 | | | | |
| | | | | | | | | | 1,405,489 | | | 1,546,070 | | | 0.90 | % |
| | | | | | | | | | | | | | | | | |
| Automobiles & Components | | | 10,000.00 | | | GENERAL MTRS CORP COM | | | 322,723 | | | 312,300 | | | | |
| | | | 1,750.00 | | | TOYOTA MTR CP ADS | | | 220,156 | | | 212,110 | | | | |
| | | | | | | | | | 542,879 | | | 524,410 | | | 0.31 | % |
| | | | | | | | | | | | | | | | | |
| TOTAL CONSUMER DISCRETIONARY | | | | | | 7,108,605 | | | 9,475,268 | | | 5.54 | % |
| | | | | | | | | | | | | | | | | |
| CONSUMER STAPLES | | | | | | | | | | | | | | | | |
| Food & Staples Retailing | | | 5,000.00 | | | BLUE SQUARE ISRAEL ADS | | | 87,963 | | | 86,250 | | | | |
| | | | 2,000.00 | | | COSTCO COMPANIES INC COM | | | 105,322 | | | 107,140 | | | | |
| | | | 50,000.00 | | | KROGER CO COM | | | 812,240 | | | 1,475,500 | | | | |
| | | | 32,000.00 | | | SAFEWAY INC COM NEW | | | 598,650 | | | 1,161,600 | | | | |
| | | | 3,000.00 | | | SYSCO CORP COM | | | 88,555 | | | 98,220 | | | | |
| | | | | | | | | | 1,692,730 | | | 2,928,710 | | | 1.71 | % |
| | | | | | | | | | | | | | | | | |
| Food, Beverage & Tobacco | | | 10,000.00 | | | ANHEUSER BUSCH COS INC COM | | | 444,333 | | | 491,900 | | | | |
| | | | 10,000.00 | | | CADBURY SCHWEPPES PLC ADR | | | 320,147 | | | 530,500 | | | | |
| | | | 1,000.00 | | | CAMPBELL SOUP CO COM | | | 34,245 | | | 39,100 | | | | |
| | | | 22,000.00 | | | COCA COLA CO COM | | | 910,468 | | | 1,148,180 | | | | |
| | | | 33,421.00 | | | DEL MONTE FOODS CO COM | | | 293,012 | | | 387,683 | | | | |
| | | | 10,000.00 | | | DIAGEO P L C SPON ADR NEW | | | 584,721 | | | 844,000 | | | | |
| | | | 12,500.00 | | | GENERAL MLS INC COM | | | 615,776 | | | 748,750 | | | | |
| | | | 10,000.00 | | | GROUP DANONE ADS | | | 302,506 | | | 331,800 | | | | |
| | | | 11,900.00 | | | HEINZ H J CO COM | | | 399,291 | | | 560,609 | | | | |
| | | | 15,000.00 | | | KRAFT FOODS INC CL A | | | 468,420 | | | 502,050 | | | | |
| | | | 12,300.00 | | | NESTLE S A SPONSORED ADR | | | 201,834 | | | 1,222,534 | | | | |
| | | | 4,000.00 | | | PEPSICO INC COM | | | 216,824 | | | 262,920 | | | | |
| | | | 3,500.00 | | | SADIA | | | 126,325 | | | 149,205 | | | | |
| | | | 4,000.00 | | | UST INC | | | 219,273 | | | 224,020 | | | | |
| | | | | | | | | | 5,137,175 | | | 7,443,251 | | | 4.35 | % |
BMC FUND, INC. | SCHEDULE I |
INVESTMENTS IN SECURITIES OF UNAFFILIATED ISSUERS (Continued) (Unaudited) | |
April 30, 2007 | |
Sectors and Industries | | Shares Held | | Company Name | | Cost | | Market Value | | Percent of Net Assets | |
| | | | | | | | | | | | | | | | | |
| Household & Personal Products | | | 40,000.00 | | | AVON PRODS INC COM | | $ | 1,091,907 | | $ | 1,592,000 | | | | |
| | | | 14,000.00 | | | PROCTER & GAMBLE CO COM | | | 892,366 | | | 901,100 | | | | |
| | | | | | | | | | 1,984,273 | | | 2,493,100 | | | 1.46 | % |
| | | | | | | | | | | | | | | | | |
| TOTAL CONSUMER STAPLES | | | | | | 8,814,178 | | | 12,865,061 | | | 7.52 | % |
| | | | | | | | | �� | | | | | | | | |
| ENERGY | | | | | | | | | | | | | | | | |
| Energy | | | 30,000.00 | | | ADVANTAGE ENERGY INCOM TR | | | 345,877 | | | 340,200 | | | | |
| | | | 18,000.00 | | | BP PLC SPONSORED ADR | | | 1,115,427 | | | 1,211,760 | | | | |
| | | | 3,000.00 | | | BP PRUDHOE BAY ROYALTY TR | | | 181,391 | | | 188,490 | | | | |
| | | | 6,200.00 | | | CHEVRON CORP | | | 223,257 | | | 482,298 | | | | |
| | | | 21,292.00 | | | CONOCOPHILLIPS COM | | | 600,414 | | | 1,476,600 | | | | |
| | | | 3,500.00 | | | DEVON ENERGY CORP NEW COM | | | 239,902 | | | 255,045 | | | | |
| | | | 5,000.00 | | | DOUBLE HULL TANKERS COM | | | 75,018 | | | 79,650 | | | | |
| | | | 25,340.00 | | | ENTERPRISE PRODS PARTN COM | | | 470,956 | | | 822,283 | | | | |
| | | | 7,104.00 | | | EXXON MOBIL CORP COM | | | 309,274 | | | 563,916 | | | | |
| | | | 500.00 | | | FRONTIER OIL CORP COM | | | 17,363 | | | 17,665 | | | | |
| | | | 5,000.00 | | | GENERAL MARITIME CORP SHS | | | 171,432 | | | 137,250 | | | | |
| | | | 3,000.00 | | | KNIGHTSBRIDGE TANKERS ORD | | | 78,032 | | | 87,480 | | | | |
| | | | 100.00 | | | MARATHON OIL CORP COM | | | 6,931 | | | 10,155 | | | | |
| | | | 3,000.00 | | | NORDIC AMERICAN TANKER COM | | | 115,277 | | | 115,560 | | | | |
| | | | 2,000.00 | | | OVERSEAS SHIPHOLDNG GP COM | | | 126,357 | | | 137,300 | | | | |
| | | | 4,000.00 | | | PETROLEUM & RES CORP COM | | | 132,543 | | | 145,760 | | | | |
| | | | 10,000.00 | | | PRECISION DRILLING TR TR U | | | 202,512 | | | 239,900 | | | | |
| | | | 5,000.00 | | | PRIDE INTL INC DEL COM | | | 148,125 | | | 160,800 | | | | |
| | | | 3,500.00 | | | ROYAL DUTCH SHELL ADR A | | | 187,274 | | | 242,725 | | | | |
| | | | 8,792.00 | | | ROYAL DUTCH SHELL ADR B | | | 431,360 | | | 621,682 | | | | |
| | | | 3,000.00 | | | SAN JUAN BASIN ROYALTY TRU | | | 91,143 | | | 95,760 | | | | |
| | | | 1,500.00 | | | SPECTRA ENERGY | | | 42,619 | | | 39,150 | | | | |
| | | | 4,750.00 | | | SUNCOR ENERGY INC COM | | | 366,747 | | | 354,175 | | | | |
| | | | 2,500.00 | | | SUPERIOR ENERGY SERVICES | | | 79,725 | | | 84,325 | | | | |
| | | | 4,500.00 | | | TENARIS S A SPONSORED ADR | | | 218,977 | | | 208,620 | | | | |
| | | | 14,500.00 | | | TEPPCO PARTNERS L P UT LTD | | | 455,590 | | | 660,475 | | | | |
| | | | 6,000.00 | | | TIDEWATER INC COM | | | 316,997 | | | 366,860 | | | | |
| | | | 2,088.00 | | | WEATHERFORD INTL LTD COM | | | 97,153 | | | 93,599 | | | | |
| TOTAL ENERGY | | | | | | | | | 6,847,673 | | | 9,239,483 | | | 5.40 | % |
| | | | | | | | | | | | | | | | | |
| FINANCIALS | | | | | | | | | | | | | | | | |
| Banks | | | 16,000.00 | | | BANK OF AMERICA CORP COM | | | 776,364 | | | 811,950 | | | | |
| | | | 9,550.00 | | | COMERICA INC COM | | | 474,885 | | | 591,241 | | | | |
| | | | 50,000.00 | | | HUDSON CITY BANCORP COM | | | 668,276 | | | 666,000 | | | | |
| | | | 250.00 | | | ICICI BANK | | | 9,452 | | | 10,080 | | | | |
| | | | 2,500.00 | | | INDYMAC BANCORP INC COM | | | 114,196 | | | 73,725 | | | | |
| | | | 10,000.00 | | | POPULAR INC COM | | | 168,850 | | | 168,100 | | | | |
| | | | 16,200.00 | | | US BANCORP DEL COM NEW | | | 318,466 | | | 556,470 | | | | |
| | | | 1,500.00 | | | WASHINGTON MUT INC COM | | | 61,113 | | | 62,970 | | | | |
| | | | 1,000.00 | | | WELLS FARGO & CO DEL COM | | | 29,330 | | | 35,890 | | | | |
| | | | | | | | | | 2,620,932 | | | 2,976,426 | | | 1.74 | % |
| | | | | | | | | | | | | | | | | |
| Diversified Financials | | | 23,800.00 | | | ALLIANCE BERNSTEIN HLDG UN | | | 1,124,767 | | | 2,163,598 | | | | |
| | | | 14,000.00 | | | ALLIED CAP CORP COM | | | 436,455 | | | 404,600 | | | | |
| | | | 500.00 | | | BEAR STEARNS COS INC COM | | | 81,003 | | | 77,850 | | | | |
| | | | 4,500.00 | | | BROOKFIELD ASSET MANAGEMEN | | | 128,037 | | | 251,675 | | | | |
| | | | 8,133.00 | | | CITIGROUP INC COM | | | 295,171 | | | 436,091 | | | | |
| | | | 10,064.00 | | | HSBC HLDGS PLC SPON ADR NE | | | 756,535 | | | 926,811 | | | | |
BMC FUND, INC. | SCHEDULE I |
INVESTMENTS IN SECURITIES OF UNAFFILIATED ISSUERS (Continued) (Unaudited) | |
April 30, 2007 | |
Sectors and Industries | | Shares Held | | Company Name | | Cost | | Market Value | | Percent of Net Assets | |
| | | | | | | | | | | | | | | | | |
| | | | 2,500.00 | | | INTERNATIONAL SECS EXC CL | | $ | 120,782 | | $ | 135,225 | | | | |
| | | | 5,000.00 | | | INVESTOOLS INC | | | 49,936 | | | 58,150 | | | | |
| | | | 10,000.00 | | | J P MORGAN CHASE & CO COM | | | 353,770 | | | 521,000 | | | | |
| | | | 5,000.00 | | | LLOYDS TSB GROUP PLC SPONS | | | 205,944 | | | 233,100 | | | | |
| | | | 50.00 | | | MOODYS CORP COM | | | 3,274 | | | 3,306 | | | | |
| | | | 7,500.00 | | | MORGAN STANLEY COM NEW | | | 393,135 | | | 630,075 | | | | |
| | | | 2,000.00 | | | NYSE EURONEXT | | | 200,551 | | | 168,660 | | | | |
| | | | | | | | | | 4,149,360 | | | 6,010,141 | | | 3.51 | % |
| | | | | | | | | | | | | | | | | |
| Insurance | | | 12,000.00 | | | AMERICAN INTL GROUP COM | | | 832,373 | | | 834,020 | | | | |
| | | | 2.00 | | | BERKSHIRE HATHAWAY A | | | 218,700 | | | 218,400 | | | | |
| | | | 3,000.00 | | | LOEWS CORP | | | 130,547 | | | 138,860 | | | | |
| | | | 12,000.00 | | | MANULIFE FINL CORP COM | | | 367,775 | | | 433,320 | | | | |
| | | | 40,000.00 | | | MARSH & MCLENNAN COS COM | | | 1,154,788 | | | 1,270,400 | | | | |
| | | | 4,000.00 | | | PRUDENTIAL FINL INC COM | | | 330,023 | | | 374,200 | | | | |
| | | | | | | | | | 3,034,206 | | | 3,269,200 | | | 1.91 | % |
| | | | | | | | | | | | | | | | | |
| Real Estate | | | 12,000.00 | | | CAPITALSOURCE INC COM | | | 327,557 | | | 309,090 | | | | |
| | | | 3,000.00 | | | NEW CENTURY FINANCIAL COM | | | 128,820 | | | 2,670 | | | | |
| | | | | | | | | | 456,377 | | | 311,760 | | | 0.18 | % |
| | | | | | | | | | | | | | | | | |
| TOTAL FINANCIALS | | | | | | | | | 10,260,875 | | | 12,567,527 | | | 7.34 | % |
| | | | | | | | | | | | | | | | | |
| HEALTH CARE | | | | | | | | | | | | | | | | |
| Health Care Equipment & | | | 10,666.00 | | | AMEDISYS INC COM | | | 316,970 | | | 328,879 | | | | |
| Services | | | 5,000.00 | | | BARD C R INC COM | | | 206,257 | | | 415,650 | | | | |
| | | | 3,000.00 | | | BAXTER INTL INC COM | | | 150,258 | | | 157,290 | | | | |
| | | | 9,500.00 | | | CIGNA CORP COM | | | 658,218 | | | 1,457,505 | | | | |
| | | | 500.00 | | | COVENTRY HEALTH CARE COM | | | 28,213 | | | 28,915 | | | | |
| | | | 12,000.00 | | | ERESEARCHTECHNOLOGY COM | | | 161,375 | | | 104,040 | | | | |
| | | | 8,400.00 | | | LABORATORY AMER HLDGS COM | | | 375,170 | | | 663,096 | | | | |
| | | | 2,500.00 | | | PEDIATRIX MED GROUP COM | | | 116,869 | | | 142,625 | | | | |
| | | | 7,000.00 | | | QUEST DIAGNOSTICS INC COM | | | 322,209 | | | 341,230 | | | | |
| | | | 550.00 | | | UNITEDHEALTH GROUP INC COM | | | 27,866 | | | 29,183 | | | | |
| | | | 2,000.00 | | | WELLCARE HEALTH PLANS | | | 169,773 | | | 159,380 | | | | |
| | | | | | | | | | 2,533,178 | | | 3,827,793 | | | 2.24 | % |
| | | | | | | | | | | | | | | | | |
| Pharmaceuticals & | | | 12,000.00 | | | AMGEN INC COM | | | 728,796 | | | 756,030 | | | | |
| Biotechnology | | | 3,000.00 | | | BIOVAIL CORP. | | | 59,573 | | | 65,220 | | | | |
| | | | 40,000.00 | | | BRISTOL MYERS SQUIBB COM | | | 965,578 | | | 1,154,400 | | | | |
| | | | 10,000.00 | | | FOREST LABS INC COM | | | 398,899 | | | 532,100 | | | | |
| | | | 5,500.00 | | | GILEAD SCIENCES INC COM | | | 335,332 | | | 403,060 | | | | |
| | | | 7,500.00 | | | GLAXOSMITHKLINE PLC SPONSO | | | 387,802 | | | 433,350 | | | | |
| | | | 10,000.00 | | | JOHNSON & JOHNSON COM | | | 608,249 | | | 642,200 | | | | |
| | | | 500.00 | | | LIFECELL CORP | | | 14,393 | | | 14,325 | | | | |
| | | | 500.00 | | | MATRIXX INITIATIVES COM | | | 12,376 | | | 9,000 | | | | |
| | | | 30,000.00 | | | MERCK & CO INC COM | | | 827,577 | | | 1,543,200 | | | | |
| | | | 10,000.00 | | | NOVARTIS A G SPONSORED ADR | | | 504,075 | | | 580,900 | | | | |
| | | | 1,000.00 | | | PDL BIOPHARMA INC COM | | | 31,315 | | | 25,260 | | | | |
| | | | 30,100.00 | | | PFIZER INC COM | | | 812,583 | | | 795,321 | | | | |
| | | | 5,000.00 | | | SANGAMO BIOSCIENCES | | | 38,736 | | | 35,900 | | | | |
BMC FUND, INC. | SCHEDULE I |
INVESTMENTS IN SECURITIES OF UNAFFILIATED ISSUERS (Continued) (Unaudited) | |
April 30, 2007 | |
Sectors and Industries | | Shares Held | | Company Name | | Cost | | Market Value | | Percent of Net Assets | |
| | | | | | | | | | | | | | | | | |
| | | | 40,000.00 | | | SCHERING PLOUGH CORP COM | | $ | 793,811 | | $ | 1,269,200 | | | | |
| | | | 11,500.00 | | | SCIELE PHARMA INC COM | | | 260,885 | | | 279,980 | | | | |
| | | | 12,500.00 | | | WYETH COM | | | 555,515 | | | 693,750 | | | | |
| | | | | | | | | | 7,335,495 | | | 9,233,196 | | | 5.40 | % |
| | | | | | | | | | | | | | | | | |
| TOTAL HEALTH CARE | | | | | | | | | 9,868,673 | | | 13,060,989 | | | 7.64 | % |
| | | | | | | | | | | | | | | | | |
| INDUSTRIALS | | | | | | | | | | | | | | | | |
| Capital Goods | | | 2,000.00 | | | AERCAP HOLDINGS | | | 54,998 | | | 58,340 | | | | |
| | | | 4,500.00 | | | CERADYNE INC COM | | | 247,904 | | | 259,825 | | | | |
| | | | 7,500.00 | | | DRS TECHNOLOGIES INC COM | | | 215,334 | | | 377,325 | | | | |
| | | | 5,000.00 | | | FORCE PROTECTION | | | 120,477 | | | 108,500 | | | | |
| | | | 7,000.00 | | | GENERAL DYNAMICS CORP COM | | | 335,505 | | | 549,500 | | | | |
| | | | 23,000.00 | | | GENERAL ELEC CO COM | | | 673,252 | | | 847,780 | | | | |
| | | | 2,200.00 | | | KUBOTA CORP ADR | | | 104,760 | | | 105,160 | | | | |
| | | | 7,500.00 | | | L-3 COMMUNICATNS HLDGS COM | | | 540,465 | | | 673,725 | | | | |
| | | | 42,655.00 | | | OWENS CORNING | | | 1,545,268 | | | 1,307,376 | | | | |
| | | | 1,500.00 | | | PARKER HANNIFIN CORP COM | | | 138,573 | | | 138,210 | | | | |
| | | | 2,500.00 | | | PRECISION CASTPARTS CORP | | | 244,232 | | | 253,225 | | | | |
| | | | 40,000.00 | | | TYCO INTL LTD NEW COM | | | 724,965 | | | 1,305,200 | | | | |
| | | | | | | | | | 4,945,733 | | | 5,984,166 | | | 3.50 | % |
| | | | | | | | | | | | | | | | | |
| Commercial Services & Supplies | | | 3,000.00 | | | CINTAS | | | 109,240 | | | 110,710 | | | | |
| | | | 5,000.00 | | | PORTFOLIO RECOVERY ASSOC C | | | 208,309 | | | 278,250 | | | | |
| | | | 6,500.00 | | | STERICYCLE INC COM | | | 444,240 | | | 559,110 | | | | |
| | | | | | | | | | 761,789 | | | 948,070 | | | 0.56 | % |
| | | | | | | | | | | | | | | | | |
| Transportation | | | 10,000.00 | | | CONTINENTAL AIRLINES | | | 361,984 | | | 365,600 | | | 0.21 | % |
| | | | | | | | | | | | | | | | | |
| TOTAL INDUSTRIALS | | | | | | | | | 6,069,506 | | | 7,297,836 | | | 4.27 | % |
| | | | | | | | | | | | | | | | | |
| INFORMATION TECHNOLOGY | | | | | | | | | | | | | | | | |
| Software & Services | | | 200.00 | | | CACI INTL INC CL A | | | 9,943 | | | 9,146 | | | | |
| | | | 100.00 | | | COGNIZANT TECHNOLOGY SOLUT | | | 7,825 | | | 8,940 | | | | |
| | | | 2,950.00 | | | GLOBAL SOURCES | | | 48,941 | | | 50,475 | | | | |
| | | | 53,000.00 | | | MICROSOFT CORP COM | | | 1,410,540 | | | 1,586,820 | | | | |
| | | | 8,500.00 | | | ORACLE CORP COM | | | 112,350 | | | 156,050 | | | | |
| | | | | | | | | | 1,589,599 | | | 1,811,431 | | | 1.06 | % |
| | | | | | | | | | | | | | | | | |
| Technology Hardware & | | | 5,750.00 | | | CANON INC ADR | | | 233,352 | | | 322,350 | | | | |
| Equipment | | | 2,500.00 | | | CISCO SYS INC COM | | | 64,778 | | | 66,850 | | | | |
| | | | 15,000.00 | | | FOUNDRY NETWORKS INC COM | | | 169,556 | | | 226,800 | | | | |
| | | | 15,000.00 | | | HEWLETT PACKARD CO COM | | | 365,950 | | | 632,100 | | | | |
| | | | 10,000.00 | | | INTERNATIONAL BUS MACH COM | | | 728,412 | | | 1,022,100 | | | | |
| | | | 5,000.00 | | | MOTOROLA INC COM | | | 98,037 | | | 86,400 | | | | |
| | | | 500.00 | | | SEAGATE TECHNOLOGY SHS | | | 13,030 | | | 11,075 | | | | |
| | | | | | | | | | 1,673,115 | | | 2,367,675 | | | 1.38 | % |
| | | | | | | | | | | | | | | | | |
| Semiconductors & | | | 500.00 | | | LAM RESEARCH CORP | | | 27,068 | | | 26,890 | | | | |
| Semiconductor Equipment | | | 500.00 | | | NVIDIA CORP COM | | | 17,076 | | | 16,445 | | | | |
| | | | | | | | | | 44,144 | | | 43,335 | | | 0.03 | % |
| | | | | | | | | | | | | | | | | |
| TOTAL INFORMATION TECHNOLOGY | | | | | | 3,306,858 | | | 4,222,441 | | | 2.47 | % |
BMC FUND, INC. | SCHEDULE I |
INVESTMENTS IN SECURITIES OF UNAFFILIATED ISSUERS (Continued) (Unaudited) | |
April 30, 2007 | |
Sectors and Industries | | Shares Held | | Company Name | | Cost | | Market Value | | Percent of Net Assets | |
| | | | | | | | | | | | | | | | | |
| MATERIALS | | | | | | | | | | | | | | | | |
| Materials | | | 10,000.00 | | | ALLIANCE RES PARTNR LP UT | | $ | 121,950 | | $ | 397,200 | | | | |
| | | | 500.00 | | | ANGLO AMERN PLC ADR | | | 5,901 | | | 13,195 | | | | |
| | | | 4,000.00 | | | BHP BILLITON LTD SPONSORED | | | 177,745 | | | 193,660 | | | | |
| | | | 500.00 | | | CEMEX S A SPON ADR 5 ORD | | | 17,398 | | | 16,200 | | | | |
| | | | 3,000.00 | | | COMPANHIA SIDERURGICA | | | 124,781 | | | 128,330 | | | | |
| | | | 2,500.00 | | | MACQUARIE INFRASTRUCTURE | | | 89,255 | | | 106,450 | | | | |
| | | | 5,000.00 | | | NUCOR CORP COM | | | 300,417 | | | 316,110 | | | | |
| | | | 6,000.00 | | | SOUTHERN COPPER CORP | | | 438,019 | | | 456,150 | | | | |
| TOTAL MATERIALS | | | | | | | | | 1,275,466 | | | 1,627,295 | | | 0.95 | % |
| | | | | | | | | | | | | | | | | |
| TELECOMMUNICATION SERVICES | | | | | | | | | | | | | |
| Telecommunication Services | | | 6,000.00 | | | AMERICA MOVIL SA DE CV SPO | | | 276,363 | | | 310,180 | | | | |
| | | | 10,000.00 | | | AT&T CORP COM | | | 335,778 | | | 387,200 | | | | |
| | | | 5,000.00 | | | BT GROUP | | | 285,933 | | | 314,750 | | | | |
| | | | 1,300.00 | | | CHINA MOBILE HONG KONG SPO | | | 60,105 | | | 58,513 | | | | |
| | | | 7,500.00 | | | CHUNGHWA TELECOM CO SPONSO | | | 136,617 | | | 149,250 | | | | |
| | | | 2,400.00 | | | MILLICOM INTL CELLULAR | | | 186,721 | | | 187,044 | | | | |
| | | | 10,000.00 | | | MOBILE TELESYS OJSC SPONSO | | | 456,142 | | | 541,140 | | | | |
| | | | 17,500.00 | | | PARTNER COMMUNICATIONS | | | 269,459 | | | 282,125 | | | | |
| | | | 1,500.00 | | | SK TELECOM LTD SPONSORED A | | | 28,945 | | | 37,245 | | | | |
| | | | 10,000.00 | | | TELECOMUNCA DE SAO PAU SPO | | | 193,980 | | | 266,700 | | | | |
| | | | 10,000.00 | | | VERIZON COMMUNICATIONS COM | | | 296,520 | | | 381,800 | | | | |
| TOTAL TELECOMMUNICATION SERVICES | | | | | 2,526,563 | | | 2,915,947 | | | 1.71 | % |
| | | | | | | | | | | | | | | | | |
| UTILITIES | | | | | | | | | | | | | | | | |
| Utilities | | | 4,000.00 | | | AMERIGAS PARTNERS L P UNIT | | | 124,334 | | | 151,800 | | | | |
| | | | 3,000.00 | | | CENTERPOINT ENERGY | | | 55,515 | | | 56,490 | | | | |
| | | | 10,000.00 | | | COMPANHIA DE SANEAMENTO SP | | | 201,178 | | | 345,500 | | | | |
| | | | 7,000.00 | | | DOMINION RES INC VA COM | | | 460,221 | | | 635,800 | | | | |
| | | | 3,000.00 | | | DUKE ENERGY CORP COM | | | 59,122 | | | 61,560 | | | | |
| | | | 12,500.00 | | | ENDESA NACIONAL ELEC SPONS | | | 465,263 | | | 682,750 | | | | |
| | | | 22,500.00 | | | EXELON CORP COM | | | 738,199 | | | 1,696,725 | | | | |
| | | | 2,000.00 | | | MIRANT | | | 78,668 | | | 82,340 | | | | |
| | | | 15,500.00 | | | ONEOK INC NEW COM | | | 301,714 | | | 750,355 | | | | |
| | | | 7,500.00 | | | QUESTAR CORP COM | | | 234,832 | | | 728,475 | | | | |
| | | | 65,000.00 | | | TECO ENERGY INC COM | | | 931,803 | | | 1,166,750 | | | | |
| | | | | | | | | | 3,650,849 | | | 6,358,545 | | | 3.72 | % |
| | | | | | | | | | | | | | | | | |
| TOTAL INVESTMENTS IN COMMON STOCKS | | | | | $ | 59,729,246 | | | 79,630,392 | | | 46.56 | % |
BMC FUND, INC. | | SCHEDULE I |
INVESTMENTS IN SECURITIES OF UNAFFILIATED ISSUERS (Continued) (Unaudited) | | |
April 30, 2007 | | | | |
| | | | | | | | | Percent | |
| | | Shares | | | | Market | | of Net | |
Company Name | | Held | | Cost | | Value | | Assets | |
| | | | | | | | | | |
PREFERRED STOCKS: | | | | | | | | | | | | | |
| BLUE WATER TR I | | | 10 | | | $ 1,001,109 | | | $ 1,000,000 | | | | |
| LEARNINGSTATION.COM | | | 1,224,661 | | | 500,000 | | | 300,000 | | | | |
| | | | | | | | | | | | | | |
| TOTAL INVESTMENTS IN PREFERRED STOCKS | | | | | | $ 1,501,109 | | | 1,300,000 | | | 0.76 | % |
BMC FUND, INC. | | | SCHEDULE I |
INVESTMENTS IN SECURITIES OF UNAFFILIATED ISSUERS (Continued) (Unaudited) |
April 30, 2007 | | | | |
| | | | | | | Market | | Percent of | |
Industries | | Company Name | | Cost | | Value | | Net Assets | |
| | | | | | | | | | |
| Short-term Investments | | | Evergreen Money Market Fund | | | $ 8,562,994 | | | $ 8,562,994 | | | | |
| | | | | | | | | | | | | | |
| Total Short-term Investments | | $ 8,562,994 | | | 8,562,994 | | | 5.01 | % |
| | | | | | | | | | | | | | |
| | | | | | | | | | | | | | |
| TOTAL INVESTMENTS - MARKET VALUE | | | | | $ 155,653,875 | | | 91.02 | % |
| | | | | | | | | | | | | | |
| | | | | | | | | | | | | | |
| | | | | | | | | | | | | | |
| | | | | | | | | | | | | | |
| | | | | | | | | | | | | | |
| Aggregate gross unrealized appreciation of security values | | | | | $ 38,317,203 | | | | |
| Aggregate gross unrealized depreciation of security values | | | | | (2,033,403 | ) | | | |
| Net appreciation of security values | | | | | 36,283,800 | | | | |
| Tax cost of securities | | | | | | | | | 119,370,075 | | | | |
| | | | | | | | | | | | | | |
| Total market value of securities | | | | | $ 155,653,875 | | | | |
BMC FUND, INC. | | SCHEDULE II |
INVESTMENTS IN AFFILIATES (Unaudited) | | | | | |
April 30, 2007 | | | | | | |
| | | Number of | | Amount of Equity | | | | | |
| | | Shares Held At | | In Net Profit | | Amount of | | Value at | |
| | | April 30, | | And Loss for the | | Dividends | | April 30, | |
Issuer | | 2007 | | Period | | (1) | | 2007 | |
| | | | | | | | | | |
| Broyhill Industries, Inc. - wholly owned | | | | | | | | | | | | | |
| subsidiary | | | 1,000 | | | $ (15,048 | ) | | $ - | | | $ 567,191 | |
| | | | | | | | | | | | | | |
| P. B. Realty, Inc. - wholly owned | | | | | | | | | | | | | |
| subsidiary | | | 1,000 | | | 294,780 | | | - | | | 12,815,973 | |
| | | | | | | | | | | | | | |
| TOTAL | | | | | | $ 279,732 | | | $ - | | | $ 13,383,164 | |
| (1) | All of the dividends received by BMC Fund, Inc. from its wholly owned subsidiaries have been credited to the investment account since BMC Fund, Inc. is accounting for its investment in the subsidiary companies on the equity method. |
Item. 2. Code of Ethics.
N/A
Item 3. Audit Committee Financial Expert.
N/A
Item 4. Principal Accountant Fees and Services.
N/A
Item 5. Audit Committee of Listed Registrants.
N/A
Item 6. Schedule of Investments.
Included as a part of the report to shareholders filed
under Item 1.
Item 7. Disclosure of Proxy Voting Policies and Procedures for
Closed-End Management Investment Companies.
N/A
Item 8. Portfolio Managers of Closed-End Investment Companies.
N/A
Item 9. Purchases of Equity Securities by Closed-End
Management Investment Company and Affiliated Purchasers.
None
Item 10. Submission of Matters to a Vote of Security Holders.
N/A
Item 11. Controls and Procedures.
Within the 90 days prior to the date of this report, the Registrant's
management carried out an evaluation, under the supervision and with
the participation of Registrant's Chief Executive Officer and Chief
Financial Officer, of the effectiveness of the Registrant's disclosure
controls and procedures pursuant to Rule 30a-3(b) of the Investment
Company Act of 1940. Based upon the evaluation, the Chief Executive
Officer and Chief Financial Officer concluded as of a date within 90
days of the filing of this report that the Registrant's disclosure
controls and procedures are effective in timely alerting them to
material information relating to the Registrant required to be included
in the Registrant's periodic SEC filings.
There were no significant changes in the Registrant's internal control
over financial reporting (as defined in Rule 30a-3(d) under the Investment
Company Act of 1940) that occurred during the second fiscal quarter
of the period covered by the report that have materially affected, or
are reasonably likely to materially affect, the Registrant's internal
control over financial reporting.
Item 12. Exhibits.
(a)(1) N/A
(a)(2) Certifications.
SIGNATURES
Pursuant to the requirements of the Securities Exchange Act of 1934
and the Investment Company Act of 1940, the Registrant has duly
caused this report to be signed on its behalf by the undersigned,
thereunto duly authorized.
BMC Fund, Inc.
By
/s/ Boyd C. Wilson, Jr.
Boyd C. Wilson, Jr.
Vice President and
Chief Financial Officer
Date: June 21, 2007
Pursuant to the requirements of the Securities Exchange Act of 1934
and the Investment Company Act of 1940, this report has been signed
below by the following persons on behalf of the registrant and in
the capacities and on the dates indicated.
By
/s/ Paul H. Broyhill
Paul H. Broyhill
Chief Executive Officer
Date: June 21, 2007
By
/s/ Boyd C. Wilson, Jr.
Boyd C. Wilson, Jr.
Vice President and
Chief Financial Officer
Date: June 21, 2007