BMC FUND, INC.
800 GOLFVIEW PARK (P. O. BOX 500)
BMC FUND, INC.
P. O. BOX 500
Item 1. Report to Stockholders.
BMC FUND, INC.
FINANCIAL STATEMENTS AND
SUPPLEMENTARY INFORMATION
(UNAUDITED)
Six Months Ended April 30, 2009
TABLE OF CONTENTS
| | Page No. |
| | |
| | |
| Directors and Officers | 1 |
| | |
| Letter to Shareholders | 2 |
| | |
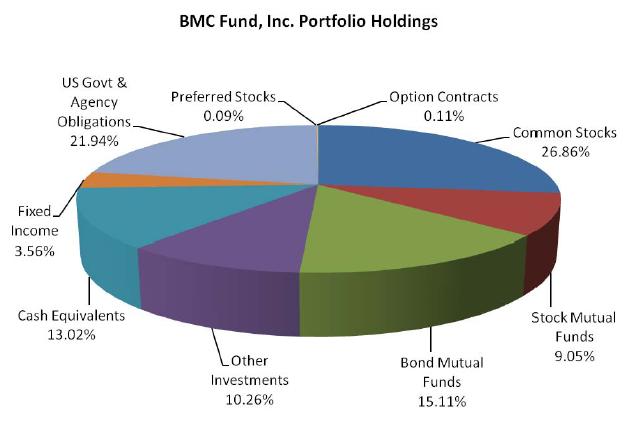
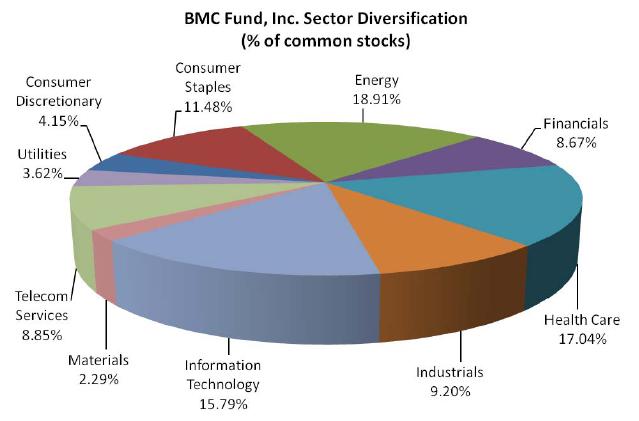
| Graphic Presentation of Portfolio Holdings and Sector Diversification | 3 |
| | |
| Statement of Assets and Liabilities | 4 |
| | |
| Statement of Operations | 5 |
| | |
| Statements of Changes In Net Assets | 6 |
| | |
| Notes to Financial Statements | 7 |
| | |
| Financial Highlights | 15 |
| | |
| Schedule of Investments | 16 |
| | |
| Schedule of Open Written Option Contracts | 30 |
BMC FUND, INC.
DIRECTORS AND OFFICERS
DIRECTORS
| | James T. Broyhill | Winston-Salem, North Carolina |
| | M. Hunt Broyhill | Hickory, North Carolina |
| | Paul H. Broyhill | Lenoir, North Carolina |
| | R. Donald Farmer | Taylorsville, North Carolina |
| | Robert G. Fox, Jr. | Charlotte, North Carolina |
| | Jan E. Gordon | Palm Harbor, Florida |
| | Gene A. Hoots | Charlotte, North Carolina |
| | Brent B. Kincaid | Lenoir, North Carolina |
| | Michael G. Landry | Fort Lauderdale, Florida |
| | John S. Little | Naples, Florida |
| | L. Glenn Orr, Jr. | Winston-Salem, North Carolina |
| | Allene B. Stevens | Lenoir, North Carolina |
OFFICERS
| | Paul H. Broyhill | Chairman and |
| | | Chief Executive Officer |
| | M. Hunt Broyhill | President |
| | Michael G. Landry | Vice President and |
| | | Chief Investment Officer |
| | Boyd C. Wilson, Jr. | Vice President and |
| | | Chief Financial Officer |
| | Jeffrey W. Clark | Chief Compliance Officer |
| | Carol Frye | Secretary and Treasurer |
TO OUR SHAREHOLDERS:
We are happy to present to you our semi-annual report (unaudited) for the six months ended April 30, 2009, which we believe contains complete and pertinent financial information.
BMC Fund, Inc. became a Regulated Investment Company (“RIC”) on April 1, 1981. During the six months ended April 30, 2009, the Company paid the following dividends per share:
| December 10, 2008 to shareholders of record November 25, 2008 | | $ | 1.12 | |
| March 10, 2009 to shareholders of record February 25, 2009 | | | .25 | |
| | | | | |
| Total | | $ | 1.37 | |
The attached Schedule of Investments is a listing of the entire Company’s diversified securities at April 30, 2009, with a total market value of $97,858,457.
Paul H. Broyhill, Chief Executive Officer
M. Hunt Broyhill, President
Michael G. Landry, Vice President
| BMC FUND, INC. | | | |
| STATEMENT OF ASSETS AND LIABILITIES (Unaudited) | | | |
| April 30, 2009 | | | |
| | | | |
| ASSETS AT MARKET VALUE: | | | |
| Investment securities (cost - $113,654,558) | | $ | 97,233,963 | |
| Investments in affiliate - wholly owned subsidiary (equity value $527,022) | | | 624,494 | |
| Cash and short-term investments | | | 113,872 | |
| Receivables, accrued interest and dividends | | | 128,501 | |
| Other assets | | | 69,553 | |
| | | | | |
| Total assets | | | 98,170,383 | |
| | | | | |
| LIABILITIES: | | | | |
| Call options written, at fair value (preimums received $1,679,043) | | | 696,055 | |
| Payable to broker | | | 2,663,814 | |
| Accounts payable and accrued expenses | | | 73,809 | |
| | | | | |
| Total liabilities | | | 3,433,678 | |
| | | | | |
| NET ASSETS AT APRIL 30, 2009 - EQUIVALENT TO $19.20 PER | | | | |
| SHARE ON 4,933,281 SHARES OF COMMON STOCK OUTSTANDING | | $ | 94,736,705 | |
| | | | | |
| SUMMARY OF SHAREHOLDERS' EQUITY: | | | | |
| Common stock, par value $5.00 per share - authorized 70,000,000 shares; | | | | |
| outstanding, 4,933,281 shares | | $ | 24,666,405 | |
| Retained earnings prior to becoming investment company | | | 81,460,646 | |
| Undistributed net investment income | | | - | |
| Realized loss on investments | | | (1,244,927 | ) |
| Undistributed nontaxable gain | | | 5,194,714 | |
| Unrealized depreciation of investments | | | (15,340,133 | ) |
| | | | | |
| NET ASSETS APPLICABLE TO COMMON STOCK OUTSTANDING | | $ | 94,736,705 | |
| | | | | |
| | | | | |
| See accompanying notes to financial statements. | | | | |
| BMC FUND, INC. | | | | | | | |
| STATEMENT OF OPERATIONS (Unaudited) | | | | | |
| Six Months Ended April 30, 2009 | | | | | | |
| | | | | | | | | |
| INVESTMENT INCOME: | | | | | | | |
| Income: | | | | | | | |
| | Interest - fixed income | | | | | $ | 64,312 | |
| | Other interest and dividends | | | | | 2,201,406 | |
| | Equity in earnings of wholly-owned subsidiary | | | | (38,946 | ) |
| | | | | | | | | |
| | Total income | | | | | | 2,226,772 | |
| | | | | | | | | |
| Expenses: | | | | | | | |
| | Legal and professional fees | | | | | 44,373 | |
| | Directors' fees (Note 8) | | | | | | 31,000 | |
| | Investment expense | | | | | | 47,060 | |
| | Salaries | | | | | | 335,088 | |
| | Property and liability insurance | | | | | 28,680 | |
| | Depreciation expense | | | | | | 2,232 | |
| | Taxes and licenses | | | | | | 60,201 | |
| | Rent | | | | | | 11,100 | |
| | Office supplies and expense | | | | | 15,022 | |
| | Dues and subscriptions | | | | | | 33,172 | |
| | Travel and entertainment | | | | | | 6,034 | |
| | | | | | | | | |
| | Total expenses | | | | | | 613,962 | |
| | | | | | | | | |
| | Investment income, net | | | | | | 1,612,810 | |
| | | | | | | | | |
| REALIZED AND UNREALIZED GAIN ON INVESTMENTS: | | | |
| | Realized gain (loss) from investments sold | | | | (309,058 | ) |
| | Change in unrealized appreciation of investments for the period | | (2,382,616 | ) |
| | | | | | | | | |
| | Net gain on investments | | | | | | (2,691,674 | ) |
| | | | | | | | | |
| NET DECREASE IN NET ASSETS RESULTING | | | | |
| FROM OPERATIONS | | | | | $ | (1,078,864 | ) |
| | | | | | | | | |
| See accompanying notes to financial statements. | | | | | |
| BMC FUND, INC. | | | | | | |
| STATEMENTS OF CHANGES IN NET ASSETS (Unaudited) | | | | | | |
| Six Months Ended April 30, 2009 and 2008 | | | | | | |
| | | | | | | |
| | | 2009 | | | 2008 | |
| | | | | | | |
| INCREASE (DECREASE) IN NET ASSETS FROM OPERATIONS: | | | | |
| Net investment income | | $ | 1,612,810 | | | $ | 3,698,737 | |
| Realized gains (losses) from investment securities sold | | | (309,058 | ) | | | 4,089,267 | |
| Change in unrealized appreciation (depreciation) of | | | | | | | | |
| investments for the year | | | (2,382,615 | ) | | | (17,211,566 | ) |
| | | | | | | | | |
| Net increase (decrease) in net assets resulting from operations | | | (1,078,863 | ) | | | (9,423,562 | ) |
| | | | | | | | | |
| Distributions to shareholders from: | | | | | | | | |
| Net realized gain on investment securities | | | - | | | | (7,018,329 | ) |
| Net investment income | | | (4,150,272 | ) | | | (2,650,902 | ) |
| Retained earnings prior to becoming an investment company | | | (2,608,324 | ) | | | - | |
| | | | | | | | | |
| TOTAL INCREASE (DECREASE) IN NET ASSETS | | | (7,837,459 | ) | | | (19,092,793 | ) |
| | | | | | | | | |
| NET ASSETS AT BEGINNING OF PERIOD | | | 102,574,164 | | | | 178,974,814 | |
| | | | | | | | | |
| NET ASSETS AT END OF PERIOD (Including | | | | | | | | |
| undistributed net investment income: | | | | | | | | |
| 2009 none - $; 2007 - $10,524,563) | | $ | 94,736,705 | | | $ | 159,882,021 | |
| | | | | | | | | |
| See accompanying notes to financial statements. | | | | | | | | |
BMC FUND, INC.
NOTES TO FINANCIAL STATEMENTS (Unaudited)
Six Months Ended April 30, 2009
1. ORGANIZATION
BMC Fund, Inc. (the “Company”) is a closed-end, diversified investment company registered under the Investment Company Act of 1940, as amended. Prior to becoming a regulated investment company on April 1, 1981, BMC Fund, Inc. operated as a regular corporation. The following is a summary of significant accounting policies followed by the Company in the preparation of its financial statements. The policies are in conformity with generally accepted accounting principles for investment companies.
2. SIGNIFICANT ACCOUNTING POLICIES
A. Investment Valuations – The investment securities are stated at market value as determined by closing prices on national securities exchanges. Investment securities include corporate bonds, mutual funds, and common and preferred stocks.
The investments in limited partnerships, other investments and venture capital are stated at estimated fair value as determined by the management of these investments and are approved by the Company’s Valuation Committee after giving consideration to historical and projected financial results, economic conditions, financial condition of investee and other factors and events subject to change, and ratified by the Company’s Board of Directors. Because of the inherent uncertainty of those valuations, the estimated values may differ significantly from the values that would have been used had a ready market value for the investments existed, and these differences could be material.
The carrying value of the investment in the wholly owned subsidiary is based on independent appraisals and internal assessments of the fair market values of the subsidiary’s underlying investments. Equity in earnings of the wholly owned subsidiary in the statement of operations represents the current year earnings of the subsidiary accounted for using the equity method.
B. Investment Transactions – Investment transactions are accounted for on the date the order to buy or sell is executed. Realized gains and losses on investments are determined on the basis of specific identification of issues sold or matured. Dividend income is recorded on the ex-dividend date and interest income is recorded on the accrual basis. Discounts and premiums on securities purchased are amortized over the lives of the respective securities.
For the six months ended April 30, 2009, the Company purchased and sold securities in the amount of $44,657,546 and $32,736,804 (excluding short-term investments and options), respectively.
BMC FUND, INC.
NOTES TO FINANCIAL STATEMENTS (Unaudited)
Six Months Ended April 30, 2009
2. SIGNIFICANT ACCOUNTING POLICIES (Continued)
C. Option Writing – When the Company writes an option, an amount equal to the premium received by the Company is recorded as a liability and is subsequently adjusted to the current fair value of the option written. Premiums received from writing options that expire unexercised are treated by the Company on the expiration date as realized gains from investments. The difference between the premium and the amount paid on effecting a closing purchase transaction, including brokerage commissions, is also treated as a realized gain, or, if the premium is less than the amount paid for the closing purchase transaction, as a realized loss. If a call option is exercised, the premium is added to the proceeds from the sale of the underlying security in determining whether the Company has realized a gain or loss. If a put option is exercised, the premium reduces the cost basis of the securities purchased by the Company. The Company as writer of an option bears the market risk of an unfavorable change in the price of the security underlying the written option.
D. Income Taxes – No federal tax provision is required as it is the Company’s policy to comply with the provisions of Subchapter M of the Internal Revenue Code of 1954, as amended, including the distribution to its shareholders of substantially all of its income and any capital gains not offset by capital losses. Also, no state income tax provision has been provided because the states in which the Company has income recognize the tax exempt status of a regulated investment company.
E. Dividend Policy – It is the Company’s policy to pay dividends during the year in sufficient amounts to meet the requirements to maintain its status as a regulated investment company.
F. Cash and Short-Term Investments – For purposes of financial reporting, the Company considers all investments at financial institutions with original maturities of three months or less to be equivalent to cash. Short-term money market investments managed by third party investors are included in investment securities.
G. Use of Estimates – The preparation of financial statements in conformity with accounting principles generally accepted in the United States of America requires management to make estimates and assumptions that affect the reported amounts of assets and liabilities and disclosure of contingent assets and liabilities at the date of the financial statements and the reported amounts of revenues and expenses during the reporting period. Actual results could differ from those estimates.
H. Fair Value Measurements – The Company adopted the provisions of Financial Accounting Standards Board Statement of Financial Accounting Standards No. 157 (“FAS 157”), “Fair Value Measurements,” on November 1, 2008. FAS 157 established a three-tier hierarchy to establish classification of fair value measurements for disclosure purposes. Inputs refer broadly to the assumptions that market participants would use in pricing the asset or liability, including assumptions about risk. Inputs may be observable or unobservable.
BMC FUND, INC.
NOTES TO FINANCIAL STATEMENTS (Unaudited)
Six Months Ended April 30, 2009
2. SIGNIFICANT ACCOUNTING POLICIES (Continued)
Observable inputs are inputs that reflect the assumptions market participants would use in pricing the asset or liability that are developed based on market data obtained from sources independent of the reporting entity. Unobservable inputs are inputs that reflect the reporting entity’s own assumptions about the assumptions market participants would use in pricing the asset or liability that are developed based on the best information available.
Various inputs are used in determining the value of the Company’s investments as of the reporting period end. The designated input levels are not necessarily an indication of the risk or liquidity associated with these investments. These inputs are categorized in the following hierarchy under applicable financial accounting standards:
Level 1 – Quoted prices in active markets for identical investments
Level 2 – Other significant observable inputs (including quoted prices for similar investments, interest rates, prepayment speeds, credit risk, etc.)
Level 3 – Significant unobservable inputs (including the Company’s own assumptions in determining the fair value of investments)
The following is a summary of the inputs used to value the Company’s investments as of April 30, 2009.
Valuation Inputs | | Investments in Securities | | | Other Financial Instruments | |
| Level 1 – Quoted Prices | | $ | 86,499,674 | | | | - | |
| Level 2 – Other Significant Observable Inputs | | | - | | | | - | |
| Level 3 – Significant Unobservable Inputs | | | 10,662,728 | | | | - | |
| Total | | $ | 97,162,402 | | | | - | |
BMC FUND, INC.
NOTES TO FINANCIAL STATEMENTS (Unaudited)
Six Months Ended April 30, 2009
2. SIGNIFICANT ACCOUNTING POLICIES (Continued)
The table below presents a reconciliation for the quarter ended April 30, 2009, for all Level 3 assets that are measured at fair value on a recurring basis.
| | For the Six Months Ended April 30, 2009 | | Fair Value Measurement Using Significant Unobservable Inputs | |
| | Balance at October 31, 2008 | | $ | - | |
| | Transferred to Level 3 | | | 12,126,307 | |
| | Purchases | | | 2,000,000 | |
| | Sales | | | (2,619,959 | ) |
| | Total realized and unrealized gains or losses | | | (843,620 | ) |
| | Balance at April 30, 2009 | | $ | 10,662,728 | |
| 3. | UNREALIZED APPRECIATION AND DEPRECIATION ON INVESTMENTS |
(tax basis)
The amount of net unrealized appreciation (depreciation) and the cost of investment securities for tax purposes, including short-term securities as April 30, 2009, were as follows:
| | Gross appreciation (excess of value over tax cost) | | $ | 3,203,626 | |
| | Gross depreciation (excess of tax cost over value) | | | (18,543,761 | ) |
| | Net unrealized depreciation | | $ | (15,340,135 | ) |
| | Cost of investments for income tax purposes | | $ | 112,502,537 | |
BMC FUND, INC.
NOTES TO FINANCIAL STATEMENTS (Unaudited)
Six Months Ended April 30, 2009
4. INVESTMENT IN AFFILIATE
| | Under Section 2(a)(3) of the Investment Company Act of 1940, a portfolio company is defined as “affiliated” if a fund owns five percent or more of its voting stock. The Company held at least five percent of the outstanding voting stock of the following company during the period ended April 30, 2009. |
| | Issuer | Number of Shares Held 4/30/09 | | Amount of Equity In Net Profit And Loss For the Period | | Dividends (1) | | Value at 4/30/09 |
| | | | | | | | | |
| | Broyhill Industries, Inc. – Wholly-owned subsidiary | 1,000 | | $ (38,947) | | $ - | | $ 624,494 |
| (1) | All of the dividends received by BMC Fund, Inc. from its wholly owned subsidiary have been credited to the investment account since BMC Fund, Inc. is accounting for its investment in the subsidiary company on the equity method. |
5. DISTRIBUTIONS TO SHAREHOLDERS
Classifications of distributions, net investment income/(loss) and net realized gain/(loss) may differ for financial statement and tax purposes. The character of distributions made during the six months from net investment income or net realized gains may differ from its ultimate characterization for federal income tax purposes. Also, due to the timing of dividend distributions, the fiscal year in which amounts are distributed may differ from the fiscal year in which the income or realized gain was recorded by the Company.
On December 10, 2008, an ordinary income distribution of $0.84 per share and a distribution from retained earnings prior to becoming an investment company of $0.28 per share were paid to shareholders of record on November 25, 2008.
On March 10, 2009, a distribution from retained earnings prior to becoming an investment company of $0.25 was paid to shareholders of record on February 25, 2009.
The tax character of distributions paid for the six months ended April 30, 2009 is as follows:
| | Distributions paid from: | | | |
| | Ordinary income | | $ | 4,150,272 | |
| | Retained earnings prior to becoming an investment company | | | 2,608,324 | |
| | Total | | $ | 6,758,596 | |
BMC FUND, INC.
NOTES TO FINANCIAL STATEMENTS (Unaudited)
Six Months Ended April 30, 2009
5. DISTRIBUTIONS TO SHAREHOLDERS (Continued)
The tax components of distributable earnings are determined in accordance with income tax regulations, which may differ from composition of net assets reported under accounting principles generally accepted. There were no such differences for the period ended April 30, 2009.
6. NEW ACCOUNTING PRONOUNCEMENTS
In March 2008, the FASB issued Statement of Financial Accounting Standards No. 161 (“FAS 161”), “Disclosures About Derivative Instruments and Hedging Activities.” FAS 161 is intended to improve financial reporting about derivative instruments and hedging activities. It is effective for financial statements issued for fiscal years and interim periods beginning after November 15, 2008. The Company believes that the adoption of FAS 161 will have no material impact on financial statement disclosures.
7. LINE OF CREDIT
On October 12, 2007 (renewed on February 27, 2009), the Company entered into an agreement with a bank for an unsecured line of credit in the amount of $7,500,000 to provide the Company more flexibility in its payment of dividend and management of its investments. The interest rate on any borrowings is at the LIBOR market index rate plus 100 basis points. The Company will pay a commitment fee of 25 basis points on any unused balance. As of April 30, 2009, the Company had no borrowings from this line of credit, which expires on March 31, 2010.
8. ADVISORY BOARD AND REMUNERATION OF DIRECTORS
The Company does not have an advisory board. The independent directors are paid an annual fee of $3,000 plus $1,000 for each meeting attended in person or $500 cash for each meeting attended by telephone. Each such independent director is paid an additional $1,000 for each day attending a committee meeting in person or $500 by telephone other than on the date of a board meeting. In addition, all directors are reimbursed for their reasonable expenses incurred in attending meetings.
9. RELATED PARTIES
The Company owns one wholly-owned subsidiary, Broyhill Industries, Inc.
The Company leases office space from Broyhill Investments, Inc., which is controlled by Paul H. Broyhill and M. Hunt Broyhill, both officers of BMC Fund, Inc. The expense associated with this related party lease for the six months ended April 30, 2009 amounted to $11,100. Broyhill Investments, Inc. also acts as a common paymaster for payroll and other shared services. This service is provided at no cost to the Company. All amounts paid by Broyhill Investments, Inc. on behalf of the Company are reimbursed by the Company. The outstanding payable related to these transactions at April 30, 2009 was $72,809.
BMC FUND, INC.
NOTES TO FINANCIAL STATEMENTS (Unaudited)
Six Months Ended April 30, 2009
Selected securities at the end of the six months have significant investment impairment issues. These selected securities have an aggregate cost basis of $9,501,109 and have been assigned no value at April 30, 2009.
| 11. | SUPPLEMENTAL PROXY INFORMATION AND 2009 ANNUAL MEETING OF SHAREHOLDERS |
The Annual Meeting of Shareholders of BMC Fund, Inc. was held on February 28, 2009 at the Company’s offices in Lenoir, North Carolina. The meeting was held for the following purposes:
1. To elect the following 12 directors to serve as follows:
| Director | Term | Expiring |
| | | |
| James T. Broyhill | 1 year | 2010 |
| M. Hunt Broyhill | 1 year | 2010 |
| Paul H. Broyhill | 1 year | 2010 |
| R. Donald Farmer | 1 year | 2010 |
| Robert G. Fox, Jr. | 1 year | 2010 |
| Jan E. Gordon | 1 year | 2010 |
| Gene A. Hoots | 1 year | 2010 |
| Brent B. Kincaid | 1 year | 2010 |
| Michael G. Landry | 1 year | 2010 |
| John S. Little | 1 year | 2010 |
| L. Glenn Orr, Jr. | 1 year | 2010 |
| Allene B. Stevens | 1 year | 2010 |
2. To vote upon such other business as may come before the meeting.
BMC FUND, INC.
NOTES TO FINANCIAL STATEMENTS (Unaudited)
Six Months Ended April 30, 2009
| 11. | SUPPLEMENTAL PROXY INFORMATION AND 2009 ANNUAL MEETING OF SHAREHOLDERS (Continued) |
The results of the proxy solicitation on the above matters were as follows:
| Director | Votes For | Votes Against | Votes Withheld | Abstentions |
| | | | | |
| James T. Broyhill | 4,852,424 | 0 | 80,857 | 0 |
| M. Hunt Broyhill | 4,852,424 | 0 | 80,857 | 0 |
| Paul H. Broyhill | 4,852,424 | 0 | 80,857 | 0 |
| R. Donald Farmer | 4,852,424 | 0 | 80,857 | 0 |
| Robert G. Fox, Jr. | 4,852,424 | 0 | 80,857 | 0 |
| Jan E. Gordon | 4,733,910 | 0 | 80,857 | 0 |
| Gene A. Hoots | 4,852,424 | 0 | 80,857 | 0 |
| Brent B. Kincaid | 4,852,424 | 0 | 80,857 | 0 |
| Michael G. Landry | 4,852,424 | 0 | 80,857 | 0 |
| John S. Little | 4,852,424 | 0 | 80,857 | 0 |
| L. Glenn Orr, Jr. | 4,852,424 | 0 | 80,857 | 0 |
| Allene B. Stevens | 4,852,424 | 0 | 80,857 | 0 |
There was no other business voted upon at the Annual Meeting of Shareholders.
12. SUPPLEMENTAL INFORMATION
Paul H. Broyhill, Chairman and Chief Executive Officer, Michael G. Landry, Vice President and Chief Investment Officer, M. Hunt Broyhill, President, Christopher R. Pavese, CFA, Managing Director, and Dan J. Wakin, Managing Director – Alternative Investments, are primarily responsible for the day-to-day management of the Company’s portfolio. Mr. Paul Broyhill has had such responsibility since the inception of the Company. Messrs. Landry and Hunt Broyhill have had such responsibility since 2001. Messrs. Landry and Hunt Broyhill have been engaged in asset management for various institutions and high net worth individuals for more than five years. Prior to joining the Company on March 1, 2005, Mr. Pavese was a Vice President and Portfolio Manager at JP Morgan Private Bank from January 1999 until February 2005. At JP Morgan, Mr. Pavese was engaged in asset management, portfolio strategy, and asset allocation for high net worth individuals, personal trusts, endowments and foundations. Mr. Wakin has had such responsibility since February 2006, and has served the Company in other capacities since 1995.
| BMC FUND, INC. |
| FINANCIAL HIGHLIGHTS |
| |
| Six Months April 30, 2009 (Unaudited), Years Ended October 31, 2008, 2007, 2006, 2005, 2004, and 2003, Seven Month Period Ended October 31, 2002, and Each of the Three Years in the Period Ended March 31, 2002 |
| The following table presents financial information divided into three parts: per share operating performance, total investment return and ratios and supplemental data for the six months ended April 30, 2009 (Unaudited), the years ended October 31, 2008, 2007, 2006, 2005, 2004, and 2003, the seven month period ended October 31, 2002, and each of the three years in the period ended March 31, 2002. The first part, per share operating performance, details the changes on a per share basis of the Company's beginning net asset value to its ending net asset value. The second part, total investment return, is based on the market price of the Company's shares of stock. Part three, ratios and supplemental data, provides additional financial information related to the Company's performance. |
PER SHARE OPERATING PERFORMANCE | | Six Months Ended April 30, 2009 (Unaudited) | | | 2008 | | | 2007 | | | 2006 | | | 2005 | | | 2004 | | | 2003 | | | Seven Months Ended October 31, 2002 | | | 2002 | | | 2001 | | | 2000 | |
| | | | | | | | | | | | | | | | | | | | | | | | | | | | | | | | | | |
| Net asset value, beginning of period | | $ | 20.79 | | | $ | 36.28 | | | $ | 33.55 | | | $ | 32.84 | | | $ | 30.94 | | | $ | 29.17 | | | $ | 25.46 | | | $ | 28.95 | | | $ | 29.44 | | | $ | 31.84 | | | $ | 29.01 | |
| Net investment income | | | 0.33 | | | | 0.73 | | | | 0.78 | | | | 1.06 | | | | 0.88 | | | | 0.82 | | | | 0.95 | | | | 0.59 | | | | 1.13 | | | | 1.31 | | | | 2.11 | |
| Net gains (losses) on investments | | | (0.55 | ) | | | (10.98 | ) | | | 4.25 | | | | 2.43 | | | | 2.48 | | | | 2.08 | | | | 3.76 | | | | (3.45 | ) | | | (0.30 | ) | | | (2.13 | ) | | | 2.11 | |
| Total from investment operations | | | (0.22 | ) | | | (10.25 | ) | | | 5.03 | | | | 3.49 | | | | 3.36 | | | | 2.90 | | | | 4.71 | | | | (2.86 | ) | | | 0.83 | | | | (0.82 | ) | | | 4.22 | |
| Less distributions: | | | | | | | | | | | | | | | | | | | | | | | | | | | | | | | | | | | | | | | | | | | | |
| Dividends from net investment income | | | 0.84 | | | | 1.04 | | | | 2.03 | | | | 2.37 | | | | - | | | | 0.65 | | | | 0.45 | | | | 0.56 | | | | 0.84 | | | | 1.58 | | | | 1.10 | |
| Distributions from capital gains | | | - | | | | 1.42 | | | | 0.27 | | | | 0.41 | | | | 1.46 | | | | 0.48 | | | | 0.55 | | | | 0.07 | | | | 0.48 | | | | - | | | | 0.29 | |
| Distributions from retained earnings | | | 0.53 | | | | - | | | | - | | | | - | | | | - | | | | - | | | | - | | | | - | | | | - | | | | - | | | | - | |
| P. B. Realty, Inc. Spin-off | | | - | | | | 2.78 | | | | - | | | | - | | | | - | | | | - | | | | - | | | | - | | | | - | | | | - | | | | - | |
| Total distributions | | | 1.37 | | | | 5.24 | | | | 2.30 | | | | 2.78 | | | | 1.46 | | | | 1.13 | | | | 1.00 | | | | 0.63 | | | | 1.32 | | | | 1.58 | | | | 1.39 | |
| Net asset value, end of period | | $ | 19.20 | | | $ | 20.79 | | | $ | 36.28 | | | $ | 33.55 | | | $ | 32.84 | | | $ | 30.94 | | | $ | 29.17 | | | $ | 25.46 | | | $ | 28.95 | | | $ | 29.44 | | | $ | 31.84 | |
| | | | | | | | | | | | | | | | | | | | | | | | | | | | | | | | | | | | | | | | | | | | | |
Per share market value, end of period1 | | $ | 26.00 | | | $ | 26.00 | | | $ | 26.00 | | | $ | 26.00 | | | $ | 26.00 | | | $ | 26.00 | | | $ | 26.00 | | | $ | 26.00 | | | $ | 26.00 | | | $ | 26.00 | | | $ | 26.00 | |
| | | | | | | | | | | | | | | | | | | | | | | | | | | | | | | | | | | | | | | | | | | | | |
TOTAL INVESTMENT RETURN2 | | | (0.84 | )% | | | (39.42 | )% | | | 19.35 | % | | | 13.40 | % | | | 12.95 | % | | | 11.14 | % | | | 18.12 | % | | | (18.85 | )% | * | | 3.20 | % | | | (3.15 | )% | | | 16.23 | % |
| | | | | | | | | | | | | | | | | | | | | | | | | | | | | | | | | | | | | | | | | | | | | |
| RATIOS/SUPPLEMENTAL DATA | | | | | | | | | | | | | | | | | | | | | | | | | | | | | | | | | | | | | | | | | | | | |
| | | | | | | | | | | | | | | | | | | | | | | | | | | | | | | | | | | | | | | | | | | | | |
| Net assets, end of period (in thousands) | | $ | 94,737 | | | $ | 102,574 | | | $ | 178,975 | | | $ | 165,500 | | | $ | 162,027 | | | $ | 152,623 | | | $ | 143,910 | | | $ | 125,596 | | | $ | 142,811 | | | $ | 145,221 | | | $ | 157,057 | |
Ratio of expenses to average net assets3 | | | 0.63 | % | | | 1.02 | % | | | 0.75 | % | | | 0.73 | % | | | 0.60 | % | | | 0.73 | % | | | 0.73 | % | | | 0.71 | % | * | | 0.62 | % | | | 0.49 | % | | | 0.40 | % |
| Ratio of net investment income to | | | | | | | | | | | | | | | | | | | | | | | | | | | | | | | | | | | | | | | | | | | | |
average net assets3 | | | 1.66 | % | | | 2.37 | % | | | 2.26 | % | | | 3.20 | % | | | 2.77 | % | | | 2.70 | % | | | 3.52 | % | | | 3.78 | % | * | | 3.91 | % | | | 4.23 | % | | | 6.99 | % |
| Portfolio turnover rate | | | 41.92 | % | | | 67.44 | % | | | 51.23 | % | | | 48.22 | % | | | 57.54 | % | | | 40.10 | % | | | 52.51 | % | | | 31.95 | % | | | 67.18 | % | | | 33.65 | % | | | 94.21 | % |
1 Unaudited - Based on stock trades, which are very limited, during that year. |
2 Unaudited - Computed as follows: income from investment operations divided by per share market value. |
3 Average is computed on a quarterly basis. |
| * Annualized |
Item. 2. Code of Ethics.
Item 3. Audit Committee Financial Expert.
Item 4. Principal Accountant Fees and Services.
Item 5. Audit Committee of Listed Registrants.
Item 6. Schedule of Investments.
Included as a part of the report to shareholders filed under Item 1.
Item 7. Disclosure of Proxy Voting Policies and Procedures for Closed-End Management Investment Companies.
Item 8. Portfolio Managers of Closed-End Investment Companies.
Item 9. Purchases of Equity Securities by Closed-End Management Investment Company and Affiliated Purchasers.
Item 10. Submission of Matters to a Vote of Security Holders.
Item 11. Controls and Procedures.
Within the 90 days prior to the date of this report, the Registrant's management carried out an evaluation, under the supervision and with the participation of Registrant's Chief Executive Officer and Chief Financial Officer, of the effectiveness of the Registrant's disclosure controls and procedures pursuant to Rule 30a-3(b) of the Investment Company Act of 1940. Based upon the evaluation, the Chief Executive Officer and Chief Financial Officer concluded as of a date within 90 days of the filing of this report that the Registrant's disclosure controls and procedures are effective in timely alerting them to material information relating to the Registrant required to be included in the Registrant's periodic SEC filings.
There were no significant changes in the Registrant's internal control over financial reporting (as defined in Rule 30a-3(d) under the Investment Company Act of 1940) that occurred during the second fiscal quarter of the period covered by the report that have materially affected, or are reasonably likely to materially affect, the Registrant's internal control over financial reporting.
Item 12. Exhibits.
(a)(2) Certifications.
Pursuant to the requirements of the Securities Exchange Act of 1934 and the Investment Company Act of 1940, the Registrant has duly caused this report to be signed on its behalf by the undersigned, thereunto duly authorized.
BMC Fund, Inc.
/s/ Boyd C. Wilson, Jr.
Boyd C. Wilson, Jr.
Pursuant to the requirements of the Securities Exchange Act of 1934 and the Investment Company Act of 1940, this report has been signed below by the following persons on behalf of the registrant and in the capacities and on the dates indicated.
/s/ Paul H. Broyhill
Paul H. Broyhill
/s/ Boyd C. Wilson, Jr.
Boyd C. Wilson, Jr.