UNITED STATES
SECURITES AND EXCHANGE COMMISSION
Washington, DC 20549
FORM N-CSRS
CERTIFIED SHAREHOLDER REPORT OF
REGISTERED MANAGEMENT INVESTMENT COMPANIES
Investment Company Act file number: 811-03150
BMC FUND, INC.
(Exact name of registrant as specified in charter)
800 GOLFVIEW PARK (P. O. BOX 500)
LENOIR, NC 28645
(Address of principal executive offices) (Zip code)
CAROL FRYE
BMC FUND, INC.
P. O. BOX 500
LENOIR, NC 28645
(Name and address of agent for service)
Registrant's telephone number including area code: 828-758-6100
Date of fiscal year end: October 31, 2012
Date of reporting period: April 30, 2012
Item 1. Report to Stockholders.
BMC FUND, INC.
FINANCIAL STATEMENTS AND
SUPPLEMENTARY INFORMATION
(UNAUDITED)
Six Months Ended April 30, 2012
TABLE OF CONTENTS
| | Page No. |
| | |
| Letter to Shareholders | 1 |
| | |
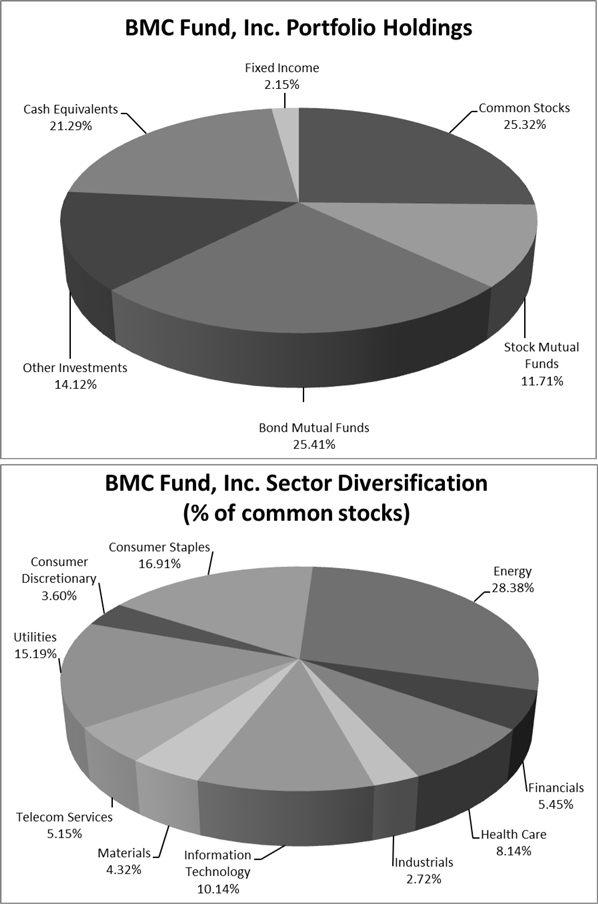
| Graphic Presentation of Portfolio Holdings and Sector Diversification | 2 |
| | |
| Statement of Assets and Liabilities | 3 |
| | |
| Statement of Operations | 4 |
| | |
| Statements of Changes In Net Assets | 5 |
| | |
| Notes to Financial Statements | 6 |
| | |
| Directors and Officers | 13 |
| | |
| Additional Information | 17 |
| | |
| Financial Highlights | 18 |
| | |
| Schedule of Investments | 19 |
| | |
| Schedule of Open Written Option Contracts | 32 |
TO OUR SHAREHOLDERS:
We are happy to present to you our semi-annual report (unaudited) for the six months ended April 30, 2012, which we believe contains complete and pertinent financial information.
BMC Fund, Inc. became a Regulated Investment Company (“RIC”) on April 1, 1981. During the six months ended April 30, 2012, the Company paid the following dividends per share:
| December 10, 2011 to shareholders of record November 25, 2011 | | $ | 0.31 | |
| March 10, 2012 to shareholders of record February 25, 2012 | | | 0.25 | |
| | | | | |
| Total | | $ | 0.56 | |
The attached Schedule of Investments is a listing of the entire Company’s diversified securities at April 30, 2012, with a total market value of $112,425,367.
Paul H. Broyhill, Chief Executive Officer
M. Hunt Broyhill, President
| BMC FUND, INC. |
| STATEMENT OF ASSETS AND LIABILITIES (Unaudited) |
| April 30, 2012 |
| ASSETS AT MARKET VALUE: | | | | |
| Investment securities (cost - $109,442,809) | | $ | 112,425,367 | |
| Cash and short-term investments | | | 187,267 | |
| Receivables, accrued interest and dividends | | | 263,698 | |
| Other assets | | | 67,676 | |
| | | | | |
| Total assets | | | 112,944,008 | |
| | | | | |
| LIABILITIES: | | | | |
| Call options written, at fair value (premiums received $657,507) | | | 306,385 | |
| Payable to broker | | | 1,517,829 | |
| Accounts payable and accrued expenses | | | 4,326 | |
| Accounts payable to affiliates | | | 114,997 | |
| | | | | |
| Total liabilities | | | 1,943,537 | |
| | | | | |
| NET ASSETS AT APRIL 30, 2012 - EQUIVALENT TO $22.50 PER SHARE ON 4,933,281 SHARES OF COMMON STOCK OUTSTANDING | | $ | 111,000,471 | |
| | | | | |
| SUMMARY OF SHAREHOLDERS' EQUITY: | | | | |
| Common stock, par value $5.00 per share - authorized 70,000,000 shares; outstanding, 4,933,281 shares | | $ | 24,666,405 | |
| Retained earnings prior to becoming investment company | | | 76,651,907 | |
| Undistributed net investment income | | | 390,917 | |
| Realized gain on investments | | | 762,848 | |
| Undistributed nontaxable gain | | | 5,194,714 | |
| Unrealized appreciation of investments | | | 3,333,680 | |
| | | | | |
| NET ASSETS APPLICABLE TO COMMON STOCK OUTSTANDING | | $ | 111,000,471 | |
See accompanying notes to financial statements.
| BMC FUND, INC. |
| STATEMENT OF OPERATIONS (Unaudited) |
| Six Months Ended April 30, 2012 |
| INVESTMENT INCOME: | | | | |
| Income: | | | | |
| Interest - fixed income | | $ | 37,445 | |
| Other interest and dividends | | | 1,494,044 | |
| | | | | |
| Total income | | | 1,531,489 | |
| | | | | |
| Expenses: | | | | |
| Legal and professional fees | | | 33,562 | |
| Directors' fees (Note 8) | | | 35,000 | |
| Investment expense | | | 30,964 | |
| Salaries | | | 303,400 | |
| Property and liability insurance | | | 25,855 | |
| Depreciation expense | | | 3,481 | |
| Taxes and licenses | | | 34,406 | |
| Rent | | | 12,915 | |
| Office supplies and expense | | | 27,976 | |
| Dues and subscriptions | | | 24,370 | |
| Travel and entertainment | | | 12,727 | |
| | | | | |
| Total expenses | | | 544,656 | |
| | | | | |
| Investment income, net | | | 986,833 | |
| | | | | |
| REALIZED AND UNREALIZED GAIN ON INVESTMENTS: | | | | |
| Realized gain from investments sold | | | 876,225 | |
| Change in unrealized appreciation of investments for the period | | | 2,830,950 | |
| | | | | |
| Net gain on investments | | | 3,707,175 | |
| | | | | |
| NET INCREASE IN NET ASSETS RESULTING FROM OPERATIONS | | $ | 4,694,008 | |
See accompanying notes to financial statements.
| BMC FUND, INC. |
| STATEMENTS OF CHANGES IN NET ASSETS (Unaudited) |
| Six Months Ended April 30, 2012 and 2011 |
| | | 2012 | | | 2011 | |
| | | | | | | |
| INCREASE (DECREASE) IN NET ASSETS FROM OPERATIONS: | | | | | | | | |
| Net investment income | | $ | 986,833 | | | $ | 1,424,505 | |
| Realized gains (losses) from investment securities sold | | | 876,225 | | | | (360,344 | ) |
| Change in unrealized appreciation (depreciation) of | | | | | | | | |
| investments for the year | | | 2,830,950 | | | | 5,335,118 | |
| | | | | | | | | |
| Net increase (decrease) in net assets resulting from operations | | | 4,694,008 | | | | 6,399,279 | |
| | | | | | | | | |
| Distributions to shareholders from: | | | | | | | | |
| Net realized gain on investment securities | | | (658,935 | ) | | | (143,667 | ) |
| Net investment income | | | (2,027,021 | ) | | | (1,339,120 | ) |
| Retained earnings prior to becoming an investment company | | | (76,681 | ) | | | (983,853 | ) |
| | | | | | | | | |
| TOTAL INCREASE (DECREASE) IN NET ASSETS | | | 1,931,371 | | | | 3,932,639 | |
| | | | | | | | | |
| NET ASSETS AT BEGINNING OF PERIOD | | | 109,069,100 | | | | 110,575,775 | |
| | | | | | | | | |
| NET ASSETS AT END OF PERIOD (Including undistributed net investment income: | | | | | | | | |
| 2012 - $390,917, 2011 - $464,537) | | $ | 111,000,471 | | | $ | 114,508,414 | |
See accompanying notes to financial statements.
| BMC FUND, INC. |
| NOTES TO FINANCIAL STATEMENTS |
| Six Months Ended April 30, 2012 (Unaudited) |
BMC Fund, Inc. (the “Company”) is a closed-end, diversified investment company registered under the Investment Company Act of 1940, as amended. Prior to becoming a regulated investment company on April 1, 1981, BMC Fund, Inc. operated as a regular corporation. The following is a summary of significant accounting policies followed by the Company in the preparation of its financial statements. The policies are in conformity with generally accepted accounting principles for investment companies.
| 2. | SIGNIFICANT ACCOUNTING POLICIES |
A. Investment Valuations – The investment securities are stated at market value as determined by closing prices on national securities exchanges. Investment securities include corporate bonds, mutual funds, and common and preferred stocks.
The investments in limited partnerships, other investments and venture capital are stated at estimated fair value as determined by the management of these investments and are approved by the Company’s Valuation Committee after giving consideration to historical and projected financial results, economic conditions, financial condition of investee and other factors and events subject to change, and ratified by the Company’s Board of Directors. Because of the inherent uncertainty of those valuations, the estimated values may differ significantly from the values that would have been used had a ready market value for the investments existed, and these differences could be material.
B. Investment Transactions – Investment transactions are accounted for on the date the order to buy or sell is executed. Realized gains and losses on investments are determined on the basis of specific identification of issues sold or matured. Dividend income is recorded on the ex-dividend date and interest income is recorded on the accrual basis. Discounts and premiums on securities purchased are amortized over the lives of the respective securities.
For the six months ended April 30, 2012, the Company purchased and sold securities in the amount of $24,126,319 and $21,864,731 (excluding short-term investments and options), respectively.
| BMC FUND, INC. |
| NOTES TO FINANCIAL STATEMENTS |
| Six Months Ended April 30, 2012 (Unaudited) |
| 2. | SIGNIFICANT ACCOUNTING POLICIES (Continued) |
C. Option Writing – When the Company writes an option, an amount equal to the premium received by the Company is recorded as a liability and is subsequently adjusted to the current fair value of the option written. Premiums received from writing options that expire unexercised are treated by the Company on the expiration date as realized gains from investments. The difference between the premium and the amount paid on effecting a closing purchase transaction, including brokerage commissions, is also treated as a realized gain, or, if the premium is less than the amount paid for the closing purchase transaction, as a realized loss. If a call option is exercised, the premium is added to the proceeds from the sale of the underlying security in determining whether the Company has realized a gain or loss. If a put option is exercised, the premium reduces the cost basis of the securities purchased by the Company. The Company as writer of an option bears the market risk of an unfavorable change in the price of the security underlying the written option.
D. Income Taxes – No federal tax provision is required as it is the Company’s policy to comply with the provisions of Subchapter M of the Internal Revenue Code of 1954, as amended, including the distribution to its shareholders of substantially all of its income and any capital gains not offset by capital losses. Also, no state income tax provision has been provided because the states in which the Company has income recognize the tax exempt status of a regulated investment company.
The Company did not have an accrual for uncertain tax positions as deductions taken and benefits accrued are based on widely understood administrative practices and procedures, and are based on clear and unambiguous tax law. Tax returns for all years 2007 and thereafter are subject to possible future examinations by tax authorities.
E. Dividend Policy – It is the Company’s policy to pay dividends during the year in sufficient amounts to meet the requirements to maintain its status as a regulated investment company.
F. Cash and Short-Term Investments – For purposes of financial reporting, the Company considers all investments at financial institutions with original maturities of three months or less to be equivalent to cash. Short-term money market investments managed by third party investors are included in investment securities.
G. Use of Estimates – The preparation of financial statements in conformity with accounting principles generally accepted in the United States of America requires management to make estimates and assumptions that affect the reported amounts of assets and liabilities and disclosure of contingent assets and liabilities at the date of the financial statements and the reported amounts of revenues and expenses during the reporting period. Actual results could differ from those estimates.
| BMC FUND, INC. |
| NOTES TO FINANCIAL STATEMENTS |
| Six Months Ended April 30, 2012 (Unaudited) |
| 2. | SIGNIFICANT ACCOUNTING POLICIES (Continued) |
H. Fair Value Measurements – The Company applies a three-tier hierarchy to establish classification of fair value measurements for disclosure purposes. Inputs refer broadly to the assumptions that market participants would use in pricing the asset or liability, including assumptions about risk. Inputs may be observable or unobservable.
Observable inputs are inputs that reflect the assumptions market participants would use in pricing the asset or liability that are developed based on market data obtained from sources independent of the reporting entity. Unobservable inputs are inputs that reflect the reporting entity’s own assumptions about the assumptions market participants would use in pricing the asset or liability that are developed based on the best information available.
Various inputs are used in determining the value of the Company’s investments as of the reporting period end. The designated input levels are not necessarily an indication of the risk or liquidity associated with these investments. These inputs are categorized in the following hierarchy under applicable financial accounting standards:
Level 1 – Quoted prices in active markets for identical investments
Level 2 – Other significant observable inputs (including quoted prices for similar investments, interest rates, prepayment speeds, credit risk, etc.)
Level 3 – Significant unobservable inputs (including the Company’s own assumptions in determining the fair value of investments)
The following is a summary of the inputs used to value the Company’s investments as of April 30, 2012
| Asset Description | | Quoted Prices
in Active
Markets for
Identical
Assets (Level 1) | | | Significant
Other
Observable
Inputs
(Level 2) | | | Significant
Unobservable
Inputs
(Level 3) | | | Total | |
| Fixed Income | | $ | 2,417,171 | | | $ | - | | | $ | - | | | $ | 2,417,171 | |
| Mutual Funds | | | | | | | | | | | | | | | | |
| Bond Mutual Funds | | | 28,571,645 | | | | - | | | | - | | | | 28,571,645 | |
| Stock Mutual Funds | | | 13,169,929 | | | | - | | | | - | | | | 13,169,929 | |
| Other Investments | | | | | | | | | | | | | | | | |
| Limited Partnerships | | | - | | | | - | | | | 15,879,843 | | | | 15,879,843 | |
| Common Stocks | | | | | | | | | | | | | | | | |
| Common Stocks – Publicly Traded | | | 28,452,676 | | | | - | | | | - | | | | 28,452,676 | |
| Call Options | | | (76,525 | ) | | | - | | | | - | | | | (76,525 | ) |
| Put Options | | | (229,860 | ) | | | - | | | | - | | | | (229,860 | ) |
| Preferred Stocks | | | - | | | | - | | | | - | | | | - | |
| Short-term Investments | | | 23,934,103 | | | | - | | | | - | | | | 23,934,103 | |
| Total Investments | | $ | 96,239,139 | | | $ | - | | | $ | 15,879,843 | | | $ | 112,118,982 | |
| BMC FUND, INC. |
| NOTES TO FINANCIAL STATEMENTS |
| Six Months Ended April 30, 2012 (Unaudited) |
SIGNIFICANT ACCOUNTING POLICIES (Continued)
The table below presents a reconciliation for the quarter ended April 30, 2012, for all Level 3 assets that are measured at fair value on a recurring basis.
| | | | | | | | | Realized & | | | | | | Net | | | | |
| | | Balance | | | Accrued | | | Unrealized | | | Net | | | Transfers | | | Balance | |
| | | as of | | | Discounts/ | | | Gains & | | | Purchases/ | | | in (out of) | | | as of | |
| Level 3 Assets | | 10/31/2011 | | | Premiums | | | Losses | | | Sales | | | Level 3 | | | 4/30/2012 | |
| Limited Partnerships | | $ | 16,414,126 | | | $ | - | | | $ | 947,614 | | | $ | (1,481,897 | ) | | $ | - | | | $ | 15,879,843 | |
| Total Investments | | $ | 16,414,126 | | | $ | - | | | $ | 947,614 | | | $ | (1,481,897 | ) | | $ | - | | | $ | 15,879,843 | |
| 3. | UNREALIZED APPRECIATION AND DEPRECIATION ON INVESTMENTS |
(tax basis)
The amount of net unrealized appreciation (depreciation) and the cost of investment securities for tax purposes, including short-term securities as April 30, 2012, were as follows:
| Gross appreciation (excess of value over tax cost) | | $ | 11,161,325 | |
| Gross depreciation (excess of tax cost over value) | | | (8,178,767 | ) |
| Net unrealized appreciation | | $ | 2,982,558 | |
| Cost of investments for income tax purposes | | $ | 109,442,809 | |
As of April 30, 2012, portfolio securities valued at $3,100,465 were held in escrow by the custodian as cover for call options written by the Company.
Transactions in options written during the six months ended April 30, 2012 were as follows:
| | | Number of
Contracts | | | Premiums
Received | |
| Options outstanding at October 31, 2011 | | | 623 | | | $ | 113,222 | |
| Options written | | | 1,137 | | | | 149,519 | |
| Options terminated in closing purchase transactions | | | (20 | ) | | | (13,180 | ) |
| Options expired | | | (528 | ) | | | (84,825 | ) |
| Options exercised | | | (521 | ) | | | (82,978 | ) |
| Options outstanding at April 30, 2012 | | | 691 | | | $ | 81,758 | |
As of April 30, 2012, short-term investments in the amount of $10,271,000 were pledged as collateral for put options sold by the Company.
| BMC FUND, INC. |
| NOTES TO FINANCIAL STATEMENTS |
| Six Months Ended April 30, 2012 (Unaudited) |
| 6. | DISTRIBUTIONS TO SHAREHOLDERS |
Classifications of distributions, net investment income/(loss) and net realized gain/(loss) may differ for financial statement and tax purposes. The character of distributions made during the six months from net investment income or net realized gains may differ from its ultimate characterization for federal income tax purposes. Also, due to the timing of dividend distributions, the fiscal year in which amounts are distributed may differ from the fiscal year in which the income or realized gain was recorded by the Company.
On December 10, 2011, a distribution of $0.31 per share was paid to shareholders of record on November 25, 2011.
On March 10, 2012, a distribution of $0.25 was paid to shareholders of record on February 25, 2012.
The tax character of distributions paid for the six months ended April 30, 2012 is as follows:
| Distributions paid from: | | | | |
| Ordinary income | | $ | 595,916 | |
| Long-term capital gains | | | 1,502,668 | |
| Retained earnings prior to becoming an investment company | | | 664,053 | |
| Total | | $ | 2,762,637 | |
The tax components of distributable earnings are determined in accordance with income tax regulations, which may differ from composition of net assets reported under accounting principles generally accepted. The difference for the period ended April 30, 2012 reflects $390,917 of undistributed net investment income and $762,848 of realized gains on investments under generally accepted accounting principles.
On April 22, 2010 (renewed April 21, 2011), the Company entered into an agreement with a bank for an unsecured line of credit in the amount of $3,500,000 to provide the Company more flexibility in its payment of dividends and management of its investments. The interest rate on any borrowings is at the one month LIBOR market index rate plus 150 basis points, with a floor of 3.00 percent. The Company will pay a commitment fee of 35 basis points on any unused balance. As of April 30, 2012, the Company had no borrowings from this line of credit, which expires on April 21, 2013.
| 8. | ADVISORY BOARD AND REMUNERATION OF DIRECTORS |
The Company does not have an advisory board. The independent directors are paid an annual fee of $3,000 plus $1,000 for each meeting attended in person or $500 cash for each meeting attended by telephone. Each such independent director is paid an additional $1,000 for each day attending a committee meeting in person or $500 by telephone other than on the date of a board meeting. In addition, all directors are reimbursed for their reasonable expenses incurred in attending meetings.
| BMC FUND, INC. |
| NOTES TO FINANCIAL STATEMENTS |
| Six Months Ended April 30, 2012 (Unaudited) |
The Company leases office space from Broyhill Investments, Inc., which is controlled by Paul H. Broyhill and M. Hunt Broyhill, both officers of BMC Fund, Inc. The expense associated with this related party lease for the six months ended April 30, 2012 amounted to $12,915. Broyhill Investments, Inc. also acts as a common paymaster for payroll and other shared services. This service is provided at no cost to the Company. All amounts paid by Broyhill Investments, Inc. on behalf of the Company are reimbursed by the Company. The outstanding payable related to these transactions at April 30, 2012 was $114,997.
Selected securities at the end of the six months have significant investment impairment issues. These selected securities have an aggregate cost basis of $6,844,080 and have been assigned no value at April 30, 2012.
| 11. | SUPPLEMENTAL PROXY INFORMATION AND 2012 ANNUAL MEETING OF SHAREHOLDERS |
The Annual Meeting of Shareholders of BMC Fund, Inc. was held on February 25, 2012 at the Company’s offices in Lenoir, North Carolina. The meeting was held for the following purposes:
1. To elect the following 12 directors to serve as follows:
| Director | Term | Expiring |
| | | |
| Kevin P. Boudreau | 1 year | 2013 |
| James T. Broyhill | 1 year | 2013 |
| M. Hunt Broyhill | 1 year | 2013 |
| Paul H. Broyhill | 1 year | 2013 |
| W. Charles Campbell | 1 year | 2013 |
| R. Donald Farmer | 1 year | 2013 |
| Robert G. Fox, Jr. | 1 year | 2013 |
| Jan E. Gordon | 1 year | 2013 |
| Brent B. Kincaid | 1 year | 2013 |
| John S. Little | 1 year | 2013 |
| L. Glenn Orr, Jr. | 1 year | 2013 |
| Allene B. Stevens | 1 year | 2013 |
2. To vote upon such other business as may come before the meeting.
| BMC FUND, INC. |
| NOTES TO FINANCIAL STATEMENTS |
| Six Months Ended April 30, 2012 (Unaudited) |
| 12. | SUPPLEMENTAL INFORMATION |
Paul H. Broyhill, Chairman and Chief Executive Officer, M. Hunt Broyhill, President, and Christopher R. Pavese, CFA, Chief Investment Officer, are primarily responsible for the day-to-day management of the Company’s portfolio. Mr. Paul Broyhill has had such responsibility since the inception of the Company. Mr. Hunt Broyhill has had such responsibility since 2001. Mr. Hunt Broyhill has been engaged in asset management for various institutions and high net worth individuals for more than five years. Prior to joining the Company on March 1, 2005, Mr. Pavese was a Vice President and Portfolio Manager at JP Morgan Private Bank from January 1999 until February 2005. At JP Morgan, Mr. Pavese was engaged in asset management, portfolio strategy, and asset allocation for high net worth individuals, personal trusts, endowments and foundations.
| BMC FUND, INC. |
| DIRECTORS AND OFFICERS |
| Six Months Ended April 30, 2012 (Unaudited) |
The following table provides information about the directors and the officers of the Fund:
| Directors Who Are Interested Persons |
| |
Name, Address and Age | | Position(s)
Held with Fund | | Term of Office and Length of Time Served | | Principal Occupation(s) During Past 5 Years | | Other Directorships Held
by Director |
| | | | | | | | | |
James T. Broyhill (84) 1930 Virginia Road Winston-Salem, NC 27104 | | Director Vice Chairman | | Since 1976 Since 2005 | | Retired; Director of Shepherd Street Equity Fund (1998-2008); President of Old Clemmons School Properties, Inc. (1998-present); former Secretary of the North Carolina Department of Commerce (1989-1991); former Chairman of the North Carolina Economic Development Board (1987-1989); former member, U.S. Senate (1986); former member, U.S. House of Representatives (1963-1986) | | Shepherd Street Equity Fund (1998-2008) |
M. Hunt Broyhill (48) 1870 9th Street Court, NW Hickory, NC 28601 | | Director President Vice President | | Since 2008 Since 2007 2001-2007 | | President of the Fund since February 2007; former Vice President of the Fund (2001-2007); Chief Executive of Broyhill Affinity Fund, LLC (2008-present), Broyhill Asset Management, LLC and Broyhill Wakin General Partners, LLC (1997-present); Director and President of Broyhill Investments, Inc. (1988-present); Director (1983-present) and President of Broyhill Family Foundation, Inc. (1988-present); General Partner of CapitalSouth Partners Fund I, LP and Capital South Partners Fund II, LP (2000-present); General Partner of CapitalSouth Partners Fund III, LP (2007-present); Senior Managing Partner and Director of Flagship Capital Partners, LLC (2007-present); Manager and Vice President of P. B. Realty, LLC (formerly P. B. Realty, Inc.) (1995-present) | | None |
| BMC FUND, INC. |
| DIRECTORS AND OFFICERS |
| Six Months Ended April 30, 2012 (Unaudited) |
| Directors Who Are Not Interested Persons |
| | | | | | | | | |
Name, Address and Age | | Position(s)
Held with Fund | | Term of Office and Length of Time Served | | Principal Occupation(s) During Past 5 Years | | Other Directorships Held
by Director |
| | | | | | | | | |
Paul H. Broyhill (88) 135 Claron Place, S.E. Lenoir, NC 28645 | | Director Chief
Executive Officer Chairman | | Since 1976 Since 2001 Since 1976 | | Director, Chairman and Chief Executive Officer of the Fund; former President of the Fund (2001-2007); Director (1972-present) and Chairman of Broyhill Investments, Inc. (1988-present); Director (1946-present) and Chairman of Broyhill Family Foundation, Inc. (1989-present); former President of Broyhill Family Foundation, Inc. (1980-1988); Manager and President of P. B. Realty, LLC (formerly P. B. Realty, Inc.) (1983-present) | | None |
W. Charles Campbell (45) 2012 Cloister Drive Charlotte, NC 28211 | | Director | | Since 2011 | | President and Chief Executive Officer of Flagship Capital Partners, LLC, a private investment real estate firm (2005-present); Co-manager of Brackett Flagship Properties, LLC, a commercial real estate firm | | None |
| | | | | | | | | |
Allene B. Stevens (90) 153 Hillhaven Place SE Lenoir, NC 28645 | | Director | | Since 1983 | | Private Investor | | |
| BMC FUND, INC. |
| DIRECTORS AND OFFICERS |
| Six Months Ended April 30, 2012 (Unaudited) |
| Directors Who Are Not Interested Persons |
| |
Name, Address and Age | | Positions
Held
with Fund | | Term of Office and Length of Time Served | | Principal Occupation During Past 5 Years | | Other Directorships Held
by Director |
| | | | | | | | | |
Kevin P. Boudreau (49) 117 Shannon Court Rocky Mount, NC 27804 | | Director | | Since 2011 | | Vice President of Tax and Risk Management, Boddie-Noell Enterprises, Inc., a diversified company with interests in restaurant and land-development projects (2005 – present) | | None |
R. Donald Farmer (65) 273 Leeward Point Loop Taylorsville, NC 28681 | | Director | | Since 2008 | | President of Don Farmer, CPA, PA, an independent public accounting firm and producer of federal income tax seminars and seminar materials (1984-present) | | None |
Robert G. Fox, Jr. (62) 6525 Robin Hollow Drive Mint Hill, NC 28227 | | Director | | Since 2008 | | Former President and Chief Banking Officer of NewDominion Bank (2005-April 2010); Executive Vice President of First Charter Bank/First Charter Corporation (1993-2005) | | None |
Brent B. Kincaid (81) 2703 Lakeview Drive Lenoir, NC 28645 | | Director | | Since 2005 | | Retired since 1998; former President and CEO of Broyhill Furniture Industries, Inc. | | None |
| | | | | | | | | |
John S. Little (80) 4601 Gulf Shore Blvd. N. #18 Naples, FL 34103 | | Director | | Since 2001 | | Retired; former Managing Director and Chief Executive, Associated Octel, London (1989-1995); former Senior Vice President of Corporate Technology, Great Lakes Chemical Corporation (1981-1989) | | None |
L. Glenn Orr, Jr. (72) 2735 Forest Drive Winston-Salem, NC 27104 | | Director | | Since 1999 | | Managing Director, Orr Holdings, LLC, a private investment company (since 2009); Managing Director, The Orr Group, an investment banking firm (1995-2008) | | Highwoods Properties, Inc. (1995-present); Medical Properties Trust (2005-present) |
| BMC FUND, INC. |
| DIRECTORS AND OFFICERS |
| Six Months Ended April 30, 2012 (Unaudited) |
| Other Executive Officers |
| |
Name, Address and Age | | Positions
Held
with Fund | | Term of Office and Length of Time Served | | Principal Occupation During Past 5 Years | | Other Directorships Held
by Officer |
| | | | | | | | | |
Boyd C. Wilson, Jr. (59) 646 Pleasant Hill Road Lenoir, NC 28645 | | Vice President and Chief Financial Officer | | Since 2006 | | Vice President and Chief Financial Officer of the Fund since February 2006; Director (2007-present) and Executive Vice President of Broyhill Investments, Inc. (2005-present); Vice President of Broyhill Family Foundation, Inc. (2007-present); Treasurer of Broyhill Wakin General Partners, LLC (2008-present); Manager and Vice President of P. B. Realty, LLC (formerly P. B. Realty, Inc.) (2006-present); Vice President – Finance & Administration of Kincaid Furniture Company, Incorporated (1990-2005) | | FNB United Corp. |
Carol Frye (54) 210 Beall Street Lenoir, NC 28645 | | Secretary and Treasurer | | Since 2001 | | Secretary and Treasurer of the Fund since 2001; Secretary and Treasurer of Broyhill Investments, Inc. (2000-present); Director (2001-present), Secretary and Treasurer of Broyhill Family Foundation, Inc. (2003-present); Secretary of Broyhill Wakin General Partners, LLC (1997-present); Secretary and Treasurer of P. B. Realty, LLC (formerly P. B. Realty, Inc.) (2001-present) | | None |
| BMC FUND, INC. |
| ADDITIONAL INFORMATION |
| Six Months Ended April 30, 2012 (Unaudited) |
Proxy Voting - The policies and procedures that the Fund uses to determine how to vote proxies relating to its portfolio securities are available without charge, upon request, by calling 828-758-6100; on the Fund’s website at http://www.bmcfund.com; and on the Securities and Exchange Commission’s website at http://www.sec.gov.
Information regarding how the Fund voted proxies relating to portfolio securities during the most recent 12-month period ended June 30 is available without charge, upon request, by calling 828-758-6100, and on the SEC’s website at http://www.sec.gov (see Form N-PX).
Portfolio Holdings - The Fund files a complete schedule of its portfolio holdings for the first and third quarters of its fiscal year with the SEC on Form N-Q. The Fund’s Form N-Q filings are available on the SEC’s website at http://www.sec.gov and may be reviewed and copied at the SEC’s Public Reference Room in Washington, DC. Information on the operation of the SEC’s Public Reference Room may be obtained by calling 1-202-551-8090.
| BMC FUND, INC. |
| FINANCIAL HIGHLIGHTS |
| Six Months Ended April 30, 2012 (Unaudited), Years Ended October 31, 2011, 2010, 2009, 2008, 2007, 2006, 2005, 2004, and 2003 and the Seven Month Period Ended October 31, 2002 |
The following table presents financial information divided into three parts: per share operating performance, total investment return and ratios and supplemental data for the years ended October 31, 2011, 2010, 2009, 2008, 2007, 2006, 2005, 2004, and 2003 and the seven month period ended October 31, 2002. The first part, per share operating performance, details the changes on a per share basis of the Company's beginning net asset value to its ending net asset value. The second part, total investment return, is based on the market price of the Company's shares of stock. Part three, ratios and supplemental data, provides additional financial information related to the Company's performance.
| | | | | | | | | | | | | | | | | | | | | | | | | | | | | | | | | Seven Months | |
| | | | | | | | | | | | | | | | | | | | | | | | | | | | | | | | | Ended | |
| | | | | | | | | | | | | | | | | | | | | | | | | | | | | | | | | October 31, | |
| | | 2012 | | | 2011 | | | 2010 | | | 2009 | | | 2008 | | | 2007 | | | 2006 | | | 2005 | | | 2004 | | | 2003 | | | 2002 | |
| | | | | | | | | | | | | | | | | | | | | | | | | | | | | | | | | | |
| PER SHARE OPERATING PERFORMANCE | | | | | | | | | | | | | | | | | | | | | | | | | | | | | | | | | |
| | | | | | | | | | | | | | | | | | | | | | | | | | | | | | | | | | |
| Net asset value, beginning of period | | $ | 22.11 | | | $ | 22.41 | | | $ | 21.20 | | | $ | 20.79 | | | $ | 36.28 | | | $ | 33.55 | | | $ | 32.84 | | | $ | 30.94 | | | $ | 29.17 | | | $ | 25.46 | | | $ | 28.95 | |
| Net investment income | | | 0.20 | | | | 0.49 | | | | 0.46 | | | | 0.48 | | | | 0.73 | | | | 0.78 | | | | 1.06 | | | | 0.88 | | | | 0.82 | | | | 0.95 | | | | 0.59 | |
| Net gains (losses) on investments | | | 0.75 | | | | 0.21 | | | | 1.70 | | | | 1.65 | | | | (10.98 | ) | | | 4.25 | | | | 2.43 | | | | 2.48 | | | | 2.08 | | | | 3.76 | | | | (3.45 | ) |
| Total from investment operations | | | 0.95 | | | | 0.70 | | | | 2.16 | | | | 2.13 | | | | (10.25 | ) | | | 5.03 | | | | 3.49 | | | | 3.36 | | | | 2.90 | | | | 4.71 | | | | (2.86 | ) |
| Less distributions: | | | | | | | | | | | | | | | | | | | | | | | | | | | | | | | | | | | | | | | | | | | | |
| Dividends from net investment income | | | 0.41 | | | | 0.27 | | | | 0.46 | | | | 0.92 | | | | 1.04 | | | | 2.03 | | | | 2.37 | | | | - | | | | 0.65 | | | | 0.45 | | | | 0.56 | |
| Distributions from capital gains | | | 0.13 | | | | 0.53 | | | | - | | | | - | | | | 1.42 | | | | 0.27 | | | | 0.41 | | | | 1.46 | | | | 0.48 | | | | 0.55 | | | | 0.07 | |
| Distributions from retained earnings | | | 0.02 | | | | 0.20 | | | | 0.49 | | | | 0.80 | | | | - | | | | - | | | | - | | | | - | | | | - | | | | - | | | | - | |
| P. B. Realty, Inc. Spin-off | | | - | | | | - | | | | - | | | | - | | | | 2.78 | | | | - | | | | - | | | | - | | | | - | | | | - | | | | - | |
| Total distributions | | | 0.56 | | | | 1.00 | | | | 0.95 | | | | 1.72 | | | | 5.24 | | | | 2.30 | | | | 2.78 | | | | 1.46 | | | | 1.13 | | | | 1.00 | | | | 0.63 | |
| Net asset value, end of period | | $ | 22.50 | | | $ | 22.11 | | | $ | 22.41 | | | $ | 21.20 | | | $ | 20.79 | | | $ | 36.28 | | | $ | 33.55 | | | $ | 32.84 | | | $ | 30.94 | | | $ | 29.17 | | | $ | 25.46 | |
| | | | | | | | | | | | | | | | | | | | | | | | | | | | | | | | | | | | | | | | | | | | | |
| Per share market value, end of period1 | | $ | 18.00 | | | $ | 18.45 | | | $ | 18.00 | | | $ | 16.75 | | | $ | 26.00 | | | $ | 26.00 | | | $ | 26.00 | | | $ | 26.00 | | | $ | 26.00 | | | $ | 26.00 | | | $ | 26.00 | |
| | | | | | | | | | | | | | | | | | | | | | | | | | | | | | | | | | | | | | | | | | | | | |
| TOTAL INVESTMENT RETURN2 | | | 10.57 | %* | | | 3.79 | % | | | 11.83 | % | | | 12.72 | % | | | (39.42 | )% | | | 19.35 | % | | | 13.40 | % | | | 12.95 | % | | | 11.14 | % | | | 18.12 | % | | | (18.85 | )% |
| | | | | | | | | | | | | | | | | | | | | | | | | | | | | | | | | | | | | | | | | | | | | |
| RATIOS/SUPPLEMENTAL DATA | | | | | | | | | | | | | | | | | | | | | | | | | | | | | | | | | | | | | | | | | | | | |
| | | | | | | | | | | | | | | | | | | | | | | | | | | | | | | | | | | | | | | | | | | | | |
| Net assets, end of period (in thousands) | | $ | 111,000 | | | $ | 109,069 | | | $ | 110,576 | | | $ | 104,603 | | | $ | 102,574 | | | $ | 178,975 | | | $ | 165,500 | | | $ | 162,027 | | | $ | 152,623 | | | $ | 143,910 | | | $ | 125,596 | |
| Ratio of expenses to average net assets3 | | | 0.99 | %* | | | 0.97 | % | | | 1.11 | % | | | 1.18 | % | | | 1.02 | % | | | 0.75 | % | | | 0.73 | % | | | 0.60 | % | | | 0.73 | % | | | 0.73 | % | | | 0.71 | % |
| Ratio of net investment income to average net assets3 | | | 1.79 | %* | | | 2.15 | % | | | 2.11 | % | | | 2.40 | % | | | 2.37 | % | | | 2.26 | % | | | 3.20 | % | | | 2.77 | % | | | 2.70 | % | | | 3.52 | % | | | 3.78 | % |
| Portfolio turnover rate | | | 19.87 | % | | | 60.41 | % | | | 38.08 | % | | | 69.62 | % | | | 67.44 | % | | | 51.23 | % | | | 48.22 | % | | | 57.54 | % | | | 40.10 | % | | | 52.51 | % | | | 31.95 | % |
1Unaudited - Based on stock trades, which are very limited, during that year.
2Unaudited - Computed as follows: income from investment operations divided by per share market value.
3Average is computed on a quarterly basis.
*Annualized
| BMC FUND, INC. |
| SCHEDULE OF INVESTMENTS (Unaudited) |
| April 30, 2012 |
| | | | | | Coupon | | | | | | | | | | | | | | | Percent | |
| | | | | | Interest | | | Maturity | | | Face | | | | | | Market | | | of Net | |
| Debt Issuer | | | | | Rate | | | Date | | | Amount | | | Cost | | | Value | | | Assets | |
| | | | | | | | | | | | | | | | | | | | | | |
| FIXED INCOME: | | | | | | | | | | | | | | | | | | | | | |
| ENTERGY CORP NEW | | | | | | | 3.625 | % | | | 9/15/2015 | | | $ | 250,000 | | | $ | 253,880 | | | $ | 255,139 | | | | | |
| XEROX CORP MED TERM NTS BE | | | | | | | 7.200 | % | | | 4/1/2016 | | | | 500,000 | | | | 566,356 | | | | 584,160 | | | | | |
| EXPRESS SCRIPTS INC | | | | | | | 3.125 | % | | | 5/15/2016 | | | | 250,000 | | | | 251,815 | | | | 260,737 | | | | | |
| HUMANA INC | | | | | | | 6.450 | % | | | 6/1/2016 | | | | 250,000 | | | | 277,919 | | | | 285,849 | | | | | |
| HEWLETT PACKARD CO | | | | | | | 3.000 | % | | | 9/15/2016 | | | | 250,000 | | | | 249,510 | | | | 257,427 | | | | | |
| TRANSOCEAN INC | �� | | | | | | 5.150 | % | | | 12/15/2016 | | | | 250,000 | | | | 253,145 | | | | 271,471 | | | | | |
| AVON PRODS INC | | | | | | | 4.200 | % | | | 7/15/2018 | | | | 500,000 | | | | 502,970 | | | | 502,388 | | | | | |
| LEHMAN BROTHERS HLDGS NIKKEI INDEX | | | 1,2,3 | | | | 0.000 | % | | | 9/29/2008 | | | | 3,000,000 | | | | 2,819,882 | | | | - | | | | | |
| LEHMAN BROTHERS HLDGS EAFE INDEX | | | 1,2,3 | | | | 0.000 | % | | | 11/15/2008 | | | | 1,000,000 | | | | 938,884 | | | | - | | | | | |
| LEHMAN BROTHERS HLDGS MEDIUM TERM NOTE | | | 1,2,3 | | | | 0.000 | % | | | 3/15/2011 | | | | 2,500,000 | | | | 2,349,746 | | | | - | | | | | |
| | | | | | | | | | | | | | | | | | | | | | | | | | | | | |
| TOTAL INVESTMENTS IN FIXED INCOME | | | | | | | | | | | | | | $ | 8,750,000 | | | $ | 8,464,107 | | | $ | 2,417,171 | | | | 2.18 | % |
| BMC FUND, INC. |
| SCHEDULE OF INVESTMENTS (Continued)(Unaudited) |
| April 30, 2012 |
| | | | | | | | | | | | Percent | |
| | | Shares | | | | | | Market | | | of Net | |
| Company Name | | Held | | | Cost | | | Value | | | Assets | |
| | | | | | | | | | | | | |
| MUTUAL FUNDS: | | | | | | | | | | | | |
| BOND MUTUAL FUNDS | | | | | | | | | | | | | | | | |
| ALLIANCEBERNSTEIN GLOBAL BOND FUND CLASS A | | | 59,031.88 | | | $ | 500,000 | | | $ | 499,410 | | | | | |
| BERWYN INCOME FUND | | | 10,150.38 | | | | 135,000 | | | | 135,508 | | | | | |
| CALAMOS CONV OPPORTUNITIES & INCOME FUND | | | 30,000.00 | | | | 272,656 | | | | 377,100 | | | | | |
| DOUBLELINE CORE FIXED INCOME FUND I | | | 45,085.66 | | | | 500,000 | | | | 502,705 | | | | | |
| DOUBLELINE EMERGING MARKETS FIXED INCOME FUND I | | | 23,496.24 | | | | 250,000 | | | | 252,115 | | | | | |
| DOUBLELINE TOTAL RETURN BOND FUND I | | | 226,010.04 | | | | 2,500,000 | | | | 2,531,312 | | | | | |
| FAIRHOLME FOCUSED INCOME FUND | | | 68,685.46 | | | | 750,000 | | | | 712,955 | | | | | |
| FIDELITY SPARTAN US BOND INDEX ADVANTAGE | | | 48,088.23 | | | | 499,156 | | | | 569,365 | | | | | |
| FIDELITY STRATEGIC INCOME FUND | | | 14,972.78 | | | | 165,000 | | | | 166,946 | | | | | |
| FLAHERTY & CRUMRINE PREFERRED INCOME FUND | | | 11,833.00 | | | | 87,440 | | | | 170,750 | | | | | |
| HARBOR BOND FUND INSTITUTIONAL | | | 77,505.80 | | | | 962,048 | | | | 977,348 | | | | | |
| ISHARES BARCLAYS 3-7 YR TREAS BOND | | | 8,750.00 | | | | 981,443 | | | | 1,071,263 | | | | | |
| ISHARES IBOXX $ INVEST GRADE CORP BOND | | | 15,000.00 | | | | 1,638,020 | | | | 1,747,200 | | | | | |
| JANUS TRITON FUND T SHARES | | | 2,916.88 | | | | 31,006 | | | | 53,262 | | | | | |
| JOHN HANCOCK PREFERRED INCOME FUND | | | 5,000.00 | | | | 112,075 | | | | 113,150 | | | | | |
| LOOMIS SAYLES BOND FUND INSTITUTIONAL | | | 120,930.18 | | | | 1,612,500 | | | | 1,778,883 | | | | | |
| LOOMIS SAYLES GLOBAL BOND FUND INSTITUTIONAL | | | 59,153.31 | | | | 1,000,000 | | | | 1,004,423 | | | | | |
| MANNING & NAPIER PRO-BLEND CONSERV TERM S | | | 3,804.54 | | | | 50,753 | | | | 50,638 | | | | | |
| METROPOLITIAN WEST TOTAL RETURN BOND M | | | 57,364.25 | | | | 603,400 | | | | 609,208 | | | | | |
| OSTERWEIS STRATEGIC INCOME | | | 19,861.83 | | | | 230,000 | | | | 230,596 | | | | | |
| PERMANENT PORTFOLIO | | | 2,976.58 | | | | 136,000 | | | | 144,692 | | | | | |
| PIMCO CORPORATE INCOME FUND | | | 12,500.00 | | | | 153,357 | | | | 199,500 | | | | | |
| PIMCO FUNDAMENTAL ADV TOTAL RETURN STRAT I | | | 248,756.22 | | | | 1,000,000 | | | | 1,017,412 | | | | | |
| PIMCO INCOME INSTITUTIONAL | | | 88,028.17 | | | | 1,000,000 | | | | 1,000,000 | | | | | |
| PIMCO ALL ASSET INSTITUTIONAL | | | 81,168.83 | | | | 1,000,000 | | | | 992,695 | | | | | |
| PIMCO ALL ASSET ALL AUTHORITY INSTITUTIONAL | | | 92,506.94 | | | | 1,000,000 | | | | 993,525 | | | | | |
| PIMCO GLOBAL ADV STRATEGY BOND INSTL | | | 42,955.33 | | | | 500,000 | | | | 496,564 | | | | | |
| PIMCO GLOBAL MULTI-ASSET FUND D | | | 108,980.84 | | | | 1,235,000 | | | | 1,228,214 | | | | | |
| PIMCO REAL RETURN INSTITUTIONAL | | | 171,411.82 | | | | 2,000,000 | | | | 2,087,796 | | | | | |
| PIMCO TOTAL RETURN FUND INSTITUTIONAL | | | 122,128.55 | | | | 1,249,375 | | | | 1,370,282 | | | | | |
| POWERSHARES PREFERRED PORT | | | 5,000.00 | | | | 66,915 | | | | 71,850 | | | | | |
| TCW TOTAL RETURN BOND I | | | 85,422.27 | | | | 850,000 | | | | 843,118 | | | | | |
| TEMPLETON EMERGING MKTS INCOME FUND | | | 25,000.00 | | | | 337,317 | | | | 390,250 | | | | | |
| TEMPLETON GLOBAL INCOME FD | | | 64,800.00 | | | | 591,441 | | | | 617,544 | | | | | |
| BMC FUND, INC. |
| SCHEDULE OF INVESTMENTS (Continued)(Unaudited) |
| April 30, 2012 |
| | | | | | | | | | | | Percent | |
| | | Shares | | | | | | Market | | | of Net | |
| Company Name | | Held | | | Cost | | | Value | | | Assets | |
| | | | | | | | | | | | | |
| MUTUAL FUNDS: | | | | | | | | | | | | | | | | |
| BOND MUTUAL FUNDS | | | | | | | | | | | | | | | | |
| THIRD AVE FOCUSED CREDIT INVESTOR | | | 65,634.33 | | | | 750,000 | | | | 659,625 | | | | | |
| USAA SHORT-TERM BOND FUND | | | 109,170.31 | | | | 1,000,000 | | | | 1,004,367 | | | | | |
| VANGUARD INTERM-TERM INVESTMENT-GRADE AD | | | 186,831.27 | | | | 1,650,552 | | | | 1,900,074 | | | | | |
| TOTAL BOND MUTUAL FUNDS | | | | | | $ | 27,400,454 | | | $ | 28,571,645 | | | | 25.74 | % |
| BMC FUND, INC. |
| SCHEDULE OF INVESTMENTS (Continued)(Unaudited) |
| April 30, 2012 |
| | | | | | | | | | | | | | | Percent | |
| | | | | | Shares | | | | | | Market | | | of Net | |
| Company Name | | | | | Held | | | Cost | | | Value | | | Assets | |
| | | | | | | | | | | | | | | | |
| MUTUAL FUNDS: | | | | | | | | | | | | | | | | | | | | |
| STOCK MUTUAL FUNDS | | | | | | | | | | | | | | | | | | | | |
| U.S. LARGE CAP EQUITIES | | | | | | | | | | | | | | | | | | | | |
| Large Cap Blend | | | | | | | | | | | | | | | | | | | | |
| INCOME FD AMER INC CL A | | | | | | | 5,963.03 | | | $ | 100,000 | | | $ | 104,532 | | | | | |
| TILSON DIVIDEND FUND | | | | | | | 6,095.57 | | | | 86,374 | | | | 84,119 | | | | | |
| TOTAL U.S. LARGE CAP EQUITIES | | | | | | | | | | | 186,374 | | | | 188,651 | | | | 0.17 | % |
| | | | | | | | | | | | | | | | | | | | | |
| INTERNATIONAL EQUITIES | | | | | | | | | | | | | | | | | | | | |
| Foreign Large Blend | | | | | | | | | | | | | | | | | | | | |
| LONGLEAF PARTNERS FDS INTERNATIONAL | | | | | | | 5,012.52 | | | | 80,100 | | | | 63,559 | | | | | |
| SPDR S&P INTL DIVIDEND | | | | | | | 500.00 | | | | 28,503 | | | | 24,215 | | | | | |
| VANGUARD INTL GROWTH FUND ADMIRAL SHARES | | | | | | | 2,728.76 | | | | 150,000 | | | | 160,315 | | | | | |
| VANGUARD TOTAL INTL STOCK FUND INV SHARES | | | | | | | 3,501.49 | | | | 51,962 | | | | 50,281 | | | | | |
| | | | | | | | | | | | 310,565 | | | | 298,370 | | | | 0.27 | % |
| | | | | | | | | | | | | | | | | | | | | |
| Foreign Large Value | | | | | | | | | | | | | | | | | | | | |
| ISHARES INC MSCI CANADA INDEX | | | | | | | 13,700.00 | | | | 302,593 | | | | 388,532 | | | | | |
| OAKMARK INTERNATIONAL FUND I | | | | | | | 5,063.26 | | | | 88,050 | | | | 93,265 | | | | | |
| THORNBURG INTERNATIONAL VALUE A | | | | | | | 2,409.34 | | | | 70,136 | | | | 64,064 | | | | | |
| | | | | | | | | | | | 460,779 | | | | 545,861 | | | | 0.49 | % |
| | | | | | | | | | | | | | | | | | | | | |
| Diversified Emerging Markets | | | | | | | | | | | | | | | | | | | | |
| ISHARES MSCI EMERGING MKTS INDEX | | | | | | | 1,250.00 | | | | 57,694 | | | | 52,769 | | | | | |
| WESTERN ASSET EMRG MKTS DEBT PORTFOLIO | | | | | | | 15,000.00 | | | | 284,410 | | | | 308,400 | | | | | |
| | | | | | | | | | | | 342,104 | | | | 361,169 | | | | 0.33 | % |
| | | | | | | | | | | | | | | | | | | | | |
| Japan Stock | | | | | | | | | | | | | | | | | | | | |
| WISDOMTREE JAPAN SMALLCAP DIVIDEND | | | | | | | 1,250.00 | | | | 47,263 | | | | 55,350 | | | | 0.05 | % |
| | | | | | | | | | | | | | | | | | | | | |
| Asia Ex-Japan Stock | | | | | | | | | | | | | | | | | | | | |
| ISHARES MSCI SINGAPORE INDEX | | | | | | | 38,750.00 | | | | 496,940 | | | | 503,556 | | | | | |
| TEMPLETON DRAGON FUND COM | | | | | | | 2,000.00 | | | | 63,349 | | | | 56,400 | | | | | |
| | | | | | | | | | | | 560,289 | | | | 559,956 | | | | 0.50 | % |
| | | | | | | | | | | | | | | | | | | | | |
| Latin America Stock | | | | | | | | | | | | | | | | | | | | |
| ISHARES MSCI BRAZIL INDEX | | | | | | | 2,885.00 | | | | 187,470 | | | | 173,836 | | | | 0.16 | % |
| | | | | | | | | | | | | | | | | | | | | |
| TOTAL INTERNATIONAL EQUITIES | | | | | | | | | | | 1,908,470 | | | | 1,994,542 | | | | 1.80 | % |
| | | | | | | | | | | | | | | | | | | | | |
| SPECIALTY FUNDS | | | | | | | | | | | | | | | | | | | | |
| Pharmaceuticals & Biotechnology | | | | | | | | | | | | | | | | | | | | |
| ISHARES NASDAQ BIOTECHNOLOGY | | | | | | | 500.00 | | | | 45,277 | | | | 62,695 | | | | 0.06 | % |
| BMC FUND, INC. |
| SCHEDULE OF INVESTMENTS (Continued)(Unaudited) |
| April 30, 2012 |
| | | | | | | | | | | | | | | Percent | |
| | | | | | Shares | | | | | | Market | | | of Net | |
| Company Name | | | | | Held | | | Cost | | | Value | | | Assets | |
| | | | | | | | | | | | | | | | |
| MUTUAL FUNDS: | | | | | | | | | | | | | | | | | | | | |
| STOCK MUTUAL FUNDS | | | | | | | | | | | | | | | | | | | | |
| Utilities | | | | | | | | | | | | | | | | | | | | |
| REAVES UTILITY INCOME FUND | | | | | | | 15,285.00 | | | | 339,969 | | | | 408,874 | | | | | |
| UTILITIES SELECT SECTOR SPDR | | | | | | | 48,000.00 | | | | 1,591,774 | | | | 1,711,680 | | | | | |
| | | | | | | | | | | | 1,931,743 | | | | 2,120,554 | | | | 1.91 | % |
| | | | | | | | | | | | | | | | | | | | | |
| Large Cap Blend | | | | | | | | | | | | | | | | | | | | |
| POWERSHARES DIVIDEND ACHIEVERS | | | | | | | 3,500.00 | | | | 49,858 | | | | 55,265 | | | | | |
| SOUND SHORE FD INC COM | | | | | | | 1,607.64 | | | | 53,422 | | | | 53,502 | | | | | |
| T ROWE PRICE PERSONAL STRAT GROWTH | | | | | | | 4,370.83 | | | | 90,476 | | | | 108,440 | | | | | |
| WISDOMTREE LARGECAP DIVIDEND | | | | | | | 1,500.00 | | | | 63,692 | | | | 79,425 | | | | | |
| YACKTMAN FUND INC COM | | | | | | | 14,258.04 | | | | 256,985 | | | | 265,628 | | | | | |
| | | | | | | | | | | | 514,433 | | | | 562,260 | | | | 0.51 | % |
| | | | | | | | | | | | | | | | | | | | | |
| Foreign Large Blend | | | | | | | | | | | | | | | | | | | | |
| WISDOMTREE TRUST EMERG MKTS EQUITY INC | | | | | | | 2,000.00 | | | | 109,230 | | | | 113,400 | | | | 0.10 | % |
| | | | | | | | | | | | | | | | | | | | | |
| Foreign Large Value | | | | | | | | | | | | | | | | | | | | |
| ISHARES DOW JONES INTL SELECT DIV INDEX | | | | | | | 3,300.00 | | | | 101,029 | | | | 105,019 | | | | 0.09 | % |
| | | | | | | | | | | | | | | | | | | | | |
| Japan Stock | | | | | | | | | | | | | | | | | | | | |
| JAPAN SMALLER CAPTLZTN FUND INC | | | | | | | 10,000.00 | | | | 74,980 | | | | 78,300 | | | | 0.07 | % |
| | | | | | | | | | | | | | | | | | | | | |
| Financial | | | | | | | | | | | | | | | | | | | | |
| FRANKLIN INCOME FUND ADV | | | | | | | 119,047.62 | | | | 250,000 | | | | 255,952 | | | | | |
| ISHARES S&P US PREFERRED STOCK INDEX | | | | | | | 1,250.00 | | | | 49,231 | | | | 48,675 | | | | | |
| SPDR S&P REGIONAL BANKING ETF | | | | | | | 5,000.00 | | | | 130,825 | | | | 140,350 | | | | | |
| | | | | | | | | | | | 430,056 | | | | 444,977 | | | | 0.40 | % |
| | | | | | | | | | | | | | | | | | | | | |
| Natural Resources | | | | | | | | | | | | | | | | | | | | |
| ENERPLUS RES FD UNIT TR G | | | | | | | 14,500.00 | | | | 291,123 | | | | 268,105 | | | | 0.24 | % |
| | | | | | | | | | | | | | | | | | | | | |
| Precious Metals | | | | | | | | | | | | | | | | | | | | |
| MARKET VECTORS JUNIOR GOLD MINERS ETF | | | | | | | 30,000.00 | | | | 852,848 | | | | 699,000 | | | | | |
| MARKET VECTORS GOLD MINERS ETF | | | | | | | 43,000.00 | | | | 2,078,475 | | | | 1,994,770 | | | | | |
| SPDR GOLD SHARES | | | 3 | | | | 10,000.00 | | | | 969,550 | | | | 1,618,800 | | | | | |
| | | | | | | | | | | | 3,900,873 | | | | 4,312,570 | | | | 3.89 | % |
| | | | | | | | | | | | | | | | | | | | | |
| Conservative Allocation | | | | | | | | | | | | | | | | | | | | |
| VANGUARD WELLESLEY INCOME INV | | | | | | | 20,045.04 | | | | 422,892 | | | | 477,072 | | | | 0.43 | % |
| BMC FUND, INC. |
| SCHEDULE OF INVESTMENTS (Continued)(Unaudited) |
| April 30, 2012 |
| | | | | | | | | | | | | | | Percent | |
| | | | | | Shares | | | | | | Market | | | of Net | |
| Company Name | | | | | Held | | | Cost | | | Value | | | Assets | |
| | | | | | | | | | | | | | | | |
| MUTUAL FUNDS: | | | | | | | | | | | | | | | | | | | | |
| STOCK MUTUAL FUNDS | | | | | | | | | | | | | | | | | | | | |
| Moderate Allocation | | | | | | | | | | | | | | | | | | | | |
| FPA CRESCENT PORTFOLIO | | | | | | | 18,462.15 | | | | 525,303 | | | | 525,063 | | | | | |
| MERGER FD SH BEN INT | | | | | | | 3,150.99 | | | | 50,069 | | | | 49,817 | | | | | |
| OAKMARK EQUITY & INCOME FUND | | | | | | | 8,920.47 | | | | 263,600 | | | | 259,318 | | | | | |
| SEQUOIA FD INC COM | | | | | | | 740.54 | | | | 108,371 | | | | 119,864 | | | | | |
| | | | | | | | | | | | 947,343 | | | | 954,062 | | | | 0.86 | % |
| | | | | | | | | | | | | | | | | | | | | |
| World Allocation | | | | | | | | | | | | | | | | | | | | |
| BLACKROCK GLOBAL ALLOCATION INV A | | | | | | | 2,587.00 | | | | 50,861 | | | | 50,162 | | | | | |
| IVY ASSET STRATEGY FD CL I | | | | | | | 31,926.78 | | | | 873,099 | | | | 827,223 | | | | | |
| WELLS FARGO ADVANTAGE ASSET ALLOC ADM | | | | | | | 40,217.43 | | | | 510,000 | | | | 507,142 | | | | | |
| WINTERGREEN INVESTOR | | | 3 | | | | 7,005.79 | | | | 102,985 | | | | 103,195 | | | | | |
| | | | | | | | | | | | 1,536,945 | | | | 1,487,722 | | | | 1.34 | % |
| | | | | | | | | | | | | | | | | | | | | |
| TOTAL SPECIALTY FUNDS | | | | | | | | | | | 10,305,924 | | | | 10,986,736 | | | | 9.90 | % |
| | | | | | | | | | | | | | | | | | | | | |
| TOTAL STOCK MUTUAL FUNDS | | | | | | | | | | | 12,400,768 | | | | 13,169,929 | | | | 11.86 | % |
| | | | | | | | | | | | | | | | | | | | | |
| TOTAL INVESTMENTS IN MUTUAL FUNDS | | | | | | | | | | $ | 39,801,222 | | | $ | 41,741,574 | | | | 37.60 | % |
| BMC FUND, INC. |
| SCHEDULE OF INVESTMENTS (Continued)(Unaudited) |
| April 30, 2012 |
| | | | | | | | | Market | | | Percent of | |
| Company Name | | | | | Cost | | | Value | | | Net Assets | |
| | | | | | | | | | | | | |
| OTHER INVESTMENTS: | | | | | | | | | | | | |
| | | | | | | | | | | | | | | | | |
| LIMITED PARTNERSHIPS: | | | | | | | | | | | | | | | | |
| ELLIOTT ASSOCIATES LP | | | 2 | | | $ | 2,000,000 | | | $ | 2,884,879 | | | | | |
| GREENLIGHT MASTERS QUALIFIED LP | | | 2 | | | | 2,500,000 | | | | 2,744,347 | | | | | |
| HAYMAN CAPITAL PARTNERS LP | | | 2 | | | | 2,500,000 | | | | 2,521,295 | | | | | |
| LMC COMPASS FUND LP | | | 2 | | | | 1,500,000 | | | | 2,177,762 | | | | | |
| MORROCROFT SPECIAL OPPORTUNITY FUND II, LP | | | 2 | | | | 1,000,000 | | | | 1,049,171 | | | | | |
| PRIVET FUND LP | | | 2 | | | | 500,000 | | | | 585,517 | | | | | |
| RIVERNORTH CAPITAL PARTNERS, LP | | | 2 | | | | 2,000,000 | | | | 2,331,090 | | | | | |
| STARK INVESTMENTS LP | | | 2 | | | | 279,858 | | | | 820,216 | | | | | |
| STARK STRUCTURED FINANCE ONSHORE FUND | | | 2 | | | | 671,300 | | | | 765,566 | | | | | |
| WALNUT INVESTMENT PARTNERS | | | 2 | | | | 235,567 | | | | - | | | | | |
| TOTAL LIMITED PARTNERSHIPS | | | | | | | 13,186,725 | | | | 15,879,843 | | | | 14.31 | % |
| | | | | | | | | | | | | | | | | |
| TOTAL OTHER INVESTMENTS | | | | | | $ | 13,186,725 | | | $ | 15,879,843 | | | | 14.31 | % |
| BMC FUND, INC. |
| SCHEDULE OF INVESTMENTS (Continued)(Unaudited) |
| April 30, 2012 |
| | | | | | | | | | | | | | | | | Percent | |
| Sectors and | | Shares | | | | | | | | | | | Market | | | of Net | |
| Industries | | Held | | | Company Name | | | | | Cost | | | Value | | | Assets | |
| | | | | | | | | | | | | | | | | | |
| COMMON STOCKS: | | | | | | | | | | | | | | | | | | | | | |
| CONSUMER DISCRETIONARY | | | | | | | | | | | | | | | | | | | | | |
| Consumer Services | | | 10,000.00 | | | COMPANHIA DE BEBIDAS DAS A | | | | | | $ | 274,264 | | | $ | 419,800 | | | | |
| | | | 1,000.00 | | | MCDONALDS CORP COM | | | | | | | 95,695 | | | | 97,450 | | | | |
| | | | 15,000.00 | | | STAPLES INC COM | | | | | | | 225,764 | | | | 231,000 | | | | |
| | | | | | | | | | | | | | 595,723 | | | | 748,250 | | | 0.67 | % |
| | | | | | | | | | | | | | | | | | | | | | |
| Retailing | | | 1,000.00 | | | DOMINOS PIZZA INC COM | | | | | | | 17,760 | | | | 37,810 | | | | |
| | | | 1,500.00 | | | PANERA BREAD CO CL A | | | 3 | | | | 219,504 | | | | 236,880 | | | | |
| | | | | | | | | | | | | | 237,264 | | | | 274,690 | | | 0.25 | % |
| | | | | | | | | | | | | | | | | | | | | | |
| TOTAL CONSUMER DISCRETIONARY | | | | | | | | | | | | | 832,987 | | | | 1,022,940 | | | 0.92 | % |
| | | | | | | | | | | | | | | | | | | | | | |
| CONSUMER STAPLES | | | | | | | | | | | | | | | | | | | | | |
| Food & Staples Retailing | | | 5,000.00 | | | CVS CAREMARK CORP COM STK | | | | | | | 156,407 | | | | 223,100 | | | | |
| | | | 5,000.00 | | | FAMILY DOLLAR STORES INC COM | | | | | | | 254,159 | | | | 337,750 | | | | |
| | | | 10,000.00 | | | WAL-MART STORES INC COM | | | | | | | 497,049 | | | | 589,100 | | | | |
| | | | | | | | | | | | | | 907,615 | | | | 1,149,950 | | | 1.04 | % |
| | | | | | | | | | | | | | | | | | | | | | |
| Food, Beverage & Tobacco | | | 10,000.00 | | | ALTRIA GROUP INC COM | | | | | | | 182,250 | | | | 322,100 | | | | |
| | | | 2,500.00 | | | DIAGEO P L C SPON ADR NEW | | | | | | | 139,962 | | | | 252,800 | | | | |
| | | | 3,500.00 | | | GENERAL MILLS INC COM | | | | | | | 122,082 | | | | 136,115 | | | | |
| | | | 1,000.00 | | | HERSHEY CO COMMON | | | | | | | 61,459 | | | | 67,010 | | | | |
| | | | 10,000.00 | | | KRAFT FOODS INC CL A | | | | | | | 324,024 | | | | 398,700 | | | | |
| | | | 2,000.00 | | | LORILLARD INC COM STK | | | | | | | 228,423 | | | | 270,580 | | | | |
| | | | 10,000.00 | | | NESTLE S A SPONSORED ADR | | | | | | | 396,900 | | | | 611,400 | | | | |
| | | | 5,000.00 | | | PHILIP MORRIS INTL COM | | | | | | | 217,000 | | | | 447,550 | | | | |
| | | | 4,000.00 | | | REYNOLDS AMERICAN INC COM | | | | | | | 143,516 | | | | 163,320 | | | | |
| | | | 2,000.00 | | | SMUCKER J M CO COM | | | | | | | 121,939 | | | | 159,260 | | | | |
| | | | | | | | | | | | | | 1,937,555 | | | | 2,828,835 | | | 2.55 | % |
| | | | | | | | | | | | | | | | | | | | | | |
| Household & Personal Products | | | 15,000.00 | | | AVON PRODS INC COM | | | | | | | 282,483 | | | | 324,000 | | | | |
| | | | 8,000.00 | | | PROCTER & GAMBLE CO COM | | | | | | | 518,350 | | | | 509,120 | | | | |
| | | | | | | | | | | | | | 800,833 | | | | 833,120 | | | 0.75 | % |
| | | | | | | | | | | | | | | | | | | | | | |
| TOTAL CONSUMER STAPLES | | | | | | | | | | | | | 3,646,003 | | | | 4,811,905 | | | 4.34 | % |
| | | | | | | | | | | | | | | | | | | | | | |
| ENERGY | | | 1,500.00 | | | APACHE CORP COM | | | | | | | 180,068 | | | | 143,910 | | | | |
| | | | 25,000.00 | | | ATLANTIC POWER CORP. | | | | | | | 351,696 | | | | 357,000 | | | | |
| | | | 2,000.00 | | | ATLAS PIPELINE PRTNS UNIT | | | | | | | 75,028 | | | | 69,920 | | | | |
| | | | 3,000.00 | | | BP PRUDHOE BAY ROYALTY TRUST | | | | | | | 256,047 | | | | 373,380 | | | | |
| | | | 2,000.00 | | | BUCKEYE PARTNERS LP COM | | | | | | | 124,792 | | | | 112,900 | | | | |
| | | | 1,500.00 | | | CHEVRON CORP | | | | | | | 160,305 | | | | 159,840 | | | | |
| | | | 28,500.00 | | | CPFL ENERGIA S A SPONS ADR | | | | | | | 499,686 | | | | 803,700 | | | | |
| | | | 1,500.00 | | | DEVON ENERGY CORP NEW COM | | | | | | | 118,668 | | | | 104,775 | | | | |
| | | | 500.00 | | | ENCANA CORP COM | | | | | | | 13,161 | | | | 10,470 | | | | |
| | | | 4,000.00 | | | ENERGY TRANSFER EQUITY LP | | | | | | | 150,093 | | | | 167,840 | | | | |
| | | | 2,500.00 | | | ENERGY TRANSFER PARTNERS LP | | | | | | | 117,514 | | | | 124,075 | | | | |
| | | | 4,000.00 | | | ENSCO PLC | | | | | | | 194,734 | | | | 218,600 | | | | |
| | | | 17,440.00 | | | ENTERPRISE PRODUCTS PARTNERS | | | | | | | 463,200 | | | | 898,858 | | | | |
| | | | 3,004.00 | | | EXXON MOBIL CORP COM | | | | | | | 226,997 | | | | 259,365 | | | | |
| | | | 8,000.00 | | | KINDER MORGAN ENERGY PARTNERS | | | | | | | 491,126 | | | | 659,520 | | | | |
| | | | 5,000.00 | | | KINDER MORGAN INC | | | | | | | 173,187 | | | | 179,500 | | | | |
| BMC FUND, INC. |
| SCHEDULE OF INVESTMENTS (Continued)(Unaudited) |
| April 30, 2012 |
| | | | | | | | | | | | | | | | | Percent | |
| Sectors and | | Shares | | | | | | | | | | | Market | | | of Net | |
| Industries | | Held | | | Company Name | | | | | Cost | | | Value | | | Assets | |
| | | | | | | | | | | | | | | | | | |
| COMMON STOCKS: | | | | | | | | | | | | | | | | | | | | | |
| ENERGY (continued) | | | 205.24 | | | KINDER MORGAN MANAGEMENT | | | 3 | | | | 7,936 | | | | 15,625 | | | | |
| | | | 336,759.66 | | | KINDER MORGAN MGMT MGMT FR | | | 3 | | | | 4 | | | | - | | | | |
| | | | 15,000.00 | | | LINN ENERGY LLC | | | | | | | 270,792 | | | | 603,750 | | | | |
| | | | 12,500.00 | | | MARKWEST ENERGY PARTNERS LP | | | | | | | 159,043 | | | | 751,875 | | | | |
| | | | 10,000.00 | | | MLP & STRATEGY EQUITY FD INC | | | | | | | 138,072 | | | | 175,400 | | | | |
| | | | 2,500.00 | | | ONEOK INC COM | | | | | | | 107,538 | | | | 214,725 | | | | |
| | | | 1,500.00 | | | PEABODY ENERGY CORP COM | | | | | | | 90,350 | | | | 46,665 | | | | |
| | | | 2,500.00 | | | PENN WEST PETROLEUM LTD | | | | | | | 45,428 | | | | 42,850 | | | | |
| | | | 8,900.00 | | | PETROLEO BRASILEIRO SA | | | | | | | 265,836 | | | | 209,550 | | | | |
| | | | 5,000.00 | | | PLAINS ALL AMERN PIPELINE | | | | | | | 245,274 | | | | 409,650 | | | | |
| | | | 5,000.00 | | | SANDRIDGE PERMIAN TRUST | | | | | | | 117,640 | | | | 118,250 | | | | |
| | | | 3,000.00 | | | SEADRILL LIMITED SHS | | | | | | | 90,941 | | | | 117,390 | | | | |
| | | | 5,000.00 | | | TARGA RESOURCES PARTNERS LP | | | | | | | 134,173 | | | | 215,150 | | | | |
| | | | 1,500.00 | | | TOTAL S A SPONSORED ADR | | | | | | | 81,234 | | | | 72,165 | | | | |
| | | | 4,500.00 | | | TRANSMONTAIGNE PARTNERS LP | | | | | | | 122,500 | | | | 153,450 | | | | |
| | | | 3,000.00 | | | TRANSOCEAN INC NEW SHS | | | | | | | 209,037 | | | | 151,170 | | | | |
| | | | 2,000.00 | | | WALTER ENERGY INC | | | | | | | 168,261 | | | | 132,620 | | | | |
| TOTAL ENERGY | | | | | | | | | | | | | 5,850,361 | | | | 8,073,938 | | | 7.27 | % |
| | | | | | | | | | | | | | | | | | | | | | |
| FINANCIALS | | | | | | | | | | | | | | | | | | | | | |
| Banks | | | 5,000.00 | | | BANK OF NOVA SCOTIA | | | | | | | 258,188 | | | | 277,300 | | | 0.25 | % |
| | | | | | | | | | | | | | | | | | | | | | |
| Diversified Financials | | | 4,500.00 | | | BERKSHIRE HATHAWAY INC CL B | | | 3 | | | | 331,206 | | | | 362,025 | | | | |
| | | | 500.00 | | | CME GROUP | | | | | | | 138,071 | | | | 132,910 | | | | |
| | | | 3,500.00 | | | NYSE EURONEXT COM | | | | | | | 95,848 | | | | 90,125 | | | | |
| | | | | | | | | | | | | | 565,125 | | | | 585,060 | | | 0.53 | % |
| | | | | | | | | | | | | | | | | | | | | | |
| Real Estate | | | 35,000.00 | | | MEDICAL PROPERTIES TRUST INC | | | | | | | 370,003 | | | | 328,300 | | | | |
| | | | 2,000.00 | | | VENTAS INC COM | | | | | | | 91,107 | | | | 117,580 | | | | |
| | | | | | | | | | | | | | 461,110 | | | | 445,880 | | | 0.40 | % |
| | | | | | | | | | | | | | | | | | | | | | |
| Financial | | | 1,500.00 | | | AMERICAN EXPRESS CO | | | | | | | 66,021 | | | | 90,315 | | | | |
| | | | 2,000.00 | | | IBERIABANK CORP COM | | | | | | | 115,213 | | | | 102,140 | | | | |
| | | | 4,500.00 | | | PROSPECT CAP CORP COM | | | | | | | 55,070 | | | | 49,140 | | | | |
| | | | | | | | | | | | | | 236,304 | | | | 241,595 | | | 0.22 | % |
| | | | | | | | | | | | | | | | | | | | | | |
| TOTAL FINANCIALS | | | | | | | | | | | | | 1,520,727 | | | | 1,549,835 | | | 1.40 | % |
| | | | | | | | | | | | | | | | | | | | | | |
| HEALTH CARE | | | | | | | | | | | | | | | | | | | | | |
| Health Care Equipment & Services | | | 2,000.00 | | | AMERISOURCEBERGEN CORP COM | | | | | | | 57,550 | | | | 74,420 | | | | |
| | | | 50.00 | | | LABORATORY CORP AMERICA HL | | | 3 | | | | 3,536 | | | | 4,395 | | | | |
| | | | 1,500.00 | | | VARIAN MEDICAL SYSTEMS INC | | | | | | | 68,108 | | | | 95,130 | | | | |
| | | | | | | | | | | | | | 129,194 | | | | 173,945 | | | 0.16 | % |
| BMC FUND, INC. |
| SCHEDULE OF INVESTMENTS (Continued)(Unaudited) |
| April 30, 2012 |
| | | | | | | | | | | | | | | | | Percent | |
| Sectors and | | Shares | | | | | | | | | | | Market | | | of Net | |
| Industries | | Held | | | Company Name | | | | | Cost | | | Value | | | Assets | |
| | | | | | | | | | | | | | | | | | |
| COMMON STOCKS: | | | | | | | | | | | | | | | | | | | | | |
| Pharmaceuticals & Biotechnology | | | 3,000.00 | | | ASTRAZENECA PLC | | | | | | | 135,341 | | | | 131,700 | | | | |
| | | | 2,000.00 | | | CUBIST PHARMACEUTICALS | | | 3 | | | | 60,030 | | | | 84,560 | | | | |
| | | | 500.00 | | | IMMUNOGEN INC COM | | | 3 | | | | 5,722 | | | | 6,375 | | | | |
| | | | 10,000.00 | | | JOHNSON & JOHNSON COM | | | | | | | 619,124 | | | | 651,000 | | | | |
| | | | 27,500.00 | | | PFIZER INC COM | | | | | | | 503,831 | | | | 629,750 | | | | |
| | | | 15,000.00 | | | SANOFI SPONSORED ADR | | | | | | | 515,822 | | | | 572,700 | | | | |
| | | | 1,000.00 | | | SEATTLE GENETICS INC COM | | | 3 | | | | 17,684 | | | | 19,770 | | | | |
| | | | 1,000.00 | | | TEVA PHARMACEUTCL INDS ADR | | | | | | | 50,285 | | | | 45,765 | | | | |
| | | | | | | | | | | | | | 1,907,839 | | | | 2,141,620 | | | 1.93 | % |
| | | | | | | | | | | | | | | | | | | | | | |
| TOTAL HEALTH CARE | | | | | | | | | | | | | 2,037,033 | | | | 2,315,565 | | | 2.09 | % |
| | | | | | | | | | | | | | | | | | | | | | |
| INDUSTRIALS | | | | | | | | | | | | | | | | | | | | | |
| Capital Goods | | | 3,000.00 | | | EMBRAER SA ADR | | | | | | | 99,154 | | | | 103,920 | | | | |
| | | | 1,500.00 | | | NORTHROP GRUMMAN CORP COM | | | | | | | 103,221 | | | | 94,920 | | | | |
| | | | 1,000.00 | | | RAYTHEON CO COM | | | | | | | 49,982 | | | | 54,140 | | | | |
| | | | 2,000.00 | | | SIEMENS AG SPONSORED ADR | | | | | | | 232,200 | | | | 185,740 | | | | |
| | | | | | | | | | | | | | 484,557 | | | | 438,720 | | | 0.40 | % |
| | | | | | | | | | | | | | | | | | | | | | |
| Commercial Services & Supplies | | | 1,000.00 | | | STERICYCLE INC COM | | | 3 | | | | 85,105 | | | | 86,600 | | | | |
| | | | 4,000.00 | | | US ECOLOGY INC COM | | | | | | | 89,131 | | | | 86,560 | | | | |
| | | | 500.00 | | | WASTE MGMT INC COM | | | | | | | 17,412 | | | | 17,100 | | | | |
| | | | | | | | | | | | | | 191,648 | | | | 190,260 | | | 0.17 | % |
| | | | | | | | | | | | | | | | | | | | | | |
| Transportation | | | 2,000.00 | | | NORFOLK SOUTHERN CORP COM | | | | | | | 146,659 | | | | 145,860 | | | 0.13 | % |
| | | | | | | | | | | | | | | | | | | | | | |
| TOTAL INDUSTRIALS | | | | | | | | | | | | | 822,864 | | | | 774,840 | | | 0.70 | % |
| | | | | | | | | | | | | | | | | | | | | | |
| INFORMATION TECHNOLOGY | | | | | | | | | | | | | | | | | | | | | |
| Software & Services | | | 28,500.00 | | | MICROSOFT CORP COM | | | | | | | 692,087 | | | | 912,427 | | | | |
| | | | 6,000.00 | | | ORACLE CORP COM | | | | | | | 151,859 | | | | 176,400 | | | | |
| | | | | | | | | | | | | | 843,946 | | | | 1,088,827 | | | 0.98 | % |
| | | | | | | | | | | | | | | | | | | | | | |
| | | | | | | | | | | | | | | | | | | | | | |
| Technology Hardware & Equipment | | | 15,700.00 | | | CISCO SYSTEMS INC COM | | | | | | | 306,658 | | | | 316,433 | | | | |
| | | | 9,000.00 | | | CORNING INC COM | | | | | | | 177,622 | | | | 129,150 | | | | |
| | | | 10,000.00 | | | DELL INC. | | | 3 | | | | 148,773 | | | | 163,700 | | | | |
| | | | 10,000.00 | | | HEWLETT PACKARD CO COM | | | | | | | 254,968 | | | | 247,600 | | | | |
| | | | 1,300.00 | | | INTL BUSINESS MACHINES CORP | | | | | | | 182,478 | | | | 269,204 | | | | |
| | | | 1,500.00 | | | QUALCOMM INC COM | | | | | | | 71,275 | | | | 95,745 | | | | |
| | | | 25,000.00 | | | XEROX CORP COM | | | | | | | 195,967 | | | | 194,500 | | | | |
| | | | | | | | | | | | | | 1,337,741 | | | | 1,416,332 | | | 1.28 | % |
| | | | | | | | | | | | | | | | | | | | | | |
| Semiconductors & | | | 11,500.00 | | | INTEL CORP COM | | | | | | | 241,047 | | | | 326,543 | | | | |
| Semiconductor Equipment | | | 1,500.00 | | | XILINX INC COM | | | | | | | 41,542 | | | | 54,570 | | | | |
| | | | | | | | | | | | | | 282,589 | | | | 381,113 | | | 0.34 | % |
| | | | | | | | | | | | | | | | | | | | | | |
| TOTAL INFORMATION TECHNOLOGY | | | | | | | | | | | | | 2,464,276 | | | | 2,886,272 | | | 2.60 | % |
| BMC FUND, INC. |
| SCHEDULE OF INVESTMENTS (Continued)(Unaudited) |
| April 30, 2012 |
| | | | | | | | | | | | | | Percent | |
| Sectors and | | Shares | | | | | | | | Market | | | of Net | |
| Industries | | Held | | | Company Name | | Cost | | | Value | | | Assets | |
| | | | | | | | | | | | | | | |
| COMMON STOCKS: | | | | | | | | | | | | | | | | | | |
| MATERIALS | | | 5,000.00 | | | BROOKFIELD INFRASTRUCTURE | | | 143,843 | | | | 157,700 | | | | | |
| | | | 5,000.00 | | | CLIFFS NATURAL RESOURCES INC | | | 350,403 | | | | 311,300 | | | | | |
| | | | 4,000.00 | | | MOSAIC CO | | | 186,574 | | | | 211,280 | | | | | |
| | | | 7,500.00 | | | NEWMONT MINING CORP COM | | | 488,457 | | | | 357,375 | | | | | |
| | | | 2,000.00 | | | POTASH CORPORATION | | | 84,161 | | | | 84,960 | | | | | |
| | | | 4,000.00 | | | RPM INTL INC COM | | | 84,679 | | | | 106,280 | | | | | |
| TOTAL MATERIALS | | | | | | | | | 1,338,117 | | | | 1,228,895 | | | | 1.11 | % |
| | | | | | | | | | | | | | | | | | | |
| TELECOMMUNICATION SERVICES | | | 2,000.00 | | | AMERICA MOVIL SA DE CV | | | 55,017 | | | | 53,300 | | | | | |
| | | | 3,000.00 | | | AT&T INC COM | | | 84,047 | | | | 98,730 | | | | | |
| | | | 2,500.00 | | | BCE INC COM | | | 99,660 | | | | 101,325 | | | | | |
| | | | 5,500.00 | | | CONSOLIDATED COMM HLDGS COM | | | 102,683 | | | | 106,425 | | | | | |
| | | | 1,000.00 | | | DISH NETWORK | | | 31,333 | | | | 31,970 | | | | | |
| | | | 5,000.00 | | | SINGAPORE TELECOMM LTD ADR | | | 121,425 | | | | 126,081 | | | | | |
| | | | 500.00 | | | SK TELECOM LTD SPONSORED A | | | 9,648 | | | | 6,760 | | | | | |
| | | | 3,000.00 | | | TELECOM ARGENTINA SA | | | 78,209 | | | | 43,890 | | | | | |
| | | | 12,000.00 | | | TELEFONICA BRASIL S.A. | | | 290,862 | | | | 341,640 | | | | | |
| | | | 19,000.00 | | | TELEFONICA S A | | | 345,548 | | | | 277,970 | | | | | |
| | | | 10,000.00 | | | VODAFONE GROUP | | | 220,750 | | | | 278,200 | | | | | |
| TOTAL TELECOMMUNICATION SERVICES | | | | | | | | | 1,439,182 | | | | 1,466,291 | | | | 1.32 | % |
| | | | | | | | | | | | | | | | | | | |
| UTILITIES | | | 2,000.00 | | | AMERIGAS PARTNERS LP COM | | | 84,720 | | | | 81,040 | | | | | |
| | | | 10,000.00 | | | COMPANHIA ENERGETICA SP ADR | | | 174,849 | | | | 246,700 | | | | | |
| | | | 6,500.00 | | | DOMINION RES INC VA COM | | | 330,756 | | | | 339,235 | | | | | |
| | | | 44,500.00 | | | DUKE ENERGY CORP COM | | | 728,152 | | | | 953,635 | | | | | |
| | | | 2,500.00 | | | ENERSIS SA | | | 49,539 | | | | 50,675 | | | | | |
| | | | 1,000.00 | | | ENTERGY CORP NEW COM | | | 69,388 | | | | 65,560 | | | | | |
| | | | 10,000.00 | | | EXELON CORP COM | | | 429,255 | | | | 390,100 | | | | | |
| | | | 3,000.00 | | | FIRSTENERGY CORP COM | | | 131,592 | | | | 140,460 | | | | | |
| | | | 2,000.00 | | | INTEGRYS ENERGY GROUP COM | | | 104,066 | | | | 109,280 | | | | | |
| | | | 10,000.00 | | | NATIONAL GRID PLC SPON ADR | | | 496,411 | | | | 540,900 | | | | | |
| | | | 6,000.00 | | | ONEOK PARTNERS LP COM | | | 155,009 | | | | 334,560 | | | | | |
| | | | 5,000.00 | | | PROGRESS ENERGY INC COM | | | 222,425 | | | | 266,100 | | | | | |
| | | | 17,500.00 | | | SOUTHERN CO COM | | | 628,940 | | | | 803,950 | | | | | |
| TOTAL UTILITIES | | | | | | | | | 3,605,102 | | | | 4,322,195 | | | | 3.89 | % |
| | | | | | | | | | | | | | | | | | | |
| TOTAL INVESTMENTS IN COMMON STOCKS | | | | | | | | $ | 23,556,652 | | | $ | 28,452,676 | | | | 25.63 | % |
| BMC FUND, INC. |
| SCHEDULE OF INVESTMENTS (Continued)(Unaudited) |
| April 30, 2012 |
| | | | | | | | | | | | | | | Percent | |
| | | | | | Shares | | | | | | Market | | | of Net | |
| Company Name | | | | | Held | | | Cost | | | Value | | | Assets | |
| | | | | | | | | | | | | | | | |
| PREFERRED STOCKS: | | | | | | | | | | | | | | | | | | | |
| LEARNINGSTATION.COM | | | 2,3 | | | | 1,224,661.00 | | | $ | 500,000 | | | $ | - | | | | |
| | | | | | | | | | | | | | | | | | | | |
| TOTAL INVESTMENTS IN PREFERRED STOCKS | | | | | | | | | | $ | 500,000 | | | $ | - | | | 0.00 | % |
| BMC FUND, INC. |
| SCHEDULE OF INVESTMENTS (Concluded)(Unaudited) |
| April 30, 2012 |
| | | | | | Market | | | Percent of | |
| Company Name | | Cost | | | Value | | | Net Assets | |
| | | | | | | | | | |
| Short-term Investments MFB NI Treasury Money Market Fund | | $ | 23,934,103 | | | $ | 23,934,103 | | | | 21.56 | % |
| | | | | | | | | | | | | |
| TOTAL INVESTMENTS - MARKET VALUE | | | | | | $ | 112,425,367 | | | | 101.28 | % |
| | | | | | | | | | | | | |
| TOTAL OTHER ASSETS IN EXCESS OF LIABILITIES | | | | | | | (1,424,896 | ) | | | -1.28 | % |
| | | | | | | | | | | | | |
| TOTAL NET ASSETS | | | | | | $ | 111,000,471 | | | | 100.00 | % |
| | | | | | | | | | | | | |
| 1In default | | | | | | | | | | | | |
| 2Market value determined by the Fund's Board of Directors | | | | | | | | | | | | |
| 3Non-income producing security | | | | | | | | | | | | |
| BMC FUND, INC. |
| SCHEDULE OF OPEN WRITTEN OPTION CONTRACTS (Unaudited) |
| April 30, 2012 |
| | | | | | | | | | | | | | | Percent | |
| | | | | | Contracts | | | | | | Market | | | of Net | |
| Company Name | | | | | Held | | | Cost | | | Value | | | Assets | |
| | | | | | | | | | | | | | | | |
| CALL OPTIONS: | | | | | | | | | | | | | | | | | | | |
| APACHE CORP CALL OPTION, $115 EXP 7/21/12 | | | 3 | | | | (15.00 | ) | | $ | (3,926 | ) | | $ | (390 | ) | | | |
| ATLAS PIPELINE PARTNERS CALL OPTION, $41 EXP 8/18/12 | | | 3 | | | | (20.00 | ) | | | (2,369 | ) | | | (300 | ) | | | |
| CHEVRON CORP CALL OPTION, $115 EXP 6/16/12 | | | 3 | | | | (10.00 | ) | | | (1,801 | ) | | | (150 | ) | | | |
| CISCO SYSTEMS CALL OPTION, $20 EXP 6/16/12 | | | 3 | | | | (100.00 | ) | | | (8,444 | ) | | | (8,400 | ) | | | |
| CME GROUP CALL OPTION, $300 EXP 6/16/12 | | | 3 | | | | (5.00 | ) | | | (2,835 | ) | | | (375 | ) | | | |
| CUBIST PHARMACEUTICAL CALL OPTION, $44 EXP 5/19/12 | | | 3 | | | | (10.00 | ) | | | (994 | ) | | | (400 | ) | | | |
| CVS CAREMARK CALL OPTION, $45 EXP 5/19/12 | | | 3 | | | | (50.00 | ) | | | (9,372 | ) | | | (3,900 | ) | | | |
| DIAGEO PLC CALL OPTION, $100 EXP 7/21/12 | | | 3 | | | | (25.00 | ) | | | (6,226 | ) | | | (9,125 | ) | | | |
| DISH NETWORK CRP CALL OPTION, $35 EXP 9/22/12 | | | 3 | | | | (10.00 | ) | | | (1,524 | ) | | | (1,500 | ) | | | |
| DOMINOS PIZZA CALL OPTION, $33 EXP 6/16/12 | | | 3 | | | | (10.00 | ) | | | (1,084 | ) | | | (4,500 | ) | | | |
| KRAFT FOODS CALL OPTION, $38 EXP 6/16/12 | | | 3 | | | | (50.00 | ) | | | (5,336 | ) | | | (10,350 | ) | | | |
| KRAFT FOODS CALL OPTION, $40 EXP 6/16/12 | | | 3 | | | | (50.00 | ) | | | (1,473 | ) | | | (3,300 | ) | | | |
| LORILLARD INC CALL OPTION, $125 EXP 6/16/12 | | | 3 | | | | (20.00 | ) | | | (2,612 | ) | | | (22,000 | ) | | | |
| MICROSOFT CORP CALL OPTION, $32 EXP 6/16/12 | | | 3 | | | | (100.00 | ) | | | (12,644 | ) | | | (7,300 | ) | | | |
| MICROSOFT CORP CALL OPTION, $34 EXP 6/16/12 | | | 3 | | | | (100.00 | ) | | | (4,945 | ) | | | (1,700 | ) | | | |
| NYSE EURONEXT CALL OPTION, $31 EXP 6/16/12 | | | 3 | | | | (11.00 | ) | | | (456 | ) | | | (55 | ) | | | |
| PANERA BREAD CALL OPTION, $165 EXP 5/19/12 | | | 3 | | | | (15.00 | ) | | | (5,077 | ) | | | (1,530 | ) | | | |
| SMUCKER J M CO CALL OPTION, $85 EXP 7/21/12 | | | 3 | | | | (10.00 | ) | | | (1,284 | ) | | | (500 | ) | | | |
| STERICYCLE INC CALL OPTION, $90 EXP 5/19/12 | | | 3 | | | | (10.00 | ) | | | (1,639 | ) | | | (400 | ) | | | |
| TELEFONICA CALL OPTION, $17.50 EXP 6/16/12 | | | 3 | | | | (70.00 | ) | | | (7,717 | ) | | | (350 | ) | | | |
| TOTAL CALL OPTIONS - LIABILITIES | | | | | | | | | | | (81,758 | ) | | | (76,525 | ) | | -0.07 | % |
| | | | | | | | | | | | | | | | | | | | |
| PUT OPTIONS: | | | | | | | | | | | | | | | | | | | |
| APOLLO GROUP PUT OPTION, $40 EXP 5/19/12 | | | 3 | | | | (125.00 | ) | | | (20,969 | ) | | | (63,750 | ) | | | |
| APPLE INC PUT OPTION, $575 EXP 5/19/12 | | | 3 | | | | (10.00 | ) | | | (12,634 | ) | | | (12,050 | ) | | | |
| APPLE INC PUT OPTION, $310 EXP 7/21/12 | | | 3 | | | | (15.00 | ) | | | (31,551 | ) | | | (465 | ) | | | |
| APPLE INC PUT OPTION, $370 EXP 7/21/12 | | | 3 | | | | (10.00 | ) | | | (16,184 | ) | | | (760 | ) | | | |
| APPLE INC PUT OPTION, $405 EXP 7/21/12 | | | 3 | | | | (5.00 | ) | | | (7,745 | ) | | | (600 | ) | | | |
| BANK OF AMERICA PUT OPTION, $5 EXP 8/18/12 | | | 3 | | | | (300.00 | ) | | | (9,232 | ) | | | (2,100 | ) | | | |
| CIT GROUP INC PUT OPTION, $25 EXP 7/21/12 | | | 3 | | | | (100.00 | ) | | | (15,594 | ) | | | (300 | ) | | | |
| CONOCOPHILLIPS PUT OPTION, $50 EXP 1/19/13 | | | 3 | | | | (100.00 | ) | | | (50,844 | ) | | | (9,000 | ) | | | |
| DELL INC PUT OPTION, $14 EXP 8/18/12 | | | 3 | | | | (75.00 | ) | | | (3,183 | ) | | | (2,175 | ) | | | |
| DELL INC PUT OPTION, $15 EXP 8/18/12 | | | 3 | | | | (75.00 | ) | | | (4,611 | ) | | | (3,750 | ) | | | |
| DELL INC PUT OPTION, $10 EXP 1/19/13 | | | 3 | | | | (250.00 | ) | | | (23,971 | ) | | | (3,500 | ) | | | |
| DISH NETWORK PUT OPTION, $25 EXP 9/22/12 | | | 3 | | | | (10.00 | ) | | | (984 | ) | | | (550 | ) | | | |
| EMC CORP PUT OPTION, $23 EXP 7/21/12 | | | 3 | | | | (25.00 | ) | | | (1,736 | ) | | | (425 | ) | | | |
| EXPRESS SCRIPT PUT OPTION, $35 EXP 5/19/12 | | | 3 | | | | (50.00 | ) | | | (10,783 | ) | | | (50 | ) | | | |
| EXPRESS SCRIPT PUT OPTION, $40 EXP 5/19/12 | | | 3 | | | | (40.00 | ) | | | (9,467 | ) | | | (280 | ) | | | |
| GOOGLE INC PUT OPTION, $540 EXP 6/16/12 | | | 3 | | | | (20.00 | ) | | | (39,398 | ) | | | (5,600 | ) | | | |
| HEWLETT PACKARD PUT OPTION, $20 EXP 1/19/13 | | | 3 | | | | (250.00 | ) | | | (75,860 | ) | | | (23,250 | ) | | | |
| INTERCONTINENTAL PUT OPTION, $100 EXP 6/16/12 | | | 3 | | | | (50.00 | ) | | | (26,002 | ) | | | (250 | ) | | | |
| ISHS SILVER TRUSTPUT OPTION, $25 EXP 7/21/12 | | | 3 | | | | (100.00 | ) | | | (15,744 | ) | | | (2,600 | ) | | | |
| LOWES COMPANIES INC PUT OPTION, $20 EXP 7/21/12 | | | 3 | | | | (125.00 | ) | | | (12,358 | ) | | | (625 | ) | | | |
| MKT VECTOR GOLD MINERS PUT OPTION, $50 EXP 6/16/12 | | | 3 | | | | (100.00 | ) | | | (25,586 | ) | | | (44,000 | ) | | | |
| ORACLE CORP PUT OPTION, $21 EXP 6/16/12 | | | 3 | | | | (100.00 | ) | | | (10,906 | ) | | | (300 | ) | | | |
| ORACLE CORP PUT OPTION, $25 EXP 6/16/12 | | | 3 | | | | (30.00 | ) | | | (3,523 | ) | | | (330 | ) | | | |
| SAP AG PUT OPTION, $42.50 EXP 6/16/12 | | | 3 | | | | (50.00 | ) | | | (8,437 | ) | | | (250 | ) | | | |
| ST. JOE CO. PUT OPTION, $10 EXP 1/19/13 | | | 3 | | | | (162.00 | ) | | | (20,721 | ) | | | (4,050 | ) | | | |
| SYMANTEC CORP PUT OPTION, $14 EXP 10/20/12 | | | 3 | | | | (500.00 | ) | | | (25,907 | ) | | | (22,000 | ) | | | |
| BMC FUND, INC. |
| SCHEDULE OF OPEN WRITTEN OPTION CONTRACTS (Unaudited) |
| April 30, 2012 |
| | | | | | | | | | | | | | | Percent | |
| | | | | | Contracts | | | | | | Market | | | of Net | |
| Company Name | | | | | Held | | | Cost | | | Value | | | Assets | |
| | | | | | | | | | | | | | | | |
| TD AMERITRADE PUT OPTION, $13 EXP 5/19/12 | | | 3 | | | | (250.00 | ) | | | (15,862 | ) | | | (3,750 | ) | | | |
| VARIAN MEDICAL SYSTEMS PUT OPTION, $60 EXP 11/17/12 | | | 3 | | | | (20.00 | ) | | | (4,494 | ) | | | (6,600 | ) | | | |
| XEROX CORP PUT OPTION, $50 EXP 1/19/13 | | | 3 | | | | (1,000.00 | ) | | | (40,673 | ) | | | (10,000 | ) | | | |
| YAHOO INC PUT OPTION, $13 EXP 7/21/12 | | | 3 | | | | (250.00 | ) | | | (18,109 | ) | | | (3,250 | ) | | | |
| YAHOO INC PUT OPTION, $14 EXP 7/21/12 | | | 3 | | | | (125.00 | ) | | | (12,681 | ) | | | (3,250 | ) | | | |
| TOTAL PUT OPTIONS - LIABILITIES | | | | | | | | | | $ | (575,749 | ) | | $ | (229,860 | ) | | -0.21 | % |
| | | | | | | | | | | | | | | | | | | | |
| TOTAL CALL AND PUT OPTIONS - LIABILITIES | | | | | | | | | | $ | (657,507 | ) | | $ | (306,385 | ) | | -0.28 | % |
Item. 2. Code of Ethics.
N/A
Item 3. Audit Committee Financial Expert.
N/A
Item 4. Principal Accountant Fees and Services.
N/A
Item 5. Audit Committee of Listed Registrants.
N/A
Item 6. Schedule of Investments.
Included as a part of the report to shareholders filed
under Item 1.
Item 7. Disclosure of Proxy Voting Policies and Procedures for
Closed-End Management Investment Companies.
N/A
Item 8. Portfolio Managers of Closed-End Investment Companies.
N/A
Item 9. Purchases of Equity Securities by Closed-End
Management Investment Company and Affiliated Purchasers.
None
Item 10. Submission of Matters to a Vote of Security Holders.
N/A
Item 11. Controls and Procedures.
Within the 90 days prior to the date of this report, the Registrant's management carried out an evaluation, under the supervision and with the participation of Registrant's Chief Executive Officer and Chief Financial Officer, of the effectiveness of the Registrant's disclosure controls and procedures pursuant to Rule 30a-3(b) of the Investment Company Act of 1940. Based upon the evaluation, the Chief Executive Officer and Chief Financial Officer concluded as of a date within 90 days of the filing of this report that the Registrant's disclosure controls and procedures are effective in timely alerting them to material information relating to the Registrant required to be included in the Registrant's periodic SEC filings.
There were no significant changes in the Registrant's internal control over financial reporting (as defined in Rule 30a-3(d) under the Investment Company Act of 1940) that occurred during the second fiscal quarter of the period covered by the report that have materially affected, or are reasonably likely to materially affect, the Registrant's internal control over financial reporting.
Item 12. Exhibits.
(a)(1) N/A
(a)(2) Certifications.
SIGNATURES
Pursuant to the requirements of the Securities Exchange Act of 1934 and the Investment Company Act of 1940, the Registrant has duly caused this report to be signed on its behalf by the undersigned, thereunto duly authorized.
BMC Fund, Inc.
By
/s/ Boyd C. Wilson, Jr.
Boyd C. Wilson, Jr.
Vice President and
Chief Financial Officer
Date: June 13, 2012
Pursuant to the requirements of the Securities Exchange Act of 1934
and the Investment Company Act of 1940, this report has been signed
below by the following persons on behalf of the registrant and in
the capacities and on the dates indicated.
By
/s/ Paul H. Broyhill
Paul H. Broyhill
Chairman and Chief Executive Officer
Date: June 13, 2012
By
/s/ Boyd C. Wilson, Jr.
Boyd C. Wilson, Jr.
Vice President and
Chief Financial Officer
Date: June 13, 2012