UNITED STATES
SECURITES AND EXCHANGE COMMISSION
Washington, DC 20549
FORM N-CSR
CERTIFIED SHAREHOLDER REPORT OF
REGISTERED MANAGEMENT INVESTMENT COMPANIES
Investment Company Act file number: 811-03150
BMC FUND, INC.
(Exact name of registrant as specified in charter)
800 HICKORY BLVD. SW
LENOIR, NC 28645
(Address of principal executive offices) (Zip code)
CAROL FRYE
BMC FUND, INC.
800 HICKORY BLVD. SW
LENOIR, NC 28645
(Name and address of agent for service)
Registrant's telephone number including area code: 828-758-6100
Date of fiscal year end: October 31, 2017
Date of reporting period: October 31, 2017
Item 1. Report to Stockholders.
BMC FUND, INC.
FINANCIAL STATEMENTS AND
SUPPLEMENTARY INFORMATION
Year Ended October 31, 2017
BMC FUND, INC.
TABLE OF CONTENTS
BMC FUND, INC.
LETTER TO SHAREHOLDERS –
MANAGEMENT’S DISCUSSION OF FUND PERFORMANCE
Year Ended October 31, 2017
TO OUR SHAREHOLDERS: MANAGEMENT’S DISCUSSION OF FUND PERFORMANCE
For fiscal year ending October 31, 2017, BMC Fund, Inc. (“BMC”) generated investment performance of 8.8% which fell short of the fund’s investment policy index and equity market performance. While our absolute return was respectable, we struggled to keep pace with surging risk assets, given our conservative positioning, which we believe is prudent at this point in the economic cycle. At fiscal year-end, BMC’s portfolio remains broadly diversified across investments in equities, fixed income, limited partnerships and other investments, and a substantial cash reserve.
As equities rallied toward all-time highs, we actively took profits in risk assets, maintaining consistent exposure to stocks while consciously increasing the fund’s allocation to more absolute-return oriented alternative investments. As a result, the majority of BMC’s largest exposures today are conservatively managed or hedged investment vehicles.
We believe prudence is paramount at this point in the cycle. The average U.S. economic expansion has lasted 58 months in the post-WWII era. We are now in the 101st month of the current economic expansion, which will soon be the second longest on record. While the current expansion is running long in the tooth, relative to history, it has fallen quite short in terms of magnitude. Real growth in GDP this cycle is far lower than any previous economic expansion.
The historic frequency of a U.S. recession over a given five-year period has been 70 percent. This expansion is entering its tenth year. Said differently, we are likely closer to the end of the cycle than the beginning. Most cycles are cut short by Fed rate hikes. Since the 1970s, the median rate hike is 325 bps and the average duration for past hikes is 2 years. We are about one year in today, but don’t have far to go before the Fed funds rate exceeds current ten-year treasury rates, signaling a recession. Time will tell.
Investors make suboptimal decisions when emotions take over, tending to buy out of excitement when the market is going up and sell out of fear when the market is falling. Today, the market is going up, so a logical framework that anticipates turbulence is more important than ever to help reason prevail.
We continue to maintain a high allocation to cash which provides us the opportunity to be a buyer when markets provide cheaper purchase prices. We continue to maintain a very short duration in our fixed income assets to minimize the impact that rising rates may have on our capital. At the same time, our more growth-oriented investments in equities and alternatives provide fuel in the engine to achieve our long-term objectives.
BMC FUND, INC.
LETTER TO SHAREHOLDERS –
MANAGEMENT’S DISCUSSION OF FUND PERFORMANCE
Year Ended October 31, 2017
During the year ended October 31, 2017, the Company paid the following dividends per share:
| December 10, 2016 to shareholders of record November 25, 2016 | | $ | .25 | |
| March 10, 2017 to shareholders of record February 25, 2017 | | | .25 | |
| June 10, 2017 to shareholders of record May 25, 2017 | | | .25 | |
| September 10, 2017 to shareholders of record August 25, 2017 | | | .25 | |
| | | | | |
| Total | | $ | 1.00 | |
The Company paid a dividend of $0.25 per share on December 11, 2017 to shareholders of record November 25, 2017.
The attached Schedule of Investments is a listing of the entire Company’s diversified securities at October 31, 2017 with a total market value of $102,919,275.
| | M. Hunt Broyhill |
| | Chairman and President |
BMC FUND, INC.
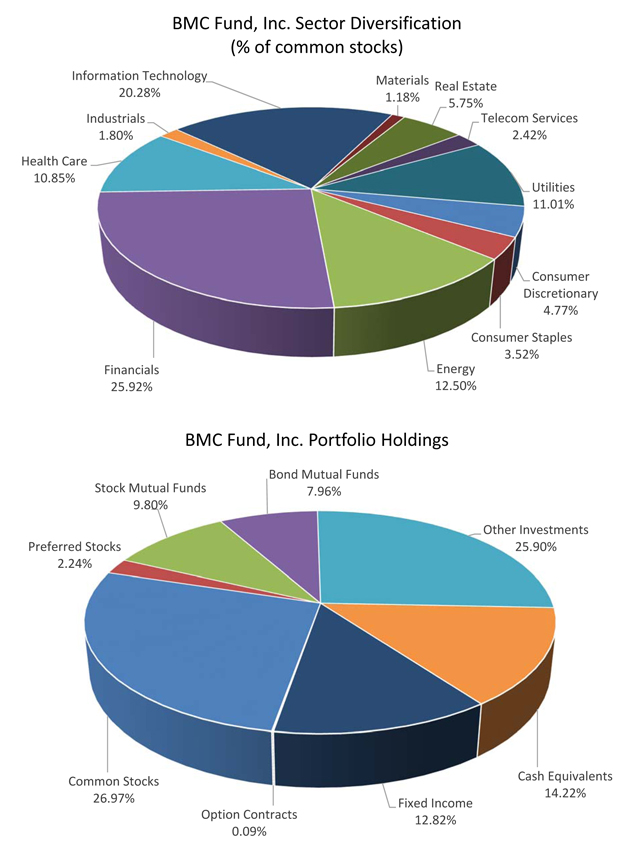
LETTER TO SHAREHOLDERS –
GRAPHIC PRESENTATION OF PORTFOLIO HOLDINGS AND
SECTOR DIVERSIFICATION
Year Ended October 31, 2017
BMC FUND, INC.
SUPPLEMENTAL INFORMATION
Year Ended October 31, 2017
SUPPLEMENTAL INFORMATION
M. Hunt Broyhill, Chairman and President, and Christopher R. Pavese, CFA, Vice President and Chief Investment Officer, are primarily responsible for the day-to-day management of the Company’s portfolio. Mr. Hunt Broyhill has had such responsibility since 2001. He has been engaged in asset management for various institutions and high net worth individuals for more than five years. Prior to joining the Company on March 1, 2005, Mr. Pavese was a Vice President and Portfolio Manager at JP Morgan Private Bank from January 1999 until February 2005. At JP Morgan, Mr. Pavese was engaged in asset management, portfolio strategy, and asset allocation for high net worth individuals, personal trusts, endowments and foundations.

REPORT OF INDEPENDENT REGISTERED PUBLIC ACCOUNTING FIRM
Board of Directors and Shareholders
BMC Fund, Inc.
We have audited the accompanying statement of assets and liabilities of the BMC Fund, Inc. (the “Fund”), including the schedule of investments and schedule of open written option contracts, as of October 31, 2017 and the related statement of operations for the year then ended, the statements of changes in net assets for each of the two years in the period then ended, and the financial highlights for each of the years ended October 31, 2017, 2016, 2015, 2014, 2013, 2012, 2011, 2010, 2009, and 2008. These financial statements and financial highlights are the responsibility of the Fund’s management. Our responsibility is to express an opinion on these financial statements and financial highlights based on our audits.
We conducted our audits in accordance with the standards of the Public Company Accounting Oversight Board (United States). Those standards require that we plan and perform the audit to obtain reasonable assurance about whether the financial statements and financial highlights are free of material misstatement. The Fund is not required to have, nor were we engaged to perform, an audit of its internal control over financial reporting. Our audits included consideration of internal control over financial reporting as a basis for designing audit procedures that are appropriate in the circumstances, but not for the purpose of expressing an opinion on the effectiveness of the Fund's internal control over financial reporting. Accordingly, we express no such opinion. An audit also includes examining, on a test basis, evidence supporting the amounts and disclosures in the financial statements. Our procedures included confirmation of securities owned as of October 31, 2017 by correspondence with the custodian and brokers or by other appropriate auditing procedures where replies from brokers were not received. An audit also includes assessing the accounting principles used and significant estimates made by management, as well as evaluating the overall financial statement presentation. We believe that our audits provide a reasonable basis for our opinion.
As explained in note 2, the financial statements include investments valued at $26,651,183 (25.22 percent of net assets), whose fair values have been estimated by management in the absence of readily determinable fair values. Management’s estimates are based upon information provided by the funds’ managers or the general partners.
In our opinion, the financial statements referred to above present fairly, in all material respects, the financial position of BMC Fund, Inc. as of October 31, 2017, the results of its operations for the year then ended, the changes in its net assets for the each of the two years in the period then ended, and the financial highlights for each of the years ended October 31, 2017, 2016, 2015, 2014, 2013, 2012, 2011, 2010, 2009, and 2008 in conformity with accounting principles generally accepted in the United States of America.
| /s/ Dixon Hughes Goodman LLP | |
| |
| Charlotte, North Carolina |
| December 18, 2017 |
| BMC FUND, INC. |
| STATEMENT OF ASSETS AND LIABILITIES |
| October 31, 2017 |
| ASSETS AT MARKET VALUE: | | | | |
| Investment securities (cost - $95,415,485) | | $ | 102,919,275 | |
| Cash and short-term investments | | | 2,946,864 | |
| Receivables, accrued interest and dividends | | | 159,396 | |
| Other assets | | | 28,317 | |
| | | | | |
| Total assets | | | 106,053,852 | |
| | | | | |
| LIABILITIES: | | | | |
| Call and put options written, at fair value (premiums received $329,933) | | | 318,585 | |
| Payable to custodian | | | 3,100 | |
| Accounts payable to affiliates | | | 74,906 | |
| | | | | |
| Total liabilities | | | 396,591 | |
| | | | | |
| NET ASSETS AT OCTOBER 31, 2017 - EQUIVALENT TO $21.42 PER SHARE ON 4,933,281 SHARES OF COMMON STOCK OUTSTANDING | | $ | 105,657,261 | |
| | | | | |
| SUMMARY OF SHAREHOLDERS' EQUITY: | | | | |
| Common stock, par value $5.00 per share - authorized 70,000,000 shares; outstanding, 4,933,281 shares | | $ | 24,666,405 | |
| Retained earnings prior to becoming investment company | | | 67,493,336 | |
| Undistributed net investment income | | | 525,092 | |
| Realized gain on investments sold and foreign currency transactions | | | 262,576 | |
| Undistributed nontaxable gain | | | 5,194,714 | |
| Unrealized appreciation of investments | | | 7,515,138 | |
| | | | | |
| NET ASSETS APPLICABLE TO COMMON STOCK OUTSTANDING | | $ | 105,657,261 | |
See accompanying notes to financial statements.
| BMC FUND, INC. |
| STATEMENT OF OPERATIONS |
| Year Ended October 31, 2017 |
| INVESTMENT INCOME: | | | | |
| Income: | | | | |
| Interest - fixed income | | $ | 322,619 | |
| Dividend income (net of $6,671 foreign tax) | | | 2,067,785 | |
| | | | | |
| Total income | | | 2,390,404 | |
| | | | | |
| Expenses: | | | | |
| Legal and professional fees | | | 66,425 | |
| Directors' fees (Note 7) | | | 55,500 | |
| Investment expense | | | 85,011 | |
| Salaries and related expenses | | | 684,465 | |
| Property and liability insurance | | | 39,346 | |
| Depreciation expense | | | 2,238 | |
| Rent | | | 44,324 | |
| Office expense and supplies | | | 41,288 | |
| Dues and subscriptions | | | 42,293 | |
| Travel and entertainment | | | 14,301 | |
| | | | | |
| Total expenses | | | 1,075,191 | |
| | | | | |
| Investment income, net | | | 1,315,213 | |
| | | | | |
| REALIZED AND UNREALIZED GAIN ON INVESTMENTS: | | | | |
| Realized gain from investments sold and foreign currency transactions | | | 2,071,779 | |
| Realized gain from expiration or closing of options contracts written | | | 168,022 | |
| Change in unrealized appreciation of investments for the period | | | 4,284,845 | |
| | | | | |
| Net gain on investments | | | 6,524,646 | |
| | | | | |
| NET INCREASE IN NET ASSETS RESULTING FROM OPERATIONS | | $ | 7,839,859 | |
See accompanying notes to financial statements.
| BMC FUND, INC. |
| STATEMENTS OF CHANGES IN NET ASSETS |
| Years Ended October 31, 2017 and 2016 |
| | | 2017 | | | 2016 | |
| | | | | | | |
| INCREASE (DECREASE) IN NET ASSETS FROM OPERATIONS: | | | | | | | | |
| Net investment income | | $ | 1,315,213 | | | $ | 1,088,200 | |
| Realized gains (losses) from investment securities sold, options and foreign currency transactions | | | 2,239,801 | | | | (270,669 | ) |
| Change in unrealized appreciation of investments for the year | | | 4,284,845 | | | | 2,182,860 | |
| | | | | | | | | |
| Net increase in net assets resulting from operations | | | 7,839,859 | | | | 3,000,391 | |
| | | | | | | | | |
| Distributions to shareholders from: | | | | | | | | |
| Net realized gain on investment securities and foreign currency transactions | | | (1,706,556 | ) | | | - | |
| Net investment income | | | (987,607 | ) | | | (1,124,388 | ) |
| Retained earnings prior to becoming an investment company | | | (2,239,118 | ) | | | (3,808,893 | ) |
| | | | | | | | | |
| TOTAL INCREASE (DECREASE) IN NET ASSETS | | | 2,906,578 | | | | (1,932,890 | ) |
| | | | | | | | | |
| NET ASSETS AT BEGINNING OF PERIOD | | | 102,750,683 | | | | 104,683,573 | |
| | | | | | | | | |
| NET ASSETS AT END OF PERIOD (Including undistributed net investment income: 2017 - $525,092, 2016 - $197,486) | | $ | 105,657,261 | | | $ | 102,750,683 | |
See accompanying notes to financial statements.
BMC FUND, INC.
NOTES TO FINANCIAL STATEMENTS
Year Ended October 31, 2017
BMC Fund, Inc. (the “Company”) is a closed-end, diversified investment company registered under the Investment Company Act of 1940, as amended. Prior to becoming a regulated investment company on April 1, 1981, BMC Fund, Inc. operated as a regular corporation. The following is a summary of significant accounting policies followed by the Company in the preparation of its financial statements.
| 2. | SIGNIFICANT ACCOUNTING POLICIES |
A. Investment Valuations – The investment securities are stated at fair value as determined by closing prices on national securities exchanges. Investment securities include corporate bonds, mutual funds, and common and preferred stocks.
The investments in limited partnerships, other investments and venture capital are stated at estimated fair value as determined by the management of these investments and are approved by the Company’s Valuation Committee after giving consideration to historical and projected financial results, economic conditions, financial condition of investee and other factors and events subject to change, and ratified by the Company’s Board of Directors. Because of the inherent uncertainty of those valuations, the estimated values may differ significantly from the values that would have been used had a ready market value for the investments existed, and these differences could be material.
B. Basis of Presentation - The financial statements have been prepared in conformity with accounting principles generally accepted in the United States of America (“GAAP”) as detailed in the Financial Accounting Standards Board’s Accounting Standards Codification.
C. Investment Transactions – Investment transactions are accounted for on the date the order to buy or sell is executed. Realized gains and losses on investments are determined on the basis of specific identification of issues sold or matured. Dividend income is recorded on the ex-dividend date and interest income is recorded on the accrual basis. Discounts and premiums on securities purchased are amortized over the lives of the respective securities. Realized gains and losses on foreign currency transactions are included with realized gains and losses on investments.
For the year ended October 31, 2017, the Company purchased and sold securities in the amount of $27,585,928 and $23,632,043 (excluding short-term investments and options), respectively.
BMC FUND, INC.
NOTES TO FINANCIAL STATEMENTS
Year Ended October 31, 2017
| 2. | SIGNIFICANT ACCOUNTING POLICIES (Continued) |
D. Option Writing – When the Company writes an option, an amount equal to the premium received by the Company is recorded as a liability and is subsequently adjusted to the current fair value of the option written. Premiums received from writing options that expire unexercised are treated by the Company on the expiration date as realized gains from investments. The difference between the premium and the amount paid on effecting a closing purchase transaction, including brokerage commissions, is also treated as a realized gain, or, if the premium is less than the amount paid for the closing purchase transaction, as a realized loss. If a call option is exercised, the premium is added to the proceeds from the sale of the underlying security in determining whether the Company has realized a gain or loss. If a put option is exercised, the premium reduces the cost basis of the securities purchased by the Company. The Company as writer of an option bears the market risk of an unfavorable change in the price of the security underlying the written option.
E. Income Taxes – No federal tax provision is required as it is the Company’s policy to comply with the provisions of Subchapter M of the Internal Revenue Code of 1954, as amended, including the distribution to its shareholders of substantially all of its income and any capital gains not offset by capital losses. Also, no state income tax provision has been provided because the states in which the Company has income recognize the tax exempt status of a regulated investment company.
The Company did not have an accrual for uncertain tax positions as deductions taken and benefits accrued are based on widely understood administrative practices and procedures, and are based on clear and unambiguous tax law. Tax returns for all years 2013 and thereafter are subject to possible future examinations by tax authorities.
F. Dividend Policy – It is the Company’s policy to pay dividends during the year in sufficient amounts to meet the requirements to maintain its status as a regulated investment company.
G. Cash and Short-Term Investments – For purposes of financial reporting, the Company considers all investments at financial institutions with original maturities of three months or less to be equivalent to cash. Short-term money market investments managed by third party investors are included in investment securities.
H. Use of Estimates – The preparation of financial statements in conformity with accounting principles generally accepted in the United States of America requires management to make estimates and assumptions that affect the reported amounts of assets and liabilities and disclosure of contingent assets and liabilities at the date of the financial statements and the reported amounts of revenues and expenses during the reporting period. Actual results could differ from those estimates.
BMC FUND, INC.
NOTES TO FINANCIAL STATEMENTS
Year Ended October 31, 2017
| 2. | SIGNIFICANT ACCOUNTING POLICIES (Continued) |
I. Fair Value Measurements – Fair value is defined as the price that would be received to sell an asset or paid to transfer a liability (i.e., the "exit price") in an orderly transaction between market participants at the measurement date.
In determining fair value, the Company uses various valuation techniques. A fair value hierarchy for inputs is used in measuring fair value that maximizes the use of observable inputs and minimizes the use of unobservable inputs by requiring that the most observable inputs are to be used when available. Valuation techniques that are consistent with the market or income approach are used to measure fair value. The fair value hierarchy is categorized into three levels based on the inputs as follows:
Level 1 - Valuations based on unadjusted quoted prices in active markets for identical assets or liabilities that the Fund has the ability to access.
Level 2 - Valuations based on inputs, other than quoted prices included in Level 1, that are observable either directly or indirectly.
Level 3 - Valuations based on inputs that are unobservable and significant to the overall fair value measurement.
Fair value is a market-based measure, based on assumptions of prices and inputs considered from the perspective of a market participant that are current as of the measurement date, rather than an entity-specific measure. Therefore, even when market assumptions are not readily available, the Company's own assumptions are set to reflect those that market participants would use in pricing the asset or liability at the measurement date.
The availability of valuation techniques and observable inputs can vary from investment to investment and are affected by a wide variety of factors, including the type of investment, whether the investment is new and not yet established in the marketplace, the liquidity of markets, and other characteristics particular to the transaction. To the extent that valuation is based on models or inputs that are less observable or unobservable in the market, the determination of fair value requires more judgment. Because of the inherent uncertainty of valuation, those estimated values may be materially higher or lower than the values that would have been used had a ready market for the investments existed. Accordingly, the degree of judgment exercised by the Company in determining fair value is greatest for investments categorized in Level 3. In certain cases, the inputs used to measure fair value may fall into different levels of the fair value hierarchy. In such cases, the level in the fair value hierarchy which the fair value measurement falls in its entirety is determined based on the lowest level input that is significant to the fair value measurement.
BMC FUND, INC.
NOTES TO FINANCIAL STATEMENTS
Year Ended October 31, 2017
| 2. | SIGNIFICANT ACCOUNTING POLICIES (Continued) |
The inputs or methodology used for valuing securities are not necessarily an indication of the risk associated with investing in those securities.
The following table summarizes fair value information for assets and liabilities measured on a recurring basis as of October 31, 2017.
| Asset Description (1) | | Quoted Prices
in Active
Markets for
Identical Assets
(Level 1) | | | Significant
Other
Observable
Inputs
(Level 2) | | | Significant
Unobservable
Inputs
(Level 3) | | | Total | |
| Fixed Income | | $ | 13,191,477 | | | $ | - | | | $ | - | | | $ | 13,191,477 | |
| Bond Mutual Funds | | | 8,189,230 | | | | - | | | | - | | | | 8,189,230 | |
| Stock Mutual Funds | | | 10,086,408 | | | | - | | | | - | | | | 10,086,408 | |
| Common Stocks – Publicly Traded | | | 27,853,414 | | | | - | | | | - | | | | 27,853,414 | |
| Preferred Stocks – Publicly Traded | | | 2,308,524 | | | | - | | | | - | | | | 2,308,524 | |
| Cash and Cash Equivalents | | | 14,639,039 | | | | - | | | | - | | | | 14,639,039 | |
| Limited Partnerships – Measured at NAV (2) | | | - | | | | - | | | | - | | | | 26,651,183 | |
| Total Investments | | $ | 76,268,092 | | | $ | - | | | $ | - | | | $ | 102,919,275 | |
| Liability Description (1) | | Quoted Prices
in Active
Markets for
Identical Assets
(Level 1) | | | Significant
Other
Observable
Inputs
(Level 2) | | | Significant
Unobservable
Inputs
(Level 3) | | | Total | |
| Call Options | | $ | (56,655 | ) | | $ | - | | | $ | - | | | $ | (56,655 | ) |
| Put Options | | | (261,930 | ) | | | - | | | | - | | | | (261,930 | ) |
| Total Investments | | $ | (318,585 | ) | | $ | - | | | $ | - | | | $ | (318,585 | ) |
| (1) | There were no transfers between Level 1, Level 2, and Level 3 during the period. |
| (2) | Certain investments measured at fair value using the net asset value per share (or its equivalent) practical expedient have not been categorized in the fair value hierarchy. The fair value amounts presented in these tables are intended to permit reconciliation of the fair value hierarchy to the amounts presented in the Schedule of Investments. |
J. Investments in Limited Partnerships - As of October 31, 2017, the Company was invested in limited partnerships. Each of these investments has certain restrictions with respect to rights of withdrawal by the Company as specified in the respective agreements. Generally, the Company is required to provide notice of its intent to withdraw after the investment has been maintained for a certain period of time. The management agreements of the limited partnerships provide for compensation to the managers in the form of fees ranging from 0.5% to 2% annually of net assets and performance incentive allowances or fees ranging from 10% to 20% of net profits earned.
BMC FUND, INC.
NOTES TO FINANCIAL STATEMENTS
Year Ended October 31, 2017
| 2. | SIGNIFICANT ACCOUNTING POLICIES (Continued) |
The following table summarizes the Company's investments in other limited partnerships as of October 31, 2017. The Company's investments in limited partnerships have certain redemption and liquidity restrictions which are described in the below table.
| Investment | | Redemptions
Notice
Period | | Redemptions
Permitted | | Liquidity
Restrictions |
| Limited Partnerships | | | | | | |
| Elliott Associates, LP | | 60 days | | Jan. 1 or July 1 | | See below (1) (2) |
| Graham Growth Partners, LP | | 30 days | | Quarterly | | None |
| Graham Institutional Partners, LP | | 60 days | | Annually | | See below (3) |
| Greenlight Masters Qualified, LP | | 105 days | | December 31 | | See below (4) |
| Infinity Premier Fund, LP | | 95 days | | Quarterly | | See below (5) (6) |
| Litespeed Partners, LP | | 45 days | | Quarterly | | See below (6) |
| Morrocroft Special Opportunity Fund II, LP | | 90 days | | Quarterly | | See below (4) (7) |
| Oaktree Enhanced Income Fund II, LP | | N/A | | N/A | | See below (8) |
| Privet Fund LP | | 90 days | | Quarterly | | See below (9) |
| Stark Investments LP | | N/A | | N/A | | See below (10) |
| Triarii Capital Partners LP | | 45 days | | Quarterly | | See below (11) |
| Virgo Societas Partnership III (Onshore), LP | | N/A | | N/A | | See below (12) |
| Walnut Investment Partners, LP | | N/A | | N/A | | See below (13) |
| Worldwide Opportunity Fund (Cayman), Ltd. | | 90 days | | June 30 or Dec. 31 | | See below (14) |
| (1) | There is a gate provision if requests for redemptions would cause a decline in aggregate net asset value of 20%. In addition to the 20% withdrawal limitation, a partner may not withdraw more than 25% of the capital in its Class B capital account on any withdrawal date. |
| (2) | There is a capital surcharge of 1 3/4% for a partial or full withdrawal which may be waived in whole or in part. |
| (3) | Minimum withdrawal of $500,000 or for all of Limited Partner’s interest in the Partnership, if less. A Limited Partner may not take a partial withdrawal if it would cause the Partnership’s aggregate net asset value to be less than $5,000,000. General Partner may permit a smaller withdrawal or waive the latter requirement |
| (4) | There is a gate provision regarding requests for redemptions, subject to various unspecified terms. |
| (5) | Withdrawals of capital contributed less than 12 months preceding the withdrawal date will be subject to a reduction equal to 3% of the requested withdrawal amount. |
| (6) | There is a gate provision if aggregate requested withdrawal amounts exceed 25% of the aggregate partner capital of the partnership, each limited partner who has submitted a timely request will receive a pro rata portion of the requested withdrawal, and any balance will be considered a timely withdrawal request with respect to the next withdrawal date. |
| (7) | Minimum withdrawal is $100,000, and subsequent withdrawals may only be made in increments of $100,000. Withdrawal maximum limits: up to 1/5 of investment on initial withdrawal date, up to 1/4 of the remainder as of any subsequent withdrawal date, up to 1/3 of the remainder as of any subsequent withdrawal date, up to 1/2 of the remainder as of any subsequent withdrawal date, and up to the remainder as of any subsequent withdrawal date. |
| (8) | Redemptions are not permitted. |
| (9) | Redemptions from portions of capital balance attributable to special investments are permitted only in the general partner’s discretion. |
| (11) | Withdrawals made during the twelve calendar months immediately following the Applicable Initial Withdrawal Date will be subject to a withdrawal charge equal to 5% of the amount permitted to be withdrawn. |
| (12) | Redemptions are not permitted. Unless the general partner elects an earlier date, the partnership expires April 17, 2019, which is the seventy-two month anniversary date of the initial closing of April 17, 2013, subject to a discretionary extension by the general partner of up to two consecutive additional one-year periods. |
| (13) | Walnut is in receivership. |
| (14) | Partial redemption may not reduce capital account below the lesser of $100,000 or 1% of the capital accounts of all investors. |
BMC FUND, INC.
NOTES TO FINANCIAL STATEMENTS
Year Ended October 31, 2017
| 2. | SIGNIFICANT ACCOUNTING POLICIES (Continued) |
The Company is subject to credit risk to the extent that the investment managers of the underlying limited partnerships are unable to fulfill their obligations according to their organizational documents. The Company, through its investments in limited partnerships, is subject to risk inherent when investing in securities and private investments. In connection with its investments, the Company is subject to the market and credit risk of those investments held or sold short by the limited partnerships. Due to the nature of the Company's investments, the above described risks are limited to the Fund's investment balances and unfunded commitments to limited partnerships.
On November 1, 2016, the Company adopted ASU 2014-15, “Disclosure of Uncertainties about an Entity’s Ability to Continue as a Going Concern.” ASU 2014-15 requires management to perform interim and annual assessments of an entity’s ability to continue as a going concern. ASU 2014-15 is effective for the annual period ending after December 15, 2016, and subsequent interim and annual periods. The adoption of ASU 2014-15 did not have a material impact on the Company’s consolidated financial position and results of operations.
On November 1, 2016, the Company adopted ASU 2015-07, “Fair Value Measurement (Topic 820): Disclosure for Investments in Certain Entities that Calculate Net Asset Value Per Share (or Its Equivalent).” ASU 2015-07 removes the requirement to categorize within the fair value hierarchy all investments for which fair value is measured using the net asset value per share practical expedient. ASU 2015-07 also removes the requirement to make certain disclosures for all investments that are eligible to be measured at fair value using the net asset value per share practical expedient. Rather, those disclosures are limited to investments for which the entity has elected to measure the fair value using the practical expedient. The adoption of ASU 2015-07 did not have a material impact on the Company’s consolidated financial position and results of operations, but did result in the Company removing our investments in limited partnerships from the fair value hierarchy in the notes to the financial statements.
| 3. | UNREALIZED APPRECIATION AND DEPRECIATION ON INVESTMENTS |
(tax basis)
The amount of net unrealized appreciation (depreciation) and the cost of investment securities for tax purposes, including short-term securities as October 31, 2017, were as follows:
| Gross appreciation (excess of value over tax cost) | | $ | 14,488,723 | |
| Gross depreciation (excess of tax cost over value) | | | (6,984,933 | ) |
| Net unrealized appreciation | | $ | 7,503,790 | |
| Cost of investments for income tax purposes | | $ | 95,415,485 | |
BMC FUND, INC.
NOTES TO FINANCIAL STATEMENTS
Year Ended October 31, 2017
As of October 31, 2017, portfolio securities valued at $1,899,490 were held in escrow by the custodian as cover for call options written by the Company.
Transactions in options written during the year ended October 31, 2017 were as follows:
| | | Number of
Contracts | | | Premiums
Received | |
| Options outstanding at October 31, 2016 | | | 2,391 | | | $ | 367,994 | |
| Options written | | | 3,120 | | | | 597,210 | |
| Options terminated in closing purchase transactions | | | (1,320 | ) | | | (174,829 | ) |
| Options expired | | | (1,870 | ) | | | (321,353 | ) |
| Options exercised | | | (786 | ) | | | (139,089 | ) |
| Options outstanding at October 31, 2017 | | | 1,535 | | | $ | 329,933 | |
As of October 31, 2017, cash in the amount of $93,973 was pledged as collateral for put options sold by the Company.
| 6. | DISTRIBUTIONS TO SHAREHOLDERS |
Classifications of distributions, net investment income/(loss) and net realized gain/(loss) may differ for financial statement and tax purposes. The character of distributions made during the year from net investment income or net realized gains may differ from its ultimate characterization for federal income tax purposes. Also, due to the timing of dividend distributions, the fiscal year in which amounts are distributed may differ from the fiscal year in which the income or realized gain was recorded by the Company.
On December 10, 2016, a distribution of $0.25 per share was paid to shareholders of record on November 25, 2016.
On March 10, 2017 a distribution of $0.25 per share was paid to shareholders of record on February 25, 2017.
On June 10, 2017, a distribution of $0.25 per share was paid to shareholders of record on May 25, 2017.
On September 10, 2017, a distribution of $0.25 per share was paid to shareholders of record on August 25, 2017.
BMC FUND, INC.
NOTES TO FINANCIAL STATEMENTS
Year Ended October 31, 2017
The tax character of distributions paid during 2017 and 2016 was as follows:
| | | 2017 | | | 2016 | |
| Distributions paid from: | | | | | | | | |
| Ordinary income | | $ | 1,891,408 | | | $ | 1,062,820 | |
| Long-term capital gains | | | 1,233,320 | | | | 861,730 | |
| Retained earnings prior to becoming an investment company | | | 1,808,553 | | | | 3,008,731 | |
| | | $ | 4,933,281 | | | $ | 4,933,281 | |
As of October 31, 2017, there were no components of distributable earnings on a tax basis.
The tax components of distributable earnings are determined in accordance with income tax regulations, which may differ from composition of net assets reported under generally accepted accounting principles. The difference for the period ended October 31, 2017 reflects $525,092 of undistributed net investment income and $262,576 of realized gains on investments under generally accepted accounting principles.
| 7. | ADVISORY BOARD AND REMUNERATION OF DIRECTORS |
The Company does not have an advisory board. The independent directors are paid an annual fee of $3,000 plus $1,000 for each meeting attended in person or $500 for each meeting attended by telephone. Each such independent director is paid an additional $1,000 for each day attending a committee meeting in person or $500 by telephone other than on the date of a board meeting. In addition, all directors are reimbursed for their reasonable expenses incurred in attending meetings.
The Company leases office space from Broyhill Investments, Inc., which is controlled by Paul H. Broyhill and M. Hunt Broyhill, both officers of BMC Fund, Inc. The expense associated with this related party lease for the year ended October 31, 2017 amounted to $44,324. Broyhill Investments, Inc. also acts as a common paymaster for payroll and other shared services. This service is provided at no cost to the Company. All amounts paid by Broyhill Investments, Inc. on behalf of the Company are reimbursed by the Company. The outstanding payable related to these transactions at October 31, 2017 was $74,906.
Selected securities at the end of the year have significant investment impairment issues. These selected securities have an aggregate cost basis of $3,951,998 and have been assigned no value at October 31, 2017.
There were no impairment charges during the year. The Fund received $142,737 in proceeds, which was treated as a return of capital.
BMC FUND, INC.
DIRECTORS AND OFFICERS
Year Ended October 31, 2017
The directors of the Fund were elected for a one-year term at the 2017 annual meeting of shareholders of the Fund.
The following table provides information about the directors and the officers of the Fund:
Directors Who Are Interested Persons
Name,
Address and Age | | Position(s)
Held
with Fund | | Term of
Office and
Length of
Time Served | | Principal
Occupation(s)
During Past
5 Years | | Other
Directorships Held
by Director
During at Least
the Past 5 Years |
| | | | | | | | | |
James T. Broyhill (90) 1930 Virginia Road Winston-Salem, NC 27104 | | Director Vice Chairman | | Since 1976 Since 2005 | | Retired; Director of Shepherd Street Equity Fund (1998-2008); Vice President of Old Clemmons School Properties, Inc. (2006-present); President of Old Clemmons School Properties, Inc. (1998-2006); former Secretary of the North Carolina Department of Commerce (1989-1991); former Chairman of the North Carolina Economic Development Board (1987-1989); former member, U. S. Senate (1986); former member, U.S. House of Representatives (1963-1986) | | None |
| | | | | | | | | |
M. Hunt Broyhill (53) 1870 9th Street Court, NW Hickory, NC 28601 | | Director Chairman President Vice President | | Since 2008 Since 2014 Since 2007 2001-2007 | | Chairman of the Fund since February 2014; President of the Fund since February 2007; former Vice President of the Fund (2001-2007); Chief Executive of Broyhill Asset Management, LLC and Broyhill Wakin General Partners, LLC (1997-present); Director and President of Broyhill Investments, Inc. (1988-present); Director (1983-present) and President of Broyhill Family Foundation, Inc. (1988-present); Senior Managing Partner and Director of Flagship Capital Partners, LLC (2007-present); Manager and Vice President of P. B. Realty, LLC (formerly P. B. Realty, Inc.) (1995-present) | | Capitala Finance Corp. (Sept. 2013-present) |
BMC FUND, INC.
DIRECTORS AND OFFICERS
Year Ended October 31, 2017
Directors Who Are Interested Persons
Name,
Address and Age | | Position(s)
Held
with Fund | | Term of
Office and
Length of
Time Served | | Principal
Occupation(s)
During Past
5 Years | | Other
Directorships Held
by Director
During at Least
the Past 5 Years |
| | | | | | | | | |
Paul H. Broyhill (93) 135 Claron Place, SE Lenoir, NC 28645 | | Director Chairman Emeritus Chief Executive Officer Chairman | | Since 1976 Since 2014 2001-2014 1976-2014 | | Director and Chairman Emeritus; former Chairman (1976-2014) and Chief Executive Officer of the Fund (2001-2014); former President of the Fund (2001-2007); Director (1972-present) and Chairman of Broyhill Investments, Inc. (1988-present); Director (1946-present) and Chairman of Broyhill Family Foundation, Inc. (1989-present); former President of Broyhill Family Foundation, Inc. (1980-1988); Manager and President of P. B. Realty, LLC (formerly P. B. Realty, Inc.) (1983-present) | | None |
| | | | | | | | | |
W. Charles Campbell (51) 1031 Huntington Park Drive Charlotte, NC 28211 | | Director | | Since 2011 | | President and Chief Executive Officer of Flagship Capital Partners, LLC, a private investment real estate firm (2005-present); Chief Executive Officer and Co-managing Partner of Flagship Healthcare Properties, LLC, (formerly Brackett Flagship Properties, LLC), a commercial real estate firm (2010-present) | | None |
| | | | | | | | | |
Jan E. Gordon (66) 3075 Rolling Woods Drive Palm Harbor, FL 34683 | | Director | | Since 2001 | | Retired; former election assistant, Pinellas County, FL Supervisor of Elections (1992-2005) | | None |
| | | | | | | | | |
Allene B. Stevens (95) 153 Hillhaven Place SE Lenoir, NC 28645 | | Director | | Since 1983 | | Private Investor | | None |
BMC FUND, INC.
DIRECTORS AND OFFICERS
Year Ended October 31, 2017
Directors Who Are Not Interested Persons
Name,
Address and Age | | Position(s)
Held
with Fund | | Term of
Office and
Length of
Time Served | | Principal
Occupation(s)
During Past
5 Years | | Other
Directorships Held
by Director
During at Least
the Past 5 Years |
| | | | | | | | | |
Kevin P. Boudreau (54) 117 Shannon Court Rocky Mount, NC 27804 | | Director | | Since 2011 | | Vice President of Tax and Risk Management, Boddie-Noell Enterprises, Inc., a diversified company with interests in restaurant and land-development projects (2005-present) | | None |
| | | | | | | | | |
Margaret M. “Peg” Broyhill (74) 1995 Cedar Rock Estates Lenoir, NC 28645 | | Director | | Since Feb. 2015 | | Resident Branch Manager (Lenoir, NC office) (1993-present) and Senior Vice President of Wells Fargo Advisors (1995-present) | | None |
| | | | | | | | | |
R. Donald Farmer (70) 375 River Haven Drive Taylorsville, NC 28681 | | Director | | Since 2008 | | President of Don Farmer, CPA, PA, an independent public accounting firm and producer of federal income tax seminars and seminar materials (1984-present) | | None |
| | | | | | | | | |
Robert G. Fox, Jr. (68) 330 Lams Way Vilas, NC 28692 | | Director | | Since 2008 | | Former President and Chief Banking Officer of NewDominion Bank (2005-April 2010); Executive Vice President of First Charter Bank/First Charter Corporation (1993-2005) | | None |
| | | | | | | | | |
Mark E. Roberts (55) 269 River Ridge Drive Wallace, NC 28466 | | Director | | Since 2014 | | Chief Investment Officer of Ironsides Asset Advisors, LLC, a registered investment advisory firm (2009-present); Chief Investment Officer of Biltmore Family Offices, LLC (May 2013-January 2017); former Director of Global Equities and Hedges Strategies, State of North Carolina Retirement System (2003-2009) | | None |
BMC FUND, INC.
DIRECTORS AND OFFICERS
Year Ended October 31, 2017
Other Executive Officers
Name,
Address and Age | | Positions
Held
with Fund | | Length of
Time Served | | Principal
Occupation
During Past
5 Years | | Directorships Held
by Officer
During at Least
the Past 5 Years |
| | | | | | | | | |
Boyd C. Wilson, Jr. (65) 646 Pleasant Hill Road Lenoir, NC 28645 | | Vice President and Chief Financial Officer | | Since 2006 | | Vice President and Chief Financial Officer of the Fund since February 2006; Director (2007-present) and Executive Vice President of Broyhill Investments, Inc. (2005-present); Vice President of Broyhill Family Foundation, Inc. (2007-present); Treasurer of Broyhill Wakin General Partners, LLC (2008-present); Manager and Vice President of P. B. Realty, LLC (formerly P. B. Realty, Inc.) (2006-present); Vice President – Finance & Administration of Kincaid Furniture Company, Incorporated (1990-2005) | | CommunityOne Bancorp (2011-2017); Bank of Granite Corp. (1996-2013) |
| | | | | | | | | |
Christopher R. Pavese (41) 166 Pleasant Point Drive Hickory, NC 28601 | | Vice President Chief Investment Officer | | Since 2014 Since 2011 | | Vice President (since February 2014) and Chief Investment Officer of the Fund since March 2011; Portfolio Manager of the Fund (2005-2011); Chief Investment Officer of Broyhill Asset Management, LLC (2008-present); Chief Investment Officer of Broyhill Affinity Fund, LLC (2008-2012) | | None |
| | | | | | | | | |
Carol Frye (60) 1009 Frosty Lane, NE Lenoir, NC 28645 | | Secretary and Treasurer | | Since 2001 | | Secretary and Treasurer of the Fund since 2001; Secretary and Treasurer of Broyhill Investments, Inc. (2000-present); Director (2001-present), Secretary and Treasurer of Broyhill Family Foundation, Inc. (2003-present); Secretary of Broyhill Wakin General Partners, LLC (1997-present); Secretary and Treasurer of P. B. Realty, LLC (formerly P. B. Realty, Inc.) (2001-present) | | None |
BMC FUND, INC.
ADDITIONAL INFORMATION
Year Ended October 31, 2017
Proxy Voting - The policies and procedures that the Fund uses to determine how to vote proxies relating to its portfolio securities are available without charge, upon request, by calling 828-758-6100; on the Fund’s website at http://www.bmcfund.com; and on the Securities and Exchange Commission’s website at http://www.sec.gov.
Information regarding how the Fund voted proxies relating to portfolio securities during the most recent 12-month period ended June 30 is available without charge, upon request, by calling 828-758-6100, and on the SEC’s website at http://www.sec.gov (see Form N-PX).
Portfolio Holdings - The Fund files a complete schedule of its portfolio holdings for the first and third quarters of its fiscal year with the SEC on Form N-Q. The Fund’s Form N-Q filings are available on the SEC’s website at http://www.sec.gov and may be reviewed and copied at the SEC’s Public Reference Room in Washington, DC. Information on the operation of the SEC’s Public Reference Room may be obtained by calling 1-202-551-8090.
BMC FUND, INC.
FINANCIAL HIGHLIGHTS
Years Ended October 31, 2017, 2016, 2015, 2014, 2013, 2012, 2011, 2010, 2009 and 2008
The following table presents financial information divided into three parts: per share operating performance, total investment return and ratios and supplemental data for the years ended October 31, 2017, 2016, 2015, 2014, 2013, 2012, 2011, 2010, 2009 and 2008. The first part, per share operating performance, details the changes on a per share basis of the Company's beginning net asset value to its ending net asset value. The second part, total investment return, is based on the market price of the Company's shares of stock. Part three, ratios and supplemental data, provides additional financial information related to the Company's performance.
| PER SHARE OPERATING PERFORMANCE | | 2017 | | | 2016 | | | 2015 | | | 2014 | | | 2013 | | | 2012 | | | 2011 | | | 2010 | | | 2009 | | | 2008 | |
| | | | | | | | | | | | | | | | | | | | | | | | | | | | | | | |
| Net asset value, beginning of period | | $ | 20.83 | | | $ | 21.22 | | | $ | 22.62 | | | $ | 22.57 | | | $ | 22.58 | | | $ | 22.11 | | | $ | 22.41 | | | $ | 21.20 | | | $ | 20.79 | | | $ | 36.28 | |
| Net investment income | | | 0.27 | | | | 0.22 | | | | 0.35 | | | | 0.42 | | | | 0.46 | | | | 0.35 | | | | 0.49 | | | | 0.46 | | | | 0.48 | | | | 0.73 | |
| Net gains (losses) on investments | | | 1.32 | | | | 0.39 | | | | (0.73 | ) | | | 0.63 | | | | 0.60 | | | | 1.18 | | | | 0.21 | | | | 1.70 | | | | 1.65 | | | | (10.98 | ) |
| Total from investment operations | | | 1.59 | | | | 0.61 | | | | (0.38 | ) | | | 1.05 | | | | 1.06 | | | | 1.53 | | | | 0.70 | | | | 2.16 | | | | 2.13 | | | | (10.25 | ) |
| Less distributions: | | | | | | | | | | | | | | | | | | | | | | | | | | | | | | | | | | | | | | | | |
| Dividends from net investment income | | | 0.20 | | | | 0.23 | | | | 0.36 | | | | 0.44 | | | | 0.47 | | | | 0.56 | | | | 0.27 | | | | 0.46 | | | | 0.92 | | | | 1.04 | |
| Distributions from capital gains | | | 0.35 | | | | - | | | | 0.44 | | | | 0.42 | | | | 0.33 | | | | 0.48 | | | | 0.53 | | | | - | | | | - | | | | 1.42 | |
| Distributions from retained earnings | | | 0.45 | | | | 0.77 | | | | 0.22 | | | | 0.14 | | | | 0.27 | | | | 0.02 | | | | 0.20 | | | | 0.49 | | | | 0.80 | | | | - | |
| P. B. Realty, Inc. Spin-off | | | - | | | | - | | | | - | | | | - | | | | - | | | | - | | | | - | | | | - | | | | - | | | | 2.78 | |
| Total distributions | | | 1.00 | | | | 1.00 | | | | 1.02 | | | | 1.00 | | | | 1.07 | | | | 1.06 | | | | 1.00 | | | | 0.95 | | | | 1.72 | | | | 5.24 | |
| Net asset value, end of period | | $ | 21.42 | | | $ | 20.83 | | | $ | 21.22 | | | $ | 22.62 | | | $ | 22.57 | | | $ | 22.58 | | | $ | 22.11 | | | $ | 22.41 | | | $ | 21.20 | | | $ | 20.79 | |
| | | | | | | | | | | | | | | | | | | | | | | | | | | | | | | | | | | | | | | | | |
| Per share market value, end of period1 | | $ | 18.00 | | | $ | 18.00 | | | $ | 18.00 | | | $ | 18.00 | | | $ | 18.00 | | | $ | 18.00 | | | $ | 18.45 | | | $ | 18.00 | | | $ | 16.75 | | | $ | 26.00 | |
| | | | | | | | | | | | | | | | | | | | | | | | | | | | | | | | | | | | | | | | | |
| TOTAL INVESTMENT RETURN2 | | | 8.83 | % | | | 3.39 | % | | | (2.11 | )% | | | 5.83 | % | | | 5.89 | % | | | 8.50 | % | | | 3.79 | % | | | 11.83 | % | | | 12.72 | % | | | (39.42 | )% |
| | | | | | | | | | | | | | | | | | | | | | | | | | | | | | | | | | | | | | | | | |
| RATIOS/SUPPLEMENTAL DATA | | | | | | | | | | | | | | | | | | | | | | | | | | | | | | | | | | | | | | | | |
| | | | | | | | | | | | | | | | | | | | | | | | | | | | | | | | | | | | | | | | | |
| Net assets, end of period (in thousands) | | $ | 105,657 | | | $ | 102,751 | | | $ | 104,684 | | | $ | 111,568 | | | $ | 111,358 | | | $ | 111,379 | | | $ | 109,069 | | | $ | 110,576 | | | $ | 104,603 | | | $ | 102,574 | |
| Ratio of expenses to average net assets3 | | | 1.03 | % | | | 1.07 | % | | | 0.98 | % | | | 0.97 | % | | | 0.95 | % | | | 1.01 | % | | | 0.97 | % | | | 1.11 | % | | | 1.18 | % | | | 1.02 | % |
| Ratio of net investment income to average net assets3 | | | 1.26 | % | | | 1.06 | % | | | 1.59 | % | | | 1.83 | % | | | 2.04 | % | | | 1.57 | % | | | 2.15 | % | | | 2.11 | % | | | 2.40 | % | | | 2.37 | % |
| Portfolio turnover rate | | | 24.07 | % | | | 15.09 | % | | | 17.10 | % | | | 22.02 | % | | | 33.12 | % | | | 32.90 | % | | | 60.41 | % | | | 38.08 | % | | | 69.62 | % | | | 67.44 | % |
1Unaudited - Based on stock trades, which are very limited, during that year.
2Unaudited - Computed as follows: income from investment operations divided by per share market value.
3Average is computed on a quarterly basis.
See accompanying notes to financial statements.
BMC FUND, INC.
SCHEDULE OF INVESTMENTS
October 31, 2017
| | | | | Coupon | | | | | | | | | | | | | | Percent | |
| | | | | Interest | | | Maturity | | Face | | | | | | Market | | | of Net | |
| Debt Issuer | | | | Rate | | | Date | | Amount | | | Cost | | | Value | | | Assets | |
| | | | | | | | | | | | | | | | | | | | |
| FIXED INCOME: | | | | | | | | | | | | | | | | | | | | | | | | |
| CORPORATE BONDS: | | | | | | | | | | | | | | | | | | | | | | | | |
| AMAZON.COM INC | | | | | 1.200 | % | | 11/29/2017 | | $ | 1,000,000 | | | $ | 1,000,181 | | | $ | 999,812 | | | | | |
| INTEL CORP | | | | | 1.350 | % | | 12/15/2017 | | | 1,000,000 | | | | 1,000,249 | | | | 1,000,015 | | | | | |
| INTERNATIONAL BUSINESS MACHINES | | | | | 1.125 | % | | 2/6/2018 | | | 1,000,000 | | | | 1,000,000 | | | | 999,322 | | | | | |
| WAL-MART STORES INC | | | | | 1.125 | % | | 4/11/2018 | | | 1,000,000 | | | | 1,000,000 | | | | 998,769 | | | | | |
| MICROSOFT CORP | | | | | 1.000 | % | | 5/1/2018 | | | 1,000,000 | | | | 1,000,000 | | | | 997,913 | | | | | |
| JOHNSON & JOHNSON | | | | | 5.150 | % | | 7/15/2018 | | | 500,000 | | | | 513,594 | | | | 513,473 | | | | | |
| BOEING CAP CORP | | | | | 2.900 | % | | 8/15/2018 | | | 500,000 | | | | 505,394 | | | | 504,464 | | | | | |
| COCA COLA CO | | | | | 0.875 | % | | 11/1/2018 | | | 1,000,000 | | | | 1,001,672 | | | | 1,000,151 | | | | | |
| STARBUCKS CORP | | | | | 2.000 | % | | 12/5/2018 | | | 1,000,000 | | | | 1,007,162 | | | | 1,003,083 | | | | | |
| ANHEUSER BUSCH INBEV FIN I | | | | | 1.900 | % | | 2/1/2019 | | | 1,000,000 | | | | 1,001,546 | | | | 1,000,981 | | | | | |
| APPLE INC | | | | | 1.700 | % | | 2/22/2019 | | | 1,000,000 | | | | 1,003,832 | | | | 1,000,549 | | | | | |
| RAYTHEON CO | | | | | 4.400 | % | | 2/15/2020 | | | 500,000 | | | | 531,535 | | | | 527,014 | | | | | |
| BRINKER INTL INC | | | | | 3.875 | % | | 5/15/2023 | | | 100,000 | | | | 98,281 | | | | 98,500 | | | | | |
| INGLES MKTS INC | | | | | 5.750 | % | | 6/15/2023 | | | 200,000 | | | | 200,953 | | | | 196,500 | | | | | |
| DAVITA INC | | | | | 5.125 | % | | 7/15/2024 | | | 100,000 | | | | 99,777 | | | | 100,250 | | | | | |
| ING US INC | | | | | 5.650 | % | | 5/15/2053 | | | 150,000 | | | | 150,000 | | | | 158,250 | | | | | |
| LINCOLN NATL CORP IND | | | | | 7.000 | % | | 5/17/2066 | | | 125,000 | | | | 94,464 | | | | 117,656 | | | | | |
| FPL GROUP CAP INC | | | | | 6.350 | % | | 10/1/2066 | | | 250,000 | | | | 227,217 | | | | 233,750 | | | | | |
| PP&L CAP FUNDING FLT RATE | | | | | 6.700 | % | | 3/30/2067 | | | 500,000 | | | | 500,000 | | | | 493,350 | | | | | |
| WISCONSIN ENERGY | | | | | 6.250 | % | | 5/15/2067 | | | 250,000 | | | | 241,261 | | | | 240,675 | | | | | |
| JP MORGAN CHASE CAP XXIII | | | | | 0.000 | % | | 5/15/2077 | | | 250,000 | | | | 232,014 | | | | 228,125 | | | | | |
| LEHMAN BROTHERS HLDGS NIKKEI INDEX | | 1,2,3 | | | 0.000 | % | | 9/29/2008 | | | 3,000,000 | | | | 1,719,319 | | | | - | | | | | |
| LEHMAN BROTHERS HLDGS EAFE INDEX | | 1,2,3 | | | 0.000 | % | | 11/15/2008 | | | 1,000,000 | | | | 565,453 | | | | - | | | | | |
| LEHMAN BROTHERS HLDGS MEDIUM TERM NOTE | | 1,2,3 | | | 0.000 | % | | 3/15/2011 | | | 2,500,000 | | | | 1,431,658 | | | | - | | | | | |
| | | | | | | | | | | | 18,925,000 | | | | 16,125,562 | | | | 12,412,602 | | | | 11.75 | % |
| | | | | | | | | | | | | | | | | | | | | | | | | |
| MUNICIPAL BONDS: | | | | | | | | | | | | | | | | | | | | | | | | |
| VIRGIN ISLANDS PUB FIN AUTH | | | | | 6.625 | % | | 10/1/2029 | | | 100,000 | | | | 85,013 | | | | 60,375 | | | | | |
| VIRGIN ISLANDS PUB FIN AUTH | | | | | 6.750 | % | | 10/1/2037 | | | 1,200,000 | | | | 988,755 | | | | 718,500 | | | | | |
| | | | | | | | | | | | 1,300,000 | | | | 1,073,768 | | | | 778,875 | | | | 0.74 | % |
| | | | | | | | | | | | | | | | | | | | | | | | | |
| TOTAL INVESTMENTS IN FIXED INCOME | | | | | | | | | | $ | 20,225,000 | | | $ | 17,199,330 | | | $ | 13,191,477 | | | | 12.49 | % |
BMC FUND, INC.
SCHEDULE OF INVESTMENTS (Continued)
October 31, 2017
| | | | | | | | | | | | | | Percent | |
| | | | | Shares | | | | | | Market | | | of Net | |
| Company Name | | | | Held | | | Cost | | | Value | | | Assets | |
| | | | | | | | | | | | | | | |
| MUTUAL FUNDS: | | | | | | | | | | | | | | | | | | |
| BOND MUTUAL FUNDS: | | | | | | | | | | | | | | | | | | |
| BLACKROCK FLOAT RATE O COM | | | | | 1,500.00 | | | $ | 19,596 | | | $ | 21,465 | | | | | |
| DOUBLELINE FDS TR DBLN LOW DURATION I | | | | | 49,603.18 | | | | 500,000 | | | | 499,008 | | | | | |
| DOUBLELINE TOTAL RETURN BOND I | | | | | 226,010.04 | | | | 2,500,000 | | | | 2,411,527 | | | | | |
| GUGGENHEIM TAXABLE MUNI MG | | | | | 8,148.00 | | | | 174,286 | | | | 180,967 | | | | | |
| LOOMIS SAYLES BOND INSTITUTIONAL | | | | | 120,930.18 | | | | 1,612,500 | | | | 1,711,162 | | | | | |
| NUVEEN PFD & INCOME TE COM | | | | | 5,000.00 | | | | 116,924 | | | | 125,850 | | | | | |
| OSTERWEIS STRATEGIC INCOME | | | | | 19,861.83 | | | | 230,000 | | | | 226,822 | | | | | |
| PIMCO FDS INCOME FUND INSTL | | | | | 128,944.70 | | | | 1,500,000 | | | | 1,605,362 | | | | | |
| POWERSHARES ETF TRUST SENIOR LN PORT | | | | | 10,000.00 | | | | 233,150 | | | | 231,200 | | | | | |
| THIRD AVENUE FOCUSED CREDIT INSTITUTIONAL | | 3 | | | 142,568.97 | | | | 848,079 | | | | 176,786 | | | | | |
| VANGUARD FIXED INC SECS ST | | | | | 46,772.69 | | | | 500,000 | | | | 500,000 | | | | | |
| VANGUARD SHORT TERM CORP BOND | | | | | 22,967.39 | | | | 500,000 | | | | 499,081 | | | | | |
| TOTAL BOND MUTUAL FUNDS | | | | | | | | | 8,734,535 | | | | 8,189,230 | | | | 7.75 | % |
| | | | | | | | | | | | | | | | | | | |
| STOCK MUTUAL FUNDS: | | | | | | | | | | | | | | | | | | |
| SPECIALTY FUNDS | | | | | | | | | | | | | | | | | | |
| Conservative Allocation | | | | | | | | | | | | | | | | | | |
| VANGUARD WELLESLEY INCOME INV | | | | | 20,045.04 | | | | 422,892 | | | | 539,211 | | | | 0.51 | % |
| | | | | | | | | | | | | | | | | | | |
| Financial | | | | | | | | | | | | | | | | | | |
| SPDR S&P REGIONAL BANKING | | | | | 4,500.00 | | | | 249,908 | | | | 256,995 | | | | 0.24 | % |
| | | | | | | | | | | | | | | | | | | |
| Consumer Discretionary | | | | | | | | | | | | | | | | | | |
| VANGUARD WORLD FDS CONSUM DIS ETF | | | | | 2,265.00 | | | | 299,965 | | | | 329,988 | | | | 0.31 | % |
| | | | | | | | | | | | | | | | | | | |
| Industrials | | | | | | | | | | | | | | | | | | |
| VANGUARD WORLD FDS INDUS INDEX ADM | | | | | 4,695.57 | | | | 300,000 | | | | 326,060 | | | | 0.31 | % |
| | | | | | | | | | | | | | | | | | | |
| Large Cap Blend | | | | | | | | | | | | | | | | | | |
| COOK & BYNUM FUND | | | | | 65,145.23 | | | | 1,000,000 | | | | 1,098,349 | | | | | |
| POWERSHARES ETF TRUST INTL DIV ACHV | | | | | 6,600.00 | | | | 99,412 | | | | 105,732 | | | | | |
| PRIMECAP ODYSSEY FUNDS ODYSSEY STK FD | | | | | 18,525.38 | | | | 500,000 | | | | 574,657 | | | | | |
| T ROWE PRICE PERSONAL STRATEGY GROWTH | | | | | 4,370.83 | | | | 90,476 | | | | 152,017 | | | | | |
| VANGUARD INDEX FDS 500 PORTFOLIO | | | | | 2,383.00 | | | | 500,000 | | | | 567,059 | | | | | |
| YACKTMAN FUND SVC | | | | | 24,771.08 | | | | 506,985 | | | | 594,506 | | | | | |
| | | | | | | | | | 2,696,873 | | | | 3,092,320 | | | | 2.93 | % |
BMC FUND, INC.
SCHEDULE OF INVESTMENTS (Continued)
October 31, 2017
| | | | | | | | | | | | | | Percent | |
| | | | | Shares | | | | | | Market | | | of Net | |
| Company Name | | | | Held | | | Cost | | | Value | | | Assets | |
| | | | | | | | | | | | | | | |
| MUTUAL FUNDS: | | | | | | | | | | | | | | | | | | |
| Large Cap Growth | | | | | | | | | | | | | | | | | | |
| PARNASSUS FD EQUITY INCOME | | | | | 12,603.98 | | | | 500,000 | | | | 552,937 | | | | 0.52 | % |
| | | | | | | | | | | | | | | | | | | |
| Mid Cap Blend | | | | | | | | | | | | | | | | | | |
| AKRE FOCUS FUND INSTL | | | | | 10,855.41 | | | | 250,000 | | | | 349,761 | | | | 0.33 | % |
| | | | | | | | | | | | | | | | | | | |
| Moderate Allocation | | | | | | | | | | | | | | | | | | |
| FPA CRESCENT PORTFOLIO | | | | | 49,409.16 | | | | 1,525,303 | | | | 1,741,179 | | | | 1.65 | % |
| | | | | | | | | | | | | | | | | | | |
| Precious Metals | | | | | | | | | | | | | | | | | | |
| ISHARES SILVER TRUST | | 3 | | | 23,802.00 | | | | 399,993 | | | | 375,834 | | | | | |
| SPDR GOLD SHARES | | 3 | | | 6,000.00 | | | | 608,120 | | | | 724,020 | | | | | |
| VANECK VECTORS GOLD MINERS | | | | | 20,832.00 | | | | 637,277 | | | | 468,303 | | | | | |
| | | | | | | | | | 1,645,390 | | | | 1,568,157 | | | | 1.48 | % |
| | | | | | | | | | | | | | | | | | | |
| Utilities | | | | | | | | | | | | | | | | | | |
| REAVES UTILITY INCOME FD C | | | | | 2,000.00 | | | | 66,620 | | | | 62,040 | | | | | |
| UTILITIES SELECT SECTOR SPDR | | | | | 23,000.00 | | | | 734,317 | | | | 1,267,760 | | | | | |
| | | | | | | | | | 800,937 | | | | 1,329,800 | | | | 1.26 | % |
| | | | | | | | | | | | | | | | | | | |
| TOTAL SPECIALTY FUNDS | | | | | | | | | 8,691,268 | | | | 10,086,408 | | | | 9.55 | % |
| | | | | | | | | | | | | | | | | | | |
| TOTAL STOCK MUTUAL FUNDS | | | | | | | | | 8,691,268 | | | | 10,086,408 | | | | 9.55 | % |
| | | | | | | | | | | | | | | | | | | |
| TOTAL INVESTMENTS IN MUTUAL FUNDS | | | | | | | | $ | 17,425,803 | | | $ | 18,275,638 | | | | 17.30 | % |
BMC FUND, INC.
SCHEDULE OF INVESTMENTS (Continued)
October 31, 2017
| | | | | | | | Market | | | Percent of | |
| Company Name | | | | Cost | | | Value | | | Net Assets | |
| | | | | | | | | | | | |
| OTHER INVESTMENTS: | | | | | | | | | | | | | | |
| | | | | | | | | | | | | | | |
| LIMITED PARTNERSHIPS: | | | | | | | | | | | | | | |
| ELLIOTT ASSOCIATES LP CL A | | 2, 3 | | $ | 2,000,000 | | | $ | 4,688,949 | | | | | |
| ELLIOTT ASSOCIATES LP CL B | | 2, 3 | | | 1,000,000 | | | | 1,169,862 | | | | | |
| GRAHAM GROWTH PARTNERS, LP | | 2, 3 | | | 1,000,000 | | | | 1,308,680 | | | | | |
| GRAHAM INSTITUTIONAL PARTNERS, LP | | 2, 3 | | | 1,000,000 | | | | 1,082,565 | | | | | |
| GREENLIGHT MASTERS QUALIFIED LP | | 2, 3 | | | 2,500,000 | | | | 3,998,700 | | | | | |
| INFINITY PREMIER FUND, LP | | 2, 3 | | | 3,000,000 | | | | 3,357,238 | | | | | |
| LITESPEED PARTNERS, LP | | 2, 3 | | | 2,500,000 | | | | 2,380,922 | | | | | |
| MORROCROFT SPECIAL OPPORTUNITY FUND II, LP | | 2, 3 | | | - | | | | 164,509 | | | | | |
| OAKTREE ENHANCED INCOME FUND II, LP | | 2, 3 | | | 2,016,616 | | | | 2,425,965 | | | | | |
| PRIVET FUND LP | | 2, 3 | | | 1,000,000 | | | | 1,602,772 | | | | | |
| STARK INVESTMENTS LP | | 2, 3 | | | 42,549 | | | | 116,913 | | | | | |
| TRIARII CAPITAL PARTNERS LP | | 2, 3 | | | 750,000 | | | | 798,817 | | | | | |
| VIRGO SOCIETAS III (ONSHORE) LP | | 2, 3 | | | 1,525,427 | | | | 2,146,969 | | | | | |
| WALNUT INVESTMENT PARTNERS | | 2, 3 | | | 235,567 | | | | - | | | | | |
| WORLDWIDE OPPORTUNITY FUND (CAYMAN) LTD. CL A-A1 | | 2, 3 | | | 1,000,000 | | | | 1,152,124 | | | | | |
| WORLDWIDE OPPORTUNITY FUND (CAYMAN) LTD. CL A-A28 | | 2, 3 | | | 50,000 | | | | 52,342 | | | | | |
| WORLDWIDE OPPORTUNITY FUND (CAYMAN) LTD. CL A-A29 | | 2, 3 | | | 50,000 | | | | 51,703 | | | | | |
| WORLDWIDE OPPORTUNITY FUND (CAYMAN) LTD. CL A-A30 | | 2, 3 | | | 50,000 | | | | 51,366 | | | | | |
| WORLDWIDE OPPORTUNITY FUND (CAYMAN) LTD. CL A-A31 | | 2, 3 | | | 50,000 | | | | 50,787 | | | | | |
| WORLDWIDE OPPORTUNITY FUND (CAYMAN) LTD. CL A-A31 | | 2, 3 | | | 50,000 | | | | 50,000 | | | | | |
| TOTAL LIMITED PARTNERSHIPS | | | | | 19,820,159 | | | | 26,651,183 | | | | 25.22 | % |
| | | | | | | | | | | | | | | |
| TOTAL OTHER INVESTMENTS | | | | $ | 19,820,159 | | | $ | 26,651,183 | | | | 25.22 | % |
BMC FUND, INC.
SCHEDULE OF INVESTMENTS (Continued)
October 31, 2017
| | | | | | | | | | | | | | | | Percent | |
| Sectors and | | Shares | | | | | | | | | | Market | | | of Net | |
| Industries | | Held | | | Company Name | | | | Cost | | | Value | | | Assets | |
| | | | | | | | | | | | | | | | | |
| COMMON STOCKS: | | | | | | | | | | | | | | | | | | | | |
| CONSUMER DISCRETIONARY | | | | | | | | | | | | | | | | | | | | |
| Consumer Durables and Apparel | | | 500.00 | | | TJX COMPANIES INC NEW COM | | | | $ | 37,713 | | | $ | 34,900 | | | | 0.03 | % |
| | | | | | | | | | | | | | | | | | | | | |
| Retailing | | | 7,500.00 | | | DOLLAR GEN CORP COM | | | | | 530,295 | | | | 606,300 | | | | | |
| | | | 7,500.00 | | | DOLLAR TREE INC COM | | 3 | | | 585,493 | | | | 684,375 | | | | | |
| | | | | | | | | | | | 1,115,788 | | | | 1,290,675 | | | | 1.22 | % |
| | | | | | | | | | | | | | | | | | | | | |
| TOTAL CONSUMER DISCRETIONARY | | | | | | | | | | | 1,153,501 | | | | 1,325,575 | | | | 1.25 | % |
| | | | | | | | | | | | | | | | | | | | | |
| CONSUMER STAPLES | | | | | | | | | | | | | | | | | | | | |
| Food, Beverage & Tobacco | | | 1,000.00 | | | ANHEUSER-BUSCH INBEV SA/NV | | | | | 116,553 | | | | 122,780 | | | | | |
| | | | 1,500.00 | | | CONSTELLATION BRANDS CL A | | | | | 136,079 | | | | 328,635 | | | �� | | |
| | | | 500.00 | | | GENERAL MILLS INC COM | | | | | 20,240 | | | | 25,960 | | | | | |
| | | | 5,000.00 | | | NESTLE S A SPONSORED ADR | | | | | 207,739 | | | | 421,150 | | | | | |
| | | | 1,000.00 | | | STARBUCKS CORPORATION | | | | | 54,225 | | | | 54,840 | | | | | |
| | | | | | | | | | | | 534,836 | | | | 953,365 | | | | 0.90 | % |
| | | | | | | | | | | | | | | | | | | | | |
| Household & Personal Products | | | 275.00 | | | PROCTER & GAMBLE CO COM | | | | | 18,418 | | | | 23,744 | | | | 0.02 | % |
| | | | | | | | | | | | | | | | | | | | | |
| TOTAL CONSUMER STAPLES | | | | | | | | | | | 553,254 | | | | 977,109 | | | | 0.92 | % |
| | | | | | | | | | | | | | | | | | | | | |
| ENERGY | | | | | | | | | | | | | | | | | | | | |
| Energy | | | 3,800.00 | | | CHEVRON CORP | | | | | 402,913 | | | | 440,382 | | | | | |
| | | | 5,404.00 | | | EXXON MOBIL CORP COM | | | | | 454,007 | | | | 450,423 | | | | | |
| | | | 1,000.00 | | | NUSTAR ENERGY LP | | | | | 47,873 | | | | 33,300 | | | | | |
| | | | 4,800.00 | | | OCCIDENTAL PETROLEUM COM | | | | | 380,566 | | | | 309,936 | | | | | |
| | | | 5,500.00 | | | PHILLIPS 66 COM | | | | | 433,181 | | | | 500,940 | | | | | |
| | | | 1,500.00 | | | ROYAL DUTCH SHELL ADR A | | | | | 100,413 | | | | 94,545 | | | | | |
| | | | 2,000.00 | | | SCHLUMBERGER LTD COM | | | | | 144,832 | | | | 128,000 | | | | | |
| | | | 9,000.00 | | | SUNOCO INC COM | | | | | 215,850 | | | | 278,730 | | | | | |
| | | | 5,500.00 | | | VALERO ENERGY CORP COM STK | | | | | 364,676 | | | | 433,895 | | | | | |
| | | | | | | | | | | | 2,544,311 | | | | 2,670,151 | | | | 2.53 | % |
| | | | | | | | | | | | | | | | | | | | | |
| Pipelines | | | 3,000.00 | | | BP PRUDHOE BAY ROYALTY TRU | | | | | 256,047 | | | | 57,150 | | | | | |
| | | | 2,000.00 | | | BUCKEYE PARTNERS LP COM | | | | | 124,792 | | | | 106,220 | | | | | |
| | | | 10,000.00 | | | ENERGY TRANSFER PARTNERS LP | | | | | 234,907 | | | | 174,100 | | | | | |
| | | | 2,000.00 | | | GASLOG PARTNERS LP UNIT LT | | | | | 49,779 | | | | 47,500 | | | | | |
| | | | 4,000.00 | | | GOLAR LNG PARTNERS LP | | | | | 87,880 | | | | 87,080 | | | | | |
| | | | 5,000.00 | | | GREEN PLAINS PARTNERS COM | | | | | 102,799 | | | | 99,000 | | | | | |
| | | | 10.00 | | | ONEOK INC COM | | | | | 520 | | | | 543 | | | | | |
| | | | 1,500.00 | | | SPECTRA ENERGY PARTNERS LP | | | | | 66,572 | | | | 64,680 | | | | | |
| | | | 5,000.00 | | | USA COMPRESSION PARTNERS COM | | | | | 86,262 | | | | 78,550 | | | | | |
| | | | 3,000.00 | | | WILLIAMS COS INC DEL COM | | | | | 109,005 | | | | 85,500 | | | | | |
| | | | | | | | | | | | 1,118,563 | | | | 800,323 | | | | 0.76 | % |
| | | | | | | | | | | | | | | | | | | | | |
| TOTAL ENERGY | | | | | | | | | | | 3,662,874 | | | | 3,470,474 | | | | 3.28 | % |
BMC FUND, INC.
SCHEDULE OF INVESTMENTS (Continued)
October 31, 2017
| | | | | | | | | | | | | | | | Percent | |
| Sectors and | | Shares | | | | | | | | | | Market | | | of Net | |
| Industries | | Held | | | Company Name | | | | Cost | | | Value | | | Assets | |
| | | | | | | | | | | | | | | | | |
| COMMON STOCKS: | | | | | | | | | | | | | | | | | | | | |
| FINANCIALS | | | | | | | | | | | | | | | | | | | | |
| Banks | | | 30,000.00 | | | ALLY FINANCIAL INC COM | | | | | 624,039 | | | | 783,900 | | | | | |
| | | | 5,000.00 | | | BANK OF AMERICA CORP COM | | | | | 96,603 | | | | 136,950 | | | | | |
| | | | 5,000.00 | | | BB&T CORP COM | | | | | 215,613 | | | | 246,200 | | | | | |
| | | | 3,000.00 | | | PACWEST BANCORP DEL COM | | | | | 148,845 | | | | 144,960 | | | | | |
| | | | 2,500.00 | | | WELLS FARGO & CO DEL COM | | | | | 113,117 | | | | 140,350 | | | | | |
| | | | | | | | | | | | 1,198,217 | | | | 1,452,360 | | | | 1.37 | % |
| | | | | | | | | | | | | | | | | | | | | |
| Diversified Financials | | | 7,000.00 | | | ALLIANCE BERNSTEIN HLDG UN | | | | | 153,050 | | | | 180,950 | | | | | |
| | | | 5,000.00 | | | ANNALY CAP MGMT INC COM | | | | | 82,125 | | | | 57,300 | | | | | |
| | | | 7,500.00 | | | ARLINGTON ASSET INVT C CL | | | | | 106,244 | | | | 86,025 | | | | | |
| | | | 2,500.00 | | | BERKSHIRE HATHAWAY INC CL B | | 3 | | | 185,407 | | | | 467,350 | | | | | |
| | | | 6,000.00 | | | BLACKSTONE MTG TR INC COM | | | | | 178,620 | | | | 190,980 | | | | | |
| | | | 2,000.00 | | | CAPITAL ONE FINL CORP COM | | | | | 161,936 | | | | 184,360 | | | | | |
| | | | 78,455.00 | | | CAPITALA FINANCE CORP COM | | | | | 1,363,703 | | | | 652,746 | | | | | |
| | | | 8,000.00 | | | CARLYLE GROUP LP COM | | | | | 201,185 | | | | 176,400 | | | | | |
| | | | 300.00 | | | CME GROUP | | | | | 16,568 | | | | 41,151 | | | | | |
| | | | 15,000.00 | | | GOLUB CAPITAL BDC INC COM | | | | | 226,480 | | | | 284,400 | | | | | |
| | | | 5,000.00 | | | NEW YORK MTG TR INC COM PA | | | | | 35,055 | | | | 30,150 | | | | | |
| | | | 27,000.00 | | | OAKTREE CAPITAL GROUP LLC UNIT | | | | | 1,185,424 | | | | 1,236,600 | | | | | |
| | | | 10,000.00 | | | OXFORD LANE CAP CORP COM | | | | | 110,256 | | | | 109,300 | | | | | |
| | | | 19,000.00 | | | THE BLACKSTONE GROUP LP | | | | | 597,210 | | | | 632,510 | | | | | |
| | | | | | | | | | | | 4,603,263 | | | | 4,330,222 | | | | 4.10 | % |
| | | | | | | | | | | | | | | | | | | | | |
| Insurance | | | 1,500.00 | | | AON PLC SHS CL A | | | | | 121,687 | | | | 215,145 | | | | | |
| | | | 5,000.00 | | | OLD REP INTL CORP COM | | | | | 84,276 | | | | 101,450 | | | | | |
| | | | 2,500.00 | | | TRAVELERS COMPANIES COM | | | | | 203,356 | | | | 331,125 | | | | | |
| | | | 5,000.00 | | | ZURICH INS GROUP LTD SPONS ARD | | | | | 148,815 | | | | 152,650 | | | | | |
| | | | | | | | | | | | 558,134 | | | | 800,370 | | | | 0.76 | % |
| | | | | | | | | | | | | | | | | | | | | |
| Real Estate | | | 31,529.00 | | | KENNEDY-WILSON HLDGS I COM | | | | | 611,662 | | | | 613,239 | | | | | |
| | | | | | | | | | | | 611,662 | | | | 613,239 | | | | 0.58 | % |
| | | | | | | | | | | | | | | | | | | | | |
| TOTAL FINANCIALS | | | | | | | | | | | 6,971,276 | | | | 7,196,191 | | | | 6.81 | % |
| | | | | | | | | | | | | | | | | | | | | |
| | | | | | | | | | | | | | | | | | | | | |
| HEALTH CARE | | | | | | | | | | | | | | | | | | | | |
| Health Care Equipment & Services | | | | | | | | | | | | | | | | | | | | |
| | | | 2,500.00 | | | DAVITA HEALTHCARE PART COM | | 3 | | | 157,625 | | | | 151,850 | | | | | |
| | | | 5,000.00 | | | HOLOGIC INC COM | | 3 | | | 216,378 | | | | 189,250 | | | | | |
| | | | 3,550.00 | | | LABORATORY CORP AMER HLDGS | | 3 | | | 376,591 | | | | 545,670 | | | | | |
| | | | 3,000.00 | | | QUEST DIAGNOSTICS INC COM | | | | | 168,045 | | | | 281,340 | | | | | |
| | | | 4,000.00 | | | ROCHE HLDG LTD SPONS ADR | | | | | 129,261 | | | | 115,620 | | | | | |
| | | | 1,600.00 | | | MCKESSON CORP COM | | | | | 231,905 | | | | 220,608 | | | | | |
| | | | | | | | | | | | 1,279,805 | | | | 1,504,338 | | | | 1.42 | % |
BMC FUND, INC.
SCHEDULE OF INVESTMENTS (Continued)
October 31, 2017
| | | | | | | | | | | | | | | | Percent | |
| Sectors and | | Shares | | | | | | | | | | Market | | | of Net | |
| Industries | | Held | | | Company Name | | | | Cost | | | Value | | | Assets | |
| | | | | | | | | | | | | | | | | |
| COMMON STOCKS: | | | | | | | | | | | | | | | | | | | | |
| Pharmaceuticals & Biotechnology | | | 1,000.00 | | | AMGEN INC COM | | | | | 150,181 | | | | 175,220 | | | | | |
| | | | 3,000.00 | | | ABBVIE INC | | | | | 218,315 | | | | 270,750 | | | | | |
| | | | 10,000.00 | | | ASTRAZENECA PLC SPONSORED | | | | | 235,531 | | | | 345,000 | | | | | |
| | | | 500.00 | | | CELGENE CORP COM | | 3 | | | 65,855 | | | | 50,485 | | | | | |
| | | | 5,000.00 | | | GILEAD SCIENCES INC COM | | | | | 383,356 | | | | 374,800 | | | | | |
| | | | 3,000.00 | | | ELI LILLY & CO COM | | | | | 132,159 | | | | 245,820 | | | | | |
| | | | 500.00 | | | MERCK & CO INC COM | | | | | 26,583 | | | | 27,545 | | | | | |
| | | | 500.00 | | | PFIZER INC COM | | | | | 12,068 | | | | 17,530 | | | | | |
| | | | | | | | | | | | 1,224,048 | | | | 1,507,150 | | | | 1.43 | % |
| | | | | | | | | | | | | | | | | | | | | |
| TOTAL HEALTH CARE | | | | | | | | | | | 2,503,853 | | | | 3,011,488 | | | | 2.85 | % |
| | | | | | | | | | | | | | | | | | | | | |
| INDUSTRIALS | | | | | | | | | | | | | | | | | | | | |
| Capital Goods | | | 500.00 | | | 3M COMPANY | | | | | 71,565 | | | | 115,095 | | | | | |
| | | | 4,000.00 | | | ABB LTD SPONSORED ADR | | 3 | | | 100,795 | | | | 104,520 | | | | | |
| | | | | | | | | | | | 172,360 | | | | 219,615 | | | | 0.21 | % |
| | | | | | | | | | | | | | | | | | | | | |
| Commercial Services & Supplies | | | 500.00 | | | ECOLAB INC COM | | | | | 52,645 | | | | 65,330 | | | | | |
| | | | 500.00 | | | WASTE MGMT INC DEL COM | | | | | 17,412 | | | | 41,085 | | | | | |
| | | | | | | | | | | | 70,057 | | | | 106,415 | | | | 0.10 | % |
| | | | | | | | | | | | | | | | | | | | | |
| Transportation | | | 20,000.00 | | | STUDENT TRANSN INC COM | | | | | 110,662 | | | | 117,200 | | | | | |
| | | | 5,000.00 | | | USD PARTNERS LP COM UT REP | | | | | 56,643 | | | | 55,725 | | | | | |
| | | | | | | | | | | | 167,305 | | | | 172,925 | | | | 0.16 | % |
| | | | | | | | | | | | | | | | | | | | | |
| TOTAL INDUSTRIALS | | | | | | | | | | | 409,722 | | | | 498,955 | | | | 0.47 | % |
| | | | | | | | | | | | | | | | | | | | | |
| INFORMATION TECHNOLOGY | | | | | | | | | | | | | | | | | | | | |
| | | | | | | | | | | | | | | | | | | | | |
| Software & Services | | | 1,101.00 | | | ALPHABET INC CAP STK CL C | | 3 | | | 641,356 | | | | 1,119,320 | | | | | |
| | | | 15,000.00 | | | CDK GLOBAL INC COM | | | | | 691,038 | | | | 953,400 | | | | | |
| | | | 5,000.00 | | | COGNIZANT TECHNOLOGY SOLUT | | | | | 276,224 | | | | 378,350 | | | | | |
| | | | 10,000.00 | | | EBAY INC COM | | 3 | | | 237,209 | | | | 376,400 | | | | | |
| | | | 3,500.00 | | | MICROSOFT CORP COM | | | | | 87,412 | | | | 291,130 | | | | | |
| | | | 4,000.00 | | | ORACLE CORP COM | | | | | 110,847 | | | | 203,600 | | | | | |
| | | | 20,000.00 | | | SYNTEL INC COM | | 3 | | | 377,062 | | | | 467,200 | | | | | |
| | | | 3,000.00 | | | TENCENT HLDGS LTD ADR | | | | | 100,845 | | | | 135,150 | | | | | |
| | | | | | | | | | | | 2,521,993 | | | | 3,924,550 | | | | 3.71 | % |
| | | | | | | | | | | | | | | | | | | | | |
| Technology Hardware & Equipment | | | 3,500.00 | | | APPLE INC COM | | | | | 349,916 | | | | 591,640 | | | | | |
| | | | 5,700.00 | | | CISCO SYSTEMS INC COM | | | | | 111,359 | | | | 194,655 | | | | | |
| | | | 8,500.00 | | | CORNING INC COM | | | | | 223,037 | | | | 266,135 | | | | | |
| | | | 557.00 | | | DELL TECHNOLOGIES INC COM | | 3 | | | 26,290 | | | | 46,103 | | | | | |
| | | | 3,500.00 | | | INTEL CORP COM | | | | | 73,338 | | | | 159,215 | | | | | |
| | | | 3,000.00 | | | MICRON TECHNOLOGY INC COM | | 3 | | | 92,445 | | | | 132,930 | | | | | |
| | | | 4,000.00 | | | QUALCOMM INC COM | | | | | 247,977 | | | | 204,040 | | | | | |
| | | | 3,000.00 | | | SEAGATE TECHNOLOGY SHS | | | | | 121,463 | | | | 110,910 | | | | | |
| | | | | | | | | | | | 1,245,825 | | | | 1,705,628 | | | | 1.61 | % |
BMC FUND, INC.
SCHEDULE OF INVESTMENTS (Continued)
October 31, 2017
| | | | | | | | | | | | | | | | Percent | |
| Sectors and | | Shares | | | | | | | | | | Market | | | of Net | |
| Industries | | Held | | | Company Name | | | | Cost | | | Value | | | Assets | |
| | | | | | | | | | | | | | | | | |
| COMMON STOCKS: | | | | | | | | | | | | | | | | | | | | |
| TOTAL INFORMATION TECHNOLOGY | | | | | | | | | | | 3,767,818 | | | | 5,630,178 | | | | 5.33 | % |
| | | | | | | | | | | | | | | | | | | | | |
| MATERIALS | | | 1,580.00 | | | DOWDUPONT INC COM | | | | | 97,247 | | | | 114,250 | | | | | |
| | | | 1,000.00 | | | EAGLE MATERIALS INC COM | | | | | 105,692 | | | | 105,570 | | | | | |
| | | | 4,000.00 | | | LOUISIANA PACIFIC CORP | | 3 | | | 113,115 | | | | 108,720 | | | | | |
| TOTAL MATERIALS | | | | | | | | | | | 316,054 | | | | 328,540 | | | | 0.31 | % |
| | | | | | | | | | | | | | | | | | | | | |
| REAL ESTATE | | | | | | | | | | | | | | | | | | | | |
| | | | 1,000.00 | | | DIGITAL RLTY TR INC COM | | | | | 58,863 | | | | 118,440 | | | | | |
| | | | 9,000.00 | | | EASTERLY GOVT PPTYS COM | | | | | 155,041 | | | | 181,080 | | | | | |
| | | | 3,500.00 | | | GEO GROUP INC COM | | | | | 83,062 | | | | 90,825 | | | | | |
| | | | 10,000.00 | | | HANNON ARMSTRONG SUST COM | | | | | 153,105 | | | | 240,600 | | | | | |
| | | | 15,000.00 | | | MEDICAL PPTYS TR INC COM | | | | | 185,835 | | | | 198,450 | | | | | |
| | | | 2,000.00 | | | OMEGA HEALTHCARE INVS COM | | | | | 60,291 | | | | 57,720 | | | | | |
| | | | 6,000.00 | | | PHYSICIANS RLTY TR COM | | | | | 112,436 | | | | 104,280 | | | | | |
| | | | 5,000.00 | | | SENIOR HSG PPTYS TR SH BEN | | | | | 99,925 | | | | 92,000 | | | | | |
| | | | 13,000.00 | | | STARWOOD PPTY TR INC COM | | | | | 286,828 | | | | 279,630 | | | | | |
| | | | 6,000.00 | | | TANGER FACTORY OUTLET COM | | | | | 153,014 | | | | 136,500 | | | | | |
| | | | 1,000.00 | | | VENTAS INC COM | | | | | 70,370 | | | | 62,750 | | | | | |
| | | | 500.00 | | | W P CAREY & CO LLC COM | | | | | 31,927 | | | | 34,075 | | | | | |
| TOTAL REAL ESTATE | | | | | | | | | | | 1,450,697 | | | | 1,596,350 | | | | 1.51 | % |
| | | | | | | | | | | | | | | | | | | | | |
| TELECOMMUNICATION SERVICES | | | 3,000.00 | | | AT&T CORP COM | | | | | 84,046 | | | | 100,950 | | | | | |
| | | | 4,500.00 | | | BCE INC COM | | | | | 191,785 | | | | 207,720 | | | | | |
| | | | 2,000.00 | | | SK TELECOM LTD SPONSORED A | | | | | 27,904 | | | | 52,280 | | | | | |
| | | | 10,000.00 | | | TELEFONICA BRASIL S.A. | | | | | 144,120 | | | | 154,000 | | | | | |
| | | | 6,691.00 | | | TELEFONICA S A SPONSORED ADR | | | | | 110,736 | | | | 69,653 | | | | | |
| | | | 3,000.00 | | | VODAFONE GROUP | | | | | 84,944 | | | | 86,940 | | | | | |
| TOTAL TELECOMMUNICATION SERVICES | | | | | | | | | | | 643,535 | | | | 671,543 | | | | 0.64 | % |
| | | | | | | | | | | | | | | | | | | | | |
| UTILITIES | | | 500.00 | | | AMERICAN STS WTR CO COM | | | | | 19,159 | | | | 26,875 | | | | | |
| | | | 13,000.00 | | | AMERIGAS PARTNERS LP COM | | | | | 581,786 | | | | 588,250 | | | | | |
| | | | 6,500.00 | | | DOMINION RES INC VA COM | | | | | 330,756 | | | | 527,410 | | | | | |
| | | | 17,187.00 | | | DUKE ENERGY CORP COM | | | | | 1,197,191 | | | | 1,517,784 | | | | | |
| | | | 1,000.00 | | | ENTERGY CORP NEW COM | | | | | 69,388 | | | | 86,260 | | | | | |
| | | | 3,000.00 | | | SOUTHERN CO COM | | | | | 122,610 | | | | 156,600 | | | | | |
| | | | 2,256.00 | | | WEC ENERGY GROUP INC COM | | | | | 89,900 | | | | 152,032 | | | | | |
| TOTAL UTILITIES | | | | | | | | | | | 2,410,790 | | | | 3,055,211 | | | | 2.89 | % |
| | | | | | | | | | | | | | | | | | | | | |
| TOTAL INVESTMENTS IN COMMON STOCKS | | | | | | | | | | $ | 23,843,374 | | | $ | 27,761,614 | | | | 26.28 | % |
BMC FUND, INC.
SCHEDULE OF INVESTMENTS (Continued)
October 31, 2017
| | | | | | | | | | | | | | Percent | |
| | | | | Contracts | | | | | | Market | | | of Net | |
| Company Name | | | | Held | | | Cost | | | Value | | | Assets | |
| | | | | | | | | | | | | | | |
| CALL OPTIONS: | | | | | | | | | | | | | | | | | | |
| TRIP ADVISOR INC CALL OPTION, $45 EXP 1/18/19 | | 3 | | | 50.00 | | | $ | 30,577 | | | $ | 22,500 | | | | 0.02 | % |
| | | | | | | | | | | | | | | | | | | |
| PUT OPTIONS: | | | | | | | | | | | | | | | | | | |
| POWERSHARES QQQ TRUST PUT OPTION, $125 EXP 12/15/17 | | 3 | | | 50.00 | | | | 11,827 | | | | 550 | | | | | |
| POWERSHARES QQQ TRUST PUT OPTION, $140 EXP 1/19/18 | | 3 | | | 50.00 | | | | 20,077 | | | | 5,500 | | | | | |
| POWERSHARES QQQ TRUST PUT OPTION, $130 EXP 3/16/18 | | 3 | | | 200.00 | | | | 29,208 | | | | 21,000 | | | | | |
| SPDR S&P 500 QT PUT OPTION, $220 EXP 11/17/17 | | 3 | | | 100.00 | | | | 11,754 | | | | 300 | | | | | |
| SPDR S&P 500 QT PUT OPTION, $240 EXP 12/15/17 | | 3 | | | 250.00 | | | | 107,886 | | | | 16,750 | | | | | |
| SPDR S&P 500 QT PUT OPTION, $250 EXP 12/15/17 | | 3 | | | 100.00 | | | | 32,334 | | | | 25,200 | | | | | |
| TOTAL PUT OPTIONS | | | | | | | | | 213,086 | | | | 69,300 | | | | 0.07 | % |
| | | | | | | | | | | | | | | | | | | |
| TOTAL INVESTMENTS IN OPTIONS | | | | | | | | $ | 243,663 | | | $ | 91,800 | | | | 0.09 | % |
BMC FUND, INC.
SCHEDULE OF INVESTMENTS (Continued)
October 31, 2017
| | | | | | | | | | | | Percent | |
| | | Shares | | | | | | Market | | | of Net | |
| Company Name | | Held | | | Cost | | | Value | | | Assets | |
| | | | | | | | | | | | | |
| PREFERRED STOCKS: | | | | | | | | | | | | | | | | |
| BAC CAP TR XIV FLOATING RATE | | | 200,000.00 | | | $ | 179,500 | | | $ | 179,000 | | | | | |
| BANK OF AMERICA CORP FLOATING RATE | | | 300,000.00 | | | | 319,500 | | | | 341,784 | | | | | |
| CITIGROUP INC FIXED-FLOATING | | | 250,000.00 | | | | 247,347 | | | | 263,795 | | | | | |
| E TRADE FINANCIAL CORP FIXED-FLOATING | | | 250,000.00 | | | | 249,687 | | | | 266,875 | | | | | |
| GENERAL ELECTRIC CO PERP PFD SER B FIXED-FLOATING | | | 250,000.00 | | | | 250,000 | | | | 247,500 | | | | | |
| GOLDMAN SACHS CAP II FIXED-FLOATING | | | 250,000.00 | | | | 229,998 | | | | 221,465 | | | | | |
| MELLON CAP IV PFD CAP FIXED-FLOATING | | | 250,000.00 | | | | 231,248 | | | | 236,250 | | | | | |
| NEW YORK MTG TR INC RED PF | | | 2,000.00 | | | | 49,337 | | | | 49,980 | | | | | |
| WACHOVIA CAP TRUST III FIXED-FLOATING | | | 500,000.00 | | | | 487,500 | | | | 501,875 | | | | | |
| | | | | | | | | | | | | | | | | |
| TOTAL INVESTMENTS IN PREFERRED STOCKS | | | | | | $ | 2,244,117 | | | $ | 2,308,524 | | | | 2.18 | % |
BMC FUND, INC.
SCHEDULE OF INVESTMENTS (Concluded)
October 31, 2017
| | | | | | | | Market | | | Percent of | |
| | | Company Name | | Cost | | | Value | | | Net Assets | |
| | | | | | | | | | | | |
| Short-term Investments | | MFB NI Treasury Money Market Fund | | $ | 14,639,039 | | | $ | 14,639,039 | | | | 13.86 | % |
| | | | | | | | | | | | | | | |
| TOTAL INVESTMENTS - MARKET VALUE | | | | | | | 102,919,275 | | | | 97.41 | % |
| | | | | | | | | | | | | | | |
| TOTAL OTHER ASSETS IN EXCESS OF LIABILITIES | | | | | | | 2,737,986 | | | | 2.59 | % |
| | | | | | | | | | | | | | | |
| TOTAL NET ASSETS | | | | | | $ | 105,657,261 | | | | 100.00 | % |
1In default
2Market value determined by the Fund's Board of Directors
3Non-income producing security
BMC FUND, INC.
SCHEDULE OF OPEN WRITTEN OPTION CONTRACTS
October 31, 2017
| | | | | | | | | | | | | | Percent | |
| | | | | Contracts | | | | | | Market | | | of Net | |
| Company Name | | | | Held | | | Cost | | | Value | | | Assets | |
| CALL OPTIONS: | | | | | | | | | | | | | | | | | | |
| ABBVIE INC CALL OPTION, $77.50 EXP 2/16/18 | | 3 | | | (15.00 | ) | | $ | (2,907 | ) | | $ | (20,250 | ) | | | | |
| CELGENE CORP CALL OPTION, $150 EXP 1/19/18 | | 3 | | | (5.00 | ) | | | (1,597 | ) | | | (35 | ) | | | | |
| CORNING INC CALL OPTION, $34 EXP 1/19/18 | | 3 | | | (20.00 | ) | | | (1,027 | ) | | | (480 | ) | | | | |
| CORNING INC CALL OPTION, $35 EXP 1/19/18 | | 3 | | | (20.00 | ) | | | (1,189 | ) | | | (240 | ) | | | | |
| DOLLAR GENERAL CALL OPTION, $75 EXP 11/17/17 | | 3 | | | (25.00 | ) | | | (7,894 | ) | | | (14,750 | ) | | | | |
| DUKE ENERGY CO CALL OPTION, $92.50 EXP 4/20/18 | | 3 | | | (100.00 | ) | | | (6,846 | ) | | | (8,500 | ) | | | | |
| HOLOGIC INC CALL OPTION, $50 EXP 12/15/17 | | 3 | | | (20.00 | ) | | | (1,704 | ) | | | (100 | ) | | | | |
| PACWEST BANCCORP CALL OPTION, $55 EXP 12/15/17 | | 3 | | | (20.00 | ) | | | (1,969 | ) | | | (100 | ) | | | | |
| PHILLIPS 66 CALL OPTION, $87.50 EXP 1/19/18 | | 3 | | | (25.00 | ) | | | (3,711 | ) | | | (11,875 | ) | | | | |
| TANGER FACTORY OUTLET CTR CALL OPTION, $30 EXP 12/15/17 | | 3 | | | (30.00 | ) | | | (1,799 | ) | | | (150 | ) | | | | |
| TJX COMPANIES CALL OPTION, $77.50 EXP 1/19/18 | | 3 | | | (15.00 | ) | | | (692 | ) | | | (175 | ) | | | | |
| TOTAL CALL OPTIONS - LIABILITIES | | | | | | | | | (31,335 | ) | | | (56,655 | ) | | | -0.05 | % |
BMC FUND, INC.
SCHEDULE OF OPEN WRITTEN OPTION CONTRACTS
October 31, 2017
| | | | | | | | | | | | | | Percent | |
| | | | | Contracts | | | | | | Market | | | of Net | |
| Company Name | | | | Held | | | Cost | | | Value | | | Assets | |
| PUT OPTIONS: | | | | | | | | | | | | | | | | | | |
| ALIBABA GROUP HOLDING PUT OPTION, $125 EXP 1/19/18 | | 3 | | | (10.00 | ) | | | (5,224 | ) | | | (240 | ) | | | | |
| BEST BUY CO PUT OPTION, $50 EXP 12/15/17 | | 3 | | | (20.00 | ) | | | (4,209 | ) | | | (2,160 | ) | | | | |
| BLACKSTONE GROUP PUT OPTION, $30 EXP 12/15/17 | | 3 | | | (25.00 | ) | | | (2,861 | ) | | | (375 | ) | | | | |
| CAMBREX CORP PUT OPTION, $45 EXP 1/19/18 | | 3 | | | (20.00 | ) | | | (3,569 | ) | | | (7,200 | ) | | | | |
| CELGENE CORP PUT OPTION, $120 EXP 1/19/18 | | 3 | | | (20.00 | ) | | | (9,559 | ) | | | (38,500 | ) | | | | |
| CELGENE CORP PUT OPTION, $130 EXP 1/19/18 | | 3 | | | (30.00 | ) | | | (21,188 | ) | | | (87,600 | ) | | | | |
| CHIPOTLE MEXICAN PUT OPTION, $250 EXP 1/19/18 | | 3 | | | (5.00 | ) | | | (4,292 | ) | | | (3,600 | ) | | | | |
| CME GROUP INC PUT OPTION, $105 EXP 1/19/18 | | 3 | | | (25.00 | ) | | | (9,186 | ) | | | (125 | ) | | | | |
| CME GROUP INC PUT OPTION, $115 EXP 1/19/18 | | 3 | | | (10.00 | ) | | | (3,185 | ) | | | (300 | ) | | | | |
| COMMSCOPE HOLDING PUT OPTION, $37 EXP 11/17/17 | | 3 | | | (30.00 | ) | | | (4,094 | ) | | | (8,850 | ) | | | | |
| DOLLAR TREE INC PUT OPTION, $70 EXP 11/17/17 | | 3 | | | (25.00 | ) | | | (6,336 | ) | | | (100 | ) | | | | |
| EQUIFAX INC PUT OPTION, $80 EXP 11/17/17 | | 3 | | | (50.00 | ) | | | (10,408 | ) | | | (350 | ) | | | | |
| FACEBOOK PUT OPTION, $120 EXP 12/15/17 | | 3 | | | (5.00 | ) | | | (2,917 | ) | | | (30 | ) | | | | |
| FORTINET INC PUT OPTION, $35 EXP 12/15/17 | | 3 | | | (50.00 | ) | | | (9,423 | ) | | | (750 | ) | | | | |
| ILLUMINA INC PUT OPTION, $155 EXP 12/15/17 | | 3 | | | (20.00 | ) | | | (15,969 | ) | | | (100 | ) | | | | |
| LULULEMON ATHLETICA PUT OPTION, $42.50 EXP 12/15/17 | | 3 | | | (30.00 | ) | | | (6,962 | ) | | | (150 | ) | | | | |
| NVDA US EQUITY PUT OPTION, $125 EXP 12/15/17 | | 3 | | | (10.00 | ) | | | (5,584 | ) | | | (80 | ) | | | | |
| ORASURE TECHNOLOGIES PUT OPTION, $15 EXP 1/19/18 | | 3 | | | (40.00 | ) | | | (3,938 | ) | | | (200 | ) | | | | |
| PHILLIP MORRIS INTL PUT OPTION, $100 EXP 1/19/18 | | 3 | | | (35.00 | ) | | | (11,676 | ) | | | (7,630 | ) | | | | |
| POWERSHARES QQQ PUT OPTION, $125 EXP 1/19/18 | | 3 | | | (50.00 | ) | | | (6,673 | ) | | | (1,450 | ) | | | | |
| QUALCOMM INC PUT OPTION, $50 EXP 1/19/18 | | 3 | | | (100.00 | ) | | | (24,045 | ) | | | (23,600 | ) | | | | |
| REDHAT INC PUT OPTION, $90 EXP 3/16/18 | | 3 | | | (30.00 | ) | | | (6,704 | ) | | | (1,800 | ) | | | | |
| SEAGATE TECHNOLOGY PUT OPTION, $38 EXP 12/15/17 | | 3 | | | (15.00 | ) | | | (3,451 | ) | | | (3,015 | ) | | | | |
| SEATTLE GENETICS PUT OPTION, $55 EXP 12/15/17 | | 3 | | | (10.00 | ) | | | (5,884 | ) | | | (1,400 | ) | | | | |
| SOUTHERN CO PUT OPTION, $45 EXP 1/19/18 | | 3 | | | (20.00 | ) | | | (2,769 | ) | | | (200 | ) | | | | |
| SPDR S&P 500 PUT OPTION, $225 EXP 12/15/17 | | 3 | | | (250.00 | ) | | | (25,864 | ) | | | (6,250 | ) | | | | |
| SPDR S&P 500 PUT OPTION, $230 EXP 1/19/18 | | 3 | | | (100.00 | ) | | | (10,376 | ) | | | (7,600 | ) | | | | |
| STARBUCKS CORP PUT OPTION, $50 EXP 4/20/18 | | 3 | | | (10.00 | ) | | | (1,715 | ) | | | (1,150 | ) | | | | |
| TRIP ADVISOR INC PUT OPTION, $35 EXP 1/19/18 | | 3 | | | (50.00 | ) | | | (11,243 | ) | | | (10,000 | ) | | | | |
| UNITED CONTINENTAL HOLDINGS PUT OPTION, $60 EXP 1/19/18 | | 3 | | | (25.00 | ) | | | (9,955 | ) | | | (10,375 | ) | | | | |
| VALERO ENERGY CORP PUT OPTION, $60 EXP 12/15/17 | | 3 | | | (20.00 | ) | | | (6,469 | ) | | | (100 | ) | | | | |
| VENTAS INC PUT OPTION, $65 EXP 2/16/18 | | 3 | | | (20.00 | ) | | | (4,469 | ) | | | (7,200 | ) | | | | |
| WEIBO CORP PUT OPTION, $55 EXP 1/19/18 | | 3 | | | (20.00 | ) | | | (7,168 | ) | | | (400 | ) | | | | |
| WEIBO CORP PUT OPTION, $65 EXP 4/20/18 | | 3 | | | (20.00 | ) | | | (5,809 | ) | | | (4,500 | ) | | | | |
| WEIBO CORP PUT OPTION, $75 EXP 4/20/18 | | 3 | | | (50.00 | ) | | | (25,422 | ) | | | (24,550 | ) | | | | |
| TOTAL PUT OPTIONS - LIABILITIES | | | | | | | | | (298,597 | ) | | | (261,930 | ) | | | -0.25 | % |
| | | | | | | | | | | | | | | | | | | |
| TOTAL CALL AND PUT OPTIONS - LIABILITIES | | | | | | | | $ | (329,932 | ) | | $ | (318,585 | ) | | | -0.30 | % |
Item. 2. Code of Ethics.
On July 26, 2003, the Board of Directors of the Registrant adopted a Code of Ethics for the principal executive officer and principal financial and accounting officer. The Code was amended by the Board of Directors on February 24, 2007.
(c)-(e) N/A
(f) A copy of the Code of Ethics is attached as an exhibit.
Item 3. Audit Committee Financial Expert.
The Board of Directors of the Registrant has determined that R. Donald Farmer, a member of its Audit Committee, is an audit committee financial expert. Mr. Farmer is an independent director of the Registrant.
Item 4. Principal Accountant Fees and Services.
(a) Audit Fees: $47,175.00 for the fiscal year ended October 31, 2016; $50,600.00 for the fiscal year ended October 31, 2017.
(b) Audit-Related Fees: $1,681.00 for the fiscal year ended October 31, 2016; $647.00 for the fiscal year ended October 31, 2017. These fees were incurred for travel-related expenses.
(c) Tax Fees: $0.00 for the fiscal year ended October 31, 2016; $0.00 for the fiscal year ended October 31, 2017. These fees were incurred for review of the tax returns.
(d) All Other Fees: $0.00 for the fiscal year ended October 31, 2016; $0.00 for the fiscal year ended October 31, 2017. These fees were incurred for report production and printing.
(e)(1) A copy of the Audit Committee's pre-approval policies and procedures is attached as an exhibit.
(e)(2) One hundred percent of the services described in Items 4(b) through 4(d) were approved in accordance with the Audit Committee Pre-Approval Policy. As a result, none of such services was approved pursuant to paragraph (c)(7)(i)(C) of Rule 2-01 of Regulation S-X.
(f) None of the hours expended on the principal accountant's engagement to audit the Registrant's financial statements for the fiscal year ended October 31, 2017 was attributed to work performed by persons other than the principal accountant's full-time, permanent employees.
(g) N/A
(h) N/A
Item 5. Audit Committee of Listed Registrants.
N/A
Item 6. Schedule of Investments.
Included as a part of the report to shareholders filed under Item 1.
Item 7. Disclosure of Proxy Voting Policies and Procedures for Closed-End Management Investment Companies.
The Board of Directors of the Registrant adopted Proxy Voting Policies and Procedures on July 26, 2003 and amended them October 30, 2003, April 5, 2004 and May 26, 2005. A copy as amended is attached as an exhibit.
Item 8. Portfolio Managers of Closed-End Investment Companies.
(a)(1) As of the date of filing of this report, M. Hunt Broyhill, Chairman and President, and Christopher R. Pavese, CFA, Vice President and Chief Investment Officer, are primarily responsible for the day-to-day management of the Company’s portfolio. Mr. Hunt Broyhill has had such responsibility since 2001. He has been engaged in asset management for various institutions and high net worth individuals for more than five years. Prior to joining the Company on March 1, 2005, Mr. Pavese was a Vice President and Portfolio Manager at JP Morgan Private Bank from January 1999 until February 2005. At JP Morgan, Mr. Pavese was engaged in asset management, portfolio strategy, and asset allocation for high net worth individuals, personal trusts, endowments and foundations.
(a)(2) The following tables provide information regarding registered investment companies other than the Registrant, other pooled investment vehicles, and other accounts over which the Registrant’s portfolio managers also have day-to-day management responsibilities. The tables provide the numbers of such accounts, the total assets in such accounts and the number of accounts and the total assets in the accounts with respect to which the fees are based on performance. The information is provided as of the Registrant’s fiscal year ended October 31, 2017.
M. Hunt Broyhill
| | Other Registered Investment Companies | Other Pooled Investment Vehicles | Other Accounts |
Number of Accounts Managed | None | 1 | 14 |
Number of Accounts Managed with Performance-Based Advisory Fees | None | None | None |
| Assets Managed | $0 | $1,594,947 | $33,369,608 |
Assets Managed with Performance-Based Advisory Fees | $0 | $0 | $0 |
Christopher R. Pavese
| | Other Registered Investment Companies | Other Pooled Investment Vehicles | Other Accounts |
Number of Accounts Managed | None | None | 81 |
Number of Accounts Managed with Performance-Based Advisory Fees | None | None | 8 |
| Assets Managed | $0 | $0 | $68,588,266 |
Assets Managed with Performance-Based Advisory Fees | $0 | $0 | $2,484,798 |
Material Conflicts of Interest
The Fund recognizes that actual or potential conflicts of interest are inherent in our business. These actual or potential conflicts may arise when a portfolio manager has day-to-day portfolio management responsibilities with respect to more than one fund or account. Certain investments may be appropriate for the Fund and also for other clients advised by the portfolio manager. Investment decisions for the Fund and other clients are made with a view to achieving their respective investment objectives and after consideration of such factors as their current holdings, availability of cash for investment and the size of their investments generally. Therein lies the possibility that a particular security could be bought or sold for the Fund and also for other clients, along with the possibility that a particular security could be bought or sold for the Fund while the opposite transaction could be occurring for other clients due to their investment strategy.
To the extent that a portfolio manager has responsibilities for managing accounts in addition to the Fund, the portfolio manager will need to divide his time and attention among relevant accounts.
The Fund also recognizes that in some cases, an actual or potential conflict may arise where a portfolio manager may have an incentive, such as a performance-based fee.
On December 13, 2014, the Board of Directors of the Registrant adopted a Conflicts of Interest Policy for Portfolio Managers.
(a)(3)
Compensation Structure of Portfolio Managers
The compensation structure for each portfolio manager is based upon a fixed salary as well as a discretionary bonus determined by the senior management of the Registrant. Salaries are determined by the senior management and are based upon an individual’s position and overall value to the Registrant. Bonuses are also determined by management and are based upon an individual’s overall contribution to the success of the Fund and the profitability of the Registrant. Salaries and bonuses for portfolio managers are not based upon criteria such as performance of the Fund or the value of assets of the Registrant. Portfolio managers also have the opportunity to participate in other employee benefits available to all of the employees of the Registrant.
(a)(4) The dollar range of the Registrant’s equity securities owned beneficially by the Registrant’s portfolio managers as of the Registrant’s fiscal year ended October 31, 2017 is set forth below:
| Name of Portfolio Manager | Dollar ($) Range of Registrant’s Shares Beneficially Owned |
| M. Hunt Broyhill | Over $1,000,000 |
| Christopher R. Pavese | $1-$10,000 |
(b) N/A
Item 9. Purchases of Equity Securities by Closed-End Management Investment Company and Affiliated Purchasers.
None
Item 10. Submission of Matters to a Vote of Security Holders.
N/A
Item 11. Controls and Procedures.
Within the 90 days prior to the date of this report, the Registrant's management carried out an evaluation, under the supervision and with the participation of Registrant's Chief Executive Officer and Chief Financial Officer, of the effectiveness of the Registrant's disclosure controls and procedures pursuant to Rule 30a-3(b) of the Investment Company Act of 1940. Based upon the evaluation, the Chief Executive Officer and Chief Financial Officer concluded as of a date within 90 days of the filing of this report that the Registrant's disclosure controls and procedures are effective in timely alerting them to material information relating to the Registrant required to be included in the Registrant's periodic SEC filings.
There were no significant changes in the Registrant's internal control over financial reporting (as defined in Rule 30a-3(d) under the Investment Company Act of 1940) that occurred during the second fiscal quarter of the period covered by the report that have materially affected, or are reasonably likely to materially affect, the Registrant's internal control over financial reporting.
Item 12. Exhibits.
(a)(1) The Registrant's Code of Ethics is attached as Exhibit 12(a)(1).
(a)(2) Certifications.
SIGNATURES
Pursuant to the requirements of the Securities Exchange Act of 1934 and the Investment Company Act of 1940, the Registrant has duly caused this report to be signed on its behalf by the undersigned, thereunto duly authorized.
BMC Fund, Inc.
By
/s/ Boyd C. Wilson, Jr.
Boyd C. Wilson, Jr.
Vice President and
Chief Financial Officer
Date: December 18, 2017
Pursuant to the requirements of the Securities Exchange Act of 1934 and the Investment Company Act of 1940, this report has been signed below by the following persons on behalf of the registrant and in the capacities and on the dates indicated.
By
/s/ M. Hunt Broyhill
M. Hunt Broyhill
Chairman and President
Date: December 18, 2017
By
/s/ Boyd C. Wilson, Jr.
Boyd C. Wilson, Jr.
Vice President and
Chief Financial Officer
Date: December 18, 2017