UNITED STATES
SECURITES AND EXCHANGE COMMISSION
Washington, DC 20549
FORM N-CSR
CERTIFIED SHAREHOLDER REPORT OF
REGISTERED MANAGEMENT INVESTMENT COMPANIES
Investment Company Act file number: 811-03150
BMC FUND, INC.
(Exact name of registrant as specified in charter)
800 GOLFVIEW PARK (P. O. BOX 500)
LENOIR, NC 28645
(Address of principal executive offices) (Zip code)
CAROL FRYE
BMC FUND, INC.
P. O. BOX 500
LENOIR, NC 28645
(Name and address of agent for service)
Registrant's telephone number including area code: 828-758-6100
Date of fiscal year end: October 31, 2015
Date of reporting period: October 31, 2015
Item 1. Report to Stockholders.
BMC FUND, INC.
FINANCIAL STATEMENTS AND
SUPPLEMENTARY INFORMATION
Year Ended October 31, 2015
TABLE OF CONTENTS
| BMC FUND, INC. |
| LETTER TO SHAREHOLDERS – |
| MANAGEMENT’S DISCUSSION OF FUND PERFORMANCE |
| Year Ended October 31, 2015 |
TO OUR SHAREHOLDERS: MANAGEMENT’S DISCUSSION OF FUND PERFORMANCE
For fiscal year ending October 31, 2015, BMC Fund, Inc. (“BMC”) generated investment performance of (0.9)%. While we fell a good bit short of our absolute performance hurdle, relative returns were reasonable given the challenging market environment – global stock indices (as measured by the MSCI All Country World Index) advanced a meager 0.6% while fixed income investors settled for returns below 2.0% on the year. At fiscal year-end, BMC’s portfolio remains broadly diversified across investments in equities, fixed income, limited partnerships and other investments, and a substantial cash reserve. We discuss each of these allocations in greater detail below and provide commentary on short-term performance, in addition to our long-term outlook.
Investment Outlook
In last year’s letter to shareholders we made the following observations regarding the investment landscape:
“As memories of the financial crisis fade, market participants have become less fearful. Consequently, valuations are rising at the same time volatility is approaching all-time lows. Highly accommodative central bank policies continue to push investors further out on the risk curve. At these extended levels, markets are susceptible to a variety of potential shocks. Given low absolute yields across asset classes, we think most traditional investments fail to adequately compensate investors for risk. In light of this environment, we think it is time to be prudent, disciplined and conservative.
“Stocks are getting more expensive because record low volatility implies that there is less risk. In fact, the opposite is true. Risk increases as prices rise – investors are just paying more for the same level of return. In other words, forward returns from buying assets at today’s prices will be lower than average. When something unexpected happens, as it always does, greed will be replaced by fear, and we will be positioned to reallocate capital at lower prices and higher expected returns.”
Little has changed since this time last year. The concerns we highlighted one year ago are still front and center today. The market may be forced to deal with these issues sooner than later. Imbalances can persist for a long time before reversing, but there are growing indications that this cycle is nearing its conclusion:
| · | Corporate debt has increased steadily over the past decade and is now roughly 50% higher than levels reached prior to the financial crisis. High yield corporate debt has nearly doubled over this period. |
| · | The average quality of debt issuance has deteriorated. Declining interest rates have created the illusion of strong corporate fundamentals. S&P has issued nearly 300 downgrades this year – the most in a single year since 2009. |
| BMC FUND, INC. |
| LETTER TO SHAREHOLDERS – |
| MANAGEMENT’S DISCUSSION OF FUND PERFORMANCE |
| Year Ended October 31, 2015 |
| · | Low cost financing has driven a surge in M&A activity rather than capital reinvestment. According to Dealogic, US M&A volume has approached $2 trillion, nearly 50% higher than the previous record set in 2007. |
| · | Debt has also been used to finance share buybacks, which has exceeded all of the free cash flow generated by US companies. Research by S&P indicates that declines in stock buybacks have shortly preceded the last three corporate default waves in 1987, 1999 and 2007. |
| · | US corporations are running out of steam – earnings per share fell over $8 through Q2-15. The previous three times earnings fell this far into negative territory were 1990, 2001 and 2007. |
While the returns in energy and commodity related sectors have been disastrous over the past year, most stock and bond indices have held up surprisingly well. We believe it is only a matter of time until recent tremors spill over into broader markets. Consequently, we are taking measures to ensure we have a plan in place to capitalize on opportunities that may come our way in the not-too-distant future. As Dwight Eisenhower said to the National Defense Conference in 1957, “Plans are worthless, but planning is everything . . . The very definition of "emergency" is that it is unexpected, therefore it is not going to happen the way you are planning.”
Planning is Everything
We are grateful for the thoughtful insights and accomplishments of both the BMC Board and Investment Committee this year. Over the course of several quarters, we discussed various plans and ultimately adopted a revised Investment Policy Statement (IPS) to guide the fund’s long-term asset allocation.
BMC’s Investment Policy Statement, serves as a strategic guide in anticipating issues related to governance of the investment program; planning an appropriate asset allocation; implementing the investment program with internal and external managers; monitoring results and risks; and providing appropriate reporting. The IPS serves as a policy guide that can offer an objective course of action to be followed during periods of market disruption when emotional or instinctive responses might otherwise motivate less prudent actions.
The purpose of the IPS is to more clearly define the investment objectives of the Fund and to describe which investments will be used to meet those objectives. BMC’s investment objective is to provide maximum income for shareholders, consistent with maintaining the Fund’s long-term purchasing power. The specific goals of the Fund – preservation of capital, current income and moderate growth - remain the same.
| BMC FUND, INC. |
| LETTER TO SHAREHOLDERS – |
| MANAGEMENT’S DISCUSSION OF FUND PERFORMANCE |
| Year Ended October 31, 2015 |
Asset Allocation
After nearly seven years of smooth sailing, many of our existing holdings have appreciated significantly and now trade near fair value. At the same time, it has become more challenging to find bargains in the stock market. As a result, we have been slow to redeploy capital into new investments after selling some of our more fully valued stocks during the year.
Buying activity did increase mid-year, as markets turned lower; we were able to use short-term weakness to increase several core positions after exited others in favor of higher quality investments. But the spike in volatility did not last long; and the quick retreat was not steep enough to generate sufficient bargains or to justify putting a substantial amount of dry powder to work. We ended the fiscal year with 38% of our capital invested in equities, at the lower end of our 30% - 70% policy range.
Given elevated expectations and public market valuations, we continue to view the risk-reward for various hedged equity and multi-strategy investments as superior to long-only stock and bond investments. As such, our allocation to alternatives increased during the year, as we funded new opportunities and increased existing positions. New commitments have been focused on external managers with long-term track records in navigating challenging markets and finding value in distressed markets. Our pipeline of opportunities remains robust. BMC ended the fiscal year with 22% of our capital invested across various alternative investments, in the middle of the fund’s 0% to 40% policy range.
With interest rates hovering near all-time lows and the threat of rate hikes on the horizon, it would seem there is more risk than reward in conventional fixed-income investments. Consequently, our allocation to bonds has continued to decline and the bulk of the fund’s current exposure is invested in short-duration credit with little interest rate risk. BMC ended the fiscal year with an 18% allocation to fixed income, slightly below the midpoint of our 0% - 40% policy range. While we would expect our bond allocation to fall further absent a significant increase in yields on offer, growing indications of distress in credit markets may also present opportunities to earn equity-like returns and generate significant income in the future. We are sharpening our pencils.
On balance, this year’s portfolio activity resulted in a greater cash balance at year-end. BMC ended the fiscal year with 22% of our capital in temporary cash and short-term investments, slightly above the top end of our 20% policy range. While that cash reserve served our shareholders well during the summer’s volatility – the fund suffered a fraction of the losses experienced by the broad market - we expect it to serve us better in the future when bargains present themselves. Without cash, it would be impossible to deploy capital when opportunities become more widespread. Until then, we must be patient as equity returns are lumpy by nature; we have no control over when value is recognized in public markets. Or as Warren Buffett stated in various letters to shareholders at Berkshire Hathaway, “Inactivity strikes us as intelligent behavior . . . Lethargy bordering on sloth remains the cornerstone of our investment style.”
| BMC FUND, INC. |
| LETTER TO SHAREHOLDERS – |
| MANAGEMENT’S DISCUSSION OF FUND PERFORMANCE |
| Year Ended October 31, 2015 |
Bottom Line
Some strategies perform exceptionally well during bull markets; others prove their merit during bear markets. Human nature tends to pull us toward those which have most recently performed best. After seven years of virtually uninterrupted rising prices, the best performers over the past one, three and five years are generally those that have taken the most risk. Consider that many strategies with strong trailing performance in 2000 and 2007 saw their records demolished by subsequent bear markets. We worry that investors are displaying similar signs of complacency today. This is dangerous behavior when combined with indications that the credit cycle is turning - “risk” might get “riskier” once again.
We encourage shareholders to examine performance over full market cycles that include both bull and bear markets. We suggest that you consider risk-adjusted returns as well. How much capital was at risk to generate a given level of return? What type of capital (i.e. stock, bond, etc.) was at risk? The institutional performance derby has created an increasingly short-term orientation obsessed with benchmarks and peer groups rather than true risk – the probability of losing one’s capital. We will continue to focus on risk management and on long-term, full-cycle returns for the benefit of our shareholders. Market indices may be expensive, but we don’t need to own an index. When we see bargains, we will buy them. We remain cautious, but are finding interesting ideas all the time. Big opportunities don’t come along every day. When it’s raining bargains, we’ll reach for a bucket.
During the year ended October 31, 2015, the Company paid the following dividends per share:
| December 10, 2014 to shareholders of record November 25, 2014 | | $ | .27 | |
| March 10, 2015 to shareholders of record February 25, 2015 | | | .25 | |
| June 10, 2015 to shareholders of record May 25, 2015 | | | .25 | |
| September 10, 2015 to shareholders of record August 25, 2015 | | | .25 | |
| | | | | |
| Total | | $ | 1.02 | |
The Company paid a dividend of $0.25 per share on December 10, 2015 to shareholders of record November 25, 2015.
The attached Schedule of Investments is a listing of the entire Company’s diversified securities at October 31, 2015 with a total market value of $103,678,726.
| | M. Hunt Broyhill |
| | Chairman and President |
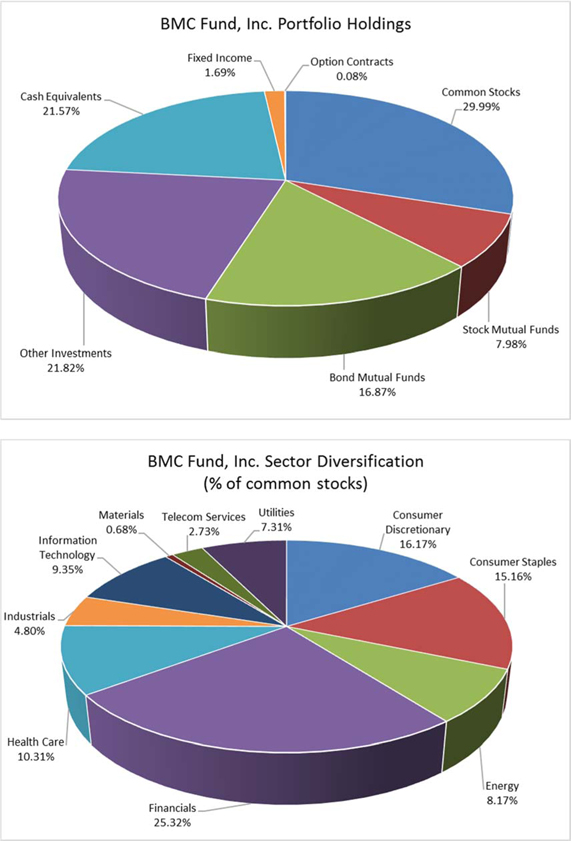
| BMC FUND, INC. |
| GRAPHIC PRESENTATION OF PORTFOLIO HOLDINGS AND |
| SECTOR DIVERSIFICATION |
| Year Ended October 31, 2015 |
| BMC FUND, INC. |
| SUPPLEMENTAL INFORMATION |
| Year Ended October 31, 2015 |
SUPPLEMENTAL INFORMATION
M. Hunt Broyhill, Chairman and President, and Christopher R. Pavese, CFA, Vice President and Chief Investment Officer, are primarily responsible for the day-to-day management of the Company’s portfolio. Mr. Hunt Broyhill has had such responsibility since 2001. He has been engaged in asset management for various institutions and high net worth individuals for more than five years. Prior to joining the Company on March 1, 2005, Mr. Pavese was a Vice President and Portfolio Manager at JP Morgan Private Bank from January 1999 until February 2005. At JP Morgan, Mr. Pavese was engaged in asset management, portfolio strategy, and asset allocation for high net worth individuals, personal trusts, endowments and foundations.
 | 6525 Morrison Blvd, Suite 500 Charlotte, NC 28211 D 704.367.7020 F 704.367.7760 www.dhgllp.com |
REPORT OF INDEPENDENT REGISTERED PUBLIC ACCOUNTING FIRM
Board of Directors and Shareholders
BMC Fund, Inc.
We have audited the accompanying statement of assets and liabilities of the BMC Fund, Inc. (the “Fund”), including the schedule of investments, as of October 31, 2015 and the related statement of operations for the year then ended, the statements of changes in net assets for each of the two years in the period then ended, and the financial highlights for each of the years ended October 31, 2015, 2014, 2013, 2012, 2011, 2010, 2009, 2008, 2007 and 2006. These financial statements and financial highlights are the responsibility of the Fund’s management. Our responsibility is to express an opinion on these financial statements and financial highlights based on our audits.
We conducted our audits in accordance with the standards of the Public Company Accounting Oversight Board (United States). Those standards require that we plan and perform the audit to obtain reasonable assurance about whether the financial statements and financial highlights are free of material misstatement. The Fund is not required to have, nor were we engaged to perform, an audit of its internal control over financial reporting. Our audits included consideration of internal control over financial reporting as a basis for designing audit procedures that are appropriate in the circumstances, but not for the purpose of expressing an opinion on the effectiveness of the Fund's internal control over financial reporting. Accordingly, we express no such opinion. An audit also includes examining, on a test basis, evidence supporting the amounts and disclosures in the financial statements. Our procedures included confirmation of securities owned as of October 31, 2015 by correspondence with the custodian and brokers or by other appropriate auditing procedures where replies from brokers were not received. An audit also includes assessing the accounting principles used and significant estimates made by management, as well as evaluating the overall financial statement presentation. We believe that our audits provide a reasonable basis for our opinion.
As explained in note 2, the financial statements include investments valued at $22,620,053 (21.6 percent of net assets), whose fair values have been estimated by management in the absence of readily determinable fair values. Management’s estimates are based upon information provided by the funds’ managers or the general partners.
In our opinion, the financial statements referred to above present fairly, in all material respects, the financial position of BMC Fund, Inc. as of October 31, 2015, the results of its operations for the year then ended, the changes in its net assets for the each of the two years in the period then ended, and the financial highlights for each of the years ended October 31, 2015, 2014, 2013, 2012, 2011, 2010, 2009, 2008, 2007 and 2006 in conformity with accounting principles generally accepted in the United States of America.
/s/ Dixon Hughes Goodman LLP
Charlotte, North Carolina
December 18, 2015
| BMC FUND, INC. |
| STATEMENT OF ASSETS AND LIABILITIES |
| October 31, 2015 |
| ASSETS AT MARKET VALUE: | | | | |
| Investment securities (cost - $102,736,528) | | $ | 103,678,726 | |
| Cash and short-term investments | | | 129,907 | |
| Receivables, accrued interest and dividends | | | 65,553 | |
| Receivable from broker | | | 855,239 | |
| Receivable from hedge fund liquidation | | | 72,509 | |
| Other assets | | | 21,438 | |
| | | | | |
| Total assets | | | 104,823,372 | |
| | | | | |
| LIABILITIES: | | | | |
| Call and put options written, at fair value (premiums received $156,772) | | | 51,535 | |
| Accounts payable and accrued expenses | | | 11,503 | |
| Payable to custodian | | | 3,200 | |
| Accounts payable to affiliates | | | 73,561 | |
| | | | | |
| Total liabilities | | | 139,799 | |
| | | | | |
| NET ASSETS AT OCTOBER 31, 2015 - EQUIVALENT TO $21.22 PER SHARE ON 4,933,281 SHARES OF COMMON STOCK OUTSTANDING | | $ | 104,683,573 | |
| | | | | |
| SUMMARY OF SHAREHOLDERS' EQUITY: | | | | |
| Common stock, par value $5.00 per share - authorized 70,000,000 shares; outstanding, 4,933,281 shares | | $ | 24,666,405 | |
| Retained earnings prior to becoming investment company | | | 73,541,345 | |
| Undistributed net investment income | | | 233,674 | |
| Realized gain on investments sold and foreign currency transactions | | | - | |
| Undistributed nontaxable gain | | | 5,194,714 | |
| Unrealized appreciation of investments | | | 1,047,435 | |
| | | | | |
| NET ASSETS APPLICABLE TO COMMON STOCK OUTSTANDING | | $ | 104,683,573 | |
See accompanying notes to financial statements.
| BMC FUND, INC. |
| STATEMENT OF OPERATIONS |
| Year Ended October 31, 2015 |
| INVESTMENT INCOME: | | | | |
| Income: | | | | |
| Interest - fixed income | | $ | 91,851 | |
| Dividend income (net of $12,696 foreign tax) | | | 2,700,685 | |
| | | | | |
| Total income | | | 2,792,536 | |
| | | | | |
| Expenses: | | | | |
| Legal and professional fees | | | 58,926 | |
| Directors' fees (Note 8) | | | 69,000 | |
| Investment expense | | | 81,262 | |
| Salaries and related expenses | | | 633,780 | |
| Property and liability insurance | | | 52,953 | |
| Depreciation expense | | | 4,266 | |
| Rent | | | 43,785 | |
| Interest Expense | | | 87 | |
| Office expense and supplies | | | 54,186 | |
| Dues and subscriptions | | | 43,381 | |
| Travel and entertainment | | | 18,930 | |
| | | | | |
| Total expenses | | | 1,060,556 | |
| | | | | |
| Investment income, net | | | 1,731,980 | |
| | | | | |
| REALIZED AND UNREALIZED GAIN (LOSS) ON INVESTMENTS: | | | | |
| Realized gain from investments sold and foreign currency transactions | | | 1,534,052 | |
| Realized loss from expiration or closing of options contracts written | | | (18,129 | ) |
| Change in unrealized appreciation of investments for the period | | | (5,100,451 | ) |
| | | | | |
| Net loss on investments | | | (3,584,528 | ) |
| | | | | |
| NET DECREASE IN NET ASSETS RESULTING FROM OPERATIONS | | $ | (1,852,548 | ) |
See accompanying notes to financial statements.
| BMC FUND, INC. |
| STATEMENTS OF CHANGES IN NET ASSETS |
| Years Ended October 31, 2015 and 2014 |
| | | 2015 | | | 2014 | |
| | | | | | | |
| INCREASE (DECREASE) IN NET ASSETS FROM OPERATIONS: | | | | | | | | |
| Net investment income | | $ | 1,731,980 | | | $ | 2,046,174 | |
| Realized gains from investment securities sold, options and foreign currency transactions | | | 1,515,923 | | | | 2,257,772 | |
| Change in unrealized appreciation of investments for the year | | | (5,100,451 | ) | | | 839,884 | |
| | | | | | | | | |
| Net increase (decrease) in net assets resulting from operations | | | (1,852,548 | ) | | | 5,143,830 | |
| | | | | | | | | |
| Distributions to shareholders from: | | | | | | | | |
| Net realized gain on investment securities and foreign currency transactions | | | (2,193,335 | ) | | | (2,081,809 | ) |
| Net investment income | | | (1,778,667 | ) | | | (2,141,953 | ) |
| Retained earnings prior to becoming an investment company | | | (1,059,945 | ) | | | (709,519 | ) |
| | | | | | | | | |
| TOTAL INCREASE (DECREASE) IN NET ASSETS | | | (6,884,495 | ) | | | 210,549 | |
| | | | | | | | | |
| NET ASSETS AT BEGINNING OF PERIOD | | | 111,568,068 | | | | 111,357,519 | |
| | | | | | | | | |
| NET ASSETS AT END OF PERIOD (Including undistributed net investment income: 2015 - $233,674, 2014 - $280,361) | | $ | 104,683,573 | | | $ | 111,568,068 | |
See accompanying notes to financial statements.
| BMC FUND, INC. |
| NOTES TO FINANCIAL STATEMENTS |
| Year Ended October 31, 2015 |
BMC Fund, Inc. (the “Company”) is a closed-end, diversified investment company registered under the Investment Company Act of 1940, as amended. Prior to becoming a regulated investment company on April 1, 1981, BMC Fund, Inc. operated as a regular corporation. The following is a summary of significant accounting policies followed by the Company in the preparation of its financial statements.
| 2. | SIGNIFICANT ACCOUNTING POLICIES |
A. Investment Valuations – The investment securities are stated at fair value as determined by closing prices on national securities exchanges. Investment securities include corporate bonds, mutual funds, and common and preferred stocks.
The investments in limited partnerships, other investments and venture capital are stated at estimated fair value as determined by the management of these investments and are approved by the Company’s Valuation Committee after giving consideration to historical and projected financial results, economic conditions, financial condition of investee and other factors and events subject to change, and ratified by the Company’s Board of Directors. Because of the inherent uncertainty of those valuations, the estimated values may differ significantly from the values that would have been used had a ready market value for the investments existed, and these differences could be material.
B. Basis of Presentation - The financial statements have been prepared in conformity with accounting principles generally accepted in the United States of America (“GAAP”) as detailed in the Financial Accounting Standards Board’s Accounting Standards Codification. The Company evaluates subsequent events through the date of filing with the Securities and Exchange Commission (“SEC”).
C. Investment Transactions – Investment transactions are accounted for on the date the order to buy or sell is executed. Realized gains and losses on investments are determined on the basis of specific identification of issues sold or matured. Dividend income is recorded on the ex-dividend date and interest income is recorded on the accrual basis. Discounts and premiums on securities purchased are amortized over the lives of the respective securities. Realized gains and losses on foreign currency transactions are included with realized gains and losses on investments.
For the year ended October 31, 2015, the Company purchased and sold securities in the amount of $18,579,404 and $21,874,772 (excluding short-term investments and options), respectively.
| BMC FUND, INC. |
| NOTES TO FINANCIAL STATEMENTS |
| Year Ended October 31, 2015 |
| 2. | SIGNIFICANT ACCOUNTING POLICIES (Continued) |
D. Option Writing – When the Company writes an option, an amount equal to the premium received by the Company is recorded as a liability and is subsequently adjusted to the current fair value of the option written. Premiums received from writing options that expire unexercised are treated by the Company on the expiration date as realized gains from investments. The difference between the premium and the amount paid on effecting a closing purchase transaction, including brokerage commissions, is also treated as a realized gain, or, if the premium is less than the amount paid for the closing purchase transaction, as a realized loss. If a call option is exercised, the premium is added to the proceeds from the sale of the underlying security in determining whether the Company has realized a gain or loss. If a put option is exercised, the premium reduces the cost basis of the securities purchased by the Company. The Company as writer of an option bears the market risk of an unfavorable change in the price of the security underlying the written option.
E. Income Taxes – No federal tax provision is required as it is the Company’s policy to comply with the provisions of Subchapter M of the Internal Revenue Code of 1954, as amended, including the distribution to its shareholders of substantially all of its income and any capital gains not offset by capital losses. Also, no state income tax provision has been provided because the states in which the Company has income recognize the tax exempt status of a regulated investment company.
The Company did not have an accrual for uncertain tax positions as deductions taken and benefits accrued are based on widely understood administrative practices and procedures, and are based on clear and unambiguous tax law. Tax returns for all years 2011 and thereafter are subject to possible future examinations by tax authorities.
F. Dividend Policy – It is the Company’s policy to pay dividends during the year in sufficient amounts to meet the requirements to maintain its status as a regulated investment company.
G. Cash and Short-Term Investments – For purposes of financial reporting, the Company considers all investments at financial institutions with original maturities of three months or less to be equivalent to cash. Short-term money market investments managed by third party investors are included in investment securities.
H. Use of Estimates – The preparation of financial statements in conformity with accounting principles generally accepted in the United States of America requires management to make estimates and assumptions that affect the reported amounts of assets and liabilities and disclosure of contingent assets and liabilities at the date of the financial statements and the reported amounts of revenues and expenses during the reporting period. Actual results could differ from those estimates.
| BMC FUND, INC. |
| NOTES TO FINANCIAL STATEMENTS |
| Year Ended October 31, 2015 |
| 2. | SIGNIFICANT ACCOUNTING POLICIES (Continued) |
I. Fair Value Measurements – Fair value is defined as the price that would be received to sell an asset or paid to transfer a liability (i.e., the "exit price") in an orderly transaction between market participants at the measurement date.
In determining fair value, the Company uses various valuation techniques. A fair value hierarchy for inputs is used in measuring fair value that maximizes the use of observable inputs and minimizes the use of unobservable inputs by requiring that the most observable inputs are to be used when available. Valuation techniques that are consistent with the market or income approach are used to measure fair value. The fair value hierarchy is categorized into three levels based on the inputs as follows:
Level 1 - Valuations based on unadjusted quoted prices in active markets for identical assets or liabilities that the Fund has the ability to access.
Level 2 - Valuations based on inputs, other than quoted prices included in Level 1, that are observable either directly or indirectly.
Level 3 - Valuations based on inputs that are unobservable and significant to the overall fair value measurement.
Fair value is a market-based measure, based on assumptions of prices and inputs considered from the perspective of a market participant that are current as of the measurement date, rather than an entity-specific measure. Therefore, even when market assumptions are not readily available, the Company's own assumptions are set to reflect those that market participants would use in pricing the asset or liability at the measurement date.
The availability of valuation techniques and observable inputs can vary from investment to investment and are affected by a wide variety of factors, including the type of investment, whether the investment is new and not yet established in the marketplace, the liquidity of markets, and other characteristics particular to the transaction. To the extent that valuation is based on models or inputs that are less observable or unobservable in the market, the determination of fair value requires more judgment. Because of the inherent uncertainty of valuation, those estimated values may be materially higher or lower than the values that would have been used had a ready market for the investments existed. Accordingly, the degree of judgment exercised by the Company in determining fair value is greatest for investments categorized in Level 3. In certain cases, the inputs used to measure fair value may fall into different levels of the fair value hierarchy. In such cases, the level in the fair value hierarchy which the fair value measurement falls in its entirety is determined based on the lowest level input that is significant to the fair value measurement.
| BMC FUND, INC. |
| NOTES TO FINANCIAL STATEMENTS |
| Year Ended October 31, 2015 |
| 2. | SIGNIFICANT ACCOUNTING POLICIES (Continued) |
J. Investments in Limited Partnerships - Investments in limited partnerships are valued, as a practical expedient, utilizing the net asset valuations provided by the underlying limited partnerships when the net asset valuations of the investments are calculated (or adjusted by the Company if necessary) in a manner consistent with GAAP for investment companies. The Company applies the practical expedient to its investments in limited partnerships on an investment-by-investment basis, and consistently with the Company's entire position in a particular investment, unless it is probable that the Company will sell a portion of an investment at an amount different from the net asset valuation.
Investments in limited partnerships are included in Level 3 of the fair value hierarchy. In determining the level, the Company considers the length of time until the investment is redeemable, including notice and lock-up periods or any other restriction on the disposition of the investment. The Company also considers the nature of the portfolios of the underlying limited partnership and their ability to liquidate their underlying investments. If the Company does not know when it will have the ability to redeem the investment or it does not have the ability to redeem its investment in the near term, the investment is included in Level 3 of the fair value hierarchy. In addition, investments which are not valued using the practical expedient are included in Level 3 in the fair value hierarchy.
K. Fair Value-Valuation Processes - The Company establishes valuation processes and procedures to ensure that the valuation techniques are fair, consistent, and verifiable. The Company has designated a valuation subcommittee, that is comprised of senior management employees of the Company, that meets on a quarterly basis, or more frequently as needed, to approve the valuations of the Fund's investments. The valuation subcommittee establishes valuations which are then provided to the Company’s valuation committee, which is comprised of disinterested directors, who review and recommend the valuations to the Company’s Board of Directors to ratify. The Company’s valuations committee is responsible for developing the Company’s written valuation processes and procedures, conducting periodic reviews of the valuation policies, and evaluating the overall fairness and consistent application of the valuation processes.
The valuations of investments in limited partnerships are supported by information received from the limited partnerships, such as monthly net asset values, investor reports, and audited financial statements, when available. If it is probable that the Company will sell an investment at an amount different from the net asset valuation or in other situations where the practical expedient is not available, or when the Company believes alternative valuation techniques are more appropriate, the valuation committee may consider other factors, including subscription and redemption rights, expected discounted cash flows, transactions in the secondary market, bids received from potential buyers, and overall market conditions in its determination of fair value.
| BMC FUND, INC. |
| NOTES TO FINANCIAL STATEMENTS |
| Year Ended October 31, 2015 |
| 2. | SIGNIFICANT ACCOUNTING POLICIES (Continued) |
The Company's Level 3 investments have been valued using the unadjusted net asset value of investments in limited partnerships. As a result, there were no unobservable inputs that have been internally developed by the Company in determining the fair values of its investments as of October 31, 2015.
The following is a summary of the inputs used to value the Company’s investments as of October 31, 2015.
| Asset Description | | Quoted Prices
in Active Markets for Identical Assets
(Level 1) | | | Significant
Other
Observable
Inputs
(Level 2) | | |
Significant
Unobservable
Inputs
(Level 3) | | | Total | |
| Fixed Income | | $ | 1,753,699 | | | $ | - | | | $ | - | | | $ | 1,753,699 | |
| Mutual Funds | | | | | | | | | | | | | | | | |
| Bond Mutual Funds | | | 17,494,116 | | | | - | | | | - | | | | 17,494,116 | |
| Stock Mutual Funds | | | 8,275,703 | | | | - | | | | - | | | | 8,275,703 | |
| Other Investments | | | | | | | | | | | | | | | | |
| Limited Partnerships | | | - | | | | - | | | | 22,620,053 | | | | 22,620,053 | |
| Common Stocks | | | | | | | | | | | | | | | | |
| Common Stocks – Publicly Traded including Call and Put Options | | | 31,169,268 | | | | - | | | | - | | | | 31,169,268 | |
| Call Options | | | (5,690 | ) | | | | | | | | | | | (5,690 | ) |
| Put Options | | | (45,845 | ) | | | - | | | | - | | | | (45,845 | ) |
| Cash and Cash Equivalents | | | 22,365,887 | | | | - | | | | - | | | | 22,365,887 | |
| Total Investments | | $ | 81,007,138 | | | $ | - | | | $ | 22,620,053 | | | $ | 103,627,191 | |
The table below presents a reconciliation for the year ended October 31, 2015, for all Level 3 assets that are measured at fair value on a recurring basis.
| | | Balance | | | Accrued | | | Unrealized | | | Realized | | | | | | | | | | | | Net
Transfers | | | Balance | |
| | | as of | | | Discounts/ | | | Gains & | | | Gains & | | | Net | | | Return of | | | Net | | | in (out of) | | | as of | |
| Level 3 Assets | | 10/31/2014 | | | Premiums | | | Losses | | | Losses | | | Purchases | | | Capital | | | Sales | | | Level 3 | | | 10/31/2015 | |
| Other Investments | | | | | | | | | | | | | | | | | | | | | | | | | | | | | | | | | | | | |
| Limited Partnerships | | $ | 21,199,217 | | | $ | - | | | $ | (771,550 | ) | | $ | 125,505 | | | $ | 8,210,821 | | | $ | (1,248,745 | ) | | $ | (4,895,195 | ) | | $ | - | | | $ | 22,620,053 | |
| Total Investments | | $ | 21,199,217 | | | $ | - | | | $ | (771,550 | ) | | $ | 125,505 | | | $ | 8,210,821 | | | $ | (1,248,745 | ) | | $ | (4,895,195 | ) | | $ | - | | | $ | 22,620,053 | |
Realized gains and losses are included in the realized gain from investments sold on the Statement of Operations. Unrealized gains and losses are included in the change in unrealized appreciation of investments on the Statement of Operations.
L. Investments in Limited Partnerships - As of October 31, 2015, the Company was invested in limited partnerships. Each of these investments has certain restrictions with respect to rights of withdrawal by the Company as specified in the respective agreements. Generally, the Company is required to provide notice of its intent to withdraw after the investment has been maintained for a certain period of time. The management agreements of the limited partnerships provide for compensation to the managers in the form of fees ranging from 0.5% to 2% annually of net assets and performance incentive allowances or fees ranging from 10% to 20% of net profits earned.
| BMC FUND, INC. |
| NOTES TO FINANCIAL STATEMENTS |
| Year Ended October 31, 2015 |
| 2. | SIGNIFICANT ACCOUNTING POLICIES (Continued) |
The following table summarizes the Company's investments in other limited partnerships as of October 31, 2015. The Company's investments in limited partnerships have certain redemption and liquidity restrictions which are described in the below table.
Investment | | Redemptions Notice Period | | Redemptions Permitted | | Liquidity Restrictions |
| Limited Partnerships | | | | | | |
| 400 Capital Credit Opportunities Fund LP | | 60 days | | Quarterly | | See below (1) |
| Elliott Associates, LP | | 60 days | | Jan. 1 or July 1 | | See below (2) (3) |
| Graham Growth Partners, LP | | 30 days | | Quarterly | | None |
| Greenlight Masters Qualified, LP | | 105 days | | December 31 | | See below (4) |
| Infinity Premier Fund, LP | | 95 days | | Quarterly | | See below (5) (6) |
| Litespeed Partners, LP | | 45 days | | Quarterly | | See below (6) |
| Morrocroft Special Opportunity Fund II, LP | | 90 days | | Quarterly | | See below (4) (7) |
| Oaktree Enhanced Income Fund II, LP | | N/A | | N/A | | See below (8) |
| Passport Long Short Fund, LP | | 15 days | | Monthly | | See below (9) |
| Privet Fund LP | | 90 days | | Quarterly | | See below (10) |
| Serengeti Multi-Series, LP | | 87 days | | Quarterly | | See below (11) |
| Stark Investments LP | | N/A | | N/A | | See below (12) |
| Stark Structured Finance Onshore LP | | N/A | | N/A | | See below (12) |
| Terra Argentine Fund, LP | | N/A | | N/A | | See below (13) |
| Virgo Societas Partnership III (Onshore), LP | | N/A | | N/A | | See below (14) |
Walnut Investment Partners, LP Worldwide Opportunity Fund (Cayman), Ltd. | | N/A 30 days | | N/A June 30 or Dec. 31 | | See below (15) See below (16) |
(1) Withdrawal proceeds are available as follows: 25% at withdrawal date; 33 1/3% of the remaining account three months after withdrawal date; 50% of the remaining amount six months after withdrawal date, and the remaining balance nine months after withdrawal date.
(2) There is a gate provision if requests for redemptions would cause a decline in aggregate net asset value of 20%. In addition to the 20% withdrawal limitation, a partner may not withdraw more than 25% of the capital in its Class B capital account on any withdrawal date.
(3) There is a capital surcharge of 1 3/4% for a partial or full withdrawal which may be waived in whole or in part.
(4) There is a gate provision regarding requests for redemptions, subject to various unspecified terms.
(5) Withdrawals of capital contributed less than 12 months preceding the withdrawal date will be subject to a reduction equal to 3% of the requested withdrawal amount.
(6) There is a gate provision if aggregate requested withdrawal amounts exceed 25% of the aggregate partner capital of the partnership, each limited partner who has submitted a timely request will receive a pro rata portion of the requested withdrawal, and any balance will be considered a timely withdrawal request with respect to the next withdrawal date.
(7) Minimum withdrawal is $100,000, and subsequent withdrawals may only be made in increments of $100,000. Withdrawal maximum limits: up to 1/5 of investment on initial withdrawal date, up to 1/4 of the remainder as of any subsequent withdrawal date, up to 1/3 of the remainder as of any subsequent withdrawal date, up to 1/2 of the remainder as of any subsequent withdrawal date, and up to the remainder as of any subsequent withdrawal date.
(8) Redemptions are not permitted.
(9) There is a gate provision if aggregate requested withdrawal amounts exceed 65% of the net asset value. Withdrawals to investors subject to this provision may be reduced pro rata based on their respective withdrawal requests. Any unpaid withdrawal amounts will be automatically submitted for the next withdrawal date.
(10) Redemptions from portions of capital balance attributable to special investments are permitted only in the general partner’s discretion.
(11) There is a three-year lock-up period for the contribution to the underlying fund which expires May 31, 2016.
(12) In liquidation.
(13) No voluntary withdrawals are permitted prior to the Effective Transition Date, which is not earlier than July 1, 2015.
(14) Redemptions are not permitted. Unless the general partner elects an earlier date, the partnership expires April 17, 2019, which is the seventy-two month anniversary date of the initial closing of April 17, 2013, subject to a discretionary extension by the general partner of up to two consecutive additional one-year periods.
(15) Walnut is in receivership.
(16) Partial redemption may not reduce capital account below the lesser of $100,000 or 1% of the capital accounts of all investors.
| BMC FUND, INC. |
| NOTES TO FINANCIAL STATEMENTS |
| Year Ended October 31, 2015 |
| 2. | SIGNIFICANT ACCOUNTING POLICIES (Continued) |
The Company is subject to credit risk to the extent that the investment managers of the underlying limited partnerships are unable to fulfill their obligations according to their organizational documents. The Company, through its investments in limited partnerships, is subject to risk inherent when investing in securities and private investments. In connection with its investments, the Company is subject to the market and credit risk of those investments held or sold short by the limited partnerships. Due to the nature of the Company's investments, the above described risks are limited to the Fund's investment balances and unfunded commitments to limited partnerships.
| 3. | UNREALIZED APPRECIATION AND DEPRECIATION ON INVESTMENTS |
(tax basis)
The amount of net unrealized appreciation (depreciation) and the cost of investment securities for tax purposes, including short-term securities as October 31, 2015, were as follows:
| Gross appreciation (excess of value over tax cost) | | $ | 9,928,661 | |
| Gross depreciation (excess of tax cost over value) | | | (8,986,463 | ) |
| Net unrealized appreciation | | $ | 942,198 | |
| Cost of investments for income tax purposes | | $ | 102,736,528 | |
As of October 31, 2015, portfolio securities valued at $473,240 were held in escrow by the custodian as cover for call options written by the Company.
Transactions in options written during the year ended October 31, 2015 were as follows:
| | | Number of Contracts | | | Premiums Received | |
| Options outstanding at October 31, 2014 | | | 815 | | | $ | 142,775 | |
| Options written | | | 1,741 | | | | 500,498 | |
| Options terminated in closing purchase transactions | | | (1,126 | ) | | | (361,181 | ) |
| Options expired | | | (490 | ) | | | (99,297 | ) |
| Options exercised | | | (305 | ) | | | (26,023 | ) |
| Options outstanding at October 31, 2015 | | | 635 | | | $ | 156,772 | |
As of October 31, 2015, short-term investments in the amount of $4,781,714 were pledged as collateral for put options sold by the Company.
| BMC FUND, INC. |
| NOTES TO FINANCIAL STATEMENTS |
| Year Ended October 31, 2015 |
| 6. | DISTRIBUTIONS TO SHAREHOLDERS |
Classifications of distributions, net investment income/(loss) and net realized gain/(loss) may differ for financial statement and tax purposes. The character of distributions made during the year from net investment income or net realized gains may differ from its ultimate characterization for federal income tax purposes. Also, due to the timing of dividend distributions, the fiscal year in which amounts are distributed may differ from the fiscal year in which the income or realized gain was recorded by the Company.
On December 10, 2014, a distribution of $0.27 per share was paid to shareholders of record on November 25, 2014.
On March 10, 2015, a distribution of $0.25 per share was paid to shareholders of record on February 25, 2015.
On June 10, 2015, a distribution of $0.25 per share was paid to shareholders of record on May 25, 2015.
On September 10, 2015, a distribution of $0.25 per share was paid to shareholders of record on August 25, 2015.
The tax character of distributions paid during 2015 and 2014 was as follows:
| | | 2015 | | | 2014 | |
| Distributions paid from: | | | | | | | | |
| Ordinary income | | $ | 1,772,955 | | | $ | 2,170,646 | |
| Long-term capital gains | | | 2,546,332 | | | | 1,233,320 | |
| Retained earnings prior to becoming an investment company | | | 712,660 | | | | 1,529,315 | |
| | | $ | 5,031,947 | | | $ | 4,933,281 | |
As of October 31, 2015, there was $861,730 of distributable earnings on a tax basis.
The tax components of distributable earnings are determined in accordance with income tax regulations, which may differ from composition of net assets reported under generally accepted accounting principles. The difference for the period ended October 31, 2015 reflects $233,674 of undistributed net investment income under generally accepted accounting principles.
| BMC FUND, INC. |
| NOTES TO FINANCIAL STATEMENTS |
| Year Ended October 31, 2015 |
On April 22, 2010, (renewed April 21, 2013), the Company entered into an agreement with a bank for an unsecured line of credit in the amount of $3,500,000 to provide the Company more flexibility in its payment of dividends and management of its investments. The interest rate on any borrowings is at the one month LIBOR market index rate plus 150 basis points, with a floor of 3.00 percent. The Company will pay a commitment fee of 35 basis points on any unused balance. As of October 31, 2015, the Company had no borrowings from this line of credit, which expires on April 21, 2016.
| 8. | ADVISORY BOARD AND REMUNERATION OF DIRECTORS |
The Company does not have an advisory board. The independent directors are paid an annual fee of $3,000 plus $1,000 for each meeting attended in person or $500 for each meeting attended by telephone. Each such independent director is paid an additional $1,000 for each day attending a committee meeting in person or $500 by telephone other than on the date of a board meeting. In addition, all directors are reimbursed for their reasonable expenses incurred in attending meetings.
The Company leases office space from Broyhill Investments, Inc., which is controlled by Paul H. Broyhill and M. Hunt Broyhill, both officers of BMC Fund, Inc. The expense associated with this related party lease for the year ended October 31, 2015 amounted to $43,785. Broyhill Investments, Inc. also acts as a common paymaster for payroll and other shared services. This service is provided at no cost to the Company. All amounts paid by Broyhill Investments, Inc. on behalf of the Company are reimbursed by the Company. The outstanding payable related to these transactions at October 31, 2015 was $73,561.
Selected securities at the end of the year have significant investment impairment issues. These selected securities have an aggregate cost basis of $4,314,384 and have been assigned no value at October 31, 2015.
The Company evaluated subsequent events through the date the financial statements were issued. At October 31, 2015, the Company’s investment in Third Avenue Focused Credit Fund Institutional Shares (“Third Avenue”) was valued at $1,113,464. Subsequent to October 31, 2015, the Company was informed that Third Avenue applied to the Securities and Exchange Commission (“SEC”) for an exemptive relief order suspending redemptions from Third Avenue. This exemptive order allows Third Avenue to conduct an orderly liquidation of the Third Avenue Fund’s investments without having to resort to forced selling of securities. The SEC granted the exemptive relief request and Third Avenue will make periodic distributions to shareholders until all of its assets have been sold. Third Avenue continues to post a net asset value for the Fund. Direct redemptions from Third Avenue are restricted at this time.
| BMC FUND, INC. |
| DIRECTORS AND OFFICERS |
| Year Ended October 31, 2015 (Unaudited) |
The directors of the Fund were elected for a one-year term at the 2015 annual meeting of shareholders of the Fund.
The following table provides information about the directors and the officers of the Fund:
| Directors Who Are Interested Persons |
Name, Address and Age | | Position(s)
Held with Fund | | Term of
Office and Length of Time Served | | Principal Occupation(s) During Past 5 Years | | Other Directorships Held
by Director During at Least the Past 5 Years |
James T. Broyhill (88) 1930 Virginia Road Winston-Salem, NC 27104 | | Director Vice Chairman | | Since 1976 Since 2005 | | Retired; Director of Shepherd Street Equity Fund (1998-2008); Vice President of Old Clemmons School Properties, Inc. (2006-present); President of Old Clemmons School Properties, Inc. (1998-2006); former Secretary of the North Carolina Department of Commerce (1989-1991); former Chairman of the North Carolina Economic Development Board (1987-1989); former member, U. S. Senate (1986); former member, U.S. House of Representatives (1963-1986) | | None |
M. Hunt Broyhill (51) 1870 9th Street Court, NW Hickory, NC 28601 | | Director Chairman President Vice President | | Since 2008 Since 2014 Since 2007 2001-2007 | | Chairman of the Fund since February 2014; President of the Fund since February 2007; former Vice President of the Fund (2001-2007); Chief Executive of Broyhill Asset Management, LLC and Broyhill Wakin General Partners, LLC (1997-present); Director and President of Broyhill Investments, Inc. (1988-present); Director (1983-present) and President of Broyhill Family Foundation, Inc. (1988-present); Senior Managing Partner and Director of Flagship Capital Partners, LLC (2007-present); Manager and Vice President of P. B. Realty, LLC (formerly P. B. Realty, Inc.) (1995-present) | | Capitala Finance Corp. (Sept. 2013-present) |
| BMC FUND, INC. |
| DIRECTORS AND OFFICERS |
| Year Ended October 31, 2015 (Unaudited) |
| Directors Who Are Interested Persons |
Name, Address and Age | | Position(s)
Held with Fund | | Term of
Office and Length of Time Served | | Principal Occupation(s) During Past 5 Years | | Other Directorships Held
by Director During at Least the Past 5 Years |
Paul H. Broyhill (91) 135 Claron Place, SE Lenoir, NC 28645 | | Director Chairman Emeritus Chief Executive Officer Chairman | | Since 1976 Since 2014 2001-2014 1976-2014 | | Director and Chairman Emeritus; former Chairman (1976-2014) and Chief Executive Officer of the Fund (2001-2014); former President of the Fund (2001-2007); Director (1972-present) and Chairman of Broyhill Investments, Inc. (1988-present); Director (1946-present) and Chairman of Broyhill Family Foundation, Inc. (1989-present); former President of Broyhill Family Foundation, Inc. (1980-1988); Manager and President of P. B. Realty, LLC (formerly P. B. Realty, Inc.) (1983-present) | | None |
W. Charles Campbell (49) 1031 Huntington Park Drive Charlotte, NC 28211 | | Director | | Since 2011 | | President and Chief Executive Officer of Flagship Capital Partners, LLC, a private investment real estate firm (2005-present); Co-manager of Brackett Flagship Properties, LLC, a commercial real estate firm (2010-present) | | None |
Allene B. Stevens (93) 153 Hillhaven Place SE Lenoir, NC 28645 | | Director | | Since 1983 | | Private Investor | | None |
| BMC FUND, INC. |
| DIRECTORS AND OFFICERS |
| Year Ended October 31, 2015 (Unaudited) |
| Directors Who Are Not Interested Persons |
Name, Address and Age | | Position(s)
Held with Fund | | Term of
Office and Length of Time Served | | Principal Occupation(s) During Past 5 Years | | Other Directorships Held
by Director During at Least the Past 5 Years |
Kevin P. Boudreau (52) 117 Shannon Court Rocky Mount, NC 27804 | | Director | | Since 2011 | | Vice President of Tax and Risk Management, Boddie-Noell Enterprises, Inc., a diversified company with interests in restaurant and land-development projects (2005-present) | | None |
Margaret M. “Peg” Broyhill (72) 1995 Cedar Rock Estates Lenoir, NC 28645 | | Director | | Since Feb. 2015 | | Resident Branch Manager (Lenoir, NC office) (1993-present) and Senior Vice President of Wells Fargo Advisors (1995-present) | | None |
R. Donald Farmer (68) 273 Leeward Point Loop Taylorsville, NC 28681 | | Director | | Since 2008 | | President of Don Farmer, CPA, PA, an independent public accounting firm and producer of federal income tax seminars and seminar materials (1984-present) | | None |
Robert G. Fox, Jr. (66) 330 Lams Way Vilas, NC 28692 | | Director | | Since 2008 | | Former President and Chief Banking Officer of NewDominion Bank (2005-April 2010); Executive Vice President of First Charter Bank/First Charter Corporation (1993-2005) | | None |
Jan E. Gordon (64) 3075 Rolling Woods Drive Palm Harbor, FL 34683 | | Director | | Since 2001 | | Retired; former election assistant, Pinellas County, FL Supervisor of Elections (1992-2005) | | None |
Brent B. Kincaid (84) 2703 Lakeview Drive Lenoir, NC 28645 | | Director | | Since 2005 | | Retired since 1998; former President and CEO of Broyhill Furniture Industries, Inc. | | None |
Mark E. Roberts (53) 269 River Ridge Drive Wallace, NC 28466 | | Director | | Since 2014 | | Chief Investment Officer of Biltmore Family Offices, LLC (May 2013-present); Chief Investment Officer of Ironsides Asset Advisors, LLC, a registered investment advisory firm (2009-present); former Director of Global Equities and Hedges Strategies, State of North Carolina Retirement System (2003-2009) | | None |
| BMC FUND, INC. |
| DIRECTORS AND OFFICERS |
| Year Ended October 31, 2015 (Unaudited) |
Name, Address and Age | | Positions
Held with Fund | | Length of Time Served | | Principal Occupation During Past 5 Years | | Directorships Held
by Officer During at Least the Past 5 Years |
Boyd C. Wilson, Jr. (63) 646 Pleasant Hill Road Lenoir, NC 28645 | | Vice President and Chief Financial Officer | | Since 2006 | | Vice President and Chief Financial Officer of the Fund since February 2006; Director (2007-present) and Executive Vice President of Broyhill Investments, Inc. (2005-present); Vice President of Broyhill Family Foundation, Inc. (2007-present); Treasurer of Broyhill Wakin General Partners, LLC (2008-present); Manager and Vice President of P. B. Realty, LLC (formerly P. B. Realty, Inc.) (2006-present); Vice President – Finance & Administration of Kincaid Furniture Company, Incorporated (1990-2005) | | CommunityOne Bancorp (2011-present); Bank of Granite Corp. (1996-2013) |
Christopher R. Pavese (39) 166 Pleasant Point Drive Hickory, NC 28601 | | Vice President Chief Investment Officer | | Since 2014 Since 2011 | | Vice President (since February 2014) and Chief Investment Officer of the Fund since March 2011; Portfolio Manager of the Fund (2005-2011); Chief Investment Officer of Broyhill Asset Management, LLC (2008-present); Chief Investment Officer of Broyhill Affinity Fund, LLC (2008-2012) | | None |
Carol Frye (58) 210 Beall Street, NW Lenoir, NC 28645 | | Secretary and Treasurer | | Since 2001 | | Secretary and Treasurer of the Fund since 2001; Secretary and Treasurer of Broyhill Investments, Inc. (2000-present); Director (2001-present), Secretary and Treasurer of Broyhill Family Foundation, Inc. (2003-present); Secretary of Broyhill Wakin General Partners, LLC (1997-present); Secretary and Treasurer of P. B. Realty, LLC (formerly P. B. Realty, Inc.) (2001-present) | | None |
| BMC FUND, INC. |
| ADDITIONAL INFORMATION |
| Year Ended October 31, 2015 (Unaudited) |
Proxy Voting - The policies and procedures that the Fund uses to determine how to vote proxies relating to its portfolio securities are available without charge, upon request, by calling 828-758-6100; on the Fund’s website at http://www.bmcfund.com; and on the Securities and Exchange Commission’s website at http://www.sec.gov.
Information regarding how the Fund voted proxies relating to portfolio securities during the most recent 12-month period ended June 30 is available without charge, upon request, by calling 828-758-6100, and on the SEC’s website at http://www.sec.gov (see Form N-PX).
Portfolio Holdings - The Fund files a complete schedule of its portfolio holdings for the first and third quarters of its fiscal year with the SEC on Form N-Q. The Fund’s Form N-Q filings are available on the SEC’s website at http://www.sec.gov and may be reviewed and copied at the SEC’s Public Reference Room in Washington, DC. Information on the operation of the SEC’s Public Reference Room may be obtained by calling 1-202-551-8090.
| BMC FUND, INC. |
| FINANCIAL HIGHLIGHTS |
| Years Ended October 31, 2015, 2014, 2013, 2012, 2011, 2010, 2009, 2008, 2007 and 2006 |
The following table presents financial information divided into three parts: per share operating performance, total investment return and ratios and supplemental data for the years ended October 31, 2015, 2014, 2013, 2012, 2011, 2010, 2009, 2008, 2007 and 2006. The first part, per share operating performance, details the changes on a per share basis of the Company's beginning net asset value to its ending net asset value. The second part, total investment return, is based on the market price of the Company's shares of stock. Part three, ratios and supplemental data, provides additional financial information related to the Company's performance.
| PER SHARE OPERATING PERFORMANCE | | 2015 | | | 2014 | | | 2013 | | | 2012 | | | 2011 | | | 2010 | | | 2009 | | | 2008 | | | 2007 | | | 2006 | |
| | | | | | | | | | | | | | | | | | | | | | | | | | | | | | | |
| Net asset value, beginning of period | | $ | 22.62 | | | $ | 22.57 | | | $ | 22.58 | | | $ | 22.11 | | | $ | 22.41 | | | $ | 21.20 | | | $ | 20.79 | | | $ | 36.28 | | | $ | 33.55 | | | $ | 32.84 | |
| Net investment income | | | 0.35 | | | | 0.42 | | | | 0.46 | | | | 0.35 | | | | 0.49 | | | | 0.46 | | | | 0.48 | | | | 0.73 | | | | 0.78 | | | | 1.06 | |
| Net gains (losses) on investments | | | (0.73 | ) | | | 0.63 | | | | 0.60 | | | | 1.18 | | | | 0.21 | | | | 1.70 | | | | 1.65 | | | | (10.98 | ) | | | 4.25 | | | | 2.43 | |
| Total from investment operations | | | (0.38 | ) | | | 1.05 | | | | 1.06 | | | | 1.53 | | | | 0.70 | | | | 2.16 | | | | 2.13 | | | | (10.25 | ) | | | 5.03 | | | | 3.49 | |
| Less distributions: | | | | | | | | | | | | | | | | | | | | | | | | | | | | | | | | | | | | | | | | |
| Dividends from net investment income | | | 0.36 | | | | 0.44 | | | | 0.47 | | | | 0.56 | | | | 0.27 | | | | 0.46 | | | | 0.92 | | | | 1.04 | | | | 2.03 | | | | 2.37 | |
| Distributions from capital gains | | | 0.44 | | | | 0.42 | | | | 0.33 | | | | 0.48 | | | | 0.53 | | | | - | | | | - | | | | 1.42 | | | | 0.27 | | | | 0.41 | |
| Distributions from retained earnings | | | 0.22 | | | | 0.14 | | | | 0.27 | | | | 0.02 | | | | 0.20 | | | | 0.49 | | | | 0.80 | | | | - | | | | - | | | | - | |
| P. B. Realty, Inc. Spin-off | | | - | | | | - | | | | - | | | | - | | | | - | | | | - | | | | - | | | | 2.78 | | | | - | | | | - | |
| Total distributions | | | 1.02 | | | | 1.00 | | | | 1.07 | | | | 1.06 | | | | 1.00 | | | | 0.95 | | | | 1.72 | | | | 5.24 | | | | 2.30 | | | | 2.78 | |
| Net asset value, end of period | | $ | 21.22 | | | $ | 22.62 | | | $ | 22.57 | | | $ | 22.58 | | | $ | 22.11 | | | $ | 22.41 | | | $ | 21.20 | | | $ | 20.79 | | | $ | 36.28 | | | $ | 33.55 | |
| | | | | | | | | | | | | | | | | | | | | | | | | | | | | | | | | | | | | | | | | |
| Per share market value, end of period1 | | $ | 18.00 | | | $ | 18.00 | | | $ | 18.00 | | | $ | 18.00 | | | $ | 18.45 | | | $ | 18.00 | | | $ | 16.75 | | | $ | 26.00 | | | $ | 26.00 | | | $ | 26.00 | |
| | | | | | | | | | | | | | | | | | | | | | | | | | | | | | | | | | | | | | | | | |
| TOTAL INVESTMENT RETURN2 | | | (2.11 | )% | | | 5.83 | % | | | 5.89 | % | | | 8.50 | % | | | 3.79 | % | | | 11.83 | % | | | 12.72 | % | | | (39.42 | )% | | | 19.35 | % | | | 13.40 | % |
| | | | | | | | | | | | | | | | | | | | | | | | | | | | | | | | | | | | | | | | | |
| RATIOS/SUPPLEMENTAL DATA | | | | | | | | | | | | | | | | | | | | | | | | | | | | | | | | | | | | | | | | |
| | | | | | | | | | | | | | | | | | | | | | | | | | | | | | | | | | | | | | | | | |
| Net assets, end of period (in thousands) | | $ | 104,684 | | | $ | 111,568 | | | $ | 111,358 | | | $ | 111,379 | | | $ | 109,069 | | | $ | 110,576 | | | $ | 104,603 | | | $ | 102,574 | | | $ | 178,975 | | | $ | 165,500 | |
| Ratio of expenses to average net assets3 | | | 0.98 | % | | | 0.97 | % | | | 0.95 | % | | | 1.01 | % | | | 0.97 | % | | | 1.11 | % | | | 1.18 | % | | | 1.02 | % | | | 0.75 | % | | | 0.73 | % |
| Ratio of net investment income to average net assets3 | | | 1.59 | % | | | 1.83 | % | | | 2.04 | % | | | 1.57 | % | | | 2.15 | % | | | 2.11 | % | | | 2.40 | % | | | 2.37 | % | | | 2.26 | % | | | 3.20 | % |
| Portfolio turnover rate | | | 17.10 | % | | | 22.02 | % | | | 33.12 | % | | | 32.90 | % | | | 60.41 | % | | | 38.08 | % | | | 69.62 | % | | | 67.44 | % | | | 51.23 | % | | | 48.22 | % |
1Unaudited - Based on stock trades, which are very limited, during that year.
2Unaudited - Computed as follows: income from investment operations divided by per share market value.
3Average is computed on a quarterly basis.
*Annualized
| BMC FUND, INC. |
| SCHEDULE OF INVESTMENTS |
| October 31, 2015 |
| | | | | Coupon | | | | | | | | | | | | | | Percent | |
| | | | | Interest | | | Maturity | | Face | | | | | | Market | | | of Net | |
| Debt Issuer | | | | Rate | | | Date | | Amount | | | Cost | | | Value | | | Assets | |
| | | | | | | | | | | | | | | | | | | | |
| FIXED INCOME: | | | | | | | | | | | | | | | | | | | | | | | | |
| XEROX CORP MEDIUM TERM | | | | | 7.200 | % | | 4/1/2016 | | | 500,000 | | | | 507,490 | | | | 511,594 | | | | | |
| EXPRESS SCRIPTS INC | | | | | 3.125 | % | | 5/15/2016 | | | 250,000 | | | | 250,253 | | | | 252,925 | | | | | |
| HEWLETT PACKARD CO | | | | | 3.000 | % | | 9/15/2016 | | | 250,000 | | | | 249,897 | | | | 254,009 | | | | | |
| TRANSOCEAN INC | | | | | 5.050 | % | | 12/15/2016 | | | 250,000 | | | | 250,827 | | | | 248,672 | | | | | |
| AMBEV INTL FIN CO LTD | | | | | 9.500 | % | | 7/24/2017 | | | 430,769 | | | | 449,680 | | | | 53,999 | | | | | |
| AVON PRODUCTS INC | | | | | 4.200 | % | | 7/15/2018 | | | 500,000 | | | | 501,386 | | | | 432,500 | | | | | |
| LEHMAN BROTHERS HLDGS NIKKEI INDEX | | 1,2,3 | | | 0.000 | % | | 9/29/2008 | | | 3,000,000 | | | | 1,886,048 | | | | - | | | | | |
| LEHMAN BROTHERS HLDGS EAFE INDEX | | 1,2,3 | | | 0.000 | % | | 11/15/2008 | | | 1,000,000 | | | | 622,026 | | | | - | | | | | |
| LEHMAN BROTHERS HLDGS MEDIUM TERM NOTE | | 1,2,3 | | | 0.000 | % | | 3/15/2011 | | | 2,500,000 | | | | 1,570,743 | | | | - | | | | | |
| | | | | | | | | | | | | | | | | | | | | | | | | |
| TOTAL INVESTMENTS IN FIXED INCOME | | | | | | | | | | $ | 8,680,769 | | | $ | 6,288,350 | | | $ | 1,753,699 | | | | 1.68 | % |
| BMC FUND, INC. |
| SCHEDULE OF INVESTMENTS (Continued) |
| October 31, 2015 |
| | | | | | | | | | | | | | | Percent | |
| | | | | | Shares | | | | | | Market | | | of Net | |
| Company Name | | | | | Held | | | Cost | | | Value | | | Assets | |
| | | | | | | | | | | | | | | | |
| MUTUAL FUNDS: | | | | | | | | | | | | | | | | | | | | |
| BOND MUTUAL FUNDS: | | | | | | | | | | | | | | | | | | | | |
| AVENUE INCOME CREDIT STRATEGIES COM | | | | | | | 50,000.00 | | | $ | 848,816 | | | $ | 654,500 | | | | | |
| DOUBLELINE TOTAL RETURN BOND I | | | | | | | 226,010.04 | | | | 2,500,000 | | | | 2,458,989 | | | | | |
| EATON VANCE FLOATING RATE A | | | | | | | 26,315.79 | | | | 250,000 | | | | 236,053 | | | | | |
| FAIRHOLME FOCUSED INCOME FUND | | | | | | | 68,685.46 | | | | 750,000 | | | | 766,530 | | | | | |
| FLAHERTY & CRUMRINE PREFERRED I | | | | | | | 11,833.00 | | | | 87,440 | | | | 157,379 | | | | | |
| FPA NEW INCOME INC COM | | | | | | | 716,128.81 | | | | 7,500,000 | | | | 7,182,772 | | | | | |
| LOOMIS SAYLES BOND INSTITUTIONAL | | | | | | | 120,930.18 | | | | 1,612,500 | | | | 1,691,813 | | | | | |
| OSTERWEIS STRATEGIC INCOME | | | | | | | 19,861.83 | | | | 230,000 | | | | 220,863 | | | | | |
| PIMCO DYNAMIC CREDIT INCOME FUND | | | | | | | 25,000.00 | | | | 565,060 | | | | 469,000 | | | | | |
| PIMCO DYNAMIC INCOME FUND COM | | | | | | | 25,000.00 | | | | 715,425 | | | | 739,500 | | | | | |
| PIMCO FDS INCOME FUND INSTL | | | | | | | 128,944.70 | | | | 1,500,000 | | | | 1,573,125 | | | | | |
| RIVERNORTH/OAKTREE HIGH INCOME I | | | | | | | 24,533.86 | | | | 250,000 | | | | 230,128 | | | | | |
| THIRD AVENUE FOCUSED CREDIT INSTITUTIONAL | | | | | | | 142,568.97 | | | | 1,500,000 | | | | 1,113,464 | | | | | |
| TOTAL BOND MUTUAL FUNDS | | | | | | | | | | | 18,309,241 | | | | 17,494,116 | | | | 16.71 | % |
| | | | | | | | | | | | | | | | | | | | | |
| STOCK MUTUAL FUNDS: | | | | | | | | | | | | | | | | | | | | |
| INTERNATIONAL EQUITIES | | | | | | | | | | | | | | | | | | | | |
| Asia Ex-Japan Stock | | | | | | | | | | | | | | | | | | | | |
| ISHARES INC MSCI SINGAPORE | | | | | | | 20,000.00 | | | | 255,572 | | | | 222,400 | | | | | |
| | | | | | | | | | | | | | | | | | | | | |
| TOTAL INTERNATIONAL EQUITIES | | | | | | | | | | | 255,572 | | | | 222,400 | | | | 0.21 | % |
| | | | | | | | | | | | | | | | | | | | | |
| SPECIALTY FUNDS | | | | | | | | | | | | | | | | | | | | |
| Conservative Allocation | | | | | | | | | | | | | | | | | | | | |
| VANGUARD WELLESLEY INCOME INV | | | | | | | 20,045.04 | | | | 422,892 | | | | 512,151 | | | | 0.49 | % |
| | | | | | | | | | | | | | | | | | | | | |
| Financial | | | | | | | | | | | | | | | | | | | | |
| FRANKLIN INCOME FUND ADVIS | | | | | | | 119,047.62 | | | | 250,000 | | | | 263,095 | | | | 0.25 | % |
| | | | | | | | | | | | | | | | | | | | | |
| Large Cap Blend | | | | | | | | | | | | | | | | | | | | |
| COOK & BYNUM FUND | | | | | | | 33,738.19 | | | | 500,000 | | | | 507,422 | | | | | |
| FEDERATED STRATEGIC VALUE DIVIDEND C | | | | | | | 15,600.62 | | | | 100,000 | | | | 94,696 | | | | | |
| SELECTED AMERICAN SHARES D | | | | | | | 2,059.31 | | | | 100,000 | | | | 83,835 | | | | | |
| T ROWE PRICE PERSONAL STRATEGY GROWTH | | | | | | | 4,370.83 | | | | 90,476 | | | | 132,086 | | | | | |
| YACKTMAN FUND SVC | | | | | | | 24,771.08 | | | | 506,985 | | | | 600,699 | | | | | |
| | | | | | | | | | | | 1,297,461 | | | | 1,418,738 | | | | 1.36 | % |
| | | | | | | | | | | | | | | | | | | | | |
| Long-Short | | | | | | | | | | | | | | | | | | | | |
| BMC FUND, INC. |
| SCHEDULE OF INVESTMENTS (Continued) |
| October 31, 2015 |
| | | | | | | | | | | | | | | Percent | |
| | | | | | Shares | | | | | | Market | | | of Net | |
| Company Name | | | | | Held | | | Cost | | | Value | | | Assets | |
| | | | | | | | | | | | | | | | |
| MUTUAL FUNDS: | | | | | | | | | | | | | | | | | | | | |
| GOTHAM ABSOLUTE RETURN INSTITUTIONAL | | | | | | | 18,436.58 | | | | 250,000 | | | | 238,016 | | | | | |
| GOTHAM NEUTRAL INSTITUTIONAL | | | | | | | 22,202.49 | | | | 250,000 | | | | 223,579 | | | | | |
| | | | | | | | | | | | 500,000 | | | | 461,595 | | | | 0.44 | % |
| | | | | | | | | | | | | | | | | | | | | |
| Mid Cap Blend | | | | | | | | | | | | | | | | | | | | |
| PROFESSIONALLY MANAGED AKR | | | 3 | | | | 10,855.41 | | | | 250,000 | | | | 256,730 | | | | 0.25 | % |
| | | | | | | | | | | | | | | | | | | | | |
| Moderate Allocation | | | | | | | | | | | | | | | | | | | | |
| FPA CRESCENT PORTFOLIO | | | | | | | 33,641.26 | | | | 1,025,302 | | | | 1,122,945 | | | | | |
| OAKMARK EQUITY & INCOME I | | | | | | | 8,920.47 | | | | 263,600 | | | | 277,783 | | | | | |
| SEQUOIA FD INC COM | | | | | | | 740.54 | | | | 108,371 | | | | 159,883 | | | | | |
| | | | | | | | | | | | 1,397,273 | | | | 1,560,611 | | | | 1.49 | % |
| | | | | | | | | | | | | | | | | | | | | |
| Precious Metals | | | | | | | | | | | | | | | | | | | | |
| MARKET VECTORS GOLD MINERS | | | | | | | 25,000.00 | | | | 1,223,726 | | | | 374,000 | | | | | |
| SPDR GOLD SHARES | | | 3 | | | | 10,000.00 | | | | 969,550 | | | | 1,093,000 | | | | | |
| | | | | | | | | | | | 2,193,276 | | | | 1,467,000 | | | | 1.40 | % |
| | | | | | | | | | | | | | | | | | | | | |
| Utilities | | | | | | | | | | | | | | | | | | | | |
| GABELLI UTILS FUND CL AAA | | | | | | | 9,964.73 | | | | 113,000 | | | | 91,775 | | | | | |
| UTILITIES SELECT SECTOR SPDR | | | | | | | 23,000.00 | | | | 734,317 | | | | 1,006,250 | | | | | |
| | | | | | | | | | | | 847,317 | | | | 1,098,025 | | | | 1.05 | % |
| | | | | | | | | | | | | | | | | | | | | |
| World Allocation | | | | | | | | | | | | | | | | | | | | |
| WELLS FARGO ADVANTAGE ASSET ALLOC ADM | | | | | | | 75,379.17 | | | | 1,010,000 | | | | 1,015,358 | | | | 0.97 | % |
| | | | | | | | | | | | | | | | | | | | | |
| TOTAL SPECIALTY FUNDS | | | | | | | | | | | 8,168,219 | | | | 8,053,303 | | | | 7.69 | % |
| | | | | | | | | | | | | | | | | | | | | |
| TOTAL STOCK MUTUAL FUNDS | | | | | | | | | | | 8,423,791 | | | | 8,275,703 | | | | 7.91 | % |
| | | | | | | | | | | | | | | | | | | | | |
| TOTAL INVESTMENTS IN MUTUAL FUNDS | | | | | | | | | | $ | 26,733,032 | | | $ | 25,769,819 | | | | 24.62 | % |
| BMC FUND, INC. |
| SCHEDULE OF INVESTMENTS (Continued) |
| October 31, 2015 |
| | | | | | | | Market | | | Percent of | |
| Company Name | | | | Cost | | | Value | | | Net Assets | |
| | | | | | | | | | | | |
| OTHER INVESTMENTS: | | | | | | | | | | | | | | |
| | | | | | | | | | | | | | | |
| LIMITED PARTNERSHIPS: | | | | | | | | | | | | | | |
| 400 CAPITAL CREDIT OPPORTUNITIES FUND LP | | 2, 3 | | $ | 500,000 | | | $ | 651,681 | | | | | |
| ELLIOTT ASSOCIATES LP CL A | | 2, 3 | | | 2,000,000 | | | | 3,895,576 | | | | | |
| ELLIOTT ASSOCIATES LP CL B | | 2, 2 | | | 388,000 | | | | 390,831 | | | | | |
| GRAHAM GROWTH PARTNERS, LP | | 2, 3 | | | 1,000,000 | | | | 1,070,800 | | | | | |
| GREENLIGHT MASTERS QUALIFIED LP | | 2, 3 | | | 2,500,000 | | | | 3,171,550 | | | | | |
| INFINITY PREMIER FUND, LP | | 2, 3 | | | 2,500,000 | | | | 2,613,008 | | | | | |
| LITESPEED PARTNERS, LP | | 2, 3 | | | 2,500,000 | | | | 2,239,085 | | | | | |
| MORROCROFT SPECIAL OPPORTUNITY FUND II, LP | | 2, 3 | | | - | | | | 368,316 | | | | | |
| OAKTREE ENHANCED INCOME FUND II, LP | | 2, 3 | | | 2,387,087 | | | | 2,270,035 | | | | | |
| PASSPORT LONG SHORT FUND | | 2, 3 | | | 1,000,000 | | | | 1,044,870 | | | | | |
| PRIVET FUND LP | | 2, 3 | | | 1,000,000 | | | | 1,282,602 | | | | | |
| SERENGETI MULTI SERIES LLC | | 2, 3 | | | 389,220 | | | | 460,755 | | | | | |
| STARK INVESTMENTS LP | | 2, 3 | | | 50,452 | | | | 122,954 | | | | | |
| STARK STRUCTURED FINANCE ONSHORE FUND | | 2, 3 | | | 13,352 | | | | 10,612 | | | | | |
| TERRA ARGENTINE FUND LP | | 2, 3 | | | 200,000 | | | | 238,310 | | | | | |
| VIRGO SOCIETAS III (ONSHORE) LP | | 2, 3 | | | 1,786,998 | | | | 1,814,818 | | | | | |
| WALNUT INVESTMENT PARTNERS | | 2, 3 | | | 235,567 | | | | - | | | | | |
| WORLDWIDE OPPORTUNITY FUND (CAYMAN) LTD. CL A-A1 | | 2, 3 | | | 500,000 | | | | 491,025 | | | | | |
| WORLDWIDE OPPORTUNITY FUND (CAYMAN) LTD. CL A-A9 | | 2, 3 | | | 100,000 | | | | 95,503 | | | | | |
| WORLDWIDE OPPORTUNITY FUND (CAYMAN) LTD. CL A-A10 | | 2, 3 | | | 100,000 | | | | 95,805 | | | | | |
| WORLDWIDE OPPORTUNITY FUND (CAYMAN) LTD. CL A-A11 | | 2, 3 | | | 100,000 | | | | 96,278 | | | | | |
| WORLDWIDE OPPORTUNITY FUND (CAYMAN) LTD. CL A-A12 | | 2, 3 | | | 100,000 | | | | 95,994 | | | | | |
| WORLDWIDE OPPORTUNITY FUND (CAYMAN) LTD. CL A-A13 | | 2, 3 | | | 100,000 | | | | 99,645 | | | | | |
| TOTAL LIMITED PARTNERSHIPS | | | | | 19,450,676 | | | | 22,620,053 | | | | 21.61 | % |
| | | | | | | | | | | | | | | |
| TOTAL OTHER INVESTMENTS | | | | $ | 19,450,676 | | | $ | 22,620,053 | | | | 21.61 | % |
| BMC FUND, INC. |
| SCHEDULE OF INVESTMENTS (Continued) |
| October 31, 2015 |
| | | | | | | | | | | | | | | | Percent | |
| Sectors and | | Shares | | | | | | | | | | Market | | | of Net | |
| Industries | | Held | | | Company Name | | | | Cost | | | Value | | | Assets | |
| | | | | | | | | | | | | | | | | |
| COMMON STOCKS: | | | | | | | | | | | | | | | | | | | | |
| CONSUMER DISCRETIONARY | | | | | | | | | | | | | | | | | | | | |
| Automobiles & Components | | | 35,000.00 | | | FIAT CHRYSLER AUTOMOBILES | | 3 | | $ | 370,405 | | | $ | 512,400 | | | | | |
| | | | 25,000.00 | | | GENERAL MOTORS CORP COM | | | | | 885,293 | | | | 872,750 | | | | | |
| | | | | | | | | | | | 1,255,698 | | | | 1,385,150 | | | | 1.32 | % |
| | | | | | | | | | | | | | | | | | | | | |
| Consumer Services | | | 50,000.00 | | | ARCOS DORADOS HOLDINGS INC CL A | | | | | 368,756 | | | | 154,000 | | | | 0.15 | % |
| | | | | | | | | | | | | | | | | | | | | |
| Hotels, Restaurants & Leisure | | | 75,000.00 | | | SEAWORLD ENTERTAINMENT INC COM | | | | | 1,384,103 | | | | 1,494,750 | | | | 1.43 | % |
| | | | | | | | | | | | | | | | | | | | | |
| Media | | | 15,000.00 | | | DISCOVERY COMMUNICATIONS NEW COM | | 3 | | | 441,711 | | | | 412,800 | | | | | |
| | | | 15,000.00 | | | TIME WARNER INC COM NEW | | | | | 1,210,848 | | | | 1,130,100 | | | | | |
| | | | | | | | | | | | 1,652,559 | | | | 1,542,900 | | | | 1.47 | % |
| | | | | | | | | | | | | | | | | | | | | |
| Recreation | | | 5,000.00 | | | MATTEL INC COM | | | | | 108,373 | | | | 122,900 | | | | 0.12 | % |
| | | | | | | | | | | | | | | | | | | | | |
| Retailing | | | 5,000.00 | | | CATO CORP NEW CL A | | | | | 160,837 | | | | 188,800 | | | | 0.18 | % |
| | | | | | | | | | | | | | | | | | | | | |
| Transportation | | | 3,000.00 | | | AMERICAN AIRLINES GROUP I COM | | | | | 128,037 | | | | 138,660 | | | | 0.13 | % |
| | | | | | | | | | | | | | | | | | | | | |
| TOTAL CONSUMER DISCRETIONARY | | | | | | | | | | | 5,058,363 | | | | 5,027,160 | | | | 4.80 | % |
| | | | | | | | | | | | | | | | | | | | | |
| CONSUMER STAPLES | | | | | | | | | | | | | | | | | | | | |
| Food & Staples Retailing | | | 1,000.00 | | | CVS HEALTH CORP COM | | | | | 104,295 | | | | 98,780 | | | | | |
| | | | 5,000.00 | | | WAL MART STORES INC COM | | | | | 297,313 | | | | 286,200 | | | | | |
| | | | | | | | | | | | 401,608 | | | | 384,980 | | | | 0.37 | % |
| | | | | | | | | | | | | | | | | | | | | |
| Food, Beverage & Tobacco | | | 25,000.00 | | | AMBEV SA SPONSORED ADR | | | | | 142,690 | | | | 121,750 | | | | | |
| | | | 7,500.00 | | | COCA COLA FEMSA S A B SPON | | | | | 699,467 | | | | 575,100 | | | | | |
| | | | 2,000.00 | | | CONSTELLATION BRANDS CL A | | | | | 181,438 | | | | 269,600 | | | | | |
| | | | 3,500.00 | | | GENERAL MILLS INC COM | | | | | 122,082 | | | | 203,385 | | | | | |
| | | | 1,000.00 | | | HERSHEY CO COMMON | | | | | 61,460 | | | | 88,690 | | | | | |
| | | | 10,000.00 | | | NESTLE S A SPONSORED ADR | | | | | 396,899 | | | | 763,000 | | | | | |
| | | | 7,500.00 | | | PEPSICO INC COM | | | | | 617,894 | | | | 766,425 | | | | | |
| | | | 8,000.00 | | | REYNOLDS AMERICAN INC COM | | | | | 143,516 | | | | 386,560 | | | | | |
| | | | 2,000.00 | | | SMUCKER J M CO COM NEW COM | | | | | 121,939 | | | | 234,780 | | | | | |
| | | | 1,000.00 | | | WHITEWAVE FOODS CO COM CL | | 3 | | | 24,151 | | | | 40,980 | | | | | |
| | | | | | | | | | | | 2,511,536 | | | | 3,450,270 | | | | 3.30 | % |
| | | | | | | | | | | | | | | | | | | | | |
| Household & Personal Products | | | 11,500.00 | | | PROCTER & GAMBLE CO COM | | | | | 840,716 | | | | 878,370 | | | | 0.84 | % |
| | | | | | | | | | | | | | | | | | | | | |
| TOTAL CONSUMER STAPLES | | | | | | | | | | | 3,753,860 | | | | 4,713,620 | | | | 4.50 | % |
| BMC FUND, INC. |
| SCHEDULE OF INVESTMENTS (Continued) |
| October 31, 2015 |
| | | | | | | | | | | | | | | | Percent | |
| Sectors and | | Shares | | | | | | | | | | Market | | | of Net | |
| Industries | | Held | | | Company Name | | | | Cost | | | Value | | | Assets | |
| | | | | | | | | | | | | | | | | |
| COMMON STOCKS: | | | | | | | | | | | | | | | | | | | | |
| ENERGY | | | | | | | | | | | | | | | | | | | | |
| Energy | | | 3,800.00 | | | CHEVRON CORP | | | | | 402,913 | | | | 345,344 | | | | | |
| | | | 4,643.00 | | | CPFL ENERGIA S A SPONSORED | | 3 | | | 103,003 | | | | 37,190 | | | | | |
| | | | 5,404.00 | | | EXXON MOBIL CORP COM | | | | | 454,007 | | | | 447,127 | | | | | |
| | | | 8,000.00 | | | HOLLYFRONTIER CORP COM | | | | | 298,885 | | | | 391,760 | | | | | |
| | | | 7,000.00 | | | MARATHON OIL CORP COM | | | | | 187,014 | | | | 128,660 | | | | | |
| | | | 4,800.00 | | | OCCIDENTAL PETROLEUM COM | | | | | 381,193 | | | | 357,792 | | | | | |
| | | | 1,500.00 | | | ROYAL DUTCH SHELL ADR A | | | | | 100,414 | | | | 78,690 | | | | | |
| | | | | | | | | | | | 1,927,429 | | | | 1,786,563 | | | | 1.71 | % |
| | | | | | | | | | | | | | | | | | | | | |
| Pipelines | | | 3,000.00 | | | BP PRUDHOE BAY ROYALTY TRU | | | | | 256,047 | | | | 117,900 | | | | | |
| | | | 2,000.00 | | | BUCKEYE PARTNERS LP COM | | | | | 124,792 | | | | 135,660 | | | | | |
| | | | 8,000.00 | | | ENERGY TRANSFER EQUITY LP | | | | | 150,093 | | | | 344,800 | | | | | |
| | | | 1,169.00 | | | TARGA RESOURCES PARTNERS L | | | | | 75,015 | | | | 35,070 | | | | | |
| | | | 3,000.00 | | | WILLIAMS COS INC DEL COM | | | | | 109,004 | | | | 118,320 | | | | | |
| | | | | | | | | | | | 714,951 | | | | 751,750 | | | | 0.72 | % |
| | | | | | | | | | | | | | | | | | | | | |
| TOTAL ENERGY | | | | | | | | | | | 2,642,380 | | | | 2,538,313 | | | | 2.42 | % |
| | | | | | | | | | | | | | | | | | | | | |
| FINANCIALS | | | | | | | | | | | | | | | | | | | | |
| Banks | | | 3,000.00 | | | BANK OF AMERICA CORP COM | | | | | 50,497 | | | | 50,340 | | | | | |
| | | | 3,000.00 | | | BB&T CORP COM | | | | | 107,875 | | | | 111,450 | | | | | |
| | | | 10,000.00 | | | BLUEHARBOR BANK NC COM | | 3 | | | 90,150 | | | | 77,000 | | | | | |
| | | | 2,500.00 | | | WELLS FARGO & CO DEL COM | | | | | 113,117 | | | | 135,350 | | | | | |
| | | | | | | | | | | | 361,639 | | | | 374,140 | | | | 0.36 | % |
| | | | | | | | | | | | | | | | | | | | | |
| Diversified Financials | | | 25,000.00 | | | ALLY FINANCIAL INC COM | | 3 | | | 524,008 | | | | 498,000 | | | | | |
| | | | 5,000.00 | | | ANNALY CAPITAL MGMT INC | | | | | 82,125 | | | | 49,750 | | | | | |
| | | | 50,000.00 | | | ARES CAPITAL CORP COM | | | | | 843,826 | | | | 761,500 | | | | | |
| | | | 2,500.00 | | | BERKSHIRE HATHAWAY INC CL B | | 3 | | | 185,406 | | | | 340,050 | | | | | |
| | | | 4,000.00 | | | CALAMOS ASSET MGMT INC | | | | | 51,070 | | | | 37,560 | | | | | |
| | | | 68,455.00 | | | CAPITALA FINANCE CORP COM | | | | | 1,248,018 | | | | 917,297 | | | | | |
| | | | 4,000.00 | | | CARLYLE GROUP LP COM | | | | | 111,750 | | | | 74,960 | | | | | |
| | | | 1,300.00 | | | CME GROUP | | | | | 71,797 | | | | 122,811 | | | | | |
| | | | 15,000.00 | | | GOLUB CAPITAL BDC INC COM | | | | | 226,480 | | | | 245,550 | | | | | |
| | | | 1,000.00 | | | NEW YORK MTG TR INC COM PA | | | | | 8,055 | | | | 5,680 | | | | | |
| | | | 25,000.00 | | | OAKTREE CAPITAL GROUP LLC UNIT | | | | | 1,097,867 | | | | 1,246,500 | | | | | |
| | | | 10,000.00 | | | PAYPAL HLDGS INC COM | | 3 | | | 306,102 | | | | 360,100 | | | | | |
| | | | 4,000.00 | | | THE BLACKSTONE GROUP LP | | | | | 119,065 | | | | 132,240 | | | | | |
| | | | | | | | | | | | 4,875,569 | | | | 4,791,998 | | | | 4.58 | % |
| | | | | | | | | | | | | | | | | | | | | |
| Insurance | | | 1,500.00 | | | AON PLC SHS CL A | | | | | 121,687 | | | | 139,965 | | | | | |
| | | | 1,000.00 | | | METLIFE INC COM | | | | | 32,265 | | | | 50,380 | | | | | |
| | | | 2,500.00 | | | TRAVELERS COMPANIES COM | | | | | 203,356 | | | | 282,225 | | | | | |
| | | | 4,000.00 | | | ZURICH INS GROUP LTD SPONS ARD | | | | | 122,260 | | | | 105,960 | | | | | |
| | | | | | | | | | | | 479,568 | | | | 578,530 | | | | 0.55 | % |
| BMC FUND, INC. |
| SCHEDULE OF INVESTMENTS (Continued) |
| October 31, 2015 |
| | | | | | | | | | | | | | | | Percent | |
| Sectors and | | Shares | | | | | | | | | | Market | | | of Net | |
| Industries | | Held | | | Company Name | | | | Cost | | | Value | | | Assets | |
| | | | | | | | | | | | | | | | | |
| COMMON STOCKS: | | | | | | | | | | | | | | | | | | | | |
| | | | | | | | | | | | | | | | | | | | | |
| Real Estate | | | 1,000.00 | | | DIGITAL RLTY TR INC COM | | | | | 58,864 | | | | 73,960 | | | | | |
| | | | 6,000.00 | | | EASTERLY GOVT PPTYS COM | | | | | 94,785 | | | | 104,880 | | | | | |
| | | | 1,000.00 | | | GEO GROUP INC COM | | | | | 32,717 | | | | 32,270 | | | | | |
| | | | 10,000.00 | | | HANNON ARMSTRONG SUST COM | | | | | 153,105 | | | | 180,100 | | | | | |
| | | | 1,000.00 | | | HCP INC COM REIT | | | | | 41,467 | | | | 37,200 | | | | | |
| | | | 10,000.00 | | | IRSA INVERSIONES Y REPRESENTACIONES | | | | | 107,792 | | | | 179,900 | | | | | |
| | | | 62,450.00 | | | KENNEDY-WILSON EUROPE REAL | | | | | 1,129,633 | | | | 1,153,516 | | | | | |
| | | | 5,000.00 | | | KENNEDY-WILSON HLDGS I COM | | | | | 108,031 | | | | 122,600 | | | | | |
| | | | 15,000.00 | | | MEDICAL PPTYS TR INC COM | | | | | 185,835 | | | | 169,500 | | | | | |
| | | | 1,100.00 | | | OMEGA HEALTHCARE INVS COM | | | | | 34,106 | | | | 37,972 | | | | | |
| | | | 500.00 | | | W P CAREY & CO LLC COM | | | | | 31,927 | | | | 31,685 | | | | | |
| | | | | | | | | | | | 1,978,262 | | | | 2,123,583 | | | | 2.03 | % |
| | | | | | | | | | | | | | | | | | | | | |
| TOTAL FINANCIALS | | | | | | | | | | | 7,695,038 | | | | 7,868,251 | | | | 7.52 | % |
| | | | | | | | | | | | | | | | | | | | | |
| HEALTH CARE | | | | | | | | | | | | | | | | | | | | |
| Health Care Equipment & Services | | | 2,000.00 | | | AMERISOURCEBERGEN CORP COM | | | | | 57,550 | | | | 193,020 | | | | | |
| | | | 5,000.00 | | | DAVITA HEALTHCARE PART COM | | 3 | | | 308,926 | | | | 387,550 | | | | | |
| | | | 3,550.00 | | | LABORATORY CORP AMER HLDGS | | 3 | | | 329,250 | | | | 435,727 | | | | | |
| | | | 4,000.00 | | | QUEST DIAGNOSTICS INC COM | | | | | 222,639 | | | | 271,800 | | | | | |
| | | | 4,000.00 | | | ROCHE HLDG LTD SPONS ADR | | | | | 129,261 | | | | 135,640 | | | | | |
| | | | 1,500.00 | | | VARIAN MEDICAL SYSTEMS INC | | 3 | | | 68,108 | | | | 117,795 | | | | | |
| | | | | | | | | | | | 1,115,734 | | | | 1,541,532 | | | | 1.47 | % |
| | | | | | | | | | | | | | | | | | | | | |
| Pharmaceuticals & Biotechnology | | | 10,000.00 | | | ASTRAZENECA PLC SPONSORED | | | | | 235,532 | | | | 318,900 | | | | | |
| | | | 1,000.00 | | | JOHNSON & JOHNSON COM | | | | | 91,105 | | | | 101,030 | | | | | |
| | | | 3,000.00 | | | ELI LILLY & CO COM | | | | | 132,158 | | | | 244,710 | | | | | |
| | | | 26,500.00 | | | PFIZER INC COM | | | | | 533,833 | | | | 896,230 | | | | | |
| | | | 1,000.00 | | | SEATTLE GENETICS INC COM | | 3 | | | 17,684 | | | | 41,490 | | | | | |
| | | | 1,000.00 | | | TEVA PHARMACEUTCL INDS ADR | | | | | 50,285 | | | | 59,190 | | | | | |
| | | | | | | | | | | | 1,060,597 | | | | 1,661,550 | | | | 1.59 | % |
| | | | | | | | | | | | | | | | | | | | | |
| TOTAL HEALTH CARE | | | | | | | | | | | 2,176,331 | | | | 3,203,082 | | | | 3.06 | % |
| | | | | | | | | | | | | | | | | | | | | |
| INDUSTRIALS | | | | | | | | | | | | | | | | | | | | |
| Capital Goods | | | 500.00 | | | 3M COMPANY | | | | | 71,565 | | | | 78,605 | | | | | |
| | | | 4,000.00 | | | AMERICAN RAILCAR INDS COM | | | | | 177,170 | | | | 230,880 | | | | | |
| | | | 12,500.00 | | | ROLLS ROYCE HOLDINGS SPONS | | | | | 143,217 | | | | 132,500 | | | | | |
| | | | 1,000.00 | | | WABTEC CORP COM | | | | | 59,525 | | | | 82,870 | | | | | |
| | | | | | | | | | | | 451,477 | | | | 524,855 | | | | 0.50 | % |
| | | | | | | | | | | | | | | | | | | | | |
| Commercial Services & Supplies | | | 5,000.00 | | | BROOKFIELD INFRASTRUCTURE | | | | | 143,408 | | | | 210,300.00 | | | | | |
| | | | 3,000.00 | | | COVANTA HLDG CORP COM | | | | | 63,948 | | | | 50,280.00 | | | | | |
| | | | 1,000.00 | | | ECOLAB INC COM | | | | | 105,289 | | | | 120,350.00 | | | | | |
| | | | 2,000.00 | | | STERICYCLE INC COM | | 3 | | | 201,180 | | | | 242,740 | | | | | |
| | | | 6,000.00 | | | US ECOLOGY INC COM | | | | | 122,962 | | | | 235,260 | | | | | |
| | | | 500.00 | | | WASTE MGMT INC DEL COM | | | | | 17,412 | | | | 26,880 | | | | | |
| | | | | | | | | | | | 654,199 | | | | 885,810 | | | | 0.85 | % |
| BMC FUND, INC. |
| SCHEDULE OF INVESTMENTS (Continued) |
| October 31, 2015 |
| | | | | | | | | | | | | | | | Percent | |
| Sectors and | | Shares | | | | | | | | | | Market | | | of Net | |
| Industries | | Held | | | Company Name | | | | Cost | | | Value | | | Assets | |
| | | | | | | | | | | | | | | | | |
| COMMON STOCKS: | | | | | | | | | | | | | | | | | | | | |
| | | | | | | | | | | | | | | | | | | | | |
| Transportation | | | 1,000.00 | | | NORFOLK SOUTHERN CORP COM | | | | | 73,330 | | | | 80,030 | | | | 0.08 | % |
| | | | | | | | | | | | | | | | | | | | | |
| TOTAL INDUSTRIALS | | | | | | | | | | | 1,179,006 | | | | 1,490,695 | | | | 1.42 | % |
| | | | | | | | | | | | | | | | | | | | | |
| INFORMATION TECHNOLOGY | | | | | | | | | | | | | | | | | | | | |
| Semiconductors & Semiconductor Equipment | | | 3,500.00 | | | INTEL CORP COM | | | | | 73,337 | | | | 118,510 | | | | 0.11 | % |
| | | | | | | | | | | | | | | | | | | | | |
| Software & Services | | | 601.00 | | | ALPHABET INC CAP STK CL C | | 3 | | | 310,940 | | | | 427,197 | | | | | |
| | | | 10,000.00 | | | CDK GLOBAL INC COM | | | | | 380,201 | | | | 497,900 | | | | | |
| | | | 10,000.00 | | | EBAY INC COM | | 3 | | | 207,766 | | | | 279,000 | | | | | |
| | | | 3,500.00 | | | MICROSOFT CORP COM | | | | | 87,412 | | | | 184,240 | | | | | |
| | | | 4,000.00 | | | ORACLE CORP COM | | | | | 110,847 | | | | 155,360 | | | | | |
| | | | | | | | | | | | 1,097,166 | | | | 1,543,697 | | | | 1.47 | % |
| | | | | | | | | | | | | | | | | | | | | |
| Technology Hardware & Equipment | | | 3,500.00 | | | APPLE INC COM | | | | | 275,010 | | | | 418,250 | | | | | |
| | | | 5,700.00 | | | CISCO SYSTEMS INC COM | | | | | 111,359 | | | | 164,445 | | | | | |
| | | | 2,500.00 | | | CORNING INC COM | | | | | 51,787 | | | | 46,500 | | | | | |
| | | | 5,000.00 | | | EMC CORP MASS COM | | | | | 123,828 | | | | 131,100 | | | | | |
| | | | 6,000.00 | | | QUALCOMM INC COM | | | | | 356,810 | | | | 356,520 | | | | | |
| | | | 20,000.00 | | | RELM WIRELESS CORP COM | | 3 | | | 53,773 | | | | 86,000 | | | | | |
| | | | 500.00 | | | SYNAPTICS INC COM | | 3 | | | 33,775 | | | | 42,545 | | | | | |
| | | | | | | | | | | | 1,006,342 | | | | 1,245,360 | | | | 1.19 | % |
| | | | | | | | | | | | | | | | | | | | | |
| TOTAL INFORMATION TECHNOLOGY | | | | | | | | | | | 2,176,845 | | | | 2,907,567 | | | | 2.78 | % |
| | | | | | | | | | | | | | | | | | | | | |
| MATERIALS | | | 1,580.00 | | | DOW CHEMICAL CO COM | | | | | 81,482 | | | | 81,639 | | | | | |
| | | | 3,000.00 | | | HI-CRUSH PARTNERS LP COM | | | | | 118,516 | | | | 17,340 | | | | | |
| | | | 1,077.00 | | | OLIN CORP COM | | | | | 21,655 | | | | 20,657 | | | | | |
| | | | 2,000.00 | | | RPM INTL INC COM | | | | | 42,340 | | | | 91,420 | | | | | |
| TOTAL MATERIALS | | | | | | | | | | | 263,993 | | | | 211,056 | | | | 0.20 | % |
| | | | | | | | | | | | | | | | | | | | | |
| TELECOMMUNICATION SERVICES | | | 2,000.00 | | | AMERICA MOVIL SA DE CV SPO | | | | | 55,017 | | | | 35,620 | | | | | |
| | | | 3,000.00 | | | AT&T CORP COM | | | | | 84,046 | | | | 100,530 | | | | | |
| | | | 4,500.00 | | | BCE INC COM | | | | | 191,785 | | | | 194,445 | | | | | |
| | | | 3,000.00 | | | ORANGE SPONSORED ADR | | | | | 47,540 | | | | 52,650 | | | | | |
| | | | 10,000.00 | | | SINGAPORE TELECOMM LTD ADR | | | | | 290,885 | | | | 284,500 | | | | | |
| | | | 2,000.00 | | | SK TELECOM LTD SPONSORED A | | | | | 27,904 | | | | 47,120 | | | | | |
| | | | 2,000.00 | | | TELECOM ARGENTINA SA | | | | | 36,419 | | | | 39,020 | | | | | |
| | | | 1,000.00 | | | TELEFONICA BRASIL S.A. | | | | | 28,025 | | | | 10,360 | | | | | |
| | | | 6,500.00 | | | TELEFONICA S A SPONSORED ADR | | | | | 108,423 | | | | 85,605 | | | | | |
| TOTAL TELECOMMUNICATION SERVICES | | | | | | | | | | | 870,044 | | | | 849,850 | | | | 0.81 | % |
| BMC FUND, INC. |
| SCHEDULE OF INVESTMENTS (Continued) |
| October 31, 2015 |
| | | | | | | | | | | | | | | | Percent | |
| Sectors and | | Shares | | | | | | | | | | Market | | | of Net | |
| Industries | | Held | | | Company Name | | | | Cost | | | Value | | | Assets | |
| | | | | | | | | | | | | | | | | |
| COMMON STOCKS: | | | | | | | | | | | | | | | | | | | | |
| | | | | | | | | | | | | | | | | | | | | |
| UTILITIES | | | 2,000.00 | | | AMERICAN ELEC PWR INC COM | | | | | 79,050 | | | | 113,300 | | | | | |
| | | | 500.00 | | | AMERICAN STS WTR CO COM | | | | | 19,159 | | | | 20,375 | | | | | |
| | | | 8,000.00 | | | AMERIGAS PARTNERS LP COM | | | | | 348,077 | | | | 341,120 | | | | | |
| | | | 6,500.00 | | | DOMINION RES INC VA COM | | | | | 330,756 | | | | 464,295 | | | | | |
| | | | 14,187.00 | | | DUKE ENERGY CORP COM | | | | | 833,466 | | | | 1,013,945 | | | | | |
| | | | 1,000.00 | | | ENTERGY CORP NEW COM | | | | | 69,388 | | | | 68,160 | | | | | |
| | | | 3,000.00 | | | SOUTHERN CO COM | | | | | 122,610 | | | | 135,300 | | | | | |
| | | | 2,256.00 | | | WEC ENERGY GROUP INC COM | | | | | 89,900 | | | | 116,319 | | | | | |
| TOTAL UTILITIES | | | | | | | | | | | 1,892,406 | | | | 2,272,814 | | | | 2.17 | % |
| | | | | | | | | | | | | | | | | | | | | |
| TOTAL INVESTMENTS IN COMMON STOCKS | | | | | | | | | | $ | 27,708,266 | | | $ | 31,082,408 | | | | 29.69 | % |
| BMC FUND, INC. |
| SCHEDULE OF INVESTMENTS (Continued) |
| October 31, 2015 |
| | | | | | | | | | | | | | Percent | |
| | | | | Contracts | | | | | | Market | | | of Net | |
| Company Name | | | | Held | | | Cost | | | Value | | | Assets | |
| | | | | | | | | | | | | | | |
| CALL OPTIONS: | | | | | | | | | | | | | | | | | | |
| ALLY FINANCIAL INC CALL OPTION, $25 EXP 1/20/17 | | 3 | | | 150 | | | $ | 33,098 | | | $ | 8,250 | | | | | |
| BHP BILLITON CALL OPTION, $50 EXP 1/15/16 | | 3 | | | 60 | | | | 21,995 | | | | 600 | | | | | |
| CHEVRON CORP NEW CALL OPTION, $110 EXP 1/15/16 | | 3 | | | 25 | | | | 20,915 | | | | 150 | | | | | |
| EOG RESOURCES INC CALL OPTION, $92.50 EXP 1/15/16 | | 3 | | | 10 | | | | 9,716 | | | | 2,250 | | | | | |
| OCCIDENTAL PETROLEUM CALL OPTION, $85 EXP 1/15/16 | | 3 | | | 40 | | | | 17,063 | | | | 1,320 | | | | | |
| PHILLIPS 66 CALL OPTION, $75 EXP 1/15/16 | | 3 | | | 35 | | | | 16,156 | | | | 54,250 | | | | | |
| SCHLUMBERGER CALL OPTION, $90 EXP 1/15/16 | | 3 | | | 20 | | | | 9,632 | | | | 680 | | | | | |
| SEADRILL LTD CALL OPTION, $14 EXP 1/15/16 | | 3 | | | 30 | | | | 4,998 | | | | 60 | | | | | |
| SEAWORLD ENTERTAINMENT CALL OPTION, $20 EXP 1/20/17 | | 3 | | | 50 | | | | 6,397 | | | | 11,400 | | | | | |
| TOTAL CALL OPTIONS | | | | | | | | | 139,970 | | | | 78,960 | | | | 0.08 | % |
| | | | | | | | | | | | | | | | | | | |
| PUT OPTIONS: | | | | | | | | | | | | | | | | | | |
| ISHARES RUSSELL 2000 INDEX PUT OPTION, $110 EXP 11/20/15 | | 3 | | | 50 | | | | 23,311 | | | | 2,950 | | | | | |
| SPDR S&P500 TR PUT OPTION, $190 EXP 12/19/15 | | 3 | | | 50 | | | | 27,036 | | | | 4,950 | | | | | |
| TOTAL PUT OPTIONS | | | | | | | | | 50,347 | | | | 7,900 | | | | 0.01 | % |
| | | | | | | | | | | | | | | | | | | |
| TOTAL INVESTMENTS IN OPTIONS | | | | | | | | $ | 190,317 | | | $ | 86,860 | | | | 0.08 | % |
| BMC FUND, INC. |
| SCHEDULE OF INVESTMENTS (Concluded) |
| October 31, 2015 |
| | | | | | | | Market | | | Percent of | |
| | | Company Name | | Cost | | | Value | | | Net Assets | |
| | | | | | | | | | | | |
| Short-term Investments | | MFB NI Treasury Money Market Fund | | $ | 22,365,887 | | | $ | 22,365,887 | | | | 21.37 | % |
| | | | | | | | | | | | | | | |
| TOTAL INVESTMENTS - MARKET VALUE | | | | | | | 103,678,726 | | | | 99.04 | % |
| | | | | | | | | | | | | | | |
| TOTAL OTHER ASSETS IN EXCESS OF LIABILITIES | | | | | 1,004,847 | | | | 0.96 | % |
| | | | | | | | | | | | | | | |
| TOTAL NET ASSETS | | | | | | $ | 104,683,573 | | | | 100.00 | % |
1In default
2Market value determined by the Fund's Board of Directors
3Non-income producing security
| BMC FUND, INC. |
| SCHEDULE OF OPEN WRITTEN OPTION CONTRACTS |
| October 31, 2015 |
| | | | | | | | | | | | | | Percent | |
| | | | | Contracts | | | | | | Market | | | of Net | |
| Company Name | | | | Held | | | Cost | | | Value | | | Assets | |
| CALL OPTIONS: | | | | | | | | | | | | | | | | | | |
| AMERICAN AIRLINES CALL OPTION, $47 EXP 11/20/15 | | 3 | | | (20 | ) | | | (4,428 | ) | | | (2,120 | ) | | | | |
| AMERICAN RAILCAR CALL OPTION, $60 EXP 12/18/15 | | 3 | | | (10 | ) | | | (2,354 | ) | | | (2,050 | ) | | | | |
| CORNING INC CALL OPTION, $23 EXP 11/20/15 | | 3 | | | (20 | ) | | | (889 | ) | | | (20 | ) | | | | |
| DUKE ENERGY CO CALL OPTION, $75 EXP 1/15/16 | | 3 | | | (20 | ) | | | (2,069 | ) | | | (1,300 | ) | | | | |
| DUKE ENERGY CO CALL OPTION, $80 EXP 1/15/16 | | 3 | | | (20 | ) | | | (1,969 | ) | | | (200 | ) | | | | |
| | | 3 | | | | | | | | | | | | | | | | |
| TOTAL CALL OPTIONS | | 3 | | | | | | | (11,709 | ) | | | (5,690 | ) | | | -0.01 | % |
| | | 3 | | | | | | | | | | | | | | | | |
| PUT OPTIONS: | | | | | | | | | | | | | | | | | | |
| AMAZON COM INC PUT OPTION, $430 EXP 1/15/16 | | 3 | | | (5 | ) | | | (10,242 | ) | | | (305 | ) | | | | |
| AMAZON COM INC PUT OPTION, $450 EXP 1/15/16 | | 3 | | | (5 | ) | | | (16,142 | ) | | | (605 | ) | | | | |
| AMERICAN AIRLINES PUT OPTION, $37 EXP 1/15/16 | | 3 | | | (30 | ) | | | (6,424 | ) | | | (1,230 | ) | | | | |
| AMERICAN AIRLINES PUT OPTION, $38 EXP 11/20/15 | | 3 | | | (50 | ) | | | (10,520 | ) | | | (350 | ) | | | | |
| APPLE INC PUT OPTION, $90 EXP 4/15/16 | | 3 | | | (20 | ) | | | (8,469 | ) | | | (2,180 | ) | | | | |
| APPLE INC PUT OPTION, $100 EXP 12/18/15 | | 3 | | | (20 | ) | | | (5,569 | ) | | | (760 | ) | | | | |
| CORNING INC PUT OPTION, $18 EXP 11/20/15 | | 3 | | | (25 | ) | | | (1,160 | ) | | | (575 | ) | | | | |
| DISCOVERY COMM INC PUT OPTION, $25 EXP 12/18/15 | | 3 | | | (150 | ) | | | (13,268 | ) | | | (5,250 | ) | | | | |
| GILEAD SCIENCE PUT OPTION, $87.50 EXP 11/20/15 | | 3 | | | (20 | ) | | | (8,569 | ) | | | (1,300 | ) | | | | |
| GILEAD SCIENCE PUT OPTION, $95 EXP 11/20/15 | | 3 | | | (10 | ) | | | (4,284 | ) | | | (230 | ) | | | | |
| GOOGLE INC PUT OPTION, $500 EXP 12/18/15 | | 3 | | | (5 | ) | | | (9,235 | ) | | | (25 | ) | | | | |
| MERCK & CO INC PUT OPTION, $55 EXP 1/15/16 | | 3 | | | (20 | ) | | | (3,768 | ) | | | (4,000 | ) | | | | |
| PHILLIPS 66 PUT OPTION, $60 EXP 1/15/16 | | 3 | | | (35 | ) | | | (16,034 | ) | | | (490 | ) | | | | |
| SCHLUMBERGER PUT OPTION, $77.50 EXP 1/15/16 | | 3 | | | (20 | ) | | | (10,268 | ) | | | (6,700 | ) | | | | |
| SEADRILL LTD PUT OPTION, $10 EXP 1/15/16 | | 3 | | | (50 | ) | | | (5,921 | ) | | | (18,550 | ) | | | | |
| SPDR S&P500 TR PUT OPTION, $160 EXP 12/19/15 | | 3 | | | (50 | ) | | | (8,171 | ) | | | (550 | ) | | | | |
| YUM BRANDS INC PUT OPTION, $55 EXP 4/15/16 | | 3 | | | (15 | ) | | | (3,442 | ) | | | (1,515 | ) | | | | |
| YUM BRANDS INC PUT OPTION, $60 EXP 1/15/16 | | 3 | | | (15 | ) | | | (3,577 | ) | | | (1,230 | ) | | | | |
| | | | | | | | | | | | | | | | | | | |
| TOTAL PUT OPTIONS - LIABILITIES | | | | | | | | | (145,063 | ) | | | (45,845 | ) | | | -0.04 | % |
| | | | | | | | | | | | | | | | | | | |
| TOTAL CALL AND PUT OPTIONS - LIABILITIES | | | | | | | | $ | (156,772 | ) | | $ | (51,535 | ) | | | -0.05 | % |
Item. 2. Code of Ethics.
On July 26, 2003, the Board of Directors of the Registrant adopted a Code of Ethics for the principal executive officer and principal financial and accounting officer. The Code was amended by the Board of Directors on February 24, 2007.
(c)-(e) N/A
(f) A copy of the Code of Ethics is attached as an exhibit.
Item 3. Audit Committee Financial Expert.
The Board of Directors of the Registrant has determined that R. Donald Farmer, a member of its Audit Committee, is an audit committee financial expert. Mr. Farmer is an independent director of the Registrant.
Item 4. Principal Accountant Fees and Services.
(a) Audit Fees: $46,800.00 for the fiscal year ended October 31, 2014; $49,175.00 for the fiscal year ended October 31, 2015.
(b) Audit-Related Fees: $1,775.00 for the fiscal year ended October 31, 2014; $1,798.70 for the fiscal year ended October 31, 2015. These fees were incurred for travel-related expenses.
(c) Tax Fees: $0.00 for the fiscal year ended October 31, 2014; $0.00 for the fiscal year ended October 31, 2015. These fees were incurred for review of the tax returns.
(d) All Other Fees: $0.00 for the fiscal year ended October 31, 2014; $0.00 for the fiscal year ended October 31, 2015. These fees were incurred for report production and printing.
(e)(1) A copy of the Audit Committee's pre-approval policies and procedures is attached as an exhibit.
(e)(2) One hundred percent of the services described in Items 4(b) through 4(d) were approved in accordance with the Audit Committee Pre-Approval Policy. As a result, none of such services was approved pursuant to paragraph (c)(7)(i)(C) of Rule 2-01 of Regulation S-X.
(f) None of the hours expended on the principal accountant's engagement to audit the Registrant's financial statements for the fiscal year ended October 31, 2015 was attributed to work performed by persons other than the principal accountant's full-time, permanent employees.
(g) N/A
(h) N/A
Item 5. Audit Committee of Listed Registrants.
N/A
Item 6. Schedule of Investments.
Included as a part of the report to shareholders filed under Item 1.
Item 7. Disclosure of Proxy Voting Policies and Procedures for Closed-End Management Investment Companies.
The Board of Directors of the Registrant adopted Proxy Voting Policies and Procedures on July 26, 2003 and amended them October 30, 2003, April 5, 2004 and May 26, 2005. A copy as amended is attached as an exhibit.
Item 8. Portfolio Managers of Closed-End Investment Companies.
(a)(1) As of the date of filing of this report, M. Hunt Broyhill, Chairman and President, and Christopher R. Pavese, CFA, Vice President and Chief Investment Officer, are primarily responsible for the day-to-day management of the Company’s portfolio. Mr. Hunt Broyhill has had such responsibility since 2001. He has been engaged in asset management for various institutions and high net worth individuals for more than five years. Prior to joining the Company on March 1, 2005, Mr. Pavese was a Vice President and Portfolio Manager at JP Morgan Private Bank from January 1999 until February 2005. At JP Morgan, Mr. Pavese was engaged in asset management, portfolio strategy, and asset allocation for high net worth individuals, personal trusts, endowments and foundations.
(a)(2) The following tables provide information regarding registered investment companies other than the Registrant, other pooled investment vehicles, and other accounts over which the Registrant’s portfolio managers also have day-to-day management responsibilities. The tables provide the numbers of such accounts, the total assets in such accounts and the number of accounts and the total assets in the accounts with respect to which the fees are based on performance. The information is provided as of the Registrant’s fiscal year ended October 31, 2015.
M. Hunt Broyhill
| | Other Registered Investment Companies | Other Pooled Investment Vehicles | Other Accounts |
Number of Accounts Managed | None | 2 | 17 |
Number of Accounts Managed with Performance-Based Advisory Fees | None | 1 | None |
| Assets Managed | $0 | $1,758,163 | $33,895,231 |
Assets Managed with Performance-Based Advisory Fees | $0 | $2,070,142 | $0 |
Christopher R. Pavese
| | Other Registered Investment Companies | Other Pooled Investment Vehicles | Other Accounts |
Number of Accounts Managed | None | None | 61 |
Number of Accounts Managed with Performance-Based Advisory Fees | None | None | 4 |
| Assets Managed | $0 | $0 | $29,688,115 |
Assets Managed with Performance-Based Advisory Fees | $0 | $0 | $1,203,185 |
Material Conflicts of Interest
The Fund recognizes that actual or potential conflicts of interest are inherent in our business. These actual or potential conflicts may arise when a portfolio manager has day-to-day portfolio management responsibilities with respect to more than one fund or account. Certain investments may be appropriate for the Fund and also for other clients advised by the portfolio manager. Investment decisions for the Fund and other clients are made with a view to achieving their respective investment objectives and after consideration of such factors as their current holdings, availability of cash for investment and the size of their investments generally. Therein lies the possibility that a particular security could be bought or sold for the Fund and also for other clients, along with the possibility that a particular security could be bought or sold for the Fund while the opposite transaction could be occurring for other clients due to their investment strategy.
To the extent that a portfolio manager has responsibilities for managing accounts in addition to the Fund, the portfolio manager will need to divide his time and attention among relevant accounts.
The Fund also recognizes that in some cases, an actual or potential conflict may arise where a portfolio manager may have an incentive, such as a performance-based fee.
On December 13, 2014, the Board of Directors of the Registrant adopted a Conflicts of Interest Policy for Portfolio Managers.
(a)(3)
Compensation Structure of Portfolio Managers
The compensation structure for each portfolio manager is based upon a fixed salary as well as a discretionary bonus determined by the senior management of the Registrant. Salaries are determined by the senior management and are based upon an individual’s position and overall value to the Registrant. Bonuses are also determined by management and are based upon an individual’s overall contribution to the success of the Fund and the profitability of the Registrant. Salaries and bonuses for portfolio managers are not based upon criteria such as performance of the Fund or the value of assets of the Registrant. Portfolio managers also have the opportunity to participate in other employee benefits available to all of the employees of the Registrant.
(a)(4) The dollar range of the Registrant’s equity securities owned beneficially by the Registrant’s portfolio managers as of the Registrant’s fiscal year ended October 31, 2015 is set forth below:
Name of Portfolio Manager | Dollar ($) Range of
Registrant’s Shares
Beneficially Owned |
| M. Hunt Broyhill | Over $1,000,000 |
| Christopher R. Pavese | $1-$10,000 |
(b) N/A
Item 9. Purchases of Equity Securities by Closed-End Management Investment Company and Affiliated Purchasers.
None
Item 10. Submission of Matters to a Vote of Security Holders.
N/A
Item 11. Controls and Procedures.
Within the 90 days prior to the date of this report, the Registrant's management carried out an evaluation, under the supervision and with the participation of Registrant's Chief Executive Officer and Chief Financial Officer, of the effectiveness of the Registrant's disclosure controls and procedures pursuant to Rule 30a-3(b) of the Investment Company Act of 1940. Based upon the evaluation, the Chief Executive Officer and Chief Financial Officer concluded as of a date within 90 days of the filing of this report that the Registrant's disclosure controls and procedures are effective in timely alerting them to material information relating to the Registrant required to be included in the Registrant's periodic SEC filings.
There were no significant changes in the Registrant's internal control over financial reporting (as defined in Rule 30a-3(d) under the Investment Company Act of 1940) that occurred during the second fiscal quarter of the period covered by the report that have materially affected, or are reasonably likely to materially affect, the Registrant's internal control over financial reporting.
Item 12. Exhibits.
(a)(1) The Registrant's Code of Ethics is attached as Exhibit 12(a)(1).
(a)(2) Certifications.
SIGNATURES
Pursuant to the requirements of the Securities Exchange Act of 1934 and the Investment Company Act of 1940, the Registrant has duly caused this report to be signed on its behalf by the undersigned, thereunto duly authorized.
BMC Fund, Inc.
By
/s/ Boyd C. Wilson, Jr.
Boyd C. Wilson, Jr.
Vice President and
Chief Financial Officer
Date: December 18, 2015
Pursuant to the requirements of the Securities Exchange Act of 1934 and the Investment Company Act of 1940, this report has been signed below by the following persons on behalf of the registrant and in the capacities and on the dates indicated.
By
/s/ M. Hunt Broyhill
M. Hunt Broyhill
Chairman and President
Date: December 18, 2015
By
/s/ Boyd C. Wilson, Jr.
Boyd C. Wilson, Jr.
Vice President and
Chief Financial Officer
Date: December 18, 2015