UNITED STATES
SECURITIES AND EXCHANGE COMMISSION
Washington, DC 20549
FORM N-CSR
CERTIFIED SHAREHOLDER REPORT OF REGISTERED MANAGEMENT INVESTMENT COMPANIES
Investment Company Act file number: 811-03150
BMC FUND, INC.
(Exact name of registrant as specified in charter)
800 GOLFVIEW PARK (P. O. BOX 500)
LENOIR, NC 28645
(Address of principal executive offices) (Zip code)
CAROL FRYE
BMC FUND, INC.
P. O. BOX 500
LENOIR, NC 28645
(Name and address of agent for service)
Registrant's telephone number including area code: 828-758-6100
Date of fiscal year end: October 31, 2012
Date of reporting period: October 31, 2012
Item 1. Report to Stockholders.
BMC FUND, INC.
FINANCIAL STATEMENTS AND
SUPPLEMENTARY INFORMATION
Year Ended October 31, 2012
TABLE OF CONTENTS
| | Page No. |
| | |
| Letter to Shareholders – Management’s Discussion of Fund Performance | 1 |
| | |
| Graphic Presentation of Portfolio Holdings and Sector Diversification | 4 |
| | |
| Supplemental Information | 5 |
| | |
| Report of Independent Registered Public Accounting Firm | 6 |
| | |
| Statement of Assets and Liabilities | 7 |
| | |
| Statement of Operations | 8 |
| | |
| Statements of Changes In Net Assets | 9 |
| | |
| Notes to Financial Statements | 10 |
| | |
| Directors and Officers | 16 |
| | |
| Additional Information | 20 |
| | |
| Financial Highlights | 21 |
| | |
| Schedule of Investments | 22 |
| | |
| Schedule of Open Written Option Contracts | 33 |
| BMC FUND, INC. |
| LETTER TO SHAREHOLDERS – |
| MANAGEMENT’S DISCUSSION OF FUND PERFORMANCE |
| Year Ended October 31, 2012 |
TO OUR SHAREHOLDERS: MANAGEMENT’S DISCUSSION OF FUND PERFORMANCE
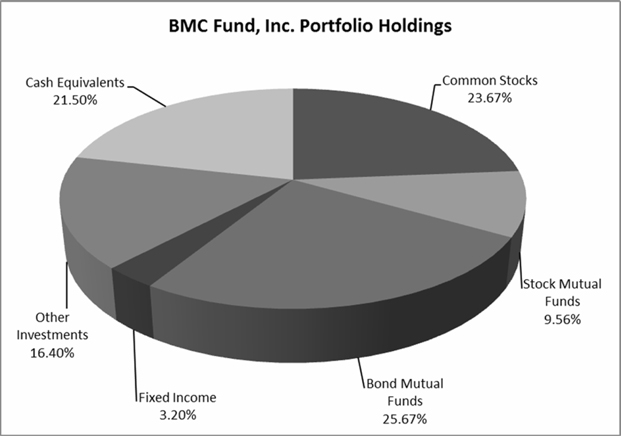
For the BMC Fund, Inc. (“BMC”) fiscal year ending October 31, 2012, investment performance was a positive 7.65%. This result is roughly equivalent with a balanced portfolio equally split between the S&P 500 and the Barclays Aggregate Bond index. Notably, we have achieved this performance with an equity allocation well below average, with the overall quality of our portfolio well above average, and while maintaining a consistent payout to shareholders. At year end, BMC’s portfolio was comprised of a 23.67% allocation of largely high quality global equities, 9.56% stock mutual funds, 28.87% fixed income, 16.40% limited partnerships and other investments, and a 21.50% cash reserve.
Most investors today are stuck in a dangerous comfort zone typified by a heavy allocation to traditional stocks and bonds. Historically, the former has provided market participants with exposure to economic growth, while the latter has offered a predictable stream of income. But past performance is not indicative of future results and the next decade promises to generate much slower growth and much lower income for investors. Disciplined, focused and flexible capital allocation will be critical in achieving long-term objectives going forward. And other things being equal, we believe a high yield is better than a low yield in this environment, as asset classes with higher yields often come with an embedded option on price appreciation as they mean revert to more normal valuations.
Given the challenges facing the global economy today and the elevated level of equity valuations, fixed income securities serve as the foundation of our asset allocation framework. However, unlike most yield-starved fixed income assets, we believe our portfolio represents an attractive mix of principal protection and upside optionality. With interest rates pegged at zero for the foreseeable future, we continue to favor “the new sovereigns” - high quality, corporate issuers with balance sheets stronger than most western world governments. At the same time our investments in mortgage-related securities provide us with upside exposure to an improving domestic housing market. Put simply, we are being paid a healthy annual cash flow on our investment, which comes with an embedded option on higher housing prices.
While the world is trapped at the “zero bound” today, we also recognize that rates won’t stay low forever, so we maintain a barbell approach to hedging both inflation and deflation risks. At one end, we believe that the cash flow produced by a heavy allocation to income generating assets provides us with a degree of principal protection and a smooth stream of returns in the event that the pace of deleveraging accelerates. At the same time, we have maintained a healthy allocation to real assets to hedge the right tail of the risk distribution. Today, gold and gold mining equities represent the majority of our exposure to natural resources. The balance is invested across a basket of MLPs, which yield a healthy 6% and provide the portfolio with a natural inflation hedge.
| BMC FUND, INC. |
| LETTER TO SHAREHOLDERS – |
| MANAGEMENT’S DISCUSSION OF FUND PERFORMANCE |
| Year Ended October 31, 2012 |
When measured in terms of the experience set of portfolio managers in the industry today, the current investment landscape and macroeconomic uncertainty is unprecedented. Yet, despite these glaringly obvious risks, equity market valuations have only been higher than current levels 20% of the time since 1926. At 22.2 times trailing ten-year earnings, today’s Cyclically Adjusted PE is very high in historic terms. So while a case can be made for fresh near-term highs in equity markets, investors should be aware that such a tactical call amounts to a speculative bet on yet higher prices, rather than a long-term fundamental investment derived on the basis of cash flow. Expected stock returns are just too low today to justify a rigid adherence to a static portfolio mix, dominated by equities.
We have, however, begun analyzing global equity markets more closely over the past quarter, as most of the world has dramatically underperformed domestic equity markets, pushing relative valuations toward extremes. There is no question that the outlook for the global economy remains extremely challenging, as shortened business cycles are more susceptible to periodic bouts of recession. At the same time, European economies can only hope for such “periodic” bouts of recession, given that consensus expectations today are moving closer to the Japanification of the EU. That being said, it is important to remember that the actual risk of permanent impairment is usually lowest when perceived risk is highest and as such, it is likely that the market has already discounted the impact of a prolonged European recession. The news only needs to be slightly less bad for stocks to rise from today’s extremely depressed valuations and it would seem that ECB President Mario Monti’s recent actions have provided markets with such a catalyst.
International equities may not have hit bottom yet, but valuations suggest we are getting close. Among the world’s major stock markets, Europe is the cheapest based on current dividend yields. It is also cheapest on cash flow yield, book value yield and earnings yield. Unfortunately, we’ve learned that a cheap asset can easily get cheaper. But we’ve also learned that unlike buying an overpriced stock which offers roughly zero chance of ever returning to previous valuation heights, investing in a heavily discounted asset can beget temporary losses, but ultimately results in much higher long-term compounded returns. Buying early is the notorious curse of the value investor. However, buying stocks when they trade at low multiples has historically been a rewarding strategy. Ned Davis Research reports that when the Cyclically Adjusted PE on European equity indices has been below 13.5, European stocks delivered annualized returns of 16.2% over the following five years. These markets currently trade at a Cyclically Adjusted PE of 12.2 – a multi-decade low.
In closing, we would note that time arbitrage is the most obvious structural opportunity to add value in the current market environment. This means committing capital to undervalued and overlooked assets with significant upside potential on a three to five year horizon, while most investors continue to struggle looking past the next quarter. We’ve found that an emphasis on current cash flow can minimize market volatility while we are “paid to wait” for price to align with value. Today, the result is a portfolio heavily invested in various fixed income assets and mortgage securities, while maintaining a healthy allocation to natural resources, comprised of precious metals and infrastructure assets yielding 6.0% with growing distributions. And finally,
| BMC FUND, INC. |
| LETTER TO SHAREHOLDERS – |
| MANAGEMENT’S DISCUSSION OF FUND PERFORMANCE |
| Year Ended October 31, 2012 |
while opportunities are increasingly limited in domestic equity markets, we believe investments in global equities, with above-average dividend yield, should provide an attractive balance of current cash flow and a cheap option on future price appreciation. We work hard every day with the goal of finding these hidden jewels, while waiting patiently to redeploy capital when prices ultimately undershoot fair value, as they always do.
During the year ended October 31, 2012, the Company paid the following dividends per share:
| December 10, 2011 to shareholders of record November 25, 2011 | | $ | .31 | |
| March 10, 2012 to shareholders of record February 25, 2012 | | | .25 | |
| June 10, 2012 to shareholders of record May 25, 2012 | | | .25 | |
| September 10, 2012 to shareholders of record August 25, 2012 | | | .25 | |
| | | | | |
| Total | | $ | 1.06 | |
The Company paid a dividend of $0.32 per share on December 10, 2012 to shareholders of record November 25, 2012.
The attached Schedule of Investments is a listing of the entire Company’s diversified securities at October 31, 2012 with a total market value of $111,608,361.
| Paul H. Broyhill | M. Hunt Broyhill |
| Chairman and Chief Executive Officer | President |
| BMC FUND, INC. |
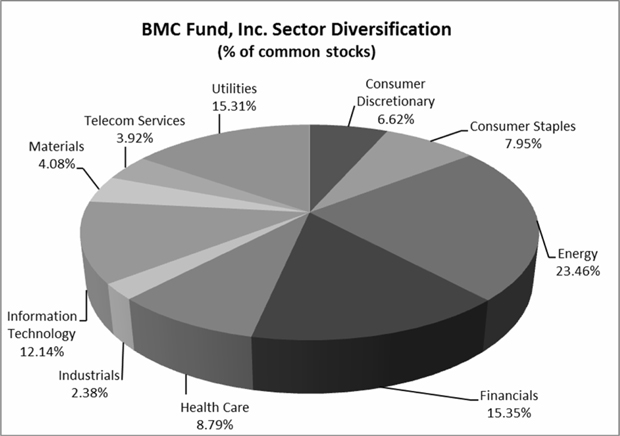
| GRAPHIC PRESENTATION OF PORTFOLIO HOLDINGS AND |
| SECTOR DIVERSIFICATION |
| Year Ended October 31, 2012 |
| BMC FUND, INC. |
| SUPPLEMENTAL INFORMATION |
| Year Ended October 31, 2012 |
SUPPLEMENTAL INFORMATION
Paul H. Broyhill, Chairman and Chief Executive Officer, M. Hunt Broyhill, President, and Christopher R. Pavese, CFA, Chief Investment Officer, are primarily responsible for the day-to-day management of the Company’s portfolio. Mr. Paul Broyhill has had such responsibility since the inception of the Company. Mr. Hunt Broyhill has had such responsibility since 2001. Mr. Hunt Broyhill has been engaged in asset management for various institutions and high net worth individuals for more than five years. Prior to joining the Company on March 1, 2005, Mr. Pavese was a Vice President and Portfolio Manager at JP Morgan Private Bank from January 1999 until February 2005. At JP Morgan, Mr. Pavese was engaged in asset management, portfolio strategy, and asset allocation for high net worth individuals, personal trusts, endowments and foundations.

REPORT OF INDEPENDENT REGISTERED PUBLIC ACCOUNTING FIRM
To the Board of Directors and
Shareholders of BMC Fund, Inc.
We have audited the accompanying statement of assets and liabilities of the BMC Fund, Inc. (the “Company”), including the schedule of investments, as of October 31, 2012 and the related statement of operations for the year then ended, the statements of changes in net assets for each of the two years in the period then ended, and the financial highlights for each of the years ended October 31, 2012, 2011, 2010, 2009, 2008, 2007, 2006, 2005, 2004, and 2003. These financial statements and financial highlights are the responsibility of the Company’s management. Our responsibility is to express an opinion on these financial statements and financial highlights based on our audits.
We conducted our audits in accordance with the standards of the Public Company Accounting Oversight Board (United States). Those standards require that we plan and perform the audit to obtain reasonable assurance about whether the financial statements and financial highlights are free of material misstatement. The Company is not required to have, nor were we engaged to perform, an audit of its internal control over financial reporting. Our audits included consideration of internal control over financial reporting as a basis for designing audit procedures that are appropriate in the circumstances, but not for the purpose of expressing an opinion on the effectiveness of the Company's internal control over financial reporting. Accordingly, we express no such opinion. An audit also includes examining, on a test basis, evidence supporting the amounts and disclosures in the financial statements. Our procedures included confirmation of securities owned as of October 31, 2012 by correspondence with the custodian and brokers or by other appropriate auditing procedures where replies from brokers were not received. An audit also includes assessing the accounting principles used and significant estimates made by management, as well as evaluating the overall financial statement presentation. We believe that our audits provide a reasonable basis for our opinion.
As explained in note 2, the financial statements include investments valued at $18,308,442 (16.44 percent of net assets), whose fair values have been estimated by management in the absence of readily determinable fair values. Management’s estimates are based upon information provided by the funds’ managers or the general partners.
In our opinion, the financial statements referred to above present fairly, in all material respects, the financial position of BMC Fund, Inc. as of October 31, 2012, the results of its operations for the year then ended, the changes in its net assets for the each of the two years in the period then ended, and the financial highlights for each of the years ended October 31, 2012, 2011, 2010, 2009, 2008, 2007, 2006, 2005, 2004, and 2003, in conformity with accounting principles generally accepted in the United States of America.
/s/ Dixon Hughes Goodman LLP
Charlotte, North Carolina
December 19, 2012
| BMC FUND, INC. |
| STATEMENT OF ASSETS AND LIABILITIES |
| October 31, 2012 |
| ASSETS AT MARKET VALUE: | | | | |
| Investment securities (cost - $107,826,654) | | $ | 111,608,361 | |
| Cash and short-term investments | | | 171,060 | |
| Receivables, accrued interest and dividends | | | 129,118 | |
| Other assets | | | 42,026 | |
| | | | | |
| Total assets | | | 111,950,565 | |
| | | | | |
| LIABILITIES: | | | | |
| Call options written, at fair value (premiums received $696,077) | | | 492,350 | |
| Accounts payable and accrued expenses | | | 2,562 | |
| Payable to custodian | | | 3,050 | |
| Accounts payable to affiliates | | | 74,042 | |
| | | | | |
| Total liabilities | | | 572,004 | |
| | | | | |
| NET ASSETS AT OCTOBER 31, 2012 - EQUIVALENT TO $22.58 PER SHARE ON 4,933,281 SHARES OF COMMON STOCK OUTSTANDING | | $ | 111,378,561 | |
| | | | | |
| SUMMARY OF SHAREHOLDERS' EQUITY: | | | | |
| Common stock, par value $5.00 per share - authorized 70,000,000 shares; outstanding, 4,933,281 shares | | $ | 24,666,405 | |
| Retained earnings prior to becoming investment company | | | 76,650,150 | |
| Undistributed net investment income | | | 401,284 | |
| Realized gain on investments | | | 480,574 | |
| Undistributed nontaxable gain | | | 5,194,714 | |
| Unrealized appreciation of investments | | | 3,985,434 | |
| | | | | |
| NET ASSETS APPLICABLE TO COMMON STOCK OUTSTANDING | | $ | 111,378,561 | |
See accompanying notes to financial statements.
| BMC FUND, INC. |
| STATEMENT OF OPERATIONS |
| Year Ended October 31, 2012 |
| INVESTMENT INCOME: | | | | |
| Income: | | | | |
| Interest - fixed income | | $ | 101,079 | |
| Other interest and dividends | | | 2,742,456 | |
| | | | | |
| Total income | | | 2,843,535 | |
| | | | | |
| Expenses: | | | | |
| Legal and professional fees | | | 52,810 | |
| Directors' fees (Note 8) | | | 70,500 | |
| Investment expense | | | 83,213 | |
| Salaries | | | 584,801 | |
| Property and liability insurance | | | 51,683 | |
| Depreciation expense | | | 6,961 | |
| Taxes and licenses | | | 76,517 | |
| Rent | | | 47,825 | |
| Office supplies and expense | | | 57,351 | |
| Dues and subscriptions | | | 57,163 | |
| Travel and entertainment | | | 23,563 | |
| | | | | |
| Total expenses | | | 1,112,387 | |
| | | | | |
| Investment income, net | | | 1,731,148 | |
| | | | | |
| REALIZED AND UNREALIZED GAIN ON INVESTMENTS: | | | | |
| Realized gain from investments sold | | | 1,162,838 | |
| Realized gain from expiration or closing of options contracts written | | | 1,162,049 | |
| Change in unrealized appreciation of investments for the period | | | 3,482,704 | |
| | | | | |
| Net gain on investments | | | 5,807,591 | |
| | | | | |
| NET INCREASE IN NET ASSETS RESULTING FROM OPERATIONS | | $ | 7,538,739 | |
See accompanying notes to financial statements.
| BMC FUND, INC. |
| STATEMENTS OF CHANGES IN NET ASSETS |
| Year Ended October 31, 2012 and 2011 |
| | | 2012 | | | 2011 | |
| | | | | | | |
| INCREASE (DECREASE) IN NET ASSETS FROM OPERATIONS: | | | | | | | | |
| Net investment income | | $ | 1,731,148 | | | $ | 2,391,073 | |
| Realized gains from investment securities | | | 2,324,887 | | | | 3,012,199 | |
| Change in unrealized appreciation (depreciation) of investments for the year | | | 3,482,704 | | | | (1,976,666 | ) |
| | | | | | | | | |
| Net increase in net assets resulting from operations | | | 7,538,739 | | | | 3,426,606 | |
| | | | | | | | | |
| Distributions to shareholders from: | | | | | | | | |
| Net realized gain on investment securities | | | (2,389,871 | ) | | | (2,610,308 | ) |
| Net investment income | | | (2,760,969 | ) | | | (1,339,120 | ) |
| Retained earnings prior to becoming an investment company | | | (78,438 | ) | | | (983,853 | ) |
| | | | | | | | | |
| TOTAL INCREASE (DECREASE) IN NET ASSETS | | | 2,309,461 | | | | (1,506,675 | ) |
| | | | | | | | | |
| NET ASSETS AT BEGINNING OF PERIOD | | | 109,069,100 | | | | 110,575,775 | |
| | | | | | | | | |
| NET ASSETS AT END OF PERIOD (Including undistributed net investment income: | | | | | | | | |
| 2012 - $401,284, 2011 - $1,431,105) | | $ | 111,378,561 | | | $ | 109,069,100 | |
See accompanying notes to financial statements.
| BMC FUND, INC. |
| NOTES TO FINANCIAL STATEMENTS |
| Year Ended October 31, 2012 |
BMC Fund, Inc. (the “Company”) is a closed-end, diversified investment company registered under the Investment Company Act of 1940, as amended. Prior to becoming a regulated investment company on April 1, 1981, BMC Fund, Inc. operated as a regular corporation. The following is a summary of significant accounting policies followed by the Company in the preparation of its financial statements. The policies are in conformity with generally accepted accounting principles for investment companies.
| 2. | SIGNIFICANT ACCOUNTING POLICIES |
A. Investment Valuations – The investment securities are stated at fair value as determined by closing prices on national securities exchanges. Investment securities include corporate bonds, mutual funds, and common and preferred stocks.
The investments in limited partnerships, other investments and venture capital are stated at estimated fair value as determined by the management of these investments and are approved by the Company’s Valuation Committee after giving consideration to historical and projected financial results, economic conditions, financial condition of investee and other factors and events subject to change, and ratified by the Company’s Board of Directors. Because of the inherent uncertainty of those valuations, the estimated values may differ significantly from the values that would have been used had a ready market value for the investments existed, and these differences could be material.
B. Investment Transactions – Investment transactions are accounted for on the date the order to buy or sell is executed. Realized gains and losses on investments are determined on the basis of specific identification of issues sold or matured. Dividend income is recorded on the ex-dividend date and interest income is recorded on the accrual basis. Discounts and premiums on securities purchased are amortized over the lives of the respective securities.
For the year ended October 31, 2012, the Company purchased and sold securities in the amount of $38,487,684 and $36,231,815 (excluding short-term investments and options), respectively.
| BMC FUND, INC. |
| NOTES TO FINANCIAL STATEMENTS |
| Year Ended October 31, 2012 |
| 2. | SIGNIFICANT ACCOUNTING POLICIES (Continued) |
C. Option Writing – When the Company writes an option, an amount equal to the premium received by the Company is recorded as a liability and is subsequently adjusted to the current fair value of the option written. Premiums received from writing options that expire unexercised are treated by the Company on the expiration date as realized gains from investments. The difference between the premium and the amount paid on effecting a closing purchase transaction, including brokerage commissions, is also treated as a realized gain, or, if the premium is less than the amount paid for the closing purchase transaction, as a realized loss. If a call option is exercised, the premium is added to the proceeds from the sale of the underlying security in determining whether the Company has realized a gain or loss. If a put option is exercised, the premium reduces the cost basis of the securities purchased by the Company. The Company as writer of an option bears the market risk of an unfavorable change in the price of the security underlying the written option.
D. Income Taxes – No federal tax provision is required as it is the Company’s policy to comply with the provisions of Subchapter M of the Internal Revenue Code of 1954, as amended, including the distribution to its shareholders of substantially all of its income and any capital gains not offset by capital losses. Also, no state income tax provision has been provided because the states in which the Company has income recognize the tax exempt status of a regulated investment company.
The Company did not have an accrual for uncertain tax positions as deductions taken and benefits accrued are based on widely understood administrative practices and procedures, and are based on clear and unambiguous tax law. Tax returns for all years 2008 and thereafter are subject to possible future examinations by tax authorities.
E. Dividend Policy – It is the Company’s policy to pay dividends during the year in sufficient amounts to meet the requirements to maintain its status as a regulated investment company.
F. Cash and Short-Term Investments – For purposes of financial reporting, the Company considers all investments at financial institutions with original maturities of three months or less to be equivalent to cash. Short-term money market investments managed by third party investors are included in investment securities.
G. Use of Estimates – The preparation of financial statements in conformity with accounting principles generally accepted in the United States of America requires management to make estimates and assumptions that affect the reported amounts of assets and liabilities and disclosure of contingent assets and liabilities at the date of the financial statements and the reported amounts of revenues and expenses during the reporting period. Actual results could differ from those estimates.
| BMC FUND, INC. |
| NOTES TO FINANCIAL STATEMENTS |
| Year Ended October 31, 2012 |
| 2. | SIGNIFICANT ACCOUNTING POLICIES (Continued) |
H. Fair Value Measurements – The Company applies a three-tier hierarchy to establish classification of fair value measurements for disclosure purposes. Inputs refer broadly to the assumptions that market participants would use in pricing the asset or liability, including assumptions about risk. Inputs may be observable or unobservable.
Observable inputs are inputs that reflect the assumptions market participants would use in pricing the asset or liability that are developed based on market data obtained from sources independent of the reporting entity. Unobservable inputs are inputs that reflect the reporting entity’s own assumptions about the assumptions market participants would use in pricing the asset or liability that are developed based on the best information available.
Various inputs are used in determining the value of the Company’s investments as of the reporting period end. The designated input levels are not necessarily an indication of the risk or liquidity associated with these investments. These inputs are categorized in the following hierarchy:
Level 1 – Quoted prices in active markets for identical investments
Level 2 – Other significant observable inputs (including quoted prices for similar investments, interest rates, prepayment speeds, credit risk, etc.)
Level 3 – Significant unobservable inputs (including the Company’s own assumptions in determining the fair value of investments)
The following is a summary of the inputs used to value the Company’s investments as of October 31, 2012.
| Asset Description | | Quoted Prices in Active Markets for Identical Assets (Level 1) | | | Significant Other Observable Inputs (Level 2) | | | Significant Unobservable Inputs (Level 3) | | | Total | |
| Fixed Income | | $ | 3,572,962 | | | $ | - | | | $ | - | | | $ | 3,572,962 | |
| Mutual Funds | | | | | | | | | | | | | | | | |
| Bond Mutual Funds | | | 28,644,475 | | | | - | | | | - | | | | 28,644,475 | |
| Stock Mutual Funds | | | 10,674,312 | | | | - | | | | - | | | | 10,674,312 | |
| Other Investments | | | | | | | | | | | | | | | | |
| Limited Partnerships | | | - | | | | - | | | | 18,308,442 | | | | 18,308,442 | |
| Common Stocks | | | | | | | | | | | | | | | | |
| Common Stocks – Publicly Traded | | | 26,417,819 | | | | - | | | | - | | | | 26,417,819 | |
| Call Options | | | (38,085 | ) | | | - | | | | - | | | | (38,085 | ) |
| Put Options | | | (454,265 | ) | | | - | | | | - | | | | (454,265 | ) |
| Cash and Cash Equivalents | | | 23,990,351 | | | | - | | | | - | | | | 23,990,351 | |
| Total Investments | | $ | 92,807,569 | | | $ | - | | | $ | 18,308,442 | | | $ | 111,116,011 | |
| BMC FUND, INC. |
| NOTES TO FINANCIAL STATEMENTS |
| Year Ended October 31, 2012 |
| 2. | SIGNIFICANT ACCOUNTING POLICIES (Continued) |
The table below presents a reconciliation for the year ended October 31, 2012, for all Level 3 assets that are measured at fair value on a recurring basis.
| | | Balance | | | Accrued | | | Unrealized | | | Realized | | | | | | | | | Transfers | | | Balance | |
| | | as of | | | Discounts/ | | | Gains & | | | Gains & | | | | | | | | | in (out of) | | | as of | |
| Level 3 Assets | | 10/31/2011 | | | Premiums | | | Losses | | | Losses | | | Purchases | | | Sales | | | Level 3 | | | 10/31/2012 | |
| Other Investments | | | | | | | | | | | | | | | | | | | | | | | | | | | | | | | | |
| Limited Partnerships | | $ | 16,414,126 | | | $ | - | | | $ | 1,560,797 | | | $ | 98,404 | | | $ | 2,500,000 | | | $ | (2,264,885 | ) | | $ | - | | | $ | 18,308,442 | |
| Total Investments | | $ | 16,414,126 | | | $ | - | | | $ | 1,560,797 | | | $ | 98,404 | | | $ | 2,500,000 | | | $ | (2,264,885 | ) | | $ | - | | | $ | 18,308,442 | |
| 3. | UNREALIZED APPRECIATION AND DEPRECIATION ON INVESTMENTS |
(tax basis)
The amount of net unrealized appreciation (depreciation) and the cost of investment securities for tax purposes, including short-term securities as October 31, 2012, were as follows:
| Gross appreciation (excess of value over tax cost) | | $ | 11,453,489 | |
| Gross depreciation (excess of tax cost over value) | | | (7,671,782 | ) |
| Net unrealized appreciation | | $ | 3,781,707 | |
| Cost of investments for income tax purposes | | $ | 107,826,654 | |
As of October 31, 2012, portfolio securities valued at $2,017,400 were held in escrow by the custodian as cover for call options written by the Company.
Transactions in options written during the year ended October 31, 2012 were as follows:
| | | Number of
Contracts | | | Premiums
Received | |
| Options outstanding at October 31, 2011 | | | 7,512 | | | $ | 937,313 | |
| Options written | | | 12,402 | | | | 1,478,315 | |
| Options terminated in closing purchase transactions | | | (1,235 | ) | | | (147,091 | ) |
| Options expired | | | (11,380 | ) | | | (1,275,572 | ) |
| Options exercised | | | (2,347 | ) | | | (296,888 | ) |
| Options outstanding at October 31, 2012 | | | 4,952 | | | $ | 696,077 | |
As of October 31, 2012, short-term investments in the amount of $13,187,213 were pledged as collateral for put options sold by the Company.
| BMC FUND, INC. |
| NOTES TO FINANCIAL STATEMENTS |
| Year Ended October 31, 2012 |
| 6. | DISTRIBUTIONS TO SHAREHOLDERS |
Classifications of distributions, net investment income/(loss) and net realized gain/(loss) may differ for financial statement and tax purposes. The character of distributions made during the year from net investment income or net realized gains may differ from its ultimate characterization for federal income tax purposes. Also, due to the timing of dividend distributions, the fiscal year in which amounts are distributed may differ from the fiscal year in which the income or realized gain was recorded by the Company.
On December 10, 2011, a distribution of $0.31 per share was paid to shareholders of record on November 25, 2011.
On March 10, 2012, a distribution of $0.25 per share was paid to shareholders of record on February 25, 2012.
On June 10, 2012, a distribution of $0.25 per share was paid to shareholders of record on May 25, 2012.
On September 10, 2012, a distribution of $.25 per share was paid to shareholders of record on August 25, 2012.
The tax character of distributions paid during 2012 and 2011 was as follows:
| | | 2012 | | | 2011 | |
| Distributions paid from: | | | | | | | | |
| Ordinary income | | $ | 1,191,003 | | | $ | 1,738,735 | |
| Long-term capital gains | | | 2,735,989 | | | | 1,233,320 | |
| Retained earnings prior to becoming an investment company | | | 1,302,286 | | | | 1,961,226 | |
| | | $ | 5,229,278 | | | $ | 4,933,281 | |
As of October 31, 2012, there was $1,564,425 of distributable earnings on a tax basis.
The tax components of distributable earnings are determined in accordance with income tax regulations, which may differ from composition of net assets reported under generally accepted accounting principles. The difference for the period ended October 31, 2012 reflects $401,284 of undistributed net investment income and $480,574 of realized gains on investments under generally accepted accounting principles.
| BMC FUND, INC. |
| NOTES TO FINANCIAL STATEMENTS |
| Year Ended October 31, 2012 |
On April 22, 2010, (renewed April 21, 2011), the Company entered into an agreement with a bank for an unsecured line of credit in the amount of $3,500,000 to provide the Company more flexibility in its payment of dividends and management of its investments. The interest rate on any borrowings is at the one month LIBOR market index rate plus 150 basis points, with a floor of 3.00 percent. The Company will pay a commitment fee of 35 basis points on any unused balance. As of October 31, 2012, the Company had no borrowings from this line of credit, which expires on April 21, 2013.
| 8. | ADVISORY BOARD AND REMUNERATION OF DIRECTORS |
The Company does not have an advisory board. The independent directors are paid an annual fee of $3,000 plus $1,000 for each meeting attended in person or $500 for each meeting attended by telephone. Each such independent director is paid an additional $1,000 for each day attending a committee meeting in person or $500 by telephone other than on the date of a board meeting. In addition, all directors are reimbursed for their reasonable expenses incurred in attending meetings.
The Company leases office space from Broyhill Investments, Inc., which is controlled by Paul H. Broyhill and M. Hunt Broyhill, both officers of BMC Fund, Inc. The expense associated with this related party lease for the year ended October 31, 2012 amounted to $47,825. Broyhill Investments, Inc. also acts as a common paymaster for payroll and other shared services. This service is provided at no cost to the Company. All amounts paid by Broyhill Investments, Inc. on behalf of the Company are reimbursed by the Company. The outstanding payable related to these transactions at October 31, 2012 was $74,042.
Selected securities at the end of the year have significant investment impairment issues. These selected securities have an aggregate cost basis of $6,359,498 and have been assigned no value at October 31, 2012.
| BMC FUND, INC. |
| DIRECTORS AND OFFICERS |
| Year Ended October 31, 2012 (Unaudited) |
The directors of the Fund were elected for a one-year term at the annual meeting of shareholders of the Fund.
The following table provides information about the directors and the officers of the Fund:
Directors Who Are Interested Persons
Name,
Address and Age | | Position(s)
Held
with Fund | | Length of
Time Served | | Principal
Occupation(s)
During Past
5 Years | | Other
Directorships Held
by Director |
| | | | | | | | | |
James T. Broyhill (85) 1930 Virginia Road Winston-Salem, NC 27104 | | Director Vice Chairman | | Since 1976 Since 2005 | | Retired; Director of Shepherd Street Equity Fund (1998-2008); Vice President of Old Clemmons School Properties, Inc. (2006-present); President of Old Clemmons School Properties, Inc. (1998-2006); former Secretary of the North Carolina Department of Commerce (1989-1991); former Chairman of the North Carolina Economic Development Board (1987-1989); former member, U. S. Senate (1986); former member, U.S. House of Representatives (1963-1986) | | None |
| | | | | | | | | |
M. Hunt Broyhill (48) 1870 9th Street Court, NW Hickory, NC 28601 | | Director President Vice President | | Since 2008 Since 2007 2001-2007 | | President of the Fund since February 2007; former Vice President of the Fund (2001-2007); Chief Executive of Broyhill Affinity Fund, LLC (2008-present), Broyhill Asset Management, LLC and Broyhill Wakin General Partners, LLC (1997-present); Director and President of Broyhill Investments, Inc. (1988-present); Director (1983-present) and President of Broyhill Family Foundation, Inc. (1988-present); General Partner of CapitalSouth Partners Fund I, LP and Capital South Partners Fund II, LP (2000-present); General Partner of CapitalSouth Partners Fund III, LP (2007-present); Senior Managing Partner and Director of Flagship Capital Partners, LLC (2007-present); Manager and Vice President of P. B. Realty, LLC (formerly P. B. | | None |
| BMC FUND, INC. |
| DIRECTORS AND OFFICERS |
| Year Ended October 31, 2012 (Unaudited) |
Directors Who Are Interested Persons
Name,
Address and Age | | Position(s)
Held
with Fund | | Length of
Time Served | | Principal
Occupation(s)
During Past
5 Years | | Other
Directorships Held
by Director |
| | | | | | | | | |
| | | | | | | Realty, Inc.) (1995-present) | | |
Paul H. Broyhill (88) 135 Claron Place, SE Lenoir, NC 28645 | | Director
Chief Executive Officer
Chairman | | Since 1976 Since 2001 Since 1976 | | Director, Chairman and Chief Executive Officer of the Fund; former President of the Fund (2001-2007); Director (1972-present) and Chairman of Broyhill Investments, Inc. (1988-present); Director (1946-present) and Chairman of Broyhill Family Foundation, Inc. (1989-present); former President of Broyhill Family Foundation, Inc. (1980-1988); Manager and President of P. B. Realty, LLC (formerly P. B. Realty, Inc.) (1983-present) | | None |
| | | | | | | | | |
W. Charles Campbell (46) 2012 Cloister Drive Charlotte, NC 28211 | | Director | | Since August 2011 | | President and Chief Executive Officer of Flagship Capital Partners, LLC, a private investment real estate firm (2005-present); Co-manager of Brackett Flagship Properties, LLC, a commercial real estate firm (2010-present) | | None |
| | | | | | | | | |
Allene B. Stevens (90) 153 Hillhaven Place SE Lenoir, NC 28645 | | Director | | Since 1983 | | Private Investor | | None |
| BMC FUND, INC. |
| DIRECTORS AND OFFICERS |
| Year Ended October 31, 2012 (Unaudited) |
Directors Who Are Not Interested Persons
Name,
Address and Age | | Position(s)
Held
with Fund | | Length of
Time Served | | Principal
Occupation(s)
During Past
5 Years | | Other
Directorships Held
by Director |
| | | | | | | | | |
Kevin P. Boudreau (49) 117 Shannon Court Rocky Mount, NC 27804 | | Director | | Since August 2011 | | Vice President of Tax and Risk Management, Boddie-Noell Enterprises, Inc., a diversified company with interests in restaurant and land-development projects (2005-present) | | None |
| | | | | | | | | |
R. Donald Farmer (65) 273 Leeward Point Loop Taylorsville, NC 28681 | | Director | | Since 2008 | | President of Don Farmer, CPA, PA, an independent public accounting firm and producer of federal income tax seminars and seminar materials (1984-present) | | None |
| | | | | | | | | |
Robert G. Fox, Jr. (63) 6525 Robin Hollow Drive Mint Hill, NC 28227 | | Director | | Since 2008 | | Former President and Chief Banking Officer of NewDominion Bank (2005-April 2010); Executive Vice President of First Charter Bank/First Charter Corporation (1993-2005) | | None |
| | | | | | | | | |
Jan E. Gordon (61) 3075 Rolling Woods Drive Palm Harbor, FL 34683 | | Director | | Since 2001 | | Retired; former election assistant, Pinellas County, FL Supervisor of Elections (1992-2005) | | None |
| | | | | | | | | |
Brent B. Kincaid (81) 2703 Lakeview Drive Lenoir, NC 28645 | | Director | | Since 2005 | | Retired since 1998; former President and CEO of Broyhill Furniture Industries, Inc. | | None |
| | | | | | | | | |
John S. Little (81) 4601 Gulf Shore Blvd. N. #18 Naples, FL 34103 | | Director | | Since 2001 | | Retired; former Managing Director and Chief Executive, Associated Octel, London (1989-1995); former Senior Vice President of Corporate Technology, Great Lakes Chemical Corporation (1981-1989) | | None |
| | | | | | | | | |
L. Glenn Orr, Jr. (72) 2735 Forest Drive Winston-Salem, NC 27104 | | Director | | Since 1999 | | President and Chief Executive Officer, Orr Holdings, LLC, a private investment company (since 2007); President and Chief Executive Officer, The Orr Group, an investment banking firm (1995 – 2006) | | Highwoods Properties, Inc.; Medical Properties Trust |
| BMC FUND, INC. |
| DIRECTORS AND OFFICERS |
| Year Ended October 31, 2012 (Unaudited) |
Other Executive Officers
Name,
Address and Age | | Positions
Held
with Fund | | Length of
Time Served | | Principal
Occupation
During Past
5 Years | | Directorships Held
by Officer |
| | | | | | | | | |
Boyd C. Wilson, Jr. (60)
646 Pleasant Hill Road
Lenoir, NC 28645
| | Vice President and Chief Financial Officer | | Since 2006 | | Vice President and Chief Financial Officer of the Fund since February 2006; Director (2007-present) and Executive Vice President of Broyhill Investments, Inc. (2005-present); Vice President of Broyhill Family Foundation, Inc. (2007-present); Treasurer of Broyhill Wakin General Partners, LLC (2008-present); Manager and Vice President of P. B. Realty, LLC (formerly P. B. Realty, Inc.) (2006-present); Vice President – Finance & Administration of Kincaid Furniture Company, Incorporated (1990-2005) | | FNB United Corp. |
| | | | | | | | | |
Carol Frye (55)
210 Beall Street, NW
Lenoir, NC 28645 | | Secretary and Treasurer | | Since 2001
| | Secretary and Treasurer of the Fund since 2001; Secretary and Treasurer of Broyhill Investments, Inc. (2000-present); Director (2001-present), Secretary and Treasurer of Broyhill Family Foundation, Inc. (2003-present); Secretary of Broyhill Wakin General Partners, LLC (1997-present); Secretary and Treasurer of P. B. Realty, LLC (formerly P. B. Realty, Inc.) (2001-present) | | None |
| BMC FUND, INC. |
| ADDITIONAL INFORMATION |
| Year Ended October 31, 2012 (Unaudited) |
Proxy Voting - The policies and procedures that the Fund uses to determine how to vote proxies relating to its portfolio securities are available without charge, upon request, by calling 828-758-6100; on the Fund’s website at http://www.bmcfund.com; and on the Securities and Exchange Commission’s website at http://www.sec.gov.
Information regarding how the Fund voted proxies relating to portfolio securities during the most recent 12-month period ended June 30 is available without charge, upon request, by calling 828-758-6100, and on the SEC’s website at http://www.sec.gov (see Form N-PX).
Portfolio Holdings - The Fund files a complete schedule of its portfolio holdings for the first and third quarters of its fiscal year with the SEC on Form N-Q. The Fund’s Form N-Q filings are available on the SEC’s website at http://www.sec.gov and may be reviewed and copied at the SEC’s Public Reference Room in Washington, DC. Information on the operation of the SEC’s Public Reference Room may be obtained by calling 1-202-551-8090.
| BMC FUND, INC. |
| FINANCIAL HIGHLIGHTS |
| Years Ended October 31, 2012, 2011, 2010, 2009, 2008, 2007, 2006, 2005, 2004, and 2003 |
| The following table presents financial information divided into three parts: per share operating performance, total investment return and ratios and supplemental data for the years ended October 31, 2012, 2011, 2010, 2009, 2008, 2007, 2006, 2005, 2004, and 2003. The first part, per share operating performance, details the changes on a per share basis of the Company's beginning net asset value to its ending net asset value. The second part, total investment return, is based on the market price of the Company's shares of stock. Part three, ratios and supplemental data, provides additional financial information related to the Company's performance. |
| PER SHARE OPERATING | | | | | | | | | | | | | | | | | | | | | | | | | | | | | | |
| PERFORMANCE | | 2012 | | | 2011 | | | 2010 | | | 2009 | | | 2008 | | | 2007 | | | 2006 | | | 2005 | | | 2004 | | | 2003 | |
| | | | | | | | | | | | | | | | | | | | | | | | | | | | | | | |
| Net asset value, beginning of period | | $ | 22.11 | | | $ | 22.41 | | | $ | 21.20 | | | $ | 20.79 | | | $ | 36.28 | | | $ | 33.55 | | | $ | 32.84 | | | $ | 30.94 | | | $ | 29.17 | | | $ | 25.46 | |
| Net investment income | | | 0.35 | | | | 0.49 | | | | 0.46 | | | | 0.48 | | | | 0.73 | | | | 0.78 | | | | 1.06 | | | | 0.88 | | | | 0.82 | | | | 0.95 | |
| Net gains (losses) on investments | | | 1.18 | | | | 0.21 | | | | 1.70 | | | | 1.65 | | | | (10.98 | ) | | | 4.25 | | | | 2.43 | | | | 2.48 | | | | 2.08 | | | | 3.76 | |
| Total from investment operations | | | 1.53 | | | | 0.70 | | | | 2.16 | | | | 2.13 | | | | (10.25 | ) | | | 5.03 | | | | 3.49 | | | | 3.36 | | | | 2.90 | | | | 4.71 | |
| Less distributions: | | | | | | | | | | | | | | | | | | | | | | | | | | | | | | | | | | | | | | | | |
| Dividends from net investment income | | | 0.56 | | | | 0.27 | | | | 0.46 | | | | 0.92 | | | | 1.04 | | | | 2.03 | | | | 2.37 | | | | - | | | | 0.65 | | | | 0.45 | |
| Distributions from capital gains | | | 0.48 | | | | 0.53 | | | | - | | | | - | | | | 1.42 | | | | 0.27 | | | | 0.41 | | | | 1.46 | | | | 0.48 | | | | 0.55 | |
| Distributions from retained earnings | | | 0.02 | | | | 0.20 | | | | 0.49 | | | | 0.80 | | | | - | | | | - | | | | - | | | | - | | | | - | | | | - | |
| P. B. Realty, Inc. Spin-off | | | - | | | | - | | | | - | | | | - | | | | 2.78 | | | | - | | | | - | | | | - | | | | - | | | | - | |
| Total distributions | | | 1.06 | | | | 1.00 | | | | 0.95 | | | | 1.72 | | | | 5.24 | | | | 2.30 | | | | 2.78 | | | | 1.46 | | | | 1.13 | | | | 1.00 | |
| Net asset value, end of period | | $ | 22.58 | | | $ | 22.11 | | | $ | 22.41 | | | $ | 21.20 | | | $ | 20.79 | | | $ | 36.28 | | | $ | 33.55 | | | $ | 32.84 | | | $ | 30.94 | | | $ | 29.17 | |
| | | | | | | | | | | | | | | | | | | | | | | | | | | | | | | | | | | | | | | | | |
| Per share market value, end of period1 | | $ | 18.00 | | | $ | 18.45 | | | $ | 18.00 | | | $ | 16.75 | | | $ | 26.00 | | | $ | 26.00 | | | $ | 26.00 | | | $ | 26.00 | | | $ | 26.00 | | | $ | 26.00 | |
| | | | | | | | | | | | | | | | | | | | | | | | | | | | | | | | | | | | | | | | | |
| TOTAL INVESTMENT RETURN2 | | | 8.50 | % | | | 3.79 | % | | | 11.83 | % | | | 12.72 | % | | | (39.42 | )% | | | 19.35 | % | | | 13.40 | % | | | 12.95 | % | | | 11.14 | % | | | 18.12 | % |
| | | | | | | | | | | | | | | | | | | | | | | | | | | | | | | | | | | | | | | | | |
| RATIOS/SUPPLEMENTAL DATA | | | | | | | | | | | | | | | | | | | | | | | | | | | | | | | | | | | | | | | | |
| | | | | | | | | | | | | | | | | | | | | | | | | | | | | | | | | | | | | | | | | |
| Net assets, end of period (in thousands) | | $ | 111,379 | | | $ | 109,069 | | | $ | 110,576 | | | $ | 104,603 | | | $ | 102,574 | | | $ | 178,975 | | | $ | 165,500 | | | $ | 162,027 | | | $ | 152,623 | | | $ | 143,910 | |
| Ratio of expenses to average net assets3 | | | 1.01 | % | | | 0.97 | % | | | 1.11 | % | | | 1.18 | % | | | 1.02 | % | | | 0.75 | % | | | 0.73 | % | | | 0.60 | % | | | 0.73 | % | | | 0.73 | % |
| Ratio of net investment income to average net assets3 | | | 1.57 | % | | | 2.15 | % | | | 2.11 | % | | | 2.40 | % | | | 2.37 | % | | | 2.26 | % | | | 3.20 | % | | | 2.77 | % | | | 2.70 | % | | | 3.52 | % |
| Portfolio turnover rate | | | 32.90 | % | | | 60.41 | % | | | 38.08 | % | | | 69.62 | % | | | 67.44 | % | | | 51.23 | % | | | 48.22 | % | | | 57.54 | % | | | 40.10 | % | | | 52.51 | % |
1Unaudited - Based on stock trades, which are very limited, during that year.
2Unaudited - Computed as follows: income from investment operations divided by per share market value.
3Average is computed on a quarterly basis.
| BMC FUND, INC. |
| SCHEDULE OF INVESTMENTS |
| October 31, 2012 |
| | | Coupon | | | | | | | | | | | | | | | Percent | |
| | | | Interest | | | Maturity | | | Face | | | | | | Market | | | of Net | |
| Debt Issuer | | | Rate | | | Date | | | Amount | | | Cost | | | Value | | | Assets | |
| | | | | | | | | | | | | | | | | | | | |
| FIXED INCOME: | | | | | | | | | | | | | | | | | | | | | | | | | |
| AMERICAN RAILCAR INDUSTRIES INC | | | | 7.500 | % | | | 3/1/2014 | | | $ | 27,000 | | | $ | 27,382 | | | $ | 27,270 | | | | | |
| PEP BOYS MANNY MOE & JACK | | | | 7.500 | % | | | 12/15/2014 | | | | 202,000 | | | | 204,958 | | | | 203,265 | | | | | |
| STONE ENERGY CORP | | | | 6.750 | % | | | 12/15/2014 | | | | 405,000 | | | | 408,090 | | | | 406,823 | | | | | |
| ENTERGY CORP NEW | | | | 3.625 | % | | | 9/15/2015 | | | | 250,000 | | | | 253,326 | | | | 263,883 | | | | | |
| XEROX CORP MEDIUM TERM | | | | 7.200 | % | | | 4/1/2016 | | | | 500,000 | | | | 558,327 | | | | 578,639 | | | | | |
| EXPRESS SCRIPTS INC | | | | 3.125 | % | | | 5/15/2016 | | | | 250,000 | | | | 251,600 | | | | 266,172 | | | | | |
| HUMANA INC | | | | 6.450 | % | | | 6/1/2016 | | | | 250,000 | | | | 274,686 | | | | 285,241 | | | | | |
| HEWLETT PACKARD CO | | | | 3.000 | % | | | 9/15/2016 | | | | 250,000 | | | | 249,563 | | | | 251,858 | | | | | |
| TRANSOCEAN INC | | | | 5.050 | % | | | 12/15/2016 | | | | 250,000 | | | | 252,835 | | | | 279,997 | | | | | |
| AMBEV INTL FIN CO LTD | | | | 9.500 | % | | | 7/24/2017 | | | | 430,769 | | | | 477,750 | | | | 494,904 | | | | | |
| AVON PRODUCTS INC | | | | 4.200 | % | | | 7/15/2018 | | | | 500,000 | | | | 502,756 | | | | 514,910 | | | | | |
| LEHMAN BROTHERS HLDGS NIKKEI INDEX | 1,2,3 | | | 0.000 | % | | | 9/29/2008 | | | | 3,000,000 | | | | 2,705,314 | | | | - | | | | | |
| LEHMAN BROTHERS HLDGS EAFE INDEX | 1,2,3 | | | 0.000 | % | | | 11/15/2008 | | | | 1,000,000 | | | | 900,010 | | | | - | | | | | |
| LEHMAN BROTHERS HLDGS MEDIUM TERM NOTE | 1,2,3 | | | 0.000 | % | | | 3/15/2011 | | | | 2,500,000 | | | | 2,254,173 | | | | - | | | | | |
| | | | | | | | | | | | | | | | | | | | | | | | | | |
| TOTAL INVESTMENTS IN FIXED INCOME | | | | | | | | | | | $ | 9,814,769 | | | $ | 9,320,770 | | | $ | 3,572,962 | | | | 3.21 | % |
| BMC FUND, INC. |
| SCHEDULE OF INVESTMENTS (Continued) |
| October 31, 2012 |
| | | | | | | | | | | | Percent | |
| | | Shares | | | | | | Market | | | of Net | |
| Company Name | | Held | | | Cost | | | Value | | | Assets | |
| | | | | | | | | | | | | |
| MUTUAL FUNDS: | | | | | | | | | | | | | | | | |
| BOND MUTUAL FUNDS: | | | | | | | | | | | | | | | | |
| ALLIANCEBERNSTEIN GLOBAL BOND FUND A | | | 59,031.88 | | | $ | 500,000 | | | $ | 511,216 | | | | | |
| BERWYN INCOME FUND | | | 10,150.38 | | | | 135,000 | | | | 136,015 | | | | | |
| CALAMOS CONVERTIBLE OPPORTUNITIES & INCOME FUND | | | 30,000.00 | | | | 272,656 | | | | 375,300 | | | | | |
| DOUBLELINE CORE FIXED INCOME I | | | 45,085.66 | | | | 500,000 | | | | 514,878 | | | | | |
| DOUBLELINE EMERGING MARKETS FIXED INCOME I | | | 23,496.24 | | | | 250,000 | | | | 262,453 | | | | | |
| DOUBLELINE TOTAL RETURN BOND N | | | 226,010.04 | | | | 2,500,000 | | | | 2,569,734 | | | | | |
| FAIRHOLME FOCUSED INCOME FUND | | | 68,685.46 | | | | 750,000 | | | | 710,895 | | | | | |
| FIDELITY SPARTAN US BOND INDEX ADVANTAGE | | | 48,088.23 | | | | 499,156 | | | | 574,654 | | | | | |
| FIDELITY STRATEGIC INCOME FUND | | | 14,972.78 | | | | 165,000 | | | | 170,690 | | | | | |
| FLAHERTY & CRUMRINE PREFERRED INCOME FUND | | | 11,833.00 | | | | 87,440 | | | | 178,678 | | | | | |
| HARBOR BOND FUND INSTITUTIONAL CLASS | | | 77,505.80 | | | | 962,048 | | | | 1,009,901 | | | | | |
| ISHARES BARCLAYS 3-7 YR TREASURY BOND | | | 8,750.00 | | | | 981,443 | | | | 1,078,437 | | | | | |
| ISHARES IBOXX $ INVESTMENT GRADE CORP BOND | | | 15,000.00 | | | | 1,638,020 | | | | 1,845,300 | | | | | |
| JANUS TRITON FUND T SHARES | | | 2,916.88 | | | | 31,006 | | | | 52,329 | | | | | |
| JOHN HANCOCK PREFERRED INCOME FUND | | | 5,000.00 | | | | 112,075 | | | | 115,200 | | | | | |
| LOOMIS SAYLES BOND FUND INSTITUTIONAL | | | 120,930.18 | | | | 1,612,500 | | | | 1,817,581 | | | | | |
| LOOMIS SAYLES GLOBAL BOND INSTITUTIONAL | | | 59,153.31 | | | | 1,000,000 | | | | 1,025,718 | | | | | |
| MANNING & NAPIER PRO BLEND CONSERV TERM S | | | 3,804.54 | | | | 50,753 | | | | 51,818 | | | | | |
| METROPOLITAN WEST TOTAL RETURN BOND M | | | 57,364.25 | | | | 603,400 | | | | 635,596 | | | | | |
| OSTERWEIS STRATEGIC INCOME FUND | | | 19,861.83 | | | | 230,000 | | | | 231,788 | | | | | |
| PIMCO CORPORATE INCOME FUND COM | | | 12,500.00 | | | | 153,357 | | | | 227,156 | | | | | |
| PIMCO FUNDAMENTAL ADV TOTAL RETURN STRAT I | | | 248,756.22 | | | | 1,000,000 | | | | 1,077,114 | | | | | |
| PIMCO INCOME FD INSTITUTIONAL | | | 128,944.70 | | | | 1,500,000 | | | | 1,582,151 | | | | | |
| PIMCO ALL ASSET INSTITUTIONAL | | | 116,232.22 | | | | 1,442,500 | | | | 1,474,987 | | | | | |
| PIMCO ALL ASSET ALL AUTHORITY INSTITUTIONAL | | | 132,228.66 | | | | 1,442,500 | | | | 1,486,250 | | | | | |
| PIMCO GLOBAL MULTI-ASSET CL D | | | 32,359.01 | | | | 350,000 | | | | 367,598 | | | | | |
| PIMCO REAL RETURN INSTITUTIONAL | | | 171,411.82 | | | | 2,000,000 | | | | 2,168,360 | | | | | |
| PIMCO TOTAL RETURN INSTITUTIONAL | | | 122,128.55 | | | | 1,249,375 | | | | 1,415,470 | | | | | |
| POWERSHARES PREFERRED PORT | | | 5,000.00 | | | | 66,915 | | | | 74,200 | | | | | |
| TCW TOTAL RETURN BOND I | | | 85,422.27 | | | | 850,000 | | | | 877,287 | | | | | |
| TEMPLETON EMERGING MKTS INCOME FUND | | | 25,000.00 | | | | 337,317 | | | | 426,500 | | | | | |
| TEMPLETON GLOBAL INCOME FD | | | 64,800.00 | | | | 591,441 | | | | 621,432 | | | | | |
| USAA SHORT-TERM BOND FUND | | | 109,170.31 | | | | 1,000,000 | | | | 1,014,192 | | | | | |
| VANGUARD INTERM-TERM INVESTMENT-GRADE ADMIRAL | | | 186,831.27 | | | | 1,650,552 | | | | 1,963,597 | | | | | |
| TOTAL BOND MUTUAL FUNDS | | | | | | $ | 26,514,454 | | | $ | 28,644,475 | | | | 25.72 | % |
| BMC FUND, INC. |
| SCHEDULE OF INVESTMENTS (Continued) |
| October 31, 2012 |
| | | | | | | | | | | | Percent | |
| | | Shares | | | | | | Market | | | of Net | |
| Company Name | | Held | | | Cost | | | Value | | | Assets | |
| | | | | | | | | | | | | |
| MUTUAL FUNDS: | | | | | | | | | | | | | | | | |
| STOCK MUTUAL FUNDS: | | | | | | | | | | | | | | | | |
| U.S. LARGE CAP EQUITIES | | | | | | | | | | | | | | | | |
| Large Cap Blend | | | | | | | | | | | | | | | | |
| INCOME FUND OF AMER INC CL A | | | 5,963.03 | | | $ | 100,000 | | | $ | 107,275 | | | | 0.10 | % |
| | | | | | | | | | | | | | | | | |
| INTERNATIONAL EQUITIES | | | | | | | | | | | | | | | | |
| Foreign Large Blend | | | | | | | | | | | | | | | | |
| VANGUARD TOTAL INTL STOCK INDEX INV SHARES | | | 3,501.49 | | | | 51,962 | | | | 50,106 | | | | 0.04 | % |
| | | | | | | | | | | | | | | | | |
| Foreign Large Value | | | | | | | | | | | | | | | | |
| ISHARES INC MSCI CANADA INDEX | | | 10,000.00 | | | | 264,925 | | | | 284,900 | | | | | |
| OAKMARK INTERNATIONAL FUND I | | | 2,531.26 | | | | 44,019 | | | | 48,549 | | | | | |
| | | | | | | | 308,944 | | | | 333,449 | | | | 0.30 | % |
| | | | | | | | | | | | | | | | | |
| Diversified Emerging Markets | | | | | | | | | | | | | | | | |
| WESTERN ASSET EMRG MKT DEBT PORTFOLIO | | | 15,000.00 | | | | 284,410 | | | | 316,650 | | | | 0.28 | % |
| | | | | | | | | | | | | | | | | |
| Asia Ex-Japan Stock | | | | | | | | | | | | | | | | |
| ISHARES INC MSCI SINGAPORE INDEX | | | 20,000.00 | | | | 255,572 | | | | 266,800 | | | | 0.24 | % |
| | | | | | | | | | | | | | | | | |
| Latin America Stock | | | | | | | | | | | | | | | | |
| ISHARES INC MSCI BRAZIL INDEX | | | 3,885.00 | | | | 220,273 | | | | 207,265 | | | | 0.19 | % |
| | | | | | | | | | | | | | | | | |
| TOTAL INTERNATIONAL EQUITIES | | | | | | | 1,121,161 | | | | 1,174,270 | | | | 1.05 | % |
| | | | | | | | | | | | | | | | | |
| SPECIALTY FUNDS | | | | | | | | | | | | | | | | |
| Energy | | | | | | | | | | | | | | | | |
| ALPS ETF TR ALERIAN MLP | | | 50,000 | | | | 818,668 | | | | 830,000 | | | | | |
| NUVEEN ENERGY MLP TOTAL RETURN | | | 10,295.00 | | | | 138,065 | | | | 185,928 | | | | | |
| | | | | | | | 956,733 | | | | 1,015,928 | | | | 0.91 | % |
| | | | | | | | | | | | | | | | | |
| Pharmaceuticals & Biotechnology | | | | | | | | | | | | | | | | |
| ISHARES TR NASDAQ BIOTECH INDEX | | | 500.00 | | | | 45,277 | | | | 65,933 | | | | 0.06 | % |
| | | | | | | | | | | | | | | | | |
| Utilities | | | | | | | | | | | | | | | | |
| SECTOR SPDR TR SBI INT-UTILITIES | | | 23,000.00 | | | | 734,317 | | | | 848,590 | | | | 0.76 | % |
| | | | | | | | | | | | | | | | | |
| Large Cap Blend | | | | | | | | | | | | | | | | |
| T. ROWE PRICE PERSONAL STRATEGY | | | 4,370.83 | | | | 90,476 | | | | 110,101 | | | | | |
| WISDOMTREE LARGECAP DIVIDEND | | | 1,500.00 | | | | 63,693 | | | | 80,985 | | | | | |
| YACKTMAN FUND SVC | | | 14,258.04 | | | | 256,985 | | | | 269,334 | | | | | |
| | | | | | | | 411,154 | | | | 460,420 | | | | 0.41 | % |
| BMC FUND, INC. |
| SCHEDULE OF INVESTMENTS (Continued) |
| October 31, 2012 |
| | | | | | | | | | | | | Percent | |
| | | | Shares | | | | | | Market | | | of Net | |
| Company Name | | | Held | | | Cost | | | Value | | | Assets | |
| | | | | | | | | | | | | | |
| MUTUAL FUNDS: | | | | | | | | | | | | | | | | | |
| Financial | | | | | | | | | | | | | | | | | |
| FRANKLIN INCOME FUND ADV | | | | 119,047.62 | | | | 250,000 | | | | 264,286 | | | | | |
| ISHARES S&P US PFD STOCK INDEX | | | | 1,250.00 | | | | 49,231 | | | | 50,075 | | | | | |
| | | | | | | | | 299,231 | | | | 314,361 | | | | 0.28 | % |
| | | | | | | | | | | | | | | | | | |
| Precious Metals | | | | | | | | | | | | | | | | | |
| MARKET VECTORS JR GOLD MINERS ETF | | | | 30,000.00 | | | | 852,848 | | | | 724,128 | | | | | |
| MARKET VECTORS GOLD MINERS ETF | | | | 43,000.00 | | | | 2,183,357 | | | | 2,274,700 | | | | | |
| SPDR GOLD SHARES | 3 | | | 10,000.00 | | | | 969,550 | | | | 1,668,300 | | | | | |
| | | | | | | | | 4,005,755 | | | | 4,667,128 | | | | 4.19 | % |
| | | | | | | | | | | | | | | | | | |
| Conservative Allocation | | | | | | | | | | | | | | | | | |
| VANGUARD WELLESLEY INCOME INV SHARES | | | | 20,045.04 | | | | 422,892 | | | | 491,705 | | | | 0.44 | % |
| | | | | | | | | | | | | | | | | | |
| Moderate Allocation | | | | | | | | | | | | | | | | | |
| FPA CRESCENT FUND | | | | 18,462.15 | | | | 525,303 | | | | 525,802 | | | | | |
| OAKMARK EQUITY & INCOME FUND | | | | 8,920.47 | | | | 263,600 | | | | 258,872 | | | | | |
| SEQUOIA FD INC COM | | | | 740.54 | | | | 108,371 | | | | 120,612 | | | | | |
| | | | | | | | | 897,274 | | | | 905,286 | | | | 0.81 | % |
| | | | | | | | | | | | | | | | | | |
| World Allocation | | | | | | | | | | | | | | | | | |
| WELLS FARGO ADVANTAGE ASSET ALLOC ADM | | | | 40,217.43 | | | | 510,000 | | | | 520,011 | | | | | |
| WINTERGREEN FD INC COM | 3 | | | 7,005.79 | | | | 102,985 | | | | 103,405 | | | | | |
| | | | | | | | | 612,985 | | | | 623,416 | | | | 0.56 | % |
| | | | | | | | | | | | | | | | | | |
| TOTAL SPECIALTY FUNDS | | | | | | | | 8,385,618 | | | | 9,392,767 | | | | 8.43 | % |
| | | | | | | | | | | | | | | | | | |
| TOTAL STOCK MUTUAL FUNDS | | | | | | | | 9,606,779 | | | | 10,674,312 | | | | 9.58 | % |
| | | | | | | | | | | | | | | | | | |
| TOTAL INVESTMENTS IN MUTUAL FUNDS | | | | | | | $ | 36,121,233 | | | $ | 39,318,787 | | | | 35.30 | % |
| BMC FUND, INC. |
| SCHEDULE OF INVESTMENTS (Continued) |
| October 31, 2012 |
| | | | | | | Market | | | Percent of | |
| Company Name | | | Cost | | | Value | | | Net Assets | |
| | | | | | | | | | | |
| OTHER INVESTMENTS: | | | | | | | | | | | | | |
| | | | | | | | | | | | | | |
| LIMITED PARTNERSHIPS: | | | | | | | | | | | | | |
| CIVIC CAPITAL CURRENCY FUND LP | 2, 3 | | $ | 1,000,000 | | | $ | 1,000,000 | | | | | |
| ELLIOTT ASSOCIATES LP | 2, 3 | | | 2,000,000 | | | | 3,030,941 | | | | | |
| GREENLIGHT MASTERS QUALIFIED LP | 2, 3 | | | 2,500,000 | | | | 2,839,109 | | | | | |
| HAYMAN CAPITAL PARTNERS LP | 2, 3 | | | 2,500,000 | | | | 2,699,827 | | | | | |
| LMC COMPASS FUND LP | 2, 3 | | | 1,500,000 | | | | 2,146,549 | | | | | |
| MORROCROFT SPECIAL OPPORTUNITY FUND II, LP | 2, 3 | | | 1,000,000 | | | | 1,127,731 | | | | | |
| PRIVET FUND LP | 2, 3 | | | 1,000,000 | | | | 1,206,276 | | | | | |
| RIVERNORTH CAPITAL PARTNERS, LP | 2, 3 | | | 2,000,000 | | | | 2,448,967 | | | | | |
| SMITH BREEDEN SECURITIZED CREDIT OPPORTUNITIES LLC | 2, 3 | | | 500,000 | | | | 510,652 | | | | | |
| STARK INVESTMENTS LP | 2, 3 | | | 278,431 | | | | 773,941 | | | | | |
| STARK STRUCTURED FINANCE ONSHORE FUND | 2, 3 | | | 460,803 | | | | 486,949 | | | | | |
| WALNUT INVESTMENT PARTNERS | 2, 3 | | | 235,567 | | | | 37,500 | | | | | |
| TOTAL LIMITED PARTNERSHIPS | | | | 14,974,801 | | | | 18,308,442 | | | | 16.44 | % |
| | | | | | | | | | | | | | |
| TOTAL OTHER INVESTMENTS | | | $ | 14,974,801 | | | $ | 18,308,442 | | | | 16.44 | % |
| BMC FUND, INC. |
| SCHEDULE OF INVESTMENTS (Continued) |
| October 31, 2012 |
| | | | | | | | | | | | | | | Percent | |
| Sectors and | | Shares | | | | | | | | | Market | | | of Net | |
| Industries | | Held | | | Company Name | | | Cost | | | Value | | | Assets | |
| | | | | | | | | | | | | | | | |
| COMMON STOCKS: | | | | | | | | | | | | | | | | | | | |
| CONSUMER DISCRETIONARY | | | | | | | | | | | | | | | | | | | |
| Consumer Services | | | 10,000.00 | | | COMPANHIA DE BEBIDAS DAS A | | | $ | 274,108 | | | $ | 407,900 | | | | | |
| | | | 1,000.00 | | | MCDONALDS CORP COM | | | | 95,695 | | | | 86,800 | | | | | |
| | | | 3,000.00 | | | RENT A CENTER INC NEW COM | | | | 102,990 | | | | 100,020 | | | | | |
| | | | | | | | | | | 472,793 | | | | 594,720 | | | | 0.53 | % |
| | | | | | | | | | | | | | | | | | | | |
| Retailing | | | 2,000.00 | | | DOMINOS PIZZA INC COM | | | | 53,719 | | | | 81,240 | | | | | |
| | | | 5,000.00 | | | LOWES COMPANIES INC COM | | | | 138,450 | | | | 161,900 | | | | | |
| | | | 1,500.00 | | | PANERA BREAD CO CL A | 3 | | | 235,356 | | | | 252,960 | | | | | |
| | | | 30,000.00 | | | PEP BOYS MANNY MOE & JACK COM | | | | 276,762 | | | | 299,700 | | | | | |
| | | | | | | | | | | 704,287 | | | | 795,800 | | | | 0.71 | % |
| | | | | | | | | | | | | | | | | | | | |
| Recreation | | | 10,000.00 | | | CEDAR FAIR LP | | | | 269,492 | | | | 358,500 | | | | 0.32 | % |
| | | | | | | | | | | | | | | | | | | | |
| TOTAL CONSUMER DISCRETIONARY | | | | | | | | | | 1,446,572 | | | | 1,749,020 | | | | 1.57 | % |
| | | | | | | | | | | | | | | | | | | | |
| CONSUMER STAPLES | | | | | | | | | | | | | | | | | | | |
| Food, Beverage & Tobacco | | | 3,500.00 | | | GENERAL MILLS INC COM | | | | 122,082 | | | | 140,280 | | | | | |
| | | | 1,000.00 | | | HERSHEY CO COM | | | | 61,459 | | | | 68,850 | | | | | |
| | | | 2,000.00 | | | LORILLARD INC | | | | 258,466 | | | | 232,020 | | | | | |
| | | | 10,000.00 | | | NESTLE S A SPONSORED ADR | 3 | | | 396,900 | | | | 633,400 | | | | | |
| | | | 4,000.00 | | | REYNOLDS AMERICAN INC COM | | | | 143,516 | | | | 166,560 | | | | | |
| | | | 2,000.00 | | | SMUCKER J M CO COM NEW | | | | 121,939 | | | | 171,280 | | | | | |
| | | | | | | | | | | 1,104,362 | | | | 1,412,390 | | | | 1.27 | % |
| | | | | | | | | | | | | | | | | | | | |
| Household & Personal Products | | | 10,000.00 | | | AVON PRODUCTS INC COM | | | | 205,795 | | | | 154,900 | | | | | |
| | | | 1,000.00 | | | KIMBERLY CLARK CORP COM | | | | 87,412 | | | | 83,450 | | | | | |
| | | | 6,500.00 | | | PROCTER & GAMBLE CO COM | | | | 417,888 | | | | 450,060 | | | | | |
| | | | | | | | | | | 711,095 | | | | 688,410 | | | | 0.62 | % |
| | | | | | | | | | | | | | | | | | | | |
| TOTAL CONSUMER STAPLES | | | | | | | | | | 1,815,457 | | | | 2,100,800 | | | | 1.89 | % |
| | | | | | | | | | | | | | | | | | | | |
| ENERGY | | | 25,000.00 | | | ATLANTIC POWER CORP. | | | | 351,695 | | | | 375,500 | | | | | |
| | | | 2,000.00 | | | ATLAS PIPELINE PRTNS UNIT | | | | 75,028 | | | | 70,760 | | | | | |
| | | | 3,000.00 | | | BP PRUDHOE BAY ROYALTY TRU | | | | 256,047 | | | | 244,560 | | | | | |
| | | | 2,000.00 | | | BUCKEYE PARTNERS L P UNIT | | | | 124,792 | | | | 96,840 | | | | | |
| | | | 1,500.00 | | | CHEVRON CORP | | | | 160,305 | | | | 165,361 | | | | | |
| | | | 4,500.00 | | | CPFL ENERGIA S A SPONSORED | | | | 103,020 | | | | 104,805 | | | | | |
| | | | 1,500.00 | | | DEVON ENERGY CORP NEW COM | | | | 118,668 | | | | 87,315 | | | | | |
| | | | 500.00 | | | ENCANA CORP COM | | | | 13,161 | | | | 11,275 | | | | | |
| | | | 4,000.00 | | | ENERGY TRANSFER EQUITY LP | | | | 150,093 | | | | 176,040 | | | | | |
| | | | 4,000.00 | | | ENSCO INTL | | | | 194,734 | | | | 231,280 | | | | | |
| | | | 17,440.00 | | | ENTERPRISE PRODS PARTN COM | | | | 463,200 | | | | 919,262 | | | | | |
| | | | 3,004.00 | | | EXXON MOBIL CORP COM | | | | 226,997 | | | | 273,875 | | | | | |
| | | | 8,000.00 | | | KINDER MORGAN ENERGY PARTNERS LP | | | | 491,126 | | | | 669,280 | | | | | |
| | | | 5,000.00 | | | KINDER MORGAN INC COM | | | | 173,187 | | | | 173,550 | | | | | |
| BMC FUND, INC. |
| SCHEDULE OF INVESTMENTS (Continued) |
| October 31, 2012 |
| | | | | | | | | | | | | | | Percent | |
| Sectors and | | Shares | | | | | | | | | Market | | | of Net | |
| Industries | | Held | | | Company Name | | | Cost | | | Value | | | Assets | |
| | | | | | | | | | | | | | | | |
| COMMON STOCKS: | | | | | | | | | | | | | | | | | | | |
| ENERGY (Continued) | | | 208.00 | | | KINDER MORGAN MANAGEMENT L | 3 | | | 7,936 | | | | 15,533 | | | | | |
| | | | 385,044.00 | | | KINDER MORGAN MGMT FR | 3 | | | 4 | | | | - | | | | | |
| | | | 7,500.00 | | | LINN ENERGY LLC | | | | 139,980 | | | | 315,900 | | | | | |
| | | | 7,500.00 | | | MARKWEST ENERGY PARTNERS L | | | | 95,426 | | | | 406,725 | | | | | |
| | | | 2,000.00 | | | OCCIDENTAL PETROLEUM COM | | | | 177,627 | | | | 157,920 | | | | | |
| | | | 5,000.00 | | | ONEOK INC COM | | | | 107,537 | | | | 236,500 | | | | | |
| | | | 1,500.00 | | | PEABODY ENERGY CORP COM | | | | 90,350 | | | | 41,850 | | | | | |
| | | | 2,500.00 | | | PENN WEST PETROLEUM LTD | | | | 45,428 | | | | 32,475 | | | | | |
| | | | 8,900.00 | | | PETROLEO BRASILEIRO SA SPO | | | | 265,836 | | | | 188,769 | | | | | |
| | | | 10,000.00 | | | PLAINS ALL AMERICAN PIPELINE | | | | 245,274 | | | | 453,800 | | | | | |
| | | | 6,000.00 | | | SEADRILL LIMITED SHS | | | | 205,464 | | | | 242,040 | | | | | |
| | | | 5,000.00 | | | TARGA RESOURCES PARTNERS, | | | | 134,173 | | | | 209,400 | | | | | |
| | | | 4,500.00 | | | TRANSMONTAIGNE PARTNERS LP | | | | 122,500 | | | | 160,020 | | | | | |
| | | | 3,000.00 | | | TRANSOCEAN INC NEW SHS | | | | 209,037 | | | | 137,070 | | | | | |
| | | | | | | | | | | | | | | | | | | | |
| TOTAL ENERGY | | | | | | | | | | 4,748,625 | | | | 6,197,705 | | | | 5.56 | % |
| FINANCIALS | | | | | | | | | | | | | | | | | | | |
| Banks | | | 2,500.00 | | | BANK N S HALIFAX COM | | | | 128,593 | | | | 135,950 | | | | 0.12 | % |
| | | | | | | | | | | | | | | | | | | | |
| Diversified Financials | | | 4,500.00 | | | BERKSHIRE HATHAWAY INC CL | 3 | | | 331,206 | | | | 388,575 | | | | | |
| | | | 2,500.00 | | | CME GROUP | | | | 138,071 | | | | 139,825 | | | | | |
| | | | 3,500.00 | | | NYSE EURONEXT | | | | 95,848 | | | | 86,660 | | | | | |
| | | | | | | | | | | 565,125 | | | | 615,060 | | | | 0.55 | % |
| | | | | | | | | | | | | | | | | | | | |
| Financial | | | 6,000.00 | | | AMERICAN CAPITAL AGENCY CORP | | | | 210,029 | | | | 198,000 | | | | | |
| | | | 1,500.00 | | | AMERICAN EXPRESS CO COM | | | | 66,021 | | | | 83,955 | | | | | |
| | | | 30,000.00 | | | ANNALY CAPITAL MGMT INC | | | | 500,431 | | | | 484,200 | | | | | |
| | | | 15,000.00 | | | GOLUB CAPITAL BDC INC COM | | | | 226,480 | | | | 234,450 | | | | | |
| | | | 15,000.00 | | | OAKTREE CAPITAL GROUP LLC UNIT | | | | 546,573 | | | | 639,450 | | | | | |
| | | | 50,000.00 | | | TWO HARBORS INVT CORP COM | | | | 569,600 | | | | 596,500 | | | | | |
| | | | | | | | | | | 2,119,134 | | | | 2,236,555 | | | | 2.01 | % |
| | | | | | | | | | | | | | | | | | | | |
| Insurance | | | 1,000.00 | | | METLIFE INC COM | | | | 32,265.00 | | | | 35,490.00 | | | | 0.03 | % |
| | | | | | | | | | | | | | | | | | | | |
| Real Estate | | | 35,000.00 | | | MEDICAL PPTYS TR INC COM | | | | 370,003 | | | | 401,800 | | | | | |
| | | | 2,000.00 | | | VENTAS INC | | | | 91,107 | | | | 126,540 | | | | | |
| | | | | | | | | | | 461,110 | | | | 528,340 | | | | 0.47 | % |
| | | | | | | | | | | | | | | | | | | | |
| REIT | | | 15,000.00 | | | CORRECTIONS CORP AMER NEW COM | | | | 431,887.00 | | | | 504,750.00 | | | | 0.45 | % |
| | | | | | | | | | | | | | | | | | | | |
| TOTAL FINANCIALS | | | | | | | | | $ | 3,738,114 | | | $ | 4,056,145 | | | | 3.64 | % |
| BMC FUND, INC. |
| SCHEDULE OF INVESTMENTS (Continued) |
| October 31, 2012 |
| | | | | | | | | | | | | | | Percent | |
| Sectors and | | Shares | | | | | | | | | Market | | | of Net | |
| Industries | | Held | | | Company Name | | | Cost | | | Value | | | Assets | |
| | | | | | | | | | | | | | | | |
| COMMON STOCKS: | | | | | | | | | | | | | | | | | | | |
| HEALTH CARE | | | | | | | | | | | | | | | | | | | |
| Health Care Equipment & Services | | | 2,000.00 | | | AMERISOURCEBERGEN CORP COM | | | $ | 57,550 | | | $ | 78,880 | | | | | |
| | | | 50.00 | | | LABORATORY CORP AMER HLDGS | 3 | | | 3,536 | | | | 4,237 | | | | | |
| | | | 1,500.00 | | | VARIAN MEDICAL SYSTEMS INC | 3 | | | 68,108 | | | | 100,140 | | | | | |
| | | | | | | | | | | 129,194 | | | | 183,257 | | | | 0.16 | % |
| | | | | | | | | | | | | | | | | | | | |
| Pharmaceuticals & Biotechnology | | | 3,000.00 | | | ASTRAZENECA PLC SPONSORED | | | | 135,341 | | | | 139,200 | | | | | |
| | | | 2,000.00 | | | CUBIST PHARMACEUTICALS | 3 | | | 60,030 | | | | 85,800 | | | | | |
| | | | 500.00 | | | IMMUNOGEN INC COM | 3 | | | 5,722 | | | | 5,540 | | | | | |
| | | | 5,000.00 | | | JOHNSON & JOHNSON COM | | | | 312,224 | | | | 354,100 | | | | | |
| | | | 3,000.00 | | | ELI LILLY & CO COM | | | | 132,158 | | | | 145,890 | | | | | |
| | | | 27,500.00 | | | PFIZER INC COM | | | | 503,831 | | | | 683,925 | | | | | |
| | | | 15,000.00 | | | SANOFI SPONSORED ADR | | | | 515,822 | | | | 657,750 | | | | | |
| | | | 1,000.00 | | | SEATTLE GENETICS INC COM | 3 | | | 17,684 | | | | 25,160 | | | | | |
| | | | 1,000.00 | | | TEVA PHARMACEUTCL INDS ADR | | | | 50,285 | | | | 40,420 | | | | | |
| | | | | | | | | | | 1,733,097 | | | | 2,137,785 | | | | 1.92 | % |
| | | | | | | | | | | | | | | | | | | | |
| TOTAL HEALTH CARE | | | | | | | | | | 1,862,291 | | | | 2,321,042 | | | | 2.08 | % |
| | | | | | | | | | | | | | | | | | | | |
| INDUSTRIALS | | | | | | | | | | | | | | | | | | | |
| Capital Goods | | | 500.00 | | | NORTHROP GRUMMAN CORP COM | | | | 34,407 | | | | 34,345 | | | | | |
| | | | 6,000.00 | | | TEEKAY LNG PARTNERS LP | | | | 230,353 | | | | 218,820 | | | | | |
| | | | | | | | | | | 264,760 | | | | 253,165 | | | | 0.23 | % |
| | | | | | | | | | | | | | | | | | | | |
| Commercial Services & Supplies | | | 1,000.00 | | | STERICYCLE INC COM | 3 | | | 85,105 | | | | 94,760 | | | | | |
| | | | 6,000.00 | | | US ECOLOGY INC COM | | | | 122,962 | | | | 142,380 | | | | | |
| | | | 500.00 | | | WASTE MGMT INC DEL COM | | | | 17,412 | | | | 16,370 | | | | | |
| | | | | | | | | | | 225,479 | | | | 253,510 | | | | 0.23 | % |
| | | | | | | | | | | | | | | | | | | | |
| Transportation | | | 2,000.00 | | | NORFOLK SOUTHERN CORP COM | | | | 146,659 | | | | 122,700 | | | | 0.11 | % |
| | | | | | | | | | | | | | | | | | | | |
| TOTAL INDUSTRIALS | | | | | | | | | | 636,898 | | | | 629,375 | | | | 0.57 | % |
| | | | | | | | | | | | | | | | | | | | |
| INFORMATION TECHNOLOGY | | | | | | | | | | | | | | | | | | | |
| Software & Services | | | 28,500.00 | | | MICROSOFT CORP COM | | | | 692,087 | | | | 813,390 | | | | | |
| | | | 6,000.00 | | | ORACLE CORP COM | | | | 151,859 | | | | 186,480 | | | | | |
| | | | 10,000.00 | | | YANDEX NV SHS CLASS A | 3 | | | 233,088 | | | | 233,100 | | | | | |
| | | | | | | | | | | 1,077,034 | | | | 1,232,970 | | | | 1.11 | % |
| | | | | | | | | | | | | | | | | | | | |
| Technology Hardware & Equipment | | | 500.00 | | | APPLE INC COM | | | | 281,190 | | | | 297,660 | | | | | |
| | | | 15,700.00 | | | CISCO SYSTEMS INC COM | | | | 306,658 | | | | 269,177 | | | | | |
| | | | 5,000.00 | | | NCR CORP NEW COM | 3 | | | 113,062 | | | | 106,400 | | | | | |
| | | | 1,500.00 | | | QUALCOMM INC COM | | | | 71,275 | | | | 87,915 | | | | | |
| | | | 10,000.00 | | | SEAGATE TECHNOLOGY SHS | | | | 300,969 | | | | 273,300 | | | | | |
| | | | 124,100.00 | | | XEROX CORP COM | | | | 876,595 | | | | 799,204 | | | | | |
| | | | | | | | | | | 1,949,749 | | | | 1,833,656 | | | | 1.64 | % |
| BMC FUND, INC. |
| SCHEDULE OF INVESTMENTS (Continued) |
| October 31, 2012 |
| | | | | | | | | | | | | | | Percent | |
| Sectors and | | Shares | | | | | | | | | Market | | | of Net | |
| Industries | | Held | | | Company Name | | | Cost | | | Value | | | Assets | |
| | | | | | | | | | | | | | | | |
| COMMON STOCKS: | | | | | | | | | | | | | | | | | | | |
| Semiconductors & | | | 6,500.00 | | | INTEL CORP COM | | | | 132,722 | | | | 140,595 | | | | 0.13 | % |
| Semiconductor Equipment | | | | | | | | | | | | | | | | | | | |
| | | | | | | | | | | | | | | | | | | | |
| TOTAL INFORMATION TECHNOLOGY | | | | | | | | | | 3,159,505 | | | | 3,207,221 | | | | 2.88 | % |
| | | | | | | | | | | | | | | | | | | | |
| MATERIALS | | | 5,000.00 | | | BROOKFIELD INFRASTRUCTURE | | | | 143,843 | | | | 171,750 | | | | | |
| | | | 2,000.00 | | | MOSAIC CO | | | | 93,287 | | | | 104,680 | | | | | |
| | | | 7,500.00 | | | NEWMONT MINING CORP COM | | | | 488,457 | | | | 409,350 | | | | | |
| | | | 2,000.00 | | | POTASH CORP | | | | 84,161 | | | | 80,740 | | | | | |
| | | | 4,000.00 | | | RPM INTL INC COM | | | | 84,679 | | | | 106,640 | | | | | |
| | | | 10,000.00 | | | TRONOX INC SHS CL A | | | | 231,634 | | | | 203,900 | | | | | |
| TOTAL MATERIALS | | | | | | | | | | 1,126,061 | | | | 1,077,060 | | | | 0.97 | % |
| | | | | | | | | | | | | | | | | | | | |
| TELECOMMUNICATION SERVICES | | | 2,000.00 | | | AMERICA MOVIL SA DE CV SPO | | | | 55,017 | | | | 50,580 | | | | | |
| | | | 3,000.00 | | | AT&T CORP COM | | | | 84,047 | | | | 103,770 | | | | | |
| | | | 2,500.00 | | | BCE INC COM | | | | 99,660 | | | | 109,150 | | | | | |
| | | | 5,500.00 | | | CONSOLIDATED COMM HLDG COM | | | | 102,683 | | | | 84,810 | | | | | |
| | | | 1,000.00 | | | DISH NETWORK | | | | 31,333 | | | | 35,630 | | | | | |
| | | | 5,000.00 | | | SINGAPORE TELECOMM LTD ADR | | | | 121,425 | | | | 131,962 | | | | | |
| | | | 2,000.00 | | | SK TELECOM LTD SPONSORED A | | | | 27,904 | | | | 31,260 | | | | | |
| | | | 4,000.00 | | | TELECOM ARGENTINA SA | | | | 88,558 | | | | 39,360 | | | | | |
| | | | 14,000.00 | | | TELEFONICA S A SPONSORED A | | | | 233,528 | | | | 183,960 | | | | | |
| | | | 12,000.00 | | | TELEPHONICA BRASIL S.A. | | | | 290,862 | | | | 264,240 | | | | | |
| TOTAL TELECOMMUNICATION SERVICES | | | | | | | | | | 1,135,017 | | | | 1,034,722 | | | | 0.93 | % |
| | | | | | | | | | | | | | | | | | | | |
| UTILITIES | | | 2,000.00 | | | AMERICAN ELEC PWR INC COM | | | | 79,050.00 | | | | 88,880.00 | | | | | |
| | | | 5,000.00 | | | AMERIGAS PARTNERS LP COM | | | | 212,399.00 | | | | 224,000.00 | | | | | |
| | | | 12,500.00 | | | COMPANHIA ENERGETICA SP AD | | | | 174,849 | | | | 149,875 | | | | | |
| | | | 6,500.00 | | | DOMINION RES INC VA COM | | | | 330,756 | | | | 343,070 | | | | | |
| | | | 19,187.00 | | | DUKE ENERGY CORP COM | | | | 950,552 | | | | 1,260,394 | | | | | |
| | | | 2,500.00 | | | ENERSIS | | | | 49,539 | | | | 42,350 | | | | | |
| | | | 1,000.00 | | | ENTERGY CORP NEW COM | | | | 69,388 | | | | 72,580 | | | | | |
| | | | 2,000.00 | | | INTEGRYS ENERGY GRP COM | | | | 104,066 | | | | 108,080 | | | | | |
| | | | 10,000.00 | | | NATIONAL GRID PLC SPON ADR | | | | 496,411 | | | | 570,100 | | | | | |
| | | | 6,000.00 | | | ONEOK PARTNERS LP COM | | | | 155,009 | | | | 365,700 | | | | | |
| | | | 17,500.00 | | | SOUTHERN CO COM | | | | 628,940 | | | | 819,700 | | | | | |
| TOTAL UTILITIES | | | | | | | | | | 3,250,959 | | | | 4,044,729 | | | | 3.63 | % |
| | | | | | | | | | | | | | | | | | | | |
| TOTAL INVESTMENTS IN COMMON STOCKS | | | | | | | | | $ | 22,919,499 | | | $ | 26,417,819 | | | | 23.72 | % |
| BMC FUND, INC. |
| SCHEDULE OF INVESTMENTS (Continued) |
| October 31, 2012 |
| | | | | | | | | | | | | Percent | |
| | | | Shares | | | | | | Market | | | of Net | |
| Company Name | | | Held | | | Cost | | | Value | | | Assets | |
| | | | | | | | | | | | | | |
| PREFERRED STOCKS: | | | | | | | | | | | | | | | | | |
| LEARNINGSTATION.COM | 2,3 | | | 1,224,661.00 | | | $ | 500,000 | | | $ | - | | | | | |
| | | | | | | | | | | | | | | | | | |
| TOTAL INVESTMENTS IN PREFERRED STOCKS | | | | | | | $ | 500,000 | | | $ | - | | | | 0.00 | % |
| BMC FUND, INC. |
| SCHEDULE OF INVESTMENTS (Concluded) |
| October 31, 2012 |
| | | | | | Market | | | Percent of | |
| Company Name | | Cost | | | Value | | | Net Assets | |
| | | | | | | | | | |
| Short-term Investments MFB NI Treasury Money Market Fund | | $ | 23,990,351 | | | $ | 23,990,351 | | | | 21.54 | % |
| | | | | | | | | | | | | |
| TOTAL INVESTMENTS - MARKET VALUE | | | | | | | 111,608,361 | | | | 100.21 | % |
| | | | | | | | | | | | | |
| TOTAL OTHER ASSETS IN EXCESS OF LIABILITIES | | | | | | | (229,800 | ) | | | -0.21 | % |
| | | | | | | | | | | | | |
| TOTAL NET ASSETS | | | | | | $ | 111,378,561 | | | | 100.00 | % |
| 1In default |
| 2Market value determined by the Fund's Board of Directors |
| 3Non-income producing security |
| BMC FUND, INC. |
| SCHEDULE OF OPEN WRITTEN OPTION CONTRACTS |
| October 31, 2012 |
| | | | | | | | | | | | | Percent | |
| | | | Contracts | | | | | | Market | | | of Net | |
| Company Name | | | Held | | | Cost | | | Value | | | Assets | |
| | | | | | | | | | | | | | |
| CALL OPTIONS: | | | | | | | | | | | | | | | | | |
| AMERICAN EXPRESS CALL OPTION, $65 EXP 1/19/13 | 3 | | | (15.00 | ) | | $ | (1,402 | ) | | $ | (150 | ) | | | | |
| CME GROUP INC CALL OPTION, $60 EXP 12/22/12 | 3 | | | (25.00 | ) | | | (3,285 | ) | | | (625 | ) | | | | |
| COMPANIA DE BEBIDAS CALL OPTION, $41.99 EXP 1/19/13 | 3 | | | (50.00 | ) | | | (3,922 | ) | | | (7,250 | ) | | | | |
| DISH NETWORK CORP CALL OPTION, $34 EXP 1/19/13 | 3 | | | (10.00 | ) | | | (984 | ) | | | (3,400 | ) | | | | |
| DOMINOS PIZZA CALL OPTION, $40 EXP 12/22/12 | 3 | | | (20.00 | ) | | | (1,769 | ) | | | (3,600 | ) | | | | |
| JOHNSON & JOHNSON CALL OPTION, $70 EXP 1/19/13 | 3 | | | (50.00 | ) | | | (4,531 | ) | | | (8,550 | ) | | | | |
| METLIFE INC CALL OPTION, $35 EXP 12/22/12 | 3 | | | (10.00 | ) | | | (1,134 | ) | | | (1,480 | ) | | | | |
| MARKET VECTORS GOLD MINERS CALL OPTION, $59 EXP 12/22/12 | 3 | | | (40.00 | ) | | | (4,337 | ) | | | (2,360 | ) | | | | |
| MARKET VECTORS JR GOLD MINERS CALL OPTION, $25 EXP 11/17/12 | 3 | | | (50.00 | ) | | | (1,922 | ) | | | (2,250 | ) | | | | |
| MOSAIC COMPANY CALL OPTION, $60 EXP 12/22/12 | 3 | | | (20.00 | ) | | | (1,909 | ) | | | (300 | ) | | | | |
| NYSE EURONEXT CALL OPTION, $29 EXP 12/22/12 | 3 | | | (30.00 | ) | | | (1,153 | ) | | | (120 | ) | | | | |
| OCCIDENTAL PETROLEUM CALL OPTION, $100 EXP 1/19/13 | 3 | | | (20.00 | ) | | | (4,699 | ) | | | (200 | ) | | | | |
| RENT A CENTER INC CALL OPTION, $40 EXP 3/16/13 | 3 | | | (30.00 | ) | | | (2,788 | ) | | | (900 | ) | | | | |
| SANOFI CALL OPTION, $45 EXP 12/22/12 | 3 | | | (50.00 | ) | | | (3,422 | ) | | | (5,250 | ) | | | | |
| STERICYCLE INC CALL OPTION, $100 EXP 2/16/13 | 3 | | | (10.00 | ) | | | (1,034 | ) | | | (1,650 | ) | | | | |
| TOTAL CALL OPTIONS - LIABILITIES | | | | | | | | (38,291 | ) | | | (38,085 | ) | | | -0.03 | % |
| | | | | | | | | | | | | | | | | | |
| PUT OPTIONS: | | | | | | | | | | | | | | | | | |
| AMGEN INC PUT OPTION, $72.50 EXP 1/19/13 | 3 | | | (35.00 | ) | | | (5,067.21 | ) | | | (2,100.00 | ) | | | | |
| APPLE INC PUT OPTION, $545 EXP 1/19/13 | 3 | | | (10.00 | ) | | | (31,428.73 | ) | | | (14,850.00 | ) | | | | |
| APPLE INC PUT OPTION, $550 EXP 2/16/13 | 3 | | | (20.00 | ) | | | (40,532.91 | ) | | | (50,000.00 | ) | | | | |
| AVON PRODUCTS PUT OPTION, $15 EXP 1/19/13 | 3 | | | (100.00 | ) | | | (8,344.35 | ) | | | (12,000.00 | ) | | | | |
| AVON PRODUCTS PUT OPTION, $17.50 EXP 1/19/13 | 3 | | | (100.00 | ) | | | (15,344.20 | ) | | | (27,000.00 | ) | | | | |
| BP PLC PUT OPTION, $37 EXP 1/19/13 | 3 | | | (30.00 | ) | | | (3,463.14 | ) | | | (1,260.00 | ) | | | | |
| CELGENE CORP PUT OPTION, $62.50 EXP 1/19/13 | 3 | | | (20.00 | ) | | | (4,248.72 | ) | | | (1,800.00 | ) | | | | |
| CHEVRON CORP NEW PUT OPTION, $95 EXP 12/22/12 | 3 | | | (20.00 | ) | | | (7,268.72 | ) | | | (700.00 | ) | | | | |
| CISCO SYSTEMS PUT OPTION, $15 EXP 1/19/13 | 3 | | | (250.00 | ) | | | (20,610.88 | ) | | | (7,000.00 | ) | | | | |
| COACH INC PUT OPTION, $45 EXP 11/17/12 | 3 | | | (50.00 | ) | | | (4,921.92 | ) | | | (250.00 | ) | | | | |
| COACH INC PUT OPTION, $50 EXP 11/17/12 | 3 | | | (25.00 | ) | | | (5,085.90 | ) | | | (500.00 | ) | | | | |
| CONOCOPHILLIPS PUT OPTION, $50 EXP 1/19/13 | 3 | | | (100.00 | ) | | | (50,843.77 | ) | | | (500.00 | ) | | | | |
| DELL INC PUT OPTION, $10 EXP 1/19/13 | 3 | | | (250.00 | ) | | | (23,971.39 | ) | | | (28,750.00 | ) | | | | |
| DOMINOS PIZZA PUT OPTION, $30 EXP 12/22/12 | 3 | | | (20.00 | ) | | | (1,268.79 | ) | | | (100.00 | ) | | | | |
| DOW CHEMICAL PUT OPTION, $25 EXP 3/16/13 | 3 | | | (50.00 | ) | | | (4,821.93 | ) | | | (3,700.00 | ) | | | | |
| EXXON MOBIL CORP PUT OPTION, $70 EXP 1/19/13 | 3 | | | (30.00 | ) | | | (11,053.08 | ) | | | (510.00 | ) | | | | |
| FEDEX CORP PUT OPTION, $80 EXP 4/20/13 | 3 | | | (25.00 | ) | | | (8,835.82 | ) | | | (5,425.00 | ) | | | | |
| GOOGLE INC PUT OPTION, $525 EXP 1/19/13 | 3 | | | (10.00 | ) | | | (18,414.02 | ) | | | (1,400.00 | ) | | | | |
| GOOGLE INC PUT OPTION, $525 EXP 12/22/12 | 3 | | | (10.00 | ) | | | (22,633.92 | ) | | | (350.00 | ) | | | | |
| HARMON INTL PUT OPTION, $40 EXP 1/19/13 | 3 | | | (50.00 | ) | | | (7,711.69 | ) | | | (10,000.00 | ) | | | | |
| HARMON INTL PUT OPTION, $40 EXP 4/20/13 | 3 | | | (50.00 | ) | | | (15,137.69 | ) | | | (17,500.00 | ) | | | | |
| HEWLETT PACKARD PUT OPTION, $20 EXP 1/19/13 | 3 | | | (250.00 | ) | | | (75,860.39 | ) | | | (156,750.00 | ) | | | | |
| JOHNSON & JOHNSON PUT OPTION, $55 EXP 1/19/13 | 3 | | | (40.00 | ) | | | (5,498.67 | ) | | | (80.00 | ) | | | | |
| JPMORGAN CHASE PUT OPTION, $31 EXP 12/22/12 | 3 | | | (50.00 | ) | | | (8,272.07 | ) | | | (400.00 | ) | | | | |
| LORILLARD INC PUT OPTION, $100 EXP 3/16/13 | 3 | | | (25.00 | ) | | | (7,044.86 | ) | | | (6,325.00 | ) | | | | |
| BMC FUND, INC. |
| SCHEDULE OF OPEN WRITTEN OPTION CONTRACTS (Continued) |
| October 31, 2012 |
| | | | | | | | | | | | | Percent | |
| | | | Contracts | | | | | | Market | | | of Net | |
| Company Name | | | Held | | | Cost | | | Value | | | Assets | |
| | | | | | | | | | | | | | |
| PUT OPTIONS (Continued): | | | | | | | | | | | | | | | | | |
| LORILLARD INC PUT OPTION, $110 EXP 12/22/12 | 3 | | | (25.00 | ) | | | (7,210.85 | ) | | | (4,850.00 | ) | | | | |
| LOWES COMPANIES PUT OPTION, $22.50 EXP 1/19/13 | 3 | | | (250.00 | ) | | | (17,079.80 | ) | | | (2,500.00 | ) | | | | |
| MCDONALDS CORP PUT OPTION, $82.50 EXP 3/16/13 | 3 | | | (40.00 | ) | | | (9,937.40 | ) | | | (8,760.00 | ) | | | | |
| MARKET VECTOR GOLD MINERS PUT OPTION, $40 EXP 12/22/12 | 3 | | | (50.00 | ) | | | (6,321.89 | ) | | | (450.00 | ) | | | | |
| NCR CORP NEW PUT OPTION, $20 EXP 1/19/13 | 3 | | | (375.00 | ) | | | (40,930.62 | ) | | | (26,250.00 | ) | | | | |
| NEWMONT MINING PUT OPTION, $40 EXP 12/22/12 | 3 | | | (25.00 | ) | | | (2,360.96 | ) | | | (75.00 | ) | | | | |
| OCCIDENTAL PETROLEUM PUT OPTION, $70 EXP 1/19/13 | 3 | | | (20.00 | ) | | | (4,483.78 | ) | | | (2,520.00 | ) | | | | |
| PENNEY J C INC PUT OPTION, $20 EXP 1/19/13 | 3 | | | (125.00 | ) | | | (11,878.57 | ) | | | (12,625.00 | ) | | | | |
| PENNEY J C INC PUT OPTION, $20 EXP 11/17/12 | 3 | | | (375.00 | ) | | | (43,846.70 | ) | | | (16,500.00 | ) | | | | |
| SEAGATE TECH PUT OPTION, $20 EXP 1/19/13 | 3 | | | (100.00 | ) | | | (4,069.98 | ) | | | (2,700.00 | ) | | | | |
| SEAGATE TECH PUT OPTION, $25 EXP 12/22/12 | 3 | | | (200.00 | ) | | | (19,953.70 | ) | | | (16,000.00 | ) | | | | |
| ST. JOE CO. PUT OPTION, $10 EXP 1/19/13 | 3 | | | (162.00 | ) | | | (20,720.62 | ) | | | (810.00 | ) | | | | |
| TJX COMPANIES PUT OPTION, $35 EXP 1/19/13 | 3 | | | (35.00 | ) | | | (4,495.48 | ) | | | (1,225.00 | ) | | | | |
| VARIAN MEDICAL SYS PUT OPTION, $60 EXP 11/17/12 | 3 | | | (20.00 | ) | | | (4,493.80 | ) | | | (500.00 | ) | | | | |
| VERIZON COMM PUT OPTION, $38 EXP 4/20/13 | 3 | | | (50.00 | ) | | | (6,221.89 | ) | | | (3,000.00 | ) | | | | |
| WELLS FARGO PUT OPTION, $22.50 EXP 1/19/13 | 3 | | | (50.00 | ) | | | (5,422.10 | ) | | | (250.00 | ) | | | | |
| XEROX CORP PUT OPTION, $5 EXP 1/19/13 | 3 | | | (1,000.00 | ) | | | (40,672.68 | ) | | | (6,000.00 | ) | | | | |
| TOTAL PUT OPTIONS - LIABILITIES | | | | | | | | (250,101 | ) | | | (105,015 | ) | | | -0.09 | % |
| | | | | | | | | | | | | | | | | | |
| TOTAL CALL AND PUT OPTIONS - LIABILITIES | | | | | | | $ | (288,392 | ) | | $ | (143,100 | ) | | | -0.13 | % |
Item. 2. Code of Ethics.
On July 26, 2003, the Board of Directors of the Registrant adopted a Code of Ethics for the principal executive officer and principal financial and accounting officer. The Code was amended by the Board of Directors on February 24, 2007.
(c)-(e) N/A
(f) A copy of the Code of Ethics is attached as an exhibit.
Item 3. Audit Committee Financial Expert.
The Board of Directors of the Registrant has determined that R. Donald Farmer, a member of its Audit Committee, is an audit committee financial expert. Mr. Farmer is an independent director of the Registrant.
Item 4. Principal Accountant Fees and Services.
(a) Audit Fees: $40,100.00 for the fiscal year ended October 31, 2011; $42,600.00 for the fiscal year ended October 31, 2012.
(b) Audit-Related Fees: $1,840.00 for the fiscal year ended October 31, 2011; $2,025.00 for the fiscal year ended October 31, 2012. These fees were incurred for travel-related expenses.
(c) Tax Fees: $0.00 for the fiscal year ended October 31, 2011; $0.00 for the fiscal year ended October 31, 2012. These fees were incurred for review of the tax returns.
(d) All Other Fees: $1,550.00 for the fiscal year ended October 31, 2011; $700.00 for the fiscal year ended October 31, 2012. These fees were incurred for report production and printing.
(e)(1) A copy of the Audit Committee's pre-approval policies and procedures is attached as an exhibit.
(e)(2) One hundred percent of the services described in Items 4(b) through 4(d) were approved in accordance with the Audit Committee Pre-Approval Policy. As a result, none of such services was approved pursuant to paragraph (c)(7)(i)(C) of Rule 2-01 of Regulation S-X.
(f) None of the hours expended on the principal accountant's engagement to audit the Registrant's financial statements for the fiscal year ended October 31, 2012 was attributed to work performed by persons other than the principal accountant's full-time, permanent employees.
(g) N/A
(h) N/A
Item 5. Audit Committee of Listed Registrants.
N/A
Item 6. Schedule of Investments.
Included as a part of the report to shareholders filed under Item 1.
Item 7. Disclosure of Proxy Voting Policies and Procedures for Closed-End Management Investment Companies.
The Board of Directors of the Registrant adopted Proxy Voting Policies and Procedures on July 26, 2003 and amended them October 30, 2003, April 5, 2004 and May 26, 2005. A copy as amended is attached as an exhibit.
Item 8. Portfolio Managers of Closed-End Investment Companies.
(a)(1) As of the date of filing of this report, Paul H. Broyhill, Chairman and Chief Executive Officer, M. Hunt Broyhill, President, and Christopher R. Pavese, CFA, Chief Investment Officer, are primarily responsible for the day-to-day management of the Registrant’s portfolio. Mr. Paul Broyhill has served in such capacity since the inception of the Registrant in 1982. Mr. Hunt Broyhill has had such responsibility since 2001. Mr. Hunt Broyhill has been engaged in asset management for various institutions and high net worth individuals for more than five years. Prior to joining the Registrant on March 1, 2005, Mr. Pavese was a Vice President and Portfolio Manager at JP Morgan Private Bank from January 1999 until February 2005. At JP Morgan, Mr. Pavese was engaged in asset management, portfolio strategy, and asset allocation for high net worth individuals, personal trusts, endowments and foundations.
(a)(2) The following tables provide information regarding registered investment companies other than the Registrant, other pooled investment vehicles, and other accounts over which the Registrant’s portfolio managers also have day-to-day management responsibilities. The tables provide the numbers of such accounts, the total assets in such accounts and the number of accounts and the total assets in the accounts with respect to which the fees are based on performance. The information is provided as of the Registrant’s fiscal year ended October 31, 2012.
Paul H. Broyhill
| | Other Registered Investment Companies | Other Pooled Investment Vehicles | Other Accounts |
Number of Accounts Managed | None | None | 5 |
Number of Accounts Managed with Performance-Based Advisory Fees | None | None | None |
| Assets Managed | $0 | $0 | $28,318,460 |
Assets Managed with Performance-Based Advisory Fees | $0 | $0 | $0 |
M. Hunt Broyhill
| | Other Registered Investment Companies | Other Pooled Investment Vehicles | Other Accounts |
Number of Accounts Managed | None | 2 | 24 |
Number of Accounts Managed with Performance-Based Advisory Fees | None | 1 | None |
| Assets Managed | $0 | $9,781,788 | $24,866,119 |
Assets Managed with Performance-Based Advisory Fees | $0 | $14,127,762 | $0 |
Christopher R. Pavese
| | Other Registered Investment Companies | Other Pooled Investment Vehicles | Other Accounts |
Number of Accounts Managed | None | None | 41 |
Number of Accounts Managed with Performance-Based Advisory Fees | None | None | None |
| Assets Managed | $0 | $0 | $14,600,000 |
Assets Managed with Performance-Based Advisory Fees | $0 | $0 | $0 |
Material Conflicts of Interest
The Fund recognizes that actual or potential conflicts of interest are inherent in our business. These actual or potential conflicts may arise when a portfolio manager has day-to-day portfolio management responsibilities with respect to more than one fund or account. Certain investments may be appropriate for the Fund and also for other clients advised by the portfolio manager. Investment decisions for the Fund and other clients are made with a view to achieving their respective investment objectives and after consideration of such factors as their current holdings, availability of cash for investment and the size of their investments generally. Therein lies the possibility that a particular security could be bought or sold for the Fund and also for other clients, along with the possibility that a particular security could be bought or sold for the Fund while the opposite transaction could be occurring for other clients due to their investment strategy.
To the extent that a portfolio manager has responsibilities for managing accounts in addition to the Fund, the portfolio manager will need to divide his time and attention among relevant accounts.
The Fund also recognizes that in some cases, an actual or potential conflict may arise where a portfolio manager may have an incentive, such as a performance-based fee.
The Fund is in the process of developing written policies and procedures designed to address conflicts of interest its portfolio managers may face.
(a)(3)
Compensation Structure of Portfolio Managers
The compensation structure for each portfolio manager is based upon a fixed salary as well as a discretionary bonus determined by the senior management of the Registrant. Salaries are determined by the senior management and are based upon an individual’s position and overall value to the Registrant. Bonuses are also determined by management and are based upon an individual’s overall contribution to the success of the Fund and the profitability of the Registrant. Salaries and bonuses for portfolio managers are not based upon criteria such as performance of the Fund or the value of assets of the Registrant. Portfolio managers also have the opportunity to participate in other employee benefits available to all of the employees of the Registrant.
(a)(4) The dollar range of the Registrant’s equity securities owned beneficially by the Registrant’s portfolio managers as of the Registrant’s fiscal year ended October 31, 2012 is set forth below:
Name of Portfolio Manager | Dollar ($) Range of Registrant’s Shares Beneficially Owned |
| Paul H. Broyhill | Over $1,000,000 |
| M. Hunt Broyhill | Over $1,000,000 |
| Christopher R. Pavese | $1-$10,000 |
(b) N/A
Item 9. Purchases of Equity Securities by Closed-End Management Investment Company and Affiliated Purchasers.
None
Item 10. Submission of Matters to a Vote of Security Holders.
N/A
Item 11. Controls and Procedures.
Within the 90 days prior to the date of this report, the Registrant's management carried out an evaluation, under the supervision and with the participation of Registrant's Chief Executive Officer and Chief Financial Officer, of the effectiveness of the Registrant's disclosure controls and procedures pursuant to Rule 30a-3(b) of the Investment Company Act of 1940. Based upon the evaluation, the Chief Executive Officer and Chief Financial Officer concluded as of a date within 90 days of the filing of this report that the Registrant's disclosure controls and procedures are effective in timely alerting them to material information relating to the Registrant required to be included in the Registrant's periodic SEC filings.
There were no significant changes in the Registrant's internal control over financial reporting (as defined in Rule 30a-3(d) under the Investment Company Act of 1940) that occurred during the second fiscal quarter of the period covered by the report that have materially affected, or are reasonably likely to materially affect, the Registrant's internal control over financial reporting.
Item 12. Exhibits.
(a)(1) The Registrant's Code of Ethics is attached as Exhibit 12(a)(1).
(a)(2) Certifications.
SIGNATURES
Pursuant to the requirements of the Securities Exchange Act of 1934 and the Investment Company Act of 1940, the Registrant has duly caused this report to be signed on its behalf by the undersigned, thereunto duly authorized.
| | BMC Fund, Inc. |
| | |
| | By: | /s/ Boyd C. Wilson, Jr. |
| | | Boyd C. Wilson, Jr. Vice President and Chief Financial Officer |
Date: December 19, 2012
Pursuant to the requirements of the Securities Exchange Act of 1934 and the Investment Company Act of 1940, this report has been signed below by the following persons on behalf of the registrant and in the capacities and on the dates indicated.
| | |
| | By: | /s/ Paul H. Broyhill |
| | | Paul H. Broyhill Chairman and Chief Executive Officer |
Date: December 19, 2012
| | |
| | By: | /s/ Boyd C. Wilson, Jr. |
| | | Boyd C. Wilson, Jr. Vice President and Chief Financial Officer |
Date: December 19, 2012