In 1924, economist John Maynard Keynes wrote that companies that reinvest profits can create “an element of compound interest operating in favour of a sound industrial investment.” At Alger, we believe reinvesting profits and producing compounding earnings growth is a powerful wealth creator. To that end, we seek companies that we believe have strong potential for compounding earnings growth, and we seek to avoid cyclical companies, including “short-duration” companies, or businesses with high current earnings that return most of their profits to shareholders. In most instances, these cyclical companies, in our view, have little or no potential for future long-term earnings growth.
As Warren Buffett has observed, investors “occasionally do crazy things” which creates opportunities for investors who can “disregard mob fears or enthusiasms….and focus on a few simple fundamentals.” We believe recent concerns about interest rates, inflation and valuations have caused many investors to act irrationally by focusing on cyclical short-duration companies while shunning the “sound industrial investment” identified by Keynes.
The strong trend of investors rejecting the appeal of long-term earnings growth, in our view, played a major role in our disappointing fund performance during the fiscal six-month period ended April 30, 2022. The fiscal period included the continuation of a dramatic rotation by many investors seeking instant gratification by favoring companies with high current earnings. This rotation was initially fueled prior to the reporting period by optimism that scaling back or eliminating measures to curtail the COVID-19 pandemic combined with unprecedented levels of fiscal stimulus would drive strong economic growth. More recently, however, optimism gave way to concerns that equities may be overvalued at a time when the economy could overheat and require the U.S. Federal Reserve (the “Fed”) to continue to raise interest rates to fight inflation.
In response, the Fed shifted its outlook-it no longer maintained that inflation was a transitory result of supply chain issues and the economy reopening, and in March, the Fed raised the federal funds rate by 25 basis points (“BPS”), its first hike since cutting the rate to zero in 2020. Furthermore, Fed statements in March led many investors to anticipate a 50BPS rate hike in May and 200BPS in aggregate hikes by the end of 2022. Fears that rate hikes could eventually spark a recession also weighed upon investor sentiment.
The rotation to short-duration companies was also partially supported by investors reacting to higher interest rates in a fairly typical fashion-they adjusted their cash flow modeling by increasing the rate at which they discount future cash flows back to the present, thereby lowering the value of long-duration companies. This process is similar to how long-term bonds are impacted more by rising rates than short-term bonds.
Many small cap growth companies tend to have little or no current earnings, but strong potential for significant sales and earnings growth. Within the Russell 2000 Growth Index, for example, we believe many Healthcare companies are high-quality businesses even though they may not generate profits due to their investments in new initiatives, their products or potential products can have high gross margins and potential for capturing market share.
As a result of investors dismissing the appeal of potential earnings growth, the Healthcare sector was one of the worst performing sectors within the small cap growth category. From a broader perspective, sectors that generally consist of companies that provide dividends and appear to be less susceptible to inflation, such as Energy and Consumer Staples, led.
Also during the fiscal six-month period, growth underperformed value across the market cap spectrum, with the -26.77% return of the Russell 2000 Growth Index being a noteworthy laggard when compared to the -9.5% return of the Russell 2000 Value Index. The broad market, as measured by the S&P 500 Index, dropped 8.17%.
Concerns about interest rates, inflation and the Russian invasion of Ukraine also extended beyond the U.S. Investors also assessed the spread of COVID-19 in China. Among non-U.S. equities, emerging markets significantly underperformed with the MSCI Emerging Markets Index declining 14.04% during the fiscal six-month reporting period. Within the index, the Utilities sector was the only sector to generate positive performance, as investors focused on companies that they perceived as having recession resistant fundamentals that provide a relatively high return of cash to shareholders. Consumer Discretionary, Healthcare and Energy were among the worst performing sectors. The selloff also included developed markets with the MSCI EAFE Index declining 11.58%. From a broader perspective, the MSCI ACWI Index declined 11.45%.
As a result of investors’ rotation out of quality companies, growth equities, we believe, are trading at attractive valuations. Notably, the Russell 2000 Growth Index price-to-earnings (P/E) ratio based on the next 12-months’ earnings, declined from 50.2x to approximately 33.5x during the six-month fiscal reporting period while the Russell 1000 Growth Index declined from 30.7x to 23.8x.
Investors who are concerned about monetary policy may want to consider two points:
First, Fed rate increases don’t always lead to recessions. In fact, since 1965 there have been three instances in which the Fed increased the federal funds rate 300 BPS or more that resulted in continued real economic growth and slowing inflation rather than recessions. Additionally, during the 12-months following the end of Fed tightening in 1985 and 1995, as well as after the Fed relented in 2018, equities generated double-digit returns.
Second, the later phases of monetary tightening have been accompanied by growth stocks outperforming value equities. The six-month periods starting approximately three months after the beginning of Fed tightening cycles initiated in 1994, 1999, 2004 and 2015 illustrate this point. Based on the returns of the Russell 3000 Growth and Russell 3000 Value indices, the median outperformance of growth during those periods was 400BPS. During later phases of rate hikes, economic growth slows, so investors may be more willing to pay a premium for companies that can increase their earnings.
We continue to believe that unprecedented levels of innovation, such as healthcare advancements in genetic science, and digital technologies including artificial intelligence, e-commerce, the metaverse, streaming entertainment, and cloud computing are providing opportunities for leading companies to reward investors by generating long-term earnings growth. We will continue to focus on conducting in-depth fundamental research as we seek leaders of innovation rather than take short-term bets on the fickle nature of investor sentiment. We believe doing so is the best strategy for helping our valued shareholders reach their investment goals.
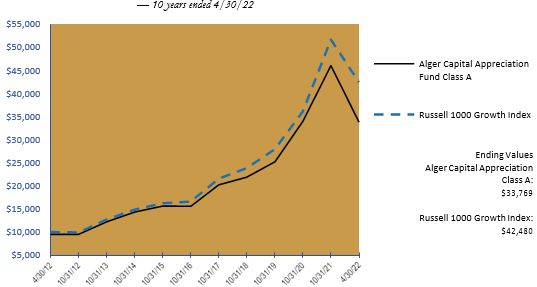
The Alger Capital Appreciation Fund returned -26.67% for the fiscal six-month period ended April 30, 2022, compared to the -17.84% return of its benchmark, the Russell 1000 Growth Index.
During the reporting period, the largest portfolio sector weightings were Information Technology and Consumer Discretionary. The largest sector overweight was Information Technology and the largest sector underweight was Consumer Staples.
The Communication Services and Real Estate sectors provided the largest contributions to relative performance. Regarding individual positions, Alibaba Group Holding Ltd. Sponsored ADR; AbbVie, Inc.; UnitedHealth Group, Inc.; Vertex Pharmaceuticals, Inc.; and Qualcomm, Inc. were the top contributors to absolute performance. AbbVie is a global biopharmaceutical company that had been shunned by many investors due to the potential for the company’s Humira treatment to face increased competition in 2023. Humira is used for rheumatology, dermatology, gastroenterology and ophthalmology. We believe, however, that AbbVie has significantly diversified its revenue and that its launch of Rinvoq for psoriatic arthritis and atopic dermatitis is promising. We believe these developments contributed to the company’s release in early 2022 of favorable quarterly results and investor confidence in the company, which supported the performance of AbbVie shares.
The Information Technology and Financials sectors were the largest detractors from relative performance. Regarding individual positions, Amazon.com, Inc.; Microsoft Corp.; Shopify, Inc. Cl. A; Alphabet, Inc., Cl. C; and PayPal Holdings, Inc. were among the top detractors from absolute performance. Shopify provides a full-service, cloud-based software platform for small and medium-sized businesses to establish and conduct e-commerce operations. Shopify’s solutions enable merchants to run their businesses across a multitude of channels by facilitating merchants’ ability to manage products and inventory, process orders and payments, build customer relationships, automate marketing campaigns and leverage analytics and reporting. Shopify is an innovation-led company that is generating high unit volume growth as it benefits from the positive dynamic change of consumer adoption of e-commerce. The company also generates attractive free cash flow. Shopify’s share price declined during the second half of the reporting period after the company announced it would reinvest gross profits into research and development, hire more engineers and salespeople, and introduce new marketing programs in order to expedite its growth. The level of investment was more than many investors had contemplated, which hurt the performance of Shopify shares.
The Alger 35 Fund generated a -32.01% return during the fiscal six-month period ended April 30, 2022, compared to the -9.65% return of its benchmark, the S&P 500 Index. During the reporting period, the largest sector weightings were Information Technology and Healthcare. The largest sector overweight was Information Technology. The Fund had no exposure to the Materials or Utilities sectors.
The Consumer Discretionary and Industrials sectors provided the greatest contributions to relative performance. Regarding individual positions, Diamondback Energy, Inc.; Qualcomm, Inc.; Vail Resorts, Inc.; Alibaba Group Holding Ltd. Sponsored ADR; and Xilinx, Inc. were among the top contributors to absolute performance. Alibaba is a leading e-commerce and cloud computing company in China. It also serves the big data analytics, digital media and entertainment markets. Alibaba’s shares have previously suffered from concerns about heightened regulatory oversight of the Chinese internet sector by the Chinese Communist Party. Additionally, many investors became concerned about the potential for U.S. exchange listed Chinese ADRs to be delisted if they failed to meet U.S. financial reporting standards by 2024. These issues caused investors to sell shares of Alibaba, which we believe created attractive valuations. In the later portion of the fiscal six-month reporting period, the shares outperformed in response to statements by the Chinese government supporting stable markets and overseas listings. The Chinese government also stated that its intensified regulatory efforts aimed at tech companies may end soon.
Information Technology and Healthcare were among the sectors that detracted from relative performance. Regarding individual positions, Shopify, Inc., Cl. A; Marqeta, Inc., Cl A; Natera, Inc.; Upstart Holdings, Inc.; and Amazon.com, Inc. were among the top detractors from absolute performance. Shares of Shopify underperformed in response to developments identified in the Alger Capital Appreciation Fund discussion.
The Alger Growth & Income Fund returned -6.49% for the fiscal six-month period ended April 30, 2022, compared to the -9.65% return of its benchmark, the S&P 500 Index.
During the reporting period, the largest portfolio sector weightings were Information Technology and Financials. The largest sector overweight was Financials and the largest sector underweight was Consumer Discretionary.
Contributors to Performance
The Information Technology and Healthcare sectors provided the largest contributions to relative performance. Regarding individual positions, Chevron Corp.; AbbVie, Inc.; Apple, Inc.; UnitedHealth Group, Inc.; and Exxon Mobil Corp. were top contributors to absolute performance. Shares of AbbVie outperformed in response to developments identified in the Alger Capital Appreciation Fund discussion.
Detractors from Performance
The Financial and Utilities sectors were the most significant detractors from relative performance. Regarding individual positions, Microsoft Corp.; JPMorgan Chase & Co.; Alphabet, Inc., Cl. A; Alphabet, Inc., Cl. C; and BlackRock, Inc. were the top detractors from absolute performance. Microsoft is a positive dynamic change beneficiary of corporate America’s transformative digitization. In a previous earnings call, Microsoft’s CEO said he expects that technology spending as a percent of GDP is likely to jump from about 5% today to 10% in a few years, and that Microsoft will continue to take market share within the technology industry. Microsoft’s enterprise cloud product, Azure, is rapidly growing and accruing market share. Microsoft reported that Azure grew 46% in the quarter ended December 31, 2021, and the company’s total revenue growth exceeded 20%. Microsoft’s share price declined despite its high unit volume growth as the broad equity market and technology stocks declined due to higher interest rates and the Russia/Ukraine conflict.
Alger Mid Cap Growth Fund
The Alger Mid Cap Growth Fund returned -34.18% for the fiscal six-month period ended April 30, 2022, compared to the -25.44% return of its benchmark, the Russell Midcap Growth Index. During the reporting period, the largest sector weightings were Information Technology and Healthcare. The largest sector overweight was Energy and the largest underweight was Industrials.
Contributors to Performance
The Consumer Discretionary and Real Estate sectors provided the largest contributions to relative performance. Regarding individual positions, Diamondback Energy, Inc.; Vail Resorts, Inc.; Palo Alto Networks, Inc.; Xilinx, Inc.; and Lucid Group, Inc. were among the top contributors to absolute performance. Vail Resorts is a premier luxury mountain resort operator whose properties include locations in Vail, Breckenridge, Beaver Creek, Park City, and Whistler. Given its strong industry position, shares of Vail Resorts contributed to portfolio performance as the company capitalized on consumers’ embrace of travel and social activity with the economy reopening from pandemic restrictions.
Detractors from Performance
The Information Technology and Healthcare sectors were among the sectors that detracted from relative performance. Regarding individual positions, Upstart Holdings, Inc.; Natera, Inc.; Marqeta, Inc., Cl. A; Paycom Software, Inc.; and Affirm Holdings, Inc., Cl. A were the top detractors from absolute performance. Natera is a specialty lab providing genetic testing services in reproductive health, oncology and transplant. Non-invasive prenatal testing (NIPT), part of the company’s reproductive health franchise, has generated the majority of revenue historically; however, we believe Natera’s oncology business has potential to contribute toward a larger share of revenue as customers increasingly adopt these tests following positive insurance reimbursement decisions and favorable clinical trial results. Natera’s share underperformed after the publication of a short report by Hindenburg Research. The company also lost a false advertisement lawsuit by CareDx, and high-growth, high-valuation companies were out of favor with investors during the fiscal reporting period. We believe many of the allegations in the short report regarding sales and the company’s relationship with a third-party billing vendor are irrelevant to Natera’s outlook and its oncology franchise, which we view as the company’s key growth engine.
Alger Mid Cap Focus Fund
The Alger Mid Cap Focus Fund generated a -33.38% return for the fiscal six-month period ended April 30, 2022, compared to the -25.44% return of its benchmark, the Russell Midcap Growth Index. During the reporting period, the largest portfolio sector weightings were Information Technology and Industrials. The largest sector overweight was Industrials and the largest sector underweight was Information Technology.
Contributors to Performance
The Communications Services and Consumer Discretionary sectors provided the largest contributions to relative performance. Regarding individual positions, Vocera Communications, Inc.; Anaplan, Inc.; Baker Hughes Company, Cl. A; Booking Holdings, Inc.; and CF Industries Holdings, Inc. were among the top contributors to absolute performance. Anaplan is a leading provider of cloud-based business planning software. Its software is a “connected planning” platform, enabling all parts of business planning to become a more dynamic, collaborative and integrated process across the enterprise. Unlike traditional business planning, Anaplan’s proprietary technology is designed to enable broader enterprise participation and better workforce collaboration during the business planning process.
Performance of Anaplan shares benefited from the company improving its sales execution which resulted in an increasing billing growth acceleration and a new record for the number of accounts with over $1 million in revenues. On March 20, 2022, subject to shareholder approval, Anaplan agreed to be acquired by private equity firm Thoma Bravo for $66 a share, an approximately 31% premium to the previous trading day’s close.
Detractors from Performance
The Industrials and Information Technology sectors were among the top detractors from relative performance. Regarding individual positions, Confluent, Inc., Cl. A; Herc Holdings, Inc.; XPO Logistics, Inc.; Generac Holdings, Inc.; and SiteOne Landscape Supply, Inc. were among the top detractors from absolute performance. Confluent is pioneering a new category of data infrastructure focused on data in motion (being transferred among locations) for software developers and enterprises. Confluent was founded by the original creators of event streaming company Apache Kafka and it is a large contributor to the open-source community and a leading commercial vendor behind Kafka. Confluent is designed to be the connective tissue by having real-time data from multiple sources constantly streamed across the enterprise for real-time analysis and data processing, powering smarter, faster and more modern digital applications.
The company’s cloud service is the only cloud-native Apache Kafka solution, a fully managed service that is serverless, infinitely scalable, elastic and secure. The stock underperformed during the first quarter because its revenue growth slowed. Cloud revenue recognition is consumption-based and Confluent stated that its fourth quarter 2021 was impacted by the holidays and workloads being shut off. However, billings for Confluent continued to grow at an elevated level and other metrics were also encouraging.
Alger Weatherbie Enduring Growth Fund
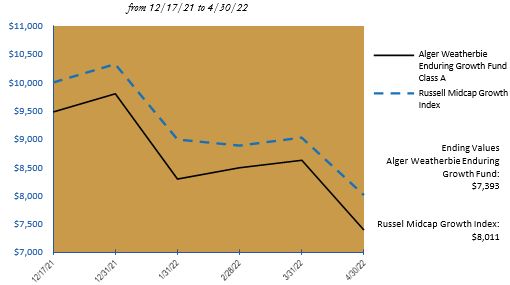
The Alger Weatherbie Enduring Growth Fund generated returned -22.00% from its December 17, 2021, inception date to April 30, 2022, compared to the -19.89% return of its benchmark, the Russell Midcap Growth Index.
During the reporting period, the largest sector weightings were Industrials and Information Technology. The largest sector overweight was Industrials. The Fund had no exposure to the Communication Services, Consumer Staples, Materials or Utilities sectors.
Contributors to Performance
The Information Technology sector and the Fund’s lack of Communication Services holdings provided the greatest contributions to relative performance.
The Fund’s contributors to absolute performance were limited to Waste Connection, Inc. and Vertex, Inc. during an abbreviated reporting period in which markets declined substantially. Vertex provides comprehensive tax solutions. Companies with complex tax operations rely on Vertex to automate their end-to-end indirect tax processes. The addressable market for Vertex is sizable, at approximately $7 billion globally. Vertex offers a solution in indirect tax – the largest corporate tax category (which includes sales tax and value-added tax), accounting for approximately $3.5 trillion of taxes annually.
Vertex reported better-than-expected results for the first quarter of 2022 and maintained full-year guidance. Its total revenue of $115.0 million was $2.0 million above publicly available Wall Street estimates and the midpoint of the company’s guidance. Adjusted earnings before interest, taxes, depreciation and amortization (EBITDA) of $19.1 million was approximately $2.3 million above consensus estimates.
Detractors from Performance
The Real Estate and Financials sectors were the most significant detractors from relative performance. Regarding individual positions, FirstService Corp.; Upstart Holdings, Inc.; HubSpot, Inc.; EPAM Systems, Inc.; and Progyny were the top detractors from absolute performance. FirstService is a leading provider of property management services to owners and homeowners associations of community and high-rise properties, as well as the provider of branded services such as California Closets and CertaPro Painters for residential homeowners. Services also include home restoration after fires, flooding or other events. FirstService continues to extend its significant scale advantage as it rolls up the property management industry and provides higher quality and greater breadth of services than its competition, while using its free cash and strong balance sheet to continue to make what we believe are attractive value-enhancing acquisitions.
FirstService’s share price declined in early 2022 market turmoil due in part to inflation concerns. The company’s fourth quarter was in-line with its internal budget and its revenues exceeded guidance. Wage inflation has been discussed across the recent period of rising inflation, but management reported improved employee retention and more favorable conditions for filling open positions. FirstService’s residential business has continued to grow faster than the overall market, and the company’s branded services continue to experience very strong demand in home improvement and other areas, which we believe should help offset a tougher near-term year-over-year comparison in restoration services due to last year’s increased demand caused by the freezing weather in Texas.
Alger Weatherbie Specialized Growth Fund
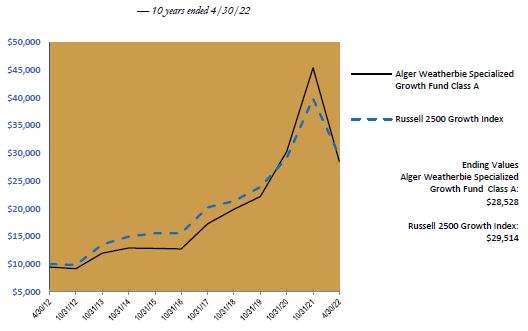
The Alger Weatherbie Specialized Growth Fund generated a -37.12% return during the fiscal six-month period ended April 30, 2022, compared to the -25.96% return of its benchmark, the Russell 2500 Growth Index.
During the reporting period, the largest portfolio sector weightings were Information Technology and Industrials. The largest sector overweight was Financials. The Fund had no exposure to Consumer Staples or Utilities sectors and insignificant exposures to the Communication Services sector.
Contributors to Performance
The Healthcare and the Communication Services sectors provided the greatest contributions to relative performance. Regarding individual positions, Apria, Inc., Signature Bank; U.S. Physical Therapy, Inc.; Petco Health & Wellness Co., Inc., Cl. A; and Sweetgreen, Inc., Cl. A. were among top contributors to absolute performance. Apria is a durable medical equipment company that provides equipment, supplies, and services prescribed by doctors for patients to home medical care for respiratory issues, obstructive sleep apnea and wounds. In early January, healthcare logistics and medical device provider Owens & Minor announced plans to acquire Apria for $1.6 billion in cash, an approximately 26% premium to the prior day’s closing price.
Detractors from Performance
The Financials sector was the largest detractor from relative performance. Regarding individual positions, Natera, Inc.; SiteOne Landscape Supply, Inc.; Latham Group Inc.; FirstService Corp.; Chegg, Inc.; and StepStone Group, Inc., Cl. A were the most significant detractors from absolute performance. Shares of Natera underperformed in response to developments identified in the Alger Mid Cap Growth Fund discussion.
Alger Small Cap Growth Fund
The Alger Small Cap Growth Fund returned -34.49% for the fiscal six-month period ended April 30, 2022, compared to the -26.77% return of its benchmark, the Russell 2000 Growth Index. During the reporting period, the largest portfolio sector weightings were Healthcare and Information Technology. The largest sector overweight was Healthcare and the largest underweight was Industrials.
Contributors to Performance
The Financials and Industrials sectors provided the greatest contributions to relative performance. Regarding individual positions, Vocera Communications, Inc.; Magnolia Oil & Gas Corp., Cl. A; US Foods Holding Corp.; Chefs’ Warehouse, Inc.; and HealthEquity Inc. were the top contributors to absolute performance. Vocera Communications is a leading provider of cloud-based communication and workflow solutions, primarily for the healthcare industry. Vocera’s core solution is an enterprise-class server software platform that allows users to communicate and collaborate using voice or Health Insurance Portability and Accountability Act (HIPAA) compliant secure texting through a variety of Vocera-designed and third-party devices. On January 6, 2022, Stryker Corporation announced an agreement to acquire Vocera for $79.25 per share, or an approximate $3.1 billion enterprise value, which was a 26.8% premium to the prior day’s closing price. The deal was completed on February 23, 2022.
Detractors from Performance
The Information Technology and Healthcare sectors were among the sectors that detracted from relative performance. Regarding individual positions, InMode Ltd.; HubSpot, Inc.; Joint Corp.; Neogen Corp.; and NanoString Technologies, Inc. were the top detractors from absolute performance.
InMode designs, develops, manufactures and commercializes innovative minimally invasive and non-invasive aesthetic medical products. InMode’s platforms harness novel radio frequency (RF) technology for emerging minimally invasive procedures that bridge the gap between temporary treatments like facials and more invasive surgical procedures like facelifts across several specialty categories such as plastic surgery, gynecology, dermatology, ophthalmology and otolaryngology (ear, nose and throat care). The aesthetics market experienced strong tailwinds coming out of the COVID-19 pandemic. These tailwinds include the “Zoom effect,” or dissatisfaction with one’s personal appearance after viewing one’s own face on Zoom, which resulted in more people deciding to undergo aesthetic procedures. De-stigmatization of aesthetics procedures, aided by social media platforms, has also supported InMode’s results. However, the stock price declined during the first quarter, in part due to a rotation out of high-valuation names. Some investors also feared a wallet share shift away from aesthetics and have concerns about InMode’s exposure to international markets due to the Ukraine/Russia conflict; however, our research suggests the company’s revenue exposure to Europe is minimal.
Alger Small Cap Focus Fund
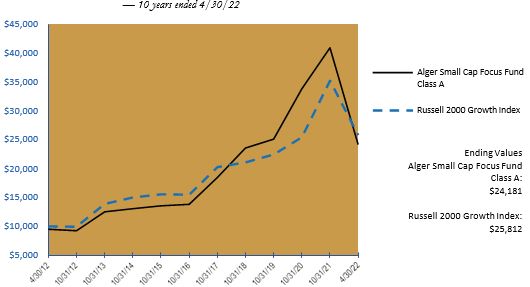
The Alger Small Cap Focus Fund returned -40.96% during the fiscal six-month period ended April 30, 2022, compared to the -26.77% return of its benchmark, the Russell 2000 Growth Index. During the reporting period, the Healthcare and Information Technology sectors were the largest portfolio sector weightings. The largest sector overweight was Healthcare. The Fund had no exposure to the Materials, Real Estate or Utilities sectors and insignificant exposure to the Communication Services sector.
Contributors to Performance
The Consumer Discretionary and Financials sectors provided the greatest contributions to relative performance. During a quarter in which equity markets declined substantially, PDC Energy, Inc.; Viper Energy Partners LP; and Allbirds, Inc., Cl. A. were the only individual positions that contributed to absolute performance. PDC Energy acquires, explores and develops properties for the production of crude oil and natural gas, including the liquid components of natural gas. It has operations in the Wattenberg Field in Colorado and the Delaware Basin in West Texas. The company’s drilling locations are split approximately 75%/25% between Colorado and West Texas. Recently, PDC Energy acquired Great Western Petroleum, LLC. The acquisition materially increased PDC Energy’s scale by adding 315 identified locations and bringing the company’s pro forma combined drilled uncompleted (DUC) and approved permit count to approximately 500 locations at year-end 2021. The stock performed strongly during the second half of the reporting period after the company announced it will link the return of capital to shareholders to 60% of free cash flow remaining after paying its base dividend, with the potential to move higher over time once the company has paid down debt to a level of approximately $1 billion. Management also suggested that the primary mode of cash return would remain share buybacks and special dividends if needed. In addition, the company raised its base dividend and increased the share buyback authorization to $1.25 billion over the next two years.
Detractors from Performance
The Healthcare and Information Technology sectors were among the top detractors from relative performance. Regarding individual positions, CryoPort, Inc.; Natera, Inc.; Heska Corporation; Everbridge, Inc.; and Paycom Software, Inc. were the top detractors from absolute performance. Shares of Natera underperformed in response to developments identified in the Alger Mid Cap Growth Fund discussion.
Alger International Focus Fund
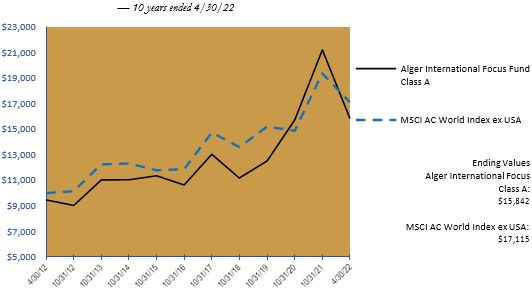
The Alger International Focus Fund recorded a -25.33% return for the fiscal six-month reporting period ended April 30, 2022, compared to the -11.68% return of its benchmark, the MSCI ACWI ex USA Index.
During the quarter, the largest portfolio sector weightings were Consumer Discretionary and Industrials. The largest sector overweight was Consumer Discretionary and the largest sector underweight was Financials.
Contributors to Performance
The Energy and Real Estate sectors provided the greatest contributions to relative performance. From a country perspective, the Fund’s lack of exposure to Russia and Canada and its underweight of Japan supported relative performance. The Fund’s underweight of Japan was also beneficial, while stock selection in the United Kingdom and South Korea provided additional support to relative performance.
Regarding individual positions, Angel One Limited; Schlumberger NV; London Stock Exchange Group plc; Samsonite International S.A.; and Core Laboratories NV were the top contributors to absolute performance. London Stock Exchange Group is a global leader in financial markets infrastructure across the exchange, trading, clearing, data, analytics and platform services. The stock outperformed during the later portion of the fiscal reporting period due to resilient earnings. Most importantly, the company delivered strong cost synergy realization related to its acquisition of Refinitiv, while also raising the guidance on total cost synergies related to the deal. This restored both confidence in management, as well as the deal rationale and created renewed investor interest in the stock, which has been rangebound for the past several months on a reduced valuation relative to global peers.
Detractors from Performance
The Industrials and Information Technology sectors were among the sectors that detracted from results. From a country perspective, Singapore, Switzerland, Australia, the Netherlands and Norway were among the top detractors from relative performance.
Regarding individual positions, Sea Ltd. (Singapore) ADR, Cl. A; EPAM Systems, Inc.; ASML Holding NV; AutoStore Holdings Ltd.; and Adyen NV were the top detractors from absolute performance. EPAM Systems provides software product development and digital platform engineering services. The company continues to benefit from secular growth in corporate digital initiatives, delivering 2021 earnings that beat consensus expectations. However, geopolitical conflict in Russia and Ukraine forced the company to cancel its earnings and sales guidance and shift its focus to business continuity plans in the first quarter of 2022. While less than 5% of revenues are exposed to Russia, Ukraine and Belarus, the company has operating exposure to those countries as its software engineers are located within the region. Demand remains strong and management has focused on relocating talent outside of conflict zones, along with recruitment across non-conflict regions, to maintain project delivery timelines. The stock de-rated significantly during the early part of 2022 as investors weighed uncertainties related to EPAM’s business operations.
Alger Health Sciences Fund
The Alger Health Sciences Fund returned -28.50% for the fiscal six-month period ended April 30, 2022, compared to the -9.65% return of the S&P 500 Index and the -7.91% return of the Russell 3000 Healthcare Index.
Contributors to Performance
Regarding individual positions, AbbVie, Inc.; Bristol-Myers Squibb Co.; McKesson Corp.; Intra-Cellular Therapies, Inc.; and Bayer AG. were the top contributors to absolute performance. Shares of AbbVie outperformed in response to developments identified in the Alger Capital Appreciation Fund discussion.
Detractors from Performance
InMode Ltd.; Azenta, Inc.; DexCom, Inc.; Celldex Therapeutics, Inc.; and Edwards Lifesciences Corp. were the top detractors from absolute performance. Shares of InMode underperformed in response to developments identified in the Alger Small Cap Growth Fund discussion.
I thank you for putting your trust in Alger.
| Sincerely, | |
| |
| | |
| Daniel C. Chung, CFA | |
| Chief Executive Officer | |
| Fred Alger Management, LLC | |
Investors cannot invest directly in an index. Index performance does not reflect the deduction for fees, expenses, or taxes.
This report and the financial statements contained herein are submitted for the general information of shareholders of the funds. This report is not authorized for distribution to prospective investors in a fund unless preceded or accompanied by an effective prospectus for the fund. Performance of funds discussed above other than the Alger 35 Fund and the Alger Mid Cap Focus Fund represents the return of Class A shares prior to the deduction of any sales charges and includes the reinvestment of any dividends or distributions. Performance for the Alger 35 Fund represents Class Z shares. Performance for the Alger Mid Cap Focus Fund represents Class I shares.
The performance data quoted represents past performance, which is not an indication or guarantee of future results.
Standardized performance results can be found on the following pages. The investment return and principal value of an investment in a fund will fluctuate so that an investor’s shares, when redeemed, may be worth more or less than their original cost. Current performance may be lower or higher than the performance quoted. For performance data current to the most recent month-end, visit us at www.alger.com or call us at (800) 992-3863.
The views and opinions of the funds’ management in this report are as of the date of the Shareholders’ Letter and are subject to change at any time subsequent to this date. There is no guarantee that any of the assumptions that formed the basis for the opinions stated herein are accurate or that they will materialize. Moreover, the information forming the basis for such assumptions is from sources believed to be reliable; however, there is no guarantee that such information is accurate. Any securities mentioned, whether owned in a fund or otherwise, are considered in the context of the construction of an overall portfolio of securities and therefore reference to them should not be construed as a recommendation or offer to purchase or sell any such security. Inclusion of such securities in a fund and transactions in such securities, if any, may be for a variety of reasons, including, without limitation, in response to cash flows, inclusion in a benchmark, and risk control. The reference to a specific security should also be understood in such context and not viewed as a statement that the security is a significant holding in a fund. Please refer to the Schedule of Investments for each fund which is included in this report for a complete list of fund holdings as of April 30, 2022. Securities mentioned in the Shareholders’ Letter, if not found in the Schedule of Investments, may have been held by the funds during the fiscal six-month period ended April 30, 2022.
Risk Disclosures
Alger Capital Appreciation Fund
Investing in the stock market involves risks, including the potential loss of principal. Growth stocks may be more volatile than other stocks as their prices tend to be higher in relation to their companies’ earnings and may be more sensitive to market, political, and economic developments. Local, regional or global events such as environmental or natural disasters, war, terrorism, pandemics, outbreaks of infectious diseases and similar public health threats, recessions, or other events could have a significant impact on investments. A significant portion of assets may be invested in securities of companies in related sectors, and may be similarly affected by economic, political, or market events and conditions and may be more vulnerable to unfavorable sector developments. Foreign securities involve special risks including currency fluctuations, inefficient trading, political and economic instability, and increased volatility.
Alger 35 Fund
Investing in the stock market involves risks, including the potential loss of principal. Growth stocks may be more volatile than other stocks as their prices tend to be higher in relation to their companies’ earnings and may be more sensitive to market, political, and economic developments. Local, regional or global events such as environmental or natural disasters, war, terrorism, pandemics, outbreaks of infectious diseases and similar public health threats, recessions, or other events could have a significant impact on investments. A significant portion of assets may be invested in securities of companies in related sectors, and may be similarly affected by economic, political, or market events and conditions and may be more vulnerable to unfavorable sector developments. Investing in companies of small and medium capitalizations involves the risk that such issuers may have limited product lines or financial resources, lack management depth, or have limited liquidity. Foreign securities involve special risks including currency fluctuations, inefficient trading, political and economic instability, and increased volatility. The Fund is classified as a “non-diversified fund” under federal securities laws because it can invest in fewer individual companies than a diversified fund. Assets may be focused in a small number of holdings, making them susceptible to risks associated with a single economic, political or regulatory event than a more diversified portfolio. Active trading may increase transaction costs, brokerage commissions, and taxes, which can lower the return on investment.
Alger Growth & Income Fund
Investing in the stock market involves risks, including the potential loss of principal. Growth stocks may be more volatile than other stocks as their prices tend to be higher in relation to their companies’ earnings and may be more sensitive to market, political, and economic developments. Local, regional or global events such as environmental or natural disasters, war, terrorism, pandemics, outbreaks of infectious diseases and similar public health threats, recessions, or other events could have a significant impact on investments. A significant portion of assets may be invested in securities of companies in related sectors, and may be similarly affected by economic, political, or market events and conditions and may be more vulnerable to unfavorable sector developments. Income-producing securities may cut or fail to declare dividends due to market downturns or for other reasons. At times, the Fund may hold a large cash position, which may underperform relative to equity securities.
Alger Mid Cap Growth Fund
Investing in the stock market involves risks, including the potential loss of principal. Growth stocks may be more volatile than other stocks as their prices tend to be higher in relation to their companies’ earnings and may be more sensitive to market, political, and economic developments. Local, regional or global events such as environmental or natural disasters, war, terrorism, pandemics, outbreaks of infectious diseases and similar public health threats, recessions, or other events could have a significant impact on investments. A significant portion of assets may be invested in securities of companies in related sectors, and may be similarly affected by economic, political, or market events and conditions and may be more vulnerable to unfavorable sector developments. Investing in companies of medium capitalizations involves the risk that such issuers may have limited product lines or financial resources, lack management depth, or have limited liquidity. Foreign securities involve special risks including currency fluctuations, inefficient trading, political and economic instability, and increased volatility. Active trading may increase transaction costs, brokerage commissions, and taxes, which can lower the return on investment.
Alger Mid Cap Focus Fund
Investing in the stock market involves risks, including the potential loss of principal. Growth stocks may be more volatile than other stocks as their prices tend to be higher in relation to their companies’ earnings and may be more sensitive to market, political, and economic developments. Local, regional or global events such as environmental or natural disasters, war, terrorism, pandemics, outbreaks of infectious diseases and similar public health threats, recessions, or other events could have a significant impact on investments. Investing in companies of medium capitalizations involves the risk that such issuers may have limited product lines or financial resources, lack management depth, or have limited liquidity. Assets may be focused in a small number of holdings, making them susceptible to risks associated with a single economic, political or regulatory event than a more diversified portfolio. A significant portion of assets may be invested in securities of companies in related sectors or industries, and may be similarly affected by economic, political, or market events and conditions and may be more vulnerable to unfavorable sector or industry developments.
The Fund is classified as a “non-diversified fund” under federal securities laws because it can invest in fewer individual companies than a diversified fund. Foreign securities involve special risks including currency fluctuations, inefficient trading, political and economic instability, and increased volatility. Active trading may increase transaction costs, brokerage commissions, and taxes, which can lower the return on investment. At times, the Fund may hold a large cash position, which may underperform relative to equity securities.
Alger Weatherbie Enduring Growth Fund
Investing in the stock market involves risks, including the potential loss of principal. Growth stocks may be more volatile than other stocks as their prices tend to be higher in relation to their companies’ earnings and may be more sensitive to market, political, and economic developments. Local, regional or global events such as environmental or natural disasters, war, terrorism, pandemics, outbreaks of infectious diseases and similar public health threats, recessions, or other events could have a significant impact on investments. A significant portion of assets may be invested in securities of companies in related sectors, and may be similarly affected by economic, political, or market events and conditions and may be more vulnerable to unfavorable sector developments. Weatherbie Capital, LLC’s use of an environmental, social, and governance (“ESG”) rating agency to implement the investment strategy may result in the selection or exclusion of securities for reasons other than financial performance and the strategy may underperform strategies that do not utilize an ESG rating agency or employ another type of ESG investment strategy. In evaluating a particular issuer’s ESG rating, as well as the account’s weighted average ESG rating, Weatherbie Capital, LLC relies exclusively on the ESG rating agency and, therefore, is dependent upon information and data from the ESG rating agency that may be incomplete or inaccurate, or that may present conflicting information and data with respect to an issuer than other third party ESG data providers utilized throughout the industry. Investing in companies of medium capitalizations involves the risk that such issuers may have limited product lines or financial resources, lack management depth, or have limited liquidity. Assets may be focused in a small number of holdings, making them susceptible to risks associated with a single economic, political or regulatory event than a more diversified portfolio. Investing in new issues involves special risks including lack of trading history, limited information and availability, and volatility. Cash positions may underperform relative to equity and fixed-income securities. Active trading may increase transaction costs, brokerage commissions, and taxes, which can lower the return on investment. The Fund is classified as a “non-diversified fund” under federal securities laws because it can invest in fewer individual companies than a diversified fund.
Alger Weatherbie Specialized Growth Fund
Investing in the stock market involves risks, including the potential loss of principal. Growth stocks may be more volatile than other stocks as their prices tend to be higher in relation to their companies’ earnings and may be more sensitive to market, political, and economic developments. Local, regional or global events such as environmental or natural disasters, war, terrorism, pandemics, outbreaks of infectious diseases and similar public health threats, recessions, or other events could have a significant impact on investments. A significant portion of assets may be invested in securities of companies in related sectors, and may be similarly affected by economic, political, or market events and conditions and may be more vulnerable to unfavorable sector developments. Investing in companies of small and medium capitalizations involves the risk that such issuers may have limited product lines or financial resources, lack management depth, or have limited liquidity. Assets may be focused in a small number of holdings, making them susceptible to risks associated with a single economic, political or regulatory event than a more diversified portfolio. Foreign securities and emerging markets involve special risks including currency fluctuations, inefficient trading, political and economic instability, and increased volatility.
Alger Small Cap Growth Fund
Investing in the stock market involves risks, including the potential loss of principal. Growth stocks may be more volatile than other stocks as their prices tend to be higher in relation to their companies’ earnings and may be more sensitive to market, political, and economic developments. Local, regional or global events such as environmental or natural disasters, war, terrorism, pandemics, outbreaks of infectious diseases and similar public health threats, recessions, or other events could have a significant impact on investments. A significant portion of assets may be invested in securities of companies in related sectors or industries, and may be similarly affected by economic, political, or market events and conditions and may be more vulnerable to unfavorable sector or industry developments. Investing in companies of small capitalizations involves the risk that such issuers may have limited product lines or financial resources, lack management depth, or have limited liquidity. At times, the Fund may hold a large cash position, which may underperform relative to equity securities.
Alger Small Cap Focus Fund
Investing in the stock market involves risks, including the potential loss of principal. Growth stocks may be more volatile than other stocks as their prices tend to be higher in relation to their companies’ earnings and may be more sensitive to market, political, and economic developments. Local, regional or global events such as environmental or natural disasters, war, terrorism, pandemics, outbreaks of infectious diseases and similar public health threats, recessions, or other events could have a significant impact on investments. A significant portion of assets may be invested in securities of companies in related sectors or industries, and may be similarly affected by economic, political, or market events and conditions and may be more vulnerable to unfavorable sector or industry developments. Investing in companies of small capitalizations involves the risk that such issuers may have limited product lines or financial resources, lack management depth, or have limited liquidity. Assets may be focused in a small number of holdings, making them susceptible to risks associated with a single economic, political or regulatory event than a more diversified portfolio. Foreign securities involve special risks including currency fluctuations, inefficient trading, political and economic instability. At times, the Fund may hold a large cash position, which may underperform relative to equity securities.
Alger International Focus Fund
Investing in the stock market involves risks, including the potential loss of principal. Growth stocks may be more volatile than other stocks as their prices tend to be higher in relation to their companies’ earnings and may be more sensitive to market, political, and economic developments. Local, regional or global events such as environmental or natural disasters, war, terrorism, pandemics, outbreaks of infectious diseases and similar public health threats, recessions, or other events could have a significant impact on investments. A significant portion of assets may be invested in securities of companies in related sectors, and may be similarly affected by economic, political, or market events and conditions and may be more vulnerable to unfavorable sector developments. Assets may be focused in a small number of holdings, making them susceptible to risks associated with a single economic, political or regulatory event than a more diversified portfolio. Foreign securities and emerging markets involve special risks including currency fluctuations, inefficient trading, political and economic instability, and increased volatility. Investing in companies of small capitalizations involves the risk that such issuers may have limited product lines or financial resources, lack management depth, or have limited liquidity. Active trading may increase transaction costs, brokerage commissions, and taxes, which can lower the return on investment.
Alger Health Sciences Fund
Investing in the stock market involves risks, including the potential loss of principal. Growth stocks may be more volatile than other stocks as their prices tend to be higher in relation to their companies’ earnings and may be more sensitive to market, political, and economic developments. Local, regional or global events such as environmental or natural disasters, war, terrorism, pandemics, outbreaks of infectious diseases and similar public health threats, recessions, or other events could have a significant impact on investments. A significant portion of assets will be invested in healthcare companies, which may be significantly affected by competition, innovation, regulation, and product obsolescence, and may be more volatile than the securities of other companies. A significant portion of assets may be invested in securities of companies in related industries, and may be similarly affected by economic, political, or market events and conditions and may be more vulnerable to unfavorable industry developments. Investing in companies of small capitalizations involves the risk that such issuers may have limited product lines or financial resources, lack management depth, or have limited liquidity. Private placements are offerings of a company’s securities not registered with the SEC and not offered to the public, for which limited information may be available. Such investments are generally considered to be illiquid. Foreign securities involve special risks including currency fluctuations, inefficient trading, political and economic instability, and increased volatility. Active trading may increase transaction costs, brokerage commissions, and taxes, which can lower the return on investment. At times, the Fund may hold a large cash position, which may underperform relative to equity securities.
For a more detailed discussion of the risks associated with a fund, please see the prospectus.
Before investing, carefully consider a fund’s investment objective, risks, charges, and expenses. For a prospectus and summary prospectus containing this and other information or for the Alger Funds’ most recent month-end performance data, visit www.alger.com, call (800) 992-3863 or consult your financial advisor. Read the prospectus and summary prospectus carefully before investing.
Distributor: Fred Alger & Company, LLC
NOT FDIC INSURED. NOT BANK GUARANTEED. MAY LOSE VALUE
Definitions:
| • | The Consumer Price Index (CPI) is a measure of the average change over time in the prices paid by urban consumers for a market basket of consumer goods and services. |
| • | Price-to-earnings is the ratio for valuing a company that measures its current share price relative to its earnings per share (EPS). |
| • | The Russell 3000 Growth Index combines the large-cap Russell 1000 Growth, the small-cap Russell 2000 Growth and the Russell Microcap Growth Index. It includes companies that are considered more growth oriented relative to the overall market as defined by Russell’s leading style methodology. The Russell 3000 Growth Index is constructed to provide a comprehensive, unbiased, and stable barometer of the growth opportunities within the broad market. |
| • | The Russell 3000 Value Index measures the performance of the broad value segment of the US equity value universe. It includes those Russell 3000 companies with lower price-to-book ratios and lower forecasted growth values. The Russell 3000 Value Index is constructed to provide a comprehensive, unbiased and stable barometer of the broad value market. |
| • | The MSCI ACWI Index (gross) is a free float-adjusted market capitalization weighted index that is designed to measure the equity market performance of developed and emerging markets. The MSCI ACWI captures large and mid-cap representation across developed markets and emerging markets countries. |
| • | The MSCI ACWI ex USA Index (gross) captures large and mid cap representation across developed markets countries (excluding the US) and emerging markets countries. The index covers approximately 85% of the global equity opportunity set outside the US. |
| • | The MSCI EAFE Index is designed to represent the performance of large and mid-cap securities across developed markets, including countries in Europe, Australasia and the Far East, excluding the U.S. and Canada. |
| • | The MSCI Emerging Markets Index (gross) is a free float-adjusted market capitalization index that is designed to measure equity market performance in the global emerging markets. |
| • | The Russell 1000 Growth Index measures the performance of the large-cap growth segment of the U.S. equity universe. It includes those Russell 1000 companies with higher growth earning potential as defined by Russell’s leading style methodology. The Russell 1000 Growth Index is constructed to provide a comprehensive and unbiased barometer for the large-cap growth segment. |
| • | The S&P 500 Growth Index is an unmanaged index considered representative of large-cap growth stocks. |
| • | The Russell Midcap Growth Index measures the performance of the mid-cap growth segment of the U.S. equity universe. It includes those Russell Midcap Index companies with higher growth earning potential as defined by Russell’s leading style methodology. The Russell Midcap Growth Index is constructed to provide a comprehensive and unbiased barometer of the mid-cap growth market. |
| • | The Russell 2500 Growth Index measures the performance of the small to mid-cap growth segment of the U.S. equity universe. It includes those Russell 2500 companies with higher growth earning potential as defined by Russell’s leading style methodology. The Russell 2500 Growth Index is constructed to provide a comprehensive and unbiased barometer of the small to mid-cap growth market. |
| • | The Russell 2000 Growth Index measures the performance of the small-cap growth segment of the U.S. equity universe. It includes those Russell 2000 companies with higher growth earning potential as defined by Russell’s leading style methodology. The Russell 2000 Growth Index is constructed to provide a comprehensive and unbiased barometer for the small-cap growth segment. |
| • | The Russell 2000 Value Index measures the performance of the small cap value segment of the U.S. equity universe. It includes those Russell 2000 companies with lower price-to-book ratios and lower forecasted growth values. The Russell 2000 Value Index is constructed to provide a comprehensive and unbiased barometer for the large-cap growth segment. |
| • | The Russell 3000 Healthcare Index is an unmanaged index that measures the performance of those companies in the Russell 3000 Index involved in the medical services or healthcare field. Also included are companies involved in research, development and production of pharmaceuticals and biotechnology |
FUND PERFORMANCE AS OF 3/31/22 (Unaudited)
AVERAGE ANNUAL TOTAL RETURNS
| | | | 1 YEAR | | | | 5 YEARS | | | | 10 YEARS | | | | SINCE INCEPTION | |
Alger Capital Appreciation Class A (Inception 12/31/96) | | | (3.61 | )% | | | 16.52 | % | | | 14.63 | % | | | 10.52 | % |
Alger Capital Appreciation Class C (Inception 7/31/97)* | | | 0.22 | % | | | 16.90 | % | | | 14.39 | % | | | 10.35 | % |
Alger Capital Appreciation Class Z (Inception 12/29/10) | | | 2.07 | % | | | 18.17 | % | | | 15.64 | % | | | 15.27 | % |
Alger 35 Fund Class Z (Inception 10/31/18)** | | | (4.16 | )% | | | n/a | | | | n/a | | | | 19.50 | % |
Alger Growth & Income Class A (Inception 12/31/96) | | | 11.48 | % | | | 13.94 | % | | | 12.85 | % | | | 9.30 | % |
Alger Growth & Income Class C (Inception 7/31/97)* | | | 15.76 | % | | | 14.30 | % | | | 12.61 | % | | | 9.13 | % |
Alger Growth & Income Class Z (Inception 3/1/12) | | | 18.00 | % | | | 15.57 | % | | | 13.80 | % | | | 13.94 | % |
Alger Mid Cap Growth Class A (Inception 12/31/96) | | | (15.17 | )% | | | 14.86 | % | | | 12.46 | % | | | 9.51 | % |
Alger Mid Cap Growth Class B (Inception 5/24/93) | | | (13.18 | )% | | | 15.60 | % | | | 12.51 | % | | | 9.48 | % |
Alger Mid Cap Growth Class C (Inception 7/31/97)* | | | (11.71 | )% | | | 15.17 | % | | | 12.16 | % | | | 8.87 | % |
Alger Mid Cap Growth Class Z (Inception 5/28/15) | | | (10.25 | )% | | | 16.43 | % | | | n/a | | | | 11.92 | % |
Alger Mid Cap Focus Class A (Inception 7/29/21) | | | n/a | | | | n/a | | | | n/a | | | | (16.72 | )% |
Alger Mid Cap Focus Class C (Inception 7/29/21) | | | n/a | | | | n/a | | | | n/a | | | | (13.33 | )% |
Alger Mid Cap Focus Class I (Inception 6/14/19) | | | (7.34 | )% | | | n/a | | | | n/a | | | | 24.48 | % |
Alger Mid Cap Focus Class Y (Inception 2/26/21) | | | (7.10 | )% | | | n/a | | | | n/a | | | | (10.58 | )% |
Alger Mid Cap Focus Class Z (Inception 6/14/19) | | | (7.05 | )% | | | n/a | | | | n/a | | | | 24.79 | % |
Alger Weatherbie Enduring Growth Class A (Inception 12/17/21) | | | n/a | | | | n/a | | | | n/a | | | | (13.74 | )% |
Alger Weatherbie Enduring Growth Class C (Inception 12/17/21) | | | n/a | | | | n/a | | | | n/a | | | | (10.11 | )% |
Alger Weatherbie Enduring Growth Class I (Inception 12/17/21) | | | n/a | | | | n/a | | | | n/a | | | | (9.00 | )% |
Alger Weatherbie Enduring Growth Class Y (Inception 12/17/21) | | | n/a | | | | n/a | | | | n/a | | | | (8.90 | )% |
Alger Weatherbie Enduring Growth Class Z (Inception 12/17/21) | | | n/a | | | | n/a | | | | n/a | | | | (8.90 | )% |
Alger Weatherbie Specialized Growth Class A (Inception 5/8/02) | | | (16.59 | )% | | | 17.75 | % | | | 12.97 | % | | | 10.37 | % |
Alger Weatherbie Specialized Growth Class C (Inception 5/8/02) | | | (13.31 | )% | | | 18.12 | % | | | 12.71 | % | | | 10.16 | % |
Alger Weatherbie Specialized Growth Class I (Inception 8/5/07) | | | (12.02 | )% | | | 19.04 | % | | | 13.59 | % | | | 10.71 | % |
Alger Weatherbie Specialized Growth Class Y (Inception 8/31/17) | | | (11.72 | )% | | | n/a | | | | n/a | | | | 18.04 | % |
Alger Weatherbie Specialized Growth Class Z (Inception 12/29/10) | | | (11.75 | )% | | | 19.42 | % | | | 13.95 | % | | | 13.21 | % |
Alger Small Cap Growth Class A (Inception 12/31/96) | | | (24.69 | )% | | | 14.27 | % | | | 11.04 | % | | | 6.27 | % |
Alger Small Cap Growth Class B (Inception 11/11/86) | | | (24.01 | )% | | | 14.89 | % | | | 11.01 | % | | | 6.25 | % |
Alger Small Cap Growth Class C (Inception 7/31/97)* | | | (21.84 | )% | | | 14.62 | % | | | 10.76 | % | | | 6.12 | % |
Alger Small Cap Growth Class Y (Inception 12/31/21) | | | n/a | | | | n/a | | | | n/a | | | | (15.90 | )% |
Alger Small Cap Growth Class Z (Inception 12/29/10) | | | (20.20 | )% | | | 15.94 | % | | | 12.06 | % | | | 11.45 | % |
Alger Small Cap Focus Class A (Inception 3/3/08) | | | (29.94 | )% | | | 11.61 | % | | | 11.18 | % | | | 9.36 | % |
Alger Small Cap Focus Class C (Inception 3/3/08) | | | (27.21 | )% | | | 12.01 | % | | | 11.01 | % | | | 9.10 | % |
Alger Small Cap Focus Class I (Inception 3/3/08) | | | (26.00 | )% | | | 12.86 | % | | | 11.91 | % | | | 9.93 | % |
Alger Small Cap Focus Class Y (Inception 2/28/17) | | | (25.76 | )% | | | 13.23 | % | | | n/a | | | | 13.43 | % |
Alger Small Cap Focus Class Z (Inception 12/29/10) | | | (25.76 | )% | | | 13.22 | % | | | 12.23 | % | | | 11.60 | % |
Alger International Focus Class A (Inception 12/31/96) | | | (10.01 | )% | | | 8.18 | % | | | 5.58 | % | | | 5.68 | % |
Alger International Focus Class B (Inception 11/11/86) | | | (9.30 | )% | | | 8.84 | % | | | 5.64 | % | | | 5.65 | % |
Alger International Focus Class C (Inception 7/31/97)* | | | (6.59 | )% | | | 8.48 | % | | | 5.32 | % | | | 5.51 | % |
Alger International Focus Class I (Inception 5/31/13) | | | (5.05 | )% | | | 9.53 | % | | | n/a | | | | 6.63 | % |
Alger International Focus Class Z (Inception 12/29/10) | | | (4.67 | )% | | | 9.81 | % | | | 6.61 | % | | | 7.06 | % |
Alger Health Sciences Fund Class A (Inception 5/1/02) | | | (9.68 | )% | | | 11.80 | % | | | 13.06 | % | | | 11.73 | % |
Alger Health Sciences Fund Class C (Inception 5/1/02) | | | (6.01 | )% | | | 12.15 | % | | | 12.81 | % | | | 11.53 | % |
Alger Health Sciences Fund Class Z (Inception 5/28/15) | | | (4.33 | )% | | | 13.41 | % | | | n/a | | | | 9.71 | % |
The performance data quoted represents past performance, which is not an indication or a guarantee of future results. The Fund’s average annual total returns include changes in share price and reinvestment of dividends and capital gains.
Beginning August 7, 2015, the Alger Small Cap Focus Fund (formerly, Alger Growth Opportunities Fund) changed its investment strategy to normally invest at least 80% of its net assets, plus any borrowings for investment purposes, in equity securities of companies that, at the time of purchase of the securities, have a total market capitalization within the range of companies included in the Russell 2000 Growth Index.
Before March 28, 2018, the Alger International Focus Fund followed different investment strategies and was managed by different portfolio managers. Prior to May 31, 2013 the Fund was named “Alger Large Cap Growth Fund,” and from May 31, 2013 to August 15, 2018 the Fund was named “Alger International Growth Fund.” Performance prior to March 28, 2018 reflects these prior management styles and does not reflect the Fund’s current investment strategies and investment personnel.
Previously, the Alger Growth & Income Fund followed a different investment objective and different strategies under the name “Alger Balanced Fund.” Performance prior to April 1, 2011 does not reflect the Fund’s current investment objective and strategies.
From August 30, 2017 to September 30, 2019, the Alger Weatherbie Specialized Growth Fund was named “Alger SMid Cap Focus Fund.” Prior to August 30, 2017, the Fund followed different investment strategies under the name “Alger SMid Cap Growth Fund” and prior to March 1, 2017 was managed by different portfolio managers. Accordingly, performance prior to those dates does not reflect the Fund’s current investment strategies and investment personnel.
Effective May 7, 2021, Class P shares of the Alger 35 Fund were reclassified as Class Z shares of the Fund. Class P-2 Shares of the Alger 35 Fund were converted to Class Z Shares after the close of business on October 29, 2021.
| * | Historical performance prior to the inception of the Class, is that of the Fund’s Class A shares, which has been adjusted to remove the sales charge imposed by Class A shares and adding the higher operating expenses of the Class C shares. |
| ** | Historical performance prior to May 7, 2021 is that of the Fund’s Class P shares. |
ALGER CAPITAL APPRECIATION FUND
Fund Highlights Through April 30, 2022 (Unaudited)
HYPOTHETICAL $10,000 INVESTMENT IN CLASS A SHARES
The chart above illustrates the change in value of a hypothetical $10,000 investment made in the Alger Capital Appreciation Fund Class A shares, with a maximum sales charge of 5.25%, and the Russell 1000 Growth Index (an unmanaged index of common stocks) for the ten years ended April 30, 2022. Figures for the Alger Capital Appreciation Fund Class A shares and the Russell 1000 Growth Index include reinvestment of dividends. Figures for the Alger Capital Appreciation Fund Class A shares also include reinvestment of capital gains. Performance for Alger Capital Appreciation Fund Class C and Class Z shares will vary from the results shown above due to differences in expenses and sales charges those classes bear. Investors cannot invest directly in any index. Index performance does not reflect deduction for fees, expenses, or taxes.
ALGER CAPITAL APPRECIATION FUND
Fund Highlights Through April 30, 2022 (Unaudited) (Continued)
PERFORMANCE COMPARISON AS OF 4/30/22
AVERAGE ANNUAL TOTAL RETURNS
| | | 1 YEAR | | | 5 YEARS | | | 10 YEARS | | | Since 11/1/1993 | |
| Class A (Inception 12/31/96) | | | (22.53 | )% | | | 12.32 | % | | | 12.94 | % | | | 9.81 | % |
| Class C (Inception 7/31/97)* | | | (19.39 | )% | | | 12.72 | % | | | 12.71 | % | | | 9.63 | % |
Russell 1000 Growth Index | | | (5.35 | )% | | | 17.28 | % | | | 15.56 | % | | | 9.23 | % |
| | | 1 YEAR | | | 5 YEARS | | | 10 YEARS | | | Since 12/29/2010 | |
| Class Z (Inception 12/29/10) | | | (17.95 | )% | | | 13.93 | % | | | 13.94 | % | | | 13.57 | % |
Russell 1000 Growth Index | | | (5.35 | )% | | | 17.28 | % | | | 15.56 | % | | | 15.21 | % |
The performance data quoted represents past performance, which is not an indication or a guarantee of future results. The Fund’s average annual total returns include changes in share price and reinvestment of dividends and capital gains. Class A returns reflect the maximum initial sales charge and Class C returns reflect the applicable contingent deferred sales charge. The chart and table above do not reflect the deduction of taxes that a shareholder would have paid on Fund distributions or on the redemption of Fund shares. Investment return and principal will fluctuate and the Fund’s shares, when redeemed, may be worth more or less than their original cost. Current performance may be higher or lower than the performance quoted. For updated performance, visit us at www.alger.com or call us at (800) 992-3863.
| * | Since inception performance is calculated since the inception of the Class A shares. Historical performance prior to July 31, 1997, inception of the class, is that of the Fund’s Class A shares, reduced to reflect the current maximum sales charge and the higher operating expenses of Class C shares. |
ALGER 35 FUND
Fund Highlights Through April 30, 2022 (Unaudited)
HYPOTHETICAL $10,000 INVESTMENT IN CLASS Z SHARES
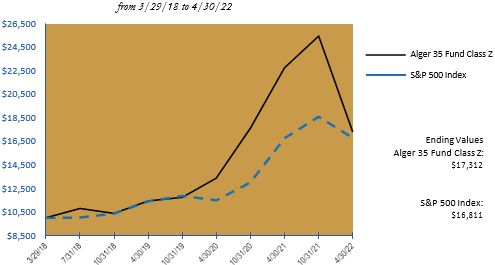
The chart above illustrates the change in value of a hypothetical $10,000 investment made in the Alger 35 Fund Class Z shares and the S&P 500 Index (an unmanaged index of common stocks) from March 29, 2018, the inception date of the Alger 35 Fund Class Z shares, through April 30, 2022. Effective May 7, 2021, Class P shares of the Alger 35 Fund were reclassified as Class Z shares. The reclassified Class Z shares have the same annual returns as the Class P shares because the shares are invested in the same portfolio of securities and the reclassified Class Z shares have the same expenses as the Fund’s Class P shares. Historical performance prior to May 7, 2021 is that of the Fund’s Class P shares. Figures for the Alger 35 Fund Class Z shares and the S&P 500 Index include reinvestment of dividends. Figures for the Alger 35 Fund Class Z shares also include reinvestment of capital gains. Investors cannot invest directly in any index. Index performance does not reflect deduction for fees, expenses, or taxes.
ALGER 35 FUND
Fund Highlights Through April 30, 2022 (Unaudited) (Continued)
PERFORMANCE COMPARISON AS OF 4/30/22
AVERAGE ANNUAL TOTAL RETURNS
| | | 1 YEAR | | | 5 YEARS | | | 10 YEARS | | | Since 3/29/2018 | |
| Class Z (Inception 3/29/18) | | | (23.96 | )% | | | n/a | | | | n/a | | | | 14.37 | % |
| S&P 500 Index | | | 0.21 | % | | | n/a | | | | n/a | | | | 13.55 | % |
The performance data quoted represents past performance, which is not an indication or a guarantee of future results. The Fund’s average annual total returns include changes in share price and reinvestment of dividends and capital gains. Effective May 7, 2021, Class P shares of the Alger 35 Fund were reclassified as Class Z shares. The reclassified Class Z shares have the same annual returns as the Class P shares because the shares are invested in the same portfolio of securities and the reclassified Class Z shares have the same expenses as the Fund’s Class P shares. Historical performance prior to May 7, 2021 is that of the Fund’s Class P shares. The chart and table above do not reflect the deduction of taxes that a shareholder would have paid on Fund distributions or on the redemption of Fund shares. Investment return and principal will fluctuate and the Fund’s shares, when redeemed, may be worth more or less than their original cost. Current performance may be higher or lower than the performance quoted. For updated performance, visit us at www.alger.com or call us at (800) 992-3863.
ALGER GROWTH & INCOME FUND
Fund Highlights Through April 30, 2022 (Unaudited)
HYPOTHETICAL $10,000 INVESTMENT IN CLASS A SHARES
The chart above illustrates the change in value of a hypothetical $10,000 investment made in the Alger Growth & Income Fund Class A shares, with a maximum sales charge of 5.25%, and the S&P 500 Index (an unmanaged index of common stocks) for the ten years ended April 30, 2022. Figures for the Alger Growth & Income Fund Class A shares and the S&P 500 Index include reinvestment of dividends. Figures for the Alger Growth & Income Fund Class A shares also include reinvestment of capital gains. Performance for the Alger Growth & Income Fund Class C and Class Z shares will vary from the results shown above due to differences in expenses and sales charges those classes bear. Investors cannot invest directly in any index. Index performance does not reflect deduction for fees, expenses, or taxes.
ALGER GROWTH & INCOME FUND
Fund Highlights Through April 30, 2022 (Unaudited) (Continued)
PERFORMANCE COMPARISON AS OF 4/30/22
AVERAGE ANNUAL TOTAL RETURNS
| | | 1 YEAR | | | 5 YEARS | | | 10 YEARS | | | Since 12/31/1996 | |
| Class A (Inception 12/31/96) | | | (1.33 | )% | | | 11.94 | % | | | 12.16 | % | | | 8.95 | % |
| Class C (Inception 7/31/97)* | | | 2.34 | % | | | 12.30 | % | | | 11.92 | % | | | 8.78 | % |
S&P 500 Index | | | 0.21 | % | | | 13.66 | % | | | 13.67 | % | | | 9.03 | % |
| | | 1 YEAR
| | | 5 YEARS | | | 10 YEARS | | | Since 3/1/2012
| |
| Class Z (Inception 3/1/12) | | | 4.45 | % | | | 13.55 | % | | | 13.10 | % | | | 12.99 | % |
S&P 500 Index | | | 0.21 | % | | | 13.66 | % | | | 13.67 | % | | | 13.65 | % |
The performance data quoted represents past performance, which is not an indication or a guarantee of future results. The Fund’s average annual total returns include changes in share price and reinvestment of dividends and capital gains. Class A returns reflect the maximum initial sales charge and Class C returns reflect the applicable contingent deferred sales charge. The chart and table above do not reflect the deduction of taxes that a shareholder would have paid on Fund distributions or on the redemption of Fund shares. Previously, Alger Growth & Income Fund followed a different investment objective and different strategies under the name “Alger Balanced Fund.” Performance prior to April 1, 2011 does not reflect the Fund’s current investment objective and strategies. Investment return and principal will fluctuate and the Fund’s shares, when redeemed, may be worth more or less than their original cost. Current performance may be higher or lower than the performance quoted. For updated performance, visit us at www.alger.com or call us at (800) 992-3863.
| * | Since inception performance is calculated since the inception of the Class A shares. Historical performance prior to July 31, 1997, inception of the class, is that of the Fund’s Class A shares, reduced to reflect the current maximum sales charge and the higher operating expenses of Class C shares. |
ALGER MID CAP GROWTH FUND**
Fund Highlights Through April 30, 2022 (Unaudited)
HYPOTHETICAL $10,000 INVESTMENT IN CLASS A SHARES

The chart above illustrates the change in value of a hypothetical $10,000 investment made in the Alger Mid Cap Growth Fund Class A shares, with a maximum sales charge of 5.25%, and the Russell Midcap Growth Index (an unmanaged index of common stocks) for the ten years ended April 30, 2022. Figures for the Alger Mid Cap Growth Fund Class A shares and Russell Midcap Growth Index include reinvestment of dividends. Figures for the Alger Mid Cap Growth Fund Class A shares also include reinvestment of capital gains. Performance for the Alger Mid Cap Growth Fund Class B, Class C and Class Z shares will vary from the results shown above due to differences in expenses and sales charges those classes bear. Investors cannot invest directly in any index. Index performance does not reflect deduction for fees, expenses, or taxes.
ALGER MID CAP GROWTH FUND**
Fund Highlights Through April 30, 2022 (Unaudited) (Continued)
PERFORMANCE COMPARISON AS OF 4/30/22
AVERAGE ANNUAL TOTAL RETURNS
| | | 1 YEAR | | | 5 YEARS | | | 10 YEARS | | | Since 12/31/1996 | |
| Class A (Inception 12/31/96) | | | (30.31 | )% | | | 10.94 | % | | | 10.65 | % | | | 8.81 | % |
| Class B (Inception 5/24/93) | | | (28.73 | )% | | | 11.66 | % | | | 10.71 | % | | | 8.77 | % |
| Class C (Inception 7/31/97)* | | | (27.47 | )% | | | 11.22 | % | | | 10.34 | % | | | 8.16 | % |
Russell Midcap Growth Index | | | (16.73 | )% | | | 12.06 | % | | | 12.17 | % | | | 9.21 | % |
| | | 1 YEAR | | | 5 YEARS | | | 10 YEARS | | | Since 5/28/2015 | |
| Class Z (Inception 5/28/15) | | | (26.27 | )% | | | 12.45 | % | | | n/a | | | | 9.26 | % |
| Russell Midcap Growth Index | | | (16.73 | )% | | | 12.06 | % | | | n/a | | | | 9.94 | % |
The performance data quoted represents past performance, which is not an indication or a guarantee of future results. The Fund’s average annual total returns include changes in share price and reinvestment of dividends and capital gains. Class A returns reflect the maximum initial sales charge and Class B and C returns reflect the applicable contingent deferred sales charge. The chart and table above do not reflect the deduction of taxes that a shareholder would have paid on Fund distributions or on the redemption of Fund shares. Investment return and principal will fluctuate and the Fund’s shares, when redeemed, may be worth more or less than their original cost. Current performance may be higher or lower than the performance quoted. For updated performance, visit us at www.alger.com or call us at (800) 992-3863.
| * | Since inception performance is calculated since the inception of the Class A shares. Historical performance prior to July 31, 1997, inception of the class, is that of the Fund’s Class A shares, reduced to reflect the current maximum sales charge and the higher operating expenses of Class C shares. |
| ** | Pursuant to the U.S. Securities and Exchange Commission’s rules on Fair Fund and Disgorgement Plans, the Alger Mid Cap Growth Fund received a Fair Fund distribution of $9,346,397, which contributed approximately 3.89% to its annual return in 2021. |
ALGER MID CAP FOCUS FUND
Fund Highlights Through April 30, 2022 (Unaudited)
HYPOTHETICAL $10,000 INVESTMENT IN CLASS I SHARES

The chart above illustrates the change in value of a hypothetical $10,000 investment made in the Alger Mid Cap Focus Fund Class I shares and the Russell Midcap Growth Index (an unmanaged index of common stocks) from June 14, 2019, the inception date of the Alger Mid Cap Focus Fund Class I shares, through April 30, 2022. Figures for the Alger Mid Cap Focus Fund Class I shares and the Russell Midcap Growth Index include reinvestment of dividends. Figures for the Alger Mid Cap Focus Fund Class I shares also include reinvestment of capital gains. Performance for the Alger Mid Cap Focus Fund Class A, C, Y and Z shares will vary from the results shown above due to differences in the expenses and sales charges that those classes bear. Investors cannot invest directly in any index. Index performance does not reflect deduction for fees, expenses, or taxes.
ALGER MID CAP FOCUS FUND
Fund Highlights Through April 30, 2022 (Unaudited) (Continued)
PERFORMANCE COMPARISON AS OF 4/30/22
AVERAGE ANNUAL TOTAL RETURNS
| | | 1 YEAR | | | 5 YEARS | | | 10 YEARS | | | Since 6/14/2019 | |
| Class I (Inception 6/14/19) | | | (22.27 | )% | | | n/a | | | | n/a | | | | 17.33 | % |
| Class Z (Inception 6/14/19) | | | (22.01 | )% | | | n/a | | | | n/a | | | | 17.64 | % |
| Russell Midcap Growth Index | | | (16.73 | )% | | | n/a | | | | n/a | | | | 9.49 | % |
| | | 1 YEAR | | | 5 YEARS | | | 10 YEARS | | | Since 2/26/2021 | |
| Class Y (Inception 2/26/21) | | | (22.03 | )% | | | n/a | | | | n/a | | | | (20.84 | )% |
Russell Midcap Growth Index | | | (16.73 | )% | | | n/a | | | | n/a | | | | (11.89 | )% |
| | | 1 YEAR | | | 5 YEARS | | | 10 YEARS | | | Since 7/29/2021 | |
| Class A (Inception 7/29/21) | | | n/a | | | | n/a | | | | n/a | | | | (28.47 | )% |
| Class C (Inception 7/29/21) | | | n/a | | | | n/a | | | | n/a | | | | (25.57 | )% |
Russell Midcap Growth Index | | | n/a | | | | n/a | | | | n/a | | | | 9.49 | % |
The performance data quoted represents past performance, which is not an indication or a guarantee of future results. The Fund’s average annual total returns include changes in share price and reinvestment of dividends and capital gains. Class A returns reflect the maximum initial sales charge and Class C returns reflect the applicable contingent deferred sales charge. The chart and table above do not reflect the deduction of taxes that a shareholder would have paid on Fund distributions or on the redemption of Fund shares. Investment return and principal will fluctuate and the Fund’s shares, when redeemed, may be worth more or less than their original cost. Current performance may be higher or lower than the performance quoted. For updated performance, visit us at www.alger.com or call us at (800) 992-3863.
ALGER WEATHERBIE ENDURING GROWTH FUND
Fund Highlights Through April 30, 2022 (Unaudited)
HYPOTHETICAL $10,000 INVESTMENT IN CLASS A SHARES
The chart above illustrates the change in value of a hypothetical $10,000 investment made in the Alger Weatherbie Enduring Growth Fund Class A shares, with a maximum sales charge of 5.25%, and the Russell Midcap Growth Index (an unmanaged index of common stocks) from December 17, 2021, the inception date of the Alger Weatherbie Enduring Growth Fund, through April 30, 2022. Figures for the Alger Weatherbie Enduring Growth Fund Class A shares and Russell Midcap Growth Index include reinvestment of dividends. Figures for the Alger Weatherbie Enduring Growth Fund Class A shares also include reinvestment of capital gains. Performance for Alger Weatherbie Enduring Growth Fund Class C, Class I, Class Y and Class Z shares will vary from the results shown above due to differences in expenses and sales charges those classes bear. Investors cannot invest directly in any index. Index performance does not reflect deduction for fees, expenses, or taxes.
ALGER WEATHERBIE ENDURING GROWTH FUND
Fund Highlights Through April 30, 2022 (Unaudited) (Continued)
PERFORMANCE COMPARISON AS OF 4/30/22
AVERAGE ANNUAL TOTAL RETURNS
| | | 1 YEAR | | | 5 YEARS | | | 10 YEARS | | | Since 12/17/2021 | |
| Class A (Inception 12/17/21) | | | n/a | | | | n/a | | | | n/a | | | | (26.07 | )% |
| Class C (Inception 12/17/21) | | | n/a | | | | n/a | | | | n/a | | | | (22.98 | )% |
| Class I (Inception 12/17/21) | | | n/a | | | | n/a | | | | n/a | | | | (22.00 | )% |
| Class Y (Inception 12/17/21) | | | n/a | | | | n/a | | | | n/a | | | | (21.90 | )% |
| Class Z (Inception 12/17/21) | | | n/a | | | | n/a | | | | n/a | | | | (21.90 | )% |
| Russell Midcap Growth Index | | | n/a | | | | n/a | | | | n/a | | | | (19.89 | )% |
The performance data quoted represents past performance, which is not an indication or a guarantee of future results. The Fund’s average annual total returns include changes in share price and reinvestment of dividends and capital gains. The chart and table above do not reflect the deduction of taxes that a shareholder would have paid on Fund distributions or on the redemption of Fund shares. Investment return and principal will fluctuate and the Fund’s shares, when redeemed, may be worth more or less than their original cost. Current performance may be higher or lower than the performance quoted. For updated performance, visit us at www.alger.com or call us at (800) 992-3863.
ALGER WEATHERBIE SPECIALIZED GROWTH FUND
Fund Highlights Through April 30, 2022 (Unaudited)
HYPOTHETICAL $10,000 INVESTMENT IN CLASS A SHARES