Washington, D.C. 20549
Mr. Hal Liebes
Form N-CSR is to be used by management investment companies to file reports with the Commission, not later than 10 days after the transmission to Stockholders of any report to be transmitted to Stockholders under Rule 30e-1 under the Investment Company Act of 1940 (17 CFR 270.30e1). The Commission may use the information provided on Form N-CSR in its regulatory, disclosure review, inspection, and policymaking roles.
A registrant is required to disclose the information specified by Form N-CSR, and the Commission will make this information public. A registrant is not required to respond to the collection of information contained in Form N-CSR unless the Form displays a currently valid Office of Management and Budget ("OMB") control number. Please direct comments concerning the accuracy of the information collection burden estimate and any suggestions for reducing the burden to the Secretary, Securities and Exchange Commission, 450 Fifth Street, NW, Washington, DC 20549-0609. The OMB has reviewed this collection of information under the clearance requirements of 44 U.S.C. § 3507.
Table of Contents
The Alger Funds
| Shareholders’ Letter (Unaudited) | April 30, 2023 |
Dear Shareholders,
The Pendulum of Market Sentiment
“In the short run, the market is a voting machine but in the long run, it is a weighing machine.” – Benjamin Graham.
Stock prices may have fluctuated over the six month period ended April 30, 2023, mostly based on interest rate movements, but we agree with Graham that over the longer term, company earnings and cash flows ultimately determine stock prices. We believe the rise in interest rates and the corresponding decline in equity valuations are subsiding, leaving Graham’s proverbial scale to determine where stocks are headed. In the final two months of 2022, optimism surrounding the potential peak of the Federal Reserve Bank’s (Fed) tightening cycle was reinforced by lower-than-expected core Consumer Price Index (CPI) readings for both November and December. Persistent inflation, particularly in wages, remained a focal point for the Fed, and the inverted yield curve amplified fears of a policy misstep or a looming economic downturn. Fed Chairman Jerome Powell indicated in December 2022, that the institution would maintain its “higher-for-longer” approach for interest rates and projected a long-run terminal rate exceeding 5.0%, which sparked concerns about the sustainability of a stock market rebound.
The first quarter of 2023 saw a reversal in the bearish investor sentiment that had marked much of the previous year. In February, the Fed reduced the pace of rate hikes to 25 basis points (bps), after a 50 bps hike in December. Powell, acknowledging the disinflation trend, did not resist the easing of financial conditions, and U.S. Treasury yields fell during the first quarter. In March, concerns around bank funding and liquidity emerged following the collapse of two regional banks, leading to significant deposit outflows at the regional level. However, the Fed, U.S. Treasury, and Federal Deposit Insurance Corporation (FDIC) took steps to contain market concerns. These steps included announcing an emergency liquidity program, guaranteeing uninsured deposits at the impacted regional banks, and allowing some bank mergers and acquisitions to take place. At the end of March, the Fed raised rates by another 25 bps, bringing the Federal Funds rate to 5.0%. In April, U.S. Gross Domestic Product (GDP) grew 1.1%, missing the 2.0% forecast and falling from the prior quarter’s 2.6%, despite robust consumer spending.
Among non-U.S. equities, developed markets saw strong performance during the fiscal six-month period ended April 30, 2023. Notable strength was driven by Europe avoiding an energy crisis due to a mild winter, and global supply chain bottlenecks seeing continued relief. As such, the MSCI EAFE Index was up 24.6%, driven by strong performance in the Financials and Industrials sectors, while the Real Estate and Energy sectors experienced relative weakness. From a broader perspective, the MSCI ACWI Index rose 13.0% during the fiscal six-month period, where the Communication Services and Information Technology sectors showed strong results, while the Healthcare and Energy sectors saw weaker performance. Within Emerging Markets, notable strength was driven by China reopening its borders, and the MSCI Emerging Markets Index was up 16.5% during the fiscal six-month period. Strong performance within the Communication Services and Information Technology sectors was slightly offset by relative weakness in the Real Estate and Energy sectors.
- 1 -
During the fiscal six-month period, growth outperformed value, with the Russell 3000 Growth Index returning 10.8%, outperforming the Russell 3000 Value Index, which posted a return of 3.4% for the period. There was also a notable bifurcation between small- and large- cap stocks, where the -3.5% return of the Russell 2000 Index considerably underperformed the 7.2% return of the Russell 1000 Index during the fiscal six-month period.
Slow Dance into Recession
The Conference Board’s Index of Leading Economic Indicators (LEI) – a composite of economic information that includes housing, consumer confidence and durable goods orders – has historically proven to be a strong predictor of recessions, particularly when the index moves into negative territory. The LEI fell into negative territory in August 2022, and as of March 2023, it shows a year-over-year decline of 7.8%.
Further, over the past thirteen tightening cycles, the United States has only achieved a soft landing (i.e., an economic slowdown without a recession) on three occasions (1984, 1994- 1995 and 2020). In each of these instances, interest rates were increased by only 300 bps. As of April 30, 2023, the Fed has increased rates by approximately 500 bps since it began its hiking cycle in March 2022. If history is any guide, we find it unlikely that the Fed can successfully orchestrate a soft landing, given the Fed has now hiked well above the approximate “soft landing” rate increase of 300 bps.
Further challenging the ability for a soft landing is the lagged impact of the Fed’s aggressive tightening cycle. It is important to note the strong historical relationship between small bank lending standards and U.S. corporate business spending, known as capital expenditures. As bank lending standards tighten, fewer loans are made and companies’ cost of capital rises. As a result, companies reduce their capital projects, either due to a lack of funds or because the higher cost makes these projects less financially attractive. In our view, bank lending standards will likely continue to tighten and slow business capital expenditures, pressuring earnings for more economically sensitive companies that rely on capital expansion projects.
As of the writing of this letter, the Fed has continued to tighten financial conditions via its interest rate increases and the roll-off of debt from its balance sheet. Further, the broader money supply growth is decelerating and is now in outright contraction for the first time since 1938, which is likely to slow economic activity. For these reasons, we believe the United States may have already entered a recession.
Going Forward
We continue to believe that unprecedented levels of innovation are creating compelling investment opportunities - corporations are digitizing their operations, cloud computing growth continues to support future innovation, and artificial intelligence, which is at an inflection point in our view, potentially enabling significant increases in productivity. In the Healthcare sector, we believe that advances in surgical technologies and innovations within biotechnology offer attractive opportunities ahead. As such, we intend to continue to focus on conducting in-depth fundamental research as we seek leaders of innovation rather than taking short-term bets on market sentiment. We believe doing so is the best strategy for helping our valued shareholders reach their investment goals.
- 2 -
Portfolio Matters
Alger Capital Appreciation Fund
The Alger Capital Appreciation Fund returned 9.42% for the fiscal six-month period ended April 30, 2023, compared to the 11.51% return of the Russell 1000 Growth Index. During the reporting period, the largest sector weightings were Information Technology and Healthcare. The largest sector overweight was Healthcare and the largest sector underweight was Information Technology.
Contributors to Performance
The Consumer Discretionary and Industrials sectors provided the largest contributions to relative performance. Regarding individual positions, Microsoft Corporation; NVIDIA Corporation; TransDigm Group Incorporated; MercadoLibre, Inc.; and Apple Inc. were among the top contributors to absolute performance.
Microsoft is a beneficiary of corporate America’s transformative digitization. Microsoft’s CEO expects technology spending as a percent of GDP to jump from about 5% now to 10% in 10 years and that Microsoft will continue to capture market share within the technology sector. The company operates through three segments: Productivity and Business Processes (Office, LinkedIn, and Dynamics), Intelligent Cloud (Server Products and Cloud Services, Azure, and Enterprise Services), and More Personal Computing (Windows, Devices, Gaming, and Search). While the company reported operating results that met consensus estimates, their investment in OpenAI’s ChatGPT captured the attention of investors, contributing to positive performance. Throughout the period, Microsoft surprised investors with continual rollouts of new AI capabilities across the company’s portfolio (e.g., Bing, GitHub, Teams, Office 365). Furthermore, the company announced Microsoft 365 Copilot, which leverages GPT-4, a large language model, combined with the Microsoft Graph of data to provide AI virtual assistance. We believe Microsoft’s investment in OpenAI provides a first-mover advantage in the AI transformer model space.
Detractors from Performance
The Healthcare and Communication Services sectors were the largest detractors from relative performance. Regarding individual positions, Tesla, Inc.; UnitedHealth Group Incorporated; Signature Bank; Albemarle Corporation; and Humana Inc. were among the top detractors from absolute performance.
UnitedHealth Group is an integrated healthcare benefits company uniquely positioned to address rising healthcare costs for its customers, due to its vertical integration, size, and scale. The Optum health benefits services unit, which accounts for approximately 45% of the company’s operating earnings, in our view, has the potential to grow even further as customers look for ways to manage rising healthcare costs. During the period, shares detracted from performance due to several factors: (1) many 2022 healthcare winners with shorter duration profiles and persistent earnings profiles, such as UnitedHealth Group, underperformed in the first quarter of 2023, (2) uncertainty surrounding Medicare Advantage reimbursement levels from the Federal government in 2023, which will be determined later in the year, and (3) increased regulatory scrutiny in the form of potential Medicare Advantage audits across the industry. While these concerns have impacted UnitedHealth in the near-term, we believe company fundamentals remain intact given its large-scale business model, competitive advantages, and medium- to long-term growth prospects.
- 3 -
Alger 35 Fund
The Alger 35 Fund generated a 1.91% return for the fiscal six-month period ended April 30, 2023, compared to the 8.63% return of the S&P 500 Index. During the reporting period, the largest sector weightings were Information Technology and Consumer Discretionary. The largest sector overweight was Consumer Discretionary and the largest sector underweight was Financials.
Contributors to Performance
The Consumer Discretionary and Real Estate sectors provided the largest contributions to relative performance. Regarding individual positions, MercadoLibre, Inc.; Advanced Micro Devices, Inc.; TransMedics Group, Inc.; Cabaletta Bio, Inc.; and Netflix, Inc. were among the top contributors to absolute performance.
MercadoLibre is the largest e-commerce company in Latin America, with its largest markets being Brazil, Argentina, and Mexico. The company offers a comprehensive suite of services, including an online marketplace for buyers and sellers, payment solutions through Mercado Pago, merchant and buyer financing through Mercado Credito, shipping services through Mercado Envios, and asset management through Mercado Fondo, among other services. We believe the e-commerce market within Central and South America remains underpenetrated, creating a favorable backdrop for MercadoLibre, as they have been growing and investing heavily to expand its first mover advantage. Moreover, we believe that the company’s growing fintech payments business, Mercado Pago, is well-positioned to potentially emerge as a leader in Central and South America, as well as an emerging online advertising presence that offers attractive margin expansion potential, in our view. During the period, shares contributed to performance after the company reported resilient fiscal fourth quarter earnings that exceeded analyst estimates. Notable drivers that contributed to the earnings beat included strong gross-merchandise-value and an increase in the average take-rate within both e-commerce and Mercado Pago.
Detractors from Performance
The Information Technology and Communication Services sectors were the largest detractors from relative performance. Regarding individual positions, 908 Devices Inc.; JD.com, Inc.; RAPT Therapeutics, Inc.; Rivian Automotive, Inc.; and Alphabet Inc. were among the top detractors from absolute performance.
Alphabet is a global technology company specializing in cloud operating systems and digital advertising. Company revenues are primarily driven by online advertising on its Google search platform, along with selling hardware devices and apps on Google Play. Shares detracted from results during the period as the company reported mixed results. The company’s net revenues were slightly below analysts’ estimates as advertisers reduced their spending during the period. However, growth in Alphabet’s cloud computing segment—Google Cloud—saw an acceleration during the period.
Alger Growth & Income Fund
The Alger Growth & Income Fund returned 9.20% for the fiscal six-month period ended April 30, 2023, compared to the 8.63% return of the S&P 500 Index. During the reporting period, the largest sector weightings were Information Technology and Healthcare. The largest sector overweight was Energy and the largest sector underweight was Consumer Discretionary.
- 4 -
Contributors to Performance
The Financials and Materials sectors provided the largest contributions to relative performance. Regarding individual positions, Microsoft Corporation; Broadcom Inc.; Apple Inc.; Meta Platforms Inc.; and KLA Corporation were among the top contributors to absolute performance. Shares of Microsoft Corporation contributed to performance in response to developments identified in the Alger Capital Appreciation Fund discussion.
Detractors from Performance
The Healthcare and Industrials sectors were the largest detractors from relative performance. Regarding individual positions, UnitedHealth Group Incorporated; Bank of America Corp; CVS Health Corporation; Cheniere Energy Partners, L.P.; and Pfizer Inc. were among the top detractors from absolute performance. Shares of UnitedHealth Group Incorporated detracted from performance in response to developments identified in the Alger Capital Appreciation Fund discussion.
Alger Mid Cap Growth Fund
The Alger Mid Cap Growth Fund returned 5.45% for the fiscal six-month period ended April 30, 2023, compared to the 6.60% return of the Russell Midcap Growth Index. During the reporting period, the largest sector weightings were Information Technology and Industrials. The largest sector overweight was Information Technology and the largest sector underweight was Consumer Discretionary.
Contributors to Performance
The Information Technology and Energy sectors provided the largest contributions to relative performance. Regarding individual positions, Prometheus Biosciences, Inc.; Constellation Software Inc.; Chipotle Mexican Grill, Inc.; Cadence Design Systems, Inc.; and TransDigm Group Incorporated were among the top contributors to absolute performance.
TransDigm Group specializes in the production of engineered aerospace components, systems and subsystems. Its core Power and Control segment includes operations that primarily develop, produce and market systems and components that provide power to or control power of aircrafts utilizing electronic, fluid, power and mechanical motion control technologies. During the period, the company reported solid fiscal first quarter results, where both revenues and earnings beat analyst estimates. Better-than-expected results were driven by strength in all three of their major market channels – commercial original equipment manufacturing (OEM), commercial aftermarket and defense – as well as strong order bookings. Moreover, management raised their fiscal full year guidance, noting favorable trends in the commercial aerospace market recovery.
Detractors from Performance
The Consumer Discretionary and Consumer Staples sectors were the largest detractors from relative performance. Regarding individual positions, CrowdStrike Holdings, Inc.; First Republic Bank; Aritzia, Inc.; BILL Holdings, Inc.; and Enphase Energy, Inc. were among the top detractors from absolute performance.
BILL Holdings is the leading provider of business-to-business (B2B) commerce solutions for small- and medium-sized businesses (SMBs), including streamlining financial operations such as accounts payables (AP) and accounts receivables (AR). Their target market is primarily U.S. SMBs with revenues up to $100 million. The company earns revenue from: (1) subscription fees charged for access to its cloud-based services; (2) usage-based transaction fees, including payments-related fees; and (3) interest earned on funds held on behalf of customers. The company is positioned as a back-office financial operations and an AP automation software-as-a-service (SaaS) platform for the SMB segment of B2B payments. According to our analysis, roughly 42% of B2B payments are still made via physical check, and 93% of businesses with less than $1 billion of annual revenue reported receiving physical checks as payment. During the period, shares detracted from performance, as the company reported weaker than expected results. Specifically, growth in total payment volume and transaction growth weakened due to the challenging macroeconomic backdrop, along with fewer net-customer additions. Despite these events, we believe company fundamentals remain intact and are well positioned to continue to penetrate the underserved SMB market with its differentiated product offerings over the long-term.
- 5 -
Alger Mid Cap Focus Fund
The Alger Mid Cap Focus Fund generated a -1.89% return for the fiscal six-month period ended April 30, 2023, compared to the 6.60% return of the Russell Midcap Growth Index. During the reporting period, the largest sector weightings were Information Technology and Healthcare. The largest sector overweight was Healthcare and the largest sector underweight was Financials.
Contributors to Performance
The Energy and Communication Services sectors provided the largest contributions to relative performance. Regarding individual positions, Prometheus Biosciences, Inc.; Insulet Corporation; Coupa Software, Inc.; Bentley Systems, Incorporated; and Viridian Therapeutics, Inc. were among the top contributors to absolute performance.
Coupa Software is a cloud-based spend management platform that digitizes many areas of core transactional spending functions, including travel and expense management, invoicing and procurement. On December 12, 2022, Coupa announced that it entered into a definitive agreement to be acquired by Thoma Bravo for $8 billion, or $81 per share, in an all-cash transaction. Shares contributed to performance in response to the Thoma Bravo announcement, as the acquisition price was at a sizable premium.
Detractors from Performance
The Information Technology and Healthcare sectors were the largest detractors from relative performance. Regarding individual positions, RAPT Therapeutics, Inc.; BILL Holdings, Inc.; Constellation Energy Corporation; CrowdStrike Holdings, Inc.; and CyberArk Software Ltd. were among the top detractors from absolute performance. Shares of BILL Holdings detracted from performance in response to developments identified in the Alger Mid Cap Growth Fund discussion.
Alger Weatherbie Specialized Growth Fund
The Alger Weatherbie Specialized Growth Fund generated a -3.20% return for the fiscal six-month period ended April 30, 2023, compared to the 1.88% return of the Russell 2500 Growth Index. During the reporting period, the largest sector weightings were Industrials and Healthcare. The largest sector overweight was Real Estate and the largest sector underweight was Materials.
Contributors to Performance
The Energy and Real Estate sectors provided the largest contributions to relative performance. Regarding individual positions, FirstService Corp; SiteOne Landscape Supply, Inc.; SPS Commerce, Inc.; Planet Fitness, Inc.; and Hamilton Lane Incorporated were among the top contributors to absolute performance.
- 6 -
SPS Commerce is a global provider of cloud-based supply chain management solutions for fulfillment, analytics, drop shipping and other use cases. The SPS Commerce platform improves the way retailers, suppliers, grocers, distributors, and logistics companies manage orders, monitor sell-through performance, and discover new products by leveraging cloud technology. During the period, shares contributed to performance as the company reported strong operating results, where revenues came in above consensus estimates. Additionally, recurring revenue increased 20% year-over-year, driven by double digit growth in both fulfillment and analytics. Despite a difficult macroeconomic environment with high inflation and recession concerns, management expressed confidence in its subscription-based business model, which is largely reliant on the number of client connections with only a small portion tied to volumes. Moreover, we believe the company is a key beneficiary of supply chain digitalization over the long-term, given the growing influence of e-commerce.
Detractors from Performance
The Healthcare and Industrials sectors were the largest detractors from relative performance. Regarding individual positions, Montrose Environmental Group Inc.; Xometry, Inc.; StepStone Group, Inc.; Globant SA; and Progyny, Inc. were among the top detractors from absolute performance.
Xometry is a leading two-sided marketplace for on-demand manufacturing services. The company provides real-time access to global manufacturing demand and capacity, with sourcing and pricing available across a network of buyers and sellers. This marketplace enables buyers (e.g., engineers and product designers) to efficiently source manufacturing processes and sellers of manufacturing services to grow their businesses. Xometry’s AI- enabled technology platform is powered by proprietary machine learning algorithms, resulting in a sophisticated marketplace for manufacturing. During the period, the company reported weaker-than-expected revenues and revised their forward guidance below consensus. Management noted that suppliers accepted orders more quickly than usual on the Xometry platform due to a challenging macroeconomic environment, causing the proprietary algorithm to reduce market pricing, resulting in weaker revenue growth and gross margin compression. The company adjusted their proprietary algorithm in January and the company stated that it expects gross margins to improve throughout the year.
Alger Small Cap Growth Fund
The Alger Small Cap Growth Fund returned -2.15% for the fiscal six-month period ended April 30, 2023, compared to the -0.29% return of the Russell 2000 Growth Index. During the reporting period, the largest sector weightings were Healthcare and Information Technology. The largest sector overweight was Healthcare and the largest sector underweight was Industrials.
Contributors to Performance
The Information Technology and Real Estate sectors provided the largest contributions to relative performance. Regarding individual positions, NeoGenomics, Inc.; Manhattan Associates, Inc.; HubSpot, Inc.; Neogen Corp; and Wingstop, Inc. were among the top contributors to absolute performance.
- 7 -
Hubspot is a cloud-based marketing and sales platform for SMBs, focusing on inbound marketing strategies to attract, engage, and convert website visitors into customers. Its platform provides a comprehensive suite of applications including search engine optimization (SEO), blogging, marketing automation, customer relationship management (CRM), and analytics, utilizing a centralized database for personalized interactions. In our view, this approach fosters warmer prospect engagement compared to traditional methods like cold calling and email blasts. Over the years, the company has evolved from a small business CRM vendor to a comprehensive provider of marketing, sales and content management solutions for global SMBs. With an approximate 3% combined market share, a large customer base, robust partner network and extensive HubSpot suite, we believe the company is well positioned to capture additional market share in the large SMB front office applications industry, as well as to expand in the upmarket segment (i.e., companies with 200 to 2,000 employees). Shares contributed to performance during the period, as the company reported better-than-expected operating results, noting strong quarterly execution against a difficult macroeconomic environment.
Detractors from Performance
The Healthcare and Industrials sectors were the largest detractors from relative performance. Regarding individual positions, Magnolia Oil & Gas Corp.; Xometry, Inc.; BILL Holdings, Inc.; HealthEquity Inc; and CareDx, Inc. were among the top detractors from absolute performance. Shares of BILL Holdings, Inc. detracted from performance in response to developments identified in the Alger Mid Cap Growth Fund discussion.
Alger Small Cap Focus Fund
The Alger Small Cap Focus Fund returned -3.55% for the fiscal six-month period ended April 30, 2023, compared to the -0.29% return of the Russell 2000 Growth Index. During the reporting period, the largest sector weightings were Healthcare and Information Technology. The largest sector overweight was Healthcare and the largest sector underweight was Consumer Discretionary.
Contributors to Performance
The Healthcare and Energy sectors provided the largest contributions to relative performance. Regarding individual positions, Prometheus Biosciences, Inc.; Heska Corporation; Guidewire Software, Inc.; Inspire Medical Systems, Inc.; and Wingstop, Inc. were among the top contributors to absolute performance.
Guidewire Software offers on-premises and cloud-based solutions for property and casualty insurance companies, automating processes such as premium billings, claims management, and policy fulfillment. Under the InsuranceSuite brand, the company provides three core systems: BillingsCenter, ClaimsCenter, and PolicyCenter. During the period, shares contributed to performance after the company reported strong operating results, where revenues and operating profits exceeded analyst estimates. Moreover, strong performance was attributable to ongoing cloud traction as the company continued to see large cloud momentum across tier-1 and tier-2 carriers. Management also raised gross margin guidance by 200 bps for the full year, approximately 500 bps ahead of what management projected in October 2022.
Detractors from Performance
The Industrials and Information Technology sectors were the largest detractors from relative performance. Regarding individual positions, Xometry, Inc.; HealthEquity Inc.; RBC Bearings Incorporated; 908 Devices Inc.; and Paycom Software, Inc. were among the top detractors from absolute performance. Shares of Xometry, Inc. detracted from performance in response to developments identified in the Alger Mid Cap Growth Fund discussion.
- 8 -
Alger International Focus Fund
The Alger International Focus Fund recorded a 10.83% return for the fiscal six-month period ended April 30, 2023, compared to the 20.96% return of the MSCI ACWI ex USA Index. During the reporting period, the largest sector weightings were Consumer Discretionary and Financials. The largest sector overweight was Consumer Discretionary and the largest sector underweight was Communication Services.
Contributors to Performance
The Healthcare and Consumer Discretionary sectors provided the largest contributions to relative performance. Regarding individual positions, Moncler SpA; Ferrari NV; LVMH Moet Hennessy Louis Vuitton SE; ASML Holding NV; and HENSOLDT AG were among the top contributors to absolute performance.
ASML is the market leader in providing photolithography systems for the semiconductor industry. ASML’s cutting-edge technology is essential to the semiconductor manufacturing process of increasingly smaller and more powerful microchips, which are widely used in consumer electronics, telecommunications, automotive, and various other industries. Despite macroeconomic weakness, the company reported strong results during the period, where earnings came in better-than-expected. Further, management noted a robust order backlog, reflecting strong demand for Extreme Ultraviolet Lithography and raised fiscal 2023 revenue guidance well above analyst estimates.
Detractors from Performance
The Financials and Energy sectors were the largest detractors from relative performance. Regarding individual positions, VERBIO Vereinigte BioEnergie AG; Angel One Limited; Teleperformance SA; Arezzo Industria e Comercio S.A.; and Alfen NV were among the top detractors from absolute performance.
VERBIO is a leading producer of the complete range of biofuels (biodiesel, bioethanol and biomethane) and byproducts at industrial scale. The company benefits from environmental protection tailwinds and an increasing effort to curb greenhouse gas emissions globally. Moreover, with biomethane serving as a direct substitute for natural gas, there is heightened investor focus on VERBIO’s ability to scale and serve as a solution to a potential energy crisis in Europe. During the period, shares detracted from performance as natural gas prices plummeted due to warmer-than-expected temperatures in Europe and the region’s ability to maintain high levels of gas storage throughout the winter. As a result, demand for biomethane slowed during the period, which negatively impacted company results.
Alger Health Sciences Fund
The Alger Health Sciences Fund returned 0.14% for the fiscal six-month period ended April 30, 2023, compared to the 8.63% return of the S&P 500 Index and the 2.29% return of the Russell 3000 Healthcare Index.
- 9 -
Contributors to Performance
Regarding individual positions, Prometheus Biosciences, Inc.; Reata Pharmaceuticals, Inc.; TransMedics Group, Inc.; Tenet Healthcare Corporation; and GE Healthcare Technologies Inc. were among the top contributors to absolute performance.
Prometheus Biosciences is a biotechnology company focused on developing precision-based medicines to treat autoimmune conditions, primarily those afflicting the intestines such as inflammatory bowel disease (IBD) indications, like ulcerative colitis and Crohn’s disease, by leveraging a proprietary bioinformatics database. Shares contributed to performance during the period as the company reported positive Phase 2 clinical trial results from its IBD study, as the drug PRA023 demonstrated significant patient improvement that was well above expectations. On April 15, 2023, the company entered into an agreement to be acquired by Merck & Co. Inc. for $9.6 billion in cash, which was approximately a 75% premium from the prior trading day’s value. The deal is expected to close in the third quarter of 2023.
Detractors from Performance
Regarding individual positions, Charles River Laboratories International, Inc.; Medpace Holdings, Inc.; UnitedHealth Group Incorporated; Tandem Diabetes Care, Inc.; and Shockwave Medical, Inc. were among the top detractors from absolute performance. Shares of UnitedHealth Group Incorporated, Inc. detracted from performance in response to developments identified in the Alger Capital Appreciation Fund discussion.
I thank you for putting your trust in Alger.
Sincerely,

Daniel C. Chung, CFA
Chief Executive Officer, Chief Investment Officer
Fred Alger Management, LLC
Investors cannot invest directly in an index. Index performance does not reflect the deduction for fees, expenses, or taxes.
This report and the financial statements contained herein are submitted for the general information of shareholders of the funds. This report is not authorized for distribution to prospective investors in a fund unless preceded or accompanied by an effective prospectus for the fund. Performance of funds discussed above, other than the Alger 35 Fund and the Alger Mid Cap Focus Fund, represents the six-month period return of Class A shares prior to the deduction of any sales charges and includes the reinvestment of any dividends or distributions. Performance for the Alger 35 Fund represents Class Z shares. Performance for the Alger Mid Cap Focus Fund represents Class I shares.
The performance data quoted in this material represents past performance, which is not an indication or a guarantee of future results.
Standard performance results can be found on the following pages. The investment return and principal value of an investment in a Fund will fluctuate so that an investor’s shares, when redeemed, may be worth more or less than their original cost. Current performance may be lower or higher than the performance quoted. For performance data current to the most recent month-end, visit us at www.alger.com, or call us at (800) 992-3863.
- 10 -
The views and opinions of the funds’ management in this report are as of the date of the Shareholders’ Letter and are subject to change at any time subsequent to this date. There is no guarantee that any of the assumptions that formed the basis for the opinions stated herein are accurate or that they will materialize. Moreover, the information forming the basis for such assumptions is from sources believed to be reliable; however, there is no guarantee that such information is accurate. Any securities mentioned, whether owned in a fund or otherwise, are considered in the context of the construction of an overall portfolio of securities and therefore reference to them should not be construed as a recommendation or offer to purchase or sell any such security. Inclusion of such securities in a fund and transactions in such securities, if any, may be for a variety of reasons, including, without limitation, in response to cash flows, inclusion in a benchmark, and risk control. The reference to a specific security should also be understood in such context and not viewed as a statement that the security is a significant holding in a fund. Please refer to the Schedule of Investments for each fund which is included in this report for a complete list of fund holdings as of April 30, 2023. Securities mentioned in the Shareholders’ Letter, if not found in the Schedules of Investments, may have been held by the funds during the fiscal six-month period ended April 30, 2023.
Risk Disclosures
Alger Capital Appreciation Fund
Investing in the stock market involves risks, including the potential loss of principal. Growth stocks may be more volatile than other stocks as their prices tend to be higher in relation to their companies’ earnings and may be more sensitive to market, political, and economic developments. Local, regional or global events such as environmental or natural disasters, war, terrorism, pandemics, outbreaks of infectious diseases and similar public health threats, recessions, or other events could have a significant impact on investments. A significant portion of assets may be invested in securities of companies in related sectors, and may be similarly affected by economic, political, or market events and conditions and may be more vulnerable to unfavorable sector developments. Foreign securities involve special risks including currency fluctuations, inefficient trading, political and economic instability, and increased volatility. Active trading may increase transaction costs, brokerage commissions, and taxes, which can lower the return on investment. At times, cash may be a larger position in the portfolio and may underperform relative to equity securities.
Alger 35 Fund
Investing in the stock market involves risks, including the potential loss of principal. Growth stocks may be more volatile than other stocks as their prices tend to be higher in relation to their companies’ earnings and may be more sensitive to market, political, and economic developments. Local, regional or global events such as environmental or natural disasters, war, terrorism, pandemics, outbreaks of infectious diseases and similar public health threats, recessions, or other events could have a significant impact on investments. A significant portion of assets may be invested in securities of companies in related sectors, and may be similarly affected by economic, political, or market events and conditions and may be more vulnerable to unfavorable sector developments. Investing in companies of small and medium capitalizations involves the risk that such issuers may have limited product lines or financial resources, lack management depth, or have limited liquidity. Foreign securities involve special risks including currency fluctuations, inefficient trading, political and economic instability, and increased volatility. The Fund is classified as a “non-diversified fund” under federal securities laws because it can invest in fewer individual companies than a diversified fund. Assets may be focused in a small number of holdings, making them susceptible to risks associated with a single economic, political or regulatory event than a more diversified portfolio. Active trading may increase transaction costs, brokerage commissions, and taxes, which can lower the return on investment. At times, cash may be a larger position in the portfolio and may underperform relative to equity securities.
- 11 -
Alger Growth & Income Fund
Investing in the stock market involves risks, including the potential loss of principal. Growth stocks may be more volatile than other stocks as their prices tend to be higher in relation to their companies’ earnings and may be more sensitive to market, political, and economic developments. Local, regional or global events such as environmental or natural disasters, war, terrorism, pandemics, outbreaks of infectious diseases and similar public health threats, recessions, or other events could have a significant impact on investments. A significant portion of assets may be invested in securities of companies in related sectors, and may be similarly affected by economic, political, or market events and conditions and may be more vulnerable to unfavorable sector developments. Income-producing securities may cut or fail to declare dividends due to market downturns or for other reasons. At times, cash may be a larger position in the portfolio and may underperform relative to equity securities.
Alger Mid Cap Growth Fund
Investing in the stock market involves risks, including the potential loss of principal. Growth stocks may be more volatile than other stocks as their prices tend to be higher in relation to their companies’ earnings and may be more sensitive to market, political, and economic developments. Local, regional or global events such as environmental or natural disasters, war, terrorism, pandemics, outbreaks of infectious diseases and similar public health threats, recessions, or other events could have a significant impact on investments. A significant portion of assets may be invested in securities of companies in related sectors, and may be similarly affected by economic, political, or market events and conditions and may be more vulnerable to unfavorable sector developments. Investing in companies of medium capitalizations involves the risk that such issuers may have limited product lines or financial resources, lack management depth, or have limited liquidity. Foreign securities involve special risks including currency fluctuations, inefficient trading, political and economic instability, and increased volatility. Active trading may increase transaction costs, brokerage commissions, and taxes, which can lower the return on investment. At times, cash may be a larger position in the portfolio and may underperform relative to equity securities.
Alger Mid Cap Focus Fund
Investing in the stock market involves risks, including the potential loss of principal. Growth stocks may be more volatile than other stocks as their prices tend to be higher in relation to their companies’ earnings and may be more sensitive to market, political, and economic developments. Local, regional or global events such as environmental or natural disasters, war, terrorism, pandemics, outbreaks of infectious diseases and similar public health threats, recessions, or other events could have a significant impact on investments. Investing in companies of medium capitalizations involves the risk that such issuers may have limited product lines or financial resources, lack management depth, or have limited liquidity. Assets may be focused in a small number of holdings, making them susceptible to risks associated with a single economic, political or regulatory event than a more diversified portfolio. A significant portion of assets may be invested in securities of companies in related sectors or industries, and may be similarly affected by economic, political, or market events and conditions and may be more vulnerable to unfavorable sector or industry developments. Foreign securities involve special risks including currency fluctuations, inefficient trading, political and economic instability, and increased volatility. Active trading may increase transaction costs, brokerage commissions, and taxes, which can lower the return on investment. At times, cash may be a larger position in the portfolio and may underperform relative to equity securities.
- 12 -
Alger Weatherbie Specialized Growth Fund
Investing in the stock market involves risks, including the potential loss of principal. Growth stocks may be more volatile than other stocks as their prices tend to be higher in relation to their companies’ earnings and may be more sensitive to market, political, and economic developments. Local, regional or global events such as environmental or natural disasters, war, terrorism, pandemics, outbreaks of infectious diseases and similar public health threats, recessions, or other events could have a significant impact on investments. A significant portion of assets may be invested in securities of companies in related sectors, and may be similarly affected by economic, political, or market events and conditions and may be more vulnerable to unfavorable sector developments. Investing in companies of small and medium capitalizations involves the risk that such issuers may have limited product lines or financial resources, lack management depth, or have limited liquidity. Assets may be focused in a small number of holdings, making them susceptible to risks associated with a single economic, political or regulatory event than a more diversified portfolio. Foreign securities and Emerging Markets involve special risks including currency fluctuations, inefficient trading, political and economic instability, and increased volatility. At times, cash may be a larger position in the portfolio and may underperform relative to equity securities.
Alger Small Cap Growth Fund
Investing in the stock market involves risks, including the potential loss of principal. Growth stocks may be more volatile than other stocks as their prices tend to be higher in relation to their companies’ earnings and may be more sensitive to market, political, and economic developments. Local, regional or global events such as environmental or natural disasters, war, terrorism, pandemics, outbreaks of infectious diseases and similar public health threats, recessions, or other events could have a significant impact on investments. A significant portion of assets may be invested in securities of companies in related sectors, and may be similarly affected by economic, political, or market events and conditions and may be more vulnerable to unfavorable sector or industry developments. Investing in companies of small capitalizations involves the risk that such issuers may have limited product lines or financial resources, lack management depth, or have limited liquidity. At times, cash may be a larger position in the portfolio and may underperform relative to equity securities.
Alger Small Cap Focus Fund
Investing in the stock market involves risks, including the potential loss of principal. Growth stocks may be more volatile than other stocks as their prices tend to be higher in relation to their companies’ earnings and may be more sensitive to market, political, and economic developments. Local, regional or global events such as environmental or natural disasters, war, terrorism, pandemics, outbreaks of infectious diseases and similar public health threats, recessions, or other events could have a significant impact on investments. A significant portion of assets may be invested in securities of companies in related sectors or industries, and may be similarly affected by economic, political, or market events and conditions and may be more vulnerable to unfavorable sector or industry developments. Investing in companies of small capitalizations involves the risk that such issuers may have limited product lines or financial resources, lack management depth, or have limited liquidity. Assets may be focused in a small number of holdings, making them susceptible to risks associated with a single economic, political or regulatory event than a more diversified portfolio. At times, cash may be a larger position in the portfolio and may underperform relative to equity securities.
- 13 -
Alger International Focus Fund
Investing in the stock market involves risks, including the potential loss of principal. Growth stocks may be more volatile than other stocks as their prices tend to be higher in relation to their companies’ earnings and may be more sensitive to market, political, and economic developments. Local, regional or global events such as environmental or natural disasters, war, terrorism, pandemics, outbreaks of infectious diseases and similar public health threats, recessions, or other events could have a significant impact on investments. A significant portion of assets may be invested in securities of companies in related sectors, and may be similarly affected by economic, political, or market events and conditions and may be more vulnerable to unfavorable sector developments. Assets may be focused in a small number of holdings, making them susceptible to risks associated with a single economic, political or regulatory event than a more diversified portfolio. Foreign securities and Emerging Markets involve special risks including currency fluctuations, inefficient trading, political and economic instability, and increased volatility. Investing in companies of small capitalizations involves the risk that such issuers may have limited product lines or financial resources, lack management depth, or have limited liquidity. At times, cash may be a larger position in the portfolio and may underperform relative to equity securities.
Alger Health Sciences Fund
Investing in the stock market involves risks, including the potential loss of principal. Growth stocks may be more volatile than other stocks as their prices tend to be higher in relation to their companies’ earnings and may be more sensitive to market, political, and economic developments. Local, regional or global events such as environmental or natural disasters, war, terrorism, pandemics, outbreaks of infectious diseases and similar public health threats, recessions, or other events could have a significant impact on investments. A significant portion of assets will be invested in healthcare companies, which may be significantly affected by competition, innovation, regulation, and product obsolescence, and may be more volatile than the securities of other companies. A significant portion of assets may be invested in securities of companies in related industries, and may be similarly affected by economic, political, or market events and conditions and may be more vulnerable to unfavorable sector developments. Assets may be focused in a small number of holdings, making them susceptible to risks associated with a single economic, political or regulatory event than a more diversified portfolio. Investing in companies of small capitalizations involves the risk that such issuers may have limited product lines or financial resources, lack management depth, or have limited liquidity. Private placements are offerings of a company’s securities not registered with the SEC and not offered to the public, for which limited information may be available. Such investments are generally considered to be illiquid. Foreign securities involve special risks including currency fluctuations, inefficient trading, political and economic instability, and increased volatility. Active trading may increase transaction costs, brokerage commissions, and taxes, which can lower the return on investment. At times, cash may be a larger position in the portfolio and may underperform relative to equity securities.
- 14 -
For a more detailed discussion of the risks associated with a fund, please see the prospectus.
Before investing, carefully consider a fund’s investment objective, risks, charges, and expenses. For a prospectus and summary prospectus containing this and other information or for The Alger Funds’ most recent month-end performance data, visit www.alger.com, call (800) 992-3863 or consult your financial advisor. Read the prospectus and summary prospectus carefully before investing.
Distributor: Fred Alger & Company, LLC
NOT FDIC INSURED. NOT BANK GUARANTEED. MAY LOSE VALUE.
Definitions:
| ● | Earnings per share (EPS) is calculated as a company’s profit divided by the outstanding shares of its common stock. |
| ● | The Consumer Price Index (CPI) measures the monthly change in prices paid by U.S. consumers. The Bureau of Labor Statistics (BLS) calculates the CPI as a weighted average of prices for a basket of goods and services representative of aggregate U.S. consumer spending. |
| ● | The MSCI ACWI captures large- and mid-cap representation across developed markets and emerging markets countries. The index covers approximately 85% of the global equity opportunity set. |
| ● | The MSCI ACWI ex USA Index captures large- and mid-cap representation across developed markets countries (excluding the US) and emerging markets countries. The index covers approximately 85% of the global equity opportunity set outside the US. |
| ● | The MSCI EAFE Index captures large- and mid-cap representation across Emerging Markets countries. The index covers approximately 85% of the free float-adjusted market capitalization in each country. The MSCI Emerging Markets Index is a free float-adjusted market capitalization index that is designed to measure equity market performance in the global emerging markets. |
| ● | The MSCI Emerging Markets Index captures large- and mid-cap representation across Emerging Markets countries. The index covers approximately 85% of the free float-adjusted market capitalization in each country. |
| ● | The Russell 1000 Growth Index measures the performance of the large-cap growth segment of the U.S. equity universe. It includes those Russell 1000 companies with higher growth earning potential as defined by Russell’s leading style methodology. The Russell 1000 Growth Index is constructed to provide a comprehensive and unbiased barometer for the large-cap growth segment. |
- 15 -
| ● | The Russell 1000 Index measures the performance of the large-cap segment of the US equity universe. It is a subset of the Russell 3000 Index and includes approximately 1,000 of the largest securities based on a combination of their market cap and current index membership. |
| ● | The Russell 2000 Growth Index measures the performance of the small- cap growth segment of the U.S. equity universe. It includes those Russell 2000 companies with higher growth earning potential as defined by Russell’s leading style methodology. The Russell 2000 Growth Index is constructed to provide a comprehensive and unbiased barometer for the small-cap growth segment. |
| ● | The Russell 2000 Index measures the performance of the small-cap segment of the US equity universe. The Russell 2000 Index is constructed to provide a comprehensive and unbiased barometer of the small-cap segment. |
| ● | The Russell 2500 Growth Index measures the performance of the small to mid-cap growth segment of the U.S. equity universe. It includes those Russell 2500 companies with higher growth earning potential as defined by Russell’s leading style methodology. The Russell 2500 Growth Index is constructed to provide a comprehensive and unbiased barometer of the small to mid-cap growth market. |
| ● | The Russell 2500 Index measures the performance of the small to midcap segment of the US equity universe, commonly referred to as “smid” cap. The Russell 2500 Index is constructed to provide a comprehensive and unbiased barometer for the small to mid-cap segment. |
| ● | The Russell 3000 Growth Index combines the large-cap Russell 1000 Growth, the small-cap Russell 2000 Growth and the Russell Microcap Growth Index. It includes companies that are considered more growth oriented relative to the overall market as defined by Russell’s leading style methodology. The Russell 3000 Growth Index is constructed to provide a comprehensive, unbiased, and stable barometer of the growth opportunities within the broad market. |
| ● | The Russell 3000 Healthcare Index is an unmanaged index that measures the performance of those companies in the Russell 3000 Index involved in the medical services or healthcare field. Also included are companies involved in research, development and production of pharmaceuticals and biotechnology |
| ● | The Russell 3000 Index measures the performance of the largest 3,000 US companies of the investable US equity market. The Russell 3000 Index is constructed to provide a comprehensive, unbiased and stable barometer of the broad market. |
- 16 -
| ● | The Russell 3000 Value Index measures the performance of the broad value segment of the US equity value universe. It includes those Russell 3000 companies with lower price-to-book ratios and lower forecasted growth values. The Russell 3000 Value Index is constructed to provide a comprehensive, unbiased and stable barometer of the broad value market. |
| ● | The Russell Microcap Growth Index measures the performance of the microcap growth segment of the US equity market. It includes Russell Microcap companies with relatively higher price-to-book ratios, higher I/B/E/S forecast medium term (2 year) growth and higher sales per share historical growth (5 years). |
| ● | The Russell Microcap Index measures the performance of the microcap segment of the US equity market. The Russell Microcap Index is constructed to provide a comprehensive and unbiased barometer for the microcap segment trading on national exchanges. |
| ● | The Russell Midcap Growth Index measures the performance of the mid- cap growth segment of the U.S. equity universe. It includes those Russell Midcap Index companies with higher growth earning potential as defined by Russell’s leading style methodology. The Russell Midcap Growth Index is constructed to provide a comprehensive and unbiased barometer of the mid-cap growth market. |
| ● | The Russell Midcap Index measures the performance of the mid-cap segment of the US equity universe. The Russell Midcap Index is constructed to provide a comprehensive and unbiased barometer for the mid-cap segment. |
| ● | The S&P 500 Index is an unmanaged index considered representative of large-cap growth stocks. |
- 17 -
ALGER CAPITAL APPRECIATION FUND
Fund Highlights Through April 30, 2023 (Unaudited)
HYPOTHETICAL $10,000 INVESTMENT IN CLASS A SHARES
— 10 years ended 4/30/23
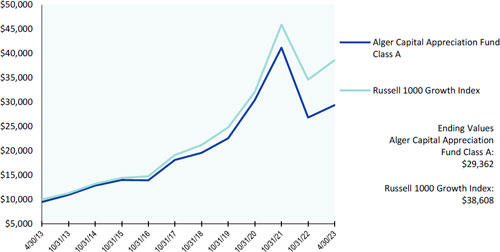
The chart above illustrates the change in value of a hypothetical $10,000 investment made in the Alger Capital Appreciation Fund Class A shares, with a maximum sales charge of 5.25%, and the Russell 1000 Growth Index (an unmanaged index of common stocks) for the ten years ended April 30, 2023. Figures for the Alger Capital Appreciation Fund Class A shares and the Russell 1000 Growth Index include reinvestment of dividends. Figures for the Alger Capital Appreciation Fund Class A shares also include reinvestment of capital gains. Performance for Alger Capital Appreciation Fund Class C and Class Z shares will vary from the results shown above due to differences in expenses and sales charges those classes bear. Investors cannot invest directly in any index. Index performance does not reflect deduction for fees, expenses, or taxes.
- 18 -
ALGER CAPITAL APPRECIATION FUND
Fund Highlights Through April 30, 2023 (Unaudited) (Continued)
| PERFORMANCE COMPARISON AS OF 4/30/23 |
| AVERAGE ANNUAL TOTAL RETURNS |
| | 1 YEAR | 5 YEARS | 10 YEARS |
| Class A | (7.95)% | 7.71% | 11.37% |
| Class C | (4.51)% | 8.06% | 11.14% |
| Class Z | (2.50)% | 9.25% | 12.35% |
| Russell 1000 Growth Index | 2.34% | 13.80% | 14.46% |
| | | | |
The performance data quoted represents past performance, which is not an indication or a guarantee of future results. The Fund’s average annual total returns include changes in share price and reinvestment of dividends and capital gains. Class A returns reflect the maximum initial sales charge and Class C returns reflect the applicable contingent deferred sales charge. The chart and table above do not reflect the deduction of taxes that a shareholder would have paid on Fund distributions or on the redemption of Fund shares. Investment return and principal will fluctuate and the Fund’s shares, when redeemed, may be worth more or less than their original cost. Current performance may be higher or lower than the performance quoted. For updated performance, visit us at www.alger.com or call us at (800) 992-3863.
- 19 -
ALGER 35 FUND
Fund Highlights Through April 30, 2023 (Unaudited)
HYPOTHETICAL $10,000 INVESTMENT IN CLASS Z SHARES
from 3/29/18 to 4/30/23
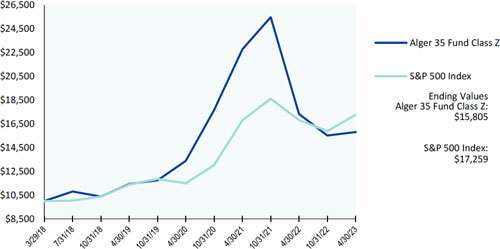
The chart above illustrates the change in value of a hypothetical $10,000 investment made in the Alger 35 Fund Class Z shares and the S&P 500 Index (an unmanaged index of common stocks) from March 29, 2018, the inception date of the Alger 35 Fund Class Z shares, through April 30, 2023. Effective May 7, 2021, Class P shares of the Alger 35 Fund were reclassified as Class Z shares. The reclassified Class Z shares have the same annual returns as the Class P shares because the shares are invested in the same portfolio of securities and the reclassified Class Z shares have the same expenses as the Fund’s Class P shares. Historical performance prior to May 7, 2021 is that of the Fund’s Class P shares. Figures for the Alger 35 Fund Class Z shares and the S&P 500 Index include reinvestment of dividends. Figures for the Alger 35 Fund Class Z shares also include reinvestment of capital gains. Investors cannot invest directly in any index. Index performance does not reflect deduction for fees, expenses, or taxes.
- 20 -
ALGER 35 FUND
Fund Highlights Through April 30, 2023 (Unaudited) (Continued)
| PERFORMANCE COMPARISON AS OF 4/30/23 |
| AVERAGE ANNUAL TOTAL RETURNS |
| | 1 YEAR | 5 YEARS | Since
Inception |
| Class Z (Inception 3/29/18) | (8.70)% | 9.35% | 9.41% |
| S&P 500 Index | 2.66% | 11.45% | 11.32% |
| | | | |
The performance data quoted represents past performance, which is not an indication or a guarantee of future results. The Fund’s average annual total returns include changes in share price and reinvestment of dividends and capital gains. Effective May 7, 2021, Class P shares of the Alger 35 Fund were reclassified as Class Z shares. The reclassified Class Z shares have the same annual returns as the Class P shares because the shares are invested in the same portfolio of securities and the reclassified Class Z shares have the same expenses as the Fund’s Class P shares. Historical performance prior to May 7, 2021 is that of the Fund’s Class P shares. The chart and table above do not reflect the deduction of taxes that a shareholder would have paid on Fund distributions or on the redemption of Fund shares. Investment return and principal will fluctuate and the Fund’s shares, when redeemed, may be worth more or less than their original cost. Current performance may be higher or lower than the performance quoted. For updated performance, visit us at www.alger. com or call us at (800) 992-3863.
- 21 -
ALGER GROWTH & INCOME FUND
Fund Highlights Through April 30, 2023 (Unaudited)
HYPOTHETICAL $10,000 INVESTMENT IN CLASS A SHARES
— 10 years ended 4/30/23
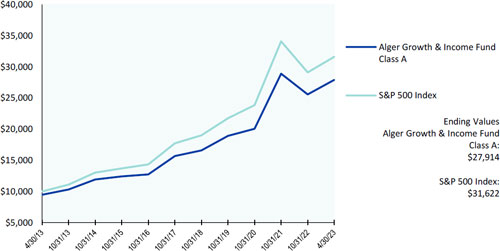
The chart above illustrates the change in value of a hypothetical $10,000 investment made in the Alger Growth & Income Fund Class A shares, with a maximum sales charge of 5.25%, and the S&P 500 Index (an unmanaged index of common stocks) for the ten years ended April 30, 2023. Figures for the Alger Growth & Income Fund Class A shares and the S&P 500 Index include reinvestment of dividends. Figures for the Alger Growth & Income Fund Class A shares also include reinvestment of capital gains. Performance for the Alger Growth & Income Fund Class C and Class Z shares will vary from the results shown above due to differences in expenses and sales charges those classes bear. Investors cannot invest directly in any index. Index performance does not reflect deduction for fees, expenses, or taxes.
- 22 -
ALGER GROWTH & INCOME FUND
Fund Highlights Through April 30, 2023 (Unaudited) (Continued)
| PERFORMANCE COMPARISON AS OF 4/30/23 |
| AVERAGE ANNUAL TOTAL RETURNS |
| | 1 YEAR | 5 YEARS | 10 YEARS |
| Class A | (2.11)% | 10.72% | 10.81% |
| Class C | 1.54% | 11.08% | 10.57% |
| Class Z | 3.62% | 12.31% | 11.75% |
| S&P 500 Index | 2.66% | 11.45% | 12.20% |
| | | | |
The performance data quoted represents past performance, which is not an indication or a guarantee of future results. The Fund’s average annual total returns include changes in share price and reinvestment of dividends and capital gains. Class A returns reflect the maximum initial sales charge and Class C returns reflect the applicable contingent deferred sales charge. The chart and table above do not reflect the deduction of taxes that a shareholder would have paid on Fund distributions or on the redemption of Fund shares. Investment return and principal will fluctuate and the Fund’s shares, when redeemed, may be worth more or less than their original cost. Current performance may be higher or lower than the performance quoted. For updated performance, visit us at www.alger.com or call us at (800) 992-3863.
- 23 -
ALGER MID CAP GROWTH FUND*
Fund Highlights Through April 30, 2023 (Unaudited)
HYPOTHETICAL $10,000 INVESTMENT IN CLASS A SHARES
— 10 years ended 4/30/23
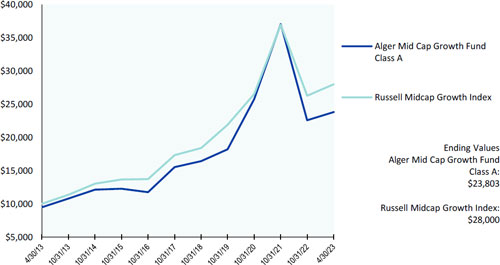
The chart above illustrates the change in value of a hypothetical $10,000 investment made in the Alger Mid Cap Growth Fund Class A shares, with a maximum sales charge of 5.25%, and the Russell Midcap Growth Index (an unmanaged index of common stocks) for the ten years ended April 30, 2023. Figures for the Alger Mid Cap Growth Fund Class A shares and Russell Midcap Growth Index include reinvestment of dividends. Figures for the Alger Mid Cap Growth Fund Class A shares also include reinvestment of capital gains. Performance for the Alger Mid Cap Growth Fund Class B, Class C and Class Z shares will vary from the results shown above due to differences in expenses and sales charges those classes bear. Investors cannot invest directly in any index. Index performance does not reflect deduction for fees, expenses, or taxes.
- 24 -
ALGER MID CAP GROWTH FUND*
Fund Highlights Through April 30, 2023 (Unaudited) (Continued)
| PERFORMANCE COMPARISON AS OF 4/30/23 |
| AVERAGE ANNUAL TOTAL RETURNS |
| | 1 YEAR | 5 YEARS | 10 YEARS |
| Class A | (7.61)% | 7.00% | 9.06% |
| Class B | (7.33)% | 7.86% | 9.21% |
| Class C | (4.17)% | 7.30% | 8.77% |
| Russell Midcap Growth Index | 1.60% | 8.96% | 10.84% |
| | | | |
| | 1 YEAR | 5 YEARS | Since
Inception |
| Class Z (Inception 5/28/15) | (2.08)% | 8.49% | 7.76% |
| Russell Midcap Growth Index | 1.60% | 8.96% | 8.85% |
| | | | |
The performance data quoted represents past performance, which is not an indication or a guarantee of future results. The Fund’s average annual total returns include changes in share price and reinvestment of dividends and capital gains. Class A returns reflect the maximum initial sales charge and Class B and C returns reflect the applicable contingent deferred sales charge. The chart and table above do not reflect the deduction of taxes that a shareholder would have paid on Fund distributions or on the redemption of Fund shares. Investment return and principal will fluctuate and the Fund’s shares, when redeemed, may be worth more or less than their original cost. Current performance may be higher or lower than the performance quoted. For updated performance, visit us at www.alger.com or call us at (800) 992-3863.
| * | Pursuant to the U.S. Securities and Exchange Commission’s rules on Fair Fund and Disgorgement Plans, the Alger Mid Cap Growth Fund received a Fair Fund distribution of $9,346,397 on September 10, 2021, which contributed approximately 0.61% and 0.31% to its five and ten year annual returns, respectively. |
- 25 -
ALGER MID CAP FOCUS FUND
Fund Highlights Through April 30, 2023 (Unaudited)
HYPOTHETICAL $10,000 INVESTMENT IN CLASS I SHARES
— 10 years ended 4/30/23
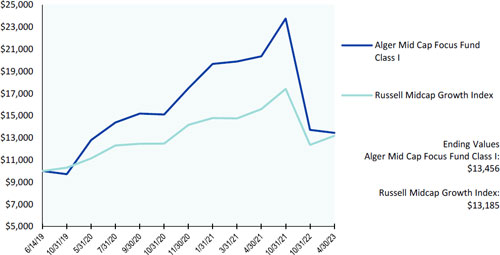
The chart above illustrates the change in value of a hypothetical $10,000 investment made in the Alger Mid Cap Focus Fund Class I shares and the Russell Midcap Growth Index (an unmanaged index of common stocks) from June 14, 2019, the inception date of the Alger Mid Cap Focus Fund Class I shares, through April 30, 2023. Figures for the Alger Mid Cap Focus Fund Class I shares and the Russell Midcap Growth Index include reinvestment of dividends. Figures for the Alger Mid Cap Focus Fund Class I shares also include reinvestment of capital gains. Performance for the Alger Mid Cap Focus Fund Class A, C, Y and Z shares will vary from the results shown above due to differences in the expenses and sales charges that those classes bear. Investors cannot invest directly in any index. Index performance does not reflect deduction for fees, expenses, or taxes.
- 26 -
ALGER MID CAP FOCUS FUND
Fund Highlights Through April 30, 2023 (Unaudited) (Continued)
| PERFORMANCE COMPARISON AS OF 4/30/23 |
| AVERAGE ANNUAL TOTAL RETURNS |
| | 1 YEAR | 5 YEARS | Since
Inception |
| Class I (Inception 6/14/19) | (14.99)% | n/a | 7.96% |
| Class Z (Inception 6/14/19) | (14.72)% | n/a | 8.27% |
| Russell Midcap Growth Index | 1.60% | n/a | 7.40% |
| | | | |
| | 1 YEAR | 5 YEARS | Since
Inception |
| Class Y (Inception 2/26/21) | (14.66)% | n/a | (18.05)% |
| Russell Midcap Growth Index | 1.60% | n/a | (5.90)% |
| | 1 YEAR | 5 YEARS | Since
Inception |
| Class A (Inception 7/29/21) | (19.54)% | n/a | (24.73)% |
| Class C (Inception 7/29/21) | (16.56)% | n/a | (22.96)% |
| Russell Midcap Growth Index | 1.60% | n/a | (12.40)% |
The performance data quoted represents past performance, which is not an indication or a guarantee of future results. The Fund’s average annual total returns include changes in share price and reinvestment of dividends and capital gains. Class A returns reflect the maximum initial sales charge and Class C returns reflect the applicable contingent deferred sales charge. The chart and table above do not reflect the deduction of taxes that a shareholder would have paid on Fund distributions or on the redemption of Fund shares. Investment return and principal will fluctuate and the Fund’s shares, when redeemed, may be worth more or less than their original cost. Current performance may be higher or lower than the performance quoted. For updated performance, visit us at www.alger.com or call us at (800) 992-3863.
- 27 -
ALGER WEATHERBIE SPECIALIZED GROWTH FUND
Fund Highlights Through April 30, 2023 (Unaudited)
HYPOTHETICAL $10,000 INVESTMENT IN CLASS A SHARES
— 10 years ended 4/30/23
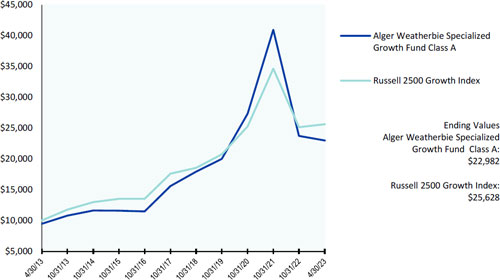
The chart above illustrates the change in value of a hypothetical $10,000 investment made in the Alger Weatherbie Specialized Growth Fund Class A shares, with a maximum sales charge of 5.25%, and the Russell 2500 Growth Index (an unmanaged index of common stocks) for the ten years ended April 30, 2023. From August 30, 2017 to September 30, 2019, the Fund was named Alger SMid Cap Focus Fund. Prior to August 30, 2017, the Fund followed different investment strategies under the name Alger SMid Cap Growth Fund and prior to March 1, 2017 was managed by different portfolio managers. Accordingly, performance prior to those dates does not reflect the Fund’s current investment strategies and investment personnel. Figures for the Alger Weatherbie Specialized Growth Fund Class A shares and the Russell 2500 Growth Index include reinvestment of dividends. Figures for the Alger Weatherbie Specialized Growth Fund Class A shares also include reinvestment of capital gains. Performance for the Alger Weatherbie Specialized Growth Fund Class C, Class I, Class Y and Class Z shares will vary from the results shown above due to differences in expenses and sales charges those classes bear. Investors cannot invest directly in any index. Index performance does not reflect deduction for fees, expenses, or taxes.
- 28 -
ALGER WEATHERBIE SPECIALIZED GROWTH FUND
Fund Highlights Through April 30, 2023 (Unaudited) (Continued)
| PERFORMANCE COMPARISON AS OF 4/30/23 |
| AVERAGE ANNUAL TOTAL RETURNS |
| | 1 YEAR | 5 YEARS | 10 YEARS |
| Class A | (15.47)% | 5.20% | 8.68% |
| Class C | (12.29)% | 5.54% | 8.42% |
| Class I | (10.69)% | 6.38% | 9.27% |
| Class Z | (10.45)% | 6.71% | 9.62% |
| Russell 2500 Growth Index | (0.07)% | 6.69% | 9.87% |
| | | | |
| | 1 YEAR | 5 YEARS | Since
Inception |
| Class Y (Inception 8/30/17) | (10.30)% | 6.78% | 8.81% |
| Russell 2500 Growth Index | (0.07)% | 6.69% | 8.36% |
| | | | |
The performance data quoted represents past performance, which is not an indication or a guarantee of future results. The Fund’s average annual total returns include changes in share price and reinvestment of dividends and capital gains. Class A returns reflect the maximum initial sales charge and Class C returns reflect the applicable contingent deferred sales charge. The chart and table above do not reflect the deduction of taxes that a shareholder would have paid on Fund distributions or on the redemption of Fund shares. From August 30, 2017 to September 30, 2019, the Fund was named “Alger SMid Cap Focus Fund.” Prior to August 30, 2017, the Fund followed different investment strategies under the name “Alger SMid Cap Growth Fund” and prior to March 1, 2017 was managed by different portfolio managers. Accordingly, performance prior to those dates does not reflect the Fund’s current investment strategies and investment personnel. Investment return and principal will fluctuate and the Fund’s shares, when redeemed, may be worth more or less than their original cost. Current performance may be higher or lower than the performance quoted. For updated performance, visit us at www.alger. com or call us at (800) 992-3863.
- 29 -
ALGER SMALL CAP GROWTH FUND*
Fund Highlights Through April 30, 2023 (Unaudited)
HYPOTHETICAL $10,000 INVESTMENT IN CLASS A SHARES
— 10 years ended 4/30/23
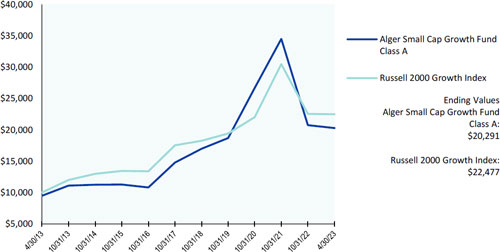
The chart above illustrates the change in value of a hypothetical $10,000 investment made in the Alger Small Cap Growth Fund Class A shares, with a maximum sales charge of 5.25%, and the Russell 2000 Growth Index (an unmanaged index of common stocks) for the ten years ended April 30, 2023. Figures for the Alger Small Cap Growth Fund Class A shares and the Russell 2000 Growth Index include reinvestment of dividends. Figures for the Alger Small Cap Growth Fund Class A shares also include reinvestment of capital gains. Performance for the Alger Small Cap Growth Fund Class B, Class C, Class Y and Class Z shares will vary from the results shown above due to differences in expenses and sales charges those classes bear. Investors cannot invest directly in any index. Index performance does not reflect deduction for fees, expenses, or taxes.
- 30 -
ALGER SMALL CAP GROWTH FUND*
Fund Highlights Through April 30, 2023 (Unaudited) (Continued)
| PERFORMANCE COMPARISON AS OF 4/30/23 |
| AVERAGE ANNUAL TOTAL RETURNS |
| | 1 YEAR | 5 YEARS | 10 YEARS |
| Class A | (14.88)% | 3.96% | 7.33% |
| Class B | (14.84)% | 4.56% | 7.40% |
| Class C | (11.85)% | 4.22% | 7.04% |
| Class Z | (9.90)% | 5.45% | 8.28% |
| Russell 2000 Growth Index | 0.72% | 4.00% | 8.44% |
| | | | |
| | 1 YEAR | 5 YEARS | Since
Inception |
| Class Y (Inception 12/31/21) | (9.79)% | n/a | (27.04)% |
| Russell 2000 Growth Index | 0.72% | n/a | (17.76)% |
| | | | |
The performance data quoted represents past performance, which is not an indication or a guarantee of future results. The Fund’s average annual total returns include changes in share price and reinvestment of dividends and capital gains. Class A returns reflect the maximum initial sales charge and Class B and C returns reflect the applicable contingent deferred sales charge. The chart and table above do not reflect the deduction of taxes that a shareholder would have paid on Fund distributions or on the redemption of Fund shares. Investment return and principal will fluctuate and the Fund’s shares, when redeemed, may be worth more or less than their original cost. Current performance may be higher or lower than the performance quoted. For updated performance, visit us at www.alger.com or call us at (800) 992-3863.
| * | Pursuant to the U.S. Securities and Exchange Commission’s Rules on Fair Fund and Disgorgement Plans, the Alger Small Cap Growth Fund received a Fair Fund distribution of $3,738,004 on September 10, 2021, which contributed approximately 0.12% and 0.06% to its five and ten year annual returns, respectively. |
- 31 -
ALGER SMALL CAP FOCUS FUND
Fund Highlights Through April 30, 2023 (Unaudited)
HYPOTHETICAL $10,000 INVESTMENT IN CLASS A SHARES
— 10 years ended 4/30/23
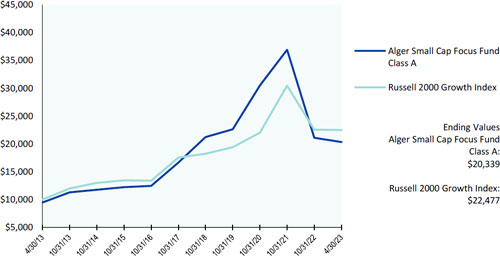
The chart above illustrates the change in value of a hypothetical $10,000 investment made in the Alger Small Cap Focus Fund Class A shares, with an initial 5.25% maximum sales charge, and the Russell 2000 Growth (an unmanaged index of common stocks) for the ten years ended April 30, 2023. Prior to August 7, 2015, the Fund followed different investment strategies under the name “Alger Growth Opportunities Fund” and prior to February 12, 2015 was managed by a different portfolio manager. Accordingly, performance prior to those dates does not reflect the Fund’s current investment strategies and investment personnel. Figures for the Alger Small Cap Focus Fund Class A shares and the Russell 2000 Growth Index include reinvestment of dividends. Figures for the Alger Small Cap Focus Fund Class A shares also include reinvestment of capital gains. Performance for the Alger Small Cap Focus Fund Class C, Class I, Class Y and Class Z shares will vary from the results shown above due to differences in expenses and sales charges those classes bear. Investors cannot invest directly in any index. Index performance does not reflect deduction for fees, expenses, or taxes.
- 32 -
ALGER SMALL CAP FOCUS FUND
Fund Highlights Through April 30, 2023 (Unaudited) (Continued)
| PERFORMANCE COMPARISON AS OF 4/30/23 |
| AVERAGE ANNUAL TOTAL RETURNS |
| | 1 YEAR | 5 YEARS | 10 YEARS |
| Class A | (11.60)% | 0.66% | 7.36% |
| Class C | (8.12)% | 1.07% | 7.20% |
| Class I | (6.44)% | 1.85% | 8.05% |
| Class Z | (6.18)% | 2.17% | 8.37% |
| Russell 2000 Growth Index | 0.72% | 4.00% | 8.44% |
| | | | |
| | 1 YEAR | 5 YEARS | Since
Inception |
| Class Y (Inception 2/28/17) | (6.18)% | 2.17% | 6.72% |
| Russell 2000 Growth Index | 0.72% | 4.00% | 6.35% |
| | | | |
The performance data quoted represents past performance, which is not an indication or a guarantee of future results. The Fund’s average annual total returns include changes in share price and reinvestment of dividends and capital gains. Class A returns reflect the maximum initial sales charge and Class C returns reflect the applicable contingent deferred sales charge. The chart and table above do not reflect the deduction of taxes that a shareholder would have paid on Fund distributions or on the redemption of Fund shares. Prior to August 7, 2015, the Fund followed different investment strategies under the name “Alger Growth Opportunities Fund” and prior to February 12, 2015 was managed by a different portfolio manager. Accordingly, performance prior to those dates does not reflect the Fund’s current investment strategies and investment personnel. Investment return and principal will fluctuate and the Fund’s shares, when redeemed, may be worth more or less than their original cost. Current performance may be higher or lower than the performance quoted. For updated performance, visit us at www.alger.com or call us at (800) 992-3863.
- 33 -
ALGER INTERNATIONAL FOCUS FUND*
Fund Highlights Through April 30, 2023 (Unaudited)
HYPOTHETICAL $10,000 INVESTMENT IN CLASS A SHARES
— 10 years ended 4/30/23
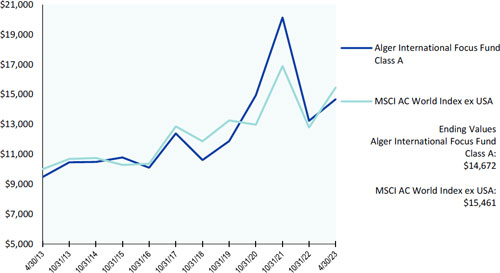
The chart above illustrates the change in value of a hypothetical $10,000 investment made in the Alger International Focus Fund Class A shares, with a maximum sales charge of 5.25%, and MSCI AC World Index ex USA (an unmanaged index of common stocks) for the ten years ended April 30, 2023. Before March 28, 2018, the Fund followed different investment strategies and was managed by different portfolio managers. Prior to May 31, 2013, the Fund was named “Alger Large Cap Growth Fund,” and from May 31, 2013 to August 15, 2018 the Fund was named “Alger International Growth Fund.” Performance prior to March 28, 2018 reflects these prior management styles and does not reflect the Fund’s current investment strategies and investment personnel. Figures for the Alger International Focus Fund Class A shares and the index include reinvestment of dividends. Figures for the Alger International Focus Fund Class A shares also include reinvestment of capital gains. Performance for the Alger International Focus Fund Class B, Class C, Class I and Class Z shares will vary from the results shown above due to differences in expenses and sales charges those classes bear. Investors cannot invest directly in any index. Index performance does not reflect deduction for fees, expenses, or taxes.
- 34 -
ALGER INTERNATIONAL FOCUS FUND*
Fund Highlights Through April 30, 2023 (Unaudited) (Continued)
| PERFORMANCE COMPARISON AS OF 4/30/23 |
| AVERAGE ANNUAL TOTAL RETURNS |
| | 1 YEAR | 5 YEARS | 10 YEARS |
| Class A | (7.56)% | 2.03% | 3.91% |
| Class B | (7.31)% | 2.72% | 4.07% |
| Class C | (4.16)% | 2.31% | 3.66% |
| Class Z | (1.99)% | 3.58% | 4.93% |
| MSCI AC World Index ex USA | 3.61% | 2.99% | 4.45% |
| | | | |
| | 1 YEAR | 5 YEARS | Since
Inception |
| Class I (Inception 5/31/13) | (2.36)% | 3.27% | 4.59% |
| MSCI AC World Index ex USA | 3.61% | 2.99% | 4.73% |
| | | | |
The performance data quoted represents past performance, which is not an indication or a guarantee of future results. The Fund’s average annual total returns include changes in share price and reinvestment of dividends and capital gains. Class A returns reflect the maximum initial sales charge and Class B and C returns reflect the applicable contingent deferred sales charge. The chart and table above do not reflect the deduction of taxes that a shareholder would have paid on Fund distributions or on the redemption of Fund shares. Investment return and principal will fluctuate and the Fund’s shares, when redeemed, may be worth more or less than their original cost. Before March 28, 2018, the Fund followed different investment strategies and was managed by different portfolio managers. Prior to May 31, 2013, the Fund was named “Alger Large Cap Growth Fund,” and from May 31, 2013 to August 15, 2018 the Fund was named “Alger International Growth Fund.” Performance prior to March 28, 2018 reflects these prior management styles and does not reflect the Fund’s current investment strategies and investment personnel. Current performance may be higher or lower than the performance quoted. For updated performance, visit us at www.alger.com or call us at (800) 992-3863.
| * | Pursuant to the U.S. Securities and Exchange Commission’s Rules on Fair Fund and Disgorgement Plans, the Alger International Focus Fund received a Fair Fund distribution of $159,091 on September 10, 2021, which contributed approximately 0.02% and 0.01% to its five and ten year annual returns, respectively. |
- 35 -
ALGER HEALTH SCIENCES FUND*
Fund Highlights Through April 30, 2023 (Unaudited)
HYPOTHETICAL $10,000 INVESTMENT IN CLASS A SHARES
— 10 years ended 4/30/23
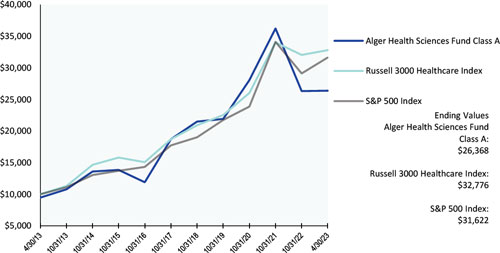
The chart above illustrates the change in value of a hypothetical $10,000 investment made in the Alger Health Sciences Fund Class A shares, with a maximum sales charge of 5.25%, the Russell 3000 Healthcare Index and the S&P 500 Index (each an unmanaged index of common stocks) for the ten years ended April 30, 2023. Figures for the Alger Health Sciences Fund Class A shares, the Russell 3000 Healthcare Index and the S&P 500 Index include reinvestment of dividends. Figures for the Alger Health Sciences Fund Class A shares also include reinvestment of capital gains. Performance for the Alger Health Sciences Fund Class C and Class Z shares will vary from the results shown above due to differences in expenses and sales charges those classes bear. Investors cannot invest directly in any index. Index performance does not reflect deduction for fees, expenses, or taxes.
- 36 -
ALGER HEALTH SCIENCES FUND*
Fund Highlights Through April 30, 2023 (Unaudited) (Continued)
| PERFORMANCE COMPARISON AS OF 4/30/23 |
| AVERAGE ANNUAL TOTAL RETURNS |
| | 1 YEAR | 5 YEARS | 10 YEARS |
| Class A | (3.56)% | 5.00% | 10.18% |
| Class C | 0.01% | 5.32% | 9.92% |
| Russell 3000 Healthcare Index | 4.61% | 11.18% | 12.60% |
| S&P 500 Index | 2.66% | 11.45% | 12.20% |
| | | | |
| | 1 YEAR | 5 YEARS | Since
Inception |
| Class Z (Inception 5/28/15) | 2.16% | 6.50% | 6.93% |
| Russell 3000 Healthcare Index | 4.61% | 11.18% | 8.85% |
| S&P 500 Index | 2.66% | 11.45% | 10.96% |
| | | | |
The performance data quoted represents past performance, which is not an indication or a guarantee of future results. The Fund’s average annual total returns include changes in share price and reinvestment of dividends and capital gains. Class A returns reflect the maximum initial sales charge and Class C returns reflect the applicable contingent deferred sales charge. The chart and table above do not reflect the deduction of taxes that a shareholder would have paid on Fund distributions or on the redemption of Fund shares. Investment return and principal will fluctuate and the Fund’s shares, when redeemed, may be worth more or less than their original cost. Current performance may be higher or lower than the performance quoted. For updated performance, visit us at www.alger.com or call us at (800) 992-3863.
| * | Pursuant to the U.S. Securities and Exchange Commission’s Rules on Fair Fund and Disgorgement Plans, the Alger Health Sciences Fund received a Fair Fund distribution of $179,832 on September 10, 2021, which contributed approximately 0.01% to its five and ten year annual returns. |
- 37 -
PORTFOLIO SUMMARY†
April 30, 2023 (Unaudited)
| SECTORS | | Alger Capital
Appreciation Fund | | Alger 35 Fund | | Alger Growth &
Income Fund | | Alger Mid Cap Growth
Fund |
| Communication Services | | 9.9 | % | | 17.4 | % | | 8.6 | % | | 4.3 | % |
| Consumer Discretionary | | 17.0 | | | 28.7 | | | 6.9 | | | 14.4 | |
| Consumer Staples | | 0.0 | | | 0.0 | | | 7.3 | | | 1.0 | |
| Energy | | 3.7 | | | 6.6 | | | 6.0 | | | 3.8 | |
| Financials | | 7.7 | | | 0.0 | | | 12.4 | | | 4.7 | |
| Healthcare | | 15.9 | | | 10.0 | | | 13.8 | | | 18.7 | |
| Industrials | | 6.9 | | | 4.5 | | | 5.9 | | | 17.7 | |
| Information Technology | | 36.0 | | | 27.9 | | | 27.0 | | | 27.3 | |
| Materials | | 2.0 | | | 2.7 | | | 2.5 | | | 3.4 | |
| Real Estate | | 0.0 | | | 1.6 | | | 3.4 | | | 3.6 | |
| Utilities | | 0.0 | | | 0.0 | | | 1.4 | | | 0.0 | |
| Short-Term Investments and Net Other Assets | | 0.9 | | | 0.6 | | | 4.8 | | | 1.1 | |
| | | 100.0 | % | | 100.0 | % | | 100.0 | % | | 100.0 | % |
| | | | | | | | | | | | | |
| SECTORS | | Alger Mid Cap Focus
Fund | | Alger Weatherbie
Specialized Growth
Fund | | Alger Small Cap
Growth Fund | | Alger Small Cap
Focus Fund |
| Communication Services | | 5.3 | % | | 0.3 | % | | 3.9 | % | | 0.0 | % |
| Consumer Discretionary | | 12.2 | | | 11.2 | | | 11.2 | | | 3.6 | |
| Consumer Staples | | 0.0 | | | 0.0 | | | 6.1 | | | 0.9 | |
| Energy | | 3.6 | | | 5.8 | | | 5.9 | | | 6.9 | |
| Financials | | 0.9 | | | 10.8 | | | 2.3 | | | 0.0 | |
| Healthcare | | 26.4 | | | 24.2 | | | 30.3 | | | 49.4 | |
| Industrials | | 10.9 | | | 19.1 | | | 8.3 | | | 9.2 | |
| Information Technology | | 37.5 | | | 18.1 | | | 26.9 | | | 27.8 | |
| Materials | | 1.2 | | | 0.0 | | | 2.7 | | | 0.0 | |
| Real Estate | | 0.0 | | | 6.0 | | | 1.5 | | | 0.0 | |
| Short-Term Investments and Net Other Assets | | 2.0 | | | 4.5 | | | 0.9 | | | 2.2 | |
| | | 100.0 | % | | 100.0 | % | | 100.0 | % | | 100.0 | % |
| | | | | | | | | | | | | |
| SECTORS | | Alger Health Sciences
Fund | |
| Healthcare | | 98.3 | % | |
| Short-Term Investments and Net Other Assets | | 1.7 | | |
| | | 100.0 | % | |
- 38 -
PORTFOLIO SUMMARY†
April 30, 2023 (Unaudited) (Continued)
| COUNTRY | | Alger International
Focus Fund | |
| Argentina | | 2.8 | % | |
| Australia | | 3.7 | | |
| Brazil | | 5.8 | | |
| China | | 11.2 | | |
| Denmark | | 2.5 | | |
| France | | 14.0 | | |
| Germany | | 6.2 | | |
| Hong Kong | | 4.0 | | |
| India | | 5.3 | | |
| Ireland | | 3.0 | | |
| Italy | | 6.8 | | |
| Japan | | 3.3 | | |
| Mexico | | 2.5 | | |
| Netherlands | | 8.6 | | |
| Norway | | 1.1 | | |
| Spain | | 1.9 | | |
| Sweden | | 1.7 | | |
| Switzerland | | 3.6 | | |
| United Kingdom | | 5.4 | | |
| United States | | 2.7 | | |
| Short-Term Investments, Cash and Net Other Assets | | 3.9 | | |
| | | 100.0 | % | |
| † | Based on net assets for each Fund. |
- 39 -
THE ALGER FUNDS | ALGER CAPITAL APPRECIATION FUND
Schedule of Investments April 30, 2023 (Unaudited)
| COMMON STOCKS—98.8% | | SHARES | | | VALUE | |
| ADVERTISING—0.7% | | | | | | | | |
| The Trade Desk, Inc., Cl. A* | | | 197,203 | | | $ | 12,688,041 | |
| AEROSPACE & DEFENSE—3.4% | | | | | | | | |
| HEICO Corp. | | | 83,456 | | | | 14,074,020 | |
| TransDigm Group, Inc. | | | 58,538 | | | | 44,781,570 | |
| | | | | | | | 58,855,590 | |
| APPAREL ACCESSORIES & LUXURY GOODS—1.2% | | | | | | | | |
| LVMH Moet Hennessy Louis Vuitton SE | | | 21,766 | | | | 20,936,308 | |
| APPAREL RETAIL—0.2% | | | | | | | | |
| The TJX Cos., Inc. | | | 49,374 | | | | 3,891,659 | |
| APPLICATION SOFTWARE—4.3% | | | | | | | | |
| Adobe, Inc.* | | | 30,535 | | | | 11,528,794 | |
| Cadence Design Systems, Inc.* | | | 59,400 | | | | 12,441,330 | |
| Datadog, Inc., Cl. A* | | | 136,286 | | | | 9,182,951 | |
| Intuit, Inc. | | | 69,159 | | | | 30,703,138 | |
| Salesforce, Inc.* | | | 54,383 | | | | 10,787,956 | |
| | | | | | | | 74,644,169 | |
| AUTOMOBILE MANUFACTURERS—1.2% | | | | | | | | |
| Tesla, Inc.* | | | 120,890 | | | | 19,863,436 | |
| AUTOMOTIVE PARTS & EQUIPMENT—0.1% | | | | | | | | |
| Mobileye Global, Inc., Cl. A* | | | 23,970 | | | | 902,231 | |
| BIOTECHNOLOGY—7.0% | | | | | | | | |
| AbbVie, Inc. | | | 143,306 | | | | 21,656,403 | |
| Biogen, Inc.* | | | 41,866 | | | | 12,736,893 | |
| Natera, Inc.* | | | 627,777 | | | | 31,840,849 | |
| Prometheus Biosciences, Inc.* | | | 115,528 | | | | 22,406,656 | |
| Regeneron Pharmaceuticals, Inc.* | | | 10,783 | | | | 8,645,702 | |
| Vaxcyte, Inc.* | | | 345,362 | | | | 14,791,854 | |
| Vertex Pharmaceuticals, Inc.* | | | 26,141 | | | | 8,907,023 | |
| | | | | | | | 120,985,380 | |
| BROADLINE RETAIL—7.9% | | | | | | | | |
| Amazon.com, Inc.* | | | 854,089 | | | | 90,063,685 | |
| MercadoLibre, Inc.* | | | 36,642 | | | | 46,809,789 | |
| | | | | | | | 136,873,474 | |
| CARGO GROUND TRANSPORTATION—0.4% | | | | | | | | |
| Old Dominion Freight Line, Inc. | | | 19,853 | | | | 6,360,703 | |
| CASINOS & GAMING—3.5% | | | | | | | | |
| Flutter Entertainment PLC* | | | 92,458 | | | | 18,474,733 | |
| Las Vegas Sands Corp.* | | | 425,304 | | | | 27,155,661 | |
| MGM Resorts International | | | 334,872 | | | | 15,042,450 | |
| | | | | | | | 60,672,844 | |
| COMMUNICATIONS EQUIPMENT—0.8% | | | | | | | | |
| Arista Networks, Inc.* | | | 81,985 | | | | 13,130,718 | |
| CONSTRUCTION MACHINERY & HEAVY TRANSPORTATION EQUIPMENT—0.6% |
| Wabtec Corp. | | | 100,723 | | | | 9,837,615 | |
- 40 -
THE ALGER FUNDS | ALGER CAPITAL APPRECIATION FUND
Schedule of Investments April 30, 2023 (Unaudited) (Continued)
| COMMON STOCKS—98.8% (CONT.) | | SHARES | | | VALUE | |
| CONSTRUCTION MATERIALS—1.2% | | | | | | | | |
| Martin Marietta Materials, Inc. | | | 58,096 | | | $ | 21,100,467 | |
| COPPER—0.1% | | | | | | | | |
| Freeport-McMoRan, Inc. | | | 63,995 | | | | 2,426,050 | |
| DIVERSIFIED BANKS—1.0% | | | | | | | | |
| JPMorgan Chase & Co. | | | 122,625 | | | | 16,951,680 | |
| DIVERSIFIED SUPPORT SERVICES—0.4% | | | | | | | | |
| Cintas Corp. | | | 13,355 | | | | 6,086,808 | |
| ELECTRICAL COMPONENTS & EQUIPMENT—0.4% | | | | | | | | |
| Eaton Corp. PLC | | | 41,193 | | | | 6,884,174 | |
| ENVIRONMENTAL & FACILITIES SERVICES—1.2% | | | | | | | | |
| GFL Environmental, Inc. | | | 319,336 | | | | 11,591,897 | |
| Waste Management, Inc. | | | 55,323 | | | | 9,186,384 | |
| | | | | | | | 20,778,281 | |
| FINANCIAL EXCHANGES & DATA—2.1% | | | | | | | | |
| CME Group, Inc., Cl. A | | | 57,769 | | | | 10,731,747 | |
| S&P Global, Inc. | | | 68,654 | | | | 24,892,567 | |
| | | | | | | | 35,624,314 | |
| FOOTWEAR—0.8% | | | | | | | | |
| NIKE, Inc., Cl. B | | | 112,454 | | | | 14,250,171 | |
| HEALTHCARE DISTRIBUTORS—0.5% | | | | | | | | |
| McKesson Corp. | | | 24,732 | | | | 9,008,384 | |
| HEALTHCARE EQUIPMENT—2.9% | | | | | | | | |
| Boston Scientific Corp.* | | | 367,571 | | | | 19,157,800 | |
| Dexcom, Inc.* | | | 77,537 | | | | 9,408,340 | |
| Intuitive Surgical, Inc.* | | | 71,083 | | | | 21,411,621 | |
| | | | | | | | 49,977,761 | |
| HEALTHCARE FACILITIES—1.1% | | | | | | | | |
| Acadia Healthcare Co., Inc.* | | | 252,051 | | | | 18,220,767 | |
| HOTELS RESORTS & CRUISE LINES—1.6% | | | | | | | | |
| Booking Holdings, Inc.* | | | 4,774 | | | | 12,824,444 | |
| Trip.com Group Ltd.#,* | | | 413,506 | | | | 14,683,598 | |
| | | | | | | | 27,508,042 | |
| INTERACTIVE HOME ENTERTAINMENT—0.0% | | | | | | | | |
| Roblox Corp., Cl. A* | | | 22,768 | | | | 810,541 | |
| INTERACTIVE MEDIA & SERVICES—5.8% | | | | | | | | |
| Alphabet, Inc., Cl. C* | | | 542,109 | | | | 58,667,036 | |
| Meta Platforms, Inc., Cl. A* | | | 171,577 | | | | 41,233,385 | |
| | | | | | | | 99,900,421 | |
| INTERNET SERVICES & INFRASTRUCTURE—0.2% | | | | | | | | |
| MongoDB, Inc., Cl. A* | | | 14,057 | | | | 3,373,118 | |
| INVESTMENT BANKING & BROKERAGE—0.1% | | | | | | | | |
| LPL Financial Holdings, Inc. | | | 12,291 | | | | 2,566,852 | |
- 41 -
THE ALGER FUNDS | ALGER CAPITAL APPRECIATION FUND
Schedule of Investments April 30, 2023 (Unaudited) (Continued)
| COMMON STOCKS—98.8% (CONT.) | | SHARES | | | VALUE | |
| LIFE SCIENCES TOOLS & SERVICES—1.3% | | | | | | | | |
| Charles River Laboratories International, Inc.* | | | 19,758 | | | $ | 3,756,391 | |
| Danaher Corp. | | | 80,344 | | | | 19,034,297 | |
| | | | | | | | 22,790,688 | |
| MANAGED HEALTHCARE—1.9% | | | | | | | | |
| UnitedHealth Group, Inc. | | | 68,321 | | | | 33,620,081 | |
| MOVIES & ENTERTAINMENT—3.4% | | | | | | | | |
| Liberty Media Corp. Series C Liberty Formula One* | | | 141,656 | | | | 10,226,147 | |
| Live Nation Entertainment, Inc.* | | | 103,100 | | | | 6,988,118 | |
| Netflix, Inc.* | | | 77,280 | | | | 25,496,990 | |
| The Walt Disney Co.* | | | 157,213 | | | | 16,114,332 | |
| | | | | | | | 58,825,587 | |
| OIL & GAS EQUIPMENT & SERVICES—1.1% | | | | | | | | |
| Schlumberger Ltd. | | | 367,143 | | | | 18,118,507 | |
| OIL & GAS EXPLORATION & PRODUCTION—2.1% | | | | | | | | |
| Diamondback Energy, Inc. | | | 121,047 | | | | 17,212,883 | |
| Hess Corp. | | | 43,459 | | | | 6,304,163 | |
| Pioneer Natural Resources Co. | | | 59,129 | | | | 12,863,514 | |
| | | | | | | | 36,380,560 | |
| OIL & GAS STORAGE & TRANSPORTATION—0.5% | | | | | | | | |
| Cheniere Energy, Inc. | | | 53,229 | | | | 8,144,037 | |
| PASSENGER GROUND TRANSPORTATION—0.5% | | | | | | | | |
| Uber Technologies, Inc.* | | | 301,094 | | | | 9,348,969 | |
| PHARMACEUTICALS—1.2% | | | | | | | | |
| AstraZeneca PLC# | | | 168,450 | | | | 12,333,909 | |
| Catalent, Inc.* | | | 44,882 | | | | 2,249,486 | |
| Eli Lilly & Co. | | | 12,861 | | | | 5,091,156 | |
| Reata Pharmaceuticals, Inc., Cl. A* | | | 16,797 | | | | 1,660,551 | |
| | | | | | | | 21,335,102 | |
| PROPERTY & CASUALTY INSURANCE—0.5% | | | | | | | | |
| The Progressive Corp. | | | 64,354 | | | | 8,777,886 | |
| RESTAURANTS—0.5% | | | | | | | | |
| Yum China Holdings, Inc. | | | 138,629 | | | | 8,481,322 | |
| SEMICONDUCTORS—9.1% | | | | | | | | |
| Advanced Micro Devices, Inc.* | | | 154,347 | | | | 13,793,992 | |
| First Solar, Inc.* | | | 42,049 | | | | 7,677,306 | |
| Marvell Technology, Inc. | | | 657,058 | | | | 25,940,650 | |
| NVIDIA Corp. | | | 319,212 | | | | 88,578,138 | |
| ON Semiconductor Corp.* | | | 100,221 | | | | 7,211,903 | |
| Taiwan Semiconductor Manufacturing Co., Ltd.# | | | 166,790 | | | | 14,060,397 | |
| | | | | | | | 157,262,386 | |
| SPECIALTY CHEMICALS—0.7% | | | | | | | | |
| Albemarle Corp. | | | 62,253 | | | | 11,545,441 | |
- 42 -
THE ALGER FUNDS | ALGER CAPITAL APPRECIATION FUND
Schedule of Investments April 30, 2023 (Unaudited) (Continued)
| COMMON STOCKS—98.8% (CONT.) | | SHARES | | | VALUE | |
| SYSTEMS SOFTWARE—14.2% | | | | | | | | |
| Microsoft Corp. | | | 714,180 | | | $ | 219,438,947 | |
| Oracle Corp. | | | 89,050 | | | | 8,434,816 | |
| Palo Alto Networks, Inc.* | | | 48,981 | | | | 8,937,073 | |
| ServiceNow, Inc.* | | | 18,241 | | | | 8,380,280 | |
| | | | | | | | 245,191,116 | |
| TECHNOLOGY HARDWARE STORAGE & PERIPHERALS—7.1% |
| Apple, Inc. | | | 722,188 | | | | 122,540,860 | |
| TRANSACTION & PAYMENT PROCESSING SERVICES—4.0% |
| PayPal Holdings, Inc.* | | | 101,687 | | | | 7,728,212 | |
| Visa, Inc., Cl. A | | | 261,012 | | | | 60,745,323 | |
| | | | | | | | 68,473,535 | |
| TOTAL COMMON STOCKS | | | | | | | | |
| (Cost $1,104,426,270) | | | | | | | 1,705,946,076 | |
| | | | | | | | | |
| PREFERRED STOCKS—0.1% | | | SHARES | | | | VALUE | |
| DATA PROCESSING & OUTSOURCED SERVICES—0.1% | | | | | | | | |
| Chime Financial, Inc., Series G*,@,(a) | | | 27,841 | | | | 1,197,441 | |
| (Cost $1,922,972) | | | | | | | 1,197,441 | |
| | | | | | | | | |
| SPECIAL PURPOSE VEHICLE—0.2% | | | | | | | VALUE | |
| DATA PROCESSING & OUTSOURCED SERVICES—0.2% | | | | | | | | |
| Crosslink Ventures Capital C, LLC, Cl. A*,@,(a),(b) | | | | | | | 2,896,878 | |
| (Cost $2,775,000) | | | | | | | 2,896,878 | |
| Total Investments | | | | | | | | |
| (Cost $1,109,124,242) | | | 99.1 | % | | $ | 1,710,040,395 | |
| Affiliated Securities (Cost $2,775,000) | | | | | | | 2,896,878 | |
| Unaffiliated Securities (Cost $1,106,349,242) | | | | | | | 1,707,143,517 | |
| Other Assets in Excess of Liabilities | | | 0.9 | % | | | 15,620,089 | |
| NET ASSETS | | | 100.0 | % | | $ | 1,725,660,484 | |
| # | American Depositary Receipts. |
| (a) | Security is valued in good faith at fair value determined using significant unobservable inputs pursuant to procedures established by the Valuation Designee (as defined in Note 2). |
| (b) | Deemed an affiliate of the Fund in accordance with Section 2(a)(3) of the Investment Company Act of 1940. See Note 11 - Affiliated Securities. |
| * | Non-income producing security. |
| @ | Restricted security - Investment in security not registered under the Securities Act of 1933. Sales or transfers of the investment may be restricted only to qualified buyers. |
| Security | | Acquisition
Date(s) | | Acquisition
Cost | | | % of net assets
(Acquisition
Date) | | | Market
Value | | | % of net assets
as of
4/30/2023 | |
| Chime Financial, Inc., Series G | | 8/24/21 | | $ | 1,922,972 | | | | 0.06 | % | | $ | 1,197,441 | | | | 0.07 | % |
| Crosslink Ventures Capital C, LLC, Cl. A | | 10/2/20 | | | 2,775,000 | | | | 0.08 | % | | | 2,896,878 | | | | 0.17 | % |
| Total | | | | | | | | | | | | $ | 4,094,319 | | | | 0.24 | % |
See Notes to Financial Statements.
- 43 -
THE ALGER FUNDS | ALGER 35 FUND
Schedule of Investments April 30, 2023 (Unaudited)
| COMMON STOCKS—99.4% | | SHARES | | | VALUE | |
| ADVERTISING—3.2% | | | | | | | | |
| The Trade Desk, Inc., Cl. A* | | | 12,762 | | | $ | 821,107 | |
| AEROSPACE & DEFENSE—4.5% | | | | | | | | |
| HEICO Corp. | | | 6,961 | | | | 1,173,903 | |
| APPLICATION SOFTWARE—3.5% | | | | | | | | |
| HubSpot, Inc.* | | | 1,243 | | | | 523,241 | |
| Paycom Software, Inc.* | | | 1,310 | | | | 380,384 | |
| | | | | | | | 903,625 | |
| BIOTECHNOLOGY—5.9% | | | | | | | | |
| Natera, Inc.* | | | 19,289 | | | | 978,338 | |
| Vaxcyte, Inc.* | | | 12,828 | | | | 549,423 | |
| | | | | | | | 1,527,761 | |
| BROADLINE RETAIL—10.4% | | | | | | | | |
| Amazon.com, Inc.* | | | 11,277 | | | | 1,189,160 | |
| JD.com, Inc.# | | | 11,238 | | | | 401,421 | |
| MercadoLibre, Inc.* | | | 864 | | | | 1,103,751 | |
| | | | | | | | 2,694,332 | |
| CASINOS & GAMING—7.0% | | | | | | | | |
| Flutter Entertainment PLC* | | | 4,240 | | | | 847,227 | |
| Las Vegas Sands Corp.* | | | 8,758 | | | | 559,198 | |
| MGM Resorts International | | | 9,102 | | | | 408,862 | |
| | | | | | | | 1,815,287 | |
| CONSTRUCTION MATERIALS—2.7% | | | | | | | | |
| Martin Marietta Materials, Inc. | | | 1,906 | | | | 692,259 | |
| ELECTRONIC EQUIPMENT & INSTRUMENTS—2.4% |
| 908 Devices, Inc.* | | | 92,106 | | | | 622,637 | |
| FOOTWEAR—4.0% | | | | | | | | |
| Deckers Outdoor Corp.* | | | 1,161 | | | | 556,514 | |
| On Holding AG, Cl. A* | | | 14,427 | | | | 468,156 | |
| | | | | | | | 1,024,670 | |
| HEALTHCARE EQUIPMENT—2.1% | | | | | | | | |
| TransMedics Group, Inc.* | | | 6,844 | | | | 541,360 | |
| HEALTHCARE TECHNOLOGY—2.0% | | | | | | | | |
| Veeva Systems, Inc., Cl. A* | | | 2,877 | | | | 515,213 | |
| HOTELS RESORTS & CRUISE LINES—7.3% | | | | | | | | |
| Booking Holdings, Inc.* | | | 248 | | | | 666,205 | |
| Hilton Worldwide Holdings, Inc. | | | 3,765 | | | | 542,235 | |
| Trip.com Group Ltd.#,* | | | 19,338 | | | | 686,693 | |
| | | | | | | | 1,895,133 | |
| INTERACTIVE MEDIA & SERVICES—5.2% | | | | | | | | |
| Alphabet, Inc., Cl. A* | | | 12,518 | | | | 1,343,682 | |
| MOVIES & ENTERTAINMENT—9.0% | | | | | | | | |
| Live Nation Entertainment, Inc.* | | | 9,375 | | | | 635,438 | |
| Netflix, Inc.* | | | 3,400 | | | | 1,121,762 | |
| Spotify Technology SA* | | | 4,337 | | | | 579,423 | |
| | | | | | | | 2,336,623 | |
| OIL & GAS EQUIPMENT & SERVICES—4.0% | | | | | | | | |
| Schlumberger Ltd. | | | 20,802 | | | | 1,026,579 | |
- 44 -
THE ALGER FUNDS | ALGER 35 FUND
Schedule of Investments April 30, 2023 (Unaudited) (Continued)
| COMMON STOCKS—99.4% (CONT.) | | SHARES | | | VALUE | |
| OIL & GAS EXPLORATION & PRODUCTION—2.6% | | | | | | | | |
| Pioneer Natural Resources Co. | | | 3,066 | | | $ | 667,008 | |
| REAL ESTATE SERVICES—1.6% | | | | | | | | |
| FirstService Corp. | | | 2,794 | | | | 421,168 | |
| SEMICONDUCTOR MATERIALS & EQUIPMENT—2.1% | | | | | | | | |
| ASML Holding NV | | | 864 | | | | 550,247 | |
| SEMICONDUCTORS—5.8% | | | | | | | | |
| Advanced Micro Devices, Inc.* | | | 5,433 | | | | 485,547 | |
| Analog Devices, Inc. | | | 2,684 | | | | 482,798 | |
| NVIDIA Corp. | | | 1,938 | | | | 537,776 | |
| | | | | | | | 1,506,121 | |
| SYSTEMS SOFTWARE—9.0% | | | | | | | | |
| Crowdstrike Holdings, Inc., Cl. A* | | | 5,719 | | | | 686,566 | |
| Microsoft Corp. | | | 5,364 | | | | 1,648,143 | |
| | | | | | | | 2,334,709 | |
| TECHNOLOGY HARDWARE STORAGE & PERIPHERALS—5.1% | | | | | | | | |
| Apple, Inc. | | | 7,852 | | | | 1,332,327 | |
| TOTAL COMMON STOCKS | | | | | | | | |
| (Cost $24,138,498) | | | | | | | 25,745,751 | |
| Total Investments | | | | | | | | |
| (Cost $24,138,498) | | | 99.4 | % | | $ | 25,745,751 | |
| Unaffiliated Securities (Cost $24,138,498) | | | | | | | 25,745,751 | |
| Other Assets in Excess of Liabilities | | | 0.6 | % | | | 161,687 | |
| NET ASSETS | | | 100.0 | % | | $ | 25,907,438 | |
| * | Non-income producing security. |
| # | American Depositary Receipts. |
See Notes to Financial Statements.
- 45 -
THE ALGER FUNDS | ALGER GROWTH & INCOME FUND
Schedule of Investments April 30, 2023 (Unaudited)
| COMMON STOCKS—90.9% | | SHARES | | | VALUE | |
| AEROSPACE & DEFENSE—1.6% | | | | | | | | |
| General Dynamics Corp. | | | 5,161 | | | $ | 1,126,853 | |
| Raytheon Technologies Corp. | | | 19,001 | | | | 1,898,200 | |
| TransDigm Group, Inc. | | | 2,476 | | | | 1,894,140 | |
| | | | | | | | 4,919,193 | |
| APPLICATION SOFTWARE—0.8% | | | | | | | | |
| Adobe, Inc.* | | | 6,939 | | | | 2,619,889 | |
| ASSET MANAGEMENT & CUSTODY BANKS—2.7% | | | | | | | | |
| BlackRock, Inc., Cl. A | | | 6,750 | | | | 4,530,600 | |
| Blackstone, Inc. | | | 34,194 | | | | 3,054,550 | |
| The Carlyle Group, Inc. | | | 28,838 | | | | 874,657 | |
| | | | | | | | 8,459,807 | |
| BIOTECHNOLOGY—3.2% | | | | | | | | |
| AbbVie, Inc. | | | 46,601 | | | | 7,042,343 | |
| Amgen, Inc. | | | 6,523 | | | | 1,563,824 | |
| Gilead Sciences, Inc. | | | 16,572 | | | | 1,362,384 | |
| | | | | | | | 9,968,551 | |
| BROADLINE RETAIL—1.9% | | | | | | | | |
| Amazon.com, Inc.* | | | 56,435 | | | | 5,951,071 | |
| BUILDING PRODUCTS—0.5% | | | | | | | | |
| Johnson Controls International PLC | | | 27,591 | | | | 1,651,045 | |
| CABLE & SATELLITE—1.1% | | | | | | | | |
| Comcast Corp., Cl. A | | | 82,688 | | | | 3,420,803 | |
| COMMODITY CHEMICALS—0.3% | | | | | | | | |
| Dow, Inc. | | | 16,874 | | | | 917,946 | |
| COMMUNICATIONS EQUIPMENT—1.0% | | | | | | | | |
| Cisco Systems, Inc. | | | 64,544 | | | | 3,049,704 | |
| CONSUMER ELECTRONICS—0.4% | | | | | | | | |
| Garmin Ltd. | | | 13,701 | | | | 1,345,027 | |
| CONSUMER STAPLES MERCHANDISE RETAIL—0.8% |
| Walmart, Inc. | | | 16,865 | | | | 2,546,109 | |
| COPPER—0.6% | | | | | | | | |
| Southern Copper Corp. | | | 24,207 | | | | 1,859,824 | |
| DIVERSIFIED BANKS—4.0% | | | | | | | | |
| Bank of America Corp. | | | 119,052 | | | | 3,485,843 | |
| JPMorgan Chase & Co. | | | 65,009 | | | | 8,986,844 | |
| | | | | | | | 12,472,687 | |
| ELECTRIC UTILITIES—0.7% | | | | | | | | |
| NextEra Energy, Inc. | | | 27,588 | | | | 2,114,068 | |
| ELECTRICAL COMPONENTS & EQUIPMENT—1.4% | | | | | | | | |
| Eaton Corp., PLC | | | 26,751 | | | | 4,470,627 | |
| FINANCIAL EXCHANGES & DATA—0.9% | | | | | | | | |
| CME Group, Inc., Cl. A | | | 15,920 | | | | 2,957,458 | |
| FOOD DISTRIBUTORS—0.6% | | | | | | | | |
| Sysco Corp. | | | 23,111 | | | | 1,773,538 | |
| GOLD—0.4% | | | | | | | | |
| Newmont Corp. | | | 25,323 | | | | 1,200,310 | |
| HEALTHCARE DISTRIBUTORS—0.6% | | | | | | | | |
| Cardinal Health, Inc. | | | 21,057 | | | | 1,728,780 | |
- 46 -
THE ALGER FUNDS | ALGER GROWTH & INCOME FUND
Schedule of Investments April 30, 2023 (Unaudited) (Continued)
| COMMON STOCKS—90.9% (CONT.) | | SHARES | | | VALUE | |
| HEALTHCARE EQUIPMENT—0.6% | | | | | | | | |
| Medtronic PLC | | | 21,661 | | | $ | 1,970,068 | |
| HOME IMPROVEMENT RETAIL—2.4% | | | | | | | | |
| The Home Depot, Inc. | | | 24,615 | | | | 7,397,792 | |
| HOUSEHOLD PRODUCTS—1.7% | | | | | | | | |
| The Procter & Gamble Co. | | | 33,253 | | | | 5,200,104 | |
| INDUSTRIAL CONGLOMERATES—1.8% | | | | | | | | |
| Honeywell International, Inc. | | | 28,196 | | | | 5,634,689 | |
| INDUSTRIAL GASES—1.2% | | | | | | | | |
| Air Products & Chemicals, Inc. | | | 12,931 | | | | 3,806,369 | |
| INTEGRATED OIL & GAS—4.5% | | | | | | | | |
| Chevron Corp. | | | 35,654 | | | | 6,010,551 | |
| Exxon Mobil Corp. | | | 43,030 | | | | 5,092,170 | |
| TotalEnergies SE# | | | 44,074 | | | | 2,817,651 | |
| | | | | | | | 13,920,372 | |
| INTEGRATED TELECOMMUNICATION SERVICES—1.2% | | | | | | | | |
| AT&T, Inc. | | | 54,783 | | | | 968,016 | |
| Verizon Communications, Inc. | | | 73,603 | | | | 2,858,004 | |
| | | | | | | | 3,826,020 | |
| INTERACTIVE MEDIA & SERVICES—6.3% | | | | | | | | |
| Alphabet, Inc., Cl. A* | | | 85,437 | | | | 9,170,808 | |
| Alphabet, Inc., Cl. C* | | | 65,999 | | | | 7,142,412 | |
| Meta Platforms, Inc., Cl. A* | | | 13,239 | | | | 3,181,596 | |
| | | | | | | | 19,494,816 | |
| INVESTMENT BANKING & BROKERAGE—2.4% | | | | | | | | |
| Morgan Stanley | | | 82,888 | | | | 7,457,433 | |
| LEISURE FACILITIES—0.5% | | | | | | | | |
| Vail Resorts, Inc. | | | 6,054 | | | | 1,456,108 | |
| MANAGED HEALTHCARE—2.8% | | | | | | | | |
| UnitedHealth Group, Inc. | | | 17,982 | | | | 8,848,762 | |
| MULTI-LINE INSURANCE—0.5% | | | | | | | | |
| The Hartford Financial Services Group, Inc. | | | 21,232 | | | | 1,507,260 | |
| MULTI-UTILITIES—0.7% | | | | | | | | |
| Sempra Energy | | | 14,099 | | | | 2,192,253 | |
| OIL & GAS EXPLORATION & PRODUCTION—0.5% | | | | | | | | |
| Pioneer Natural Resources Co. | | | 7,593 | | | | 1,651,857 | |
| OIL & GAS STORAGE & TRANSPORTATION—0.5% | | | | | | | | |
| ONEOK, Inc. | | | 21,700 | | | | 1,419,397 | |
| PHARMACEUTICALS—6.6% | | | | | | | | |
| AstraZeneca PLC# | | | 42,175 | | | | 3,088,054 | |
| Bristol-Myers Squibb Co. | | | 25,520 | | | | 1,703,970 | |
| Eli Lilly & Co. | | | 8,460 | | | | 3,348,976 | |
| GSK PLC# | | | 25,088 | | | | 903,921 | |
| Johnson & Johnson | | | 32,186 | | | | 5,268,848 | |
| Merck & Co., Inc. | | | 20,845 | | | | 2,406,972 | |
| Novartis AG# | | | 14,930 | | | | 1,531,370 | |
| Pfizer, Inc. | | | 59,637 | | | | 2,319,283 | |
| | | | | | | | 20,571,394 | |
- 47 -
THE ALGER FUNDS | ALGER GROWTH & INCOME FUND
Schedule of Investments April 30, 2023 (Unaudited) (Continued)
| COMMON STOCKS—90.9% (CONT.) | | SHARES | | | VALUE | |
| RAIL TRANSPORTATION—0.6% | | | | | | | | |
| Union Pacific Corp. | | | 9,944 | | | $ | 1,946,041 | |
| RESTAURANTS—1.7% | | | | | | | | |
| McDonald's Corp. | | | 9,160 | | | | 2,709,070 | |
| Starbucks Corp. | | | 22,945 | | | | 2,622,384 | |
| | | | | | | | 5,331,454 | |
| SEMICONDUCTOR MATERIALS & EQUIPMENT—2.4% | | | | | | | | |
| KLA Corp. | | | 19,343 | | | | 7,476,843 | |
| SEMICONDUCTORS—4.6% | | | | | | | | |
| Broadcom, Inc. | | | 13,081 | | | | 8,195,246 | |
| QUALCOMM, Inc. | | | 34,891 | | | | 4,075,269 | |
| Taiwan Semiconductor Manufacturing Co., Ltd.# | | | 23,422 | | | | 1,974,475 | |
| | | | | | | | 14,244,990 | |
| SOFT DRINKS & NON-ALCOHOLIC BEVERAGES—2.9% | | | | | | | | |
| PepsiCo, Inc. | | | 26,841 | | | | 5,123,678 | |
| The Coca-Cola Co. | | | 62,552 | | | | 4,012,711 | |
| | | | | | | | 9,136,389 | |
| SYSTEMS SOFTWARE—9.9% | | | | | | | | |
| Microsoft Corp. | | | 93,864 | | | | 28,840,653 | |
| Oracle Corp. | | | 20,566 | | | | 1,948,011 | |
| | | | | | | | 30,788,664 | |
| TECHNOLOGY HARDWARE STORAGE & PERIPHERALS—8.3% |
| Apple, Inc. | | | 153,088 | | | | 25,975,972 | |
| TOBACCO—1.3% | | | | | | | | |
| Altria Group, Inc. | | | 47,999 | | | | 2,280,433 | |
| Philip Morris International, Inc. | | | 17,327 | | | | 1,732,180 | |
| | | | | | | | 4,012,613 | |
| TRANSACTION & PAYMENT PROCESSING SERVICES—1.5% |
| Visa, Inc., Cl. A | | | 19,475 | | | | 4,532,417 | |
| TOTAL COMMON STOCKS | | | | | | | | |
| (Cost $191,772,295) | | | | | | | 283,226,514 | |
| | | | | | | | | |
| MASTER LIMITED PARTNERSHIP—0.5% | | | SHARES | | | | VALUE | |
| OIL & GAS STORAGE & TRANSPORTATION—0.5% | | | | | | | | |
| Cheniere Energy Partners LP | | | 35,211 | | | | 1,605,974 | |
| (Cost $1,508,792) | | | | | | | 1,605,974 | |
| | | | | | | | | |
| REAL ESTATE INVESTMENT TRUST—3.8% | | | SHARES | | | | VALUE | |
| HEALTHCARE—0.6% | | | | | | | | |
| Welltower, Inc. | | | 24,010 | | | | 1,902,072 | |
| INDUSTRIAL—0.5% | | | | | | | | |
| Prologis, Inc. | | | 11,480 | | | | 1,437,870 | |
| MORTGAGE—0.4% | | | | | | | | |
| Blackstone Mortgage Trust, Inc., Cl. A | | | 67,406 | | | | 1,229,485 | |
| RETAIL—0.7% | | | | | | | | |
| Simon Property Group, Inc. | | | 18,684 | | | | 2,117,271 | |
| SPECIALIZED—0.6% | | | | | | | | |
| Lamar Advertising Co., Cl. A | | | 18,096 | | | | 1,912,385 | |
- 48 -
THE ALGER FUNDS | ALGER GROWTH & INCOME FUND
Schedule of Investments April 30, 2023 (Unaudited) (Continued)
| REAL ESTATE INVESTMENT TRUST—3.8% (CONT.) | | SHARES | | | VALUE | |
| TELECOM TOWER—1.0% | | | | | | | | |
| Crown Castle, Inc. | | | 25,786 | | | $ | 3,173,999 | |
| TOTAL REAL ESTATE INVESTMENT TRUST | | | | | | | | |
| (Cost $12,063,404) | | | | | | | 11,773,082 | |
| | | | | | | |
| SHORT—TERM INVESTMENTS—2.9% | | SHARES | | | VALUE | |
| U.S. GOVERNMENT—2.9% | | | | | | |
| U.S. Treasury Bill, 0.00%, 5/2/23 | | | 9,000,000 | | | | 8,999,158 | |
| (Cost $8,999,158) | | | | | | | 8,999,158 | |
| Total Investments | | | | | | | | |
| (Cost $214,343,649) | | | 98.1 | % | | $ | 305,604,728 | |
| Unaffiliated Securities (Cost $214,343,649) | | | | | | | 305,604,728 | |
| Other Assets in Excess of Liabilities | | | 1.9 | % | | | 5,978,533 | |
| NET ASSETS | | | 100.0 | % | | $ | 311,583,261 | |
| # | American Depositary Receipts. |
| * | Non-income producing security. |
See Notes to Financial Statements.
- 49 -
THE ALGER FUNDS | ALGER MID CAP GROWTH FUND
Schedule of Investments April 30, 2023 (Unaudited)
| COMMON STOCKS—97.8% | | SHARES | | | VALUE | |
| ADVERTISING—2.1% | | | | | | | | |
| The Trade Desk, Inc., Cl. A* | | | 62,233 | | | $ | 4,004,071 | |
| AEROSPACE & DEFENSE—4.8% | | | | | | | | |
| HEICO Corp. | | | 25,359 | | | | 4,276,542 | |
| TransDigm Group, Inc. | | | 6,399 | | | | 4,895,235 | |
| | | | | | | | 9,171,777 | |
| APPAREL ACCESSORIES & LUXURY GOODS—1.4% | | | | | | | | |
| Lululemon Athletica, Inc.* | | | 7,141 | | | | 2,713,080 | |
| APPAREL RETAIL—0.5% | | | | | | | | |
| Burlington Stores, Inc.* | | | 5,008 | | | | 965,592 | |
| APPLICATION SOFTWARE—13.3% | | | | | | | | |
| Cadence Design Systems, Inc.* | | | 23,067 | | | | 4,831,383 | |
| Constellation Software, Inc. | | | 2,959 | | | | 5,792,017 | |
| Datadog, Inc., Cl. A* | | | 31,602 | | | | 2,129,342 | |
| Guidewire Software, Inc.* | | | 43,602 | | | | 3,322,037 | |
| Manhattan Associates, Inc.* | | | 19,227 | | | | 3,185,529 | |
| Paycom Software, Inc.* | | | 9,239 | | | | 2,682,729 | |
| The Descartes Systems Group, Inc.* | | | 40,289 | | | | 3,192,786 | |
| | | | | | | | 25,135,823 | |
| AUTOMOTIVE PARTS & EQUIPMENT—0.6% | | | | | | | | |
| Mobileye Global, Inc., Cl. A* | | | 28,058 | | | | 1,056,103 | |
| AUTOMOTIVE RETAIL—3.0% | | | | | | | | |
| AutoZone, Inc.* | | | 2,127 | | | | 5,664,860 | |
| BIOTECHNOLOGY—4.5% | | | | | | | | |
| Apellis Pharmaceuticals, Inc.* | | | 14,858 | | | | 1,239,603 | |
| Celldex Therapeutics, Inc.* | | | 33,918 | | | | 1,066,382 | |
| Natera, Inc.* | | | 64,058 | | | | 3,249,022 | |
| Prometheus Biosciences, Inc.* | | | 12,676 | | | | 2,458,510 | |
| Vaxcyte, Inc.* | | | 10,944 | | | | 468,731 | |
| | | | | | | | 8,482,248 | |
| BUILDING PRODUCTS—0.5% | | | | | | | | |
| Trex Co., Inc.* | | | 18,515 | | | | 1,012,030 | |
| CARGO GROUND TRANSPORTATION—1.8% | | | | | | | | |
| Old Dominion Freight Line, Inc. | | | 10,899 | | | | 3,491,931 | |
| CONSTRUCTION & ENGINEERING—1.5% | | | | | | | | |
| WillScot Mobile Mini Holdings Corp.* | | | 63,070 | | | | 2,863,378 | |
| CONSTRUCTION MACHINERY & HEAVY TRANSPORTATION EQUIPMENT—1.5% | | | | | | | | |
| Wabtec Corp. | | | 28,635 | | | | 2,796,780 | |
| CONSTRUCTION MATERIALS—2.0% | | | | | | | | |
| Martin Marietta Materials, Inc. | | | 10,499 | | | | 3,813,237 | |
| CONSUMER STAPLES MERCHANDISE RETAIL—1.0% | | | | | | | | |
| BJ’s Wholesale Club Holdings, Inc.* | | | 25,661 | | | | 1,959,731 | |
| DIVERSIFIED METALS & MINING—0.4% | | | | | | | | |
| MP Materials Corp.* | | | 33,485 | | | | 725,620 | |
| ELECTRONIC COMPONENTS—1.7% | | | | | | | | |
| Amphenol Corp., Cl. A | | | 43,884 | | | | 3,311,926 | |
| ELECTRONIC EQUIPMENT & INSTRUMENTS—1.7% | | | | | | | | |
| Novanta, Inc.* | | | 20,584 | | | | 3,146,059 | |
-50-
THE ALGER FUNDS | ALGER MID CAP GROWTH FUND
Schedule of Investments April 30, 2023 (Unaudited) (Continued)
| COMMON STOCKS—97.8% (CONT.) | | SHARES | | | VALUE | |
| ENVIRONMENTAL & FACILITIES SERVICES—3.6% | | | | | | | | |
| GFL Environmental, Inc. | | | 189,273 | | | $ | 6,870,610 | |
| FINANCIAL EXCHANGES & DATA—2.6% | | | | | | | | |
| MSCI, Inc., Cl. A | | | 10,292 | | | | 4,965,375 | |
| HEALTHCARE EQUIPMENT—3.5% | | | | | | | | |
| IDEXX Laboratories, Inc.* | | | 6,835 | | | | 3,363,913 | |
| Insulet Corp.* | | | 10,072 | | | | 3,203,299 | |
| | | | | | | | 6,567,212 | |
| HEALTHCARE FACILITIES—1.9% | | | | | | | | |
| Acadia Healthcare Co., Inc.* | | | 48,942 | | | | 3,538,017 | |
| HEALTHCARE TECHNOLOGY—1.7% | | | | | | | | |
| Veeva Systems, Inc., Cl. A* | | | 18,072 | | | | 3,236,334 | |
| HOME IMPROVEMENT RETAIL—2.3% | | | | | | | | |
| Floor & Decor Holdings, Inc., Cl. A* | | | 43,756 | | | | 4,346,721 | |
| HOMEBUILDING—1.1% | | | | | | | | |
| NVR, Inc.* | | | 347 | | | | 2,026,480 | |
| HOTELS RESORTS & CRUISE LINES—2.0% | | | | | | | | |
| Hilton Worldwide Holdings, Inc. | | | 26,152 | | | | 3,766,411 | |
| INSURANCE BROKERS—0.5% | | | | | | | | |
| Ryan Specialty Holdings, Inc., Cl. A* | | | 23,227 | | | | 949,055 | |
| INTERNET SERVICES & INFRASTRUCTURE—1.2% | | | | | | | | |
| MongoDB, Inc., Cl. A* | | | 9,656 | | | | 2,317,054 | |
| IT CONSULTING & OTHER SERVICES—0.5% | | | | | | | | |
| EPAM Systems, Inc.* | | | 3,136 | | | | 885,732 | |
| LIFE SCIENCES TOOLS & SERVICES—6.9% | | | | | | | | |
| Mettler-Toledo International, Inc.* | | | 2,112 | | | | 3,150,048 | |
| Repligen Corp.* | | | 21,539 | | | | 3,265,958 | |
| West Pharmaceutical Services, Inc. | | | 18,349 | | | | 6,628,393 | |
| | | | | | | | 13,044,399 | |
| METAL, GLASS & PLASTIC CONTAINERS—1.0% | | | | | | | | |
| Ball Corp. | | | 36,749 | | | | 1,954,312 | |
| MOVIES & ENTERTAINMENT—2.2% | | | | | | | | |
| Liberty Media Corp. Series C Liberty Formula One* | | | 46,727 | | | | 3,373,222 | |
| Live Nation Entertainment, Inc.* | | | 12,920 | | | | 875,718 | |
| | | | | | | | 4,248,940 | |
| OIL & GAS EQUIPMENT & SERVICES—1.0% | | | | | | | | |
| Baker Hughes Co., Cl. A | | | 64,552 | | | | 1,887,501 | |
| OIL & GAS EXPLORATION & PRODUCTION—2.8% | | | | | | | | |
| Diamondback Energy, Inc. | | | 37,191 | | | | 5,288,560 | |
| PROPERTY & CASUALTY INSURANCE—1.6% | | | | | | | | |
| Intact Financial Corp. | | | 19,953 | | | | 3,018,393 | |
| REAL ESTATE SERVICES—3.6% | | | | | | | | |
| FirstService Corp. | | | 45,230 | | | | 6,817,970 | |
| RESEARCH & CONSULTING SERVICES—4.0% | | | | | | | | |
| CoStar Group, Inc.* | | | 45,994 | | | | 3,539,238 | |
| Verisk Analytics, Inc., Cl. A | | | 21,278 | | | | 4,130,273 | |
| | | | | | | | 7,669,511 | |
- 51 -
THE ALGER FUNDS | ALGER MID CAP GROWTH FUND
Schedule of Investments April 30, 2023 (Unaudited) (Continued)
| COMMON STOCKS—97.8% (CONT.) | | SHARES | | | VALUE | |
| RESTAURANTS—3.5% | | | | | | | | |
| Chipotle Mexican Grill, Inc., Cl. A* | | | 2,320 | | | $ | 4,796,878 | |
| Domino’s Pizza, Inc. | | | 5,612 | | | | 1,781,642 | |
| | | | | | | | 6,578,520 | |
| SEMICONDUCTOR MATERIALS & EQUIPMENT—2.4% | | | | | | | | |
| KLA Corp. | | | 6,704 | | | | 2,591,364 | |
| SolarEdge Technologies, Inc.* | | | 6,700 | | | | 1,913,721 | |
| | | | | | | | 4,505,085 | |
| SEMICONDUCTORS—3.9% | | | | | | | | |
| Marvell Technology, Inc. | | | 52,448 | | | | 2,070,647 | |
| Microchip Technology, Inc. | | | 39,820 | | | | 2,906,462 | |
| ON Semiconductor Corp.* | | | 33,540 | | | | 2,413,538 | |
| | | | | | | | 7,390,647 | |
| SYSTEMS SOFTWARE—1.7% | | | | | | | | |
| Palo Alto Networks, Inc.* | | | 17,341 | | | | 3,164,039 | |
| TOTAL COMMON STOCKS | | | | | | | | |
| (Cost $166,711,582) | | | | | | | 185,351,124 | |
| | | | | | | | | |
| PREFERRED STOCKS—0.0% | | | SHARES | | | | VALUE | |
| BIOTECHNOLOGY—0.0% | | | | | | | | |
| Prosetta Biosciences, Inc., Series D*,@,(a),(b) | | | 219,610 | | | | — |
|
| (Cost $988,245) | | | | | | | — |
|
| | | | | | | | | |
| RIGHTS—0.2% | | | SHARES | | | | VALUE | |
| BIOTECHNOLOGY—0.2% | | | | | | | | |
| Tolero CDR*,@,(a),(c) | | | 590,059 | | | | 395,340 | |
| (Cost $315,501) | | | | | | | 395,340 | |
| | | | | | | | | |
| SPECIAL PURPOSE VEHICLE—0.9% | | | | | | | VALUE | |
| DATA PROCESSING & OUTSOURCED SERVICES—0.9% | | | | | | | | |
| Crosslink Ventures Capital C, LLC, Cl. A*,@,(a),(b) | | | | | | | 1,252,704 | |
| Crosslink Ventures Capital C, LLC, Cl. B*,@,(a),(b) | | | | | | | 498,883 | |
| | | | | | | | 1,751,587 | |
| TOTAL SPECIAL PURPOSE VEHICLE | | | | | | | | |
| (Cost $1,675,000) | | | | | | | 1,751,587 | |
| Total Investments | | | | | | | | |
| (Cost $169,690,328) | | | 98.9 | % | | $ | 187,498,051 | |
| Affiliated Securities (Cost $2,663,245) | | | | | | | 1,751,587 | |
| Unaffiliated Securities (Cost $167,027,083) | | | | | | | 185,746,464 | |
| Other Assets in Excess of Liabilities | | | 1.1 | % | | | 1,991,667 | |
| NET ASSETS | | | 100.0 | % | | $ | 189,489,718 | |
| (a) | Security is valued in good faith at fair value determined using significant unobservable inputs pursuant to procedures established by the Valuation Designee (as defined in Note 2). |
| (b) | Deemed an affiliate of the Fund in accordance with Section 2(a)(3) of the Investment Company Act of 1940. See Note 11 - Affiliated Securities. |
| (c) | Contingent Deferred Rights. |
| * | Non-income producing security. |
- 52 -
THE ALGER FUNDS | ALGER MID CAP GROWTH FUND
Schedule of Investments April 30, 2023 (Unaudited) (Continued)
| @ | Restricted security - Investment in security not registered under the Securities Act of 1933. Sales or transfers of the investment may be restricted only to qualified buyers. |
Security | | Acquisition Date(s) | | Acquisition Cost | | | % of net assets (Acquisition Date) | | | Market Value | | | % of net assets as of 4/30/2023 | |
| Crosslink Ventures Capital C, LLC, Cl. A | | 10/2/20 | | $ | 1,200,000 | | | | 0.50 | % | | $ | 1,252,704 | | | | 0.66 | % |
| Crosslink Ventures Capital C, LLC, Cl. B | | 12/16/20 | | | 475,000 | | | | 0.19 | % | | | 498,883 | | | | 0.26 | % |
| Prosetta Biosciences, Inc., Series D | | 2/6/15 | | | 988,245 | | | | 0.50 | % | | | 0 | | | | 0.00 | % |
| Tolero CDR | | 2/6/17 | | | 315,501 | | | | 0.19 | % | | | 395,340 | | | | 0.21 | % |
| Total | | | | | | | | | | | | $ | 2,146,927 | | | | 1.13 | % |
See Notes to Financial Statements.
- 53 -
THE ALGER FUNDS | ALGER MID CAP FOCUS FUND
Schedule of Investments April 30, 2023 (Unaudited)
| COMMON STOCKS—98.0% | | SHARES | | | VALUE | |
| ADVERTISING—0.5% | | | | | | | | |
| The Trade Desk, Inc., Cl. A* | | | 26,555 | | | $ | 1,708,549 | |
| AEROSPACE & DEFENSE—5.9% | | | | | | | | |
| Axon Enterprise, Inc.* | | | 31,061 | | | | 6,544,863 | |
| HEICO Corp. | | | 45,840 | | | | 7,730,458 | |
| Mercury Systems, Inc.* | | | 129,063 | | | | 6,152,433 | |
| | | | | | | | 20,427,754 | |
| APPLICATION SOFTWARE—26.5% | | | | | | | | |
| ACI Worldwide, Inc.* | | | 398,418 | | | | 10,091,928 | |
| Agilysys, Inc.* | | | 132,627 | | | | 10,350,211 | |
| Alteryx, Inc., Cl. A* | | | 77,958 | | | | 3,206,413 | |
| ANSYS, Inc.* | | | 17,696 | | | | 5,555,128 | |
| AppFolio, Inc., Cl. A* | | | 41,452 | | | | 5,787,528 | |
| Bentley Systems, Inc., Cl. B | | | 317,825 | | | | 13,526,632 | |
| Bill.com Holdings, Inc.* | | | 50,466 | | | | 3,876,293 | |
| Cadence Design Systems, Inc.* | | | 33,663 | | | | 7,050,715 | |
| Datadog, Inc., Cl. A* | | | 72,011 | | | | 4,852,101 | |
| Everbridge, Inc.* | | | 346,599 | | | | 9,108,622 | |
| Manhattan Associates, Inc.* | | | 23,022 | | | | 3,814,285 | |
| Splunk, Inc.* | | | 77,427 | | | | 6,677,305 | |
| Tyler Technologies, Inc.* | | | 21,329 | | | | 8,084,331 | |
| | | | | | | | 91,981,492 | |
| AUTOMOTIVE RETAIL—2.4% | | | | | | | | |
| O’Reilly Automotive, Inc.* | | | 8,971 | | | | 8,229,188 | |
| BIOTECHNOLOGY—7.8% | | | | | | | | |
| Madrigal Pharmaceuticals, Inc.* | | | 16,641 | | | | 5,191,992 | |
| Natera, Inc.* | | | 294,020 | | | | 14,912,694 | |
| Viridian Therapeutics, Inc.* | | | 249,134 | | | | 6,983,226 | |
| | | | | | | | 27,087,912 | |
| CARGO GROUND TRANSPORTATION—1.7% | | | | | | | | |
| Old Dominion Freight Line, Inc. | | | 18,622 | | | | 5,966,303 | |
| CASINOS & GAMING—4.0% | | | | | | | | |
| Flutter Entertainment PLC* | | | 36,951 | | | | 7,383,459 | |
| Las Vegas Sands Corp.* | | | 102,692 | | | | 6,556,884 | |
| | | | | | | | 13,940,343 | |
| CONSTRUCTION MATERIALS—1.2% | | | | | | | | |
| Martin Marietta Materials, Inc. | | | 11,306 | | | | 4,106,339 | |
| ELECTRONIC EQUIPMENT & INSTRUMENTS—1.8% | | | | | | | | |
| Novanta, Inc.* | | | 41,410 | | | | 6,329,104 | |
| ENVIRONMENTAL & FACILITIES SERVICES—3.3% | | | | | | | | |
| Waste Connections, Inc. | | | 81,715 | | | | 11,370,642 | |
| FINANCIAL EXCHANGES & DATA—0.9% | | | | | | | | |
| Tradeweb Markets, Inc., Cl. A | | | 45,767 | | | | 3,222,455 | |
| FOOTWEAR—0.7% | | | | | | | | |
| On Holding AG, Cl. A* | | | 78,491 | | | | 2,547,033 | |
- 54 -
THE ALGER FUNDS | ALGER MID CAP FOCUS FUND
Schedule of Investments April 30, 2023 (Unaudited) (Continued)
| COMMON STOCKS—98.0% (CONT.) | | SHARES | | | VALUE | |
| HEALTHCARE EQUIPMENT—9.5% | | | | | | |
| Dexcom, Inc.* | | | 52,180 | | | $ | 6,331,521 | |
| IDEXX Laboratories, Inc.* | | | 15,300 | | | | 7,530,048 | |
| Insulet Corp.* | | | 48,944 | | | | 15,566,150 | |
| Shockwave Medical, Inc.* | | | 12,623 | | | | 3,662,690 | |
| | | | | | | | 33,090,409 | |
| HEALTHCARE FACILITIES—1.2% | | | | | | | | |
| Acadia Healthcare Co., Inc.* | | | 59,967 | | | | 4,335,014 | |
| HEALTHCARE TECHNOLOGY—1.7% | | | | | | | | |
| Veeva Systems, Inc., Cl. A* | | | 32,551 | | | | 5,829,233 | |
| INTERNET SERVICES & INFRASTRUCTURE—2.2% | | | | | | | | |
| Shopify, Inc., Cl. A* | | | 155,054 | | | | 7,512,366 | |
| LIFE SCIENCES TOOLS & SERVICES—6.2% | | | | | | | | |
| Agilent Technologies, Inc. | | | 31,949 | | | | 4,326,853 | |
| Illumina, Inc.* | | | 29,601 | | | | 6,084,782 | |
| Repligen Corp.* | | | 31,589 | | | | 4,789,840 | |
| West Pharmaceutical Services, Inc. | | | 17,224 | | | | 6,221,998 | |
| | | | | | | | 21,423,473 | |
| MOVIES & ENTERTAINMENT—4.8% | | | | | | | | |
| Liberty Media Corp. Series C Liberty Formula One* | | | 127,034 | | | | 9,170,584 | |
| World Wrestling Entertainment, Inc., Cl. A | | | 69,186 | | | | 7,414,664 | |
| | | | | | | | 16,585,248 | |
| OIL & GAS EXPLORATION & PRODUCTION—3.6% | | | | | | | | |
| Diamondback Energy, Inc. | | | 86,873 | | | | 12,353,341 | |
| OTHER SPECIALTY RETAIL—4.2% | | | | | | | | |
| Five Below, Inc.* | | | 26,650 | | | | 5,259,644 | |
| Ulta Beauty, Inc.* | | | 17,183 | | | | 9,475,222 | |
| | | | | | | | 14,734,866 | |
| RESTAURANTS—0.9% | | | | | | | | |
| Chipotle Mexican Grill, Inc., Cl. A* | | | 1,582 | | | | 3,270,975 | |
| SEMICONDUCTOR MATERIALS & EQUIPMENT—1.6% | | | | | | | | |
| SolarEdge Technologies, Inc.* | | | 19,053 | | | | 5,442,108 | |
| SEMICONDUCTORS—3.5% | | | | | | | | |
| Advanced Micro Devices, Inc.* | | | 82,730 | | | | 7,393,580 | |
| ON Semiconductor Corp.* | | | 68,515 | | | | 4,930,340 | |
| | | | | | | | 12,323,920 | |
| SYSTEMS SOFTWARE—1.9% | | | | | | | | |
| Palo Alto Networks, Inc.* | | | 36,465 | | | | 6,653,404 | |
| TOTAL COMMON STOCKS | | | | | | | | |
| (Cost $329,777,451) | | | | | | | 340,471,471 | |
| Total Investments | | | | | | | | |
| (Cost $329,777,451) | | | 98.0 | % | | $ | 340,471,471 | |
| Unaffiliated Securities (Cost $329,777,451) | | | | | | | 340,471,471 | |
| Other Assets in Excess of Liabilities | | | 2.0 | % | | | 6,972,846 | |
| NET ASSETS | | | 100.0 | % | | $ | 347,444,317 | |
| * | Non-income producing security. |
See Notes to Financial Statements.
- 55 -
THE ALGER FUNDS | ALGER WEATHERBIE SPECIALIZED GROWTH FUND
Schedule of Investments April 30, 2023 (Unaudited)
| COMMON STOCKS—95.5% | | SHARES | | | VALUE | |
| ADVERTISING—0.3% | | | | | | | | |
| TechTarget, Inc.* | | | 49,604 | | | $ | 1,691,000 | |
| AEROSPACE & DEFENSE—0.7% | | | | | | | | |
| Kratos Defense & Security Solutions, Inc.* | | | 362,041 | | | | 4,670,329 | |
| APPAREL ACCESSORIES & LUXURY GOODS—0.1% | | | | | | | | |
| Canada Goose Holdings, Inc.* | | | 37,027 | | | | 726,470 | |
| APPAREL RETAIL—0.2% | | | | | | | | |
| MYT Netherlands Parent BV#,* | | | 289,506 | | | | 1,421,474 | |
| APPLICATION SOFTWARE—9.6% | | | | | | | | |
| nCino, Inc.* | | | 55,801 | | | | 1,379,959 | |
| SPS Commerce, Inc.* | | | 255,393 | | | | 37,619,389 | |
| Vertex, Inc., Cl. A* | | | 1,143,425 | | | | 23,611,726 | |
| | | | | | | | 62,611,074 | |
| ASSET MANAGEMENT & CUSTODY BANKS—5.4% | | | | | | | | |
| Hamilton Lane, Inc., Cl. A | | | 253,803 | | | | 18,700,205 | |
| StepStone Group, Inc., Cl. A | | | 749,244 | | | | 16,505,845 | |
| | | | | | | | 35,206,050 | |
| BIOTECHNOLOGY—4.2% | | | | | | | | |
| ACADIA Pharmaceuticals, Inc.* | | | 582,916 | | | | 12,433,598 | |
| Natera, Inc.* | | | 142,602 | | | | 7,232,773 | |
| Ultragenyx Pharmaceutical, Inc.* | | | 183,807 | | | | 8,026,852 | |
| | | | | | | | 27,693,223 | |
| BROADLINE RETAIL—1.7% | | | | | | | | |
| Ollie’s Bargain Outlet Holdings, Inc.* | | | 168,774 | | | | 11,012,504 | |
| CARGO GROUND TRANSPORTATION—1.0% | | | | | | | | |
| RXO, Inc.* | | | 353,255 | | | | 6,390,383 | |
| CONSUMER FINANCE—0.0% | | | | | | | | |
| Upstart Holdings, Inc.* | | | 22,251 | | | | 309,289 | |
| EDUCATION SERVICES—2.8% | | | | | | | | |
| Chegg, Inc.* | | | 996,631 | | | | 17,919,425 | |
| ELECTRONIC EQUIPMENT & INSTRUMENTS—3.4% | | | | | | | | |
| Novanta, Inc.* | | | 145,218 | | | | 22,195,119 | |
| ENVIRONMENTAL & FACILITIES SERVICES—9.5% | | |
|
| | | | |
| Casella Waste Systems, Inc., Cl. A* | | | 441,330 | | | | 39,278,370 | |
| Montrose Environmental Group, Inc.* | | | 745,960 | | | | 22,721,942 | |
| | | | | | | | 62,000,312 | |
| HEALTHCARE EQUIPMENT—9.1% | | | | | | | | |
| Glaukos Corp.* | | | 472,383 | | | | 22,442,916 | |
| Impulse Dynamics PLC, Class E*,@,(a) | | | 904,912 | | | | 2,986,210 | |
| Inmode Ltd.* | | | 146,002 | | | | 5,440,035 | |
| Inogen, Inc.* | | | 361,130 | | | | 4,806,640 | |
| Inspire Medical Systems, Inc.* | | | 42,161 | | | | 11,283,548 | |
| Nevro Corp.* | | | 387,602 | | | | 11,345,111 | |
| Tandem Diabetes Care, Inc.* | | | 27,999 | | | | 1,108,200 | |
| | | | | | | | 59,412,660 | |
| HEALTHCARE FACILITIES—1.5% | | | | | | | | |
| US Physical Therapy, Inc. | | | 91,208 | | | | 9,710,004 | |
- 56 -
THE ALGER FUNDS | ALGER WEATHERBIE SPECIALIZED GROWTH FUND
Schedule of Investments April 30, 2023 (Unaudited) (Continued)
| COMMON STOCKS—95.5% (CONT.) | | SHARES | | | VALUE | |
| HEALTHCARE SERVICES—2.6% | | | | | | |
| Agiliti, Inc.* | | | 915,370 | | | $ | 15,304,986 | |
| NeoGenomics, Inc.* | | | 120,400 | | | | 1,760,248 | |
| | | | | | | | 17,065,234 | |
| HEALTHCARE TECHNOLOGY—1.3% | | |
|
| | | | |
| Definitive Healthcare Corp., Cl. A* | | | 815,903 | | | | 8,730,162 | |
| IT CONSULTING & OTHER SERVICES—2.6% | | | | | | | | |
| CI&T, Inc., Cl. A* | | | 943,688 | | | | 3,718,131 | |
| Globant SA* | | | 67,877 | | | | 10,647,865 | |
| Grid Dynamics Holdings, Inc.* | | | 263,154 | | | | 2,860,484 | |
| | | | | | | | 17,226,480 | |
| LEISURE FACILITIES—5.3% | | | | | | | | |
| Planet Fitness, Inc., Cl. A* | | | 405,408 | | | | 33,705,621 | |
| Xponential Fitness, Inc., Cl. A* | | | 15,092 | | | | 499,243 | |
| | | | | | | | 34,204,864 | |
| LEISURE PRODUCTS—0.2% | | | | | | | | |
| Latham Group, Inc.* | | | 530,497 | | | | 1,278,498 | |
| MANAGED HEALTHCARE—5.5% | | | | | | | | |
| Progyny, Inc.* | | | 1,074,344 | | | | 35,711,195 | |
| OIL & GAS EQUIPMENT & SERVICES—5.8% | | | | | | | | |
| Core Laboratories NV | | | 1,094,857 | | | | 24,645,231 | |
| Dril-Quip, Inc.* | | | 486,126 | | | | 13,261,517 | |
| | | | | | | | 37,906,748 | |
| REAL ESTATE SERVICES—6.0% | | | | | | | | |
| FirstService Corp. | | | 261,036 | | | | 39,348,567 | |
| REGIONAL BANKS—0.5% | | | | | | | | |
| Axos Financial, Inc.* | | | 46,561 | | | | 1,893,636 | |
| Seacoast Banking Corp. of Florida | | | 58,250 | | | | 1,292,567 | |
| | | | | | | | 3,186,203 | |
| RESTAURANTS—0.9% | | | | | | | | |
| Wingstop, Inc. | | | 27,744 | | | | 5,551,852 | |
| SEMICONDUCTORS—1.6% | | | | | | | | |
| Impinj, Inc.* | | | 93,071 | | | | 8,228,407 | |
| SiTime Corp.* | | | 18,685 | | | | 2,026,762 | |
| | | | | | | | 10,255,169 | |
| SYSTEMS SOFTWARE—0.9% | | | | | | | | |
| Rapid7, Inc.* | | | 122,208 | | | | 5,940,531 | |
| TRADING COMPANIES & DISTRIBUTORS—7.9% | | |
|
| | | | |
| SiteOne Landscape Supply, Inc.* | | | 204,065 | | | | 30,148,563 | |
| Transcat, Inc.* | | | 245,470 | | | | 18,726,906 | |
| Xometry, Inc., Cl. A* | | | 189,530 | | | | 2,632,572 | |
| | | | | | | | 51,508,041 | |
| TRANSACTION & PAYMENT PROCESSING SERVICES—4.9% | | | | | | | | |
| Flywire Corp.* | | | 1,096,603 | | | | 31,987,910 | |
| TOTAL COMMON STOCKS | | | | | | | | |
| (Cost $637,402,193) | | | | | | | 622,870,770 | |
- 57 -
THE ALGER FUNDS | ALGER WEATHERBIE SPECIALIZED GROWTH FUND
Schedule of Investments April 30, 2023 (Unaudited) (Continued)
| PREFERRED STOCKS—0.0% | | SHARES | | | VALUE | |
| BIOTECHNOLOGY—0.0% | | | | | | | | |
| Prosetta Biosciences, Inc., Series D*,@,(a),(b) | | | 231,474 | | | $ | — | |
| (Cost $1,041,633) | | | | | | | — | |
| | | | | | | | | |
| SHORT—TERM INVESTMENTS—3.4% | | | SHARES | | | | VALUE | |
| U.S. GOVERNMENT—3.4% | | | | | | | | |
| U.S. Treasury Bill, 0.0%, 5/2/23 | | | 22,000,000 | | | | 21,997,942 | |
| (Cost $21,997,942) | | | | | | | 21,997,942 | |
| Total Investments | | | | | | | | |
| (Cost $660,441,768) | | | 98.9 | % | | $ | 644,868,712 | |
| Affiliated Securities (Cost $1,041,633) | | | | | | | — | |
| Unaffiliated Securities (Cost $659,400,135) | | | | | | | 644,868,712 | |
| Other Assets in Excess of Liabilities | | | 1.1 | % | | | 7,026,458 | |
| NET ASSETS | | | 100.0 | % | | $ | 651,895,170 | |
| # | American Depositary Receipts. |
| (a) | Security is valued in good faith at fair value determined using significant unobservable inputs pursuant to procedures established by the Valuation Designee (as defined in Note 2). |
| (b) | Deemed an affiliate of the Fund in accordance with Section 2(a)(3) of the Investment Company Act of 1940. See Note 11 - Affiliated Securities. |
| * | Non-income producing security. |
| @ | Restricted security - Investment in security not registered under the Securities Act of 1933. Sales or transfers of the investment may be restricted only to qualified buyers. |
Security | | Acquisition Date(s) | | Acquisition Cost | | | % of net assets (Acquisition Date) | | | Market Value | | | % of net assets as of 4/30/2023 | |
| Impulse Dynamics PLC, Class E | | 2/11/22 | | $ | 2,986,210 | | | | 0.24 | % | | $ | 2,986,210 | | | | 0.46 | % |
| Prosetta Biosciences, Inc., Series D | | 2/6/15 | | | 1,041,633 | | | | 0.10 | % | | | 0 | | | | 0.00 | % |
| Total | | | | | | | | | | | | $ | 2,986,210 | | | | 0.46 | % |
See Notes to Financial Statements.
- 58 -
THE ALGER FUNDS | ALGER SMALL CAP GROWTH FUND
Schedule of Investments April 30, 2023 (Unaudited)
| COMMON STOCKS—96.9% | | SHARES | | | VALUE | |
| ADVERTISING—0.4% | | | | | | | | |
| Magnite, Inc.* | | | 149,769 | | | $ | 1,407,829 | |
| AEROSPACE & DEFENSE—6.2% | | | | | | | | |
| HEICO Corp. | | | 89,724 | | | | 15,131,055 | |
| Hexcel Corp. | | | 34,820 | | | | 2,509,826 | |
| Mercury Systems, Inc.* | | | 71,176 | | | | 3,392,960 | |
| | | | | | | | 21,033,841 | |
| APPAREL ACCESSORIES & LUXURY GOODS—1.6% | | | | | | | | |
| Capri Holdings Ltd.* | | | 131,164 | | | | 5,443,306 | |
| APPAREL RETAIL—0.7% | | | | | | | | |
| Aritzia, Inc.* | | | 26,284 | | | | 835,423 | |
| Victoria’s Secret & Co.* | | | 53,575 | | | | 1,661,361 | |
| | | | | | | | 2,496,784 | |
| APPLICATION SOFTWARE—23.1% | | | | | | | | |
| ACI Worldwide, Inc.* | | | 257,174 | | | | 6,514,217 | |
| AppFolio, Inc., Cl. A* | | | 26,631 | | | | 3,718,220 | |
| Bill.com Holdings, Inc.* | | | 51,956 | | | | 3,990,740 | |
| Blackbaud, Inc.* | | | 79,209 | | | | 5,493,540 | |
| Blackline, Inc.* | | | 55,731 | | | | 3,104,774 | |
| Everbridge, Inc.* | | | 93,302 | | | | 2,451,977 | |
| Guidewire Software, Inc.* | | | 36,894 | | | | 2,810,954 | |
| HubSpot, Inc.* | | | 16,330 | | | | 6,874,114 | |
| Manhattan Associates, Inc.* | | | 70,581 | | | | 11,693,860 | |
| Paycom Software, Inc.* | | | 21,276 | | | | 6,177,912 | |
| Q2 Holdings, Inc.* | | | 108,919 | | | | 2,681,586 | |
| SEMrush Holdings, Inc., Cl. A* | | | 94,341 | | | | 911,334 | |
| Smartsheet, Inc., Cl. A* | | | 71,669 | | | | 2,929,112 | |
| Sprout Social, Inc., Cl. A* | | | 73,507 | | | | 3,620,955 | |
| SPS Commerce, Inc.* | | | 64,213 | | | | 9,458,575 | |
| Vertex, Inc., Cl. A* | | | 260,255 | | | | 5,374,266 | |
| | | | | | | | 77,806,136 | |
| ASSET MANAGEMENT & CUSTODY BANKS—0.3% | | | | | | | | |
| Affiliated Managers Group, Inc. | | | 7,756 | | | | 1,119,811 | |
| BIOTECHNOLOGY—4.7% | | | | | | | | |
| ADMA Biologics, Inc.* | | | 506,775 | | | | 1,697,696 | |
| Alkermes PLC* | | | 40,937 | | | | 1,168,751 | |
| Arcus Biosciences, Inc.* | | | 40,904 | | | | 730,137 | |
| Avidity Biosciences, Inc.* | | | 70,040 | | | | 868,496 | |
| Cabaletta Bio, Inc.* | | | 200,093 | | | | 2,076,965 | |
| Celldex Therapeutics, Inc.* | | | 53,039 | | | | 1,667,546 | |
| Karuna Therapeutics, Inc.* | | | 12,763 | | | | 2,532,690 | |
| MoonLake Immunotherapeutics, Cl. A* | | | 44,970 | | | | 957,861 | |
| Morphic Holding, Inc.* | | | 35,366 | | | | 1,671,397 | |
| RAPT Therapeutics, Inc.* | | | 72,460 | | | | 1,318,772 | |
| Vaxcyte, Inc.* | | | 24,964 | | | | 1,069,208 | |
| | | | | | | | 15,759,519 | |
| CONSUMER STAPLES MERCHANDISE RETAIL—3.2% | | | | | | | | |
| BJ’s Wholesale Club Holdings, Inc.* | | | 140,639 | | | | 10,740,600 | |
- 59 -
THE ALGER FUNDS | ALGER SMALL CAP GROWTH FUND
Schedule of Investments April 30, 2023 (Unaudited) (Continued)
| COMMON STOCKS—96.9% (CONT.) | | SHARES | | | VALUE | |
| DIVERSIFIED SUPPORT SERVICES—0.4% | | | | | | | | |
| Ritchie Bros. Auctioneers, Inc. | | | 22,371 | | | $ | 1,279,397 | |
| ELECTRICAL COMPONENTS & EQUIPMENT—0.4% | | | | | | | | |
| Sunrun, Inc.* | | | 66,735 | | | | 1,404,104 | |
| ELECTRONIC EQUIPMENT & INSTRUMENTS—0.9% | | | | | | | | |
| 908 Devices, Inc.* | | | 456,169 | | | | 3,083,702 | |
| FOOD DISTRIBUTORS—2.9% | | | | | | | | |
| The Chefs’ Warehouse, Inc.* | | | 94,528 | | | | 3,144,001 | |
| US Foods Holding Corp.* | | | 170,857 | | | | 6,560,909 | |
| | | | | | | | 9,704,910 | |
| FOOTWEAR—0.5% | | | | | | | | |
| On Holding AG, Cl. A* | | | 53,861 | | | | 1,747,789 | |
| HEALTHCARE DISTRIBUTORS—0.2% | | | | | | | | |
| PetIQ, Inc., Cl. A* | | | 62,035 | | | | 731,393 | |
| HEALTHCARE EQUIPMENT—10.3% | | | | | | | | |
| Impulse Dynamics PLC, Class E*,@,(a) | | | 1,105,151 | | | | 3,646,998 | |
| Inmode Ltd.* | | | 103,438 | | | | 3,854,100 | |
| Insulet Corp.* | | | 29,158 | | | | 9,273,410 | |
| Mesa Laboratories, Inc. | | | 27,736 | | | | 4,618,322 | |
| Paragon 28, Inc.* | | | 75,516 | | | | 1,391,005 | |
| QuidelOrtho Corp.* | | | 79,576 | | | | 7,157,861 | |
| Shockwave Medical, Inc.* | | | 6,006 | | | | 1,742,701 | |
| Tandem Diabetes Care, Inc.* | | | 79,550 | | | | 3,148,589 | |
| | | | | | | | 34,832,986 | |
| HEALTHCARE SERVICES—0.6% | | | | | | | | |
| Guardant Health, Inc.* | | | 30,906 | | | | 697,239 | |
| Privia Health Group, Inc.* | | | 48,330 | | | | 1,335,358 | |
| | | | | | | | 2,032,597 | |
| HEALTHCARE SUPPLIES—2.3% | | | | | | | | |
| Neogen Corp.* | | | 443,260 | | | | 7,632,937 | |
| HEALTHCARE TECHNOLOGY—2.5% | | | | | | | | |
| Doximity, Inc., Cl. A* | | | 18,271 | | | | 671,459 | |
| Veeva Systems, Inc., Cl. A* | | | 43,687 | | | | 7,823,468 | |
| | | | | | | | 8,494,927 | |
| HOMEBUILDING—0.5% | | | | | | | | |
| Skyline Champion Corp.* | | | 23,895 | | | | 1,772,292 | |
| INDUSTRIAL MACHINERY & SUPPLIES & COMPONENTS—0.6% | | | | | | | | |
| Gates Industrial Corp., PLC* | | | 161,017 | | | | 2,168,899 | |
| INTERACTIVE HOME ENTERTAINMENT—1.3% | | | | | | | | |
| Take-Two Interactive Software, Inc.* | | | 35,288 | | | | 4,385,946 | |
| INTERACTIVE MEDIA & SERVICES—0.8% | | | | | | | | |
| Bumble, Inc., Cl. A* | | | 66,183 | | | | 1,205,193 | |
| Tripadvisor, Inc.* | | | 80,266 | | | | 1,423,116 | |
| | | | | | | | 2,628,309 | |
| LEISURE FACILITIES—1.0% | | | | | | | | |
| Planet Fitness, Inc., Cl. A* | | | 40,235 | | | | 3,345,138 | |
- 60 -
THE ALGER FUNDS | ALGER SMALL CAP GROWTH FUND
Schedule of Investments April 30, 2023 (Unaudited) (Continued)
| COMMON STOCKS—96.9% (CONT.) | | SHARES | | | VALUE | |
| LIFE SCIENCES TOOLS & SERVICES—7.0% | | | | | | | | |
| Akoya Biosciences, Inc.* | | | 139,659 | | | $ | 972,027 | |
| Bio-Techne Corp. | | | 135,569 | | | | 10,829,252 | |
| CryoPort, Inc.* | | | 115,779 | | | | 2,435,990 | |
| ICON PLC* | | | 9,581 | | | | 1,846,163 | |
| MaxCyte, Inc.* | | | 193,490 | | | | 967,450 | |
| NanoString Technologies, Inc.* | | | 153,836 | | | | 1,507,593 | |
| Personalis, Inc.* | | | 314,078 | | | | 716,098 | |
| Repligen Corp.* | | | 28,185 | | | | 4,273,691 | |
| | | | | | | | 23,548,264 | |
| MANAGED HEALTHCARE—1.5% | | | | | | | | |
| HealthEquity, Inc.* | | | 96,344 | | | | 5,149,587 | |
| MOVIES & ENTERTAINMENT—1.4% | | | | | | | | |
| Live Nation Entertainment, Inc.* | | | 69,490 | | | | 4,710,032 | |
| OIL & GAS EQUIPMENT & SERVICES—1.0% | | | | | | | | |
| ChampionX Corp. | | | 79,644 | | | | 2,156,760 | |
| ProPetro Holding Corp.* | | | 166,265 | | | | 1,153,879 | |
| | | | | | | | 3,310,639 | |
| OIL & GAS EXPLORATION & PRODUCTION—4.9% | | | | | | | | |
| Coterra Energy, Inc. | | | 85,796 | | | | 2,196,378 | |
| Magnolia Oil & Gas Corp., Cl. A | | | 683,486 | | | | 14,435,224 | |
| | | | | | | | 16,631,602 | |
| PHARMACEUTICALS—1.2% | | | | | | | | |
| Pliant Therapeutics, Inc.* | | | 54,049 | | | | 1,526,885 | |
| Reata Pharmaceuticals, Inc., Cl. A* | | | 17,099 | | | | 1,690,407 | |
| Ventyx Biosciences, Inc.* | | | 24,827 | | | | 933,495 | |
| | | | | | | | 4,150,787 | |
| REGIONAL BANKS—0.9% | | | | | | | | |
| Webster Financial Corp. | | | 79,755 | | | | 2,974,862 | |
| RESEARCH & CONSULTING SERVICES—0.4% | | | | | | | | |
| LegalZoom.com, Inc.* | | | 144,125 | | | | 1,351,893 | |
| RESTAURANTS—6.9% | | | | | | | | |
| Kura Sushi USA, Inc., Cl. A* | | | 48,845 | | | | 3,366,397 | |
| Shake Shack, Inc., Cl. A* | | | 151,624 | | | | 8,310,511 | |
| The Cheesecake Factory, Inc. | | | 80,375 | | | | 2,707,834 | |
| Wingstop, Inc. | | | 43,860 | | | | 8,776,825 | |
| | | | | | | | 23,161,567 | |
| SEMICONDUCTOR MATERIALS & EQUIPMENT—0.9% | | | | | | | | |
| SolarEdge Technologies, Inc.* | | | 10,807 | | | | 3,086,803 | |
| SEMICONDUCTORS—0.9% | | | | | | | | |
| Universal Display Corp. | | | 22,496 | | | | 3,002,316 | |
| SPECIALTY CHEMICALS—2.7% | | | | | | | | |
| Balchem Corp. | | | 68,033 | | | | 8,939,536 | |
| SYSTEMS SOFTWARE—0.4% | | | | | | | | |
| Rapid7, Inc.* | | | 28,874 | | | | 1,403,565 | |
| TRADING COMPANIES & DISTRIBUTORS—0.3% | | | | | | | | |
| Xometry, Inc., Cl. A* | | | 62,192 | | | | 863,847 | |
- 61 -
THE ALGER FUNDS | ALGER SMALL CAP GROWTH FUND
Schedule of Investments April 30, 2023 (Unaudited) (Continued)
| COMMON STOCKS—96.9% (CONT.) | | SHARES | | | VALUE | |
| TRANSACTION & PAYMENT PROCESSING SERVICES—1.1% | | | | | | | | |
| DLocal Ltd., Cl. A* | | | 173,167 | | | $ | 2,424,338 | |
| Marqeta, Inc., Cl. A* | | | 288,721 | | | | 1,169,320 | |
| | | | | | | | 3,593,658 | |
| TOTAL COMMON STOCKS | | | | | | | | |
| (Cost $327,651,324) | | | | | | | 326,932,110 | |
| | | | | | | | | |
| PREFERRED STOCKS—0.0% | | | SHARES | | | | VALUE | |
| BIOTECHNOLOGY—0.0% | | | | | | | | |
| Prosetta Biosciences, Inc., Series D*,@,(a),(b) | | | 50,688 | | | | — |
|
| (Cost $228,096) | | | | | | | — |
|
| | | | | | | | | |
| RIGHTS—0.0% | | | SHARES | | | | VALUE | |
| BIOTECHNOLOGY—0.0% | | | | | | | | |
| Tolero CDR*,@,(a),(c) | | | 174,782 | | | | 117,104 | |
| (Cost $94,483) | | | | | | | 117,104 | |
| | | | | | | | | |
| REAL ESTATE INVESTMENT TRUST—1.5% | | | SHARES | | | | VALUE | |
| RETAIL—1.5% | | | | | | | | |
| Tanger Factory Outlet Centers, Inc. | | | 258,634 | | | | 5,071,813 | |
| (Cost $4,259,450) | | | | | | | 5,071,813 | |
| | | | | | | | | |
| SPECIAL PURPOSE VEHICLE—0.7% | | | | | | | VALUE | |
| DATA PROCESSING & OUTSOURCED SERVICES—0.7% | | | | | | | | |
| Crosslink Ventures Capital C, LLC, Cl. A*,@,(a),(b) | | | | | | | 1,879,056 | |
| Crosslink Ventures Capital C, LLC, Cl. B*,@,(a),(b) | | | | | | | 498,883 | |
| | | | | | | | 2,377,939 | |
| TOTAL SPECIAL PURPOSE VEHICLE | | | | | | | | |
| (Cost $2,275,000) | | | | | | | 2,377,939 | |
| | | | | | | | | |
| SHORT—TERM INVESTMENTS—1.5% | | | SHARES | | | | VALUE | |
| U.S.GOVERNMENT—1.5% | | | | | | | | |
| U.S. Treasury Bill, 0.0%, 5/2/23 | | | 5,000,000 | | | | 4,999,532 | |
| (Cost $4,999,532) | | | | | | | 4,999,532 | |
| Total Investments | | | | | | | | |
| (Cost $339,507,885) | | | 100.6 | % | | $ | 339,498,498 | |
| Affiliated Securities (Cost $2,503,096) | | | | | | | 2,377,939 | |
| Unaffiliated Securities (Cost $337,004,789) | | | | | | | 337,120,559 | |
| Liabilities in Excess of Other Assets | | | (0.6 | )% | | | (2,126,534 | ) |
| NET ASSETS | | | 100.0 | % | | $ | 337,371,964 | |
| (a) | Security is valued in good faith at fair value determined using significant unobservable inputs pursuant to procedures established by the Valuation Designee (as defined in Note 2). |
| (b) | Deemed an affiliate of the Fund in accordance with Section 2(a)(3) of the Investment Company Act of 1940. See Note 11 - Affiliated Securities. |
| (c) | Contingent Deferred Rights. |
| * | Non-income producing security. |
- 62 -
THE ALGER FUNDS | ALGER SMALL CAP GROWTH FUND
Schedule of Investments April 30, 2023 (Unaudited) (Continued)
| @ | Restricted security - Investment in security not registered under the Securities Act of 1933. Sales or transfers of the investment may be restricted only to qualified buyers. |
Security | | Acquisition Date(s) | | Acquisition Cost | | | % of net assets (Acquisition Date) | | | Market Value | | | % of net assets as of 4/30/2023 | |
| Crosslink Ventures Capital C, LLC, Cl. A | | 10/2/20 | | $ | 1,800,000 | | | | 0.49 | % | | $ | 1,879,056 | | | | 0.56 | % |
| Crosslink Ventures Capital C, LLC, Cl. B | | 12/16/20 | | | 475,000 | | | | 0.10 | % | | | 498,883 | | | | 0.15 | % |
| Impulse Dynamics PLC, Class E | | 2/11/22 | | | 3,646,998 | | | | 0.69 | % | | | 3,646,998 | | | | 1.08 | % |
| Prosetta Biosciences, Inc., Series D | | 2/6/15 | | | 228,096 | | | | 0.10 | % | | | 0 | | | | 0.00 | % |
| Tolero CDR | | 2/6/17 | | | 94,483 | | | | 0.08 | % | | | 117,104 | | | | 0.03 | % |
| Total | | | | | | | | | | | | $ | 6,142,041 | | | | 1.82 | % |
See Notes to Financial Statements.
- 63 -
THE ALGER FUNDS | ALGER SMALL CAP FOCUS FUND
Schedule of Investments April 30, 2023 (Unaudited)
| COMMON STOCKS—97.8% | | SHARES | | | VALUE | |
| AEROSPACE & DEFENSE—3.4% | | | | | | |
| Axon Enterprise, Inc.* | | | 151,218 | | | $ | 31,863,145 | |
| Mercury Systems, Inc.* | | | 919,513 | | | | 43,833,184 | |
| | | | | | | | 75,696,329 | |
| APPLICATION SOFTWARE—24.7% | | | | | | | | |
| ACI Worldwide, Inc.* | | | 1,077,549 | | | | 27,294,316 | |
| Agilysys, Inc.* | | | 676,507 | | | | 52,794,606 | |
| Altair Engineering, Inc., Cl. A* | | | 338,264 | | | | 23,357,129 | |
| AppFolio, Inc., Cl. A* | | | 347,061 | | | | 48,456,657 | |
| Blackline, Inc.* | | | 829,468 | | | | 46,209,662 | |
| Clearwater Analytics Holdings, Inc., Cl. A* | | | 3,771,754 | | | | 58,122,729 | |
| Everbridge, Inc.* | | | 1,403,607 | | | | 36,886,792 | |
| Guidewire Software, Inc.* | | | 856,913 | | | | 65,288,202 | |
| Model N, Inc.* | | | 657,343 | | | | 20,246,164 | |
| PagerDuty, Inc.* | | | 847,654 | | | | 25,480,479 | |
| PROS Holdings, Inc.*,(a) | | | 2,881,995 | | | | 81,762,198 | |
| Q2 Holdings, Inc.* | | | 746,982 | | | | 18,390,697 | |
| Smartsheet, Inc., Cl. A* | | | 658,540 | | | | 26,914,530 | |
| Sprout Social, Inc., Cl. A* | | | 275,448 | | | | 13,568,569 | |
| | | | | | | | 544,772,730 | |
| BIOTECHNOLOGY—7.9% | | | | | | | | |
| Cabaletta Bio, Inc.*,(a) | | | 3,058,993 | | | | 31,752,347 | |
| Natera, Inc.* | | | 1,705,418 | | | | 86,498,801 | |
| Prometheus Biosciences, Inc.* | | | 295,777 | | | | 57,365,949 | |
| | | | | | | | 175,617,097 | |
| HEALTHCARE EQUIPMENT—23.0% | | | | | | | | |
| AtriCure, Inc.* | | | 1,318,646 | | | | 58,007,238 | |
| Axonics, Inc.* | | | 731,897 | | | | 42,054,802 | |
| Heska Corp.*,(a) | | | 713,593 | | | | 83,604,556 | |
| Inari Medical, Inc.* | | | 209,358 | | | | 13,905,558 | |
| Inspire Medical Systems, Inc.* | | | 291,886 | | | | 78,117,450 | |
| Insulet Corp.* | | | 181,525 | | | | 57,732,211 | |
| QuidelOrtho Corp.* | | | 625,713 | | | | 56,282,884 | |
| Shockwave Medical, Inc.* | | | 271,212 | | | | 78,694,874 | |
| TransMedics Group, Inc.* | | | 499,532 | | | | 39,512,981 | |
| | | | | | | | 507,912,554 | |
| HEALTHCARE SUPPLIES—2.1% | | | | | | | | |
| Silk Road Medical, Inc.* | | | 1,047,757 | | | | 46,122,263 | |
| HEALTHCARE TECHNOLOGY—3.8% | | | | | | | | |
| Evolent Health, Inc., Cl. A* | | | 1,185,349 | | | | 43,158,557 | |
| Veeva Systems, Inc., Cl. A* | | | 226,645 | | | | 40,587,587 | |
| | | | | | | | 83,746,144 | |
| INDUSTRIAL MACHINERY & SUPPLIES & COMPONENTS—4.3% | | | | | | | | |
| RBC Bearings, Inc.* | | | 420,178 | | | | 95,384,608 | |
- 64 -
THE ALGER FUNDS | ALGER SMALL CAP FOCUS FUND
Schedule of Investments April 30, 2023 (Unaudited) (Continued)
| COMMON STOCKS—97.8% (CONT.) | | SHARES | | | VALUE | |
| LIFE SCIENCES TOOLS & SERVICES—11.6% | | | | | | | | |
| BioLife Solutions, Inc.* | | | 1,674,562 | | | $ | 29,405,309 | |
| Bio-Techne Corp. | | | 765,923 | | | | 61,181,929 | |
| Bruker Corp. | | | 789,640 | | | | 62,484,213 | |
| CryoPort, Inc.* | | | 1,911,090 | | | | 40,209,334 | |
| Repligen Corp.* | | | 411,668 | | | | 62,421,219 | |
| | | | | | | | 255,702,004 | |
| OIL & GAS EQUIPMENT & SERVICES—2.5% | | | | | | | | |
| ChampionX Corp. | | | 2,082,466 | | | | 56,393,179 | |
| OIL & GAS EXPLORATION & PRODUCTION—4.4% | | | | | | | | |
| PDC Energy, Inc. | | | 712,141 | | | | 46,324,772 | |
| Viper Energy Partners LP | | | 1,698,261 | | | | 49,996,804 | |
| | | | | | | | 96,321,576 | |
| PACKAGED FOODS & MEATS—0.9% | | | | | | | | |
| Freshpet, Inc.* | | | 306,471 | | | | 21,137,305 | |
| PHARMACEUTICALS—1.0% | | | | | | | | |
| Pliant Therapeutics, Inc.* | | | 825,578 | | | | 23,322,579 | |
| RESEARCH & CONSULTING SERVICES—0.6% | | | | | | | | |
| Exponent, Inc. | | | 145,591 | | | | 13,401,652 | |
| RESTAURANTS—3.6% | | | | | | | | |
| Kura Sushi USA, Inc., Cl. A* | | | 85,335 | | | | 5,881,288 | |
| Wingstop, Inc. | | | 363,371 | | | | 72,714,171 | |
| | | | | | | | 78,595,459 | |
| SYSTEMS SOFTWARE—3.1% | | | | | | | | |
| Gitlab, Inc., Cl. A* | | | 444,594 | | | | 13,497,874 | |
| Rapid7, Inc.* | | | 461,783 | | | | 22,447,271 | |
| Tenable Holdings, Inc.* | | | 868,113 | | | | 32,111,500 | |
| | | | | | | | 68,056,645 | |
| TRADING COMPANIES & DISTRIBUTORS—0.9% | | | | | | | | |
| Herc Holdings, Inc. | | | 80,097 | | | | 8,011,302 | |
| Xometry, Inc., Cl. A* | | | 899,547 | | | | 12,494,708 | |
| | | | | | | | 20,506,010 | |
| TOTAL COMMON STOCKS | | | | | | | | |
| (Cost $1,903,163,290) | | | 97.8 | % | | | 2,162,688,134 | |
| | | | | | | | | |
| RIGHTS—0.0% | | | SHARES | | | | VALUE | |
| BIOTECHNOLOGY—0.0% | | | | | | | | |
| Tolero CDR*,@,(b),(c) | | | 11,905 | | | | 7,976 | |
| (Cost $6,436) | | | | | | | 7,976 | |
| | | | | | | | | |
| SHORT—TERM INVESTMENTS—0.5% | | | SHARES | | | | VALUE | |
| U.S. GOVERNMENT—0.5% | | | | | | | | |
| U.S. Treasury Bill, 0.0%, 5/2/23 | | | 10,000,000 | | | | 9,999,064 | |
| (Cost $9,999,064) | | | | | | | 9,999,064 | |
| Total Investments | | | | | | | | |
| (Cost $1,913,168,790) | | | 98.3 | % | | $ | 2,172,695,174 | |
| Affiliated Securities (Cost $202,483,189) | | | | | | | 197,119,101 | |
| Unaffiliated Securities (Cost $1,710,685,601) | | | | | | | 1,975,576,073 | |
| Other Assets in Excess of Liabilities | | | 1.7 | % | | | 36,554,794 | |
| NET ASSETS | | | 100.0 | % | | $ | 2,209,249,968 | |
- 65 -
THE ALGER FUNDS | ALGER SMALL CAP FOCUS FUND
Schedule of Investments April 30, 2023 (Unaudited) (Continued)
| (a) | Deemed an affiliate of the Fund in accordance with Section 2(a)(3) of the Investment Company Act of 1940. See Note 11 - Affiliated Securities. |
| (b) | Security is valued in good faith at fair value determined using significant unobservable inputs pursuant to procedures established by the Valuation Designee (as defined in Note 2). |
| (c) | Contingent Deferred Rights. |
| * | Non-income producing security. |
| @ | Restricted security - Investment in security not registered under the Securities Act of 1933. Sales or transfers of the investment may be restricted only to qualified buyers. |
Security | | Acquisition Date(s) | | Acquisition Cost | | | % of net assets (Acquisition Date) | | | Market Value | | | % of net assets as of 4/30/2023 | |
| Tolero CDR | | 2/6/17 | | $ | 6,436 | | | | 0.00 | % | | $ | 7,976 | | | | 0.00 | % |
| Total | | | | | | | | | | | | $ | 7,976 | | | | 0.00 | % |
See Notes to Financial Statements.
- 66 -
THE ALGER FUNDS | ALGER INTERNATIONAL FOCUS FUND
Schedule of Investments April 30, 2023 (Unaudited)
| COMMON STOCKS—96.1% | | SHARES | | | VALUE | |
| ARGENTINA—2.8% | | | | | | | | |
| BROADLINE RETAIL—2.8% | | | | | | | | |
| MercadoLibre, Inc.* | | | 3,100 | | | $ | 3,960,219 | |
| (Cost $4,207,483) | | | | | | | | |
| AUSTRALIA—3.7% | | | | | | | | |
| HEALTHCARE SUPPLIES—1.9% | | | | | | | | |
| Nanosonics Ltd.* | | | 694,062 | | | | 2,644,324 | |
| HEALTHCARE TECHNOLOGY—1.8% | | | | | | | | |
| Pro Medicus Ltd. | | | 62,000 | | | | 2,545,101 | |
| TOTAL AUSTRALIA | | | | | | | | |
| (Cost $4,793,451) | | | | | | | 5,189,425 | |
| BRAZIL—5.8% | | | | | | | | |
| DIVERSIFIED BANKS—2.7% | | | | | | | | |
| NU Holdings Ltd., Cl. A* | | | 723,000 | | | | 3,730,680 | |
| DIVERSIFIED CAPITAL MARKETS—1.6% | | | | | | | | |
| Banco BTG Pactual SA | | | 491,000 | | | | 2,305,492 | |
| FOOTWEAR—1.5% | | | | | | | | |
| Arezzo Industria e Comercio SA | | | 158,000 | | | | 2,102,760 | |
| TOTAL BRAZIL | | | | | | | | |
| (Cost $8,158,006) | | | | | | | 8,138,932 | |
| CHINA—11.2% | | | | | | | | |
| AUTOMOBILE MANUFACTURERS—3.1% | | | | | | | | |
| BYD Co., Ltd., Cl. H | | | 144,484 | | | | 4,381,658 | |
| BREWERS—2.4% | | | | | | | | |
| Budweiser Brewing Co. APAC Ltd. | | | 1,153,000 | | | | 3,331,260 | |
| BROADLINE RETAIL—1.5% | | | | | | | | |
| Alibaba Group Holding Ltd.#,* | | | 24,800 | | | | 2,100,312 | |
| HOTELS RESORTS & CRUISE LINES—2.0% | | | | | | | | |
| Trip.com Group Ltd.#,* | | | 78,000 | | | | 2,769,780 | |
| RESTAURANTS—2.2% | | | | | | | | |
| Meituan, Cl. B* | | | 184,600 | | | | 3,154,898 | |
| TOTAL CHINA | | | | | | | | |
| (Cost $16,720,256) | | | | | | | 15,737,908 | |
| DENMARK—2.5% | | | | | | | | |
| PHARMACEUTICALS—2.5% | | | | | | | | |
| Novo Nordisk AS, Cl. B | | | 20,800 | | | | 3,459,841 | |
| (Cost $2,859,218) | | | | | | | | |
| FRANCE—14.0% | | | | | | | | |
| APPAREL ACCESSORIES & LUXURY GOODS—2.6% | | | | | | | | |
| LVMH Moet Hennessy Louis Vuitton SE | | | 3,850 | | | | 3,703,243 | |
| DATA PROCESSING & OUTSOURCED SERVICES—2.4% | | | | | | | | |
| Teleperformance | | | 16,857 | | | | 3,368,965 | |
| ELECTRICAL COMPONENTS & EQUIPMENT—2.4% | | | | | | | | |
| Schneider Electric SE | | | 19,300 | | | | 3,365,764 | |
| HEALTHCARE SUPPLIES—2.2% | | | | | | | | |
| EssilorLuxottica SA | | | 15,900 | | | | 3,147,882 | |
- 67 -
THE ALGER FUNDS | ALGER INTERNATIONAL FOCUS FUND
Schedule of Investments April 30, 2023 (Unaudited) (Continued)
| COMMON STOCKS—96.1% (CONT.) | | SHARES | | | VALUE | |
| FRANCE—14.0% (CONT.) | | | | | | |
| LIFE SCIENCES TOOLS & SERVICES—2.5% | | | | | | | | |
| Eurofins Scientific SE | | | 50,500 | | | $ | 3,527,417 | |
| OIL & GAS STORAGE & TRANSPORTATION—1.9% | | | | | | | | |
| Gaztransport Et Technigaz SA | | | 24,324 | | | | 2,601,238 | |
| TOTAL FRANCE | | | | | | | | |
| (Cost $16,443,701) | | | | | | | 19,714,509 | |
| GERMANY—6.2% | | | | | | | | |
| AEROSPACE & DEFENSE—2.6% | | | | | | | | |
| Hensoldt AG | | | 98,800 | | | | 3,705,501 | |
| LIFE SCIENCES TOOLS & SERVICES—2.1% | | | | | | | | |
| Gerresheimer AG | | | 27,700 | | | | 3,018,397 | |
| OIL & GAS REFINING & MARKETING—1.5% | | | | | | | | |
| VERBIO Vereinigte BioEnergie AG | | | 55,054 | | | | 2,050,427 | |
| TOTAL GERMANY | | | | | | | | |
| (Cost $8,172,674) | | | | | | | 8,774,325 | |
| HONG KONG—4.0% | | | | | | | | |
| APPAREL ACCESSORIES & LUXURY GOODS—2.0% | | | | | | | | |
| Samsonite International SA* | | | 900,000 | | | | 2,851,960 | |
| FINANCIAL EXCHANGES & DATA—2.0% | | | | | | | | |
| Hong Kong Exchanges & Clearing Ltd. | | | 67,000 | | | | 2,781,633 | |
| TOTAL HONG KONG | | | | | | | | |
| (Cost $5,297,206) | | | | | | | 5,633,593 | |
| INDIA—5.3% | | | | | | | | |
| APPAREL ACCESSORIES & LUXURY GOODS—1.2% | | | | | | | | |
| Kalyan Jewellers India Ltd.* | | | 1,309,074 | | | | 1,652,079 | |
| DIVERSIFIED BANKS—2.6% | | | | | | | | |
| HDFC Bank Ltd.# | | | 52,900 | | | | 3,692,420 | |
| HOTELS RESORTS & CRUISE LINES—1.5% | | | | | | | | |
| MakeMyTrip Ltd.* | | | 91,778 | | | | 2,151,276 | |
| TOTAL INDIA | | | | | | | | |
| (Cost $6,757,542) | | | | | | | 7,495,775 | |
| IRELAND—3.0% | | | | | | | | |
| PACKAGED FOODS & MEATS—3.0% | | | | | | | | |
| Kerry Group PLC, Cl. A | | | 40,441 | | | | 4,259,433 | |
| (Cost $4,489,017) | | | | | | | | |
| ITALY—6.8% | | | | | | | | |
| APPAREL ACCESSORIES & LUXURY GOODS—2.5% | | | | | | | | |
| Moncler SpA | | | 47,386 | | | | 3,515,149 | |
| AUTOMOBILE MANUFACTURERS—4.3% | | | | | | | | |
| Ferrari NV | | | 21,462 | | | | 5,980,172 | |
| TOTAL ITALY | | | | | | | | |
| (Cost $4,763,745) | | | | | | | 9,495,321 | |
| JAPAN—3.3% | | | | | | | | |
| ELECTRONIC EQUIPMENT & INSTRUMENTS—2.5% | | | | | | | | |
| Keyence Corp. | | | 7,900 | | | | 3,563,078 | |
- 68 -
THE ALGER FUNDS | ALGER INTERNATIONAL FOCUS FUND
Schedule of Investments April 30, 2023 (Unaudited) (Continued)
| COMMON STOCKS—96.1% (CONT.) | | SHARES | | | VALUE | |
| JAPAN—3.3% (CONT.) | | | | | | |
| SEMICONDUCTOR MATERIALS & EQUIPMENT—0.8% | | | | | | | | |
| Lasertec Corp. | | | 8,200 | | | $ | 1,115,741 | |
| TOTAL JAPAN | | | | | | | | |
| (Cost $3,657,229) | | | | | | | 4,678,819 | |
| MEXICO—2.5% | | | | | | | | |
| AIRPORT SERVICES—2.5% | | | | | | | | |
| Grupo Aeroportuario del Centro Norte SAB de CV | | | 323,000 | | | | 3,543,792 | |
| (Cost $3,031,019) | | | | | | | | |
| NETHERLANDS—8.6% | | | | | | | | |
| HEAVY ELECTRICAL EQUIPMENT—2.1% | | | | | | | | |
| Alfen Beheer BV* | | | 36,800 | | | | 2,977,466 | |
| SEMICONDUCTOR MATERIALS & EQUIPMENT—4.1% | | | | | | | | |
| ASML Holding NV | | | 9,100 | | | | 5,774,976 | |
| TRANSACTION & PAYMENT PROCESSING SERVICES—2.4% | | | | | | | | |
| Adyen NV* | | | 2,075 | | | | 3,334,217 | |
| TOTAL NETHERLANDS | | | | | | | | |
| (Cost $4,618,115) | | | | | | | 12,086,659 | |
| NORWAY—1.1% | | | | | | | | |
| ENVIRONMENTAL & FACILITIES SERVICES—1.1% | | | | | | | | |
| Aker Carbon Capture ASA* | | | 1,560,510 | | | | 1,601,262 | |
| (Cost $3,626,911) | | | | | | | | |
| SPAIN—1.9% | | | | | | | | |
| BIOTECHNOLOGY—1.9% | | | | | | | | |
| Grifols SA#,* | | | 350,741 | | | | 2,616,528 | |
| (Cost $5,818,963) | | | | | | | | |
| SWEDEN—1.7% | | | | | | | | |
| ASSET MANAGEMENT & CUSTODY BANKS—1.7% | | | | | | | | |
| EQT AB | | | 112,298 | | | | 2,418,752 | |
| (Cost $1,658,438) | | | | | | | | |
| SWITZERLAND—3.6% | | | | | | | | |
| ASSET MANAGEMENT & CUSTODY BANKS—1.6% | | | | | | | | |
| Partners Group Holding AG | | | 2,284 | | | | 2,217,155 | |
| SPECIALTY CHEMICALS—2.0% | | | | | | | | |
| Sika AG | | | 10,150 | | | | 2,803,664 | |
| TOTAL SWITZERLAND | | | | | | | | |
| (Cost $3,032,454) | | | | | | | 5,020,819 | |
| UNITED KINGDOM—5.4% | | | | | | | | |
| FINANCIAL EXCHANGES & DATA—2.9% | | | | | | | | |
| London Stock Exchange Group PLC | | | 39,200 | | | | 4,115,409 | |
| PHARMACEUTICALS—2.5% | | | | | | | | |
| AstraZeneca PLC | | | 23,500 | | | | 3,458,055 | |
| TOTAL UNITED KINGDOM | | | | | | | | |
| (Cost $6,013,748) | | | | | | | 7,573,464 | |
- 69 -
THE ALGER FUNDS | ALGER INTERNATIONAL FOCUS FUND
Schedule of Investments April 30, 2023 (Unaudited) (Continued)
| COMMON STOCKS—96.1% (CONT.) | | SHARES | | | VALUE | |
| UNITED STATES—2.7% | | | | | | |
| OIL & GAS EQUIPMENT & SERVICES—2.7% | | | | | | | | |
| Schlumberger Ltd. | | | 75,400 | | | $ | 3,720,990 | |
| (Cost $2,359,583) | | | | | | | | |
| TOTAL COMMON STOCKS | | | | | | | | |
| (Cost $116,478,759) | | | | | | | 135,120,366 | |
| Total Investments | | | | | | | | |
| (Cost $116,478,759) | | | 96.1 | % | | $ | 135,120,366 | |
| Unaffiliated Securities (Cost $116,478,759) | | | | | | | 135,120,366 | |
| Other Assets in Excess of Liabilities | | | 3.9 | % | | | 5,531,803 | |
| NET ASSETS | | | 100.0 | % | | $ | 140,652,169 | |
| # | American Depositary Receipts. |
| * | Non-income producing security. |
See Notes to Financial Statements.
- 70 -
THE ALGER FUNDS | ALGER HEALTH SCIENCES FUND
Schedule of Investments April 30, 2023 (Unaudited)
| COMMON STOCKS—97.4% | | SHARES | | | VALUE | |
| BIOTECHNOLOGY—24.1% | | | | | | | | |
| AbbVie, Inc. | | | 37,676 | | | $ | 5,693,597 | |
| ADMA Biologics, Inc.* | | | 828,080 | | | | 2,774,068 | |
| Aerovate Therapeutics, Inc.* | | | 65,527 | | | | 1,374,101 | |
| Apellis Pharmaceuticals, Inc.* | | | 41,640 | | | | 3,474,025 | |
| Biogen, Inc.* | | | 5,789 | | | | 1,761,187 | |
| Biohaven Ltd.* | | | 104,438 | | | | 1,366,049 | |
| BioMarin Pharmaceutical, Inc.* | | | 32,073 | | | | 3,080,291 | |
| Celldex Therapeutics, Inc.* | | | 13,573 | | | | 426,735 | |
| Compass Therapeutics, Inc.* | | | 174,563 | | | | 525,435 | |
| Exact Sciences Corp.* | | | 11,584 | | | | 742,187 | |
| HilleVax, Inc.* | | | 87,043 | | | | 1,218,602 | |
| Natera, Inc.* | | | 42,648 | | | | 2,163,107 | |
| Prothena Corp., PLC* | | | 23,491 | | | | 1,236,096 | |
| Regeneron Pharmaceuticals, Inc.* | | | 4,863 | | | | 3,899,105 | |
| Vaxcyte, Inc.* | | | 24,793 | | | | 1,061,884 | |
| Vertex Pharmaceuticals, Inc.* | | | 17,709 | | | | 6,033,988 | |
| | | | | | | | 36,830,457 | |
| HEALTHCARE DISTRIBUTORS—1.7% | | | | | | | | |
| Cardinal Health, Inc. | | | 32,057 | | | | 2,631,880 | |
| HEALTHCARE EQUIPMENT—24.4% | | | | | | | | |
| Boston Scientific Corp.* | | | 146,197 | | | | 7,619,787 | |
| Dexcom, Inc.* | | | 20,176 | | | | 2,448,156 | |
| Edwards Lifesciences Corp.* | | | 38,504 | | | | 3,387,582 | |
| GE HealthCare Technologies, Inc.* | | | 78,971 | | | | 6,423,501 | |
| Impulse Dynamics PLC, Class E*,@,(a) | | | 1,515,152 | | | | 5,000,002 | |
| Insulet Corp.* | | | 6,177 | | | | 1,964,533 | |
| Masimo Corp.* | | | 8,320 | | | | 1,573,645 | |
| Penumbra, Inc.* | | | 7,886 | | | | 2,240,570 | |
| Teleflex, Inc. | | | 11,538 | | | | 3,144,336 | |
| TransMedics Group, Inc.* | | | 45,101 | | | | 3,567,489 | |
| | | | | | | | 37,369,601 | |
| HEALTHCARE FACILITIES—8.0% | | | | | | | | |
| Acadia Healthcare Co., Inc.* | | | 58,271 | | | | 4,212,410 | |
| HCA Healthcare, Inc. | | | 9,120 | | | | 2,620,450 | |
| Tenet Healthcare Corp.* | | | 74,768 | | | | 5,481,990 | |
| | | | | | | | 12,314,850 | |
| HEALTHCARE SERVICES—2.5% | | | | | | | | |
| Accolade, Inc.* | | | 202,108 | | | | 2,734,521 | |
| Option Care Health, Inc.* | | | 34,545 | | | | 1,110,622 | |
| | | | | | | | 3,845,143 | |
| HEALTHCARE SUPPLIES—8.2% | | | | | | | | |
| Alcon, Inc. | | | 71,051 | | | | 5,173,674 | |
| Align Technology, Inc.* | | | 6,344 | | | | 2,063,704 | |
| Coloplast AS, Cl. B | | | 22,691 | | | | 3,269,026 | |
| Merit Medical Systems, Inc.* | | | 25,914 | | | | 2,106,549 | |
| | | | | | | | 12,612,953 | |
| HEALTHCARE TECHNOLOGY—0.3% | | | | | | | | |
| Phreesia, Inc.* | | | 14,535 | | | | 459,887 | |
- 71 -
THE ALGER FUNDS | ALGER HEALTH SCIENCES FUND
Schedule of Investments April 30, 2023 (Unaudited) (Continued)
| COMMON STOCKS—97.4% (CONT.) | | SHARES | | | VALUE | |
| LIFE SCIENCES TOOLS & SERVICES—11.1% | | | | | | | | |
| Bruker Corp. | | | 67,320 | | | $ | 5,327,032 | |
| Charles River Laboratories International, Inc.* | | | 27,489 | | | | 5,226,209 | |
| Lonza Group AG | | | 6,687 | | | | 4,170,282 | |
| Stevanato Group SpA | | | 83,352 | | | | 2,209,661 | |
| | | | | | | | 16,933,184 | |
| MANAGED HEALTHCARE—3.3% | | | | | | | | |
| Humana, Inc. | | | 9,498 | | | | 5,038,594 | |
| PHARMACEUTICALS—13.8% | | | | | | | | |
| AstraZeneca PLC# | | | 64,275 | | | | 4,706,216 | |
| Catalent, Inc.* | | | 22,315 | | | | 1,118,428 | |
| Daiichi Sankyo Co., Ltd. | | | 105,400 | | | | 3,617,291 | |
| Eli Lilly & Co. | | | 7,293 | | | | 2,887,007 | |
| Merck & Co., Inc. | | | 40,557 | | | | 4,683,117 | |
| Reata Pharmaceuticals, Inc., Cl. A* | | | 28,443 | | | | 2,811,875 | |
| Ventyx Biosciences, Inc.* | | | 36,075 | | | | 1,356,420 | |
| | | | | | | | 21,180,354 | |
| TOTAL COMMON STOCKS | | | | | | | | |
| (Cost $137,217,022) | | | | | | | 149,216,903 | |
| | | | | | | | | |
| PREFERRED STOCKS—0.0% | | | SHARES | | | | VALUE | |
| BIOTECHNOLOGY—0.0% | | | | | | | | |
| Prosetta Biosciences, Inc., Series D*,@,(a),(b) | | | 897,366 | | | | — |
|
| (Cost $4,038,147) | | | | | | | — |
|
| | | | | | | | | |
| RIGHTS—0.9% | | | SHARES | | | | VALUE | |
| BIOTECHNOLOGY—0.9% | | | | | | | | |
| Tolero CDR*,@,(a),(c) | | | 1,956,996 | | | | 1,311,187 | |
| (Cost $1,044,370) | | | | | | | 1,311,187 | |
| Total Investments | | | | | | | | |
| (Cost $142,299,539) | | | 98.3 | % | | $ | 150,528,090 | |
| Affiliated Securities (Cost $4,038,147) | | | | | | | — | |
| Unaffiliated Securities (Cost $138,261,392) | | | | | | | 150,528,090 | |
| Other Assets in Excess of Liabilities | | | 1.7 | % | | | 2,649,599 | |
| NET ASSETS | | | 100.0 | % | | $ | 153,177,689 | |
| # | American Depositary Receipts. |
| (a) | Security is valued in good faith at fair value determined using significant unobservable inputs pursuant to procedures established by the Valuation Designee (as defined in Note 2). |
| (b) | Deemed an affiliate of the Fund in accordance with Section 2(a)(3) of the Investment Company Act of 1940. See Note 11 - Affiliated Securities. |
| (c) | Contingent Deferred Rights. |
| * | Non-income producing security. |
- 72 -
THE ALGER FUNDS | ALGER HEALTH SCIENCES FUND
Schedule of Investments April 30, 2023 (Unaudited) (Continued)
| @ | Restricted security - Investment in security not registered under the Securities Act of 1933. Sales or transfers of the investment may be restricted only to qualified buyers. |
Security | | Acquisition Date(s) | | Acquisition Cost | | | % of net assets (Acquisition Date) | | | Market Value | | | % of net assets as of 4/30/2023 | |
| Impulse Dynamics PLC, Class E | | 2/11/22 | | $ | 5,000,002 | | | | 2.09 | % | | $ | 5,000,002 | | | | 3.26 | % |
| Prosetta Biosciences, Inc., Series D | | 2/6/15 | | | 4,038,147 | | | | 2.00 | % | | | 0 | | | | 0.00 | % |
| Tolero CDR | | 2/6/17 | | | 1,044,370 | | | | 0.90 | % | | | 1,311,187 | | | | 0.86 | % |
| Total | | | | | | | | | | | | $ | 6,311,189 | | | | 4.12 | % |
See Notes to Financial Statements.
- 73 -
THE ALGER FUNDS
Statements of Assets and Liabilities April 30, 2023 (Unaudited)
| | Alger Capital Appreciation Fund | | Alger 35 Fund | |
| | | | | | | |
| ASSETS: | | | | | | |
| Investments in unaffiliated securities, at value (Identified cost below)* see accompanying schedules of investments | $ | 1,707,143,517 | | $ | 25,745,751 | |
| Investments in affiliated securities, at value (Identified cost below)** see accompanying schedules of investments | | 2,896,878 | | | — | |
| Cash and cash equivalents | | 35,107,858 | | | — | |
| Foreign cash † | | 143,557 | | | — | |
| Receivable for investment securities sold | | 7,570,469 | | | 128,152 | |
| Receivable for shares of beneficial interest sold | | 1,868,867 | | | 600,000 | |
| Dividends and interest receivable | | 594,473 | | | 11,011 | |
| Receivable from Investment Manager | | 36,836 | | | 8,175 | |
| Prepaid expenses | | 283,561 | | | 15,095 | |
| Total Assets | | 1,755,646,016 | | | 26,508,184 | |
| | | | | | | |
LIABILITIES: | | | | | | |
| Payable for investment securities purchased | | 19,963,783 | | | — | |
| Payable for shares of beneficial interest redeemed | | 8,001,157 | | | — | |
| Bank overdraft | | — | | | 561,606 | |
| Accrued investment advisory fees | | 1,144,135 | | | 9,492 | |
| Accrued distribution fees | | 220,858 | | | — | |
| Accrued shareholder administrative fees | | 18,623 | | | 211 | |
| Accrued administrative fees | | 38,844 | | | 580 | |
| Accrued transfer agent fees | | 429,252 | | | 256 | |
| Accrued fund accounting fees | | 56,403 | | | 8,741 | |
| Accrued printing fees | | 54,368 | | | 488 | |
| Accrued professional fees | | 37,221 | | | 18,320 | |
| Accrued custodian fees | | 14,509 | | | 172 | |
| Accrued trustee fees | | 5,384 | | | 57 | |
| Accrued other expenses | | 995 | | | 823 | |
| Total Liabilities | | 29,985,532 | | | 600,746 | |
| NET ASSETS | $ | 1,725,660,484 | | $ | 25,907,438 | |
| | | | | | | |
NET ASSETS CONSIST OF: | | | | | | |
| Paid in capital (par value of $.001 per share) | | 1,095,606,351 | | | 40,308,171 | |
| Distributable earnings (Distributions in excess of earnings) | | 630,054,133 | | | (14,400,733 | ) |
| NET ASSETS | $ | 1,725,660,484 | | $ | 25,907,438 | |
| * Identified cost | $ | 1,106,349,242 | (a) | $ | 24,138,498 | (b) |
| ** Identified cost | $ | 2,775,000 | (a) | $ | — | |
| † Cost of foreign cash | $ | 143,529 | | $ | — | |
| See Notes to Financial Statements. | | | | | | |
- 74 -
THE ALGER FUNDS
Statements of Assets and Liabilities April 30, 2023 (Unaudited) (Continued)
| | Alger Capital Appreciation Fund | | Alger 35 Fund | |
| NET ASSETS BY CLASS: |
| Class A | $ | 771,340,961 | | $ | — | |
| Class C | $ | 77,864,628 | | $ | — | |
| Class Z | $ | 876,454,895 | | $ | 25,907,438 | |
| |
| SHARES OF BENEFICIAL INTEREST OUTSTANDING — NOTE 6: |
| Class A | | 35,402,930 | | | — | |
| Class C | | 6,068,139 | | | — | |
| Class Z | | 37,515,448 | | | 2,662,714 | |
| |
| NET ASSET VALUE PER SHARE: |
| Class A — Net Asset Value Per Share Class A | $ | 21.79 | | $ | — | |
Class A — Offering Price Per Share
(includes a 5.25% sales charge) | $ | 22.99 | | $ | — | |
| Class C — Net Asset Value Per Share Class C | $ | 12.83 | | $ | — | |
| Class Z — Net Asset Value Per Share Class Z | $ | 23.36 | | $ | 9.73 | |
| See Notes to Financial Statements. |
| (a) | At April 30, 2023, the net unrealized appreciation on investments, based on cost for federal income tax purposes of $1,140,324,071, amounted to $569,716,324 which consisted of aggregate gross unrealized appreciation of $623,648,025 and aggregate gross unrealized depreciation of $53,931,701. |
| (b) | At April 30, 2023, the net unrealized appreciation on investments, based on cost for federal income tax purposes of $25,262,257, amounted to $483,494 which consisted of aggregate gross unrealized appreciation of $2,457,525 and aggregate gross unrealized depreciation of $1,974,031. |
- 75 -
THE ALGER FUNDS
Statements of Assets and Liabilities April 30, 2023 (Unaudited) (Continued)
| | Alger Growth & Income Fund | | Alger Mid Cap Growth Fund | |
| ASSETS: | | | | | | |
| Investments in unaffiliated securities, at value (Identified cost below)* see accompanying schedules of investments | $ | 305,604,728 | | $ | 185,746,464 | |
| Investments in affiliated securities, at value (Identified cost below)** see accompanying schedules of investments | | — | | | 1,751,587 | |
| Cash and cash equivalents | | 5,334,761 | | | 3,933,966 | |
| Foreign cash † | | — | | | 5 | |
| Receivable for investment securities sold | | — | | | 1,051,467 | |
| Receivable for shares of beneficial interest sold | | 447,701 | | | 85,239 | |
| Dividends and interest receivable | | 412,958 | | | 8,607 | |
| Receivable from Investment Manager | | — | | | 5,717 | |
| Prepaid expenses | | 87,713 | | | 95,278 | |
| Total Assets | | 311,887,861 | | | 192,678,330 | |
| | | | | | | |
LIABILITIES: | | | | | | |
| Payable for investment securities purchased | | — | | | 2,812,236 | |
| Payable for shares of beneficial interest redeemed | | 40,222 | | | 95,518 | |
| Accrued investment advisory fees | | 126,402 | | | 117,780 | |
| Accrued distribution fees | | 45,077 | | | 41,977 | |
| Accrued shareholder administrative fees | | 3,309 | | | 2,409 | |
| Accrued administrative fees | | 6,952 | | | 4,262 | |
| Accrued transfer agent fees | | 39,146 | | | 45,561 | |
| Accrued professional fees | | 18,900 | | | 29,114 | |
| Accrued fund accounting fees | | 14,230 | | | 13,393 | |
| Accrued printing fees | | 7,234 | | | 15,388 | |
| Accrued custodian fees | | 2,133 | | | 5,245 | |
| Accrued trustee fees | | 353 | | | 456 | |
| Accrued other expenses | | 642 | | | 5,273 | |
| Total Liabilities | | 304,600 | | | 3,188,612 | |
| NET ASSETS | $ | 311,583,261 | | $ | 189,489,718 | |
| | | | | | | |
NET ASSETS CONSIST OF: | | | | | | |
| Paid in capital (par value of $.001 per share) | | 218,076,710 | | | 241,994,813 | |
| Distributable earnings (Distributions in excess of earnings) | | 93,506,551 | | | (52,505,095 | ) |
| NET ASSETS | $ | 311,583,261 | | $ | 189,489,718 | |
| * Identified cost | $ | 214,343,649 | (a) | $ | 167,027,083 | (b) |
| ** Identified cost | $ | — | | $ | 2,663,245 | (b) |
| † Cost of foreign cash | $ | — | | $ | 5 | |
| See Notes to Financial Statements. | | | | | | |
- 76 -
THE ALGER FUNDS
Statements of Assets and Liabilities April 30, 2023 (Unaudited) (Continued)
| | Alger Growth & Income Fund | | Alger Mid Cap Growth Fund | |
| |
| NET ASSETS BY CLASS: |
| Class A | $ | 123,374,070 | | $ | 146,971,144 | |
| Class B | $ | — | | $ | 10,547,097 | |
| Class C | $ | 24,613,583 | | $ | 4,010,847 | |
| Class Z | $ | 163,595,608 | | $ | 27,960,630 | |
| | | | | | | |
| SHARES OF BENEFICIAL INTEREST OUTSTANDING — NOTE 6: |
| Class A | | 2,173,715 | | | 12,877,151 | |
| Class B | | — | | | 1,475,361 | |
| Class C | | 441,209 | | | 602,441 | |
| Class Z | | 2,878,502 | | | 2,371,491 | |
| | | | | | | |
| NET ASSET VALUE PER SHARE: |
| Class A — Net Asset Value Per Share Class A | $ | 56.76 | | $ | 11.41 | |
Class A — Offering Price Per Share
(includes a 5.25% sales charge) | $ | 59.90 | | $ | 12.05 | |
| Class B — Net Asset Value Per Share Class B | $ | — | | $ | 7.15 | |
| Class C — Net Asset Value Per Share Class C | $ | 55.79 | | $ | 6.66 | |
| Class Z — Net Asset Value Per Share Class Z | $ | 56.83 | | $ | 11.79 | |
See Notes to Financial Statements.
| (a) | At April 30, 2023, the net unrealized appreciation on investments, based on cost for federal income tax purposes of $213,554,607, amounted to $92,050,121 which consisted of aggregate gross unrealized appreciation of $94,266,972 and aggregate gross unrealized depreciation of $2,216,851. |
| (b) | At April 30, 2023, the net unrealized appreciation on investments, based on cost for federal income tax purposes of $172,002,917, amounted to $15,495,134 which consisted of aggregate gross unrealized appreciation of $23,498,226 and aggregate gross unrealized depreciation of $8,003,092. |
- 77 -
THE ALGER FUNDS
Statements of Assets and Liabilities April 30, 2023 (Unaudited) (Continued)
| | Alger Mid Cap Focus
Fund | | Alger Weatherbie
Specialized Growth Fund | |
| ASSETS: | | | | | | |
| Investments in unaffiliated securities, at value (Identified cost below)* see accompanying schedules of investments | $ | 340,471,471 | | $ | 644,868,712 | |
| Investments in unaffiliated securities, at value (Identified cost below)** see accompanying schedules of investments | | — | | | — | |
| Cash and cash equivalents | | 442,596 | | | 7,108,472 | |
| Receivable for investment securities sold | | 11,073,287 | | | 4,811,174 | |
| Receivable for shares of beneficial interest sold | | 174,694 | | | 277,800 | |
| Dividends and interest receivable | | 2,856 | | | 18,090 | |
| Receivable from Investment Manager | | — | | | 1,831 | |
| Prepaid expenses | | 104,241 | | | 140,386 | |
| Total Assets | | 352,269,145 | | | 657,226,465 | |
| | | | | | | |
LIABILITIES: | | | | | | |
| Payable for investment securities purchased | | 4,137,798 | | | 3,080,411 | |
| Payable for shares of beneficial interest redeemed | | 362,608 | | | 1,488,347 | |
| Due to investment adviser | | 24 | | | — | |
| Accrued investment advisory fees | | 185,678 | | | 437,666 | |
| Accrued distribution fees | | 7,521 | | | 58,647 | |
| Accrued shareholder administrative fees | | 2,935 | | | 6,177 | |
| Accrued administrative fees | | 7,952 | | | 14,859 | |
| Accrued printing fees | | 52,468 | | | 68,135 | |
| Accrued professional fees | | 21,482 | | | 28,072 | |
| Accrued fund accounting fees | | 20,472 | | | 30,874 | |
| Accrued transfer agent fees | | 18,682 | | | 107,564 | |
| Accrued custodian fees | | 2,570 | | | 6,037 | |
| Accrued trustee fees | | 1,279 | | | 2,311 | |
| Accrued other expenses | | 3,359 | | | 2,195 | |
| Total Liabilities | | 4,824,828 | | | 5,331,295 | |
| NET ASSETS | $ | 347,444,317 | | $ | 651,895,170 | |
| | | | | | | |
NET ASSETS CONSIST OF: | | | | | | |
| Paid in capital (par value of $.001 per share) | | 511,743,225 | | | 971,220,502 | |
| Distributions in excess of earnings | | (164,298,908 | ) | | (319,325,332 | ) |
| NET ASSETS | $ | 347,444,317 | | $ | 651,895,170 | |
| * Identified cost | $ | 329,777,451 | (a) | $ | 659,400,135 | (b) |
| ** Identified cost | $ | — | | $ | 1,041,633 | (b) |
| See Notes to Financial Statements. | | | | | | |
- 78 -
THE ALGER FUNDS
Statements of Assets and Liabilities April 30, 2023 (Unaudited) (Continued)
| | Alger Mid Cap Focus
Fund | | Alger Weatherbie
Specialized Growth Fund | |
| | | | | | | |
| NET ASSETS BY CLASS: | | | | | | |
| Class A | $ | 5,387,535 | | $ | 105,467,753 | |
| Class C | $ | 2,638,265 | | $ | 37,581,316 | |
| Class I | $ | 19,838,064 | | $ | 26,066,567 | |
| Class Y | $ | 207,723 | | $ | 44,657,728 | |
| Class Z | $ | 319,372,730 | | $ | 438,121,806 | |
| | | | | | | |
| SHARES OF BENEFICIAL INTEREST OUTSTANDING — NOTE 6: |
| Class A | | 452,568 | | | 9,414,364 | |
| Class C | | 224,801 | | | 6,197,544 | |
| Class I | | 1,665,153 | | | 2,245,943 | |
| Class Y | | 17,243 | | | 3,744,960 | |
| Class Z | | 26,511,593 | | | 35,495,986 | |
| | | | | | | |
NET ASSET VALUE PER SHARE: | | | | | | |
| Class A — Net Asset Value Per Share Class A | $ | 11.90 | | $ | 11.20 | |
Class A — Offering Price Per Share
(includes a 5.25% sales charge) | $ | 12.56 | | $ | 11.82 | |
| Class C — Net Asset Value Per Share Class C | $ | 11.74 | | $ | 6.06 | |
| Class I — Net Asset Value Per Share Class I | $ | 11.91 | | $ | 11.61 | |
| Class Y — Net Asset Value Per Share Class Y | $ | 12.05 | | $ | 11.92 | |
| Class Z — Net Asset Value Per Share Class Z | $ | 12.05 | | $ | 12.34 | |
| See Notes to Financial Statements. | | | | | | |
| (a) | At April 30, 2023, the net unrealized appreciation on investments, based on cost for federal income tax purposes of $335,039,965, amounted to $5,431,506 which consisted of aggregate gross unrealized appreciation of $29,864,148 and aggregate gross unrealized depreciation of $24,462,642. |
| | |
| (b) | At April 30, 2023, the net unrealized depreciation on investments, based on cost for federal income tax purposes of $687,235,959, amounted to $42,367,247 which consisted of aggregate gross unrealized appreciation of $73,910,914 and aggregate gross unrealized depreciation of $116,278,161. |
- 79 -
THE ALGER FUNDS
Statements of Assets and Liabilities April 30, 2023 (Unaudited) (Continued)
| | Alger Small Cap Growth Fund | | Alger Small Cap Focus Fund | |
| ASSETS: | | | | | | |
| Investments in unaffiliated securities, at value (Identified cost below)* see accompanying schedules of investments | $ | 337,120,559 | | $ | 1,975,576,073 | |
| Investments in affiliated securities, at value (Identified cost below)** see accompanying schedules of investments | | 2,377,939 | | | 197,119,101 | |
| Cash and cash equivalents | | 2,077,699 | | | 23,903,731 | |
| Receivable for investment securities sold | | 4,942,704 | | | 19,837,415 | |
| Receivable for shares of beneficial interest sold | | 232,059 | | | 1,069,929 | |
| Dividends and interest receivable | | 83,902 | | | — | |
| Receivable from Investment Manager | | 2,090 | | | 18,179 | |
| Prepaid expenses | | 127,315 | | | 323,712 | |
| Total Assets | | 346,964,267 | | | 2,217,848,140 | |
| | | | | | | |
LIABILITIES: | | | | | | |
| Payable for investment securities purchased | | 8,764,222 | | | 2,149,065 | |
| Payable for shares of beneficial interest redeemed | | 392,897 | | | 3,989,710 | |
| Accrued investment advisory fees | | 227,232 | | | 1,378,668 | |
| Accrued distribution fees | | 43,878 | | | 132,171 | |
| Accrued shareholder administrative fees | | 3,616 | | | 19,885 | |
| Accrued administrative fees | | 7,715 | | | 50,551 | |
| Accrued transfer agent fees | | 62,784 | | | 531,411 | |
| Accrued professional fees | | 35,046 | | | 27,932 | |
| Accrued printing fees | | 22,436 | | | 225,790 | |
| Accrued fund accounting fees | | 15,641 | | | 63,244 | |
| Accrued custodian fees | | 11,751 | | | 15,687 | |
| Accrued trustee fees | | 1,136 | | | 10,588 | |
| Accrued other expenses | | 3,949 | | | 3,470 | |
| Total Liabilities | | 9,592,303 | | | 8,598,172 | |
| NET ASSETS | $ | 337,371,964 | | $ | 2,209,249,968 | |
| | | | | | | |
NET ASSETS CONSIST OF: | | | | | | |
| Paid in capital (par value of $.001 per share) | | 415,386,006 | | | 2,814,234,051 | |
| Distributions in excess of earnings | | (78,014,042 | ) | | (604,984,083 | ) |
| NET ASSETS | $ | 337,371,964 | | $ | 2,209,249,968 | |
| * Identified cost | $ | 337,004,789 | (a) | $ | 1,710,685,601 | (b) |
| ** Identified cost | $ | 2,503,096 | (a) | $ | 202,483,189 | (b) |
| See Notes to Financial Statements. | | | | | | |
- 80 -
THE ALGER FUNDS
Statements of Assets and Liabilities April 30, 2023 (Unaudited) (Continued)
| | Alger Small Cap Growth Fund | | Alger Small Cap Focus Fund | |
| NET ASSETS BY CLASS: | | | | | | |
| Class A | $ | 130,103,734 | | $ | 189,342,087 | |
| Class B | $ | 2,538,719 | | $ | — | |
| Class C | $ | 17,983,702 | | $ | 89,079,170 | |
| Class I | $ | — | | $ | 91,595,198 | |
| Class Y | $ | 8,790,130 | | $ | 205,291,747 | |
| Class Z | $ | 177,955,679 | | $ | 1,633,941,766 | |
| | | | | | | |
| SHARES OF BENEFICIAL INTEREST OUTSTANDING — NOTE 6: |
| Class A | | 15,067,229 | | | 11,607,736 | |
| Class B | | 437,539 | | | — | |
| Class C | | 3,354,285 | | | 6,277,929 | |
| Class I | | — | | | 5,439,471 | |
| Class Y | | 964,117 | | | 11,866,433 | |
| Class Z | | 19,565,219 | | | 94,461,648 | |
| | | | | | | |
NET ASSET VALUE PER SHARE: | | | | | | |
| Class A — Net Asset Value Per Share Class A | $ | 8.63 | | $ | 16.31 | |
Class A — Offering Price Per Share
(includes a 5.25% sales charge) | $ | 9.11 | | $ | 17.22 | |
| Class B — Net Asset Value Per Share Class B | $ | 5.80 | | $ | — | |
| Class C — Net Asset Value Per Share Class C | $ | 5.36 | | $ | 14.19 | |
| Class I — Net Asset Value Per Share Class I | $ | — | | $ | 16.84 | |
| Class Y — Net Asset Value Per Share Class Y | $ | 9.12 | | $ | 17.30 | |
| Class Z — Net Asset Value Per Share Class Z | $ | 9.10 | | $ | 17.30 | |
| See Notes to Financial Statements. | | | | | | |
| (a) | At April 30, 2023, the net unrealized depreciation on investments, based on cost for federal income tax purposes of $339,798,207, amounted to $299,709 which consisted of aggregate gross unrealized appreciation of $75,777,290 and aggregate gross unrealized depreciation of $76,076,999. |
| | |
| (b) | At April 30, 2023, the net unrealized appreciation on investments, based on cost for federal income tax purposes of $1,941,898,662, amounted to $230,796,512 which consisted of aggregate gross unrealized appreciation of $509,455,136 and aggregate gross unrealized depreciation of $278,658,624. |
- 81 -
THE ALGER FUNDS
Statements of Assets and Liabilities April 30, 2023 (Unaudited) (Continued)
| | Alger International Focus Fund | | Alger Health Sciences Fund | |
| | | | | |
| ASSETS: | | | | | | |
| Investments in unaffiliated securities, at value (Identified cost below)* see accompanying schedules of investments | $ | 135,120,366 | | $ | 150,528,090 | |
| Investments in unaffiliated securities, at value (Identified cost below)** see accompanying schedules of investments | | — | | | — | |
| Cash and cash equivalents | | 5,339,208 | | | 1,943,022 | |
| Foreign cash † | | 25,305 | | | — | |
| Receivable for investment securities sold | | 69 | | | 1,704,074 | |
| Receivable for shares of beneficial interest sold | | 9,288 | | | 12,841 | |
| Dividends and interest receivable | | 308,764 | | | 170,107 | |
| Receivable from Investment Manager | | 9,080 | | | — | |
| Prepaid expenses | | 81,076 | | | 76,640 | |
| Total Assets | | 140,893,156 | | | 154,434,774 | |
| | | | | | | |
| LIABILITIES: | | | | | | |
| Payable for investment securities purchased | | — | | | 757,281 | |
| Payable for shares of beneficial interest redeemed | | 4,520 | | | 276,545 | |
| Accrued investment advisory fees | | 82,220 | | | 68,941 | |
| Accrued distribution fees | | 34,880 | | | 22,927 | |
| Accrued shareholder administrative fees | | 1,816 | | | 1,736 | |
| Accrued administrative fees | | 3,184 | | | 3,447 | |
| Accrued transfer agent fees | | 37,464 | | | 53,718 | |
| Accrued professional fees | | 32,894 | | | 27,877 | |
| Accrued fund accounting fees | | 11,718 | | | 11,559 | |
| Accrued printing fees | | 11,311 | | | 24,924 | |
| Accrued custodian fees | | 8,891 | | | 2,558 | |
| Accrued trustee fees | | 222 | | | 532 | |
| Accrued other expenses | | 11,867 | | | 5,040 | |
| Total Liabilities | | 240,987 | | | 1,257,085 | |
| NET ASSETS | $ | 140,652,169 | | $ | 153,177,689 | |
| | | | | | | |
NET ASSETS CONSIST OF: | | | | | | |
| Paid in capital (par value of $.001 per share) | | 132,643,632 | | | 176,218,714 | |
| Distributable earnings (Distributions in excess of earnings) | | 8,008,537 | | | (23,041,025 | ) |
| NET ASSETS | $ | 140,652,169 | | $ | 153,177,689 | |
| * Identified cost | $ | 116,478,759 | (a) | $ | 138,261,392 | (b) |
| ** Identified cost | $ | — | | $ | 4,038,147 | (b) |
| † Cost of foreign cash | $ | 25,300 | | $ | — | |
| See Notes to Financial Statements. | | | | | | |
- 82 -
THE ALGER FUNDS
Statements of Assets and Liabilities April 30, 2023 (Unaudited) (Continued)
| | Alger International Focus Fund | | Alger Health Sciences Fund | |
| | | | | |
| NET ASSETS BY CLASS: | | | | | | |
| Class A | $ | 107,811,859 | | $ | 83,832,495 | |
| Class B | $ | 13,840,840 | | $ | — | |
| Class C | $ | 1,304,048 | | $ | 7,153,983 | |
| Class I | $ | 1,173,096 | | $ | — | |
| Class Z | $ | 16,522,326 | | $ | 62,191,211 | |
| |
| SHARES OF BENEFICIAL INTEREST OUTSTANDING — NOTE 6: |
| Class A | | 6,385,615 | | | 4,015,169 | |
| Class B | | 957,137 | | | — | |
| Class C | | 95,498 | | | 548,525 | |
| Class I | | 69,238 | | | — | |
| Class Z | | 956,016 | | | 2,919,494 | |
| | | | | | | |
| NET ASSET VALUE PER SHARE: | | | | | | |
| Class A — Net Asset Value Per Share Class A | $ | 16.88 | | $ | 20.88 | |
Class A — Offering Price Per Share
(includes a 5.25% sales charge) | $ | 17.82 | | $ | 22.04 | |
| Class B — Net Asset Value Per Share Class B | $ | 14.46 | | $ | — | |
| Class C — Net Asset Value Per Share Class C | $ | 13.66 | | $ | 13.04 | |
| Class I — Net Asset Value Per Share Class I | $ | 16.94 | | $ | — | |
| Class Z — Net Asset Value Per Share Class Z | $ | 17.28 | | $ | 21.30 | |
| See Notes to Financial Statements. | | |
| (a) | At April 30, 2023, the net unrealized appreciation on investments, based on cost for federal income tax purposes of $118,865,079, amounted to $16,255,287 which consisted of aggregate gross unrealized appreciation of $30,495,184 and aggregate gross unrealized depreciation of $14,239,897. |
| (b) | At April 30, 2023, the net unrealized appreciation on investments, based on cost for federal income tax purposes of $143,081,719, amounted to $7,446,371 which consisted of aggregate gross unrealized appreciation of $15,716,295 and aggregate gross unrealized depreciation of $8,269,924. |
- 83 -
THE ALGER FUNDS
Statements of Operations for the six months ended April 30, 2023 (Unaudited)
| | Alger Capital Appreciation Fund | | Alger 35 Fund | |
| | | | | | | |
| INCOME: | | | | | | |
| Dividends (net of foreign withholding taxes*) | $ | 6,186,134 | | $ | 51,870 | |
| Interest | | 562,627 | | | 13,052 | |
| Total Income | | 6,748,761 | | | 64,922 | |
| | | | | | | |
EXPENSES: | | | | | | |
| Investment advisory fees — Note 3(a) | | 6,836,241 | | | 56,529 | |
| Distribution fees — Note 3(c) | | | | | | |
| Class A | | 925,702 | | | — | |
| Class C | | 403,131 | | | — | |
| Shareholder administrative fees — Note 3(f) | | 111,087 | | | 1,256 | |
| Administration fees — Note 3(b) | | 232,095 | | | 3,455 | |
| Transfer agent fees — Note 3(f) | | 478,121 | | | 1,357 | |
| Fund accounting fees | | 136,977 | | | 27,002 | |
| Professional fees | | 71,533 | | | 18,908 | |
| Printing fees | | 53,704 | | | 478 | |
| Registration fees | | 50,008 | | | 2,286 | |
| Trustee fees — Note 3(g) | | 43,671 | | | 633 | |
| Custodian fees | | 38,414 | | | 1,549 | |
| Interest expenses | | 235 | | | 1,498 | |
| Other expenses | | 85,023 | | | 2,118 | |
| Total Expenses | | 9,465,942 | | | 117,069 | |
| Less, expense reimbursements/waivers — Note 3(a) | | (283,270 | ) | | (46,171 | ) |
| Net Expenses | | 9,182,672 | | | 70,898 | |
| NET INVESTMENT LOSS | | (2,433,911 | ) | | (5,976 | ) |
| |
| REALIZED AND UNREALIZED GAIN (LOSS) ON INVESTMENTS AND FOREIGN CURRENCY: |
| Net realized gain (loss) on unaffiliated investments | | 68,480,540 | | | (2,684,391 | ) |
| Net realized (loss) on foreign currency transactions | | (3,216 | ) | | (678 | ) |
| Net change in unrealized appreciation on unaffiliated investments | | 87,216,785 | | | 3,164,071 | |
| Net change in unrealized (depreciation) on affiliated investments | | (37,962 | ) | | — | |
| Net change in unrealized appreciation on foreign currency | | 20,426 | | | 49 | |
| Net realized and unrealized gain on investments and foreign currency | | 155,676,573 | | | 479,051 | |
| NET INCREASE IN NET ASSETS RESULTING FROM OPERATIONS | $ | 153,242,662 | | $ | 473,075 | |
| * Foreign withholding taxes | $ | 66,549 | | $ | 207 | |
See Notes to Financial Statements.
- 84 -
THE ALGER FUNDS
Statements of Operations for the six months ended April 30, 2023 (Unaudited) (Continued)
| | Alger Growth & Income Fund | | Alger Mid Cap Growth Fund | |
| | | | | | | |
| INCOME: | | | | | | |
| Dividends (net of foreign withholding taxes*) | $ | 3,415,669 | | $ | 621,898 | |
| Interest | | 281,625 | | | 87,067 | |
| Income from securities lending | | 25 | | | — | |
| Total Income | | 3,697,319 | | | 708,965 | |
| | | | | | | |
EXPENSES: | | | | | | |
| Investment advisory fees — Note 3(a) | | 704,827 | | | 706,601 | |
| Distribution fees — Note 3(c) | | | | | | |
| Class A | | 144,677 | | | 179,273 | |
| Class B | | — | | | 50,971 | |
| Class C | | 118,105 | | | 20,855 | |
| Shareholder administrative fees — Note 3(f) | | 18,626 | | | 14,425 | |
| Administration fees — Note 3(b) | | 38,765 | | | 25,568 | |
| Transfer agent fees — Note 3(f) | | 55,505 | | | 58,395 | |
| Fund accounting fees | | 44,432 | | | 41,405 | |
| Registration fees | | 25,085 | | | 20,448 | |
| Professional fees | | 23,235 | | | 28,991 | |
| Custodian fees | | 10,262 | | | 9,774 | |
| Printing fees | | 8,666 | | | 12,169 | |
| Trustee fees — Note 3(g) | | 6,941 | | | 4,675 | |
| Interest expenses | | 4 | | | 263 | |
| Other expenses | | 13,764 | | | 12,535 | |
| Total Expenses | | 1,212,894 | | | 1,186,348 | |
| Less, expense reimbursements/waivers — Note 3(a) | | — | | | (34,392 | ) |
| Net Expenses | | 1,212,894 | | | 1,151,956 | |
| NET INVESTMENT INCOME (LOSS) | | 2,484,425 | | | (442,991 | ) |
| |
| REALIZED AND UNREALIZED GAIN (LOSS) ON INVESTMENTS AND FOREIGN CURRENCY: |
| Net realized gain (loss) on unaffiliated investments | | 812,287 | | | (11,319,401 | ) |
| Net realized (loss) on foreign currency transactions | | (4 | ) | | (3,290 | ) |
| Net change in unrealized appreciation on unaffiliated investments | | 21,459,422 | | | 21,783,569 | |
| Net change in unrealized (depreciation) on affiliated investments | | — | | | (23,959 | ) |
| Net change in unrealized appreciation on foreign currency | | — | | | 538 | |
| Net realized and unrealized gain on investments and foreign currency | | 22,271,705 | | | 10,437,457 | |
| NET INCREASE IN NET ASSETS RESULTING FROM OPERATIONS | $ | 24,756,130 | | $ | 9,994,466 | |
| * Foreign withholding taxes | $ | 29,109 | | $ | 7,734 | |
See Notes to Financial Statements.
- 85 -
THE ALGER FUNDS
Statements of Operations for the six months ended April 30, 2023 (Unaudited) (Continued)
| | Alger Mid Cap Focus
Fund | | Alger Weatherbie
Specialized Growth Fund | |
| | | | | | | |
| INCOME: | | | | | | |
| Dividends (net of foreign withholding taxes*) | $ | 779,594 | | $ | 976,442 | |
| Interest | | 155,679 | | | 435,957 | |
| Total Income | | 935,273 | | | 1,412,399 | |
| | | | | | | |
EXPENSES: | | | | | | |
| Investment advisory fees — Note 3(a) | | 1,230,375 | | | 2,847,007 | |
| Distribution fees — Note 3(c) | | | | | | |
| Class A | | 6,585 | | | 140,272 | |
| Class C | | 13,067 | | | 202,483 | |
| Class I | | 63,389 | | | 34,535 | |
| Shareholder administrative fees — Note 3(f) | | 19,905 | | | 40,111 | |
| Administration fees — Note 3(b) | | 54,034 | | | 96,658 | |
| Registration fees | | 54,498 | | | 47,408 | |
| Fund accounting fees | | 53,843 | | | 76,322 | |
| Printing fees | | 36,637 | | | 48,933 | |
| Transfer agent fees — Note 3(f) | | 34,825 | | | 126,624 | |
| Professional fees | | 31,627 | | | 43,660 | |
| Custodian fees | | 11,028 | | | 29,676 | |
| Trustee fees — Note 3(g) | | 10,234 | | | 18,026 | |
| Interest expenses | | 9,966 | | | — | |
| Other expenses | | 21,684 | | | 42,264 | |
| Total Expenses | | 1,651,697 | | | 3,793,979 | |
| Less, expense reimbursements/waivers — Note 3(a) | | (225 | ) | | (16,163 | ) |
| Net Expenses | | 1,651,472 | | | 3,777,816 | |
| NET INVESTMENT LOSS | | (716,199 | ) | | (2,365,417 | ) |
| |
| REALIZED AND UNREALIZED GAIN (LOSS) ON INVESTMENTS AND FOREIGN CURRENCY: |
| Net realized (loss) on unaffiliated investments | | (54,245,607 | ) | | (85,131,710 | ) |
| Net realized (loss) on foreign currency transactions | | (2,712 | ) | | (12 | ) |
| Net change in unrealized appreciation on unaffiliated investments | | 47,353,778 | | | 64,395,834 | |
| Net change in unrealized appreciation on foreign currency | | 59 | | | — | |
| Net realized and unrealized (loss) on investments and foreign currency | | (6,894,482 | ) | | (20,735,888 | ) |
| NET DECREASE IN NET ASSETS RESULTING FROM OPERATIONS | $ | (7,610,681 | ) | $ | (23,101,305 | ) |
| * Foreign withholding taxes | $ | 6,251 | | $ | 21,761 | |
See Notes to Financial Statements.
- 86 -
THE ALGER FUNDS
Statements of Operations for the six months ended April 30, 2023 (Unaudited) (Continued)
| | Alger Small Cap Growth Fund | | Alger Small Cap Focus Fund | |
| | | | | |
| INCOME: | | | | | | |
| Dividends (net of foreign withholding taxes*) | $ | 704,461 | | $ | 4,544,453 | |
| Interest | | 174,671 | | | 528,149 | |
| Total Income | | 879,132 | | | 5,072,602 | |
| | | | | | | |
EXPENSES: | | | | | | |
| Investment advisory fees — Note 3(a) | | 1,435,641 | | | 9,222,721 | |
| Distribution fees — Note 3(c) | | | | | | |
| Class A | | 166,348 | | | 250,132 | |
| Class B | | 13,518 | | | — | |
| Class C | | 93,724 | | | 474,385 | |
| Class I | | — | | | 142,919 | |
| Shareholder administrative fees — Note 3(f) | | 22,746 | | | 132,556 | |
| Administration fees — Note 3(b) | | 48,741 | | | 338,167 | |
| Transfer agent fees — Note 3(f) | | 81,207 | | | 554,680 | |
| Fund accounting fees | | 51,938 | | | 176,954 | |
| Registration fees | | 47,529 | | | 84,719 | |
| Professional fees | | 36,931 | | | 88,943 | |
| Custodian fees | | 13,379 | | | 42,927 | |
| Trustee fees — Note 3(g) | | 9,333 | | | 63,933 | |
| Printing fees | | 6,494 | | | 154,516 | |
| Interest expenses | | 954 | | | 32,915 | |
| Other expenses | | 20,817 | | | 147,975 | |
| Total Expenses | | 2,049,300 | | | 11,908,442 | |
| Less, expense reimbursements/waivers — Note 3(a) | | (13,547 | ) | | (30,498 | ) |
| Net Expenses | | 2,035,753 | | | 11,877,944 | |
| NET INVESTMENT LOSS | | (1,156,621 | ) | | (6,805,342 | ) |
| |
| REALIZED AND UNREALIZED GAIN (LOSS) ON INVESTMENTS AND FOREIGN CURRENCY: |
| Net realized (loss) on unaffiliated investments | | (48,684,785 | ) | | (239,280,805 | ) |
| Net realized (loss) on affiliated investments | | — | | | (28,881,463 | ) |
| Net realized (loss) on foreign currency transactions | | (18,758 | ) | | (1,504 | ) |
| Net change in unrealized appreciation on unaffiliated investments | | 42,237,730 | | | 124,820,378 | |
| Net change in unrealized appreciation (depreciation) on affiliated investments | | (32,167 | ) | | 47,917,221 | |
| Net realized and unrealized (loss) on investments and foreign currency | | (6,497,980 | ) | | (95,426,173 | ) |
| NET DECREASE IN NET ASSETS RESULTING FROM OPERATIONS | $ | (7,654,601 | ) | $ | (102,231,515 | ) |
| * Foreign withholding taxes | $ | 3,624 | | $ | 49,005 | |
| See Notes to Financial Statements. |
- 87 -
THE ALGER FUNDS
Statements of Operations for the six months ended April 30, 2023 (Unaudited) (Continued)
| | Alger International Focus Fund | | Alger Health Sciences Fund | |
| | | | | | | |
| INCOME: | | | | | | |
| Dividends (net of foreign withholding taxes*) | $ | 634,762 | | $ | 380,081 | |
| Interest | | 46,918 | | | 70,795 | |
| Total Income | | 681,680 | | | 450,876 | |
| | | | | | | |
EXPENSES: | | | | | | |
| Investment advisory fees — Note 3(a) | | 490,320 | | | 448,603 | |
| Distribution fees — Note 3(c) | | | | | | |
| Class A | | 132,819 | | | 107,883 | |
| Class B | | 68,599 | | | — | |
| Class C | | 7,292 | | | 36,749 | |
| Class I | | 1,429 | | | — | |
| Shareholder administrative fees — Note 3(f) | | 10,852 | | | 11,200 | |
| Administration fees — Note 3(b) | | 18,991 | | | 22,430 | |
| Transfer agent fees — Note 3(f) | | 47,433 | | | 50,163 | |
| Fund accounting fees | | 40,130 | | | 36,377 | |
| Professional fees | | 30,755 | | | 25,909 | |
| Registration fees | | 28,341 | | | 17,683 | |
| Custodian fees | | 20,812 | | | 7,315 | |
| Printing fees | | 8,028 | | | 15,128 | |
| Trustee fees — Note 3(g) | | 3,323 | | | 4,233 | |
| Interest expenses | | 150 | | | 821 | |
| Other expenses | | 8,348 | | | 12,809 | |
| Total Expenses | | 917,622 | | | 797,303 | |
| Less, expense reimbursements/waivers — Note 3(a) | | (57,238 | ) | | — | |
| Net Expenses | | 860,384 | | | 797,303 | |
| NET INVESTMENT LOSS | | (178,704 | ) | | (346,427 | ) |
| |
| REALIZED AND UNREALIZED GAIN (LOSS) ON INVESTMENTS AND FOREIGN CURRENCY: |
| Net realized gain (loss) on unaffiliated investments | | (758,110 | ) | | 13,077,347 | |
| Net realized (loss) on foreign currency transactions | | (21,125 | ) | | (42,744 | ) |
| Net change in unrealized appreciation (depreciation) on unaffiliated investments | | 15,045,724 | | | (12,682,563 | ) |
| Net change in unrealized appreciation on foreign currency | | 21,477 | | | 4,810 | |
| Net realized and unrealized gain on investments and foreign currency | | 14,287,966 | | | 356,850 | |
| NET INCREASE IN NET ASSETS RESULTING FROM OPERATIONS | $ | 14,109,262 | | $ | 10,423 | |
| * Foreign withholding taxes | $ | 64,806 | | $ | 3,529 | |
See Notes to Financial Statements.
- 88 -
THE ALGER FUNDS
Statements of Changes in Net Assets (Unaudited)
| | Alger Capital Appreciation Fund | |
| | | For the Six Months Ended
April 30, 2023 | | | For the Year Ended
October 31, 2022 | |
| | | | | | | |
Net investment loss | $ | (2,433,911 | ) | $ | (8,588,618 | ) |
| Net realized gain on investments and foreign currency | | 68,477,324 | | | 54,838,009 | |
| Net change in unrealized appreciation (depreciation) on investments and foreign currency | | 87,199,249 | | | (1,140,768,396 | ) |
| Net increase (decrease) in net assets resulting from operations | | 153,242,662 | | | (1,094,519,005 | ) |
| | | | | | | |
Dividends and distributions to shareholders: | | | | | | |
| Class A | | (30,288,660 | ) | | (284,398,857 | ) |
| Class C | | (5,650,846 | ) | | (53,540,254 | ) |
| Class Z | | (33,055,502 | ) | | (297,591,139 | ) |
| Total dividends and distributions to shareholders | | (68,995,008 | ) | | (635,530,250 | ) |
| |
| Increase (decrease) from shares of beneficial interest transactions: |
| Class A | | (39,784,544 | ) | | 13,515,228 | |
| Class C | | (14,933,419 | ) | | (4,551,506 | ) |
| Class Z | | (119,406,673 | ) | | 113,901,081 | |
| Net increase (decrease) from shares of beneficial interest transactions — Note 6 | | (174,124,636 | ) | | 122,864,803 | |
| Total decrease | | (89,876,982 | ) | | (1,607,184,452 | ) |
| | | | | | | |
Net Assets: | | | | | | |
| Beginning of period | | 1,815,537,466 | | | 3,422,721,918 | |
| END OF PERIOD | $ | 1,725,660,484 | | $ | 1,815,537,466 | |
| See Notes to Financial Statements. | | | | | | |
- 89 -
THE ALGER FUNDS
Statements of Changes in Net Assets (Unaudited) (Continued)
| | Alger 35 Fund | |
| | For the
Six Months Ended
April 30, 2023 | | For the
Year Ended
October 31, 2022 | |
| | | | | | | |
Net investment income (loss) | $ | (5,976 | ) | $ | 4,021 | |
| Net realized loss on investments and foreign currency | | (2,685,069 | ) | | (4,926,564 | ) |
| Net change in unrealized appreciation (depreciation) on investments and foreign currency | | 3,164,120 | | | (12,333,559 | ) |
| Net increase (decrease) in net assets resulting from operations | | 473,075 | | | (17,256,102 | ) |
| | | | | | | |
Dividends and distributions to shareholders: | | | | | | |
| Class Z | | (5,582 | ) | | (10,551,417 | ) |
| Total dividends and distributions to shareholders | | (5,582 | ) | | (10,551,417 | ) |
| |
| Increase (decrease) from shares of beneficial interest transactions: |
| Class Z | | (536,453 | ) | | 9,624,945 | |
| Net increase (decrease) from shares of beneficial interest transactions — Note 6 | | (536,453 | ) | | 9,624,945 | |
| Total decrease | | (68,960 | ) | | (18,182,574 | ) |
| | | | | | | |
Net Assets: | | | | | | |
| Beginning of period | | 25,976,398 | | | 44,158,972 | |
| END OF PERIOD | $ | 25,907,438 | | $ | 25,976,398 | |
| See Notes to Financial Statements. | | | | | | |
- 90 -
THE ALGER FUNDS
Statements of Changes in Net Assets (Unaudited) (Continued)
| | | Alger Growth & Income Fund | |
| | | For the Six Months Ended
April 30, 2023 | | | For the Year Ended
October 31, 2022 | |
| | | | | | | |
Net investment income | $ | 2,484,425 | | $ | 2,552,839 | |
| Net realized gain (loss) on investments and foreign currency | | 812,283 | | | (246,144 | ) |
| Net change in unrealized appreciation (depreciation) on investments and foreign currency | | 21,459,422 | | | (27,439,139 | ) |
| Net increase (decrease) in net assets resulting from operations | | 24,756,130 | | | (25,132,444 | ) |
| | | | | | | |
Dividends and distributions to shareholders: | | | | | | |
| Class A | | (819,760 | ) | | (4,709,966 | ) |
| Class C | | (85,053 | ) | | (687,923 | ) |
| Class Z | | (1,197,850 | ) | | (2,219,203 | ) |
| Total dividends and distributions to shareholders | | (2,102,663 | ) | | (7,617,092 | ) |
| |
| Increase (decrease) from shares of beneficial interest transactions: |
| Class A | | 5,907,738 | | | 19,951,923 | |
| Class C | | 1,605,164 | | | 6,180,541 | |
| Class Z | | 37,015,410 | | | 88,363,764 | |
| Net increase from shares of beneficial interest transactions — Note 6 | | 44,528,312 | | | 114,496,228 | |
| Total increase | | 67,181,779 | | | 81,746,692 | |
| | | | | | | |
Net Assets: | | | | | | |
| Beginning of period | | 244,401,482 | | | 162,654,790 | |
| END OF PERIOD | $ | 311,583,261 | | $ | 244,401,482 | |
| See Notes to Financial Statements. | | | | | | |
- 91 -
THE ALGER FUNDS
Statements of Changes in Net Assets (Unaudited) (Continued)
| | | Alger Mid Cap Growth Fund | |
| | | For the Six Months Ended
April 30, 2023 | | | For the Year Ended
October 31, 2022 | |
| | | | | | | |
Net investment loss | $ | (442,991 | ) | $ | (1,528,046 | ) |
| Net realized loss on investments and foreign currency | | (11,322,691 | ) | | (55,825,563 | ) |
| Net change in unrealized appreciation (depreciation) on investments and foreign currency | | 21,760,148 | | | (73,648,453 | ) |
| Net increase (decrease) in net assets resulting from operations | | 9,994,466 | | | (131,002,062 | ) |
| | | | | | | |
Dividends and distributions to shareholders: | | | | | | |
| Class A | | — | | | (67,153,291 | ) |
| Class B | | — | | | (6,406,978 | ) |
| Class C | | — | | | (2,944,693 | ) |
| Class Z | | — | | | (15,837,405 | ) |
| Total dividends and distributions to shareholders | | — | | | (92,342,367 | ) |
| |
| Increase (decrease) from shares of beneficial interest transactions: |
| Class A | | (7,479,975 | ) | | 52,482,791 | |
| Class B | | (403,064 | ) | | 5,161,326 | |
| Class C | | (751,758 | ) | | 2,481,849 | |
| Class Z | | (3,972,604 | ) | | 16,160,525 | |
| Net increase (decrease) from shares of beneficial interest transactions — Note 6 | | (12,607,401 | ) | | 76,286,491 | |
| Total decrease | | (2,612,935 | ) | | (147,057,938 | ) |
| | | | | | | |
Net Assets: | | | | | | |
| Beginning of period | | 192,102,653 | | | 339,160,591 | |
| END OF PERIOD | $ | 189,489,718 | | $ | 192,102,653 | |
| See Notes to Financial Statements. | | | | |
- 92 -
THE ALGER FUNDS
Statements of Changes in Net Assets (Unaudited) (Continued)
| | | Alger Mid Cap Focus Fund | |
| | | For the Six Months Ended
April 30, 2023 | | | For the Year Ended
October 31, 2022 | |
| | | | | | | |
Net investment loss | $ | (716,199 | ) | $ | (2,374,048 | ) |
| Net realized loss on investments and foreign currency | | (54,248,319 | ) | | (114,966,878 | ) |
| Net change in unrealized appreciation (depreciation) on investments and foreign currency | | 47,353,837 | | | (271,346,889 | ) |
| Net decrease in net assets resulting from operations | | (7,610,681 | ) | | (388,687,815 | ) |
| | | | | | | |
Dividends and distributions to shareholders: | | | | | | |
| Class A | | — | | | (237,662 | ) |
| Class C | | — | | | (228,199 | ) |
| Class I | | — | | | (12,826,323 | ) |
| Class Y | | — | | | (12,097 | ) |
| Class Z | | 162 | | | (70,824,262 | ) |
| Total dividends and distributions to shareholders | | 162 | | | (84,128,543 | ) |
| | | | | | | |
| Increase (decrease) from shares of beneficial interest transactions: |
| Class A | | 380,433 | | | 5,256,417 | |
| Class C | | 256,967 | | | 1,924,208 | |
| Class I | | (41,552,019 | ) | | (12,108,519 | ) |
| Class Y | | (228,756 | ) | | 422,581 | |
| Class Z | | (40,235,137 | ) | | (31,386,124 | ) |
| Net decrease from shares of beneficial interest transactions — Note 6 | | (81,378,512 | ) | | (35,891,437 | ) |
| Total decrease | | (88,989,031 | ) | | (508,707,795 | ) |
| | | | | | | |
Net Assets: | | | | | | |
| Beginning of period | | 436,433,348 | | | 945,141,143 | |
| END OF PERIOD | $ | 347,444,317 | | $ | 436,433,348 | |
| See Notes to Financial Statements. | | | | | | |
- 93 -
THE ALGER FUNDS
Statements of Changes in Net Assets (Unaudited) (Continued)
| | | Alger Weatherbie Specialized Growth Fund | |
| | | For the Six Months Ended
April 30, 2023 | | | For the Year Ended
October 31, 2022 | |
| | | | | | | |
Net investment loss | $ | (2,365,417 | ) | $ | (8,040,908 | ) |
| Net realized loss on investments and foreign currency | | (85,131,722 | ) | | (193,750,586 | ) |
| Net change in unrealized appreciation (depreciation) on investments and foreign currency | | 64,395,834 | | | (501,688,673 | ) |
| Net decrease in net assets resulting from operations | | (23,101,305 | ) | | (703,480,167 | ) |
| | | | | | | |
Dividends and distributions to shareholders: | | | | | | |
| Class A | | — | | | (45,296,523 | ) |
| Class C | | — | | | (27,504,338 | ) |
| Class I | | — | | | (12,964,988 | ) |
| Class Y | | — | | | (10,407,118 | ) |
| Class Z | | — | | | (205,452,142 | ) |
| Total dividends and distributions to shareholders | | — | | | (301,625,109 | ) |
| |
| Increase (decrease) from shares of beneficial interest transactions: |
| Class A | | (10,651,343 | ) | | 8,933,676 | |
| Class C | | (5,775,676 | ) | | 9,708,887 | |
| Class I | | (2,651,353 | ) | | (4,904,091 | ) |
| Class Y | | (1,355,660 | ) | | 26,302,379 | |
| Class Z | | (81,287,377 | ) | | (36,895,543 | ) |
| Net increase (decrease) from shares of beneficial interest transactions — Note 6 | | (101,721,409 | ) | | 3,145,308 | |
| Total decrease | | (124,822,714 | ) | | (1,001,959,968 | ) |
| | | | | | | |
Net Assets: | | | | | | |
| Beginning of period | | 776,717,884 | | | 1,778,677,852 | |
| END OF PERIOD | $ | 651,895,170 | | $ | 776,717,884 | |
| See Notes to Financial Statements. | | | | | | |
- 94 -
THE ALGER FUNDS
Statements of Changes in Net Assets (Unaudited) (Continued)
| | | Alger Small Cap Growth Fund | |
| | | For the Six Months Ended
April 30, 2023 | | | For the Year Ended
October 31, 2022 | |
| | | | | | | |
Net investment loss | $ | (1,156,621 | ) | $ | (4,114,910 | ) |
| Net realized loss on investments and foreign currency | | (48,703,543 | ) | | (24,248,827 | ) |
| Net change in unrealized appreciation (depreciation) on investments and foreign currency | | 42,205,563 | | | (242,568,455 | ) |
| Net decrease in net assets resulting from operations | | (7,654,601 | ) | | (270,932,192 | ) |
| | | | | | | |
| Dividends and distributions to shareholders: | | | | | | |
| Class A | | — | | | (21,314,734 | ) |
| Class B | | — | | | (673,335 | ) |
| Class C | | — | | | (4,854,023 | ) |
| Class Z | | — | | | (30,391,004 | ) |
| Total dividends and distributions to shareholders | | — | | | (57,233,096 | ) |
| | | | | | | |
| Increase (decrease) from shares of beneficial interest transactions: |
| Class A | | (9,026,266 | ) | | 1,762,230 | |
| Class B | | (431,283 | ) | | 32,505 | |
| Class C | | (2,581,876 | ) | | 2,204,699 | |
| Class Y | | 895,171 | | | 8,398,532 | |
| Class Z | | (33,085,434 | ) | | 13,599,272 | |
| Net increase (decrease) from shares of beneficial interest transactions — Note 6 | | (44,229,688 | ) | | 25,997,238 | |
| Total decrease | | (51,884,289 | ) | | (302,168,050 | ) |
| | | | | | | |
| Net Assets: | | | | | | |
| Beginning of period | | 389,256,253 | | | 691,424,303 | |
| END OF PERIOD | $ | 337,371,964 | | $ | 389,256,253 | |
| See Notes to Financial Statements. | | | | | | |
- 95 -
THE ALGER FUNDS
Statements of Changes in Net Assets (Unaudited) (Continued)
| | | Alger Small Cap Focus Fund | |
| | | For the Six Months Ended
April 30, 2023 | | | For the Year Ended
October 31, 2022 | |
| | | | | | | |
Net investment loss | $ | (6,805,342 | ) | $ | (24,812,632 | ) |
| Net realized loss on investments and foreign currency | | (268,163,772 | ) | | (562,947,494 | ) |
| Net change in unrealized appreciation (depreciation) on investments and foreign currency | | 172,737,599 | | | (2,516,845,916 | ) |
| Net decrease in net assets resulting from operations | | (102,231,515 | ) | | (3,104,606,042 | ) |
| | | | | | | |
Dividends and distributions to shareholders: | | | | | | |
| Class A | | — | | | (30,754,287 | ) |
| Class C | | — | | | (16,779,423 | ) |
| Class I | | — | | | (22,355,553 | ) |
| Class Y | | — | | | (21,468,256 | ) |
| Class Z | | — | | | (324,678,159 | ) |
| Total dividends and distributions to shareholders | | — | | | (416,035,678 | ) |
| Increase (decrease) from shares of beneficial interest transactions: |
| Class A | | (28,998,122 | ) | | (79,791,951 | ) |
| Class C | | (15,567,626 | ) | | (33,316,935 | ) |
| Class I | | (47,048,840 | ) | | (96,988,803 | ) |
| Class Y | | (44,998,029 | ) | | 58,351,945 | |
| Class Z | | (481,348,941 | ) | | (1,239,048,797 | ) |
| Net decrease from shares of beneficial interest transactions — Note 6 | | (617,961,558 | ) | | (1,390,794,541 | ) |
| Total decrease | | (720,193,073 | ) | | (4,911,436,261 | ) |
| | | | | | | |
Net Assets: | | | | | | |
| Beginning of period | | 2,929,443,041 | | | 7,840,879,302 | |
| END OF PERIOD | $ | 2,209,249,968 | | $ | 2,929,443,041 | |
| See Notes to Financial Statements. | | | | | | |
- 96 -
THE ALGER FUNDS
Statements of Changes in Net Assets (Unaudited) (Continued)
| | Alger International Focus Fund |
| | | For the Six Months Ended
April 30, 2023 | | | For the Year Ended
October 31, 2022 | |
| | | | | | | |
| Net investment loss | $ | (178,704 | ) | $ | (803,647 | ) |
| Net realized loss on investments and foreign currency | | (779,235 | ) | | (7,032,633 | ) |
| Net change in unrealized appreciation (depreciation) on investments and foreign currency | | 15,067,201 | | | (63,553,455 | ) |
| Net increase (decrease) in net assets resulting from operations | | 14,109,262 | | | (71,389,735 | ) |
| | | | | | | |
| Dividends and distributions to shareholders: | | | | | | |
| Class A | | — | | | (12,365,251 | ) |
| Class B | | — | | | (1,940,439 | ) |
| Class C | | — | | | (400,190 | ) |
| Class I | | — | | | (49,121 | ) |
| Class Z | | — | | | (2,237,931 | ) |
| Total dividends and distributions to shareholders | | — | | | (16,992,932 | ) |
| |
| Increase (decrease) from shares of beneficial interest transactions: |
| Class A | | (3,274,035 | ) | | 7,386,726 | |
| Class B | | (776,260 | ) | | 116,320 | |
| Class C | | (446,338 | ) | | (1,107,606 | ) |
| Class I | | (3,420 | ) | | 1,119,741 | |
| Class Z | | 397,920 | | | (2,079,971 | ) |
| Net increase (decrease) from shares of beneficial interest transactions — Note 6 | | (4,102,133 | ) | | 5,435,210 | |
| Total increase (decrease) | | 10,007,129 | | | (82,947,457 | ) |
| | | | | | | |
Net Assets: | | | | | | |
| Beginning of period | | 130,645,040 | | | 213,592,497 | |
| END OF PERIOD | $ | 140,652,169 | | $ | 130,645,040 | |
| See Notes to Financial Statements. | | | | | | |
- 97 -
THE ALGER FUNDS
Statements of Changes in Net Assets (Unaudited) (Continued)
| | | Alger Health Sciences Fund | |
| | | For the Six Months Ended
April 30, 2023 | | | For the Year Ended
October 31, 2022 | |
| | | | | | | |
Net investment loss | $ | (346,427 | ) | $ | (408,441 | ) |
| Net realized gain (loss) on investments and foreign currency | | 13,034,603 | | | (43,429,932 | ) |
| Net change in unrealized depreciation on investments and foreign currency | | (12,677,753 | ) | | (47,165,991 | ) |
| Net increase (decrease) in net assets resulting from operations | | 10,423 | | | (91,004,364 | ) |
| | | | | | | |
Dividends and distributions to shareholders: | | | | | | |
| Class A | | — | | | (28,166,595 | ) |
| Class C | | — | | | (3,704,768 | ) |
| Class Z | | — | | | (34,925,658 | ) |
| Total dividends and distributions to shareholders | | — | | | (66,797,021 | ) |
| |
| Increase (decrease) from shares of beneficial interest transactions: |
| Class A | | (7,273,438 | ) | | 7,680,846 | |
| Class C | | (642,446 | ) | | 956,992 | |
| Class Z | | (16,731,996 | ) | | (23,842,039 | ) |
| Net decrease from shares of beneficial interest transactions — Note 6 | | (24,647,880 | ) | | (15,204,201 | ) |
| Total decrease | | (24,637,457 | ) | | (173,005,586 | ) |
| | | | | | | |
Net Assets: | | | | | | |
| Beginning of period | | 177,815,146 | | | 350,820,732 | |
| END OF PERIOD | $ | 153,177,689 | | $ | 177,815,146 | |
| See Notes to Financial Statements. | | | | | | |
- 98 -
THE ALGER FUNDS
Financial Highlights for a share outstanding throughout the period (Unaudited)
| Alger Capital Appreciation Fund | Class A | |
| | | | Six months
ended
4/30/2023(i) | | | | Year ended
10/31/2022 | | | | Year ended
10/31/2021 | | | | Year ended
10/31/2020 | | | | Year ended
10/31/2019 | | | | Year ended
10/31/2018 | |
| Net asset value, beginning of period | | $ | 20.77 | | | $ | 39.48 | | | $ | 33.76 | | | $ | 27.12 | | | $ | 26.20 | | | $ | 25.86 | |
| INCOME FROM INVESTMENT OPERATIONS: | | | | | | | | | | | | | | | | | | | | | | | | |
| Net investment loss(ii) | | | (0.05 | ) | | | (0.13 | ) | | | (0.24 | ) | | | (0.12 | ) | | | (0.07 | ) | | | (0.06 | ) |
| Net realized and unrealized gain (loss) on investments | | | 1.91 | | | | (11.17 | ) | | | 11.11 | | | | 8.96 | | | | 3.53 | | | | 2.07 | |
| Total from investment operations | | | 1.86 | | | | (11.30 | ) | | | 10.87 | | | | 8.84 | | | | 3.46 | | | | 2.01 | |
| Distributions from net realized gains | | | (0.84 | ) | | | (7.41 | ) | | | (5.15 | ) | | | (2.20 | ) | | | (2.54 | ) | | | (1.67 | ) |
| Net asset value, end of period | | $ | 21.79 | | | $ | 20.77 | | | $ | 39.48 | | | $ | 33.76 | | | $ | 27.12 | | | $ | 26.20 | |
| Total return(iii) | | | 9.42 | % | | | (34.88 | )% | | | 35.41 | % | | | 34.79 | % | | | 15.29 | % | | | 8.15 | % |
| RATIOS/SUPPLEMENTAL DATA: | | | | | | | | | | | | | | | | | | |
| Net assets, end of period (000’s omitted) | | $ | 771,341 | | | $ | 774,249 | | | $ | 1,523,572 | | | $ | 1,320,073 | | | $ | 1,174,346 | | | $ | 1,257,811 | |
| Ratio of gross expenses to average net assets | | | 1.26 | % | | | 1.20 | % | | | 1.15 | % | | | 1.17 | % | | | 1.21 | % | | | 1.21 | % |
| Ratio of net expenses to average net assets | | | 1.26 | % | | | 1.20 | % | | | 1.15 | % | | | 1.17 | % | | | 1.21 | % | | | 1.21 | % |
| Ratio of net investment loss to average net assets | | | (0.47 | )% | | | (0.49 | )% | | | (0.67 | )% | | | (0.41 | )% | | | (0.27 | )% | | | (0.23 | )% |
| Portfolio turnover rate | | | 56.98 | % | | | 108.26 | % | | | 78.77 | % | | | 89.91 | % | | | 77.04 | % | | | 67.33 | % |
See Notes to Financial Statements.
| (i) | Ratios have been annualized; total return and portfolio turnover rate have not been annualized. |
| (ii) | Amount was computed based on average shares outstanding during the period. |
| (iii) | Does not reflect the effect of sales charges, if applicable. |
- 99 -
THE ALGER FUNDS
Financial Highlights for a share outstanding throughout the period (Unaudited)
| Alger Capital Appreciation Fund | Class C | |
| | | | Six months
ended
4/30/2023(i) | | | | Year ended
10/31/2022 | | | | Year ended
10/31/2021 | | | | Year ended
10/31/2020 | | | | Year ended
10/31/2019 | | | | Year ended
10/31/2018 | |
| Net asset value, beginning of period | | $ | 12.63 | | | $ | 27.13 | | | $ | 24.79 | | | $ | 20.60 | | | $ | 20.69 | | | $ | 20.91 | |
| INCOME FROM INVESTMENT OPERATIONS: | | | | | | | | | | | | | | | | | | | | | | | | |
| Net investment loss(ii) | | | (0.07 | ) | | | (0.20 | ) | | | (0.35 | ) | | | (0.25 | ) | | | (0.20 | ) | | | (0.20 | ) |
| Net realized and unrealized gain (loss) on investments | | | 1.11 | | | | (6.89 | ) | | | 7.84 | | | | 6.64 | | | | 2.65 | | | | 1.65 | |
| Total from investment operations | | | 1.04 | | | | (7.09 | ) | | | 7.49 | | | | 6.39 | | | | 2.45 | | | | 1.45 | |
| Distributions from net realized gains | | | (0.84 | ) | | | (7.41 | ) | | | (5.15 | ) | | | (2.20 | ) | | | (2.54 | ) | | | (1.67 | ) |
| Net asset value, end of period | | $ | 12.83 | | | $ | 12.63 | | | $ | 27.13 | | | $ | 24.79 | | | $ | 20.60 | | | $ | 20.69 | |
| Total return(iii) | | | 8.98 | % | | | (35.36 | )% | | | 34.43 | % | | | 33.82 | % | | | 14.44 | % | | | 7.35 | % |
| RATIOS/SUPPLEMENTAL DATA: | | | | | | | | | | | | | | | | | | | | | | | | |
| Net assets, end of period (000’s omitted) | | $ | 77,865 | | | $ | 91,815 | | | $ | 211,972 | | | $ | 204,909 | | | $ | 219,511 | | | $ | 243,523 | |
| Ratio of gross expenses to average net assets | | | 2.02 | % | | | 1.95 | % | | | 1.90 | % | | | 1.91 | % | | | 1.95 | % | | | 1.94 | % |
| Ratio of net expenses to average net assets | | | 2.02 | % | | | 1.95 | % | | | 1.90 | % | | | 1.91 | % | | | 1.95 | % | | | 1.94 | % |
| Ratio of net investment loss to average net assets | | | (1.22 | )% | | | (1.24 | )% | | | (1.42 | )% | | | (1.13 | )% | | | (1.01 | )% | | | (0.96 | )% |
| Portfolio turnover rate | | | 56.98 | % | | | 108.26 | % | | | 78.77 | % | | | 89.91 | % | | | 77.04 | % | | | 67.33 | % |
See Notes to Financial Statements.
| (i) | Ratios have been annualized; total return and portfolio turnover rate have not been annualized. |
| (ii) | Amount was computed based on average shares outstanding during the period. |
| (iii) | Does not reflect the effect of sales charges, if applicable. |
- 100 -
THE ALGER FUNDS
Financial Highlights for a share outstanding throughout the period (Unaudited)
| Alger Capital Appreciation Fund | Class Z | |
| | | | Six months
ended
4/30/2023(i) | | | | Year ended
10/31/2022 | | | | Year ended
10/31/2021 | | | | Year ended
10/31/2020 | | | | Year ended
10/31/2019 | | | | Year ended
10/31/2018 | |
| Net asset value, beginning of period | | $ | 22.16 | | | $ | 41.50 | | | $ | 35.15 | | | $ | 28.06 | | | $ | 26.94 | | | $ | 26.46 | |
| INCOME FROM INVESTMENT OPERATIONS: | | | | | | | | | | | | | | | | | | | | | | | | |
| Net investment income (loss)(ii) | | | (0.01 | ) | | | (0.04 | ) | | | (0.13 | ) | | | (0.03 | ) | | | 0.02 | | | | 0.03 | |
| Net realized and unrealized gain (loss) on investments | | | 2.05 | | | | (11.89 | ) | | | 11.63 | | | | 9.32 | | | | 3.64 | | | | 2.12 | |
| Total from investment operations | | | 2.04 | | | | (11.93 | ) | | | 11.50 | | | | 9.29 | | | | 3.66 | | | | 2.15 | |
| Distributions from net realized gains | | | (0.84 | ) | | | (7.41 | ) | | | (5.15 | ) | | | (2.20 | ) | | | (2.54 | ) | | | (1.67 | ) |
| Net asset value, end of period | | $ | 23.36 | | | $ | 22.16 | | | $ | 41.50 | | | $ | 35.15 | | | $ | 28.06 | | | $ | 26.94 | |
| Total return(iii) | | | 9.65 | % | | | (34.67 | )% | | | 35.85 | % | | | 35.26 | % | | | 15.69 | % | | | 8.51 | % |
| RATIOS/SUPPLEMENTAL DATA: | | | | | | | | | | | | | | | | | | | | | | | | |
| Net assets, end of period (000’s omitted) | | $ | 876,455 | | | $ | 949,473 | | | $ | 1,687,179 | | | $ | 1,823,041 | | | $ | 1,409,374 | | | $ | 1,240,605 | |
| Ratio of gross expenses to average net assets | | | 0.92 | % | | | 0.86 | % | | | 0.83 | % | | | 0.84 | % | | | 0.87 | % | | | 0.87 | % |
| Ratio of expense reimbursements to average net assets | | | (0.07 | )% | | | (0.01 | )% | | | — | | | | — | | | | — | | | | — | |
| Ratio of net expenses to average net assets | | | 0.85 | % | | | 0.85 | % | | | 0.83 | % | | | 0.84 | % | | | 0.87 | % | | | 0.87 | % |
| Ratio of net investment income (loss) to average net assets | | | (0.05 | )% | | | (0.14 | )% | | | (0.34 | )% | | | (0.09 | )% | | | 0.06 | % | | | 0.10 | % |
| Portfolio turnover rate | | | 56.98 | % | | | 108.26 | % | | | 78.77 | % | | | 89.91 | % | | | 77.04 | % | | | 67.33 | % |
See Notes to Financial Statements.
| (i) | Ratios have been annualized; total return and portfolio turnover rate have not been annualized. |
| (ii) | Amount was computed based on average shares outstanding during the period. |
| (iii) | Does not reflect the effect of sales charges, if applicable. |
- 101 -
THE ALGER FUNDS
Financial Highlights for a share outstanding throughout the period (Unaudited)
| Alger 35 Fund | | Class Z | |
| | | Six months
ended
4/30/2023(i) | | | Year ended
10/31/2022 | | | Year ended
10/31/2021(vii) | | | Year ended
10/31/2020 | | | Year ended
10/31/2019 | | | From 3/29/2018 (commencement of operations) to 10/31/2018(ii) | |
| Net asset value, beginning of period | | $ | 9.55 | | | $ | 21.33 | | | $ | 17.41 | | | $ | 11.61 | | | $ | 10.38 | | | $ | 10.00 | |
| INCOME FROM INVESTMENT OPERATIONS: | | | | | | | | | | | | | | | | | | | | | | | | |
| Net investment income (loss)(iii) | | | — | (iv) | | | — | (iv) | | | (0.01 | ) | | | (0.05 | ) | | | 0.03 | | | | 0.01 | |
| Net realized and unrealized gain (loss) on investments | | | 0.18 | | | | (6.68 | ) | | | 6.95 | | | | 5.87 | | | | 1.31 | | | | 0.37 | |
| Total from investment operations | | | 0.18 | | | | (6.68 | ) | | | 6.94 | | | | 5.82 | | | | 1.34 | | | | 0.38 | |
| Dividends from net investment income | | | — | (v) | | | — | | | | — | (v) | | | (0.02 | ) | | | (0.04 | ) | | | — | |
| Distributions from net realized gains | | | — | | | | (5.10 | ) | | | (3.02 | ) | | | — | | | | (0.07 | ) | | | — | |
| Net asset value, end of period | | $ | 9.73 | | | $ | 9.55 | | | $ | 21.33 | | | $ | 17.41 | | | $ | 11.61 | | | $ | 10.38 | |
| Total return(vi) | | | 1.91 | % | | | (39.09 | )% | | | 44.27 | % | | | 50.22 | % | | | 13.19 | % | | | 3.80 | % |
| RATIOS/SUPPLEMENTAL DATA: | | | | | | | | | | | | | | | | | | | | | | | | |
| Net assets, end of period (000’s omitted) | | $ | 25,907 | | | $ | 25,976 | | | $ | 44,159 | | | $ | 14,128 | | | $ | 9,094 | | | $ | 7,782 | |
| Ratio of gross expenses to average net assets | | | 0.93 | % | | | 0.94 | % | | | 0.92 | % | | | 2.02 | % | | | 2.37 | % | | | 2.46 | % |
| Ratio of expense reimbursements to average net assets | | | (0.37 | )% | | | (0.39 | )% | | | (0.52 | )% | | | (1.12 | )% | | | (1.97 | )% | | | (2.06 | )% |
| Ratio of net expenses to average net assets | | | 0.56 | % | | | 0.55 | % | | | 0.40 | % | | | 0.90 | % | | | 0.40 | % | | | 0.40 | % |
| Ratio of net investment income (loss) to average net assets | | | (0.05 | )% | | | 0.01 | % | | | (0.07 | )% | | | 0.36 | % | | | 0.30 | % | | | 0.23 | % |
| Portfolio turnover rate | | | 158.70 | % | | | 202.40 | % | | | 136.61 | % | | | 121.74 | % | | | 115.25 | % | | | 31.20 | % |
See Notes to Financial Statements.
| (i) | Ratios have been annualized; total return and portfolio turnover rate have not been annualized. |
| (ii) | Ratios have been annualized; total return has not been annualized; portfolio turnover is for the seven months then ended. |
| (iii) | Amount was computed based on average shares outstanding during the period. |
| (iv) | Amount was less than $0.005 per share. |
| (v) | Amount was more than $(0.001) per share. |
| (vi) | Does not reflect the effect of sales charges, if applicable. |
| (vii) | Class P Shares were reclassified as Class Z Shares on May 7, 2021 and after the close of business on October 29, 2021, Class P-2 Shares were converted to Class Z Shares. |
- 102 -
THE ALGER FUNDS
Financial Highlights for a share outstanding throughout the period (Unaudited)
| Alger Growth & Income Fund | | Class A | |
| | | | Six months
ended
4/30/2023(i) | | | | Year ended
10/31/2022 | | | | Year ended
10/31/2021 | | | | Year ended
10/31/2020 | | | | Year ended
10/31/2019 | | | | Year ended
10/31/2018 | |
| Net asset value, beginning of period | | $ | 52.35 | | | $ | 61.76 | | | $ | 43.88 | | | $ | 43.55 | | | $ | 40.77 | | | $ | 39.68 | |
| INCOME FROM INVESTMENT OPERATIONS: | | | | | | | | | | | | | | | | | | | | | | | | |
| Net investment income(ii) | | | 0.45 | | | | 0.71 | | | | 0.63 | | | | 0.69 | | | | 0.70 | | | | 0.65 | |
| Net realized and unrealized gain (loss) on investments | | | 4.34 | | | | (7.49 | ) | | | 18.47 | | | | 1.88 | | | | 4.54 | | | | 1.64 | |
| Total from investment operations | | | 4.79 | | | | (6.78 | ) | | | 19.10 | | | | 2.57 | | | | 5.24 | | | | 2.29 | |
| Dividends from net investment income | | | (0.38 | ) | | | (0.56 | ) | | | (0.55 | ) | | | (0.66 | ) | | | (0.61 | ) | | | (0.57 | ) |
| Distributions from net realized gains | | | — | | | | (2.07 | ) | | | (0.67 | ) | | | (1.58 | ) | | | (1.85 | ) | | | (0.63 | ) |
| Net asset value, end of period | | $ | 56.76 | | | $ | 52.35 | | | $ | 61.76 | | | $ | 43.88 | | | $ | 43.55 | | | $ | 40.77 | |
| Total return(iii) | | | 9.20 | % | | | (11.53 | )% | | | 44.12 | % | | | 5.98 | % | | | 13.94 | % | | | 5.78 | % |
| RATIOS/SUPPLEMENTAL DATA: | | | | | | | | | | | | | | | | | | | | | | | | |
| Net assets, end of period (000’s omitted) | | $ | 123,374 | | | $ | 108,039 | | | $ | 106,439 | | | $ | 74,251 | | | $ | 74,924 | | | $ | 70,859 | |
| Ratio of gross expenses to average net assets | | | 0.96 | % | | | 0.97 | % | | | 0.98 | % | | | 1.06 | % | | | 1.07 | % | | | 1.06 | % |
| Ratio of net expenses to average net assets | | | 0.96 | % | | | 0.97 | % | | | 0.98 | % | | | 1.06 | % | | | 1.07 | % | | | 1.06 | % |
| Ratio of net investment income to average net assets | | | 1.67 | % | | | 1.24 | % | | | 1.15 | % | | | 1.60 | % | | | 1.72 | % | | | 1.59 | % |
| Portfolio turnover rate | | | 2.06 | % | | | 1.96 | % | | | 8.40 | % | | | 9.29 | % | | | 7.30 | % | | | 11.05 | % |
See Notes to Financial Statements.
| (i) | Ratios have been annualized; total return and portfolio turnover rate have not been annualized. |
| (ii) | Amount was computed based on average shares outstanding during the period. |
| (iii) | Does not reflect the effect of sales charges, if applicable. |
- 103 -
THE ALGER FUNDS
Financial Highlights for a share outstanding throughout the period (Unaudited)
| Alger Growth & Income Fund | | Class C | |
| | | | Six months
ended
4/30/2023(i) | | | | Year ended
10/31/2022 | | | | Year ended
10/31/2021 | | | | Year ended
10/31/2020 | | | | Year ended
10/31/2019 | | | | Year ended
10/31/2018 | |
| Net asset value, beginning of period | | $ | 51.46 | | | $ | 60.77 | | | $ | 43.22 | | | $ | 42.93 | | | $ | 40.20 | | | $ | 39.14 | |
| INCOME FROM INVESTMENT OPERATIONS: | | | | | | | | | | | | | | | | | | | | | | | | |
| Net investment income(ii) | | | 0.24 | | | | 0.28 | | | | 0.21 | | | | 0.36 | | | | 0.39 | | | | 0.34 | |
| Net realized and unrealized gain (loss) on investments | | | 4.28 | | | | (7.38 | ) | | | 18.18 | | | | 1.85 | | | | 4.49 | | | | 1.60 | |
| Total from investment operations | | | 4.52 | | | | (7.10 | ) | | | 18.39 | | | | 2.21 | | | | 4.88 | | | | 1.94 | |
| Dividends from net investment income | | | (0.19 | ) | | | (0.14 | ) | | | (0.17 | ) | | | (0.34 | ) | | | (0.30 | ) | | | (0.25 | ) |
| Distributions from net realized gains | | | — | | | | (2.07 | ) | | | (0.67 | ) | | | (1.58 | ) | | | (1.85 | ) | | | (0.63 | ) |
| Net asset value, end of period | | $ | 55.79 | | | $ | 51.46 | | | $ | 60.77 | | | $ | 43.22 | | | $ | 42.93 | | | $ | 40.20 | |
| Total return(iii) | | | 8.79 | % | | | (12.18 | )% | | | 43.01 | % | | | 5.19 | % | | | 13.12 | % | | | 4.96 | % |
| RATIOS/SUPPLEMENTAL DATA: | | | | | | | | | | | | | | | | | | | | | | | | |
| Net assets, end of period (000’s omitted) | | $ | 24,614 | | | $ | 21,111 | | | $ | 18,194 | | | $ | 13,127 | | | $ | 14,946 | | | $ | 16,074 | |
| Ratio of gross expenses to average net assets | | | 1.71 | % | | | 1.73 | % | | | 1.73 | % | | | 1.81 | % | | | 1.82 | % | | | 1.82 | % |
| Ratio of net expenses to average net assets | | | 1.71 | % | | | 1.73 | % | | | 1.73 | % | | | 1.81 | % | | | 1.82 | % | | | 1.82 | % |
| Ratio of net investment income to average net assets | | | 0.92 | % | | | 0.49 | % | | | 0.40 | % | | | 0.86 | % | | | 0.97 | % | | | 0.84 | % |
| Portfolio turnover rate | | | 2.06 | % | | | 1.96 | % | | | 8.40 | % | | | 9.29 | % | | | 7.30 | % | | | 11.05 | % |
See Notes to Financial Statements.
| (i) | Ratios have been annualized; total return and portfolio turnover rate have not been annualized. |
| (ii) | Amount was computed based on average shares outstanding during the period. |
| (iii) | Does not reflect the effect of sales charges, if applicable. |
- 104 -
THE ALGER FUNDS
Financial Highlights for a share outstanding throughout the period (Unaudited)
| Alger Growth & Income Fund | | Class Z | |
| | | | Six months
ended
4/30/2023(i) | | | | Year ended
10/31/2022 | | | | Year ended
10/31/2021 | | | | Year ended
10/31/2020 | | | | Year ended
10/31/2019 | | | | Year ended
10/31/2018 | |
| Net asset value, beginning of period | | $ | 52.42 | | | $ | 61.84 | | | $ | 43.94 | | | $ | 43.60 | | | $ | 40.81 | | | $ | 39.71 | |
| INCOME FROM INVESTMENT OPERATIONS: | | | | | | | | | | | | | | | | | | | | | | | | |
| Net investment income(ii) | | | 0.54 | | | | 0.90 | | | | 0.80 | | | | 0.86 | | | | 0.85 | | | | 0.80 | |
| Net realized and unrealized gain (loss) on investments | | | 4.34 | | | | (7.51 | ) | | | 18.49 | | | | 1.88 | | | | 4.56 | | | | 1.64 | |
| Total from investment operations | | | 4.88 | | | | (6.61 | ) | | | 19.29 | | | | 2.74 | | | | 5.41 | | | | 2.44 | |
| Dividends from net investment income | | | (0.47 | ) | | | (0.74 | ) | | | (0.72 | ) | | | (0.82 | ) | | | (0.77 | ) | | | (0.71 | ) |
| Distributions from net realized gains | | | — | | | | (2.07 | ) | | | (0.67 | ) | | | (1.58 | ) | | | (1.85 | ) | | | (0.63 | ) |
| Net asset value, end of period | | $ | 56.83 | | | $ | 52.42 | | | $ | 61.84 | | | $ | 43.94 | | | $ | 43.60 | | | $ | 40.81 | |
| Total return(iii) | | | 9.37 | % | | | (11.25 | )% | | | 44.54 | % | | | 6.39 | % | | | 14.39 | % | | | 6.16 | % |
| RATIOS/SUPPLEMENTAL DATA: | | | | | | | | | | | | | | | | | | | | | | | | |
| Net assets, end of period (000’s omitted) | | $ | 163,596 | | | $ | 115,251 | | | $ | 38,021 | | | $ | 21,672 | | | $ | 26,979 | | | $ | 24,604 | |
| Ratio of gross expenses to average net assets | | | 0.64 | % | | | 0.65 | % | | | 0.66 | % | | | 0.73 | % | | | 0.76 | % | | | 0.76 | % |
| Ratio of expense reimbursements to average net assets | | | — | | | | — | | | | — | (iv) | | | (0.04 | )% | | | (0.07 | )% | | | (0.05 | )% |
| Ratio of net expenses to average net assets | | | 0.64 | % | | | 0.65 | % | | | 0.66 | % | | | 0.69 | % | | | 0.69 | % | | | 0.71 | % |
| Ratio of net investment income to average net assets | | | 1.98 | % | | | 1.62 | % | | | 1.45 | % | | | 2.00 | % | | | 2.10 | % | | | 1.96 | % |
| Portfolio turnover rate | | | 2.06 | % | | | 1.96 | % | | | 8.40 | % | | | 9.29 | % | | | 7.30 | % | | | 11.05 | % |
See Notes to Financial Statements.
| (i) | Ratios have been annualized; total return and portfolio turnover rate have not been annualized. |
| (ii) | Amount was computed based on average shares outstanding during the period. |
| (iii) | Does not reflect the effect of sales charges, if applicable. |
| (iv) | Amount was less than 0.005%. |
- 105 -
THE ALGER FUNDS
Financial Highlights for a share outstanding throughout the period (Unaudited)
| Alger Mid Cap Growth Fund | | Class A | |
| | | | Six months
ended
4/30/2023(i) | | | | Year ended
10/31/2022 | | | | Year ended
10/31/2021 | | | | Year ended
10/31/2020 | | | | Year ended
10/31/2019 | | | | Year ended
10/31/2018 | |
| Net asset value, beginning of period | | $ | 10.82 | | | $ | 25.20 | | | $ | 19.29 | | | $ | 14.81 | | | $ | 14.13 | | | $ | 13.47 | |
| INCOME FROM INVESTMENT OPERATIONS: | | | | | | | | | | | | | | | | | | | | | | | | |
| Net investment income (loss)(ii) | | | (0.03 | ) | | | (0.09 | ) | | | 0.48 | | | | (0.12 | ) | | | (0.09 | ) | | | (0.11 | ) |
| Net realized and unrealized gain (loss) on investments | | | 0.62 | | | | (7.71 | ) | | | 7.58 | | | | 5.80 | | | | 1.48 | | | | 0.88 | |
| Total from investment operations | | | 0.59 | | | | (7.80 | ) | | | 8.06 | | | | 5.68 | | | | 1.39 | | | | 0.77 | |
| Dividends from net investment income | | | — | | | | (0.45 | ) | | | — | | | | — | | | | — | | | | — | |
| Distributions from net realized gains | | | — | | | | (6.13 | ) | | | (2.15 | ) | | | (1.20 | ) | | | (0.71 | ) | | | (0.11 | ) |
| Net asset value, end of period | | $ | 11.41 | | | $ | 10.82 | | | $ | 25.20 | | | $ | 19.29 | | | $ | 14.81 | | | $ | 14.13 | |
| Total return(iii) | | | 5.45 | % | | | (39.13 | )% | | | 44.05 | %(iv) | | | 41.34 | % | | | 10.95 | % | | | 5.78 | % |
| RATIOS/SUPPLEMENTAL DATA: | | | | | | | | | | | | | | | | | | | | | | | | |
| Net assets, end of period (000’s omitted) | | $ | 146,971 | | | $ | 146,648 | | | $ | 259,895 | | | $ | 187,552 | | | $ | 139,110 | | | $ | 138,370 | |
| Ratio of gross expenses to average net assets | | | 1.27 | % | | | 1.24 | % | | | 1.21 | % | | | 1.30 | % | | | 1.30 | % | | | 1.30 | % |
| Ratio of net expenses to average net assets | | | 1.27 | % | | | 1.24 | % | | | 1.21 | % | | | 1.30 | % | | | 1.30 | % | | | 1.30 | % |
| Ratio of net investment income (loss) to average net assets | | | (0.50 | )% | | | (0.68 | )% | | | 2.15 | % | | | (0.76 | )% | | | (0.65 | )% | | | (0.77 | )% |
| Portfolio turnover rate | | | 48.19 | % | | | 204.79 | % | | | 170.96 | % | | | 181.73 | % | | | 182.97 | % | | | 125.34 | % |
See Notes to Financial Statements.
| (i) | Ratios have been annualized; total return and portfolio turnover rate have not been annualized. |
| (ii) | Amount was computed based on average shares outstanding during the period. |
| (iii) | Does not reflect the effect of sales charges, if applicable. |
| (iv) | Pursuant to the U.S. Securities and Exchange Commission’s Rules on Fair Fund and Disgorgement Plans, the Alger Mid Cap Growth Fund received a Fair Fund distribution of $9,346,397, which contributed approximately 3.89% to its annual return. |
- 106 -
THE ALGER FUNDS
Financial Highlights for a share outstanding throughout the period (Unaudited)
| Alger Mid Cap Growth Fund | | Class B | |
| | | | Six months
ended
4/30/2023(i) | | | | Year ended
10/31/2022 | | | | Year ended
10/31/2021 | | | | Year ended
10/31/2020 | | | | Year ended
10/31/2019 | | | | Year ended
10/31/2018 | |
| Net asset value, beginning of period | | $ | 6.78 | | | $ | 18.60 | | | $ | 14.70 | | | $ | 11.55 | | | $ | 11.22 | | | $ | 10.80 | |
| INCOME FROM INVESTMENT OPERATIONS: | | | | | | | | | | | | | | | | | | | | | | | | |
| Net investment income (loss)(ii) | | | (0.02 | ) | | | (0.06 | ) | | | 0.35 | | | | (0.08 | ) | | | (0.10 | ) | | | (0.17 | ) |
| Net realized and unrealized gain (loss) on investments | | | 0.39 | | | | (5.15 | ) | | | 5.70 | | | | 4.43 | | | | 1.14 | | | | 0.70 | |
| Total from investment operations | | | 0.37 | | | | (5.21 | ) | | | 6.05 | | | | 4.35 | | | | 1.04 | | | | 0.53 | |
| Dividends from net investment income | | | — | | | | (0.48 | ) | | | — | | | | — | | | | — | | | | — | |
| Distributions from net realized gains | | | — | | | | (6.13 | ) | | | (2.15 | ) | | | (1.20 | ) | | | (0.71 | ) | | | (0.11 | ) |
| Net asset value, end of period | | $ | 7.15 | | | $ | 6.78 | | | $ | 18.60 | | | $ | 14.70 | | | $ | 11.55 | | | $ | 11.22 | |
| Total return(iii) | | | 5.46 | % | | | (39.16 | )% | | | 44.24 | %(iv) | | | 41.41 | % | | | 10.66 | % | | | 4.98 | % |
| RATIOS/SUPPLEMENTAL DATA: | | | | | | | | | | | | | | | | | | | | | | | | |
| Net assets, end of period (000’s omitted) | | $ | 10,547 | | | $ | 10,404 | | | $ | 18,276 | | | $ | 15,411 | | | $ | 13,772 | | | $ | 15,361 | |
| Ratio of gross expenses to average net assets | | | 1.97 | % | | | 1.95 | % | | | 1.93 | % | | | 2.03 | % | | | 2.04 | % | | | 2.05 | % |
| Ratio of expense reimbursements to average net assets | | | (0.67 | )% | | | (0.67 | )% | | | (0.76 | )% | | | (0.82 | )% | | | (0.47 | )% | | | — | |
| Ratio of net expenses to average net assets | | | 1.30 | % | | | 1.28 | % | | | 1.17 | % | | | 1.21 | % | | | 1.57 | % | | | 2.05 | % |
| Ratio of net investment income (loss) to average net assets | | | (0.54 | )% | | | (0.71 | )% | | | 2.08 | % | | | (0.66 | )% | | | (0.92 | )% | | | (1.50 | )% |
| Portfolio turnover rate | | | 48.19 | % | | | 204.79 | % | | | 170.96 | % | | | 181.73 | % | | | 182.97 | % | | | 125.34 | % |
See Notes to Financial Statements.
| (i) | Ratios have been annualized; total return and portfolio turnover rate have not been annualized. |
| (ii) | Amount was computed based on average shares outstanding during the period. |
| (iii) | Does not reflect the effect of sales charges, if applicable. |
| (iv) | Pursuant to the U.S. Securities and Exchange Commission’s Rules on Fair Fund and Disgorgement Plans, the Alger Mid Cap Growth Fund received a Fair Fund distribution of $9,346,397, which contributed approximately 3.89% to its annual return. |
- 107 -
THE ALGER FUNDS
Financial Highlights for a share outstanding throughout the period (Unaudited)
| Alger Mid Cap Growth Fund | | Class C | |
| | | | Six months
ended
4/30/2023(i) | | | | Year ended
10/31/2022 | | | | Year ended
10/31/2021 | | | | Year ended
10/31/2020 | | | | Year ended
10/31/2019 | | | | Year ended
10/31/2018 | |
| Net asset value, beginning of period | | $ | 6.34 | | | $ | 17.82 | | | $ | 14.26 | | | $ | 11.33 | | | $ | 11.08 | | | $ | 10.67 | |
| INCOME FROM INVESTMENT OPERATIONS: | | | | | | | | | | | | | | | | | | | | | | | | |
| Net investment income (loss)(ii) | | | (0.04 | ) | | | (0.12 | ) | | | 0.23 | | | | (0.18 | ) | | | (0.16 | ) | | | (0.18 | ) |
| Net realized and unrealized gain (loss) on investments | | | 0.36 | | | | (4.88 | ) | | | 5.48 | | | | 4.31 | | | | 1.12 | | | | 0.70 | |
| Total from investment operations | | | 0.32 | | | | (5.00 | ) | | | 5.71 | | | | 4.13 | | | | 0.96 | | | | 0.52 | |
| Dividends from net investment income | | | — | | | | (0.35 | ) | | | — | | | | — | | | | — | | | | — | |
| Distributions from net realized gains | | | — | | | | (6.13 | ) | | | (2.15 | ) | | | (1.20 | ) | | | (0.71 | ) | | | (0.11 | ) |
| Net asset value, end of period | | $ | 6.66 | | | $ | 6.34 | | | $ | 17.82 | | | $ | 14.26 | | | $ | 11.33 | | | $ | 11.08 | |
| Total return(iii) | | | 5.05 | % | | | (39.60 | )% | | | 42.91 | %(iv) | | | 40.26 | % | | | 10.03 | % | | | 4.94 | % |
| RATIOS/SUPPLEMENTAL DATA: | | | | | | | | | | | | | | | | | | | | | | | | |
| Net assets, end of period (000’s omitted) | | $ | 4,011 | | | $ | 4,562 | | | $ | 8,244 | | | $ | 5,691 | | | $ | 6,014 | | | $ | 7,647 | |
| Ratio of gross expenses to average net assets | | | 2.11 | % | | | 2.05 | % | | | 2.00 | % | | | 2.10 | % | | | 2.14 | % | | | 2.11 | % |
| Ratio of net expenses to average net assets | | | 2.11 | % | | | 2.05 | % | | | 2.00 | % | | | 2.10 | % | | | 2.14 | % | | | 2.11 | % |
| Ratio of net investment income (loss) to average net assets | | | (1.35 | )% | | | (1.49 | )% | | | 1.41 | % | | | (1.52 | )% | | | (1.48 | )% | | | (1.55 | )% |
| Portfolio turnover rate | | | 48.19 | % | | | 204.79 | % | | | 170.96 | % | | | 181.73 | % | | | 182.97 | % | | | 125.34 | % |
See Notes to Financial Statements.
| (i) | Ratios have been annualized; total return and portfolio turnover rate have not been annualized. |
| (ii) | Amount was computed based on average shares outstanding during the period. |
| (iii) | Does not reflect the effect of sales charges, if applicable. |
| (iv) | Pursuant to the U.S. Securities and Exchange Commission’s Rules on Fair Fund and Disgorgement Plans, the Alger Mid Cap Growth Fund received a Fair Fund distribution of $9,346,397, which contributed approximately 3.89% to its annual return. |
- 108 -
THE ALGER FUNDS
Financial Highlights for a share outstanding throughout the period (Unaudited)
| Alger Mid Cap Growth Fund | | Class Z | |
| | | | Six months
ended
4/30/2023(i) | | | | Year ended
10/31/2022 | | | | Year ended
10/31/2021 | | | | Year ended
10/31/2020 | | | | Year ended
10/31/2019 | | | | Year ended
10/31/2018 | |
| Net asset value, beginning of period | | $ | 11.16 | | | $ | 25.78 | | | $ | 19.63 | | | $ | 15.01 | | | $ | 14.27 | | | $ | 13.56 | |
| INCOME FROM INVESTMENT OPERATIONS: | | | | | | | | | | | | | | | | | | | | | | | | |
| Net investment income (loss)(ii) | | | (0.01 | ) | | | (0.05 | ) | | | 0.63 | | | | (0.07 | ) | | | (0.06 | ) | | | (0.07 | ) |
| Net realized and unrealized gain (loss) on investments | | | 0.64 | | | | (7.92 | ) | | | 7.67 | | | | 5.89 | | | | 1.51 | | | | 0.89 | |
| Total from investment operations | | | 0.63 | | | | (7.97 | ) | | | 8.30 | | | | 5.82 | | | | 1.45 | | | | 0.82 | |
| Dividends from net investment income | | | — | | | | (0.52 | ) | | | — | | | | — | | | | — | | | | — | |
| Distributions from net realized gains | | | — | | | | (6.13 | ) | | | (2.15 | ) | | | (1.20 | ) | | | (0.71 | ) | | | (0.11 | ) |
| Net asset value, end of period | | $ | 11.79 | | | $ | 11.16 | | | $ | 25.78 | | | $ | 19.63 | | | $ | 15.01 | | | $ | 14.27 | |
| Total return(iii) | | | 5.65 | % | | | (38.95 | )% | | | 44.55 | %(iv) | | | 41.75 | % | | | 11.27 | % | | | 6.03 | % |
| RATIOS/SUPPLEMENTAL DATA: | | | | | | | | | | | | | | | | | | | | | | | | |
| Net assets, end of period (000’s omitted) | | $ | 27,961 | | | $ | 30,488 | | | $ | 52,746 | | | $ | 26,804 | | | $ | 17,558 | | | $ | 14,230 | |
| Ratio of gross expenses to average net assets | | | 0.95 | % | | | 0.93 | % | | | 0.92 | % | | | 0.99 | % | | | 1.03 | % | | | 1.03 | % |
| Ratio of net expenses to average net assets | | | 0.95 | % | | | 0.93 | % | | | 0.92 | % | | | 0.99 | % | | | 1.03 | % | | | 1.03 | % |
| Ratio of net investment income (loss) to average net assets | | | (0.18 | )% | | | (0.37 | )% | | | 2.75 | % | | | (0.46 | )% | | | (0.38 | )% | | | (0.49 | )% |
| Portfolio turnover rate | | | 48.19 | % | | | 204.79 | % | | | 170.96 | % | | | 181.73 | % | | | 182.97 | % | | | 125.34 | % |
See Notes to Financial Statements.
| (i) | Ratios have been annualized; total return and portfolio turnover rate have not been annualized. |
| (ii) | Amount was computed based on average shares outstanding during the period. |
| (iii) | Does not reflect the effect of sales charges, if applicable. |
| (iv) | Pursuant to the U.S. Securities and Exchange Commission’s Rules on Fair Fund and Disgorgement Plans, the Alger Mid Cap Growth Fund received a Fair Fund distribution of $9,346,397, which contributed approximately 3.89% to its annual return. |
- 109 -
THE ALGER FUNDS
Financial Highlights for a share outstanding throughout the period (Unaudited)
| Alger Mid Cap Focus Fund | | Class A | |
| | | | Six months
ended
4/30/2023(i) | | | | Year ended
10/31/2022 | | | | From 7/29/2021
(commencement
of operations)
to 10/31/2021(ii) | |
| Net asset value, beginning of period | | $ | 12.14 | | | $ | 23.43 | | | $ | 20.67 | |
| INCOME FROM INVESTMENT OPERATIONS: | | | | | | | | | | | | |
| Net investment loss(iii) | | | (0.04 | ) | | | (0.09 | ) | | | (0.04 | ) |
| Net realized and unrealized gain (loss) on investments | | | (0.20 | ) | | | (9.14 | ) | | | 2.80 | |
| Total from investment operations | | | (0.24 | ) | | | (9.23 | ) | | | 2.76 | |
| Distributions from net realized gains | | | — | | | | (2.06 | ) | | | — | |
| Net asset value, end of period | | $ | 11.90 | | | $ | 12.14 | | | $ | 23.43 | |
| Total return(iv) | | | (1.98 | )% | | | (42.27 | )% | | | 13.35 | % |
| RATIOS/SUPPLEMENTAL DATA: | | | | | | | | | | | | |
| Net assets, end of period (000’s omitted) | | $ | 5,388 | | | $ | 5,083 | | | $ | 1,669 | |
| Ratio of gross expenses to average net assets | | | 1.10 | % | | | 1.05 | % | | | 0.96 | % |
| Ratio of net expenses to average net assets | | | 1.10 | % | | | 1.05 | % | | | 0.96 | % |
| Ratio of net investment loss to average net assets | | | (0.64 | )% | | | (0.66 | )% | | | (0.72 | )% |
| Portfolio turnover rate | | | 78.62 | % | | | 267.86 | % | | | 250.31 | % |
See Notes to Financial Statements.
| (i) | Ratios have been annualized; total return and portfolio turnover rate have not been annualized. |
| (ii) | Ratios have been annualized; total return has not been annualized; portfolio turnover is for the twelve months then ended. |
| (iii) | Amount was computed based on average shares outstanding during the period. |
| (iv) | Does not reflect the effect of sales charges, if applicable. |
- 110 -
THE ALGER FUNDS
Financial Highlights for a share outstanding throughout the period (Unaudited)
| Alger Mid Cap Focus Fund | | Class C |
| | | | Six months
ended
4/30/2023(i) | | | | Year ended
10/31/2022 | | | | From 7/29/2021
(commencement
of operations)
to 10/31/2021(ii) | |
| Net asset value, beginning of period | | $ | 12.01 | | | $ | 23.38 | | | $ | 20.67 | |
| INCOME FROM INVESTMENT OPERATIONS: | | | | | | | | | | | | |
| Net investment loss(iii) | | | (0.08 | ) | | | (0.21 | ) | | | (0.09 | ) |
| Net realized and unrealized gain (loss) on investments | | | (0.19 | ) | | | (9.10 | ) | | | 2.80 | |
| Total from investment operations | | | (0.27 | ) | | | (9.31 | ) | | | 2.71 | |
| Distributions from net realized gains | | | — | | | | (2.06 | ) | | | — | |
| Net asset value, end of period | | $ | 11.74 | | | $ | 12.01 | | | $ | 23.38 | |
| Total return(iv) | | | (2.25 | )% | | | (42.78 | )% | | | 13.16 | % |
| RATIOS/SUPPLEMENTAL DATA: | | | | | | | | | | | | |
| Net assets, end of period (000’s omitted) | | $ | 2,638 | | | $ | 2,433 | | | $ | 2,317 | |
| Ratio of gross expenses to average net assets | | | 1.91 | % | | | 1.85 | % | | | 1.76 | % |
| Ratio of net expenses to average net assets | | | 1.91 | % | | | 1.85 | % | | | 1.76 | % |
| Ratio of net investment loss to average net assets | | | (1.45 | )% | | | (1.46 | )% | | | (1.50 | )% |
| Portfolio turnover rate | | | 78.62 | % | | | 267.86 | % | | | 250.31 | % |
See Notes to Financial Statements.
| (i) | Ratios have been annualized; total return and portfolio turnover rate have not been annualized. |
| (ii) | Ratios have been annualized; total return has not been annualized; portfolio turnover is for the twelve months then ended. |
| (iii) | Amount was computed based on average shares outstanding during the period. |
| (iv) | Does not reflect the effect of sales charges, if applicable. |
- 111 -
THE ALGER FUNDS
Financial Highlights for a share outstanding throughout the period (Unaudited)
| Alger Mid Cap Focus Fund | | Class I | |
| | | | Six months
ended
4/30/2023(i) | | | | Year ended
10/31/2022 | | | | Year ended
10/31/2021 | | | | Year ended
10/31/2020 | | | | From 6/14/2019 (commencement of operations) to 10/31/2019(ii) | |
| Net asset value, beginning of period | | $ | 12.14 | | | $ | 23.43 | | | $ | 15.10 | | | $ | 9.70 | | | $ | 10.00 | |
| INCOME FROM INVESTMENT OPERATIONS: | | | | | | | | | | | | | | | | | | | | |
| Net investment loss(iii) | | | (0.03 | ) | | | (0.10 | ) | | | (0.17 | ) | | | (0.14 | ) | | | (0.04 | ) |
| Net realized and unrealized gain (loss) on investments | | | (0.20 | ) | | | (9.13 | ) | | | 8.76 | | | | 5.54 | | | | (0.26 | ) |
| Total from investment operations | | | (0.23 | ) | | | (9.23 | ) | | | 8.59 | | | | 5.40 | | | | (0.30 | ) |
| Distributions from net realized gains | | | — | | | | (2.06 | ) | | | (0.26 | ) | | | — | | | | — | |
| Net asset value, end of period | | $ | 11.91 | | | $ | 12.14 | | | $ | 23.43 | | | $ | 15.10 | | | $ | 9.70 | |
| Total return(iv) | | | (1.89 | )% | | | (42.28 | )% | | | 57.36 | % | | | 55.35 | % | | | (3.00 | )% |
| RATIOS/SUPPLEMENTAL DATA: | | | | | | | | | | | | | | | | | | | | |
| Net assets, end of period (000’s omitted) | | $ | 19,838 | | | $ | 62,499 | | | $ | 145,539 | | | $ | 67,796 | | | $ | 2,023 | |
| Ratio of gross expenses to average net assets | | | 1.07 | % | | | 1.01 | % | | | 0.95 | % | | | 1.14 | % | | | 1.91 | % |
| Ratio of expense reimbursements to average net assets | | | — | | | | — | | | | — | | | | (0.03 | )% | | | (0.71 | )% |
| Ratio of net expenses to average net assets | | | 1.07 | % | | | 1.01 | % | | | 0.95 | % | | | 1.11 | % | | | 1.20 | % |
| Ratio of net investment loss to average net assets | | | (0.54 | )% | | | (0.63 | )% | | | (0.85 | )% | | | (1.04 | )% | | | (0.97 | )% |
| Portfolio turnover rate | | | 78.62 | % | | | 267.86 | % | | | 250.31 | % | | | 123.43 | % | | | 65.50 | % |
See Notes to Financial Statements.
| (i) | Ratios have been annualized; total return and portfolio turnover rate have not been annualized. |
| (ii) | Ratios have been annualized; total return has not been annualized; portfolio turnover is for the five months then ended. |
| (iii) | Amount was computed based on average shares outstanding during the period. |
| (iv) | Does not reflect the effect of sales charges, if applicable. |
- 112 -
THE ALGER FUNDS
Financial Highlights for a share outstanding throughout the period (Unaudited)
| Alger Mid Cap Focus Fund | | Class Y | |
| | | | Six months
ended
4/30/2023(i) | | | | Year ended
10/31/2022 | | | | From 2/26/2021
(commencement
of operations) to
10/31/2021(ii) | |
| Net asset value, beginning of period | | $ | 12.26 | | | $ | 23.56 | | | $ | 20.65 | |
| INCOME FROM INVESTMENT OPERATIONS: | | | | | | | | | | | | |
| Net investment loss(iii) | | | (0.01 | ) | | | (0.06 | ) | | | (0.08 | ) |
| Net realized and unrealized gain (loss) on investments | | | (0.20 | ) | | | (9.18 | ) | | | 2.99 | |
| Total from investment operations | | | (0.21 | ) | | | (9.24 | ) | | | 2.91 | |
| Distributions from net realized gains | | | — | | | | (2.06 | ) | | | — | |
| Net asset value, end of period | | $ | 12.05 | | | $ | 12.26 | | | $ | 23.56 | |
| Total return(iv) | | | (1.71 | )% | | | (42.07 | )% | | | 14.09 | % |
| RATIOS/SUPPLEMENTAL DATA: | | | | | | | | | | | | |
| Net assets, end of period (000’s omitted) | | $ | 208 | | | $ | 443 | | | $ | 137 | |
| Ratio of gross expenses to average net assets | | | 0.81 | % | | | 0.74 | % | | | 0.72 | % |
| Ratio of expense reimbursements to average net assets | | | (0.11 | )% | | | (0.05 | )% | | | (0.02 | )% |
| Ratio of net expenses to average net assets | | | 0.70 | % | | | 0.69 | % | | | 0.70 | % |
| Ratio of net investment loss to average net assets | | | (0.20 | )% | | | (0.44 | )% | | | (0.57 | )% |
| Portfolio turnover rate | | | 78.62 | % | | | 267.86 | % | | | 250.31 | % |
See Notes to Financial Statements.
| (i) | Ratios have been annualized; total return and portfolio turnover rate have not been annualized. |
| (ii) | Ratios have been annualized; total return has not been annualized; portfolio turnover is for the twelve months then ended. |
| (iii) | Amount was computed based on average shares outstanding during the period. |
| (iv) | Does not reflect the effect of sales charges, if applicable. |
- 113 -
THE ALGER FUNDS
Financial Highlights for a share outstanding throughout the period (Unaudited)
| Alger Mid Cap Focus Fund | | Class Z | |
| | | | Six months
ended
4/30/2023(i) | | | | Year ended
10/31/2022 | | | | Year ended
10/31/2021 | | | | Year ended
10/31/2020 | | | | From 6/14/2019 (commencement of operations) to 10/31/2019(ii) | |
| Net asset value, beginning of period | | $ | 12.26 | | | $ | 23.57 | | | $ | 15.15 | | | $ | 9.71 | | | $ | 10.00 | |
| INCOME FROM INVESTMENT OPERATIONS: | | | | | | | | | | | | | | | | | | | | |
| Net investment loss(iii) | | | (0.02 | ) | | | (0.05 | ) | | | (0.12 | ) | | | (0.10 | ) | | | (0.03 | ) |
| Net realized and unrealized gain (loss) on investments | | | (0.19 | ) | | | (9.20 | ) | | | 8.80 | | | | 5.54 | | | | (0.26 | ) |
| Total from investment operations | | | (0.21 | ) | | | (9.25 | ) | | | 8.68 | | | | 5.44 | | | | (0.29 | ) |
| Distributions from net realized gains | | | — | | | | (2.06 | ) | | | (0.26 | ) | | | — | | | | — | |
| Net asset value, end of period | | $ | 12.05 | | | $ | 12.26 | | | $ | 23.57 | | | $ | 15.15 | | | $ | 9.71 | |
| Total return(iv) | | | (1.71 | )% | | | (42.10 | )% | | | 57.77 | % | | | 55.70 | % | | | (2.80 | )% |
| RATIOS/SUPPLEMENTAL DATA: | | | | | | | | | | | | | | | | | | | | |
| Net assets, end of period (000’s omitted) | | $ | 319,373 | | | $ | 365,976 | | | $ | 795,479 | | | $ | 307,532 | | | $ | 28,230 | |
| Ratio of gross expenses to average net assets | | | 0.79 | % | | | 0.71 | % | | | 0.68 | % | | | 0.91 | % | | | 1.86 | % |
| Ratio of expense reimbursements to average net assets | | | — | | | | — | | | | — | | | | (0.05 | )% | | | (0.87 | )% |
| Ratio of net expenses to average net assets | | | 0.79 | % | | | 0.71 | % | | | 0.68 | % | | | 0.86 | % | | | 0.99 | % |
| Ratio of net investment income (loss) to average net assets | | | (0.33 | )% | | | (0.33 | )% | | | (0.58 | )% | | | (0.77 | )% | | | (0.74 | )% |
| Portfolio turnover rate | | | 78.62 | % | | | 267.86 | % | | | 250.31 | % | | | 123.43 | % | | | 65.50 | % |
See Notes to Financial Statements.
| (i) | Ratios have been annualized; total return and portfolio turnover rate have not been annualized. |
| (ii) | Ratios have been annualized; total return has not been annualized; portfolio turnover is for the five months then ended. |
| (iii) | Amount was computed based on average shares outstanding during the period. |
| (iv) | Does not reflect the effect of sales charges, if applicable. |
- 114 -
THE ALGER FUNDS
Financial Highlights for a share outstanding throughout the period (Unaudited)
| | | | |
Alger Weatherbie Specialized Growth Fund | | Class A | |
| | | | Six months
ended
4/30/2023(i) | | | | Year ended
10/31/2022 | | | | Year ended
10/31/2021 | | | | Year ended
10/31/2020 | | | | Year ended
10/31/2019 | | | | Year ended
10/31/2018 | |
| Net asset value, beginning of period | | $ | 11.57 | | | $ | 24.96 | | | $ | 17.46 | | | $ | 13.30 | | | $ | 13.08 | | | $ | 12.87 | |
| INCOME FROM INVESTMENT OPERATIONS: | | | | | | | | | | | | | | | | | | | | | | | | |
| Net investment loss(ii) | | | (0.05 | ) | | | (0.14 | ) | | | (0.23 | ) | | | (0.16 | ) | | | (0.14 | ) | | | (0.15 | ) |
| Net realized and unrealized gain (loss) on investments | | | (0.32 | ) | | | (8.91 | ) | | | 8.70 | | | | 4.88 | | | | 1.39 | | | | 1.90 | |
| Total from investment operations | | | (0.37 | ) | | | (9.05 | ) | | | 8.47 | | | | 4.72 | | | | 1.25 | | | | 1.75 | |
| Distributions from net realized gains | | | — | | | | (4.34 | ) | | | (0.97 | ) | | | (0.56 | ) | | | (1.03 | ) | | | (1.54 | ) |
| Net asset value, end of period | | $ | 11.20 | | | $ | 11.57 | | | $ | 24.96 | | | $ | 17.46 | | | $ | 13.30 | | | $ | 13.08 | |
| Total return(iii) | | | (3.20 | )% | | | (42.03 | )% | | | 49.80 | % | | | 36.57 | % | | | 11.57 | % | | | 15.02 | % |
| RATIOS/SUPPLEMENTAL DATA: | | | | | | | | | | | | | | | | | | | | | | | | |
| Net assets, end of period (000’s omitted) | | $ | 105,468 | | | $ | 119,741 | | | $ | 259,394 | | | $ | 174,709 | | | $ | 140,368 | | | $ | 111,456 | |
| Ratio of gross expenses to average net assets | | | 1.30 | % | | | 1.25 | % | | | 1.20 | % | | | 1.27 | % | | | 1.31 | % | | | 1.33 | % |
| Ratio of net expenses to average net assets | | | 1.30 | % | | | 1.25 | % | | | 1.20 | % | | | 1.27 | % | | | 1.31 | % | | | 1.33 | % |
| Ratio of net investment loss to average net assets | | | (0.90 | )% | | | (0.95 | )% | | | (1.03 | )% | | | (1.09 | )% | | | (1.08 | )% | | | (1.16 | )% |
| Portfolio turnover rate | | | 20.02 | % | | | 55.97 | % | | | 61.53 | % | | | 66.84 | % | | | 64.83 | % | | | 42.56 | % |
See Notes to Financial Statements.
| (i) | Ratios have been annualized; total return and portfolio turnover rate have not been annualized. |
| (ii) | Amount was computed based on average shares outstanding during the period. |
| (iii) | Does not reflect the effect of sales charges, if applicable. |
- 115 -
THE ALGER FUNDS
Financial Highlights for a share outstanding throughout the period (Unaudited)
| | | | | |
Alger Weatherbie Specialized Growth Fund | | | Class C | |
| | | | Six months
ended
4/30/2023(i) | | | | Year ended
10/31/2022 | | | | Year ended
10/31/2021 | | | | Year ended
10/31/2020 | | | | Year ended
10/31/2019 | | | | Year ended
10/31/2018 | |
| Net asset value, beginning of period | | $ | 6.29 | | | $ | 15.93 | | | $ | 11.52 | | | $ | 9.01 | | | $ | 9.30 | | | $ | 9.65 | |
| INCOME FROM INVESTMENT OPERATIONS: | | | | | | | | | | | | | | | | | | | | | | | | |
| Net investment loss(ii) | | | (0.05 | ) | | | (0.14 | ) | | | (0.25 | ) | | | (0.19 | ) | | | (0.17 | ) | | | (0.18 | ) |
| Net realized and unrealized gain (loss) on investments | | | (0.18 | ) | | | (5.16 | ) | | | 5.63 | | | | 3.26 | | | | 0.91 | | | | 1.37 | |
| Total from investment operations | | | (0.23 | ) | | | (5.30 | ) | | | 5.38 | | | | 3.07 | | | | 0.74 | | | | 1.19 | |
| Distributions from net realized gains | | | — | | | | (4.34 | ) | | | (0.97 | ) | | | (0.56 | ) | | | (1.03 | ) | | | (1.54 | ) |
| Net asset value, end of period | | $ | 6.06 | | | $ | 6.29 | | | $ | 15.93 | | | $ | 11.52 | | | $ | 9.01 | | | $ | 9.30 | |
| Total return(iii) | | | (3.66 | )% | | | (42.46 | )% | | | 48.68 | % | | | 35.62 | % | | | 10.70 | % | | | 14.11 | % |
| RATIOS/SUPPLEMENTAL DATA: | | | | | | | | | | | | | | | | | | | | | | | | |
| Net assets, end of period (000’s omitted) | | $ | 37,581 | | | $ | 44,815 | | | $ | 103,331 | | | $ | 64,497 | | | $ | 44,908 | | | $ | 36,325 | |
| Ratio of gross expenses to average net assets | | | 2.05 | % | | | 2.02 | % | | | 1.95 | % | | | 2.03 | % | | | 2.05 | % | | | 2.08 | % |
| Ratio of net expenses to average net assets | | | 2.05 | % | | | 2.02 | % | | | 1.95 | % | | | 2.03 | % | | | 2.05 | % | | | 2.08 | % |
| Ratio of net investment loss to average net assets | | | (1.65 | )% | | | (1.72 | )% | | | (1.79 | )% | | | (1.85 | )% | | | (1.82 | )% | | | (1.91 | )% |
| Portfolio turnover rate | | | 20.02 | % | | | 55.97 | % | | | 61.53 | % | | | 66.84 | % | | | 64.83 | % | | | 42.56 | % |
See Notes to Financial Statements.
| (i) | Ratios have been annualized; total return and portfolio turnover rate have not been annualized. |
| (ii) | Amount was computed based on average shares outstanding during the period. |
| (iii) | Does not reflect the effect of sales charges, if applicable. |
- 116 -
THE ALGER FUNDS
Financial Highlights for a share outstanding throughout the period (Unaudited)
| | | | |
Alger Weatherbie Specialized Growth Fund | | Class I | |
| | | | Six months
ended
4/30/2023(i) | | | | Year ended
10/31/2022 | | | | Year ended
10/31/2021 | | | | Year ended
10/31/2020 | | | | Year ended
10/31/2019 | | | | Year ended
10/31/2018 | |
| Net asset value, beginning of period | | $ | 11.99 | | | $ | 25.67 | | | $ | 17.94 | | | $ | 13.64 | | | $ | 13.38 | | | $ | 13.14 | |
| INCOME FROM INVESTMENT OPERATIONS: | | | | | | | | | | | | | | | | | | | | | | | | |
| Net investment loss(ii) | | | (0.05 | ) | | | (0.14 | ) | | | (0.23 | ) | | | (0.16 | ) | | | (0.14 | ) | | | (0.16 | ) |
| Net realized and unrealized gain (loss) on investments | | | (0.33 | ) | | | (9.20 | ) | | | 8.93 | | | | 5.02 | | | | 1.43 | | | | 1.94 | |
| Total from investment operations | | | (0.38 | ) | | | (9.34 | ) | | | 8.70 | | | | 4.86 | | | | 1.29 | | | | 1.78 | |
| Distributions from net realized gains | | | — | | | | (4.34 | ) | | | (0.97 | ) | | | (0.56 | ) | | | (1.03 | ) | | | (1.54 | ) |
| Net asset value, end of period | | $ | 11.61 | | | $ | 11.99 | | | $ | 25.67 | | | $ | 17.94 | | | $ | 13.64 | | | $ | 13.38 | |
| Total return(iii) | | | (3.17 | )% | | | (42.02 | )% | | | 49.81 | % | | | 36.69 | % | | | 11.61 | % | | | 14.94 | % |
| RATIOS/SUPPLEMENTAL DATA: | | | | | | | | | | | | | | | | | | | | | | | | |
| Net assets, end of period (000’s omitted) | | $ | 26,067 | | | $ | 29,612 | | | $ | 77,214 | | | $ | 66,294 | | | $ | 58,615 | | | $ | 35,669 | |
| Ratio of gross expenses to average net assets | | | 1.27 | % | | | 1.25 | % | | | 1.19 | % | | | 1.24 | % | | | 1.26 | % | | | 1.35 | % |
| Ratio of net expenses to average net assets | | | 1.27 | % | | | 1.25 | % | | | 1.19 | % | | | 1.24 | % | | | 1.26 | % | | | 1.35 | % |
| Ratio of net investment loss to average net assets | | | (0.87 | )% | | | (0.95 | )% | | | (1.02 | )% | | | (1.07 | )% | | | (1.03 | )% | | | (1.18 | )% |
| Portfolio turnover rate | | | 20.02 | % | | | 55.97 | % | | | 61.53 | % | | | 66.84 | % | | | 64.83 | % | | | 42.56 | % |
See Notes to Financial Statements.
| (i) | Ratios have been annualized; total return and portfolio turnover rate have not been annualized. |
| (ii) | Amount was computed based on average shares outstanding during the period. |
| (iii) | Does not reflect the effect of sales charges, if applicable. |
- 117 -
THE ALGER FUNDS
Financial Highlights for a share outstanding throughout the period (Unaudited)
| | | | |
Alger Weatherbie Specialized Growth Fund | | Class Y | |
| | | | Six months
ended
4/30/2023(i) | | | | Year ended
10/31/2022 | | | | Year ended
10/31/2021 | | | | Year ended
10/31/2020 | | | | Year ended
10/31/2019 | | | | Year ended
10/31/2018 | |
| Net asset value, beginning of period | | $ | 12.29 | | | $ | 26.12 | | | $ | 18.17 | | | $ | 13.77 | | | $ | 13.44 | | | $ | 13.14 | |
| INCOME FROM INVESTMENT OPERATIONS: | | | | | | | | | | | | | | | | | | | | | | | | |
| Net investment loss(ii) | | | (0.03 | ) | | | (0.08 | ) | | | (0.16 | ) | | | (0.11 | ) | | | (0.09 | ) | | | (0.10 | ) |
| Net realized and unrealized gain (loss) on investments | | | (0.34 | ) | | | (9.41 | ) | | | 9.08 | | | | 5.07 | | | | 1.45 | | | | 1.94 | |
| Total from investment operations | | | (0.37 | ) | | | (9.49 | ) | | | 8.92 | | | | 4.96 | | | | 1.36 | | | | 1.84 | |
| Distributions from net realized gains | | | — | | | | (4.34 | ) | | | (0.97 | ) | | | (0.56 | ) | | | (1.03 | ) | | | (1.54 | ) |
| Net asset value, end of period | | $ | 11.92 | | | $ | 12.29 | | | $ | 26.12 | | | $ | 18.17 | | | $ | 13.77 | | | $ | 13.44 | |
| Total return(iii) | | | (2.93 | )% | | | (41.81 | )% | | | 50.35 | % | | | 37.08 | % | | | 12.12 | % | | | 15.45 | % |
| RATIOS/SUPPLEMENTAL DATA: | | | | | | | | | | | | | | | | | | | | | | | | |
| Net assets, end of period (000’s omitted) | | $ | 44,658 | | | $ | 47,379 | | | $ | 61,163 | | | $ | 32,702 | | | $ | 12,903 | | | $ | 3,832 | |
| Ratio of gross expenses to average net assets | | | 0.95 | % | | | 0.91 | % | | | 0.89 | % | | | 0.94 | % | | | 0.97 | % | | | 1.05 | % |
| Ratio of expense reimbursements to average net assets | | | (0.07 | )% | | | (0.04 | )% | | | (0.02 | )% | | | (0.07 | )% | | | (0.10 | )% | | | (0.18 | )% |
| Ratio of net expenses to average net assets | | | 0.88 | % | | | 0.87 | % | | | 0.87 | % | | | 0.87 | % | | | 0.87 | % | | | 0.87 | % |
| Ratio of net investment loss to average net assets | | | (0.48 | )% | | | (0.55 | )% | | | (0.70 | )% | | | (0.69 | )% | | | (0.64 | )% | | | (0.67 | )% |
| Portfolio turnover rate | | | 20.02 | % | | | 55.97 | % | | | 61.53 | % | | | 66.84 | % | | | 64.83 | % | | | 42.56 | % |
See Notes to Financial Statements.
| (i) | Ratios have been annualized; total return and portfolio turnover rate have not been annualized. |
| (ii) | Amount was computed based on average shares outstanding during the period. |
| (iii) | Does not reflect the effect of sales charges, if applicable. |
- 118 -
THE ALGER FUNDS
Financial Highlights for a share outstanding throughout the period (Unaudited)
| | | | |
Alger Weatherbie Specialized Growth Fund | | Class Z | |
| | | | Six months
ended
4/30/2023(i) | | | | Year ended
10/31/2022 | | | | Year ended
10/31/2021 | | | | Year ended
10/31/2020 | | | | Year ended
10/31/2019 | | | | Year ended
10/31/2018 | |
| Net asset value, beginning of period | | $ | 12.73 | | | $ | 26.87 | | | $ | 18.68 | | | $ | 14.15 | | | $ | 13.80 | | | $ | 13.46 | |
| INCOME FROM INVESTMENT OPERATIONS: | | | | | | | | | | | | | | | | | | | | | | | | |
| Net investment loss(ii) | | | (0.03 | ) | | | (0.10 | ) | | | (0.17 | ) | | | (0.12 | ) | | | (0.10 | ) | | | (0.12 | ) |
| Net realized and unrealized gain (loss) on investments | | | (0.36 | ) | | | (9.70 | ) | | | 9.33 | | | | 5.21 | | | | 1.48 | | | | 2.00 | |
| Total from investment operations | | | (0.39 | ) | | | (9.80 | ) | | | 9.16 | | | | 5.09 | | | | 1.38 | | | | 1.88 | |
| Distributions from net realized gains | | | — | | | | (4.34 | ) | | | (0.97 | ) | | | (0.56 | ) | | | (1.03 | ) | | | (1.54 | ) |
| Net asset value, end of period | | $ | 12.34 | | | $ | 12.73 | | | $ | 26.87 | | | $ | 18.68 | | | $ | 14.15 | | | $ | 13.80 | |
| Total return(iii) | | | (3.06 | )% | | | (41.82 | )% | | | 50.32 | % | | | 37.00 | % | | | 11.94 | % | | | 15.37 | % |
| RATIOS/SUPPLEMENTAL DATA: | | | | | | | | | | | | | | | | | | | | | | | | |
| Net assets, end of period (000’s omitted) | | $ | 438,122 | | | $ | 535,172 | | | $ | 1,277,576 | | | $ | 620,005 | | | $ | 284,393 | | | $ | 147,665 | |
| Ratio of gross expenses to average net assets | | | 0.95 | % | | | 0.91 | % | | | 0.88 | % | | | 0.94 | % | | | 0.97 | % | | | 1.00 | % |
| Ratio of expense reimbursements to average net assets | | | — | | | | — | | | | — | | | | — | | | | — | | | | (0.01 | )% |
| Ratio of net expenses to average net assets | | | 0.95 | % | | | 0.91 | % | | | 0.88 | % | | | 0.94 | % | | | 0.97 | % | | | 0.99 | % |
| Ratio of net investment loss to average net assets | | | (0.54 | )% | | | (0.61 | )% | | | (0.72 | )% | | | (0.76 | )% | | | (0.73 | )% | | | (0.82 | )% |
| Portfolio turnover rate | | | 20.02 | % | | | 55.97 | % | | | 61.53 | % | | | 66.84 | % | | | 64.83 | % | | | 42.56 | % |
See Notes to Financial Statements.
| (i) | Ratios have been annualized; total return and portfolio turnover rate have not been annualized. |
| (ii) | Amount was computed based on average shares outstanding during the period. |
| (iii) | Does not reflect the effect of sales charges, if applicable. |
- 119 -
THE ALGER FUNDS
Financial Highlights for a share outstanding throughout the period (Unaudited)
| | | | |
| Alger Small Cap Growth Fund | | Class A | |
| | | | Six months
ended
4/30/2023(i) | | | | Year ended
10/31/2022 | | | | Year ended
10/31/2021 | | | | Year ended
10/31/2020 | | | | Year ended
10/31/2019 | | | | Year ended
10/31/2018 | |
| Net asset value, beginning of period | | $ | 8.83 | | | $ | 16.21 | | | $ | 12.59 | | | $ | 9.34 | | | $ | 9.54 | | | $ | 8.40 | |
| INCOME FROM INVESTMENT OPERATIONS: | | | | | | | | | | | | | | | | | | | | | | | | |
| Net investment loss(ii) | | | (0.03 | ) | | | (0.11 | ) | | | (0.07 | ) | | | (0.12 | ) | | | (0.11 | ) | | | (0.10 | ) |
| Net realized and unrealized gain (loss) on investments | | | (0.17 | ) | | | (5.93 | ) | | | 3.76 | | | | 3.91 | | | | 0.85 | | | | 1.34 | |
| Total from investment operations | | | (0.20 | ) | | | (6.04 | ) | | | 3.69 | | | | 3.79 | | | | 0.74 | | | | 1.24 | |
| Distributions from net realized gains | | | — | | | | (1.34 | ) | | | (0.07 | ) | | | (0.54 | ) | | | (0.94 | ) | | | (0.10 | ) |
| Net asset value, end of period | | $ | 8.63 | | | $ | 8.83 | | | $ | 16.21 | | | $ | 12.59 | | | $ | 9.34 | | | $ | 9.54 | |
| Total return(iii) | | | (2.15 | )% | | | (39.87 | )% | | | 29.27 | %(iv) | | | 42.80 | % | | | 9.94 | % | | | 14.94 | % |
| RATIOS/SUPPLEMENTAL DATA: | | | | | | | | | | | | | | | | | | | | | | | | |
| Net assets, end of period (000’s omitted) | | $ | 130,104 | | | $ | 142,244 | | | $ | 262,708 | | | $ | 187,489 | | | $ | 116,308 | | | $ | 111,271 | |
| Ratio of gross expenses to average net assets | | | 1.29 | % | | | 1.29 | % | | | 1.23 | % | | | 1.33 | % | | | 1.39 | % | | | 1.38 | % |
| Ratio of net expenses to average net assets | | | 1.29 | % | | | 1.29 | % | | | 1.23 | % | | | 1.33 | % | | | 1.39 | % | | | 1.38 | % |
| Ratio of net investment loss to average net assets | | | (0.80 | )% | | | (1.01 | )% | | | (0.46 | )% | | | (1.11 | )% | | | (1.17 | )% | | | (1.06 | )% |
| Portfolio turnover rate | | | 11.90 | % | | | 15.44 | % | | | 34.85 | % | | | 12.67 | % | | | 17.09 | % | | | 28.68 | % |
See Notes to Financial Statements.
| (i) | Ratios have been annualized; total return and portfolio turnover rate have not been annualized. |
| (ii) | Amount was computed based on average shares outstanding during the period. |
| (iii) | Does not reflect the effect of sales charges, if applicable. |
| (iv) | Pursuant to the U.S. Securities and Exchange Commission’s Rules on Fair Fund and Disgorgement Plans, the Alger Small Cap Growth Fund received a Fair Fund distribution of $3,738,004, which contributed approximately 0.72% to its annual return. |
- 120 -
THE ALGER FUNDS
Financial Highlights for a share outstanding throughout the period (Unaudited)
| | | | |
| Alger Small Cap Growth Fund | | Class B | |
| | | | Six months
ended
4/30/2023(i) | | | | Year ended
10/31/2022 | | | | Year ended
10/31/2021 | | | | Year ended
10/31/2020 | | | | Year ended
10/31/2019 | | | | Year ended
10/31/2018 | |
| Net asset value, beginning of period | | $ | 5.94 | | | $ | 11.41 | | | $ | 8.88 | | | $ | 6.74 | | | $ | 7.20 | | | $ | 6.42 | |
| INCOME FROM INVESTMENT OPERATIONS: | | | | | | | | | | | | | | | | | | | | | | | | |
| Net investment loss(ii) | | | (0.03 | ) | | | (0.08 | ) | | | (0.05 | ) | | | (0.08 | ) | | | (0.11 | ) | | | (0.13 | ) |
| Net realized and unrealized gain (loss) on investments | | | (0.11 | ) | | | (4.05 | ) | | | 2.65 | | | | 2.76 | | | | 0.59 | | | | 1.01 | |
| Total from investment operations | | | (0.14 | ) | | | (4.13 | ) | | | 2.60 | | | | 2.68 | | | | 0.48 | | | | 0.88 | |
| Distributions from net realized gains | | | — | | | | (1.34 | ) | | | (0.07 | ) | | | (0.54 | ) | | | (0.94 | ) | | | (0.10 | ) |
| Net asset value, end of period | | $ | 5.80 | | | $ | 5.94 | | | $ | 11.41 | | | $ | 8.88 | | | $ | 6.74 | | | $ | 7.20 | |
| Total return(iii) | | | (2.36 | )% | | | (39.91 | )% | | | 29.38 | %(iv) | | | 42.68 | % | | | 9.51 | % | | | 13.93 | % |
| RATIOS/SUPPLEMENTAL DATA: | | | | | | | | | | | | | | | | | | | | | | | | |
| Net assets, end of period (000’s omitted) | | $ | 2,539 | | | $ | 3,038 | | | $ | 5,821 | | | $ | 5,095 | | | $ | 4,523 | | | $ | 4,958 | |
| Ratio of gross expenses to average net assets | | | 2.02 | % | | | 2.00 | % | | | 1.96 | % | | | 2.07 | % | | | 2.19 | % | | | 2.23 | % |
| Ratio of expense reimbursements to average net assets | | | (0.63 | )% | | | (0.64 | )% | | | (0.74 | )% | | | (0.73 | )% | | | (0.41 | )% | | | — | |
| Ratio of net expenses to average net assets | | | 1.39 | % | | | 1.36 | % | | | 1.22 | % | | | 1.34 | % | | | 1.78 | % | | | 2.23 | % |
| Ratio of net investment loss to average net assets | | | (0.89 | )% | | | (1.09 | )% | | | (0.48 | )% | | | (1.11 | )% | | | (1.57 | )% | | | (1.90 | )% |
| Portfolio turnover rate | | | 11.90 | % | | | 15.44 | % | | | 34.85 | % | | | 12.67 | % | | | 17.09 | % | | | 28.68 | % |
See Notes to Financial Statements.
| (i) | Ratios have been annualized; total return and portfolio turnover rate have not been annualized. |
| (ii) | Amount was computed based on average shares outstanding during the period. |
| (iii) | Does not reflect the effect of sales charges, if applicable. |
| (iv) | Pursuant to the U.S. Securities and Exchange Commission’s Rules on Fair Fund and Disgorgement Plans, the Alger Small Cap Growth Fund received a Fair Fund distribution of $3,738,004, which contributed approximately 0.72% to its annual return. |
- 121 -
THE ALGER FUNDS
Financial Highlights for a share outstanding throughout the period (Unaudited)
| Alger Small Cap Growth Fund | | Class C | |
| | | | Six months
ended
4/30/2023(i) | | | | Year ended
10/31/2022 | | | | Year ended
10/31/2021 | | | | Year ended
10/31/2020 | | | | Year ended
10/31/2019 | | | | Year ended
10/31/2018 | |
| Net asset value, beginning of period | | $ | 5.51 | | | $ | 10.76 | | | $ | 8.44 | | | $ | 6.47 | | | $ | 6.99 | | | $ | 6.22 | |
| INCOME FROM INVESTMENT OPERATIONS: | | | | | | | | | | | | | | | | | | | | | | | | |
| Net investment loss(ii) | | | (0.04 | ) | | | (0.12 | ) | | | (0.13 | ) | | | (0.14 | ) | | | (0.13 | ) | | | (0.12 | ) |
| Net realized and unrealized gain (loss) on investments | | | (0.11 | ) | | | (3.79 | ) | | | 2.52 | | | | 2.65 | | | | 0.55 | | | | 0.99 | |
| Total from investment operations | | | (0.15 | ) | | | (3.91 | ) | | | 2.39 | | | | 2.51 | | | | 0.42 | | | | 0.87 | |
| Distributions from net realized gains | | | — | | | | (1.34 | ) | | | (0.07 | ) | | | (0.54 | ) | | | (0.94 | ) | | | (0.10 | ) |
| Net asset value, end of period | | $ | 5.36 | | | $ | 5.51 | | | $ | 10.76 | | | $ | 8.44 | | | $ | 6.47 | | | $ | 6.99 | |
| Total return(iii) | | | (2.72 | )% | | | (40.32 | )% | | | 28.41 | %(iv) | | | 41.76 | % | | | 8.87 | % | | | 14.22 | % |
| RATIOS/SUPPLEMENTAL DATA: | | | | | | | | | | | | | | | | | | | | | | | | |
| Net assets, end of period (000’s omitted) | | $ | 17,984 | | | $ | 21,105 | | | $ | 39,148 | | | $ | 18,365 | | | $ | 6,257 | | | $ | 5,837 | |
| Ratio of gross expenses to average net assets | | | 2.09 | % | | | 2.09 | % | | | 2.00 | % | | | 2.09 | % | | | 2.20 | % | | | 2.16 | % |
| Ratio of net expenses to average net assets | | | 2.09 | % | | | 2.09 | % | | | 2.00 | % | | | 2.09 | % | | | 2.20 | % | | | 2.16 | % |
| Ratio of net investment loss to average net assets | | | (1.59 | )% | | | (1.81 | )% | | | (1.21 | )% | | | (1.90 | )% | | | (1.98 | )% | | | (1.82 | )% |
| Portfolio turnover rate | | | 11.90 | % | | | 15.44 | % | | | 34.85 | % | | | 12.67 | % | | | 17.09 | % | | | 28.68 | % |
See Notes to Financial Statements.
| (i) | Ratios have been annualized; total return and portfolio turnover rate have not been annualized. |
| (ii) | Amount was computed based on average shares outstanding during the period. |
| (iii) | Does not reflect the effect of sales charges, if applicable. |
| (iv) | Pursuant to the U.S. Securities and Exchange Commission’s Rules on Fair Fund and Disgorgement Plans, the Alger Small Cap Growth Fund received a Fair Fund distribution of $3,738,004, which contributed approximately 0.72% to its annual return. |
- 122 -
THE ALGER FUNDS
Financial Highlights for a share outstanding throughout the period (Unaudited)
| | | | |
| Alger Small Cap Growth Fund | | Class Y | |
| | | | Six months ended 4/30/2023(i) | | | | From 12/31/2021
(commencement
of operations) to
10/31/2022(ii) | |
| Net asset value, beginning of period | | $ | 9.31 | | | $ | 13.84 | |
| INCOME FROM INVESTMENT OPERATIONS: | | | | | | | | |
| Net investment loss(iii) | | | (0.02 | ) | | | (0.04 | ) |
| Net realized and unrealized gain (loss) on investments | | | (0.17 | ) | | | (4.49 | ) |
| Total from investment operations | | | (0.19 | ) | | | (4.53 | ) |
| Net asset value, end of period | | $ | 9.12 | | | $ | 9.31 | |
| Total return(iv) | | | (2.04 | )% | | | (32.73 | )% |
| RATIOS/SUPPLEMENTAL DATA: | | | | | | | | |
| Net assets, end of period (000’s omitted) | | $ | 8,790 | | | $ | 8,050 | |
| Ratio of gross expenses to average net assets | | | 0.96 | % | | | 0.96 | % |
| Ratio of expense reimbursements to average net assets | | | (0.12 | )% | | | (0.12 | )% |
| Ratio of net expenses to average net assets | | | 0.84 | % | | | 0.84 | % |
| Ratio of net investment loss to average net assets | | | (0.36 | )% | | | (0.44 | )% |
| Portfolio turnover rate | | | 11.90 | % | | | 15.44 | % |
See Notes to Financial Statements.
| (i) | Ratios have been annualized; total return and portfolio turnover rate have not been annualized. |
| (ii) | Ratios have been annualized; total return has not been annualized; portfolio turnover is for the ten months then ended. |
| (iii) | Amount was computed based on average shares outstanding during the period. |
| (iv) | Does not reflect the effect of sales charges, if applicable. |
- 123 -
THE ALGER FUNDS
Financial Highlights for a share outstanding throughout the period (Unaudited)
| Alger Small Cap Growth Fund | | Class Z | |
| | | | Six months
ended
4/30/2023(i) | | | | Year ended
10/31/2022 | | | | Year ended
10/31/2021 | | | | Year ended
10/31/2020 | | | | Year ended
10/31/2019 | | | | Year ended
10/31/2018 | |
| Net asset value, beginning of period | | $ | 9.29 | | | $ | 16.92 | | | $ | 13.10 | | | $ | 9.66 | | | $ | 9.80 | | | $ | 8.60 | |
| INCOME FROM INVESTMENT OPERATIONS: | | | | | | | | | | | | | | | | | | | | | | | | |
| Net investment loss(ii) | | | (0.02 | ) | | | (0.08 | ) | | | (0.02 | ) | | | (0.10 | ) | | | (0.07 | ) | | | (0.06 | ) |
| Net realized and unrealized gain (loss) on investments | | | (0.17 | ) | | | (6.21 | ) | | | 3.91 | | | | 4.08 | | | | 0.87 | | | | 1.36 | |
| Total from investment operations | | | (0.19 | ) | | | (6.29 | ) | | | 3.89 | | | | 3.98 | | | | 0.80 | | | | 1.30 | |
| Distributions from net realized gains | | | — | | | | (1.34 | ) | | | (0.07 | ) | | | (0.54 | ) | | | (0.94 | ) | | | (0.10 | ) |
| Net asset value, end of period | | $ | 9.10 | | | $ | 9.29 | | | $ | 16.92 | | | $ | 13.10 | | | $ | 9.66 | | | $ | 9.80 | |
| Total return(iii) | | | (2.05 | )% | | | (39.66 | )% | | | 29.66 | %(iv) | | | 43.38 | % | | | 10.33 | % | | | 15.30 | % |
| RATIOS/SUPPLEMENTAL DATA: | | | | | | | | | | | | | | | | | | | | | | | | |
| Net assets, end of period (000’s omitted) | | $ | 177,956 | | | $ | 214,819 | | | $ | 383,748 | | | $ | 179,276 | | | $ | 21,782 | | | $ | 13,179 | |
| Ratio of gross expenses to average net assets | | | 0.97 | % | | | 0.96 | % | | | 0.93 | % | | | 1.00 | % | | | 1.12 | % | | | 1.12 | % |
| Ratio of expense reimbursements to average net assets | | | — | | | | — | | | | — | | | | (0.03 | )% | | | (0.13 | )% | | | (0.13 | )% |
| Ratio of net expenses to average net assets | | | 0.97 | % | | | 0.96 | % | | | 0.93 | % | | | 0.97 | % | | | 0.99 | % | | | 0.99 | % |
| Ratio of net investment loss to average net assets | | | (0.47 | )% | | | (0.68 | )% | | | (0.12 | )% | | | (0.81 | )% | | | (0.78 | )% | | | (0.65 | )% |
| Portfolio turnover rate | | | 11.90 | % | | | 15.44 | % | | | 34.85 | % | | | 12.67 | % | | | 17.09 | % | | | 28.68 | % |
See Notes to Financial Statements.
| (i) | Ratios have been annualized; total return and portfolio turnover rate have not been annualized. |
| (ii) | Amount was computed based on average shares outstanding during the period. |
| (iii) | Does not reflect the effect of sales charges, if applicable. |
| (iv) | Pursuant to the U.S. Securities and Exchange Commission’s Rules on Fair Fund and Disgorgement Plans, the Alger Small Cap Growth Fund received a Fair Fund distribution of $3,738,004, which contributed approximately 0.72% to its annual return. |
- 124 -
THE ALGER FUNDS
Financial Highlights for a share outstanding throughout the period (Unaudited)
| Alger Small Cap Focus Fund | | Class A | |
| | | | Six months
ended
4/30/2023(i) | | | | Year ended
10/31/2022 | | | | Year ended
10/31/2021 | | | | Year ended
10/31/2020 | | | | Year ended
10/31/2019 | | | | Year ended
10/31/2018 | |
| Net asset value, beginning of period | | $ | 16.91 | | | $ | 31.74 | | | $ | 26.22 | | | $ | 19.93 | | | $ | 18.86 | | | $ | 14.91 | |
| INCOME FROM INVESTMENT OPERATIONS: | | | | | | | | | | | | | | | | | | | | | | | | |
| Net investment loss(ii) | | | (0.08 | ) | | | (0.19 | ) | | | (0.31 | ) | | | (0.25 | ) | | | (0.19 | ) | | | (0.17 | ) |
| Net realized and unrealized gain (loss) on investments | | | (0.52 | ) | | | (12.84 | ) | | | 5.83 | | | | 7.03 | | | | 1.41 | | | | 4.26 | |
| Total from investment operations | | | (0.60 | ) | | | (13.03 | ) | | | 5.52 | | | | 6.78 | | | | 1.22 | | | | 4.09 | |
| Dividends from net investment income | | | — | | | | — | | | | — | | | | (0.19 | ) | | | — | | | | — | |
| Distributions from net realized gains | | | — | | | | (1.80 | ) | | | — | | | | (0.30 | ) | | | (0.15 | ) | | | (0.14 | ) |
| Net asset value, end of period | | $ | 16.31 | | | $ | 16.91 | | | $ | 31.74 | | | $ | 26.22 | | | $ | 19.93 | | | $ | 18.86 | |
| Total return(iii) | | | (3.55 | )% | | | (42.88 | )% | | | 21.05 | % | | | 34.74 | % | | | 6.59 | % | | | 27.72 | % |
| RATIOS/SUPPLEMENTAL DATA: | | | | | | | | | | | | | | | | | | | | | | | | |
| Net assets, end of period (000’s omitted) | | $ | 189,342 | | | $ | 226,738 | | | $ | 560,577 | | | $ | 566,606 | | | $ | 523,291 | | | $ | 300,066 | |
| Ratio of gross expenses to average net assets | | | 1.42 | % | | | 1.32 | % | | | 1.18 | % | | | 1.22 | % | | | 1.19 | % | | | 1.18 | % |
| Ratio of net expenses to average net assets | | | 1.42 | % | | | 1.32 | % | | | 1.18 | % | | | 1.22 | % | | | 1.19 | % | | | 1.18 | % |
| Ratio of net investment loss to average net assets | | | (1.01 | )% | | | (0.96 | )% | | | (0.98 | )% | | | (1.11 | )% | | | (0.95 | )% | | | (0.92 | )% |
| Portfolio turnover rate | | | 26.08 | % | | | 37.57 | % | | | 56.71 | % | | | 37.49 | % | | | 48.84 | % | | | 27.04 | % |
See Notes to Financial Statements.
| (i) | Ratios have been annualized; total return and portfolio turnover rate have not been annualized. |
| (ii) | Amount was computed based on average shares outstanding during the period. |
| (iii) | Does not reflect the effect of sales charges, if applicable. |
- 125 -
THE ALGER FUNDS
Financial Highlights for a share outstanding throughout the period (Unaudited)
| Alger Small Cap Focus Fund | | Class C | |
| | | | Six months
ended
4/30/2023(i) | | | | Year ended
10/31/2022 | | | | Year ended
10/31/2021 | | | | Year ended
10/31/2020 | | | | Year ended
10/31/2019 | | | | Year ended
10/31/2018 | |
| Net asset value, beginning of period | | $ | 14.75 | | | $ | 28.12 | | | $ | 23.40 | | | $ | 17.85 | | | $ | 17.04 | | | $ | 13.58 | |
| INCOME FROM INVESTMENT OPERATIONS: | | | | | | | | | | | | | | | | | | | | | | | | |
| Net investment loss(ii) | | | (0.11 | ) | | | (0.28 | ) | | | (0.47 | ) | | | (0.37 | ) | | | (0.31 | ) | | | (0.27 | ) |
| Net realized and unrealized gain (loss) on investments | | | (0.45 | ) | | | (11.29 | ) | | | 5.19 | | | | 6.30 | | | | 1.27 | | | | 3.87 | |
| Total from investment operations | | | (0.56 | ) | | | (11.57 | ) | | | 4.72 | | | | 5.93 | | | | 0.96 | | | | 3.60 | |
| Dividends from net investment income | | | — | | | | — | | | | — | | | | (0.08 | ) | | | — | | | | — | |
| Distributions from net realized gains | | | — | | | | (1.80 | ) | | | — | | | | (0.30 | ) | | | (0.15 | ) | | | (0.14 | ) |
| Net asset value, end of period | | $ | 14.19 | | | $ | 14.75 | | | $ | 28.12 | | | $ | 23.40 | | | $ | 17.85 | | | $ | 17.04 | |
| Total return(iii) | | | (3.80 | )% | | | (43.23 | )% | | | 20.17 | % | | | 33.85 | % | | | 5.76 | % | | | 26.82 | % |
| RATIOS/SUPPLEMENTAL DATA: | | | | | | | | | | | | | | | | | | | | | | | | |
| Net assets, end of period (000’s omitted) | | $ | 89,079 | | | $ | 108,988 | | | $ | 267,800 | | | $ | 248,577 | | | $ | 212,737 | | | $ | 131,655 | |
| Ratio of gross expenses to average net assets | | | 1.98 | % | | | 1.93 | % | | | 1.90 | % | | | 1.94 | % | | | 1.95 | % | | | 1.94 | % |
| Ratio of net expenses to average net assets | | | 1.98 | % | | | 1.93 | % | | | 1.90 | % | | | 1.94 | % | | | 1.95 | % | | | 1.94 | % |
| Ratio of net investment loss to average net assets | | | (1.57 | )% | | | (1.57 | )% | | | (1.70 | )% | | | (1.83 | )% | | | (1.71 | )% | | | (1.66 | )% |
| Portfolio turnover rate | | | 26.08 | % | | | 37.57 | % | | | 56.71 | % | | | 37.49 | % | | | 48.84 | % | | | 27.04 | % |
| See Notes to Financial Statements. | |
| (i) | Ratios have been annualized; total return and portfolio turnover rate have not been annualized. |
| (ii) | Amount was computed based on average shares outstanding during the period. |
| (iii) | Does not reflect the effect of sales charges, if applicable. |
- 126 -
THE ALGER FUNDS
Financial Highlights for a share outstanding throughout the period (Unaudited)
| Alger Small Cap Focus Fund | | Class I | |
| | | | Six months
ended
4/30/2023(i) | | | | Year ended
10/31/2022 | | | | Year ended
10/31/2021 | | | | Year ended
10/31/2020 | | | | Year ended
10/31/2019 | | | | Year ended
10/31/2018 | |
| Net asset value, beginning of period | | $ | 17.44 | | | $ | 32.61 | | | $ | 26.93 | | | $ | 20.44 | | | $ | 19.34 | | | $ | 15.28 | |
| INCOME FROM INVESTMENT OPERATIONS: | | | | | | | | | | | | | | | | | | | | | | | | |
| Net investment loss(ii) | | | (0.06 | ) | | | (0.18 | ) | | | (0.31 | ) | | | (0.24 | ) | | | (0.19 | ) | | | (0.17 | ) |
| Net realized and unrealized gain (loss) on investments | | | (0.54 | ) | | | (13.19 | ) | | | 5.99 | | | | 7.22 | | | | 1.44 | | | | 4.37 | |
| Total from investment operations | | | (0.60 | ) | | | (13.37 | ) | | | 5.68 | | | | 6.98 | | | | 1.25 | | | | 4.20 | |
| Dividends from net investment income | | | — | | | | — | | | | — | | | | (0.19 | ) | | | — | | | | — | |
| Distributions from net realized gains | | | — | | | | (1.80 | ) | | | — | | | | (0.30 | ) | | | (0.15 | ) | | | (0.14 | ) |
| Net asset value, end of period | | $ | 16.84 | | | $ | 17.44 | | | $ | 32.61 | | | $ | 26.93 | | | $ | 20.44 | | | $ | 19.34 | |
| Total return(iii) | | | (3.44 | )% | | | (42.77 | )% | | | 21.09 | % | | | 34.86 | % | | | 6.58 | % | | | 27.77 | % |
| RATIOS/SUPPLEMENTAL DATA: | | | | | | | | | | | | | | | | | | | | | | | | |
| Net assets, end of period (000’s omitted) | | $ | 91,595 | | | $ | 144,513 | | | $ | 421,986 | | | $ | 360,756 | | | $ | 455,937 | | | $ | 340,636 | |
| Ratio of gross expenses to average net assets | | | 1.19 | % | | | 1.18 | % | | | 1.14 | % | | | 1.15 | % | | | 1.18 | % | | | 1.17 | % |
| Ratio of net expenses to average net assets | | | 1.19 | % | | | 1.18 | % | | | 1.14 | % | | | 1.15 | % | | | 1.18 | % | | | 1.17 | % |
| Ratio of net investment loss to average net assets | | | (0.76 | )% | | | (0.83 | )% | | | (0.95 | )% | | | (1.04 | )% | | | (0.93 | )% | | | (0.90 | )% |
| Portfolio turnover rate | | | 26.08 | % | | | 37.57 | % | | | 56.71 | % | | | 37.49 | % | | | 48.84 | % | | | 27.04 | % |
| See Notes to Financial Statements. | |
| (i) | Ratios have been annualized; total return and portfolio turnover rate have not been annualized. |
| (ii) | Amount was computed based on average shares outstanding during the period. |
| (iii) | Does not reflect the effect of sales charges, if applicable. |
- 127 -
THE ALGER FUNDS
Financial Highlights for a share outstanding throughout the period (Unaudited)
| Alger Small Cap Focus Fund | | Class Y | |
| | | | Six months
ended
4/30/2023(i) | | | | Year ended
10/31/2022 | | | | Year ended
10/31/2021 | | | | Year ended 10/31/2020 | | | | Year ended
10/31/2019 | | | | Year ended
10/31/2018 | |
| Net asset value, beginning of period | | $ | 17.89 | | | $ | 33.29 | | | $ | 27.41 | | | $ | 20.79 | | | $ | 19.60 | | | $ | 15.44 | |
| INCOME FROM INVESTMENT OPERATIONS: | | | | | | | | | | | | | | | | | | | | | | | | |
| Net investment loss(ii) | | | (0.04 | ) | | | (0.09 | ) | | | (0.21 | ) | | | (0.18 | ) | | | (0.14 | ) | | | (0.12 | ) |
| Net realized and unrealized gain (loss) on investments | | | (0.55 | ) | | | (13.51 | ) | | | 6.09 | | | | 7.36 | | | | 1.48 | | | | 4.42 | |
| Total from investment operations | | | (0.59 | ) | | | (13.60 | ) | | | 5.88 | | | | 7.18 | | | | 1.34 | | | | 4.30 | |
| Dividends from net investment income | | | — | | | | — | | | | — | | | | (0.26 | ) | | | — | | | | — | |
| Distributions from net realized gains | | | — | | | | (1.80 | ) | | | — | | | | (0.30 | ) | | | (0.15 | ) | | | (0.14 | ) |
| Net asset value, end of period | | $ | 17.30 | | | $ | 17.89 | | | $ | 33.29 | | | $ | 27.41 | | | $ | 20.79 | | | $ | 19.60 | |
| Total return(iii) | | | (3.30 | )% | | | (42.58 | )% | | | 21.45 | % | | | 35.32 | % | | | 6.96 | % | | | 28.13 | % |
| RATIOS/SUPPLEMENTAL DATA: | | | | | | | | | | | | | | | | | | | | | | | | |
| Net assets, end of period (000’s omitted) | | $ | 205,292 | | | $ | 257,064 | | | $ | 394,801 | | | $ | 266,570 | | | $ | 94,694 | | | $ | 25,691 | |
| Ratio of gross expenses to average net assets | | | 0.88 | % | | | 0.85 | % | | | 0.83 | % | | | 0.84 | % | | | 0.87 | % | | | 0.88 | % |
| Ratio of expense reimbursements to average net assets | | | (0.03 | )% | | | — | | | | — | | | | — | (iv) | | | (0.02 | )% | | | — | |
| Ratio of net expenses to average net assets | | | 0.85 | % | | | 0.85 | % | | | 0.83 | % | | | 0.84 | % | | | 0.85 | % | | | 0.88 | % |
Ratio of net investment loss to average net assets | | | (0.45 | )% | | | (0.46 | )% | | | (0.65 | )% | | | (0.74 | )% | | | (0.64 | )% | | | (0.63 | )% |
| Portfolio turnover rate | | | 26.08 | % | | | 37.57 | % | | | 56.71 | % | | | 37.49 | % | | | 48.84 | % | | | 27.04 | % |
| See Notes to Financial Statements. | |
| (i) | Ratios have been annualized; total return and portfolio turnover rate have not been annualized. |
| (ii) | Amount was computed based on average shares outstanding during the period. |
| (iii) | Does not reflect the effect of sales charges, if applicable. |
| (iv) | Amount was more than (0.005)% per share. |
- 128 -
THE ALGER FUNDS
Financial Highlights for a share outstanding throughout the period (Unaudited)
| Alger Small Cap Focus Fund | | Class Z | |
| | | Six months
ended
4/30/2023(i) | | | Year ended
10/31/2022 | | | Year ended
10/31/2021 | | | Year ended
10/31/2020 | | | Year ended
10/31/2019 | | | Year ended
10/31/2018 | |
| Net asset value, beginning of period | | $ | 17.88 | | | $ | 33.29 | | | $ | 27.41 | | | $ | 20.79 | | | $ | 19.60 | | | $ | 15.44 | |
| INCOME FROM INVESTMENT OPERATIONS: | | | | | | | | | | | | | | | | | | | | | | | | |
| Net investment loss(ii) | | | (0.04 | ) | | | (0.10 | ) | | | (0.21 | ) | | | (0.18 | ) | | | (0.13 | ) | | | (0.12 | ) |
| Net realized and unrealized gain (loss) on investments | | | (0.54 | ) | | | (13.51 | ) | | | 6.09 | | | | 7.36 | | | | 1.47 | | | | 4.42 | |
| Total from investment operations | | | (0.58 | ) | | | (13.61 | ) | | | 5.88 | | | | 7.18 | | | | 1.34 | | | | 4.30 | |
| Dividends from net investment income | | | — | | | | — | | | | — | | | | (0.26 | ) | | | — | | | | — | |
| Distributions from net realized gains | | | — | | | | (1.80 | ) | | | — | | | | (0.30 | ) | | | (0.15 | ) | | | (0.14 | ) |
| Net asset value, end of period | | $ | 17.30 | | | $ | 17.88 | | | $ | 33.29 | | | $ | 27.41 | | | $ | 20.79 | | | $ | 19.60 | |
| Total return(iii) | | | (3.24 | )% | | | (42.61 | )% | | | 21.45 | % | | | 35.30 | % | | | 6.96 | % | | | 28.13 | % |
| RATIOS/SUPPLEMENTAL DATA: | | | | | | | | | | | | | | | | | | | | | | | | |
| Net assets, end of period (000’s omitted) | | $ | 1,633,942 | | | $ | 2,192,139 | | | $ | 6,195,714 | | | $ | 4,499,832 | | | $ | 2,459,793 | | | $ | 1,329,712 | |
| Ratio of gross expenses to average net assets | | | 0.86 | % | | | 0.84 | % | | | 0.83 | % | | | 0.85 | % | | | 0.86 | % | | | 0.87 | % |
| Ratio of net expenses to average net assets | | | 0.86 | % | | | 0.84 | % | | | 0.83 | % | | | 0.85 | % | | | 0.86 | % | | | 0.87 | % |
| Ratio of net investment loss to average net assets | | | (0.45 | )% | | | (0.49 | )% | | | (0.65 | )% | | | (0.74 | )% | | | (0.62 | )% | | | (0.61 | )% |
| Portfolio turnover rate | | | 26.08 | % | | | 37.57 | % | | | 56.71 | % | | | 37.49 | % | | | 48.84 | % | | | 27.04 | % |
See Notes to Financial Statements.
| (i) | Ratios have been annualized; total return and portfolio turnover rate have not been annualized. |
| (ii) | Amount was computed based on average shares outstanding during the period. |
| (iii) | Does not reflect the effect of sales charges, if applicable. |
- 129 -
THE ALGER FUNDS
Financial Highlights for a share outstanding throughout the period (Unaudited)
| Alger International Focus Fund | | Class A | |
| | | Six months
ended
4/30/2023(i) | | | Year ended
10/31/2022 | | | Year ended
10/31/2021 | | | Year ended
10/31/2020 | | | Year ended
10/31/2019 | | | Year ended
10/31/2018 | |
| Net asset value, beginning of period | | $ | 15.23 | | | $ | 25.12 | | | $ | 18.67 | | | $ | 15.51 | | | $ | 14.30 | | | $ | 17.58 | |
| INCOME FROM INVESTMENT OPERATIONS: | | | | | | | | | | | | | | | | | | | | | | | | |
| Net investment income (loss)(ii) | | | (0.02 | ) | | | (0.10 | ) | | | (0.11 | ) | | | (0.06 | ) | | | (0.02 | ) | | | 0.06 | |
| Net realized and unrealized gain (loss) on investments | | | 1.67 | | | | (7.82 | ) | | | 6.56 | | | | 3.91 | | | | 1.66 | | | | (2.46 | ) |
| Total from investment operations | | | 1.65 | | | | (7.92 | ) | | | 6.45 | | | | 3.85 | | | | 1.64 | | | | (2.40 | ) |
| Dividends from net investment income | | | — | | | | — | | | | — | | | | (0.69 | ) | | | (0.43 | ) | | | (0.88 | ) |
| Distributions from net realized gains | | | — | | | | (1.97 | ) | | | — | | | | — | | | | — | | | | — | |
| Net asset value, end of period | | $ | 16.88 | | | $ | 15.23 | | | $ | 25.12 | | | $ | 18.67 | | | $ | 15.51 | | | $ | 14.30 | |
| Total return(iii) | | | 10.83 | % | | | (34.27 | )% | | | 34.87 | %(iv) | | | 25.69 | % | | | 11.99 | % | | | (14.35 | )% |
| RATIOS/SUPPLEMENTAL DATA: | | | | | | | | | | | | | | | | | | | | | | | | |
| Net assets, end of period (000’s omitted) | | $ | 107,812 | | | $ | 100,262 | | | $ | 158,223 | | | $ | 120,832 | | | $ | 100,814 | | | $ | 98,105 | |
| Ratio of gross expenses to average net assets | | | 1.29 | % | | | 1.27 | % | | | 1.22 | % | | | 1.34 | % | | | 1.37 | % | | | 1.29 | % |
| Ratio of net expenses to average net assets | | | 1.29 | % | | | 1.27 | % | | | 1.22 | % | | | 1.34 | % | | | 1.37 | % | | | 1.29 | % |
| Ratio of net investment income (loss) to average net assets | | | (0.30 | )% | | | (0.53 | )% | | | (0.49 | )% | | | (0.37 | )% | | | (0.11 | )% | | | 0.38 | % |
| Portfolio turnover rate | | | 25.89 | % | | | 49.36 | % | | | 75.27 | % | | | 105.22 | % | | | 151.99 | % | | | 207.22 | % |
See Notes to Financial Statements.
| (i) | Ratios have been annualized; total return and portfolio turnover rate have not been annualized. |
| (ii) | Amount was computed based on average shares outstanding during the period. |
| (iii) | Does not reflect the effect of sales charges, if applicable. |
| (iv) | Pursuant to the U.S. Securities and Exchange Commission’s Rules on Fair Fund and Disgorgement Plans, the Alger International Focus Fund received a Fair Fund distribution of $159,091, which contributed approximately 0.11% to its annual return. |
- 130 -
THE ALGER FUNDS
Financial Highlights for a share outstanding throughout the period (Unaudited)
| Alger International Focus Fund | | Class B | |
| | | Six months
ended
4/30/2023(i) | | | Year ended
10/31/2022 | | | Year ended
10/31/2021 | | | Year ended
10/31/2020 | | | Year ended
10/31/2019 | | | Year ended
10/31/2018 | |
| Net asset value, beginning of period | | $ | 13.04 | | | $ | 21.81 | | | $ | 16.19 | | | $ | 13.44 | | | $ | 12.38 | | | $ | 15.35 | |
| INCOME FROM INVESTMENT OPERATIONS: | | | | | | | | | | | | | | | | | | | | | | | | |
| Net investment loss(ii) | | | (0.02 | ) | | | (0.09 | ) | | | (0.08 | ) | | | (0.02 | ) | | | (0.04 | ) | | | (0.06 | ) |
| Net realized and unrealized gain (loss) on investments | | | 1.44 | | | | (6.71 | ) | | | 5.70 | | | | 3.38 | | | | 1.44 | | | | (2.13 | ) |
| Total from investment operations | | | 1.42 | | | | (6.80 | ) | | | 5.62 | | | | 3.36 | | | | 1.40 | | | | (2.19 | ) |
| Dividends from net investment income | | | — | | | | — | | | | — | | | | (0.61 | ) | | | (0.34 | ) | | | (0.78 | ) |
| Distributions from net realized gains | | | — | | | | (1.97 | ) | | | — | | | | — | | | | — | | | | — | |
| Net asset value, end of period | | $ | 14.46 | | | $ | 13.04 | | | $ | 21.81 | | | $ | 16.19 | | | $ | 13.44 | | | $ | 12.38 | |
| Total return(iii) | | | 10.89 | % | | | (34.30 | )% | | | 35.02 | %(iv) | | | 25.83 | % | | | 11.82 | % | | | (15.00 | )% |
| RATIOS/SUPPLEMENTAL DATA: | | | | | | | | | | | | | | | | | | | | | | | | |
| Net assets, end of period (000’s omitted) | | $ | 13,841 | | | $ | 13,200 | | | $ | 22,147 | | | $ | 18,427 | | | $ | 17,646 | | | $ | 17,639 | |
| Ratio of gross expenses to average net assets | | | 1.98 | % | | | 1.97 | % | | | 1.94 | % | | | 2.05 | % | | | 2.09 | % | | | 2.01 | % |
| Ratio of expense reimbursements to average net assets | | | (0.70 | )% | | | (0.69 | )% | | | (0.82 | )% | | | (0.88 | )% | | | (0.51 | )% | | | — | |
| Ratio of net expenses to average net assets | | | 1.28 | % | | | 1.28 | % | | | 1.12 | % | | | 1.17 | % | | | 1.58 | % | | | 2.01 | % |
| Ratio of net investment loss to average net assets | | | (0.30 | )% | | | (0.54 | )% | | | (0.39 | )% | | | (0.18 | )% | | | (0.30 | )% | | | (0.40 | )% |
| Portfolio turnover rate | | | 25.89 | % | | | 49.36 | % | | | 75.27 | % | | | 105.22 | % | | | 151.99 | % | | | 207.22 | % |
See Notes to Financial Statements.
| (i) | Ratios have been annualized; total return and portfolio turnover rate have not been annualized. |
| (ii) | Amount was computed based on average shares outstanding during the period. |
| (iii) | Does not reflect the effect of sales charges, if applicable. |
| (iv) | Pursuant to the U.S. Securities and Exchange Commission’s Rules on Fair Fund and Disgorgement Plans, the Alger International Focus Fund received a Fair Fund distribution of $159,091, which contributed approximately 0.11% to its annual return. |
- 131 -
THE ALGER FUNDS
Financial Highlights for a share outstanding throughout the period (Unaudited)
| Alger International Focus Fund | | Class C | |
| | | Six months
ended
4/30/2023(i) | | | Year ended
10/31/2022 | | | Year ended
10/31/2021 | | | Year ended
10/31/2020 | | | Year ended
10/31/2019 | | | Year ended
10/31/2018 | |
| Net asset value, beginning of period | | $ | 12.37 | | | $ | 20.94 | | | $ | 15.68 | | | $ | 13.11 | | | $ | 12.07 | | | $ | 14.98 | |
| INCOME FROM INVESTMENT OPERATIONS: | | | | | | | | | | | | | | | | | | | | | | | | |
| Net investment loss(ii) | | | (0.08 | ) | | | (0.22 | ) | | | (0.24 | ) | | | (0.15 | ) | | | (0.12 | ) | | | (0.06 | ) |
| Net realized and unrealized gain (loss) on investments | | | 1.37 | | | | (6.38 | ) | | | 5.50 | | | | 3.29 | | | | 1.41 | | | | (2.09 | ) |
| Total from investment operations | | | 1.29 | | | | (6.60 | ) | | | 5.26 | | | | 3.14 | | | | 1.29 | | | | (2.15 | ) |
| Dividends from net investment income | | | — | | | | — | | | | — | | | | (0.57 | ) | | | (0.25 | ) | | | (0.76 | ) |
| Distributions from net realized gains | | | — | | | | (1.97 | ) | | | — | | | | — | | | | — | | | | — | |
| Net asset value, end of period | | $ | 13.66 | | | $ | 12.37 | | | $ | 20.94 | | | $ | 15.68 | | | $ | 13.11 | | | $ | 12.07 | |
| Total return(iii) | | | 10.43 | % | | | (34.82 | )% | | | 33.86 | %(iv) | | | 24.68 | % | | | 11.07 | % | | | (15.08 | )% |
| RATIOS/SUPPLEMENTAL DATA: | | | | | | | | | | | | | | | | | | | | | | | | |
| Net assets, end of period (000’s omitted) | | $ | 1,304 | | | $ | 1,594 | | | $ | 4,368 | | | $ | 2,760 | | | $ | 3,603 | | | $ | 4,712 | |
| Ratio of gross expenses to average net assets | | | 2.10 | % | | | 2.09 | % | | | 1.97 | % | | | 2.13 | % | | | 2.23 | % | | | 2.09 | % |
| Ratio of net expenses to average net assets | | | 2.10 | % | | | 2.09 | % | | | 1.97 | % | | | 2.13 | % | | | 2.23 | % | | | 2.09 | % |
| Ratio of net investment loss to average net assets | | | (1.15 | )% | | | (1.40 | )% | | | (1.23 | )% | | | (1.13 | )% | | | (0.99 | )% | | | (0.41 | )% |
| Portfolio turnover rate | | | 25.89 | % | | | 49.36 | % | | | 75.27 | % | | | 105.22 | % | | | 151.99 | % | | | 207.22 | % |
See Notes to Financial Statements.
| (i) | Ratios have been annualized; total return and portfolio turnover rate have not been annualized. |
| (ii) | Amount was computed based on average shares outstanding during the period. |
| (iii) | Does not reflect the effect of sales charges, if applicable. |
| (iv) | Pursuant to the U.S. Securities and Exchange Commission’s Rules on Fair Fund and Disgorgement Plans, the Alger International Focus Fund received a Fair Fund distribution of $159,091, which contributed approximately 0.11% to its annual return. |
- 132 -
THE ALGER FUNDS
Financial Highlights for a share outstanding throughout the period (Unaudited)
| Alger International Focus Fund | | Class I | |
| | | Six months
ended
4/30/2023(i) | | | Year ended
10/31/2022 | | | Year ended
10/31/2021 | | | Year ended
10/31/2020 | | | Year ended
10/31/2019 | | | Year ended
10/31/2018 | |
| Net asset value, beginning of period | | $ | 15.28 | | | $ | 25.20 | | | $ | 18.72 | | | $ | 15.54 | | | $ | 14.31 | | | $ | 17.54 | |
| INCOME FROM INVESTMENT OPERATIONS: | | | | | | | | | | | | | | | | | | | | | | | | |
| Net investment income (loss)(ii) | | | (0.02 | ) | | | (0.08 | ) | | | (0.10 | ) | | | (0.02 | ) | | | 0.01 | | | | 0.09 | |
| Net realized and unrealized gain (loss) on investments | | | 1.68 | | | | (7.87 | ) | | | 6.58 | | | | 3.93 | | | | 1.67 | | | | (2.48 | ) |
| Total from investment operations | | | 1.66 | | | | (7.95 | ) | | | 6.48 | | | | 3.91 | | | | 1.68 | | | | (2.39 | ) |
| Dividends from net investment income | | | — | | | | — | | | | — | | | | (0.73 | ) | | | (0.45 | ) | | | (0.84 | ) |
| Distributions from net realized gains | | | — | | | | (1.97 | ) | | | — | | | | — | | | | — | | | | — | |
| Net asset value, end of period | | $ | 16.94 | | | $ | 15.28 | | | $ | 25.20 | | | $ | 18.72 | | | $ | 15.54 | | | $ | 14.31 | |
| Total return(iii) | | | 10.86 | % | | | (34.28 | )% | | | 34.94 | %(iv) | | | 25.98 | % | | | 12.41 | % | | | (14.27 | )% |
| RATIOS/SUPPLEMENTAL DATA: | | | | | | | | | | | | | | | | | | | | | | | | |
| Net assets, end of period (000’s omitted) | | $ | 1,173 | | | $ | 1,061 | | | $ | 591 | | | $ | 642 | | | $ | 970 | | | $ | 2,156 | |
| Ratio of gross expenses to average net assets | | | 1.29 | % | | | 1.30 | % | | | 1.24 | % | | | 1.34 | % | | | 1.48 | % | | | 1.19 | % |
| Ratio of expense reimbursements to average net assets | | | (0.04 | )% | | | (0.05 | )% | | | (0.05 | )% | | | (0.27 | )% | | | (0.36 | )% | | | (0.04 | )% |
| Ratio of net expenses to average net assets | | | 1.25 | % | | | 1.25 | % | | | 1.19 | % | | | 1.07 | % | | | 1.12 | % | | | 1.15 | % |
| Ratio of net investment income (loss) to average net assets | | | (0.27 | )% | | | (0.44 | )% | | | (0.45 | )% | | | (0.10 | )% | | | 0.06 | % | | | 0.51 | % |
| Portfolio turnover rate | | | 25.89 | % | | | 49.36 | % | | | 75.27 | % | | | 105.22 | % | | | 151.99 | % | | | 207.22 | % |
See Notes to Financial Statements.
| (i) | Ratios have been annualized; total return and portfolio turnover rate have not been annualized. |
| (ii) | Amount was computed based on average shares outstanding during the period. |
| (iii) | Does not reflect the effect of sales charges, if applicable. |
| (iv) | Pursuant to the U.S. Securities and Exchange Commission’s Rules on Fair Fund and Disgorgement Plans, the Alger International Focus Fund received a Fair Fund distribution of $159,091, which contributed approximately 0.11% to its annual return. |
- 133 -
THE ALGER FUNDS
Financial Highlights for a share outstanding throughout the period (Unaudited)
| Alger International Focus Fund | | Class Z | |
| | | Six months
ended
4/30/2023(i) | | | Year ended
10/31/2022 | | | Year ended
10/31/2021 | | | Year ended
10/31/2020 | | | Year ended
10/31/2019 | | | Year ended
10/31/2018 | |
| Net asset value, beginning of period | | $ | 15.55 | | | $ | 25.52 | | | $ | 18.90 | | | $ | 15.69 | | | $ | 14.46 | | | $ | 17.77 | |
| INCOME FROM INVESTMENT OPERATIONS: | | | | | | | | | | | | | | | | | | | | | | | | |
| Net investment income (loss)(ii) | | | 0.01 | | | | (0.02 | ) | | | (0.03 | ) | | | — | (iii) | | | 0.05 | | | | 0.12 | |
| Net realized and unrealized gain (loss) on investments | | | 1.72 | | | | (7.98 | ) | | | 6.65 | | | | 3.98 | | | | 1.67 | | | | (2.48 | ) |
| Total from investment operations | | | 1.73 | | | | (8.00 | ) | | | 6.62 | | | | 3.98 | | | | 1.72 | | | | (2.36 | ) |
| Dividends from net investment income | | | — | | | | — | | | | — | | | | (0.77 | ) | | | (0.49 | ) | | | (0.95 | ) |
| Distributions from net realized gains | | | — | | | | (1.97 | ) | | | — | | | | — | | | | — | | | | — | |
| Net asset value, end of period | | $ | 17.28 | | | $ | 15.55 | | | $ | 25.52 | | | $ | 18.90 | | | $ | 15.69 | | | $ | 14.46 | |
| Total return(iv) | | | 11.13 | % | | | (34.03 | )% | | | 35.34 | %(v) | | | 26.23 | % | | | 12.64 | % | | | (14.03 | )% |
| RATIOS/SUPPLEMENTAL DATA: | | | | | | | | | | | | | | | | | | | | | | | | |
| Net assets, end of period (000’s omitted) | | $ | 16,522 | | | $ | 14,528 | | | $ | 28,264 | | | $ | 12,621 | | | $ | 13,462 | | | $ | 14,597 | |
| Ratio of gross expenses to average net assets | | | 0.96 | % | | | 0.95 | % | | | 0.92 | % | | | 1.02 | % | | | 1.10 | % | | | 1.01 | % |
| Ratio of expense reimbursements to average net assets | | | (0.12 | )% | | | (0.09 | )% | | | (0.03 | )% | | | (0.13 | )% | | | (0.21 | )% | | | (0.12 | )% |
| Ratio of net expenses to average net assets | | | 0.84 | % | | | 0.86 | % | | | 0.89 | % | | | 0.89 | % | | | 0.89 | % | | | 0.89 | % |
| Ratio of net investment income (loss) to average net assets | | | 0.15 | % | | | (0.13 | )% | | | (0.13 | )% | | | 0.01 | % | | | 0.36 | % | | | 0.71 | % |
| Portfolio turnover rate | | | 25.89 | % | | | 49.36 | % | | | 75.27 | % | | | 105.22 | % | | | 151.99 | % | | | 207.22 | % |
See Notes to Financial Statements.
| (i) | Ratios have been annualized; total return and portfolio turnover rate have not been annualized. |
| (ii) | Amount was computed based on average shares outstanding during the period. |
| (iii) | Amount was less than $0.005 per share. |
| (iv) | Does not reflect the effect of sales charges, if applicable. |
| (v) | Pursuant to the U.S. Securities and Exchange Commission’s Rules on Fair Fund and Disgorgement Plans, the Alger International Focus Fund received a Fair Fund distribution of $159,091, which contributed approximately 0.11% to its annual return. |
- 134 -
THE ALGER FUNDS
Financial Highlights for a share outstanding throughout the period (Unaudited)
| Alger Health Sciences Fund | | Class A | |
| | | Six months
ended
4/30/2023(i) | | | Year ended
10/31/2022 | | | Year ended
10/31/2021 | | | Year ended
10/31/2020 | | | Year ended
10/31/2019 | | | Year ended
10/31/2018 | |
| Net asset value, beginning of period | | $ | 20.85 | | | $ | 36.66 | | | $ | 31.75 | | | $ | 26.55 | | | $ | 28.04 | | | $ | 25.16 | |
| INCOME FROM INVESTMENT OPERATIONS: | | | | | | | | | | | | | | | | | | | | | | | | |
| Net investment loss(ii) | | | (0.05 | ) | | | (0.07 | ) | | | (0.21 | ) | | | (0.09 | ) | | | (0.09 | ) | | | (0.19 | ) |
| Net realized and unrealized gain (loss) on investments | | | 0.08 | | | | (8.74 | ) | | | 8.87 | | | | 7.20 | | | | 0.48 | | | | 3.82 | |
| Total from investment operations | | | 0.03 | | | | (8.81 | ) | | | 8.66 | | | | 7.11 | | | | 0.39 | | | | 3.63 | |
| Distributions from net realized gains | | | — | | | | (7.00 | ) | | | (3.75 | ) | | | (1.91 | ) | | | (1.88 | ) | | | (0.75 | ) |
| Net asset value, end of period | | $ | 20.88 | | | $ | 20.85 | | | $ | 36.66 | | | $ | 31.75 | | | $ | 26.55 | | | $ | 28.04 | |
| Total return(iii) | | | 0.14 | % | | | (27.31 | )% | | | 29.12 | %(iv) | | | 28.09 | % | | | 1.96 | % | | | 14.92 | % |
| RATIOS/SUPPLEMENTAL DATA: | | | | | | | | | | | | | | | | | | | | | | | | |
| Net assets, end of period (000’s omitted) | | $ | 83,832 | | | $ | 91,059 | | | $ | 151,514 | | | $ | 127,925 | | | $ | 108,095 | | | $ | 131,731 | |
| Ratio of gross expenses to average net assets | | | 1.09 | % | | | 1.05 | % | | | 1.00 | % | | | 1.04 | % | | | 1.12 | % | | | 1.15 | % |
| Ratio of net expenses to average net assets | | | 1.09 | % | | | 1.05 | % | | | 1.00 | % | | | 1.04 | % | | | 1.12 | % | | | 1.15 | % |
| Ratio of net investment loss to average net assets | | | (0.53 | )% | | | (0.30 | )% | | | (0.63 | )% | | | (0.30 | )% | | | (0.34 | )% | | | (0.68 | )% |
| Portfolio turnover rate | | | 128.72 | % | | | 240.89 | % | | | 152.78 | % | | | 131.29 | % | | | 148.78 | % | | | 89.73 | % |
See Notes to Financial Statements.
| (i) | Ratios have been annualized; total return and portfolio turnover rate have not been annualized. |
| (ii) | Amount was computed based on average shares outstanding during the period. |
| (iii) | Does not reflect the effect of sales charges, if applicable. |
| (iv) | Pursuant to the U.S. Securities and Exchange Commission’s Rules on Fair Fund and Disgorgement Plans, the Alger Health Sciences Fund received a Fair Fund distribution of $179,832, which contributed approximately 0.07% to its annual return. |
- 135 -
THE ALGER FUNDS
Financial Highlights for a share outstanding throughout the period (Unaudited)
| Alger Health Sciences Fund | | Class C | |
| | | Six months
ended
4/30/2023(i) | | | Year ended
10/31/2022 | | | Year ended
10/31/2021 | | | Year ended
10/31/2020 | | | Year ended
10/31/2019 | | | Year ended
10/31/2018 | |
| Net asset value, beginning of period | | $ | 13.08 | | | $ | 26.11 | | | $ | 23.74 | | | $ | 20.44 | | | $ | 22.21 | | | $ | 20.23 | |
| INCOME FROM INVESTMENT OPERATIONS: | | | | | | | | | | | | | | | | | | | | | | | | |
| Net investment loss(ii) | | | (0.09 | ) | | | (0.16 | ) | | | (0.34 | ) | | | (0.23 | ) | | | (0.23 | ) | | | (0.31 | ) |
| Net realized and unrealized gain (loss) on investments | | | 0.05 | | | | (5.87 | ) | | | 6.46 | | | | 5.44 | | | | 0.34 | | | | 3.04 | |
| Total from investment operations | | | (0.04 | ) | | | (6.03 | ) | | | 6.12 | | | | 5.21 | | | | 0.11 | | | | 2.73 | |
| Distributions from net realized gains | | | — | | | | (7.00 | ) | | | (3.75 | ) | | | (1.91 | ) | | | (1.88 | ) | | | (0.75 | ) |
| Net asset value, end of period | | $ | 13.04 | | | $ | 13.08 | | | $ | 26.11 | | | $ | 23.74 | | | $ | 20.44 | | | $ | 22.21 | |
| Total return(iii) | | | (0.31 | )% | | | (27.85 | )% | | | 28.11 | %(iv) | | | 27.12 | % | | | 1.20 | % | | | 14.03 | % |
| RATIOS/SUPPLEMENTAL DATA: | | | | | | | | | | | | | | | | | | | | | | | | |
| Net assets, end of period (000’s omitted) | | $ | 7,154 | | | $ | 7,828 | | | $ | 14,334 | | | $ | 11,862 | | | $ | 10,963 | | | $ | 15,322 | |
| Ratio of gross expenses to average net assets | | | 1.88 | % | | | 1.84 | % | | | 1.76 | % | | | 1.81 | % | | | 1.89 | % | | | 1.93 | % |
| Ratio of net expenses to average net assets | | | 1.88 | % | | | 1.84 | % | | | 1.76 | % | | | 1.81 | % | | | 1.89 | % | | | 1.93 | % |
| Ratio of net investment loss to average net assets | | | (1.33 | )% | | | (1.10 | )% | | | (1.39 | )% | | | (1.07 | )% | | | (1.12 | )% | | | (1.46 | )% |
| Portfolio turnover rate | | | 128.72 | % | | | 240.89 | % | | | 152.78 | % | | | 131.29 | % | | | 148.78 | % | | | 89.73 | % |
See Notes to Financial Statements.
| (i) | Ratios have been annualized; total return and portfolio turnover rate have not been annualized. |
| (ii) | Amount was computed based on average shares outstanding during the period. |
| (iii) | Does not reflect the effect of sales charges, if applicable. |
| (iv) | Pursuant to the U.S. Securities and Exchange Commission’s Rules on Fair Fund and Disgorgement Plans, the Alger Health Sciences Fund received a Fair Fund distribution of $179,832, which contributed approximately 0.07% to its annual return. |
- 136 -
THE ALGER FUNDS
Financial Highlights for a share outstanding throughout the period (Unaudited)
| Alger Health Sciences Fund | | Class Z | |
| | | Six months
ended
4/30/2023(i) | | | Year ended
10/31/2022 | | | Year ended
10/31/2021 | | | Year ended
10/31/2020 | | | Year ended
10/31/2019 | | | Year ended
10/31/2018 | |
| Net asset value, beginning of period | | $ | 21.24 | | | $ | 37.09 | | | $ | 31.99 | | | $ | 26.69 | | | $ | 28.09 | | | $ | 25.11 | |
| INCOME FROM INVESTMENT OPERATIONS: | | | | | | | | | | | | | | | | | | | | | | | | |
| Net investment income (loss)(ii) | | | (0.02 | ) | | | — | (iii) | | | (0.11 | ) | | | — | (iii) | | | 0.01 | | | | (0.09 | ) |
| Net realized and unrealized gain (loss) on investments | | | 0.08 | | | | (8.85 | ) | | | 8.96 | | | | 7.25 | | | | 0.47 | | | | 3.82 | |
| Total from investment operations | | | 0.06 | | | | (8.85 | ) | | | 8.85 | | | | 7.25 | | | | 0.48 | | | | 3.73 | |
| Dividends from net investment income | | | — | | | | — | | | | — | | | | (0.04 | ) | | | — | | | | — | |
| Distributions from net realized gains | | | — | | | | (7.00 | ) | | | (3.75 | ) | | | (1.91 | ) | | | (1.88 | ) | | | (0.75 | ) |
| Net asset value, end of period | | $ | 21.30 | | | $ | 21.24 | | | $ | 37.09 | | | $ | 31.99 | | | $ | 26.69 | | | $ | 28.09 | |
| Total return(iv) | | | 0.28 | % | | | (27.05 | )% | | | 29.53 | %(v) | | | 28.50 | % | | | 2.34 | % | | | 15.32 | % |
| RATIOS/SUPPLEMENTAL DATA: | | | | | | | | | | | | | | | | | | | | | | | | |
| Net assets, end of period (000’s omitted) | | $ | 62,191 | | | $ | 78,928 | | | $ | 184,972 | | | $ | 131,109 | | | $ | 77,023 | | | $ | 57,640 | |
| Ratio of gross expenses to average net assets | | | 0.75 | % | | | 0.72 | % | | | 0.68 | % | | | 0.71 | % | | | 0.79 | % | | | 0.84 | % |
| Ratio of expense reimbursements to average net assets | | | — | | | | — | | | | — | | | | — | | | | (0.04 | )% | | | (0.06 | )% |
| Ratio of net expenses to average net assets | | | 0.75 | % | | | 0.72 | % | | | 0.68 | % | | | 0.71 | % | | | 0.75 | % | | | 0.78 | % |
| Ratio of net investment income (loss) to average net assets | | | (0.20 | )% | | | 0.01 | % | | | (0.31 | )% | | | (0.01 | )% | | | 0.02 | % | | | (0.32 | )% |
| Portfolio turnover rate | | | 128.72 | % | | | 240.89 | % | | | 152.78 | % | | | 131.29 | % | | | 148.78 | % | | | 89.73 | % |
See Notes to Financial Statements.
| (i) | Ratios have been annualized; total return and portfolio turnover rate have not been annualized. |
| (ii) | Amount was computed based on average shares outstanding during the period. |
| (iii) | Amount was less than $0.005 per share. |
| (iv) | Does not reflect the effect of sales charges, if applicable. |
| (v) | Pursuant to the U.S. Securities and Exchange Commission’s Rules on Fair Fund and Disgorgement Plans, the Alger Health Sciences Fund received a Fair Fund distribution of $179,832, which contributed approximately 0.07% to its annual return. |
- 137 -
THE ALGER FUNDS
NOTES TO FINANCIAL STATEMENTS (Unaudited)
NOTE 1 — General:
The Alger Funds (the “Trust”) is an open-end registered investment company organized as a business trust under the laws of the Commonwealth of Massachusetts. The Trust qualifies as an investment company as defined in Financial Accounting Standards Board (“FASB”) Accounting Standards Codification 946-Financial Services – Investment Companies. The Trust operates as a series company currently offering an unlimited number of shares of beneficial interest in ten series — Alger Capital Appreciation Fund, Alger 35 Fund, Alger Growth & Income Fund, Alger Mid Cap Growth Fund, Alger Mid Cap Focus Fund, Alger Weatherbie Specialized Growth Fund, Alger Small Cap Growth Fund, Alger Small Cap Focus Fund, Alger International Focus Fund and Alger Health Sciences Fund (collectively, the “Funds” or individually, each a “Fund”). Alger Capital Appreciation Fund, Alger 35 Fund, Alger Mid Cap Growth Fund, Alger Mid Cap Focus Fund, Alger Weatherbie Specialized Growth Fund, Alger Small Cap Growth Fund, Alger Small Cap Focus Fund, Alger International Focus Fund and Alger Health Sciences Fund normally invest primarily in equity securities and each has an investment objective of long-term capital appreciation. Alger Growth & Income Fund also normally invests primarily in equity securities and has an investment objective of both capital appreciation and current income.
Each Fund offers one or more of the following share classes: Class A, B, C, I, Y and Z. Class A shares are generally subject to an initial sales charge while Class B and C shares are generally subject to a deferred sales charge. Class B shares will automatically convert to Class A shares eight years after the end of the calendar month in which the order to purchase was accepted. The conversion is completed without the imposition of any sales charges or other fees. Class C shares will automatically convert to Class A shares on the fifth business day of the month following the eighth anniversary of the purchase date of a shareholder’s Class C shares, without the imposition of any sales load, fee or other charge. Class B and C shares held at certain dealers may not convert to Class A shares or may be converted on a different schedule. At conversion, a proportionate amount of shares representing reinvested dividends and distributions will also be converted into Class A shares. Effective August 27, 2019, Class C shares were closed to direct shareholders and are only available for purchase through certain financial intermediaries and group retirement plan recordkeeping platforms. Class I, Y and Z shares are generally sold to institutional investors and are sold without an initial or deferred sales charge. Class Y and Z shares are generally subject to a minimum initial investment of $500,000. Each class has identical rights to assets and earnings, except that each share class bears the pro rata allocation of the Fund’s expenses other than a class expense (not including advisory or custodial fees or other expenses related to the management of the Fund’s assets).
Class Y shares of Alger Small Cap Growth Fund launched on December 31, 2021.
NOTE 2 — Significant Accounting Policies:
(a) Investment Valuation: The Funds value their financial instruments at fair value using independent dealers or pricing services under policies approved by the Board of Trustees of the Trust (the “Board”). Investments held by the Funds are valued on each day the New York Stock Exchange (the “NYSE”) is open, as of the close of the NYSE (normally 4:00 p.m. Eastern Time).
- 138 -
THE ALGER FUNDS
NOTES TO FINANCIAL STATEMENTS (Unaudited) (Continued)
The Board has designated, pursuant to Rule 2a-5 under the Investment Company Act of 1940, as amended (the “1940 Act”), the Funds’ investment adviser, Fred Alger Management, LLC (“Alger Management” or the “Investment Manager”) as its valuation designee (the “Valuation Designee”) to make fair value determinations subject to the Board’s review and oversight. The Valuation Designee has established a Valuation Committee (“Committee”) comprised of representatives of the Investment Manager and officers of the Funds to assist in performing the duties and responsibilities of the Valuation Designee.
The Valuation Designee has established valuation processes including but not limited to: (i) making fair value determinations when market quotations for financial instruments are not readily available in accordance with valuation policies and procedures adopted by the Board; (ii) assessing and managing material risks associated with fair valuation determinations; (iii) selecting, applying and testing fair valuation methodologies; and (iv) overseeing and evaluating pricing services used by the Funds. The Valuation Designee regularly reports its fair valuation determinations and related valuation information to the Board. The Committee generally meets quarterly and on an as-needed basis to review and evaluate the effectiveness of the valuation policies and procedures in accordance with the requirements of Rule 2a-5.
Investments in money market funds and short-term securities held by the Funds having a remaining maturity of sixty days or less are valued at amortized cost which approximates market value.
Equity securities, including traded rights, warrants and option contracts for which valuation information is readily available, are valued at the last quoted sales price or official closing price on the primary market or exchange on which they are traded as reported by an independent pricing service. In the absence of quoted sales, such securities are generally valued at the bid price or, in the absence of a recent bid price, the equivalent as obtained from one or more of the major market makers for the securities to be valued.
Securities in which the Funds invest may be traded in foreign markets that close before the close of the NYSE. Developments that occur between the close of the foreign markets and the close of the NYSE may result in adjustments to the closing foreign prices to reflect what the Valuation Designee, through its Committee, believes to be the fair value of these securities as of the close of the NYSE. The Funds may also fair value securities in other situations, for example, when a particular foreign market is closed but the Funds are open.
- 139 -
THE ALGER FUNDS
NOTES TO FINANCIAL STATEMENTS (Unaudited) (Continued)
FASB Accounting Standards Codification 820 – Fair Value Measurements and Disclosures (“ASC 820”) defines fair value as the price that the Funds would receive upon selling an investment in a timely transaction to an independent buyer in the principal or most advantageous market of the investment. ASC 820 established a three-tier hierarchy to maximize the use of observable market data and minimize the use of unobservable inputs and to establish classification of fair value measurements for disclosure purposes. Inputs refer broadly to the assumptions that market participants would use in pricing the asset or liability and may be observable or unobservable. Observable inputs are based on market data obtained from sources independent of the Funds. Unobservable inputs are inputs that reflect the Funds’ own assumptions based on the best information available in the circumstances. The three-tier hierarchy of inputs is summarized in the three broad Levels listed below.
| • | Level 1 – quoted prices in active markets for identical investments |
| • | Level 2 – significant other observable inputs (including quoted prices for similar investments, amortized cost, interest rates, prepayment speeds, credit risk, etc.) |
| • | Level 3 – significant unobservable inputs (including the Funds’ own assumptions in determining the fair value of investments) |
The Funds’ valuation techniques are generally consistent with either the market or the income approach to fair value. The market approach considers prices and other relevant information generated by market transactions involving identical or comparable assets to measure fair value. The income approach converts future amounts to a current, or discounted, single amount. These fair value measurements are determined on the basis of the value indicated by current market expectations about such future events. Inputs for Level 1 include exchange-listed prices and broker quotes in an active market. Inputs for Level 2 include the last trade price in the case of a halted security, an exchange-listed price which has been adjusted for fair value factors, and prices of closely related securities. Additional Level 2 inputs include an evaluated price which is based upon a compilation of observable market information such as spreads for fixed income and preferred securities. Inputs for Level 3 include, but are not limited to, revenue multiples, earnings before interest, taxes, depreciation and amortization (“EBITDA”) multiples, discount rates, time to exit and the probabilities of success of certain outcomes. Such unobservable market information may be obtained from a company’s financial statements and from industry studies, market data, and market indicators such as benchmarks and indexes. Because of the inherent uncertainty and often limited markets for restricted securities, the valuations assigned to such securities by the Funds may significantly differ from the valuations that would have been assigned by the Funds had there been an active market for such securities.
(b) Cash and Cash Equivalents: Cash and cash equivalents include U.S. dollars, foreign cash and overnight time deposits.
(c) Securities Transactions and Investment Income: Securities transactions are recorded on a trade date basis. Realized gains and losses from securities transactions are recorded on the identified cost basis. Dividend income is recognized on the ex-dividend date and interest income is recognized on the accrual basis.
Premiums and discounts on debt securities purchased are amortized or accreted over the lives of the respective securities.
(d) Foreign Currency Transactions: The books and records of the Funds are maintained in U.S. dollars. Foreign currencies, investments and other assets and liabilities are translated into U.S. dollars at the prevailing rates of exchange on the valuation date. Purchases and sales of investment securities and income and expenses are translated into U.S. dollars at the prevailing exchange rates on the respective dates of such transactions.
- 140 -
THE ALGER FUNDS
NOTES TO FINANCIAL STATEMENTS (Unaudited) (Continued)
Net realized gains and losses on foreign currency transactions represent net gains and losses from the disposition of foreign currencies, currency gains and losses realized between the trade dates and settlement dates of security transactions, and the difference between the amount of net investment income accrued and the U.S. dollar amount actually received. The effects of changes in foreign currency exchange rates on investments in securities are included in realized and unrealized gain or loss on investments in the accompanying Statements of Operations.
(e) Forward Foreign Exchange Contracts: Certain Funds may enter into forward foreign currency contracts to hedge against foreign currency exchange rate risk on their non-U.S. dollar denominated securities or to facilitate settlement of foreign currency denominated portfolio transactions. A forward foreign currency contract is an agreement between two parties to buy and sell a currency at a set price on a future date. The contract is marked-to-market daily and the change in value is recorded by a Fund as an unrealized gain or loss. Realized gains or losses equal to the difference between the value of the contract at the time it was opened and the value at the time it was closed are recorded upon delivery or receipt of the currency.
These contracts may involve market risk in excess of the unrealized gain or loss reflected on the Statements of Assets and Liabilities. In addition, the Funds could be exposed to risk if the counterparties are unable to meet the terms of the contracts or if the value of the currency changes unfavorably to the base currency.
(f) Lending of Fund Securities: The Funds may lend their securities to financial institutions, provided that the market value of the securities loaned will not at any time exceed one third of a Fund’s total assets including borrowings, as defined in its prospectuses. The Funds earn fees on the securities loaned, which are included in interest income in the accompanying Statements of Operations. In order to protect against the risk of failure by the borrower to return the securities loaned or any delay in the delivery of such securities, the loan is collateralized by cash or securities that are maintained with Brown Brothers Harriman & Company, the Funds’ custodian (the “Custodian”), in an amount equal to at least 102 percent of the current market value of U.S. loaned securities or 105 percent for non-U.S. loaned securities. The market value of the loaned securities is determined at the close of business of the Funds. Any required additional collateral is delivered to the Custodian each day and any excess collateral is returned to the borrower on the next business day. In the event the borrower fails to return the loaned securities when due, the Funds may take the collateral to replace the securities. If the value of the collateral is less than the purchase cost of replacement securities, the Custodian shall be responsible for any shortfall, but only to the extent that the shortfall is not due to any diminution in collateral value, as defined in the securities lending agreement. The Funds are required to maintain the collateral in a segregated account and determine its value each day until the loaned securities are returned. Cash collateral may be invested as determined by the Funds. Collateral is returned to the borrower upon settlement of the loan. There were no securities loaned as of April 30, 2023.
- 141 -
THE ALGER FUNDS
NOTES TO FINANCIAL STATEMENTS (Unaudited) (Continued)
(g) Dividends to Shareholders: Dividends and distributions payable to shareholders are recorded by the Funds on the ex-dividend date. The Funds declare and pay dividends from net investment income, if available, annually except that Alger Growth & Income Fund declares and pays such dividends quarterly. With respect to all Funds, dividends from net realized gains, offset by any loss carryforward, are declared and paid annually after the end of the fiscal year in which earned.
Each share class is treated separately in determining the amount of dividends from net investment income payable to holders of its shares.
The characterization of distributions to shareholders for financial reporting purposes is determined in accordance with federal income tax rules. Therefore, the source of a Fund’s distributions may be shown in the accompanying financial statements as either from, or in excess of, net investment income, net realized gain on investment transactions, or return of capital, depending on the type of book/tax differences that may exist. Capital accounts within the financial statements are adjusted for permanent book/tax differences. Reclassifications result primarily from the differences in tax treatment of net operating losses, passive foreign investment companies, and foreign currency transactions. The reclassifications are done annually at year-end and have no impact on the net asset values of the Funds and are designed to present each Fund’s capital accounts on a tax basis.
(h) Federal Income Taxes: It is each Fund’s policy to comply with the requirements of the Internal Revenue Code Subchapter M applicable to regulated investment companies and to distribute all of its taxable income to its shareholders. Provided that the Funds maintain such compliance, no federal income tax provision is required. Each Fund is treated as a separate entity for the purpose of determining such compliance.
FASB Accounting Standards Codification 740 – Income Taxes (“ASC 740”) requires the Funds to measure and recognize in their financial statements the benefit of a tax position taken (or expected to be taken) on an income tax return if such position will more likely than not be sustained upon examination based on the technical merits of the position. No tax years are currently under investigation. The Funds file income tax returns in the U.S. Federal jurisdiction, as well as the New York State and New York City jurisdictions. The statute of limitations on the Funds’ tax returns remains open for the tax years 2019-2022. Management does not believe there are any uncertain tax positions that require recognition of a tax liability.
(i) Allocation Methods: The Trust accounts separately for the assets, liabilities and operations of each Fund. Expenses directly attributable to each Fund are charged to that Fund’s operations; expenses which are applicable to all Funds are allocated among them based on net assets. Income, realized and unrealized gains and losses, and expenses of each Fund are allocated among the Fund’s classes based on relative net assets, with the exception of distribution fees, transfer agency fees, and shareholder servicing and related fees.
(j) Estimates: These financial statements have been prepared in accordance with accounting principles generally accepted in the United States of America, which require using estimates and assumptions that affect the reported amounts therein. These unaudited interim financial statements reflect all adjustments that are, in the opinion of management, necessary to present a fair statement of results for the interim period. Actual results may differ from those estimates. All such estimates are of a normal recurring nature.
- 142 -
THE ALGER FUNDS
NOTES TO FINANCIAL STATEMENTS (Unaudited) (Continued)
NOTE 3 — Investment Advisory Fees and Other Transactions with Affiliates:
(a) Investment Advisory Fees: Fees incurred by each Fund, pursuant to the provisions of the Trust’s Investment Advisory Agreement with the Investment Manager, are payable monthly and computed based on the following rates. The actual rate paid as a percentage of average daily net assets, for the six months ended April 30, 2023, is set forth below under the heading “Actual Rate”:
| | | Tier 1 | | | Tier 2 | | | Tier 3 | | | Tier 4 | | | Tier 5 | | | Actual Rate | |
| Alger Capital Appreciation Fund(a) | | | 0.81 | % | | | 0.65 | % | | | 0.60 | % | | | 0.55 | % | | | 0.45 | % | | | 0.81 | % |
| Alger 35 Fund(b) | | | 0.45 | | | | — | | | | — | | | | — | | | | — | | | | 0.45 | |
| Alger Growth & Income Fund(b) | | | 0.50 | | | | — | | | | — | | | | — | | | | — | | | | 0.50 | |
| Alger Mid Cap Growth Fund(c) | | | 0.76 | | | | 0.70 | | | | — | | | | — | | | | — | | | | 0.76 | |
| Alger Mid Cap Focus Fund(d) | | | 0.70 | | | | 0.50 | | | | — | | | | — | | | | — | | | | 0.63 | |
| Alger Weatherbie Specialized Growth Fund(c) | | | 0.81 | | | | 0.75 | | | | — | | | | — | | | | — | | | | 0.81 | |
| Alger Small Cap Growth Fund(c) | | | 0.81 | | | | 0.75 | | | | — | | | | — | | | | — | | | | 0.81 | |
| Alger Small Cap Focus Fund(b) | | | 0.75 | | | | — | | | | — | | | | — | | | | — | | | | 0.75 | |
| Alger International Focus Fund(c) | | | 0.71 | | | | 0.60 | | | | — | | | | — | | | | — | | | | 0.71 | |
| Alger Health Sciences Fund(b) | | | 0.55 | | | | — | | | | — | | | | — | | | | — | | | | 0.55 | |
(a) Tier 1 rate is paid on assets up to $2 billion, Tier 2 rate is paid on assets between $2 billion and $3 billion, Tier 3 rate is paid on assets between $3 billion and $4 billion, Tier 4 rate is paid on assets between $4 billion and $5 billion, and Tier 5 rate is paid on assets in excess of $5 billion.
(b) Tier 1 rate is paid on all assets.
(c) Tier 1 rate is paid on assets up to $1 billion and Tier 2 rate is paid on assets in excess of $1 billion.
(d) Tier 1 rate is paid on assets up to $250 million, and Tier 2 rate is paid on assets in excess of $250 million.
The sub-adviser to the Alger Weatherbie Specialized Growth Fund, Weatherbie Capital, LLC (“Weatherbie” or the “Sub-Adviser”), an affiliate of Alger Management, is paid a fee from the advisory fee that Alger Management receives at no additional cost to the Alger Weatherbie Specialized Growth Fund. The sub-advisory fee is equal to 70% of the net management fee paid by the Alger Weatherbie Specialized Growth Fund to Alger Management with respect to the sub-advised assets. For the six months ended April 30, 2023, Alger Management paid a sub-advisory fee of $1,981,560 for the Alger Weatherbie Specialized Growth Fund to Weatherbie.
- 143 -
THE ALGER FUNDS
NOTES TO FINANCIAL STATEMENTS (Unaudited) (Continued)
Alger Management has contractually agreed to waive and/or reimburse Fund expenses (excluding custody fees, acquired fund fees and expenses, dividend expense on short sales, net borrowing costs, interest, taxes, brokerage and extraordinary expenses, to the extent applicable) through February 28, 2025 to the extent necessary to limit other expenses and any other applicable share class-specific expenses to the rates, based on average daily net assets, as listed in the table below.
Prior to April 1, 2023, Alger Management had contractually agreed to waive and/or reimburse Fund expenses (excluding acquired fund fees and expenses, dividend expense on short sales, borrowing costs, interest, taxes, brokerage and extraordinary expenses, if applicable) for certain Funds in order for the total annual fund operating expenses to not exceed certain rates, based on average net assets.
| | | CLASS | | | FEES WAIVED / REIMBURSED FOR THE SIX MONTHS ENDED | |
| | | A | | | C | | | I | | | Y | | | Z | | | APRIL 30, 2023 | |
| Alger Capital Appreciation Fund | | | — | | | | — | | | | — | | | | — | | | | 0.04 | %(a) | | $ | 283,270 | |
| Alger Mid Cap Growth Fund | | | — | | | | — | | | | — | | | | — | | | | 0.23 | (b) | | | — | |
| Alger Mid Cap Focus Fund | | | 0.53 | %(c) | | | 1.28 | %(c) | | | 0.58 | %(c) | | | 0.07 | %(c) | | | 0.37 | (c) | | | 225 | |
| Alger Weatherbie Specialized Growth Fund | | | — | | | | — | | | | — | | | | 0.07 | (d) | | | — | | | | 16,163 | |
| Alger Small Cap Growth Fund | | | — | | | | — | | | | — | | | | 0.03 | (e) | | | 0.18 | (e) | | | 5,025 | |
| Alger Small Cap Focus Fund | | | — | | | | — | | | | — | | | | 0.10 | (f) | | | — | | | | 30,498 | |
| Alger International Focus Fund | | | — | | | | — | | | | 0.54 | (g) | | | — | | | | 0.13 | (g) | | | 9,227 | |
| Alger Health Sciences Fund | | | — | | | | — | | | | — | | | | — | | | | 0.20 | (h) | | | — | |
(a) Prior to April 1, 2023, total annual fund operating expenses for Alger Capital Appreciation Fund, Class Z shares, could not exceed 0.85%.
(b) Prior to April 1, 2023, total annual fund operating expenses for Alger Mid Cap Growth Fund, Class Z shares, could not exceed 0.99%.
(c) Prior to April 1, 2023, total annual fund operating expenses for Alger Mid Cap Focus Fund, Class A, C, I, Y and Z shares, could not exceed 1.15%, 1.90%, 1.20%, 0.69% and 0.99%, respectively.
(d) Prior to April 1, 2023, total annual fund operating expenses for Alger Weatherbie Specialized Growth Fund, Class Y shares, could not exceed 0.87%.
(e) Prior to April 1, 2023, total annual fund operating expenses for Alger Small Cap Growth Fund, Class Y and Z shares, could not exceed 0.84% and 0.99%, respectively.
(f) Prior to April 1, 2023, total annual fund operating expenses for Alger Small Cap Focus Fund, Class Y shares, could not exceed 0.85%.
(g) Prior to April 1, 2023, total annual fund operating expenses for Alger International Focus Fund, Class I and Z shares, could not exceed 1.25% and 0.84%, respectively.
(h) Prior to April 1, 2023, total annual fund operating expenses for Alger Health Sciences Fund, Class Z shares, could not exceed 0.75%.
Alger Management may recoup any fees waived or expenses reimbursed pursuant to the contract; however, a Fund will only make repayments to the Investment Manager if such repayment does not cause a Fund’s expense ratio after the repayment is taken into account, to exceed both (i) the expense cap in place at the time such amounts were waived or reimbursed, and (ii) a Fund’s current expense cap. Such recoupment is limited to two years from the date the amount is initially waived or reimbursed. For the period ended April 30, 2023, the recoupment made by the Alger Small Cap Focus Fund to the Investment Manager was $2,468.
- 144 -
THE ALGER FUNDS
NOTES TO FINANCIAL STATEMENTS (Unaudited) (Continued)
Alger Management has also agreed to limit expenses of the Class Z shares of Alger 35 Fund, for the life of the Fund, whereby it reimburses expenses to the extent Fund operating expenses, excluding advisory fees, exceed 0.10%, based on average daily net assets. The expense reimbursement arrangement does not include interest, taxes, brokerage, dividend expense on short sales, borrowing costs and extraordinary expenses. Fees waived for the Alger 35 Fund were $46,171 for the six months ended April 30, 2023.
In addition, Alger Management voluntarily reduced its 12b-1 fee effective April 1, 2019, for the Class B shares of the Alger Mid Cap Growth Fund, Alger Small Cap Growth Fund and Alger International Focus Fund by $34,392, $8,522 and $48,011, respectively, for the six months ended April 30, 2023.
(b) Administration Fees: Fees incurred by each Fund, pursuant to the provisions of the Trust’s Fund Administration Agreement with Alger Management, are payable monthly and computed based on the average daily net assets of each Fund at the annual rate of 0.0275%.
(c) Distribution Fees:
Class A Shares: The Trust has adopted a Plan of Distribution pursuant to which each Fund pays Fred Alger & Company, LLC, each Fund's distributor (the “Distributor” or “Alger LLC”) a fee at the annual rate of 0.25% of the respective average daily net assets of the Class A shares of the designated Fund to compensate Alger LLC for its activities and expenses incurred in distributing and/or administering the Class A shares and/or shareholder servicing. The fees paid may be more or less than the expenses incurred by Alger LLC.
Class B Shares: The Trust has adopted a Plan of Distribution pursuant to which Class B shares of each Fund issuing such shares reimburse Alger LLC for costs and expenses incurred by Alger LLC in connection with advertising, marketing and selling the Class B shares, and shareholder servicing, not to exceed an annual rate of 1% of the respective average daily net assets of the Class B shares of the designated Fund. If in any month, the costs incurred by Alger LLC relating to the Class B shares are in excess of the distribution fees charged to the Class B shares of the Fund, the excess may be carried forward, with interest, and sought to be reimbursed in future periods. As of April 30, 2023, such excess carried forward was $12,939,746, $20,407,519 and $20,171,619 for Class B shares of Alger Mid Cap Growth Fund, Alger Small Cap Growth Fund and Alger International Focus Fund, respectively. Contingent deferred sales charges imposed on redemptions of Class B shares will reduce the amount of distribution expenses for which reimbursement may be sought. See Note 3(d) below.
Class C Shares: The Trust has adopted a Distribution Plan pursuant to which Class C shares of each Fund pays Alger LLC a fee at the annual rate of 1% of the respective average daily net assets of the Class C shares of the designated Fund to compensate Alger LLC for its activities and expenses incurred in distributing the Class C shares and/or shareholder servicing. Fees paid may be more or less than the expenses incurred by Alger LLC.
- 145 -
THE ALGER FUNDS
NOTES TO FINANCIAL STATEMENTS (Unaudited) (Continued)
Class I Shares: The Trust has adopted a Distribution Plan pursuant to which Class I shares of each Fund issuing such shares pays Alger LLC a fee at the annual rate of 0.25% of the average daily net assets of the Fund’s Class I shares to compensate Alger LLC for its activities and expenses incurred in distributing the Class I shares and/or shareholder servicing. Fees paid may be more or less than the expenses incurred by Alger LLC.
(d) Sales Charges: Sales of shares of the Funds may be subject to contingent deferred sales charges. The contingent deferred sales charges are used by Alger LLC to offset distribution expenses previously incurred. Sales charges do not represent expenses of the Trust. For the six months ended April 30, 2023, contingent deferred sales charges imposed, all of which were retained by Alger LLC, were as follows:
| | | CONTINGENT DEFERRED SALES CHARGES | |
| Alger Capital Appreciation Fund | | $ | 1,186 | |
| Alger Growth & Income Fund | | | 819 | |
| Alger Mid Cap Growth Fund | | | 281 | |
| Alger Mid Cap Focus Fund | | | 115 | |
| Alger Weatherbie Specialized Growth Fund | | | 3,013 | |
| Alger Small Cap Growth Fund | | | 1,793 | |
| Alger Small Cap Focus Fund | | | 1,789 | |
| Alger International Focus Fund | | | 1,254 | |
| Alger Health Sciences Fund | | | 881 | |
(e) Brokerage Commissions: During the six months ended April 30, 2023, Alger Capital Appreciation Fund, Alger 35 Fund, Alger Growth & Income Fund, Alger Mid Cap Growth Fund, Alger Mid Cap Focus Fund, Alger Small Cap Growth Fund, Alger Small Cap Focus Fund, Alger International Focus Fund and Alger Health Sciences Fund paid Alger LLC, $168,493, $10,016, $556, $6,250, $107,340, $45,724, $159,906, $11,648 and $39,061, respectively, in connection with securities transactions.
(f) Shareholder Administrative Fees: The Trust has entered into a Shareholder Administrative Services Agreement with Alger Management to compensate Alger Management for liaising with, and providing administrative oversight of, the Trust’s transfer agent, and for other related services. The Funds compensate Alger Management at the annual rate of 0.0165% of their respective average daily net assets for the Class A, Class B and Class C shares and 0.01% of their respective average daily net assets for the Class I, Class Y and Class Z shares for these services.
Alger Management makes payments to intermediaries that provide sub-accounting services to omnibus accounts invested in the Funds. A portion of the fees paid by Alger Management to intermediaries that provide sub-accounting services are charged back to the appropriate Fund, subject to certain limitations, as approved by the Board. For the six months ended April 30, 2023, Alger Management charged back to Alger Capital Appreciation Fund, Alger Growth & Income Fund, Alger Mid Cap Growth Fund, Alger Mid Cap Focus Fund, Alger Weatherbie Specialized Growth Fund, Alger Small Cap Growth Fund, Alger Small Cap Focus Fund, Alger International Focus Fund and Alger Health Sciences Fund $290,004, $26,993, $22,037, $9,300, $64,755, $36,303, $364,182, $12,275 and $26,077, respectively, for these services, which are included in transfer agent fees in the accompanying Statements of Operations.
- 146 -
THE ALGER FUNDS
NOTES TO FINANCIAL STATEMENTS (Unaudited) (Continued)
(g) Trustee Fees: Each trustee who is not an “interested person” of the Trust, as defined in the 1940 Act (“Independent Trustee”), receives a fee of $156,000 per annum, paid pro rata based on net assets by each fund in the Alger Fund Complex, plus travel expenses incurred for attending board meetings. The term “Alger Fund Complex” refers to the Trust, The Alger Institutional Funds, The Alger Funds II, The Alger Portfolios, Alger Global Focus Fund and The Alger ETF Trust, each of which is a registered investment company managed by Alger Management. The Independent Trustee appointed as Chairman of the Board receives additional compensation of $22,000 per annum paid pro rata based on net assets by each fund in the Alger Fund Complex. Additionally, each member of the Audit Committee receives a fee of $13,000 per annum, paid pro rata based on net assets by each fund in the Alger Fund Complex.
The Board has adopted a policy requiring Trustees to receive a minimum of 10% of their annual compensation in shares of one or more of the funds in the Alger Fund Complex.
(h) Interfund Trades: The Funds may engage in purchase and sale transactions with other funds advised by Alger Management or sub-advised by Weatherbie. For the six months ended April 30, 2023, these purchases and sales were as follows:
| | | PURCHASES | | | SALES | | | REALIZED GAIN (LOSS) | |
| Alger Mid Cap Focus Fund | | $ | — | | | $ | 1,806,412 | | | $ | 245,273 | |
| Alger Small Cap Growth Fund | | | 2,417,616 | | | | — | | | | — | |
| Alger Small Cap Focus Fund | | | 1,806,412 | | | | 5,079,448 | | | | (7,847,525 | ) |
(i) Interfund Loans: The Funds, along with other funds in the Alger Fund Complex, may borrow money from and lend money to each other for temporary or emergency purposes with the exception of the Alger International Focus Fund, which can only borrow for temporary or emergency purposes. To the extent permitted under its investment restrictions, each Fund may lend uninvested cash in an amount up to 15% of its net assets to other funds in the Alger Fund Complex. If a Fund has borrowed from other funds in the Alger Fund Complex and has aggregate borrowings from all sources that exceed 10% of the Fund’s total assets, such Fund will secure all of its loans from other funds in the Alger Fund Complex. The interest rate charged on interfund loans is equal to the average of the overnight time deposit rate and bank loan rate available to the Funds. There were no interfund loans outstanding as of April 30, 2023.
During the six months ended April 30, 2023, Alger Capital Appreciation Fund and Alger Small Cap Focus Fund earned interfund loan interest income of $1,242 and $11,977, respectively, and Alger Capital Appreciation Fund, Alger 35 Fund, Alger Mid Cap Growth Fund, Alger Mid Cap Focus Fund, Alger Small Cap Growth Fund, Alger Small Cap Focus Fund and Alger Health Sciences Fund incurred interfund loan interest expenses of $221, $726, $237, $9,961, $948, $32,851 and $462, respectively, which are included in interest income and interest expenses, respectively, in the accompanying Statements of Operations.
- 147 -
THE ALGER FUNDS
NOTES TO FINANCIAL STATEMENTS (Unaudited) (Continued)
(j) Other Transactions with Affiliates: Certain officers and one Trustee of the Trust are directors and/or officers of Alger Management, the Distributor (the “Distributor” or “Alger LLC”), or their affiliates. At April 30, 2023, Alger Management and its affiliated entities owned the following shares:
| | | SHARE CLASS | |
| | | A | | | B | | | C | | | I | | | Y | | | Z | |
| Alger Capital Appreciation Fund | | | 77,161 | | | | — | | | | — | | | | — | | | | — | | | | 39,620 | |
| Alger 35 Fund | | | — | | | | — | | | | — | | | | — | | | | — | | | | 1,593,347 | |
| Alger Growth & Income Fund | | | — | | | | — | | | | — | | | | — | | | | — | | | | 32,315 | |
| Alger Mid Cap Growth Fund | | | — | | | | — | | | | — | | | | — | | | | — | | | | 139,187 | |
| Alger Mid Cap Focus Fund | | | — | | | | — | | | | — | | | | 100,035 | | | | 4,843 | | | | 927,860 | |
| Alger Weatherbie Specialized Growth Fund | | | 187,751 | | | | — | | | | — | | | | — | | | | 10,066 | | | | 185 | |
| Alger Small Cap Growth Fund | | | 71,040 | | | | — | | | | — | | | | — | | | | 36,127 | | | | 106,938 | |
| Alger Small Cap Focus Fund | | | — | | | | — | | | | — | | | | — | | | | 787 | | | | 310,266 | |
| Alger International Focus Fund | | | — | | | | — | | | | — | | | | — | | | | — | | | | 85,519 | |
NOTE 4 — Securities Transactions:
The following summarizes the securities transactions by each Fund, other than U.S. Government securities, short-term securities and forward foreign currency contracts, for the six months ended April 30, 2023:
| | | PURCHASES | | | SALES | |
| Alger Capital Appreciation Fund | | $ | 968,093,103 | | | $ | 1,175,540,404 | |
| Alger 35 Fund | | | 39,574,689 | | | | 40,084,444 | |
| Alger Growth & Income Fund | | | 47,595,653 | | | | 5,551,451 | |
| Alger Mid Cap Growth Fund | | | 88,842,503 | | | | 89,034,610 | |
| Alger Mid Cap Focus Fund | | | 305,980,144 | | | | 389,444,364 | |
| Alger Weatherbie Specialized Growth Fund | | | 138,593,328 | | | | 240,294,731 | |
| Alger Small Cap Growth Fund | | | 41,800,030 | | | | 64,082,470 | |
| Alger Small Cap Focus Fund | | | 646,324,803 | | | | 1,252,611,638 | |
| Alger International Focus Fund | | | 35,132,311 | | | | 42,794,936 | |
| Alger Health Sciences Fund | | | 208,673,042 | | | | 229,571,779 | |
- 148 -
THE ALGER FUNDS
NOTES TO FINANCIAL STATEMENTS (Unaudited) (Continued)
NOTE 5 — Borrowing:
The Funds may borrow from the Custodian on an uncommitted basis. Each Fund pays the Custodian a market rate of interest, generally based upon a rate of return with respect to each respective currency borrowed, taking into consideration relevant overnight and short-term reference rates and the range of distribution between and among the interest rates paid on deposits to other institutions, less applicable commissions, if any. Borrowings from the Custodian are included in Bank overdrafts in the Statements of Assets and Liabilities. The Funds may also borrow from other funds in the Alger Fund Complex, as discussed in Note 3(i). For the six months ended April 30, 2023, the Funds had the following borrowings from the Custodian and other funds in the Alger Fund Complex:
| | | AVERAGE DAILY
BORROWING | | WEIGHTED AVERAGE
INTEREST RATE |
| Alger Capital Appreciation Fund | | $ | 9,711 | | | | 4.87 | % |
| Alger 35 Fund | | | 50,445 | | | | 5.99 | |
| Alger Growth & Income Fund | | | 137 | | | | 5.91 | |
| Alger Mid Cap Growth Fund | | | 9,902 | | | | 5.36 | |
| Alger Mid Cap Focus Fund | | | 395,574 | | | | 5.08 | |
| Alger Weatherbie Specialized Growth Fund | | $ | 239 | | | | 5.92 | % |
| Alger Small Cap Growth Fund | | | 37,794 | | | | 5.09 | |
| Alger Small Cap Focus Fund | | | 1,343,478 | | | | 4.94 | |
| Alger International Focus Fund | | | 276 | | | | 5.90 | |
| Alger Health Sciences Fund | | | 28,555 | | | | 5.80 | |
The highest amount borrowed from the Custodian and other funds in the Alger Fund Complex during the six months ended April 30, 2023 by each Fund was as follows:
| | | HIGHEST BORROWING |
| Alger Capital Appreciation Fund | | $ | 1,039,000 | |
| Alger 35 Fund | | | 561,067 | |
| Alger Growth & Income Fund | | | 8,281 | |
| Alger Mid Cap Growth Fund | | | 1,027,000 | |
| Alger Mid Cap Focus Fund | | | 27,329,000 | |
| Alger Weatherbie Specialized Growth Fund | | | 14,420 | |
| Alger Small Cap Growth Fund | | | 1,108,000 | |
| Alger Small Cap Focus Fund | | | 22,988,000 | |
| Alger International Focus Fund | | | 22,760 | |
| Alger Health Sciences Fund | | | 1,855,000 | |
- 149 -
THE ALGER FUNDS
NOTES TO FINANCIAL STATEMENTS (Unaudited) (Continued)
NOTE 6 — Share Capital:
The Trust has an unlimited number of authorized shares of beneficial interest of $.001 par value which are presently divided into ten series. Each series is divided into separate classes. During the six months ended April 30, 2023, and the year ended October 31, 2022, transactions of shares of beneficial interest were as follows:
| | | FOR THE SIX MONTHS ENDED
APRIL 30, 2023 | | FOR THE YEAR ENDED
OCTOBER 31, 2022 |
| | | SHARES | | AMOUNT | | SHARES | | AMOUNT |
| Alger Capital Appreciation Fund | | | | | | | | | | | | | | | | |
| Class A: | | | | | | | | | | | | | | | | |
| Shares sold | | | 2,102,945 | | | $ | 42,381,224 | | | | 6,000,142 | | | $ | 160,613,838 | |
| Shares converted from Class C | | | 34,716 | | | | 700,867 | | | | 78,399 | | | | 2,165,868 | |
| Dividends reinvested | | | 1,253,214 | | | | 24,437,672 | | | | 7,597,941 | | | | 236,675,867 | |
| Shares redeemed | | | (5,273,687 | ) | | | (107,304,307 | ) | | | (14,983,247 | ) | | | (385,940,345 | ) |
| Net increase (decrease) | | | (1,882,812 | ) | | $ | (39,784,544 | ) | | | (1,306,765 | ) | | $ | 13,515,228 | |
| Class C: | | | | | | | | | | | | | | | | |
| Shares sold | | | 303,150 | | | $ | 3,594,335 | | | | 917,381 | | | $ | 14,823,256 | |
| Shares converted to Class A | | | (58,665 | ) | | | (700,867 | ) | | | (126,672 | ) | | | (2,165,868 | ) |
| Dividends reinvested | | | 464,915 | | | | 5,355,816 | | | | 2,637,277 | | | | 50,292,867 | |
| Shares redeemed | | | (1,913,309 | ) | | | (23,182,703 | ) | | | (3,969,807 | ) | | | (67,501,761 | ) |
| Net decrease | | | (1,203,909 | ) | | $ | (14,933,419 | ) | | | (541,821 | ) | | $ | (4,551,506 | ) |
| Class Z: | | | | | | | | | | | | | | | | |
| Shares sold | | | 2,951,007 | | | $ | 63,604,108 | | | | 8,886,657 | | | $ | 247,659,419 | |
| Dividends reinvested | | | 1,308,238 | | | | 27,316,002 | | | | 7,554,946 | | | | 250,370,897 | |
| Shares redeemed | | | (9,589,453 | ) | | | (210,326,783 | ) | | | (14,251,217 | ) | | | (384,129,235 | ) |
| Net increase (decrease) | | | (5,330,208 | ) | | $ | (119,406,673 | ) | | | 2,190,386 | | | $ | 113,901,081 | |
| | | | | | | | | | | | | | | | | |
| Alger 35 Fund | | | | | | | | | | | | | | | | |
| Class Z: | | | | | | | | | | | | | | | | |
| Shares sold | | | 64,211 | | | $ | 623,786 | | | | 40,255 | | | $ | 487,994 | |
| Dividends reinvested | | | 216 | | | | 1,955 | | | | 747,267 | | | | 10,551,417 | |
| Shares redeemed | | | (122,292 | ) | | | (1,162,194 | ) | | | (136,944 | ) | | | (1,414,466 | ) |
| Net increase (decrease) | | | (57,865 | ) | | $ | (536,453 | ) | | | 650,578 | | | $ | 9,624,945 | |
| | | | | | | | | | | | | | | | | |
| Alger Growth & Income Fund | | | | | | | | | | | | | | | | |
| Class A: | | | | | | | | | | | | | | | | |
| Shares sold | | | 300,532 | | | $ | 16,304,219 | | | | 515,271 | | | $ | 29,459,291 | |
| Shares converted from Class C | | | 1,534 | | | | 84,965 | | | | 3,410 | | | | 186,340 | |
| Dividends reinvested | | | 14,299 | | | | 761,954 | | | | 71,532 | | | | 4,322,564 | |
| Shares redeemed | | | (206,501 | ) | | | (11,243,400 | ) | | | (249,872 | ) | | | (14,016,272 | ) |
| Net increase | | | 109,864 | | | $ | 5,907,738 | | | | 340,341 | | | $ | 19,951,923 | |
| Class C: | | | | | | | | | | | | | | | | |
| Shares sold | | | 108,939 | | | $ | 5,762,084 | | | | 180,118 | | | $ | 9,975,860 | |
| Shares converted to Class A | | | (1,560 | ) | | | (84,965 | ) | | | (3,467 | ) | | | (186,340 | ) |
| Dividends reinvested | | | 1,593 | | | | 83,551 | | | | 11,180 | | | | 673,395 | |
| Shares redeemed | | | (77,963 | ) | | | (4,155,506 | ) | | | (77,010 | ) | | | (4,282,374 | ) |
| Net increase | | | 31,009 | | | $ | 1,605,164 | | | | 110,821 | | | $ | 6,180,541 | |
| Class Z: | | | | | | | | | | | | | | | | |
| Shares sold | | | 1,171,467 | | | $ | 63,675,319 | | | | 1,892,410 | | | $ | 104,985,589 | |
| Dividends reinvested | | | 21,609 | | | | 1,151,810 | | | | 34,141 | | | | 2,015,228 | |
| Shares redeemed | | | (513,127 | ) | | | (27,811,719 | ) | | | (342,836 | ) | | | (18,637,053 | ) |
| Net increase | | | 679,949 | | | $ | 37,015,410 | | | | 1,583,715 | | | $ | 88,363,764 | |
- 150 -
THE ALGER FUNDS
NOTES TO FINANCIAL STATEMENTS (Unaudited) (Continued)
| | | FOR THE SIX MONTHS ENDED
APRIL 30, 2023 | | FOR THE YEAR ENDED
OCTOBER 31, 2022 |
| | | SHARES | | AMOUNT | | SHARES | | AMOUNT |
| Alger Mid Cap Growth Fund | | | | | | | | | | | | | | | | |
| Class A: | | | | | | | | | | | | | | | | |
| Shares sold | | | 172,609 | | | $ | 1,880,253 | | | | 914,935 | | | $ | 12,779,301 | |
| Shares converted from Class B | | | 7,851 | | | | 86,849 | | | | 39,929 | | | | 499,789 | |
| Shares converted from Class C | | | 9,505 | | | | 102,725 | | | | 4,455 | | | | 62,406 | |
| Dividends reinvested | | | — | | | | — | | | | 3,949,371 | | | | 62,202,597 | |
| Shares redeemed | | | (870,693 | ) | | | (9,549,802 | ) | | | (1,662,534 | ) | | | (23,061,302 | ) |
| Net increase (decrease) | | | (680,728 | ) | | $ | (7,479,975 | ) | | | 3,246,156 | | | $ | 52,482,791 | |
| Class B: | | | | | | | | | | | | | | | | |
| Shares sold | | | 30,087 | | | $ | 209,249 | | | | 306,507 | | | $ | 2,429,187 | |
| Shares converted to Class A | | | (12,533 | ) | | | (86,849 | ) | | | (63,092 | ) | | | (499,789 | ) |
| Dividends reinvested | | | — | | | | — | | | | 648,341 | | | | 6,399,126 | |
| Shares redeemed | | | (77,653 | ) | | | (525,464 | ) | | | (338,973 | ) | | | (3,167,198 | ) |
| Net increase (decrease) | | | (60,099 | ) | | $ | (403,064 | ) | | | 552,783 | | | $ | 5,161,326 | |
| Class C: | | | | | | | | | | | | | | | | |
| Shares sold | | | 16,461 | | | $ | 104,254 | | | | 129,451 | | | $ | 1,156,792 | |
| Shares converted to Class A | | | (16,257 | ) | | | (102,725 | ) | | | (7,374 | ) | | | (62,406 | ) |
| Dividends reinvested | | | — | | | | — | | | | 312,841 | | | | 2,906,295 | |
| Shares redeemed | | | (117,809 | ) | | | (753,287 | ) | | | (177,595 | ) | | | (1,518,832 | ) |
| Net increase (decrease) | | | (117,605 | ) | | $ | (751,758 | ) | | | 257,323 | | | $ | 2,481,849 | |
| Class Z: | | | | | | | | | | | | | | | | |
| Shares sold | | | 237,215 | | | $ | 2,717,528 | | | | 1,467,938 | | | $ | 24,776,780 | |
| Dividends reinvested | | | — | | | | — | | | | 730,556 | | | | 11,835,012 | |
| Shares redeemed | | | (598,598 | ) | | | (6,690,132 | ) | | | (1,511,602 | ) | | | (20,451,267 | ) |
| Net increase (decrease) | | | (361,383 | ) | | $ | (3,972,604 | ) | | | 686,892 | | | $ | 16,160,525 | |
- 151 -
THE ALGER FUNDS
NOTES TO FINANCIAL STATEMENTS (Unaudited) (Continued)
| | | FOR THE SIX MONTHS ENDED
APRIL 30, 2023 | | FOR THE YEAR ENDED
OCTOBER 31, 2022 |
| | | SHARES | | AMOUNT | | SHARES | | AMOUNT |
| Alger Mid Cap Focus Fund | | | | | | | | | | | | | | | | |
| Class A: | | | | | | | | | | | | | | | | |
| Shares sold | | | 150,042 | | | $ | 1,785,774 | | | | 437,847 | | | $ | 6,471,602 | |
| Dividends reinvested | | | — | | | | — | | | | 12,508 | | | | 226,140 | |
| Shares redeemed | | | (116,324 | ) | | | (1,405,341 | ) | | | (102,747 | ) | | | (1,441,325 | ) |
| Net increase | | | 33,718 | | | $ | 380,433 | | | | 347,608 | | | $ | 5,256,417 | |
| Class C: | | | | | | | | | | | | | | | | |
| Shares sold | | | 76,501 | | | $ | 892,828 | | | | 205,863 | | | $ | 3,441,176 | |
| Dividends reinvested | | | — | | | | — | | | | 12,103 | | | | 218,218 | |
| Shares redeemed | | | (54,212 | ) | | | (635,861 | ) | | | (114,553 | ) | | | (1,735,186 | ) |
| Net increase | | | 22,289 | | | $ | 256,967 | | | | 103,413 | | | $ | 1,924,208 | |
| Class I: | | | | | | | | | | | | | | | | |
| Shares sold | | | 193,844 | | | $ | 2,313,624 | | | | 1,024,323 | | | $ | 17,245,006 | |
| Dividends reinvested | | | — | | | | — | | | | 678,515 | | | | 12,274,336 | |
| Shares redeemed | | | (3,675,352 | ) | | | (43,865,643 | ) | | | (2,767,242 | ) | | | (41,627,861 | ) |
| Net decrease | | | (3,481,508 | ) | | $ | (41,552,019 | ) | | | (1,064,404 | ) | | $ | (12,108,519 | ) |
| Class Y:* | | | | | | | | | | | | | | | | |
| Shares sold | | | 2,319 | | | $ | 27,630 | | | | 30,243 | | | $ | 420,561 | |
| Dividends reinvested | | | — | | | | — | | | | 116 | | | | 2,107 | |
| Shares redeemed | | | (21,248 | ) | | | (256,386 | ) | | | (9 | ) | | | (87 | ) |
| Net increase (decrease) | | | (18,929 | ) | | $ | (228,756 | ) | | | 30,350 | | | $ | 422,581 | |
| Class Z: | | | | | | | | | | | | | | | | |
| Shares sold | | | 3,823,741 | | | $ | 45,649,005 | | | | 13,358,332 | | | $ | 215,931,807 | |
| Dividends reinvested | | | — | | | | — | | | | 3,770,479 | | | | 68,698,120 | |
| Shares redeemed | | | (7,160,522 | ) | | | (85,884,142 | ) | | | (21,026,998 | ) | | | (316,016,051 | ) |
| Net decrease | | | (3,336,781 | ) | | $ | (40,235,137 | ) | | | (3,898,187 | ) | | $ | (31,386,124 | ) |
- 152 -
THE ALGER FUNDS
NOTES TO FINANCIAL STATEMENTS (Unaudited) (Continued)
| | | FOR THE SIX MONTHS ENDED
APRIL 30, 2023 | | FOR THE YEAR ENDED
OCTOBER 31, 2022 |
| | | SHARES | | AMOUNT | | SHARES | | AMOUNT |
| Alger Weatherbie Specialized Growth Fund |
| Class A: | | | | | | | | | | | | | | | | |
| Shares sold | | | 540,727 | | | $ | 6,199,204 | | | | 2,207,109 | | | $ | 31,475,922 | |
| Shares converted from Class C | | | 2,343 | | | | 26,487 | | | | 10,193 | | | | 195,953 | |
| Dividends reinvested | | | — | | | | — | | | | 2,355,077 | | | | 40,837,032 | |
| Shares redeemed | | | (1,477,175 | ) | | | (16,877,034 | ) | | | (4,618,177 | ) | | | (63,575,231 | ) |
| Net increase (decrease) | | | (934,105 | ) | | $ | (10,651,343 | ) | | | (45,798 | ) | | $ | 8,933,676 | |
| Class C: | | | | | | | | | | | | | | | | |
| Shares sold | | | 298,157 | | | $ | 1,841,777 | | | | 1,004,246 | | | $ | 8,908,341 | |
| Shares converted to Class A | | | (4,320 | ) | | | (26,487 | ) | | | (17,106 | ) | | | (195,953 | ) |
| Dividends reinvested | | | — | | | | — | | | | 2,635,295 | | | | 24,982,600 | |
| Shares redeemed | | | (1,225,119 | ) | | | (7,590,966 | ) | | | (2,980,283 | ) | | | (23,986,101 | ) |
| Net increase (decrease) | | | (931,282 | ) | | $ | (5,775,676 | ) | | | 642,152 | | | $ | 9,708,887 | |
| Class I: | | | | | | | | | | | | | | | | |
| Shares sold | | | 86,348 | | | $ | 1,039,284 | | | | 430,300 | | | $ | 7,169,370 | |
| Dividends reinvested | | | — | | | | — | | | | 505,518 | | | | 9,079,102 | |
| Shares redeemed | | | (311,075 | ) | | | (3,690,637 | ) | | | (1,472,639 | ) | | | (21,152,563 | ) |
| Net decrease | | | (224,727 | ) | | $ | (2,651,353 | ) | | | (536,821 | ) | | $ | (4,904,091 | ) |
| Class Y: | | | | | | | | | | | | | | | | |
| Shares sold | | | 524,622 | | | $ | 6,273,472 | | | | 2,793,770 | | | $ | 42,898,361 | |
| Dividends reinvested | | | — | | | | — | | | | 343,618 | | | | 6,305,382 | |
| Shares redeemed | | | (634,555 | ) | | | (7,629,132 | ) | | | (1,624,371 | ) | | | (22,901,364 | ) |
| Net increase (decrease) | | | (109,933 | ) | | $ | (1,355,660 | ) | | | 1,513,017 | | | $ | 26,302,379 | |
| Class Z: | | | | | | | | | | | | | | | | |
| Shares sold | | | 6,013,033 | | | $ | 76,530,108 | | | | 25,026,249 | | | $ | 397,063,874 | |
| Dividends reinvested | | | — | | | | — | | | | 9,047,802 | | | | 171,998,722 | |
| Shares redeemed | | | (12,571,000 | ) | | | (157,817,485 | ) | | | (39,559,633 | ) | | | (605,958,139 | ) |
| Net decrease | | | (6,557,967 | ) | | $ | (81,287,377 | ) | | | (5,485,582 | ) | | $ | (36,895,543 | ) |
- 153 -
THE ALGER FUNDS
NOTES TO FINANCIAL STATEMENTS (Unaudited) (Continued)
| | | FOR THE SIX MONTHS ENDED
APRIL 30, 2023 | | FOR THE YEAR ENDED
OCTOBER 31, 2022 |
| | | SHARES | | AMOUNT | | SHARES | | AMOUNT |
| Alger Small Cap Growth Fund | | | | | | | | | | | | | | | | |
| Class A: | | | | | | | | | | | | | | | | |
| Shares sold | | | 579,472 | | | $ | 4,969,154 | | | | 2,219,196 | | | $ | 24,488,782 | |
| Shares converted from Class B | | | 12,049 | | | | 105,791 | | | | 49,641 | | | | 549,484 | |
| Shares converted from Class C | | | 467 | | | | 4,070 | | | | 1,542 | | | | 15,219 | |
| Dividends reinvested | | | — | | | | — | | | | 1,565,131 | | | | 20,221,493 | |
| Shares redeemed | | | (1,627,693 | ) | | | (14,105,281 | ) | | | (3,937,640 | ) | | | (43,512,748 | ) |
| Net increase (decrease) | | | (1,035,705 | ) | | $ | (9,026,266 | ) | | | (102,130 | ) | | $ | 1,762,230 | |
| Class B: | | | | | | | | | | | | | | | | |
| Shares sold | | | 14,794 | | | $ | 83,645 | | | | 69,274 | | | $ | 489,107 | |
| Shares converted to Class A | | | (17,903 | ) | | | (105,791 | ) | | | (73,759 | ) | | | (549,484 | ) |
| Dividends reinvested | | | — | | | | — | | | | 77,256 | | | | 672,125 | |
| Shares redeemed | | | (70,664 | ) | | | (409,137 | ) | | | (71,673 | ) | | | (579,243 | ) |
| Net increase (decrease) | | | (73,773 | ) | | $ | (431,283 | ) | | | 1,098 | | | $ | 32,505 | |
| Class C: | | | | | | | | | | | | | | | | |
| Shares sold | | | 276,727 | | | $ | 1,468,136 | | | | 791,975 | | | $ | 5,337,182 | |
| Shares converted to Class A | | | (750 | ) | | | (4,070 | ) | | | (2,453 | ) | | | (15,219 | ) |
| Dividends reinvested | | | — | | | | — | | | | 590,149 | | | | 4,786,108 | |
| Shares redeemed | | | (754,579 | ) | | | (4,045,942 | ) | | | (1,186,581 | ) | | | (7,903,372 | ) |
| Net increase (decrease) | | | (478,602 | ) | | $ | (2,581,876 | ) | | | 193,090 | | | $ | 2,204,699 | |
| Class Y:** | | | | | | | | | | | | | | | | |
| Shares sold | | | 142,291 | | | $ | 1,295,054 | | | | 890,852 | | | $ | 8,643,853 | |
| Shares redeemed | | | (43,208 | ) | | | (399,883 | ) | | | (25,818 | ) | | | (245,321 | ) |
| Net increase | | | 99,083 | | | $ | 895,171 | | | | 865,034 | | | $ | 8,398,532 | |
| Class Z: | | | | | | | | | | | | | | | | |
| Shares sold | | | 3,604,967 | | | $ | 32,762,015 | | | | 14,423,124 | | | $ | 162,619,241 | |
| Dividends reinvested | | | — | | | | — | | | | 2,222,719 | | | | 30,117,848 | |
| Shares redeemed | | | (7,164,047 | ) | | | (65,847,449 | ) | | | (16,204,110 | ) | | | (179,137,817 | ) |
| Net increase (decrease) | | | (3,559,080 | ) | | $ | (33,085,434 | ) | | | 441,733 | | | $ | 13,599,272 | |
- 154 -
THE ALGER FUNDS
NOTES TO FINANCIAL STATEMENTS (Unaudited) (Continued)
| | | FOR THE SIX MONTHS ENDED
APRIL 30, 2023 | | FOR THE YEAR ENDED
OCTOBER 31, 2022 |
| | | SHARES | | AMOUNT | | SHARES | | AMOUNT |
| Alger Small Cap Focus Fund | | | | | | | | | | | | | | | | |
| Class A: | | | | | | | | | | | | | | | | |
| Shares sold | | | 901,394 | | | $ | 14,580,231 | | | | 2,079,038 | | | $ | 42,247,967 | |
| Shares converted from Class C | | | 3,176 | | | | 51,679 | | | | 3,678 | | | | 95,518 | |
| Dividends reinvested | | | — | | | | — | | | | 1,045,786 | | | | 26,134,180 | |
| Shares redeemed | | | (2,703,922 | ) | | | (43,630,032 | ) | | | (7,382,999 | ) | | | (148,269,616 | ) |
| Net decrease | | | (1,799,352 | ) | | $ | (28,998,122 | ) | | | (4,254,497 | ) | | $ | (79,791,951 | ) |
| Class C: | | | | | | | | | | | | | | | | |
| Shares sold | | | 195,587 | | | $ | 2,749,455 | | | | 361,903 | | | $ | 6,758,876 | |
| Shares converted to Class A | | | (3,643 | ) | | | (51,679 | ) | | | (4,175 | ) | | | (95,518 | ) |
| Dividends reinvested | | | — | | | | — | | | | 669,148 | | | | 14,661,031 | |
| Shares redeemed | | | (1,301,570 | ) | | | (18,265,402 | ) | | | (3,163,891 | ) | | | (54,641,324 | ) |
| Net decrease | | | (1,109,626 | ) | | $ | (15,567,626 | ) | | | (2,137,015 | ) | | $ | (33,316,935 | ) |
| Class I: | | | | | | | | | | | | | | | | |
| Shares sold | | | 1,491,996 | | | $ | 24,576,037 | | | | 2,388,085 | | | $ | 52,040,663 | |
| Dividends reinvested | | | — | | | | — | | | | 817,179 | | | | 21,017,843 | |
| Shares redeemed | | | (4,339,025 | ) | | | (71,624,877 | ) | | | (7,857,664 | ) | | | (170,047,309 | ) |
| Net decrease | | | (2,847,029 | ) | | $ | (47,048,840 | ) | | | (4,652,400 | ) | | $ | (96,988,803 | ) |
| Class Y: | | | | | | | | | | | | | | | | |
| Shares sold | | | 2,629,879 | | | $ | 44,194,028 | | | | 5,178,987 | | | $ | 111,652,914 | |
| Dividends reinvested | | | — | | | | — | | | | 722,905 | | | | 19,019,637 | |
| Shares redeemed | | | (5,135,787 | ) | | | (89,192,057 | ) | | | (3,388,609 | ) | | | (72,320,606 | ) |
| Net increase (decrease) | | | (2,505,908 | ) | | $ | (44,998,029 | ) | | | 2,513,283 | | | $ | 58,351,945 | |
| Class Z: | | | | | | | | | | | | | | | | |
| Shares sold | | | 10,675,726 | | | $ | 183,174,303 | | | | 53,012,266 | | | $ | 1,149,885,044 | |
| Dividends reinvested | | | — | | | | — | | | | 10,465,710 | | | | 275,248,186 | |
| Shares redeemed | | | (38,785,403 | ) | | | (664,523,244 | ) | | | (127,025,685 | ) | | | (2,664,182,027 | ) |
| Net decrease | | | (28,109,677 | ) | | $ | (481,348,941 | ) | | | (63,547,709 | ) | | $ | (1,239,048,797 | ) |
- 155 -
THE ALGER FUNDS
NOTES TO FINANCIAL STATEMENTS (Unaudited) (Continued)
| | | FOR THE SIX MONTHS ENDED
APRIL 30, 2023 | | FOR THE YEAR ENDED
OCTOBER 31, 2022 |
| | | SHARES | | AMOUNT | | SHARES | | AMOUNT |
| Alger International Focus Fund | | | | | | | | | | | | | | | | |
| Class A: | | | | | | | | | | | | | | | | |
| Shares sold | | | 83,541 | | | $ | 1,382,214 | | | | 272,542 | | | $ | 5,095,123 | |
| Shares converted from Class B | | | 4,084 | | | | 67,442 | | | | 11,100 | | | | 214,147 | |
| Shares converted from Class C | | | 656 | | | | 10,816 | | | | 2,157 | | | | 41,626 | |
| Dividends reinvested | | | — | | | | — | | | | 517,441 | | | | 11,740,747 | |
| Shares redeemed | | | (286,827 | ) | | | (4,734,507 | ) | | | (517,683 | ) | | | (9,704,917 | ) |
| Net increase (decrease) | | | (198,546 | ) | | $ | (3,274,035 | ) | | | 285,557 | | | $ | 7,386,726 | |
| Class B: | | | | | | | | | | | | | | | | |
| Shares sold | | | 5,456 | | | $ | 77,979 | | | | 10,257 | | | $ | 145,522 | |
| Shares converted to Class A | | | (4,768 | ) | | | (67,442 | ) | | | (12,932 | ) | | | (214,147 | ) |
| Dividends reinvested | | | — | | | | — | | | | 99,778 | | | | 1,938,691 | |
| Shares redeemed | | | (55,666 | ) | | | (786,797 | ) | | | (100,637 | ) | | | (1,753,746 | ) |
| Net increase (decrease) | | | (54,978 | ) | | $ | (776,260 | ) | | | (3,534 | ) | | $ | 116,320 | |
| Class C: | | | | | | | | | | | | | | | | |
| Shares sold | | | 8,305 | | | $ | 111,555 | | | | 14,352 | | | $ | 245,440 | |
| Shares converted to Class A | | | (810 | ) | | | (10,816 | ) | | | (2,638 | ) | | | (41,626 | ) |
| Dividends reinvested | | | — | | | | — | | | | 21,218 | | | | 393,811 | |
| Shares redeemed | | | (40,921 | ) | | | (547,077 | ) | | | (112,626 | ) | | | (1,705,231 | ) |
| Net decrease | | | (33,426 | ) | | $ | (446,338 | ) | | | (79,694 | ) | | $ | (1,107,606 | ) |
| Class I: | | | | | | | | | | | | | | | | |
| Shares sold | | | 2,265 | | | $ | 37,740 | | | | 64,844 | | | $ | 1,462,329 | |
| Dividends reinvested | | | — | | | | — | | | | 2,147 | | | | 48,866 | |
| Shares redeemed | | | (2,485 | ) | | | (41,160 | ) | | | (20,997 | ) | | | (391,454 | ) |
| Net increase (decrease) | | | (220 | ) | | $ | (3,420 | ) | | | 45,994 | | | $ | 1,119,741 | |
| Class Z: | | | | | | | | | | | | | | | | |
| Shares sold | | | 145,778 | | | $ | 2,476,118 | | | | 356,479 | | | $ | 6,998,893 | |
| Dividends reinvested | | | — | | | | — | | | | 90,502 | | | | 2,089,682 | |
| Shares redeemed | | | (123,808 | ) | | | (2,078,198 | ) | | | (620,623 | ) | | | (11,168,546 | ) |
| Net increase (decrease) | | | 21,970 | | | $ | 397,920 | | | | (173,642 | ) | | $ | (2,079,971 | ) |
- 156 -
THE ALGER FUNDS
NOTES TO FINANCIAL STATEMENTS (Unaudited) (Continued)
| | | FOR THE SIX MONTHS ENDED
APRIL 30, 2023 | | FOR THE YEAR ENDED
OCTOBER 31, 2022 |
| | | SHARES | | AMOUNT | | SHARES | | AMOUNT |
| Alger Health Sciences Fund | | | | | | | | | | | | | | | | |
| Class A: | | | | | | | | | | | | | | | | |
| Shares sold | | | 116,973 | | | $ | 2,417,120 | | | | 551,350 | | | $ | 12,970,639 | |
| Shares converted from Class C | | | 1,217 | | | | 24,929 | | | | 7,202 | | | | 167,019 | |
| Dividends reinvested | | | — | | | | — | | | | 974,155 | | | | 24,529,213 | |
| Shares redeemed | | | (470,336 | ) | | | (9,715,487 | ) | | | (1,298,720 | ) | | | (29,986,025 | ) |
| Net increase (decrease) | | | (352,146 | ) | | $ | (7,273,438 | ) | | | 233,987 | | | $ | 7,680,846 | |
| Class C: | | | | | | | | | | | | | | | | |
| Shares sold | | | 39,886 | | | $ | 524,266 | | | | 69,406 | | | $ | 1,071,149 | |
| Shares converted to Class A | | | (1,943 | ) | | | (24,929 | ) | | | (11,391 | ) | | | (167,019 | ) |
| Dividends reinvested | | | — | | | | — | | | | 226,913 | | | | 3,607,915 | |
| Shares redeemed | | | (88,103 | ) | | | (1,141,783 | ) | | | (235,168 | ) | | | (3,555,053 | ) |
| Net increase (decrease) | | | (50,160 | ) | | $ | (642,446 | ) | | | 49,760 | | | $ | 956,992 | |
| Class Z: | | | | | | | | | | | | | | | | |
| Shares sold | | | 177,172 | | | $ | 3,722,530 | | | | 1,269,543 | | | $ | 31,739,077 | |
| Dividends reinvested | | | — | | | | — | | | | 1,302,121 | | | | 33,295,227 | |
| Shares redeemed | | | (974,218 | ) | | | (20,454,526 | ) | | | (3,842,061 | ) | | | (88,876,343 | ) |
| Net decrease | | | (797,046 | ) | | $ | (16,731,996 | ) | | | (1,270,397 | ) | | $ | (23,842,039 | ) |
* Inception date December 17, 2021.
** Inception date December 31, 2021.
NOTE 7 — Income Tax Information:
At October 31, 2022, the Alger 35 Fund, the Alger Growth & Income Fund, the Alger Mid Cap Growth Fund, the Alger Mid Cap Focus Fund, the Alger Weatherbie Specialized Growth Fund, the Alger Small Cap Growth Fund, the Alger Small Cap Focus Fund, the Alger International Focus Fund and the Alger Health Sciences Fund, for federal income tax purposes, had capital loss carryforwards of $3,821,422, $175,048, $55,039,064, $112,987,257, $183,450,481, $24,317,021, $545,792,970, $6,464,970 and $43,177,529, respectively.
Under the Regulated Investment Company Modernization Act of 2010, capital losses incurred by the Funds will not be subject to expiration.
The difference between book-basis and tax-basis unrealized appreciation (depreciation) is determined annually and is attributable primarily to the tax deferral of losses on wash sales, U.S. Internal Revenue Code Section 988 currency transactions, nondeductible expenses on dividends sold short, the tax treatment of partnership investments, the realization of unrealized appreciation of passive foreign investment companies, and the return of capital from real estate investment trust investments.
The Funds accrue tax on unrealized gains in foreign jurisdictions that impose a foreign capital tax.
- 157 -
THE ALGER FUNDS
NOTES TO FINANCIAL STATEMENTS (Unaudited) (Continued)
NOTE 8 — Fair Value Measurements:
The following is a summary of the inputs used as of April 30, 2023 in valuing the Funds’ investments carried at fair value on a recurring basis. Based upon the nature, characteristics, and risks associated with their investments, the Funds have determined that presenting them by security type and sector is appropriate.
| Alger Capital Appreciation Fund | | TOTAL | | | LEVEL 1 | | | LEVEL 2 | | | LEVEL 3 | |
| COMMON STOCKS |
| Communication Services | | $ | 172,224,590 | | | $ | 172,224,590 | | | $ | — | | | $ | — | |
| Consumer Discretionary | | | 293,379,487 | | | | 253,968,446 | | | | 39,411,041 | | | | — | |
| Energy | | | 62,643,104 | | | | 62,643,104 | | | | — | | | | — | |
| Financials | | | 132,394,267 | | | | 132,394,267 | | | | — | | | | — | |
| Healthcare | | | 275,938,163 | | | | 275,938,163 | | | | — | | | | — | |
| Industrials | | | 118,152,140 | | | | 118,152,140 | | | | — | | | | — | |
| Information Technology | | | 616,142,367 | | | | 616,142,367 | | | | — | | | | — | |
| Materials | | | 35,071,958 | | | | 35,071,958 | | | | — | | | | — | |
| TOTAL COMMON STOCKS | | $ | 1,705,946,076 | | | $ | 1,666,535,035 | | | $ | 39,411,041 | | | $ | — | |
| PREFERRED STOCKS |
| Information Technology | | | 1,197,441 | | | | — | | | | — | | | | 1,197,441 | |
| SPECIAL PURPOSE VEHICLE |
| Information Technology | | | 2,896,878 | | | | — | | | | — | | | | 2,896,878 | |
| TOTAL INVESTMENTS IN SECURITIES | | $ | 1,710,040,395 | | | $ | 1,666,535,035 | | | $ | 39,411,041 | | | $ | 4,094,319 | |
| Alger 35 Fund | | TOTAL | | | LEVEL 1 | | | LEVEL 2 | | | LEVEL 3 | |
| COMMON STOCKS |
| Communication Services | | | 4,501,412 | | | | 4,501,412 | | | | — | | | | — | |
| Consumer Discretionary | | | 7,429,422 | | | | 6,582,195 | | | | 847,227 | | | | — | |
| Energy | | | 1,693,587 | | | | 1,693,587 | | | | — | | | | — | |
| Healthcare | | | 2,584,334 | | | | 2,584,334 | | | | — | | | | — | |
| Industrials | | | 1,173,903 | | | | 1,173,903 | | | | — | | | | — | |
| Information Technology | | | 7,249,666 | | | | 7,249,666 | | | | — | | | | — | |
| Materials | | | 692,259 | | | | 692,259 | | | | — | | | | — | |
| Real Estate | | | 421,168 | | | | 421,168 | | | | — | | | | — | |
| TOTAL COMMON STOCKS | | $ | 25,745,751 | | | $ | 24,898,524 | | | $ | 847,227 | | | $ | — | |
| TOTAL INVESTMENTS IN SECURITIES | | $ | 25,745,751 | | | $ | 24,898,524 | | | $ | 847,227 | | | $ | — | |
- 158 -
THE ALGER FUNDS
NOTES TO FINANCIAL STATEMENTS (Unaudited) (Continued)
| Alger Growth & Income Fund | | TOTAL | | | LEVEL 1 | | | LEVEL 2 | | | LEVEL 3 | |
| COMMON STOCKS |
| Communication Services | | $ | 26,741,639 | | | $ | 26,741,639 | | | $ | — | | | $ | — | |
| Consumer Discretionary | | | 21,481,452 | | | | 21,481,452 | | | | — | | | | — | |
| Consumer Staples | | | 22,668,753 | | | | 22,668,753 | | | | — | | | | — | |
| Energy | | | 16,991,626 | | | | 16,991,626 | | | | — | | | | — | |
| Financials | | | 37,387,062 | | | | 37,387,062 | | | | — | | | | — | |
| Healthcare | | | 43,087,555 | | | | 43,087,555 | | | | — | | | | — | |
| Industrials | | | 18,621,595 | | | | 18,621,595 | | | | — | | | | — | |
| Information Technology | | | 84,156,062 | | | | 84,156,062 | | | | — | | | | — | |
| Materials | | | 7,784,449 | | | | 7,784,449 | | | | — | | | | — | |
| Utilities | | | 4,306,321 | | | | 4,306,321 | | | | — | | | | — | |
| TOTAL COMMON STOCKS | | $ | 283,226,514 | | | $ | 283,226,514 | | | $ | — | | | $ | — | |
| MASTER LIMITED PARTNERSHIP |
| Energy | | | 1,605,974 | | | | 1,605,974 | | | | — | | | | — | |
| REAL ESTATE INVESTMENT TRUST |
| Financials | | | 1,229,485 | | | | 1,229,485 | | | | — | | | | — | |
| Real Estate | | | 10,543,597 | | | | 10,543,597 | | | | — | | | | — | |
| TOTAL REAL ESTATE INVESTMENT TRUST | | $ | 11,773,082 | | | $ | 11,773,082 | | | $ | — | | | $ | — | |
| SHORT TERM INVESTMENTS |
| U.S. Government | | | 8,999,158 | | | | — | | | | 8,999,158 | | | | — | |
| TOTAL INVESTMENTS IN SECURITIES | | $ | 305,604,728 | | | $ | 296,605,570 | | | $ | 8,999,158 | | | $ | — | |
| Alger Mid Cap Growth Fund | | TOTAL | | | LEVEL 1 | | | LEVEL 2 | | | LEVEL 3 | |
| COMMON STOCKS |
| Communication Services | | | 8,253,011 | | | | 8,253,011 | | | | — | | | | — | |
| Consumer Discretionary | | | 27,117,767 | | | | 27,117,767 | | | | — | | | | — | |
| Consumer Staples | | | 1,959,731 | | | | 1,959,731 | | | | — | | | | — | |
| Energy | | | 7,176,061 | | | | 7,176,061 | | | | — | | | | — | |
| Financials | | | 8,932,823 | | | | 8,932,823 | | | | — | | | | — | |
| Healthcare | | | 34,868,210 | | | | 34,868,210 | | | | — | | | | — | |
| Industrials | | | 33,876,017 | | | | 33,876,017 | | | | — | | | | — | |
| Information Technology | | | 49,856,365 | | | | 49,856,365 | | | | — | | | | — | |
| Materials | | | 6,493,169 | | | | 6,493,169 | | | | — | | | | — | |
| Real Estate | | | 6,817,970 | | | | 6,817,970 | | | | — | | | | — | |
| TOTAL COMMON STOCKS | | $ | 185,351,124 | | | $ | 185,351,124 | | | $ | — | | | $ | — | |
| PREFERRED STOCKS |
| Healthcare | | | — | * | | | — | | | | — | | | | — | * |
| RIGHTS |
| Healthcare | | | 395,340 | | | | — | | | | — | | | | 395,340 | |
| SPECIAL PURPOSE VEHICLE |
| Information Technology | | | 1,751,587 | | | | — | | | | — | | | | 1,751,587 | |
| TOTAL INVESTMENTS IN SECURITIES | | $ | 187,498,051 | | | $ | 185,351,124 | | | $ | — | | | $ | 2,146,927 | |
- 159 -
THE ALGER FUNDS
NOTES TO FINANCIAL STATEMENTS (Unaudited) (Continued)
| Alger Mid Cap Focus Fund | | TOTAL | | | LEVEL 1 | | | LEVEL 2 | | | LEVEL 3 | |
| COMMON STOCKS |
| Communication Services | | $ | 18,293,797 | | | $ | 18,293,797 | | | $ | — | | | $ | — | |
| Consumer Discretionary | | | 42,722,405 | | | | 35,338,946 | | | | 7,383,459 | | | | — | |
| Energy | | | 12,353,341 | | | | 12,353,341 | | | | — | | | | — | |
| Financials | | | 3,222,455 | | | | 3,222,455 | | | | — | | | | — | |
| Healthcare | | | 91,766,041 | | | | 91,766,041 | | | | — | | | | — | |
| Industrials | | | 37,764,699 | | | | 37,764,699 | | | | — | | | | — | |
| Information Technology | | | 130,242,394 | | | | 130,242,394 | | | | — | | | | — | |
| Materials | | | 4,106,339 | | | | 4,106,339 | | | | — | | | | — | |
| TOTAL COMMON STOCKS | | $ | 340,471,471 | | | $ | 333,088,012 | | | $ | 7,383,459 | | | $ | — | |
| TOTAL INVESTMENTS IN SECURITIES | | $ | 340,471,471 | | | $ | 333,088,012 | | | $ | 7,383,459 | | | $ | — | |
Alger Weatherbie Specialized Growth Fund | | TOTAL | | | LEVEL 1 | | | LEVEL 2 | | | LEVEL 3 | |
| COMMON STOCKS |
| Communication Services | | | 1,691,000 | | | | 1,691,000 | | | | — | | | | — | |
| Consumer Discretionary | | | 72,115,087 | | | | 72,115,087 | | | | — | | | | — | |
| Energy | | | 37,906,748 | | | | 37,906,748 | | | | — | | | | — | |
| Financials | | | 70,689,452 | | | | 70,689,452 | | | | — | | | | — | |
| Healthcare | | | 158,322,478 | | | | 155,336,268 | | | | — | | | | 2,986,210 | |
| Industrials | | | 124,569,065 | | | | 124,569,065 | | | | — | | | | — | |
| Information Technology | | | 118,228,373 | | | | 118,228,373 | | | | — | | | | — | |
| Real Estate | | | 39,348,567 | | | | 39,348,567 | | | | — | | | | — | |
| TOTAL COMMON STOCKS | | $ | 622,870,770 | | | $ | 619,884,560 | | | $ | — | | | $ | 2,986,210 | |
| PREFERRED STOCKS |
| Healthcare | | | — | * | | | — | | | | — | | | | — | * |
| SHORT TERM INVESTMENTS |
| U.S. Government | | | 21,997,942 | | | | — | | | | 21,997,942 | | | | — | |
| TOTAL INVESTMENTS IN SECURITIES | | $ | 644,868,712 | | | $ | 619,884,560 | | | $ | 21,997,942 | | | $ | 2,986,210 | |
- 160 -
THE ALGER FUNDS
NOTES TO FINANCIAL STATEMENTS (Unaudited) (Continued)
| Alger Small Cap Growth Fund | | TOTAL | | | LEVEL 1 | | | LEVEL 2 | | | LEVEL 3 | |
| COMMON STOCKS |
| Communication Services | | $ | 13,132,116 | | | $ | 13,132,116 | | | $ | — | | | $ | — | |
| Consumer Discretionary | | | 37,966,876 | | | | 37,966,876 | | | | — | | | | — | |
| Consumer Staples | | | 20,445,510 | | | | 20,445,510 | | | | — | | | | — | |
| Energy | | | 19,942,241 | | | | 19,942,241 | | | | — | | | | — | |
| Financials | | | 7,688,331 | | | | 7,688,331 | | | | — | | | | — | |
| Healthcare | | | 102,332,997 | | | | 98,685,999 | | | | — | | | | 3,646,998 | |
| Industrials | | | 28,101,981 | | | | 28,101,981 | | | | — | | | | — | |
| Information Technology | | | 88,382,522 | | | | 88,382,522 | | | | — | | | | — | |
| Materials | | | 8,939,536 | | | | 8,939,536 | | | | — | | | | — | |
| TOTAL COMMON STOCKS | | $ | 326,932,110 | | | $ | 323,285,112 | | | $ | — | | | $ | 3,646,998 | |
| PREFERRED STOCKS |
| Healthcare | | | — | * | | | — | | | | — | | | | — | * |
| RIGHTS |
| Healthcare | | | 117,104 | | | | — | | | | — | | | | 117,104 | |
| REAL ESTATE INVESTMENT TRUST |
| Real Estate | | | 5,071,813 | | | | 5,071,813 | | | | — | | | | — | |
| SPECIAL PURPOSE VEHICLE |
| Information Technology | | | 2,377,939 | | | | — | | | | — | | | | 2,377,939 | |
| SHORT TERM INVESTMENTS |
| U.S. Government | | | 4,999,532 | | | | — | | | | 4,999,532 | | | | — | |
| TOTAL INVESTMENTS IN SECURITIES | | $ | 339,498,498 | | | $ | 328,356,925 | | | $ | 4,999,532 | | | $ | 6,142,041 | |
| Alger Small Cap Focus Fund | | TOTAL | | | LEVEL 1 | | | LEVEL 2 | | | LEVEL 3 | |
| COMMON STOCKS |
| Consumer Discretionary | | | 78,595,459 | | | | 78,595,459 | | | | — | | | | — | |
| Consumer Staples | | | 21,137,305 | | | | 21,137,305 | | | | — | | | | — | |
| Energy | | | 152,714,755 | | | | 152,714,755 | | | | — | | | | — | |
| Healthcare | | | 1,092,422,641 | | | | 1,092,422,641 | | | | — | | | | — | |
| Industrials | | | 204,988,599 | | | | 204,988,599 | | | | — | | | | — | |
| Information Technology | | | 612,829,375 | | | | 612,829,375 | | | | — | | | | — | |
| TOTAL COMMON STOCKS | | $ | 2,162,688,134 | | | $ | 2,162,688,134 | | | $ | — | | | $ | — | |
| RIGHTS |
| Healthcare | | | 7,976 | | | | — | | | | — | | | | 7,976 | |
| SHORT TERM INVESTMENTS |
| U.S. Government | | | 9,999,064 | | | | — | | | | 9,999,064 | | | | — | |
| TOTAL INVESTMENTS IN SECURITIES | | $ | 2,172,695,174 | | | $ | 2,162,688,134 | | | $ | 9,999,064 | | | $ | 7,976 | |
- 161 -
THE ALGER FUNDS
NOTES TO FINANCIAL STATEMENTS (Unaudited) (Continued)
| Alger International Focus Fund | | TOTAL | | | LEVEL 1 | | | LEVEL 2 | | | LEVEL 3 | |
| COMMON STOCKS |
| Consumer Discretionary | | $ | 38,323,506 | | | $ | 19,064,519 | | | $ | 19,258,987 | | | $ | — | |
| Consumer Staples | | | 7,590,693 | | | | — | | | | 7,590,693 | | | | — | |
| Energy | | | 8,372,655 | | | | 3,720,990 | | | | 4,651,665 | | | | — | |
| Financials | | | 24,595,758 | | | | 9,728,592 | | | | 14,867,166 | | | | — | |
| Healthcare | | | 24,417,545 | | | | 2,616,528 | | | | 21,801,017 | | | | — | |
| Industrials | | | 18,562,750 | | | | 3,543,792 | | | | 15,018,958 | | | | — | |
| Information Technology | | | 10,453,795 | | | | — | | | | 10,453,795 | | | | — | |
| Materials | | | 2,803,664 | | | | — | | | | 2,803,664 | | | | — | |
| TOTAL COMMON STOCKS | | $ | 135,120,366 | | | $ | 38,674,421 | | | $ | 96,445,945 | | | $ | — | |
| TOTAL INVESTMENTS IN SECURITIES | | $ | 135,120,366 | | | $ | 38,674,421 | | | $ | 96,445,945 | | | $ | — | |
| Alger Health Sciences Fund | | TOTAL | | | LEVEL 1 | | | LEVEL 2 | | | LEVEL 3 | |
| COMMON STOCKS | | | | | | | | | | | | | | | | |
| Healthcare | | $ | 149,216,903 | | | $ | 127,986,628 | | | $ | 16,230,273 | | | $ | 5,000,002 | |
| PREFERRED STOCKS | | | | | | | | | | | | | | | | |
| Healthcare | | | — | * | | | — | | | | — | | | | — | * |
| RIGHTS | | | | | | | | | | | | | | | | |
| Healthcare | | | 1,311,187 | | | | — | | | | — | | | | 1,311,187 | |
| TOTAL INVESTMENTS IN SECURITIES | | $ | 150,528,090 | | | $ | 127,986,628 | | | $ | 16,230,273 | | | $ | 6,311,189 | |
* Alger Mid Cap Growth Fund’s, Alger Weatherbie Specialized Growth Fund’s, Alger Small Cap Growth Fund’s and Alger Health Sciences Fund’s holdings of Prosetta Biosciences, Inc., Series D shares are classified as a Level 3 investment and are fair valued at zero as of April 30, 2023.
| | | FAIR VALUE
MEASUREMENTS
USING SIGNIFICANT
UNOBSERVABLE
INPUTS (LEVEL 3) | |
| Alger Capital Appreciation Fund | | Common Stocks | |
| Opening balance at November 1, 2022 | | $ | 444,301 | (a) |
| Transfers into Level 3 | | | — | |
| Transfers out of Level 3 | | | — | |
| Total gains or losses | | | | |
| Included in net realized gain (loss) on investments | | | (955,344 | ) |
| Included in net change in unrealized appreciation (depreciation) on investments | | | 1,446,392 | |
| Purchases and sales | | | | |
| Purchases | | | — | |
| Sales | | | (935,349 | ) |
| Closing balance at April 30, 2023 | | | — | |
| Net change in unrealized appreciation (depreciation) attributable to investments still held at April 30, 2023** | | $ | — | |
- 162 -
THE ALGER FUNDS
NOTES TO FINANCIAL STATEMENTS (Unaudited) (Continued)
| | | FAIR VALUE
MEASUREMENTS
USING SIGNIFICANT
UNOBSERVABLE
INPUTS (LEVEL 3) | |
| Alger Capital Appreciation Fund | | Preferred Stocks | |
| Opening balance at November 1, 2022 | | $ | 1,215,538 | |
| Transfers into Level 3 | | | — | |
| Transfers out of Level 3 | | | — | |
| Total gains or losses | | | | |
| Included in net realized gain (loss) on investments | | | — | |
| Included in net change in unrealized appreciation (depreciation) on investments | | | (18,097 | ) |
| Purchases and sales | | | | |
| Purchases | | | — | |
| Sales | | | — | |
| Closing balance at April 30, 2023 | | | 1,197,441 | |
| Net change in unrealized appreciation (depreciation) attributable to investments still held at April 30, 2023** | | $ | (18,097 | ) |
| | | FAIR VALUE
MEASUREMENTS
USING SIGNIFICANT
UNOBSERVABLE
INPUTS (LEVEL 3) | |
Alger Capital Appreciation Fund | | Special Purpose Vehicle | |
| Opening balance at November 1, 2022 | | $ | 2,934,840 | |
| Transfers into Level 3 | | | — | |
| Transfers out of Level 3 | | | — | |
| Total gains or losses | | | | |
| Included in net realized gain (loss) on investments | | | — | |
| Included in net change in unrealized appreciation (depreciation) on investments | | | (37,962 | ) |
| Purchases and sales | | | | |
| Purchases | | | — | |
| Sales | | | — | |
| Closing balance at April 30, 2023 | | | 2,896,878 | |
| Net change in unrealized appreciation (depreciation) attributable to investments still held at April 30, 2023** | | $ | (37,962 | ) |
- 163 -
THE ALGER FUNDS
NOTES TO FINANCIAL STATEMENTS (Unaudited) (Continued)
| | | FAIR VALUE
MEASUREMENTS
USING SIGNIFICANT
UNOBSERVABLE
INPUTS (LEVEL 3) | |
| Alger Mid Cap Growth Fund | | Preferred Stocks | |
| Opening balance at November 1, 2022 | | $ | — | * |
| Transfers into Level 3 | | | — | |
| Transfers out of Level 3 | | | — | |
| Total gains or losses | | | | |
| Included in net realized gain (loss) on investments | | | — | |
| Included in net change in unrealized appreciation (depreciation) on investments | | | — | |
| Purchases and sales | | | | |
| Purchases | | | — | |
| Sales | | | — | |
| Closing balance at April 30, 2023 | | | — | * |
| Net change in unrealized appreciation (depreciation) attributable to investments still held at April 30, 2023** | | $ | — | |
| | | FAIR VALUE
MEASUREMENTS
USING SIGNIFICANT
UNOBSERVABLE
INPUTS (LEVEL 3) | |
| Alger Mid Cap Growth Fund | | Rights | |
| Opening balance at November 1, 2022 | | $ | 354,035 | |
| Transfers into Level 3 | | | — | |
| Transfers out of Level 3 | | | — | |
| Total gains or losses | | | | |
| Included in net realized gain (loss) on investments | | | — | |
| Included in net change in unrealized appreciation (depreciation) on investments | | | 41,305 | |
| Purchases and sales | | | | |
| Purchases | | | — | |
| Sales | | | — | |
| Closing balance at April 30, 2023 | | | 395,340 | |
| Net change in unrealized appreciation (depreciation) attributable to investments still held at April 30, 2023** | | $ | 41,305 | |
- 164 -
THE ALGER FUNDS
NOTES TO FINANCIAL STATEMENTS (Unaudited) (Continued)
| | | FAIR VALUE
MEASUREMENTS
USING SIGNIFICANT
UNOBSERVABLE
INPUTS (LEVEL 3) | |
| Alger Mid Cap Growth Fund | | Special Purpose Vehicle | |
| Opening balance at November 1, 2022 | | $ | 1,775,546 | |
| Transfers into Level 3 | | | — | |
| Transfers out of Level 3 | | | — | |
| Total gains or losses | | | | |
| Included in net realized gain (loss) on investments | | | — | |
| Included in net change in unrealized appreciation (depreciation) on investments | | | (23,959 | ) |
| Purchases and sales | | | | |
| Purchases | | | — | |
| Sales | | | — | |
| Closing balance at April 30, 2023 | | | 1,751,587 | |
| Net change in unrealized appreciation (depreciation) attributable to investments still held at April 30, 2023** | | $ | (23,959 | ) |
| | | FAIR VALUE
MEASUREMENTS
USING SIGNIFICANT
UNOBSERVABLE
INPUTS (LEVEL 3) | |
| Alger Weatherbie Specialized Growth Fund | | Common Stocks | |
| Opening balance at November 1, 2022 | | $ | 2,986,210 | |
| Transfers into Level 3 | | | — | |
| Transfers out of Level 3 | | | — | |
| Total gains or losses | | | | |
| Included in net realized gain (loss) on investments | | | — | |
| Included in net change in unrealized appreciation (depreciation) on investments | | | — | |
| Purchases and sales | | | | |
| Purchases | | | — | |
| Sales | | | — | |
| Closing balance at April 30, 2023 | | | 2,986,210 | |
| Net change in unrealized appreciation (depreciation) attributable to investments still held at April 30, 2023** | | $ | — | |
- 165 -
THE ALGER FUNDS
NOTES TO FINANCIAL STATEMENTS (Unaudited) (Continued)
| | | FAIR VALUE
MEASUREMENTS
USING SIGNIFICANT
UNOBSERVABLE
INPUTS (LEVEL 3) | |
| Alger Weatherbie Specialized Growth Fund | | Preferred Stocks | |
| Opening balance at November 1, 2022 | | $ | — | * |
| Transfers into Level 3 | | | — | |
| Transfers out of Level 3 | | | — | |
| Total gains or losses | | | | |
| Included in net realized gain (loss) on investments | | | — | |
| Included in net change in unrealized appreciation (depreciation) on investments | | | — | |
| Purchases and sales | | | | |
| Purchases | | | — | |
| Sales | | | — | |
| Closing balance at April 30, 2023 | | | — | * |
| Net change in unrealized appreciation (depreciation) attributable to investments still held at April 30, 2023** | | $ | — | |
| | | FAIR VALUE
MEASUREMENTS
USING SIGNIFICANT
UNOBSERVABLE
INPUTS (LEVEL 3) | |
| Alger Small Cap Growth Fund | | Common Stocks | |
| Opening balance at November 1, 2022 | | $ | 3,646,998 | |
| Transfers into Level 3 | | | — | |
| Transfers out of Level 3 | | | — | |
| Total gains or losses | | | | |
| Included in net realized gain (loss) on investments | | | — | |
| Included in net change in unrealized appreciation (depreciation) on investments | | | — | |
| Purchases and sales | | | | |
| Purchases | | | — | |
| Sales | | | — | |
| Closing balance at April 30, 2023 | | | 3,646,998 | |
| Net change in unrealized appreciation (depreciation) attributable to investments still held at April 30, 2023** | | $ | — | |
- 166 -
THE ALGER FUNDS
NOTES TO FINANCIAL STATEMENTS (Unaudited) (Continued)
| | | FAIR VALUE
MEASUREMENTS
USING SIGNIFICANT
UNOBSERVABLE
INPUTS (LEVEL 3) | |
| Alger Small Cap Growth Fund | | Preferred Stocks | |
| Opening balance at November 1, 2022 | | $ | — | * |
| Transfers into Level 3 | | | — | |
| Transfers out of Level 3 | | | — | |
| Total gains or losses | | | | |
| Included in net realized gain (loss) on investments | | | — | |
| Included in net change in unrealized appreciation (depreciation) on investments | | | — | |
| Purchases and sales | | | | |
| Purchases | | | — | |
| Sales | | | — | |
| Closing balance at April 30, 2023 | | | — | * |
| Net change in unrealized appreciation (depreciation) attributable to investments still held at April 30, 2023** | | $ | — | |
| | | FAIR VALUE
MEASUREMENTS
USING SIGNIFICANT
UNOBSERVABLE
INPUTS (LEVEL 3) | |
| Alger Small Cap Growth Fund | | Rights | |
| Opening balance at November 1, 2022 | | $ | 104,869 | |
| Transfers into Level 3 | | | — | |
| Transfers out of Level 3 | | | — | |
| Total gains or losses | | | | |
| Included in net realized gain (loss) on investments | | | — | |
| Included in net change in unrealized appreciation (depreciation) on investments | | | 12,235 | |
| Purchases and sales | | | | |
| Purchases | | | — | |
| Sales | | | — | |
| Closing balance at April 30, 2023 | | | 117,104 | |
| Net change in unrealized appreciation (depreciation) attributable to investments still held at April 30, 2023** | | $ | 12,235 | |
- 167 -
THE ALGER FUNDS
NOTES TO FINANCIAL STATEMENTS (Unaudited) (Continued)
| | | FAIR VALUE
MEASUREMENTS
USING SIGNIFICANT
UNOBSERVABLE
INPUTS (LEVEL 3) | |
| Alger Small Cap Growth Fund | | Special Purpose Vehicle | |
| Opening balance at November 1, 2022 | | $ | 2,410,106 | |
| Transfers into Level 3 | | | — | |
| Transfers out of Level 3 | | | — | |
| Total gains or losses | | | | |
| Included in net realized gain (loss) on investments | | | — | |
| Included in net change in unrealized appreciation (depreciation) on investments | | | (32,167 | ) |
| Purchases and sales | | | | |
| Purchases | | | — | |
| Sales | | | — | |
| Closing balance at April 30, 2023 | | | 2,377,939 | |
| Net change in unrealized appreciation (depreciation) attributable to investments still held at April 30, 2023** | | $ | (32,167 | ) |
| | | FAIR VALUE
MEASUREMENTS
USING SIGNIFICANT
UNOBSERVABLE
INPUTS (LEVEL 3) | |
| Alger Small Cap Focus Fund | | Rights | |
| Opening balance at November 1, 2022 | | $ | 7,143 | |
| Transfers into Level 3 | | | — | |
| Transfers out of Level 3 | | | — | |
| Total gains or losses | | | | |
| Included in net realized gain (loss) on investments | | | — | |
| Included in net change in unrealized appreciation (depreciation) on investments | | | 833 | |
| Purchases and sales | | | | |
| Purchases | | | — | |
| Sales | | | — | |
| Closing balance at April 30, 2023 | | | 7,976 | |
| Net change in unrealized appreciation (depreciation) attributable to investments still held at April 30, 2023** | | $ | 833 | |
- 168 -
THE ALGER FUNDS
NOTES TO FINANCIAL STATEMENTS (Unaudited) (Continued)
| | | FAIR VALUE
MEASUREMENTS
USING SIGNIFICANT
UNOBSERVABLE
INPUTS (LEVEL 3) | |
| Alger Health Sciences Fund | | Common Stocks | |
| Opening balance at November 1, 2022 | | $ | 5,000,002 | |
| Transfers into Level 3 | | | — | |
| Transfers out of Level 3 | | | — | |
| Total gains or losses | | | | |
| Included in net realized gain (loss) on investments | | | — | |
| Included in net change in unrealized appreciation (depreciation) on investments | | | — | |
| Purchases and sales | | | | |
| Purchases | | | — | |
| Sales | | | — | |
| Closing balance at April 30, 2023 | | | 5,000,002 | |
| Net change in unrealized appreciation (depreciation) attributable to investments still held at April 30, 2023** | | $ | — | |
| | | FAIR VALUE
MEASUREMENTS
USING SIGNIFICANT
UNOBSERVABLE
INPUTS (LEVEL 3) | |
| Alger Health Sciences Fund | | Preferred Stocks | |
| Opening balance at November 1, 2022 | | $ | — | * |
| Transfers into Level 3 | | | — | |
| Transfers out of Level 3 | | | — | |
| Total gains or losses | | | | |
| Included in net realized gain (loss) on investments | | | — | |
| Included in net change in unrealized appreciation (depreciation) on investments | | | — | |
| Purchases and sales | | | | |
| Purchases | | | — | |
| Sales | | | — | |
| Closing balance at April 30, 2023 | | | — | * |
| Net change in unrealized appreciation (depreciation) attributable to investments still held at April 30, 2023** | | $ | — | |
- 169 -
THE ALGER FUNDS
NOTES TO FINANCIAL STATEMENTS (Unaudited) (Continued)
| | | FAIR VALUE
MEASUREMENTS
USING SIGNIFICANT
UNOBSERVABLE
INPUTS (LEVEL 3) | |
| Alger Health Sciences Fund | | Rights | |
| Opening balance at November 1, 2022 | | $ | 1,174,198 | |
| Transfers into Level 3 | | | — | |
| Transfers out of Level 3 | | | — | |
| Total gains or losses | | | | |
| Included in net realized gain (loss) on investments | | | — | |
| Included in net change in unrealized appreciation (depreciation) on investments | | | 136,989 | |
| Purchases and sales | | | | |
| Purchases | | | — | |
| Sales | | | — | |
| Closing balance at April 30, 2023 | | | 1,311,187 | |
| Net change in unrealized appreciation (depreciation) attributable to investments still held at April 30, 2023** | | $ | 136,989 | |
(a) Represents the sale of Level 3 common stock, Altaba, Inc., for the period ended April 30, 2023.
* Includes securities that are fair valued at zero.
** Net change in unrealized appreciation (depreciation) is included in net change in unrealized appreciation (depreciation) on investments in the accompanying statement of operations.
The following table provides quantitative information about each Fund’s Level 3 fair value measurements of its investments as of April 30, 2023. The table below is not intended to be all-inclusive, but rather provides information on the Level 3 inputs as they relate to each Fund’s fair value measurements.
| | | Fair Value
April 30, 2023 | | | Valuation
Methodology | | Unobservable
Input | | Input/Range | | Weighted
Average Inputs | |
| Alger Capital Appreciation Fund |
| Preferred Stocks | | $ | 1,197,441 | | | Market Approach | | Transaction Price Revenue Multiple | | N/A
15.0x-17.0x | | N/A | |
| Special Purpose Vehicle | | | 2,896,878 | | | Market Approach | | Transaction Price Revenue Multiple | | N/A
15.0x-17.0x | | N/A | |
| Alger Mid Cap Growth Fund |
| Preferred Stocks | | $ | — | * | | Income Approach | | Discount Rate | | 100.00% | | N/A | |
| Rights | | | 395,340 | | | Income Approach | | Discount Rate Probability of Success | | 8.14%-9.44%
0.00%-60.00% | | N/A | |
| Special Purpose Vehicle | | | 1,751,587 | | | Market Approach | | Transaction Price Revenue Multiple | | N/A
15.0x-17.0x | | N/A | |
| Alger Weatherbie Specialized Growth Fund |
| Common Stocks | | $ | 2,986,210 | | | Market Approach | | Priced at Cost | | N/A | | N/A | |
| Preferred Stocks | | | — | * | | Income Approach | | Discount Rate | | 100.00% | | N/A | |
- 170 -
THE ALGER FUNDS
NOTES TO FINANCIAL STATEMENTS (Unaudited) (Continued)
| | | Fair Value
April 30, 2023 | | | Valuation
Methodology | | Unobservable Input | | Input/Range | | Weighted Average Inputs | |
| Alger Small Cap Growth Fund |
| Common Stocks | | $ | 3,646,998 | | | Market Approach | | Priced at Cost | | N/A | | N/A | |
| Preferred Stocks | | | — | * | | Income Approach | | Discount Rate | | 100.00% | | N/A | |
| Rights | | | 117,104 | | | Income Approach | | Discount Rate Probability of Success | | 8.14%-9.44%
0.00%-60.00% | | N/A | |
| Special Purpose Vehicle | | | 2,377,939 | | | Market Approach | | Transaction Price Revenue Multiple | | N/A 15.0x-17.0x | | N/A | |
| Alger Small Cap Focus Fund |
| Rights | | $ | 7,976 | | | Income Approach | | Discount Rate Probability of Success | | 8.14%-9.44%
0.00%-60.00% | | N/A | |
| Alger Health Sciences Fund |
| Common Stocks | | $ | 5,000,002 | | | Market Approach | | Priced at Cost | | N/A | | N/A | |
| Preferred Stocks | | | — | * | | Income Approach | | Discount Rate | | 100.00% | | N/A | |
| Rights | | | 1,311,187 | | | Income Approach | | Discount Rate Probability of Success | | 8.14%-9.44%
0.00%-60.00% | | N/A | |
* Prosetta Biosciences, Inc., Series D shares are classified as a Level 3 investment and are fair valued at zero as of April 30, 2023.
The significant unobservable inputs used in the fair value measurement of each Fund’s securities are revenue and EBITDA multiples, discount rates, and the probability of success of certain outcomes. Significant increases and decreases in these inputs in isolation and interrelationships between these inputs would have resulted in significantly higher or lower fair value measurements than those noted in the table above. Generally, all other things being equal, increases in revenue and EBITDA multiples, decreases in discount rates, and increases in the probability of success result in higher fair value measurements, whereas decreases in revenues and EBITDA multiples, increases in discount rates, and decreases in the probability of success result in lower fair value measurements.
Certain of the Funds’ assets and liabilities are held at carrying amount or face value, which approximates fair value for financial reporting purposes. As of April 30, 2023, such assets were categorized within the ASC 820 disclosure hierarchy as follows:
- 171 -
THE ALGER FUNDS
NOTES TO FINANCIAL STATEMENTS (Unaudited) (Continued)
| | | TOTAL | | | LEVEL 1 | | | LEVEL 2 | | | LEVEL 3 | |
| Cash, foreign cash and cash equivalents | | | | | | | | | | | | | | | | |
| Alger Capital Appreciation Fund | | $ | 35,251,415 | | | $ | 143,557 | | | $ | 35,107,858 | | | $ | — | |
| Alger 35 Fund | | | �� | | | | — | | | | — | | | | — | |
| Bank overdraft | | | (561,606 | ) | | | (561,606 | ) | | | — | | | | — | |
| Alger Growth & Income Fund | | | 5,334,761 | | | | — | | | | 5,334,761 | | | | — | |
| Alger Mid Cap Growth Fund | | | 3,933,971 | | | | 5 | | | | 3,933,966 | | | | — | |
| Alger Mid Cap Focus Fund | | | 442,596 | | | | — | | | | 442,596 | | | | — | |
| Alger Weatherbie Specialized Growth Fund | | | 7,108,472 | | | | — | | | | 7,108,472 | | | | — | |
| Alger Small Cap Growth Fund | | | 2,077,699 | | | | — | | | | 2,077,699 | | | | — | |
| Alger Small Cap Focus Fund | | | 23,903,731 | | | | — | | | | 23,903,731 | | | | — | |
| Alger International Focus Fund | | | 5,364,513 | | | | 25,305 | | | | 5,339,208 | | | | — | |
| Alger Health Sciences Fund | | | 1,943,022 | | | | — | | | | 1,943,022 | | | | — | |
NOTE 9 — Derivatives:
FASB Accounting Standards Codification 815 – Derivatives and Hedging (“ASC 815”) requires qualitative disclosures about objectives and strategies for using derivatives, quantitative disclosures about fair value amounts of and gains and losses on derivative instruments, and disclosures about credit-risk-related contingent features in derivative agreements.
There were no derivative instruments held by the Funds throughout the period or as of April 30, 2023.
NOTE 10 — Principal Risks:
Alger Capital Appreciation Fund — Investing in the stock market involves risks, including the potential loss of principal. The value of these securities, like other investments, may move up or down, sometimes rapidly and unpredictably. Your Fund shares at any point in time may be worth less than what you invested, even after taking into account the reinvestment of Fund dividends and distributions. Local, regional or global events such as environmental or natural disasters, war, terrorism, pandemics, outbreaks of infectious diseases and similar public health threats, recessions, or other events could have a significant impact on investments. Growth stocks may be more volatile than other stocks as their prices tend to be higher in relation to their companies’ earnings and may be more sensitive to market, political, and economic developments. A significant portion of assets may be invested in securities of companies in related sectors, and may be similarly affected by economic, political, or market events and conditions and may be more vulnerable to unfavorable sector developments. Foreign securities involve special risks including currency fluctuations, inefficient trading, political and economic instability, and increased volatility. Active trading may increase transaction costs, brokerage commissions, and taxes, which can lower the return on investment. At times, the Fund may hold a large cash or cash equivalent position, which may underperform relative to equity securities.
- 172 -
THE ALGER FUNDS
NOTES TO FINANCIAL STATEMENTS (Unaudited) (Continued)
Alger 35 Fund — Investing in the stock market involves risks, including the potential loss of principal. The value of these securities, like other investments, may move up or down, sometimes rapidly and unpredictably. Your Fund shares at any point in time may be worth less than what you invested, even after taking into account the reinvestment of Fund dividends and distributions. Local, regional or global events such as environmental or natural disasters, war, terrorism, pandemics, outbreaks of infectious diseases and similar public health threats, recessions, or other events could have a significant impact on investments. Growth stocks may be more volatile than other stocks as their prices tend to be higher in relation to their companies’ earnings and may be more sensitive to market, political, and economic developments. A significant portion of assets may be invested in securities of companies in related sectors, and may be similarly affected by economic, political, or market events and conditions and may be more vulnerable to unfavorable sector developments. Investing in companies of small and medium capitalizations involves the risk that such issuers may have limited product lines or financial resources, lack management depth, or have limited liquidity. Foreign securities involve special risks including currency fluctuations, inefficient trading, political and economic instability, and increased volatility. The Fund is classified as a “non-diversified fund” under federal securities laws because it can invest in fewer individual companies than a diversified fund. Assets may be focused in a small number of holdings, making them susceptible to risks associated with a single economic, political or regulatory event than a more diversified portfolio. Active trading may increase transaction costs, brokerage commissions, and taxes, which can lower the return on investment. At times, the Fund may hold a large cash or cash equivalent position, which may underperform relative to equity securities.
Alger Growth & Income Fund — Investing in the stock market involves risks, including the potential loss of principal. The value of these securities, like other investments, may move up or down, sometimes rapidly and unpredictably. Your Fund shares at any point in time may be worth less than what you invested, even after taking into account the reinvestment of Fund dividends and distributions. Local, regional or global events such as environmental or natural disasters, war, terrorism, pandemics, outbreaks of infectious diseases and similar public health threats, recessions, or other events could have a significant impact on investments. Growth stocks may be more volatile than other stocks as their prices tend to be higher in relation to their companies’ earnings and may be more sensitive to market, political, and economic developments. A significant portion of assets may be invested in securities of companies in related sectors, and may be similarly affected by economic, political, or market events and conditions and may be more vulnerable to unfavorable sector developments. Income-producing securities may cut or fail to declare dividends due to market downturns or for other reasons. At times, the Fund may hold a large cash or cash equivalent position, which may underperform relative to equity securities.
Alger Mid Cap Growth Fund — Investing in the stock market involves risks, including the potential loss of principal. The value of these securities, like other investments, may move up or down, sometimes rapidly and unpredictably. Your Fund shares at any point in time may be worth less than what you invested, even after taking into account the reinvestment of Fund dividends and distributions. Local, regional or global events such as environmental or natural disasters, war, terrorism, pandemics, outbreaks of infectious diseases and similar public health threats, recessions, or other events could have a significant impact on investments. Growth stocks may be more volatile than other stocks as their prices tend to be higher in relation to their companies’ earnings and may be more sensitive to market, political, and economic developments. A significant portion of assets may be invested in securities of companies in related sectors, and may be similarly affected by economic, political, or market events and conditions and may be more vulnerable to unfavorable sector developments. Investing in companies of medium capitalizations involves the risk that such issuers may have limited product lines or financial resources, lack management depth, or have limited liquidity. Foreign securities involve special risks including currency fluctuations, inefficient trading, political and economic instability, and increased volatility. Active trading may increase transaction costs, brokerage commissions, and taxes, which can lower the return on investment. At times, the Fund may hold a large cash or cash equivalent position, which may underperform relative to equity securities.
- 173 -
THE ALGER FUNDS
NOTES TO FINANCIAL STATEMENTS (Unaudited) (Continued)
Alger Mid Cap Focus Fund — Investing in the stock market involves risks, including the potential loss of principal. The value of these securities, like other investments, may move up or down, sometimes rapidly and unpredictably. Your Fund shares at any point in time may be worth less than what you invested, even after taking into account the reinvestment of Fund dividends and distributions. Local, regional or global events such as environmental or natural disasters, war, terrorism, pandemics, outbreaks of infectious diseases and similar public health threats, recessions, or other events could have a significant impact on investments. Growth stocks may be more volatile than other stocks as their prices tend to be higher in relation to their companies’ earnings and may be more sensitive to market, political, and economic developments. Investing in companies of medium capitalizations involves the risk that such issuers may have limited product lines or financial resources, lack management depth, or have limited liquidity. Assets may be focused in a small number of holdings, making them susceptible to risks associated with a single economic, political or regulatory event than a more diversified portfolio. A significant portion of assets may be invested in securities of companies in related sectors or industries, and may be similarly affected by economic, political, or market events and conditions and may be more vulnerable to unfavorable sector or industry developments. Foreign securities involve special risks including currency fluctuations, inefficient trading, political and economic instability, and increased volatility. Active trading may increase transaction costs, brokerage commissions, and taxes, which can lower the return on investment. At times, the Fund may hold a large cash or cash equivalent position, which may underperform relative to equity securities.
Alger Weatherbie Specialized Growth Fund — Investing in the stock market involves risks, including the potential loss of principal. The value of these securities, like other investments, may move up or down, sometimes rapidly and unpredictably. Your Fund shares at any point in time may be worth less than what you invested, even after taking into account the reinvestment of Fund dividends and distributions. Local, regional or global events such as environmental or natural disasters, war, terrorism, pandemics, outbreaks of infectious diseases and similar public health threats, recessions, or other events could have a significant impact on investments. Growth stocks may be more volatile than other stocks as their prices tend to be higher in relation to their companies’ earnings and may be more sensitive to market, political, and economic developments. A significant portion of assets may be invested in securities of companies in related sectors, and may be similarly affected by economic, political, or market events and conditions and may be more vulnerable to unfavorable sector developments. Investing in companies of small and medium capitalizations involves the risk that such issuers may have limited product lines or financial resources, lack management depth, or have limited liquidity. Assets may be focused in a small number of holdings, making them susceptible to risks associated with a single economic, political or regulatory event than a more diversified portfolio. Foreign securities and emerging markets involve special risks including currency fluctuations, inefficient trading, political and economic instability, and increased volatility. At times, the Fund may hold a large cash or cash equivalent position, which may underperform relative to equity securities.
- 174 -
THE ALGER FUNDS
NOTES TO FINANCIAL STATEMENTS (Unaudited) (Continued)
Alger Small Cap Growth Fund — Investing in the stock market involves risks, including the potential loss of principal. The value of these securities, like other investments, may move up or down, sometimes rapidly and unpredictably. Your Fund shares at any point in time may be worth less than what you invested, even after taking into account the reinvestment of Fund dividends and distributions. Local, regional or global events such as environmental or natural disasters, war, terrorism, pandemics, outbreaks of infectious diseases and similar public health threats, recessions, or other events could have a significant impact on investments. Growth stocks may be more volatile than other stocks as their prices tend to be higher in relation to their companies’ earnings and may be more sensitive to market, political, and economic developments. A significant portion of assets may be invested in securities of companies in related sectors, and may be similarly affected by economic, political, or market events and conditions and may be more vulnerable to unfavorable sector developments. Investing in companies of small capitalizations involves the risk that such issuers may have limited product lines or financial resources, lack management depth, or have limited liquidity. At times, the Fund may hold a large cash or cash equivalent position, which may underperform relative to equity securities.
Alger Small Cap Focus Fund — Investing in the stock market involves risks, including the potential loss of principal. The value of these securities, like other investments, may move up or down, sometimes rapidly and unpredictably. Your Fund shares at any point in time may be worth less than what you invested, even after taking into account the reinvestment of Fund dividends and distributions. Local, regional or global events such as environmental or natural disasters, war, terrorism, pandemics, outbreaks of infectious diseases and similar public health threats, recessions, or other events could have a significant impact on investments. Growth stocks may be more volatile than other stocks as their prices tend to be higher in relation to their companies’ earnings and may be more sensitive to market, political, and economic developments. A significant portion of assets may be invested in securities of companies in related sectors or industries, and may be similarly affected by economic, political, or market events and conditions and may be more vulnerable to unfavorable sector or industry developments. Investing in companies of small capitalizations involves the risk that such issuers may have limited product lines or financial resources, lack management depth, or have limited liquidity. Assets may be focused in a small number of holdings, making them susceptible to risks associated with a single economic, political or regulatory event than a more diversified portfolio. At times, the Fund may hold a large cash or cash equivalent position, which may underperform relative to equity securities.
- 175 -
THE ALGER FUNDS
NOTES TO FINANCIAL STATEMENTS (Unaudited) (Continued)
Alger International Focus Fund — Investing in the stock market involves risks, including the potential loss of principal. The value of these securities, like other investments, may move up or down, sometimes rapidly and unpredictably. Your Fund shares at any point in time may be worth less than what you invested, even after taking into account the reinvestment of Fund dividends and distributions. Local, regional or global events such as environmental or natural disasters, war, terrorism, pandemics, outbreaks of infectious diseases and similar public health threats, recessions, or other events could have a significant impact on investments. Growth stocks may be more volatile than other stocks as their prices tend to be higher in relation to their companies’ earnings and may be more sensitive to market, political, and economic developments. A significant portion of assets may be invested in securities of companies in related sectors, and may be similarly affected by economic, political, or market events and conditions and may be more vulnerable to unfavorable sector developments. Assets may be focused in a small number of holdings, making them susceptible to risks associated with a single economic, political or regulatory event than a more diversified portfolio. Foreign securities and emerging markets involve special risks including currency fluctuations, inefficient trading, political and economic instability, and increased volatility. Investing in companies of small capitalizations involves the risk that such issuers may have limited product lines or financial resources, lack management depth, or have limited liquidity. At times, the Fund may hold a large cash or cash equivalent position, which may underperform relative to equity securities.
Alger Health Sciences Fund — Investing in the stock market involves risks, including the potential loss of principal. The value of these securities, like other investments, may move up or down, sometimes rapidly and unpredictably. Your Fund shares at any point in time may be worth less than what you invested, even after taking into account the reinvestment of Fund dividends and distributions. Local, regional or global events such as environmental or natural disasters, war, terrorism, pandemics, outbreaks of infectious diseases and similar public health threats, recessions, or other events could have a significant impact on investments. Growth stocks may be more volatile than other stocks as their prices tend to be higher in relation to their companies’ earnings and may be more sensitive to market, political, and economic developments. A significant portion of assets will be invested in healthcare companies, which may be significantly affected by competition, innovation, regulation, and product obsolescence, and may be more volatile than the securities of other companies. A significant portion of assets may be invested in securities of companies in related industries, and may be similarly affected by economic, political, or market events and conditions and may be more vulnerable to unfavorable industry developments. Assets may be focused in a small number of holdings, making them susceptible to risks associated with a single economic, political or regulatory event than a more diversified portfolio. Investing in companies of small capitalizations involves the risk that such issuers may have limited product lines or financial resources, lack management depth, or have limited liquidity. Private placements are offerings of a company’s securities not registered with the SEC and not offered to the public, for which limited information may be available. Such investments are generally considered to be illiquid. Foreign securities involve special risks including currency fluctuations, inefficient trading, political and economic instability, and increased volatility. Active trading may increase transaction costs, brokerage commissions, and taxes, which can lower the return on investment. At times, the Fund may hold a large cash or cash equivalent position, which may underperform relative to equity securities.
- 176 -
THE ALGER FUNDS
NOTES TO FINANCIAL STATEMENTS (Unaudited) (Continued)
NOTE 11 — Affiliated Securities:
During the six-month period ended April 30, 2023, as disclosed in the following table, certain Funds held 5% or more of the outstanding voting securities of the issuers listed below. As such, these issuers were “affiliated persons” of the applicable Fund(s) for purposes of the 1940 Act. Transactions during the six-month period ended April 30, 2023 with such affiliated persons are summarized below. During this period, other Funds in the Trust may also have held voting shares of the issuers at levels below 5%.
| Security | | Shares
Held at
October 31,
2022 | | | Shares
Purchased | | | Shares
Sold | | | Shares
Held at
April 30,
2023 | | | Dividend
Income | | | Realized
Gain (Loss) | | | Net Change
in
Unrealized
App(Dep) | | | Value at
April 30,
2023 | |
| Alger Capital Appreciation Fund | | | | | | | | | | | | | | | | | | | | | |
| Special Purpose Vehicle | | | | | | | | | | | | | | | | | | | | | |
| Crosslink Ventures Capital C, LLC, Cl. A*** | | | | | | | | | | | | | | | | | | $ | — | | | $ | — | | | $ | (37,962 | ) | | $ | 2,896,878 | |
| Total | | | | | | | | | | | | | | | | | | $ | — | | | $ | — | | | $ | (37,962 | ) | | $ | 2,896,878 | |
| Security | | Shares
Held at
October 31,
2022 | | | Shares
Purchased | | | Shares
Sold | | | Shares
Held at
April 30,
2023 | | | Dividend
Income | | | Realized
Gain (Loss) | | | Net Change
in
Unrealized
App(Dep) | | | Value at
April 30,
2023 | |
| Alger Mid Cap Growth Fund | | | | | | | | | | | | | | | | | | | | | |
| Preferred Stocks | | | | | | | | | | | | | | | | | | | | | | | | | | | | | | | | |
| Prosetta Biosciences, Inc., Series D** | | | 219,610 | | | | — | | | | — | | | | 219,610 | | | $ | — | | | $ | — | | | $ | — | | | $ | — | * |
| Special Purpose Vehicle | | | | | | | | | | | | | | | | | | | | | |
| Crosslink Ventures Capital C, LLC, Cl. A*** | | | | | | | | | | | | | | | | | | | — | | | | — | | | | (16,416 | ) | | | 1,252,704 | |
| Crosslink Ventures Capital C, LLC, Cl. B*** | | | | | | | | | | | | | | | | | | | — | | | | — | | | | (7,543 | ) | | | 498,883 | |
| Total | | | | | | | | | | | | | | | | | | $ | — | | | $ | — | | | $ | (23,959 | ) | | $ | 1,751,587 | * |
- 177 -
THE ALGER FUNDS
NOTES TO FINANCIAL STATEMENTS (Unaudited) (Continued)
| Security | | Shares
Held at October 31,
2022 | | | Shares
Purchased | | | Shares
Sold | | | Shares
Held at April 30,
2023 | | | Dividend
Income | | | Realized
Gain (Loss) | | | Net Change
in
Unrealized
App(Dep) | | | Value at
April 30,
2023 | |
| Alger Weatherbie Specialized Growth Fund |
| Preferred Stocks |
| Prosetta Biosciences, Inc., Series D** | | | 231,474 | | | | — | | | | — | | | | 231,474 | | | $ | — | | | $ | — | | | $ | — | | | $ | — | * |
| Total | | | | | | | | | | | | | | | | | | $ | — | | | $ | — | | | $ | — | | | $ | — | * |
| Security | | Shares
Held at
October 31,
2022 | | | Shares
Purchased | | | Shares
Sold | | | Shares
Held at
April 30,
2023 | | | Dividend
Income | | | Realized
Gain (Loss) | | | Net Change
in
Unrealized
App(Dep) | | | Value at
April 30,
2023 | |
| Alger Small Cap Growth Fund |
| Preferred Stocks |
| Prosetta Biosciences, Inc., Series D** | | | 50,688 | | | | — | | | | — | | | | 50,688 | | | | — | | | | — | | | | — | | | | — | * |
| Special Purpose Vehicle |
| Crosslink Ventures Capital C, LLC, Cl. A*** | | | | | | | | | | | | | | | | | | | — | | | | — | | | | (24,624 | ) | | | 1,879,056 | |
| Crosslink Ventures Capital C, LLC, Cl. B*** | | | | | | | | | | | | | | | | | | | — | | | | — | | | | (7,543 | ) | | | 498,883 | |
| Total | | | | | | | | | | | | | | | | | | $ | — | | | $ | — | | | $ | (32,167 | ) | | $ | 2,377,939 | * |
| Security | | Shares
Held at
October 31,
2022 | | | Shares
Purchased | | | Shares
Sold | | | Shares
Held at
April 30,
2023 | | | Dividend
Income | | | Realized
Gain (Loss) | | | Net Change
in
Unrealized
App(Dep) | | | Value at
April 30,
2023 | |
| Alger Small Cap Focus Fund |
| Common Stocks |
| 908 Devices, Inc.**** | | | 1,991,055 | | | | 53,198 | | | | (2,044,253 | ) | | | — | | | | — | | | | (26,557,727 | ) | | | 9,318,305 | | | | — | |
| Cabaletta Bio, Inc. | | | — | | | | 3,058,993 | | | | — | | | | 3,058,993 | | | | — | | | | — | | | | (1,225,144 | ) | | | 31,752,347 | |
| Heska Corp. | | | 468,150 | | | | 245,443 | | | | — | | | | 713,593 | | | | — | | | | — | | | | 29,704,367 | | | | 83,604,556 | |
| PROS Holdings, Inc. | | | 2,978,898 | | | | — | | | | (96,903 | ) | | | 2,881,995 | | | | — | | | | (2,323,736 | ) | | | 12,109,715 | | | | 81,762,198 | |
| Total | | | | | | | | | | | | | | | | | | $ | — | | | $ | (28,881,463 | ) | | $ | 49,907,243 | | | $ | 197,119,101 | |
| Security | | Shares
Held at
October 31,
2022 | | | Shares
Purchased | | | Shares
Sold | | | Shares
Held at
April 30,
2023 | | | Dividend
Income | | | Realized
Gain (Loss) | | | Net Change
in
Unrealized
App(Dep) | | | Value at
April 30,
2023 | |
| Alger Health Sciences Fund |
| Preferred Stocks |
| Prosetta Biosciences, Inc., Series D** | | | 897,366 | | | | — | | | | — | | | | 897,366 | | | $ | — | | | $ | — | | | $ | — | | | $ | — | * |
| Total | | | | | | | | | | | | | | | | | | $ | — | | | $ | — | | | $ | — | | | $ | — | * |
- 178 -
THE ALGER FUNDS
NOTES TO FINANCIAL STATEMENTS (Unaudited) (Continued)
* Prosetta Biosciences, Inc., Series D shares are classified as a Level 3 investment and are fair valued at zero as of April 30, 2023.
** Prosetta Biosciences, Inc., Series D is deemed to be an affiliate of the Funds because the Funds and Prosetta Biosciences, Inc., Series D are under common control.
*** The Alger Fund Complex and other entities managed by Alger Management fully own Crosslink Ventures Capital C, LLC, Class A and Crosslink Ventures Capital C, LLC, Class B. There were no capital increases or decreases for the six-month period ended April 30, 2023.
**** Non-affiliated at April 30, 2023.
NOTE 12 — Subsequent Events:
Management of each Fund has evaluated events that have occurred subsequent to April 30, 2023, through the issuance date of the Financial Statements. No such events have been identified which require recognition and/or disclosure.
- 179 -
THE ALGER FUNDS
ADDITIONAL INFORMATION (Unaudited)
Shareholder Expense Example
As a shareholder of a Fund, you incur two types of costs: transaction costs, if applicable, including sales charges (loads) and redemption fees; and ongoing costs, including management fees, distribution (12b-1) fees, if applicable, and other Fund expenses. This example is intended to help you understand your ongoing costs (in dollars) of investing in a Fund and to compare these costs with the ongoing costs of investing in other mutual funds.
The example below is based on an investment of $1,000 invested at the beginning of the six-month period starting November 1, 2022 and ending April 30, 2023 and held for the entire period.
Actual Expenses
The first line for each class of shares in the table below provides information about actual account values and actual expenses. You may use the information in this line, together with the amount you invested, to estimate the expenses that you paid over the period. Simply divide your account value by $1,000 (for example, an $8,600 account value divided by $1,000 = 8.6), then multiply the result by the number in the first line under the heading entitled “Expenses Paid During the Six Months Ended April 30, 2023” to estimate the expenses you paid on your account during this period.
Hypothetical Example for Comparison Purposes
The second line for each class of shares in the table below provides information about hypothetical account values and hypothetical expenses based on the actual expense ratio for each class of the Fund’s shares and an assumed rate of return of 5% per year before expenses, which is not the Fund’s actual return. The hypothetical account values and expenses may not be used to estimate the actual ending account balance or expenses you paid for the period. You may use this information to compare the ongoing costs of investing in the Fund and other funds. To do so, compare this 5% hypothetical example with the 5% hypothetical examples that appear in the shareholder reports of other funds.
Please note that the expenses shown in the table are meant to highlight your ongoing costs only and do not reflect any transaction costs, such as sales charges (loads) and redemption fees. Therefore, the second line under each class of shares in the table is useful in comparing ongoing costs only, and will not help you determine the relative total costs of owning different funds. In addition, if these transactional costs were included, your costs would have been higher.
- 180 -
THE ALGER FUNDS
ADDITIONAL INFORMATION (Unaudited) (Continued)
| | | | | Beginning
Account
Value November 1, 2022 | | | Ending
Account
Value April 30, 2023 | | | Expenses
Paid During the Six Months
Ended April 30, 2023(a) | | | Annualized
Expense Ratio
For the Six Months
Ended April 30, 2023(b) | |
| Alger Capital Appreciation Fund |
| Class A | Actual | | | $ | 1,000.00 | | | $ | 1,036.80 | | | $ | 6.36 | | | | 1.26 | % |
| | Hypothetical(c) | | | | 1,000.00 | | | | 1,018.55 | | | | 6.31 | | | | 1.26 | |
| Class C | Actual | | | | 1,000.00 | | | | 1,079.80 | | | | 10.42 | | | | 2.02 | |
| | Hypothetical(c) | | | | 1,000.00 | | | | 1,014.78 | | | | 10.09 | | | | 2.02 | |
| Class Z | Actual | | | | 1,000.00 | | | | 1,096.50 | | | | 4.42 | | | | 0.85 | |
| | Hypothetical(c) | | | | 1,000.00 | | | | 1,020.58 | | | | 4.26 | | | | 0.85 | |
| |
| Alger 35 Fund |
| Class Z | Actual | | | $ | 1,000.00 | | | $ | 1,019.10 | | | $ | 2.80 | | | | 0.56 | % |
| | Hypothetical(c) | | | | 1,000.00 | | | | 1,022.02 | | | | 2.81 | | | | 0.56 | |
| |
| Alger Growth & Income Fund |
| Class A | Actual | | | $ | 1,000.00 | | | $ | 1,034.70 | | | $ | 4.84 | | | | 0.96 | % |
| | Hypothetical(c) | | | | 1,000.00 | | | | 1,020.03 | | | | 4.81 | | | | 0.96 | |
| Class C | Actual | | | | 1,000.00 | | | | 1,077.90 | | | | 8.81 | | | | 1.71 | |
| | Hypothetical(c) | | | | 1,000.00 | | | | 1,016.31 | | | | 8.55 | | | | 1.71 | |
| Class Z | Actual | | | | 1,000.00 | | | | 1,093.70 | | | | 3.32 | | | | 0.64 | |
| | Hypothetical(c) | | | | 1,000.00 | | | | 1,021.62 | | | | 3.21 | | | | 0.64 | |
| |
| Alger Mid Cap Growth Fund |
| Class A | Actual | | | $ | 1,000.00 | | | $ | 999.10 | | | $ | 6.29 | | | | 1.27 | % |
| | Hypothetical(c) | | | | 1,000.00 | | | | 1,018.50 | | | | 6.36 | | | | 1.27 | |
| Class B | Actual | | | | 1,000.00 | | | | 1,004.60 | | | | 6.46 | | | | 1.30 | |
| | Hypothetical(c) | | | | 1,000.00 | | | | 1,018.35 | | | | 6.51 | | | | 1.30 | |
| Class C | Actual | | | | 1,000.00 | | | | 1,040.50 | | | | 10.68 | | | | 2.11 | |
| | Hypothetical(c) | | | | 1,000.00 | | | | 1,014.33 | | | | 10.54 | | | | 2.11 | |
| Class Z | Actual | | | | 1,000.00 | | | | 1,056.50 | | | | 4.84 | | | | 0.95 | |
| | Hypothetical(c) | | | | 1,000.00 | | | | 1,020.08 | | | | 4.76 | | | | 0.95 | |
| |
| Alger Mid Cap Focus Fund |
| Class A | Actual | | | $ | 1,000.00 | | | $ | 929.00 | | | $ | 5.26 | | | | 1.10 | % |
| | Hypothetical(c) | | | | 1,000.00 | | | | 1,019.34 | | | | 5.51 | | | | 1.10 | |
| Class C | Actual | | | | 1,000.00 | | | | 967.70 | | | | 9.32 | | | | 1.91 | |
| | Hypothetical(c) | | | | 1,000.00 | | | | 1,015.32 | | | | 9.54 | | | | 1.91 | |
| Class I | Actual | | | | 1,000.00 | | | | 981.10 | | | | 5.26 | | | | 1.07 | |
| | Hypothetical(c) | | | | 1,000.00 | | | | 1,019.49 | | | | 5.36 | | | | 1.07 | |
| Class Y | Actual | | | | 1,000.00 | | | | 982.90 | | | | 3.44 | | | | 0.70 | |
| | Hypothetical(c) | | | | 1,000.00 | | | | 1,021.32 | | | | 3.51 | | | | 0.70 | |
| Class Z | Actual | | | | 1,000.00 | | | | 982.90 | | | | 3.88 | | | | 0.79 | |
| | Hypothetical(c) | | | | 1,000.00 | | | | 1,020.88 | | | | 3.96 | | | | 0.79 | |
- 181 -
THE ALGER FUNDS
ADDITIONAL INFORMATION (Unaudited) (Continued)
| | | | | Beginning
Account
Value November 1, 2022 | | | Ending
Account
Value April 30, 2023 | | | Expenses
Paid During the Six Months
Ended April 30, 2023(a) | | | Annualized
Expense Ratio
For the Six Months
Ended April 30, 2023(b) | |
| Alger Weatherbie Specialized Growth Fund |
| Class A | Actual | | | $ | 1,000.00 | | | $ | 917.30 | | | $ | 6.18 | | | | 1.30 | % |
| | Hypothetical(c) | | | | 1,000.00 | | | | 1,018.35 | | | | 6.51 | | | | 1.30 | |
| Class C | Actual | | | | 1,000.00 | | | | 953.80 | | | | 9.93 | | | | 2.05 | |
| | Hypothetical(c) | | | | 1,000.00 | | | | 1,014.63 | | | | 10.24 | | | | 2.05 | |
| Class I | Actual | | | | 1,000.00 | | | | 968.30 | | | | 6.20 | | | | 1.27 | |
| | Hypothetical(c) | | | | 1,000.00 | | | | 1,018.50 | | | | 6.36 | | | | 1.27 | |
| Class Y | Actual | | | | 1,000.00 | | | | 970.70 | | | | 4.30 | | | | 0.88 | |
| | Hypothetical(c) | | | | 1,000.00 | | | | 1,020.43 | | | | 4.41 | | | | 0.88 | |
| Class Z | Actual | | | | 1,000.00 | | | | 969.40 | | | | 4.64 | | | | 0.95 | |
| | Hypothetical(c) | | | | 1,000.00 | | | | 1,020.08 | | | | 4.76 | | | | 0.95 | |
| |
| Alger Small Cap Growth Fund |
| Class A | Actual | | | $ | 1,000.00 | | | $ | 927.00 | | | $ | 6.16 | | | | 1.29 | % |
| | Hypothetical(c) | | | | 1,000.00 | | | | 1,018.40 | | | | 6.46 | | | | 1.29 | |
| Class B | Actual | | | | 1,000.00 | | | | 927.60 | | | | 6.64 | | | | 1.39 | |
| | Hypothetical(c) | | | | 1,000.00 | | | | 1,017.90 | | | | 6.95 | | | | 1.39 | |
| Class C | Actual | | | | 1,000.00 | | | | 963.00 | | | | 10.17 | | | | 2.09 | |
| | Hypothetical(c) | | | | 1,000.00 | | | | 1,014.43 | | | | 10.44 | | | | 2.09 | |
| Class Y | Actual | | | | 1,000.00 | | | | 979.60 | | | | 4.12 | | | | 0.84 | |
| | Hypothetical(c) | | | | 1,000.00 | | | | 1,020.63 | | | | 4.21 | | | | 0.84 | |
| Class Z | Actual | | | | 1,000.00 | | | | 979.50 | | | | 4.76 | | | | 0.97 | |
| | Hypothetical(c) | | | | 1,000.00 | | | | 1,019.98 | | | | 4.86 | | | | 0.97 | |
| |
| Alger Small Cap Focus Fund |
| Class A | Actual | | | $ | 1,000.00 | | | $ | 913.70 | | | $ | 6.74 | | | | 1.42 | % |
| | Hypothetical(c) | | | | 1,000.00 | | | | 1,017.75 | | | | 7.10 | | | | 1.42 | |
| Class C | Actual | | | | 1,000.00 | | | | 952.40 | | | | 9.58 | | | | 1.98 | |
| | Hypothetical(c) | | | | 1,000.00 | | | | 1,014.98 | | | | 9.89 | | | | 1.98 | |
| Class I | Actual | | | | 1,000.00 | | | | 965.60 | | | | 5.80 | | | | 1.19 | |
| | Hypothetical(c) | | | | 1,000.00 | | | | 1,018.89 | | | | 5.96 | | | | 1.19 | |
| Class Y | Actual | | | | 1,000.00 | | | | 967.00 | | | | 4.15 | | | | 0.85 | |
| | Hypothetical(c) | | | | 1,000.00 | | | | 1,020.58 | | | | 4.26 | | | | 0.85 | |
| Class Z | Actual | | | | 1,000.00 | | | | 967.60 | | | | 4.20 | | | | 0.86 | |
| | Hypothetical(c) | | | | 1,000.00 | | | | 1,020.53 | | | | 4.31 | | | | 0.86 | |
- 182 -
THE ALGER FUNDS
ADDITIONAL INFORMATION (Unaudited) (Continued)
| | | | | Beginning
Account
Value November 1, 2022 | | | Ending
Account
Value April 30, 2023 | | | Expenses
Paid During the Six Months
Ended April 30, 2023(a) | | | Annualized
Expense Ratio
For the Six Months
Ended April 30, 2023(b) | |
| Alger International Focus Fund |
| Class A | Actual | | | $ | 1,000.00 | | | $ | 1,050.40 | | | $ | 6.56 | | | | 1.29 | % |
| | Hypothetical(c) | | | | 1,000.00 | | | | 1,018.40 | | | | 6.46 | | | | 1.29 | |
| Class B | Actual | | | | 1,000.00 | | | | 1,058.90 | | | | 6.53 | | | | 1.28 | |
| | Hypothetical(c) | | | | 1,000.00 | | | | 1,018.45 | | | | 6.41 | | | | 1.28 | |
| Class C | Actual | | | | 1,000.00 | | | | 1,094.30 | | | | 10.90 | | | | 2.10 | |
| | Hypothetical(c) | | | | 1,000.00 | | | | 1,014.38 | | | | 10.49 | | | | 2.10 | |
| Class I | Actual | | | | 1,000.00 | | | | 1,108.60 | | | | 6.54 | | | | 1.25 | |
| | Hypothetical(c) | | | | 1,000.00 | | | | 1,018.60 | | | | 6.26 | | | | 1.25 | |
| Class Z | Actual | | | | 1,000.00 | | | | 1,111.30 | | | | 4.40 | | | | 0.84 | |
| | Hypothetical(c) | | | | 1,000.00 | | | | 1,020.63 | | | | 4.21 | | | | 0.84 | |
| |
| Alger Health Sciences Fund |
| Class A | Actual | | | $ | 1,000.00 | | | $ | 948.70 | | | $ | 5.27 | | | | 1.09 | % |
| | Hypothetical(c) | | | | 1,000.00 | | | | 1,019.39 | | | | 5.46 | | | | 1.09 | |
| Class C | Actual | | | | 1,000.00 | | | | 987.00 | | | | 9.26 | | | | 1.88 | |
| | Hypothetical(c) | | | | 1,000.00 | | | | 1,015.47 | | | | 9.39 | | | | 1.88 | |
| Class Z | Actual | | | | 1,000.00 | | | | 1,002.80 | | | | 3.72 | | | | 0.75 | |
| | Hypothetical(c) | | | | 1,000.00 | | | | 1,021.08 | | | | 3.76 | | | | 0.75 | |
(a) Expenses are equal to the annualized expense ratio of the respective share class, multiplied by the average account value over the period, multiplied by 181/365 (to reflect the one-half year period).
(b) Annualized.
(c) 5% annual return before expenses.
- 183 -
THE ALGER FUNDS
ADDITIONAL INFORMATION (Unaudited) (Continued)
Privacy Policy
| U.S. Consumer Privacy Notice | Rev. 6/22/21 |
| FACTS | WHAT DOES ALGER DO WITH YOUR PERSONAL INFORMATION? |
| Why? | Financial companies choose how they share your personal information. Federal law gives consumers the right to limit some but not all sharing. Federal law also requires us to tell you how we collect, share, and protect your personal information. Please read this notice carefully to understand what we do. |
| What? | The types of personal information we collect and share depend on the product or service you have with us. This information can include: • Social Security number and • Account balances and • Transaction history and • Purchase history and • Assets When you are no longer our customer, we continue to share your information as described in this notice. |
| How? | All financial companies need to share personal information to run their everyday business. In the section below, we list the reasons financial companies can share personal information; the reasons Alger chooses to share; and whether you can limit this sharing. |
| Reasons we can share your personal information | Does Alger share? | Can you limit this sharing? |
| For our everyday business purposes — such as to process your transactions, maintain your account(s), respond to court orders and legal investigations, or report to credit bureaus | Yes | No |
| For our marketing purposes — to offer our products and services to you | Yes | No |
For joint marketing with other financial companies | No | We don’t share |
| For our affiliates’ everyday business purposes — information about your transactions and experiences | Yes | No |
| For our affiliates’ everyday business purposes — information about your creditworthiness | No | We don’t share |
| For nonaffiliates to market to you | No | We don’t share |
| Questions? Call 1-800-223-3810 | | |
- 184 -
THE ALGER FUNDS
ADDITIONAL INFORMATION (Unaudited) (Continued)
| Who we are | |
| Who is providing this notice? | Alger includes Fred Alger Management, LLC and Fred Alger & Company, LLC as well as the following funds: The Alger Funds, The Alger Funds II, The Alger Institutional Funds, The Alger Portfolios, Alger Global Focus Fund, and The Alger ETF Trust. |
| What we do | |
| How does Alger protect my personal information? | To protect your personal information from unauthorized access and use, we use security measures that comply with federal law. These measures include computer safeguards and secured files and buildings. |
| How does Alger collect my personal information? | We collect your personal information, for example, when you: • Open an account or • Make deposits or withdrawals from your account or • Give us your contact information or • Provide account information or • Pay us by check. |
| Why can’t I limit all sharing? | Federal law gives you the right to limit some but not all sharing related to: • sharing for affiliates’ everyday business purposes ─ information about your credit worthiness • affiliates from using your information to market to you • sharing for nonaffiliates to market to you State laws and individual companies may give you additional rights to limit sharing. |
| Definitions | |
| Affiliates | Companies related by common ownership or control. They can be financial and nonfinancial companies. • Our affiliates include Fred Alger Management, LLC, Weatherbie Capital, LLC and Fred Alger & Company, LLC as well as the following funds: The Alger Funds, The Alger Funds II, The Alger Institutional Funds, The Alger Portfolios, Alger Global Focus Fund, and The Alger ETF Trust. |
| Nonaffiliates | Companies not related by common ownership or control. They can be financial and nonfinancial companies. |
| Joint marketing | A formal agreement between nonaffiliated financial companies that together market financial products or services to you. |
- 185 -
THE ALGER FUNDS
ADDITIONAL INFORMATION (Unaudited) (Continued)
Proxy Voting Policies
A description of the policies and procedures the Funds use to determine how to vote proxies relating to portfolio securities and the proxy voting record is available, without charge, by calling (800) 992-3863 or online on the Funds’ website at http://www.alger.com or on the SEC’s website at http://www.sec.gov.
Fund Holdings
The Board has adopted policies and procedures relating to disclosure of the Funds’ portfolio securities. These policies and procedures recognize that there may be legitimate business reasons for holdings to be disclosed and seek to balance those interests to protect the proprietary nature of the trading strategies and implementation thereof by the Funds.
Generally, the policies prohibit the release of information concerning portfolio holdings, which have not previously been made public, to individual investors, institutional investors, intermediaries that distribute the Funds’ shares and other parties which are not employed by the Investment Manager or its affiliates except when the legitimate business purposes for selective disclosure and other conditions (designed to protect the Funds) are acceptable.
The Funds file their complete schedules of portfolio holdings with the SEC semi-annually in shareholder reports on Form N-CSR and after the first and third fiscal quarters as an exhibit to their reports on Form N-PORT. The Funds’ Forms N-CSR and N-PORT are available online on the SEC’s website at www.sec.gov.
In addition, the Funds make publicly available their month-end top 10 holdings (top 5 holdings with respect to Alger 35 Fund) with a 10 day lag and their month-end full portfolios with a 60 day lag on their website www.alger.com and through other marketing communications (including printed advertising/sales literature and/or shareholder telephone customer service centers). No compensation or other consideration is directly received for the non-public disclosure of portfolio holdings information.
In accordance with the foregoing, the Funds provide portfolio holdings information to third parties including financial intermediaries and service providers who need access to this information in the performance of their services and are subject to duties of confidentiality
(1) imposed by law, including a duty not to trade on non-public information, and/or (2) pursuant to an agreement that confidential information is not to be disclosed or used (including trading on such information) other than as required by law. From time to time, the Funds will communicate with these third parties to confirm that they understand the Funds’ policies and procedures regarding such disclosure. These agreements must be approved by the Trust’s Chief Compliance Officer.
The Board periodically reviews a report disclosing the third parties to whom each Fund’s holdings information has been disclosed and the purpose for such disclosure, and it considers whether or not the release of information to such third parties is in the best interest of the Fund and its shareholders.
- 186 -
THE ALGER FUNDS
ADDITIONAL INFORMATION (Unaudited) (Continued)
In addition to material the Funds routinely provide to shareholders, the Investment Manager may make additional statistical information available regarding the Alger Family of Funds. Such information may include, but not be limited to, relative weightings and characteristics of a Fund versus an index (such as P/E ratio, alpha, beta, capture ratio, maximum drawdown, standard deviation, EPS forecasts, Sharpe ratio, information ratio, R-squared, and market cap analysis), security specific impact on overall portfolio performance, month-end top ten contributors to and detractors from performance, portfolio turnover, and other similar information. Shareholders should visit www.alger.com or may also contact the Funds at (800) 992-3863 to obtain such information.
Liquidity Risk Management Program
In accordance with Rule 22e-4 under the 1940 Act (the “Liquidity Rule”), the Trust has adopted and implemented a liquidity risk management program (the “LRMP”), which is reasonably designed to assess and manage the Funds’ liquidity risk.
The Board met on December 6, 2022 (the “Meeting”) to review the LRMP. The Board previously appointed Alger Management as the program administrator for the LRMP and approved an agreement with ICE Data Services (“ICE”), a third party vendor that assists the Funds with liquidity classifications required by the Liquidity Rule. Alger Management also previously delegated oversight of the LRMP to the Liquidity Risk Committee (the “Committee”). At the Meeting, the Committee, on behalf of Alger Management, provided the Board with a report that addressed the operation of the LRMP and assessed its adequacy and effectiveness of implementation, and any material changes to the LRMP (the “Report”). The Report covered the period from December 1, 2021 through November 30, 2022 (the “Review Period”).
The Report stated that the Committee assessed the Funds’ liquidity risk by considering qualitative factors such as the Funds’ investment strategy, holdings, diversification of investments, redemption policies, cash flows, cash levels, shareholder concentration, and access to borrowings, among others, in conjunction with the quantitative classifications generated by ICE. In addition, in connection with the review of the Funds’ liquidity risks and the operation of the LRMP and the adequacy and effectiveness of its implementation, the Committee also evaluated the levels at which to set the reasonably anticipated trade size (“RATS”) and market price impact. The Report described the process for determining that the Funds primarily holds investments that are highly liquid. The Report noted that the Committee also performed stress tests on the Funds, and concluded that the Funds remained primarily highly liquid. The Report stated that during the Reporting Period, the Committee approved updated liquidity parameters for the Funds based on discussions with ICE, certain other third parties, and internal groups at Alger Management relating to RATS and average daily trading volumes in normal and stressed conditions for the various market capitalizations of holdings in the Funds.
- 187 -
THE ALGER FUNDS
ADDITIONAL INFORMATION (Unaudited) (Continued)
There were no material changes to the LRMP during the Review Period. The Report provided to the Board stated that the Committee concluded that, based on the operation of the functions, as described in the Report, during the Review Period, the Trust’s LRMP was operating effectively and adequately with respect to the Funds and has been effectively implemented during the Review Period.
- 188 -
THE ALGER FUNDS
ADDITIONAL INFORMATION (Unaudited) (Continued)
THE ALGER FUNDS
100 Pearl Street, 27th Floor
New York, NY 10004
(800) 992-3863
www.alger.com
Investment Manager
Fred Alger Management, LLC
100 Pearl Street, 27th Floor
New York, NY 10004
Sub-Adviser
Weatherbie Capital, LLC
265 Franklin Street, Suite 1603
Boston, MA 02110
Distributor
Fred Alger & Company, LLC
100 Pearl Street, 27th Floor
New York, NY 10004
Transfer Agent and Dividend Disbursing Agent
UMB Fund Services, Inc.
235 W. Galena Street
Milwaukee, WI 53212
Custodian
Brown Brothers Harriman & Company
50 Post Office Square
Boston, MA 02110
Independent Registered Public Accounting Firm
Deloitte & Touche LLP
30 Rockefeller Plaza
New York, NY 10112
This report is submitted for the general information of the shareholders of the series of The Alger Funds. It is not authorized for distribution to prospective investors unless accompanied by an effective Prospectus for the Fund, which contains information concerning the Fund’s investment policies, fees and expenses as well as other pertinent information.
- 189 -
Not applicable.
Not applicable.
Not applicable.
Not applicable.
Not applicable.
Not applicable.
Not applicable.
Not applicable.
(a) The Registrant’s principal executive officer and principal financial officer have concluded that the Registrant’s disclosure controls and procedures (as defined in Rule 30a-3(c) under the Investment Company Act of 1940, as amended) are effective based on their evaluation of the disclosure controls and procedures as of a date within 90 days of the filing date of this document.
(b) No changes in the Registrant’s internal control over financial reporting occurred during the Registrant’s second fiscal quarter of the period covered by this report that materially affected, or are reasonably likely to materially affect, the Registrant’s internal control over financial reporting.
Not applicable.
Pursuant to the requirements of the Securities Exchange Act of 1934 and the Investment Company Act of 1940, the registrant has duly caused this report to be signed on its behalf by the undersigned, thereunto duly authorized.
Pursuant to the requirements of the Securities Exchange Act of 1934 and the Investment Company Act of 1940, this report has been signed below by the following persons on behalf of the registrant and in the capacities and on the dates indicated.