| ITEM 1. | REPORTS TO STOCKHOLDERS. |

Table of Contents
The Alger Funds
Dear Shareholders,
“Compound interest is the eighth wonder of the world. He who understands it, earns it; he who doesn’t, pays it.” – Albert Einstein
This principle resonates deeply with us at Alger, where we embrace the power of compound growth in corporate fundamentals, such as sales, earnings, and cash flow, as a cornerstone of long-term wealth creation. Our investment approach focuses on identifying companies with strong potential for sustained earnings growth over the long-term, avoiding those that we believe are “short duration” companies, or businesses with high current earnings and low potential for future long-term growth. In most instances, short duration companies, in our view, return most of their profits to shareholders because of a lack of compelling reinvestment opportunities. By investing in companies that we believe will gain market share and compound their earnings growth, we aim to position our portfolios to be resilient across varying economic conditions, thereby maximizing long-term value for our shareholders.
Reflecting on the fiscal year ended October 31, 2023, the narrative of the market was one of resilience and recovery. Following a turbulent 2022, where higher interest rates in response to elevated inflation reduced equity valuations, investor sentiment turned positive in 2023, driven by easing inflation, stabilizing corporate earnings, and the increasing likelihood of a soft-landing (i.e., an economic slowdown without a recession). Further, a surge of enthusiasm around Artificial Intelligence (AI) contributed to outsized returns for certain of the largest companies within the Information Technology and Communication Services sectors. Not all sectors shared in this rally, as the Energy and Health Care sectors underperformed the S&P 500 Index. While there were bumps along the way, from a regional banking crisis in March 2023 to a steady rise in interest rates, the S&P 500 Index finished up 10.14% during the fiscal twelve-month period ended October 31, 2023.
In the final two months of 2022, optimism grew as core Consumer Price Index (“CPI”) readings for November and December came in below expectations, suggesting the peak of the Federal Reserve’s (the “Fed”) tightening cycle. However, persistent wage inflation and an inverted yield curve raised concerns about potential policy errors and an impending economic downturn. In December, Fed Chairman Jerome Powell affirmed a “higher-for-longer” stance for interest rates and forecasted a terminal rate above 5.0%, casting doubts on the stock market’s recovery.
As we moved into 2023, however, the first quarter saw a reversal in the bearish sentiment that had marked much of the previous year. In February, the Fed slowed down its rate hikes to 25 basis points, a reduction from December’s 50 basis point hike. In March, concerns around bank funding and liquidity emerged following the collapse of two regional banks, leading to significant deposit outflows at the regional level. The Fed, U.S. Treasury, and Federal Deposit Insurance Corporation (FDIC) took steps to alleviate these market concerns, including announcing an emergency liquidity program, guaranteeing uninsured deposits, and allowing some bank mergers and acquisitions.
Transitioning into the second quarter, U.S. economic data released in June reinforced the soft-landing-narrative with signs of (1) disinflation, as evidenced by the May CPI report coming in softer than expected with headline CPI posting the lowest annual increase in more than two years, (2) resilient labor markets, as May payrolls beat estimates for a 14th straight month, and (3) a stronger housing market, with builder confidence at the highest in nearly a year, housing starts at the highest in over a year, and multi-unit starts at the highest in nearly four decades.
Despite the strong first half rally in 2023, U.S. equities fell during the third quarter. While investors initially embraced a continuation of prevailing narratives around AI and expectations of a soft-landing lifting equity markets in July, mounting concerns surrounding aggressive Fed policy and a sharp rise in interest rates led to declining equity prices in August and September. Moreover, the resumption of student loan payments, diminished savings from the pandemic, and higher energy prices reignited worries that a decline in U.S. consumer spending could lead to the possibility of an upcoming recession. Rising interest rates were seen as one of the largest headwinds to risk assets during the third quarter, where the yield of the U.S. 10-year note increased by 76 basis points to 4.57% and the yield on the two-year note increased nearly 20 basis points to 5.04%. While the rate of inflation decelerated meaningfully over the past year, the monthly CPI readings for July and August rose 0.2% and 0.6%, respectively. That said, the rise in interest rates was driven more by the term premium (i.e., the additional yield that investors demand for lending money for longer periods of time) and less so on rising inflation expectations during the third quarter.
On the monetary policy front, after a 25 basis point rate hike in July that met expectations, the Fed held rates steady at its September meeting, bringing the Federal Funds rate to 5.25-5.50%. In October, U.S. equities fell in large part due to rising interest rates, with the yield of the U.S. 10-year note increasing by approximately 30 basis points to 4.88%. Higher bond yields were driven by several factors, such as an increase in U.S. Treasury issuance and a reinforced stance on a higher-for-longer Fed policy, bolstered by a robust September retail sales report and better-than-expected U.S. GDP data for the third quarter. Further, the average 30-year fixed mortgage rate reached new multi decade highs of 8.06%, as of October 31, 2023, helping drive mortgage demand from homebuyers to the lowest level since 1995.
Among non-U.S. equities, developed markets saw strong performance during the fiscal twelve-month period ended October 31, 2023. Notable strength was driven by Europe avoiding an energy crisis due to a mild winter, and Japan’s economy being bolstered by well-received corporate reforms to improve governance. As such, the MSCI ACWI ex-USA Index rose 12.66% during the fiscal twelve-month period ended October 31, 2023, with the Financials and Consumer Discretionary sectors showing strong results, while the Real Estate and Utilities sectors saw weaker performance. Within Emerging Markets, encouraging market sentiment stemmed from Chinese officials abandoning their ‘Zero-Covid’ policy in late 2022, indicating an earlier-than-expected re-opening of the economy. While renewed concerns about China’s property sector and weaker-than-expected economic recovery data curtailed investor enthusiasm in the first half of 2023, better-than-feared third quarter GDP data emerged in October. As such, the MSCI Emerging Markets Index was up 11.26% during the fiscal twelve-month period ended October 31, 2023. Strong performance within the Consumer Discretionary and Information Technology sectors was partially offset by relative weakness in the Materials and Utilities sectors.
Going Forward
We continue to believe that an unprecedented level of innovation is creating compelling investment opportunities – corporations are digitizing their operations, cloud computing growth continues to support future innovation, and artificial intelligence, which is at an inflection point in our view, potentially enabling significant increases in productivity. In the Health Care sector, we believe that advances in surgical technologies and innovations within biotechnology offer attractive opportunities ahead. As such, we intend to continue to focus on conducting in-depth fundamental research as we seek leaders of innovation rather than taking short-term bets on market sentiment. We believe this strategy embodies Albert Einstein’s wisdom, harnessing the powerful force of compound interest to help our shareholders achieve their long-term investment goals.
Portfolio Matters
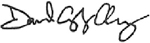
Alger Capital Appreciation Fund
The Alger Capital Appreciation Fund returned 16.95% for the fiscal twelve-month period ended October 31, 2023, compared to the 18.95% return of the Russell 1000 Growth Index. During the reporting period, the largest sector weightings were Information Technology and Consumer Discretionary. The largest sector overweight was Health Care and the largest sector underweight was Consumer Staples.
Contributors to Performance
The Consumer Discretionary and Industrials sectors provided the largest contributions to relative performance. Regarding individual positions, Microsoft Corp.; NVIDIA Corp.; Amazon.com, Inc.; TransDigm Group Incorporated; and Meta Platforms Inc. were among the top contributors to absolute performance.
Microsoft is a beneficiary of corporate America’s transformative digitization. Microsoft’s CEO expects technology spending as a percent of GDP to jump from about 5% now to 10% in 10 years and that Microsoft will continue to capture market share within the technology sector. The company operates through three segments: Productivity and Business Processes (Office, LinkedIn, and Dynamics), Intelligent Cloud (Server Products and Cloud Services, Azure, and Enterprise Services), and More Personal Computing (Windows, Devices, Gaming, and Search). While the company reported operating results that met consensus estimates, their investment in OpenAI’s ChatGPT captured the attention of investors, contributing to positive performance. Throughout the period, Microsoft surprised investors with continual rollouts of new AI capabilities across the company’s portfolio (e.g., Bing, GitHub, Teams, Office 365). Moreover, the company witnessed significant growth in its Intelligent Cloud segment, as Azure continues to expand its market share. Despite the encouraging results throughout the period, demand challenges stemming from companies looking to optimize their cloud spending led to a deceleration in cloud growth during the fiscal fourth quarter, compared to the previous quarter. Acknowledging that cloud optimization may curb the company’s growth in the short term, we remain confident about the company’s prospects going forward, particularly in the realm of AI adoption. Further, CEO Satya Nadella has recently indicated that substantial revenue contributions from AI could begin to materialize around the first half of 2024.
Detractors from Performance
The Health Care and Financials sectors were the largest detractors from relative performance. Regarding individual positions, Tesla, Inc.; Albemarle Corp.; UnitedHealth Group Inc.; Signature Bank; and Humana Inc. were among the top detractors from absolute performance.
UnitedHealth Group is an integrated healthcare benefits company uniquely positioned to address rising healthcare costs for its customers, due to its vertical integration, size, and scale. The Optum health benefits services unit, which accounts for approximately 45% of the company’s operating earnings, in our view, has the potential to grow even further as customers look for ways to manage rising healthcare costs. During the period, shares detracted from performance due to several factors, including (1) many 2022 healthcare winners with shorter duration profiles and persistent earnings profiles, such as UnitedHealth Group, underperformed in the first quarter of 2023, (2) uncertainty surrounding Medicare Advantage reimbursement levels from the Federal government in 2023, which will be determined later in 2023, and (3) increased regulatory scrutiny in the form of potential Medicare Advantage audits across the industry. While these concerns have impacted UnitedHealth in the near-term, we believe company fundamentals remain intact given its large-scale business model, competitive advantages, and medium- to long-term growth prospects.
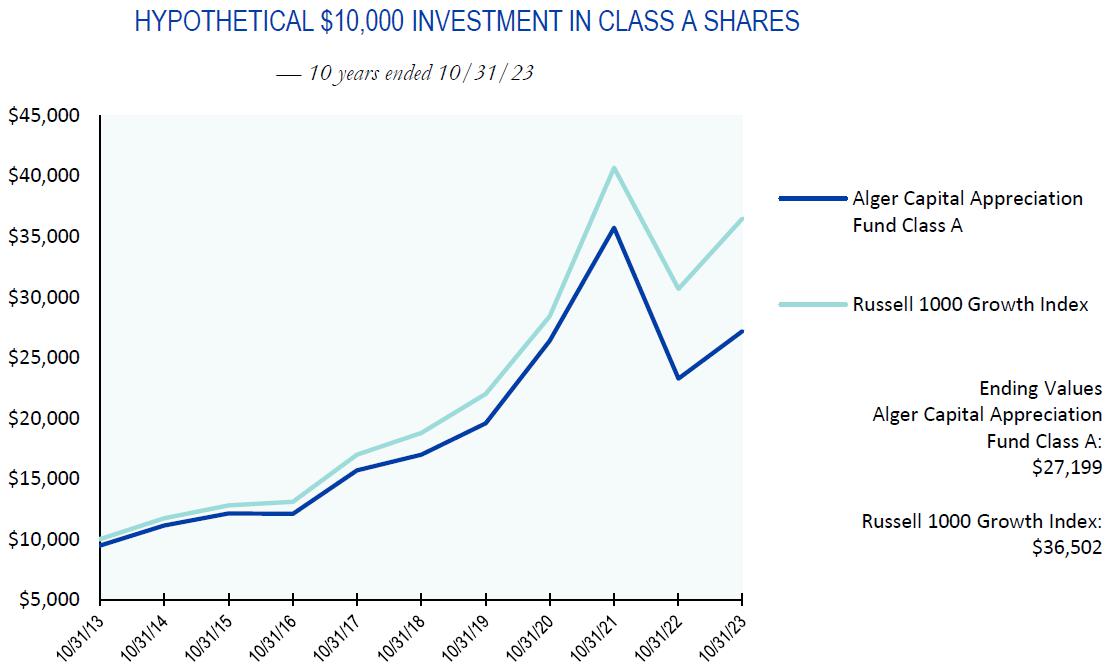
Alger 35 Fund
The Alger 35 Fund generated a 1.38% return for the fiscal twelve-month period ended October 31, 2023, compared to the 10.14% return of the S&P 500 Index. During the reporting period, the largest sector weightings were Information Technology and Consumer Discretionary. The largest sector overweight was Consumer Discretionary and the largest sector underweight was Financials.
Contributors to Performance
The Materials and Financials sectors provided the largest contributions to relative performance. Regarding individual positions, Microsoft Corp.; Advanced Micro Devices, Inc.; Netflix, Inc.; NVIDIA Corp.; and Alphabet Inc. were among the top contributors to absolute performance.
NVIDIA is a leading supplier of graphics processing units for a variety of end markets, such as gaming, PCs, data centers, virtual reality and high-performance computing. The company is leading in most secular growth categories in computing, especially artificial intelligence and super-computing parallel processing techniques for solving complex computational problems. Simply put, NVIDIA’s computational power is a critical enabler of AI and therefore, in our view, critical to AI adoption. As such, we believe NVIDIA is a long-term high unit volume growth opportunity. During the period, shares contributed to performance as NVIDIA reported solid operating results well above analyst expectations, driven by strong demand from data centers. Growing AI data center workloads are driving demand for the increased interconnections and fully accelerated software stacks, thereby enabling leading application performance and fast result times.
Detractors from Performance
The Information Technology and Consumer Discretionary sectors were the largest detractors from relative performance. Regarding individual positions, 908 Devices Inc.; JD.com, Inc.; Schlumberger N.V.; Rivian Automotive, Inc.; and Lindblad Expeditions Holdings, Inc. were among the top detractors from absolute performance.
Schlumberger engages in the provision of technology and services for reservoir characterization, drilling, production and processing to the oil and gas industry. During the fiscal year, the company reported mixed operating results, where better-than-expected revenues were offset by lower-than-expected gross profit margins. Strong company revenues were driven by solid execution within Well Construction and Production Systems, while Schlumberger’s Digital & Integration segment saw some weakness as a result of a pipeline shutdown causing temporary production delays in Ecuador, along with falling commodity prices that impacted Canadian projects. Moreover, despite management raising forward guidance on operating profits and free-cash-flow generation, these projections fell short of analyst estimates.
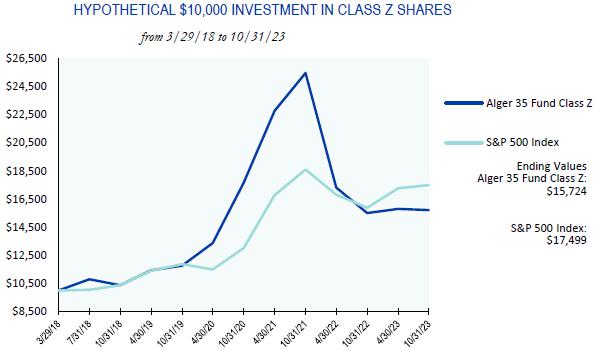
Alger Growth & Income Fund
The Alger Growth & Income Fund returned 11.39% for the fiscal twelve-month period ended October 31, 2023, compared to the 10.14% return of the S&P 500 Index. During the reporting period, the largest sector weightings were Information Technology and Health Care. The largest sector overweight was Energy and the largest sector underweight was Consumer Discretionary.
Contributors to Performance
The Information Technology and Health Care sectors provided the largest contributions to relative performance. Regarding individual positions, Microsoft Corp.; Broadcom Inc.; KLA Corp.; Meta Platforms Inc.; and Apple Inc. were among the top contributors to absolute performance. Shares of Microsoft Corp. contributed to performance in response to developments identified in the Alger Capital Appreciation Fund discussion.
Detractors from Performance
The Consumer Discretionary and Industrials sectors were the largest detractors from relative performance. Regarding individual positions, Bank of America Corp; Chevron Corp.; Pfizer Inc.; Crown Castle Inc.; and Johnson & Johnson were among the top detractors from absolute performance.
Bank of America Corp is one of the world’s leading financial firms that offers a wide array of banking and non-banking financial services and products both domestically and internationally. These services are delivered through three primary business segments: Global Consumer & Small Business Banking, Global Corporate & Investment Banking, and Global Wealth & Investment Management. While the company reported better-than-expected operating results, driven by strong net interest income, shares declined after two regional banks failed which sparked contagion concerns in late March. Further, the company reported during its fiscal third quarter earnings report that its unrealized held-to-maturity securities losses were greater than expected.
Alger Mid Cap Growth Fund
The Alger Mid Cap Growth Fund returned 0.18% for the fiscal twelve-month period ended October 31, 2023, compared to the 3.35% return of the Russell Midcap Growth Index. During the reporting period, the largest sector weightings were Information Technology and Industrials. The largest sector overweight was Real Estate and the largest sector underweight was Consumer Discretionary.
Contributors to Performance
The Energy and Communication Services sectors provided the largest contributions to relative performance. Regarding individual positions, Prometheus Biosciences, Inc.; Cadence Design Systems, Inc.; TransDigm Group Inc.; Constellation Software Inc.; and Chipotle Mexican Grill, Inc. were among the top contributors to absolute performance.
TransDigm specializes in the production of engineered aerospace components, systems and subsystems. Its core Power and Control segment includes operations that primarily develop, produce and market systems and components that provide power to or control power of aircrafts utilizing electronic, fluid, power and mechanical motion control technologies. Shares contributed to performance during the period, as the company has reported solid operating results, driven by strength in all three of their major market channels – commercial original equipment manufacturing, commercial aftermarket, and defense. Moreover, strong order bookings have been aided by China’s easing COVID-19 mobility restrictions, which has increased air travel. Given the robust order bookings and favorable trends in the commercial aerospace market recovery, management raised their fiscal full year earnings guidance.
Detractors from Performance
The Consumer Discretionary and Industrials sectors were the largest detractors from relative performance. Regarding individual positions, CrowdStrike Holdings, Inc.; Repligen Corp.; Paycom Software, Inc.; DexCom, Inc.; and TransUnion were among the top detractors from absolute performance.
Repligen Corp. is a life science organization committed to supplying tools, consumables, and data analytics to the bioprocessing industry. It functions via four divisions: Filtration, Chromatography, Proteins & Affinity Resins, and Process Analytics. Repligen’s offerings play a key role in the creation and production of biological therapeutics, such as monoclonal antibodies, recombinant proteins, viral vectors, and cell and gene therapies. While the company reported operating results that were roughly in-line with consensus estimates, management lowered their full year 2023 forward guidance for revenues and earnings. The downward revision was attributed to destocking pressures throughout the bioprocessing industry, as inventory levels built up during COVID-19 remain higher than expected, leading to irregular order patterns in the near-term. Further, during its fiscal first quarter, the company experienced a 40% drop in orders from China, approximately 10% of company sales, which raised concerns about China’s recovery from COVID-19 lockdowns.
Alger Mid Cap Focus Fund
The Alger Mid Cap Focus Fund generated a -6.67% return for the fiscal twelve-month period ended October 31, 2023, compared to the 3.35% return of the Russell Midcap Growth Index. During the reporting period, the largest sector weightings were Information Technology and Health Care. The largest sector overweight was Information Technology and the largest sector underweight was Financials.
Contributors to Performance
The Energy and Materials sectors provided the largest contributions to relative performance. Regarding individual positions, Vertiv Holdings Co.; Bentley Systems, Inc.; Splunk Inc.; Prometheus Biosciences, Inc; and AppFolio Inc were among the top contributors to absolute performance.
Vertiv offers critical cooling and power management infrastructure technologies to meet the specific requirements of a diverse group of customers which primarily include datacenter customers. We believe the company is well positioned to potentially benefit from the secular demand in datacenters, as Vertiv holds leading positions in power and thermal management across the datacenter complex. During the period, the company reported strong operating results, where revenues and earnings handedly beat analyst estimates. Better-than-expected revenues were driven by higher pricing and volume growth. As the leading global supplier of power and thermal solutions to datacenters, we believe Vertiv is well positioned to benefit from the AI investment in datacenters, given the intense demand from hyperscalers for faster computing.
Detractors from Performance
The Health Care and Information Technology sectors were the largest detractors from relative performance. Regarding individual positions, Natera, Inc.; Everbridge, Inc.; RAPT Therapeutics, Inc.; Madrigal Pharmaceuticals, Inc.; and Constellation Energy Corp. were among the top detractors from absolute performance.
Constellation Energy Corporation is a leading generation and retail company that manages the largest fleet of nuclear and other carbon-free electricity sources in the United States. The company aims to achieve 100% carbon-free owned assets by 2040, with an interim goal of 95% by 2030. Around 90% of the generated output comes from nuclear power or renewable energy sources, with their assets primarily located in the Mid-Atlantic and Northeast regions (IL, PA, NJ, MD, & NY). As the second-largest retail business in the U.S., Constellation Energy holds over 20% market share in the commercial and industrial sector. During the period, shares detracted from performance as natural gas prices, which typically set the electricity price powered by nuclear, plummeted due to the warm winter experienced in North America. While the company hedged 90% of its topline natural gas exposure, the decline in gas prices served as an overhang because of its detrimental impact on 2024. It is important to note that the Production Tax Credits (PTC) will take effect in 2024, providing a minimum price from 2024-2032. However, weak natural gas prices remove the potential benefits associated on the name, resulting in negative sentiment. Natural gas prices may be weather dependent going forward.
Alger Weatherbie Specialized Growth Fund
The Alger Weatherbie Specialized Growth Fund generated a -12.53% return for the fiscal twelve-month period ended October 31, 2023, compared to the -4.80% return of the Russell 2500 Growth Index. During the reporting period, the largest sector weightings were Health Care and Industrials. The largest sector overweight was Health Care and the largest sector underweight was Materials.
Contributors to Performance
The Real Estate and Energy sectors provided the largest contributions to relative performance. Regarding individual positions, SPS Commerce, Inc.; Vertex, Inc.; Glaukos Corp; Hamilton Lane Inc.; and FirstService Corp were among the top contributors to absolute performance.
SPS Commerce is a global provider of cloud-based supply chain management solutions for fulfillment, analytics, drop shipping and other use cases. The SPS Commerce platform improves the way retailers, suppliers, grocers, distributors, and logistics companies manage orders, monitor sell-through performance, and discover new products by leveraging cloud technology. During the period, shares contributed to performance as the company reported strong operating results, where revenues came in above consensus estimates. Additionally, recurring revenue increased 20% year-over-year, driven by double digit growth in both fulfillment and analytics. Despite a difficult macroeconomic environment with high inflation and recession concerns, management expressed confidence in its subscription-based business model, which is largely reliant on the number of client connections with only a small portion tied to volumes. Moreover, we believe the company is a key beneficiary of supply chain digitalization over the long-term, given the growing influence of e-commerce.
Detractors from Performance
The Consumer Discretionary and Health Care sectors were the largest detractors from relative performance. Regarding individual positions, Chegg, Inc.; Agiliti, Inc.; Montrose Environmental Group Inc; Definitive Healthcare Corp.; and Nevro Corp. were among the top detractors from absolute performance.
Chegg is a leading online direct-to-consumer education business, which provides online textbook rentals and other internet-delivered services, such as homework help, tutoring and assistance with obtaining scholarships and finding internships. Despite reporting strong operating results, the company provided disappointing forward guidance citing greater competitive pressure from ChatGPT/AI platforms. While management appears to be doing its best to address this issue, including a collaboration with OpenAI announced in April, the company remains unable to offer visibility as to how the impact of ChatGPT/AI will play out as four-year college students weigh subscription costs for all learning resources versus free access to generative AI platforms.
Alger Small Cap Growth Fund
The Alger Small Cap Growth Fund returned -10.53% for the fiscal twelve-month period ended October 31, 2023, compared to the -7.63% return of the Russell 2000 Growth Index. During the reporting period, the largest sector weightings were Health Care and Information Technology. The largest sector overweight was Health Care and the largest sector underweight was Industrials.
Contributors to Performance
The Information Technology and Real Estate sectors provided the largest contributions to relative performance. Regarding individual positions, Manhattan Associates, Inc.; NeoGenomics, Inc.; Structure Therapeutics, Inc.; SPS Commerce, Inc.; and HubSpot, Inc. were among the top contributors to absolute performance.
Hubspot is a cloud-based marketing and sales platform for small- and medium-sized businesses (“SMBs”), focusing on inbound marketing strategies to attract, engage, and convert website visitors into customers. Its platform provides a comprehensive suite of applications including search engine optimization (SEO), blogging, marketing automation, customer relationship management (CRM), and analytics, utilizing a centralized database for personalized interactions. In our view, this approach fosters warmer prospect engagement compared to traditional methods like cold calling and email blasts. Over the years, the company has evolved from a small business CRM vendor to a comprehensive provider of marketing, sales and content management solutions for global SMBs. With an approximate 3% combined market share, a large customer base, robust partner network and extensive HubSpot suite, we believe the company is well positioned to capture additional market share in the large SMB front office applications industry, as well as to expand in the upmarket segment (i.e., companies with 200 to 2,000 employees). Shares contributed to performance during the period, as the company reported strong operating results, noting better-than-expected revenues coupled with the highest number of new customer adds in two years. With the avid appetite to embrace generative AI technologies, we believe Hubspot has the potential to further its momentum with noteworthy architectural advantages tied to a unified data platform, broad distribution reach and a central role in front-office workflows.
Detractors from Performance
The Health Care and Industrials sectors were the largest detractors from relative performance. Regarding individual positions, Insulet Corp.; Tandem Diabetes Care, Inc.; Bio-Techne Corp.; Xometry, Inc.; and QuidelOrtho Corp. were among the top detractors from absolute performance.
Insulet Corp. is a medical device company focused on commercializing its Omnipod portfolio of insulin delivery devices. The company’s Omnipod device is a tubeless insulin pump that is in the shape of a pod and is directly attached to a patient’s body. The key differentiator between Insulet’s insulin delivery devices and those of competitors is the tubeless feature – this enables a more discrete administration of insulin. Insulet’s Omnipod portfolio includes three key product lines: Classic Omnipod, Omnipod DASH, and Omnipod 5. The Omnipod technology is also used as a subcutaneous drug delivery system to deliver certain therapeutics. During the period, shares detracted from performance as investors became concerned about the long-term impact of GLP-1 drugs, a newer class of drugs that are highly effective in treating diabetes and obesity.
Alger Small Cap Focus Fund
The Alger Small Cap Focus Fund returned -17.50% for the fiscal twelve-month period ended October 31, 2023, compared to the -7.63% return of the Russell 2000 Growth Index. During the reporting period, the largest sector weightings were Health Care and Information Technology. The largest sector overweight was Health Care and the largest sector underweight was Industrials.
Contributors to Performance
The Consumer Discretionary and Materials sectors provided the largest contributions to relative performance. Regarding individual positions, Prometheus Biosciences, Inc.; Heska Corp.; Guidewire Software, Inc.; AppFolio Inc; and Agilysys, Inc. were among the top contributors to absolute performance.
Heska Corp. sells diagnostic tools and specialty products to the animal health market. Specifically, Heska sells blood testing and supplies, digital imaging products, software and single-use products primarily for cats and dogs. The company also offers private label vaccines and pharmaceutical produces primarily for cattle and other small mammals. Shares contributed to performance after the company announced on April 3, 2023 that private company Mars, Incorporated had agreed to take Heska private.
Detractors from Performance
The Health Care and Industrials sectors were the largest detractors from relative performance. Regarding individual positions, Xometry, Inc.; CryoPort, Inc.; Silk Road Medical, Inc.; Shockwave Medical, Inc.; and BioLife Solutions, Inc. were among the top detractors from absolute performance.
Xometry is a leading two-sided marketplace for on-demand manufacturing services. The company provides real-time access to global manufacturing demand and capacity, with sourcing and pricing available across a network of buyers and sellers. This marketplace enables buyers (e.g., engineers and product designers) to efficiently source manufacturing processes and sellers of manufacturing services to grow their businesses. Xometry’s AI-enabled technology platform is powered by proprietary machine learning algorithms, resulting in a sophisticated marketplace for manufacturing. During the period, shares detracted from performance as the company reported weaker-than-expected operating results, where company revenues came in well below consensus estimates. Management noted that suppliers accepted orders more quickly than usual on the Xometry platform due to a challenging macroeconomic environment. As a result, this prompted the company’s proprietary algorithm to lower market pricing, which in turn led to slower revenue growth and gross margin compression.
Alger International Focus Fund
The Alger International Focus Fund recorded a 3.61% return for the fiscal twelve-month period ended October 31, 2023, compared to the 12.66% return of the MSCI ACWI ex USA Index. During the reporting period, the largest sector weightings were Consumer Discretionary and Financials. The largest sector overweight was Consumer Discretionary and the largest sector underweight was Materials.
Contributors to Performance
The Consumer Discretionary and Health Care sectors provided the largest contributions to relative performance. Regarding individual positions, Ferrari NV; Nu Holdings Ltd.; ASML Holding NV; Kalyan Jewellers India Ltd.; and Elm Co. were among the top contributors to absolute performance.
Nu Holdings Ltd. (NU) is a rapidly growing Brazilian neobank (i.e., a financial technology bank) founded in 2013 initially focusing on customer-friendly credit cards. The company has grown to over 48 million customers and offers a wide variety of financial products like personal loans, checking accounts, and brokerage accounts. We believe NU offers a strong value proposition compared to neobank peers and incumbent players and has ample runway to grow across Latin America due to its exceptionally low customer acquisition costs. During the period, shares contributed to performance after the company reported strong operating results, where revenues and earnings beat analyst estimates. Better-than-expected revenues were driven by higher rates and improved returns on credit cards following fast expansion of their interest earning portfolio. Moreover, client growth remained strong despite high penetration in Brazil, while non-performing-loan trends appear to be stabilizing, giving management comfort to accelerate loan origination.
Detractors from Performance
The Industrials and Financials sectors were the largest detractors from relative performance. Regarding individual positions, Alfen NV; Teleperformance SA; VERBIO Vereinigte BioEnergie AG; Arezzo Industria e Comercio S.A.; and Angel One Limited were among the top detractors from absolute performance.
Alfen is a supplier of smart energy solutions which are geared towards energy transition. The company designs, develops, and produces smart grids, energy storage systems and EV charging equipment. During the period, shares detracted from performance as the company released its first half 2023 fiscal results that fell short of expectations. Despite accelerating strength and a growing backlog in its Smart Grid and Energy Storage Solutions (ESS) businesses, its EV Charging business continued to experience volume headwinds from inventory destocking at their channel partners. In addition, the mix shift effects of hyper growth in ESS were margin-dilutive at the group level. While both factors were widely known, the negative sentiment continued to weigh on the stock.
Alger Health Sciences Fund
The Alger Health Sciences Fund returned -12.61% for the fiscal twelve-month period ended October 31, 2023, compared to the 10.14% return of the S&P 500 Index and the -5.47% return of the Russell 3000 Health Care Index.
Contributors to Performance
Regarding individual positions, Prometheus Biosciences, Inc.; Reata Pharmaceuticals, Inc.; Eli Lilly and Co.; ADMA Biologics, Inc.; and Tenet Healthcare Corp. were among the top contributors to absolute performance.
Prometheus Biosciences is a biotechnology company focused on developing precision-based medicines to treat autoimmune conditions, primarily those afflicting the intestines such as inflammatory bowel disease (IBD) indications like ulcerative colitis and Crohn’s disease by leveraging a proprietary bioinformatics database. Shares outperformed after the company announced in April 2023 that it would be acquired by Merck & Co.
Detractors from Performance
Regarding individual positions, Shockwave Medical, Inc.; Elanco Animal Health, Inc.; AstraZeneca; Acadia Healthcare Co., Inc.; and Charles River Laboratories International, Inc. were among the top detractors from absolute performance.
Acadia Healthcare Co. is a leading U.S. mental health services provider and operator of various treatment centers and facilities. Demand for behavioral health services continued to grow to all-time highs outstripping already insufficient supply, where only 28% of the U.S. population has adequate access to mental health care professionals, according to the Health Resources & Services Administration. As such, patients, employers, payers and society-at-large are increasingly recognizing the importance of mental behavioral health, which has resulted in (1) unmet demand in the market and (2) greater funding and improved rate increases to be directed at mental health providers. We believe the unmet demand trends and supportive payments backdrop allow Acadia to grow via facility expansions, new facility openings and tuck-in acquisitions. During the period, the company reported in-line operating results where management raised full year 2023 sales guidance but maintained 2023 earnings guidance. Subsequently, shares sold off following management’s comments around higher than anticipated labor costs, which explained why analysts’ 2023 earnings guidance remained unchanged.
I thank you for putting your trust in Alger.
Sincerely,
Daniel C. Chung, CFA
Chief Executive Officer, Chief Investment Officer
Fred Alger Management, LLC
Investors cannot invest directly in an index. Index performance does not reflect the deduction for fees, expenses, or taxes.
This report and the financial statements contained herein are submitted for the general information of shareholders of the funds. This report is not authorized for distribution to prospective investors in a fund unless preceded or accompanied by an effective prospectus for the fund. Performance of funds discussed above, other than the Alger 35 Fund, represents the twelve-month period return of Class A shares prior to the deduction of any sales charges and includes the reinvestment of any dividends or distributions. Performance for the Alger 35 Fund represents Class Z shares.
The performance data quoted in this material represents past performance, which is not an indication or a guarantee of future results.
Standard performance results can be found on the following pages. The investment return and principal value of an investment in a Fund will fluctuate so that an investor’s shares, when redeemed, may be worth more or less than their original cost. Current performance may be lower or higher than the performance quoted. For performance data current to the most recent month-end, visit us at www.alger.com, or call us at (800) 992-3863.
The views and opinions of the funds’ management in this report are as of the date of the Shareholders’ Letter and are subject to change at any time subsequent to this date. There is no guarantee that any of the assumptions that formed the basis for the opinions stated herein are accurate or that they will materialize. Moreover, the information forming the basis for such assumptions is from sources believed to be reliable; however, there is no guarantee that such information is accurate. Any securities mentioned, whether owned in a fund or otherwise, are considered in the context of the construction of an overall portfolio of securities and therefore reference to them should not be construed as a recommendation or offer to purchase or sell any such security. Inclusion of such securities in a fund and transactions in such securities, if any, may be for a variety of reasons, including, without limitation, in response to cash flows, inclusion in a benchmark, and risk control. The reference to a specific security should also be understood in such context and not viewed as a statement that the security is a significant holding in a fund. Please refer to the Schedule of Investments for each fund which is included in this report for a complete list of fund holdings as of October 31, 2023. Securities mentioned in the Shareholders’ Letter, if not found in the Schedules of Investments, may have been held by the funds during the fiscal twelve-month period ended October 31, 2023.
Risk Disclosures
Alger Capital Appreciation Fund
Investing in the stock market involves risks, including the potential loss of principal. Growth stocks may be more volatile than other stocks as their prices tend to be higher in relation to their companies’ earnings and may be more sensitive to market, political, and economic developments. Local, regional or global events such as environmental or natural disasters, war, terrorism, pandemics, outbreaks of infectious diseases and similar public health threats, recessions, or other events could have a significant impact on investments. A significant portion of assets may be invested in securities of companies in related sectors, and may be similarly affected by economic, political, or market events and conditions and may be more vulnerable to unfavorable sector developments. Foreign securities involve special risks including currency fluctuations, inefficient trading, political and economic instability, and increased volatility. Active trading may increase transaction costs, brokerage commissions, and taxes, which can lower the return on investment. At times, cash may be a larger position in the portfolio and may underperform relative to equity securities.
Alger 35 Fund
Investing in the stock market involves risks, including the potential loss of principal. Growth stocks may be more volatile than other stocks as their prices tend to be higher in relation to their companies’ earnings and may be more sensitive to market, political, and economic developments. Local, regional or global events such as environmental or natural disasters, war, terrorism, pandemics, outbreaks of infectious diseases and similar public health threats, recessions, or other events could have a significant impact on investments. A significant portion of assets may be invested in securities of companies in related sectors, and may be similarly affected by economic, political, or market events and conditions and may be more vulnerable to unfavorable sector developments. Investing in companies of small and medium capitalizations involves the risk that such issuers may have limited product lines or financial resources, lack management depth, or have limited liquidity. Foreign securities involve special risks including currency fluctuations, inefficient trading, political and economic instability, and increased volatility. The fund is classified as a “non-diversified fund” under federal securities laws because it can invest in fewer individual companies than a diversified fund. Assets may be focused in a small number of holdings, making them susceptible to risks associated with a single economic, political or regulatory event than a more diversified portfolio. Active trading may increase transaction costs, brokerage commissions, and taxes, which can lower the return on investment. At times, cash may be a larger position in the portfolio and may underperform relative to equity securities.
Alger Growth & Income Fund
Investing in the stock market involves risks, including the potential loss of principal. Growth stocks may be more volatile than other stocks as their prices tend to be higher in relation to their companies’ earnings and may be more sensitive to market, political, and economic developments. Local, regional or global events such as environmental or natural disasters, war, terrorism, pandemics, outbreaks of infectious diseases and similar public health threats, recessions, or other events could have a significant impact on investments. A significant portion of assets may be invested in securities of companies in related sectors, and may be similarly affected by economic, political, or market events and conditions and may be more vulnerable to unfavorable sector developments. Income-producing securities may cut or fail to declare dividends due to market downturns or for other reasons. At times, cash may be a larger position in the portfolio and may underperform relative to equity securities.
Alger Mid Cap Growth Fund
Investing in the stock market involves risks, including the potential loss of principal. Growth stocks may be more volatile than other stocks as their prices tend to be higher in relation to their companies’ earnings and may be more sensitive to market, political, and economic developments. Local, regional or global events such as environmental or natural disasters, war, terrorism, pandemics, outbreaks of infectious diseases and similar public health threats, recessions, or other events could have a significant impact on investments. A significant portion of assets may be invested in securities of companies in related sectors, and may be similarly affected by economic, political, or market events and conditions and may be more vulnerable to unfavorable sector developments. Investing in companies of medium capitalizations involves the risk that such issuers may have limited product lines or financial resources, lack management depth, or have limited liquidity. Foreign securities involve special risks including currency fluctuations, inefficient trading, political and economic instability, and increased volatility. Active trading may increase transaction costs, brokerage commissions, and taxes, which can lower the return on investment. At times, cash may be a larger position in the portfolio and may underperform relative to equity securities.
Alger Mid Cap Focus Fund
Investing in the stock market involves risks, including the potential loss of principal. Growth stocks may be more volatile than other stocks as their prices tend to be higher in relation to their companies’ earnings and may be more sensitive to market, political, and economic developments. Local, regional or global events such as environmental or natural disasters, war, terrorism, pandemics, outbreaks of infectious diseases and similar public health threats, recessions, or other events could have a significant impact on investments. Investing in companies of medium capitalizations involves the risk that such issuers may have limited product lines or financial resources, lack management depth, or have limited liquidity. Assets may be focused in a small number of holdings, making them susceptible to risks associated with a single economic, political or regulatory event than a more diversified portfolio. A significant portion of assets may be invested in securities of companies in related sectors or industries, and may be similarly affected by economic, political, or market events and conditions and may be more vulnerable to unfavorable sector or industry developments. Foreign securities involve special risks including currency fluctuations, inefficient trading, political and economic instability, and increased volatility. Active trading may increase transaction costs, brokerage commissions, and taxes, which can lower the return on investment. At times, cash may be a larger position in the portfolio and may underperform relative to equity securities.
Alger Weatherbie Specialized Growth Fund
Investing in the stock market involves risks, including the potential loss of principal. Growth stocks may be more volatile than other stocks as their prices tend to be higher in relation to their companies’ earnings and may be more sensitive to market, political, and economic developments. Local, regional or global events such as environmental or natural disasters, war, terrorism, pandemics, outbreaks of infectious diseases and similar public health threats, recessions, or other events could have a significant impact on investments. A significant portion of assets may be invested in securities of companies in related sectors, and may be similarly affected by economic, political, or market events and conditions and may be more vulnerable to unfavorable sector developments. Investing in companies of small and medium capitalizations involves the risk that such issuers may have limited product lines or financial resources, lack management depth, or have limited liquidity. Assets may be focused in a small number of holdings, making them susceptible to risks associated with a single economic, political or regulatory event than a more diversified portfolio. Foreign securities and emerging markets involve special risks including currency fluctuations, inefficient trading, political and economic instability, and increased volatility. At times, cash may be a larger position in the portfolio and may underperform relative to equity securities.
Alger Small Cap Growth Fund
Investing in the stock market involves risks, including the potential loss of principal. Growth stocks may be more volatile than other stocks as their prices tend to be higher in relation to their companies’ earnings and may be more sensitive to market, political, and economic developments. Local, regional or global events such as environmental or natural disasters, war, terrorism, pandemics, outbreaks of infectious diseases and similar public health threats, recessions, or other events could have a significant impact on investments. A significant portion of assets may be invested in securities of companies in related sectors, and may be similarly affected by economic, political, or market events and conditions and may be more vulnerable to unfavorable sector or industry developments. Investing in companies of small capitalizations involves the risk that such issuers may have limited product lines or financial resources, lack management depth, or have limited liquidity. At times, cash may be a larger position in the portfolio and may underperform relative to equity securities.
Alger Small Cap Focus Fund
Investing in the stock market involves risks, including the potential loss of principal. Growth stocks may be more volatile than other stocks as their prices tend to be higher in relation to their companies’ earnings and may be more sensitive to market, political, and economic developments. Local, regional or global events such as environmental or natural disasters, war, terrorism, pandemics, outbreaks of infectious diseases and similar public health threats, recessions, or other events could have a significant impact on investments. A significant portion of assets may be invested in securities of companies in related sectors or industries, and may be similarly affected by economic, political, or market events and conditions and may be more vulnerable to unfavorable sector or industry developments. Investing in companies of small capitalizations involves the risk that such issuers may have limited product lines or financial resources, lack management depth, or have limited liquidity. Assets may be focused in a small number of holdings, making them susceptible to risks associated with a single economic, political or regulatory event than a more diversified portfolio. At times, cash may be a larger position in the portfolio and may underperform relative to equity securities.
Alger International Focus Fund
Investing in the stock market involves risks, including the potential loss of principal. Growth stocks may be more volatile than other stocks as their prices tend to be higher in relation to their companies’ earnings and may be more sensitive to market, political, and economic developments. Local, regional or global events such as environmental or natural disasters, war, terrorism, pandemics, outbreaks of infectious diseases and similar public health threats, recessions, or other events could have a significant impact on investments. A significant portion of assets may be invested in securities of companies in related sectors, and may be similarly affected by economic, political, or market events and conditions and may be more vulnerable to unfavorable sector developments. Assets may be focused in a small number of holdings, making them susceptible to risks associated with a single economic, political or regulatory event than a more diversified portfolio. Foreign securities and emerging markets involve special risks including currency fluctuations, inefficient trading, political and economic instability, and increased volatility. Investing in companies of small capitalizations involves the risk that such issuers may have limited product lines or financial resources, lack management depth, or have limited liquidity. At times, cash may be a larger position in the portfolio and may underperform relative to equity securities.
Alger Health Sciences Fund
Investing in the stock market involves risks, including the potential loss of principal. Growth stocks may be more volatile than other stocks as their prices tend to be higher in relation to their companies’ earnings and may be more sensitive to market, political, and economic developments. Local, regional or global events such as environmental or natural disasters, war, terrorism, pandemics, outbreaks of infectious diseases and similar public health threats, recessions, or other events could have a significant impact on investments. A significant portion of assets will be invested in healthcare companies, which may be significantly affected by competition, innovation, regulation, and product obsolescence, and may be more volatile than the securities of other companies. A significant portion of assets may be invested in securities of companies in related industries, and may be similarly affected by economic, political, or market events and conditions and may be more vulnerable to unfavorable sector developments. Assets may be focused in a small number of holdings, making them susceptible to risks associated with a single economic, political or regulatory event than a more diversified portfolio. Investing in companies of small capitalizations involves the risk that such issuers may have limited product lines or financial resources, lack management depth, or have limited liquidity. Private placements are offerings of a company’s securities not registered with the SEC and not offered to the public, for which limited information may be available. Such investments are generally considered to be illiquid. Foreign securities involve special risks including currency fluctuations, inefficient trading, political and economic instability, and increased volatility. Active trading may increase transaction costs, brokerage commissions, and taxes, which can lower the return on investment. At times, cash may be a larger position in the portfolio and may underperform relative to equity securities.
For a more detailed discussion of the risks associated with a fund, please see the prospectus.
Before investing, carefully consider a fund’s investment objective, risks, charges, and expenses. For a prospectus and summary prospectus containing this and other information or for The Alger Funds’ most recent month-end performance data, visit www.alger.com, call (800) 992-3863 or consult your financial advisor. Read the prospectus and summary prospectus carefully before investing.
Distributor: Fred Alger & Company, LLC
NOT FDIC INSURED. NOT BANK GUARANTEED. MAY LOSE VALUE.
Definitions:
| ● | Earnings per share (EPS) is calculated as a company’s profit divided by the outstanding shares of its common stock. |
| ● | The Consumer Price Index (CPI) measures the monthly change in prices paid by U.S. consumers. The Bureau of Labor Statistics (BLS) calculates the CPI as a weighted average of prices for a basket of goods and services representative of aggregate U.S. consumer spending. |
| ● | The MSCI ACWI ex USA Index captures large- and mid-cap representation across developed markets countries (excluding the US) and emerging markets countries. The index covers approximately 85% of the global equity opportunity set outside the U.S. |
| ● | The MSCI Emerging Markets Index captures large- and mid-cap representation across Emerging Markets countries. The index covers approximately 85% of the free float-adjusted market capitalization in each country. |
| ● | The Russell 1000 Growth Index measures the performance of the large-cap growth segment of the U.S. equity universe. It includes those Russell 1000 companies with higher growth earning potential as defined by Russell’s leading style methodology. The Russell 1000 Growth Index is constructed to provide a comprehensive and unbiased barometer for the large-cap growth segment. |
| ● | The Russell 1000 Index measures the performance of the large-cap segment of the U.S. equity universe. It is a subset of the Russell 3000 Index and includes approximately 1,000 of the largest securities based on a combination of their market cap and current index membership. |
| ● | The Russell 2000 Growth Index measures the performance of the small-cap growth segment of the U.S. equity universe. It includes those Russell 2000 companies with higher growth earning potential as defined by Russell’s leading style methodology. The Russell 2000 Growth Index is constructed to provide a comprehensive and unbiased barometer for the small-cap growth segment. |
| ● | The Russell 2000 Index measures the performance of the small-cap segment of the U.S. equity universe. The Russell 2000 Index is constructed to provide a comprehensive and unbiased barometer of the small-cap segment. |
| ● | The Russell 2500 Growth Index measures the performance of the small to mid-cap growth segment of the U.S. equity universe. It includes those Russell 2500 companies with higher growth earning potential as defined by Russell’s leading style methodology. The Russell 2500 Growth Index is constructed to provide a comprehensive and unbiased barometer of the small to mid-cap growth market. |
| ● | The Russell 2500 Index measures the performance of the small to midcap segment of the U.S. equity universe, commonly referred to as “smid” cap. The Russell 2500 Index is constructed to provide a comprehensive and unbiased barometer for the small to mid-cap segment. |
| ● | The Russell 3000 Healthcare Index is an unmanaged index that measures the performance of those companies in the Russell 3000 Index involved in the medical services or healthcare field. Also included are companies involved in research, development and production of pharmaceuticals and biotechnology |
| ● | The Russell 3000 Index measures the performance of the largest 3,000 U.S. companies of the investable U.S. equity market. The Russell 3000 Index is constructed to provide a comprehensive, unbiased and stable barometer of the broad market. |
| ● | The Russell Microcap Index measures the performance of the microcap segment of the U.S. equity market. The Russell Microcap Index is constructed to provide a comprehensive and unbiased barometer for the microcap segment trading on national exchanges. |
| ● | The Russell Midcap Growth Index measures the performance of the mid-cap growth segment of the U.S. equity universe. It includes those Russell Midcap Index companies with higher growth earning potential as defined by Russell’s leading style methodology. The Russell Midcap Growth Index is constructed to provide a comprehensive and unbiased barometer of the mid-cap growth market. |
| ● | The Russell Midcap Index measures the performance of the mid-cap segment of the U.S. equity universe. The Russell Midcap Index is constructed to provide a comprehensive and unbiased barometer for the mid-cap segment. |
| ● | The S&P 500 Index is an unmanaged index considered representative of large-cap growth stocks. |
ALGER CAPITAL APPRECIATION FUND
Fund Highlights Through October 31, 2023 (Unaudited)
The chart above illustrates the change in value of a hypothetical $10,000 investment made in the Alger Capital Appreciation Fund Class A shares, with a maximum sales charge of 5.25%, and the Russell 1000 Growth Index (an unmanaged index of common stocks) for the ten years ended October 31, 2023. Figures for the Alger Capital Appreciation Fund Class A shares and the Russell 1000 Growth Index include reinvestment of dividends. Figures for the Alger Capital Appreciation Fund Class A shares also include reinvestment of capital gains. Performance for Alger Capital Appreciation Fund Class C and Class Z shares will vary from the results shown above due to differences in expenses and sales charges those classes bear. Investors cannot invest directly in any index. Index performance does not reflect deduction for fees, expenses, or taxes.
ALGER CAPITAL APPRECIATION FUND
Fund Highlights Through October 31, 2023 (Unaudited) (Continued)
PERFORMANCE COMPARISON AS OF 10/31/23
AVERAGE ANNUAL TOTAL RETURNS
| 1 YEAR | 5 YEARS | 10 YEARS | ||||
| Class A | 10.82% | 8.72% | 10.52% | |||
| Class C | 15.03% | 9.08% | 10.29% | |||
| Class Z | 17.44% | 10.28% | 11.50% | |||
| Russell 1000 Growth Index | 18.95% | 14.22% | 13.82% | |||
The performance data quoted represents past performance, which is not an indication or a guarantee of future results. The Fund’s average annual total returns include changes in share price and reinvestment of dividends and capital gains. Class A returns reflect the maximum initial sales charge and Class C returns reflect the applicable contingent deferred sales charge. The chart and table above do not reflect the deduction of taxes that a shareholder would have paid on Fund distributions or on the redemption of Fund shares. Investment return and principal will fluctuate and the Fund’s shares, when redeemed, may be worth more or less than their original cost. Current performance may be higher or lower than the performance quoted. For updated performance, visit us at www.alger.com or call us at (800) 992-3863.
ALGER 35 FUND
Fund Highlights Through October 31, 2023 (Unaudited)
The chart above illustrates the change in value of a hypothetical $10,000 investment made in the Alger 35 Fund Class Z shares and the S&P 500 Index (an unmanaged index of common stocks) from March 29, 2018, the inception date of the Alger 35 Fund Class Z shares, through October 31, 2023. Effective May 7, 2021, Class P shares of the Alger 35 Fund were reclassified as Class Z shares. The reclassified Class Z shares have the same annual returns as the Class P shares because the shares are invested in the same portfolio of securities and the reclassified Class Z shares have the same expenses as the Fund’s Class P shares. Historical performance prior to May 7, 2021 is that of the Fund’s Class P shares. Figures for the Alger 35 Fund Class Z shares and the S&P 500 Index include reinvestment of dividends. Figures for the Alger 35 Fund Class Z shares also include reinvestment of capital gains. Investors cannot invest directly in any index. Index performance does not reflect deduction for fees, expenses, or taxes.
ALGER 35 FUND
Fund Highlights Through October 31, 2023 (Unaudited) (Continued)
PERFORMANCE COMPARISON AS OF 10/31/23
AVERAGE ANNUAL TOTAL RETURNS
| 1 YEAR | 5 YEARS | Since Inception | ||||
| Class Z (Inception 3/29/18) | 1.38% | 8.66% | 8.43% | |||
| S&P 500 Index | 10.14% | 11.01% | 10.52% | |||
The performance data quoted represents past performance, which is not an indication or a guarantee of future results. The Fund’s average annual total returns include changes in share price and reinvestment of dividends and capital gains. Effective May 7, 2021, Class P shares of the Alger 35 Fund were reclassified as Class Z shares. The reclassified Class Z shares have the same annual returns as the Class P shares because the shares are invested in the same portfolio of securities and the reclassified Class Z shares have the same expenses as the Fund’s Class P shares. Historical performance prior to May 7, 2021 is that of the Fund’s Class P shares. The chart and table above do not reflect the deduction of taxes that a shareholder would have paid on Fund distributions or on the redemption of Fund shares. Investment return and principal will fluctuate and the Fund’s shares, when redeemed, may be worth more or less than their original cost. Current performance may be higher or lower than the performance quoted. For updated performance, visit us at www.alger. com or call us at (800) 992-3863.
ALGER GROWTH & INCOME FUND
Fund Highlights Through October 31, 2023 (Unaudited)
The chart above illustrates the change in value of a hypothetical $10,000 investment made in the Alger Growth & Income Fund Class A shares, with a maximum sales charge of 5.25%, and the S&P 500 Index (an unmanaged index of common stocks) for the ten years ended October 31, 2023. Figures for the Alger Growth & Income Fund Class A shares and the S&P 500 Index include reinvestment of dividends. Figures for the Alger Growth & Income Fund Class A shares also include reinvestment of capital gains. Performance for the Alger Growth & Income Fund Class C and Class Z shares will vary from the results shown above due to differences in expenses and sales charges those classes bear. Investors cannot invest directly in any index. Index performance does not reflect deduction for fees, expenses, or taxes.
ALGER GROWTH & INCOME FUND
Fund Highlights Through October 31, 2023 (Unaudited) (Continued)
PERFORMANCE COMPARISON AS OF 10/31/23
AVERAGE ANNUAL TOTAL RETURNS
| 1 YEAR | 5 YEARS | 10 YEARS | ||||
| Class A | 5.54% | 10.20% | 10.10% | |||
| Class C | 9.56% | 10.56% | 9.87% | |||
| Class Z | 11.75% | 11.77% | 11.04% | |||
| S&P 500 Index | 10.14% | 11.01% | 11.18% | |||
The performance data quoted represents past performance, which is not an indication or a guarantee of future results. The Fund’s average annual total returns include changes in share price and reinvestment of dividends and capital gains. Class A returns reflect the maximum initial sales charge and Class C returns reflect the applicable contingent deferred sales charge. The chart and table above do not reflect the deduction of taxes that a shareholder would have paid on Fund distributions or on the redemption of Fund shares. Investment return and principal will fluctuate and the Fund’s shares, when redeemed, may be worth more or less than their original cost. Current performance may be higher or lower than the performance quoted. For updated performance, visit us at www.alger.com or call us at (800) 992-3863.
ALGER MID CAP GROWTH FUND*
Fund Highlights Through October 31, 2023 (Unaudited)
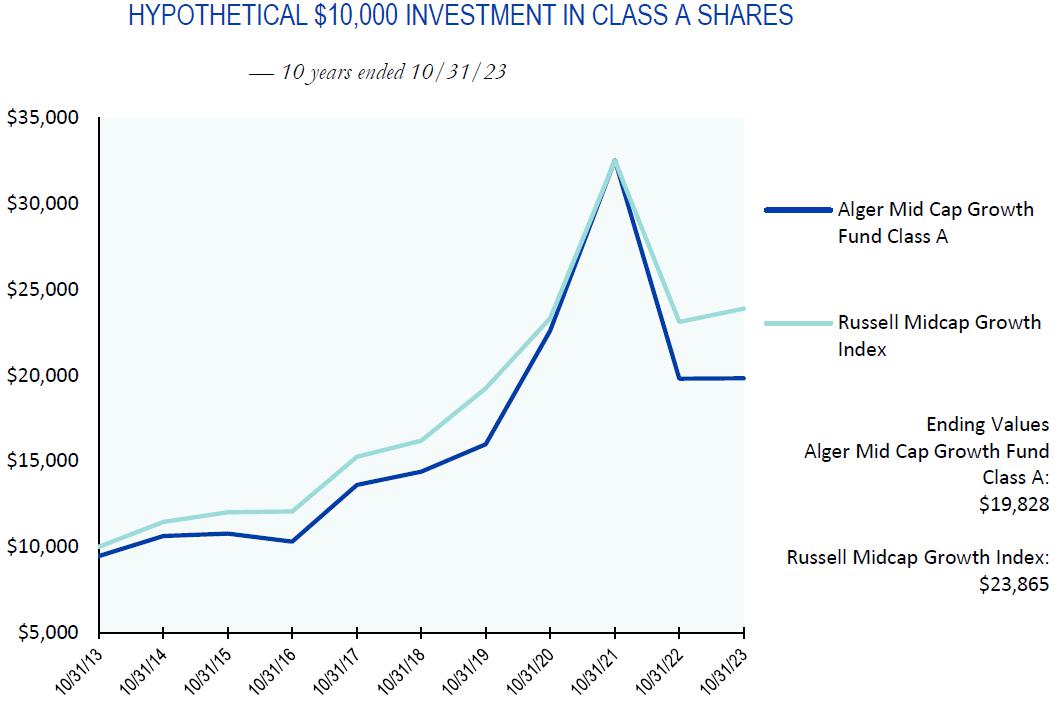
The chart above illustrates the change in value of a hypothetical $10,000 investment made in the Alger Mid Cap Growth Fund Class A shares, with a maximum sales charge of 5.25%, and the Russell Midcap Growth Index (an unmanaged index of common stocks) for the ten years ended October 31, 2023. Figures for the Alger Mid Cap Growth Fund Class A shares and Russell Midcap Growth Index include reinvestment of dividends. Figures for the Alger Mid Cap Growth Fund Class A shares also include reinvestment of capital gains. Performance for the Alger Mid Cap Growth Fund Class B, Class C and Class Z shares will vary from the results shown above due to differences in expenses and sales charges those classes bear. Investors cannot invest directly in any index. Index performance does not reflect deduction for fees, expenses, or taxes.
ALGER MID CAP GROWTH FUND*
Fund Highlights Through October 31, 2023 (Unaudited) (Continued)
PERFORMANCE COMPARISON AS OF 10/31/23
AVERAGE ANNUAL TOTAL RETURNS
| 1 YEAR | 5 YEARS | 10 YEARS | ||||
| Class A | (5.08)% | 5.48% | 7.08% | |||
| Class B | (4.85)% | 6.39% | 7.27% | |||
| Class C | (1.62)% | 5.77% | 6.80% | |||
| Russell Midcap Growth Index | 3.35% | 8.09% | 9.09% | |||
| 1 YEAR | 5 YEARS | Since Inception | ||||
| Class Z (Inception 5/28/15) | 0.54% | 6.95% | 6.65% | |||
| Russell Midcap Growth Index | 3.35% | 8.09% | 7.91% | |||
The performance data quoted represents past performance, which is not an indication or a guarantee of future results. The Fund’s average annual total returns include changes in share price and reinvestment of dividends and capital gains. Class A returns reflect the maximum initial sales charge and Class B and C returns reflect the applicable contingent deferred sales charge. The chart and table above do not reflect the deduction of taxes that a shareholder would have paid on Fund distributions or on the redemption of Fund shares. Investment return and principal will fluctuate and the Fund’s shares, when redeemed, may be worth more or less than their original cost. Current performance may be higher or lower than the performance quoted. For updated performance, visit us at www.alger.com or call us at (800) 992-3863.
| * | Pursuant to the U.S. Securities and Exchange Commission’s rules on Fair Fund and Disgorgement Plans, the Alger Mid Cap Growth Fund received a Fair Fund distribution of $9,346,397 on September 10, 2021, which contributed approximately 0.60% and 0.30% to its five and ten year annual returns, respectively. |
ALGER MID CAP FOCUS FUND
Fund Highlights Through October 31, 2023 (Unaudited)
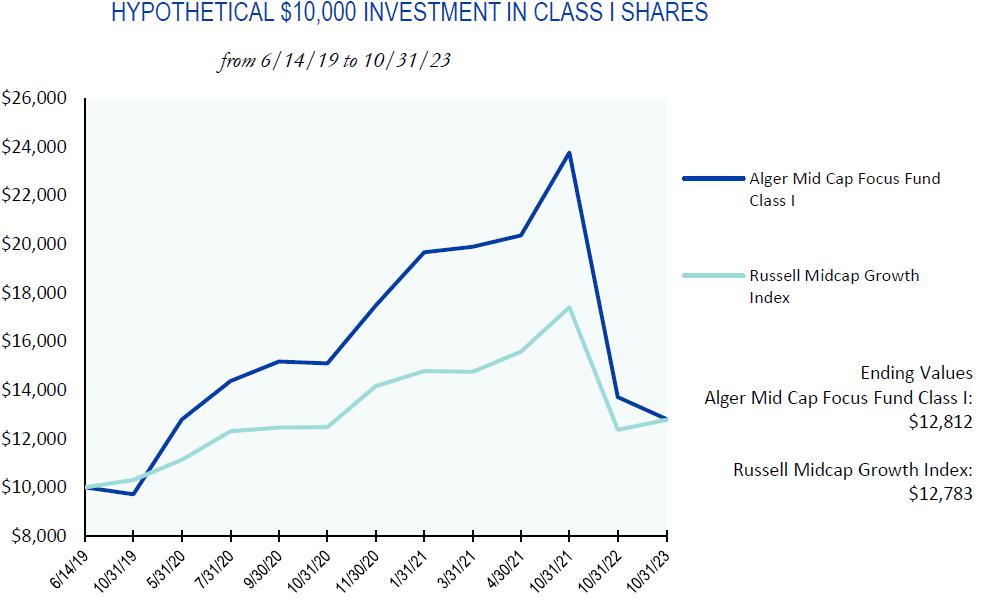
The chart above illustrates the change in value of a hypothetical $10,000 investment made in the Alger Mid Cap Focus Fund Class I shares and the Russell Midcap Growth Index (an unmanaged index of common stocks) from June 14, 2019, the inception date of the Alger Mid Cap Focus Fund Class I shares, through October 31, 2023. Figures for the Alger Mid Cap Focus Fund Class I shares and the Russell Midcap Growth Index include reinvestment of dividends. Figures for the Alger Mid Cap Focus Fund Class I shares also include reinvestment of capital gains. Performance for the Alger Mid Cap Focus Fund Class A, C, Y and Z shares will vary from the results shown above due to differences in the expenses and sales charges that those classes bear. Investors cannot invest directly in any index. Index performance does not reflect deduction for fees, expenses, or taxes.
ALGER MID CAP FOCUS FUND
Fund Highlights Through October 31, 2023 (Unaudited) (Continued)
PERFORMANCE COMPARISON AS OF 10/31/23
AVERAGE ANNUAL TOTAL RETURNS
| 1 YEAR | 5 YEARS | Since Inception | ||||
| Class I (Inception 6/14/19) | (6.59)% | n/a | 5.83% | |||
| Class Z (Inception 6/14/19) | (6.28)% | n/a | 6.13% | |||
| Russell Midcap Growth Index | 3.35% | n/a | 5.77% |
| 1 YEAR | 5 YEARS | Since Inception | ||||
| Class Y (Inception 2/26/21) | (6.28)% | n/a | (16.41)% | |||
| Russell Midcap Growth Index | 3.35% | n/a | (5.91)% |
| 1 YEAR | 5 YEARS | Since Inception | ||||
| Class A (Inception 7/29/21) | (11.55)% | n/a | (21.53)% | |||
| Class C (Inception 7/29/21) | (8.25)% | n/a | (20.25)% | |||
| Russell Midcap Growth Index | 3.35% | n/a | (11.00)% |
The performance data quoted represents past performance, which is not an indication or a guarantee of future results. The Fund’s average annual total returns include changes in share price and reinvestment of dividends and capital gains. Class A returns reflect the maximum initial sales charge and Class C returns reflect the applicable contingent deferred sales charge. The chart and table above do not reflect the deduction of taxes that a shareholder would have paid on Fund distributions or on the redemption of Fund shares. Investment return and principal will fluctuate and the Fund’s shares, when redeemed, may be worth more or less than their original cost. Current performance may be higher or lower than the performance quoted. For updated performance, visit us at www.alger.com or call us at (800) 992-3863.
ALGER WEATHERBIE SPECIALIZED GROWTH FUND
Fund Highlights Through October 31, 2023 (Unaudited)
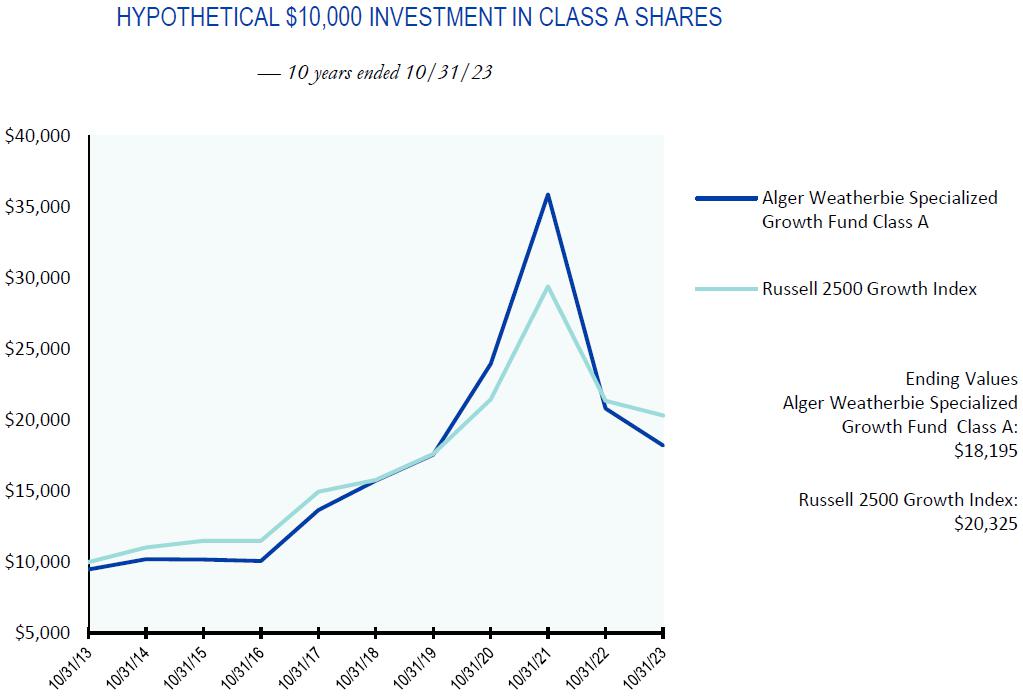
The chart above illustrates the change in value of a hypothetical $10,000 investment made in the Alger Weatherbie Specialized Growth Fund Class A shares, with a maximum sales charge of 5.25%, and the Russell 2500 Growth Index (an unmanaged index of common stocks) for the ten years ended October 31, 2023. From August 30, 2017 to September 30, 2019, the Fund was named Alger SMid Cap Focus Fund. Prior to August 30, 2017, the Fund followed different investment strategies under the name Alger SMid Cap Growth Fund and prior to March 1, 2017 was managed by different portfolio managers. Accordingly, performance prior to those dates does not reflect the Fund’s current investment strategies and investment personnel. Figures for the Alger Weatherbie Specialized Growth Fund Class A shares and the Russell 2500 Growth Index include reinvestment of dividends. Figures for the Alger Weatherbie Specialized Growth Fund Class A shares also include reinvestment of capital gains. Performance for the Alger Weatherbie Specialized Growth Fund Class C, Class I, Class Y and Class Z shares will vary from the results shown above due to differences in expenses and sales charges those classes bear. Investors cannot invest directly in any index. Index performance does not reflect deduction for fees, expenses, or taxes.
ALGER WEATHERBIE SPECIALIZED GROWTH FUND
Fund Highlights Through October 31, 2023 (Unaudited) (Continued)
PERFORMANCE COMPARISON AS OF 10/31/23
AVERAGE ANNUAL TOTAL RETURNS
| 1 YEAR | 5 YEARS | 10 YEARS | ||||
| Class A | (17.12)% | 1.87% | 6.17% | |||
| Class C | (14.22)% | 2.17% | 5.92% | |||
| Class I | (12.59)% | 2.98% | 6.74% | |||
| Class Z | (12.25)% | 3.31% | 7.10% | |||
| Russell 2500 Growth Index | (4.80)% | 5.22% | 7.35% | |||
| 1 YEAR | 5 YEARS | Since Inception | ||||
| Class Y (Inception 8/30/17) | (12.21)% | 3.38% | 6.32% | |||
| Russell 2500 Growth Index | (4.80)% | 5.22% | 6.48% | |||
The performance data quoted represents past performance, which is not an indication or a guarantee of future results. The Fund’s average annual total returns include changes in share price and reinvestment of dividends and capital gains. Class A returns reflect the maximum initial sales charge and Class C returns reflect the applicable contingent deferred sales charge. The chart and table above do not reflect the deduction of taxes that a shareholder would have paid on Fund distributions or on the redemption of Fund shares. From August 30, 2017 to September 30, 2019, the Fund was named “Alger SMid Cap Focus Fund.” Prior to August 30, 2017, the Fund followed different investment strategies under the name “Alger SMid Cap Growth Fund” and prior to March 1, 2017 was managed by different portfolio managers. Accordingly, performance prior to those dates does not reflect the Fund’s current investment strategies and investment personnel. Investment return and principal will fluctuate and the Fund’s shares, when redeemed, may be worth more or less than their original cost. Current performance may be higher or lower than the performance quoted. For updated performance, visit us at www.alger. com or call us at (800) 992-3863.
ALGER SMALL CAP GROWTH FUND*
Fund Highlights Through October 31, 2023 (Unaudited)
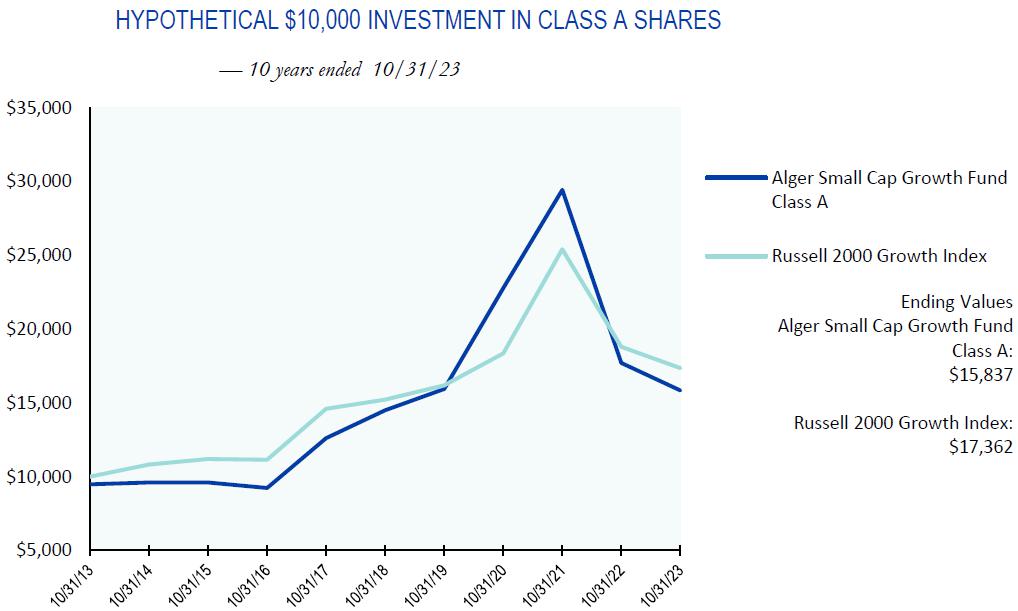
The chart above illustrates the change in value of a hypothetical $10,000 investment made in the Alger Small Cap Growth Fund Class A shares, with a maximum sales charge of 5.25%, and the Russell 2000 Growth Index (an unmanaged index of common stocks) for the ten years ended October 31, 2023. Figures for the Alger Small Cap Growth Fund Class A shares and the Russell 2000 Growth Index include reinvestment of dividends. Figures for the Alger Small Cap Growth Fund Class A shares also include reinvestment of capital gains. Performance for the Alger Small Cap Growth Fund Class B, Class C, Class Y and Class Z shares will vary from the results shown above due to differences in expenses and sales charges those classes bear. Investors cannot invest directly in any index. Index performance does not reflect deduction for fees, expenses, or taxes.
ALGER SMALL CAP GROWTH FUND*
Fund Highlights Through October 31, 2023 (Unaudited) (Continued)
PERFORMANCE COMPARISON AS OF 10/31/23
AVERAGE ANNUAL TOTAL RETURNS
| 1 YEAR | 5 YEARS | 10 YEARS | ||||
| Class A | (15.24)% | 0.68% | 4.71% | |||
| Class B | (15.08)% | 1.38% | 4.81% | |||
| Class C | (12.14)% | 0.97% | 4.45% | |||
| Class Z | (10.23)% | 2.13% | 5.64% | |||
| Russell 2000 Growth Index | (7.63)% | 2.68% | 5.67% | |||
| 1 YEAR | 5 YEARS | Since Inception | ||||
| Class Y (Inception 12/31/21) | (10.20)% | n/a | (24.11)% | |||
| Russell 2000 Growth Index | (7.63)% | n/a | (16.75)% | |||
The performance data quoted represents past performance, which is not an indication or a guarantee of future results. The Fund’s average annual total returns include changes in share price and reinvestment of dividends and capital gains. Class A returns reflect the maximum initial sales charge and Class B and C returns reflect the applicable contingent deferred sales charge. The chart and table above do not reflect the deduction of taxes that a shareholder would have paid on Fund distributions or on the redemption of Fund shares. Investment return and principal will fluctuate and the Fund’s shares, when redeemed, may be worth more or less than their original cost. Current performance may be higher or lower than the performance quoted. For updated performance, visit us at www.alger.com or call us at (800) 992-3863.
| * | Pursuant to the U.S. Securities and Exchange Commission’s Rules on Fair Fund and Disgorgement Plans, the Alger Small Cap Growth Fund received a Fair Fund distribution of $3,738,004 on September 10, 2021, which contributed approximately 0.11% and 0.06% to its five and ten year annual returns, respectively. |
ALGER SMALL CAP FOCUS FUND
Fund Highlights Through October 31, 2023 (Unaudited)
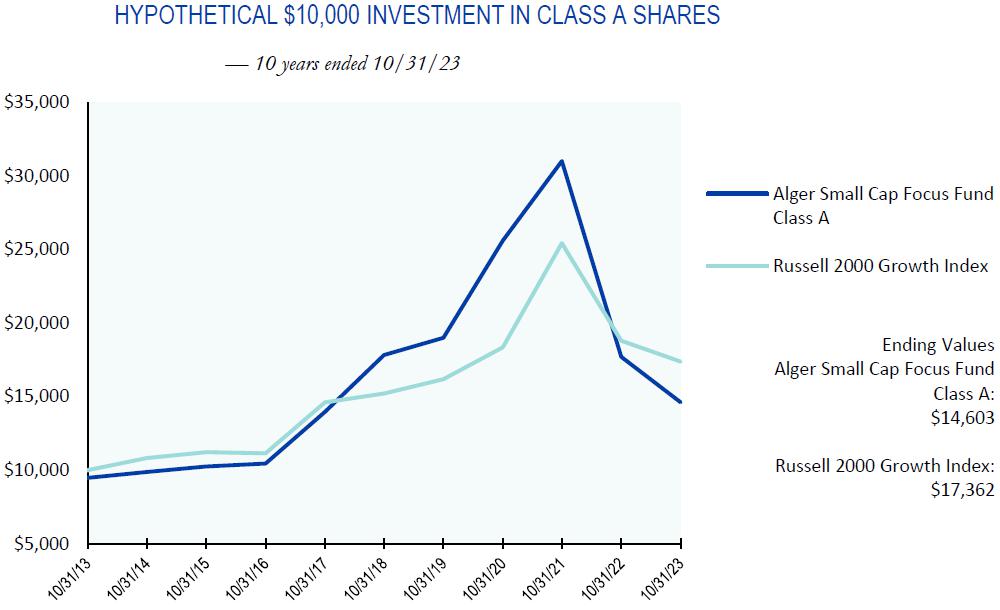
The chart above illustrates the change in value of a hypothetical $10,000 investment made in the Alger Small Cap Focus Fund Class A shares, with an initial 5.25% maximum sales charge, and the Russell 2000 Growth (an unmanaged index of common stocks) for the ten years ended October 31, 2023. Prior to August 7, 2015, the Fund followed different investment strategies under the name “Alger Growth Opportunities Fund” and prior to February 12, 2015 was managed by a different portfolio manager. Accordingly, performance prior to those dates does not reflect the Fund’s current investment strategies and investment personnel. Figures for the Alger Small Cap Focus Fund Class A shares and the Russell 2000 Growth Index include reinvestment of dividends. Figures for the Alger Small Cap Focus Fund Class A shares also include reinvestment of capital gains. Performance for the Alger Small Cap Focus Fund Class C, Class I, Class Y and Class Z shares will vary from the results shown above due to differences in expenses and sales charges those classes bear. Investors cannot invest directly in any index. Index performance does not reflect deduction for fees, expenses, or taxes.
ALGER SMALL CAP FOCUS FUND
Fund Highlights Through October 31, 2023 (Unaudited) (Continued)
PERFORMANCE COMPARISON AS OF 10/31/23
AVERAGE ANNUAL TOTAL RETURNS
| 1 YEAR | 5 YEARS | 10 YEARS | ||||
| Class A | (21.85)% | (4.94)% | 3.86% | |||
| Class C | (18.79)% | (4.55)% | 3.71% | |||
| Class I | (17.32)% | (3.81)% | 4.54% | |||
| Class Z | (17.00)% | (3.49)% | 4.86% | |||
| Russell 2000 Growth Index | (7.63)% | 2.68% | 5.67% | |||
| 1 YEAR | 5 YEARS | Since Inception | ||||
| Class Y (Inception 2/28/17) | (16.99)% | (3.48)% | 3.79% | |||
| Russell 2000 Growth Index | (7.63)% | 2.68% | 4.65% | |||
The performance data quoted represents past performance, which is not an indication or a guarantee of future results. The Fund’s average annual total returns include changes in share price and reinvestment of dividends and capital gains. Class A returns reflect the maximum initial sales charge and Class C returns reflect the applicable contingent deferred sales charge. The chart and table above do not reflect the deduction of taxes that a shareholder would have paid on Fund distributions or on the redemption of Fund shares. Prior to August 7, 2015, the Fund followed different investment strategies under the name “Alger Growth Opportunities Fund” and prior to February 12, 2015 was managed by a different portfolio manager. Accordingly, performance prior to those dates does not reflect the Fund’s current investment strategies and investment personnel. Investment return and principal will fluctuate and the Fund’s shares, when redeemed, may be worth more or less than their original cost. Current performance may be higher or lower than the performance quoted. For updated performance, visit us at www.alger.com or call us at (800) 992-3863.
ALGER INTERNATIONAL FOCUS FUND*
Fund Highlights Through October 31, 2023 (Unaudited)
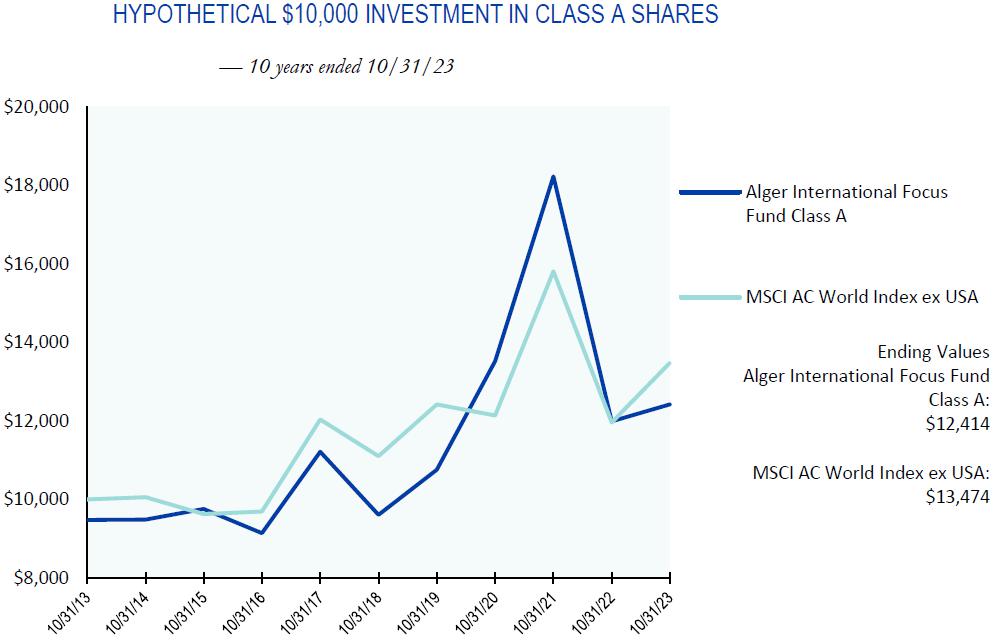
The chart above illustrates the change in value of a hypothetical $10,000 investment made in the Alger International Focus Fund Class A shares, with a maximum sales charge of 5.25%, and MSCI AC World Index ex USA (an unmanaged index of common stocks) for the ten years ended October 31, 2023. Before March 28, 2018, the Fund followed different investment strategies and was managed by different portfolio managers. Prior to August 15, 2018 the Fund was named “Alger International Growth Fund.” Performance prior to March 28, 2018 reflects these prior management styles and does not reflect the Fund’s current investment strategies and investment personnel. Figures for the Alger International Focus Fund Class A shares and the index include reinvestment of dividends. Figures for the Alger International Focus Fund Class A shares also include reinvestment of capital gains. Performance for the Alger International Focus Fund Class B, Class C, Class I and Class Z shares will vary from the results shown above due to differences in expenses and sales charges those classes bear. Investors cannot invest directly in any index. Index performance does not reflect deduction for fees, expenses, or taxes.
ALGER INTERNATIONAL FOCUS FUND*
Fund Highlights Through October 31, 2023 (Unaudited) (Continued)
PERFORMANCE COMPARISON AS OF 10/31/23
AVERAGE ANNUAL TOTAL RETURNS
| 1 YEAR | 5 YEARS | 10 YEARS | ||||
| Class A | (1.80)% | 4.15% | 2.19% | |||
| Class B | (1.40)% | 4.95% | 2.38% | |||
| Class C | 1.67% | 4.41% | 1.92% | |||
| Class I | 3.60% | 5.41% | 2.89% | |||
| Class Z | 4.12% | 5.74% | 3.19% | |||
| MSCI AC World Index ex USA | 12.66% | 3.96% | 3.03% | |||
The performance data quoted represents past performance, which is not an indication or a guarantee of future results. The Fund’s average annual total returns include changes in share price and reinvestment of dividends and capital gains. Class A returns reflect the maximum initial sales charge and Class B and C returns reflect the applicable contingent deferred sales charge. The chart and table above do not reflect the deduction of taxes that a shareholder would have paid on Fund distributions or on the redemption of Fund shares. Investment return and principal will fluctuate and the Fund’s shares, when redeemed, may be worth more or less than their original cost. Before March 28, 2018, the Fund followed different investment strategies and was managed by different portfolio managers. Prior to August 15, 2018 the Fund was named “Alger International Growth Fund.” Performance prior to March 28, 2018 reflects this prior management style and does not reflect the Fund’s current investment strategies and investment personnel. Current performance may be higher or lower than the performance quoted. For updated performance, visit us at www.alger.com or call us at (800) 992-3863.
| * | Pursuant to the U.S. Securities and Exchange Commission’s Rules on Fair Fund and Disgorgement Plans, the Alger International Focus Fund received a Fair Fund distribution of $159,091 on September 10, 2021, which contributed approximately 0.02% and 0.01% to its five and ten year annual returns, respectively. |
ALGER HEALTH SCIENCES FUND*
Fund Highlights Through October 31, 2023 (Unaudited)
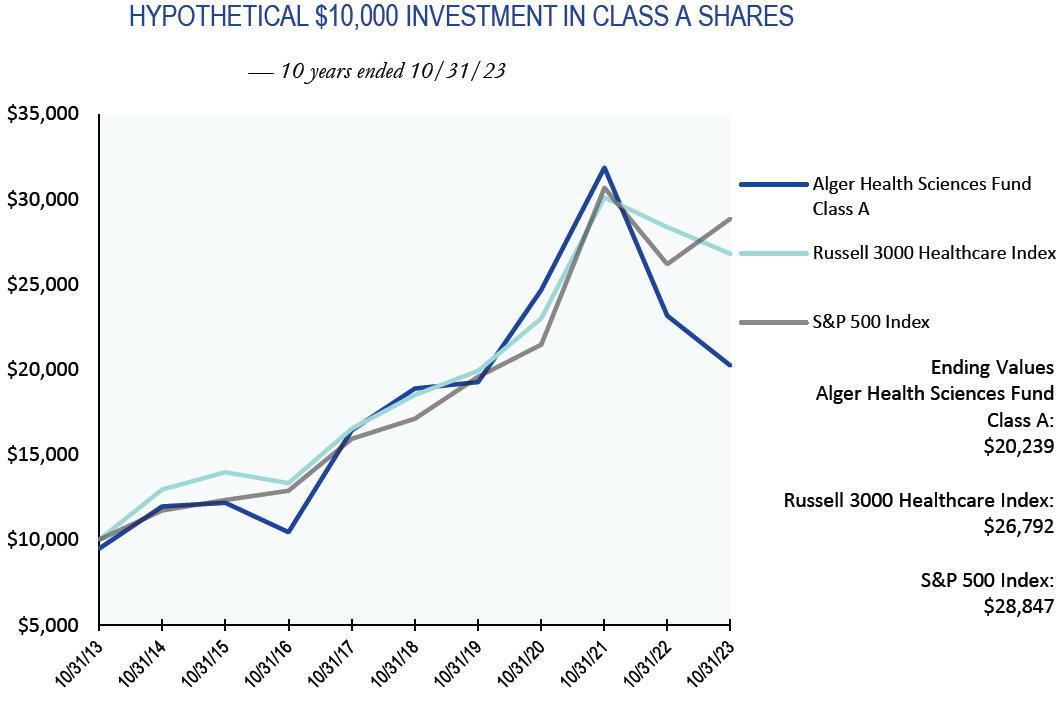
The chart above illustrates the change in value of a hypothetical $10,000 investment made in the Alger Health Sciences Fund Class A shares, with a maximum sales charge of 5.25%, the Russell 3000 Healthcare Index and the S&P 500 Index (each an unmanaged index of common stocks) for the ten years ended October 31, 2023. Figures for the Alger Health Sciences Fund Class A shares, the Russell 3000 Healthcare Index and the S&P 500 Index include reinvestment of dividends. Figures for the Alger Health Sciences Fund Class A shares also include reinvestment of capital gains. Performance for the Alger Health Sciences Fund Class C and Class Z shares will vary from the results shown above due to differences in expenses and sales charges those classes bear. Investors cannot invest directly in any index. Index performance does not reflect deduction for fees, expenses, or taxes.
ALGER HEALTH SCIENCES FUND*
Fund Highlights Through October 31, 2023 (Unaudited) (Continued)
PERFORMANCE COMPARISON AS OF 10/31/23
AVERAGE ANNUAL TOTAL RETURNS
| 1 YEAR | 5 YEARS | 10 YEARS | ||||
| Class A | (17.22)% | 0.30% | 7.30% | |||
| Class C | (14.25)% | 0.60% | 7.05% | |||
| Russell 3000 Healthcare Index | (5.47)% | 7.69% | 10.36% | |||
| S&P 500 Index | 10.14% | 11.01% | 11.18% | |||
| 1 YEAR | 5 YEARS | Since Inception | ||||
| Class Z (Inception 5/28/15) | (12.29)% | 1.74% | 4.82% | |||
| Russell 3000 Healthcare Index | (5.47)% | 7.69% | 7.29% | |||
| S&P 500 Index | 10.14% | 11.01% | 10.45% | |||
The performance data quoted represents past performance, which is not an indication or a guarantee of future results. The Fund’s average annual total returns include changes in share price and reinvestment of dividends and capital gains. Class A returns reflect the maximum initial sales charge and Class C returns reflect the applicable contingent deferred sales charge. The chart and table above do not reflect the deduction of taxes that a shareholder would have paid on Fund distributions or on the redemption of Fund shares. Investment return and principal will fluctuate and the Fund’s shares, when redeemed, may be worth more or less than their original cost. Current performance may be higher or lower than the performance quoted. For updated performance, visit us at www.alger.com or call us at (800) 992-3863.
| * | Pursuant to the U.S. Securities and Exchange Commission’s Rules on Fair Fund and Disgorgement Plans, the Alger Health Sciences Fund received a Fair Fund distribution of $179,832 on September 10, 2021, which contributed approximately 0.01% to its five and ten year annual returns. |
October 31, 2023 (Unaudited)
| SECTORS | Alger Capital Appreciation Fund | Alger 35 Fund | Alger Growth & Income Fund | Alger Mid Cap Growth Fund | ||||||||||||
| Communication Services | 14.9 | % | 19.1 | % | 8.9 | % | 6.7 | % | ||||||||
| Consumer Discretionary | 12.5 | 16.2 | 7.0 | 10.9 | ||||||||||||
| Consumer Staples | 0.0 | 0.0 | 6.9 | 1.6 | ||||||||||||
| Energy | 3.5 | 10.7 | 5.6 | 3.7 | ||||||||||||
| Financials | 5.2 | 1.5 | 11.5 | 8.5 | ||||||||||||
| Healthcare | 13.1 | 10.9 | 13.2 | 15.4 | ||||||||||||
| Industrials | 7.2 | 4.3 | 5.9 | 18.6 | ||||||||||||
| Information Technology | 41.1 | 34.9 | 29.7 | 26.4 | ||||||||||||
| Materials | 1.4 | 0.0 | 2.2 | 2.1 | ||||||||||||
| Real Estate | 0.0 | 0.0 | 2.7 | 5.1 | ||||||||||||
| Utilities | 0.0 | 0.0 | 1.7 | 0.0 | ||||||||||||
| Short-Term Investments and Net Other Assets | 1.1 | 2.4 | 4.7 | 1.0 | ||||||||||||
| 100.0 | % | 100.0 | % | 100.0 | % | 100.0 | % | |||||||||
| SECTORS | Alger Mid Cap Focus Fund | Alger Weatherbie Specialized Growth Fund | Alger Small Cap Growth Fund | Alger Small Cap Focus Fund | ||||||||||||
| Communication Services | 6.8 | % | 0.0 | % | 4.5 | % | 0.0 | % | ||||||||
| Consumer Discretionary | 8.7 | 6.6 | 11.8 | 3.6 | ||||||||||||
| Consumer Staples | 1.6 | 0.2 | 3.5 | 1.5 | ||||||||||||
| Energy | 4.6 | 2.5 | 4.9 | 2.8 | ||||||||||||
| Financials | 0.0 | 14.4 | 3.4 | 0.0 | ||||||||||||
| Healthcare | 18.9 | 27.5 | 31.4 | 37.7 | ||||||||||||
| Industrials | 12.2 | 19.4 | 10.6 | 9.4 | ||||||||||||
| Information Technology | 45.9 | 20.1 | 28.4 | 45.6 | ||||||||||||
| Materials | 2.0 | 0.0 | 1.1 | 1.2 | ||||||||||||
| Real Estate | 0.0 | 5.9 | 0.0 | 0.0 | ||||||||||||
| Short-Term Investments and Net Other Assets | (0.7 | ) | 3.4 | 0.4 | (1.8 | ) | ||||||||||
| 100.0 | % | 100.0 | % | 100.0 | % | 100.0 | % | |||||||||
| SECTORS | Alger Health Sciences Fund | |||
| Financials | 0.2 | % | ||
| Healthcare | 95.0 | |||
Short-Term Investments and Net Other Assets | 4.8 | |||
| 100.0 | % | |||
PORTFOLIO SUMMARY†
October 31, 2023 (Unaudited) (Continued)
| COUNTRY | Alger International Focus Fund | |||
| Argentina | 2.7 | % | ||
| Australia | 4.7 | |||
| Brazil | 6.5 | |||
| China | 6.6 | |||
| Denmark | 3.1 | |||
| France | 12.8 | |||
| Germany | 6.6 | |||
| Greece | 1.9 | |||
| Hong Kong | 2.1 | |||
| India | 7.8 | |||
| Ireland | 2.4 | |||
| Italy | 6.1 | |||
| Japan | 6.8 | |||
| Mexico | 0.5 | |||
| Netherlands | 5.1 | |||
| Norway | 1.1 | |||
| Saudi Arabia | 3.1 | |||
| Spain | 2.2 | |||
| Sweden | 1.9 | |||
| Switzerland | 4.4 | |||
| United Kingdom | 4.7 | |||
| United States | 3.2 | |||
| Short-Term Investments, Cash and Net Other Assets | 3.7 | |||
| 100.0 | % | |||
| † | Based on net assets for each Fund. |
THE ALGER FUNDS | ALGER CAPITAL APPRECIATION FUND
Schedule of Investments October 31, 2023
| COMMON STOCKS—98.6% | SHARES | VALUE | ||||||
| ADVERTISING—0.7% | ||||||||
| The Trade Desk, Inc., Cl. A* | 146,267 | $ | 10,379,106 | |||||
| AEROSPACE & DEFENSE—2.8% | ||||||||
| HEICO Corp. | 88,271 | 13,983,009 | ||||||
| TransDigm Group, Inc.* | 35,951 | 29,770,664 | ||||||
| 43,753,673 | ||||||||
| APPLICATION SOFTWARE—4.0% | ||||||||
| Adobe, Inc.* | 66,230 | 35,238,334 | ||||||
| Cadence Design Systems, Inc.* | 53,844 | 12,914,483 | ||||||
| Intuit, Inc. | 29,511 | 14,606,470 | ||||||
| 62,759,287 | ||||||||
| AUTOMOBILE MANUFACTURERS—1.4% | ||||||||
| Rivian Automotive, Inc., Cl. A* | 67,284 | 1,091,346 | ||||||
| Tesla, Inc.* | 106,538 | 21,397,092 | ||||||
| 22,488,438 | ||||||||
| AUTOMOTIVE PARTS & EQUIPMENT—0.4% | ||||||||
| Mobileye Global, Inc., Cl. A* | 176,085 | 6,280,952 | ||||||
| BIOTECHNOLOGY—4.0% | ||||||||
| Amgen, Inc. | 51,531 | 13,176,477 | ||||||
| Natera, Inc.* | 458,723 | 18,105,797 | ||||||
| Regeneron Pharmaceuticals, Inc.* | 9,993 | 7,793,441 | ||||||
| Vaxcyte, Inc.* | 261,175 | 12,562,517 | ||||||
| Vertex Pharmaceuticals, Inc.* | 32,981 | 11,942,750 | ||||||
| 63,580,982 | ||||||||
| BROADLINE RETAIL—8.7% | ||||||||
| Amazon.com, Inc.* | 850,895 | 113,245,615 | ||||||
| MercadoLibre, Inc.* | 19,863 | 24,644,819 | ||||||
| 137,890,434 | ||||||||
| CARGO GROUND TRANSPORTATION—0.4% | ||||||||
| Old Dominion Freight Line, Inc. | 17,611 | 6,633,359 | ||||||
| CASINOS & GAMING—1.2% | ||||||||
| DraftKings, Inc., Cl. A* | 364,153 | 10,057,906 | ||||||
| Flutter Entertainment PLC* | 55,553 | 8,725,827 | ||||||
| 18,783,733 | ||||||||
| CONSTRUCTION & ENGINEERING—0.5% | ||||||||
| Quanta Services, Inc. | 51,572 | 8,618,713 | ||||||
| CONSTRUCTION MACHINERY & HEAVY TRANSPORTATION EQUIPMENT—0.5% | ||||||||
| Wabtec Corp. | 76,207 | 8,079,466 | ||||||
| CONSTRUCTION MATERIALS—1.1% | ||||||||
| Martin Marietta Materials, Inc. | 42,362 | 17,323,516 | ||||||
| DIVERSIFIED SUPPORT SERVICES—0.2% | ||||||||
| Cintas Corp. | 6,948 | 3,523,470 | ||||||
| ELECTRICAL COMPONENTS & EQUIPMENT—1.2% | ||||||||
| Eaton Corp., PLC | 30,877 | 6,419,637 | ||||||
| Vertiv Holdings Co., Cl. A | 320,223 | 12,575,157 | ||||||
| 18,994,794 | ||||||||
THE ALGER FUNDS | ALGER CAPITAL APPRECIATION FUND
Schedule of Investments October 31, 2023 (Continued)
| COMMON STOCKS—98.6% (CONT.) | SHARES | VALUE | ||||||
| ENVIRONMENTAL & FACILITIES SERVICES—1.1% | ||||||||
| GFL Environmental, Inc. | 559,306 | $ | 16,119,199 | |||||
| Veralto Corp.* | 24,965 | 1,722,585 | ||||||
| 17,841,784 | ||||||||
| FINANCIAL EXCHANGES & DATA—2.2% | ||||||||
| CME Group, Inc., Cl. A | 61,672 | 13,164,505 | ||||||
| S&P Global, Inc. | 61,336 | 21,425,278 | ||||||
| 34,589,783 | ||||||||
| HEALTHCARE DISTRIBUTORS—1.1% | ||||||||
| McKesson Corp. | 39,472 | 17,973,970 | ||||||
| HEALTHCARE EQUIPMENT—2.8% | ||||||||
| Boston Scientific Corp.* | 349,448 | 17,888,243 | ||||||
| Dexcom, Inc.* | 149,040 | 13,239,223 | ||||||
| Intuitive Surgical, Inc.* | 44,479 | 11,663,284 | ||||||
| TransMedics Group, Inc.* | 28,786 | 1,078,899 | ||||||
| 43,869,649 | ||||||||
| HEALTHCARE FACILITIES—0.8% | ||||||||
| Acadia Healthcare Co., Inc.* | 181,097 | 13,312,441 | ||||||
| HOTELS RESORTS & CRUISE LINES—0.8% | ||||||||
| Booking Holdings, Inc.* | 1,744 | 4,864,993 | ||||||
| Trip.com Group Ltd.#,* | 232,973 | 7,921,082 | ||||||
| 12,786,075 | ||||||||
| INDUSTRIAL GASES—0.3% | ||||||||
| Air Products & Chemicals, Inc. | 18,701 | 5,281,910 | ||||||
| INTERACTIVE MEDIA & SERVICES—11.5% | ||||||||
| Alphabet, Inc., Cl. C* | 628,538 | 78,755,811 | ||||||
| Meta Platforms, Inc., Cl. A* | 284,491 | 85,708,604 | ||||||
| Pinterest, Inc., Cl. A* | 582,311 | 17,399,453 | ||||||
| 181,863,868 | ||||||||
| INTERNET SERVICES & INFRASTRUCTURE—0.6% | ||||||||
| MongoDB, Inc., Cl. A* | 26,009 | 8,962,441 | ||||||
| LIFE SCIENCES TOOLS & SERVICES—0.9% | ||||||||
| Danaher Corp. | 70,350 | 13,508,607 | ||||||
| MANAGED HEALTHCARE—2.3% | ||||||||
| Humana, Inc. | 32,868 | 17,212,643 | ||||||
| UnitedHealth Group, Inc. | 37,314 | 19,983,886 | ||||||
| 37,196,529 | ||||||||
| MOVIES & ENTERTAINMENT—2.7% | ||||||||
| Liberty Media Corp. Series C Liberty Formula One* | 183,029 | 11,840,146 | ||||||
| Netflix, Inc.* | 64,963 | 26,744,617 | ||||||
| Spotify Technology SA* | 25,384 | 4,182,268 | ||||||
| 42,767,031 | ||||||||
THE ALGER FUNDS | ALGER CAPITAL APPRECIATION FUND
Schedule of Investments October 31, 2023 (Continued)
| COMMON STOCKS—98.6% (CONT.) | SHARES | VALUE | ||||||
| OIL & GAS EQUIPMENT & SERVICES—1.1% | ||||||||
| Schlumberger NV | 298,632 | $ | 16,621,857 | |||||
| OIL & GAS EXPLORATION & PRODUCTION—1.8% | ||||||||
| Diamondback Energy, Inc. | 60,367 | 9,678,037 | ||||||
| Hess Corp. | 55,404 | 8,000,338 | ||||||
| Pioneer Natural Resources Co. | 43,003 | 10,277,717 | ||||||
| 27,956,092 | ||||||||
| OIL & GAS STORAGE & TRANSPORTATION—0.6% | ||||||||
| Cheniere Energy, Inc. | 61,155 | 10,177,415 | ||||||
| PASSENGER GROUND TRANSPORTATION—0.5% | ||||||||
| Uber Technologies, Inc.* | 187,044 | 8,095,264 | ||||||
| PHARMACEUTICALS—1.2% | ||||||||
| Eli Lilly & Co. | 35,394 | 19,605,798 | ||||||
| SEMICONDUCTORS—11.9% | ||||||||
| Advanced Micro Devices, Inc.* | 129,661 | 12,771,608 | ||||||
| Broadcom, Inc. | 18,586 | 15,637,703 | ||||||
| Marvell Technology, Inc. | 524,868 | 24,784,267 | ||||||
| NVIDIA Corp. | 292,101 | 119,118,788 | ||||||
| Taiwan Semiconductor Manufacturing Co., Ltd.# | 192,731 | 16,634,613 | ||||||
| 188,946,979 | ||||||||
| SYSTEMS SOFTWARE—16.6% | ||||||||
| Microsoft Corp. | 708,830 | 239,662,511 | ||||||
| Oracle Corp. | 31,827 | 3,290,912 | ||||||
| Palo Alto Networks, Inc.* | 5,950 | 1,445,969 | ||||||
| ServiceNow, Inc.* | 32,091 | 18,672,149 | ||||||
| 263,071,541 | ||||||||
| TECHNOLOGY HARDWARE STORAGE & PERIPHERALS—7.7% | ||||||||
| Apple, Inc. | 662,853 | 113,195,407 | ||||||
| Dell Technologies, Inc., Cl. C | 120,855 | 8,086,408 | ||||||
| 121,281,815 | ||||||||
| TRANSACTION & PAYMENT PROCESSING SERVICES—3.0% | ||||||||
| Visa, Inc., Cl. A | 199,261 | 46,846,261 | ||||||
| TOTAL COMMON STOCKS | ||||||||
| (Cost $896,279,978) | 1,561,647,033 | |||||||
| PREFERRED STOCKS—0.1% | SHARES | VALUE | ||||||
| DATA PROCESSING & OUTSOURCED SERVICES—0.1% | ||||||||
| Chime Financial, Inc., Series G*,@,(a) | 27,841 | 1,049,884 | ||||||
| (Cost $1,922,972) | 1,049,884 | |||||||
| SPECIAL PURPOSE VEHICLE—0.2% | VALUE | |||||||
| DATA PROCESSING & OUTSOURCED SERVICES—0.2% | ||||||||
| Crosslink Ventures C, LLC, Cl. A*,@,(a),(b) | 2,555,109 | |||||||
| (Cost $2,775,000) | 2,555,109 | |||||||
THE ALGER FUNDS | ALGER CAPITAL APPRECIATION FUND
Schedule of Investments October 31, 2023 (Continued)
| VALUE | ||||||||
| Total Investments | ||||||||
| (Cost $900,977,950) | 98.9 | % | $ | 1,565,252,026 | ||||
| Affiliated Securities (Cost $2,775,000) | 2,555,109 | |||||||
| Unaffiliated Securities (Cost $898,202,950) | 1,562,696,917 | |||||||
| Other Assets in Excess of Liabilities | 1.1 | % | 18,062,601 | |||||
| NET ASSETS | 100.0 | % | $ | 1,583,314,627 | ||||
| # | American Depositary Receipts. |
| (a) | Security is valued in good faith at fair value determined using significant unobservable inputs pursuant to procedures established by the Valuation Designee (as defined in Note 2). |
| (b) | Deemed an affiliate of the Fund in accordance with Section 2(a)(3) of the Investment Company Act of 1940. See Note 11 - Affiliated Securities. |
| * | Non-income producing security. |
| @ | Restricted security - Investment in security not registered under the Securities Act of 1933. Sales or transfers of the investment may be restricted only to qualified buyers. |
| Security | Acquisition Date(s) | Acquisition Cost | % of net assets Date) | Market Value | % of net assets as of 10/31/2023 | |||||||||||||
| Chime Financial, Inc., Series G | 8/24/21 | $ | 1,922,972 | 0.06 | % | $ | 1,049,884 | 0.07 | % | |||||||||
| Crosslink Ventures C, LLC, Cl. A | 10/2/20 | 2,775,000 | 0.08 | % | 2,555,109 | 0.16 | % | |||||||||||
| Total | $ | 3,604,993 | 0.23 | % | ||||||||||||||
See Notes to Financial Statements.
THE ALGER FUNDS | ALGER 35 FUND
Schedule of Investments October 31, 2023
| COMMON STOCKS—97.6% | SHARES | VALUE | ||||||
| ADVERTISING—2.1% | ||||||||
| The Trade Desk, Inc., Cl. A* | 7,517 | $ | 533,406 | |||||
| AEROSPACE & DEFENSE—1.8% | ||||||||
| HEICO Corp., Cl. A | 3,582 | 455,380 | ||||||
| APPAREL RETAIL—0.9% | ||||||||
| Burlington Stores, Inc.* | 1,958 | 236,977 | ||||||
| APPLICATION SOFTWARE—4.0% | ||||||||
| AppFolio, Inc., Cl. A* | 5,401 | 1,013,065 | ||||||
| BIOTECHNOLOGY—5.4% | ||||||||
| Amgen, Inc. | 1,910 | 488,387 | ||||||
| Cabaletta Bio, Inc.* | 37,609 | 536,304 | ||||||
| Natera, Inc.* | 9,042 | 356,888 | ||||||
| 1,381,579 | ||||||||
| BROADLINE RETAIL—9.0% | ||||||||
| Amazon.com, Inc.* | 12,413 | 1,652,046 | ||||||
| MercadoLibre, Inc.* | 521 | 646,426 | ||||||
| 2,298,472 | ||||||||
| CABLE & SATELLITE—1.8% | ||||||||
| Charter Communications, Inc., Cl. A* | 1,167 | 470,067 | ||||||
| CASINOS & GAMING—2.9% | ||||||||
| DraftKings, Inc., Cl. A* | 26,561 | 733,615 | ||||||
| COMMUNICATIONS EQUIPMENT—1.7% | ||||||||
| Arista Networks, Inc.* | 2,137 | 428,191 | ||||||
| ELECTRONIC EQUIPMENT & INSTRUMENTS—2.0% | ||||||||
| 908 Devices, Inc.* | 87,931 | 521,431 | ||||||
| FINANCIAL EXCHANGES & DATA—1.5% | ||||||||
| Cboe Global Markets, Inc. | 2,423 | 397,105 | ||||||
| HEALTHCARE EQUIPMENT—1.8% | ||||||||
| Impulse Dynamics PLC, Class E*,@,(a) | 164,939 | 470,076 | ||||||
| HOTELS RESORTS & CRUISE LINES—3.4% | ||||||||
| Booking Holdings, Inc.* | 85 | 237,112 | ||||||
| Lindblad Expeditions Holdings, Inc.* | 102,244 | 635,958 | ||||||
| 873,070 | ||||||||
| INTERACTIVE MEDIA & SERVICES—10.3% | ||||||||
| Alphabet, Inc., Cl. A* | 4,042 | 501,531 | ||||||
| Meta Platforms, Inc., Cl. A* | 4,606 | 1,387,650 | ||||||
| Pinterest, Inc., Cl. A* | 25,217 | 753,484 | ||||||
| 2,642,665 | ||||||||
| INTERNET SERVICES & INFRASTRUCTURE—2.1% | ||||||||
| MongoDB, Inc., Cl. A* | 761 | 262,233 | ||||||
| Shopify, Inc., Cl. A* | 5,919 | 279,318 | ||||||
| 541,551 | ||||||||
| MOVIES & ENTERTAINMENT—4.9% | ||||||||
| Netflix, Inc.* | 1,719 | 707,695 | ||||||
| Spotify Technology SA* | 3,304 | 544,367 | ||||||
| 1,252,062 | ||||||||
| OIL & GAS EQUIPMENT & SERVICES—5.8% | ||||||||
| Schlumberger NV | 26,589 | 1,479,944 | ||||||
THE ALGER FUNDS | ALGER 35 FUND
Schedule of Investments October 31, 2023 (Continued)
| COMMON STOCKS—97.6% (CONT.) | SHARES | VALUE | ||||||
| OIL & GAS EXPLORATION & PRODUCTION—4.9% | ||||||||
| Pioneer Natural Resources Co. | 5,270 | $ | 1,259,530 | |||||
| PASSENGER GROUND TRANSPORTATION—2.5% | ||||||||
| Uber Technologies, Inc.* | 14,803 | 640,674 | ||||||
| PHARMACEUTICALS—3.7% | ||||||||
| Eli Lilly & Co. | 1,729 | 957,745 | ||||||
| SEMICONDUCTORS—12.7% | ||||||||
| Advanced Micro Devices, Inc.* | 2,637 | 259,744 | ||||||
| Marvell Technology, Inc. | 4,972 | 234,778 | ||||||
| NVIDIA Corp. | 6,140 | 2,503,892 | ||||||
| Rambus, Inc.* | 4,660 | 253,178 | ||||||
| 3,251,592 | ||||||||
| SYSTEMS SOFTWARE—12.4% | ||||||||
| Microsoft Corp. | 6,982 | 2,360,684 | ||||||
| Zscaler, Inc.* | 5,182 | 822,332 | ||||||
| 3,183,016 | ||||||||
| TOTAL COMMON STOCKS | ||||||||
| (Cost $24,470,015) | 25,021,213 | |||||||
| Total Investments | ||||||||
| (Cost $24,470,015) | 97.6 | % | $ | 25,021,213 | ||||
| Unaffiliated Securities (Cost $24,470,015) | 25,021,213 | |||||||
| Other Assets in Excess of Liabilities | 2.4 | % | 619,310 | |||||
| NET ASSETS | 100.0 | % | $ | 25,640,523 | ||||
| * | Non-income producing security. |
| (a) | Security is valued in good faith at fair value determined using significant unobservable inputs pursuant to procedures established by the Valuation Designee (as defined in Note 2). |
| @ | Restricted security - Investment in security not registered under the Securities Act of 1933. Sales or transfers of the investment may be restricted only to qualified buyers. |
| Security | Acquisition Date(s) | Acquisition Cost | % of net assets Date) | Market Value | % of net assets as of 10/31/2023 | |||||||||||||
| Impulse Dynamics PLC, Class E | 6/2/23 | $ | 544,299 | 1.97 | % | $ | 470,076 | 1.83 | % | |||||||||
| Total | $ | 470,076 | 1.83 | % | ||||||||||||||
See Notes to Financial Statements.
THE ALGER FUNDS | ALGER GROWTH & INCOME FUND
Schedule of Investments October 31, 2023
| COMMON STOCKS—91.6% | SHARES | VALUE | ||||||
| AEROSPACE & DEFENSE—1.1% | ||||||||
| General Dynamics Corp. | 5,161 | $ | 1,245,401 | |||||
| TransDigm Group, Inc.* | 2,910 | 2,409,742 | ||||||
| 3,655,143 | ||||||||
| APPLICATION SOFTWARE—1.2% | ||||||||
| Adobe, Inc.* | 7,270 | 3,868,076 | ||||||
| ASSET MANAGEMENT & CUSTODY BANKS—2.5% | ||||||||
| BlackRock, Inc., Cl. A | 6,750 | 4,132,890 | ||||||
| Blackstone, Inc. | 34,194 | 3,157,816 | ||||||
| The Carlyle Group, Inc. | 28,838 | 794,198 | ||||||
| 8,084,904 | ||||||||
| BIOTECHNOLOGY—3.1% | ||||||||
| AbbVie, Inc. | 47,888 | 6,760,828 | ||||||
| Amgen, Inc. | 7,450 | 1,904,965 | ||||||
| Gilead Sciences, Inc. | 16,572 | 1,301,565 | ||||||
| 9,967,358 | ||||||||
| BROADLINE RETAIL—2.4% | ||||||||
| Amazon.com, Inc.* | 58,683 | 7,810,121 | ||||||
| BUILDING PRODUCTS—0.4% | ||||||||
| Johnson Controls International PLC | 27,591 | 1,352,511 | ||||||
| CABLE & SATELLITE—1.1% | ||||||||
| Comcast Corp., Cl. A | 87,118 | 3,597,102 | ||||||
| COMMODITY CHEMICALS—0.3% | ||||||||
| Dow, Inc. | 16,874 | 815,689 | ||||||
| COMMUNICATIONS EQUIPMENT—1.1% | ||||||||
| Cisco Systems, Inc. | 64,544 | 3,364,679 | ||||||
| CONSUMER ELECTRONICS—0.4% | ||||||||
| Garmin Ltd. | 13,701 | 1,404,764 | ||||||
| CONSUMER STAPLES MERCHANDISE RETAIL—0.9% | ||||||||
| Walmart, Inc. | 16,865 | 2,755,910 | ||||||
| COPPER—0.5% | ||||||||
| Southern Copper Corp. | 24,207 | 1,716,276 | ||||||
| DIVERSIFIED BANKS—3.8% | ||||||||
| Bank of America Corp. | 119,052 | 3,135,830 | ||||||
| JPMorgan Chase & Co. | 65,009 | 9,040,151 | ||||||
| 12,175,981 | ||||||||
| ELECTRIC UTILITIES—0.5% | ||||||||
| NextEra Energy, Inc. | 27,588 | 1,608,380 | ||||||
| ELECTRICAL COMPONENTS & EQUIPMENT—1.7% | ||||||||
| Eaton Corp., PLC | 26,751 | 5,561,800 | ||||||
| FINANCIAL EXCHANGES & DATA—1.1% | ||||||||
| CME Group, Inc., Cl. A | 17,081 | 3,646,110 | ||||||
| FOOD DISTRIBUTORS—0.5% | ||||||||
| Sysco Corp. | 23,111 | 1,536,650 | ||||||
| GOLD—0.2% | ||||||||
| Newmont Corp. | 16,811 | 629,908 | ||||||
| HEALTHCARE DISTRIBUTORS—0.7% | ||||||||
| Cardinal Health, Inc. | 22,877 | 2,081,807 | ||||||
THE ALGER FUNDS | ALGER GROWTH & INCOME FUND
Schedule of Investments October 31, 2023 (Continued)
| COMMON STOCKS—91.6% (CONT.) | SHARES | VALUE | ||||||
| HEALTHCARE EQUIPMENT—0.5% | ||||||||
| Medtronic PLC | 21,661 | $ | 1,528,400 | |||||
| HOME IMPROVEMENT RETAIL—2.3% | ||||||||
| The Home Depot, Inc. | 25,325 | 7,209,774 | ||||||
| HOUSEHOLD PRODUCTS—1.6% | ||||||||
| The Procter & Gamble Co. | 34,108 | 5,117,223 | ||||||
| INDUSTRIAL CONGLOMERATES—1.6% | ||||||||
| Honeywell International, Inc. | 28,196 | 5,167,199 | ||||||
| INDUSTRIAL GASES—1.2% | ||||||||
| Air Products & Chemicals, Inc. | 13,611 | 3,844,291 | ||||||
| INTEGRATED OIL & GAS—4.0% | ||||||||
| Chevron Corp. | 36,643 | 5,339,984 | ||||||
| Exxon Mobil Corp. | 43,030 | 4,554,726 | ||||||
| TotalEnergies SE# | 44,074 | 2,935,328 | ||||||
| 12,830,038 | ||||||||
| INTEGRATED TELECOMMUNICATION SERVICES—0.8% | ||||||||
| Verizon Communications, Inc. | 73,603 | 2,585,673 | ||||||
| INTERACTIVE MEDIA & SERVICES—7.0% | ||||||||
| Alphabet, Inc., Cl. A* | 83,368 | 10,344,301 | ||||||
| Alphabet, Inc., Cl. C* | 65,999 | 8,269,675 | ||||||
| Meta Platforms, Inc., Cl. A* | 13,239 | 3,988,514 | ||||||
| 22,602,490 | ||||||||
| INVESTMENT BANKING & BROKERAGE—1.7% | ||||||||
| Morgan Stanley | 76,835 | 5,441,455 | ||||||
| LEISURE FACILITIES—0.4% | ||||||||
| Vail Resorts, Inc. | 6,054 | 1,284,962 | ||||||
| MANAGED HEALTHCARE—3.0% | ||||||||
| UnitedHealth Group, Inc. | 17,982 | 9,630,440 | ||||||
| MULTI-LINE INSURANCE—0.6% | ||||||||
| The Hartford Financial Services Group, Inc. | 24,060 | 1,767,207 | ||||||
| MULTI-UTILITIES—1.2% | ||||||||
| Consolidated Edison, Inc. | 20,076 | 1,762,472 | ||||||
| Sempra Energy | 28,198 | 1,974,706 | ||||||
| 3,737,178 | ||||||||
| OIL & GAS EXPLORATION & PRODUCTION—0.6% | ||||||||
| Pioneer Natural Resources Co. | 7,593 | 1,814,727 | ||||||
| OIL & GAS STORAGE & TRANSPORTATION—0.4% | ||||||||
| ONEOK, Inc. | 21,700 | 1,414,840 | ||||||
| PERSONAL CARE PRODUCTS—0.3% | ||||||||
| Kenvue, Inc. | 42,884 | 797,642 | ||||||
| PHARMACEUTICALS—5.9% | ||||||||
| AstraZeneca PLC# | 42,175 | 2,666,725 | ||||||
| Bristol-Myers Squibb Co. | 25,520 | 1,315,045 | ||||||
| Eli Lilly & Co. | 8,460 | 4,686,248 | ||||||
| GSK PLC# | 25,088 | 895,642 | ||||||
| Johnson & Johnson | 24,556 | 3,642,637 | ||||||
| Merck & Co., Inc. | 23,180 | 2,380,586 | ||||||
| Novartis AG# | 14,930 | 1,397,149 | ||||||
THE ALGER FUNDS | ALGER GROWTH & INCOME FUND
Schedule of Investments October 31, 2023 (Continued)
| COMMON STOCKS—91.6% (CONT.) | SHARES | VALUE | ||||||
| PHARMACEUTICALS—5.9% (CONT.) | ||||||||
| Pfizer, Inc. | 59,637 | $ | 1,822,507 | |||||
| 18,806,539 | ||||||||
| RAIL TRANSPORTATION—0.6% | ||||||||
| Union Pacific Corp. | 9,944 | 2,064,474 | ||||||
| RESTAURANTS—1.5% | ||||||||
| McDonald’s Corp. | 10,375 | 2,720,014 | ||||||
| Starbucks Corp. | 22,945 | 2,116,447 | ||||||
| 4,836,461 | ||||||||
| SEMICONDUCTOR MATERIALS & EQUIPMENT—2.9% | ||||||||
| KLA Corp. | 19,709 | 9,257,317 | ||||||
| SEMICONDUCTORS—5.2% | ||||||||
| Broadcom, Inc. | 12,924 | 10,873,866 | ||||||
| QUALCOMM, Inc. | 34,891 | 3,802,770 | ||||||
| Taiwan Semiconductor Manufacturing Co., Ltd.# | 23,422 | 2,021,553 | ||||||
| 16,698,189 | ||||||||
| SOFT DRINKS & NON-ALCOHOLIC BEVERAGES—2.5% | ||||||||
| PepsiCo, Inc. | 28,373 | 4,632,743 | ||||||
| The Coca-Cola Co. | 62,552 | 3,533,563 | ||||||
| 8,166,306 | ||||||||
| SYSTEMS SOFTWARE—10.4% | ||||||||
| Microsoft Corp. | 93,990 | 31,778,959 | ||||||
| Oracle Corp. | 14,614 | 1,511,088 | ||||||
| 33,290,047 | ||||||||
| TECHNOLOGY HARDWARE STORAGE & PERIPHERALS—8.9% | ||||||||
| Apple, Inc. | 155,398 | 26,537,316 | ||||||
| Dell Technologies, Inc., Cl. C | 28,791 | 1,926,406 | ||||||
| 28,463,722 | ||||||||
| TOBACCO—1.1% | ||||||||
| Altria Group, Inc. | 47,999 | 1,928,120 | ||||||
| Philip Morris International, Inc. | 19,614 | 1,748,784 | ||||||
| 3,676,904 | ||||||||
| TRADING COMPANIES & DISTRIBUTORS—0.5% | ||||||||
| Ferguson PLC | 9,700 | 1,456,940 | ||||||
| TRANSACTION & PAYMENT PROCESSING SERVICES—1.4% | ||||||||
| Visa, Inc., Cl. A | 19,475 | 4,578,573 | ||||||
| TOTAL COMMON STOCKS | ||||||||
| (Cost $196,377,544) | 293,702,180 | |||||||
| MASTER LIMITED PARTNERSHIP—0.6% | SHARES | VALUE | ||||||
| OIL & GAS STORAGE & TRANSPORTATION—0.6% | ||||||||
| Cheniere Energy Partners LP | 35,211 | 1,963,366 | ||||||
| (Cost $1,508,792) | 1,963,366 | |||||||
| REAL ESTATE INVESTMENT TRUST—3.1% | SHARES | VALUE | ||||||
| HEALTHCARE—0.6% | ||||||||
| Welltower, Inc. | 24,010 | 2,007,476 | ||||||
| INDUSTRIAL—0.4% | ||||||||
| Prologis, Inc. | 11,480 | 1,156,610 | ||||||
| MORTGAGE—0.4% | ||||||||
| Blackstone Mortgage Trust, Inc., Cl. A(a) | 67,406 | 1,344,750 | ||||||
THE ALGER FUNDS | ALGER GROWTH & INCOME FUND
Schedule of Investments October 31, 2023 (Continued)
| REAL ESTATE INVESTMENT TRUST—3.1% (CONT.) | SHARES | VALUE | ||||||
| RETAIL—0.6% | ||||||||
| Simon Property Group, Inc. | 18,684 | $ | 2,053,185 | |||||
| SPECIALIZED—0.5% | ||||||||
| Lamar Advertising Co., Cl. A | 19,469 | 1,601,715 | ||||||
| TELECOM TOWER—0.6% | ||||||||
| Crown Castle, Inc. | 20,830 | 1,936,773 | ||||||
| TOTAL REAL ESTATE INVESTMENT TRUST | ||||||||
| (Cost $11,239,200) | 10,100,509 | |||||||
| SHORT—TERM INVESTMENTS—1.9% | SHARES | VALUE | ||||||
| MONEY MARKET FUND—0.3% | ||||||||
| Invesco Government & Agency Portfolio(b) | 1,023,499 | 1,023,499 | ||||||
| U.S. GOVERNMENT—1.6% | ||||||||
| U.S. Treasury Bill, 0.00%, 11/2/23 | 5,000,000 | 4,999,278 | ||||||
| TOTAL SHORT—TERM INVESTMENTS | ||||||||
| (Cost $6,022,777) | 6,022,777 | |||||||
| Total Investments | ||||||||
| (Cost $215,148,313) | 97.2 | % | $ | 311,788,832 | ||||
| Unaffiliated Securities (Cost $215,148,313) | 311,788,832 | |||||||
| Other Assets in Excess of Liabilities | 2.8 | % | 8,894,947 | |||||
| NET ASSETS | 100.0 | % | $ | 320,683,779 | ||||
| (a) | All or portion of the security is on loan. |
| (b) | This security represents cash collateral received in connection with security lending agreements. |
| # | American Depositary Receipts. |
| * | Non-income producing security. |
See Notes to Financial Statements.
THE ALGER FUNDS | ALGER MID CAP GROWTH FUND
Schedule of Investments October 31, 2023
| COMMON STOCKS—98.0% | SHARES | VALUE | ||||||
| ADVERTISING—2.4% | ||||||||
| The Trade Desk, Inc., Cl. A* | 63,641 | $ | 4,515,965 | |||||
| AEROSPACE & DEFENSE—4.5% | ||||||||
| HEICO Corp. | 29,099 | 4,609,573 | ||||||
| TransDigm Group, Inc.* | 4,837 | 4,005,471 | ||||||
| 8,615,044 | ||||||||
| APPLICATION SOFTWARE—14.0% | ||||||||
| Bill.com Holdings, Inc.* | 7,292 | 665,687 | ||||||
| Cadence Design Systems, Inc.* | 19,713 | 4,728,163 | ||||||
| Constellation Software, Inc. | 2,910 | 5,834,082 | ||||||
| Datadog, Inc., Cl. A* | 45,066 | 3,671,527 | ||||||
| Guidewire Software, Inc.* | 37,378 | 3,368,879 | ||||||
| Manhattan Associates, Inc.* | 16,495 | 3,216,195 | ||||||
| Procore Technologies, Inc.* | 35,046 | 2,140,960 | ||||||
| The Descartes Systems Group, Inc.* | 39,732 | 2,871,913 | ||||||
| 26,497,406 | ||||||||
| ASSET MANAGEMENT & CUSTODY BANKS—2.2% | ||||||||
| Ares Management Corp., Cl. A | 41,961 | 4,136,935 | ||||||
| AUTOMOTIVE PARTS & EQUIPMENT—0.5% | ||||||||
| Mobileye Global, Inc., Cl. A* | 27,932 | 996,335 | ||||||
| AUTOMOTIVE RETAIL—1.8% | ||||||||
| AutoZone, Inc.* | 1,362 | 3,373,851 | ||||||
| BIOTECHNOLOGY—2.4% | ||||||||
| Natera, Inc.* | 82,101 | 3,240,526 | ||||||
| Vaxcyte, Inc.* | 28,727 | 1,381,769 | ||||||
| 4,622,295 | ||||||||
| BUILDING PRODUCTS—0.5% | ||||||||
| Trex Co., Inc.* | 18,329 | 1,030,273 | ||||||
| CARGO GROUND TRANSPORTATION—2.5% | ||||||||
| Old Dominion Freight Line, Inc. | 12,587 | 4,741,020 | ||||||
| CONSTRUCTION & ENGINEERING—0.8% | ||||||||
| WillScot Mobile Mini Holdings Corp.* | 36,801 | 1,450,327 | ||||||
| CONSTRUCTION MACHINERY & HEAVY TRANSPORTATION EQUIPMENT—1.8% | ||||||||
| Wabtec Corp. | 32,838 | 3,481,485 | ||||||
| CONSTRUCTION MATERIALS—2.1% | ||||||||
| Martin Marietta Materials, Inc. | 9,831 | 4,020,289 | ||||||
| CONSUMER STAPLES MERCHANDISE RETAIL—1.1% | ||||||||
| BJ’s Wholesale Club Holdings, Inc.* | 30,087 | 2,049,527 | ||||||
| ELECTRICAL COMPONENTS & EQUIPMENT—1.0% | ||||||||
| Vertiv Holdings Co., Cl. A | 50,716 | 1,991,617 | ||||||
| ELECTRONIC COMPONENTS—2.5% | ||||||||
| Amphenol Corp., Cl. A | 57,845 | 4,659,415 | ||||||
| ELECTRONIC EQUIPMENT & INSTRUMENTS—1.0% | ||||||||
| Novanta, Inc.* | 13,773 | 1,818,862 | ||||||
| ENVIRONMENTAL & FACILITIES SERVICES—3.0% | ||||||||
| GFL Environmental, Inc. | 199,346 | 5,745,152 | ||||||
THE ALGER FUNDS | ALGER MID CAP GROWTH FUND
Schedule of Investments October 31, 2023 (Continued)
| COMMON STOCKS—98.0% (CONT.) | SHARES | VALUE | ||||||
| FINANCIAL EXCHANGES & DATA—3.0% | ||||||||
| MarketAxess Holdings, Inc. | 4,511 | $ | 964,226 | |||||
| MSCI, Inc., Cl. A | 10,038 | 4,733,419 | ||||||
| 5,697,645 | ||||||||
| HEALTHCARE EQUIPMENT—3.8% | ||||||||
| Dexcom, Inc.* | 26,533 | 2,356,927 | ||||||
| IDEXX Laboratories, Inc.* | 10,322 | 4,123,329 | ||||||
| Insulet Corp.* | 5,665 | 751,009 | ||||||
| 7,231,265 | ||||||||
| HEALTHCARE FACILITIES—1.8% | ||||||||
| Acadia Healthcare Co., Inc.* | 46,580 | 3,424,096 | ||||||
| HEALTHCARE TECHNOLOGY—1.9% | ||||||||
| Veeva Systems, Inc., Cl. A* | 18,328 | 3,531,989 | ||||||
| HOME IMPROVEMENT RETAIL—1.1% | ||||||||
| Floor & Decor Holdings, Inc., Cl. A* | 24,173 | 1,991,855 | ||||||
| HOMEBUILDING—0.9% | ||||||||
| NVR, Inc.* | 320 | 1,732,038 | ||||||
| HOTELS RESORTS & CRUISE LINES—2.1% | ||||||||
| Hilton Worldwide Holdings, Inc. | 26,521 | 4,018,727 | ||||||
| HUMAN RESOURCE & EMPLOYMENT SERVICES—1.4% | ||||||||
| Paycom Software, Inc. | 6,822 | 1,671,185 | ||||||
| Paylocity Holding Corp.* | 5,337 | 957,458 | ||||||
| 2,628,643 | ||||||||
| INSURANCE BROKERS—1.5% | ||||||||
| Ryan Specialty Holdings, Inc., Cl. A* | 66,100 | 2,855,520 | ||||||
| INTERACTIVE MEDIA & SERVICES—1.7% | ||||||||
| Pinterest, Inc., Cl. A* | 105,307 | 3,146,573 | ||||||
| INTERNET SERVICES & INFRASTRUCTURE—2.1% | ||||||||
| MongoDB, Inc., Cl. A* | 11,705 | 4,033,426 | ||||||
| IT CONSULTING & OTHER SERVICES—2.0% | ||||||||
| Globant SA* | 22,234 | 3,786,228 | ||||||
| LIFE SCIENCES TOOLS & SERVICES—5.3% | ||||||||
| Mettler-Toledo International, Inc.* | 1,467 | 1,445,288 | ||||||
| Repligen Corp.* | 29,280 | 3,939,917 | ||||||
| West Pharmaceutical Services, Inc. | 14,392 | 4,580,830 | ||||||
| 9,966,035 | ||||||||
| MOVIES & ENTERTAINMENT—2.6% | ||||||||
| Liberty Media Corp. Series C Liberty Formula One* | 47,388 | 3,065,530 | ||||||
| Spotify Technology SA* | 11,527 | 1,899,188 | ||||||
| 4,964,718 | ||||||||
| OIL & GAS EXPLORATION & PRODUCTION—3.7% | ||||||||
| Diamondback Energy, Inc. | 43,676 | 7,002,136 | ||||||
| OTHER SPECIALTY RETAIL—0.7% | ||||||||
| Five Below, Inc.* | 7,701 | 1,339,820 | ||||||
| PROPERTY & CASUALTY INSURANCE—1.8% | ||||||||
| Intact Financial Corp. | 24,237 | 3,405,573 | ||||||
THE ALGER FUNDS | ALGER MID CAP GROWTH FUND
Schedule of Investments October 31, 2023 (Continued)
| COMMON STOCKS—98.0% (CONT.) | SHARES | VALUE | ||||||
| REAL ESTATE SERVICES—5.1% | ||||||||
| CoStar Group, Inc.* | 49,821 | $ | 3,657,360 | |||||
| FirstService Corp. | 43,165 | 6,106,552 | ||||||
| 9,763,912 | ||||||||
| RESEARCH & CONSULTING SERVICES—3.1% | ||||||||
| TransUnion | 10,621 | 466,049 | ||||||
| Verisk Analytics, Inc., Cl. A | 23,491 | 5,340,914 | ||||||
| 5,806,963 | ||||||||
| RESTAURANTS—3.8% | ||||||||
| Chipotle Mexican Grill, Inc., Cl. A* | 1,921 | 3,730,966 | ||||||
| Domino’s Pizza, Inc. | 10,448 | 3,541,768 | ||||||
| 7,272,734 | ||||||||
| SEMICONDUCTORS—4.0% | ||||||||
| Lattice Semiconductor Corp.* | 24,530 | 1,364,113 | ||||||
| Marvell Technology, Inc. | 86,370 | 4,078,392 | ||||||
| ON Semiconductor Corp.* | 33,116 | 2,074,386 | ||||||
| 7,516,891 | ||||||||
| SOFT DRINKS & NON-ALCOHOLIC BEVERAGES—0.5% | ||||||||
| Celsius Holdings, Inc.* | 6,322 | 961,513 | ||||||
| TOTAL COMMON STOCKS | ||||||||
| (Cost $179,393,402) | 185,824,098 | |||||||
| PREFERRED STOCKS—0.0% | SHARES | VALUE | ||||||
| BIOTECHNOLOGY—0.0% | ||||||||
| Prosetta Biosciences, Inc., Series D*,@,(a),(b) | 219,610 | — | ||||||
| (Cost $988,245) | — | |||||||
| WARRANTS—0.0% | SHARES | VALUE | ||||||
| APPLICATION SOFTWARE—0.0% | ||||||||
| Constellation Software, Inc., 3/31/40*,(a) | 2,045 | — | ||||||
| (Cost $0) | — | |||||||
| RIGHTS—0.2% | SHARES | VALUE | ||||||
| BIOTECHNOLOGY—0.2% | ||||||||
| Tolero CDR*,@,(a),(c) | 590,059 | 401,240 | ||||||
| (Cost $315,501) | 401,240 | |||||||
| SPECIAL PURPOSE VEHICLE—0.8% | VALUE | |||||||
| DATA PROCESSING & OUTSOURCED SERVICES—0.8% | ||||||||
| Crosslink Ventures C, LLC, Cl. A*,@,(a),(b) | 1,104,912 | |||||||
| Crosslink Ventures C, LLC, Cl. B*,@,(a),(b) | 437,361 | |||||||
| 1,542,273 | ||||||||
| TOTAL SPECIAL PURPOSE VEHICLE | ||||||||
| (Cost $1,675,000) | 1,542,273 | |||||||
| Total Investments | ||||||||
| (Cost $182,372,148) | 99.0 | % | $ | 187,767,611 | ||||
| Affiliated Securities (Cost $2,663,245) | 1,542,273 | |||||||
| Unaffiliated Securities (Cost $179,708,903) | 186,225,338 | |||||||
| Other Assets in Excess of Liabilities | 1.0 | % | 1,827,935 | |||||
| NET ASSETS | 100.0 | % | $ | 189,595,546 | ||||
THE ALGER FUNDS | ALGER MID CAP GROWTH FUND
Schedule of Investments October 31, 2023 (Continued)
| (a) | Security is valued in good faith at fair value determined using significant unobservable inputs pursuant to procedures established by the Valuation Designee (as defined in Note 2). |
| (b) | Deemed an affiliate of the Fund in accordance with Section 2(a)(3) of the Investment Company Act of 1940. See Note 11 - Affiliated Securities. |
| (c) | Contingent Deferred Rights. |
| * | Non-income producing security. |
| @ | Restricted security - Investment in security not registered under the Securities Act of 1933. Sales or transfers of the investment may be restricted only to qualified buyers. |
| Security | Acquisition Date(s) | Acquisition Cost | % of net assets (Acquisition Date) | Market Value | % of net assets as of 10/31/2023 | |||||||||||||
| Crosslink Ventures C, LLC, Cl. A | 10/2/20 | $ | 1,200,000 | 0.50 | % | $ | 1,104,912 | 0.59 | % | |||||||||
| Crosslink Ventures C, LLC, Cl. B | 12/16/20 | 475,000 | 0.19 | % | 437,361 | 0.23 | % | |||||||||||
| Prosetta Biosciences, Inc., Series D | 2/6/15 | 988,245 | 0.50 | % | 0 | 0.00 | % | |||||||||||
| Tolero CDR | 2/6/17 | 315,501 | 0.19 | % | 401,240 | 0.21 | % | |||||||||||
| Total | $ | 1,943,513 | 1.03 | % | ||||||||||||||
��
See Notes to Financial Statements.
THE ALGER FUNDS | ALGER MID CAP FOCUS FUND
Schedule of Investments October 31, 2023
| COMMON STOCKS—100.7% | SHARES | VALUE | ||||||
| ADVERTISING—2.1% | ||||||||
| The Trade Desk, Inc., Cl. A* | 68,915 | $ | 4,890,208 | |||||
| AEROSPACE & DEFENSE—5.2% | ||||||||
| Axon Enterprise, Inc.* | 24,530 | 5,016,140 | ||||||
| HEICO Corp. | 45,840 | 7,261,514 | ||||||
| 12,277,654 | ||||||||
| APPLICATION SOFTWARE—22.8% | ||||||||
| Agilysys, Inc.* | 82,064 | 7,040,270 | ||||||
| ANSYS, Inc.* | 24,190 | 6,731,109 | ||||||
| AppFolio, Inc., Cl. A* | 39,850 | 7,474,664 | ||||||
| Bentley Systems, Inc., Cl. B | 106,028 | 5,157,202 | ||||||
| Cadence Design Systems, Inc.* | 32,648 | 7,830,623 | ||||||
| Constellation Software, Inc. | 1,282 | 2,570,204 | ||||||
| Datadog, Inc., Cl. A* | 54,228 | 4,417,955 | ||||||
| Manhattan Associates, Inc.* | 24,365 | 4,750,688 | ||||||
| Splunk, Inc.* | 10,851 | 1,596,833 | ||||||
| Tyler Technologies, Inc.* | 15,764 | 5,878,396 | ||||||
| 53,447,944 | ||||||||
| AUTOMOTIVE PARTS & EQUIPMENT—1.2% | ||||||||
| Mobileye Global, Inc., Cl. A* | 77,873 | 2,777,730 | ||||||
| AUTOMOTIVE RETAIL—2.4% | ||||||||
| O’Reilly Automotive, Inc.* | 6,013 | 5,594,736 | ||||||
| BIOTECHNOLOGY—7.5% | ||||||||
| Exact Sciences Corp.* | 45,439 | 2,798,588 | ||||||
| Madrigal Pharmaceuticals, Inc.* | 11,217 | 1,473,690 | ||||||
| Natera, Inc.* | 205,700 | 8,118,979 | ||||||
| Neurocrine Biosciences, Inc.* | 47,227 | 5,239,363 | ||||||
| 17,630,620 | ||||||||
| CARGO GROUND TRANSPORTATION—2.9% | ||||||||
| Old Dominion Freight Line, Inc. | 18,188 | 6,850,692 | ||||||
| CASINOS & GAMING—1.1% | ||||||||
| DraftKings, Inc., Cl. A* | 96,128 | 2,655,055 | ||||||
| COMMUNICATIONS EQUIPMENT—1.3% | ||||||||
| Arista Networks, Inc.* | 15,025 | 3,010,559 | ||||||
| CONSTRUCTION MATERIALS—2.0% | ||||||||
| Martin Marietta Materials, Inc. | 11,306 | 4,623,476 | ||||||
| ELECTRICAL COMPONENTS & EQUIPMENT—4.1% | ||||||||
| Vertiv Holdings Co., Cl. A | 243,736 | 9,571,513 | ||||||
| ELECTRONIC EQUIPMENT & INSTRUMENTS—2.3% | ||||||||
| Novanta, Inc.* | 41,410 | 5,468,605 | ||||||
| FOOTWEAR—2.3% | ||||||||
| Deckers Outdoor Corp.* | 8,938 | 5,336,522 | ||||||
| HEALTHCARE EQUIPMENT—5.4% | ||||||||
| Dexcom, Inc.* | 48,189 | 4,280,629 | ||||||
| IDEXX Laboratories, Inc.* | 14,161 | 5,656,895 | ||||||
| Shockwave Medical, Inc.* | 13,621 | 2,809,467 | ||||||
| 12,746,991 | ||||||||
| HEALTHCARE TECHNOLOGY—2.7% | ||||||||
| Veeva Systems, Inc., Cl. A* | 32,551 | 6,272,903 | ||||||
THE ALGER FUNDS | ALGER MID CAP FOCUS FUND
Schedule of Investments October 31, 2023 (Continued)
| COMMON STOCKS—100.7% (CONT.) | SHARES | VALUE | ||||||
| HOME IMPROVEMENT RETAIL—1.7% | ||||||||
| Floor & Decor Holdings, Inc., Cl. A* | 48,053 | $ | 3,959,567 | |||||
| INTERACTIVE MEDIA & SERVICES—2.9% | ||||||||
| Baidu, Inc.#,* | 20,634 | 2,166,570 | ||||||
| Pinterest, Inc., Cl. A* | 156,801 | 4,685,214 | ||||||
| 6,851,784 | ||||||||
| INTERNET SERVICES & INFRASTRUCTURE—7.3% | ||||||||
| Cloudflare, Inc., Cl. A* | 69,065 | 3,915,295 | ||||||
| MongoDB, Inc., Cl. A* | 14,872 | 5,124,742 | ||||||
| Shopify, Inc., Cl. A* | 118,272 | 5,581,256 | ||||||
| Snowflake, Inc., Cl. A* | 18,012 | 2,614,082 | ||||||
| 17,235,375 | ||||||||
| LIFE SCIENCES TOOLS & SERVICES—3.3% | ||||||||
| Avantor, Inc.* | 137,030 | 2,388,433 | ||||||
| West Pharmaceutical Services, Inc. | 17,224 | 5,482,227 | ||||||
| 7,870,660 | ||||||||
| MOVIES & ENTERTAINMENT—1.8% | ||||||||
| Liberty Media Corp. Series C Liberty Formula One* | 65,151 | 4,214,618 | ||||||
| OIL & GAS EXPLORATION & PRODUCTION—4.6% | ||||||||
| Diamondback Energy, Inc. | 67,779 | 10,866,329 | ||||||
| SEMICONDUCTOR MATERIALS & EQUIPMENT—1.2% | ||||||||
| ASML Holding NV# | 4,624 | 2,768,898 | ||||||
| SEMICONDUCTORS—8.0% | ||||||||
| Advanced Micro Devices, Inc.* | 57,314 | 5,645,429 | ||||||
| First Solar, Inc.* | 18,983 | 2,704,128 | ||||||
| Marvell Technology, Inc. | 78,238 | 3,694,398 | ||||||
| Monolithic Power Systems, Inc. | 8,097 | 3,576,769 | ||||||
| ON Semiconductor Corp.* | 51,635 | 3,234,417 | ||||||
| 18,855,141 | ||||||||
| SOFT DRINKS & NON-ALCOHOLIC BEVERAGES—1.6% | ||||||||
| Celsius Holdings, Inc.* | 25,457 | 3,871,755 | ||||||
| SYSTEMS SOFTWARE—3.0% | ||||||||
| CyberArk Software Ltd.* | 9,165 | 1,499,761 | ||||||
| ServiceNow, Inc.* | 9,479 | 5,515,356 | ||||||
| 7,015,117 | ||||||||
| TOTAL COMMON STOCKS | ||||||||
| (Cost $227,758,893) | 236,664,452 | |||||||
| Total Investments | ||||||||
| (Cost $227,758,893) | 100.7 | % | $ | 236,664,452 | ||||
| Unaffiliated Securities (Cost $227,758,893) | 236,664,452 | |||||||
| Liabilities in Excess of Other Assets | (0.7 | )% | (1,743,553 | ) | ||||
| NET ASSETS | 100.0 | % | $ | 234,920,899 | ||||
| * | Non-income producing security. |
| # | American Depositary Receipts. |
See Notes to Financial Statements.
THE ALGER FUNDS | ALGER WEATHERBIE SPECIALIZED GROWTH FUND
Schedule of Investments October 31, 2023
| COMMON STOCKS—96.6% | SHARES | VALUE | ||||||
| AEROSPACE & DEFENSE—2.0% | ||||||||
| AAR Corp.* | 68,300 | $ | 4,054,288 | |||||
| Kratos Defense & Security Solutions, Inc.* | 356,269 | 6,074,386 | ||||||
| 10,128,674 | ||||||||
| APPAREL RETAIL—0.2% | ||||||||
| MYT Netherlands Parent BV#,* | 289,506 | 842,463 | ||||||
| APPLICATION SOFTWARE—14.0% | ||||||||
| Intapp, Inc.* | 17,652 | 603,698 | ||||||
| nCino, Inc.* | 220,605 | 6,199,001 | ||||||
| Sprout Social, Inc., Cl. A* | 161,026 | 6,969,205 | ||||||
| SPS Commerce, Inc.* | 165,262 | 26,498,109 | ||||||
| Vertex, Inc., Cl. A* | 1,291,252 | 31,261,211 | ||||||
| 71,531,224 | ||||||||
| ASSET MANAGEMENT & CUSTODY BANKS—8.0% | ||||||||
| Hamilton Lane, Inc., Cl. A | 210,375 | 17,696,745 | ||||||
| StepStone Group, Inc., Cl. A | 821,203 | 23,240,045 | ||||||
| 40,936,790 | ||||||||
| BIOTECHNOLOGY—7.4% | ||||||||
| ACADIA Pharmaceuticals, Inc.* | 1,002,382 | 22,623,762 | ||||||
| Natera, Inc.* | 206,029 | 8,131,964 | ||||||
| Ultragenyx Pharmaceutical, Inc.* | 196,557 | 6,958,118 | ||||||
| 37,713,844 | ||||||||
| BROADLINE RETAIL—3.4% | ||||||||
| Ollie’s Bargain Outlet Holdings, Inc.* | 227,002 | 17,533,635 | ||||||
| CARGO GROUND TRANSPORTATION—1.4% | ||||||||
| RXO, Inc.* | 420,380 | 7,360,854 | ||||||
| CONSUMER FINANCE—0.8% | ||||||||
| Upstart Holdings, Inc.* | 160,366 | 3,853,595 | ||||||
| ELECTRONIC EQUIPMENT & INSTRUMENTS—2.0% | ||||||||
| Novanta, Inc.* | 77,472 | 10,230,952 | ||||||
| ENVIRONMENTAL & FACILITIES SERVICES—7.0% | ||||||||
| Casella Waste Systems, Inc., Cl. A* | 380,336 | 28,696,351 | ||||||
| Montrose Environmental Group, Inc.* | 319,975 | 7,397,822 | ||||||
| 36,094,173 | ||||||||
| HEALTHCARE EQUIPMENT—10.7% | ||||||||
| Glaukos Corp.* | 426,153 | 29,063,635 | ||||||
| Impulse Dynamics PLC, Class E*,@,(a) | 904,912 | 2,578,999 | ||||||
| Inmode Ltd.* | 105,152 | 2,008,403 | ||||||
| Inogen, Inc.* | 316,553 | 1,414,992 | ||||||
| Inspire Medical Systems, Inc.* | 90,116 | 13,261,470 | ||||||
| iRhythm Technologies, Inc.* | 7,912 | 621,250 | ||||||
| Nevro Corp.* | 316,807 | 4,571,525 | ||||||
| Tandem Diabetes Care, Inc.* | 71,552 | 1,237,850 | ||||||
| 54,758,124 | ||||||||
| HEALTHCARE FACILITIES—1.1% | ||||||||
| US Physical Therapy, Inc. | 67,674 | 5,692,060 | ||||||
THE ALGER FUNDS | ALGER WEATHERBIE SPECIALIZED GROWTH FUND
Schedule of Investments October 31, 2023 (Continued)
| COMMON STOCKS—96.6% (CONT.) | SHARES | VALUE | ||||||
| HEALTHCARE SERVICES—1.8% | ||||||||
| Agiliti, Inc.* | 617,132 | $ | 3,474,453 | |||||
| NeoGenomics, Inc.* | 397,969 | 5,579,526 | ||||||
| 9,053,979 | ||||||||
| HEALTHCARE TECHNOLOGY—0.9% | ||||||||
| Definitive Healthcare Corp., Cl. A* | 804,754 | 4,635,383 | ||||||
| IT CONSULTING & OTHER SERVICES—0.6% | ||||||||
| Globant SA* | 18,755 | 3,193,789 | ||||||
| LEISURE FACILITIES—1.6% | ||||||||
| Planet Fitness, Inc., Cl. A* | 118,664 | 6,558,559 | ||||||
| Xponential Fitness, Inc., Cl. A* | 114,687 | 1,636,584 | ||||||
| 8,195,143 | ||||||||
| LEISURE PRODUCTS—0.2% | ||||||||
| Latham Group, Inc.* | 523,711 | 1,199,298 | ||||||
| MANAGED HEALTHCARE—5.6% | ||||||||
| Progyny, Inc.* | 930,375 | 28,711,373 | ||||||
| OIL & GAS EQUIPMENT & SERVICES—2.5% | ||||||||
| Core Laboratories NV | 343,359 | 7,354,750 | ||||||
| Dril-Quip, Inc.* | 250,506 | 5,425,960 | ||||||
| 12,780,710 | ||||||||
| PERSONAL CARE PRODUCTS—0.2% | ||||||||
| Oddity Tech Ltd., Cl. A* | 45,719 | 1,168,120 | ||||||
| REAL ESTATE SERVICES—5.9% | ||||||||
| FirstService Corp. | 213,940 | 30,266,092 | ||||||
| REGIONAL BANKS—0.3% | ||||||||
| Axos Financial, Inc.* | 41,967 | 1,512,071 | ||||||
| RESEARCH & CONSULTING SERVICES—0.2% | ||||||||
| NV5 Global, Inc.* | 12,901 | 1,217,209 | ||||||
| RESTAURANTS—1.2% | ||||||||
| Wingstop, Inc. | 32,165 | 5,878,797 | ||||||
| SEMICONDUCTORS—3.2% | ||||||||
| Impinj, Inc.* | 175,324 | 11,327,684 | ||||||
| SiTime Corp.* | 49,894 | 4,979,421 | ||||||
| 16,307,105 | ||||||||
| SYSTEMS SOFTWARE—0.3% | ||||||||
| Rapid7, Inc.* | 35,462 | 1,648,628 | ||||||
| TRADING COMPANIES & DISTRIBUTORS—8.8% | ||||||||
| SiteOne Landscape Supply, Inc.* | 178,163 | 24,545,517 | ||||||
| Transcat, Inc.* | 206,364 | 18,576,887 | ||||||
| Xometry, Inc., Cl. A* | 140,987 | 2,051,361 | ||||||
| 45,173,765 | ||||||||
| TRANSACTION & PAYMENT PROCESSING SERVICES—5.3% | ||||||||
| Flywire Corp.* | 1,016,851 | 27,343,123 | ||||||
| TOTAL COMMON STOCKS | ||||||||
| (Cost $518,175,498) | 494,960,973 | |||||||
| PREFERRED STOCKS—0.0% | SHARES | VALUE | ||||||
| BIOTECHNOLOGY—0.0% | ||||||||
| Prosetta Biosciences, Inc., Series D*,@,(a),(b) | 231,474 | — | ||||||
| (Cost $1,041,633) | — | |||||||
THE ALGER FUNDS | ALGER WEATHERBIE SPECIALIZED GROWTH FUND
Schedule of Investments October 31, 2023 (Continued)
| SHORT—TERM INVESTMENTS—0.6% | SHARES | VALUE | ||||||
| U.S. GOVERNMENT—0.6% | ||||||||
| U.S. Treasury Bill, 0.00%, 11/2/23 | 3,000,000 | $ | 2,999,567 | |||||
| (Cost $2,999,567) | 2,999,567 | |||||||
| Total Investments | ||||||||
| (Cost $522,216,698) | 97.2 | % | $ | 497,960,540 | ||||
| Affiliated Securities (Cost $1,041,633) | — | |||||||
| Unaffiliated Securities (Cost $521,175,065) | 497,960,540 | |||||||
| Other Assets in Excess of Liabilities | 2.8 | % | 14,435,353 | |||||
| NET ASSETS | 100.0 | % | $ | 512,395,893 | ||||
| # | American Depositary Receipts. |
| (a) | Security is valued in good faith at fair value determined using significant unobservable inputs pursuant to procedures established by the Valuation Designee (as defined in Note 2). |
| (b) | Deemed an affiliate of the Fund in accordance with Section 2(a)(3) of the Investment Company Act of 1940. See Note 11 - Affiliated Securities. |
| * | Non-income producing security. |
| @ | Restricted security - Investment in security not registered under the Securities Act of 1933. Sales or transfers of the investment may be restricted only to qualified buyers. |
| Security | Acquisition Date(s) | Acquisition | % of net assets Date) | Market Value | % of net assets as of 10/31/2023 | |||||||||||||
| Impulse Dynamics PLC, Class E | 2/11/22 | $ | 2,986,210 | 0.24 | % | $ | 2,578,999 | 0.50 | % | |||||||||
| Prosetta Biosciences, Inc., Series D | 2/6/15 | 1,041,633 | 0.10 | % | 0 | 0.00 | % | |||||||||||
| Total | $ | 2,578,999 | 0.50 | % | ||||||||||||||
See Notes to Financial Statements.
THE ALGER FUNDS | ALGER SMALL CAP GROWTH FUND
Schedule of Investments October 31, 2023
| COMMON STOCKS—98.8% | SHARES | VALUE | ||||||
| AEROSPACE & DEFENSE—6.2% | ||||||||
| HEICO Corp. | 76,241 | $ | 12,077,337 | |||||
| Hexcel Corp. | 34,820 | 2,156,054 | ||||||
| Mercury Systems, Inc.* | 71,176 | 2,560,913 | ||||||
| 16,794,304 | ||||||||
| APPAREL ACCESSORIES & LUXURY GOODS—1.6% | ||||||||
| Capri Holdings Ltd.* | 82,630 | 4,229,003 | ||||||
| APPAREL RETAIL—1.0% | ||||||||
| Victoria’s Secret & Co.* | 154,291 | 2,758,723 | ||||||
| APPLICATION SOFTWARE—24.3% | ||||||||
| ACI Worldwide, Inc.* | 158,341 | 3,225,406 | ||||||
| Alteryx, Inc., Cl. A* | 26,132 | 836,485 | ||||||
| AppFolio, Inc., Cl. A* | 26,631 | 4,995,177 | ||||||
| Bill.com Holdings, Inc.* | 34,953 | 3,190,859 | ||||||
| Blackbaud, Inc.* | 70,794 | 4,629,928 | ||||||
| Blackline, Inc.* | 50,428 | 2,476,015 | ||||||
| Everbridge, Inc.* | 93,302 | 1,922,954 | ||||||
| Guidewire Software, Inc.* | 36,894 | 3,325,256 | ||||||
| HubSpot, Inc.* | 10,753 | 4,556,799 | ||||||
| Manhattan Associates, Inc.* | 69,328 | 13,517,573 | ||||||
| Q2 Holdings, Inc.* | 108,919 | 3,270,838 | ||||||
| Smartsheet, Inc., Cl. A* | 71,669 | 2,833,792 | ||||||
| Sprout Social, Inc., Cl. A* | 73,507 | 3,181,383 | ||||||
| SPS Commerce, Inc.* | 49,244 | 7,895,783 | ||||||
| Vertex, Inc., Cl. A* | 260,255 | 6,300,774 | ||||||
| 66,159,022 | ||||||||
| ASSET MANAGEMENT & CUSTODY BANKS—0.7% | ||||||||
| Affiliated Managers Group, Inc. | 16,297 | 2,000,620 | ||||||
| AUTOMOTIVE PARTS & EQUIPMENT—0.0% | ||||||||
| Atmus Filtration Technologies, Inc.* | 4,639 | 87,028 | ||||||
| BIOTECHNOLOGY—10.0% | ||||||||
| ACELYRIN, Inc.* | 28,653 | 291,831 | ||||||
| ADMA Biologics, Inc.* | 506,775 | 1,712,899 | ||||||
| Akero Therapeutics, Inc.* | 27,751 | 330,792 | ||||||
| Arcus Biosciences, Inc.* | 40,904 | 642,602 | ||||||
| Bridgebio Pharma, Inc.* | 53,285 | 1,387,541 | ||||||
| Cabaletta Bio, Inc.* | 274,652 | 3,916,538 | ||||||
| ImmunoGen, Inc.* | 97,892 | 1,454,675 | ||||||
| Immunovant, Inc.* | 102,002 | 3,371,166 | ||||||
| Karuna Therapeutics, Inc.* | 12,763 | 2,126,443 | ||||||
| Krystal Biotech, Inc.* | 12,609 | 1,473,614 | ||||||
| Mirati Therapeutics, Inc.* | 14,432 | 801,409 | ||||||
| MoonLake Immunotherapeutics, Cl. A* | 64,582 | 3,345,993 | ||||||
| Morphic Holding, Inc.* | 35,366 | 705,552 | ||||||
| Nuvalent, Inc., Cl. A* | 37,939 | 1,976,243 | ||||||
| Prothena Corp., PLC* | 17,994 | 656,061 | ||||||
| RAPT Therapeutics, Inc.* | 43,641 | 573,879 | ||||||
| Vaxcyte, Inc.* | 52,635 | 2,531,744 | ||||||
| 27,298,982 | ||||||||
THE ALGER FUNDS | ALGER SMALL CAP GROWTH FUND
Schedule of Investments October 31, 2023 (Continued)
| COMMON STOCKS—98.8% (CONT.) | SHARES | VALUE | ||||||
| BUILDING PRODUCTS—0.3% | ||||||||
| The AZEK Co., Inc., Cl. A* | 33,730 | $ | 883,726 | |||||
| CONSTRUCTION MATERIALS—0.6% | ||||||||
| Summit Materials, Inc., Cl. A* | 44,911 | 1,477,572 | ||||||
| CONSUMER STAPLES MERCHANDISE RETAIL—1.2% | ||||||||
| BJ’s Wholesale Club Holdings, Inc.* | 47,851 | 3,259,610 | ||||||
| ELECTRONIC EQUIPMENT & INSTRUMENTS—1.0% | ||||||||
| 908 Devices, Inc.* | 456,169 | 2,705,082 | ||||||
| FOOTWEAR—0.7% | ||||||||
| On Holding AG, Cl. A* | 70,241 | 1,803,086 | ||||||
| HEALTHCARE DISTRIBUTORS—0.4% | ||||||||
| PetIQ, Inc., Cl. A* | 62,035 | 1,164,397 | ||||||
| HEALTHCARE EQUIPMENT—4.7% | ||||||||
| Impulse Dynamics PLC, Class E*,@,(a) | 1,105,151 | 3,149,680 | ||||||
| Inmode Ltd.* | 103,438 | 1,975,666 | ||||||
| Insulet Corp.* | 15,849 | 2,101,102 | ||||||
| QuidelOrtho Corp.* | 57,114 | 3,488,523 | ||||||
| Shockwave Medical, Inc.* | 6,006 | 1,238,798 | ||||||
| Tandem Diabetes Care, Inc.* | 56,741 | 981,619 | ||||||
| 12,935,388 | ||||||||
| HEALTHCARE SERVICES—0.6% | ||||||||
| Guardant Health, Inc.* | 27,943 | 723,165 | ||||||
| Privia Health Group, Inc.* | 48,330 | 1,015,896 | ||||||
| 1,739,061 | ||||||||
| HEALTHCARE SUPPLIES—1.6% | ||||||||
| Neogen Corp.* | 284,112 | 4,230,428 | ||||||
| HEALTHCARE TECHNOLOGY—2.9% | ||||||||
| Doximity, Inc., Cl. A* | 18,271 | 373,276 | ||||||
| Veeva Systems, Inc., Cl. A* | 39,269 | 7,567,529 | ||||||
| 7,940,805 | ||||||||
| HOMEBUILDING—1.0% | ||||||||
| Skyline Champion Corp.* | 47,727 | 2,798,234 | ||||||
| HOMEFURNISHING RETAIL—0.6% | ||||||||
| RH* | 7,262 | 1,582,826 | ||||||
| HOTELS RESORTS & CRUISE LINES—0.2% | ||||||||
| MakeMyTrip Ltd.* | 14,927 | 578,123 | ||||||
| HUMAN RESOURCE & EMPLOYMENT SERVICES—0.7% | ||||||||
| Paycom Software, Inc. | 7,412 | 1,815,718 | ||||||
| INDUSTRIAL MACHINERY & SUPPLIES & COMPONENTS—3.1% | ||||||||
| Gates Industrial Corp., PLC* | 202,298 | 2,209,094 | ||||||
| RBC Bearings, Inc.* | 17,465 | 3,839,506 | ||||||
| The Middleby Corp.* | 22,355 | 2,523,209 | ||||||
| 8,571,809 | ||||||||
| INTERACTIVE HOME ENTERTAINMENT—1.7% | ||||||||
| Take-Two Interactive Software, Inc.* | 35,288 | 4,719,770 | ||||||
| INTERACTIVE MEDIA & SERVICES—0.8% | ||||||||
| Bumble, Inc., Cl. A* | 157,067 | 2,110,980 | ||||||
| LEISURE FACILITIES—0.8% | ||||||||
| Planet Fitness, Inc., Cl. A* | 40,235 | 2,223,788 | ||||||
THE ALGER FUNDS | ALGER SMALL CAP GROWTH FUND
Schedule of Investments October 31, 2023 (Continued)
| COMMON STOCKS—98.8% (CONT.) | SHARES | VALUE | ||||||
| LIFE SCIENCES TOOLS & SERVICES—5.9% | ||||||||
| Bio-Techne Corp. | 123,555 | $ | 6,749,810 | |||||
| CryoPort, Inc.* | 115,779 | 1,123,056 | ||||||
| ICON PLC* | 9,581 | 2,337,381 | ||||||
| MaxCyte, Inc.* | 193,490 | 572,730 | ||||||
| Mesa Laboratories, Inc. | 17,339 | 1,626,918 | ||||||
| Quanterix Corp.* | 22,478 | 488,222 | ||||||
| Repligen Corp.* | 23,424 | 3,151,934 | ||||||
| 16,050,051 | ||||||||
| MANAGED HEALTHCARE—2.5% | ||||||||
| HealthEquity, Inc.* | 96,344 | 6,905,938 | ||||||
| MOVIES & ENTERTAINMENT—2.0% | ||||||||
| Live Nation Entertainment, Inc.* | 69,490 | 5,560,590 | ||||||
| OIL & GAS EQUIPMENT & SERVICES—1.1% | ||||||||
| ChampionX Corp. | 97,023 | 2,988,308 | ||||||
| OIL & GAS EXPLORATION & PRODUCTION—3.8% | ||||||||
| Magnolia Oil & Gas Corp., Cl. A | 463,096 | 10,396,505 | ||||||
| PERSONAL CARE PRODUCTS—1.0% | ||||||||
| e.l.f. Beauty, Inc.* | 15,699 | 1,454,199 | ||||||
| Oddity Tech Ltd., Cl. A* | 47,544 | 1,214,749 | ||||||
| 2,668,948 | ||||||||
| PHARMACEUTICALS—2.8% | ||||||||
| Cymabay Therapeutics, Inc.* | 162,152 | 2,656,050 | ||||||
| Pliant Therapeutics, Inc.* | 54,049 | 792,899 | ||||||
| Structure Therapeutics, Inc.#,* | 52,711 | 3,916,427 | ||||||
| Ventyx Biosciences, Inc.* | 24,827 | 358,005 | ||||||
| 7,723,381 | ||||||||
| REGIONAL BANKS—1.1% | ||||||||
| Webster Financial Corp. | 79,755 | 3,028,297 | ||||||
| RESTAURANTS—5.9% | ||||||||
| Cava Group, Inc.* | 20,457 | 646,237 | ||||||
| Kura Sushi USA, Inc., Cl. A* | 55,791 | 3,187,898 | ||||||
| Shake Shack, Inc., Cl. A* | 98,741 | 5,533,446 | ||||||
| Wingstop, Inc. | 36,606 | 6,690,478 | ||||||
| 16,058,059 | ||||||||
| SEMICONDUCTORS—1.8% | ||||||||
| Rambus, Inc.* | 30,156 | 1,638,376 | ||||||
| Universal Display Corp. | 22,496 | 3,130,993 | ||||||
| 4,769,369 | ||||||||
| SOFT DRINKS & NON-ALCOHOLIC BEVERAGES—1.3% | ||||||||
| Celsius Holdings, Inc.* | 23,525 | 3,577,917 | ||||||
| SPECIALTY CHEMICALS—0.5% | ||||||||
| Balchem Corp. | 10,486 | 1,218,893 | ||||||
| SYSTEMS SOFTWARE—0.5% | ||||||||
| Rapid7, Inc.* | 28,874 | 1,342,352 | ||||||
| TRADING COMPANIES & DISTRIBUTORS—0.3% | ||||||||
| Xometry, Inc., Cl. A* | 62,192 | 904,894 | ||||||
THE ALGER FUNDS | ALGER SMALL CAP GROWTH FUND
Schedule of Investments October 31, 2023 (Continued)
| COMMON STOCKS—98.8% (CONT.) | SHARES | VALUE | ||||||
| TRANSACTION & PAYMENT PROCESSING SERVICES—1.6% | ||||||||
| DLocal Ltd., Cl. A* | 173,167 | $ | 2,917,864 | |||||
| Marqeta, Inc., Cl. A* | 288,721 | 1,492,687 | ||||||
| 4,410,551 | ||||||||
| TOTAL COMMON STOCKS | ||||||||
| (Cost $268,716,016) | 269,472,138 | |||||||
| PREFERRED STOCKS—0.0% | SHARES | VALUE | ||||||
| BIOTECHNOLOGY—0.0% | ||||||||
| Prosetta Biosciences, Inc., Series D*,@,(a),(b) | 50,688 | — | ||||||
| (Cost $228,096) | — | |||||||
| RIGHTS—0.0% | SHARES | VALUE | ||||||
| BIOTECHNOLOGY—0.0% | ||||||||
| Tolero CDR*,@,(a),(c) | 174,782 | 118,852 | ||||||
| (Cost $94,483) | 118,852 | |||||||
| SPECIAL PURPOSE VEHICLE—0.8% | VALUE | |||||||
| DATA PROCESSING & OUTSOURCED SERVICES—0.8% | ||||||||
| Crosslink Ventures C, LLC, Cl. A*,@,(a),(b) | 1,657,368 | |||||||
| Crosslink Ventures C, LLC, Cl. B*,@,(a),(b) | 437,361 | |||||||
| 2,094,729 | ||||||||
| TOTAL SPECIAL PURPOSE VEHICLE | ||||||||
| (Cost $2,275,000) | 2,094,729 | |||||||
| Total Investments | ||||||||
| (Cost $271,313,595) | 99.6 | % | $ | 271,685,719 | ||||
| Affiliated Securities (Cost $2,503,096) | 2,094,729 | |||||||
| Unaffiliated Securities (Cost $268,810,499) | 269,590,990 | |||||||
| Other Assets in Excess of Liabilities | 0.4 | % | 1,177,699 | |||||
| NET ASSETS | 100.0 | % | $ | 272,863,418 | ||||
| # | American Depositary Receipts. |
| (a) | Security is valued in good faith at fair value determined using significant unobservable inputs pursuant to procedures established by the Valuation Designee (as defined in Note 2). |
| (b) | Deemed an affiliate of the Fund in accordance with Section 2(a)(3) of the Investment Company Act of 1940. See Note 11 - Affiliated Securities. |
| (c) | Contingent Deferred Rights. |
| * | Non-income producing security. |
| @ | Restricted security - Investment in security not registered under the Securities Act of 1933. Sales or transfers of the investment may be restricted only to qualified buyers. |
| Security | Acquisition Date(s) | Acquisition Cost | % of net assets Date) | Market Value | % of net assets as of 10/31/2023 | |||||||||||||
| Crosslink Ventures C, LLC, Cl. A | 10/2/20 | $ | 1,800,000 | 0.49 | % | $ | 1,657,368 | 0.61 | % | |||||||||
| Crosslink Ventures C, LLC, Cl. B | 12/16/20 | 475,000 | 0.10 | % | 437,361 | 0.16 | % | |||||||||||
| Impulse Dynamics PLC, Class E | 2/11/22 | 3,646,998 | 0.69 | % | 3,149,680 | 1.16 | % | |||||||||||
| Prosetta Biosciences, Inc., Series D | 2/6/15 | 228,096 | 0.10 | % | 0 | 0.00 | % | |||||||||||
| Tolero CDR | 2/6/17 | 94,483 | 0.08 | % | 118,852 | 0.04 | % | |||||||||||
| Total | $ | 5,363,261 | 1.97 | % | ||||||||||||||
See Notes to Financial Statements.
THE ALGER FUNDS | ALGER SMALL CAP FOCUS FUND
Schedule of Investments October 31, 2023
| COMMON STOCKS—101.8% | SHARES | VALUE | ||||||
| APPLICATION SOFTWARE—35.8% | ||||||||
| Agilysys, Inc.* | 617,102 | $ | 52,941,181 | |||||
| Altair Engineering, Inc., Cl. A* | 485,800 | 30,177,896 | ||||||
| Alteryx, Inc., Cl. A* | 564,556 | 18,071,438 | ||||||
| AppFolio, Inc., Cl. A* | 398,096 | 74,670,867 | ||||||
| Blackline, Inc.* | 715,846 | 35,148,039 | ||||||
| Clearwater Analytics Holdings, Inc., Cl. A* | 2,960,709 | 53,529,619 | ||||||
| Confluent, Inc., Cl. A* | 1,188,773 | 34,367,427 | ||||||
| Everbridge, Inc.* | 1,143,199 | 23,561,331 | ||||||
| Guidewire Software, Inc.* | 578,241 | 52,116,861 | ||||||
| Intapp, Inc.* | 412,894 | 14,120,975 | ||||||
| nCino, Inc.* | 678,833 | 19,075,207 | ||||||
| PROS Holdings, Inc.*,(a) | 2,701,224 | 84,143,128 | ||||||
| Q2 Holdings, Inc.* | 746,982 | 22,431,869 | ||||||
| Smartsheet, Inc., Cl. A* | 598,521 | 23,665,520 | ||||||
| 538,021,358 | ||||||||
| BIOTECHNOLOGY—12.7% | ||||||||
| Ascendis Pharma AS#,* | 168,423 | 15,041,858 | ||||||
| Cabaletta Bio, Inc.*,(a) | 2,838,165 | 40,472,233 | ||||||
| Immunovant, Inc.* | 874,653 | 28,907,282 | ||||||
| Krystal Biotech, Inc.* | 127,615 | 14,914,365 | ||||||
| MoonLake Immunotherapeutics, Cl. A* | 617,540 | 31,994,747 | ||||||
| Natera, Inc.* | 1,528,731 | 60,339,013 | ||||||
| 191,669,498 | ||||||||
| BUILDING PRODUCTS—1.2% | ||||||||
| Trex Co., Inc.* | 310,960 | 17,479,062 | ||||||
| COMMUNICATIONS EQUIPMENT—1.7% | ||||||||
| Extreme Networks, Inc.* | 1,252,416 | 25,824,818 | ||||||
| CONSTRUCTION & ENGINEERING—0.2% | ||||||||
| MYR Group, Inc.* | 26,079 | 3,020,731 | ||||||
| CONSTRUCTION MATERIALS—1.2% | ||||||||
| Summit Materials, Inc., Cl. A* | 570,735 | 18,777,182 | ||||||
| ELECTRICAL COMPONENTS & EQUIPMENT—0.8% | ||||||||
| Vicor Corp.* | 298,518 | 11,564,587 | ||||||
| HEALTHCARE EQUIPMENT—11.6% | ||||||||
| Alphatec Holdings, Inc.* | 2,078,399 | 19,079,703 | ||||||
| AtriCure, Inc.* | 1,178,140 | 40,810,770 | ||||||
| Glaukos Corp.* | 227,865 | 15,540,393 | ||||||
| Impulse Dynamics PLC, Class E*,@,(b) | 7,255,544 | 20,678,300 | ||||||
| Inari Medical, Inc.* | 422,774 | 25,666,609 | ||||||
| Shockwave Medical, Inc.* | 201,584 | 41,578,716 | ||||||
| TransMedics Group, Inc.* | 304,645 | 11,418,095 | ||||||
| 174,772,586 | ||||||||
| HEALTHCARE TECHNOLOGY—3.7% | ||||||||
| Schrodinger, Inc.* | 619,504 | 13,443,237 | ||||||
| Veeva Systems, Inc., Cl. A* | 217,828 | 41,977,634 | ||||||
| 55,420,871 | ||||||||
| HOTELS RESORTS & CRUISE LINES—0.1% | ||||||||
| MakeMyTrip Ltd.* | 21,406 | 829,054 | ||||||
THE ALGER FUNDS | ALGER SMALL CAP FOCUS FUND
Schedule of Investments October 31, 2023 (Continued)
| COMMON STOCKS—101.8% (CONT.) | SHARES | VALUE | ||||||
| INDUSTRIAL MACHINERY & SUPPLIES & COMPONENTS—5.5% | ||||||||
| Helios Technologies, Inc. | 99,999 | $ | 5,171,948 | |||||
| RBC Bearings, Inc.* | 349,730 | 76,884,643 | ||||||
| 82,056,591 | ||||||||
| LIFE SCIENCES TOOLS & SERVICES—7.3% | ||||||||
| BioLife Solutions, Inc.* | 1,588,311 | 16,041,941 | ||||||
| Bio-Techne Corp. | 612,239 | 33,446,617 | ||||||
| CryoPort, Inc.* | 1,929,436 | 18,715,529 | ||||||
| Repligen Corp.* | 312,513 | 42,051,749 | ||||||
| 110,255,836 | ||||||||
| OIL & GAS EQUIPMENT & SERVICES—2.8% | ||||||||
| ChampionX Corp. | 1,388,813 | 42,775,440 | ||||||
| PERSONAL CARE PRODUCTS—0.6% | ||||||||
| e.l.f. Beauty, Inc.* | 101,256 | 9,379,343 | ||||||
| PHARMACEUTICALS—2.4% | ||||||||
| Cymabay Therapeutics, Inc.* | 1,611,075 | 26,389,409 | ||||||
| Structure Therapeutics, Inc.#,* | 128,568 | 9,552,602 | ||||||
| 35,942,011 | ||||||||
| RESTAURANTS—3.5% | ||||||||
| Kura Sushi USA, Inc., Cl. A* | 249,354 | 14,248,088 | ||||||
| Wingstop, Inc. | 211,011 | 38,566,480 | ||||||
| 52,814,568 | ||||||||
| SEMICONDUCTORS—3.0% | ||||||||
| Impinj, Inc.* | 184,553 | 11,923,969 | ||||||
| Rambus, Inc.* | 602,259 | 32,720,732 | ||||||
| 44,644,701 | ||||||||
| SOFT DRINKS & NON-ALCOHOLIC BEVERAGES—0.9% | ||||||||
| Celsius Holdings, Inc.* | 86,411 | 13,142,249 | ||||||
| SYSTEMS SOFTWARE—5.1% | ||||||||
| Gitlab, Inc., Cl. A* | 711,921 | 30,811,941 | ||||||
| Rapid7, Inc.* | 411,318 | 19,122,174 | ||||||
| Tenable Holdings, Inc.* | 625,957 | 26,359,049 | ||||||
| 76,293,164 | ||||||||
| TRADING COMPANIES & DISTRIBUTORS—1.7% | ||||||||
| Xometry, Inc., Cl. A* | 1,744,213 | 25,378,299 | ||||||
| TOTAL COMMON STOCKS | ||||||||
| (Cost $1,522,166,566) | 1,530,061,949 | |||||||
| RIGHTS—0.0% | SHARES | VALUE | ||||||
| BIOTECHNOLOGY—0.0% | ||||||||
| Tolero CDR*,@,(b),(c) | 11,905 | 8,095 | ||||||
| (Cost $6,436) | 8,095 | |||||||
| Total Investments | ||||||||
| (Cost $1,522,173,002) | 101.8 | % | $ | 1,530,070,044 | ||||
| Affiliated Securities (Cost $135,264,013) | 124,615,361 | |||||||
| Unaffiliated Securities (Cost $1,386,908,989) | 1,405,454,683 | |||||||
| Liabilities in Excess of Other Assets | (1.8 | )% | (26,403,272 | ) | ||||
| NET ASSETS | 100.0 | % | $ | 1,503,666,772 | ||||
THE ALGER FUNDS | ALGER SMALL CAP FOCUS FUND
Schedule of Investments October 31, 2023 (Continued)
| # | American Depositary Receipts. |
| (a) | Deemed an affiliate of the Fund in accordance with Section 2(a)(3) of the Investment Company Act of 1940. See Note 11 - Affiliated Securities. |
| (b) | Security is valued in good faith at fair value determined using significant unobservable inputs pursuant to procedures established by the Valuation Designee (as defined in Note 2). |
| (c) | Contingent Deferred Rights. |
| * | Non-income producing security. |
| @ | Restricted security - Investment in security not registered under the Securities Act of 1933. Sales or transfers of the investment may be restricted only to qualified buyers. |
| Security | Acquisition Date(s) | Acquisition Cost | % of net assets Date) | Market Value | % of net assets as of 10/31/2023 | |||||||||||||
| Impulse Dynamics PLC, Class E | 6/2/23 | $ | 23,943,295 | 1.11 | % | $ | 20,678,300 | 1.38 | % | |||||||||
| Tolero CDR | 2/6/17 | 6,436 | 0.00 | % | 8,095 | 0.00 | % | |||||||||||
| Total | $ | 20,686,395 | 1.38 | % | ||||||||||||||
See Notes to Financial Statements.
THE ALGER FUNDS | ALGER INTERNATIONAL FOCUS FUND
Schedule of Investments October 31, 2023
| COMMON STOCKS—96.3% | SHARES | VALUE | ||||||
| ARGENTINA—2.7% | ||||||||
| BROADLINE RETAIL—2.7% | ||||||||
| MercadoLibre, Inc.* | 3,150 | $ | 3,908,331 | |||||
| (Cost $4,206,900) | ||||||||
| AUSTRALIA—4.7% | ||||||||
| APPLICATION SOFTWARE—1.1% | ||||||||
| WiseTech Global Ltd. | 45,000 | 1,675,407 | ||||||
| HEALTHCARE SUPPLIES—1.3% | ||||||||
| Nanosonics Ltd.* | 780,062 | 1,861,679 | ||||||
| HEALTHCARE TECHNOLOGY—2.3% | ||||||||
| Pro Medicus Ltd. | 69,800 | 3,324,781 | ||||||
| TOTAL AUSTRALIA | ||||||||
| (Cost $7,246,995) | 6,861,867 | |||||||
| BRAZIL—6.5% | ||||||||
| DIVERSIFIED BANKS—3.6% | ||||||||
| NU Holdings Ltd., Cl. A* | 649,000 | 5,321,800 | ||||||
| DIVERSIFIED CAPITAL MARKETS—1.5% | ||||||||
| Banco BTG Pactual SA | 380,000 | 2,231,370 | ||||||
| FOOTWEAR—1.4% | ||||||||
| Arezzo Industria e Comercio SA | 177,700 | 2,058,364 | ||||||
| TOTAL BRAZIL | ||||||||
| (Cost $8,077,602) | 9,611,534 | |||||||
| CHINA—6.6% | ||||||||
| AUTOMOBILE MANUFACTURERS—2.2% | ||||||||
| BYD Co., Ltd., Cl. H | 106,984 | 3,253,480 | ||||||
| BROADLINE RETAIL—1.4% | ||||||||
| Alibaba Group Holding Ltd.#,* | 24,800 | 2,046,992 | ||||||
| HOTELS RESORTS & CRUISE LINES—2.0% | ||||||||
| Trip.com Group Ltd.#,* | 85,800 | 2,917,200 | ||||||
| RESTAURANTS—1.0% | ||||||||
| Meituan, Cl. B* | 104,100 | 1,475,657 | ||||||
| TOTAL CHINA | ||||||||
| (Cost $10,542,671) | 9,693,329 | |||||||
| DENMARK—3.1% | ||||||||
| PHARMACEUTICALS—3.1% | ||||||||
| Novo Nordisk AS, Cl. B | 47,600 | 4,592,562 | ||||||
| (Cost $3,442,270) | ||||||||
| FRANCE—12.8% | ||||||||
| APPAREL ACCESSORIES & LUXURY GOODS—2.1% | ||||||||
| LVMH Moet Hennessy Louis Vuitton SE | 4,350 | 3,114,592 | ||||||
| DATA PROCESSING & OUTSOURCED SERVICES—1.7% | ||||||||
| Teleperformance SE | 22,007 | 2,531,962 | ||||||
| ELECTRICAL COMPONENTS & EQUIPMENT—2.1% | ||||||||
| Schneider Electric SE | 19,900 | 3,062,049 | ||||||
| HEALTHCARE SUPPLIES—2.2% | ||||||||
| EssilorLuxottica SA | 17,900 | 3,241,702 | ||||||
THE ALGER FUNDS | ALGER INTERNATIONAL FOCUS FUND
Schedule of Investments October 31, 2023 (Continued)
| COMMON STOCKS—96.3% (CONT.) | SHARES | VALUE | ||||||
| FRANCE—12.8% (CONT.) | ||||||||
| LIFE SCIENCES TOOLS & SERVICES—2.0% | ||||||||
| Eurofins Scientific SE | 56,800 | $ | 2,882,065 | |||||
| OIL & GAS STORAGE & TRANSPORTATION—2.7% | ||||||||
| Gaztransport Et Technigaz SA | 30,324 | 3,879,112 | ||||||
| TOTAL FRANCE | ||||||||
| (Cost $19,239,945) | 18,711,482 | |||||||
| GERMANY—6.6% | ||||||||
| AEROSPACE & DEFENSE—2.5% | ||||||||
| Hensoldt AG | 123,300 | 3,653,995 | ||||||
| LIFE SCIENCES TOOLS & SERVICES—2.1% | ||||||||
| Gerresheimer AG | 32,900 | 3,068,979 | ||||||
| OIL & GAS REFINING & MARKETING—2.0% | ||||||||
| VERBIO Vereinigte BioEnergie AG | 85,554 | 2,895,508 | ||||||
| TOTAL GERMANY | ||||||||
| (Cost $10,735,735) | 9,618,482 | |||||||
| GREECE—1.9% | ||||||||
| OTHER SPECIALTY RETAIL—1.9% | ||||||||
| JUMBO SA | 105,700 | 2,780,634 | ||||||
| (Cost $2,795,695) | ||||||||
| HONG KONG—2.1% | ||||||||
| FINANCIAL EXCHANGES & DATA—2.1% | ||||||||
| Hong Kong Exchanges & Clearing Ltd. | 88,000 | 3,078,552 | ||||||
| (Cost $3,463,364) | ||||||||
| INDIA—7.8% | ||||||||
| DIVERSIFIED BANKS—2.7% | ||||||||
| HDFC Bank Ltd.# | 71,700 | 4,054,635 | ||||||
| HOTELS RESORTS & CRUISE LINES—2.5% | ||||||||
| MakeMyTrip Ltd.* | 93,578 | 3,624,276 | ||||||
| PACKAGED FOODS & MEATS—2.6% | ||||||||
| Patanjali Foods Ltd. | 229,156 | 3,763,801 | ||||||
| TOTAL INDIA | ||||||||
| (Cost $9,679,923) | 11,442,712 | |||||||
| IRELAND—2.4% | ||||||||
| PACKAGED FOODS & MEATS—2.4% | ||||||||
| Kerry Group PLC, Cl. A | 45,441 | 3,510,368 | ||||||
| (Cost $4,943,578) | ||||||||
| ITALY—6.1% | ||||||||
| APPAREL ACCESSORIES & LUXURY GOODS—1.7% | ||||||||
| Moncler SpA | 47,886 | 2,487,298 | ||||||
| AUTOMOBILE MANUFACTURERS—4.4% | ||||||||
| Ferrari NV | 21,362 | 6,443,634 | ||||||
| TOTAL ITALY | ||||||||
| (Cost $5,102,231) | 8,930,932 | |||||||
THE ALGER FUNDS | ALGER INTERNATIONAL FOCUS FUND
Schedule of Investments October 31, 2023 (Continued)
| COMMON STOCKS—96.3% (CONT.) | SHARES | VALUE | ||||||
| JAPAN—6.8% | ||||||||
| ELECTRONIC EQUIPMENT & INSTRUMENTS—2.3% | ||||||||
| Keyence Corp. | 8,900 | $ | 3,445,356 | |||||
| PACKAGED FOODS & MEATS—1.7% | ||||||||
| Kotobuki Spirits Co., Ltd. | 182,500 | 2,423,415 | ||||||
| SEMICONDUCTOR MATERIALS & EQUIPMENT—2.8% | ||||||||
| Lasertec Corp. | 24,900 | 4,112,988 | ||||||
| TOTAL JAPAN | ||||||||
| (Cost $9,475,938) | 9,981,759 | |||||||
| MEXICO—0.5% | ||||||||
| AIRPORT SERVICES—0.5% | ||||||||
| Grupo Aeroportuario del Centro Norte SAB de CV | 96,000 | 735,912 | ||||||
| (Cost $891,135) | ||||||||
| NETHERLANDS—5.1% | ||||||||
| HEAVY ELECTRICAL EQUIPMENT—1.2% | ||||||||
| Alfen Beheer BV* | 55,000 | 1,734,040 | ||||||
| SEMICONDUCTOR MATERIALS & EQUIPMENT—3.9% | ||||||||
| ASML Holding NV | 9,550 | 5,741,242 | ||||||
| TOTAL NETHERLANDS | ||||||||
| (Cost $4,235,734) | 7,475,282 | |||||||
| NORWAY—1.1% | ||||||||
| ENVIRONMENTAL & FACILITIES SERVICES—1.1% | ||||||||
| Aker Carbon Capture ASA* | 1,755,510 | 1,669,169 | ||||||
| (Cost $3,833,709) | ||||||||
| SAUDI ARABIA—3.1% | ||||||||
| ADVERTISING—1.3% | ||||||||
| Arabian Contracting Services Co. | 36,000 | 1,936,454 | ||||||
| IT CONSULTING & OTHER SERVICES—1.8% | ||||||||
| Elm Co. | 14,000 | 2,617,603 | ||||||
| TOTAL SAUDI ARABIA | ||||||||
| (Cost $3,842,713) | 4,554,057 | |||||||
| SPAIN—2.2% | ||||||||
| BIOTECHNOLOGY—2.2% | ||||||||
| Grifols SA#,* | 394,741 | 3,193,455 | ||||||
| (Cost $6,248,951) | ||||||||
| SWEDEN—1.9% | ||||||||
| ASSET MANAGEMENT & CUSTODY BANKS—1.9% | ||||||||
| EQT AB | 151,298 | 2,764,595 | ||||||
| (Cost $2,403,414) | ||||||||
| SWITZERLAND—4.4% | ||||||||
| ASSET MANAGEMENT & CUSTODY BANKS—2.6% | ||||||||
| Partners Group Holding AG | 3,594 | 3,805,347 | ||||||
| SPECIALTY CHEMICALS—1.8% | ||||||||
| Sika AG | 11,400 | 2,727,979 | ||||||
| TOTAL SWITZERLAND | ||||||||
| (Cost $4,833,766) | 6,533,326 | |||||||
THE ALGER FUNDS | ALGER INTERNATIONAL FOCUS FUND
Schedule of Investments October 31, 2023 (Continued)
| COMMON STOCKS—96.3% (CONT.) | SHARES | VALUE | ||||||
| UNITED KINGDOM—4.7% | ||||||||
| FINANCIAL EXCHANGES & DATA—2.8% | ||||||||
| London Stock Exchange Group PLC | 40,200 | $ | 4,055,816 | |||||
| PHARMACEUTICALS—1.9% | ||||||||
| AstraZeneca PLC | 22,900 | 2,867,048 | ||||||
| TOTAL UNITED KINGDOM | ||||||||
| (Cost $6,116,010) | 6,922,864 | |||||||
| UNITED STATES—3.2% | ||||||||
| OIL & GAS EQUIPMENT & SERVICES—3.2% | ||||||||
| Schlumberger NV | 84,800 | 4,719,968 | ||||||
| (Cost $2,934,506) | ||||||||
| TOTAL COMMON STOCKS | ||||||||
| (Cost $134,292,785) | 141,291,172 | |||||||
| Total Investments | ||||||||
| (Cost $134,292,785) | 96.3 | % | $ | 141,291,172 | ||||
| Unaffiliated Securities (Cost $134,292,785) | 141,291,172 | |||||||
| Other Assets in Excess of Liabilities | 3.7 | % | 5,355,890 | |||||
| NET ASSETS | 100.0 | % | $ | 146,647,062 | ||||
| # | American Depositary Receipts. |
| * | Non-income producing security. |
See Notes to Financial Statements.
THE ALGER FUNDS | ALGER HEALTH SCIENCES FUND
Schedule of Investments October 31, 2023
| COMMON STOCKS—94.1% | SHARES | VALUE | ||||||
| BIOTECHNOLOGY—30.3% | ||||||||
| AbbVie, Inc. | 29,519 | $ | 4,167,492 | |||||
| Aerovate Therapeutics, Inc.* | 24,747 | 262,566 | ||||||
| Amgen, Inc. | 22,883 | 5,851,183 | ||||||
| Arrowhead Pharmaceuticals, Inc.* | 38,262 | 940,863 | ||||||
| Ascendis Pharma AS#,* | 28,777 | 2,570,074 | ||||||
| Biohaven Ltd.* | 59,721 | 1,583,204 | ||||||
| Cabaletta Bio, Inc.* | 89,169 | 1,271,550 | ||||||
| Forte Biosciences, Inc.* | 1,192,842 | 585,685 | ||||||
| Grifols SA* | 10,960 | 122,997 | ||||||
| HilleVax, Inc.* | 87,043 | 957,473 | ||||||
| ImmunoGen, Inc.* | 114,378 | 1,699,657 | ||||||
| Ionis Pharmaceuticals, Inc.* | 18,269 | 808,769 | ||||||
| Neurocrine Biosciences, Inc.* | 25,491 | 2,827,971 | ||||||
| Regeneron Pharmaceuticals, Inc.* | 6,935 | 5,408,537 | ||||||
| REVOLUTION Medicines, Inc.* | 30,751 | 608,870 | ||||||
| Vaxcyte, Inc.* | 23,290 | 1,120,249 | ||||||
| Vertex Pharmaceuticals, Inc.* | 13,787 | 4,992,411 | ||||||
| 35,779,551 | ||||||||
| HEALTHCARE DISTRIBUTORS—7.3% | ||||||||
| Cardinal Health, Inc. | 31,885 | 2,901,535 | ||||||
| McKesson Corp. | 12,457 | 5,672,420 | ||||||
| 8,573,955 | ||||||||
| HEALTHCARE EQUIPMENT—17.5% | ||||||||
| Becton Dickinson & Co. | 14,267 | 3,606,412 | ||||||
| Boston Scientific Corp.* | 72,370 | 3,704,620 | ||||||
| Dexcom, Inc.* | 16,818 | 1,493,943 | ||||||
| Edwards Lifesciences Corp.* | 8,700 | 554,364 | ||||||
| Glaukos Corp.* | 17,525 | 1,195,205 | ||||||
| IDEXX Laboratories, Inc.* | 574 | 229,296 | ||||||
| Impulse Dynamics PLC, Class E*,@,(a) | 2,163,678 | 6,166,482 | ||||||
| Inari Medical, Inc.* | 18,012 | 1,093,509 | ||||||
| Intuitive Surgical, Inc.* | 4,466 | 1,171,075 | ||||||
| Shockwave Medical, Inc.* | 5,661 | 1,167,638 | ||||||
| TransMedics Group, Inc.* | 7,219 | 270,568 | ||||||
| 20,653,112 | ||||||||
| HEALTHCARE FACILITIES—1.9% | ||||||||
| Acadia Healthcare Co., Inc.* | 30,575 | 2,247,568 | ||||||
| HEALTHCARE SERVICES—4.1% | ||||||||
| The Cigna Group | 15,511 | 4,796,001 | ||||||
| HEALTHCARE SUPPLIES—1.3% | ||||||||
| Alcon, Inc. | 8,300 | 594,050 | ||||||
| Schott Pharma AG & Co. KGaA* | 32,868 | 952,997 | ||||||
| 1,547,047 | ||||||||
| HEALTHCARE TECHNOLOGY—0.7% | ||||||||
| Veeva Systems, Inc., Cl. A* | 4,344 | 837,132 | ||||||
| LIFE & HEALTH INSURANCE—0.2% | ||||||||
| Oscar Health, Inc., Cl. A* | 50,525 | 258,688 | ||||||
THE ALGER FUNDS | ALGER HEALTH SCIENCES FUND
Schedule of Investments October 31, 2023 (Continued)
| COMMON STOCKS—94.1% (CONT.) | SHARES | VALUE | ||||||
| LIFE SCIENCES TOOLS & SERVICES—2.3% | ||||||||
| Avantor, Inc.* | 11,968 | $ | 208,602 | |||||
| Danaher Corp. | 1,227 | 235,608 | ||||||
| Pacific Biosciences of California, Inc.* | 35,670 | 220,441 | ||||||
| Stevanato Group SpA | 33,928 | 948,288 | ||||||
| West Pharmaceutical Services, Inc. | 3,347 | 1,065,317 | ||||||
| 2,678,256 | ||||||||
| MANAGED HEALTHCARE—18.1% | ||||||||
| Humana, Inc. | 18,643 | 9,763,153 | ||||||
| Molina Healthcare, Inc.* | 1,807 | 601,640 | ||||||
| UnitedHealth Group, Inc. | 20,436 | 10,944,704 | ||||||
| 21,309,497 | ||||||||
| PHARMACEUTICALS—10.4% | ||||||||
| AstraZeneca PLC# | 48,504 | 3,066,908 | ||||||
| Elanco Animal Health, Inc.* | 65,792 | 579,627 | ||||||
| Eli Lilly & Co. | 9,163 | 5,075,661 | ||||||
| Novartis AG | 37,499 | 3,510,447 | ||||||
| 12,232,643 | ||||||||
| TOTAL COMMON STOCKS | ||||||||
| (Cost $111,598,154) | 110,913,450 | |||||||
| PREFERRED STOCKS—0.0% | SHARES | VALUE | ||||||
| BIOTECHNOLOGY—0.0% | ||||||||
| Prosetta Biosciences, Inc., Series D*,@,(a),(b) | 897,366 | — | ||||||
| (Cost $4,038,147) | — | |||||||
| RIGHTS—1.1% | SHARES | VALUE | ||||||
| BIOTECHNOLOGY—1.1% | ||||||||
| Tolero CDR*,@,(a),(c) | 1,956,996 | 1,330,757 | ||||||
| (Cost $1,044,370) | 1,330,757 | |||||||
| Total Investments | ||||||||
| (Cost $116,680,671) | 95.2 | % | $ | 112,244,207 | ||||
| Affiliated Securities (Cost $4,038,147) | — | |||||||
| Unaffiliated Securities (Cost $112,642,524) | 112,244,207 | |||||||
| Other Assets in Excess of Liabilities | 4.8 | % | 5,620,640 | |||||
| NET ASSETS | 100.0 | % | $ | 117,864,847 | ||||
| # | American Depositary Receipts. |
| (a) | Security is valued in good faith at fair value determined using significant unobservable inputs pursuant to procedures established by the Valuation Designee (as defined in Note 2). |
| (b) | Deemed an affiliate of the Fund in accordance with Section 2(a)(3) of the Investment Company Act of 1940. See Note 11 - Affiliated Securities. |
| (c) | Contingent Deferred Rights. |
| * | Non-income producing security. |
THE ALGER FUNDS | ALGER HEALTH SCIENCES FUND
Schedule of Investments October 31, 2023 (Continued)
| @ | Restricted security - Investment in security not registered under the Securities Act of 1933. Sales or transfers of the investment may be restricted only to qualified buyers. |
| Security | Acquisition Date(s) | Acquisition Cost | % of net assets (Acquisition Date) | Market Value | % of net assets as of 10/31/2023 | |||||||||||||
| Impulse Dynamics PLC, Class E | 2/11/22 | $ | 5,000,002 | 2.09 | % | $ | 4,318,183 | 3.66 | % | |||||||||
| Impulse Dynamics PLC, Class E | 6/2/23 | $ | 2,140,136 | 1.45 | % | $ | 1,848,299 | 1.57 | % | |||||||||
| Prosetta Biosciences, Inc., Series D | 2/6/15 | 4,038,147 | 2.00 | % | 0 | 0.00 | % | |||||||||||
| Tolero CDR | 2/6/17 | 1,044,370 | 0.90 | % | 1,330,757 | 1.13 | % | |||||||||||
| Total | $ | 7,497,239 | 6.36 | % | ||||||||||||||
See Notes to Financial Statements.
THE ALGER FUNDS
Statements of Assets and Liabilities October 31, 2023
| Alger Capital Appreciation Fund | Alger 35 Fund | |||||||
| ASSETS: | ||||||||
| Investments in unaffiliated securities, at value (Identified cost below)* see accompanying schedules of investments | $ | 1,562,696,917 | $ | 25,021,213 | ||||
| Investments in affiliated securities, at value (Identified cost below)** see accompanying schedules of investments | 2,555,109 | — | ||||||
| Cash and cash equivalents | 11,685,548 | 201,838 | ||||||
| Receivable for investment securities sold | 24,946,939 | 1,656,007 | ||||||
| Receivable for shares of beneficial interest sold | 437,334 | — | ||||||
| Dividends and interest receivable | 384,984 | 452 | ||||||
| Receivable from Investment Manager | 44,196 | 11,350 | ||||||
| Prepaid expenses | 179,023 | 7,471 | ||||||
| Total Assets | 1,602,930,050 | 26,898,331 | ||||||
| LIABILITIES: | ||||||||
| Payable for investment securities purchased | 14,381,904 | 1,210,325 | ||||||
| Payable for shares of beneficial interest redeemed | 3,198,228 | — | ||||||
| Accrued investment advisory fees | 1,152,594 | 10,284 | ||||||
| Accrued distribution fees | 226,605 | — | ||||||
| Accrued shareholder administrative fees | 18,928 | 229 | ||||||
| Accrued administrative fees | 39,131 | 628 | ||||||
| Accrued transfer agent fees | 346,321 | 53 | ||||||
| Accrued fund accounting fees | 108,584 | 9,102 | ||||||
| Accrued printing fees | 68,409 | 615 | ||||||
| Accrued professional fees | 48,961 | 24,896 | ||||||
| Accrued custodian fees | 15,130 | 628 | ||||||
| Accrued trustee fees | 7,700 | 110 | ||||||
| Accrued other expenses | 2,928 | 938 | ||||||
| Total Liabilities | 19,615,423 | 1,257,808 | ||||||
| NET ASSETS | $ | 1,583,314,627 | $ | 25,640,523 | ||||
| NET ASSETS CONSIST OF: | ||||||||
| Paid in capital (par value of $.001 per share) | 823,914,887 | 40,166,612 | ||||||
| Distributable earnings (Distributions in excess of earnings) | 759,399,740 | (14,526,089 | ) | |||||
| NET ASSETS | $ | 1,583,314,627 | $ | 25,640,523 | ||||
| * Identified cost | $ | 898,202,950 | (a) | $ | 24,470,015 | (b) | ||
| ** Identified cost | $ | 2,775,000 | (a) | $ | — | |||
| See Notes to Financial Statements. | ||||||||
THE ALGER FUNDS
Statements of Assets and Liabilities October 31, 2023 (Continued)
| Alger Capital Appreciation Fund | Alger 35 Fund | |||||||
| NET ASSETS BY CLASS: | ||||||||
| Class A | $ | 737,324,149 | $ | — | ||||
| Class C | $ | 67,775,734 | $ | — | ||||
| Class Z | $ | 778,214,744 | $ | 25,640,523 | ||||
| SHARES OF BENEFICIAL INTEREST OUTSTANDING — NOTE 6: | ||||||||
| Class A | 31,660,922 | — | ||||||
| Class C | 4,961,274 | — | ||||||
| Class Z | 31,097,792 | 2,649,197 | ||||||
| NET ASSET VALUE PER SHARE: | ||||||||
| Class A — Net Asset Value Per Share Class A | $ | 23.29 | $ | — | ||||
| Class A — Offering Price Per Share (includes a 5.25% sales charge) | $ | 24.58 | $ | — | ||||
| Class C — Net Asset Value Per Share Class C | $ | 13.66 | $ | — | ||||
| Class Z — Net Asset Value Per Share Class Z | $ | 25.02 | $ | 9.68 | ||||
| See Notes to Financial Statements. | ||||||||
| (a) | At October 31, 2023, the net unrealized appreciation on investments, based on cost for federal income tax purposes of $918,293,726, amounted to $646,958,300 which consisted of aggregate gross unrealized appreciation of $680,760,066 and aggregate gross unrealized depreciation of $33,801,766. |
| (b) | At October 31, 2023, the net unrealized appreciation on investments, based on cost for federal income tax purposes of $24,798,426, amounted to $222,787 which consisted of aggregate gross unrealized appreciation of $1,511,649 and aggregate gross unrealized depreciation of $1,288,862. |
THE ALGER FUNDS
Statements of Assets and Liabilities October 31, 2023 (Continued)
| Alger Growth & Income Fund | Alger Mid Cap Growth Fund | |||||||
| ASSETS: | ||||||||
| Investments in unaffiliated securities, at value (Identified cost below)* see accompanying schedules of investments # (Including securities loaned at value $1,008,552) | $ | 311,788,832 | $ | 186,225,338 | ||||
| Investments in affiliated securities, at value (Identified cost below)** see accompanying schedules of investments | — | 1,542,273 | ||||||
| Cash and cash equivalents | 9,762,865 | 1,834,537 | ||||||
| Receivable for investment securities sold | 1,842,653 | 3,554,748 | ||||||
| Receivable for shares of beneficial interest sold | 895,634 | 69,202 | ||||||
| Receivable for interfund loans | 2,093,772 | — | ||||||
| Dividends and interest receivable | 341,334 | 5,002 | ||||||
| Receivable from Investment Manager | — | 6,098 | ||||||
| Prepaid expenses | 65,138 | 105,550 | ||||||
| Total Assets | 326,790,228 | 193,342,748 | ||||||
| LIABILITIES: | ||||||||
| Collateral on securities loaned at value (Note 4) | 1,023,499 | — | ||||||
| Payable for investment securities purchased | 4,478,686 | 3,274,588 | ||||||
| Payable for shares of beneficial interest redeemed | 314,444 | 172,293 | ||||||
| Accrued investment advisory fees | 139,057 | 132,583 | ||||||
| Accrued distribution fees | 49,520 | 42,848 | ||||||
| Accrued shareholder administrative fees | 3,653 | 2,626 | ||||||
| Accrued administrative fees | 7,648 | 4,797 | ||||||
| Accrued transfer agent fees | 29,643 | 48,151 | ||||||
| Accrued professional fees | 25,551 | 32,928 | ||||||
| Accrued fund accounting fees | 18,703 | 14,678 | ||||||
| Accrued printing fees | 10,001 | 13,743 | ||||||
| Accrued custodian fees | 3,082 | 5,036 | ||||||
| Accrued trustee fees | 1,078 | 818 | ||||||
| Accrued other expenses | 1,884 | 2,113 | ||||||
| Total Liabilities | 6,106,449 | 3,747,202 | ||||||
| NET ASSETS | $ | 320,683,779 | $ | 189,595,546 | ||||
| NET ASSETS CONSIST OF: | ||||||||
| Paid in capital (par value of $.001 per share) | 223,059,959 | 251,615,778 | ||||||
| Distributable earnings (Distributions in excess of earnings) | 97,623,820 | (62,020,232 | ) | |||||
| NET ASSETS | $ | 320,683,779 | $ | 189,595,546 | ||||
| * Identified cost | $ | 215,148,313 | (a) | $ | 179,708,903 | (b) | ||
| ** Identified cost | $ | — | $ | 2,663,245 | (b) | |||
| # Includes collateral on stock loan | $ | 1,023,499 | $ | — | ||||
| See Notes to Financial Statements. | ||||||||
THE ALGER FUNDS
Statements of Assets and Liabilities October 31, 2023 (Continued)
| Alger Growth & Income Fund | Alger Mid Cap Growth Fund | |||||||
| NET ASSETS BY CLASS: | ||||||||
| Class A | $ | 128,089,569 | $ | 134,439,481 | ||||
| Class B | $ | — | $ | 9,562,760 | ||||
| Class C | $ | 24,149,091 | $ | 3,319,388 | ||||
| Class Z | $ | 168,445,119 | $ | 42,273,917 | ||||
| SHARES OF BENEFICIAL INTEREST OUTSTANDING — NOTE 6: | ||||||||
| Class A | 2,227,538 | 12,396,582 | ||||||
| Class B | — | 1,407,925 | ||||||
| Class C | 427,346 | 527,061 | ||||||
| Class Z | 2,925,226 | 3,767,317 | ||||||
| NET ASSET VALUE PER SHARE: | ||||||||
| Class A — Net Asset Value Per Share Class A | $ | 57.50 | $ | 10.84 | ||||
| Class A — Offering Price Per Share (includes a 5.25% sales charge) | $ | 60.69 | $ | 11.45 | ||||
| Class B — Net Asset Value Per Share Class B | $ | — | $ | 6.79 | ||||
| Class C — Net Asset Value Per Share Class C | $ | 56.51 | $ | 6.30 | ||||
| Class Z — Net Asset Value Per Share Class Z | $ | 57.58 | $ | 11.22 | ||||
| See Notes to Financial Statements. | ||||||||
| (a) | At October 31, 2023, the net unrealized appreciation on investments, based on cost for federal income tax purposes of $214,090,866, amounted to $97,697,965 which consisted of aggregate gross unrealized appreciation of $102,578,092 and aggregate gross unrealized depreciation of $4,880,127. |
| (b) | At October 31, 2023, the net unrealized appreciation on investments, based on cost for federal income tax purposes of $184,569,937, amounted to $3,501,549 which consisted of aggregate gross unrealized appreciation of $18,518,092 and aggregate gross unrealized depreciation of $15,016,543. |
THE ALGER FUNDS
Statements of Assets and Liabilities October 31, 2023 (Continued)
| Alger Mid Cap Focus Fund | Alger Weatherbie Specialized Growth Fund | |||||||
| ASSETS: | ||||||||
| Investments in unaffiliated securities, at value (Identified cost below)* see accompanying schedules of investments | $ | 236,664,452 | $ | 497,960,540 | ||||
| Investments in affiliated securities, at value (Identified cost below)** see accompanying schedules of investments | — | — | ||||||
| Cash and cash equivalents | 233 | 2,879,807 | ||||||
| Receivable for investment securities sold | 2,273,055 | 15,724,697 | ||||||
| Receivable for shares of beneficial interest sold | 113,918 | 570,754 | ||||||
| Dividends and interest receivable | — | 18,090 | ||||||
| Receivable from Investment Manager | 108 | 3,516 | ||||||
| Prepaid expenses | 90,698 | 91,451 | ||||||
| Total Assets | 239,142,464 | 517,248,855 | ||||||
| LIABILITIES: | ||||||||
| Payable for investment securities purchased | — | 2,974,678 | ||||||
| Payable for shares of beneficial interest redeemed | 2,005,188 | 1,139,716 | ||||||
| Payable for interfund loans | 1,918,006 | — | ||||||
| Accrued investment advisory fees | 152,222 | 387,717 | ||||||
| Accrued distribution fees | 5,705 | 49,826 | ||||||
| Accrued shareholder administrative fees | 2,219 | 5,475 | ||||||
| Accrued administrative fees | 6,004 | 13,163 | ||||||
| Accrued printing fees | 45,310 | 66,208 | ||||||
| Accrued fund accounting fees | 27,983 | 49,514 | ||||||
| Accrued professional fees | 26,571 | 42,569 | ||||||
| Accrued transfer agent fees | 25,292 | 111,013 | ||||||
| Accrued trustee fees | 2,901 | 3,932 | ||||||
| Accrued custodian fees | 2,515 | 6,700 | ||||||
| Accrued other expenses | 1,649 | 2,451 | ||||||
| Total Liabilities | 4,221,565 | 4,852,962 | ||||||
| NET ASSETS | $ | 234,920,899 | $ | 512,395,893 | ||||
| NET ASSETS CONSIST OF: | ||||||||
| Paid in capital (par value of $.001 per share) | 407,505,841 | 880,763,760 | ||||||
| Distributions in excess of earnings | (172,584,942 | ) | (368,367,867 | ) | ||||
| NET ASSETS | $ | 234,920,899 | $ | 512,395,893 | ||||
| * Identified cost | $ | 227,758,893 | (a) | $ | 521,175,065 | (b) | ||
| ** Identified cost | $ | — | $ | 1,041,633 | (b) | |||
| See Notes to Financial Statements. | ||||||||
THE ALGER FUNDS
Statements of Assets and Liabilities October 31, 2023 (Continued)
| Alger Mid Cap Focus Fund | Alger Weatherbie Specialized Growth Fund | |||||||
| NET ASSETS BY CLASS: | ||||||||
| Class A | $ | 3,306,942 | $ | 86,256,992 | ||||
| Class C | $ | 2,070,033 | $ | 29,558,687 | ||||
| Class I | $ | 11,511,579 | $ | 13,178,749 | ||||
| Class Y | $ | 189,199 | $ | 43,624,696 | ||||
| Class Z | $ | 217,843,146 | $ | 339,776,769 | ||||
| SHARES OF BENEFICIAL INTEREST OUTSTANDING — NOTE 6: | ||||||||
| Class A | 291,775 | 8,525,711 | ||||||
| Class C | 185,988 | 5,418,833 | ||||||
| Class I | 1,015,339 | 1,257,714 | ||||||
| Class Y | 16,460 | 4,041,621 | ||||||
| Class Z | 18,963,744 | 30,425,341 | ||||||
| NET ASSET VALUE PER SHARE: | ||||||||
| Class A — Net Asset Value Per Share Class A | $ | 11.33 | $ | 10.12 | ||||
| Class A — Offering Price Per Share (includes a 5.25% sales charge) | $ | 11.96 | $ | 10.68 | ||||
| Class C — Net Asset Value Per Share Class C | $ | 11.13 | $ | 5.45 | ||||
| Class I — Net Asset Value Per Share Class I | $ | 11.34 | $ | 10.48 | ||||
| Class Y — Net Asset Value Per Share Class Y | $ | 11.49 | $ | 10.79 | ||||
| Class Z — Net Asset Value Per Share Class Z | $ | 11.49 | $ | 11.17 | ||||
| See Notes to Financial Statements. | ||||||||
| (a) | At October 31, 2023, the net unrealized appreciation on investments, based on cost for federal income tax purposes of $228,624,876, amounted to $8,039,576 which consisted of aggregate gross unrealized appreciation of $25,070,750 and aggregate gross unrealized depreciation of $17,031,174. |
| (b) | At October 31, 2023, the net unrealized depreciation on investments, based on cost for federal income tax purposes of $551,484,364, amounted to $53,523,824 which consisted of aggregate gross unrealized appreciation of $65,799,839 and aggregate gross unrealized depreciation of $119,323,663. |
THE ALGER FUNDS
Statements of Assets and Liabilities October 31, 2023 (Continued)
| Alger Small Cap Growth Fund | Alger Small Cap Focus Fund | |||||||
| ASSETS: | ||||||||
| Investments in unaffiliated securities, at value (Identified cost below)* see accompanying schedules of investments | $ | 269,590,990 | $ | 1,405,454,683 | ||||
| Investments in affiliated securities, at value (Identified cost below)** see accompanying schedules of investments | 2,094,729 | 124,615,361 | ||||||
| Cash and cash equivalents | 580,729 | — | ||||||
| Receivable for investment securities sold | 2,146,818 | 3,675,146 | ||||||
| Receivable for shares of beneficial interest sold | 275,745 | 907,391 | ||||||
| Receivable from Investment Manager | 2,594 | 9,209 | ||||||
| Prepaid expenses | 83,028 | 166,915 | ||||||
| Total Assets | 274,774,633 | 1,534,828,705 | ||||||
| LIABILITIES: | ||||||||
| Payable for shares of beneficial interest redeemed | 1,491,858 | 26,894,641 | ||||||
| Bank overdraft | — | 428 | ||||||
| Payable for interfund loans | — | 2,093,772 | ||||||
| Accrued investment advisory fees | 205,109 | 1,075,958 | ||||||
| Accrued distribution fees | 41,149 | 101,076 | ||||||
| Accrued shareholder administrative fees | 3,294 | 15,513 | ||||||
| Accrued administrative fees | 6,964 | 39,452 | ||||||
| Accrued transfer agent fees | 60,058 | 468,598 | ||||||
| Accrued professional fees | 48,461 | 113,031 | ||||||
| Accrued printing fees | 26,602 | 253,365 | ||||||
| Accrued custodian fees | 12,703 | 23,527 | ||||||
| Accrued fund accounting fees | 12,351 | 62,339 | ||||||
| Accrued trustee fees | 1,908 | 18,286 | ||||||
| Accrued other expenses | 758 | 1,947 | ||||||
| Total Liabilities | 1,911,215 | 31,161,933 | ||||||
| NET ASSETS | $ | 272,863,418 | $ | 1,503,666,772 | ||||
| NET ASSETS CONSIST OF: | ||||||||
| Paid in capital (par value of $.001 per share) | 375,463,001 | 2,364,561,557 | ||||||
| Distributions in excess of earnings | (102,599,583 | ) | (860,894,785 | ) | ||||
| NET ASSETS | $ | 272,863,418 | $ | 1,503,666,772 | ||||
| * Identified cost | $ | 268,810,499 | (a) | $ | 1,386,908,989 | (b) | ||
| ** Identified cost | $ | 2,503,096 | (a) | $ | 135,264,013 | (b) | ||
| See Notes to Financial Statements. | ||||||||
THE ALGER FUNDS
Statements of Assets and Liabilities October 31, 2023 (Continued)
| Alger Small Cap Growth Fund | Alger Small Cap Focus Fund | |||||||
| NET ASSETS BY CLASS: | ||||||||
| Class A | $ | 110,041,275 | $ | 128,365,906 | ||||
| Class B | $ | 2,212,123 | $ | — | ||||
| Class C | $ | 14,850,798 | $ | 62,091,476 | ||||
| Class I | $ | — | $ | 52,677,746 | ||||
| Class Y | $ | 7,257,580 | $ | 136,083,506 | ||||
| Class Z | $ | 138,501,642 | $ | 1,124,448,138 | ||||
| SHARES OF BENEFICIAL INTEREST OUTSTANDING — NOTE 6: | ||||||||
| Class A | 13,924,833 | 9,200,545 | ||||||
| Class B | 416,780 | — | ||||||
| Class C | 3,038,839 | 5,129,401 | ||||||
| Class I | — | 3,653,138 | ||||||
| Class Y | 867,651 | 9,163,838 | ||||||
| Class Z | 16,610,316 | 75,756,730 | ||||||
| NET ASSET VALUE PER SHARE: | ||||||||
| Class A — Net Asset Value Per Share Class A | $ | 7.90 | $ | 13.95 | ||||
| Class A — Offering Price Per Share (includes a 5.25% sales charge) | $ | 8.34 | $ | 14.73 | ||||
| Class B — Net Asset Value Per Share Class B | $ | 5.31 | $ | — | ||||
| Class C — Net Asset Value Per Share Class C | $ | 4.89 | $ | 12.11 | ||||
| Class I — Net Asset Value Per Share Class I | $ | — | $ | 14.42 | ||||
| Class Y — Net Asset Value Per Share Class Y | $ | 8.36 | $ | 14.85 | ||||
| Class Z — Net Asset Value Per Share Class Z | $ | 8.34 | $ | 14.84 | ||||
| See Notes to Financial Statements. | ||||||||
| (a) | At October 31, 2023, the net unrealized depreciation on investments, based on cost for federal income tax purposes of $275,477,910, amounted to $3,792,191 which consisted of aggregate gross unrealized appreciation of $59,849,125 and aggregate gross unrealized depreciation of $63,641,316. |
| (b) | At October 31, 2023, the net unrealized depreciation on investments, based on cost for federal income tax purposes of $1,577,813,855, amounted to $47,743,811 which consisted of aggregate gross unrealized appreciation of $215,506,477 and aggregate gross unrealized depreciation of $263,250,288. |
THE ALGER FUNDS
Statements of Assets and Liabilities October 31, 2023 (Continued)
| Alger International Focus Fund | Alger Health Sciences Fund | |||||||
| ASSETS: | ||||||||
| Investments in unaffiliated securities, at value (Identified cost below)* see accompanying schedules of investments | $ | 141,291,172 | $ | 112,244,207 | ||||
| Investments in affiliated securities, at value (Identified cost below)** see accompanying schedules of investments | — | — | ||||||
| Cash and cash equivalents | 6,176,361 | 6,768,835 | ||||||
| Receivable for investment securities sold | 1,482,362 | — | ||||||
| Receivable for shares of beneficial interest sold | 11,367 | 130,995 | ||||||
| Dividends and interest receivable | 203,138 | 147,066 | ||||||
| Receivable from Investment Manager | 10,633 | 8,800 | ||||||
| Prepaid expenses | 69,679 | 59,821 | ||||||
| Total Assets | 149,244,712 | 119,359,724 | ||||||
| LIABILITIES: | ||||||||
| Payable for investment securities purchased | 2,235,905 | — | ||||||
| Payable for shares of beneficial interest redeemed | 51,651 | 1,264,539 | ||||||
| Foreign capital gain tax payable | 52,776 | — | ||||||
| Accrued investment advisory fees | 93,332 | 59,092 | ||||||
| Accrued distribution fees | 34,182 | 19,380 | ||||||
| Accrued shareholder administrative fees | 1,959 | 1,492 | ||||||
| Accrued administrative fees | 3,615 | 2,954 | ||||||
| Accrued transfer agent fees | 42,085 | 57,849 | ||||||
| Accrued professional fees | 40,051 | 53,605 | ||||||
| Accrued fund accounting fees | 15,757 | 10,719 | ||||||
| Accrued printing fees | 13,929 | 19,939 | ||||||
| Accrued custodian fees | 4,844 | 1,790 | ||||||
| Accrued trustee fees | 577 | 1,009 | ||||||
| Accrued other expenses | 6,987 | 2,509 | ||||||
| Total Liabilities | 2,597,650 | 1,494,877 | ||||||
| NET ASSETS | $ | 146,647,062 | $ | 117,864,847 | ||||
| NET ASSETS CONSIST OF: | ||||||||
| Paid in capital (par value of $.001 per share) | 148,538,310 | 158,240,956 | ||||||
| Distributions in excess of earnings | (1,891,248 | ) | (40,376,109 | ) | ||||
| NET ASSETS | $ | 146,647,062 | $ | 117,864,847 | ||||
| * Identified cost | $ | 134,292,785 | (a) | $ | 112,642,524 | (b) | ||
| ** Identified cost | $ | — | $ | 4,038,147 | (b) | |||
| See Notes to Financial Statements. | ||||||||
THE ALGER FUNDS
Statements of Assets and Liabilities October 31, 2023 (Continued)
| Alger International Focus Fund | Alger Health Sciences Fund | |||||||
| NET ASSETS BY CLASS: | ||||||||
| Class A | $ | 97,017,601 | $ | 65,337,048 | ||||
| Class B | $ | 12,465,014 | $ | — | ||||
| Class C | $ | 1,137,841 | $ | 4,802,464 | ||||
| Class I | $ | 1,104,013 | $ | — | ||||
| Class Z | $ | 34,922,593 | $ | 47,725,335 | ||||
| SHARES OF BENEFICIAL INTEREST OUTSTANDING — NOTE 6: | ||||||||
| Class A | 6,149,973 | 3,585,544 | ||||||
| Class B | 922,556 | — | ||||||
| Class C | 89,633 | 423,729 | ||||||
| Class I | 69,729 | — | ||||||
| Class Z | 2,157,601 | 2,561,501 | ||||||
| NET ASSET VALUE PER SHARE: | ||||||||
| Class A — Net Asset Value Per Share Class A | $ | 15.78 | $ | 18.22 | ||||
| Class A — Offering Price Per Share (includes a 5.25% sales charge) | $ | 16.65 | $ | 19.23 | ||||
| Class B — Net Asset Value Per Share Class B | $ | 13.51 | $ | — | ||||
| Class C — Net Asset Value Per Share Class C | $ | 12.69 | $ | 11.33 | ||||
| Class I — Net Asset Value Per Share Class I | $ | 15.83 | $ | — | ||||
| Class Z — Net Asset Value Per Share Class Z | $ | 16.19 | $ | 18.63 | ||||
| See Notes to Financial Statements. | ||||||||
| (a) | At October 31, 2023, the net unrealized appreciation on investments, based on cost for federal income tax purposes of $135,861,804, amounted to $5,429,368 which consisted of aggregate gross unrealized appreciation of $24,559,184 and aggregate gross unrealized depreciation of $19,129,816. |
| (b) | At October 31, 2023, the net unrealized depreciation on investments, based on cost for federal income tax purposes of $118,767,505, amounted to $6,523,299 which consisted of aggregate gross unrealized appreciation of $5,655,567 and aggregate gross unrealized depreciation of $12,178,866. |
THE ALGER FUNDS
Statements of Operations for the year ended October 31, 2023
| Alger Capital Appreciation Fund | Alger 35 Fund | |||||||
| INCOME: | ||||||||
| Dividends (net of foreign withholding taxes*) | $ | 10,238,385 | $ | 90,184 | ||||
| Interest | 751,696 | 27,690 | ||||||
| Total Income | 10,990,081 | 117,874 | ||||||
| EXPENSES: | ||||||||
| Investment advisory fees — Note 3(a) | 13,930,219 | 118,568 | ||||||
| Distribution fees — Note 3(c) | ||||||||
| Class A | 1,924,811 | — | ||||||
| Class C | 789,689 | — | ||||||
| Shareholder administrative fees — Note 3(f) | 227,156 | 2,635 | ||||||
| Administration fees — Note 3(b) | 472,940 | 7,246 | ||||||
| Transfer agent fees — Note 3(f) | 987,141 | 2,698 | ||||||
| Fund accounting fees | 317,467 | 54,462 | ||||||
| Printing fees | 163,708 | 1,313 | ||||||
| Professional fees | 125,695 | 41,124 | ||||||
| Registration fees | 100,321 | 11,278 | ||||||
| Trustee fees — Note 3(g) | 89,188 | 1,344 | ||||||
| Custodian fees | 83,085 | 5,759 | ||||||
| Interest expenses | 77,463 | 2,408 | ||||||
| Other expenses | 235,666 | 5,901 | ||||||
| Total Expenses | 19,524,549 | 254,736 | ||||||
| Less, expense reimbursements/waivers — Note 3(a) | (620,626 | ) | (105,739 | ) | ||||
| Net Expenses | 18,903,923 | 148,997 | ||||||
| NET INVESTMENT LOSS | (7,913,842 | ) | (31,123 | ) | ||||
| REALIZED AND UNREALIZED GAIN (LOSS) ON INVESTMENTS AND FOREIGN CURRENCY: | ||||||||
| Net realized gain (loss) on unaffiliated investments | 134,543,497 | (1,728,699 | ) | |||||
| Net realized gain on redemptions-in-kind | 3,557,014 | — | ||||||
| Net realized (loss) on foreign currency transactions | (15,250 | ) | (1,365 | ) | ||||
| Net change in unrealized appreciation on unaffiliated investments | 150,916,477 | 2,108,016 | ||||||
| Net change in unrealized (depreciation) on affiliated investments | (379,731 | ) | — | |||||
| Net change in unrealized appreciation on foreign currency | 14,575 | 30 | ||||||
| Net realized and unrealized gain on investments and foreign currency | 288,636,582 | 377,982 | ||||||
| NET INCREASE IN NET ASSETS RESULTING FROM OPERATIONS | $ | 280,722,740 | $ | 346,859 | ||||
| * Foreign withholding taxes | $ | 124,224 | $ | 985 | ||||
| See Notes to Financial Statements. | ||||||||
THE ALGER FUNDS
Statements of Operations for the year ended October 31, 2023 (Continued)
| Alger Growth & Income Fund | Alger Mid Cap Growth Fund | |||||||
| INCOME: | ||||||||
| Dividends (net of foreign withholding taxes*) | $ | 6,890,044 | $ | 974,548 | ||||
| Interest | 589,452 | 156,012 | ||||||
| Income from securities lending | 10,342 | — | ||||||
| Total Income | 7,489,838 | 1,130,560 | ||||||
| EXPENSES: | ||||||||
| Investment advisory fees — Note 3(a) | 1,516,864 | 1,493,216 | ||||||
| Distribution fees — Note 3(c) | ||||||||
| Class A | 307,524 | 369,261 | ||||||
| Class B | — | 104,730 | ||||||
| Class C | 243,041 | 40,671 | ||||||
| Shareholder administrative fees — Note 3(f) | 39,913 | 30,193 | ||||||
| Administration fees — Note 3(b) | 83,428 | 54,031 | ||||||
| Transfer agent fees — Note 3(f) | 118,705 | 124,589 | ||||||
| Fund accounting fees | 93,361 | 84,346 | ||||||
| Registration fees | 57,037 | 45,835 | ||||||
| Professional fees | 48,480 | 58,748 | ||||||
| Printing fees | 33,184 | 30,256 | ||||||
| Custodian fees | 19,090 | 25,022 | ||||||
| Trustee fees — Note 3(g) | 15,449 | 9,894 | ||||||
| Interest expenses | 722 | 344 | ||||||
| Other expenses | 34,289 | 31,811 | ||||||
| Total Expenses | 2,611,087 | 2,502,947 | ||||||
| Less, expense reimbursements/waivers — Note 3(a) | — | (69,459 | ) | |||||
| Net Expenses | 2,611,087 | 2,433,488 | ||||||
| NET INVESTMENT INCOME (LOSS) | 4,878,751 | (1,302,928 | ) | |||||
| REALIZED AND UNREALIZED GAIN (LOSS) ON INVESTMENTS AND FOREIGN CURRENCY: | ||||||||
| Net realized (loss) on unaffiliated investments | (473,924 | ) | (8,867,226 | ) | ||||
| Net realized (loss) on foreign currency transactions | — | (4,348 | ) | |||||
| Net change in unrealized appreciation on unaffiliated investments | 26,838,862 | 9,580,623 | ||||||
| Net change in unrealized (depreciation) on affiliated investments | — | (233,273 | ) | |||||
| Net change in unrealized appreciation on foreign currency | — | 339 | ||||||
| Net realized and unrealized gain on investments and foreign currency | 26,364,938 | 476,115 | ||||||
| NET INCREASE (DECREASE) IN NET ASSETS RESULTING FROM OPERATIONS | $ | 31,243,689 | $ | (826,813 | ) | |||
| * Foreign withholding taxes | $ | 52,313 | $ | 17,713 | ||||
| See Notes to Financial Statements. | ||||||||
THE ALGER FUNDS
Statements of Operations for the year ended October 31, 2023 (Continued)
| Alger Mid Cap Focus Fund | Alger Weatherbie Specialized Growth Fund | |||||||
| INCOME: | ||||||||
| Dividends (net of foreign withholding taxes*) | $ | 1,022,309 | $ | 1,898,300 | ||||
| Interest | 222,708 | 919,386 | ||||||
| Total Income | 1,245,017 | 2,817,686 | ||||||
| EXPENSES: | ||||||||
| Investment advisory fees — Note 3(a) | 2,222,125 | 5,446,099 | ||||||
| Distribution fees — Note 3(c) | ||||||||
| Class A | 12,657 | 269,458 | ||||||
| Class C | 24,685 | 383,891 | ||||||
| Class I | 84,584 | 59,890 | ||||||
| Shareholder administrative fees — Note 3(f) | 34,948 | 76,737 | ||||||
| Administration fees — Note 3(b) | 94,759 | 184,898 | ||||||
| Fund accounting fees | 107,337 | 161,254 | ||||||
| Registration fees | 98,519 | 98,990 | ||||||
| Transfer agent fees — Note 3(f) | 76,455 | 274,988 | ||||||
| Printing fees | 62,980 | 104,618 | ||||||
| Professional fees | 55,681 | 86,458 | ||||||
| Interest expenses | 27,771 | 2,668 | ||||||
| Custodian fees | 20,596 | 48,996 | ||||||
| Trustee fees — Note 3(g) | 20,098 | 35,908 | ||||||
| Other expenses | 53,806 | 105,182 | ||||||
| Total Expenses | 2,997,001 | 7,340,035 | ||||||
| Less, expense reimbursements/waivers — Note 3(a) | (948 | ) | (35,423 | ) | ||||
| Net Expenses | 2,996,053 | 7,304,612 | ||||||
| NET INVESTMENT LOSS | (1,751,036 | ) | (4,486,926 | ) | ||||
| REALIZED AND UNREALIZED GAIN (LOSS) ON INVESTMENTS AND FOREIGN CURRENCY: | ||||||||
| Net realized (loss) on unaffiliated investments | (61,614,670 | ) | (130,028,359 | ) | ||||
| Net realized (loss) on foreign currency transactions | (7,445 | ) | (12 | ) | ||||
| Net change in unrealized appreciation on unaffiliated investments | 45,565,317 | 55,712,732 | ||||||
| Net change in unrealized appreciation on foreign currency | 59 | — | ||||||
| Net realized and unrealized (loss) on investments and foreign currency | (16,056,739 | ) | (74,315,639 | ) | ||||
| NET DECREASE IN NET ASSETS RESULTING FROM OPERATIONS | $ | (17,807,775 | ) | $ | (78,802,565 | ) | ||
| * Foreign withholding taxes | $ | 11,014 | $ | 38,251 | ||||
| See Notes to Financial Statements. | ||||||||
THE ALGER FUNDS
Statements of Operations for the year ended October 31, 2023 (Continued)
| Alger Small Cap Growth Fund | Alger Small Cap Focus Fund | |||||||
| INCOME: | ||||||||
| Dividends (net of foreign withholding taxes*) | $ | 1,110,307 | $ | 5,809,747 | ||||
| Interest | 235,124 | 892,234 | ||||||
| Total Income | 1,345,431 | 6,701,981 | ||||||
| EXPENSES: | ||||||||
| Investment advisory fees — Note 3(a) | 2,754,333 | 16,742,742 | ||||||
| Distribution fees — Note 3(c) | ||||||||
| Class A | 328,041 | 465,334 | ||||||
| Class B | 26,201 | — | ||||||
| Class C | 182,123 | 874,245 | ||||||
| Class I | — | 236,861 | ||||||
| Shareholder administrative fees — Note 3(f) | 43,887 | 241,018 | ||||||
| Administration fees — Note 3(b) | 93,511 | 613,901 | ||||||
| Transfer agent fees — Note 3(f) | 168,507 | 1,170,584 | ||||||
| Fund accounting fees | 98,966 | 327,355 | ||||||
| Registration fees | 90,947 | 152,521 | ||||||
| Professional fees | 79,566 | 212,200 | ||||||
| Printing fees | 44,004 | 364,991 | ||||||
| Custodian fees | 33,987 | 86,167 | ||||||
| Trustee fees — Note 3(g) | 18,434 | 125,367 | ||||||
| Interest expenses | 4,076 | 229,309 | ||||||
| Other expenses | 57,441 | 360,420 | ||||||
| Total Expenses | 4,024,024 | 22,203,015 | ||||||
| Less, expense reimbursements/waivers — Note 3(a) | (28,456 | ) | (92,140 | ) | ||||
| Net Expenses | 3,995,568 | 22,110,875 | ||||||
| NET INVESTMENT LOSS | (2,650,137 | ) | (15,408,894 | ) | ||||
| REALIZED AND UNREALIZED GAIN (LOSS) ON INVESTMENTS, CONTRACTS FOR DIFFERENCE AND FOREIGN CURRENCY: | ||||||||
| Net realized (loss) on unaffiliated investments | (72,343,637 | ) | (246,526,812 | ) | ||||
| Net realized (loss) on affiliated investments | — | (30,591,023 | ) | |||||
| Net realized (loss) on foreign currency transactions | (19,456 | ) | (1,504 | ) | ||||
| Net realized gain on contracts for difference | — | 707,735 | ||||||
| Net change in unrealized appreciation (depreciation) on unaffiliated investments | 42,902,451 | (121,524,400 | ) | |||||
| Net change in unrealized appreciation (depreciation) on affiliated investments | (315,377 | ) | 42,632,657 | |||||
| Net realized and unrealized (loss) on investments, contracts for difference and foreign currency | (29,776,019 | ) | (355,303,347 | ) | ||||
| NET DECREASE IN NET ASSETS RESULTING FROM OPERATIONS | $ | (32,426,156 | ) | $ | (370,712,241 | ) | ||
| * Foreign withholding taxes | $ | 5,436 | $ | 49,005 | ||||
| See Notes to Financial Statements. | ||||||||
THE ALGER FUNDS
Statements of Operations for the year ended October 31, 2023 (Continued)
| Alger International Focus Fund | Alger Health Sciences Fund | |||||||
| INCOME: | ||||||||
| Dividends (net of foreign withholding taxes*) | $ | 1,494,133 | $ | 730,914 | ||||
| Interest | 138,780 | 123,211 | ||||||
| Total Income | 1,632,913 | 854,125 | ||||||
| EXPENSES: | ||||||||
| Investment advisory fees — Note 3(a) | 1,009,184 | 828,941 | ||||||
| Distribution fees — Note 3(c) | ||||||||
| Class A | 267,056 | 203,871 | ||||||
| Class B | 137,615 | — | ||||||
| Class C | 13,684 | 66,870 | ||||||
| Class I | 2,924 | — | ||||||
| Shareholder administrative fees — Note 3(f) | 22,141 | 20,807 | ||||||
| Administration fees — Note 3(b) | 39,088 | 41,447 | ||||||
| Transfer agent fees — Note 3(f) | 98,959 | 108,903 | ||||||
| Fund accounting fees | 84,676 | 71,937 | ||||||
| Professional fees | 63,576 | 72,440 | ||||||
| Registration fees | 60,565 | 36,103 | ||||||
| Custodian fees | 54,419 | 16,883 | ||||||
| Printing fees | 26,539 | 29,420 | ||||||
| Trustee fees — Note 3(g) | 7,178 | 8,377 | ||||||
| Interest expenses | 150 | 1,346 | ||||||
| Other expenses | 23,116 | 38,607 | ||||||
| Total Expenses | 1,910,870 | 1,545,952 | ||||||
| Less, expense reimbursements/waivers — Note 3(a) | (120,145 | ) | (17,284 | ) | ||||
| Net Expenses | 1,790,725 | 1,528,668 | ||||||
| NET INVESTMENT LOSS | (157,812 | ) | (674,543 | ) | ||||
| REALIZED AND UNREALIZED GAIN (LOSS) ON INVESTMENTS AND FOREIGN CURRENCY: | ||||||||
| Net realized gain on unaffiliated investments | 489,021 | ** | 8,608,079 | |||||
| Net realized (loss) on foreign currency transactions | (44,961 | ) | (76,960 | ) | ||||
| Net change in unrealized appreciation (depreciation) on unaffiliated investments | 3,349,728 | *** | (25,347,578 | ) | ||||
| Net change in unrealized appreciation on foreign currency | 17,152 | 2,823 | ||||||
| Net realized and unrealized gain (loss) on investments and foreign currency | 3,810,940 | (16,813,636 | ) | |||||
| NET INCREASE (DECREASE) IN NET ASSETS RESULTING FROM OPERATIONS | $ | 3,653,128 | $ | (17,488,179 | ) | |||
| * Foreign withholding taxes | $ | 171,366 | $ | 16,125 | ||||
| See Notes to Financial Statements. | ||||||||
** Includes capital gain tax of $177,532.
*** Includes net change in unrealized appreciation (depreciation) of foreign capital gains taxes of $(52,776).
THE ALGER FUNDS
Statements of Changes in Net Assets
| Alger Capital Appreciation Fund | ||||||||
| For the Year Ended October 31, 2023 | For the Year Ended October 31, 2022 | |||||||
| Net investment loss | $ | (7,913,842 | ) | $ | (8,588,618 | ) | ||
| Net realized gain on investments, redemptions in-kind, and foreign currency | 138,085,261 | 54,838,009 | ||||||
| Net change in unrealized appreciation (depreciation) on investments and foreign currency | 150,551,321 | (1,140,768,396 | ) | |||||
| Net increase (decrease) in net assets resulting from operations | 280,722,740 | (1,094,519,005 | ) | |||||
| Dividends and distributions to shareholders: | ||||||||
| Class A | (30,288,660 | ) | (284,398,857 | ) | ||||
| Class C | (5,650,846 | ) | (53,540,254 | ) | ||||
| Class Z | (33,055,502 | ) | (297,591,139 | ) | ||||
| Total dividends and distributions to shareholders | (68,995,008 | ) | (635,530,250 | ) | ||||
| Increase (decrease) from shares of beneficial interest transactions: | ||||||||
| Class A | (128,629,089 | ) | 13,515,228 | |||||
| Class C | (30,383,646 | ) | (4,551,506 | ) | ||||
| Class Z | (284,937,836 | ) | 113,901,081 | |||||
| Net increase (decrease) from shares of beneficial interest transactions — Note 6 | (443,950,571 | ) | 122,864,803 | |||||
| Total decrease | (232,222,839 | ) | (1,607,184,452 | ) | ||||
| Net Assets: | ||||||||
| Beginning of period | 1,815,537,466 | 3,422,721,918 | ||||||
| END OF PERIOD | $ | 1,583,314,627 | $ | 1,815,537,466 | ||||
| See Notes to Financial Statements. | ||||||||
THE ALGER FUNDS
Statements of Changes in Net Assets (Continued)
| Alger 35 Fund | ||||||||
| For the Year Ended October 31, 2023 | For the Year Ended October 31, 2022 | |||||||
| Net investment income (loss) | $ | (31,123 | ) | $ | 4,021 | |||
| Net realized loss on investments and foreign currency | (1,730,064 | ) | (4,926,564 | ) | ||||
| Net change in unrealized appreciation (depreciation) on investments and foreign currency | 2,108,046 | (12,333,559 | ) | |||||
| Net increase (decrease) in net assets resulting from operations | 346,859 | (17,256,102 | ) | |||||
| Dividends and distributions to shareholders: | ||||||||
| Class Z | (5,582 | ) | (10,551,417 | ) | ||||
| Total dividends and distributions to shareholders | (5,582 | ) | (10,551,417 | ) | ||||
| Increase (decrease) from shares of beneficial interest transactions: | ||||||||
| Class Z | (677,152 | ) | 9,624,945 | |||||
| Net increase (decrease) from shares of beneficial interest transactions — Note 6 | (677,152 | ) | 9,624,945 | |||||
| Total decrease | (335,875 | ) | (18,182,574 | ) | ||||
| Net Assets: | ||||||||
| Beginning of period | 25,976,398 | 44,158,972 | ||||||
| END OF PERIOD | $ | 25,640,523 | $ | 25,976,398 | ||||
| See Notes to Financial Statements. | ||||||||
THE ALGER FUNDS
Statements of Changes in Net Assets (Continued)
| Alger Growth & Income Fund | ||||||||
| For the Year Ended October 31, 2023 | For the Year Ended October 31, 2022 | |||||||
| Net investment income | $ | 4,878,751 | $ | 2,552,839 | ||||
| Net realized loss on investments and foreign currency | (473,924 | ) | (246,144 | ) | ||||
| Net change in unrealized appreciation (depreciation) on investments and foreign currency | 26,838,862 | (27,439,139 | ) | |||||
| Net increase (decrease) in net assets resulting from operations | 31,243,689 | (25,132,444 | ) | |||||
| Dividends and distributions to shareholders: | ||||||||
| Class A | (1,709,205 | ) | (4,709,966 | ) | ||||
| Class C | (167,164 | ) | (687,923 | ) | ||||
| Class Z | (2,596,584 | ) | (2,219,203 | ) | ||||
| Total dividends and distributions to shareholders | (4,472,953 | ) | (7,617,092 | ) | ||||
| Increase from shares of beneficial interest transactions: | ||||||||
| Class A | 9,135,768 | 19,951,923 | ||||||
| Class C | 814,481 | 6,180,541 | ||||||
| Class Z | 39,561,312 | 88,363,764 | ||||||
| Net increase from shares of beneficial interest transactions — Note 6 | 49,511,561 | 114,496,228 | ||||||
| Total increase | 76,282,297 | 81,746,692 | ||||||
| Net Assets: | ||||||||
| Beginning of period | 244,401,482 | 162,654,790 | ||||||
| END OF PERIOD | $ | 320,683,779 | $ | 244,401,482 | ||||
| See Notes to Financial Statements. | ||||||||
THE ALGER FUNDS
Statements of Changes in Net Assets (Continued)
| Alger Mid Cap Growth Fund | ||||||||
| For the Year Ended October 31, 2023 | For the Year Ended October 31, 2022 | |||||||
| Net investment loss | $ | (1,302,928 | ) | $ | (1,528,046 | ) | ||
| Net realized loss on investments and foreign currency | (8,871,574 | ) | (55,825,563 | ) | ||||
| Net change in unrealized appreciation (depreciation) on investments and foreign currency | 9,347,689 | (73,648,453 | ) | |||||
| Net decrease in net assets resulting from operations | (826,813 | ) | (131,002,062 | ) | ||||
| Dividends and distributions to shareholders: | ||||||||
| Class A | — | (67,153,291 | ) | |||||
| Class B | — | (6,406,978 | ) | |||||
| Class C | — | (2,944,693 | ) | |||||
| Class Z | — | (15,837,405 | ) | |||||
| Total dividends and distributions to shareholders | — | (92,342,367 | ) | |||||
| Increase (decrease) from shares of beneficial interest transactions: | ||||||||
| Class A | (13,368,649 | ) | 52,482,791 | |||||
| Class B | (912,334 | ) | 5,161,326 | |||||
| Class C | (1,263,818 | ) | 2,481,849 | |||||
| Class Z | 13,864,507 | 16,160,525 | ||||||
| Net increase (decrease) from shares of beneficial interest transactions — Note 6 | (1,680,294 | ) | 76,286,491 | |||||
| Total decrease | (2,507,107 | ) | (147,057,938 | ) | ||||
| Net Assets: | ||||||||
| Beginning of period | 192,102,653 | 339,160,591 | ||||||
| END OF PERIOD | $ | 189,595,546 | $ | 192,102,653 | ||||
| See Notes to Financial Statements. | ||||||||
THE ALGER FUNDS
Statements of Changes in Net Assets (Continued)
| Alger Mid Cap Focus Fund | ||||||||
| For the Year Ended October 31, 2023 | For the Year Ended October 31, 2022 | |||||||
| Net investment loss | $ | (1,751,036 | ) | $ | (2,374,048 | ) | ||
| Net realized loss on investments and foreign currency | (61,622,115 | ) | (114,966,878 | ) | ||||
| Net change in unrealized appreciation (depreciation) on investments and foreign currency | 45,565,376 | (271,346,889 | ) | |||||
| Net decrease in net assets resulting from operations | (17,807,775 | ) | (388,687,815 | ) | ||||
| Dividends and distributions to shareholders: | ||||||||
| Class A | — | (237,662 | ) | |||||
| Class C | — | (228,199 | ) | |||||
| Class I | — | (12,826,323 | ) | |||||
| Class Y | — | (12,097 | ) | |||||
| Class Z | — | (70,824,262 | ) | |||||
| Total dividends and distributions to shareholders | — | (84,128,543 | ) | |||||
| Increase (decrease) from shares of beneficial interest transactions: | ||||||||
| Class A | (1,501,313 | ) | 5,256,417 | |||||
| Class C | (197,849 | ) | 1,924,208 | |||||
| Class I | (49,382,479 | ) | (12,108,519 | ) | ||||
| Class Y | (239,173 | ) | 422,581 | |||||
| Class Z | (132,383,860 | ) | (31,386,124 | ) | ||||
| Net decrease from shares of beneficial interest transactions — Note 6 | (183,704,674 | ) | (35,891,437 | ) | ||||
| Total decrease | (201,512,449 | ) | (508,707,795 | ) | ||||
| Net Assets: | ||||||||
| Beginning of period | 436,433,348 | 945,141,143 | ||||||
| END OF PERIOD | $ | 234,920,899 | $ | 436,433,348 | ||||
| See Notes to Financial Statements. | ||||||||
THE ALGER FUNDS
Statements of Changes in Net Assets (Continued)
| Alger Weatherbie Specialized Growth Fund | ||||||||
| For the Year Ended October 31, 2023 | For the Year Ended October 31, 2022 | |||||||
| Net investment loss | $ | (4,486,926 | ) | $ | (8,040,908 | ) | ||
| Net realized loss on investments and foreign currency | (130,028,371 | ) | (193,750,586 | ) | ||||
| Net change in unrealized appreciation (depreciation) on investments and foreign currency | 55,712,732 | (501,688,673 | ) | |||||
| Net decrease in net assets resulting from operations | (78,802,565 | ) | (703,480,167 | ) | ||||
| Dividends and distributions to shareholders: | ||||||||
| Class A | — | (45,296,523 | ) | |||||
| Class C | — | (27,504,338 | ) | |||||
| Class I | — | (12,964,988 | ) | |||||
| Class Y | — | (10,407,118 | ) | |||||
| Class Z | — | (205,452,142 | ) | |||||
| Total dividends and distributions to shareholders | — | (301,625,109 | ) | |||||
| Increase (decrease) from shares of beneficial interest transactions: | ||||||||
| Class A | (20,682,121 | ) | 8,933,676 | |||||
| Class C | (10,526,217 | ) | 9,708,887 | |||||
| Class I | (14,562,771 | ) | (4,904,091 | ) | ||||
| Class Y | 2,521,614 | 26,302,379 | ||||||
| Class Z | (142,269,931 | ) | (36,895,543 | ) | ||||
| Net increase (decrease) from shares of beneficial interest transactions — Note 6 | (185,519,426 | ) | 3,145,308 | |||||
| Total decrease | (264,321,991 | ) | (1,001,959,968 | ) | ||||
| Net Assets: | ||||||||
| Beginning of period | 776,717,884 | 1,778,677,852 | ||||||
| END OF PERIOD | $ | 512,395,893 | $ | 776,717,884 | ||||
| See Notes to Financial Statements. | ||||||||
THE ALGER FUNDS
Statements of Changes in Net Assets (Continued)
| Alger Small Cap Growth Fund | ||||||||
| For the Year Ended October 31, 2023 | For the Year Ended October 31, 2022 | |||||||
| Net investment loss | $ | (2,650,137 | ) | $ | (4,114,910 | ) | ||
| Net realized loss on investments and foreign currency | (72,363,093 | ) | (24,248,827 | ) | ||||
| Net change in unrealized appreciation (depreciation) on investments and foreign currency | 42,587,074 | (242,568,455 | ) | |||||
| Net decrease in net assets resulting from operations | (32,426,156 | ) | (270,932,192 | ) | ||||
| Dividends and distributions to shareholders: | ||||||||
| Class A | — | (21,314,734 | ) | |||||
| Class B | — | (673,335 | ) | |||||
| Class C | — | (4,854,023 | ) | |||||
| Class Z | — | (30,391,004 | ) | |||||
| Total dividends and distributions to shareholders | — | (57,233,096 | ) | |||||
| Increase (decrease) from shares of beneficial interest transactions: | ||||||||
| Class A | (19,030,032 | ) | 1,762,230 | |||||
| Class B | (555,792 | ) | 32,505 | |||||
| Class C | (4,264,017 | ) | 2,204,699 | |||||
| Class Y | 50,894 | 8,398,532 | ||||||
| Class Z | (60,167,732 | ) | 13,599,272 | |||||
| Net increase (decrease) from shares of beneficial interest transactions — Note 6 | (83,966,679 | ) | 25,997,238 | |||||
| Total decrease | (116,392,835 | ) | (302,168,050 | ) | ||||
| Net Assets: | ||||||||
| Beginning of period | 389,256,253 | 691,424,303 | ||||||
| END OF PERIOD | $ | 272,863,418 | $ | 389,256,253 | ||||
| See Notes to Financial Statements. | ||||||||
THE ALGER FUNDS
Statements of Changes in Net Assets (Continued)
| Alger Small Cap Focus Fund | ||||||||
| For the Year Ended October 31, 2023 | For the Year Ended October 31, 2022 | |||||||
| Net investment loss | $ | (15,408,894 | ) | $ | (24,812,632 | ) | ||
| Net realized loss on investments, contracts for difference and foreign currency | (276,411,604 | ) | (562,947,494 | ) | ||||
| Net change in unrealized depreciation on investments, contracts for difference and foreign currency | (78,891,743 | ) | (2,516,845,916 | ) | ||||
| Net decrease in net assets resulting from operations | (370,712,241 | ) | (3,104,606,042 | ) | ||||
| Dividends and distributions to shareholders: | ||||||||
| Class A | — | (30,754,287 | ) | |||||
| Class C | — | (16,779,423 | ) | |||||
| Class I | — | (22,355,553 | ) | |||||
| Class Y | — | (21,468,256 | ) | |||||
| Class Z | — | (324,678,159 | ) | |||||
| Total dividends and distributions to shareholders | — | (416,035,678 | ) | |||||
| Increase (decrease) from shares of beneficial interest transactions: | ||||||||
| Class A | (66,345,053 | ) | (79,791,951 | ) | ||||
| Class C | (31,267,447 | ) | (33,316,935 | ) | ||||
| Class I | (76,517,074 | ) | (96,988,803 | ) | ||||
| Class Y | (90,663,856 | ) | 58,351,945 | |||||
| Class Z | (790,270,598 | ) | (1,239,048,797 | ) | ||||
| Net decrease from shares of beneficial interest transactions — Note 6 | (1,055,064,028 | ) | (1,390,794,541 | ) | ||||
| Total decrease | (1,425,776,269 | ) | (4,911,436,261 | ) | ||||
| Net Assets: | ||||||||
| Beginning of period | 2,929,443,041 | 7,840,879,302 | ||||||
| END OF PERIOD | $ | 1,503,666,772 | $ | 2,929,443,041 | ||||
| See Notes to Financial Statements. | ||||||||
THE ALGER FUNDS
Statements of Changes in Net Assets (Continued)
| Alger International Focus Fund | ||||||||
| For the Year Ended October 31, 2023 | For the Year Ended October 31, 2022 | |||||||
| Net investment loss | $ | (157,812 | ) | $ | (803,647 | ) | ||
| Net realized gain (loss) on investments and foreign currency | 444,060 | (7,032,633 | ) | |||||
| Net change in unrealized appreciation (depreciation) on investments and foreign currency | 3,366,880 | (63,553,455 | ) | |||||
| Net increase (decrease) in net assets resulting from operations | 3,653,128 | (71,389,735 | ) | |||||
| Dividends and distributions to shareholders: | ||||||||
| Class A | — | (12,365,251 | ) | |||||
| Class B | — | (1,940,439 | ) | |||||
| Class C | — | (400,190 | ) | |||||
| Class I | — | (49,121 | ) | |||||
| Class Z | — | (2,237,931 | ) | |||||
| Total dividends and distributions to shareholders | — | (16,992,932 | ) | |||||
| Increase (decrease) from shares of beneficial interest transactions: | ||||||||
| Class A | (7,326,082 | ) | 7,386,726 | |||||
| Class B | (1,290,607 | ) | 116,320 | |||||
| Class C | (525,791 | ) | (1,107,606 | ) | ||||
| Class I | 5,648 | 1,119,741 | ||||||
| Class Z | 21,485,726 | (2,079,971 | ) | |||||
| Net increase from shares of beneficial interest transactions — Note 6 | 12,348,894 | 5,435,210 | ||||||
| Total increase (decrease) | 16,002,022 | (82,947,457 | ) | |||||
| Net Assets: | ||||||||
| Beginning of period | 130,645,040 | 213,592,497 | ||||||
| END OF PERIOD | $ | 146,647,062 | $ | 130,645,040 | ||||
| See Notes to Financial Statements. | ||||||||
THE ALGER FUNDS
Statements of Changes in Net Assets (Continued)
| Alger Health Sciences Fund | ||||||||
| For the Year Ended October 31, 2023 | For the Year Ended October 31, 2022 | |||||||
| Net investment loss | $ | (674,543 | ) | $ | (408,441 | ) | ||
| Net realized gain (loss) on investments and foreign currency | 8,531,119 | (43,429,932 | ) | |||||
| Net change in unrealized depreciation on investments and foreign currency | (25,344,755 | ) | (47,165,991 | ) | ||||
| Net decrease in net assets resulting from operations | (17,488,179 | ) | (91,004,364 | ) | ||||
| Dividends and distributions to shareholders: | ||||||||
| Class A | — | (28,166,595 | ) | |||||
| Class C | — | (3,704,768 | ) | |||||
| Class Z | — | (34,925,658 | ) | |||||
| Total dividends and distributions to shareholders | — | (66,797,021 | ) | |||||
| Increase (decrease) from shares of beneficial interest transactions: | ||||||||
| Class A | (15,939,100 | ) | 7,680,846 | |||||
| Class C | (2,218,608 | ) | 956,992 | |||||
| Class Z | (24,304,412 | ) | (23,842,039 | ) | ||||
| Net decrease from shares of beneficial interest transactions — Note 6 | (42,462,120 | ) | (15,204,201 | ) | ||||
| Total decrease | (59,950,299 | ) | (173,005,586 | ) | ||||
| Net Assets: | ||||||||
| Beginning of period | 177,815,146 | 350,820,732 | ||||||
| END OF PERIOD | $ | 117,864,847 | $ | 177,815,146 | ||||
| See Notes to Financial Statements. | ||||||||
THE ALGER FUNDS
Financial Highlights for a share outstanding throughout the period
| Alger Capital Appreciation Fund | Class A | |||||||||||||||||||
| Year ended 10/31/2023 | Year ended 10/31/2022 | Year ended 10/31/2021 | Year ended 10/31/2020 | Year ended 10/31/2019 | ||||||||||||||||
| Net asset value, beginning of period | $ | 20.77 | $ | 39.48 | $ | 33.76 | $ | 27.12 | $ | 26.20 | ||||||||||
| INCOME FROM INVESTMENT OPERATIONS: | ||||||||||||||||||||
| Net investment loss(i) | (0.14 | ) | (0.13 | ) | (0.24 | ) | (0.12 | ) | (0.07 | ) | ||||||||||
| Net realized and unrealized gain (loss) on investments | 3.50 | (11.17 | ) | 11.11 | 8.96 | 3.53 | ||||||||||||||
| Total from investment operations | 3.36 | (11.30 | ) | 10.87 | 8.84 | 3.46 | ||||||||||||||
| Distributions from net realized gains | (0.84 | ) | (7.41 | ) | (5.15 | ) | (2.20 | ) | (2.54 | ) | ||||||||||
| Net asset value, end of period | $ | 23.29 | $ | 20.77 | $ | 39.48 | $ | 33.76 | $ | 27.12 | ||||||||||
| Total return(ii) | 16.95 | % | (34.88 | )% | 35.41 | % | 34.79 | % | 15.29 | % | ||||||||||
| RATIOS/SUPPLEMENTAL DATA: | ||||||||||||||||||||
| Net assets, end of period (000’s omitted) | $ | 737,324 | $ | 774,249 | $ | 1,523,572 | $ | 1,320,073 | $ | 1,174,346 | ||||||||||
| Ratio of gross expenses to average net assets | 1.28 | % | 1.20 | % | 1.15 | % | 1.17 | % | 1.21 | % | ||||||||||
| Ratio of net expenses to average net assets | 1.28 | % | 1.20 | % | 1.15 | % | 1.17 | % | 1.21 | % | ||||||||||
| Ratio of net investment loss to average net assets | (0.64 | )% | (0.49 | )% | (0.67 | )% | (0.41 | )% | (0.27 | )% | ||||||||||
| Portfolio turnover rate(iii) | 85.55 | % | 108.26 | % | 78.77 | % | 89.91 | % | 77.04 | % | ||||||||||
| See Notes to Financial Statements. | ||||||||||||||||||||
| (i) | Amount was computed based on average shares outstanding during the period. |
| (ii) | Does not reflect the effect of sales charges, if applicable. |
| (iii) | Portfolio turnover excludes the value of portfolio securities received or delivered as a result of in-kind fund share transactions. |
THE ALGER FUNDS
Financial Highlights for a share outstanding throughout the period
| Alger Capital Appreciation Fund | Class C | |||||||||||||||||||
| Year ended 10/31/2023 | Year ended 10/31/2022 | Year ended 10/31/2021 | Year ended 10/31/2020 | Year ended 10/31/2019 | ||||||||||||||||
| Net asset value, beginning of period | $ | 12.63 | $ | 27.13 | $ | 24.79 | $ | 20.60 | $ | 20.69 | ||||||||||
| INCOME FROM INVESTMENT OPERATIONS: | ||||||||||||||||||||
| Net investment loss(i) | (0.18 | ) | (0.20 | ) | (0.35 | ) | (0.25 | ) | (0.20 | ) | ||||||||||
| Net realized and unrealized gain (loss) on investments | 2.05 | (6.89 | ) | 7.84 | 6.64 | 2.65 | ||||||||||||||
| Total from investment operations | 1.87 | (7.09 | ) | 7.49 | 6.39 | 2.45 | ||||||||||||||
| Distributions from net realized gains | (0.84 | ) | (7.41 | ) | (5.15 | ) | (2.20 | ) | (2.54 | ) | ||||||||||
| Net asset value, end of period | $ | 13.66 | $ | 12.63 | $ | 27.13 | $ | 24.79 | $ | 20.60 | ||||||||||
| Total return(ii) | 16.03 | % | (35.36 | )% | 34.43 | % | 33.82 | % | 14.44 | % | ||||||||||
| RATIOS/SUPPLEMENTAL DATA: | ||||||||||||||||||||
| Net assets, end of period (000’s omitted) | $ | 67,776 | $ | 91,815 | $ | 211,972 | $ | 204,909 | $ | 219,511 | ||||||||||
| Ratio of gross expenses to average net assets | 2.05 | % | 1.95 | % | 1.90 | % | 1.91 | % | 1.95 | % | ||||||||||
| Ratio of net expenses to average net assets | 2.05 | % | 1.95 | % | 1.90 | % | 1.91 | % | 1.95 | % | ||||||||||
| Ratio of net investment loss to average net assets | (1.40 | )% | (1.24 | )% | (1.42 | )% | (1.13 | )% | (1.01 | )% | ||||||||||
| Portfolio turnover rate(iii) | 85.55 | % | 108.26 | % | 78.77 | % | 89.91 | % | 77.04 | % | ||||||||||
| See Notes to Financial Statements. | ||||||||||||||||||||
| (i) | Amount was computed based on average shares outstanding during the period. |
| (ii) | Does not reflect the effect of sales charges, if applicable. |
| (iii) | Portfolio turnover excludes the value of portfolio securities received or delivered as a result of in-kind fund share transactions. |
THE ALGER FUNDS
Financial Highlights for a share outstanding throughout the period
| Alger Capital Appreciation Fund | Class Z | |||||||||||||||||||
| Year ended 10/31/2023 | Year ended 10/31/2022 | Year ended 10/31/2021 | Year ended 10/31/2020 | Year ended 10/31/2019 | ||||||||||||||||
| Net asset value, beginning of period | $ | 22.16 | $ | 41.50 | $ | 35.15 | $ | 28.06 | $ | 26.94 | ||||||||||
| INCOME FROM INVESTMENT OPERATIONS: | ||||||||||||||||||||
| Net investment income (loss)(i) | (0.05 | ) | (0.04 | ) | (0.13 | ) | (0.03 | ) | 0.02 | |||||||||||
| Net realized and unrealized gain (loss) on investments | 3.75 | (11.89 | ) | 11.63 | 9.32 | 3.64 | ||||||||||||||
| Total from investment operations | 3.70 | (11.93 | ) | 11.50 | 9.29 | 3.66 | ||||||||||||||
| Distributions from net realized gains | (0.84 | ) | (7.41 | ) | (5.15 | ) | (2.20 | ) | (2.54 | ) | ||||||||||
| Net asset value, end of period | $ | 25.02 | $ | 22.16 | $ | 41.50 | $ | 35.15 | $ | 28.06 | ||||||||||
| Total return(ii) | 17.44 | % | (34.67 | )% | 35.85 | % | 35.26 | % | 15.69 | % | ||||||||||
| RATIOS/SUPPLEMENTAL DATA: | ||||||||||||||||||||
| Net assets, end of period (000’s omitted) | $ | 778,215 | $ | 949,473 | $ | 1,687,179 | $ | 1,823,041 | $ | 1,409,374 | ||||||||||
| Ratio of gross expenses to average net assets | 0.93 | % | 0.86 | % | 0.83 | % | 0.84 | % | 0.87 | % | ||||||||||
| Ratio of expense reimbursements to average net assets | (0.07 | )% | (0.01 | )% | — | — | — | |||||||||||||
| Ratio of net expenses to average net assets | 0.86 | % | 0.85 | % | 0.83 | % | 0.84 | % | 0.87 | % | ||||||||||
| Ratio of net investment income (loss) to average net assets | (0.21 | )% | (0.14 | )% | (0.34 | )% | (0.09 | )% | 0.06 | % | ||||||||||
| Portfolio turnover rate(iii) | 85.55 | % | 108.26 | % | 78.77 | % | 89.91 | % | 77.04 | % | ||||||||||
| See Notes to Financial Statements. | ||||||||||||||||||||
| (i) | Amount was computed based on average shares outstanding during the period. |
| (ii) | Does not reflect the effect of sales charges, if applicable. |
| (iii) | Portfolio turnover excludes the value of portfolio securities received or delivered as a result of in-kind fund share transactions. |
THE ALGER FUNDS
Financial Highlights for a share outstanding throughout the period
| Alger 35 Fund | Class Z | |||||||||||||||||||
| Year ended 10/31/2023 | Year ended 10/31/2022 | Year ended 10/31/2021(i) | Year ended 10/31/2020(i) | Year ended 10/31/2019(i) | ||||||||||||||||
| Net asset value, beginning of period | $ | 9.55 | $ | 21.33 | $ | 17.41 | $ | 11.61 | $ | 10.38 | ||||||||||
| INCOME FROM INVESTMENT OPERATIONS: | ||||||||||||||||||||
| Net investment income (loss)(ii) | (0.01 | ) | — | (iii) | (0.01 | ) | (0.05 | ) | 0.03 | |||||||||||
| Net realized and unrealized gain (loss) on investments | 0.14 | (6.68 | ) | 6.95 | 5.87 | 1.31 | ||||||||||||||
| Total from investment operations | 0.13 | (6.68 | ) | 6.94 | 5.82 | 1.34 | ||||||||||||||
| Dividends from net investment income | — | (iii) | — | — | (iv) | (0.02 | ) | (0.04 | ) | |||||||||||
| Distributions from net realized gains | — | (5.10 | ) | (3.02 | ) | — | (0.07 | ) | ||||||||||||
| Net asset value, end of period | $ | 9.68 | $ | 9.55 | $ | 21.33 | $ | 17.41 | $ | 11.61 | ||||||||||
| Total return(v) | 1.38 | % | (39.09 | )% | 44.27 | % | 50.22 | % | 13.19 | % | ||||||||||
| RATIOS/SUPPLEMENTAL DATA: | ||||||||||||||||||||
| Net assets, end of period (000’s omitted) | $ | 25,640 | $ | 25,976 | $ | 44,159 | $ | 14,128 | $ | 9,094 | ||||||||||
| Ratio of gross expenses to average net assets | 0.97 | % | 0.94 | % | 0.92 | % | 2.02 | % | 2.37 | % | ||||||||||
| Ratio of expense reimbursements to average net assets | (0.40 | )% | (0.39 | )% | (0.52 | )% | (1.12 | )% | (1.97 | )% | ||||||||||
| Ratio of net expenses to average net assets | 0.57 | % | 0.55 | % | 0.40 | % | 0.90 | % | 0.40 | % | ||||||||||
| Ratio of net investment income (loss) to average net assets | (0.12 | )% | 0.01 | % | (0.07 | )% | 0.36 | % | 0.30 | % | ||||||||||
| Portfolio turnover rate | 412.77 | % | 202.40 | % | 136.61 | % | 121.74 | % | 115.25 | % | ||||||||||
| See Notes to Financial Statements. | ||||||||||||||||||||
| (i) | Class P Shares were reclassified as Class Z Shares on May 7, 2021 and after the close of business on October 29, 2021, Class P-2 Shares were converted to Class Z Shares. |
| (ii) | Amount was computed based on average shares outstanding during the period. |
| (iii) | Amount was less than $0.005 per share. |
| (iv) | Amount was more than $(0.001) per share. |
| (v) | Does not reflect the effect of sales charges, if applicable. |
THE ALGER FUNDS
Financial Highlights for a share outstanding throughout the period
| Alger Growth & Income Fund | Class A | |||||||||||||||||||
| Year ended 10/31/2023 | Year ended 10/31/2022 | Year ended 10/31/2021 | Year ended 10/31/2020 | Year ended 10/31/2019 | ||||||||||||||||
| Net asset value, beginning of period | $ | 52.35 | $ | 61.76 | $ | 43.88 | $ | 43.55 | $ | 40.77 | ||||||||||
| INCOME FROM INVESTMENT OPERATIONS: | ||||||||||||||||||||
| Net investment income(i) | 0.85 | 0.71 | 0.63 | 0.69 | 0.70 | |||||||||||||||
| Net realized and unrealized gain (loss) on investments | 5.09 | (7.49 | ) | 18.47 | 1.88 | 4.54 | ||||||||||||||
| Total from investment operations | 5.94 | (6.78 | ) | 19.10 | 2.57 | 5.24 | ||||||||||||||
| Dividends from net investment income | (0.79 | ) | (0.56 | ) | (0.55 | ) | (0.66 | ) | (0.61 | ) | ||||||||||
| Distributions from net realized gains | — | (2.07 | ) | (0.67 | ) | (1.58 | ) | (1.85 | ) | |||||||||||
| Net asset value, end of period | $ | 57.50 | $ | 52.35 | $ | 61.76 | $ | 43.88 | $ | 43.55 | ||||||||||
| Total return(ii) | 11.39 | % | (11.53 | )% | 44.12 | % | 5.98 | % | 13.94 | % | ||||||||||
| RATIOS/SUPPLEMENTAL DATA: | ||||||||||||||||||||
| Net assets, end of period (000’s omitted) | $ | 128,090 | $ | 108,039 | $ | 106,439 | $ | 74,251 | $ | 74,924 | ||||||||||
| Ratio of gross expenses to average net assets | 0.96 | % | 0.97 | % | 0.98 | % | 1.06 | % | 1.07 | % | ||||||||||
| Ratio of net expenses to average net assets | 0.96 | % | 0.97 | % | 0.98 | % | 1.06 | % | 1.07 | % | ||||||||||
| Ratio of net investment income to average net assets | 1.51 | % | 1.24 | % | 1.15 | % | 1.60 | % | 1.72 | % | ||||||||||
| Portfolio turnover rate | 4.29 | % | 1.96 | % | 8.40 | % | 9.29 | % | 7.30 | % | ||||||||||
| See Notes to Financial Statements. | ||||||||||||||||||||
| (i) | Amount was computed based on average shares outstanding during the period. |
| (ii) | Does not reflect the effect of sales charges, if applicable. |
THE ALGER FUNDS
Financial Highlights for a share outstanding throughout the period
| Alger Growth & Income Fund | Class C | |||||||||||||||||||
| Year ended 10/31/2023 | Year ended 10/31/2022 | Year ended 10/31/2021 | Year ended 10/31/2020 | Year ended 10/31/2019 | ||||||||||||||||
| Net asset value, beginning of period | $ | 51.46 | $ | 60.77 | $ | 43.22 | $ | 42.93 | $ | 40.20 | ||||||||||
| INCOME FROM INVESTMENT OPERATIONS: | ||||||||||||||||||||
| Net investment income(i) | 0.43 | 0.28 | 0.21 | 0.36 | 0.39 | |||||||||||||||
| Net realized and unrealized gain (loss) on investments | 5.00 | (7.38 | ) | 18.18 | 1.85 | 4.49 | ||||||||||||||
| Total from investment operations | 5.43 | (7.10 | ) | 18.39 | 2.21 | 4.88 | ||||||||||||||
| Dividends from net investment income | (0.38 | ) | (0.14 | ) | (0.17 | ) | (0.34 | ) | (0.30 | ) | ||||||||||
| Distributions from net realized gains | — | (2.07 | ) | (0.67 | ) | (1.58 | ) | (1.85 | ) | |||||||||||
| Net asset value, end of period | $ | 56.51 | $ | 51.46 | $ | 60.77 | $ | 43.22 | $ | 42.93 | ||||||||||
| Total return(ii) | 10.56 | % | (12.18 | )% | 43.01 | % | 5.19 | % | 13.12 | % | ||||||||||
| RATIOS/SUPPLEMENTAL DATA: | ||||||||||||||||||||
| Net assets, end of period (000’s omitted) | $ | 24,149 | $ | 21,111 | $ | 18,194 | $ | 13,127 | $ | 14,946 | ||||||||||
| Ratio of gross expenses to average net assets | 1.71 | % | 1.73 | % | 1.73 | % | 1.81 | % | 1.82 | % | ||||||||||
| Ratio of net expenses to average net assets | 1.71 | % | 1.73 | % | 1.73 | % | 1.81 | % | 1.82 | % | ||||||||||
| Ratio of net investment income to average net assets | 0.77 | % | 0.49 | % | 0.40 | % | 0.86 | % | 0.97 | % | ||||||||||
| Portfolio turnover rate | 4.29 | % | 1.96 | % | 8.40 | % | 9.29 | % | 7.30 | % | ||||||||||
| See Notes to Financial Statements. | ||||||||||||||||||||
| (i) | Amount was computed based on average shares outstanding during the period. |
| (ii) | Does not reflect the effect of sales charges, if applicable. |
THE ALGER FUNDS
Financial Highlights for a share outstanding throughout the period
| Alger Growth & Income Fund | Class Z | |||||||||||||||||||
| Year ended 10/31/2023 | Year ended 10/31/2022 | Year ended 10/31/2021 | Year ended 10/31/2020 | Year ended 10/31/2019 | ||||||||||||||||
| Net asset value, beginning of period | $ | 52.42 | $ | 61.84 | $ | 43.94 | $ | 43.60 | $ | 40.81 | ||||||||||
| INCOME FROM INVESTMENT OPERATIONS: | ||||||||||||||||||||
| Net investment income(i) | 1.03 | 0.90 | 0.80 | 0.86 | 0.85 | |||||||||||||||
| Net realized and unrealized gain (loss) on investments | 5.10 | (7.51 | ) | 18.49 | 1.88 | 4.56 | ||||||||||||||
| Total from investment operations | 6.13 | (6.61 | ) | 19.29 | 2.74 | 5.41 | ||||||||||||||
| Dividends from net investment income | (0.97 | ) | (0.74 | ) | (0.72 | ) | (0.82 | ) | (0.77 | ) | ||||||||||
| Distributions from net realized gains | — | (2.07 | ) | (0.67 | ) | (1.58 | ) | (1.85 | ) | |||||||||||
| Net asset value, end of period | $ | 57.58 | $ | 52.42 | $ | 61.84 | $ | 43.94 | $ | 43.60 | ||||||||||
| Total return(ii) | 11.75 | % | (11.25 | )% | 44.54 | % | 6.39 | % | 14.39 | % | ||||||||||
| RATIOS/SUPPLEMENTAL DATA: | ||||||||||||||||||||
| Net assets, end of period (000’s omitted) | $ | 168,445 | $ | 115,251 | $ | 38,021 | $ | 21,672 | $ | 26,979 | ||||||||||
| Ratio of gross expenses to average net assets | 0.65 | % | 0.65 | % | 0.66 | % | 0.73 | % | 0.76 | % | ||||||||||
| Ratio of expense reimbursements to average net assets | — | — | — | (iii) | (0.04 | )% | (0.07 | )% | ||||||||||||
| Ratio of net expenses to average net assets | 0.65 | % | 0.65 | % | 0.66 | % | 0.69 | % | 0.69 | % | ||||||||||
| Ratio of net investment income to average net assets | 1.82 | % | 1.62 | % | 1.45 | % | 2.00 | % | 2.10 | % | ||||||||||
| Portfolio turnover rate | 4.29 | % | 1.96 | % | 8.40 | % | 9.29 | % | 7.30 | % | ||||||||||
| See Notes to Financial Statements. | ||||||||||||||||||||
| (i) | Amount was computed based on average shares outstanding during the period. |
| (ii) | Does not reflect the effect of sales charges, if applicable. |
| (iii) | Amount was less than 0.005%. |
THE ALGER FUNDS
Financial Highlights for a share outstanding throughout the period
| Alger Mid Cap Growth Fund | Class A | |||||||||||||||||||
| Year ended 10/31/2023 | Year ended 10/31/2022 | Year ended 10/31/2021 | Year ended 10/31/2020 | Year ended 10/31/2019 | ||||||||||||||||
| Net asset value, beginning of period | $ | 10.82 | $ | 25.20 | $ | 19.29 | $ | 14.81 | $ | 14.13 | ||||||||||
| INCOME FROM INVESTMENT OPERATIONS: | ||||||||||||||||||||
| Net investment income (loss)(i) | (0.08 | ) | (0.09 | ) | 0.48 | (0.12 | ) | (0.09 | ) | |||||||||||
| Net realized and unrealized gain (loss) on investments | 0.10 | (7.71 | ) | 7.58 | 5.80 | 1.48 | ||||||||||||||
| Total from investment operations | 0.02 | (7.80 | ) | 8.06 | 5.68 | 1.39 | ||||||||||||||
| Dividends from net investment income | — | (0.45 | ) | — | — | — | ||||||||||||||
| Distributions from net realized gains | — | (6.13 | ) | (2.15 | ) | (1.20 | ) | (0.71 | ) | |||||||||||
| Net asset value, end of period | $ | 10.84 | $ | 10.82 | $ | 25.20 | $ | 19.29 | $ | 14.81 | ||||||||||
| Total return(ii) | 0.18 | % | (39.13 | )% | 44.05 | %(iii) | 41.34 | % | 10.95 | % | ||||||||||
| RATIOS/SUPPLEMENTAL DATA: | ||||||||||||||||||||
| Net assets, end of period (000’s omitted) | $ | 134,439 | $ | 146,648 | $ | 259,895 | $ | 187,552 | $ | 139,110 | ||||||||||
| Ratio of gross expenses to average net assets | 1.27 | % | 1.24 | % | 1.21 | % | 1.30 | % | 1.30 | % | ||||||||||
| Ratio of net expenses to average net assets | 1.27 | % | 1.24 | % | 1.21 | % | 1.30 | % | 1.30 | % | ||||||||||
| Ratio of net investment income (loss) to average net assets | (0.69 | )% | (0.68 | )% | 2.15 | % | (0.76 | )% | (0.65 | )% | ||||||||||
| Portfolio turnover rate | 78.35 | % | 204.79 | % | 170.96 | % | 181.73 | % | 182.97 | % | ||||||||||
| See Notes to Financial Statements. | ||||||||||||||||||||
| (i) | Amount was computed based on average shares outstanding during the period. |
| (ii) | Does not reflect the effect of sales charges, if applicable. |
| (iii) | Pursuant to the U.S. Securities and Exchange Commission’s Rules on Fair Fund and Disgorgement Plans, the Alger Mid Cap Growth Fund received a Fair Fund distribution of $9,346,397, which contributed approximately 3.89% to its annual return. |
THE ALGER FUNDS
Financial Highlights for a share outstanding throughout the period
| Alger Mid Cap Growth Fund | Class B | |||||||||||||||||||
| Year ended 10/31/2023 | Year ended 10/31/2022 | Year ended 10/31/2021 | Year ended 10/31/2020 | Year ended 10/31/2019 | ||||||||||||||||
| Net asset value, beginning of period | $ | 6.78 | $ | 18.60 | $ | 14.70 | $ | 11.55 | $ | 11.22 | ||||||||||
| INCOME FROM INVESTMENT OPERATIONS: | ||||||||||||||||||||
| Net investment income (loss)(i) | (0.05 | ) | (0.06 | ) | 0.35 | (0.08 | ) | (0.10 | ) | |||||||||||
| Net realized and unrealized gain (loss) on investments | 0.06 | (5.15 | ) | 5.70 | 4.43 | 1.14 | ||||||||||||||
| Total from investment operations | 0.01 | (5.21 | ) | 6.05 | 4.35 | 1.04 | ||||||||||||||
| Dividends from net investment income | — | (0.48 | ) | — | — | — | ||||||||||||||
| Distributions from net realized gains | — | (6.13 | ) | (2.15 | ) | (1.20 | ) | (0.71 | ) | |||||||||||
| Net asset value, end of period | $ | 6.79 | $ | 6.78 | $ | 18.60 | $ | 14.70 | $ | 11.55 | ||||||||||
| Total return(ii) | 0.15 | % | (39.16 | )% | 44.24 | %(iii) | 41.41 | % | 10.66 | % | ||||||||||
| RATIOS/SUPPLEMENTAL DATA: | ||||||||||||||||||||
| Net assets, end of period (000’s omitted) | $ | 9,563 | $ | 10,404 | $ | 18,276 | $ | 15,411 | $ | 13,772 | ||||||||||
| Ratio of gross expenses to average net assets | 1.98 | % | 1.95 | % | 1.93 | % | 2.03 | % | 2.04 | % | ||||||||||
| Ratio of expense reimbursements to average net assets | (0.66 | )% | (0.67 | )% | (0.76 | )% | (0.82 | )% | (0.47 | )% | ||||||||||
| Ratio of net expenses to average net assets | 1.32 | % | 1.28 | % | 1.17 | % | 1.21 | % | 1.57 | % | ||||||||||
| Ratio of net investment income (loss) to average net assets | (0.73 | )% | (0.71 | )% | 2.08 | % | (0.66 | )% | (0.92 | )% | ||||||||||
| Portfolio turnover rate | 78.35 | % | 204.79 | % | 170.96 | % | 181.73 | % | 182.97 | % | ||||||||||
| See Notes to Financial Statements. | ||||||||||||||||||||
| (i) | Amount was computed based on average shares outstanding during the period. |
| (ii) | Does not reflect the effect of sales charges, if applicable. |
| (iii) | Pursuant to the U.S. Securities and Exchange Commission’s Rules on Fair Fund and Disgorgement Plans, the Alger Mid Cap Growth Fund received a Fair Fund distribution of $9,346,397, which contributed approximately 3.89% to its annual return. |
THE ALGER FUNDS
Financial Highlights for a share outstanding throughout the period
| Alger Mid Cap Growth Fund | Class C | |||||||||||||||||||
| Year ended 10/31/2023 | Year ended 10/31/2022 | Year ended 10/31/2021 | Year ended 10/31/2020 | Year ended 10/31/2019 | ||||||||||||||||
| Net asset value, beginning of period | $ | 6.34 | $ | 17.82 | $ | 14.26 | $ | 11.33 | $ | 11.08 | ||||||||||
| INCOME FROM INVESTMENT OPERATIONS: | ||||||||||||||||||||
| Net investment income (loss)(i) | (0.10 | ) | (0.12 | ) | 0.23 | (0.18 | ) | (0.16 | ) | |||||||||||
| Net realized and unrealized gain (loss) on investments | 0.06 | (4.88 | ) | 5.48 | 4.31 | 1.12 | ||||||||||||||
| Total from investment operations | (0.04 | ) | (5.00 | ) | 5.71 | 4.13 | 0.96 | |||||||||||||
| Dividends from net investment income | — | (0.35 | ) | — | — | — | ||||||||||||||
| Distributions from net realized gains | — | (6.13 | ) | (2.15 | ) | (1.20 | ) | (0.71 | ) | |||||||||||
| Net asset value, end of period | $ | 6.30 | $ | 6.34 | $ | 17.82 | $ | 14.26 | $ | 11.33 | ||||||||||
| Total return(ii) | (0.63 | )% | (39.60 | )% | 42.91 | %(iii) | 40.26 | % | 10.03 | % | ||||||||||
| RATIOS/SUPPLEMENTAL DATA: | ||||||||||||||||||||
| Net assets, end of period (000’s omitted) | $ | 3,319 | $ | 4,562 | $ | 8,244 | $ | 5,691 | $ | 6,014 | ||||||||||
| Ratio of gross expenses to average net assets | 2.13 | % | 2.05 | % | 2.00 | % | 2.10 | % | 2.14 | % | ||||||||||
| Ratio of net expenses to average net assets | 2.13 | % | 2.05 | % | 2.00 | % | 2.10 | % | 2.14 | % | ||||||||||
| Ratio of net investment income (loss) to average net assets | (1.54 | )% | (1.49 | )% | 1.41 | % | (1.52 | )% | (1.48 | )% | ||||||||||
| Portfolio turnover rate | 78.35 | % | 204.79 | % | 170.96 | % | 181.73 | % | 182.97 | % | ||||||||||
| See Notes to Financial Statements. | ||||||||||||||||||||
| (i) | Amount was computed based on average shares outstanding during the period. |
| (ii) | Does not reflect the effect of sales charges, if applicable. |
| (iii) | Pursuant to the U.S. Securities and Exchange Commission’s Rules on Fair Fund and Disgorgement Plans, the Alger Mid Cap Growth Fund received a Fair Fund distribution of $9,346,397, which contributed approximately 3.89% to its annual return. |
THE ALGER FUNDS
Financial Highlights for a share outstanding throughout the period
| Alger Mid Cap Growth Fund | Class Z | |||||||||||||||||||
| Year ended | Year ended | Year ended | Year ended | Year ended | ||||||||||||||||
| 10/31/2023 | 10/31/2022 | 10/31/2021 | 10/31/2020 | 10/31/2019 | ||||||||||||||||
| Net asset value, beginning of period | $ | 11.16 | $ | 25.78 | $ | 19.63 | $ | 15.01 | $ | 14.27 | ||||||||||
| INCOME FROM INVESTMENT OPERATIONS: | ||||||||||||||||||||
| Net investment income (loss)(i) | (0.05 | ) | (0.05 | ) | 0.63 | (0.07 | ) | (0.06 | ) | |||||||||||
| Net realized and unrealized gain (loss) on investments | 0.11 | (7.92 | ) | 7.67 | 5.89 | 1.51 | ||||||||||||||
| Total from investment operations | 0.06 | (7.97 | ) | 8.30 | 5.82 | 1.45 | ||||||||||||||
| Dividends from net investment income | — | (0.52 | ) | — | — | — | ||||||||||||||
| Distributions from net realized gains | — | (6.13 | ) | (2.15 | ) | (1.20 | ) | (0.71 | ) | |||||||||||
| Net asset value, end of period | $ | 11.22 | $ | 11.16 | $ | 25.78 | $ | 19.63 | $ | 15.01 | ||||||||||
| Total return(ii) | 0.54 | % | (38.95 | )% | 44.55 | %(iii) | 41.75 | % | 11.27 | % | ||||||||||
| RATIOS/SUPPLEMENTAL DATA: | ||||||||||||||||||||
| Net assets, end of period (000’s omitted) | $ | 42,274 | $ | 30,488 | $ | 52,746 | $ | 26,804 | $ | 17,558 | ||||||||||
| Ratio of gross expenses to average net assets | 0.96 | % | 0.93 | % | 0.92 | % | 0.99 | % | 1.03 | % | ||||||||||
| Ratio of net expenses to average net assets | 0.96 | % | 0.93 | % | 0.92 | % | 0.99 | % | 1.03 | % | ||||||||||
| Ratio of net investment income (loss) to average net assets | (0.41 | )% | (0.37 | )% | 2.75 | % | (0.46 | )% | (0.38 | )% | ||||||||||
| Portfolio turnover rate | 78.35 | % | 204.79 | % | 170.96 | % | 181.73 | % | 182.97 | % | ||||||||||
See Notes to Financial Statements.
| (i) | Amount was computed based on average shares outstanding during the period. |
| (ii) | Does not reflect the effect of sales charges, if applicable. |
| (iii) | Pursuant to the U.S. Securities and Exchange Commission’s Rules on Fair Fund and Disgorgement Plans, the Alger Mid Cap Growth Fund received a Fair Fund distribution of $9,346,397, which contributed approximately 3.89% to its annual return. |
THE ALGER FUNDS
Financial Highlights for a share outstanding throughout the period
| Alger Mid Cap Focus Fund | Class A | |||||||||||
| From 7/29/2021 | ||||||||||||
| (commencement | ||||||||||||
| Year ended | Year ended | of operations) to | ||||||||||
| 10/31/2023 | 10/31/2022 | 10/31/2021(i) | ||||||||||
| Net asset value, beginning of period | $ | 12.14 | $ | 23.43 | $ | 20.67 | ||||||
| INCOME FROM INVESTMENT OPERATIONS: | ||||||||||||
| Net investment loss(ii) | (0.10 | ) | (0.09 | ) | (0.04 | ) | ||||||
| Net realized and unrealized gain (loss) on investments | (0.71 | ) | (9.14 | ) | 2.80 | |||||||
| Total from investment operations | (0.81 | ) | (9.23 | ) | 2.76 | |||||||
| Distributions from net realized gains | — | (2.06 | ) | — | ||||||||
| Net asset value, end of period | $ | 11.33 | $ | 12.14 | $ | 23.43 | ||||||
| Total return(iii) | (6.67 | )% | (42.27 | )% | 13.35 | % | ||||||
| RATIOS/SUPPLEMENTAL DATA: | ||||||||||||
| Net assets, end of period (000’s omitted) | $ | 3,307 | $ | 5,083 | $ | 1,669 | ||||||
| Ratio of gross expenses to average net assets | 1.14 | % | 1.05 | % | 0.96 | % | ||||||
| Ratio of net expenses to average net assets | 1.14 | % | 1.05 | % | 0.96 | % | ||||||
| Ratio of net investment loss to average net assets | (0.80 | )% | (0.66 | )% | (0.72 | )% | ||||||
| Portfolio turnover rate | 121.07 | % | 267.86 | % | 250.31 | % | ||||||
See Notes to Financial Statements.
| (i) | Ratios have been annualized; total return has not been annualized; portfolio turnover is for the four months then ended. |
| (ii) | Amount was computed based on average shares outstanding during the period. |
| (iii) | Does not reflect the effect of sales charges, if applicable. |
THE ALGER FUNDS
Financial Highlights for a share outstanding throughout the period
| Alger Mid Cap Focus Fund | Class C | |||||||||||
| From 7/29/2021 | ||||||||||||
| (commencement | ||||||||||||
| Year ended | Year ended | of operations) to | ||||||||||
| 10/31/2023 | 10/31/2022 | 10/31/2021(i) | ||||||||||
| Net asset value, beginning of period | $ | 12.01 | $ | 23.38 | $ | 20.67 | ||||||
| INCOME FROM INVESTMENT OPERATIONS: | ||||||||||||
| Net investment loss(ii) | (0.19 | ) | (0.21 | ) | (0.09 | ) | ||||||
| Net realized and unrealized gain (loss) on investments | (0.69 | ) | (9.10 | ) | 2.80 | |||||||
| Total from investment operations | (0.88 | ) | (9.31 | ) | 2.71 | |||||||
| Distributions from net realized gains | — | (2.06 | ) | — | ||||||||
| Net asset value, end of period | $ | 11.13 | $ | 12.01 | $ | 23.38 | ||||||
| Total return(iii) | (7.33 | )% | (42.78 | )% | 13.16 | % | ||||||
| RATIOS/SUPPLEMENTAL DATA: | ||||||||||||
| Net assets, end of period (000’s omitted) | $ | 2,070 | $ | 2,433 | $ | 2,317 | ||||||
| Ratio of gross expenses to average net assets | 1.96 | % | 1.85 | % | 1.76 | % | ||||||
| Ratio of expense reimbursements to average net assets | (0.02 | )% | — | — | ||||||||
| Ratio of net expenses to average net assets | 1.94 | % | 1.85 | % | 1.76 | % | ||||||
| Ratio of net investment loss to average net assets | (1.60 | )% | (1.46 | )% | (1.50 | )% | ||||||
| Portfolio turnover rate | 121.07 | % | 267.86 | % | 250.31 | % | ||||||
See Notes to Financial Statements.
| (i) | Ratios have been annualized; total return has not been annualized; portfolio turnover is for the four months then ended. |
| (ii) | Amount was computed based on average shares outstanding during the period. |
| (iii) | Does not reflect the effect of sales charges, if applicable. |
THE ALGER FUNDS
Financial Highlights for a share outstanding throughout the period
| Alger Mid Cap Focus Fund | Class I | |||||||||||||||||||
| From 6/14/2019 | ||||||||||||||||||||
| (commencement | ||||||||||||||||||||
| Year ended | Year ended | Year ended | Year ended | of operations) to | ||||||||||||||||
| 10/31/2023 | 10/31/2022 | 10/31/2021 | 10/31/2020 | 10/31/2019(i) | ||||||||||||||||
| Net asset value, beginning of period | $ | 12.14 | $ | 23.43 | $ | 15.10 | $ | 9.70 | $ | 10.00 | ||||||||||
| INCOME FROM INVESTMENT OPERATIONS: | ||||||||||||||||||||
| Net investment loss(ii) | (0.08 | ) | (0.10 | ) | (0.17 | ) | (0.14 | ) | (0.04 | ) | ||||||||||
| Net realized and unrealized gain (loss) on investments | (0.72 | ) | (9.13 | ) | 8.76 | 5.54 | (0.26 | ) | ||||||||||||
| Total from investment operations | (0.80 | ) | (9.23 | ) | 8.59 | 5.40 | (0.30 | ) | ||||||||||||
| Distributions from net realized gains | — | (2.06 | ) | (0.26 | ) | — | — | |||||||||||||
| Net asset value, end of period | $ | 11.34 | $ | 12.14 | $ | 23.43 | $ | 15.10 | $ | 9.70 | ||||||||||
| Total return(iii) | (6.59 | )% | (42.28 | )% | 57.36 | % | 55.35 | % | (3.00 | )% | ||||||||||
| RATIOS/SUPPLEMENTAL DATA: | ||||||||||||||||||||
| Net assets, end of period (000’s omitted) | $ | 11,512 | $ | 62,499 | $ | 145,539 | $ | 67,796 | $ | 2,023 | ||||||||||
| Ratio of gross expenses to average net assets | 1.12 | % | 1.01 | % | 0.95 | % | 1.14 | % | 1.91 | % | ||||||||||
| Ratio of expense reimbursements to average net assets | — | — | — | (0.03 | )% | (0.71 | )% | |||||||||||||
| Ratio of net expenses to average net assets | 1.12 | % | 1.01 | % | 0.95 | % | 1.11 | % | 1.20 | % | ||||||||||
| Ratio of net investment loss to average net assets | (0.67 | )% | (0.63 | )% | (0.85 | )% | (1.04 | )% | (0.97 | )% | ||||||||||
| Portfolio turnover rate | 121.07 | % | 267.86 | % | 250.31 | % | 123.43 | % | 65.50 | % | ||||||||||
See Notes to Financial Statements.
| (i) | Ratios have been annualized; total return has not been annualized; portfolio turnover is for the five months then ended. |
| (ii) | Amount was computed based on average shares outstanding during the period. |
| (iii) | Does not reflect the effect of sales charges, if applicable. |
THE ALGER FUNDS
Financial Highlights for a share outstanding throughout the period
| Alger Mid Cap Focus Fund | Class Y | |||||||||||
| From 2/26/2021 | ||||||||||||
| (commencement | ||||||||||||
| Year ended | Year ended | of operations) to | ||||||||||
| 10/31/2023 | 10/31/2022 | 10/31/2021(i) | ||||||||||
| Net asset value, beginning of period | $ | 12.26 | $ | 23.56 | $ | 20.65 | ||||||
| INCOME FROM INVESTMENT OPERATIONS: | ||||||||||||
| Net investment loss(ii) | (0.04 | ) | (0.06 | ) | (0.08 | ) | ||||||
| Net realized and unrealized gain (loss) on investments | (0.73 | ) | (9.18 | ) | 2.99 | |||||||
| Total from investment operations | (0.77 | ) | (9.24 | ) | 2.91 | |||||||
| Distributions from net realized gains | — | (2.06 | ) | — | ||||||||
| Net asset value, end of period | $ | 11.49 | $ | 12.26 | $ | 23.56 | ||||||
| Total return(iii) | (6.28 | )% | (42.07 | )% | 14.09 | % | ||||||
| RATIOS/SUPPLEMENTAL DATA: | ||||||||||||
| Net assets, end of period (000’s omitted) | $ | 189 | $ | 443 | $ | 137 | ||||||
| Ratio of gross expenses to average net assets | 0.84 | % | 0.74 | % | 0.72 | % | ||||||
| Ratio of expense reimbursements to average net assets | (0.12 | )% | (0.05 | )% | (0.02 | )% | ||||||
| Ratio of net expenses to average net assets | 0.72 | % | 0.69 | % | 0.70 | % | ||||||
| Ratio of net investment loss to average net assets | (0.32 | )% | (0.44 | )% | (0.57 | )% | ||||||
| Portfolio turnover rate | 121.07 | % | 267.86 | % | 250.31 | % | ||||||
See Notes to Financial Statements.
| (i) | Ratios have been annualized; total return has not been annualized; portfolio turnover is for the eight months then ended. |
| (ii) | Amount was computed based on average shares outstanding during the period. |
| (iii) | Does not reflect the effect of sales charges, if applicable. |
THE ALGER FUNDS
Financial Highlights for a share outstanding throughout the period
| Alger Mid Cap Focus Fund | Class Z | |||||||||||||||||||
| From 6/14/2019 | ||||||||||||||||||||
| (commencement | ||||||||||||||||||||
| Year ended | Year ended | Year ended | Year ended | of operations) to | ||||||||||||||||
| 10/31/2023 | 10/31/2022 | 10/31/2021 | 10/31/2020 | 10/31/2019(i) | ||||||||||||||||
| Net asset value, beginning of period | $ | 12.26 | �� | $ | 23.57 | $ | 15.15 | $ | 9.71 | $ | 10.00 | |||||||||
| INCOME FROM INVESTMENT OPERATIONS: | ||||||||||||||||||||
| Net investment loss(ii) | (0.06 | ) | (0.05 | ) | (0.12 | ) | (0.10 | ) | (0.03 | ) | ||||||||||
| Net realized and unrealized gain (loss) on investments | (0.71 | ) | (9.20 | ) | 8.80 | 5.54 | (0.26 | ) | ||||||||||||
| Total from investment operations | (0.77 | ) | (9.25 | ) | 8.68 | 5.44 | (0.29 | ) | ||||||||||||
| Distributions from net realized gains | — | (2.06 | ) | (0.26 | ) | — | — | |||||||||||||
| Net asset value, end of period | $ | 11.49 | $ | 12.26 | $ | 23.57 | $ | 15.15 | $ | 9.71 | ||||||||||
| Total return(iii) | (6.28 | )% | (42.10 | )% | 57.77 | % | 55.70 | % | (2.80 | )% | ||||||||||
| RATIOS/SUPPLEMENTAL DATA: | ||||||||||||||||||||
| Net assets, end of period (000’s omitted) | $ | 217,843 | $ | 365,976 | $ | 795,479 | $ | 307,532 | $ | 28,230 | ||||||||||
| Ratio of gross expenses to average net assets | 0.83 | % | 0.71 | % | 0.68 | % | 0.91 | % | 1.86 | % | ||||||||||
| Ratio of expense reimbursements to average net assets | — | — | — | (0.05 | )% | (0.87 | )% | |||||||||||||
| Ratio of net expenses to average net assets | 0.83 | % | 0.71 | % | 0.68 | % | 0.86 | % | 0.99 | % | ||||||||||
| Ratio of net investment income (loss) to average net assets | (0.48 | )% | (0.33 | )% | (0.58 | )% | (0.77 | )% | (0.74 | )% | ||||||||||
| Portfolio turnover rate | 121.07 | % | 267.86 | % | 250.31 | % | 123.43 | % | 65.50 | % | ||||||||||
See Notes to Financial Statements.
| (i) | Ratios have been annualized; total return has not been annualized; portfolio turnover is for the five months then ended. |
| (ii) | Amount was computed based on average shares outstanding during the period. |
| (iii) | Does not reflect the effect of sales charges, if applicable. |
THE ALGER FUNDS
Financial Highlights for a share outstanding throughout the period
| Alger Weatherbie Specialized Growth Fund | Class A | |||||||||||||||||||
| Year ended | Year ended | Year ended | Year ended | Year ended | ||||||||||||||||
| 10/31/2023 | 10/31/2022 | 10/31/2021 | 10/31/2020 | 10/31/2019 | ||||||||||||||||
| Net asset value, beginning of period | $ | 11.57 | $ | 24.96 | $ | 17.46 | $ | 13.30 | $ | 13.08 | ||||||||||
| INCOME FROM INVESTMENT OPERATIONS: | ||||||||||||||||||||
| Net investment loss(i) | (0.10 | ) | (0.14 | ) | (0.23 | ) | (0.16 | ) | (0.14 | ) | ||||||||||
| Net realized and unrealized gain (loss) on investments | (1.35 | ) | (8.91 | ) | 8.70 | 4.88 | 1.39 | |||||||||||||
| Total from investment operations | (1.45 | ) | (9.05 | ) | 8.47 | 4.72 | 1.25 | |||||||||||||
| Distributions from net realized gains | — | (4.34 | ) | (0.97 | ) | (0.56 | ) | (1.03 | ) | |||||||||||
| Net asset value, end of period | $ | 10.12 | $ | 11.57 | $ | 24.96 | $ | 17.46 | $ | 13.30 | ||||||||||
| Total return(ii) | (12.53 | )% | (42.03 | )% | 49.80 | % | 36.57 | % | 11.57 | % | ||||||||||
| RATIOS/SUPPLEMENTAL DATA: | ||||||||||||||||||||
| Net assets, end of period (000’s omitted) | $ | 86,257 | $ | 119,741 | $ | 259,394 | $ | 174,709 | $ | 140,368 | ||||||||||
| Ratio of gross expenses to average net assets | 1.32 | % | 1.25 | % | 1.20 | % | 1.27 | % | 1.31 | % | ||||||||||
| Ratio of net expenses to average net assets | 1.32 | % | 1.25 | % | 1.20 | % | 1.27 | % | 1.31 | % | ||||||||||
| Ratio of net investment loss to average net assets | (0.90 | )% | (0.95 | )% | (1.03 | )% | (1.09 | )% | (1.08 | )% | ||||||||||
| Portfolio turnover rate | 40.32 | % | 55.97 | % | 61.53 | % | 66.84 | % | 64.83 | % | ||||||||||
See Notes to Financial Statements.
| (i) | Amount was computed based on average shares outstanding during the period. |
| (ii) | Does not reflect the effect of sales charges, if applicable. |
THE ALGER FUNDS
Financial Highlights for a share outstanding throughout the period
| Alger Weatherbie Specialized Growth Fund | Class C | |||||||||||||||||||
| Year ended | Year ended | Year ended | Year ended | Year ended | ||||||||||||||||
| 10/31/2023 | 10/31/2022 | 10/31/2021 | 10/31/2020 | 10/31/2019 | ||||||||||||||||
| Net asset value, beginning of period | $ | 6.29 | $ | 15.93 | $ | 11.52 | $ | 9.01 | $ | 9.30 | ||||||||||
| INCOME FROM INVESTMENT OPERATIONS: | ||||||||||||||||||||
| Net investment loss(i) | (0.10 | ) | (0.14 | ) | (0.25 | ) | (0.19 | ) | (0.17 | ) | ||||||||||
| Net realized and unrealized gain (loss) on investments | (0.74 | ) | (5.16 | ) | 5.63 | 3.26 | 0.91 | |||||||||||||
| Total from investment operations | (0.84 | ) | (5.30 | ) | 5.38 | 3.07 | 0.74 | |||||||||||||
| Distributions from net realized gains | — | (4.34 | ) | (0.97 | ) | (0.56 | ) | (1.03 | ) | |||||||||||
| Net asset value, end of period | $ | 5.45 | $ | 6.29 | $ | 15.93 | $ | 11.52 | $ | 9.01 | ||||||||||
| Total return(ii) | (13.35 | )% | (42.46 | )% | 48.68 | % | 35.62 | % | 10.70 | % | ||||||||||
| RATIOS/SUPPLEMENTAL DATA: | ||||||||||||||||||||
| Net assets, end of period (000’s omitted) | $ | 29,559 | $ | 44,815 | $ | 103,331 | $ | 64,497 | $ | 44,908 | ||||||||||
| Ratio of gross expenses to average net assets | 2.08 | % | 2.02 | % | 1.95 | % | 2.03 | % | 2.05 | % | ||||||||||
| Ratio of net expenses to average net assets | 2.08 | % | 2.02 | % | 1.95 | % | 2.03 | % | 2.05 | % | ||||||||||
| Ratio of net investment loss to average net assets | (1.67 | )% | (1.72 | )% | (1.79 | )% | (1.85 | )% | (1.82 | )% | ||||||||||
| Portfolio turnover rate | 40.32 | % | 55.97 | % | 61.53 | % | 66.84 | % | 64.83 | % | ||||||||||
See Notes to Financial Statements.
| (i) | Amount was computed based on average shares outstanding during the period. |
| (ii) | Does not reflect the effect of sales charges, if applicable. |
THE ALGER FUNDS
Financial Highlights for a share outstanding throughout the period
| Alger Weatherbie Specialized Growth Fund | Class I | |||||||||||||||||||
| Year ended | Year ended | Year ended | Year ended | Year ended | ||||||||||||||||
| 10/31/2023 | 10/31/2022 | 10/31/2021 | 10/31/2020 | 10/31/2019 | ||||||||||||||||
| Net asset value, beginning of period | $ | 11.99 | $ | 25.67 | $ | 17.94 | $ | 13.64 | $ | 13.38 | ||||||||||
| INCOME FROM INVESTMENT OPERATIONS: | ||||||||||||||||||||
| Net investment loss(i) | (0.10 | ) | (0.14 | ) | (0.23 | ) | (0.16 | ) | (0.14 | ) | ||||||||||
| Net realized and unrealized gain (loss) on investments | (1.41 | ) | (9.20 | ) | 8.93 | 5.02 | 1.43 | |||||||||||||
| Total from investment operations | (1.51 | ) | (9.34 | ) | 8.70 | 4.86 | 1.29 | |||||||||||||
| Distributions from net realized gains | — | (4.34 | ) | (0.97 | ) | (0.56 | ) | (1.03 | ) | |||||||||||
| Net asset value, end of period | $ | 10.48 | $ | 11.99 | $ | 25.67 | $ | 17.94 | $ | 13.64 | ||||||||||
| Total return(ii) | (12.59 | )% | (42.02 | )% | 49.81 | % | 36.69 | % | 11.61 | % | ||||||||||
| RATIOS/SUPPLEMENTAL DATA: | ||||||||||||||||||||
| Net assets, end of period (000’s omitted) | $ | 13,179 | $ | 29,612 | $ | 77,214 | $ | 66,294 | $ | 58,615 | ||||||||||
| Ratio of gross expenses to average net assets | 1.31 | % | 1.25 | % | 1.19 | % | 1.24 | % | 1.26 | % | ||||||||||
| Ratio of net expenses to average net assets | 1.31 | % | 1.25 | % | 1.19 | % | 1.24 | % | 1.26 | % | ||||||||||
| Ratio of net investment loss to average net assets | (0.88 | )% | (0.95 | )% | (1.02 | )% | (1.07 | )% | (1.03 | )% | ||||||||||
| Portfolio turnover rate | 40.32 | % | 55.97 | % | 61.53 | % | 66.84 | % | 64.83 | % | ||||||||||
See Notes to Financial Statements.
| (i) | Amount was computed based on average shares outstanding during the period. |
| (ii) | Does not reflect the effect of sales charges, if applicable. |
THE ALGER FUNDS
Financial Highlights for a share outstanding throughout the period
| Alger Weatherbie Specialized Growth Fund | Class Y | |||||||||||||||||||
| Year ended | Year ended | Year ended | Year ended | Year ended | ||||||||||||||||
| 10/31/2023 | 10/31/2022 | 10/31/2021 | 10/31/2020 | 10/31/2019 | ||||||||||||||||
| Net asset value, beginning of period | $ | 12.29 | $ | 26.12 | $ | 18.17 | $ | 13.77 | $ | 13.44 | ||||||||||
| INCOME FROM INVESTMENT OPERATIONS: | ||||||||||||||||||||
| Net investment loss(i) | (0.06 | ) | (0.08 | ) | (0.16 | ) | (0.11 | ) | (0.09 | ) | ||||||||||
| Net realized and unrealized gain (loss) on investments | (1.44 | ) | (9.41 | ) | 9.08 | 5.07 | 1.45 | |||||||||||||
| Total from investment operations | (1.50 | ) | (9.49 | ) | 8.92 | 4.96 | 1.36 | |||||||||||||
| Distributions from net realized gains | — | (4.34 | ) | (0.97 | ) | (0.56 | ) | (1.03 | ) | |||||||||||
| Net asset value, end of period | $ | 10.79 | $ | 12.29 | $ | 26.12 | $ | 18.17 | $ | 13.77 | ||||||||||
| Total return(ii) | (12.21 | )% | (41.81 | )% | 50.35 | % | 37.08 | % | 12.12 | % | ||||||||||
| RATIOS/SUPPLEMENTAL DATA: | ||||||||||||||||||||
| Net assets, end of period (000’s omitted) | $ | 43,625 | $ | 47,379 | $ | 61,163 | $ | 32,702 | $ | 12,903 | ||||||||||
| Ratio of gross expenses to average net assets | 0.96 | % | 0.91 | % | 0.89 | % | 0.94 | % | 0.97 | % | ||||||||||
| Ratio of expense reimbursements to average net assets | (0.07 | )% | (0.04 | )% | (0.02 | )% | (0.07 | )% | (0.10 | )% | ||||||||||
| Ratio of net expenses to average net assets | 0.89 | % | 0.87 | % | 0.87 | % | 0.87 | % | 0.87 | % | ||||||||||
| Ratio of net investment loss to average net assets | (0.47 | )% | (0.55 | )% | (0.70 | )% | (0.69 | )% | (0.64 | )% | ||||||||||
| Portfolio turnover rate | 40.32 | % | 55.97 | % | 61.53 | % | 66.84 | % | 64.83 | % | ||||||||||
See Notes to Financial Statements.
| (i) | Amount was computed based on average shares outstanding during the period. |
| (ii) | Does not reflect the effect of sales charges, if applicable. |
THE ALGER FUNDS
Financial Highlights for a share outstanding throughout the period
| Alger Weatherbie Specialized Growth Fund | Class Z | |||||||||||||||||||
| Year ended | Year ended | Year ended | Year ended | Year ended | ||||||||||||||||
| 10/31/2023 | 10/31/2022 | 10/31/2021 | 10/31/2020 | 10/31/2019 | ||||||||||||||||
| Net asset value, beginning of period | $ | 12.73 | $ | 26.87 | $ | 18.68 | $ | 14.15 | $ | 13.80 | ||||||||||
| INCOME FROM INVESTMENT OPERATIONS: | ||||||||||||||||||||
| Net investment loss(i) | (0.07 | ) | (0.10 | ) | (0.17 | ) | (0.12 | ) | (0.10 | ) | ||||||||||
| Net realized and unrealized gain (loss) on investments | (1.49 | ) | (9.70 | ) | 9.33 | 5.21 | 1.48 | |||||||||||||
| Total from investment operations | (1.56 | ) | (9.80 | ) | 9.16 | 5.09 | 1.38 | |||||||||||||
| Distributions from net realized gains | — | (4.34 | ) | (0.97 | ) | (0.56 | ) | (1.03 | ) | |||||||||||
| Net asset value, end of period | $ | 11.17 | $ | 12.73 | $ | 26.87 | $ | 18.68 | $ | 14.15 | ||||||||||
| Total return(ii) | (12.25 | )% | (41.82 | )% | 50.32 | % | 37.00 | % | 11.94 | % | ||||||||||
| RATIOS/SUPPLEMENTAL DATA: | ||||||||||||||||||||
| Net assets, end of period (000’s omitted) | $ | 339,777 | $ | 535,172 | $ | 1,277,576 | $ | 620,005 | $ | 284,393 | ||||||||||
| Ratio of gross expenses to average net assets | 0.96 | % | 0.91 | % | 0.88 | % | 0.94 | % | 0.97 | % | ||||||||||
| Ratio of net expenses to average net assets | 0.96 | % | 0.91 | % | 0.88 | % | 0.94 | % | 0.97 | % | ||||||||||
| Ratio of net investment loss to average net assets | (0.54 | )% | (0.61 | )% | (0.72 | )% | (0.76 | )% | (0.73 | )% | ||||||||||
| Portfolio turnover rate | 40.32 | % | 55.97 | % | 61.53 | % | 66.84 | % | 64.83 | % | ||||||||||
See Notes to Financial Statements.
| (i) | Amount was computed based on average shares outstanding during the period. |
| (ii) | Does not reflect the effect of sales charges, if applicable. |
THE ALGER FUNDS
Financial Highlights for a share outstanding throughout the period
| Alger Small Cap Growth Fund | Class A | |||||||||||||||||||
| Year ended | Year ended | Year ended | Year ended | Year ended | ||||||||||||||||
| 10/31/2023 | 10/31/2022 | 10/31/2021 | 10/31/2020 | 10/31/2019 | ||||||||||||||||
| Net asset value, beginning of period | $ | 8.83 | $ | 16.21 | $ | 12.59 | $ | 9.34 | $ | 9.54 | ||||||||||
| INCOME FROM INVESTMENT OPERATIONS: | ||||||||||||||||||||
| Net investment loss(i) | (0.08 | ) | (0.11 | ) | (0.07 | ) | (0.12 | ) | (0.11 | ) | ||||||||||
| Net realized and unrealized gain (loss) on investments | (0.85 | ) | (5.93 | ) | 3.76 | 3.91 | 0.85 | |||||||||||||
| Total from investment operations | (0.93 | ) | (6.04 | ) | 3.69 | 3.79 | 0.74 | |||||||||||||
| Distributions from net realized gains | — | (1.34 | ) | (0.07 | ) | (0.54 | ) | (0.94 | ) | |||||||||||
| Net asset value, end of period | $ | 7.90 | $ | 8.83 | $ | 16.21 | $ | 12.59 | $ | 9.34 | ||||||||||
| Total return(ii) | (10.53 | )% | (39.87 | )% | 29.27 | %(iii) | 42.80 | % | 9.94 | % | ||||||||||
| RATIOS/SUPPLEMENTAL DATA: | ||||||||||||||||||||
| Net assets, end of period (000’s omitted) | $ | 110,041 | $ | 142,244 | $ | 262,708 | $ | 187,489 | $ | 116,308 | ||||||||||
| Ratio of gross expenses to average net assets | 1.32 | % | 1.29 | % | 1.23 | % | 1.33 | % | 1.39 | % | ||||||||||
| Ratio of net expenses to average net assets | 1.32 | % | 1.29 | % | 1.23 | % | 1.33 | % | 1.39 | % | ||||||||||
| Ratio of net investment loss to average net assets | (0.93 | )% | (1.01 | )% | (0.46 | )% | (1.11 | )% | (1.17 | )% | ||||||||||
| Portfolio turnover rate | 30.15 | % | 15.44 | % | 34.85 | % | 12.67 | % | 17.09 | % | ||||||||||
See Notes to Financial Statements.
| (i) | Amount was computed based on average shares outstanding during the period. |
| (ii) | Does not reflect the effect of sales charges, if applicable. |
| (iii) | Pursuant to the U.S. Securities and Exchange Commission’s Rules on Fair Fund and Disgorgement Plans, the Alger Small Cap Growth Fund received a Fair Fund distribution of $3,738,004, which contributed approximately 0.72% to its annual return. |
THE ALGER FUNDS
Financial Highlights for a share outstanding throughout the period
| Alger Small Cap Growth Fund | Class B | |||||||||||||||||||
| Year ended | Year ended | Year ended | Year ended | Year ended | ||||||||||||||||
| 10/31/2023 | 10/31/2022 | 10/31/2021 | 10/31/2020 | 10/31/2019 | ||||||||||||||||
| Net asset value, beginning of period | $ | 5.94 | $ | 11.41 | $ | 8.88 | $ | 6.74 | $ | 7.20 | ||||||||||
| INCOME FROM INVESTMENT OPERATIONS: | ||||||||||||||||||||
| Net investment loss(i) | (0.06 | ) | (0.08 | ) | (0.05 | ) | (0.08 | ) | (0.11 | ) | ||||||||||
| Net realized and unrealized gain (loss) on investments | (0.57 | ) | (4.05 | ) | 2.65 | 2.76 | 0.59 | |||||||||||||
| Total from investment operations | (0.63 | ) | (4.13 | ) | 2.60 | 2.68 | 0.48 | |||||||||||||
| Distributions from net realized gains | — | (1.34 | ) | (0.07 | ) | (0.54 | ) | (0.94 | ) | |||||||||||
| Net asset value, end of period | $ | 5.31 | $ | 5.94 | $ | 11.41 | $ | 8.88 | $ | 6.74 | ||||||||||
| Total return(ii) | (10.61 | )% | (39.91 | )% | 29.38 | %(iii) | 42.68 | % | 9.51 | % | ||||||||||
| RATIOS/SUPPLEMENTAL DATA: | ||||||||||||||||||||
| Net assets, end of period (000’s omitted) | $ | 2,212 | $ | 3,038 | $ | 5,821 | $ | 5,095 | $ | 4,523 | ||||||||||
| Ratio of gross expenses to average net assets | 2.05 | % | 2.00 | % | 1.96 | % | 2.07 | % | 2.19 | % | ||||||||||
| Ratio of expense reimbursements to average net assets | (0.64 | )% | (0.64 | )% | (0.74 | )% | (0.73 | )% | (0.41 | )% | ||||||||||
| Ratio of net expenses to average net assets | 1.41 | % | 1.36 | % | 1.22 | % | 1.34 | % | 1.78 | % | ||||||||||
| Ratio of net investment loss to average net assets | (1.02 | )% | (1.09 | )% | (0.48 | )% | (1.11 | )% | (1.57 | )% | ||||||||||
| Portfolio turnover rate | 30.15 | % | 15.44 | % | 34.85 | % | 12.67 | % | 17.09 | % | ||||||||||
See Notes to Financial Statements.
| (i) | Amount was computed based on average shares outstanding during the period. |
| (ii) | Does not reflect the effect of sales charges, if applicable. |
| (iii) | Pursuant to the U.S. Securities and Exchange Commission’s Rules on Fair Fund and Disgorgement Plans, the Alger Small Cap Growth Fund received a Fair Fund distribution of $3,738,004, which contributed approximately 0.72% to its annual return. |
THE ALGER FUNDS
Financial Highlights for a share outstanding throughout the period
| Alger Small Cap Growth Fund | Class C | |||||||||||||||||||
| Year ended | Year ended | Year ended | Year ended | Year ended | ||||||||||||||||
| 10/31/2023 | 10/31/2022 | 10/31/2021 | 10/31/2020 | 10/31/2019 | ||||||||||||||||
| Net asset value, beginning of period | $ | 5.51 | $ | 10.76 | $ | 8.44 | $ | 6.47 | $ | 6.99 | ||||||||||
| INCOME FROM INVESTMENT OPERATIONS: | ||||||||||||||||||||
| Net investment loss(i) | (0.09 | ) | (0.12 | ) | (0.13 | ) | (0.14 | ) | (0.13 | ) | ||||||||||
| Net realized and unrealized gain (loss) on investments | (0.53 | ) | (3.79 | ) | 2.52 | 2.65 | 0.55 | |||||||||||||
| Total from investment operations | (0.62 | ) | (3.91 | ) | 2.39 | 2.51 | 0.42 | |||||||||||||
| Distributions from net realized gains | — | (1.34 | ) | (0.07 | ) | (0.54 | ) | (0.94 | ) | |||||||||||
| Net asset value, end of period | $ | 4.89 | $ | 5.51 | $ | 10.76 | $ | 8.44 | $ | 6.47 | ||||||||||
| Total return(ii) | (11.25 | )% | (40.32 | )% | 28.41 | %(iii) | 41.76 | % | 8.87 | % | ||||||||||
| RATIOS/SUPPLEMENTAL DATA: | ||||||||||||||||||||
| Net assets, end of period (000’s omitted) | $ | 14,851 | $ | 21,105 | $ | 39,148 | $ | 18,365 | $ | 6,257 | ||||||||||
| Ratio of gross expenses to average net assets | 2.12 | % | 2.09 | % | 2.00 | % | 2.09 | % | 2.20 | % | ||||||||||
| Ratio of net expenses to average net assets | 2.12 | % | 2.09 | % | 2.00 | % | 2.09 | % | 2.20 | % | ||||||||||
| Ratio of net investment loss to average net assets | (1.72 | )% | (1.81 | )% | (1.21 | )% | (1.90 | )% | (1.98 | )% | ||||||||||
| Portfolio turnover rate | 30.15 | % | 15.44 | % | 34.85 | % | 12.67 | % | 17.09 | % | ||||||||||
See Notes to Financial Statements.
| (i) | Amount was computed based on average shares outstanding during the period. |
| (ii) | Does not reflect the effect of sales charges, if applicable. |
| (iii) | Pursuant to the U.S. Securities and Exchange Commission’s Rules on Fair Fund and Disgorgement Plans, the Alger Small Cap Growth Fund received a Fair Fund distribution of $3,738,004, which contributed approximately 0.72% to its annual return. |
THE ALGER FUNDS
Financial Highlights for a share outstanding throughout the period
| Alger Small Cap Growth Fund | Class Y | |||||||
| From 12/31/2021 | ||||||||
| (commencement | ||||||||
| Year ended | of operations) to | |||||||
| 10/31/2023 | 10/31/2022(i) | |||||||
| Net asset value, beginning of period | $ | 9.31 | $ | 13.84 | ||||
| INCOME FROM INVESTMENT OPERATIONS: | ||||||||
| Net investment loss(ii) | (0.04 | ) | (0.04 | ) | ||||
| Net realized and unrealized gain (loss) on investments | (0.91 | ) | (4.49 | ) | ||||
| Total from investment operations | (0.95 | ) | (4.53 | ) | ||||
| Net asset value, end of period | $ | 8.36 | $ | 9.31 | ||||
| Total return(iii) | (10.20 | )% | (32.73 | )% | ||||
| RATIOS/SUPPLEMENTAL DATA: | ||||||||
| Net assets, end of period (000’s omitted) | $ | 7,258 | $ | 8,050 | ||||
| Ratio of gross expenses to average net assets | 0.99 | % | 0.96 | % | ||||
| Ratio of expense reimbursements to average net assets | (0.14 | )% | (0.12 | )% | ||||
| Ratio of net expenses to average net assets | 0.85 | % | 0.84 | % | ||||
| Ratio of net investment loss to average net assets | (0.47 | )% | (0.44 | )% | ||||
| Portfolio turnover rate | 30.15 | % | 15.44 | % | ||||
See Notes to Financial Statements.
| (i) | Ratios have been annualized; total return has not been annualized; portfolio turnover is for the ten months then ended. |
| (ii) | Amount was computed based on average shares outstanding during the period. |
| (iii) | Does not reflect the effect of sales charges, if applicable. |
THE ALGER FUNDS
Financial Highlights for a share outstanding throughout the period
| Alger Small Cap Growth Fund | Class Z | |||||||||||||||||||
| Year ended | Year ended | Year ended | Year ended | Year ended | ||||||||||||||||
| 10/31/2023 | 10/31/2022 | 10/31/2021 | 10/31/2020 | 10/31/2019 | ||||||||||||||||
| Net asset value, beginning of period | $ | 9.29 | $ | 16.92 | $ | 13.10 | $ | 9.66 | $ | 9.80 | ||||||||||
| INCOME FROM INVESTMENT OPERATIONS: | ||||||||||||||||||||
| Net investment loss(i) | (0.05 | ) | (0.08 | ) | (0.02 | ) | (0.10 | ) | (0.07 | ) | ||||||||||
| Net realized and unrealized gain (loss) on investments | (0.90 | ) | (6.21 | ) | 3.91 | 4.08 | 0.87 | |||||||||||||
| Total from investment operations | (0.95 | ) | (6.29 | ) | 3.89 | 3.98 | 0.80 | |||||||||||||
| Distributions from net realized gains | — | (1.34 | ) | (0.07 | ) | (0.54 | ) | (0.94 | ) | |||||||||||
| Net asset value, end of period | $ | 8.34 | $ | 9.29 | $ | 16.92 | $ | 13.10 | $ | 9.66 | ||||||||||
| Total return(ii) | (10.23 | )% | (39.66 | )% | 29.66 | %(iii) | 43.38 | % | 10.33 | % | ||||||||||
| RATIOS/SUPPLEMENTAL DATA: | ||||||||||||||||||||
| Net assets, end of period (000’s omitted) | $ | 138,502 | $ | 214,819 | $ | 383,748 | $ | 179,276 | $ | 21,782 | ||||||||||
| Ratio of gross expenses to average net assets | 0.99 | % | 0.96 | % | 0.93 | % | 1.00 | % | 1.12 | % | ||||||||||
| Ratio of expense reimbursements to average net assets | — | — | — | (0.03 | )% | (0.13 | )% | |||||||||||||
| Ratio of net expenses to average net assets | 0.99 | % | 0.96 | % | 0.93 | % | 0.97 | % | 0.99 | % | ||||||||||
| Ratio of net investment loss to average net assets | (0.59 | )% | (0.68 | )% | (0.12 | )% | (0.81 | )% | (0.78 | )% | ||||||||||
| Portfolio turnover rate | 30.15 | % | 15.44 | % | 34.85 | % | 12.67 | % | 17.09 | % | ||||||||||
See Notes to Financial Statements.
| (i) | Amount was computed based on average shares outstanding during the period. |
| (ii) | Does not reflect the effect of sales charges, if applicable. |
| (iii) | Pursuant to the U.S. Securities and Exchange Commission’s Rules on Fair Fund and Disgorgement Plans, the Alger Small Cap Growth Fund received a Fair Fund distribution of $3,738,004, which contributed approximately 0.72% to its annual return. |
THE ALGER FUNDS
Financial Highlights for a share outstanding throughout the period
| Alger Small Cap Focus Fund | Class A | |||||||||||||||||||
| Year ended | Year ended | Year ended | Year ended | Year ended | ||||||||||||||||
| 10/31/2023 | 10/31/2022 | 10/31/2021 | 10/31/2020 | 10/31/2019 | ||||||||||||||||
| Net asset value, beginning of period | $ | 16.91 | $ | 31.74 | $ | 26.22 | $ | 19.93 | $ | 18.86 | ||||||||||
| INCOME FROM INVESTMENT OPERATIONS: | ||||||||||||||||||||
| Net investment loss(i) | (0.19 | ) | (0.19 | ) | (0.31 | ) | (0.25 | ) | (0.19 | ) | ||||||||||
| Net realized and unrealized gain (loss) on investments | (2.77 | ) | (12.84 | ) | 5.83 | 7.03 | 1.41 | |||||||||||||
| Total from investment operations | (2.96 | ) | (13.03 | ) | 5.52 | 6.78 | 1.22 | |||||||||||||
| Dividends from net investment income | — | — | — | (0.19 | ) | — | ||||||||||||||
| Distributions from net realized gains | — | (1.80 | ) | — | (0.30 | ) | (0.15 | ) | ||||||||||||
| Net asset value, end of period | $ | 13.95 | $ | 16.91 | $ | 31.74 | $ | 26.22 | $ | 19.93 | ||||||||||
| Total return(ii) | (17.50 | )% | (42.88 | )% | 21.05 | % | 34.74 | % | 6.59 | % | ||||||||||
| RATIOS/SUPPLEMENTAL DATA: | ||||||||||||||||||||
| Net assets, end of period (000’s omitted) | $ | 128,366 | $ | 226,738 | $ | 560,577 | $ | 566,606 | $ | 523,291 | ||||||||||
| Ratio of gross expenses to average net assets | 1.48 | % | 1.32 | % | 1.18 | % | 1.22 | % | 1.19 | % | ||||||||||
| Ratio of net expenses to average net assets | 1.48 | % | 1.32 | % | 1.18 | % | 1.22 | % | 1.19 | % | ||||||||||
| Ratio of net investment loss to average net assets | (1.18 | )% | (0.96 | )% | (0.98 | )% | (1.11 | )% | (0.95 | )% | ||||||||||
| Portfolio turnover rate | 68.04 | % | 37.57 | % | 56.71 | % | 37.49 | % | 48.84 | % | ||||||||||
See Notes to Financial Statements.
| (i) | Amount was computed based on average shares outstanding during the period. |
| (ii) | Does not reflect the effect of sales charges, if applicable. |
THE ALGER FUNDS
Financial Highlights for a share outstanding throughout the period
| Alger Small Cap Focus Fund | Class C | |||||||||||||||||||
| Year ended | Year ended | Year ended | Year ended | Year ended | ||||||||||||||||
| 10/31/2023 | 10/31/2022 | 10/31/2021 | 10/31/2020 | 10/31/2019 | ||||||||||||||||
| Net asset value, beginning of period | $ | 14.75 | $ | 28.12 | $ | 23.40 | $ | 17.85 | $ | 17.04 | ||||||||||
| INCOME FROM INVESTMENT OPERATIONS: | ||||||||||||||||||||
| Net investment loss(i) | (0.24 | ) | (0.28 | ) | (0.47 | ) | (0.37 | ) | (0.31 | ) | ||||||||||
| Net realized and unrealized gain (loss) on investments | (2.40 | ) | (11.29 | ) | 5.19 | 6.30 | 1.27 | |||||||||||||
| Total from investment operations | (2.64 | ) | (11.57 | ) | 4.72 | 5.93 | 0.96 | |||||||||||||
| Dividends from net investment income | — | — | — | (0.08 | ) | — | ||||||||||||||
| Distributions from net realized gains | — | (1.80 | ) | — | (0.30 | ) | (0.15 | ) | ||||||||||||
| Net asset value, end of period | $ | 12.11 | $ | 14.75 | $ | 28.12 | $ | 23.40 | $ | 17.85 | ||||||||||
| Total return(ii) | (17.97 | )% | (43.23 | )% | 20.17 | % | 33.85 | % | 5.76 | % | ||||||||||
| RATIOS/SUPPLEMENTAL DATA: | ||||||||||||||||||||
| Net assets, end of period (000’s omitted) | $ | 62,091 | $ | 108,988 | $ | 267,800 | $ | 248,577 | $ | 212,737 | ||||||||||
| Ratio of gross expenses to average net assets | 2.02 | % | 1.93 | % | 1.90 | % | 1.94 | % | 1.95 | % | ||||||||||
| Ratio of net expenses to average net assets | 2.02 | % | 1.93 | % | 1.90 | % | 1.94 | % | 1.95 | % | ||||||||||
| Ratio of net investment loss to average net assets | (1.72 | )% | (1.57 | )% | (1.70 | )% | (1.83 | )% | (1.71 | )% | ||||||||||
| Portfolio turnover rate | 68.04 | % | 37.57 | % | 56.71 | % | 37.49 | % | 48.84 | % | ||||||||||
See Notes to Financial Statements.
| (i) | Amount was computed based on average shares outstanding during the period. |
| (ii) | Does not reflect the effect of sales charges, if applicable. |
THE ALGER FUNDS
Financial Highlights for a share outstanding throughout the period
| Alger Small Cap Focus Fund | Class I | |||||||||||||||||||
| Year ended | Year ended | Year ended | Year ended | Year ended | ||||||||||||||||
| 10/31/2023 | 10/31/2022 | 10/31/2021 | 10/31/2020 | 10/31/2019 | ||||||||||||||||
| Net asset value, beginning of period | $ | 17.44 | $ | 32.61 | $ | 26.93 | $ | 20.44 | $ | 19.34 | ||||||||||
| INCOME FROM INVESTMENT OPERATIONS: | ||||||||||||||||||||
| Net investment loss(i) | (0.15 | ) | (0.18 | ) | (0.31 | ) | (0.24 | ) | (0.19 | ) | ||||||||||
| Net realized and unrealized gain (loss) on investments | (2.87 | ) | (13.19 | ) | 5.99 | 7.22 | 1.44 | |||||||||||||
| Total from investment operations | (3.02 | ) | (13.37 | ) | 5.68 | 6.98 | 1.25 | |||||||||||||
| Dividends from net investment income | — | — | — | (0.19 | ) | — | ||||||||||||||
| Distributions from net realized gains | — | (1.80 | ) | — | (0.30 | ) | (0.15 | ) | ||||||||||||
| Net asset value, end of period | $ | 14.42 | $ | 17.44 | $ | 32.61 | $ | 26.93 | $ | 20.44 | ||||||||||
| Total return(ii) | (17.32 | )% | (42.77 | )% | 21.09 | % | 34.86 | % | 6.58 | % | ||||||||||
| RATIOS/SUPPLEMENTAL DATA: | ||||||||||||||||||||
| Net assets, end of period (000’s omitted) | $ | 52,678 | $ | 144,513 | $ | 421,986 | $ | 360,756 | $ | 455,937 | ||||||||||
| Ratio of gross expenses to average net assets | 1.24 | % | 1.18 | % | 1.14 | % | 1.15 | % | 1.18 | % | ||||||||||
| Ratio of net expenses to average net assets | 1.24 | % | 1.18 | % | 1.14 | % | 1.15 | % | 1.18 | % | ||||||||||
| Ratio of net investment loss to average net assets | (0.91 | )% | (0.83 | )% | (0.95 | )% | (1.04 | )% | (0.93 | )% | ||||||||||
| Portfolio turnover rate | 68.04 | % | 37.57 | % | 56.71 | % | 37.49 | % | 48.84 | % | ||||||||||
See Notes to Financial Statements.
| (i) | Amount was computed based on average shares outstanding during the period. |
| (ii) | Does not reflect the effect of sales charges, if applicable. |
THE ALGER FUNDS
Financial Highlights for a share outstanding throughout the period
| Alger Small Cap Focus Fund | Class Y | |||||||||||||||||||
| Year ended | Year ended | Year ended | Year ended | Year ended | ||||||||||||||||
| 10/31/2023 | 10/31/2022 | 10/31/2021 | 10/31/2020 | 10/31/2019 | ||||||||||||||||
| Net asset value, beginning of period | $ | 17.89 | $ | 33.29 | $ | 27.41 | $ | 20.79 | $ | 19.60 | ||||||||||
| INCOME FROM INVESTMENT OPERATIONS: | ||||||||||||||||||||
| Net investment loss(i) | (0.09 | ) | (0.09 | ) | (0.21 | ) | (0.18 | ) | (0.14 | ) | ||||||||||
| Net realized and unrealized gain (loss) on investments | (2.95 | ) | (13.51 | ) | 6.09 | 7.36 | 1.48 | |||||||||||||
| Total from investment operations | (3.04 | ) | (13.60 | ) | 5.88 | 7.18 | 1.34 | |||||||||||||
| Dividends from net investment income | — | — | — | (0.26 | ) | — | ||||||||||||||
| Distributions from net realized gains | — | (1.80 | ) | — | (0.30 | ) | (0.15 | ) | ||||||||||||
| Net asset value, end of period | $ | 14.85 | $ | 17.89 | $ | 33.29 | $ | 27.41 | $ | 20.79 | ||||||||||
| Total return(ii) | (16.99 | )% | (42.58 | )% | 21.45 | % | 35.32 | % | 6.96 | % | ||||||||||
| RATIOS/SUPPLEMENTAL DATA: | ||||||||||||||||||||
| Net assets, end of period (000’s omitted) | $ | 136,084 | $ | 257,064 | $ | 394,801 | $ | 266,570 | $ | 94,694 | ||||||||||
| Ratio of gross expenses to average net assets | 0.90 | % | 0.85 | % | 0.83 | % | 0.84 | % | 0.87 | % | ||||||||||
| Ratio of expense reimbursements to average net assets | (0.04 | )% | — | — | — | (iii) | (0.02 | )% | ||||||||||||
| Ratio of net expenses to average net assets | 0.86 | % | 0.85 | % | 0.83 | % | 0.84 | % | 0.85 | % | ||||||||||
| Ratio of net investment loss to average net assets | (0.55 | )% | (0.46 | )% | (0.65 | )% | (0.74 | )% | (0.64 | )% | ||||||||||
| Portfolio turnover rate | 68.04 | % | 37.57 | % | 56.71 | % | 37.49 | % | 48.84 | % | ||||||||||
See Notes to Financial Statements.
| (i) | Amount was computed based on average shares outstanding during the period. |
| (ii) | Does not reflect the effect of sales charges, if applicable. |
| (iii) | Amount was more than (0.005)% per share. |
THE ALGER FUNDS
Financial Highlights for a share outstanding throughout the period
| Alger Small Cap Focus Fund | Class Z | |||||||||||||||||||
| Year ended | Year ended | Year ended | Year ended | Year ended | ||||||||||||||||
| 10/31/2023 | 10/31/2022 | 10/31/2021 | 10/31/2020 | 10/31/2019 | ||||||||||||||||
| Net asset value, beginning of period | $ | 17.88 | $ | 33.29 | $ | 27.41 | $ | 20.79 | $ | 19.60 | ||||||||||
| INCOME FROM INVESTMENT OPERATIONS: | ||||||||||||||||||||
| Net investment loss(i) | (0.10 | ) | (0.10 | ) | (0.21 | ) | (0.18 | ) | (0.13 | ) | ||||||||||
| Net realized and unrealized gain (loss) on investments | (2.94 | ) | (13.51 | ) | 6.09 | 7.36 | 1.47 | |||||||||||||
| Total from investment operations | (3.04 | ) | (13.61 | ) | 5.88 | 7.18 | 1.34 | |||||||||||||
| Dividends from net investment income | — | — | — | (0.26 | ) | — | ||||||||||||||
| Distributions from net realized gains | — | (1.80 | ) | — | (0.30 | ) | (0.15 | ) | ||||||||||||
| Net asset value, end of period | $ | 14.84 | $ | 17.88 | $ | 33.29 | $ | 27.41 | $ | 20.79 | ||||||||||
| Total return(ii) | (17.00 | )% | (42.61 | )% | 21.45 | % | 35.30 | % | 6.96 | % | ||||||||||
| RATIOS/SUPPLEMENTAL DATA: | ||||||||||||||||||||
| Net assets, end of period (000’s omitted) | $ | 1,124,448 | $ | 2,192,139 | $ | 6,195,714 | $ | 4,499,832 | $ | 2,459,793 | ||||||||||
| Ratio of gross expenses to average net assets | 0.88 | % | 0.84 | % | 0.83 | % | 0.85 | % | 0.86 | % | ||||||||||
| Ratio of net expenses to average net assets | 0.88 | % | 0.84 | % | 0.83 | % | 0.85 | % | 0.86 | % | ||||||||||
| Ratio of net investment loss to average net assets | (0.58 | )% | (0.49 | )% | (0.65 | )% | (0.74 | )% | (0.62 | )% | ||||||||||
| Portfolio turnover rate | 68.04 | % | 37.57 | % | 56.71 | % | 37.49 | % | 48.84 | % | ||||||||||
See Notes to Financial Statements.
| (i) | Amount was computed based on average shares outstanding during the period. |
| (ii) | Does not reflect the effect of sales charges, if applicable. |
THE ALGER FUNDS
Financial Highlights for a share outstanding throughout the period
| Alger International Focus Fund | Class A | |||||||||||||||||||
| Year ended | Year ended | �� | Year ended | Year ended | Year ended | |||||||||||||||
| 10/31/2023 | 10/31/2022 | 10/31/2021 | 10/31/2020 | 10/31/2019 | ||||||||||||||||
| Net asset value, beginning of period | $ | 15.23 | $ | 25.12 | $ | 18.67 | $ | 15.51 | $ | 14.30 | ||||||||||
| INCOME FROM INVESTMENT OPERATIONS: | ||||||||||||||||||||
| Net investment loss(i) | (0.03 | ) | (0.10 | ) | (0.11 | ) | (0.06 | ) | (0.02 | ) | ||||||||||
| Net realized and unrealized gain (loss) on investments | 0.58 | (7.82 | ) | 6.56 | 3.91 | 1.66 | ||||||||||||||
| Total from investment operations | 0.55 | (7.92 | ) | 6.45 | 3.85 | 1.64 | ||||||||||||||
| Dividends from net investment income | — | — | — | (0.69 | ) | (0.43 | ) | |||||||||||||
| Distributions from net realized gains | — | (1.97 | ) | — | — | — | ||||||||||||||
| Net asset value, end of period | $ | 15.78 | $ | 15.23 | $ | 25.12 | $ | 18.67 | $ | 15.51 | ||||||||||
| Total return(ii) | 3.61 | % | (34.27 | )% | 34.87 | %(iii) | 25.69 | % | 11.99 | % | ||||||||||
| RATIOS/SUPPLEMENTAL DATA: | ||||||||||||||||||||
| Net assets, end of period (000’s omitted) | $ | 97,018 | $ | 100,262 | $ | 158,223 | $ | 120,832 | $ | 100,814 | ||||||||||
| Ratio of gross expenses to average net assets | 1.31 | % | 1.27 | % | 1.22 | % | 1.34 | % | 1.37 | % | ||||||||||
| Ratio of net expenses to average net assets | 1.31 | % | 1.27 | % | 1.22 | % | 1.34 | % | 1.37 | % | ||||||||||
| Ratio of net investment loss to average net assets | (0.15 | )% | (0.53 | )% | (0.49 | )% | (0.37 | )% | (0.11 | )% | ||||||||||
| Portfolio turnover rate | 52.23 | % | 49.36 | % | 75.27 | % | 105.22 | % | 151.99 | % | ||||||||||
See Notes to Financial Statements.
| (i) | Amount was computed based on average shares outstanding during the period. |
| (ii) | Does not reflect the effect of sales charges, if applicable. |
| (iii) | Pursuant to the U.S. Securities and Exchange Commission’s Rules on Fair Fund and Disgorgement Plans, the Alger International Focus Fund received a Fair Fund distribution of $159,091, which contributed approximately 0.11% to its annual return. |
THE ALGER FUNDS
Financial Highlights for a share outstanding throughout the period
| Alger International Focus Fund | Class B | |||||||||||||||||||
| Year ended | Year ended | Year ended | Year ended | Year ended | ||||||||||||||||
| 10/31/2023 | 10/31/2022 | 10/31/2021 | 10/31/2020 | 10/31/2019 | ||||||||||||||||
| Net asset value, beginning of period | $ | 13.04 | $ | 21.81 | $ | 16.19 | $ | 13.44 | $ | 12.38 | ||||||||||
| INCOME FROM INVESTMENT OPERATIONS: | ||||||||||||||||||||
| Net investment loss(i) | (0.02 | ) | (0.09 | ) | (0.08 | ) | (0.02 | ) | (0.04 | ) | ||||||||||
| Net realized and unrealized gain (loss) on investments | 0.49 | (6.71 | ) | 5.70 | 3.38 | 1.44 | ||||||||||||||
| Total from investment operations | 0.47 | (6.80 | ) | 5.62 | 3.36 | 1.40 | ||||||||||||||
| Dividends from net investment income | — | — | — | (0.61 | ) | (0.34 | ) | |||||||||||||
| Distributions from net realized gains | — | (1.97 | ) | — | — | — | ||||||||||||||
| Net asset value, end of period | $ | 13.51 | $ | 13.04 | $ | 21.81 | $ | 16.19 | $ | 13.44 | ||||||||||
| Total return(ii) | 3.60 | % | (34.30 | )% | 35.02 | %(iii) | 25.83 | % | 11.82 | % | ||||||||||
| RATIOS/SUPPLEMENTAL DATA: | ||||||||||||||||||||
| Net assets, end of period (000’s omitted) | $ | 12,465 | $ | 13,200 | $ | 22,147 | $ | 18,427 | $ | 17,646 | ||||||||||
| Ratio of gross expenses to average net assets | 2.00 | % | 1.97 | % | 1.94 | % | 2.05 | % | 2.09 | % | ||||||||||
| Ratio of expense reimbursements to average net assets | (0.70 | )% | (0.69 | )% | (0.82 | )% | (0.88 | )% | (0.51 | )% | ||||||||||
| Ratio of net expenses to average net assets | 1.30 | % | 1.28 | % | 1.12 | % | 1.17 | % | 1.58 | % | ||||||||||
| Ratio of net investment loss to average net assets | (0.15 | )% | (0.54 | )% | (0.39 | )% | (0.18 | )% | (0.30 | )% | ||||||||||
| Portfolio turnover rate | 52.23 | % | 49.36 | % | 75.27 | % | 105.22 | % | 151.99 | % | ||||||||||
See Notes to Financial Statements.
| (i) | Amount was computed based on average shares outstanding during the period. |
| (ii) | Does not reflect the effect of sales charges, if applicable. |
| (iii) | Pursuant to the U.S. Securities and Exchange Commission’s Rules on Fair Fund and Disgorgement Plans, the Alger International Focus Fund received a Fair Fund distribution of $159,091, which contributed approximately 0.11% to its annual return. |
THE ALGER FUNDS
Financial Highlights for a share outstanding throughout the period
| Alger International Focus Fund | Class C | |||||||||||||||||||
| Year ended | Year ended | Year ended | Year ended | Year ended | ||||||||||||||||
| 10/31/2023 | 10/31/2022 | 10/31/2021 | 10/31/2020 | 10/31/2019 | ||||||||||||||||
| Net asset value, beginning of period | $ | 12.37 | $ | 20.94 | $ | 15.68 | $ | 13.11 | $ | 12.07 | ||||||||||
| INCOME FROM INVESTMENT OPERATIONS: | ||||||||||||||||||||
| Net investment loss(i) | (0.15 | ) | (0.22 | ) | (0.24 | ) | (0.15 | ) | (0.12 | ) | ||||||||||
| Net realized and unrealized gain (loss) on investments | 0.47 | (6.38 | ) | 5.50 | 3.29 | 1.41 | ||||||||||||||
| Total from investment operations | 0.32 | (6.60 | ) | 5.26 | 3.14 | 1.29 | ||||||||||||||
| Dividends from net investment income | — | — | — | (0.57 | ) | (0.25 | ) | |||||||||||||
| Distributions from net realized gains | — | (1.97 | ) | — | — | — | ||||||||||||||
| Net asset value, end of period | $ | 12.69 | $ | 12.37 | $ | 20.94 | $ | 15.68 | $ | 13.11 | ||||||||||
| Total return(ii) | 2.67 | % | (34.82 | )% | 33.86 | %(iii) | 24.68 | % | 11.07 | % | ||||||||||
| RATIOS/SUPPLEMENTAL DATA: | ||||||||||||||||||||
| Net assets, end of period (000’s omitted) | $ | 1,138 | $ | 1,594 | $ | 4,368 | $ | 2,760 | $ | 3,603 | ||||||||||
| Ratio of gross expenses to average net assets | 2.21 | % | 2.09 | % | 1.97 | % | 2.13 | % | 2.23 | % | ||||||||||
| Ratio of net expenses to average net assets | 2.21 | % | 2.09 | % | 1.97 | % | 2.13 | % | 2.23 | % | ||||||||||
| Ratio of net investment loss to average net assets | (1.07 | )% | (1.40 | )% | (1.23 | )% | (1.13 | )% | (0.99 | )% | ||||||||||
| Portfolio turnover rate | 52.23 | % | 49.36 | % | 75.27 | % | 105.22 | % | 151.99 | % | ||||||||||
See Notes to Financial Statements.
| (i) | Amount was computed based on average shares outstanding during the period. |
| (ii) | Does not reflect the effect of sales charges, if applicable. |
| (iii) | Pursuant to the U.S. Securities and Exchange Commission’s Rules on Fair Fund and Disgorgement Plans, the Alger International Focus Fund received a Fair Fund distribution of $159,091, which contributed approximately 0.11% to its annual return. |
THE ALGER FUNDS
Financial Highlights for a share outstanding throughout the period
| Alger International Focus Fund | Class I | |||||||||||||||||||
| Year ended | Year ended | Year ended | Year ended | Year ended | ||||||||||||||||
| 10/31/2023 | 10/31/2022 | 10/31/2021 | 10/31/2020 | 10/31/2019 | ||||||||||||||||
| Net asset value, beginning of period | $ | 15.28 | $ | 25.20 | $ | 18.72 | $ | 15.54 | $ | 14.31 | ||||||||||
| INCOME FROM INVESTMENT OPERATIONS: | ||||||||||||||||||||
| Net investment income (loss)(i) | (0.02 | ) | (0.08 | ) | (0.10 | ) | (0.02 | ) | 0.01 | |||||||||||
| Net realized and unrealized gain (loss) on investments | 0.57 | (7.87 | ) | 6.58 | 3.93 | 1.67 | ||||||||||||||
| Total from investment operations | 0.55 | (7.95 | ) | 6.48 | 3.91 | 1.68 | ||||||||||||||
| Dividends from net investment income | — | — | — | (0.73 | ) | (0.45 | ) | |||||||||||||
| Distributions from net realized gains | — | (1.97 | ) | — | — | — | ||||||||||||||
| Net asset value, end of period | $ | 15.83 | $ | 15.28 | $ | 25.20 | $ | 18.72 | $ | 15.54 | ||||||||||
| Total return(ii) | 3.60 | % | (34.28 | )% | 34.94 | %(iii) | 25.98 | % | 12.41 | % | ||||||||||
| RATIOS/SUPPLEMENTAL DATA: | ||||||||||||||||||||
| Net assets, end of period (000’s omitted) | $ | 1,104 | $ | 1,061 | $ | 591 | $ | 642 | $ | 970 | ||||||||||
| Ratio of gross expenses to average net assets | 1.32 | % | 1.30 | % | 1.24 | % | 1.34 | % | 1.48 | % | ||||||||||
| Ratio of expense reimbursements to average net assets | (0.04 | )% | (0.05 | )% | (0.05 | )% | (0.27 | )% | (0.36 | )% | ||||||||||
| Ratio of net expenses to average net assets | 1.28 | % | 1.25 | % | 1.19 | % | 1.07 | % | 1.12 | % | ||||||||||
| Ratio of net investment income (loss) to average net assets | (0.12 | )% | (0.44 | )% | (0.45 | )% | (0.10 | )% | 0.06 | % | ||||||||||
| Portfolio turnover rate | 52.23 | % | 49.36 | % | 75.27 | % | 105.22 | % | 151.99 | % | ||||||||||
See Notes to Financial Statements.
| (i) | Amount was computed based on average shares outstanding during the period. |
| (ii) | Does not reflect the effect of sales charges, if applicable. |
| (iii) | Pursuant to the U.S. Securities and Exchange Commission’s Rules on Fair Fund and Disgorgement Plans, the Alger International Focus Fund received a Fair Fund distribution of $159,091, which contributed approximately 0.11% to its annual return. |
THE ALGER FUNDS
Financial Highlights for a share outstanding throughout the period
| Alger International Focus Fund | Class Z | |||||||||||||||||||
| Year ended 10/31/2023 | Year ended 10/31/2022 | Year ended 10/31/2021 | Year ended 10/31/2020 | Year ended 10/31/2019 | ||||||||||||||||
| Net asset value, beginning of period | $ | 15.55 | $ | 25.52 | $ | 18.90 | $ | 15.69 | $ | 14.46 | ||||||||||
| INCOME FROM INVESTMENT OPERATIONS: | ||||||||||||||||||||
| Net investment income (loss)(i) | 0.04 | (0.02 | ) | (0.03 | ) | – | (ii) | 0.05 | ||||||||||||
| Net realized and unrealized gain (loss) on investments | 0.60 | (7.98 | ) | 6.65 | 3.98 | 1.67 | ||||||||||||||
| Total from investment operations | 0.64 | (8.00 | ) | 6.62 | 3.98 | 1.72 | ||||||||||||||
| Dividends from net investment income | — | — | — | (0.77 | ) | (0.49 | ) | |||||||||||||
| Distributions from net realized gains | — | (1.97 | ) | — | — | — | ||||||||||||||
| Net asset value, end of period | $ | 16.19 | $ | 15.55 | $ | 25.52 | $ | 18.90 | $ | 15.69 | ||||||||||
| Total return(iii) | 4.12 | % | (34.03 | )% | 35.34 | %(iv) | 26.23 | % | 12.64 | % | ||||||||||
| RATIOS/SUPPLEMENTAL DATA: | ||||||||||||||||||||
| Net assets, end of period (000’s omitted) | $ | 34,923 | $ | 14,528 | $ | 28,264 | $ | 12,621 | $ | 13,462 | ||||||||||
| Ratio of gross expenses to average net assets | 1.00 | % | 0.95 | % | 0.92 | % | 1.02 | % | 1.10 | % | ||||||||||
| Ratio of expense reimbursements to average net assets | (0.12 | )% | (0.09 | )% | (0.03 | )% | (0.13 | )% | (0.21 | )% | ||||||||||
| Ratio of net expenses to average net assets | 0.88 | % | 0.86 | % | 0.89 | % | 0.89 | % | 0.89 | % | ||||||||||
| Ratio of net investment income (loss) to average net assets | 0.21 | % | (0.13 | )% | (0.13 | )% | 0.01 | % | 0.36 | % | ||||||||||
| Portfolio turnover rate | 52.23 | % | 49.36 | % | 75.27 | % | 105.22 | % | 151.99 | % | ||||||||||
See Notes to Financial Statements.
| (i) | Amount was computed based on average shares outstanding during the period. |
| (ii) | Amount was less than $0.005 per share. |
| (iii) | Does not reflect the effect of sales charges, if applicable. |
| (iv) | Pursuant to the U.S. Securities and Exchange Commission’s Rules on Fair Fund and Disgorgement Plans, the Alger International Focus Fund received a Fair Fund distribution of $159,091, which contributed approximately 0.11% to its annual return. |
THE ALGER FUNDS
Financial Highlights for a share outstanding throughout the period
| Alger Health Sciences Fund | Class A | |||||||||||||||||||
| Year ended 10/31/2023 | Year ended 10/31/2022 | Year ended 10/31/2021 | Year ended 10/31/2020 | Year ended 10/31/2019 | ||||||||||||||||
| Net asset value, beginning of period | $ | 20.85 | $ | 36.66 | $ | 31.75 | $ | 26.55 | $ | 28.04 | ||||||||||
| INCOME FROM INVESTMENT OPERATIONS: | ||||||||||||||||||||
| Net investment loss(i) | (0.12 | ) | (0.07 | ) | (0.21 | ) | (0.09 | ) | (0.09 | ) | ||||||||||
| Net realized and unrealized gain (loss) on investments | (2.51 | ) | (8.74 | ) | 8.87 | 7.20 | 0.48 | |||||||||||||
| Total from investment operations | (2.63 | ) | (8.81 | ) | 8.66 | 7.11 | 0.39 | |||||||||||||
| Distributions from net realized gains | — | (7.00 | ) | (3.75 | ) | (1.91 | ) | (1.88 | ) | |||||||||||
| Net asset value, end of period | $ | 18.22 | $ | 20.85 | $ | 36.66 | $ | 31.75 | $ | 26.55 | ||||||||||
| Total return(ii) | (12.61 | )% | (27.31 | )% | 29.12 | %(iii) | 28.09 | % | 1.96 | % | ||||||||||
| RATIOS/SUPPLEMENTAL DATA: | ||||||||||||||||||||
| Net assets, end of period (000’s omitted) | $ | 65,337 | $ | 91,059 | $ | 151,514 | $ | 127,925 | $ | 108,095 | ||||||||||
| Ratio of gross expenses to average net assets | 1.13 | % | 1.05 | % | 1.00 | % | 1.04 | % | 1.12 | % | ||||||||||
| Ratio of net expenses to average net assets | 1.13 | % | 1.05 | % | 1.00 | % | 1.04 | % | 1.12 | % | ||||||||||
| Ratio of net investment loss to average net assets | (0.57 | )% | (0.30 | )% | (0.63 | )% | (0.30 | )% | (0.34 | )% | ||||||||||
| Portfolio turnover rate | 305.60 | % | 240.89 | % | 152.78 | % | 131.29 | % | 148.78 | % | ||||||||||
See Notes to Financial Statements.
| (i) | Amount was computed based on average shares outstanding during the period. |
| (ii) | Does not reflect the effect of sales charges, if applicable. |
| (iii) | Pursuant to the U.S. Securities and Exchange Commission’s Rules on Fair Fund and Disgorgement Plans, the Alger Health Sciences Fund received a Fair Fund distribution of $179,832, which contributed approximately 0.07% to its annual return. |
THE ALGER FUNDS
Financial Highlights for a share outstanding throughout the period
| Alger Health Sciences Fund | Class C | |||||||||||||||||||
| Year ended 10/31/2023 | Year ended 10/31/2022 | Year ended 10/31/2021 | Year ended 10/31/2020 | Year ended 10/31/2019 | ||||||||||||||||
| Net asset value, beginning of period | $ | 13.08 | $ | 26.11 | $ | 23.74 | $ | 20.44 | $ | 22.21 | ||||||||||
| INCOME FROM INVESTMENT OPERATIONS: | ||||||||||||||||||||
| Net investment loss(i) | (0.18 | ) | (0.16 | ) | (0.34 | ) | (0.23 | ) | (0.23 | ) | ||||||||||
| Net realized and unrealized gain (loss) on investments | (1.57 | ) | (5.87 | ) | 6.46 | 5.44 | 0.34 | |||||||||||||
| Total from investment operations | (1.75 | ) | (6.03 | ) | 6.12 | 5.21 | 0.11 | |||||||||||||
| Distributions from net realized gains | — | (7.00 | ) | (3.75 | ) | (1.91 | ) | (1.88 | ) | |||||||||||
| Net asset value, end of period | $ | 11.33 | $ | 13.08 | $ | 26.11 | $ | 23.74 | $ | 20.44 | ||||||||||
| Total return(ii) | (13.38 | )% | (27.85 | )% | 28.11 | %(iii) | 27.12 | % | 1.20 | % | ||||||||||
| RATIOS/SUPPLEMENTAL DATA: | ||||||||||||||||||||
| Net assets, end of period (000’s omitted) | $ | 4,802 | $ | 7,828 | $ | 14,334 | $ | 11,862 | $ | 10,963 | ||||||||||
| Ratio of gross expenses to average net assets | 1.95 | % | 1.84 | % | 1.76 | % | 1.81 | % | 1.89 | % | ||||||||||
| Ratio of net expenses to average net assets | 1.95 | % | 1.84 | % | 1.76 | % | 1.81 | % | 1.89 | % | ||||||||||
| Ratio of net investment loss to average net assets | (1.39 | )% | (1.10 | )% | (1.39 | )% | (1.07 | )% | (1.12 | )% | ||||||||||
| Portfolio turnover rate | 305.60 | % | 240.89 | % | 152.78 | % | 131.29 | % | 148.78 | % | ||||||||||
See Notes to Financial Statements.
| (i) | Amount was computed based on average shares outstanding during the period. |
| (ii) | Does not reflect the effect of sales charges, if applicable. |
| (iii) | Pursuant to the U.S. Securities and Exchange Commission’s Rules on Fair Fund and Disgorgement Plans, the Alger Health Sciences Fund received a Fair Fund distribution of $179,832, which contributed approximately 0.07% to its annual return. |
THE ALGER FUNDS
Financial Highlights for a share outstanding throughout the period
| Alger Health Sciences Fund | Class Z | |||||||||||||||||||
| Year ended 10/31/2023 | Year ended 10/31/2022 | Year ended 10/31/2021 | Year ended 10/31/2020 | Year ended 10/31/2019 | ||||||||||||||||
| Net asset value, beginning of period | $ | 21.24 | $ | 37.09 | $ | 31.99 | $ | 26.69 | $ | 28.09 | ||||||||||
| INCOME FROM INVESTMENT OPERATIONS: | ||||||||||||||||||||
| Net investment income (loss)(i) | (0.04 | ) | — | (ii) | (0.11 | ) | — | (ii) | 0.01 | |||||||||||
| Net realized and unrealized gain (loss) on investments | (2.57 | ) | (8.85 | ) | 8.96 | 7.25 | 0.47 | |||||||||||||
| Total from investment operations | (2.61 | ) | (8.85 | ) | 8.85 | 7.25 | 0.48 | |||||||||||||
| Dividends from net investment income | — | — | — | (0.04 | ) | — | ||||||||||||||
| Distributions from net realized gains | — | (7.00 | ) | (3.75 | ) | (1.91 | ) | (1.88 | ) | |||||||||||
| Net asset value, end of period | $ | 18.63 | $ | 21.24 | $ | 37.09 | $ | 31.99 | $ | 26.69 | ||||||||||
| Total return(iii) | (12.29 | )% | (27.05 | )% | 29.53 | %(iv) | 28.50 | % | 2.34 | % | ||||||||||
| RATIOS/SUPPLEMENTAL DATA: | ||||||||||||||||||||
| Net assets, end of period (000’s omitted) | $ | 47,725 | $ | 78,928 | $ | 184,972 | $ | 131,109 | $ | 77,023 | ||||||||||
| Ratio of gross expenses to average net assets | 0.78 | % | 0.72 | % | 0.68 | % | 0.71 | % | 0.79 | % | ||||||||||
| Ratio of expense reimbursements to average net assets | (0.03 | )% | — | — | — | (0.04 | )% | |||||||||||||
| Ratio of net expenses to average net assets | 0.75 | % | 0.72 | % | 0.68 | % | 0.71 | % | 0.75 | % | ||||||||||
| Ratio of net investment income (loss) to average net assets | (0.19 | )% | 0.01 | % | (0.31 | )% | (0.01 | )% | 0.02 | % | ||||||||||
| Portfolio turnover rate | 305.60 | % | 240.89 | % | 152.78 | % | 131.29 | % | 148.78 | % | ||||||||||
See Notes to Financial Statements.
| (i) | Amount was computed based on average shares outstanding during the period. |
| (ii) | Amount was less than $0.005 per share. |
| (iii) | Does not reflect the effect of sales charges, if applicable. |
| (iv) | Pursuant to the U.S. Securities and Exchange Commission’s Rules on Fair Fund and Disgorgement Plans, the Alger Health Sciences Fund received a Fair Fund distribution of $179,832, which contributed approximately 0.07% to its annual return. |
THE ALGER FUNDS
NOTE 1 — General:
The Alger Funds (the “Trust”) is an open-end registered investment company organized as a business trust under the laws of the Commonwealth of Massachusetts. The Trust qualifies as an investment company as defined in Financial Accounting Standards Board (“FASB”) Accounting Standards Codification 946-Financial Services – Investment Companies. The Trust operates as a series company currently offering an unlimited number of shares of beneficial interest in ten series — Alger Capital Appreciation Fund, Alger 35 Fund, Alger Growth & Income Fund, Alger Mid Cap Growth Fund, Alger Mid Cap Focus Fund, Alger Weatherbie Specialized Growth Fund, Alger Small Cap Growth Fund, Alger Small Cap Focus Fund, Alger International Focus Fund and Alger Health Sciences Fund (collectively, the “Funds” or individually, each a “Fund”). Alger Capital Appreciation Fund, Alger 35 Fund, Alger Mid Cap Growth Fund, Alger Mid Cap Focus Fund, Alger Weatherbie Specialized Growth Fund, Alger Small Cap Growth Fund, Alger Small Cap Focus Fund, Alger International Focus Fund and Alger Health Sciences Fund normally invest primarily in equity securities and each has an investment objective of long-term capital appreciation. Alger Growth & Income Fund also normally invests primarily in equity securities and has an investment objective of both capital appreciation and current income.
Each Fund offers one or more of the following share classes: Class A, B, C, I, Y and Z. Class A shares are generally subject to an initial sales charge while Class B and C shares are generally subject to a deferred sales charge. Class B shares will automatically convert to Class A shares eight years after the end of the calendar month in which the order to purchase was accepted. The conversion is completed without the imposition of any sales charges or other fees. Class C shares will automatically convert to Class A shares on the fifth business day of the month following the eighth anniversary of the purchase date of a shareholder’s Class C shares, without the imposition of any sales load, fee or other charge. Class B and C shares held at certain dealers may not convert to Class A shares or may be converted on a different schedule. At conversion, a proportionate amount of shares representing reinvested dividends and distributions will also be converted into Class A shares. Effective August 27, 2019, Class C shares were closed to direct shareholders and are only available for purchase through certain financial intermediaries and group retirement plan recordkeeping platforms. Class I, Y and Z shares are generally sold to institutional investors and are sold without an initial or deferred sales charge. Class Y and Z shares are generally subject to a minimum initial investment of $500,000. Each class has identical rights to assets and earnings, except that each share class bears the pro rata allocation of the Fund’s expenses other than a class expense (not including advisory or custodial fees or other expenses related to the management of the Fund’s assets).
On May 23, 2023, the Board of Trustees of the Trust (the “Board”) approved the transition of the Funds’ custodian and administrator from Brown Brothers Harriman & Company (the “Custodian”) to The Bank of New York Mellon. This change is anticipated to become effective in early 2024.
THE ALGER FUNDS
NOTES TO FINANCIAL STATEMENTS (Continued)
NOTE 2 — Significant Accounting Policies:
(a) Investment Valuation: The Funds value their financial instruments at fair value using independent dealers or pricing services under policies approved by the Board. Investments held by the Funds are valued on each day the New York Stock Exchange (the “NYSE”) is open, as of the close of the NYSE (normally 4:00 p.m. Eastern Time).
The Board has designated, pursuant to Rule 2a-5 under the Investment Company Act of 1940, as amended (the “1940 Act”), the Funds’ investment adviser, Fred Alger Management, LLC (“Alger Management” or the “Investment Manager”) as its valuation designee (the “Valuation Designee”) to make fair value determinations subject to the Board’s review and oversight. The Valuation Designee has established a Valuation Committee (“Committee”) comprised of representatives of the Investment Manager and officers of the Funds to assist in performing the duties and responsibilities of the Valuation Designee.
The Valuation Designee has established valuation processes including but not limited to: (i) making fair value determinations when market quotations for financial instruments are not readily available in accordance with valuation policies and procedures adopted by the Board; (ii) assessing and managing material risks associated with fair valuation determinations; (iii) selecting, applying and testing fair valuation methodologies; and (iv) overseeing and evaluating pricing services used by the Funds. The Valuation Designee regularly reports its fair valuation determinations and related valuation information to the Board. The Committee generally meets quarterly and on an as-needed basis to review and evaluate the effectiveness of the valuation policies and procedures in accordance with the requirements of Rule 2a-5.
Investments in money market funds and short-term securities held by the Funds having a remaining maturity of sixty days or less are valued at amortized cost which approximates market value.
Equity securities, including traded rights, warrants and option contracts for which valuation information is readily available, are valued at the last quoted sales price or official closing price on the primary market or exchange on which they are traded as reported by an independent pricing service. In the absence of quoted sales, such securities are generally valued at the bid price or, in the absence of a recent bid price, the equivalent as obtained from one or more of the major market makers for the securities to be valued.
Contracts for difference (“CFDs”) are privately negotiated in the over-the-counter market (“OTC CFDs”). OTC CFDs are valued at the last reported sale or official closing price on the primary market or exchange of the underlying asset or liability. In the absence of quoted sales, such securities are generally valued at the bid price, or, in the absence of a recent bid price, the equivalent as obtained from one or more of the major market makers for the securities to be valued.
Securities in which the Funds invest may be traded in foreign markets that close before the close of the NYSE. Developments that occur between the close of the foreign markets and the close of the NYSE may result in adjustments to the closing foreign prices to reflect what the Valuation Designee, through its Committee, believes to be the fair value of these securities as of the close of the NYSE. The Funds may also fair value securities in other situations, for example, when a particular foreign market is closed but the NYSE is open.
THE ALGER FUNDS
NOTES TO FINANCIAL STATEMENTS (Continued)
FASB Accounting Standards Codification 820 – Fair Value Measurements and Disclosures (“ASC 820”) defines fair value as the price that the Funds would receive upon selling an investment in a timely transaction to an independent buyer in the principal or most advantageous market of the investment. ASC 820 established a three-tier hierarchy to maximize the use of observable market data and minimize the use of unobservable inputs and to establish classification of fair value measurements for disclosure purposes. Inputs refer broadly to the assumptions that market participants would use in pricing the asset or liability and may be observable or unobservable. Observable inputs are based on market data obtained from sources independent of the Funds. Unobservable inputs are inputs that reflect the Funds’ own assumptions based on the best information available in the circumstances. The three-tier hierarchy of inputs is summarized in the three broad Levels listed below.
| ● | Level 1 – quoted prices in active markets for identical investments |
| ● | Level 2 – significant other observable inputs (including quoted prices for similar investments, amortized cost, interest rates, prepayment speeds, credit risk, etc.) |
| ● | Level 3 – significant unobservable inputs (including the Funds’ own assumptions in determining the fair value of investments) |
The Funds’ valuation techniques are generally consistent with either the market or the income approach to fair value. The market approach considers prices and other relevant information generated by market transactions involving identical or comparable assets to measure fair value. The income approach converts future amounts to a current, or discounted, single amount. These fair value measurements are determined on the basis of the value indicated by current market expectations about such future events. Inputs for Level 1 include exchange-listed prices and broker quotes in an active market. Inputs for Level 2 include the last trade price in the case of a halted security, an exchange-listed price which has been adjusted for fair value factors, and prices of closely related securities. Additional Level 2 inputs include an evaluated price which is based upon a compilation of observable market information such as spreads for fixed income and preferred securities. Inputs for Level 3 include, but are not limited to, revenue multiples, earnings before interest, taxes, depreciation and amortization (“EBITDA”) multiples, discount rates, time to exit and the probabilities of success of certain outcomes. Such unobservable market information may be obtained from a company’s financial statements and from industry studies, market data, and market indicators such as benchmarks and indexes. Because of the inherent uncertainty and often limited markets for restricted securities, the valuations assigned to such securities by the Funds may significantly differ from the valuations that would have been assigned by the Funds had there been an active market for such securities.
(b) Cash and Cash Equivalents: Cash and cash equivalents include U.S. dollars, foreign cash and overnight time deposits.
THE ALGER FUNDS
NOTES TO FINANCIAL STATEMENTS (Continued)
(c) Securities Transactions and Investment Income: Securities transactions are recorded on a trade date basis. Realized gains and losses from securities transactions are recorded on the identified cost basis. Dividend income is recognized on the ex-dividend date and interest income is recognized on the accrual basis.
Premiums and discounts on debt securities purchased are amortized or accreted over the lives of the respective securities.
(d) Foreign Currency Transactions: The books and records of the Funds are maintained in U.S. dollars. Foreign currencies, investments and other assets and liabilities are translated into U.S. dollars at the prevailing rates of exchange on the valuation date. Purchases and sales of investment securities and income and expenses are translated into U.S. dollars at the prevailing exchange rates on the respective dates of such transactions.
Net realized gains and losses on foreign currency transactions represent net gains and losses from the disposition of foreign currencies, currency gains and losses realized between the trade dates and settlement dates of security transactions, and the difference between the amount of net investment income accrued and the U.S. dollar amount actually received. The effects of changes in foreign currency exchange rates on investments in securities are included in realized and unrealized gain or loss on investments in the accompanying Statements of Operations.
(e) Contracts for difference: Each Fund may engage in OTC CFDs. OTC CFDs are derivative instruments that allow a Fund to take a position on the change in the market price of an underlying asset, such as an equity security, or the value of an index. With a short OTC CFD, a Fund is seeking to profit from falls in the market price of an asset. Changes in the fair value of OTC CFDs are recorded as unrealized gains and losses on the Statements of Assets and Liabilities. A Fund generally records a realized gain or loss on the expiration, termination or settlement of an OTC CFD.
(f) Lending of Fund Securities: The Funds may lend their securities to financial institutions, provided that the market value of the securities loaned will not at any time exceed one third of a Fund’s total assets including borrowings, as defined in its prospectuses. The Funds earn fees on the securities loaned, which are included in income from securities lending in the accompanying Statements of Operations. In order to protect against the risk of failure by the borrower to return the securities loaned or any delay in the delivery of such securities, the loan is collateralized by cash or securities that are maintained with the Funds’ Custodian, in an amount equal to at least 102 percent of the current market value of U.S. loaned securities or 105 percent for non-U.S. loaned securities. The market value of the loaned securities is determined at the close of business of the Funds. Any required additional collateral is delivered to the Custodian each day and any excess collateral is returned to the borrower on the next business day. In the event the borrower fails to return the loaned securities when due, the Funds may take the collateral to replace the securities. If the value of the collateral is less than the purchase cost of replacement securities, the Custodian shall be responsible for any shortfall, but only to the extent that the shortfall is not due to any diminution in collateral value, as defined in the securities lending agreement. The Funds are required to maintain the collateral in a segregated account and determine its value each day until the loaned securities are returned. Cash collateral may be invested as determined by the Funds. Collateral is returned to the borrower upon settlement of the loan.
THE ALGER FUNDS
NOTES TO FINANCIAL STATEMENTS (Continued)
(g) Dividends to Shareholders: Dividends and distributions payable to shareholders are recorded by the Funds on the ex-dividend date. The Funds declare and pay dividends from net investment income, if available, annually except that Alger Growth & Income Fund declares and pays such dividends quarterly. With respect to all Funds, dividends from net realized gains, offset by any loss carryforward, are declared and paid annually after the end of the fiscal year in which earned.
Each share class is treated separately in determining the amount of dividends from net investment income payable to holders of its shares.
The characterization of distributions to shareholders for financial reporting purposes is determined in accordance with federal income tax rules. Therefore, the source of a Fund’s distributions may be shown in the accompanying financial statements as either from, or in excess of, net investment income, net realized gain on investment transactions, or return of capital, depending on the type of book/tax differences that may exist. Capital accounts within the financial statements are adjusted for permanent book/tax differences. Reclassifications result primarily from the differences in tax treatment of net operating losses, passive foreign investment companies, and foreign currency transactions. The reclassifications are done annually at year-end and have no impact on the net asset values of the Funds and are designed to present each Fund’s capital accounts on a tax basis.
(h) Federal Income Taxes: It is each Fund’s policy to comply with the requirements of the Internal Revenue Code Subchapter M applicable to regulated investment companies and to distribute all of its taxable income to its shareholders. Provided that the Funds maintain such compliance, no federal income tax provision is required. Each Fund is treated as a separate entity for the purpose of determining such compliance.
FASB Accounting Standards Codification 740 – Income Taxes (“ASC 740”) requires the Funds to measure and recognize in their financial statements the benefit of a tax position taken (or expected to be taken) on an income tax return if such position will more likely than not be sustained upon examination based on the technical merits of the position. No tax years are currently under investigation. The Funds file income tax returns in the U.S. Federal jurisdiction, as well as the New York State and New York City jurisdictions. The statute of limitations on the Funds’ tax returns remains open for the tax years 2019-2022. Management does not believe there are any uncertain tax positions that require recognition of a tax liability.
(i) Allocation Methods: The Trust accounts separately for the assets, liabilities and operations of each Fund. Expenses directly attributable to each Fund are charged to that Fund’s operations; expenses which are applicable to all Funds are allocated among them based on net assets. Income, realized and unrealized gains and losses, and expenses of each Fund are allocated among the Fund’s classes based on relative net assets, with the exception of distribution fees, transfer agency fees, and shareholder servicing and related fees.
THE ALGER FUNDS
NOTES TO FINANCIAL STATEMENTS (Continued)
(j) Estimates: These financial statements have been prepared in accordance with accounting principles generally accepted in the United States of America, which require using estimates and assumptions that affect the reported amounts therein. Actual results may differ from those estimates. All such estimates are of a normal recurring nature.
NOTE 3 — Investment Advisory Fees and Other Transactions with Affiliates:
(a) Investment Advisory Fees: Fees incurred by each Fund, pursuant to the provisions of the Trust’s Investment Advisory Agreement with the Investment Manager, are payable monthly and computed based on the following rates. The actual rate paid as a percentage of average daily net assets, for the year ended October 31, 2023, is set forth below under the heading “Actual Rate”:
| Tier 1 | Tier 2 | Tier 3 | Tier 4 | Tier 5 | Actual Rate | |||||||||||||||||||
| Alger Capital Appreciation Fund(a) | 0.81 | % | 0.65 | % | 0.60 | % | 0.55 | % | 0.45 | % | 0.81 | % | ||||||||||||
| Alger 35 Fund(b) | 0.45 | — | — | — | — | 0.45 | ||||||||||||||||||
| Alger Growth & Income Fund(b) | 0.50 | — | — | — | — | 0.50 | ||||||||||||||||||
| Alger Mid Cap Growth Fund(c) | 0.76 | 0.70 | — | — | — | 0.76 | ||||||||||||||||||
| Alger Mid Cap Focus Fund(d) | 0.70 | 0.50 | — | — | — | 0.65 | ||||||||||||||||||
| Alger Weatherbie Specialized Growth Fund(c) | 0.81 | 0.75 | — | — | — | 0.81 | ||||||||||||||||||
| Alger Small Cap Growth Fund(c) | 0.81 | 0.75 | — | — | — | 0.81 | ||||||||||||||||||
| Alger Small Cap Focus Fund(b) | 0.75 | — | — | — | — | 0.75 | ||||||||||||||||||
| Alger International Focus Fund(c) | 0.71 | 0.60 | — | — | — | 0.71 | ||||||||||||||||||
| Alger Health Sciences Fund(b) | 0.55 | — | — | — | — | 0.55 | ||||||||||||||||||
(a) Tier 1 rate is paid on assets up to $2 billion, Tier 2 rate is paid on assets between $2 billion and $3 billion, Tier 3 rate is paid on assets between $3 billion and $4 billion, Tier 4 rate is paid on assets between $4 billion and $5 billion, and Tier 5 rate is paid on assets in excess of $5 billion.
(b) Tier 1 rate is paid on all assets.
(c) Tier 1 rate is paid on assets up to $1 billion and Tier 2 rate is paid on assets in excess of $1 billion.
(d) Tier 1 rate is paid on assets up to $250 million, and Tier 2 rate is paid on assets in excess of $250 million.
The sub-adviser to the Alger Weatherbie Specialized Growth Fund, Weatherbie Capital, LLC (“Weatherbie” or the “Sub-Adviser”), an affiliate of Alger Management, is paid a fee from the advisory fee that Alger Management receives at no additional cost to the Alger Weatherbie Specialized Growth Fund. The sub-advisory fee is equal to 70% of the net management fee paid by the Alger Weatherbie Specialized Growth Fund to Alger Management with respect to the sub-advised assets. For the year ended October 31, 2023, Alger Management paid a sub-advisory fee of $3,787,473 for the Alger Weatherbie Specialized Growth Fund to Weatherbie.
THE ALGER FUNDS
NOTES TO FINANCIAL STATEMENTS (Continued)
Alger Management has contractually agreed to waive and/or reimburse Fund expenses (excluding advisory fees, custody fees, acquired fund fees and expenses, dividend expense on short sales, net borrowing costs, interest, taxes, brokerage and extraordinary expenses, to the extent applicable) through February 28, 2025 to the extent necessary to limit other expenses and any other applicable share class-specific expenses to the rates, based on average daily net assets, as listed in the table below.
Prior to April 1, 2023, Alger Management had contractually agreed to waive and/or reimburse Fund expenses (excluding acquired fund fees and expenses, dividend expense on short sales, borrowing costs, interest, taxes, brokerage and extraordinary expenses, if applicable) for certain Funds in order for the total annual fund expenses to not exceed certain rates, based on average net assets.
| CLASS | FEES WAIVED / REIMBURSED FOR THE YEAR ENDED | |||||||||||||||||||||||
| A | C | I | Y | Z | OCTOBER 31, 2023 | |||||||||||||||||||
| Alger Capital Appreciation Fund | — | — | — | — | 0.04 | %(a) | $ | 620,626 | ||||||||||||||||
| Alger 35 Fund(b) | — | — | — | — | 0.10 | 105,739 | ||||||||||||||||||
| Alger Mid Cap Growth Fund | — | — | — | — | 0.23 | (c) | — | |||||||||||||||||
| Alger Mid Cap Focus Fund | 0.53 | %(d) | 1.28 | %(d) | 0.58 | %(d) | 0.07 | %(d) | 0.37 | (d) | 948 | |||||||||||||
| Alger Weatherbie Specialized Growth Fund | — | — | — | 0.07 | (e) | — | 35,423 | |||||||||||||||||
| Alger Small Cap Growth Fund | — | — | — | 0.03 | (f) | 0.18 | (f) | 11,733 | ||||||||||||||||
| Alger Small Cap Focus Fund | — | — | — | 0.10 | (g) | — | 92,140 | |||||||||||||||||
| Alger International Focus Fund | — | — | 0.54 | (h) | — | 0.13 | (h) | 23,813 | ||||||||||||||||
| Alger Health Sciences Fund | — | — | — | — | 0.20 | (i) | 17,284 | |||||||||||||||||
(a) Prior to April 1, 2023, total annual fund expenses for Alger Capital Appreciation Fund, Class Z shares, could not exceed 0.85%.
(b) Alger Management has agreed to limit total annual operating expenses, excluding advisory fees, for the Alger 35 Fund, for the life of the Fund
(c) Prior to April 1, 2023, total annual fund expenses for Alger Mid Cap Growth Fund, Class Z shares, could not exceed 0.99%.
(d) Prior to April 1, 2023, total annual fund expenses for Alger Mid Cap Focus Fund, Class A, C, I, Y and Z shares, could not exceed 1.15%, 1.90%, 1.20%, 0.69% and 0.99%, respectively.
(e) Prior to April 1, 2023, total annual fund expenses for Alger Weatherbie Specialized Growth Fund, Class Y shares, could not exceed 0.87%.
(f) Prior to April 1, 2023, total annual fund expenses for Alger Small Cap Growth Fund, Class Y and Z shares, could not exceed 0.84% and 0.99%, respectively.
(g) Prior to April 1, 2023, total annual fund expenses for Alger Small Cap Focus Fund, Class Y shares, could not exceed 0.85%.
(h) Prior to April 1, 2023, total annual fund expenses for Alger International Focus Fund, Class I and Z shares, could not exceed 1.25% and 0.84%, respectively.
(i) Prior to April 1, 2023, total annual fund expenses for Alger Health Sciences Fund, Class Z shares, could not exceed 0.75%.
Alger Management may recoup any fees waived or expenses reimbursed pursuant to the contract; however, a Fund will only make repayments to the Investment Manager if such repayment does not cause a Fund’s expense ratio after the repayment is taken into account, to exceed both (i) the expense cap in place at the time such amounts were waived or reimbursed, and (ii) a Fund’s current expense cap. Such recoupment is limited to two years from the date the amount is initially waived or reimbursed. For the year ended October 31, 2023, the recoupment made by the Alger Small Cap Focus Fund and Alger Health Sciences Fund to the Investment Manager was $2,468 and $413, respectively.
THE ALGER FUNDS
NOTES TO FINANCIAL STATEMENTS (Continued)
In addition, Alger Management voluntarily reduced its 12b-1 fee effective April 1, 2019, for the Class B shares of the Alger Mid Cap Growth Fund, Alger Small Cap Growth Fund and Alger International Focus Fund by $69,459, $16,723 and $96,332, respectively, for the year ended October 31, 2023.
(b) Administration Fees: Fees incurred by each Fund, pursuant to the provisions of the Trust’s Fund Administration Agreement with Alger Management, are payable monthly and computed based on the average daily net assets of each Fund at the annual rate of 0.0275%.
(c) Distribution Fees:
Class A Shares: The Trust has adopted a Plan of Distribution pursuant to which each Fund pays Fred Alger & Company, LLC, each Fund’s distributor and an affiliate of the Investment Manager (the “Distributor” or “Alger LLC”) a fee at the annual rate of 0.25% of the respective average daily net assets of the Class A shares of the designated Fund to compensate Alger LLC for its activities and expenses incurred in distributing and/or administering the Class A shares and/or shareholder servicing. The fees paid may be more or less than the expenses incurred by Alger LLC.
Class B Shares: The Trust has adopted a Plan of Distribution pursuant to which Class B shares of each Fund issuing such shares reimburse Alger LLC for costs and expenses incurred by Alger LLC in connection with advertising, marketing and selling the Class B shares, and shareholder servicing, not to exceed an annual rate of 1% of the respective average daily net assets of the Class B shares of the designated Fund. If in any month, the costs incurred by Alger LLC relating to the Class B shares are in excess of the distribution fees charged to the Class B shares of the Fund, the excess may be carried forward, with interest, and sought to be reimbursed in future periods. As of October 31, 2023, such excess carried forward was $13,402,169, $21,133,510 and $20,892,933 for Class B shares of Alger Mid Cap Growth Fund, Alger Small Cap Growth Fund and Alger International Focus Fund, respectively. Contingent deferred sales charges imposed on redemptions of Class B shares will reduce the amount of distribution expenses for which reimbursement may be sought. See Note 3(d) below.
Class C Shares: The Trust has adopted a Distribution Plan pursuant to which Class C shares of each Fund pays Alger LLC a fee at the annual rate of 1% of the respective average daily net assets of the Class C shares of the designated Fund to compensate Alger LLC for its activities and expenses incurred in distributing the Class C shares and/or shareholder servicing. Fees paid may be more or less than the expenses incurred by Alger LLC.
Class I Shares: The Trust has adopted a Distribution Plan pursuant to which Class I shares of each Fund issuing such shares pays Alger LLC a fee at the annual rate of 0.25% of the average daily net assets of the Fund’s Class I shares to compensate Alger LLC for its activities and expenses incurred in distributing the Class I shares and/or shareholder servicing. Fees paid may be more or less than the expenses incurred by Alger LLC.
THE ALGER FUNDS
NOTES TO FINANCIAL STATEMENTS (Continued)
(d) Sales Charges: Sales of shares of the Funds may be subject to contingent deferred sales charges. The contingent deferred sales charges are used by Alger LLC to offset distribution expenses previously incurred. Sales charges do not represent expenses of the Trust. For the year ended October 31, 2023, contingent deferred sales charges imposed, all of which were retained by Alger LLC, were as follows:
CONTINGENT DEFERRED SALES CHARGES | ||||
| Alger Capital Appreciation Fund | $ | 2,804 | ||
| Alger Growth & Income Fund | 1,460 | |||
| Alger Mid Cap Growth Fund | 1,017 | |||
| Alger Mid Cap Focus Fund | 160 | |||
| Alger Weatherbie Specialized Growth Fund | 4,919 | |||
| Alger Small Cap Growth Fund | 3,477 | |||
| Alger Small Cap Focus Fund | 2,806 | |||
| Alger International Focus Fund | 1,969 | |||
| Alger Health Sciences Fund | 1,603 | |||
(e) Brokerage Commissions: During the year ended October 31, 2023, Alger Capital Appreciation Fund, Alger 35 Fund, Alger Growth & Income Fund, Alger Mid Cap Growth Fund, Alger Mid Cap Focus Fund, Alger Small Cap Growth Fund, Alger Small Cap Focus Fund, Alger International Focus Fund and Alger Health Sciences Fund paid Alger LLC, $233,685, $25,185, $556, $11,464, $126,270, $75,252, $273,713, $14,698 and $98,068, respectively, in connection with securities transactions.
(f) Shareholder Administrative Fees: The Trust has entered into a Shareholder Administrative Services Agreement with Alger Management to compensate Alger Management for liaising with, and providing administrative oversight of, the Trust’s transfer agent, and for other related services. The Funds compensate Alger Management at the annual rate of 0.0165% of their respective average daily net assets for the Class A, Class B and Class C shares and 0.01% of their respective average daily net assets for the Class I, Class Y and Class Z shares for these services.
Alger Management makes payments to intermediaries that provide sub-accounting services to omnibus accounts invested in the Funds. A portion of the fees paid by Alger Management to intermediaries that provide sub-accounting services are charged back to the appropriate Fund, subject to certain limitations, as approved by the Board. For the year ended October 31, 2023, Alger Management charged back to Alger Capital Appreciation Fund, Alger Growth & Income Fund, Alger Mid Cap Growth Fund, Alger Mid Cap Focus Fund, Alger Weatherbie Specialized Growth Fund, Alger Small Cap Growth Fund, Alger Small Cap Focus Fund, Alger International Focus Fund and Alger Health Sciences Fund $583,173, $57,561, $44,382, $16,176, $119,832, $67,574, $687,435, $24,204 and $48,642, respectively, for these services, which are included in transfer agent fees in the accompanying Statements of Operations.
THE ALGER FUNDS
NOTES TO FINANCIAL STATEMENTS (Continued)
(g) Trustee Fees: Each trustee who is not an “interested person” of the Trust, as defined in the 1940 Act (“Independent Trustee”), receives a fee of $156,000 per annum, paid pro rata based on net assets by each fund in the Alger Fund Complex, plus travel expenses incurred for attending board meetings. The term “Alger Fund Complex” refers to the Trust, The Alger Institutional Funds, The Alger Funds II, The Alger Portfolios, Alger Global Focus Fund and The Alger ETF Trust, each of which is a registered investment company managed by Alger Management. The Independent Trustee appointed as Chairman of the Board receives additional compensation of $22,000 per annum paid pro rata based on net assets by each fund in the Alger Fund Complex. Additionally, each member of the Audit Committee receives a fee of $13,000 per annum, paid pro rata based on net assets by each fund in the Alger Fund Complex.
The Board has adopted a policy requiring Trustees to receive a minimum of 10% of their annual compensation in shares of one or more of the funds in the Alger Fund Complex.
(h) Interfund Trades: The Funds may engage in purchase and sale transactions with other funds advised by Alger Management or sub-advised by Weatherbie. For the year ended October 31, 2023, these purchases and sales were as follows:
| PURCHASES | SALES | REALIZED GAIN (LOSS) | ||||||||||
| Alger Mid Cap Focus Fund | $ | — | $ | 1,806,412 | $ | 245,273 | ||||||
| Alger Small Cap Growth Fund | 2,417,616 | — | — | |||||||||
| Alger Small Cap Focus Fund | 1,806,412 | 5,079,448 | (7,847,525 | ) | ||||||||
(i) Interfund Loans: The Funds, along with other funds in the Alger Fund Complex, may borrow money from and lend money to each other for temporary or emergency purposes with the exception of the Alger International Focus Fund, which can only borrow for temporary or emergency purposes. To the extent permitted under its investment restrictions, each Fund may lend uninvested cash in an amount up to 15% of its net assets to other funds in the Alger Fund Complex. If a Fund has borrowed from other funds in the Alger Fund Complex and has aggregate borrowings from all sources that exceed 10% of the Fund’s total assets, such Fund will secure all of its loans from other funds in the Alger Fund Complex. The interest rate charged on interfund loans is equal to the average of the overnight time deposit rate and bank loan rate available to the Funds. As of October 31, 2023, Alger Mid Cap Focus Fund borrowed $1,918,006, including interest, from Alger Dynamic Opportunities Fund, an affiliated fund, at a rate of 6.01%, which was payable November 1, 2023 and categorized as Level 2 within the fair value hierarchy. In addition, Alger Small Cap Focus Fund borrowed $2,093,772, including interest, from Alger Growth & Income Fund at a rate of 6.01%, which was payable November 1, 2023 and categorized as Level 2 within the fair value hierarchy.
During the year ended October 31, 2023, Alger Capital Appreciation Fund, Alger Growth & Income Fund, Alger Mid Cap Growth Fund, Alger Weatherbie Specialized Growth Fund, Small Cap Growth Fund, Alger Small Cap Focus Fund and Alger Health and Sciences Fund earned interfund loan interest income of $17,984, $15,321, $1,977, $94,202, $2,500, $81,748 and $211, respectively, and Alger Capital Appreciation Fund, Alger 35 Fund, Alger Mid Cap Growth Fund, Alger Mid Cap Focus Fund, Alger Small Cap Growth Fund, Alger Small Cap Focus Fund and Alger Health Sciences Fund incurred interfund loan interest expenses of $72,383, $726, $237, $27,506, $3,973, $119,355 and $936, respectively, which are included in interest income and interest expenses, respectively, in the accompanying Statements of Operations.
THE ALGER FUNDS
NOTES TO FINANCIAL STATEMENTS (Continued)
(j) Other Transactions with Affiliates: Certain officers and one Trustee of the Trust are directors and/or officers of Alger Management, the Distributor, or their affiliates. At October 31, 2023, Alger Management and its affiliated entities owned the following shares:
| SHARE CLASS | ||||||||||||||||||||||||
| A | B | C | I | Y | Z | |||||||||||||||||||
| Alger Capital Appreciation Fund | 77,161 | — | — | — | — | 43,358 | ||||||||||||||||||
| Alger 35 Fund | — | — | — | — | — | 1,593,347 | ||||||||||||||||||
| Alger Growth & Income Fund | — | — | — | — | — | 32,390 | ||||||||||||||||||
| Alger Mid Cap Growth Fund | — | — | — | — | — | 139,187 | ||||||||||||||||||
| Alger Mid Cap Focus Fund | — | — | — | 100,035 | 4,843 | 927,860 | ||||||||||||||||||
| Alger Weatherbie Specialized Growth Fund | 187,751 | — | — | — | 10,066 | 185 | ||||||||||||||||||
| Alger Small Cap Growth Fund | 71,040 | — | — | — | 36,127 | 106,938 | ||||||||||||||||||
| Alger Small Cap Focus Fund | — | — | — | — | 787 | 310,266 | ||||||||||||||||||
| Alger International Focus Fund | — | — | — | — | — | 63,226 | ||||||||||||||||||
| Alger Healthcare Sciences Fund | — | — | — | — | — | 4,784 | ||||||||||||||||||
NOTE 4 — Securities Transactions:
The following summarizes the securities transactions by each Fund, other than U.S. Government securities, in-kind transactions, short-term securities, and OTC CFDs, for the year ended October 31, 2023:
| PURCHASES | SALES | ||||||
| Alger Capital Appreciation Fund | $ | 1,462,615,650 | $ | 1,920,768,323 | |||
| Alger 35 Fund | 106,105,450 | 107,238,409 | |||||
| Alger Growth & Income Fund | 59,519,711 | 12,408,132 | |||||
| Alger Mid Cap Growth Fund | 161,184,549 | 151,130,736 | |||||
| Alger Mid Cap Focus Fund | 413,199,673 | 591,313,068 | |||||
| Alger Weatherbie Specialized Growth Fund | 263,436,634 | 439,263,191 | |||||
| Alger Small Cap Growth Fund | 100,925,525 | 162,730,397 | |||||
| Alger Small Cap Focus Fund | 1,513,184,777 | 2,491,312,148 | |||||
| Alger International Focus Fund | 80,952,704 | 72,216,195 | |||||
| Alger Health Sciences Fund | 451,460,950 | 493,499,997 | |||||
THE ALGER FUNDS
NOTES TO FINANCIAL STATEMENTS (Continued)
The following table summarizes the Alger Growth & Income Fund’s securities lending agreements by counterparty which are subject to rights of offset as of October 31, 2023.
| Fair Value | ||||||||||||||||
| Securities | Cash | on Non- | ||||||||||||||
| Loaned at | Collateral | Cash Collateral | Net | |||||||||||||
| Counterparty | Value | Received(a) | Received | Amount(b) | ||||||||||||
| Barclays Capital, Inc. | $ | 1,077 | $ | 1,077 | — | — | ||||||||||
| BNP Paribas Securities Corp. | 339,150 | 339,150 | — | — | ||||||||||||
| UBS AG London Branch | 109,725 | 109,725 | — | — | ||||||||||||
| Citigroup Global Markets, Inc. | 558,600 | 558,600 | — | — | ||||||||||||
(a) Collateral with a value of $1,023,499 has been received in connection with securities lending agreements and excess collateral received from the individual counterparty is not shown for financial reporting purposes.
(b) The market value of loaned securities is determined as of October 31, 2023. The net amount would be subject to the borrower default indemnity in the event of default by the counterparty.
Loans of securities are terminable at any time and the borrower, after notice, is required to return borrowed securities within the standard time period for settlements of securities transactions.
The market value of any securities on loan, all of which are classified as equity securities in the Funds’ Schedules of Investments, and the value of any related collateral are shown separately in the Statements of Assets and Liabilities as a component of investments at value, and collateral on securities loaned at value, respectively. As of October 31, 2023, any securities on loan were collateralized by cash. The cash collateral invested by the securities lending agent, Brown Brothers Harriman & Co., if any, is disclosed in the Schedules of Investments.
NOTE 5 — Borrowing:
The Funds may borrow from the Custodian on an uncommitted basis. Each Fund pays the Custodian a market rate of interest, generally based upon a rate of return with respect to each respective currency borrowed, taking into consideration relevant overnight and short-term reference rates and the range of distribution between and among the interest rates paid on deposits to other institutions, less applicable commissions, if any. Borrowings from the Custodian are included in Bank overdrafts in the Statements of Assets and Liabilities. The Funds may also borrow from other funds in the Alger Fund Complex, as discussed in Note 3(i). For the year ended October 31, 2023, the Funds had the following borrowings from the Custodian and other funds in the Alger Fund Complex:
| AVERAGE DAILY | WEIGHTED AVERAGE | |||||||
| BORROWING | INTEREST RATE | |||||||
| Alger Capital Appreciation Fund | $ | 1,301,607 | 5.95 | % | ||||
| Alger 35 Fund | 37,569 | 6.41 | ||||||
| Alger Growth & Income Fund | 10,072 | 7.17 | ||||||
| Alger Mid Cap Growth Fund | 6,036 | 5.70 | ||||||
| Alger Mid Cap Focus Fund | 499,946 | 5.56 | ||||||
| Alger Weatherbie Specialized Growth Fund | 35,922 | 7.43 | ||||||
THE ALGER FUNDS
NOTES TO FINANCIAL STATEMENTS (Continued)
| AVERAGE DAILY | WEIGHTED AVERAGE | |||||||
| BORROWING | INTEREST RATE | |||||||
| Alger Small Cap Growth Fund | $ | 72,497 | 5.62 | % | ||||
| Alger Small Cap Focus Fund | 2,161,087 | 5.65 | ||||||
| Alger International Focus Fund | 3,041 | 4.94 | ||||||
| Alger Health Sciences Fund | 23,105 | 5.83 | ||||||
The highest amount borrowed from the Custodian and other funds in the Alger Fund Complex during the year ended October 31, 2023 by each Fund was as follows:
| HIGHEST BORROWING | ||||
| Alger Capital Appreciation Fund | $ | 23,879,848 | ||
| Alger 35 Fund | 561,067 | |||
| Alger Growth & Income Fund | 3,651,356 | |||
| Alger Mid Cap Growth Fund | 1,027,000 | |||
| Alger Mid Cap Focus Fund | 27,329,000 | |||
| Alger Weatherbie Specialized Growth Fund | 3,267,106 | |||
Alger Small Cap Growth Fund | 4,234,000 | |||
| Alger Small Cap Focus Fund | 42,511,799 | |||
| Alger International Focus Fund | 1,059,487 | |||
| Alger Health Sciences Fund | 2,320,638 | |||
THE ALGER FUNDS
NOTES TO FINANCIAL STATEMENTS (Continued)
NOTE 6 — Share Capital:
The Trust has an unlimited number of authorized shares of beneficial interest of $.001 par value which are presently divided into ten series. Each series is divided into separate classes. During the year ended October 31, 2023, and the year ended October 31, 2022, transactions of shares of beneficial interest were as follows:
| FOR THE YEAR ENDED | FOR THE YEAR ENDED | |||||||||||||||
| OCTOBER 31, 2023 | OCTOBER 31, 2022 | |||||||||||||||
| SHARES | AMOUNT | SHARES | AMOUNT | |||||||||||||
| Alger Capital Appreciation Fund | ||||||||||||||||
| Class A: | ||||||||||||||||
| Shares sold | 3,537,512 | $ | 76,640,966 | 6,000,142 | $ | 160,613,838 | ||||||||||
| Shares converted from Class C | 84,727 | 1,897,301 | 78,399 | 2,165,868 | ||||||||||||
| Dividends reinvested | 1,253,214 | 24,437,672 | 7,597,941 | 236,675,867 | ||||||||||||
| Shares redeemed | (10,500,273 | ) | (231,605,028 | ) | (14,983,247 | ) | (385,940,345 | ) | ||||||||
| Net increase (decrease) | (5,624,820 | ) | $ | (128,629,089 | ) | (1,306,765 | ) | $ | 13,515,228 | |||||||
| Class C: | ||||||||||||||||
| Shares sold | 422,757 | $ | 5,278,761 | 917,381 | $ | 14,823,256 | ||||||||||
| Shares converted to Class A | (143,727 | ) | (1,897,301 | ) | (126,672 | ) | (2,165,868 | ) | ||||||||
| Dividends reinvested | 464,915 | 5,355,816 | 2,637,277 | 50,292,867 | ||||||||||||
| Shares redeemed | (3,054,719 | ) | (39,120,922 | ) | (3,969,807 | ) | (67,501,761 | ) | ||||||||
| Net decrease | (2,310,774 | ) | $ | (30,383,646 | ) | (541,821 | ) | $ | (4,551,506 | ) | ||||||
| Class Z: | ||||||||||||||||
| Shares sold | 4,779,741 | $ | 110,145,650 | 8,886,657 | $ | 247,659,419 | ||||||||||
| Dividends reinvested | 1,308,238 | 27,316,002 | 7,554,946 | 250,370,897 | ||||||||||||
| Redemptions in-kind* | (262,465 | ) | (6,841,180 | ) | — | — | ||||||||||
| Shares redeemed | (17,573,378 | ) | (415,558,308 | ) | (14,251,217 | ) | (384,129,235 | ) | ||||||||
| Net increase (decrease) | (11,747,864 | ) | $ | (284,937,836 | ) | 2,190,386 | $ | 113,901,081 | ||||||||
| Alger 35 Fund | ||||||||||||||||
| Class Z: | ||||||||||||||||
| Shares sold | 68,140 | $ | 663,778 | 40,255 | $ | 487,994 | ||||||||||
| Dividends reinvested | 216 | 1,955 | 747,267 | 10,551,417 | ||||||||||||
| Shares redeemed | (139,738 | ) | (1,342,885 | ) | (136,944 | ) | (1,414,466 | ) | ||||||||
| Net increase (decrease) | (71,382 | ) | $ | (677,152 | ) | 650,578 | $ | 9,624,945 | ||||||||
| Alger Growth & Income Fund | ||||||||||||||||
| Class A: | ||||||||||||||||
| Shares sold | 527,117 | $ | 29,676,367 | 515,271 | $ | 29,459,291 | ||||||||||
| Shares converted from Class C | 5,320 | 310,461 | 3,410 | 186,340 | ||||||||||||
| Dividends reinvested | 28,256 | 1,585,591 | 71,532 | 4,322,564 | ||||||||||||
| Shares redeemed | (397,006 | ) | (22,436,651 | ) | (249,872 | ) | (14,016,272 | ) | ||||||||
| Net increase | 163,687 | $ | 9,135,768 | 340,341 | $ | 19,951,923 | ||||||||||
| Class C: | ||||||||||||||||
| Shares sold | 154,981 | $ | 8,440,964 | 180,118 | $ | 9,975,860 | ||||||||||
| Shares converted to Class A | (5,409 | ) | (310,461 | ) | (3,467 | ) | (186,340 | ) | ||||||||
| Dividends reinvested | 2,984 | 164,188 | 11,180 | 673,395 | ||||||||||||
| Shares redeemed | (135,410 | ) | (7,480,210 | ) | (77,010 | ) | (4,282,374 | ) | ||||||||
| Net increase | 17,146 | $ | 814,481 | 110,821 | $ | 6,180,541 | ||||||||||
| Class Z: | ||||||||||||||||
| Shares sold | 2,022,593 | $ | 113,851,751 | 1,892,410 | $ | 104,985,589 | ||||||||||
| Dividends reinvested | 44,637 | 2,511,494 | 34,141 | 2,015,228 | ||||||||||||
| Shares redeemed | (1,340,557 | ) | (76,801,933 | ) | (342,836 | ) | (18,637,053 | ) | ||||||||
| Net increase | 726,673 | $ | 39,561,312 | 1,583,715 | $ | 88,363,764 | ||||||||||
THE ALGER FUNDS
NOTES TO FINANCIAL STATEMENTS (Continued)
| FOR THE YEAR ENDED | FOR THE YEAR ENDED | |||||||||||||||
| OCTOBER 31, 2023 | OCTOBER 31, 2022 | |||||||||||||||
| SHARES | AMOUNT | SHARES | AMOUNT | |||||||||||||
| Alger Mid Cap Growth Fund | ||||||||||||||||
| Class A: | ||||||||||||||||
| Shares sold | 551,685 | $ | 6,297,530 | 914,935 | $ | 12,779,301 | ||||||||||
| Shares converted from Class B | 19,695 | 227,620 | 39,929 | 499,789 | ||||||||||||
| Shares converted from Class C | 11,080 | 121,416 | 4,455 | 62,406 | ||||||||||||
| Dividends reinvested | — | — | 3,949,371 | 62,202,597 | ||||||||||||
| Shares redeemed | (1,743,757 | ) | (20,015,215 | ) | (1,662,534 | ) | (23,061,302 | ) | ||||||||
| Net increase (decrease) | (1,161,297 | ) | $ | (13,368,649 | ) | 3,246,156 | $ | 52,482,791 | ||||||||
| Class B: | ||||||||||||||||
| Shares sold | 58,313 | $ | 420,023 | 306,507 | $ | 2,429,187 | ||||||||||
| Shares converted to Class A | (31,447 | ) | (227,620 | ) | (63,092 | ) | (499,789 | ) | ||||||||
| Dividends reinvested | — | — | 648,341 | 6,399,126 | ||||||||||||
| Shares redeemed | (154,401 | ) | (1,104,737 | ) | (338,973 | ) | (3,167,198 | ) | ||||||||
| Net increase (decrease) | (127,535 | ) | $ | (912,334 | ) | 552,783 | $ | 5,161,326 | ||||||||
| Class C: | ||||||||||||||||
| Shares sold | 44,391 | $ | 294,878 | 129,451 | $ | 1,156,792 | ||||||||||
| Shares converted to Class A | (18,964 | ) | (121,416 | ) | (7,374 | ) | (62,406 | ) | ||||||||
| Dividends reinvested | — | — | 312,841 | 2,906,295 | ||||||||||||
| Shares redeemed | (218,412 | ) | (1,437,280 | ) | (177,595 | ) | (1,518,832 | ) | ||||||||
| Net increase (decrease) | (192,985 | ) | $ | (1,263,818 | ) | 257,323 | $ | 2,481,849 | ||||||||
| Class Z: | ||||||||||||||||
| Shares sold | 2,007,842 | $ | 25,149,971 | 1,467,938 | $ | 24,776,780 | ||||||||||
| Dividends reinvested | — | — | 730,556 | 11,835,012 | ||||||||||||
| Shares redeemed | (973,399 | ) | (11,285,464 | ) | (1,511,602 | ) | (20,451,267 | ) | ||||||||
| Net increase | 1,034,443 | $ | 13,864,507 | 686,892 | $ | 16,160,525 | ||||||||||
THE ALGER FUNDS
NOTES TO FINANCIAL STATEMENTS (Continued)
| FOR THE YEAR ENDED | FOR THE YEAR ENDED | |||||||||||||||
| OCTOBER 31, 2023 | OCTOBER 31, 2022 | |||||||||||||||
| SHARES | AMOUNT | SHARES | AMOUNT | |||||||||||||
| Alger Mid Cap Focus Fund | ||||||||||||||||
| Class A: | ||||||||||||||||
| Shares sold | 161,323 | $ | 1,923,171 | 437,847 | $ | 6,471,602 | ||||||||||
| Dividends reinvested | — | — | 12,508 | 226,140 | ||||||||||||
| Shares redeemed | (288,398 | ) | (3,424,484 | ) | (102,747 | ) | (1,441,325 | ) | ||||||||
| Net increase (decrease) | (127,075 | ) | $ | (1,501,313 | ) | 347,608 | $ | 5,256,417 | ||||||||
| Class C: | ||||||||||||||||
| Shares sold | 87,481 | $ | 1,024,452 | 205,863 | $ | 3,441,176 | ||||||||||
| Dividends reinvested | — | — | 12,103 | 218,218 | ||||||||||||
| Shares redeemed | (104,005 | ) | (1,222,301 | ) | (114,553 | ) | (1,735,186 | ) | ||||||||
| Net increase (decrease) | (16,524 | ) | $ | (197,849 | ) | 103,413 | $ | 1,924,208 | ||||||||
| Class I: | ||||||||||||||||
| Shares sold | 232,401 | $ | 2,784,004 | 1,024,323 | $ | 17,245,006 | ||||||||||
| Dividends reinvested | — | — | 678,515 | 12,274,336 | ||||||||||||
| Shares redeemed | (4,363,723 | ) | (52,166,483 | ) | (2,767,242 | ) | (41,627,861 | ) | ||||||||
| Net decrease | (4,131,322 | ) | $ | (49,382,479 | ) | (1,064,404 | ) | $ | (12,108,519 | ) | ||||||
| Class Y:** | ||||||||||||||||
| Shares sold | 5,023 | $ | 61,710 | 30,243 | $ | 420,561 | ||||||||||
| Dividends reinvested | — | — | 116 | 2,107 | ||||||||||||
| Shares redeemed | (24,735 | ) | (300,883 | ) | (9 | ) | (87 | ) | ||||||||
| Net increase (decrease) | (19,712 | ) | $ | (239,173 | ) | 30,350 | $ | 422,581 | ||||||||
| Class Z: | ||||||||||||||||
| Shares sold | 5,274,737 | $ | 63,482,127 | 13,358,332 | $ | 215,931,807 | ||||||||||
| Dividends reinvested | — | — | 3,770,479 | 68,698,120 | ||||||||||||
| Shares redeemed | (16,159,367 | ) | (195,865,987 | ) | (21,026,998 | ) | (316,016,051 | ) | ||||||||
| Net decrease | (10,884,630 | ) | $ | (132,383,860 | ) | (3,898,187 | ) | $ | (31,386,124 | ) | ||||||
THE ALGER FUNDS
NOTES TO FINANCIAL STATEMENTS (Continued)
| FOR THE YEAR ENDED | FOR THE YEAR ENDED | |||||||||||||||
| OCTOBER 31, 2023 | OCTOBER 31, 2022 | |||||||||||||||
| SHARES | AMOUNT | SHARES | AMOUNT | |||||||||||||
| Alger Weatherbie Specialized Growth Fund | ||||||||||||||||
| Class A: | ||||||||||||||||
| Shares sold | 849,539 | $ | 9,718,361 | 2,207,109 | $ | 31,475,922 | ||||||||||
| Shares converted from Class C | 11,630 | 132,822 | 10,193 | 195,953 | ||||||||||||
| Dividends reinvested | — | — | 2,355,077 | 40,837,032 | ||||||||||||
| Shares redeemed | (2,683,927 | ) | (30,533,304 | ) | (4,618,177 | ) | (63,575,231 | ) | ||||||||
| Net increase (decrease) | (1,822,758 | ) | $ | (20,682,121 | ) | (45,798 | ) | $ | 8,933,676 | |||||||
| Class C: | ||||||||||||||||
| Shares sold | 460,033 | $ | 2,859,283 | 1,004,246 | $ | 8,908,341 | ||||||||||
| Shares converted to Class A | (21,521 | ) | (132,822 | ) | (17,106 | ) | (195,953 | ) | ||||||||
| Dividends reinvested | — | — | 2,635,295 | 24,982,600 | ||||||||||||
| Shares redeemed | (2,148,505 | ) | (13,252,678 | ) | (2,980,283 | ) | (23,986,101 | ) | ||||||||
| Net increase (decrease) | (1,709,993 | ) | $ | (10,526,217 | ) | 642,152 | $ | 9,708,887 | ||||||||
| Class I: | ||||||||||||||||
| Shares sold | 193,862 | $ | 2,373,638 | 430,300 | $ | 7,169,370 | ||||||||||
| Dividends reinvested | — | — | 505,518 | 9,079,102 | ||||||||||||
| Shares redeemed | (1,406,818 | ) | (16,936,409 | ) | (1,472,639 | ) | (21,152,563 | ) | ||||||||
| Net decrease | (1,212,956 | ) | $ | (14,562,771 | ) | (536,821 | ) | $ | (4,904,091 | ) | ||||||
| Class Y: | ||||||||||||||||
| Shares sold | 1,187,990 | $ | 14,576,900 | 2,793,770 | $ | 42,898,361 | ||||||||||
| Dividends reinvested | — | — | 343,618 | 6,305,382 | ||||||||||||
| Shares redeemed | (1,001,262 | ) | (12,055,286 | ) | (1,624,371 | ) | (22,901,364 | ) | ||||||||
| Net increase | 186,728 | $ | 2,521,614 | 1,513,017 | $ | 26,302,379 | ||||||||||
| Class Z: | ||||||||||||||||
| Shares sold | 10,702,308 | $ | 135,652,242 | 25,026,249 | $ | 397,063,874 | ||||||||||
| Dividends reinvested | — | — | 9,047,802 | 171,998,722 | ||||||||||||
| Shares redeemed | (22,330,920 | ) | (277,922,173 | ) | (39,559,633 | ) | (605,958,139 | ) | ||||||||
| Net decrease | (11,628,612 | ) | $ | (142,269,931 | ) | (5,485,582 | ) | $ | (36,895,543 | ) | ||||||
THE ALGER FUNDS
NOTES TO FINANCIAL STATEMENTS (Continued)
| FOR THE YEAR ENDED | FOR THE YEAR ENDED | |||||||||||||||
| OCTOBER 31, 2023 | OCTOBER 31, 2022 | |||||||||||||||
| SHARES | AMOUNT | SHARES | AMOUNT | |||||||||||||
| Alger Small Cap Growth Fund | ||||||||||||||||
| Class A: | ||||||||||||||||
| Shares sold | 857,919 | $ | 7,430,074 | 2,219,196 | $ | 24,488,782 | ||||||||||
| Shares converted from Class B | 14,745 | 129,808 | 49,641 | 549,484 | ||||||||||||
| Shares converted from Class C | 900 | 7,906 | 1,542 | 15,219 | ||||||||||||
| Dividends reinvested | — | — | 1,565,131 | 20,221,493 | ||||||||||||
| Shares redeemed | (3,051,665 | ) | (26,597,820 | ) | (3,937,640 | ) | (43,512,748 | ) | ||||||||
| Net increase (decrease) | (2,178,101 | ) | $ | (19,030,032 | ) | (102,130 | ) | $ | 1,762,230 | |||||||
| Class B: | ||||||||||||||||
| Shares sold | 16,544 | $ | 93,912 | 69,274 | $ | 489,107 | ||||||||||
| Shares converted to Class A | (21,915 | ) | (129,808 | ) | (73,759 | ) | (549,484 | ) | ||||||||
| Dividends reinvested | — | — | 77,256 | 672,125 | ||||||||||||
| Shares redeemed | (89,161 | ) | (519,896 | ) | (71,673 | ) | (579,243 | ) | ||||||||
| Net increase (decrease) | (94,532 | ) | $ | (555,792 | ) | 1,098 | $ | 32,505 | ||||||||
| Class C: | ||||||||||||||||
| Shares sold | 434,487 | $ | 2,342,165 | 791,975 | $ | 5,337,182 | ||||||||||
| Shares converted to Class A | (1,450 | ) | (7,906 | ) | (2,453 | ) | (15,219 | ) | ||||||||
| Dividends reinvested | — | — | 590,149 | 4,786,108 | ||||||||||||
| Shares redeemed | (1,227,085 | ) | (6,598,276 | ) | (1,186,581 | ) | (7,903,372 | ) | ||||||||
| Net increase (decrease) | (794,048 | ) | $ | (4,264,017 | ) | 193,090 | $ | 2,204,699 | ||||||||
| Class Y:*** | ||||||||||||||||
| Shares sold | 183,924 | $ | 1,677,124 | 890,852 | $ | 8,643,853 | ||||||||||
| Shares redeemed | (181,307 | ) | (1,626,230 | ) | (25,818 | ) | (245,321 | ) | ||||||||
| Net increase | 2,617 | $ | 50,894 | 865,034 | $ | 8,398,532 | ||||||||||
| Class Z: | ||||||||||||||||
| Shares sold | 5,751,027 | $ | 52,675,776 | 14,423,124 | $ | 162,619,241 | ||||||||||
| Dividends reinvested | — | — | 2,222,719 | 30,117,848 | ||||||||||||
| Shares redeemed | (12,265,010 | ) | (112,843,508 | ) | (16,204,110 | ) | (179,137,817 | ) | ||||||||
| Net increase (decrease) | (6,513,983 | ) | $ | (60,167,732 | ) | 441,733 | $ | 13,599,272 | ||||||||
THE ALGER FUNDS
NOTES TO FINANCIAL STATEMENTS (Continued)
| FOR THE YEAR ENDED | FOR THE YEAR ENDED | |||||||||||||||
| OCTOBER 31, 2023 | OCTOBER 31, 2022 | |||||||||||||||
| SHARES | AMOUNT | SHARES | AMOUNT | |||||||||||||
| Alger Small Cap Focus Fund | ||||||||||||||||
| Class A: | ||||||||||||||||
| Shares sold | 1,586,778 | $ | 25,437,390 | 2,079,038 | $ | 42,247,967 | ||||||||||
| Shares converted from Class C | 4,512 | 73,412 | 3,678 | 95,518 | ||||||||||||
| Dividends reinvested | — | — | 1,045,786 | 26,134,180 | ||||||||||||
| Shares redeemed | (5,797,833 | ) | (91,855,855 | ) | (7,382,999 | ) | (148,269,616 | ) | ||||||||
| Net decrease | (4,206,543 | ) | $ | (66,345,053 | ) | (4,254,497 | ) | $ | (79,791,951 | ) | ||||||
| Class C: | ||||||||||||||||
| Shares sold | 317,383 | $ | 4,418,813 | 361,903 | $ | 6,758,876 | ||||||||||
| Shares converted to Class A | (5,180 | ) | (73,412 | ) | (4,175 | ) | (95,518 | ) | ||||||||
| Dividends reinvested | — | — | 669,148 | 14,661,031 | ||||||||||||
| Shares redeemed | (2,570,357 | ) | (35,612,848 | ) | (3,163,891 | ) | (54,641,324 | ) | ||||||||
| Net decrease | (2,258,154 | ) | $ | (31,267,447 | ) | (2,137,015 | ) | $ | (33,316,935 | ) | ||||||
| Class I: | ||||||||||||||||
| Shares sold | 1,703,452 | $ | 28,073,282 | 2,388,085 | $ | 52,040,663 | ||||||||||
| Dividends reinvested | — | — | 817,179 | 21,017,843 | ||||||||||||
| Shares redeemed | (6,336,814 | ) | (104,590,356 | ) | (7,857,664 | ) | (170,047,309 | ) | ||||||||
| Net decrease | (4,633,362 | ) | $ | (76,517,074 | ) | (4,652,400 | ) | $ | (96,988,803 | ) | ||||||
| Class Y: | ||||||||||||||||
| Shares sold | 3,453,919 | $ | 57,953,737 | 5,178,987 | $ | 111,652,914 | ||||||||||
| Dividends reinvested | — | — | 722,905 | 19,019,637 | ||||||||||||
| Shares redeemed | (8,662,422 | ) | (148,617,593 | ) | (3,388,609 | ) | (72,320,606 | ) | ||||||||
| Net increase (decrease) | (5,208,503 | ) | $ | (90,663,856 | ) | 2,513,283 | $ | 58,351,945 | ||||||||
| Class Z: | ||||||||||||||||
| Shares sold | 21,039,949 | $ | 359,111,581 | 53,012,266 | $ | 1,149,885,044 | ||||||||||
| Dividends reinvested | — | — | 10,465,710 | 275,248,186 | ||||||||||||
| Shares redeemed | (67,854,544 | ) | (1,149,382,179 | ) | (127,025,685 | ) | (2,664,182,027 | ) | ||||||||
| Net decrease | (46,814,595 | ) | $ | (790,270,598 | ) | (63,547,709 | ) | $ | (1,239,048,797 | ) | ||||||
THE ALGER FUNDS
NOTES TO FINANCIAL STATEMENTS (Continued)
| FOR THE YEAR ENDED | FOR THE YEAR ENDED | |||||||||||||||
| OCTOBER 31, 2023 | OCTOBER 31, 2022 | |||||||||||||||
| SHARES | AMOUNT | SHARES | AMOUNT | |||||||||||||
| Alger International Focus Fund | �� | |||||||||||||||
| Class A: | ||||||||||||||||
| Shares sold | 158,889 | $ | 2,653,129 | 272,542 | $ | 5,095,123 | ||||||||||
| Shares converted from Class B | 7,585 | 127,067 | 11,100 | 214,147 | ||||||||||||
| Shares converted from Class C | 2,050 | 34,641 | 2,157 | 41,626 | ||||||||||||
| Dividends reinvested | — | — | 517,441 | 11,740,747 | ||||||||||||
| Shares redeemed | (602,712 | ) | (10,140,919 | ) | (517,683 | ) | (9,704,917 | ) | ||||||||
| Net increase (decrease) | (434,188 | ) | $ | (7,326,082 | ) | 285,557 | $ | 7,386,726 | ||||||||
| Class B: | ||||||||||||||||
| Shares sold | 9,944 | $ | 143,537 | 10,257 | $ | 145,522 | ||||||||||
| Shares converted to Class A | (8,855 | ) | (127,067 | ) | (12,932 | ) | (214,147 | ) | ||||||||
| Dividends reinvested | — | — | 99,778 | 1,938,691 | ||||||||||||
| Shares redeemed | (90,648 | ) | (1,307,077 | ) | (100,637 | ) | (1,753,746 | ) | ||||||||
| Net increase (decrease) | (89,559 | ) | $ | (1,290,607 | ) | (3,534 | ) | $ | 116,320 | |||||||
| Class C: | ||||||||||||||||
| Shares sold | 12,124 | $ | 164,152 | 14,352 | $ | 245,440 | ||||||||||
| Shares converted to Class A | (2,538 | ) | (34,641 | ) | (2,638 | ) | (41,626 | ) | ||||||||
| Dividends reinvested | — | — | 21,218 | 393,811 | ||||||||||||
| Shares redeemed | (48,877 | ) | (655,302 | ) | (112,626 | ) | (1,705,231 | ) | ||||||||
| Net decrease | (39,291 | ) | $ | (525,791 | ) | (79,694 | ) | $ | (1,107,606 | ) | ||||||
| Class I: | ||||||||||||||||
| Shares sold | 4,044 | $ | 69,031 | 64,844 | $ | 1,462,329 | ||||||||||
| Dividends reinvested | — | — | 2,147 | 48,866 | ||||||||||||
| Shares redeemed | (3,773 | ) | (63,383 | ) | (20,997 | ) | (391,454 | ) | ||||||||
| Net increase | 271 | $ | 5,648 | 45,994 | $ | 1,119,741 | ||||||||||
| Class Z: | ||||||||||||||||
| Shares sold | 1,530,829 | $ | 26,775,938 | 356,479 | $ | 6,998,893 | ||||||||||
| Dividends reinvested | — | — | 90,502 | 2,089,682 | ||||||||||||
| Shares redeemed | (307,274 | ) | (5,290,212 | ) | (620,623 | ) | (11,168,546 | ) | ||||||||
| Net increase (decrease) | 1,223,555 | $ | 21,485,726 | (173,642 | ) | $ | (2,079,971 | ) | ||||||||
THE ALGER FUNDS
NOTES TO FINANCIAL STATEMENTS (Continued)
| FOR THE YEAR ENDED | FOR THE YEAR ENDED | |||||||||||||||
| OCTOBER 31, 2023 | OCTOBER 31, 2022 | |||||||||||||||
| SHARES | AMOUNT | SHARES | AMOUNT | |||||||||||||
| Alger Health Sciences Fund | ||||||||||||||||
| Class A: | ||||||||||||||||
| Shares sold | 175,274 | $ | 3,599,809 | 551,350 | $ | 12,970,639 | ||||||||||
| Shares converted from Class C | 1,782 | 35,923 | 7,202 | 167,019 | ||||||||||||
| Dividends reinvested | — | — | 974,155 | 24,529,213 | ||||||||||||
| Shares redeemed | (958,827 | ) | (19,574,832 | ) | (1,298,720 | ) | (29,986,025 | ) | ||||||||
| Net increase (decrease) | (781,771 | ) | $ | (15,939,100 | ) | 233,987 | $ | 7,680,846 | ||||||||
| Class C: | ||||||||||||||||
| Shares sold | 50,076 | $ | 653,525 | 69,406 | $ | 1,071,149 | ||||||||||
| Shares converted to Class A | (2,849 | ) | (35,923 | ) | (11,391 | ) | (167,019 | ) | ||||||||
| Dividends reinvested | — | — | 226,913 | 3,607,915 | ||||||||||||
| Shares redeemed | (222,183 | ) | (2,836,210 | ) | (235,168 | ) | (3,555,053 | ) | ||||||||
| Net increase (decrease) | (174,956 | ) | $ | (2,218,608 | ) | 49,760 | $ | 956,992 | ||||||||
| Class Z: | ||||||||||||||||
| Shares sold | 638,634 | $ | 12,889,940 | 1,269,543 | $ | 31,739,077 | ||||||||||
| Dividends reinvested | — | — | 1,302,121 | 33,295,227 | ||||||||||||
| Shares redeemed | (1,793,673 | ) | (37,194,352 | ) | (3,842,061 | ) | (88,876,343 | ) | ||||||||
| Net decrease | (1,155,039 | ) | $ | (24,304,412 | ) | (1,270,397 | ) | $ | (23,842,039 | ) | ||||||
* Certain shareholders of the Fund redeemed shares in-kind.
** Inception date December 17, 2021.
*** Inception date December 31, 2021.
Redemptions In-Kind: A Fund may make payment for Fund shares redeemed wholly or in part by transferring portfolio securities to shareholders. For the year ended October 31, 2023, the Alger Capital Appreciation Fund had redemptions in-kind with total proceeds in the amount of $6,841,180. The net realized gains on these redemptions in-kind amounted to $3,557,014, which are not considered taxable for federal income tax purposes.
NOTE 7 — Income Tax Information:
The tax character of distributions paid during the year ended October 31, 2023 and the year ended October 31, 2022 was as follows:
| FOR THE YEAR ENDED | FOR THE YEAR ENDED | |||||||
| OCTOBER 31, 2023 | OCTOBER 31, 2022 | |||||||
| Alger Capital Appreciation Fund | ||||||||
| Distributions paid from: | ||||||||
| Ordinary Income | $ | — | $ | 84,937,556 | ||||
| Long-term capital gain | 68,995,008 | 550,592,694 | ||||||
| Total distributions paid | $ | 68,995,008 | $ | 635,530,250 | ||||
THE ALGER FUNDS
NOTES TO FINANCIAL STATEMENTS (Continued)
| FOR THE YEAR ENDED | FOR THE YEAR ENDED | |||||||
| OCTOBER 31, 2023 | OCTOBER 31, 2022 | |||||||
| Alger 35 Fund | ||||||||
| Distributions paid from: | ||||||||
| Ordinary Income | $ | 5,582 | $ | 2,856,188 | ||||
| Long-term capital gain | — | 7,695,229 | ||||||
| Total distributions paid | $ | 5,582 | $ | 10,551,417 | ||||
| Alger Growth & Income Fund | ||||||||
| Distributions paid from: | ||||||||
| Ordinary Income | $ | 4,472,953 | $ | 2,654,256 | ||||
| Long-term capital gain | — | 4,962,836 | ||||||
| Total distributions paid | $ | 4,472,953 | $ | 7,617,092 | ||||
| Alger Mid Cap Growth Fund | ||||||||
| Distributions paid from: | ||||||||
| Ordinary Income | $ | — | $ | 39,056,482 | ||||
| Long-term capital gain | — | 53,285,885 | ||||||
| Total distributions paid | $ | — | $ | 92,342,367 | ||||
| Alger Mid Cap Focus Fund | ||||||||
| Distributions paid from: | ||||||||
| Ordinary Income | $ | — | $ | 69,647,668 | ||||
| Long-term capital gain | — | 14,480,875 | ||||||
| Total distributions paid | $ | — | $ | 84,128,543 | ||||
| Alger Weatherbie Specialized Growth Fund | ||||||||
| Distributions paid from: | ||||||||
| Ordinary Income | $ | — | $ | 157,918,577 | ||||
| Long-term capital gain | — | 143,706,532 | ||||||
| Total distributions paid | $ | — | $ | 301,625,109 | ||||
| Alger Small Cap Growth Fund | ||||||||
| Distributions paid from: | ||||||||
| Ordinary Income | $ | — | $ | — | ||||
| Long-term capital gain | — | 57,233,096 | ||||||
| Total distributions paid | $ | — | $ | 57,233,096 | ||||
| Alger Small Cap Focus Fund | ||||||||
| Distributions paid from: | ||||||||
| Ordinary Income | $ | — | $ | — | ||||
| Long-term capital gain | — | 416,035,678 | ||||||
| Total distributions paid | $ | — | $ | 416,035,678 | ||||
THE ALGER FUNDS
NOTES TO FINANCIAL STATEMENTS (Continued)
| FOR THE YEAR ENDED | FOR THE YEAR ENDED | |||||||
| OCTOBER 31, 2023 | OCTOBER 31, 2022 | |||||||
| Alger International Focus Fund | ||||||||
| Distributions paid from: | ||||||||
| Ordinary Income | $ | — | $ | — | ||||
| Long-term capital gain | — | 16,992,932 | ||||||
| Total distributions paid | $ | — | $ | 16,992,932 | ||||
| Alger Health Sciences Fund | ||||||||
| Distributions paid from: | ||||||||
| Ordinary Income | $ | — | $ | 15,390,772 | ||||
| Long-term capital gain | — | 51,406,248 | ||||||
| Total distributions paid | $ | — | $ | 66,797,020 | ||||
As of October 31, 2023, the components of accumulated earnings on a tax basis were as follows:
| Alger Capital Appreciation Fund | ||||
| Undistributed ordinary income | $ | — | ||
| Undistributed long-term gains | 120,337,274 | |||
| Net accumulated earnings | 120,337,274 | |||
| Capital loss carryforwards | — | |||
| Late year ordinary income losses | (7,849,488 | ) | ||
| Net unrealized appreciation | 646,911,954 | |||
| Total accumulated earnings | $ | 759,399,740 | ||
| Alger 35 Fund | ||||
| Undistributed ordinary income | $ | — | ||
| Undistributed long-term gains | — | |||
| Net accumulated earnings | — | |||
| Capital loss carryforwards | (6,346,684 | ) | ||
| Late year ordinary income losses | (35,996 | ) | ||
| Net unrealized depreciation | (8,143,409 | ) | ||
| Total accumulated earnings | $ | (14,526,089 | ) | |
| Alger Growth & Income Fund | ||||
| Undistributed ordinary income | $ | 576,002 | ||
| Undistributed long-term gains | — | |||
| Net accumulated earnings | 576,002 | |||
| Capital loss carryforwards | (648,306 | ) | ||
| Late year ordinary income losses | — | |||
| Net unrealized appreciation | 97,696,124 | |||
| Total accumulated earnings | $ | 97,623,820 | ||
THE ALGER FUNDS
NOTES TO FINANCIAL STATEMENTS (Continued)
| Alger Mid Cap Growth Fund | ||||
| Undistributed ordinary income | $ | — | ||
| Undistributed long-term gains | — | |||
| Net accumulated earnings | — | |||
| Capital loss carryforwards | (64,005,757 | ) | ||
| Late year ordinary income losses | (1,211,795 | ) | ||
| Net unrealized depreciation | 3,197,320 | |||
| Total accumulated earnings | $ | (62,020,232 | ) | |
| Alger Mid Cap Focus Fund | ||||
| Undistributed ordinary income | $ | — | ||
| Undistributed long-term gains | — | |||
| Net accumulated earnings | — | |||
| Capital loss carryforwards | (179,083,087 | ) | ||
| Late year ordinary income losses | (1,541,431 | ) | ||
| Net unrealized depreciation | 8,039,576 | |||
| Total accumulated earnings | $ | (172,584,942 | ) | |
| Alger Weatherbie Specialized Growth Fund | ||||
| Undistributed ordinary income | $ | — | ||
| Undistributed long-term gains | — | |||
| Net accumulated earnings | — | |||
| Capital loss carryforwards | (310,918,954 | ) | ||
| Late year ordinary income losses | (3,925,088 | ) | ||
| Net unrealized depreciation | (53,523,825 | ) | ||
| Total accumulated earnings | $ | (368,367,867 | ) | |
| Alger Small Cap Growth Fund | ||||
| Undistributed ordinary income | $ | — | ||
| Undistributed long-term gains | — | |||
| Net accumulated earnings | — | |||
| Capital loss carryforwards | (96,550,950 | ) | ||
| Late year ordinary income losses | (2,256,442 | ) | ||
| Net unrealized depreciation | (3,792,191 | ) | ||
| Total accumulated earnings | $ | (102,599,583 | ) | |
| Alger Small Cap Focus Fund | ||||
| Undistributed ordinary income | $ | — | ||
| Undistributed long-term gains | — | |||
| Net accumulated earnings | — | |||
| Capital loss carryforwards | (794,814,795 | ) | ||
| Late year ordinary income losses | (18,336,179 | ) | ||
| Net unrealized appreciation | (47,743,811 | ) | ||
| Total accumulated earnings | $ | (860,894,785 | ) |
THE ALGER FUNDS
NOTES TO FINANCIAL STATEMENTS (Continued)
| Alger International Focus Fund | ||||
| Undistributed ordinary income | $ | — | ||
| Undistributed long-term gains | — | |||
| Net accumulated earnings | — | |||
| Capital loss carryforwards | (6,922,542 | ) | ||
| Late year ordinary income losses | (166,138 | ) | ||
| Net unrealized appreciation | 5,197,432 | |||
| Total accumulated earnings | $ | (1,891,248 | ) | |
| Alger Health Sciences Fund | ||||
| Undistributed ordinary income | $ | — | ||
| Undistributed long-term gains | — | |||
| Net accumulated earnings | — | |||
| Capital loss carryforwards | (33,264,796 | ) | ||
| Late year ordinary income losses | (587,985 | ) | ||
| Net unrealized appreciation | (6,523,328 | ) | ||
| Total accumulated earnings | $ | (40,376,109 | ) |
During the year ended October 31, 2023, the Alger 35 Fund, the Alger Growth & Income Fund, the Alger Mid Cap Growth Fund, the Alger Mid Cap Focus Fund, the Alger Weatherbie Specialized Growth Fund, the Alger Small Cap Growth Fund, the Alger Small Cap Focus Fund, the Alger International Focus Fund and the Alger Health Sciences Fund, for federal income tax purposes, had capital loss carryforwards of $6,346,684, $648,306, $64,005,757, $179,083,087, $310,918,954, $96,550,950, $794,814,795, $6,922,542 and $33,264,796, respectively. These amounts will not be subject to expiration under the Regulated Investment Company Modernization Act of 2010, and these amounts may be applied against future net realized gains until their utilization.
The difference between book-basis and tax-basis unrealized appreciation (depreciation) is determined annually and is attributable primarily to the tax deferral of losses on wash sales, U.S. Internal Revenue Code Section 988 currency transactions, nondeductible expenses on dividends sold short, tax treatment of partnership investments, realization of unrealized appreciation of passive foreign investment companies, and return of capital from real estate investment trust investments.
The Funds accrue tax on unrealized gains in foreign jurisdictions that impose a foreign capital tax. For the year ended October 31, 2023, this amount was not material.
Permanent differences, primarily from net operating losses and real estate investment trusts and partnership investments sold by the Funds, resulted in the following reclassifications among the Funds’ components of net assets at October 31, 2023:
| Alger Capital Appreciation Fund | ||||
| Distributable earnings | $ | 1,865,529 | ||
| Paid-in Capital | $ | (1,865,529 | ) | |
THE ALGER FUNDS
NOTES TO FINANCIAL STATEMENTS (Continued)
| Alger 35 Fund | ||||
| Distributable earnings | $ | 860 | ||
| Paid-in Capital | $ | (860 | ) | |
| Alger Growth & Income Fund | ||||
| Distributable earnings | $ | — | ||
| Paid-in Capital | $ | — | ||
| Alger Mid Cap Growth Fund | ||||
| Distributable earnings | $ | 1,306,142 | ||
| Paid-in Capital | $ | (1,306,142 | ) | |
| Alger Mid Cap Focus Fund | ||||
| Distributable earnings | $ | 1,911,222 | ||
| Paid-in Capital | $ | (1,911,222 | ) | |
| Alger Weatherbie Specialized Growth Fund | ||||
| Distributable earnings | $ | 6,658,725 | ||
| Paid-in Capital | $ | (6,658,725 | ) | |
| Alger Small Cap Growth Fund | ||||
| Distributable earnings | $ | 186,014 | ||
| Paid-in Capital | $ | (186,014 | ) | |
| Alger Small Cap Focus Fund | ||||
| Distributable earnings | $ | 12,570,024 | ||
| Paid-in Capital | $ | (12,570,024 | ) | |
| Alger International Focus Fund | ||||
| Distributable earnings | $ | 556,349 | ||
| Paid-in Capital | $ | (556,349 | ) | |
| Alger Health Sciences Fund | ||||
| Distributable earnings | $ | 163,518 | ||
| Paid-in Capital | $ | (163,518 | ) | |
THE ALGER FUNDS
NOTES TO FINANCIAL STATEMENTS (Continued)
NOTE 8 — Fair Value Measurements:
The following is a summary of the inputs used as of October 31, 2023 in valuing the Funds’ investments carried at fair value on a recurring basis. Based upon the nature, characteristics, and risks associated with their investments, the Funds have determined that presenting them by security type and sector is appropriate.
| Alger Capital Appreciation Fund | TOTAL | LEVEL 1 | LEVEL 2 | LEVEL 3 | ||||||||||||
| COMMON STOCKS | ||||||||||||||||
| Communication Services | $ | 235,010,005 | $ | 235,010,005 | $ | — | $ | — | ||||||||
| Consumer Discretionary | 198,229,632 | 189,503,805 | 8,725,827 | — | ||||||||||||
| Energy | 54,755,364 | 54,755,364 | — | — | ||||||||||||
| Financials | 81,436,044 | 81,436,044 | — | — | ||||||||||||
| Healthcare | 209,047,976 | 209,047,976 | — | — | ||||||||||||
| Industrials | 115,540,523 | 115,540,523 | — | — | ||||||||||||
| Information Technology | 645,022,063 | 645,022,063 | — | — | ||||||||||||
| Materials | 22,605,426 | 22,605,426 | — | — | ||||||||||||
| TOTAL COMMON STOCKS | $ | 1,561,647,033 | $ | 1,552,921,206 | $ | 8,725,827 | $ | — | ||||||||
| PREFERRED STOCKS | ||||||||||||||||
| Information Technology | 1,049,884 | — | — | 1,049,884 | ||||||||||||
| SPECIAL PURPOSE VEHICLE | ||||||||||||||||
| Information Technology | 2,555,109 | — | — | 2,555,109 | ||||||||||||
| TOTAL INVESTMENTS IN SECURITIES | $ | 1,565,252,026 | $ | 1,552,921,206 | $ | 8,725,827 | $ | 3,604,993 | ||||||||
| Alger 35 Fund | TOTAL | LEVEL 1 | LEVEL 2 | LEVEL 3 | ||||||||||||
| COMMON STOCKS | ||||||||||||||||
| Communication Services | 4,898,200 | 4,898,200 | — | — | ||||||||||||
| Consumer Discretionary | 4,142,134 | 4,142,134 | — | — | ||||||||||||
| Energy | 2,739,474 | 2,739,474 | — | — | ||||||||||||
| Financials | 397,105 | 397,105 | — | — | ||||||||||||
| Healthcare | 2,809,400 | 2,339,324 | — | 470,076 | ||||||||||||
| Industrials | 1,096,054 | 1,096,054 | — | — | ||||||||||||
| Information Technology | 8,938,846 | 8,938,846 | — | — | ||||||||||||
| TOTAL COMMON STOCKS | $ | 25,021,213 | $ | 24,551,137 | $ | — | $ | 470,076 | ||||||||
| TOTAL INVESTMENTS IN SECURITIES | $ | 25,021,213 | $ | 24,551,137 | $ | — | $ | 470,076 | ||||||||
THE ALGER FUNDS
NOTES TO FINANCIAL STATEMENTS (Continued)
| Alger Growth & Income Fund | TOTAL | LEVEL 1 | LEVEL 2 | LEVEL 3 | ||||||||||||
| COMMON STOCKS | ||||||||||||||||
| Communication Services | $ | 28,785,265 | $ | 28,785,265 | $ | — | $ | — | ||||||||
| Consumer Discretionary | 22,546,082 | 22,546,082 | — | — | ||||||||||||
| Consumer Staples | 22,050,635 | 22,050,635 | — | — | ||||||||||||
| Energy | 16,059,605 | 16,059,605 | — | — | ||||||||||||
| Financials | 35,694,230 | 35,694,230 | — | — | ||||||||||||
| Healthcare | 42,014,544 | 42,014,544 | — | — | ||||||||||||
| Industrials | 19,258,067 | 19,258,067 | — | — | ||||||||||||
| Information Technology | 94,942,030 | 94,942,030 | — | — | ||||||||||||
| Materials | 7,006,164 | 7,006,164 | — | — | ||||||||||||
| Utilities | 5,345,558 | 5,345,558 | — | — | ||||||||||||
| TOTAL COMMON STOCKS | $ | 293,702,180 | $ | 293,702,180 | $ | — | $ | — | ||||||||
| MASTER LIMITED PARTNERSHIP | ||||||||||||||||
| Energy | 1,963,366 | 1,963,366 | — | — | ||||||||||||
| REAL ESTATE INVESTMENT TRUST | ||||||||||||||||
| Financials | 1,344,750 | 1,344,750 | — | — | ||||||||||||
| Real Estate | 8,755,759 | 8,755,759 | — | — | ||||||||||||
| TOTAL REAL ESTATE INVESTMENT TRUST | $ | 10,100,509 | $ | 10,100,509 | $ | — | $ | — | ||||||||
| SHORT-TERM INVESTMENTS | ||||||||||||||||
| Money Market Fund | 1,023,499 | 1,023,499 | — | — | ||||||||||||
| U.S. Government | 4,999,278 | — | 4,999,278 | — | ||||||||||||
| TOTAL SHORT-TERM INVESTMENTS | $ | 6,022,777 | $ | 1,023,499 | $ | — | $ | — | ||||||||
| TOTAL INVESTMENTS IN SECURITIES | $ | 311,788,832 | $ | 306,789,554 | $ | 4,999,278 | $ | — | ||||||||
| Alger Mid Cap Growth Fund | TOTAL | LEVEL 1 | LEVEL 2 | LEVEL 3 | ||||||||||||
| COMMON STOCKS | ||||||||||||||||
| Communication Services | 12,627,256 | 12,627,256 | — | — | ||||||||||||
| Consumer Discretionary | 20,725,360 | 20,725,360 | — | — | ||||||||||||
| Consumer Staples | 3,011,040 | 3,011,040 | — | — | ||||||||||||
| Energy | 7,002,136 | 7,002,136 | — | — | ||||||||||||
| Financials | 16,095,673 | 16,095,673 | — | — | ||||||||||||
| Healthcare | 28,775,680 | 28,775,680 | — | — | ||||||||||||
| Industrials | 35,490,524 | 35,490,524 | — | — | ||||||||||||
| Information Technology | 48,312,228 | 48,312,228 | — | — | ||||||||||||
| Materials | 4,020,289 | 4,020,289 | — | — | ||||||||||||
| Real Estate | 9,763,912 | 9,763,912 | — | — | ||||||||||||
| TOTAL COMMON STOCKS | $ | 185,824,098 | $ | 185,824,098 | $ | — | $ | — | ||||||||
| PREFERRED STOCKS | ||||||||||||||||
| Healthcare | — | * | — | — | — | * | ||||||||||
| WARRANTS | ||||||||||||||||
| Information Technology | — | ** | — | — | ** | — | ||||||||||
| RIGHTS | ||||||||||||||||
| Healthcare | 401,240 | — | — | 401,240 | ||||||||||||
| SPECIAL PURPOSE VEHICLE | ||||||||||||||||
| Information Technology | 1,542,273 | — | — | 1,542,273 | ||||||||||||
| TOTAL INVESTMENTS IN SECURITIES | $ | 187,767,611 | $ | 185,824,098 | $ | — | $ | 1,943,513 | ||||||||
THE ALGER FUNDS
NOTES TO FINANCIAL STATEMENTS (Continued)
| Alger Mid Cap Focus Fund | TOTAL | LEVEL 1 | LEVEL 2 | LEVEL 3 | ||||||||||||
| COMMON STOCKS | ||||||||||||||||
| Communication Services | $ | 15,956,610 | $ | 15,956,610 | $ | — | $ | — | ||||||||
| Consumer Discretionary | 20,323,610 | 20,323,610 | — | — | ||||||||||||
| Consumer Staples | 3,871,755 | 3,871,755 | — | — | ||||||||||||
| Energy | 10,866,329 | 10,866,329 | — | — | ||||||||||||
| Healthcare | 44,521,174 | 44,521,174 | — | — | ||||||||||||
| Industrials | 28,699,859 | 28,699,859 | — | — | ||||||||||||
| Information Technology | 107,801,639 | 107,801,639 | — | — | ||||||||||||
| Materials | 4,623,476 | 4,623,476 | — | — | ||||||||||||
| TOTAL COMMON STOCKS | $ | 236,664,452 | $ | 236,664,452 | $ | — | $ | — | ||||||||
| TOTAL INVESTMENTS IN SECURITIES | $ | 236,664,452 | $ | 236,664,452 | $ | — | $ | — | ||||||||
| Alger Weatherbie Specialized Growth Fund | TOTAL | LEVEL 1 | LEVEL 2 | LEVEL 3 | ||||||||||||
| COMMON STOCKS | ||||||||||||||||
| Consumer Discretionary | 33,649,336 | 33,649,336 | — | — | ||||||||||||
| Consumer Staples | 1,168,120 | 1,168,120 | — | — | ||||||||||||
| Energy | 12,780,710 | 12,780,710 | — | — | ||||||||||||
| Financials | 73,645,579 | 73,645,579 | — | — | ||||||||||||
| Healthcare | 140,564,763 | 137,985,764 | — | 2,578,999 | ||||||||||||
| Industrials | 99,974,675 | 99,974,675 | — | — | ||||||||||||
| Information Technology | 102,911,698 | 102,911,698 | — | — | ||||||||||||
| Real Estate | 30,266,092 | 30,266,092 | — | — | ||||||||||||
| TOTAL COMMON STOCKS | $ | 494,960,973 | $ | 492,381,974 | $ | — | $ | 2,578,999 | ||||||||
| PREFERRED STOCKS | ||||||||||||||||
| Healthcare | — | * | — | — | — | * | ||||||||||
| SHORT-TERM INVESTMENTS | ||||||||||||||||
| U.S. Government | 2,999,567 | — | 2,999,567 | — | ||||||||||||
| TOTAL INVESTMENTS IN SECURITIES | $ | 497,960,540 | $ | 492,381,974 | $ | 2,999,567 | $ | 2,578,999 | ||||||||
THE ALGER FUNDS
NOTES TO FINANCIAL STATEMENTS (Continued)
| Alger Small Cap Growth Fund | TOTAL | LEVEL 1 | LEVEL 2 | LEVEL 3 | ||||||||||||
| COMMON STOCKS | ||||||||||||||||
| Communication Services | $ | 12,391,340 | $ | 12,391,340 | $ | — | $ | — | ||||||||
| Consumer Discretionary | 32,118,870 | 32,118,870 | — | — | ||||||||||||
| Consumer Staples | 9,506,475 | 9,506,475 | — | — | ||||||||||||
| Energy | 13,384,813 | 13,384,813 | — | — | ||||||||||||
| Financials | 9,439,468 | 9,439,468 | — | — | ||||||||||||
| Healthcare | 85,988,431 | 82,838,751 | — | 3,149,680 | ||||||||||||
| Industrials | 28,970,451 | 28,970,451 | — | — | ||||||||||||
| Information Technology | 74,975,825 | 74,975,825 | — | — | ||||||||||||
| Materials | 2,696,465 | 2,696,465 | — | — | ||||||||||||
| TOTAL COMMON STOCKS | $ | 269,472,138 | $ | 266,322,458 | $ | — | $ | 3,149,680 | ||||||||
| PREFERRED STOCKS | ||||||||||||||||
| Healthcare | — | * | — | — | — | * | ||||||||||
| RIGHTS | ||||||||||||||||
| Healthcare | 118,852 | — | — | 118,852 | ||||||||||||
| SPECIAL PURPOSE VEHICLE | ||||||||||||||||
| Information Technology | 2,094,729 | — | — | 2,094,729 | ||||||||||||
| TOTAL INVESTMENTS IN SECURITIES | $ | 271,685,719 | $ | 266,322,458 | $ | — | $ | 5,363,261 | ||||||||
| Alger Small Cap Focus Fund | TOTAL | LEVEL 1 | LEVEL 2 | LEVEL 3 | ||||||||||||
| COMMON STOCKS | ||||||||||||||||
| Consumer Discretionary | 53,643,622 | 53,643,622 | — | — | ||||||||||||
| Consumer Staples | 22,521,592 | 22,521,592 | — | — | ||||||||||||
| Energy | 42,775,440 | 42,775,440 | — | — | ||||||||||||
| Healthcare | 568,060,802 | 547,382,502 | — | 20,678,300 | ||||||||||||
| Industrials | 139,499,270 | 139,499,270 | — | — | ||||||||||||
| Information Technology | 684,784,041 | 684,784,041 | — | — | ||||||||||||
| Materials | 18,777,182 | 18,777,182 | — | — | ||||||||||||
| TOTAL COMMON STOCKS | $ | 1,530,061,949 | $ | 1,509,383,649 | $ | — | $ | 20,678,300 | ||||||||
| RIGHTS | ||||||||||||||||
| Healthcare | 8,095 | — | — | 8,095 | ||||||||||||
| TOTAL INVESTMENTS IN SECURITIES | $ | 1,530,070,044 | $ | 1,509,383,649 | $ | — | $ | 20,686,395 | ||||||||
| Alger International Focus Fund | TOTAL | LEVEL 1 | LEVEL 2 | LEVEL 3 | ||||||||||||
| COMMON STOCKS | ||||||||||||||||
| Communication Services | 1,936,454 | 1,936,454 | — | — | ||||||||||||
| Consumer Discretionary | 34,110,458 | 23,779,431 | 10,331,027 | — | ||||||||||||
| Consumer Staples | 9,697,584 | 3,763,801 | 5,933,783 | — | ||||||||||||
| Energy | 11,494,588 | 4,719,968 | 6,774,620 | — | ||||||||||||
| Financials | 25,312,115 | 11,607,805 | 13,704,310 | — | ||||||||||||
| Healthcare | 25,032,271 | 3,193,455 | 21,838,816 | — | ||||||||||||
| Industrials | 13,387,127 | 735,912 | 12,651,215 | — | ||||||||||||
| Information Technology | 17,592,596 | — | 17,592,596 | — | ||||||||||||
| Materials | 2,727,979 | — | 2,727,979 | — | ||||||||||||
| TOTAL COMMON STOCKS | $ | 141,291,172 | $ | 49,736,826 | $ | 91,554,346 | $ | — | ||||||||
| TOTAL INVESTMENTS IN SECURITIES | $ | 141,291,172 | $ | 49,736,826 | $ | 91,554,346 | $ | — | ||||||||
THE ALGER FUNDS
NOTES TO FINANCIAL STATEMENTS (Continued)
| Alger Health Sciences Fund | TOTAL | LEVEL 1 | LEVEL 2 | LEVEL 3 | ||||||||||||
| COMMON STOCKS | ||||||||||||||||
| Financials | $ | 258,688 | $ | 258,688 | $ | — | $ | — | ||||||||
| Healthcare | 110,654,762 | 100,260,786 | 4,227,494 | 6,166,482 | ||||||||||||
| TOTAL COMMON STOCKS | $ | 110,913,450 | $ | 100,519,474 | $ | 4,227,494 | $ | 6,166,482 | ||||||||
| PREFERRED STOCKS | ||||||||||||||||
| Healthcare | — | * | — | — | — | * | ||||||||||
| RIGHTS | ||||||||||||||||
| Healthcare | 1,330,757 | — | — | 1,330,757 | ||||||||||||
| TOTAL INVESTMENTS IN SECURITIES | $ | 112,244,207 | $ | 100,519,474 | $ | 4,227,494 | $ | 7,497,239 |
* Alger Mid Cap Growth Fund’s, Alger Weatherbie Specialized Growth Fund’s, Alger Small Cap Growth Fund’s and Alger Health Sciences Fund’s holdings of Prosetta Biosciences, Inc., Series D shares are classified as a Level 3 investment and are fair valued at zero as of October 31, 2023.
** Alger Mid Cap Growth Fund’s holdings of Constellation Software, Inc. warrants expiring March 31, 2040, are classified as a Level 2 investment and are fair valued at zero as of October 31, 2023.
FAIR VALUE | ||||
| Alger 35 Fund | Common Stocks | |||
| Opening balance at November 1, 2022 | $ | — | ||
| Transfers into Level 3 | — | |||
| Transfers out of Level 3 | — | |||
| Total gains or losses | ||||
| Included in net realized gain (loss) on investments | — | |||
| Included in net change in unrealized appreciation (depreciation) on investments | (74,223 | ) | ||
| Purchases and sales | ||||
| Purchases | 544,299 | |||
| Sales | — | |||
| Closing balance at October 31, 2023 | 470,076 | |||
| Net change in unrealized appreciation (depreciation) attributable to investments still held at October 31, 2023* | $ | (74,223 | ) |
THE ALGER FUNDS
NOTES TO FINANCIAL STATEMENTS (Continued)
| FAIR VALUE MEASUREMENTS USING SIGNIFICANT UNOBSERVABLE INPUTS (LEVEL 3) | ||||
| Alger Small Cap Growth Fund | Common Stocks | |||
| Opening balance at November 1, 2022 | $ | 3,646,998 | ||
| Transfers into Level 3 | — | |||
| Transfers out of Level 3 | — | |||
| Total gains or losses | ||||
| Included in net realized gain (loss) on investments | — | |||
| Included in net change in unrealized appreciation (depreciation) on investments | (497,318 | ) | ||
| Purchases and sales | ||||
| Purchases | — | |||
| Sales | — | |||
| Closing balance at October 31, 2023 | 3,149,680 | |||
| Net change in unrealized appreciation (depreciation) attributable to investments still held at October 31, 2023* | $ | (497,318 | ) |
| FAIR VALUE MEASUREMENTS USING SIGNIFICANT UNOBSERVABLE INPUTS (LEVEL 3) | ||||
| Alger Small Cap Focus Fund | Common Stocks | |||
| Opening balance at November 1, 2022 | $ | — | ||
| Transfers into Level 3 | — | |||
| Transfers out of Level 3 | — | |||
| Total gains or losses | ||||
| Included in net realized gain (loss) on investments | — | |||
| Included in net change in unrealized appreciation (depreciation) on investments | (3,264,995 | ) | ||
| Purchases and sales | ||||
| Purchases | 23,943,295 | |||
| Sales | — | |||
| Closing balance at October 31, 2023 | 20,678,300 | |||
| Net change in unrealized appreciation (depreciation) attributable to investments still held at October 31, 2023* | $ | (3,264,995 | ) |
THE ALGER FUNDS
NOTES TO FINANCIAL STATEMENTS (Continued)
| FAIR VALUE MEASUREMENTS USING SIGNIFICANT UNOBSERVABLE INPUTS (LEVEL 3) | ||||
| Alger Health Sciences Fund | Common Stocks | |||
| Opening balance at November 1, 2022 | $ | 5,000,002 | ||
| Transfers into Level 3 | — | |||
| Transfers out of Level 3 | — | |||
| Total gains or losses | ||||
| Included in net realized gain (loss) on investments | — | |||
| Included in net change in unrealized appreciation (depreciation) on investments | (973,655 | ) | ||
| Purchases and sales | ||||
| Purchases | 2,140,135 | |||
| Sales | — | |||
| Closing balance at October 31, 2023 | 6,166,482 | |||
| Net change in unrealized appreciation (depreciation) attributable to investments still held at October 31, 2023* | $ | (973,655 | ) |
| FAIR VALUE MEASUREMENTS USING SIGNIFICANT UNOBSERVABLE INPUTS (LEVEL 3) | ||||
| Alger Health Sciences Fund | Rights | |||
| Opening balance at November 1, 2022 | $ | 1,174,198 | ||
| Transfers into Level 3 | — | |||
| Transfers out of Level 3 | — | |||
| Total gains or losses | ||||
| Included in net realized gain (loss) on investments | — | |||
| Included in net change in unrealized appreciation (depreciation) on investments | 156,559 | |||
| Purchases and sales | ||||
| Purchases | — | |||
| Sales | — | |||
| Closing balance at October 31, 2023 | 1,330,757 | |||
| Net change in unrealized appreciation (depreciation) attributable to investments still held at October 31, 2023* | 156,559 |
* Net change in unrealized appreciation (depreciation) is included in net change in unrealized appreciation (depreciation) on investments in the accompanying statement of operations.
THE ALGER FUNDS
NOTES TO FINANCIAL STATEMENTS (Continued)
The following table provides quantitative information about each Fund’s Level 3 fair value measurements of its investments as of October 31, 2023. The table below is not intended to be all-inclusive, but rather provides information on the Level 3 inputs as they relate to each Fund’s fair value measurements.
| Fair Value October 31, 2023 | Valuation Methodology | Unobservable Input | Input/Range | Weighted Average Inputs |
| ||||||||
| Alger Capital Appreciation Fund | |||||||||||||
| Preferred Stocks | $ | 1,049,884 | Market Approach | Revenue Multiple | 11.0x-13.0x | N/A | |||||||
| Special Purpose Vehicle | 2,555,109 | Market Approach | Revenue Multiple | 11.0x-13.0x | N/A | ||||||||
| Alger 35 Fund | |||||||||||||
| Common Stocks | $ | 470,076 | Market Approach | Revenue Multiple | 5.0x-6.0x | N/A | |||||||
| Transaction Price | N/A | N/A | |||||||||||
| Alger Mid Cap Growth Fund | |||||||||||||
| Preferred Stocks | $ | — | * | Income Approach | Discount Rate | 100.00% | N/A | ||||||
| Rights | 401,240 | Income Approach | Discount Rate | 9.26%-9.75% | N/A | ||||||||
| Probability of Success | 0.00%-60.00% | ||||||||||||
| Special Purpose Vehicle | 1,542,273 | Market Approach | Revenue Multiple | 11.0x-13.0x | N/A | ||||||||
| Alger Weatherbie Specialized Growth Fund | |||||||||||||
| Common Stocks | $ | 2,578,999 | Market Approach | Revenue Multiple | 5.0x-6.0x | N/A | |||||||
| Transaction Price | N/A | N/A | |||||||||||
| Preferred Stocks | — | * | Income Approach | Discount Rate | 100.00% | N/A | |||||||
| Alger Small Cap Growth Fund | |||||||||||||
| Common Stocks | $ | 3,149,680 | Market Approach | Revenue Multiple | 5.0x-6.0x | N/A | |||||||
| Transaction Price | N/A | N/A | |||||||||||
| Preferred Stocks | — | * | Income Approach | Discount Rate | 100.00% | N/A | |||||||
| Rights | 118,852 | Income Approach | Discount Rate | 9.26%-9.75% | N/A | ||||||||
| Probability of Success | 0.00%-60.00% | ||||||||||||
| Special Purpose Vehicle | 2,094,729 | Market Approach | Revenue Multiple | 11.0x-13.0x | N/A | ||||||||
| Alger Small Cap Focus Fund | |||||||||||||
| Common Stocks | $ | 20,678,300 | Market Approach | Revenue Multiple | 5.0x-6.0x | N/A | |||||||
| Transaction Price | N/A | N/A | |||||||||||
| Rights | 8,095 | Income Approach | Discount Rate | 9.26%-9.75% | N/A | ||||||||
| Probability of Success | 0.00%-60.00% | ||||||||||||
THE ALGER FUNDS
NOTES TO FINANCIAL STATEMENTS (Continued)
Fair Value October 31, 2023 | Valuation Methodology | Unobservable Input | Input/Range | Weighted Average Inputs | ||||||||||||||
| Alger Health Sciences Fund | ||||||||||||||||||
| Common Stocks | $ | 6,166,482 | Market Approach | Revenue Multiple | 5.0x-6.0x | N/A | ||||||||||||
| Transaction Price | N/A | N/A | ||||||||||||||||
| Preferred Stocks | — | * | Income Approach | Discount Rate | 100.00% | N/A | ||||||||||||
| Rights | 1,330,757 | Income Approach | Discount Rate | 9.26%-9.75% | N/A | |||||||||||||
| Probability of Success | 0.00%-60.00% | |||||||||||||||||
* Prosetta Biosciences, Inc., Series D shares are classified as a Level 3 investment and are fair valued at zero as of October 31, 2023.
The significant unobservable inputs used in the fair value measurement of each Fund’s securities are revenue and EBITDA multiples, discount rates, and the probability of success of certain outcomes. Significant increases and decreases in these inputs in isolation and interrelationships between these inputs would have resulted in significantly higher or lower fair value measurements than those noted in the table above. Generally, all other things being equal, increases in revenue and EBITDA multiples, decreases in discount rates, and increases in the probability of success result in higher fair value measurements, whereas decreases in revenues and EBITDA multiples, increases in discount rates, and decreases in the probability of success result in lower fair value measurements. For the year ended October 31, 2023, there were no changes in valuation methodology on Level 3 investments.
Certain of the Funds’ assets and liabilities are held at carrying amount or face value, which approximates fair value for financial reporting purposes. As of October 31, 2023, such assets were categorized within the ASC 820 disclosure hierarchy as follows:
| TOTAL | LEVEL 1 | LEVEL 2 | LEVEL 3 | |||||||||||||
| Assets | ||||||||||||||||
| Cash, foreign cash and cash equivalents | ||||||||||||||||
| Alger Capital Appreciation Fund | $ | 11,685,548 | $ | — | $ | 11,685,548 | $ | — | ||||||||
| Alger 35 Fund | 201,838 | — | 201,838 | — | ||||||||||||
| Alger Growth & Income Fund | 9,762,865 | — | 9,762,865 | — | ||||||||||||
| Alger Mid Cap Growth Fund | 1,834,537 | — | 1,834,537 | — | ||||||||||||
| Alger Mid Cap Focus Fund | 233 | — | 233 | — | ||||||||||||
| Alger Weatherbie Specialized Growth Fund | 2,879,807 | — | 2,879,807 | — | ||||||||||||
| Alger Small Cap Growth Fund | 580,729 | — | 580,729 | — | ||||||||||||
| Alger International Focus Fund | 6,176,361 | — | 6,176,361 | — | ||||||||||||
| Alger Health Sciences Fund | 6,768,835 | — | 6,768,835 | — | ||||||||||||
| Liabilities | ||||||||||||||||
| Bank overdraft | ||||||||||||||||
| Alger Small Cap Focus Fund | $ | (428 | ) | $ | (428 | ) | $ | — | $ | — | ||||||
THE ALGER FUNDS
NOTES TO FINANCIAL STATEMENTS (Continued)
NOTE 9 — Derivatives:
FASB Accounting Standards Codification 815 – Derivatives and Hedging (“ASC 815”) requires qualitative disclosures about objectives and strategies for using derivatives, quantitative disclosures about fair value amounts of and gains and losses on derivative instruments, and disclosures about credit-risk-related contingent features in derivative agreements.
Contracts for Difference — The Funds may enter into CFDs. CFDs are leveraged derivative instruments that allow a Fund to take a position on the change in the market price of an underlying asset, such as a stock, or the value of an index or currency exchange rate. With a short CFD, a Fund is seeking to profit from a decrease in the market price of the asset. CFDs are subject to liquidity risk because the liquidity of CFDs is based on the liquidity of the underlying instrument, and are subject to counterparty risk, i.e., the risk that the counterparty to the CFD transaction may be unable or unwilling to make payments or to otherwise honor its financial obligations under the terms of the contract. It is also possible that the market price of the CFD will move between the time the order is placed by a Fund and when it is executed by the issuer, which can result in the trade being executed at a less favorable price. CFDs, like many other derivative instruments, involve the risk that, if the derivative security declines in value, additional margin would be required to maintain the margin level. The seller may require a Fund to deposit additional sums to cover this decline in value, and the margin call may be made at short notice. If additional margin is not provided in time, the seller may liquidate the positions at a loss which a Fund is liable. The potential for margin calls and large losses are much greater in CFDs than in other leveraged products. Most CFDs are traded OTC. CFDs are not registered with the SEC or any U.S. regulator, and are not subject to U.S. regulation. In a short position, a Fund will receive or pay an amount based upon the amount, if any, by which the notional amount of the CFD would have decreased or increased in value had it sold the particular stocks short, less the dividends that would have been paid on those stocks, plus a floating rate of interest on the notional amount of the CFD. All of these components are reflected in the market value of the CFD.
For the year ended October 31, 2023, the average monthly notional amount of CFDs for Alger Small Cap Focus Fund was $3,240,494. CFDs were held during one month of the period. The effect of CFDs on the accompanying Statement of Operations for the year ended October 31, 2023 was as follows:
| NET REALIZED GAIN ON CFDS | ||||
| Alger Small Cap Focus Fund | ||||
| OTC CFDs+ | $ | 707,735 | ||
| Total | $ | 707,735 |
+ Equity contracts.
THE ALGER FUNDS
NOTES TO FINANCIAL STATEMENTS (Continued)
NOTE 10 — Principal Risks:
Alger Capital Appreciation Fund — Investing in the stock market involves risks, including the potential loss of principal. The value of these securities, like other investments, may move up or down, sometimes rapidly and unpredictably. Your Fund shares at any point in time may be worth less than what you invested, even after taking into account the reinvestment of Fund dividends and distributions. Local, regional or global events such as environmental or natural disasters, war, terrorism, pandemics, outbreaks of infectious diseases and similar public health threats, recessions, or other events could have a significant impact on investments. Growth stocks may be more volatile than other stocks as their prices tend to be higher in relation to their companies’ earnings and may be more sensitive to market, political, and economic developments. A significant portion of assets may be invested in securities of companies in related sectors, and may be similarly affected by economic, political, or market events and conditions and may be more vulnerable to unfavorable sector developments. Foreign securities involve special risks including currency fluctuations, inefficient trading, political and economic instability, and increased volatility. Active trading may increase transaction costs, brokerage commissions, and taxes, which can lower the return on investment. At times, the Fund may hold a large cash or cash equivalent position, which may underperform relative to equity securities.
Alger 35 Fund — Investing in the stock market involves risks, including the potential loss of principal. The value of these securities, like other investments, may move up or down, sometimes rapidly and unpredictably. Your Fund shares at any point in time may be worth less than what you invested, even after taking into account the reinvestment of Fund dividends and distributions. Local, regional or global events such as environmental or natural disasters, war, terrorism, pandemics, outbreaks of infectious diseases and similar public health threats, recessions, or other events could have a significant impact on investments. Growth stocks may be more volatile than other stocks as their prices tend to be higher in relation to their companies’ earnings and may be more sensitive to market, political, and economic developments. A significant portion of assets may be invested in securities of companies in related sectors, and may be similarly affected by economic, political, or market events and conditions and may be more vulnerable to unfavorable sector developments. Investing in companies of small and medium capitalizations involves the risk that such issuers may have limited product lines or financial resources, lack management depth, or have limited liquidity. Foreign securities involve special risks including currency fluctuations, inefficient trading, political and economic instability, and increased volatility. The Fund is classified as a “non-diversified fund” under federal securities laws because it can invest in fewer individual companies than a diversified fund. Assets may be focused in a small number of holdings, making them susceptible to risks associated with a single economic, political or regulatory event than a more diversified portfolio. Active trading may increase transaction costs, brokerage commissions, and taxes, which can lower the return on investment. At times, the Fund may hold a large cash or cash equivalent position, which may underperform relative to equity securities.
THE ALGER FUNDS
NOTES TO FINANCIAL STATEMENTS (Continued)
Alger Growth & Income Fund — Investing in the stock market involves risks, including the potential loss of principal. The value of these securities, like other investments, may move up or down, sometimes rapidly and unpredictably. Your Fund shares at any point in time may be worth less than what you invested, even after taking into account the reinvestment of Fund dividends and distributions. Local, regional or global events such as environmental or natural disasters, war, terrorism, pandemics, outbreaks of infectious diseases and similar public health threats, recessions, or other events could have a significant impact on investments. Growth stocks may be more volatile than other stocks as their prices tend to be higher in relation to their companies’ earnings and may be more sensitive to market, political, and economic developments. A significant portion of assets may be invested in securities of companies in related sectors, and may be similarly affected by economic, political, or market events and conditions and may be more vulnerable to unfavorable sector developments. Income-producing securities may cut or fail to declare dividends due to market downturns or for other reasons. At times, the Fund may hold a large cash or cash equivalent position, which may underperform relative to equity securities.
Alger Mid Cap Growth Fund — Investing in the stock market involves risks, including the potential loss of principal. The value of these securities, like other investments, may move up or down, sometimes rapidly and unpredictably. Your Fund shares at any point in time may be worth less than what you invested, even after taking into account the reinvestment of Fund dividends and distributions. Local, regional or global events such as environmental or natural disasters, war, terrorism, pandemics, outbreaks of infectious diseases and similar public health threats, recessions, or other events could have a significant impact on investments. Growth stocks may be more volatile than other stocks as their prices tend to be higher in relation to their companies’ earnings and may be more sensitive to market, political, and economic developments. A significant portion of assets may be invested in securities of companies in related sectors, and may be similarly affected by economic, political, or market events and conditions and may be more vulnerable to unfavorable sector developments. Investing in companies of medium capitalizations involves the risk that such issuers may have limited product lines or financial resources, lack management depth, or have limited liquidity. Foreign securities involve special risks including currency fluctuations, inefficient trading, political and economic instability, and increased volatility. Active trading may increase transaction costs, brokerage commissions, and taxes, which can lower the return on investment. At times, the Fund may hold a large cash or cash equivalent position, which may underperform relative to equity securities.
Alger Mid Cap Focus Fund — Investing in the stock market involves risks, including the potential loss of principal. The value of these securities, like other investments, may move up or down, sometimes rapidly and unpredictably. Your Fund shares at any point in time may be worth less than what you invested, even after taking into account the reinvestment of Fund dividends and distributions. Local, regional or global events such as environmental or natural disasters, war, terrorism, pandemics, outbreaks of infectious diseases and similar public health threats, recessions, or other events could have a significant impact on investments. Growth stocks may be more volatile than other stocks as their prices tend to be higher in relation to their companies’ earnings and may be more sensitive to market, political, and economic developments. Investing in companies of medium capitalizations involves the risk that such issuers may have limited product lines or financial resources, lack management depth, or have limited liquidity. Assets may be focused in a small number of holdings, making them susceptible to risks associated with a single economic, political or regulatory event than a more diversified portfolio. A significant portion of assets may be invested in securities of companies in related sectors or industries, and may be similarly affected by economic, political, or market events and conditions and may be more vulnerable to unfavorable sector or industry developments. Foreign securities involve special risks including currency fluctuations, inefficient trading, political and economic instability, and increased volatility. Active trading may increase transaction costs, brokerage commissions, and taxes, which can lower the return on investment. At times, the Fund may hold a large cash or cash equivalent position, which may underperform relative to equity securities.
THE ALGER FUNDS
NOTES TO FINANCIAL STATEMENTS (Continued)
Alger Weatherbie Specialized Growth Fund — Investing in the stock market involves risks, including the potential loss of principal. The value of these securities, like other investments, may move up or down, sometimes rapidly and unpredictably. Your Fund shares at any point in time may be worth less than what you invested, even after taking into account the reinvestment of Fund dividends and distributions. Local, regional or global events such as environmental or natural disasters, war, terrorism, pandemics, outbreaks of infectious diseases and similar public health threats, recessions, or other events could have a significant impact on investments. Growth stocks may be more volatile than other stocks as their prices tend to be higher in relation to their companies’ earnings and may be more sensitive to market, political, and economic developments. A significant portion of assets may be invested in securities of companies in related sectors, and may be similarly affected by economic, political, or market events and conditions and may be more vulnerable to unfavorable sector developments. Investing in companies of small and medium capitalizations involves the risk that such issuers may have limited product lines or financial resources, lack management depth, or have limited liquidity. Assets may be focused in a small number of holdings, making them susceptible to risks associated with a single economic, political or regulatory event than a more diversified portfolio. Foreign securities and emerging markets involve special risks including currency fluctuations, inefficient trading, political and economic instability, and increased volatility. At times, the Fund may hold a large cash or cash equivalent position, which may underperform relative to equity securities.
Alger Small Cap Growth Fund — Investing in the stock market involves risks, including the potential loss of principal. The value of these securities, like other investments, may move up or down, sometimes rapidly and unpredictably. Your Fund shares at any point in time may be worth less than what you invested, even after taking into account the reinvestment of Fund dividends and distributions. Local, regional or global events such as environmental or natural disasters, war, terrorism, pandemics, outbreaks of infectious diseases and similar public health threats, recessions, or other events could have a significant impact on investments. Growth stocks may be more volatile than other stocks as their prices tend to be higher in relation to their companies’ earnings and may be more sensitive to market, political, and economic developments. A significant portion of assets may be invested in securities of companies in related sectors, and may be similarly affected by economic, political, or market events and conditions and may be more vulnerable to unfavorable sector developments. Investing in companies of small capitalizations involves the risk that such issuers may have limited product lines or financial resources, lack management depth, or have limited liquidity. At times, the Fund may hold a large cash or cash equivalent position, which may underperform relative to equity securities.
THE ALGER FUNDS
NOTES TO FINANCIAL STATEMENTS (Continued)
Alger Small Cap Focus Fund — Investing in the stock market involves risks, including the potential loss of principal. The value of these securities, like other investments, may move up or down, sometimes rapidly and unpredictably. Your Fund shares at any point in time may be worth less than what you invested, even after taking into account the reinvestment of Fund dividends and distributions. Local, regional or global events such as environmental or natural disasters, war, terrorism, pandemics, outbreaks of infectious diseases and similar public health threats, recessions, or other events could have a significant impact on investments. Growth stocks may be more volatile than other stocks as their prices tend to be higher in relation to their companies’ earnings and may be more sensitive to market, political, and economic developments. A significant portion of assets may be invested in securities of companies in related sectors or industries, and may be similarly affected by economic, political, or market events and conditions and may be more vulnerable to unfavorable sector or industry developments. Investing in companies of small capitalizations involves the risk that such issuers may have limited product lines or financial resources, lack management depth, or have limited liquidity. Assets may be focused in a small number of holdings, making them susceptible to risks associated with a single economic, political or regulatory event than a more diversified portfolio. At times, the Fund may hold a large cash or cash equivalent position, which may underperform relative to equity securities.
Alger International Focus Fund — Investing in the stock market involves risks, including the potential loss of principal. The value of these securities, like other investments, may move up or down, sometimes rapidly and unpredictably. Your Fund shares at any point in time may be worth less than what you invested, even after taking into account the reinvestment of Fund dividends and distributions. Local, regional or global events such as environmental or natural disasters, war, terrorism, pandemics, outbreaks of infectious diseases and similar public health threats, recessions, or other events could have a significant impact on investments. Growth stocks may be more volatile than other stocks as their prices tend to be higher in relation to their companies’ earnings and may be more sensitive to market, political, and economic developments. A significant portion of assets may be invested in securities of companies in related sectors, and may be similarly affected by economic, political, or market events and conditions and may be more vulnerable to unfavorable sector developments. Assets may be focused in a small number of holdings, making them susceptible to risks associated with a single economic, political or regulatory event than a more diversified portfolio. Foreign securities and emerging markets involve special risks including currency fluctuations, inefficient trading, political and economic instability, and increased volatility. Investing in companies of small capitalizations involves the risk that such issuers may have limited product lines or financial resources, lack management depth, or have limited liquidity. At times, the Fund may hold a large cash or cash equivalent position, which may underperform relative to equity securities.
THE ALGER FUNDS
NOTES TO FINANCIAL STATEMENTS (Continued)
Alger Health Sciences Fund — Investing in the stock market involves risks, including the potential loss of principal. The value of these securities, like other investments, may move up or down, sometimes rapidly and unpredictably. Your Fund shares at any point in time may be worth less than what you invested, even after taking into account the reinvestment of Fund dividends and distributions. Local, regional or global events such as environmental or natural disasters, war, terrorism, pandemics, outbreaks of infectious diseases and similar public health threats, recessions, or other events could have a significant impact on investments. Growth stocks may be more volatile than other stocks as their prices tend to be higher in relation to their companies’ earnings and may be more sensitive to market, political, and economic developments. A significant portion of assets will be invested in healthcare companies, which may be significantly affected by competition, innovation, regulation, and product obsolescence, and may be more volatile than the securities of other companies. A significant portion of assets may be invested in securities of companies in related industries, and may be similarly affected by economic, political, or market events and conditions and may be more vulnerable to unfavorable industry developments. Assets may be focused in a small number of holdings, making them susceptible to risks associated with a single economic, political or regulatory event than a more diversified portfolio. Investing in companies of small capitalizations involves the risk that such issuers may have limited product lines or financial resources, lack management depth, or have limited liquidity. Private placements are offerings of a company’s securities not registered with the SEC and not offered to the public, for which limited information may be available. Such investments are generally considered to be illiquid. Foreign securities involve special risks including currency fluctuations, inefficient trading, political and economic instability, and increased volatility. Active trading may increase transaction costs, brokerage commissions, and taxes, which can lower the return on investment. At times, the Fund may hold a large cash or cash equivalent position, which may underperform relative to equity securities.
NOTE 11 — Affiliated Securities:
During the year ended October 31, 2023, as disclosed in the following table, certain Funds held 5% or more of the outstanding voting securities of the issuers listed below. As such, these issuers were “affiliated persons” of the applicable Fund(s) for purposes of the 1940 Act. Transactions during the year ended October 31, 2023 with such affiliated persons are summarized below. During this period, other Funds in the Trust may also have held voting shares of the issuers at levels below 5%.
| Shares | Shares | Net Change | ||||||||||||||||||||||||||||
| Held at | Held at | in | Value at | |||||||||||||||||||||||||||
| October 31, | Shares | Shares | October 31, | Dividend | Realized | Unrealized | October 31, | |||||||||||||||||||||||
| Security | 2022 | Purchased | Sold | 2023 | Income | Gain (Loss) | App(Dep) | 2023 | ||||||||||||||||||||||
| Alger Capital Appreciation Fund | ||||||||||||||||||||||||||||||
| Special Purpose Vehicle | ||||||||||||||||||||||||||||||
| Crosslink | ||||||||||||||||||||||||||||||
| Ventures C, | ||||||||||||||||||||||||||||||
| LLC, Cl. A*** | — | — | — | — | $ | — | — | $ | (379,731 | ) | $ | 2,555,109 | ||||||||||||||||||
| Total | $ | — | — | $ | (379,731 | ) | $ | 2,555,109 | ||||||||||||||||||||||
THE ALGER FUNDS
NOTES TO FINANCIAL STATEMENTS (Continued)
| Security | Shares Held at October 31, 2022 | Shares Purchased | Shares Sold | Shares Held at October 31, 2023 | Dividend Income | Realized Gain (Loss) | Net Change in Unrealized App(Dep) | Value at October 31, 2023 | ||||||||||||||||||||||||
| Alger Mid Cap Growth Fund | ||||||||||||||||||||||||||||||||
| Preferred Stocks | ||||||||||||||||||||||||||||||||
| Prosetta Biosciences, Inc., Series D** | 219,610 | — | — | 219,610 | $ | — | $ | — | $ | — | $ | — | * | |||||||||||||||||||
| Special Purpose Vehicle | ||||||||||||||||||||||||||||||||
| Crosslink Ventures C, LLC, Cl. A*** | — | — | — | — | — | — | (164,208 | ) | 1,104,912 | |||||||||||||||||||||||
| Crosslink Ventures C, LLC, Cl. B*** | — | — | — | — | — | — | (69,065 | ) | 437,361 | |||||||||||||||||||||||
| Total | $ | — | $ | — | $ | (233,273 | ) | $ | 1,542,273 | |||||||||||||||||||||||
| Security | Shares Held at October 31, 2022 | Shares Purchased | Shares Sold | Shares Held at October 31, 2023 | Dividend Income | Realized Gain (Loss) | Net Change in Unrealized App(Dep) | Value at October 31, 2023 | ||||||||||||||||||||||||
| Alger Weatherbie Specialized Growth Fund | ||||||||||||||||||||||||||||||||
| Preferred Stocks | ||||||||||||||||||||||||||||||||
| Prosetta Biosciences, Inc., Series D** | 231,474 | — | — | 231,474 | — | — | — | — | * | |||||||||||||||||||||||
| Total | $ | — | $ | — | $ | — | $ | — | ||||||||||||||||||||||||
| Security | Shares Held at October 31, 2022 | Shares Purchased | Shares Sold | Shares Held at October 31, 2023 | Dividend Income | Realized Gain (Loss) | Net Change in Unrealized App(Dep) | Value at October 31, 2023 | ||||||||||||||||||||||||
| Alger Small Cap Growth Fund | ||||||||||||||||||||||||||||||||
| Preferred Stocks | ||||||||||||||||||||||||||||||||
| Prosetta Biosciences, Inc., Series D** | 50,688 | — | — | 50,688 | — | — | — | — | * | |||||||||||||||||||||||
| Special Purpose Vehicle | ||||||||||||||||||||||||||||||||
| Crosslink Ventures C, LLC, Cl. A*** | — | — | — | — | — | — | (246,312 | ) | 1,657,368 | |||||||||||||||||||||||
| Crosslink Ventures C, LLC, Cl. B*** | — | — | — | — | — | — | (69,065 | ) | 437,361 | |||||||||||||||||||||||
| Total | $ | — | $ | — | $ | (315,377 | ) | $ | 2,094,729 | |||||||||||||||||||||||
THE ALGER FUNDS
NOTES TO FINANCIAL STATEMENTS (Continued)
| Security | Shares Held at October 31, 2022 | Shares Purchased | Shares Sold | Shares Held at October 31, 2023 | Dividend Income | Realized Gain (Loss) | Net Change in Unrealized App(Dep) | Value at October 31, 2023 | ||||||||||||||||||||||||
| Alger Small Cap Focus Fund | ||||||||||||||||||||||||||||||||
| Common Stocks | ||||||||||||||||||||||||||||||||
| 908 Devices, Inc.**** | 1,991,055 | 53,198 | (2,044,253 | ) | — | $ | — | $ | (26,557,727 | ) | $ | 9,318,305 | $ | — | ||||||||||||||||||
| Cabaletta Bio, Inc. | — | 3,220,950 | (382,785 | ) | 2,838,165 | — | 1,208,752 | 10,158,231 | 40,472,233 | |||||||||||||||||||||||
| Heska Corp.**** | 468,150 | 245,443 | (5,943,732 | ) | — | — | 29,578,316 | 1,990,021 | — | |||||||||||||||||||||||
| PROS Holdings, Inc. | 2,978,898 | — | 277,674 | 2,701,224 | — | (5,242,048 | ) | 23,156,120 | 84,143,128 | |||||||||||||||||||||||
| Total | $ | — | $ | (1,012,707 | ) | $ | 44,622,677 | $ | 124,615,361 | |||||||||||||||||||||||
| Security | Shares Held at October 31, 2022 | Shares Purchased | Shares Sold | Shares Held at October 31, 2023 | Dividend Income | Realized Gain (Loss) | Net Change in Unrealized App(Dep) | Value at October 31, 2023 | ||||||||||||||||||||||||
| Alger Health Sciences Fund | ||||||||||||||||||||||||||||||||
| Preferred Stocks | ||||||||||||||||||||||||||||||||
| Prosetta Biosciences, Inc., Series D** | 897,366 | — | — | 897,366 | $ | — | $ | — | $ | — | $ | — | * | |||||||||||||||||||
| Total | $ | — | $ | — | $ | — | $ | — | ||||||||||||||||||||||||
* Prosetta Biosciences, Inc., Series D shares are classified as a Level 3 investment and are fair valued at zero as of October 31, 2023.
** Prosetta Biosciences, Inc., Series D is deemed to be an affiliate of the Funds because the Funds and Prosetta Biosciences, Inc., Series D are under common control.
*** The Alger Fund Complex and other entities managed by Alger Management fully own Crosslink Ventures C, LLC, Class A and Crosslink Ventures C, LLC, Class B. There were no capital increases or decreases for the year ended October 31, 2023.
**** Non-affiliated at October 31, 2023.
NOTE 12 — Subsequent Events:
Management of each Fund has evaluated events that have occurred subsequent to October 31, 2023, through the issuance date of the Financial Statements. No such events have been identified which require recognition and/or disclosure.
REPORT OF INDEPENDENT REGISTERED PUBLIC ACCOUNTING FIRM
To the Shareholders and the Board of Trustees of The Alger Funds:
Opinion on the Financial Statements and Financial Highlights
We have audited the accompanying statements of assets and liabilities of The Alger Funds comprised of Alger Capital Appreciation Fund, Alger 35 Fund, Alger Growth & Income Fund, Alger Mid Cap Growth Fund, Alger Mid Cap Focus Fund, Alger Weatherbie Specialized Growth Fund, Alger Small Cap Growth Fund, Alger Small Cap Focus Fund, Alger International Focus Fund and Alger Health Sciences Fund (collectively, the “Funds”), including the schedules of investments, as of October 31, 2023, the related statements of operations for the year then ended, the statements of changes in net assets for each of the two years in the period then ended, the financial highlights for each of the five years in the period then ended (or for the period listed in the table below), and the related notes. In our opinion, the financial statements and financial highlights present fairly, in all material respects, the financial position of each of the funds constituting The Alger Funds as of October 31, 2023, and the results of their operations for the year then ended, the changes in their net assets for each of the two years in the period then ended, and the financial highlights for each of the five years in the period then ended (or for the period listed in the table below), in conformity with accounting principles generally accepted in the United States of America.
| Individual Fund | |
| comprising The | |
| Alger Funds | Financial Highlights |
Alger Mid Cap Focus Fund | For each of the four years in the period ended October 31, 2023 and the period from June 14, 2019 (commencement of operations) through October 31, 2019 |
Basis for Opinion
These financial statements and financial highlights are the responsibility of the Funds’ management. Our responsibility is to express an opinion on the Funds’ financial statements and financial highlights based on our audits. We are a public accounting firm registered with the Public Company Accounting Oversight Board (United States) (PCAOB) and are required to be independent with respect to the Funds in accordance with the U.S. federal securities laws and the applicable rules and regulations of the Securities and Exchange Commission and the PCAOB.
We conducted our audits in accordance with the standards of the PCAOB. Those standards require that we plan and perform the audit to obtain reasonable assurance about whether the financial statements and financial highlights are free of material misstatement, whether due to error or fraud. The Funds are not required to have, nor were we engaged to perform, an audit of their internal control over financial reporting. As part of our audits we are required to obtain an understanding of internal control over financial reporting but not for the purpose of expressing an opinion on the effectiveness of the Funds’ internal control over financial reporting. Accordingly, we express no such opinion.
REPORT OF INDEPENDENT REGISTERED PUBLIC ACCOUNTING FIRM
Our audits included performing procedures to assess the risks of material misstatement of the financial statements and financial highlights, whether due to error or fraud, and performing procedures that respond to those risks. Such procedures included examining, on a test basis, evidence regarding the amounts and disclosures in the financial statements and financial highlights. Our audits also included evaluating the accounting principles used and significant estimates made by management, as well as evaluating the overall presentation of the financial statements and financial highlights. Our procedures included confirmation of securities owned as of October 31, 2023, by correspondence with the custodian and brokers; when replies were not received from brokers, we performed other auditing procedures. We believe that our audits provide a reasonable basis for our opinion.
Deloitte & Touche LLP
New York, New York
December 22, 2023
We have served as the auditor of one or more investment companies within the Alger group of investment companies since 2009.
THE ALGER FUNDS
ADDITIONAL INFORMATION (Unaudited)
Shareholder Expense Example
As a shareholder of a Fund, you incur two types of costs: transaction costs, if applicable, including sales charges (loads) and redemption fees; and ongoing costs, including management fees, distribution (12b-1) fees, if applicable, and other fund expenses. This example is intended to help you understand your ongoing costs (in dollars) of investing in a Fund and to compare these costs with the ongoing costs of investing in other mutual funds.
The example below is based on an investment of $1,000 invested at the beginning of the six-month period starting May 1, 2023 and ending October 31, 2023 and held for the entire period.
Actual Expenses
The first line for each class of shares in the table below provides information about actual account values and actual expenses. You may use the information in this line, together with the amount you invested, to estimate the expenses that you paid over the period. Simply divide your account value by $1,000 (for example, an $8,600 account value divided by $1,000 = 8.6), then multiply the result by the number in the first line under the heading entitled “Expenses Paid During the Six Months Ended October 31, 2023” to estimate the expenses you paid on your account during this period.
Hypothetical Example for Comparison Purposes
The second line for each class of shares in the table below provides information about hypothetical account values and hypothetical expenses based on the actual expense ratio for each class of the Fund’s shares and an assumed rate of return of 5% per year before expenses, which is not the Fund’s actual return. The hypothetical account values and expenses may not be used to estimate the actual ending account balance or expenses you paid for the period. You may use this information to compare the ongoing costs of investing in the Fund and other funds. To do so, compare this 5% hypothetical example with the 5% hypothetical examples that appear in the shareholder reports of other funds.
Please note that the expenses shown in the table are meant to highlight your ongoing costs only and do not reflect any transaction costs, such as sales charges (loads) and redemption fees. Therefore, the second line under each class of shares in the table is useful in comparing ongoing costs only, and will not help you determine the relative total costs of owning different funds. In addition, if these transactional costs were included, your costs would have been higher.
THE ALGER FUNDS
ADDITIONAL INFORMATION (Unaudited) (Continued)
| Beginning Account Value May 1, 2023 | Ending Account Value October 31, 2023 | Expenses Paid During the Six Months Ended October 31, 2023(a) | Annualized Expense Ratio For the Six Months Ended October 31, 2023(b) | ||||||
| Alger Capital Appreciation Fund | |||||||||
| Class A | Actual | $ | 1,000.00 | $ | 1,012.60 | $ | 6.49 | 1.28 | % |
| Hypothetical(c) | 1,000.00 | 1,018.75 | 6.51 | 1.28 | |||||
| Class C | Actual | 1,000.00 | 1,054.70 | 10.62 | 2.05 | ||||
| Hypothetical(c) | 1,000.00 | 1,014.87 | 10.41 | 2.05 | |||||
| Class Z | Actual | 1,000.00 | 1,071.10 | 4.49 | 0.86 | ||||
| Hypothetical(c) | 1,000.00 | 1,020.87 | 4.38 | 0.86 | |||||
| Alger 35 Fund | |||||||||
| Class Z | Actual | $ | 1,000.00 | $ | 994.90 | $ | 2.87 | 0.57 | % |
| Hypothetical(c) | 1,000.00 | 1,022.33 | 2.91 | 0.57 | |||||
| Alger Growth & Income Fund | |||||||||
| Class A | Actual | $ | 1,000.00 | $ | 966.40 | $ | 4.76 | 0.96 | % |
| Hypothetical(c) | 1,000.00 | 1,020.37 | 4.89 | 0.96 | |||||
| Class C | Actual | 1,000.00 | 1,006.30 | 8.65 | 1.71 | ||||
| Hypothetical(c) | 1,000.00 | 1,016.59 | 8.69 | 1.71 | |||||
| Class Z | Actual | 1,000.00 | 1,021.70 | 3.31 | 0.65 | ||||
| Hypothetical(c) | 1,000.00 | 1,021.93 | 3.31 | 0.65 | |||||
| Alger Mid Cap Growth Fund | |||||||||
| Class A | Actual | $ | 1,000.00 | $ | 900.30 | $ | 6.08 | 1.27 | % |
| Hypothetical(c) | 1,000.00 | 1,018.80 | 6.46 | 1.27 | |||||
| Class B | Actual | 1,000.00 | 902.20 | 6.33 | 1.32 | ||||
| Hypothetical(c) | 1,000.00 | 1,018.55 | 6.72 | 1.32 | |||||
| Class C | Actual | 1,000.00 | 936.50 | 10.40 | 2.13 | ||||
| Hypothetical(c) | 1,000.00 | 1,014.47 | 10.82 | 2.13 | |||||
| Class Z | Actual | 1,000.00 | 951.70 | 4.72 | 0.96 | ||||
| Hypothetical(c) | 1,000.00 | 1,020.37 | 4.89 | 0.96 | |||||
THE ALGER FUNDS
ADDITIONAL INFORMATION (Unaudited) (Continued)
| Beginning Account Value May 1, 2023 | Ending Account Value October 31, 2023 | Expenses Paid During the Six Months Ended October 31, 2023(a) | Annualized Expense Ratio For the Six Months Ended October 31, 2023(b) | |||||||||||||||||
| Alger Mid Cap Focus Fund | ||||||||||||||||||||
| Class A | Actual | $ | 1,000.00 | $ | 902.10 | $ | 5.47 | 1.14 | % | |||||||||||
| Hypothetical(c) | 1,000.00 | 1,019.46 | 5.80 | 1.14 | ||||||||||||||||
| Class C | Actual | 1,000.00 | 938.60 | 9.48 | 1.94 | |||||||||||||||
| Hypothetical(c) | 1,000.00 | 1,015.43 | 9.86 | 1.94 | ||||||||||||||||
| Class I | Actual | 1,000.00 | 952.10 | 5.51 | 1.12 | |||||||||||||||
| Hypothetical(c) | 1,000.00 | 1,019.56 | 5.70 | 1.12 | ||||||||||||||||
| Class Y | Actual | 1,000.00 | 953.50 | 3.55 | 0.72 | |||||||||||||||
| Hypothetical(c) | 1,000.00 | 1,021.58 | 3.67 | 0.72 | ||||||||||||||||
| Class Z | Actual | 1,000.00 | 953.50 | 4.09 | 0.83 | |||||||||||||||
| Hypothetical(c) | 1,000.00 | 1,021.02 | 4.23 | 0.83 | ||||||||||||||||
| Alger Weatherbie Specialized Growth Fund | ||||||||||||||||||||
| Class A | Actual | $ | 1,000.00 | $ | 856.20 | $ | 6.18 | 1.32 | % | |||||||||||
| Hypothetical(c) | 1,000.00 | 1,018.55 | 6.72 | 1.32 | ||||||||||||||||
| Class C | Actual | 1,000.00 | 890.30 | 9.91 | 2.08 | |||||||||||||||
| Hypothetical(c) | 1,000.00 | 1,014.72 | 10.56 | 2.08 | ||||||||||||||||
| Class I | Actual | 1,000.00 | 902.70 | 6.28 | 1.31 | |||||||||||||||
| Hypothetical(c) | 1,000.00 | 1,018.60 | 6.67 | 1.31 | ||||||||||||||||
| Class Y | Actual | 1,000.00 | 904.40 | 4.27 | 0.89 | |||||||||||||||
| Hypothetical(c) | 1,000.00 | 1,020.72 | 4.53 | 0.89 | ||||||||||||||||
| Class Z | Actual | 1,000.00 | 905.20 | 4.61 | 0.96 | |||||||||||||||
| Hypothetical(c) | 1,000.00 | 1,020.37 | 4.89 | 0.96 | ||||||||||||||||
| Alger Small Cap Growth Fund | ||||||||||||||||||||
| Class A | Actual | $ | 1,000.00 | $ | 866.20 | $ | 6.21 | 1.32 | % | |||||||||||
| Hypothetical(c) | 1,000.00 | 1,018.55 | 6.72 | 1.32 | ||||||||||||||||
| Class B | Actual | 1,000.00 | 869.70 | 6.64 | 1.41 | |||||||||||||||
| Hypothetical(c) | 1,000.00 | 1,018.10 | 7.17 | 1.41 | ||||||||||||||||
| Class C | Actual | 1,000.00 | 903.20 | 10.17 | 2.12 | |||||||||||||||
| Hypothetical(c) | 1,000.00 | 1,014.52 | 10.76 | 2.12 | ||||||||||||||||
| Class Y | Actual | 1,000.00 | 916.70 | 4.11 | 0.85 | |||||||||||||||
| Hypothetical(c) | 1,000.00 | 1,020.92 | 4.33 | 0.85 | ||||||||||||||||
| Class Z | Actual | 1,000.00 | 916.50 | 4.78 | 0.99 | |||||||||||||||
| Hypothetical(c) | 1,000.00 | 1,020.21 | 5.04 | 0.99 | ||||||||||||||||
THE ALGER FUNDS
ADDITIONAL INFORMATION (Unaudited) (Continued)
| Beginning Account Value May 1, 2023 | Ending Account Value October 31, 2023 | Expenses Paid During the Six Months Ended October 31, 2023(a) | Annualized Expense Ratio For the Six Months Ended October 31, 2023(b) | |||||||||||||||||
| Alger Small Cap Focus Fund | ||||||||||||||||||||
| Class A | Actual | $ | 1,000.00 | $ | 810.60 | $ | 6.75 | 1.48 | % | |||||||||||
| Hypothetical(c) | 1,000.00 | 1,017.74 | 7.53 | 1.48 | ||||||||||||||||
| Class C | Actual | 1,000.00 | 844.20 | 9.39 | 2.02 | |||||||||||||||
| Hypothetical(c) | 1,000.00 | 1,015.02 | 10.26 | 2.02 | ||||||||||||||||
| Class I | Actual | 1,000.00 | 856.30 | 5.80 | 1.24 | |||||||||||||||
| Hypothetical(c) | 1,000.00 | 1,018.95 | 6.31 | 1.24 | ||||||||||||||||
| Class Y | Actual | 1,000.00 | 858.40 | 4.03 | 0.86 | |||||||||||||||
| Hypothetical(c) | 1,000.00 | 1,020.87 | 4.38 | 0.86 | ||||||||||||||||
| Class Z | Actual | 1,000.00 | 857.80 | 4.12 | 0.88 | |||||||||||||||
| Hypothetical(c) | 1,000.00 | 1,020.77 | 4.48 | 0.88 | ||||||||||||||||
| Alger International Focus Fund | ||||||||||||||||||||
| Class A | Actual | $ | 1,000.00 | $ | 885.50 | $ | 6.23 | 1.31 | % | |||||||||||
| Hypothetical(c) | 1,000.00 | 1,018.60 | 6.67 | 1.31 | ||||||||||||||||
| Class B | Actual | 1,000.00 | 887.60 | 6.19 | 1.30 | |||||||||||||||
| Hypothetical(c) | 1,000.00 | 1,018.65 | 6.61 | 1.30 | ||||||||||||||||
| Class C | Actual | 1,000.00 | 920.40 | 10.70 | 2.21 | |||||||||||||||
| Hypothetical(c) | 1,000.00 | 1,014.06 | 11.22 | 2.21 | ||||||||||||||||
| Class I | Actual | 1,000.00 | 934.50 | 6.24 | 1.28 | |||||||||||||||
| Hypothetical(c) | 1,000.00 | 1,018.75 | 6.51 | 1.28 | ||||||||||||||||
| Class Z | Actual | 1,000.00 | 936.90 | 4.30 | 0.88 | |||||||||||||||
| Hypothetical(c) | 1,000.00 | 1,020.77 | 4.48 | 0.88 | ||||||||||||||||
| Alger Health Sciences Fund | ||||||||||||||||||||
| Class A | Actual | $ | 1,000.00 | $ | 826.70 | $ | 5.20 | 1.13 | % | |||||||||||
| Hypothetical(c) | 1,000.00 | 1,019.51 | 5.75 | 1.13 | ||||||||||||||||
| Class C | Actual | 1,000.00 | 860.20 | 9.14 | 1.95 | |||||||||||||||
| Hypothetical(c) | 1,000.00 | 1,015.38 | 9.91 | 1.95 | ||||||||||||||||
| Class Z | Actual | 1,000.00 | 874.60 | 3.54 | 0.75 | |||||||||||||||
| Hypothetical(c) | 1,000.00 | 1,021.42 | 3.82 | 0.75 | ||||||||||||||||
(a) Expenses are equal to the annualized expense ratio of the respective share class, multiplied by the average account value over the period, multiplied by 184/365 (to reflect the one-half year period).
(b) Annualized.
(c) 5% annual return before expenses.
THE ALGER FUNDS
ADDITIONAL INFORMATION (Unaudited) (Continued)
Tax Information
Alger Capital Appreciation Fund designates $68,995,008 as approximate amounts of capital gain dividend for the purpose of the dividends paid deduction.
In accordance with subchapter M of the Internal Revenue Code of 1986, as amended, for the year ended October 31, 2023, 100% of Alger 35 Fund’s and Alger Growth & Income Fund’s dividends qualified for the dividends deduction for corporations, respectively. For the year ended October 31, 2023, certain dividends paid by the Funds may be subject to a maximum rate of 15%, as provided by the Jobs and Growth Tax Relief Reconciliation Act of 2003. Of the distributions paid during the fiscal year, 100% of the Alger 35 Fund’s and 100% of the Alger Growth & Income Fund’s dividends may be considered qualified dividend income.
Shareholders should not use the above information to prepare their tax returns. Since the Funds’ fiscal year is not the calendar year, another notification will be sent with respect to calendar year 2023. Such notification, which will reflect the amount to be used by tax payers on their federal income tax returns, will be made in conjunction with Form 1099 DIV and will be mailed in January 2024. Shareholders are advised to consult their own tax advisers with respect to the tax consequences of their investment in a Fund.
THE ALGER FUNDS
ADDITIONAL INFORMATION (Unaudited) (Continued)
Trustees and Officers of the Trust
Information about the trustees and officers of the Trust is set forth below. Each Trustee serves until an event of termination, such as death or resignation, or until his or her successor is duly elected; each officer’s term of office is one year.
Additional information regarding the Trustees and Officers of the Trust is available in the Trust’s Statement of Additional Information.
THE ALGER FUNDS
ADDITIONAL INFORMATION (Unaudited) (Continued)
Name (Year of Birth) and Address(1) | Position(s) Held with the Trust and Length of Time Served | Principal Occupation(s) During Past Five Years | Number of Funds in the Alger Fund Complex(3) which are Overseen by Trustee | Other Directorships Held by Trustee During Past Five Years |
| Interested Trustee(2): | ||||
| Hilary M. Alger (1961) | Trustee since 2003 | Non-Profit Fundraising Consultant since 2015, Schultz & Williams, Non-profit Fundraising Consultant since 2014, Hilary Alger Consulting, Emeritus Trustee since 2020 and Trustee from 2013 to 2020, Philadelphia Ballet; School Committee Member since 2017, Germantown Friends School. | 28 | Board of Directors, Alger Associates, Inc.; Director of Target Margin Theater |
| Non-Interested Trustees: | ||||
| Charles F. Baird, Jr. (1953) | Trustee since 2000 | Managing Partner since 1997, North Castle Partners (private equity securities group). | 28 | None |
| Roger P. Cheever (1945) | Trustee since 2000 | Retired; Associate Vice President for Development Strategy from 2020 to 2021 and Associate Vice President Principal Gifts from 2008 to 2020, Harvard University. | 28 | Board of Directors, Alger SICAV Fund |
| David Rosenberg (1962) | Trustee since 2007 | Associate Professor of Law since August 2000, Zicklin School of Business, Baruch College, City University of New York. | 28 | None |
| Nathan E. Saint-Amand M.D. (1938) | Trustee since 1986 | Medical doctor in private practice since 1970; Member of the Board of the Manhattan Institute (non-profit policy research) since 1988. | 28 | None |
(1) The address of each Trustee is c/o Fred Alger Management, LLC, 100 Pearl Street, 27th Floor, New York, NY 10004.
(2) Ms. Alger is an “interested person” (as defined in the Investment Company Act of 1940, as amended) of the Trust by virtue of her ownership control of Alger Associates, Inc., which indirectly controls Alger Management and its affiliates.
(3) “Alger Fund Complex” refers to the Trust and the five other registered investment companies managed by Alger Management and the series therof. Each Trustee serves until an event of termination, such as death or resignation, or until his or her successor is duly elected. Each of the Trustees serves on the board of trustees of the other five registered investment companies in the Alger Fund Complex.
THE ALGER FUNDS
ADDITIONAL INFORMATION (Unaudited) (Continued)
| Name (Year of Birth), Position | Officer | |
| with Trust and Address(1) | Principal Occupations | Since |
| Officers(2): | ||
Hal Liebes (1964) President, Principal Executive Officer | Executive Vice President, Chief Operating Officer (“COO”) and Secretary, Alger Management; COO and Secretary, Alger Associates, Inc.; Director, Alger SICAV; Vice President, COO, Manager and Secretary, Alger Capital, LLC and Alger Group Holdings, LLC; Executive Director and Chairman, Alger Management, Ltd.; COO and Secretary, Weatherbie Capital, LLC Secretary and Manager Alger Apple Real Estate LLC; Manager, Alger Partners Investors I LLC, Alger Partners Investors II LLC, Alger Partners Investors-Crossbay LLC, and Alger Partners Investors KEIGF; Secretary, Alger Boulder LLC. | 2005 |
Tina Payne (1974) Secretary, Chief Compliance Officer, Chief Legal Officer | Senior Vice President, General Counsel, Chief Compliance Officer (“CCO”) and Assistant Secretary, Alger Management; Senior Vice President, General Counsel, and Secretary, Alger LLC; CCO and Authorized Signer, Alger Management, Ltd.; Vice President and Assistant Secretary, Alger Group Holdings, LLC; Assistant Secretary, Weatherbie Capital, LLC. | 2017 |
Michael D. Martins (1965) Treasurer, Principal Financial Officer | Senior Vice President of Alger Management. | 2005 |
Sergio M. Pavone (1961) Assistant Treasurer | Vice President of Alger Management. | 2007 |
Mia G. Pillinger (1989) Assistant Secretary | Vice President and Associate Counsel of Alger Management. Formerly, Associate at Willkie Farr & Gallagher, LLP, from 2016 to 2020. | 2020 |
Sushmita Sahu (1981) AML Compliance Officer | Vice President of Alger Management. | 2021 |
| (1) | The address of each officer is c/o Fred Alger Management, LLC, 100 Pearl Street, 27th Floor, New York, NY 10004. |
| (2) | Each officer’s term of office is one year. Each officer serves in the same capacity for the other funds in the Alger Fund Complex. |
The Statement of Additional Information contains additional information about the Trust’s Trustees and officers and is available without charge upon request by calling (800) 992-3863.
THE ALGER FUNDS
ADDITIONAL INFORMATION (Unaudited) (Continued)
Board Approval of Investment Advisory Agreements
At a meeting held on September 19, 2023 (the “Meeting”), the Board of Trustees (the “Board”) of The Alger Funds (the “Trust”), including a majority of the trustees who are not “interested persons” (as defined in the Investment Company Act of 1940, as amended) of the Trust (the “Independent Trustees”), reviewed and approved the continuation of the investment advisory agreement between Fred Alger Management, LLC (“Fred Alger Management”) and the Trust, on behalf of each Fund, and the investment sub-advisory agreement between Fred Alger Management and Weatherbie Capital, LLC (the “Sub-Adviser”), an affiliate of Fred Alger Management, on behalf of Alger Weatherbie Specialized Growth Fund (each, a “Management Agreement”), for an additional one-year period. Fred Alger Management and the Sub-Adviser are collectively referred to herein as the “Manager.”
In considering the continuation of each Management Agreement, the Board reviewed and considered information provided by the Manager and its representatives at the Meeting and throughout the year at meetings of the Board and its committees. The Board also reviewed and considered information the Manager provided in response to a request for information Independent Trustee counsel submitted to the Manager on behalf of the Independent Trustees in connection with the Board’s annual contract consideration, as well as information provided in response to a supplemental request from Independent Trustee counsel on behalf of the Independent Trustees. The materials for the Meeting included a presentation and analysis of the Funds and the Manager by FUSE Research Network LLC (“FUSE”), an independent consulting firm. The Board also received a presentation from FUSE representatives at the Meeting and, among other things, received a description of the methodology FUSE used to select the mutual funds included in each Fund’s Peer Universe and Peer Group (as described below). The Board considered the information provided to it about the Funds together, and with respect to each Fund separately, as the Board deemed appropriate.
The Independent Trustees also received advice from, and met separately with, their Independent Trustee counsel in considering whether to approve the continuation of each Management Agreement. The Independent Trustees also received a memorandum from Independent Trustee counsel discussing the legal standards and their duties in considering the continuation of the Management Agreements, and counsel reviewed those standards with the Independent Trustees during their separate meeting. The Independent Trustees also met separately with senior management of the Manager, during which time the Independent Trustees discussed various matters related to proposed continuation of the Management Agreements.
The Board reviewed the materials provided and considered all of the factors it deemed relevant in approving the continuance of each Management Agreement, including, but not limited to: (i) the nature, extent and quality of the services provided by the Manager; (ii) the short- and long-term investment performance of each Fund; (iii) the costs of the services the Manager provided and profits it realized; (iv) the extent to which economies of scale are realized as a Fund grows; and (v) whether fee levels reflect these economies of scale for the benefit of Fund shareholders. The Board did not identify any one factor as dispositive, and each Board member may have attributed different weights to the factors considered.
THE ALGER FUNDS
ADDITIONAL INFORMATION (Unaudited) (Continued)
In the discussions that follow, reference is made to the “median” in the Peer Group and Peer Universe categories. With respect to performance, below median performance represents performance that is worse relative to the median, and above median performance represents performance that is better relative to the median of the funds in the relevant Performance Universe. With respect to expenses, below median fees or expenses represent fees or expenses that are lower relative to the median, and above median fees or expenses represent fees or expenses that are higher relative to the median of the funds in the relevant Expense Group (as described below). FUSE information is calculated on a share class basis. References appearing below with regard to a Fund’s performance results and comparative fees and expenses generally relate to Class A shares of the Fund (each Fund’s oldest share class), except for Alger 35 Fund, for which Class Z shares were used (the Fund’s only share class), and Alger Mid Cap Focus Fund, for which Class I shares were used (the Fund’s oldest share class).
In particular, in approving the continuance of each Management Agreement, the Board considered the following factors:
Nature, Extent and Quality of Services
The Board reviewed and considered information regarding the nature, extent and quality of investment management services provided by the Manager to the Funds. This information included, among other things, the qualifications, background and experience of the professional personnel who perform services for the Funds; the structure of investment professional compensation; oversight of third-party service providers; short- and long-term investment performance, fee and expense information; fees and payments to intermediaries for fund administration, transfer agency and shareholder services; legal and compliance matters; risk controls; pricing and other services provided by the Manager; and the range of advisory fees the Manager charged to other funds and accounts under its management, including the Manager’s explanation of differences among such funds and accounts and the Funds, where relevant. The Board noted that it received information at regular meetings throughout the year regarding the services rendered by the Manager concerning the management of each Fund’s affairs, including certain portfolio manager presentations, and Fred Alger Management’s role in coordinating and overseeing providers of other services to the Funds. The Board also noted the work undertaken by the Manager with respect to implementing new regulatory requirements applicable to the Funds.
The Board noted Fred Alger Management’s history and expertise in the “growth” style of investment management, as well as Fred Alger Management’s consistency in applying its “growth” style investment philosophy and process. With respect to the Alger Weatherbie Specialized Growth Fund, the Board also considered the investment approach of the Sub-Adviser, which takes a fundamental, bottom-up research approach to investing in growth equities, similar to that of Fred Alger Management. The Board noted the length of time the Manager had provided services as an investment adviser to each Fund and also noted FUSE’s analysis that certain Funds’ long-term performance record supports Fred Alger Management’s view on its overall investment capabilities.
THE ALGER FUNDS
ADDITIONAL INFORMATION (Unaudited) (Continued)
The Board also reviewed and considered the benefits provided to Fund shareholders of investing in a Fund that is part of the Alger Family of Funds. The Board noted the continuing strong financial position of the Manager and its commitment to the fund business.
Following consideration of such information, the Trustees determined that they remain satisfied with the nature, extent and quality of services provided by the Manager to the Funds under the Management Agreements.
Fund Performance
The Board reviewed and considered the performance results of each Fund over various time periods. The Board considered the performance returns for each Fund in comparison to the performance returns of a universe of mutual funds deemed comparable to the Fund based on various investment, operational, and pricing characteristics (“Peer Universe”), and a group of mutual funds from within such Peer Universe deemed comparable to the Fund based primarily on investment strategy similarity (“Peer Group”), each as selected by FUSE, as well as to the Fund’s benchmark index. The Board noted that long-term performance could be impacted by one period of significant outperformance or underperformance.
The Board also reviewed and considered Fund performance reports provided by management and discussions that occurred with investment personnel and senior management at Board meetings throughout the year. The Board further noted that representatives of the Manager review with the Trustees the recent and longer-term performance of each Fund, including contributors to and detractors from Fund performance at every quarterly meeting of the Board throughout the year. In considering the Funds’ performance generally, the Board observed the Manager’s consistency in implementing its growth style investment process and philosophy for the Funds and considered how a strategy’s “growthiness” as compared to peers can impact relative performance results, even among comparisons that either FUSE or the Manager already have identified as having growth characteristics. In this regard, the Board considered FUSE’s commentary regarding the Funds’ growth investment style as compared to a universe of peers comprised of actively managed funds within each Fund’s Morningstar category, and as compared to each Fund’s benchmark index, as measured by Morningstar’s Raw Value-Growth score.
The Trustees concluded that each Fund’s performance was acceptable, including particularly in the context of management’s plans to address underperformance where applicable. Further discussion of the Board’s considerations with respect to each Fund’s performance is set forth below.
Alger Capital Appreciation Fund. The Board noted that the Fund’s annualized total return for the one-, three-, five- and 10-year periods underperformed or was equal to the median of its Peer Group. The Board also noted that the Fund’s annualized total return for the one- and 10-year periods was in the second quartile of its Peer Universe, for the three-year period was in the fourth quartile of its Peer Universe, and for the five-year period was in the third quartile of its Peer Universe. In this regard, the Board considered FUSE’s commentary that the Fund has produced improved performance versus its Peer Group and Peer Universe over the near term. The Board also considered FUSE’s commentary that overall, strategies with a growth bias have underperformed during the last three years.
THE ALGER FUNDS
ADDITIONAL INFORMATION (Unaudited) (Continued)
Alger 35 Fund. The Board noted that the Fund’s annualized total return for the one-year, three-year, five-year, and since inception periods underperformed the median of its Peer Group. The Board also noted that the Fund’s annualized total return for the one-, three- and five-year periods was in the fourth quartile of its Peer Universe, and for the since inception period was in the third quartile of its Peer Universe. In this regard, the Board considered FUSE’s commentary that “growthier” large growth funds have underperformed peers during the last three years.
Alger Growth & Income Fund. The Board noted that the Fund’s annualized total return for the one-year period underperformed the median of its Peer Group, and for the three-, five- and 10-year periods outperformed the median of its Peer Group. The Board also noted that the Fund’s annualized total return for the one-year period was in the third quartile of its Peer Universe, and for the three-, five-, and 10-year periods was in the first quartile of its Peer Universe. In this regard, the Board considered FUSE’s commentary that the Fund is among the most value-oriented strategies within the large blend universe, and that growthier large blend products outperformed peers with a value bias over the last year, such as the Fund.
Alger Mid Cap Growth Fund. The Board noted that the Fund’s annualized total return for the one-year period underperformed the median of its Peer Group, and for the three-, five-, and 10-year periods outperformed or was equal to the median of its Peer Group. The Board also noted that the Fund’s annualized total return for the one-, three-, five and 10-year periods was in the third quartile of its Peer Universe. The Board considered FUSE’s commentary that the Fund is among the “growthiest” funds in its Peer Universe and the correlation to excess performance for mid cap growth funds with a lower growth style factor.
Alger Mid Cap Focus Fund. The Board noted that the Fund’s annualized total return for the one-year, three-year and since inception periods underperformed the median of its Peer Group. The Board also noted that the Fund’s annualized total return for the one-year period and three-year period was in the fourth quartile of its Peer Universe, and for the since inception period was in the second quartile. The Board considered FUSE’s commentary that the Fund is among the “growthiest” strategies of its peers and the correlation between strategies with a higher growth bias and underperformance compared to peers. The Board further considered their discussions with senior management on potential steps under consideration to address the Fund’s performance.
Alger Weatherbie Specialized Growth Fund. The Board noted that the Fund’s annualized total return for the one-, three-, five-, and 10-year periods underperformed the median of its Peer Group. The Board also noted that the Fund’s annualized total return for the one- and three-year periods was in the fourth quartile of its Peer Universe, the five-year period was in the third quartile, and the 10 year period was in the second quartile of its Peer Universe. The Board considered FUSE’s commentary that over the three-year period, the least “growthy” funds outperformed peers.
THE ALGER FUNDS
ADDITIONAL INFORMATION (Unaudited) (Continued)
Alger Small Cap Growth Fund. The Board noted that the Fund’s annualized total return for the one-, three-, five- and 10-year periods underperformed the median of its Peer Group and was in the fourth quartile of its Peer Universe. The Board considered FUSE’s commentary that sector bets and a growth bias contributed to the Fund’s underperformance. The Board further considered their discussions with senior management on potential steps under consideration to address the Fund’s performance.
Alger Small Cap Focus Fund. The Board noted that the Fund’s annualized total return for the one-, three-, five- and 10-year periods underperformed the median of its Peer Group and was in the fourth quartile of its Peer Universe. In this regard, the Board considered FUSE’s commentary that the Fund is among the “growthiest” funds in its comparison universe and the correlation between the “growthiness” of small cap growth funds and underperformance. The Board further considered their discussions with senior management on potential steps under consideration to address the Fund’s performance.
Alger International Focus Fund. The Board noted that the Fund’s annualized total return for the one- and 10-year periods underperformed the median of its Peer Group, and for the three- and five-year periods outperformed the median of its Peer Group. The Board also noted that the Fund’s annualized total return for the one- and 10-year period was in the fourth quartile of its Peer Universe, for the three- and five-year period was in the third quartile of its Peer Universe. The Board considered FUSE’s commentary that the Fund has a heavy growth bias compared to its peers and that funds with a lower focus on growth outperformed their “growthier” peers during each of the previous three years.
Alger Health Sciences Fund. The Board noted that the Fund’s annualized total return for the one-, three-, five- and 10-year periods underperformed the median of its Peer Group. The Board also noted that the Fund’s annualized total return for the one-, three- and five-year periods was in the fourth quartile of its Peer Universe, and for the 10-year period was in the third quartile of its Peer Universe. The Board considered FUSE’s commentary that the Fund’s small capitalization bias as compared to peers has negatively impacted performance.
Comparative Fees and Expenses
For each Fund, the Board reviewed and considered the contractual management fee (the “Contractual Management Fee”) payable by the Fund to Fred Alger Management in light of the nature, extent and quality of the services provided by the Manager pursuant to the Management Agreements. The Board also reviewed and considered any fee waiver and/ or expense reimbursement arrangements for each Fund, including specific share classes thereof as well as any changes to specific class expense reimbursement arrangements that the Board had made during the prior year, and considered the actual fee rate (after taking any waivers and reimbursements into account) payable by the Fund (the “Actual Management Fee”). Additionally, the Board received and considered information comparing each Fund’s Contractual Management Fee, Actual Management Fee and overall expenses, including administrative fees payable to Fred Alger Management, with those of the funds in the Peer Group provided by FUSE. The Board reviewed the methodology used by FUSE in calculating expense information, including that for purposes of the comparisons below, the Contractual Management Fee used by FUSE for the Fund and peers includes the advisor fee and administrative fee, if a fund reports both.
THE ALGER FUNDS
ADDITIONAL INFORMATION (Unaudited) (Continued)
The Board discussed the factors that could contribute to each Fund’s Contractual Management Fee, Actual Management Fee or total expenses being above or below the median of the Fund’s Peer Group. The Board concluded that the Contractual Management Fee charged to each Fund is reasonable in relation to the services rendered by Fred Alger Management and is the product of arm’s length negotiations. Further discussion of the Board’s considerations with respect to each Fund’s comparative fees and expenses is set forth below.
Alger Capital Appreciation Fund. The Board noted that the Contractual Management Fee and total expenses for the Fund were above the median and in the fourth (most expensive) quartile of its Peer Group.
Alger 35 Fund. The Board noted that the Contractual Management Fee and total expenses for the Fund were below the median and in the first (least expensive) quartile of its Peer Group.
Alger Growth & Income Fund. The Board noted that the Contractual Management Fee and total expenses for the Fund were below the median and in the first (least expensive) quartile of its Peer Group.
Alger Mid Cap Growth Fund. The Board noted that the Contractual Management Fee and total expenses for the Fund were above the median and in the third quartile of its Peer Group. The Board considered, and subsequently approved, Fred Alger Management’s proposal to introduce an expense cap for Class I shares of the Fund, effective February 29, 2024
Alger Mid Cap Focus Fund. The Board noted that the Contractual Management Fee and total expenses for the Fund were below the median and in the first (least expensive) quartile of its Peer Group.
Alger Weatherbie Specialized Growth Fund. The Board noted that the Contractual Management Fee and total expenses for the Fund were above the median and in the third quartile of its Peer Group. The Board also noted that, with respect to the Fund, the Sub-Adviser is paid by Fred Alger Management out of the management fee Fred Alger Management receives from the Fund.
Alger Small Cap Growth Fund. The Board noted that the Contractual Management Fee for the Fund was below the median and in the second quartile, and total expenses for the Fund were above the median and in the third quartile of its Peer Group.
Alger Small Cap Focus Fund. The Board noted that the Contractual Management Fee for the Fund was equal to the median and in the second quartile of its Peer Group, and total expenses for the Fund were above the median and in the fourth quartile of its Peer Group.
THE ALGER FUNDS
ADDITIONAL INFORMATION (Unaudited) (Continued)
Alger International Focus Fund. The Board noted that the Contractual Management Fee for the Fund was below the median and in the first (least expensive) quartile of its Peer Group, and that total expenses for the Fund were above the median and in the third quartile of its Peer Group.
Alger Health Sciences Fund. The Board noted that the Contractual Management Fee and total expenses for the Fund were below the median and in the first (least expensive) quartile of its Peer Group.
In connection with its consideration of each Fund’s fees payable under the Management Agreement, the Board also received information on the range of fees charged by the Manager for funds and accounts of a similar investment strategy to each Fund that are under its management. The Board noted management’s explanation that comparisons with such accounts may be of limited relevance given the different structures and regulatory requirements of mutual funds, such as the Funds, versus those accounts and the differences in the levels of services required by the Funds as compared to those accounts.
Profitability
The Board reviewed and considered information regarding the profits realized by Fred Alger Management in connection with the operation of each Fund. In this respect, the Board considered overall profitability, including in comparison to certain investment advisory peers, as well as the profits of Fred Alger Management in providing investment management and other services to each Fund during the year ended June 30, 2023. The Board also reviewed the profitability methodology and any changes thereto, noting that management maintains a consistent methodology year to year. The Board considered FUSE’s view that Fred Alger Management’s expense allocation policies align with accepted industry practices.
The Board noted that costs incurred in establishing and maintaining the infrastructure necessary for the mutual fund operations conducted by Fred Alger Management may not be fully reflected in the expenses allocated to each Fund in determining Fred Alger Management’s profitability.
The Board also considered the extent to which the Manager might derive ancillary benefits from Fund operations, including, for example, through soft dollar arrangements. Based upon its consideration of all these factors, the Trustees concluded that the level of profits realized by Fred Alger Management and its affiliates from providing services to each Fund was not excessive in view of the nature, extent and quality of services provided to each Fund.
Economies of Scale
For each Fund, the Board reviewed and considered the extent to which the Manager may realize economies of scale, if any, as the Fund grows larger and whether the Fund’s management fee structure reflects any economies of scale for the benefit of Fund shareholders. The Board noted the existence of management fee breakpoints for Alger Capital Appreciation Fund, Alger International Focus Fund, Alger Mid Cap Focus Fund, Alger Mid Cap Growth Fund, Alger Weatherbie Specialized Growth Fund, and Alger Small Cap Growth Fund, which operate to share economies of scale with a Fund’s shareholders by reducing the Fund’s effective management fees as the Fund grows in size. The Board considered the Manager’s view that the overall size of Fred Alger Management allows it to realize other economies of scale, such as with office space, purchases of technology, and other general business expenses, including with respect to Funds that did not have management fee breakpoints.
THE ALGER FUNDS
ADDITIONAL INFORMATION (Unaudited) (Continued)
The Trustees concluded that for each Fund, to the extent economies of scale may be realized by Fred Alger Management, the benefits of such economies of scale would be shared with the Fund and its shareholders as the Fund grows, including through the management fee breakpoints in place for applicable Funds.
Conclusion
The Board’s consideration of the Contractual Management Fee for each Fund also had the benefit of a number of years of reviews of the Management Agreement, during which lengthy discussions took place between the Board and representatives of the Manager. Certain aspects of the arrangements may receive greater scrutiny in some years than in others, and the Board’s conclusions may be based, in part, on its consideration of the Fund’s arrangements in prior years.
Based on its review, consideration and evaluation of all factors it believed relevant, including the above-described factors and conclusions, the Board, including the Independent Trustees voting separately, unanimously approved the continuation of each Management Agreement for an additional one-year period.
THE ALGER FUNDS
ADDITIONAL INFORMATION (Unaudited) (Continued)
Privacy Policy
| U.S. Consumer Privacy Notice | Rev. 6/22/21 |
| FACTS | WHAT DOES ALGER DO WITH YOUR PERSONAL INFORMATION? |
| Why? | Financial companies choose how they share your personal information. Federal law gives consumers the right to limit some but not all sharing. Federal law also requires us to tell you how we collect, share, and protect your personal information. Please read this notice carefully to understand what we do. |
| What? | The types of personal information we collect and share depend on the product or service you have with us. This information can include: • Social Security number and • Account balances and • Transaction history and • Purchase history and • Assets When you are no longer our customer, we continue to share your information as described in this notice. |
| How? | All financial companies need to share personal information to run their everyday business. In the section below, we list the reasons financial companies can share personal information; the reasons Alger chooses to share; and whether you can limit this sharing. |
| Reasons we can share your personal information | Does Alger share? | Can you limit this sharing? |
| For our everyday business purposes — such as to process your transactions, maintain your account(s), respond to court orders and legal investigations, or report to credit bureaus | Yes | No |
| For our marketing purposes — to offer our products and services to you | Yes | No |
For joint marketing with other financial companies | No | We don’t share |
| For our affiliates’ everyday business purposes — information about your transactions and experiences | Yes | No |
| For our affiliates’ everyday business purposes — information about your creditworthiness | No | We don’t share |
| For nonaffiliates to market to you | No | We don’t share |
| Questions? Call 1-800-223-3810 |
THE ALGER FUNDS
ADDITIONAL INFORMATION (Unaudited) (Continued)
| Who we are | |
| Who is providing this notice? | Alger includes Fred Alger Management, LLC and Fred Alger & Company, LLC as well as the following funds: The Alger Funds, The Alger Funds II, The Alger Institutional Funds, The Alger Portfolios, Alger Global Focus Fund, and The Alger ETF Trust. |
| What we do | |
| How does Alger protect my personal information? | To protect your personal information from unauthorized access and use, we use security measures that comply with federal law. These measures include computer safeguards and secured files and buildings. |
| How does Alger collect my personal information? | We collect your personal information, for example, when you: • Open an account or • Make deposits or withdrawals from your account or • Give us your contact information or • Provide account information or • Pay us by check.
|
| Why can’t I limit all sharing? | Federal law gives you the right to limit some but not all sharing related to: • sharing for affiliates’ everyday business purposes ─ information about your credit worthiness • affiliates from using your information to market to you • sharing for nonaffiliates to market to you State laws and individual companies may give you additional rights to limit sharing. |
| Definitions | |
| Affiliates | Companies related by common ownership or control. They can be financial and nonfinancial companies. • Our affiliates include Fred Alger Management, LLC, Weatherbie Capital, LLC and Fred Alger & Company, LLC as well as the following funds: The Alger Funds, The Alger Funds II, The Alger Institutional Funds, The Alger Portfolios, Alger Global Focus Fund, and The Alger ETF Trust. |
| Nonaffiliates | Companies not related by common ownership or control. They can be financial and nonfinancial companies. |
| Joint marketing | A formal agreement between nonaffiliated financial companies that together market financial products or services to you. |
THE ALGER FUNDS
ADDITIONAL INFORMATION (Unaudited) (Continued)
Proxy Voting Policies
A description of the policies and procedures the Funds use to determine how to vote proxies relating to portfolio securities and the proxy voting record is available, without charge, by calling (800) 992-3863 or online on the Funds’ website at http://www.alger.com or on the SEC’s website at http://www.sec.gov.
Fund Holdings
The Board has adopted policies and procedures relating to disclosure of the Funds’ portfolio securities. These policies and procedures recognize that there may be legitimate business reasons for holdings to be disclosed and seek to balance those interests to protect the proprietary nature of the trading strategies and implementation thereof by the Funds.
Generally, the policies prohibit the release of information concerning portfolio holdings, which have not previously been made public, to individual investors, institutional investors, intermediaries that distribute the Funds’ shares and other parties which are not employed by the Investment Manager or its affiliates except when the legitimate business purposes for selective disclosure and other conditions (designed to protect the Funds) are acceptable.
The Funds file their complete schedules of portfolio holdings with the SEC semi-annually in shareholder reports on Form N-CSR and after the first and third fiscal quarters as an exhibit to their reports on Form N-PORT. The Funds’ Forms N-CSR and N-PORT are available online on the SEC’s website at www.sec.gov.
In addition, the Funds make publicly available their month-end top 10 holdings (top 5 holdings with respect to Alger 35 Fund) with a 10 day lag and their month-end full portfolios with a 60 day lag on their website www.alger. com and through other marketing communications (including printed advertising/sales literature and/or shareholder telephone customer service centers). No compensation or other consideration is directly received for the non-public disclosure of portfolio holdings information.
In accordance with the foregoing, the Funds provide portfolio holdings information to third parties including financial intermediaries and service providers who need access to this information in the performance of their services and are subject to duties of confidentiality (1) imposed by law, including a duty not to trade on non-public information, and/or (2) pursuant to an agreement that confidential information is not to be disclosed or used (including trading on such information) other than as required by law. From time to time, the Funds will communicate with these third parties to confirm that they understand the Funds’ policies and procedures regarding such disclosure. These agreements must be approved by the Trust’s Chief Compliance Officer.
The Board periodically reviews a report disclosing the third parties to whom each Fund’s holdings information has been disclosed and the purpose for such disclosure, and it considers whether or not the release of information to such third parties is in the best interest of the Fund and its shareholders.
THE ALGER FUNDS
ADDITIONAL INFORMATION (Unaudited) (Continued)
In addition to material the Funds routinely provide to shareholders, the Investment Manager may make additional statistical information available regarding the Alger Family of Funds. Such information may include, but not be limited to, relative weightings and characteristics of a Fund versus an index (such as P/E ratio, alpha, beta, capture ratio, maximum drawdown, standard deviation, EPS forecasts, Sharpe ratio, information ratio, R-squared, and market cap analysis), security specific impact on overall portfolio performance, month-end top ten contributors to and detractors from performance, portfolio turnover, and other similar information. Shareholders should visit www.alger.com or may also contact the Funds at (800) 992-3863 to obtain such information.
THE ALGER FUNDS
100 Pearl Street, 27th Floor
New York, NY 10004
(800) 992-3863
www.alger.com
Investment Manager
Fred Alger Management, LLC
100 Pearl Street, 27th Floor
New York, NY 10004
Sub-Adviser
Weatherbie Capital, LLC
265 Franklin Street, Suite 1603
Boston, MA 02110
Distributor
Fred Alger & Company, LLC
100 Pearl Street, 27th Floor
New York, NY 10004
Transfer Agent and Dividend Disbursing Agent
UMB Fund Services, Inc.
235 W. Galena Street
Milwaukee, WI 53212
Custodian
Brown Brothers Harriman & Company
50 Post Office Square
Boston, MA 02110
Independent Registered Public Accounting Firm
Deloitte & Touche LLP
30 Rockefeller Plaza
New York, NY 10112
This report is submitted for the general information of the shareholders of the series of The Alger Funds. It is not authorized for distribution to prospective investors unless accompanied by an effective Prospectus for the Fund, which contains information concerning the Fund’s investment policies, fees and expenses as well as other pertinent information.
(This page has been intentionally left blank)
(This page has been intentionally left blank)
| ITEM 2. | CODE OF ETHICS. |
| (a) | The Registrant has adopted a code of ethics (the "Code of Ethics") that applies to its principal executive officer, principal financial officer, principal accounting officer or controller, or persons performing similar functions. |
| (b) | Not applicable. |
| (c) | The Registrant has not amended its Code of Ethics during the period covered by the shareholder report presented in Item 1 hereto. |
| (d) | The Registrant has not granted a waiver or an implicit waiver from a provision of its Code of Ethics during the period covered by the shareholder report presented in Item 1 hereto. |
| (e) | Not applicable. |
| (f) | The Registrant's Code of Ethics is attached as an Exhibit hereto. |
| ITEM 3. | AUDIT COMMITTEE FINANCIAL EXPERT. |
| ITEM 4. | PRINCIPAL ACCOUNTANT FEES AND SERVICES. |
| October 31, 2023 | $ | 278,000 | ||
| October 31, 2022 | $ | 397,800 |
| October 31, 2023 | $ | 57,352 | ||
| October 31, 2022 | $ | 69,117 |
| October 31, 2023 | $ | 42,430 | ||
| October 31, 2022 | $ | 33,342 |
| October 31, 2023 | $ | 260,680 | € | 105,649 | ||||
| October 31, 2022 | $ | 300,142, | € | 99,042 |
| ITEM 5. | AUDIT COMMITTEE OF LISTED REGISTRANTS. |
| ITEM 6. | INVESTMENTS. |
| ITEM 7. | DISCLOSURE OF PROXY VOTING POLICIES AND PROCEDURES FOR CLOSED-END MANAGEMENT INVESTMENT COMPANIES. |
| ITEM 8. | PORTFOLIO MANAGERS OF CLOSED-END MANAGEMENT INVESTMENT COMPANIES. |
| ITEM 9. | PURCHASES OF EQUITY SECURITIES BY CLOSED-END MANAGEMENT INVESTMENT COMPANY AND AFFILIATED PURCHASERS. |
| ITEM 10. | SUBMISSION OF MATTERS TO A VOTE OF SECURITY HOLDERS. |
| ITEM 11. | CONTROLS AND PROCEDURES. |
| ITEM 12. | Disclosure of Securities Lending Activities for Closed-End Management Investment Companies. |
| ITEM 13. | EXHIBITS. |
| By: | /s/ Hal Liebes | |
| Name: | Hal Liebes | |
| Title: | Principal Executive Officer | |
| Date: | December 20, 2023 |
| By: | /s/ Hal Liebes | |
| Name: | Hal Liebes | |
| Title: | Principal Executive Officer | |
| Date: | December 20, 2023 |
| By: | /s/ Michael D. Martins | |
| Name: | Michael D. Martins | |
| Title: | Principal Financial Officer | |
| Date: | December 20, 2023 |