UNITED STATES
SECURITIES AND EXCHANGE COMMISSION
Washington, D.C. 20549
FORM N-CSR
CERTIFIED SHAREHOLDER REPORT OF REGISTERED
MANAGEMENT INVESTMENT COMPANIES
Investment Company Act file Number 811-03171
| Value Line U.S. Government Securities Fund, Inc. |
(Exact name of registrant as specified in charter)
220 East 42nd Street, New York, N.Y. 10017 |
(Address of principal executive offices) (Zip Code)
Registrant’s telephone number, including area code: 212-907-1500
Date of fiscal year end: August 31, 2008
Date of reporting period: August 31, 2008
Item I. Reports to Stockholders.
| INVESTMENT ADVISER | EULAV Asset Management, LLC (A Wholly-Owned Subsidiary of Value Line, Inc.) 220 East 42nd Street New York, NY 10017-5891 | A N N U A L R E P O R T | |
| August 31, 2008 | |||
DISTRIBUTOR | Value Line Securities, Inc. 220 East 42nd Street New York, NY 10017-5891 | ||
CUSTODIAN BANK | State Street Bank and Trust Co. 225 Franklin Street Boston, MA 02110 | ||
SHAREHOLDER | State Street Bank and Trust Co. | Value Line U.S. Government Securities Fund, Inc. | |
| SERVICING AGENT | c/o BFDS | ||
| P.O. Box 219729 | |||
| Kansas City, MO 64121-9729 | |||
INDEPENDENT | PricewaterhouseCoopers LLP | ||
| REGISTERED PUBLIC | 300 Madison Avenue | ||
| ACCOUNTING FIRM | New York, NY 10017 | ||
| LEGAL COUNSEL | Peter D. Lowenstein, Esq. | ||
| 496 Valley Road | |||
| Cos Cob, CT 06807-0272 | |||
DIRECTORS | John W. Chandler | ||
| Frances T. Newton | |||
| Francis C. Oakley | |||
| David H. Porter | |||
| Paul Craig Roberts | |||
| Thomas T. Sarkany | |||
| Nancy-Beth Sheerr | |||
OFFICERS | Mitchell E. Appel | ||
| President | |||
| Howard A. Brecher | |||
| Vice President and Secretary | |||
| Emily D. Washington | |||
| Treasurer | |||
![[logo]](https://capedge.com/proxy/N-CSR/0001188112-08-003046/img001.jpg) | |||
| This audited report is issued for information to shareholders. It is not authorized for distribution to prospective investors unless preceded or accompanied by a currently effective prospectus of the Fund (obtainable from the Distributor). | |||
| #542156 | |||
Value Line U.S. Government Securities Fund, Inc.
| To Our Value Line U.S. Government |
To Our Shareholders (unaudited):
During the fiscal year ended August 31, 2008, bond prices climbed as interest rates fell.
The decline in interest rates resulted from a weakening economy along with a global credit crisis triggered by a meltdown in sub-prime mortgages. This prompted the Federal Reserve Board to reduce interest rates, bringing the Fed Funds rate, from 5.25% to 2.00% during the period. In addition, the Federal Reserve instituted other measures to safeguard the financial system as the financial health of major banks and brokerages was threatened by the credit crisis.
During the period, short-term bonds experienced the strongest rally. Because of the credit crisis and the threat to the financial sector, investors flocked to the safety of short maturity high quality bonds, particularly U.S. Treasuries. The 2-year Treasury note yield fell from 4.13% to 2.37%. Longer maturities also participated in the rally. The 10-year Treasury note declined from 4.53% to 3.81%.
Your Fund benefited from the bond rally generating a total return of 6.22% for the year ending August 31, 2008. As compared to other funds in its Lipper peer group, the Fund ranked in the top 35th percentile outperforming nearly two-thirds of the other funds it competes with. Like its peers, your Fund holds a substantial position in AAA rated U.S. Government Agency obligations including the Federal Farm Credit Bank, the Federal Home Loan Bank, the Federal National Mortgage Association, and the Federal Home Loan Mortgage Corporation which have historically provided a higher level of income than all other U.S. Government debt securities.
In contrast, the benchmark Lehman Brothers Intermediate US Government Bond Index(1) had a total return of 7.73% for the year ended August 31, 2008. The Index is comprised of primarily longer term (typically 5 to 10 year maturity) U.S. Treasury securities which historically have yielded less income than the U.S. Government Agency debt owned by your Fund. In light of this year’s sub-prime mortgage debacle, investors bypassed the AAA rated U.S. Government Agency debt that your Fund invests in and instead rushed to buy short-term U.S. Treasury Notes. This buying frenzy drove down interest rates on newly issued short and longer term U.S. Treasury securities which at the same time bumped up the market values of the bonds that comprise the Index. In short, your Fund yields a higher level of income than the Index, but because the market value of the U.S. Treasury securities that comprise the Index rose unusually fast, the total return (which includes both income and market appreciation) of the Index surpassed that of your Fund. We expect that your Fund’s performance going forward will more closely follow the benchmark as investors realize that investments in U.S. Government Agency issues offer the advantages of both safety and superior yields.
| (1) | The Lehman Brothers Intermediate U.S. Government Bond Index represents the intermediate maturities (1-10 years) of the U.S. Treasury and U.S. Agency segment of the fixed-income market. The returns for the Index do not reflect charges, expenses, or taxes, and it is not possible to directly invest in this Index. |
| 2 |
Value Line U.S. Government Securities Fund, Inc.
| Securities Fund Shareholders |
Therefore, we believe that our strategy of investing part of the Fund’s assets in a well diversified, yet highly rated portfolio of U.S. Government sponsored mortgage-backed securities is in the best long-term interests of the Fund and its shareholders. Additionally, we control risk by limiting the portfolio’s average maturity to 5-7 years. We believe this will protect the Fund from dramatic swings in value caused by gyrating interest rates and produce more stable and consistent performance.
Thank you for your confidence in Value Line; we appreciate your continued support.
| Sincerely, | |
![[signature]](https://capedge.com/proxy/N-CSR/0001188112-08-003046/img002.jpg) | |
| Mitchell Appel, President | |
| October 16, 2008 |
Economic Observations (unaudited)
The recession that many feared would evolve in the first half of this year has yet to officially take hold, as the nation’s gross domestic product, rather than contracting, actually showed improvement in the initial two quarters of this year, with a fairly healthy 2.8% gain being tallied in the April-through-June period. However, this positive pattern does not seem to be continuing. In fact, we sense that GDP increased by no better than 1% in the third quarter. Worse still, it is likely that a combination of the recent turbulence in the financial sector, ongoing erosion in the housing market, rising unemployment, and slowing industrial activity may cause GDP to contract in the fourth quarter.
Moreover, we think the economy may fade further during next year’s opening period, thereby producing the nation’s first recession since 2001. We believe the severity of this downturn will be limited by the recent decline in oil prices. (Lower oil prices act as a stimulus by keeping more money in the hands of consumers.) Our expectation is that modest growth will return before midyear. We expect a stronger business expansion to evolve by 2010, with the help of a partial comeback in housing, falling unemployment, and increased confidence in the financial sector.
Meanwhile, inflation, which had moved up due to prior increases in oil, food, and commodity costs, may now start to moderate, thanks to the aforementioned drop in oil prices and the prospective downturn in the economy. Thereafter, absent a stronger long-term business upturn than we now forecast, inflation should be held in relative check through the early years of the next decade.
| 3 |
Value Line U.S. Government Securities Fund, Inc.
| (unaudited) |
The following graph compares the performance of Value Line U.S. Government Securities Fund, Inc. to that of the Lehman Brothers Intermediate U.S. Government Bond Index. Value Line U.S. Government Securities Fund, Inc. is a professionally managed mutual fund, while the Index is not available for investment and is unmanaged. The returns for the Index do not reflect charges, expenses or taxes but do include the reinvestment of dividends. The comparison is shown for illustrative purposes only.
Comparison of a change in Value of a $10,000 Investment in the Value Line U.S. Government Securities Fund, Inc.
and the Lehman Brothers Intermediate U.S. Government Bond Index*
![[LINE GRAPH]](https://capedge.com/proxy/N-CSR/0001188112-08-003046/img003.jpg)
Performance Data:**
Average Annual Total Return | Growth of an Assumed Investment of $10,000 | |||
| 1 year ended 8/31/08 | 6.22% | $10,622 | ||
| 5 years ended 8/31/08 | 3.80% | $12,050 | ||
| 10 years ended 8/31/08 | 4.79% | $15,965 |
| * | The Lehman Brothers Intermediate U.S. Government Bond Index is representative of securities issued by the U.S. Government. It includes fixed-rate debt securities with maturities between one and ten years. The returns for the Index do not reflect charges, expenses, or taxes, which are deducted from the Fund’s returns and it is not possible to directly invest in this unmanaged Index. |
| ** | The performance data quoted represent past performance and are no guarantee of future performance. The average annual total returns and growth of an assumed investment of $10,000 include dividends reinvested and capital gains distributions accepted in shares. The investment return and principal value of an investment will fluctuate so that an investment, when redeemed, may be worth more or less than its original cost. The performance data and graph do not reflect the deduction of taxes that a shareholder would pay on fund distributions or the redemption of fund shares. |
| 4 |
| Value Line U.S. Government Securities Fund, Inc. |
| FUND EXPENSES (unaudited): |
Example
As a shareholder of the Fund, you incur ongoing costs, including management fees; distribution and service (12b-1) fees; and other Fund expenses. This Example is intended to help you understand your ongoing costs (in dollars) of investing in the Fund and to compare these costs with the ongoing costs of investing in other mutual funds.
The Example is based on an investment of $1,000 invested at the beginning of the period and held for the entire period (March 1, 2008 through August 31, 2008).
Actual Expenses
The first line of the table below provides information about actual account values and actual expenses. You may use the information in this line, together with the amount you invested, to estimate the expenses that you paid over the period. Simply divide your account value by $1,000 (for example an $8,600 account value divided by $1,000=8.6), then multiply the result by the number in the first line under the heading “Expenses Paid During Period” to estimate the expenses you paid on your account during this period.
Hypothetical Example for Comparison Purposes
The second line of the table below provides information about hypothetical account values and hypothetical expenses based on the Fund’s actual expense ratio and an assumed rate of return of 5% per year before expenses, which is not the Fund’s actual return. The hypothetical account values and expenses may not be used to estimate the actual ending account balance or expenses you paid for the period. You may use this information to compare the ongoing costs of investing in the Fund and other funds. To do so, compare this 5% hypothetical example with the 5% hypothetical examples that appear in the shareholder reports of the other funds.
Please note that the expenses shown in the table are meant to highlight your ongoing costs only and do not reflect any transactional costs, such as sales charges (loads), redemption fees, or exchange fees. Therefore, the table is useful in comparing ongoing costs only, and will not help you determine the relative total costs of owning different funds. In addition, if transactional costs were included your costs would have been higher.
Beginning account value 3/1/08 | Ending account value 8/31/08 | Expenses* paid during period 3/1/08 thru 8/31/08 | |||||||||
| Actual | $ | 1,000.00 | $ | 999.71 | $ | 3.82 | |||||
| Hypothetical (5% return before expenses) | $ | 1,000.00 | $ | 1,021.32 | $ | 3.86 | |||||
| * | Expenses are equal to the Fund’s annualized expense ratio of 0.76% multiplied by the average account value over the period, multiplied by 184/366 to reflect the one-half year period. This expense ratio may differ from the expense ratio shown in the Financial Highlights. |
| 5 | |
| Value Line U.S. Government Securities Fund, Inc. |
| Portfolio Highlights at August 31, 2008 (unaudited) |
Ten Largest Holdings
| Issue | Principal Amount | Value | Percentage of Net Assets | |||||||
| Federal Farm Credit Bank, 3.70%, 5/15/13 | $ | 4,000,000 | $ | 3,952,892 | 4.5 | % | ||||
| Federal Home Loan Bank, 7.45%, 2/3/20 | $ | 3,000,000 | $ | 3,699,921 | 4.2 | % | ||||
| Federal Farm Credit Bank, 5.70%, 7/3/17 | $ | 3,000,000 | $ | 3,244,131 | 3.7 | % | ||||
| Federal Farm Credit Bank, 3.50%, 10/3/11 | $ | 3,000,000 | $ | 2,992,095 | 3.4 | % | ||||
| State Street Bank & Trust, Repurchase Agreement, 1.48%, 9/2/08 | $ | 2,900,000 | $ | 2,900,000 | 3.3 | % | ||||
| Federal Home Loan Bank, 3.38%, 6/24/11 | $ | 2,300,000 | $ | 2,283,574 | 2.6 | % | ||||
| Federal Home Loan Bank, 3.88%, 12/10/10 | $ | 2,200,000 | $ | 2,229,702 | 2.5 | % | ||||
| Federal Home Loan Mortgage Corporation Gold PC, 5.00%, 6/1/23 | $ | 2,000,000 | $ | 1,982,263 | 2.3 | % | ||||
| Federal National Mortgage Association, 3.00%, 1/14/11 | $ | 2,000,000 | $ | 1,980,486 | 2.2 | % | ||||
| Federal Home Loan Bank, 3.50%, 7/16/10 | $ | 1,500,000 | $ | 1,510,302 | 1.7 | % | ||||
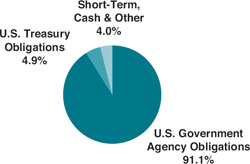
Asset Allocation — Percentage of Fund’s Net Assets
| Coupon Distribution |
Percentage of Fund’s investments | ||||
| Less than 4% | 24.1 | % | ||
| 4–4.99% | 20.5 | % | ||
| 5–5.99% | 39.8 | % | ||
| 6–6.99% | 8.9 | % | ||
| 7–7.99% | 6.7 | % | ||
| 6 |
Value Line U.S. Government Securities Fund, Inc.
| Schedule of Investments |
Principal Amount | Rate | Maturity Date | Value | ||||||||
| U.S. TREASURY OBLIGATIONS (4.9%) | |||||||||||
| $ | 1,000,000 | U.S. Treasury Notes | 4.50 | % | 2/28/11 | $ | 1,048,984 | ||||
| 1,000,000 | U.S. Treasury Notes | 4.00 | 2/15/14 | 1,043,984 | |||||||
| 1,144,850 | U.S. Treasury Notes (1) | 1.63 | 1/15/15 | 1,162,024 | |||||||
| 1,000,000 | U.S. Treasury Notes | 4.00 | 2/15/15 | 1,044,844 | |||||||
| 4,144,850 | TOTAL U.S. TREASURY OBLIGATIONS | ||||||||||
| (Cost $4,246,470) | 4,299,836 | ||||||||||
| U.S. GOVERNMENT AGENCY OBLIGATIONS (91.1%) | |||||||||||
| FEDERAL FARM CREDIT BANK (15.1%) | |||||||||||
| 1,000,000 | Federal Farm Credit Bank | 6.82 | 3/16/09 | 1,021,246 | |||||||
| 1,000,000 | Federal Farm Credit Bank | 4.88 | 2/18/11 | 1,034,874 | |||||||
| 3,000,000 | Federal Farm Credit Bank | 3.50 | 10/3/11 | 2,992,095 | |||||||
| 1,000,000 | Federal Farm Credit Bank | 4.85 | 10/25/12 | 1,038,749 | |||||||
| 4,000,000 | Federal Farm Credit Bank | 3.70 | 5/15/13 | 3,952,892 | |||||||
| 3,000,000 | Federal Farm Credit Bank | 5.70 | 7/3/17 | 3,244,131 | |||||||
| 13,000,000 | TOTAL FEDERAL FARM CREDIT BANK | ||||||||||
| (Cost $13,036,889) | 13,283,987 | ||||||||||
| FEDERAL HOME LOAN BANK (21.4%) | |||||||||||
| 1,000,000 | Federal Home Loan Bank | 5.25 | 11/14/08 | 1,004,877 | |||||||
| 1,000,000 | Federal Home Loan Bank | 4.38 | 3/17/10 | 1,020,045 | |||||||
| 1,500,000 | Federal Home Loan Bank | 3.50 | 7/16/10 | 1,510,302 | |||||||
| 1,000,000 | Federal Home Loan Bank | 4.38 | 9/17/10 | 1,024,321 | |||||||
| 2,200,000 | Federal Home Loan Bank | 3.88 | 12/10/10 | 2,229,702 | |||||||
| 1,000,000 | Federal Home Loan Bank | 2.63 | 5/20/11 | 979,184 | |||||||
| 1,000,000 | Federal Home Loan Bank | 4.25 | 6/10/11 | 1,020,743 | |||||||
| 2,300,000 | Federal Home Loan Bank | 3.38 | 6/24/11 | 2,283,574 | |||||||
| 1,000,000 | Federal Home Loan Bank | 3.63 | 5/29/13 | 985,553 | |||||||
| 1,000,000 | Federal Home Loan Bank | 4.00 | 9/6/13 | 999,410 | |||||||
| 1,000,000 | Federal Home Loan Bank | 4.50 | 9/16/13 | 1,022,952 | |||||||
| 1,000,000 | Federal Home Loan Bank | 4.50 | 11/14/14 | 1,016,297 | |||||||
| 3,000,000 | Federal Home Loan Bank | 7.45 | 2/3/20 | 3,699,921 | |||||||
| 18,000,000 | TOTAL FEDERAL HOME LOAN BANK | ||||||||||
| (Cost $18,309,187) | 18,796,881 | ||||||||||
| FEDERAL HOME LOAN MORTGAGE CORPORATION (27.6%) | |||||||||||
| 1,121,344 | Federal Home Loan Mortgage Corporation REMIC Trust Series 3197 Class AB | 5.50 | 8/15/13 | 1,144,952 | |||||||
| 697,280 | Federal Home Loan Mortgage Corporation REMIC Trust Series 2849 Class VA | 5.00 | 8/15/15 | 703,391 | |||||||
| 726,212 | Federal Home Loan Mortgage Corporation REMIC Trust Series R003 Class AG | 5.13 | 10/15/15 | 734,182 | |||||||
| See Notes to Financial Statements. |
| 7 |
Value Line U.S. Government Securities Fund, Inc.
| August 31, 2008 |
Principal Amount | Rate | Maturity Date | Value | ||||||||
| $ | 961,658 | Federal Home Loan Mortgage Corporation REMIC Trust Series 2767 Class CA | 4.00 | % | 9/15/17 | $ | 951,132 | ||||
| 18,692 | Federal Home Loan Mortgage Corporation Gold PC Pool #E92226 | 5.00 | 11/1/17 | 18,739 | |||||||
| 1,000,000 | Federal Home Loan Mortgage Corporation | 5.13 | 11/17/17 | 1,041,245 | |||||||
| 319,936 | Federal Home Loan Mortgage Corporation Gold PC Pool #E93499 | 5.00 | 12/1/17 | 320,748 | |||||||
| 21,353 | Federal Home Loan Mortgage Corporation Gold PC Pool #E92829 | 5.00 | 12/1/17 | 21,407 | |||||||
| 622,705 | Federal Home Loan Mortgage Corporation REMIC Trust Series 2892 Class DC | 4.50 | 12/15/17 | 619,843 | |||||||
| 20,213 | Federal Home Loan Mortgage Corporation Gold PC Pool #E98960 | 5.00 | 9/1/18 | 20,265 | |||||||
| 52,299 | Federal Home Loan Mortgage Corporation Gold PC Pool #B12822 | 5.00 | 3/1/19 | 52,432 | |||||||
| 48,610 | Federal Home Loan Mortgage Corporation Gold PC Pool #B17398 | 4.50 | 12/1/19 | 47,769 | |||||||
| 364,373 | Federal Home Loan Mortgage Corporation Gold PC Pool #G18044 | 4.50 | 3/1/20 | 356,815 | |||||||
| 179,268 | Federal Home Loan Mortgage Corporation Gold PC Pool #B18034 | 4.50 | 4/1/20 | 175,549 | |||||||
| 43,234 | Federal Home Loan Mortgage Corporation Gold PC Pool #J00118 | 5.00 | 10/1/20 | 43,060 | |||||||
| 548,994 | Federal Home Loan Mortgage Corporation Gold PC Pool #J00139 | 5.00 | 10/1/20 | 546,784 | |||||||
| 49,069 | Federal Home Loan Mortgage Corporation Gold PC Pool #G11986 | 5.00 | 4/1/21 | 48,703 | |||||||
| 61,797 | Federal Home Loan Mortgage Corporation Gold PC Pool #G12319 | 5.00 | 6/1/21 | 61,549 | |||||||
| 201,279 | Federal Home Loan Mortgage Corporation Gold PC Pool #J03233 | 5.00 | 8/1/21 | 199,777 | |||||||
| 1,434,369 | Federal Home Loan Mortgage Corporation Gold PC Pool #G12381 | 5.00 | 9/1/21 | 1,428,596 | |||||||
| 720,069 | Federal Home Loan Mortgage Corporation REMIC Trust Series 2773 Class DA | 5.00 | 6/15/22 | 725,032 | |||||||
| 341,025 | Federal Home Loan Mortgage Corporation REMIC Trust Series 2937 Class JC | 5.00 | 9/15/22 | 342,626 | |||||||
| 2,000,000 | Federal Home Loan Mortgage Corporation Gold PC Pool #J08096 | 5.00 | 6/1/23 | 1,982,263 | |||||||
| 649,306 | Federal Home Loan Mortgage Corporation REMIC Trust Series 3132 Class MA | 5.50 | 12/15/23 | 659,813 | |||||||
| 734,707 | Federal Home Loan Mortgage Corporation REMIC Trust Series 3147 Class YE | 5.50 | 7/15/24 | 746,459 | |||||||
| See Notes to Financial Statements. |
| 8 |
Value Line U.S. Government Securities Fund, Inc.
| Schedule of Investments |
Principal Amount | Rate | Maturity Date | Value | ||||||||
| $ | 1,000,000 | Federal Home Loan Mortgage Corporation REMIC Trust Series 2690 Class OE | 5.00 | % | 11/15/28 | $ | 1,008,000 | ||||
| 1,000,000 | Federal Home Loan Mortgage Corporation | 6.75 | 3/15/31 | 1,227,264 | |||||||
| 745,332 | Federal Home Loan Mortgage Corporation REMIC Trust Series 3061 Class HA | 5.50 | 4/15/31 | 758,655 | |||||||
| 484,927 | Federal Home Loan Mortgage Corporation REMIC Trust Series 2645 Class NA | 3.50 | 9/15/31 | 462,423 | |||||||
| 344,789 | Federal Home Loan Mortgage Corporation REMIC Trust Series 2594 Class OR | 4.25 | 6/15/32 | 340,576 | |||||||
| 1,388,591 | Federal Home Loan Mortgage Corporation Gold PC Pool #C77717 | 6.00 | 3/1/33 | 1,409,248 | |||||||
| 911,981 | Federal Home Loan Mortgage Corporation Gold PC Pool #A29526 | 5.00 | 1/1/35 | 879,280 | |||||||
| 489,222 | Federal Home Loan Mortgage Corporation Gold PC Pool #A29633 | 5.00 | 1/1/35 | 471,681 | |||||||
| 534,682 | Federal Home Loan Mortgage Corporation Pool #783022 (2) | 4.42 | 2/1/35 | 536,301 | |||||||
| 570,049 | Federal Home Loan Mortgage Corporation Gold PC Pool #A56491 | 5.00 | 1/1/37 | 549,074 | |||||||
| 363,610 | Federal Home Loan Mortgage Corporation Gold PC Pool #G08184 | 5.00 | 1/1/37 | 350,231 | |||||||
| 883,383 | Federal Home Loan Mortgage Corporation Gold PC Pool #A56467 | 5.50 | 1/1/37 | 872,508 | |||||||
| 1,436,745 | Federal Home Loan Mortgage Corporation Gold PC Pool #A59334 | 5.50 | 4/1/37 | 1,417,934 | |||||||
| 1,000,000 | Federal Home Loan Mortgage Corporation Gold PC Pool #A80938 | 5.50 | 8/1/38 | 986,907 | |||||||
| 24,091,103 | TOTAL FEDERAL HOME LOAN MORTGAGE | ||||||||||
| CORPORATION (Cost $24,113,294) | 24,263,213 | ||||||||||
| FEDERAL NATIONAL MORTGAGE ASSOCIATION (25.0%) | |||||||||||
| 26,079 | Federal National Mortgage Association Pool #254243 | 6.00 | 2/1/09 | 26,599 | |||||||
| 54,233 | Federal National Mortgage Association Pool #254273 | 5.00 | 3/1/09 | 54,652 | |||||||
| 900,000 | Federal National Mortgage Association | 3.75 | 6/25/10 | 904,325 | |||||||
| 2,000,000 | Federal National Mortgage Association | 3.00 | 1/14/11 | 1,980,486 | |||||||
| 261,888 | Federal National Mortgage Association Pool #255325 | 4.50 | 7/1/11 | 263,563 | |||||||
| 91,594 | Federal National Mortgage Association Pool #511823 | 5.50 | 5/1/16 | 93,387 | |||||||
| 63,972 | Federal National Mortgage Association Pool #615289 | 5.50 | 12/1/16 | 65,224 | |||||||
| 182,962 | Federal National Mortgage Association Pool #622373 | 5.50 | 12/1/16 | 186,543 | |||||||
| 114,646 | Federal National Mortgage Association Pool #631328 | 5.50 | 2/1/17 | 116,783 | |||||||
| 169,047 | Federal National Mortgage Association Pool #623503 | 6.00 | 2/1/17 | 173,994 | |||||||
| 15,704 | Federal National Mortgage Association Pool #643277 | 5.50 | 4/1/17 | 15,997 | |||||||
| 15,468 | Federal National Mortgage Association Pool #638247 | 5.50 | 5/1/17 | 15,757 | |||||||
| See Notes to Financial Statements. |
| 9 |
| Value Line U.S. Government Securities Fund, Inc. | |
| August 31, 2008 |
Principal Amount | Rate | Maturity Date | Value | ||||||||
| $ | 914,328 | Federal National Mortgage Association REMIC Trust Series 2003-52 Class KR | 3.50 | % | 7/25/17 | $ | 894,156 | ||||
| 314,823 | Federal National Mortgage Association Pool #254684 | 5.00 | 3/1/18 | 315,818 | |||||||
| 101,741 | Federal National Mortgage Association Pool #685183 | 5.00 | 3/1/18 | 102,062 | |||||||
| 115,535 | Federal National Mortgage Association Pool #703936 | 5.00 | 5/1/18 | 115,901 | |||||||
| 466,775 | Federal National Mortgage Association Pool #790984 | 5.00 | 7/1/19 | 467,668 | |||||||
| 510,214 | Federal National Mortgage Association Pool #786915 | 5.00 | 8/1/19 | 511,190 | |||||||
| 335,600 | Federal National Mortgage Association REMIC Trust Series 2003-28 Class KA | 4.25 | 3/25/22 | 330,674 | |||||||
| 851,307 | Federal National Mortgage Association REMIC Trust Series 2003-17 Class ED | 4.25 | 9/25/22 | 831,176 | |||||||
| 336,533 | Federal National Mortgage Association REMIC Trust Series 2003-38 Class TC | 5.00 | 3/25/23 | 335,635 | |||||||
| 159,368 | Federal National Mortgage Association Pool #412682 | 6.00 | 3/1/28 | 162,436 | |||||||
| 183,932 | Federal National Mortgage Association Pool #425239 | 6.50 | 4/1/28 | 191,114 | |||||||
| 817,205 | Federal National Mortgage Association REMIC Trust Series 2003-26 Class AW | 4.00 | 4/25/30 | 804,330 | |||||||
| 1,000,000 | Federal National Mortgage Association REMIC Trust Series 2006-102 Class PB | 5.00 | 4/25/30 | 998,703 | |||||||
| 1,000,000 | Federal National Mortgage Association | 7.25 | 5/15/30 | 1,286,052 | |||||||
| 1,309 | Federal National Mortgage Association Pool #568625 | 7.50 | 1/1/31 | 1,409 | |||||||
| 99,506 | Federal National Mortgage Association Pool #571090 | 7.50 | 1/1/31 | 107,141 | |||||||
| 1,884 | Federal National Mortgage Association Pool #573935 | 7.50 | 3/1/31 | 2,029 | |||||||
| 44,615 | Federal National Mortgage Association Pool #629297 | 6.50 | 2/1/32 | 46,287 | |||||||
| 427,798 | Federal National Mortgage Association Pool #626440 | 7.50 | 2/1/32 | 459,321 | |||||||
| 52,951 | Federal National Mortgage Association Pool #634996 | 6.50 | 5/1/32 | 54,919 | |||||||
| 71,387 | Federal National Mortgage Association Pool #254383 | 7.50 | 6/1/32 | 76,648 | |||||||
| 305,296 | Federal National Mortgage Association Pool #254476 | 5.50 | 9/1/32 | 303,350 | |||||||
| 9,302 | Federal National Mortgage Association Pool #688539 | 5.50 | 3/1/33 | 9,240 | |||||||
| 432,547 | Federal National Mortgage Association Pool #650386 | 5.00 | 7/1/33 | 418,795 | |||||||
| 458,540 | Federal National Mortgage Association Pool #726889 | 5.50 | 7/1/33 | 455,474 | |||||||
| 447,031 | Federal National Mortgage Association Pool #759028 | 5.50 | 1/1/34 | 444,042 | |||||||
| 232,556 | Federal National Mortgage Association Pool #761913 | 5.50 | 2/1/34 | 230,710 | |||||||
| 239,521 | Federal National Mortgage Association Pool #763393 | 5.50 | 2/1/34 | 237,919 | |||||||
| 269,362 | Federal National Mortgage Association Pool #769862 | 5.50 | 2/1/34 | 267,224 | |||||||
| 25,853 | Federal National Mortgage Association Pool #769682 | 5.00 | 3/1/34 | 24,990 | |||||||
| 874,312 | Federal National Mortgage Association REMIC Trust Series 2004-60 Class LB | 5.00 | 4/25/34 | 852,139 | |||||||
| 20,620 | Federal National Mortgage Association Pool #778141 | 5.00 | 5/1/34 | 19,932 | |||||||
| 384,043 | Federal National Mortgage Association Pool #773586 | 5.50 | 6/1/34 | 380,995 | |||||||
| 410,856 | Federal National Mortgage Association Pool #255311 | 6.00 | 7/1/34 | 416,454 | |||||||
| 18,990 | Federal National Mortgage Association Pool #258149 | 5.50 | 9/1/34 | 18,839 | |||||||
| 4,326 | Federal National Mortgage Association Pool #789150 | 5.00 | 10/1/34 | 4,181 | |||||||
| See Notes to Financial Statements. |
| 10 |
| Value Line U.S. Government Securities Fund, Inc. | |
| Schedule of Investments |
Principal Amount | Rate | Maturity Date | Value | ||||||||
| $ | 609,096 | Federal National Mortgage Association Pool #255496 | 5.00 | % | 11/1/34 | $ | 588,779 | ||||
| 59,476 | Federal National Mortgage Association Pool #797154 | 5.50 | 11/1/34 | 59,004 | |||||||
| 136,093 | Federal National Mortgage Association Pool #801063 | 5.50 | 11/1/34 | 135,013 | |||||||
| 241,662 | Federal National Mortgage Association Pool #803675 | 5.50 | 12/1/34 | 239,744 | |||||||
| 251,644 | Federal National Mortgage Association Pool #804683 | 5.50 | 12/1/34 | 249,647 | |||||||
| 541,117 | Federal National Mortgage Association Pool #815813 (2) | 4.58 | 2/1/35 | 545,306 | |||||||
| 45,416 | Federal National Mortgage Association Pool #255580 | 5.50 | 2/1/35 | 45,056 | |||||||
| 603,296 | Federal National Mortgage Association Pool #735224 | 5.50 | 2/1/35 | 599,263 | |||||||
| 675,315 | Federal National Mortgage Association Pool #896016 | 6.00 | 8/1/36 | 682,934 | |||||||
| 863,481 | Federal National Mortgage Association Pool #901561 | 5.50 | 10/1/36 | 854,469 | |||||||
| 954,133 | Federal National Mortgage Association Pool #919584 | 6.00 | 6/1/37 | 964,546 | |||||||
| 984,835 | Federal National Mortgage Association Pool #943647 | 5.50 | 7/1/37 | 973,578 | |||||||
| 21,801,123 | TOTAL FEDERAL NATIONAL MORTGAGE ASSOCIATION | ||||||||||
| (Cost $21,894,578) | 22,013,602 | ||||||||||
| GOVERNMENT NATIONAL MORTGAGE ASSOCIATION (2.0%) | |||||||||||
| 203,178 | Government National Mortgage Association Pool #003645 | 4.50 | 12/20/19 | 199,764 | |||||||
| 11,002 | Government National Mortgage Association Pool #541349 | 6.00 | 4/15/31 | 11,220 | |||||||
| 8,952 | Government National Mortgage Association Pool #557681 | 6.00 | 8/15/31 | 9,128 | |||||||
| 134,088 | Government National Mortgage Association Pool #548880 | 6.00 | 12/15/31 | 136,738 | |||||||
| 91,964 | Government National Mortgage Association Pool #551762 | 6.00 | 4/15/32 | 93,752 | |||||||
| 47,364 | Government National Mortgage Association Pool #582415 | 6.00 | 11/15/32 | 48,285 | |||||||
| 315,983 | Government National Mortgage Association Pool #604485 | 6.00 | 7/15/33 | 322,029 | |||||||
| 162,933 | Government National Mortgage Association Pool #622603 | 6.00 | 11/15/33 | 166,051 | |||||||
| 7,876 | Government National Mortgage Association Pool #429786 | 6.00 | 12/15/33 | 8,027 | |||||||
| 323,133 | Government National Mortgage Association Pool #605025 | 6.00 | 2/15/34 | 329,013 | |||||||
| 10,308 | Government National Mortgage Association Pool #626480 | 6.00 | 2/15/34 | 10,495 | |||||||
| 86,754 | Government National Mortgage Association Pool #610944 | 5.50 | 4/15/34 | 86,923 | |||||||
| 102,319 | Government National Mortgage Association Pool #605245 | 5.50 | 6/15/34 | 102,518 | |||||||
| 238,694 | Government National Mortgage Association Pool #583008 | 5.50 | 6/15/34 | 239,158 | |||||||
| 1,744,548 | TOTAL GOVERNMENT NATIONAL MORTGAGE | ||||||||||
| ASSOCIATION (Cost $1,768,308) | 1,763,101 | ||||||||||
| 78,636,774 | TOTAL U.S. GOVERNMENT AGENCY OBLIGATIONS | ||||||||||
| (Cost $79,122,256) | 80,120,784 | ||||||||||
TOTAL INVESTMENT SECURITIES (96.0%) (Cost $83,368,726) | 84,420,620 | ||||||||||
| See Notes to Financial Statements. | |
| 11 |
| Value Line U.S. Government Securities Fund, Inc. | |
| August 31, 2008 |
Principal Amount | Value | ||||||
| REPURCHASE AGREEMENT (3.3%) | |||||||
| $ | 2,900,000 | With State Street Bank & Trust, 1.48%, dated 8/29/08, due 9/2/08, | |||||
delivery value $2,900,477 (collateralized by $2,890,000 U.S. Treasury Notes 3.625%, due 1/15/10, with a value of $2,961,965) (Cost $2,900,000) | $ | 2,900,000 | |||||
| CASH AND OTHER ASSETS IN EXCESS OF LIABILITIES (0.7%) | 598,260 | ||||||
| NET ASSETS (100.0%) | $ | 87,918,880 | |||||
NET ASSET VALUE, OFFERING AND REDEMPTION PRICE PER OUTSTANDING SHARE ($87,918,880 ÷ 7,567,078 shares outstanding) | $ | 11.62 | |||||
| (1) | Treasury Inflation Protected Security (TIPS). |
| (2) | Adjustable rate security. The rate shown is as of August 31, 2008. |
| See Notes to Financial Statements. |
| 12 |
Value Line U.S. Government Securities Fund, Inc.
Statement of Assets and Liabilities at August 31, 2008 | ||||
| Assets: | ||||
| Investment securities, at value | ||||
| (Cost - $83,368,726) | $ | 84,420,620 | ||
| Repurchase agreements (Cost - $2,900,000) | 2,900,000 | |||
| Cash | 49,338 | |||
| Receivable for securities sold | 1,026,865 | |||
| Interest receivable | 609,048 | |||
| Prepaid expenses | 15,374 | |||
| Receivable for capital shares sold | 6,371 | |||
| Total Assets | 89,027,616 | |||
| Liabilities: | ||||
| Payable for securities purchased | 1,037,406 | |||
| Payable for capital shares repurchased | 26 | |||
| Accrued expenses: | ||||
| Advisory fee | 37,160 | |||
| Directors’ fees and expenses | 2,905 | |||
| Other | 31,239 | |||
Total Liabilities. | 1,108,736 | |||
| Net Assets | $ | 87,918,880 | ||
| Net assets consist of: | ||||
| Capital stock, at $1 par value (authorized 100,000,000, outstanding 7,567,078 shares) | $ | 7,567,078 | ||
| Additional paid-in capital | 79,601,589 | |||
| Undistributed net investment income | 553,512 | |||
Accumulated net realized loss on investments | (855,193 | ) | ||
Net unrealized appreciation of investments | ,051,894 | |||
| Net Assets | $ | 87,918,880 | ||
Net Asset Value, Offering and Redemption Price per Outstanding Share ($87,918,880 ÷ 7,567,078 shares outstanding) | $ | 11.62 |
| Statement of Operations for the Year Ended August 31, 2008 | ||||
| Investment Income: | ||||
| Interest | $ | 4,196,211 | ||
| Expenses: | ||||
| Advisory fee | 445,191 | |||
| Service and distribution plan fees | 222,596 | |||
| Transfer agent fees | 60,745 | |||
| Printing and postage | 41,860 | |||
| Auditing and legal fees | 41,775 | |||
| Custodian fees | 36,654 | |||
| Registration and filing fees | 25,248 | |||
| Directors’ fees and expenses | 7,896 | |||
| Insurance | 5,470 | |||
| Other | 7,509 | |||
| Total Expenses Before Custody Credits and Fees Waived | 894,944 | |||
| Less: Service and Distribution Plan Fees Waived | (222,596 | ) | ||
| Less: Custody Credits | (2,304 | ) | ||
| Net Expenses | 670,044 | |||
| Net Investment Income | 3,526,167 | |||
| Net Realized and Unrealized Gain/(Loss) on Investments: | ||||
| Net Realized Gain | 776,804 | |||
| Change in Net Unrealized Appreciation/(Depreciation) | 1,067,300 | |||
| Net Realized Gain and Change in Net Unrealized Appreciation/(Depreciation) on Investments | 1,844,104 | |||
| Net Increase in Net Assets from Operations | $ | 5,370,271 |
| See Notes to Financial Statements. |
| 13 |
Value Line U.S. Government Securities Fund, Inc.
| Statement of Changes in Net Assets for the Years Ended August 31, 2008 and 2007 | |||||||
| Year Ended | Year Ended | ||||||
| August 31, 2008 | August 31, 2007 | ||||||
| Operations: | |||||||
| Net investment income | $ | 3,526,167 | $ | 3,932,844 | |||
| Net realized gain/(loss) on investments | 776,804 | (324,815 | ) | ||||
| Change in net unrealized appreciation/(depreciation) | 1,067,300 | 704,073 | |||||
| Net increase in net assets from operations | 5,370,271 | 4,312,102 | |||||
| Distributions to Shareholders: | |||||||
| Net investment income | (3,798,290 | ) | (3,962,359 | ) | |||
| Capital Share Transactions: | |||||||
| Proceeds from sale of shares | 5,566,270 | 2,701,583 | |||||
| Proceeds from reinvestment of dividends and distributions to shareholders | 3,269,818 | 3,390,260 | |||||
| Cost of shares repurchased | (11,374,963 | ) | (14,761,153 | ) | |||
| Net decrease in net assets from capital share transactions | (2,538,875 | ) | (8,669,310 | ) | |||
| Total Decrease in Net Assets | (966,894 | ) | (8,319,567 | ) | |||
| Net Assets: | |||||||
| Beginning of year | 88,885,774 | 97,205,341 | |||||
| End of year | $ | 87,918,880 | $ | 88,885,774 | |||
| Undistributed net investment income, at end of year | $ | 553,512 | $ | 795,290 | |||
| See Notes to Financial Statements. |
| 14 |
Value Line U.S. Government Securities Fund, Inc.
| Notes to Financial Statements |
1. Significant Accounting Policies
Value Line U.S. Government Securities Fund, Inc. (the “Fund”) is registered under the Investment Company Act of 1940, as amended, as a diversified, open-end management investment company whose primary investment objective is to obtain maximum income without undue risk to principal. Capital preservation and possible capital appreciation are secondary objectives.
The following significant accounting principles are in conformity with generally accepted accounting principles for investment companies. Such policies are consistently followed by the Fund in the preparation of its financial statements. Generally accepted accounting principles require management to make estimates and assumptions that affect the reported amounts and disclosures in the financial statements. Actual results may differ from those estimates.
(A) Security Valuation: The Fund’s investments are carried at value. With assistance from an independent pricing service (the “Service”) approved by the Board of Directors, portfolio securities are valued at the midpoint between the latest available and representative asked and bid prices on the basis of valuations provided by dealers in such securities. Some of the general factors which may be considered by the dealers in arriving at such valuations include the fundamental analytic data relating to the security and an evaluation of the forces which influence the market in which these securities are purchased and sold. Determination of values may involve subjective judgment, as the actual market value of a particular security can be established only by negotiation between the parties in a sales transaction. If a portfolio security is not priced in this manner, the value is determined on the valuation date by reference to valuations obtained from the Service which determines valuations for normal institutional-size trading units of debt securities, without exclusive reliance upon quoted prices. The Service takes into account appropriate factors such as institutional-size trading in similar groups of securities, yield, quality, coupon rate, maturity, type of issue, trading characteristics and other market data in determining valuations. Short-term instruments with maturities of 60 days or less at the date of purchase are valued at amortized cost, which approximates market value. Other assets and securities for which market valuations are not readily available will be valued at fair value by the Adviser pursuant to policies and procedures adopted by the Board of Directors. At August 31, 2008, there were no securities that had been fair valued.
In September 2006, the Financial Accounting Standards Board (FASB) issued Statement of Financial Accounting Standards No. 157, “Fair Value Measurements” (SFAS No. 157). SFAS No. 157 defines fair value, establishes a framework for measuring fair value in accordance with generally accepted accounting principles and expands disclosure about fair value measurements. SFAS No. 157 is effective for fiscal years beginning after November 15, 2007. Management is currently evaluating the impact the adoption of SFAS No. 157 will have on the Fund’s financial statement disclosures.
(B) Repurchase Agreements: In connection with transactions in repurchase agreements, the Fund’s custodian takes possession of the underlying collateral securities, the value of which exceeds the principal amount of the repurchase transaction, including accrued interest. To the extent that any repurchase transaction exceeds one business day, it is the Fund’s policy to mark-to-market the collateral on a daily basis to ensure the adequacy of the collateral. In the event of default of the obligation to repurchase, the Fund has the right to liquidate the collateral and apply the proceeds in satisfaction of the obligation. Under certain circumstances, in the event of default or bankruptcy by the other party to the agreement, realization and/or retention of the collateral or proceeds may be subject to legal proceedings.
(C) Federal Income Taxes: It is the Fund’s policy to comply with the requirements of the Internal Revenue Code applicable to regulated investment companies, including the distribution requirements of the Tax Reform Act of 1986, and to distribute all of its taxable income and capital gains to its shareholders. Therefore, no federal income tax provision is required.
15
Value Line U.S. Government Securities Fund, Inc.
| August 31, 2008 |
In July 2006, the Financial Accounting Standards Board issued Interpretation No. 48, “Accounting for Uncertainty in Income Taxes — an Interpretation of FASB Statement No. 109” (the “Interpretation” or “FIN 48”). The Interpretation establishes for all entities, including pass-through entities such as the Fund, a minimum threshold for financial statement recognition of the benefit of positions taken in filing tax returns (including whether an entity is taxable in a particular jurisdiction), and requires certain expanded tax disclosures. The Interpretation is effective for fiscal years beginning after December 15, 2006, and is to be applied to all open tax years as of the date of effectiveness. As of August 31, 2008, management has reviewed the tax positions for the tax years still subject to tax audit under the statute of limitations, evaluated the implications of FIN 48, and determined that there is no impact to the Fund’s financial statements at this time.
(D) Security Transactions and Related Income: Security transactions are accounted for on the date the securities are purchased or sold. Realized gains and losses on securities transactions are determined using the identified cost method. Interest income, adjusted for amortization of discount and premium, is earned from settlement date and recognized on the accrual basis. Gains and losses realized on prepayments received on mortgage-related securities are recorded as interest income.
The Fund may invest in Treasury Inflation-Protection Securities (TIPS). The principal value and interest payout of TIPS are periodically adjusted according to the rate of inflation based on the Consumer Price Index. The adjustments for principal and income due to inflation are reflected in interest income in the Statement of Operations.
(E) Representations and Indemnifications: In the normal course of business, the Fund enters into contracts that contain a variety of representations and warranties which provide general indemnifications. The Fund’s maximum exposure under these arrangements is unknown, as this would involve future claims that may be made against the Fund that have not yet occurred. However, based on experience, the Fund expects the risk of loss to be remote.
2. Investment Risks
Securities issued by U.S. Government agencies or government-sponsored enterprises may not be guaranteed by the U.S. Treasury. The Government National Mortgage Association (“GNMA” or “Ginnie Mae”), a wholly-owned U.S. Government corporation, is authorized to guarantee, with the full faith and credit of the U.S. Government, the timely payment of principal and interest on securities issued by institutions approved by GNMA and backed by pools of mortgages insured by the Federal Housing Administration or guaranteed by the Department of Veterans Affairs. Government-related guarantors (i.e., not backed by the full faith and credit of the U.S. Government) include the Federal National Mortgage Association (“FNMA” or “Fannie Mae”) and the Federal Home Loan Mortgage Corporation (“FHLMC” or “Freddie Mac”). Pass-through securities issued by FNMA are guaranteed as to timely payment of principal and interest by FNMA but are not backed by the full faith and credit of the U.S. Government. FHLMC guarantees the timely payment of interest and ultimate collection of principal, but its participation certificates are not backed by the full faith and credit of the U.S. Government.
16
Value Line U.S. Government Securities Fund, Inc.
| Notes to Financial Statements |
3. Capital Share Transactions and Dividends to Shareholders
Transactions in capital stock were as follows:
Year Ended August 31, 2008 | Year Ended August 31, 2007 | ||||||
| Shares sold | 476,713 | 237,939 | |||||
| Shares issued in reinvestment of dividends | 284,139 | 299,774 | |||||
| Shares repurchased | (980,119 | ) | (1,299,287 | ) | |||
| Net decrease | (219,267 | ) | (761,574 | ) | |||
| Dividends per share from net investment income | $ | 0.4975 | $ | 0.4900 | |||
Dividends and distributions to shareholders are recorded on the ex-dividend date.
4. Purchases and Sales of Securities
Purchases and sales of investment securities, excluding short-term investments, were as follows:
Year Ended August 31, 2008 | ||||
| Purchases: | ||||
| U.S. Treasury Obligations | $ | 6,187,265 | ||
| U.S. Government Agency Obligations | 36,617,095 | |||
| $ | 42,804,360 | |||
| Sales: | ||||
| U.S. Treasury Obligations | $ | 9,733,281 | ||
| U.S. Government Agency Obligations | 35,287,433 | |||
| $ | 45,020,714 | |||
5. Income Taxes
At August 31, 2008, information on the tax basis of investments is as follows:
| Cost of investments for tax purposes | $ | 86,290,786 | ||
| Gross tax unrealized appreciation | $ | 1,435,100 | ||
| Gross tax unrealized depreciation | (405,266 | ) | ||
| Net tax unrealized appreciation on investments | $ | 1,029,834 | ||
| Undistributed ordinary income | $ | 553,512 | ||
| Capital loss carryforward, expires August 31, 2012 | $ | 11,348 | ||
| Capital loss carryforward, expires August 31, 2014 | 39,865 | |||
| Capital loss carryforward, expires August 31, 2015 | 781,920 | |||
| Capital loss carryforward, at August 31, 2008 | $ | 833,133 |
To the extent that current or future capital gains are offset by capital losses, the Fund does not anticipate distributing any such gains to shareholders.
During the year ended August 31, 2008, the Fund utilized capital loss carryforwards of $585,494.
During the year ended August 31, 2008, $1,546,597 of the Fund’s capital loss carryforward expired.
Permanent book-tax differences relating to the classification of income in the current year were reclassified within the composition of the net asset accounts. The Fund increased undistributed net investment income by $30,345, decreased accumulated net realized loss on investments by $1,516,252 and decreased additional paid-in capital by $1,546,597. Net assets were not affected by this reclassification. These reclasses are primarily due to differing treatments of expired capital loss carryforward, bond premiums and paydown gains and losses for tax purposes.
The tax composition of dividends paid during the year ended August 31, 2008 and year ended August 31, 2007 is as follows:
August 31, 2008 | August 31, 2007 | ||||||
| Ordinary income | $ | 3,798,290 | $ | 3,962,359 | |||
| 17 |
Value Line U.S. Government Securities Fund, Inc.
| August 31, 2008 |
6. Investment Advisory Fees, Service and Distribution Fees and Transactions With Affiliates
On June 30, 2008, Value Line, Inc. reorganized its investment management division into EULAV Asset Management, LLC (“EULAV”), a newly formed, wholly-owned subsidiary. As part of the reorganization, each advisory agreement was transferred from Value Line, Inc. to EULAV and EULAV replaced Value Line, Inc. as the Fund’s investment adviser. The portfolio managers, who are now employees of EULAV, have not changed as a result of the reorganization.
An advisory fee of $445,191 was paid or payable to Value Line, Inc. or EULAV, the Fund’s investment adviser (“Adviser”), for the year ended August 31, 2008. This was computed at the rate of 1/2 of 1% of the Fund’s average daily net assets during the year and was paid monthly.
The Adviser provides research, investment programs, and supervision of the investment portfolio and pays costs of administrative services, office space, equipment and compensation of administrative, bookkeeping, and clerical personnel necessary for managing the affairs of the Fund. The Adviser also provides persons, satisfactory to the Fund’s Board of Directors, to act as officers and employees of the Fund and pays their salaries and wages. Direct expenses of the Fund are charged to the Fund while common expenses of the Value Line Funds, are allocated proportionately based upon the Funds’ respective net assets. The Fund bears all other costs and expenses.
The Fund has a Service and Distribution Plan (the “Plan”), adopted pursuant to Rule 12b-1 under the Investment Company Act of 1940. The Plan compensates Value Line Securities, Inc. (the “Distributor” or “VLS”), a wholly-owned subsidiary of Value Line, Inc., for advertising, marketing and distributing the Fund’s shares and for servicing the Fund’s shareholders at an annual rate of 0.25% of the Fund’s average daily net assets. Fees amounting to $222,596, before fee waivers, were accrued under this Plan for the year ended August 31, 2008. Effective March 7, 2006, the Distributor voluntarily reduced the Fund’s 12b-1 Fee by 0.10% under the Plan. Effective February 20, 2007, the Distributor voluntarily increased such waiver to equal 0.25% of the Fund’s average daily net assets. Effective January 1, 2009 through December 31, 2010, the Distributor contractually agreed to waive the 12b-1 fee. The fees waived amounted to $222,596 for the year ended August 31, 2008. The Distributor has no right to recoup previously waived amounts. There is no assurance that the Distributor will extend the fee waiver beyond such date.
For the year ended August 31, 2008 the Fund’s expenses were reduced by $2,304 under a custody credit arrangement with the Custodian.
Certain officers, employees and a director of Value Line, Inc. and the Distributor are also officers and a director of the Fund.
The Adviser and/or affiliated companies and the Value Line, Inc. Profit Sharing and Savings Plan at August 31, 2008 owned 54,399 shares of the Fund’s capital stock, representing less than 1% of the outstanding shares. In addition, certain officers and directors of the Fund owned 554 shares, representing less than 1% of the outstanding shares.
| 18 |
Value Line U.S. Government Securities Fund, Inc.
| Notes to Financial Statements |
7. Other
By letter dated June 15, 2005, the staff of the Northeast Regional Office of the Securities and Exchange Commission (“SEC”) informed Value Line Inc. (“VLI”) that it was conducting an investigation in the matter of Value Line Securities, Inc. (“VLS”). VLI has supplied numerous documents to the SEC in response to its requests and various individuals, including employees and former employees of VLI, directors of the Fund and others, have provided testimony to the SEC. On May 8, 2008, the SEC issued a formal order of private investigation regarding whether VLS’ brokerage charges and related expense reimbursements from the Value Line Funds (“Funds”) during periods prior to 2005 were excessive and whether adequate disclosure was made to the SEC and the boards of directors and shareholders of the Funds. Thereafter, certain officers of VLI, who are former officers of the Funds, asserted their constitutional privilege not to provide testimony. VLI intends to seek to settle this matter with the SEC. Although management of VLI cannot determine the outcome of this matter, it reasonably believes that there are no loss contingencies that should be accrued or disclosed in the Fund’s financial statements and that the resolution of this matter is not likely to have a materially adverse effect on the ability of the Adviser or VLS to perform their respective contracts with the Fund.
| 19 |
Value Line U.S. Government Securities Fund, Inc.
| Financial Highlights |
Selected data for a share of capital stock outstanding throughtout each year:
| Years Ended August 31, | ||||||||||||||||
| 2008 | 2007 | 2006 | 2005 | 2004 | ||||||||||||
| Net asset value, beginning of year | $ | 11.42 | $ | 11.37 | $ | 11.74 | $ | 11.87 | $ | 11.84 | ||||||
| Income from investment operations: | ||||||||||||||||
| Net investment income | 0.46 | 0.51 | 0.47 | 0.52 | 0.41 | |||||||||||
| Net gains or (losses) on securities (both realized | ||||||||||||||||
| and unrealized) | 0.24 | 0.03 | (0.32 | ) | (0.19 | ) | 0.03 | |||||||||
| Total from investment operations | 0.70 | 0.54 | 0.15 | 0.33 | 0.44 | |||||||||||
| Less distributions: | ||||||||||||||||
| Dividends from net investment income | (0.50 | ) | (0.49 | ) | (0.52 | ) | (0.46 | ) | (0.41 | ) | ||||||
| Net asset value, end of year | $ | 11.62 | $ | 11.42 | $ | 11.37 | $ | 11.74 | $ | 11.87 | ||||||
| Total return | 6.22 | % | 4.86 | % | 1.33 | % | 2.86 | % | 3.79 | % | ||||||
| Ratios/Supplemental Data: | ||||||||||||||||
| Net assets, end of year (in thousands) | $ | 87,919 | $ | 88,886 | $ | 97,205 | $ | 112,140 | $ | 121,444 | ||||||
Ratio of expenses to average net assets(1) | 1.01 | %(2) | 0.93 | %(2) | 1.05 | (2) | 1.04 | % | 0.98 | % | ||||||
| Ratio of net investment income to average net assets | 3.96 | % | 4.28 | % | 3.88 | % | 3.60 | % | 3.40 | % | ||||||
| Portfolio turnover rate | 51 | % | 38 | % | 22 | % | 60 | % | 35 | % | ||||||
| (1) | Ratio reflects expenses grossed up for custody credit arrangement. The ratio of expenses to average net assets, net of custody credits, would have been 1.00% for the year ended August 31, 2008, 0.92% for the year ended August 31, 2007, 1.04% for the year ended August 31, 2006 and would not have changed for the years ended August 31, 2005 and August 31, 2004. |
| (2) | Ratio reflects expenses grossed up for the voluntary fee waiver of a portion of the service and distribution plan fees by the Distributor. The ratio of expenses to average net assets net of the voluntary fee waiver, but exclusive of the custody credit arrangement would have been 0.76% for the year ended August 31, 2008, 0.75% for the year ended August 31, 2007 and 1.00% as of August 31, 2006. |
| See Notes to Financial Statements. |
| 20 |
Value Line U.S. Government Securities Fund, Inc.
| Report of Independent Registered Public Accounting Firm |
To the Board of Directors and Shareholders of Value Line U.S. Government Securities Fund, Inc.
In our opinion, the accompanying statement of assets and liabilities, including the schedule of investments, and the related statements of operations and of changes in net assets and the financial highlights present fairly, in all material respects, the financial position of Value Line U.S. Government Securities Fund, Inc. (the “Fund”) at August 31, 2008, the results of its operations for the year then ended, the changes in its net assets for each of the two years in the period then ended and the financial highlights for each of the five years in the period then ended, in conformity with accounting principles generally accepted in the United States of America. These financial statements and financial highlights (hereafter referred to as “financial statements”) are the responsibility of the Fund’s management. Our responsibility is to express an opinion on these financial statements based on our audits. We conducted our audits of these financial statements in accordance with the standards of the Public Company Accounting Oversight Board (United States). Those standards require that we plan and perform the audit to obtain reasonable assurance about whether the financial statements are free of material misstatement. An audit includes examining, on a test basis, evidence supporting the amounts and disclosures in the financial statements, assessing the accounting principles used and significant estimates made by management, and evaluating the overall financial statement presentation. We believe that our audits, which included confirmation of securities at August 31, 2008 by correspondence with the custodian and brokers, provide a reasonable basis for our opinion.
PrincewaterhouseCoopers LLP
New York, New York
October 30, 2008
| 21 |
Value Line U.S. Government Securities Fund, Inc.
The Fund files its complete schedule of portfolio holdings with the Securities and Exchange Commission (“SEC”) for the first and third quarters of each fiscal year on Form N-Q. The Fund’s Forms N-Q are available on the SEC’s website at http://www.sec.gov and may be reviewed and copied at the SEC’s Public Reference Room in Washington, D.C. Information on the operation of the Public Reference Room may be obtained by calling 1-800-SEC-0330.
A description of the policies and procedures that the Fund uses to determine how to vote proxies relating to portfolio securities, and information regarding how the Fund voted these proxies during the most recent 12-month period ended June 30 is available through the Fund’s website at http://www.vlfunds.com and on the SEC’s website at http://www.sec.gov. The description of the policies and procedures is also available without charge, upon request, by calling 1-800-243-2729.
| 22 |
Value Line U.S. Government Securities Fund, Inc.
| Factors Considered by the Board in Approving the Investment Advisory Agreement for Value Line U.S. Government Securities Fund (unaudited) |
The Investment Company Act of 1940 (the “1940 Act”) requires the Board of Directors, including a majority of Directors who are not interested persons of the Value Line U.S. Government Securities Fund (the “Fund”), as that term is defined in the 1940 Act (the “Independent Directors”), annually to consider the investment advisory agreement (the “Agreement”) between the Fund and its investment adviser, Value Line, Inc.1 (“Value Line”). As required by the 1940 Act, the Board requested and Value Line provided such information as the Board deemed to be reasonably necessary to evaluate the terms of the Agreement. At meetings held throughout the year, including the meeting specifically focused upon the review of the Agreement, the Independent Directors met in executive sessions separately from the non-Independent Director of the Fund and any officers of Value Line. In selecting Value Line and approving the continuance of the Agreement, the Independent Directors relied upon the assistance of counsel to the Independent Directors.
Both in the meetings which specifically addressed the approval of the Agreement and at other meetings held during the course of the year, the Board, including the Independent Directors, received materials relating to Value Line’s investment and management services under the Agreement. These materials included information on (i) the investment performance of the Fund, compared to a peer group of funds consisting of the Fund and all retail and institutional intermediate U.S. government funds regardless of asset size or primary channel of distribution (the “Performance Universe”), and its benchmark index, each as classified by Lipper Inc., an independent evaluation service (“Lipper”); (ii) sales and redemption data with respect to the Fund; (iii) the general investment outlook in the markets in which the Fund invests; (iv) arrangements with respect to the distribution of the Fund’s shares; (v) the allocation of the Fund’s brokerage; and (vi) the overall nature, quality and extent of services provided by Value Line.
As part of the review of the continuance of the Agreement, the Board requested, and Value Line provided, additional information in order to evaluate the quality of Value Line’s services and the reasonableness of its fees under the Agreement. In a separate executive session, the Independent Directors reviewed information, which included data comparing: (i) the Fund’s management fee rate, transfer agent and custodian fee rates, service fee (including 12b-1 fees) rates, and the rate of the Fund’s other non-management fees, to those incurred by a peer group of funds consisting of the Fund and 13 other intermediate U.S. government funds, as selected objectively by Lipper (“Expense Group”), and a peer group of funds consisting of the Fund, the Expense Group and all other retail front-end load and no-load intermediate U.S. government funds (excluding outliers), as selected objectively by Lipper (“Expense Universe”); (ii) the Fund’s expense ratio to those of its Expense Group and Expense Universe; and (iii) the Fund’s investment performance over various time periods to the average performance of the Performance Universe as well as the Lipper Intermediate U.S. Government Index (the “Lipper Index”). In the separate executive session, the Independent Directors also reviewed information regarding: (a) Value Line’s financial results and condition, including Value Line’s and certain of its affiliates’ profitability from the services that have been performed for the Fund as well as the Value Line family of funds; (b) the Fund’s current investment management staffing; and (c) the Fund’s potential for achieving economies of scale. In support of its review of the statistical information, the Board was provided with a detailed description of the methodology used by Lipper to determine the Expense Group, the Expense Universe and the Performance Universe to prepare its information.
| 1 | On June 30, 2008, Value Line, Inc., the Fund’s former investment adviser, reorganized its investment management division into EULAV Asset Management, LLC, a newly formed wholly-owned subsidiary located at 220 East 42nd Street, New York, NY 10017. As part of the reorganization, the Fund’s investment advisory agreement was transferred from Value Line to EULAV and EULAV replaced Value Line as the Fund’s investment adviser. Value Line, Inc. is referred to as the investment adviser in this document because at the time of the meeting of the Board of Directors discussed herein Value Line, Inc. remained the Fund’s investment adviser. | |
| 23 |
Value Line U.S. Government Securities Fund, Inc.
| Factors Considered by the Board in Approving the Investment Advisory Agreement for Value Line U.S. Government Securities Fund (unaudited) |
The following summarizes matters considered by the Board in connection with its renewal of the Agreement. However, the Board did not identify any single factor as all-important or controlling, and the summary does not detail all the matters that were considered.
Investment Performance. The Board reviewed the Fund’s overall investment performance and compared it to its Performance Universe and the Lipper Index. The Board noted that the Fund’s performance for the one-year, three-year, five-year and ten-year periods ended December 31, 2007 was above the performance of the Performance Universe average and below that of the Lipper Index.
Value Line’s Personnel and Methods. The Board reviewed the background of the portfolio manager responsible for the daily management of the Fund’s portfolio, seeking to achieve the Fund’s investment objective and adhering to the Fund’s investment strategy. The Independent Directors also engaged in discussions with Value Line’s senior management responsible for the overall functioning of the Fund’s investment operations. Based on this review, the Board concluded that the Fund’s management team and Value Line’s overall resources were well developed and that Value Line had investment management capabilities and personnel essential to performing its duties under the Agreement.
Management Fee and Expenses. The Board considered Value Line’s fee under the Agreement relative to the management fees charged by its Expense Group and Expense Universe averages. The Fund’s management fee rate for the most recent fiscal year was slightly lower than that of both the Expense Group average and the Expense Universe average. Based on this, the Board determined that the Fund’s management fee rate payable to Value Line under the Agreement does not constitute fees that are so disproportionately large as to bear no reasonable relationship to the services rendered and that could not have been the product of arm’s-length bargaining, and concluded that the management fee rate under the Agreement is fair and reasonable.
The Board also considered the Fund’s total expense ratio relative to its Expense Group and Expense Universe averages. The Board noted that, effective March 7, 2006, Value Line Securities, Inc., the Fund’s principal underwriter, voluntarily agreed to waive 0.10% of the Fund’s Rule 12b-1 fee, thereby reducing the Fund’s Rule 12b-1 fee rate from 0.25% to 0.15% of the Fund’s average daily net assets. In addition, effective February 20, 2007 and February 1, 2008, Value Line Securities, Inc. voluntarily agreed for one year periods to waive all of the Fund’s Rule 12b-1 fee, thereby reducing the Fund’s Rule 12b-1 fee rate from 0.25% to 0.00%. Finally, Value Line Securities, Inc. and the Board agreed to extend the current waiver of all of the Fund’s Rule 12b-1 fee for the period beginning on January 1, 2009 and ending December 31, 2010 and to make the waiver contractual so that it can not be changed without the Board’s approval during such period. As a result of the current Rule 12b-1 fee waiver, the Board noted that the Fund’s total expense ratio (after giving effect to these waivers) was less than that of both the Expense Group average and the Expense Universe average and concluded that the average expense ratio was satisfactory for the purpose of approving the continuance of the Agreement for the coming year.
| 24 |
Value Line U.S. Government Securities Fund, Inc.
Factors Considered by the Board in Approving the Investment Advisory Agreement for Value Line U.S. Government Securities Fund (unaudited)
Nature and Quality of Other Services. The Board considered the nature, quality, cost and extent of other services provided by Value Line and its affiliate, Value Line Securities, Inc., the Fund’s principal underwriter. At meetings held throughout the year, the Board reviewed the effectiveness of Value Line’s overall compliance program, as well as the services provided by Value Line Securities, Inc. The Board also reviewed the services provided by Value Line and its affiliate in supervising third party service providers. Based on this review, the Board concluded that the nature, quality, cost and extent of such other services provided by Value Line and its affiliate were satisfactory, reliable and beneficial to the Fund’s shareholders.
Profitability. The Board considered the level of Value Line’s profits with respect to the management of the Fund, including the impact of certain actions taken during prior years. These actions included Value Line’s review of its methodology in allocating certain of its costs to the management of each fund, Value Line’s reduction (voluntary in some instances and contractual in other instances) of management and/or Rule 12b-1 fees for certain funds, Value Line’s termination of the use of soft dollar research, and the cessation of trading through its affiliate, Value Line Securities, Inc. Based on a review of these actions and Value Line’s overall profitability, the Board concluded that Value Line’s profits from management of the Fund, including the financial results derived from the Fund, were within a range the Board considered reasonable.
Other Benefits. The Board also considered the character and amount of other direct and incidental benefits received by Value Line and its affiliates from their association with the Fund. The Board concluded that potential “fall-out” benefits that Value Line and its affiliates may receive, such as greater name recognition, appear to be reasonable, and may in some cases benefit the Fund.
Economies of Scale. The Board noted that, given the current and anticipated size of the Fund, any perceived and potential economies of scale were not yet a significant consideration for the Fund and the addition of break points was determined not to be necessary at this time.
Fees and Services Provided for Other Comparable Funds/Accounts Managed by Value Line and its Affiliates. In addition to comparing the Fund’s management fee rate to unaffiliated mutual funds included in the Fund’s Expense Group and Expense Universe, the Board was informed by Value Line that Value Line and its affiliates do not manage any investment companies comparable to the Fund.
Conclusion. The Board, in light of Value Line’s overall performance, considered it appropriate to continue to retain Value Line as the Fund’s investment adviser. Based on their evaluation of all material factors deemed relevant, and with the advice of independent counsel, the Board concluded that the Fund’s Agreement is fair and reasonable and voted to approve the continuation of the Agreement for another year.
| 25 |
Value Line U.S. Government Securities Fund, Inc.
| Management of the Fund |
| MANAGEMENT INFORMATION |
The business and affairs of the Fund are managed by the Fund’s officers under the direction of the Board of Directors. The following table sets forth information on each Director and Officer of the Fund. Each Director serves as a director or trustee of each of the 14 Value Line Funds. Each Director serves until his or her successor is elected and qualified.
| Name, Address, and Age | Position | Length of Time Served | Principal Occupation During the Past 5 Years | Other Directorships Held by Director | ||||
| Interested Director* | ||||||||
Thomas T. Sarkany Age 62 | Director | Since 2008 | Mutual Fund Marketing Director of Value Line Securities, Inc. (the “Distributor”). | None | ||||
| Non-Interested Directors | ||||||||
John W. Chandler 1611 Cold Springs Road Williamstown, MA 01267 Age 84 | Director (Lead Independent Director since 2007) | Since 1991 | Consultant, Academic Search Consultation Service, Inc.; (1992–2004); Trustee Emeritus and Chairman (1993–1994) of the Board of Trustees of Duke University; President Emeritus, Williams College. | None | ||||
Frances T. Newton 4921 Buckingham Drive Charlotte, NC 28209 Age 66 | Director | Since 2000 | Retired; Customer Support Analyst, Duke Power Company until 2007. | None | ||||
Francis C. Oakley 54 Scott Hill Road Williamstown, MA 01267 Age 76 | Director | Since 2000 | Professor of History, Williams College, (1961 to 2002). Professor Emeritus since 2002. President Emeritus since 1994 and President, (1985 – 1994); Chairman (1993–1997) and Interim President (2002–2003) of the American Council of Learned Societies. Trustee since 1997 and Chairman of the Board since 2005, National Humanities Center. | None | ||||
David H. Porter 5 Birch Run Drive Saratoga Springs, NY 12866 Age 72 | Director | Since 1997 | Visiting Professor of Classics, Williams College, since 1999; President Emeritus, Skidmore College since 1999 and President, (1987–1998). | None |
| 26 |
Value Line U.S. Government Securities Fund, Inc.
| Management of the Fund |
| Name, Address, and Age | Position | Length of Time Served | Principal Occupation During the Past 5 Years | Other Directorships Held by Director | ||||
Paul Craig Roberts 169 Pompano Street Panama City Beach, FL 32413 Age 68 | Director | Since 1983 | Chairman, Institute for Political Economy. | None | ||||
Nancy-Beth Sheerr 1409 Beaumont Drive Gladwyne, PA 19035 Age 58 | Director | Since 1996 | Senior Financial Advisor, Veritable L.P. (investment adviser) since 2004; Senior Financial Advisor, Hawthorn, 2001–2004. | None | ||||
| Officers | ||||||||
Mitchell E. Appel Age 37 | President | Since 2008 | President of each of the 14 Value Line Funds since June 2008; Chief Financial Officer of Value Line since April 2008 and from September 2005 to November 2007; Treasurer from June 2005 to September 2005; Chief Financial Officer of XTF Asset Management from November 2007 to April 2008; Chief Financial Officer of Circle Trust Company from 2003 through May 2005; Chief Financial Officer of the Distributor since April 2008. | |||||
Howard A. Brecher Age 54 | Vice President and Secretary | Since 2008 | Vice President and Secretary of each of the 14 Value Line Funds since June 2008; Vice President, Secretary and a Director of Value Line; Vice President of the Distributor and Secretary since June 2008; Vice President, Secretary, Treasurer, General Counsel and a Director of Arnold Bernhard & Co., Inc. | |||||
Emily D. Washington Age 29 | Treasurer | Since 2008 | Associate Director of Mutual Fund Accounting at Value Line until August 2008; Treasurer and Chief Financial Officer (Principal Financial and Accounting Officer) of the Value Line Funds since August 2008. |
| * | Mr. Sarkany is an “interested person” as defined in the Investment Company Act of 1940 by virtue of his position with the Distributor. |
Unless otherwise indicated, the address for each of the above is 220 East 42nd Street, New York, NY 10017.
| The Fund’s Statement of Additional Information (SAI) includes additional information about the Fund’s directors and is available, without charge, upon request by calling 1-800-243-2729. |
| 27 |
Value Line U.S. Government Securities Fund, Inc.
| The Value Line Family of Funds |
1950 — The Value Line Fund seeks long-term growth of capital. Current income is a secondary objective.
1952 — Value Line Income and Growth Fund’s primary investment objective is income, as high and dependable as is consistent with reasonable risk. Capital growth to increase total return is a secondary objective.
1956 — The Value Line Premier Growth Fund seeks long-term growth of capital. No consideration is given to current income in the choice of investments.
1972 — Value Line Larger Companies Fund’s sole investment objective is to realize capital growth.
1979 — The Value Line Cash Fund, a money market fund, seeks to secure as high a level of current income as is consistent with maintaining liquidity and preserving capital. An investment in the Fund is not insured or guaranteed by the Federal Deposit Insurance Corporation or any other government agency. Although the Fund seeks to preserve the value of your investment at $1.00 per share, it is possible to lose money by investing in the Fund.
1981 — Value Line U.S. Government Securities Fund seeks maximum income without undue risk to capital. Under normal conditions, at least 80% of the value of its net assets will be invested in securities issued or guaranteed by the U.S. Government and its agencies and instrumentalities.
1983 — Value Line Centurion Fund* seeks long-term growth of capital.
1984 — The Value Line Tax Exempt Fund seeks to provide investors with the maximum income exempt from federal income taxes while avoiding undue risk to principal. The Fund may be subject to state and local taxes and the Alternative Minimum Tax (if applicable).
1985 — Value Line Convertible Fund seeks high current income together with capital appreciation primarily from convertible securities ranked 1 or 2 for year-ahead performance by the Value Line Convertible Ranking System.
1986 — Value Line Aggressive Income Trust seeks to maximize current income.
1987 — Value Line New York Tax Exempt Trust seeks to provide New York taxpayers with the maximum income exempt from New York State, New York City and federal income taxes while avoiding undue risk to principal. The Trust may be subject to state and local taxes and the Alternative Minimum Tax (if applicable).
1987 — Value Line Strategic Asset Management Trust* seeks to achieve a high total investment return consistent with reasonable risk.
1993 — Value Line Emerging Opportunities Fund invests primarily in common stocks or securities convertible into common stock, with its primary objective being long-term growth of capital.
1993 — Value Line Asset Allocation Fund seeks high total investment return, consistent with reasonable risk. The Fund invests in stocks, bonds and money market instruments utilizing quantitative modeling to determine the asset mix.
| * | Only available through the purchase of Guardian Investor, a tax deferred variable annuity, or ValuePlus, a variable life insurance policy. |
For more complete information about any of the Value Line Funds, including charges and expenses, send for a prospectus from Value Line Securities, Inc., 220 East 42nd Street, New York, New York 10017-5891 or call 1-800-243-2729, 9 am – 5 pm CST, Monday – Friday, or visit us at www.vlfunds.com. Read the prospectus carefully before you invest or send money.
| 28 |
Item 2. Code of Ethics
(a) The Registrant has adopted a Code of Ethics that applies to its principal executive officer, and principal financial officer and principal accounting officer.
(f) Pursuant to item 12(a), the Registrant is attaching as an exhibit a copy of its Code of Ethics that applies to its principal executive officer, and principal financial officer and principal accounting officer.
Item 3. Audit Committee Financial Expert.
(a)(1)The Registrant has an Audit Committee Financial Expert serving on its Audit Committee.
(2) The Registrant’s Board has designated John W. Chandler, a member of the Registrant’s Audit Committee, as the Registrant’s Audit Committee Financial Expert. Mr. Chandler is an independent director who is a senior consultant with Academic Search Consultation Service. He spent most of his professional career at Williams College, where he served as a faculty member, Dean of the Faculty, and President (1973-85). He also served as President of Hamilton College (1968-73), and as President of the Association of American Colleges and Universities (1985-90). He has also previously served as Trustee Emeritus and Chairman of the Board of Trustees of Duke University.
A person who is designated as an “audit committee financial expert” shall not make such person an “expert” for any purpose, including without limitation under Section 11 of the Securities Act of 1933 or under applicable fiduciary laws, as a result of being designated or identified as an audit committee financial expert. The designation or identification of a person as an audit committee financial expert does not impose on such person any duties, obligations, or liabilities that are greater than the duties, obligations, and liabilities imposed on such person as a member of the audit committee and Board of Trustees in the absence of such designation or identification.
Item 4. Principal Accountant Fees and Services
| (a) Audit Fees 2008 - $15,705 | ||
| (b) Audit-Related fees – None. | ||
| (c) Tax Preparation Fees 2008 -$9,850 | ||
| (d) All Other Fees – None | ||
| (e) (1) | Audit Committee Pre-Approval Policy. All services to be performed for the Registrant by PricewaterhouseCoopers LLP must be pre-approved by the audit committee. All services performed during 2008 were pre-approved by the committee. | |
| (e) (2) Not applicable. | ||
| (f) Not applicable. | ||
| (g) Aggregate Non-Audit Fees 2008 -$2,400 | ||
| (h) Not applicable. | ||
Item 11. Controls and Procedures.
| (a) | The registrant’s principal executive officer and principal financial officer have concluded that the registrant’s disclosure controls and procedures (as defined in rule 30a-2(c) under the Act (17 CFR 270.30a-2(c)) based on their evaluation of these controls and procedures as of a date within 90 days of the filing date of this report, are appropriately designed to ensure that material information relating to the registrant is made known to such officers and are operating effectively. |
| (b) | The registrant’s principal executive officer and principal financial officer have determined that there have been no significant changes in the registrant’s internal controls or in other factors that could significantly affect these controls subsequent to the date of their evaluation, including corrective actions with regard to significant deficiencies and material weaknesses. |
Item 12. Exhibits.
| (a) | Code of Business Conduct and Ethics for Principal Executive and Senior Financial Officers attached hereto as Exhibit 99.CODE ETH | |
| (b) | (1) Certification pursuant to Rule 30a-2(a) under the Investment Company Act of 1940 (17 CFR 270.30a-2) attached hereto as Exhibit 99.CERT. | |
(2) Certification pursuant to Section 906 of the Sarbanes-Oxley Act of 2002 attached hereto as Exhibit 99.906.CERT. |
SIGNATURES
Pursuant to the requirements of the Securities Exchange Act of 1934 and the Investment Company Act of 1940, the registrant has duly caused this report to be signed on its behalf by the undersigned, thereunto duly authorized.
| By | /s/ Mitchell E. Appel | |
| Mitchell E. Appel, President |
| Date: | October 30, 2008 | ||
Pursuant to the requirements of the Securities Exchange Act of 1934 and the Investment Company Act of 1940, this report has been signed below by the following persons on behalf of the registrant and in the capacities and on the dates indicated.
| By: | /s/ Mitchell E. Appel | |
| Mitchell E. Appel, President, Principal Executive Officer |
| By: | /s/ Emily D. Washington | |
| Emily D. Washington, Treasurer, Principal Financial Officer |
| Date: | October 30, 2008 | ||