UNITED STATES
SECURITIES AND EXCHANGE COMMISSION
Washington, D.C. 20549
FORM N-CSR
CERTIFIED SHAREHOLDER REPORT OF REGISTERED
MANAGEMENT INVESTMENT COMPANIES
Investment Company Act file Number _811-03171_
Value Line U.S. Government Securities Fund, Inc.
(Exact name of registrant as specified in charter)
220 East 42nd Street, New York, N.Y. 10017
(Address of principal executive offices) (Zip Code)
Registrant’s telephone number, including area code: 212-907-1500
Date of fiscal year end: August 31, 2009
Date of reporting period: August 31, 2009
Item I. Reports to Stockholders.
A copy of the Annual Report to Stockholders for the period ended 8/31/09
is included with this Form.
| INVESTMENT ADVISER | EULAV Asset Management, LLC | A N N U A L R E P O R T |
| 220 East 42nd Street | A u g u s t 3 1 , 2 0 0 9 | |
| New York, NY 10017-5891 | ||
| DISTRIBUTOR | EULAV Securities, Inc. | |
| 220 East 42nd Street | ||
| New York, NY 10017-5891 | ||
| (Formerly Value Line Securities, Inc.) | ||
| CUSTODIAN BANK | State Street Bank and Trust Co. | |
| 225 Franklin Street | ||
| Boston, MA 02110 | ||
| SHAREHOLDER | State Street Bank and Trust Co. | |
| SERVICING AGENT | c/o BFDS | Value Line U.S. Government Securities Fund, Inc. |
| P.O. Box 219729 | ||
| Kansas City, MO 64121-9729 | ||
| INDEPENDENT | PricewaterhouseCoopers LLP | |
| REGISTERED PUBLIC | 300 Madison Avenue | |
ACCOUNTING FIRM | New York, NY 10017 | |
LEGAL COUNSEL | Peter D. Lowenstein, Esq. | |
| 496 Valley Road | ||
| Cos Cob, CT 06807-0272 | ||
| DIRECTORS | Joyce E. Heinzerling | |
| Francis C. Oakley | ||
| David H. Porter | ||
| Paul Craig Roberts | ||
| Thomas T. Sarkany | ||
| Nancy-Beth Sheerr | ||
| Daniel S. Vandivort | ||
| OFFICERS | Mitchell E. Appel | |
| President | ||
| Howard A. Brecher | ||
| Vice President and Secretary | ||
| Michael Wagner | ||
| Chief Compliance Officer | ||
| Emily D. Washington | ||
| Treasurer | ||
 |
| This audited report is issued for information to shareholders. It is not authorized for distribution to prospective investors unless preceded or accompanied by a currently effective prospectus of the Fund (obtainable from the Distributor). |
| #00068208 |
Value Line U.S. Government Securities Fund, Inc.
| To Our Value Line U.S. Government |
To Our Shareholders (unaudited):
Enclosed is your annual report for the period August 31, 2009. I encourage you to carefully review this report, which includes economic observations, your Fund’s performance data and highlights, schedule of investments, and financial statements.
During the fiscal year ended August 31, 2009, interest rates fell and bond prices appreciated. Your Fund benefited from the bond rally generating a total return of 7.46% for the year ended August 31, 2009. The Fund outperformed its benchmark, the Barclays Intermediate U.S. Government Bond Index (1), which returned 6.26%. The Fund’s overweight position in high grade mortgage backed securities and government agencies helped boost performance.
The decline in interest rates resulted from a deep economic recession where Gross Domestic Product experienced declines of 5.4% in the last quarter of 2008, and 6.4% in the first quarter of 2009. This crisis caused the Federal Reserve Board to lower interest rates to their lowest historical level, bringing the Fed Funds rate, from 2.00% to 0.25% during the period. In addition, the Federal Reserve continued other measures directed toward stabilizing the financial system which was initially threatened by the meltdown in sub-prime mortgages.
During the period, short-term bonds experienced the strongest rally as the yield on the 2-year U.S. Treasury note fell from 2.37% to 0.97%. Longer maturities also participated in the rally. The 10-year U.S. Treasury note declined from 3.81% to 3.40%.
Going forward, we expect price appreciation will be harder to achieve as interest rates are at very low historical levels and the economy is beginning to stabilize. However, rates should not climb either, due to a continuation of economic softness and problems within the country’s financial institutions.
Therefore, we believe that our strategy of investing the Fund’s assets in a well diversified, yet highly rated portfolio of government sponsored mortgage-backed securities and government agencies will best serve the long-term interests of the Fund and its shareholders. Additionally, we control risk by concentrating the portfolio’s holdings in intermediate maturities. We believe this may protect the Fund from dramatic swings in value caused by volatile interest rates and produce more stable and consistent performance.
Thank you for your confidence in Value Line Funds.
| Sincerely, | ||
| /s/ Mitchell Appel | ||
Mitchell Appel, President October 10, 2009 | ||
| (1) | The Barclays Intermediate U.S. Government Bond Index represents the intermediate maturities (1-10 years) of the U.S. Treasury and U.S. Agency segment of the fixed-income market. The returns for the Index do not reflect charges, expenses, or taxes, and it is not possible to directly invest in this Index. |
2
Value Line U.S. Government Securities Fund, Inc.
| Securities Fund Shareholders |
Economic Observations (unaudited)
The deep and prolonged recession, which commenced during the latter part of 2007, has run its course. Specifically, the downturn, which had produced steep declines of 5.4% and 6.4% in the nation’s gross domestic product in the fourth quarter of 2008 and the first quarter of this year, respectively, appears to have ended in the recently concluded third quarter. For example, following a more limited business setback in the second quarter, when GDP eased by just 0.7%, the economy snapped back over the summer, producing growth that may well have averaged 3%, or so, in the July-through-September period, aided strongly by the recent “cash-for-clunkers” program. GDP should now advance at a somewhat more restrained pace of 2%, or slightly more, over the final three months of 2009, underpinned by further, uneven gains in consumer spending and industrial activity. It is worth noting that the prospective rate of GDP growth during the current half would be below the historical norm of 3%-4%. The problem is that there is just too much aggregate weakness in certain core business sectors, notably housing and employment, to produce the higher level of consumer activity needed for more significant rates of economic growth.
Overall, the long and painful recession was traceable to several events, beginning with sharp declines in housing construction, home sales, and real estate prices. We also experienced a large reduction in credit availability, a high level of bank failures, increasing foreclosure rates, multiple-decade highs in unemployment, lackluster retail activity, and weak manufacturing. Unfortunately, some of these problems are likely to remain with us for several quarters more—most notably the weaknesses in housing and employment. Such continuing difficulties underscore why we still expect somewhat below-trend rates of economic growth through 2010. Encouragingly, though, the majority of business barometers are either stabilizing or improving selectively. It is much the same overseas, where severe business declines had earlier been seen across Europe and Asia. Those setbacks, which generally got under way several months after our own reversal commenced, have also largely run their course. Following this initially modest business recovery—which we expect to continue through 2010—we would look for enough brightening in both housing and employment to underpin a more definitive economic recovery in 2011 and through the middle years of the next decade.
Meantime, inflation, which had moved sharply higher in this country last year, following dramatic increases in oil, food, and commodity prices, has proceeded in a largely uneven fashion in more recent months, reflecting numerous, but often shortlived, gyrations in key pricing categories. We expect pricing to continue charting an uneven course over the next several quarters, with further up and down swings in oil and commodities being the norm as the economy transitions from recession to recovery. On average, we think that pricing will increase less sharply going forward over the next year or two than it did before the 2007-2009 recession. Looking further out, we anticipate some pricing pressures will evolve gradually as the business expansion presumably gathers strength over the next several years. The Federal Reserve, meanwhile, is unlikely to start raising interest rates until well into 2010, and to do so rather gently when its does finally opt to tighten the monetary reins. Clearly, the risks to the sustainability of the formative economic up cycle would seem too great for the central bank to consider tightening the credit reins aggressively anytime soon.
All in all, we see a comparatively benign period ahead, in the aggregate, for the equity and fixed-income markets over the next year or so.
3
Value Line U.S. Government Securities Fund, Inc.
| (unaudited) |
The following graph compares the performance of the Value Line U.S. Government Securities Fund, Inc. to that of the Barclays Capital Intermediate U.S. Government Bond Index. The Value Line U.S. Government Securities Fund, Inc. is a professionally managed mutual fund, while the Index is not available for investment and is unmanaged. The returns for the Index do not reflect charges, expenses or taxes but do include the reinvestment of dividends. The comparison is shown for illustrative purposes only.
Comparison of a Change in Value of a $10,000 Investment in the Value Line U.S. Government Securities
Fund, Inc. and the Barclays Capital Intermediate U.S. Government Bond Index*
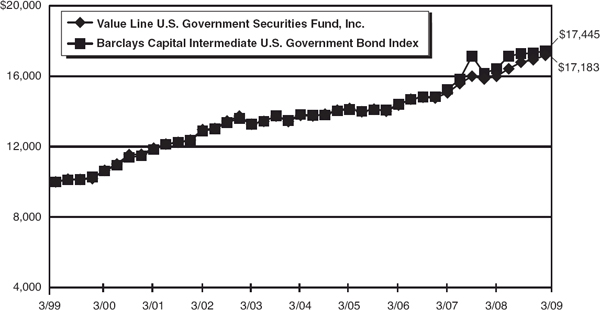
Performance Data: **
Average Annual Total Return | Growth of an Assumed Investment of $10,000 | ||||
| 1 year ended 8/31/09 | 7.46% | $ 10,746 | |||
| 5 years ended 8/31/09 | 4.52% | $ 12,476 | |||
| 10 years ended 8/31/09 | 5.56% | $ 17,183 |
| * | The Barclays Capital Intermediate U.S. Government Bond Index is representative of securities issued by the U.S. Government. It includes fixed-rate debt securities with maturities between one and ten years. The returns for the Index do not reflect charges, expenses, or taxes, which are deducted from the Fund’s returns and it is not possible to directly invest in this unmanaged Index. |
| ** | The performance data quoted represent past performance and are no guarantee of future performance. The average annual total returns and growth of an assumed investment of $10,000 include dividends reinvested and capital gains distributions accepted in shares. The investment return and principal value of an investment will fluctuate so that an investment, when redeemed, may be worth more or less than its original cost. The performance data and graph do not reflect the deduction of taxes that a shareholder would pay on fund distributions or the redemption of fund shares. |
4
Value Line U.S. Government Securities Fund, Inc.
FUND EXPENSES (unaudited):
Example
As a shareholder of the Fund, you incur ongoing costs, including management fees, distribution and service (12b-1) fees, and other Fund expenses. This Example is intended to help you understand your ongoing costs (in dollars) of investing in the Fund and to compare these costs with the ongoing costs of investing in other mutual funds.
The Example is based on an investment of $1,000 invested at the beginning of the period and held for the entire period (March 1, 2009 through August 31, 2009).
Actual Expenses
The first line of the table below provides information about actual account values and actual expenses. You may use the information in this line, together with the amount you invested, to estimate the expenses that you paid over the period. Simply divide your account value by $1,000 (for example an $8,600 account value divided by $1,000 = 8.6), then multiply the result by the number in the first line under the heading “Expenses Paid During Period” to estimate the expenses you paid on your account during this period.
Hypothetical Example for Comparison Purposes
The second line of the table below provides information about hypothetical account values and hypothetical expenses based on the Fund’s actual expense ratio and an assumed rate of return of 5% per year before expenses, which is not the Fund’s actual return. The hypothetical account values and expenses may not be used to estimate the actual ending account balance or expenses you paid for the period. You may use this information to compare the ongoing costs of investing in the Fund and other funds. To do so, compare this 5% hypothetical example with the 5% hypothetical examples that appear in the shareholder reports of the other funds.
Please note that the expenses shown in the table are meant to highlight your ongoing costs only and do not reflect any transactional costs, such as sales charges (loads), redemption fees, or exchange fees. Therefore, the table is useful in comparing ongoing costs only and will not help you determine the relative total costs of owning different funds. In addition, if transactional costs were included, your costs would have been higher.
Beginning account value 3/1/09 | Ending account value 8/31/09 | Expenses paid during period 3/1/09 thru 8/31/09* | |||||||
| Actual | $1,000.00 | $1,023.43 | $4.42 | ||||||
| Hypothetical (5% return before expenses) | $1,000.00 | $1,020.84 | $4.41 | ||||||
| * | Expenses are equal to the Fund’s annualized expense ratio of 0.87% multiplied by the average account value over the period, multiplied by 184/365 to reflect the one-half year period. This expense ratio may differ from the expense ratio shown in the Financial Highlights. |
5
Value Line U.S. Government Securities Fund, Inc.
| Portfolio Highlights at August 31, 2009 (unaudited) |
Ten Largest Holdings
| Issue | Principal Amount | Value | Percentage of Net Assets | |||
| U.S. Treasury Bonds, 7.88%, 2/15/21 | $3,000,000 | $4,123,125 | 4.6% | |||
| Federal Farm Credit Bank, 5.70%, 7/3/17 | $3,000,000 | $3,347,664 | 3.8% | |||
| Federal National Mortgage Association, 2.75%, 3/13/14 | $3,000,000 | $3,034,080 | 3.4% | |||
| Federal Home Loan Bank, 3.63%, 10/18/13 | $2,500,000 | $2,621,315 | 2.9% | |||
| Federal Farm Credit Bank, 3.50%, 10/3/11 | $2,000,000 | $2,088,086 | 2.3% | |||
Government National Mortgage Association, REMIC Trust Series 2009-34 Class HA 4.50%, 2/16/34 | $1,987,986 | $2,045,122 | 2.3% | |||
| U.S. Treasury Notes, 3.25%, 5/31/16 | $2,000,000 | $2,035,468 | 2.3% | |||
Government National Mortgage Association, REMIC Trust Series 2009-20 Class AB 5.00%, 3/16/32 | $1,466,592 | $1,531,974 | 1.7% | |||
| Federal Home Loan Mortgage Corporation, 2.50%, 1/7/14 | $1,500,000 | $1,504,080 | 1.7% | |||
Federal Home Loan Mortgage Corporation, Gold PC Pool #J08096 5.00%, 6/1/23 | $1,393,291 | $1,453,124 | 1.6% | |||
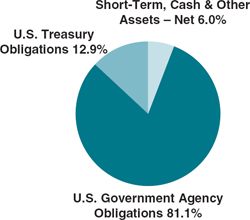
Asset Allocation — Percentage of Fund’s Net Assets
| Coupon Distribution |
Percentage of Fund’s Investments | ||||
| Less than 4% | 21.9 | % | ||
| 4-4.99% | 22.7 | % | ||
| 5-5.99% | 41.4 | % | ||
| 6-6.99% | 6.8 | % | ||
| 7-7.99% | 7.2 | % | ||
6
Value Line U.S. Government Securities Fund, Inc.
| Schedule of Investments | August 31, 2009 |
Principal Amount | Rate | Maturity Date | Value | ||||||||
| U.S. GOVERNMENT AGENCY OBLIGATIONS (81.1%) | |||||||||||
| FEDERAL FARM CREDIT BANK (8.4%) | |||||||||||
| $ | 2,000,000 | Federal Farm Credit Bank | 3.50 | % | 10/3/11 | $ | 2,088,086 | ||||
| 1,000,000 | Federal Farm Credit Bank | 4.85 | 10/25/12 | 1,086,474 | |||||||
| 1,000,000 | Federal Farm Credit Bank | 2.63 | 4/17/14 | 996,334 | |||||||
| 3,000,000 | Federal Farm Credit Bank | 5.70 | 7/3/17 | 3,347,664 | |||||||
| 7,000,000 | TOTAL FEDERAL FARM CREDIT BANK | ||||||||||
| (Cost $7,033,918) | 7,518,558 | ||||||||||
| FEDERAL HOME LOAN BANK (6.5%) | |||||||||||
| 1,000,000 | Federal Home Loan Bank | 3.63 | 5/29/13 | 1,050,900 | |||||||
| 2,500,000 | Federal Home Loan Bank | 3.63 | 10/18/13 | 2,621,315 | |||||||
| 1,000,000 | Federal Home Loan Bank | 4.50 | 11/14/14 | 1,080,741 | |||||||
| 1,000,000 | Federal Home Loan Bank | 5.00 | 11/17/17 | 1,081,979 | |||||||
| 5,500,000 | TOTAL FEDERAL HOME LOAN BANK | ||||||||||
| (Cost $5,705,773) | 5,834,935 | ||||||||||
| FEDERAL HOME LOAN MORTGAGE CORPORATION (34.4%) | |||||||||||
| 760,266 | Federal Home Loan Mortgage Corporation REMIC Trust Series 3197 Class AB | 5.50 | 8/15/13 | 786,151 | |||||||
| 1,500,000 | Federal Home Loan Mortgage Corporation | 2.50 | 1/7/14 | 1,504,080 | |||||||
| 1,000,000 | Federal Home Loan Mortgage Corporation | 3.00 | 7/28/14 | 1,014,548 | |||||||
| 1,000,000 | Federal Home Loan Mortgage Corporation | 4.50 | 1/15/15 | 1,080,793 | |||||||
| 611,679 | Federal Home Loan Mortgage Corporation REMIC Trust Series 2849 Class VA | 5.00 | 8/15/15 | 653,847 | |||||||
| 483,930 | Federal Home Loan Mortgage Corporation REMIC Trust Series R003 Class AG | 5.13 | 10/15/15 | 496,443 | |||||||
| 1,000,000 | Federal Home Loan Mortgage Corporation | 5.50 | 7/18/16 | 1,125,188 | |||||||
| 735,336 | Federal Home Loan Mortgage Corporation REMIC Trust Series 2767 Class CA | 4.00 | 9/15/17 | 763,192 | |||||||
| 14,398 | Federal Home Loan Mortgage Corporation Gold PC Pool #E92226 | 5.00 | 11/1/17 | 15,220 | |||||||
| 1,000,000 | Federal Home Loan Mortgage Corporation | 5.13 | 11/17/17 | 1,103,417 | |||||||
| 241,263 | Federal Home Loan Mortgage Corporation Gold PC Pool #E93499 | 5.00 | 12/1/17 | 255,030 | |||||||
| 16,848 | Federal Home Loan Mortgage Corporation Gold PC Pool #E92829 | 5.00 | 12/1/17 | 17,810 | |||||||
| 547,528 | Federal Home Loan Mortgage Corporation REMIC Trust Series 2892 Class DC | 4.50 | 12/15/17 | 568,890 | |||||||
| 820,559 | Federal Home Loan Mortgage Corporation REMIC Trust Series 2643 Class ME | 3.50 | 3/15/18 | 842,599 | |||||||
See Notes to Financial Statements.
7
Value Line U.S. Government Securities Fund, Inc.
| Schedule of Investments |
Principal Amount | Rate | Maturity Date | Value | ||||||||
| $ | 15,011 | Federal Home Loan Mortgage Corporation Gold PC Pool #E98960 | 5.00 | % | 9/1/18 | $ | 15,863 | ||||
| 47,863 | Federal Home Loan Mortgage Corporation Gold PC Pool #B12822 | 5.00 | 3/1/19 | 50,579 | |||||||
| 42,599 | Federal Home Loan Mortgage Corporation Gold PC Pool #B17398 | 4.50 | 12/1/19 | 44,552 | |||||||
| 291,677 | Federal Home Loan Mortgage Corporation Gold PC Pool #G18044 | 4.50 | 3/1/20 | 303,405 | |||||||
| 133,261 | Federal Home Loan Mortgage Corporation Gold PC Pool #B18034 | 4.50 | 4/1/20 | 138,619 | |||||||
| 37,426 | Federal Home Loan Mortgage Corporation Gold PC Pool #J00118 | 5.00 | 10/1/20 | 39,316 | |||||||
| 508,155 | Federal Home Loan Mortgage Corporation Gold PC Pool #J00139 | 5.00 | 10/1/20 | 533,817 | |||||||
| 37,407 | Federal Home Loan Mortgage Corporation Gold PC Pool #G11986 | 5.00 | 4/1/21 | 39,145 | |||||||
| 47,448 | Federal Home Loan Mortgage Corporation Gold PC Pool #G12319 | 5.00 | 6/1/21 | 49,844 | |||||||
| 170,859 | Federal Home Loan Mortgage Corporation Gold PC Pool #J03233 | 5.00 | 8/1/21 | 178,793 | |||||||
| 1,094,689 | Federal Home Loan Mortgage Corporation Gold PC Pool #G12381 | 5.00 | 9/1/21 | 1,149,970 | |||||||
| 568,053 | Federal Home Loan Mortgage Corporation REMIC Trust Series 2773 Class DA | 5.00 | 6/15/22 | 594,176 | |||||||
| 41,543 | Federal Home Loan Mortgage Corporation REMIC Trust Series 2937 Class JC | 5.00 | 9/15/22 | 41,618 | |||||||
| 1,393,291 | Federal Home Loan Mortgage Corporation Gold PC Pool #J08096 | 5.00 | 6/1/23 | 1,453,124 | |||||||
| 784,661 | Federal Home Loan Mortgage Corporation Gold PC Pool #J08202 | 5.00 | 7/1/23 | 818,480 | |||||||
| 878,021 | Federal Home Loan Mortgage Corporation Gold PC Pool #J09098 | 5.00 | 12/1/23 | 915,727 | |||||||
| 473,307 | Federal Home Loan Mortgage Corporation REMIC Trust Series 3132 Class MA | 5.50 | 12/15/23 | 493,714 | |||||||
| 987,327 | Federal Home Loan Mortgage Corporation Gold PC Pool #J09739 | 4.50 | 5/1/24 | 1,016,998 | |||||||
| 528,341 | Federal Home Loan Mortgage Corporation REMIC Trust Series 3147 Class YE | 5.50 | 7/15/24 | 551,892 | |||||||
| 1,000,000 | Federal Home Loan Mortgage Corporation REMIC Trust Series 2690 Class OE | 5.00 | 11/15/28 | 1,048,765 | |||||||
| 974,128 | Federal Home Loan Mortgage Corporation Gold PC Pool #C91239 | 4.50 | 3/1/29 | 992,638 | |||||||
| 1,000,000 | Federal Home Loan Mortgage Corporation | 6.75 | 3/15/31 | 1,270,954 | |||||||
| 507,326 | Federal Home Loan Mortgage Corporation REMIC Trust Series 3061 Class HA | 5.50 | 4/15/31 | 520,535 | |||||||
See Notes to Financial Statements.
8
Value Line U.S. Government Securities Fund, Inc.
| August 31, 2009 |
Principal Amount | Rate | Maturity Date | Value | ||||||||
| $ | 860,021 | Federal Home Loan Mortgage Corporation REMIC Trust Series 2878 Class AQ | 5.00 | % | 5/15/31 | $ | 886,631 | ||||
| 788,748 | Federal Home Loan Mortgage Corporation REMIC Trust Series 2761 Class AB | 5.00 | 8/15/31 | 816,144 | |||||||
| 337,720 | Federal Home Loan Mortgage Corporation REMIC Trust Series 2645 Class NA | 3.50 | 9/15/31 | 343,540 | |||||||
| 211,486 | Federal Home Loan Mortgage Corporation REMIC Trust Series 2594 Class OR | 4.25 | 6/15/32 | 215,381 | |||||||
| 1,034,610 | Federal Home Loan Mortgage Corporation Gold PC Pool #C77717 | 6.00 | 3/1/33 | 1,099,698 | |||||||
| 671,857 | Federal Home Loan Mortgage Corporation Gold PC Pool #A29526 | 5.00 | 1/1/35 | 692,498 | |||||||
| 373,061 | Federal Home Loan Mortgage Corporation Gold PC Pool #A29633 | 5.00 | 1/1/35 | 384,522 | |||||||
| 397,091 | Federal Home Loan Mortgage Corporation Pool #783022 (1) | 4.42 | 2/1/35 | 402,543 | |||||||
| 435,250 | Federal Home Loan Mortgage Corporation Gold PC Pool #A56491 | 5.00 | 1/1/37 | 448,010 | |||||||
| 283,718 | Federal Home Loan Mortgage Corporation Gold PC Pool #G08184 | 5.00 | 1/1/37 | 292,036 | |||||||
| 657,147 | Federal Home Loan Mortgage Corporation Gold PC Pool #A56467 | 5.50 | 1/1/37 | 686,167 | |||||||
| 1,179,967 | Federal Home Loan Mortgage Corporation Gold PC Pool #A59334 | 5.50 | 4/1/37 | 1,231,336 | |||||||
| 756,111 | Federal Home Loan Mortgage Corporation Gold PC Pool #A80938 | 5.50 | 8/1/38 | 788,985 | |||||||
| 29,280,987 | TOTAL FEDERAL HOME LOAN MORTGAGE CORPORATION | ||||||||||
| (Cost $29,510,283) | 30,777,223 | ||||||||||
| FEDERAL NATIONAL MORTGAGE ASSOCIATION (26.2%) | |||||||||||
| 182,866 | Federal National Mortgage Association Pool #255325 | 4.50 | 7/1/11 | 189,136 | |||||||
| 3,000,000 | Federal National Mortgage Association | 2.75 | 3/13/14 | 3,034,080 | |||||||
| 50,093 | Federal National Mortgage Association Pool #511823 | 5.50 | 5/1/16 | 53,343 | |||||||
| 996,432 | Federal National Mortgage Association REMIC Trust Series 2005-40 Class VG | 4.50 | 6/25/16 | 1,042,590 | |||||||
| 46,123 | Federal National Mortgage Association Pool #615289 | 5.50 | 12/1/16 | 49,116 | |||||||
| 156,700 | Federal National Mortgage Association Pool #622373 | 5.50 | 12/1/16 | 166,866 | |||||||
| 93,399 | Federal National Mortgage Association Pool #631328 | 5.50 | 2/1/17 | 99,692 | |||||||
| 128,739 | Federal National Mortgage Association Pool #623503 | 6.00 | 2/1/17 | 137,855 | |||||||
| 8,946 | Federal National Mortgage Association Pool #643277 | 5.50 | 4/1/17 | 9,549 | |||||||
| 13,690 | Federal National Mortgage Association Pool #638247 | 5.50 | 5/1/17 | 14,613 | |||||||
| 672,836 | Federal National Mortgage Association REMIC Trust Series 2003-52 Class KR | 3.50 | 7/25/17 | 691,221 | |||||||
See Notes to Financial Statements.
9
Value Line U.S. Government Securities Fund, Inc.
| Schedule of Investments |
Principal Amount | Rate | Maturity Date | Value | ||||||||
| $ | 246,428 | Federal National Mortgage Association Pool #254684 | 5.00 | % | 3/1/18 | $ | 260,721 | ||||
| 80,863 | Federal National Mortgage Association Pool #685183 | 5.00 | 3/1/18 | 85,553 | |||||||
| 94,704 | Federal National Mortgage Association Pool #703936 | 5.00 | 5/1/18 | 100,197 | |||||||
| 868,054 | Federal National Mortgage Association Pool #257566 | 4.50 | 1/1/19 | 908,067 | |||||||
| 946,044 | Federal National Mortgage Association Pool #780956 | 4.50 | 5/1/19 | 989,700 | |||||||
| 354,540 | Federal National Mortgage Association Pool #790984 | 5.00 | 7/1/19 | 374,107 | |||||||
| 368,297 | Federal National Mortgage Association Pool #786915 | 5.00 | 8/1/19 | 388,622 | |||||||
| 966,421 | Federal National Mortgage Association Pool #735063 | 4.50 | 12/1/19 | 1,011,017 | |||||||
| 231,169 | Federal National Mortgage Association REMIC Trust Series 2003-28 Class KA | 4.25 | 3/25/22 | 239,164 | |||||||
| 613,614 | Federal National Mortgage Association REMIC Trust Series 2003-17 Class ED | 4.25 | 9/25/22 | 636,184 | |||||||
| 257,275 | Federal National Mortgage Association REMIC Trust Series 2003-38 Class TC | 5.00 | 3/25/23 | 271,592 | |||||||
| 120,154 | Federal National Mortgage Association Pool #412682 | 6.00 | 3/1/28 | 127,975 | |||||||
| 179,519 | Federal National Mortgage Association Pool #425239 | 6.50 | 4/1/28 | 194,452 | |||||||
| 508,498 | Federal National Mortgage Association REMIC Trust Series 2003-26 Class AW | 4.00 | 4/25/30 | 516,145 | |||||||
| 1,000,000 | Federal National Mortgage Association REMIC Trust Series 2006-102 Class PB | 5.00 | 4/25/30 | 1,046,957 | |||||||
| 1,000,000 | Federal National Mortgage Association | 7.25 | 5/15/30 | 1,342,852 | |||||||
| 1,280 | Federal National Mortgage Association Pool #568625 | 7.50 | 1/1/31 | 1,428 | |||||||
| 97,822 | Federal National Mortgage Association Pool #571090 | 7.50 | 1/1/31 | 109,117 | |||||||
| 1,854 | Federal National Mortgage Association Pool #573935 | 7.50 | 3/1/31 | 2,068 | |||||||
| 40,286 | Federal National Mortgage Association Pool #629297 | 6.50 | 2/1/32 | 43,511 | |||||||
| 394,155 | Federal National Mortgage Association Pool #626440 | 7.50 | 2/1/32 | 438,426 | |||||||
| 45,324 | Federal National Mortgage Association Pool #634996 | 6.50 | 5/1/32 | 48,924 | |||||||
| 66,837 | Federal National Mortgage Association Pool #254383 | 7.50 | 6/1/32 | 74,344 | |||||||
| 219,124 | Federal National Mortgage Association Pool #254476 | 5.50 | 9/1/32 | 229,588 | |||||||
| 7,822 | Federal National Mortgage Association Pool #688539 | 5.50 | 3/1/33 | 8,195 | |||||||
| 383,925 | Federal National Mortgage Association Pool #650386 | 5.00 | 7/1/33 | 396,200 | |||||||
| 348,845 | Federal National Mortgage Association Pool #726889 | 5.50 | 7/1/33 | 365,449 | |||||||
| 367,735 | Federal National Mortgage Association Pool #759028 | 5.50 | 1/1/34 | 385,239 | |||||||
| 226,050 | Federal National Mortgage Association Pool #761913 | 5.50 | 2/1/34 | 236,597 | |||||||
| 208,708 | Federal National Mortgage Association Pool #763393 | 5.50 | 2/1/34 | 218,642 | |||||||
| 204,816 | Federal National Mortgage Association Pool #769862 | 5.50 | 2/1/34 | 214,373 | |||||||
| 23,330 | Federal National Mortgage Association Pool #769682 | 5.00 | 3/1/34 | 24,061 | |||||||
| 758,047 | Federal National Mortgage Association REMIC Trust Series 2004-60 Class LB | 5.00 | 4/25/34 | 798,137 | |||||||
| 18,434 | Federal National Mortgage Association Pool #778141 | 5.00 | 5/1/34 | 19,012 | |||||||
| 322,353 | Federal National Mortgage Association Pool #773586 | 5.50 | 6/1/34 | 337,394 | |||||||
| 354,472 | Federal National Mortgage Association Pool #255311 | 6.00 | 7/1/34 | 375,554 | |||||||
| 14,542 | Federal National Mortgage Association Pool #258149 | 5.50 | 9/1/34 | 15,220 | |||||||
| 3,688 | Federal National Mortgage Association Pool #789150 | 5.00 | 10/1/34 | 3,803 | |||||||
| 512,834 | Federal National Mortgage Association Pool #255496 | 5.00 | 11/1/34 | 528,910 | |||||||
| 47,428 | Federal National Mortgage Association Pool #797154 | 5.50 | 11/1/34 | 49,641 | |||||||
See Notes to Financial Statements.
10
Value Line U.S. Government Securities Fund, Inc.
| August 31, 2009 |
Principal Amount | Rate | Maturity Date | Value | ||||||||
| $ | 119,323 | Federal National Mortgage Association Pool #801063 | 5.50 | % | 11/1/34 | $ | 124,891 | ||||
| 193,958 | Federal National Mortgage Association Pool #803675 | 5.50 | 12/1/34 | 203,009 | |||||||
| 246,695 | Federal National Mortgage Association Pool #804683 | 5.50 | 12/1/34 | 258,205 | |||||||
| 417,079 | Federal National Mortgage Association Pool #815813 (1) | 4.59 | 2/1/35 | 422,290 | |||||||
| 38,503 | Federal National Mortgage Association Pool #255580 | 5.50 | 2/1/35 | 40,299 | |||||||
| 494,069 | Federal National Mortgage Association Pool #735224 | 5.50 | 2/1/35 | 517,585 | |||||||
| 533,721 | Federal National Mortgage Association Pool #896016 | 6.00 | 8/1/36 | 563,629 | |||||||
| 642,195 | Federal National Mortgage Association Pool #901561 | 5.50 | 10/1/36 | 670,554 | |||||||
| 880,723 | Federal National Mortgage Association Pool #919584 | 6.00 | 6/1/37 | 928,973 | |||||||
| 802,885 | Federal National Mortgage Association Pool #943647 | 5.50 | 7/1/37 | 837,337 | |||||||
| 22,224,266 | TOTAL FEDERAL NATIONAL MORTGAGE ASSOCIATION | ||||||||||
| (Cost $22,494,939) | 23,471,971 | ||||||||||
| GOVERNMENT NATIONAL MORTGAGE ASSOCIATION (5.6%) | |||||||||||
| 171,540 | Government National Mortgage Association Pool #003645 | 4.50 | 12/20/19 | 179,902 | |||||||
| 10,662 | Government National Mortgage Association Pool #541349 | 6.00 | 4/15/31 | 11,362 | |||||||
| 3,564 | Government National Mortgage Association Pool #557681 | 6.00 | 8/15/31 | 3,798 | |||||||
| 87,186 | Government National Mortgage Association Pool #548880 | 6.00 | 12/15/31 | 92,909 | |||||||
| 1,466,592 | Government National Mortgage Association REMIC Trust Series 2009-20 Class AB | 5.00 | 3/16/32 | 1,531,974 | |||||||
| 65,098 | Government National Mortgage Association Pool #551762 | 6.00 | 4/15/32 | 69,371 | |||||||
| 38,220 | Government National Mortgage Association Pool #582415 | 6.00 | 11/15/32 | 40,729 | |||||||
| 274,250 | Government National Mortgage Association Pool #604485 | 6.00 | 7/15/33 | 292,082 | |||||||
| 153,377 | Government National Mortgage Association Pool #622603 | 6.00 | 11/15/33 | 163,349 | |||||||
| 6,138 | Government National Mortgage Association Pool #429786 | 6.00 | 12/15/33 | 6,537 | |||||||
| 211,778 | Government National Mortgage Association Pool #605025 | 6.00 | 2/15/34 | 224,820 | |||||||
| 8,720 | Government National Mortgage Association Pool #626480 | 6.00 | 2/15/34 | 9,258 | |||||||
| 1,987,986 | Government National Mortgage Association REMIC Trust Series 2009-34 Class HA | 4.50 | 2/16/34 | 2,045,122 | |||||||
| 85,262 | Government National Mortgage Association Pool #610944 | 5.50 | 4/15/34 | 89,562 | |||||||
| 194,200 | Government National Mortgage Association Pool #583008 | 5.50 | 6/15/34 | 203,994 | |||||||
See Notes to Financial Statements.
11
Value Line U.S. Government Securities Fund, Inc.
| Schedule of Investments |
Principal Amount | Rate | Maturity Date | Value | ||||||||
| $ | 69,710 | Government National Mortgage Association Pool #605245 | 5.50 | % | 6/15/34 | $ | 73,226 | ||||
| 4,834,283 | TOTAL GOVERNMENT NATIONAL MORTGAGE ASSOCIATION | ||||||||||
| (Cost $4,977,159) | 5,037,995 | ||||||||||
| 68,839,536 | TOTAL U.S. GOVERNMENT AGENCY OBLIGATIONS | ||||||||||
| (Cost $69,722,072) | 72,640,682 | ||||||||||
| U.S. TREASURY OBLIGATIONS (12.9%) | |||||||||||
| 1,167,010 | U.S. Treasury Notes (2) | 2.00 | 1/15/14 | 1,188,891 | |||||||
| 1,000,000 | U.S. Treasury Notes | 2.63 | 7/31/14 | 1,011,875 | |||||||
| 1,000,000 | U.S. Treasury Notes | 4.00 | 2/15/15 | 1,072,578 | |||||||
| 1,000,000 | U.S. Treasury Notes | 4.13 | 5/15/15 | 1,078,516 | |||||||
| 1,000,000 | U.S. Treasury Notes | 4.25 | 8/15/15 | 1,084,062 | |||||||
| 2,000,000 | U.S. Treasury Notes | 3.25 | 5/31/16 | 2,035,468 | |||||||
| 3,000,000 | U.S. Treasury Bonds | 7.88 | 2/15/21 | 4,123,125 | |||||||
| 10,167,010 | TOTAL U.S. TREASURY OBLIGATIONS | ||||||||||
| (Cost $11,382,279) | 11,594,155 | ||||||||||
| TOTAL INVESTMENT SECURITIES (94.0%) (3) | |||||||||||
| (Cost $81,104,351) | 84,235,197 | ||||||||||
| REPURCHASE AGREEMENT (5.4%) (3) | |||||||||||
| 4,800,000 | With Morgan Stanley, 0.18%, dated 8/31/09, due 9/1/09, delivery value $4,800,024 (collateralized by | ||||||||||
| $4,870,000 U.S. Treasury Notes 0.875%, due 03/31/11 with a value of $4,899,988) | 4,800,000 | ||||||||||
| CASH AND OTHER ASSETS IN EXCESS OF LIABILITIES (0.6%) | 573,500 | ||||||||||
| NET ASSETS (100.0%) | $ | 89,608,697 | |||||||||
| NET ASSET VALUE, OFFERING AND REDEMPTION PRICE PER OUTSTANDING SHARE ($89,608,697 ÷ 7,432,574 shares outstanding) | $ | 12.06 | |||||||||
| (1) | Adjustable rate security. The rate shown is as of August 31, 2009. |
| (2) | Treasury Inflation Protected Security (TIPS). |
| (3) | Unless otherwise indicated, the values of the Portfolio are determined based on Level 2 inputs established by FAS 157. (Note 1B) |
See Notes to Financial Statements.
12
| Value Line U.S. Government Securities Fund, Inc. |
| Statement of Assets and Liabilities |
| at August 31, 2009 |
| Assets: | ||||
| Investment securities, at value (Cost - $81,104,351) | $ | 84,235,197 | ||
| Repurchase agreement (Cost - $4,800,000) | 4,800,000 | |||
| Cash | 99,685 | |||
| Interest receivable | 536,785 | |||
| Prepaid expenses | 21,087 | |||
| Receivable for capital shares sold | 4,090 | |||
| Total Assets | 89,696,844 | |||
| Liabilities: | ||||
| Payable for capital shares repurchased | 3,892 | |||
| Accrued expenses: | ||||
| Advisory fee | 37,881 | |||
| Directors’ fees and expenses | 5,253 | |||
| Other | 41,121 | |||
| Total Liabilities | 88,147 | |||
| Net Assets | $ | 89,608,697 | ||
| Net assets consist of: | ||||
| Capital stock, at $1.00 par value (authorized 100,000,000, outstanding 7,432,574 shares) | $ | 7,432,574 | ||
| Additional paid-in capital | 78,141,871 | |||
| Undistributed net investment income | 504,629 | |||
| Accumulated net realized gain on investments | 398,777 | |||
| Net unrealized appreciation of investments | 3,130,846 | |||
| Net Assets | $ | 89,608,697 | ||
Net Asset Value, Offering and Redemption Price per Outstanding Share ($89,608,697 ÷ 7,432,574 shares outstanding) | $ | 12.06 |
| Statement of Operations |
| for the Year Ended August 31, 2009 |
| Investment Income: | ||||
| Interest | $ | 3,779,756 | ||
| Expenses: | ||||
| Advisory fee | 451,332 | |||
| Service and distribution plan fees | 225,666 | |||
| Printing and postage | 68,301 | |||
| Auditing and legal fees | 67,020 | |||
| Transfer agent fees | 53,773 | |||
| Custodian fees | 33,924 | |||
| Registration and filing fees | 30,494 | |||
| Directors’ fees and expenses | 13,226 | |||
| Insurance | 11,084 | |||
| Other | 7,080 | |||
| Total Expenses Before Custody Credits and Fees Waived | 961,900 | |||
| Less: Service and Distribution Plan Fees Waived | (225,666 | ) | ||
| Less: Custody Credits | (4 | ) | ||
| Net Expenses | 736,230 | |||
| Net Investment Income | 3,043,526 | |||
| Net Realized and Unrealized Gain/(Loss) on Investments: | ||||
| Net Realized Gain | 1,298,443 | |||
| Change in Net Unrealized Appreciation | 2,078,952 | |||
| Net Realized Gain and Change in Net Unrealized Appreciation on Investments | 3,377,395 | |||
| Net Increase in Net Assets from Operations | $ | 6,420,921 |
See Notes to Financial Statements.
13
| Value Line U.S. Government Securities Fund, Inc. |
| Statement of Changes in Net Assets |
| for the Years Ended August 31, 2009 and 2008 |
Year Ended August 31, 2009 | Year Ended August 31, 2008 | ||||||
| Operations: | |||||||
| Net investment income | $ | 3,043,526 | $ | 3,526,167 | |||
| Net realized gain on investments | 1,298,443 | 776,804 | |||||
| Change in net unrealized appreciation | 2,078,952 | 1,067,300 | |||||
| Net increase in net assets from operations | 6,420,921 | 5,370,271 | |||||
| Distributions to Shareholders: | |||||||
| Net investment income | (3,136,882 | ) | (3,798,290 | ) | |||
| Capital Share Transactions: | |||||||
| Proceeds from sale of shares | 8,161,899 | 5,566,270 | |||||
| Proceeds from reinvestment of dividends to shareholders | 2,727,452 | 3,269,818 | |||||
| Cost of shares repurchased | (12,483,573 | ) | (11,374,963 | ) | |||
| Net decrease in net assets from capital share transactions | (1,594,222 | ) | (2,538,875 | ) | |||
| Total Increase/(Decrease) in Net Assets | 1,689,817 | (966,894 | ) | ||||
| Net Assets: | |||||||
| Beginning of year | 87,918,880 | 88,885,774 | |||||
| End of year | $ | 89,608,697 | $ | 87,918,880 | |||
| Undistributed net investment income, at end of year | $ | 504,629 | $ | 553,512 | |||
See Notes to Financial Statements.
14
| Value Line U.S. Government Securities Fund, Inc. |
| Notes to Financial Statements |
1. Significant Accounting Policies
Value Line U.S. Government Securities Fund, Inc. (the “Fund”) is registered under the Investment Company Act of 1940, as amended, as a diversified, open-end management investment company whose primary investment objective is to obtain maximum income without undue risk to principal. Capital preservation and possible capital appreciation are secondary objectives.
The following significant accounting principles are in conformity with generally accepted accounting principles for investment companies. Such policies are consistently followed by the Fund in the preparation of its financial statements. Generally accepted accounting principles require management to make estimates and assumptions that affect the reported amounts and disclosure in the financial statements. Actual results may differ from those estimates.
(A) Security Valuation: The Fund’s investments are carried at value. With assistance from an independent pricing service (the “Service”) approved by the Board of Directors, portfolio securities are valued at the midpoint between the latest available and representative asked and bid prices on the basis of valuations provided by dealers in such securities. Some of the general factors which may be considered by the dealers in arriving at such valuations include the fundamental analytic data relating to the security and an evaluation of the forces which influence the market in which these securities are purchased and sold. Determination of values may involve subjective judgment, as the actual market value of a particular security can be established only by negotiation between the parties in a sales transaction. If a portfolio security is not priced in this manner, the value is determined on the valuation date by reference to valuations obtained from the Service which determines valuations for normal institutional-size trading units of debt securities, without exclusive reliance upon quoted prices. The Service takes into account appropriate factors such as institutional-size trading in similar groups of securities, yield, quality, coupon rate, maturity, type of issue, trading characteristics and other market data in determining valuations. Short-term instruments with maturities of 60 days or less at the date of purchase are valued at amortized cost, which approximates market value. Other assets and securities for which market valuations are not readily available will be valued at fair value by the Adviser pursuant to policies and procedures adopted by the Board of Directors. At August 31, 2009, there were no securities that had been fair valued.
(B) Fair Value Measurements: The Fund adopted Financial Accounting Standards Board Statement of Financial Accounting Standards No. 157, Fair Value Measurements (“FAS 157”), effective September 1, 2008. In accordance with FAS 157, fair value is defined as the price that the Fund would receive upon selling an investment in a timely transaction to an independent buyer in the principal or most advantageous market of the investment. FAS 157 established a three-tier hierarchy to maximize the use of observable market data and minimize the use of unobservable inputs and to establish classification of fair value measurements for disclosure purposes. Inputs refer broadly to the assumptions that market participants would use in pricing the asset or liability, including assumptions about risk, for example, the risk inherent in a particular valuation technique used to measure fair value including such a pricing model and/or the risk inherent in the inputs to the valuation technique. Inputs may be observable or unobservable. Observable inputs are inputs that reflect the assumptions market participants would use in pricing the asset or liability developed based on market data obtained from sources independent of the reporting entity. Unobservable inputs are inputs that reflect the reporting entity’s own assumptions about the assumptions market participants would use in pricing the asset or liability developed based on the best information available in the circumstances. The three-tier hierarchy of inputs is summarized in the three broad Levels listed below.
15
| Value Line U.S. Government Securities Fund, Inc. |
| August 31, 2009 |
| ● | Level 1 – quoted prices in active markets for identical investments |
● | Level 2 – other significant observable inputs (including quoted prices for similar investments, interest rates, prepayment speeds, credit risk, etc.) |
● | Level 3 – significant unobservable inputs (including the Fund’s own assumptions in determining the fair value of investments) |
In April 2009, the FASB issued FASB Staff Position No. 157-4, “Determining Fair Value When the Volume and Level of Activity for the Asset or Liability Have Significantly Decreased and Identifying Transactions That Are Not Orderly” (“FSP 157-4”). FSP 157-4 provides additional guidance for estimating fair value in accordance with FAS 157 when the volume and level of activity for the asset or liability have significantly decreased as well as guidance on identifying circumstances that indicate a transaction is not orderly. The type of inputs used to value each security are identified in the Schedule of Investments, which also includes a breakdown of the Schedule’s investments by category.
The following is a summary of the inputs used as of August 31, 2009 in valuing the Fund’s investments carried at value:
| Investments in Securities: | Level 1 | Level 2 | Level 3 | Total | ||||||||||||
| Assets | ||||||||||||||||
| U.S. Government Agency Obligations | $ | 0 | $ | 72,640,682 | $ | 0 | $ | 72,640,682 | ||||||||
| U.S. Treasury Obligations | 0 | 11,594,515 | 0 | 11,594,515 | ||||||||||||
| Short Term Investment | 0 | 4,800,000 | 0 | 4,800,000 | ||||||||||||
| Total Investments in Securities | $ | 0 | $ | 89,035,197 | $ | 0 | $ | 89,035,197 | ||||||||
(C) Repurchase Agreements: In connection with transactions in repurchase agreements, the Fund’s custodian takes possession of the underlying collateral securities, the value of which exceeds the principal amount of the repurchase transaction, including accrued interest. To the extent that any repurchase transaction exceeds one business day, it is the Fund’s policy to mark-to-market the collateral on a daily basis to ensure the adequacy of the collateral. In the event of default of the obligation to repurchase, the Fund has the right to liquidate the collateral and apply the proceeds in satisfaction of the obligation. Under certain circumstances, in the event of default or bankruptcy by the other party to the agreement, realization and/or retention of the collateral or proceeds may be subject to legal proceedings.
(D) Federal Income Taxes: It is the Fund’s policy to comply with the requirements of the Internal Revenue Code applicable to regulated investment companies, including the distribution requirements of the Tax Reform Act of 1986, and to distribute all of its taxable income and capital gains to its shareholders. Therefore, no federal income tax provision is required.
In July 2006, the Financial Accounting Standards Board issued Interpretation No. 48, “Accounting for Uncertainty in Income Taxes — an Interpretation of FASB Statement No. 109” (the “Interpretation” or “FIN 48”). The Interpretation establishes for all entities, including pass-through entities such as the Fund, a minimum threshold for financial statement recognition of the benefit of positions taken in filing tax returns (including whether an entity is taxable in a particular jurisdiction), and requires certain expanded tax disclosures. The Interpretation is effective for fiscal years beginning after December 15, 2006, and is to be applied to all open tax years as of the date of effectiveness. As of August 31, 2009, management has reviewed the tax positions for the tax years still subject to tax audit under the statute of limitations, evaluated the implications of FIN 48, and determined that there is no impact to the Fund’s financial statements at this time.
16
| Value Line U.S. Government Securities Fund, Inc. |
| Notes to Financial Statements |
(E) Security Transactions and Related Income: Security transactions are accounted for on the date the securities are purchased or sold. Realized gains and losses on securities transactions are determined using the identified cost method. Interest income, adjusted for the amortization of discount and premium, is earned from settlement date and recognized on the accrual basis. Gains and losses realized on prepayments received on mortgage-related securities are recorded as interest income.
The Fund may invest in Treasury Inflation-Protection Securities (TIPS). The principal value and interest payout of TIPS are periodically adjusted according to the rate of inflation based on the Consumer Price Index. The adjustments for principal and income due to inflation are reflected in interest income in the Statement of Operations.
(F) Representations and Indemnifications: In the normal course of business, the Fund enters into contracts that contain a variety of representations and warranties which provide general indemnifications. The Fund’s maximum exposure under these arrangements is unknown as this would involve future claims that may be made against the Fund that have not yet occurred. However, based on experience, the Fund expects the risk of loss to be remote.
(G) Subsequent Events: In accordance with the provision set forth in the FAS 165 Subsequent Events, management has evaluated the possibility of subsequent events existing in the Fund’s financial statements through October 29, 2009, the date on which these financial statements were issued. Management has determined that there are no material events that would require disclosure in the Fund’s financial statements through this date.
2. Investment Risks
Securities issued by U.S. Government agencies or government-sponsored enterprises may not be guaranteed by the U.S. Treasury. The Government National Mortgage Association (“GNMA” or “Ginnie Mae”), a wholly-owned U.S. Government corporation, is authorized to guarantee, with the full faith and credit of the U.S. Government, the timely payment of principal and interest on securities issued by institutions approved by GNMA and backed by pools of mortgages insured by the Federal Housing Administration or guaranteed by the Department of Veteran Affairs. Government-related guarantors (i.e., not backed by the full faith and credit of the U.S. Government) include the Federal National Mortgage Association (“FNMA” or “Fannie Mae”) and the Federal Home Loan Mortgage Corporation (“FHLMC” or “Freddie Mac”). Pass-through securities issued by FNMA are guaranteed as to timely payment of principal and interest by FNMA but are not backed by the full faith and credit of the U.S. Government. FHLMC guarantees the timely payment of interest and ultimate collection of principal, but its participation certificates are not backed by the full faith and credit of the U.S. Government.
3. Capital Share Transactions and Dividends to Shareholders
Transactions in capital stock were as follows:
Year Ended August 31, 2009 | Year Ended August 31, 2008 | ||||||
| Shares sold | 687,083 | 476,713 | |||||
| Shares issued to shareholders in reinvestment of dividends | 229,495 | 284,139 | |||||
| Shares repurchased | (1,051,082 | ) | (980,119 | ) | |||
| Net decrease | (134,504 | ) | (219,267 | ) | |||
| Dividends per share from net investment income | $ | 0.4148 | $ | 0.4975 | |||
Dividends and distributions to shareholders are recorded on the ex-dividend date.
17
| Value Line U.S. Government Securities Fund, Inc. |
| August 31, 2009 |
4. Purchases and Sales of Securities
Purchases and sales of investment securities, excluding short-term securities, were as follows:
Year Ended August 31, 2009 | ||||
| Purchases: | ||||
| U.S. Treasury Obligations | $ | 14,586,072 | ||
U.S. Government Agency Obligations | 35,013,786 | |||
| Total Purchases | $ | 49,599,858 | ||
| Sales: | ||||
| U.S. Treasury Obligations | $ | 7,448,470 | ||
U.S. Government Agency Obligations | 45,633,383 | |||
| Total Sales | $ | 53,081,853 | ||
5. Income Taxes
At August 31, 2009, information on the tax components of capital is as follows:
| Cost of investments for tax purposes | $ | 85,971,692 | ||
| Gross tax unrealized appreciation | $ | 3,115,453 | ||
| Gross tax unrealized depreciation | $ | (51,948 | ) | |
| Net tax unrealized appreciation on investments | $ | 3,063,505 | ||
| Undistributed ordinary income | $ | 520,816 | ||
| Undistributed long-term gain | $ | 449,931 |
During the year ended August 31, 2009, the Fund utilized capital loss carryforwards of $833,133 and had none remaining.
Permanent book-tax differences relating to the classification of income in the current year were reclassified within the composition of the net asset accounts. The Fund increased undistributed net investment income by $44,473, and decreased accumulated net realized gain on investments by $44,473. Net assets were not affected by this reclassification. These reclasses were primarily due to differing treatments of bond premiums and paydown gains and losses for tax purposes.
The tax composition of dividends paid during the years ended August 31, 2009 and August 31, 2008 is as follows:
| August 31, 2009 | August 31, 2008 | |||||||
| Ordinary income | $ | 3,136,882 | $ | 3,798,290 | ||||
6. Investment Advisory Fees, Service and Distribution Fees and Transactions With Affiliates
On June 30, 2008, Value Line, Inc. (“Value Line”) the parent company of both the Distributor and the Adviser, reorganized its investment management division into EULAV Asset Management, LLC (“EULAV”), a newly formed, wholly-owned subsidiary. As part of the reorganization, each advisory agreement was transferred from Value Line, Inc. to EULAV and EULAV replaced Value Line, Inc. as the Fund’s investment adviser. The portfolio managers, who are now employees of EULAV, have not changed as a result of the reorganization.
An advisory fee of $451,332 was paid or payable to EULAV Asset Management, LLC (the “Adviser”) for the year ended August 31, 2009. This was computed at the rate of 1/2 of 1% of the Fund’s average daily net assets during the year and paid monthly.
The Adviser provides research, investment programs, and supervision of the investment portfolio and pays costs of administrative services, office space, equipment, and compensation of administrative, bookkeeping, and clerical personnel necessary for managing the affairs of the Fund. The Adviser also provides persons, satisfactory to the Fund’s Board of Directors, to act as officers of the Fund and pays their salaries. Direct expenses of the Fund are charged to the Fund while common expenses of the Value Line Funds are allocated proportionately based upon the Funds’ respective net assets. The Fund bears all other costs and expenses.
18
Value Line U.S. Government Securities Fund, Inc.
| Notes to Financial Statements |
The Fund has a Service and Distribution Plan (the “Plan”) adopted pursuant to Rule 12b-1 under the Investment Company Act of 1940. The Plan compensates EULAV Securities, Inc. (the “Distributor”), formerly Value Line Securities, Inc. prior to May 5, 2009, for advertising, marketing and distributing the Fund’s shares and for servicing the Fund’s shareholders at an annual rate of 0.25% of the Fund’s average daily net assets. Fees amounting to $225,666, before fee waivers, were accrued under the Plan for the year ended August 31, 2009. Effective January 1, 2009 through December 31, 2010, the Distributor contractually agreed to waive the 12b-1 fee. The fees waived amounted to $225,666 for the year ended August 31, 2009. The Distributor has no right to recoup previously waived amounts. There is no assurance that the Distributor will extend the fee waiver beyond such date.
Certain officers, employees and a director of Value Line and the Distributor are also officers and a director of the Fund.
Value Line and/or affiliated companies and the Value Line Profit Sharing and Savings Plan at August 31, 2009 owned 138,095 shares of the Fund’s capital stock, representing 1.86% of the outstanding shares. In addition, certain officers and directors of the Fund owned 433 shares, representing less than 1% of the outstanding shares.
7. Other
As previously disclosed, the Securities and Exchange Commission (“SEC”) conducted an investigation regarding whether the Distributor’s brokerage charges and related expense reimbursements from the Value Line Funds (“Funds”) during periods prior to 2005 were excessive and whether adequate disclosure was made to the SEC and the Boards of Directors and shareholders of the Funds. Value Line, Inc. (“Value Line”), the parent company of both the Distributor and the Adviser, has made an offer to settle the investigation. The settlement offer, in which Value Line neither admits nor denies the investigation’s findings, provides that, if accepted by the SEC, approximately $43.7 million would be paid by Value Line into a Fair Fund to reimburse shareholders who owned shares in the affected mutual funds in the period covered by the settlement. In addition, under the settlement offer, Value Line’s Chief Executive Officer (“CEO”) and former Chief Compliance Officer would be barred from serving as an officer or director of a public company and from association with an investment adviser, broker-dealer or registered investment company subject, in the case of the CEO, to a limited exception from the associational bar for a period of one year from the entry of the settlement order in order to enable steps to be taken that will terminate her association with the Value Line mutual funds, asset management and distribution businesses. The settlement offer will not be effective unless approved by the SEC and no assurance can be given that such approval will be obtained. Value Line management ended the Value Line Funds’ use of affiliated brokerage in 2004. Value Line has informed the Fund’s management of its belief that there are no loss or gain contingencies that should be accrued or disclosed in the Fund’s financial statements and that the settlement of the SEC investigation is not likely to have a material adverse effect on the ability of the Adviser or the Distributor to perform their respective contracts with the Fund.
19
Value Line U.S. Government Securities Fund, Inc.
| Financial Highlights |
Selected data for a share of capital stock outstanding throughout each year:
| Years Ended August 31, | ||||||||||||||||||||
| 2009 | 2008 | 2007 | 2006 | 2005 | ||||||||||||||||
| Net asset value, beginning of year | $ | 11.62 | $ | 11.42 | $ | 11.37 | $ | 11.74 | $ | 11.87 | ||||||||||
| Income from investment operations: | ||||||||||||||||||||
| Net investment income | 0.40 | 0.46 | 0.51 | 0.47 | 0.52 | |||||||||||||||
| Net gains or (losses) on securities (both realized and unrealized) | 0.45 | 0.24 | 0.03 | (0.32 | ) | (0.19 | ) | |||||||||||||
| Total from investment operations | 0.85 | 0.70 | 0.54 | 0.15 | 0.33 | |||||||||||||||
| Less distributions: | ||||||||||||||||||||
| Dividends from net investment income | (0.41 | ) | (0.50 | ) | (0.49 | ) | (0.52 | ) | (0.46 | ) | ||||||||||
| Net asset value, end of year | $ | 12.06 | $ | 11.62 | $ | 11.42 | $ | 11.37 | $ | 11.74 | ||||||||||
| Total return | 7.46 | % | 6.22 | % | 4.86 | % | 1.33 | % | 2.86 | % | ||||||||||
| Ratios/Supplemental Data: | ||||||||||||||||||||
| Net assets, end of year (in thousands) | $ | 89,609 | $ | 87,919 | $ | 88,886 | $ | 97,205 | $ | 112,140 | ||||||||||
Ratio of expenses to average net assets(1) | 1.07 | % | 1.01 | % | 0.93 | % | 1.05 | % | 1.04 | % | ||||||||||
Ratio of expenses to average net assets(2) | 0.82 | % | 0.76 | % | 0.75 | % | 1.00 | % | 1.04 | % | ||||||||||
| Ratio of net investment income to average net assets | 3.37 | % | 3.96 | % | 4.28 | % | 3.88 | % | 3.60 | % | ||||||||||
| Portfolio turnover rate | 58 | % | 51 | % | 38 | % | 22 | % | 60 | % | ||||||||||
| (1) | Ratio reflects expenses grossed up for custody credit arrangement and grossed up for the waiver of a portion of the advisory fee by the Adviser and a portion of the service and distribution plan fees by the Distributor. The ratio of expenses to average net assets, net of custody credits, but exclusive of the fee waivers would have been 1.00%, 0.92%, 1.04% for the years ended August 31, 2008, August 31, 2007 and August 31 2006, respectively, and would not have changed for other periods shown. |
| (2) | Ratio reflect expenses net of the waiver of a portion of the advisory fee by the Adviser and a portion of the service and distribution plan fees by the Distributor and net of the custody credit arrangement. |
See Notes to Financial Statements.
20
Value Line U.S. Government Securities Fund, Inc.
| Report of Independent Registered Public Accounting Firm |
To the Board of Directors and Shareholders of Value Line U.S. Government Securities Fund, Inc.
In our opinion, the accompanying statement of assets and liabilities, including the schedule of investments, and the related statements of operations and of changes in net assets and the financial highlights present fairly, in all material respects, the financial position of Value Line U.S. Government Securities Fund, Inc. (the “Fund”) at August 31, 2009, the results of its operations for the year then ended, the changes in its net assets for each of the two years in the period then ended and the financial highlights for each of the five years in the period then ended, in conformity with accounting principles generally accepted in the United States of America. These financial statements and financial highlights (hereafter referred to as “financial statements”) are the responsibility of the Fund’s management; our responsibility is to express an opinion on these financial statements based on our audits. We conducted our audits of these financial statements in accordance with the standards of the Public Company Accounting Oversight Board (United States). Those standards require that we plan and perform the audit to obtain reasonable assurance about whether the financial statements are free of material misstatement. An audit includes examining, on a test basis, evidence supporting the amounts and disclosures in the financial statements, assessing the accounting principles used and significant estimates made by management, and evaluating the overall financial statement presentation. We believe that our audits, which included confirmation of securities at August 31, 2009 by correspondence with the custodian, provide a reasonable basis for our opinion.
PricewaterhouseCoopers LLP
New York, New York
October 29, 2009
21
Value Line U.S. Government Securities Fund, Inc.
| Factors Considered by the Board in Approving the Investment Advisory Agreement for U.S. Government Securities Fund, Inc. (unaudited) |
The Investment Company Act of 1940 (the “1940 Act”) requires the Board of Directors, including a majority of Directors who are not “interested persons” of U.S. Government Securities Fund, Inc. (the “Fund”), as that term is defined in the 1940 Act (the “Independent Directors”), annually to consider the investment advisory agreement (the “Agreement”) between the Fund and its investment adviser, EULAV Asset Management, LLC1 (the “Adviser”). As required by the 1940 Act, the Board requested and the Adviser provided such information as the Board deemed to be reasonably necessary to evaluate the terms of the Agreement. At meetings held throughout the year, including the meeting specifically focused upon the review of the Agreement, the Independent Directors met in executive sessions separately from the non-Independent Director of the Fund and any officers of the Adviser. In selecting the Adviser and approving the continuance of the Agreement, the Independent Directors relied upon the assistance of counsel to the Independent Directors.
Both in the meetings which specifically addressed the approval of the Agreement and at other meetings held during the course of the year, the Board, including the Independent Directors, received materials relating to the Adviser’s investment and management services under the Agreement. These materials included information on: (i) the investment performance of the Fund, compared to a peer group of funds consisting of the Fund and all retail and institutional intermediate U.S. government funds regardless of asset size or primary channel of distribution (the “Performance Universe”), and its benchmark index, each as classified by Lipper Inc., an independent evaluation service (“Lipper”); (ii) the investment process, portfolio holdings, investment restrictions, valuation procedures, and financial statements for the Fund; (iii) sales and redemption data with respect to the Fund; (iv) the general investment outlook in the markets in which the Fund invests; (v) arrangements with respect to the distribution of the Fund’s shares; (vi) the allocation and cost of the Fund’s brokerage (none of which was effected through any affiliate of the Adviser); and (vii) the overall nature, quality and extent of services provided by the Adviser.
As part of the review of the continuance of the Agreement, the Board requested, and the Adviser provided, additional information in order to evaluate the quality of the Adviser’s services and the reasonableness of its fees under the Agreement. In a separate executive session, the Independent Directors reviewed information, which included data comparing: (i) the Fund’s management fee rate, transfer agent and custodian fee rates, service fee (including 12b-1 fees) rates, and the rate of the Fund’s other non-management fees, to those incurred by a peer group of funds consisting of the Fund, 6 other retail front-end load and no-load intermediate U.S. government funds and 5 retail front-end load and no-load general U.S. government funds as selected objectively by Lipper (“Expense Group”), and a peer group of funds consisting of the Fund, the Expense Group and all other retail front-end load and no-load intermediate U.S. government funds and general U.S. government funds (excluding outliers), as selected objectively by Lipper (“Expense Universe”); (ii) the Fund’s expense ratio to those of its Expense Group and Expense Universe; and (iii) the Fund’s investment performance over various time periods to the average performance of the Performance Universe as well as the appropriate Lipper Index, as selected objectively by Lipper (the “Lipper Index”). In the separate executive session, the Independent Directors also reviewed information regarding: (a) the Adviser’s financial results and condition, including the Adviser’s and certain of its affiliates’ profitability from the services that have been performed for the Fund as well as the Value Line family of funds; (b) the Fund’s current investment management staffing; and (c) the Fund’s potential for achieving economies of scale. In support of its review of the statistical information, the Board was provided with a detailed description of the methodology used by Lipper to determine the Expense Group, the Expense Universe and the Performance Universe to prepare its information. The Independent Directors also requested and reviewed information provided by the Adviser relating to an investigation by the Securities and Exchange Commission in the matter of Value Line Securities, Inc. 2, the Fund’s principal underwriter and affiliate of the Adviser (the “Distributor”), and a representation by Value Line, Inc. that the resolution of this matter is not likely to have a materially adverse effect on the ability of the Adviser or the Distributor to perform their respective contracts with the Fund.
1 On June 30, 2008, Value Line, Inc., the Fund’s former investment adviser, reorganized its investment management division into EULAV Asset Management, LLC, a newly formed wholly-owned subsidiary located at 220 East 42nd Street, New York, NY 10017. As part of the reorganization, the Fund’s investment advisory agreement was transferred from Value Line, Inc. to EULAV Asset Management, LLC, and EULAV Asset Management, LLC replaced Value Line, Inc. as the Fund’s investment adviser. For periods prior to June 30, 2008, the term “Adviser” refers to Value Line, Inc.
22
| Value Line U.S. Government Securities Fund, Inc. |
The following summarizes matters considered by the Board in connection with its renewal of the Agreement. However, the Board did not identify any single factor as all-important or controlling, and the summary does not detail all the matters that were considered.
Investment Performance. The Board reviewed the Fund’s overall investment performance and compared it to its Performance Universe and the Lipper Index. The Board noted that the Fund outperformed the Performance Universe average for the one-year, three-year, five-year and ten-year periods ended December 31, 2008. The Board also noted that the Fund’s performance for the one-year period ended December 31, 2008 was higher than that of the Lipper Index but that the Fund’s performance for the three-year, five-year and ten-year periods ended December 31, 2008 was below the performance of the Lipper Index.
The Adviser’s Personnel and Methods. The Board reviewed the background of the portfolio manager responsible for the daily management of the Fund’s portfolio, seeking to achieve the Fund’s investment objectives and adhering to the Fund’s investment strategies. The Independent Directors also engaged in discussions with the Adviser’s senior management responsible for the overall functioning of the Fund’s investment operations. The Board concluded that the Fund’s management team and the Adviser’s overall resources were adequate and that the Adviser had investment management capabilities and personnel essential to performing its duties under the Agreement.
Management Fee and Expenses. The Board considered the Adviser’s fee under the Agreement relative to the management fees charged by its Expense Group and Expense Universe averages. The Board noted that, for the most recent fiscal year, the Fund’s management fee rate was less than that of both the Expense Group average and the Expense Universe average.
The Board also considered the Fund’s total expense ratio relative to its Expense Group and Expense Universe averages. The Board noted that, effective March 7, 2006, the Distributor voluntarily agreed to waive 0.10% of the Fund’s Rule 12b-1 fee, thereby reducing the Fund’s Rule 12b-1 fee rate from 0.25% to 0.15% of the Fund’s average daily net assets. In addition, effective February 20, 2007, the Distributor voluntarily agreed to waive all of the Fund’s Rule 12b-1 fee, thereby reducing the Fund’s Rule 12b-1 fee rate from 0.25% to 0.00%. Finally, the Distributor and the Board agreed to extend the waiver of all of the Fund’s Rule 12b-1 fee for the period beginning on January 1, 2009 and ending December 31, 2010 and to make the waiver contractual so that it can not be changed without the Board’s approval during such period. As a result of the Rule 12b-1 fee waiver, the Board noted that the Fund’s total expense ratio after giving effect to the waiver was less than that of the Expense Group average and the Expense Universe average. The Board concluded that the average expense ratio was satisfactory for the purpose of approving the continuance of the Agreement for the coming year.
2 On May 6, 2009, Value Line Securities, Inc. changed its name to EULAV Securities, Inc. No other change was made to the Distributor’s organization, including its operations and personnel.
23
| Value Line U.S. Government Securities Fund, Inc. |
Nature and Quality of Other Services. The Board considered the nature, quality, cost and extent of other services provided by the Adviser and the Distributor. At meetings held throughout the year, the Board reviewed the effectiveness of the Adviser’s overall compliance program, as well as the services provided by the Distributor. The Board also reviewed the services provided by the Adviser and its affiliates in supervising third party service providers. Based on this review, the Board concluded that the nature, quality, cost and extent of such other services provided by the Adviser and its affiliates were satisfactory, reliable and beneficial to the Fund’s shareholders.
Profitability. The Board considered the level of profitability of the Adviser and its affiliates with respect to the Fund individually and in the aggregate for all the funds within the Value Line group of funds, including the impact of certain actions taken during prior years. These actions included the Adviser’s reduction (voluntary in some instances and contractual in other instances) of management and/or Rule 12b-1 fees for certain funds, the Adviser’s termination of the use of soft dollar research, and the cessation of trading through the Distributor. The Board concluded that the profitability of the Adviser and its affiliates with respect to the Fund, including the financial results derived from the Fund’s Agreement, were within a range the Board considered reasonable.
Other Benefits. The Board also considered the character and amount of other direct and incidental benefits received by the Adviser and its affiliates from their association with the Fund. The Board concluded that potential “fall-out” benefits that the Adviser and its affiliates may receive, such as greater name recognition, appear to be reasonable, and may in some cases benefit the Fund.
Economies of Scale. The Board noted that, given the current and anticipated size of the Fund, any perceived and potential economies of scale were not yet a significant consideration for the Fund and the addition of break points was determined not to be necessary at this time.
Fees and Services Provided for Other Comparable Funds/Accounts Managed by the Adviser and its Affiliates. In addition to comparing the Fund’s management fee rate to unaffiliated mutual funds included in the Fund’s Expense Group and Expense Universe, the Board was informed by the Adviser that the Adviser and its affiliates do not manage any investment companies or other institutional accounts comparable to the Fund.
Conclusion. The Board, in light of the Adviser’s overall performance, considered it appropriate to continue to retain the Adviser as the Fund’s investment adviser. Based on their evaluation of all material factors deemed relevant, and with the advice of independent counsel, the Board determined that the Fund’s management fee rate payable to the Adviser under the Agreement does not constitute fees that are so disproportionately large as to bear no reasonable relationship to the services rendered and that could not have been the product of arm’s-length bargaining, and concluded that the management fee rate under the Agreement is fair and reasonable. Further, the Board concluded that the Fund’s Agreement is fair and reasonable and approved the continuation of the Agreement for another year.
24
| Value Line U.S. Government Securities Fund, Inc. |
The Fund files its complete schedule of portfolio holdings with the Securities and Exchange Commission (“SEC”) for the first and third quarters of each fiscal year on Form N-Q. The Fund’s Forms N-Q are available on the SEC’s website at http://www.sec.gov and may be reviewed and copied at the SEC’s Public Reference Room in Washington, D.C. Information on the operation of the Public Reference Room may be obtained by calling 1-800-SEC-0330.
A description of the policies and procedures that the Fund uses to determine how to vote proxies relating to portfolio securities, and information regarding how the Fund voted these proxies for the 12-month period ended June 30 is available through the Fund’s website at http://www.vlfunds.com and on the SEC’s website at http://www.sec.gov. The description of the policies and procedures is also available without charge, upon request, by calling 1-800-243-2729.
25
| Value Line U.S. Government Securities Fund, Inc. |
| Management of the Fund |
MANAGEMENT INFORMATION
The business and affairs of the Fund are managed by the Fund’s officers under the direction of the Board of Directors. The following table sets forth information on each Director and Officer of the Fund. Each Director serves as a director or trustee of each of the 14 Value Line Funds. Each Director serves until his or her successor is elected and qualified.
| Name, Address, and DOB | Position | Length of Time Served | Principal Occupation(s) During the Past 5 Years | Other Directorships Held by Director | ||||
| Interested Director* | ||||||||
Thomas T. Sarkany DOB: June 1946 | Director | Since 2008 | Mutual Fund Marketing Director of EULAV Securities, Inc. (the “Distributor”) | None | ||||
| Non-Interested Directors | ||||||||
Joyce E. Heinzerling 500 East 77th Street New York, NY 10162 DOB: January 1956 | Director | Since 2008 | President, Meridian Fund Advisers LLC. since April 2009; General Counsel, Archery Capital LLC (private investment fund) until April 2009. | Burnham Investors Trust, since 2004 (4 funds). | ||||
Francis C. Oakley 54 Scott Hill Road Williamstown, MA 01267 DOB: October 1931 | Director (Lead Independent Director since 2008) | Since 1993 | Professor of History, Williams College, (1961-2002). Professor Emeritus since 2002; President Emeritus since 1994 and President, (1985-1994) Chairman (1993-1997) and Interim President (2002-2003) of the American Council of Learned Societies. Trustee since 1997 and Chairman of the Board since 2005, National Humanities Center. | None | ||||
David H. Porter 5 Birch Run Drive Saratoga Springs, NY 12866 DOB: October 1935 | Director | Since 1997 | Professor, Skidmore College, since 2008; Visiting Professor of Classics, Williams College, (1999-2008); President Emeritus, Skidmore College since 1999 and President, (1987-1998). | None | ||||
Paul Craig Roberts 169 Pompano St. Panama City Beach, FL 32413 DOB: April 1939 | Director | Since 1983 | Chairman, Institute for Political Economy. | None | ||||
Nancy-Beth Sheerr 1409 Beaumont Drive Gladwyne, PA 19035 DOB: March 1949 | Director | Since 1996 | Senior Financial Advisor, Veritable L.P. (Investment Adviser) since 2004. | None |
26
| Value Line U.S. Government Securities Fund, Inc. |
| Management of the Fund |
| Name, Address, and DOB | Position | Length of Time Served | Principal Occupation(s) During the Past 5 Years | Other Directorships Held by Director | ||||
Daniel S. Vandivort 59 Indian Head Road Riverside, CT 06878 DOB: July 1954 | Director | Since 2008 | President, Chief Investment Officer, Weiss, Peck and Greer/Robeco Investment Management 2005-2007; Managing Director, Weiss, Peck and Greer, 1995-2005. | None | ||||
| Officers | ||||||||
Mitchell E. Appel DOB: August 1970 | President | Since 2008 | President of each of the Value Line Funds since June 2008; Chief Financial Officer of Value Line since April 2008 and from September 2005 to November 2007; Treasurer from June 2005 to September 2005; Ch ief Financial Officer of XTF Asset Management from November 2007 to April 2008; Chief Financial Officer of Circle Trust Company from 2003 through May 2005; Chief Financial Officer of the Distributor since April 2008 and President since February 2009; President of the Adviser since February 2009. | |||||
Howard A. Brecher DOB: October 1953 | Vice President and Secretary | Since 2008 | Vice President and Secretary of each of the Value Line Funds since June 2008; Vice President, Secretary and a Director of Value Line; Secretary and Treasurer of the Adviser since February 2009; Vice President, Secretary, Treasurer, General Counsel and a Director of Arnold Bernhard & Co., Inc. | |||||
Michael J. Wagner DOB: November 1950 | Chief Compliance Officer | Since 2009 | Chief Compliance Officer of Value Line Funds since June 2009; President, Northern Lights Compliance Services, LLC, since 2006; Compliance Services Officer, Northstar Financial Services, LLC, 2006 to January 2008; Chief Operating Officer, Northern Lights Compliance Services, LLC, 2004 to 2006; President and Manager, Gemini Fund Services, LLC, 2004 to 2006; Director of Constellation Trust Company 2004 to 2009. | |||||
Emily D. Washington DOB: January 1979 | Treasurer | Since 2008 | Treasurer and Chief Financial Officer (Principal Financial and Accounting Officer) of each of the Value Line Funds since August 2008; Associate Director of Mutual Fund Accounting at Value Line until August 2008. | |||||
| * | Mr. Sarkany is an “interested person” as defined in the Investment Company Act of 1940 by virtue of his position with the Distributor. |
Unless otherwise indicated, the address for each of the above officers is c/o Value Line Funds, 220 East 42nd Street, New York, NY 10017. | |
| The Fund’s Statement of Additional Information (SAI) includes additional information about the Fund’s Directors and is available, without charge, upon request by calling 1-800-243-2729 or on the Fund’s website, www.vlfunds.com. | |
27
| Value Line U.S. Government Securities Fund, Inc. |
| The Value Line Family of Funds |
1950 — The Value Line Fund seeks long-term growth of capital. Current income is a secondary objective.
1952 — Value Line Income and Growth Fund’s primary investment objective is income, as high and dependable as is consistent with reasonable risk. Capital growth to increase total return is a secondary objective.
1956 — Value Line Premier Growth Fund seeks long-term growth of capital. No consideration is given to current income in the choice of investments.
1972 — Value Line Larger Companies Fund’s sole investment objective is to realize capital growth.
1979 — Value Line U.S. Government Money Market Fund, Inc.** a money market fund, seeks to secure as high a level of current income as is consistent with maintaining liquidity and preserving capital. An investment in the Fund is not insured or guaranteed by the Federal Deposit Insurance Corporation or any other government agency. Although the Fund seeks to preserve the value of your investment at $1.00 per share, it is possible to lose money by investing in the Fund.
1981 — Value Line U.S. Government Securities Fund seeks maximum income without undue risk to capital. Under normal conditions, at least 80% of the value of its net assets will be invested in securities issued or guaranteed by the U.S. Government and its agencies and instrumentalities.
1983 — Value Line Centurion Fund* seeks long-term growth of capital.
1984 — The Value Line Tax Exempt Fund seeks to provide investors with the maximum income exempt from federal income taxes while avoiding undue risk to principal. The fund may be subject to state and local taxes and the Alternative Minimum Tax (if applicable).
1985 — Value Line Convertible Fund seeks high current income together with capital appreciation primarily from convertible securities ranked 1 or 2 for year-ahead performance by the Value Line Convertible Ranking System.
1986 — Value Line Aggressive Income Trust seeks to maximize current income.
1987 — Value Line New York Tax Exempt Trust seeks to provide New York taxpayers with the maximum income exempt from New York State, New York City and federal income taxes while avoiding undue risk to principal. The Trust may be subject to state and local taxes and the Alternative Minimum Tax (if applicable).
1987 — Value Line Strategic Asset Management Trust* seeks to achieve a high total investment return consistent with reasonable risk.
1993 — Value Line Emerging Opportunities Fund invests primarily in common stocks or securities convertible into common stock, with its primary objective being long-term growth of capital.
1993 — Value Line Asset Allocation Fund seeks high total investment return, consistent with reasonable risk. The Fund invests in stocks, bonds and money market instruments utilizing quantitative modeling to determine the asset mix.
| * | Only available through the purchase of Guardian Investor, a tax deferred variable annuity, or ValuePlus, a variable life insurance policy. |
| ** | Effective August 19, 2009, The Value Line Cash Fund, Inc. changed its name to the Value Line U.S. Government Money Market Fund, Inc. |
For more complete information about any of the Value Line Funds, including charges and expenses, send for a prospectus from EULAV Securities, Inc., 220 East 42nd Street, New York, New York 10017-5891 or call 1-800-243-2729, 9am-5pm CST, Monday-Friday, or visit us at www.vlfunds.com. Read the prospectus carefully before you invest or send money.
28
Item 2. Code of Ethics
(a) The Registrant has adopted a Code of Ethics that applies to its principal
executive officer, and principal financial officer and principal accounting officer.
(f) Pursuant to item 12(a), the Registrant is attaching as an exhibit a copy of its
Code of Ethics that applies to its principal executive officer, and principal financial officer and principal accounting officer.
Item 3. Audit Committee Financial Expert.
(a)(1)The Registrant has an Audit Committee Financial Expert serving on its Audit Committee.
(2) The Registrant’s Board has designated Daniel S.Vandivort, a member of the Registrant’s Audit Committee, as the Registrant’s Audit Committee Financial Expert. Mr. Vansivort is an independent director who has served as President,Chief Investment Officer to Weis,Peck and Greer/Robeco Investment Management. He has also previously served as Managing Director for Weis,Peck and Greer(1995-2005).
A person who is designated as an “audit committee financial expert” shall not make such person an "expert" for any purpose, including without limitation under Section 11 of the Securities Act of 1933 or under applicable fiduciary laws, as a result of being designated or identified as an audit committee financial expert. The designation or identification of a person as an audit committee financial expert does not impose on such person any duties, obligations, or liabilities that are greater than the duties, obligations, and liabilities imposed on such person as a member of the audit committee and Board of Trustees in the absence of such designation or identification.
Item 4. Principal Accountant Fees and Services
| (a)Audit Fees 2009 - $21,927 | ||
| (b) Audit-Related fees – None. | ||
| (c) Tax Preparation Fees 2009 -$12,300 | ||
| (d) All Other Fees – None | ||
| (e) (1) | Audit Committee Pre-Approval Policy. All services to be performed for the Registrant by PricewaterhouseCoopers LLP must be pre-approved by the audit committee. All services performed during 2009 were pre-approved by the committee. | |
| (e) (2) | Not applicable. | |
| (f) Not applicable. | ||
| (g) Aggregate Non-Audit Fees 2009 -$2,050 | ||
| (h) Not applicable. | ||
Item 11. Controls and Procedures.
| (a) | The registrant’s principal executive officer and principal financial officer have concluded that the registrant’s disclosure controls and procedures (as defined in rule 30a-2(c) under the Act (17 CFR 270.30a-2(c) ) based on their evaluation of these controls and procedures as of a date within 90 days of the filing date of this report, are appropriately designed to ensure that material information relating to the registrant is made known to such officers and are operating effectively. | |
| (b) | The registrant’s principal executive officer and principal financial officer have determined that there have been no significant changes in the registrant’s internal controls or in other factors that could significantly affect these controls subsequent to the date of their evaluation, including corrective actions with regard to significant deficiencies and material weaknesses. |
Item 12. Exhibits.
| (a) | Code of Business Conduct and Ethics for Principal Executive and Senior Financial Officers attached hereto as Exhibit 99.CODE.ETH. | ||
| (b) | (1) | Certification pursuant to Rule 30a-2(a) under the Investment Company Act of 1940 (17 CFR 270.30a-2) attached hereto as Exhibit 99.CERT. | |
| (2) | Certification pursuant to Section 906 of the Sarbanes-Oxley Act of 2002 attached hereto as Exhibit 99.906.CERT. | ||
SIGNATURES
Pursuant to the requirements of the Securities Exchange Act of 1934 and the Investment Company Act of 1940, the registrant has duly caused this report to be signed on its behalf by the undersigned, thereunto duly authorized.
| By | /s/ Mitchell E. Appel | |
| Mitchell E. Appel, President | ||
| Date: | October 29, 2009 |
Pursuant to the requirements of the Securities Exchange Act of 1934 and the Investment Company Act of 1940, this report has been signed below by the following persons on behalf of the registrant and in the capacities and on the dates indicated.
| By: | /s/ Mitchell E. Appel | |
| Mitchell E. Appel, President,Principal Executive Officer | ||
| By: | /s/ Emily D. Washington | |
| Emily D. Washington, Treasurer, Principal Financial Officer | ||
| Date: | October 29, 2009 | |