UNITED STATES
SECURITIES AND EXCHANGE COMMISSION
Washington, D.C. 20549
FORM 20-F
(Mark One)
o Registration statement pursuant to Section 12(b) or 12(g) of the Securities Exchange Act of 1934
or
x Annual report pursuant to Section 13 or 15(d) of the Securities Exchange Act of 1934
For the fiscal year ended December 31, 2006
or
o Transition report pursuant to Section 13 or 15(d) of the Securities Exchange Act of 1934
or
o Shell company report pursuant to section 13 or 15(d) of the securities Exchange Act of 1934
Date of event requiring this shell company report
For the transition period from to
Commission file number: 1-8382
AKTIEBOLAGET SVENSK EXPORTKREDIT
(Exact name of Registrant as Specified in Its Charter)
(SWEDISH EXPORT CREDIT CORPORATION)
(Translation of Registrant’s Name into English)
Kingdom of Sweden
(Jurisdiction of incorporation or organization)
Västra Trädgårdsgatan 11 B, Stockholm, Sweden
(Address of principal executive offices)
Securities registered or to be registered pursuant to Section 12(b) of the Act:
5.721% Redeemable Notes due 2020
(Title of Class)
Securities registered or to be registered pursuant to Section 12 (g) of the Act:
None
(Title of Class)
Securities for which there is a reporting obligation pursuant to Section 15(d) of the Act:
Medium-Term Notes Series D
(Title of Class)
Indicate the number of outstanding shares of each of the issuer’s classes of capital or common stock as of the close of the period covered by the annual report:
Class A shares | | 640,000 |
Class B shares | | 350,000 |
Indicate by check mark if the registrant is a well-known seasoned issuer, as defined in Rule 405 of the Securities Act.
x Yes oNo
If this report is an annual or transition report, indicate by check mark if the registrant is not required to file reports pursuant to Section 13 or 15(d) of the Securities Exchange Act of 1934.
o Yes xNo
Note — Checking the box above will not relieve any registrant required to file reports pursuant to Section 13 or 15(d) of the Securities Exchange Act of 1934 from their obligations under those Sections.
Indicate by check mark whether the registrant: (1) has filed all reports required to be filed by Section 13 or 15(d) of the Securities Exchange Act of 1934 during the preceding 12 months (or for such shorter period that the registrant was required to file such reports), and (2) has been subject to such filing requirements for the past 90 days:
Yes x No o
Indicate by check mark whether the registrant is a large accelerated filer, an accelerated filer, or a non-accelerated filer. See definition of “accelerated filer and large accelerated filer” in Rule 12b-2 of the Exchange Act. (Check one):
Large accelerated filer o Accelerated filer o Non-accelerated filer x
Indicate by check mark which financial statement item the registrant has elected to follow:
Item 17 o Item 18 x
If this is an annual report, indicate by check mark whether the registrant is a shell company (as defined in Rule 12b-2 of the Exchange Act).
o Yes xNo
(APPLICABLE ONLY TO ISSUERS INVOLVED IN BANKRUPTCY PROCEEDINGS DURING THE PAST FIVE YEARS)
Indicate by check mark whether the registrant has filed all documents and reports required to be filed by Sections 12, 13 or 15(d) of the Securities Exchange Act of 1934 subsequent to the distribution of securities under a plan confirmed by a court.
o Yes oNo
In this Report, unless otherwise specified, all amounts are expressed in Swedish kronor (“Skr”). See Item 3, “Key Information”, for a description of historical exchange rates and other matters relating to the Swedish kronor. On March 30, 2007, the exchange rate for into Swedish kronor per U.S. dollars based on the noon buying rate in New York City for cable transfers in foreign currencies as certified for customs purposes by the Federal Reserve Bank of New York was Skr X.XXX per U.S. dollar. No representation is made that Swedish kronor amounts have been, could have been or could be converted into U.S. dollars at that rate.
INTRODUCTORY NOTES
In this Report, unless otherwise indicated, all descriptions and financial information relate to Aktiebolaget Svensk Exportkredit (Swedish Export Credit Corporation) (“SEK” or the “Company”) as a whole, and include both “SEK exclusive of the S-system” and the “State Support System” (the “S-system”), each of which is described in detail herein. In certain instances, information relating to the S-system on a stand-alone basis is provided separately.
SEK is a “public company” according to the Swedish Companies Act. A Swedish company, even if its shares are not listed on an exchange and are not publicly traded, may choose to declare itself a “public company”. Only public debt companies are allowed to raise funds from the public through the issuance of debt instruments. In certain cases, a public company is required to add the denotation “publ” to its name.
FORWARD-LOOKING STATEMENTS
This Report contains forward-looking statements. In addition, the Company may make forward-looking statements in its periodic reports to the U.S. Securities and Exchange Commission (the “SEC”) on Form 6-K, in its annual and interim reports, offering circulars and prospectuses, press releases and other written information. The Board of Directors, officers and employees may also make oral forward-looking statements to third parties, including financial analysts. Forward-looking statements are statements that are not historical facts. Examples of forward-looking statements include:
· financial projections and estimates and their underlying assumptions;
· statements regarding plans, objectives and expectations relating to future operations and services;
· statements regarding the impact of regulatory initiatives on the Company’s operations;
· statements regarding general industry and macroeconomic growth rates and the Company’s performance relative to them; and
· statements regarding future performance.
Forward-looking statements generally are identified by the words “expect”, “anticipate”, “believe”, “intend”, “estimate”, “should”, and similar expressions.
Forward-looking statements are based on current plans, estimates and projections, and therefore you should not place too much reliance on them. Forward-looking statements speak only as of the date they are made, and the Company undertakes no obligation to update any forward-looking statement in light of new information or future events, although the Company intends to continue to meet its ongoing disclosure obligations under the U.S. securities laws (such as the obligations to file annual reports on Form 20-F and reports on Form 6-K) and under other applicable laws. Forward-looking statements involve inherent risks and uncertainties, most of which are difficult to predict and generally beyond the Company’s control. You are cautioned that a number of important factors could cause actual results or outcomes to differ materially from those expressed in, or implied by, the forward-looking statements. These factors include, among others, the following:
· changes in general economic business conditions, especially in Sweden;
· changes and volatility in currency exchange and interest rates;
· dislocations in one or more segments of the financial markets; and
· changes in government policy and regulations and in political and social conditions.
ii
PART I
Item 1. Identity of Directors, Senior Management and Advisors
Not required as this 20-F is filed as an Annual Report.
Item 2. Offer Statistics and Expected Timetable
Not required as this 20-F is filed as an Annual Report.
1
Item 3. �� Key Information
a. General
The following selected financial data at and for the years ended December 31, 2006, 2005, 2004, 2003 and 2002 have been derived from SEK’s consolidated financial statements prepared in accordance with generally accepted accounting principles in Sweden (Swedish GAAP). SEK prepares its accounts in accordance with Swedish GAAP, which differs in significant respects from generally accepted accounting principles in the United States (U.S. GAAP). Information relating to the nature and effect of such differences is presented in Note 37 to the Consolidated Financial Statements.
The economic purpose of holding a derivative is consistently reflected in the accounting treatment under Swedish GAAP, both when applying deferral hedge accounting and when carried at fair value. Therefore, there is under Swedish GAAP no measurement or recognition inconsistency (sometimes referred to as an accounting mismatch or mixed measurement attributes) that would otherwise arise from measuring assets, liabilities or derivatives or recognizing the gains and losses on them on different bases.
Based on its experience and knowledge of the functioning of SEK’s economic hedging, management believes Swedish GAAP better reflects the effects of the economic hedge relationships on net income and shareholders’ funds. That is the case, for example, regarding the Skr 647.8 million positive adjustment in 2006, reflected in Note 37 to the Consolidated Financial Statements as a reconciling adjustment, to U.S. GAAP to shareholders’ funds as of year-end. It only applies because SEK did not qualify for hedge accounting under U.S. GAAP from January 1, 2001, until June 30, 2002. This amount is correctly presented based on the rules of SFAS 133, Accounting for Derivatives Instruments and Hedging Activities, but would not in management’s opinion have appeared under Swedish GAAP.
There are further significant differences between SEK’s net profit and shareholders’ funds calculated under Swedish GAAP as compared to these items calculated under U.S. GAAP. These differences arise primarily from the requirements of U.S. GAAP that (1) changes in the fair value of derivatives that are not part of a qualifying fair value hedge relationship are required to be recognized currently in the income statement while the contract which the derivative is economically hedging is carried at amortized cost and (2) changes in currency exchange rates affecting the fair value of foreign-currency instruments in the available-for-sale portfolio that are not eligible for hedge accounting are reported only as increases or decreases in shareholders’ funds, while the largely offsetting changes in the Swedish kronor position of the related funding must be recognized currently in the income statement.
The following information should be read in conjunction with the more detailed discussion contained in Item 5 “Operating and Financial Review and Prospects”.
Selected Financial Data
| | Year Ended December 31, | |
| | | | | | | | | | | |
(In Skr million, unless otherwise stated) | | 2006 | | 2005 | | 2004 | | 2003 | | 2002 | |
INCOME STATEMENT DATA | | | | | | | | | | | |
| | | | | | | | | | | |
Net interest revenues/(expenses): | | | | | | | | | | | |
SEK excluding the S-system | | 797.8 | | 759.1 | | 801.7 | | 757.5 | | 798.2 | |
S-system(A) | | (13.8 | ) | 48.9 | | 33.9 | | (67.5 | ) | (193.9 | ) |
| | | | | | | | | | | |
Operating profit | | 543.2 | | 498.1 | | 611.8 | | 595.3 | | 664.4 | |
| | | | | | | | | | | |
Net profit (Swedish GAAP) | | 385.6 | | 346.9 | | 439.6 | | 427.5 | | 479.7 | |
| | | | | | | | | | | |
After-tax return on equity (%) | | 10.5 | % | 10.6 | % | 14.9 | % | 13.6 | % | 14.0 | % |
Earnings per share (Swedish GAAP) (Skr) | | 389 | | 350 | | 444 | | 432 | | 485 | |
Dividend per share (Skr) (C) | | — | | — | | — | | 1,252 | | 364 | |
| | | | | | | | | | | |
Net profit (loss) (U.S. GAAP) (D) (E) | | 2,146.2 | | (1,537.9 | ) | 1,076.7 | | 643.2 | | 2,613.4 | |
Comprehensive income (U.S. GAAP) (G) | | 719.3 | | 283.9 | | 336.5 | | 70.9 | | 429.5 | |
2
Ratios of earnings to fixed charges (Swedish GAAP) (H) | | 1.09 | | 1.10 | | 1.14 | | 1.16 | | 1.16 | |
| | | | | | | | | | | |
Ratios of earnings to fixed charges (U.S. GAAP) (H) | | 1.48 | | 0.59 | | 1.34 | | 1.22 | | 1.96 | |
| | | | | | | | | | | |
Earnings (loss) per share (U.S. GAAP) (Skr) | | 2,168 | | (1,553 | ) | 1,088 | | 650 | | 2,640 | |
| | At December 31, | |
(Skr million) | | 2006 | | 2005 | | 2004 | | 2003 | | 2002 | |
BALANCE SHEET DATA | | | | | | | | | | | |
Total Credits Outstanding (I) | | 91,148.5 | | 78,147.4 | | 57,931.9 | | 60,870.5 | | 65,470.1 | |
| | | | | | | | | | | |
of which SEK excluding the S-system (I) | | 82,023.6 | | 67,808.1 | | 51,191.6 | | 53,140.5 | | 53,988.9 | |
| | | | | | | | | | | |
of which S-system (I) | | 9,124.9 | | 10,339.3 | | 6,740.3 | | 7,730.0 | | 11,481.2 | |
| | | | | | | | | | | |
Total assets | | 229,200.9 | | 207,493.2 | | 162,066.2 | | 151,800.5 | | 132,538.5 | |
| | | | | | | | | | | |
Total debt | | 209,535.1 | | 191,713.5 | | 143,895.3 | | 135,565.9 | | 114,838.2 | |
| | | | | | | | | | | |
of which subordinated debt | | 2,857.9 | | 3,254.9 | | 2,764.7 | | 3,001.0 | | 2,224.6 | |
| | | | | | | | | | | |
Deferred taxes related to untaxed reserves (B) | | 357.0 | | 370.7 | | 373.8 | | 376.5 | | 380.8 | |
| | | | | | | | | | | |
Shareholders’ funds (Swedish GAAP) (C) | | 4,124.3 | | 3,738.7 | | 3,391.8 | | 2,952.2 | | 3,764.7 | |
| | | | | | | | | | | |
Total liabilities and shareholders’ funds | | 229,200.9 | | 207,493.2 | | 162,066.2 | | 151,800.5 | | 132,538.5 | |
| | | | | | | | | | | |
Shareholders’ funds (U.S. GAAP) (D) (E) (F) | | 5,219.3 | | 4,500.0 | | 4,216.1 | | 3,879.6 | | 5,048.7 | |
(A) The difference between interest revenues, net commission revenues and any net foreign exchange gains related to lending and liquid assets under the S-system, on the one hand, and interest expenses related to borrowing, all financing costs and any net foreign exchange losses incurred by SEK under the S-system, on the other hand, is reimbursed by or, as applicable, paid to the Swedish State and, therefore, has no impact on operating profit or net profit.
(B) In accordance with Swedish GAAP, no untaxed reserves are reported in separate line items in the Consolidated Balance Sheet nor are changes in untaxed reserves reported in the Consolidated Income Statement. Instead, in the Consolidated Balance Sheet, the untaxed reserves are presented as (i) an after-tax portion, included in non-distributable capital, and (ii) a portion representing deferred taxes, reported as one component of allocations. (See Notes 25 and 27 to the Consolidated Financial Statements.)
(C) In connection with the sale of the Class B shares to the Swedish State on June 30, 2003, SEK paid a total dividend in 2003 of Skr 1,240 million solely to ABB Structured Finance Investment AB, the former holder of the Class B shares that represented approximately 35.5% of the Company’s share capital. There was no dividend paid in 2006, 2005 or 2004 to the Swedish State, which now owns all of the shares of SEK.
(D) The effect of SFAS No. 133, Accounting for Derivative Instruments and Hedging Activities, and SFAS No. 138, Accounting for Certain Derivative Instruments and Certain Hedging Activities results in significant adjustments in computing net profit and shareholders’ funds according to U.S. GAAP. This is a result of having to mark at fair value in the balance sheet certain derivatives which do not qualify for hedge accounting. However, the variability in net income related to the instruments that qualify for hedge accounting is to some extent reduced because the Company is able to apply hedge accounting to certain assets and liabilities. (See Note 37 to the Consolidated Financial Statements.)
(E) SEK holds securities in a number of different currencies which are classified as available for sale for U.S. GAAP purposes. No net foreign exchange exposures arise from these holdings because, although the value of the assets in Swedish kronor terms changes according to the relevant exchange rates, there is an largely offsetting change in the Swedish kronor value of the related funding. Under Swedish GAAP both the assets and the liabilities are translated at closing exchange rates and the differences between historical book value and current value are reflected in foreign exchange effects in earnings, where they offset each other. This reflects the economic substance of
3
holding assets in a certain currency, financed by liabilities in that currency. However, under U.S. GAAP, the valuation effects of changes in currency exchange rates on the value of the investments classified as available for sale and not otherwise hedged by a derivative in a fair value hedging relationship are taken directly to equity whereas the offsetting changes in Swedish kronor terms of the borrowing are reflected in earnings. This leads to an accounting result which in management’s view does not reflect either the underlying risk position or the economics of the transactions. The result of the foregoing is that for the year 2006 SEK’s U.S. GAAP net profit reflects the addition, before tax effects, of Skr 2,302.9 million of foreign exchange difference on available-for-sale securities, which amount is not reflected in Swedish GAAP net profit (2005: deduction of Skr 2,617.9 million, 2004: addition of Skr 1,000.0 million). There is no difference in total shareholders’ funds between Swedish GAAP and U.S. GAAP as a result of this treatment (although there are differences in individual components of shareholders’ funds). (See Note 37 to the Consolidated Financial Statements.)
(F) At January 1, 2001, the carrying value of certain assets and liabilities that qualified for hedge accounting under previous U.S. GAAP standards was adjusted by Skr 1.6 billion with an offsetting recognition of the fair value of derivative instruments formerly designated in fair value type hedge relationships. Changes in the fair value of the previously designated derivatives are being recognized in income while the adjustment to the carrying value of the assets and liabilities is being accreted to income. The result of the foregoing is that for the year 2006 SEK’s U.S. GAAP shareholders’ funds reflects the addition of Skr 647.8 million before tax effects (2005: addition of Skr 819.7 million; 2004 addition of Skr 991.6 million). (See Note 37 to the Consolidated Financial Statements.)
(G) Comprehensive income (loss) (U.S. GAAP) comprises net profit (loss) (U.S. GAAP) and other comprehensive income (U.S. GAAP). (See Note 37 to the Consolidated Financial Statements.)
(H) For the purpose of calculating ratios of earnings to fixed charges, earnings consist of net profit for the year, plus taxes and fixed charges. Fixed charges consist of interest expenses, including borrowing costs, in SEK exclusive of the S-system.
(I) Amounts of credits as reported under the “old format”. The old format includes all credits — i.e., credits documented as interest-bearing securities (which are not included in the amounts reported as credits under the “new format”), as well as credits granted against traditional documentation. The amounts reported under the old format, in SEK’s opinion, reflect the real credit/lending volumes of SEK. The comments regarding lending volumes included in this report therefore refer to amounts based on the old format unless otherwise stated. (See Item 5c Operating and Financial Review and Prospects — Assets and Business Volume and Note 17 to the Consolidated Financial Statements.)
4
Foreign Exchange Rates
The Company publishes its financial statements in Swedish kronor (“Skr”). The following table sets forth for the years indicated certain information concerning the exchange rate for Swedish kronor as against the U.S. dollar (“USD”) based on the noon buying rate in New York City for cable transfers in foreign currencies as certified for customs purposes by the Federal Reserve Bank of New York.
Calendar Year | | High | | Low | | Average(A) | | Period End | |
2007 | | 7.1060 | | 6.7818 | | 6.9823 | | 6.9837 | |
2006 | | 7.9656 | | 6.7674 | | 7.3098 | | 6.8342 | |
2005 | | 8.2434 | | 6.6855 | | 7.5170 | | 7.9370 | |
2004 | | 7.7725 | | 6.5939 | | 7.3480 | | 6.6687 | |
2003 | | 8.7920 | | 7.1950 | | 8.0351 | | 7.1950 | |
2002 | | 10.7290 | | 8.6950 | | 9.6571 | | 8.6950 | |
(A) The average of the exchange rates on the last day of each month during the period.
The following table sets forth for the months indicated certain information concerning the exchange rate for Swedish kronor as against the U.S. dollar based on the noon buying rate in New York City for cable transfers in foreign currencies as certified for customs purposes by the Federal Reserve Bank of New York.
One-Month Period Ended | | High | | Low | |
March 31, 2007 | | 7.1060 | | 6.9622 | |
February 28, 2007 | | 7.0823 | | 6.9436 | |
January 31, 2007 | | 7.0829 | | 6.7818 | |
December 31, 2006 | | 6.9204 | | 6.7674 | |
November 30, 2006 | | 7.2096 | | 6.8331 | |
October 31, 2006 | | 7.4200 | | 7.2111 | |
September 30, 2006 | | 7.3450 | | 7.2410 | |
The noon buying rate on March 30, 2007 was USD 1 = Skr 6.9837
No representation is made that Swedish kronor amounts have been, could have been or could be converted into U.S. dollars at the foregoing rates on any of the dates indicated.
5
d. Risk factors
SEK’s financial performance is affected by borrower and counterparty credit quality and general economic conditions.
Risks arising from the credit quality of borrowers and counterparties and the recoverability of loans and amounts due from counterparties in derivative transactions are inherent in SEK’s businesses. Adverse changes in the credit quality of SEK’s borrowers and counterparties or a general deterioration in the economic conditions, or arising from systemic risks in the financial systems could affect the recoverability and value of its assets and require an increase in SEK’s provision for bad and doubtful debts and other provisions. SEK has developed guidelines to mitigate and manage these risks, which mainly entail the strict selection of borrowers and counterparties and the use of guarantees and credit derivatives. Over-the-counter derivative transactions under ISDA Master Agreements are only entered into with the provision of collateral or mark-to-market agreements.
A credit-rating downgrade may substantially reduce SEK’s earnings.
The Company is dependent on access to the international capital markets to fund its capital requirements. The cost and availability of financing is generally dependent on SEK’s credit rating. The Company currently has favorable credit ratings from various credit rating agencies. The Company’s credit rating depends on many factors, some of which are outside of its control. Factors that are significant in determining SEK’s credit ratings or that otherwise could affect its ability to raise financing include ownership structure, asset quality, liquidity profile, capital ratios, prudent banking, government support and public policy role. A deterioration in any of these factors or combination of these factors may lead rating agencies to downgrade SEK’s credit rating. If the Company was to receive a downgrade in its credit rating, it would likely become necessary to offer increased interest rates in the capital markets in order to obtain financing, which would likely substantially lower the Company’s profit margins and earnings and negatively affect the Company’s business.
Reduced accessibility to the international capital markets at a desired interest rate could lower SEK’s profit margins.
Any situation that impairs the Company’s access to the capital markets or increases the cost of financing could have a negative effect on its profit margin. For instance, the Company must compete with domestic and foreign financial institutions in the capital markets for financing. This competition could raise the cost of financing to the Company by forcing it to offer higher interest rates in order to attract investors.
Changes in interest rates may reduce SEK’s earnings.
Increases in interest rates may force the Company to respond by offering higher interest rates to investors when seeking financing in the capital markets. Furthermore, market conditions may result in lower interest rates on loans extended by the Company and on its investments. Any decrease in the average interest income on SEK’s assets relative to the average interest expense on its liabilities will reduce the Company’s net income. In recent years there has been a decline in the Company’s average margin on debt-financed assets as well as in the earnings on the investment of its equity capital.
SEK’s hedging strategies may not prevent losses.
SEK is constantly attempting to manage interest rate, currency, credit and other market-related risks, as well as refinancing risks. If any of the variety of instruments and strategies the Company uses to hedge its exposure to these various types of risk is not effective, the Company may incur losses. The Company may not be able to obtain economically efficient hedging opportunities that will enable it to carry on its present policies with respect to new assets and liabilities.
Fluctuations in foreign currency exchange rates could harm SEK’s profit margins.
As an international lending institution, the Company is subject to currency risk. The Company’s earnings may fluctuate due to currency translations, and changes in currency exchange rates adverse to the Company could cause a reduction in profits.
Additionally, as the Company’s financial statements are reported in Swedish kronor, a majority of the items presented in the balance sheet are subject to fluctuations as a result of changes in the U.S. dollar/Swedish kronor and the euro/Swedish kronor exchange rate. Even though the Company is carefully
6
monitoring and hedging its foreign currency exposures changes in currency exchange rates adverse to the Company could cause a reduction in profits. Also, a strengthening of the kronor against other currencies may reduce demand for the products of SEK’s customers and thus reduce demand for its loans.
Increasing competition may adversely affect SEK’s income and business.
Competition in the Company’s business is based on service, product innovation, product features, price, commission structure, financial strength and name recognition. The Company competes with a large number of other credit institutions, including domestic and foreign banks. Some of these institutions offer a broader array of products, have more competitive pricing and may have greater financial resources with which to compete. Increasing competition may have significant negative effects on the Company’s results if the Company is unable to match the products and services of its competitors.
Operational risks are inherent in SEK’s businesses.
SEK’s businesses are dependent on the ability to process complex transactions efficiently and accurately. Operational risk and losses can result from fraud, errors by employees, failure to document transactions properly or to obtain proper internal authorization, equipment failures, natural disasters or the failure of external systems, for example, those of SEK’s suppliers or counterparties. The extensive risk management conducted by SEK is often complicated and therefore leads to additional operational risk that is minimized in a corresponding manner. There is also a risk that SEK’s reputation will be damaged if SEK fails to comply with current legislation and best practice or in another manner fails to meet its commitments, even those that are not explicit. Although such risks are reduced through active efforts relating to risk culture, compliance with regulations and corporate governance, it is only possible to be reasonably, but not absolutely, certain that such procedures will be effective in controlling each of the operational risks.
SEK’s business is subject to regulation and regulatory oversight. Any significant regulatory developments could have an effect on how SEK conducts its business and on SEK’s results of operations.
SEK is subject to financial services laws, regulations, administrative actions and policies in each location in which SEK operates. This supervision and regulation, in particular in Sweden, if changed could materially affect SEK’s business, the products and services it offers or the value of its assets.
Item 4. Information on the Company
a. General
SEK is a public stock corporation organized under the Swedish Companies Act. It is wholly-owned by the Swedish State through the Ministry of Foreign Affairs (“Sweden” or the “State”).
SEK was founded in 1962 in order to strengthen the competitiveness of the Swedish export industry by meeting the need for long-term credits. SEK’s objective is to engage in financing activities in accordance with the Swedish Banking and Financing Business Act and in connection therewith primarily to promote the development of Swedish commerce and industry as well as otherwise engage in Swedish and international financing activities on commercial grounds.
SEK provides long-term sustainable financial solutions for the private and public sectors with the aim of promoting the development and international competitiveness of Swedish industry and trade. SEK’s mission is to secure access to financial solutions for export and infrastructure. Business activities include export credits, lending, structured financing, project financing, leasing, capital market products and financial advisory services. SEK offers its solutions to corporations and financial institutions as well as domestic and international investors. SEK extends credits, or loans, on commercial terms at prevailing fixed or floating market rates of interest in “SEK exclusive of the S-system”, and credits on State-supported terms at fixed rates of interest that may be lower than prevailing fixed market rates in the “State Support System” (the “S-system”). The S-system is administered on behalf of the State by SEK against compensation.
From its roots and base in export credits, SEK’s product range has expanded to promote the development of Swedish commerce and industry and the Swedish export industry. Over the years, SEK has
7
been active in the creation of new financial solutions. SEK’s clear niche specialization in long-term financial products, combined with its financial capacity and flexible organization, are key factors in the management of its operations. SEK’s borrowing activities in the international capital markets have given SEK expertise in financial instruments, an expertise that has earned international awards from financial publications on several occasions. This experience, together with maintaining credit quality and credit ratings (as of March 2007: AA+ from Standard & Poors and Aa1 from Moody’s Investors Service), has allowed SEK to offer its customers tailored products and what SEK believes are highly competitive terms.
SEK has intensified the broadening of both its range of services and customer base in recent years in response to changes in demand and the opportunities created by the development of new forms of cooperation and financial instruments. Among other things SEK has increased its financing of infrastructure projects with Swedish regional and local authorities, with the aim of supporting the development and competitiveness of Swedish commerce and industry. SEK also intermediates capital market products to third party investors, and has also to a greater extent become involved as a financial advisor for international projects. The expansion of SEK’s services and customer base reflects SEK’s efforts to become a broader-range finance house with specialists in certain areas, while continuing to emphasize its traditional role as a long-term lender.
The increasing integration of business in the Nordic countries is consistent with SEK’s goal of having a position in the Nordic countries within its niche: long-term financial solutions. SEK has a representative office in Helsinki, which, with its focus on major Finnish companies and local authorities, furthers this development. The operations in Helsinki are important for strengthening SEK’s position in the Nordic market.
Since the early 1990s, SEK has been involved in Sweden’s fast-growing trade with the countries in the Baltic region. The overall goal is to contribute to a continued positive economic development in the region, while strengthening the presence of Swedish and other Nordic business. Within the framework of these activities there are also increased business opportunities that have been created by the enlargement in 2004 of the European Union to include new members from the Baltic region and Eastern Europe.
SEK’s relationship with domestic, Nordic and other international investors and partners strengthen its ability to develop financial solutions which meet its customers’ requirements. This network enables SEK to participate in co-financing arrangements and advisory assignments, as well as in benchmarking and cooperation in areas such as risk management and business systems.
The address of the Company’s principal executive office is AB Svensk Exportkredit (Swedish Export Credit Corporation), Västra Trädgårdsgatan 11B, Stockholm, Sweden, and the Company’s telephone number is 011-46-8-613-8300. The Company’s authorized representative in the United States is the Consulate General of Sweden, One Dag Hammarskjöld Plaza, 885 Second Avenue, New York, NY 10017, and the telephone number is (212) 583-2550.
The following table summarizes SEK’s credits outstanding and debt outstanding at December 31, 2006, 2005 and 2004:
| | At December 31, | |
(Skr million) | | 2006 | | 2005 | | 2004 | |
| | | | | | | |
Total credits outstanding (old format)(A) | | 91,148 | | 78,147 | | 57,932 | |
Of which S-system | | 9,125 | | 10,339 | | 6,740 | |
| | | | | | | |
Total debt outstanding | | 209,535 | | 191,714 | | 143,895 | |
Of which S-system | | 6 | | 278 | | 526 | |
(A) Amounts of credits as reported under the “old format”. The old format includes all credits — i.e., credits documented as interest-bearing securities (which are not included in the amounts reported as credits under the “new format”), as well as credits granted against traditional credit agreement documentation. These amounts, in SEK’s opinion, reflect the real credit/lending volumes of SEK. The comments regarding lending volumes included in this report therefore refer to amounts based on the old format unless otherwise stated. (See also Note 17 to the Consolidated Financial Statements.)
8
b. Lending Operations — General
The following table sets forth certain data regarding the Company’s lending operations during the five-year period ended December 31, 2006:
| | Year ending December 31, | |
(Skr million) | | 2006 | | 2005 | | 2004 | | 2003 | | 2002 | |
| | | | | | | | | | | |
Offers of long-term credits accepted (A) | | 56,923 | | 37,525 | | 22,748 | | 18,960 | | 13,365 | |
of which S-system (B) | | 8,537 | | 3,195 | | 2,619 | | 1,939 | | 172 | |
Total credit disbursements | | 24,022 | | 20,981 | | 11,459 | | 9,954 | | 7,896 | |
of which S-system | | 2,037 | | 4,493 | | 1,732 | | 1,032 | | 1,377 | |
Total credit repayments, including effects of currency translations | | 12,970 | | 6,878 | | 14,396 | | 17,334 | | 14,599 | |
of which S-system | | 3,306 | | 894 | | 2,721 | | 4,784 | | 5,357 | |
Total net increase / (decrease) in credits outstanding | | 12,741 | | 10,671 | | (8,050 | ) | 1,739 | | (6,478 | ) |
of which S-system | | (1,219 | ) | 3,603 | | (1,516 | ) | (3,238 | ) | (3,981 | ) |
| | | | | | | | | | | |
Credits outstanding at December 31: | | | | | | | | | | | |
Credits outstanding (old format)(A) | | 91,148 | | 78,147 | | 57,932 | | 60,870 | | 65,470 | |
of which S-system | | 9,125 | | 10,339 | | 6,740 | | 7,730 | | 11,481 | |
Credits outstanding (new format)(A) | | 56,134 | | 43,393 | | 32,722 | | 40,772 | | 39,033 | |
of which S-system | | 9,132 | | 10,351 | | 6,748 | | 8,264 | | 11,502 | |
Total credit commitments outstanding at December 31 | | 21,889 | | 15,114 | | 16,353 | | 14,358 | | 11,849 | |
of which S-system | | 14,163 | | 9,067 | | 10,226 | | 10,025 | | 10,124 | |
(A) Amounts of credits reported under the “old format” include all credits — i.e., credits granted against documentation in the form of interest-bearing securities (which are not included in the credits reported as credits under the “new format”), as well as credits granted against traditional credit agreement documentation. Amounts of credits under new format includes credits granted against traditional credit agreement documentation, deposits with banks and states, repurchase agreements, and cash on demand. Credits under new format is a presentation in accordance with Swedish GAAP, while credits under old format is a non-GAAP presentation. Amounts reported under the old format, in SEK’s opinion, reflect the real credit/lending volumes of SEK. SEK views credits granted against documentation in the form of interest-bearing securities as real credit volumes, while deposits with banks and states, repurchase agreements, and cash on demand in SEK’s opinion is a part of liquidity volumes. The comments regarding lending volumes included in this report, therefore, refer to amounts based on the old format unless otherwise stated. (See also Item 5. c. “Operating and Financial Review and Prospects — Assets and Business Volume” and Note 17 to the Consolidated Financial Statements.)
(B) SEK offers S-system financing at CIRR (Commercial Interest Reference Rate) rates. The CIRR-rates for new credits are subject to periodic review and adjustment by the OECD. As described below under “—S-system”, the OECD Consensus stipulates that credit offers will be valid for acceptance during a period of not more than four months. Thereafter the CIRR rate can be locked in for a maximum period of six months in order for the credit agreement to be finalized. The attractiveness of an S-system credit offer is, therefore, dependent on the general movement of interest rates during the relevant four month period which is, in turn, a significant factor contributing to the year-to-year differences in offers of long-term credits accepted in the S-system.
Most of the credits granted by SEK are related to Swedish exports. Measured by revenues, the largest markets for the export of goods from Sweden are Western Europe and North America. However, exports to other, including less developed, markets are also important. Accordingly, the need for export financing may be related to transactions involving buyers in many different countries, with varying levels of creditworthiness. Pursuant to its counterparty risk exposure policy, SEK is selective in accepting any type of risk exposure. This policy seeks to ensure that SEK is neither dependent on the creditworthiness of individual buyers of Swedish goods and services, nor on the countries in which they are domiciled, but on the creditworthiness of individual counterparties to whom SEK accepts counterparty risk exposure.
9
The following table shows the geographic distribution of SEK’s credits outstanding and committed (old format) by domicile of borrower at December 31, 2006. The table further shows, by domicile and category, the related risk counterparties to whom SEK’s counterparty risk exposures are allocated when taking into account prevailing guarantees and collateral. The table at December 31, 2006 includes both credits outstanding and credits committed while the tables at December 31, 2005 and 2004 only include credits outstanding. The addition in 2006 of credits committed in the table is made to better reflect the geographical distribution of all credit related amounts, both outstanding and those that may in the near future be disbursed.
| | | | Domicile and category of the related counterparties, to whom SEK is risk exposed | |
| | | | Sweden | | Other Nordic Area | | Other Western Europe & U.S. | | Asia & Latin America (A) | |
at December 31, 2006 | | | | | | Govern- | | | | | | | | | | | | | | | | | | | | | | | | | | | | | |
(Skr billion) | | | | | | ment & | | | | | | | | | | | | | | | | | | | | | | | | | | | | | |
| | Total | | | | Munici- | | | | Corpo- | | | | Govern- | | | | Corpo- | | | | Govern- | | | | Corpo- | | | | Govern- | | | | Corpo- | |
Domicile of SEK´s borrowers | | amount | | Sum | | palities | | Bank | | ration | | Sum | | ment | | Bank | | ration | | Sum | | ment | | Bank | | ration | | Sum | | ment | | Bank | | ration | |
Africa | | 1.5 | | 1.4 | | 1.4 | | | | | | | | | | | | | | 0.1 | | | | 0.1 | | | | | | | | | | | |
Asia | | 21.5 | | 12.9 | | 12.8 | | | | 0.1 | | 0.1 | | 0.1 | | | | | | 8.5 | | 7.9 | | 0.6 | | | | | | | | | | | |
Latin America | | 6.9 | | 3.4 | | 3.2 | | 0.2 | | | | | | | | | | | | 3.3 | | 2.5 | | 0.8 | | | | 0.2 | | | | | | 0.2 | |
North America | | 0.6 | | 0.2 | | 0.2 | | | | | | | | | | | | | | 0.4 | | | | | | 0.4 | | | | | | | | | |
Sweden | | 44.7 | | 41.7 | | 18.5 | | 15.9 | | 7.3 | | 0.4 | | 0.4 | | | | | | 2.3 | | 0.4 | | 1.7 | | 0.2 | | 0.3 | | | | | | 0.3 | |
Other Nordic Area | | 21.0 | | 0.7 | | | | 0.7 | | | | 18.7 | | 8.1 | | 5.3 | | 5.3 | | 1.6 | | | | 1.6 | | | | | | | | | | | |
Other Western Europe | | 13.8 | | 1.8 | | 1.8 | | | | | | | | | | | | | | 12.0 | | 7.4 | | 3.1 | | 1.5 | | | | | | | | | |
Baltic Area | | 0.7 | | | | | | | | | | | | | | | | | | 0.7 | | | | 0.7 | | | | | | | | | | | |
Other Eastern Europe | | 2.9 | | 1.3 | | 1.3 | | | | | | 0.3 | | 0.3 | | | | | | 1.1 | | 0.8 | | 0.3 | | | | 0.2 | | 0.2 | | | | | |
Total | | 113.6 | | 63.4 | | 39.2 | | 16.8 | | 7.4 | | 19.5 | | 8.9 | | 5.3 | | 5.3 | | 30.0 | | 19.0 | | 8.9 | | 2.1 | | 0.7 | | 0.2 | | 0.0 | | 0.5 | |
(A) SEK had insignificant credits outstanding in Asia & Latin America prior to 2006.
The following tables show the geographic distribution of SEK’s credits outstanding (old format) by domicile of borrower at December 31, 2005, and 2004. The tables further show, by domicile and category, the related risk counterparties to whom SEK’s counterparty risk exposures are allocated when taking into account prevailing guarantees and collateral.
| | | | Domicile and category of the related counterparties, to whom SEK is risk exposed | |
| | | | Sweden | | Other Nordic Area | | Other Western Europe & U.S. | |
at December 31, 2005 | | | | | | Govern- | | | | | | | | | | | | | | | | | | | | | |
Skr billion) | | | | | | ment & | | | | | | | | | | | | | | | | | | | | | |
Domicile of SEK´s
borrowers | | Total
amount | | Sum | | Muni-
cipalities | | Bank | | Corpo-
ration | | Sum | | Govern-
ment | | Bank | | Corpo-
ration | | Sum | | Govern-
ment | | Bank | | Corpo-
ration | |
Africa | | 1.5 | | 1.4 | | 1.4 | | | | | | | | | | | | | | 0.1 | | | | 0.1 | | | |
Asia | | 9.5 | | 5.2 | | 5.0 | | 0.1 | | 0.1 | | 0.3 | | 0.3 | | | | | | 4.0 | | 3.4 | | 0.6 | | | |
Latin America | | 5.9 | | 4.3 | | 4.0 | | 0.3 | | | | | | | | | | | | 1.6 | | 1.0 | | 0.4 | | 0.2 | |
North America | | 0.8 | | 0.2 | | 0.2 | | | | | | | | | | | | | | 0.6 | | | | 0.3 | | 0.3 | |
Sweden | | 36.8 | | 32.9 | | 12.0 | | 15.1 | | 5.8 | | 0.4 | | | | 0.4 | | | | 3.5 | | | | 3.2 | | 0.3 | |
Other Nordic Area | | 14.9 | | 0.1 | | 0.1 | | | | | | 12.6 | | 5.4 | | 4.5 | | 2.7 | | 2.2 | | | | 2.2 | | | |
Other Western Europe | | 6.9 | | 1.9 | | 1.9 | | | | | | | | | | | | | | 5.0 | | 1.1 | | 3.2 | | 0.7 | |
Baltic Area | | 0.4 | | | | | | | | | | | | | | | | | | 0.4 | | 0.3 | | 0.1 | | | |
Other Eastern Europe | | 1.4 | | 0.5 | | 0.5 | | | | | | 0.4 | | 0.4 | | | | | | 0.5 | | 0.4 | | 0.1 | | | |
Total | | 78.1 | | 46.5 | | 25.1 | | 15.5 | | 5.9 | | 13.7 | | 6.1 | | 4.9 | | 2.7 | | 17.9 | | 6.2 | | 10.2 | | 1.5 | |
10
| | | | Domicile and category of the related counterparties, towhom SEK is risk exposed | |
| | | | Sweden | | Other Nordic Area | | Other Western Europe & U.S. | |
at December 31, 2004 | | | | | | Govern- | | | | | | | | | | | | | | | | | | | | | |
Skr billion) | | | | | | ment & | | | | | | | | | | | | | | | | | | | | | |
Domicile of borrowers | | Total
amount | | Sum | | Muni-
cipalities | | Bank | | Corpo-
ration | | Sum | | Govern-
ment | | Bank | | Corpo-
ration | | Sum | | Govern-
ment | | Bank | | Corpo-
ration | |
Africa | | 1.5 | | 1.4 | | 1.4 | | | | | | | | | | | | | | 0.1 | | | | 0.1 | | | |
Asia | | 6.0 | | 4.7 | | 4.5 | | 0.1 | | 0.1 | | 0.5 | | 0.5 | | | | | | 0.8 | | 0.2 | | 0.6 | | | |
Latin America | | 3.0 | | 2.4 | | 2.2 | | 0.2 | | | | | | | | | | | | 0.6 | | 0.2 | | 0.4 | | | |
North America | | 0.8 | | 0.3 | | 0.3 | | | | | | | | | | | | | | 0.5 | | | | 0.1 | | 0.4 | |
Sweden | | 31.4 | | 27.0 | | 10.5 | | 10.3 | | 6.2 | | 0.1 | | | | 0.1 | | | | 4.3 | | | | 4.3 | | | |
Other Nordic Area | | 10.2 | | | | | | | | | | 8.1 | | 1.9 | | 3.1 | | 3.1 | | 21 | | | | 2.1 | | | |
Other Western Europe | | 4.1 | | | | | | | | | | | | | | | | | | 4.1 | | 0.7 | | 2.2 | | 1.2 | |
Baltic Area | | 0.0 | | | | | | | | | | | | | | | | | | 0.0 | | | | 0.0 | | | |
Other Eastern Europe | | 0.9 | | 0.5 | | 0.5 | | | | | | | | | | | | | | 0.4 | | 0.2 | | 0.2 | | | |
Total | | 57.9 | | 36.3 | | 19.4 | | 10.6 | | 6.3 | | 8.7 | | 2.4 | | 3.2 | | 3.1 | | 12.9 | | 1.3 | | 10.0 | | 1.6 | |
As most credits are supported by elements from more than one category, resulting in more than one party being responsible for the same payments to SEK, the above tables reflect the counterparty (either borrower or guarantor) that SEK believes to be the stronger credit.
SEK exclusive of the S-system
SEK exclusive of the S-system reports credits in the following categories:
1. Medium and long-term export financing of durable goods and services.
2. Lines of credit for the refinancing of finance companies’, banks’ and exporting companies’ portfolios of revolving export receivables. Refinancing of export leasing agreements and short-term export finance. Credits for direct market investments abroad that will promote exports of Swedish goods and services. Credits for research and development, to promote Swedish industry and commerce.
3. Credits for investments in infrastructure to promote Swedish industry and commerce.
SEK’s lending also includes financing in cooperation with intergovernmental organizations and foreign export credit agencies. (These credits are included under the relevant underlying type of credit).
The Company also extends export financing by establishing credit lines or protocols, principally with countries in Eastern Europe and Asia. (These credits are included under the relevant underlying type of credit).
11
Credits outstanding (exclusive of those under the S-System) at December 31, 2006, 2005 and 2004 were distributed among SEK’s various categories of credits as follows:
Credits outstanding, type of credits | | 2006 | | 2005 | | 2004 | |
(Skr million) | | | | | | | |
| | | | | | | |
Financing of capital goods exports | | 22,383 | | 14,082 | | 9,149 | |
Other export related credits | | 40,482 | | 37,880 | | 29,260 | |
Infrastructure | | 19,158 | | 15,846 | | 12,783 | |
Total | | 82,023 | | 67,808 | | 51,192 | |
Offers granted by the Company for credits that borrowers accepted (exclusive of those under the S-System) during the years ended December 31, 2006, 2005 and 2004 were distributed among SEK’s various categories of credits as follows:
Offers accepted, type of credit | | 2006 | | 2005 | | 2004 | |
(Skr million) | | | | | | | |
| | | | | | | |
Financing of capital goods exports | | 16,136 | | 7,767 | | 4,171 | |
Other export related credits | | 16,499 | | 15,858 | | 10,178 | |
Infrastructure | | 15,751 | | 10,705 | | 5,781 | |
Total | | 48,386 | | 34,330 | | 20,130 | |
A long-term trend has been the reduction in importance of the traditional financing of durable goods in Sweden’s export industry. SEK’s services have therefore changed over time to meet customers’ needs. This means that a credit granted could be either in the form of capital goods export financing or another category of export related credits such as direct lending to export companies through acquisitions of securities issued under the companies’ capital markets programs. As SEK is a relatively small player in the market, the changes in volumes from year to year are more the effect of specific business opportunities than the effect of fluctuation in the overall volume of the markets for export credits.
The volume of infrastructure credits reflects the decision of the shareholders, including the Swedish Government, in 1996 to broaden SEK’s mandate to include infrastructure financing that directly or indirectly enhances the Swedish export industry. In that connection municipalities and other public authorities in Sweden and elsewhere in the Nordic region have become an increasingly important sector of business that SEK targets.
Export financing is extended at prevailing market rates of interest. The Company normally makes credit offers at a quoted interest rate that is subject to change prior to acceptance of the credit offer (an “indicative credit offer”). However, credit offers can also be made at a binding interest rate (a “firm credit offer”), but such credit offers have until now rarely been made and are then only valid for short periods. When a borrower accepts an indicative credit offer, the interest rate is set and a binding credit commitment by the Company arises.
Before the Company makes any credit commitment, it ensures that the currency in which the credit is to be funded is expected to be available for the entire credit period at an interest rate (taking into account the costs of currency swaps) that, as of the day the commitment is made, results in a margin that the Company deems sufficient. Except for the portion of the Company’s credits in Swedish kronor that are financed by the Company’s shareholders’ funds and untaxed reserves, the Company borrows, on an aggregate basis, at maturities corresponding to or exceeding those of prospective credits. The Company may accordingly decide not to hedge for movements in interest rate risk particular credit commitments until some time after they are made. Interest rate risks associated with such uncovered commitments are monitored closely and may not exceed interest rate risk limits established by the Board of Directors. The Company’s policies with regard to counterparty exposures are described in Item 11.b “Quantitative and Qualitative Disclosures about Market Risk — Risk Management”.
12
The Company’s initial credit offer and subsequent credit commitment set forth the maximum principal amount of the credit, the currency in which the credit will be denominated, the repayment schedule and the disbursement schedule.
The following table shows the currency breakdown of credit offers accepted for credits with maturities exceeding one year for each year in the three-year period ended December 31, 2006.
| | Percentage of credit offers accepted | |
Currency in which credit is denominated | | 2006 | | 2005 | | 2004 | |
Swedish kronor | | 40 | % | 49 | % | 43 | % |
Euro | | 41 | % | 41 | % | 36 | % |
U.S. dollars | | 18 | % | 7 | % | 20 | % |
Other | | 1 | % | 3 | % | 1 | % |
Total | | 100 | % | 100 | % | 100 | % |
The decrease in the Swedish kronor component of new credit offers accepted in 2006 reflects a slowdown in new infrastructure lending by SEK. The increase in the U.S. dollar component of new credit offers accepted in 2006 reflects a trend toward increased demand for traditional export credits from Swedish companies which is often denominated in U.S. dollar and increased volumes of new credits to Finnish companies and municipalities. The increase in the Swedish kronor component of new credit offers accepted in 2005 reflected increased infrastructure lending by SEK that year. The decline in the U.S. dollar component of new credit offers accepted in 2005 reflects a trend toward increased demand for euro-denominated credits from Swedish companies, and increased volumes of new credits to Finnish companies and municipalities.
S-system
The S-system was established by the State on July 1, 1978, as a State-sponsored export financing program designed to maintain the competitive position of Swedish exporters of capital goods and services in world markets. After a trial period, in April 1984 the Swedish Parliament extended the S-system indefinitely. The S-system today comprises the normal export financing program at CIRR (Commercial Interest Reference Rate) rates and a tied aid credit program. Pursuant to arrangements established in 1978 and amended from time to time thereafter, the Company administers the S-system on behalf of the State against compensation based mainly on outstanding credit volumes.
Pursuant to agreements between SEK and the State, as long as any credits or borrowings remain outstanding under the S-system, the difference between interest revenues and net commission revenues related to lending and liquid assets under the S-system, on the one hand, and interest expenses related to borrowing, all other financing costs and any net foreign exchange losses incurred by SEK under the S-system, on the other hand, are reimbursed by (or paid to) the State. SEK treats the S-system as a separate operation for accounting purposes, with its own income statement. Although the deficits (surpluses) of programs under the S-system are reimbursed by (or paid to) the State, any credit losses that may be incurred under such programs are not reimbursed by the State. Accordingly, SEK has to obtain appropriate credit support for these credits as well, all of which are reported on SEK’s balance sheet.
The S-system is designed to comply with the Arrangement on Guidelines for Officially Supported Export Credits of the Organization for Economic Cooperation and Development (the “OECD Consensus”), of which Sweden is a member. The OECD Consensus establishes minimum interest rates, required down payments and maximum credit periods for government-supported export credit programs. Terms vary according to the per capita income of the importing country.
SEK offers S-system financing at CIRR rates. The CIRR-rates for new credits are subject to periodic review and adjustment by the OECD. The OECD Consensus stipulates that credit offers can be valid for a period of not more than four months, during which period the commercial contract shall be signed. Thereafter the CIRR rate can be locked in for a maximum period of six months in order for the credit agreement to be finalized. No commitment fee is charged for Swedish CIRR credits. The arranging bank receives compensation of 0.25 percent per annum, based on the outstanding credit amount, to cover its costs for arranging and managing the credit.
13
The OECD Consensus also provides eligibility standards for tied or partially tied concessionary credits. In principle, such credits are not permitted to be extended to countries whose per capita GNP for at least two consecutive years have exceeded the World Bank threshold for 17-year loans. Tied or partially tied concessionary credits to other countries are not permitted to be extended to finance public or private projects that normally would be commercially viable if financed on market or OECD Consensus terms.
SEK participates with government agencies in a State-sponsored export financing program (the “Concessionary Credit Program”) for exports to certain developing countries, presently incorporating a foreign aid element of at least 35 percent. The foreign aid element is granted in the form of lower rates of interest and/or deferred repayment schedules, and the State reimburses SEK in the S-system for the costs incurred as a result of SEK’s participation in such program. In general, credits under the program are made with State guarantees administered by the Exportkreditnämnden (EKN) (Sweden’s Export Credits Guarantee Board). All such credits granted by SEK must also undergo SEK’s customary approval process.
The following table sets forth the volumes of offers accepted, undisbursed credits at year end, new credits disbursed and credits outstanding at year end under the various programs in the S-system for each year in the three-year period ended December 31, 2006. The increase in volumes of offers accepted and undisbursed credits at year end under the CIRR-credits program was related to an increased demand of traditional export credits with terms that are eligible in the CIRR-system. The increase in volumes of offers accepted and undisbursed credits at year-end under the concessionary credit program in 2005 was primarily related to a single transaction.
| | Concessionary
Credit Program | | CIRR-credits | | Total | |
(Skr million) | | 2006 | | 2005 | | 2004 | | 2006 | | 2005 | | 2004 | | 2006 | | 2005 | | 2004 | |
| | | | | | | | | | | | | | | | | | | |
Offers accepted | | 38 | | 126 | | 17 | | 8,499 | | 3,069 | | 2,602 | | 8,537 | | 3,195 | | 2,619 | |
Undisbursed credits at year-end | | 16 | | 107 | | 43 | | 14,147 | | 8,960 | | 10,183 | | 14,163 | | 9,067 | | 10,226 | |
New credits disbursed | | 102 | | 59 | | 34 | | 1,935 | | 4,435 | | 1 698 | | 2,037 | | 4,494 | | 1,732 | |
Credits outstanding at year-end | | 858 | | 1,265 | | 1,410 | | 8,267 | | 9,074 | | 5,330 | | 9,125 | | 10,339 | | 6,740 | |
Credit Support for Outstanding Credits
The Company’s policies with regard to counterparty exposures are described in Item 11.b “Quantitative and Qualitative Disclosures about Market Risk — Risk Management”.
14
The following table shows the credit support by category for the Company’s outstanding credits for the five-year period ended December 31, 2006. As most credits are supported by elements from more than one category, resulting in more than one party being responsible for the same payments to SEK, this table reflects the counterparty (either borrower or guarantor) that SEK believes to be the stronger credit.
| | Percentage of Total Credits | |
| | Outstanding at December 31, | |
Consolidated Group | | 2006 | | 2005 | | 2004 | | 2003 | | 2002 | |
Credits with Swedish State guarantees via EKN (A) | | 14 | % | 17 | % | 16 | % | 20 | % | 26 | % |
Credits with Swedish State guarantees via National Debt Office (B) | | 1 | % | 1 | % | 2 | % | 3 | % | 3 | % |
Credits with Swedish State guarantees (total) | | 15 | % | 18 | % | 18 | % | 23 | % | 29 | % |
Credits to or guaranteed by Swedish credit institutions (C) | | 17 | % | 19 | % | 17 | % | 15 | % | 15 | % |
Credits to or guaranteed by foreign bank groups or governments (D) | | 35 | % | 33 | % | 28 | % | 28 | % | 25 | % |
Credits to or guaranteed by other Swedish counterparties, primarily corporations (E) | | 7 | % | 8 | % | 10 | % | 10 | % | 14 | % |
Credits to or guaranteed by Municipalities | | 17 | % | 17 | % | 18 | % | 14 | % | 7 | % |
Credits to or guaranteed by other foreign counterparties, primarily corporations | | 9 | % | 5 | % | 9 | % | 10 | % | 10 | % |
Total | | 100 | % | 100 | % | 100 | % | 100 | % | 100 | % |
See “Lending Operations — General” for information on the geographical distribution of borrowers.
(A) EKN guarantees are in substance credit insurance against losses caused by the default of a foreign borrower or buyer in meeting its contractual obligations in connection with the purchase of Swedish goods or services. In the case of a foreign private borrower or buyer, coverage is for “commercial” and, in most cases, “political” risks. Coverage for “commercial” risk refers to losses caused by events such as the borrower’s or buyer’s insolvency or failure to make required payments within a certain time period (usually six months). Coverage for “political” risk refers to losses caused by events such as a moratorium, revolution or war in the importing country or the imposition of import or currency control measures in such country.
Generally, an EKN guarantee covers 85-90 percent of losses incurred due to covered risks. Disputed claims must be resolved by a court judgment or arbitral award, unless otherwise agreed by EKN. In the table above, only the percentages guaranteed have been included.
EKN is a State agency whose obligations are backed by the full faith and credit of Sweden.
(B) State guarantees issued by the National Debt Office are unconditional obligations backed by the full faith and credit of Sweden.
(C) At December 31, 2006, credits in this category amounting to approximately 6 % (2005: 8, 2004: 10) of total credits were obligations of the four largest commercial bank groups in Sweden including credit guarantees in the form of bank guarantees or credit derivatives.
(D) Principally obligations of other Nordic, Western European or North American bank groups, together with obligations of Western European governments including credit guarantees in the form of bank guarantees or credit derivatives.
(E) At December 31, 2006, approximately 66% (2005: 79, 2004: 71) of credits in this category represented credits to or guarantees issued by ten large Swedish corporations.
15
See also Item 11. b) “Quantitative and Qualitative Disclosures about Market Risk — Risk Management” for a discussion of how bank guarantees and credit derivatives are used to mitigate credit exposures.
The decline in credits guaranteed by the Swedish Government is a result of SEK’s diversification strategy. Under this strategy, SEK’s intention is to reduce the relative proportion of its risk exposure towards Swedish counterparties, although the reduction in Swedish Government exposure has been largely offset by the increase in exposure to Swedish municipalities.
c. Organization
SEK organizes its activities into three main business areas: Corporate & Structured Finance, Capital Markets and SEK Securities.
Corporate & Structured Finance. The Corporate & Structured Finance group is responsible for all activities in general lending, export credits, project finance, leasing and other structured finance projects, as well as origination and advisory services. The business area Corporate has overall responsibility for SEK’s relationships with its customers. The business area Structured Finance is responsible for structured finance solutions, project financing and leasing products. As a complement to SEK’s lending activity, the business area Financial Advisors offers independent consulting services to both the private and public sectors based on SEK’s experience in various areas, especially export credits and project finance, risk management and capital markets.
Capital Markets. The Capital Markets group comprises four sub-functions: Funding, Liquidity Management, Syndication and Credit Investments. Funding is responsible for managing SEK’s borrowing program and Liquidity Management is responsible for the investment of SEK’s liquidity portfolio. See also Item 5, “Operating and Financial Review and Prospects — Liquidity, Capital Resources and Funding — Liquidity”. Syndication handles risk syndication and risk cover solutions. Credit Investments handles corporate bond investment and trading.
SEK Securities. AB SEK Securities is a wholly-owned subsidiary with a license from the Swedish Financial Supervisory Authority to conduct a securities business. AB SEK Securities intermediates capital markets products to third party investors principally in the primary market via private placements.
In addition, SEK maintains a risk control unit that operates independently of the business areas. See Item 11b, “Quantitative and Qualitative Disclosures About Market Risk—Risk Management”.
d. Swedish Government Supervision
The Company operates as a credit market institution within the meaning of the Swedish Banking and Financing Business Act (the “Act”). As such, it is subject to supervision and regulation by the Swedish Financial Supervisory Authority (the “Supervisory Authority”), which licenses and monitors the activities of credit market companies to ensure their compliance with the Act and regulations thereunder and their corporate charters.
Among other things, the Supervisory Authority requires SEK to submit reports on a three-month, six-month and twelve-month basis and may conduct periodic inspections. The Supervisory Authority also may (and currently does) appoint an external auditor to participate with SEK’s independent auditors in examining the Company’s financial statements and the management of the Company.
As a credit market institution, SEK is also subject to regulation of its capital adequacy and limits on credit to a single customer pursuant to the Capital Adequacy and Large Exposures (Credit Institutions and Securities Companies) Act, as amended.
The capital adequacy requirements under Swedish law comply with international guidelines, including the recommendations issued by the Basel Committee on Banking Regulation and Supervisory Practices at the Bank for International Settlements (the “Basel Committee”). The principal measure of capital adequacy is a capital to risk asset ratio, which compares the capital base to the total of assets and off-balance sheet items. The capital base is divided into two components, one of them being “core” or “Tier
16
1” capital, which includes equity capital and, with certain limitations, non-cumulative preferred shares and similar instruments. Non-cumulative preferred shares and similar instruments may not be included in Tier 1 capital to the extent they exceed 15% of the Tier 1 capital other than non-cumulative preferred shares and similar instruments. The other component in the capital base is “supplementary” or “Tier 2” capital, which includes non-cumulative preferred shares and similar instruments not included in core capital, plus subordinated obligations with an original term of at least five years (with a deduction of 20% for each of the last five years prior to maturity). Until December 31, 2006 assets were assigned a weighting based on relative credit risk (0%, 10%, 20%, 50% or 100%) depending on the debtor or the type of collateral, if any, securing the assets. The minimum capital ratio requirement was 8%, and not more than 50% of an institution’s regulatory capital may comprise supplementary capital. SEK’s policy is to maintain a strong capital base, well in excess of the regulatory minimum. At December 31, 2006, SEK’s total regulatory capital ratio was 13.8% and its Tier 1 ratio was 9.4%. See also Item 5, “Operating and Financial Review and Prospects — Liquidity, Capital Resources and Funding — Capital Adequacy.”
As of January 1, 2007, the revised capital adequacy rules of the Basel Committee, referred to as Basel II, became applicable to credit institutions in Sweden and the EU, including SEK. In July 2005, SEK submitted an application to the Supervisory Authority related to the use of the Internal Ratings Based Approach when calculating risk-weighted claims under Basel II. The application was approved subject to legislation being fully implemented in Sweden. In March 2007, the Supervisory Authority finally determined that SEK can use an Internal Rating Based Approach when calculating risk-weighted claims under Basel II based on legislation adopted in Sweden in the beginning of 2007. The quantitative analysis regarding Pillar I (methods for calculating minimum capital requirements for certain risks) was implemented in 2005. During 2006 the required capital base, depending on the Company’s risk profile with regard to all relevant risks, was established (Pillar II). Reporting under the new rules will be made for the first time as of March 31, 2007. See also item 11. “Quantitative and Qualitative Disclosures About Market Risks” for a discussion regarding Basel II and its effects.
Under the regulatory rules for large exposures, a “large exposure” is defined as a (risk-weighted) exposure to a single counterparty (or counterparty group) that exceeds 10% of the institution’s regulatory total capital base. These rules state that no individual large exposure may exceed 25% of the regulatory total capital base of the institution, and that the aggregate amount of large exposures may not exceed 800% of the institution’s regulatory total capital base. The aggregate amount of SEK’s large exposures on December 31, 2006, was 148% of SEK’s regulatory total capital base, and consisted of risk-weighted exposures to eleven different counterparties (or counterparty groups). These counterparties (or counterparty groups) were all rated by at least one of the major rating agencies, Moody’s and Standard & Poor’s, with ratings of not lower than investment grade.
The Company’s subsidiary, AB SEK Securities, is licensed to conduct a securities business and as such is regulated by the Swedish Financial Supervisory Authority under the Securities Operations Act.
e. Competition
SEK is the only institution authorized by the State to make export financing credits under the S-system. In that connection, and with support from the Swedish State, SEK helps Swedish export companies compete with other export companies within OECD member countries which have similar support from their respective domestic export credit agencies, who also provide government-supported export credits. Lending from SEK exclusive of the S-system, including infrastructure credits mainly to municipalities, faces competition from other Swedish and foreign financial institutions, as well as from direct or indirect financing programs of exporters themselves. Deregulation and globalization of the world’s financial markets have resulted in an increasingly competitive environment for financial institutions, including SEK, for both lending opportunities and funding sources.
f. Property, Plants and Equipment
The Company owns, through its wholly-owned subsidiary AB SEKTIONEN, an office building in the City of Stockholm. The major part of the building is used by the Company as its headquarters.
Item 4A. Unresolved Staff Comments
None.
17
Item 5. Operating and Financial Review and Prospects
a. Overview
Substantially all of SEK’s revenues and net income derive from the net interest revenues earned on its credits and interest-bearing securities. Funding for these assets comes from shareholders’ funds and debt securities issued in the international capital markets. Accordingly, key elements in SEK’s profits from year to year are the spread, or difference, between the rate of interest earned on its debt-financed assets and the cost of that debt, the rate of interest earned on the investment of its shareholders’ funds and the outstanding volumes of credits and interest-bearing securities in the balance sheet, as well as the relative proportions of its assets funded by debt and shareholders’ funds.
In recent years SEK’s profit under Swedish GAAP has mainly been declining, however, with a break in the trend in 2006, which showed higher operating and net profits than the year before. The decline reflects several factors, including (1) reduction in shareholders’ funds in 2003 in connection with changes in SEK’s ownership, resulting in a higher portion of SEK’s assets being funded through debt financing, and (2) the lower interest rate environment in recent years that has resulted in maturing investments of the Company’s shareholders funds being reinvested at lower rates. However, both of these factors impact on operating profit has diminished during 2005 and 2006. One of the additional factors affecting net profit has been higher volumes of debt-financed interest-bearing assets in the balance sheet, however at lower margins. The margin on new business improved somewhat during 2006 but that has not yet provided any significant effect on net profit. Furthermore, increased costs related to new and pending regulations, particularly Basel II and IFRS, have affected net profit negatively in recent years, especially during 2005 and 2006.
The Company has continued to rebuild shareholder’s funds through retained earnings and a restrictive dividend policy. In recent years SEK has also expanded into business areas that may produce non-interest revenue, although commission income has not thus far made a material contribution to SEK’s revenues and profits.
b. Critical Accounting Policies and Estimates
Critical Accounting Policies and Estimates under Swedish GAAP
The Company has identified the followings critical accounting policies according to Swedish GAAP:
· Deferral hedge accounting
· Valuation principles when securities and derivatives are carried at fair value
· Foreign currency exchange revaluation
· Provisions for probable credit losses
The economic purpose of holding a derivative is consistently reflected in the accounting treatment under Swedish GAAP, both when applying deferral hedge accounting and when carried at fair value. Therefore, there is under Swedish GAAP no measurement or recognition inconsistency (sometimes referred to as an accounting mismatch or mixed measurement attributes) that would otherwise arise from measuring assets, liabilities or derivatives or recognizing the gains and losses on them on different bases.
Deferral hedge accounting
The Company has identified as critical accounting policies those accounting policies regarding the application of deferral hedge accounting according to Swedish GAAP. For accounting policies regarding deferral hedge accounting according to Swedish GAAP see the discussion below and Notes 1(j) and 1(q) to the Consolidated Financial Statements.
Certain of the Company’s lending and investing transactions are hedged on-balance sheet or off-balance sheet by transactions with matching principal or notional amounts, interest rates, currencies and other relevant factors, such that the Company’s exposure to changes in net fair values of such transactions due to
18
movements in interest and/or exchange rates is hedged. Under Swedish GAAP, SEK applies deferral hedge accounting for all transactions that are economically hedged. Economic hedging is done primarily on a contract-by-contract basis but in some cases on a portfolio basis.
For transactions without matched and offsetting balance sheet positions, SEK enters into derivative transactions, in order to achieve an effective economic hedge. These instruments include interest-rate basis related, currency related and other agreements that SEK uses for the purpose of hedging or eliminating mainly interest rate and currency exchange rate exposures as well as exposures related to embedded derivatives.
SEK accounts for derivatives in accordance with deferral hedge accounting rules under Swedish GAAP. If deferral hedge accounting is applicable, the change in the amortized cost of the derivative is recorded in earnings, which corresponds to a similar but opposite change in the amortized cost of the underlying assets or liabilities, also recorded in earnings. For the major part of transactions on or off balance sheet, both derivatives and underlying instruments are recorded at amortized cost.
Where the securities are carried at amortized cost, changes in their estimated fair values, arising from changes in management’s assessment of the underlying assumptions, may result in the recording of a permanent diminution in their value. In such case, it would also be necessary for SEK’s management to exercise judgment as to whether or not changes in the underlying valuation assumptions are only temporary. SEK monitors on an ongoing basis the validity of such assumptions.
Valuation principles when securities and derivatives are carried at fair value
For financial instruments classified as held-for-trading both derivatives and underlying instruments are marked-to-market. In reporting the amounts of its assets and derivatives, and its revenues and expenses, the Company must make assumptions and estimates in assessing the fair value of certain assets and derivatives, especially where unquoted or illiquid securities or other debt instruments are involved. If the conditions underlying these assumptions and estimates were to change, the amounts reported could be different.
When the securities are carried at fair value, fair value is calculated with the use of market quotations, pricing models and discounted cash flows. Certain of the Company’s securities are not publicly traded, and quoted market prices are not readily available. However, different pricing models or assumptions or changes in relevant current information could produce different valuation results. Furthermore, the estimated fair value of a security may, under certain market conditions, differ significantly from the amount that could be realized if the security were sold immediately.
When the derivative instruments are carried at fair value, fair value is calculated based upon internally established valuations that are consistent with external valuation models, quotations furnished by dealers in such instruments or market quotations. However, different pricing models or assumptions or changes in relevant current information could produce different valuation results.
Although variability is inherent in these estimates, when carrying instruments at fair value for securities and derivatives, management believes the amounts presented in the financial statements under Swedish GAAP will be appropriate based upon the facts available.
Foreign currency exchange revaluation
SEK is economically hedged regarding foreign currency exchange revaluation effects related to revaluation of balance sheet components. A major part of its assets, liabilities and related derivatives is denominated in foreign currency. Under Swedish GAAP both the assets and the liabilities are translated at closing exchange rates and the differences between historical book value and current value are reflected as foreign exchange effects in revenues and expenses, where they largely offset each other. This reflects the economic substance of SEK’s policy of holding assets financed by liabilities denominated in, or hedged into, the same currency.
Provisions for probable credit losses
Provisions for probable credit losses are made if and when SEK determines that the obligor under a credit or another asset held, and existing guarantees and collaterals, will probably fail to cover SEK’s full
19
claim. If the judgment underlying this determination were to change it could result in a material change in provisions for probable credit losses.
Critical Accounting Policies in Reconciliation to U.S. GAAP
The Company has also identified as critical accounting policies those accounting policies regarding the application of hedge accounting according to U.S GAAP. For accounting policies regarding hedge accounting and measurements of fair values according to U.S. GAAP see Note 37 to the Consolidated Financial Statements and Notes 1(j) and 1(q) to the Consolidated Financial Statements for comparison to Swedish GAAP.
On January 1, 2001, SFAS No. 133, Accounting for Derivative Instruments and Hedging Activities, and SFAS No. 138, Accounting for Certain Derivative Instruments and Certain Hedging Activities, became applicable to SEK. SEK did not achieve hedge accounting under U.S. GAAP for any of its instruments at the inception of SFAS 133. Although SEK structured a substantial portion of its transactions to qualify for hedge accounting treatment under these rules beginning in July 2002, certain transactions for which SEK is economically hedged continue not to qualify for hedge accounting treatment under U.S. GAAP. For these reasons, since January 1, 2001 there have been and are expected to continue to be significant differences between SEK’s net profit and shareholders’ funds calculated under Swedish GAAP as compared to these items calculated under U.S. GAAP. These differences arise primarily from the requirements of U.S. GAAP that (1) changes in the fair value of derivatives that are not part of a qualifying fair value hedge relationship are required to be recognized currently in the income statement while the contract which the derivative is economically hedging is carried at amortized cost and (2) changes in currency exchange rates affecting the fair value of foreign-currency instruments in the available-for-sale portfolio that are not eligible for hedge accounting are reported only as increases or decreases in shareholders’ funds, while the largely offsetting changes in the Swedish kronor position of the related funding must be recognized currently in the income statement. Based on its experience and knowledge of the functioning of SEK’s economic hedging, management believes Swedish GAAP better reflects the effects of the economic hedge relationships on net income and shareholders’ funds.
Under U.S. GAAP some of the inherent uncertainty of valuation techniques when calculating fair value related to securities and derivatives described under Swedish GAAP accounting policies will have a greater impact. This is due to the fact that a larger portion of financial assets, liabilities and derivatives is carried at fair value with effects of changes in fair value going through the income statement or directly through equity.
SEK has determined that Swedish kronor (Skr) is its functional currency under U.S. GAAP.
For a more detailed description of critical accounting policies and estimates under U.S. GAAP, see Note 37 to the Consolidated Financial Statements.
Implementation of International Financial Reporting Standards
SEK will adopt International Financial Reporting Standards (IFRS) for the fiscal year beginning January 1, 2007, with 2006 being the comparative year. The accounting rules for hedge accounting in International Accounting Standard 39 Financial Instruments: Recognition and Measurement (IAS 39) will create the most significant change to SEK’s present accounting policies under Swedish GAAP. For a discussion of SEK’s internal project for conversion to IFRS and the impact on SEK’s balance sheet and equity of implementing IFRS, see Note 1 to the Consolidated Financial Statements. An increased volatility in profit or loss and in shareholders’ funds related to IFRS can be expected in 2007 and onwards.
20
The following main adjustments in the balance sheet and in the shareholders’ funds of the consolidated group as of January 1, 2006, will result from the adoption of IFRS from January 1, 2007.
Adjustments in the balance sheet on January 1, 2006
(Skr billion) | | Sw. GAAP | | Adjustment | | IFRS | |
Total assets | | 207.5 | | 4.2 | | 211.7 | |
of which credits | | 43.4 | | 0.2 | | 43.6 | |
of which securities | | 149.4 | | 0.9 | | 150.3 | |
of which derivatives | | 7.5 | | 3.1 | | 10.6 | |
| | | | | | | |
Total liabilities | | 203.8 | | 4.3 | | 208.1 | |
of which senior securities issued | | 187.8 | | -7.4 | | 180.4 | |
of which subordinated securities issued | | 3.3 | | 0.4 | | 3.7 | |
of which derivatives | | 5.8 | | 11.3 | | 17.1 | |
Adjustments in shareholders’ funds on January 1, 2006
(Skr billion) | | | |
Opening balance in accordance with old accounting principles (Sw. GAAP) | | 3.7 | |
Adjustments to shareholders’ funds related mainly to IAS 39 | | -0.1 | |
Opening balance in accordance with new accounting principles (IFRS) | | 3.6 | |
c. Assets and Business Volume
Total Assets
SEK’s total assets at December 31, 2006, increased to Skr 229.2 billion (2005: 207.5). The main components of the net change in total assets were a Skr 8.8 billion increase in the portfolio of interest-bearing securities, and a Skr 13.0 billion increase in the credit portfolio. Currency exchange effects negatively affected the book values of these portfolios by approximately Skr 7.6 billion and Skr 5.3 billion, respectively, primarily as a result of the depreciation of the Euro and the U.S. dollar against the Swedish kronor. Credits outstanding represented Skr 91.1 billion (2005: 78.1) of total assets, while interest-bearing securities represented Skr 123.4 billion (2005: 114.6).
In addition to the revenue-generating assets, the balance sheet at year-end 2006 also included Skr 4.2 billion (2005: 4.0) representing accrued and prepaid items, Skr 0.2 billion (2005: 0.2) representing non-financial assets, and Skr 10.3 billion (2005: 10.6) representing other assets. The main component of the last item is the aggregate net value of derivative instruments with positive values (see Note 1 (q) to the Consolidated Financial Statements). The approximate month-end average volume of total assets during the year was Skr 220.6 billion (2005: 191.0).
SEK maintains a high level of liquid assets and a low funding risk. At December 31, 2006, the aggregate volume of borrowed funds and shareholders’ funds exceeded the aggregate volume of credits outstanding and credits committed though not yet disbursed at all maturities. See also the graph “Development over Time of SEK’s Available Funds” under Item 11b, “Quantitative and Qualitative Disclosures About Market Risks — Risk Management”. SEK’s current policy is to invest its surplus liquidity in instruments with average maturities not exceeding three years and average ratings of at least AA3 from Moody’s and AA- from Standard & Poor’s.
Amounts of credits reported under the “old format” include all credits — i.e., credits granted against documentation in the form of interest-bearing securities (which are not included in the credits reported as credits under the “new format”), as well as credits granted against traditional credit agreement documentation. Amounts of credits under new format includes credits granted against traditional credit agreement documentation, deposits with banks and states, repurchase agreements, and cash on demand. Credits under new format is a presentation in accordance with Swedish GAAP, while credits under old format is a non-GAAP presentation. Amounts reported under the old format, in SEK’s opinion, reflect the real credit/lending volumes of SEK. SEK views credits granted against documentation in the form of interest-bearing securities as real credit volumes, while deposits with banks and states, repurchase
21
agreements, and cash on demand in SEK’s opinion is a part of liquidity volumes. The comments regarding lending volumes included in this report, therefore, refer to amounts based on the old format unless otherwise stated. (See also Note 17 to the Consolidated Financial Statements.)
The following table shows a reconciliation from the Swedish GAAP presentation (new format) to a non-GAAP presentation (old format) for Credits Outstanding as of December 31, 2006 and 2005.
| | 2006 | | 2005 | |
| | Consolidated | | Parent | | Of which | | Consolidated | | Parent | | Of which | |
| | Group | | Company | | S-system | | Group | | Company | | S-system | |
Total credits outstanding (new format) | | 56,134.1 | | 56,133.5 | | 9,131.7 | | 43,393.4 | | 43,439.5 | | 10,351.4 | |
Deposits with banks and states, repurchase agreements and cash on demand | | -4,094.8 | | -4,094.2 | | -6.8 | | -2,453.0 | | -2,499.0 | | -12.1 | |
Credits reported as interest-bearing securities | | 39,109.2 | | 39,109.2 | | — | | 37,206.8 | | 37,206.8 | | — | |
Total credits outstanding (old format) | | 91,148.5 | | 91,148.5 | | 9,124.9 | | 78,147.4 | | 78,147.4 | | 10,339.3 | |
| | | | | | | | | | | | | | |
Business Volume
In a market still characterized by high liquidity and reduced margins, SEK concluded a very high level of financial transactions with customers. Such financial transactions increased by 47% compared with the previous year. SEK’s total volume of new customer financial transactions during 2006 amounted to Skr 63.9 billion (2005: 43.5). New credits accepted totaled Skr 56.9 billion (2005: 37.5) and syndicated customer transactions totaled Skr 7.0 billion (2005: 6.0).
Credits to corporates (including export credits) represented the largest share, as well as the largest increase among new credits. New export credits amounted to Skr 18.6 billion (2005: 11.3), a reflection of the successful Swedish exporting industry.
SEK continues to be active in the field of infrastructure finance, both as a lender and an advisor. Credits to Swedish municipalities for infrastructure purposes remain on a high level. Many of these projects include measures to improve environmental factors.
SEK has continued to offer credits to small and medium sized enterprises (SME’s). In this area SEK also expanded its advisory activities.
New Customer Financial Transactions:
| | Year ended December 31, | |
(Skr billion) | | 2006 | | 2005 | |
Export credits | | 18.6 | | 11.3 | |
Other credits to exporters | | 6.0 | | 1.3 | |
Credits to other corporates | | 3.1 | | 0.4 | |
Credits to public sector | | 15.8 | | 12.1 | |
Credits to financial sector | | 13.4 | | 12.4 | |
Syndicated customer transactions | | 7.0 | | 6.0 | |
Total | | 63.9 | | 43.5 | |
Skr 8.5 billion (2005: 3.2) of long-term credits was granted under the S-system.
The total amount of credits outstanding and credits committed though not yet disbursed increased during the year to Skr 113.0 billion at December 31, 2006 (2005: 92.3), of which Skr 91.1 billion (2005: 78.1) represented credits outstanding, an increase of 17%. The increase related mainly to increased new business volumes. Of the aggregate amount of credits outstanding and credits committed, Skr 23.3 billion (2005: 19.4) was related to the S-system, of which Skr 9.1 billion (2005: 10.3) represented credits outstanding.
22
The aggregate amount of outstanding offers for new credits at year-end decreased to Skr 25.8 billion (2005: 36.8). Of that amount offers for new credits outstanding in the S-system at December 31, 2006 were Skr 12.6 billion (2005: 35.2). The decrease in amount of outstanding offers for new credits in the S-system was related to the expiration of a few larger offers as well as an increased portion of offers outstanding being accepted by borrowers in 2006.
| | | | | | | | | | | | |
| | Total | | | | Of which S-system |
| | | | | | Total | | | | Of which | | |
| | | | | | | | | | CIRR- | | Concessionary |
| | | | | | | | | | credits | | credits |
Volume Development, Lending (Skr million) | | 2006 | | 2005 | | 2006 | | 2005 | | 2006 | | 2006 |
Offers of direct long-term credits accepted (A) | | 56,923 | | 37,525 | | 8,537 | | 3,195 | | 8,499 | | 38 |
Syndicated customer transactions | | 7,010 | | 5,950 | | — | | — | | — | | — |
Total customer financial transactions | | 63,933 | | 43,475 | | 8,537 | | 3,195 | | 8,499 | | 38 |
Undisbursed credits at year-end (A) | | 21,889 | | 14,171 | | 14,163 | | 9,067 | | 14,147 | | 16 |
Credits outstanding at year-end (old format) (A) | | 91,148 | | 78,147 | | 9,125 | | 10,339 | | 8,267 | | 858 |
Credits outstanding at year-end (new format) (A) | | 56,134 | | 43,393 | | 9,132 | | 10,351 | | 8,274 | | 858 |
(A) Amounts of credits reported under the “old format” include all credits — i.e., credits granted against documentation in the form of interest-bearing securities (which are not included in the credits reported as credits under the “new format”), as well as credits granted against traditional credit agreement documentation. Amounts reported under the old format, in SEK’s opinion, reflect the real credit/lending volumes of SEK. The comments regarding lending volumes included in this report, therefore, refer to amounts based on the old format unless otherwise stated. See also Note 17 to the Consolidated Financial Statements.
d. Counterparty Risk Exposures.
SEK aims to maintain its asset quality at a high level. The table “Counterparty Risk Exposures” in Item 11.b, “Quantitative and Qualitative Disclosures About Market Risk — Risk Management”, shows the distribution of risk exposures to the various categories of counterparties of SEK’s on-balance sheet assets and off-balance sheet items. There were no major shifts in the breakdown of SEK’s counterparty risk exposures. Of the total risk exposures 67% (2005: 69) were against banks, mortgage institutions and other financial institutions; 19% (2005: 16) were against highly rated OECD states; 8% (2005: 7) were against local and regional authorities; and 6% (2005: 8) were against corporations.
SEK is a party to financial instruments with off-balance sheet exposures in its ordinary course of business. The amounts of such exposures are shown in the table “Capital Base and Required Capital” under “—Liquidity, Capital Resources and Funding — Capital Adequacy”. These instruments include interest-rate related, currency related and other agreements that SEK uses for the purpose of hedging or eliminating mainly interest rate and currency exchange rate exposures. The accounting policies applied to such instruments are described in Note 1(q) to the Consolidated Financial Statements. It can be noted that certain values related to derivatives and other financial instruments, traditionally denoted “off-balance sheet instruments”, are accounted for as on-balance sheet items included in the items “Other assets” and “Other liabilities”.
SEK has maintained, and intends to maintain, a conservative policy as regards counterparty exposures arising from its credit portfolio and from other assets as well as from derivative instruments and other financial instruments traditionally accounted for as off-balance sheet instruments. SEK’s policy as regards to counterparty exposures is to be selective in its acceptance of counterparty exposures in order to ensure high overall credit quality in its portfolio.
23
e. Results of Operations
SEK
Operating profit in 2006 was Skr 543.2 million (2005: 498.1, 2004: 611.8). The increase in operating profit in 2006 compared with 2005 was related mainly to an increase in net interest earnings, due primarily to increased volumes of debt-financed assets, that offset higher administrative costs in 2006 than in 2005. The decrease in operating profit in 2005 compared with 2004 was mainly related to the recovery of a credit loss in 2004 amounting to approximately Skr 45 million.
Net interest earnings totaled Skr 797.8 million (2005: 759.1, 2004: 801.7). Net interest earnings include net margins from debt-financed assets, on the one hand, and revenues from the investment portfolio (i.e., the long-term fixed-rate assets financed by SEK’s equity), on the other hand. The increase in total net interest earnings was due to increased net interest earnings from debt-financed assets.
For the financial year 2006, the contribution to net interest earnings from debt-financed assets was Skr 609.6 million (2005: 571.1, 2003: 562.3). The increase was a result of significantly increased average volumes of debt-financed assets outstanding during 2006 compared to 2005 and 2004. The underlying month-end average volume of such debt-financed assets was Skr 191.7 billion (2005: 165.4, 2004: 137.9). The increase in volumes was related both to the credit portfolio and to the liquidity portfolio both in 2006 and 2005 even though in 2006 the increase in the credit portfolio was the more significant increase.
The average margin of debt-financed assets was 0.32 % per annum (2005: 0.35, 2004: 0.41). The decrease in average margin of debt financed assets in 2006 was due to decreased margins in the credit portfolio as a result of higher margins in old credits that have matured than in the new credits accepted during the year. Margins in new credits accepted have, however, increased somewhat in 2006 compared with 2005. The decrease in average margin in debt financed assets 2005 compared to 2004 was due to high volumes of credit granted to the financial and public sectors with relatively lower margins than in the corporate sector.
The contribution to net interest earnings from the investment portfolio was Skr 188.2 million (2005: 188.0, 2004: 239.4). The decline in 2005 compared to 2004 was due to lower average yields on the portfolio, in which some long-term, fixed-rate assets with high interest rates matured and were reinvested at substantially lower interest rates. During 2006 this effect was not as significant as previous years.
Commissions earned were Skr 26.4 million in 2006, compared to commissions earned of Skr 14.0 million in 2005 and Skr 15.9 million in 2004. The increase in 2006 was due mainly to higher activities in financial advisory services and higher commission rates for capital market transactions in SEK Securities. The decrease in 2005 compared with 2004 was mainly due to lower commission rates for capital market transactions.
Commissions incurred amounted to Skr 26.7 million (2005: 30.8, 2004: 17.2). The increase in commissions incurred during 2005 was mainly due to the fees of advisers assisting SEK in preparing to comply with certain regulatory requirements, primarily Basel II and IFRS. During 2006 this effect was not as significant as during 2005.
Operating profit in 2006 includes Skr 25.4 million (2005: 22.8, 2004: 17.9) representing remuneration from the S-system, based mainly on outstanding volumes of credits. This is compensation paid to SEK for carrying the S-system credits and the related credit risks in SEK’s balance sheets. The average outstanding volume of credits outstanding in the S-system increased by Skr 1.7 billion in 2006 and increased by Skr 0.6 billion in 2005, resulting in an increase in the remuneration in both years compared with the year before.
Operating profit in 2006 also includes net results of financial transactions amounting to Skr 3.8 million (2005: 1.4, 2004: 5.3). Net results of financial transactions include market valuation effects in the trading portfolio and currency exchange effects as well as realized profits. The variation in net results of financial transactions arises primarily from unrealized market valuation effects.
24
Administrative expenses in 2006 increased to Skr 254.0 million (2005: 238.4, 2004: 230.3). The increase in administrative expenses was due mainly to costs related to activities to secure compliance with new and pending regulations regarding capital adequacy, financial reporting and corporate governance. Costs for new regulations were also included in commissions incurred. These factors also contributed to the increase in 2005 compared to 2004. The increase in 2006 also reflected higher personnel expenses. The average number of employees was 151 in 2006 (2005:147, 2004: 131).
During 2006 the administrative expenses were affected by a Skr 2.8 million provision under SEK’s general incentive system for its staff. No provision related to the system was made in 2005. During 2004 the administrative expenses included a Skr 12.9 million provision under the system. The total cost for the incentive system for each individual year is limited to an amount equaling two months salary per employee plus social insurance costs. In addition to the general incentive system, SEK is also party to individual, performance-related remuneration agreements.
Depreciation of non-financial assets increased to Skr 30.4 million (2005: 29.7, 2004: 26.4). Costs were mainly related to depreciations of intangible assets related to SEK’s business system. The essential parts of the replacement of SEK’s business system were concluded at the end of 2004.
No credit losses were incurred during 2006, 2005 and 2004. During 2004 a Skr 45.3 million recovery of a credit loss was recognized in income.
Net profit for 2006 was Skr 385.6 million (2005: 346.9, 2004: 439.6), after charges for taxes amounting to Skr 157.6 million (2005: 151.2, 2004: 172.2). The effective tax rate for 2006 was 29.0 % (2005: 30.4, 2004: 28.1). The decrease in effective tax rate in 2006 compared with 2005 was related to an increased amount of non-taxable income. The increase in effective tax in 2005 compared with 2004 was related to new tax regulations in Sweden from 2005. In addition to the standard tax rate (28%), taxes related to holding untaxed reserves have been imposed since 2005.
The net profit for 2006, reconciled to U.S. GAAP, was Skr 2,146.2 million, compared to a net loss of Skr 1,537.9 million in 2005 and a net profit of Skr 1,076.7 million in 2004. The aggregate U.S. GAAP adjustments, net of the related tax effect, produced a positive adjustment of Skr 1,760.6 million in 2006, compared to a negative adjustment of Skr 1,884.8 million in 2005 and a positive adjustment of Skr 637.1 million in 2004.
These substantially higher adjustments (positive or negative) in the U.S. GAAP reconciliation during the three year period presented above, when compared to periods prior to 2001, were primarily the result of the application, beginning in 2001, of Statement of Financial Accounting Standard 133 (SFAS 133), which has increased the volatility of SEK’s U.S. GAAP net income and shareholders’ funds. SFAS 133 requires, among other things, that changes in the fair value of derivatives that are not part of a qualifying fair value hedge relationship must be recognized currently in the income statement. Positive adjustments to U.S. GAAP income for derivatives and hedging activities, before related tax effects, amounted to a positive adjustment of Skr 183.3 million in 2006, compared to positive adjustments in 2005 (Skr 162.5 million) and 2004 (Skr 82.6 million). Because a substantial portion of the Company’s assets, liabilities and derivatives were structured to qualify for hedge accounting under SFAS 133 from July 1, 2002, after that date there has been some reduction in volatility in U.S. GAAP income except for the effects of the U.S. GAAP treatment of currency exchange rate changes discussed in the next paragraph. A main component of the remaining volatility in income for derivatives and hedging activities is related to derivatives in the portfolio of held-to-maturity securities for which hedge accounting of interest rate risk is not permitted under U.S. GAAP. Another main component of the remaining volatility is related to derivatives that are used to hedge perpetual subordinated debt but which do not yet qualify for hedge accounting. It should be noted that SEK is economically hedged for transactions on which hedge accounting is applicable under Swedish GAAP, but not under U.S. GAAP. For this reason, management believes Swedish GAAP better reflects the effects of the economic hedge relationships on net income and shareholders’ funds related to transactions that qualify for hedge accounting under Swedish GAAP, but not under U.S. GAAP.
Related to this development is the impact of adjustments under U.S. GAAP for changes in currency exchange rates affecting the fair value of foreign currency denominated instruments in SEK’s available-for-sale portfolio that are not eligible for hedge accounting under SFAS 133 and the carrying value of their related funding. The effect of changes in exchange rates on the instruments themselves are reported only as increases
25
or decreases in shareholders’ funds, but the largely offsetting changes in the Swedish kronor position of the related funding must be recognized currently in the income statement. In 2006, when the Swedish kronor appreciated against funding currencies, SEK reported a positive adjustment of Skr 2,302.9 million for foreign exchange differences in computing net profit under U.S. GAAP (with a corresponding negative adjustment of Skr 2,302.9 million to other comprehensive income in shareholders’ funds). In 2005, when the Swedish kronor depreciated against these funding currencies, SEK reported a negative adjustment to net loss under U.S. GAAP for foreign exchange differences, before related tax effects, of Skr 2,617.9 million (with corresponding positive adjustments of Skr 2,617.9 million during 2005 to other comprehensive income in shareholders’ funds). In 2004, when the Swedish kronor appreciated against funding currencies, SEK reported a positive adjustment of Skr 1,000.0 million for foreign exchange differences in computing net profit under U.S. GAAP (with a corresponding negative adjustment of Skr 1,000.0 million to other comprehensive income in shareholders’ funds).
It should be noted that SEK is economically hedged against the foreign currency exchange effects of the revaluation of balance sheet components. For this reason, management believes Swedish GAAP better reflects the effects of the economic hedge relationships on net income related to foreign currency denominated instruments in the available-for-sale portfolio.
The reconciliation of SEK’s net income to U.S. GAAP was negatively affected by a loss in 2006 from SEK’s repurchase of its own debt, which under U.S. GAAP is recognized immediately in the income statement, amounting to Skr 142.2 million. In 2005, a corresponding gain positively affected the adjustments to the income statement, amounting to Skr 13.0 million. There were corresponding adjustments amounting to a loss of Skr 21.9 million in 2004.
See Note 37 to the Consolidated Financial Statements.
The S-system
The difference between interest revenues, net commission revenues and any net foreign exchange gains related to lending and liquid assets under the S-system, on the one hand, and interest expenses related to borrowing, all financing costs and any net foreign exchange losses incurred by SEK under the S-system, on the other hand, is reimbursed by or, as applicable, paid to the Swedish State and, therefore, has no impact on operating profit or net profit.
CIRR credits, one of the two types of credits in the S-system, contributed to the S-system results with a surplus of Skr 26.6 million in 2006 (2005: 113.3, 2004: 145.3). The decline in results from CIRR credits are mainly due to maturing transactions with positive margins being replaced with credits with negative margins.
Costs related to concessionary credits, the other type of credits in the S-system, were Skr 64.4 million in 2006 (2005: 90.5, 2004: 126.4). Decreases in net interest costs for concessionary credits are mainly due to a continuing decrease in volume of outstanding concessionary credits.
The S-system paid a net compensation to SEK amounting to Skr 25.4 million in 2006 (2005: 22.8, 2004: 17.9). This is compensation paid to SEK for carrying the S-system credits and the related credit risks on SEK’s balance sheets. The State, on the other hand, reimbursed SEK an additional Skr 12.4 million to cover negative net interest and net foreign exchange differences. In 2005, SEK paid a net amount of Skr 45.6 million, and in 2004 SEK paid a net amount of Skr 36.8 million related to positive net interest and foreign exchange differences.
Results in the S-System by Type of Credit | |
(Skr million) | | CIRR credits | | Concessionary credits | | Net result for S-system | |
| | 2006 | | 2005 | | 2004 | | 2006 | | 2005 | | 2004 | | 2006 | | 2005 | | 2004 | |
Interest revenues/(expenses) | | 48.0 | | 135.9 | | 155.4 | | (61.8 | ) | (87.0 | ) | (121.6 | ) | (13.8 | ) | 48.9 | | 33.9 | |
Remuneration to SEK | | (22.8 | ) | (19.3 | ) | (13.0 | ) | (2.6 | ) | (3.5 | ) | (4.8 | ) | (25.4 | ) | (22.8 | ) | (17.9 | ) |
Foreign exchange differences | | 1.4 | | (3.3 | ) | 2.9 | | — | | — | | — | | 1.4 | | (3.3 | ) | 2.9 | |
Total | | 26.6 | | 113.3 | | 145.3 | | (64.4 | ) | (90.5 | ) | (126.4 | ) | (37.8 | ) | 22.8 | | 18.9 | |
26
f. Liquidity, Capital Resources and Funding
Liquidity
In accordance with SEK’s funding and liquidity policies, at December 31, 2006 the aggregate volume of funds borrowed and shareholders’ funds exceeded the aggregate volume of credits outstanding and credits committed though not yet disbursed at all maturities. See the graph “Development over Time of SEK’s Available Funds” shown below in Item 11b, “Quantitative and Qualitative Disclosures About Market Risk — Risk Management”.
SEK endeavors to take advantage of borrowing opportunities that arise and, where SEK deems it advantageous, to pre-fund its credits. Its interest-bearing securities, other than credits, were Skr 119.3 billion at December 31, 2006 (2005: 112.1), an increase of 6.4 % compared to 2005. The increase in these investment securities reflected SEK’s increased borrowing activities in response to well diversified borrowing opportunities in all major capital markets.
SEK’s policy is to maintain a high degree of liquidity in its portfolio of interest-bearing securities. At December 31, 2006, the book value of its interest-bearing securities with maturities of one year or less was Skr 43.1 billion (2005: 55.1). At December 31, 2006,the aggregate of SEK’s credits and interest-bearing securities with maturities of one year or less was lower than its total senior debt with such maturities by Skr 16.5 billion while at December 31, 2005 the aggregate of SEK’s credits and interest-bearing securities with maturities of one year or less exceeded its total senior debt with such maturities by Skr 16.0 billion . However, in terms of liquidity planning, SEK views its total portfolio of liquid assets as available liquid funds. See also diagram “Development over Time of SEK’s Available Funds” in Item 11.b “Quantitative and Qualitative Disclosures About Market Risk — Risk Management” which shows that SEK’s outstanding and committed credits are funded through maturity.
The following table sets forth as of December 31, 2006 the maturity profile of SEK’s contractual cash obligations.
Contractual Cash Obligations(3) | | | | At December 31, 2006 | |
(Skr million) | | | | Payments Due by Period | |
| | | | Less Than | | | | | | After | |
| | Total | | 1 year | | 1-3 years | | 4-5 years | | 5 years | |
Senior debt | | 206,677.2 | | 69,725.5 | | 46,978.6 | | 38,360.2 | | 51,612.9 | |
Subordinated debt(1),(2) | | 2,857.9 | | — | | — | | — | | 2,857.9 | |
Other long-term obligations | | 16.6 | | 0.5 | | 1.5 | | 1.0 | | 13.6 | |
Total contractual cash obligations | | 209,551.7 | | 69,726.0 | | 46,980.1 | | 38,361.2 | | 54,484.4 | |
(1) Maturity, 2015, subject to redemption beginning in 2010 with the approval of the Swedish Financial Supervisory Authority (Nominal Euro 50 million).
(2) Perpetual maturity subject to redemption beginning in 2008 with the approval of the Swedish Financial Supervisory Authority (Nominal USD 350 million).
(3) Excluding derivative contracts that relate to hedged positions. Current fair value of these derivatives as of December 31, 2006 and 2005, can be seen in the table Capital Base and Required Capital in the section Capital Adequacy. Cash payment obligations associated with such derivative financial instruments designated in fair value hedge relationships are arranged to correspond in timing and inversely in amount with cash flows under settlement of hedged assets and liabilities.
See also “— Funding” for additional information on the maturities of SEK’s debt.
27
The following table sets forth the maturity profile of credits outstanding as of December 31, 2006.
Credits outstanding | | | |
| | At December 31, 2006 | |
| | Amount of Credits Outstanding Expiration Per Period | |
| | Total | | Less | | | | | | | |
| | Amounts | | than | | | | | | After | |
(Skr million) | | Outstanding | | 1 year | | 1-3 years | | 4-5 years | | 5 years | |
Credits outstanding | | 91,148.5 | | 25,617.0 | | 29,963.4 | | 15,727.8 | | 19,840.3 | |
The following table sets forth the maturity profile of SEK’s commercial commitments as of December 31, 2006, all of which represented committed undisbursed credits:
Commercial Commitments | | | |
| | At December 31, 2006 | |
| | Amount of Commitment Expiration Per Period | |
| | Total | | Less | | | | | | | |
| | Amounts | | than | | | | | | After | |
(Skr million) | | Committed | | 1 year | | 1-3 years | | 4-5 years | | 5 years | |
Commercial commitments | | 21,888.5 | | 443.4 | | 904.0 | | 1,743.1 | | 18,798.0 | |
For further information about funding and liquidity risk see Item 11.b) “Quantitative and Qualitative Disclosures About Market Risk — Risk Management”, especially the diagram “Development over Time of SEK’s Available Funds” in Item 11.b.
Funding
The Company funds its lending primarily through public and private offerings of debt securities in the international capital and money markets. In many cases SEK has been willing to provide “tailor-made” structures responding to the needs of the investors. SEK also maintains a number of borrowing programs that allow it to respond quickly to borrowing opportunities or the need to fund a credit quickly.
SEK remained highly active in the capital markets in 2006. The volume of new long-term borrowing in the year was Skr 61.3 billion, compared with Skr 52.3 billion and Skr 38.8 billion for the years ended December 31, 2005 and 2004, respectively. New borrowings in 2006 comprised 348 transactions (2005: 278). During 2006 SEK made two global benchmark transactions: a five-year USD 1 billion issue, and a three-year USD 1 billion issue. These issues were received well by investors.
The outstanding volume of debt with original maturities of one year or less increased in 2006. This was related to the increased volumes mainly in the liquidity portfolio which were funded short-term awaiting more long-term funding. At December 31, 2006, outstanding debt with remaining maturities of one year or less was Skr 69,725.5 million, compared with Skr 45,809.0 million at December 31, 2005. The average maturity of SEK’s senior debt at December 31, 2006, had decreased to 5.5 from 6.2 years at December 31, 2005. See “Consolidated Statements of Cash Flows” in the Consolidated Financial Statements and Note 29 to the Consolidated Financial Statements. It should be noted that actual average maturity can be shorter than formal maturity reflected above.
The rating level established in 2003 has remained unchanged during 2006. SEK’s long-term debt rating is AA+ from Standard & Poor´s and Aa1 from Moody’s. The maintenance of high ratings is essential to SEK’s funding costs and profitability.
Capital Adequacy
The capital base as well as the minimum capital that SEK is required to maintain are determined in accordance with the capital adequacy requirements under Swedish law that are applicable to all credit
28
institutions and securities companies supervised by the Swedish Financial Supervisory Authority and conform to the rules of the Basel Committee.
SEK has a capital adequacy ratio that is well above the minimum required by law. At December 31, 2006, the regulatory total capital adequacy ratio was 13.8% (2005: 15.9), which is approximately twice the amount required under Swedish law. Of the regulatory total ratio, the Tier-1 ratio represented 9.4% at December 31, 2006 (2005: 9.7). SEK also calculates adjusted capital adequacy ratios with inclusion in the Tier-1 capital base of SEK’s guarantee fund capital of Skr 600 million in addition to the regulatory capital base. The adjusted total capital adequacy ratio was 15.0% at December 31, 2006 (2005: 17.3), of which 10.6% (2005: 11.1) represented adjusted Tier-1 capital.
The guarantee fund permits SEK to demand additional capital of up to Skr 600 million from the Swedish State if SEK finds it necessary in order to be able to fulfill its obligations.
SEK’s regulatory capital base was Skr 6,944 million at December 31, 2006 (2005: 6,935), of which the Tier-1 related amount was Skr 4,705 million (2005: 4,241). The adjusted capital base was Skr 7,544 million (2005: 7,535), of which the Tier-1 amount was Skr 5,305 million (2005: 4,841). Risk-weighted claims at year-end amounted to Skr 50,244 million (2005: 43,586). Accordingly, the minimum capital required to satisfy the statutory 8 % standard was Skr 4,019 million at December 31, 2006 (2005: 3,488).
The Company believes that its access to capital is sufficient for its needs.
The decline in Tier-2 capital ratio at December 31, 2006 compared with December 31, 2005, was related to currency exchange effects on Tier-2 capital that is denominated in U.S. dollar and Euro, as well as increased amounts of risk-weighted assets, especially market exposures.
The table “Capital Base and Required Capital” includes additional information on SEK’s regulatory capital.
29
Capital Base and Required Capital
According to the capital adequacy requirements of Swedish Law, which conform to international guidelines.
However, in addition to the regulated capital base, the adjusted capital adequacy ratios illustrated below are
calculated with inclusion in the Tier-1 capital base of SEK’s guarantee capital of Skr 600 million.
(Amounts in Skr mn)
| | Consolidated Group | | Parent Company | |
I. Capital requirement | | December 31, 2006 | | December 31, 2005 | | December 31, 2006 | | December 31, 2005 | |
| | | | Weighted | | Required | | | | Weighted | | Required | | | | Weighted | | Required | | | | Weighted | | Required | |
| | Claims | | claims | | capital | | Claims | | claims | | capital | | Claims | | claims | | capital | | Claims | | claims | | capital | |
On-balance sheet items | | 229,201 | | 45,995 | | 3,679 | | 207,493 | | 39,926 | | 3,195 | | 229,289 | | 46,083 | | 3,687 | | 207,557 | | 39,953 | | 3,196 | |
Off-balance sheet items | | 22,481 | | 4,244 | | 340 | | 18,328 | | 3,622 | | 290 | | 22,481 | | 4,244 | | 340 | | 18,328 | | 3,622 | | 290 | |
Other exposures | | n.a. | | 5 | | 0 | | n.a. | | 38 | | 3 | | n.a. | | 5 | | 0 | | n.a. | | 38 | | 3 | |
Total | | 251,682 | | 50,244 | | 4,019 | | 225,821 | | 43,586 | | 3,488 | | 251,770 | | 50,332 | | 4,027 | | 225,885 | | 43,613 | | 3,489 | |
| | | | | | | | | | | | | | | | | | | | | | | | | |
Breakdown by category: | | | | | | | | | | | | | | | | | | | | | | | | | |
A. Riskweight 0% | | 75,331 | | — | | — | | 62,784 | | — | | — | | 75,331 | | — | | — | | 62,784 | | — | | — | |
B1. Riskweight 10% | | 1,459 | | 146 | | 12 | | 5,203 | | 520 | | 42 | | 1,459 | | 146 | | 12 | | 5,203 | | 520 | | 42 | |
B2. Riskweight 20% | | 107,333 | | 21,467 | | 1,717 | | 111,233 | | 22,247 | | 1,780 | | 107,333 | | 21,467 | | 1,717 | | 111,279 | | 22,256 | | 1,780 | |
C. Riskweight 50% | | 1,093 | | 546 | | 44 | | 922 | | 461 | | 37 | | 1,093 | | 546 | | 44 | | 922 | | 461 | | 37 | |
D. Riskweight 100% | | 18,977 | | 18,977 | | 1,517 | | 15,469 | | 15,469 | | 1,238 | | 19,065 | | 19,065 | | 1,525 | | 15,487 | | 15,487 | | 1,239 | |
E. Market exposures | | 47,489 | | 9,108 | | 729 | | 30,210 | | 4,889 | | 391 | | 47,489 | | 9,108 | | 729 | | 30,210 | | 4,889 | | 391 | |
Total | | 251,682 | | 50,244 | | 4,019 | | 225,821 | | 43,586 | | 3,488 | | 251,770 | | 50,332 | | 4,027 | | 225,885 | | 43,613 | | 3,489 | |
II. Capital base (A) | | | | | | | | | | III. Capital Adequacy Ratio | | | | | | | | | |
| | Consolidated Group | | Parent Company | | | | Consolidated Group | | Parent Company | |
| | 12/2006 | | 12/2005 | | 12/2006 | | 12/2005 | | | | 12/2006 | | 12/2005 | | 12/2006 | | 12/2005 | |
Tier-1 capital | | 4,705 | | 4,241 | | 4,740 | | 4,274 | | Total | | 13.8 | % | 15.9 | % | 13.9 | % | 16.0 | % |
Tier-2 capital | | 2,239 | | 2,694 | | 2,235 | | 2,690 | | Of which: | | | | | | | | | |
Of which: | | | | | | | | | | Tier-1 ratio | | 9.4 | % | 9.7 | % | 9.4 | % | 9.8 | % |
Upper Tier-2 | | 1,787 | | 2,223 | | 1,783 | | 2,219 | | Tier-2 ratio | | 4.4 | % | 6.2 | % | 4.5 | % | 6.2 | % |
Lower Tier-2 | | 452 | | 471 | | 452 | | 471 | | Of which: | | | | | | | | | |
Total | | 6,944 | | 6,935 | | 6,974 | | 6,964 | | Upper Tier-2 ratio | | 3.5 | % | 5.1 | % | 3.6 | % | 5.1 | % |
| | | | | | | | | | Lower Tier-2 ratio | | 0.9 | % | 1.1 | % | 0.9 | % | 1.1 | % |
Adjusted Tier-1 capital | | 5,305 | | 4,841 | | 5,340 | | 4,874 | | Adjusted Total | | 15.0 | % | 17.3 | % | 15.0 | % | 17.3 | % |
Adjusted Total | | 7,544 | | 7,535 | | 7,574 | | 7,564 | | Of which: Adj. Tier-1 ratio | | 10.6 | % | 11.1 | % | 10.6 | % | 11.2 | % |
IV. Specification of off-balance sheet items(B) | | | | | | | | | | | | | | Book value on-balance sheet | |
Consolidated Group and Parent Company | | | | | | | | | | | | | | Related to derivative | | Related to derivative | |
| | | | | | | | | | | | | | contracts with positive | | contracts with negative | |
| | Of which | | real exposures: | | real exposures | |
| | | | | | Positive | | | | Negative | | | | Positive | | Negative | | Positive | | Negative | |
| | Nominal | | Converted | | real | | Potential | | real | | Weighted | | book | | book | | book | | book | |
December 31, 2006 | | amounts | | claims | | exposures | | exposures | | exposures | | claims | | values | | values | | values | | values | |
Derivative financial contracts: | | | | | | | | | | | | | | | | | | | | | |
Currency related agreements | | 162,811 | | 4,407 | | 1,128 | | 3,279 | | 5,564 | | 992 | | 751 | | 1,329 | | 2,938 | | 2,865 | |
Interest rate related contracts | | 159,677 | | 1,277 | | 764 | | 513 | | 4,431 | | 287 | | 901 | | 1,704 | | 1,490 | | 122 | |
Equity related contracts | | 51,712 | | 5,364 | | 1,443 | | 3,921 | | 3,350 | | 1,964 | | 298 | | 1,026 | | 417 | | 661 | |
Commodity related contracts, etc. | | 6,013 | | 460 | | 10 | | 450 | | 661 | | 194 | | 1 | | 643 | | 6 | | 0 | |
Total derivative contracts | | 380,213 | | 11,508 | | 3,345 | | 8,163 | | 14,006 | | 3,437 | | 1,951 | | 4,702 | | 4,851 | | 3,648 | |
Other off-balance sheet contracts and commitments: | | | | | | | | | | | | | | | | | | | | | |
Repurchase agreements etc. (repos) | | 29 | | 29 | | — | | 29 | | — | | — | | | | | | | | | |
Undisbursed credits | | 21,888 | | 10,944 | | — | | 10,944 | | — | | 807 | | | | | | | | | |
Total | | 402,130 | | 22,481 | | 3,345 | | 19,136 | | 14,006 | | 4,244 | | | | | | | | | |
| | | | | | | | | | | | | | | | | | | | | |
December 31, 2005 | | | | | | | | | | | | | | | | | | | | | |
Derivative financial contracts: | | | | | | | | | | | | | | | | | | | | | |
Currency related agreements | | 157,551 | | 4,915 | | 2,032 | | 2,883 | | 8,104 | | 1,050 | | 1,653 | | 636 | | 3,225 | | 1,310 | |
Interest rate related contracts | | 161,317 | | 1,128 | | 599 | | 529 | | 4,204 | | 243 | | 1,326 | | 2,052 | | 838 | | 42 | |
Equity related contracts | | 42,963 | | 4,279 | | 1,129 | | 3,150 | | 1,502 | | 1,189 | | 104 | | 1,187 | | 368 | | 88 | |
Commodity related contracts, etc. | | 5,500 | | 422 | | 3 | | 419 | | 691 | | 204 | | 1 | | 504 | | 33 | | — | |
Total derivative contracts | | 367,331 | | 10,744 | | 3,763 | | 6,981 | | 14,501 | | 2,686 | | 3,084 | | 4,379 | | 4,464 | | 1,440 | |
Other off-balance sheet contracts and commitments: | | | | | | | | | | | | | | | | | | | | | |
Repurchase agreements etc. (repos) | | 27 | | 27 | | — | | 27 | | — | | — | | | | | | | | | |
Undisbursed credits | | 15,114 | | 7,557 | | — | | 7,557 | | — | | 936 | | | | | | | | | |
Total | | 382,472 | | 18,328 | | 3,763 | | 14,565 | | 14,501 | | 3,622 | | | | | | | | | |
(A) The capital base includes the profit for the year 2006.
(B) In accordance with SEK’s policies with regard to counterparty, interest rate, and currency exchange exposures, SEK uses, and is a party to, different kinds of off-balance sheet financial instruments, mostly various interest rate related and currency exchange related contracts (swaps, etc). It is worth noting that the nominal amounts of such derivative instruments do not reflect real exposures, but merely constitute the basis from which the exposures (converted claims) are derived.
30
In the ordinary course of business SEK is a party to financial instruments with off-balance sheet exposure. The amounts of such exposures are shown in the table above. These instruments include primarily interest rate related and currency related agreements.
New Capital Adequacy Rules
The Basel Committee for Bank Supervision has headed a review of capital adequacy regulations. The Basel Committee issued its first consultative paper in 1999 and the New Basel Capital Accord, Basel II, were adopted 2004. The regulations came into force in January 2007. The Swedish Financial Supervisory Authority together with the financial sector (including SEK) has been making preparations for the adoption.
In addition to the capital requirements for credit and market risks contained in the present regulations, there will be a capital requirement for operational risks. According to the rules, capital adequacy requirements, following approval from the supervisory authority, can be based on the financial institutions’ internal systems and assessment. A number of strict requirements have to be met in order to qualify for this alternative. SEK has received such an approval from the supervisory authority. In addition to these methods there are standard rules similar to the present regulatory framework. See also item 11 Quantitative and Qualitative Disclosures about Market Risks for a more detailed description of how SEK will apply Basel II.
Certain Off-Balance Sheet Arrangements
SEK has not entered into any transactions, agreements or other contractual arrangements with any unconsolidated entities under which it has any obligations arising (1) under a guarantee contract with any of the characteristics specified in Financial Accounting Standard Board (FASB) Interpretation No. 45 paragraph 3, (2) out of a variable interest in an unconsolidated entity referred to in FASB Interpretation No. 46, or (3) under an instrument in SEK’s assets or to which it has transferred assets subject to a retained or contingent interest or similar arrangement that serves as credit liquidity or market risk support to such entity.
g. Recent Accounting Pronouncements Issued
No new or revised Swedish accounting pronouncements affecting recognition or measurement came into effect in 2006.
The Company has been preparing for the implementation of International Financial Reporting Standards (IFRSs) in their entirety, which applies to the consolidated financial statements of SEK as from January 1, 2007. For a further description of these changes refer to Note 1 to the Consolidated Financial Statements.
There were no new or revised standards or interpretations adopted by the Company in 2006. Accounting pronouncements recently issued by FASB effective as from fiscal year 2007 are described in Note 37 to the Consolidated Financial Statements.
Item 6. Directors, Senior Management and Employees
The Board of Directors is responsible for the management of the Company.
The Company’s Articles of Association currently provide that the Board of Directors shall consist of six to eight directors. The State, as holder of all the Class A shares and Class B shares, elects the directors. The Annual General Meeting appoints the Chairman of the Board of Directors. The Board of Directors may appoint a Vice Chairman of the Board of Directors.
31
The Board of Directors convenes at least six times a year.
The directors of the Board of Directors are elected at the Annual General Meeting to serve for the period until the end of the next Annual General Meeting. The Annual General Meeting is required to be held not later than June 30 of each year. Executive officers are appointed by the Board of Directors to serve for a non-fixed period.
Certain information with respect to the Company’s directors, and executive officers is set forth below. Unless otherwise indicated, such information is given as of the date of this Report.
Board of Directors and Executive Officers | | | | |
Name | | Age* | | Position |
| | | | |
Ulf Berg | | 55 | | Chairman of the Board and Director |
Christina Liffner | | 56 | | Deputy Chairman of the Board and Director |
Karin Apelman | | 45 | | Director |
Pirkko Juntti | | 61 | | Director |
Helena Levander | | 49 | | Director |
Bo Netz | | 44 | | Director |
Harald Sandberg | | 56 | | Director |
Risto Silander | | 49 | | Director |
| | | | |
Peter Yngwe | | 49 | | President |
Måns Höglund | | 55 | | Executive Director, Corporate & Structured Finance |
Jane Lundgren Ericsson | | 41 | | Executive Director, President, AB SEK Securities |
Sirpa Rusanen | | 42 | | Executive Director, Human Resources |
Sven-Olof Söderlund | | 54 | | Executive Director, Risk & IT |
Per Åkerlind | | 44 | | Executive Director, CFO and Head of Capital Markets |
* At December 31, 2006
Biographical Details
Mr. Berg was appointed Chairman of the Board and a director in May 2006. He has been President of the Swedish Trade Council since 2004. Prior to that he has served in various executive capacities at Saab Ericsson Space, and Ericsson Microwave System and was President of Ericsson AB from 2002 to 2003. During 2003 to 2004 he ran his own management consulting company. He is Chairman of the Board of directors of SWE-DISH Satellite Systems AB and a Director of Volvo Aero.
Mrs. Liffner was appointed a director by the State in June 2003 and Deputy Chairman of the Board in April 2004. She has served in various executive capacities at AssiDomän AB, ABB Atom AB, Asea AB and Surahammars Bruks AB since 1979. She is chairman of the board of Svensk Adressändring AB and Svenska Endometriosföreningen. She is a director of Sveaskog AB, Skandinava, Länsförsäkringar Bergslagen AB, Vasakronan AB, and Prevas AB.
Mrs. Apelman was appointed a director by the State in June 2003. She has been Chief Financial Officer at Luftfartsverket since 2001. Prior to that she served in various executive capacities at Saab Aircraft Leasing and Scandinavian Airlines (SAS). She is Deputy Chairman of the Board of A-banan Projekt AB, Second Deputy Chairman of the Board of The Swedish Export Credits Guarantee Board (EKN) and Director of Göteborg City Airport and Deputy Director of Nordic Airport Properties AB and Arlanda Schipol Development Company AB. On the February 1 she was appointed by the State as Director-General of EKN and took up the duties on March 5, 2007.
Mrs. Juntti was appointed a director in May 2005. She has served in various executive capacities at the Board of Sales Taxation (VAT) in Turku, Finland, Ministry for Foreign Affairs in Helsinki, Finnish Export Credit Ltd, JP Morgan London and PCA Corporate Finance OY. She is a director and chairman of Audit Committee of Rautaruukki Oyj.
32
Mrs. Levander was appointed a director in April 2004. She is CEO and Partner of Nordic Investor Services AB. Prior to that she has served in various executive capacities at Neonet AB, Odin Fonder and Nordea Asset Management. She is a director of SBAB, Mandator AB, Geveko AB, Transatlantic AB and Stampen AB.
Mr. Netz was appointed a director in May 2006. He has been Director at Ministry for Finance since 1995 and prior to that he served in various executive capacities at The Swedish National Audit Office and Ministry of Finance. He is Director of the Swedish Lotteriinspektionen (overall responsibility for licensing and supervision within the field of gambling).
Mr. Sandberg was appointed a director in May 2006. He has been Director at Ministry for Foreign Affairs since 1994 and from 1998 to 2005 he was Sweden’s Ambassador in Indonesia and South Korea.
Mr. Silander was appointed a director in April 2004. He is a private investor and prior to that he served 20 years in various executive capacities at Alfred Berg, ABN AMRO; UBS, Goldman Sachs, Handelsbanken and Citibank. He is Director of East Capital Asset Management AB, Endeavour Funds Ltd., Quesada AB, 11 Real Asset Fund AB, The Trygg Foundation and Stronghold Invest AB.
Mr. Yngwe has been President since April 1997. Prior to that he had been CFO of the Company from March 1991. From 1988 until then he served as Treasurer, Treasury and Trading Division of the Company, and prior to that, he served at the Finance Department of the Company in various capacities beginning in 1984.
Mr. Höglund has been Executive Director, Head of Corporate & Structured Finance since January 2002. Prior to that he served as Head Private Banking Sweden at Nordea beginning in 2000, and before that he served in executive capacities at Unibank Sweden Branch, FöreningsSparbanken/Sparbankernas Bank (Swedbank), Gotabanken, Stockholm, Götabanken, London and Hambros Bank, London.
Mrs. Lundgren Ericsson has been Executive Director since April 2005 and served as President, AB SEK Securities, since 2002. Prior to that she served as SEK´s Head of Legal and Transaction Management beginning in 1993.
Mrs. Rusanen has been Executive Director, Human Resources since 2005. Prior to that she served as Human Resource Manager at Ericsson since 1997 and as a teacher at Värmdö School and Chapman School in Karlskrona since 1991.
Mr. Söderlund has been Executive Director of Risk & IT since January 2007. Prior to that he served as Executive Director, Strategic Analysis and Planning since December 1999 and prior to that he has been Executive Director of Risk & Credit Management beginning in January 1998. He was Controller of the Company from 1988 to 1997.
Mr. Åkerlind has been Executive Director, CFO and Head of Capital Markets since June 2002. Prior to that he served as Executive Director, Treasurer and Head of Debt Capital Markets beginning in September 2000.
Compensation of Directors and Officers.
The aggregate remuneration of all directors and executive officers as a group paid or accrued in 2006 was Skr 18.1 million (2005: 18.8, 2004: 16.1), all of which was in the form of salaries and variable remuneration, in the case of executive officers, and in the case of directors consisted of fees that were nominal in amount. The employees of the Company are covered by various national social service programs to which the Company contributes. The Company also maintains a pension plan with an insurance company to which the Company contributed approximately Skr 7.7 (2005: 6.0, 2004: 5.5) million in 2006 on behalf of all officers as a group.
The total amount of the pension obligations related to executive officers (including those listed above), charged to results and reported as an allocation, was Skr 16.6 million at December 31, 2006.
33
The Chairman of the Board received Skr 0.2 million and each other director received Skr 0.1 million in remuneration in 2006. Certain directors received additional compensation for service on Board committees as set forth below.
The President’s remuneration and other benefits in 2006 totaled Skr 3.9 million. The President did not receive any variable compensation. Of the total remuneration to the President, Skr 3.8 million is qualifying income for pension purposes. The President is entitled to annual pension benefits upon retirement at age 60 equal to 75 % of his terminal pay until age 65 after which it is reduced. Such commitments are covered by insurance.
Remuneration to other executive officers of the Company in 2006 totaled Skr 13.1 million of which Skr 1.3 million represented variable remuneration. The variable remuneration relate to individual set targets and targets defined in the Company’s business plan. Certain key executive officers of the Company (including those listed above) have employment contracts providing, in the event such contract is terminated by the Company, certain compensation during a period of, at the most of two year subject to deduction for any salary received in new employment. None of the Directors have contracts with the Company providing for benefits upon termination of service.
See also Note 10 to the Consolidated Financial Statements.
Activities and division of responsibility within the Board of Directors
The Chairman of the Board’s responsibilities is regulated in the Swedish Companies Act and the procedural rules of the Board of Directors. The Chairman of the Board monitors board activities and is responsible for other directors receiving the requisite information. Where necessary, the Chairman is directly involved in matters of heightened importance to the Company and represents the Company on issues arising in connection with the shareholder. Aside from appointing the President, the Board of Directors’ primary tasks are to adopt business plans and budgets, approve major investments and significant changes to the Company’s corporate organizational structure, and establish company-wide rules and procedures. Additionally, the Board of Directors monitors financial progress, and bears ultimate responsibility for internal control and risk management.
Except in the capacity of a director, no director is an affiliate of the Company or its management.
Appointment of the Board of Directors and Auditors
The nomination process for appointment of the Board of Directors is handled by the Swedish Ministry for Foreign Affairs. This process is coordinated by the unit for government action within the Ministry of Industry, Employment and Communications. The owner is responsible for the choice of auditor. However, the practical work of procuring auditors is managed by the Company. The final decision is taken by the owner at the annual general meeting.
Review of Board Activities
The Board of Directors met on seven occasions in 2006 and held one special strategy seminar. Board activities were conducted pursuant to established procedural rules. These meetings considered annual and interim financial statements, business operations, the business plan for 2007—2009, the budget for 2007, reports from internal audit and from the compliance function, incentive schemes, organizational and staffing issues, and current projects regarding the development of IT systems and projects relating to new accounting standards, the Sarbanes-Oxley Act, and the adoption of Basel II rules for the financial sector. In order to better understand the forces behind globalization and the Swedish companies needs in China, the Board of Directors and the Executive Committee jointly conducted a study trip to China during 2006.
The Board’s Credit Committee (which considers credit issues), Finance Committee (which considers financial issues other than credit issues) and Remuneration Committee (which considers specific remuneration issues) held 12, 5 and 7 meetings respectively in the financial year.
34
Committees
The following is a description of the Company’s committees on which members of the Board of Directors participate as committee members. Other than in the case of the audit committee, which is composed of the entire Board of Directors, each committee acts pursuant to authority delegated from the Board of Directors in accordance with Swedish law and the Articles of Association. The Board of Directors reviews the minutes of the meetings of, and the actions taken by, each of such committees.
Audit Committee
The Company does not have a separately designated “audit committee” within the meaning of Rule 10A-3 under the Securities Exchange Act of 1934. As a result, the entire Board of Directors acts as the Company’s audit committee for the purposes of such rule. The Board of Directors has found it appropriate, in light of the nature of the Company’s business activities, that the Board of Directors as a whole should deal with the issues that otherwise would be dealt with by a separately-designated audit committee. For more information, see Item 16D, “Exemptions from Listing Standards for Audit Committees”.
Credit Committee
This Committee is the Board of Directors’ working committee on issues relating to credits and credit decisions.
The Board members currently sitting on this Committee are Christina Liffner (Chairman), Pirkko Juntti, Helena Levander and Harald Sandberg. The President and the Executive Director, Risk & IT were regular Committee members from the Company’s executive management. The Chairman of the Committee receives an annual fee of Skr 40,000 for services in such capacity. Each of the other Committee members, other than the regular members from the Executive Committee, receives annual fees of Skr 28,000. No fees was received by Committee members employed by the Company.
Finance Committee
This Committee is the working and reference committee on issues relating to the Company’s finance operations.
The Finance Committee is authorized to decide on borrowing up to a pre-determined amount of risk capital. The Board members currently sitting on this Committee are Risto Silander (Chairman), Karin Apelman, Pirkko Juntti and Bo Netz. The President and the Chief Financial Officer were regular Committee members from the Company’s executive management. The Chairman of the Committee receives an annual fee of Skr 36,000 for services in such capacity. Each of the other Committee members appointed by the Board receives annual fees of Skr 26,000 for such services. No fees are payable to Committee members from the Company’s Executive Committee.
Remuneration Committee
This Committee is a working committee for issues regarding remuneration and other terms applying to the executive management, and for overall policy issues regarding remuneration and employment terms.
The Board members currently sitting on this Committee are Ulf Berg (Chairman), Christina Liffner and Harald Sandberg. The President participated in Committee meetings on issues not relating to his own employment terms. No fees are paid to any committee member for services on this committee.
Employee Relations
During the year, the number of employees averaged 151 (2005: 147, 2004: 131), of whom 69 (2005: 71, 2004: 62) were female and 82 (2005: 76, 2004: 69) were male. The number of employees is small in relation to the volume of lending because the number of lending transactions is relatively few and the administration and documentation of credits is in many cases handled by the banks participating in the transactions. The Company has not experienced any strikes or labor disputes and considers its employee relations to be good.
35
Item 7. Major Shareholders and Related Party Transactions
Under the Company’s Articles of Association, the shares of the Company are divided into Class A and Class B shares, each class having equal voting rights except that the holder of the Class A shares elects four directors and the holder of the Class B shares elects two directors. Under the Articles of Association, holders of shares of the Company have a right of preemption in the event of a transfer of shares of the Company to a person who is not previously a holder of shares of the same class in the Company.
On June 30, 2003, the Kingdom of Sweden became the sole (100 %) owner of SEK. The State owns all of the Class A shares and all of the Class B shares.
The following table sets forth the current share ownership of the Company:
Shareholder | | Ownership % | | Number of shares | | | |
| | | | | | | |
Kingdom of Sweden | | Appr. 64.65 | % | 640,000 | | Class A Shares | |
| | | | | | | |
Kingdom of Sweden | | Appr. 35.35 | % | 350,000 | | Class B Shares | |
| | | | | | | |
| | 100.00 | % | 990,000 | | Shares | |
During the three year period from June 2000 to June 2003 the State held 64.65 % of the Company’s voting shares, with the other 35.35 % held by ABB Structured Finance Investment AB. Prior to that date, the State held 50 percent of the Company’s voting shares, with the other 50 percent held by major commercial banks in Sweden.
Ownership and governance
SEK is 100 % owned by the Swedish State. The State exerts its influence at the Company’s general meetings and through representation on the Board of Directors. The representation on the Board of Directors, among other things, satisfies the Swedish State’s requirement of maintaining a good insight into the Company’s operations.
The governance of SEK is divided between the shareholder, the Board of Directors and the President, in accordance with the Swedish Companies Act, the Articles of Association, and the Board of Directors’ procedural rules. The Board of Directors appoints the President who conducts ongoing management in accordance with the Board of Directors’ guidelines and instructions.
The State as shareholder has decided that State-owned companies should observe the Swedish Corporate Governance Code (“the Code”).
Transactions with Related Parties
The Company held interest bearing securities issued by the State and entities partially or wholly controlled by the State totaling Skr 1,641.2 million at December 31, 2006 and Skr 1,675.9 million at February 28, 2007. By means of direct guarantees extended by the National Debt Office and by EKN, carrying the full faith and credit of Sweden, 16 % of the Company’s outstanding loans at December 31, 2006 were supported by the State. In addition, under the S-system the difference between interest revenues, net commission revenues and any foreign exchange gains related to lending, on the one hand, and interest expenses related to borrowing, all financing costs, any foreign exchange losses, on the other hand, are reimbursed by the State. The State also pays compensation to SEK for administering the S-system. See Item 4, “Information on the Company — Lending Operations — General — S-system”. SEK compensates the State for providing Skr 600 million in guarantee fund capital. See Note 6 to Consolidated Financial Statements.
The Company enters into transactions in the ordinary course of business with entities that are partially or wholly owned or controlled by the State. The Company may also extend export loans (in the form of direct or pass-through loans) to entities related to the State although no such loans were outstanding at December 31,
36
2006 or at February 28, 2007. Transactions with such parties are conducted on the same terms (including interest rates and repayment schedules) as transactions with unrelated parties.
See also Note 31 to the Consolidated Financial Statements.
Item 8. Financial Information
Consolidated Financial Statements
See Item 18, “Financial Statements”.
Legal Proceedings
There are no material pending or, to the Company’s knowledge, threatened legal or governmental proceedings to which the Company is or would be a party or to which any of its property is or would be subject.
Dividend Policy
SEK’s dividend policy strives to provide SEK’s shareholder with a competitive long-term return on equity consistent with maintaining a risk capital that is well above the regulatory requirements. In connection with the ownership change and the decrease of core capital in 2003 the Swedish State stated that SEK will have a restrictive dividend policy.
Item 9. The Offer and Listing
Nature of Trading Market
The Company’s 3.50% Global Notes due January 15, 2008 and 4% Global Notes due June 15, 2010, all of which are listed on the Luxembourg Stock Exchange, the Company’s 5.721% Redeemable Notes due 2020, which are listed on the New York Stock Exchange, and the Company’s 4.125% Global Notes due October 15, 2008, 4.625% Global Notes due February 17, 2009, 4.875% Global Notes due September 29, 2011 and 4.875% Global Notes due January 19, 2010, which are listed on the London Stock Exchange, are the only issues of the Company’s Medium Term Notes, Series C and D (the “Medium Term Notes”) listed on any stock exchange. The Company has applied to list its 5.125% Global Notes due March 1, 2017 on the London Stock Exchange. Other issues of Medium Term Notes are traded in the over-the-counter market.
Item 10. Additional Information
Exchange Controls and Other Limitations Affecting Security Holders
There are currently no Swedish exchange control laws or laws restricting the import or export of capital. No approvals are necessary under Swedish law to enable the Company, at the times and in the manner provided in the Company’s debt securities and the indentures or other instruments pursuant to which such securities have been issued, to acquire and transfer out of Sweden all the amounts necessary to pay in full the principal of and/or interest on such securities, and any additional amounts payable with respect thereto, and no external approval would be required for any form of prepayment of such securities.
Under Swedish law and the Company’s Articles of Association, there are no limitations on the right of non-resident or foreign owners to hold debt securities issued by the Company.
Memorandum and Articles of Association
Set forth below is a brief summary of certain significant provisions of the Company’s Articles of Association and Swedish law. This description does not purport to be complete and is qualified by reference to the Articles of Association, which are filed as an exhibit to this Report.
37
Registration
The Company’s registry number with the Swedish Company Registry (Sw. bolagsregistret) held by the Swedish Companies Registration Office (Sw. Bolagsverket) is 556084-0315.
Purpose
Under Article 2 of the Articles of Association, the Company’s objective is to engage in financing activities in accordance with the Financing Business Act (as from July 1, 2004 substituted by the Banking and Financing Act, however without any influence in this context) and in connection therewith primarily promote the development of Swedish commerce and industry and Swedish export industry as well as otherwise engaging in Swedish and international financing activities on commercial grounds. SEK’s financing activities include, but are not limited to: (i) the borrowing of funds through the issuance of bonds and other debt instruments, (ii) the granting of credits, (iii) the granting of credit guarantees, and (iv) holding of and conduct of trading in securities.
Certain Powers of Directors
Under the Swedish Companies Act (Sw. Aktiebolagslagen), the Board of Directors is ultimately responsible for the Company’s organization and the management of its affairs.
A resolution of the Board of Directors requires the approval of a majority of the members of the board. However, the Board of Directors may delegate the authority to borrow and lend funds on behalf of the Company to the President or another employee, acting singly or jointly, provided that such financing transaction does not implicate the fundamental policy of the Company or otherwise is of great significance to the Company. There are no legal requirements on any member of the Board of Directors to own shares in the Company, or to retire at a certain age.
Although the Articles of Association do not address voting by directors on matters in which they are interested, under the Swedish Companies Act, a director may not take part in the following:
1. Agreements between a director and the Company;
2. Agreements between the Company and third parties, where a director has a material interest in the matter that may conflict with the interests of the Company; or
3. Agreements between the Company and a legal entity that the director himself, or together with someone else, may represent.
Unless the director, directly or indirectly, through a legal entity, owns all of the shares in the company as issued and, as regards clause 3., where the legal entity contracting with the company as within the same group of companies.
Under the Companies Act, the Company may not lend funds to shareholders or directors.
Under Swedish law, the president and at least half of the board members must be resident in a European Economic Area country unless exempted by the Swedish Companies Registration Office. Under Swedish law, a director’s term of office may not be more than four years, but the Company’s Articles of Association require one year terms. A director may, however, serve any number of consecutive terms. Directors elected at the general meeting of the shareholders may be removed from office by a general meeting of the shareholders, and vacancies on the board, except when filled by a deputy director, may only be filled by a resolution of shareholders. Each year, if not otherwise stipulated in the Company’s Articles of Association, one director is elected Chairman of the Board by resolution of the Board (unless elected by the shareholders) at the first meeting following its appointment.
38
Description of the Shares
The share capital of the Company shall be not less than Skr 700 million and not more than Skr 2,800 million. Shares may be issued in two Classes, Class A and Class B, respectively. Class A and Class B shares enjoy the same rights to dividends and rights to surplus in event of liquidation. Holders of Class A and Class B shares have a preferential right to subscribe for new shares of their respective Class in proportion to the number of shares of the same Class previously held by the shareholder. Further, all shareholders have a preferential right to subscribe for any shares remaining in any Class of shares as a result of one or more shareholders not having exercised their respective preferential right in whole or in part. No shareholder is obliged to make additional capital contributions in the Company solely as a result of it being a shareholder.
Shareholder’s rights may only be changed by a majority (and in certain cases a qualified majority) of the shares represented at a general meeting of the shareholders. However, all resolutions passed by a general meeting of the shareholders are subject to mandatory provisions of Swedish law, for practical purposes primarily the Swedish Companies Act. In particular, there are rules protecting minority shareholders and there is a general principle that all shares and shareholders shall be treated equally. Further, the Articles of Association of the Company may not be amended without the approval of the Swedish Government.
Annual General Meeting
The Annual General Meeting is held once a year within six months after the end of the preceding fiscal year. Holders of Class A and Class B shares alternate in electing the Chairman of each Annual General Meeting. Each person entitled to vote at the Annual General Meeting shall have the right to vote all the shares owned and represented by him. There are no restrictions on the rights of non-Swedish nationals to own shares or vote their shares at the Annual General Meeting.
Swedish law provides that, in matters other than elections, resolutions are passed by a simple majority of the votes cast, except in certain circumstances including:
· a resolution to amend the Articles of Association requires a majority of at least two-thirds of the votes cast as well as at least two-thirds of the shares represented at the meeting;
· a resolution to amend the Articles of Association that reduces any existing shareholder’s rights to profits or other assets, restricts the transferability of issued shares or alters the legal relationship between issued shares, normally requires the unanimous approval of the shareholders present or represented at the meeting and representing at least nine-tenths of all shares issued; and
· a resolution to amend the Articles of Association for the purpose of limiting the number of shares which a shareholder may vote at an annual general meeting, or requiring a company to retain a larger amount of the net profit than required by the Companies Act, or amending shareholders’ rights in a winding-up of the Company, normally requires the approval of shareholders representing at least two-thirds of the votes cast and at least nine-tenths of the shares represented at the meeting.
In elections, the person receiving the most votes is deemed to have been elected.
Swedish Taxation
The following summary outlines certain Swedish tax consequences relating to holders of SEK’s debt securities that are not considered to be Swedish residents for Swedish tax purposes, if not otherwise stated. The summary is based on the laws of the Kingdom of Sweden as currently in effect and is intended to provide general information only. The summary does not address the rules regarding reporting obligations for, among others, payers of interest. Investors should consult their professional tax advisors regarding the Swedish tax and other tax consequences (including the applicability and effect of double taxation treaties) of acquiring, owning and disposing of debt securities in their particular circumstances.
Holders not resident in Sweden
Payments of any principal amount or any amount that is considered to be interest for Swedish tax purposes to the holder of any debt security should not be subject to Swedish income tax, provided that such holder is not resident in Sweden for Swedish tax purposes and
39
provided that such holder does not have a permanent establishment in Sweden with which the debt securities are effectively connected.
Swedish withholding tax, or Swedish tax deduction, is not imposed on payments of any principal amount or any amount that is considered to be interest for Swedish tax purposes to a holder, except for certain payments of interest to a private individual (or an estate of a deceased individual) with residence in Sweden for Swedish tax purposes.
Holders resident in Sweden
Generally, for Swedish corporations and private individuals (and estates of deceased individuals) with residence in Sweden for Swedish tax purposes, all capital income (e.g., income that is considered to be interest for Swedish tax purposes and capital gains on debt securities) will be taxable. Specific tax consequences, however, may be applicable to certain categories of corporations, e.g., investment companies and life insurance companies.
If the debt securities are held by a Swedish nominee in accordance with the Swedish Financial Instruments Accounts Act (SFS 1998:1479), Swedish preliminary taxes are withheld by the nominee on payments of amounts that are considered to be interest for Swedish tax purposes to a private individual (or an estate of a deceased individual) with residence in Sweden for Swedish tax purposes.
Documents on Display
The Company files reports and other information with the SEC. You can request copies of these documents, upon payment of a duplicating fee, by writing to the SEC. You may also read and copy these documents at the SEC’s public reference room in Washington, D.C.:
100 F Street, N. E.
Washington, D.C. 20549
Please call the SEC at 1-800-SEC-0330 for further information on its public reference rooms, including those in New York and Chicago. Some of the Company’s filings are also available on the SEC’s website at http://www.sec.gov.
40
Item 11. Quantitative and Qualitative Disclosures About Market Risk
a. Quantitative Information About Market Risk
The following presentation of the Company’s market risk in derivative financial instruments is a sensitivity analysis expressing the potential loss in fair values from selected hypothetical changes in market rates and prices. The changes are chosen as to reflect reasonably possible near-term changes in those rates and prices. The changes are not less than ten percent of end of period market rates or prices.
Quantitative information about market risk inherent in derivative financial instruments, other
financial instruments, and derivative commodity instruments |
| | | | As of December 31, |
| | | | 2006 | | 2005 |
(Skr million) | | | | | | |
| | | | | | |
Trading | | a) Interest Rate Risk | | — | | — |
| | Swedish kronor | | — | | — |
| | Other currencies | | — | | — |
| | b) Foreign Currency Exchange Risk | | — | | — |
| | c) Commodity Price Risk | | — | | — |
| | d) Other Relevant Market Risk | | 66.0 | | 37.3 |
| | | | | | |
Other Than Trading | | a) Interest Rate Risk | | 36.9 | | 47.3 |
| | Swedish kronor | | 14.3 | | 25.3 |
| | Other currencies | | 22.6 | | 22.0 |
| | b) Foreign Currency Exchange Risk | | 0.4 | | 4.4 |
| | c) Commodity Price Risk | | — | | — |
| | d) Other Relevant Market Risk | | 84.1 | | 48.0 |
Definitions
Trading Portfolio:
Other Relevant Market Rate Risk
The risk category comprises credit spread risks in transactions held for trading. Credit spread risk is defined as the risk arising from market value change that occurs as a result of shifts in the interest margin related to credit spread. The risk is measured as the change in the market value at a certain shift in the credit spread. Credit spread changes between 2 and 55 basis points have been used.
The risk category other relevant market rate risk comprises only one risk category, credit spread risks. The changes in credit spreads are likely to differ depending on the financial instrument’s features with regard to risk counterparty’s rating and sector, and the maturity of the exposure. Therefore, we have selected what we believe to be a reasonable hypothetical change individually for each instrument, all of which are within the range of 2-55 basis points. This is in contrast to, for example, interest rate risks, where all instruments, regardless of maturity, have been calculated applying the same basis point change.
Other Than Trading:
Interest Rate Risk
41
Interest rate risk is defined as the higher of (i) the parallel-shift interest rate-change risk, calculated based on the assumption of a one percentage point interest rate-change at all maturities, and (ii) the rotation interest rate-change risk, calculated based on the assumption of changes of the interest-rates in different directions at different maturities with half a percentage point. Interest rate risk is calculated for items reported on or off balance sheet.
Foreign Currency Exchange Risk
Foreign currency exchange risk is defined as the change in fair values for items reported, on or off balance sheet, which would be the result of a change in the value of the Swedish kronor by ten percent.
Other Relevant Market Rate Risk
This risk category comprises basis risk liquidity in different currencies. The risk is defined as risk for differences in an interest base for different currencies if there is a surplus and/or deficit for a certain period. Basis risk is calculated as a present value change in the event of a change of base by a certain number (standard measurement) of basis points. The assumed potential differences in interest base were 5 to 10 basis points depending on foreign exchange currency.
Limitations in the Quantitative Information About Market Risk
There are limitations on any method for measuring market risk. In particular, some limitations could cause the above sensitivity analysis not to reflect fully the Company’s net market risk exposure. Such limitations include the fact that some instruments are not included in the calculation (see below) and that actual changes in rates and prices under certain specific market conditions situations could differ materially from assumed reasonably possible near-term changes.
Instruments not included in the calculation
Perpetual subordinated debt with related hedging transactions, as well as the assets in which shareholders’ funds and untaxed reserves are invested, are excluded from the calculation of these interest rate risks and limits. The volume of perpetual subordinated debt at December 31, 2006, amounted to USD 350 million corresponding to Skr 2,405 million. The interest rate risk related to Skr 2,397 million of this volume was hedged with interest rate swaps with maturities between 2019 and 2034.
The basis for excluding the instrument is (i) the question of whether a subordinated debt, included in the capital base for capital adequacy calculation purposes, should be regarded as an item in the balance sheet subject to exposure to interest rate risk and (ii) the difficulties of calculating the interest rate risk to be hedged in a perpetual instrument.
All other relevant instruments that have inherent market risk have been included in the calculation. This includes derivative financial instruments, other financial instruments and derivative commodity instruments to the extent such instruments are not derivative financial instruments.
See also Notes 32, 33, 34 and 35 to the Consolidated Financial Statements for further quantitative disclosures about market risk.
b. Risk Management
Risk management ability provides business opportunities and stability
Risk management is a key factor for being able to offer SEK’s customers favorable financing and to develop SEK’s business activities and thus contribute to the company’s long-term development.
SEK’s customers often require large credits with long maturities and sometimes with risks that would be too large to be acceptable without risk mitigating measures. Therefore, in order to be able to carry out such transactions, a well-developed risk management is required with the ability to recognize the counterparties and deals that are desirable. Risk management requires knowledge and processes that are able to handle previously
42
well-known risks according to well-defined techniques but also are able to identify new risks and manage them by developing new techniques. It is not only in customer financing that risk management skills are decisive for success. For many years SEK’s funding has taken advantage of the market’s various types of risk preferences. By being flexible and accepting new types of structure at an early stage — but also being able to handle the interest risks — it is possible to satisfy investor demands regarding risk exposure and at the same time obtain financing on favorable terms. A key part of this management is transaction documentation. SEK has for many years been pushing forward the development of documentation techniques through determined quality work.
Aims, focus and objectives of risk management
As stated above, risk management is a central part of SEK’s business model and activities. Meeting customers’ financing needs does not rely only on efficient and innovative risk management of the transactions themselves. It is equally important to be able to take advantage of market opportunities in order to obtain funding and manage liquidity on attractive terms. This in turn provides the basis for favorable conditions for granting credits. The focus of risk management is mainly to reduce and limit risks, since SEK’s business model implies a transaction volume which is large in relation to the capital base. The objective of risk management is to create conditions under which SEK is able to meet the needs of its customers, particularly regarding financing needs. SEK also wishes to take advantage of business opportunities in such a manner that net risks are at a level that is sustainable in the long term in relation to SEK’s capital base. The aim is to maintain a high creditworthiness. Risk management contains two important components. One is to manage risks so that net risks are kept at the right level. The other is to assess the internal capital adequacy and ensure a level and composition of the capital base that is in harmony with the development of business activities. This balance is an integrated and important part of the annual business planning .The business plan is followed up continuously throughout the year.
Methods, approach and procedures
In order to achieve high quality in risk management it is important to have clear instructions and good technical knowledge to ensure the correct analysis and assessment of the individual counterparty or transaction. In addition to clear instructions and technical expertise, day-to-day work throughout the company must be permeated with a good risk culture. This is why SEK places great importance on having clear and reliable routines, a clear segregation of duties and competent and skilled employees. SEK also emphasizes ethical and moral issues. Persistent and consistent conduct, develops the risk awareness and attitudes of employees. Risk management at SEK involves identifying, analyzing, measuring and reporting exposure to different types of risks. Based on such risk information and with the aid of different techniques, transformation of risk to the risk types and levels that are acceptable and desirable can take place. Risk levels are mainly assessed through a combination of exposure measurement (which solely indicates the amount that is exposed to risk) and a qualitative assessment. For certain types of risk some simple standardized risk measurements (which indicate an estimated possible loss based on certain assumptions on the risk in question) are used in addition. In recent years SEK has started to develop more quantitative risk measures.
This is in line with the general development of methods — both in the academic world and in commercial operations — and legal requirements. One example of SEK’s progress is a project designed to further improve business management and control. Business management and control is to be based on economic capital. One essential component in this work consists of the permission that SEK has been granted from the Swedish Financial Supervisory Authority to base the capital requirement for credit risk on an internal risk classification method under the reformed Basel Rules (Basel II). (See also section Basel II).
Basic Principles for Risk Management
· SEK will carry out its business in such a manner that SEK is perceived as a first-class counterparty by its business counterparties.
· SEK shall be selective in its acceptance of counterparty exposures in order to ensure high creditworthiness.
· All SEK’s credit commitments will at all times be fully funded through maturity.
· SEK will at all times have a capital base that is well above regulatory requirements.
43
Risks — an overview
In its business activities SEK is exposed to a number of different risks, from credit risks to operational risks. In order to be able to offer customers financial solutions — for the most part long-term financing solutions that promote Swedish exports — SEK sometimes carries out transactions that, without risk-mitigation activities, would have a higher risk than the Company considers acceptable. In order to be able to carry out such transactions despite this, SEK uses a number of methods to reduce or transform risks to desired levels. The main methods used for reducing or transforming risks include derivative instruments and guarantees. As a result, SEK’s net risks — although SEK’s gross exposures in certain cases may be considerable — are controlled, limited and relatively small.
To ensure that the inherent gross exposures of a transaction can be transformed in an effective and controlled manner, SEK has developed clear guidelines with regard to which gross exposures can be accepted and which risk transformation techniques can be applied.
The following risk categories are particularly important to SEK:
· Credit risks are SEK’s largest risks. Credit risks are inherent in all assets and other contracts, where a counterparty is obliged to fulfill obligations. Credit risks are limited through a strict selection of counterparties, and they are managed, among other things, by use of guarantees and credit derivatives. A purchased credit derivative contract provides the holder with the right under certain conditions —among others, default of the underlying, risk-covered counterparty — to sell an asset, for its nominal value, to the issuer of the credit derivative contract. Accordingly, credit derivative contracts make it possible for the buyer to create a combined risk (double default) to the underlying counterparty and the issuer of the credit derivative contract.
SEK transforms by the use of credit derivative contracts large volumes of exposures to individual counterparties to combined (double default) exposures, where one counterparty (the issuer of the credit derivative contract) is a financial institution. Through the use, in addition thereto, of contracts that oblige the individual issuer of credit derivative contracts to provide collateral in case the market value of the issued credit derivative contracts exceeds a certain level, the total risk is further reduced. The market value of a credit derivative contract is derived from the change in creditworthiness of the underlying risk — covered counterparty. As a result of this, SEK will — provided that the creditworthiness of the underlying counterparties, the credit risk to whom is covered by the credit derivative contracts, deteriorates continuously — successively receive collateral for these risks. This risk mitigation technique is, therefore, particularly efficient from a real risk management perspective.
· Market risks arise due to mismatches of assets and liabilities in individual currencies and/or in interest-rate terms. The resulting market risks are denoted currency exchange-rate risks and interest-rate risks, respectively.
Market risks can arise also in transactions that include embedded derivative contracts. Mostly, SEK eliminates markets risks related to embedded derivative contracts by entering into matching (off—setting) transactions. An embedded derivative contract is a part of a host contract (for instance, a bond), and its effect is that some or all of the cash flows of the host contract will be modified based on the development of the value of the underlying assets/debts/prices or other values that are defined in the embedded derivative contract.
· Interest-rate risks are managed at an individual contract level and at a total portfolio level. The interest-rate risks are restricted by limits set by the Board of Directors.
· Currency exchange-rate risks are kept at a very low level, since SEK usually matches assets and liabilities in terms of currencies. The remaining currency exchange-rate risk, which is limited, arises due to the difference between revenues and costs (net interest margins) related to assets and liabilities in the respective currencies.
· Market-related counterparty risks—which are a kind of credit risk—arise when derivative instruments are used to manage risks. In order to limit this risk, SEK enters into such transactions solely with counterparties with high creditworthiness. A further reduction of the risk is achieved since SEK strives to obtain collateral or
44
mark-to-market agreements — which means that the highest permitted risk level, regardless of any market value changes that may occur, is set in advance — from its counterparties before entering into derivative contracts.
Operational risks. Since SEK’s transactions often have long maturities and a high level of complexity, SEK has high demands on systems, processes and employees in order to minimize operational risk. The extensive risk management conducted by SEK is often complicated and, therefore, leads to additional operational risk, that is minimized in a corresponding manner. There is also a risk that SEK’s reputation will be damaged if the Company fails to comply with current legislation and best practice or in another manner fails to meet its commitments, even those that are not explicit. Such risks are reduced through active efforts relating to risk culture, compliance with the regulations and corporate governance.
45
46
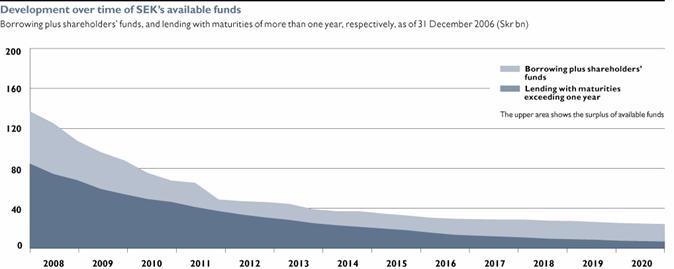
In the table Development over Time of SEK’s Available Funds certain simplifying assumptions are made, the most important being that shareholders’ funds as of December 31, 2006, will remain unchanged over time.
Risk matrix
SEK’s risk management primarily involves using various techniques to transform gross risks into net risks that are at a level acceptable to SEK. The matrix below describes this risk management for SEK’s most significant risk categories.
GROSS EXPOSURES | | RISK MANAGEMENT | | NET RISK |
Credit-related counterparty risk (See also Note 32 to the Consolidated Financial Statements)
Some of SEK’s credits are granted to parties that have a lower credit quality and therefore higher risk than that to which SEK wishes to be exposed. This applies to a large extent to export credits where the ability to provide financing is a key competitive tool for the supplier. Even in cases where customers have a good credit quality, the gross risks can be higher than desirable if the financing requirements are substantial. | | · By use of different methods for corporations, municipalities and financial institutions, SEK establishes credit ratings for its individual counterparties. Most of the counterparties against whom SEK accepts net exposures are also credit rated by one or more of the internationally recognized rating agencies. In order to be able to keep the credit risk at the desired level, SEK usually uses various types of guarantees and other risk-mitigating solutions. For export credits, where the ultimate borrower may have a low creditworthiness, guarantees from Export Credit Agencies (ECAs) and banks are normally used. To | | · The net risk is limited mainly to counterparties with high creditworthiness. In many cases there are several guarantors for one and the same exposure. The net risk for an exposure with several guarantors will be considerably lower than the risk would have been against an individual counterparty. In cases where credit derivatives are used for transformation of a gross risk, the net exposure, in the event of a gradual deterioration of the borrower’s credit quality, will gradually decrease. This is done through the collateral adjustment that covers a change in market value above a certain set level. |
47
| | avoid larger than desired risks, SEK may need risk-cover also in those cases where the counterparties have high creditworthiness, if the financing requirements are large. In such cases, credit derivatives are normally used. The counterparty risks related to the credit derivative contracts are usually managed through ISDA-agreements with a collateral or mark-to-market supplement. | | |
| | | | |
Market-related counterparty risk (See also Note 32 to the Consolidated Financial Statements) Various derivative instruments such as swaps, forward contracts and options are used to limit and reduce risks. The value of these can be considerable in the event of market changes particularly for contracts with long maturities. This gives rise to a market-related counterparty risk where realization of the value of such contracts depends on the counterparty’s ability to meet its obligations throughout the entire contract period. | | · In order to keep counterparty risks at a controlled and acceptable level, SEK carefully chooses counterparties with high credit quality for derivative transactions. To further reduce these risks, SEK strives to obtain collateral or mark-to-market agreements — which means that the highest permitted risk level, regardless of market value changes that may occur, are decided in advance — from their counterparties before entering into a derivative contract. | | ·The combination of a careful choice of counterparties and collateral agreements leads to a limited net risk. All exposures related to market-related counterparty risk must be contained within set counterparty limits. |
48
Market risks—Interest rates (See also Note 33 to the Consolidated Financial Statements)
In order to be able to offer credits — often with complicated disbursement and repayment structures — with fixed interest at attractive terms, it is cost efficient for SEK to take some interest rate risk. SEK’s borrowing is also often made at fixed interest. SEK primarily sets interest rate terms based on the various needs and preferences of customers and counterparties. Consequently, assets and liabilities can to some extent have different fixed interest periods, which leads to interest-rate risk. | | · SEK uses various techniques for measuring and managing interest-rate risks which are designed to give a clear picture and good control of these risks. Using different derivatives, the original interest-rate risks in assets and liabilities are normally transformed from long to short fixed interest terms in currencies with well functioning markets. EUR, USD and Skr are preferably used. | | ·The net risk is limited. To the extent derivatives are used to manage interest-rate risk, a market-related counterparty risk remains against counterparties in the derivative transactions. |
| | | | |
Market risks—Currency (See also Note 33 to the Consolidated Financial Statements)
SEK’s granting of credits and a large portion of its borrowing can take place in the currency of the borrower’s and investor’s respectively choice. It is therefore seldom that borrowing and lending are made in the same currency and therefore directly balance each other. Liquidity investments and some borrowing may, to the extent that market conditions allow, be made in currencies SEK chooses in order to match assets and liabilities. | | · Differences in exposures to individual currencies that exist between different transactions are fully matched with the aid of various derivatives, primarily currency swaps. Currency exposure in addition to this arises in the net interest income that is continuously generated in foreign currency. This is hedged regularly in order to minimize risks. | | · The net risk only comprises an accrued net interest income in foreign currency, that is hedged regularly, which results in very low risk. To the extent derivatives are used to handle currency risk, a market-related counterparty risk remains against counterparties in the derivative transactions. |
| | | | |
Market risks—Credit spreads (See also Note 33 to the Consolidated Financial Statements)
SEK has a trading portfolio whose holdings are market valued with regard to changes in the interest rate margin which the market requires to compensate for the credit risk. | | · SEK regularly marks to market the values of the holdings in the trading portfolio. Risk is measured as the change in market value at a specific change of credit spread. The size of the change in the risk calculation depends on the risk counterparty’s rating and sector and the maturity of the exposure. Holdings must have high liquidity. | | · SEK limits the holding in this portfolio to issuers with good credit quality in selected sectors. Taken overall, the portfolio comprises liquid assets with a controlled risk that is measured in clearly defined risk measurements. |
49
Market risks—Other markets (See also Note 33 to the Consolidated Financial Statements)
A large portion of SEK’s funding is carried out on terms that are adapted to investor requirements for exposure to different risks. Such adjustments provide exposure not only against credit risk but also changes in different market prices and other market-related variables, such as index for example. These adjustments result in funding transactions that contain embedded derivatives. The risk in these derivatives must be managed to avoid undesirable exposures for SEK. | | · Unwanted market risks in embedded derivatives are hedged by SEK by using free-standing derivative contracts with offsetting risk profiles. | | · Generally, SEK does not have any net exposure to other types of risk than interest rate, currency and credit risks. The derivatives used for hedging of undesired market risks result in a market-related counterparty risk against counterparties in the derivative transactions. |
| | | | |
Financing and Liquidity risks (See also Note 34 to the Consolidated Financial Statements)
SEK’s customers demand credits in different currencies and with different maturities. Maturities are often long. In order to avoid funding risk, it is SEK’s policy that all credit commitments must be funded until maturity. A limited liquidity risk exists however in the management of SEK’s liquidity. | | · All credit commitments are funded throughout their entire term. Surplus borrowing is invested in assets with good credit quality and highly liquidity. SEK also has a strict policy for liquidity risk in its short-term liquidity management. This policy includes requirements for backup facilities. | | · SEK has overall a very limited and well controlled funding and liquidity risk. |
| | | | |
Operational risks (See also Note 35 to the Consolidated Financial Statements)
SEK’s transactions often have long maturities and a high degree of complexity which create operational risks. The extensive risk management carried out by SEK for different types of risk is often complicated, and therefore leads to additional operational risk. | | · SEK places great importance on developing structural capital by having clear and reliable routines, a clear division of responsibility, competent and knowledgeable employees and good systems support. SEK also conducts determined work on ethical and moral issues. Persistent and consistent conduct develops the risk awareness and attitudes of employees. | | · Operational risk exists in all operations and can never be totally avoided. Through consistent quality assurance work operational risks are kept at a controlled, acceptable level. |
50
Basel II
As from the beginning of 2007, the reformed Basel Rules (Basel II) are effective in Sweden and the rest of the EU. The main purpose of the new rules is to achieve greater transparency and improved risk management in banks and financial institutions and, thus, boost the stability of the financial system. An important part of this is that institutions shall maintain capital levels that are commensurate with the institutions’ risk profile. The main structure of the new system consists of the three so-called pillars. Pillar 1 deals with minimum capital requirements for credit and market risks and also for operational risks, based on explicit calculation rules.
SEK has been granted permission from the Swedish Financial Supervisory Authority to base the capital requirement for credit risks on an internal risk classification method. Regulatory capital for credit risks will in the future, therefore, better reflect the actual risks associated with SEK’s transactions.
Further, under Pillar 2 the Company shall identify risks and assess risk management from a wider perspective, to supplement the capital requirements calculated within the scope of Pillar 1. This Internal Capital Adequacy Assessment Process (ICAAP) also includes qualitative risks which can not be directly measured in the form of positions which can be covered by capital. Pillar 3 addresses greater openness and transparency, the manner in which institutions are to report (in the wide sense of the term) their operations to the market and the general public. SEK views these changes altogether as a potential way to obtain business benefits and to create added value for the various stakeholders in the company.
The Internal Ratings Based (IRB) based approach
SEK’s internal risk classification system (IRB system) consists of all the various methods, work and decision-making processes, control mechanisms, control documents, IT systems, procedures and routines which support risk classification and the quantifications of credit risk. SEK’s risk classification system is aimed at assessing the credit risks associated with individual counterparties.
Using a variety of different methods for corporates, municipalities and financial institutions, SEK rates the credit risk of each individual counterparty. SEK’s internal risk classification method is based on both qualitative and quantitative factors. SEKs IRB approach is to a large extent based on assessments by analysts but also to some extent rests on statistical models or methods. Within the framework of SEK’s essentially expert-based system, quantitative models are used to support or refine the Company’s risk assessments. SEK determines default probabilities for its various risk classes by mapping its internal rating scale against the rating scales of the external rating institutions, and then uses the external rating institutions’ default statistics to calculate default probabilities.
A fundamental precondition for the Company to use the IRB system is to have a continuous and efficient process for the validation of all parts of the system. Thus, SEK must prove that the prediction capacity of its internal risk estimate procedure is adequate. To comply with this requirement, SEK has developed and implemented special procedures for validating the risk classification system and the estimates of risk parameters.
The reliability of the SEK’s IRB system depends on how well the forward-looking estimates accord with subsequently observable outcomes. Applying a continuous and efficient validation process enables SEK to detect discrepancies, which in turn increases the possibilities to remedy any deficiencies in the IRB system. The below illustrations show the correlation between SEK’s internal risk classification and Standard & Poor’s and Moody’s external credit ratings, respectively.
The existence of discrepancies may reflect differences in analytical assessments and the times assessment were made. In summary, the internal assessments are well in accordance with the external ratings.
51
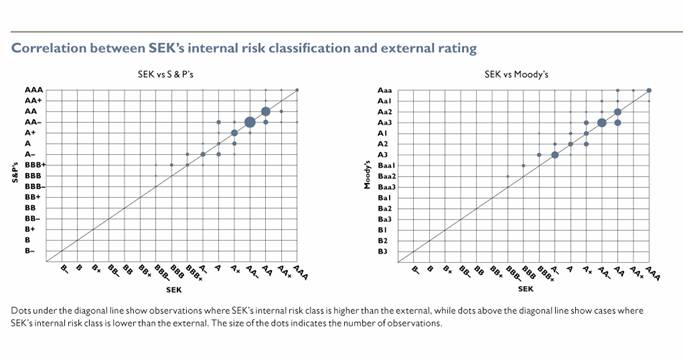
ICAAP
One aspect of great importance under Pillar 2 is that institutions are responsible for designing their own process for internal capital adequacy assessment (ICAAP). The implication is that institutions must in an overall and comprehensive manner measure their risk and assess their risk management and based thereon, assess their capital needs and also communicate analyses and conclusions to the Swedish Financial Supervisory Authority. The ICAAP must be documented and disclosed within the whole Company. As part of its strategic planning process, SEK’s board of directors and executive management establish the Company’s risk appetite and clear objectives with regard to the level and composition of the the capital requirement. SEK’s ICAAP is assessed as being well in line with the underlying principles, intentions and evaluations of the rules and is shown schematically as in the illustration below.

For all quantifiable risks the analysis comprizes size of exposure, assessment of risk management and operational risks directly attributable to the risk types. SEK manages individual risks separately, but some consideration is also given to interaction between various risks. According to SEK’s definition, strategic risk has two dimensions: the chosen strategy could be proven wrong and would therefore not result in achievement
52
of the objectives; and the risk that the chosen strategy cannot be adapted to changes in the surrounding environment. The first dimension reflects the implementation of the chosen strategy in the form of the level of the risks. The risk management work is assessed by compiling the results of the individual assessments of credit risk, market risk, liquidity risk and operational risk. The composition and quality of the credit portfolio is a strategic decision relative to credit risk. Correspondingly, where operational risk is concerned the Company’s choice of level, e.g., regarding systems and processes, is a strategic decision. External risk, which covers the other dimension of the strategic risk, illustrates the Company’s sensitivity to changes in the surrounding world and urges the Company to adapt its strategy to changes.
For internal assessment of the capital requirement need under Pillar 2 (primarily regarding credit risk) SEK works with so-called economic capital, which relative to the regulatory capital requirement is a more precise and risk-sensitive measure. Economic capital is based on the calculation of Value at Risk (VaR) and constitutes a crucial element of the Company’s ICAAP. SEK’s assessment as to whether the Company in addition to the minimum capital requirement calculated under Pillar 1 needs to allocate more capital for credit risk under Pillar 2, is based mainly on a quantitative analysis. This approach is based on comparative analysis, i.e., a comparison between the so-called Basel-formula and the calculation of economic capital at a confidence level of 99.9%. Naturally, this quantitative approach is supplemented with qualitative assessments.
The primary objective of the analysis is to assess whether or not the total capital requirement when taking Pillar 2 into account should be set higher than the mechanically calculated capital requirement under Pillar 1. In addition, we deem it to be crucial to also be able to break down the difference with regard to the various individual factors. Even if the difference (net) may be small, the analysis shows that the difference between the approaches under Pillar 1 and Pillar 2, respectively, related to individual factors can have a major effect on risk.
Among the factors which increase the need for economic capital in the overall internal capital adequacy assessment is the fact that the Company takes a more cautious view on the loss given default (LGD) relative to the Basel-formula, Another factor that increases the need for capital under Pillar 2 is that the Company takes into consideration individual large exposures and the concentration risks inherent in these. Moreover, Pillar 1 allows for certain types of exposures to be entirely excluded from capital requirements. It is the Company’s opinion that capital, in relation to actual risk, is required also for such exposures.
Among the components that reduce the need for economic capital, we can mention that SEK adopts other correlations assumptions than the Basel-formula. The fact that the Pillar 1 rules contain limits which are expressed in terms of an absolute level relative to the lowest permissible default probability (0.03%) applying to most exposure classes, results in an overestimation of the credit risk associated with counterparties with a high creditworthiness. The Pillar 1 rules do not take into consideration the risk reduction that results from very short maturities. However, the economic capital model does take this effect into the account. The major positive factor which the Company is not allowed to take into account under Pillar 1 is the full risk reduction obtained by guarantees and credit derivatives, (i.e., combined risks, or so called double default) in combination with collateral agreements with issuers of credit derivatives.
Item 12. Description of Securities Other than Equity Securities
Not applicable.
53
PART II
Item 13. Defaults, Dividend Arrearages and Delinquencies
None.
Item 14. Material Modifications to the Rights of Security Holders and Use of Proceeds
None.
Item 15. Controls and Procedures
The Company carried out an evaluation under the supervision and with the participation of the Company’s management, including the President, the Chief Financial Officer and the Chief Accounting Officer, of the effectiveness of the design and operation of the Company’s disclosure controls and procedures (as defined in Rule 13a-15 under the Securities Exchange Act of 1934) as of December 31, 2006. There are inherent limitations to the effectiveness of any system of disclosure controls and procedures, including the possibility of human error and the circumvention or overriding of the controls and procedures. Accordingly, even effective disclosure controls and procedures can only provide reasonable assurance of achieving their control objectives. Based upon the Company’s evaluation, the President, the Chief Financial Officer and the Chief Accounting Officer concluded that the disclosure controls and procedures as of December 31, 2006 were effective.
There has been no change in the Company’s internal control over financial reporting during 2006 that has materially affected, or is reasonably likely to materially affect, the Company’s internal control over financial reporting.
Item 16A. Audit Committee Financial Expert
The Company currently does not have a separately-designated audit committee. Accordingly, for purposes of the Sarbanes-Oxley Act of 2002, the entire Board of Directors serves as the audit committee. While certain members of the Board of Directors have varying degrees of financial and accounting experience, the Board has not concluded that any of its members is an audit committee financial expert within the meaning of the regulations adopted under the Sarbanes-Oxley Act of 2002.
In this context, it should be noted that the Company is under the supervision of the Swedish Financial Supervisory Authority. In addition to the auditors elected by the Annual General Meeting, the Swedish Financial Supervisory Authority appoints an independent accountant to audit on its behalf the Company’s financial statements. Accordingly, the Company believes that there is a meaningful independent review of its financial statements beyond that performed by the independent auditors elected by the Annual General Meeting.
54
Item 16B. Code of Ethics
The Company has in place ethical guidelines that apply to all employees including all executive officers. The guidelines are consistent with and also in some aspects more restrictive than Swedish regulations. The ethical guidelines are designed to deter wrongdoing and promote:
- honest and ethical conduct, including the ethical handling of actual and apparent conflicts of interest between personal and professional relationships; and
- compliance with applicable governmental laws, rules and regulations.
Although these ethical guidelines do not meet the definition of “code of ethics” in the regulations adopted pursuant to the Sarbanes-Oxley Act of 2002, primarily because they do not specifically address matters relating to the Company’s disclosure in reports and documents filed with the SEC and in other public communications, the Company believes that its ethical guidelines are sufficient for their stated purpose and to comply with Swedish regulations and guidelines.
Item 16C. Principal Accountant Fees and Services
The following table sets forth for the years ending December 31, 2006, 2005, and 2004, the costs related to aggregate fees by the principal independent auditors, KPMG.
| | 2006 | | 2005 | | 2004 | |
Audit fee | | 6.6 | | 7.6 | | 7.8 | |
| | | | | | | |
Audit-related fee | | 0.0 | | 0.1 | | 0.4 | |
| | | | | | | |
Tax fee | | 0.2 | | 0.2 | | 0.3 | |
| | | | | | | |
All other fees | | 0.9 | | 1.9 | | 3.6 | |
| | 7.7 | | 9.8 | | 12.1 | |
“Audit fee” comprises the aggregate fees in relation with the audit of consolidated and annual financial statements, reviews of interim financial statements and attestation services that are provided in connection with statutory, regulatory and stock exchange filings or engagements, and services provided in connection with issuances of debt. “Audit-related fee” comprises fees charged for assurance and related services that are reasonably related to the performance of the audit or review of the financial statements. “Tax fee” comprises fees for professional services rendered by the principal independent auditors for tax compliance and tax advice. “All other fees” comprises fees mainly related to consultation and assistance provided in connection with the Company’s preparation for adoption of International Financial Reporting Standards as described in Note 1 to the Consolidated Financial Statements.
Item 16D. Exemption from the listing standards for Audit Committees
As described in further detail in Item 6 “Directors, Senior Management and Employees”, the Board of Directors comprises the Company’s audit committee for purposes of Rule 10A-3 under the Securities Exchange Act of 1934. Each of the members of the Board of Directors is a representative or designee of the Swedish State. The Swedish State is an affiliate (sole shareholder) of the Company. However, no member of the Board of Directors is an executive officer of the Company. Thus, although no member of the Board of Directors satisfies the non-affiliate prong of the independence standard for audit committee members described in Rule 10A-3(b)(1) (ii) (B) under the Securities Exchange Act of 1934, the Company relies, as to each member of the Board of Directors, on the exemption from this prong for foreign governmental representatives described in Rule 10A-3(b)(1)(iv)(E). The Company does not believe that its reliance on the above exemption materially adversely affects the ability of the Company’s Board of Directors, in its role as audit committee, to act independently and to satisfy its duties.
55
Item 16E. Purchases of Equity Securities by the Issuer and Affiliated Purchasers.
Not applicable.
PART III
Item 17. Financial Statements
Not applicable.
56
Item 18. Financial Statements
The Company’s consolidated and parent company financial statements for the fiscal year ended December 31, 2006, prepared in accordance with Item 18 of Form 20-F, begin on page F-1 of this Report.
57
Consolidated Financial Statements
58
Item 19. Exhibits
Exhibits
Documents filed as exhibits to this Annual Report.
1.1 Articles of Association (incorporated by reference to the Form 6-K filed by the Company on May 27, 2004, file no. 1-8382).
2.1 Indenture, dated as of August 15, 1991, between the Company and J.P. Morgan Trust Company National Association (as successor in interest to the First National Bank of Chicago), as trustee, providing for the issuance of debt securities, in one or more series, by the Company (filed as Exhibit 4(a) to the Company’s Report of Foreign Issuer on Form 6-K (File No. 1-8382) dated September 30, 1991 and incorporated herein by reference).
2.2 First Supplemental Indenture dated as of June 2, 2004 between the Company and J.P. Morgan Trust Company, National Association (filed as Exhibit 4(b) to the Company’s Registration Statement on Form F-3 (No. 333-131369) dated January 30, 2006 and incorporated herein by reference).
2.3 Second Supplemental Indenture, dated as of January 30, 2006, between the Company and J.P. Morgan Trust Company, National Association (filed as Exhibit 4(c) to the Company’s Registration Statement on Form F-3 (No. 333-131369) dated January 30, 2006, and incorporated herein by reference).
2.4 Fiscal Agency Agreement dated July 5, 2006 relating to up to Euro 25,000,000,000 aggregate principal amount of debt securities authorized to be issued under the Company’s Program for the Continuous Issuance of Debt Instruments.
2.5 Deed of Covenant dated July 5, 2006 relating to up to Euro 25,000,000,000 aggregate principal amount of securities of SEK authorized to be issued under the Company’s Program for the Continuous Issuance of Debt Instruments.
2.6 Fiscal Agency Agreement dated August 21, 1997 relating to securities other than Yen-denominated securities to be issued under the Company’s U.S.$10,000,000,000 aggregate principal amount Program for the Continuous Issuance of Debt Instruments in Asia. (Filed as Exhibit 2.3 to the Company’s Annual Report on Form 20-F (file No. 1-8382) for the year ended December 31, 2003 filed by the Company on April 28, 2004 and incorporated by reference herein).
2.7 Deed of Covenant dated August 21, 1997 relating to securities other than Yen-denominated securities to be issued under the Company’s U.S.$10,000,000,000 aggregate principal amount Program for the Continuous Issuance of Debt Instruments in Asia. (Filed as Exhibit 2.4 to the Company’s Annual Report on Form 20-F (file No. 1-8382) for the year ended December 31, 2003 filed on the Company on April 28, 2004 and incorporated by reference herein).
2.8 Agreement with Commissioned Companies for Bondholders dated October 28, 1997 relating to up to Yen 500,000,000,000 aggregate principal amount of securities of SEK to be issued under the Real Asian MTN Program Yen 500,000,000,000 Samurai MTN Program (English translation). (Filed as Exhibit 2.5 to the Company’s Annual Report on Form 20-F (file No. 1-8382) for the year ended December 31, 2003 filed by the Company on April 28, 2004 and incorporated by reference herein).
7.1 Calculation of Ratios of Earnings to Fixed Charges—U.S. Accounting Principles.
59
7.2 Calculation of Ratios of Earnings to Fixed Charges—Swedish Accounting Principles.
8.1 Subsidiaries as of the end of the year covered by this report are AB SEKTIONEN, AB SEK Securities, SEK Financial Advisors AB and SEK Financial Services AB, each of which is incorporated in Sweden.
12.1 Certifications pursuant to Rule 13a-14(a) or Rule 15d-14(a) under the Securities Exchange Act of 1934.
13.1 Certifications Pursuant to 18 U.S.C Section 1350, as Adopted Pursuant to Section 906 of the Sarbanes-Oxley Act of 2002.
15.1 Consent of the Independent Registered Public Accounting Firm.
60
REPORT OF INDEPENDENT REGISTERED PUBLIC ACCOUNTING FIRM
To the Board of Directors and shareholder of
AB Svensk Exportkredit:
We have audited the accompanying consolidated and parent company balance sheets of AB Svensk Exportkredit (Swedish Export Credit Corporation) (the “Company”) as of December 31, 2006 and 2005, and the related consolidated and parent company statements of income, changes in shareholders’ funds and cash flows for each of the years in the three-year period ended December 31, 2006. These financial statements are the responsibility of the Company’s management. Our responsibility is to express an opinion on these financial statements based on our audits.
We conducted our audits in accordance with the standards of the Public Company Accounting Oversight Board (United States). Those standards require that we plan and perform the audit to obtain reasonable assurance about whether the financial statements are free of material misstatement. An audit includes examining, on a test basis, evidence supporting the amounts and disclosures in the financial statements. An audit also includes assessing the accounting principles used and significant estimates made by management, as well as evaluating the overall financial statement presentation. We believe that our audits provide a reasonable basis for our opinion.
In our opinion, the consolidated and parent company financial statements referred to above present fairly, in all material respects, the financial position of the Company at December 31, 2006 and 2005, and the results of operations and of cash flows for each of the years in the three-year period ended December 31, 2006, in conformity with generally accepted accounting principles in Sweden.
Accounting principles generally accepted in Sweden vary in certain significant respects from U.S. generally accepted accounting principles. Information relating to the nature and effect of such differences is presented in Note 37 to the consolidated financial statements.
| KPMG Bohlins AB | |
| | |
| | |
| By | |
| | Anders Linér |
| | Authorized Public Accountant |
| | | |
Stockholm, Sweden
March 7, 2007 except Note 31 and
Note 37 which are as of April X, 2007
F-1
AB SVENSK EXPORTKREDIT
(Swedish Export Credit Corporation)
CONSOLIDATED AND PARENT COMPANY STATEMENTS OF INCOME
| | 2006 | | 2005 | | 2004 | |
SEK (exclusive of the S-system)
(Skr million) | | Consolidated
Group | | Parent
Company | | Consolidated
Group | | Parent
Company | | Consolidated
Group | | Parent
Company | |
Interest revenues | | 7,188.1 | | 7,191.0 | | 5,946.7 | | 5,949.5 | | 5,055.4 | | 5,058.2 | |
Interest expenses | | -6,390.3 | | -6,390.6 | | -5,187.6 | | -5,187.8 | | -4,253.7 | | -4,253.9 | |
Net interest revenues (Note 4, 5) | | 797.8 | | 800.4 | | 759.1 | | 761.7 | | 801.7 | | 804.3 | |
Commissions earned (Note 6) | | 26.4 | | 3.1 | | 14.0 | | 4.4 | | 15.9 | | 6.9 | |
Commissions incurred (Note 6) | | -26.7 | | -22.6 | | -30.8 | | -30.0 | | -17.2 | | -17.3 | |
Remuneration from the S-system | | 25.4 | | 25.4 | | 22.8 | | 22.8 | | 17.9 | | 17.9 | |
Net results of financial transactions (Note 7, 8) | | 3.8 | | 3.8 | | 1.4 | | 1.4 | | 5.3 | | 5.4 | |
Other operating income (Note 9) | | 1.5 | | 2.9 | | 0.5 | | 2.8 | | 0.3 | | 1.4 | |
Administrative expenses (Note 10) | | -254.0 | | -242.3 | | -238.4 | | -230.9 | | -230.3 | | -227.4 | |
Depreciations of non-financial assets (Note 11, 12, 13) | | -30.4 | | -27.9 | | -29.7 | | -27.4 | | -26.4 | | -24.2 | |
Other operating expenses (Note 9) | | -0.6 | | 0.1 | | -0.8 | | -0.1 | | -0.7 | | -0.1 | |
Recovered credit loss (Note 38) | | — | | — | | — | | — | | 45.3 | | 45.3 | |
Operating profit | | 543.2 | | 542.9 | | 498.1 | | 504.7 | | 611.8 | | 612.2 | |
| | | | | | | | | | | | | |
Changes in untaxed reserves (Note 15) | | n.a. | | 49.4 | | n.a. | | 11.1 | | n.a. | | 9.9 | |
| | | | | | | | | | | | | |
Taxes (Note 16) | | -157.6 | | -170.6 | | -151.2 | | -155.5 | | -172.2 | | -174.5 | |
NET PROFIT FOR THE YEAR | | 385.6 | | 421.7 | | 346.9 | | 360.3 | | 439.6 | | 447.6 | |
| | | | | | | | | | | | | |
Earnings per share, Skr (Note 37) | | 389 | | | | 350 | | | | 444 | | | |
The above income statements do not include the S-system, the results of which are shown below.
S-system
(Skr million) | | 2006 | | 2005 | | 2004 | |
Interest revenues | | 444.3 | | 384.8 | | 384.1 | |
Interest expenses | | -458.1 | | -335.9 | | -350.2 | |
Net interest revenues (+)/ expenses (-) (Note 4, 5) | | -13.8 | | 48.9 | | 33.9 | |
Remuneration to SEK | | -25.4 | | -22.8 | | -17.9 | |
Foreign exchange effects (Note 7) | | 1.4 | | -3.3 | | 2.9 | |
Reimbursement from (+)/ to (-) the State | | 37.8 | | -22.8 | | -18.9 | |
NET | | 0.0 | | 0.0 | | 0.0 | |
See accompanying notes to the consolidated financial statements.
F-2
AB SVENSK EXPORTKREDIT
(Swedish Export Credit Corporation)
CONSOLIDATED AND PARENT COMPANY BALANCE SHEETS
| | December 31, 2006 | | | | December 31, 2005 | |
(Skr million) | | Consolidated
Group | | Parent
Company | | Of which
S-system | | | | Consolidated
Group | | Parent
Company | | Of which
S-system | |
ASSETS | | | | | | | | | | | | | | | |
Cash in hand | | 0.0 | | 0.0 | | — | | | | 0.0 | | 0.0 | | — | |
Treasuries/government bonds (Note 18) | | 1,786.7 | | 1,786.7 | | — | | | | 1,902.6 | | 1,902.6 | | — | |
of which current assets | | (1,503.1 | ) | (1,503.1 | ) | — | | | | (1,607.9 | ) | (1,607.9 | ) | — | |
of which fixed assets | | (283.7 | ) | (283.7 | ) | — | | | | (294.7 | ) | (294.7 | ) | — | |
Credits to credit institutions (Note 17) | | 14,159.0 | | 14,158.4 | | 3,737.3 | | | | 11,963.8 | | 12,009.9 | | 4,496.5 | |
Credits to the public (Note 17) | | 41,975.1 | | 41,975.1 | | 5,394.4 | | | | 31,429.6 | | 31,429.6 | | 5,854.9 | |
Other interest-bearing securities (Note 18) | | 156,602.2 | | 156,602.2 | | — | | | | 147,436.9 | | 147,436.9 | | — | |
of which current assets | | (117,469.8 | ) | (117,469.8 | ) | — | | | | (109,807.3 | ) | (109,807.3 | ) | — | |
of which fixed assets | | (39,132.4 | ) | (39,132.4 | ) | — | | | | (37,629.6 | ) | (37,629.6 | ) | — | |
of which credits | | (39,109.2 | ) | (39,109.2 | ) | — | | | | (37,206.8 | ) | (37,206.8 | ) | — | |
Shares in subsidiaries (Note 19) | | n.a. | | 118.6 | | — | | | | n.a. | | 118.6 | | — | |
Non-financial assets (Note 11, 12, 13) | | 168.5 | | 56.4 | | — | | | | 192.0 | | 78.4 | | — | |
Other assets (Note 20) | | 10,301.6 | | 10,384.3 | | 22.2 | | | | 10,564.3 | | 10,577.7 | | 1.2 | |
Prepaid expenses and accrued revenues (Note 21) | | 4,207.8 | | 4,206.9 | | 153.9 | | | | 4,004.0 | | 4,003.2 | | 148.7 | |
TOTAL ASSETS | | 229,200.9 | | 229,288.6 | | 9,307.8 | | | | 207,493.2 | | 207,556.9 | | 10,501.3 | |
| | | | | | | | | | | | | | | |
LIABILITIES, ALLOCATIONS AND SHAREHOLDERS’ FUNDS | | | | | | | | | | | | | | | |
| | | | | | | | | | | | | | | |
Borrowing from credit institutions (Note 22) | | 3,245.6 | | 3,255.6 | | 6.0 | | | | 563.6 | | 573.6 | | 2.3 | |
Borrowing from the public (Note 22) | | 56.0 | | 58.9 | | — | | | | 74.9 | | 77.8 | | — | |
Senior securities issued (Note 22) | | 203,375.6 | | 203,375.6 | | — | | | | 187,820.1 | | 187,820.1 | | 275.3 | |
Other liabilities (Note 23) | | 11,359.6 | | 11,408.7 | | 58.2 | | | | 7,773.9 | | 7,798.6 | | 87.6 | |
Lending/(borrowing) between SEK and the S-system | | — | | — | | 9,083.7 | | | | — | | — | | 9,978.8 | |
Accrued expenses and prepaid revenues (Note 24) | | 3,808.2 | | 3,806.6 | | 159.9 | | | | 3,879.3 | | 3,878.4 | | 157.3 | |
Allocations (Note 25) | | 373.7 | | 16.6 | | — | | | | 387.8 | | 17.1 | | — | |
Subordinated securities issued (Note 26) | | 2,857.9 | | 2,857.9 | | — | | | | 3,254.9 | | 3,254.9 | | — | |
Total liabilities and allocations | | 225,076.6 | | 224,779.9 | | 9,307.8 | | | | 203,754.5 | | 203,420.5 | | 10,501.3 | |
| | | | | | | | | | | | | | | |
Untaxed reserves (Note 15) | | n.a. | | 1,274.2 | | — | | | | n.a. | | 1,323.6 | | — | |
| | | | | | | | | | | | | | | |
Share capital | | 990.0 | | 990.0 | | — | | | | 990.0 | | 990.0 | | — | |
Non-distributable reserves | | 1,126.6 | | 208.3 | | — | | | | 1,165.6 | | 212.1 | | — | |
Total non-distributable capital | | 2,116.6 | | 1,198.3 | | — | | | | 2,155.6 | | 1,202.1 | | — | |
Profit carried forward | | 1,622.1 | | 1,614.5 | | — | | | | 1,236.2 | | 1,250.4 | | — | |
Net profit for the year | | 385.6 | | 421.7 | | — | | | | 346.9 | | 360.3 | | — | |
Total distributable capital | | 2,007.7 | | 2,036.2 | | — | | | | 1,583.1 | | 1,610.7 | | — | |
Total shareholders’ funds (Note 27) | | 4,124.3 | | 3,234.5 | | — | | | | 3,738.7 | | 2,812.8 | | — | |
TOTAL LIABILITIES, ALLOCATIONS AND SHAREHOLDERS’ FUNDS | | 229,200.9 | | 229,288.6 | | 9,307.8 | | | | 207,493.2 | | 207,556.9 | | 10,501.3 | |
| | | | | | | | | | | | | | | |
COLLATERAL PROVIDED | | | | | | | | | | | | | | | |
Collateral provided | | None | | None | | None | | | | None | | None | | None | |
Interest-bearing securities (Note 1 (l)) subject to lending | | 29.0 | | 29.0 | | — | | | | 27.3 | | 27.3 | | — | |
| | | | | | | | | | | | | | | |
CONTINGENT LIABILITIES (Note 28) | | None | | None | | None | | | | None | | None | | None | |
| | | | | | | | | | | | | | | |
COMMITMENTS | | | | | | | | | | | | | | | |
Committed undisbursed credits (Note 28) | | 21,888.5 | | 21,888.5 | | 14,162.6 | | | | 15,114.1 | | 15,114.1 | | 9,066.7 | |
See accompanying notes to the consolidated financial statements.
F-3
Consolidated Statements of Changes in Shareholders’ Funds
Consolidated Group
(Skr million) | | | | 2006 | | | | 2005 | | | | 2004 | |
Opening balance | | | | 3,738.7 | | | | 3,391.8 | | | | 2,952.2 | |
Dividend paid | | | | — | | | | — | | | | — | |
Net profit for the year | | | | 385.6 | | | | 346.9 | | | | 439.6 | |
Closing balance (Note 27) | | | | 4,124.3 | | | | 3,738.7 | | | | 3,391.8 | |
The reconciliation between opening balance and closing balance with respect to the different sub-components in shareholders’ funds is shown in Note 27.
See accompanying notes to the consolidated financial statements.
F-4
AB SVENSK EXPORTKREDIT
(Swedish Export Credit Corporation)
CONSOLIDATED AND PARENT COMPANY STATEMENTS OF CASH FLOWS
(A) | | 2006 | | 2005 | | 2004 | |
(Skr million) | | Parent
Group | | Consolidated
Company | | Parent
Group | | Consolidated
Company | | Parent
Group | | Consolidated
Company | |
CASH FLOWS FROM OPERATING ACTIVITIES | | | | | | | | | | | | | |
Net profit for the year | | 385.6 | | 421.7 | | 346.9 | | 360.3 | | 439.6 | | 447.6 | |
Adjustments to reconcile net profit to net cash provided by operating activities: | | | | | | | | | | | | | |
Changes in untaxed reserves | | n.a | | -49.4 | | n.a | | -11.1 | | n.a | | -9.9 | |
Increase(+)/decrease(-) in deferred taxes | | -13.8 | | — | | -3.1 | | — | | -2.7 | | — | |
Depreciations | | 30.4 | | 27.9 | | 29.7 | | 27.4 | | 26.4 | | 24.2 | |
Decrease(+)/increase(-) in prepaid expenses and accrued revenues | | -203.8 | | -203.7 | | -541.0 | | -540.4 | | -71.6 | | -71.6 | |
Decrease(-)/increase(+) in accrued expenses and prepaid revenues | | -71.1 | | -71.8 | | 669.2 | | 670.9 | | 301.4 | | 299.3 | |
Decrease(+)/increase(-) in derivative instruments with positive or negative values | | 3,277.5 | | 3,277.4 | | -4,298.2 | | -4,298.2 | | 955.5 | | 955.5 | |
Other changes — net | | 570.3 | | 525.5 | | -1,993.3 | | -1,950.0 | | 244.0 | | 246.8 | |
Disbursements of credits (B) | | -24,021.6 | | -24,021.6 | | -20,980.6 | | -20,980.6 | | -11,458.6 | | -11,458.6 | |
Repayments of credits, including effects of currency translations | | 12,969.9 | | 12,969.9 | | 6,878.0 | | 6,878.0 | | 14,396.4 | | 14,396.4 | |
Net increase(-)/decrease(+) in bonds and securities held (C) | | -9,049.4 | | -9,049.4 | | -31,351.0 | | -31,350.9 | | -18,231.4 | | -18,231.4 | |
Other changes related to credits - net (B) | | -1,688.8 | | -1,642.2 | | 3,431.4 | | 3,382.6 | | 5,111.9 | | 5,112.7 | |
NET CASH USED IN(-)/PROVIDED BY(+) OPERATING ACTIVITIES | | -17,814.8 | | -17,815.7 | | -47,812.0 | | -47,812.0 | | -8,289.1 | | -8,289.0 | |
| | | | | | | | | | | | | |
CASH FLOWS FROM INVESTING ACTIVITIES | | | | | | | | | | | | | |
Capital expenditures | | -6.9 | | -5.9 | | -6.0 | | -4.1 | | -40.3 | | -45.3 | |
NET CASH USED IN(-)/PROVIDED BY(+) INVESTING ACTIVITIES | | -6.9 | | -5.9 | | -6.0 | | -4.1 | | -40.3 | | -45.3 | |
| | | | | | | | | | | | | |
CASH FLOWS FROM FINANCING ACTIVITIES | | | | | | | | | | | | | |
Net decrease (-)/increase (+) in originally short-term debt | | 17,029.4 | | 17,029.4 | | 10,381.8 | | 10,381.8 | | 908.1 | | 908.1 | |
Proceeds from issuance of long-term senior debt | | 61,277.9 | | 61,277.9 | | 52,343.0 | | 52,343.0 | | 38,802.9 | | 38,802.9 | |
Proceeds from issuance of long-term subordinated debt | | — | | — | | 471.9 | | 471.9 | | — | | — | |
Repayments of long-term senior subordinated debt | | — | | — | | -471.9 | | -471.9 | | — | | — | |
Adjustment of long-term subordinated debt due to currency translations | | -397.0 | | -397.0 | | 490.2 | | 490.2 | | -236.3 | | -236.3 | |
Repayments of long-term senior debt, including effects of currency translations | | -60,302.6 | | -60,302.7 | | -17,514.8 | | -17,516.7 | | -33,054.6 | | -33,049.7 | |
Dividend paid | | — | | — | | — | | — | | — | | — | |
Own long-term debt repurchased, net change | | 214.0 | | 214.0 | | 2,117.8 | | 2,117.8 | | 1,909.3 | | 1,909.3 | |
NET CASH USED IN(-)/PROVIDED BY(+) FINANCING ACTIVITIES | | 17,821.7 | | 17,821.6 | | 47,818.0 | | 47,816.1 | | 8,329.4 | | 8,334.3 | |
| | | | | | | | | | | | | |
Net decrease(-)increase(+) in cash and cash equivalents | | 0.0 | | 0.0 | | 0.0 | | 0.0 | | 0.0 | | 0.0 | |
Cash and cash equivalents at beginning of period | | 0.0 | | 0.0 | | 0.0 | | 0.0 | | 0.0 | | 0.0 | |
Cash and cash equivalents at end of period (B) | | 0.0 | | 0.0 | | 0.0 | | 0.0 | | 0.0 | | 0.0 | |
(A) The statements of cash flows have been drawn up in accordance with principles applied by the Swedish Financial Accounting Standards Council’s recommendation number 7 — Accounting Recommendation for Cash Flows.
(B) Deposits with banks are included as one component of credits to credit institutions. However, the gross amount of new deposits made during the year has not been included in the amount of Disbursements of credits. Instead, the net change during the year in deposits has been included in Other changes - - net. The amount of deposits with banks at December 31, 2006 was Skr 2,640.0 million (2005: 936,1, 2004:4,382.6). Such amounts are not included in the amounts of Cash in hand on the balance sheet.
(C) Net increase(-)/decrease(+) in credits granted against documentation in the form of interest-bearing securities are included as one component in Net increase/decrease in bonds and securities held.
See accompanying notes to the consolidated financial statements.
F-5
AB SVENSK EXPORTKREDIT
(Swedish Export Credit Corporation)
Notes to the Income Statements, Balance Sheets and Statements of Cash Flows
All amounts are in Skr million, unless otherwise indicated.
Swedish Financial Supervisory Authority’s regulations regarding Annual Reports
This annual report has been prepared in compliance with regulations of the Swedish Financial Supervisory Authority regarding annual reports for Credit Institutions and Securities Companies (FFFS 2002:22) and the Swedish Financial Accounting Standards Council’s recommendations.
Introductory Note
The Parent Company compared with the Consolidated Group
The Company reports separate Income Statements and Balance Sheet Statements for the Consolidated Group and the Parent Company.
The Consolidated Group (the “Consolidated Group” or the “Group”) comprises AB Svensk Exportkredit ( “SEK” or the “Parent Company”) and its wholly-owned subsidiaries AB SEKTIONEN, AB SEK Securities, SEK Financial Advisors AB, and SEK Financial Services AB (the “Subsidiaries”). AB SEKTIONEN’s main material asset is its building, serving as SEK’s headquarters, and SEKTIONEN does not presently operate any business other than renting its building to SEK. AB SEK Securities is a securities company under the supervision of the Swedish Financial Supervisory Authority. SEK Financial Advisors AB’s objective is to engage in advisory services. SEK Financial Services AB is an inactive company.
The information in the following notes represents, unless otherwise stated, both the Consolidated Group and the Parent Company.
Note 1. Accounting Principles
Introduction
Swedish accounting legislation, as well as the related accounting regulations of the Swedish Financial Supervisory Authority, is adapted to applicable EU directives. The regulations apply to Swedish credit institutions, including SEK.
The regulations include, among other things, specific rules for hedge accounting which enables reporting based on consistent valuation principles for financial assets and financial liabilities that are acquired to hedge the holder against unfavorable changes in the net values of such assets and liabilities. Hedge accounting was also applied in previous years.
Implementation of International Financial Reporting Standards
According to an EU regulation, the consolidated financial statements of companies with listed debt or equity instruments in a regulated market in the EU should be prepared in conformity with the International Financial Reporting Standards (IFRS) that have been endorsed for application in the EU from January 1, 2005. However, according to article 9 of the regulation, EU member states may decide that companies that have issued listed debt securities but not issued listed equity instruments in a regulated
F-6
market in the EU may start the application of IFRS from January 1, 2007. The Swedish legislation implementing this EU-regulation incorporates this facility, and because SEK has issued listed debt securities, but not listed equity instruments in a regulated market within the EU, its adoption of IFRS has not been compulsory until from January 1, 2007. The financial year 2006 will be the comparative year, and therefore, the opening balance for IFRS will be as of January 1, 2006.
SEK has identified the accounting rules for financial instruments that are contained in IAS 39, IAS 32 and IFRS 7 as the area where the implementation of IFRS will have the highest impact compared to present accounting policies. Specifically, the requirement to measure all derivative financial instruments at fair value and the detailed rules for hedge accounting in IAS 39 will create the most significant changes to SEK’s present accounting policies and disclosures. The present rules for deferral hedge accounting according to Swedish GAAP differ significantly from the principles and rules on hedge accounting in IAS 39.
An internal conversion project for applying IFRS has been in progress during the years 2004 to 2006. The main conversion activities in SEK that are related to the application of IAS 39 are (a) evaluating the different alternatives for hedge accounting within IAS 39, (b) classifying assets and liabilities in different accounting categories, and (c) preparing administrative systems for the new accounting requirements.
With regards to accounting for economic hedges according to IAS 39, one of the two main alternatives available to SEK is to apply Fair Value Hedge Accounting (FVHA) on transactions where a derivative is hedging a fixed interest rate risk arising from a hedged asset or liability. The same derivative or another derivative can also be hedging foreign exchange risk or credit risk. The other alternative is to designate fixed interest rate assets and liabilities which are hedged by derivatives irrevocably at initial recognition as instruments at fair value through profit or loss (Fair Value Option, FVO). One main difference between those two methods is that the latter includes changes in credit spread in the fair value measurement which is excluded when applying FVHA. In some instances, Cash Flow Hedge Accounting (CFHA) will also be applied by SEK.
SEK has chosen hedge accounting strategies for its financial instruments outstanding as of January 1, 2006, and onwards, and classified financial instruments into appropriate accounting categories. For the financial assets, there are mainly four categories available: financial assets at fair value through profit or loss; available for sale; loans and receivables; and held-to-maturity. No financial transactions will be classified in the held-to-maturity category. There are only two categories available for financial liabilities: financial liabilities at fair value through profit or loss; and other financial liabilities. Derivatives are always classified as financial assets or liabilities at fair value.
With regard to financial assets, the category loans and receivables will be a main category for SEK. This category is used not only for loans originated by SEK but also for securities acquired by SEK that are not quoted on an active market. However, securities quoted on an active market can not be classified in the category loans and receivables. Therefore, a number of securities, deemed to be quoted on an active market, will be classified mainly as available-for-sale securities. Furthermore, a large part of financial assets that under previous accounting policies have been classified as held-for-trading will remain under that classification. However, certain financial assets that under previous accounting policies were classified as held-for-trading are in the opening balance under IFRS classified mainly as loans and receivables due to a change in the intention of the investments. The category loans and receivables transactions will be measured at amortized costs. In the case where one or more derivatives is hedging currency and/or interest rate exposures FVHA will be applied. Transactions that are classified as available-for-sale securities are carried at fair value, with changes in fair value recognized in a special component of equity. In the case where one or more derivatives is hedging currency and/or interest rate exposures FVHA will be applied. Furthermore, certain transactions classified as loans and receivables will be subject to CFHA.
As for senior securities issued, a major part will be classified as financial liabilities at fair value through profit or loss (FVO). Furthermore, a large part of senior securities issued will be classified as other
F-7
financial liabilities. In the category other financial liabilities transactions will be carried at amortized costs. In the case where one or more derivatives is hedging currency, interest rate, and/or other exposures FVHA will be applied. Subordinated debt will be classified as other financial liabilities and mainly be subject to FVHA.
An increased volatility in profit or loss and in equity related to IFRS can be expected in 2007 and onwards.
The following accounting policies have been applied:
(a) Consolidation. The consolidated financial statements have been drawn up in accordance with the Swedish Financial Accounting Standards Council’s recommendation number 1:00, Consolidated Accounts, based on the purchase method.
No untaxed reserves are reported separately in the Consolidated Balance Sheet, nor are revenues and expenses, including taxes, related to untaxed reserves reported separately in the Consolidated Income Statement. Instead, in the Consolidated Balance Sheet, the untaxed reserves are presented as (i) an after-tax portion, reported as one component of non-distributable capital, and (ii) a portion representing deferred taxes, reported as one component of “allocations”. Any changes in the untaxed reserves are reported as adjustments to the relevant items in the Consolidated Balance Sheet. However, untaxed reserves are disclosed in the Balance Sheet of the Parent Company as are changes in untaxed reserves in the Income Statement of the Parent Company. Accordingly, some line items in the Balance Sheets and Income Statements are applicable only to the Parent Company or the Consolidated Group, as the case may be. For line items that are not applicable, the abbreviation “n.a.” has been used.
(b) The State-supported system (“S-system”). SEK administers, against compensation, the state’s export credit support system, and the state’s tied aid credit program (the “S-system”). Pursuant to agreements between SEK and the state, the state reimburses all interest differentials, financing costs and net foreign exchange losses under the S-system while any credits or borrowings remain outstanding. These settlements are every three months in arrears. Claims for reimbursement from the state (and liabilities for reimbursement to the state) are reported as “Other Assets — Due from the state” (see also Note 20) until settled.
Results in the S-System by Type of Credit | | CIRR credits | | Concessionary credits | | Net result for S-system | |
(Skr million) | | 2006 | | 2005 | | 2004 | | 2006 | | 2005 | | 2004 | | 2006 | | 2005 | | 2004 | |
| | | | | | | | | | | | | | | | | | | |
Interest Revenues/(expenses) | | 48.0 | | 135.9 | | 155.4 | | (61,8 | ) | (87.0 | ) | (121.6 | ) | (13.8 | ) | 48.9 | | 33.9 | |
Remuneration to SEK | | (22.8 | ) | (19.3 | ) | (13.0 | ) | (2,6 | ) | (3.5 | ) | (4.8 | ) | (25.4 | ) | (22.8 | ) | (17.9 | ) |
Foreign exchange differences | | 1.4 | | (3.3 | ) | 2.9 | | — | | — | | — | | 1.4 | | (3.3 | ) | 2.9 | |
Total | | 26.6 | | 113.3 | | 145.3 | | (64,4 | ) | (90.5 | ) | (126.4 | ) | (37.8 | ) | 22.8 | | 18.9 | |
(c) S-system statements. Separate income statements are shown for the S-system. Amounts included in such income statements are not included in income statements of the Consolidated Group and the Parent Company.
For Balance Sheets, all amounts related to the S-system are included in the relevant amounts shown for the Consolidated Group and the Parent Company. However, the Balance Sheets columns headed “Of which S-system”, state the S-system items separately.
F-8
Assets and liabilities related to the administration of the S-system are assets and liabilities, respectively, of SEK. However, the results under such system are settled between SEK and the state as described in Note 1(b).
(d) Accrual basis accounting. The SEK-group applies the accrual basis of accounting.
(e) Settlement or trade date reporting. The reporting on the balance sheet is based on trade date, however, in the case of credits and debt, on settlement dates.
(f) Gross basis reporting. The reporting of all interest revenues and interest expenses is made on a gross basis with the exception of interest revenues and interest expenses related to derivative instruments. In accordance with the regulations of the Swedish Financial Supervisory Authority, interest revenues and interest expenses related to derivative instruments are reported on a net basis.
(g) Current and fixed financial assets. Financial assets are classified as “current financial assets” or “fixed financial assets”. Fixed financial assets are assets which the Company has the intention and ability to hold to maturity. Current financial assets are all financial assets other than fixed assets. See also Note 1(j).
(h) Untaxed reserves. In accordance with Swedish tax law the Parent Company maintains certain untaxed reserves. (See also Note 1(a).)
(i) Currency translation. Assets and liabilities in foreign currencies have been translated to Swedish kronor at the year-end exchange rates (see Note 2). Currency exchange effects are included as one component of “net results of financial transactions”.
Revenues and expenses denominated in foreign currencies are translated to Swedish kronor at the current exchange rate as of the respective day of accrual. Any changes in the currency exchange rates between the relevant currencies and Swedish kronor related to the period between the day of accrual and the day of settlement are reported as currency exchange effects.
(j) Securities. The following principles have been applied with regard to interest-bearing securities (“securities” or “interest-bearing securities”):
Securities that are financially managed to provide the company with market interest earnings on the investment of its equity, with the intention of retention until maturity (securities classified as held-to-maturity securities), are classified as fixed financial assets in the Balance Sheet and reported at amortized cost.
Credits granted against documentation in the form of interest-bearing securities, as opposed to traditional credit agreements, and aimed to be held to maturity (“held-to-maturity account securities”), are reported on the balance sheet as one component of securities classified as fixed financial assets and reported at amortized cost.
Securities included in interest-rate and currency-exchange-rate hedged transactions (“hedge account securities”) are classified as current financial assets and reported — in accordance with the hedge accounting rules — at amortized cost. Hedge account securities are offset by other financial instruments, mostly derivatives or liabilities, with matching principal or notional amounts, interest rates and currencies, so that the Company’s exposure to changes in net values of such securities due to movements in interest and exchange rates is hedged.
It is the Company’s policy to manage investing and funding activities to minimize potential fair value exposure to movements in interest and currency exchange rates. In accordance with this policy, the Company may on a limited basis invest in non-hedged securities to be reported at market value. Securities in the Trading Portfolio (securities classified as held-for-trading securities) as defined by the regulations of the Swedish Financial Supervisory Authority, are classified as current financial assets and reported at market value. The difference between market value and amortized cost (unrealized net gains or losses) of
F-9
securities classified as held-for-trading is reported as one component of net results of financial transactions in accordance with the Swedish Financial Supervisory Authority’s regulations.
Gains and losses realized in connection with sales of hedge account securities are deferred and amortized as one component of interest revenues or interest expenses, as applicable, while gains and losses in connection with sales of other securities are reported as a component of net results of financial transactions. Such amortized gains or losses are not at present a material component of assets and liabilities.
The reporting of securities will, according to regulations of the Swedish Financial Supervisory Authority, be broken down by two component categories, namely (i) “treasuries, etc., eligible for refinancing with central banks”, and (ii) “other interest-bearing securities”. SEK has no legal right to refinance any securities with the Swedish Central Bank. SEK has, therefore, determined to instead use the term “treasuries/government bonds”. All the above statements in this Note 1 (j) apply to both categories of securities, i.e., to “treasuries/government bonds” and to “other interest-bearing securities”.
(k) Deposits. Under the regulations of the Swedish Financial Supervisory Authority, deposits with banks are reported as one component of “credits to credit institutions”.
(l) Repurchase agreements and bond lending. Repurchase agreements are reported as financial transactions on the balance sheet. Securities lent to other parties are reported as securities on the balance sheet. However, according to regulations of the Swedish Financial Supervisory Authority, securities/assets sold subject to repurchase agreements and securities/assets lent to other parties will — although not formally representing collateral — be reported under the heading “collateral provided”.
(m) Past-due and doubtful credits. Past-due credits are credits or other assets on which interest or principal has been contractually past-due for more than 60 days. Doubtful credits (or other assets) are credits (or other assets) that are past due or where the payments most likely will not be fulfilled according to the terms of agreement. Restructured credits (or other assets) are credits (or other assets) on which the interest-rate has been reduced to below commercial levels.
(n) Provisions for probable credit losses. Provisions for probable credit losses are made if and when SEK determines that the obligor under a credit, or another asset held, and existing guarantee or collateral will probably fail to cover SEK’s full claim. Such determinations are made for each individual credit/asset. No such provisions were made in 2006. There has been no need to make any provision in groups for individually valued claims.
(o) Depreciation and amortization. Office equipment is depreciated on a straight-line method over an estimated useful life of five years. Buildings and building equipment relating to the building held by the acquired subsidiary AB SEKTIONEN, are also depreciated on the straight line method over an estimated useful life of 67 years. Intangible assets, i.e. capitalized IT software investments are amortized by 20 percent per year from the date the asset is available for use. (See also Note 1(s)).
(p) Reacquired debt. SEK from time to time reacquires its debt instruments. The nominal value of reacquired debt is deducted from the corresponding liability on the balance sheet. Unless the instrument has been repurchased with the intention of cancellation, any discount or premium in connection with the repurchase is amortized during the remaining contractual tenure of the instrument.
(q) Derivative instruments. In its normal course of business, SEK uses, and is a party to, different types of derivative instruments, mostly interest-rate related and currency-exchange-rate related instruments, for the purpose of hedging or eliminating SEK’s interest-rate and currency-exchange-rate exposures.
Such instruments are reported, in accordance with the hedge accounting rules, at amortized cost.
F-10
Net receivables or liabilities related to individual currency-exchange-rate related instruments are reported on the balance sheet as one component of “other assets” or “other liabilities”, as the case may be. The amounts included in “other assets” or “other liabilities”, related to such instruments, reflect the differences between the nominal value of the receivable or asset constituent, on the one hand, and the liability constituent, on the other hand, of each such instrument held.
Counterparty exposures in derivative instruments and off-balance sheet contracts are calculated and included in the reporting of capital adequacy in accordance with the Swedish Financial Supervisory Authority’s regulations.
(r) Pension obligations. The Company sponsors a defined benefit multiemployer plan covering all employees. All contributions paid or payable to the plan have been expensed. In addition, the Company has supplementary pension obligations to certain key employees. The benefits currently earned are covered by annuity contracts, the cost of which has been expensed. A one-off pension liability to former employees is carried in the balance sheet at the actuarially calculated present value of the obligation.
Swedish Financial Accounting Standards RR 29, Remuneration to Employees, which is based on IAS 19 Employee benefits, has been applied. The standard includes, among other things, how to account for and provide information on remuneration in the form of pension commitments. This standard also stipulates defined-benefit accounting for arrangements with multi-employer plans, provided sufficient information is available for the Company to account for its proportionate share of such defined-benefit obligations, plan assets and costs associated with such plan. However, this information is not yet available for the Company.
(s) Intangible assets. Swedish Financial Accounting Standards RR15, Intangible Assets, has been applied on the capitalized portion of investments in IT-system which includes expenses considered to relate to the intangible asset, such as consulting fees and expenses for Company personnel contributing to producing such intangible asset.
(t) Income tax. Income tax for the profit or loss for the year comprises current and deferred taxes. Current tax is expected to be payable on taxable income for the financial year. Deferred tax includes deferred tax in the untaxed reserves of the individual Group companies and deferred taxes on taxable temporary differences.
(u) Certain references. In certain cases, references are made in the “Notes to the income statements, balance sheets, and statements of cash flows,” to information included in other sections of this report. Such information shall be deemed to be included herein by reference.
F-11
Note 2. Currency exchange rates
Assets, liabilities and off-balance sheet contracts denominated in foreign currencies (i.e., other currencies than Swedish kronor) have been translated to Swedish kronor at the year-end exchange rates between such currencies and Swedish kronor.
The relevant exchange rates for the currencies representing the largest portions of SEK’s in the balance sheet reported net assets and liabilities were the following (expressed in Swedish kronor per unit of each foreign currency):
| | 2006 | | 2005 | | 2004 | |
Currency | | Exchange | | Portion at | | Exchange | | Portion at | | Exchange | | Portion at | |
| | rate | | year-end, % | | rate | | year-end, % | | rate | | year-end | |
| | | | | | | | | | | | | |
USD | | 6.8725 | | 40.3 | % | 7.9525 | | 46.0 | % | 6.6125 | | 23.7 | % |
EUR | | 9.05 | | 31.9 | % | 9.430 | | 26.4 | % | 9.007 | | 41.8 | % |
SKR | | 1 | | 9.3 | % | 1 | | 8.0 | % | 1 | | 10.8 | % |
JPY | | 0.0578 | | 5.5 | % | 0.0678 | | 8.7 | % | 0.06375 | | 13.1 | % |
AUD | | 5.4375 | | 4.4 | % | 5.8325 | | 3.5 | % | 5.12 | | 3.6 | % |
GBP | | 13.4875 | | 2.4 | % | 13.7325 | | 0.7 | % | 12.71 | | 0.9 | % |
Others | | — | | 6.2 | % | — | | 6.7 | % | — | | 6.1 | % |
Note 3. Assets, liabilities and off-balance sheet contracts denominated in foreign currencies
Assets, liabilities and off-balance sheet contracts denominated in foreign currencies are included in the total amount of assets, liabilities and off-balance sheet contracts reported by the following amounts (expressed in millions of Swedish kronor).
| | 2006 | | 2005 | |
| | Consolidated | | Parent | | Of which | | Consolidated | | Parent | | Of which | |
| | Group | | Company | | S-system | | Group | | Company | | S-system | |
Total assets | | 229,200.9 | | 229,288.6 | | 9,307.8 | | 207,493.2 | | 207,556.9 | | 10,501.3 | |
of which denominated
in foreign currencies | | 197,445.7 | | 197,446.3 | | 9,176.4 | | 180,552.9 | | 180,553.7 | | 10,337.1 | |
Total liabilities | | 225,076.7 | | 224,779.9 | | 9,307.8 | | 203,754.5 | | 203,420.5 | | 10,501.3 | |
of which denominated
in foreign currencies | | 197,447.7 | | 197,447.7 | | 9,179.7 | | 180,514.9 | | 180,497.4 | | 10,332.9 | |
| | 2006 | | 2005 | |
| | Consolidated | | Parent | | Consolidated | | Parent | |
| | Group | | Company | | Group | | Company | |
Total nominal amount
of off-balance sheet
contracts and commitments | | 402,130.3 | | 402,130.3 | | 382,472.5 | | 382,472.5 | |
of which denominated
in foreign currencies | | 371,553.1 | | 371,553.1 | | 361,499.3 | | 361,499.3 | |
In the case of off-balance sheet contracts, individual contracts that include both an asset-constituent and a liability-constituent have been included in the category “of which denominated in foreign currencies” if at least one constituent of the contract is denominated in a foreign currency. Although large gross amounts of assets and liabilities are denominated in foreign currencies, only limited net currency exchange exposures are allowed under SEK’s policy with regard to foreign currency exposures. See also Note 33.
If the translation from foreign currencies to Swedish kronor would have been made at the end of year 2006 with the translation rates that were applicable at the end of the year 2005, the volume of total assets at the end of year 2006 would have been Skr 242.1 billion, i.e., Skr 12.9 billion more than actually reported. Of that amount, Skr 5.3 billion relates to lending and Skr 7.6 billion relates to interest-bearing securities.
F-12
Note 4. Net interest revenues
| | 2006 | | 2005 | | 2004 | |
| | Consolidated | | Parent | | | | Consolidated | | Parent | | | | Consolidated | | Parent | | | |
| | Group | | Company | | S-system | | Group | | Company | | S-system | | Group | | Company | | S-system | |
Interest revenues were related to: | | | | | | | | | | | | | | | | | | | |
Credits to credit institutions | | 472.7 | | 472.6 | | 184.6 | | 300.1 | | 300.1 | | 182.2 | | 188.5 | | 188.4 | | 181.2 | |
Credits to the public | | 985.7 | | 985.7 | | 244.0 | | 657.1 | | 657.1 | | 165.3 | | 584.7 | | 584.7 | | 148.8 | |
Interest-bearing securities | | 5,274.8 | | 5,274.8 | | — | | 4,696.9 | | 4,696.8 | | 0.7 | | 4,133.1 | | 4,133.1 | | 5.9 | |
Other items | | 454.9 | | 457.9 | | 15.7 | | 292.6 | | 295.5 | | 36.6 | | 149.1 | | 152.0 | | 48.2 | |
Total interest revenues | | 7,188.1 | | 7,191.0 | | 444.3 | | 5,946.7 | | 5,949.5 | | 384.8 | | 5,055.4 | | 5,058.2 | | 384.1 | |
| | | | | | | | | | | | | | | | | | | |
Interest expenses were related to: | | | | | | | | | | | | | | | | | | | |
Borrowings from credit institutions | | 44.5 | | 44.7 | | 0.0 | | 37.1 | | 37.3 | | 0.0 | | 34.2 | | 34.4 | | 0.0 | |
Borrowings from the public | | 1.7 | | 1.8 | | 0.0 | | 1.3 | | 1.3 | | 0.0 | | 1.0 | | 1.0 | | 0.0 | |
Senior securities issued | | 10,312.2 | | 10,312.2 | | 1.3 | | 7,211.5 | | 7,211.5 | | 21.7 | | 5,504.2 | | 5,504.2 | | 92.0 | |
Subordinated securities issued | | 165.2 | | 165.2 | | — | | 150.6 | | 150.6 | | — | | 170.6 | | 170.6 | | 0.0 | |
Derivative instruments | | -4,193.7 | | -4,193.7 | | -27.5 | | -2,294.5 | | -2,294.5 | | 53.9 | | -1,523.9 | | -1,523.9 | | 132.6 | |
Other items | | 60.4 | | 60.4 | | 484.3 | | 81.6 | | 81.6 | | 260.3 | | 67.6 | | 67.6 | | 125.6 | |
Total interest expenses | | 6,390.3 | | 6,390.6 | | 458.1 | | 5,187.6 | | 5,187.8 | | 335.9 | | 4,253.7 | | 4,253.9 | | 350.2 | |
| | | | | | | | | | | | | | | | | | | |
Net interest revenues | | 797.8 | | 800.4 | | -13.8 | | 759.1 | | 761.7 | | 48.9 | | 801.7 | | 804.3 | | 33.9 | |
SEK´s policy with regard to counterparty exposures states that SEK will be selective in accepting counterparty
exposures. See Note 32.
The average interest-rate on credits outstanding under the category “credits to the public” at year-end was
4.2 percent (3.2) and 4.4 percent (4.2) under the S-system. It should be noted that such interest rates represent
aggregated information related to fixed-rate as well as floating-rate credits denominated in varying currencies
with varying maturities.
Net interest revenues include Skr 0.5 million of net earnings related to financial leasing objects. See also Note 17.
Note 5. Interest-rate exposures
SEK´s policy with regard to interest-rate exposures is described in Note 33.
Note 6. Net commission revenues
| | 2006 | | 2005 | | 2004 | |
| | Consolidated | | Parent | | | | Consolidated | | Parent | | | | Consolidated | | Parent | | | |
| | Group | | Company | | S-system | | Group | | Company | | S-system | | Group | | Company | | S-system | |
Commissions earned were related to: | | | | | | | | | | | | | | | | | | | |
Financial consultant commissions | | 18.4 | | 1.6 | | — | | 6.9 | | — | | — | | 6.1 | | 5.0 | | — | |
Other commissions earned | | 1.4 | | 1.5 | | — | | 1.7 | | 1.7 | | — | | 1.9 | | 1.9 | | — | |
Capital market commissions | | 6.6 | | 0.0 | | — | | 5.4 | | 2.7 | | — | | 7.9 | | — | | — | |
Total commissions earned | | 26.4 | | 3.1 | | — | | 14.0 | | 4.4 | | — | | 15.9 | | 6.9 | | — | |
| | | | | | | | | | | | | | | | | | | |
Commissions incurred were related to: | | | | | | | | | | | | | | | | | | | |
Risk capital guarantee from shareholder | | 3.6 | | 3.6 | | — | | 3.6 | | 3.6 | | — | | 3.6 | | 3.6 | | — | |
Financial consultant commissions | | 4.2 | | 0.3 | | — | | 1.7 | | 0.0 | | — | | 1.4 | | 1.4 | | — | |
Other commissions incurred | | 18.9 | | 18.7 | | — | | 25.5 | | 26.4 | | — | | 12.2 | | 12.3 | | — | |
Total commissions incurred | | 26.7 | | 22.6 | | — | | 30.8 | | 30.0 | | — | | 17.2 | | 17.3 | | — | |
| | | | | | | | | | | | | | | | | | | |
Net commission revenues | | -0.3 | | -19.5 | | — | | -16.8 | | -25.6 | | — | | -1.3 | | -10.4 | | — | |
F-13
Note 7. Net results of financial transactions
| | 2006 | | 2005 | | 2004 | |
| | Consolidated | | Parent | | | | Consolidated | | Parent | | | | Consolidated | | Parent | | | |
| | Group | | Company | | S-system | | Group | | Company | | S-system | | Group | | Company | | S-system | |
| | | | | | | | | | | | | | | | | | | |
Net results of financial transactions were related to: | | | | | | | | | | | | | | | | | | | |
Currency exchange effects | | -0.2 | | -0.2 | | 1.4 | | -3.1 | | -3.1 | | -3.3 | | -5.1 | | -5.1 | | 2.9 | |
Unrealized profits (+)/losses (-) related to interest-bearing securities and other financial instruments | | 3.1 | | 3.1 | | — | | 4.6 | | 4.6 | | — | | 6.2 | | 6.2 | | — | |
Realized profits (+)/ losses (-) related to interest-bearing securities and other financial instruments | | 0.9 | | 0.9 | | — | | -0.1 | | -0.1 | | — | | 4.2 | | 4.3 | | — | |
Total results of financial transactions | | 3.8 | | 3.8 | | 1.4 | | 1.4 | | 1.4 | | -3.3 | | 5.3 | | 5.4 | | 2.9 | |
Note 8. Currency exchange exposures
SEK´s policy with regard to currency exchange exposures is described in Note 33.
Note 9. Other operating income and expenses
| | 2006 | | 2005 | | 2004 | |
| | Consolidated | | Parent | | | | Consolidated | | Parent | | | | Consolidated | | Parent | | | |
Other operating income: | | Group | | Company | | S-system | | Group | | Company | | S-system | | Group | | Company | | S-system | |
Effects related to compensation from
S-system | | 1.0 | | 1.0 | | — | | — | | — | | — | | 0.3 | | 0.3 | | — | |
Other | | 0.5 | | 1.9 | | — | | 0.5 | | 2.8 | | — | | 0.0 | | 1.1 | | — | |
Total other operating income | | 1.5 | | 2.9 | | — | | 0.5 | | 2.8 | | — | | 0.3 | | 1.4 | | — | |
| | 2006 | | 2005 | | 2004 | |
| | Consolidated | | Parent | | | | Consolidated | | Parent | | | | Consolidated | | Parent | | | |
Other operating expenses: | | Group | | Company | | S-system | | Group | | Company | | S-system | | Group | | Company | | S-system | |
Effects related to compensation to
S-system | | — | | — | | — | | 0.1 | | 0.1 | | — | | 0.0 | | 0.0 | | — | |
Other | | 0.6 | | -0.1 | | — | | 0.7 | | — | | — | | 0.7 | | 0.1 | | — | |
Total other operating expenses | | 0.6 | | -0.1 | | — | | 0.8 | | 0.1 | | — | | 0.7 | | 0.1 | | — | |
F-14
Note 10. Administrative expenses
| | 2006 | | 2005 | | 2004 | |
| | Consolidated | | Parent | | Consolidated | | Parent | | Consolidated | | Parent | |
Administrative expenses were related to: | | Group | | Company | | Group | | Company | | Group | | Company | |
Personnel expenses: | | | | | | | | | | | | | |
Salaries and remuneration to the Board of | | | | | | | | | | | | | |
Directors and the President | | 7.3 | | 4.8 | | 7.8 | | 5.2 | | 5.7 | | 4.5 | |
Salaries and remuneration to other employees | | 83.3 | | 76.3 | | 79.0 | | 74.8 | | 80.7 | | 77.6 | |
Pensions (1) | | 32.1 | | 29.6 | | 29.0 | | 26.8 | | 25.3 | | 24.3 | |
Social insurance | | 28.4 | | 25.5 | | 26.8 | | 24.8 | | 29.9 | | 28.5 | |
Other personnel expenses | | 6.9 | | 6.4 | | 5.9 | | 5.6 | | 6.2 | | 6.1 | |
Total personnel expenses | | 158.0 | | 142.6 | | 148.5 | | 137.2 | | 147.8 | | 141.0 | |
| | | | | | | | | | | | | |
Other administrative expenses: | | | | | | | | | | | | | |
The company’s real estate and premises | | 8.2 | | 12.2 | | 11.5 | | 15.3 | | 12.2 | | 16.0 | |
Other expenses | | 87.8 | | 87.5 | | 78.4 | | 78.4 | | 70.3 | | 70.4 | |
Total other administrative expenses | | 96.0 | | 99.7 | | 89.9 | | 93.7 | | 82.5 | | 86.4 | |
| | | | | | | | | | | | | |
Total administrative expenses | | 254.0 | | 242.3 | | 238.4 | | 230.9 | | 230.3 | | 227.4 | |
(1) Of which: Calculated pension expenses | | 1.1 | | 1.1 | | 1.1 | | 1.1 | | 1.1 | | 1.1 |
Pension premium expenses (2) | | 31.0 | | 28.5 | | 27.9 | | 25.7 | | 24.2 | | 23.2 |
(2) Of which Skr 2.6 million (2005: 1.9, 2004: 1.9) relates to the President and of which Skr 2.0 million (2005: 1.3, 2004: 1.0) in excess of what is tax-deductible. Skr 4.4 million (2005: 4.1, 2004: 3.6) pertains to other key officers included in senior management, of which Skr 2.0 million (2005: 1.6, 2004:1.1) is in excess of what is tax-deductible.
Remuneration to certain officers and directors
The following information regarding the benefits of certain officers and directors is consistent with regulations and instructions including the recommendation of the Swedish Industry and Commerce Stock Exchange Committee:
The Board of Directors consited of 8 Directors at year end (2005: 9), of whom 4 were female (2005: 4) and 4 were male (2005: 5). The Chairman of the Board of Directors received remuneration of Skr 0.2 million in 2006 (2005: 0.2, 2004:0.2). The Vice Chairman of the Board of Directors received remuneration of Skr 0.1 million in 2006 (2005: 0.1, 2004: 0.1). Other Directors received following remuneration: Karin Apelman Skr 0.1 million (2005: 0.1); Pirkko Juntti Skr 0.1 million (2005: 0.1); Helena Levander Skr 0.1 million (2005: 0.1); Bo Netz Skr 0.1 million (2005: n.a.); Harald Sandberg Skr 0.1 million (2005: n.a.); Risto Silander Skr 0.1 million (2005: 0.1)
The Board of Directors appoints Directors to the Board of Directors’ Credit Committee, Finance Committee, and Remuneration Committee annually. For engagement in the Credit Committee and the Finance Committee, Directors received separate remuneration, in accordance with decision on Annual General Meeting, amounting to in aggregate Skr 0.2 million (2005: 0.2).
The President’s remuneration consists of fixed salary and other benefits. The president received a total of 3.9 million for 2006 (2005: 3.7, 2004:3.7) in remuneration. The president does not receive variable remuneration (2005: -. 2004: 0.8). Of the total remuneration to the President, Skr 3.8 million (2005: 3.7, 2004: 3.5 ) is qualifying income for pension purposes. His retirement age is 60 years, with a pension, to the benefit of himself, of 75 percent of his final salary up to 65 years after which it reduces. Such commitment is a defined benefitplan and includes survivors’ pension.
The remuneration to other key officers included in the Executive Committee, in total 6 (2005: 6) persons, consists of fixed salary, other benefits and in some cases variable remuneration. The amount of the remuneration to other key officers in the Executive Committee was Skr 13.1 million (2005: 14.1, 2004: 11.5 ), of which Skr 1.3 million (2005: 2.7) was variable remuneration. The variable remuneration relates to individual targets and targets defined in SEK’s business plan. Of total remuneration to these key officers Skr 10.2 million (2005: 11.1, 2004: 10.6) is qualifying income for pension purposes. If employment contracts are terminated by the company, certain key officers in the Executive Committee are entitled to payment of compensation for a two-year period, although any salary received in new employment will be deducted. Key officers included in the Executive Committee have a retirement age between 60 and 65 years. The pension commitments are covered by insurance, are in most cases defined contribution plans and include survivors’ pension.
Total sick leave for all employees was 2.1 percent (2005: 1.9) of total regular hours of work. Total sick leave for women was 3.4 percent (2005: 2.6) and for men 0.9 percent (2005: 1.1). The proportion of total sick leave that was related to sick leave of 60 days or more was 26.7 percent (2005: 20.5).
Breakdown of total sick leave by age: | | 2006 | | 2005 | |
- 29 years | | 1.0 | % | 0.9 | % |
30 - 49 years | | 2.0 | % | 2.0 | % |
50 years- | | 2.7 | % | 2.0 | % |
Remuneration to the auditors and related audit companies (remuneration may for accounting purposes be included in other items than administrative expenses):
| | 2006 | | 2005 | | 2004 | |
| | Audit fee | | Other | | Audit fee | | Other | | Audit fee | | Other | |
Audit company | | | | fee | | | | fee | | | | fee | |
Deloitte | | 0.2 | | — | | 0.2 | | — | | 0.3 | | 0.2 | |
KPMG | | 6.6 | | 1.1 | | 7.6 | | 2.2 | | 7.8 | | 4.3 | |
Riksrevisionen | | 0.1 | | — | | 0.1 | | — | | 0.1 | | — | |
Total remuneration | | 6.9 | | 1.1 | | 7.9 | | 2.2 | | 8.2 | | 4.5 | |
Audit fee includes also auditing of reporting to authorities and issue prospectus.
F-15
Note 11. Office and building equipment
| | 2006 | | 2005 | | 2004 | |
| | Consolidated | | Parent | | Consolidated | | Parent | | Consolidated | | Parent | |
| | Group | | Company | | Group | | Company | | Group | | Company | |
Acquisition cost | | 50.3 | | 50.3 | | 44.7 | | 44.7 | | 41.0 | | 41.0 | |
Accumulated depreciations at year-end | | -29.6 | | -29.6 | | -23.3 | | -23.3 | | -17.2 | | -17.2 | |
Of which made during the year | | (-6.6 | ) | (-6.6 | ) | (-6.1 | ) | (-6.1 | ) | (-5.7 | ) | (-5.7 | ) |
Book value | | 20.7 | | 20.7 | | 21.4 | | 21.4 | | 23.8 | | 23.8 | |
See also Note 1 (o).
Note 12. Intangible assets
| | 2006 | | 2005 | | 2004 | |
| | Consolidated | | Parent | | Consolidated | | Parent | | Consolidated | | Parent | |
| | Group | | Company | | Group | | Company | | Group | | Company | |
Acquisition cost | | 109.4 | | 106.4 | | 108.3 | | 106.3 | | 105.9 | | 105.9 | |
Accumulated depreciations at year-end | | -71.7 | | -71.2 | | -50.0 | | -49.9 | | -28.4 | | -28.4 | |
Of which made during the year | | (-21.7 | ) | (-21.3 | ) | (-21.5 | ) | (-21.3 | ) | (-18.5 | ) | (-18.5 | ) |
Book value | | 37.7 | | 35.2 | | 58.3 | | 56.4 | | 77.5 | | 77.5 | |
See also Notes 1 (o) and 1 (s)
Note 13. Buildings and land
| | 2006 | | 2005 | | 2004 | |
| | Consolidated | | Parent | | Consolidated | | Parent | | Consolidated | | Parent | |
| | Group | | Company | | Group | | Company | | Group | | Company | |
Buildings: | | | | | | | | | | | | | |
Acquisition cost | | 142.8 | | 0.7 | | 142.8 | | 0.7 | | 142.8 | | 0.7 | |
Accumulated depreciations at year-end | | -32.7 | | -0.3 | | -30.6 | | -0.3 | | -28.5 | | -0.3 | |
Of which made during the year | | (-2.1 | ) | (0.0 | ) | (-2.1 | ) | (0.0 | ) | (-2.2 | ) | (0.0 | ) |
Book value | | 110.1 | | 0.4 | | 112.2 | | 0.4 | | 114.3 | | 0.4 | |
Taxable value | | 28.6 | | 0.6 | | 28.4 | | 0.4 | | 28.4 | | 0.4 | |
| | | | | | | | | | | | | |
Land: | | | | | | | | | | | | | |
Acquisition cost | | 0.1 | | 0.1 | | 0.1 | | 0.1 | | 0.1 | | 0.1 | |
Accumulated depreciations at year-end | | — | | — | | — | | — | | — | | — | |
Of which made during the year | | (— | ) | (— | ) | (— | ) | (— | ) | (— | ) | (— | ) |
Book value | | 0.1 | | 0.1 | | 0.1 | | 0.1 | | 0.1 | | 0.1 | |
Taxable value | | 41.4 | | 0.4 | | 41.3 | | 0.3 | | 41.3 | | 0.3 | |
| | | | | | | | | | | | | |
Buildings and land: | | | | | | | | | | | | | |
Total acquisition cost | | 142.9 | | 0.8 | | 142.9 | | 0.8 | | 142.9 | | 0.8 | |
Total accumulated depreciations at year-end | | -32.7 | | -0.3 | | -30.6 | | -0.3 | | -28.5 | | -0.3 | |
Of which made during the year | | (-2.1 | ) | (0.0 | ) | (-2.1 | ) | (0.0 | ) | (-2.2 | ) | (0.0 | ) |
Total book value | | 110.2 | | 0.5 | | 112.3 | | 0.5 | | 114.4 | | 0.5 | |
Total taxable value | | 70.0 | | 1.0 | | 69.7 | | 0.7 | | 69.7 | | 0.7 | |
See also Note 1 (o).
F-16
Note 14. Counterparty risk exposures
SEK’s policy with regard to counterparty risk exposures is described in Note 32, Further in the table “Counterparty Risk Exposures” in Note 32 is shown SEK’s counterparty exposures, broken down by different categories of contracts, at year end.
Note 15. Untaxed reserves
| | 2006 | | 2005 | | 2004 | |
| | Parent | | Parent | | Parent | |
| | Company | | Company | | Company | |
Tax allocation reserve: | | | | | | | |
Opening balance | | 1,323.6 | | 1,334.6 | | 1,344.6 | |
Dissolution during the year | | -252.3 | | -195.4 | | -218.5 | |
Allocation during the year | | 202.9 | | 184.4 | | 208.5 | |
Closing balance | | 1,274.2 | | 1,323.6 | | 1,334.6 | |
Of which: | | | | | | | |
1999 Tax allocation reserve | | — | | — | | 195.4 | |
2000 Tax allocation reserve | | — | | 252.3 | | 252.3 | |
2001 Tax allocation reserve | | 244.4 | | 244.4 | | 244.4 | |
2002 Tax allocation reserve | | 230.2 | | 230.2 | | 230.2 | |
2003 Tax allocation reserve | | 203.7 | | 203.7 | | 203.7 | |
2004 Tax allocation reserve | | 208.6 | | 208.6 | | 208.6 | |
2005 Tax allocation reserve | | 184.4 | | 184.4 | | — | |
2006 Tax allocation reserve | | 202.9 | | — | | — | |
In the financial statements of the Consolidated Group, the untaxed reserves of the Group companies are allocated by 72 percent to “non-distributable shareholders’ funds” and by 28 percent to deferred taxes (related to untaxed reserves), included as one component of “allocations”, in the Balance Sheet. Changes in the amounts reported as deferred taxes are included in “taxes” in the Income Statement. Accordingly, the amounts related to the Group companies’ untaxed reserves are included in the statements of the Consolidated Group as shown below:
| | 2006 | | 2005 | | 2004 | |
| | Consolidated | | Consolidated | | Consolidated | |
| | Group | | Group | | Group | |
Balance sheet: | | | | | | | |
Opening balance included in “non-distributable shareholders’ funds” | | 953.5 | | 961.4 | | 968.3 | |
Net change during the year | | -35.2 | | -7.9 | | -6.9 | |
Closing balance included in “non-distributable shareholders’ funds” | | 918.3 | | 953.5 | | 961.4 | |
| | | | | | | |
Opening balance reported as “deferred taxes” (included in “allocations”) | | 370.7 | | 373.8 | | 376.5 | |
Net change during the year | | -13.7 | | -3.1 | | -2.7 | |
Closing balance reported as “deferred taxes” (included in “allocations”) | | 357.0 | | 370.7 | | 373.8 | |
| | | | | | | |
Total opening balance included in “allocations” and “non-distributable shareholders’ funds’“ | | 1,324.2 | | 1,335.2 | | 1,344.8 | |
Total net change during the year | | -48.9 | | -11.0 | | -9.6 | |
Total closing balance included in “allocations” and “non-distributable shareholders’ funds” | | 1,275.3 | | 1,324.2 | | 1,335.2 | |
F-17
Note 16. Taxes
| | 2006 | | 2005 | | 2004 | |
| | Consolidated | | Parent | | Consolidated | | Parent | | Consolidated | | Parent | |
| | Group | | Company | | Group | | Company | | Group | | Company | |
Provision for taxes for the year | | 171.0 | | 170.5 | | 155.0 | | 154.9 | | 175.7 | | 175.2 | |
Less: Credit for foreign taxes | | — | | — | | -0.7 | | -0.7 | | -0.8 | | -0.8 | |
Provisions for taxes before change in deferred taxes | | 171.0 | | 170.5 | | 154.3 | | 154.2 | | 174.9 | | 174.4 | |
| | | | | | | | | | | | | |
Change in deferred taxes related to group contribution | | n.a. | | — | | n.a. | | 1.2 | | n.a. | | — | |
Change in deferred taxes related to other assets | | 0.2 | | — | | -0.1 | | — | | -0.1 | | — | |
Change in deferred taxes related to allocations | | 0.1 | | 0.1 | | 0.1 | | 0.1 | | 0.1 | | 0.1 | |
Change in deferred taxes related to untaxed reserves | | -13.7 | | n.a. | | -3.1 | | n.a | | -2.7 | | n.a. | |
Total change in deffered taxes | | -13.4 | | 0.1 | | -3.1 | | 1.3 | | -2.7 | | 0.1 | |
| | | | | | | | | | | | | |
Net amount of taxes | | 157.6 | | 170.6 | | 151.2 | | 155.5 | | 172.2 | | 174.5 | |
Deferred taxes are accounted for in accordance with the Swedish Financial Accounting Standards Council’s recommendation RR 9 — Income Taxes.
The nominal tax rate is 28 percent (2005: 28, 2004:28); the effective tax rate is 29.0 percent (2005: 30.4, 2004: 28.1).
Difference between nominal and effective tax rate
| | 2006 | | 2005 | | 2004 | |
| | Consolidated | | Consolidated | | Consolidated | |
% | | Group | | Group | | Group | |
Nominal income tax rate | | 28.0 | | 28.0 | | 28.0 | |
Tax costs related to holding untaxed reserves | | 1.6 | | 2.1 | | — | |
Other items | | -0.6 | | 0.3 | | 0.1 | |
Effective tax rate | | 29.0 | | 30.4 | | 28.1 | |
Deferred taxes are calculated based on statutory, nominal tax rates. Exceptions from that rule are only made in the case where the fair value exceeds the tax based price when the tax effects have been an important part of the business transaction. In that case the deferred taxes may be recorded on a discounted basis and are calculated at the rate that results in a recognition of a tax liability equal to the differential between the purchase price and the fair value. If the deferred taxes instead were calculated based on the statutory, nominal tax rate, an accumulated deferred tax liability amounting to Skr 30.2 million (2005: 30.8, 2004:31.1) would have been posted to the balance sheet.
F-18
Note 17. Credits outstanding
| | 2006 | | 2005 | |
| | Consolidated | | Parent | | Of which | | Consolidated | | Parent | | Of which | |
| | Group | | Company | | S-system | | Group | | Company | | S-system | |
Credits to credit institutions | | 14,159.0 | | 14,158.4 | | 3,737.3 | | 11,963.8 | | 12,009.9 | | 4,496.5 | |
Credits to the public | | 41,975.1 | | 41,975.1 | | 5,394.4 | | 31,429.6 | | 31,429.6 | | 5,854.9 | |
Total credits outstanding | | 56,134.1 | | 56,133.5 | | 9,131.7 | | 43,393.4 | | 43,439.5 | | 10,351.4 | |
| | | | | | | | | | | | | |
Of which denominated in: | | | | | | | | | | | | | |
Swedish kronor | | 14,237.4 | | 14,236.8 | | 114.0 | | 12,857.9 | | 12,858.7 | | 181.1 | |
Foreign currencies | | 41,896.7 | | 41,896.7 | | 9,017.7 | | 30,535.5 | | 30,580.8 | | 10,170.3 | |
| | | | | | | | | | | | | |
| | | | | | | | | | | | | |
Deposits with banks and states, repurchase agreements and cash on demand | | -4,094.8 | | -4,094.2 | | -6.8 | | -2,453.0 | | -2,499.0 | | -12.1 | |
Credits reported as interest-bearing securities (A) | | 39,109.2 | | 39,109.2 | | — | | 37,206.8 | | 37,206.8 | | — | |
Total credits outstanding, including credits reported as interest-bearing securities, but excluding deposits with banks | | 91,148.5 | | 91,148.5 | | 9,124.9 | | 78,147.4 | | 78,147.4 | | 10,339.3 | |
(A) In accordance with regulations of Swedish Financial Supervisory Authority credits granted against documentation in the form of interest-bearing securities, as opposed to traditional credit agreements, are reported on the balance sheet as one component of securities classified as fixed financial assets.
Credits outstanding are classified as fixed financial assets.
During 2003, SEK, in its ordinary course of business, acquired leasing objects which were classified as financial leasing objects (as opposed to operational leasing objects) in accordance with the Swedish Financial Accounting Standards Council’s Recommendation number 6:99 — Leasing Agreements. When making such classification all aspects regarding the leasing contract, including third party guarantees, should be taken into account. The acquisition price of the leasing objects amounted to Skr 380.2 million (2005: 380.2), and the book value of at year-end amounted to Skr 176.8 million (2005: 233.3).
The counterparty exposures related to credits outstanding are shown in Note 32.
In accordance with regulations of Swedish Financial Supervisory Authority past-due credits (as defined by Swedish Financial Supervisory Authorities) will be reported. In addition to the following information see notes 1(m) and 1(n).
| | 2006 | | 2005 | |
| | Consolidated | | Parent | | Of which | | Consolidated | | Parent | | Of which | |
Past-due and doubtful credits at year-end: | | Group | | Company | | S-system | | Group | | Company | | S-system | |
| | | | | | | | | | | | | |
Past-due credits (B): | | | | | | | | | | | | | |
Aggregate amount of principal and interest past-due | | 1.0 | | 1.0 | | 1.0 | | — | | — | | — | |
of which covered by adequate guarantees | | 1.0 | | 1.0 | | 1.0 | | — | | — | | — | |
Principal amount not past-due on such credits | | 2.9 | | 2.9 | | 2.9 | | — | | — | | — | |
of which covered by adequate guarantees | | 2.9 | | 2.9 | | 2.9 | | — | | — | | — | |
(B) All past-due credits are covered by adequate guarantees.
The average interest rate on credits outstanding at year-end 2006 under the category “Past-due credits” was 6.0 percent.
F-19
Note 18. Interest-bearing securities
Under the regulations, credits granted against documentation in the form of interest-bearing securities, as opposed to traditional credit agreements, are reported on the balance sheet as one component of securities classified as fixed financial assets. Such credits are included by Skr 39,109.2 million (2005: 37,206.8) in the amount of other interest-bearing securities, classified as fixed financial assets, reported.
The counterparty exposures related to interest-bearing securities are shown in Note 32.
The following table includes aggregated book values and fair values of securities held at year-end.
Securities held at year-end. Aggregated book values and fair values
| | 2006 | | 2005 | |
| | Aggregated | | Aggregated | | Aggregated | | Aggregated | |
Consolidated Group and Parent Company | | Book Value | | Fair Value | | Book Value | | Fair Value | |
Security account | | | | | | | | | |
Held-to-maturity | | 39,416.1 | | 39,818.1 | | 37,924.3 | | 38,301.9 | |
Hedge | | 71,617.4 | | 72,501.0 | | 81,328.7 | | 82,466.9 | |
Trading | | 47,355.4 | | 47,355.4 | | 30,086.5 | | 30,086.5 | |
Total | | 158,388.9 | | 159,674.5 | | 149,339.5 | | 150,855.3 | |
Of the total book value, Skr 77,286.7 million was related to securities whose book value exceeded the nominal value and Skr 81,102.2 million was related to securities whose book value was below the nominal value. The nominal values for these two categories amounted to Skr 77,187.6 million and Skr 81,361.3 million, respectively.
The following table shows net unrealized gains and losses, gross unrealized losses and gross unrealized gains, aggregated by investment category at December 31, 2006 and 2005.
| | 2006 | | 2005 | |
| | Unrealized | | Unrealized | | Unrealized | | Unrealized | | Unrealized | | Unrealized | |
| | Net Gains | | Losses | | Gains | | Net Gains | | Losses | | Gains | |
Security account | | | | | | | | | | | | | |
Held-to-maturity | | 402.0 | | 62.8 | | 464.8 | | 377.6 | | 92.6 | | 470.2 | |
Hedge | | 883.6 | | 68.0 | | 951.6 | | 1,138.2 | | 107.1 | | 1,245.3 | |
Trading | | — | | — | | — | | — | | — | | — | |
Total | | 1,285.6 | | 130.8 | | 1,416.4 | | 1,515.8 | | 199.7 | | 1,715.5 | |
The following table shows gross unrealized losses and fair value, aggregated by investment category, and length of time that individual securities have been in a continuous unrealized loss position at December 31, 2006 and 2005.
| | 2006 | |
| | Less Than 12 Months | | 12 Months or More | | Total | |
| | | | Unrealised | | | | Unrealised | | | | Unrealised | |
| | Fair Value | | Losses | | Fair Value | | Losses | | Fair Value | | Losses | |
Security account | | | | | | | | | | | | | |
Held-to-Maturity | | 3,527.9 | | 35.8 | | 3,033.8 | | 27.7 | | 6,561.7 | | 62.9 | |
Hedge | | 20,956.3 | | 52.6 | | 5,070.6 | | 15.3 | | 26,026.9 | | 67.9 | |
Total | | 24,484.2 | | 88.4 | | 8,104.4 | | 42.3 | | 32,588.6 | | 130.8 | |
| | 2005 | |
| | Less Than 12 Months | | 12 Months or More | | Total | |
| | | | Unrealised | | | | Unrealised | | | | Unrealised | |
| | Fair Value | | Losses | | Fair Value | | Losses | | Fair Value | | Losses | |
Security account | | | | | | | | | | | | | |
Held-to-Maturity | | 15,301.8 | | 70.1 | | 5,381.0 | | 22.5 | | 20,682.8 | | 92.6 | |
Hedge | | 37,037.2 | | 85.5 | | 5,054.6 | | 21.6 | | 42,091.8 | | 107.1 | |
Total | | 52,339.0 | | 155.6 | | 10,435.6 | | 44.1 | | 62,774.6 | | 199.7 | |
The unrealized losses are related to changes in general market conditions, for example interest rate level, and there is no evidence that there is a probability of non-collection of nominal or interest amount. SEK has the intention and the ability to hold the held-to-maturity securities to maturity. Securities in the hedge category are hedged with derivatives which carry equal, but offsetting, unrealized gains.
F-20
Interest-bearing securities
| | Treasuries & government bonds etc. | | Other interest-bearing securities | |
Consolidated Group and Parent Company | | Book Value | | Fair Value | | Unrealized Gains or Losses | | Book Value | | Fair Value | | Unrealized Gains or Losses | |
Current financial assets: | | | | | | | | | | | | | |
| | | | | | | | | | | | | |
- Government debt, Swedish | | 1,357.5 | | 1,382.3 | | 24.8 | | | | | | | |
- Municipalities, Swedish | | | | | | | | 349.4 | * | 347.3 | * | -2.1 | * |
- Mortgage institutions, Swedish | | | | | | | | 7,030.1 | | 7,072.5 | | 42.4 | |
- Other Swedish issuers: | | | | | | | | | | | | | |
- Banking groups | | | | | | | | 2,906.2 | | 2,932.5 | | 26.3 | |
- Other financial corporations | | | | | | | | 1,145.1 | | 1,154.5 | | 9.4 | |
- Other corporations | | | | | | | | 921.7 | | 940.7 | | 19.0 | |
- Goverment debt, foreign | | 145.5 | | 146.4 | | 0.9 | | | | | | | |
- Municipalities and provinces, foreign | | | | | | | | | | | | | |
| | | | | | | | | | | | | |
- Other foreign issuers: | | | | | | | | | | | | | |
- Banking groups of which subordinated | | | | | | | | 54,856.3 | | 55,204.0 | | 347.7 | |
- Other financial corporations | | 0.0 | | 0.0 | | 0.0 | | 49,577.8 | | 49,993.3 | | 415.5 | |
- Other corporations | | | | | | | | 683.2 | | 682.9 | | -0.3 | |
| | | | | | | | | | | | | |
Subtotal | | 1,503.0 | | 1,528.7 | | 25.7 | | 117,469.8 | | 118,327.7 | | 857.9 | |
*of which issued by public authorities | | | | | | | | 349.4 | * | 347.3 | * | -2.1 | * |
| | | | | | | | | | | | | |
Fixed financial assets: | | | | | | | | | | | | | |
| | | | | | | | | | | | | |
- Government debt, Swedish | | 283.7 | | 299.6 | | 15.9 | | | | | | | |
- Municipalities, Swedish | | | | | | | | 2,907.4 | * | 2,898.8 | * | -8.6 | * |
- Mortgage institutions, Swedish | | | | | | | | 300.0 | | 301.8 | | 1.8 | |
- Other Swedish issuers: | | | | | | | | | | | | | |
- Banking groups | | | | | | | | 11,302.2 | | 11,338.7 | | 36.5 | |
- Other financial corporations | | | | | | | | 2,909.9 | | 2,941.3 | | 31.4 | |
- Other corporations | | | | | | | | 3,511.0 | | 3,548.0 | | 37.0 | |
- Goverment debt, foreign | | 0.0 | | 0.0 | | 0.0 | | | | | | | |
- Municipalities and provinces, foreign | | | | | | | | 310.5 | * | 313.9 | * | 3.4 | * |
| | | | | | | | | | | | | |
- Other foreign issuers: | | | | | | | | | | | | | |
- Banking groups | | | | | | | | 7,833.6 | | 7,925.9 | | 92.3 | |
- Other financial corporations | | | | | | | | 6,431.1 | | 6,537.3 | | 106.2 | |
- Other corporations | | | | | | | | 3,626.7 | | 3,712.8 | | 86.1 | |
Subtotal | | 283.7 | | 299.6 | | 15.9 | | 39,132.4 | | 39,518.5 | | 386.1 | |
*of which issued by public authorities | | | | | | | | 3,217.9 | * | 3,212.7 | * | -5.2 | * |
| | | | | | | | | | | | | |
| | | | | | | | | | | | | |
Total of current and fixed financial assets: | | | | | | | | | | | | | |
| | | | | | | | | | | | | |
- Government debt, Swedish | | 1,641.2 | | 1,681.9 | | 40.7 | | | | | | | |
- Municipalities, Swedish | | | | | | | | 3,256.8 | * | 3,246.1 | * | -10.7 | * |
- Mortgage institutions, Swedish | | | | | | | | 7,330.1 | | 7,374.3 | | 44.2 | |
- Other Swedish issuers: | | | | | | | | | | | | | |
- Banking groups | | | | | | | | 14,208.4 | | 14,271.2 | | 62.8 | |
- Other financial corporations | | | | | | | | 4,055.0 | | 4,095.8 | | 40.8 | |
- Other corporations | | | | | | | | 4,432.7 | | 4,488.7 | | 56.0 | |
- Goverment debt, foreign | | 145.5 | | 146.4 | | 0.9 | | | | | | | |
- Municipalities and provinces, foreign | | | | | | | | 310.5 | * | 313.9 | * | 3.4 | * |
- Other foreign issuers: | | | | | | | | | | | | | |
- Banking groups of which subordinated | | | | | | | | 62,689.9 | | 63,129.9 | | 440.0 | |
- Other financial corporations | | 0.0 | | 0.0 | | 0.0 | | 56,008.9 | | 56,530.6 | | 521.7 | |
- Other corporations | | | | | | | | 4,309.9 | | 4,395.7 | | 85.8 | |
Grand total | | 1,786.7 | | 1,828.3 | | 41.6 | | 156,602.2 | | 157,846.2 | | 1,244.0 | |
*of which issued by public authorities | | | | | | | | 3,567.3 | * | 3,560.0 | * | -7.3 | * |
Of which: S-system | | — | | — | | — | | | | | | | |
Securities subject to hedge accounting | | 1,503.0 | | 1,528.7 | | 25.7 | | 70,114.4 | | 70,972.3 | | 857.9 | |
Securities with market values quoted on an exchange | | 1,786.7 | | 1,828.2 | | 41.5 | | 45,673.5 | | 46,259.2 | | 585.7 | |
F-21
| | Total 2006 | | Total 2005 | |
| | | | | | Unrealized | | | | | | Unrealized | |
| | Book Value | | Fair Value | | Gains or Losses | | Book Value | | Fair Value | | Gains or Losses | |
| | | | | | | | | | | | | |
Current financial assets: | | | | | | | | | | | | | |
| | | | | | | | | | | | | |
- Government debt, Swedish | | 1,357.5 | | 1,382.3 | | 24.8 | | 1,441.6 | | 1,522.8 | | 81.2 | |
- Municipalities, Swedish | | 349.4 | * | 347.3 | * | -2.1 | * | 600.0 | * | 598.2 | * | -1.8 | * |
- Mortgage institutions, Swedish | | 7,030.1 | | 7,072.5 | | 42.4 | | 7,069.9 | | 7,067.0 | | -2.9 | |
- Other Swedish issuers: | | | | | | | | | | | | | |
- Banking groups | | 2,906.2 | | 2,932.5 | | 26.3 | | 2,669.5 | | 2,669.1 | | -0.4 | |
- Other financial corporation | | 1,145.1 | | 1,154.5 | | 9.4 | | 1,882.0 | | 1,896.4 | | 14.4 | |
- Other corporations | | 921.7 | | 940.7 | | 19.0 | | 3,437.0 | | 3,446.3 | | 9.3 | |
- Goverment debt, foreign | | 145.5 | | 146.4 | | 0.9 | | 166.3 | | 170.2 | | 3.9 | |
- Municipalities and provinces, foreign | | — | | — | | — | | — | | — | | — | |
| | | | | | | | | | | | | |
- Other foreign issuers: | | | | | | | | | | | | | |
- Banking groups of which subordinated | | 54,856.3 | | 55,204.0 | | 347.7 | | 46,232.0 | | 46,318.6 | | 86.6 | |
- Other financial corporations | | 49,577.8 | | 49,993.3 | | 415.5 | | 34,033.9 | | 34,444.7 | | 410.8 | |
- Other corporations | | 683.2 | | 682.9 | | -0.3 | | 13,883.0 | | 14,420.1 | | 537.1 | |
| | | | | | | | | | | | | |
Subtotal | | 118,972.8 | | 119,856.4 | | 883.6 | | 111,415.2 | | 112,553.4 | | 1,138.2 | |
*-of which issued by public authorities | | 349.4 | * | 347.3 | * | -2.1 | * | 600.0 | * | 598.2 | * | -1.8 | * |
| | | | | | | | | | | | | |
Fixed financial assets: | | | | | | | | | | | | | |
| | | | | | | | | | | | | |
- Government debt, Swedish | | 283.7 | | 299.6 | | 15.9 | | 294.7 | | 368.1 | | 73.4 | |
- Municipalities, Swedish | | 2,907.4 | * | 2,898.8 | * | -8.6 | * | 1,980.1 | * | 2,003.1 | * | 23.0 | * |
- Mortgage institutions,Swedish | | 300.0 | | 301.8 | | 1.8 | | 300.0 | | 299.0 | | -1.0 | |
- Other Swedish issuers: | | | | | | | | | | | | | |
- Banking groups | | 11,302.2 | | 11,338.7 | | 36.5 | | 11,400.6 | | 11,378.0 | | -22.6 | |
- Other financial corporations | | 2,909.9 | | 2,941.3 | | 31.4 | | 2,690.5 | | 2,690.0 | | -0.5 | |
- Other corporations | | 3,511.0 | | 3,548.0 | | 37.0 | | 3,365.4 | | 3,429.3 | | 63.9 | |
- Goverment debt, foreign | | 0.0 | | 0.0 | | 0.0 | | — | | — | | — | |
- Municipalities and provinces, foreign | | 310.5 | * | 313.9 | * | 3.4 | * | — | | — | | — | |
| | | | | | | | | | | | | |
- Other foreign issuers: | | | | | | | | | | | | | |
- Banking groups | | 7,833.6 | | 7,925.9 | | 92.3 | | 4,179.0 | | 4,175.4 | | -3.6 | |
- Other financial corporations | | 6,431.1 | | 6,537.3 | | 106.2 | | 2,868.7 | | 2,920.1 | | 51.4 | |
- Other corporations | | 3,626.7 | | 3,712.8 | | 86.1 | | 10,845.3 | | 11,038.9 | | 193.6 | |
Subtotal | | 39,416.1 | | 39,818.1 | | 402.0 | | 37,924.3 | | 38,301.9 | | 377.6 | |
*-of which issued by public authorities | | 3,217.9 | * | 3,212.7 | * | -5.2 | * | 1,980.1 | * | 2,003.1 | * | 23.0 | * |
| | | | | | | | | | | | | |
Total of current and fixed financial assets: | | | | | | | | | | | | | |
| | | | | | | | | | | | | |
- Government debt, Swedish | | 1,641.2 | | 1,681.9 | | 40.7 | | 1,736.3 | | 1,890.9 | | 154.6 | |
- Municipalities, Swedish | | 3,256.8 | * | 3,246.1 | * | -10.7 | * | 2,580.1 | * | 2,601.3 | * | 21.2 | * |
- Mortgage institutions,Swedish | | 7,330.1 | | 7,374.3 | | 44.2 | | 7,369.9 | | 7,366.0 | | -3.9 | |
- Other Swedish issuers: | | | | | | | | | | | | | |
- Banking groups | | 14,208.4 | | 14,271.2 | | 62.8 | | 14,070.1 | | 14,047.1 | | -23.0 | |
- Other financial corporations | | 4,055.0 | | 4,095.8 | | 40.8 | | 4,572.5 | | 4,586.4 | | 13.9 | |
- Other corporations | | 4,432.7 | | 4,488.7 | | 56.0 | | 6,802.4 | | 6,875.6 | | 73.2 | |
- Goverment debt, foreign | | 145.5 | | 146.4 | | 0.9 | | 166.3 | | 170.2 | | 3.9 | |
- Municipalities and provinces, foreign | | 310.5 | * | 313.9 | * | 3.4 | * | — | | — | | — | |
- Other foreign issuers: | | | | | | | | | | | | | |
- Banking groups of which subordinated | | 62,689.9 | | 63,129.9 | | 440.0 | | 50,411.0 | | 50,494.0 | | 83.0 | |
- Other financial corporations | | 56,008.9 | | 56,530.6 | | 521.7 | | 36,902.6 | | 37,364.8 | | 462.2 | |
- Other corporations | | 4,309.9 | | 4,395.7 | | 85.8 | | 24,728.3 | | 25,459.0 | | 730.7 | |
Grand total | | 158,388.9 | | 159,674.5 | | 1,285.6 | | 149,339.5 | | 150,855.3 | | 1,515.8 | |
*- of which issued by public authorities | | 3,567.3 | * | 3,560.0 | * | -7.3 | * | 2,580.1 | * | 2,601.3 | * | 21.2 | * |
Of which: S-system | | — | | — | | — | | — | | — | | — | |
Securities subject to hedge accounting | | 71,617.4 | | 72,501.0 | | 883.6 | | 81,328.7 | | 82,466.9 | | 1,138.2 | |
Securites with market values quoted on an exchange | | 47,460.2 | | 48,087.4 | | 627.2 | | 44,189.0 | | 45,136.6 | | 947.6 | |
F-22
Note 19. Shares in subsidiaries
| | 2006 | | 2005 | |
| | Consolidated | | Parent | | Of which | | Consolidated | | Parent | | Of which | |
| | Group | | Company | | S-system | | Group | | Company | | S-system | |
Shares in subsidiary (AB SEKTIONEN) (A) | | n.a. | | 103.5 | | — | | n.a. | | 103.5 | | — | |
Shares in subsidiary (AB SEK Securities) (B) | | n.a. | | 10.0 | | — | | n.a. | | 10.0 | | — | |
Shares in subsidiary (SEK Financial Advisors AB) (C) | | n.a. | | 5.0 | | — | | n.a. | | 5.0 | | — | |
Shares in subsidiary (SEK Financial Services AB) (D) | | n.a. | | 0.1 | | — | | n.a. | | 0.1 | | — | |
Total | | — | | 118.6 | | — | | — | | 118.6 | | — | |
(A): The wholly-owned subsidiary, AB SEKTIONEN (reg.no. 556121-0252), is domiciled in Stockholm.
The company’s shareholders’ funds at year-end 2006 amounted to Skr 0.6 million.
The nominal value of the shares in AB SEKTIONEN was Skr 0.4 million. See also Note 1(a).
(B): The wholly-owned subsidiary, AB SEK Securities (reg.no. 556608-8885), is domiciled in Stockholm.
The company´s shareholders’ funds at year-end 2006 amounted to Skr 10.0 million.
The nominal value of the shares in AB SEK Securities was Skr 10 million. See also Note 1(a).
(C): The wholly-owned subsidiary, SEK Financial Advisors AB (reg.no. 556660-2420), is domiciled in Stockholm.
The company’s shareholders’ funds at year-end 2006 amounted to Skr 6.1 million.
The nominal value of the shares in SEK Financial Advisors AB was Skr 0.5 million. See also Note 1(a).
(D): The wholly-owned subsidiary, SEK Financial Services AB (reg.no. 556683-3462), is domiciled in Stockholm.
The company´s shareholders’ funds at year-end 2006 amounted to Skr 0.1 million.
The nominal value of the shares in SEK Financial Services AB was Skr 0.1 million. See also Note 1(a).
The net result of the Subsidiaries for the year 2006 was Skr 1.1 million (2005: -3.0).
Note 20. Other assets
| | 2006 | | 2005 | |
| | Consolidated | | Parent | | Of which | | Consolidated | | Parent | | Of which | |
| | Group | | Company | | S-system | | Group | | Company | | S-system | |
Due from the State | | 13.6 | | 13.6 | | 11.6 | | 0.3 | | 0.0 | | 0.0 | |
Claim on subsidiary | | n.a. | | 83.6 | | — | | n.a. | | 79.8 | | — | |
Derivative contracts with positive values | | 6,802.1 | | 6,802.1 | | 4.6 | | 7,548.4 | | 7,548.4 | | 0.0 | |
Debt for which value has not yet been received | | 2,940.7 | | 2,940.7 | | — | | 2,707.4 | | 2,707.4 | | — | |
Claims for assets sold though not yet delivered and paid for | | 0.0 | | 0.0 | | — | | 80.0 | | 13.9 | | — | |
Other | | 542.5 | | 544.3 | | 6.0 | | 228.2 | | 228.1 | | 1.2 | |
Total | | 10,301.6 | | 10,384.3 | | 22.2 | | 10,564.3 | | 10,577.7 | | 1.2 | |
Note 21. Prepaid expenses and accrued revenues
| | 2006 | | 2005 | |
| | Consolidated | | Parent | | Of which | | Consolidated | | Parent | | Of which | |
| | Group | | Company | | S-system | | Group | | Company | | S-system | |
Interest revenues accrued | | 4,197.5 | | 4,197.5 | | 153.9 | | 3,996.2 | | 3,996.2 | | 148.7 | |
Prepaid expenses and other accrued revenues | | 10.3 | | 9.4 | | — | | 7.8 | | 7.0 | | — | |
Total | | 4,207.8 | | 4,206.9 | | 153.9 | | 4,004.0 | | 4,003.2 | | 148.7 | |
F-23
Note 22. Senior debt
| | 2006 | | 2005 | |
| | Consolidated | | Parent | | Of which | | Consolidated | | Parent | | Of which | |
| | Group | | Company | | S-system | | Group | | Company | | S-system | |
Total senior borrowings exclusive of senior securities issued | | 3,301.6 | | 3,314.5 | | 6.0 | | 638.5 | | 651.4 | | 2.3 | |
Total senior securities issued | | 203,375.6 | | 203,375.6 | | 0.0 | | 187,820.1 | | 187,820.1 | | 275.3 | |
Total senior debt outstanding | | 206,677.2 | | 206,690.1 | | 6.0 | | 188,458.6 | | 188,471.5 | | 277.6 | |
| | | | | | | | | | | | | |
Of which denominated in: | | | | | | | | | | | | | |
Swedish kronor | | 11,681.2 | | 11,694.1 | | 4.0 | | 8,747.8 | | 8,760.7 | | 0.0 | |
Foreign currencies | | 194,996.0 | | 194,996.0 | | 2.0 | | 179,710.8 | | 179,710.8 | | 277.6 | |
| | | | | | | | | | | | | |
The reported amount of total senior debt outstanding has been affected (reduced) by the following amounts, representing own debt repurchased | | -492.1 | | -492.1 | | — | | -620.8 | | -620.8 | | — | |
SEK senior debt is obtained through private and public offerings of debt securities in the international capital and money markets. Debt securities is issued with different currencies, different interest rates (fixed, floating, or with a formula), different payment terms and maturity dates, and different conversion or redemption features.
Total senior debt at December 31, 2006 and at December 31 2005, had the following maturities and weighted average rates:
| | 2006 | | | | 2005 | |
| | Consolidated | | Range of | | Weighted | | | | Consolidated | | Range of | | Weighted | |
| | Group | | Maturities | | average coupon | | | | Group | | Maturities | | average coupon | |
Senior debt with floating rate coupon | | 1,094.2 | | 2007-2021 | | Libor - 0.21 | %(a) | | | 11,387.6 | | 2006-2035 | | Libor - 0.13 | %(a) |
Senior debt with coupon based on formula | | 94,450.9 | | 2007-2037 | | n.a. | (b) | | | 61,025.1 | | 2006-2036 | | n.a. | (b) |
Senior debt in the form of a zero coupon bond | | 2,333.3 | | 2007-2045 | | 0.0 | %(c) | | | 5,879.2 | | 2006-2045 | | 0.0 | %(c) |
Senior debt with fixed rate coupon | | 108,798.8 | | 2007-2046 | | 4.5 | %(d) | | | 110,166.7 | | 2006-2046 | | 4.2 | %(d) |
Total senior debt outstanding | | 206,677.2 | | | | | | | | 188,458.6 | | | | | |
(a) Senior debt with floating rate coupon has a coupon which is fixed for normally three or six month based on a Libor floating rate or have similar features.
(b) Senior debt with coupon based on a formula where the formula can include currency exchange rates, interest rates, equity prices, commodity prices, etc. The coupon will therefore vary between each coupon period and it is not possible to calculate a weighted average coupon for the entire life of the debt. Such debt is generally economically hedged by equal, but opposite, features in a swap.
(c) Zero coupon bond issued with a discount giving it a yield similar to that of a fixed coupon bond.
(d) Based on year-end balances and year end foreign currency or Swedish krona interest rates, not including the effects of interest and currency swaps, if any, directly associated with the original debt issuance.
No collateral is posted for any senior debt. Senior debt includes transactions which have call- or put-options which in the case where there is a swap hedging the individual debt, the swap has equal, but opposite, features.
Note 23. Other liabilities
| | 2006 | | 2005 | |
| | Consolidated | | Parent | | Of which | | Consolidated | | Parent | | Of which | |
| | Group | | Company | | S-system | | Group | | Company | | S-system | |
Liability to subsidiaries | | n.a | | 50.7 | | — | | n.a | | 43.6 | | — | |
Tax liability | | 0.5 | | — | | — | | 3.9 | | 3.8 | | — | |
Derivative contracts with negative values | | 8,350.5 | | 8,350.5 | | 0.0 | | 5,819.3 | | 5,819.3 | | 3.2 | |
Liabilities related to assets acquired though not yet delivered and paid for | | 905.0 | | 905.0 | | — | | 113.5 | | 94.6 | | — | |
Other | | 2,103.6 | | 2,102.5 | | 58.2 | | 1,837.2 | | 1,837.3 | | 84.4 | |
Total | | 11,359.6 | | 11,408.7 | | 58.2 | | 7,773.9 | | 7,798.6 | | 87.6 | |
Note 24. Accrued expenses and prepaid revenues
| | 2006 | | 2005 | |
| | Consolidated | | Parent | | Of which | | Consolidated | | Parent | | Of which | |
| | Group | | Company | | S-system | | Group | | Company | | S-system | |
Interest expenses accrued | | 3,783.4 | | 3,782.7 | | 159.9 | | 3,807.7 | | 3,816.6 | | 157.3 | |
Prepaid revenues and other accrued expenses | | 24.8 | | 23.9 | | 0.0 | | 71.6 | | 61.8 | | 0.0 | |
Total | | 3,808.2 | | 3,806.6 | | 159.9 | | 3,879.3 | | 3,878.4 | | 157.3 | |
F-24
Note 25. Allocations
| | 2006 | | 2005 | |
| | Consolidated | | Parent | | Of which | | Consolidated | | Parent | | Of which | |
| | Group | | Company | | S-system | | Group | | Company | | S-system | |
Pension liabilities | | 16.6 | | 16.6 | | — | | 17.1 | | 17.1 | | — | |
Deferred taxes related to untaxed reserves | | 357.1 | | n.a. | | — | | 370.7 | | n.a. | | — | |
Total | | 373.7 | | 16.6 | | — | | 387.8 | | 17.1 | | — | |
Note 26. Subordinated debt
| | 2006 | | 2005 | |
| | Consolidated | | Parent | | Of which | | Consolidated | | Parent | | Of which | |
| | Group | | Company | | S-system | | Group | | Company | | S-system | |
Perpetual, non-cumulative subordinated loan, foreign currency (A), (B) | | 2,405.4 | | 2,405.4 | | — | | 2,783.4 | | 2,783.4 | | — | |
Non-perpetual, cumulative subordinated loan, foreign currency (C) | | 452.5 | | 452.5 | | — | | 471.5 | | 471.5 | | — | |
| | | | | | | | | | | | | |
Total subordinated debt outstanding | | 2,857.9 | | 2,857.9 | | — | | 3,254.9 | | 3,254.9 | | — | |
| | | | | | | | | | | | | |
Of which denominated in: | | | | | | | | | | | | | |
Swedish kronor | | — | | — | | — | | — | | — | | — | |
Foreign currencies | | 2,857.9 | | 2,857.9 | | — | | 3,254.9 | | 3,254.9 | | — | |
(A) Nominal value USD 200 million. Interest payments quarterly in arrears at a rate of 5.40 percent per annum. Redeemable, at SEK’s option, on or after December 27, 2008, at 100 percent of the nominal value. Redemption requires the prior approval of the Swedish Financial Supervisory Authority.
Interest payment will not be made if SEK not has available distributable capital for making such a payment. The investors’ right to receive accrued but unpaid interest will thereafter be lost (non-cumulative). In order to avoid that the issuer will be obliged to enter into liquidation the general meeting together with the approval of the Swedish Financial Supervisory Authority may decide that principal amount and any unpaid interest will be utilized in meeting losses. However, SEK can not thereafter pay any dividend to its shareholders before the principal amount has been reinstated as debt in full in the balance sheet or been redeemed with approval by the Swedish Financial Supervisory Authority and such accrued but unpaid interest has been paid.
(B) Nominal value USD 150 million. Interest payments quarterly in arrears at a rate of 6.375 percent per annum. Redeemable, at SEK’s option, on or after December 27, 2008, at 100 percent of the nominal value. Redemption requires the prior approval of the Swedish Financial Supervisory Authority.
Interest payment will not be made if SEK not has available distributable capital for making such a payment. The investors’ right to receive accrued but unpaid interest will thereafter be lost (non-cumulative). In order to avoid that the issuer will be obliged to enter into liquidation the general meeting together with the approval of the Swedish Financial Supervisory Authority may decide that principal amount and any unpaid interest will be utilized in meeting losses. However, SEK can not thereafter pay any dividend to its shareholders before the principal amount has been reinstated as debt in full in the balance sheet or been redeemed with approval by the Swedish Financial Supervisory Authority and such accrued but unpaid interest has been paid.
(C): Nominal value EUR 50 million. Matures on June 30, 2015. Interest payments quarterly in arrears at a rate of Euribor plus 0.20 percent. Redeemable, at SEK’s option, on or after June 21, 2010, at 100 percent of the nominal value. If not redeemed coupon will increase to Euribor plus 1.70 percent.Redemption requires the prior approval of the Swedish Financial Supervisory Authority.
The accrued interest related to the subordinated debt, at year-end Skr 1.7 million (2005: 1.5), has been included in the item “Accrued expenses and prepaid revenues”.
The subordinated loans are subordinated to the Company’s other debts, which means that payment will not be performed until other creditors have received repayment.
F-25
Note 27. Shareholders’ funds
| | Share | | | | | | | | | | | | | |
| | capital (A) | | Other non- | | Total non- | | Undis- | | Net profit | | Total | | | |
| | and Legal | | distributable | | distributable | | tributed | | for the | | distributable | | | |
| | reserve | | capital | | capital | | profits | | year | | capital | | TOTAL | |
Consolidated Group 2006: | | | | | | | | | | | | | | | |
Opening balance | | 1,188.0 | | 967.6 | | 2,155.6 | | 1,583.1 | | | | 1,583.1 | | 3,738.7 | |
Allocation to fund for unrealized gains | | | | -3.8 | | -3.8 | | 3.8 | | | | 3.8 | | | |
Transfer between distributable and non-distributable capital | | | | -35.2 | | -35.2 | | 35.2 | | | | 35.2 | | | |
Net profit for the year | | | | | | | | | | 385.6 | | 385.6 | | 385.6 | |
Closing balance | | 1,188.0 | | 928.6 | | 2,116.6 | | 1,622.1 | | 385.6 | | 2,007.7 | | 4,124.3 | |
| | | | | | | | | | | | | | | |
Parent Company 2006: | | | | | | | | | | | | | | | |
Opening balance | | 1,188.0 | | 14.1 | | 1,202.1 | | 1,610.7 | | | | 1,610.7 | | 2,812.8 | |
Allocation to fund for unrealized gains | | | | -3.8 | | -3.8 | | 3.8 | | | | 3.8 | | | |
Net profit for the year | | | | | | | | | | 421.7 | | 421.7 | | 421.7 | |
Closing balance | | 1,188.0 | | 10.3 | | 1,198.3 | | 1,614.5 | | 421.7 | | 2,036.2 | | 3,234.5 | |
| | | | | | | | | | | | | | | |
Consolidated Group 2005: | | | | | | | | | | | | | | | |
Opening balance | | 1,188.0 | | 972.8 | | 2,160.8 | | 1,231.0 | | | | 1,231.0 | | 3,391.8 | |
Allocation to fund for unrealized gains | | | | 2.7 | | 2.7 | | -2.7 | | | | -2.7 | | | |
Transfer between distributable and non-distributable capital | | | | -7.9 | | -7.9 | | 7.9 | | | | 7.9 | | | |
Net profit for the year | | | | | | | | | | 346.9 | | 346.9 | | 346.9 | |
Closing balance | | 1,188.0 | | 967.6 | | 2,155.6 | | 1,236.2 | | 346.9 | | 1,583.1 | | 3,738.7 | |
| | | | | | | | | | | | | | | |
Parent Company 2005: | | | | | | | | | | | | | | | |
Opening balance | | 1,188.0 | | 11.4 | | 1,199.4 | | 1,256.1 | | | | 1,256.1 | | 2,455.5 | |
Allocation to fund for unrealized gains | | | | 2.7 | | 2.7 | | -2.7 | | | | -2.7 | | | |
Group contribution | | | | | | | | -3.0 | | | | -3.0 | | -3.0 | |
Net profit for the year | | | | | | | | | | 360.3 | | 360.3 | | 360.3 | |
Closing balance | | 1,188.0 | | 14.1 | | 1,202.1 | | 1,250.4 | | 360.3 | | 1,610.7 | | 2,812.8 | |
| | | | | | | | | | | | | | | |
Consolidated Group 2004: | | | | | | | | | | | | | | | |
Opening balance | | 1,130.0 | | 977.6 | | 2,107.6 | | 844.6 | | | | 844.6 | | 2,952.2 | |
Allocation to legal reserve | | 58.0 | | | | 58.0 | | -58.0 | | | | -58.0 | | | |
Allocation to fund for unrealized gains | | | | 2.1 | | 2.1 | | -2.1 | | | | -2.1 | | | |
Transfer between distributable and non-distributable capital | | | | -6.9 | | -6.9 | | 6.9 | | | | 6.9 | | | |
Net profit for the year | | | | | | | | | | 439.6 | | 439.6 | | 439.6 | |
Closing balance | | 1,188.0 | | 972.8 | | 2,160.8 | | 791.4 | | 439.6 | | 1,231.0 | | 3,391.8 | |
| | | | | | | | | | | | | | | |
Parent Company 2004: | | | | | | | | | | | | | | | |
Opening balance | | 1,130.0 | | 9.3 | | 1,139.3 | | 868.6 | | | | 868.6 | | 2,007.9 | |
Allocation to legal reserve | | 58.0 | | | | 58.0 | | -58.0 | | | | -58.0 | | | |
Allocation to fund for unrealized gains | | | | 2.1 | | 2.1 | | -2.1 | | | | -2.1 | | | |
Net profit for the year | | | | | | | | | | 447.6 | | 447.6 | | 447.6 | |
Closing balance | | 1,188.0 | | 11.4 | | 1,199.4 | | 808.5 | | 447.6 | | 1,256.1 | | 2,455.5 | |
(A):The share capital amounts to Skr 990 million (990,000 shares at Skr 1,000 each) and the legal reserve amounts to Skr 198 million. All line items in the column “Share capital and Legal reserve” include these two components.
The Swedish State’s ownership share in SEK is 100 percent. The ownership of the Swedish State is managed by the Ministry for Foreign Affairs.
It is the intention of the shareholder and of the Company that SEK will always have risk capital that is well above the regulatory requirements.
The Swedish State has established a guarantee fund of callable capital, amounting to Skr 600 million in favor of SEK. SEK may call on capital under the guarantee if SEK finds it necessary in order to be able to fulfill its obligations.
F-26
The Board of Directors and the President have on March 7, 2007, made the following proposal regarding distribution of profits related to the Parent Company. Total distributable capital in the Consolidated Group as of December 31, 2006, was Skr 2,007.7 million.
(Skr million) | | | |
After no payment of dividend to the shareholders as approved by the 2006 Annual General Meeting, the remaining profit carried forward is | | 1,614.5 | |
Add profit for the year after appropriations and taxes | | 421.7 | |
At the disposal of the Annual General Meeting | | 2,036.2 | |
| | | |
The Board of Directors and the President propose that the Annual General Meeting dispose of these funds as follows: | | | |
¾ Dividend | | — | |
¾ Remaining disposable funds to be carried forward. | | 2,036.2 | |
| | 2,036.2 | |
F-27
Capital Base and Required Capital
According to the capital adequacy requirements of Swedish Law, which conform to international guidelines.
However, in addition to the regulated capital base, the adjusted capital adequacy ratios illustrated below are
calculated with inclusion in the Tier-1 capital base of SEK’s guarantee capital of Skr 600 million.
(Amounts in Skr mn)
I. Capital requirement
| | Consolidated Group | | Parent Company | |
| | December 31, 2006 | | December 31, 2005 | | December 31, 2006 | | December 31, 2005 | |
| | | | Weighted | | Required | | | | Weighted | | Required | | | | Weighted | | Required | | | | Weighted | | Required | |
| | Claims | | claims | | capital | | Claims | | claims | | capital | | Claims | | claims | | capital | | Claims | | claims | | capital | |
On-balance sheet items | | 229,201 | | 45,995 | | 3,679 | | 207,493 | | 39,926 | | 3,195 | | 229,289 | | 46,083 | | 3,687 | | 207,557 | | 39,953 | | 3,196 | |
Off-balance sheet items | | 22,481 | | 4,244 | | 340 | | 18,328 | | 3,622 | | 290 | | 22,481 | | 4,244 | | 340 | | 18,328 | | 3,622 | | 290 | |
Other exposures | | n.a. | | 5 | | 0 | | n.a. | | 38 | | 3 | | n.a. | | 5 | | 0 | | n.a. | | 38 | | 3 | |
Total | | 251,682 | | 50,244 | | 4,019 | | 225,821 | | 43,586 | | 3,488 | | 251,770 | | 50,332 | | 4,027 | | 225,885 | | 43,613 | | 3,489 | |
| | | | | | | | | | | | | | | | | | | | | | | | | |
Breakdown by category: | | | | | | | | | | | | | | | | | | | | | | | | | |
A. Riskweight 0% | | 75,331 | | — | | — | | 62,784 | | — | | — | | 75,331 | | — | | — | | 62,784 | | — | | — | |
B1. Riskweight 10% | | 1,459 | | 146 | | 12 | | 5,203 | | 520 | | 42 | | 1,459 | | 146 | | 12 | | 5,203 | | 520 | | 42 | |
B2. Riskweight 20% | | 107,333 | | 21,467 | | 1,717 | | 111,233 | | 22,247 | | 1,780 | | 107,333 | | 21,467 | | 1,717 | | 111,279 | | 22,256 | | 1,780 | |
C. Riskweight 50% | | 1,093 | | 546 | | 44 | | 922 | | 461 | | 37 | | 1,093 | | 546 | | 44 | | 922 | | 461 | | 37 | |
D. Riskweight 100% | | 18,977 | | 18,977 | | 1,517 | | 15,469 | | 15,469 | | 1,238 | | 19,065 | | 19,065 | | 1,525 | | 15,487 | | 15,487 | | 1,239 | |
E. Market exposures | | 47,489 | | 9,108 | | 729 | | 30,210 | | 4,889 | | 391 | | 47,489 | | 9,108 | | 729 | | 30,210 | | 4,889 | | 391 | |
Total | | 251,682 | | 50,244 | | 4,019 | | 225,821 | | 43,586 | | 3,488 | | 251,770 | | 50,332 | | 4,027 | | 225,885 | | 43,613 | | 3,489 | |
II. Capital base (A)
| | Consolidated Group | | Parent Company | |
| | 12/2006 | | 12/2005 | | 12/2006 | | 12/2005 | |
Tier-1 capital | | 4,705 | | 4,241 | | 4,740 | | 4,274 | |
Tier-2 capital | | 2,239 | | 2,694 | | 2,235 | | 2,690 | |
Of which: | | | | | | | | | |
Upper Tier-2 | | 1,787 | | 2,223 | | 1,783 | | 2,219 | |
Lower Tier-2 | | 452 | | 471 | | 452 | | 471 | |
Total | | 6,944 | | 6,935 | | 6,974 | | 6,964 | |
| | | | | | | | | |
Adjusted Tier-1 capital | | 5,305 | | 4,841 | | 5,340 | | 4,874 | |
Adjusted Total | | 7,544 | | 7,535 | | 7,574 | | 7,564 | |
III. Capital Adequacy Ratio
| | Consolidated Group | | Parent Company | |
| | 12/2006 | | 12/2005 | | 12/2006 | | 12/2005 | |
Total | | 13.8 | % | 15.9 | % | 13.9 | % | 16.0 | % |
Of which: | | | | | | | | | |
Tier-1 ratio | | 9.4 | % | 9.7 | % | 9.4 | % | 9.8 | % |
Tier-2 ratio | | 4.4 | % | 6.2 | % | 4.5 | % | 6.2 | % |
Of which: | | | | | | | | | |
Upper Tier-2 ratio | | 3.5 | % | 5.1 | % | 3.6 | % | 5.1 | % |
Lower Tier-2 ratio | | 0.9 | % | 1.1 | % | 0.9 | % | 1.1 | % |
Adjusted Total | | 15.0 | % | 17.3 | % | 15.0 | % | 17.3 | % |
Of which: Adj. Tier-1 ratio | | 10.6 | % | 11.1 | % | 10.6 | % | 11.2 | % |
IV. Specification of off-balance sheet items(B)
Consolidated Group and Parent Company:
| | | | Book value on-balance sheet | |
| | | | Related to derivative | | Related to derivative | |
| | | | contracts with positive | | contracts with negative | |
| | Of which: | | real exposures: | | real exposures: | |
| | | | | | Positive | | | | Negative | | | | Positive | | Negative | | Positive | | Negative | |
| | Nominal | | Converted | | real | | Potential | | real | | Weighted | | book | | book | | book | | book | |
December 31, 2006 | | amounts | | claims | | exposures | | exposures | | exposures | | claims | | values | | values | | values | | values | |
Derivative financial contracts: | | | | | | | | | | | | | | | | | | | | | |
Currency related agreements | | 162,811 | | 4,407 | | 1,128 | | 3,279 | | 5,564 | | 992 | | 751 | | 1,329 | | 2,938 | | 2,865 | |
Interest rate related contracts | | 159,677 | | 1,277 | | 764 | | 513 | | 4,431 | | 287 | | 901 | | 1,704 | | 1,490 | | 122 | |
Equity related contracts | | 51,712 | | 5,364 | | 1,443 | | 3,921 | | 3,350 | | 1,964 | | 298 | | 1,026 | | 417 | | 661 | |
Commodity related contracts, etc | | 6,013 | | 460 | | 10 | | 450 | | 661 | | 194 | | 1 | | 643 | | 6 | | 0 | |
Total derivative contracts | | 380,213 | | 11,508 | | 3,345 | | 8,163 | | 14,006 | | 3,437 | | 1,951 | | 4,702 | | 4,851 | | 3,648 | |
Other off-balance sheet contracts and commitments: | | | | | | | | | | | | | | | | | | | | | |
Repurchase agreements etc. (repos) | | 29 | | 29 | | — | | 29 | | — | | — | | | | | | | | | |
Undisbursed credits | | 21,888 | | 10,944 | | — | | 10,944 | | — | | 807 | | | | | | | | | |
Total | | 402,130 | | 22,481 | | 3,345 | | 19,136 | | 14,006 | | 4,244 | | | | | | | | | |
| | | | | | | | | | | | | | | | | | | | | |
December 31, 2005 | | | | | | | | | | | | | | | | | | | | | |
Derivative financial contracts: | | | | | | | | | | | | | | | | | | | | | |
Currency related agreements | | 157,551 | | 4,915 | | 2,032 | | 2,883 | | 8,104 | | 1,050 | | 1,653 | | 636 | | 3,225 | | 1,310 | |
Interest rate related contracts | | 161,317 | | 1,128 | | 599 | | 529 | | 4,204 | | 243 | | 1,326 | | 2,052 | | 838 | | 42 | |
Equity related contracts | | 42,963 | | 4,279 | | 1,129 | | 3,150 | | 1,502 | | 1,189 | | 104 | | 1,187 | | 368 | | 88 | |
Commodity related contracts, etc. | | 5,500 | | 422 | | 3 | | 419 | | 691 | | 204 | | 1 | | 504 | | 33 | | — | |
Total derivative contracts | | 367,331 | | 10,744 | | 3,763 | | 6,981 | | 14,501 | | 2,686 | | 3,084 | | 4,379 | | 4,464 | | 1,440 | |
Other off-balance sheet contracts and commitments: | | | | | | | | | | | | | | | | | | | | | |
Repurchase agreements etc. (repos) | | 27 | | 27 | | — | | 27 | | — | | — | | | | | | | | | |
Undisbursed credits | | 15,114 | | 7,557 | | — | | 7,557 | | — | | 936 | | | | | | | | | |
Total | | 382,472 | | 18,328 | | 3,763 | | 14,565 | | 14,501 | | 3,622 | | | | | | | | | |
(A) The capital base includes the profit for the year 2006.
(B) In accordance with SEK’s policies with regard to counterparty, interest rate, and currency exchange exposures, SEK uses, and is a party to, different kinds of off-balance sheet financial instruments, mostly various interest rate related and currency exchange related contracts (swaps, etc.). It is worth noting that the nominal amounts of such derivative instruments do not reflect real exposures, but merely constitute the basis from which the exposures (converted claims) are derived.
F-28
Note 28. Contingent liabilites and commitments
Contingent liabilities and commitments are reported in connection with the balance sheet. Further, the amounts are also specified in section IV “Specification of off-balance items” of the table “Capital Base and Required Capital” in Note 27”.
In accordance with SEK’s policies with regard to counterparty, interest rate, and currency exchange exposures, SEK uses, and is a party to, different kinds of off-balance sheet financial instruments, mostly various interest rate related and currency exchange related contracts (swaps, etc.). It is worth noting that the nominal amounts of such derivative instruments do not reflect real exposures, but merely constitute the basis from which the exposures (converted claims) are derived. In the table “Capital Base and Required Capital” are included derivative instruments to a nominal value amounting to Skr 380,213 million (2005: 367,331). Credit derivatives issued are included in this amount with Skr 1,256.2 million (2005: 858.9).
Note 29. Certain assets and liabilities
Break-down by maturity, 2006
| | | | | | | | 3 months < | | 1 year < | | 5 years< | | | | Average | |
| | Total | | Maturity | | Maturity <= | | Maturity | | Maturity | | Maturity | | Maturity | | Maturity | |
| | book value | | on demand | | 3 months | | <= 1 year | | <= 5 years | | <=10 years | | >10 years | | (in days) | |
| | | | | | | | | | | | | | | | | |
Credits outstanding (A) | | 56,134.1 | | 201.5 | | 5,428.7 | | 4,476.2 | | 15,101.4 | | 22,121.2 | | 8,805.1 | | 2,222 | |
Interest-bearing securities (A) | | 158,388.9 | | — | | 14,414.2 | | 28,709.2 | | 92,962.8 | | 19,247.8 | | 3,054.9 | | 1,014 | |
Total assets | | 214,523.0 | | 201.5 | | 19,842.9 | | 33,185.4 | | 108,064.2 | | 41,369.0 | | 11,860.0 | | | |
| | | | | | | | | | | | | | | | | |
Borrowing from credit institutions | | 3,245.6 | | 162.6 | | 3,083.0 | | 0.0 | | 0.0 | | 0.0 | | 0.0 | | 15 | |
Borrowing from the public | | 56.0 | | — | | 55.8 | | 0.2 | | 0.0 | | 0.0 | | 0.0 | | 52 | |
Senior securities issued | | 203,375.6 | | — | | 38,182.1 | | 28,241.8 | | 85,338.8 | | 21,169.0 | | 30,443.9 | | 1,994 | |
Total senior debt | | 206,677.2 | | 162.6 | | 41,320.9 | | 28,242.0 | | 85,338.8 | | 21,169.0 | | 30,443.9 | | 1,962 | |
| | | | | | | | | | | | | | | | | |
Net | | 7,845.8 | | 38.9 | | -21,478.0 | | 4,943.4 | | 22,725.4 | | 20,200.0 | | -18,583.9 | | | |
Break-down by expected repricing date, 2006
| | | | | | | | 3 months < | | 1 year < | | 5 years< | | | | Average | |
| | Total | | Repricing | | Repricing <= | | Repricing | | Repricing | | Repricing | | Repricing | | Repricing | |
| | book value | | on demand | | 3 months | | <= 1 year | | <= 5 years | | <=10 years | | >10 years | | (in days) | |
| | | | | | | | | | | | | | | | | |
Total credits outstanding | | 56,134.1 | | 201.5 | | 29,115.6 | | 11,662.8 | | 6,284.3 | | 7,259.1 | | 1,610.8 | | 713 | |
| | | | | | | | | | | | | | | | | |
Interest—bearing securities | | 158,388.9 | | — | | 128,268.7 | | 9,722.1 | | 16,875.6 | | 3,223.9 | | 298.6 | | 220 | |
| | | | | | | | | | | | | | | | | |
Total assets | | 214,523.0 | | 201.5 | | 157,384.3 | | 21,384.9 | | 23,159.9 | | 10,483.0 | | 1,909.4 | | | |
| | | | | | | | | | | | | | | | | |
Borrowing from credit institutions | | 3,245.6 | | 162.6 | | 3,083.0 | | 0.0 | | 0.0 | | 0.0 | | 0.0 | | 15 | |
Borrowing from the public | | 56.0 | | — | | 55.8 | | 0.2 | | 0.0 | | 0.0 | | 0.0 | | 52 | |
Senior securities issued | | 203,375.6 | | — | | 55,045.8 | | 40,218.6 | | 81,875.9 | | 15,299.5 | | 10,935.8 | | 1,055 | |
Total senior debt | | 206,677.2 | | 162.6 | | 58,184.6 | | 40,218.8 | | 81,875.9 | | 15,299.5 | | 10,935.8 | | 1,038 | |
| | | | | | | | | | | | | | | | | |
Net | | 7,845.8 | | 38.9 | | 99,199.7 | | -18,833.9 | | -58,716.0 | | -4,816.5 | | -9,026.4 | | | |
(A) New format.
Note 30. Comparison of book values and fair values
Although, as a consequence of the policies applied with regard to interest-rate and currency exchange exposures, the net value of the Company’s assets (with exception for assets held to hedge the return on the Company’s equity), liabilities and off-balance sheet instruments generally is not materially affected by changes in interest—rates and currency exchange rates, the Company has determined — solely for the purpose of satisfying the regulations in effect — to report fair values of its assets, liabilities and other contracts at year-end. The Company has — with exception of the S-system, the results of which are settled by the State according to agreements between SEK and the State (see also Notes 1 (b) — (c)) — positive margins between the yield on its assets and the yield on its liabilities. These margins are reported on an accrual basis over the maturity of the underlying contracts. Accordingly, the fair value of the liabilities of SEK (i.e., SEK exclusive of the S-system) does not exceed the difference between, on the one hand, the aggregate fair value of SEK’s assets and derivative contracts and, on the other hand, the book value of
F-29
SEK’s shareholders’ funds. The following table includes book values and fair values at year end (however, see below) for items reported, on or off balance sheet, in the cases when book values and fair values, according to the Company’s calculations, differ.
In the cases where quoted market values for the relevant items are available (which is the case for certain interest—bearing securities), such market values, calculated based on bid prices, have been used. However, it should be noted that for a large portion of the items there are no such quoted market values. In those cases, the fair values have been estimated or derived. The process of estimating or deriving such values naturally involves a high degree of uncertainty.
In the process of estimating or deriving fair values, certain simplifying assumptions have been made. For instance, the fair values of credits with fixed interest rates have been calculated based on estimated market interest rates that would have been applicable if the credits had been granted on December 31, 2006, other things being equal. Similarly, the fair values of borrowings with fixed interest rates have been calculated based on estimated market interest rates that would have been applicable if the borrowings had been made on December 31, 2006, other things being equal. Additionally, the fair values of assets, liabilities, and other contracts with floating interest rates have been approximated as equal to the nominal amount of such contracts. The Company estimates the fair values of “Prepaid expenses and accrued revenues” and “Accrued expenses and prepaid revenues” to be approximately the same as their book values.
Accordingly, the fair values reported do to a large extent represent values that have been estimated by the Company. The information in this Note should therefore not be interpreted as basis for the value of the Company in total.
With regard to the S-system, it should be noted that the results under such system are settled by the State according to agreements between SEK and the State. See also Notes 1(b)-(c).
Due to large uncertainty about the fair values, the values in the following table are stated in billions of Swedish kronor.
It should be noted that certain business contracts of the Company may include components that are included in various items, reported on- or off-balance sheet.
Note 30. Comparison of book values and fair values
| | Consolidated
Group and | | Of which
S-system | | Consolidated
Group and | | | | Consolidated | | Of which | |
| | Parent
Company | | Parent
Company | | Parent
Company | | Of which
S-system | | Group and
Surplus/ | | S-system
Surplus/ | |
2006 (Skr billion) | | Book value | | Book value | | Fair value | | Fair value | | Deficit value | | Deficit value | |
Treasuries/government bonds | | 1.8 | | — | | 1.8 | | — | | 0.0 | | — | |
Other interest—bearing securities | | 156.6 | | — | | 157.8 | | — | | 1.2 | | — | |
Credits to credit institutions | | 14.2 | | 3.7 | | 14.3 | | 3.8 | | 0.1 | | 0.1 | |
Credits to the public | | 42.0 | | 5.4 | | 42.4 | | 5.4 | | 0.4 | | 0.0 | |
Derivative contracts (net liabilities) | | -1.5 | | 0.0 | | -7.8 | | 0.0 | | -6.3 | | 0.0 | |
Borrowing from credit institutions | | -3.2 | | 0.0 | | -3.3 | | 0.0 | | -0.1 | | 0.0 | |
Borrowing from the public | | -0.1 | | 0.0 | | -0.1 | | 0.0 | | 0.0 | | 0.0 | |
Senior securities issued | | -203.4 | | 0.0 | | -195.7 | | 0.0 | | 7.7 | | 0.0 | |
Subordinated securities issued | | -2.9 | | — | | -3.1 | | — | | -0.2 | | — | |
Note 31. Transactions with Related Parties
The Swedish State owns 100 percent of the Company’s share capital. By means of direct guarantees extended by the National Debt Office and The Swedish Export Credits Guarantee Board (EKN), supported by the full faith and credit of Sweden, 15 percent of the Company’s outstanding loans at December 31, 2006, were guaranteed by the State. SEK administers, against compensation, the State’s export credit support system, and the State’s tied aid credit program (the “S-system”) Pursuant to an agreement between SEK and the State, SEK is reimbursed for certain costs under the S-system. See Note 1 (b).
F-30
The Company enters into transactions in the ordinary course of business with entities that are partially or wholly owned or controlled by the State, as well as with the other shareholder(s). Such transactions may include borrowings as well as extensions of credits (in the form of direct or pass-through credits). Transactions with such parties are conducted on the same terms (including interest rates and repayment schedules) as transactions with unrelated parties.
The amounts of assets and liabilities in respect of related parties outstanding at December 31, 2006, 2005 and 2004, respectively, and selected other information regarding transactions with related parties during the three-year period ended December 31, 2006, are as follows:
| | December 31, | |
(In millions of Skr) | | 2006 | | 2005 | | 2004 | |
Interest-bearing Securities (1) | | 1,641.2 | | 1,736.3 | | 1,819.9 | |
| | | | | | | |
Outstanding Credits (1) | | — | | — | | — | |
| | | | | | | |
Outstanding Senior Debt | | 56.0 | | 72.5 | | 78.7 | |
| | | | | | | |
Outstanding Subordinated Debt | | — | | — | | — | |
1) Not including interest bearing securities and credits guaranteed by the State and related entities or other shareholders.
| | Year Ended December 31, | |
(In millions of Skr) | | 2006 | | 2005 | | 2004 | |
Net interest revenues (2) | | 36.6 | | 102.0 | | 106.7 | |
| | | | | | | |
Net commission expenses | | (3.6 | ) | (3.6 | ) | (3.6 | ) |
(2) Excluding reimbursement from the State
NOTE 32. Counterparty risks
A counterparty risk represents the risk of the loss that would occur if a borrower (or party in another contract involving counterparty risk) and its guarantors are unable to perform in accordance with the terms and conditions of a contract. Counterparty exposure can be related to a credit or positive market value in another contract (market-related counterparty risk). Counterparty risk exposure is always preceded by a decision on a counterparty limit within which the exposure must be contained. The volume of derivative contracts is shown in the capital adequacy table in Note 27. A specific type of counterparty risk is settlement risk. Settlement risk is the risk of loss corresponding to the change in market value if a counterparty who has completed a deal defaults before fulfilling its part of the transaction.
Quantitative model for credit risks
In addition to controlling credit risks through measurement of exposed amounts against limits, SEK also calculates credit risk with the aid of a method based on the probability of bankruptcy, exposure in the event of bankruptcy and the loss proportion in the event of bankruptcy.
The table shows the breakdown, by counterparty category, of SEK’s total counterparty risk exposures related to credits, interest-bearing securities and off-balance sheet items as of December 31, 2006 and 2005, respectively.
F-31
Counterparty risk exposures
(Skr billion)
Consolidated Group and Parent Company:
| | | | | | Credits & Interest- | | | | Derivatives, | |
| | Total | | | | bearing securities | | | | Undisbursed credits, etc. | |
| | 12/2006 | | 12/2005 | | | | 12/2006 | | 12/2005 | | | | 12/2006 | | 12/2005 | |
Classified by type of counterparty | | Amount | | % | | Amount | | % | | | | Amount | | % | | Amount | | % | | | | Amount | | % | | Amount | | % | |
States | | 43.9 | | 19 | | 34.8 | | 16 | | | | 36.3 | | 17 | | 28.9 | | 15 | | | | 7.6 | | 34 | | 5.9 | | 32 | |
Municipalities | | 19.1 | | 8 | | 14.8 | | 7 | | | | 16.7 | | 8 | | 14.5 | | 7 | | | | 2.4 | | 11 | | 0.3 | | 2 | |
Mortgage institutions | | 7.3 | | 3 | | 7.4 | | 4 | | | | 7.3 | | 3 | | 7.4 | | 4 | | | | — | | — | | — | | — | |
Banks | | 90.7 | | 38 | | 93.8 | | 44 | | | | 84.8 | | 39 | | 87.2 | | 45 | | | | 5.9 | | 26 | | 6.6 | | 36 | |
Other credit institutions | | 62.4 | | 26 | | 44.4 | | 21 | | | | 57.8 | | 27 | | 40.2 | | 21 | | | | 4.6 | | 21 | | 4.2 | | 23 | |
Corporations and others | | 14.2 | | 6 | | 15.9 | | 8 | | | | 12.3 | | 6 | | 14.5 | | 8 | | | | 1.9 | | 8 | | 1.4 | | 7 | |
Total | | 237.6 | | 100 | | 211.1 | | 100 | | | | 215.2 | | 100 | | 192.7 | | 100 | | | | 22.4 | | 100 | | 18.4 | | 100 | |
The table below shows the breakdown of borrowers (primary obligors) by region and related risk counterparties (taking into account guarantees and other collateral) by region and category as of December 31, 2006.
Credits outstanding (incl. committed credits)
Risk: Domicile and category of the related counterparties, to whose risk SEK is exposed
| | | | | | |
(Skr billion) | | | | | Sweden | | | Other Nordic Area | | | Other Western Europe & U.S. | | | Asia & Latinamerica | |
| | | | | | | Govern- | | | | | | | | | | | | | | | | | | | | | | | | | | | | | | | | |
| | | | | | | ment & | | | | | | | | | | | | | | | | | | | | | | | | | | | | | | | | |
Domicile of SEK´s | | Total | | | | | Munici- | | | | Corpo- | | | | | Govern- | | | | Corpo- | | | | | Govern- | | | | Corpo- | | | | | Govern- | | | | Corpo- | |
borrowers | | amount | | | Sum | | palities | | Bank | | ration | | | Sum | | ment | | Bank | | ration | | | Sum | | ment | | Bank | | ration | | | Sum | | ment | | Bank | | ration | |
Africa | | 1.5 | | | 1.4 | | 1.4 | | | | | | | | | | | | | | | | 0.1 | | | | 0.1 | | | | | | | | | | | | |
Asia | | 21.5 | | | 12.9 | | 12.8 | | | | 0.1 | | | 0.1 | | 0.1 | | | | | | | 8.5 | | 7.9 | | 0.6 | | | | | | | | | | | | |
Latin America | | 6.9 | | | 3.4 | | 3.2 | | 0.2 | | | | | | | | | | | | | | 3.3 | | 2.5 | | 0.8 | | | | | 0.2 | | | | | | 0.2 | |
North America | | 0.6 | | | 0.2 | | 0.2 | | | | | | | | | | | | | | | | 0.4 | | | | | | 0.4 | | | | | | | | | | |
Sweden | | 44.7 | | | 41.7 | | 18.5 | | 15.9 | | 7.3 | | | 0.4 | | 0.4 | | | | | | | 2.3 | | 0.4 | | 1.7 | | 0.2 | | | 0.3 | | | | | | 0.3 | |
Other Nordic Area | | 21.0 | | | 0.7 | | | | 0.7 | | | | | 18.7 | | 8.1 | | 5.3 | | 5.3 | | | 1.6 | | | | 1.6 | | | | | | | | | | | | |
Other Western Europe | | 13.8 | | | 1.8 | | 1.8 | | | | | | | | | | | | | | | | 12.0 | | 7.4 | | 3.1 | | 1.5 | | | | | | | | | | |
Baltic Area | | 0.7 | | | | | | | | | | | | | | | | | | | | | 0.7 | | | | 0.7 | | | | | | | | | | | | |
Other Eastern Europe | | 2.9 | | | 1.3 | | 1.3 | | | | | | | 0.3 | | 0.3 | | | | | | | 1.1 | | 0.8 | | 0.3 | | | | | 0.2 | | 0.2 | | | | | |
Total | | 113.6 | | | 63.4 | | 39.2 | | 16.8 | | 7.4 | | | 19.5 | | 8.9 | | 5.3 | | 5.3 | | | 30.0 | | 19.0 | | 8.9 | | 2.1 | | | 0.7 | | 0.2 | | 0.0 | | 0.5 | |
Note 33. Market risks
A market risk occurs when the terms of a contract mean that the size of the payments linked to the contract or the value of the contract varies due to a market variable, such as interest rates or exchange rates. SEK’s policy allows net exposure to interest rate, currency and credit related market risks. Other market risks must be hedged.
Market risk measurement (Skr million) as of December 31, 2006
| | | | Risk (see | |
Measurement | | Limit | | under each heading) | |
Interest rate risk | | | | | |
Parallel shift | | | | | |
Total | | 190 | | 36.9 | |
of which, foreign currency | | | | 22.6 | |
of which, Skr | | | | 14.3 | |
of which within 12 months | | 50 | | 15.6 | |
of which, foreign currency | | | | 4.3 | |
of which, Skr | | | | 11.2 | |
Basis risk liquidity in different currencies | | 190 | | 84.1 | |
Credit spread risk | | 175 | | 66.0 | |
Currency risk | | 30 | | 0.4 | |
F-32
MEASUREMENTS/DEFINITIONS:
Interest rate risks:
The interest rate risk is calculated from a parallel shift in the yield curve of one percentage point. Perpetual subordinated debt with related hedging transactions, as well as the assets in which shareholders’ funds and untaxed reserves are invested, are excluded from the calculation of these interest rate risks and limits.
Basis risk:
Differences in an interest base for different currencies imply a risk if there is a surplus and/or deficit for a certain period. Basis risk is calculated as a present value change in the event of a change of base by a certain number (standard measurement) of basis points. At year—end this standard measurement was 5 or 10 basis points for various currencies.
Credit spread risks:
The risk comprises the market value change that occurs when the interest margin the market requires as compensation for credit risk changes. The risk is measured as the change in the market value at a certain change of credit spread. The changed credit spread used when calculating this risk depends on the risk counterparty’s rating and sector and the maturity of the exposure. At year—end credit spread changes between 2 and 55 basis points were used.
Interest rate risk in perpetual subordinated debt:
The volume of perpetual subordinated debt at December 31, 2006, amounted to USD 350 million corresponding to Skr 2,405 million. The interest rate risk related to Skr 2,397 million of this volume was hedged with interest rate swaps with maturities between 2019 and 2034.
Interest rate risks in assets corresponding to shareholders’ funds and untaxed reserves:
In order to ensure a long—term stable return on equity, SEK’s policy is to invest shareholders’ funds in SEK’s office building (Skr 0.1 billion) and securities with medium maturities. At year—end 2006, the volume of securities for this purpose had a book value of approximately Skr 4.3 billion with an average outstanding maturity of 3.7 years.
Currency risks:
The risk is calculated as a change in the value of foreign currency positions resulting from a 10 percentage point change in the exchange rate for the Swedish kronor.
Note 34. Funding and liquidity risks
SEK’s funding and liquidity risk is measured on the basis of different forecasts regarding the development of available funds defined as shareholders’ funds and untaxed reserves as well as borrowing in comparison with committed credits.
Note 35. Operational risks
Operational risks within SEK are defined as the risk of economic losses due to:
— legal or judicial events
— human error or fraud
— inadequate or incomplete processes, routines, management principles, systems and organizational structure
— external events (catastrophes, power cuts, etc.)
— insufficient compliance
F-33
Note 36. Decision-making rules for risk limits
The Board of Directors decides total market risk limits. Management of risks and parts of these limits are delegated to employees within the business organization.
SEK’s Executive Committee can make decisions on the establishment of counterparty risk limits up to certain levels which are adopted by the Board. Executive Committee has in turn within certain limits and on certain conditions authorized employees within Executive Committee to make credit decisions jointly. The establishment of limits above those adopted by the Board as limits for Executive Committee can only be decided by the Board of Directors or the Credit Committee whose members are chosen from the Board of Directors and Executive Committee.
Note 37. Reconciliation to accounting principles generally accepted in the United States
Swedish generally accepted accounting principles vary in certain respects from U.S. GAAP. The significant variations with respect to SEK excluding the S-system are:
Functional currency — SEK has determined that Swedish kronor (Skr) is its functional currency under U.S. GAAP. The determination is based on several factors, the important ones being that SEK’s shareholders’ funds are denominated in Swedish kronor, its performance is evaluated based on a result expressed in Swedish kronor, and that a large portion of expenses especially related to administrative expenses is denominated Swedish kronor. SEK also manages its risk exposure with regard to foreign currency exposure in such a way that the exposure between Swedish kronor and other currencies is hedged. Under Swedish GAAP there is no explicit requirement to determine functional currency.
Derivatives — Statement of Financial Accounting Standard (SFAS) No. 133, Accounting for Derivative Instruments and Hedging Activities, and SFAS No. 138, Accounting for Certain Derivative Instruments and Certain Hedging Activities, were effective for the Company as of January 1, 2001. SFAS 133 and SFAS 138 require that an entity recognizes all derivatives as either assets or liabilities measured at fair value. The accounting for changes in the fair value of a derivative depends on the use of the derivative. Derivatives that are not designated as part of a hedging relationship must be adjusted to fair value through income. If a derivative is a hedge, depending on the nature of the hedge, the effective portion of the hedge derivative’s change in fair value is either (i) offset against the change in fair value of the hedged asset, liability or firm commitment for the risk being hedged through income, or (ii) held in equity until the hedged item is recognized through income. The ineffective portion of a hedge derivatives’ change in fair value is recognized immediately in income.
Certain assets, liabilities and designated derivatives had qualified for hedge accounting under previous U.S. GAAP standards. These hedging relationships did not on January 1, 2001, nor on December 31, 2001, qualify for hedge accounting under SFAS 133. Therefore, the adoption of SFAS 133 increased the volatility of reported earnings under U.S. GAAP until June 30, 2002. From July 1, 2002, certain assets, liabilities and designated derivatives qualified for hedge accounting under U.S. GAAP and thereby the volatility in the item “Derivatives and hedging activities” in earnings has been reduced.
The remaining volatility in earnings in the item “Derivatives and hedging activities” is related to derivatives that under U.S. GAAP do not qualify for hedge accounting even though they have been acquired or written for the purpose of economically hedging assets or liabilities. One main component of the remaining volatility is related to derivatives in the portfolio of held-to-maturity securities where according to U.S. GAAP hedge accounting is not allowed. Another main component of the remaining volatility is related to derivatives hedging perpetual subordinated debt where hedge accounting has not yet been achieved. Such changes in fair value are included in “derivatives and hedging activities” in the summary of significant adjustments tables which follow.
Adoption of SFAS 133 resulted in the Company recording a cumulative after-tax increase in other comprehensive income of Skr 181 million (net of related income tax of Skr 71 million) at January
F-34
1, 2001. Also at January 1, 2001, the carrying value of certain assets and liabilities that qualified for hedge accounting under previous U.S. GAAP standards and were deemed fair value hedges was adjusted by Skr 1,645 million with no impact on net income. Because such hedging relationships did not qualify for hedge accounting under the new accounting standards, changes in the fair value of the previously designated derivatives are being recognized in income while the adjustment to the carrying value of the assets and liabilities is being accreted to income on a straight line basis over eleven years, which is estimated to approximate the application of a level yield method over the contractual life of hedged assets and liabilities. The Company monitors changes in the amount and composition of hedged accounts and will make adjustments deemed necessary to maintain an approximate level yield amortization method.
Foreign exchange differences on investment securities —SEK holds securities in a number of different currencies which are classified as available for sale for U.S. GAAP purposes. No net foreign exchange exposures arise from these, because, although the value of the assets in Swedish kronor terms changes according to the relevant exchange rates, there is a substantially identical offsetting change in the Swedish kronor value of the related funding. Under Swedish GAAP both the assets and the liabilities are translated at closing exchange rates and the differences between historical book value and current value are reflected in foreign exchange effects in earnings, where they offset each other. This reflects the economic substance of holding currency assets financed by liabilities denominated in, or hedged into, the same currency.
However, under U.S. GAAP the valuation effects of changes in currency exchange rates in value of the investments classified as available for sale and not otherwise hedged by a derivative in a fair value hedging relationship is taken directly to equity whereas the offsetting changes in Swedish kronor terms of the borrowing is taken to earnings. This leads to a mismatch between recognition of the income statement impact of changes in currency exchange rates, with exchange rate changes impacting funding liabilities reported in current earnings whereas exchange rate changes impacting the carrying amount of available for sale securities are reported as a component of other comprehensive earnings.
The result of the foregoing is that for the year 2006 SEK’s U.S. GAAP profits were increased by Skr 2,302.9 million compared to Swedish GAAP profits, and for the years 2005 and 2004 SEK’s U.S. GAAP profits were reduced by Skr 2,617.9 million and increased by Skr 1000.0 million, respectively, compared to Swedish GAAP profits, in each case before tax effects. There is no difference in total shareholders’ funds between Swedish GAAP and U.S. GAAP as a result of this treatment (although there are differences in individual components of shareholders’ funds).
Own debt repurchased — Under U.S. GAAP, any gain or loss incurred in connection with reacquisition of the Company’s debt instruments would be recognized immediately together with gains or losses on early termination of related derivatives. See Note 1 (p) for the Swedish GAAP treatment.
Debt Securities — The Company holds a large hedge account in securities which under Swedish GAAP are reported on an amortized-cost basis (see Note 1(j)). The Company has determined to treat all of its securities held in the hedge account as available-for-sale securities under U.S. GAAP and, accordingly, to recognize related unrealized gains or losses, net of tax, as other comprehensive income.
As of January 1, 1996, the Company transferred certain debt securities which were reported as trading-securities under U.S. GAAP to held-to-maturity securities. The excess of the market value over par value, previously recorded in income, at the date of such transfer is amortized over the remaining life of the security.
Deferred taxation — U.S. GAAP requires the recognition of a deferred tax liability on all taxable differences in full. A deferred tax asset is recognized for temporary differences that will result in deductible amounts in the future. To the extent that it is more likely than not that a recorded deferred tax asset will not be realized, an offsetting valuation allowance is recorded. Such comprehensive tax accounting has been required also in Sweden since 2001 when IAS 12, with some modifications, was adopted as Swedish GAAP.
Thus, under Swedish GAAP a net deferred tax liability of Skr 352.5 million (2005: 365.9) is reported at December 31, 2006, comprising a liability of Skr 357.1 million (2005: 370.7) relating to untaxed reserves (see Note 25) and a deferred tax asset of Skr 4.6 million (2005: 4.8) relating to pension
F-35
liabilities not yet allowed as a cost for tax purposes (Note 25). In the US GAAP reconciliation, additional deferred tax liabilities of Skr 30.2 million (2005: 30.8) are recognized relating to property (see Note 16 and the section Other below) and a deferred tax asset of Skr 0.0 million (2005: 5.6) relating to other temporary differences (not counting the tax effects of other reconciling U.S. GAAP adjustments).
Other — Other items include the fair value of a step up in value of acquired property not recognized under U.S. GAAP (see Note 16 and the section “Deferred taxation” above).
Earnings per share — Earnings per share (Swedish GAAP) and earnings per share (U.S. GAAP) are calculated as, respectively, net profit (Swedish GAAP) per share and net profit (U.S. GAAP) per share. The total number of shares at December 31, 2006, 2005 and 2004 was 990,000.
No reconciliation of significant material variations between Swedish accounting principles and U.S. GAAP has been made with respect to the S-system because any such variations that affected the Company’s net profit would be offset by an adjustment in the amount reimbursed by the State. (See Notes 1(b) and 1(c)). Due to the retention of some credit risk on loans extended by the Company within the S-system, under U.S GAAP SEK would be required to account for all effects related to the income statement of the S-system as gross revenues or costs for SEK; such presentation would not however result in an adjustment to reported net income or shareholders’ funds under U.S. GAAP.
The statements of cash flows have been presented in accordance with International Accounting standard number 7 — Cash Flow Statements (IAS 7).
F-36
The following is a summary of the significant adjustments to net profit that would be required if U.S. GAAP were to be applied instead of Swedish GAAP for the twelve-month periods ending:
| | | | December 31, | | | |
(In millions of Skr unless otherwise stated) | | | | 2006 | | | | 2005 | | | | 2004 | | | |
Net profit for the period under Swedish GAAP | | | | 385.6 | | | | 346.9 | | | | 439.6 | | | |
Amortization of unrealized gains on securities transferred into the held-to-maturity category in 1996 | | | | (4.3 | ) | | | (3.9 | ) | | | (5.1 | ) | | |
Gains/(losses) in connection with repurchases of own-debt | | | | 142.2 | | | | 13.0 | | | | (21.9 | ) | | |
Derivatives and hedging activities | | | | 183.3 | | | | 162.5 | | | | 82.6 | | | |
Accretion of discount on liabilities and amortization of premiums on assets that qualified for hedge accounting before adoption of SFAS 133 | | | | (171.9 | ) | | | (171.9 | ) | | | (171.9 | ) | | |
Foreign exchange differences on available-for-sale securities | | | | 2,302.9 | | | | (2,617.9 | ) | | | 1,000.0 | | | |
Tax effect of U.S. GAAP adjustments | | | | (686.6 | ) | | | 733.1 | | | | (247.4 | ) | | |
Deferred taxation | | | | (5.0 | ) | | | 0.3 | | | | 0.8 | | | |
Net adjustments | | | | 1,760.6 | | | | (1,884.8 | ) | | | 637.1 | | | |
Net profit for the period under U.S. GAAP | | | | 2,146.2 | | | | (1,537.9 | ) | | | 1,076.7 | | | |
| | | | | | | | | | | | | | | |
Earnings (loss) per share under U.S. GAAP (Skr) | | | | 2,167.9 | | | | (1,553.4 | ) | | | 1,087.6 | | | |
F-37
The following is a summary of the significant adjustments to comprehensive income that would be required if U.S. GAAP were to be applied instead of Swedish GAAP for the twelve-month period ending:
| | | | December 31, | | | |
(In millions of Skr unless otherwise stated) | | | | 2006 | | | | 2005 | | | | 2004 | | | |
Net profit for the period under U.S. GAAP | | | | 2,146.2 | | | | (1,537.9 | ) | | | 1,076.7 | | | |
Other comprehensive income: | | | | | | | | | | | | | | | |
Difference between fair value and book value of available-for-sale securities (exclusive of foreign exchange differences) * | | | | 323.8 | | | | (82.5 | ) | | | 16.7 | | | |
Difference between fair value and book value of available-for-sale securities solely related to foreign exchange differences ** | | | | (2,302.9 | ) | | | 2,617.9 | | | | (1,000.0 | ) | | |
Fair value of derivatives recognized upon adoption of SFAS 133 related to cash flow type hedges | | | | (2.7 | ) | | | (5.1 | ) | | | (44.8 | ) | | |
Tax effect on other comprehensive income | | | | 554.9 | | | | (708.5 | ) | | | 287.9 | | | |
Total other comprehensive income | | | | (1,426.9 | ) | | | 1,821.8 | | | | (740.2 | ) | | |
Comprehensive income under U.S. GAAP | | | | 719.3 | | | | 283.9 | | | | 336.5 | | | |
* Reclassification has been made in other comprehensive income related to securities sold during the period. The realized gain (exclusive of foreign exchange differences) on available-for-sale securities sold during the twelve-month period ending December 31, 2006, amounted to Skr 5.1 million (2005: loss 0.4, 2004: gains 9.4).
** Reclassification has been made in other comprehensive income related to available-for-sale securities sold during the twelve-month period ending December 31, 2006. The realized losses (solely related to foreign exchange differences) on available-for-sale securities sold during the period amounted to Skr 467.0 million (2005: gains 260.7, 2004: losses 93.5).
F-38
The following is a summary of the significant adjustments to shareholders’ funds that would be required if U.S. GAAP were to be applied instead of Swedish GAAP:
| | | | December 31, | | | |
(In millions of Skr) | | | | 2006 | | | | 2005 | | | |
Shareholders’ funds under Swedish GAAP | | | | 4,124.3 | | | | 3,738.7 | | | |
Unamortized gains on securities transferred to held to maturity securities in 1996 | | | | 11.3 | | | | 15.6 | | | |
Difference between fair value and book value in available-for-sale securities | | | | 360.9 | | | | 37.1 | | | |
Fair value of derivatives recognized upon adoption of SFAS 133 related to cash flow type hedges | | | | (4.3 | ) | | | (1.6 | ) | | |
Derivatives and hedging activities | | | | 357.8 | | | | 174.5 | | | |
Discount on liabilities and premium on assets that qualified for hedge accounting prior to adoption of SFAS 133 | | | | 647.8 | | | | 819.7 | | | |
Gains/(losses) in connection with repurchases of own-debt | | | | 143.3 | | | | 1.1 | | | |
Other | | | | 33.1 | | | | 33.1 | | | |
Tax effect of U.S. GAAP adjustments | | | | (424.7 | ) | | | (293.0 | ) | | |
Deferred taxation | | | | (30.2 | ) | | | (25.2 | ) | | |
Net adjustments | | | | 1,095.0 | | | | 761.3 | | | |
Shareholders’ funds under U.S. GAAP | | | | 5,219.3 | | | | 4,500.0 | | | |
Reportable segments of SEK’s operations under SFAS No. 131 “Disclosures about Segments of an Enterprise and Related Information” are SEK (exclusive of the S-system) and the S-system, both reported separately in the consolidated income statement with additional information in Note 1(b), Note 1(c), and Note 4.
The holding gains on available-for-sale securities, including foreign exchange difference adjusted from net profit, would under U.S. GAAP be reported as “Other Comprehensive Income” under SFAS No. 130 “Reporting Comprehensive Income”.
Accounting for derivative instruments and hedging activities — SFAS 133 “Accounting for Derivative Instruments and Hedging Activities,” as amended by SFAS 138 (the “Standard”) is the foundation of a set of U.S. GAAP requirements for accounting for derivatives. The Standard requires that all derivative instruments be recorded on the balance sheet at fair value; the accounting for changes in fair value of the derivative depends on whether the derivative qualifies as a hedge. If the derivative instrument does not qualify as a hedge, changes in fair value are reported in earnings when they occur. However, if the derivative qualifies as a hedge, the accounting varies based on the type of risk being hedged (see previous discussion herein of accounting for derivatives in designated hedging relationships).
F-39
In the hedging relationship of a financial asset or liability, SEK designates the risk being hedged as one of the following:
(1) The risk of changes in the overall fair value of the entire hedged item
(2) The risk of changes in its fair value attributable to changes in the designated benchmark rate (referred to as interest rate risk)
(3) The risk of changes in its fair value attributable to changes in the related foreign currency exchange rates (referred to as foreign exchange risk)
(4) The risk of changes in its fair value attributable to changes in the obligor’s creditworthiness and changes in the spread over the benchmark interest rate with respect to the hedged item’s credit sector at inception of the hedge (referred to as credit risk).
If the risk designated as being hedged is not the risk in (1) in the paragraph above, SEK may designate one or more of the other risks (interest rate risk, foreign currency exchange risk and credit risk) as the hedged risk. The benchmark interest rate being hedged in a hedge of interest rate risk will be specifically identified as part of the designation and documentation at the inception of the hedging relationship.
As SEK currently hedges the risk of fair value changes in its loans or investments, the transactions are accounted for according to the fair value hedge model pursuant to SFAS 133.
There are currently four different strategies used within SEK to hedge changes in fair value.
(A) Hedge of changes in fair value due to interest rates. It is SEK’s objective to mitigate the risk of changes in fair value due to changes in interest rates, i.e., to convert a fixed interest rate in loans or investments into a variable interest rate. The hedging instrument is an interest rate swap (IRS), swapping fixed to floating interest rates.
(B) Hedge of changes in fair value due to interest and foreign exchange rates. It is SEK’s objective to mitigate the risk of changes in fair value due to changes in interest and foreign exchange rates, i.e. to convert a fixed interest rate in one currency into a variable interest rate in the functional currency. The hedging instrument is a Cross currency interest rate swap (CIRS), going from fixed interest rate in one currency to floating interest rate in another currency.
(C) Hedge of changes in fair value due to interest rates, including embedded derivatives bifurcated from debt host contracts. As in strategy (A), above it is SEK’s objective to mitigate the risk of changes in fair value due to changes in interest rates, i.e., to convert a fixed interest rate in loans or investments into a variable interest rate. The hedging instrument is a group of derivatives consisting of IRS and options, forwards or futures. The group of derivatives results in going from fixed interest rate to floating interest rate.
(D) Hedge of changes in fair value due to interest and foreign exchange rates, including embedded derivatives bifurcated from debt host contracts. As in strategy (B) above, it is SEK’s objective to mitigate the risk of changes in fair value due to changes in interest and foreign exchange rates, i.e., to convert a fixed interest rate in one currency into a variable interest rate in the functional currency. The hedging instrument is a group of derivatives consisting of CIRS and options, forwards or futures. The group of derivatives results in going from fixed interest rate in one currency to floating interest rate in another currency.
Both at inception of the hedge and on an ongoing basis, SEK’s hedging relationships are expected to be highly effective in offsetting changes in fair values attributable to the hedged risks.
The fair value of the derivative is estimated using discounted cash flow analysis. The discount factors are derived from the zero coupon curve, based on the swap curve, for each currency.
F-40
Embedded features, such as options, futures or forwards, are valued using the best accessible market data and best practice valuation models. A valuation from an external counterparty may also be used. Using a market price for the transaction in question or for a similar transaction derives the fair value of the option, future or forward contracts. The fair value may also be delivered from an external counterparty. Under U.S. GAAP some of the inherent uncertainty of valuation techniques when calculating fair value related to securities and derivatives has a greater impact than under Swedish GAAP. This is due to the fact that a large portion of financial assets, liabilities and derivatives is carried at fair value with effects of changes in fair value going through the income statement or directly to shareholders´ funds.
Quantitative disclosures about ineffectiveness — Net gain or loss recognized in earnings representing (a) the amount of hedge ineffectiveness in fair value hedges, and (b) the component of the derivative instruments’ gain or loss, if any, excluded from the assessment of hedge effectiveness is reported as one component of “Derivatives and hedging activities” in the statement of significant adjustments to net profit that would be required if U.S. GAAP were to be applied instead of Swedish GAAP. For the year ended December 31, 2006, net gains amounting to Skr 39.7 million (2005: net losses amounting to Skr 19.2 million, 2004: net gains amounting to Skr 73.0 million) related to the amount of hedge ineffectiveness in fair value hedges were reported as one component of the item “Derivatives and hedging activities”.
Recent Accounting Matters
In February 2006, the FASB issued SFAS No. 155, “Accounting for Certain Hybrid Financial Instruments” (“SFAS 155”). SFAS 155 allows any hybrid financial instrument that contains an embedded derivative that otherwise would require bifurcation under SFAS No. 133, “Accounting for Derivative Instruments and Hedging Activities” to be carried at fair value in its entirety, with changes in fair value recognized in earnings. In addition, SFAS 155 requires that beneficial interests in securitized financial assets be analyzed to determine whether they are freestanding derivatives or contain an embedded derivative. SFAS 155 also eliminates a prior restriction on the types of passive derivatives that a qualifying special purpose entity is permitted to hold. SFAS 155 is applicable to new or modified financial instruments in fiscal years beginning after September 15, 2006, though the provisions related to fair value accounting for hybrid financial instruments can also be applied to existing instruments. Early adoption, as of the beginning of an entity’s fiscal year, is also permitted, provided interim financial statements have not yet been issued. The Company is currently evaluating the potential impact, if any, which the adoption of SFAS 155 will have on the schedule of significant adjustments to U.S. GAAP from Swedish GAAP included in the Company’s consolidated financial statements.
In September 2006, the FASB issued SFAS No. 157, “Fair Value Measurements” (“SFAS 157”). SFAS 157 defines fair value, establishes a framework for measuring fair value in generally accepted accounting principles (GAAP) and expands disclosures about fair value measurements.. SFAS 157 is effective for financial statements issued for fiscal years beginning after November 15, 2007, and interim periods within those fiscal years. Earlier application is encouraged, provided that the reporting entity has not yet issued financial statements for that fiscal year, including financial statements for an interim period within that fiscal year. The Company is currently evaluating the potential impact, if any, which the adoption of SFAS 157 will have on the schedule of significant adjustments to U.S. GAAP from Swedish GAAP included in the Company’s consolidated financial statements.
In September 2006, the FASB issued SFAS No. 158, “Employers’ Accounting for Defined Benefit Pension and Other Postretirement Plans — an amendment of FASB Statements No. 87, 88, 106, and 132R “ (“SFAS 158”). SFAS 158 requires an employer to recognize the overfunded or underfunded status of a defined benefit postretirement plan (other than a multiemployer plan) as an asset or liability in its statement of financial position and to recognize changes in that funded status in the year in which the changes occur through comprehensive income. SFAS 158 further requires the determination of the fair values of a plan’s assets at a company’s year-end and recognition of actuarial gains and losses, prior service costs or credits, and transition assets or obligations as a component of accumulated other comprehensive income. Since SEK has no publicly traded equity securities, the Company under this statement is only required to recognize the funded status as of the end of the fiscal year ending after June 15, 2007, and to measure plan assets and the benefit obligation as of the date of the fiscal year-end as from the fiscal year ending
F-41
December 31, 2008.The Company is currently evaluating whether the adoption of SFAS 158 will have a material impact on the Company’s schedule of significant adjustments to U.S. GAAP from Swedish GAAP included in the Company’s consolidated financial statements.
In February 2007, the FASB issued SFAS No. 159, “The Fair value Option for Financial Assets and Financial Liabilities —Including an amendment of FASB Statement No. 115” (“SFAS 159”). SFAS 159 permits entities to choose to measure many financial instruments and certain other items at fair value. The objective is to improve financial reporting by providing entities with the opportunity to mitigate volatility in reported earnings caused by measuring related assets and liabilities differently without having to apply complex hedge accounting provisions. SFAS 159 is applicable to new or modified financial instruments in fiscal years beginning after September 15, 2007, Early adoption, as of the beginning of an entity’s fiscal year, is also permitted, provided interim financial statements have not yet been issued. The Company is currently evaluating the potential impact, if any, which the adoption of SFAS 159 will have on the schedule of significant adjustments to U.S. GAAP from Swedish GAAP included in the Company’s consolidated financial statements.
In September 2006, the Securities and Exchange Commission (SEC) issued Staff Accounting Bulletin (SAB) No. 108 “Considering the Effects of Prior Year Misstatements when Quantifying Misstatements in Current Year Financial Statements” (SAB 108). SAB 108 provides guidance on how prior year misstatements should be considered when quantifying misstatements in the current year financial statements. SAB 108 requires registrants to quantify misstatements using both a balance sheet and an income statement approach and evaluate whether either approach results in quantifying a misstatement that, when all relevant quantitative and qualitative factors are considered, is material. SAB 108 does not change the guidance in SAB 99, “Materiality”, when evaluating the materiality of misstatements. SAB 108 is effective for fiscal years ending after November 15, 2006. Upon initial application, SAB 108 permits a one-time cumulative effect adjustment to beginning retained earnings. No adjustment was required to beginning retained earnings as a result of the adoption of SAB 108.
F-42
Note 38. Recovered credit loss
| | 2006 | | 2005 | | 2004 | |
| | Consolidated
Group | | Parent
Company | | S-system | | Consolidated
Group | | Parent
Company | | S-system | | Consolidated
Group | | Parent
Company | | S-system | |
Recovered credit loss | | — | | — | | — | | — | | — | | — | | 45.3 | | 45.3 | | — | |
Total recovered credit loss | | — | | — | | — | | — | | — | | — | | 45.3 | | 45.3 | | — | |
In 1992 a provision of Skr 100 million for an anticipated loan loss was made. The provision was related to an exposure towards Svenska Kreditförsäkringsaktiebolaget, a Swedish insurance company, that was declaired bankrupt.
SEKhad received remuneration in advance during the years 1993—2004 amounting to Skr 45.3 million which were reserved pending dispositions of potential claims. In 2004 such amount was deemed irrevocable which is why in 2004 it was recognized in income.
F-43
SIGNATURES
The Company hereby certifies that it meets all requirements for filing on Form 20-F and that it has duly caused and authorized the undersigned to sign this Annual Report on its behalf.
| | AKTIEBOLAGET SVENSK EXPORTKREDIT |
| | (Swedish Export Credit Corporation) |
| | | | |
| | | | |
| | | By | /s/Peter Yngwe |
| | | | Peter Yngwe, President |
| | | | |
| | | | |
Date: April 2, 2007 | | | | |
EXHIBIT INDEX
Exhibits
Documents filed as exhibits to this Annual Report.
1.1 Articles of Association (incorporated by reference to the Form 6-K filed by the Company on May 27, 2004, file no. 1-8382).
2.1 Indenture, dated as of August 15, 1991, between the Company and J.P. Morgan Trust Company, National Association (as successor in interest to the First National Bank of Chicago) as Trustee, providing for the issuance of debt securities, in one or more series, by the Company (filed as Exhibit 4(a) to the Registrant’s Report of Foreign Issuer on Form 6-K (File No. 1-8382) dated September 30, 1991 and incorporated herein by reference).
2.2 First Supplemental Indenture dated as of June 2, 2004 between the Company and J.P. Morgan Trust Company, National Association (filed as Exhibit 4(b) to the Registrant’s Registration Statement on Form F-3 (No. 333-131369) dated January 30, 2006 and incorporated herein by reference).
2.3 Second Supplemental Indenture, dated as of January 30, 2006, between the Company and J.P. Morgan Trust Company, National Association (filed as Exhibit 4(c) to the Registrant’s Registration Statement on Form F-3 (No. 333-131369) dated January 30, 2006 and incorporated herein by reference).
2.4 Fiscal Agency Agreement dated July 5, 2006 relating to up to Euro 25,000,000,000 aggregate principal amount of debt securities authorized to be issued under the Company’s Program for the Continuous Issuance of Debt Instruments.
2.5 Deed of Covenant dated July 5, 2006 relating to up to Euro 25,000,000,000 aggregate principal amount of securities of SEK authorized to be issued under the Company’s Program for the Continuous Issuance of Debt Instruments.
2.6 Fiscal Agency Agreement dated August 21, 1997 relating to securities other than Yen-denominated securities to be issued under the Company’s U.S.$10,000,000,000 aggregate principal amount Program for the Continuous Issuance of Debt Instruments in Asia. (Filed as Exhibit 2.3 to the Company’s Annual Report on Form 20-F (file No. 1-8382) for for the year ended December 31, 2003 filed on the Company on April 28, 2004 and incorporated by reference herein).
2.7 Deed of Covenant dated August 21, 1997 relating to securities other than Yen-denominated securities to be issued under the Company’s U.S.$10,000,000,000 aggregate principal amount Program for the Continuous Issuance of Debt Instruments in Asia. (Filed as Exhibit 2.4 to the Company’s Annual Report on Form 20-F (file No. 1-8382) for for the year ended December 31, 2003 filed on the Company on April 28, 2004 and incorporated by reference herein).
2.8 Agreement with Commissioned Companies for Bondholders dated October 28, 1997 relating to up to Yen 500,000,000,000 aggregate principal amount of securities of SEK to be issued under the
Real Asian MTN Program Yen 500,000,000,000 Samurai MTN Program (English translation). (Filed as Exhibit 2.5 to the Company’s Annual Report on Form 20-F (file No. 1-8382) for for the year ended December 31, 2003 filed by the Company on April 28, 2004 and incorporated by reference herein).
7.1 Calculation of Ratios of Earnings to Fixed Charges—U.S. Accounting Principles.
7.2 Calculation of Ratios of Earnings to Fixed Charges—Swedish Accounting Principles.
8.1 Subsidiaries as of the end of the year covered by this report are AB SEKTIONEN, AB SEK Securities, SEK Financial Advisors AB, and SEK Financial Services AB, each of which is incorporated in Sweden.
12.1 Certifications pursuant to Rule 13a-14(a) or Rule 15d-14(a) under the Securities Exchange Act of 1934.
13.1 Certifications Pursuant to 18 U.S.C Section 1350, as Adopted Pursuant to Section 906 of the Sarbanes-Oxley Act of 2002.
15.1 Consent of the Independent Registered Public Accounting Firm.