Table of Contents
As filed with the Securities and Exchange Commission on March 25, 2011
UNITED STATES
SECURITIES AND EXCHANGE COMMISSION
Washington, D.C. 20549
FORM 20-F
(Mark One)
o | Registration statement pursuant to Section 12(b) or 12(g) of the Securities Exchange Act of 1934 |
| |
or |
| |
x | Annual report pursuant to Section 13 or 15(d) of the Securities Exchange Act of 1934
For the fiscal year ended December 31, 2010 |
| |
or |
| |
o | Transition report pursuant to Section 13 or 15(d) of the Securities Exchange Act of 1934 |
| |
or |
| |
o | Shell company report pursuant to section 13 or 15(d) of the securities Exchange Act of 1934 |
Date of event requiring this shell company report . . . . . . . . . . . . . . . . . . .
For the transition period from to
Commission file number: 001-8382
AKTIEBOLAGET SVENSK EXPORTKREDIT |
(Exact name of Registrant as Specified in Its Charter) |
|
(SWEDISH EXPORT CREDIT CORPORATION) |
(Translation of Registrant’s Name into English) |
|
Kingdom of Sweden |
(Jurisdiction of incorporation or organization) |
|
Klarabergsviadukten 61-63, Stockholm, Sweden |
(Address of principal executive offices) |
Securities registered or to be registered pursuant to Section 12(b) of the Act:
See list on following pages
Securities registered or to be registered pursuant to Section 12(g) of the Act:
None |
(Title of Class) |
|
Securities for which there is a reporting obligation pursuant to Section 15(d) of the Act: |
|
· Debt Securities
· Index Warrants |
(Title of Class) |
Indicate the number of outstanding shares of each of the issuer’s classes of capital or common stock as of the close of the period covered by the annual report:
Indicate by check mark if the registrant is a well-known seasoned issuer, as defined in Rule 405 of the Securities Act.
x Yes o No
If this report is an annual or transition report, indicate by check mark if the registrant is not required to file reports pursuant to Section 13 or 15(d) of the Securities Exchange Act of 1934.
o Yes x No
Note — Checking the box above will not relieve any registrant required to file reports pursuant to Section 13 or 15(d) of the Securities Exchange Act of 1934 from their obligations under those Sections.
Indicate by check mark whether the registrant: (1) has filed all reports required to be filed by Section 13 or 15(d) of the Securities Exchange Act of 1934 during the preceding 12 months (or for such shorter period that the registrant was required to file such reports), and (2) has been subject to such filing requirements for the past 90 days:
x Yes o No
Indicate by check mark whether the registrant is a large accelerated filer, an accelerated filer, or a non-accelerated filer. See definition of “accelerated filer and large accelerated filer” in Rule 12b-2 of the Exchange Act. (Check one):
Large accelerated filer o | | Accelerated filer o | | Non-accelerated filer x |
Indicate by check mark which basis of accounting the registrant has used to prepare the financial statements included in this filing:
U.S. GAAP o | | International Financial Reporting Standards as issued
by the International Accounting Standards Board x | | Other o |
If “Other” has been checked in response to the previous question indicate by check mark which financial statement item the registrant has elected to follow.
o Item 17 o Item 18
If this is an annual report, indicate by check mark whether the registrant is a shell company (as defined in Rule 12b-2 of the Exchange Act).
o Yes x No
(APPLICABLE ONLY TO ISSUERS INVOLVED IN BANKRUPTCY PROCEEDINGS DURING THE PAST FIVE YEARS)
Indicate by check mark whether the registrant has filed all documents and reports required to be filed by Sections 12, 13 or 15(d) of the Securities Exchange Act of 1934 subsequent to the distribution of securities under a plan confirmed by a court.
o Yes o No
Securities registered or to be registered pursuant to Section 12(b) of the Act:
Title of each Class | | Name of each exchange on which
registered |
| | |
ELEMENTSSM Linked to the SPECTRUM Large Cap U.S. Sector Momentum Index developed by BNP Paribas due August 8, 2022 | | NYSE ARCA, Inc. |
| | |
ELEMENTSSM Linked to the Rogers International Commodity Index® — Agriculture Total ReturnSM due October 24, 2022, Medium-Term Notes, Series D | | NYSE ARCA, Inc. |
| | |
ELEMENTSSM Linked to the Rogers International Commodity Index® — Energy Total ReturnSM due October 24, 2022, Medium-Term Notes, Series D | | NYSE ARCA, Inc. |
| | |
ELEMENTSSM Linked to the Rogers International Commodity Index® — Metals Total ReturnSM due October 24, 2022, Medium-Term Notes, Series D | | NYSE ARCA, Inc. |
| | |
ELEMENTSSM Linked to the Rogers International Commodity Index® — Total ReturnSM due October 24, 2022, Medium-Term Notes, Series D | | NYSE ARCA, Inc. |
| | |
ELEMENTSSM Linked to the MLCX Biofuels Index (Exchange Series) — Total Return due February 13, 2023, Medium-Term Notes, Series D | | NYSE ARCA, Inc. |
| | |
ELEMENTSSM Linked to the MLCX Grains Index — Total Return due February 14, 2023, Medium-Term Notes, Series D | | NYSE ARCA, Inc. |
| | |
Accelerated Return Notes Linked to the Financial Select Sector Index due March 25, 2011 | | NYSE ARCA, Inc. |
| | |
Accelerated Return Notes Linked to the S&P 500 Index due April 29, 2011 | | NYSE ARCA, Inc. |
| | |
Accelerated Return Notes Linked to the Russell 2000 Index due March 25, 2011 | | NYSE ARCA, Inc. |
| | |
Capped Leveraged Index Return Notes Linked to the S&P 500 Index Due August 26, 2011 | | NYSE ARCA, Inc. |
Table of Contents
INTRODUCTORY NOTES
In this annual report on Form 20-F (the “annual report”), unless otherwise specified, all amounts are expressed in Swedish kronor (“Skr”). See Item 3, “Key Information”, for a description of historical exchange rates and other matters relating to the Swedish kronor.
In this annual report, unless otherwise indicated, all descriptions and financial information relate to the consolidated group consisting of Aktiebolaget Svensk Exportkredit (Publ) (Swedish Export Credit Corporation) (the “ Parent Company”), including the “State Support System” (the “S-system”), which is described in detail herein, and the Parent Company’s wholly-owned subsidiaries AB Sektionen, AB SEK Securities, SEK Financial Advisors AB, SEK Financial Services AB, SEK Customer Finance AB, SEK Exportlånet AB and Venantius AB (including its wholly-owned subsidiary VF Finans AB) (the “Subsidiaries” and together with the Parent Company, “SEK”, the “Consolidated Group” or the “Group”). In certain instances, information relating to the S-system on a stand-alone basis is provided separately. The consolidated financial statements of SEK included in Item 18 (the “Consolidated Financial Statements”) comprise the financial statements of the Parent Company and the Subsidiaries. In certain cases, comparable figures for earlier financial periods are reported in parentheses after the relevant figure for the current period. For example, “(2009: Skr 10 million)” means that the relevant figure for 2009, or at December 31, 2009, as the context requires, was Skr 10 million.
As used herein, the words “we”, “our”, “us” and “ours” refer to the Parent Company or to the Group, as the context requires.
The Parent Company is a “public company” within the meaning of the Swedish Companies Act. A Swedish company, even if its shares are not listed on an exchange and are not publicly traded, may choose to declare itself a “public company”. Only public companies are allowed to raise funds from the public through the issuance of debt instruments. In certain cases (including that applicable to the Parent Company), a public company is required to add the notation “Publ” to its name.
FORWARD-LOOKING STATEMENTS
This annual report contains forward-looking statements. We have based these forward-looking statements on our current expectations and projections about future events. These statements include but are not limited to:
· statements regarding financial projections and estimates and their underlying assumptions;
· statements regarding plans, objectives and expectations relating to future operations and services;
· statements regarding the impact of regulatory initiatives on the SEK’s operations;
· statements regarding general industry and macroeconomic growth rates and the SEK’s performance relative to them; and
· statements regarding future performance.
Forward-looking statements generally are identified by the words “expect”, “anticipate”, “believe”, “intend”, “estimate”, “should”, and similar expressions.
Forward-looking statements are based on current plans, estimates and projections, and therefore readers should not place undue reliance on them. Forward-looking statements speak only as of the date they are made, and SEK undertakes no obligation to update any forward-looking statement in light of new information or future events, although the SEK intends to continue to meet its ongoing disclosure obligations under the U.S. securities laws (such as the obligations to file annual reports on Form 20-F and reports on Form 6-K) and under other applicable laws. Forward-looking statements involve inherent risks and uncertainties, most of which are difficult to predict and generally beyond SEK’s control. Readers are cautioned that a number of important factors could cause actual results or outcomes to differ materially from those expressed in, or implied by, forward-looking statements. These factors include, among others, the following:
· Disruptions in the financial markets or economic recessions;
· Credit risk;
· Potential material weakness in our internal controls over financial reporting;
· Potential reductions in our access to international capital markets;
· Volatile or illiquid market conditions;
· The fact that our hedging strategies may not prevent losses;
· Fluctuations in foreign currency exchange rates;
· Increasing competition;
ii
Table of Contents
· Operational risk;
· Natural disasters, political unrest or other events beyond our control
· Potential changes in law or regulation; and
· Adverse developments in emerging market countries.
iii
Table of Contents
PART I
ITEM 1. IDENTITY OF DIRECTORS, SENIOR MANAGEMENT AND ADVISORS
Not required as this 20-F is filed as an Annual Report.
ITEM 2. OFFER STATISTICS AND EXPECTED TIMETABLE
Not required as this 20-F is filed as an Annual Report.
1
Table of Contents
ITEM 3. KEY INFORMATION
A Selected Financial Data
The following selected consolidated financial data should be read in conjunction with our Consolidated Financial Statements and related notes. The consolidated statement of comprehensive income data for the years ended December 31, 2010, 2009, 2008, 2007and 2006 and the consolidated statement of financial position data as of December 31, 2010, 2009, 2008, 2007, and 2006 have been derived from SEK’s Consolidated Financial Statements prepared in accordance with International Financial Reporting Standards as issued by the International Accounting Standard Board (IASB), and as adopted by the European Union (herein “IFRS”).
While complying with IFRS, SEK also complies with additional requirements of the Swedish Annual Accounts Act for Credit Institutions and Securities Companies (1995:1559) (ÅRKL), the recommendation RFR 1.Supplementary Accounting Principles for Groups, issued by the Swedish Financial Reporting Board (RFR) and the accounting regulations of the Swedish Financial Supervisory Authority (FFFS 2008:25).
Beginning in 2010 SEK has in the presentation of the Consolidated Group elected the option provided under IFRS to redefine its presentations with regard to the income statement and balance sheet. Thus, the income statement and the Statement of Comprehensive Income have been consolidated into one statement, the Statement of Comprehensive Income. Furthermore, the balance sheet has been renamed the Statement of Financial Position. In addition, the line “net profit” in the statement of financial position has been removed and is now included as part of “retained earnings”. SEK has also redefined the presentation of the Statement of Financial Position by renaming the first line item from “cash in hand” to “cash and cash equivalents,” in order to provide more relevant information to our investors. Cash and cash equivalents includes assets that are immediately convertible into cash and short term deposits, the payout of which is known in advance and for which the time to maturity at acquisition does not exceed three months. Financial data for prior periods included herein has been revised to reflect this new presentation.
In accordance with IFRS 8, SEK has the following three business segments: granting of loans, advisory services and capital market products. Advisory services and capital market products are similar with respect to risks and returns. The combine revenues for the segments other than granting of loans amounted to less than 1 percent of the Consolidated Group’s total revenues and their operating profits amounted to less than 1 percent of the Consolidated Group’s total operating profit, while less than 1 percent of the Consolidated Group’s total assets were attributable to these two segments .As a result, these segments are not separately reported on. SEK therefore has reported separately only on the segment “granting of loans.”
The following information should be read in conjunction with the more detailed discussion contained in Item 5 “Operating and Financial Review and Prospects”.
| | Year Ended December 31, | |
(In Skr mn, unless otherwise stated) | | 2010 | | 2009 | | 2008 | | 2007 | | 2006 | |
CONSOLIDATED STATEMENT OF COMPREHENSIVE INCOME DATA | | | | | | | | | | | |
| | | | | | | | | | | |
Net interest revenues | | 1,898.5 | | 1,994.3 | | 1,543.3 | | 833.1 | | 793.0 | |
Operating income | | 4,395.9 | | 3,097.2 | | 1,099.5 | | 810.3 | | 667.4 | |
Operating profit (A) | | 3,939.7 | | 2,368.6 | | 185.2 | | 497.0 | | 383.3 | |
Net profit (after taxes) | | 2,891.7 | | 1,727.3 | | 143.9 | | 345.9 | | 270.5 | |
Proposed dividend per share (Skr) | | 75.44 | | 129.83 | | — | | — | | — | |
Total comprehensive income | | 1,522.6 | | 3,060.9 | | 343.6 | | 238.7 | | 199.9 | |
Ratios of earnings to fixed charges (B) | | 1.38 | | 1.21 | | 1.02 | | 1.05 | | 1.05 | |
2
Table of Contents
(A) Operating profit equals operating income minus personnel expenses, other expenses, depreciation and amortization of non-financial assets and net credit losses. See the Consolidated Statement of Comprehensive Income on page F-2.
(B) For the purpose of calculating ratios of earnings to fixed charges, earnings consist of net profit for the year, plus taxes and fixed charges. Fixed charges consist of interest expenses, including borrowing costs, of SEK. See also Exhibit 7.1 Statement of Ratios of Earnings to Fixed Charges.
| | December 31, | |
(In Skr mn, unless otherwise stated) | | 2010 | | 2009 | | 2008 | | 2007 | | 2006 | |
CONSOLIDATED STATEMENT OF FINANCIAL POSITION DATA | | | | | | | | | | | |
| | | | | | | | | | | |
Total loans outstanding (C) | | 179,656.4 | | 185,832.4 | | 158,678.0 | | 109,286.8 | | 91,086.7 | |
Total assets | | 339,687.6 | | 371,588.0 | | 370,014.2 | | 297,236.8 | | 245,213.3 | |
Total debt | | 303,261.9 | | 327,938.0 | | 312,791.0 | | 272,289.4 | | 218,182.8 | |
of which subordinated | | 2,590.3 | | 3,142.8 | | 3,323.5 | | 2,837.0 | | 2,933.2 | |
Equity | | 12,569.8 | | 13,455.2 | | 10,394.3 | | 4,610.4 | | 4,371.7 | |
of which share capital | | 3,990.0 | | 3,990.0 | | 3,990.0 | | 990.0 | | 990.0 | |
Number of shares | | 3,990,000 | | 3,990,000 | | 3,990,000 | | 990,000 | | 990,000 | |
Total liabilities and equity | | 339,687.6 | | 371,588.0 | | 370,014.2 | | 297,236.8 | | 245,213.3 | |
(C) Loans outstanding consist of loans due from commercial and financial institutions including loans in the form of interest bearing securities. Certain deposits with banks and states are not a part of total loans, although they are included in the items Loans to Credit Institutions and Loans to the Public in the statement of financial position. For a reconciliation of loans outstanding, see Note 11 to the Consolidated Financial Statements.
Foreign Exchange Rates
The Group’s reporting currency is the Swedish kronor (“Skr”). The following tables set forth, for the periods and dates indicated, information concerning the noon buying rates for cable transfers in Swedish kronor, expressed in Skr per $1.00, as certified for customs purposes by the Federal Reserve Bank of New York.
Calendar Year | | High | | Low | | Average (A) | | Period End | |
2010 | | 8.0593 | | 6.5145 | | 7.2053 | | 6.7571 | |
2009 | | 9.2863 | | 6.7908 | | 7.6028 | | 7.1532 | |
2008 | | 8.4858 | | 5.8346 | | 6.6424 | | 7.8770 | |
2007 | | 7.1060 | | 6.2356 | | 6.7232 | | 6.4568 | |
2006 | | 7.9656 | | 6.7674 | | 7.3098 | | 6.8342 | |
(A) The average of the exchange rates on the last day of each month during the period.
Calendar Month 2010 | | High | | Low | |
October | | 6.7725 | | 6.5580 | |
November | | 7.0130 | | 6.5145 | |
December | | 6.9666 | | 6.7571 | |
3
Table of Contents
Calendar Month 2011 | | High | | Low | |
January | | 6.8977 | | 6.4318 | |
February | | 6.5005 | | 6.3442 | |
March 1st until March 18th | | 6.4762 | | 6.3080 | |
The noon buying rate on March 18, 2011 was USD 1 = Skr 6.308
No representation is made that Swedish kronor amounts have been, could have been or could be converted into U.S. dollars at the foregoing rates on any of the dates indicated.
B. Risk factors
Disruptions in the financial markets or economic recessions may have an adverse effect on SEK’s ability to repay its debt.
SEK’s financial performance, as represented in its statements of financial positions and of comprehensive income, may be adversely affected by a number of factors, many of which are outside the Group’s control. Recent disruptions in the international financial markets and the recent worldwide recession had direct and indirect effects on SEK’s business volumes, profitability, and asset quality and its ability to finance its operations. Future such disruptions or global recessions may reduce the Group’s ability to repay its debt.
In addition, certain major economies around the world are currently in recession or have experienced low growth or economic stagnation in recent periods. This, or any return to recessive conditions in any significant market that has recently emerged from recession, may ultimately impact the industrial development of commercial or industrial entities in countries around the world, which could also affect the business volumes, profitability or asset qualities of the Group. There can be no certainty that measures taken by various governments and monetary authorities will succeed in re-establishing, on a sustainable basis, the conditions necessary for economic growth. Therefore, uncertainty remains as to the future global economic outlook, and many countries’ economies could experience long periods of slow growth or recurring recessions.
Additionally, even in the absence of slow economic growth or recessions, other economic circumstances — including, but not limited to, increases in energy prices, fluctuations in the prices of commodities or other raw materials, contractions in infrastructure spending, fluctuations in market interest or exchange rates, and concerns over the financial health of sovereign governments and their instrumentalities — may have negative consequences for the companies and industries that the Group provides financing to (as well as the financial condition of SEK’s financial counterparties) and could, in addition to the other factors cited above, have material adverse effects on the Group’s business prospects, financial condition or ability to fulfill debt obligations.
SEK is exposed to credit risk even in normal economic circumstances. Disruptions in the financial markets or economic recession may further affect the credit quality of borrowers and other risk counterparties negatively, which may cause credit losses or affect the value of assets.
Risks arising from the credit quality of borrowers and counterparties and the recoverability of loans and amounts due from counterparties in derivative transactions are inherent in SEK’s businesses. Consequently, SEK may incur credit losses or delinquency in debt repayments even in normal economic circumstances. Financial market disruptions or economic recessions may further affect SEK’s customers and counterparties, negatively reducing their ability to fulfill their obligations. Market and economic disruptions may affect business and consumer spending, bankruptcy rates and asset prices, among other things, creating a greater likelihood that more of SEK’s customers or counterparties could require less credit or become delinquent in their loans or other obligations to SEK. SEK has, in the recent past, been forced to write down
4
Table of Contents
the value of some of its assets as a result of disruptions in the financial markets, and SEK may be forced to do so again in future periods. Such disruptions may affect the recoverability and value of SEK’s assets and require an increase in SEK’s provisions for delinquent and defaulted debt and other provisions, which could in turn have a material adverse effect on SEK’s business and/or ability to repay debts.
Operational risks such as material weaknesses and other deficiencies in internal control over financial reporting and disclosure processes could result in errors, affect operating results and cause investors to lose confidence in our reported results.
Management identified a significant deficiency in the Group’s internal control over financial reporting in its evaluation of the effectiveness of the Group’s internal control over financial reporting as of December 31, 2009 due to a deficiency in marking-to-market certain financial instruments as of December 31, 2009. SEK has made efforts to address this deficiency as described in Item 15, and as of December 31, 2010 the deficiency had been remediated. SEK’s financial reporting, however, remains subject to the risk that it may identify other material weaknesses or significant deficiencies in its internal controls over financial reporting in future periods.
Reduced access to international capital markets for the financing of SEK’s operations, or less favorable financing terms, may have negative impacts on SEK’s profitability and its ability to fulfill its obligations.
In order to finance its operations, SEK is dependent on the international capital markets, where it competes with other issuers to obtain financing. Although SEK has been able to successfully finance its operations to date, factors outside SEK’s control may have material adverse effects on the Group’s continued ability to obtain such financing or could cause the cost of such financing increase. The market turmoil of 2008 and 2009, and ongoing recessions in certain major countries, made it very difficult for many issuers to obtain financing, especially with longer maturities, and SEK during 2008, to some extent, had to reduce the maturity profile of its borrowing. Continued market disruptions may make such funding more expensive and difficult to obtain, consequently reducing the Group’s profitability and/or its ability to fulfill its obligations.
A key factor affecting the cost and availability of financing is SEK’s credit rating. Although the Group currently has favorable credit ratings from various credit rating agencies, those credit ratings depend on many factors, some of which are outside of SEK’s control. Factors that are significant in determining SEK’s credit ratings or that otherwise could affect its ability to raise financing include its ownership structure, asset quality, liquidity profile, short- and long-term financial prospects, risk exposures, capital ratios, and prudential measures, as well as government support and SEK’s public policy role. Deterioration in any of these factors or any combination of these factors may lead rating agencies to downgrade SEK’s credit ratings. If the Group were to experience a downgrade in its credit ratings, it would likely become necessary to offer increased interest rates in the capital markets in order to obtain financing, which would likely substantially lower the Group’s profit margins and earnings, harm its overall liquidity and negatively affect its business and its ability to fulfill its obligations.
SEK may experience negative changes in the value of its assets or liabilities and may incur other losses related to volatile and illiquid market conditions.
Market volatility, illiquid market conditions and disruptions in the credit markets have during certain periods made it difficult to value certain of SEK’s assets and liabilities. Subsequent valuations, in light of factors then prevailing, may result in significant changes in the values of such assets or liabilities in future periods. In addition, at the time of any sale of any such assets, the prices SEK ultimately realizes will depend on the demand and liquidity in the market at that time and may be materially lower than such assets’ current fair values. Any of these factors could require SEK to negatively change the carrying amount of such assets or liabilities, which may have an adverse effect on the Group’s financial condition in future periods.
SEK’s hedging strategies may not prevent losses.
SEK uses hedging instruments in an attempt to manage interest rate, currency, credit and other market-related risks. If any of the variety of instruments and strategies the Group uses to hedge its exposure to these
5
Table of Contents
various types of risk is not effective, the Group may incur losses, impairing its ability to timely repay or refinance its debts. In addition, there can be no assurance that the Group will continue to be able to hedge risks related to current or future assets or liabilities in accordance with its current policies in an efficient manner or at all. Disruptions such as market crises and economic recessions may impose strain on the availability and effectiveness of hedging instruments or strategies and could have an adverse effect on SEK’s financial condition and its ability to fulfill its obligations.
Fluctuations in foreign currency exchange rates could harm SEK’s business.
As an international lending institution, the Group is subject to exchange-rate risk. The adequacy of the Group’s financial resources may be impacted by changes in currency exchange rates that affect the value in Swedish currency of the Group’s foreign-currency obligations. The values of a majority of the items presented in the balance sheet are subject to fluctuations as a result of changes in the U.S. dollar/Swedish krona and the euro/Swedish krona exchange rates. Even though the Group carefully monitors and hedges its foreign currency exposures, changes in currency exchange rates adverse to the Group could harm SEK’s business, its profitability and its ability to repay its debts. Also, any strengthening of the Swedish krona against other currencies may reduce demand for the products sold overseas by SEK’s Swedish clients and thus reduce demand for its loans from end-purchasers of such products, or cause such clients to experience increased difficulty in repaying their loans to SEK. Such eventualities could therefore have an adverse effect on SEK’s financial condition and its ability to fulfill its obligations.
Increasing competition may adversely affect SEK’s income and business.
Competition in the Group’s business is based on service, product innovation, product features, price, commission structures, financial strength and name recognition. The Group competes with a large number of other credit institutions, including domestic and foreign banks. Some of these institutions offer a broader array of products or have more competitive pricing or greater financial resources with which to compete than SEK. Increasing competition may have significant negative effects on the Group’s financial performance if the Group is unable to match the products and services of its competitors or has to impose negative changes to its prices or rates in order to compete for customer business, investments or financing. Such changes could have material adverse effects on SEK’s business and its ability to repay debts.
We are exposed to significant operational risk.
Broadly, operational risk can arise from fraud, errors by employees, failure to document transactions properly or to obtain proper internal authorizations, equipment failures, natural disasters or the failure of external systems such as, for example, those of SEK’s suppliers or counterparties. SEK’s businesses are dependent on our ability to process complex transactions efficiently and accurately. Failure to address operational risk may lead to additional costs, losses or damages to SEK’s reputation which may negatively affect customers’ and investors’ confidence, and thus SEK’s business, financial performance and/or ability to repay debts.
There is also a risk that SEK’s reputation will be damaged if SEK fails to comply with current legislation and best practices or in any other way fails to meet its commitments, including those that are not explicit. Although operational risks can be reduced by properly documented processes, adequate systems, a culture of sensitivity to risk, compliance with regulations, effective corporate governance and other factors supporting internal control, such procedures may not be effective in controlling each of the operational risks SEK faces. A significant failure in managing our operational risk could materially and adversely affect SEK’s business, financial condition, results of operation and/or ability to repay debts.
Changes in law or regulation may adversely affect SEK’s business
SEK’s business is subject to regulation and regulatory oversight. Any significant regulatory development could affect the manner in which SEK conducts its business and SEK’s results of operations. SEK is subject to financial services laws, regulations, administrative actions and policies in each location in which SEK operates. Financial regulators around the world have responded to the recent crisis by proposing significant changes to the regulatory regime applicable to financial service companies such as ours. Changes to the current system of supervision and regulation, or any failure to comply with applicable rules (and
6
Table of Contents
particularly those in Sweden) could materially and adversely affect SEK’s business, financial condition or results of operation and/or ability to repay debts.
Developments in emerging market countries may adversely affect the Group’s business.
The Group operates in a number of emerging markets and its exposure to such markets has increased in recent years, as the number and importance of investment and trade links between Sweden and such countries have increased. Economic and political developments in emerging markets, including economic crises or political instability may have material adverse effects on the Group’s business prospects, results of operations and/or ability to repay debts.
Natural disasters, political unrest and other factors beyond SEK’s control may disrupt financial markets and economic conditions in markets that SEK relies on
In order to finance its operations, SEK is dependent on the international capital markets, where it competes with other issuers to obtain financing. Although this has not been the case to date, natural disasters, like the recent earthquake and tsunami in Japan, may have material adverse effects on the Group’s continued ability to obtain such financing or could cause the cost of such financing to increase.
ITEM 4. INFORMATION ON THE GROUP AND THE PARENT COMPANY
A. History and Development
Aktiebolaget Svensk Exportkredit (Swedish Export Credit Corporation) is a “public company” under the Swedish Companies Act. It is wholly owned by the Swedish state through the Ministry of Foreign Affairs (“Sweden” or the “State”).
The Parent Company was founded in 1962 in order to strengthen the competitiveness of the Swedish export industry by meeting a need for long-term credits for both exporters and their foreign customers. SEK’s objective is to engage in financing activities in accordance with the Swedish Banking and Financing Business Act and, in connection therewith, to promote the development of Swedish commerce and industry as well as otherwise engaging in Swedish and international financing activities on commercial terms. The duration of the Parent Company is indefinite.
The address of the Parent Company’s principal executive office is AB Svensk Exportkredit (Swedish Export Credit Corporation), Klarabergsviadukten 61-63, Stockholm, Sweden; and the Parent Company’s telephone number is +46-8-613-83-00. The Parent Company’s authorized representative in the United States is Mr. David Dangoor, the honorary consul general of the Kingdom of Sweden in The City of New York. The contact information for Mr. Dangoor is as follows:
David Dangoor
Honorary Consul General of Sweden
455 Park Avenue, 21st Floor
New York, New York 10022
Tel. No.: +1-212-888-3000
B. Business Overview
SEK provides financial solutions for the Swedish export industry with the aim of promoting the development and international competitiveness of Swedish industry and trade. Its business activities are concentrated on lending to Swedish exporters and their customers through corporate lending, export lending, structured financing, project financing, trade financing and leasing. In addition, SEK offers financial advisory services. SEK offers its solutions to corporations and financial institutions as well as domestic and international investors. SEK extends loans, on commercial terms at prevailing fixed or floating market rates
7
Table of Contents
of interest in “SEK exclusive of the S-system”, as well as loanson State-supported terms at fixed rates of interest that may be lower than prevailing fixed market rates in the “State Support System” (the “S-system”). The S-system is administered on behalf of the State by SEK in return for compensation.
SEK’s mission has developed over the years since SEK began its operations in 1962. From its roots and base in export credits, SEK’s product range has expanded to more broadly promote the development of Swedish commerce and industry and particularly the Swedish export industry. However, SEK is a niche operator in the financial market. SEK works mainly with lending and as a result of this we act as a complement to the banks which are active in Sweden. SEK’s unique position means that SEK cooperates with banks and other financial institutions. Over the years, SEK has been active in the creation of new financial solutions. SEK’s niche specialization in long-term export-related financing, combined with its financial capacity and flexible organization, are key factors in the management of its operations. SEK’s borrowing activities in the international capital markets have given SEK expertise in financial instruments.
SEK has sought to broaden both its range of services and its customer base in previous years in response to changes in demand and the new market opportunities. However, since the financial crisis of late 2008, SEK has concentrated its efforts on its core customers, companies in the Swedish export industry. Nonetheless, SEK also is involved as a financial advisor for international projects even if these services are not a material part of SEK´s total business activities. In 2010, SEK carried out extensive work to define and clarify its role and position in order to meet future challenges.
Despite the liquidity shortage that occurred in 2008 and 2009 (and especially during the latter half of 2008), much of the Swedish export industry continued to do well, and SEK experienced significant demand for financing throughout 2009. During 2010, the Swedish export companies were more able to fund themselves directly through the capital markets and that fact, together with strong performance in the export industry, resulted in a decline in demand for financing. Meanwhile emerging economies, especially Asian markets, are continuing their strong development, with increasing purchasing power and increasingly modern and developed infrastructure. The Swedish export industry is largely focused on infrastructure, telecoms, energy supply, transport and environmental technology — all areas that are enjoying strong demand in emerging economies.
SEK has certain limited exposures towards countries in Europe which have been under economic pressure, such as Ireland. SEK has not, however, deemed it necessary to make any write-downs related to these exposures. See Note 27 to the Consolidated Financial Statements for information on exposures towards different European countries. The Japanese capital market has traditionally been an important market for SEK´s funding. SEK has been active in this market for a long time. However, part of SEK’s policy is to be independent of any specific market and SEK is therefore striving to be active in many different geographical markets for its funding. Hence, even if the Japanese capital markets experience difficulties in the long- or short-term, whether as a result of the recent natural disasters or otherwise. Management believes that SEK would be able to raise funding for its ordinary business activities.
In December 2008, SEK received an infusion of Skr 3.0 billion in new capital from its owner, the Swedish State and also received from the Swedish State the totality of the shares of Venantius AB, valued at approximately Skr 2.4 billion, as a part of the State’s program to strengthen SEK’s capacity to finance the Swedish export industry. For additional information regarding the acquisition of Venantius see Note 31 to the Consolidated Financial Statements. In December 2009, Venantius’ remaining loan portfolio (with a carrying amount of less than Skr 100 million at that time) was acquired by an external counterparty. Therefore, there were no outstanding loans in SEK’s consolidated balance sheet related to Venantius on December 31, 2009 or on December 31, 2010.
In order to further enhance the possibility for SEK to promote the Swedish export industry, on February 5, 2009 the government decided to provide SEK with access to a loan facility during 2009 amounting to Skr 100 billion via the Swedish National Debt Office, an action that was approved by the parliament. Further, the parliament authorized the government to sell government guarantees to SEK, on market terms, to cover up to Skr 450 billion of new borrowing during 2009. In 2010, the parliament also has authorized the government to sell government guarantees to SEK on market terms, for new borrowing during
8
Table of Contents
2010 of up to Skr 250 billion (i.e., an upper limit Skr 200 billion lower than that of the guarantees made available during 2009). In January 2011, both the loan facility and the ability to purchase state guarantees were extended for 2011 on the same terms. SEK has not to date experienced a need to use the loan facility or purchase any of the Swedish government guarantees.
On October 28, 2010, SEK sold its entire stake in Swedbank AB. The holding was placed with a number of Swedish and international institutional investors. SEK had previously announced that it should not be regarded as a long-term owner but rather had the intention to sell the stake in a responsible way. The shares, which had been acquired at a cost of Skr 997.6 million, were sold for a total of Skr 3,562.7 million resulting in a profit of Skr 2,565.0 million before taxes. At the board meeting held on October 29, 2010, SEK’s Board of Directors resolved to call an extraordinary general meeting with the purpose to propose an extra dividend amounting to Skr 1,890.0 million, equal to the realized profit from the sale after tax. The extraordinary general meeting was held on December 1, 2010 and a decision on a special dividend amounting to Skr 1,890.0 million was made. The dividend was paid to SEK’s owner, the Swedish State, on December 15, 2010. For further information regarding SEK’s stake in Swedbank AB and SEK’s related dispute with Sparbanksstiftelsernas Förvaltnings AB (“SFAB”), see Note 23 and Item 8 Legal Proceedings.
The Board of Directors resolved on March 11, 2011, to propose to the Annual General Meeting to be held on April 29, 2011, that a dividend in the aggregate amount Skr 301.0 million (or Skr 75.44 per share) should be paid to the shareholder in relation to financial year 2010.
SEK believes that its relationships with domestic, Nordic and other international investors and partners strengthen its ability to develop financial solutions which meet its customers’ requirements. This network of relationships enables SEK to participate in co-financing arrangements and advisory assignments, as well as in benchmarking and cooperation in areas such as risk management and business systems.
SEK has not made any material capital expenditures, nor engaged in any material divestitures (including interests in other companies) during the three financial years preceding the date of this report.
a. Competition
SEK is the only institution authorized by the Swedish State to grant export financing loans under the S-system. With support from the State, SEK helps Swedish export companies compete with other export companies within OECD member countries which have similar support from their respective domestic export credit agencies, which also provide government-supported export credits. Lending from SEK exclusive of the S-system, including infrastructure credits, faces competition from other Swedish and foreign financial institutions, as well as from direct or indirect financing programs of exporters themselves. Deregulation and globalization of the world’s financial markets have resulted in an increasingly competitive environment for financial institutions, including SEK, for both lending opportunities and funding sources.
The following table summarizes SEK’s loans outstanding, including the S-system, and debt outstanding at December 31, 2010 and 2009:
| | At December 31, | |
Skr mn | | 2010 | | 2009 | |
Total loans outstanding(A) | | 179,656 | | 185,832 | |
Total debt outstanding (B) | | 303,262 | | 327,938 | |
(A) Loans outstanding consist of loans due from commercial and financial institutions including loans in the form of interest bearing securities. Certain deposits with banks and states are not a part of total loans, although they are included in the items Loans to Credit Institutions and Loans to the Public in the statement of financial position. For a reconciliation of loans outstanding, see Note 11 to the Consolidated Financial Statements.
(B) Includes subordinated debt of Skr 2,590 million and Skr 3,143 million as of December 31, 2010 and 2009 respectively.
9
Table of Contents
b. Lending Operations - General
The following table sets forth certain data regarding the Group’s lending operations, including the S-system, during the two-year period ending December 31, 2010:
| | Year ending December 31, | |
Skr mn | | 2010 | | 2009 | |
Offers of long-term loans accepted | | 48,749 | | 121,465 | |
Total loan disbursements | | -39,008 | | -74,311 | |
Total loan repayments | | 37,518 | | 39,578 | |
Total net increase/ (decrease) in loans outstanding | | -6,176 | | 27,154 | |
Loans outstanding | | 179,656 | | 185,832 | |
Loan commitments outstanding but undisbursed(A) | | 38,205 | | 46,331 | |
(A) If a loan has been accepted by the borrower it can be disbursed immediately. However, disbursement may be delayed due to a number of factors. In some cases, an accepted loan may never be disbursed, including as a result of changes in the commercial and financial institutions´ need for the funds. Currency exchange effects also affect the amount of loan commitments that will result in loans outstanding. Therefore, the volume of loans accepted does not equal the volume of disbursements of loans as presented in the Statement of Cash Flows in the Consolidated Financial Statements for a single financial year. Loans accepted but not yet disbursed are presented under the heading “Commitments” as “Committed undisbursed loans” and amounted on December 31, 2010 and 2009 to Skr 38,205.2 million and Skr 46,331.1 million, respectively. See the Statements of Financial Positions in the Consolidated Financial Statements.
Total loans outstanding by type of loan:
Skr mn | | 2010 | | 2009 | | 2008 | | 2007 | | 2006 | |
Total lending for export of durable products | | 80,050 | | 68,120 | | 64,937 | | 38,646 | | 30,673 | |
Other lending related to export | | 76,809 | | 90,802 | | 65,988 | | 50,627 | | 40,635 | |
Lending related to infrastructure | | 22,797 | | 26,910 | | 27,753 | | 20,014 | | 19,841 | |
Total | | 179,656 | | 185,832 | | 158,678 | | 109,287 | | 91,149 | |
Most of the loans granted by SEK are granted to purchasers of Swedish exports. Measured by revenues, the largest markets for the export of goods from Sweden are Western Europe and North America. However, exports to other markets, including less developed markets, are also important. Accordingly, the need for export financing may be related to transactions involving buyers in many different countries, with varying levels of creditworthiness. Pursuant to its counterparty risk exposure policy, SEK is selective in accepting any type of risk exposure. This policy seeks to ensure that SEK is neither dependent on the creditworthiness of individual buyers of Swedish goods and services, nor on the countries in which they are domiciled, but rather on the creditworthiness of individual counterparties from which SEK accepts counterparty risk exposure. For additional information on SEK’s approach to risk, see Note 30 to the Consolidated Financial Statements.
SEK relies to a large extent on guarantees in its lending. The guarantors are principally made up of government agencies, such as the Swedish EKN, the Export Import Bank of the United States (“USEXIM”), the UK’s Exports Credits Guarantee Department of the United Kingdom (“ECGD”), the Compagnie Financière pour la Commerce Exterieure (“Coface”) of France and Hermes Versicherungs AG of Germany, as well as financial institutions and, to a lesser extent, commercial entities. All counterparties are analyzed and receive an internal rating in accordance with SEK’s internal ratings methodology. The rating scale comprises 18 ratings from ‘AAA’ to ‘D’. The amount of risk SEK is willing to accept on any one counterparty is defined by a limit. Credit risk is allocated to a guarantor according to SEK’s policy and therefore, when disclosing credit risk net exposures, the majority of SEK’s guaranteed credit exposure is shown as exposure to sovereign counterparties.
10
Table of Contents
The following tables shows SEK’s gross and net credit exposures, respectively, to counterparties by geography and type of counterparty (taking into account applicable guarantees but not collateral) at December 31, 2010 and 2009.
Gross exposure split by region and exposure classes as at December 31, 2010 and 2009
Skr billion | | Africa | | Asia | | North America | | Oceania | | South
America | | Sweden | | Other Nordic
countries | | Other
European
countries | | Total | |
Central governments | | 0.0 (0.0 | ) | 7.8 (7.9 | ) | 0.0 (0.0 | ) | 0.0 (0.0 | ) | 0.3 (0.4 | ) | 2.1 (3.2 | ) | 3.6 (13.8 | ) | 6.6 (12.4 | ) | 20.4 (37.7 | ) |
Government export credit agencies | | 0.0 (0.0 | ) | 0.0 (0.0 | ) | 0.0 (0.0 | ) | 0.0 (0.0 | ) | 0.0 (0.0 | ) | 0.0 (0.0 | ) | 0.0 (0.0 | ) | 0.0 (0.0 | ) | 0.0 (0.0 | ) |
Regional governments | | 0.0 (0.0 | ) | 0.0 (0.0 | ) | 0.0 (0.0 | ) | 0.0 (0.0 | ) | 0.0 (0.0 | ) | 12.9 (10.7 | ) | 1.6 (2.5 | ) | 0.0 (0.0 | ) | 14.5 (13.2 | ) |
Multilateral development banks | | 0.0 (0.0 | ) | 0.0 (0.0 | ) | 0.0 (0.0 | ) | 0.0 (0.0 | ) | 0.0 (0.0 | ) | 0.0 (0.0 | ) | 0.0 (0.0 | ) | 0.0 (0.0 | ) | 0.0 (0.0 | ) |
Financial institutions | | 0.6 (0.0 | ) | 0.9 (2.1 | ) | 11.7 (16.1 | ) | 5.5 (4.9 | ) | 0.0 (0.3 | ) | 31.8 (36.0 | ) | 12.2 (7.3 | ) | 36.1 (51.8 | ) | 98.8 (118.5 | ) |
Corporates | | 2.2 (2.2 | ) | 26.7 (29.2 | ) | 20.5 (23.0 | ) | 0.9 (1.1 | ) | 3.9 (3.2 | ) | 68.2 (62.6 | ) | 17.6 (20.2 | ) | 46.7 (47.1 | ) | 186.7 (188.6 | ) |
Securisation positions | | 0.0 (0.0 | ) | 0.0 (0.0 | ) | 4.3 (4.9 | ) | 4.6 (6.1 | ) | 0.0 (0.0 | ) | 0.0 (0.0 | ) | 0.0 (0.4 | ) | 16.5 (24.2 | ) | 25.4 (35.6 | ) |
| | 2.8 (2.2 | ) | 35.4 (39.2 | ) | 36.5 (44.0 | ) | 11.0 (12.1 | ) | 4.2 (3.9 | ) | 115.0 (112.5 | ) | 35.0 (44.2 | ) | 105.9 (135.5 | ) | 345.8 (393.6 | ) |
Net exposure split by region and exposure classes as at December 31, 2010 and 2009
Skr billion | | Africa | | Asia | | North America | | Oceania | | South
America | | Sweden | | Other
Nordic
countries | | Other
European
countries | | Total | |
Central governments | | 0.0 (0.0 | ) | 0.0 (0.0 | ) | 0.0 (0.0 | ) | 0.0 (0.0 | ) | 0.0 (0.0 | ) | 2.9 (3.2 | ) | 3.6 (14.1 | ) | 10.0 (16.3 | ) | 16.5 (33.6 | ) |
Government export credit agencies | | 0.0 (0.0 | ) | 0.0 (0.0 | ) | 8.4 (10.0 | ) | 0.0 (0.0 | ) | 0.0 (0.0 | ) | 96.2 (91.5 | ) | 1.5 (1.8 | ) | 17.7 (21.8 | ) | 123.8 (125.1 | ) |
Regional governments | | 0.0 (0.0 | ) | 0.0 (0.0 | ) | 0.0 (0.0 | ) | 0.0 (0.0 | ) | 0.0 (0.0 | ) | 21.8 (21.1 | ) | 1.9 (2.9 | ) | 0.0 (0.0 | ) | 23.7 (24.0 | ) |
Multilateral development banks | | 0.0 (0.0 | ) | 0.0 (0.0 | ) | 0.0 (0.0 | ) | 0.0 (0.0 | ) | 0.0 (0.0 | ) | 0.0 (0.0 | ) | 0.0 (0.0 | ) | 0.4 (0.4 | ) | 0.4 (0.4 | ) |
Financial institutions | | 0.0 (0.0 | ) | 0.7 (0.6 | ) | 17.5 (24.3 | ) | 5.5 (4.9 | ) | 0.0 (0.0 | ) | 29.0 (34.3 | ) | 13.0 (8.3 | ) | 48.4 (65.5 | ) | 114.1 (137.9 | ) |
Corporates | | 0.0 (0.0 | ) | 0.6 (0.8 | ) | 1.4 (0.8 | ) | 0.0 (0.0 | ) | 0.1 (0.0 | ) | 28.9 (23.6 | ) | 7.3 (8.0 | ) | 5.0 (5.5 | ) | 43.3 (38.7 | ) |
Securization positions | | 0.0 (0.0 | ) | 0.0 (0.0 | ) | 4.4 (4.9 | ) | 4.6 (6.1 | ) | 0.0 (0.0 | ) | 0.0 (0.0 | ) | 0.0 (0.4 | ) | 15.0 (22.5 | ) | 24.0 (33.9 | ) |
| | 0.0 (0.0 | ) | 1.3 (1.4 | ) | 31.7 (40.0 | ) | 10.1 (11.0 | ) | 0.1 (0.0 | ) | 178.8 (173.7 | ) | 27.3 (35.5 | ) | 96.5 (132.0 | ) | 345.8 (393.6 | ) |
SEK has no exposure to subprime, Alt-A, negative amortizing or other high-risk lending, including loans which have been modified or would otherwise qualify as a troubled debt, other than the very limited amount of such assets disclosed in Note 9 to our Consolidated Financial Statements (we note that these assets are, in any event, outside of the S-system). As disclosed in Note 9 to the Consolidated Financial Statements, the two sub-prime-related CDOs that SEK is exposed to have been impaired due to an expected future inability of the relevant counterparties to fulfil the related contractual agreements.
Provisions for incurred impairment losses are made if and when SEK determines that it is probable that the obligor under a loan, or another asset held, and any existing guarantee or collateral, will fail to cover SEK’s full claim. Such determinations are made for each individual loan or asset. Objective evidence consists of significant financial difficulties affecting the issuer or debtor, outstanding or delayed payments or other observable factors, which suggest a measurable decrease in expected future cash flows. If there is objective evidence that an impairment loss on loans or receivables has been incurred, the amount of the loss is measured as the difference between the asset’s carrying amount and the present value of estimated future cash flows discounted at the financial asset’s original effective interest rate. The amount of the loss is recognized in profit and loss.
After such individual determinations have been made and if there is no objective evidence for impairment of an individually assessed financial asset, regardless of whether the asset is individually material or not, SEK includes the asset in a group of financial assets with similar credit risk characteristics and determines collectively any need for impairment of such assets. The need for impairment is related to loan losses which have been incurred as of the balance sheet date but have not yet been identified as individual loan losses. The reserve related to such impairments not linked to a specific counterparty is based on internal assessments of the credit quality of SEK’s assets, as manifested in, among other things, the credit ratings of counterparties, as determined either externally by a credit rating agency or internally in accordance with
11
Table of Contents
SEK’s own model for credit rating. If there is objective evidence for a general downward trend with regard to such rating this could constitute evidence for a need for an additional provision.
Net credit losses:
| | For the Year Ended December 31, | |
Skr mn | | 2010 | | 2009 | | 2008 | | 2007 | | 2006 | |
Net credit losses | | -119.7 | | -436.0 | | -561.8 | | — | | — | |
Reversal of previous write-downs | | 126.9 | | 153.0 | | 4.8 | | — | | — | |
Net impairments and reversals | | 7.2 | | -283.0 | | -557.0 | | — | | — | |
Recovered credit losses | | 1.0 | | 36.7 | | 4.7 | | — | | — | |
Net credit losses | | 8.2 | | -246.3 | | -552.3 | | — | | — | |
of which related to loans(1) | | 92.8 | | 56.7 | | -387.9 | | — | | — | |
related to liquidity portfolio(1) | | -84.6 | | -303.0 | | -164.4 | | — | | — | |
(1) For the definition of loans and liquidity, see Note 11 to the Consolidated Financial Statements. SEK had no credit losses, recoveries or reversals of previous write-downs in 2007 and 2006.
Changes in reserves of financial assets:
| | For the Year Ended December 31, | |
Skr mn | | 2010 | | 2009 | | 2008 | | 2007 | | 2006 | |
Balance brought forward | | -939.9 | | -1,028.5 | | — | | — | | — | |
Carrying value at acquisition | | — | | — | | -472.1 | | — | | — | |
Impaired financial assets sold | | 371.6 | | 371.6 | | 0.6 | | — | | — | |
Net impairments and reversals | | 7.2 | | -283.0 | | -557.0 | | — | | — | |
Balance carried forward | | -561.1 | | -939.9 | | -1,028.5 | | — | | — | |
of which related to loans(1) | | -519.5 | | -472.4 | | -864.1 | | — | | — | |
of related to liquidity portfolio(1) | | -41.6 | | -467.5 | | -164.4 | | — | | — | |
(1) For the definition of loans and liquidity, see Note 11 to the Consolidated Financial Statements. SEK had no reserves in 2007 and 2006.
c. SEK exclusive of the S-system
Outside of the S-system, (or in “SEK exclusive of the S-system,” as we refer to the business of SEK other than the S-system), SEK reports loans in the following categories:
Loan Types and Underwriting Policies
1. Medium and long-term loans for the financing of exports of capital goods;
2. Other export-related loans, consisting primarily of:
(a) lines of credit provided to finance companies, banks and exporters to fund their portfolios of export receivables;
(b) loans for the funding of export lease agreements and short-term export finance loans;
12
Table of Contents
(c) loans for direct investments outside of Sweden that will promote exports of Swedish goods and services; and
(d) loans for research and development activities designed to promote Swedish industry and commerce; and
3. Loans for investments in infrastructure to promote Swedish industry and commerce.
SEK’s credit underwriting policies and requirements are similar regardless of loan type. The majority of our loans are guaranteed by export credit agencies or banks, or by credit default swaps issued by banks or other financial institutions.
SEK’s initial loan offer and subsequent commitment set forth the maximum principal amount of the loan, the currency in which the loan will be denominated, and the repayment and disbursement schedule.
Loans outstanding (exclusive of those under the S-system) as of the dates indicated were distributed among SEK’s various categories of loans as follows:
Loans outstanding (exclusive of the S-system) by type of loans:
| | As of December 31, | |
Skr mn | | 2010 | | 2009 | | 2008 | | 2007 | | 2006 | |
Lending for export of durable products | | 56,061 | | 53,806 | | 54,842 | | 29,859 | | 21,548 | |
Other lending related to export | | 76,809 | | 90,802 | | 65,988 | | 50,627 | | 40,635 | |
Lending related to infrastructure | | 22,797 | | 26,910 | | 27,753 | | 20,014 | | 19,841 | |
Total | | 155,667 | | 171,518 | | 148,583 | | 100,500 | | 82,024 | |
Interest Rates
Outside of the S-system, SEK extends loans at prevailing market rates of interest, whether fixed or floating. SEK normally makes loan offers at a specified interest rate that is subject to change prior to acceptance of the offer (an “indicative loan offer”). When a borrower accepts an indicative loan offer, the interest rate is set normally at the then-prevailing market rate (which might have changed since the loan commitment was made), and a binding loan commitment arises.
SEK extends loans in different currencies, depending on the needs of its borrowers. Before SEK makes any loan commitment, it ensures that the currency in which the loan is to be funded is expected to be available for the entire term of the loan at an interest rate (taking into account the cost of funding) that, as of the day the commitment is made, results in a margin that management deems sufficient.
Outside the S-system, export financing is extended at prevailing market rates of interest. The Group normally makes loan offers at a quoted interest rate that is subject to change prior to acceptance of the loan offer (an “indicative loan offer”). However, loan offers can also be made at a binding interest rate (a “firm loan offer”), but such loan offers have until now rarely been made and are then only valid for short periods. When a borrower accepts an indicative loan offer, the interest rate is set and a binding loan commitment by the Group arises.
Guarantees and Credit Default Swaps
If a guarantee or credit default swap is entered into for risk-mitigating purposes (which is ordinarily the case in SEK’s lending operations outside the S-system) the instrument protects a pre-defined amount of SEK’s exposure with respect to the principal amount of the underlying loan (and in some cases interest) as long as the issuer of the guarantee or credit default swap is financially sound. The amount so protected is ordinarily 75%-100% of the principal amount. Most of the counterparties against whom SEK accepts net exposures are rated by one or more of the internationally recognized rating agencies. For export loans, where the ultimate borrower may have relatively low creditworthiness, guarantees from export credit agencies (“ECAs”) and banks are normally used.
13
Table of Contents
Loan Maturities
SEK was founded in 1962 in order to strengthen the competitiveness of the Swedish export industry by meeting a perceived need for long-term loans for both exporters and their foreign customers. SEK’s historical role and competitive advantage (and one that continues today) has therefore been in the provision of long-term financing in order to promote the Swedish export industry. Since many of the projects the export industry engages in are long-term projects, both with regard to disbursement periods and repayment periods, SEK’s loans often have longer terms than those of normal commercial loan products offered by commercial banks. However, SEK also meets its customers’ needs by providing short-term financing when required. SEK’s loan maturities therefore range from very short-term loans (with terms of three to six months) through loans for as long as 20 or 30 years.
Offers granted by the Group for loans that borrowers accepted (exclusive of those under the S-system) were distributed among SEK’s various categories of loans as follows on December 31, 2010 and December 31, 2009.
Offers accepted, type of loan
Skr mn | | 2010 | | 2009 | |
Total lending for export of durable products | | 37,263 | | 72,974 | |
Other lending related to export | | 442 | | 7,290 | |
Lending related to infrastructure | | 2,284 | | 14,799 | |
Total | | 39,989 | | 95,063 | |
Of the total volume of offers accepted during 2010, Skr 38,205.2 million (2009: Skr 46,331.1 million) has not been disbursed in the end of respective reporting period. If a loan has been accepted by the borrower it can be disbursed immediately. However, disbursement may be delayed due to a number of factors. In some cases, an accepted loan may never be disbursed, including as a result of changes in the customer’s need for the funds. Currency exchange effects also affect the amount of loan commitments that will result in loans outstanding.
A long-term trend in the development of SEK’s business has been the reduction in importance of the traditional financing of durable goods for Sweden’s export industry, even though an increase in SEK’s offers accepted was seen in 2008 and 2009 due to SEK being one of the few providers of financing to the export industry in Sweden during the recent market turmoil. SEK’s services have therefore changed over time to meet customers’ needs. This means that a loan “granted” could be either in the form of durable goods export financing or another type of loan such as direct lending to an export company through corporate loans or through SEK’s acquisitions of securities issued under the export company’s capital markets programs.
SEK’s mandate also includes infrastructure financing that directly or indirectly enhances the Swedish export industry.
Currency
Before the Group makes any loan commitment, it ensures that the currency in which the loan is to be funded is expected to be available for the entire loan period at an interest rate (taking into account the costs of foreign exchange derivatives) that, as of the day the commitment is made, results in a margin that the Group deems sufficient. The Group borrows, on an aggregate basis, at maturities corresponding to or exceeding those of prospective loans. The Group may accordingly decide not to hedge particular loan commitments for movements in interest rate risk until sometime after they are made. Interest rate risks associated with such unhedged commitments are monitored closely and may not exceed interest rate risk limits established by the Parent Company’s board of directors. SEK’s policies with regard to counterparty exposures are described in Note 30 to the Consolidated Financial Statements.
14
Table of Contents
The following table shows the currency breakdown of loan offers accepted for loans with maturities exceeding one year for each year in the two-year period ending December 31, 2010.
| | Percentage of loan offers accepted | |
Currency in which loan is denominated | | 2010 | | 2009 | |
Swedish kronor | | 24 | % | 27 | % |
Euros | | 36 | % | 32 | % |
U.S. dollars | | 34 | % | 27 | % |
Other | | 6 | % | 14 | % |
Total | | 100 | % | 100 | % |
d. S-system
The S-system was established by the Swedish State on July 1, 1978, as a State-sponsored export-financing program designed to maintain the competitive position of Swedish exporters of capital goods and services in world markets. With respect to the financing of services, this could relate, for example, to services provided by the exporter to a customer in connection with the export of goods.
After a trial period, in April 1984 the Swedish Parliament extended the S-system indefinitely. The S-system today comprises the normal export-financing program at CIRR (Commercial Interest Reference Rate) rates and a concessionary loan program (with a foreign aid element), as more fully described below. Pursuant to arrangements established in 1978 and amended from time to time thereafter, the Group administers the S-system on behalf of the State in return for compensation based mainly on outstanding loan volumes.
Pursuant to agreements between SEK and the State, as long as any loans or borrowings remain outstanding under the S-system, the difference between interest revenues and net commission revenues related to lending and liquid assets under the S-system, on the one hand, and interest expenses related to borrowing, all other financing costs and any net foreign exchange losses incurred by SEK under the S-system, on the other hand, are reimbursed by (or paid to) the State. SEK treats the S-system as a separate operation for accounting purposes. Although the deficits (or surpluses) of programs under the S-system are reimbursed by (or paid to) the State, any loan losses that may be incurred under such programs are not reimbursed by the State. Accordingly, SEK has to obtain appropriate credit support for these loans as well. All of the loans for lending under the S-system are reported on SEK’s statement of financial position. SEK has consequently presented the operations of the S-system in the statement of comprehensive income as the amount of net commission received, accounted for as interest income (either in gross commission revenue or gross commission expense) rather than present the gross amounts collected and paid in accordance with the agreement with the Swedish State. In general, loans under the program are made with State guarantees administered by the Exportkreditnämnden (EKN) (Sweden’s Export Credits Guarantee Board). All such loans granted by SEK must also undergo SEK’s customary approval process.
The following table sets forth the volumes of offers accepted, undisbursed loans at year end, new loans disbursed and loans outstanding at year end under the various programs in the S-system for each year in the two-year period ended December 31, 2010. The significant decrease in the volume of offers accepted under the CIRR-loans program in 2010 reflected a decrease in demand for such loans due to the fact that during 2009 the financial crisis made it more advantageous to borrow at the CIRR rate compared with market rates. The decrease in the volume of offers accepted under the Concessionary Loan Program in 2010 was primarily related to a small number of large transactions undertaken during 2009.
| | Concessionary Loan Program | | CIRR-loans | | Total | |
Skr mn | | 2010 | | 2009 | | 2010 | | 2009 | | 2010 | | 2009 | |
Offers accepted | | 43 | | 163 | | 8,717 | | 26,239 | | 8,760 | | 26,402 | |
Not disbursed loans at year-end | | 311 | | 497 | | 16,259 | | 25,889 | | 16,570 | | 26,386 | |
New loans disbursed | | 209 | | 189 | | 13,939 | | 6,741 | | 14,148 | | 6,930 | |
Loans outstanding at year-end | | 779 | | 699 | | 23,210 | | 13,615 | | 23,989 | | 14,314 | |
15
Table of Contents
Loans outstanding in the S-system by type of loan
Skr mn | | 2010 | | 2009 | | 2008 | | 2007 | | 2006 | |
Lending for export of durable products | | 23,989 | | 14,314 | | 10,095 | | 8,787 | | 9,125 | |
Other lending related to export | | n.a | | n.a | | n.a | | n.a | | n.a | |
Lending related to infrastructure | | n.a | | n.a | | n.a | | n.a | | n.a | |
Total | | 23,989 | | 14,314 | | 10,095 | | 8,787 | | 9,125 | |
Loan Types and Underwriting Policies
Within the S-system, SEK extends loans only for the medium- and long-term financing of capital goods exports.
S-system lending includes financing in cooperation with intergovernmental organizations and foreign export credit agencies (“ECAs”).
Our credit underwriting policies and requirements for S-system loans are similar regardless of loan type. The majority of these loans are also guaranteed by export credit agencies.
SEK’s initial loan offer and subsequent commitment set forth the maximum principal amount of a loan, the currency in which the loan will be denominated, the repayment schedule and the disbursement schedule.
Interest Rates
Because Sweden is a member of the Organization for Economic Cooperation and Development (the “OECD”), the S-system is designed to comply with the Arrangement on Guidelines for Officially Supported Export Credits of the OECD (the “OECD Consensus”). The OECD Consensus establishes minimum interest rates, required down payments and maximum loan periods for government-supported export loan programs. Terms vary according to the per-capita income of the importing country.
SEK offers S-system financing at commercial interest reference rates (“CIRR”) established by the OECD in accordance with the OECD Consensus. The CIRR rates for new loans are subject to periodic review and adjustment by the OECD. The OECD Consensus stipulates that loan offers may remain valid for a period of not more than four months, during which period a commercial contract must be signed, if at all, with offers that aren’t accepted within that period lapsing automatically. Thereafter the CIRR rate can be locked in for a maximum period of six months in order for the loan agreement to be finalized. No commitment fee is charged for CIRR loans to Swedish counterparties. Arranging banks receive compensation of 0.25 percent per annum, based on the outstanding loan amount, to cover their costs for arranging and managing loans. The arranging bank for an S-system loan can either be SEK itself or a commercial bank in Sweden.
The OECD Consensus also provides eligibility standards for concessionary loans. In principle, such loans are not permitted to be extended to purchasers in countries whose per-capita GNP for at least two consecutive years has exceeded the World Bank threshold applicable to the granting of 17-year World Bank loans. Concessionary credits to purchasers in other countries are not permitted to be extended to finance public or private projects that normally would be commercially viable if financed on market or OECD Consensus terms.
SEK participates with government agencies in an export-financing program (the “Concessionary Credit Program”) financed by the Swedish state to promote exports to certain developing countries, presently incorporating a foreign aid element of at least 35 percent. The foreign aid element is reflected in the form of lower rates of interest and/or deferred repayment schedules, and the Swedish government reimburses SEK through the S-system for the costs incurred as a result of SEK’s participation in such program.
16
Table of Contents
Guarantees
In general, loans under the S-system are guaranteed by Sweden’s Export Credits Guarantee Board (“EKN”). If a guarantee is entered into for risk-mitigating purposes it protects a pre-defined amount of SEK’s exposure with respect to principal (and in some cases interest) as long as the issuer of the guarantee is financially sound. All credits granted by SEK within the S-system must also undergo SEK’s customary credit approval process.
Loan Maturities
Under the S-system, loan maturities generally range from one year up to 20-30 years.
e. Credit Support for Outstanding Loans
The Group’s policies with regard to counterparty exposures are described in detail in Note 30 to the Consolidated Financial Statements.
The following table illustrates the counterparties for the Group’s outstanding loans and guarantees as of December 31, 2010 and December 31, 2009. Although most loans fall into more than one category for any given loan, this table reflects only the counterparty (either borrower or guarantor) that SEK believes to be the stronger in terms of creditworthiness.
| | 2010 | | 2009 | |
Loan credit exposure to Swedish State guarantees via EKN(A) | | 44 | % | 22 | % |
Loan credit exposure to Swedish State guarantees via National Debt Office(B) | | 0 | % | 0 | % |
Loan credit exposure to Swedish State guarantees, total | | 44 | % | 22 | % |
Loan credit exposure to Swedish credit institutions(C) | | 8 | % | 10 | % |
Loan credit exposure to foreign bank groups or governments(D) | | 22 | % | 32 | % |
Loan credit exposure to Swedish counterparties, primarily corporations(E) | | 13 | % | 5 | % |
Loan credit exposure to municipalities | | 4 | % | 14 | % |
Loan credit exposure to other foreign counterparties, primarily corporations | | 9 | % | 18 | % |
Total | | 100 | % | 100 | % |
See “— Lending Operations — General” for information on the geographical distribution of borrowers.
(A) EKN guarantees are in substance insurance against losses caused by the default of a foreign borrower or buyer in meeting its contractual obligations in connection with the purchase of Swedish goods or services. In the case of a foreign private borrower or buyer, coverage is for “commercial” and, in most cases, “political” risks. Coverage for “commercial” risk refers to losses caused by events such as the borrower’s or buyer’s insolvency or failure to make required payments within a certain time period (usually six months). Coverage for “political” risk refers to losses caused by events such as a moratorium, revolution or war in the importing country or the imposition of import or currency control measures in such country. Disputed claims must be resolved by a court judgment or arbitral award, unless otherwise agreed by EKN. In the table above only the particular amount of any given total loan that is guaranteed is listed as such. The amount of any such loan that is not covered by the relevant guarantee is excluded. EKN is a State agency whose obligations are backed by the full faith and credit of Sweden.
(B) State guarantees issued by the National Debt Office are unconditional obligations backed by the full faith and credit of Sweden.
17
Table of Contents
(C) At December 31, 2010, loans in this category amounting to approximately 3.7 percent (2009: 4 percent) of total loans were obligations of the four largest commercial bank groups in Sweden including guarantees in the form of bank guarantees or credit derivatives.
(D) At December 31, 2010 principally obligations of other Nordic, Western European or North American bank groups, together with obligations of Western European governments including guarantees in the form of bank guarantees or credit derivatives.
(E) At December 31, 2010, approximately 8.8 percent (2009: 13 percent) of the total loan credit exposure represented loans to the ten largest Swedish corporations.
See also Note 27 to the Consolidated Financial Statements.
f. Organizational Structure
SEK has the following business segments, as defined in IFRS 8 Segment reporting: “granting of loans”, “advisory services”, and “capital market products”. SEK organizes its activities in these segments into three main business areas which are approximately correlated to the above business segments in accordance with financial reporting requirements: Corporate Lending, Structured Finance, and Customer Finance (granting of loans), Advisory Services (advisory services), and SEK Securities (capital market products). In addition, SEK has a Customer Relations Management (“CRM”) function which is responsible for all customer relations contacts with different customers and cooperates intensively with the business areas.
In accordance with IFRS 8, SEK has the following three business segments: granting of loans, advisory services and capital market products. Advisory services and capital market products are similar with respect to risks and returns. The combine revenues for the segments other than granting of loans amounted to less than 1 percent of the Consolidated Group’s total revenues and their operating profits amounted to less than 1 percent of the Consolidated Group’s total operating profit, while less than 1 percent of the Consolidated Group’s total assets were attributable to these two segments .As a result, these segments are not separately reported on. SEK therefore has reported separately only on the segment “granting of loans.”
SEK’s Funding group, a group outside of the three main business areas, is responsible for long-term funding and related matters. Furthermore, the Treasury group is responsible for treasury activities and, short-term funding as well as liquidity management.
Corporate Lending, Structured Finance, and Customer Finance. The business area is responsible for all business activities in corporate lending, export credits, project finance, trade finance, leasing, customer finance and other structured finance projects including financing in local currencies, as well as origination within their business areas.
Advisory Services. As a complement to SEK’s lending activity, the Advisory Services business area offers independent consulting services to both the private and public sectors based on SEK’s experience in various areas, especially export projects and project finance.
SEK Securities. AB SEK Securities is a wholly-owned subsidiary with a license from the Swedish Financial Supervisory Authority to conduct a securities business. AB SEK Securities sells investors capital markets products issued by third-party issuers, principally in the primary market via private placements. The business area has been reduced in importance and scale, as SEK in 2009 and 2010 has focused its business activities towards Corporate Lending, Structured Finance and Corporate Finance.
Funding and Treasury. Funding is responsible for managing SEK’s long-term borrowing program and Treasury is responsible for treasury activities, short-term funding as well as liquidity management. See also Item 5, “Operating and Financial Review and Prospects — Liquidity, Capital Resources and Funding — Liquidity”.
In addition, SEK maintains a risk control unit, an internal audit function and a compliance function, all of which operate independently of the business areas. See also Note 30 to the Consolidated Financial Statements.
18
Table of Contents
g. Swedish Government Supervision
The Parent Company operates as a credit market institution within the meaning of the Swedish Banking and Financing Business Act (the “Act”). As such, it is subject to supervision and regulation by the Swedish Financial Supervisory Authority (the “Supervisory Authority”), which licenses and monitors the activities of credit market institutions to ensure their compliance with the Act and the regulations linked to it and such institutions’ corporate charters.
Among other things, the Supervisory Authority requires SEK to submit reports on a three-month, six-month and twelve-month basis and may conduct periodic inspections. The Supervisory Authority also may (but currently does not) appoint an external auditor to participate with SEK’s independent auditors in examining the Group’s and the Parent Company’s financial statements and the management of the Group.
The Swedish National Audit Office may audit the activities that are conducted by the Swedish State in the form of limited companies, if the State as owner has a controlling influence over the activities. The State has such controlling influence over the activities of the Parent Company which is a limited company. The National Audit Office has appointed Authorized Public Accountant Filip Cassel as the auditor for SEK for the period from the 2010 annual general meeting up to and including the 2014 annual general meeting, with Authorized Public Accountant Anders Herjevik as alternate for the same period.
As a credit market institution, SEK is also subject to regulation of its capital adequacy and limits on credit to any single customer pursuant to the Capital Adequacy and Large Exposures (Credit Institutions and Securities Companies) Act, as amended.
As of January 1, 2007, the revised capital adequacy rules of the Basel Committee, on Banking Regulation and Supervisory Practices at the Bank for International Settlements (the “Basel Committee”) referred to as Basel II became applicable to credit institutions in Sweden and the European Union, including SEK.
In July 2005, SEK submitted an application to the Supervisory Authority related to the use of the Internal Ratings Based Approach when calculating risk-weighted claims under Basel II. In March 2007, the Supervisory Authority finally determined that SEK can use an Internal Ratings Based Approach when calculating risk-weighted claims under Basel II based on legislation adopted in Sweden at the beginning of 2007. The quantitative analysis regarding Pillar 1 (methods for calculating minimum capital requirements for certain risks) was implemented in 2005. During 2006 the required capital base, depending on the Group’s risk profile with regard to all relevant risks, was established (Pillar 2). Reporting under the new rules was done for the first time as of March 31, 2007.
Pillar 3 concerns, and places demands on, improved openness and transparency and how institutions report on their operations to the market and the public. During 2009, SEK reported in accordance with Pillar 3 for the first time. See Note 26 to the Consolidated Financial Statements for further details on the capital adequacy of SEK and for a discussion regarding Basel II and its effects.
The capital adequacy requirements under Swedish law comply with international guidelines, including the recommendations issued by the Basel Committee. The principal measure of capital adequacy is a capital to risk-weighted assets ratio, which compares the capital base to the total of risk-weighted assets and off-balance sheet items. The capital base is divided into two components, one of them being “core” or Tier-1 capital, which includes equity capital and, with certain limitations, non-cumulative preferred shares and similar instruments. Prior to December 2008, non-cumulative preferred shares and similar instruments could not be included in Tier -1 capital to the extent they exceed 15 percent of the Tier-1-capital other than non-cumulative preferred shares and similar instruments. In December 2008, the Swedish Financial Supervisory Authority promulgated new regulations concerning the calculation of primary capital with the effect that credit institutions and securities companies are now permitted to maintain a larger proportion of “Tier-1-eligible capital” in their Tier-1 capital. This capital may constitute up to 30 percent of the total amount of Tier-1 capital, in comparison to the previously allowed 15 percent.
The other component in the capital base is “supplementary” or “Tier -2” capital, which includes non-cumulative preferred shares and similar instruments not included in core capital, plus subordinated obligations with original terms of at least five years (with a deduction of 20 percent for each of the last five years prior to
19
Table of Contents
maturity). Assets are assigned a weighting based on relative credit risk depending on the debtor or the type of collateral, if any, securing the assets. Under the new regime, Basel II, a greater emphasis is placed on ratings and all of SEK’s counterparties are internally rated by SEK in order to meet the capital requirements. The minimum capital ratio requirement under Pillar 1 is 8 percent, and not more than 50 percent of an institution’s regulatory capital may comprise supplementary capital. SEK’s policy is to maintain a strong capital base, well in excess of the regulatory minimum.
At December 31, 2010, SEK’s total regulatory capital ratio was 22.4 percent (2009: 18.7 percent) and its Tier -1 ratio was 22.4 percent (2009: 17.9 percent). The regulatory capital ratio has been negatively affected by certain transitional rules imposed by the Swedish Financial Supervisory Authority, which remained in place until the financial year 2010. At the end of financial year 2010 the effects are however not material and therefore ratios excluding transitional rules equal those including such rules. Were one to exclude the effect of these transitional rules, SEK’s total regulatory capital ratio at December 31, 2009, would have been 19.8 percent and its Tier-1 ratio 18.9 percent. See also Note 26 to the Consolidated Financial Statements.
Changes in the capital adequacy rules that came into force at the end of 2010 will cause changes in the Tier-1 capital requirements applicable to SEK. If the changed rules would have been applied on the present capital base this would have created that Tier-1 capital would have decreased by 3.7 percent to 18.7 percent with the corresponding increase in Tier-2 capital. As all Tier-1 capital contributions are securities issued under the previous regulatory framework, the entire value for such securities is therefore included in Tier-1 capital according to the transitional arrangements in FFFS 2010:10.
SEK’s perpetual subordinated debt amounting to EUR 50 million and maturing on June 30, 2015 was redeemed before maturity on June 30, 2010 at the nominal amount in accordance with the terms of the instruments and in accordance with special dispensation granted by the Swedish Financial Supervisory Authority. See also Note 26 to the Consolidated Financial Statements.
Under the regulatory rules for large exposures, a “large exposure” is defined as a (risk-weighted) exposure to a single counterparty (or counterparty group) that exceeds 10 percent of the institution’s regulatory total capital base. These rules state that no individual large exposure may exceed 25 percent of the regulatory total capital base of the institution, and that the aggregate amount of large exposures may not exceed 800 percent of the institution’s regulatory total capital base. The aggregate amount of SEK’s large exposures on December 31, 2010, was 277 percent (2009: 120 percent) of SEK’s regulatory total capital base and consisted of risk-weighted exposures to 20 (2009:8) different counterparties (or counterparty groups). These counterparties (or counterparty groups) were all rated by at least one of the major rating agencies, Moody’s and Standard & Poor’s, with ratings of not lower than investment grade. The increase in aggregated amount of SEK´s large exposures emanates primarily from the new rules for large exposures that came into force as of December 31, 2010.
The Parent Company’s subsidiary, AB SEK Securities, is licensed to conduct a securities business and as such is regulated by the Swedish Financial Supervisory Authority under the Securities Operations Act. Among other things, the Supervisory Authority requires AB SEK Securities to submit reports on a regular basis and may conduct periodic inspections. The Supervisory Authority also may (but currently does not) appoint an external auditor. Furthermore, AB SEK Securities is also subject to regulation of its capital adequacy and limits on credit to any single customer pursuant to the Capital Adequacy and Large Exposures (Credit Institutions and Securities Companies) Act, as amended.
h. Property, Plants and Equipment
The Parent Company owns, through its wholly-owned subsidiary AB Sektionen, an office building in the City of Stockholm. The major part of the building was used by the Group as its headquarters until December 17, 2010. The available office space in the building is approximately 2,200 square meters. SEK may not utilize the building for other purposes than as an office. The building is not secured by a mortgage. SEK´s current headquarters are leased and AB Sektionen is now for sale.
20
Table of Contents
ITEM 4A. UNRESOLVED STAFF COMMENTS
None.
ITEM 5. OPERATING AND FINANCIAL REVIEW AND PROSPECTS
a. Overview
Substantially all of SEK’s revenues and net income derive from the net interest revenues earned on its loans and interest-bearing securities. Funding for these assets comes from equity, including the capital contributed to the Parent Company by the State and from debt securities issued in the international capital markets. Accordingly, key determinants of SEK’s profits from year to year are the spread, or difference, between the rate of interest earned on its debt-financed assets and the cost of that debt, the rate of interest earned on the investment of its equity and the outstanding volumes of credits and interest-bearing securities in the balance sheet, as well as the relative proportions of its assets funded by debt and equity. SEK raises debt with terms that may be fixed, floating, or linked to various indexes. SEK’s strategy is to economically hedge these terms to floating IBOR rates to match its debt financed assets. The quality of SEK’s statement of financial position, stable credit rating and public policy role within Sweden with a close connection to the Swedish state have enabled SEK to achieve funding at a level which is competitive in the market.
Furthermore, after the implementation in 2007 of international accounting standards, IFRS, another key influence on SEK’s results of operations has been the changes in fair value of assets, liabilities and derivatives reported at fair value.
The declining trend over recent years in SEK’s profit under IFRS (for the financial years 2008, 2007 and 2006) was broken in 2009 as SEK reported a substantial increase in earnings. In 2010, this trend continued.
Operating profit (IFRS) totaled Skr 3,939.7 million, an increase of 66.3 percent from the previous year (2009: Skr 2,368.6 million). The increase in operating profit was mainly due to:
(1) a gain realized in connection with the sale of the shareholding in Swedbank AB amounting to Skr 2,565.0 million,
(2) lower provisions for expected credit losses, and,
(3) an increase in recovered credit losses.
This increase in operating profit was partially offset by a revaluation of certain assets and liabilities at fair value, which resulted in the previous year’s earnings being positively affected by an unrealized Skr 769.3 million change in value and in 2010 earnings being negatively affected by an unrealized Skr 175.0 million change in value. In addition, the increase in earnings was reduced by lower net interest revenues, lower gains from the repurchase of SEK’s own issued bonds and a realized loss on the sale of securities holdings.
b. Critical Accounting Policies and Estimates
When applying the Group’s accounting policies management makes judgments and estimates that have a significant effect on the amounts recognized in the financial statements. The estimates are based on past experience and assumptions that the company believes are fair and reasonable. These estimates and the judgments behind them affect the reported amounts of assets, liabilities and off-balance sheet items, as well as income and expenses in the financial statements presented. Actual outcomes can later differ from the estimates and the assumptions made. Please see below for items where critical estimates have been made. The company assesses the judgments made related to the following critical accounting policies to be of most significance:
· The functional currency,
· Classifications of securities as quoted on an active market,
21
Table of Contents
· The selection of the appropriate valuation techniques when prices from active markets are not available for derivatives and other financial instruments carried at fair value,
· The judgment that SEK should be regarded as an agent with respect to the S-system
The functional currency
SEK has determined that the Swedish krona (Skr) is its functional currency under IFRS. Large portions of its assets, liabilities and related derivatives are denominated in foreign currency. Under IFRS both assets and liabilities are translated at closing exchange rates and the differences between historical book values and current values are reflected as foreign exchange effects in revenues and expenses, where they often largely offset each other. This reflects the economic substance of SEK’s policy of holding assets financed by liabilities denominated in, or hedged into, the same currency. See Note 27 for information on SEK’s positions in foreign currency.
Classifications of securities as quoted on an active market
When classifying securities as loans and receivables, SEK makes judgments as to whether these securities are quoted on active markets based on a number of pre-established factors. SEK has established an operational definition of when a transaction should be regarded as quoted on an active market. An instrument is regarded as quoted on an active market if there are sufficient numbers of parties offering bid and/or ask prices. All other transactions are regarded as not quoted on an active market. In the case of uncertainty, additional qualitative criteria are taken into consideration in accordance with a predefined process. If a larger number of securities were deemed to be quoted on an active market, these securities would be classified as assets available-for-sale and carried at fair value with the after-tax changes in fair value for these securities would affect other comprehensive income.
The selection of the appropriate valuation techniques when prices from active markets are not available for derivatives and other financial instruments carried at fair value
When reporting the amounts of its assets, liabilities and derivatives, as well as its revenues and expenses, assumptions and estimates must be made in assessing the fair value of financial instruments and derivatives, especially where unquoted or illiquid securities or other debt instruments are involved. SEK makes judgments regarding what the most appropriate valuation techniques are for the different financial instruments held by the Group. If the conditions underlying these assumptions and estimates were to change, the amounts reported could be different. When financial instruments are carried at fair value, fair value is calculated through the use of market quotations, pricing models, valuations established by external parties and discounted cash flows. The majority of SEK’s financial instruments are not publicly traded, and quoted market prices are not readily available. Different pricing models or assumptions could produce different valuation results. Furthermore, the estimated fair value of a financial instrument may, under certain market conditions, differ significantly from the amount that could be realized if the security were sold immediately.
See Note 27 of the Consolidated Financial Statements for disclosure of change in value of assets and liabilities if the market interest rate rises or falls by one percentage point.
The judgment that SEK should be regarded as an agent with respect to the S-system
SEK has determined that the S-system should be considered to be an assignment where SEK acts as an agent on behalf of the Swedish State rather than being the principal in the individual transactions. This assessment has been made based on a number of factors such as: (i) that SEK does not in substance, even though in form, have the risks and rewards of ownership; (ii) that SEK does not have discretion in establishing prices; and (iii) that SEK receives compensation in the form of a fixed commission. SEK has consequently presented the economic activities of the S-system on a net basis in the income statement, recording the net commission received, rather than the gross amounts collected in accordance with the agreement with the Swedish State. If SEK were regarded as a principal with respect to the S-system, all revenues and expenses in the S-system would be revenues and expenses of SEK. However, the net effect on SEK’s operating profit would be unchanged. Please see more information regarding the S-system in Note 24.
22
Table of Contents
Furthermore, the company has identified the following key sources of estimation uncertainty when applying IFRS:
· Provisions for probable credit losses;
· Estimates of fair values when quoted market prices are not available;
· Valuation of derivatives without observable market prices.
Provisions for probable credit losses
Provisions for probable credit losses are made if and when SEK determines that it is probable the obligor under a loan or another asset held by SEK, in each case together with existing guarantees and collateral, will fail to cover SEK’s full claim. If the judgment underlying this determination were to change, this could result in a material change in provisions for probable credit losses.
Impairment is recognized as the difference between the carrying value of a loan and the discounted value of our best estimate of future cash repayments. This estimate takes into account a number of factors related to the obligor. The actual amounts of future cash flows and the dates they are received may differ from these estimates and consequently actual losses incurred may differ from those recognized in the financial statements. If, for example, the actual amount of total future cash flow were 10 percent higher or lower than the estimate, this would affect operating profit for the financial year ended December 31, 2010 by Skr 50—60 million and equity by Skr 30—40 million at that date.
Estimates of fair value when quoted market prices are not available
If a transaction is classified as assets or liabilities at fair value through profit or loss, fair value must include any impact of credit spreads. When quoted market prices are not available for such instruments, certain assumptions must be made about the credit spread of either the counterparty or one’s own credit spread depending on whether the instrument is an asset or a liability. If these assumptions were to be changed, this could result in a material change in the fair value of these instruments.
If the assumption with relation to the valuation of assets classified at fair value through profit or loss were changed such that the average credit spread applied to such assets were 0.10 percent higher or lower than the average spread actually used in the calculations, this would affect operating profit for the fiscal year ended December 31, 2010 by approximately Skr 20—30 million and equity, at such date, by approximately Skr 30—40 million.
If the assumption with relation to the valuation of liabilities classified at fair value through profit or loss were changed such that the average credit spread applied to such liabilities were 0.10 percent higher or lower than the average spread actually used in the calculations, this would affect operating profit for the fiscal year ended December 31, 2010 by approximately Skr 400—500 million and equity, at such date, by approximately Skr 300—400 million.
SEK issues debt instruments in many financial markets. A large portion of these are hybrid instruments with embedded derivatives. SEK’s policy is to hedge the risks in these instruments using swaps with corresponding structures in order to obtain effective economic hedges. These hybrid debt instruments are classified as financial liabilities measured at fair value. As there are no market quotes for this group of transactions, valuation models, valuations established by external parties or quotations furnished by dealers in such instruments are used to calculate fair value. The same model is used for a hybrid liability and the structured swap hedging the instrument, except for adjustments due to counterparty or SEK’s own credit risk. Thus, with the exception of effects from changes in counterparty and SEK’s own credit risk valuations, fair-value changes in a hybrid liability are always matched by corresponding changes in the fair value of the swap that hedges that liability. Although SEK’s credit rating has not changed during the year, developments on financial markets have to some extent affected the prices at which SEK’s debt is issued. These changes, which are different in different markets, have been included in the calculation of fair value for these liabilities. The models used include both directly observable and implied market parameters.
23
Table of Contents
Please see more information regarding valuation techniques in Note 13.
Valuation of derivatives without observable market prices
A large part of SEK’s portfolio of senior securities and related derivatives is in the form of structured products where the fair value of certain embedded derivatives (even though not bifurcated) sometimes require sophisticated models in order to value these instruments. If the assumptions used in these models were to change, this could result in a material change in the fair value of these instruments. Since SEK only enters into market-matched hedge relationships (economic or accounting hedges) the only potential material effect on profit or loss or equity would result if there were changes in the credit spreads.
SEK uses swap agreements (primarily) to hedge risk exposures in financial assets and liabilities. SEK enters into the swap agreements only under ISDA master agreements and all swap contracts are with financial institutions as counterparties. Counterparty risks are managed by using a credit support annex or other agreement where the credit exposure is mitigated on at least a monthly basis. Swaps are measured at fair value by using market quoted rates where available. If market quotes are not available, valuation models are used. For counterparties in respect of which SEK has a positive swap portfolio value, SEK uses a model to adjust the net exposure fair value for changes in the counterparty’s credit quality. The models used include both directly observable and implied market parameters.
Please see more information regarding valuation techniques in Note 13.
c. Recent Accounting Pronouncements Issued
In all material aspects, the accounting policies are unchanged in comparison with the financial statements included in SEK’s Annual Report on Form 20-F for the year ended on December 31, 2009, with the exceptions stated below.
The group has adopted the following revised standards from IASB as from January 1, 2010:
IAS 24 Related Party Disclosures. The definition of related parties has changed so that some relief is given on related-party transactions disclosures when a company is state-owned, such as is the case with SEK. The amended standard must be applied no later than 2011 but may be adopted earlier. SEK has adopted the standard as of January 1, 2010. The amendment decreases the scope of required disclosures regarding transactions with state-owned companies.
The following other amendments to standards and interpretations have been adopted by SEK, but have had little or no impact on the SEK’s financial reporting:
IFRS 3R Business Combinations. This revised standard introduced a number of changes in accounting for business combinations, particularly changes of the accounting for transaction costs, for contingent consideration and for business combinations achieved in stages.
IAS 27R, Consolidated and Separate Financial Statements. This revised standard requires that changes in ownership interests in a subsidiary, where the majority owner does not lose control, be accounted for as equity transactions. Furthermore, the IAS 27R changes the accounting when the controlling influence over a subsidiary is terminated.
IAS 39 Financial Instruments: Recognition and Measurement. The amendment clarifies when an option for early repayment of a loan is “closely related” to the loan.
Beginning in 2010 SEK has in the presentation of the consolidated group elected the option provided under IFRS to redefine its presentations with regard to income statement and balance sheet. Thus, in the Consolidated Group, the income statement and the statement of comprehensive income have been consolidated into one statement, the statement of comprehensive income. Furthermore, the balance sheet has been renamed to statement of financial position. Furthermore, the line “net profit” in the Consolidated Statement of Financial Position has been removed and is now included as part of “retained earnings”.
24
Table of Contents
Furthermore, SEK has redefined the presentation of statement of financial position in the Consolidated Group to rename the first line item from “cash in hand” to “cash and cash equivalents,” in order to provide more relevant information to our investors. Cash and cash equivalents includes assets that are immediately convertible into cash and short term deposits, the payout of which is known in advance and for which the time to maturity at acquisition does not exceed three months.
The following new standards and changes in standards and interpretations not yet adopted are considered to be relevant to SEK:
IFRS 7, Financial Instruments: Disclosures. Amendments comprise more explicit disclosure requirements related to credit risks, credit collateral and credit protection measurements taken. SEK’s preliminary conclusion is that the amendment of this standard will not affect the financial disclosure provided by SEK in any material way. These standards will be effective for financial years commencing on or after January 1, 2011.
IFRS 9, Financial Instruments: This standard is part of a complete overhaul of the existing standard IAS 39 and reduces the number of valuation categories for financial assets, leaves the number of categories of financial liabilities unchanged as well as rules for how changes in own credit spread should be recorded when own debt is measured at fair value. The standard will be supplemented by rules on write-downs, hedge accounting and derecognition from statements of financial position. IFRS 9 must be applied for annual periods beginning January 1, 2013. Since all parts of the standard are not completed, SEK has not yet evaluated their effects.
d. Assets and Business Volume
Total Assets
SEK’s total assets at the end of the year amounted to Skr 339.7 billion, which is an 8.6 percent decrease from December 31, 2009 (year-end 2009: Skr 371.6 billion). This decrease is primarily attributable to lower liquidity and, in part, to a stronger Swedish krona, primarily against the US dollar and the euro, distributed across both the loan portfolio and liquidity portfolio (see Note 11).
The total volume of outstanding offers for export credits amounted to Skr 86.6 billion at the end of the year, an increase of 2.5 percent (year-end 2009: Skr 84.5 billion). Of the volume of outstanding offers of loans, the majority, Skr 75.8 billion, was attributable the S-system (year-end 2009: Skr 77.5 billion).
Business Volume
Throughout the financial crisis SEK was able to offer financing for the Swedish export industry. The volume of new lending returned to a more normal level in 2010 compared with the extraordinary situation of 2009.
SEK’s new lending for 2010 amounted to Skr 48.7 billion (2009: Skr 122.5 billion). Despite the significant decrease from 2009, direct lending volumes to Swedish exporters and their customers were, at the second-highest level ever in SEK’s history. We believe this shows that SEK’s role as a reliable partner for the Swedish export industry remains important and that SEK’s market position is strong. For a country like Sweden which is dependent on exports, reliable access to attractive financing solutions is essential to the success of the exporters.
The amount of outstanding and undisbursed loans totaled Skr 217.9 billion at the end of the year, which represents a decrease of 6.2 percent (year-end 2009: Skr 232.2 billion). Of this amount, Skr 179.7 billion consisted of loans outstanding, which is a decrease of 3.0 percent from the previous year (year-end 2009: Skr 185.8 billion). Of the total volume of outstanding and committed but undisbursed loans, Skr 40.6 billion (year-end 2009: Skr 40.7 billion) related to the S-system, of which Skr 24.0 billion (year-end 2009: Skr 14.3 billion) consisted of loans outstanding. The increase of loans outstanding in the S-system is attributable to the fact that loans that were accepted for lending in 2008 and 2009 were largely paid out in 2010 (see Note 24). The S-
25
Table of Contents
system is made up of CIRR loans, which is the Swedish State’s export credit support system, and the State’s tied aid credit program.
Over the past year, SEK has provided a range of major Swedish exporters, such as Atlas Copco, Ericsson, Scania, and SSAB, with direct financing, enabling important export transactions.
Swedish exporters’ need for export credits remained high in 2010. SEK’s customers were active in many of Sweden’s key export markets, particularly in the fast-growing Asian markets. These are markets that are becoming increasingly important for Swedish exporters.
New Customer Financing
| | Year ending December 31, | |
Skr billion | | 2010 | | 2009 | | 2008 | |
Lending for: | | | | | | | |
Exporters | | 46.0 | | 100.5 | | 41.4 | |
SMEs via the financial sector (1) | | 0.4 | | 6.2 | | 14.1 | |
Swedish infrastructure | | 2.3 | | 14.8 | (2) | 8.1 | (2) |
Syndicated customer transactions | | 0.0 | | 1.0 | | 1.3 | |
Total (3) | | 48.7 | | 122.5 | | 64.9 | |
(1) For the promotion of financing of small- and medium-sized exporters.
(2) Principally short-term financing to Swedish municipalities.
(3) Of which Skr 21.4 billion has not yet been disbursed by the end of each year (year-end 2009: Skr 38.8 billion; year-end 2008: Skr 7.7 billion).
Japan has been one of SEK’s most important funding markets since the 1980s. In 2010, the Japanese market accounted for 53 percent (2009: 29 percent) of SEK’s total new borrowings. In addition to the Japanese market SEK has also been active in the European and U.S. markets. European markets accounted for 12 percent (2009: 29 percent) of SEK’s total new borrowing during 2010.
The U.S. market provided SEK with approximately 19 percent (2009: 24 percent) of its total new borrowing in 2010. In October SEK issued a USD 1 billion five-year global benchmark bond, which was the company’s first public benchmark transaction in US dollars since September 2009.
In 2010 SEK also initiated work on SEK bonds aimed at Swedish private investors and distribution agreements have been concluded with a number of key distributors. This project is an important part of SEK’s strategy to diversify its funding.
e. Counterparty Risk Exposures.
Of the total counterparty risk exposure as of December 31, 2010, 41 percent (year-end 2009: 40 percent) was to central governments and government export credit agencies; 33 percent (year-end 2009: 35 percent) was to financial institutions; 7 percent (year-end 2009: 9 percent) was to securitization positions; 12 percent (year-end 2009: 10 percent) was to corporations and 7 percent (year-end 2009: 6 percent) was to local and regional authorities. SEK’s exposure to derivative counterparties is significantly less than the amount of derivatives reported as assets, Skr 37.7 billion (year-end 2009: Skr 22.7 billion), since most derivatives are accompanied by collateral agreements. See the table titled “Total Exposures” in Note 27.
SEK maintains a conservative policy with regard to market exposures, such as interest rate risks, currency risks and operational risks. See Note 27 to the Consolidated Financial Statements.
26
Table of Contents
Total Exposures
Amounts reflecting net exposures are reported taking into consideration guarantees and credit derivatives.
| | Total | | Loans & interest-bearing securitites | | Undisbursed loans, derivatives, etc. | |
Skr billion | | December 31, 2010 | | December 31, 2009 | | December 31, 2010 | | December 31, 2009 | | December 31, 2010 | | December 31, 2009 | |
Classified by type of exposure class | | Amount | | % | | Amount | | % | | Amount | | % | | Amount | | % | | Amount | | % | | Amount | | % | |
Central governments (1) | | 113.2 | | 33 | | 125.6 | | 32 | | 80.4 | | 27 | | 86.4 | | 26 | | 32.8 | | 64 | | 39.2 | | 64 | |
Regional governments | | 23.7 | | 7 | | 24.0 | | 6 | | 23.2 | | 8 | | 23.2 | | 7 | | 0.5 | | 1 | | 0.8 | | 1 | |
Government export credit agencies | | 27.5 | | 8 | | 33.5 | | 8 | | 25.5 | | 9 | | 30.0 | | 9 | | 2.0 | | 4 | | 3.5 | | 6 | |
Financial institutions | | 114.1 | | 33 | | 137.9 | | 35 | | 101.6 | | 35 | | 123.3 | | 37 | | 12.5 | | 24 | | 14.6 | | 24 | |
Securitization positions | | 24.0 | | 7 | | 33.9 | | 9 | | 24.0 | | 8 | | 33.9 | | 10 | | 0.0 | | 0 | | 0.0 | | 0 | |
Corporates | | 43.3 | | 12 | | 38.7 | | 10 | | 39.7 | | 13 | | 35.3 | | 11 | | 3.6 | | 7 | | 3.4 | | 5 | |
Total | | 345.8 | | 100 | | 393.6 | | 100 | | 294.4 | | 100 | | 332.1 | | 100 | | 51.4 | | 100 | | 61.5 | | 100 | |
(1) Includes exposures to the Swedish Export Guarantee Board (EKN)
f. Results of Operations
Net Interest Revenues
2010 versus 2009
Net interest revenues totaled Skr 1,898.5 million, which is a decrease of 4.8 percent from the previous year (2009: Skr 1,994.3 million). This decrease was primarily due to fees of Skr 120.5 million to the government’s stability fund, which is mandatory for Swedish credit institutions.
The average margin on debt-financed assets was 0.49 percent, a decrease of 3 basis point from the previous year (2009: 0.52 percent). The decrease in the margin was primarily attributable to costs relating to the above-mentioned statutory fee payable to the government’s stability fund.
The average volume of debt-financed assets amounted to Skr 308.3 billion during the year, a decrease of 1.7 percent from the previous year (2009: Skr 313.5 billion). The average volume of the loan portfolio, however, increased from the previous year as a result of the very significant demand for loans in 2009. Due to this demand, disbursement of previously accepted loans increased over the course of 2009 and into 2010, which increased the average volume of the loan portfolio. Average liquidity portfolio decreased compared with the previous year. See Note 11 for the definition of liquidity portfolio. However, margins in the loan portfolio increased slightly, while margins in the liquidity portfolio declined. If the fee paid to the government stability fund is excluded, the margin on debt-financed assets increased overall.
2009 versus 2008
Net interest revenues totaled Skr 1,994.3 million, as compared to Skr 1,543.3 million in 2008, an increase of approximately 29 percent. The increase was mainly due to increased lending volumes but also reflected increased average margins on debt-financed assets, particularly in the credit portfolio. The equity that SEK received from the Swedish State during December 2008 also contributed positively to the increase in net interest revenues, by permitting new lending not financed by debt.
The average margin on debt-financed assets amounted to 0.52 percent in 2009, as compared to 0.49 percent in 2008. Margins on currency swaps, which in normal times are very modest, also contributed materially to net interest revenues. The contribution was mainly realized in the first half of 2009 as compared to the corresponding period in 2008, when the financial crisis had not yet deepened. Furthermore, SEK generated higher margins in its granting of credits during 2009 than in 2008 partially as a result of the financial crisis because premiums charged to borrowers related to business risk were significantly higher than in the past. This resulted in SEK being able to receive higher risk-adjusted premiums on its customer lending while SEK’s own risk premium on its own borrowing was basically unchanged or even lowered due to SEK’s favorable position in being able to borrow U.S. dollars.
27
Table of Contents
The average volume of debt-financed assets amounted to Skr 313.5 billion during 2009 as compared to Skr 269.5 billion in 2008, an increase of approximately 16 percent. The increase in volumes occurred mainly in the credit portfolio and reflected the fact that SEK was one of the few available sources of financing in the Swedish credit market during the early part of 2009.
Commissions earned and commissions incurred
2010 versus 2009
Commission earned amounted to Skr 19.7 million (2009: Skr 26.2 million). Commissions incurred amounted to Skr 19.9 million (2009: Skr 26.4 million). The decrease in both commissions earned and commissions incurred was primarily due to lower revenues and lower costs in advisory services.
2009 versus 2008
Commissions earned amounted to Skr 26.2 million in 2009, as compared to Skr 34.7 million in 2008. The approximate 24 percent decrease was due mainly to lower amounts of capital market commissions (down by approximately 83 percent from Skr 14.3 million to Skr 2.5 million). Commissions incurred amounted to Skr 26.4 million as compared to Skr 21.7 million in 2008, with the approximate 22 percent increase primarily reflecting higher costs for services related to financial instruments.
Net results of financial transactions
2010 versus 2009
Net results of financial transactions totaled Skr 2,497.6 million (2009: Skr 1,103.1 million). This significant increase from 2009 is primarily attributable to the gain realized from the sale of the shares in Swedbank, which totaled Skr 2,565.0 million, as explained in more detail below. However, this was partially offset by the fact that the net results of financial transactions from the previous year included an unrealized increase in value of Skr 769.3 million from the revaluation of certain financial assets and liabilities at fair value, while the corresponding item in 2010 consisted of an unrealized decrease in value totaling Skr 175.0 million. The significant increase in value in 2009 was related to the recovery from the financial crisis, which reduced market values in 2008, while the decline in value in 2010 was primarily related to the changes in value of long-term borrowing. In addition, lower gains were noted in 2010 from the repurchase of SEK’s own issued bonds and a loss on a sale of securities in the liquidity portfolio. This was partially offset by increased revenues from renegotiated loans recorded as securities.
On October 28, 2010, SEK sold its entire stake in Swedbank AB. The holding was placed with a number of Swedish and international institutional investors. SEK had previously announced that it should not be regarded as a long-term owner but rather had the intention to sell the stake in a responsible way. The shares, which had been acquired at a cost of Skr 997.6 million, were sold for a total of Skr 3,562.7 million resulting in a profit of Skr 2,565.0 million before taxes. At the board meeting held on October 29, 2010, SEK’s Board of Directors resolved to call an extraordinary general meeting with the purpose to propose an extra dividend amounting to Skr 1,890.0 million, equal to the realized profit from the sale after tax. The extraordinary general meeting was held on December 1, 2010, a decision on a special dividend amounting to Skr 1,890.0 million was taken. The dividend was paid to SEK’s owner, the Swedish State, on December 15, 2010. For further information regarding SEK’s stake in Swedbank AB see Note 23.
2009 versus 2008
Net results of financial transactions totaled Skr 1,103.1 million in 2009, as compared to negative Skr 456.9 million in 2008, of which Skr 333.8 million in 2009 as compared to Skr 191.8 million in 2008 related to realized gains on repurchases of SEK’s own debt and net currency exchange effects and Skr 769.3 million in 2009, as compared to negative Skr 648.7 million in 2008, related to unrealized changes in market valuations.
28
Table of Contents
The increase in realized changes in market valuations from Skr 87.3 million in 2008 to Skr 302.3 million in 2009 was primarily attributable to the aforementioned gains on the repurchase of SEK’s own debt.
The increase in unrealized market valuations cited above was primarily attributable to the changes in credit spreads on assets. These spreads affected the unrealized value of the assets negatively at the height of the financial crisis but have now largely reversed to levels prevailing before the financial crisis started. Assets affected by these valuation effects in SEK’s balance sheet are assets irrevocably categorized at initial recognition at fair value through profit or loss. Such assets had a book value on December 31, 2009 of Skr 10.0 billion as compared to a book value of Skr 11.2 billion at December 31, 2008. See also Note 12 to the Consolidated Financial Statements. Some of these assets are secured against the credit risk by credit default swaps. Part of the material negative unrealized effects during 2008, which reversed during 2009, was related to the fact that the difference between the bonds’ credit spreads and the spreads on credit derivatives increased significantly in 2008, which resulted in the negative fair-value changes.
Furthermore, unrealized losses on currency swaps, pursuant to which SEK initially exchanges USD to EUR, decreased during 2009. These derivatives are used to convert our dollar-denominated obligations to Euro-denominated obligations. During 2009, due to stabilized conditions affecting the pricing of such derivatives, the opening balance of unrealized losses was reduced thus creating an unrealized gain in 2009.
Personnel expenses and other expenses
2010 versus 2009
Personnel expenses totaled Skr 259.4 million (2009: Skr 312.2 million) and other expenses amounted to Skr 191.9 million (2009: Skr 159.0 million). The cost for the general incentive system in 2010 was Skr 0.0 million (2009: Skr 22.8 million). For information about the general incentive system and other terms and conditions of remuneration, see Note 5. The increase in other costs is primarily attributable to expenses associated with strengthening internal controls, as well as defining and clarifying SEK’s role and market positioning.
2009 versus 2008
Personnel expenses totaled Skr 312.2 million in 2009 as compared to Skr 228.5 million in 2008 and other expenses totaled Skr 159.0 million as compared to Skr 112.5 million in 2008. The cost increase was primarily attributable to business growth, the acquisition of Venantius and increased costs related to the development and efficiency of internal controls linked to government requirements and regulations. Personnel costs and other expenses in 2009 also include a provision amounting to approximately Skr 25 million recorded in connection with the final settlement of Venantius’ activities.
Personnel costs include an accrual for the estimated cost of the overall employee incentive system of Skr 22.8 million 2009 as compared to Skr 19.3 million for 2008. Senior executives receive no variable remuneration. The general incentive scheme for other employees is based on Adjusted Operating Profit (See Item 10 Additional Information, Supplemental Statistical Measure.)
In December 2009, the Swedish Financial Supervisory Authority promulgated new regulations (FFFS 2009:6) regarding remuneration policies in companies under its supervision. See “Remuneration policy” in Item 6 for information on how these policies are applied.
The total annual cost for the incentive system for each employee is limited to an amount equaling two months’ salary for that employee plus social insurance costs. SEK’s general incentive system, which is based on Adjusted Operating Profit, includes all permanent employees of the Group except for the executive officers, as aforesaid, and certain employees working in Advisory Services. The total number of employees included in the general incentive system at December 31, 2009, was 209 as compared to 170 at December 31, 2008. In addition to the general incentive system, SEK is also a party to individual, performance-related remuneration agreements.
Total variable remuneration for any individual employee may amount to a maximum equivalent to four months’ salary for that employee. Senior executives cannot receive variable compensation.
29
Table of Contents
Depreciation and amortization of non-financial assets
2010 versus 2009
The depreciations and amortization of non-financial assets amounted to Skr 13.1 million (2009: Skr 11.1 million). These costs were primarily attributable to the amortization of intangible assets relating to SEK’s business systems.
2009 versus 2008
Depreciation and amortization of non-financial assets amounted to Skr 11.1 million in 2009 compared to Skr 21.0 million in 2008. In both years these costs were mainly related to the depreciation of intangible assets related to SEK’s business IT system.
Impairments and reversals of previous write-downs of financial assets
2010 versus 2009
Impairments and reversals of previous write-downs of financial assets equal to Skr 7.2 million were made during the year (2009: Skr —283.0 million). In 2010 the need for impairments of credit losses decreased compared with 2009, when higher provisions made, primarily for expected losses related to Glitnir Bank, two CDOs with downgraded credit ratings and a general reserve for credit risks (for which individual counterparties have not been identified). Additional impairments of these CDOs were made in 2010.
SEK has investments in two Collateralized Debt Obligations (“CDOs”), both consisting of first-priority tranches, with end-exposure to the U.S. market. The ratings on these were downgraded significantly in 2008 and the quality of the assets continued to deteriorate in 2009 and 2010. The book value of these assets (before impairment) is Skr 638.4 million (2009: Skr 683.5 million). Based on information known as of December 31, 2010, the company assesses that the need for impairment increased in 2010 by Skr 122.5 million (2009: Skr 217.9 million) to a total of Skr 475.4 million (2009: Skr 352.9 million).
Reversals of previously made impairments amounted to Skr 126.9 million (2009: Skr 153.0 million), mostly attributable to the fact that SEK received more proceeds than expected from unwinding its claim against Glitnir Bank and to the reversal of part of the general reserve for credit risks (for which individual counterparties have not been identified). A reversal of the general reserve was made since it was determined that the credit risk for those exposures covered by this estimate had decreased (see Note 9 to the Consolidated Financial Statements).
2009 versus 2008
Impairments and reversals of previous write-downs of financial assets recorded in 2009 amounted to Skr -283.0 million as compared to Skr -557.0 million in 2008. These write-downs consist mainly of additional provisions for expected losses on financial assets for which impairments were initially been recorded in 2008. The relevant investments consist of (i) two collateralized debt obligations with significantly impaired credit ratings, as to which the additional impairment during 2009 amounted to Skr 217.9 million, following Skr 135.0 million in impairments recorded in 2008, and (ii) exposures to Glitnir Bank, in respect of which additional provisions amounting to Skr 70.0 million were recorded in 2009, following on Skr 389 million in impairments recorded in 2008. There was also a new provision of Skr 85.0 million recorded in 2009, as compared to Skr 0.0 million in 2008, which is not linked to a specific counterparty. The impact of new impairments recorded in 2009 was partially offset by a net reversal of reserves amounting to Skr 95.0 million in connection with the sale of Venantius’ credit portfolio (no such reversal was made in 2008).
Individual assets that SEK has determined to be impaired have been written down by a total of approximately 68 percent of their combined total book value as of December 31, 2009.
30
Table of Contents
As is mentioned above, SEK holds two collateralized debt obligations (first-priority-tranches) with end-exposure to the U.S. mortgage market. The rating of these assets was severely downgraded during 2008, and the quality of the assets further deteriorated during 2009. The book value of these assets (before impairment) amounts to Skr 683 million, and based on information known as of year-end 2009, the Group recorded additional impairment during 2009 of approximately Skr 217.9 million, bring the total impairment to approximately Skr 352.9 million (see Note 9 to the Consolidated Financial Statements).
Recovered credit losses
2010 versus 2009
In 2010, Skr 1.0 million was recovered on an earlier reported credit loss, as compared to a total of Skr 36.7 million in such recoveries in 2009. The decrease primarily reflected the fact that Venantius sold its credit portfolio in the end of 2009 and therefore no credit losses were recovered in Venantius during 2010.
2009 versus 2008
In 2009, Skr 36.7 million was recovered on an earlier reported credit loss, as compared to a total of Skr 4.7 million in such recoveries in 2008. The increase primarily reflected recovered credit losses in Venantius.
Operating Profit
2010 versus 2009
Operating profit (IFRS) totaled Skr 3,939.7 million, an increase of 66.3 percent from the previous year (2009: Skr 2,368.6 million). The increase in operating profit was mainly due to (1) the gain realized in connection with the sale of the shareholding in Swedbank AB amounting to Skr 2,565.0 million, (2) lower provisions for expected credit losses and (3) an increase in recovered credit losses. This was partially offset by a revaluation of certain assets and liabilities at fair value, which resulted in the previous year’s earnings being positively affected by an unrealized Skr 769.3 million change in value and in 2010 earnings being negatively affected by an unrealized Skr 175.0 million change in value. In addition, the increase in earnings was reduced by lower net interest revenues, lower gains from the repurchase of SEK’s own issued bonds and a realized loss on the sale of securities holdings.
2009 versus 2008
Operating profit amounted to Skr 2,368.6 million in 2009, a sharp increase from the Skr 185.2 million recorded in 2008. The significant increase in operating profit was mainly due to an increase in net results of financial transactions of Skr 1,560.0 million, an increase in net interest revenues of Skr 451.0 million and a decrease in impairments recorded on financial assets of Skr 274.0 million, each of which is discussed in more detail above. These increases were partially offset by the increase in personnel and other expenses noted above.
Net profit (after taxes)
2010 versus 2009
Net profit for the year amounted to Skr 2,891.7 million (2009: Skr 1,727.3 million). Tax on net profit amounted to Skr 1,048.0 million (2009: Skr 641.3 million), of which Skr 1,038.8 million (2009: Skr 398.0 million) consisted of current tax and Skr 9.2 million (2009: Skr 243.3 million) consisted of deferred tax (see Note 10). The increase in net profit for the year was primarily due to the gain realized from the sale of shares in Swedbank, which had a positive impact of Skr 1,890.0 million after tax, with no such corresponding impact during 2009.
31
Table of Contents
��
2009 versus 2008
Net profit amounted to Skr 1,727.3 million in 2009 as compared to Skr 143.9 million in 2008. In addition to reflecting the sharp increase in operating profit, net profit was positively impacted by a reduction in the corporate tax rate, effective as of January 1, 2009, from 28 percent to 26.3 percent. The impact on 2009 net profit of the reduced tax rate amounted to Skr 40.3 million as compared to Skr 19.3 million in 2008 (when the lower rate was already applied to deferred taxes).
g. Liquidity, Capital Resources and Funding
Liquidity
SEK has a conservative policy for liquidity and funding risk. The policy requires that all loan commitments are funded through maturity. As a consequence SEK continues to have a high level of liquid assets and a low funding risk. The aggregate volume of debt and equity exceeded the aggregate volume of loans outstanding and committed. Accordingly, all loan commitments are funded through maturity. See also the chart title “Development Over Time of SEK’s Available Funds” chart in the “Risk” section in this Annual Report. The Risk section is an integral part of this Report of the Directors.
Contractual Commitments
The following table sets forth as of December 31, 2010 the maturity analysis of SEK’s debt and other obligations. Repayments which are subject to notice are treated as if notice were to given immediately, except for “Subordinated securities issued” and “Derivatives” where repayments are assumed on the relevant maturity date. The table includes interest payments.
Financial Liability Maturity
| | At December 31, 2010 | |
| | Cash flow due by Period | |
Skr million | | Total
Cash flow | | Less than
1 month | | 1-3 months | | 3-12 months | | 1-5 years | | After 5 years | |
Senior debt | | -335,988.3 | | -9,810.8 | | -43,098.0 | | -76,422.9 | | -158,901.6 | | -47,755.0 | |
Borrowing from credit institutions | | -14,336.2 | | -3,141.2 | | -2,122.9 | | -2,129.6 | | -6,942.5 | | 0.0 | |
Borrowing from the public | | -19.4 | | — | | -18.4 | | -1.0 | | — | | — | |
Senior securities issued | | -321,632.7 | | -6,669.6 | | -40,956.7 | | -74,292.3 | | -151,959.1 | | -47,755.0 | |
Subordinated securities issued (1) | | -4,155.5 | | 0.0 | | -34.6 | | -103.9 | | -554.1 | | -3,462.9 | |
Derivatives | | 2,823.4 | | 207.6 | | 1,237.1 | | 2,095.2 | | 701.3 | | -1,417.8 | |
Total | | -337,320.4 | | -9,603.2 | | -41,895.5 | | -74,431.6 | | -158,754.4 | | -52,635.7 | |
(1) Perpetual maturity subject to redemption beginning in 2008 with the approval of the Swedish Financial Supervisory Authority (Nominal USD 350 million).
In addition to the financial liabilities above SEK has committed but undisbursed loans outstanding. If a loan is accepted by the borrower it can be disbursed immediately. However, disbursements may be delayed due to a number of factors. In some cases, accepted loans may never be disbursed, including as a result of changes in the customer’s need for the funds.
Financial Assets (Loans and derivatives) Maturity
The following table sets forth the maturity analysis of loans and derivatives outstanding as of December 31, 2010.
32
Table of Contents
| | Cash flow due by Period | |
Skr million | | Total
Cash flow | | Less than
1 month | | 1-3 months | | 3-12 months | | 1-5 years | | After 5 years | |
Loans in the form of interest-bearing securities | | 85,243.7 | | 417.5 | | 4,873.3 | | 11,846.4 | | 41,018.2 | | 27,088.3 | |
Loans to credit institutions | | 25,357.2 | | 680.1 | | 1,626.2 | | 4,810.8 | | 8,142.0 | | 10,098.1 | |
Loans to the public | | 94,568.4 | | 3,071.2 | | 4,980.7 | | 10,804.4 | | 52,807.2 | | 22,904.9 | |
Loans | | 205,169.3 | | 4,168.8 | | 11,480.2 | | 27,461.6 | | 101,967.4 | | 60,091.3 | |
Derivatives | | 46,880.7 | | 2,020.6 | | 8,411.6 | | 14,953.7 | | 15,786.4 | | 5,708.4 | |
Total | | 252,050.0 | | 6,189.4 | | 19,891.8 | | 42,415.3 | | 117,753.8 | | 65,799.7 | |
Loan Commitments Not Disbursed
The table below presents the period in which the undisbursed loans are expected to be disbursed.
| | At December 31, 2010 | |
| | Amount of Loans Outstanding Expiration Per Period | |
Skr mn | | Total
Amounts
Outstanding | | Less Than
1 month | | 1-3
months | | 3-12
months | | 1-5 years | | After 5
years | |
Loan Commitments Not Disbursed | | 40,084.7 | | 4,009.5 | | 4,568.7 | | 7,274.7 | | 8,480.4 | | 15,751.4 | |
Management’s opinion is that the Group’s liquidity is sufficient for the Group’s present requirements. With regard to liabilities the Group has the intention to refinance these through borrowings on the financial markets or in part using available liquidity, see Note 11. For further information about funding and liquidity risk, see the graph “Development over Time of SEK’s Available Funds” in Note 30 to the Consolidated Financial Statements.
Funding
The Group funds its lending primarily through public and private offerings of debt securities in the international capital and money markets. In many cases, SEK has been willing to provide “tailor-made” structures responding to the needs of particular investors. In those cases, SEK enters into offsetting derivative positions which convert the terms of the funding to variable interest rates mainly in USD or EUR to avoid exposure to changes in interest rates resulting from such structures. SEK also maintains a number of borrowing programs that allows it to respond quickly to borrowing opportunities or the need to fund a particular loan quickly.
SEK continued to have reliable access to the world’s capital markets throughout 2010, with new borrowing amounting to Skr 76.6 billion (2009: Skr 111.8 billion). Management believes that financial volatility that affected parts of Europe during the year resulted in investors around the world turning to institutions like SEK.
As noted, SEK’s new borrowing in 2010 amounted to Skr 76.6 billion (2009: Skr 111.8 billion), which is a decrease of Skr 35.2 billion from 2009. Repurchase of own debt amounted to Skr 9.2 billion (2009: Skr 10.2 billion) and early redemption on own debt amounted to Skr 24.6 billion (2009: Skr 24.9 billion). The decrease in new borrowing is primarily due to reduced borrowing requirements owing to lower lending volumes. SEK’s position in the international capital markets remains very strong.
SEK’s presence in the international capital markets is always important to its funding. However, at times when liquidity in the markets is weak, this continual presence is important to ensuring that SEK is able to access funding and therefore engage in long-term borrowing.
SEK’s new borrowing in 2010 was dominated by the Japanese private bond market, which accounted for 53 percent (2009: 29 percent) of total new borrowing. The Japanese market accounted for such a large share of funding owing to the attractive borrowing terms offered.
33
Table of Contents
Senior and Subordinated debt
The table below shows SEK´s senior and subordinated debt.
| | As of December 31, | |
Skr mn | | 2010 | | 2009 | |
Senior debt | | 300,672 | | 324,795 | |
Subordinated debt | | 2,590 | | 3,143 | |
Total debt | | 303,262 | | 327,938 | |
of which reported at fair value | | 162,595 | | 140,756 | |
As of December 31, 2010, debt consisted of bonds sold publicly or in private placements in various countries around the world pursuant to a number of different debt issuance programs. SEK has undertaken large, syndicated issuances to satisfy its liquidity needs. It also issues bonds that are structured to meet the specific investment needs of individual investors or small groups of investors. Currently, SEK has the following funding programs in place:
As of December 31, 2010 | |
Funding programs | | Value outstanding(1) | |
Medium-term note programs: | | | |
Unlimited Euro Medium-Term Note Programme | | USD 31,752.8 million | |
Unlimited SEC-registered U.S. Medium-Term Note Program | | USD 8,394.5 million | |
Unlimited Swedish Medium-Term Note Program | | Skr 1,464.5 million | |
Skr 8,000,000,000 Swedish Medium-Term Note Program | | Skr 4,217.0 million | |
Unlimited MTN/STN AUD Debt Issuance Programme | | AUD 213.5 million | |
Commercial paper programs: | | | |
USD 3,000,000,000 U.S. Commercial Paper Program | | USD 0.0 million | |
USD 4,000,000,000 Euro-Commercial Paper Program | | USD 0.0 million | |
(1) Amortized cost excluding fair value adjustments.
Debt Maturities
The following table illustrates debt maturities by different types of senior and subordinated debt.
Skr million | | 2011 | | 2012 | | 2013 | | 2014 | | 2015 | | Thereafter | | Total | |
| | (Skr million, except interest rate ranges) | |
Senior debt | | 61,425.0 | | 26,391.8 | | 43,885.9 | | 59,130.0 | | 23,844.6 | | 85,994.4 | | 300,671.7 | |
of which fixed-rate | | 27,560.2 | | 8,023.9 | | 10,386.1 | | 39,975.2 | | 10,196.9 | | 24,358.0 | | 120,500.3 | |
of which variable-rate | | 2,624.8 | | 5,083.1 | | 632.9 | | 8,642.8 | | 120.4 | | 449.5 | | 17,553.5 | |
of which formula-based | | 31,239.9 | | 13,284.8 | | 32,866.8 | | 10,512.0 | | 13,527.3 | | 61,186.9 | | 162,617.7 | |
| | | | | | | | | | | | | | | |
Subordinated debt | | 0.0 | | 0.0 | | 0.0 | | 0.0 | | 0.0 | | 2,590.3 | | 2,590.3 | |
of which fixed rate | | 0.0 | | 0.0 | | 0.0 | | 0.0 | | 0.0 | | 2,590.3 | | 2,590.3 | |
of which variable rate | | 0.0 | | 0.0 | | 0.0 | | 0.0 | | 0.0 | | 0.0 | | 0.0 | |
Total debt | | 61,424.9 | | 26,391.8 | | 43,885.8 | | 59,130.0 | | 23,844.6 | | 88,584.7 | | 303,261.8 | |
34
Table of Contents
Senior Debt by Category:
The following table illustrates our outstanding senior debt by category.
| | As of December 31, | |
Skr million | | 2010 | | 2009 | |
Fixed-rate(1) | | 120,500.3 | | 164,138.1 | |
Variable-rate (1) | | 17,553.6 | | 17,493.1 | |
Formula-based (1) | | 162,617.8 | | 143,164.0 | |
of which interest rate-linked | | 20,699.8 | | 25,833.4 | |
of which currency-linked | | 52,795.3 | | 44,511.0 | |
of which equity-linked | | 68,787.1 | | 55,686.6 | |
of which commodity-linked | | 18,273.8 | | 13,776.7 | |
of which credit-linked | | 2,061.8 | | 3,356.3 | |
Total senior debt | | 300,671.7 | | 324,795.2 | |
(1) As of December 31, 2010, the interest rate ranges for fixed-rate senior debt and variable-rate senior debt were 0.17 percent to 8.21 percent per annum and 0.22 percent to 2.097 percent per annum, respectively. The wide range of interest rates reflects the fact that the debt is issued in many different currencies and with different maturities.
SEK’s economic hedges are expected to be effective in offsetting changes in fair values attributable to hedged risks. Certain assets and liabilities in such hedges require complex judgments regarding the most appropriate valuation models and assumptions. The gross values of certain assets and liabilities (primarily derivative and senior securities issued by SEK), which effectively hedge each other, are affected by this complexity. If different valuation models or assumptions were employed instead of those used in the valuations in this report, or if assumptions were changed, this could produce different results regarding the gross value of such securities issued and hedging derivatives. Changes in the fair value of derivatives will usually be offset by changes in fair value of securities issued, and the connected change in the fair value will thus not have a material effect on either results or equity. SEK’s credit spreads on its own debt, however, are not hedged with regard to securities issued, and therefore a change in the assumptions used for this could affect profit and equity by a significant amount.
The outstanding volume of debt with remaining maturities of one year or less increased during 2010. At December 31, 2010, outstanding debt with remaining maturities of one year or less, under the assumption that instruments callable within one year are called, amounted to Skr 129.3 billion, compared with Skr 99.4 billion at December 31, 2009.
Certain Off-Balance Sheet Arrangements
SEK has a Skr 100 billion loan facility with the Swedish National Debt Office. The Swedish parliament has also authorized the government to enable SEK to purchase state guaranties on commercial terms for new borrowing of up to Skr 250 billion. In January 2011, both the loan facility and the ability to purchase state guarantees were extended for 2011.
Trend Information
SEK’s future development is based on a number of factors, some of which are difficult to predict and generally beyond the company’s control. These factors include:
· Changes in general economic business conditions
· Changes and volatility in currency exchange and interest rates
· Changes in the competitive situation in one or more financial markets
· Changes in government policy and regulations, as well as in political and social conditions
· Natural disasters, political unrest or other events beyond our control may impact one or more financial
35
Table of Contents
markets or general business conditions
For additional information on the trends affecting SEK and the risks it faces, see the discussions under “Business Volume” above and the “Risk Factors” in Item 3.
ITEM 6. DIRECTORS, SENIOR MANGEMENT AND EMPLOYEES
The board of directors of the Parent Company (the “Board of Directors”) is responsible for the management of the Parent Company.
The Parent Company’s Articles of Association currently provide that the Board of Directors shall consist of six to nine directors. The State, as holder of all the shares, elects the directors. The Chairman of the Board of Directors is appointed at each Annual General Meeting. The Board of Directors may appoint a Vice Chairman of the Board of Directors.
The Board of Directors convenes at least six times a year.
The members of the Board of Directors are elected at each Annual General Meeting to serve for the period until the end of the next Annual General Meeting. An Annual General Meeting is required to be held not later than June 30 of each year. Executive officers are appointed by the Board of Directors to serve for non-fixed periods.
Certain information with respect to the Parent Company’s directors and executive officers is set forth below. Unless otherwise indicated, such information is given as of the date of this annual report.
Board of Directors and Executive Officers
Name | | Age(1) | | Position(1) |
Ulf Berg | | 59 | | Chairman of the Board and Director |
Christina Liffner | | 60 | | Vice Chairman of the Board and Director |
Karin Apelman | | 49 | | Director |
Jan Belfrage | | 66 | | Director |
Helena Levander | | 53 | | Director |
Jan Roxendal | | 57 | | Director |
Risto Silander | | 53 | | Director |
Eva Walder | | 59 | | Director |
Per Östensson | | 51 | | Director |
| | | | |
Peter Yngwe | | 53 | | President |
Måns Höglund | | 59 | | Executive Director, Corporate & Structured Finance |
Jane Lundgren Ericsson(2) | | 45 | | Executive Director, President, AB SEK Securities |
Sirpa Rusanen | | 46 | | Executive Director, Human Resources |
Susanna Rystedt | | 46 | | Executive Director, Chief Administrative Officer |
Sven-Olof Söderlund | | 58 | | Executive Director, Risk & Planning |
Per Åkerlind(2) | | 48 | | Executive Director, CFO and Head of Capital Markets |
Johan Winlund | | 41 | | Executive Director, Communications |
(1) At December 31, 2010
(2) As of January 2011, Jane Lundgren is Vice Chief Operating Officer and Per Åkerlind is Chief Operating Officer.
36
Table of Contents
Members of the Board of Directors
Mrs. Apelman was appointed a director by the State in June 2003. She has been Director General of The Swedish Export Credits Guarantee Board ( EKN) since 2007. Prior to that she served as Chief Financial Officer at Luftfartsverket since 2001. Prior to that she served in various executive capacities at Saab Aircraft Leasing and Scandinavian Airlines (SAS). She has previously served as Deputy Chairman of the Board of A-banan Projekt AB, Second Deputy Chairman of the Board of The Swedish Export Credits Guarantee Board (EKN) and Director of Göteborg City Airport, Deputy Director of Nordic Airport Properties AB and Arlanda Schipol Development Company AB. She is a director of Swedavia, member of the Swedish Radiation Safety Authority’s financing delegation and the oversight committee of the Swedish Legal, Financial and Administrative Services Agency.
Mr. Belfrage was appointed a director in April 2010. He is a director at Marginalen group and Litorina Capital 3. Previously he was a director at Litorina Capital 4. He served in various executive capacities at Crédit Agricole, Citigroup Nordic Countries, Citigroup Sweden, Aga AB, and AB SKF.
Mr. Berg was appointed to the Board of Directors as Chairman in May 2006. He has been President of the Swedish Trade Council since 2004. Prior to that he served in various executive capacities at Saab Ericsson Space and Ericsson Microwave System and was President of Ericsson AB from 2002 to 2003. From 2003 to 2004, he ran his own management consulting company. He is a director of Volvo Aero and Speed International AB.
Mrs. Liffner was appointed a director in June 2003 and was appointed Deputy Chairman of the Board of Directors in April 2004. She has served in various executive capacities at AssiDomän AB, ABB Atom AB, Asea AB and Surahammars Bruks AB since 1979. She is the chairwoman of the boards of directors of Svensk Adressändring AB and the Swedish Endrometriosis Association. She is a director of Sveaskog AB, Länsförsäkringar Bergslagen AB, SJR in Scandinavia AB and Prevas AB.
Mrs. Levander was appointed a director in April 2004. She is a Partner and the President of Nordic Investor Services AB. Previously she has served in various executive capacities at Neonet AB, Odin Fonder and Nordea Asset Management. She is a director of SBAB, Mandator AB, Geveko AB, Transatlantic AB, Stampen AB, Erik Penser Bankaktiebolag, Nordisk Energiförvaltning ASA and Wiborg Kapitalförvaltning.
Mr. Roxendal was appointed a director in 2007. He is President of Gambro AB, the chairman of the board of directors of Securia Intressenter AB and a director of VBN Chamber Business Networks AB. Previously, he has served as Chief Executive Officer of Intrum Justitia AB and as an executive vice president in the ABB Group and as Chief Executive Officer of ABB Financial Services. He is a director of mySafety Group AB and Swedish Export Credits Guarantee Bord (EKN).
Mr. Silander was appointed a director in April 2004. He is a director of East Capital Asset Management AB, 11 Real Asset Fund AB, The Trygg Foundation, Stronghold Invest AB, Varenne AB, BREVAN Howard Ltd. and E. Öhman Jr AB. Gamla SEB Trygg Liv, deputy. Previously, he served for 20 years in various executive capacities at Alfred Berg, ABN AMRO, UBS, Goldman Sachs, Handelsbanken and Citibank.
Ms. Walder was appointed a director in May 2009. She has been a Director at the Ministry for Foreign Affairs since 2009, and from 2006 to 2009 she was Sweden’s Ambassador in Finland. Between 2002 and 2006 she was Director at the Ministry for Foreign Affairs.
Mr. Östensson was appointed a director in August 2010. He has been Senior Adviser at the Swedish Ministry of Finance since 1998 and he is a director at Swedfund. Previously he has been Adviser at the Swedish Ministry for Foreign Affairs Central and Eastern Europe, Marketing Consultant at The Swedish Trade Council Australia, Product Manager at ITT Flygt, and Consultant at Sweco.
Executive Officers
Mr. Yngwe has been President and Chief Executive Officer (CEO) since April 1997. Prior to that he was the Chief Financial Officer of the Parent Company (beginning in March 1991) and, prior to that the
37
Table of Contents
Treasurer, of the Parent Company (beginning in 1988). He joined the Parent Company in 1984 and served in various capacities in the Finance Department of the Group prior to becoming the Group´s Treasurer.
Mr. Höglund has been Executive Director, International since January 2011. Previously he was Executive Director, Head of Corporate and Structured Finance since January 2002. Prior to that he served as Head of Private Banking for Sweden at Nordea, beginning in 2000, and, before that, he served in executive capacities at Unibank, Sweden Branch: FöreningsSparbanken/Sparbankernas Bank (Swedbank); Gotabanken, Stockholm, Götabanken, London and Hambros Bank, London. He is Chairman of the Board of Directors of Searching 4Knowledge AB.
Mrs. Lundgren Ericsson has been Vice Chief Operating Officer since January 2011, Executive Director since April 2005 and has served as President, AB SEK Securities, since 2002. Previously she served as SEK’s Head of Legal and Transaction Management, beginning in 1993.
Mrs. Rusanen has been Executive Director, Human Resources since 2005. Prior to that she served as Human Resource Manager at Ericsson, beginning in 1997.
Mrs. Rystedt has been Executive Director and Chief Administrative Officer since March 2009. Prior to that she has served as Head of Business Development & IT at SEB Life beginning in 2005. From 2002 and until then she served as Head of IT at SEB Trygg Liv, and before that she served in other capacities at SEB Trygg Liv and Enskilda Securities and as a member of the Group Staff within the SEB Group, beginning in 1990.
Mr. Söderlund has been Executive Director of Strategic Analysis since January 2011. Previously he was Executive Director of Risk & Planning since April 2009. Prior to that he served as Executive Director, Risk & IT from January 2007 and Executive Director, Strategic Analysis & Planning, from December 1999, and, prior to that, he was Executive Director of Risk & Credit Management, beginning in January 1998. He was the Controller of the Group from 1988 to 1997.
Mr. Åkerlind has been Executive Director, COO since January 2011. Previously he was Executive Director, CFO and Head of Capital Markets since June 2002. Prior to that he served as Executive Director, Treasurer and Head of Debt Capital Markets beginning in September 2000. Prior to that he served in various capacities within the Debt Capital Markets group, beginning in 1990.
Mr. Winlund has been Executive Director since January 1, 2011 and Head of Communications since August 2007. Prior to that he served six years as Communications officer at TV4, Sweden’s largest television company. Before that, beginning in 2000, he served as Communications officer at Telia Finans.
Compensation of Directors and Officers.
The aggregate remuneration of all directors and executive officers as a group paid or accrued in 2010 was Skr 17.9 million (2009: Skr 17.3 million; 2008: Skr 15.7 million), all of which was in the form of salaries in the case of executive officers, and in the case of directors consisted of fees. The employees of the Group, including its executive officers, are covered by various national social service programs to which the Group contributes. The Group also maintains a pension plan with an insurance company to which the Group contributed approximately Skr 9.8 million in 2010 (2009: Skr 7.9 million; 2008: Skr 7.2 million) on behalf of all executive officers as a group.
The total amount of the pension obligations related to executive officers (including those listed above), charged to results and reported as a provision, was Skr 14.3 million at December 31, 2010 (year-end 2009: Skr 14.5 million; year-end 2008: Skr 13.5 million).
In 2010, the Chairman of the Board of Directors received Skr 0.2 million (2009: Skr 0.2 million; 2008: Skr 0.2 million) and each other director received between Skr 0.0 million and 0.2 million (2009: Skr 0.1 million; 2008: Skr 0.1 million) in remuneration. Certain directors received additional compensation for service on board committees as set forth below.
38
Table of Contents
The President and Chief Executive Officer’s remuneration and other benefits in 2010 totaled Skr 4.2 million (2009: Skr 4.2 million; 2008: Skr 4.2 million). The President did not receive any variable compensation. The entirety of such remuneration represented qualifying income for pension purposes in each of 2010, 2009, and 2008. During 2010, the President’s employment contract was renegotiated, including changes to terms regarding age of retirement, redundancy pay and pension benefits. The contract now follows the governmental guidelines for conditions of employment of senior executives (issued April 20, 2009).The President and Chief Executive Officer´s retirement age is 65.
Remuneration to other executive officers of the Parent Company in 2010 totaled Skr 12.7 million (2009: Skr 12.1 million; 2008: Skr 10.4 million) of which Skr 0.0 million (2009: Skr 0.0 million; 2008: Skr 0.0 million) represented variable remuneration. Certain key executive officers of the Parent Company (including those listed above) have employment contracts providing for certain compensation during a period of, at the most, two years, in the event such contracts are terminated by the Parent Company, subject to deduction for any salary received in new employment. None of the directors have contracts with SEK providing for benefits upon termination of service.
See also Note 5 to the Consolidated Financial Statements.
Board Practices
Activities and Division of Responsibility within the Board of Directors
The Board of Directors establishes rules of procedure every year. The rules of procedure govern such matters as reporting to the Board of Directors, the frequency and form of Board meetings, and delegation and assessment of the work of the Board of Directors and the President. Besides the appointment of the President, the most important tasks of the Board of Directors are to draw up business plans and budgets, make certain lending- and funding-related decisions, approve major investments and significant changes to the company organization, and to establish central policies and instructions. In addition to this, the Board monitors financial development and has ultimate responsibility for internal control, compliance and risk management.
In addition, the Board is responsible for a well thought-out and firmly established policy and strategy for dealing with respect for the environment, social responsibility, human rights, corruption and equal opportunities and diversity.
The Chairman of the Board leads the work of the Board of Directors and is responsible for ensuring that the other members of the Board are provided with the necessary information.
When required, the Chairman of the Board participates in important meetings and represents the company in ownership matters. The tasks of the Chairman of the Board of Directors conform to the Swedish Companies Act and the rules of procedure of the Board of Directors. SEK’s general counsel acts as secretary to the Board of Directors.
The Board has established a credit committee (the body that deals with credit-related matters), a finance committee (the body that deals with other financial matters besides those relating to credits), an audit committee (the body that deals with the company’s financial reporting, risk assessment, internal control etc) and a remuneration committee (the body that deals with certain remuneration matters). Besides the Board committees and the work for which the Chairman is responsible, work is not divided within the Board of Directors.
Appointing the Board of Directors and Auditors
The Board of Directors should consist of at least six and at most nine members. Nomination to the Board of Directors is dealt with by the Swedish Ministry of Foreign Affairs. This process is coordinated by the unit for government action within the Ministry of Finance.
Auditors are appointed by the Annual General Meeting for a period of four years.
39
Table of Contents
Review of Board Activities
The Board of Directors met on 11 occasions in 2010. In addition to this, the Board of Directors held a special strategy seminar. The work of the Board was carried out in accordance with the established rules of procedure. Meetings of the Board discussed such matters as annual and interim reports, business activities, the 2011-2013 business plan, the 2011 budget, organizational and staffing issues, staff member review, the Swedish National Audit Office’s review report on AB Svensk Exportkredit (RiR 2010:15) and the positioning of SEK for the future. One of the Board meetings was held in Ludvika. In conjunction with this meeting the Company’s Board and executive management carried out a study visit to ABB and Bombardier. During the financial year the Board’s credit committee, finance committee, remuneration committee and audit committee met on 14, 5, 7 and 6 occasions respectively. While examining the annual and interim accounts, the external auditors participated in 5 meetings of the Board of Directors and reported to and conducted a dialogue with the Board about their observations arising from the scrutiny and assessment of SEK’s operations.
Committees
The following is a description of the Parent Company’s committees on which members of the Board of Directors participate as committee members. Each committee acts pursuant to authority delegated from the Board of Directors in accordance with Swedish law and the procedural rules of the Board of Directors. The Board of Directors reviews the minutes of the meetings of, and the actions taken by, each of such committees.
Credit Committee
The committee discusses matters relating to credits and credit decisions. The Board of Directors has drawn up policy and instructions for the Credit Committee. At the request of the Board, the committee has issued a credit instruction that has been reported to the Board. Minutes from meetings of the committee are submitted to the Board and examined during Board meetings. Decision-making rights regarding credits follow an order of delegation established by the Board of Directors. The Board has appointed the following four members to the Credit Committee: Karin Apelman (chairwoman), Jan Belfrage, Helena Levander and Eva Walder. From executive management, The President, the Head of Strategic Planning and the Head of Corporate & Structured Finance attended the committee’s meetings. The company’s general counsel acted as the secretary to the committee.
Finance Committee
The committee is a drafting group for the Board of Directors in overall questions relating to the company’s financial activities. Such financial activities refer to long-term and short-term borrowing, liquidity management, risk measurement and risk limits, and matters relating to policy or quality assurance. The Finance Committee is empowered to decide on interest rate limits and currency risk limits.
The Board of Directors has established policy and instructions for the Finance Committee. At the request of the Board, the committee has issued a finance instruction that has been reported to the Board. Minutes from meetings of the committee are submitted to the Board and examined during Board meetings. The Board has appointed the following four members to the Finance Committee: Risto Silander (chairman), Karin Apelman, Jan Roxendal and Per Östensson. From the executive management, the President and the CFO attended the committee’s meetings. The company’s general counsel acted as the secretary to the committee.
Remuneration Committee
The committee discusses matters relating to salaries and other benefits for the President and overall issues relating to salaries and other benefits. During 2010 the committee decided on salaries and other benefits for the executive management (with the exception of the President). As of 2011 the committee will prepare proposals on salaries and other benefits for the executive management (including the President). The committee will also prepare proposals for the terms and outcomes of a general incentive program.
The Board of Directors has drawn up instructions for the Remuneration Committee. Minutes from meetings of the Remuneration Committee are submitted to the Board and examined during Board meetings.
40
Table of Contents
The Board has appointed the following three members to the Remuneration Committee: Ulf Berg (chairman), Christina Liffner and Eva Walder. The President participated in meetings of the committee in matters that did not relate to the President’s terms and conditions of employment. SEK’s Human Resources Director participated in the committee’s meetings. The company’s general counsel acted as the secretary to the committee.
Audit Committee
The committee (established in accordance with the Swedish Companies Act) discusses matters relating to the company’s financial reporting and corporate governance report (including the Board’s report of internal control over financial reporting) in accordance with the Swedish Corporate Governance Code. The Audit Committee establishes overall instructions for the company’s auditing work. The Board has set out the instructions for the Audit Committee and appointed the following Board members to the committee: Jan Roxendal (chairman) and Christina Liffner. The President and the Administrative Director also attended the committee’s meetings. SEK’s Chief Accounting Officer, the person responsible for SEK’s internal control support function and SEK’s Head of Internal Audit have reported on the committee’s work and SEK’s general counsel has acted as the secretary to the committee. All meetings are also attended by the auditors appointed by the annual general meeting, and the auditor’s report their observations from the audit. The meetings of the committee are also attended by an auditor appointed by Swedish National Audit Office.
Employee Relations
During the year, the number of employees averaged 228 (2009: 211 employees; 2008: 183 employees), of whom 100 (2009: 93; 2008: 78) were female and 128 (2009: 118; 2008: 105) were male. The total number of employees is small in relation to the volume of lending because the number of lending transactions is relatively small and the administration and documentation of loans is in many cases handled by the banks participating in the transactions. The Group has not experienced any strikes or labor disputes and considers its employee relations to be good.
Members of the Board of Directors, the CEO, and other executive officers have no share ownership in the Parent Company or Subsidiaries and no options have been granted to them with respect to the Parent Company’s shares. There are no arrangements for involving the employees in the capital of the Parent Company, including any arrangement that involves the issue or grant of options or shares or securities of the Parent Company.
ITEM 7. MAJOR SHAREHOLDERS AND RELATED PARTY TRANSACTIONS
A, Major Shareholders
Until April 29, 2010, the shares of the Parent Company were divided into 2,579,394 Class A shares and 1,410,606 Class B shares, with each A-share and each B-share having a par value of Skr 1,000, and each class having equal voting rights, under the Parent Company’s Articles of Association. At the Annual General Meeting of April 29, 2010, the Articles of Association were changed so that the division of the company’s shares into A-shares and B-shares was abolished, effective April 29, 2010. The total amount of shares is now 3,990,000. Since June 30, 2003, the Swedish State has been the sole (100 %) owner of SEK. The State owns all of the shares. Under the Articles of Association, holders of shares of the Parent Company have a right of preemption in the event of a transfer of shares of the Parent Company to a person other than an existing holder of shares of the same class in the Parent Company.
The following table sets forth the share ownership of the Parent Company before and after the abolition of the A-shares and B-shares:
41
Table of Contents
Share ownership of the Parent Company until April 29, 2010.
Shareholder | | | | Ownership % | | Number of shares | | | |
Kingdom of Sweden | | Appr. | | 64.65 | | 2,579,394 | | Class A shares | |
Kingdom of Sweden | | Appr. | | 35.35 | | 1,410,606 | | Class B shares | |
| | | | 100.00 | | 3,990,000 | | Shares | |
Share ownership of the Parent Company from April 30, 2010.
Shareholder | | | | Ownership % | | Number of shares | | | |
Kingdom of Sweden | | Appr. | | 100.00 | | 3,990,000 | | Shares | |
| | | | 100.00 | | 3,990,000 | | Shares | |
Ownership and governance
SEK is owned by the Swedish State. The State exerts its influence at the Parent Company’s general meetings and through representation on the Board of Directors.
The governance of SEK is divided between the shareholder, the Board of Directors and the President, in accordance with the Swedish Companies Act, the Articles of Association, and the Board of Directors’ procedural rules. The Board of Directors appoints the President, who conducts ongoing management in accordance with the Board of Directors’ guidelines and instructions.
The State as shareholder has decided that State-owned companies should observe the Swedish Corporate Governance Code.
B. Transactions with related parties
SEK defines related parties for the Consolidated Group as:
· Its shareholder, the Swedish State
· Organizations that are controlled through a common owner, the Swedish
State
· Key management personnel
The Swedish State owns 100 percent of the Parent Company’s share capital. By means of direct guarantees extended by the National Debt Office, EKN — The Swedish Export Credits Guarantee Board and by Sida, supported by the full faith and credit of Sweden, 25.4 percent of the Group’s outstanding loans as of December 31, 2010, were guaranteed by the State (year-end 2009: 16.0). SEK administers, in return for compensation, the State’s export credit support system, and the State’s concessionary credit program (the “S-system”). Pursuant to an agreement between SEK and the State, SEK is reimbursed for certain costs under the S-system. See Note 1(d) to the Consolidated Financial Statements and Item 4 above.
The Government has established a guarantee fund of callable capital, amounting to Skr 600 million in favor of SEK. SEK may call on capital under the guarantee if SEK finds it necessary in order to be able to fulfill its obligations. SEK pays a commercial fee for this guarantee. See Note 3 to the Consolidated Financial Statements.
In December 2008, SEK received an infusion of Skr 3.0 billion in new capital from its owner, the Swedish State and has also received from the Swedish State the totality of the shares of Venantius AB, valued at approximately Skr 2.4 billion, as a part of the State’s program to strengthen SEK’s capacity to finance the Swedish export industry. For additional information regarding the acquisition of Venantius see Note 31 to the Consolidated Financial Statements. In addition, on February 5, 2009 the government decided to provide SEK with access to a loan facility during 2009 amounting to Skr 100 billion via the Swedish National Debt Office, an action that was approved by the parliament. Further, the parliament authorized the government to sell government guarantees to SEK, on market terms, to cover up to Skr 450 billion of new borrowing during 2009. In 2010, the parliament also authorized the government to sell government guarantees to SEK on market terms, for new borrowing during 2010 of up to Skr 250 billion (i.e., an upper limit Skr 200 billion
42
Table of Contents
lower than that of the guarantees made available during 2009). In January 2011, both the loan facility and the ability to purchase state guarantees were extended for 2011 on the same terms. SEK has not to date experienced a need to use the loan facility or purchase any of the Swedish government guarantees.
The Group enters into transactions in the ordinary course of business with entities that are partially or wholly-owned or controlled by the State. The Group also extends export loans (in the form of direct or pass-through loans) to entities related to the State. Transactions with such parties are conducted on the same terms (including as to interest rates and repayment schedules) as transactions with unrelated parties.
Key management personnel include the following persons:
· The members of the Board of Directors
· The President and CEO
· Other executive officers
For information about remuneration and other benefits to key management personnel, see Note 5 to the Consolidated Financial Statements.
See also Note 28 to the Consolidated Financial Statements for further details on related-party transactions.
ITEM 8. FINANCIAL INFORMATION
A. Consolidated Financial Statements and Other Financial Statements.
See Item 18, “Financial Statements”.
Legal Proceedings
In March 2009, in connection with the settlement of a claim against Sparbanksstiftelsernas Förvaltnings AB (“SFAB”), SEK came to an agreement with SFAB by which SEK, through a purchase, assumed ownership of 25,520,000 shares in Swedbank AB representing approximately 3.3 percent of Swedbank’s total share capital and votes. On June 16, 2009 SEK received a claim from SFAB challenging the agreement related to the transfer of ownership in the shares of Swedbank AB, which claim has been rejected by SEK. SEK subsequently subscribed for new shares in a rights offering of Swedbank AB in the autumn of 2009. Payment for new shares of Skr 497.6 million was delivered on October 6, 2009. SEK’s holding in Swedbank AB amounted to 3.3 percent and the number of shares amounted to 38,280,000 after participating in the rights offering.
On October 26, 2009, SEK received an additional claim from SFAB relating to the value of SEK’s entire then-current stake in Swedbank (38,280,000 shares), including fair valuation changes. These shares had an acquisition cost of a total of Skr 997.6 million, and, as of September 30, 2010, had a book value of Skr 3,592.0 million, which corresponded to the fair value. The aforementioned additional claim did not affect SEK’s previous conclusion that SFAB has no valid claim, and, therefore, it has been rejected.
On November 11, 2009, SFAB announced that it had initiated arbitration proceedings. On March 1, 2010, SFAB submitted a statement of claim against SEK at the Arbitration Institute of the Stockholm Chamber of Commerce. The statement of claim has subsequently (after SEK filed its defense) been supplemented and developed. The arbitration process is still ongoing. On March 5, 2010, SFAB also submitted an application for summons against SEK in the said dispute to the City Court of Stockholm. SEK still believes that SFAB’s demands are unfounded and has therefore not made any financial provisions in respect of any of the actions taken by SFAB as described above.
On October 28, 2010, SEK sold its entire stake in Swedbank AB. The holding was privately placed with a number of Swedish and international institutional investors. SEK, a holder of shares in Swedbank since March 2009, had previously announced that it should not be regarded as a long-term owner but rather had the intention to sell the stake in a responsible way. The shares, which had been acquired at a cost of Skr 997.6 million, were sold for a total of Skr 3,562.7 million resulting in a profit of Skr 2,565.0 million before taxes. At
43
Table of Contents
the board meeting held on October 29, 2010, SEK’s Board of Directors resolved to call an extraordinary general meeting with the purpose to propose an extra dividend amounting to Skr 1,890.0 million, equal to the realized profit from the sale after tax. The extraordinary general meeting was held on December 1, 2010, a decision on a special dividend amounting to Skr 1,890.0 million was taken. The dividend was paid to SEK’s owner, the Swedish state, on December 15, 2010. See Note 23 to the Consolidated Financial Statements for information about SEK’s dispute with SFAB.
SEK has not recorded any impairment related to its exposures to the Lehman Brothers group.
Following Lehman Brothers Holdings Inc.’s (the parent company in the Lehman Brothers group) request for bankruptcy protection on September 15, 2008, SEK replaced most of the outstanding derivative contracts the parent company had entered into with three different Lehman Brothers entities. In accordance with the terms of the original contracts (which generally took the form of ISDA Master Agreements), SEK prepared statements of claim (“Calculation Statements”) in relation to all of these Lehman Brothers entities. The Calculation Statements were delivered to the respective counterparties in the beginning of October 2008.
The majority of the contracts SEK had with different Lehman Brothers entities served primarily to hedge SEK against market risk. Those contracts have been replaced with new contracts. In addition, SEK had entered into credit default swaps with Lehman Brothers entities that were accounted for as financial guarantee and therefore recorded at amortized cost. The underlying counterparties covered by these credit default swaps all had such creditworthiness as to qualify under SEK’s policies to be held without credit default swap coverage. SEK has therefore not replaced these credit default swaps. However, the Calculation Statements include claims for calculated costs related to the replacement of these financial guarantees. SEK’s claims against Lehman Brothers associated with these financial guarantees total approximately Skr 1.3 billion, which has not been recognized in the Statement of Financial Position due to the requirement that contingent assets only be recognized when there is virtual certainty of collection. Given the unprecedented nature of the Lehman Brothers bankruptcy filing and the expected length of the bankruptcy process, an assessment has been made that the “virtual certainty of collection” standard has not been met.
In June 2009, Lehman Brothers Finance S.A. (in liquidation, with PricewaterhouseCoopers as appointed liquidators) (“LBF”) notified the Parent Company that LBF was demanding the payment of amounts that LBF claimed were due under one of the original ISDA Master Agreements (the “LBF Agreement”), plus interest, rejecting SEK’s claims for cross-affiliate set-off, interest and damages, as reflected in certain of the Calculation Statements. SEK rejected LBF’s claim for payment and its other objections to the relevant Calculation Statements. SEK disagrees with LBF’s position, and intends to vigorously defend its position.
SEK believes that, the company will not suffer any significant losses related to the bankruptcy of Lehman Brothers and has therefore not made any provision for this. SEK’s set-off and damage claims have however not been settled, and no assurance can be given that they will be compensated in full. Nor can any guarantees on the outcome of the group’s dispute with LBF be given. SEK will continue to evaluate the situation and await the outcome of Lehman Brothers Holdings Inc.’s bankruptcy.
There is no other material pending or, to the Group’s knowledge, threatened, legal or governmental proceedings to which the Group is or would be a party or to which any of its property is or would be subject.
Dividend Policy
SEK’s dividend policy strives to provide SEK’s shareholder with a competitive long-term return on equity consistent with maintaining capital that is well above the regulatory capital requirements. The dividend policy established at the Annual General Meeting on April 30, 2008, states that SEK should, over time, pay a dividend of at least thirty percent of net profit after tax.
At the board meeting held on October 29, 2010, SEK’s Board of Directors resolved to call an extraordinary general meeting with the purpose to propose an extra dividend amounting to Skr 1,890.0 million, equal to the realized profit from the sale of SEKs entire stake in Swedbank AB, after tax. The extraordinary general meeting was held on December 1, 2010, and a decision on a special dividend amounting to Skr 1,890.0 million was taken. The dividend was paid to SEK’s owner, the Swedish state, on December 15, 2010.
44
Table of Contents
The Board of Directors resolved on March 11, 2011, to propose to the Annual General Meeting to be held on April 29, 2011 that a dividend in the aggregate amount of Skr 301.0 million (or Skr 75.44 per share) be paid to the shareholder in relation to financial year 2010.
| | In relation to respective years | |
Skr mn | | 2010 | | 2009 | | 2008 | |
Dividend | | 301.0 | | 518.0 | | — | |
Special dividend | | 1,890.0 | | — | | — | |
For additional details regarding equity, see the Consolidated Statement of Equity.
A. Significant Changes
Except as otherwise disclosed in this report, there has been no significant change in our financial position since December 31, 2010.
ITEM 9. THE OFFER AND LISTING
Nature of Trading Market
The Parent Company’s shares, all of which are owned by the State, are not listed on any exchange in Sweden or outside Sweden.
All issues of the Parent Company’s U.S. Medium-Term Notes listed on securities exchanges in the United States are set forth on the cover of this Report. Certain global issues of such notes are listed on European exchanges. In particular, the Parent Company’s 4.875% Global Notes due September 29, 2011, 5.125% Global Notes due March 1, 2017, Floating Rate Global Notes due August 14, 2014, 3.25% Global Notes due September 16, 2014, and 1.750% Global Notes due October 2015 are listed on the London Stock Exchange.
Other issues of the Parent Company’s Medium Term Notes are traded in the over-the-counter market.
ITEM 10. ADDITIONAL INFORMATION
Exchange Controls and Other Limitations Affecting Security Holders
There are currently no Swedish exchange control laws or laws restricting the import or export of capital. No approvals are necessary under Swedish law to enable the Group at the times and in the manner provided in the Group’s debt securities and the indentures or other instruments pursuant to which such securities have been issued, to acquire and transfer out of Sweden all the amounts necessary to pay in full the principal of and/or interest on such securities, and any additional amounts payable with respect thereto, and no external approval would be required for any prepayment of such securities.
Under Swedish law and the Parent Company’s Articles of Association, there are no limitations on the right of non-resident or foreign owners to hold debt securities issued by the Parent Company.
Memorandum and Articles of Association
Set forth below is a brief summary of certain significant provisions of the Parent Company’s Articles of Association and Swedish law. This description does not purport to be complete and is qualified by reference to the Articles of Association, which are incorporated by reference, as an exhibit to this annual report.
45
Table of Contents
Registration
The Parent Company’s registry number with the Swedish Company Registry (Sw. bolagsregistret) of the Swedish Companies Registration Office (Sw. Bolagsverket) is 556084-0315.
Purpose
Under Article 3 of the Articles of Association, the Parent Company’s objective is to engage, on commercial grounds, in Swedish and international financing activities in accordance with the Banking and Financing Business Act (2004:297) in order to promote activities of Swedish interest, directly or indirectly related to Swedish export industry including Swedish infrastructure, and further to otherwise strengthen the internationalization and competitiveness of the Swedish industry. The Parent Company’s financing activities include, but are not limited to: (i) borrowing funds, for example by accepting deposits from the general public or issuing bonds or other comparable debt instruments, (ii) granting and intermediating loans, for example in the form of loans secured by charges over real property or claims, (iii) issuing guarantees and assume similar obligations, and (iv) holding of and conduct trading in securities.
Certain Powers of Directors
Under the Swedish Companies Act (Sw. Aktiebolagslagen), the Board of Directors is ultimately responsible for the Parent Company’s organization and the management of its affairs.
A resolution of the Board of Directors requires the approval of a majority of the members of the board. However, the Board of Directors may delegate the authority to borrow and lend funds on behalf of the Parent Company to the President or another employee, acting singly or jointly, provided that such financing transaction does not contravene any fundamental policy of the Parent Company and is not otherwise of great significance to the Parent Company. There are no legal requirements applicable to any member of the Board of Directors requiring the ownership of shares in the Parent Company, or requiring retirement at a certain age.
Although the Articles of Association do not address voting by directors on matters in which they are interested, under the Swedish Companies Act, a director may not take part in the Board of Directors’ deliberations with respect to any of the following:
1. Agreements between such director and the Parent Company;
2. Agreements between the Parent Company and third parties, where such director has a material interest in the matter that may conflict with the interests of the Parent Company; or
3. Agreements between the Parent Company and a legal entity that such director himself, or together with someone else, may represent.
Under the Swedish Companies Act, the Parent Company may not lend funds to shareholders or directors.
Under Swedish law, the president and at least half of the board directors must be resident in a European Economic Area country unless exempted by the Swedish Companies Registration Office. Under Swedish law, a director’s term of office may not be more than four years, but the Parent Company’s Articles of Association require one-year terms. A director may, however, serve any number of consecutive terms. Directors elected at a general meeting of the shareholders may be removed from office at another general meeting of the shareholders, and vacancies on the board, except when filled by a deputy director, may only be filled by a resolution of shareholders. Each year, if not otherwise stipulated in the Parent Company’s Articles of Association, one director is elected Chairman of the Board of Directors by resolution of the Board of Directors (unless elected by the shareholders) at the first meeting following its appointment.
The Share Capital
The share capital of the Parent Company shall be not less than Skr 1,500 million and not more than Skr 6,000 million. No shareholder is obliged to make additional capital contributions in the Parent Company solely as a result of it being a shareholder.
46
Table of Contents
Shareholders’ rights may only be changed by a majority (and in certain cases a qualified majority) of the shares represented at a general meeting of the shareholders. However, all resolutions passed at a general meeting of the shareholders are subject to mandatory provisions of Swedish law (for practical purposes, primarily the Swedish Companies Act). In particular, there are rules protecting minority shareholders and there is a general principle that all shares and shareholders shall be treated equally.
Annual General Meeting
The Annual General Meeting is held once a year within six months after the end of the preceding fiscal year. Notices convening an Annual General Meeting or any other general meeting called to resolve upon any , amendment of the Articles of Association, shall be issued not earlier than six weeks and not later than four weeks prior to the meeting. Notices convening a general meeting, in cases other than those set forth in the preceding sentence, shall be issued not earlier than six weeks and not later than two weeks prior to the meeting. Each person entitled to vote at an Annual General Meeting shall have the right to vote all the shares owned and represented by him. There are no restrictions on the rights of non-Swedish nationals to own shares or vote their shares at the Annual General Meeting.
Swedish law provides that, in matters other than elections, resolutions are passed by a simple majority of the votes cast, except that (among other exceptions):
· A resolution to amend the Articles of Association (except as described in the following paragraphs) requires a majority of at least two-thirds of the votes cast as well as at least two-thirds of the shares represented at the meeting;
· A resolution to amend the Articles of Association that reduces any existing shareholder’s rights to profits or other assets, restricts the transferability of issued shares or alters the legal relationship between issued shares, normally requires the unanimous approval of the shareholders present or represented at the meeting and representing at least nine-tenths of all shares issued; and
· A resolution to amend the Articles of Association for the purpose of limiting the number of shares which a shareholder may vote at an annual general meeting, normally requires the approval of shareholders representing at least two-thirds of the votes cast and at least nine-tenths of the shares represented at the meeting.
In elections, the person receiving the most votes is deemed to have been elected.
Swedish Taxation
The following summary outlines certain Swedish tax consequences relating to holders of SEK’s debt securities that are not considered to be Swedish residents for Swedish tax purposes, if not otherwise stated. The summary is based on the laws of the Kingdom of Sweden as currently in effect and is intended to provide general information only. The summary does not address the rules regarding reporting obligations for, among others, payers of interest. Investors should consult their professional tax advisors regarding the Swedish tax and other tax consequences (including the applicability and effect of tax treaties for the avoidance of double taxation) of acquiring, owning and disposing of debt securities in their particular circumstances.
Holders not resident in Sweden
Payments of any principal amount or any amount that is considered to be interest for Swedish tax purposes to the holder of any debt security should not be subject to Swedish income tax, provided that such a holder is not resident in Sweden for Swedish tax purposes and provided that such a holder does not have a permanent establishment in Sweden to which the debt securities are effectively connected.
However and somewhat simplified, provided that the value or the return of the debt securities is related to securities taxed as shares, private individuals who have been residents of Sweden or have had a habitual abode in Sweden at any time during the calendar year of disposal or redemption or the ten calendar years preceding the year of disposal or redemption, are liable for capital gains taxation in Sweden upon disposal or
47
Table of Contents
redemption of such debt securities. In a number of cases though, the applicability of this rule is limited by the applicable tax treaty for the avoidance of double taxation.
Swedish withholding tax, or Swedish tax deduction, is not imposed on payments of any principal amount or any amount that is considered to be interest for Swedish tax purposes to a holder, except for certain payments of interest to a private individual or an estate of a deceased individual with residence in Sweden for Swedish tax purposes.
Holders resident in Sweden
Generally, for Swedish corporations and private individuals (and estates of deceased individuals) with residence in Sweden for Swedish tax purposes, all capital income (e.g., income that is considered to be interest for Swedish tax purposes and capital gains on debt securities) will be taxable. Specific tax consequences, however, may be applicable to certain categories of corporations, e.g., life insurance companies. Further, specific tax consequences may be applicable if, and to the extent, the holder of debt securities realizes a capital loss on the debt securities and to any currency exchange gains or losses.
If amounts that are considered to be interest for Swedish tax purposes are paid by Euroclear Sweden AB or by another legal entity domiciled in Sweden, including a Swedish branch of a non-Swedish corporation, to a private individual (or an estate of a deceased individual) with residence in Sweden for Swedish tax purposes, Swedish preliminary taxes are normally withheld by Euroclear Sweden AB or such legal entity on such payments.
Supplemental Statistical Measure
In its Swedish corporate reports and in certain presentations to financial analysts, SEK discloses a supplemental statistical measure of its business performance, which we refer to in such reports and presentations as “Kärnresultatet” (or “Core Earnings”), and which we refer to herein as our “Adjusted Operating Profit.” Adjusted Operating Profit is not an IFRS financial measure, although it is calculated on the basis of our consolidated operating profit as calculated under IFRS.
SEK’s management considers — and SEK believes that its sole shareholder, the Swedish State, considers — Adjusted Operating Profit to be a useful supplemental measure in evaluating the performance of SEK’s business over the long term, because it excludes that portion of our net results of financial transactions that arises from changes in the fair value of financial assets (other than held-for-trading securities), financial liabilities and related derivatives.
Because Adjusted Operating Profit ignores such changes in fair value (which may significantly affect SEK’s performance as measured pursuant to IFRS), this relatively stable statistical measure is also used by SEK for internal performance reporting (in respect of business areas, business portfolios and individual managers), and for budgeting and forecasting purposes. Adjusted Operating Profit is used as a key measure for internal earnings budgeting, because market volatility affects our IFRS operating profit significantly but affects our Adjusted Operating Profit only marginally. Adjusted Operating Profit is the primary basis for calculating the amount of variable remuneration payable under the Group’s employee-incentive programs to all of our permanent employees except for a small number of employees working in our advisory services business and our executive officers.
While strongly cautioning that Adjusted Operating Profit should not be considered in isolation as a measure of SEK’s profitability and is not a substitute for the most directly comparable IFRS measure (which is operating profit), SEK believes that it is important to disclose its Adjusted Operating Profit in its reports filed with the SEC so as to communicate equivalent information to all of the Group’s investors worldwide, and so as to make investors aware of our management’s use of a non-IFRS measure in the steering and planning of our business. Please note, however, that SEK’s management generally considers the Group’s operating profit calculated in accordance with IFRS, alongside its Adjusted Operating Profit, in making important business decisions.
Adjusted Operating Profit amounted to Skr 4,114.7 million in the year ended December 31, 2010, a significant increase, as compared to the year ended December 31, 2009 (when Adjusted Operating Profit
48
Table of Contents
amounted to Skr 1,599.3 million). The increase in Adjusted Operating Profit resulted primarily from the realized gain from the selling of shares in Swedbank AB, amounting to Skr 2,565.0 million before tax.
Adjusted Operating Profit amounted to Skr 1,599.3 million in the year ended December 31, 2009, an increase of approximately 92 percent, as compared to the year ended December 31, 2008 (when Adjusted Operating Profit amounted to Skr 833.9 million). The increase in Adjusted Operating Profit resulted primarily from net interest earnings due to higher business volumes and lower funding costs during 2009.
Below is a reconciliation showing the differences between our operating profit calculated in accordance with IFRS and our Adjusted Operating Profit.
Adjusted Operating profit
| | For the year ended December 31,
2010 | |
Skr mn | | 2010 | | 2009 | | 2008 | |
Operating profit (IFRS) | | 3,939.7 | | 2,368.6 | | 185.2 | |
| | | | | | | |
Less changes in fair value related to financial assets or liabilities at fair value through profit or loss (1) | | -564.4 | | 2,477.5 | | -241.3 | |
Less changes in fair value related to available-for-sale securities | | 31.7 | | 1.2 | | -133.3 | |
Less changes in fair value related to loans and receivables | | 149.1 | | 611.7 | | -1,594.5 | |
| | | | | | | |
Less changes in fair value related to other financial liabilities | | 558.6 | | -3,859.7 | | 2,617.8 | |
| | | | | | | |
Net change — reported as part of “Net results of financial transactions” — see Note 4 to the Consolidated statement of financial position | | 175.0 | | -769.3 | | 648.7 | |
| | | | | | | |
Adjusted Operating Profit | | 4,114.7 | | 1,599.3 | | 833.9 | |
(1) Of which Skr 845.1 million (2009: Skr -1,096.0 million) was related to derivatives and Skr 280.7 million (2009: Skr 3,573.5 million) was related to other assets or liabilities at fair value through profit or loss.
49
Table of Contents
Adjusted Operating profit excluding profit from sale of Swedbank shares
| | For the year ended December 31, | |
Skr mn | | 2010 | | 2009 | | 2008 | |
Operating profit (IFRS) | | 3,939.7 | | 2,368.6 | | 185.2 | |
Less profit from sale of Swedbank shares | | -2,565.0 | | — | | — | |
Less changes in fair value related to financial assets or liabilities at fair value through profit or loss (1) | | -564.4 | | 2,477.5 | | -241.3 | |
Less changes in fair value related to available-for-sale securities | | 31.7 | | 1.2 | | -133.3 | |
Less changes in fair value related to loans and receivables | | 149.1 | | 611.7 | | -1,594.5 | |
| | | | | | | |
Less changes in fair value related to other financial liabilities | | 558.6 | | -3,859.7 | | 2,617.8 | |
| | | | | | | |
Net change — reported as part of “Net results of financial transactions” — see Note 4 to the Consolidated statement of financial position | | 175.0 | | -769.3 | | 648.7 | |
| | | | | | | |
Adjusted Operating Profit | | 1,549.7 | | 1,599.3 | | 833.9 | |
(1) Of which Skr 845.1 million (2009: Skr -1,096.0 million) was related to derivatives and Skr 280.7 million (2009: Skr 3,573.5 million) was related to other assets or liabilities at fair value through profit or loss.
Changes in the fair values of financial assets available for sale and loans and receivables have been accounted for through profit and loss when such assets are subject to fair value hedge accounting in terms of changes in fair value related to the hedged risk. See Note 13 to the Consolidated Financial Statements for information on the portion of those assets that are subject to fair-value hedge accounting.
There are significant limitations associated with the use of Adjusted Operating Profit as compared with operating profit in gauging the performance of our business, including the limitations inherent in our determination of which fair-value changes are excluded from our operating profit to derive our Adjusted Operating Profit. SEK’s management makes these determinations using established systems and processes and on the basis of the best information available at the time of determination.
Adjusted Operating Profit represents operating profit, calculated in accordance with IFRS, less changes in the fair values of financial assets, other than held-for-trading assets, and changes in the fair values of financial liabilities and related derivatives. The main reason why we exclude changes in the fair values of derivatives related to our financial assets and liabilities in presenting Adjusted Operating Profit is because we believe it is useful to present a measure that values derivatives used for hedging purposes and the items that they are used to hedge on the same basis. As can be expected for any company engaged in international trade financing, SEK is an extensive user of derivatives, which we use only for the purpose of hedging financial risk (and not for trading or speculative purposes). Under IFRS, a derivative is always required to be carried at fair value on a company’s balance sheet while the underlying asset or liability that the derivative serves to hedge is, for one reason or another, required to be carried at amortized cost. There are practical reasons why hedge accounting or the fair-value option may be difficult to apply to the underlying asset or liability, which gives
50
Table of Contents
rise to the mixed measurement of derivatives and such underlying assets or liabilities. Therefore, we believe that Adjusted Operating Profit is a useful alternative statistical measure, in part, because it helps us understand our business results under a constant valuation methodology for derivatives and the underlying assets and liabilities they hedge.
The reason why we exclude the changes in the fair values of our financial assets other than held-for-trading assets in calculating our Adjusted Operating Profit is that we have the ability and absolute intention to hold them to maturity, and thus believe it is useful to present a supplemental statistical measure that does not “mark to market” such assets. The reason why we exclude the changes in the fair values of financial liabilities from Adjusted Operating Profit is that we believe it is useful to present a measure that does not include adjustments in the value of such liabilities related to our own credit spread (under IFRS, a credit deterioration at SEK may produce an unrealized gain).
Adjusted Operating Profit is a non-IFRS statistical measure and should not be relied upon for any purpose by investors or considered to constitute a substitute or replacement for any IFRS financial measure, including our operating profit.
Material Contracts
The Parent Company is a party to certain material contracts, as defined in the Instructions to Item 10c of Form 20-F. Such contracts are either filed with this annual report or incorporated by reference herein. Please see Item 19 herein.
Documents on Display
The Parent Company files reports and other information with the SEC. For a fee, members of the public may request copies of these documents by writing to the SEC. Such documents may also be read and copied at the SEC’s public reference room in Washington, D.C.:
100 F Street, N. E.
Washington, D.C. 20549
Please call the SEC at 1-800-SEC-0330 for further information on its public reference rooms, including those in New York and Chicago. The Parent Company’s filings are also available on the SEC’s website at http://www.sec.gov.
51
Table of Contents
ITEM 11. QUANTITATIVE AND QUALITATIVE DISCLOSURES ABOUT MARKET RISKS
All information about Quantitative and Qualitative Disclosures about Market Risks are included in Note 30 to the Consolidated Financial Statements.
ITEM 12. DESCRIPTION OF SECURITIES OTHER THAN EQUITY SECURITIES
Not applicable.
PART II
ITEM 13. DEFAULTS, DIVIDEND ARREARAGES AND DELINQUENCIES
None.
ITEM 14. MATERIAL MODIFICATIONS TO THE RIGHTS OF SECURITY HOLDERS AND USE OF PROCEEDS
None.
ITEM 15. CONTROLS AND PROCEDURES
Disclosure Controls and Procedures
Our chief executive officer, chief financial officer, chief administrative officer and chief accounting officer have evaluated the effectiveness of our disclosure controls and procedures (as defined in Rule 13a-15(e) under the Exchange Act) as of December 31, 2010. The Group’s disclosure controls and procedures are designed to ensure that information required to be disclosed in the reports the Parent Company files or submits under the Exchange Act is recorded, processed, summarized and reported within the time periods specified in the applicable rules and forms, and that it is accumulated and communicated to the Parent Company’s management, including the chief executive officer, chief financial officer, chief administrative and chief accounting officer, as appropriate to allow timely decisions regarding required disclosure.
Based upon that evaluation, the chief executive officer, chief financial officer, chief administrative officer and chief accounting officer concluded that the Group’s internal control over financial reporting described in Management’s Report on Internal Control over Financial Reporting below, the Group’s disclosure controls and procedures were effective as of December 31, 2010.
Management’s Report on Internal Control over Financial Reporting
As required by section 404 of the Sarbanes-Oxley Act of 2002, management is responsible for establishing and maintaining adequate internal control over the Group’s financial reporting.
On September 15, 2010, the SEC amended its rules and forms to conform them to the new Section 404(c) of the Sarbanes-Oxley Act that was added by Section 989G of the Dodd-Frank Act. The amended rules and forms permanently exempt non-accelerated filers (e.g., companies with less than US$75 million of public float, companies with only registered debt and preferred securities) such as SEK from section 404(b) of the Sarbanes-Oxley Act. As a result, the Company is not required to include in this Annual Report an attestation report of its public accounting firm on internal control over financial reporting. The Company must still provide management’s annual assessment of internal control over financial reporting.
The Group’s internal control over financial reporting (ICFR) includes policies and procedures that pertain to the maintenance of records that, in reasonable detail, accurately and fairly reflect transactions and dispositions
52
Table of Contents
of assets; provide reasonable assurance regarding the reliability of financial reporting and the preparation of financial statements for external purposes in accordance with IFRS.
Management conducted an evaluation of the effectiveness, as of December 31, 2010, of our internal control over financial reporting based on SEC’s Interpretive Release No. 33-8810, “Commission Guidance Regarding Management’s Report on Internal Control Over Financial Reporting.” The conclusion from the evaluation was that SEK management’s internal control over financial reporting was effective as of December 31, 2010.
Changes in Internal Control over Financial Reporting
As of December 31, 2008, management determined that the Group did not maintain effective internal control over the valuation of certain assets and liabilities recorded at fair value and that this condition constituted a material weakness. In order to remedy the material weakness in ICFR identified as of December 31, 2008 SEK has implemented a number of specific remediation measures in 2009 and 2010, listed below, which have improved our ICFR in the following ways and have allowed SEK to conclude that management’s internal control over financial reporting was effective as of December 31, 2010:
· In 2009, in connection with its on-going risk assessment process, SEK conducted a renewed risk assessment for the processes related to hedge effectiveness testing and measuring credit spreads in order to better identify risks and establish required control enhancements.
· In 2009, SEK took specific actions to remediate controls in its valuation processes, as follows:
· An automated model for measuring credit spreads has been implemented; this covers the vast majority of all credit spreads measured.
· Controls have been developed, implemented and tested for automated models for measuring credit spreads.
· Enhancements have been made with regard to documentation in the process of measuring credit spreads. Such enhancements include detailed requirements for documentation when automatically-fed market data is replaced by manually-fed adjusted market data (which occurs rarely). Such manual adjustments are clearly documented with detailed explanations for such adjustments.
· Enhancements have been made to the segregation of duties relating to the process of manually adjusting credit spreads. Such enhancements include more specific requirements for segregation of duties when automatically-fed market data is replaced by manually-fed adjusted market data. Such adjustments are determined by one department and input into the system thereafter by another department whereas previously there was no separation of functions.
· Analytical controls relating to the valuation of credit spreads have been enhanced and are considered to be effective. The analytical controls include a requirement that senior management explain in quantitative and qualitative terms changes in credit spreads affecting valuations based on knowledge of market movements and the type of assets that have been revalued.
· The number of controls over the hedge-effectiveness process has increased from four to seven controls.
· Documentation during hedge-effectiveness testing has been enhanced through greater segregation. In particular, a department other than the department entering and controlling a hedged item in the sub-ledger is required to perform the related testing of effectiveness.
· Enhancements have been made to the documentation of hedge-effectiveness testing. Such enhancements include documenting specific considerations when a hedging transaction is close to being potentially ineffective.
· Hedge effectiveness testing has been enhanced by documenting the effectiveness of the entire population of hedged transactions.
53
Table of Contents
· Hedge-effectiveness testing has been enhanced by ensuring that values used when measuring effectiveness reconcile to the final values recorded in the general ledger.
· In 2010, SEK recruited one additional person (in addition to personnel already responsible for performing such activities) with the primary responsibility to perform hedge-effectiveness testing in order to increase the total amount of time spent on and the quality of that activity.
· In 2010, SEK’s middle office and back offices were reorganized. One person was recruited as the head of back office. Therefore, the responsibility of the head of the middle office was limited to that of valuation and effectiveness testing responsibilities, while other responsibilities not related to these areas were transferred to the head of back office, which resulted in a further improved segregation of duties.
· In 2010, SEK has further developed and enhanced its methods for measuring hedge effectiveness, including improved timelines, and expanded data inputs for measurement. This means that the hedge effectiveness testing is now performed at an earlier stage of the financial statement close process, thereby leaving more time for analyzing the outcome and disconnecting hedge relations if necessary.
· In 2010, SEK determined that certain controls performed when entering into a hedging transaction, consisting of comparing the principal terms between the hedged and hedging items, should have the status of a key control. As a result, there is now an evidenced quality check of the transactions eligible for hedge accounting before hedge effectiveness testing is performed.
Other than the changes identified above, there have been no changes to the Group’s internal control over financial reporting that have materially affected, or are reasonably likely to materially affect, the Group’s internal control over financial reporting.
ITEM 16A. AUDIT COMMITTEE FINANCIAL EXPERT
The Audit Committee of the Parent Company’s board of directors was established for the first time in January 2008. This committee, whose members are Jan Roxendal (Chairman) and Christina Liffner has a mandate to, among other things, supervise the Group’s financial reporting and review the work of its independent auditors. While the members of the Audit Committee have varying degrees of financial and accounting experience, the committee has not concluded that any of its members is an “audit committee financial expert” within the meaning of the regulations adopted under the Sarbanes-Oxley Act of 2002.
The Parent Company has not found it necessary to designate an audit committee financial expert because the Group is under the supervision of the Swedish Financial Supervisory Authority. Accordingly, the SEK believes that there is the opportunity for meaningful independent review of its financial statements by qualified experts (at the Swedish Financial Supervisory Authority), in addition to the independent review performed by the Parent Company’s external auditor.
ITEM 16B. CODE OF ETHICS
The Group has in place ethical guidelines that apply to all employees including all executive officers. The guidelines are consistent with, and also in some respects more restrictive than, applicable Swedish regulations. The ethical guidelines are designed to deter wrongdoing and promote:
· honest and ethical conduct, including the ethical handling of actual and apparent conflicts of interest between personal and professional relationships; and
· compliance with applicable governmental laws, rules and regulations.
Although these ethical guidelines do not meet the definition of “code of ethics” in the regulations adopted pursuant to the Sarbanes-Oxley Act of 2002, primarily because they do not specifically address matters relating to the Parent Company’s disclosure in reports and documents filed with the SEC and in other public communications, the Parent Company believes that its ethical guidelines are sufficient to regulate the conduct of SEK’s executive officers, including its principal executive officer, its principal financial officer and its principal accounting officer. The guidelines have also been specifically designed to comply with relevant
54
Table of Contents
Swedish regulations and guidelines (including the Swedish Governance Code), which is why SEK has not attempted to alter them to comply with the Sarbanes-Oxley Act of 2002.
ITEM 16C. PRINCIPAL ACCOUNTANT FEES AND SERVICES
The following table sets forth, for the years ending December 31, 2010 and 2009, the fees billed from the Parent Company’s independent auditors, Ernst & Young (E&Y) for 2010 and 2009.
| | 2010 | | 2009 | |
(Skr million) | | KPMG | | E&Y | | Total | | KPMG | | E&Y | | Total | |
Audit fee | | 0.0 | | 13.5 | | 13.5 | | 4.2 | | 16.4 | | 20.6 | |
Audit-related fee | | 1.9 | | 0.5 | | 2.4 | | 2.3 | | 0.2 | | 2.5 | |
Tax related fee | | 0.2 | | 0.2 | | 0.4 | | 0.1 | | 0.3 | | 0.4 | |
Other fees | | 3.1 | | 1.2 | | 4.3 | | — | | 5.8 | | 5.8 | |
Total | | 5.2 | | 15.4 | | 20.6 | | 6.6 | | 22.7 | | 29.3 | |
In the table above, “Audit fee” comprises the aggregate fees in relation to the audit of consolidated and annual financial statements, reviews of interim financial statements and attestation services that are provided in connection with statutory, regulatory and stock exchange filings or engagements, and services provided in connection with issuances of debt. “Audit-related fee” comprises fees charged for assurance and related services that are reasonably related to the performance of the audit or review of the financial statements. “Tax fee” comprises fees for professional services rendered by the principal independent auditors for tax compliance and tax advice. “All other fees” comprises fees mainly related to consultation and assistance provided in connection with improving the Group’s internal control over financial reporting in accordance with Sarbanes-Oxley Act of 2002.
See also Item 16G herein for information about corporate governance as it relates to the external auditors of the Parent Company.
ITEM 16D. EXEMPTION FROM THE LISTING STANDARDS FOR AUDIT COMMITTEES
Prior to 2008, the Board of Directors as a whole comprised the Parent Company’s audit committee for purposes of Rule 10A-3 under the Securities Exchange Act of 1934. In January 2008, the Board of Directors established a separate Audit Committee, with two directors as members. See Item 6 “Directors, Senior Management and Employees — Audit Committee. Each of the members of the Board of Directors, and thus the Audit Committee, is a representative or designee of the Swedish State. As its sole shareholder, the Swedish State is an affiliate of the Parent Company. However, no member of the Board of Directors is an executive officer of the Parent Company. Thus, although no member of the Board of Directors or the Audit Committee satisfies the non-affiliate requirement of the independence standard for audit committee members described in Rule 10A-3 (b) (1) (ii) (B) under the Securities Exchange Act of 1934, the Parent Company relies, as to each member of the Board of Directors and the Audit Committee, on the exemption from this requirement for foreign governmental representatives described in Rule 10A-3(b) (1) (iv) (E). The Parent Company does not believe that its reliance on the above exemption materially adversely affected the ability of the Parent Company’s Board of Directors, in its role as audit committee, or will affect the ability of the Audit Committee, to act independently and to satisfy its duties.
ITEM 16E. PURCHASES OF EQUITY SECURITIES BY THE ISSUER AND AFFILIATED PURCHASERS.
None.
55
Table of Contents
ITEM 16F. CHANGE IN REGISTRANT’S CERTIFYING ACCOUNTANT
Not applicable.
ITEM 16G. CORPORATE GOVERNANCE
As a result of the listing of certain of its debt securities on NYSE ARCA, SEK is subject to Rule 10A-3 under the Exchange Act. Rule 10A-3, with which SEK complies fully, sets out certain requirements with respect to the independence of audit committee members and with respect to audit committees’ duties, powers and responsibilities. Rule 10A-3 contains certain exemptions for foreign issuers, however, and SEK avails itself of certain of these exemptions. In particular: (i) as noted in Item 16D above, it relies on Section (b)(1)(iv)(E) of the Rule (applicable to audit committee members that are representatives or designees of a foreign government, which all of SEK’s audit committee members are) to satisfy the independence requirement set forth in Section (b)(1)(ii)(B) of the Rule; and (ii) it relies on the “Instructions” accompanying the Rule, which provide that, to the extent that a foreign issuer’s home-country legal requirements conflict with the prescriptions of the Rule concerning the duties, powers or responsibilities of audit committees (i.e., due to the assignment of such duties, powers or responsibilities to another corporate body under local law), it is sufficient to allocate to the audit committee advisory powers, or powers and/or responsibilities concerning the making of proposals to the relevant decision-making body. Regarding the foregoing, Section (b) (2) of the Rule states that an issuer’s audit committee should be directly responsible for the appointment, compensation, retention and oversight of external auditors. Under Swedish law, these powers are reserved to the Parent Company’s shareholder. Thus, the charter for SEK’s audit committee gives the committee an advisory role (to the shareholder) with respect to the aforesaid (but does not make the committee directly responsible).
PART III
ITEM 17. FINANCIAL STATEMENTS
Not applicable.
ITEM 18. FINANCIAL STATEMENTS
The Group’s Consolidated Financial Statements prepared in accordance with Item 18 of Form 20-F; begin on page F-1 of this annual report.
56
Table of Contents
ITEM 19. EXHIBITS
1.1 | Articles of Association of the Registrant in effect as of the date of this annual report (filed as Exhibit 1.1 to the Company’s Annual Report on Form 20-F (No. 001-08382) for the year ended December 31, 2008 filed by the Company on May 20, 2009 and incorporated herein by reference). |
| |
2.1 | Indenture, dated as of August 15, 1991, between the Company and J.P. Morgan Trust Company, National Association (as successor in interest to the First National Bank of Chicago) as Trustee, providing for the issuance of debt securities, in one or more series, by the Company (filed as Exhibit 4(a) to the Company’s Report of Foreign Issuer on Form 6-K (No.: 001-08382) dated September 30, 1991 and incorporated herein by reference). |
| |
2.2 | First Supplemental Indenture dated as of June 2, 2004 between the Company and J.P. Morgan Trust Company, National Association (filed as Exhibit 4(b) to the Company’s Registration Statement on Form F-3 (No. 333-131369) dated January 30, 2006 and incorporated herein by reference). |
| |
2.3 | Second Supplemental Indenture, dated as of January 30, 2006, between the Company and J.P. Morgan Trust Company, National Association (filed as Exhibit 4(c) to the Company’s Registration Statement on Form F-3 (No. 333-131369) dated January 30, 2006 and incorporated herein by reference). |
| |
2.4 | Third Supplemental Indenture, dated as of October 23, 2008, between the Company and Bank of New York Mellon Trust Company, National Association (as a successor in interest to The First National Bank of Chicago and J.P. Morgan Trust Company, National Association) as Trustee(filed as Exhibit 4 to the Company’s Report on Form 6-K dated October 23, 2008 (No. 001-08382) and incorporated herein by reference). |
| |
2.5 | Form of Warrant Agreement for Index Warrants, with Form of Index Warrant Certificate attached thereto (filed as Exhibit 4(e) to the Company’s Registration Statement on Form F-3 (No. 333- 156118) dated December 15, 2008 and incorporated herein by reference). |
| |
2.6 | Fiscal Agency Agreement dated June 5, 2009 relating to an unlimited aggregate principal amount of debt securities authorized to be issued under the Company’s Program for the Continuous Issuance of Debt Instruments (filed as Exhibit 2.6 to the Company’s Annual Report on Form 20-F (No. 001-08382) for the year ended December 31, 2009 filed by the Company on April 1, 2010 and incorporated herein by reference). |
| |
2.7 | Deed of Covenant dated June 5, 2009 relating to an unlimited aggregate principal amount of securities of SEK authorized to be issued under the Company’s Program for the Continuous Issuance of Debt Instruments (filed as Exhibit 2.6 to the Company’s Annual Report on Form 20-F (No. 001-08382) for the year ended December 31, 2009 filed by the Company on April 1, 2010 and incorporated herein by reference). |
| |
2.8 | Fourth Supplemental Indenture, dated as of March 8, 2010, between the Company and Bank of New York Mellon Trust Company, National Association (as a successor in interest to The First National Bank of Chicago and J.P. Morgan Trust Company, National Association) as Trustee (filed as Exhibit 4(f) to the Company’s Post-Effective Amendment (No. 333-156118) to the Company’s Registration Statement on Form F-3, filed by the Company on March 10, 2010 and incorporated herein by reference). |
| |
2.9 | English-language summary of the Terms and Conditions dated 5 February 2010 relating an unlimited principal amount debt securities authorized to be issued under the Company’s Swedish MTN Progamme (filed as Exhibit 2.9 to the Company’s Annual Report on Form 20-F (No. 001-08382) for the year ended December 31, 2009 filed by the Company on April 1, 2010 and incorporated herein by reference). |
| |
2.10 | ASX Austraclear Registry and IPA Services Agreement dated 14 October 2009 relating to an unlimited principal amount of debt securities authorized to be issued under the Company’s Australian Dollar Debt Issue Programme |
58
Table of Contents
| (filed as Exhibit 2.10 to the Company’s Annual Report on Form 20-F (No. 001-08382) for the year ended December 31, 2009 filed by the Company on April 1, 2010 and incorporated herein by reference). |
| |
2.11 | Note Deed Poll dated 2 June 2006 relating to an unlimited principal amount of debt securities authorized to be issued under the Company’s Australian Dollar Debt Issue Programme (filed as Exhibit 2.11 to the Company’s Annual Report on Form 20-F (No. 001-08382) for the year ended December 31, 2009 filed by the Company on April 1, 2010 and incorporated herein by reference). |
| |
7.1 | Statement of Calculation of Ratios of Earnings to Fixed Charges (filed herewith). |
| |
8.1 | List of Subsidiaries (filed herewith) |
| |
12.1 | Certifications pursuant to Rule 13a-14(a) or Rule 15d-14(a) under the Securities Exchange Act of 1934 (filed herewith). |
| |
13.1 | Certifications Pursuant to 18 U.S.C Section 1350, as adopted Pursuant to Section 906 of the Sarbanes-Oxley Act of 2002 (filed herewith). |
| |
15.1. | Consent of Independent Registered Public Accounting Firm (filed herewith). |
Pursuant to Instruction 2(b) (i) in the “Instructions as to Exhibits” in Form 20-F, various instruments defining the rights of holders of long-term debt securities issued by the Company are not being filed herewith because such debt securities are not registered with the Commission and the total amount of debt securities authorized under each such instrument does not exceed 10% of the total assets of the Company. The Company hereby agrees to furnish a copy of any such instrument to the Commission upon request.
59
Table of Contents
AB SVENSK EXPORTKREDIT (Swedish Export Credit Corporation)
To the Board of Directors and shareholder of
AB Svensk Exportkredit:
We have audited the accompanying consolidated statements of financial position of AB Svensk Exportkredit (Swedish Export Credit Corporation) (the “Company”) as of December 31, 2010 and 2009, and the related consolidated statements of comprehensive income, equity and cash flows for each of the three years in the period ended December 31, 2010. These consolidated financial statements are the responsibility of the Company’s management. Our responsibility is to express an opinion on these consolidated financial statements based on our audits.
We conducted our audit in accordance with the standards of the Public Company Accounting Oversight Board (United States). Those standards require that we plan and perform the audit to obtain reasonable assurance about whether the financial statements are free of material misstatement. We were not engaged to perform an audit of the Company’s internal controls over financial reporting. Our audit included consideration of internal control over financial reporting as a basis for designing audit procedures that are appropriate in the circumstances, but not for the purpose of expressing an opinion on the effectiveness of the Company’s internal control over financial reporting. Accordingly, we express no such opinion. An audit also includes examining, on a test basis, evidence supporting the amounts and disclosures in the financial statements, assessing the accounting principles used and significant estimates made by management and evaluating the overall financial statement presentation. We believe that our audit provides a reasonable basis for our opinion.
In our opinion, the financial statements referred to above present fairly, in all material respects, the consolidated financial position of AB Svensk Exportkredit at December 31, 2010 and 2009, and the consolidated results of its operations and its cash flows for each of the three years in the period ended December 31, 2010, in conformity with International Financial Reporting Standards as issued by the International Accounting Standards Board and as adopted by the European Union.
| Ernst & Young AB |
| | |
| By | /s/ Jan Birgerson |
| | Jan Birgerson |
| | Authorized Public Accountant |
Stockholm, Sweden
March 25, 2011
F-1
Table of Contents
AB SVENSK EXPORTKREDIT (Swedish Export Credit Corporation)
CONSOLIDATED STATEMENT OF COMPREHENSIVE INCOME
Skr mn | | Note | | 2010 | | 2009 | | 2008 | |
| | | | | | | | | |
Interest revenues | | | | 12,183.1 | | 13,306.4 | | 12,964.1 | |
Interest expenses | | | | -10,284.6 | | -11,312.1 | | -11,420.8 | |
| | | | | | | | | |
Net interest revenues | | 2 | | 1,898.5 | | 1,994.3 | | 1,543.3 | |
| | | | | | | | | |
Commissions earned | | 3 | | 19.7 | | 26.2 | | 34.7 | |
Commissions incurred | | 3 | | -19.9 | | -26.4 | | -21.7 | |
Net results of financial transactions | | 4 | | 2,497.6 | | 1,103.1 | | -456.9 | |
Other operating income | | | | — | | 0.0 | | 0.1 | |
| | | | | | | | | |
Operating income | | | | 4,395.9 | | 3,097.2 | | 1,099.5 | |
| | | | | | | | | |
Personnel expenses | | 5 | | -259.4 | | -312.2 | | -228.5 | |
Other expenses | | 6 | | -191.9 | | -159.0 | | -112.5 | |
Depreciations and amortizations of non-financial assets | | 7 | | -13.1 | | -11.1 | | -21.0 | |
Net credit losses | | 9 | | 8.2 | | -246.3 | | -552.3 | |
| | | | | | | | | |
Operating profit | | | | 3,939.7 | | 2,368.6 | | 185.2 | |
| | | | | | | | | |
Taxes | | 10 | | -1,048.0 | | -641.3 | | -41.3 | |
| | | | | | | | | |
Net profit for the year (after taxes) (1) | | | | 2,891.7 | | 1,727.3 | | 143.9 | |
| | | | | | | | | |
Available-for-sale securities | | | | -1,652.1 | | 1,784.5 | | -63.1 | |
Derivatives in cash flow hedges | | | | -205.6 | | 25.0 | | 339.5 | |
Tax on other comprehensive income | | 10 | | 488.6 | | -475.9 | | -76.7 | |
Total other comprehensive income | | | | -1,369.1 | | 1,333.6 | | 199.7 | |
Total comprehensive income (1) | | | | 1,522.6 | | 3,060.9 | | 343.6 | |
(1) The entire profit goes to the shareholder of the parent company.
The accompanying notes are an integral part of these statements
F-2
Table of Contents
AB SVENSK EXPORTKREDIT (Swedish Export Credit Corporation)
CONSOLIDATED STATEMENT OF FINANCIAL POSITION
Skr mn | | Note | | December 31, 2010 | | December 31, 2009 | |
ASSETS | | | | | | | |
| | | | | | | |
Cash and cash equivalents | | 11 ,12 | | 8,798.0 | | 17,636.5 | |
Treasuries/government bonds | | 11, 12 | | 5,431.3 | | 11,717.4 | |
Other interest-bearing securities except loans | | 11, 12 | | 100,533.0 | | 123,378.6 | |
Loans in the form of interest-bearing securities | | 11, 12 | | 71,805.8 | | 87,499.1 | |
Loans to credit institutions | | 9 ,11, 12 | | 22,538.9 | | 23,543.2 | |
Loans to the public | | 9 ,11, 12 | | 87,101.9 | | 75,890.1 | |
Derivatives | | 14 | | 37,659.8 | | 22,654.1 | |
Shares and participation | | 15 | | 0.0 | | 2,710.1 | |
Property, plant, equipment and intangible assets | | 7 | | 159.3 | | 130.7 | |
Other assets | | 16 | | 1,704.1 | | 1,962.9 | |
Prepaid expenses and accrued revenues | | 17 | | 3,955.5 | | 4,465.3 | |
Total assets | | | | 339,687.6 | | 371,588.0 | |
| | | | | | | |
LIABILITIES AND EQUITY | | | | | | | |
| | | | | | | |
Borrowing from credit institutions | | 12 ,18 | | 14,342.8 | | 4,049.9 | |
Borrowing from the public | | 12 ,18 | | 19.3 | | 0.0 | |
Senior securities issued | | 12 ,18 | | 286,309.5 | | 320,745.3 | |
Derivatives | | 14 | | 18,057.4 | | 22,567.3 | |
Other liabilities | | 19 | | 1,640.6 | | 2,536.5 | |
Accrued expenses and prepaid revenues | | 20 | | 3,443.4 | | 3,913.7 | |
Deferred tax liabilities | | 10 | | 660.9 | | 1,123.8 | |
Provisions | | 21 | | 53.6 | | 53.5 | |
Subordinated securities issued | | 11 ,22 | | 2,590.3 | | 3,142.8 | |
Total liabilities | | | | 327,117.8 | | 358,132.8 | |
| | | | | | | |
Share capital | | | | 3,990.0 | | 3,990.0 | |
Reserves | | | | -4.3 | | 1,364.8 | |
Retained earnings | | | | 8,584.1 | | 8,100.4 | |
Total equity | | | | 12,569.8 | | 13,455.2 | |
| | | | | | | |
Total liabilities and equity | | | | 339,687.6 | | 371,588.0 | |
| | | | | | | |
COLLATERAL PROVIDED ETC | | | | | | | |
Collateral provided | | | | None | | None | |
Interest-bearing securities | | | | | | | |
Subject to lending | | | | 229.7 | | 236.1 | |
| | | | | | | |
CONTINGENT ASSETS AND LIABILITIES | | 23 | | 4.5 | | 5.8 | |
| | | | | | | |
COMMITMENTS | | | | | | | |
Committed undisbursed loans | | 23 | | 38,205.2 | | 46,331.1 | |
The accompanying notes are an integral part of these statements.
F-3
Table of Contents
AB SVENSK EXPORTKREDIT (Swedish Export Credit Corporation)
CONSOLIDATED STATEMENT OF CHANGES IN EQUITY
| | | | | | Reserves | | | |
Consolidated Group
Skr mn | | Equity | | Share capital (1) | | Hedge
reserve (4) | | Fair value
reserve (5) | | Retained earnings | |
| | | | | | | | | | | |
Opening balance of equity 2008 | | 4,610.4 | | 990.0 | | -86.7 | | -81.8 | | 3,788.9 | |
Net profit for the year | | 143.9 | | | | | | | | 143.9 | |
Other comprehensive income: | | | | | | | | | | | |
Changes in fair-value | | | | | | | | | | | |
Available-for-sale securities | | -109.6 | | | | | | -109.6 | | | |
Derivatives in cash flow hedges | | 254.1 | | | | 254.1 | | | | | |
Reclassified to profit or loss | | 131.9 | | | | 85.4 | | 46.5 | | | |
Tax on other comprehensive income | | -76.7 | | | | -91.3 | | 14.6 | | | |
Total other comprehensive income | | 199.7 | | | | 248.2 | | -48.5 | | | |
Total comprehensive income | | 343.6 | | | | 248.2 | | -48.5 | | 143.9 | |
New issue | | 3,000.0 | | 3,000.0 | | | | | | | |
Shareholders’ contribution | | 2,440.3 | | | | | | | | 2,440.3 | |
Dividend | | — | | | | | | | | | |
Closing balance of equity 2008 (2),(3),(6) | | 10,394.3 | | 3,990.0 | | 161.5 | | -130.3 | | 6,373.1 | |
| | | | | | | | | | | |
Opening balance of equity 2009 | | 10,394.3 | | 3,990.0 | | 161.5 | | -130.3 | | 6,373.1 | |
Net profit for the year | | 1,727.3 | | | | | | | | 1,727.3 | |
Other comprehensive income: | | | | | | | | | | | |
Changes in fair-value | | | | | | | | | | | |
Available-for-sale securities | | 1,711.3 | | | | | | 1,711.3 | | | |
Derivatives in cash flow hedges | | -388.6 | | | | -388.6 | | | | | |
Reclassified to profit or loss | | 486.8 | | | | 413.6 | | 73.2 | | | |
Tax on other comprehensive income | | -475.9 | | | | -6.5 | | -469.4 | | | |
Total other comprehensive income | | 1,333.6 | | | | 18.5 | | 1,315.1 | | | |
Total comprehensive income | | 3,060.9 | | | | 18.5 | | 1,315.1 | | 1,727.3 | |
Dividend | | — | | | | | | | | | |
Closing balance of equity 2009 (2), (3), (6) | | 13,455.2 | | 3,990.0 | | 180.0 | | 1,184.8 | | 8,100.4 | |
| | | | | | | | | | | |
Opening balance of equity 2010 | | 13,455.2 | | 3,990.0 | | 180.0 | | 1,184.8 | | 8,100.4 | |
Net profit for the year | | 2,891.7 | | | | | | | | 2,891.7 | |
Other comprehensive income: | | | | | | | | | | | |
Changes in fair-value | | | | | | | | | | | |
Available-for-sale securities | | 836.7 | | | | | | 836.7 | | | |
Derivatives in cash flow hedges | | -618.8 | | | | -618.8 | | | | | |
Reclassified to profit or loss | | -2,075.6 | | | | 413.2 | | -2,488.8 | | | |
Tax on other comprehensive income | | 488.6 | | | | 54.1 | | 434.5 | | | |
Total other comprehensive income | | -1,369.1 | | | | -151.5 | | -1,217.6 | | | |
Total comprehensive income | | 1,522.6 | | | | -151.5 | | -1,217.6 | | 2,891.7 | |
Dividend | | -2,408.0 | | | | | | | | -2,408.0 | |
Closing balance of equity 2010 (2), (3), (6) | | 12,569.8 | | 3,990.0 | | 28.5 | | -32.8 | | 8,584.1 | |
(1) Until April 29, 2010, divided into 2,579,394 A-shares and 1,410,606 B-shares, with each A-share and each B-share having a par value of Skr 1,000. At the Annual General Meeting of April 29, 2010, the Articles of Association were changed so that the division of the company’s shares into A-shares and B-shares was abolished, effective April 29, 2010. The change was approved by the Swedish Financial Supervisory Authority in August 2010. The total amount of shares is 3,990,000.
(2) The entire equity goes to the shareholder of the parent company.
(3) According to the Swedish Annual Accounts Act for Credit Institutions and Securities Companies, the non-distributable capital for the Consolidated Group at year-end amounted to Skr 5,965.4 million (year-end 2009: Skr 5,211.2 million; year-end 2008: Skr 5,026.9 million) and distributable capital amounted to Skr 6,604.4 million (year-end 2009: Skr 8,244.0 million; 2008: Skr 5,367.4 million).
(4) Hedge reserve is shown as net after-tax difference between fair value and amortized cost recognized through other comprehensive income related to derivatives
F-4
Table of Contents
in cash flow hedges.
(5) Fair value reserve is shown as after-tax difference between fair value and amortized cost recognized through other comprehensive income related to available-for-sale securities. After reclassification as of July 1, 2008, the fair value reserves are amortized over the remaining life of these reclassified assets. During 2009 and 2010 new assets in the category available-for-sale have been acquired. Fair value reserve amounted to Skr —32.8 (year-end 2009: Skr 1,184.8 million), of which Skr 0.0 million (year-end 2009: Skr 1,262.1 million) represented shares with positive value, Skr 6.4 million (year-end 2009: Skr 7.6 million) represented interest-bearing securities with positive changes in fair value, Skr —0.8 million, (year-end 2009: Skr —8.5 million) represented interest-bearing securities with negative changes in fair value and Skr —38.4 million (year-end 2009: Skr —76.4 million) remained from the reclassification in 2008.
(6) SEK has access to a guarantee of Skr 600 million, issued by the owner, the Swedish state, from which SEK has the right to withdraw capital if SEK deems it be necessary to be able to fulfill its obligations. Given that SEK’s owner, the Swedish state, in 2008 contributed substantial amounts of new equity to SEK, the abovementioned guarantee has been deemed by SEK no longer be required and will therefore expire on June 30, 2011.
Proposal for the distribution of profits
All amounts are in Skr million, unless otherwise indicated.
An extra dividend amounting to Skr 1,890.0 million has been paid in December 2010. The Board of Directors resolved on March 11, 2011, to propose to the Annual General Meeting to be held on April 29, 2011, that a dividend in the aggregate amount of Skr 301.0 million (or Skr 75.44 per share) should be paid to the shareholder in relation to financial year 2010.
F-5
Table of Contents
AB SVENSK EXPORTKREDIT (Swedish Export Credit Corporation)
CONSOLIDATED STATEMENT OF CASH FLOWS
| | Consolidated Group | |
Skr mn | | 2010 | | 2009 | | 2008 | |
Operating activities | | | | | | | |
Operating profit (1) | | 3,939.7 | | 2,368.6 | | 185.2 | |
| | | | | | | |
Adjustments to convert operating profit to cash flow: | | | | | | | |
Write-down of impaired financial instruments | | 81.7 | | 283.0 | | 557.0 | |
Depreciation | | 10.6 | | 11.1 | | 21.0 | |
Decrease (+)/increase (-) in derivative instruments excluding exchange rate differences | | 3,289.8 | | -1,570.9 | | 31,058.5 | |
Exchange rate differences | | 0.9 | | -33.2 | | -15.5 | |
Decrease (+)/increase (-) other | | 32.8 | | 144.8 | | 48.6 | |
Income tax paid | | -387.8 | | -174.6 | | -213.1 | |
Total adjustments to convert operating profit to cash flow | | 3,028.0 | | -1,339.8 | | 31,456.5 | |
| | | | | | | |
Disbursements of loans | | -39,007.8 | | -74,310.9 | | -38,055.2 | |
Repayments of loans | | 37,517.5 | | 39,577.8 | | 9,594.9 | |
Net increase(-)/decrease(+) in bonds and securities held | | 9,914.4 | | -5,274.1 | | 30,056.5 | |
Other changes - net | | 130.1 | | 1,645.6 | | -2,230.6 | |
Cash flow from operating activities | | 15,521.9 | | -37,332.8 | | 31,007.3 | |
| | | | | | | |
Investing activities | | | | | | | |
Capital expenditures | | -42.2 | | -3.2 | | -13.5 | |
Acquisition of Venantius (4) | | — | | — | | 577.1 | |
Cash flow from investing activities | | -42.2 | | -3.2 | | 563.6 | |
| | | | | | | |
Financing activities | | | | | | | |
Proceeds from issuance of short-term senior debt | | 46,931.5 | | 93,478.5 | | -32,324.2 | |
Proceeds from issuance of long-term senior debt | | 76,667.5 | | 111,831.5 | | 86,136.2 | |
Repayments of debt | | -111,742.0 | | -138,975.6 | (3) | -35,664.7 | |
Repurchase or early redemption of own long-term debt (3) | | -33,759.5 | | -35,141.7 | (3) | -39,245.4 | |
New share issue | | — | | — | | 3,000.0 | |
Dividend paid | | -2,408.0 | | — | | — | |
Cash flow from financing activities | | -24,310.5 | | 31,192.7 | | -18,098.1 | |
| | | | | | | |
Cash flow for the year | | -8,830.8 | | -6,143.3 | | 13,472.8 | |
| | | | | | | |
Cash and cash equivalents at beginning of year | | 17,636.5 | | 23,771.1 | | 10,211.5 | |
Net decrease (-)/increase (+) in cash and cash equivalents | | -8,830.8 | | -6,143.3 | | 13,472.8 | |
Exchange rate differences on cash and cash equivalents | | -7.7 | | 8.7 | | 86.8 | |
Cash and cash equivalents at end of year (2) | | 8,798.0 | | 17,636.5 | | 23,771.1 | |
Comments on the cash flow statement:
(1) Interest payments received and expenses paid
| | Consolidated Group | |
Skr mn | | 2010 | | 2009 | | 2008 | |
Interest payments received | | 12,684.1 | | 14,960.5 | | 12,150.6 | |
Interest expenses paid | | 10,786.7 | | 12,851.2 | | 10,756.9 | |
(2) Cash and cash equivalents
| | Consolidated Group | |
Skr mn | | 2010 | | 2009 | | 2008 | |
Cash at banks | | 225.0 | | 384.3 | | 1,965.6 | |
Cash equivalents | | 8,573.0 | | 17,252.2 | | 21,805.5 | |
Total cash and cash equivalents | | 8,798.0 | | 17,636.5 | | 23,771.1 | |
F-6
Table of Contents
AB SVENSK EXPORTKREDIT (Swedish Export Credit Corporation)
(3) Compared to previously presented cash flow for 2009 Skr 24,882.0 million and for 2008 Skr 35,848.7 million has been re-categorized from “Repayments of debt” to “Repurchase or early redemption of own long-term debt”.
(4) See Note 31 regarding the acquisition of Venantius.
“Cash at banks” represents amounts that immediately can be converted into cash. Cash equivalents represents short term, liquid instruments where the amount is known in advance and where time to maturity did not exceed three months on the acquisition date. See Note 11.
NOTES TO THE CONSOLIDATED FINANCIAL STATEMENTS
All amounts are in Skr million, unless otherwise indicated.
Introductory Note
REPORTING ENTITY
AB Svensk Exportkredit is a company domiciled in Sweden. The address of the company’s registered office is Klarabergsviadukten 61-63, P.O. Box 194, 101 23 Stockholm. The consolidated financial statements of SEK as of December 31, 2010 encompass SEK and its wholly owned subsidiaries AB Sektionen, AB SEK Securities, SEK Financial Advisors AB, SEK Financial Services AB, SEK Customer Finance AB, SEK Exportlånet AB and Venantius AB, including the latter’s wholly-owned subsidiary VF Finans AB (the Subsidiaries). These are together referred to as the “Consolidated Group” or “the Group”. AB Sektionen’s main property, plant and equipment is its building, which served as SEK’s headquarters up to December 17, 2010, when SEK moved its headquarters to new, rented, premises. AB Sektionen does not presently operate any business other than renting its building to SEK which is now for sale. AB SEK Securities is a securities company under the supervision of the Swedish Financial Supervisory Authority. SEK Financial Advisors AB, SEK Customer Finance AB and Venantius AB are no longer engaged in any active business. SEK Financial Services AB and SEK Exportlånet AB are inactive companies.
BASIS OF PRESENTATION
(i) Statement of compliance
Since January 1, 2007, SEK has applied International Financial Reporting Standards (IFRS) as issued by the International Accounting Standards Board (IASB) and endorsed by the European Union (EU). Additional standards, consistent with IFRS, are imposed by the Swedish Annual Accounts Act for Credit Institutions and Securities Companies (1995:1559) (ÅRKL), Recommendation RFR 1, Supplementary Accounting Principles for Groups, issued by the Swedish Financial Reporting Board (RFR) and the accounting regulations of the Financial Supervisory Authority (FFFS 2008:25), all of which have been complied with in preparing the consolidated financial statements of which these notes form part.
The consolidated financial statements were approved for issuance by SEK’s board of directors (the Board of Directors) on March 11, 2011. The Group’s statements of comprehensive income and financial position are subject to approval by SEK’s shareholder, at the annual general meeting to be held on April 29, 2011.
(ii) Basis of measurement
The consolidated financial statements have been prepared on a historical cost basis except for the following;
· derivative financial instruments are measured at fair value,
· financial instruments at fair value through profit or loss are measured at fair value,
· available-for-sale financial assets are measured at fair value, and
· hedged items in fair value hedges are recorded at amortized cost, adjusted for changes in fair value with regards to the hedged risks.
(iii) Functional and presentation currency
SEK has determined that Swedish krona (Skr) is its functional and presentation currency under IFRS. The determination is based on several factors, the important ones being that SEK’s equity is denominated in Swedish kronor, its performance is evaluated based on a result expressed in Swedish kronor, and that a large portion of expenses especially personnel expenses, other expenses and its taxes are denominated in Swedish kronor. SEK manages its foreign currency exposure so that it is hedged.
(iv) Going concern
SEK’s Board of Directors and management have made an assessment of SEK’s ability to continue as a going concern and are satisfied that SEK has the resources to continue in business for the foreseeable future. Furthermore, the Board of Directors and management are not aware of any material uncertainties that may cast significant doubt upon SEK’s ability to continue as a going concern. Therefore, the financial statements continue to be prepared on the going concern basis.
F-7
Table of Contents
Note 1. Significant accounting policies
The accounting policies set out below have been applied consistently to all periods presented in these consolidated financial statements, if not stated otherwise.
TABLE OF CONTENTS
(a) Changed accounting policies and disclosure requirements and standards not yet adopted
The accounting policies, in all material aspects, are unchanged in comparison with the financial statements included in SEK’s 2009 Annual Report on Form 20-F, with the exceptions stated below.
The group has adopted the following revised standards from IASB as from January 1, 2010:
IAS 24 Related Party Disclosures. The definition of related parties has changed so that some relief is given on related-party transactions disclosures when a company is state-owned, such as is the case with SEK. The amended standard must be applied no later than 2011 but may be adopted earlier. SEK has adopted the standard early from January 1, 2010. The amendment affects the scope of required disclosures regarding transactions with state-owned companies.
The following other amendments to standards and interpretations have been adopted by SEK, but have had little or no impact on the SEK’s financial reporting:
IFRS 3R Business Combinations. This revised standard introduced a number of changes in accounting for business combinations, particularly changes of the accounting for transaction costs, for contingent considerations and for business combinations achieved in stages.
IAS 27R, Consolidated and Separate Financial Statements. This revised standard requires that changes in ownership interests in a subsidiary, where the majority owner does not lose control, be accounted for as equity transactions. Furthermore, the IAS 27R changes the accounting when the controlling influence over a subsidiary is terminated.
IAS 39 Financial Instruments: Recognition and Measurement. This revised standard clarifies when an option to repay a loan is “closely related” to the loan.
From 2010 SEK has in the presentation of the consolidated group elected the option provided under IFRS to redefine its presentations with regard to income statement and balance sheet. Thus, in the Consolidated Group, the income statement and the statement of comprehensive income have been consolidated into one statement, the statement of comprehensive income.
Furthermore, the balance sheet has been renamed to statement of financial position and the line “net profit” in the consolidated statement of financial position has been removed and is now included as part of “retained earnings”.
Furthermore, SEK has redefined the presentation of statement of financial position in the Consolidated Group to rename the first line item from “cash in hand” to “cash and cash equivalents,” in order to provide more relevant information to our investors. Cash and cash equivalents includes assets that are immediately convertible into cash and short term deposits, the payout of which is known in advance and for which the time to maturity at acquisition does not exceed three months.
The following new standards and changes in standards and interpretations not yet adopted are considered to be relevant to SEK:
IFRS 7, Financial Instruments: Disclosures. Amendments comprise more explicit disclosure requirements related to credit risks, credit collateral and credit protection measurements taken. SEK’s preliminary conclusion is that the amendment of this standard will not affect the financial disclosure provided by SEK in any material way. This standard will be effective for financial years commencing on or after January 1, 2011.
F-8
Table of Contents
IFRS 9, Financial Instruments: This standard is part of a complete overhaul of the existing standard IAS 39 and reduces the number of valuation categories for financial assets, leaves the number of categories of financial liabilities unchanged as well as rules for how changes in own credit spread should be recorded when own debt is measured at fair value. The standard will be supplemented by rules on write-downs, hedge accounting and ademptions from statements of financial position. IFRS 9 must be applied for annual periods beginning January 1, 2013. Since all parts of the standard are not completed, SEK has not yet evaluated their effects.
(b) Basis of consolidation
Subsidiaries are entities controlled by the Group. Control exists when the Group has the power to govern the financial and operating policies of an entity so as to obtain benefits from its activities. Business combinations are accounted for in accordance with the purchase method. The financial statements of subsidiaries are included in the consolidated financial statements from the date that control commences until the date that control ceases. The accounting policies of subsidiaries are consistent with Group policies. Intra-group transactions and balances, and any unrealized income and expenses arising from intra-group transactions are eliminated in preparing the consolidated financial statements. Unless otherwise stated or clear from context the information in these notes relates to both the Consolidated Group and the parent company.
At the date of the acquisition of a company the assets and liabilities in the acquired company are recognized at fair value. The difference between the acquisition value of the shares in the company and the net assets in the company is recorded as goodwill. The fair values of assets and liabilities in the acquired company are determined by management taking into consideration independent valuation. In cases where the shares have been acquired without any exchange of cash remuneration, the fair value of the shares in the acquired company is also determined by management taking into consideration independent valuation.
Goodwill is not depreciated, but is subject to impairment -testing.
(c) Segment reporting
Segment information is presented from a management perspective and business segments are identified based on internal reporting to senior executive decision makers. SEK has the following three business segments: granting of loans, advisory services and capital market products. Revenues for the two segments other than granting of loans represented less than 1 percent of total Group revenue and the operating income of each was less than 1 percent of total Group operating income in each period under consideration, while the assets of each accounted for less than 1 percent of the Group’s total assets at each relevant last day of reporting period. Therefore, they are together presented as “other segments”.
(d) Recognition of operating income and expense
(i) Net interest income
Interest revenues and interest expenses related to all financial assets and liabilities, regardless of classification, are recognized in net interest revenues. The reporting of all interest revenues and interest expenses is made on a gross basis with the exception of interest revenues and interest expenses related to derivative instruments which are reported on a net basis. Interest revenues and interest expenses are calculated and recognized based on the effective interest rate method or based on a method that results in interest revenue or interest expense that is a reasonable approximation of that obtained using the effective interest method as the basis for the calculation.
The State-supported system (“S-system”). SEK administers, for compensation, the Swedish State’s export credit support system, and the State’s related aid credit program (together the “S-system”). Pursuant to agreements between SEK and the State, the State reimburses SEK for all interest differentials, financing costs and net foreign exchange losses under the S-system so long as any loans or borrowings remain outstanding. SEK has determined that the S-system should be considered to be an assignment where SEK acts as an agent on behalf of the Swedish State rather than being the principal in the individual transactions. This assessment has been made based on a number of factors such as: (i) that SEK does not in substance, even though in form, have the risks and rewards of ownership; (ii)��that SEK does not have discretion in establishing prices; and (iii) that SEK receives compensation in the form of a fixed commission. Accordingly, the costs reimbursed by the State are not accounted for in SEK’s statement of comprehensive income. The State’s reimbursements are made on a quarterly basis. Assets and liabilities related to the S-system, are included in the statement of financial position for the Consolidated Group. SEK’s net compensation from administrating the S-system is recognized as part of interest revenues in the statement of comprehensive income.
(ii) Net fee and commission income
Net fee and commission income is presented as commissions earned or commissions incurred. The recognition of commission income depends on the purpose for which the fee is received. Fees are either recognized as revenue when services are provided or amortized over the period of a specific business transaction. Commissions incurred are transaction-based, and are recognized in the period in which the services are received.
(iii) Net result of financial transactions
Net results of financial transactions include realized gains and losses related to all financial instruments and unrealized gains and losses related to all financial instruments carried at fair value in the statement of financial position except when the fair value changes are recorded in other comprehensive income. Gains and losses comprise gains and losses related to currency exchange
F-9
Table of Contents
effects, interest rate changes and changes in the creditworthiness of the counterparty to the financial contract. The item also includes market-value changes attributable to hedged risks in fair value hedges.
(e) Foreign currency transactions
Monetary assets and liabilities in foreign currencies have been translated to the functional currency (Swedish kronor) at the exchange rates prevailing on the last day of each relevant reporting period. Revenues and costs in foreign currencies are translated to Swedish kronor at the current exchange rate as of the respective date of accrual. Any changes in the exchange rates between the relevant currencies and Swedish kronor related to the period between the day of accrual and the day of settlement are reported as currency exchange effects. Currency exchange effects are included as one component of “Net results of financial transactions”.
(f) Financial instruments
(i) Recognition and de-recognition in the statement of financial position
The recognition of financial instruments in, and their de-recognition from, the statement of financial position is based on the trade dates for securities bought as well as securities issued and derivatives. All other financial instruments are recognized and derecognized on their respective settlement date. The difference between the carrying amount of a financial liability or an asset (or part of a financial liability or an asset) extinguished or transferred to another party and the consideration paid is recognized in the statement of comprehensive income as one component of “Net results of financial transactions”.
(ii) Measurement on initial recognition
When financial instruments are initially recognized, they are measured at fair value plus, in the case of a financial assets or financial liabilities not carried at fair value through profit or loss, transaction costs that are directly attributable to the acquisition or issuance of the financial asset or financial liability.
(iii) Offsetting
Financial assets and liabilities are set off and the net amount is presented in the statement of financial position when the Group has a legal right to set off the amounts and intends either to settle on a net basis or to realize the asset and settle the liability simultaneously. This offsetting generally occurs in only a limited number of cases.
(iv) Classification of financial assets and liabilities
Financial assets are categorized into three categories for valuation purposes: loans and receivables, financial assets at fair value through profit or loss and financial assets available-for-sale. Financial liabilities are categorized into two categories for valuation purposes: financial liabilities at fair value through profit or loss and other financial liabilities.
Loans and receivables. With regard to financial assets, the category loans and receivables constitute the main category for SEK. This category is used not only for loans originated by SEK but also for securities acquired by SEK that are not quoted on an active market. Securities that SEK holds that are quoted on an active market are classified as available-for-sale securities. Transactions in the category loans and receivables are measured at amortized cost, using the effective interest rate method. When a derivative is used to hedge a currency and/or interest rate exposure relating to a loan or receivable, fair value hedge accounting is applied. Furthermore, for certain transactions classified as loans and receivables cash flow hedge accounting is applied. This is the case when SEK wish to hedge itself from variability in the cash flow from these assets.
Financial assets at fair value through profit or loss. There are two main subcategories in the category financial assets at fair value through profit or loss: financial assets designated upon initial recognition at fair value through profit or loss; and assets held-for-trading. Where two or more derivatives hedge both interest rate and credit exposures in a financial asset, such transactions may be classified irrevocably as a financial asset at fair value through profit or loss. Making such designations eliminates or significantly reduces an accounting mismatch that would otherwise arise from measuring assets or liabilities or recognizing the gains or losses on them on different bases. Derivatives are always classified as financial assets or liabilities at fair value through profit or loss except when they are subject to hedge accounting.
Financial assets available for sale. Assets that are classified as available-for-sale securities are carried at fair value, with changes in fair value recognized in other comprehensive income. If assets are sold changes in fair value are transferred from other comprehensive income to profit or loss. Among other things, this category is used for securities quoted on an active market that would otherwise be classified in the category loans and receivables. Listed shares that are available for sale are also included in this category.
Financial liabilities at fair value through profit or loss. There are two main subcategories in the category financial liabilities at fair value through profit or loss: financial liabilities designated upon initial recognition at fair value through profit or loss; and liabilities held for trading. Senior securities issued by SEK are irrevocably classified as financial liabilities at fair value through profit or loss if they contain embedded derivatives that otherwise would be bifurcated and accounted for separately. Derivatives are always classified as financial assets or liabilities at fair value through profit or loss except when they are subject to hedge accounting.
Other financial liabilities. All senior securities issued by SEK other than those classified as financial liabilities at fair value
F-10
Table of Contents
through profit or loss are classified as other financial liabilities and measured at amortized cost, using the effective interest rate method. Where one or more derivatives is hedging currency, interest rate, and/or other exposures, fair value hedge accounting is applied. Subordinated debt is classified within other financial liabilities and is mainly subject to fair value hedge accounting. When applying fair value hedge accounting on perpetual subordinated debt, hedging of the subordinated debt is made for the time period which corresponds to the time to maturity of the derivative.
(v) Presentation of certain financial instruments in the statement of financial position
The presentation of financial instruments in the statement of financial position differs in certain respects from the categorization of financial instruments made for valuation purposes. Loans in the form of interest-bearing securities comprises loans granted to customers which are contractually documented in the form of interest-bearing securities, as opposed to bilateral loan agreements, which are classified in the statement of financial position either as loans to credit institutions or loans to the public. All other securities, which are not classified in the statement of financial position as loans in the form of interest-bearing securities, are classified as either cash and cash equivalents, treasuries/government bonds or other interest-bearing securities except loans.
(vi) Measurement of certain financial instruments
Derivatives. In the ordinary course of its business, SEK uses, and is a party to, different types of derivatives for the purpose of hedging or eliminating SEK’s interest-rate, currency-exchange-rate and other exposures. Derivatives are always classified as financial assets or liabilities at fair value through profit or loss except in connection with hedge accounting. Where SEK decides to categorize a financial asset or liability at fair value through profit or loss the purpose is always to avoid the mismatch that would otherwise arise from the fact that the changes in the value of the derivative, measured at fair value, would not match the changes in value of the underlying asset or liability, measured at amortized cost.
Guarantees. SEK is a holder of financial guarantee contracts in connection with certain loans. Such guarantees are ordinarily accounted for as guarantees in accordance with SEK’s established accounting policy and therefore are not recorded in the statement of financial position (except for the deferred costs of related guarantee fees paid in advance for future periods). In limited situations, the relevant risk-mitigating instruments do not fulfill the requirements to be considered guarantees and are therefore recorded as derivatives and valued at fair value through profit or loss. When SEK classifies a risk-mitigating instrument as a financial guarantee, SEK always owns the specific asset which the financial guarantee is risk mitigating and the potential amount SEK can receive from the counterpart in the risk-mitigating instrument represents only the actual loss incurred by SEK related to its holding.
Embedded derivatives. In the ordinary course of its business, SEK issues or acquires financial assets or liabilities that contain embedded derivatives. Where financial assets or financial liabilities contain embedded derivatives it is the company’s policy to elect the option to recognize and measure the embedded derivatives together with the underlying instruments rather than separately bifurcate and measure the embedded derivatives at fair value.
Leasing assets. SEK, in the ordinary course of its business, acquires leases which are classified as finance leases (as opposed to operating leases). When making such a classification, all aspects of the leasing contract, including third party guarantees, are taken into account. Finance leases are reported as receivables from the lessees in the category loans and receivables. Any lease payment which is received from a lessee is divided into two components for measurement purposes, one component constituting an amortization of the loan and the other component recorded as interest revenues.
Committed undisbursed loans. Committed undisbursed loans ,disclosed under the heading “Commitments” below the statement of financial position, are measured as the undiscounted future cash flow concerning loan payments related to loans committed but not yet disbursed at the period end date.
Repurchase agreements and securities lending. Repurchase agreements are reported as financial transactions in the statement of financial position. Securities or other assets sold subject to repurchase agreements and securities or other assets lent to other parties are reported under the heading “Collateral provided” below the statement of financial position. Cash received from the relevant counterparties is recognized in the statement of financial position as borrowing. Cash advanced to the counterparties is recognized in the statement of financial position under “loans to credit institutions” or “loans to the public”.
Reacquired debt. SEK from time to time reacquires its own debt instruments. Gains or losses that SEK realizes when reacquiring own debt instruments are accounted for in the statement of comprehensive income as one component of net results of financial transactions.
(vii) Hedge accounting
SEK applies hedge accounting in cases when SEK uses derivatives to create economic hedging and the hedge relationship is eligible for hedge accounting. The method used for hedge accounting is either fair value hedge accounting or cash-flow hedge accounting. In order to be able to apply hedge accounting the hedging relationships must be highly effective in offsetting changes in fair values attributable to the hedged risks both at inception of the hedge and on an ongoing basis. If the hedge efficiency does not fall within established boundaries the hedge relationship is ended.
F-11
Table of Contents
Fair-value hedge accounting. Fair-value hedge accounting is used for transactions in which one or several derivatives hedge interest rate risk which has arisen from a fixed-rate financial asset or liability. When applying fair value hedging, the hedged item is revalued at fair value with regard to the risk being hedged. SEK defines the risk being hedged in fair-value hedge accounting as the risk of a change in fair value with regard to a chosen reference rate (referred to as interest rate risk). The hedging instrument may consist of one or several derivatives exchanging fixed interest to floating interest in the same currency (interest rate swap(s)) or one or several instruments exchanging fixed interest in one currency to floating interest in another currency (interest and currency swap(s)).
If a fair value hedge relationship no longer fulfills the requirements for hedge accounting, the hedged item ceases to be measured at fair value and is measured at amortized cost and the previously recorded fair value changes for the hedged item are amortized over the previously hedged item’s remaining maturity.
Cash-flow hedge accounting. Cash-flow hedge accounting is used for transactions in which one or several derivatives hedge risk for variability in the cash flows from a floating-rate financial asset or liability. When hedging cash flows, the hedged asset or liability is measured at amortized cost and changes in fair value in the hedging instrument are reported in other comprehensive income. When the hedged cash flow is reported through profit or loss or other comprehensive income, the fair value changes in the hedging instrument are reclassified from other comprehensive income to operating profit. SEK defines the risk hedged in a cash-flow hedge as the risk of variability of cash flows with regard to a chosen reference rate (referred to as cash flow risk). The hedging instrument may consist of one or several derivatives exchanging floating interest to fixed interest in the same currency (interest rate swap(s)) or one or several instruments exchanging floating interest in one currency to fixed interest in another currency (interest and currency swap(s)).
If a cash flow hedge relationship no longer fulfills the requirements for hedge accounting and accumulated gains or losses related to the hedge have been recorded in equity, such gains or losses remain in equity and are amortized through other comprehensive income to profit or loss over the previously hedged item’s remaining maturity.
(viii) Principles for determination of fair value of financial instruments
The best evidence of fair value is quoted prices in an active market. The majority of SEK’s financial instruments are not publicly traded, and quoted market values are not readily available.
For all classes of financial instruments (assets and liabilities) fair value is established by using internally established valuation models, externally established valuation models, prices furnished by external parties and dealers in such instruments or market quotations. If the market for a financial instrument is not active, fair value is established by using a valuation technique. The objective of using a valuation technique is to establish what the transaction price would have been on the measurement date in an arm’s length exchange motivated by normal business considerations. Valuation techniques include using recent arm’s length market transactions between knowledgeable, willing parties, if available, reference to the current fair value of another instrument that is substantially the same, discounted cash flow analysis and option pricing models. Periodically, the valuation techniques are calibrated and tested for validity using prices from observable current market transactions in the same instruments or based on any available observable-market data.
In calculating fair value, SEK seeks to use observable market quotes (market data), to best reflect the market’s view on prices. These market quotes are used, directly or indirectly, in quantitative models for the calculation of fair value. Examples of the indirect use of market data are:
· the derivation of discount curves from observable market data, which is interpolated to calculate the non-observable data points,
· quantitative models which are used to calculate fair value on a financial instrument, where the model is calibrated so that one can use available market data to recreate observable market prices on similar instruments, and
· the valuation of simple options with maturities that are between two observed market quotes. In this case, interpolation is used to produce intermediate quotes.
In some cases, due to low liquidity in the market, there is no access to observable market data. In these cases, SEK follows market practice by basing its valuations on:
· Historically observed market data. One example is a valuation depending on the correlation between two exchange rates, where the correlation is determined by time series analysis.
· Similar observable market data. One example is SEK’s valuation of the volatility of a stock option whose maturity is longer than the longest option for which observable market quotes are available. In such a case SEK extrapolates a value based on the observable market quotes for shorter maturities.
F-12
Table of Contents
For observable market data SEK uses third-party information based on purchased contracts (such as Reuters and Bloomberg). This type of information can be divided into two groups where the first group consists of directly observable prices, and the second consists of market data calculated from the observed prices.
Examples from the first group are, for various currencies and maturities, currency rates, stock prices, share index levels, swap prices, future prices, basis spreads and bond prices. The discount curves SEK uses, which are a cornerstone for valuation at fair value, are constructed from observable market data.
Examples from the second group are the standard quote forms, such as call options in the foreign exchange market quoted through volatility which is calculated so that the so-called Black-Scholes model recreates observable prices. Further examples from this group are, for various currencies and maturities, currency volatility, swap volatility, cap/floor volatilities, stock volatility, and dividend schedules for equity and CDS spreads.
For transactions that cannot be valued based on observable market data, the use of non-observable market data is necessary. One example of non-observable market data that SEK uses consists of discount curves created using observable market data, but then extrapolated to calculate the non-observable data. Another example of non-observable data is when market correlation used in valuation models is based on transactions with low liquidity, for example spread options.
(ix) Determination of fair value of certain types of financial instruments
Derivative instruments. Derivative instruments are carried at fair value, and fair value is calculated based upon internally established valuations, external valuation models, quotations furnished by external parties or dealers in such instruments or market quotations. When calculating fair value for derivative instruments, the impact on the fair value of the instrument related to counterparty credit risk is based on publicly quoted prices on credit default swaps of the counterpart if such prices are available.
Issued debt instruments. When calculating fair value on issued debt instruments the effect of SEK’s own credit risk is made based on internally established models based on observations on different markets. Furthermore, certain assumptions about expected lifetime are made for certain liabilities carried at fair value and the derivatives that hedge the debt instruments. Assumptions on expected lifetime are evaluated and reconsidered on a quarterly basis. The models used include both observable and non-observable parameters for valuation.
Issued debt instruments which are hybrid instruments with embedded derivatives. SEK issues debt instruments in many financial markets. A large portion of these are hybrid instruments with embedded derivates. SEK’s policy is to hedge the risks in these instruments using derivatives in order to obtain effective economic hedges. These hybrid debt instruments are classified as financial liabilities measured at fair value through profit or loss. As there are no market quotes for these instruments, valuation models, valuations established by external parties or quotes furnished by dealers in such instruments are used to calculate fair value. The same valuation model is used for a hybrid debt instruments and the derivative hedging the instrument, except with regard for adjustments due to counterparty or own credit risk.
See further information in Note 13 of the valuation techniques applied for certain types of financial instruments.
(x) Impairment of financial assets
SEK monitors loans and receivables and other assets for impairment as described below. Loans and other financial assets are identified as impaired if there is objective evidence of impairment and an impairment test indicates a loss.
Provisions for incurred impairment losses. Provisions for incurred impairment losses are recorded if and when SEK determines it is probable that the obligor of a loan, or another financial asset held by SEK, in each case together with any existing guarantee or collateral, will fail to cover SEK’s full claim. Such determinations are made for each individual loan or other financial asset. Objective evidence consists of significant financial difficulties, with the issuer or debtor, outstanding or delayed payments or other observable facts which suggest a measurable decrease in expected future cash flow. If there is objective evidence that an impairment loss on loans or other financial asset has been incurred, the amount of the loss is measured as the difference between the asset’s carrying amount and the present value of estimated future cash flows (excluding future credit losses that have not been incurred) discounted to the relevant period-end date at the financial asset’s original effective interest rate. The amount of the loss is recognized in profit or loss.
After an individual determination has been made, and if there is no objective evidence for impairment of an individually assessed financial asset, regardless of whether the asset is individually material or not, the company includes the asset in a group of financial assets with similar credit risk characteristics and determines, collectively, the need for impairment of such assets. The need for impairment is related to loan losses which have occurred as of a period-end date but which have not yet been identified as individual loan losses.
Impairment of an asset is made to a reserve account which, in the consolidated statement of financial position, reduces the item line to which it relates.
F-13
Table of Contents
If and when a decline in the fair value of an available-for-sale financial asset has been recognized in other comprehensive income and there is objective evidence that the asset is impaired, the cumulative loss that has been recognized is removed from other comprehensive income and recognized in profit or loss even though the financial asset has not been derecognized in the statement of financial position.
Charge-offs are recorded when it is evident that it is highly unlikely that any remaining part of SEK’s claim on a counterparty will be reimbursed within the foreseeable future and when there exists no guarantee or collateral covering the claim. Charge-offs may also be made once bankruptcy proceedings have been concluded and a final loss can be established taking into account the value of any assets held by the bankruptcy estate and SEK’s share of these assets.
Recoveries are recorded only if there is virtual certainty of collection, such as in the aftermath of a bankruptcy proceeding when the payment due to be paid to SEK has been finally determined.
When a loan is classified as impaired, is past due or is otherwise non-performing, the interest is accounted for in the same manner as the principal amount. Thus, the interest related to any portion of a loan that is expected to be repaid in the future is recorded in earnings, discounted at the original effective interest rate, while the interest related to any portion of a loan that is not expected to be collected in accordance with the relevant loan agreement will not be recorded in earnings.
(g) Tangible assets
Items of property are measured at cost less accumulated depreciation and impairment losses. Costs include expenditures that are directly attributable to the acquisition of the asset. When parts of an item of property or equipment have different useful lives, they are accounted for as separate items (major components) of property and equipment. Office equipment, buildings and equipment relating to the building are depreciated on a straight-line method over their estimated useful lives. Land is not depreciated. The average useful lives, depreciation methods and book values are evaluated and reconsidered on a yearly basis. From the time an asset is classified as an asset held for sale no depreciation is carried out.
(h) Intangible assets
Intangible assets comprise mainly of the capitalized portion of investments in IT systems, which includes expenses related to the intangible assets, such as consulting fees and expenses for Group personnel contributing to producing such intangible assets. Each intangible asset is depreciated on a straight-line method over an estimated useful life from the date the asset is available for use. The average useful lives are evaluated and reconsidered on a yearly-basis.
(i) Employee benefits
SEK sponsors both defined benefit and defined contribution pension plans.
Defined contribution plans
A defined contribution plan is a post-employment benefit plan under which an entity (SEK, in this case) pays fixed contributions into a separate entity and will have no legal or constructive obligation to pay further amounts. Obligations for contributions to defined contribution pension plans are recognized as an employee benefit expense in profit or loss when due as employees provide services to the entity during a period. Prepaid contributions are recognized as an asset to the extent that a cash refund or a reduction in future payments is available.
Defined benefit plans
Defined benefit plans are post-employment benefit plans other than defined contribution plans.
The net obligation in respect of defined benefit plans is calculated separately for each plan by estimating the amount of future benefits employees have earned in return for their service in the current and prior periods; that benefit is discounted to determine its present value and the fair value of any plan assets is deducted.
The cost for defined benefit plans is calculated using the “projected unit credit method”, which distributes the cost of a plan over a covered employee’s service period. The calculation is performed annually by independent actuaries. The obligations are valued at the present value of the expected future disbursements, taking into consideration assumptions such as expected future pay increases, rate of inflation, and changes in mortality rates. The discount rate used is the equivalent of the interest rate for government bonds with a remaining term approximating that of the actual -commitments.
Changes in actuarial assumptions may result in actuarial gains or losses affecting the fair value of plan obligations. Such gains or losses, within a 10 percent “corridor”, are not immediately recognized. Gains or losses exceeding the 10 percent corridor are amortized over the remaining estimated service period of the -employees.
The companies of the Group support various public pension plans covering all employees. All expenditures and accrued expenses related to pension plans have been expensed. The Group has both defined contribution and defined benefit pension commitments. The most significant pension plan is BTP for bank employees in Sweden, which is secured through insurance with the insurance company SPP. This plan, now categorized as a defined-benefit plan, was previously reported as a defined-contribution plan,
F-14
Table of Contents
because SEK did not previously have access to sufficient information regarding the plan. From 2009, the information has been made available and the plan has been reported as defined-benefit plan in accordance with IAS 19. In addition to this there are a number of individual pension solutions based on length of service and compensation at or near retirement.
(j) Equity
Equity in the Consolidated Group consists of the following items: share capital; reserves; retained earnings; and net profit for the year. Reserves consist of the following items: reserve for fair value changes on available-for-sale assets and reserve for fair value changes on derivatives in cash-flow hedges.
(k) Income tax
Income tax on the profit or loss for the year comprises current and deferred taxes. Current tax is tax expected to be payable on taxable income for the financial year. Deferred tax includes deferred tax in the untaxed reserves of the individual Group companies and deferred taxes on other taxable temporary differences. Deferred taxes on taxable temporary differences are calculated with an expected tax rate of 26.3 percent. Deferred taxes are calculated on all taxable temporary differences regardless of whether a given temporary difference is recognized in the income statement or through other comprehensive income. There are no material temporary differences that have not been recognized.
(l) Critical accounting policies, judgments and estimates
When applying the Group’s accounting policies management makes judgments and estimates that have a significant effect on the amounts recognized in the financial statements. The estimates are based on past experience and assumptions that the company believes are fair and reasonable. These estimates and the judgments behind them affect the reported amounts of assets, liabilities and off-balance sheet items, as well as income and expenses in the financial statements presented. Actual outcomes can later differ from the estimates and the assumptions made. Please see below for items where critical estimates have been made. The company assesses the judgments made related to the following critical accounting policies to be of most significance:
· The functional currency,
· Classifications of securities as quoted on an active market,
· The selection of the appropriate valuation techniques when prices from active markets are not available for derivatives and other financial instruments carried at fair value,
· The judgment that SEK should be regarded as an agent with respect to the S-system
The functional currency
SEK has determined that the Swedish krona (Skr) is its functional currency under IFRS. Large portions of its assets, liabilities and related derivatives are denominated in foreign currency. Under IFRS both assets and liabilities are translated at closing exchange rates and the differences between historical book values and current values are reflected as foreign exchange effects in revenues and expenses, where they often largely offset each other. This reflects the economic substance of SEK’s policy of holding assets financed by liabilities denominated in, or hedged into, the same currency. See note 27 for information on SEK’s positions in foreign currency.
Classifications of securities as quoted on an active market
When classifying securities as loans and receivables, SEK makes judgments as to whether these securities are quoted on active markets based on a number of pre-established factors. SEK has established an operational definition of when a transaction should be regarded as quoted on an active market. An instrument is regarded as quoted on an active market if there are sufficient numbers of parties offering bid and/or ask prices. All other transactions are regarded as not quoted on an active market. In the case of uncertainty, additional qualitative criteria are taken into consideration in accordance with a predefined process. If a larger number of securities were deemed to be quoted on an active market, these securities would be classified as assets available-for-sale and carried at fair value with the after-tax changes in fair value for these securities would affect other comprehensive income.
The selection of the appropriate valuation techniques when prices from active markets are not available for derivatives and other financial instruments carried at fair value
When reporting the amounts of its assets, liabilities and derivatives, as well as its revenues and expenses, assumptions and estimates must be made in assessing the fair value of financial instruments and derivatives, especially where unquoted or illiquid securities or other debt instruments are involved. SEK makes judgments regarding what the most appropriate valuation techniques are for the different financial instruments held by the Group. If the conditions underlying these assumptions and estimates were to change, the amounts reported could be different. When financial instruments are carried at fair value, fair value is calculated through the use of market quotations, pricing models, valuations established by external parties and discounted cash flows. The majority of SEK’s financial instruments are not publicly traded, and quoted market prices are not readily available. Different pricing models or assumptions could produce different valuation results. Furthermore, the estimated fair value of a financial instrument may, under certain market conditions, differ significantly from the amount that could be realized if the security were sold immediately.
See Note 27 for disclosure of change in value of assets and liabilities if the market interest rate rises or falls by one percentage point.
F-15
Table of Contents
The judgment that SEK should be regarded as an agent with respect to the S-system
SEK has determined that the S-system should be considered to be an assignment where SEK acts as an agent on behalf of the Swedish State rather than being the principal in the individual transactions. This assessment has been made based on a number of factors such as: (i) that SEK does not in substance, even though in form, have the risks and rewards of ownership; (ii) that SEK does not have discretion in establishing prices; and (iii) that SEK receives compensation in the form of a fixed commission. SEK has consequently presented the economic activities of the S-system on a net basis in the income statement, recording the net commission received, rather than the gross amounts collected in accordance with the agreement with the Swedish State. If SEK were regarded as a principal with respect to the S-system, all revenues and expenses in the S-system would be revenues and expenses of SEK. However, the net effect on SEK’s operating profit would be unchanged. Please see more information regarding the S-system in note 24.
Furthermore, the company has identified the following key sources of estimation uncertainty when applying IFRS:
· Provisions for probable credit losses,
· Estimates of fair values when quoted market prices are not available,
· Valuation of derivatives without observable market prices
Provisions for probable credit losses
Provisions for probable credit losses are made if and when SEK determines that it is probable the obligor under a loan or another asset held by SEK, in each case together with existing guarantees and collateral, will fail to cover SEK’s full claim. If the judgment underlying this determination were to change, this could result in a material change in provisions for probable credit losses.
Impairment is recognized as the difference between the carrying value of a loan and the discounted value of our best estimate of future cash repayments. This estimate takes into account a number of factors related to the obligor. The actual amounts of future cash flows and the dates they are received may differ from these estimates and consequently actual losses incurred may differ from those recognized in the financial statements. If, for example, the actual amount of total future cash flow were 10 percent higher or lower than the estimate, this would affect operating profit for the financial year ended December 31, 2010 by Skr 50–60 million and equity by Skr 30–40 million at that date.
Estimates of fair value when quoted market prices are not available
If a transaction is classified as assets or liabilities at fair value through profit or loss, fair value must include any impact of credit spreads. When quoted market prices are not available for such instruments, certain assumptions must be made about the credit spread of either the counterparty or one’s own credit spread depending on whether the instrument is an asset or a liability. If these assumptions were to be changed, this could result in a material change in the fair value of these instruments.
If the assumption with relation to the valuation of assets classified at fair value through profit or loss were changed such that the average credit spread applied to such assets were 0.10 percent higher or lower than the average spread actually used in the calculations, this would affect operating profit for the fiscal year ended December 31, 2010 by approximately Skr 20–30 million and equity, at such date, by approximately Skr 30–40 million.
If the assumption with relation to the valuation of liabilities classified at fair value through profit or loss were changed such that the average credit spread applied to such liabilities were 0.10 percent higher or lower than the average spread actually used in the calculations, this would affect operating profit for the fiscal year ended December 31, 2010 by approximately Skr 400–500 million and equity, at such date, by approximately Skr 300–400 million.
SEK issues debt instruments in many financial markets. A large portion of these are hybrid instruments with embedded derivatives. SEK’s policy is to hedge the risks in these instruments using swaps with corresponding structures in order to obtain effective economic hedges. These hybrid debt instruments are classified as financial liabilities measured at fair value. As there are no market quotes for this group of transactions, valuation models, valuations established by external parties or quotations furnished by dealers in such instruments are used to calculate fair value. The same model is used for a hybrid liability and the structured swap hedging the instrument, except for adjustments due to counterparty or SEK’s own credit risk. Thus, with the exception of effects from changes in counterparty and SEK’s own credit risk valuations, fair-value changes in a hybrid liability are always matched by corresponding changes in the fair value of the swap that hedges that liability. Although SEK’s credit rating has not changed during the year, developments on financial markets have to some extent affected the prices at which SEK’s debt is issued. These changes, which are different in different markets, have been included in the calculation of fair value for these liabilities. The models used include both directly observable and implied market parameters.
Please see more information regarding valuation techniques in Note 13.
F-16
Table of Contents
Valuation of derivatives without observable market prices
A large part of SEK’s portfolio of senior securities and related derivatives is in the form of structured products where the fair value of certain embedded derivatives (even though not bifurcated) sometimes require sophisticated models in order to value these instruments. If the assumptions used in these models were to change, this could result in a material change in the fair value of these instruments. Since SEK only enters into market-matched hedge relationships (economic or accounting hedges) the only potential material effect on profit or loss or equity would result if there were changes in the credit spreads.
SEK uses swap agreements (primarily) to hedge risk exposures in financial assets and liabilities. SEK enters into the swap agreements only under ISDA master agreements and all swap contracts are with financial institutions as counterparties. Counterparty risks are managed by using a credit support annex or other agreement where the credit exposure is mitigated on at least a monthly basis. Swaps are measured at fair value by using market quoted rates where available. If market quotes are not available, valuation models are used. For counterparties in respect of which SEK has a positive swap portfolio value, SEK uses a model to adjust the net exposure fair value for changes in the counterparty’s credit quality. The models used include both directly observable and implied market parameters.
Please see more information regarding valuation techniques in Note 13.
F-17
Table of Contents
Note 2. Net interest revenues
| | Consolidated Group | |
Skr mn | | 2010 | | 2009 | | 2008 | |
Interest revenues were related to: | | | | | | | |
Loans to credit institutions | | 1,191.9 | | 1,635.2 | | 1,679.5 | |
Loans to the public | | 3,018.1 | | 2,983.6 | | 1,488.6 | |
Interest-bearing securities | | 1,679.8 | | 3,043.6 | | 9,423.2 | |
Impaired financial assets | | 3.1 | | 34.4 | | 36.4 | |
Derivatives | | 6,290.2 | | 5,609.6 | | 336.1 | |
Total interest revenues | | 12,183.1 | | 13,306.4 | | 12,964.1 | |
Total interest expenses | | -10,284.6 | | -11,312.1 | | -11,420.8 | |
Net interest revenues | | 1,898.5 | | 1,994.3 | | 1,543.3 | |
| | Consolidated Group | |
Skr mn | | 2010 | | 2009 | | 2008 | |
Interest revenues were related to: | | | | | | | |
Financial assets available for sale | | 66.8 | | 5.2 | | 391.7 | |
Financial assets at fair value through profit or loss | | 6,715.4 | | 6,340.8 | | 1,175.8 | |
Loans and receivables | | 5,400.9 | | 6,960.4 | | 11,396.6 | |
Total interest revenues | | 12,183.1 | | 13,306.4 | | 12,964.1 | |
| | | | | | | |
Interest expenses were related to: | | | | | | | |
Financial liabilities at fair value through profit or loss | | -4,149.9 | | -4,391.9 | | -5,085.3 | |
Financial guarantees | | -248.6 | | -212.5 | | -107.7 | |
Other financial liabilities | | -5,886.1 | | -6,707.7 | | -6,227.8 | |
Total interest expenses | | -10,284.6 | | -11,312.1 | | -11,420.8 | |
| | | | | | | |
Net interest revenues | | 1,898.5 | | 1,994.3 | | 1,543.3 | |
In interest revenues Skr 48.7 million (2009: Skr 27.3 million, 2008: Skr 22.4 million) represent remuneration from the S-system (see Note 24). Interest revenues in the Consolidated Group by geographic market are approximately 24 percent (2009: 22 percent,2008: 29 percent) from Sweden, 52 percent (2009: 9 percent,2008: 49 percent) from other European countries and 24 percent (2009: 69 percent,2008: 22 percent) from other countries outside of Europe.
Note 3. Net commissions
| | Consolidated Group | |
Skr mn | | 2010 | | 2009 | | 2008 | |
Commissions earned were related to: | | | | | | | |
Financial consultant commissions | | 12.7 | | 23.2 | | 19.1 | |
Capital market commissions | | 6.8 | | 2.5 | | 14.3 | |
Other commissions earned | | 0.2 | | 0.5 | | 1.3 | |
Total commissions earned | | 19.7 | | 26.2 | | 34.7 | |
| | | | | | | |
Commissions incurred were related to: | | | | | | | |
Risk capital guarantee from shareholder | | -3.6 | | -3.6 | | -3.6 | |
Financial consultant commissions | | -1.5 | | -6.1 | | -1.8 | |
Other commissions incurred | | -14.8 | | -16.7 | | -16.3 | |
Total commissions incurred | | -19.9 | | -26.4 | | -21.7 | |
Net commissions | | -0.2 | | -0.2 | | 13.0 | |
Commissions earned in the Consolidated Group by geographic market is approximately 51 percent (2009: 44 percent,2008: 30 percent) from Sweden, 34 percent (2009: 43 percent,2008: 10 percent) from Europe except Sweden, and 15 percent (2009: 13 percent,2008: 60 percent) from countries outside of Europe.
Commissions incurred in the Consolidated Group by geographic market is approximately 35 percent (2009: 31 percent,2008: 0 percent) from Sweden, 60 percent (2009: 49 percent,2008: 10 percent) from Europe except Sweden, and approximately 6 percent (2009: 20 percent,2008: 90 percent) from countries outside of Europe.
Commissions earned from financial assets and liabilities not measured at fair value through profit or loss amounts, for the Consolidated Group to Skr 0.2
F-18
Table of Contents
million (2009: Skr 0.5 million, 2008: Skr 1.3 million).
Commissions incurred from financial assets and liabilities not measured at fair value through profit or loss amounts, for the Consolidated Group to Skr 0.7 million (2009: Skr 2.3 million, 2008: Skr 0.2 million.
Note 4. Net result of financial transactions
| | Consolidated Group | |
Skr mn | | 2010 | | 2009 | | 2008 | |
Net results of financial transactions were related to: | | | | | | | |
Realized and unrealized results related to assets held-for-trading (3) | | — | | 0.0 | | -35.9 | |
Currency exchange effects on assets and liabilities excluding assets and liabilities valued at fair value | | -0.8 | | 31.5 | | 140.4 | |
Realized results on settled assets and repurchased debt (1) | | 2,673.4 | | 302.3 | | 87.3 | |
Total net results of financial transactions, before certain fair value changes | | 2,672.6 | | 333.8 | | 191.8 | |
| | | | | | | |
Changes in fair value related to financial assets, financial liabilities and related derivatives | | -175.0 | | 769.3 | | -648.7 | |
Total net results of financial transactions | | 2,497.6 | | 1,103.1 | | -456.9 | |
Changes in fair value related to financial assets, financial liabilities and related derivatives, for categories of financial instruments
| | Consolidated Group | |
Skr mn | | 2010 | | 2009 | | 2008 | |
Financial assets or liabilities at fair value through profit or loss on initial recognition as one to be measured at fair value (FVO): | | | | | | | |
of which derivatives | | 845.1 | | 1,096.0 | | -18,400.4 | |
of which other financial assets and liabilities | | -280.7 | | -3,573.5 | | 18,641.7 | |
Financial assets available-for-sale (2) | | -31.7 | | -1.2 | | 133.3 | |
Loans and receivables (2) | | -149.1 | | -611.7 | | 1,594.5 | |
Other financial liabilities (2) | | -558.6 | | 3,859.7 | | -2,617.8 | |
Ineffectiveness of cash flow hedges that have been reported in the profit or loss | | 0.0 | | 0.0 | | 0.0 | |
Total | | -175.0 | | 769.3 | | -648.7 | |
| | | | | | | |
of which total amount of the change in fair value estimated using valuation technique based on assumptions that are not supported by prices from observable current market transactions in the same instrument recognised in profit or loss during the period | | -175.0 | | 770.5 | | -782.0 | |
Realized results on settled assets and repurchased debt
| | Consolidated Group | |
Skr mn | | 2010 | | 2009 | | 2008 | |
Financial assets or liabilities at fair value through profit or loss | | 140.1 | | 190.3 | | 79.9 | |
Financial assets available-for-sale | | 2,565.0 | | 0.0 | | -11.0 | |
Loans and receivables | | -38.5 | | -2.2 | | 0.0 | |
Financial guarantees | | — | | 0.0 | | 2.1 | |
Other financial liabilities | | 6.8 | | 114.2 | | 16.3 | |
Total | | 2,673.4 | | 302.3 | | 87.3 | |
(1) The disposal of the shares in Swedbank in the fourth quarter 2010 is reported in “Realized results on settled assets and repurchased debt”, totaling Skr 2,565.0 million, which corresponds to the changes in fair value that earlier have been reported previously as other comprehensive income and have been included in the fair value reserve within equity.
(2) Changes in fair value of financial assets available-for-sale, loans and receivables and other financial liabilities have been accounted for through profit or loss when such asset or liability is subject to fair value hedging in terms of changes in fair value related to the hedged risk. See Note 12 for information on the portion of those assets or liabilities that are subject to fair value hedging.
(3) In 2008 assets held for trading were reclassified to the category loans and receivable. Earlier those were accounted for at fair-value.
F-19
Table of Contents
Note 5. Personnel expenses
| | Consolidated Group | |
Skr mn | | 2010 | | 2009 | | 2008 | |
Personnel expenses: | | | | | | | |
Salaries and remuneration to the Board of Directors and the Presidents | | -6.9 | | -11.4 | | -9.6 | |
Salaries and remuneration to Senior Executives | | -10.9 | | -10.5 | | -9.0 | |
Salaries and remuneration to other employees | | -113.1 | | -156.2 | | -116.7 | |
Pensions | | -67.0 | | -67.6 | | -36.6 | |
Social insurance | | -45.1 | | -53.1 | | -42.7 | |
Other personnel expenses | | -16.4 | | -13.4 | | -13.9 | |
Total personnel expenses | | -259.4 | | -312.2 | | -228.5 | |
Of the pensions, Skr 3.4 million (2009: Skr 2.7 million, 2008: Skr 2.6 million) relates to the President, of which Skr 2.0 million (2009: Skr 1.9 million, 2008: Skr 1.9 million) is in excess of what is tax-deductible. Skr 6.4 million (2009: Skr 5.3 million, 2008: Skr 4.6 million) pertains to other senior executives, of which Skr 2.9 million (2009: Skr 2.2 million, 2008: Skr 2.1 million) is in excess of what is tax-deductible.
| | Consolidated Group | |
Average number of employees | | 2010 | | 2009 | | 2008 | |
Women | | 100 | | 93 | | 78 | |
Men | | 128 | | 118 | | 105 | |
Total | | 228 | | 211 | | 183 | |
| | Consolidated Group | |
Number of employees at year-end | | 2010 | | 2009 | | 2008 | |
Women | | 106 | | 101 | | 93 | |
Men | | 129 | | 126 | | 116 | |
Total | | 235 | | 227 | | 209 | |
Number of employees abroad amounted at year-end to 1 (year-end 2009: 1 employee, year-end 2008: 6 employees). The salary amounted to Skr 2.4 million (2009: Skr 2.7 million, 2008: Skr 5.3 million) and total personnel expenses amounted to Skr 3.3 million (2009: Skr 4.2 million, 2008: Skr 6.4 million).
Women in the Board of Directors and among the Senior Executives, % | | 2010 | | 2009 | | 2008 | |
Board of Directors | | 44 | | 50 | | 44 | |
Senior Executives | | 43 | | 43 | | 33 | |
The combined total of the remuneration to senior executives, excluding the President, amounted to Skr 12.7 million (2009: Skr 12.1 million, 2008: Skr 10.4 million). Of the remuneration to senior executives, Skr 12.4 million (2009: Skr 12.1 million, 2008: Skr 10.1 million) is qualifying for pension purposes. Of the remuneration to the President, Skr 4.1 million (2009: Skr 4.2 million, 2008: Skr 4.2 million) is qualifying for pension purposes. Variable remuneration is not paid for the President or any other senior executives.
F-20
Table of Contents
| | 2010 | |
Remuneration and other benefits to the Board of Directors and Senior
Executives in the Consolidated Group, Skr thousand | | Fee, includes
committee fee | | Fixed
salary | | Other
benefits | | Pension fee | | Total | |
Chairman of the Board of Directors: | | | | | | | | | | | |
Ulf Berg | | -185 | | | | | | | | -185 | |
Vice Chairman of the Board of Directors: | | | | | | | | | | | |
Christina Liffner | | -132 | | | | | | | | -132 | |
Other members of the Board of Directors: | | | | | | | | | | | |
Karin Apelman | | -160 | | | | | | | | -160 | |
Jan Belfrage | | -77 | | | | | | | | -77 | |
Helena Levander | | -114 | | | | | | | | -114 | |
Jan Roxendal | | -138 | | | | | | | | -138 | |
Risto Silander | | -118 | | | | | | | | -118 | |
Eva Walder | | -37 | | | | | | | | -37 | |
Board members who resigned at the AGM 2010: | | | | | | | | | | | |
Bo Netz | | -35 | | | | | | | | -35 | |
Senior Executives: | | | | | | | | | | | |
Peter Yngwe, President and CEO | | | | -4,047 | | -144 | | -3,398 | | -7,590 | |
Jane Lundgren Ericsson, President-AB SEK Securities | | | | -1,699 | | -55 | | -340 | | -2,094 | |
Sirpa Rusanen, Executive Director-Human Resources | | | | -1,128 | | -83 | | -375 | | -1,585 | |
Måns Höglund, Executive Director-Corporate & Structured Finance | | | | -2,862 | | -124 | | -2,212 | | -5,198 | |
Per Åkerlind, Executive Director-Capital Markets | | | | -2,717 | | -123 | | -2,154 | | -4,994 | |
Sven-Olof Söderlund, Executive Director-Strategic Analysis & Planning | | | | -1,992 | | -101 | | -836 | | -2,929 | |
Susanna Rystedt, Executive Director-Administration | | | | -1,735 | | -68 | | -498 | | -2,301 | |
Total | | -996 | | -16,180 | | -697 | | -9,813 | | -27,687 | |
| | 2009 | |
Remuneration and other benefits to the Board of Directors and Senior
Executives in the Consolidated Group, Skr thousand | | Fee, includes
committee fee | | Fixed
salary | | Other
benefits | | Pension fee | | Total | |
Chairman of the Board of Directors: | | | | | | | | | | | |
Ulf Berg | | -165 | | | | | | | | -165 | |
Vice Chairman of the Board of Directors: | | | | | | | | | | | |
Christina Liffner | | -135 | | | | | | | | -135 | |
Other members of the Board of Directors: | | | | | | | | | | | |
Karin Apelman | | -131 | | | | | | | | -131 | |
Pirkko Juntti | | -36 | | | | | | | | -36 | |
Helena Levander | | -114 | | | | | | | | -114 | |
Bo Netz | | -108 | | | | | | | | -108 | |
Harald Sandberg | | -39 | | | | | | | | -39 | |
Risto Silander | | -118 | | | | | | | | -118 | |
Jan Roxendal | | -138 | | | | | | | | -138 | |
Eva Walder | | -75 | | | | | | | | -75 | |
Senior Executives: | | | | | | | | | | | |
Peter Yngwe, President and CEO | | | | -4,018 | | -133 | | -2,718 | | -6,868 | |
Jane Lundgren Ericsson, President-AB SEK Securities | | | | -1,597 | | -37 | | -340 | | -1,974 | |
Sirpa Rusanen, Executive Director-Human Resources | | | | -1,133 | | -80 | | -319 | | -1,532 | |
Måns Höglund, Executive Director-Corporate & Structured Finance | | | | -2,862 | | -130 | | -2,143 | | -5,134 | |
Per Åkerlind, Executive Director-Capital Markets | | | | -2,674 | | -113 | | -1,221 | | -4,007 | |
Sven-Olof Söderlund, Executive Director-Strategic Analysis & Planning | | | | -1,957 | | -95 | | -864 | | -2,917 | |
Susanna Rystedt, Executive Director-Administration | | | | -1,386 | | -53 | | -387 | | -1,826 | |
Total | | -1,059 | | -15,627 | | -640 | | -7,992 | | -25,318 | |
F-21
Table of Contents
| | 2008 | |
Remuneration and other benefits to the Board of Directors and Senior
Executives in the Consolidated Group, Skr thousand | | Fee, includes
committee fee | | Fixed
salary | | Other
benefits | | Pension fee | | Total | |
Chairman of the Board of Directors: | | | | | | | | | | | |
Ulf Berg | | -163 | | | | | | | | -163 | |
Vice Chairman of the Board of Directors: | | | | | | | | | | | |
Christina Liffner | | -156 | | | | | | | | -156 | |
Other members of the Board of Directors: | | | | | | | | | | | |
Karin Apelman | | -107 | | | | | | | | -107 | |
Pirkko Juntti | | -113 | | | | | | | | -113 | |
Helena Levander | | -113 | | | | | | | | -113 | |
Bo Netz | | -107 | | | | | | | | -107 | |
Harald Sandberg | | -113 | | | | | | | | -113 | |
Risto Silander | | -117 | | | | | | | | -117 | |
Jan Roxendal | | -135 | | | | | | | | -135 | |
Senior Executives: | | | | | | | | | | | |
Peter Yngwe, President and CEO | | | | -4,010 | | -146 | | -2,603 | | -6,759 | |
Jane Lundgren Ericsson, President-AB SEK Securities | | | | -1,365 | | -16 | | -351 | | -1,733 | |
Sirpa Rusanen, Executive Director-Human Resources | | | | -1,106 | | -40 | | -318 | | -1,463 | |
Måns Höglund, Executive Director-Corporate & Structured Finance | | | | -2,857 | | -142 | | -2,109 | | -5,108 | |
Per Åkerlind, Executive Director-Capital Markets | | | | -2,667 | | -140 | | -1,104 | | -3,911 | |
Sven-Olof Söderlund, Executive Director-Strategic Analysis & Planning | | | | -1,988 | | -89 | | -674 | | -2,752 | |
Total | | -1,127 | | -13,994 | | -574 | | -7,158 | | -22,853 | |
Comprehensive information on the company’s remuneration policy in accordance with the Swedish Financial Supervisory Authority’s Regulations and General Guideline’s governing remuneration policies in credit institutions, investment firms and fund management companies (Chapter 5. FFFS 2009:6), is disclosed on the company’s website (www.sek.se) in connection with the publication of annual accounts. The company’s disclosure provides information about the principles for 2010 year’s remuneration. The disclosure also describes the design of the remuneration policy, as adopted by the company.
The employment contracts of Peter Yngwe, Per Åkerlind and Sven-Olof Söderlund which followed the applicable governmental guidelines for Senior Executives when they were written, have been renegotiated in the last six months of 2010. Pension fees above 30 percent (which is the maximum percentage according to the most recent governmental guidelines) of their fixed salary belong either to premiums paid before the renegotiations or to the extra pension premium for Peter Yngwe and Per Åkerlind (Skr 3.0 million each, Skr 1.0 million paid in 2010, and Skr 1.0 million for payment in 2011, and Skr 1.0 million in 2012) included in the renegotiations. Each compensation pension premium is conditional to the fact that the employee remains employed by SEK, and is not paid if the employee himself resigns before each time of payment. Peter Yngwe, Per Åkerlind and Sven-Olof Söderlund are entitled to a notice period from SEK of six months prior to termination of employment, and they are also entitled to eighteen months severance pay according to the fixed monthly salary upon termination of employment. Deduction is done if new employment is obtained. For all other senior executives except one the period of notice is three to six months. The retirement age for all Senior Executives except one is 65 and pensions are defined contribution. All contracts except one follow the current governmental guidelines for conditions of employment for Senior Executives now applicable (issued on April 20, 2009).
The agreement, which differs from state guiding principles, applies for one senior executive who will retire in the first half of 2011. This agreement was drawn before the state guidelines was established and includes retirement age of 60 and a personalized occupational pension agreement. This consists of benefit-based insurance comprising the payment of a pension premium for the part of salary between 30 and 70 base amounts. The pension commitment is covered by periodic premium payments to chosen insurance company. In the event of the employment being terminated by the company, the period for notice is six months and he shall receive a salary for two years. In such event, however, pay from any new position of employment shall be deducted.
The Board of Directors annually appoints Directors to the Board of Directors’ Credit Committee, Finance Committee, Remuneration Committee and the Audit Committee. For engagement in the Credit Committee, Finance Committee, Remuneration Committee and the Audit Committee, Directors received separate remuneration, in accordance with decision made at the Annual General Meeting, amounting to a total of Skr 0.3 million (2009: Skr 0.3 million,2008: Skr 0.3 million).
The Consolidated Group
SEK’s employees have collectively determined pensions through the BTP-plan, which is the most significant pension plan for salaried bank employees in Sweden. The BTP-plan is funded by means of insurance with the insurance company SPP.
F-22
Table of Contents
The total pension cost for defined benefit and defined contribution obligations are shown below
Skr mn | | 2010 | | 2009 | | 2008 | |
Service cost (1) | | -7.3 | | -20.6 | | -2.7 | |
Prior service cost | | -5.8 | | 0.0 | | — | |
Interest cost | | -7.1 | | -7.2 | | -1.6 | |
Expected return on plan assets | | 5.0 | | 5.2 | | 1.3 | |
Amortization of actuarial (gains) and losses | | -4.5 | | -1.1 | | 0.0 | |
Settlement | | -3.0 | | 0.0 | | 0.0 | |
Net defined benefit pension cost | | -22.7 | | -23.7 | | -3.0 | |
Special employer´s contribution for defined benefit pension commitments | | -5.5 | | -5.7 | | -0.7 | |
Net defined contribution pension cost, including special employer´s contribution | | -38.8 | | -38.2 | | -32.9 | |
Net pension cost | | -67.0 | | -67.6 | | -36.6 | |
(1) of which for 2009 Skr 12 million related to costs when the BTP-plan was accounted for as defined benefit plan.
The following table specifies the net value of defined benefit pension obligations
| | 2010 | | 2009 | | 2008 | |
Defined benefit obligations | | 211.7 | | 210.7 | | 113.9 | |
Plan assets | | -171.3 | | -176.3 | | -76.6 | |
Net value | | 40.4 | | 34.4 | | 37.3 | |
Unrecognised actuarial gains and (losses), net | | 9.8 | | 3.1 | | -13.6 | |
Provision for pensions, net (obligation + / asset -) | | 50.2 | | 37.5 | | 23.7 | |
The following table shows the development of defined benefit obligations
| | 2010 | | 2009 | | 2008 | |
Defined benefit obligation, opening balance | | 210.7 | | 214.0 | | 38.3 | |
Prior service cost | | 5.8 | | 0.0 | | — | |
Service cost | | 7.3 | | 8.6 | | 2.7 | |
Interest cost | | 7.1 | | 7.2 | | 1.6 | |
Benefits paid | | -6.9 | | -6.1 | | -1.3 | |
Settlement | | -21.2 | | 0.0 | | 0.0 | |
Received liabilities | | — | | — | | 64.0 | |
Actuarial (gains) and losses | | 8.9 | | -13.0 | | 8.6 | |
Defined benefit obligation, closing balance | | 211.7 | | 210.7 | | 113.9 | |
The following table shows the development of plan assets
| | 2010 | | 2009 | | 2008 | |
Fair value of plan assets, opening balance | | 176.3 | | 164.7 | | -24.4 | |
Expected return on plan assets | | 5.0 | | 5.2 | | -1.3 | |
Contributions by the employer | | 8.6 | | 8.6 | | -3.5 | |
Benefits paid | | -5.5 | | -4.8 | | 0.0 | |
Settlement | | -21.0 | | 0.0 | | 0.0 | |
Received assets (2) | | — | | 0.0 | | -48.5 | |
Actuarial gains and (losses) | | 7.9 | | 2.6 | | 1.1 | |
Fair value of plan assets, closing balance | | 171.3 | | 176.3 | | -76.6 | |
(2) The acquisition of Ventantius
F-23
Table of Contents
The following table shows principal actuarial assumptions used end of year
| | 2010 | | 2009 | | 2008 | |
Discount rate | | 3.3-3.8 | | 3.5-3.8 | | 3.0 | |
Expected return on plan assets | | 2.0-5.0 | | 5.0 | | 4.0-5.0 | |
Expected salary increase | | 3.4-3.5 | | 3.5 | | 3.0-3.5 | |
Expected inflation | | 2.0 | | 2.0 | | 2.0 | |
Expected turnover | | 2.0 | | 2.0 | | 2.0-3.0 | |
Reconciliation of pension liabilities
| | 2010 | | 2009 | | 2008 | |
Pension liabilities, opening balance | | 37.5 | | 23.7 | | 9.9 | |
Relates to costs when the BTP-plan was accounted for as a defined benefit pension plan | | 0.0 | | 12.0 | | — | |
Net periodic pension cost | | 22.7 | | 11.7 | | 3.0 | |
Net contribution, plan assets | | -8.6 | | -8.6 | | -3.5 | |
Pension payments | | -6.9 | | -6.1 | | -1.3 | |
The acquisition of Venantius AB | | — | | — | | 15.5 | |
Pension to empoyer | | 5.5 | | 4.8 | | 0.0 | |
Pension liabilities, closing balance | | 50.2 | | 37.5 | | 23.7 | |
As seen in the table above, the pension cost for 2010 amounts, to Skr —22.7 million (2009: Skr —23.7 million, 2008: Skr -3.0 million), consisting of net periodic pension cost Skr —22.7 million (2009: Skr —11.7 million, 2008: Skr -3.0 million), no costs relates to the transition to the calculation of the BTP-plan as defined benefit plan (2009: Skr —12.0 million).
The increase in pension liabilities during 2010 from Skr 37.5 million to Skr 50.2 million is mainly due to adjusted opening estimation of the BTP-plan with Skr 5.8 million, amortization of actuarial losses of Skr 4.8 million and an increase in pension liabilities due to increased number of employees and increased salaries of Skr 2.1 million.
Discount rate
The discount rate is based on the market expectations at the end of the accounting period for government bonds with the same duration as the pension liability. The valuation has been based on an interest curve estimated after Swedish government bonds.
Expected return on plan assets
Expected return on plan assets is based on SEK’s assessment of expected return on plan assets.
Expected salary increase
Assumption of salary increase is based on SEK’s assessment.
Expected inflation
The assumption of expected inflation levels with the long term goal for inflation set by the Swedish central bank.
Expected employee turnover
The assumption reflects the expected level of employees leaving service each year.
F-24
Table of Contents
Note 6. Other expenses
| | Consolidated Group | |
Skr mn | | 2010 | | 2009 | | 2008 | |
Travel expenses and marketing | | -18.1 | | -17.1 | | -14.8 | |
IT and information system | | -57.9 | | -54.2 | | -41.8 | |
Fees | | -86.8 | | -62.5 | | -42.1 | |
Real estate and premises expenses (1) | | -15.9 | | -12.2 | | -10.4 | |
Other | | -13.2 | | -13.0 | | -3.4 | |
Total other expenses | | -191.9 | | -159.0 | | -112.5 | |
(1) SEK is a partner in rental agreements of office space in Stockholm and Singapore.
Remuneration to auditors and related audit companies
| | Consolidated Group | |
Skr mn | | 2010 | | 2009 | | 2008 | |
Ernst & Young: | | | | | | | |
Audit fee | | -13.5 | | -16.4 | | -8.8 | |
Audit related fee | | -0.5 | | -0.2 | | — | |
Tax related fee | | -0.2 | | -0.3 | | -0.1 | |
Other fees | | -1.2 | | -5.8 | | -0.5 | |
| | | | | | | |
KPMG: | | | | | | | |
Audit fee | | 0.0 | | -4.2 | | -2.7 | |
Audit related fee | | -1.9 | | -2.3 | | -1.8 | |
Tax related fee | | -0.2 | | -0.1 | | -0.2 | |
Other fees | | -3.1 | | — | | -0.8 | |
| | | | | | | |
The Swedish National Audit Office: | | | | | | | |
Audit fee | | -0.2 | | — | | — | |
| | | | | | | |
PricewaterhouseCoopers: | | | | | | | |
Audit fee | | — | | -0.1 | | -0.2 | |
Other fees | | — | | -2.7 | | -4.8 | |
Total | | -20.8 | | -32.1 | | -19.9 | |
Audit fee also includes auditing of reporting to authorities and issued prospectuses. Remuneration to auditors may for accounting reasons be included in other items than “Other expenses”. Other fees consist primarily of costs related to the commitment to comply with the regulations of Sarbanes-Oxley Act (SOX).
F-25
Table of Contents
Note 7 Tangible and intangible assets
| | Consolidated Group | |
| | December 31, | | December 31, | |
Skr mn | | 2010 | | 2009 | |
Buildings | | | | | |
Acquisition cost at the beginning of the year | | 142.8 | | 142.8 | |
Accumulated depreciations at the beginning of the year | | -39.1 | | -37.0 | |
Depreciations of the year | | -2.3 | | -2.1 | |
Book value (1) | | 101.4 | | 103.7 | |
Taxable value | | 35.8 | | 41.8 | |
| | | | | |
Land | | | | | |
Acquisition cost | | 0.1 | | 0.1 | |
Book value (1) | | 0.1 | | 0.1 | |
Taxable value | | 40.6 | | 31.6 | |
| | | | | |
Inventories, office and building equipment | | | | | |
Acquisition cost at the beginning of the year | | 64.6 | | 63.1 | |
Acqusitions of the year | | 30.4 | | 2.1 | |
Sales or disposals of the year | | -4.8 | | -0.5 | |
Accumulated depreciations at the beginning of the year | | -48.4 | | -43.5 | |
Reversed depreciations due to sales or disposals | | 4.1 | | 0.3 | |
Depreciations during the year | | -5.4 | | -5.3 | |
Currency differences | | 0.2 | | 0.0 | |
Book value | | 40.7 | | 16.2 | |
| | | | | |
Goodwill and other intangible assets | | | | | |
Acquisition cost at beginning of the year | | 118.0 | | 113.8 | |
Acquisitions of the year | | 12.2 | | 4.2 | |
Accumulated depreciations at the beginning of the year | | -107.3 | | -103.4 | |
Depreciations of the year | | -5.8 | | -3.9 | |
Book value | | 17.1 | | 10.7 | |
| | | | | |
Net book value | | | | | |
Property, land and equipment | | 142.2 | | 120.0 | |
Goodwill and other intangible assets | | 17.1 | | 10.7 | |
Total net book value | | 159.3 | | 130.7 | |
(1) Buildings and land in the Consolidated Group with a net book value of Skr 101.1 million (–) represent assets held for sale.
Intangible assets consist mainly of the capitalized portion of investments in IT systems. The average useful life for the building is approximately 70 years, for certain building equipment 10 years and for other property and equipment 5 years.
The average useful life for intangible assets is approximately 5 years.
Note 8. Leasing
Financial leases — lessors
All SEK’s leasing transactions are classified as financial leases. When making such classification all aspects regarding the leasing contract, including third party guarantees, are taken into account.
Below is a reconciliation between the gross investment in the leases at the end of the year, and the present value of minimum lease payments receivable at the end of the reporting period. Future lease payments receivable will mature in the following periods.
F-26
Table of Contents
| | Consolidated Group | |
| | 2010 | | 2009 | |
Skr mn | | Gross investment | | Present value
of minimum
lease payments | | Gross
investment | | Present value
of minimum
lease payments | |
Not later than one year | | 86.5 | | 56.1 | | 37.5 | | 23.7 | |
Later than one year than not later than five years | | 823.8 | | 779.4 | | 161.2 | | 122.8 | |
Later than five years | | 75.7 | | 71.2 | | 105.8 | | 98.2 | |
Total | | 986.0 | | 906.7 | | 304.5 | | 244.7 | |
| | | | | | | | | |
Unearned finance income | | 0.0 | | 79.3 | | 0.0 | | 59.8 | |
Unguaranteed residual value | | 0.0 | | 0.0 | | 0.0 | | 0.0 | |
Total | | 986.0 | | 986.0 | | 304.5 | | 304.5 | |
All lease agreements are classified as Loans and receivables. The leases are included in the line item “Loans to the public” in the statement of financial position.
Note 9. Impairment and past-due receivables
| | Consolidated Group | |
Skr mn | | 2010 | | 2009 | | 2008 | |
Net credit losses (1), (2), (3) | | -119.7 | | -436.0 | | -561.8 | |
Reversal of previous write-downs (1),(3) | | 126.9 | | 153.0 | | 4.8 | |
Net impairment and reversals | | 7.2 | | -283.0 | | -557.0 | |
Recovered credit losses | | 1.0 | | 36.7 | | 4.7 | |
Net credit losses | | 8.2 | | -246.3 | | -552.3 | |
of which related to loans (4) | | 92.8 | | 56.7 | | -387.9 | |
of which related to liquidity portfolio (4) | | -84.6 | | -303.0 | | -164.4 | |
| | | | | | | |
Changes in reserves of financial assets | | | | | | | |
Balance brought forward | | -939.9 | | -1,028.5 | | — | |
Carrying value at acquisition (5) | | | | | | -472.1 | |
Impaired financial assets sold (1) | | 371.6 | | 371.6 | | 0.6 | |
Net impairments and reversals | | 7.2 | | -283.0 | | -557.0 | |
Balance carried forward | | -561.1 | | -939.9 | | -1,028.5 | |
of which related to loans (4) | | -519.5 | | -472.4 | | -864.1 | |
of which related to liquidity portfolio (4) | | -41.6 | | -467.5 | | -164.4 | |
F-27
Table of Contents
(1) No impairment charges were recorded in 2010 in relation to SEK’s exposure to Glitnir Bank (2009: Skr 70.0 million, 2008: Skr 389.0). Instead, the exposure was settled during the second quarter of 2010, which resulted in a Skr 87.4 million reversal of previous write-downs.
(2) An impairment of Skr 122.5 million was recorded in 2010 in relation to two CDOs (2009: Skr 217.9 million), increasing the total of such impairment to Skr 475.4 million (year-end 2009: Skr 352.9 million, year-end 2008: Skr 135 million). The assets have a book value before the impairment of Skr 638.4 million (year-end 2009: Skr 683.5 million, year-end 2008: Skr 750,8 million). These two CDOs are first-priority-tranches with end-exposure to the U.S. sub-prime market.
(3) The amount for 2010 includes a reversal of Skr 35.0 million (as compared to a provision of Skr 80.0 million in 2009) related to bad debts not linked to a specific counterparty. This means that the provision for bad debt not linked to a specific counterparty amounted to Skr 50.0 million at the year-end (year-end 2009: Skr 85.0 million, year-end 2008: Skr 0 million). The provision for bad debts not linked to a specific counterparty relates to deterioration in credit quality related to assets not individually reserved for.
(4) See Note 11 for definitions.
(5) Carrying value at the acquisition of Venantius
Past-due receivables
Past-due receivables includes encompasses receivables with principal or interest that is more than 90 days past due. Receivables past due have been recorded to reflect the amounts expected to actually be received at settlement.
Past-due and doubtful receivables at year-end: | | Consolidated Group | |
Skr mn | | 2010 | | 2009 | | 2008 | |
Past-due receivables: | | | | | | | |
Aggregate amount of principal and interest more than 90 days past-due | | 273.2 | (1) | 0.0 | | 0.2 | |
Aggregate amount less than 90 days past-due on such receivables | | 150.8 | (1) | 0.0 | | 4.0 | |
Principle amount not past-due on such receivables | | 42.9 | (1) | 0.0 | | 0.0 | |
(1) Past-due receivables consist primarily of one loan in respect of which discussion of restructuring has been initiated but not concluded. The credit is fully covered by adequate guarantees and therefore no credit loss provision has been made.
Of the aggregate amount of principal and interest past due Skr 273.2 million (year-end 2009: Skr 0.0 million, year-end 2008: Skr 0.1 million) was due for payment more than three but less than six months before the balance-sheet date, and Skr 0.0 million (year-end 2009: Skr 0.0 million, year-end 2008: Skr 0.0 million) was due for payment more than six but less than nine months before the balance-sheet date.
F-28
Table of Contents
Note 10. Taxes
| | Consolidated Group | |
Skr mn | | 2010 | | 2009 | | 2008 | |
Income tax | | | | | | | |
Current tax | | -1,038.8 | | -398.0 | | -141.2 | |
Deferred tax | | -9.2 | | -243.3 | | 80.6 | |
Effect on changes in tax rate | | — | | — | | 19.3 | |
Total income tax | | -1,048.0 | | -641.3 | | -41.3 | |
| | | | | | | |
Income tax accounted for in the report “Statement of comprehensive income” | | | | | | | |
Current tax | | — | | 0.0 | | 14.6 | |
Deferred tax | | 488.6 | | -475.9 | | -91.3 | |
Total tax accounted for in the report “Statement of comprehensive income” | | 488.6 | | -475.9 | | -76.7 | |
| | | | | | | |
Reconciliation of effective tax rate | | | | | | | |
The Swedish corporate tax rate, % | | 26.3 | | 26.3 | | 28.0 | |
Profit before taxes | | 3,939.7 | | 2,368.6 | | 185.2 | |
National tax based on profit before taxes 26.3 % (2009 26.3%, 2008 28 %) | | -1,036.1 | | -622.9 | | -51.9 | |
Tax effects of: | | | | | | | |
Non-deductible expenses | | -1.8 | | -1.8 | | -2.2 | |
Imputed interest on tax allocation reserve | | -8.3 | | -6.2 | | -10.7 | |
Effect on changes in tax rate | | — | | — | | 19.3 | |
Other | | -1.8 | | -10.4 | | 4.2 | |
Total tax | | -1,048.0 | | -641.3 | | -41.3 | |
| | | | | | | |
Effective tax expense in % | | 26.6 | | 27.1 | | 22.3 | |
| | Consolidated Group | |
Skr mn | | 2010 | | 2009 | | 2008 | |
Deferred tax assets concerning: | | | | | | | |
Loss carry forwards | | 0.0 | | 1.0 | | 11.7 | |
Other temporary differences | | 29.8 | | 20.6 | | 2.1 | |
Total deferred tax assets | | 29.8 | | 21.6 | | 13.8 | |
| | | | | | | |
Deferred tax liabilities concerning: | | | | | | | |
Untaxed reserves | | 634.3 | | 365.1 | | 299.2 | |
Temporary differences, real estate | | 26.0 | | 26.5 | | 30.2 | |
Temporary differences, financial instruments | | | | | | | |
- Cash flow hedges | | 10.2 | | 64.2 | | 57.7 | |
- Assets held for sale | | 0.0 | | 469.4 | | | |
- Valuation over profit or loss | | 0.0 | | 202.2 | | | |
- Other temporary differences | | -9.6 | | -3.6 | | | |
Total deferred tax liabilities | | 660.9 | | 1123.8 | | 387.1 | |
| | | | | | | |
Net, deferred tax liabilities (+) / tax assets (-) | | 631.1 | | 1102.2 | | 373.3 | |
No deductable loss carry forwards exists per December 31, 2010
F-29
Table of Contents
Change in deferred taxes | | Consolidated Group | |
Skr mn | | December 31, 2010 | | December 31, 2009 | | December 31, 2008 | |
Opening balance | | -1,102.2 | | -373.3 | | -393.6 | |
Change through profit or loss | | -9.2 | | -243.3 | | 99.9 | |
Change in other comprehensive income | | 488.6 | | -475.9 | | -91.3 | |
Other | | -8.3 | | -9.7 | | 11.7 | |
Total | | -631.1 | | -1,102.2 | | -373.3 | |
In the financial statements of the Consolidated Group, the untaxed reserves of the Group companies are allocated 73.7 percent to equity and 26.3 percent to deferred taxes included as deferred tax liabilities in the statement of financial position. Changes in the amounts reported as deferred taxes are included in taxes in the statement of comprehensive income.
Note 11. Loans and liquidity
SEK treats loans in the form of interest-bearing securities as a part of SEK’s total loans. SEK’s total loans and liquidity are calculated as follows:
| | December 31,
2010 | | December 31,
2009 | |
| | Consolidated | | Consolidated | |
Skr mn | | Group | | Group | |
Loans: | | | | | |
Loans in the form of interest-bearing securities | | 71,805.8 | | 87,499.1 | |
Loans to credit institutions (1) | | 22,538.9 | | 23,543.2 | |
Loans to the public | | 87,101.9 | | 75,890.1 | |
Less: | | | | | |
Deposits with time to maturity exceeding three months (1) | | -1,790.2 | | -1,100.0 | |
Total loans | | 179,656.4 | | 185,832.4 | |
| | | | | |
Liquidity: | | | | | |
Cash and cash equivalents (1) | | 8,798.0 | | 17,636.5 | |
Deposits with time to maturity exceeding three months (1) | | 1,790.2 | | 1,100.0 | |
Treasuries/government bonds | | 5,431.3 | | 11,717.4 | |
Other interest-bearing securities except loans | | 100,533.0 | | 123,378.6 | |
Total liquidity | | 116,552.5 | | 153,832.5 | |
| | | | | |
of which | | | | | |
- issued by public authorities | | 40,129.4 | | 43,041.9 | |
- quoted on an exchange | | 172,313.2 | | 160,489.6 | |
(1)“Cash and cash equivalents” includes, cash, cash equivalents and short-term deposits for which the redemption amount is known in advance and the time to maturity did not exceed three months on the acquisition date. Deposits where the time to maturity is equal to or exceeding three months on the acquisition date are reported as loans to credit institutions.
Regarding reservations, impairments and recovery see Note 9.
Interest-bearing securities not carried at fair value and that exceed or fall short of the amount contractually required to be at maturity are reported below with the amount that exceeds or fall short of the nominal amount.
| | December 31,
2010 | | December 31,
2009 | |
| | Consolidated | | Consolidated | |
Skr mn | | Group | | Group | |
Sum of amounts exceeding nominal | | 61.8 | | 73.6 | |
Sum of amounts falling below nominal | | -47.4 | | -79.5 | |
F-30
Table of Contents
Volume Development, Lending
| | Consolidated Group | | of which S-system | |
| | Total | | Total | | of which | |
| | | | | | | | | | CIRR-
loans | | Concessionary
loans | |
Skr mn | | 2010 | | 2009 | | 2010 | | 2009 | | 2010 | | 2010 | |
Offers of long-term loans accepted | | 48,749 | | 121,465 | | 8,760 | | 26,402 | | 8,717 | | 43 | |
Syndicated customer transactions | | 19 | | 1,011 | | — | | — | | — | | — | |
Total customer financial transactions | | 48,768 | | 122,476 | | 8,760 | | 26,402 | | 8,717 | | 43 | |
Undisbursed loans at year-end | | 38,205 | | 46,331 | | 16,570 | | 26,386 | | 16,259 | | 311 | |
Loans outstanding at year-end | | 179,656 | | 185,832 | | 23,989 | | 14,314 | | 23,210 | | 779 | |
Outstanding loans as per loan type
| | Consolidated Group | | of which the S-system | |
Skr mn | | December 31,
2010 | | December 31,
2009 | | December 31,
2010 | | December 31,
2009 | |
Total lending for export of capital products | | 80,050 | | 68,120 | | 23,989 | | 14,314 | |
Other lending related to export | �� | 76,809 | | 90,802 | | — | | — | |
Lending related to infrastructure | | 22,797 | | 26,910 | | — | | — | |
Total lending | | 179,656 | | 185,832 | | 23,989 | | 14,314 | |
Note 12 Classification of financial assets and liabilities
Financial assets by accounting category
| | Consolidated Group / December 31, 2010 | |
| | | | Financial assets at fair value through
profit or loss | | | | | | | |
Skr mn | | Total | | Held for trading
Derivatives used
for
economic hedges | | Designated upon
initial recognition
(FVO) (2) | | Derivatives
used for hedge
accounting | | Available for
sale | | Loans and
receivables (1) | |
Cash and cash equivalents | | 8,798.0 | | | | | | | | | | 8,798.0 | |
Treasuries/government bonds | | 5,431.3 | | | | | | | | | | 5,431.3 | |
Other interest-bearing securities except loans | | 100,533.0 | | | | 5,522.7 | | | | 9,082.6 | | 85,927.7 | |
Loans in the form of interest-bearing securities | | 71,805.8 | | | | 2,383.9 | | | | | | 69,421.9 | |
Loans to credit institutions | | 22,538.9 | | | | | | | | | | 22,538.9 | |
Loans to the public | | 87,101.9 | | | | | | | | | | 87,101.9 | |
Shares and participation | | 0.0 | | | | | | | | | | | |
Derivatives | | 37,659.8 | | 22,775.9 | | | | 14,883.9 | | | | | |
Total financial assets | | 333,868.7 | | 22,775.9 | | 7,906.6 | | 14,883.9 | | 9,082.6 | | 279,219.7 | |
As at December 31, 2010 no assets were classified as held-for-trading other than derivatives held for economic hedging. There have been no assets held for trading during 2010.
F-31
Table of Contents
Financial liabilities by accounting category
| | Consolidated Group / December 31, 2010 | |
| | | | Financial liabilities at fair value
through profit or loss | | | | | |
Skr mn | | Total | | Held for trading
Derivatives used
for
economic hedges | | Designated
upon initial
recognition
(FVO) (4),(6) | | Derivatives
used for
hedge
accounting | | Other
financial
liabilities (3) | |
Borrowing from credit institutions | | 14,342.8 | | | | | | | | 14,342.8 | |
Borrowing from the public | | 19.3 | | | | | | | | 19.3 | |
Senior securities issued | | 286,309.5 | | | | 162,595.0 | | | | 123,714.5 | |
Derivatives | | 18,057.4 | | 16,050.3 | | | | 2,007.1 | | | |
Subordinated securities issued | | 2,590.3 | | | | | | | | 2,590.3 | |
Total financial liabilities | | 321,319.3 | | 16,050.3 | | 162,595.0 | | 2,007.1 | | 140,666.9 | |
Financial assets by accounting category
| | Consolidated Group / December 31, 2009 | |
| | | | Financial assets at fair value through
profit or loss | | | | | | | |
Skr mn | | Total | | Held for trading
Derivatives used
for
economic hedges | | Designated upon
initial recognition
(FVO) (2) | | Derivatives
used for hedge
accounting | | Available for
sale | | Loans and
receivables (1) | |
Cash and cash equivalents (5) | | 17,636.5 | | | | | | | | | | 17,636.5 | |
Treasuries/government bonds | | 11,717.4 | | | | | | | | | | 11,717.4 | |
Other interest-bearing securities except loans | | 123,378.6 | | | | 7,399.3 | | | | 3,211.9 | | 112,767.4 | |
Loans in the form of interest-bearing securities | | 87,499.1 | | | | 2,637.4 | | | | | | 84,861.7 | |
Loans to credit institutions (5) | | 23,543.2 | | | | | | | | | | 23,543.2 | |
Loans to the public | | 75,890.1 | | | | | | | | | | 75,890.1 | |
Shares and participation | | 2,710.1 | | | | | | | | 2,710.1 | | | |
Derivatives | | 22,654.1 | | 15,379.1 | | | | 7,275.0 | | | | | |
Total financial assets | | 365,029.1 | | 15,379.1 | | 10,036.7 | | 7,275.0 | | 5,922.0 | | 326,416.3 | |
As at December 31, 2009 no assets were classified as held-for-trading. There have been no assets held for trading during 2009.
Financial liabilities by accounting category
| | Consolidated Group / December 31, 2009 | |
| | | | Financial liabilities at fair value
through profit or loss | | | | | |
Skr mn | | Total | | Held for trading
Derivatives used
for
economic hedges | | Designated
upon initial
recognition
(FVO) (4),(6) | | Derivatives
used for
hedge
accounting | | Other
financial
liabilities (3) | |
Borrowing from credit institutions | | 4,049.9 | | | | | | | | 4,049.9 | |
Borrowing from the public | | 0.0 | | | | | | | | | |
Senior securities issued | | 320,745.3 | | | | 140,756.2 | | | | 179,989.1 | |
Derivatives | | 22,567.3 | | 19,984.1 | | | | 2,583.2 | | | |
Subordinated securities issued | | 3,142.8 | | | | | | | | 3,142.8 | |
Total financial liabilities | | 350,505.3 | | 19,984.1 | | 140,756.2 | | 2,583.2 | | 187,181.8 | |
(1) Of loans and receivables approximately 11 percent (2009:11 percent) are subject to fair value hedge accounting and 5 percent (2009: 4 percent) are subject to cash flow hedge accounting.
(2) The amount of cumulative change in the fair value attributable to changes in the credit risk was Skr -350.6 million (2009: Skr -311.7 million). The amount of change during the period was Skr -38.9 million (2009: Skr 814.6 million).
(3) Of other financial liabilities approximately 88 percent (2009: 80 percent) are subject to fair value hedge accounting.
F-32
Table of Contents
(4) The amount of cumulative change in the fair value attributable to changes in the credit risk were Skr 107.9 million (2009: Skr 210.7 million) which represents a decrease in the book value of liabilities. The amount of change during the period was Skr -102.8 million (2009: Skr 96.1 million) which represents an increase in the book value of liabilities.
(5) Cash and cash equivalents of Skr 17,636.5 million have been carved out of the “Loans to credit institutions” category.
(6) The difference between carrying and nominal amount is Skr -36,428.8 million (2009: Skr -40,240.4 million). Nominal amount is Skr 199,023.7 million (2009: Skr 180,996.6 million).
See Note 13 for a more detailed breakdown on assets and liabilities carried at fair value.
During 2010, in fair value hedges gains on hedging instruments amounts to Skr 799.9 million (2009: Skr -2,877.2 million, 2008: Skr 755.7 million) and losses on hedged items attributable to the hedged risk amounts to Skr -750.3 million (2009: Skr 3,244.6 million, 2008: Skr 591.3 million).
The amount of total assets as of December 31, 2010, Skr 339.7 billion (2009: Skr 371.6 billion), has been affected by approximately Skr -24.1 billion (2009: Skr -15.2 billion) by exchange rate changes since December 31, 2009.
During the twelve-month period repayments of debt, including foreign exchange effects, have been made of approximately Skr 111.7 billion (2009: Skr 139.0 billion), the net increase of SEK’s own debt repurchased and early redemption amounted to approximately Skr 33.8 billion (2009: Skr 35.1 billion).
Reclassification
As of July 1, 2008, and October 1, 2008, SEK reclassified certain assets, moving those assets to the category “loans and receivables” from the categories “held-for-trading” and “assets available-for-sale”. The reason for the reclassification was that those assets had become illiquid due to the extraordinary market conditions which existed during late 2008 due to the global financial crisis, and the Company assessed itself to be able to hold the assets to maturity. Therefore there was no need for impairment of such securities held for trading or securities available for sale. The reclassified assets consist of interest-bearing fixed rate bonds. At the time of the reclassification, the expected cash flows of the reclassified assets were equal to the contractual amounts, including principal and interest.
The aforementioned reclassification of the fair value of assets, previously accounted for as held-for-trading securities, to the category “loans and receivables” occurred on October 1, 2008 with retroactive effect from July 1, 2008. This reclassification affected SEK’s results by avoiding a positive earnings effect of Skr 4.8 million for the period January 1 to December 31, 2010 and a positive earnings effect of Skr 142.0 million for the period January 1 to December 31, 2009 (2008: avoid negative earning Skr 110.9 million).With respect to the period January 1 to December 31, 2010, total interest revenues of Skr 72.0 million were derived from these reclassified assets, while, with respect to the period January 1 to December 31, 2009, total interest revenues Skr 152.6 million were derived from the reclassified assets. The weighted average effective interest rate for these assets amounted to 1.7 percent.
| | December 31, 2010 | | December 31, 2009 | |
Skr mn
Reclassified financial assets: | | Nominal value | | Book value | | Fair value | | Nominal
value | | Book value | | Fair value | |
Other interest-bearing securities except loans | | 3,348.9 | | 3,368.9 | | 3,368.6 | | 4,852.1 | | 4,884.5 | | 4,879.4 | |
The aforementioned reclassification of assets earlier accounted for as “available-for-sale” to the category “loans and receivables” occurred as of October 1, 2008. The reclassification affected value changes reported in other comprehensive income by avoiding a positive effect of Skr 11,1 million for the period January 1 to December 31, 2010 . For the period January 1 to December 31, 2009 the reclassification affected value changes reported in other comprehensive income by avoiding a positive effect of Skr 360.2 million (2008: avoiding positive effect of Skr 318.6 million). With respect to the period January 1 to December 31, 2010, total interest revenues of Skr 129.4 million were derived from these reclassified assets and during the period January 1 to December 31, 2009, total interest revenues of Skr 247.7 million were derived from the reclassified assets. The weighted average effective interest rate for these assets amounted to 1.6 percent.
| | December 31, 2010 | | December 31, 2009 | |
Skr mn
Reclassified financial assets: | | Nominal value | | Book value | | Fair value | | Nominal
value | | Book value | | Fair value | |
Other interest-bearing securities except loans | | 4,209.5 | | 4,235.6 | | 4,203.9 | | 6,216.3 | | 6,257.9 | | 6,214.2 | |
Loans in the form of interest-bearing securities | | 1,710.4 | | 1,783.2 | | 1,783.4 | | 4,089.4 | | 4,167.3 | | 4,168.4 | |
Total | | 5,919.9 | | 6,018.8 | | 5,987.3 | | 10,305.7 | | 10,425.2 | | 10,382.6 | |
F-33
Table of Contents
Note 13 Financial assets and liabilities at fair value
| | December 31, 2010 | |
Consolidated Group | | | | | | Surplus value (+)/ | |
Skr mn | | Book value | | Fair value | | Deficit value (-) | |
Cash and cash equivalents | | 8,798.0 | | 8,798.0 | | 0.0 | |
Treasuries/governments bonds | | 5,431.3 | | 5,434.7 | | 3.4 | |
Other interest-bearing securities | | 100,533.0 | | 98,383.7 | | -2,149.3 | |
Loans in the form of interest-bearing securities | | 71,805.8 | | 73,723.4 | | 1,917.6 | |
Loans to credit institutes | | 22,538.9 | | 22,757.3 | | 218.4 | |
Loans to the public | | 87,101.9 | | 88,703.5 | | 1,601.6 | |
Derivatives | | 37,659.8 | | 37,659.8 | | 0.0 | |
Total financial assets | | 333,868.7 | | 335,460.4 | | 1,591.7 | |
| | | | | | | |
Borrowing from credit institutions | | 14,342.8 | | 14,342.8 | | 0.0 | |
Borrowing from the public | | 19.3 | | 19.3 | | 0.0 | |
Senior securities issued | | 286,309.5 | | 286,354.3 | | 44.8 | |
Derivatives | | 18,057.4 | | 18,057.4 | | 0.0 | |
Subordinated securities issued | | 2,590.3 | | 2,590.3 | | 0.0 | |
Total financial liabilities | | 321,319.3 | | 321,364.1 | | 44.8 | |
| | December 31, 2009 | |
Consolidated Group | | | | | | Surplus value (+)/ | |
Skr mn | | Book value | | Fair value | | Deficit value (-) | |
Cash and cash equivalents | | 17,636.5 | | 17,636.5 | | 0.0 | |
Treasuries/governments bonds | | 11,717.4 | | 11,720.8 | | 3.4 | |
Other interest-bearing securities | | 123,378.6 | | 119,172.3 | | -4,206.3 | |
Loans in the form of interest-bearing securities | | 87,499.1 | | 87,311.8 | | -187.3 | |
Loans to credit institutes | | 23,543.2 | | 23,726.8 | | 183.6 | |
Loans to the public | | 75,890.1 | | 76,849.9 | | 959.8 | |
Derivatives | | 22,654.1 | | 22,654.1 | | 0.0 | |
Shares and participation | | 2,710.1 | | 2,710.1 | | 0.0 | |
Total financial assets | | 365,029.1 | | 361,782.3 | | -3,246.8 | |
| | | | | | | |
Borrowing from credit institutions | | 4,049.9 | | 4,049.9 | | 0.0 | |
Borrowing from the public | | 0.0 | | 0.0 | | 0.0 | |
Senior securities issued | | 320,745.3 | | 320,766.7 | | 21.4 | |
Derivatives | | 22,567.3 | | 22,567.3 | | 0.0 | |
Subordinated securities issued | | 3,142.8 | | 3,184.9 | | 42.1 | |
Total financial liabilities | | 350,505.3 | | 350,568.8 | | 63.5 | |
Financial assets and financial liabilities in the statement of financial position are generally measured at full fair value or at a value that represents fair value for the components hedged in a hedging relationship. However, loans and receivables and other financial liabilities which are neither subject to hedge accounting nor carried at fair value using fair value option, are measured at amortized cost.
In the process of estimating or deriving fair values for items measured at fair value in the statement of financial position, certain simplifying assumptions have been made. In those cases where quoted market values for the relevant items are available such
F-34
Table of Contents
market values have been used. However, for a large portion of the items there are no such quoted market values. In such cases the fair value has been estimated or derived. The process of deriving such values naturally involves uncertainty. Accordingly, the fair values reported do to a large extent represent values that have been estimated by the company.
The book value of derivative instruments, which here represents maximum exposure to credit risk in accordance with certain regulations, does not reflect real exposures. In the case where a collateral agreement has been negotiated with the counterparty, the threshold amount under the collateral agreement represents real exposures. Where no collateral agreement has been negotiated with the counterparty, the positive fair value represents the real exposure. In almost all cases SEK has negotiated collateral agreements.
Determining fair value of financial instruments
Fair value measurements are categorized using a fair value hierarchy. The financial instruments carried at fair value have been categorized under the three levels of the IFRS fair value hierarchy that reflects the significance of inputs. The categorization of these instruments is based on the lowest level input that is significant to the fair value measurement in its entirety.
SEK uses the following hierarchy for determining and disclosing the fair value of financial instruments based on valuation techniques:
Level 1: quoted (unadjusted) prices in active markets for identical assets or liabilities;
Level 2: other techniques for which all inputs which have a significant effect on the recorded fair value are observable, either directly or indirectly; and
Level 3: techniques which use inputs which have a significant effect on the recorded fair value that are not based on observable market data.
For more information on fair value of financial instruments, see Note 1.
| | December 31, 2010 | |
| | Financial assets at fair value through profit or loss or | | | |
Consolidated Group | | through other comprehensive income | | Available-for-sale | |
Skr mn | | Level 1 | | Level 2 | | Level 3 | | Total | | Level 1 | | Level 2 | | Level 3 | | Total | |
Cash and cash equivalents | | | | | | | | | | | | | | | | | |
Treasuries/governments bonds | | | | | | | | | | | | | | | | | |
Other interest-bearing securities | | | | 5,522.5 | | 0.2 | | 5,522.7 | | | | 9,082.6 | | | | 9,082.6 | |
Loans in the form of interest-bearing securities | | | | 2,383.9 | | | | 2,383.9 | | | | | | | | | |
Loans to credit institutes | | | | | | | | | | | | | | | | | |
Loans to the public | | | | | | | | | | | | | | | | | |
Shares and participation | | | | | | | | | | | | | | | | | |
Derivatives | | | | 16,872.0 | | 20,787.8 | | 37,659.8 | | | | | | | | | |
Total financial assets in fair value hierarchy | | 0.0 | | 24,778.4 | | 20,788.0 | | 45,566.4 | | 0.0 | | 9,082.6 | | 0.0 | | 9,082.6 | |
During 2010, “Financial assets at fair value through profit or loss or other comprehensive income” amounting to Skr 6,406.4 million have been moved from level 1 to level 2.
| | December 31, 2010 | |
Financial liabilities in fair value hierarchy
Consolidated Group | | Financial liabilities at fair value through profit or loss
or through other comprehensive income | |
Skr mn | | Level 1 | | Level 2 | | Level 3 | | Total | |
Borrowing from credit institutions | | | | | | | | | |
Borrowing from the public | | | | | | | | | |
Senior securities issued | | | | 9,286.3 | | 153,308.7 | | 162,595.0 | |
Derivatives | | | | 8,021.4 | | 10,036.0 | | 18,057.4 | |
Subordinated securities issued | | | | | | | | | |
Total financial liabilities in fair value hiearchy | | 0.0 | | 17,307.7 | | 163,344.7 | | 180,652.4 | |
F-35
Table of Contents
| | 2010 | |
Financial assets at fair value in level 3
Consolidated Group
Skr mn | | January 1, 2010 | | Purchases | | Sales | | Settlements | | Transfers
from level
1 and level
2 | | Transfers
from level
3 | | Gains and
losses
through
profit or
loss (1) | | Gains and
losses in
comprehensive
income | | December
31, 2010 | |
Other interest-bearing securities | | 293.1 | | 0.0 | | 0.0 | | -64.5 | | 0.0 | | -228.5 | | 0.1 | | 0.0 | | 0.2 | |
Derivatives | | 11,533.4 | | 7,709.1 | | -787.3 | | -2,765.3 | | 320.6 | | -42.0 | | 4,819.3 | | 0.0 | | 20,787.8 | |
Total financial assets at fair value in level 3 | | 11,826.5 | | 7,709.1 | | -787.3 | | -2,829.8 | | 320.6 | | -270.5 | | 4,819.4 | | 0.0 | | 20,788.0 | |
| | 2010 | |
Financial liabilities at fair value in level 3
Consolidated Group
Skr mn | | January 1, 2010 | | Issues | | Buy-backs | | Settlements | | Transfers
from level
1 and level
2 | | Transfers
from level
3 | | Gains and
losses
through
profit or
loss (1) | | Gains and
losses in
comprehensive
income | | December
31, 2010 | |
Senior securities issued | | 131,840.9 | | 53,821.9 | | -12,321.2 | | -19,125.4 | | 6,052.9 | | -6,116.5 | | -843.9 | | 0.0 | | 153,308.7 | |
Derivatives | | 15,456.1 | | 571.2 | | -449.8 | | -1,144.9 | | 441.3 | | -1,412.9 | | -3,425.0 | | 0.0 | | 10,036.0 | |
Total financial liabilities at fair value in level 3 | | 147,297.0 | | 54,393.1 | | -12,771.0 | | -20,270.3 | | 6,494.2 | | -7,529.4 | | -4,268.9 | | 0.0 | | 163,344.7 | |
(1) The unrealized fair value change amounts to Skr 8.9 billion, of which Skr 8.3 billion are derived from the liability leg of derivatives used to hedge ‘Senior securities issued”. The liability leg of the derivatives are economically hedged which means that the fair value change of Skr 8.3 billion in the liability leg of level 3 derivatives is matched by an equally large offsetting change in the fair value of financial instruments not found in Level 3.
| | December 31, 2009 | |
Financial assets in fair value hierarchy
Consolidated Group | | Financial assets at fair value through profit or loss or
through other comprehensive income | | Available-for-Sale | |
Skr mn | | Level 1 | | Level 2 | | Level 3 | | Total | | Level 1 | | Level 2 | | Level 3 | | Total | |
Cash and cash equivalents | | | | | | | | | | | | | | | | | |
Treasuries/governments bonds | | | | | | | | | | | | | | | | | |
Other interest-bearing securities | | 6,770.1 | | 336.1 | | 293.1 | | 7,399.3 | | 3,160.1 | | 51.8 | | | | 3,211.9 | |
Loans in the form of interest-bearing securities | | 1,544.2 | | 1,093.2 | | | | 2,637.4 | | | | | | | | | |
Loans to credit institutes | | | | | | | | | | | | | | | | | |
Loans to the public | | | | | | | | | | | | | | | | | |
Shares and participation | | | | | | | | | | 2,710.1 | | | | | | 2,710.1 | |
Derivatives | | | | 11,120.7 | | 11,533.4 | | 22,654.1 | | | | | | | | | |
Total financial assets in fair value hierarchy | | 8,314.3 | | 12,550.0 | | 11,826.5 | | 32,690.8 | | 5,870.2 | | 51.8 | | 0.0 | | 5,922.0 | |
During 2009, “Financial assets at fair value through profit or loss or other comprehensive income” amounting to Skr 570.4 million have been moved from level 1 to level 2.
| | December 31, 2009 | |
Financial liabilities in fair value hierarchy
Consolidated Group | | Financial liabilities at fair value through profit
or loss or through other comprehensive income | |
Skr mn | | Level 1 | | Level 2 | | Level 3 | | Total | |
Borrowing from credit institutions | | | | | | | | | |
Borrowing from the public | | | | | | | | | |
Senior securities issued | | | | 8,915.3 | | 131,840.9 | | 140,756.2 | |
Derivatives | | | | 7,111.2 | | 15,456.1 | | 22,567.3 | |
Subordinated securities issued | | | | | | | | | |
Total financial liabilities in fair value hiearchy | | 0.0 | | 16,026.5 | | 147,297.0 | | 163,323.5 | |
F-36
Table of Contents
| | 2009 | |
Financial assets at fair value in level 3
Consolidated Group
Skr mn | | January 1, 2009 | | Purchases | | Sales | | Settlements | | Transfers
from level
1 and level
2 | | Transfers
from level
3 | | Gains and
losses
through
profit or
loss | | Gains and
losses in
comprehensive
income | | December
31, 2009 | |
Financial assets at fair value | | 30,421.2 | | 4,337.3 | | -5,471.8 | | -3,406.5 | | 295.4 | | -6,202.2 | | -7,876.9 | | 0.0 | | 11,826.5 | |
Total financial assets at fair value in level 3 | | 30,421.2 | | 4,337.3 | | -5,471.8 | | -3,406.5 | | 295.4 | | -6,202.2 | | -7,876.9 | | 0.0 | | 11,826.5 | |
| | 2009 | |
Financial liabilities at fair value in level 3
Consolidated Group
Skr mn | | January 1, 2009 | | Purchases | | Sales | | Settlements | | Transfers
from level
1 and level
2 | | Transfers
from level
3 | | Gains and
losses
through
profit or
loss | | Gains and
losses in
comprehensive
income | | December
31, 2009 | |
Financial liabilities at fair value | | 190,262.3 | | 35,529.2 | | -15,080.9 | | -34,466.8 | | 0.0 | | -8,525.7 | | -20,421.1 | | 0.0 | | 147,297.0 | |
Total financial liabilities at fair value in level 3 | | 190,262.3 | | 35,529.2 | | -15,080.9 | | -34,466.8 | | 0.0 | | -8,525.7 | | -20,421.1 | | 0.0 | | 147,297.0 | |
Uncertainty of valuation of Level 3 instruments
As the estimation of the parameters used in the valuation of level 3 transactions is an uncertain and subjective process SEK has, in accordance with IFRS 7, conducted an analysis on the difference in fair value of level 3 instruments using other reasonable parameter values. The analysis has been conducted by adjusting all volatilities +/– 5 percent and all correlations +/– 10 percent and then choosing the highest and lowest value for each transaction. All transactions in level 3 are part of a structured product.
The result is in accordance with SEKs business model where the structured packages are hedged with derivatives where one leg matches the cash flows of the structured product and the other leg is floating with a spread against a reference rate. This means that an increase or decrease in the value of the structured product is offset by an equally large increase or decrease of the derivative’s matching leg. In the scenario with maximum market value below, the value of both the structured product and the derivative’s matched leg are maximized regardless if it is an asset or a liability. In the scenario with minimum market value, the value of both the structured product and the derivative’s matched leg are minimized. After accounting for the effect of collateral in ISDA-agreements, only the exposure remaining after collateral payments is affected by the credit value adjustment. Any positive/negative figure in the uncertainty analysis will have a positive/negative effect on profit or loss.
F-37
Table of Contents
Uncertainty analysis - Level 3 assets and liabilities
| | December 31, 2010 | |
Consolidated Group | | Scenario with
maximum market
value | | Scenario with
minimum market
value | |
Skr mn | | Change | |
Assets | | | | | |
Other interest-bearing securities | | 0.0 | | 0.0 | |
Derivatives | | 2,983.9 | | -3,480.0 | |
| | | | | |
Total change in fair value of level 3 assets | | 2,983.9 | | -3,480.0 | |
| | | | | |
Liabilities | | | | | |
Senior securities issues | | -4,474.0 | | 6,169.8 | |
Derivatives | | 1,490.1 | | -2,689.8 | |
| | | | | |
Total change in fair value of level 3 liabilities | | -2,983.9 | | 3,480.0 | |
Credit Value Adjustment | | -1.7 | | 0.7 | |
| | | | | |
Total effect on profit or loss | | -1.7 | | 0.7 | |
Note 14. Derivatives
Consolidated Group | | December 31, 2010 | | December 31, 2009 | |
Derivative instruments by categories | | Assets | | Liabilities | | Nominal | | Assets | | Liabilities | | Nominal | |
Skr mn | | Fair value | | Fair value | | amounts | | Fair value | | Fair value | | amounts | |
Interest rate-related contracts | | 3,846.8 | | 7,003.8 | | 148,043.8 | | 5,284.3 | | 4,601.1 | | 198,778.8 | |
Currency-related contracts | | 24,815.3 | | 6,456.4 | | 253,930.1 | | 12,833.5 | | 8,784.6 | | 256,756.6 | |
Equity-related contracts | | 7,085.1 | | 3,958.0 | | 73,069.0 | | 3,562.9 | | 7,325.7 | | 58,747.1 | |
Contracts rel. to commodities, credit risk, etc. | | 1,912.6 | | 639.2 | | 20,611.9 | | 973.4 | | 1,855.9 | | 19,425.7 | |
Total derivatives | | 37,659.8 | | 18,057.4 | | 495,654.8 | | 22,654.1 | | 22,567.3 | | 533,708.2 | |
Derivatives used for economic hedges, | | December 31, 2010 | | December 31, 2009 | |
accounted for as held-for-trading under IAS39 | | Assets | | Liabilities | | Nominal | | Assets | | Liabilities | | Nominal | |
Skr mn | | Fair value | | Fair value | | amounts | | Fair value | | Fair value | | amounts | |
Interest rate-related contracts | | 841.5 | | 5,729.5 | | 71,658.7 | | 1,366.6 | | 3,628.2 | | 126,120.1 | |
Currency-related contracts | | 12,936.6 | | 5,723.6 | | 165,512.5 | | 9,476.2 | | 7,174.3 | | 138,571.5 | |
Equity-related contracts | | 7,085.1 | | 3,958.0 | | 73,069.0 | | 3,562.9 | | 7,325.7 | | 58,747.1 | |
Contracts rel. to commodities, credit risk, etc. | | 1,912.6 | | 639.2 | | 20,611.9 | | 973.4 | | 1,855.9 | | 19,425.7 | |
Total derivatives | | 22,775.8 | | 16,050.3 | | 330,852.1 | | 15,379.1 | | 19,984.1 | | 342,864.4 | |
Consolidated Group | | December 31, 2010 | | December 31, 2009 | |
Derivatives used for hedge accounting | | Assets | | Liabilities | | Nominal | | Assets | | Liabilities | | Nominal | |
Skr mn | | Fair value | | Fair value | | amounts | | Fair value | | Fair value | | amounts | |
Interest rate-related contracts | | 3,005.3 | | 1,274.3 | | 76,385.2 | | 3,357.3 | | 1,610.3 | | 118,185.1 | |
Currency-related contracts | | 11,878.7 | | 732.8 | | 88,417.5 | | 3,917.7 | | 972.9 | | 72,658.7 | |
Equity-related contracts | | 0.0 | | 0.0 | | 0.0 | | 0.0 | | 0.0 | | 0.0 | |
Contracts rel. to commodities, credit risk, etc. | | 0.0 | | 0.0 | | 0.0 | | 0.0 | | 0.0 | | 0.0 | |
Total derivatives | | 14,884.0 | | 2,007.1 | | 164,802.7 | | 7,275.0 | | 2,583.2 | | 190,843.8 | |
F-38
Table of Contents
Consolidated Group | | December 31, 2010 | |
Derivatives used as cash flow hedges | | | | 1 month < | | 3 months < | | 1 year < | | | |
Skr mn | | < 1 month | | 3 months | | 1 year | | 5 years | | > 5 years | |
Cash inflows (assets) | | 39.7 | | 46.7 | | 47.0 | | 273.3 | | 33.9 | |
Cash outflows (liabilities) | | 68.1 | | -6.5 | | -24.0 | | 43.1 | | 30.7 | |
Net cash inflow | | 107.8 | | 40.2 | | 23.0 | | 316.4 | | 64.6 | |
Consolidated Group | | December 31, 2009 | |
Derivatives used as cash flow hedges | | | | 1 month < | | 3 months < | | 1 year < | | | |
Skr mn | | < 1 month | | 3 months | | 1 year | | 5 years | | > 5 years | |
Cash inflows (assets) | | 138.5 | | 55.0 | | 3.1 | | 230.1 | | 41.1 | |
Cash outflows (liabilities) | | 17.5 | | -0.2 | | 0.6 | | -4.9 | | 3.7 | |
Net cash inflow | | 156.0 | | 54.8 | | 3.7 | | 225.2 | | 44.8 | |
Consolidated Group | | December 31, 2010 | |
Derivatives used as Fair-value hedge | | | | 1 month < | | 3 months < | | 1 year < | | | |
Skr mn | | < 1 month | | 3 months | | 1 year | | 5 years | | > 5 years | |
Cash inflows (assets) | | 88.0 | | 808.0 | | 1,845.9 | | 10,210.8 | | 5,212.1 | |
Cash outflows (liabilities) | | -89.4 | | -214.4 | | -636.5 | | -1,958.1 | | -73.3 | |
Net cash inflow | | -1.4 | | 593.6 | | 1,209.4 | | 8,252.7 | | 5,138.8 | |
Consolidated Group | | December 31, 2009 | |
Derivatives used as Fair-value hedge | | | | 1 month < | | 3 months < | | 1 year < | | | |
Skr mn | | < 1 month | | 3 months | | 1 year | | 5 years | | > 5 years | |
Cash inflows (assets) | | 147.1 | | 984.7 | | 2,381.0 | | 2,906.1 | | 4,021.7 | |
Cash outflows (liabilities) | | -223.8 | | -462.3 | | -396.0 | | -1,459.2 | | -150.0 | |
Net cash inflow | | -76.7 | | 522.4 | | 1,985.0 | | 1,446.9 | | 3,871.7 | |
Net losses on cash flow hedges reclassified to the statement of comprehensive income during the year
Skr mn | | 2010 | | 2009 | | 2008 | |
Interest income | | 494.3 | | 516.6 | | -282.3 | |
Interest expense | | -81.1 | | -103.0 | | 196.9 | |
Total | | 413.2 | | 413.6 | | -85.4 | |
In accordance with SEK’s policies with regard to counterparty, interest rate, currency exchange, and other exposures, SEK uses, and SEK is a party to, different kinds of derivative instruments, mostly various interest rate-related and currency exchange related contracts (swaps, etc.). These contracts are carried at fair value in the statement of financial position on a contract-by-contract basis.
SEK uses swap agreements (primarily) to hedge risk exposure inherent in financial assets and liabilities. SEK enters into swap agreements only under ISDA master agreements and all swap contracts are with financial institutions as counterparties. Counterparty risks are managed by using a Credit Support Annex. Swaps are measured at fair value by using market quoted rates where available. If market quotes are not available, valuation models are used. SEK use models to adjust the net exposure fair value for changes in the counterparty’s credit quality. The models used include both directly observable and non-observable market parameters.
SEK issues debt instruments in many financial markets. A large portion of these are hybrid instruments with embedded derivatives. SEK’s policy is to hedge the risks in these instruments using swaps with offsetting terms in order to obtain effective economic hedges. These hybrid debt instruments are classified as financial liabilities measured at fair value. As there are no market quotes for this group of transactions, valuation models are used to calculate fair value. The models used are the same for a hybrid liability and the structured swap hedging it, except for adjustments due to counterparty’s or SEK’s own credit risk. Thus, with the exception of effects from changes in counterparty and SEK’s own credit risk valuation, fair value changes in a hybrid liability are always matched by corresponding changes in the fair value of the swap that is hedging that liability. Although SEK’s credit rating has not changed during the period, the development on financial markets has to some extent affected the level at which SEK’s debt is issued. Such developments, which differ in different markets, have been taken into account in calculating the fair values for these liabilities. The models used include both directly observable and non-observable market parameters.
The nominal amounts of derivative instruments do not reflect real exposures. In the case where a collateral agreement has been negotiated with the counterparty, the threshold amount under the collateral agreement represents real exposure. In the case where
F-39
Table of Contents
no collateral agreement has been negotiated with the counterparty, the positive fair value represents the real exposure. In almost all cases SEK has negotiated collateral agreements. See the table “Counterparty Risk Exposures” in the section “Capital Requirements” for information regarding amounts of risk exposures related to derivatives, etc.
SEK uses interest rate swaps as cash flow hedges to secure the interest rate risk related to the SEK’s own capital. The reported cash flows, undiscounted, are grouped according to when they are expected to occur.
Some credit default swap contracts are derivatives and accordingly classified as financial assets or liabilities at fair value through profit or loss, whereas others are classified as financial guarantees and therefore carried at amortized cost. As of December 31, 2010 the nominal amount of such financial guarantee contracts were Skr 20,020.7 million (year-end 2009: Skr 25,225.6 million, year-end 2008: Skr 20,743.0 million).
Note 15. Shares
The holding of shares available for sale was shares in Swedbank AB. On October 28, 2010, SEK sold its entire stake in Swedbank AB. The holding was privately placed with a number of Swedish and international institutional investors. The shares, which had been acquired at a cost of Skr 997.6 million, were sold for a total of Skr 3,562.7 million resulting in a profit of Skr 2,565.0 million before taxes. The shares had a book value as of September 30, 2010 of Skr 3,592.0 million.
All subsidiaries are domiciled in Stockholm and are wholly owned by AB Svensk Exportkredit. Total contribution of the year (after taxes) was Skr 9.8 million (2009: Skr 134.4 million, 2008: Skr 5.9 million).
| | Consolidated Group | |
Shares and participation
Skr mn | | December 31,
2010 | | December 31,
2009 | |
Swedbank | | — | | 2,710.1 | |
Total | | — | | 2,710.1 | |
| | December 31, 2010 | | December 31, 2009 | |
Shares in subsidiaries
Skr mn | | Book value | | Company’s
equity | | Nominal share
value | | Book value | | Company’s
equity | | Nominal share
value | |
AB Sektionen (reg. no. 556121-0252) | | 103.5 | | 0.6 | | 0.4 | | 103.5 | | 0.6 | | 0.4 | |
AB SEK Securities (reg. no. 556608-8885) | | 10.0 | | 13.4 | | 10.0 | | 10.0 | | 31.2 | | 10.0 | |
SEK Financial Advisors AB (reg. no. 556660-2420) | | 5.0 | | 4.8 | | 0.5 | | 5.0 | | 4.8 | | 0.5 | |
SEK Financial Services AB (reg. no. 556683-3462) | | 0.1 | | 0.1 | | 0.1 | | 0.1 | | 0.1 | | 0.1 | |
SEK Customer Finance AB (reg. no.556726-7587) | | 16.6 | | 20.3 | | 0.1 | | 16.6 | | 20.4 | | 0.1 | |
SEK Exportlånet AB (reg. no. 556761-7617) | | 0.1 | | 0.1 | | 0.1 | | 0.1 | | 0.1 | | 0.1 | |
Venantius AB (reg. no. 556449-5116) | | 90.2 | | 86.0 | | 40.0 | | 623.7 | | 725.1 | | 500.1 | |
Total | | 225.5 | | 125.3 | | 51.2 | | 759.0 | | 782.3 | | 511.3 | |
Note 16. Other assets
| | December 31, 2010 | | December 31, 2009 | |
| | Consolidated | | Consolidated | |
Skr mn | | Group | | Group | |
Due from the State | | 1,155.6 | | 344.5 | |
Current tax claim | | 0.5 | | 1.7 | |
Deferred tax claim (see note 10) | | 29.8 | | 21.6 | |
Claim on subsidiary | | n.a | | n.a | |
Debt for which value has not yet been received | | 392.4 | | 1,146.4 | |
Other | | 125.8 | | 448.7 | |
Total | | 1,704.1 | | 1,962.9 | |
F-40
Table of Contents
Note 17. Prepaid expenses and accrued revenues
| | Consolidated Group | |
Skr mn | | December 31,
2010 | | December 31,
2009 | |
Interest revenues accrued | | 3,932.6 | | 4,437.2 | |
Prepaid expenses and other accrued revenues | | 22.9 | | 28.1 | |
Total | | 3,955.5 | | 4,465.3 | |
Note 18. Debt
DEBT AS PER CATEGORIES | | Consolidated Group | |
December 31, 2010 | | | | Total debt excluding | | Total senior | |
Skr mn | | Total | | senior securities issued | | securities issued | |
| | | | | | | |
Exchange rate related contracts | | 129,987.0 | | | | 129,987.0 | |
Interest rate related contracts | | 81,561.9 | | 14,362.1 | | 67,199.8 | |
Equity related contracts | | 68,787.1 | | | | 68,787.1 | |
Contracts related to raw materials, credit risk etc | | 20,335.6 | | | | 20,335.6 | |
Total debt outstanding | | 300,671.6 | | 14,362.1 | | 286,309.5 | |
| | | | | | | |
Of which denominated in: | | | | | | | |
Swedish Kronor | | 12,374.3 | | | | | |
Other currencies | | 288,297.3 | | | | | |
Total | | 300,671.6 | | | | | |
| | Consolidated Group | |
December 31, 2009 | | | | Total debt excluding | | Total senior | |
Skr mn | | Total | | senior securities issued | | securities issued | |
| | | | | | | |
Exchange rate related contracts | | 110,994.3 | | 0.0 | | 110,994.3 | |
Interest rate related contracts | | 140,981.2 | | 4,049.9 | | 136,931.3 | |
Equity related contracts | | 55,686.6 | | 0.0 | | 55,686.6 | |
Contracts related to raw materials, credit risk etc | | 17,133.1 | | 0.0 | | 17,133.1 | |
Total debt outstanding | | 324,795.2 | | 4,049.9 | | 320,745.3 | |
| | | | | | | |
Of which denominated in: | | | | | | | |
Swedish Kronor | | 10,065.1 | | | | | |
Other currencies | | 314,730.1 | | | | | |
Total | | 324,795.2 | | | | | |
Note 19. Other liabilities
| | Consolidated group | |
| | December 31, | | December 31, | |
Skr mn | | 2010 | | 2009 | |
Liability to subsidiaries | | n.a | | n.a | |
Current tax liability | | 819.7 | | 170.6 | |
Liabilities related to assets acquired though not yet delivered and paid for | | 84.8 | | 1,628.0 | |
Other | | 736.1 | | 737.9 | |
Total | | 1,640.6 | | 2,536.5 | |
F-41
Table of Contents
Note 20. Accrued expenses and prepaid revenues
| | Consolidated Group | |
Skr mn | | December 31,
2010 | | December 31,
2009 | |
Interest expenses accrued | | 3,337.7 | | 3,839.8 | |
Prepaid revenues and other accrued expenses | | 105.7 | | 73.9 | |
Total | | 3,443.4 | | 3,913.7 | |
Note 21. Provisions
| | Consolidated Group | |
| | December 31, | | December 31, | |
Skr mn | | 2010 | | 2009 | |
Pension liabilities | | 50.2 | | 37.6 | |
Termination reserve | | 3.4 | | 15.9 | |
Total | | 53.6 | | 53.5 | |
Note 22. Subordinated debt securities
| | Consolidated Group | |
Skr mn | | December 31,
2010 | | December 31,
2009 | |
Perpetual, non-cumulative subordinated loan, foreign currency (1) (2) | | 2,590.3 | | 2,625.2 | |
Non-perpetual, cumulative subordinated loan, foreign currency (3) | | — | | 517.6 | |
Total subordinated debt outstanding | | 2,590.3 | | 3,142.8 | |
| | | | | |
Of which denominated in: | | | | | |
Swedish kronor | | — | | — | |
Foreign currencies | | 2,590.3 | | 3,142.8 | |
(1) Nominal value USD 200 million. Interest payments quarterly in arrears at a rate of 5.40 percent per annum. Redeemable, at SEK’s option only, on or after December 27, 2008, and quarterly thereafter at 100 percent of the nominal value. Redemption requires the prior approval of the Swedish Financial Supervisory Authority. Interest payment will not be made if SEK does not have available distributable capital for making such a payment. The investor’s right to receive accrued but unpaid interest will thereafter be lost (noncumulative). In order to avoid the issuer to be obliged to enter into liquidation the general meeting together with the approval of the Swedish Supervisory Authority may decide that principal amount and any unpaid interest will be utilized in meeting losses. However, SEK cannot thereafter pay any dividend to its shareholders before the principal amount has been reinstated as debt in full in the statement of financial position or been redeemed with approval by the Swedish Financial Supervisory Authority and such accrued but unpaid interest has been paid.
(2) Nominal value USD 150 million. Interest payments quarterly in arrears at a rate of 6.375 percent per annum. Redeemable, at SEK’s option only, on or after December 27, 2008, and quarterly thereafter at 100 percent of the nominal value. Redemption requires the prior approval of the Swedish Financial Supervisory Authority. Interest payment will not be made if SEK does not have available distributable capital for making such a payment. The investor’s right to receive accrued but unpaid interest will thereafter be lost (noncumulative). In order to avoid the issuer to be obliged to enter into liquidation the general meeting together with the approval of the Swedish Supervisory Authority may decide that principal amount and any unpaid interest will be utilized in meeting losses. However, SEK cannot thereafter pay any dividend to its shareholders before the principal amount has been reinstated as debt in full in the statement of financial position or been redeemed with approval by the Swedish Financial Supervisory Authority and such accrued but unpaid interest has been paid.
(3) SEK: s non-perpetual subordinated loan amounting to EUR 50 million with maturity date June 30, 2015 was redeemed as of June 30, 2010 to nominal amount in accordance with the loan agreement and permission from the Swedish Financial Supervisory Authority.
The accrued interest related to the subordinated debt, at year-end Skr 1.5 million (year-end 2009: Skr 1.6 million, year-end 2008: Skr 1.8 million), has been included in the item “Accrued expenses and prepaid revenues”.
The subordinated loans are subordinated to the company’s other debts, which means that payment will not be performed until other creditors have received repayment.
F-42
Table of Contents
Note 23. Contingent liabilities, contingent assets and commitments
Contingent liabilities and commitments are disclosed in connection with the consolidated statements of financial position as of December 31, 2010. Commitments consist of committed undisbursed loans. Such committed undisbursed loans represent loan offers that have been accepted by the customer but not yet disbursed. Of the Skr 38,205.2 million of committed undisbursed loans at December 31, 2010 (year-end 2009: Skr 46,331.1 million), committed undisbursed loans under the S-system represented Skr 16,570.1 million (year-end 2009: Skr 26,386.2 million). Such commitments under the S-system sometimes include a fixed-rate option, the cost of which is reimbursed by the Swedish state in accordance with an agreement with the state (see Note 24).
Following Lehman Brothers Holdings Inc.’s (the parent company in the Lehman Brothers group) request for bankruptcy protection on September 15, 2008, SEK replaced most of the outstanding derivative contracts the parent company had entered into with three different Lehman Brothers entities. In accordance with the terms of the original contracts (which generally took the form of ISDA Master Agreements), SEK prepared statements of claim (“Calculation Statements”) in relation to all of these Lehman Brothers entities. The Calculation Statements were delivered to the respective counterparties in the beginning of October 2008.
The majority of the contracts SEK had with different Lehman Brothers entities served primarily to hedge SEK against market risk. Those contracts have been replaced with new contracts. In addition, SEK had entered into credit default swaps with Lehman Brothers entities that were accounted for as financial guarantee and therefore recorded at amortized cost. The underlying counterparties covered by these credit default swaps all had such creditworthiness as to qualify under SEK’s policies to be held without credit default swap coverage. SEK has therefore not replaced these credit default swaps. However, the Calculation Statements include claims for calculated costs related to the replacement of these financial guarantees. SEK’s claims against Lehman Brothers associated with these financial guarantees total approximately Skr 1.3 billion, which has not been recognized in the statement of financial position due to the requirement that contingent assets only be recognized when there is virtual certainty of collection. Given the unprecedented nature of the Lehman Brothers bankruptcy filing and the expected length of the bankruptcy process, an assessment has been made that the “virtual certainty of collection” standard has not been met.
In June 2009, Lehman Brothers Finance S.A. (in liquidation, with PricewaterhouseCoopers as appointed liquidators) (“LBF”) notified the Parent Company that LBF was demanding the payment of amounts that LBF claimed were due under one of the original ISDA Master Agreements (the “LBF Agreement”), plus interest, rejecting SEK’s claims for cross-affiliate set-off, interest and damages, as reflected in certain of the Calculation Statements. SEK rejected LBF’s claim for payment and its other objections to the relevant Calculation Statements. SEK disagrees with LBF’s position, and intends to vigorously defend its position.
SEK believes that, the company will not suffer any significant losses related to the bankruptcy of Lehman Brothers and has therefore not made any provision for this. SEK’s set-off and damage claims have however not been settled, and no assurance can be given that they will be compensated in full. Nor can any guarantees on the outcome of the group’s dispute with LBF be given. SEK will continue to evaluate the situation and await the outcome of Lehman Brothers Holdings Inc.’s bankruptcy.
In March 2009, in connection with the settlement of a claim against Sparbanksstiftelsernas Förvaltnings AB (“SFAB”), SEK came to an agreement with SFAB by which SEK, through a purchase, assumed ownership of 25,520,000 shares in Swedbank AB representing approximately 3.3 percent of Swedbank’s total share capital and votes. On June 16, 2009 SEK received a claim from SFAB challenging the agreement related to the transfer of ownership in the shares of Swedbank AB, which claim has been rejected by SEK. SEK subsequently subscribed for new shares in a rights offering of Swedbank AB in the autumn of 2009. Payment for new shares of Skr 497.6 million was delivered on October 6, 2009. SEK’s holding in Swedbank AB amounted to 3.3 percent and the number of shares amounted to 38,280,000 after participating in the rights offering.
On October 26, 2009, SEK received an additional claim from SFAB relating to the value of SEK’s entire current stake in Swedbank (38,280,000 shares), including fair valuation changes. These shares had an acquisition cost of a total of Skr 997.6 million, and, as of September 30, 2010, had a book value of Skr 3,592.0 million, which corresponded to the fair value. The aforementioned additional claim does not affect SEK’s previous conclusion that SFAB has no valid claim, and, therefore, it has been rejected.
On November 11, 2009, SFAB announced that it had initiated arbitration proceedings. On March 1, 2010, SFAB submitted a statement of claim against SEK at the Arbitration Institute of the Stockholm Chamber of Commerce. The statement of claim has subsequently (-after SEK filed its defense) been supplemented and developed. The arbitration process is still ongoing. On March 5, 2010, SFAB also submitted an application for summons against SEK in the said dispute to the City Court of Stockholm. SEK still considers that SFAB’s demands are unfounded and has therefore not made any financial provisions in respect of any of the actions taken by SFAB as described above.
On October 28, 2010, SEK sold its entire stake in Swedbank AB. The holding was privately placed with a number of Swedish and
F-43
Table of Contents
international institutional investors. SEK, a holder of shares in Swedbank since March 2009, had previously announced that it should not be regarded as a long-term owner but rather had the intention to sell the stake in a responsible way. The shares, which had been acquired at a cost of Skr 997.6 million, were sold for a total of Skr 3,562.7 million resulting in a profit of Skr 2,565.0 million before taxes. At the board meeting held on October 29, 2010, SEK’s Board of Directors resolved to call an extraordinary general meeting with the purpose to propose an extra dividend amounting to Skr 1,890.0 million, equal to the realized profit from the sale after tax. The extraordinary general meeting was held on December 1, 2010, a decision on a special dividend amounting to Skr 1,890.0 million was taken. The dividend was paid to SEK’s owner, the Swedish state, on December 15, 2010.
Note 24. S-system
Pursuant to an agreement between SEK and the Swedish state, SEK has specific conditions for granting loans in the S-system. See Note 1(d) (i). The remuneration from the S-system to SEK in accordance with the agreement, which amounted to Skr 48.7 million for the year (2009: Skr 27.3 million, 2008: Skr 22.4 million), is disclosed as a part of interest revenues in the statements of comprehensive income for SEK. The assets and liabilities of the S-system are included in SEK’s statements of financial position.
CIRR loans (Commercial Interest Reference Rate) represent one of the two loan types in the S-system, the other being concessionary loans. The net result in the S-system for the year amounted to Skr —27.8 million (2009: Skr —43.2 million, 2008: Skr 68.9 million), of which the net result for the CIRR loans represented Skr 11.6 million (2009: Skr —5.5 million, 2008: Skr 105.4 million).
Statements of comprehensive income for the S-system
Skr mn | | 2010 | | 2009 | | 2008 | |
Interest revenues | | 680.2 | | 493.6 | | 500.5 | |
Interest expenses | | -710.7 | | -507.2 | | -409.5 | |
Net interest revenues | | -30.5 | | -13.6 | | 91.0 | |
Remuneration to SEK | | -48.7 | | -27.3 | | -22.4 | |
Commissions earned | | 50.8 | | — | | — | |
Foreign exchange effects | | 0.6 | | -2.3 | | 0.3 | |
Reimbursement to (-) / from (+) the State | | 27.8 | | 43.2 | | -68.9 | |
Net result | | 0.0 | | 0.0 | | 0.0 | |
Statements of financial position for the S-system (included in SEK’s statements of financial position)
Skr mn | | December 31, 2010 | | December 31, 2009 | |
Cash and cash equivalents | | 55.9 | | 42.0 | |
Loans | | 23,989.0 | | 14,314.2 | |
Derivatives | | 16.9 | | 232.5 | |
Other assets | | 1,466.8 | | 581.3 | |
Total assets | | 25,528.6 | | 15,170.0 | |
| | | | | |
Liabilities | | 24,353.6 | | 14,627.9 | |
Derivatives | | 1,175.0 | | 542.1 | |
Equity | | — | | — | |
Total liabilities and equity | | 25,528.6 | | 15,170.0 | |
| | | | | |
Commitments | | | | | |
Committed undisbursed loans (Note 11) | | 16,570.1 | | 26,386.2 | |
Results under the S-System by type of loan | | CIRR loans | | Concessionary loans | |
Skr mn | | 2010 | | 2009 | | 2008 | | 2010 | | 2009 | | 2008 | |
Net interest revenues | | 7.0 | | 22.3 | | 125.8 | | -37.5 | | -35.9 | | -34.8 | |
Remuneration to SEK | | -46.8 | | -25.5 | | -20.7 | | -1.9 | | -1.8 | | -1.7 | |
Commissions earned | | 50.8 | | — | | — | | — | | — | | — | |
Foreign exchange effects | | 0.6 | | -2.3 | | 0.3 | | — | | — | | — | |
Total | | 11.6 | | -5.5 | | 105.4 | | -39.4 | | -37.7 | | -36.5 | |
F-44
Table of Contents
Note 25. Segment Reporting
In accordance with IFRS 8, SEK has the following three business segments: granting of loans, advisory services and capital market products. Advisory services and capital market products are similar with respect to risks and returns. The combined revenues for the segments other than granting of loans amounted to less than 1 percent of the Consolidated Group’s total revenues and their operating profits amounted to less than 1 percent of the Consolidated Group’s total operating profit, while less than 1 percent of the Consolidated Group’s total assets were attributable to these two segments. As a result, these segments are not separately reported on in these notes. SEK therefore has reported separately only on the segment “granting of loans”. The company’s management follows mainly the income measure adjusted operating profit at its follow-up.
SEK’s management considers - and SEK believes that its sole shareholder, the Swedish State, considers - Adjusted Operating Profit to be a useful supplemental measure in evaluating the performance of SEK’s business over the long term, because it excludes some market valuation effects according to IFRS.
Granting of loans include the following products and services: lending, export finance and structured finance projects. Advisory services include the following products and services: independent consulting services. Capital market products include the following products and services: capital market products to third party investors.
| | 2010 | |
Income
Skr mn | | Interest
revenues | | Interest
expenses | | Net interest
revenues | | External
commissions-
earned | | Internal
commissions-
earned | | Sum of
commissions-
earned | |
Granting of loans | | 12,182.8 | | -10,299.8 | | 1,883.0 | | 1.0 | | — | | 1.0 | |
Other segments (1) | | 0.3 | | — | | 0.3 | | 18.7 | | 10.4 | | 29.1 | |
Elimination (3) | | — | | 15.2 | | 15.2 | | — | | -10.4 | | -10.4 | |
Total | | 12,183.1 | | -10,284.6 | | 1,898.5 | | 19.7 | | 0.0 | | 19.7 | |
| | 2009 | |
| | | | | | | | External | | Internal | | Sum of | |
Income | | Interest | | Interest | | Net interest | | commissions- | | commissions- | | comissions- | |
Skr mn | | revenues | | expense | | revenues | | earned | | earned | | earned | |
Granting of loans | | 13,306.1 | | -11,319.8 | | 1,986.3 | | 1.0 | | 0.0 | | 1.0 | |
Other segments (1) | | 0.3 | | 0.0 | | 0.3 | | 25.2 | | 46.5 | | 71.7 | |
Elimination (3) | | — | | 7.7 | | 7.7 | | — | | -46.5 | | -46.5 | |
Total | | 13,306.4 | | -11,312.1 | | 1,994.3 | | 26.2 | | 0.0 | | 26.2 | |
| | 2008 | |
| | | | | | | | External | | Internal | | Sum of | |
Income | | Interest | | Interest | | Net interest | | commissions- | | commissions- | | comissions- | |
Skr mn | | revenues | | expense | | revenues | | earned | | earned | | earned | |
Granting of loans | | 12,963.2 | | -11,420.8 | | 1,542.4 | | 1.5 | | 0.0 | | 1.5 | |
Other segments (1) | | 0.9 | | 0.0 | | 0.9 | | 33.2 | | 0.0 | | 33.2 | |
Elimination (3) | | — | | 0.0 | | 0.0 | | — | | 0.0 | | 0.0 | |
Total | | 12,964.1 | | -11,420.8 | | 1,543.3 | | 34.7 | | 0.0 | | 34.7 | |
F-45
Table of Contents
Operating profit
Skr mn | | 2010 | | 2009 | | 2008 | |
| | | | | | | |
Granting of loans (5) | | 4,109.1 | | 1,564.7 | | 831.9 | |
Other segments (5) | | 5.6 | | 34.6 | | 2.0 | |
Adjusted operating-profit (core earnings) (2) | | 4,114.7 | | 1,599.3 | | 833.9 | |
Change in value according to IFRS (5) | | -175.0 | | 769.3 | | -648.7 | |
Operating profit (4) | | 3,939.7 | | 2,368.6 | | 185.2 | |
Assets (4)
Skr mn | | 2010 | | 2009 | |
| | | | | |
Granting of loans | | 339,665.9 | | 370,076.8 | |
Other segments (1) | | 21.7 | | 1,511.2 | |
Elimination | | — | | — | |
Total | | 339,687.6 | | 371,588.0 | |
| | 2010 | | 2009 | | 2008 | |
Income geographical areas
Skr mn | | Interest-
revenues | | Commissions-
earned | | Total | | Interest-
revenues | | Commissions-
earned | | Total | | Interest-
revenues | | Commissions-
earned | | Total | |
Sweden | | 2,943.9 | | 10.1 | | 2,954.0 | | 2,883.8 | | 11.5 | | 2,895.3 | | 3,909.3 | | 11.1 | | 3,920.4 | |
Europe except Sweden | | 6,265.2 | | 6.7 | | 6,271.9 | | 1,211.0 | | 11.3 | | 1,222.3 | | 6,312.0 | | 1.6 | | 6,313.6 | |
Other European countries | | 2,974.0 | | 2.9 | | 2,976.9 | | 9,211.6 | | 3.4 | | 9,215.0 | | 2,742.8 | | 22.0 | | 2,764.8 | |
Total | | 12,183.1 | | 19.7 | | 12,202.8 | | 13,306.4 | | 26.2 | | 13,332.6 | | 12,964.1 | | 34.7 | | 12,998.8 | |
(1) Other segments consist of segments advisory services and capital market products.
(2) Excluding unrealized fair value changes according to IAS 39.
(3) Elimination for internal sales between segments.
(4) Including unrealized fair value changes according to IAS 39.
(5) Of total tax, Skr 1,046.5 million (2009: Skr 632.2 million, 2008: Skr 40.7 million) is related to granting of loans and Skr 1.5 million (2009: Skr 9.1 million, 2008: Skr 0.6 million) is related to other segments.
Note 26. Capital Adequacy
The capital adequacy ratio of SEK as a consolidated financial entity, calculated according to Basel II, Pillar 1, as of December 31, 2010 was 22.4 percent (year-end 2009: 19.8 percent, year-end 2008: 21.4 percent) without taking into account the effects of currently applicable transitional rules (see below).
Capital Base
| | Consolidated Group | |
Skr mn | | December 31, 2010 | | December 31, 2009 | |
Primary capital (Tier-1) | | 14,432 | | 12,556 | |
Supplementary capital (Tier-2) (1) | | — | | 606 | |
...Of which upper Tier-2 | | — | | 181 | |
...Of which lower Tier-2 | | — | | 425 | |
Total capital base (2) | | 14,432 | | 13,162 | |
| | | | | |
Adjusted Tier-1 capital (3) | | 15,032 | | 13,156 | |
Adjusted total capital base | | 15,032 | | 13,762 | |
(1) SEK’s non-perpetual subordinated loan amounting to EUR 50 million with a maturity date of June 30, 2015 was redeemed as of June 30, 2010 at its nominal value in accordance with the loan agreement and permission from the Swedish Financial Supervisory Authority.
(2) Total capital base, including expected loss surplus in accordance with the IRB approach. The capital base includes net profit for the period less proposed and expected dividends related to the said period. As of December 31, 2009 the capital base was reduced by the book value of shares in Swedbank AB by Skr 2,710.0 million since the value exceeded 10 percent of the total capital base.
(3) The adjusted capital adequacy ratios are calculated with the inclusion in the capital base of the State provided guarantee, amounting to Skr 600 million, to which SEK has access, in addition to the legal primary capital base. Given that SEK’s owner, the Swedish state, in 2008 contributed substantial amounts of new equity to SEK, has the above mentioned guarantee been deemed by SEK no longer be required and will therefore likely expire at June 30, 2011.
F-46
Table of Contents
Capital base - Adjusting items
| | Consolidated Group | |
Skr mn | | December 31, 2010 | | December 31, 2009 | |
Equity | | 12,570 | | 13,455 | |
Equity-portions of untaxed reserves | | n.a | | n.a | |
Expected dividend | | -301 | | -518 | |
Items recognized at fair value | | -75 | | -1,520 | |
Intangible assets and other adjustements | | -58 | | -30 | |
Tier-1 eligible subordinated debt | | 2,381 | | 2,524 | |
Deduction from Tier-1 | | n.a | | -1,355 | |
100% of expected loss in accordance with IRB-calculation | | -85 | | n.a | |
Total Tier-1 capital | | 14,432 | | 12,556 | |
| | | | | |
Tier-2 eligible subordinated debt | | n.a | | 518 | |
Deduction from Tier- 2 capital | | n.a | | -1,355 | |
Financial assets available for sale | | n.a | | 1,262 | |
100% of expected surplus in accordance with IRB-calculation | | n.a | | 181 | |
Total Tier-2 capital | | 0 | | 606 | |
Impact on the capital base from expected loss
Expected loss is calculated according to law and regulations, based on information from SEK’s internal ratings-based approach (IRB approach). Such an expected loss does not represent real, individually anticipated losses, but reflects a theoretically calculated amount. Expected loss is a gross deduction from the capital base. This deduction is decreased by impairments of financial assets for which expected loss is calculated. If the impairments exceed the expected loss, the surplus is added to the capital base. As of December 31, 2010 the deduction from the capital base amounted to Skr 85 million. The amount reduces Tier-1 capital. As of December 31, 2009, impairments exceeded the amount of the theoretically calculated expected loss by Skr 181 million (2008: Skr 72 million). The excess amount was added to SEK’s Tier-2 capital.
| | Consolidated Group | |
| | December 31, 2010 | | December 31, 2009 | |
Skr mn | | Weighted claims | | Required capital | | Weighted
claims | | Required
capital | |
Credit risk standardised method | | 925 | | 74 | | 842 | | 67 | |
Credit risk IRB method | | 58,157 | | 4,653 | | 62,349 | | 4,988 | |
Currency exchange risks | | — | | — | | — | | — | |
Operational risk | | 5,371 | | 430 | | 3,137 | | 251 | |
Total Basel II | | 64,453 | | 5,157 | | 66,328 | | 5,306 | |
| | | | | | | | | |
Basel I based additional requirement (1) | | 26 | | 2 | | 3,880 | | 311 | |
Total Basel II inkl. additional requirement | | 64,479 | | 5,159 | | 70,208 | | 5,617 | |
| | | | | | | | | |
Total Basel I | | 80,599 | | 6,448 | | 87,760 | | 7,021 | |
(1) The item “Basel I-based additional requirements” is calculated in accordance with § 5 of the law (2006:1372) on implementation of the capital adequacy requirements (2006:1371).
Credit risks
For risk classification and quantification of credit risk SEK uses an internal ratings-based (IRB) approach. The Swedish Financial Supervisory Authority has approved SEK’s IRB approach. Specifically, SEK applies the Foundation Approach. Under the Foundation Approach, the company determines the probability of default within one year (PD) of each of its counterparties, while
F-47
Table of Contents
the Swedish Financial Supervisory Authority establishes the remaining parameters.
Operational risks
The regulations provide opportunities for companies to use different methods for the calculation of capital requirements for operational risks. SEK calculates the capital requirement for operational risks according to the Basic Indicator Approach. The capital requirement for operational risk under the Basic Indicator Approach equals 15 percent of a revenue indicator. The revenue indicator represents an average of operational revenues during the prior three years. Operational revenues are calculated as the sum of the following items: interest and leasing revenues, interest and leasing expenses, dividends received, commissions earned, commissions incurred, net results of financial transactions and other operational revenues.
Transitional rules
Since 2007, the capital requirement has been determined, primarily, based on Basel II rules. The legislature has, however, chosen not to immediately allow the full effect of the Basel II regulations. The reason for this is that these rules would result in a lower capital requirement than that calculated on the basis of the earlier, less risk-sensitive, Basel I rules for those institutions that use internal rating methods. Therefore, during a transitional period initially set from 2007 to 2009, the relevant institutions (including SEK) have made parallel calculations of their capital requirement based on the earlier, less risk-sensitive, Basel I rules. In the event that the capital requirement calculated under the Basel I rules — reduced to 95 percent of the calculated total in 2007, 90 percent in 2008, and 80 percent in 2009 — has exceeded the capital requirement based on the Basel II rules, the capital requirement based on the Basel I rules (reduced by the relevant percentage) has constituted the minimum capital requirement during the transitional period. The authorities decided during 2009 to extend the transitional rules to apply until the end of 2011. The capital requirement will thereby also be reduced to 80 percent of the calculated total during 2010 and 2011.
Capital Adequacy Analysis (Pillar 1)
| | Consolidated Group | |
| | December 31, 2010 | | December 31, 2009 | |
| | Excl. Basel I based
add. requirement | | Incl. Basel I
based add.
requirement | | Excl. Basel I
based add.
requirement | | Incl. Basel I
based add.
requirement | |
Total capital adequacy | | 22.4 | % | 22.4 | % | 19.8 | % | 18.7 | % |
...Of which related to primary capital (Tier-1) | | 22.4 | % | 22.4 | % | 18.9 | % | 17.9 | % |
...Of which related to supplementary capital (Tier-2) | | — | | — | | 0.9 | % | 0.9 | % |
Of which upper Tier-2 | | — | | — | | 0.3 | % | 0.3 | % |
Of which lower Tier-2 | | — | | — | | 0.6 | % | 0.6 | % |
| | | | | | | | | |
Adjusted total | | 23.3 | % | 23.3 | % | 20.7 | % | 19.6 | % |
...Of which adjusted Tier-1 | | 23.3 | % | 23.3 | % | 19.8 | % | 18.7 | % |
| | | | | | | | | |
Capital adequacy quota (total capital base/total required capital) | | 2.80 | | 2.80 | | 2.48 | | 2.34 | |
F-48
Table of Contents
Note 27. Risk information
For further information regarding SEK’s see Note 30 “Risk and Capital management” included in this report.
The table of credit quality as per category in the statement of financial position and the table that illustrates the link between statement of financial position categories and exposures according to Basel II contain Book values. Other tables contain nominal values.
Credit Risk
| | December 31, 2010 | |
| | Maximum exposure to credit risk | |
Consolidated Group
Skr mn | | Financial
assets at fair
value through
profit or loss | | Assets
available for
sale | | Loans and
receivables | |
Cash and cash equivalents | | | | | | 8,798.0 | |
Treasuries/government bonds | | | | | | 5,437.2 | |
Other interest-bearing securities except loans | | 5,316.5 | | 9,056.9 | | 86,358.5 | |
Loans in the form of interest-bearing securities | | 2,214.9 | | | | 69,040.4 | |
Loans to credit institutions | | | | | | 25,281.3 | |
Loans to the public | | | | | | 121,718.9 | |
Derivatives | | 37,659.8 | | | | | |
Total financial assets | | 45,191.2 | | 9,056.9 | | 316,634.3 | |
| | December 31, 2009 | |
| | Maximum exposure to credit risk | |
Consolidated Group
Skr mn | | Financial
assets at fair
value through
profit or loss | | Assets
available for
sale | | Loans- and
receivables | |
Cash in hand | | | | | | 17,636.5 | |
Treasuries/government bonds | | | | | | 11,727.8 | |
Other interest-bearing securities except loans | | 7,196.7 | | 3,201.7 | | 113,058.6 | |
Loans in the form of interest-bearing securities | | 2,472.2 | | | | 84,853.3 | |
Loans to credit institutions | | | | | | 25,442.9 | |
Loans to the public | | | | | | 119,281.5 | |
Derivatives | | 22,654.1 | | | | | |
Total financial assets | | 32,323.0 | | 3,201.7 | | 372,000.6 | |
Maximum exposure to credit risk for “Loans to credit institutions” and “Loans to the public” include undisbursed loans at year-end entered at nominal value.
F-49
Table of Contents
The table below displays the credit quality as per category in the statement of financial position. The amounts are book values.
The table does not include undisbursed loans and derivatives.
Consolidated Group | | December 31, 2010 | |
Skr mn | | Book value | | AAA | | AA+ to BBB- | | BB+ to D(1) | |
Cash and cash equivalents | | 8,798.0 | | | | 8,798.0 | | | |
Treasuries/government bonds | | 5,431.3 | | 899.0 | | 4,494.1 | | 38.2 | |
Other interest-bearing securities except loans | | 100,533.0 | | 24,263.6 | | 75,966.2 | | 303.2 | |
Loans in the form of interest-bearing securities | | 71,805.8 | | 23,399.5 | | 46,287.0 | | 2,119.3 | |
Loans to credit institutions | | 22,538.9 | | 10,572.9 | | 11,253.2 | | 712.8 | |
Loans to the public | | 87,101.9 | | 59,430.7 | | 23,988.9 | | 3,682.3 | |
Total financial assets | | 296,208.9 | | 118,565.7 | | 170,787.4 | | 6,855.8 | |
(1) Skr 296.2 million (2009: Skr 381.1 million) have rating class CCC or D.
Consolidated Group | | December 31, 2009 | |
Skr mn | | Book value | | AAA | | AA+ to BBB- | | BB+ to D | |
Cash and cash equivalents | | 17,636.5 | | 4,733.4 | | 12,903.1 | | | |
Treasuries/government bonds | | 11,717.4 | | 7,691.8 | | 3,981.5 | | 44.1 | |
Other interest-bearing securities except loans | | 123,378.6 | | 39,785.7 | | 83,089.8 | | 503.1 | |
Loans in the form of interest-bearing securities | | 87,499.1 | | 27,767.7 | | 57,708.4 | | 2,023.0 | |
Loans to credit institutions | | 23,543.2 | | 8,624.7 | | 3,942.3 | | 10,976.2 | |
Loans to the public | | 75,890.1 | | 49,271.6 | | 24,629.9 | | 1,988.7 | |
Shares and participation | | 2,710.1 | | | | 2,710.1 | | | |
Total financial assets | | 342,375.0 | | 137,874.8 | | 188,965.1 | | 15,535.1 | |
The credit qualities of financial assets are evaluated by use of internal or external rating.
The table below illustrates the link between the statement of financial position categories and exposures according to Basel II.
| | December 31, 2010 | |
Consolidated Group
Skr billion | | Book value | | Adjustment
from Book
value to
Exposure | | Adjustment to
exposure class | | Amendment for
undisbursed
credits and
counterparty
exposure | | Exposure | | Exposure class | |
Treasuries/government bonds | | 5.4 | | 0.0 | | 9.1 | | 2.0 | | 16.5 | | Central governments | |
Other interest-bearing securities except loans | | 100.5 | | -0.3 | | -9.2 | | 32.8 | | 123.8 | | Government export credit agencies | |
Loans in the form of interest-bearing securities | | 71.8 | | -0.5 | | -48.1 | | 0.5 | | 23.7 | | Regional governments | |
Loans to credit institutions including cash and cash equivalents(1) | | 31.3 | | -0.3 | | -30.6 | | 0.0 | | 0.4 | | Multilateral development banks | |
Loans to the public | | 87.1 | | -0.6 | | 15.1 | | 12.5 | | 114.1 | | Financial institutions, including equity exposures | |
| | | | | | 39.7 | | 3.6 | | 43.3 | | Corporates | |
Derivatives | | 37.7 | | -14.1 | | -23.6 | | | | | | | |
| | | | | | 24.0 | | | | 24.0 | | Securitization positions | |
Total financial assets | | 333.8 | | -15.8 | | -23.6 | | 51.4 | | 345.8 | | | |
F-50
Table of Contents
| | December 31, 2009 | |
Consolidated Group
Skr billion | | Book value | | Adjustment
from Book
value to
Exposure | | Adjustment to
exposure class | | Amendment for
undisbursed
credits and
counterparty
exposure | | Credit exposure | | Exposure class | |
Treasuries/government bonds | | 11.7 | | 0.0 | | 19.7 | | 2.2 | | 33.6 | | Central governments | |
Other interest-bearing securities except loans | | 123.4 | | -0.3 | | -38.6 | | 40.6 | | 125.1 | | Government export credit agencies | |
Loans in the form of interest-bearing securities | | 87.5 | | 0.8 | | -65.1 | | 0.8 | | 24.0 | | Regional governments | |
Loans to credit institutions including cash and cash equivalents(1) | | 41.2 | | -10.9 | | -29.9 | | | | 0.4 | | Multilateral development banks | |
Loans to the public | | 75.9 | | 2.8 | | 47.4 | | 11.8 | | 137.9 | | Financial institutions, including equity exposures | |
Shares and participation | | 2.7 | | | | 32.6 | | 3.4 | | 38.7 | | Corporates | |
Derivatives | | 22.7 | | -15.2 | | -7.5 | | | | | | | |
| | | | | | 33.9 | | | | 33.9 | | Securitization positions | |
Total financial assets | | 365.1 | | -22.8 | | -7.5 | | 58.8 | | 393.6 | | | |
(1) Skr 0.7 billion (2009: Skr 7.4 billion) of the book value for Loans to credit institutions are cash collateral posted to SEK.
Reduction in derivative exposures from applying netting under current ISDA Master Agreements according to Basel II regulations regarding counterparty risk in derivative transactions amounts to Skr 14.1 billion (2009: Skr 15.2 billion). For further information regarding counterparty risk in derivative transactions under Basel II, see note 30 “Risk and Capital management”.
Total credit exposures Consolidated Group
Amounts expressing gross exposures are shown before guarantees and credit derivatives while net exposures are reported after taking into consideration guarantees and credit derivatives.
Total exposures | | Total | | Loans & interest-bearing securitites | | Undisbursed loans, derivatives, etc | |
Skr billion | | December 31, 2010 | | December 31, 2009 | | December 31, 2010 | | December 31, 2009 | | December 31, 2010 | | December 31, 2009 | |
Classified by type of exposure class | | Amount | | % | | Amount | | % | | Amount | | % | | Amount | | % | | Amount | | % | | Amount | | % | |
Central governments (1) | | 113.2 | | 33 | | 125.6 | | 32 | | 80.4 | | 27 | | 86.4 | | 26 | | 32.8 | | 64 | | 39.2 | | 64 | |
Regional governments | | 23.7 | | 7 | | 24.0 | | 6 | | 23.2 | | 8 | | 23.2 | | 7 | | 0.5 | | 1 | | 0.8 | | 1 | |
Government export credit agencies | | 27.5 | | 8 | | 33.5 | | 8 | | 25.5 | | 9 | | 30.0 | | 9 | | 2.0 | | 4 | | 3.5 | | 6 | |
Financial institutions | | 114.1 | | 33 | | 137.9 | | 35 | | 101.6 | | 35 | | 123.3 | | 37 | | 12.5 | | 24 | | 14.6 | | 24 | |
Securitization positions | | 24.0 | | 7 | | 33.9 | | 9 | | 24.0 | | 8 | | 33.9 | | 10 | | 0.0 | | 0 | | 0.0 | | 0 | |
Corporates | | 43.3 | | 12 | | 38.7 | | 10 | | 39.7 | | 13 | | 35.3 | | 11 | | 3.6 | | 7 | | 3.4 | | 5 | |
Total | | 345.8 | | 100 | | 393.6 | | 100 | | 294.4 | | 100 | | 332.1 | | 100 | | 51.4 | | 100 | | 61.5 | | 100 | |
(1) Includes exposures to Swedish Export Guarantee Board (EKN).
Credit exposures allocation beetween IRB-approach and the standardized approach
| | December 31, 2010 | | December 31, 2009 | |
Skr billion | | Net exposures | | Share | | Net exposures | | Share | |
Standardized approach | | | | | | | | | |
Central governments | | 16.5 | | 5 | % | 33.6 | | 8 | % |
Government export credit agencies | | 123.8 | | 36 | % | 125.1 | | 32 | % |
Regional governements | | 23.7 | | 7 | % | 24.0 | | 6 | % |
Multilateral development banks | | 0.4 | | 0 | % | 0.4 | | 0 | % |
Corporates | | 0.1 | | 0 | % | 0.0 | | 0 | % |
Sum | | 164.5 | | 48 | % | 183.1 | | 46 | % |
IRB method | | | | | | | | | |
Financial institutions | | 114.1 | | 33 | % | 137.9 | | 35 | % |
Corporates | | 43.2 | | 12 | % | 38.7 | | 10 | % |
Securitization positions | | 24.0 | | 7 | % | 33.9 | | 9 | % |
Sum | | 181.3 | | 52 | % | 210.5 | | 54 | % |
| | 345.8 | | 100 | % | 393.6 | | 100 | % |
F-51
Table of Contents
Credit exposures by region and exposure class
Gross exposure by region and exposure class, as of December 31, 2010
Skr billion | | Africa | | Asia | | North
America | | Oceania | | South
America | | Sweden | | Other
Nordic
countries | | Other
European
countries | | Total | |
Central governments | | 0.0 | | 7.8 | | 0.0 | | 0.0 | | 0.3 | | 2.1 | | 3.6 | | 6.6 | | 20.4 | |
Government export credit agencies | | 0.0 | | 0.0 | | 0.0 | | 0.0 | | 0.0 | | 0.0 | | 0.0 | | 0.0 | | 0.0 | |
Regional governements | | 0.0 | | 0.0 | | 0.0 | | 0.0 | | 0.0 | | 12.9 | | 1.6 | | 0.0 | | 14.5 | |
Multilateral development banks | | 0.0 | | 0.0 | | 0.0 | | 0.0 | | 0.0 | | 0.0 | | 0.0 | | 0.0 | | 0.0 | |
Financial institutions | | 0.6 | | 0.9 | | 11.7 | | 5.5 | | 0.0 | | 31.8 | | 12.2 | | 36.1 | | 98.8 | |
Corporates | | 2.2 | | 26.7 | | 20.5 | | 0.9 | | 3.9 | | 68.2 | | 17.6 | | 46.7 | | 186.7 | |
Securitization positions | | 0.0 | | 0.0 | | 4.3 | | 4.6 | | 0.0 | | 0.0 | | 0.0 | | 16.5 | | 25.4 | |
| | 2.8 | | 35.4 | | 36.5 | | 11.0 | | 4.2 | | 115.0 | | 35.0 | | 105.9 | | 345.8 | |
Gross exposure by region and exposure class, as of December 31, 2009
Skr billion | | Africa | | Asia | | North
America | | Oceania | | South
America | | Sweden | | Other
Nordic
countries | | Other
European
countries | | Total | |
Central governments | | 0.0 | | 7.9 | | 0.0 | | 0.0 | | 0.4 | | 3.2 | | 13.8 | | 12.4 | | 37.7 | |
Government export credit agencies | | 0.0 | | 0.0 | | 0.0 | | 0.0 | | 0.0 | | 0.0 | | 0.0 | | 0.0 | | 0.0 | |
Regional governements | | 0.0 | | 0.0 | | 0.0 | | 0.0 | | 0.0 | | 10.7 | | 2.5 | | 0.0 | | 13.2 | |
Multilateral development banks | | 0.0 | | 0.0 | | 0.0 | | 0.0 | | 0.0 | | 0.0 | | 0.0 | | 0.0 | | 0.0 | |
Financial institutions | | 0.0 | | 2.1 | | 16.1 | | 4.9 | | 0.3 | | 36.0 | | 7.3 | | 51.8 | | 118.5 | |
Corporates | | 2.2 | | 29.2 | | 23.0 | | 1.1 | | 3.2 | | 62.6 | | 20.2 | | 47.1 | | 188.6 | |
Securitization positions | | 0.0 | | 0.0 | | 4.9 | | 6.1 | | 0.0 | | 0.0 | | 0.4 | | 24.2 | | 35.6 | |
| | 2.2 | | 39.2 | | 44.0 | | 12.1 | | 3.9 | | 112.5 | | 44.2 | | 135.5 | | 393.6 | |
Net exposure by region and exposure class, as of December 31, 2010
Skr billion | | Africa | | Asia | | North
America | | Oceania | | South
America | | Sweden | | Other
Nordic
countries | | Other
European
countries | | Total | |
Central governments | | 0.0 | | 0.0 | | 0.0 | | 0.0 | | 0.0 | | 2.9 | | 3.6 | | 10.0 | | 16.5 | |
Government export credit agencies | | 0.0 | | 0.0 | | 8.4 | | 0.0 | | 0.0 | | 96.2 | | 1.5 | | 17.7 | | 123.8 | |
Regional governements | | 0.0 | | 0.0 | | 0.0 | | 0.0 | | 0.0 | | 21.8 | | 1.9 | | 0.0 | | 23.7 | |
Multilateral development banks | | 0.0 | | 0.0 | | 0.0 | | 0.0 | | 0.0 | | 0.0 | | 0.0 | | 0.4 | | 0.4 | |
Financial institutions | | 0.0 | | 0.7 | | 17.5 | | 5.5 | | 0.0 | | 29.0 | | 13.0 | | 48.4 | | 114.1 | |
Corporates | | 0.0 | | 0.6 | | 1.4 | | 0.0 | | 0.1 | | 28.9 | | 7.3 | | 5.0 | | 43.3 | |
Securitisation positions | | 0.0 | | 0.0 | | 4.4 | | 4.6 | | 0.0 | | 0.0 | | 0.0 | | 15.0 | | 24.0 | |
| | 0.0 | | 1.3 | | 31.7 | | 10.1 | | 0.1 | | 178.8 | | 27.3 | | 96.5 | | 345.8 | |
Net exposure by region and exposure class, as of December 31, 2009
Skr billion | | Africa | | Asia | | North
America | | Oceania | | South
America | | Sweden | | Other
Nordic
countries | | Other
European
countries | | Total | |
Central governments | | 0.0 | | 0.0 | | 0.0 | | 0.0 | | 0.0 | | 3.2 | | 14.1 | | 16.3 | | 33.6 | |
Government export credit agencies | | 0.0 | | 0.0 | | 10.0 | | 0.0 | | 0.0 | | 91.5 | | 1.8 | | 21.8 | | 125.1 | |
Regional governements | | 0.0 | | 0.0 | | 0.0 | | 0.0 | | 0.0 | | 21.1 | | 2.9 | | 0.0 | | 24.0 | |
Multilateral development banks | | 0.0 | | 0.0 | | 0.0 | | 0.0 | | 0.0 | | 0.0 | | 0.0 | | 0.4 | | 0.4 | |
Financial institutions | | 0.0 | | 0.6 | | 24.3 | | 4.9 | | 0.0 | | 34.3 | | 8.3 | | 65.5 | | 137.9 | |
Corporates | | 0.0 | | 0.8 | | 0.8 | | 0.0 | | 0.0 | | 23.6 | | 8.0 | | 5.5 | | 38.7 | |
Securitisation positions | | 0.0 | | 0.0 | | 4.9 | | 6.1 | | 0.0 | | 0.0 | | 0.4 | | 22.5 | | 33.9 | |
| | 0.0 | | 1.4 | | 40.0 | | 11.0 | | 0.0 | | 173.7 | | 35.5 | | 132.0 | | 393.6 | |
F-52
Table of Contents
Net exposure Other European Countries , as of
December 31, 2010
Skr billion | | Total | |
United Kingdom | | 32.0 | |
France | | 15.9 | |
Germany | | 13.8 | |
The Netherlands | | 9.0 | |
Belgium | | 8.2 | |
Ireland | | 3.7 | |
Spain | | 3.5 | |
Poland | | 3.1 | |
Switzerland | | 2.7 | |
Italy | | 1.7 | |
Portugal | | 0.9 | |
Other countries | | 2.0 | |
| | 96.5 | |
Net exposure Other European Countries, as of
December 31, 2009
Skr billion | | Total | |
United Kingdom | | 36.3 | |
Germany | | 25.3 | |
France | | 22.6 | |
Spain | | 11.6 | |
The Netherlands | | 8.6 | |
Ireland | | 6.4 | |
Belgium | | 4.6 | |
Italy | | 4.6 | |
Switzerland | | 4.5 | |
Poland | | 3.6 | |
Portugal | | 1.1 | |
Other countries | | 2.8 | |
| | 132.0 | |
Corporate exposures by industry (GICS)
| | December 31, 2010 | | December 31, 2009 | |
Skr billion | | Gross
exposure | | Net
exposure | | Gross exposure | | Net exposure | |
Utilities | | 13.4 | | 6.4 | | 13.5 | | 5.2 | |
Energy | | 1.9 | | 0.7 | | 2.2 | | 0.8 | |
Finance | | 26.4 | | 2.7 | | 28.9 | | 2.7 | |
Health care | | 5.7 | | 1.0 | | 6.2 | | 1.4 | |
Industrials | | 31.5 | | 12.9 | | 30.5 | | 14.2 | |
IT and telecom | | 64.7 | | 6.2 | | 70.1 | | 5.6 | |
Consumer goods | | 14.7 | | 5.3 | | 12.6 | | 2.7 | |
Materials | | 27.4 | | 8.1 | | 24.0 | | 6.1 | |
Other | | 1.0 | | 0.0 | | 0.6 | | 0.0 | |
Total | | 186.7 | | 43.3 | | 188.6 | | 38.7 | |
Securitization positions held by consolidated group
The tables below includes current aggregated information regarding SEK’s total net exposures (after effects related to risk-coverage) related to securitization positions held and current ratings. Ratings in the table as of 31 December 2010 are stated as the second lowest of the ratings from Standard & Poor’s, Moody’s and Fitch. When only two ratings are available the lowest is stated. All of these assets represent first-priority tranches, and they have all been rated ‘AAA’/’Aaa’ by Standard & Poor’s or Moody’s at acquisition.
| | December 31, 2010 | |
Net exposures | | | | | | | | | | | | | | | | | | ...of which | | ...of which | | ...of which | | ...of which | | ...of which | | ...of which | | ...of which | |
Skr mn | | | | Credit | | Auto | | | | Consumer | | | | | | | | rated | | rated | | rated | | rated | | rated | | rated | | CDO rated | |
Exposure | | RMBS(3) | | Cards | | Loans | | CMBS(3) | | Loans | | CDO(3) | | CLO(3) | | Total | | ‘AAA’ | | ‘AA+’ | | ‘AA’ | | ‘AA-’ | | ‘A+’ | | ‘A’ | | ‘CCC’ | |
Australia | | 4,620 | | | | | | | | | | | | | | 4,620 | | 4,620 | | | | | | | | | | | | | |
Belgium | | 765 | | | | | | | | | | | | | | 765 | | 765 | | | | | | | | | | | | | |
France | | | | | | 146 | | | | | | | | | | 146 | | 146 | | | | | | | | | | | | | |
Germany | | | | | | 388 | | 73 | | | | | | | | 461 | | 461 | | | | | | | | | | | | | |
Ireland | | 999 | | | | | | | | | | | | 41 | | 1,040 | | 484 | | | | | | 212 | (2) | 41 | (2) | 303 | (2) | | |
Japan | | | | | | 9 | | | | | | | | | | 9 | | 9 | | | | | | | | | | | | | |
The Netherlands | | 1,157 | | | | | | | | | | | | 142 | | 1,299 | | 1,299 | | | | | | | | | | | | | |
Portugal | | 382 | | | | | | | | | | | | | | 382 | | 382 | | | | | | | | | | | | | |
Spain | | 1,096 | | | | 120 | | | | 154 | | | | 306 | | 1,676 | | 1,027 | | 347 | (2) | 302 | (2) | | | | | | | | |
United Kingdom | | 9,216 | | | | | | | | | | | | | | 9,216 | | 9,216 | | | | | | | | | | | | | |
United States | | | | 450 | | | | | | | | 163 | | 3,270 | | 3,883 | | 2,717 | | 1,003 | (2) | | | | | | | | | 163 | (1) |
Total | | 18,235 | | 450 | | 663 | | 73 | | 154 | | 163 | | 3,759 | | 23,497 | | 21,126 | | 1,350 | | 302 | | 212 | | 41 | | 303 | | 163 | |
(1) These assets consist of two CDOs (first-priority tranches) with end-exposure to the U.S market. There have been no delays with payments under the tranches. However, the ratings of the assets were downgraded dramatically during 2008 and 2009, by Standard & Poor’s from ‘AAA’ to ‘CC’, by Moody’s from ‘Aaa’ to ‘Ca’ and by Fitch from ‘AAA’ to ‘CCC’. Due to the dramatic rating downgrades, the Company has analyzed the expected cash flows of the assets. Based on
F-53
Table of Contents
information presently known, the Company has recorded a total impairment of Skr 475.4 million for these assets.
(2) Of these assets Skr 1,747.6 million still have the highest-possible rating from at least one of the rating institutions.
(3) RMBS = Residential Mortgage-Backed Securities
CMBS =Commercial Mortgage-Backed Securities
CDO = Collateralized Debt Obligations
CLO = Collateralized Loan Obligations
| | December 31, 2009 | |
Net exposures | | | | | | | | | | | | | | | | | | ...of which | | ...of which | | ...of which | | ...of which | | ...of which | |
Skr mn | | | | Credit | | Auto | | | | Consumer | | | | | | | | rated | | rated | | rated | | rated | | CDO rated | |
Exposure | | RMBS(3) | | Cards | | Loans | | CMBS(3) | | Loans | | CDO(3) | | CLO(3) | | Total | | ‘AAA’ | | ‘AA+’ | | ‘AA’ | | ‘A+’ | | ‘CCC’ | |
Australia | | 6,072 | | | | | | | | | | | | | | 6,072 | | 6,072 | | | | | | | | | |
Austria | | | | | | 61 | | | | | | | | | | 61 | | 61 | | | | | | | | | |
Belgium | | 880 | | | | | | | | | | | | | | 880 | | 880 | | | | | | | | | |
Denmark | | | | | | | | | | | | | | 413 | | 413 | | 413 | | | | | | | | | |
France | | | | | | 396 | | | | 22 | | | | | | 418 | | 418 | | | | | | | | | |
Germany | | | | | | 1,212 | | 86 | | | | | | | | 1,299 | | 1,299 | | | | | | | | | |
Ireland | | 1,306 | | | | | | | | | | | | 462 | | 1,767 | | 1,306 | | 173 | (2) | | | 289 | (2) | | |
Japan | | | | | | 26 | | | | | | | | | | 26 | | 26 | | | | | | | | | |
The Netherlands | | 1,445 | | | | 47 | | | | | | | | 398 | | 1,889 | | 1,843 | | 47 | (2) | | | | | | |
Portugal | | 478 | | | | | | | | | | | | | | 478 | | 478 | | | | | | | | | |
Spain | | 1,497 | | | | 238 | | | | 354 | | | | 649 | | 2,738 | | 1,892 | | 371 | (2) | 475 | (2) | | | | |
United Kingdom | | 12,026 | | 984 | | | | | | | | | | | | 13,009 | | 13,009 | | | | | | | | | |
United States | | | | 518 | | | | | | | | 330 | | 3,683 | | 4,531 | | 3,012 | | 1,189 | (2) | | | | | 330 | (1) |
Total | | 23,703 | | 1,501 | | 1,980 | | 86 | | 376 | | 330 | | 5,605 | | 33,582 | | 30,708 | | 1,780 | | 475 | | 289 | | 330 | |
(1) These assets consist of two CDOs (first-priority tranches) with end-exposure to the U.S market. There have been no delays with payments under the tranches. However, the ratings of the assets have been downgraded dramatically during 2008 and 2009, by Standard & Poor’s from ‘AAA’ to ‘CC’, by Moody’s from ‘Aaa’ to ‘Ca’ and by Fitch from ‘AAA’ to ‘CCC’. Due to the dramatic rating downgrades, the Company has analyzed the expected cash flows of the assets. The Company has recorded a total impairment of Skr 353.0 million for these assets.
(2) Of these assets Skr 1,786.0 million still have the highest-possible rating from at least one of the rating institutions.
(3) RMBS = Residential Mortgage-Backed Securities
CMBS =Commercial Mortgage-Backed Securities
CDO = Collateralized Debt Obligations
CLO = Collateralized Loan Obligations
Market risk
The positions that SEK secures, relating to market risk, can be positions that cannot be valued to fair value in the statments of financial position due to of accounting reasons. Thus, the financial risk estimated by SEK may differ from the changes in value recognized in operating profit or in other comprehensive income.
SEK assumes a one-percentage-point change in the market rate for the sensitivity analyses relating to interest rate risk. SEK assesses a reasonable assumption to be that the average change in market rates will not exceed one percentage point over the next year.
Change in value if the market interest rate rises by one percentage point as of December 31, 2010
The impact on the value of assets and liabilities, including derivatives, when market interest rates rise by one percentage point (+1%).
Consolidated Group
Skr mn | | M < 1 year | | 1 year <
M < 3 years | | 3 years <
M < 5 years | | M> 5 years | | Total | |
Foreign currency | | -1.3 | | -5.3 | | -7.6 | | 140.3 | | 126.1 | |
Swedish Skr | | -4.0 | | -58.7 | | -151.4 | | -216.1 | | -430.2 | |
| | -5.3 | | -64.0 | | -159.0 | | -75.8 | | -304.1 | |
of which financial instruments measured at fair value through profit or loss
Skr mn | | M < 1 year | | 1 year <
M < 3 years | | 3 years <
M < 5 years | | M> 5 years | | Total | |
Foreign currency | | 315.8 | | 4.2 | | 4.5 | | 165.2 | | 489.7 | |
Swedish Skr | | 87.9 | | 2.0 | | 0.3 | | -9.3 | | 80.9 | |
| | 403.7 | | 6.2 | | 4.8 | | 155.9 | | 570.6 | |
F-54
Table of Contents
of which financial instruments measured at fair value through comprehensive income
Skr mn | | M < 1 year | | 1 year <
M < 3 years | | 3 years <
M < 5 years | | M> 5 years | | Total | |
Foreign currency | | -8.3 | | 0.0 | | 0.0 | | 0.0 | | -8.3 | |
Swedish Skr | | -5.6 | | -55.0 | | -145.2 | | -202.8 | | -408.6 | |
| | -13.9 | | -55.0 | | -145.2 | | -202.8 | | -416.9 | |
Change in value if the market interest rate rises by one percentage point as of December 31, 2009
The impact on the value of assets and liabilities, including derivatives, when market interest rates rise by one percentage point (+1%).
Consolidated Group
Skr mn | | M < 1 year | | 1 year <
M < 3 years | | 3 years <
M < 5 years | | M> 5 years | | Total | |
Foreign currency | | 2.4 | | -6.8 | | -4.8 | | 130.4 | | 121.2 | |
Swedish Skr | | 0.0 | | -59.9 | | -119.7 | | -132.3 | | -311.9 | |
| | 2.4 | | -66.7 | | -124.5 | | -1.9 | | -190.7 | |
of which financial instruments measured at fair value through profit or loss
Skr mn | | M < 1 year | | 1 year <
M < 3 years | | 3 years <
M < 5 years | | M> 5 years | | Total | |
Foreign currency | | 311.0 | | 3.0 | | 6.9 | | 147.5 | | 468.4 | |
Swedish Skr | | 88.3 | | 2.8 | | 0.0 | | -10.4 | | 80.7 | |
| | 399.3 | | 5.8 | | 6.9 | | 137.1 | | 549.1 | |
of which financial instruments measured at fair value through other comprehensive income
Skr mn | | M < 1 year | | 1 year <
M < 3 years | | 3 years <
M < 5 years | | M> 5 years | | Total | |
Foreign currency | | -4.0 | | 0.0 | | 0.0 | | 0.0 | | -4.0 | |
Swedish Skr | | -2.6 | | -59.4 | | -115.7 | | -118.1 | | -295.8 | |
| | -6.6 | | -59.4 | | -115.7 | | -118.1 | | -299.8 | |
Change in value if the market interest rate declines by one percentage point as of December 31, 2010
The impact on the value of assets and liabilities, including derivatives, when market interest rates declines by one percentage point (-1%).
Consolidated Group
Skr mn | | M < 1 year | | 1 year <
M < 3 years | | 3 years <
M < 5 years | | M> 5 years | | Total | |
Foreign currency | | 5.4 | | 5.0 | | 8.0 | | -209.5 | | -191.1 | |
Swedish Skr | | 4.0 | | 60.3 | | 158.5 | | 231.8 | | 454.6 | |
| | 9.4 | | 65.3 | | 166.5 | | 22.3 | | 263.5 | |
of which financial instruments measured at fair value through profit or loss
Skr mn | | M < 1 year | | 1 year <
M < 3 years | | 3 years <
M < 5 years | | M> 5 years | | Total | |
Foreign currency | | -201.7 | | -4.3 | | -4.7 | | -236.1 | | -446.8 | |
Swedish Skr | | -88.9 | | -2.1 | | -0.3 | | 10.2 | | -81.1 | |
| | -290.6 | | -6.4 | | -5.0 | | -225.9 | | -527.9 | |
of which financial instruments measured at fair value through comprehensive income
Skr mn | | M < 1 year | | 1 year <
M < 3 years | | 3 years <
M < 5 years | | M> 5 years | | Total | |
Foreign currency | | 6.6 | | 0.0 | | 0.0 | | 0.0 | | 6.6 | |
Swedish Skr | | 5.7 | | 56.5 | | 152.0 | | 217.3 | | 431.5 | |
| | 12.3 | | 56.5 | | 152.0 | | 217.3 | | 438.1 | |
F-55
Table of Contents
Change in value if the market interest rate declines by one percentage point as of December 31, 2009
The impact on the value of assets and liabilities, including derivatives, when market interest rates declines by one percentage point (-1%).
Consolidated Group
Skr mn | | M < 1 year | | 1 year <
M < 3 years | | 3 years <
M < 5 years | | M> 5 years | | Total | |
Foreign currency | | 11.6 | | 7.0 | | 5.1 | | -194.0 | | -170.3 | |
Swedish Skr | | -2.5 | | 57.8 | | 125.3 | | 141.1 | | 321.7 | |
| | 9.1 | | 64.8 | | 130.4 | | -52.9 | | 151.4 | |
of which financial instruments measured at fair value through profit or loss
Skr mn | | M < 1 year | | 1 year <
M < 3 years | | 3 years <
M < 5 years | | M> 5 years | | Total | |
Foreign currency | | -154.6 | | -3.1 | | -7.2 | | -212.3 | | -377.2 | |
Swedish Skr | | -41.3 | | -2.9 | | 0.0 | | 11.5 | | -32.7 | |
| | -195.9 | | -6.0 | | -7.2 | | -200.8 | | -409.9 | |
of which financial instruments measured at fair value through comprehensive income
Skr mn | | M < 1 year | | 1 year <
M < 3 years | | 3 years <
M < 5 years | | M> 5 years | | Total | |
Foreign currency | | 2.0 | | 0.0 | | 0.0 | | 0.0 | | 2.0 | |
Swedish Skr | | 0.9 | | 57.4 | | 121.1 | | 125.7 | | 305.1 | |
| | 2.9 | | 57.4 | | 121.1 | | 125.7 | | 307.1 | |
Assets, liabilities and derivatives denominated in foreign currencies
Assets, liabilities and derivatives denominated in foreign currencies (i.e., currencies other than Swedish kronor) have been translated to Swedish kronor at the year-end exchange rates between such currencies and Swedish kronor. The relevant exchange rates for the currencies representing the largest portions of the Consolidated Group in the statement of financial position reported assets and liabilities are presented in table below (expressed in Swedish kronor per unit of each foreign currency). The portion at year-end represents portion of aggregated volumes of assets and liabilities denominated in foreign currency. Foreign currency position at year-end represents the net of all assets and liabilities in the statement of financial position in each currency.
| | December 31, 2010 | | December 31, 2009 | |
| | | | Portion at | | | | | | Portion at | | Foreign | |
| | Exchange | | year-end, | | Foreign currency | | Exchange | | year-end, | | currency | |
Currency | | rate | | % | | position | | rate | | % | | position | |
SKR | | 1 | | 68.8 | | n.a | | 1 | | 58.2 | | n.a | |
EUR | | 9.002 | | 9.3 | | -1595.7 | | 10.3530 | | 13.7 | | -2,393.6 | |
USD | | 6.8025 | | 8.4 | | 1433.9 | | 7.2125 | | 11.7 | | 2,073.5 | |
JPY | | 0.08345 | | 9.3 | | -1594.1 | | 0.07845 | | 9.1 | | -1,608.3 | |
CHF | | 7.2355 | | 1.9 | | 329.1 | | 6.9535 | | 3.4 | | 597.7 | |
MXN | | 0.5500 | | 1.6 | | -273.3 | | 0.5500 | | 1.3 | | -237.1 | |
Others | | — | | 0.7 | | -110.5 | | — | | 2.6 | | -107.8 | |
Total foreign currency position | | | | | | -1,810.6 | | | | | | -1,675.6 | |
The FX-risk is limited to the accrued net income in foreign currency and is hedged regularly. In accordance with SEK’s policies for risk management, foreign currency positions related to unrealized fair value changes are not hedged. At year-end, foreign currency positions exclusive of unrealized fair value changes amounted to Skr 160.1 million (year-end 2009: Skr 41.7 million).
F-56
Table of Contents
| | Consolidated Group | |
Skr mn | | December 31,
2010 | | December 31,
2009 | |
Total assets | | 339,687.6 | | 371,588.0 | |
of which denominated in foreign currencies | | 284,816.0 | | 327,573.4 | |
Total liabilities | | 327,117.8 | | 358,132.8 | |
of which denominated in foreign currencies | | 284,581.2 | | 325,059.5 | |
Liquidity risk
Contractual flows
| | December 31, 2010 | |
| | | | | | Maturity | | Maturity | | Maturity | | | |
Consolidated Group | | Sum | | Maturity | | 1 month < | | 3 months < | | 1 year < | | Maturity | |
Skr mn | | Cash Flow | | < 1 month | | 3 months | | 1 year | | 5 years | | > 5 years | |
Financial Assets | | | | | | | | | | | | | |
Cash and cash equivalents | | 8,798.0 | | 8,798.0 | | | | | | | | | |
Treasuries/government bonds | | 7,201.6 | | 0.0 | | 7,201.6 | | 0.0 | | 0.0 | | 0.0 | |
Other interest-bearing securities except loans | | 110,020.3 | | 5,027.7 | | 19,953.0 | | 39,706.4 | | 36,562.6 | | 8,770.6 | |
Loans in the form of interest-bearing securities | | 85,243.7 | | 417.5 | | 4,873.3 | | 11,846.4 | | 41,018.2 | | 27,088.3 | |
Loans to credit institutions | | 25,357.2 | | 680.1 | | 1,626.2 | | 4,810.8 | | 8,142.0 | | 10,098.1 | |
Loans to the public | | 94,568.4 | | 3,071.2 | | 4,980.7 | | 10,804.4 | | 52,807.2 | | 22,904.9 | |
Derivatives | | 46,880.7 | | 2,020.6 | | 8,411.6 | | 14,953.7 | | 15,786.4 | | 5,708.4 | |
| | | | | | | | | | | | | |
Total | | 378,069.9 | | 20,015.1 | | 47,046.4 | | 82,121.7 | | 154,316.4 | | 74,570.3 | |
| | December 31, 2010 | |
| | | | | | Maturity | | Maturity | | Maturity | | | |
Consolidated Group | | Sum | | Maturity | | 1 month < | | 3 months < | | 1 year < | | Maturity | |
Skr mn | | Cash Flow | | < 1 month | | 3 months | | 1 year | | 5 years | | > 5 years | |
Financial Liabilities | | | | | | | | | | | | | |
Borrowing from credit institutions | | -14,336.2 | | -3,141.2 | | -2,122.9 | | -2,129.6 | | -6,942.5 | | 0.0 | |
Borrowing from the public | | | | | | | | | | | | | |
Senior securities issued | | -321,632.7 | | -6,669.6 | | -40,956.7 | | -74,292.3 | | -151,959.1 | | -47,755.0 | |
Derivatives | | 2,823.4 | | 207.6 | | 1,237.1 | | 2,095.2 | | 701.3 | | -1,417.8 | |
Subordinated securities issued | | -4,155.5 | | 0.0 | | -34.6 | | -103.9 | | -554.1 | | -3,462.9 | |
| | | | | | | | | | | | | |
Total | | -337,301.0 | | -9,603.2 | | -41,877.1 | | -74,430.6 | | -158,754.4 | | -52,635.7 | |
| | | | | | | | | | | | | |
Commitments | | | | | | | | | | | | | |
Committed undisbursed loans | | 3,341.5 | | -4,006.9 | | -4,439.8 | | -6,821.3 | | 7,250.9 | | 11,358.6 | |
| | | | | | | | | | | | | |
Cash flow surplus (+) / deficit (-) | | 44,110.4 | | 6,405.0 | | 729.5 | | 869.8 | | 2,812.9 | | 33,293.2 | |
| | | | | | | | | | | | | |
Accumulated cash flow surplus (+) / deficit (-) | | 44,110.4 | | 6,405.0 | | 7,134.5 | | 8,004.3 | | 10,817.2 | | 44,110.4 | |
F-57
Table of Contents
| | December 31, 2009 | |
| | | | | | Maturity | | Maturity | | Maturity | | | |
Consolidated Group | | Sum | | Maturity | | 1 month < | | 3 months < | | 1 year < | | Maturity | |
Skr mn | | Cash Flow | | < 1 month | | 3 months | | 1 year | | 5 years | | > 5 years | |
Financial Assets | | | | | | | | | | | | | |
Cash and cash equivalents | | 17,636.5 | | 17,636.5 | | | | | | | | | |
Treasuries/government bonds | | 11,744.2 | | 355.8 | | 7,196.9 | | 4,143.0 | | 48.5 | | | |
Other interest-bearing securities except loans | | 131,082.2 | | 5,665.9 | | 17,299.1 | | 38,353.6 | | 55,158.8 | | 14,604.8 | |
Loans in the form of interest-bearing securities | | 103,375.2 | | 656.1 | | 9,848.7 | | 12,351.7 | | 52,814.5 | | 27,704.2 | |
Loans to credit institutions | | 35,154.5 | | 4,307.4 | | 5,656.2 | | 4,500.5 | | 9,156.7 | | 11,533.7 | |
Loans to the public | | 86,460.9 | | 4,610.1 | | 3,755.9 | | 10,319.8 | | 45,314.2 | | 22,460.9 | |
Shares and participants (1) | | 2,710.1 | | | | | | | | | | 2,710.1 | |
Derivatives | | 33,450.5 | | 1,408.9 | | 3,579.0 | | 7,546.6 | | 14,472.6 | | 6,443.4 | |
| | | | | | | | | | | | | |
Total | | 421,614.1 | | 34,640.7 | | 47,335.8 | | 77,215.2 | | 176,965.3 | | 85,457.1 | |
| | December 31, 2009 | |
| | | | | | Maturity | | Maturity | | Maturity | | | |
Consolidated Group | | Sum | | Maturity | | 1 month < | | 3 months < | | 1 year < | | Maturity | |
Skr mn | | Cash Flow | | < 1 month | | 3 months | | 1 year | | 5 years | | > 5 years | |
Financial Liabilities | | | | | | | | | | | | | |
Borrowing from credit institutions | | -4,050.0 | | -4,046.4 | | | | | | -3.6 | | | |
Borrowing from the public | | | | | | | | | | | | | |
Senior securities issued | | -394,744.6 | | -9,970.5 | | -20,631.9 | | -64,733.5 | | -164,789.5 | | -134,619.2 | |
Derivatives | | 1,259.4 | | -413.7 | | -205.7 | | 8,456.1 | | -3,532.8 | | -3,044.5 | |
Subordinated securities issued | | -3,439.8 | | | | -13.4 | | -60.2 | | -321.1 | | -3,045.1 | |
| | | | | | | | | | | | | |
Total | | -400,975.0 | | -14,430.6 | | -20,851.0 | | -56,337.6 | | -168,647.0 | | -140,708.8 | |
| | | | | | | | | | | | | |
Commitments | | | | | | | | | | | | | |
Commited undisbursed loans | | 4,771.7 | | -6,214.9 | | -9,465.2 | | -12,934.3 | | 8,883.5 | | 24,502.7 | |
| | | | | | | | | | | | | |
Cash flow surplus (+) / deficit (-) | | 25,410.8 | | 13,995.2 | | 17,019.6 | | 7,943.3 | | 17,201.8 | | -30,749.0 | |
| | | | | | | | | | | | | |
Accumulated cash flow surplus (+) / deficit (-) | | 25,410.8 | | 13,995.2 | | 31,014.8 | | 38,958.1 | | 56,159.9 | | 25,410.8 | |
(1) Swedbank shares
Repayments which are subject to notice are treated as if notice were to given immediately, except for “Loans to credit institutions”, “Loans to the public”, “Subordinated securities issued” and “Derivatives” where repayments are assumed on maturity date. For information regarding Liquidity risk, see note 30 “Risk and Capital management”. The amounts above contain accrued interest.
Note 28. Transactions with related parties
SEK defines related parties in the Consolidated Group as:
· Shareholder, the Swedish State
· Organizations that are controlled through a common owner, the Swedish State
· Key management personnel
The Swedish State owns 100 percent of the company’s share capital. By means of direct guarantees extended by the National Debt Office, EKN — The Swedish Export Credits Guarantee Board and by Sida, supported by the full faith and credit of Sweden, 25.4 percent of the company’s outstanding loans on December 31, 2010, were guaranteed by the State (year-end 2009: 16.0 percent). SEK administers, in return for compensation, the State’s export credit support system, and t he State’s tied aid credit program (the “S-system”). Pursuant to an agreement between SEK and the State, SEK is reimbursed for certain costs under the S-system (see Note 1(d) and Note 24).
F-58
Table of Contents
The Government has established a guarantee fund of callable capital, amounting to Skr 600.0 million in favor of SEK. SEK may call on capital under the guarantee if SEK finds it necessary in order to be able to fulfill its obligations. SEK pays a commercial fee for this guarantee (see Note 3).
SEK has a Skr 100 billion credit facility with the Swedish National Debt Office. The Swedish parliament has also authorized the government to enable SEK purchase state guarantees on commercial terms for new borrowing of up to Skr 250 billion. In January 2011, both the loan facility and the ability to purchase state guarantees were extended for 2011.
The company enters into transactions in the ordinary course of business with entities that are partially or wholly-owned or controlled by the State. The company also extends export credits (in the form of direct or pass-through loans) to entities related to the State. Transactions with such parties are conducted on the same terms (including interest rates and repayment schedules) as transactions with unrelated parties.
Key management personnel include the following positions:
· The Board of Directors
· The President and CEO
· Other members in the Executive Committee
For information about remuneration and other benefits to key management personnel see Note 5, “Personnel costs”.
The following table summarizes the Consolidated Group’s transactions with its related parties:
| | 2010 | |
| | Shareholder, the Swedish State | | Organizations that are controlled
through a common owner, the
Swedish State | | Total | |
Skr mn | | Assets/
Liabilities | | Interest income/
Interest expense | | Assets/
Liabilities | | Interest income/
Interest expense | | Assets/
Liabilities | | Interest income/
Interest expense | |
Treasuries/government bonds | | — | | — | | | | 1.0 | | — | | 1.0 | |
Other interest-bearing securities except loans | | | | | | 4,314.4 | | 49.8 | | 4,314.4 | | 49.8 | |
Loans in the form of interest-bearing securities | | | | | | 1,541.8 | | 26.8 | | 1,541.8 | | 26.8 | |
Loans to credit institutions | | | | | | 1,790.5 | | 132.0 | | 1,790.5 | | 132.0 | |
Loans to the public | | | | | | 629.6 | | 12.4 | | 629.6 | | 12.4 | |
Total | | — | | — | | 8,276.3 | | 222.0 | | 8,276.3 | | 222.0 | |
Borrowing from credit institutions | | | | | | | | | | | | | |
Borrowing from the public | | | | — | | | | | | | | — | |
Senior securities issued | | | | | | | | | | | | | |
Total | | — | | — | | — | | — | | — | | — | |
| | 2009 | |
| | Shareholder, the Swedish State | | Organizations that are controlled
through a common owner, the
Swedish State | | Total | |
Skr mn | | Assets/
Liabilities | | Interest income/
Interest expense | | Assets/
Liabilities | | Interest income/
Interest expense | | Assets/
Liabilities | | Interest income/
Interest expense | |
Treasuries/government bonds | | 99.8 | | 20.9 | | | | | | 99.8 | | 20.9 | |
Other interest-bearing securities except loans | | | | | | 5,157.7 | | 77.9 | | 5,157.7 | | 77.9 | |
Loans in the form of interest-bearing securities | | | | | | 1,602.5 | | 41.0 | | 1,602.5 | | 41.0 | |
Loans to credit institutions | | | | | | 1,963.7 | | 195.4 | | 1,963.7 | | 195.4 | |
Loans to the public | | | | | | 685.6 | | 15.6 | | 685.6 | | 15.6 | |
Total | | 99.8 | | 20.9 | | 9,409.5 | | 329.9 | | 9,509.3 | | 350.8 | |
Borrowing from credit institutions | | | | | | | | | | | | | |
Borrowing from the public | | | | 1.4 | | | | | | | | 1.4 | |
Senior securities issued | | | | | | | | | | | | | |
Total | | 0.0 | | 1.4 | | 0.0 | | 0.0 | | 0.0 | | 1.4 | |
F-59
Table of Contents
| | 2008 | |
| | Shareholder, the Swedish State | | Organizations that are controlled
through a common owner, the
Swedish State | | Total | |
Skr mn | | Assets/
Liabilities | | Interest income/
Interest expense | | Assets/
Liabilities | | Interest income/
Interest expense | | Assets/
Liabilities | | Interest income/
Interest expense | |
Treasuries/government bonds | | 1,495.0 | | 36.0 | | | | | | 1,495.0 | | 36.0 | |
Other interest-bearing securities except loans | | | | | | 4,456.0 | | 211.0 | | 4,456.0 | | 211.0 | |
Loans in the form of interest-bearing securities | | | | | | 1,858.7 | | 101.0 | | 1,858.7 | | 101.0 | |
Loans to credit institutions | | | | | | 2,073.7 | | 229.0 | | 2,073.7 | | 229.0 | |
Loans to the public | | | | | | 460.4 | | 16.0 | | 460.4 | | 16.0 | |
Total | | 1,495.0 | | 36.0 | | 8,848.8 | | 557.0 | | 10,343.8 | | 593.0 | |
Borrowing from credit institutions | | | | | | | | | | | | | |
Borrowing from the public | | 186.0 | | 4.0 | | | | | | 186.0 | | 4.0 | |
Senior securities issued | | | | | | | | | | | | | |
Total | | 186.0 | | 4.0 | | 0.0 | | 0.0 | | 186.0 | | 4.0 | |
Note 29. Events after the reporting period
SEK has a Skr 100 billion credit facility with the Swedish National Debt Office. The Swedish parliament has also authorized the government to enable SEK to purchase state guarantees on commercial terms for new borrowing of up to Skr 250 billion. In January 2011, both the loan facility and the ability to purchase state guarantees were extended for 2011 on the same terms.
The Japanese capital market has traditionally been an important market for SEK´s funding. However, part of SEK’s policy is to be independent of any specific market and SEK is therefore striving to be active in many different geographical markets for its funding. Hence, even if the Japanese capital markets experience difficulties in the long- or short-term, whether as a result of the recent natural disasters or otherwise, management believes that SEK would be able to raise funding for its ordinary business activities..
Note 30. Risk and Capital management.
In this Note 30, the term “company” refers to the Parent Company or the Group, as the context requires.
During 2010, there were no significant changes to SEK’s objectives, principles, risk management methods or methods of measuring risk. Furthermore, neither the types of risk exposures nor the origins of these exposures have changed materially.
On December 31, 2010, SEK’s risk-weighted assets (RWA), as calculated in accordance with Basel II (without taking into consideration the transitional rules applicable during the current period of transition from Basel I to Basel II) were equal to Skr 64.5 billion, which implies a Tier-1 ratio of 22.4 percent and a total capital adequacy ratio of 22.4 percent. Adjusted in accordance with the Swedish Financial Supervisory Authority’s transitional rules — which have been extended through the end of 2011 — SEK’s reported risk-weighted assets were Skr 64.5 billion, also implying a Tier-1 ratio of 22.4 percent and a total capital adequacy ratio of 22.4 percent.
SEK’s capital adequacy assessment process is deemed to be in line with the Basel II framework’s underlying principles and concepts. In summary, SEK’s assessment is that SEK’s expected available capital amply covers the expected risks in the different scenarios that SEK envisages, in a way that supports SEK’s high credit-worthiness.
Risk, liquidity and capital management
Risk management is a key factor in SEK’s ability to offer its customers favorable financing solutions and develop SEK’s business activities, and thus contribute to the company’s long-term development.
Providing its customers with financial solutions and products causes SEK to expose itself to various risks that have to be managed. The company’s profitability is directly dependent on its ability to assess, manage and price these risks, while at the same time retaining sufficient capital strength to be able to cope with unforeseen developments. For this reason, risk management is a constant priority for SEK and is continually being developed. Support from SEK’s Board of Directors (the Board), a clear line of decision-making, awareness of risk among our employees, uniform definitions and principles, control of risks incurred within an approved framework and transparency in external accounts make up the cornerstones of SEK’s risk and capital management.
It is not only in transactions with customers that risk management skills are vital for success. Based on SEK’s strategy, which has been used for many years, SEK’s borrowing activities benefit from the market’s various types of risk preferences. By being flexible and accepting new types of structures at an early stage — while also being able to manage the risks that these imply — the company can satisfy investor demands regarding risk exposure while also obtaining funding on favorable terms.
F-60
Table of Contents
SEK has a conservative policy on liquidity and funding risk, which means, for example, that all credit commitments — outstanding credits as well as agreed but undisbursed credits — will at all times be fully funded throughout the maturity period.
SEK annually assesses the development of its future capital requirements and available capital, primarily in connection with its yearly three-year business plan. One of the aims of this internal capital adequacy assessment (ICAAP) is to ensure that the size of SEK’s capital is sufficiently in line with risks and supports a high level of creditworthiness. In summary, the conclusion of this assessment is that the expected available capital amply covers the company’s expected risks in the various scenarios envisaged by the company.
Risk management and risk control
SEK defines risk in terms of the probability of a negative deviation from an expected financial outcome. Risk is a balancing of the probability of consequence of any given event. The term “risk” is generally only used when there is at least one negative consequence of an event. This balancing means that the overall risk may be high, even if the probability is low, if the consequences are serious. Risk management includes all activities that affect the assumption of risk, i.e., SEK’s processes and systems that identify, measure, analyze, monitor and report risks at an early stage. Adequate internal control, consisting of a set of rules, systems and routines, as well as monitoring adherence to these, is designed to ensure that the company is run in a reliable, efficient and controlled manner. We understand risk control to comprise all activities for measuring, reporting and addressing risks, independent of the (risk-taking) commercial units. SEK exercises risk control from two different perspectives: (i) through risk-related management and control that primarily includes risk management and limits, and (ii) through management and control that is carried out at the company level and that includes organization, corporate governance and internal control.
Ultimate responsibility for SEK’s business and for ensuring that it is carried out with adequate internal control lies with the Board. The Board has established a dedicated Finance Committee, which assists the Board with overall issues regarding the company’s financial operations. These financial operations include long- and short-term funding, liquidity management, risk measurement and risk limits, as well as matters regarding policy and quality control. The Finance Committee can make decisions on interest rate and currency limits. After the Board of Directors itself, the Board’s Credit Committee comprises the highest decision-making body in regard to credit decisions. The Board’s Audit Committee discusses matters relating to the company’s financial reporting and corporate governance report (including the Board’s internal control report). The Board’s Remuneration committee discusses matters relating to salaries and other benefits for the President and overall issues relating to salaries and other benefits. The Committee also prepares proposals on salaries and other benefits for the executive management and on the terms for and outcome of the general incentive system.
The Board draws up central policy documents and, at every meeting, receives a summary report of the risk position. For further information regarding the Board’s work see the Corporate Governance Report section. The President is responsible for day-to-day management. Under the level of the Board and the President, there are committees with various powers to make decisions depending on the type of risks. The Credit Committee is responsible for matters relating to credits and credit risk management within SEK. The Credit Committee has the right to make credit decisions within the scope of its mandate and on the basis of the order of delegation decided by the Board. The Asset and Liability Committee manages issues such as those regarding SEK’s overall risk level and proposes market risk limits and methods for risk measurement and the allocation of internal capital. Within the framework of the Board’s overall capital policy, the Asset and Liability Committee draws up guidelines for the distribution of responsibility, the handling of SEK’s risk types and for the relationship between risk and capital.
The Internal Control Committee is responsible for managing and addressing operational risk and following up on incident reports, and also constitutes the drafting and decision-making body for new products. The President chairs all of the above mentioned committees.
SEK’s risk-related management and control is directed towards credit, market, liquidity, and operational risks. Management and control at the corporate level includes the entire company, i.e., all risks, but they are directed especially at risk appetite, capital targets and business environment risk.
Independent risk control is carried out by SEK’s Risk Control function, which reports to SEK’s Head of Risk and to the President. Based on a portfolio perspective, Risk Control is responsible for the control, analysis and reporting of financial risks and measurement and monitoring of operational risk. The financial risks primarily consist of credit and counterparty risks, market risks, as well as liquidity and funding risk. This function oversees the company’s scope and alignment regarding risk strategy, risk management and rating methodology for credit risk classification, as well as calculating, analyzing and forecasting regulatory capital adequacy and the need for economic capital. This function is also responsible for the choice of methods and models and acts as a center of excellence with the aim of contributing to increasing SEK’s risk management capacity in order to analyze the effects of diversification and risk mitigation. An important part of Risk Control’s work consists in ensuring that the function is keeping pace with the business functions in terms of its knowledge of the risks that occur in the company, enabling it to manage new issues that arise within this area.
SEK has also a Compliance function. This function supports the organization in ensuring that operations are run according to applicable regulations, and also monitors compliance with regulations within the company. The Compliance function reports to the President but is also obliged to report to the Board. Internal Audit investigates and assesses the efficiency and integrity of the risk management described above. As of February 2, 2011 the Head of Internal Audit reports to the Board. Internal Audit performs auditing activities in accordance with by the Board approved audit plan. The Head of Internal Audit reports regularly to the Board, the Board’s Audit Committee and to the President and on a regular basis also informs SEK’s executive management.
F-61
Table of Contents
It is a fundamental principle for all control functions to be independent of commercial activities.
The chart “SEK — Corporate Governance Structure” below shows SEK’s organization for management and control.
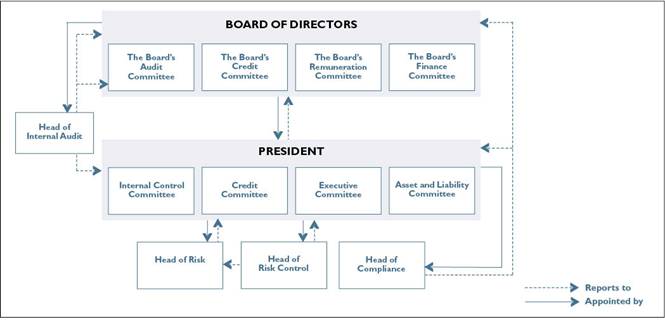
Aim, focus and objectives of risk management
As stated above, risk management is a central part of SEK’s business model and activities. Meeting customers’ financing needs does not rely only on efficient and innovative risk management in respect of the credit transactions themselves. It is equally important to be able to take advantage of market opportunities in order to obtain funding and manage liquidity on attractive terms. This in turn provides the basis for favorable conditions for granting credits. The focus of risk management is mainly to reduce and limit risks to a set extent. The objective of risk management is to create conditions under which SEK is able to meet the needs of its customers for financial solutions. SEK also wishes to take advantage of business opportunities in such a way that net risks are at levels that are sustainable in the long term in relation to SEK’s risk capital. Risk management comprises two important components. One is to manage risks so that net risks are kept at the right level. The other is to assess the capital requirement and ensure a level for and composition of risk capital that is aligned with business activities.
During 2010, there have been no significant changes to SEK’s objectives, principles, risk management methods or methods of measuring risk. Furthermore, the exposure to various types of risk, or their origins, has not changed -materially.
Core Principles for Risk Management
SEK shall carry out its business in such a manner that SEK is perceived by its business counterparties as a first-class counterparty.
SEK shall be selective in its choice of counterparties in order to ensure high creditworthiness.
All SEK’s credit commitments shall at all times be fully funded throughout the maturity.
SEK shall at all times have risk capital well above regulatory requirements.
SEK’s risk management
SEK’s risk management primarily involves using various techniques to transform and reduce gross risks into net risks that are at an acceptable level for SEK. The matrix below describes management’s view on risk management for SEK’s most significant risk categories.
F-62
Table of Contents
gross exposure | | risk management | | net risk |
| | | | |
Credit risk Some of SEK’s credits are granted to parties that have lower credit quality and therefore higher risk than SEK wishes to be exposed to. This applies to a large extent to export credits, for which the ability to provide financing is a key competitive tool for suppliers. Even in cases where customers have good credit quality, the gross risks can be higher than is desirable if the financing requirements are substantial. SEK’s liquidity shall be invested in assets with good credit quality. Gross exposures do not take into account any risk mitigation/risk diversification. | | By using different methods for corporates and financial institutions, SEK establishes credit ratings for its individual counterparties. Most of the counterparties against whom SEK accepts net exposures are also rated by one or more of the internationally recognized rating agencies. In order to be able to keep the credit risk at the desired level, SEK usually uses various types of guarantees and other risk-mitigating solutions. For export credits, where the ultimate borrower may have low creditworthiness, guarantees from Export Credit Agencies (ECAs) and banks are normally used. To avoid larger than desired risks, SEK may also require risk mitigation in those cases where counterparties have high creditworthiness but where the financing requirements are large. In such cases, credit derivatives are normally used. | | The net risk is limited mainly to counterparties with high creditworthiness. In many cases there are several guarantors liable for payment in respect of the same exposure. The net risk for an exposure with several guarantors that are liable for payment is considerably lower than the risk would have been against an individual counterparty. Net risk takes into account any risk mitigation/risk distribution. |
| | | | |
Counterparty risk in derivative transactions Various derivative transactions such as swaps, forward contracts and options are used to limit and reduce risks. The value of these transactions can be considerable in the event of market changes, particularly for transactions with long maturities. This gives rise to a counterparty risk in derivative transactions for which realization of the value of such transactions depends on the counterparty’s ability to meet its obligations throughout the entire -contract period. Counterparty risk in derivative transactions is a form of credit risk. | | In order to keep counterparty risks at a controlled and acceptable level, SEK methodically chooses counterparties with good credit quality for derivative transactions. To further reduce these risks, SEK strives to obtain collateral agreements from counterparties before entering into a derivative transaction. This means that the highest permitted risk level is decided in advance, regardless of market value changes that may occur. | | The combination of a choice of counterparties and collateral agreements leads to limited net risk. All exposures related to counterparty risk in derivative transactions must be contained within set counterparty limits. |
| | | | |
Market risks — Interest rates In order to be able to offer credits — often with complex disbursement and repayment structures — with fixed interest at attractive terms, it is cost-efficient for SEK to take on some interest rate risk. SEK’s borrowing is also often made at fixed interest. SEK primarily sets interest rate terms based on the various needs and preferences of customers and counterparties. Consequently, assets and liabilities can to some extent have different fixed interest periods, which lead to interest rate risk. | | SEK uses various techniques for measuring and managing interest rate risks which are designed to provide a clear picture and good control of these risks. Using different derivatives, the original interest rate risks in assets and liabilities are normally transformed from long-term to short-term interest terms in currencies with well-functioning markets. | | The net risk is limited. To the extent derivatives are used to manage interest rate risk, a market-related counterparty risk remains against counterparties in the derivative transactions. |
F-63
Table of Contents
Market risks — Currency SEK’s lending and a large proportion of its borrowing can take place in the currencies chosen by the borrower and investor, respectively. It seldom happens that borrowing and lending are made in the same currency and therefore directly balance each other. Liquidity investments and some borrowing may, insofar as market conditions allow, be made in the currencies SEK chooses in order to match assets and liabilities. | | Differences in exposures to individual currencies that exist between different transactions are matched with the aid of various derivatives, primarily currency swaps. Currency exposure also arises in the net interest income that is continuously generated in foreign currency. This is hedged regularly in order to minimize risks. | | The net risk comprises an accrued net interest income in foreign currency that is hedged regularly, which results in low risk. To the extent derivatives are used to manage currency risk, a market-related counterparty risk remains against counterparties in the derivative transactions. |
| | | | |
Market risks — Other markets A large portion of SEK’s funding is carried out on terms that are adapted to investor requirements regarding exposure to different risks. Such adjustments provide exposure not only to credit risk but also to changes in different market prices and other market-related variables, such as indices. These adjustments result in funding transactions that contain embedded derivatives. The risk in these derivatives must be managed to avoid undesirable exposures for SEK. | | Unwanted market risks, e.g. in embedded derivatives, are hedged by SEK on a contractual basis using free-standing derivative transactions with offsetting risk profiles. | | Generally, SEK does not have any net exposure to any types of risk other than interest rate, currency and credit risks. The derivatives used for hedging undesired market risks result in a market-related counterparty risk against counterparties in the derivative transactions. |
| | | | |
Liquidity and funding risk SEK’s customers require credits in different currencies with different maturities. Maturities are often long. In order to avoid funding risk, it is SEK’s policy that all credit commitments — outstanding credits and agreed but undisbursed credits — must be funded until maturity. A limited liquidity risk exists, however, in the management of SEK’s liquidity. | | All credit commitments — outstanding credits and agreed but undisbursed credits — are funded throughout their entire maturity. Surplus borrowing is invested in assets with good credit quality and with a maturity profile that matches expected needs. SEK also has a strict policy for liquidity risk in its short-term liquidity management. This policy includes requirements for back-up facilities. | | Overall, SEK has a limited and well controlled liquidity and funding risk. |
| | | | |
Operational risk SEK’s transactions often have long maturities and a high degree of complexity, which creates operational risk. The extensive risk management carried out by SEK for different types of risk is often complex and therefore leads to additional operational risk. | | SEK places great importance on developing structural capital by having clear and reliable routines, a clear division of responsibility, competent and knowledgeable employees and good systems support. SEK also works continually on ethical issues. Long-term, consistent efforts result in the development of risk awareness and attitudes among employees. | | Operational risk exists in all operations and can never be totally avoided. Operational risk is, however, kept to a controlled, acceptable level through consistent quality assurance work. |
F-64
Table of Contents
Credit risk
Credit risk represents the risk of the loss that would occur if a borrower or other party in another contract involving counterparty risk and any guarantors are unable to fulfill their obligations in accordance with contractual terms and conditions. Exposure to credit risk can be related to lending, investment of liquidity and other assets, as well as guarantees, other risk-mitigating instruments, and positive market values in other contracts. Credit risk exposure to a counterparty is always preceded by a decision on a credit or counterparty limit, which the exposure must not exceed. Credit risks are SEK’s largest risks. Credit risks are inherent in all assets and other contracts in which a counterparty is obliged to fulfill obligations. Credit risks are limited through the methodical and risk-based selection of counterparties, and they are managed, for example, through the use of guarantees and credit derivatives.
Events in 2010
During 2010 the level of risk in SEK’s credits and liquidity, defined as the average risk weighting, increased marginally, while the total volume of risk-weighted assets (RWA) fell slightly. As a result of this, overall risk is deemed to be materially unchanged compared with the end of 2009. In addition, there have been no major changes in the composition of SEK’s credits and liquidity. The migration matrix below, based on internal risk classification, shows a marginally negative migration for the highest risk classes and a more neutral trend for other risk classes. Compared with 2009, overall migration was more balanced in 2010 and fewer counterparties saw a change in risk class.
Risk management
SEK applies the Foundation internal ratings-based approach (IRB approach) to calculate the capital requirement for credit risks. The Swedish Financial Supervisory Authority has, however, exempted SEK until December 31, 2012 for the following exposures:
· Exemption from the IRB approach for export credits guaranteed by the Swedish Export Credits Guarantee Board (EKN) or equivalent foreign entities within the OECD.
· Exemption from the IRB approach for the central governments exposure class.
· Exemption from the IRB approach for exposures in the Customer Finance business area.
The standardized approach is used to calculate the capital requirement for credit risks for exposures that are exempted from the IRB approach.
Migration matrix, corporate entities and financial institutions under the IRB approach December 31, 2010
The migration matrix displays the rating breakdown as of December 31, 2010 for counterparties for which SEK applies the IRB method, relative to ratings as of December 31, 2009. For information regarding rating linked to financial assets, see Note 27.
The table should be read row by row. The first row displays the breakdown by rating as of December 31, 2010 for the counterparties that as of December 31, 2009 were rated ‘AAA’. The second row displays the breakdown by rating as of December 31, 2010 for the counterparties that as of December 31, 2009 were rated ‘AA+’, and so on. The shaded diagonal thus displays the percentage of counterparties whose rating was unchanged as of December 31, 2010, compared with December 31, 2009.
F-65
Table of Contents
| | 2010 | | | |
| | AAA | | AA+ | | AA | | AA- | | A+ | | A | | A- | | BBB
+ | | BBB | | BBB- | | BB+ | | BB | | BB- | | B+ | | B | | B- | | CCC/C | | D | | Total | |
AAA | | 97 | % | | | 3 | % | | | | | | | | | | | | | | | | | | | | | | | | | | | | | | | 100 | % |
AA+ | | | | 60 | % | 31 | % | 3 | % | 5 | % | | | | | | | | | | | | | | | | | | | | | | | | | | | 100 | % |
AA | | | | | | 84 | % | 11 | % | | | 5 | % | | | | | | | | | | | | | | | | | | | | | | | | | 100 | % |
AA- | | 3 | % | | | 3 | % | 82 | % | 8 | % | 3 | % | | | 3 | % | | | | | | | | | | | | | | | | | | | | | 100 | % |
A+ | | | | | | | | | | 79 | % | 18 | % | 3 | % | | | | | | | | | | | | | | | | | | | | | | | 100 | % |
A | | | | | | 2 | % | | | 10 | % | 81 | % | 4 | % | 2 | % | | | | | | | | | | | | | | | | | | | | | 100 | % |
A- | | | | | | | | | | | | | | 88 | % | 12 | % | | | | | | | | | | | | | | | | | | | | | 100 | % |
BBB+ | | | | | | | | | | | | | | 4 | % | 86 | % | 9 | % | | | 2 | % | | | | | | | | | | | | | | | 100 | % |
BBB | | | | | | | | | | | | | | | | | | 88 | % | 12 | % | | | | | | | | | | | | | | | | | 100 | % |
BBB- | | | | | | | | | | | | | | | | 3 | % | 38 | % | 46 | % | 13 | % | | | | | | | | | | | | | | | 100 | % |
BB+ | | | | | | | | | | | | | | | | | | 6 | % | 24 | % | 53 | % | 18 | % | | | | | | | | | | | | | 100 | % |
BB | | | | | | | | | | | | | | | | | | | | | | 22 | % | 78 | % | | | | | | | | | | | | | 100 | % |
BB- | | | | | | | | | | | | | | | | | | | | | | | | 10 | % | 80 | % | 10 | % | | | | | | | | | 100 | % |
B+ | | | | | | | | | | | | | | | | | | | | | | | | | | 50 | % | 50 | % | | | | | | | | | 100 | % |
B | | | | | | | | | | | | | | | | | | | | | | | | | | | | | | 50 | % | 50 | % | | | | | 100 | % |
B- | | | | | | | | | | | | | | | | | | | | | | | | | | | | | | | | 100 | % | | | | | 100 | % |
CCC | | | | | | | | | | | | | | | | | | | | | | | | | | | | | | | | 75 | % | 25 | % | | | 100 | % |
D | | | | | | | | | | | | | | | | | | | | | | | | | | | | | | | | | | | | 100 | % | 100 | % |
All of SEK’s counterparties must be assigned a risk classification or rating internally, except those counterparties that are included in the exemptions from the requirement for internal risk classification granted to SEK by the Swedish Financial Supervisory Authority. The decision concerning an internal rating for a counterparty is taken by SEK’s Rating Committee. Rating Committee members are appointed by the Executive Committee in such a way that a majority of the members represent non-commercial functions within the company. The Rating Committee members, who come from various functions within SEK, must have both broad and in-depth expertise in risk assessment and/or experience in credit ratings.
The design of the company’s IRB system includes a number of both operational and analytical aspects. The operational design concerns the organizational process for and control of how counterparties are assigned risk classifications. Important operational aspects include where in the company the risk classification is made and established, and how the responsibility for monitoring, validation and control is distributed throughout the organization. The analytical design concerns how risk is measured and assessed. This includes how loss concepts are defined and measured, and which methods and models are used for risk classification and the calculation of risk. The analytical design of risk classification systems often differentiates significantly between different financial institutions. The systems, however, share the fact that every credit exposure within a specific risk class is associated with a number of quantifiable risk expressions. The two expressions that together primarily explain the credit risk of an exposure are the probability of default or cessation of payments by a borrower (Probability of Default, PD) and the portion of the loan that will be lost in the event of a default (Loss Given Default, LGD). Using these two parameters and the size of the outstanding exposure at default (Exposure at Default, EAD), it is possible to calculate the statistically expected loss (Expected Loss, EL) for a given counterparty
F-66
Table of Contents
exposure. By using what is known as the Basel formula, the unexpected loss (UL) can also be estimated. In the Foundation IRB approach, only the PD is estimated internally. The values of the other parameters are set by the supervisory authority.(1)
An internal risk classification system is a tool for improving the precision of credit assessments and making them consistent. By storing historical data of counterparties’ defaults and credit rating history, SEK is able to monitor its credit assessments and create a clearer “institutional memory” within the organization. This historical data helps SEK in revealing and correcting systematic erroneous assessments. By allocating each counterparty, an explicit (cardinal) default probability, the company can check its own risk classification against external sources.
SEK’s methodology for internal risk classification is based on both qualitative and quantitative factors. Within SEK, risk classification is based, to a high degree, on the analyst assessments. Individual counterparties are rated through the use of different methods for corporates and financial institutions. The aim of using a common rating scale for all counterparties is essentially to be able to correctly price and quantify risk over time for SEK’s counterparties and thereby maintain the desired level of risk in the company. The tool used for this is the credit rating, which is an ordinal ranking system. Therefore, risk classification within SEK is largely an issue of a relative assessment. This risk classification does not aim to estimate the precise probability of default, but rather to place counterparties in a category of comparable counterparties, based on a risk perspective.
SEK’s IRB system comprises all of the various methods, working and decision-making processes, control mechanisms, guideline documents, IT systems, and processes and procedures that support risk classification and the quantification of credit risk.
SEK’s IRB system is evaluated yearly by means of quantitative and qualitative validations.
Limits and monitoring
SEK uses limits to manage lending and to limit risks to a set extent. This limit expresses the highest acceptable exposure to a risk counterpart for each future date. A limit, granted by the appropriate committee, permits SEK’s business functions to, within a limit, conclude business transactions in SEK’s name that will imply credit risk in respect of the relevant counterpart. All limits and risk classifications shall be reviewed at least once a year. Exposures judged to be problem credits(2) are subject to more frequent reviews, and the limit will be blocked(3) for identified problem credits. The purpose is to be able at an early stage to identify commitments with elevated loss risk and ensure that the risk classification reflects the actual risk of the risk counterpart.
Counterparty risk in derivative transactions
Counterparty risk in derivative transactions — which is a kind of credit risk — arises when derivative transactions are used to manage risks. In order to limit this risk, SEK enters into such transactions solely with counterparties with good creditworthiness. Risk is further reduced through SEK’s efforts to obtain collateral agreements from its counterparties before the derivative transactions are entered into. These agreements mean that the highest permitted risk levels, in relation to each individual counterparty, are agreed in advance. The formulation of these agreements is designed to ensure that agreed risk levels will not be exceeded, independent of market value changes that may occur.
For counterparty exposures that exceed the threshold amounts under ISDA Credit Support Annexes as a result of market value changes, credit support is demanded so that the counterparty exposure is reduced to an approved level. The positive gross value of all derivative transactions in the balance sheet as of December 31, 2010 was Skr 37.7 billon (year-end 2009: Skr 22.7 billion). After netting on the basis of the current ISDA Master Agreements (by counterparty), the exposure was Skr 23.6 billion (year-end 2009: Skr 7.5 billion), i.e., Skr 14.1 billion less than the gross exposure (year-end 2009: Skr 15.2 billion less than gross exposure). As of December 31, 2010 the counterparties had paid Skr 14.3 billion (year-end 2009: Skr 3.9 billon). At the end of 2010 SEK had provided credit support under ISDA Master Agreements with different counterparties amounting to Skr 0.7 billion (year-end 2009: Skr 7.4 billion), reducing the counterparties’ total risk exposure for SEK by the corresponding amount.
Credit risk protection
SEK’s credit risks are limited by the methodical and risk-based selection of counterparties and are managed, among other things, by the use of guarantees and credit derivatives. A purchased credit derivative contract provides the holder with the right, under certain circumstances — including the default of the underlying/risk-covered counterparty — to sell an
(1) Under normal circumstances the maturity will be 2.5 years and the LGD will be 45 percent.
(2) An exposure (receivable) to a risk counterparty that is judged by SEK to have a high probability (of) not fulfilling all of its commitments in accordance with the original contractual terms at the due date.
(3) A blocked limit means that no new deals may be concluded with the counterparty.
F-67
Table of Contents
asset, with implied risk for the underlying counterparty, at its nominal value to the issuer of the credit derivative contract. Accordingly, credit derivative transactions make it possible for the buyer to create a combined risk of the underlying counterparty and the issuer of the credit derivative contract. SEK uses credit derivative transactions to convert large volumes of exposures to individual counterparties into combined exposures, in which one counterparty (the issuer of the credit derivative contract) is a financial institution.
Overall risk is further reduced through the use of contracts that require individual issuers of credit derivative contracts to provide collateral in the event that the market value of the issued credit derivative transactions exceeds a certain level. The market value of a credit derivative transaction is, among other things, derived from the change in creditworthiness of the underlying/risk-covered counterparty. As a result, if there is a deterioration in the creditworthiness of the underlying counterparty whose credit risk is covered by the credit derivative transactions, SEK successively receives collateral for the risks covered. This risk mitigation technique is, therefore, effective from a real risk management perspective.
Guarantees
SEK relies to a large extent on guarantees in its lending. The guarantors are principally made up of government export credit agencies, such as the Swedish Exports Credit Guarantee Board (EKN), the Export Import Bank of the United States (USEXIM), the Exports Credits Guarantee Department of the United Kingdom (ECGD), the Compagnie Financière pour la Commerce Exterieure (Coface) of France and Euler Hermes Kreditversicherungs AG of Germany, as well as financial institutions and, to a lesser extent, non-financial corporations. Credit risk is allocated to a guarantor in accordance with SEK’s policy and therefore, when disclosing net credit risk exposures, the majority of SEK’s guaranteed credit exposure is shown as exposure to sovereign counterparties. As of December 31, 2010, government export credit agencies guaranteed a total of Skr 123.8 billion, or 36 percent of SEK’s total credit exposures (year-end 2009: Skr 125.1 billion, or 32 percent). Skr 109.6 billion covered corporate exposures, Skr 6.1 billion covered exposures to financial institutions, and Skr 8.1 billion covered government exposures (year-end 2009: Skr 107.6 billion, Skr 9.1 billion, and Skr 8.4 billion, respectively). The guaranteed corporate exposures are included in the class of financial instruments referred to as “Loans to the public”, the guaranteed exposures to financial institutions in the class “Loans to credit institutions” and the guaranteed exposures to governments in the class “Loans to the public”.
Credit derivatives
At year-end 2010, Skr 26.8 billion of SEK’s assets were secured through CDS (Credit Default Swaps) coverage obtained from 19 different financial institutions (year-end 2009: Skr 34.0 billion, obtained from 21 different financial institutions). Skr 25.3 billion covered corporate exposures, Skr 1.5 billion covered exposures in securitization positions and Skr 0.0 billion covered exposures to financial institutions (year-end 2009: Skr 31.9 billion, Skr 1.7 billion, and Skr 0.4 billion respectively). All exposures covered by CDSs are included in the class of financial instruments known as “Other interest-bearing securities, except loans”, “Loans in the form of interest-bearing securities” or “Loans to the public”. SEK has what are referred to as collateral agreements in place with issuers of credit derivatives.
Collateral
SEK uses various types of collateral or risk mitigation to reduce or transfer credit risks. Approved risk mitigation methods under the ISDA Credit Support Annex generally consist of cash and, to a limited extent, government bonds. Any collateral that SEK demands must be managed and documented in a manner such that the collateral fulfills its function and can be used in the intended manner when needed. When a credit decision is made, the creditor’s assessed creditworthiness and ability to repay are taken into account, together — where applicable — with the value of any collateral. The credit decision may be made on condition that certain collateral is provided.
SEK held, for a short period of time (between December 2008 and December 2009) a small portfolio of loans which were secured by collateral in the form of real estate. For those loans, third-party appraisals were regularly done, and the book values of such loans were impaired if deemed necessary. Furthermore, SEK on an infrequently basis carries on its books other loans secured by collateral in the form of highly liquid financial instruments, for example equity instruments that are actively traded on a stock exchange. Such instruments are regularly monitored, at least on a monthly basis and more often if deemed necessary.
Concentration risks
SEK’s exposures are regularly analyzed and reported in respect of risk concentration dependent on (i) the size of individual commitments, (ii) domicile and (iii) sector. The analysis refers to both direct and indirect exposures from, for example, credit derivatives. The previously described concentration risks are reflected in SEK’s calculation of economic capital for credit risks where they contribute to a higher capital need than the capital requirement calculated under Pillar 1. Pillar 1 does not take concentration risks into account when calculating capital requirements.
Under the regulatory rules for large exposures, a “large exposure” is defined as a (risk-weighted) exposure to a single
F-68
Table of Contents
counterparty (or counterparty group) that exceeds 10 percent of SEK’s total capital base. The aggregate amount of SEK’s large exposures as of December 31, 2010, was 277 percent of SEK’s total capital base, and consisted of risk-weighted exposures to 20 different counterparties, or counterparty groups, of which the majority relate to combined exposures for which more than one counterparty is responsible for the same payments (year-end 2009: 120 percent and 8 different counterparties or counterparty groups). The increase in aggregated amount of SEK’s large exposures emanates primarily from the new rules for large exposures that came into force December 31, 2010.
Market risks
Market risks occur when the terms of a contract are such that the size of the payments linked to the contract or the value of the contract vary due to a market variable, such as an interest rate or exchange rate. The resulting market risks are denoted as interest rate risks and currency risk, respectively. The company does not consider itself to be exposed to market risks other than those mentioned above since other market risks are hedged.
Risk management
SEK’s management of market risks is defined in steering documents established by the Board’s Finance Committee. In addition to the steering documents established by the Board’s Finance Committee, SEK has instructions defining methodology for the calculation of interest rate risk. The instructions are established yearly by the Asset and Liability Committee. SEK’s net market risks are well defined and limited.
SEK’s policy allows, within defined limits, net exposure to the market risks of interest rate risk and currency risk. Other market risks must be hedged. Interest rate risk and currency risk are measured and reported regularly to the Asset and Liability Committee and the Board’s Finance Committee.
Measurement and reporting
The following describes how SEK internally measures and reports market risk. For the impact on results and other comprehensive income, see Note 27.
Risk neutrality for interest rate risk in debt-financed assets and debt excluding perpetual subordinated debt can only be achieved if both currency, interest rate terms and the overall maturity period for the liabilities matches the corresponding assets. Conditions are different with regard to shareholders’ funds as interest rate terms cannot be matched. According to SEK’s approach, risk neutrality should be based around the aim of minimizing the impact of earnings and forming a link with the shareholder’s required return on equity. According to prevalent capital market theory, the required return on equity consists of two separate parts; the risk-free rate and a risk premium. If the required return on equity is to follow this theory, earnings should not remain unchanged if interest rates were to change. On the contrary, a change in interest rates that represents the proportion of the risk-free rate should be considered risk-neutral. In addition to this theory, SEK has taken as its starting point an assessment of the average maturity in the credits and has also taken reinvestment risk into consideration. On this basis, SEK has defined zero risk in assets funded with shareholder’s funds as a maturity structure where 1/7 of the total portfolio matures every year from year 1 to year 7.
Currency risks are kept at a low level since SEK matches assets and liabilities in terms of currencies. The limited remaining currency risk mainly arises on an ongoing basis due to differences between revenues and costs (net interest margins) related to assets and liabilities in the respective currency.
Interest rate risk in debt-financed assets and debt excluding perpetual subordinated debt
Interest rate risk in debt-financed assets and debt excluding perpetual subordinated debt is measured as the highest of the risks calculated from a positive one-percentage-point parallel shift in the yield curve and the risk from a half-percentage-point rotation of the yield curve. Perpetual subordinated debt with related hedging transactions, as well as assets in which shareholders’ equity and untaxed reserves are invested, are excluded from these calculations. The limit for interest rate risk in debt-financed assets and debt excluding perpetual subordinated debt was Skr 70 million at the end of 2010 (year-end 2009: Skr 70 million). The risk amounted to Skr 47 million at the end of 2010 (year-end 2009: Skr 37 million).
Basis risk
The differences in the interest rate basis for different currencies lead to a risk in the case of surpluses or deficits in borrowings in relation to loans in individual currencies over a specific period. The basis risk is calculated (with the exception of surpluses in Skr, USD and EUR) as the change in present value due to changes in interest rate bases by a certain number of basis points (according to a standardized method). Surpluses in Skr, USD and EUR are excluded from the calculation of basis risk since the majority of SEK’s lending is made in these currencies. Surpluses in these currencies may fairly swiftly be converted into lending, if desired. The limit for basis risk was Skr 190 million at the end of 2010 (year-end 2009: Skr 190 million). Total basis risk amounted to Skr 91 million at the end of 2010 (year-end 2009: Skr 107 million).
F-69
Table of Contents
Interest rate risk in perpetual subordinated debt
The volume of perpetual subordinated debt on December 31, 2010 amounted to USD 350 million (year-end 2009: USD 350 million), corresponding to Skr 2,381 million (year-end 2009: Skr 2,524 million). The interest rate risk relating to this volume was hedged with interest rate swaps with maturities between 2019 and 2034. The interest rate risk in perpetual subordinated debt is measured as the highest of the risks calculated from a positive one-percentage-point parallel shift in the yield curve and the risk from a half-percentage-point rotation of the yield curve. The maturity for perpetual subordinated debt has been approximated to 30 years. Thus SEK measures an approximated interest rate risk related to perpetual subordinated debt. The interest rate risk in perpetual subordinated debt was Skr 144 million at the end of 2010 (year-end 2009: Skr 125 million). There is no specific limit for this risk.
Interest rate risk in assets corresponding to shareholders’ funds
In order to ensure a long-term stable return on equity, SEK’s policy is to invest shareholders’ funds in securities with medium-term maturities. At year-end 2010, the volume of securities for this purpose amounted to Skr 13.6 billion with an average outstanding maturity of 3.4 years (year-end 2009: Skr 9.8 billion, with an average outstanding maturity of 3.2 years). The interest rate risk in assets corresponding to shareholders’ funds is calculated as a change in present value at a one-percentage-point parallel upward shift in the yield curve compared with a benchmark portfolio according to the zero-risk definition. According to this definition, which aims to reflect the risk taking into account the shareholder’s demand for long-term return on shareholders’ funds, the interest rate risk was Skr 48 million at the end of 2010 (year-end 2009: Skr 43 million).
Currency risk
The risk is calculated as a change in the value of foreign currency positions resulting from a ten-percentage-point change in the exchange rate for the respective currency and the Swedish krona. The limit for currency risks was Skr 15 million at the end of 2010 (year-end 2009: Skr 15 million). The currency risk amounted to Skr 2 million at the end of 2010 (year-end 2009: Skr 4 million).
Other price risk
The company does not consider itself to be exposed to market risks other than those described above since other market risks are hedged.
Liquidity and funding risk
Liquidity and funding risk is defined as the risk of not being able to settle payment obligations immediately when due.
Events in 2010
In 2009 and 2010, global regulators have been working on new measures of both structural and stressed liquidity. SEK closely monitors regulators’ work. SEK is prepared for new rules being implemented and preparatory work for implementing the new rules is ongoing.
In 2010, SEK completed a review of the company’s liquidity risk management. As a result, methodology for scenario analysis of liquidity has been developed. Furthermore, a review of liquidity risk-related governance reporting has also been conducted.
Risk management
SEK’s liquidity and funding risk is regulated by steering documents established by the Board’s Finance Committee. SEK has a conservative policy for liquidity and funding risk. The policy requires that all credit commitments — outstanding credits and agreed but undisbursed credits — be funded through maturity. Since this policy means that no refinancing risk is allowed, the strategy generates liquidity. Liquidity and funding risk are measured and reported regularly to the Asset and Liability Committee and the Board’s Finance Committee.
SEK’s conservative policy for liquidity and funding risk is measured and reported on the basis of various forecasts regarding the development of available funds in comparison with various credit commitments — outstanding credits and undisbursed credits. Available funds are defined as shareholder’s funds, borrowing and credit facilities with the Swedish National Debt Office. Excess funds, i.e. the portion of available funds not already used to finance loans, must be invested in assets with good credit quality. See the Liquidity section for further details. The credit facility with the Swedish National Debt Office is valid through to December 31, 2011 and distributed as follows: 80 percent may be used for funding lending within the S-system and 20 percent may be used for funding lending in SEK. See the chart “Development over time of SEK’s available funds”. Part of SEK’s structured long-term borrowing includes early redemption clauses that will be triggered if certain market conditions are met. Thus the actual maturity for such contracts is associated with uncertainty. In the chart “Development over time of SEK’s available funds”, such borrowing has been
F-70
Table of Contents
assumed to be due at the first possible redemption opportunity. This assumption is an expression of the precautionary principle that the company applies concerning liquidity and funding management. In addition, SEK also carries out various sensitivity analyses with regard to such instruments, in which different market conditions are simulated.
Development over time of SEK’s available funds
Borrowing, credit facility with Swedish National Debt Office, shareholder’s funds and lending with maturities of more than one year, as of December 31, 2010
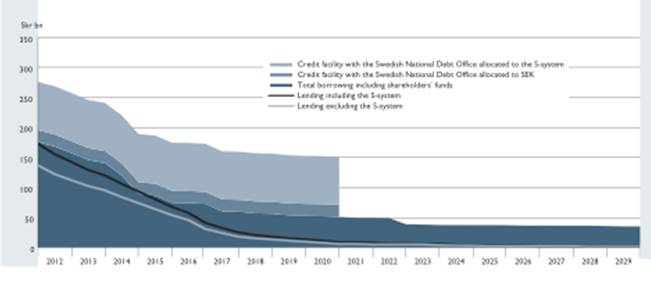
Funding
SEK’s funding strategy is defined in the steering document Financing Strategy, which is established by the Board’s Finance Committee. An important part of the Financing Strategy aims at ensuring that SEK’s funding is well diversified with regard to markets, investors, counterparties and currencies.
Short-term funding
For the purpose of ensuring access to funding, SEK has several revolving funding programs for maturities of less than one year. These include a US Commercial Paper program (UCP) and a European Commercial Paper program (ECP), with the latter allowing borrowing in multiple currencies. The table “Short-term funding programs” illustrates these funding sources. The total volume of short-term programs was USD 7.0 billion, of which USD 0.0 billion had been utilized as of December 31, 2010 (year-end 2009: total volume of USD 7.0 billion, USD 4.3 billion utilized). SEK also has swing lines that function as back-up facilities for the commercial paper programs.
Short-term Funding Programs
| | | | ECP | |
Program type
Currency | | UCP
USD | | Multi
currencies | |
Number of dealers | | 4 | | 4 | |
Dealer of the day facility | | No | | Yes | |
Program size | | 3,000 MUSD | | 4,000 MUSD | |
Usage as of Dec. 31, 2010 | | 0 MUSD | | 0 MUSD | |
Usage as of Dec. 31, 2009 | | 2,225 MUSD | | 2,093 MUSD | |
F-71
Table of Contents
Maturity | | Maximum 270 days | | Maximum 364 days | |
Long-term funding
To secure access to large volumes of funding, and to ensure that insufficient liquidity among individual funding sources does not constitute an obstacle to operations, SEK issues bonds with different structures, currencies and maturities. In addition, SEK carries out issues in many different geographic markets. The charts below illustrate some of the aspects of the diversification of SEK’s funding. SEK’s long-term funding during 2010 amounted to Skr 76.6 billion (2009: Skr 111.8 billion).
Long-term funding by structure type

Long-term funding by currency

Long-term funding in 2010 by market

Liquidity
Liquidity is necessary to meet SEK’s policy for liquidity and funding risk. The size of SEK’s liquidity depends on a number of factors. SEK’s Finance Policy stipulates that all SEK’s credit commitments — outstanding credits and undisbursed credits — shall be funded though maturity. One of the largest contributing factors to the size of liquidity is the amount of undisbursed credits. At the end of 2010 undisbursed credits amounted to 33 percent of total liquidity (year-end 2009: 30 percent). As part of its liquidity portfolio, SEK also requires a buffer to ensure that SEK can fulfill payments related to collateral agreements that the company has with its derivative counterparties in order to reciprocally
F-72
Table of Contents
manage counterparty risk in derivative transactions. The buffer shall also enable the company to repurchase its own debt from investors that wish to sell their bonds earlier than final maturity. Finally, the buffer shall also enable SEK, during a certain timeframe, to grant loans to the usual extent even if the funding markets are completely or partly closed. The maturity profile in the liquidity portfolio shall reflect the net maturity of funding and lending. Investments shall be made in assets of good credit quality. Furthermore, the duration of the assets shall be in accordance with defined guidelines. SEK assesses that, according to plan, the assets will be held to maturity. Liquidity portfolio amounted to Skr 116.6 billion at the end of 2010 (year-end 2009: Skr 153.8 billion). The decrease emanates primarily from a lower volume of undisbursed credit commitments and from expectations of lower lending volumes in coming years. The buffer can be expected to decrease further as access to liquidity in the market improves. The strengthening of the Swedish krona in 2010 also contributed to the lower volume. The charts following provide a breakdown of the liquidity portfolio by exposure type, maturity and rating as of December 31, 2010. The remaining maturity in liquidity decreased in 2010. Furthermore, credit quality declined in 2010 owing mainly to fewer investments in government-guaranteed issues from financial institutes. The migration of securitization positions during 2010 also contributed to lower credit quality.
Liquidity by type of exposure

Liquidity portfolio by Remaining maturity (“M”)
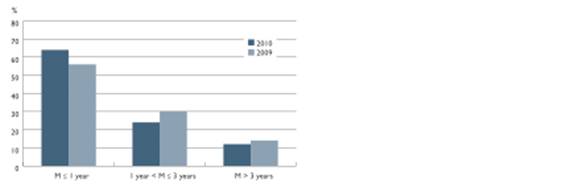
F-73
Table of Contents
Liquidity portfolio by rating
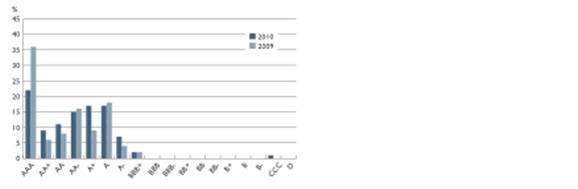
Contingency plan
SEK has established a contingency funding plan for the management of liquidity crises. The plan describes what constitutes a liquidity crisis according to SEK and what measures SEK intends to take if such a crisis is deemed to have occurred. The plan also describes the decision-making organization during a liquidity crisis. An internal and external communication plan is also included.
Scenario analyses
SEK regularly performs scenario analyses with the aim of increasing its preparedness and of ensuring that the company can cope with situations such as the partial or complete cessation of different funding sources. The scenarios cover company-specific and market-related problems, both individually and in combination. The outcome of the scenarios are in line with SEK’s liquidity and funding policy, in which SEK is to have a cash surplus to ensure that it is prepared for payments in the form of agreed but undisbursed credits, payments under collateral agreements and a potential increase in demand for lending.
The chart below shows the development of accumulated cash flows for a stressed market scenario. The assumptions behind this scenario include the following: that not all funding that matures can be refinanced; that cash needs to be paid out under collateral agreements; and that SEK meets all of its previously agreed credit commitments. Account is also taken of the fact that some of the liquidity portfolio can be quickly converted into liquid funds at short notice. In addition to this, SEK holds a significant amount of assets eligible as collateral in central banks. These have not been realized in the stressed scenario below. Instead, they serve as an additional buffer in case market conditions should become even more disadvantageous than anticipated.
Stress test and cash flow in the market stress scenario
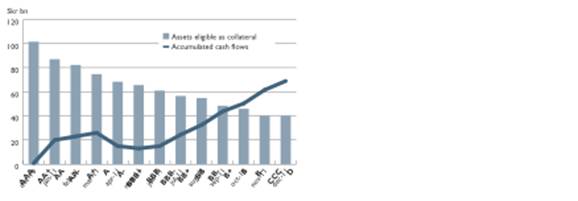
Operational risk
Operational risk is defined as the risk of loss resulting from inadequate internal processes, human error, faulty systems or from external events. This definition also includes legal risk.
F-74
Table of Contents
Events in 2010
In 2010 the company worked to improve internal control in accordance with an established action plan. These measures included improvements of and greater efficiency in certain controls in processes regarding financial reporting. In particular, processes, methods and controls to measure the efficiency of hedge relationships and to manage credit spreads in financial reporting have been improved. The executive management has assessed the internal control of financial reporting in accordance with the SEC’s rules applicable to foreign private issuers. The conclusion as at December 31, 2010 was that effective and efficient controls were in place relating to internal control of financial reporting.
Risk management
To support the work with operational risk, SEK has steering documents which define risk appetite, responsibilities, reporting processes and management of incidents and risk analysis in conjunction with the introduction of new products. Responsibility for the ongoing management of operational risk lies within the business. The Internal Control function provides support for the business and also summarizes and reports on incidents at the Internal Control Committee. Risk Control is responsible for the measurement and assessment of operational risk.
Since SEK’s transactions often have long maturities and a high level of complexity, SEK places high demands on systems, processes, and employees in order to minimize operational risk. The extensive risk management conducted by SEK is often complex and, therefore, leads to additional operational risk that SEK correspondingly attempts to minimize. There is also a risk that SEK’s reputation will be damaged if the company fails to comply with current legislation and best practice or in any other manner fails to meet its commitments, even those that are not explicit. Such risk is reduced through active efforts relating to risk culture, compliance with regulations and corporate governance.
Basel II provides opportunities for companies to use different methods for the calculation of the capital requirement for operational risk. Calculation of this capital requirement may utilize the Basic Indicator Approach, which can be used without permission from the Swedish Financial Supervisory Authority. There are also more advanced methods — the Standardized Approach and the Advanced Measurements Approaches — which require announcement to the Swedish Financial Supervisory Authority respective specific approval from the Swedish Financial Supervisory Authority. SEK calculates its capital requirement for operational risk according to the Basic Indicator Approach. The capital requirement for operational risk under the Basic Indicator Approach equals 15 percent of a revenue indicator. The revenue indicator represents an average of operating revenues over the last three years. Operating revenues are calculated as the sum of the following items: interest and leasing revenues, interest and leasing expenses, dividends received, commission earned, commission paid, net earnings from financial transactions, and other operational revenues.
Incident reporting system
SEK has a reporting system which supports the reporting and management of incidents that occur. As soon as an incident occurs the head of the function in which the incident occurred must ensure that an incident report is written. Incident reports provide information about the event, potential costs related to the incident and measures taken to prevent a repeat of the incident.
Risk analysis
Both new products and major changes in products, markets and services must undergo a risk analysis with regard to operational risk. This risk analysis aims to ensure that demands on appropriate processes, internal control, documentation, registration, risk measurement, accounting and reporting can be maintained for a new product. The analysis must also contain an impact analysis. Decision-making support in the form of an analysis of the new product shall be documented and presented to the Internal Control Committee. The Internal Control Committee decides on approval of new products. Feedback on the outcome after the introduction of the new product must be provided within six months to the Internal Control Committee. Crisis and contingency plans are in place within the company to handle serious disruptions.
Internal capital adequacy assessment
Under Basel II Pillar 2, companies are responsible for designing their own processes for internal capital adequacy assessment (ICAAP). This requires institutions to identify their risks and assess their risk management in an extensive and comprehensive manner and, based on this, to assess their capital needs. They must also communicate their analyses and conclusions to the Swedish Financial Supervisory Authority. The ICAAP must be documented and disclosed throughout the company. As part of its strategic planning process, SEK’s Board and executive management establish the company’s risk appetite and clear objectives with regard to the capital structure. An important part of the company’s capital planning is the performance of a scenario analysis. The scenario analysis illustrates, in summary, how capital needs would be affected by unfavorable developments in the business environment.
SEK’s ICAAP is assessed as being well in line with the underlying principles, intentions and values of the regulations.
F-75
Table of Contents
To calculate capital requirements in accordance with Pillar 2, SEK uses other methods than those used to calculate the capital requirements under Pillar 1. Under Pillar 2, a number of other risks are analyzed in addition to those risks covered by capital under Pillar 1. These risks are analyzed based on a perspective of proportionality, with the greatest focus being placed on those risks that are of most significance for SEK. For example, for internal evaluation and assessment of capital requirements regarding credit risks under Pillar 2, SEK works with what is referred to as economic capital. This is a more exact and risk-sensitive measure than the regulatory capital requirement under Pillar 1.The need for economic capital is based on a calculation of Value at Risk (VaR) and forms a central part of the company’s internal assessment. SEK’s assessment of whether, in addition to the capital requirement calculated under Pillar 1, the company needs to allocate capital for credit risk under Pillar 2 is mainly based on a quantitative approach. This approach is also complemented by a comparative analysis of the capital requirement under the Basel formula and the necessary economic capital (calculated with a confidence level of 99.9 percent). This quantitative approach is further complemented by qualitative assessments. The primary aim of the analysis is to assess whether the total capital requirements under Pillar 2 should be set higher than the automatically calculated capital requirement under Pillar 1.
In addition, it is considered important to be able to break the difference down according to the various individual factors. Although the (net) difference may be small, the analysis shows that the difference between the approaches under Pillar 1 and Pillar 2, respectively, for individual factors may have a large impact on the quantification of risk. Factors that increase the capital requirement in the overall internal assessment include the company’s view on the loss proportion in the event of default (LGD), which is more conservative than the Basel formula. Another factor that increases the need for capital consists in the company, under Pillar 2, taking into account concentration risks caused by (i) name concentration and (ii) high correlations between counterparties in the portfolio due to domicile and sector. The regulations also permit certain types of exposure to be exempted from capital requirements under Pillar 1. It is SEK’s opinion that capital, in relation to actual risk, is also needed for such exposures. The regulations do not — under Pillar 1 — take into account the risk reduction resulting from a very short maturity. The company’s model for the calculation of economic capital does, however, take this effect into consideration. A positive factor, from which the company is not permitted to benefit under Pillar 1, is the full effect of risk reduction through the use of guarantees and credit derivatives (i.e., combined risks, or “double default”), as well as collateral agreements with issuers of credit derivatives. In total, with regard to credit risk, concentration risk comprises the single largest risk contribution in the company’s comparative analysis.
Note 31 Acquisition
Acquisition of Venantius AB (publ)
Headquartered in Stockholm
Corporate identity number 556449-5116
In November 2008, the Swedish government proposed that AB Svensk Exportkredit’s capacity to assist the Swedish export industry with long-term funding be improved. As part of this, AB Svensk Exportkredit received all shares in Venantius AB through a shareholder’s contribution on December 18, 2008. AB Svensk Exportkredit obtained control over the operations upon the date of acquisition.
Venantius was established in 1995, according to a parliamentary decision, in order to take over loan facilities with potentially high credit risk from SBAB. The loan portfolio comprised Skr 33 billion in housing loans at the time. At the time of the acquisition, the equity in Venantius AB amounted to Skr 2.4 billion, loans to the public totaled approximately Skr 0.5 billion and liquid funds amounted to approximately Skr 1.9 billion.
AB Svensk Exportkredit and Venantius AB are controlled through a common owner, the Swedish State. AB Svensk Exportkredit has chosen to account for the contribution of Venantius AB using the purchase method of consolidation.
The value of the shares in Venantius AB received through a shareholder’s contribution and the value of assets and liabilities have been established on the basis of an independent valuation. The amounts presented in the following tables provide information on the carrying amounts and fair value adjustments. At the time of the acquisition Venantius AB had 11 employees. Annual revenues in 2008 amounted to approximately Skr 145 million. For practical reasons, it is not possible to specify earnings according to IFRS as the company did not follow IFRS accounting rules before the acquisition. The contribution from Venantius AB since the acquisition has amounted to Skr 9.2 million in 2008.
F-76
Table of Contents
The acquisition value accounted for in AB Svensk Exportkredit, including the costs of the acquisition, is shown in the table below (in Skr million):
Shareholder’s contribution from the Swedish State | | 2,440.3 | |
Additional costs of the acquisition | | 1.0 | |
Total | | 2,441.3 | |
Cash flow from investing activities at the acquisition was Skr 577, 1 million.
F-77
Table of Contents
SIGNATURES
The registrant hereby certifies that it meets all requirements for filing on Form 20-F and that it has duly caused and authorized the undersigned to sign this annual report on its behalf.
| AKTIEBOLAGET SVENSK EXPORTKREDIT (publ) |
| (Swedish Export Credit Corporation) |
| (Registrant) |
| |
| |
| | By | /s/ Peter Yngwe |
| | Peter Yngwe, President |
Stockholm, Sweden
March 25, 2011
II-1
Table of Contents
EXHIBIT INDEX
1.1 | Articles of Association of the Registrant in effect as of the date of this annual report (filed as Exhibit 1.1 to the Company’s Annual Report on Form 20-F (No. 001-08382) for the year ended December 31, 2008 filed by the Company on May 20, 2009 and incorporated herein by reference). |
| |
2.1 | Indenture, dated as of August 15, 1991, between the Company and J.P. Morgan Trust Company, National Association (as successor in interest to the First National Bank of Chicago) as Trustee, providing for the issuance of debt securities, in one or more series, by the Company (filed as Exhibit 4(a) to the Company’s Report of Foreign Issuer on Form 6-K (No.: 001-08382) dated September 30, 1991 and incorporated herein by reference). |
| |
2.2 | First Supplemental Indenture dated as of June 2, 2004 between the Company and J.P. Morgan Trust Company, National Association (filed as Exhibit 4(b) to the Company’s Registration Statement on Form F-3 (No. 333-131369) dated January 30, 2006 and incorporated herein by reference). |
| |
2.3 | Second Supplemental Indenture, dated as of January 30, 2006, between the Company and J.P. Morgan Trust Company, National Association (filed as Exhibit 4(c) to the Company’s Registration Statement on Form F-3 (No. 333-131369) dated January 30, 2006 and incorporated herein by reference). |
| |
2.4 | Third Supplemental Indenture, dated as of October 23, 2008, between the Company and Bank of New York Mellon Trust Company, National Association (as a successor in interest to The First National Bank of Chicago and J.P. Morgan Trust Company, National Association) as Trustee(filed as Exhibit 4 to the Company’s Report on Form 6-K dated October 23, 2008 (No. 001-08382) and incorporated herein by reference). |
| |
2.5 | Form of Warrant Agreement for Index Warrants, with Form of Index Warrant Certificate attached thereto (filed as Exhibit 4(e) to the Company’s Registration Statement on Form F-3 (No. 333- 156118) dated December 15, 2008 and incorporated herein by reference). |
| |
2.6 | Fiscal Agency Agreement dated June 5, 2009 relating to an unlimited aggregate principal amount of debt securities authorized to be issued under the Company’s Program for the Continuous Issuance of Debt Instruments (filed as Exhibit 2.6 to the Company’s Annual Report on Form 20-F (No. 001-08382) for the year ended December 31, 2009 filed by the Company on April 1, 2010 and incorporated herein by reference). |
| |
2.7 | Deed of Covenant dated June 5, 2009 relating to an unlimited aggregate principal amount of securities of SEK authorized to be issued under the Company’s Program for the Continuous Issuance of Debt Instruments (filed as Exhibit 2.6 to the Company’s Annual Report on Form 20-F (No. 001-08382) for the year ended December 31, 2009 filed by the Company on April 1, 2010 and incorporated herein by reference). |
| |
2.8 | Fourth Supplemental Indenture, dated as of March 8, 2010, between the Company and Bank of New York Mellon Trust Company, National Association (as a successor in interest to The First National Bank of Chicago and J.P. Morgan Trust Company, National Association) as Trustee (filed as Exhibit 4(f) to the Company’s Post-Effective Amendment (No. 333-156118) to the Company’s Registration Statement on Form F-3, filed by the Company on March 10, 2010 and incorporated herein by reference). |
| |
2.9 | English-language summary of the Terms and Conditions dated 5 February 2010 relating an unlimited principal amount debt securities authorized to be issued under the Company’s Swedish MTN Progamme (filed as Exhibit 2.9 to the Company’s Annual Report on Form 20-F (No. 001-08382) for the year ended December 31, 2009 filed by the Company on April 1, 2010 and incorporated herein by reference). |
| |
2.10 | ASX Austraclear Registry and IPA Services Agreement dated 14 October 2009 relating to an unlimited principal amount of debt securities authorized to be issued under the Company’s Australian Dollar Debt Issue Programme |
II-2
Table of Contents
| (filed as Exhibit 2.10 to the Company’s Annual Report on Form 20-F (No. 001-08382) for the year ended December 31, 2009 filed by the Company on April 1, 2010 and incorporated herein by reference). |
| |
2.11 | Note Deed Poll dated 2 June 2006 relating to an unlimited principal amount of debt securities authorized to be issued under the Company’s Australian Dollar Debt Issue Programme (filed as Exhibit 2.11 to the Company’s Annual Report on Form 20-F (No. 001-08382) for the year ended December 31, 2009 filed by the Company on April 1, 2010 and incorporated herein by reference). |
| |
7.1 | Statement of Calculation of Ratios of Earnings to Fixed Charges (filed herewith). |
| |
8.1 | List of Subsidiaries (filed herewith) |
| |
12.1 | Certifications pursuant to Rule 13a-14(a) or Rule 15d-14(a) under the Securities Exchange Act of 1934 (filed herewith). |
| |
13.1 | Certifications Pursuant to 18 U.S.C Section 1350, as adopted Pursuant to Section 906 of the Sarbanes-Oxley Act of 2002 (filed herewith). |
| |
15.1. | Consent of Independent Registered Public Accounting Firm (filed herewith). |
| |
Pursuant to Instruction 2(b)(i) in the “Instructions as to Exhibits” in Form 20-F, various instruments defining the rights of holders of long-term debt securities issued by the Company are not being filed herewith because such debt securities are not registered with the Commission and the total amount of debt securities authorized under each such instrument does not exceed 10% of the total assets of the Company. The Company hereby agrees to furnish a copy of any such instrument to the Commission upon request.
III-3