United States
Securities and Exchange Commission
Washington, D.C. 20549
Form N-CSR
Certified Shareholder Report of Registered Management Investment Companies
811-3181
(Investment Company Act File Number)
Federated Short-Intermediate Duration Municipal Trust
_______________________________________________________________
(Exact Name of Registrant as Specified in Charter)
Federated Investors Funds
4000 Ericsson Drive
Warrendale, Pennsylvania 15086-7561
(Address of Principal Executive Offices)
(412) 288-1900
(Registrant's Telephone Number)
John W. McGonigle, Esquire
Federated Investors Tower
1001 Liberty Avenue
Pittsburgh, Pennsylvania 15222-3779
(Name and Address of Agent for Service)
(Notices should be sent to the Agent for Service)
Date of Fiscal Year End: 06/30/17
Date of Reporting Period: 06/30/17
| Item 1. | Reports to Stockholders |

Annual Shareholder Report
June 30, 2017
| Share Class | Ticker |
| A | FMTAX |
| Institutional | FSHIX |
| Service | FSHSX |
Federated Short-Intermediate Duration Municipal Trust
Fund Established 1981
Dear Valued Shareholder,
I am pleased to present the Annual Shareholder Report for your fund covering the period from July 1, 2016 through June 30, 2017. This report includes Management's Discussion of Fund Performance, a complete listing of your fund's holdings, performance information and financial statements along with other important fund information.
In addition, our website, FederatedInvestors.com, offers easy access to Federated resources that include timely fund updates, economic and market insights from our investment strategists, and financial planning tools. We invite you to register to take full advantage of its capabilities.
Thank you for investing with Federated. I hope you find this information useful and look forward to keeping you informed.
Sincerely,
John B. Fisher, President
Not FDIC Insured • May Lose Value • No Bank Guarantee
CONTENTS
| 1 |
| 10 |
| 11 |
| 37 |
| 40 |
| 41 |
| 42 |
| 43 |
| 52 |
| 53 |
| 55 |
| 63 |
| 69 |
| 69 |
Management's Discussion of Fund Performance (unaudited)
The total return of Federated Short-Intermediate Duration Municipal Trust (the “Fund”), based on net asset value for the 12-month reporting period ended June 30, 2017, was 0.09% for the Class A Shares, 0.49% for the Institutional Shares and 0.25% for the Service Shares. The 0.49% total return for the Institutional Shares for the reporting period consisted of 1.36% of AMT-free, tax-exempt dividends and -0.87% of depreciation in the net asset value of the shares.1 The total return of the S&P Municipal Bond 0-7 Years, Investment-Grade, Non-AMT, 5% Prerefunded Index (SPMB7),2,3 a benchmark for the Fund, was 0.41% while the total return of the S&P 1-5 Year National AMT-Free Municipal Bond Index (SPNAFMB)4 was 0.44% during the same period. The total return of the Lipper Short Municipal Debt Funds Average (LSMDF),5 a peer group average for the Fund, was 0.24% over the reporting period. The Fund's and the LSMDF's total returns for the most recently completed fiscal year reflected actual cash flows, transaction costs and other expenses, which were not reflected in the total return of any index.
During the reporting period, the most significant factors affecting the Fund's performance relative to the SPMB7 were: (a) the effective duration of its portfolio (which indicates the portfolio's sensitivity to changes in interest rates)6,7 (b) the allocation of the portfolio among securities of similar issuers (referred to as sectors); and (c) the credit rating of portfolio securities (credit quality).8
MARKET OVERVIEW
During the reporting period, 10-year U.S. Treasury yields increased from a low of 1.36% in July of 2016 to a high of 2.63% in March of 2017 and averaged 2.09%. Economic activity in the U.S. expanded at a moderate pace despite the global economic and financial setbacks in recent months.
Inflation showed signs of picking up late in the reporting period; however, it continued to run below the 2% longer-run objective of the Federal Reserve (Fed). This partly reflected declines in energy prices and impacts of the dollar's strength on non-energy imports. The Fed's decision to raise the federal funds target rate (FFTR) by 0.25% three times during the reporting period was mostly anticipated by the markets. In determining the size and timing of changes in the FFTR, changes in the Federal Open Market Committee's objectives of maximum employment and a 2% inflation target, are essential. The labor market continued to strengthen as economic activity expanded at a moderate pace. Job gains remained solid and the unemployment rate stayed near its lows late in the reporting period. Measures of consumer and business sentiment also improved. There remained considerable uncertainty about the prospects for changes in fiscal and other government policies as well as about the
Annual Shareholder Report
timing and magnitude of the net effect of such changes on economic activity. Health care reform, tax reform, changes in financial regulations and increased infrastructure spending were among the important policy issues the Trump administration mentioned as priorities.
During the reporting period, developments in Europe continued to be a focus for investors which indirectly affected interest rate levels in the tax-exempt municipal bond market. Just before the reporting period, the vote by the United Kingdom to leave the European Union (“Brexit”) resulted in immediate asset price volatility and some financial markets, particularly certain foreign exchange markets, experienced brief periods of strained liquidity. Safe haven asset prices appreciated substantially, but broad-based market dislocations did not develop. Overall, the negative sentiment surrounding the Brexit outcome was subsequently alleviated by expectations of the central banks being more accommodative. Nevertheless, several long-term global risks related to Brexit remained, such as the potential for conservative, populist political parties to gain influence in subsequent elections in Europe. France and Germany have been of particular interest because of their leadership positions within the European Union. The populist's loss in the French national elections created a relief rally for the markets concerning potential trade related impacts. There also continued to be downside risks to growth emanating from the region, given its unresolved imbalances, weak economic growth and continued deflationary risks. The U.S. dollar strengthened against the currencies of most advanced economies amid concerns about growth in those countries as well as announcements by several central banks regarding monetary policy actions. The European Central Bank announced that it would maintain its asset purchase program.
Downward pressure on domestic energy activity continued over most of the reporting period as oil prices remained mostly below $50 per barrel. The imbalance of crude oil supply relative to demand remained, and it was not expected to resolve quickly. The collapse in the price of oil supported the fixed-income markets by further reducing price pressures and generating concerns that the drop in oil prices might reflect declining demand in a weakening global economy. The support for household spending from lower energy prices was offset by the restraint implied by the appreciation of the U.S. dollar and the possibility of adverse effects from slower economic growth in China.
State and local government payrolls increased somewhat near the end of the reporting period while nominal construction spending by these governments declined reflecting a reticence to take on additional debt. The spread between “AAA”-rated and “BBB”-rated general obligation debt widened at different maturities along the yield curve during the period. Credit quality continued to be generally stable. However, fiscal distress continued to be a focal point for states such as Connecticut, New Jersey and Illinois. The municipal bond market's technical (supply and demand) position was mostly favorable over the reporting period. The issuance of municipal debt was lower than in previous periods as issuers were hesitant to add additional leverage and the economic
Annual Shareholder Report
benefits of refunding existing debt became less advantageous. Flows from investors into intermediate, long and high-yield municipal bonds were positive and broad-based for a significant portion of the reporting period. The intermittent flight-to-quality by investors as a result of the unstable global political and economic environment also favored municipal bonds as they were viewed as a safer alternative investment.
Late in the reporting period, the state of Illinois failed to enact a budget for the second consecutive year after running large multi-year deficits resulting in the accumulation of $14 billion in unpaid bills and significant underfunding of pensions. The State did suffer multiple notch downgrades to lower investment-grade,9 and the rating agencies warned of imminent downgrades to “junk” without the passage of a budget and additional revenues.10 Across both state and local governments, the ongoing pressures on public pension plans and their unfunded liabilities continued to receive significant scrutiny.
DURATION
The Fund's dollar-weighted average modified duration at the end of the reporting period was 1.74 years. Duration management and the positioning of the bond maturities held along the short-intermediate portion of the municipal yield curve continued to be a significant component of the Fund's investment strategy. Reflecting the expected increases of the FFTR over the period and the movement to higher short-term municipal interest rates, the Fund's duration generally ranged from 1.60 years to 1.75 years over the period. The Fund's average duration over the reporting period was about 1.70 years and considerably shorter than that of the SPMB7, which was 2.72 years at the end of the reporting period.
The municipal short-intermediate yield curve, ranging from weekly variable rate demand notes (VRDNs) to seven years in maturity, shifted upward about 40 to 50 basis points over the reporting period mostly in parallel fashion due to the Fed increasing the FFTR three times over the period as rate normalization continues in conjunction with favorable economic growth, inflation and employment. Also, the election and pro-growth policies of the Trump administration were material factors in changing the mindset of the market and the path of interest rates. Because of this parallel shift upward in yields, bonds with progressively shorter maturities/durations performed better than those with longer maturities/durations. As a result, floating rate notes (FRNs), whose coupons are tied to 7-day Securities Industry and Financial Markets Association (SIFMA) plus a spread, and bonds from one to two years outperformed bonds with incremental longer maturities/durations within this zero to seven-year short-intermediate maturity band.
Annual Shareholder Report
With yields rising, management allocated over 60% of the Fund's assets to durations of less than two years utilizing FRNs, VRDNs and short-maturity bonds. The Fund was consistently underweight within the SPMB7 duration allocations along the yield curve from three to six years. These decisions positively impacted the Fund's performance relative to the SPMB7.
With the three Fed tightenings and bond interest rates moving upward over the reporting period, the Fund's 25% allocation to FRNs and 5-10% allocation to core VRDNs with coupons that reset weekly benefited from the 50 basis point rise in the base SIFMA 7-day index (weekly reset). Over 30% of the Fund benefited from this increase in tax-exempt coupons for these instruments and this positively impacted both the income and price performance for the FRNs, and the income on VRDNs and commercial paper rolls. These security selection and yield curve decisions positively impacted Fund performance relative to the SPMB7.
SECTOR ALLOCATION
During the reporting period, the Fund received a negative contribution to excess return from sector allocations.
The Fund maintained higher percentage portfolio allocation, relative to the SPMB7, to securities of toll roads, hospitals and senior care bonds. These allocations helped the Fund's performance due to the outperformance of these sectors relative to the SPMB7. The Fund also had an underweight, relative to the SPMB7, in state and local general obligation debt, and this helped Fund performance as this sector continued to underperform within the SPMB7. Also, the security selection decision within this sector for the Fund did help relative performance as well.
The Fund's overweight and security selection decisions (mainly First Energy Solutions debt which was exited during the period) within industrial development and pollution control revenue sector (corporate obligors and investor-owned electric and gas utilities) contributed negative excess return relative to SPMB7.
The Fund was underweight pre-refunded bonds (which are bonds for which the principal and interest payments are secured or guaranteed by cash or U.S. Treasury securities held in an escrow account), and since this sector was an underperformer within the SPMB7, this positively affected Fund performance. The Fund held no exposure to Puerto Rico or its public corporations over the reporting period, and this benefited performance over the reporting period as the market prepared for an issuer default and congressional legislation.
Annual Shareholder Report
CREDIT QUALITY
During the reporting period, investor appetite for yield in the low interest rate environment increased municipal bond fund inflows and resulted in outperformance of bonds rated “A” and “BBB” (or unrated bonds of comparable quality) relative to bonds rated in the higher rating categories (or unrated bonds of comparable quality). Bonds in the non-investment grade category, below “BBB,” also outperformed the higher rating categories. With the decrease in credit spreads during the reporting period, and to a lesser extent for “AAA”-rated and “AA”-rated (or unrated comparable quality) debt, the Fund's overweight position, relative to the SPMB7, in “A”-rated and “BBB”-rated (or unrated comparable quality) debt and a small position in “B”- rated debt (Chicago Board of Education) during the reporting period had a large and positive excess return impact on the Fund's performance, as the yield on “A”-rated and “BBB”-rated (or unrated comparable quality) and high-yield debt decreased to a greater extent than for higher investment-grade securities.
| 1 | Income may be subject to state and local taxes. The investment adviser normally will invest the Fund's assets entirely in securities whose interest is not subject to the AMT for individuals and corporations, such that, normally, distributions of annual interest income are exempt from the AMT (in addition to the federal regular income tax). However, in certain circumstances (such as, for example, when there is a lack of supply of non-AMT securities or there are advantageous market conditions), to pursue the Fund's investment objective, the Fund's adviser may invest the Fund's assets in securities that may be subject to the AMT. In such circumstances, interest from the Fund's investments may be subject to the AMT. As of October 31, 2007, the Fund changed from investing in a portfolio of tax-exempt securities with a dollar-weighted average portfolio maturity of less than three years to investing in a portfolio of tax-exempt securities with a dollar-weighted average portfolio duration of less than five years. As a result of the difference in investment strategy, the Fund's performance shown might have differed materially. |
| 2 | Please see the footnotes to the line graphs under “Fund Performance and Growth of a $10,000 Investment” below for the definition of, and more information about, the SPMB7. |
| 3 | The total return for the S&P Municipal Bond Short Intermediate Index (SPMBSII), the Fund's broad-based securities market index, was 0.36% during the same period. Please also see the footnotes to the line graphs below for definitions of, and further information about, the SPMBSII. |
| 4 | Please see the footnotes to the line graphs under “Fund Performance and Growth of a $10,000 Investment” below for the definition of, and more information about, the SPNAFMB. |
| 5 | Please see the footnotes to the line graphs under “Fund Performance and Growth of a $10,000 Investment” below for the definition of, and more information about, the LSMDF. |
| 6 | Bond prices are sensitive to changes in interest rates, and a rise in interest rates can cause a decline in their prices. |
| 7 | Duration is a measure of a security's price sensitivity to changes in interest rates. Securities with longer durations are more sensitive to changes in interest rates than securities with shorter durations. For purposes of this Management's Discussion of Fund Performance, duration is determined using a third-party analytical system. |
| 8 | Credit ratings pertain only to the securities in the portfolio and do not protect Fund shares against market risk. Credit ratings are an indication of the risk that a security will default. They do not protect a security from credit risk. Lower-rated bonds typically offer higher yields to help compensate investors for the increased risk associated with them. Among these risks are lower creditworthiness, greater price volatility, more risk to principal and income than with higher-rated securities and increased possibilities of default. |
Annual Shareholder Report
| 9 | Investment-grade securities are securities that are rated at least “BBB” or unrated securities of a comparable quality. Noninvestment-grade securities are securities that are not rated at least “BBB” or unrated securities of a comparable quality. Investment-grade securities and noninvestment-grade securities may either be: (a) rated by a nationally recognized statistical rating organization or rating agency; or (b) unrated securities that the Fund's investment adviser (“Adviser”) believes are of comparable quality. The rating agencies that provided the ratings for rated securities include Standard and Poor's, Moody's Investor Services, Inc. and Fitch Rating Service. When ratings vary, the highest rating is used. Credit ratings of “AA” or better are considered to be high credit quality; credit ratings of “A” are considered high or medium/good quality; and credit ratings of “BBB” are considered to be medium/good credit quality and the lowest category of investment-grade securities; credit ratings of “BB” and below are lower-rated, noninvestment-grade securities or junk bonds; and credit ratings of “CCC” or below are noninvestment-grade securities that have high default risk. Any credit quality breakdown does not give effect to the impact of any credit derivative investments made by the Fund. Credit ratings are an indication of the risk that a security will default. They do not protect a security from credit risk. Lower-rated bonds typically offer higher yields to help compensate investors for the increased risk associated with them. Among these risks are lower creditworthiness, greater price volatility, more risk to principal and income than with higher-rated securities and increased possibilities of default. |
| 10 | Subsequent to the end of the reporting period, the legislature overrode the governor's budget veto to enact increases in personal and corporate income taxes that should raise $5 billion per year. These actions stabilized the state's ratings for now, but challenges persist on the spending and pension side. |
Annual Shareholder Report
FUND PERFORMANCE AND GROWTH OF A $10,000 INVESTMENT
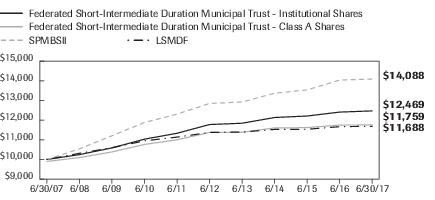
The graph below illustrates the hypothetical investment of $10,0001 in the Federated Short-Intermediate Duration Municipal Trust (the “Fund”) from June 30, 2007 to June 30, 2017, compared to the S&P Municipal Bond Short Intermediate Index (SPMBSII),2 and the Lipper Short Municipal Debt Funds Average (LSMDF).3 Because the S&P 1-5 Year National AMT-Free Municipal Bond Index (SPNAFMB)4,5 and the S&P Municipal Bond 0-7 Years Investment Grade Non-AMT 5% Prerefunded Index (SPMB7),5,6 secondary indexes for the Fund, do not yet have 10 years of published return information, the indexes have been omitted from the line graph below. The Average Annual Total Return table below shows returns for each class averaged over the stated periods.
Growth of a $10,000 Investment
Growth of $10,000 as of June 30, 2017
| Federated Short-Intermediate Duration Municipal Trust - | Institutional Shares | Class A Shares | SPMBSII | LSMDF |
| F | F | I | I |
| 6/30/2007 | 10,000 | 9,900 | 10,000 | 10,000 |
| 6/30/2008 | 10,247 | 10,097 | 10,539 | 10,315 |
| 6/30/2009 | 10,589 | 10,383 | 11,207 | 10,597 |
| 6/30/2010 | 11,033 | 10,764 | 11,880 | 10,948 |
| 6/30/2011 | 11,332 | 11,001 | 12,306 | 11,137 |
| 6/30/2012 | 11,776 | 11,375 | 12,848 | 11,373 |
| 6/30/2013 | 11,843 | 11,382 | 12,923 | 11,395 |
| 6/30/2014 | 12,134 | 11,604 | 13,369 | 11,528 |
| 6/30/2015 | 12,210 | 11,619 | 13,535 | 11,537 |
| 6/30/2016 | 12,409 | 11,749 | 14,037 | 11,668 |
| 6/30/2017 | 12,469 | 11,759 | 14,088 | 11,688 |
41 graphic description end -->
The Fund offers multiple shares classes whose performance may be greater than or less than its other share class(es) due to differences in sales charges and expenses. See the Average Annual Returns table below for the returns of additional classes not shown in the line graph above.
| ■ | Total returns shown for Class A include the maximum sales charge of 1.00% ($10,000 investment minus $100 sales charge = $9,900) |
Annual Shareholder Report
Average Annual Total Returns for the Period Ended 6/30/2017
(returns reflect all applicable sales charges as specified below in footnote #1)
| | 1 Year | 5 Years | 10 Years |
| Class A Shares | (0.87)% | 0.46% | 1.63% |
| Institutional Shares | 0.49% | 1.15% | 2.23% |
| Service Shares | 0.25% | 0.90% | 1.99% |
| SPMBSII | 0.36% | 1.86% | 3.49% |
| SPMB7 | 0.41% | 1.55% | — |
| SPNAFMB | 0.44% | 1.12% | — |
| LSMDF | 0.24% | 0.64% | 1.55% |
Performance data quoted represents past performance which is no guarantee of future results. Investment return and principal value will fluctuate so that an investor's shares, when redeemed, may be worth more or less than their original cost. Mutual fund performance changes over time and current performance may be lower or higher than what is stated. For current to the most recent month-end performance and after-tax returns, visit FederatedInvestors.com or call 1-800-341-7400. Returns shown do not reflect the deduction of taxes that a shareholder would pay on Fund distributions or the redemption of Fund shares. Mutual funds are not obligations of or guaranteed by any bank and are not federally insured.
| 1 | Represents a hypothetical investment of $10,000 in the Fund after deducting applicable sales charges: For Class A Shares, the maximum sales charge of 1.00% ($10,000 investment minus $100 sales charge = $9,900). The Fund's performance assumes the reinvestment of all dividends and distributions. The SPMBSII, SPMB7, SPNAFMB and the LSMDF have been adjusted to reflect reinvestment of dividends on securities in the indexes and the average. As of October 31, 2007, the Fund changed from investing in a portfolio of tax-exempt securities with a dollar-weighted average portfolio maturity of less than three years to investing in a portfolio of tax-exempt securities with a dollar-weighted average portfolio duration of less than five years. As a result of the difference in investment strategy, the Fund's performance shown might have differed materially. |
| 2 | The SPMBSII consists of bonds in the S&P Municipal Bond Index with a minimum maturity of one year and a maximum maturity of eight years. The S&P Municipal Bond Index is designed to track fixed-rate tax-free bonds and bonds subject to the AMT. The S&P Municipal Bond Index includes bonds of all quality—from “AAA” to non-rated, including defaulted bonds—and from all sectors of the municipal bond market. The SPMBSII is not adjusted to reflect sales charges, expenses and other fees that the Securities and Exchange Commission (SEC) requires to be reflected in the Fund's performance. Unlike the Fund, the SPMBSII is unmanaged and is not affected by cash flows. It is not possible to invest directly in this index. |
| 3 | The LSMDF represents the average of the total returns reported by all the mutual funds designated by Lipper, Inc. as falling in the category indicated, and is not adjusted to reflect any sales charges. However, these returns are reported net of expenses or other fees that the SEC requires to be reflected in a fund's performance. |
| 4 | The SPNAFMB is a broad, comprehensive, market value-weighted index designed to measure the performance of the investment-grade tax-exempt U.S. municipal bond market with an effective maturity of 1 to 5 years. Bonds issued by U.S. territories, including Puerto Rico, are excluded from this index. The SPNAFMB is not adjusted to reflect sales charges, expenses and other fees that the SEC requires to be reflected in the Fund's performance. The SPNAFMB is unmanaged, and, unlike the Fund, is not affected by cash flows. It is not possible to invest directly in an index. |
Annual Shareholder Report
| 5 | Because the SPMB7 and SPNAFMB indexes do not yet have 10 years of published performance information, they do not have average annual total returns for the 10-year period. |
| 6 | The SPMB7 represents the portion of the S&P Municipal Bond Investment Grade Index composed solely of investment-grade bonds (those with ratings higher than “BBB-”/“Baa3”) with remaining maturities of between zero and seven years that are not subject to AMT, 5% of which are pre-refunded. The SPMB7 is not adjusted to reflect sales charges, expenses and other fees that the SEC requires to be reflected in the Fund's performance. The SPMB7 is unmanaged, and, unlike the Fund, is not affected by cash flows. It is not possible to invest directly in an index. |
Annual Shareholder Report
Portfolio of Investments Summary Table (unaudited)
At June 30, 2017, the Fund's sector composition1 was as follows:
| Sector Composition | Percentage of
Total Net Assets |
| Hospital | 18.2% |
| General Obligation—Local | 12.1% |
| Toll Road | 10.7% |
| Electric and Gas | 8.3% |
| Senior Care | 5.5% |
| General Obligation—State | 5.2% |
| Industrial Development/Pollution Control | 4.9% |
| General Obligation—State Appropriation | 4.3% |
| Water and Sewer | 4.1% |
| Public Power | 3.8% |
| Other2 | 22.0% |
| Other Assets and Liabilities—Net3 | 0.9% |
| TOTAL | 100.0% |
| 1 | Sector classifications, and the assignment of holdings to such sectors, are based upon the economic sector and/or revenue source of the underlying obligor, as determined by the Fund's Adviser. For securities that have been enhanced by a third-party, including bond insurers and banks, sector classifications are based upon the economic sector and/or revenue source of the underlying obligor, as determined by the Fund's Adviser. |
| 2 | For purposes of this table, sector classifications constitute 77.1% of the Fund's total net assets. Remaining sectors have been aggregated under the designation “Other.” |
| 3 | Assets, other than investments in securities, less liabilities. See Statement of Assets and Liabilities. |
Annual Shareholder Report
Portfolio of Investments
June 30, 2017
Principal
Amount | | | Value |
| | | MUNICIPAL BONDS—95.5% | |
| | | Alabama—1.2% | |
| $430,000 | | Birmingham, AL Waterworks Board, Subordinate Water Revenue Refunding Bonds (Series 2016-B), 5.00%, 1/1/2023 | $502,520 |
| 1,035,000 | | Birmingham, AL Waterworks Board, Subordinate Water Revenue Refunding Bonds (Series 2016-B), 5.00%, 1/1/2024 | 1,231,091 |
| 10,000,000 | | Black Belt Energy Gas District, AL, Gas Supply Revenue Bonds (Series 2017), 4.00% TOBs (Royal Bank of Canada GTD), 7/1/2022 | 10,972,600 |
| | | TOTAL | 12,706,211 |
| | | Alaska—0.7% | |
| 2,000,000 | | Valdez, AK Marine Terminal, Revenue Refunding Bonds (Series 2003A), 5.00% (BP PLC), 1/1/2021 | 2,214,160 |
| 5,000,000 | | Valdez, AK Marine Terminal, Revenue Refunding Bonds (Series 2003B), 5.00% (BP PLC), 1/1/2021 | 5,535,400 |
| | | TOTAL | 7,749,560 |
| | | Arizona—0.7% | |
| 3,000,000 | 1 | Arizona Health Facilities Authority, Variable Rate Revenue Refunding Bonds (Series 2013A-1), 2.76% TOBs (Phoenix Children's Hospital), Mandatory Tender 2/5/2020 | 3,043,170 |
| 5,000,000 | | Maricopa County, AZ Pollution Control Corp., PCR Revenue Refunding Bonds (Series 2010A), 2.40% TOBs (Public Service Co., NM), Mandatory Tender 6/1/2020 | 5,034,500 |
| | | TOTAL | 8,077,670 |
| | | Arkansas—0.7% | |
| 500,000 | | Beaver Water District of Benton and Washington Counties, AR, Revenue Refunding Bonds (Series 2010), 3.00%, 11/15/2017 | 503,940 |
| 7,250,000 | | Independence County, AR, PCR Refunding Bonds (Series 2013), 2.375% (Entergy Arkansas, Inc.), 1/1/2021 | 7,450,680 |
| | | TOTAL | 7,954,620 |
| | | California—7.8% | |
| 1,000,000 | | Alameda Corridor Transportation Authority, CA, Tax-Exempt Senior Lien Revenue Refunding Bonds (Series 2013A), 5.00%, 10/1/2019 | 1,082,900 |
| 500,000 | | Alameda Corridor Transportation Authority, CA, Tax-Exempt Subordinate Lien Revenue Refunding Bonds (Series 2016A), 4.00%, 10/1/2021 | 541,515 |
| 750,000 | | Alameda Corridor Transportation Authority, CA, Tax-Exempt Subordinate Lien Revenue Refunding Bonds (Series 2016A), 4.00%, 10/1/2023 | 827,978 |
| 1,000,000 | | Alameda Corridor Transportation Authority, CA, Tax-Exempt Subordinate Lien Revenue Refunding Bonds (Series 2016A), 5.00%, 10/1/2022 | 1,143,750 |
Annual Shareholder Report
Principal
Amount | | | Value |
| | | MUNICIPAL BONDS—continued | |
| | | California—continued | |
| $10,000,000 | | Bay Area Toll Authority, CA, San Francisco Bay Area Toll Bridge Revenue Bonds (Series 2014C), 1.875% TOBs, Mandatory Tender 4/1/2019 | $10,086,400 |
| 5,000,000 | 1 | Bay Area Toll Authority, CA, San Francisco Bay Area Toll Bridge Revenue Bonds (SIFMA Index Rate Bonds Series 2007B-1), 2.01% TOBs, Mandatory Tender 4/1/2024 | 5,078,350 |
| 10,000,000 | 1 | Bay Area Toll Authority, CA, San Francisco Bay Area Toll Bridge Revenue Bonds (SIFMA Index Rate Bonds Series 2007G-1), 2.01% TOBs, Mandatory Tender 4/1/2024 | 10,156,700 |
| 13,000,000 | | California Health Facilities Financing Authority, Revenue Bonds (Series 2013B), 5.00% TOBs (St. Joseph Health System), Mandatory Tender 10/15/2019 | 14,050,140 |
| 2,045,000 | | California Health Facilities Financing Authority, Revenue Bonds (Series 2017C), 5.00% TOBs (Kaiser Permanente), Mandatory Tender 11/1/2022 | 2,400,339 |
| 2,500,000 | | California Infrastructure & Economic Development Bank, Revenue Refunding Bonds (Series 2010B), 1.75% TOBs (Pacific Gas & Electric Co.), Mandatory Tender 6/1/2022 | 2,500,025 |
| 2,000,000 | | California Infrastructure & Economic Development Bank, Revenue Refunding Bonds (Series 2010E), 1.75% TOBs (Pacific Gas & Electric Co.), Mandatory Tender 6/1/2022 | 2,000,020 |
| 500,000 | | California Municipal Finance Authority, Revenue Refunding Bonds (Series 2017A), 5.00% (Community Medical Centers), 2/1/2018 | 511,070 |
| 1,000,000 | | California Municipal Finance Authority, Revenue Refunding Bonds (Series 2017A), 5.00% (Community Medical Centers), 2/1/2019 | 1,055,960 |
| 1,000,000 | | California Municipal Finance Authority, Revenue Refunding Bonds (Series 2017A), 5.00% (Community Medical Centers), 2/1/2020 | 1,087,200 |
| 1,100,000 | | California Municipal Finance Authority, Revenue Refunding Bonds (Series 2017A), 5.00% (Community Medical Centers), 2/1/2021 | 1,225,400 |
| 1,000,000 | | California Municipal Finance Authority, Revenue Refunding Bonds (Series 2017A), 5.00% (Community Medical Centers), 2/1/2022 | 1,138,810 |
| 2,000,000 | | California Municipal Finance Authority, Revenue Refunding Bonds (Series 2017A), 5.00% (Community Medical Centers), 2/1/2023 | 2,315,760 |
| 2,000,000 | | California Municipal Finance Authority, Revenue Refunding Bonds (Series 2017A), 5.00% (Community Medical Centers), 2/1/2024 | 2,349,580 |
| 5,000,000 | | California PCFA, Solid Waste Disposal Revenue Refunding Bonds (Series 1998B), 3.625% (Waste Management, Inc.), 6/1/2018 | 5,113,600 |
| 1,440,000 | | California State Public Works Board, Lease Revenue Bonds (Series 2012H), 5.00%, 4/1/2019 | 1,539,158 |
| 9,250,000 | 1 | California State, UT GO Bonds (Index Floating Rate Bonds Series 2013E), 1.572% TOBs, Mandatory Tender 12/1/2018 | 9,286,908 |
| 4,000,000 | 1 | California State, UT GO Refunding Bonds (Series 2012B), 1.91%, 5/1/2019 | 4,019,320 |
| 3,000,000 | 1 | California State, UT GO Refunding Bonds (Series 2012B), 2.06%, 5/1/2020 | 3,027,660 |
Annual Shareholder Report
Principal
Amount | | | Value |
| | | MUNICIPAL BONDS—continued | |
| | | California—continued | |
| $2,500,000 | | Foothill/Eastern Transportation Corridor Agency, CA, Toll Road Revenue Refunding Bonds (Series 2013B-2), 5.00% TOBs, Mandatory Tender 1/15/2020 | $2,647,900 |
| 1,050,000 | | Orange County, CA Transportation Authority, Senior Lien Toll Road Revenue Refunding Bonds (Series 2013), 5.00% (91 Express Lanes-OCTA), 8/15/2019 | 1,136,688 |
| | | TOTAL | 86,323,131 |
| | | Colorado—0.7% | |
| 700,000 | | Colorado Health Facilities Authority, Revenue Refunding Bonds (Series 2015A), 3.00% (Covenant Retirement Communities, Inc.), 12/1/2017 | 705,313 |
| 600,000 | | Colorado Health Facilities Authority, Revenue Refunding Bonds (Series 2015A), 4.00% (Covenant Retirement Communities, Inc.), 12/1/2018 | 619,908 |
| 625,000 | | Colorado Health Facilities Authority, Revenue Refunding Bonds (Series 2015A), 4.00% (Covenant Retirement Communities, Inc.), 12/1/2019 | 656,137 |
| 1,000,000 | | Colorado Health Facilities Authority, Revenue Refunding Bonds (Series 2015A), 5.00% (Covenant Retirement Communities, Inc.), 12/1/2020 | 1,095,470 |
| 750,000 | | Colorado Health Facilities Authority, Revenue Refunding Bonds (Series 2015A), 5.00% (Covenant Retirement Communities, Inc.), 12/1/2021 | 837,907 |
| 250,000 | | Colorado Health Facilities Authority, Revenue Refunding Bonds (Series 2015A), 5.00% (Covenant Retirement Communities, Inc.), 12/1/2022 | 283,248 |
| 250,000 | | Colorado Health Facilities Authority, Revenue Refunding Bonds (Series 2016), 4.00% (Christian Living Communities), 1/1/2018 | 252,050 |
| 225,000 | | Colorado Health Facilities Authority, Revenue Refunding Bonds (Series 2016), 4.00% (Christian Living Communities), 1/1/2019 | 230,114 |
| 250,000 | | Colorado Health Facilities Authority, Revenue Refunding Bonds (Series 2016), 4.00% (Christian Living Communities), 1/1/2020 | 258,730 |
| 350,000 | | Colorado Health Facilities Authority, Revenue Refunding Bonds (Series 2016), 4.00% (Christian Living Communities), 1/1/2021 | 365,110 |
| 400,000 | | Colorado Health Facilities Authority, Revenue Refunding Bonds (Series 2016), 4.00% (Christian Living Communities), 1/1/2022 | 418,448 |
| 640,000 | | Colorado Health Facilities Authority, Revenue Refunding Bonds (Series 2016), 5.00% (Christian Living Communities), 1/1/2023 | 701,082 |
| 750,000 | | Colorado Health Facilities Authority, Revenue Refunding Bonds (Series 2016), 5.00% (Christian Living Communities), 1/1/2024 | 826,380 |
| 600,000 | | Colorado Health Facilities Authority, Revenue Refunding Bonds (Series 2016), 5.00% (Christian Living Communities), 1/1/2025 | 663,102 |
| | | TOTAL | 7,912,999 |
Annual Shareholder Report
Principal
Amount | | | Value |
| | | MUNICIPAL BONDS—continued | |
| | | Connecticut—2.9% | |
| $2,580,000 | | Bridgeport, CT, UT GO Refunding Bonds (Series 2012B), 5.00%, 8/15/2017 | $2,592,410 |
| 5,000,000 | 1 | Connecticut State HEFA, Revenue Bonds (Series 2014B Floating Rate Note), 1.254% TOBs (Yale-New Haven Hospital), Mandatory Tender 7/1/2019 | 4,992,250 |
| 10,000,000 | 1 | Connecticut State, UT GO SIFMA Index Bonds (Series 2012A), 2.16%, 4/15/2020 | 10,133,800 |
| 2,000,000 | 1 | Connecticut State, UT GO SIFMA Index Bonds (Series 2012D), 1.83%, 9/15/2019 | 2,000,640 |
| 1,500,000 | 1 | Connecticut State, UT GO SIFMA Index Bonds (Series 2013A), 1.81%, 3/1/2023 | 1,497,735 |
| 2,255,000 | 1 | Connecticut State, UT GO SIFMA Index Bonds (Series 2013A), 1.86%, 3/1/2024 | 2,246,837 |
| 4,000,000 | 1 | Connecticut State, UT GO SIFMA Index Bonds (Series 2013A), 1.90%, 3/1/2025 | 3,974,560 |
| 2,100,000 | | West Haven, CT, UT GO Bonds, 4.00% (AGM INS), 8/1/2018 | 2,159,514 |
| 2,000,000 | | West Haven, CT, UT GO Bonds, 4.00% (AGM INS), 8/1/2019 | 2,098,560 |
| | | TOTAL | 31,696,306 |
| | | Florida—4.5% | |
| 4,500,000 | 1 | Citizens Property Insurance Corp. FL, (Citizens Property Insurance Coastal Account), SIFMA Floating Rate Notes (Series 2015A-2), 1.76%, 6/1/2018 | 4,493,295 |
| 630,000 | | Florida State Municipal Power Agency, Stanton II Project Revenue Bonds (Series 2012A), 4.00%, 10/1/2017 | 634,990 |
| 1,720,000 | | Halifax Hospital Medical Center, FL, Revenue Refunding Bonds, 4.00%, 6/1/2018 | 1,762,725 |
| 1,600,000 | | Halifax Hospital Medical Center, FL, Revenue Refunding Bonds, 5.00%, 6/1/2019 | 1,704,544 |
| 755,000 | | Halifax Hospital Medical Center, FL, Revenue Refunding Bonds, 5.00%, 6/1/2020 | 827,623 |
| 1,195,000 | | Halifax Hospital Medical Center, FL, Revenue Refunding Bonds, 5.00%, 6/1/2021 | 1,340,432 |
| 1,000,000 | | Halifax Hospital Medical Center, FL, Revenue Refunding Bonds, 5.00%, 6/1/2022 | 1,142,910 |
| 600,000 | | Hillsborough County, FL IDA, Hospital Revenue Refunding Bonds (Series 2012A), 5.00% (Tampa General Hospital), 10/1/2018 | 627,870 |
| 630,000 | | Hillsborough County, FL IDA, Hospital Revenue Refunding Bonds (Series 2012A), 5.00% (Tampa General Hospital), 10/1/2019 | 679,524 |
| 525,000 | | Hillsborough County, FL IDA, Hospital Revenue Refunding Bonds (Series 2012A), 5.00% (Tampa General Hospital), 10/1/2020 | 582,755 |
| 1,245,000 | | Hillsborough County, FL IDA, Hospital Revenue Refunding Bonds (Series 2012A), 5.00% (Tampa General Hospital), 10/1/2021 | 1,416,947 |
Annual Shareholder Report
Principal
Amount | | | Value |
| | | MUNICIPAL BONDS—continued | |
| | | Florida—continued | |
| $1,300,000 | | Hillsborough County, FL IDA, Hospital Revenue Refunding Bonds (Series 2012A), 5.00% (Tampa General Hospital), 10/1/2022 | $1,511,120 |
| 1,000,000 | | Jacksonville, FL, Special Revenue Refunding Bonds (Series 2016A), 5.00%, 10/1/2022 | 1,167,460 |
| 200,000 | | Lakeland, FL Energy Systems, Energy System Revenue & Refunding Bonds (Series 2016), 5.00%, 10/1/2017 | 202,088 |
| 500,000 | | Lakeland, FL Energy Systems, Energy System Revenue & Refunding Bonds (Series 2016), 5.00%, 10/1/2018 | 524,605 |
| 570,000 | | Lakeland, FL Energy Systems, Energy System Revenue & Refunding Bonds (Series 2016), 5.00%, 10/1/2020 | 636,947 |
| 750,000 | | Lakeland, FL Energy Systems, Energy System Revenue & Refunding Bonds (Series 2016), 5.00%, 10/1/2021 | 860,573 |
| 2,145,000 | | Lakeland, FL Energy Systems, Energy System Revenue & Refunding Bonds (Series 2016), 5.00%, 10/1/2022 | 2,513,919 |
| 2,000,000 | | Lakeland, FL Energy Systems, Energy System Revenue & Refunding Bonds (Series 2016), 5.00%, 10/1/2023 | 2,387,920 |
| 4,900,000 | | Miami-Dade County, FL IDA, Solid Waste Disposal Revenue Bonds (Series 2007), 1.75% TOBs (Waste Management, Inc.), Mandatory Tender 11/1/2019 | 4,921,217 |
| 2,200,000 | | Okeechobee County, FL, 1.55% TOBs (Waste Management, Inc.), Mandatory Tender 7/1/2021 | 2,178,858 |
| 305,000 | | Orange County, FL, Health Facilities Authority, Revenue Bonds (Series 2014), 3.00% (Presbyterian Retirement Communities), 8/1/2017 | 305,369 |
| 1,300,000 | | Orange County, FL, Health Facilities Authority, Revenue Bonds (Series 2014), 4.00% (Presbyterian Retirement Communities), 8/1/2019 | 1,351,038 |
| 1,750,000 | | Orlando & Orange County Expressway Authority, FL, Revenue Refunding Bonds (Series 2012A), 5.00%, 7/1/2018 | 1,818,232 |
| 1,500,000 | | Orlando & Orange County Expressway Authority, FL, Revenue Refunding Bonds (Series 2012A), 5.00%, 7/1/2019 | 1,609,980 |
| 1,350,000 | | Orlando & Orange County Expressway Authority, FL, Revenue Refunding Bonds (Series 2012A), 5.00%, 7/1/2020 | 1,492,843 |
| 1,500,000 | | Orlando, FL Utilities Commission, Utility System Revenue Refunding Bonds (Series 2011B), 5.00%, 10/1/2018 | 1,574,775 |
| 2,500,000 | | Palm Beach County, FL Health Facilities Authority, Retirement Communities Revenue Bonds (Series 2016), 4.00% (ACTS Retirement Life Communities, Inc.), 11/15/2019 | 2,622,500 |
| 2,500,000 | | Palm Beach County, FL Health Facilities Authority, Retirement Communities Revenue Bonds (Series 2016), 4.00% (ACTS Retirement Life Communities, Inc.), 11/15/2020 | 2,658,350 |
| 3,265,000 | | Palm Beach County, FL Health Facilities Authority, Retirement Communities Revenue Bonds (Series 2016), 5.00% (ACTS Retirement Life Communities, Inc.), 11/15/2021 | 3,638,842 |
| | | TOTAL | 49,190,251 |
Annual Shareholder Report
Principal
Amount | | | Value |
| | | MUNICIPAL BONDS—continued | |
| | | Georgia—2.2% | |
| $2,500,000 | | Atlanta, GA Airport Passenger Facilities Charge Revenue, Subordinate Lien General Revenue Bonds (Series 2010B), 5.00%, 1/1/2018 | $2,550,800 |
| 10,000,000 | | Burke County, GA Development Authority, Vogtle Project Revenue Refunding Bonds, 1.85% TOBs (Georgia Power Co.), Mandatory Tender 8/22/2019 | 9,974,800 |
| 3,000,000 | | Fulton County, GA Water & Sewage System, Revenue Refunding Bonds (Series 2011), 5.00%, 1/1/2019 | 3,174,360 |
| 830,000 | | Gainesville & Hall County, GA Development Authority, Retirement Communities Revenue Refunding Bonds (Series 2012), 4.00% (ACTS Retirement Life Communities, Inc.), 11/15/2017 | 837,188 |
| 7,500,000 | 1 | Gainesville & Hall County, GA Hospital Authority, (Northeast Georgia Health System, Inc.), RACs (Series 2014B), 1.86% TOBs, Mandatory Tender 2/18/2020 | 7,519,875 |
| | | TOTAL | 24,057,023 |
| | | Hawaii—0.1% | |
| 1,000,000 | | Hawaii State Department of Budget & Finance, Special Purpose Senior Living Revenue Refunding Bonds (Series 2012), 5.00% (Kahala Nui), 11/15/2017 | 1,013,640 |
| 500,000 | | Hawaii State Department of Budget & Finance, Special Purpose Senior Living Revenue Refunding Bonds (Series 2012), 5.00% (Kahala Nui), 11/15/2018 | 522,900 |
| | | TOTAL | 1,536,540 |
| | | Illinois—8.5% | |
| 4,000,000 | 1 | Chicago, IL Board of Education, UT GO Refunding Bonds (Series 2013A-3 SIFMA Index), 1.74% TOBs, Mandatory Tender 6/1/2018 | 3,979,360 |
| 400,000 | | Chicago, IL Midway Airport, Second Lien Revenue & Refunding Bonds (Series 2014B), 5.00%, 1/1/2019 | 422,632 |
| 500,000 | | Chicago, IL Midway Airport, Second Lien Revenue & Refunding Bonds (Series 2014B), 5.00%, 1/1/2020 | 544,635 |
| 3,250,000 | | Chicago, IL Midway Airport, Second Lien Taxable Revenue Refunding Bonds (Series 2013C), 5.00%, 1/1/2021 | 3,635,547 |
| 1,500,000 | | Chicago, IL Midway Airport, Second Lien Taxable Revenue Refunding Bonds (Series 2013C), 5.00%, 1/1/2022 | 1,712,295 |
| 1,500,000 | | Chicago, IL O'Hare International Airport, General Airport Senior Lien Revenue Refunding Bonds (Series 2015B), 5.00%, 1/1/2020 | 1,636,230 |
| 2,000,000 | | Chicago, IL O'Hare International Airport, General Airport Senior Lien Revenue Refunding Bonds (Series 2015B), 5.00%, 1/1/2021 | 2,243,820 |
| 1,450,000 | | Chicago, IL O'Hare International Airport, General Airport Senior Lien Revenue Refunding Bonds (Series 2016C), 5.00%, 1/1/2024 | 1,726,675 |
| 1,875,000 | | Chicago, IL O'Hare International Airport, General Airport Third Lien Revenue Bonds (Series 2011B), 5.00%, 1/1/2018 | 1,912,706 |
| 1,135,000 | | Chicago, IL Water Revenue, Second Lien Water Revenue Bonds (Series 2016A-1), 5.00%, 11/1/2023 | 1,287,816 |
Annual Shareholder Report
Principal
Amount | | | Value |
| | | MUNICIPAL BONDS—continued | |
| | | Illinois—continued | |
| $1,000,000 | | Chicago, IL Water Revenue, Second Lien Water Revenue Refunding Bonds (Series 2004), 5.00%, 11/1/2020 | $1,095,520 |
| 1,000,000 | | Chicago, IL Water Revenue, Second Lien Water Revenue Refunding Bonds (Series 2004), 5.00%, 11/1/2021 | 1,116,770 |
| 5,000,000 | | Chicago, IL Water Revenue, Second Lien Water Revenue Refunding Bonds (Series 2004), 5.00%, 11/1/2022 | 5,643,700 |
| 2,645,000 | | Chicago, IL Water Revenue, Second Lien Water Revenue Refunding Bonds (Series 2004), 5.00%, 11/1/2023 | 3,001,123 |
| 1,170,000 | | Cook County, IL, Refunding UT GO Bonds (Series 2014A), 5.00%, 11/15/2017 | 1,186,439 |
| 1,500,000 | | Cook County, IL, Refunding UT GO Bonds (Series 2014A), 5.00%, 11/15/2018 | 1,570,380 |
| 3,000,000 | 1 | Illinois Finance Authority, (Presbyterian Homes Obligated Group), Revenue Bonds (Series 2016B), 2.085% TOBs, Mandatory Tender 5/1/2021 | 3,014,010 |
| 6,500,000 | | Illinois Finance Authority, Revenue Bonds (Series 2008A-2), 5.00% TOBs (Advocate Health Care Network), Mandatory Tender 2/1/2020 | 7,090,395 |
| 2,500,000 | | Illinois Finance Authority, Revenue Bonds (Series 2011IL), 3.00% (Trinity Healthcare Credit Group), 12/1/2017 | 2,520,550 |
| 5,000,000 | | Illinois Finance Authority, Revenue Bonds (Series 2012 E-2), 1.75% TOBs (Ascension Health Alliance Senior Credit Group), Mandatory Tender 4/1/2021 | 5,021,300 |
| 550,000 | | Illinois Finance Authority, Revenue Bonds (Series 2016A), 4.00% (Presbyterian Homes Obligated Group), 11/1/2018 | 568,651 |
| 1,000,000 | | Illinois Finance Authority, Revenue Bonds (Series 2016A), 4.00% (Presbyterian Homes Obligated Group), 5/1/2019 | 1,043,920 |
| 1,855,000 | | Illinois Finance Authority, Revenue Bonds (Series 2016A), 5.00% (Presbyterian Homes Obligated Group), 5/1/2020 | 2,025,549 |
| 1,200,000 | | Illinois Finance Authority, Revenue Bonds (Series 2016A), 5.00% (Presbyterian Homes Obligated Group), 11/1/2021 | 1,358,196 |
| 1,500,000 | | Illinois Finance Authority, Revenue Bonds (Series 2016A), 5.00% (Presbyterian Homes Obligated Group), 11/1/2022 | 1,726,620 |
| 1,800,000 | | Illinois Finance Authority, Revenue Bonds (Series 2016A), 5.00% (Presbyterian Homes Obligated Group), 11/1/2023 | 2,099,574 |
| 5,000,000 | | Illinois Finance Authority, Revenue Bonds (Series A-1), 5.00% TOBs (Advocate Health Care Network), Mandatory Tender 1/15/2020 | 5,442,250 |
| 4,000,000 | | Illinois State Toll Highway Authority, Toll Highway Senior Revenue Bonds (Series 2013B-1), 5.00%, 12/1/2018 | 4,216,160 |
| 3,000,000 | | Illinois State, Build Illinois Bonds (Series 2016A), 5.00% (Illinois State Sales Tax), 6/15/2023 | 3,408,090 |
| 2,000,000 | | Illinois State, Build Illinois Bonds (Series 2016A), 5.00% (Illinois State Sales Tax), 6/15/2024 | 2,295,480 |
| 1,000,000 | | Illinois State, Build Illinois Bonds (Series 2016C), 4.00% (Illinois State Sales Tax), 6/15/2023 | 1,074,160 |
Annual Shareholder Report
Principal
Amount | | | Value |
| | | MUNICIPAL BONDS—continued | |
| | | Illinois—continued | |
| $1,000,000 | | Illinois State, Build Illinois Bonds (Series 2016C), 5.00% (Illinois State Sales Tax), 6/15/2022 | $1,126,880 |
| 4,000,000 | | Illinois State, Refunding UT GO Bonds (Series 2010), 5.00%, 1/1/2018 | 4,053,880 |
| 5,500,000 | | Illinois State, UT GO Bonds (Series of February 2014), 4.00%, 2/1/2019 | 5,577,880 |
| 1,750,000 | | Illinois State, UT GO Bonds (Series of February 2014), 4.00%, 2/1/2020 | 1,768,217 |
| 1,000,000 | | Illinois State, UT GO Bonds (Series of February 2014), 5.00%, 2/1/2019 | 1,029,520 |
| 2,000,000 | | Illinois State, UT GO Bonds (Series of February 2014), 5.00%, 2/1/2020 | 2,069,800 |
| 2,205,000 | | Kendall, Kane, & Will Counties, IL Community United School District No. 308, Refunding GO School Bonds (Series 2012), 4.00%, 10/1/2018 | 2,282,197 |
| | | TOTAL | 93,528,927 |
| | | Indiana—1.3% | |
| 855,000 | | Indiana State Finance Authority Hospital Revenue, Hospital Revenue Bonds (Series 2012A), 5.00% (Community Health Network), 5/1/2020 | 938,106 |
| 1,290,000 | | Indiana State Finance Authority Hospital Revenue, Hospital Revenue Bonds (Series 2013A), 5.00% (Beacon Health System Obligated Group), 8/15/2018 | 1,346,425 |
| 1,000,000 | | Indiana State Finance Authority Hospital Revenue, Hospital Revenue Bonds (Series 2013A), 5.00% (Beacon Health System Obligated Group), 8/15/2020 | 1,111,880 |
| 1,000,000 | | Indiana State Finance Authority, Second Lien Wastewater Utility Revenue Bonds (Series 2011B), 5.00% (CWA Authority), 10/1/2018 | 1,048,690 |
| 2,500,000 | | Indiana State Finance Authority, Second Lien Wastewater Utility Revenue Bonds (Series 2011B), 5.00% (CWA Authority), 10/1/2019 | 2,698,250 |
| 4,000,000 | | Rockport, IN PCR, Revenue Refunding Bonds (Series 2008D), 2.05% TOBs (Indiana Michigan Power Co.), Mandatory Tender 6/1/2021 | 4,002,720 |
| 3,000,000 | | Whiting, IN Environmental Facilities, Revenue Bonds (Series 2009), 5.25% (BP PLC), 1/1/2021 | 3,346,560 |
| | | TOTAL | 14,492,631 |
| | | Iowa—0.8% | |
| 6,000,000 | | Iowa Finance Authority, Hospital Revenue & BANs (Series 2015), 1.75% (Shenandoah Medical Center), 6/1/2018 | 6,001,800 |
| 3,000,000 | | People's Memorial Hospital of Buchanan County, IA, Hospital Revenue Notes (Series 2016), 1.50% (Buchanan County Health Center), 12/1/2018 | 2,990,550 |
| | | TOTAL | 8,992,350 |
| | | Kansas—0.3% | |
| 500,000 | | Wyandotte County, KS Unified Government Utility System, Improvement & Revenue Refunding Bonds (Series 2014-A), 4.00%, 9/1/2018 | 516,915 |
| 1,000,000 | | Wyandotte County, KS Unified Government Utility System, Improvement & Revenue Refunding Bonds (Series 2014-A), 5.00%, 9/1/2020 | 1,108,680 |
Annual Shareholder Report
Principal
Amount | | | Value |
| | | MUNICIPAL BONDS—continued | |
| | | Kansas—continued | |
| $1,000,000 | | Wyandotte County, KS Unified Government Utility System, Improvement & Revenue Refunding Bonds (Series 2014-A), 5.00%, 9/1/2021 | $1,139,760 |
| | | TOTAL | 2,765,355 |
| | | Kentucky—1.6% | |
| 5,000,000 | | Kentucky EDFA, Revenue Bonds (Series 2009B), 2.70% TOBs (Catholic Health Initiatives), Mandatory Tender 11/10/2021 | 5,116,750 |
| 8,700,000 | | Kentucky Public Transportation Infrastructure Authority, Subordinate Toll Revenue BANs (Series 2013A), 5.00%, 7/1/2017 | 8,700,783 |
| 4,000,000 | | Louisville & Jefferson County, KY Metropolitan Government, Environmental Facilities Revenue Refunding Bonds (Series 2017A), 1.25% TOBs (Louisville Gas & Electric Co.), Mandatory Tender 6/2/2019 | 3,992,880 |
| | | TOTAL | 17,810,413 |
| | | Louisiana—2.0% | |
| 3,600,000 | 1 | Louisiana State Gas & Fuels Second Lien, Revenue Refunding Bonds (Series 2013B-2 LIBOR Index), 1.285% TOBs, Mandatory Tender 5/1/2018 | 3,594,564 |
| 8,570,000 | | Louisiana State Offshore Terminal Authority, Deepwater Port Revenue Bonds (Series 2010B-1), 2.20% TOBs (Loop LLC), Mandatory Tender 10/1/2017 | 8,586,969 |
| 3,765,000 | | St. Charles Parish, LA Gulf Opportunity Zone, Revenue Bonds (Series 2010), 4.00% TOBs (Valero Energy Corp.), Mandatory Tender 6/1/2022 | 3,976,593 |
| 2,500,000 | | Tobacco Settlement Financing Corp., LA, Tobacco Settlement Asset-Backed Refunding Bonds (Series 2013A), 5.00%, 5/15/2018 | 2,575,950 |
| 3,250,000 | | Tobacco Settlement Financing Corp., LA, Tobacco Settlement Asset-Backed Refunding Bonds (Series 2013A), 5.00%, 5/15/2019 | 3,428,230 |
| | | TOTAL | 22,162,306 |
| | | Massachusetts—0.4% | |
| 1,915,000 | 1 | Massachusetts Development Finance Agency, (Partners Healthcare Systems), Revenue Bonds (Series 2015O-3), 1.39% TOBs, Mandatory Tender 1/29/2020 | 1,898,742 |
| 2,120,000 | | Massachusetts Municipal Wholesale Electric Co., Power Supply Project Revenue Bonds (Nuclear Project No. 6 Series 2011), 5.00%, 7/1/2017 | 2,120,254 |
| | | TOTAL | 4,018,996 |
| | | Michigan—4.4% | |
| 1,125,000 | | Michigan State Finance Authority Revenue, Local Government Loan Program Revenue Bonds (Series 2014B), 5.00% (Public Lighting Authority), 7/1/2019 | 1,194,592 |
| 1,200,000 | | Michigan State Finance Authority Revenue, Local Government Loan Program Revenue Bonds (Series 2014B), 5.00% (Public Lighting Authority), 7/1/2020 | 1,304,412 |
Annual Shareholder Report
Principal
Amount | | | Value |
| | | MUNICIPAL BONDS—continued | |
| | | Michigan—continued | |
| $2,000,000 | | Michigan State Finance Authority Revenue, Local Government Loan Program Revenue Bonds (Series 2015A), 5.00% (Detroit, MI City School District)/(Q-SBLF GTD), 5/1/2018 | $2,062,620 |
| 3,000,000 | | Michigan State Finance Authority Revenue, Local Government Loan Program Revenue Bonds (Series 2015A), 5.00% (Detroit, MI City School District)/(Q-SBLF GTD), 5/1/2019 | 3,189,420 |
| 4,500,000 | | Michigan State Finance Authority Revenue, Local Government Loan Program Revenue Bonds (Series 2015A), 5.00% (Detroit, MI City School District)/(Q-SBLF GTD), 5/1/2020 | 4,914,630 |
| 5,000,000 | | Michigan State Finance Authority Revenue, Senior Lien Revenue Bonds (Series 2014 D-1), 5.00% (Detroit, MI Water Supply System)/(AGM INS), 7/1/2022 | 5,727,500 |
| 2,000,000 | | Michigan State Finance Authority Revenue, Senior Lien Revenue Bonds (Series D-1), 5.00% (Detroit, MI Water Supply System)/(AGM INS), 7/1/2020 | 2,194,880 |
| 2,500,000 | | Michigan State Finance Authority Revenue, Senior Lien Revenue Bonds (Series D-1), 5.00% (Detroit, MI Water Supply System)/(AGM INS), 7/1/2021 | 2,808,650 |
| 1,500,000 | | Michigan State Finance Authority, Local Government Loan Program Revenue Bonds (Series 2014B), 4.00% (Public Lighting Authority), 7/1/2017 | 1,500,120 |
| 10,000,000 | 1 | Michigan State Financial Authority, (Trinity Healthcare Credit Group), Hospital Revenue Bonds (Series 2015MI), 1.36% TOBs, Mandatory Tender 12/1/2020 | 9,994,200 |
| 1,000,000 | | Michigan Strategic Fund, LT Obligation Revenue Bonds (Series 2011), 5.00% (Michigan State), 10/15/2019 | 1,079,360 |
| 1,170,000 | | Michigan Strategic Fund, LT Obligation Revenue Bonds (Series 2011), 5.00% (Michigan State), 10/15/2020 | 1,295,319 |
| 4,500,000 | | Michigan Strategic Fund, Variable Rate LO Revenue Refunding Bonds (Series 2008ET-2), 1.45% TOBs (Detroit Edison Co.), Mandatory Tender 9/1/2021 | 4,423,815 |
| 3,500,000 | | Michigan Strategic Fund, Variable Rate LO Revenue Refunding Bonds (Series 2008ET-2), 1.45% TOBs (Detroit Edison Co.), Mandatory Tender 9/1/2021 | 3,440,745 |
| 1,165,000 | | Royal Oak, MI Hospital Finance Authority, Hospital Revenue Refunding Bonds (Series 2014D), 5.00% (Beaumont Health Credit Group), 9/1/2017 | 1,173,015 |
| 1,500,000 | | Royal Oak, MI Hospital Finance Authority, Hospital Revenue Refunding Bonds (Series 2014D), 5.00% (Beaumont Health Credit Group), 9/1/2019 | 1,616,190 |
| | | TOTAL | 47,919,468 |
| | | Minnesota—1.0% | |
| 3,500,000 | | Duluth, MN ISD No. 709, COP (Series 2016A), 3.00% (School District Credit Program GTD), 2/1/2020 | 3,638,075 |
Annual Shareholder Report
Principal
Amount | | | Value |
| | | MUNICIPAL BONDS—continued | |
| | | Minnesota—continued | |
| $4,935,000 | | Duluth, MN ISD No. 709, COP (Series 2016A), 3.00% (School District Credit Program GTD), 2/1/2021 | $5,180,665 |
| 2,030,000 | | Duluth, MN ISD No. 709, COP (Series 2016A), 5.00% (School District Credit Program GTD), 2/1/2022 | 2,325,182 |
| | | TOTAL | 11,143,922 |
| | | Mississippi—0.8% | |
| 560,000 | | Mississippi Development Bank, SO Refunding Bonds (Series 2013A), 5.00% (Harrison County, MS Highway), 1/1/2018 | 571,206 |
| 1,000,000 | | Mississippi Development Bank, SO Refunding Bonds (Series 2013A), 5.00% (Harrison County, MS Highway), 1/1/2019 | 1,055,660 |
| 400,000 | | Mississippi Development Bank, SO Refunding Bonds (Series 2013B), 4.00% (Laurel, MS Highway), 1/1/2018 | 406,004 |
| 1,500,000 | | Mississippi Development Bank, SO Refunding Bonds (Series 2013B), 4.00% (Laurel, MS Highway), 1/1/2019 | 1,560,300 |
| 1,425,000 | | Mississippi Development Bank, SO Refunding Bonds (Series 2013C), 5.00% (Madison County, MS Highway), 1/1/2019 | 1,504,316 |
| 3,250,000 | | Mississippi Hospital Equipment & Facilities Authority, Revenue Bonds (2010 Series 1), 5.00% (North Mississippi Health Services), 10/1/2017 | 3,282,597 |
| | | TOTAL | 8,380,083 |
| | | Missouri—1.7% | |
| 3,780,000 | | Missouri State Environmental Improvement & Energy Resources Authority, Environmental Improvement Revenue Refunding Bonds (Series 1992), 1.25% (Kansas City Power And Light Co.), 7/1/2017 | 3,780,038 |
| 850,000 | | Missouri State HEFA, Senior Living Facilities Revenue Bonds (Series 2016B), 5.00% (Lutheran Senior Services), 2/1/2025 | 977,491 |
| 255,000 | | Missouri State HEFA, Senior Living Facilities Revenue Bonds (Series 2014A), 4.00% (Lutheran Senior Services), 2/1/2018 | 258,981 |
| 535,000 | | Missouri State HEFA, Senior Living Facilities Revenue Bonds (Series 2014A), 4.00% (Lutheran Senior Services), 2/1/2020 | 565,763 |
| 565,000 | | Missouri State HEFA, Senior Living Facilities Revenue Bonds (Series 2014A), 5.00% (Lutheran Senior Services), 2/1/2021 | 625,048 |
| 600,000 | | Missouri State HEFA, Senior Living Facilities Revenue Bonds (Series 2016A), 4.00% (Lutheran Senior Services), 2/1/2019 | 621,990 |
| 800,000 | | Missouri State HEFA, Senior Living Facilities Revenue Bonds (Series 2016A), 4.00% (Lutheran Senior Services), 2/1/2020 | 843,920 |
| 500,000 | | Missouri State HEFA, Senior Living Facilities Revenue Bonds (Series 2016A), 5.00% (Lutheran Senior Services), 2/1/2023 | 570,705 |
| 500,000 | | Missouri State HEFA, Senior Living Facilities Revenue Bonds (Series 2016B), 4.00% (Lutheran Senior Services), 2/1/2018 | 507,805 |
| 650,000 | | Missouri State HEFA, Senior Living Facilities Revenue Bonds (Series 2016B), 4.00% (Lutheran Senior Services), 2/1/2019 | 673,823 |
| 800,000 | | Missouri State HEFA, Senior Living Facilities Revenue Bonds (Series 2016B), 5.00% (Lutheran Senior Services), 2/1/2021 | 885,024 |
Annual Shareholder Report
Principal
Amount | | | Value |
| | | MUNICIPAL BONDS—continued | |
| | | Missouri—continued | |
| $650,000 | | Missouri State HEFA, Senior Living Facilities Revenue Bonds (Series 2016B), 5.00% (Lutheran Senior Services), 2/1/2022 | $732,901 |
| 1,200,000 | | Missouri State HEFA, Senior Living Facilities Revenue Bonds (Series 2016B), 5.00% (Lutheran Senior Services), 2/1/2023 | 1,369,692 |
| 750,000 | | Missouri State HEFA, Senior Living Facilities Revenue Bonds (Series 2016B), 5.00% (Lutheran Senior Services), 2/1/2024 | 862,200 |
| 750,000 | | Missouri State HEFA, Senior Living Facilities Revenue Bonds (Series 2016B), 5.00% (Lutheran Senior Services), 2/1/2026 | 862,207 |
| 2,000,000 | | St. Louis, MO Apartment Revenue, Airport Revenue Refunding and Airport Revenue Bonds (Series 2017A), 5.00% (St. Louis Lambert International Airport)/(AGM INS), 7/1/2022 | 2,327,280 |
| 2,335,000 | | St. Louis, MO Apartment Revenue, Airport Revenue Refunding and Airport Revenue Bonds (Series 2017A), 5.00% (St. Louis Lambert International Airport)/(AGM INS), 7/1/2023 | 2,759,106 |
| | | TOTAL | 19,223,974 |
| | | Multi State—0.4% | |
| 3,900,000 | 1,2,3 | Eaton Vance Municipal Bond Fund II, Institutional MuniFund Term Preferred Shares (Series 2019), 1.96%, 7/1/2019 | 3,898,323 |
| | | Nebraska—1.3% | |
| 8,000,000 | | Central Plains Energy Project, NE, Gas Supply Revenue Refunding Bonds (Series 2014), 5.00% TOBs (Royal Bank of Canada, GTD), Mandatory Tender 12/1/2019 | 8,638,560 |
| 1,000,000 | | Nebraska Public Power District, General Revenue Bonds (Series 2012A), 4.00%, 1/1/2018 | 1,015,410 |
| 1,500,000 | | Omaha, NE Public Power District, Electric System Revenue Bonds (Series 2016A), 5.00%, 2/1/2023 | 1,778,580 |
| 2,000,000 | | Omaha, NE Public Power District, Electric System Revenue Bonds (Series 2016A), 5.00%, 2/1/2024 | 2,410,560 |
| | | TOTAL | 13,843,110 |
| | | Nevada—1.4% | |
| 3,700,000 | | Clark County, NV Pollution Control, PCR Revenue Bonds (Series 2017), 1.60% TOBs (Nevada Power Co.), Mandatory Tender 5/21/2020 | 3,704,033 |
| 2,250,000 | | Humboldt County, NV, PCR Refunding Bonds (Series 2016A), 1.25% TOBs (Sierra Pacific Power Co.), Mandatory Tender 6/3/2019 | 2,245,140 |
| 6,500,000 | | Washoe County, NV Gas & Water Facilities Revenue, Revenue Refunding Bonds (Series 2016B), 3.00% TOBs (Sierra Pacific Power Co.), Mandatory Tender 6/1/2022 | 6,824,935 |
| 2,250,000 | | Washoe County, NV School District, Refunding LT GO Bonds (Series 2012A), 4.00%, 6/1/2019 | 2,370,420 |
| | | TOTAL | 15,144,528 |
| | | New Jersey—7.1% | |
| 3,000,000 | | Asbury Park, NJ, 2.50% BANs, 6/15/2018 | 3,023,190 |
Annual Shareholder Report
Principal
Amount | | | Value |
| | | MUNICIPAL BONDS—continued | |
| | | New Jersey—continued | |
| $4,000,000 | | Carteret, NJ, 2.00% BANs, 10/26/2017 | $4,010,280 |
| 2,789,501 | | Eatontown, NJ, (Series 2016A), 2.00% BANs, 9/28/2017 | 2,794,355 |
| 2,500,000 | | Gloucester County, NJ Improvement Authority, Resource Recovery Revenue Refunding Bonds (Series 1999A), 2.125% TOBs (Waste Management, Inc.), Mandatory Tender 12/1/2017 | 2,508,650 |
| 2,432,722 | | Hillside Township, NJ, 2.25% BANs, 8/4/2017 | 2,434,620 |
| 3,750,000 | | Middle Township, NJ Board of Education, 2.00% BANs, 7/14/2017 | 3,751,688 |
| 3,000,000 | | New Jersey EDA, Cigarette Tax Revenue Refunding Bonds (Series 2012), 5.00% (NJ Dedicated Cigarette Excise Tax), 6/15/2018 | 3,082,200 |
| 5,000,000 | | New Jersey EDA, School Facilities Construction Refunding Bonds (Series 2015 XX), 5.00% (New Jersey State), 6/15/2022 | 5,338,850 |
| 10,000,000 | 1 | New Jersey EDA, School Facilities Construction Refunding SIFMA Index Bonds (Series 2013 I), 2.16% (New Jersey State), 9/1/2025 | 9,449,400 |
| 1,000,000 | | New Jersey Health Care Facilities Financing Authority, Refunding Bonds (Series 2011), 5.00% (Meridian Health System Obligated Group), 7/1/2018 | 1,038,170 |
| 5,230,000 | | New Jersey State Transportation Trust Fund Authority, Transportation Program Bonds (Series 2014AA), 5.00% (New Jersey State), 6/15/2018 | 5,377,172 |
| 10,000,000 | 1 | New Jersey State Transportation Trust Fund Authority, Transportation Program Notes (SIFMA Index Multimodal Notes)/(Series 2014BB-2), 2.11% TOBs (New Jersey State), Mandatory Tender 12/15/2021 | 9,720,200 |
| 1,000,000 | | New Jersey State Transportation Trust Fund Authority, Transportation System Bonds (Series 2011B), 5.00% (New Jersey State), 6/15/2018 | 1,028,140 |
| 5,750,000 | 1 | New Jersey Turnpike Authority, Revenue Bonds (SIFMA Index Bonds Series 2013 E-3), 1.59% TOBs, Mandatory Tender 1/1/2018 | 5,752,702 |
| 5,000,000 | | New Jersey Turnpike Authority, Turnpike Revenue Bonds (Series 2012B), 5.00%, 1/1/2019 | 5,285,200 |
| 475,000 | | New Jersey Turnpike Authority, Turnpike Revenue Bonds (Series 2013A), 5.00%, 1/1/2018 | 484,505 |
| 1,500,000 | | New Jersey Turnpike Authority, Turnpike Revenue Bonds (Series 2013A), 5.00%, 1/1/2020 | 1,636,230 |
| 3,741,000 | | Newark, NJ, 3.00% RANs, 12/4/2017 | 3,761,089 |
| 2,573,436 | | Phillipsburg, NJ, 2.00% BANs, 8/15/2017 | 2,575,649 |
| 3,227,000 | | Pine Beach, NJ, 2.50% BANs, 11/3/2017 | 3,236,326 |
| 2,121,780 | | West Orange Township, NJ, 2.00% BANs, 9/8/2017 | 2,124,453 |
| | | TOTAL | 78,413,069 |
| | | New Mexico—2.4% | |
| 3,500,000 | | Farmington, NM, PCR Refunding Bonds (Series 2010B), 2.125% TOBs (Public Service Co., NM), 6/1/2022 | 3,513,055 |
| 5,000,000 | | Farmington, NM, PCR Refunding Bonds (Series 2016A), 1.875% TOBs (Public Service Co., NM), Mandatory Tender 10/1/2021 | 4,961,400 |
| 7,000,000 | | Farmington, NM, Refunding PCRBs (Series 2012A), 1.875% TOBs (El Paso Electric Co.), Mandatory Tender 9/1/2017 | 7,003,570 |
Annual Shareholder Report
Principal
Amount | | | Value |
| | | MUNICIPAL BONDS—continued | |
| | | New Mexico—continued | |
| $2,500,000 | | New Mexico Municipal Energy Acquisition Authority, Gas Supply Revenue Refunding Bonds (Series 2014A), 5.00% TOBs (Royal Bank of Canada, Montreal GTD), Mandatory Tender 8/1/2019 | $2,671,975 |
| 8,150,000 | 1 | New Mexico Municipal Energy Acquisition Authority, Gas Supply Revenue Refunding Bonds (Series 2014B), 1.45% TOBs (Royal Bank of Canada, Montreal GTD), Mandatory Tender 8/1/2019 | 8,136,226 |
| | | TOTAL | 26,286,226 |
| | | New York—7.2% | |
| 2,944,000 | | Adams Village, NY, 2.50% BANs, 3/30/2018 | 2,961,016 |
| 2,500,000 | | Erie County, NY IDA, School Facility Revenue Refunding Bonds (Series 2011B), 5.00% (Buffalo, NY City School District), 5/1/2018 | 2,585,225 |
| 3,300,000 | | Greece, NY, 2.00% BANs, 8/24/2017 | 3,305,709 |
| 9,000,000 | 1 | Long Island Power Authority, NY, Electric System General Revenue Bonds (Series 2015C), 1.615%, Mandatory Tender 11/1/2018 | 9,037,170 |
| 3,000,000 | 1 | Metropolitan Transportation Authority, NY, (MTA Transportation Revenue), Transportation Revenue Variable Rate Refunding Bonds (Series 2002D-2A), 1.295%, 4/6/2020 | 3,012,570 |
| 3,000,000 | 1 | Metropolitan Transportation Authority, NY, (MTA Transportation Revenue), Transportation Revenue Variable Rate Refunding Bonds (Series 2002D-A2), 1.405%, 4/6/2021 | 3,022,950 |
| 10,000,000 | 1 | Metropolitan Transportation Authority, NY, (MTA Transportation Revenue), Transportation Revenue Variable Rate Refunding Bonds (Series 2002G-3), 1.404%, 2/1/2020 | 10,064,800 |
| 1,000,000 | | Metropolitan Transportation Authority, NY, Transportation Revenue Bonds (Series 2005G), 5.00% (MTA Transportation Revenue), 11/15/2017 | 1,015,650 |
| 2,500,000 | 1 | Metropolitan Transportation Authority, NY, Transportation Revenue Variable Rate Refunding Bonds (Subseries 2002D-2B), 1.325% TOBs (MTA Transportation Revenue), Mandatory Tender 5/15/2018 | 2,506,175 |
| 2,000,000 | 1 | Metropolitan Transportation Authority, NY, Transportation Revenue Variable Rate Refunding Bonds (Subseries 2002G-1D), 1.534% (MTA Transportation Revenue), 11/1/2017 | 2,003,500 |
| 3,495,000 | | New York City, NY TFA, Future Tax Secured Subordinate Revenue Bonds (Series 2010 I-2), 5.00%, 11/1/2017 | 3,543,685 |
| 330,000 | | New York City, NY TFA, Future Tax Secured Subordinate Revenue Bonds (Series 2010 I-2), 5.00% (United States Treasury COL), 11/1/2017 | 334,604 |
| 3,800,000 | 1 | New York City, NY, UT GO Bonds (Series 2008J, Subseries J-4), 1.46%, 8/1/2025 | 3,800,304 |
| 2,000,000 | | New York City, NY, UT GO Bonds (Series 2012F), 5.00%, 8/1/2018 | 2,085,480 |
| 2,000,000 | | New York City, NY, UT GO Bonds (Series 2012F), 5.00%, 8/1/2019 | 2,157,100 |
| 500,000 | | New York City, NY, UT GO Bonds (Series A-1), 5.00%, 8/1/2018 | 521,370 |
| 1,005,000 | | New York City, NY, UT GO Bonds (Series C), 5.00%, 8/1/2018 | 1,047,954 |
Annual Shareholder Report
Principal
Amount | | | Value |
| | | MUNICIPAL BONDS—continued | |
| | | New York—continued | |
| $1,300,000 | | New York State Thruway Authority, General Revenue Bonds (Series 2012I), 5.00% (New York State Thruway Authority - General Revenue), 1/1/2018 | $1,325,883 |
| 1,000,000 | | New York State Thruway Authority, General Revenue Bonds (Series 2012I), 5.00% (New York State Thruway Authority - General Revenue), 1/1/2019 | 1,057,040 |
| 3,125,000 | | New York State Thruway Authority, General Revenue Junior Indebtedness Obligations (Series 2013A), 5.00% (New York State Thruway Authority - General Revenue), 5/1/2019 | 3,340,375 |
| 4,480,000 | | Pine Bush, NY CSD, 2.00% BANs, 9/1/2017 | 4,485,510 |
| 3,000,000 | | Rockland County, NY, LT GO Bonds (Series 2014A), 5.00% (AGM INS), 3/1/2020 | 3,259,710 |
| 3,000,000 | | Rockland County, NY, LT GO Bonds (Series 2014A), 5.00% (AGM INS), 3/1/2021 | 3,339,390 |
| 2,000,000 | | Suffolk County, NY EDC, Revenue Bonds (Series 2011), 5.00% (Catholic Health Services of Long Island Obligated Group), 7/1/2018 | 2,074,920 |
| 2,000,000 | | Triborough Bridge & Tunnel Authority, NY, General Revenue Refunding Bonds (Series 2012B), 5.00%, 11/15/2018 | 2,111,140 |
| 5,000,000 | 1 | Triborough Bridge & Tunnel Authority, NY, Subordinate Revenue Variable Rate Refunding Bonds (Series 2016 4A), 1.404%, 12/1/2021 | 5,024,950 |
| | | TOTAL | 79,024,180 |
| | | North Carolina—1.2% | |
| 2,000,000 | | Cape Fear Public Utility Authority, NC, Water & Sewer System Revenue Refunding Bonds (Series 2016), 5.00%, 8/1/2022 | 2,349,480 |
| 850,000 | | Charlotte, NC, Airport Revenue Bonds (Series 2017A), 5.00% (Charlotte, NC Douglas International Airport), 7/1/2021 | 970,139 |
| 550,000 | | Charlotte, NC, Airport Revenue Bonds (Series 2017A), 5.00% (Charlotte, NC Douglas International Airport), 7/1/2023 | 653,862 |
| 900,000 | | Charlotte, NC, Airport Revenue Bonds (Series 2017A), 5.00% (Charlotte, NC Douglas International Airport), 7/1/2025 | 1,101,762 |
| 750,000 | | Charlotte, NC, Airport Revenue Bonds (Series 2017C), 4.00% (Charlotte, NC Douglas International Airport), 7/1/2022 | 839,483 |
| 1,000,000 | | Charlotte, NC, Airport Revenue Bonds (Series 2017C), 4.00% (Charlotte, NC Douglas International Airport), 7/1/2023 | 1,131,960 |
| 580,000 | | Charlotte, NC, Airport Revenue Bonds (Series 2017C), 5.00% (Charlotte, NC Douglas International Airport), 7/1/2020 | 643,725 |
| 825,000 | | Charlotte, NC, Airport Revenue Bonds (Series 2017C), 5.00% (Charlotte, NC Douglas International Airport), 7/1/2021 | 941,605 |
| 1,350,000 | | Charlotte, NC, Airport Revenue Bonds (Series 2017C), 5.00% (Charlotte, NC Douglas International Airport), 7/1/2025 | 1,652,643 |
| 1,250,000 | | North Carolina Eastern Municipal Power Agency, Power System Revenue Bonds (Series 2012A), 5.00% (United States Treasury COL), 1/1/2018 | 1,276,162 |
Annual Shareholder Report
Principal
Amount | | | Value |
| | | MUNICIPAL BONDS—continued | |
| | | North Carolina—continued | |
| $1,000,000 | | North Carolina Eastern Municipal Power Agency, Power System Revenue Bonds (Series 2012A), 5.00% (United States Treasury COL), 1/1/2019 | $1,059,050 |
| 900,000 | 1 | North Carolina Medical Care Commission, Health Care Facilities Revenue Refunding Bonds (Series 2012C), 1.65% TOBs (Wake Forest Baptist Obligated Group), Mandatory Tender 12/1/2017 | 899,118 |
| | | TOTAL | 13,518,989 |
| | | Ohio—3.3% | |
| 2,070,000 | 1 | Allen County, OH, (Mercy Health), Adjustable Rate Hospital Facilities Revenue Bonds (Series 2015B), 1.66% TOBs, Mandatory Tender 5/1/2020 | 2,069,938 |
| 2,685,000 | | Cleveland, OH Public Power System, Revenue Refunding Bonds (Series 2010), 5.00%, 11/15/2017 | 2,724,496 |
| 7,400,000 | 1,2,3 | Eaton Vance Ohio Municipal Bond Fund, Institutional MuniFund Term Preferred Shares (Series 2019), 1.91%, 7/1/2019 | 7,389,566 |
| 2,000,000 | | Hamilton County, OH Sewer System, Improvement & Revenue Refunding Bonds (Series 2013A), 5.00%, 12/1/2017 | 2,034,960 |
| 5,000,000 | 1 | Lancaster, OH Port Authority, Gas Supply Revenue Refunding Bonds (Series 2014), 1.424% TOBs (Royal Bank of Canada, Montreal GTD), Mandatory Tender 8/1/2019 | 4,971,700 |
| 5,000,000 | | Monroe County, OH, 1.50% BANs, 10/6/2017 | 5,000,200 |
| 2,000,000 | | Ohio State Building Authority, State Facilities Revenue Refunding Bonds (Series 2010C), 5.00%, 10/1/2018 | 2,098,160 |
| 235,000 | | Ohio State Higher Educational Facility Commission, Revenue Bonds, 4.00% (Case Western Reserve University, OH), 12/1/2017 | 238,064 |
| 1,765,000 | | Ohio State Higher Educational Facility Commission, Revenue Bonds, 4.00% (Case Western Reserve University, OH)/(United States Treasury COL), 12/1/2017 | 1,787,698 |
| 1,000,000 | | Ohio State Higher Educational Facility Commission, Revenue Bonds (Series 2011A), 5.00% (University of Dayton), 12/1/2017 | 1,017,000 |
| 750,000 | | Ohio State Higher Educational Facility Commission, Revenue Refunding Bonds (Series 2013), 4.00% (Case Western Reserve University, OH), 12/1/2019 | 799,118 |
| 1,800,000 | | Ohio Water Development Authority, 1.55% TOBs (Waste Management, Inc.), Mandatory Tender 7/1/2021 | 1,787,796 |
| 2,245,000 | | Parma Heights, OH, 1.75% BANs, 7/19/2017 | 2,245,651 |
| 2,500,000 | | Plain City, OH, 2.125% BANs, 5/15/2018 | 2,515,050 |
| | | TOTAL | 36,679,397 |
| | | Oklahoma—2.8% | |
| 1,410,000 | | Canadian County Educational Facilities Authority, OK, Educational Facilities Lease Revenue Bonds (Series 2012), 4.00% (Mustang Public Schools), 9/1/2019 | 1,488,340 |
Annual Shareholder Report
Principal
Amount | | | Value |
| | | MUNICIPAL BONDS—continued | |
| | | Oklahoma—continued | |
| $2,685,000 | | Canadian County Educational Facilities Authority, OK, Educational Facilities Lease Revenue Bonds (Series 2012), 4.50% (Mustang Public Schools), 9/1/2020 | $2,927,831 |
| 2,285,000 | | Canadian County Educational Facilities Authority, OK, Educational Facilities Lease Revenue Bonds (Series 2012), 4.50% (Mustang Public Schools), 9/1/2021 | 2,540,417 |
| 2,775,000 | | Canadian County Educational Facilities Authority, OK, Educational Facilities Lease Revenue Bonds (Series 2017), 4.00% (Mustang Public Schools), 9/1/2024 | 3,116,270 |
| 3,000,000 | | Cleveland County, OK Educational Facilities Authority, Educational Facilities Lease Revenue Bonds (Series 2016), 5.00% (Moore Public Schools), 6/1/2019 | 3,206,070 |
| 2,000,000 | | Oklahoma County, OK Finance Authority, Educational Facilities Lease Revenue Bonds (Series 2012), 4.00% (Midwest City-Del City Public Schools), 3/1/2018 | 2,039,600 |
| 2,700,000 | | Oklahoma County, OK Finance Authority, Educational Facilities Lease Revenue Bonds (Series 2012), 4.00% (Midwest City-Del City Public Schools), 3/1/2019 | 2,818,773 |
| 1,850,000 | | Oklahoma Development Finance Authority, Solid Waste Disposal Revenue Bonds (Series 2004A), 2.375% (Waste Management, Inc.), 12/1/2021 | 1,902,133 |
| 3,150,000 | | Oklahoma State Capital Improvement Authority, State Facilities Revenue Refunding Bonds (Series 2010A), 5.00% (Oklahoma State), 7/1/2017 | 3,150,378 |
| 1,255,000 | | Tulsa County, OK Industrial Authority, Educational Facilities Lease Revenue Bonds (Series 2011), 3.125% (Broken Arrow Public Schools), 9/1/2018 | 1,284,580 |
| 2,600,000 | | Tulsa County, OK Industrial Authority, Educational Facilities Lease Revenue Bonds (Series 2011), 5.00% (Broken Arrow Public Schools), 9/1/2019 | 2,799,836 |
| 2,000,000 | | Tulsa County, OK Industrial Authority, Educational Facilities Lease Revenue Bonds (Series 2012), 3.50% (Broken Arrow Public Schools), 9/1/2017 | 2,008,900 |
| 1,000,000 | | Tulsa County, OK Industrial Authority, Educational Facilities Lease Revenue Bonds (Series 2016), 5.00% (Broken Arrow Public Schools), 9/1/2022 | 1,156,360 |
| | | TOTAL | 30,439,488 |
| | | Oregon—0.2% | |
| 1,325,000 | | Tri-County Metropolitan Transportation District of Oregon, Payroll Tax & Grant Receipt Revenue Bonds (Series 2013), 4.00%, 11/1/2017 | 1,327,597 |
| 900,000 | | Tri-County Metropolitan Transportation District of Oregon, Payroll Tax & Grant Receipt Revenue Bonds (Series 2013), 5.00%, 11/1/2018 | 903,240 |
| | | TOTAL | 2,230,837 |
Annual Shareholder Report
Principal
Amount | | | Value |
| | | MUNICIPAL BONDS—continued | |
| | | Pennsylvania—7.2% | |
| $3,000,000 | | Allegheny County Sanitation Authority, Sewer Revenue Bonds (Series 2011), 5.00% (AGM INS), 6/1/2018 | $3,107,610 |
| 1,000,000 | | Allegheny County Sanitation Authority, Sewer Revenue Refunding Bonds (Series 2016), 5.00% (AGM INS), 12/1/2024 | 1,205,880 |
| 850,000 | | Allegheny County Sanitation Authority, Sewer Revenue Refunding Bonds (Series 2016), 5.00% (AGM INS), 12/1/2025 | 1,032,835 |
| 4,000,000 | 1 | Berks County, PA Municipal Authority, Variable Rate Revenue Bonds (Series 2012B), 2.41% TOBs (Reading Hospital & Medical Center), Mandatory Tender 7/1/2022 | 4,028,640 |
| 835,000 | | Cumberland County, PA Municipal Authority, Revenue Bonds (Series 2015), 4.00% (Diakon Lutheran Social Ministries), 1/1/2019 | 862,872 |
| 1,000,000 | | Cumberland County, PA Municipal Authority, Revenue Bonds (Series 2015), 4.00% (Diakon Lutheran Social Ministries), 1/1/2020 | 1,051,090 |
| 2,000,000 | | Cumberland County, PA Municipal Authority, Revenue Bonds (Series 2015), 5.00% (Diakon Lutheran Social Ministries), 1/1/2021 | 2,199,860 |
| 425,000 | | Cumberland County, PA Municipal Authority, Revenue Bonds (Series of 2016), 5.00% (Diakon Lutheran Social Ministries), 1/1/2018 | 432,446 |
| 2,315,000 | | Cumberland County, PA Municipal Authority, Revenue Bonds (Series of 2016), 5.00% (Diakon Lutheran Social Ministries), 1/1/2019 | 2,426,467 |
| 1,115,000 | | Cumberland County, PA Municipal Authority, Revenue Bonds (Series of 2016), 5.00% (Diakon Lutheran Social Ministries), 1/1/2022 | 1,251,197 |
| 1,155,000 | | Cumberland County, PA Municipal Authority, Revenue Bonds (Series of 2016), 5.00% (Diakon Lutheran Social Ministries), 1/1/2024 | 1,336,312 |
| 550,000 | | East Hempfield Township, PA IDA, Revenue & Revenue Refunding Bonds (Series 2016), 4.00% (Willow Valley Retirement Communities), 12/1/2018 | 570,625 |
| 365,000 | | East Hempfield Township, PA IDA, Revenue & Revenue Refunding Bonds (Series 2016), 4.00% (Willow Valley Retirement Communities), 12/1/2019 | 386,298 |
| 500,000 | | East Hempfield Township, PA IDA, Revenue & Revenue Refunding Bonds (Series 2016), 4.00% (Willow Valley Retirement Communities), 12/1/2020 | 539,540 |
| 500,000 | | East Hempfield Township, PA IDA, Revenue & Revenue Refunding Bonds (Series 2016), 5.00% (Willow Valley Retirement Communities), 12/1/2022 | 579,175 |
| 750,000 | | East Hempfield Township, PA IDA, Revenue & Revenue Refunding Bonds (Series 2016), 5.00% (Willow Valley Retirement Communities), 12/1/2023 | 880,868 |
| 12,500,000 | 1 | Geisinger Authority, PA Health System, Health System Revenue Bonds (Series 2014B), 1.892% TOBs (Geisinger Health System), Mandatory Tender 6/1/2024 | 12,413,125 |
| 750,000 | | Hempfield, PA School District, UT GO Bonds (Series 2015), 4.00% (State Aid Withholding GTD), 10/15/2017 | 756,765 |
| 380,000 | | Hempfield, PA School District, UT GO Bonds (Series 2015), 5.00% (State Aid Withholding GTD), 10/15/2018 | 398,924 |
Annual Shareholder Report
Principal
Amount | | | Value |
| | | MUNICIPAL BONDS—continued | |
| | | Pennsylvania—continued | |
| $625,000 | | Monroeville, PA Finance Authority, Revenue Bonds (Series 2012), 4.00% (UPMC Health System), 2/15/2018 | $636,769 |
| 4,000,000 | | Montgomery County, PA IDA, PCR Refunding Bonds (Series 2002A), 2.55% TOBs (Exelon Generation Co. LLC), Mandatory Tender 6/1/2020 | 3,980,480 |
| 8,000,000 | 1 | Northampton County, PA General Purpose Authority, Variable Rate Hospital Revenue Bonds (Series 2013B), 2.31% TOBs (St. Luke's Hospital of Bethlehem), Mandatory Tender 8/15/2020 | 8,010,480 |
| 2,000,000 | | Pennsylvania EDFA, Solid Waste Disposal Revenue Bonds (Series 2004A), 1.85% TOBs (Waste Management, Inc.), 11/1/2021 | 1,990,300 |
| 5,000,000 | | Pennsylvania State Higher Education Facilities Authority, Student Housing Project at East Stroudsburg University of Pennsylvania Revenue BAN, 0.875% (University Properties, Inc.), 2/1/2018 | 4,993,550 |
| 10,000,000 | 1 | Pennsylvania State Turnpike Commission, Variable Rate Turnpike Revenue Bonds (Series 2013B), 2.06%, 12/1/2019 | 10,058,600 |
| 10,000,000 | 1 | Pennsylvania State Turnpike Commission, Variable Rate Turnpike Revenue Bonds (SIFMA Index Bonds)/(Series 2014B), 1.89%, 12/1/2021 | 10,060,300 |
| 1,970,000 | 1 | Scranton, PA School District, GO Notes (Series 2014)/(LIBOR Floating Rate Tender Notes), 1.714%, Mandatory Tender 4/2/2018 | 1,974,590 |
| 2,520,000 | 1 | State Public School Building Authority, PA, LIBOR Index Rate Revenue Bonds (Series 2014), 1.50% TOBs (Albert Gallatin Area School District), Mandatory Tender 9/1/2018 | 2,519,370 |
| | | TOTAL | 79,684,968 |
| | | Rhode Island—2.7% | |
| 2,250,000 | | Rhode Island Housing & Mortgage Finance Corp., Multi-Family Development Bonds (2017 Series 1-A), 1.60% TOBs, 4/1/2019 | 2,247,480 |
| 4,000,000 | | Rhode Island Housing & Mortgage Finance Corp., Multi-Family Development Bonds (2017 Series 1-B), 1.70% TOBs, 10/1/2019 | 3,996,000 |
| 4,120,000 | | Rhode Island State and Providence Plantations, GO Bonds (Series 2011A), 5.00% (United States Treasury COL), 8/1/2019 | 4,454,132 |
| 1,125,000 | | Rhode Island State and Providence Plantations, UT GO Bonds (Series 2011), 5.00%, 8/1/2018 | 1,174,376 |
| 3,075,000 | | Rhode Island State and Providence Plantations, UT GO Bonds (Series 2011A), 5.00% (United States Treasury COL), 8/1/2018 | 3,209,962 |
| 1,000,000 | | Rhode Island State Health and Educational Building Corp., Hospital Financing Revenue Refunding Bonds (Series 2016), 5.00% (Lifespan Obligated Group), 5/15/2018 | 1,028,990 |
| 1,500,000 | | Rhode Island State Health and Educational Building Corp., Hospital Financing Revenue Refunding Bonds (Series 2016), 5.00% (Lifespan Obligated Group), 5/15/2019 | 1,585,305 |
| 1,500,000 | | Rhode Island State Health and Educational Building Corp., Hospital Financing Revenue Refunding Bonds (Series 2016), 5.00% (Lifespan Obligated Group), 5/15/2020 | 1,621,605 |
Annual Shareholder Report
Principal
Amount | | | Value |
| | | MUNICIPAL BONDS—continued | |
| | | Rhode Island—continued | |
| $2,250,000 | | Rhode Island State Health and Educational Building Corp., Hospital Financing Revenue Refunding Bonds (Series 2016), 5.00% (Lifespan Obligated Group), 5/15/2021 | $2,476,822 |
| 2,250,000 | | Rhode Island State Health and Educational Building Corp., Hospital Financing Revenue Refunding Bonds (Series 2016), 5.00% (Lifespan Obligated Group), 5/15/2022 | 2,514,915 |
| 2,000,000 | | Rhode Island State Health and Educational Building Corp., Hospital Financing Revenue Refunding Bonds (Series 2016), 5.00% (Lifespan Obligated Group), 5/15/2023 | 2,264,920 |
| 2,285,000 | | Rhode Island State Health and Educational Building Corp., Hospital Financing Revenue Refunding Bonds (Series 2016), 5.00% (Lifespan Obligated Group), 5/15/2024 | 2,616,645 |
| 1,000,000 | | Rhode Island State Health and Educational Building Corp., Revenue Refunding Bonds (Providence Public Buildings Authority)/(Series 2013A), 5.00% (Providence, RI), 5/15/2018 | 1,032,340 |
| | | TOTAL | 30,223,492 |
| | | South Carolina—0.6% | |
| 645,000 | | Charleston County, SC Special Source, Revenue Bonds (Series 2013), 5.00%, 12/1/2018 | 680,810 |
| 1,000,000 | | Charleston County, SC Special Source, Revenue Bonds (Series 2013), 5.00%, 12/1/2019 | 1,090,800 |
| 1,000,000 | | Charleston County, SC Special Source, Revenue Bonds (Series 2013), 5.00%, 12/1/2020 | 1,122,630 |
| 1,000,000 | | Piedmont Municipal Power Agency, SC, Electric Revenue Refunding Bonds (Series 2010A-2), 5.00%, 1/1/2018 | 1,019,760 |
| 3,000,000 | | South Carolina Jobs-EDA, Revenue Notes (Series 2017A), 2.25% (East Point Academy), 5/1/2019 | 2,991,750 |
| | | TOTAL | 6,905,750 |
| | | South Dakota—0.1% | |
| 750,000 | | Educational Enhancement Funding Corp., SD, Tobacco Settlement Revenue Bonds (Series 2013B), 5.00%, 6/1/2023 | 857,557 |
| | | Tennessee—0.2% | |
| 1,500,000 | | Metropolitan Government Nashville & Davidson County, TN Water & Sewer, Subordinate Lien Water & Sewer Revenue Refunding Bonds (Series 2012), 5.00%, 7/1/2018 | 1,558,800 |
| 935,000 | | Metropolitan Government Nashville & Davidson County, TN Water & Sewer, Subordinate Lien Water & Sewer Revenue Refunding Bonds (Series 2012), 5.00%, 7/1/2019 | 1,003,367 |
| | | TOTAL | 2,562,167 |
| | | Texas—8.2% | |
| 5,000,000 | | Central Texas Regional Mobility Authority, Senior Lien Revenue & Refunding Bonds (Series 2015B), 5.00% TOBs, Mandatory Tender 1/6/2021 | 5,458,100 |
Annual Shareholder Report
Principal
Amount | | | Value |
| | | MUNICIPAL BONDS—continued | |
| | | Texas—continued | |
| $850,000 | | Central Texas Regional Mobility Authority, Senior Lien Revenue Refunding Bonds (Series 2013A), 5.00%, 1/1/2018 | $866,227 |
| 1,000,000 | | Central Texas Regional Mobility Authority, Senior Lien Revenue Refunding Bonds (Series 2013A), 5.00%, 1/1/2019 | 1,053,660 |
| 500,000 | | Central Texas Regional Mobility Authority, Senior Lien Revenue Refunding Bonds (Series 2013A), 5.00%, 1/1/2020 | 542,185 |
| 1,400,000 | | Central Texas Regional Mobility Authority, Senior Lien Revenue Refunding Bonds (Series 2013A), 5.00%, 1/1/2021 | 1,559,488 |
| 5,000,000 | | Clear Creek, TX ISD, Variable Rate UT School Building Bonds (Series 2013B), 3.00% TOBs (PSFG GTD), Mandatory Tender 8/14/2017 | 5,011,850 |
| 5,000,000 | | Clear Creek, TX ISD, Variable Rate UT School Building Bonds (Series 2013B), 3.00% TOBs (PSFG GTD), Mandatory Tender 8/14/2019 | 5,155,550 |
| 1,750,000 | | Dallas-Fort Worth, TX International Airport, Joint Revenue Refunding Bonds (Series 2012B), 5.00%, 11/1/2018 | 1,840,877 |
| 3,250,000 | | Dallas-Fort Worth, TX International Airport, Joint Revenue Refunding Bonds (Series 2012B), 5.00%, 11/1/2019 | 3,528,362 |
| 2,000,000 | 1 | Harris County, TX Cultural Education Facilities Finance Corp., (Texas Children's Hospital), Hospital Revenue Bonds (Series 2015-3), 1.657%, Mandatory Tender 6/1/2020 | 2,022,680 |
| 5,635,000 | 1 | Harris County, TX Cultural Education Facilities Finance Corp., Hospital Revenue Refunding Bonds (Series 2013B), 1.81% (Memorial Hermann Health System), 6/1/2022 | 5,634,718 |
| 4,500,000 | 1 | Harris County, TX Cultural Education Facilities Finance Corp., Hospital Revenue Refunding Bonds (Series 2013B), 1.86% (Memorial Hermann Health System), 6/1/2023 | 4,503,465 |
| 5,685,000 | 1 | Harris County, TX Cultural Education Facilities Finance Corp., Hospital Revenue Refunding Bonds (Series 2013B), 1.96% (Memorial Hermann Health System), 6/1/2024 | 5,689,946 |
| 1,515,000 | 1 | Harris County, TX, Revenue Refunding Bonds (Series 2012A), 1.54% (Harris County, TX Toll Road Authority), 8/15/2017 | 1,515,061 |
| 2,500,000 | 1 | Harris County, TX, Revenue Refunding Bonds (Series 2012A), 1.69% (Harris County, TX Toll Road Authority), 8/15/2018 | 2,501,625 |
| 2,335,000 | | Houston, TX Convention & Entertainment Facilities Department, Hotel Occupancy Tax & Special Revenue Refunding Bonds (Series 2011A), 5.00%, 9/1/2018 | 2,438,067 |
| 3,570,000 | | Lubbock, TX HFDC, Revenue Refunding Bonds (Series 2008B), 5.00% (St. Joseph Health System), 7/1/2019 | 3,832,502 |
| 4,905,000 | | Midlothian, TX ISD, Variable Rate UT GO Refunding Bonds (Series 2013-C), 3.00% TOBs, Mandatory Tender 8/1/2019 | 5,070,887 |
| 95,000 | | Midlothian, TX ISD, Variable Rate UT GO Refunding Bonds (Series 2013-C), 3.00% TOBs (United States Treasury PRF), Mandatory Tender 8/1/2019 | 98,575 |
| 200,000 | | New Hope Cultural Education Facilities Finance Corporation, Revenue Bonds (Series 2016), 1.00% (Westminster Manor), 11/1/2017 | 199,712 |
Annual Shareholder Report
Principal
Amount | | | Value |
| | | MUNICIPAL BONDS—continued | |
| | | Texas—continued | |
| $330,000 | | New Hope Cultural Education Facilities Finance Corporation, Revenue Bonds (Series 2016), 3.00% (Westminster Manor), 11/1/2019 | $338,197 |
| 735,000 | | New Hope Cultural Education Facilities Finance Corporation, Revenue Bonds (Series 2016), 4.00% (Westminster Manor), 11/1/2021 | 788,354 |
| 500,000 | | New Hope Cultural Education Facilities Finance Corporation, Revenue Bonds (Series 2016), 5.00% (Westminster Manor), 11/1/2023 | 567,680 |
| 625,000 | | New Hope Cultural Education Facilities Finance Corporation, Revenue Bonds (Series 2016), 5.00% (Westminster Manor), 11/1/2024 | 713,356 |
| 1,105,000 | | New Hope Cultural Education Facilities Finance Corporation, Revenue Bonds (Series 2016), 5.00% (Westminster Manor), 11/1/2025 | 1,261,026 |
| 2,000,000 | | North Texas Tollway Authority, System First Tier Revenue Refunding Bonds (Series 2011B), 5.00%, 1/1/2019 | 2,113,160 |
| 5,000,000 | 1 | North Texas Tollway Authority, System First Tier Variable Rate Revenue Refunding Bonds (Series 2011A SIFMA Index Floating Rate), 1.71%, Mandatory Tender 1/1/2019 | 4,999,800 |
| 6,335,000 | 1 | North Texas Tollway Authority, System First Tier Variable Rate Revenue Refunding Bonds (Series 2014C SIFMA Index Floating Rate), 1.58%, Mandatory Tender 1/1/2020 | 6,308,710 |
| 5,000,000 | | Plano, TX ISD, UT GO School Building Bonds, 5.00% (PSFG GTD), 2/15/2023 | 5,919,800 |
| 1,250,000 | | Sam Rayburn, TX Municipal Power Agency, Power Supply System Revenue Refunding Bonds (Series 2012), 5.00%, 10/1/2019 | 1,345,075 |
| 550,000 | | Sam Rayburn, TX Municipal Power Agency, Power Supply System Revenue Refunding Bonds (Series 2012), 5.00%, 10/1/2021 | 618,486 |
| 2,375,000 | | Texas State Public Finance Authority, Refunding UT GO Bonds (Series 2011), 5.00% (Texas State), 10/1/2018 | 2,493,394 |
| 3,665,000 | | Texas State Transportation Commission, First Tier Revenue Refunding Put Bonds (Series 2015-A), 5.00% TOBs (Central Texas Turnpike System), Mandatory Tender 4/1/2020 | 3,998,148 |
| | | TOTAL | 89,988,723 |
| | | Utah—0.6% | |
| 2,400,000 | | Intermountain Power Agency, Subordinated Power Supply Revenue Refunding Bonds (Series 2014A), 5.00%, 7/1/2018 | 2,494,560 |
| 3,600,000 | | Intermountain Power Agency, Subordinated Power Supply Revenue Refunding Bonds (Series 2014A), 5.00%, 7/1/2019 | 3,864,708 |
| | | TOTAL | 6,359,268 |
| | | Virginia—0.7% | |
| 1,000,000 | | Roanoke, VA EDA, Hospital Revenue Bonds (Series 2012), 5.00% (Carilion Health System Obligated Group), 7/1/2019 | 1,072,500 |
| 2,000,000 | | Roanoke, VA EDA, Hospital Revenue Bonds (Series 2012), 5.00% (Carilion Health System Obligated Group), 7/1/2020 | 2,211,000 |
Annual Shareholder Report
Principal
Amount | | | Value |
| | | MUNICIPAL BONDS—continued | |
| | | Virginia—continued | |
| $4,000,000 | | Virginia Peninsula Port Authority, Coal Terminal Revenue Refunding Bonds (Series 2003), 1.55% TOBs (Dominion Terminal Associates)/(Dominion Resources, Inc. GTD), Mandatory Tender 10/1/2019 | $3,979,720 |
| | | TOTAL | 7,263,220 |
| | | Washington—2.0% | |
| 3,415,000 | | Tobacco Settlement Authority, WA, Tobacco Settlement Revenue Refunding Bonds (Series 2013), 5.00%, 6/1/2019 | 3,649,576 |
| 5,000,000 | | Tobacco Settlement Authority, WA, Tobacco Settlement Revenue Refunding Bonds (Series 2013), 5.00%, 6/1/2020 | 5,497,500 |
| 3,000,000 | 2,3 | Washington State EDFA, Solid Waste Disposal Revenue Bonds (Series 2008), 2.125% (Waste Management, Inc.), 6/1/2020 | 3,020,430 |
| 3,760,000 | 1 | Washington State Health Care Facilities Authority, (Fred Hutchinson Cancer Research Center), Variable Rate LIBOR Index Revenue Bonds (Series 2017B), 1.92%, 7/1/2022 | 3,779,665 |
| 3,000,000 | 1 | Washington State Health Care Facilities Authority, (Fred Hutchinson Cancer Research Center), Variable Rate SIMFA Index Revenue Bonds (Series 2017C), 1.96%, 7/3/2023 | 3,006,900 |
| 3,000,000 | | Washington State Health Care Facilities Authority, Revenue Bonds (Series 2012B), 5.00% TOBs (Providence Health & Services), Mandatory Tender 10/1/2021 | 3,412,350 |
| | | TOTAL | 22,366,421 |
| | | West Virginia—0.5% | |
| 2,500,000 | | Mason County, WV, PCRBs, 1.625% TOBs (Appalachian Power Co.), Mandatory Tender 10/1/2018 | 2,514,850 |
| 3,325,000 | | West Virginia EDA, Solid Waste Disposal Facilities Revenue Refunding Bonds (Series 2015A), 1.90% TOBs (Appalachian Power Co.), Mandatory Tender 4/1/2019 | 3,329,322 |
| | | TOTAL | 5,844,172 |
| | | Wisconsin—1.1% | |
| 4,785,000 | | Wisconsin Health & Educational Facilities Authority, Revenue Bonds (Series 2011A), 5.00% (Gundersen Lutheran), 10/15/2019 | 5,172,824 |
| 1,310,000 | | Wisconsin Health & Educational Facilities Authority, Revenue Bonds (Series 2011A), 5.00% (Gundersen Lutheran), 10/15/2020 | 1,457,886 |
| 2,250,000 | | Wisconsin State, Refunding UT GO Bonds (2016 Series 1), 5.00%, 11/1/2022 | 2,657,588 |
| 1,000,000 | | WPPI Energy, WI, Power Supply System Revenue Bonds (Series 2016A), 5.00%, 7/1/2021 | 1,134,650 |
| 700,000 | | WPPI Energy, WI, Power Supply System Revenue Bonds (Series 2016A), 5.00%, 7/1/2022 | 811,083 |
Annual Shareholder Report
Principal
Amount | | | Value |
| | | MUNICIPAL BONDS—continued | |
| | | Wisconsin—continued | |
| $500,000 | | WPPI Energy, WI, Power Supply System Revenue Bonds (Series 2016A), 5.00%, 7/1/2023 | $590,035 |
| | | TOTAL | 11,824,066 |
| | | TOTAL MUNICIPAL BONDS
(IDENTIFIED COST $1,046,498,230) | 1,051,000,687 |
| | | SHORT-TERM MUNICIPALS—3.6%4 | |
| | | California—0.3% | |
| 3,300,000 | | Palomar Pomerado Health, CA, (Series 2006C) ARS (AGM INS), 1.73%, 7/6/2017 | 3,300,000 |
| | | Georgia—0.9% | |
| 2,250,000 | | Burke County, GA Development Authority, (Second Series 1995) Daily VRDNs (Georgia Power Co.), 1.01%, 7/3/2017 | 2,250,000 |
| 2,975,000 | | Floyd County, GA Development Authority PCRB, (First Series 1996) Daily VRDNs (Georgia Power Co.), 1.01%, 7/3/2017 | 2,975,000 |
| 5,000,000 | | Gainesville & Hall County, GA Hospital Authority (Northeast Georgia Health System, Inc.), R-Float (Series 2017C) Weekly VRENs, 1.45%, 7/6/2017 | 5,000,000 |
| | | TOTAL | 10,225,000 |
| | | Illinois—1.1% | |
| 6,075,000 | 2,3 | Chicago, IL Board of Education, Golden Blue (Series 2017-005) Weekly VRENs (Barclays Bank plc LIQ)/(Barclays Bank plc LOC), 1.21%, 7/6/2017 | 6,075,000 |
| 6,495,000 | 2,3 | Metropolitan Pier & Exposition Authority, IL, Tender Option Bond Trust Certificates (Series 2015-XF1045) Weekly VRDNs (Deutsche Bank AG GTD)/(Deutsche Bank AG LIQ), 1.26%, 7/6/2017 | 6,495,000 |
| | | TOTAL | 12,570,000 |
| | | Pennsylvania—0.8% | |
| 8,810,000 | | Pennsylvania State Higher Education Facilities Authority, (Thomas Jefferson University), VRMOs (Series 2015B), 1.30%, 7/6/2017 | 8,810,000 |
| | | Texas—0.5% | |
| 1,725,000 | | Port of Port Arthur Navigation District of Jefferson County, TX, (Series 2010A) Daily VRDNs (Motiva Enterprises LLC), 1.35%, 7/3/2017 | 1,725,000 |
| 1,375,000 | | Port of Port Arthur Navigation District of Jefferson County, TX, (Series 2010C) Daily VRDNs (Motiva Enterprises LLC), 1.35%, 7/3/2017 | 1,375,000 |
Annual Shareholder Report
Principal
Amount | | | Value |
| | | SHORT-TERM MUNICIPALS—continued4 | |
| | | Texas—continued | |
| $2,250,000 | | Port of Port Arthur Navigation District of Jefferson County, TX, (Series 2010D) Daily VRDNs (Motiva Enterprises LLC), 1.35%, 7/3/2017 | $2,250,000 |
| | | TOTAL | 5,350,000 |
| | | TOTAL SHORT-TERM MUNICIPALS
(IDENTIFIED COST $40,255,000) | 40,255,000 |
| | | TOTAL MUNICIPAL INVESTMENTS—99.1%
(IDENTIFIED COST $1,086,753,230)5 | 1,091,255,687 |
| | | OTHER ASSETS AND LIABILITIES - NET—0.9%6 | 9,593,283 |
| | | TOTAL NET ASSETS—100% | $1,100,848,970 |
At June 30, 2017, the Fund holds no securities that are subject to the federal alternative minimum tax (AMT) (unaudited).
| 1 | Floating rate notes with current rate and current maturity or reset date shown. |
| 2 | Denotes a restricted security that either: (a) cannot be offered for public sale without first being registered, or being able to take advantage of an exemption from registration, under the Securities Act of 1933; or (b) is subject to a contractual restriction on public sales. At June 30, 2017, these restricted securities amounted to $26,878,319, which represented 2.4% of total net assets. |
| 3 | Denotes a restricted security that may be resold without restriction to “qualified institutional buyers” as defined in Rule 144A under the Securities Act of 1933 and that the Fund has determined to be liquid under criteria established by the Fund's Board of Trustees (the “Trustees”). At June 30, 2017, these liquid restricted securities amounted to $26,878,319, which represented 2.4% of total net assets. |
| 4 | Current rate and next reset date shown for Variable Rate Demand Instruments. |
| 5 | The cost of investments for federal tax purposes amounts to $1,086,742,262. |
| 6 | Assets, other than investments in securities, less liabilities. See Statement of Assets and Liabilities. |
Note: The categories of investments are shown as a percentage of total net assets at June 30, 2017.
Various inputs are used in determining the value of the Fund's investments. These inputs are summarized in the three broad levels listed below:
Level 1—quoted prices in active markets for identical securities.
Level 2—other significant observable inputs (including quoted prices for similar securities, interest rates, prepayment speeds, credit risk, etc.). Also includes securities valued at amortized cost.
Level 3—significant unobservable inputs (including the Fund's own assumptions in determining the fair value of investments).
The inputs or methodology used for valuing securities are not an indication of the risk associated with investing in those securities.
As of June 30, 2017, all investments of the Fund utilized Level 2 inputs in valuing the Fund's assets carried at fair value.
Annual Shareholder Report
The following acronyms are used throughout this portfolio:
| AGM | —Assured Guaranty Municipal Corp. |
| ARS | —Auction Rate Securities |
| BANs | —Bond Anticipation Notes |
| COL | —Collateralized |
| COPs | —Certificates of Participation |
| CSD | —Central School District |
| EDA | —Economic Development Authority |
| EDC | —Economic Development Corporation |
| EDFA | —Economic Development Finance Authority |
| GO | —General Obligation |
| GTD | —Guaranteed |
| HEFA | —Health and Education Facilities Authority |
| HFDC | —Health Facility Development Corporation |
| IDA | —Industrial Development Authority |
| INS | —Insured |
| ISD | —Independent School District |
| LIBOR | —London Interbank Offered Rates |
| LIQ | —Liquidity Agreement |
| LO | —Limited Obligation |
| LOC | —Letter of Credit |
| LT | —Limited Tax |
| PCFA | —Pollution Control Finance Authority |
| PCR | —Pollution Control Revenue |
| PCRBs | —Pollution Control Revenue Bonds |
| PRF | —Pre-refunded |
| PSFG | —Public School Fund Guarantee |
| Q-SBLF | —Qualified School Bond Loan Fund |
| RACs | —Revenue Anticipation Certificates |
| RANs | —Revenue Anticipation Notes |
| SIFMA | —Securities Industry and Financial Markets Association |
| SO | —Special Obligation |
| TFA | —Transitional Finance Authority |
| TOBs | —Tender Option Bonds |
| UT | —Unlimited Tax |
| VRDNs | —Variable Rate Demand Notes |
| VRENs | —Variable Rate Extendible Notes |
| VRMOs | —Variable Rate Remarketed Obligations |
See Notes which are an integral part of the Financial Statements
Annual Shareholder Report
Financial Highlights–Class A Shares
(For a Share Outstanding Throughout Each Period)
| Year Ended June 30 | 2017 | 2016 | 2015 | 2014 | 2013 |
| Net Asset Value, Beginning of Period | $10.35 | $10.32 | $10.40 | $10.30 | $10.41 |
| Income From Investment Operations: | | | | | |
| Net investment income | 0.09 | 0.09 | 0.09 | 0.10 | 0.12 |
| Net realized and unrealized gain (loss) on investments | (0.08) | 0.03 | (0.08) | 0.10 | (0.11) |
| TOTAL FROM INVESTMENT OPERATIONS | 0.01 | 0.12 | 0.01 | 0.20 | 0.01 |
| Less Distributions: | | | | | |
| Distributions from net investment income | (0.09) | (0.09) | (0.09) | (0.10) | (0.12) |
| Net Asset Value, End of Period | $10.27 | $10.35 | $10.32 | $10.40 | $10.30 |
| Total Return1 | 0.09% | 1.12% | 0.13% | 1.95% | 0.06% |
| Ratios to Average Net Assets: | | | | | |
| Net expenses | 0.96% | 0.96% | 0.96% | 0.96% | 0.97% |
| Net investment income | 0.86% | 0.83% | 0.90% | 0.97% | 1.12% |
| Expense waiver/reimbursement2 | 0.08% | 0.08% | 0.08% | 0.09% | 0.09% |
| Supplemental Data: | | | | | |
| Net assets, end of period (000 omitted) | $228,127 | $314,598 | $342,677 | $414,381 | $539,402 |
| Portfolio turnover | 32% | 15% | 17% | 22% | 15% |
| 1 | Based on net asset value, which does not reflect the sales charge, redemption fee or contingent deferred sales charge, if applicable. |
| 2 | This expense decrease is reflected in both the net expense and net investment income ratios shown above. |
See Notes which are an integral part of the Financial Statements
Annual Shareholder Report
Financial Highlights–Institutional Shares
(For a Share Outstanding Throughout Each Period)
| Year Ended June 30 | 2017 | 2016 | 2015 | 2014 | 2013 |
| Net Asset Value, Beginning of Period | $10.35 | $10.32 | $10.40 | $10.30 | $10.41 |
| Income From Investment Operations: | | | | | |
| Net investment income | 0.14 | 0.14 | 0.15 | 0.15 | 0.17 |
| Net realized and unrealized gain (loss) on investments | (0.09) | 0.03 | (0.08) | 0.10 | (0.11) |
| TOTAL FROM INVESTMENT OPERATIONS | 0.05 | 0.17 | 0.07 | 0.25 | 0.06 |
| Less Distributions: | | | | | |
| Distributions from net investment income | (0.14) | (0.14) | (0.15) | (0.15) | (0.17) |
| Net Asset Value, End of Period | $10.26 | $10.35 | $10.32 | $10.40 | $10.30 |
| Total Return1 | 0.49% | 1.63% | 0.63% | 2.46% | 0.57% |
| Ratios to Average Net Assets: | | | | | |
| Net expenses | 0.46% | 0.46% | 0.46% | 0.46% | 0.47% |
| Net investment income | 1.36% | 1.33% | 1.40% | 1.47% | 1.62% |
| Expense waiver/reimbursement2 | 0.23% | 0.23% | 0.23% | 0.24% | 0.21% |
| Supplemental Data: | | | | | |
| Net assets, end of period (000 omitted) | $840,891 | $876,680 | $807,057 | $671,802 | $479,671 |
| Portfolio turnover | 32% | 15% | 17% | 22% | 15% |
| 1 | Based on net asset value. |
| 2 | This expense decrease is reflected in both the net expense and net investment income ratios shown above. |
See Notes which are an integral part of the Financial Statements
Annual Shareholder Report
Financial Highlights–Service Shares
(For a Share Outstanding Throughout Each Period)
| Year Ended June 30 | 2017 | 2016 | 2015 | 2014 | 2013 |
| Net Asset Value, Beginning of Period | $10.35 | $10.32 | $10.40 | $10.30 | $10.41 |
| Income From Investment Operations: | | | | | |
| Net investment income | 0.11 | 0.11 | 0.12 | 0.13 | 0.14 |
| Net realized and unrealized gain (loss) on investments | (0.09) | 0.03 | (0.08) | 0.10 | (0.11) |
| TOTAL FROM INVESTMENT OPERATIONS | 0.02 | 0.14 | 0.04 | 0.23 | 0.03 |
| Less Distributions: | | | | | |
| Distributions from net investment income | (0.11) | (0.11) | (0.12) | (0.13) | (0.14) |
| Net Asset Value, End of Period | $10.26 | $10.35 | $10.32 | $10.40 | $10.30 |
| Total Return1 | 0.25% | 1.39% | 0.38% | 2.21% | 0.32% |
| Ratios to Average Net Assets: | | | | | |
| Net expenses | 0.70% | 0.70% | 0.71% | 0.71% | 0.71% |
| Net investment income | 1.12% | 1.09% | 1.15% | 1.22% | 1.38% |
| Expense waiver/reimbursement2 | 0.33% | 0.33% | 0.33% | 0.34% | 0.34% |
| Supplemental Data: | | | | | |
| Net assets, end of period (000 omitted) | $31,831 | $30,225 | $30,838 | $35,800 | $37,815 |
| Portfolio turnover | 32% | 15% | 17% | 22% | 15% |
| 1 | Based on net asset value. |
| 2 | This expense decrease is reflected in both the net expense and net investment income ratios shown above. |
See Notes which are an integral part of the Financial Statements
Annual Shareholder Report
Statement of Assets and Liabilities
June 30, 2017
| Assets: | | |
| Total investment in securities, at value (identified cost $1,086,753,230) | | $1,091,255,687 |
| Cash | | 29,371 |
| Income receivable | | 8,977,833 |
| Receivable for shares sold | | 4,617,260 |
| TOTAL ASSETS | | 1,104,880,151 |
| Liabilities: | | |
| Payable for shares redeemed | $3,528,203 | |
| Income distribution payable | 108,340 | |
| Payable for other service fees (Notes 2 and 5) | 167,322 | |
| Payable for distribution services fee (Note 5) | 47,532 | |
| Payable for investment adviser fee (Note 5) | 9,371 | |
| Payable for administrative fee (Note 5) | 2,380 | |
| Accrued expenses (Note 5) | 168,033 | |
| TOTAL LIABILITIES | | 4,031,181 |
| Net assets for 107,261,548 shares outstanding | | $1,100,848,970 |
| Net Assets Consists of: | | |
| Paid-in capital | | $1,101,951,957 |
| Net unrealized appreciation of investments | | 4,502,457 |
| Accumulated net realized loss on investments | | (5,617,754) |
| Undistributed net investment income | | 12,310 |
| TOTAL NET ASSETS | | $1,100,848,970 |
| Net Asset Value, Offering Price and Redemption Proceeds Per Share: | | |
| Class A Shares: | | |
| Net asset value per share ($228,126,620 ÷ 22,221,534 shares outstanding), no par value, unlimited shares authorized | | $10.27 |
| Offering price per share (100/99.00 of $10.27) | | $10.37 |
| Redemption proceeds per share | | $10.27 |
| Institutional Shares: | | |
| Net asset value per share ($840,891,417 ÷ 81,939,027 shares outstanding), no par value, unlimited shares authorized | | $10.26 |
| Offering price per share | | $10.26 |
| Redemption proceeds per share | | $10.26 |
| Service Shares: | | |
| Net asset value per share ($31,830,933 ÷ 3,100,987 shares outstanding), no par value, unlimited shares authorized | | $10.26 |
| Offering price per share | | $10.26 |
| Redemption proceeds per share | | $10.26 |
See Notes which are an integral part of the Financial Statements
Annual Shareholder Report
Statement of Operations
Year Ended June 30, 2017
| Investment Income: | | | |
| Interest | | | $21,409,959 |
| Expenses: | | | |
| Investment adviser fee (Note 5) | | $4,711,009 | |
| Administrative fee (Note 5) | | 923,326 | |
| Custodian fees | | 43,967 | |
| Transfer agent fees | | 246,490 | |
| Directors'/Trustees' fees (Note 5) | | 17,421 | |
| Auditing fees | | 28,300 | |
| Legal fees | | 9,730 | |
| Distribution services fee (Note 5) | | 775,204 | |
| Other service fees (Notes 2 and 5) | | 2,067,172 | |
| Portfolio accounting fees | | 241,865 | |
| Share registration costs | | 106,631 | |
| Printing and postage | | 33,702 | |
| Miscellaneous (Note 5) | | 34,108 | |
| TOTAL EXPENSES | | 9,238,925 | |
| Waivers and Reimbursement: | | | |
| Waiver of investment adviser fee (Note 5) | $(990,063) | | |
| Waivers and reimbursement of other operating expenses (Notes 2 and 5) | (1,376,947) | | |
| TOTAL WAIVERS AND REIMBURSEMENT | | (2,367,010) | |
| Net expenses | | | 6,871,915 |
| Net investment income | | | 14,538,044 |
| Realized and Unrealized Loss on Investments: | | | |
| Net realized loss on investments | | | (669,033) |
| Net change in unrealized appreciation of investments | | | (11,612,319) |
| Net realized and unrealized loss on investments | | | (12,281,352) |
| Change in net assets resulting from operations | | | $2,256,692 |
See Notes which are an integral part of the Financial Statements
Annual Shareholder Report
Statement of Changes in Net Assets
| Year Ended June 30 | 2017 | 2016 |
| Increase (Decrease) in Net Assets | | |
| Operations: | | |
| Net investment income | $14,538,044 | $13,910,723 |
| Net realized loss on investments | (669,033) | (23,984) |
| Net change in unrealized appreciation/depreciation of investments | (11,612,319) | 3,524,443 |
| CHANGE IN NET ASSETS RESULTING FROM OPERATIONS | 2,256,692 | 17,411,182 |
| Distributions to Shareholders: | | |
| Distributions from net investment income | | |
| Class A Shares | (2,372,631) | (2,571,603) |
| Institutional Shares | (11,788,751) | (11,040,339) |
| Service Shares | (359,480) | (302,236) |
| CHANGE IN NET ASSETS RESULTING FROM DISTRIBUTIONS TO SHAREHOLDERS | (14,520,862) | (13,914,178) |
| Share Transactions: | | |
| Proceeds from sale of shares | 492,654,243 | 421,898,570 |
| Net asset value of shares issued to shareholders in payment of distributions declared | 13,142,010 | 12,604,340 |
| Cost of shares redeemed | (614,185,784) | (397,068,609) |
| CHANGE IN NET ASSETS RESULTING FROM SHARE TRANSACTIONS | (108,389,531) | 37,434,301 |
| Change in net assets | (120,653,701) | 40,931,305 |
| Net Assets: | | |
| Beginning of period | 1,221,502,671 | 1,180,571,366 |
| End of period (including undistributed net investment income of $12,310 and $6,096, respectively) | $1,100,848,970 | $1,221,502,671 |
See Notes which are an integral part of the Financial Statements
Annual Shareholder Report
Notes to Financial Statements
June 30, 2017
1. ORGANIZATION
Federated Short-Intermediate Duration Municipal Trust (the “Fund”) is registered under the Investment Company Act of 1940, as amended (the “Act”), as a diversified, open-end management investment company. The Fund offers three classes of shares: Class A Shares, Institutional Shares and Service Shares. All shares of the Fund have equal rights with respect to voting, except on class-specific matters. The investment objective of the Fund is to provide dividend income which is exempt from federal regular income tax. The Fund pursues this investment objective by investing its assets so that normally distributions of annual interest income are exempt from federal regular income tax. Also distributions normally (except in certain circumstances described in the Fund's Prospectus) will not be subject to the federal AMT for individuals and corporations, but may be subject to state and local taxes.
2. SIGNIFICANT ACCOUNTING POLICIES
The following is a summary of significant accounting policies consistently followed by the Fund in the preparation of its financial statements. These policies are in conformity with U.S. generally accepted accounting principles (GAAP).
Investment Valuation
In calculating its net asset value (NAV), the Fund generally values investments as follows:
| ■��� | Fixed-income securities are fair valued using price evaluations provided by a pricing service approved by the Trustees. |
| ■ | Shares of other mutual funds or non-exchange-traded investment companies are valued based upon their reported NAVs. |
| ■ | Derivative contracts listed on exchanges are valued at their reported settlement or closing price, except that options are valued at the mean of closing bid and asked quotations. |
| ■ | Over-the-counter (OTC) derivative contracts are fair valued using price evaluations provided by a pricing service approved by the Trustees. |
| ■ | For securities that are fair valued in accordance with procedures established by and under the general supervision of the Trustees, certain factors may be considered such as: the last traded or purchase price of the security, information obtained by contacting the issuer or dealers, analysis of the issuer's financial statements or other available documents, fundamental analytical data, the nature and duration of restrictions on disposition, the movement of the market in which the security is normally traded, public trading in similar securities or derivative contracts of the issuer or comparable issuers, movement of a relevant index, or other factors including but not limited to industry changes and relevant government actions. |
If any price, quotation, price evaluation or other pricing source is not readily available when the NAV is calculated, if the Fund cannot obtain price evaluations from a pricing service or from more than one dealer for an investment within a reasonable period of time as set forth in the Fund's valuation policies and procedures, or if information furnished by a pricing service, in the opinion of the valuation committee (“Valuation Committee”), is deemed not representative of the fair value of such security, the Fund uses the fair value of the investment determined in accordance with the procedures described below. There can be no assurance that the Fund could obtain the fair value assigned to an investment if it sold the investment at approximately the time at which the Fund determines its NAV per share.
Annual Shareholder Report
Fair Valuation Procedures
The Trustees have ultimate responsibility for determining the fair value of investments for which market quotations are not readily available. The Trustees have appointed a Valuation Committee comprised of officers of the Fund, Federated Investment Management Company (“Adviser”) and certain of the Adviser's affiliated companies to assist in determining fair value and in overseeing the calculation of the NAV. The Trustees have also authorized the use of pricing services recommended by the Valuation Committee to provide fair value evaluations of the current value of certain investments for purposes of calculating the NAV. The Valuation Committee employs various methods for reviewing third-party pricing-service evaluations including periodic reviews of third-party pricing services' policies, procedures and valuation methods (including key inputs, methods, models and assumptions), transactional back-testing, comparisons of evaluations of different pricing services and review of price challenges by the Adviser based on recent market activity. In the event that market quotations and price evaluations are not available for an investment, the Valuation Committee determines the fair value of the investment in accordance with procedures adopted by the Trustees. The Trustees periodically review and approve the fair valuations made by the Valuation Committee and any changes made to the procedures.
Factors considered by pricing services in evaluating an investment include the yields or prices of investments of comparable quality, coupon, maturity, call rights and other potential prepayments, terms and type, reported transactions, indications as to values from dealers and general market conditions. Some pricing services provide a single price evaluation reflecting the bid-side of the market for an investment (a “bid” evaluation). Other pricing services offer both bid evaluations and price evaluations indicative of a price between the prices bid and asked for the investment (a “mid” evaluation). The Fund normally uses bid evaluations for any U.S. Treasury and Agency securities, mortgage-backed securities and municipal securities. The Fund normally uses mid evaluations for any other types of fixed-income securities and any OTC derivative contracts. In the event that market quotations and price evaluations are not available for an investment, the fair value of the investment is determined in accordance with procedures adopted by the Trustees.
Investment Income, Gains and Losses, Expenses and Distributions
Investment transactions are accounted for on a trade-date basis. Realized gains and losses from investment transactions are recorded on an identified-cost basis. Interest income and expenses are accrued daily. Dividend income and distributions to shareholders are recorded on the ex-dividend date. Distributions of net investment income, if any, are declared daily and paid monthly. Non-cash dividends included in dividend income, if any, are recorded at fair value. Amortization/accretion of premium and discount is included in investment income. Investment income, realized and unrealized gains and losses and certain fund-level expenses are allocated to each class based on relative average daily net assets, except that Class A Shares, Institutional Shares and Service Shares may bear distribution services fees and other service fees unique to those classes. The detail of the total fund expense waivers and reimbursement of $2,367,010 is disclosed in various locations in this Note 2 and Note 5.
Dividends are declared separately for each class. No class has preferential dividend rights; differences in per share dividend rates are generally due to differences in separate class expenses.
Annual Shareholder Report
Other Service Fees
The Fund may pay other service fees up to 0.25% of the average daily net assets of the Fund's Class A Shares, Institutional Shares and Service Shares to unaffiliated financial intermediaries or to Federated Shareholder Services Company (FSSC) for providing services to shareholders and maintaining shareholder accounts. Subject to the terms described in the Expense Limitation note, FSSC may voluntarily reimburse the Fund for other service fees. For the year ended June 30, 2017, other service fees for the Fund were as follows:
| | Other
Service Fees
Incurred | Other
Service Fees
Reimbursed |
| Class A Shares | $692,843 | $— |
| Institutional Shares | 1,296,610 | (1,296,610) |
| Service Shares | 77,719 | — |
| TOTAL | $2,067,172 | $(1,296,610) |
Federal Taxes
It is the Fund's policy to comply with the Subchapter M provision of the Internal Revenue Code (the “Code”) and to distribute to shareholders each year substantially all of its income. Accordingly, no provision for federal income tax is necessary. As of and during the year ended June 30, 2017, the Fund did not have a liability for any uncertain tax positions. The Fund recognizes interest and penalties, if any, related to tax liabilities as income tax expense in the Statement of Operations. As of June 30, 2017, tax years 2014 through 2017 remain subject to examination by the Fund's major tax jurisdictions, which include the United States of America and the Commonwealth of Massachusetts.
When-Issued and Delayed-Delivery Transactions
The Fund may engage in when-issued or delayed-delivery transactions. The Fund records when-issued securities on the trade date and maintains security positions such that sufficient liquid assets will be available to make payment for the securities purchased. Securities purchased on a when-issued or delayed-delivery basis are marked to market daily and begin earning interest on the settlement date. Losses may occur on these transactions due to changes in market conditions or the failure of counterparties to perform under the contract.
Restricted Securities
The Fund may purchase securities which are considered restricted. Restricted securities are securities that either: (a) cannot be offered for public sale without first being registered, or being able to take advantage of an exemption from registration, under the Securities Act of 1933; or (b) are subject to contractual restrictions on public sales. In some cases, when a security cannot be offered for public sale without first being registered, the issuer of the restricted security has agreed to register such securities for resale, at the issuer's expense, either upon demand by the Fund or in connection with another registered offering of the securities. Many such restricted securities may be resold in the secondary market in transactions exempt from registration. Restricted securities may be determined to be liquid under criteria established by the Trustees. The Fund will not incur any registration costs upon such resales. The Fund's restricted securities, like other securities, are priced in accordance with procedures established by and under the general supervision of the Trustees.
Annual Shareholder Report
Other
The preparation of financial statements in conformity with GAAP requires management to make estimates and assumptions that affect the amounts of assets, liabilities, expenses and revenues reported in the financial statements. Actual results could differ from those estimated. The Fund applies investment company accounting and reporting guidance.
3. SHARES OF BENEFICIAL INTEREST
The following tables summarize share activity:
| Year Ended June 30 | 2017 | 2016 |
| Class A Shares: | Shares | Amount | Shares | Amount |
| Shares sold | 9,173,325 | $94,387,804 | 10,301,399 | $106,408,630 |
| Shares issued to shareholders in payment of distributions declared | 228,179 | 2,342,549 | 244,561 | 2,526,841 |
| Shares redeemed | (17,563,395) | (179,731,212) | (13,355,619) | (137,904,478) |
NET CHANGE RESULTING FROM
CLASS A SHARE TRANSACTIONS | (8,161,891) | $(83,000,859) | (2,809,659) | $(28,969,007) |
| Year Ended June 30 | 2017 | 2016 |
| Institutional Shares: | Shares | Amount | Shares | Amount |
| Shares sold | 37,509,536 | $385,216,536 | 29,831,507 | $308,048,910 |
| Shares issued to shareholders in payment of distributions declared | 1,019,163 | 10,458,529 | 948,690 | 9,795,288 |
| Shares redeemed | (41,284,124) | (422,935,074) | (24,285,976) | (250,744,468) |
| NET CHANGE RESULTING FROM INSTITUTIONAL SHARE TRANSACTIONS | (2,755,425) | $(27,260,009) | 6,494,221 | $67,099,730 |
| Year Ended June 30 | 2017 | 2016 |
| Service Shares: | Shares | Amount | Shares | Amount |
| Shares sold | 1,274,505 | $13,049,903 | 720,048 | $7,441,030 |
| Shares issued to shareholders in payment of distributions declared | 33,230 | 340,932 | 27,329 | 282,211 |
| Shares redeemed | (1,126,379) | (11,519,498) | (815,467) | (8,419,663) |
NET CHANGE RESULTING FROM
SERVICE SHARE TRANSACTIONS | 181,356 | $1,871,337 | (68,090) | $(696,422) |
NET CHANGE RESULTING FROM
TOTAL FUND SHARE TRANSACTIONS | (10,735,960) | $(108,389,531) | 3,616,472 | $37,434,301 |
4. FEDERAL TAX INFORMATION
The timing and character of income and capital gain distributions are determined in accordance with income tax regulations, which may differ from GAAP. These differences are due to differing treatments for discount accretion/premium amortization of debt securities and expiration of capital loss carryforwards.
Annual Shareholder Report
For the year ended June 30, 2017, permanent differences identified and reclassified among the components of net assets were as follows:
| Increase (Decrease) |
| Paid-In Capital | Accumulated
Net Realized
Gain (Loss) | Undistributed
Net Investment
Income (Loss) |
| $(2,201,047) | $2,212,015 | $(10,968) |
Net investment income (loss), net realized gains (losses) and net assets were not affected by the reclassification.
The tax character of distributions as reported on the Statement of Changes in Net Assets for the years ended June 30, 2017 and 2016, was as follows:
| | 2017 | 2016 |
| Tax-exempt income | $14,520,862 | $13,914,178 |
As of June 30, 2017, the components of distributable earnings on a tax basis were as follows:
| Undistributed tax-exempt income | $12,310 |
| Net unrealized appreciation | $4,513,425 |
| Capital loss carryforwards | $(5,628,722) |
The difference between book-basis and tax-basis net unrealized appreciation/depreciation is attributable to differing treatments for discount accretion/premium amortization on debt securities.
At June 30, 2017, the cost of investments for federal tax purposes was $1,086,742,262. The net unrealized appreciation of investments for federal tax purposes was $4,513,425. This consists of net unrealized appreciation from investments for those securities having an excess of value over cost of $8,237,858 and net unrealized depreciation from investments for those securities having an excess of cost over value of $3,724,433.
At June 30, 2017, the Fund had a capital loss carryforward of $5,628,722 which will reduce the Fund's taxable income arising from future net realized gains on investments, if any, to the extent permitted by the Code, thereby reducing the amount of distributions to shareholders which would otherwise be necessary to relieve the Fund of any liability for federal income tax. Pursuant to the Code, a net capital loss incurred in taxable years beginning on or before December 22, 2010, is characterized as short-term and may be carried forward for a maximum of eight tax years (“Carryforward Limit”), whereas a net capital loss incurred in taxable years beginning after December 22, 2010, retains its character as either short-term or long-term, does not expire and is required to be utilized prior to the losses which have a Carryforward Limit.
Annual Shareholder Report
The following schedule summarizes the Fund's capital loss carryforwards and expiration years:
| Expiration Year | Short-Term | Long-Term | Total |
| No expiration | $1,284,614 | $906,538 | $2,191,152 |
| 2018 | $2,870,784 | NA | $2,870,784 |
| 2019 | $566,786 | NA | $566,786 |
Capital loss carryforwards of $2,201,047 expired during the year ended June 30, 2017.
5. INVESTMENT ADVISER FEE AND OTHER TRANSACTIONS WITH AFFILIATES
Investment Adviser Fee
The advisory agreement between the Fund and the Adviser provides for an annual fee equal to 0.40% of the Fund's average daily net assets. Under the investment advisory contract, which is subject to annual review by the Trustees, the Adviser will reimburse the amount, limited to the amount of the advisory fee, by which the Fund's Institutional Shares aggregate annual operating expenses, including the investment advisory fee, but excluding interest, taxes, brokerage commissions, expenses of registering and qualifying the Fund and its shares under federal and state laws and regulations, expenses of withholding taxes and extraordinary expenses, exceed 0.45% of the Fund's Institutional Shares average daily net assets. To comply with the 0.45% limitation imposed under the investment advisory contract, the Adviser may waive its advisory fee and/or reimburse its advisory fee or other Fund expenses, affiliates of the Adviser may waive, reimburse or reduce amounts otherwise included in the aggregate annual operating expenses of the Fund, or there may be a combination of waivers, reimbursements and/or reductions by the Adviser and its affiliates. The amount that the Adviser waives/reimburses under the investment advisory contract will be reduced to the extent that affiliates of the Adviser waive, reimburse or reduce amounts that would otherwise be included in the aggregate annual operating expenses of the Fund. In addition, subject to the terms described in the Expense Limitation note, the Adviser may also voluntarily choose to waive any portion of its fee. For the year ended June 30, 2017, the Adviser waived $990,063 of its fee.
Administrative Fee
Federated Administrative Services (FAS), under the Administrative Services Agreement, provides the Fund with administrative personnel and services. For purposes of determining the appropriate rate breakpoint, “Investment Complex” is defined as all of the Federated Funds subject to a fee under the Administrative Services Agreement. The fee paid to FAS is based on the average daily net assets of the Investment Complex as specified below, plus certain out-of-pocket expenses:
| Administrative Fee | Average Daily Net Assets
of the Investment Complex |
| 0.150% | on the first $5 billion |
| 0.125% | on the next $5 billion |
| 0.100% | on the next $10 billion |
| 0.075% | on assets in excess of $20 billion |
Annual Shareholder Report
Subject to the terms described in the Expense Limitation note, FAS may voluntarily choose to waive any portion of its fee. For the year ended June 30, 2017, the annualized fee paid to FAS was 0.078% of average daily net assets of the Fund.
Distribution Services Fee
The Fund has adopted a Distribution Plan (the “Plan”) pursuant to Rule 12b-1 under the Act. Under the terms of the Plan, the Fund will compensate Federated Securities Corp. (FSC), the principal distributor, from the daily net assets of the Fund's Class A Shares and Service Shares to finance activities intended to result in the sale of these shares. The Plan provides that the Fund may incur distribution expenses at the following percentages of average daily net assets annually, to compensate FSC:
| Share Class Name | Percentage of Average
Daily Net Assets of Class |
| Class A Shares | 0.25% |
| Service Shares | 0.25% |
Subject to the terms described in the Expense Limitation note, FSC may voluntarily choose to waive any portion of its fee. For the year ended June 30, 2017, distribution services fees for the Fund were as follows:
| | Distribution
Services Fees
Incurred | Distribution
Services Fees
Waived |
| Class A Shares | $694,867 | $— |
| Service Shares | 80,337 | (80,337) |
| TOTAL | $775,204 | $(80,337) |
When FSC receives fees, it may pay some or all of them to financial intermediaries whose customers purchase shares. For the year ended June 30, 2017, FSC retained $2,426 of fees paid by the Fund.
Sales Charges
Front-end sales charges and contingent deferred sales charges (CDSC) do not represent expenses of the Fund. They are deducted from the proceeds of sales of Fund shares prior to investment or from redemption proceeds prior to remittance, as applicable.
Other Service Fee
For the year ended June 30, 2017, FSSC received $879 and reimbursed $1,296,610 of the other service fees disclosed in Note 2.
Expense Limitation
In addition to the contractual fee waiver described under “Investment Adviser Fee” above with regards to the Fund's Institutional Shares, the Adviser and certain of its affiliates (which may include FSC, FAS and FSSC) on their own initiative have agreed to waive certain amounts of their respective fees and/or reimburse expenses. Total annual fund operating expenses (as shown in the financial highlights, excluding interest expense and extraordinary expenses, if any) paid by the Fund's Class A Shares, Institutional Shares and Service Shares (after the voluntary waivers and reimbursements) will not exceed 0.97%, 0.47% and 0.71% (the “Fee Limit”), respectively, up to but not including the later of (the “Termination Date”):
Annual Shareholder Report
(a) September 1, 2018; or (b) the date of the Fund's next effective Prospectus. While the Adviser and its applicable affiliates currently do not anticipate terminating or increasing these arrangements prior to the Termination Date, these arrangements may only be terminated or the Fee Limit increased prior to the Termination Date with the agreement of the Trustees.
Interfund Transactions
During the year ended June 30, 2017, the Fund engaged in purchase and sale transactions with funds that have a common investment adviser (or affiliated investment advisers), common Trustees and/or common Officers. These purchase and sale transactions complied with Rule 17a-7 under the Act and amounted to $201,905,000 and $309,980,000, respectively.
General
Certain Officers and Trustees of the Fund are Officers or Trustees of certain of the above companies. To efficiently facilitate payment, Trustees' fees and certain expenses related to conducting meetings of the Trustees and other miscellaneous expenses are paid by an affiliate of the Adviser which in due course are reimbursed by the Fund. These expenses related to conducting meetings of the Directors/Trustees and other miscellaneous expenses may be included in Accrued and Miscellaneous Expenses on the Statement of Assets and Liabilities and Statement of Operations, respectively.
6. Investment TRANSACTIONS
Purchases and sales of investments, excluding long-term U.S. government securities and short-term obligations, for the year ended June 30, 2017, were as follows:
| Purchases | $258,668,707 |
| Sales | $281,746,513 |
7. LINE OF CREDIT
The Fund participates with certain other Federated Funds, on a several basis, in an up to $500,000,000 unsecured, 364-day, committed, revolving line of credit (LOC) agreement. The LOC was made available to finance temporarily the repurchase or redemption of shares of the Fund, failed trades, payment of dividends, settlement of trades and for other short-term, temporary or emergency general business purposes. The Fund cannot borrow under the LOC if an inter-fund loan is outstanding. The Fund's ability to borrow under the LOC also is subject to the limitations of the Act and various conditions precedent that must be satisfied before the Fund can borrow. Loans under the LOC are charged interest at a fluctuating rate per annum equal to the highest, on any day, of (a) (i) the federal funds effective rate, (ii) the one month London Interbank Offered Rate (LIBOR), and (iii) 0.0%, plus (b) a margin. The LOC also requires the Fund to pay, quarterly in arrears and at maturity, its pro rata share of a commitment fee based on the amount of the lenders' commitment that has not been utilized. As of June 30, 2017, the Fund had no outstanding loans. During the year ended June 30, 2017, the Fund did not utilize the LOC.
Annual Shareholder Report
8. INTERFUND LENDING
Pursuant to an Exemptive Order issued by the Securities and Exchange Commission (SEC), the Fund, along with other funds advised by subsidiaries of Federated Investors, Inc., may participate in an interfund lending program. This program provides an alternative credit facility allowing the Fund to borrow from other participating affiliated funds. As of June 30, 2017, there were no outstanding loans. During the year ended June 30, 2017, the program was not utilized.
9. Federal Tax INFORMATION (UNAUDITED)
For the fiscal year ended June 30, 2017, 100% of distributions from net investment income is exempt from federal income tax, other than the federal AMT.
10. REGULATORY UPDATES
On October 13, 2016, the SEC amended existing rules intended to modernize reporting and disclosure of information. These amendments relate to Regulation S-X which sets forth the form and content of financial statements. At this time, management is evaluating the implications of adopting these amendments and their impact on the financial statements and accompanying notes.
Annual Shareholder Report
Report of Independent Registered Public Accounting Firm
TO THE BOARD OF TRUSTEES AND SHAREHOLDERS OF Federated Short-Intermediate Duration Municipal Trust:
We have audited the accompanying statement of assets and liabilities of Federated Short-Intermediate Duration Municipal Trust (the “Fund”), including the portfolio of investments, as of June 30, 2017, and the related statement of operations for the year then ended, the statement of changes in net assets for each of the two years in the period then ended and the financial highlights for each of the five years in the period then ended. These financial statements and financial highlights are the responsibility of the Fund's management. Our responsibility is to express an opinion on these financial statements and financial highlights based on our audits.
We conducted our audits in accordance with standards of the Public Company Accounting Oversight Board (United States). Those standards require that we plan and perform the audit to obtain reasonable assurance about whether the financial statements and financial highlights are free of material misstatement. We were not engaged to perform an audit of the Fund's internal control over financial reporting. Our audits included consideration of internal control over financial reporting as a basis for designing audit procedures that are appropriate in the circumstances, but not for the purpose of expressing an opinion on the effectiveness of the Fund's internal control over financial reporting. Accordingly, we express no such opinion. An audit also includes examining, on a test basis, evidence supporting the amounts and disclosures in the financial statements and financial highlights, assessing the accounting principles used and significant estimates made by management, and evaluating the overall financial statement presentation. Our procedures included confirmation of securities owned as of June 30, 2017, by correspondence with the custodian and others. We believe that our audits provide a reasonable basis for our opinion.
In our opinion, the financial statements and financial highlights referred to above present fairly, in all material respects, the financial position of Federated Short-Intermediate Duration Municipal Trust at June 30, 2017, the results of its operations for the year then ended, the changes in its net assets for each of the two years in the period then ended and the financial highlights for each of the five years in the period then ended, in conformity with U.S. generally accepted accounting principles.
Boston, Massachusetts
August 23, 2017
Annual Shareholder Report
Shareholder Expense Example (unaudited)
As a shareholder of the Fund, you incur two types of costs: (1) transaction costs, including sales charges (loads) on purchase or redemption payments; and (2) ongoing costs, including management fees and to the extent applicable, distribution (12b-1) fees and/or other service fees and other Fund expenses. This Example is intended to help you to understand your ongoing costs (in dollars) of investing in the Fund and to compare these costs with the ongoing costs of investing in other mutual funds. It is based on an investment of $1,000 invested at the beginning of the period and held for the entire period from January 1, 2017 to June 30, 2017.
ACTUAL EXPENSES
The first section of the table below provides information about actual account values and actual expenses. You may use the information in this section, together with the amount you invested, to estimate the expenses that you incurred over the period. Simply divide your account value by $1,000 (for example, an $8,600 account value divided by $1,000 = 8.6), then multiply the result by the number in the first section under the heading entitled “Expenses Paid During Period” to estimate the expenses attributable to your investment during this period.
HYPOTHETICAL EXAMPLE FOR COMPARISON PURPOSES
The second section of the table below provides information about hypothetical account values and hypothetical expenses based on the Fund's actual expense ratio and an assumed rate of return of 5% per year before expenses, which is not the Fund's actual return. Thus, you should not use the hypothetical account values and expenses to estimate the actual ending account balance or your expenses for the period. Rather, these figures are required to be provided to enable you to compare the ongoing costs of investing in the Fund with other funds. To do so, compare this 5% hypothetical example with the 5% hypothetical examples that appear in the shareholder reports of the other funds.
Annual Shareholder Report
Please note that the expenses shown in the table are meant to highlight your ongoing costs only and do not reflect any transaction costs, such as sales charges (loads) on purchase or redemption payments. Therefore, the second section of the table is useful in comparing ongoing costs only, and will not help you determine the relative total costs of owning different funds. In addition, if these transaction costs were included, your costs would have been higher.
| | Beginning
Account Value
1/1/2017 | Ending
Account Value
6/30/2017 | Expenses Paid
During Period1 |
| Actual: | | | |
| Class A Shares | $1,000 | $1,014.40 | $4.79 |
| Institutional Shares | $1,000 | $1,015.90 | $2.30 |
| Service Shares | $1,000 | $1,014.70 | $3.50 |
Hypothetical (assuming a 5% return
before expenses): | | | |
| Class A Shares | $1,000 | $1,020.03 | $4.81 |
| Institutional Shares | $1,000 | $1,022.51 | $2.31 |
| Service Shares | $1,000 | $1,021.32 | $3.51 |
| 1 | Expenses are equal to the Fund's annualized net expense ratios, multiplied by the average account value over the period, multiplied by 181/365 (to reflect the one-half-year period). The annualized net expense ratios are as follows: |
| | |
| Class A Shares | 0.96% |
| Institutional Shares | 0.46% |
| Service Shares | 0.70% |
Annual Shareholder Report
Board of Trustees and Trust Officers
The Board of Trustees is responsible for managing the Trust's business affairs and for exercising all the Trust's powers except those reserved for the shareholders. The following tables give information about each Trustee and the senior officers of the Fund. Where required, the tables separately list Trustees who are “interested persons” of the Fund (i.e., “Interested” Trustees) and those who are not (i.e., “Independent” Trustees). Unless otherwise noted, the address of each person listed is Federated Investors Tower, 1001 Liberty Avenue, Pittsburgh, PA 15222. The address of all Independent Trustees listed is 4000 Ericsson Drive, Warrendale, PA 15086-7561; Attention: Mutual Fund Board. As of December 31, 2016, the Trust comprised one portfolio(s), and the Federated Fund Family consisted of 40 investment companies (comprising 124 portfolios). Unless otherwise noted, each Officer is elected annually. Unless otherwise noted, each Trustee oversees all portfolios in the Federated Fund Family and serves for an indefinite term. The Fund's Statement of Additional Information includes additional information about Trust Trustees and is available, without charge and upon request, by calling 1-800-341-7400.
IN MEMORIAM–JOHN F. DONAHUE
(Former Chairman and President, and Emeritus Director/Trustee, of the Federated Funds, and Founder, Former Chairman, President and Chief Executive Officer, and Chairman Emeritus, of Federated Investors, Inc.)
With profound sadness, Federated announces the passing of John F. (“Jack”) Donahue, who founded, along with Richard B. Fisher, Federated in 1955 and served as a leader and member of the Boards of Directors/Trustees of the Federated Funds and the Board of Directors of Federated Investors, Inc. Mr. Donahue was a family man of deep faith with exemplary character and fealty, who served his religion, family, community, and the Federated Funds and Federated, as well as their shareholders, officers and employees, with distinction. His integrity, intelligence, and keen sense of fiduciary duty, coupled with his faith, family and background as a West Point graduate and Strategic Air Command B-29 pilot, served as a foundation for his strong business acumen and leadership. Among his many achievements, Mr. Donahue's steadfast and innovative leadership of the Federated Funds and Federated, as well as within the investment management industry, led to the birth of money market funds in the 1970s and their growth as an innovative, efficient and effective cash management vehicle throughout the 1980s, 1990s, 2000s and beyond. Federated expresses deep gratitude to Mr. Donahue for his inspiring leadership, distinguished service and contributions as a husband, father, founder, Board member and officer, colleague and friend. He will be greatly missed.
Annual Shareholder Report
Interested Trustees Background
Name
Birth Date
Positions Held with Trust
Date Service Began | Principal Occupation(s) for Past Five Years,
Other Directorships Held and Previous Position(s) |
J. Christopher Donahue*
Birth Date: April 11, 1949
Trustee
Indefinite Term
Began serving: October 1999 | Principal Occupations: Principal Executive Officer and President of certain of the Funds in the Federated Fund Family; Director or Trustee of the Funds in the Federated Fund Family; President, Chief Executive Officer and Director, Federated Investors, Inc.; Chairman and Trustee, Federated Investment Management Company; Trustee, Federated Investment Counseling; Chairman and Director, Federated Global Investment Management Corp.; Chairman and Trustee, Federated Equity Management Company of Pennsylvania; Trustee, Federated Shareholder Services Company; Director, Federated Services Company.
Previous Positions: President, Federated Investment Counseling; President and Chief Executive Officer, Federated Investment Management Company, Federated Global Investment Management Corp. and Passport Research, Ltd; Chairman, Passport Research, Ltd. |
Thomas R. Donahue*
Birth Date: October 20, 1958
Trustee
Indefinite Term
Began serving: May 2016 | Principal Occupations: Director or Trustee of certain of the funds in the Federated Fund Family; Chief Financial Officer, Treasurer, Vice President and Assistant Secretary, Federated Investors, Inc.; Chairman and Trustee, Federated Administrative Services; Chairman and Director, Federated Administrative Services, Inc.; Trustee and Treasurer, Federated Advisory Services Company; Director or Trustee and Treasurer, Federated Equity Management Company of Pennsylvania, Federated Global Investment Management Corp., Federated Investment Counseling, and Federated Investment Management Company; Director, MDTA LLC; Director, Executive Vice President and Assistant Secretary, Federated Securities Corp.; Director or Trustee and Chairman, Federated Services Company and Federated Shareholder Services Company; and Director and President, FII Holdings, Inc.
Previous Positions: Director, Federated Investors, Inc.; Assistant Secretary, Federated Investment Management Company, Federated Global Investment Management Company and Passport Research, LTD; Treasurer, Passport Research, LTD; Executive Vice President, Federated Securities Corp.; and Treasurer, FII Holdings, Inc. |
| * | Family relationships and reasons for “interested” status: J. Christopher Donahue and Thomas R. Donahue are brothers. Both are “interested” due to their beneficial ownership of shares of Federated Investors, Inc. and the positions they hold with Federated and its subsidiaries. |
Annual Shareholder Report
INDEPENDENT Trustees Background
Name
Birth Date
Positions Held with Trust
Date Service Began | Principal Occupation(s) for Past Five Years,
Other Directorships Held, Previous Position(s) and Qualifications |
John T. Collins
Birth Date: January 24, 1947
Trustee
Indefinite Term
Began serving: September 2013 | Principal Occupations: Director or Trustee of the Federated Fund Family; formerly, Chairman and CEO, The Collins Group, Inc. (a private equity firm) (Retired).
Other Directorships Held: Director, Current Chair of the Compensation Committee, KLX Corp.
Qualifications: Mr. Collins has served in several business and financial management roles and directorship positions throughout his career. Mr. Collins previously served as Chairman and CEO, The Collins Group, Inc. (a private equity firm). Mr. Collins serves as Chairman Emeriti, Bentley University. Mr. Collins previously served as Director and Audit Committee Member, Bank of America Corp.; Director, FleetBoston Financial Corp.; and Director, Beth Israel Deaconess Medical Center (Harvard University Affiliate Hospital). |
G. Thomas Hough
Birth Date: February 28, 1955
Trustee
Indefinite Term
Began serving: August 2015 | Principal Occupations: Director or Trustee of the Federated Fund Family; formerly, Vice Chair, Ernst & Young LLP (public accounting firm) (Retired).
Other Directorships Held: Director, Chair of the Audit Committee, Governance Committee, Publix Super Markets, Inc.; Director, Member of the Audit Committee and Technology Committee of Equifax, Inc.
Qualifications: Mr. Hough has served in accounting, business management and directorship positions throughout his career. Mr. Hough most recently held the position of Americas Vice Chair of Assurance with Ernst & Young LLP (public accounting firm). Mr. Hough is an Executive Committee member of the United States Golf Association, he serves on the President's Cabinet and Business School Board of Visitors for the University of Alabama and is on the Business School Board of Visitors for Wake Forest University. |
Annual Shareholder Report
Name
Birth Date
Positions Held with Trust
Date Service Began | Principal Occupation(s) for Past Five Years,
Other Directorships Held, Previous Position(s) and Qualifications |
Maureen Lally-Green
Birth Date: July 5, 1949
Trustee
Indefinite Term
Began serving: August 2009 | Principal Occupations: Director or Trustee of the Federated Fund Family; Dean of the Duquesne University School of Law; Adjunct Professor of Law, Duquesne University School of Law; formerly, Interim Dean of the Duquesne University School of Law; Associate General Secretary and Director, Office of Church Relations, Diocese of Pittsburgh.
Other Directorships Held: Director, CONSOL Energy Inc.
Qualifications: Judge Lally-Green has served in various legal and business roles and directorship positions throughout her career. Judge Lally-Green previously served as: Associate General Secretary, Diocese of Pittsburgh; a member of the Superior Court of Pennsylvania; and as a Professor of Law, Duquesne University School of Law. Judge Lally-Green also currently holds the positions on either a public or not for profit Board of Directors as follows: Director and Chair, UPMC Mercy Hospital; Regent, St. Vincent Seminary; Director and Vice Chair, Our Campaign for the Church Alive!, Inc.; Director, Saint Vincent College; Member, Pennsylvania State Board of Education (public); and Director and Chair, Cardinal Wuerl North Catholic High School, Inc. Judge Lally-Green has held the positions of: Director, Auberle; Director, Epilepsy Foundation of Western and Central Pennsylvania; Director, Ireland Institute of Pittsburgh; Director, Saint Thomas More Society; Director, Catholic High Schools of the Diocese of Pittsburgh, Inc.; and Director, Pennsylvania Bar Institute. |
Peter E. Madden
Birth Date: March 16, 1942
Trustee
Indefinite Term
Began serving: November 1991 | Principal Occupation: Director or Trustee, and Chair of the Board of Directors or Trustees, of the Federated Fund Family; Retired.
Other Directorships Held: None.
Qualifications: Mr. Madden has served in several business management, mutual fund services and directorship positions throughout his career. Mr. Madden previously served as President, Chief Operating Officer and Director, State Street Bank and Trust Company (custodian bank) and State Street Corporation (financial services). He was Director, VISA USA and VISA International and Chairman and Director, Massachusetts Bankers Association. Mr. Madden served as Director, Depository Trust Corporation and Director, The Boston Stock Exchange. Mr. Madden also served as a Representative to the Commonwealth of Massachusetts General Court. |
Charles F. Mansfield, Jr.
Birth Date: April 10, 1945
Trustee
Indefinite Term
Began serving: March 1999 | Principal Occupations: Director or Trustee of the Federated Fund Family; Management Consultant.
Other Directorships Held: None.
Qualifications: Mr. Mansfield has served as a Marine Corps officer and in several banking, business management, educational roles and directorship positions throughout his long career. He remains active as a Management Consultant. |
Annual Shareholder Report
Name
Birth Date
Positions Held with Trust
Date Service Began | Principal Occupation(s) for Past Five Years,
Other Directorships Held, Previous Position(s) and Qualifications |
Thomas M. O'Neill
Birth Date: June 14, 1951
Trustee
Indefinite Term
Began serving: October 2006 | Principal Occupations: Director or Trustee, Chair of the Audit Committee of the Federated Fund Family; Sole Proprietor, Navigator Management Company (investment and strategic consulting).
Other Directorships Held: None.
Qualifications: Mr. O'Neill has served in several business, mutual fund and financial management roles and directorship positions throughout his career. Mr. O'Neill serves as Director, Medicines for Humanity and Director, The Golisano Children's Museum of Naples, Florida. Mr. O'Neill previously served as Chief Executive Officer and President, Managing Director and Chief Investment Officer, Fleet Investment Advisors; President and Chief Executive Officer, Aeltus Investment Management, Inc.; General Partner, Hellman, Jordan Management Co., Boston, MA; Chief Investment Officer, The Putnam Companies, Boston, MA; Credit Analyst and Lending Officer, Fleet Bank; Director and Consultant, EZE Castle Software (investment order management software); and Director, Midway Pacific (lumber). |
P. Jerome Richey
Birth Date: February 23, 1949
Trustee
Indefinite Term
Began serving: September 2013 | Principal Occupations: Director or Trustee of the Federated Fund Family; Management Consultant; formerly, Senior Vice Chancellor and Chief Legal Officer, University of Pittsburgh and Executive Vice President and Chief Legal Officer, CONSOL Energy Inc.
Other Directorships Held: None.
Qualifications: Mr. Richey has served in several business and legal management roles and directorship positions throughout his career. Mr. Richey most recently held the positions of Senior Vice Chancellor and Chief Legal Officer, University of Pittsburgh. Mr. Richey previously served as Chairman of the Board, Epilepsy Foundation of Western Pennsylvania and Chairman of the Board, World Affairs Council of Pittsburgh. Mr. Richey previously served as Chief Legal Officer and Executive Vice President, CONSOL Energy Inc.; and Board Member, Ethics Counsel and Shareholder, Buchanan Ingersoll & Rooney PC (a law firm). |
John S. Walsh
Birth Date: November 28, 1957
Trustee
Indefinite Term
Began serving: March 1999 | Principal Occupations: Director or Trustee of the Federated Fund Family; President and Director, Heat Wagon, Inc. (manufacturer of construction temporary heaters); President and Director, Manufacturers Products, Inc. (distributor of portable construction heaters); President, Portable Heater Parts, a division of Manufacturers Products, Inc.
Other Directorships Held: None.
Qualifications: Mr. Walsh has served in several business management roles and directorship positions throughout his career. Mr. Walsh previously served as Vice President, Walsh & Kelly, Inc. (paving contractors). |
Annual Shareholder Report
OFFICERS
Name
Birth Date
Positions Held with Trust
Date Service Began | Principal Occupation(s) for Past Five Years
and Previous Position(s) |
John W. McGonigle
Birth Date: October 26, 1938
EXECUTIVE VICE PRESIDENT AND SECRETARY
Officer since: May 1981 | Principal Occupations: Executive Vice President and Secretary of the Federated Fund Family; Vice Chairman, Executive Vice President, Secretary and Director, Federated Investors, Inc.
Previous Positions: Trustee, Federated Investment Management Company and Federated Investment Counseling; Director, Federated Global Investment Management Corp., Federated Services Company and Federated Securities Corp. |
Lori A. Hensler
Birth Date: January 6, 1967
TREASURER
Officer since: April 2013 | Principal Occupations: Principal Financial Officer and Treasurer of the Federated Fund Family; Senior Vice President, Federated Administrative Services; Financial and Operations Principal for Federated Securities Corp. and Edgewood Services, Inc.; and Assistant Treasurer, Federated Investors Trust Company. Ms. Hensler has received the Certified Public Accountant designation.
Previous Positions: Controller of Federated Investors, Inc.; Senior Vice President and Assistant Treasurer, Federated Investors Management Company; Treasurer, Federated Investors Trust Company; Assistant Treasurer, Federated Administrative Services, Federated Administrative Services, Inc., Federated Securities Corp., Edgewood Services, Inc., Federated Advisory Services Company, Federated Equity Management Company of Pennsylvania, Federated Global Investment Management Corp., Federated Investment Counseling, Federated Investment Management Company, Passport Research, Ltd., and Federated MDTA, LLC; Financial and Operations Principal for Federated Securities Corp., Edgewood Services, Inc. and Southpointe Distribution Services, Inc. |
Richard B. Fisher
Birth Date: May 17, 1923
VICE PRESIDENT
Officer since: May 1981 | Principal Occupations: Vice Chairman or Vice President of some of the Funds in the Federated Fund Family; Vice Chairman, Federated Investors, Inc.; Chairman, Federated Securities Corp.
Previous Positions: President and Director or Trustee of some of the Funds in the Federated Fund Family; Executive Vice President, Federated Investors, Inc.; Director and Chief Executive Officer, Federated Securities Corp. |
Annual Shareholder Report
Name
Birth Date
Positions Held with Trust
Date Service Began | Principal Occupation(s) for Past Five Years
and Previous Position(s) |
John B. Fisher
Birth Date: May 16, 1956
PRESIDENT
Officer since: November 2004 | Principal Occupations: Principal Executive Officer and President of certain of the Funds in the Federated Fund Family; Director or Trustee of certain of the Funds in the Federated Fund Family; Vice President, Federated Investors, Inc.; President, Director/Trustee and CEO, Federated Advisory Services Company, Federated Equity Management Company of Pennsylvania, Federated Global Investment Management Corp., Federated Investment Counseling, Federated Investment Management Company; President and CEO of Passport Research, Ltd.; President of some of the Funds in the Federated Fund Complex and Director, Federated Investors Trust Company.
Previous Positions: President and Director of the Institutional Sales Division of Federated Securities Corp.; President and Director of Federated Investment Counseling; Director, Edgewood Securities Corp.; Director, Federated Services Company; Director, Federated Investors, Inc.; Chairman and Director, Southpointe Distribution Services, Inc. and President, Technology, Federated Services Company. |
Peter J. Germain
Birth Date: September 3, 1959
CHIEF LEGAL OFFICER
Officer since: January 2005 | Principal Occupations: Mr. Germain is Chief Legal Officer of the Federated Fund Family. He is General Counsel and Vice President, Federated Investors, Inc.; President, Federated Administrative Services and Federated Administrative Services, Inc.; Vice President, Federated Securities Corp.; Secretary, Federated Private Asset Management, Inc.; and Secretary, Retirement Plan Service Company of America. Mr. Germain joined Federated in 1984 and is a member of the Pennsylvania Bar Association.
Previous Positions: Deputy General Counsel, Special Counsel, Managing Director of Mutual Fund Services, Federated Investors, Inc.; Senior Vice President, Federated Services Company; and Senior Corporate Counsel, Federated Investors, Inc. |
Stephen Van Meter
Birth Date: June 5, 1975
CHIEF COMPLIANCE OFFICER AND SENIOR VICE PRESIDENT
Officer since: July 2015 | Principal Occupations: Senior Vice President and Chief Compliance Officer of the Federated Fund Family; Vice President and Chief Compliance Officer of Federated Investors, Inc. and Chief Compliance Officer of certain of its subsidiaries. Mr. Van Meter joined Federated in October 2011. He holds FINRA licenses under Series 3, 7, 24 and 66.
Previous Positions: Mr. Van Meter previously held the position of Compliance Operating Officer, Federated Investors, Inc. Prior to joining Federated, Mr. Van Meter served at the United States Securities and Exchange Commission in the positions of Senior Counsel, Office of Chief Counsel, Division of Investment Management and Senior Counsel, Division of Enforcement. |
Deborah A. Cunningham
Birth Date: September 15, 1959
CHIEF INVESTMENT OFFICER
Officer since: August 2011 | Principal Occupations: Deborah A. Cunningham was named Chief Investment Officer of Federated's money market products in 2004. She joined Federated in 1981 and has been a Senior Portfolio Manager since 1997 and an Executive Vice President of the Fund's Adviser since 2009. Ms. Cunningham has received the Chartered Financial Analyst designation and holds an M.S.B.A. in Finance from Robert Morris College. |
Annual Shareholder Report
Name
Birth Date
Positions Held with Trust
Date Service Began | Principal Occupation(s) for Past Five Years
and Previous Position(s) |
Mary Jo Ochson
Birth Date: September 12, 1953
CHIEF INVESTMENT OFFICER
Officer since: May 2004 | Principal Occupations: Mary Jo Ochson was named Chief Investment Officer of Federated's tax-exempt, fixed-income products in 2004 and Chief Investment Officer of Federated's Tax-Free Money Markets in 2010. She joined Federated in 1982 and has been a Senior Portfolio Manager and a Senior Vice President of the Fund's Adviser since 1996. Ms. Ochson has received the Chartered Financial Analyst designation and holds an M.B.A. in Finance from the University of Pittsburgh. |
Annual Shareholder Report
Evaluation and Approval of Advisory Contract–May 2017
Federated Short-Intermediate Duration Municipal Trust (the “Fund”)
Following a review and recommendation of approval by the Fund's independent trustees, the Fund's Board of Trustees (the “Board”) reviewed and unanimously approved the continuation of the Fund's investment advisory contract for an additional one-year term at its May 2017 meetings. The Board's decision regarding the contract reflects the exercise of its business judgment after considering all of the information received on whether to continue the existing arrangements.
The Board had previously appointed a Senior Officer, whose duties include specified responsibilities relating to the process by which advisory fees are to be charged to a Federated fund. The Senior Officer has the authority to retain consultants, experts, or staff as may be reasonably necessary to assist in the performance of his duties, reports directly to the Board, and may be terminated only with the approval of a majority of the independent members of the Board. The Senior Officer prepared and furnished to the Board an independent, written evaluation that covered topics discussed below (the “Senior Officer's Evaluation”). The Board considered the Senior Officer's Evaluation, along with other information, in deciding to approve the investment advisory contract.
The Board also considered judicial decisions concerning allegedly excessive investment advisory fees in its decision. Using these judicial decisions as a guide, the Board has indicated that the following factors may be relevant to an adviser's fiduciary duty with respect to its receipt of compensation from a fund: (1) the nature and quality of the services provided by an adviser to a fund and its shareholders (including the performance of the Fund and of comparable funds); (2) an adviser's cost of providing the services (including the profitability to an adviser of providing advisory services to a fund); (3) the extent to which an adviser may realize “economies of scale” as a fund grows larger and, if such economies of scale exist, whether they have been shared with a fund and its shareholders or the family of funds; (4) any “fall-out financial benefits” that accrue to an adviser because of its relationship with a fund (including research services received from brokers that execute fund trades and any fees paid to affiliates of an adviser for services rendered to a fund); (5) comparative fee and expense structures (including a comparison of fees paid to an adviser with those paid by similar funds); and (6) the extent of care, conscientiousness and independence with which the Fund's board members perform their duties and their expertise (including whether they are fully informed about all facts the Board deems relevant to its consideration of an adviser's services and fees). The Board noted that the Securities and Exchange Commission (“SEC”) disclosure requirements regarding the basis for the Board's approval of the Fund's investment advisory contract generally align with the factors listed above.
Annual Shareholder Report
Consistent with the judicial decisions and SEC disclosure requirements, the Board also considered management fees charged to institutional and other clients of Federated Investment Management Company (the “Adviser”) and its advisory affiliates for what might be viewed as like services. The Board was aware of these factors and was guided by them in its review of the Fund's investment advisory contract to the extent it considered them to be appropriate and relevant, as discussed further below.
The Board considered and weighed these factors in light of its substantial accumulated experience in governing the Fund and working with Federated Investors, Inc. and its affiliates (“Federated”) on matters relating to the Federated funds. The Board was assisted in its deliberations by independent legal counsel. In addition to the extensive materials that comprise and accompany the Senior Officer's Evaluation, the Board received detailed information about the Fund and the Federated organization throughout the year, and in connection with its May meetings. Federated provided much of this information at each regular meeting of the Board, and furnished additional information in connection with the May meetings at which the Board's formal approval of the investment advisory contract occurred. At the May meetings in addition to meeting in separate sessions of the independent trustees without management present, senior management of the Adviser also met with the independent trustees and their counsel to discuss the materials presented and any other matters thought relevant by the Adviser or the trustees. Between regularly scheduled meetings, the Board also received information on particular matters as the need arose. The Board's consideration of the investment advisory contract included review of the Senior Officer's Evaluation, accompanying data and additional information covering such matters as: the Adviser's investment philosophy, revenue, profitability, personnel and processes; investment and operating strategies; the Fund's short-term and long-term performance (in absolute terms, both on a gross basis and net of expenses, as well as in terms relative to its particular investment program and certain competitor or “peer group” funds and/or other benchmarks, as appropriate) and comments on the reasons for performance; the Fund's investment objectives; the Fund's expenses, including the advisory fee and the overall expense structure of the Fund (both in absolute terms and relative to similar and/or competing funds), with due regard for contractual or voluntary expense limitations; the use and allocation of brokerage commissions derived from trading the Fund's portfolio securities (if any); and the nature, quality and extent of the advisory and other services provided to the Fund by the Adviser and its affiliates. The Board also considered the preferences and expectations of Fund shareholders; the entrepreneurial risk assumed by the Adviser in sponsoring the Fund; the continuing state of competition in the mutual fund industry and market practices; the range of comparable fees for similar funds in the mutual fund industry; the Fund's relationship to the Federated funds which include a comprehensive array of funds with different investment objectives, policies and strategies which are generally available for
Annual Shareholder Report
exchange without the incurrence of additional sales charges; compliance and audit reports concerning the Federated funds and the Federated companies that service them (including communications from regulatory agencies), as well as Federated's responses to any issues raised therein; and relevant developments in the mutual fund industry and how the Federated funds and/or Federated are responding to them. The Board's evaluation process is evolutionary. The criteria considered and the emphasis placed on relevant criteria change in recognition of changing circumstances in the mutual fund marketplace.
While mindful that courts have cautioned against giving such comparisons too much weight, the Board has found the use of comparisons of the Fund's fees and expenses to other mutual funds with comparable investment programs to be relevant to its deliberations. In this regard, the Board was presented with, and considered, information regarding the contractual advisory fee rates, net advisory fee rates, total expense ratios and each element of the Fund's total expense ratio (i.e., gross and net advisory fees, custody fees, portfolio accounting fees and transfer agency fees) relative to the Fund's peers. The Board focused on comparisons with other similar mutual funds more heavily than non-mutual fund products or services because it is believed that they are more relevant. For example, other mutual funds are the products most like the Fund, in that they are readily available to Fund shareholders as alternative investment vehicles. Also, they are the type of investment vehicle, in fact, chosen and maintained by the Fund's investors. The range of their fees and expenses, therefore, appears to be a relevant indicator of what consumers have found to be reasonable in the marketplace in which the Fund competes.
The Board reviewed the contractual advisory fee rate, net advisory fee rate where partially waived and other expenses of the Fund and noted the position of the Fund's fee rates relative to its peers. In this regard, the Board noted that the contractual advisory fee rate was above the median of the relevant peer group, but the Board noted the applicable waivers and reimbursements and that the overall expense structure of the Fund remained competitive in the context of other factors considered by the Board.
For comparison, the Senior Officer has reviewed Federated's fees for providing advisory services to products outside the Federated funds (e.g., institutional and separate accounts and sub-adviser services). He concluded that mutual funds and institutional accounts are inherently different products. Those differences include, but are not limited to, different types of targeted investors; being subject to different laws and regulations; different legal structures; different average account sizes and portfolio management techniques made necessary by different cash flows and different associated costs; and the time spent by portfolio managers and their teams, funds financial services, legal, compliance and risk management in reviewing securities pricing, addressing different administrative responsibilities, addressing different degrees of risk
Annual Shareholder Report
associated with management and a variety of different costs. The Senior Officer did not consider the fees for providing advisory services to these outside products to be determinative in judging the appropriateness of mutual fund advisory fees.
Following such evaluation, and full deliberations, the Board concluded that the expenses of the Fund are reasonable and supported renewal of the Fund's investment advisory contract.
The Board considered the nature, extent and quality of the services provided to the Fund by the Adviser and the resources of the Adviser and its affiliates dedicated to the Fund. In this regard, the Board evaluated, among other things, the Adviser's personnel, experience, track record, overall reputation and willingness to invest in personnel and infrastructure that benefit the Fund. In addition, the Board reviewed the qualifications, backgrounds and responsibilities of the portfolio management team primarily responsible for the day-to-day management of the Fund. The Board noted the compliance programs of, and the compliance-related resources provided to, the Fund by the Adviser. The Fund's ability to deliver competitive performance when compared to its peer group was also deemed to be relevant by the Board as a useful indicator of how the Adviser is executing the Fund's investment program. The Adviser's ability to execute this program was one of the Board's considerations in reaching a conclusion that the nature, extent and quality of the Adviser's investment management services warrant the continuation of the investment advisory contract.
In evaluating the Fund's investment performance, the Board considered performance results in light of the Fund's investment objective, strategies and risks, as disclosed in the Fund's prospectus. The Board particularly considered detailed investment reports on the Fund's performance that were provided to the Board throughout the year and in connection with the May meetings. The Senior Officer also reviewed information compiled by Federated, using data supplied by independent fund ranking organizations, regarding the performance of, and fees charged by, other mutual funds, noting his view that comparisons to fund peer groups may be helpful, though not conclusive, in judging the reasonableness of the proposed fees. The Board considered, in evaluating such comparisons, that in some cases individual funds may exhibit significant and unique differences in their objectives and management techniques when compared to other funds within an industry peer group.
For the periods covered by the Senior Officer's Evaluation, the Fund's performance for the three-year and five-year periods was above the median of the relevant peer group, and the Fund's performance fell below the median of the relevant peer group for the one-year period. The Board discussed the Fund's performance with the Adviser and recognized the efforts being taken by the Adviser in the context of the other factors considered relevant by the Board.
Annual Shareholder Report
Following such evaluation, and full deliberations, the Board concluded that the performance of the Fund supported renewal of the Fund's investment advisory contract.
The Board also received financial information about Federated, including information regarding the compensation and ancillary (or “fall-out”) benefits Federated derived from its relationships with the Federated funds. This information covered not only the fees under the investment advisory contracts, but also fees received by Federated's subsidiaries for providing other services to the Federated funds under separate contracts (e.g., for serving as the Federated funds' administrator). The information also detailed any indirect benefit Federated may derive from its receipt of research services from brokers who execute Federated fund trades. In addition, the Board considered the fact that, in order for a fund to be competitive in the marketplace, Federated and its affiliates frequently waived fees and/or reimbursed expenses and have disclosed to Fund investors and/or indicated to the Board their intention to do so in the future. Moreover, the Board receives regular reporting as to the institution, adjustment or elimination of these voluntary waivers. The Board considered Federated's previous reductions in contractual management fees to certain funds in response to the Senior Officer's recommendations.
Federated furnished information, requested by the Senior Officer, that reported revenues on a fund-by-fund basis and made estimates of the allocation of expenses on a fund-by-fund basis, using allocation methodologies specified by the Senior Officer. The Senior Officer noted that, while these cost allocation reports apply consistent allocation processes, the inherent difficulties in allocating costs continues to cause the Senior Officer to question the precision of the process and to conclude that such reports may be unreliable, since a single change in an allocation estimate may dramatically alter the resulting estimate of cost and/or profitability of a fund and may produce unintended consequences. The allocation information, including the Senior Officer's view that fund-by-fund estimations may be unreliable, was considered in the analysis by the Board.
The Board and the Senior Officer also reviewed information compiled by Federated comparing its profitability information to other publicly held fund management companies. In this regard, the Senior Officer concluded that Federated's profit margins did not appear to be excessive. The Senior Officer also noted that Federated appeared financially sound, with the resources to fulfill its obligations under its contracts with the Fund.
The Senior Officer's Evaluation also discussed the notion of possible realization of “economies of scale” as a fund grows larger. In this regard, the Board considered that the Adviser has made significant and long-term investments in areas that support all of the Federated funds, such as personnel and processes for the portfolio management, shareholder services, compliance, internal audit and risk management functions, as well as systems technology (including technology relating to cybersecurity) and that the benefits of these efforts (as well as any economies of scale, should they exist) were likely to be
Annual Shareholder Report
enjoyed by the fund family as a whole. The Board noted that the Adviser's investments in these areas are extensive. In addition, the Board considered that Federated and its affiliates have frequently waived fees and/or reimbursed expenses and that this has allowed fund shareholders to share potential economies of scale from a fund's inception. Federated, as it does throughout the year, and in connection with the Board's review, furnished information relative to revenue sharing or adviser paid fees. Federated and the Senior Officer noted that this information should be viewed to determine if there was an incentive to either not apply breakpoints, or to apply breakpoints at higher levels. It should not be viewed to determine the appropriateness of advisory fees because it would represent marketing and distribution expenses. Finally, the Board also noted the absence of any applicable regulatory or industry guidelines on this subject, which (as discussed in the Senior Officer's Evaluation) is compounded by the lack of any common industry practice or general pattern with respect to structuring fund advisory fees with “breakpoints” that serve to reduce the fee as a fund attains a certain size.
While the Senior Officer noted certain items for follow-up reporting to the Board and further consideration by management, he stated that his observations and information accompanying the Senior Officer's Evaluation supported a finding by the Board that the management fee for the Fund was reasonable. Under these circumstances, no changes were recommended to, and no objection was raised to the continuation of the Fund's investment advisory contract.
In its decision to continue an existing investment advisory contract, the Board was mindful of the potential disruptions of the Fund's operations and various risks, uncertainties and other effects that could occur as a result of a decision to terminate or not renew an investment advisory contract. In particular, the Board recognized that many shareholders have invested in the Fund on the strength of the Adviser's industry standing and reputation and with the expectation that the Adviser will have a continuing role in providing advisory services to the Fund. Thus, the Board's approval of the investment advisory contract reflected the fact that it is the shareholders who have effectively selected the Adviser by virtue of having invested in the Fund. The Board concluded that, in light of the factors discussed above, including the nature, quality and scope of the services provided to the Fund by the Adviser and its affiliates, continuation of the investment advisory contract was appropriate.
The Board based its decision to approve the investment advisory contract on the totality of the circumstances and relevant factors and with a view to past and future long-term considerations. Not all of the factors and considerations identified above were necessarily relevant to the Fund, nor did the Board consider any one of them to be determinative. With respect to the factors that were relevant, the Board's decision to approve the continuation of the contract reflects its determination that Federated's performance and actions provided a satisfactory basis to support the decision to continue the existing arrangement.
Annual Shareholder Report
Voting Proxies on Fund Portfolio Securities
A description of the policies and procedures that the Fund uses to determine how to vote proxies, if any, relating to securities held in the Fund's portfolio is available, without charge and upon request, by calling 1-800-341-7400. A report on “Form N-PX” of how the Fund voted any such proxies during the most recent 12-month period ended June 30 is available via the Proxy Voting Record (Form N-PX) link associated with the Fund and share class name at www.FederatedInvestors.com/FundInformation. Form N-PX filings are also available at the SEC's website at www.sec.gov.
Quarterly Portfolio Schedule
The Fund files with the SEC a complete schedule of its portfolio holdings, as of the close of the first and third quarters of its fiscal year, on “Form N-Q.” These filings are available on the SEC's website at www.sec.gov and may be reviewed and copied at the SEC's Public Reference Room in Washington, DC. (Call 1-800-SEC-0330 for information on the operation of the Public Reference Room.) You may also access this information via the link to the Fund and share class name at www.FederatedInvestors.com/FundInformation.
Annual Shareholder Report
Mutual funds are not bank deposits or obligations, are not guaranteed by any bank and are not insured or guaranteed by the U.S. government, the Federal Deposit Insurance Corporation, the Federal Reserve Board or any other government agency. Investment in mutual funds involves investment risk, including the possible loss of principal.
This Report is authorized for distribution to prospective investors only when preceded or accompanied by the Fund's Prospectus, which contains facts concerning its objective and policies, management fees, expenses and other information.
Federated Short-Intermediate Duration Municipal Trust
Federated Investors Funds
4000 Ericsson Drive
Warrendale, PA 15086-7561
Contact us at FederatedInvestors.com
or call 1-800-341-7400.
Federated Securities Corp., Distributor
CUSIP 313907305
CUSIP 313907107
CUSIP 313907206
37173 (8/17)
Federated is a registered trademark of Federated Investors, Inc.
2017 ©Federated Investors, Inc.
(a) As of the end of the period covered by this report, the registrant has adopted a code of ethics (the "Section 406 Standards for Investment Companies - Ethical Standards for Principal Executive and Financial Officers") that applies to the registrant's Principal Executive Officer and Principal Financial Officer; the registrant's Principal Financial Officer also serves as the Principal Accounting Officer.
(c) There was no amendment to the registrant’s code of ethics described in Item 2(a) above during the period covered by the report.
(d) There was no waiver granted, either actual or implicit, from a provision to the registrant’s code of ethics described in Item 2(a) above during the period covered by the report.
(e) Not Applicable
(f)(3) The registrant hereby undertakes to provide any person, without charge, upon request, a copy of the code of ethics. To request a copy of the code of ethics, contact the registrant at 1-800-341-7400, and ask for a copy of the Section 406 Standards for Investment Companies - Ethical Standards for Principal Executive and Financial Officers.
Item 3. Audit Committee Financial Expert
The registrant's Board has determined that each of the following members of the Board's Audit Committee is an “audit committee financial expert,” and is "independent," for purposes of this Item: John T. Collins, G. Thomas Hough and Thomas M. O'Neill.
| Item 4. | Principal Accountant Fees and Services |
(a) Audit Fees billed to the registrant for the two most recent fiscal years:
Fiscal year ended 2017 – $29,400
Fiscal year ended 2016 - $28,300
(b) Audit-Related Fees billed to the registrant for the two most recent fiscal years:
Fiscal year ended 2017 - $0
Fiscal year ended 2016 - $0
Amount requiring approval of the registrant’s audit committee pursuant to paragraph (c)(7)(ii) of Rule 2-01 of Regulation S-X, $0 and $0 respectively.
(c) Tax Fees billed to the registrant for the two most recent fiscal years:
Fiscal year ended 2017- $0
Fiscal year ended 2016- $0
Amount requiring approval of the registrant’s audit committee pursuant to paragraph (c)(7)(ii) of Rule 2-01 of Regulation S-X, $0 and $0 respectively.
(d) All Other Fees billed to the registrant for the two most recent fiscal years:
Fiscal year ended 2017- $0
Fiscal year ended 2016- $0
Amount requiring approval of the registrant’s audit committee pursuant to paragraph (c)(7)(ii) of Rule 2-01 of Regulation S-X, $0 and $0 respectively.
(e)(1) Audit Committee Policies regarding Pre-approval of Services.
The Audit Committee is required to pre-approve audit and non-audit services performed by the independent auditor in order to assure that the provision of such services do not impair the auditor’s independence. Unless a type of service to be provided by the independent auditor has received general pre-approval, it will require specific pre-approval by the Audit Committee. Any proposed services exceeding pre-approved cost levels will require specific pre-approval by the Audit Committee.
Certain services have the general pre-approval of the Audit Committee. The term of the general pre-approval is 12 months from the date of pre-approval, unless the Audit Committee specifically provides for a different period. The Audit Committee will annually review the services that may be provided by the independent auditor without obtaining specific pre-approval from the Audit Committee and may grant general pre-approval for such services. The Audit Committee will revise the list of general pre-approved services from time to time, based on subsequent determinations. The Audit Committee will not delegate its responsibilities to pre-approve services performed by the independent auditor to management.
The Audit Committee has delegated pre-approval authority to its Chairman. The Chairman will report any pre-approval decisions to the Audit Committee at its next scheduled meeting. The Committee will designate another member with such pre-approval authority when the Chairman is unavailable.
AUDIT SERVICES
The annual Audit services engagement terms and fees will be subject to the specific pre-approval of the Audit Committee. The Audit Committee must approve any changes in terms, conditions and fees resulting from changes in audit scope, registered investment company (RIC) structure or other matters.
In addition to the annual Audit services engagement specifically approved by the Audit Committee, the Audit Committee may grant general pre-approval for other Audit Services, which are those services that only the independent auditor reasonably can provide. The Audit Committee has pre-approved certain Audit services, all other Audit services must be specifically pre-approved by the Audit Committee.
AUDIT-RELATED SERVICES
Audit-related services are assurance and related services that are reasonably related to the performance of the audit or review of the Company’s financial statements or that are traditionally performed by the independent auditor. The Audit Committee believes that the provision of Audit-related services does not impair the independence of the auditor, and has pre-approved certain Audit-related services, all other Audit-related services must be specifically pre-approved by the Audit Committee.
TAX SERVICES
The Audit Committee believes that the independent auditor can provide Tax services to the Company such as tax compliance, tax planning and tax advice without impairing the auditor’s independence. However, the Audit Committee will not permit the retention of the independent auditor in connection with a transaction initially recommended by the independent auditor, the purpose of which may be tax avoidance and the tax treatment of which may not be supported in the Internal Revenue Code and related regulations. The Audit Committee has pre-approved certain Tax services, all Tax services involving large and complex transactions must be specifically pre-approved by the Audit Committee.
ALL OTHER SERVICES
With respect to the provision of services other than audit, review or attest services the pre-approval requirement is waived if:
| (1) | The aggregate amount of all such services provided constitutes no more than five percent of the total amount of revenues paid by the registrant, the registrant’s adviser (not including any sub-adviser whose role is primarily portfolio management and is subcontracted with or overseen by another investment adviser), and any entity controlling, controlled by, or under common control with the investment adviser that provides ongoing services to the registrant to its accountant during the fiscal year in which the services are provided; |
| (2) | Such services were not recognized by the registrant, the registrant’s adviser (not including any sub-adviser whose role is primarily portfolio management and is subcontracted with or overseen by another investment adviser), and any entity controlling, controlled by, or under common control with the investment adviser that provides ongoing services to the registrant at the time of the engagement to be non-audit services; and |
| (3) | Such services are promptly brought to the attention of the Audit Committee of the issuer and approved prior to the completion of the audit by the Audit Committee or by one or more members of the Audit Committee who are members of the board of directors to whom authority to grant such approvals has been delegated by the Audit Committee. |
The Audit Committee may grant general pre-approval to those permissible non-audit services classified as All Other services that it believes are routine and recurring services, and would not impair the independence of the auditor.
The SEC’s rules and relevant guidance should be consulted to determine the precise definitions of prohibited non-audit services and the applicability of exceptions to certain of the prohibitions.
PRE-APPROVAL FEE LEVELS
Pre-approval fee levels for all services to be provided by the independent auditor will be established annually by the Audit Committee. Any proposed services exceeding these levels will require specific pre-approval by the Audit Committee.
PROCEDURES
Requests or applications to provide services that require specific approval by the Audit Committee will be submitted to the Audit Committee by both the independent auditor and the Principal Accounting Officer and/or Internal Auditor, and must include a joint statement as to whether, in their view, the request or application is consistent with the SEC’s rules on auditor independence.
(e)(2) Percentage of services identified in items 4(b) through 4(d) that were approved by the registrants audit committee pursuant to paragraph (c)(7)(i)(C) of Rule 2-01 of Regulation S-X:
4(b)
Fiscal year ended 2017– 0%
Fiscal year ended 2016- 0%
Percentage of services provided to the registrants investment adviser and any entity controlling, controlled by, or under common control with the investment adviser that provides ongoing services to the registrant that were approved by the registrants audit committee pursuant to paragraph (c)(7)(i)(C) of Rule 2-01 of Regulation S-X, 0% and 0% respectively.
4(c)
Fiscal year ended 2017– 0%
Fiscal year ended 2016– 0%
Percentage of services provided to the registrants investment adviser and any entity controlling, controlled by, or under common control with the investment adviser that provides ongoing services to the registrant that were approved by the registrants audit committee pursuant to paragraph (c)(7)(i)(C) of Rule 2-01 of Regulation S-X, 0% and 0% respectively.
4(d)
Fiscal year ended 2017– 0%
Fiscal year ended 2016– 0%
Percentage of services provided to the registrants investment adviser and any entity controlling, controlled by, or under common control with the investment adviser that provides ongoing services to the registrant that were approved by the registrants audit committee pursuant to paragraph (c)(7)(i)(C) of Rule 2-01 of Regulation S-X, 0% and 0% respectively.
| (g) | Non-Audit Fees billed to the registrant, the registrant’s investment adviser, and certain entities controlling, controlled by or under common control with the investment adviser: |
Fiscal year ended 2017- $268,903
Fiscal year ended 2016- $74,163
| (h) | The registrant’s Audit Committee has considered that the provision of non-audit services that were rendered to the registrant’s adviser (not including any sub-adviser whose role is primarily portfolio management and is subcontracted with or overseen by another investment adviser), and any entity controlling, controlled by, or under common control with the investment adviser that provides ongoing services to the registrant that were not pre-approved pursuant to paragraph (c)(7)(ii) of Rule 2-01 of Regulation S-X is compatible with maintaining the principal accountant’s independence. |
In its required communications to the Audit Committee of the registrant’s Board, Ernst & Young LLP (“EY”), the registrant’s independent public accountant, informed the Audit Committee that EY and/ or covered person professionals within EY maintain lending relationships with certain owners of greater than 10% of the shares of the registrant and/or certain investment companies within the “investment company complex” as defined under Rule 2-01(f)(14) of Regulation S-X, which are affiliates of the registrant. EY has advised the Audit Committee that these lending relationships implicate Rule 2-01(c)(1)(ii)(A) of Regulation S-X (referred to as the “Loan Rule”). The Loan Rule prohibits an independent public accountant, or covered person professionals at such firm, from having a financial relationship (such as a loan) with a lender that is a record or beneficial owner of more than 10% of an audit client’s equity securities. For purposes of the Loan Rule, audit clients include the registrant, as well as all registered investment companies advised by advisory subsidiaries of Federated Investors, Inc., the Adviser (for which EY serves as independent public accountant), and their respective affiliates (collectively, the “Federated Fund Complex”).
EY informed the Audit Committee that EY believes that these lending relationships described above do not and will not impair EY’s ability to exercise objective and impartial judgment in connection with the audits of the financial statements for the registrant and a reasonable investor with knowledge of all relevant facts and circumstances would conclude that EY has been and is capable of objective and impartial judgment on all issues encompassed within EY’s audits.
On June 20, 2016, the Division of Investment Management of the Securities and Exchange Commission (“SEC”) issued a no-action letter to another mutual fund complex (see Fidelity Management & Research Company et al., No-Action Letter) related to similar Loan Rule matters as those described above. In that letter, the SEC Staff confirmed that it would not recommend enforcement action against an investment company that relied on the audit services performed by an independent public accountant where the Loan Rule was implicated in certain specified circumstances. In that letter, the SEC staff indicated that it would not recommend enforcement action against the investment company complex if the Loan Rule is implicated provided that: (1) the auditor has complied with PCAOB Rule 3526(b)(1) and 3526(b)(2); (2) the Loan Rule is implicated because of lending relationships; and (3) notwithstanding such lending relationships that implicate the Loan Rule, the auditor has concluded that it is objective and impartial with respect to the issues encompassed within its engagement as auditor of the funds. The circumstances described in the no-action letter are substantially similar to the circumstances that implicated the Loan Rule with respect to EY and the registrant. The relief provided in the SEC no-action letter is effective for 18 months from its June 20, 2016 issuance date.
If it were to be determined that the relief available under the no-action letter was improperly relied upon, or that the independence requirements under the federal securities laws were not otherwise complied with regarding the registrant, for certain periods, any of the registrant’s filings with the SEC which contain financial statements of the registrant for such periods may not comply with applicable federal securities laws, the registrant’s ability to offer shares under its current registration statement may be impacted, and certain financial reporting and/or other covenants with, and representations and warranties to, the registrant’s lender under its committed line of credit may be impacted. Such events could have a material adverse effect on the registrant and the Federated Fund Complex.
| Item 5. | Audit Committee of Listed Registrants |
Not Applicable
| Item 6. | Schedule of Investments |
(a) The registrant’s Schedule of Investments is included as part of the Report to Stockholders filed under Item 1 of this form.
(b) Not Applicable; Fund had no divestments during the reporting period covered since the previous Form N-CSR filing.
| Item 7. | Disclosure of Proxy Voting Policies and Procedures for Closed-End Management Investment Companies |
Not Applicable
| Item 8. | Portfolio Managers of Closed-End Management Investment Companies |
Not Applicable
| Item 9. | Purchases of Equity Securities by Closed-End Management Investment Company and Affiliated Purchasers |
Not Applicable
| Item 10. | Submission of Matters to a Vote of Security Holders |
No Changes to Report
| Item 11. | Controls and Procedures |
(a) The registrant’s President and Treasurer have concluded that the
registrant’s disclosure controls and procedures (as defined in rule 30a-3(c) under the Act) are effective in design and operation and are sufficient to form the basis of the certifications required by Rule 30a-(2) under the Act, based on their evaluation of these disclosure controls and procedures within 90 days of the filing date of this report on Form N-CSR.
(b) There were no changes in the registrant’s internal control over financial reporting (as defined in rule 30a-3(d) under the Act) during the second fiscal quarter of the period covered by this report that have materially affected, or are reasonably likely to materially affect, the registrant’s internal control over financial reporting.
(a)(1) Code of Ethics- Not Applicable to this Report.
(a)(2) Certifications of Principal Executive Officer and Principal Financial Officer.
(a)(3) Not Applicable.
(b) Certifications pursuant to 18 U.S.C. Section 1350.
SIGNATURES
Pursuant to the requirements of the Securities Exchange Act of 1934 and the Investment Company Act of 1940, the registrant has duly caused this report to be signed on its behalf by the undersigned, thereunto duly authorized.
Registrant Federated Short-Intermediate Duration Municipal Trust
By /S/ Lori A. Hensler
Lori A. Hensler
Principal Financial Officer
Date August 23, 2017
Pursuant to the requirements of the Securities Exchange Act of 1934 and the Investment Company Act of 1940, this report has been signed below by the following persons on behalf of the registrant and in the capacities and on the dates indicated.
By /S/ John B. Fisher
John B. Fisher
Principal Executive Officer
Date August 23, 2017
By /S/ Lori A. Hensler
Lori A. Hensler
Principal Financial Officer
Date August 23, 2017