United States
Securities and Exchange Commission
Washington, D.C. 20549
Form N-CSR
Certified Shareholder Report of Registered Management Investment Companies
811-3181
(Investment Company Act File Number)
Federated Hermes Short-Intermediate Duration Municipal Trust
_______________________________________________________________
(Exact Name of Registrant as Specified in Charter)
Federated Hermes Funds
4000 Ericsson Drive
Warrendale, Pennsylvania 15086-7561
(Address of Principal Executive Offices)
(412) 288-1900
(Registrant's Telephone Number)
Peter J. Germain, Esquire
1001 Liberty Avenue
Pittsburgh, Pennsylvania 15222-3779
(Name and Address of Agent for Service)
(Notices should be sent to the Agent for Service)
Date of Fiscal Year End: 06/30/20
Date of Reporting Period: 06/30/20
| Item 1. | Reports to Stockholders |

| Share Class | Ticker | A | FMTAX | Institutional | FSHIX | Service | FSHSX |


| 1 | Income may be subject to state and local taxes. The investment adviser normally will invest the Fund’s assets entirely in securities whose interest is not subject to the AMT for individuals, such that, normally, distributions of annual interest income are exempt from the AMT (in addition to the federal regular income tax). However, in certain circumstances (such as, for example, when there is a lack of supply of non-AMT securities or there are advantageous market conditions), to pursue the Fund’s investment objective, the Fund’s adviser may invest the Fund’s assets in securities that may be subject to the AMT. In such circumstances, interest from the Fund’s investments may be subject to the AMT. |
| 2 | Please see the footnotes to the line graphs under “Fund Performance and Growth of a $10,000 Investment” below for the definition of, and more information about, the SPMBSI. |
| 3 | Please see the footnotes to the line graphs under “Fund Performance and Growth of a $10,000 Investment” below for the definition of, and more information about, the LSMDF. |
| 4 | Bond prices are sensitive to changes in interest rates, and a rise in interest rates can cause a decline in their prices. |
| 5 | Duration is a measure of a security’s price sensitivity to changes in interest rates. Securities with longer durations are more sensitive to changes in interest rates than securities with shorter durations. For purposes of this Management’s Discussion of Fund Performance, duration is determined using a third-party analytical system. |
| 6 | Credit ratings pertain only to the securities in the portfolio and do not protect Fund shares against market risk. Credit ratings are an indication of the risk that a security will default. They do not protect a security from credit risk. Lower-rated bonds typically offer higher yields to help compensate investors for the increased risk associated with them. Among these risks are lower creditworthiness, greater price volatility, more risk to principal and income than with higher-rated securities and increased possibilities of default. |
| 7 | The amount of public information available about municipal securities is generally less than that for corporate bonds. Special factors, such as legislative changes and local and business developments, may adversely affect the yield or value of municipal securities. |
| 8 | Investment-grade securities are securities that are rated at least “BBB” or unrated securities of a comparable quality. Noninvestment-grade securities are securities that are not rated at least “BBB” or unrated securities of a comparable quality. Investment-grade securities and noninvestment-grade securities may either be: (a) rated by a nationally recognized statistical rating organization or rating agency; or (b) unrated securities that the Fund’s investment adviser (“Adviser”) believes are of comparable quality. The rating agencies that provided the ratings for rated securities include Standard and Poor’s, Moody’s Investor Services, Inc. and Fitch Rating Service. When ratings vary, the highest rating is used. Credit ratings of “AA” or better are considered to be high credit quality; credit ratings of “A” are considered high or medium/good quality; and credit ratings of “BBB” are considered to be medium/good credit quality and the lowest category of investment-grade securities; credit ratings of “BB” and below are lower-rated, noninvestment-grade securities or junk bonds; and credit ratings of “CCC” or below are noninvestment-grade securities that have high default risk. Any credit quality breakdown does not give effect to the impact of any credit derivative investments made by the Fund. Credit ratings are an indication of the risk that a security will default. They do not protect a security from credit risk. Lower-rated bonds typically offer higher yields to help compensate investors for the increased risk associated with them. Among these risks are lower creditworthiness, greater price volatility, more risk to principal and income than with higher-rated securities and increased possibilities of default. |
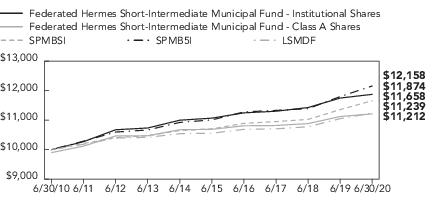
| Federated Hermes Short-Intermediate Municipal Fund - | Institutional Shares | Class A Shares | SPMBSI | SPMB5I | LSMDF |
| F | F | I | I | I | |
| 6/30/2010 | 10,000 | 9,900 | 10,000 | 10,000 | 10,000 |
| 6/30/2011 | 10,271 | 10,120 | 10,211 | 10,288 | 10,183 |
| 6/30/2012 | 10,674 | 10,464 | 10,407 | 10,596 | 10,392 |
| 6/30/2013 | 10,734 | 10,471 | 10,473 | 10,667 | 10,417 |
| 6/30/2014 | 10,998 | 10,675 | 10,647 | 10,923 | 10,542 |
| 6/30/2015 | 11,067 | 10,689 | 10,704 | 11,008 | 10,557 |
| 6/30/2016 | 11,247 | 10,809 | 10,891 | 11,279 | 10,688 |
| 6/30/2017 | 11,302 | 10,818 | 10,950 | 11,330 | 10,706 |
| 6/30/2018 | 11,427 | 10,883 | 11,025 | 11,388 | 10,775 |
| 6/30/2019 | 11,748 | 11,122 | 11,356 | 11,798 | 11,050 |
| 6/30/2020 | 11,874 | 11,212 | 11,658 | 12,158 | 11,239 |
| ■ | Total returns shown for Class A include the maximum sales charge of 1.00% ($10,000 investment minus $100 sales charge = $9,900) |
| 1 Year | 5 Years | 10 Years | |
| Class A Shares | -0.16% | 0.77% | 1.15% |
| Institutional Shares | 1.07% | 1.42% | 1.73% |
| Service Shares | 0.93% | 1.19% | 1.50% |
| SPMBSI | 2.66% | 1.72% | 1.55% |
| SPMB5I | 3.05% | 2.01% | 1.97% |
| LSMDF | 1.68% | 1.29% | 1.17% |
| 1 | Represents a hypothetical investment of $10,000 in the Fund after deducting applicable sales charges: for Class A Shares, the maximum sales charge of 1.00% ($10,000 investment minus $100 sales charge = $9,900). The Fund’s performance assumes the reinvestment of all dividends and distributions. The SPMBSI, SPMB5I and LSMDF have been adjusted to reflect reinvestment of dividends on securities in the indexes and the average. |
| 2 | The SPMBSI consists of bonds in the S&P Municipal Bond Index with a minimum maturity of 6 months and a maximum maturity of 4 years. The SPMBSI is not adjusted to reflect sales charges, expenses and other fees that the SEC requires to be reflected in the Fund’s performance. The SPMBSI is unmanaged and, unlike the Fund, is not affected by cash flows. It is not possible to invest directly in an index. |
| 3 | The SPMB5I represents the portion of the S&P Municipal Bond Investment Grade Index composed solely of investment-grade bonds (those with ratings higher than “BBB-“/”Baa3”) with remaining maturities of between one and five years, 5% of which are pre-refunded. The SPMB5I is not adjusted to reflect sales charges, expenses and other fees that the SEC requires to be reflected in the Fund’s performance. The SPMB5I is unmanaged and, unlike the Fund, is not affected by cash flows. It is not possible to invest directly in an index. |
| 4 | The LSMDF represents the average of the total returns reported by all the mutual funds designated by Lipper, Inc. as falling in the category indicated, and is not adjusted to reflect any sales charges. However, these returns are reported net of expenses or other fees that the SEC requires to be reflected in a fund’s performance. |
| Sector Composition | Percentage of Total Net Assets |
| Hospital | 13.9% |
| Industrial Development/Pollution Control | 11.1% |
| Prepaid Gas Utility | 9.3% |
| General Obligation-Local | 9.1% |
| Electric and Gas | 8.9% |
| Toll Road | 7.4% |
| Public Power | 6.3% |
| Senior Care | 5.5% |
| Water and Sewer | 5.0% |
| Airport | 3.3% |
| Other2 | 20.8% |
| Other Assets and Liabilities—Net3 | (0.6)% |
| TOTAL | 100.0% |
| 1 | Sector classifications, and the assignment of holdings to such sectors, are based upon the economic sector and/or revenue source of the underlying obligor, as determined by the Fund’s Adviser. For securities that have been enhanced by a third-party, including bond insurers and banks, sector classifications are based upon the economic sector and/or revenue source of the underlying obligor, as determined by the Fund’s Adviser. |
| 2 | For purposes of this table, sector classifications constitute 79.8% of the Fund’s total net assets. Remaining sectors have been aggregated under the designation “Other.” |
| 3 | Assets, other than investments in securities, less liabilities. See Statement of Assets and Liabilities. |
| Principal Amount | Value | ||
| MUNICIPAL BONDS—92.5% | |||
| Alabama—2.6% | |||
| $6,500,000 | Black Belt Energy Gas District, AL, Gas Prepay Revenue Bonds Project No. 4 (Series 2019A-1) TOBs, (Morgan Stanley GTD), 4.000%, Mandatory Tender 12/1/2025 | $7,392,515 | |
| 1,000,000 | Black Belt Energy Gas District, AL, Gas Prepay Revenue Bonds Project No. 5 (Series 2020A-1) TOBs, (Morgan Stanley GTD), 4.000%, Mandatory Tender 10/1/2026 | 1,153,080 | |
| 8,000,000 | Lower Alabama Gas District, Gas Project Revenue Bonds Project No.2 (Series 2020A) TOBs, (Goldman Sachs Group, Inc. GTD), 4.000%, Mandatory Tender 12/1/2025 | 9,102,880 | |
| 2,500,000 | Mobile, AL IDB (Alabama Power Co.), PCR Bonds (Series 2007A) TOBs, 1.000%, Mandatory Tender 6/26/2025 | 2,500,000 | |
| 450,000 | Prattville, AL IDB (International Paper Co.), Environmental Improvement Revenue Refunding Bonds (Series 2019B) TOBs, 2.000%, Mandatory Tender 10/1/2024 | 464,859 | |
| 425,000 | Prattville, AL IDB (International Paper Co.), Recovery Zone Facility Revenue Refunding Bonds (Series 2019C) TOBs, 2.000%, Mandatory Tender 10/1/2024 | 439,033 | |
| TOTAL | 21,052,367 | ||
| Alaska—1.5% | |||
| 8,000,000 | Alaska Industrial Development and Export Authority (Yukon-Kuskokwim Health Corp.), Loan Anticipation Revenue Notes (Series 2017), 3.500%, 12/1/2020 | 8,015,440 | |
| 1,250,000 | Alaska International Airports System, Revenue Refunding Bonds (Series 2016A), 5.000%, 10/1/2024 | 1,453,350 | |
| 1,010,000 | Alaska State Housing Finance Corp., Revenue Bonds (Series 2013A), 5.000%, 12/1/2022 | 1,091,780 | |
| 1,550,000 | Anchorage, AK Electric Utility System, Senior Lien Revenue Refunding Bonds (Series 2014A), 5.000%, 12/1/2022 | 1,714,377 | |
| TOTAL | 12,274,947 | ||
| Arizona—1.4% | |||
| 3,330,000 | Chandler, AZ IDA (Intel Corp.), Industrial Development Revenue Bonds (Series 2019) TOBs, 4.918%, Mandatory Tender 6/3/2024 | 3,834,994 | |
| 1,750,000 | Phoenix, AZ Civic Improvement Corp.—Airport System, Junior Lien Airport Revenue Bonds (Series 2019B), 5.000%, 7/1/2023 | 1,956,535 | |
| 1,000,000 | Phoenix, AZ Civic Improvement Corp.—Airport System, Junior Lien Airport Revenue Bonds (Series 2019B), 5.000%, 7/1/2024 | 1,152,220 | |
| 1,500,000 | Phoenix, AZ Civic Improvement Corp.—Airport System, Junior Lien Airport Revenue Bonds (Series 2019B), 5.000%, 7/1/2025 | 1,774,620 |
| Principal Amount | Value | ||
| MUNICIPAL BONDS—continued | |||
| Arizona—continued | |||
| $3,000,000 | Tempe, AZ IDA (Mirabella at ASU), Revenue Bonds (Series 2017B), (Original Issue Yield: 4.750%), 4.700%, 10/1/2024 | $2,984,970 | |
| TOTAL | 11,703,339 | ||
| California—5.0% | |||
| 5,000,000 | 1 | Bay Area Toll Authority, CA, San Francisco Bay Area Toll Bridge Revenue Bonds (SIFMA Index Rate Bonds Series 2007B-1) FRNs, 1.230% (SIFMA 7-day +1.100%), Mandatory Tender 4/1/2024 | 4,989,250 |
| 10,000,000 | 1 | Bay Area Toll Authority, CA, San Francisco Bay Area Toll Bridge Revenue Bonds (SIFMA Index Rate Bonds Series 2007G-1) FRNs, 1.230% (SIFMA 7-day +1.100%), Mandatory Tender 4/1/2024 | 9,978,500 |
| 2,045,000 | California Health Facilities Financing Authority (Kaiser Permanente), Revenue Bonds (Series 2017C) TOBs, 5.000%, Mandatory Tender 11/1/2022 | 2,250,584 | |
| 1,000,000 | California Municipal Finance Authority (Community Medical Centers), Revenue Refunding Bonds (Series 2017A), 5.000%, 2/1/2022 | 1,061,580 | |
| 2,000,000 | California Municipal Finance Authority (Community Medical Centers), Revenue Refunding Bonds (Series 2017A), 5.000%, 2/1/2023 | 2,197,540 | |
| 2,000,000 | California Municipal Finance Authority (Community Medical Centers), Revenue Refunding Bonds (Series 2017A), 5.000%, 2/1/2024 | 2,267,640 | |
| 1,500,000 | 2 | California Municipal Finance Authority (Waste Management, Inc.), Solid Waste Disposal Revenue Bonds (Series 2009A) TOBs, 1.300%, Mandatory Tender 2/3/2025 | 1,506,675 |
| 3,750,000 | California State, UT GO Various Purpose Bonds, 5.000%, 3/1/2029 | 5,035,500 | |
| 2,500,000 | California State, UT GO Various Purpose Bonds, 5.000%, 3/1/2030 | 3,427,925 | |
| 2,860,000 | Los Angeles Department of Water & Power (Los Angeles, CA Department of Water & Power (Electric/Power System)), Power System Revenue Bonds (Series 2020A), 5.000%, 7/1/2029 | 3,911,622 | |
| 2,000,000 | Southern California Public Power Authority (Power Projects), Windy Point/Windy Flats Project Revenue Refunding Bonds (Series 2020-1) Green Bonds, 5.000%, 4/1/2024 | 2,323,320 | |
| 2,000,000 | Western Placer, CA Unified School District, Community Facilities District No.2 2020 Bond Anticipation Notes, 2.000%, 6/1/2025 | 2,040,760 | |
| TOTAL | 40,990,896 | ||
| Colorado—1.6% | |||
| 350,000 | Colorado Health Facilities Authority (Christian Living Communities), Revenue Refunding Bonds (Series 2016), 4.000%, 1/1/2021 | 349,913 | |
| 400,000 | Colorado Health Facilities Authority (Christian Living Communities), Revenue Refunding Bonds (Series 2016), 4.000%, 1/1/2022 | 399,196 |
| Principal Amount | Value | ||
| MUNICIPAL BONDS—continued | |||
| Colorado—continued | |||
| $640,000 | Colorado Health Facilities Authority (Christian Living Communities), Revenue Refunding Bonds (Series 2016), 5.000%, 1/1/2023 | $651,565 | |
| 750,000 | Colorado Health Facilities Authority (Christian Living Communities), Revenue Refunding Bonds (Series 2016), 5.000%, 1/1/2024 | 767,122 | |
| 600,000 | Colorado Health Facilities Authority (Christian Living Communities), Revenue Refunding Bonds (Series 2016), 5.000%, 1/1/2025 | 615,774 | |
| 1,000,000 | Colorado Health Facilities Authority (Covenant Retirement Communities, Inc.), Revenue Refunding Bonds (Series 2015A), 5.000%, 12/1/2020 | 1,010,160 | |
| 750,000 | Colorado Health Facilities Authority (Covenant Retirement Communities, Inc.), Revenue Refunding Bonds (Series 2015A), 5.000%, 12/1/2021 | 775,237 | |
| 250,000 | Colorado Health Facilities Authority (Covenant Retirement Communities, Inc.), Revenue Refunding Bonds (Series 2015A), 5.000%, 12/1/2022 | 263,945 | |
| 3,000,000 | Denver, CO City & County Department of Aviation, Airport System Revenue Refunding Bonds (Series 2019D) TOBs, 5.000%, Mandatory Tender 11/15/2022 | 3,290,790 | |
| 450,000 | E-470 Public Highway Authority, CO, Senior Revenue Bonds (Series 2020A), 5.000%, 9/1/2024 | 529,407 | |
| 280,000 | E-470 Public Highway Authority, CO, Senior Revenue Bonds (Series 2020A), 5.000%, 9/1/2025 | 338,674 | |
| 1,480,000 | E-470 Public Highway Authority, CO, Senior Revenue Bonds (Series 2020A), 5.000%, 9/1/2026 | 1,836,769 | |
| 2,000,000 | E-470 Public Highway Authority, CO, Senior Revenue Bonds (Series 2020A), 5.000%, 9/1/2027 | 2,537,800 | |
| TOTAL | 13,366,352 | ||
| Connecticut—1.7% | |||
| 1,000,000 | Connecticut State Special Transportation Fund, Special Tax Obligation Bonds Transportation Infrastructure Purposes (Series 2020A), 5.000%, 5/1/2028 | 1,272,930 | |
| 2,600,000 | Connecticut State Special Transportation Fund, Special Tax Obligation Bonds Transportation Infrastructure Purposes (Series 2020A), 5.000%, 5/1/2029 | 3,361,774 | |
| 1,000,000 | Connecticut State Special Transportation Fund, Special Tax Obligation Bonds Transportation Infrastructure Purposes (Series 2020A), 5.000%, 5/1/2030 | 1,315,460 | |
| 1,500,000 | 1 | Connecticut State, UT GO SIFMA Index Bonds (Series 2013A) FRNs, 1.030% (SIFMA 7-day +0.900%), 3/1/2023 | 1,500,675 |
| 2,255,000 | 1 | Connecticut State, UT GO SIFMA Index Bonds (Series 2013A) FRNs, 1.080% (SIFMA 7-day +0.950%), 3/1/2024 | 2,252,948 |
| Principal Amount | Value | ||
| MUNICIPAL BONDS—continued | |||
| Connecticut—continued | |||
| $4,000,000 | 1 | Connecticut State, UT GO SIFMA Index Bonds (Series 2013A) FRNs, 1.120% (SIFMA 7-day +0.990%), 3/1/2025 | $3,994,560 |
| TOTAL | 13,698,347 | ||
| Delaware—0.2% | |||
| 2,000,000 | Delaware Economic Development Authority (Delmarva Power and Light Co.), Gas Facilities Revenue Refunding Bonds (Series 2020A) TOBs, 1.050%, Mandatory Tender 7/1/2025 | 2,009,220 | |
| Florida—1.7% | |||
| 575,000 | Broward County, FL Port Facilities, Revenue Refunding Bonds (Series 2011A), (Assured Guaranty Municipal Corp. INS), 5.000%, 9/1/2024 | 598,719 | |
| 1,500,000 | Citizens Property Insurance Corp. FL, Revenue Bonds (Series 2015A1), 5.000%, 6/1/2022 | 1,587,945 | |
| 1,500,000 | Citizens Property Insurance Corp. FL, Senior Secured Revenue Bonds (Series 2012 A-1), 5.000%, 6/1/2021 | 1,558,785 | |
| 1,195,000 | Halifax Hospital Medical Center, FL, Revenue Refunding Bonds, 5.000%, 6/1/2021 | 1,237,924 | |
| 1,000,000 | Halifax Hospital Medical Center, FL, Revenue Refunding Bonds, 5.000%, 6/1/2022 | 1,074,050 | |
| 1,245,000 | Hillsborough County, FL IDA (Tampa General Hospital), Hospital Revenue Refunding Bonds (Series 2012A), 5.000%, 10/1/2021 | 1,305,594 | |
| 1,300,000 | Hillsborough County, FL IDA (Tampa General Hospital), Hospital Revenue Refunding Bonds (Series 2012A), 5.000%, 10/1/2022 | 1,412,424 | |
| 3,265,000 | Palm Beach County, FL Health Facilities Authority (ACTS Retirement Life Communities, Inc.), Retirement Communities Revenue Bonds (Series 2016), 5.000%, 11/15/2021 | 3,410,619 | |
| 1,345,000 | Volusia County, FL Education Facility Authority (Stetson University, Inc.), Revenue Refunding Bonds (Series 2015), 5.000%, 6/1/2024 | 1,514,524 | |
| TOTAL | 13,700,584 | ||
| Georgia—4.4% | |||
| 1,000,000 | Atlanta, GA (Atlantic Station Project), Tax Allocation Refunding Bonds (Series 2017), 5.000%, 12/1/2022 | 1,097,430 | |
| 1,000,000 | Atlanta, GA (Atlantic Station Project), Tax Allocation Refunding Bonds (Series 2017), 5.000%, 12/1/2023 | 1,134,330 | |
| 800,000 | Atlanta, GA (Atlantic Station Project), Tax Allocation Refunding Bonds (Series 2017), 5.000%, 12/1/2024 | 934,920 | |
| 3,000,000 | Burke County, GA Development Authority (Georgia Power Co.), Vogtle Project Pollution Control Revenue Bonds (Fifth Series 1995) TOBs, 2.050%, Mandatory Tender 11/19/2021 | 3,035,220 | |
| 7,000,000 | 1 | Main Street Natural Gas, Inc., GA, Gas Supply Revenue Bonds (Series 2018B) FRNs, (Royal Bank of Canada GTD), 0.866% (1-month USLIBOR x 0.67 +0.750%), Mandatory Tender 9/1/2023 | 6,940,220 |
| Principal Amount | Value | ||
| MUNICIPAL BONDS—continued | |||
| Georgia—continued | |||
| $5,000,000 | Main Street Natural Gas, Inc., GA, Gas Supply Revenue Bonds (Series 2018C) TOBs, (Royal Bank of Canada GTD), 4.000%, Mandatory Tender 12/1/2023 | $5,471,700 | |
| 5,300,000 | Main Street Natural Gas, Inc., GA, Gas Supply Revenue Bonds (Series 2019B) TOBs, (Toronto Dominion Bank GTD), 4.000%, Mandatory Tender 12/2/2024 | 5,980,997 | |
| 5,500,000 | Monroe County, GA Development Authority Pollution Control (Georgia Power Co.), Scherer Plant Pollution Control Revenue Bonds (First Series 1995), 2.250%, 7/1/2025 | 5,631,285 | |
| 3,500,000 | Private Colleges & Universities Facilities of GA (Emory University), Revenue Bonds (Series 2020B), 5.000%, 9/1/2030 | 4,805,885 | |
| 850,000 | Savannah, GA EDA (International Paper Co.), Recovery Zone Facility Revenue Refunding Bonds (Series 2019A) TOBs, 2.000%, Mandatory Tender 10/1/2024 | 878,067 | |
| TOTAL | 35,910,054 | ||
| Illinois—5.3% | |||
| 1,000,000 | Chicago, IL Midway Airport, Second Lien Revenue & Refunding Bonds (Series 2014B), 5.000%, 1/1/2022 | 1,059,760 | |
| 1,500,000 | Chicago, IL Midway Airport, Second Lien Revenue Refunding Bonds (Series 2013C), 5.000%, 1/1/2022 | 1,589,640 | |
| 2,000,000 | Chicago, IL O’Hare International Airport, General Airport Senior Lien Revenue Refunding Bonds (Series 2015B), 5.000%, 1/1/2021 | 2,041,900 | |
| 1,000,000 | Chicago, IL O’Hare International Airport, Revenue Refunding Bonds (Series 2015B), 5.000%, 1/1/2023 | 1,097,280 | |
| 1,135,000 | Chicago, IL Water Revenue, Second Lien Water Revenue Bonds (Series 2016A-1), 5.000%, 11/1/2023 | 1,260,758 | |
| 1,000,000 | Chicago, IL Water Revenue, Second Lien Water Revenue Refunding Bonds (Series 2004), 5.000%, 11/1/2020 | 1,011,570 | |
| 1,000,000 | Chicago, IL Water Revenue, Second Lien Water Revenue Refunding Bonds (Series 2004), 5.000%, 11/1/2021 | 1,045,780 | |
| 5,000,000 | Chicago, IL Water Revenue, Second Lien Water Revenue Refunding Bonds (Series 2004), 5.000%, 11/1/2022 | 5,397,250 | |
| 2,645,000 | Chicago, IL Water Revenue, Second Lien Water Revenue Refunding Bonds (Series 2004), 5.000%, 11/1/2023 | 2,938,066 | |
| 1,780,000 | Illinois Finance Authority (Admiral at the Lake), Revenue Refunding Bonds (Series 2017), 5.000%, 5/15/2022 | 1,774,251 | |
| 1,845,000 | Illinois Finance Authority (Admiral at the Lake), Revenue Refunding Bonds (Series 2017), 5.000%, 5/15/2023 | 1,833,229 | |
| 1,200,000 | Illinois Finance Authority (Presbyterian Homes Obligated Group), Revenue Bonds (Series 2016A), 5.000%, 11/1/2021 | 1,243,944 | |
| 1,500,000 | Illinois Finance Authority (Presbyterian Homes Obligated Group), Revenue Bonds (Series 2016A), 5.000%, 11/1/2022 | 1,592,040 | |
| 1,800,000 | Illinois Finance Authority (Presbyterian Homes Obligated Group), Revenue Bonds (Series 2016A), 5.000%, 11/1/2023 | 1,950,696 |
| Principal Amount | Value | ||
| MUNICIPAL BONDS—continued | |||
| Illinois—continued | |||
| $3,000,000 | 1 | Illinois Finance Authority (Presbyterian Homes Obligated Group), Revenue Bonds (Series 2016B) FRNs, 1.471% (1-month USLIBOR x 0.70 +1.350%), Mandatory Tender 5/1/2021 | $3,001,350 |
| 3,000,000 | Illinois Housing Development Authority (Century Woods), Multifamily Housing Revenue Bonds (Series 2019) TOBs, (GNMA COL), 1.868%, Mandatory Tender 10/1/2021 | 3,044,130 | |
| 1,750,000 | Illinois State, UT GO Bonds (Series 2020B), 5.500%, 5/1/2024 | 1,897,000 | |
| 1,500,000 | Illinois State, UT GO Refunding Bonds (Series 2018A), 5.000%, 10/1/2021 | 1,541,790 | |
| 2,000,000 | Illinois State, UT GO Refunding Bonds (Series 2018A), 5.000%, 10/1/2022 | 2,089,780 | |
| 1,000,000 | Illinois State, UT GO Refunding Bonds (Series 2018A), 5.000%, 10/1/2023 | 1,059,330 | |
| 2,300,000 | Illinois State, UT GO Refunding Bonds (Series 2018A), 5.000%, 10/1/2028 | 2,522,065 | |
| 1,925,000 | Railsplitter Tobacco Settlement Authority, IL, Tobacco Settlement Revenue Bonds (Series 2017), 5.000%, 6/1/2026 | 2,284,705 | |
| TOTAL | 43,276,314 | ||
| Indiana—2.0% | |||
| 725,000 | Ball State University, IN, Revenue Refunding Bonds (Series 2016), 5.000%, 7/1/2021 | 758,901 | |
| 500,000 | Ball State University, IN, Revenue Refunding Bonds (Series 2016), 5.000%, 7/1/2022 | 543,715 | |
| 1,000,000 | Indiana Municipal Power Agency, Revenue Refunding Bonds (Series 2016C), 5.000%, 1/1/2024 | 1,154,850 | |
| 7,000,000 | Indiana State EDA (Republic Services, Inc.), (Series A) TOBs, 0.650%, Mandatory Tender 9/1/2020 | 6,999,160 | |
| 2,000,000 | Indiana State Finance Authority Hospital Revenue (Beacon Health System Obligated Group), Hospital Revenue Bonds (Series 2013A), 5.000%, 8/15/2020 | 2,010,680 | |
| 1,000,000 | Indiana State Finance Authority Hospital Revenue (Beacon Health System Obligated Group), Hospital Revenue Bonds (Series 2013A), 5.000%, 8/15/2021 | 1,049,590 | |
| 4,000,000 | Rockport, IN PCR (Indiana Michigan Power Co.), Revenue Refunding Bonds (Series 2008D) TOBs, 2.050%, Mandatory Tender 6/1/2021 | 4,038,000 | |
| TOTAL | 16,554,896 | ||
| Iowa—0.1% | |||
| 1,040,000 | Ames, IA Hospital Revenue (Mary Greeley Medical Center), Revenue Refunding Bonds (Series 2016), 5.000%, 6/15/2023 | 1,157,770 | |
| Kansas—0.5% | |||
| 2,000,000 | Holton, KS (Holton Community Hospital), Hospital Loan Anticipation Revenue Bonds (Series 2019), 2.500%, 7/1/2021 | 2,011,560 |
| Principal Amount | Value | ||
| MUNICIPAL BONDS—continued | |||
| Kansas—continued | |||
| $1,000,000 | Wyandotte County, KS Unified Government Utility System, Improvement & Refunding Revenue Bonds (Series 2014-A), 5.000%, 9/1/2021 | $1,053,240 | |
| 1,000,000 | Wyandotte County, KS Unified Government Utility System, Revenue Bonds (Series 2016A), 5.000%, 9/1/2024 | 1,178,710 | |
| TOTAL | 4,243,510 | ||
| Kentucky—4.3% | |||
| 2,640,000 | Kentucky Bond Development Corp. (St. Elizabeth Medical Center), Hospital Facilities Revenue Refunding Bonds (Series 2016), 5.000%, 5/1/2024 | 3,045,187 | |
| 5,000,000 | Kentucky Economic Development Finance Authority (Catholic Health Initiatives), Revenue Bonds (Series 2009B) TOBs, 2.700%, Mandatory Tender 11/10/2021 | 5,114,800 | |
| 3,000,000 | Louisville & Jefferson County, KY Metropolitan Government (Louisville Gas & Electric Co.), Pollution Control Revenue Bonds (Series 2005A) TOBs, 1.750%, Mandatory Tender 7/1/2026 | 3,078,030 | |
| 4,000,000 | Louisville & Jefferson County, KY Metropolitan Government (Louisville Gas & Electric Co.), Revenue Refunding Bonds Series 2013A (Remarketing 4/1/19) TOBs, 1.850%, Mandatory Tender 4/1/2021 | 4,029,720 | |
| 5,000,000 | Public Energy Authority of Kentucky, Gas Supply Revenue Bonds (Series 2018A) TOBs, (Morgan Stanley GTD), 4.000%, Mandatory Tender 4/1/2024 | 5,490,400 | |
| 4,000,000 | Public Energy Authority of Kentucky, Gas Supply Revenue Bonds (Series 2018B) TOBs, (BP PLC GTD), 3.956%, Mandatory Tender 1/1/2025 | 4,405,760 | |
| 9,000,000 | Public Energy Authority of Kentucky, Gas Supply Revenue Bonds (Series 2020A) TOBs, (BP PLC GTD), 4.000%, Mandatory Tender 6/1/2026 | 10,161,900 | |
| TOTAL | 35,325,797 | ||
| Louisiana—1.3% | |||
| 6,000,000 | Louisiana State Offshore Terminal Authority (Loop LLC), Deepwater Port Revenue Bonds (Series 2010B-1A) TOBs, 2.000%, Mandatory Tender 10/1/2022 | 5,935,620 | |
| 790,000 | New Orleans, LA Aviation Board, Revenue Bonds (Series 2015A), 5.000%, 1/1/2024 | 898,175 | |
| 3,765,000 | St. Charles Parish, LA Gulf Opportunity Zone (Valero Energy Corp.), Revenue Bonds (Series 2010) TOBs, 4.000%, Mandatory Tender 6/1/2022 | 3,924,297 | |
| TOTAL | 10,758,092 | ||
| Maryland—0.2% | |||
| 850,000 | Rockville, MD Mayor & City Council Econ Dev Revenue (Ingleside at King Farm), Paydown Securities TEMPS-70 (Series 2017C-2), 3.000%, 11/1/2025 | 789,370 |
| Principal Amount | Value | ||
| MUNICIPAL BONDS—continued | |||
| Maryland—continued | |||
| $1,000,000 | Rockville, MD Mayor & City Council Econ Dev Revenue (Ingleside at King Farm), Paydown Securities TEMPS-85 (Series 2017C-1), 3.500%, 11/1/2026 | $938,560 | |
| TOTAL | 1,727,930 | ||
| Massachusetts—1.4% | |||
| 2,000,000 | Massachusetts Development Finance Agency (Harvard University), Revenue Refunding Bonds (Series 2020A), 5.000%, 10/15/2029 | 2,753,100 | |
| 1,000,000 | Massachusetts Development Finance Agency (Harvard University), Revenue Refunding Bonds (Series 2020A), 5.000%, 10/15/2030 | 1,405,720 | |
| 6,000,000 | Massachusetts State Development Finance Agency (Boston University), Revenue Bonds (Series 2019 DD-1) TOBs, 5.000%, Mandatory Tender 4/1/2024 | 6,832,140 | |
| 365,000 | Massachusetts State Housing Finance Agency Housing Revenue, SFM Revenue Bonds (Series 172), 4.000%, 6/1/2045 | 383,889 | |
| TOTAL | 11,374,849 | ||
| Michigan—2.0% | |||
| 5,000,000 | Michigan State Finance Authority Revenue (Great Lakes, MI Water Authority Water Supply System), Senior Lien Revenue Bonds (Series 2014 D-1), (Assured Guaranty Municipal Corp. INS), 5.000%, 7/1/2022 | 5,458,850 | |
| 2,500,000 | Michigan State Finance Authority Revenue (Great Lakes, MI Water Authority Water Supply System), Senior Lien Revenue Bonds (Series D-1), (Assured Guaranty Municipal Corp. INS), 5.000%, 7/1/2021 | 2,614,850 | |
| 1,200,000 | Michigan State Finance Authority Revenue (Public Lighting Authority ), Local Government Loan Program Revenue Bonds (Series 2014B), 5.000%, 7/1/2020 | 1,200,000 | |
| 1,205,000 | Michigan State Trunk Line, State Trunk Line Fund Refunding Bonds (Series 2020A), 5.000%, 11/15/2023 | 1,380,063 | |
| 1,000,000 | Michigan State Trunk Line, State Trunk Line Fund Refunding Bonds (Series 2020A), 5.000%, 11/15/2024 | 1,183,620 | |
| 3,500,000 | Michigan Strategic Fund (Detroit Edison Co.), Variable Rate Limited Obligation Revenue Refunding Bonds (Series 2008ET-2) TOBs, 1.450%, Mandatory Tender 9/1/2021 | 3,516,135 | |
| 1,170,000 | Michigan Strategic Fund (Michigan State), LT Obligation Revenue Bonds (Series 2011), 5.000%, 10/15/2020 | 1,184,063 | |
| TOTAL | 16,537,581 | ||
| Minnesota—0.4% | |||
| 3,000,000 | 1 | Minnesota State HFA, Residential Housing Finance Bonds (Series 2018D) FRNs, 0.560% (SIFMA 7-day +0.430%), Mandatory Tender 7/3/2023 | 2,991,000 |
| Principal Amount | Value | ||
| MUNICIPAL BONDS—continued | |||
| Mississippi—0.6% | |||
| $1,250,000 | Mississippi Business Finance Corp. (Waste Management, Inc.), Solid Waste Disposal Revenue Bonds (Series 2002) TOBs, 2.200%, Mandatory Tender 6/3/2024 | $1,281,737 | |
| 4,000,000 | Warren County, MS Gulf Opportunity Zone (International Paper Co.), Revenue Refunding Bonds (Series 2020A) TOBs, 1.375%, Mandatory Tender 6/16/2025 | 4,021,920 | |
| TOTAL | 5,303,657 | ||
| Missouri—1.0% | |||
| 1,570,000 | Cape Girardeau County, MO IDA (St. Francis Medical Center, MO), Revenue Bonds (Series 2013A), 5.000%, 6/1/2022 | 1,689,367 | |
| 565,000 | Missouri State HEFA (Lutheran Senior Services), Senior Living Facilities Revenue Bonds (Series 2014A), 5.000%, 2/1/2021 | 570,949 | |
| 500,000 | Missouri State HEFA (Lutheran Senior Services), Senior Living Facilities Revenue Bonds (Series 2016A), 5.000%, 2/1/2023 | 520,975 | |
| 800,000 | Missouri State HEFA (Lutheran Senior Services), Senior Living Facilities Revenue Bonds (Series 2016B), 5.000%, 2/1/2021 | 808,424 | |
| 650,000 | Missouri State HEFA (Lutheran Senior Services), Senior Living Facilities Revenue Bonds (Series 2016B), 5.000%, 2/1/2022 | 667,570 | |
| 1,200,000 | Missouri State HEFA (Lutheran Senior Services), Senior Living Facilities Revenue Bonds (Series 2016B), 5.000%, 2/1/2023 | 1,250,340 | |
| 750,000 | Missouri State HEFA (Lutheran Senior Services), Senior Living Facilities Revenue Bonds (Series 2016B), 5.000%, 2/1/2024 | 791,925 | |
| 850,000 | Missouri State HEFA (Lutheran Senior Services), Senior Living Facilities Revenue Bonds (Series 2016B), 5.000%, 2/1/2025 | 906,840 | |
| 750,000 | Missouri State HEFA (Lutheran Senior Services), Senior Living Facilities Revenue Bonds (Series 2016B), 5.000%, 2/1/2026 | 806,565 | |
| TOTAL | 8,012,955 | ||
| Montana—0.6% | |||
| 4,860,000 | 1 | Montana Facility Finance Authority (Billings Clinic Obligated Group), Variable Rate Revenue Bonds (Series 2018C) FRNs, 0.680% (SIFMA 7-day +0.550%), Mandatory Tender 8/15/2023 | 4,845,469 |
| Nevada—2.4% | |||
| 6,665,000 | Clark County, NV Airport System, Airport System Subordinate Lien Revenue Refunding Bonds (Series 2019A), 5.000%, 7/1/2026 | 8,105,306 | |
| 3,000,000 | Clark County, NV School District, LT GO Building Bonds (Series 2020A), (Assured Guaranty Municipal Corp. INS), 5.000%, 6/15/2028 | 3,829,380 | |
| 875,000 | Clark County, NV School District, LT GO Building Bonds (Series 2020A), (Assured Guaranty Municipal Corp. INS), 5.000%, 6/15/2030 | 1,159,900 | |
| 6,500,000 | Washoe County, NV Gas & Water Facilities Revenue (Sierra Pacific Power Co.), Refunding Revenue Bonds (Series 2016B) TOBs, 3.000%, Mandatory Tender 6/1/2022 | 6,726,915 | |
| TOTAL | 19,821,501 |
| Principal Amount | Value | ||
| MUNICIPAL BONDS—continued | |||
| New Hampshire—0.5% | |||
| $4,000,000 | National Finance Authority, NH (Waste Management, Inc.), Solid Waste Disposal Refunding Revenue Bonds (Series 2019A-2) TOBs, 2.150%, Mandatory Tender 7/1/2024 | $4,090,000 | |
| New Jersey—4.5% | |||
| 2,000,000 | Kearny, NJ Board of Education GANs, 2.350%, 7/9/2020 | 2,000,760 | |
| 5,000,000 | New Jersey EDA (New Jersey State), School Facilities Construction Refunding Bonds (Series 2015 XX), 5.000%, 6/15/2022 | 5,258,250 | |
| 10,000,000 | 1 | New Jersey EDA (New Jersey State), School Facilities Construction Refunding SIFMA Index Bonds (Series 2013 I) FRNs, 1.380% (SIFMA 7-day +1.250%), 9/1/2025 | 9,644,400 |
| 1,000,000 | New Jersey EDA (New Jersey-American Water Co., Inc.), Water Facilities Refunding Revenue Bonds (Series 2020A), 1.000%, 6/1/2023 | 998,560 | |
| 2,000,000 | New Jersey EDA (New Jersey-American Water Co., Inc.), Water Facilities Refunding Revenue Bonds (Series 2020C), 1.150%, 6/1/2023 | 1,997,120 | |
| 1,000,000 | New Jersey Turnpike Authority, Revenue Bonds (Series 2017A), 5.000%, 1/1/2027 | 1,236,170 | |
| 5,000,000 | 1 | New Jersey Turnpike Authority, Turnpike Revenue Bonds (Series 2017D-3) FRNs, 0.721% (1-month USLIBOR x 0.70 +0.600%), 1/1/2023 | 4,958,550 |
| 5,000,000 | 1 | New Jersey Turnpike Authority, Turnpike Revenue Bonds (Series 2017D-4) FRNs, 0.821% (1-month USLIBOR x 0.70 +0.700%), 1/1/2024 | 4,937,050 |
| 1,000,000 | Tobacco Settlement Financing Corp., NJ, Tobacco Settlement Asset-Backed Refunding Bonds (Series 2018A), 5.000%, 6/1/2022 | 1,078,140 | |
| 2,500,000 | Tobacco Settlement Financing Corp., NJ, Tobacco Settlement Asset-Backed Refunding Bonds (Series 2018A), 5.000%, 6/1/2023 | 2,790,275 | |
| 2,000,000 | Tobacco Settlement Financing Corp., NJ, Tobacco Settlement Asset-Backed Refunding Bonds (Series 2018A), 5.000%, 6/1/2024 | 2,304,080 | |
| TOTAL | 37,203,355 | ||
| New Mexico—0.7% | |||
| 3,500,000 | Farmington, NM (Public Service Co., NM), Pollution Control Revenue Refunding Bonds (Series 2010B) TOBs, 2.125%, Mandatory Tender 6/1/2022 | 3,500,840 | |
| 2,200,000 | New Mexico Municipal Energy Acquisition Authority, Gas Supply Revenue Refunding and Acquisition Bonds (Series 2019A) TOBs, (Royal Bank of Canada GTD), 5.000%, Mandatory Tender 5/1/2025 | 2,586,870 | |
| TOTAL | 6,087,710 | ||
| New York—2.7% | |||
| 5,500,000 | Chautauqua County, NY Capital Resource Corporation (NRG Energy, Inc.), Exempt Facilities Revenue Refunding Bonds (Series 2020) TOBs, 1.278%, Mandatory Tender 4/3/2023 | 5,395,280 |
| Principal Amount | Value | ||
| MUNICIPAL BONDS—continued | |||
| New York—continued | |||
| $4,000,000 | Long Island Power Authority, NY, Electric System General Revenue Bonds (Series 2019B) TOBs, 1.614%, Mandatory Tender 9/1/2024 | $3,986,640 | |
| 3,000,000 | 1 | Metropolitan Transportation Authority, NY (MTA Transportation Revenue), Transportation Revenue Variable Rate Refunding Bonds (Series 2002D-A2) FRNs, (Assured Guaranty Municipal Corp. INS), 0.799% (1-month USLIBOR x 0.69 +0.680%), Mandatory Tender 4/6/2021 | 2,967,180 |
| 5,000,000 | 1 | Metropolitan Transportation Authority, NY (MTA Transportation Revenue), Transportation Revenue Variable Rate Refunding Bonds (Series 2011B) FRNs, 0.666% (1-month USLIBOR x 0.67 +0.550%), Mandatory Tender 11/1/2022 | 4,714,150 |
| 3,000,000 | New York City Housing Development Corp., Sustainable Neighborhood Bonds (Series 2019B-2) TOBs, 2.100%, Mandatory Tender 7/3/2023 | 3,058,530 | |
| 2,500,000 | New York State HFA, Affordable Housing Revenue Bonds (Series 2019F Group 3) TOBs, (New York State Mortgage Agency GTD), 1.875%, Mandatory Tender 11/1/2021 | 2,501,625 | |
| TOTAL | 22,623,405 | ||
| North Carolina—1.7% | |||
| 825,000 | Columbus County, NC Industrial Facilities & Pollution Control Financing Authority (International Paper Co.), Environmental Improvement Revenue Refunding Bonds (Series 2019A) TOBs, 2.000%, Mandatory Tender 10/1/2024 | 852,241 | |
| 1,100,000 | North Carolina HFA, Revenue Bonds (Series 2017 38-B), 4.000%, 7/1/2047 | 1,188,770 | |
| 1,875,000 | North Carolina State Grant Anticipation Revenue, Grant Anticipation Revenue Vehicle Bonds (Series 2019), 5.000%, 3/1/2025 | 2,252,794 | |
| 1,600,000 | North Carolina State Grant Anticipation Revenue, Grant Anticipation Revenue Vehicle Bonds (Series 2019), 5.000%, 3/1/2026 | 1,976,672 | |
| 1,750,000 | North Carolina State Turnpike Authority, Triangle Expressway System Senior Lien Turnpike Revenue Refunding Bonds (Series 2018), 5.000%, 1/1/2027 | 2,039,450 | |
| 1,000,000 | North Carolina State Turnpike Authority, Triangle Expressway System Senior Lien Turnpike Revenue Refunding Bonds (Series 2018), 5.000%, 1/1/2028 | 1,183,160 | |
| 2,000,000 | Wake County, NC, UT GO Refunding Bonds (Series 2020A), 5.000%, 4/1/2027 | 2,573,420 | |
| 1,000,000 | Wake County, NC, UT GO Refunding Bonds (Series 2020A), 5.000%, 4/1/2028 | 1,323,190 | |
| 500,000 | Wake County, NC, UT GO Refunding Bonds (Series 2020A), 5.000%, 4/1/2029 | 678,725 | |
| TOTAL | 14,068,422 |
| Principal Amount | Value | ||
| MUNICIPAL BONDS—continued | |||
| North Dakota—0.3% | |||
| $2,200,000 | Burleigh Co., ND Health Care Revenue (Missouri Slope North Campus), Healthcare BANs (Series 2020), 3.000%, 11/1/2021 | $2,139,830 | |
| Ohio—3.1% | |||
| 3,500,000 | Allen County, OH (Bon Secours Mercy Health), Hospital Facilities Revenue Bonds (Series 2017B) TOBs, 2.150%, Mandatory Tender 5/5/2022 | 3,754,135 | |
| 1,350,000 | American Municipal Power-Ohio, Inc. (Combined Hydroelectric Projects), Revenue Refunding Bonds (Series 2020A), 5.000%, 2/15/2026 | 1,652,454 | |
| 1,600,000 | American Municipal Power-Ohio, Inc. (Combined Hydroelectric Projects), Revenue Refunding Bonds (Series 2020A), 5.000%, 2/15/2027 | 2,003,120 | |
| 1,750,000 | American Municipal Power-Ohio, Inc. (Combined Hydroelectric Projects), Revenue Refunding Bonds (Series 2020A), 5.000%, 2/15/2028 | 2,238,705 | |
| 1,500,000 | American Municipal Power-Ohio, Inc., Revenue Refunding Bonds (Series 2017A), 5.000%, 2/15/2025 | 1,793,625 | |
| 650,000 | Cleveland, OH (Cleveland, OH Water), Water Revenue Bonds (Series 2020FF), 5.000%, 1/1/2026 | 799,838 | |
| 950,000 | Cleveland, OH (Cleveland, OH Water), Water Revenue Bonds (Series 2020FF), 5.000%, 1/1/2027 | 1,199,413 | |
| 600,000 | Cleveland, OH (Cleveland, OH Water), Water Revenue Bonds (Series 2020FF), 5.000%, 1/1/2028 | 777,768 | |
| 1,100,000 | Cleveland, OH (Cleveland, OH Water), Water Revenue Bonds (Series 2020FF), 5.000%, 1/1/2029 | 1,456,466 | |
| 800,000 | Cleveland, OH (Cleveland, OH Water), Water Revenue Bonds (Series 2020FF), 5.000%, 1/1/2030 | 1,082,000 | |
| 500,000 | Hamilton County, OH Hospital Facilities Authority (UC Health ), Revenue Bonds (Series 2014), 5.000%, 2/1/2023 | 550,325 | |
| 3,500,000 | Lancaster, OH Port Authority, Gas Supply Revenue Refunding Bonds (Series 2019) TOBs, (Royal Bank of Canada GTD), 4.945%, Mandatory Tender 2/1/2025 | 4,084,185 | |
| 790,000 | Lorain County, OH, (Series B) BANs, 1.300%, 2/6/2021 | 791,082 | |
| 1,500,000 | Ohio State Air Quality Development Authority (American Electric Power Co., Inc.), Air Quality Revenue Refunding Bonds (Series 2014A) TOBs, 2.400%, Mandatory Tender 10/1/2029 | 1,522,650 | |
| 455,000 | Ohio State Hospital Revenue (University Hospitals Health System, Inc.), Hospital Revenue Bonds (Series 2020A), 5.000%, 1/15/2026 | 540,062 | |
| 345,000 | Ohio State Hospital Revenue (University Hospitals Health System, Inc.), Hospital Revenue Bonds (Series 2020A), 5.000%, 1/15/2027 | 416,267 | |
| 1,000,000 | Ohio State Hospital Revenue (University Hospitals Health System, Inc.), Hospital Revenue Bonds (Series 2020B) TOBs, 5.000%, Mandatory Tender 1/15/2025 | 1,170,700 | |
| TOTAL | 25,832,795 |
| Principal Amount | Value | ||
| MUNICIPAL BONDS—continued | |||
| Oklahoma—2.2% | |||
| $2,285,000 | Canadian County Educational Facilities Authority, OK (Mustang Public Schools), Educational Facilities Lease Revenue Bonds (Series 2012), 4.500%, 9/1/2021 | $2,393,675 | |
| 3,500,000 | Cleveland County, OK Educational Facilities Authority (Norman Public Schools), Educational Facilities Lease Revenue Bonds (Series 2019), 5.000%, 6/1/2024 | 4,040,365 | |
| 3,200,000 | Cleveland County, OK Educational Facilities Authority (Norman Public Schools), Educational Facilities Lease Revenue Bonds (Series 2019), 5.000%, 6/1/2025 | 3,801,248 | |
| 5,000,000 | Oklahoma Development Finance Authority (Gilcrease Developers, LLC), Limited Obligation Revenue Bonds (Series 2020), 1.625%, 7/6/2023 | 4,963,550 | |
| 1,850,000 | Oklahoma Development Finance Authority (Waste Management, Inc.), Solid Waste Disposal Revenue Bonds (Series 2004A), 2.375%, 12/1/2021 | 1,890,607 | |
| 1,000,000 | Tulsa County, OK Industrial Authority (Broken Arrow Public Schools), Educational Facilities Lease Revenue Bonds (Series 2016), 5.000%, 9/1/2022 | 1,095,590 | |
| TOTAL | 18,185,035 | ||
| Pennsylvania—6.6% | |||
| 850,000 | Allegheny County, PA Sanitation Authority, Sewer Revenue Refunding Bonds (Series 2016), (Assured Guaranty Municipal Corp. INS), 5.000%, 12/1/2025 | 1,051,204 | |
| 2,000,000 | Berks County, PA Municipal Authority (Tower Health), Revenue Bonds (Series 2020B-1) TOBs, 5.000%, Mandatory Tender 2/1/2025 | 2,225,380 | |
| 2,000,000 | Cumberland County, PA Municipal Authority (Diakon Lutheran Social Ministries), Revenue Bonds (Series 2015), 5.000%, 1/1/2021 | 2,017,920 | |
| 1,115,000 | Cumberland County, PA Municipal Authority (Diakon Lutheran Social Ministries), Revenue Bonds (Series of 2016), 5.000%, 1/1/2022 | 1,143,366 | |
| 1,155,000 | Cumberland County, PA Municipal Authority (Diakon Lutheran Social Ministries), Revenue Bonds (Series of 2016), 5.000%, 1/1/2024 | 1,217,358 | |
| 500,000 | East Hempfield Township, PA IDA (Willow Valley Retirement Communities), Revenue & Revenue Refunding Bonds (Series 2016), 4.000%, 12/1/2020 | 504,505 | |
| 500,000 | East Hempfield Township, PA IDA (Willow Valley Retirement Communities), Revenue & Revenue Refunding Bonds (Series 2016), 5.000%, 12/1/2022 | 536,025 | |
| 750,000 | East Hempfield Township, PA IDA (Willow Valley Retirement Communities), Revenue & Revenue Refunding Bonds (Series 2016), 5.000%, 12/1/2023 | 824,138 |
| Principal Amount | Value | ||
| MUNICIPAL BONDS—continued | |||
| Pennsylvania—continued | |||
| $12,500,000 | 1 | Geisinger Authority, PA Health System (Geisinger Health System), Health System Revenue Bonds (Series 2014B) FRNs, 1.193% (1-month USLIBOR x 0.67 +1.070%), Mandatory Tender 6/1/2024 | $12,437,750 |
| 5,000,000 | Lehigh County, PA IDA (PPL Electric Utilities Corp.), Pollution Control Revenue Refunding Bonds (Series 2016A) TOBs, 1.770%, Mandatory Tender 9/1/2022 | 5,054,550 | |
| 2,250,000 | 1 | Montgomery County, PA Higher Education & Health Authority Hospital (Thomas Jefferson University), Revenue Bonds (Series 2018C) FRNs, 0.850% (SIFMA 7-day +0.720%), Mandatory Tender 9/1/2023 | 2,249,775 |
| 1,000,000 | 1 | Northampton County, PA General Purpose Authority (St. Luke’s University Health Network), Variable Rate Hospital Revenue Bonds (Series 2018B) FRNs, 1.161% (1-month USLIBOR x 0.70 +1.040%), Mandatory Tender 8/15/2024 | 994,460 |
| 6,500,000 | Pennsylvania Economic Development Financing Authority (Waste Management, Inc.), Solid Waste Disposal Revenue Bonds (Series 2011) TOBs, 2.150%, Mandatory Tender 7/1/2024 | 6,655,675 | |
| 2,000,000 | Pennsylvania EDFA (Waste Management, Inc.), Solid Waste Disposal Revenue Bonds (Series 2004A), 1.850%, 11/1/2021 | 2,027,460 | |
| 2,000,000 | 1 | Pennsylvania HFA, SFM Revenue Bonds (Series 2018-127C) FRNs, 0.699% (1-month USLIBOR x 0.70 +0.570%), Mandatory Tender 10/1/2023 | 1,958,520 |
| 1,500,000 | Pennsylvania State Higher Education Facilities Authority (University of the Sciences in Philadelphia), Revenue Refunding Bonds (Series 2015A), 5.000%, 11/1/2023 | 1,569,105 | |
| 5,000,000 | 1 | Pennsylvania State Turnpike Commission, Variable Rate Turnpike Revenue Bonds (SIFMA Index Bonds)(Series 2014B) FRNs, 1.110% (SIFMA 7-day +0.980%), 12/1/2021 | 4,985,900 |
| 1,700,000 | Philadelphia, PA Gas Works, 1998 General Ordinance Revenue Refunding Bonds (14th Series 2016), 5.000%, 10/1/2021 | 1,780,563 | |
| 1,000,000 | Philadelphia, PA, GO Bonds (Series 2019B), 5.000%, 2/1/2025 | 1,181,450 | |
| 1,000,000 | Philadelphia, PA, GO Bonds (Series 2019B), 5.000%, 2/1/2026 | 1,213,150 | |
| 1,250,000 | Philadelphia, PA, GO Bonds (Series 2019B), 5.000%, 2/1/2027 | 1,553,587 | |
| 1,470,000 | 1 | Scranton, PA School District, GO Notes (Series 2014) (LIBOR Floating Rate Tender Notes) FRNs, (Pennsylvania School District Intercept Program GTD), 0.967% (1-month USLIBOR x 0.68 +0.850%), Mandatory Tender 4/1/2021 | 1,466,942 |
| TOTAL | 54,648,783 | ||
| Rhode Island—1.3% | |||
| 2,250,000 | Rhode Island State Health and Educational Building Corp. (Lifespan Obligated Group), Hospital Financing Revenue Refunding Bonds (Series 2016), 5.000%, 5/15/2021 | 2,320,313 | |
| 2,250,000 | Rhode Island State Health and Educational Building Corp. (Lifespan Obligated Group), Hospital Financing Revenue Refunding Bonds (Series 2016), 5.000%, 5/15/2022 | 2,400,570 |
| Principal Amount | Value | ||
| MUNICIPAL BONDS—continued | |||
| Rhode Island—continued | |||
| $2,000,000 | Rhode Island State Health and Educational Building Corp. (Lifespan Obligated Group), Hospital Financing Revenue Refunding Bonds (Series 2016), 5.000%, 5/15/2023 | $2,195,940 | |
| 3,285,000 | Rhode Island State Health and Educational Building Corp. (Lifespan Obligated Group), Hospital Financing Revenue Refunding Bonds (Series 2016), 5.000%, 5/15/2024 | 3,692,307 | |
| TOTAL | 10,609,130 | ||
| South Carolina—1.0% | |||
| 1,000,000 | Charleston County, SC Special Source, Revenue Bonds (Series 2013), 5.000%, 12/1/2020 | 1,019,800 | |
| 7,200,000 | Laurens County, SC Water and Sewer Commission, Waterworks Distribution System Bond Anticipation Notes (Series 2020), 1.375%, 2/1/2022 | 7,256,808 | |
| TOTAL | 8,276,608 | ||
| South Dakota—0.1% | |||
| 750,000 | Educational Enhancement Funding Corp., SD, Tobacco Settlement Revenue Bonds (Series 2013B), 5.000%, 6/1/2023 | 839,153 | |
| Tennessee—1.6% | |||
| 11,300,000 | Tennergy Corp., TN Gas Revenue, Gas Supply Revenue Bonds (Series 2019A) TOBs, (Royal Bank of Canada GTD), 4.891%, Mandatory Tender 10/1/2024 | 13,064,269 | |
| 370,000 | Tennessee Housing Development Agency, Revenue Refunding Bonds (Series 220142C), 4.000%, 1/1/2045 | 392,000 | |
| TOTAL | 13,456,269 | ||
| Texas—15.7% | |||
| 600,000 | Austin, TX Airport System, Revenue Bonds (Series 2019B), 5.000%, 11/15/2024 | 696,954 | |
| 650,000 | Austin, TX Airport System, Revenue Bonds (Series 2019B), 5.000%, 11/15/2025 | 774,319 | |
| 1,000,000 | Austin, TX Airport System, Revenue Bonds (Series 2019B), 5.000%, 11/15/2026 | 1,217,990 | |
| 5,000,000 | Central Texas Regional Mobility Authority, Senior Lien Revenue & Refunding Bonds (Series 2015B) TOBs, 5.000%, Mandatory Tender 1/7/2021 | 5,003,900 | |
| 1,400,000 | Central Texas Regional Mobility Authority, Senior Lien Revenue Refunding Bonds (Series 2013A), 5.000%, 1/1/2021 | 1,418,648 | |
| 1,500,000 | Dallas, TX Area Rapid Transit, Revenue Refunding Bonds (Series 2016B), 5.000%, 12/1/2022 | 1,667,130 | |
| 9,000,000 | Denton, TX Independent School District, Variable Rate UT GO School Building Bonds (Series 2014-B) TOBs, (Texas Permanent School Fund Guarantee Program GTD), 2.000%, Mandatory Tender 8/1/2024 | 9,438,210 |
| Principal Amount | Value | ||
| MUNICIPAL BONDS—continued | |||
| Texas—continued | |||
| $6,580,000 | Eagle Mountain-Saginaw, TX Independent School District, Variable Rate Unlimited Tax School Building Bonds (Series 2011) TOBs, (Texas Permanent School Fund Guarantee Program GTD), 2.000%, Mandatory Tender 8/1/2024 | $6,911,237 | |
| 3,000,000 | Eanes, TX Independent School District, Variable Rate UT School Building Bonds (Series 2019B) TOBs, (Texas Permanent School Fund Guarantee Program GTD), 1.750%, Mandatory Tender 8/1/2025 | 3,111,090 | |
| 5,920,000 | Fort Bend, TX Independent School District, UT GO Refunding Bonds (Series 2019A) TOBs, (Texas Permanent School Fund Guarantee Program GTD), 1.950%, Mandatory Tender 8/1/2022 | 6,035,973 | |
| 2,500,000 | Georgetown, TX Independent School District, Variable Rate Unlimited Tax School Building Bonds (Series 2019B) TOBs, (Texas Permanent School Fund Guarantee Program GTD), 2.750%, Mandatory Tender 8/1/2022 | 2,602,150 | |
| 5,635,000 | 1 | Harris County, TX Cultural Education Facilities Finance Corp. (Memorial Hermann Health System), Hospital Revenue Refunding Bonds (Series 2013B) FRNs, 1.030% (SIFMA 7-day +0.900%), 6/1/2022 | 5,633,760 |
| 4,500,000 | 1 | Harris County, TX Cultural Education Facilities Finance Corp. (Memorial Hermann Health System), Hospital Revenue Refunding Bonds (Series 2013B) FRNs, 1.080% (SIFMA 7-day +0.950%), 6/1/2023 | 4,502,610 |
| 5,685,000 | 1 | Harris County, TX Cultural Education Facilities Finance Corp. (Memorial Hermann Health System), Hospital Revenue Refunding Bonds (Series 2013B) FRNs, 1.180% (SIFMA 7-day +1.050%), 6/1/2024 | 5,686,762 |
| 5,000,000 | Harris County, TX Education Facilities Finance Corp. (Texas Children’s Hospital), Hospital Revenue Bonds (Series 2019B) TOBs, 4.918%, Mandatory Tender 10/1/2024 | 5,886,350 | |
| 2,000,000 | 1 | Irving, TX Hospital Authority (Baylor Scott & White Medical Center, Irving), Hospital Revenue Bonds (Series 2017B) FRNs, 1.230% (SIFMA 7-day +1.100%), Mandatory Tender 10/15/2023 | 1,950,460 |
| 1,500,000 | Lower Colorado River Authority, TX (LCRA Transmission Services Corp.), Transmission Contract Refunding Revenue Bonds (Series 2019), 5.000%, 5/15/2024 | 1,747,875 | |
| 1,000,000 | Lower Colorado River Authority, TX (LCRA Transmission Services Corp.), Transmission Contract Refunding Revenue Bonds (Series 2019), 5.000%, 5/15/2025 | 1,200,140 | |
| 750,000 | Lower Colorado River Authority, TX (LCRA Transmission Services Corp.), Transmission Contract Refunding Revenue Bonds (Series 2019), 5.000%, 5/15/2026 | 921,885 | |
| 1,000,000 | Lower Colorado River Authority, TX (LCRA Transmission Services Corp.), Transmission Contract Refunding Revenue Bonds (Series 2019), 5.000%, 5/15/2027 | 1,258,110 |
| Principal Amount | Value | ||
| MUNICIPAL BONDS—continued | |||
| Texas—continued | |||
| $1,000,000 | Lower Colorado River Authority, TX (LCRA Transmission Services Corp.), Transmission Contract Refunding Revenue Bonds (Series 2019), 5.000%, 5/15/2028 | $1,284,390 | |
| 1,000,000 | Lower Colorado River Authority, TX (LCRA Transmission Services Corp.), Transmission Contract Refunding Revenue Bonds (Series 2020), 5.000%, 5/15/2025 | 1,200,140 | |
| 1,250,000 | Lower Colorado River Authority, TX (LCRA Transmission Services Corp.), Transmission Contract Refunding Revenue Bonds (Series 2020), 5.000%, 5/15/2026 | 1,536,475 | |
| 2,300,000 | Matagorda County, TX Navigation District No. 1 (AEP Texas, Inc.), Pollution Control Revenue Refunding Bonds (Series 2001A), 2.600%, 11/1/2029 | 2,334,270 | |
| 7,535,000 | Midlothian, TX Independent School District, Variable Rate Unlimited Tax Refunding Bonds (Series 2013C) TOBs, (Texas Permanent School Fund Guarantee Program GTD), 2.000%, Mandatory Tender 8/1/2024 | 7,901,879 | |
| 855,000 | New Hope Cultural Education Facilities Finance Corporation (Longhorn Village), Retirement Facilities Revenue Bonds (Series 2017), 5.000%, 1/1/2022 | 861,122 | |
| 945,000 | New Hope Cultural Education Facilities Finance Corporation (Longhorn Village), Retirement Facilities Revenue Bonds (Series 2017), 5.000%, 1/1/2024 | 957,087 | |
| 980,000 | New Hope Cultural Education Facilities Finance Corporation (Longhorn Village), Retirement Facilities Revenue Bonds (Series 2017), 5.000%, 1/1/2025 | 993,377 | |
| 735,000 | New Hope Cultural Education Facilities Finance Corporation (Westminster Manor), Revenue Bonds (Series 2016), 4.000%, 11/1/2021 | 743,533 | |
| 500,000 | New Hope Cultural Education Facilities Finance Corporation (Westminster Manor), Revenue Bonds (Series 2016), 5.000%, 11/1/2023 | 527,225 | |
| 625,000 | New Hope Cultural Education Facilities Finance Corporation (Westminster Manor), Revenue Bonds (Series 2016), 5.000%, 11/1/2024 | 667,519 | |
| 1,105,000 | New Hope Cultural Education Facilities Finance Corporation (Westminster Manor), Revenue Bonds (Series 2016), 5.000%, 11/1/2025 | 1,193,842 | |
| 1,500,000 | North East, TX Independent School District, Variable Rate UT GO Refunding Bonds (Series 2019) TOBs, (Texas Permanent School Fund Guarantee Program GTD), 2.175%, Mandatory Tender 8/1/2024 | 1,581,960 | |
| 1,400,000 | North Texas Tollway Authority, First Tier Revenue Refunding Bonds (Series 2017A), 5.000%, 1/1/2025 | 1,548,652 | |
| 2,000,000 | North Texas Tollway Authority, Second Tier Revenue Refunding Bonds (Series 2019B), 5.000%, 1/1/2025 | 2,355,280 |
| Principal Amount | Value | ||
| MUNICIPAL BONDS—continued | |||
| Texas—continued | |||
| $2,500,000 | North Texas Tollway Authority, Second Tier Revenue Refunding Bonds (Series 2019B), 5.000%, 1/1/2026 | $3,023,750 | |
| 2,500,000 | North Texas Tollway Authority, Second Tier Revenue Refunding Bonds (Series 2019B), 5.000%, 1/1/2027 | 3,097,475 | |
| 7,945,000 | Northside, TX Independent School District, Variable Rate UT GO School Building and Refunding Bonds (Series 2019) TOBs, (Texas Permanent School Fund Guarantee Program GTD), 1.600%, Mandatory Tender 8/1/2024 | 8,185,019 | |
| 6,000,000 | Pflugerville, TX Independent School District, Variable Rate UT School Building Bonds (Series 2019B) TOBs, (Texas Permanent School Fund Guarantee Program GTD), 2.500%, Mandatory Tender 8/15/2023 | 6,329,940 | |
| 2,500,000 | Prosper, TX Independent School District, Adjustable Rate UT School Building Bonds (Series 2019B) TOBs, (Texas Permanent School Fund Guarantee Program GTD), 2.000%, Mandatory Tender 8/15/2023 | 2,596,625 | |
| 550,000 | Sam Rayburn, TX Municipal Power Agency, Power Supply System Revenue Refunding Bonds (Series 2012), 5.000%, 10/1/2021 | 579,645 | |
| 7,500,000 | San Antonio, TX Electric & Gas System, Variable Rate Junior Lien Revenue Refunding Bonds (Series 2020) TOBs, 1.721%, Mandatory Tender 12/1/2025 | 7,638,150 | |
| 4,000,000 | San Antonio, TX Water System, Water System Variable Rate Junior Lien Revenue Bonds (Series 2019A) TOBs, 2.625%, Mandatory Tender 5/1/2024 | 4,247,800 | |
| TOTAL | 129,050,708 | ||
| Utah—0.6% | |||
| 4,000,000 | Utah County, UT Hospital Revenue (IHC Health Services, Inc.), Revenue Bonds (Series 2020 B-2) TOBs, 5.000%, Mandatory Tender 8/1/2026 | 4,970,480 | |
| Virginia—2.9% | |||
| 4,500,000 | Chesapeake Bay Bridge & Tunnel District, VA, First Tier General Resolution Revenue Bonds Anticipation Notes (Series 2019), 5.000%, 11/1/2023 | 4,853,970 | |
| 7,500,000 | Louisa, VA IDA (Virginia Electric & Power Co.), PCR Refunding Bonds (Series 2008A) TOBs, 1.900%, Mandatory Tender 6/1/2023 | 7,719,300 | |
| 2,000,000 | Roanoke, VA EDA (Carilion Health System Obligated Group), Hospital Revenue Bonds (Series 2012), 5.000%, 7/1/2020 | 2,000,000 | |
| 2,500,000 | Virginia State Public Building Authority Public Facilities, Public Facilities Revenue Refunding Bonds (Series 2020B), 5.000%, 8/1/2025 | 3,058,925 | |
| 1,500,000 | Virginia State Public Building Authority Public Facilities, Public Facilities Revenue Refunding Bonds (Series 2020B), 5.000%, 8/1/2030 | 2,077,215 |
| Principal Amount | Value | ||
| MUNICIPAL BONDS—continued | |||
| Virginia—continued | |||
| $3,750,000 | Wise County, VA IDA (Virginia Electric & Power Co.), (Series 2010A) TOBs, 1.200%, Mandatory Tender 5/31/2024 | $3,759,262 | |
| TOTAL | 23,468,672 | ||
| Washington—3.7% | |||
| 1,000,000 | Energy Northwest, WA, Columbia Generating Station Electric Revenue Refunding Bonds (Series 2020A), 5.000%, 7/1/2030 | 1,376,850 | |
| 2,000,000 | Energy Northwest, WA, Project 1 Electric Revenue Refunding Bonds (Series 2017-A), 5.000%, 7/1/2026 | 2,178,920 | |
| 1,250,000 | Energy Northwest, WA, Project 1 Electric Revenue Refunding Bonds (Series 2020A), 5.000%, 7/1/2027 | 1,608,538 | |
| 1,000,000 | Energy Northwest, WA, Project 1 Electric Revenue Refunding Bonds (Series 2020A), 5.000%, 7/1/2028 | 1,317,700 | |
| 1,750,000 | Port of Seattle, WA Revenue, Intermediate Lien Revenue Bonds (Series 2019), 5.000%, 4/1/2022 | 1,870,277 | |
| 2,000,000 | Port of Seattle, WA Revenue, Intermediate Lien Revenue Bonds (Series 2019), 5.000%, 4/1/2023 | 2,202,840 | |
| 1,500,000 | Port of Seattle, WA Revenue, Intermediate Lien Revenue Bonds (Series 2019), 5.000%, 4/1/2024 | 1,698,990 | |
| 1,825,000 | Port of Seattle, WA Revenue, Intermediate Lien Revenue Bonds (Series 2019), 5.000%, 4/1/2025 | 2,121,216 | |
| 2,000,000 | Port of Seattle, WA Revenue, Intermediate Lien Revenue Bonds (Series 2019), 5.000%, 4/1/2026 | 2,375,840 | |
| 2,000,000 | 1 | Seattle, WA Municipal Light & Power, Refunding Revenue Bonds—SIFMA Index (Series 2018C) FRNs, 0.620% (SIFMA 7-day +0.490%), Mandatory Tender 11/1/2023 | 1,977,100 |
| 1,500,000 | Seattle, WA Municipal Light & Power, Revenue Refunding Bonds (Series 2016C), 5.000%, 10/1/2023 | 1,724,760 | |
| 3,760,000 | 1 | Washington State Health Care Facilities Authority (Fred Hutchinson Cancer Research Center), Variable Rate LIBOR Index Revenue Bonds (Series 2017B) FRNs, 1.224% (1-month USLIBOR x 0.67 +1.100%), Mandatory Tender 7/1/2022 | 3,757,669 |
| 3,000,000 | 1 | Washington State Health Care Facilities Authority (Fred Hutchinson Cancer Research Center), Variable Rate SIFMA Index Revenue Bonds (Series 2017C) FRNs, 1.180% (SIFMA 7-day +1.050%), Mandatory Tender 7/3/2023 | 3,008,370 |
| 3,000,000 | Washington State Health Care Facilities Authority (Providence St. Joseph Health), Revenue Bonds (Series 2012B) TOBs, 5.000%, Mandatory Tender 10/1/2021 | 3,155,640 | |
| TOTAL | 30,374,710 | ||
| West Virginia—0.5% | |||
| 4,000,000 | West Virginia EDA Solid Waste Disposal Facilities (Appalachian Power Co.), Revenue Refunding Bonds Amos Project (Series 2015A) TOBs, 2.550%, Mandatory Tender 4/1/2024 | 4,116,920 |
| Principal Amount | Value | ||
| MUNICIPAL BONDS—continued | |||
| Wisconsin—0.2% | |||
| $1,310,000 | Wisconsin Health & Educational Facilities Authority (Gundersen Lutheran), Revenue Bonds (Series 2011A), 5.000%, 10/15/2020 | $1,325,209 | |
| Wyoming—0.4% | |||
| 3,000,000 | Sweetwater County, WY PCRB (Idaho Power Co.), PCR Refunding Bonds (Series 2006), 1.700%, 7/15/2026 | 3,086,700 | |
| TOTAL MUNICIPAL BONDS (IDENTIFIED COST $749,347,966) | 761,091,321 | ||
| 1 | SHORT-TERM MUNICIPALS—8.1% | ||
| California—2.1% | |||
| 17,600,000 | Nuveen California AMT-Free Quality Municipal Income Fund, (Series A) Weekly VRDNs, 0.920%, 7/1/2020 | 17,600,000 | |
| Mississippi—0.2% | |||
| 1,400,000 | Mississippi Business Finance Corp. (Gulf Power Co.) Daily VRDNs, 0.260%, 7/1/2020 | 1,400,000 | |
| New York—0.2% | |||
| 1,850,000 | New York City, NY, (Series B-3) Weekly VRENs, 0.400%, 7/1/2020 | 1,850,000 | |
| Texas—5.1% | |||
| 1,100,000 | Brazos River Harbor, TX Navigation District of Brazoria County (BASF Corp.), (Series 1996) Weekly VRDNs, 0.650%, 7/1/2020 | 1,100,000 | |
| 2,700,000 | Port of Port Arthur Navigation District of Jefferson County, TX (Motiva Enterprises LLC), (Series 2010A) Daily VRDNs, 0.900%, 7/1/2020 | 2,700,000 | |
| 17,495,000 | Port of Port Arthur Navigation District of Jefferson County, TX (Motiva Enterprises LLC), (Series 2010B) Daily VRDNs, 0.900%, 7/1/2020 | 17,495,000 | |
| 15,675,000 | Port of Port Arthur Navigation District of Jefferson County, TX (Motiva Enterprises LLC), (Series 2010C) Daily VRDNs, 0.920%, 7/1/2020 | 15,675,000 | |
| 4,600,000 | Port of Port Arthur Navigation District of Jefferson County, TX (Motiva Enterprises LLC), (Series 2010D) Weekly VRDNs, 1.950%, 7/1/2020 | 4,600,000 | |
| TOTAL | 41,570,000 | ||
| Wisconsin—0.5% | |||
| 4,500,000 | Wisconsin State HEFA (Marshfield Clinic), (Series 2020C) Weekly VRENs, 0.890%, 7/2/2020 | 4,500,000 | |
| TOTAL SHORT-TERM MUNICIPALS (IDENTIFIED COST $66,920,000) | 66,920,000 | ||
| TOTAL INVESTMENT IN SECURITIES—100.6% (IDENTIFIED COST $816,267,966)3 | 828,011,321 | ||
| OTHER ASSETS AND LIABILITIES - NET—(0.6)%4 | (4,791,144) | ||
| TOTAL NET ASSETS—100% | $823,220,177 |
| 1 | Current rate and current maturity or next reset date shown for floating rate notes and variable rate notes/demand instruments. Certain variable rate securities are not based on a published reference rate and spread but are determined by the issuer or agent and are based on current market conditions. These securities do not indicate a reference rate and spread in their description above. |
| 2 | Denotes a restricted security that either: (a) cannot be offered for public sale without first being registered, or availing of an exemption from registration, under the Securities Act of 1933; or (b) is subject to a contractual restriction on public sales. At June 30, 2020, these restricted securities amounted to $1,506,675, which represented 0.2% of total net assets. |
| 3 | The cost of investments for federal tax purposes amounts to $816,266,618. |
| 4 | Assets, other than investments in securities, less liabilities. See Statement of Assets and Liabilities. |
| AMT | —Alternative Minimum Tax |
| BANs | —Bond Anticipation Notes |
| COL | —Collateralized |
| EDA | —Economic Development Authority |
| EDFA | —Economic Development Finance Authority |
| FRNs | —Floating Rate Notes |
| GANs | —Grant Anticipation Notes |
| GNMA | —Government National Mortgage Association |
| GO | —General Obligation |
| GTD | —Guaranteed |
| HEFA | —Health and Education Facilities Authority |
| HFA | —Housing Finance Authority |
| IDA | —Industrial Development Authority |
| IDB | —Industrial Development Bond |
| INS | —Insured |
| LIBOR | —London Interbank Offered Rate |
| LT | —Limited Tax |
| PCR | —Pollution Control Revenue |
| SFM | —Single Family Mortgage |
| SIFMA | —Securities Industry and Financial Markets Association |
| TEMPS | —Tax Exempt Mandatory Paydown Securities |
| TOBs | —Tender Option Bonds |
| UT | —Unlimited Tax |
| VRDNs | —Variable Rate Demand Notes |
| VRENs | —Variable Rate Extendible Notes |
| Year Ended June 30 | 2020 | 2019 | 2018 | 2017 | 2016 |
| Net Asset Value, Beginning of Period | $10.30 | $10.22 | $10.27 | $10.35 | $10.32 |
| Income From Investment Operations: | |||||
| Net investment income | 0.13 | 0.14 | 0.11 | 0.09 | 0.09 |
| Net realized and unrealized gain (loss) | (0.05) | 0.08 | (0.05) | (0.08) | 0.03 |
| TOTAL FROM INVESTMENT OPERATIONS | 0.08 | 0.22 | 0.06 | 0.01 | 0.12 |
| Less Distributions: | |||||
| Distributions from net investment income | (0.13) | (0.14) | (0.11) | (0.09) | (0.09) |
| Net Asset Value, End of Period | $10.25 | $10.30 | $10.22 | $10.27 | $10.35 |
| Total Return1 | 0.81% | 2.20% | 0.60% | 0.09% | 1.12% |
| Ratios to Average Net Assets: | |||||
| Net expenses2 | 0.81%3 | 0.96%3 | 0.96%3 | 0.96% | 0.96% |
| Net investment income | 1.30% | 1.41% | 1.07% | 0.86% | 0.83% |
| Expense waiver/reimbursement4 | 0.11% | 0.10% | 0.09% | 0.08% | 0.08% |
| Supplemental Data: | |||||
| Net assets, end of period (000 omitted) | $250,177 | $178,706 | $178,414 | $228,127 | $314,598 |
| Portfolio turnover | 49% | 39% | 18% | 32% | 15% |
| 1 | Based on net asset value, which does not reflect the sales charge, redemption fee or contingent deferred sales charge, if applicable. |
| 2 | Amount does not reflect net expenses incurred by investment companies in which the Fund may invest. |
| 3 | The net expense ratio is calculated without reduction for expense offset arrangements. The net expense ratio is 0.81% for the year ended June 30, 2020 and 0.96% for the years ended June 30, 2019 and 2018, after taking into account these expense reductions. |
| 4 | This expense decrease is reflected in both the net expense and net investment income ratios shown above. Amount does not reflect expense waiver/reimbursement recorded by investment companies in which the Fund may invest. |
| Year Ended June 30 | 2020 | 2019 | 2018 | 2017 | 2016 |
| Net Asset Value, Beginning of Period | $10.30 | $10.21 | $10.26 | $10.35 | $10.32 |
| Income From Investment Operations: | |||||
| Net investment income | 0.17 | 0.19 | 0.16 | 0.14 | 0.14 |
| Net realized and unrealized gain (loss) | (0.06) | 0.09 | (0.05) | (0.09) | 0.03 |
| TOTAL FROM INVESTMENT OPERATIONS | 0.11 | 0.28 | 0.11 | 0.05 | 0.17 |
| Less Distributions: | |||||
| Distributions from net investment income | (0.17) | (0.19) | (0.16) | (0.14) | (0.14) |
| Net Asset Value, End of Period | $10.24 | $10.30 | $10.21 | $10.26 | $10.35 |
| Total Return1 | 1.07% | 2.81% | 1.10% | 0.49% | 1.63% |
| Ratios to Average Net Assets: | |||||
| Net expenses2 | 0.46%3 | 0.46%3 | 0.46%3 | 0.46% | 0.46% |
| Net investment income | 1.66% | 1.91% | 1.58% | 1.36% | 1.33% |
| Expense waiver/reimbursement4 | 0.18% | 0.21% | 0.24% | 0.23% | 0.23% |
| Supplemental Data: | |||||
| Net assets, end of period (000 omitted) | $561,612 | $575,676 | $689,739 | $840,891 | $876,680 |
| Portfolio turnover | 49% | 39% | 18% | 32% | 15% |
| 1 | Based on net asset value. |
| 2 | Amount does not reflect net expenses incurred by investment companies in which the Fund may invest. |
| 3 | The net expense ratio is calculated without reduction for expense offset arrangements. The net expense ratio is 0.46% for the years ended June 30, 2020, 2019 and 2018 after taking into account these expense reductions. |
| 4 | This expense decrease is reflected in both the net expense and net investment income ratios shown above. Amount does not reflect expense waiver/reimbursement recorded by investment companies in which the Fund may invest. |
| Year Ended June 30 | 2020 | 2019 | 2018 | 2017 | 2016 |
| Net Asset Value, Beginning of Period | $10.30 | $10.22 | $10.26 | $10.35 | $10.32 |
| Income From Investment Operations: | |||||
| Net investment income | 0.14 | 0.17 | 0.14 | 0.11 | 0.11 |
| Net realized and unrealized gain (loss) | (0.05) | 0.08 | (0.04) | (0.09) | 0.03 |
| TOTAL FROM INVESTMENT OPERATIONS | 0.09 | 0.25 | 0.10 | 0.02 | 0.14 |
| Less Distributions: | |||||
| Distributions from net investment income | (0.14) | (0.17) | (0.14) | (0.11) | (0.11) |
| Net Asset Value, End of Period | $10.25 | $10.30 | $10.22 | $10.26 | $10.35 |
| Total Return1 | 0.93% | 2.46% | 0.95% | 0.25% | 1.39% |
| Ratios to Average Net Assets: | |||||
| Net expenses2 | 0.70%3 | 0.70%3 | 0.71%3 | 0.70% | 0.70% |
| Net investment income | 1.42% | 1.67% | 1.30% | 1.12% | 1.09% |
| Expense waiver/reimbursement4 | 0.21% | 0.35% | 0.34% | 0.33% | 0.33% |
| Supplemental Data: | |||||
| Net assets, end of period (000 omitted) | $11,431 | $11,663 | $14,429 | $31,831 | $30,225 |
| Portfolio turnover | 49% | 39% | 18% | 32% | 15% |
| 1 | Based on net asset value. |
| 2 | Amount does not reflect net expenses incurred by investment companies in which the Fund may invest. |
| 3 | The net expense ratio is calculated without reduction for expense offset arrangements. The net expense ratio is 0.70% for the years ended June 30, 2020 and 2019 and 0.71% for the year ended June 30, 2018, after taking into account these expense reductions. |
| 4 | This expense decrease is reflected in both the net expense and net investment income ratios shown above. Amount does not reflect expense waiver/reimbursement recorded by investment companies in which the Fund may invest. |
| Assets: | ||
| Investment in securities, at value (identified cost $816,267,966) | $828,011,321 | |
| Income receivable | 5,775,632 | |
| Receivable for investments sold | 3,634,547 | |
| Receivable for shares sold | 1,634,310 | |
| TOTAL ASSETS | 839,055,810 | |
| Liabilities: | ||
| Payable for investments purchased | $10,957,240 | |
| Bank overdraft | 3,137,194 | |
| Payable for shares redeemed | 1,313,006 | |
| Income distribution payable | 161,961 | |
| Payable for other service fees (Notes 2 and 5) | 83,697 | |
| Payable for administrative fee (Note 5) | 11,340 | |
| Payable for investment adviser fee (Note 5) | 6,381 | |
| Accrued expenses (Note 5) | 164,814 | |
| TOTAL LIABILITIES | 15,835,633 | |
| Net assets for 80,355,493 shares outstanding | $823,220,177 | |
| Net Assets Consists of: | ||
| Paid-in capital | $824,515,186 | |
| Total distributable earnings (loss) | (1,295,009) | |
| TOTAL NET ASSETS | $823,220,177 | |
| Net Asset Value, Offering Price and Redemption Proceeds Per Share: | ||
| Class A Shares: | ||
| Net asset value per share ($250,177,415 ÷ 24,417,956 shares outstanding), no par value, unlimited shares authorized | $10.25 | |
| Offering price per share (100/99.00 of $10.25) | $10.35 | |
| Redemption proceeds per share | $10.25 | |
| Institutional Shares: | ||
| Net asset value per share ($561,611,843 ÷ 54,822,212 shares outstanding), no par value, unlimited shares authorized | $10.24 | |
| Offering price per share | $10.24 | |
| Redemption proceeds per share | $10.24 | |
| Service Shares: | ||
| Net asset value per share ($11,430,919 ÷ 1,115,325 shares outstanding), no par value, unlimited shares authorized | $10.25 | |
| Offering price per share | $10.25 | |
| Redemption proceeds per share | $10.25 |
| Investment Income: | |||
| Interest | $17,267,765 | ||
| Expenses: | |||
| Investment adviser fee (Note 5) | $3,268,620 | ||
| Administrative fee (Note 5) | 652,049 | ||
| Custodian fees | 26,272 | ||
| Transfer agent fees | 303,847 | ||
| Directors’/Trustees’ fees (Note 5) | 11,603 | ||
| Auditing fees | 31,000 | ||
| Legal fees | 8,674 | ||
| Distribution services fee (Note 5) | 219,132 | ||
| Other service fees (Notes 2 and 5) | 983,376 | ||
| Portfolio accounting fees | 197,323 | ||
| Share registration costs | 53,964 | ||
| Printing and postage | 37,528 | ||
| Miscellaneous (Notes 5) | 37,570 | ||
| TOTAL EXPENSES | 5,830,958 | ||
| Waivers, Reimbursement and Reduction: | |||
| Waiver of investment adviser fee (Note 5) | $(897,289) | ||
| Waiver/reimbursement of other operating expenses (Notes 2 and 5) | (452,280) | ||
| Reduction of custodian fees (Note 6) | (4,729) | ||
| TOTAL WAIVERS, REIMBURSEMENT AND REDUCTION | (1,354,298) | ||
| Net expenses | 4,476,660 | ||
| Net investment income | 12,791,105 | ||
| Realized and Unrealized Gain (Loss) on Investments: | |||
| Net realized gain (loss) on investments | (8,293,147) | ||
| Net change in unrealized appreciation of investments | 1,952,628 | ||
| Net realized and unrealized loss on investments | (6,340,519) | ||
| Change in net assets resulting from operations | $6,450,586 |
| Year Ended June 30 | 2020 | 2019 |
| Increase (Decrease) in Net Assets | ||
| Operations: | ||
| Net investment income | $12,791,105 | $14,276,959 |
| Net realized loss | (8,293,147) | (623,243) |
| Net change in unrealized appreciation | 1,952,628 | 6,091,235 |
| CHANGE IN NET ASSETS RESULTING FROM OPERATIONS | 6,450,586 | 19,744,951 |
| Distributions to Shareholders: | ||
| Class A Shares | (2,664,326) | (2,215,655) |
| Institutional Shares | (9,910,741) | (11,712,101) |
| Service Shares | (159,725) | (222,748) |
| CHANGE IN NET ASSETS RESULTING FROM DISTRIBUTIONS TO SHAREHOLDERS | (12,734,792) | (14,150,504) |
| Share Transactions: | ||
| Proceeds from sale of shares | 353,571,070 | 245,693,169 |
| Proceeds from shares issued in connection with the tax-free transfer of assets from PNC Tax Exempt Limited Maturity Bond Fund | 72,083,408 | — |
| Net asset value of shares issued to shareholders in payment of distributions declared | 10,233,287 | 11,750,967 |
| Cost of shares redeemed | (372,428,512) | (379,575,916) |
| CHANGE IN NET ASSETS RESULTING FROM SHARE TRANSACTIONS | 63,459,253 | (122,131,780) |
| Change in net assets | 57,175,047 | (116,537,333) |
| Net Assets: | ||
| Beginning of period | 766,045,130 | 882,582,463 |
| End of period | $823,220,177 | $766,045,130 |
| Shares of the Fund Issued | Acquired Fund Net Assets Received | Unrealized Appreciation1 | Net Assets of the Fund Immediately Prior to Combination | Net Assets of the Fund Immediately After Combination |
| 6,991,585 | $72,083,408 | $1,739,110 | $796,990,717 | $869,074,125 |
| 1 | Unrealized Appreciation is included in Acquired Fund Net Assets Received amount shown above. |
| Net Investment Income | $13,259,438 |
| Net realized and unrealized gain on investments | $(6,115,331) |
| Net increase in net assets resulting from operations | $7,144,107 |
| ■ | Fixed-income securities are fair valued using price evaluations provided by a pricing service approved by the Fund’s Board of Trustees (the “Trustees”). |
| ■ | Shares of other mutual funds or non-exchange-traded investment companies are valued based upon their reported NAVs. |
| ■ | Derivative contracts listed on exchanges are valued at their reported settlement or closing price, except that options are valued at the mean of closing bid and asked quotations. |
| ■ | Over-the-counter (OTC) derivative contracts are fair valued using price evaluations provided by a pricing service approved by the Trustees. |
| ■ | For securities that are fair valued in accordance with procedures established by and under the general supervision of the Trustees, certain factors may be considered such as: the last traded or purchase price of the security, information obtained by contacting the issuer or dealers, analysis of the issuer’s financial statements or other available documents, fundamental analytical data, the nature and duration of restrictions on disposition, the movement of the market in which the security is normally traded, public trading in similar securities or derivative contracts of the issuer or comparable issuers, movement of a relevant index, or other factors including but not limited to industry changes and relevant government actions. |
| Other Service Fees Incurred | Other Service Fees Reimbursed | |
| Class A Shares | $515,590 | $— |
| Institutional Shares | 440,433 | (440,433) |
| Service Shares | 27,353 | — |
| TOTAL | $983,376 | $(440,433) |
| Security | Acquisition Date | Acquisition Cost | Market Value |
| California Municipal Finance Authority (Waste Management, Inc.), Solid Waste Disposal Revenue Bonds (Series 2009A) TOBs, 1.300%, Mandatory Tender 2/3/2025 | 1/30/2020 | $1,500,000 | $1,506,675 |
| Year Ended June 30 | 2020 | 2019 | ||
| Class A Shares: | Shares | Amount | Shares | Amount |
| Shares sold | 17,277,889 | $177,588,498 | 7,703,129 | $78,866,999 |
| Shares issued to shareholders in payment of distributions declared | 254,356 | 2,613,605 | 213,927 | 2,186,844 |
| Shares redeemed | (10,465,660) | (107,445,312) | (8,024,722) | (81,872,734) |
| NET CHANGE RESULTING FROM CLASS A SHARE TRANSACTIONS | 7,066,585 | $72,756,791 | (107,666) | $(818,891) |
| Year Ended June 30 | 2020 | 2019 | ||
| Institutional Shares: | Shares | Amount | Shares | Amount |
| Shares sold | 16,964,998 | $174,293,170 | 16,203,313 | $165,418,595 |
| Proceeds from shares issued in connection with the tax-free transfer of assets from PNC Tax Exempt Limited Maturity Bond Fund | 6,976,326 | 71,926,097 | — | — |
| Shares issued to shareholders in payment of distributions declared | 727,281 | 7,474,683 | 916,837 | 9,366,667 |
| Shares redeemed | (25,761,369) | (262,806,964) | (28,728,654) | (293,246,385) |
| NET CHANGE RESULTING FROM INSTITUTIONAL SHARE TRANSACTIONS | (1,092,764) | $(9,113,014) | (11,608,504) | $(118,461,123) |
| Year Ended June 30 | 2020 | 2019 | ||
| Service Class Shares: | Shares | Amount | Shares | Amount |
| Shares sold | 165,367 | $1,689,402 | 137,787 | $1,407,575 |
| Proceeds from shares issued in connection with the tax-free transfer of assets from PNC Tax Exempt Limited Maturity Bond Fund | 15,258 | 157,311 | — | — |
| Shares issued to shareholders in payment of distributions declared | 14,110 | 144,999 | 19,327 | 197,456 |
| Shares redeemed | (211,953) | (2,176,236) | (436,799) | (4,456,797) |
| NET CHANGE RESULTING FROM SERVICE SHARE TRANSACTIONS | (17,218) | $(184,524) | (279,685) | $(2,851,766) |
| NET CHANGE RESULTING FROM TOTAL FUND SHARE TRANSACTIONS | 5,956,603 | $63,459,253 | (11,995,855) | $(122,131,780) |
| 2020 | 2019 | |
| Ordinary income | $151,757 | $695 |
| Tax-exempt income | $12,583,035 | $14,149,809 |
| Undistributed tax-exempt income | $18,973 |
| Net unrealized appreciation | $11,744,703 |
| Capital loss carryforwards | $(13,058,685) |
| Short-Term | Long-Term | Total |
| $7,904,454 | $5,154,231 | $13,058,685 |
| Administrative Fee | Average Daily Net Assets of the Investment Complex |
| 0.100% | on assets up to $50 billion |
| 0.075% | on assets over $50 billion |
| Distribution Services Fee Incurred | Distribution Services Fee Waived | |
| Class A Shares | $ 207,285 | $— |
| Service Shares | 11,847 | (11,847) |
| TOTAL | $219,132 | $(11,847) |
| Purchases | $331,249,204 |
| Sales | $270,272,899 |

August 24, 2020
| Beginning Account Value 1/1/2020 | Ending Account Value 6/30/2020 | Expenses Paid During Period1 | |
| Actual: | |||
| Class A Shares | $1,000 | $998.90 | $3.43 |
| Institutional Shares | $1,000 | $999.20 | $2.19 |
| Service Shares | $1,000 | $999.00 | $3.38 |
| Hypothetical (assuming a 5% return before expenses): | |||
| Class A Shares | $1,000 | $1,021.43 | $3.47 |
| Institutional Shares | $1,000 | $1,022.68 | $2.21 |
| Service Shares | $1,000 | $1,021.48 | $3.42 |
| 1 | Expenses are equal to the Fund’s annualized net expense ratios, multiplied by the average account value over the period, multiplied by 182/366 (to reflect the one-half-year period). The annualized net expense ratios are as follows: |
| Class A Shares | 0.69% |
| Institutional Shares | 0.44% |
| Service Shares | 0.68% |
| Name Birth Date Positions Held with Trust Date Service Began | Principal Occupation(s) for Past Five Years, Other Directorships Held and Previous Position(s) |
| J. Christopher Donahue* Birth Date: April 11, 1949 Trustee Indefinite Term Began serving: October 1999 | Principal Occupations: Principal Executive Officer and President of certain of the Funds in the Federated Hermes Fund Family; Director or Trustee of the Funds in the Federated Hermes Fund Family; President, Chief Executive Officer and Director, Federated Hermes, Inc.; Chairman and Trustee, Federated Investment Management Company; Trustee, Federated Investment Counseling; Chairman and Director, Federated Global Investment Management Corp.; Chairman and Trustee, Federated Equity Management Company of Pennsylvania; Trustee, Federated Shareholder Services Company; Director, Federated Services Company. Previous Positions: President, Federated Investment Counseling; President and Chief Executive Officer, Federated Investment Management Company, Federated Global Investment Management Corp. and Passport Research, Ltd; Chairman, Passport Research, Ltd. |
| Name Birth Date Positions Held with Trust Date Service Began | Principal Occupation(s) for Past Five Years, Other Directorships Held and Previous Position(s) |
| Thomas R. Donahue* Birth Date: October 20, 1958 Trustee Indefinite Term Began serving: May 2016 | Principal Occupations: Director or Trustee of certain of the funds in the Federated Hermes Fund Family; Chief Financial Officer, Treasurer, Vice President and Assistant Secretary, Federated Hermes, Inc.; Chairman and Trustee, Federated Administrative Services; Chairman and Director, Federated Administrative Services, Inc.; Trustee and Treasurer, Federated Advisory Services Company; Director or Trustee and Treasurer, Federated Equity Management Company of Pennsylvania, Federated Global Investment Management Corp., Federated Investment Counseling, and Federated Investment Management Company; Director, MDTA LLC; Director, Executive Vice President and Assistant Secretary, Federated Securities Corp.; Director or Trustee and Chairman, Federated Services Company and Federated Shareholder Services Company; and Director and President, FII Holdings, Inc. Previous Positions: Director, Federated Hermes, Inc.; Assistant Secretary, Federated Investment Management Company, Federated Global Investment Management Company and Passport Research, LTD; Treasurer, Passport Research, LTD; Executive Vice President, Federated Securities Corp.; and Treasurer, FII Holdings, Inc. |
| * | Family relationships and reasons for “interested” status: J. Christopher Donahue and Thomas R. Donahue are brothers. Both are “interested” due to their beneficial ownership of shares of Federated Hermes, Inc. and the positions they hold with Federated Hermes, Inc. and its subsidiaries. |
| Name Birth Date Positions Held with Trust Date Service Began | Principal Occupation(s) for Past Five Years, Other Directorships Held, Previous Position(s) and Qualifications |
| John T. Collins Birth Date: January 24, 1947 Trustee Indefinite Term Began serving: September 2013 | Principal Occupations: Director or Trustee of the Federated Hermes Fund Family; formerly, Chairman and CEO, The Collins Group, Inc. (a private equity firm) (Retired). Other Directorships Held: Director, Chairman of the Compensation Committee, KLX Energy Services Holdings, Inc. (oilfield services); former Director of KLX Corp. (aerospace). Qualifications: Mr. Collins has served in several business and financial management roles and directorship positions throughout his career. Mr. Collins previously served as Chairman and CEO of The Collins Group, Inc. (a private equity firm) and as a Director of KLX Corp. Mr. Collins serves as Chairman Emeriti, Bentley University. Mr. Collins previously served as Director and Audit Committee Member, Bank of America Corp.; Director, FleetBoston Financial Corp.; and Director, Beth Israel Deaconess Medical Center (Harvard University Affiliate Hospital). |
| Name Birth Date Positions Held with Trust Date Service Began | Principal Occupation(s) for Past Five Years, Other Directorships Held, Previous Position(s) and Qualifications |
| G. Thomas Hough Birth Date: February 28, 1955 Trustee Indefinite Term Began serving: August 2015 | Principal Occupations: Director or Trustee, Chair of the Audit Committee of the Federated Hermes Fund Family; formerly, Vice Chair, Ernst & Young LLP (public accounting firm) (Retired). Other Directorships Held: Director, Chair of the Audit Committee, Equifax, Inc.; Director, Member of the Audit Committee, Haverty Furniture Companies, Inc.; formerly, Director, Member of Governance and Compensation Committees, Publix Super Markets, Inc. Qualifications: Mr. Hough has served in accounting, business management and directorship positions throughout his career. Mr. Hough most recently held the position of Americas Vice Chair of Assurance with Ernst & Young LLP (public accounting firm). Mr. Hough serves on the President’s Cabinet and Business School Board of Visitors for the University of Alabama. Mr. Hough previously served on the Business School Board of Visitors for Wake Forest University, and he previously served as an Executive Committee member of the United States Golf Association. |
| Maureen Lally-Green Birth Date: July 5, 1949 Trustee Indefinite Term Began serving: August 2009 | Principal Occupations: Director or Trustee of the Federated Hermes Fund Family; Adjunct Professor of Law, Duquesne University School of Law; formerly, Dean of the Duquesne University School of Law and Professor of Law and Interim Dean of the Duquesne University School of Law; formerly, Associate General Secretary and Director, Office of Church Relations, Diocese of Pittsburgh. Other Directorships Held: Director, CNX Resources Corporation (formerly known as CONSOL Energy Inc.). Qualifications: Judge Lally-Green has served in various legal and business roles and directorship positions throughout her career. Judge Lally-Green previously held the position of Dean of the School of Law of Duquesne University (as well as Interim Dean). Judge Lally-Green previously served as a member of the Superior Court of Pennsylvania and as a Professor of Law, Duquesne University School of Law. Judge Lally-Green was appointed by the Supreme Court of Pennsylvania to serve on the Supreme Court’s Board of Continuing Judicial Education and the Supreme Court’s Appellate Court Procedural Rules Committee. Judge Lally-Green also currently holds the positions on not for profit or for profit boards of directors as follows: Director and Chair, UPMC Mercy Hospital; Director and Vice Chair, Our Campaign for the Church Alive!, Inc.; Regent, Saint Vincent Seminary; Member, Pennsylvania State Board of Education (public); Director, Catholic Charities, Pittsburgh; and Director CNX Resources Corporation (formerly known as CONSOL Energy Inc.). Judge Lally-Green has held the positions of: Director, Auberle; Director, Epilepsy Foundation of Western and Central Pennsylvania; Director, Ireland Institute of Pittsburgh; Director, Saint Thomas More Society; Director and Chair, Catholic High Schools of the Diocese of Pittsburgh, Inc.; Director, Pennsylvania Bar Institute; Director, St. Vincent College; and Director and Chair, North Catholic High School, Inc. |
| Name Birth Date Positions Held with Trust Date Service Began | Principal Occupation(s) for Past Five Years, Other Directorships Held, Previous Position(s) and Qualifications |
| Charles F. Mansfield, Jr. Birth Date: April 10, 1945 Trustee Indefinite Term Began serving: March 1999 | Principal Occupations: Director or Trustee of the Federated Hermes Fund Family; Management Consultant and Author. Other Directorships Held: None. Qualifications: Mr. Mansfield has served as a Marine Corps officer and in several banking, business management, educational roles and directorship positions throughout his long career. He remains active as a Management Consultant and Author. |
| Thomas M. O’Neill Birth Date: June 14, 1951 Trustee Indefinite Term Began serving: October 2006 | Principal Occupations: Director or Trustee of the Federated Hermes Fund Family; Sole Proprietor, Navigator Management Company (investment and strategic consulting). Other Directorships Held: None. Qualifications: Mr. O’Neill has served in several business, mutual fund and financial management roles and directorship positions throughout his career. Mr. O’Neill serves as Director, Medicines for Humanity and Director, The Golisano Children’s Museum of Naples, Florida. Mr. O’Neill previously served as Chief Executive Officer and President, Managing Director and Chief Investment Officer, Fleet Investment Advisors; President and Chief Executive Officer, Aeltus Investment Management, Inc.; General Partner, Hellman, Jordan Management Co., Boston, MA; Chief Investment Officer, The Putnam Companies, Boston, MA; Credit Analyst and Lending Officer, Fleet Bank; Director and Consultant, EZE Castle Software (investment order management software); and Director, Midway Pacific (lumber). |
| P. Jerome Richey Birth Date: February 23, 1949 Trustee Indefinite Term Began serving: September 2013 | Principal Occupations: Director or Trustee of the Federated Hermes Fund Family; Management Consultant; Retired; formerly, Senior Vice Chancellor and Chief Legal Officer, University of Pittsburgh and Executive Vice President and Chief Legal Officer, CNX Resources Corporation (formerly known as CONSOL Energy Inc.). Other Directorships Held: None. Qualifications: Mr. Richey has served in several business and legal management roles and directorship positions throughout his career. Mr. Richey most recently held the positions of Senior Vice Chancellor and Chief Legal Officer, University of Pittsburgh. Mr. Richey previously served as Chairman of the Board, Epilepsy Foundation of Western Pennsylvania and Chairman of the Board, World Affairs Council of Pittsburgh. Mr. Richey previously served as Chief Legal Officer and Executive Vice President, CNX Resources Corporation (formerly known as CONSOL Energy Inc.); and Board Member, Ethics Counsel and Shareholder, Buchanan Ingersoll & Rooney PC (a law firm). |
| Name Birth Date Positions Held with Trust Date Service Began | Principal Occupation(s) for Past Five Years, Other Directorships Held, Previous Position(s) and Qualifications |
| John S. Walsh Birth Date: November 28, 1957 Trustee Indefinite Term Began serving: March 1999 | Principal Occupations: Director or Trustee, and Chair of the Board of Directors or Trustees, of the Federated Hermes Fund Family; President and Director, Heat Wagon, Inc. (manufacturer of construction temporary heaters); President and Director, Manufacturers Products, Inc. (distributor of portable construction heaters); President, Portable Heater Parts, a division of Manufacturers Products, Inc. Other Directorships Held: None. Qualifications: Mr. Walsh has served in several business management roles and directorship positions throughout his career. Mr. Walsh previously served as Vice President, Walsh & Kelly, Inc. (paving contractors). |
| Name Birth Date Positions Held with Trust Date Service Began | Principal Occupation(s) for Past Five Years and Previous Position(s) |
| Lori A. Hensler Birth Date: January 6, 1967 TREASURER Officer since: April 2013 | Principal Occupations: Principal Financial Officer and Treasurer of the Federated Hermes Fund Family; Senior Vice President, Federated Administrative Services; Financial and Operations Principal for Federated Securities Corp. and Edgewood Services, Inc.; and Assistant Treasurer, Federated Investors Trust Company. Ms. Hensler has received the Certified Public Accountant designation. Previous Positions: Controller of Federated Hermes, Inc.; Senior Vice President and Assistant Treasurer, Federated Investors Management Company; Treasurer, Federated Investors Trust Company; Assistant Treasurer, Federated Administrative Services, Federated Administrative Services, Inc., Federated Securities Corp., Edgewood Services, Inc., Federated Advisory Services Company, Federated Equity Management Company of Pennsylvania, Federated Global Investment Management Corp., Federated Investment Counseling, Federated Investment Management Company, Passport Research, Ltd., and Federated MDTA, LLC; Financial and Operations Principal for Federated Securities Corp., Edgewood Services, Inc. and Southpointe Distribution Services, Inc. |
| Name Birth Date Positions Held with Trust Date Service Began | Principal Occupation(s) for Past Five Years and Previous Position(s) |
| John B. Fisher Birth Date: May 16, 1956 PRESIDENT Officer since: November 2004 | Principal Occupations: Principal Executive Officer and President of certain of the Funds in the Federated Hermes Fund Family; Director or Trustee of certain of the Funds in the Federated Hermes Fund Family; Vice President, Federated Hermes, Inc.; President, Director/Trustee and CEO, Federated Advisory Services Company, Federated Equity Management Company of Pennsylvania, Federated Global Investment Management Corp., Federated Investment Counseling, Federated Investment Management Company; President and CEO of Passport Research, Ltd.; President of some of the Funds in the Federated Fund Complex and Director, Federated Investors Trust Company. Previous Positions: President and Director of the Institutional Sales Division of Federated Securities Corp.; President and Director of Federated Investment Counseling; Director, Edgewood Securities Corp.; Director, Federated Services Company; Director, Federated Hermes, Inc.; Chairman and Director, Southpointe Distribution Services, Inc. and President, Technology, Federated Services Company. |
| Peter J. Germain Birth Date: September 3, 1959 CHIEF LEGAL OFFICER, SECRETARY and EXECUTIVE VICE PRESIDENT Officer since: January 2005 | Principal Occupations: Mr. Germain is Chief Legal Officer, Secretary and Executive Vice President of the Federated Hermes Fund Family. He is General Counsel, Chief Legal Officer, Secretary and Executive Vice President, Federated Hermes, Inc.; Trustee and Senior Vice President, Federated Investors Management Company; Trustee and President, Federated Administrative Services; Director and President, Federated Administrative Services, Inc.; Director and Vice President, Federated Securities Corp.; Director and Secretary, Federated Private Asset Management, Inc.; Secretary, Federated Shareholder Services Company; and Secretary, Retirement Plan Service Company of America. Mr. Germain joined Federated Hermes in 1984 and is a member of the Pennsylvania Bar Association. Previous Positions: Deputy General Counsel, Special Counsel, Managing Director of Mutual Fund Services, Federated Hermes, Inc.; Senior Vice President, Federated Services Company; and Senior Corporate Counsel, Federated Hermes, Inc. |
| Stephen Van Meter Birth Date: June 5, 1975 CHIEF COMPLIANCE OFFICER AND SENIOR VICE PRESIDENT Officer since: July 2015 | Principal Occupations: Senior Vice President and Chief Compliance Officer of the Federated Hermes Fund Family; Vice President and Chief Compliance Officer of Federated Hermes, Inc. and Chief Compliance Officer of certain of its subsidiaries. Mr. Van Meter joined Federated Hermes, Inc. in October 2011. He holds FINRA licenses under Series 3, 7, 24 and 66. Previous Positions: Mr. Van Meter previously held the position of Compliance Operating Officer, Federated Hermes, Inc. Prior to joining Federated Hermes, Inc., Mr. Van Meter served at the United States Securities and Exchange Commission in the positions of Senior Counsel, Office of Chief Counsel, Division of Investment Management and Senior Counsel, Division of Enforcement. |
| Name Birth Date Positions Held with Trust Date Service Began | Principal Occupation(s) for Past Five Years and Previous Position(s) |
| Deborah A. Cunningham Birth Date: September 15, 1959 CHIEF INVESTMENT OFFICER Officer since: August 2011 | Principal Occupations: Deborah A. Cunningham was named Chief Investment Officer of Federated Hermes’ money market products in 2004. She joined Federated Hermes in 1981 and has been a Senior Portfolio Manager since 1997 and an Executive Vice President of the Fund’s Adviser since 2009. Ms. Cunningham has received the Chartered Financial Analyst designation and holds an M.S.B.A. in Finance from Robert Morris College. |
| Mary Jo Ochson Birth Date: September 12, 1953 CHIEF INVESTMENT OFFICER Officer since: May 2004 | Principal Occupations: Mary Jo Ochson was named Chief Investment Officer of Federated’s tax-exempt, fixed-income products in 2004 and Chief Investment Officer of Federated’s Tax-Free Money Markets in 2010. She joined Federated in 1982 and has been a Senior Portfolio Manager and a Senior Vice President of the Fund’s Adviser since 1996. Ms. Ochson has received the Chartered Financial Analyst designation and holds an M.B.A. in Finance from the University of Pittsburgh. |
| ■ | the liquidity risk framework used to assess, manage, and periodically review each Fund’s liquidity risk and the results of this assessment, including a review of the Funds’ access to other available funding sources such as the Funds’ interfund lending facility, redemptions in-kind and committed lines of credit and confirmation that the Fund did not have to access any of these alternative funding sources during the Period; |
| ■ | the periodic classifications of the Fund’s investments into one of four liquidity categories and the methodologies and inputs used to classify the investments, including the Fund’s reasonably anticipated trade size; |
| ■ | the analysis received from a third-party liquidity assessment vendor that is taken into account in the process of determining the liquidity classifications of the Fund’s investments and the results of an evaluation of the services performed by the vendor in support of this process; |
| ■ | the fact that the Fund invested primarily in highly liquid investments during the Period and, therefore, was not required to establish, and has not established, an HLIM and the procedures for monitoring the status of the Fund as investing primarily in highly liquid investments; |
| ■ | the fact that the Fund invested no more than 15% of its assets in illiquid investments during the Period and the procedures for monitoring this limit; and |
| ■ | liquidity events during the Period, including the impact on liquidity caused by extended non-U.S. market closures and the market disruptions resulting from the novel coronavirus outbreak, and the fact that there were no specific liquidity events during the Period that materially affected the Fund’s liquidity risk. |


Federated Hermes Funds
4000 Ericsson Drive
Warrendale, PA 15086-7561
or call 1-800-341-7400.
CUSIP 313907107
CUSIP 313907206

| Item 2. | Code of Ethics |
(a) As of the end of the period covered by this report, the registrant has adopted a code of ethics (the "Section 406 Standards for Investment Companies - Ethical Standards for Principal Executive and Financial Officers") that applies to the registrant's Principal Executive Officer and Principal Financial Officer; the registrant's Principal Financial Officer also serves as the Principal Accounting Officer.
(c) There was no amendment to the registrant’s code of ethics described in Item 2(a) above during the period covered by the report.
(d) There was no waiver granted, either actual or implicit, from a provision to the registrant’s code of ethics described in Item 2(a) above during the period covered by the report.
(e) Not Applicable
(f)(3) The registrant hereby undertakes to provide any person, without charge, upon request, a copy of the code of ethics. To request a copy of the code of ethics, contact the registrant at 1-800-341-7400, and ask for a copy of the Section 406 Standards for Investment Companies - Ethical Standards for Principal Executive and Financial Officers.
Item 3. Audit Committee Financial Expert
The registrant's Board has determined that each of the following members of the Board's Audit Committee is an “audit committee financial expert,” and is "independent," for purposes of this Item: John T. Collins, G. Thomas Hough and Thomas M. O'Neill.
| Item 4. | Principal Accountant Fees and Services |
(a) Audit Fees billed to the registrant for the two most recent fiscal years:
Fiscal year ended 2020 – $31,600
Fiscal year ended 2019 - $31,000
(b) Audit-Related Fees billed to the registrant for the two most recent fiscal years:
Fiscal year ended 2020 - $0
Fiscal year ended 2019 - $0
Amount requiring approval of the registrant’s audit committee pursuant to paragraph (c)(7)(ii) of Rule 2-01 of Regulation S-X, $1,347 and $0 respectively. Fiscal year ended 2020- Audit consent fee for N-14 merger document.
(c) Tax Fees billed to the registrant for the two most recent fiscal years:
Fiscal year ended 2020 - $0
Fiscal year ended 2019 - $0
Amount requiring approval of the registrant’s audit committee pursuant to paragraph (c)(7)(ii) of Rule 2-01 of Regulation S-X, $0 and $0 respectively.
(d) All Other Fees billed to the registrant for the two most recent fiscal years:
Fiscal year ended 2020 - $0
Fiscal year ended 2019 - $0
Amount requiring approval of the registrant’s audit committee pursuant to paragraph (c)(7)(ii) of Rule 2-01 of Regulation S-X, $0 and $0 respectively.
(e)(1) Audit Committee Policies regarding Pre-approval of Services.
The Audit Committee is required to pre-approve audit and non-audit services performed by the independent auditor in order to assure that the provision of such services do not impair the auditor’s independence. Unless a type of service to be provided by the independent auditor has received general pre-approval, it will require specific pre-approval by the Audit Committee. Any proposed services exceeding pre-approved cost levels will require specific pre-approval by the Audit Committee.
Certain services have the general pre-approval of the Audit Committee. The term of the general pre-approval is 12 months from the date of pre-approval, unless the Audit Committee specifically provides for a different period. The Audit Committee will annually review the services that may be provided by the independent auditor without obtaining specific pre-approval from the Audit Committee and may grant general pre-approval for such services. The Audit Committee will revise the list of general pre-approved services from time to time, based on subsequent determinations. The Audit Committee will not delegate to management its responsibilities to pre-approve services performed by the independent auditor.
The Audit Committee has delegated pre-approval authority to its Chairman for services that do not exceed a specified dollar threshold. The Chairman or Chief Audit Executive will report any such pre-approval decisions to the Audit Committee at its next scheduled meeting. The Committee will designate another member with such pre-approval authority when the Chairman is unavailable.
AUDIT SERVICES
The annual Audit services engagement terms and fees will be subject to the specific pre-approval of the Audit Committee. The Audit Committee will approve, if necessary, any changes in terms, conditions and fees resulting from changes in audit scope, registered investment company (RIC) structure or other matters.
In addition to the annual Audit services engagement specifically approved by the Audit Committee, the Audit Committee may grant general pre-approval for other Audit services, which are those services that only the independent auditor reasonably can provide. The Audit Committee has pre-approved certain Audit services; with limited exception, all other audit services must be specifically pre-approved by the Audit Committee.
AUDIT-RELATED SERVICES
Audit-related services are assurance and related services that are reasonably related to the performance of the audit or review of the RIC’s financial statements or that are traditionally performed by the independent auditor. The Audit Committee believes that the provision of Audit-related services does not impair the independence of the auditor, and has pre-approved certain audit-related services; all other audit-related services must be specifically pre-approved by the Audit Committee.
TAX SERVICES
The Audit Committee believes that the independent auditor can provide Tax services to the RIC such as tax compliance, tax planning and tax advice without impairing the auditor’s independence. However, the Audit Committee will not permit the retention of the independent auditor in connection with a transaction initially recommended by the independent auditor, the purpose of which may be tax avoidance and the tax treatment of which may not be supported in the Internal Revenue Code and related regulations. The Audit Committee has pre-approved certain Tax services; with limited exception, all tax services involving large and complex transactions must be specifically pre-approved by the Audit Committee.
ALL OTHER SERVICES
With respect to the provision of permissible services other than audit, review or attest services the pre-approval requirement is waived if:
| (1) | With respect to such services rendered to the Funds, the aggregate amount of all such services provided constitutes no more than five percent of the total amount of revenues paid by the audit client to its accountant during the fiscal year in which the services are provided; and, |
| (2) | With respect to such services rendered to the Fund’s investment adviser and any entity controlling, controlled by to under common control with the investment adviser such as affiliated non-U.S. and U.S. funds not under the Audit Committee’s purview and which do not fall within a category of service which has been determined by the Audit Committee not to have a direct impact on the operations or financial reporting of the RIC, the aggregate amount of all services provided constitutes no more than five percent of the total amount of revenues paid to the RIC’s auditor by the RIC, its investment adviser and any entity controlling, controlled by, or under common control with the investment adviser during the fiscal year in which the services are provided; and |
| (3) | Such services were not recognized by the issuer or RIC at the time of the engagement to be non-audit services; and |
| (4) | Such services are promptly brought to the attention of the Audit Committee and approved prior to the completion of the audit by the Audit Committee or by one or more members of the Audit Committee who are members of the Board of Directors to whom authority to grant such approvals has been delegated by the Audit Committee. |
The Audit Committee may grant general pre-approval to those permissible non-audit services which qualify for pre-approval and which it believes are routine and recurring services, and would not impair the independence of the auditor.
The SEC’s rules and relevant guidance should be consulted to determine the precise definitions of these services and applicability of exceptions to certain of the prohibitions.
PRE-APPROVAL FEE LEVELS
Pre-approval fee levels for all services to be provided by the independent auditor will be established annually by the Audit Committee. Any proposed services exceeding these levels will require specific pre-approval by the Audit Committee.
PROCEDURES
Requests or applications to provide services that require specific approval by the Audit Committee will be submitted to the Audit Committee by the Fund’s Principal Accounting Officer and/or the Chief Audit Executive of Federated Hermes, Inc., only after those individuals have determined that the request or application is consistent with the SEC’s rules on auditor independence.
(e)(2) Percentage of services identified in items 4(b) through 4(d) that were approved by the registrants audit committee pursuant to paragraph (c)(7)(i)(C) of Rule 2-01 of Regulation S-X:
4(b)
Fiscal year ended 2020 – 0%
Fiscal year ended 2019 - 0%
Percentage of services provided to the registrants investment adviser and any entity controlling, controlled by, or under common control with the investment adviser that provides ongoing services to the registrant that were approved by the registrants audit committee pursuant to paragraph (c)(7)(i)(C) of Rule 2-01 of Regulation S-X, 0% and 0% respectively.
4(c)
Fiscal year ended 2020 – 0%
Fiscal year ended 2019 – 0%
Percentage of services provided to the registrants investment adviser and any entity controlling, controlled by, or under common control with the investment adviser that provides ongoing services to the registrant that were approved by the registrants audit committee pursuant to paragraph (c)(7)(i)(C) of Rule 2-01 of Regulation S-X, 0% and 0% respectively.
4(d)
Fiscal year ended 2020 – 0%
Fiscal year ended 2019 – 0%
Percentage of services provided to the registrants investment adviser and any entity controlling, controlled by, or under common control with the investment adviser that provides ongoing services to the registrant that were approved by the registrants audit committee pursuant to paragraph (c)(7)(i)(C) of Rule 2-01 of Regulation S-X, 0% and 0% respectively.
| (f) | NA |
| (g) | Non-Audit Fees billed to the registrant, the registrant’s investment adviser, and certain entities controlling, controlled by or under common control with the investment adviser: |
Fiscal year ended 2020 - $145,425
Fiscal year ended 2019 - $659,491
| (h) | The registrant’s Audit Committee has considered that the provision of non-audit services that were rendered to the registrant’s adviser (not including any sub-adviser whose role is primarily portfolio management and is subcontracted with or overseen by another investment adviser), and any entity controlling, controlled by, or under common control with the investment adviser that provides ongoing services to the registrant that were not pre-approved pursuant to paragraph (c)(7)(ii) of Rule 2-01 of Regulation S-X is compatible with maintaining the principal accountant’s independence. |
The registrant’s management and Audit Committee continue to believe that the registrant’s registered public accounting firm, Ernst & Young LLP (“EY”), has the ability to exercise objective and impartial judgment on all issues encompassed within their audit services. EY is required to make a determination that it satisfies certain independence requirements under the federal securities laws. Like other registrants, there is a risk that activities or relationships of EY, or its partners or employees, can prevent a determination from being made that it satisfies such independence requirements with respect to the registrant, which could render it ineligible to serve as the registrant’s independent public accountant.
In its required communications to the Audit Committee of the registrant’s Board, EY informed the Audit Committee that EY and/or covered person professionals within EY maintain lending relationships with certain owners of greater than 10% of the shares of certain investment companies within the “investment company complex” as defined under Rule 2-01(f)(14) of Regulation S-X, which are affiliates of the registrant. EY has advised the Audit Committee that these lending relationships implicate Rule 2-01(c)(1)(ii)(A) of Regulation S-X (referred to as the “Loan Rule”). The Loan Rule prohibits an independent public accountant, or covered person professionals at such firm, from having a financial relationship (such as a loan) with a lender that is a record or beneficial owner of more than 10% of an audit client’s equity securities. For purposes of the Loan Rule, audit clients include the registrant, as well as all registered investment companies advised by advisory subsidiaries of Federated Hermes, Inc., the Adviser (for which EY serves as independent public accountant), and their respective affiliates (collectively, the “Federated Hermes Fund Complex”).
EY informed the Audit Committee that EY believes that these lending relationships described above do not and will not impair EY’s ability to exercise objective and impartial judgment in connection with financial statement audits of their respective funds of the registrant and a reasonable investor with knowledge of all relevant facts and circumstances would conclude that EY has been and is capable of objective and impartial judgment on all issues encompassed within EY’s audits.
On June 20, 2016, the Division of Investment Management of the Securities and Exchange Commission (“SEC”) issued a no-action letter to another mutual fund complex (see Fidelity Management & Research Company et al., No-Action Letter) related to similar Loan Rule matters as those described above (the “Letter”). In the Letter, the SEC Staff confirmed that it would not recommend enforcement action against an investment company that relied on the audit services performed by an independent public accountant where the Loan Rule was implicated in certain specified circumstances provided that: (1) the auditor has complied with PCAOB Rule 3526(b)(1) and 3526(b)(2); (2) the Loan Rule is implicated because of lending relationships; and (3) notwithstanding such lending relationships that implicate the Loan Rule, the auditor has concluded that it is objective and impartial with respect to the issues encompassed within its engagement as auditor of the funds. The circumstances described in the Letter are substantially similar to the circumstances that implicated the Loan Rule with respect to EY and the registrant. On September 22, 2017, the SEC extended the expiration of the Letter until the effectiveness of any amendments to the Loan Rule designed to address the concerns in the Letter. On June 18, 2019, the SEC adopted amendments (effective October 3, 2019) to the Loan Rule, which, refocus the analysis that must be conducted to determine whether an auditor is independent when the auditor has a lending relationship with certain shareholders of an audit client at any time during an audit or professional engagement period.
If it were to be determined that, with respect to the Loan Rule, the relief available under the Letter was improperly relied upon, or that the independence requirements under the federal securities laws were not complied with regarding the registrant, for certain periods, and/or given the implication of the Investment Rule for certain periods, any of the registrant’s filings with the SEC which contain financial statements of the registrant for such periods may be determined not to be consistent with or comply with applicable federal securities laws, the registrant’s ability to offer shares under its current registration statement may be impacted, and certain financial reporting and/or other covenants with, and representations and warranties to, the registrant’s lender under its committed line of credit may be impacted. Such events could have a material adverse effect on the registrant and the Federated Hermes Fund Complex.
| Item 5. | Audit Committee of Listed Registrants |
Not Applicable
| Item 6. | Schedule of Investments |
(a) The registrant’s Schedule of Investments is included as part of the Report to Stockholders filed under Item 1 of this form.
(b) Not Applicable; Fund had no divestments during the reporting period covered since the previous Form N-CSR filing.
| Item 7. | Disclosure of Proxy Voting Policies and Procedures for Closed-End Management Investment Companies |
Not Applicable
| Item 8. | Portfolio Managers of Closed-End Management Investment Companies |
Not Applicable
| Item 9. | Purchases of Equity Securities by Closed-End Management Investment Company and Affiliated Purchasers |
Not Applicable
| Item 10. | Submission of Matters to a Vote of Security Holders |
No Changes to Report
| Item 11. | Controls and Procedures |
(a) The registrant’s President and Treasurer have concluded that the
registrant’s disclosure controls and procedures (as defined in rule 30a-3(c) under the Act) are effective in design and operation and are sufficient to form the basis of the certifications required by Rule 30a-(2) under the Act, based on their evaluation of these disclosure controls and procedures within 90 days of the filing date of this report on Form N-CSR.
(b) There were no changes in the registrant’s internal control over financial reporting (as defined in rule 30a-3(d) under the Act) during the registrant’s most recent fiscal half-year (the registrant’s second fiscal half-year in the case of an annual report) that have materially affected, or are reasonably likely to materially affect, the registrant’s internal control over financial reporting.
| Item 12. | Disclosure of Securities Lending Activities for Closed-End Management Investment Companies |
Not Applicable
| Item 13. | Exhibits |
(a)(1) Code of Ethics- Not Applicable to this Report.
(a)(2) Certifications of Principal Executive Officer and Principal Financial Officer.
(a)(3) Not Applicable.
(b) Certifications pursuant to 18 U.S.C. Section 1350.
SIGNATURES
Pursuant to the requirements of the Securities Exchange Act of 1934 and the Investment Company Act of 1940, the registrant has duly caused this report to be signed on its behalf by the undersigned, thereunto duly authorized.
Registrant Federated Hermes Short-Intermediate Duration Municipal Trust
By /S/ Lori A. Hensler
Lori A. Hensler, Principal Financial Officer
Date August 24, 2020
Pursuant to the requirements of the Securities Exchange Act of 1934 and the Investment Company Act of 1940, this report has been signed below by the following persons on behalf of the registrant and in the capacities and on the dates indicated.
By /S/ John B. Fisher
John B. Fisher, Principal Executive Officer
Date August 24, 2020
By /S/ Lori A. Hensler
Lori A. Hensler, Principal Financial Officer
Date August 24, 2020